atmospheric turbulence measurements using small
TRANSCRIPT
Atmospheric Turbulence Measurements Using Small Unmanned Aircraft Systems
Dale LawrenceAbhiram Doddi
John FarnsworthLakshmi Kantha
Aerospace Engineering SciencesUniversity of Colorado
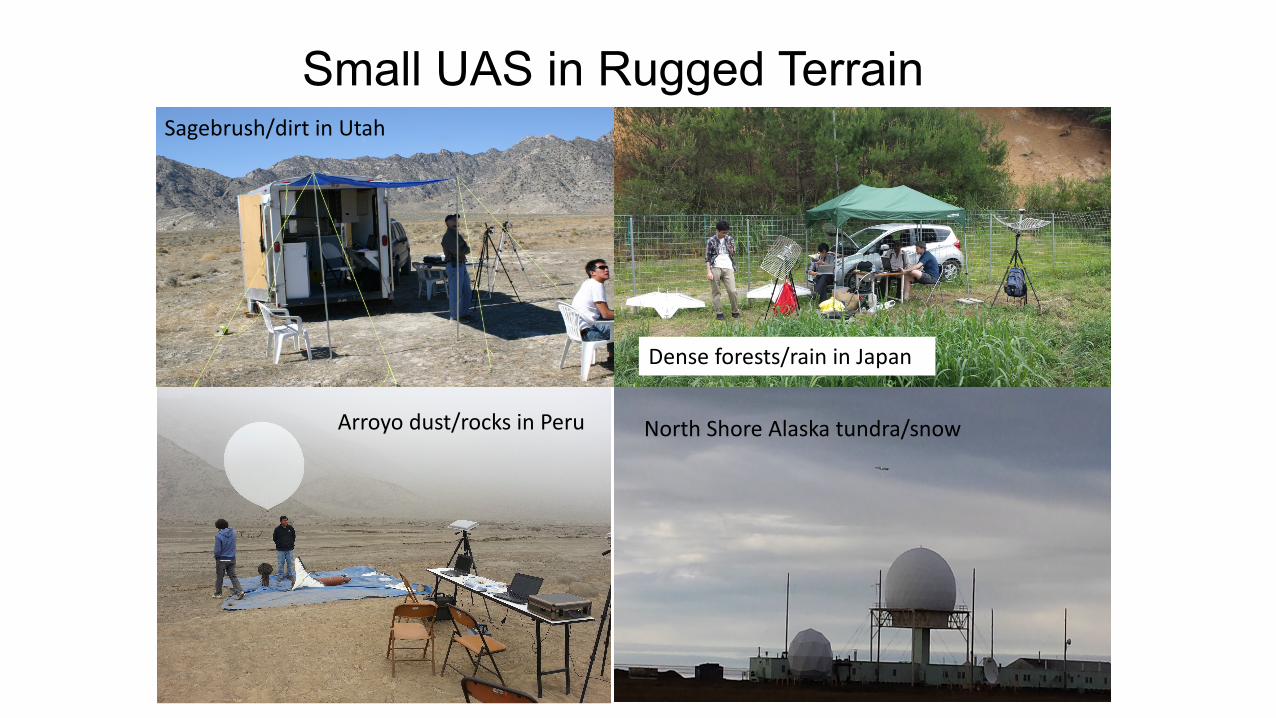
Small UAS in Rugged Terrain
Arroyo dust/rocks in Peru North Shore Alaska tundra/snow
Sagebrush/dirt in Utah
Dense forests/rain in Japan
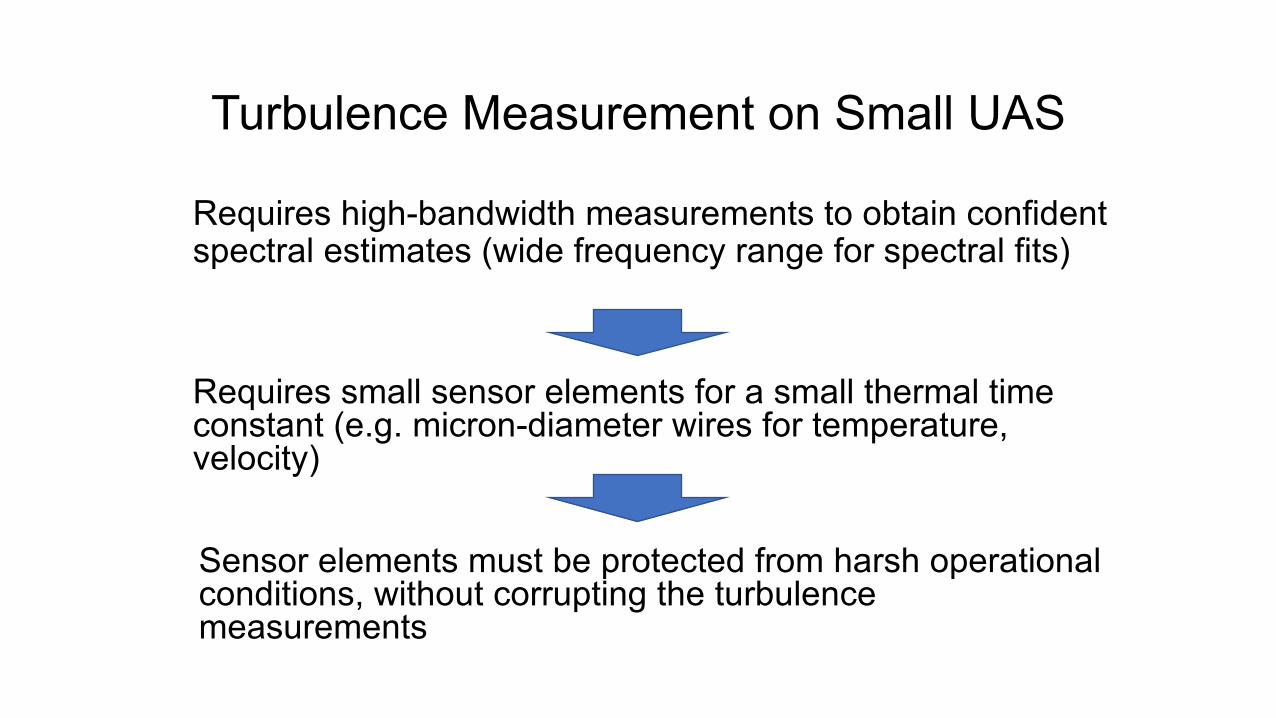
Turbulence Measurement on Small UAS
Requires high-bandwidth measurements to obtain confident spectral estimates (wide frequency range for spectral fits)
Requires small sensor elements for a small thermal time constant (e.g. micron-diameter wires for temperature, velocity)
Sensor elements must be protected from harsh operational conditions, without corrupting the turbulence measurements
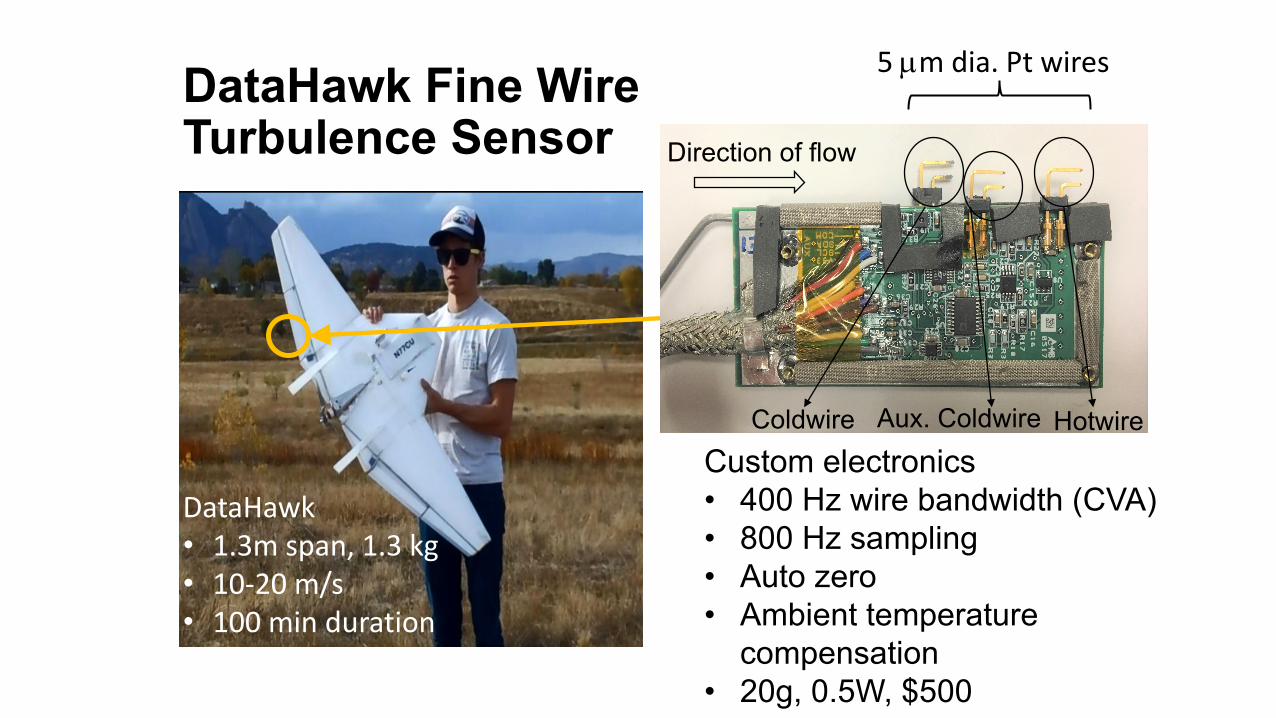
DataHawk Fine Wire Turbulence Sensor
5 µm dia. Pt wires
Custom electronics• 400 Hz wire bandwidth (CVA)• 800 Hz sampling• Auto zero• Ambient temperature
compensation• 20g, 0.5W, $500
DataHawk• 1.3m span, 1.3 kg• 10-20 m/s• 100 min duration
Aux. ColdwireColdwire
Direction of flow
Hotwire
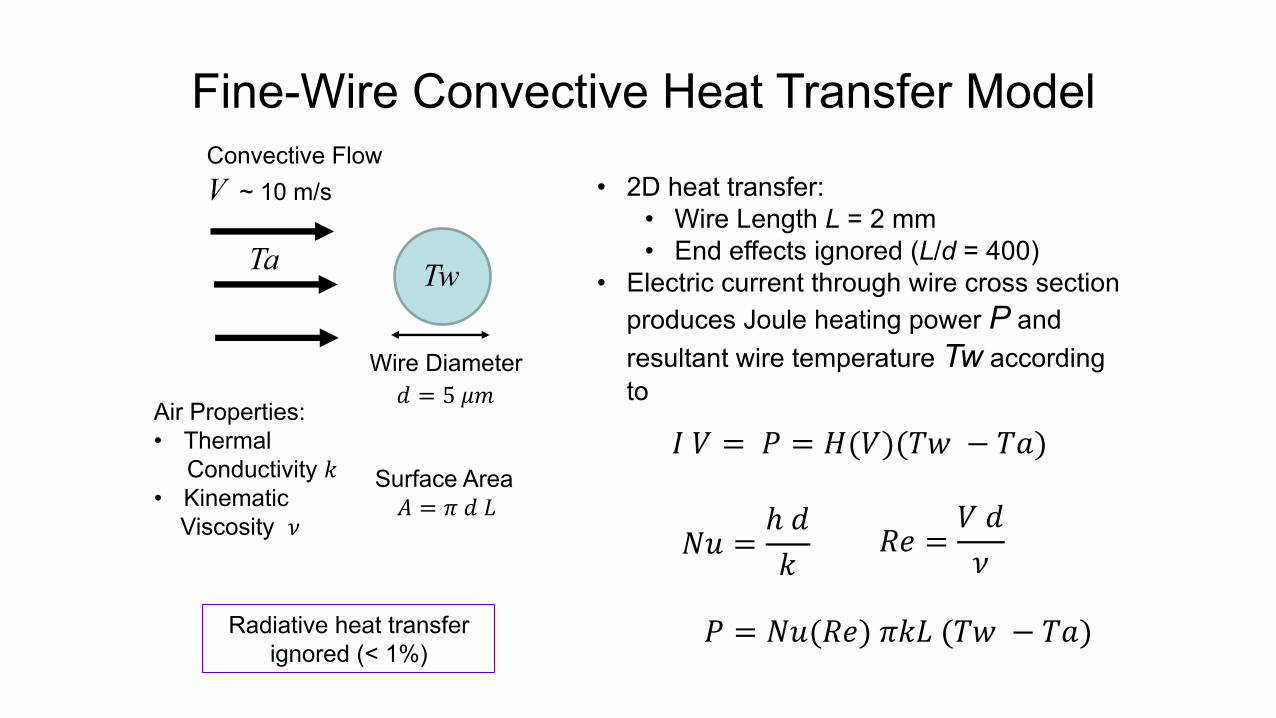
Fine-Wire Convective Heat Transfer Model
Wire Diameter
Convective FlowV ~ 10 m/s • 2D heat transfer:
• Wire Length L = 2 mm• End effects ignored (L/d = 400)
• Electric current through wire cross section produces Joule heating power P and resultant wire temperature Tw according to
! " = $ = %(")(() − (+)
,- = ℎ /0
1 = 2 / 3
$ = ,-(45) 203 (() − (+)
/ = 5 78
Surface Area
45 = " /9
Air Properties:• Thermal
Conductivity 0• Kinematic
Viscosity 9
Radiative heat transfer ignored (< 1%)
TwTa
100 102 104
10-10
10-5
100
Frequency, [Hz]
Pow
er S
pect
ral D
ensi
ty, [
(m/s
)2 /Hz]
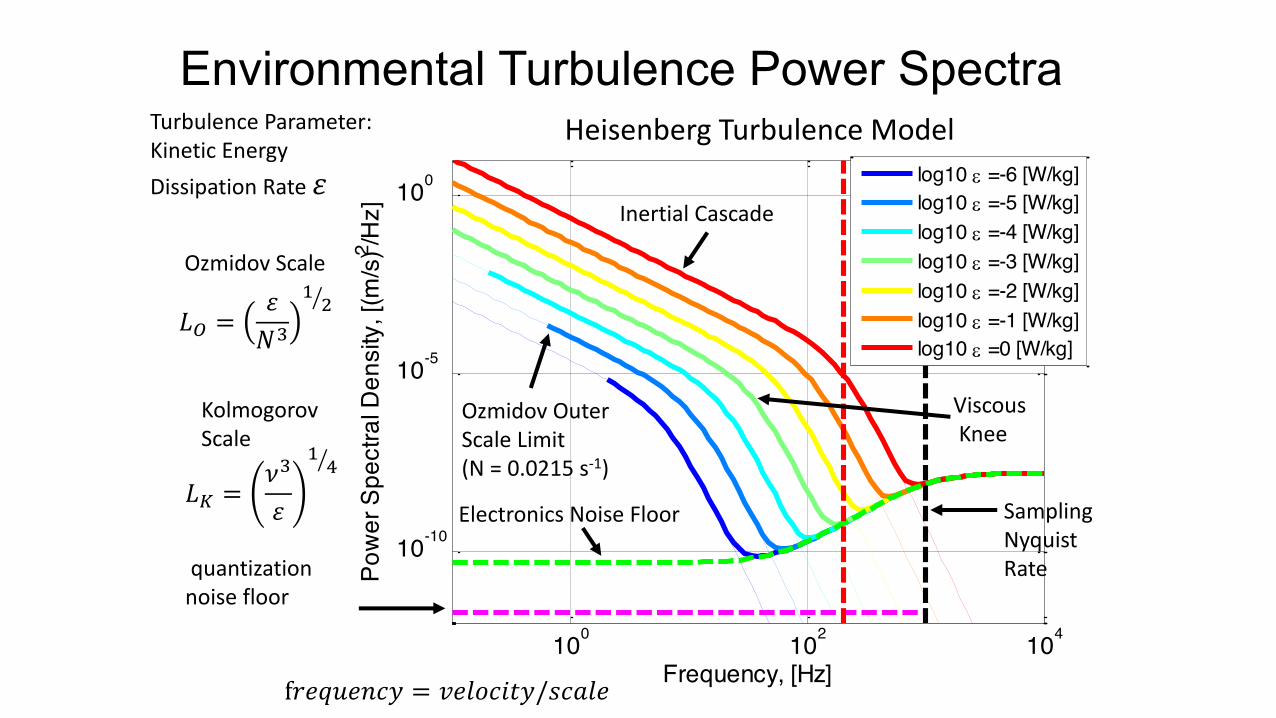
Heisenberg Turbulence Model, 2 m/s Mean Flow, 20km Alt.
log10 e =-6 [W/kg]log10 e =-5 [W/kg]log10 e =-4 [W/kg]log10 e =-3 [W/kg]log10 e =-2 [W/kg]log10 e =-1 [W/kg]log10 e =0 [W/kg]
Environmental Turbulence Power Spectra
Sampling Nyquist Rate
Electronics Noise Floor
quantization noise floor
Ozmidov Outer Scale Limit (N = 0.0215 s-1)
Inertial Cascade
ViscousKnee
!" =$%&
'( )
!* =+&$
'( ,
f./01/234 = 5/673894/;3<6/
Ozmidov Scale
Kolmogorov Scale
Heisenberg Turbulence ModelTurbulence Parameter:Kinetic Energy
Dissipation Rate $
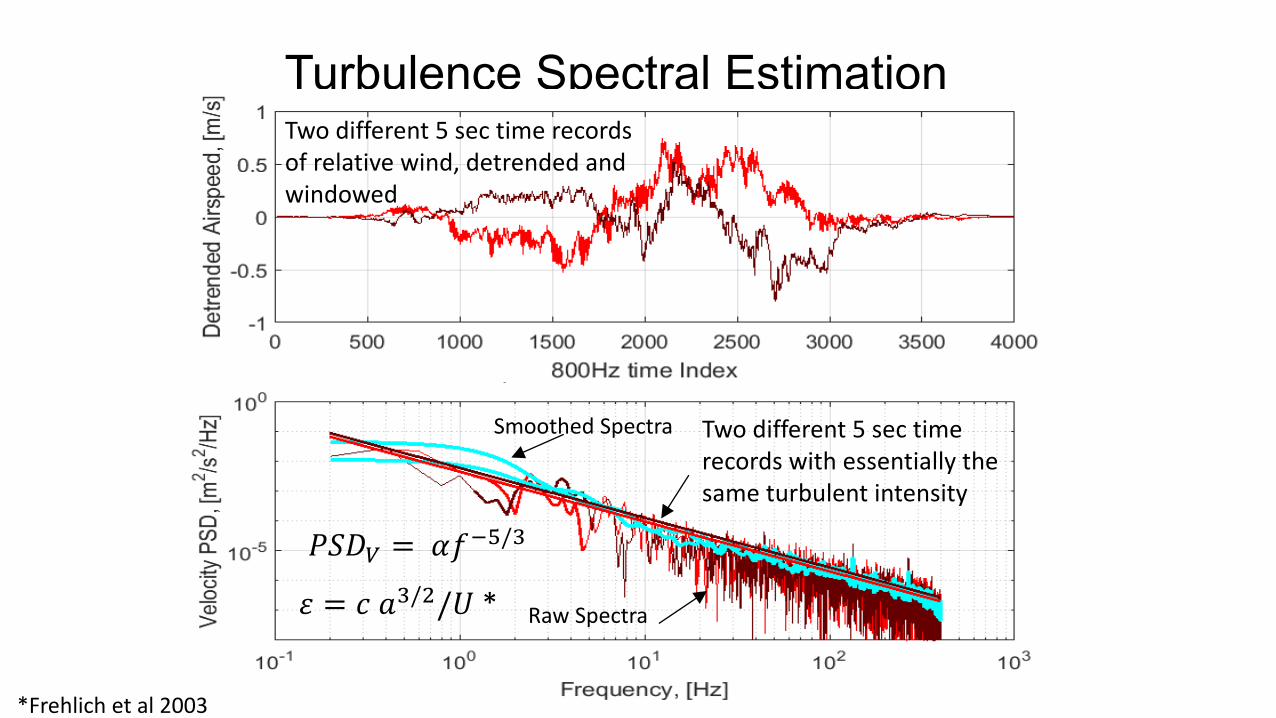
Turbulence Spectral Estimation
Smoothed Spectra
Raw Spectra
Two different 5 sec time records with essentially the same turbulent intensity
Two different 5 sec time records of relative wind, detrended and windowed
Smoothed Spectra
!"#$ = &'()/+
, = - .+///0 *
*Frehlich et al 2003
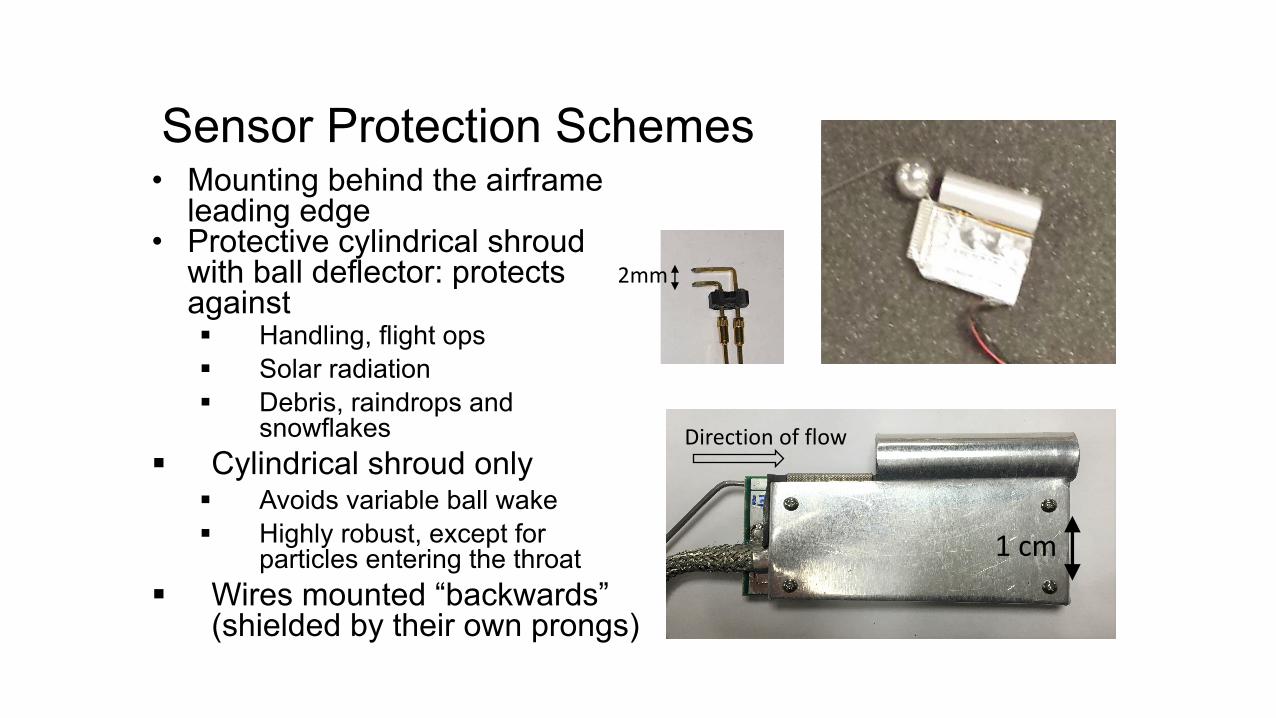
Sensor Protection Schemes• Mounting behind the airframe
leading edge• Protective cylindrical shroud
with ball deflector: protects against § Handling, flight ops§ Solar radiation § Debris, raindrops and
snowflakes§ Cylindrical shroud only
§ Avoids variable ball wake§ Highly robust, except for
particles entering the throat§ Wires mounted “backwards”
(shielded by their own prongs)
1 cm
Direction of flow
2mm
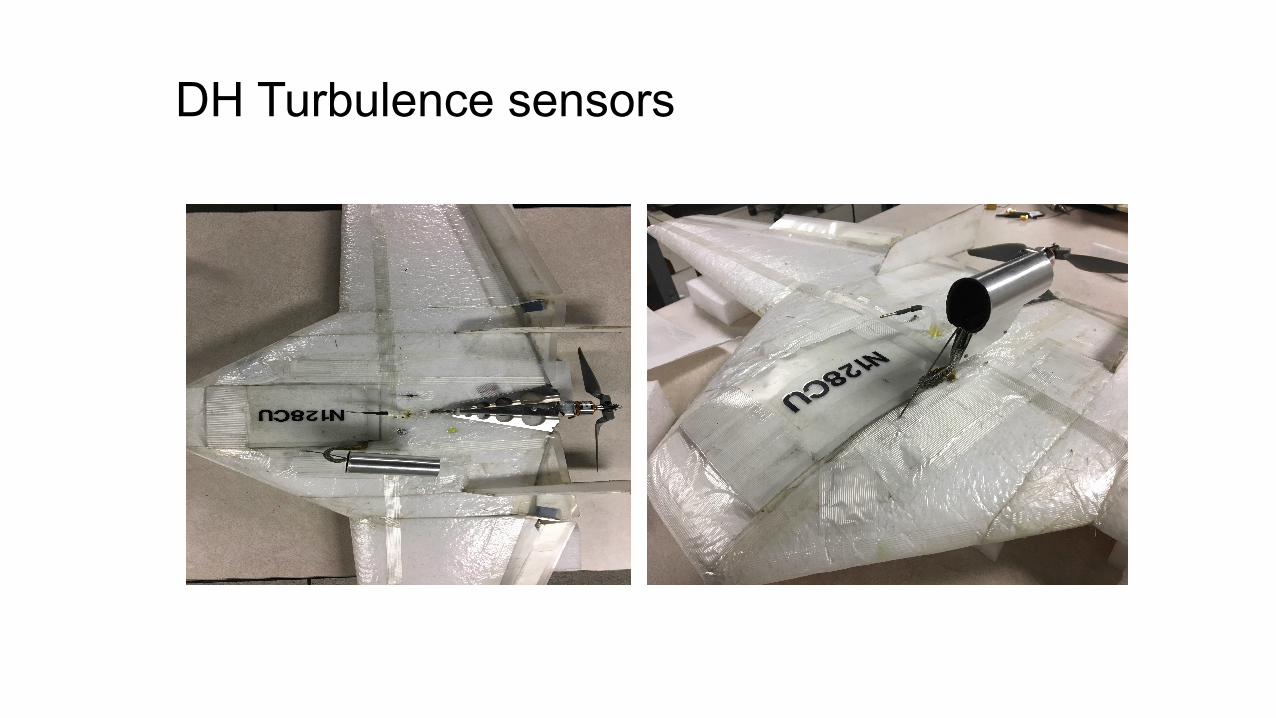
DH Turbulence sensors
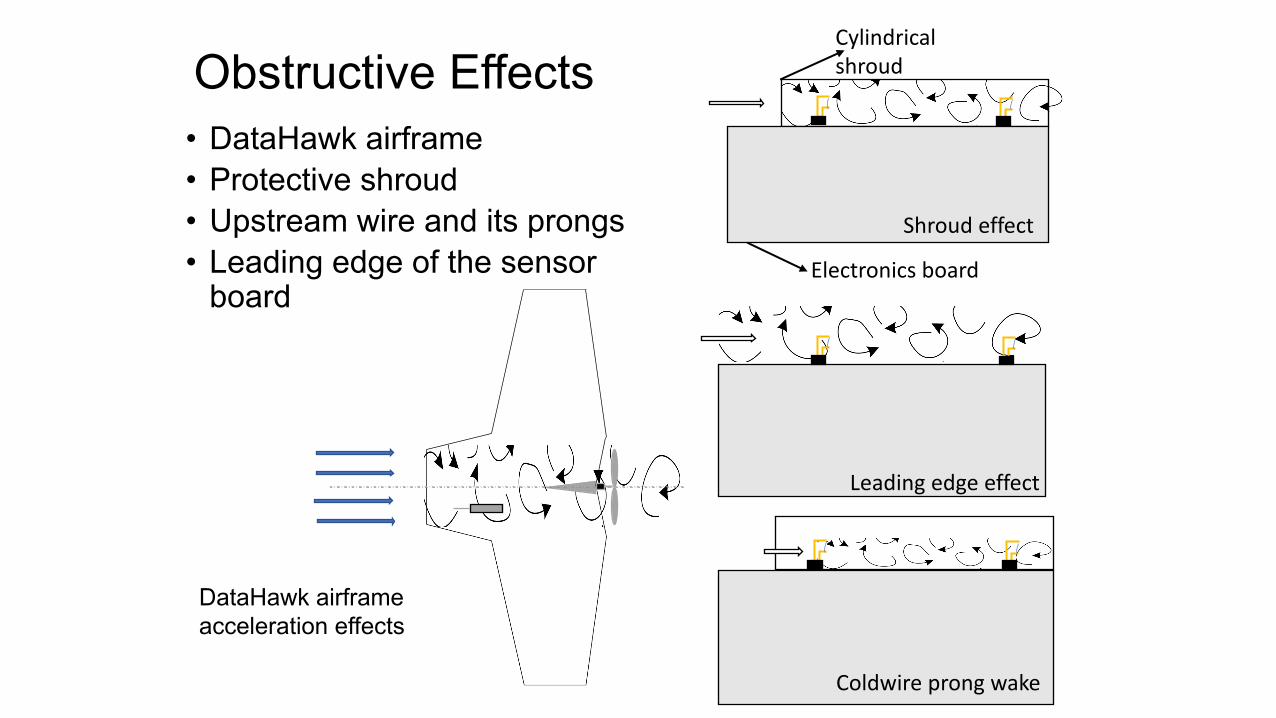
Obstructive Effects
DataHawk airframe acceleration effects
• DataHawk airframe• Protective shroud• Upstream wire and its prongs• Leading edge of the sensor
board
Shroud effect
Electronics board
Cylindrical shroud
Leading edge effect
Coldwire prong wake
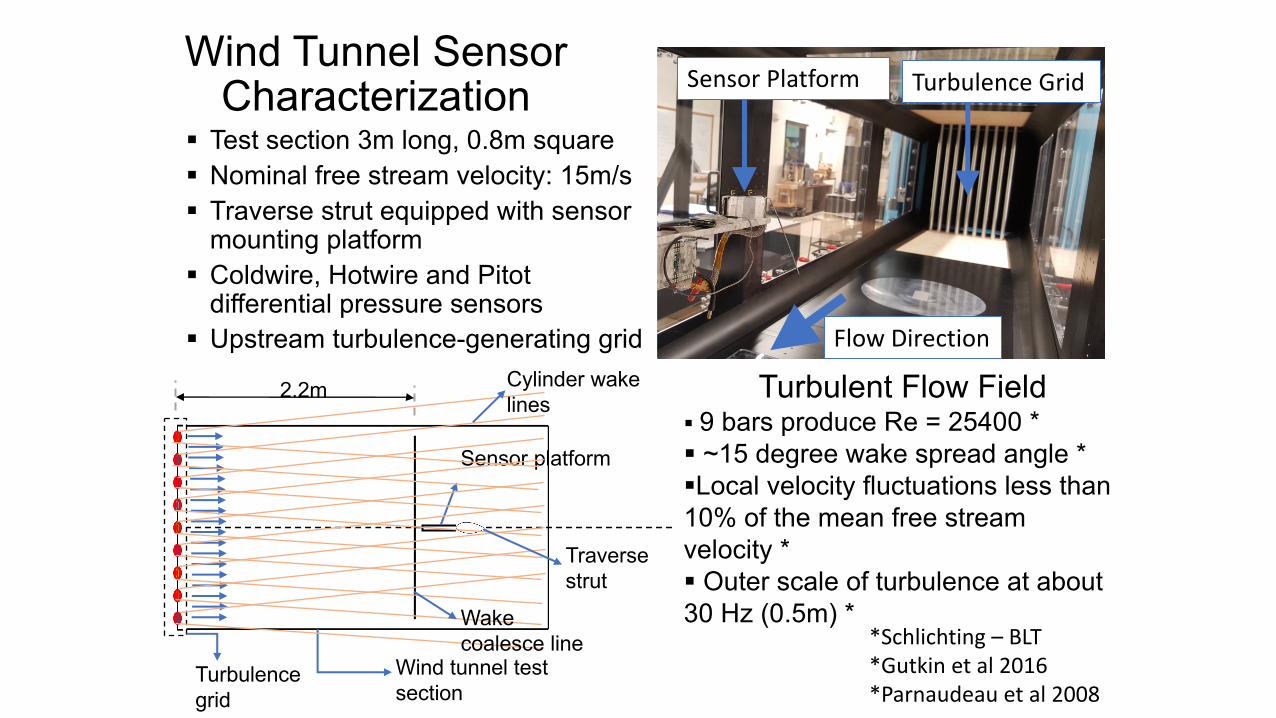
Wind Tunnel Sensor Characterization
§ Test section 3m long, 0.8m square§ Nominal free stream velocity: 15m/s§ Traverse strut equipped with sensor
mounting platform§ Coldwire, Hotwire and Pitot
differential pressure sensors§ Upstream turbulence-generating grid
Turbulent Flow Field§ 9 bars produce Re = 25400 *§ ~15 degree wake spread angle *§Local velocity fluctuations less than 10% of the mean free stream velocity *§ Outer scale of turbulence at about 30 Hz (0.5m) *
Sensor Platform Turbulence Grid
Flow Direction
Traverse strut
Wind tunnel test section
Turbulence grid
Sensor platform
2.2m Cylinder wake lines
Wake coalesce line *Schlichting – BLT
*Gutkin et al 2016*Parnaudeau et al 2008
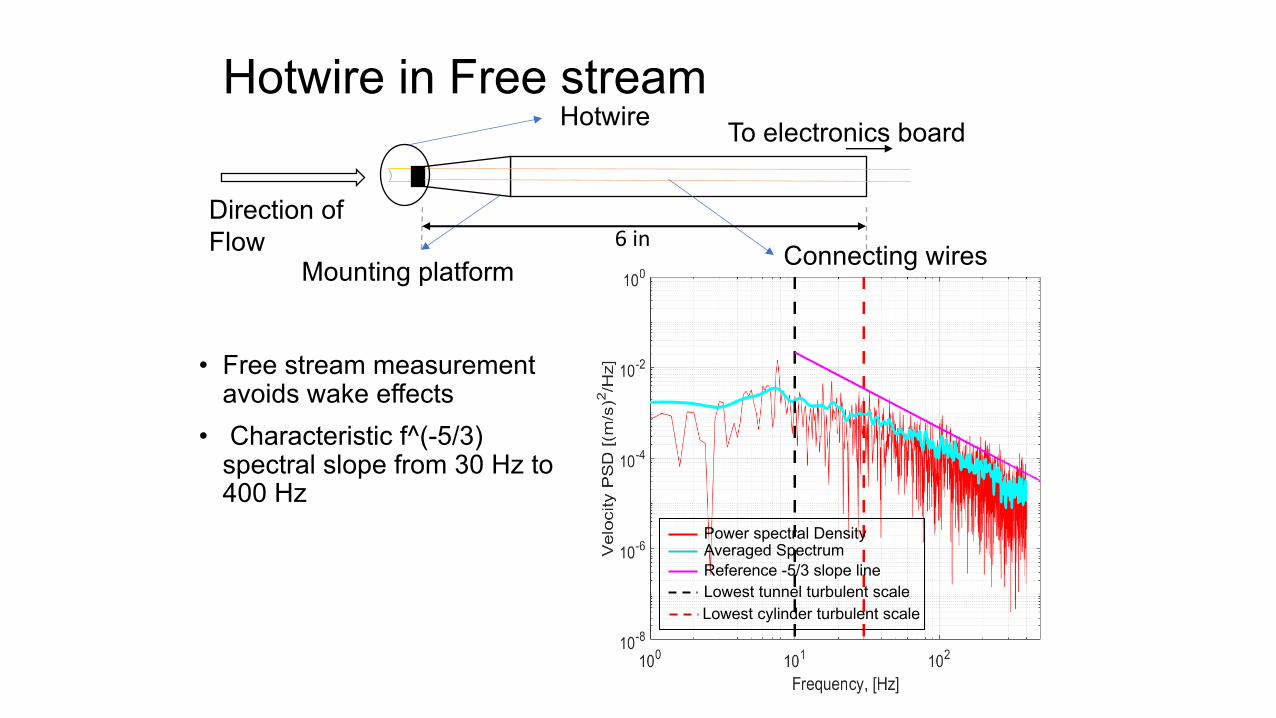
• Free stream measurement avoids wake effects
• Characteristic f^(-5/3) spectral slope from 30 Hz to 400 Hz
Hotwire in Free stream
Power spectral DensityAveraged SpectrumReference -5/3 slope lineLowest tunnel turbulent scaleLowest cylinder turbulent scale
To electronics board
Connecting wiresMounting platform
Hotwire
Direction of Flow 6 in
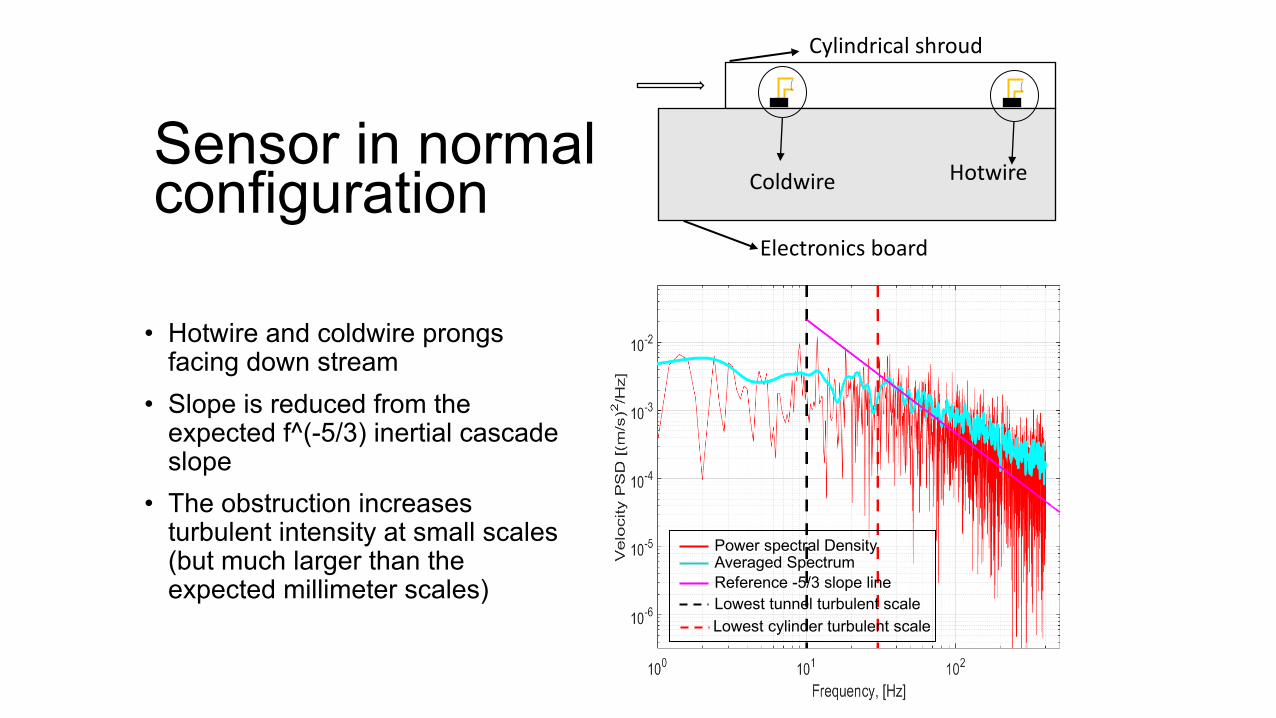
• Hotwire and coldwire prongs facing down stream
• Slope is reduced from the expected f^(-5/3) inertial cascade slope
• The obstruction increases turbulent intensity at small scales (but much larger than the expected millimeter scales)
Sensor in normal configuration
Electronics board
Cylindrical shroud
Coldwire Hotwire
Power spectral DensityAveraged SpectrumReference -5/3 slope lineLowest tunnel turbulent scaleLowest cylinder turbulent scale
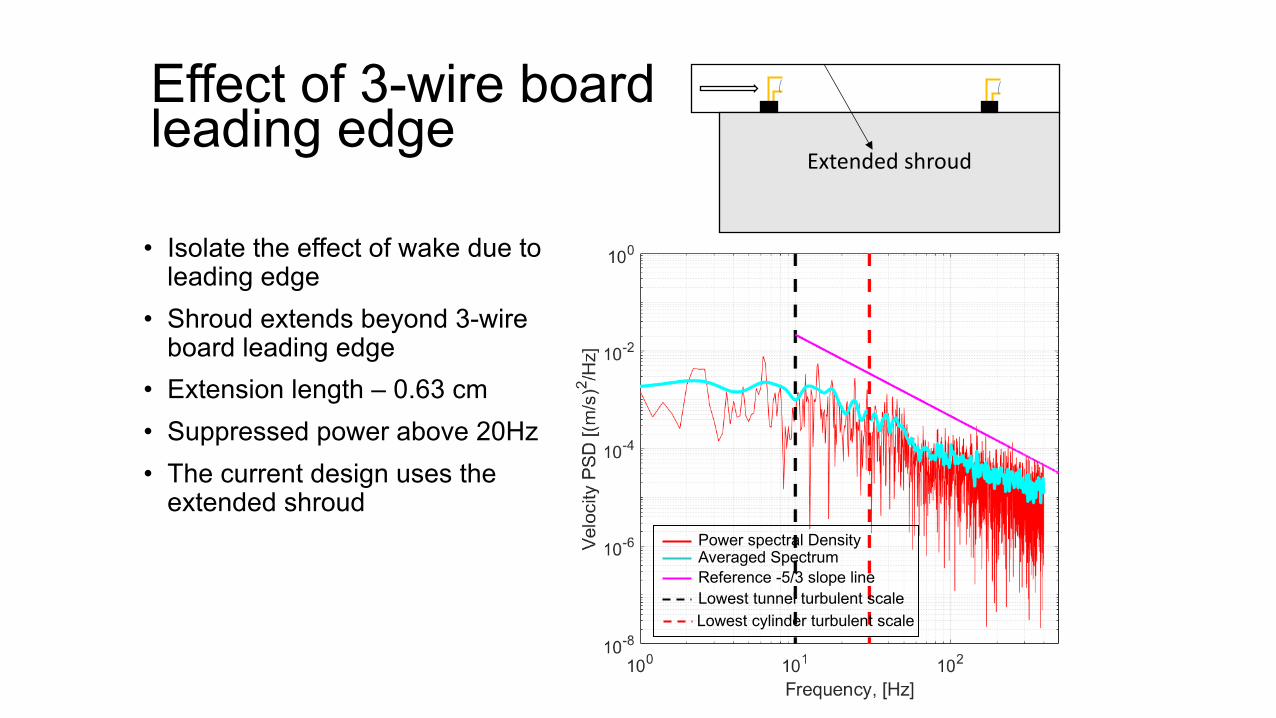
• Isolate the effect of wake due to leading edge
• Shroud extends beyond 3-wire board leading edge
• Extension length – 0.63 cm• Suppressed power above 20Hz• The current design uses the
extended shroud
Effect of 3-wire board leading edge
Extended shroud
Power spectral DensityAveraged SpectrumReference -5/3 slope lineLowest tunnel turbulent scaleLowest cylinder turbulent scale
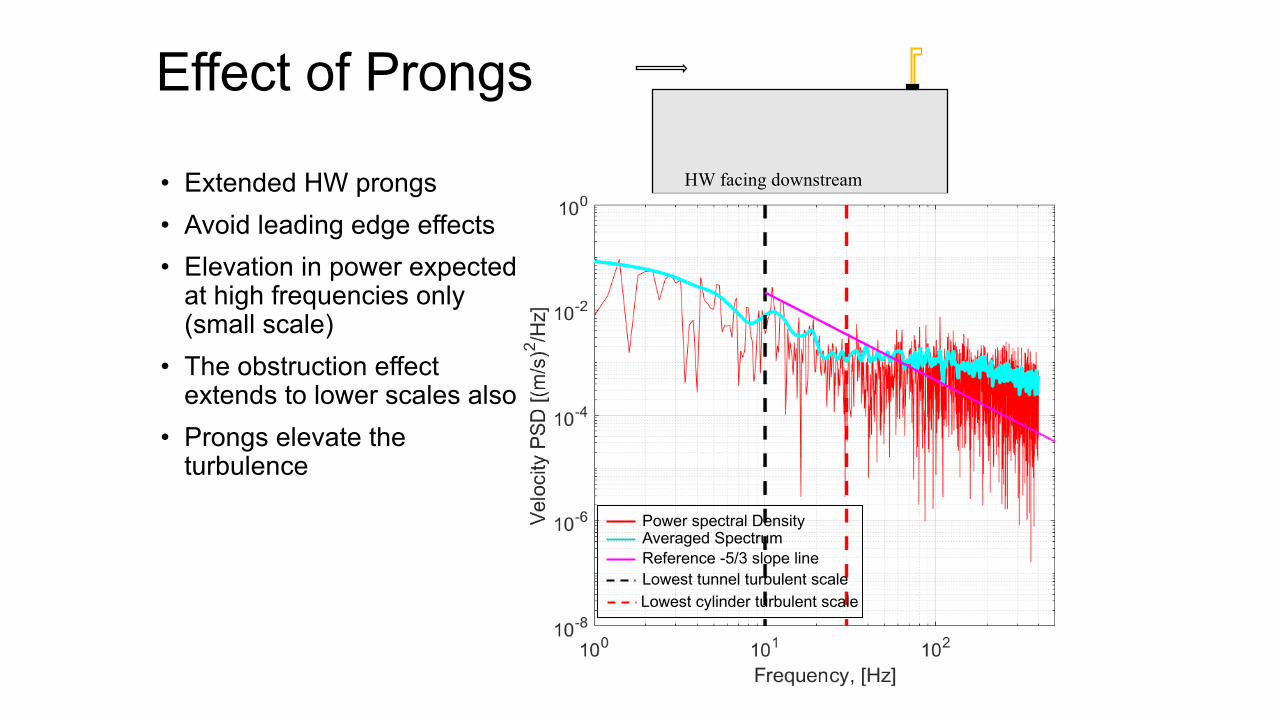
• Extended HW prongs• Avoid leading edge effects• Elevation in power expected
at high frequencies only (small scale)
• The obstruction effect extends to lower scales also
• Prongs elevate the turbulence
Effect of Prongs
HW facing downstream
Power spectral DensityAveraged SpectrumReference -5/3 slope lineLowest tunnel turbulent scaleLowest cylinder turbulent scale
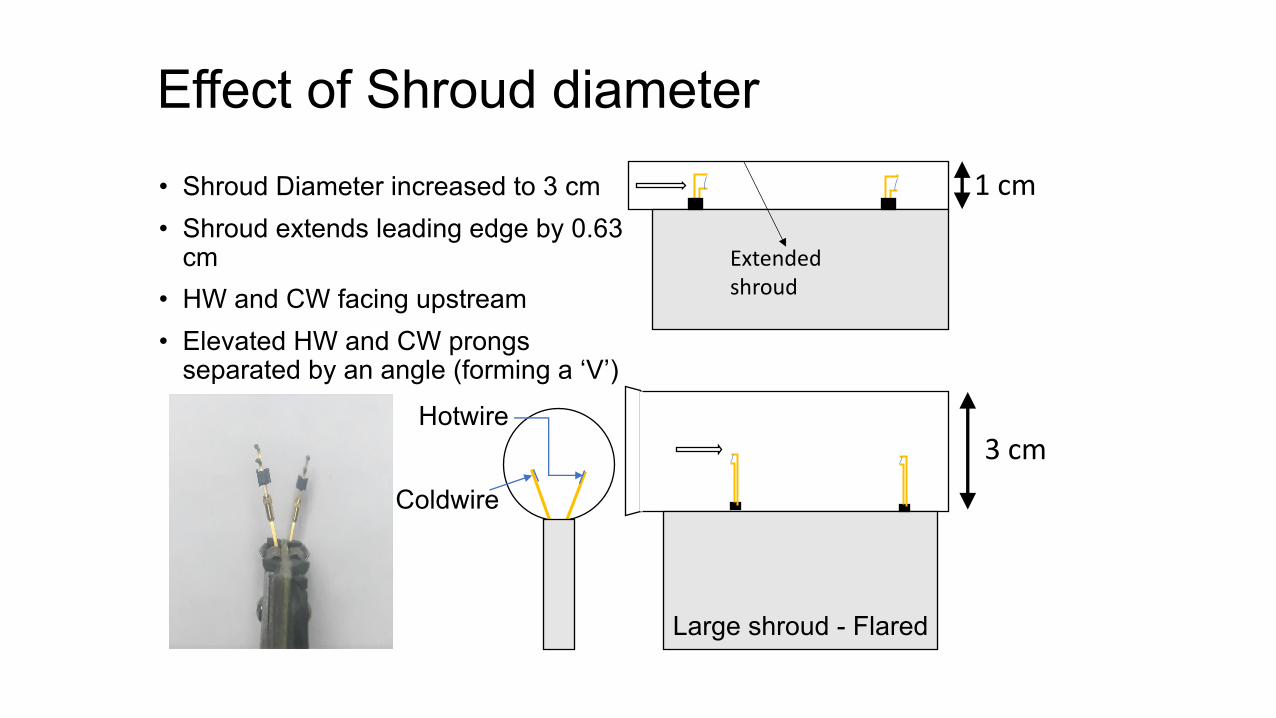
• Shroud Diameter increased to 3 cm
• Shroud extends leading edge by 0.63 cm
• HW and CW facing upstream
• Elevated HW and CW prongs separated by an angle (forming a ‘V’)
Effect of Shroud diameter
Large shroud - Flared
Hotwire
Coldwire
Extended shroud
1 cm
3 cm
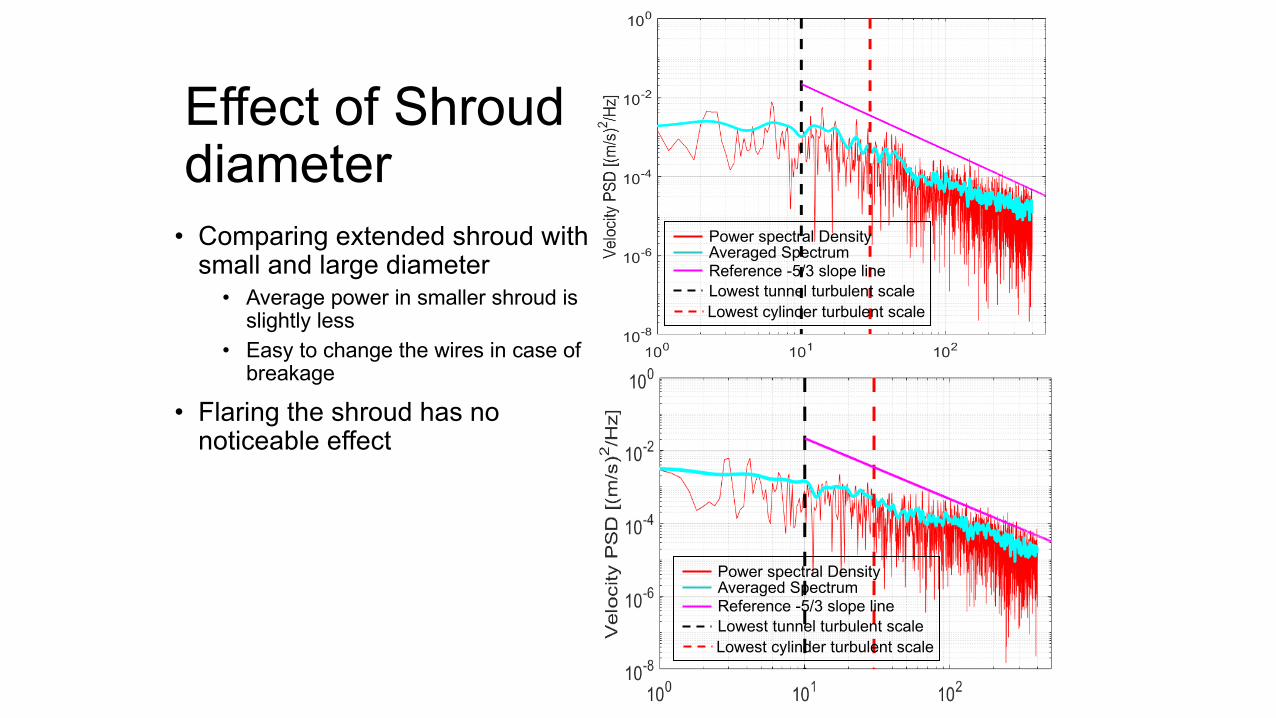
• Comparing extended shroud with small and large diameter
• Average power in smaller shroud is slightly less
• Easy to change the wires in case of breakage
• Flaring the shroud has no noticeable effect
Effect of Shroud diameter
Power spectral DensityAveraged SpectrumReference -5/3 slope lineLowest tunnel turbulent scaleLowest cylinder turbulent scale
Power spectral DensityAveraged SpectrumReference -5/3 slope lineLowest tunnel turbulent scaleLowest cylinder turbulent scale
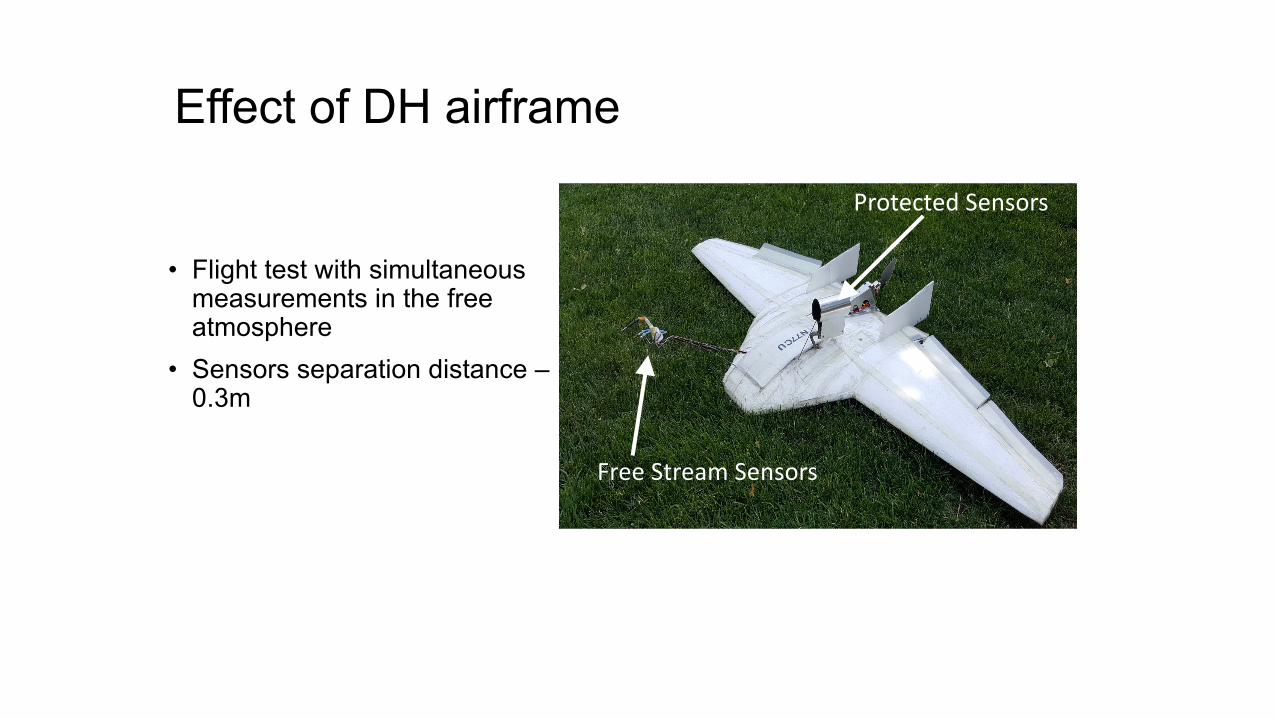
• Flight test with simultaneous measurements in the free atmosphere
• Sensors separation distance –0.3m
Effect of DH airframe
Free Stream Sensors
Protected Sensors
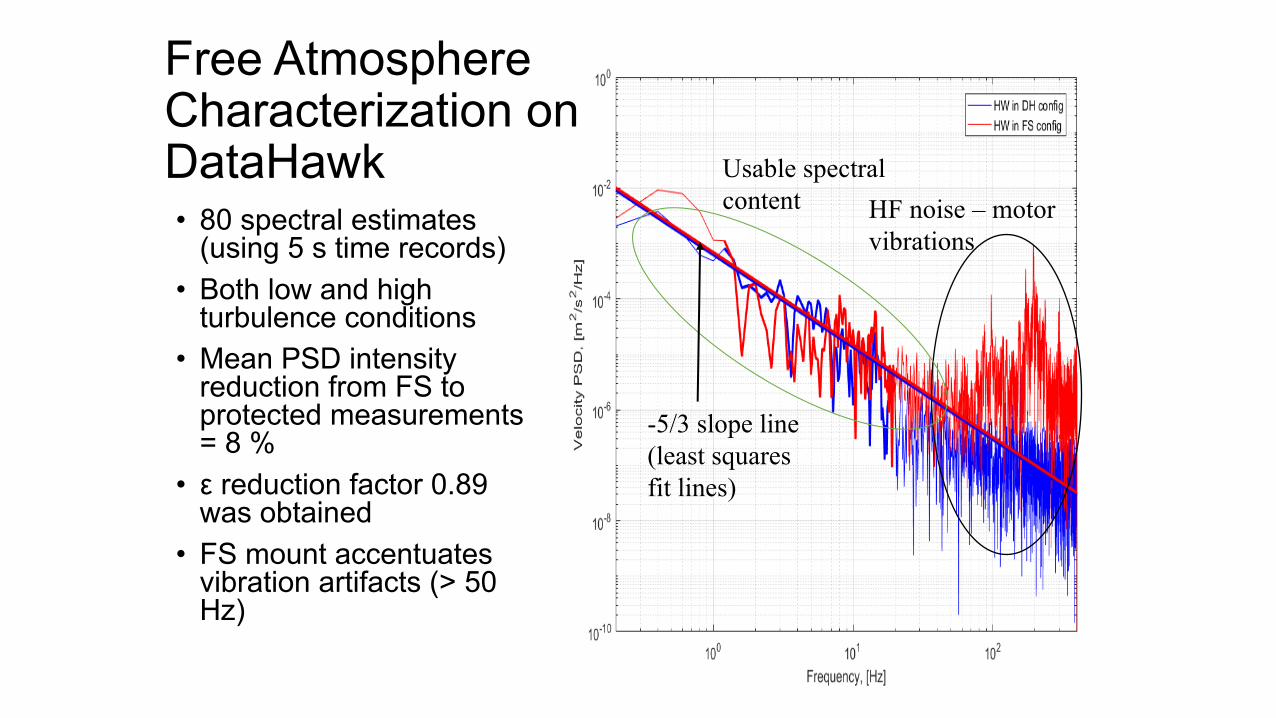
HF noise – motor vibrations
Usable spectral content
-5/3 slope line (least squares fit lines)
Free Atmosphere Characterization on DataHawk • 80 spectral estimates
(using 5 s time records)• Both low and high
turbulence conditions • Mean PSD intensity
reduction from FS to protected measurements = 8 %
• ε reduction factor 0.89 was obtained
• FS mount accentuates vibration artifacts (> 50 Hz)
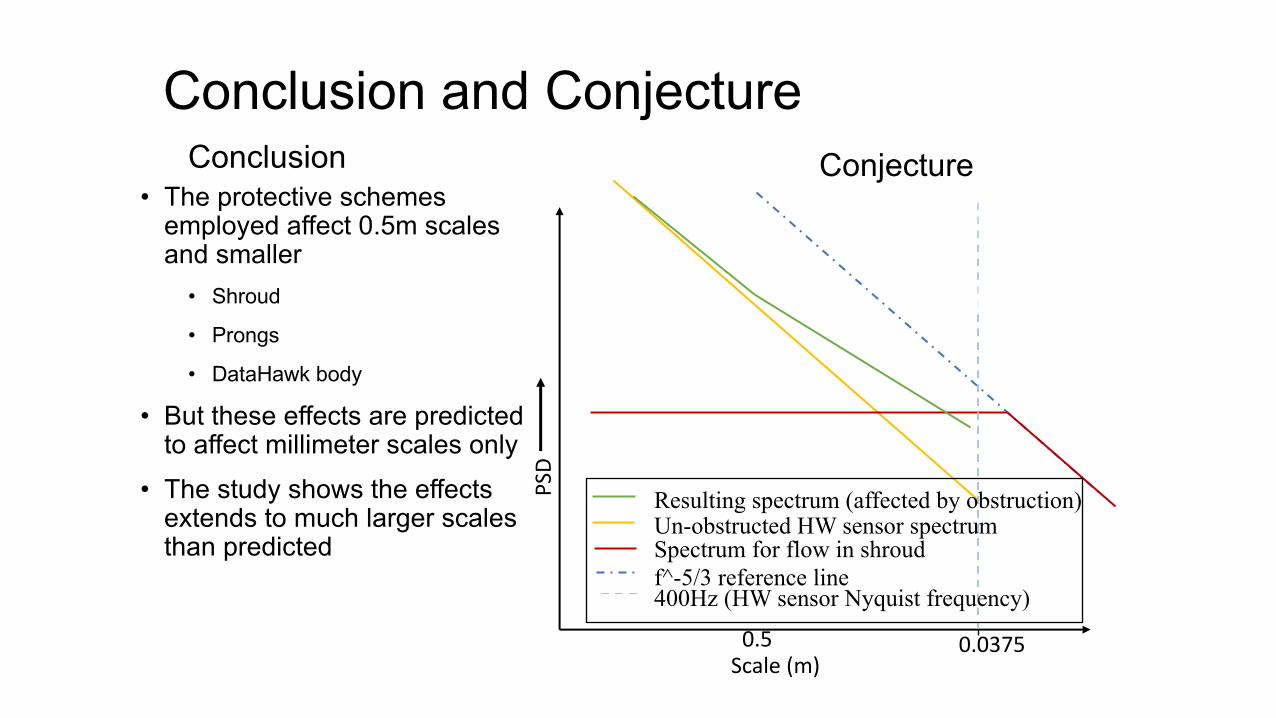
Conclusion and ConjectureConclusion
• The protective schemes employed affect 0.5m scales and smaller
• Shroud
• Prongs
• DataHawk body
• But these effects are predicted to affect millimeter scales only
• The study shows the effects extends to much larger scales than predicted
Conjecture
Scale (m)
PSD
Resulting spectrum (affected by obstruction)Un-obstructed HW sensor spectrum Spectrum for flow in shroudf^-5/3 reference line400Hz (HW sensor Nyquist frequency)
0.5 0.0375