association of blood concentrations of complement split
TRANSCRIPT

Washington University School of Medicine Washington University School of Medicine
Digital Commons@Becker Digital Commons@Becker
Open Access Publications
3-1-2019
Association of blood concentrations of complement split product Association of blood concentrations of complement split product
iC3b and serum C3 with systemic lupus erythematosus disease iC3b and serum C3 with systemic lupus erythematosus disease
activity activity
Alfred H J Kim
Vibeke Strand
Deepali P Sen
Qiang Fu
Nancy L Mathis
See next page for additional authors
Follow this and additional works at: https://digitalcommons.wustl.edu/open_access_pubs
brought to you by COREView metadata, citation and similar papers at core.ac.uk
provided by Digital Commons@Becker

Authors Authors Alfred H J Kim, Vibeke Strand, Deepali P Sen, Qiang Fu, Nancy L Mathis, Martin J Schmidt, Robin R Bruchas, Nick R Staten, Paul K Olson, Chad M Stiening, and John P Atkinson

420
Arthritis & RheumatologyVol. 71, No. 3, March 2019, pp 420–430DOI 10.1002/art.40747 © 2018 The Authors. Arthritis & Rheumatology published by Wiley Periodicals, Inc. on behalf of American College of Rheumatology. This is an open access article under the terms of the Creative Commons Attribution-NonCommercial License, which permits use, distribution and reproduction in any medium, provided the original work is properly cited and is not used for commercial purposes.
Association of Blood Concentrations of Complement Split Product iC3b and Serum C3 With Systemic Lupus Erythematosus Disease ActivityAlfred H. J. Kim,1 Vibeke Strand,2 Deepali P. Sen,1 Qiang Fu,3 Nancy L. Mathis,1 Martin J. Schmidt,4 Robin R. Bruchas,4 Nick R. Staten,4 Paul K. Olson,4 Chad M. Stiening,4 and John P. Atkinson1
Objective. To examine correlations between blood levels of complement split product iC3b and serum compo-nent C3 with clinically meaningful changes in disease activity in patients with systemic lupus erythematosus (SLE).
Methods. A total of 159 consecutive patients with SLE, diagnosed according to the American College of Rheumatology or Systemic Lupus International Collaborating Clinics classification criteria, were enrolled in CAS-TLE (Complement Activation Signatures in Systemic Lupus Erythematosus), a prospective observational study. Patients with 1–7 study visits were included in this longitudinal analysis. In addition, 48 healthy volunteers were enrolled to establish a normal reference value for the ratio of blood iC3b to serum C3 concentrations. Serum C3 and C4 levels were measured by nephelometry, and blood iC3b levels were measured by a lateral flow assay. SLE disease activity was monitored with the Responder Index 50 instrument of the SLE Disease Activity Index 2000.
Results. Relative changes in the iC3b:C3 ratio, levels of anti–double- stranded DNA (anti- dsDNA) antibodies, and use of a supraphysiologic dose of prednisone (>7.5 mg/day) each independently correlated with SLE dis-ease activity, as determined in multilevel multiple logistic regression analyses. Only the iC3b:C3 ratio was sig-nificantly associated with clinically meaningful improvements in disease activity among patients with SLE who were receiving a supraphysiologic dose of prednisone. The iC3b:C3 ratio outperformed C3 and C4 levels with regard to discriminating active SLE from inactive SLE, and major flares from no disease activity. The iC3:C3 ra-tio, anti- dsDNA antibody levels, erythrocyte sedimentation rate, and use of a supraphysiologic prednisone dose were each independently associated with the presence of lupus nephritis, whereas none of these measures was associated with SLE rash. The association of the iC3b:C3 ratio with lupus nephritis was independent of other observed clinical manifestations.
Conclusion. The ratio of blood iC3b to serum C3 concentrations correlates with the extent of SLE disease activity and with clinically meaningful changes in disease activity in patients with SLE. Furthermore, the iC3b:C3 ratio may discriminate between active and inactive SLE, and between major flares and no active disease.
The content is solely the responsibility of the authors and does not necessarily represent the official views of the NIH.
Supported by the NIH (grant R21-AR-069833 from the National Institute of Arthritis and Musculoskeletal and Skin Diseases) and Kypha, Inc.
1Alfred H. J. Kim, MD, PhD, Deepali P. Sen, MBBS, Nancy L. Mathis, AA, John P. Atkinson, MD: Washington University School of Medicine, Saint Louis, Missouri; 2Vibeke Strand, MD: Stanford University School of Medicine, Palo Alto, California; 3Qiang Fu PhD: Saint Louis University, Saint Louis, Missouri; 4Martin J. Schmidt, PhD, Robin R. Bruchas, PhD (current address: Pulse Therapeutics, Inc., Saint Louis, Missouri), Nick R. Staten, BS (current address: Washington University School of Medicine, Saint Louis, Missouri), Paul K. Olson, PhD (current address: Common Place Holdings, Saint Louis, Missouri), Chad M. Stiening, PhD: Kypha, Inc., Saint Louis, Missouri.
Dr. Kim has received consulting fees, speaking fees, and/or honoraria from Exagen Diagnostics (less than $10,000). Dr. Strand has received consulting fees from Kypha, Inc., AbbVie, Amgen, AstraZeneca, Bristol-Myers
Squibb, Celgene Corporation, EMD Serono, Genentech/Roche Holding AG, GlaxoSmithKline, Janssen, Eli Lilly and Company, Novartis International AG, Pfizer, and UCB (less than $10,000 each). Drs. Fu, Bruchas, and Olson and Ms Mathis and Mr. Staten have received consulting fees from Kypha, Inc. (less than $10,000 each). Drs. Schmidt and Stiening own stock or stock options in Kypha, Inc. Dr. Atkinson has received consulting fees, speaking fees, and/or honoraria from Kypha, Inc., Compliment Corporation, Gemini Therapeutics, Celldex Therapeutics, Clinical Pharmacy Services, CDMI, Omeros Corporation, Achillion Pharmaceuticals, True North Therapeutics, BioMarin Pharmaceutical, Annexon Biosciences, and AdMiRx (less than $10,000 each).
Address correspondence to Alfred H. J. Kim, MD, PhD, Division of Rheumatology, Department of Medicine, Washington University School of Medicine, 660 South Euclid Avenue, Campus Box 8045, Saint Louis, MO 63110. E-mail: [email protected].
Submitted for publication January 2, 2018; accepted in revised form September 27, 2018.

CORRELATION OF IC3B:C3 RATIOS WITH SLE DISEASE ACTIVITY | 421
INTRODUCTION
The complement system plays a central role in systemic lupus erythematosus (SLE) (1). Its activation by immune com-plexes drives type III hypersensitivity reactions, leading to inflam-matory responses in the target tissue. Failure to remove cellular debris, a process that is highly dependent on complement, is also an important tenet in the pathophysiology of SLE. Its presence in tissue serves as a diagnostic tool, and decreased concentra-tions of serum complement components C4 and C3 can serve as markers of active disease (2,3). Complement also influences immune cell function, with numerous abnormalities observed in mice deficient in various complement components (4). Comple-ment split products are generated during activation of the com-plement cascades, which bind to various cell- bound complement receptors and elicit effector responses (5).
The correlation between decreased serum complement com-ponent levels and extent of SLE disease activity was first observed in 1951 in 4 patients with active disease and depressed CH50 val-ues that normalized following treatment with adrenocorticotropic hormone therapy (6). Furthermore, an association between nor-malization of C3 levels and an improved disease activity index was observed in studies of renal biopsy tissue from patients with lupus nephritis (7). Complement activation increases during SLE flares, and therefore complement proteins are predicted to be consumed with concomitant generation of activation- derived products at a rate proportional to the degree of disease activity (8). However, interpretation of values may be confounded because of the unknown impact of increased acute- phase production of C3 and C4 (9–11), and because some individuals with low C4 gene copy numbers have persistently low serum C4 levels (12). Nevertheless, clinicians have relied on decreased serum levels of complement components C3 and C4 as a key standard to indicate SLE flares.
Improved detection of complement activation would enhance clinicians’ ability to more readily assess disease activity and promptly identify and treat disease flares in SLE. To overcome the limitations in evaluating soluble complement components, inves-tigators have queried whether complement split products (11,13–22) are more sensitive measures of complement activation, and whether their concentrations in the blood and serum would show a strong correlation with SLE disease activity. Recent advances in detecting complement split products have renewed interest in their assessment in patients with SLE (23,24).
The utility of cell- bound complement activation products (CB- CAPs) has been demonstrated in molecular studies of SLE. These include erythrocyte- associated C4d (E- C4d) and C3d (E- C3d), which may be used to assist in the diagnosis of SLE (25–27) and also to possibly monitor SLE disease activity (28,29). How-ever, 2 issues limit the clinical utility of CB- CAPs: 1) results are not rapidly available, because detection requires flow cytometry, and 2) erythrocyte measurements are a reflection of complement activation and SLE disease activity over the 120- day lifespan of
the erythrocyte rather than the immediate clinical situation. Efforts to measure C3d on other cell types with shorter lifespans (e.g., reticulocytes [R- C4d]) have demonstrated better correlation with indices of disease activity, including scores on the Safety of Estro-gens in Lupus Erythematosus National Assessment version of the SLE Disease Activity Index (SLEDAI) (30), while C3dg:C3 ratios were found to be correlated with disease activity in juvenile arthritis (31), rheumatoid arthritis, and SLE (32).
Recently, serum and plasma levels of C3dg (33) and plasma levels of C4d (34) were shown to be useful in distinguishing between subjects with SLE and healthy controls. Furthermore, plasma C4d levels correlated with disease activity in patients with SLE and were predictive of the future recurrence of nephritis (34). In summary, complement split products appear to offer promise as biomarkers of SLE disease activity.
Compared to CB- CAPs, soluble complement split products confer the advantage of shorter half- lives and more rapid turna-round of the results. One such split product, iC3b, is the break-down product of C3b (35) (for a detailed outline, see Supplemen-tary Figure 1, available on the Arthritis & Rheumatology web site at http://onlinelibrary.wiley.com/doi/10.1002/art.40747/abstract) with a half- life of ~90 minutes (36), compared to 2 minutes for C3a (37) and C3b (36), and 50 hours for C3d (38). These proper-ties offer the potential for employing iC3b to measure complement activation at the time of sampling. The extremely short half- lives of C3a and C3b may prevent their detection (since the sample processing time is shorter), while the longer half- life of C3d may not reflect concurrent complement activation. Two prior studies utilizing enzyme- linked immunosorbent assay (ELISA) to examine iC3b levels in SLE patients (18,39) found that plasma and serum iC3b levels were increased in patients with active SLE com-pared to healthy controls. However, these data may have been confounded by in vitro activation of C3 (40), which may lead to artefactually elevated iC3b levels (24), thereby limiting past deter-minations of iC3b to serve as a useful biomarker of complement activation.
We hypothesized that using the ratio of blood iC3b to serum C3 levels may offer a more accurate assessment of complement activation when compared to iC3b or C3 levels alone, since it measures complement consumption relative to production. Physiologically, once a flare initiates, complement activation by immune complexes drives iC3b production and an inflammatory milieu. Interleukin- 6 generated from this pro-cess increases hepatic production of C3 and C4 (9–11). In this early stage of the flare, iC3b levels are predicted to increase as a result of the heightened disease activity, while C3 levels may remain above the lower limit of normal (>LLN) because of augmented biosynthesis. As complement activation con-tinues and consumption exceeds production, C3 levels will decrease below the LLN (<LLN), and iC3b levels will remain above the upper limit of normal (>ULN). When effective treat-ment begins, the inflammatory milieu attenuates such that C3

KIM ET AL 422 |
synthesis and iC3b production decrease as complement acti-vation slows. The levels of iC3b return to baseline as the levels of C3 normalize. Thus, we hypothesized that the iC3b:C3 ratio would initially be characterized by iC3b levels >ULN and C3 levels <LLN, followed by increases in C3 levels to exceed LLN. Effective treatment may also normalize iC3b levels. Impor-tantly, changes in either iC3b or the iC3b:C3 ratio may specif-ically identify parallel changes in SLE disease activity, possibly taking place at a stage earlier than that of clinically apparent changes.
To better understand how complement split products could be used as actionable data in SLE, we initiated the CASTLE (Complement Activation Signatures in Systemic Lupus Erythema-tosus) study. This prospective observational study seeks to eval-uate how soluble and cell- bound complement activation signa-tures are altered in the presence of various disease activity states, clinical manifestations, and subsets of SLE. As part of the pilot phase of this study, we investigated the longitudinal association of blood iC3b levels, serum C3 levels, and iC3b:C3 ratios with SLE disease activity, using a novel assay platform that measures iC3b with the accuracy of an ELISA but without the complicating factor of artefact generation by in vitro activation (24). Furthermore, we examined how iC3b levels could correlate with the presence of lupus nephritis and occurrence of rash in patients with SLE.
PATIENTS AND METHODS
Study design and ethics approval. The pilot phase of CASTLE was implemented as a prospective observational study in patients with SLE. The study was designed to examine the relationship between blood iC3b and/or serum C3 levels and the extent of SLE disease activity. The study was approved by the Washington University School of Medicine Institutional Review Board (protocol no. 201401105, initially approved March 18, 2014 and last approved May 4, 2018, and protocol no. 201410004, initially approved October 20, 2014 and last approved July 11, 2016).
Patient recruitment. A total of 159 consecutive patients with SLE, whose diagnosis was validated using the American Col-lege of Rheumatology (41) and/or Systemic Lupus International Collaborating Clinics (42) classification criteria, were recruited from the Lupus Clinic at Washington University School of Medicine from April 2014 to December 2016. Patients with 1–7 visits were included in the analysis. Subjects with concomitant blood- borne contagious infectious diseases (i.e., hepatitis A, B, or C or HIV), cirrhosis, end- stage renal disease, or pregnancy were excluded, because complement physiology is altered and not well under-stood in these cohorts. In addition, subjects suspected of having a concurrent bacterial infection at the visit were excluded. Medi-cations taken at the time of the visit, including the dose of pred-nisone, were confirmed by each provider (AHJK and DPS).
To determine the normal reference range for the iC3b:C3 ratio, 48 healthy adult volunteers without any complement- mediated conditions (e.g., infection, autoimmunity, and trauma, among others) were enrolled. These subjects were not taking immunomodulatory medications at the time of sample collection.
Assessment of SLE disease activity. In each patient, disease activity was assessed using the SLEDAI 2000 (SLEDAI- 2K; scale 0–105) at the initial study visit, and the SLE-DAI- 2K Responder Index 50 (RI- 50) at every subsequent visit (43). The SLEDAI- 2K RI- 50 was chosen because it assesses ≥50% improvement in disease activity based on the SLEDAI- 2K disease activity score from which it is derived (44) and is more practical for use in the clinical setting than the British Isles Lupus Assessment Group disease activity score. Active SLE was defined as SLEDAI- 2K or SLEDAI- 2K RI- 50 scores >4 (45). In analyses using serology- free SLEDAI- 2K RI- 50 scores (with-out values for complement and anti–double- stranded DNA [anti- dsDNA] antibody levels), scores >2 were considered to reflect active disease. Clinically meaningful improvement was defined as a decrease of ≥4 in the SLEDAI- 2K RI- 50 scores from the prior visit, and clinically meaningful deterioration (i.e., flare) was defined as an increase of ≥4 in SLEDAI- 2K RI- 50 scores from the prior visit. These definitions were derived from the original SLEDAI (46) and have been validated for both the SLEDAI- 2K (47) and SLEDAI- 2K RI- 50 (48) instruments.
Major flares were determined using the Fortin definition (49), which required at least 1 of the following criteria to be fulfilled: 1) new or increased prednisone dose >20 mg/day, 2) necessity for new or increased immunosuppression, 3) hospitalization due to SLE, or 4) death due to SLE.
Each provider received training in scoring disease activity using the SLEDAI- 2K RI- 50 instrument (http://www.sri-50.com) and each was blinded with regard to the iC3b and iC3b:C3 determinations during the entire study.
Laboratory assessments and definition of qualita-tive variables. Levels of iC3b were determined by a lateral flow assay, using 2 antigen- specific antibodies (Kypha, Inc.) (24). The blood samples used for determination of iC3b were diluted 1:100 in a proprietary buffer within 30 minutes of ve ni-puncture. The buffer was designed to prevent spontaneous complement activation and iC3b breakdown (24). The diluted samples were then immediately frozen on dry ice and trans-ferred to a −80°C freezer and stored until assayed. The levels of iC3b remained stable for at least 6 months using this approach (data not shown).
C3 and C4 levels were measured by nephelometry, and anti- dsDNA antibody levels were determined by ELISA. The iC3b:C3 ratios (in μg/mg) were calculated as (iC3b × 100)/C3. Investigations of C3, C4, and anti- dsDNA antibody lev-els, the erythrocyte sedimentation rate (ESR), and C- reactive

CORRELATION OF IC3B:C3 RATIOS WITH SLE DISEASE ACTIVITY | 423
protein (CRP) levels were performed at the core laboratories of Barnes- Jewish Hospital in St. Louis, Missouri. The supraphys-iologic dose of prednisone was defined as a dose >7.5 mg/day. Race was self- reported.
Statistical analysis. Statistical analyses were per-formed using SAS version 9.4 (SAS Institute). Descriptive sta-tistics were summarized as the mean ± SD for continuous variables, and proportion for categorical variables. The normal reference range for the iC3b:C3 ratio and iC3b levels was cal-culated using the robust method (50) based on median val-ues (due to the non- normal distribution of the data and the relatively small sample size of the healthy control group). The generalized estimating equation (GEE) method was used to produce population average estimates across patients while accounting for repeated measures in the same patient (51). The logit models with GEE were implemented in Proc GEE in the SAS statistical package. Binary logistic regression mod-els examined associations of SLE disease activity with bio-chemical markers. Ordinal logistic regression models were employed to characterize associations between clinically meaningful changes in disease activity and biomarkers, since the outcome variable is ordinal.
The 3 categories of clinically meaningful changes in dis-ease activity (clinically meaningful improvement, unchanged, and clinically meaningful deterioration) were treated as a con-tinuum. The average odds of improvement were defined as the odds of clinically meaningful improvement compared to unchanged disease activity and clinically meaningful dete-rioration combined. Similarly, the average odds of flare were defined as the odds of clinically meaningful deterioration com-pared to unchanged disease activity and clinically meaningful improvement combined. Odds ratios (ORs) and 95% confi-dence intervals (95% CIs) were estimated.
To examine the sensitivity and specificity of the iC3b:C3 ratio and levels of iC3b, C3, C4, and anti- dsDNA antibodies for different SLE disease outcomes, receiver operator characteristic (ROC) curves with GEE analyses were conducted. The areas under the ROC curve (AUCs) with 95% CIs were estimated. The Mann- Whitney U statistical test was used for the comparison of all biomarkers against iC3b:C3 (52). To evaluate the inde-pendence of the association of iC3b:C3 with lupus nephritis (independent of other clinical manifestations of SLE), ordinary linear regression with GEE was performed.
RESULTS
Patient characteristics. Baseline characteristics (defined as those at the time of entry into the pilot phase of the CASTLE study) of the 159 patients with SLE who provided informed con-sent to participate are described in Table 1. Of the 159 patients, 89.3% were female, 57.9% were African American and 42.1%
were of European descent, and the mean ± SD age was 41.3 ± 13.6 years. With regard to SLE characteristics, 67.8% of patients were anti- dsDNA antibody positive, 37.1% were receiving a sup-raphysiologic dose of prednisone (defined as >7.5 mg/day), and 18.2% had at least 1 renal manifestation, either urinary casts, pro-teinuria, hematuria, or pyuria. Of those patients receiving a sup-raphysiologic dose of prednisone, the mean ± SD dose was 16.1 ± 14.5 mg/day. Furthermore, in patients at baseline, the mean ± SD SLEDAI- 2K disease activity score was 5.14 ± 5.74, mean ± SD blood iC3b levels were 4.47 ± 2.83 μg/ml (range 0.7–21.0), and the mean ± SD iC3b:C3 ratio was 5.01 ± 6.11 μg/mg (range 0.66–74.51) (Table 1). The characteristics of the 48 healthy control subjects are detailed in Supplementary Table 1 (available on the Arthritis & Rheumatology web site at http://onlinelibrary.wiley.com/
doi/10.1002/art.40747/abstract).
Association of iC3b:C3 ratios with active SLE dis-ease status. We first compared the distribution of iC3b:C3 ratios between patients with active disease, patients with inac-tive disease, and healthy controls. Patients with active SLE had an elevated iC3b:C3 ratio (mean ± SD 7.03 ± 7.84 μg/mg) as compared to patients with inactive SLE (4.30 ± 2.03 μg/mg) and healthy controls (1.69 ± 0.57 μg/mg) (Kruskal- Wallis H statistic = 132.5, P < 0.0001 for each comparison) (Figure 1A). The median ULN of the iC3b:C3 ratio was 2.79 μg/mg (95% CI 2.51–3.07). Based on this median ULN, 85.2% of patients (195 of 229) with active SLE and 76.4% of patients (191 of 250) with inactive disease had an iC3b:C3 ratio >ULN. When the iC3b:C3 ratio was used to classify active disease, only 50.2% of patients were classified correctly. The persistence of elevated iC3b:C3
Table 1. Baseline characteristics of the 159 patients with systemic lupus erythematosus enrolled in the CASTLE prospective observational study*
Age, mean ± SD years 41.3 ± 13.6Female, % 89.3African American, % 57.9Receiving a supraphysiologic
dose of prednisone, %†37.1
Prednisone dose, mean ± SD mg/day
16.14 ± 14.46
SLEDAI- 2K score, mean ± SD 5.14 ± 5.74Anti- dsDNA antibody positive,
%67.8
Nephritis, % 18.2Blood iC3b levels, mean ± SD
(range) μg/ml4.47 ± 2.83 (0.7–21.0)
Blood iC3b:C3 ratio, mean ± SD (range) μg/mg
5.01 ± 6.11 (0.66–74.51)
* CASTLE = Complement Activation Signatures in Systemic Lupus Erythematosus; SLEDAI- 2K = Systemic Lupus Erythematosus Dis-ease Activity Index 2000; anti- dsDNA = anti–double- stranded DNA. † Defined as >7.5 mg/day.

KIM ET AL 424 |
ratios during periods of disease inactivity confirms prior obser-vations of C3 hypercatabolism in the majority of patients with SLE (53).
In comparison, a small difference in iC3b levels was observed between patients with active SLE (mean ± SD 5.95 ± 2.99 μg/ml) and patients with inactive SLE (5.22 ± 2.68 μg/ml) (Figure 1B). The median ULN of iC3b levels was 3.705 μg/ml (95% CI 3.266–4.190). Based on this value, 76.9% of patients (176 of 229) with active SLE and 62.0% of patients (155 of 250) with inactive SLE had an iC3b level >ULN. When iC3b levels were used to classify active disease, only 53.2% were classified correctly.
Furthermore, C3 levels in patients with active disease were lower than in those with inactive disease (mean ± SD 103.3 ± 35.3 mg/dl versus 121.5 ± 25.2 mg/dl) (Figure 1C). Categorizing patients according to C3 levels <LLN (<90 mg/dl) correctly clas-sified 77.2% of patients with active SLE. Nevertheless, C3 levels <LLN were observed in only 37.1% (85 of 229) of patients with active disease and in 10.0% (25 of 250) of those with inactive dis-ease, confirming the low sensitivity of C3 levels <LLN for detecting active disease.
Since the iC3b:C3 ratio poorly classified active SLE, we hypothesized that relative changes in the iC3b:C3 ratio, rather than an absolute cutoff, may more sensitively detect active dis-ease. We examined the strength of association between relative changes in the iC3b:C3 ratio and other variables and the pres-ence of active SLE compared to the presence of inactive SLE. In logistic regression analyses in which we examined correla-tions of disease activity with each individual variable, we found that relative changes in the iC3b:C3 ratio, ESR, and levels of C3, C4, and anti- dsDNA antibodies each correlated with active disease after the analyses had been controlled for the number of clinic visits (i.e., number of clinic visits did not confound for other examined variables) (Figure 2A). When all covariates were included in the same multiple regression model, only changes in the iC3b:C3 ratio, anti- dsDNA antibody level, and use of a supraphysiologic dose of prednisone were independently asso-ciated with active disease (Figure 2B). Furthermore, the strength of the association between relative changes in the iC3b:C3 ratio and active disease increased when analyses were controlled for anti- dsDNA antibody levels and use of a supraphysiologic dose of prednisone (OR 1.13 versus OR 1.29 for every 1- unit increase in iC3b:C3).
We found similar results using serology- free SLEDAI- 2K RI- 50 scores for measuring disease activity. Relative changes in the iC3b:C3 ratio, C3 levels, and ESR were each associated with active disease (Figure 2C) after analyses were controlled for the number of clinic visits. In multivariate analysis, relative changes in the iC3b:C3 ratio, iC3b levels, and CRP levels and use of a supraphysiologic dose of prednisone were each independently associated with active disease (Figure 2D). Surprisingly, change in iC3b levels was negatively associated with active disease in both analyses (Figures 2B and D), after controlling for iC3b:C3 ratios, CRP levels, and use of a supraphysiologic prednisone dose. The strength of the association between changes in the
Figure 1. Elevated iC3b:C3 ratios are more commonly observed in patients with active systemic lupus erythematosus (SLE). The distributions of iC3b:C3 ratios (A), serum iC3b levels (B), and serum C3 levels (C) were compared between patients with active SLE (n = 229), patients with inactive SLE (n = 250), and healthy controls (n = 48). Values are the mean ± SD. The broken horizontal line indicates the upper limit of normal (ULN). * = P < 0.0001; ** = P < 0.008 by 1- tailed analysis of variance with Dunn’s correction.

CORRELATION OF IC3B:C3 RATIOS WITH SLE DISEASE ACTIVITY | 425
iC3b:C3 ratio and active disease increased in the multivariate analysis (OR 1.06 in individual univariate analysis versus OR 1.23 in multivariate analysis for every 1- unit increase in the iC3b:C3 ratio). These data demonstrate a relationship between the iC3b:C3 ratio and SLE disease activity.
Correlation of iC3b:C3 ratios with clinically mean-ingful changes in SLE disease activity among patients receiving a supraphysiologic dose of prednisone. We examined whether iC3b:C3 ratios were associated with clinically meaningful changes in disease activity using longitudinal data. In all study subjects, no biochemical markers were associated with clinically meaningful changes in disease activity (Figure 3A), although iC3b:C3 ratios trended toward an association.
Since patients who were receiving a supraphysiologic dose of prednisone were more likely to have active disease (Fig-ures 2B and D), we examined clinically meaningful changes in disease activity in this subgroup. In our univariate regression analysis, only incremental change in the iC3b:C3 ratio had a sta-tistically significant association with clinically meaningful changes in disease activity among patients receiving a supraphysiologic dose of prednisone OR 0.95 for clinically meaningful improve-ment in disease activity for every 1-unit decrease in the iC3b:C3 ratio, and OR 1.05 for clinically meaningful deterioration for every 1-unit increase in the iC3b:C3 ratio (Figure 3B).
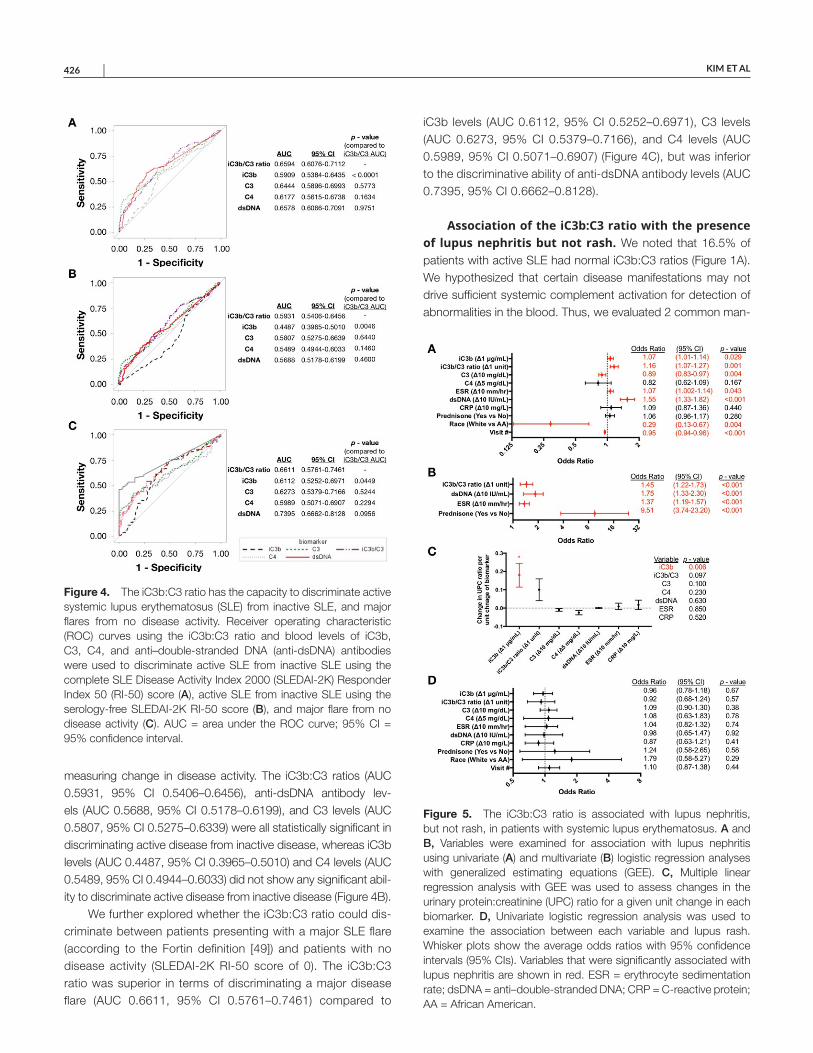
Better discrimination of SLE disease activity with iC3b:C3 ratios than with low C3 or low C4 levels. We evaluated the ability of the iC3b:C3 ratio to discriminate between active and inactive SLE, in comparison to the discriminative abilities of iC3b, C3, and C4 levels, by performing ROC curve analyses. The iC3b:C3 ratio performed the best in terms of discriminating active disease (AUC 0.6594, 95% CI 0.6076–0.7112), followed by anti- dsDNA antibody levels (AUC 0.6578, 95% CI 0.6066–0.7091), C3 levels (AUC 0.6444, 95% CI 0.5896–0.6993), iC3b levels (AUC 0.5909, 95% CI 0.5384–0.6435), and C4 levels (AUC 0.6177, 95% CI 0.5615–0.6738) (Figure 4A). We confirmed these results using the serology- free SLEDAI- 2K RI- 50 scores for
Figure 2. The iC3b:C3 ratio is associated with active systemic lupus erythematosus (SLE). A and B, Variables were examined for association with active disease as determined using the SLE Disease Activity Index 2000 (SLEDAI- 2K) scores, in univariate (A) and multivariate (B) logistic regression analyses with generalized estimating equations (GEE). C and D, Variables were examined for association with the serology- free SLEDAI- 2K Responder Index 50 scores in univariate (C) and multivariate (D) logistic regression analyses with GEE. Whisker plots show the average odds ratios with 95% confidence intervals (95% CIs). Variables that were significantly associated with active SLE are shown in red. ESR = erythrocyte sedimentation rate; dsDNA = anti–double- stranded DNA; CRP = C- reactive protein; AA = African American.
Figure 3. The iC3b:C3 ratio is associated with clinically meaningful change in systemic lupus erythematosus (SLE) disease activity in patients with more active disease. Variables were examined in univariate logistic regression analyses with generalized estimating equations for association with clinically meaningful changes in SLE disease activity in all study subjects assessed in longitudinal analyses (A), and in only those taking a supraphysiologic dose of prednisone (daily dose >7.5 mg/day) (B). Whisker plots show the average odds ratios with 95% confidence intervals (95% CIs). The statistically significant association of the iC3b:C3 ratio with clinically meaningful change is shown in red. ESR = erythrocyte sedimentation rate; dsDNA = anti–double- stranded DNA; CRP = C- reactive protein; AA = African American.
KIM ET AL 426 |
measuring change in disease activity. The iC3b:C3 ratios (AUC 0.5931, 95% CI 0.5406–0.6456), anti- dsDNA antibody lev-els (AUC 0.5688, 95% CI 0.5178–0.6199), and C3 levels (AUC 0.5807, 95% CI 0.5275–0.6339) were all statistically significant in discriminating active disease from inactive disease, whereas iC3b levels (AUC 0.4487, 95% CI 0.3965–0.5010) and C4 levels (AUC 0.5489, 95% CI 0.4944–0.6033) did not show any significant abil-ity to discriminate active disease from inactive disease (Figure 4B).
We further explored whether the iC3b:C3 ratio could dis-criminate between patients presenting with a major SLE flare (according to the Fortin definition [49]) and patients with no disease activity (SLEDAI- 2K RI- 50 score of 0). The iC3b:C3 ratio was superior in terms of discriminating a major disease flare (AUC 0.6611, 95% CI 0.5761–0.7461) compared to
iC3b levels (AUC 0.6112, 95% CI 0.5252–0.6971), C3 levels (AUC 0.6273, 95% CI 0.5379–0.7166), and C4 levels (AUC 0.5989, 95% CI 0.5071–0.6907) (Figure 4C), but was inferior to the discriminative ability of anti- dsDNA antibody levels (AUC 0.7395, 95% CI 0.6662–0.8128).
Association of the iC3b:C3 ratio with the presence of lupus nephritis but not rash. We noted that 16.5% of patients with active SLE had normal iC3b:C3 ratios (Figure 1A). We hypothesized that certain disease manifestations may not drive sufficient systemic complement activation for detection of abnormalities in the blood. Thus, we evaluated 2 common man-
Figure 4. The iC3b:C3 ratio has the capacity to discriminate active systemic lupus erythematosus (SLE) from inactive SLE, and major flares from no disease activity. Receiver operating characteristic (ROC) curves using the iC3b:C3 ratio and blood levels of iC3b, C3, C4, and anti–double- stranded DNA (anti- dsDNA) antibodies were used to discriminate active SLE from inactive SLE using the complete SLE Disease Activity Index 2000 (SLEDAI- 2K) Responder Index 50 (RI- 50) score (A), active SLE from inactive SLE using the serology- free SLEDAI- 2K RI- 50 score (B), and major flare from no disease activity (C). AUC = area under the ROC curve; 95% CI = 95% confidence interval.
Figure 5. The iC3b:C3 ratio is associated with lupus nephritis, but not rash, in patients with systemic lupus erythematosus. A and B, Variables were examined for association with lupus nephritis using univariate (A) and multivariate (B) logistic regression analyses with generalized estimating equations (GEE). C, Multiple linear regression analysis with GEE was used to assess changes in the urinary protein:creatinine (UPC) ratio for a given unit change in each biomarker. D, Univariate logistic regression analysis was used to examine the association between each variable and lupus rash. Whisker plots show the average odds ratios with 95% confidence intervals (95% CIs). Variables that were significantly associated with lupus nephritis are shown in red. ESR = erythrocyte sedimentation rate; dsDNA = anti–double- stranded DNA; CRP = C- reactive protein; AA = African American.

CORRELATION OF IC3B:C3 RATIOS WITH SLE DISEASE ACTIVITY | 427
ifestations of SLE that we speculated would drive different levels of complement activation, rash and lupus nephritis (defined as having any non- zero score in the urinary cast, hematuria, pro-teinuria, or pyuria domains of the SLEDAI- 2K RI- 50 score).
We first compared the presence of lupus nephritis in SLE patients to a status of no disease activity (patients with a SLEDAI- 2K RI- 50 score of 0). In the univariate regression analy-ses, relative changes in iC3b levels, the iC3b:C3 ratio, C3 levels, ESR, and anti- dsDNA antibody levels as well as race and number of visits each correlated with the presence of lupus nephritis (Fig-ure 5A). In the multivariate regression analyses, only changes in the iC3b:C3 ratio, anti- dsDNA antibody levels, and ESR and use of a supraphysiologic dose of prednisone independently correlated with the presence of lupus nephritis (Figure 5B). A 1- unit increase in the iC3b:C3 ratio increased the odds of lupus nephritis by 45%.
Since other clinical manifestations of SLE may contribute to the iC3b:C3 ratio, we examined whether the association of iC3b:C3 ratios with lupus nephritis may be confounded by these other manifestations. Using ordinary linear regression with GEE, we found that iC3b:C3 ratios were associated with the presence of lupus nephritis independent of the presence of pleurisy, pericarditis, leukopenia, thrombocytopenia, arthritis, rash, alopecia, and mucocutaneous ulcers (see Supplementary Table 2, available on the Arthritis & Rheumatology web site at http://onlinelibrary.wiley.com/doi/10.1002/art.40747/abstract). No such independent association was observed in the pres-ence of vasculitis or myositis, although these data may be a reflection of a lack of statistical power.
We then examined the quantitative changes in urinary pro-tein:creatinine (UPC) ratios for every unit change in iC3b levels, iC3b:C3 ratios, C3 levels, C4 levels, anti- dsDNA antibody levels, ESR, and CRP levels. Only relative changes in the iC3b levels had a statistically significant association with the UPC ratio (P = 0.006), with an increase in the UPC ratio of 0.18 for every 1- μg/ml increase in the iC3b level (Figure 5C). Both the iC3b:C3 ratios and C3 levels trended toward a significant association (for iC3b:C3, P = 0.097; for C3 levels, P = 0.100), with an increase in the UPC ratio of 0.10 for every 1- unit increase in the iC3b:C3 ratio, and an increase in the UPC ratio of 0.01 for every 10- mg/dl decrease in the C3 level.
When we examined the strength of association of iC3b:C3 ratios with the presence of lupus rash only, in comparison to that in patients with no active disease, no correlation was observed (Figure 5D). Moreover, none of the other biochemical measures (anti- dsDNA antibody levels, C3 levels, C4 levels, ESR, or iC3b levels) correlated with the presence of lupus rash. This establishes that the iC3b:C3 ratio may not correlate with all disease manifes-tations in SLE.
DISCUSSION
Clinicians currently assess complement activation on the basis of a reduction <LLN in the serum complement compo-
nents C3 and C4. However, several factors limit the usefulness of these measures in tracking SLE disease activity. For example, during SLE flares, consumption (due to activation) and produc-tion (due to inflammation- induced liver production as part of the acute- phase response) of C3 and C4 occur, which may prevent their early detection.
Complement activation generates numerous soluble and surface- bound split products that interact with stimulatory com-plement receptors and membrane- bound regulators of comple-ment activation. Consequently, the value of measuring comple-ment split products has just begun to be realized. For example, increased erythrocyte- and platelet- bound C4d can provide util-ity in the diagnosis of SLE (25–28).
A major unmet need in SLE is identifying biomarkers that might consistently reflect the levels of disease activity. To address this problem, we examined whether iC3b:C3 ratios were associated with changes in SLE disease activity. We employed a lateral flow assay designed to rapidly determine blood iC3b levels in the absence of artefactual elevation of iC3b (24). We provide evidence that the iC3b:C3 ratio corre-lated with changes in SLE disease activity, with clinically mean-ingful changes in disease activity evident in patients receiving a supraphysiologic dose of prednisone, and with the presence of lupus nephritis in SLE patients. In addition, the iC3b:C3 ratio was demonstrated to have favorable characteristics for identifying active SLE and major SLE flare. The performance characteristics of the iC3b:C3 ratio compare favorably with those of C3 or C4 levels in the serum.
Furthermore, we found an association between iC3b:C3 ratios and the presence of lupus nephritis that was independent of other observed clinical manifestations of SLE, and the levels of iC3b correlated with the UPC ratio. These results are not surpris-ing, given the significant degree of complement activation asso-ciated with lupus nephritis. Our findings support the use of the iC3b:C3 ratio as a biomarker of lupus nephritis disease activity.
Our data also confirm the lack of usefulness of absolute cutoff values, derived from healthy controls, for interpreting the levels of complement components or split products, in relation to SLE disease activity. We determined that elevated iC3b lev-els or iC3b:C3 ratios poorly classified active disease (identify-ing ~50% of patients). Low C3 levels also had poor sensitivity in detecting active disease (identifying 37.1% of patients). The poor sensitivity of low C3 levels is likely attributable to patients who experienced disease flares and had reductions in C3 lev-els that remained above the LLN but were lower than their baseline C3 levels during disease inactivity. This has previously been observed in patients with lupus nephritis (54). In contrast, the regression analyses demonstrated a positive correlation between the iC3b:C3 ratio and active disease, independent of other biomarkers evaluated. These results indicate that a relative change in complement levels likely has more value in assessing disease activity than an absolute cutoff value.

KIM ET AL 428 |
The lateral flow assay employed in this study offers rapid and precise measurements of iC3b. Results are obtained in 20 minutes with the accuracy of an ELISA (24). A cassette that measures C3 using lateral flow assay has recently been pro-duced, and data from a prototype possessed an accuracy that was similar to that of nephelometry (24). Thus, following addi-tional validation, dual measurements of iC3b and C3 levels could potentially be obtained to generate the iC3b:C3 ratio as a point- of- care test.
Lower blood iC3b levels were independently associated with higher odds of active disease for a given iC3b:C3 ratio, anti- dsDNA antibody level, and use of a supraphysiologic dose of prednisone. This finding is surprising, because the production of iC3b should increase with complement activation. We initially speculated that the expression levels of complement receptors in SLE may influence iC3b levels. The surface density of the iC3b receptors CR1 and CR2 are inversely correlated with SLE dis-ease activity (55). CR1 can bind to C3b, inactivate it into iC3b, and then into C3dg and C3c (Supplementary Figure 1 [http://onlinelibrary.wiley.com/doi/10.1002/art.40747/abstract]). Thus, in those with more active disease, less iC3b may be formed due to a decrease in CR1 expression. Conversely, decreased CR2 expres-sion in active disease could result in increased iC3b levels due to reduced clearance. Furthermore, proteins important in SLE (inter-feron- α and the downstream product of iC3b proteolysis, C3d) are also ligands for CR2 (56), which may further increase iC3b levels due to receptor occupancy. Thus, the differences in iC3b receptor expression observed during active disease likely do not explain why iC3b levels are inversely correlated with disease activity. This highlights the need to better characterize the half- lives and sys-temic and local handling of complement split products, such as iC3b, in patients with SLE.
A possible limitation to the use of complement split prod-ucts for evaluation of SLE disease activity is that not all manifes-tations may be related to detectable systemic activation of com-plement. Dermoepidermal junction deposition of C3d and C4d are observed in the skin of patients with active SLE rash (57), suggesting that complement split products are generated. Nev-ertheless, we found that lupus rash alone did not correlate with changes in the iC3b:C3 ratio. This suggests that a certain thresh-old of complement activation, perhaps combined with perfusion characteristics of the inflamed organ, is required.
We observed that CRP levels were independently associated with active disease based on the serology- free SLEDAI- 2K RI- 50 scores. CRP levels were found to poorly correlate with anti- dsDNA antibody levels and low complement levels (58), and thus this measure is thought to be poorly associated with disease activity in SLE. Nevertheless, increases in the CRP level of ~15 mg/liter have been observed during flares, particularly in patients with serositis (58). We agree with the findings of others, that increases in the CRP level during active disease are attenuated as compared to what might be anticipated; this could explain why a signal was
observed only when anti- dsDNA antibody levels and hypocomple-mentemia were removed from the analysis.
We acknowledge that there may be variability in how iC3b:C3 ratios behave depending on as yet undiscovered patient disease characteristics. However, our data demonstrate that the measurement of iC3b:C3 ratios is more informative than traditional biomarkers. These data support the development of larger- scale studies to confirm the utility of iC3b:C3 ratios in SLE, especially in identifying those who may develop lupus nephritis. Our data also suggest that a comprehensive, quan-titative assessment of soluble and cell- bound complement split products from patients with various disease activity states needs to be performed, especially in light of data demonstrating the efficacy of complement inhibition in lupus nephritis (59). Iden-tifying the array of complement signatures in the blood and on immune cells longitudinally will likely generate important obser-vations regarding SLE pathophysiology, and may help refine how to best utilize complement split products for the assessment of SLE disease activity.
ACKNOWLEDGMENTS
The authors would like to acknowledge Lacey Feigl for administrative assistance, Zahi Touma for help in implementing the SLEDAI- 2K RI- 50 instrument at Washington University and for critical reading of the manuscript, Rebecca Schriefer for crit-ical reading of the manuscript, and all of the patients for their participation in this study.
AUTHOR CONTRIBUTIONS
All authors were involved in drafting the article or revising it critically for important intellectual content, and all authors approved the final ver-sion to be published. Dr. Kim had full access to all of the data in the study and takes responsibility for the integrity of the data and the accuracy of the data analysis.Study conception and design. Kim, Strand, Sen, Fu, Schmidt, Olson, Stiening, Atkinson.Acquisition of data. Kim, Sen, Mathis, Bruchas, Staten.Analysis and interpretation of data. Kim, Strand, Sen, Fu, Schmidt, Atkinson.
ROLE OF THE STUDY SPONSOR
Kypha Inc. provided support for the study. The authors were inde-pendently responsible for the study design, data collection, interpretation of the results, and drafting of the manuscript, and had the final decision to submit the manuscript for publication. Publication of this article was not contingent upon approval by Kypha, Inc.
REFERENCES 1. Leffler J, Bengtsson AA, Blom AM. The complement system
in systemic lupus erythematosus: an update. Ann Rheum Dis 2014;73:1601–6.
2. Atkinson JP. Complement activation and complement receptors in systemic lupus erythematosus. Springer Semin Immunopathol 1986;9:179–94.

CORRELATION OF IC3B:C3 RATIOS WITH SLE DISEASE ACTIVITY | 429
3. Lloyd W, Schur PH. Immune complexes, complement, and anti- DNA in exacerbations of systemic lupus erythematosus (SLE). Medicine (Baltimore) 1981;60:208–17.
4. Dunkelberger JR, Song WC. Complement and its role in innate and adaptive immune responses. Cell Res 2010;20:34–50.
5. Gershov D, Kim S, Brot N, Elkon KB. C- reactive protein binds to apoptotic cells, protects the cells from assembly of the terminal complement components, and sustains an antiinflammatory innate immune response: implications for systemic autoimmunity. J Exp Med 2000;192:1353–64.
6. Vaughan JH, Bayles TB, Favour CB. The response of serum γ glob-ulin level and complement titer to adrenocorticotropic hormone therapy in lupus erythematosus disseminatus. J Lab Clin Med 1951;37:698–702.
7. Pillemer SR, Austin HA III, Tsokos GC, Balow JE. Lupus nephritis: association between serology and renal biopsy measures. J Rheu-matol 1988;15:284–8.
8. Schur PH, Sandson J. Immunologic factors and clinical activity in systemic lupus erythematosus. N Engl J Med 1968;278:533–8.
9. Gabay C, Kushner I. Acute- phase proteins and other systemic re-sponses to inflammation. N Engl J Med 1999;340:448–54.
10. Sliwinski AJ, Zvaifler NJ. Decreased synthesis of the third compo-nent of complement (C3) in hypocomplementenic systemic lupus erythematosus. Clin Exp Immunol 1972;11:21–9.
11. Sturfelt G, Sjoholm AG. Complement components, complement ac-tivation, and acute phase response in systemic lupus erythemato-sus. Int Arch Allergy Appl Immunol 1984;75:75–83.
12. Yang Y, Chung EK, Zhou B, Lhotta K, Hebert LA, Birmingham DJ, et al. The intricate role of complement component C4 in human systemic lupus erythematosus. Curr Dir Autoimmun 2004;7:98–132.
13. Nagy G, Brozik M, Varga L, Fust G, Kirschfink M, Kiss E, et al. Use-fulness of detection of complement activation products in evaluating SLE activity. Lupus 2000;9:19–25.
14. Senaldi G, Makinde VA, Vergani D, Isenberg DA. Correlation of the activation of the fourth component of complement (C4) with disease activity in systemic lupus erythematosus. Ann Rheum Dis 1988;47:913–7.
15. Buyon JP, Tamerius J, Belmont HM, Abramson SB. Assessment of disease activity and impending flare in patients with systemic lupus erythematosus: comparison of the use of complement split products and conventional measurements of complement. Arthritis Rheum 1992;35:1028–37.
16. Kerr LD, Adelsberg BR, Spiera H. Complement activation in sys-temic lupus erythematosus: a marker of inflammation. J Rheumatol 1986;13:313–9.
17. Manzi S, Rairie JE, Carpenter AB, Kelly RH, Jagarlapudi SP, Sereika SM, et al. Sensitivity and specificity of plasma and urine complement split products as indicators of lupus disease activity. Arthritis Rheum 1996;39:1178–88.
18. Porcel JM, Ordi J, Castro-Salomo A, Vilardell M, Rodrigo MJ, Gene T, et al. The value of complement activation products in the assess-ment of systemic lupus erythematosus flares. Clin Immunol Immuno-pathol 1995;74:283–8.
19. Hopkins P, Belmont HM, Buyon J, Philips M, Weissmann G, Abramson SB. Increased levels of plasma anaphylatoxins in systemic lupus erythematosus predict flares of the disease and may elicit vascular injury in lupus cerebritis. Arthritis Rheum 1988;31:632–41.
20. Wild G, Watkins J, Ward AM, Hughes P, Hume A, Rowell NR. C4a anaphylatoxin levels as an indicator of disease activity in systemic lupus erythematosus. Clin Exp Immunol 1990;80:167–70.
21. Belmont HM, Hopkins P, Edelson HS, Kaplan HB, Ludewig R, Weissmann G, et al. Complement activation during systemic lupus
erythematosus: C3a and C5a anaphylatoxins circulate during exac-erbations of disease. Arthritis Rheum 1986;29:1085–9.
22. Gawryl MS, Chudwin DS, Langlois PF, Lint TF. The terminal com-plement complex, C5b- 9, a marker of disease activity in patients with systemic lupus erythematosus. Arthritis Rheum 1988;31: 188–95.
23. Calano SJ, Shih PA, Liu CC, Kao AH, Navratil JS, Manzi S, et al. Cell- bound complement activation products (CB- CAPs) as a source of lupus biomarkers. Adv Exp Med Biol 2006;586:381–90.
24. Schramm EC, Staten NR, Zhang Z, Bruce SS, Kellner C, Atkinson JP, et al. A quantitative lateral flow assay to detect complement acti-vation in blood. Anal Biochem 2015;477:78–85.
25. Kalunian KC, Chatham WW, Massarotti EM, Reyes-Thomas J, Harris C, Furie RA, et al. Measurement of cell- bound complement activa-tion products enhances diagnostic performance in systemic lupus erythematosus. Arthritis Rheum 2012;64:4040–7.
26. Putterman C, Furie R, Ramsey-Goldman R, Askanase A, Buyon J, Kalunian K, et al. Cell- bound complement activation products in sys-temic lupus erythematosus: comparison with anti- double- stranded DNA and standard complement measurements. Lupus Sci Med 2014;1:e000056.
27. Wallace DJ, Silverman SL, Conklin J, Barken D, Dervieux T. Systemic lupus erythematosus and primary fibromyalgia can be distinguished by testing for cell- bound complement activation products. Lupus Sci Med 2016;3:e000127.
28. Kao AH, Navratil JS, Ruffing MJ, Liu CC, Hawkins D, McKinnon KM, et al. Erythrocyte C3d and C4d for monitoring disease activity in sys-temic lupus erythematosus. Arthritis Rheum 2010;62:837–44.
29. Buyon J, Furie R, Putterman C, Ramsey-Goldman R, Kalunian K, Barken D, et al. Reduction in erythrocyte- bound complement acti-vation products and titres of anti- C1q antibodies associate with clin-ical improvement in systemic lupus erythematosus. Lupus Sci Med 2016;3:e000165.
30. Liu CC, Manzi S, Kao AH, Navratil JS, Ruffing MJ, Ahearn JM. Retic-ulocytes bearing C4d as biomarkers of disease activity for systemic lupus erythematosus. Arthritis Rheum 2005;52:3087–99.
31. Miller JJ III, Olds LC, Silverman ED, Milgrom H, Curd JG. Different patterns of C3 and C4 activation in the varied types of juvenile arthri-tis. Pediatr Res 1986;20:1332–7.
32. Ekdahl KN, Norberg D, Bengtsson AA, Sturfelt G, Nilsson UR, Nilsson B. Use of serum or buffer- changed EDTA- plasma in a rap-id, inexpensive, and easy- to- perform hemolytic complement assay for differential diagnosis of systemic lupus erythematosus and mon-itoring of patients with the disease. Clin Vaccine Immunol 2007;14: 549–55.
33. Troldborg A, Jensen L, Deleuran B, Stengaard-Pedersen K, Thiel S, Jensenius JC. The C3dg fragment of complement is superior to conventional c3 as a diagnostic biomarker in systemic lupus erythe-matosus. Front Immunol 2018;9:581.
34. Martin M, Smolag KI, Bjork A, Gullstrand B, Okroj M, Leffler J, et al. Plasma C4d as marker for lupus nephritis in systemic lupus erythe-matosus. Arthritis Res Ther 2017;19:266.
35. Lachmann PJ. The amplification loop of the complement pathways. Adv Immunol 2009;104:115–49.
36. Sim E, Wood AB, Hsiung LM, Sim RB. Pattern of degradation of human complement fragment, C3b. FEBS Lett 1981;132:55–60.
37. Nilsson B, Ekdahl KN. Complement diagnostics: concepts, indications, and practical guidelines. Clin Dev Immunol 2012; 2012:962702.
38. Bedwell AE, Elson CJ, Carter SD, Dieppe PA, Hutton CW, Czudek R. Isolation and analysis of complement activating aggregates from synovial fluid of patients with rheumatoid ar-thritis using monoclonal anti- C3d antibodies. Ann Rheum Dis 1987;46:55–64.
KIM ET AL 430 |
39. Negoro N, Okamura M, Takeda T, Koda S, Amatsu K, Inoue T, et al. The clinical significance of iC3b neoantigen expression in plasma from patients with systemic lupus erythematosus. Arthritis Rheum 1989;32:1233–42.
40. Mollnes TE, Garred P, Bergseth G. Effect of time, temperature and anticoagulants on in vitro complement activation: consequences for collection and preservation of samples to be examined for comple-ment activation. Clin Exp Immunol 1988;73:484–8.
41. Hochberg MC. Updating the American College of Rheumatology re-vised criteria for the classification of systemic lupus erythematosus [letter]. Arthritis Rheum 1997;40:1725.
42. Petri M, Orbai AM, Alarcon GS, Gordon C, Merrill JT, Fortin PR, et al. Derivation and validation of the Systemic Lupus International Collab-orating Clinics classification criteria for systemic lupus erythemato-sus. Arthritis Rheum 2012;64:2677–86.
43. Strand V, Chu AD. Measuring outcomes in systemic lupus erythe-matosus clinical trials. Expert Rev Pharmacoecon Outcomes Res 2011;11:455–68.
44. Touma Z, Gladman DD, Ibanez D, Urowitz MB. Development and initial validation of the Systemic Lupus Erythematosus Disease Activity Index 2000 Responder Index 50. J Rheumatol 2011;38:275–84.
45. Yee CS, Farewell VT, Isenberg DA, Griffiths B, Teh LS, Bruce IN, et al. The use of Systemic Lupus Erythematosus Disease Activity In-dex- 2000 to define active disease and minimal clinically meaning-ful change based on data from a large cohort of systemic lupus erythematosus patients. Rheumatology (Oxford) 2011;50:982–8.
46. Gladman DD, Urowitz MB, Kagal A, Hallett D. Accurately describ-ing changes in disease activity in systemic lupus erythematosus. J Rheumatol 2000;27:377–9.
47. Gladman DD, Ibanez D, Urowitz MB. Systemic lupus erythematosus disease activity index 2000. J Rheumatol 2002;29:288–91.
48. Touma Z, Gladman DD, Su J, Ibanez D, Urowitz MB. SLEDAI- 2K does not conceal worsening in a particular system when there is overall improvement. J Rheumatol 2015;42:1401–5.
49. Fortin PR, Ferland D, Moore AD, Belisle P, Joseph L, Clarke AE. Rates and predictors of lupus flares. Arthritis Rheum 1998;41:S218–S.
50. Horn PS, Pesce AJ, Copeland BE. A robust approach to reference interval estimation and evaluation. Clin Chem 1998;44:622–31.
51. Zeger SL, Diggle PJ. Semiparametric models for longitudinal data with application to CD4 cell numbers in HIV seroconverters. Biometrics 1994;50:689–99.
52. DeLong ER, DeLong DM, Clarke-Pearson DL. Comparing the areas under two or more correlated receiver operating charac-teristic curves: a nonparametric approach. Biometrics 1988;44: 837–45.
53. Swaak AJ, van Rooyen A, Vogelaar C, Pillay M, Hack E. Comple-ment (C3) metabolism in systemic lupus erythematosus in relation to the disease course. Rheumatol Int 1986;6:221–6.
54. Birmingham DJ, Irshaid F, Nagaraja HN, Zou X, Tsao BP, Wu H, et al. The complex nature of serum C3 and C4 as biomarkers of lupus renal flare. Lupus 2010;19:1272–80.
55. Wilson JG, Ratnoff WD, Schur PH, Fearon DT. Decreased expres-sion of the C3b/C4b receptor (CR1) and the C3d receptor (CR2) on B lymphocytes and of CR1 on neutrophils of patients with systemic lupus erythematosus. Arthritis Rheum 1986;29:739–47.
56. Delcayre AX, Salas F, Mathur S, Kovats K, Lotz M, Lernhardt W. Ep-stein Barr virus/complement C3d receptor is an interferon α receptor. EMBO J 1991;10:919–26.
57. Magro CM, Dyrsen ME. The use of C3d and C4d immunohisto-chemistry on formalin- fixed tissue as a diagnostic adjunct in the assessment of inflammatory skin disease. J Am Acad Dermatol 2008;59:822–33.
58. Gaitonde S, Samols D, Kushner I. C- reactive protein and systemic lupus erythematosus. Arthritis Rheum 2008;59:1814–20.
59. Pickering MC, Ismajli M, Condon MB, McKenna N, Hall AE, Lightstone L, et al. Eculizumab as rescue therapy in severe resistant lupus nephritis. Rheumatology (Oxford) 2015;54:2286–8.