assessment of different cereal brans (sorghum, barely and
TRANSCRIPT

1
ثس هللا اشح اشح١
Sudan University of Science and Technology
College of Graduate Studies
(SUST)
Assessment of different cereal brans (sorghum, barely and
millet) as prebiotics in goat milk fermented with Bifidbacterium
longum BB536
في لبن ، الشعير والدخن ( كبريبايوتك الرفيعة )الذرة المختلفة تقييم نخالة الحبوب
الماعز المخمر بواسطة بكتريا
Bifidbacterium longum BB536
By:
Limia Hashim Mohammed Eltaher
B. Sc of Science (Honors) in Biochemistry and Food Science, University of Khartoum,
SUDAN.
M.Sc. in food Science and Technology, College of Agricultural Studies, Sudan
University of Science and Technology, SUDAN
Supervisor:
Associate Professor Dr. Barka Mohammed Kabeir Barka
Department of Food Science and Technology
College of Agricultural Studies, SUST
Co- Supervisor:
Assistant Professor Dr. Salma Elghali Mustafa
Department of Food Science and Technology
College of Agricultural Studies, SUST
Desember 2020

I
اآلية
الرحيم الرحمن هللا بسم
:تعايل قال
. ق ليال ( إال العلم من ) وما أوتيتم
صدق اهلل العظيم (58سورة األسراء اآلية )

II
Dedication
I dedicated this dissertation
To my great parents
To my husband and my little sons
To my big family for their kind helps and support.
It also goes to teachers, scientists, researchers and all
Seekers for knowledge.

III
Acknowledgement
Alhamdulillah, I finished my study with help and full
support of my lord ALLAH, guidance of my supervisor,
cooperation of friends and family.
I would like to express my deepest gratitude to my
supervisor Dr. Barka Mohammad Kabeir and Dr. Salma
Elghali Mustafa for excellent guidance, patience and
providing me with valuable advice to finalize this research.
I would like to thank all staff at Department of Food
Science and Technology (College of Agricultural Studied,
SUST) for the kind cooperation.
Finally I would like to thank my mother Elatia Osman,
father Hashim Mohammed El Tahir and My husband
Yasser Mustafa. They were always there cheering me up
and stood beside me supporting me financially and morally
to further my study to this level, my ALLAH bless and
grand them of good health and great wealth.
IV
List of Contents
Title Page
No.
ا٠٢خ
…………………………………………………………………….
I
Dedication …………………………………………………………… II
Acknowledgements …………………………………………………. III
List of Contents …………………………………………………….. IV
List of Tables ……………………………………………………….. XII
Abstract…………………………………………………………….. .. XV
خض اجحث
…………………………………………………………….
XVIII
CHAPTER ONE …………………………………………………… 1
INTRODUCTION ………………………………………………… 1
CHAPTER TWO ………………………………………………….. 4
LITERATURE REVIEW ………………………………………… 4
2.1. Functional foods……………………………………………….. . 4
2.1.1 History of functional foods……………………………… ….. 4
2.1.2 Definition of functional foods ……………………………….. 5
2.1. 3 Categories of functional foods ……………………………… 5
2.1.3.1 Natural foods
…………………………………………………
5
2.1.3.2 Processed foods, GM foods …………………………………. 5
2.1.4Classification of functional foods …………………………… 6
2.2.1General description of milks ………………………………… 6
2.2.2 Goat and milk production…………………………………… 8
2.2.3 Cow and milk production …………………………………… 8
V
2.2.4 Camel milk composition ……………………………………. 9
2.2.5 processing of milk…………………………………………… 10
2.2.6 Definition of fermented milk ……………………………….. 10
2.2.7 Type of fermentation ……………………………………….. 11
2.2.8 Fermented milk products……………………………………. 11
2.2.9 Starter culture for milk fermentation………………………… 12
2.3 Prebiotics ……………………………………………………….. 12
2.3.1. The prebiotic concept ………………………………………. 13
2.3.2. Advantages and disadvantages of the prebiotic strategy……. 14
2.3.2.1 Advantages over probiotics ……………………………….. 14
2.3.2.2 Disadvantages over probiotics ……………………………. 15
2.3.3. Types of prebiotics …………………………………………. 15
2.3.4 Prebiotics and symbiotics…………………………………… 16
2.3.5 Present probiotic and prebiotic foods………………………… 17
2.4 Inulin …………………………………………………………… 17
2.5 Probiotics ………………………………………………………. 18
2.5.1 Definition of probiotics………………………………………. 18
2.5.2History of probiotics …………………………………………. 19
2.5.4 Probiotic strains ……………………………………………… 19
2.5.5 Characteristics of probiotics microorganism ……………….. 20
2.5.6 Health benefits of probiotic ………………………………….. 21
2.5.7 Criteria of selection of appropriate probiotic ………………. 22
2.5.8 Microorganism used as probiotic……………………………. 24
2.5.9 Bifidobacteria………………………………………………… 24
2.5.10. B.longumBB536 …………………………………………… 25
CHAPTER THREE ………………………………………………. 27

VI
MATERIALS AND METHODS ………………………………… 27
3.1 Materials ……………………………………………………….. 27
3.1.1. Preparation of different brans ……………………………… 27
3.1.2. Preparation of fermentation inoculums ……………………. 28
3.1.3 Production of fermented product …………………………… 28
3.2. Experimental rats design …………………………………….. 28
3.2.1 Animals ……………………………………………………… 28
3.2.2 Experimental design ………………………………………… 29
3.2.2.1 Chemical and apparatus ………………………………….. 29
3.2.3.2 Experimental design feed ………………………………….. 29
3.2.3 Blood sampling ………………………………………………. 30
3.3 Methods ………………………………………………………… 30
3.3.1Physico-chemical methods…………………………………….. 30
3.3.1.1 Total soluble solids…………………………………………. 30
3.3.1.2 Hydrogen ion concentration………………………………... 31
3.3.1.3 Titerable acidity……………………………………………. 31
3.3.2Proximate analyses……………………………………………. 31
3.3.2.1 Moisture content……………………………………………. 31
3.3.2.2 Ash content…………………………………………………. 32
3.3.2.3 Oil content…………………………………………………… 33
3.3.2.4 Crude protein content………………………………………. 34
3.3.2.5 Crude fiber content…………………………………………. 35
3.3.2.6 Minerals content……………………………………………. 36
3.3.2.7 Total and reducing sugars………………………………….. 37
3.3.2.8 Calculation of carbohydrates………………………………. 38
3.4 Production of probiotic fermented product……………………. 38
3.4.1 Production of fermented product…………………………….. 38

VII
3.5. Chemical analysis of milk and fermented product……………… 39
3.5.1 Protein content……………………………………………….. 39
3.5.2 Determination of fat content ………………………………… 40
3.5.3 Ash content…………………………………………………… 40
3.5.4 Determination of crude
fiber…………………………………….
40
3.5.5 Calculation of carbohydrates………………………………… 41
3.5.6 Determination of pH value…………………………………… 41
3.6 Microbiological analysis of fermented product…………………. 42
3.6.1 Preparation of equipments and media……………………….. 42
3.6.2 Preparation of the samples…………………………………… 42
3.6.3 Enumeration of viable cell of B. longumBB536……………….
42
3.6.4 Total bacterial count (TBC)………………………………….. 43
3.6.4.1Preparation of the media……………………………………. 43
3.6.4.2 Plating………………………………………………………. 43
3.6.4.3 Counting……………………………………………………. 43
3.6.5 E.coli counts………………………………………………….. 44
3.6.5.1 Preparation of the media…………………………………… 44
3.6.5.2 Plating and counting………………………………………… 44
3.6.6 Staphylococcus aureus counts ………………………………… 44
3.6.6.1 Preparation of the media ………………………………….. 45
3.6.3 Enumeration of viable cell of B. longumBB536………………. 42
3.6.4 Total bacterial count (TBC)………………………………….. 43
3.6.4.1Preparation of the media……………………………………. 43
3.6.4.2 Plating……………………………………………………….. 43
3.6.4.3 Counting…………………………………………………….. 43

VIII
3.6.5 E.coli
counts…………………………………………………….
44
3.6.5.1 Preparation of the media…………………………………… 44
3.6.5.2 Plating and counting…………………………………………. 44
3.6.7 Yeast and molds count ………………………………………. 45
3.6.7.1Preparation of the media……………………………………. 45
3.6.7.2 Plating and counting………………………………………… 46
3.6.8 Salmonella…………………………………………………………… 46
3.6.8.1 Preparation of the media…………………………………… 46
3.6.8.2 Plating and counting……………………………………….. 46
3.6.8.3 Counting …………………………………………………… 46
3.7 Hematology…………………………………………………….. 47
3.8 Biochemistry……………………………………………………. 47
3.8.1 Serum enzymes and minerals………………………………… 47
3.8.2 Glucose……………………………………………………….. 47
3.8.3 Direct bilirubin………………………………………………… 48
3.8.4 Urea……………………………………………………………. 48
3.8.5 Creatinine……………………………………………………… 50
3.8.6 Cholesterol……………………………………………………. 51
3.8.7 High density lipoprotein (HDL)……………………………… 52
3.8.8 Triglycerides………………………………………………….. 54
3.9 Bacteriological enumeration in colon of rats fed fermented goat
milk supplemented with inulin and different cereal brans…………..
54
3.10 Statistical analysis…………………………………………….. 56
CHAPTER FOUR…………………………………………………. 57
RESULTS AND DICUSSION…………………………………….. 57
4.1 Proximate composition of cereal brans ……………………….. 57

IX
4.2 Menirals content
…………………………………………………..
59
4.3 Total, reducing and none reducing sugars……………………… 60
4.4 Physicochemical properties and chemical composition of
different fresh milks………………………………………………….
61
4.5 The growth of Bifdobacterium longum BB356 during
fermentation of different fresh milks
…………………………………
62
4.6 pH changes during fermentation of different fresh milk with
B.longum BB356 ……………………………………………………
64
4.7 TSS changes during fermentation of different fresh milk with B.
longum BB536………………………………………………………
64
4.8 Chemical composition of fermented goat milk supplemented
with inulin and different brans
…………………………………………..
67
4.9 Justification of using goat milk for formulation of fermented
product ………………………………………………………………
69
4.10 The growth of Bifidobacterium. longum BB536 during
fermentation of goat milk supplemented with inulin and different
cereal brans…………………………………………………………..
70
4.11 pH changes during fermentation of goat milk supplemented
with inulin and different cereal bran with Bifidobacterium longum
BB536
73

X
4.9 Justification of using goat milk for formulation of fermented
product ………………………………………………………………
69
4.10 The growth of Bifidobacterium. longum BB536 during
fermentation of goat milk supplemented with inulin and different
cereal brans…………………………………………………………
70
4.11 pH changes during fermentation of goat milk supplemented
with inulin and different cereal bran with Bifidobacterium longum
BB536
73
4.12 TSS changes during fermentation of goat milk
supplemented with inulin and different brans with
Bifidobacterium longum BB536 ……
75
4.13 Titratable acidity during fermentation of goat milk
supplemented with inulin and different brans with Bifidobacterium
longum BB536 …………
77
4.14 Mineral content of goat milk supplemented with inulin and
different brans fermented with Bifidobacterium longum BB536…….
79
4.15 The viable counts of Bifidobacterium longum BB536 log (CFU/
ml) during refrigeration storage of fermented goat milk
supplemented with inulin and different cereal brans
………………..
81
4.16 Reducing sugars during refrigeration storage of fermented goat
milk supplemented with inulin and goat milk with brans………….
84
4.17 Reduction of pH during refrigeration storage of fermented goat
milk supplemented with inulin and different brans………………..
86

XI
4.18 Changes in TSS during the storage of different fermented goat
milk supplemented with inulin and cereal brans……………………
88
4.19 Changes in moisture during the storage of different
fermented goat milk supplemented with inulin and cereal
brans….
89
4.20 Changes in titratable acidity during the storage of fermented
goat milk supplemented with inulin and different brans…………
92
4.21 Changes in minerals content during the storage of different
fermented goat milk supplemented with inulin and different
brans.
94
4.22 Effect of oral feeding with strain BB536 of fermented goat milk
supplemented with different prebiotics on body weights of rat ………
97
4.23 Feed intake and water consumption of rats orally fed with
different treatments …………………………………………………
99
4.24 Haematological parameters of rats orally fed with BB536
fermented goat milk supplemented with different prebiotics……
102
4.25 Blood biochemistry parameters of rats orally fed with
goat milk supplemented with different prebiotics ……………
106
4.26 Different microbial groups in colon of rats orally fed fermented
goat milk supplemented with different prebiotics ………………….
110
CHAPTER FIVE ………………………………………………….. 113
CONCLUSION AND RECOMMENDATIONS………………… 113
5.1 Conclusion ……………………………………………………… 113
5.2 Recommendation …………………………………………… 114

XII
List of Tables
Table No. Title Page No.
Table 1 The experimental rat groups and their diets 29
Table 2 Enumeration media and incubation environments of different
microbiota groups in colon of rats fed different products
55
Table 3 Proximate composition of Inulin and cereal brans 58
Table 4 Mineral content (mg/100g) of inulin and different cereal bran 59
Table 5 Total, reducing and non reducing sugars (mg/100g) of cereal
brans
60
Table 6 Physicochemical properties and chemical composition of
different fresh milks
61
Table7 The viable count of Bifidobacterium longum BB536 log
(CFU/ml) during fermentation of different types of fresh milks
63
Table 8 pH change during the growth of Bifidobacterium longum
BB536 in different types of fresh milk
65
Table 9 TSS (100%) change during the growth of Bifidobacterium
longum BB536 in different types of fresh milk
66
Table 10 Chemical composition of goat milk supplemented with inulin
and different brans and fermented with Bifidobacterium
longum BB536
68
Table 11 The viable count of Bifidobacterium longum BB536 log
(CFU/ml) during fermentation of goat milk supplemented with
inulin and different brans
72
Table 12 pH change during the growth of Bifidobacterium longum
BB536 in goat milk supplemented with inulin and different
brans
74

XIII
Table 13 TSS changes during fermentation of goat milk supplemented
with inulin and different brans Bifidobacterium longum BB536
76
Table 14 Titrable acidity (%) during fermentation of goat milk
supplemented with inulin and different brans with the strain
Bifidobacterium longum BB536
78
Table 15 Mineral content (100%) of goat milk supplemented with inulin
and different brans fermented with Bifidobacterium longum
BB536
80
Table 16 The viable counts of Bifidobacteriumlongum BB536log (CFU/
ml) during refrigeration storage of fermented goat milk
supplemented with inulin and different cereal brans
83
Table 17 Reducing sugar during refrigeration storage of fermented goat
milk supplemented with inulin and different cereal brans
85
Table 18 pH during refrigeration storage of fermented goat milk
supplemented with inulin and different cereal brans
87
Table 19 TSS during refrigeration storage of fermented goat milk
supplemented with inulin and different cereal brans
90
Table 20 Moisture during refrigeration storage of fermented goat milk
supplemented with inulin and different cereal brans
91
Table 21 Titratable acidity during refrigeration storage of fermented
goat milk supplemented with inulin and different cereal brans
93
Table 22 Mineral content of the different goat milk supplemented with
inulin and sorghum bran during refrigeration storage
95
Table 23 Mineral content of the different goat milk supplemented with
barely bran and millet bran during refrigeration storage
96
Table 24 Weight (g) of different groups of rats orally feed goat milk

XIV
supplemented with different prebiotics for 30 days 98
Table 25 Feeed intake and water consumption of rats orally fed with
different treatments
101
Table 26 Hematology parameters of rats orally fed with goat milk
supplemented with different prebiotics for 30 days
104
Table 27 Biochemistry parameters of rats orally with fermented goat
milk supplemented with different prebiotics for 30 days
108
Table 28 Different microbial groups in colon of rats orally fed with
fermented goat milk supplemented with different prebiotics
112

XV
Abstract
This study was carried out to explore prebiotic effect of different cereal bran
on Bifidobacterium longum BB536 growth stimulation for developing
functional food. Fermentation medium was formulated from goat milk
supplemented with 10% inulin (controlled) or each of the different cereal
bran sorghum, barley, and millet. Probiotic strain B. longum BB 536 was
used for fermentation. Prebiotic effects of different cereal bran were
examined. Safety and beneficial effect of fermented goat milk supplemented
with different bran on colon bacterial groups of fed rats were evaluated.
Different analyses including proximate, mineral, strain BB536 viable count,
physicochemical analysis were conducted. Thirty male Albino rats were
acclimatized for two weeks to experimental conditions and randomly
assigned into five groups. The control group received a normal rat diet.
Other rats groups received fermented goat milk supplemented with each of
inulin, sorghum bran, barley bran and millet bran. The experimental trials
were extended for 6 weeks. Inulin was an excellent source of fiber,
carbohydrate, and minerals (Ca, K, Mg and Na). Among cereal, bran barley
contained the highest level of fiber, followed by sorghum and then millet
barn. Moreover, cereal bran is a good source of protein, fat and ash. During
fermentation, the maximum growths of the strain BB 536 (12 h incubation)
were 7.53±0.16b -8.43±0.03cLog CFU/ml in fermented goat milk
supplemented with inulin and different cereal bran. These counts exceed the
minimum number (6 log CFU/ml products) required to the presence in
probiotic food. Further, rates of strain BB 536 increases induced by different
cereal bran (7.65 – 8.43CFU/ml) are comparable to that of the commercial
prebiotic inulin (7.53 CFU/ml). Therefore, different types of cereal bran
have a prebiotic effect on strain BB 536 growth when supplemented with
XVI
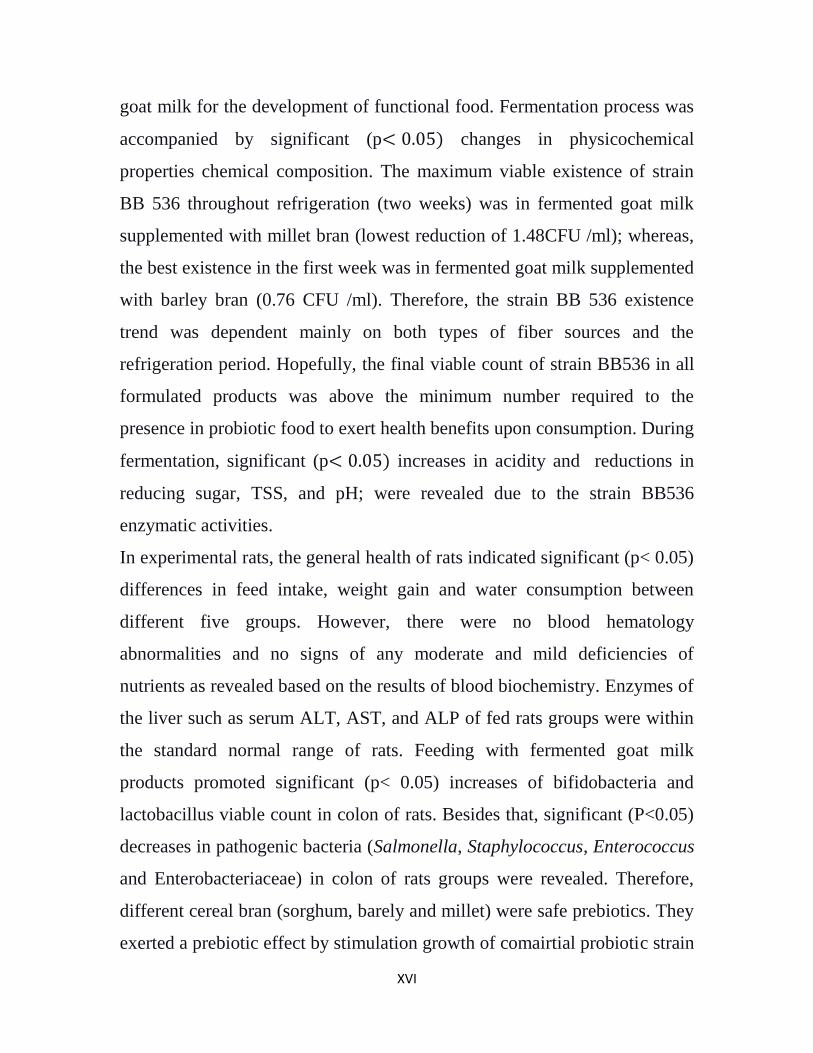
goat milk for the development of functional food. Fermentation process was
accompanied by significant (p changes in physicochemical
properties chemical composition. The maximum viable existence of strain
BB 536 throughout refrigeration (two weeks) was in fermented goat milk
supplemented with millet bran (lowest reduction of 1.48CFU /ml); whereas,
the best existence in the first week was in fermented goat milk supplemented
with barley bran (0.76 CFU /ml). Therefore, the strain BB 536 existence
trend was dependent mainly on both types of fiber sources and the
refrigeration period. Hopefully, the final viable count of strain BB536 in all
formulated products was above the minimum number required to the
presence in probiotic food to exert health benefits upon consumption. During
fermentation, significant (p increases in acidity and reductions in
reducing sugar, TSS, and pH; were revealed due to the strain BB536
enzymatic activities.
In experimental rats, the general health of rats indicated significant (p< 0.05)
differences in feed intake, weight gain and water consumption between
different five groups. However, there were no blood hematology
abnormalities and no signs of any moderate and mild deficiencies of
nutrients as revealed based on the results of blood biochemistry. Enzymes of
the liver such as serum ALT, AST, and ALP of fed rats groups were within
the standard normal range of rats. Feeding with fermented goat milk
products promoted significant (p< 0.05) increases of bifidobacteria and
lactobacillus viable count in colon of rats. Besides that, significant (P<0.05)
decreases in pathogenic bacteria (Salmonella, Staphylococcus, Enterococcus
and Enterobacteriaceae) in colon of rats groups were revealed. Therefore,
different cereal bran (sorghum, barely and millet) were safe prebiotics. They
exerted a prebiotic effect by stimulation growth of comairtial probiotic strain

XVII
BB536 (IN VIVO) and enhanced of beneficial bacteria and suppression of
pathogens in colon of rats (IN VITRO).Thus they are useful for synibiotic
(probiotic and prebiotic in same product) application in dairy functional
foods.
XVIII
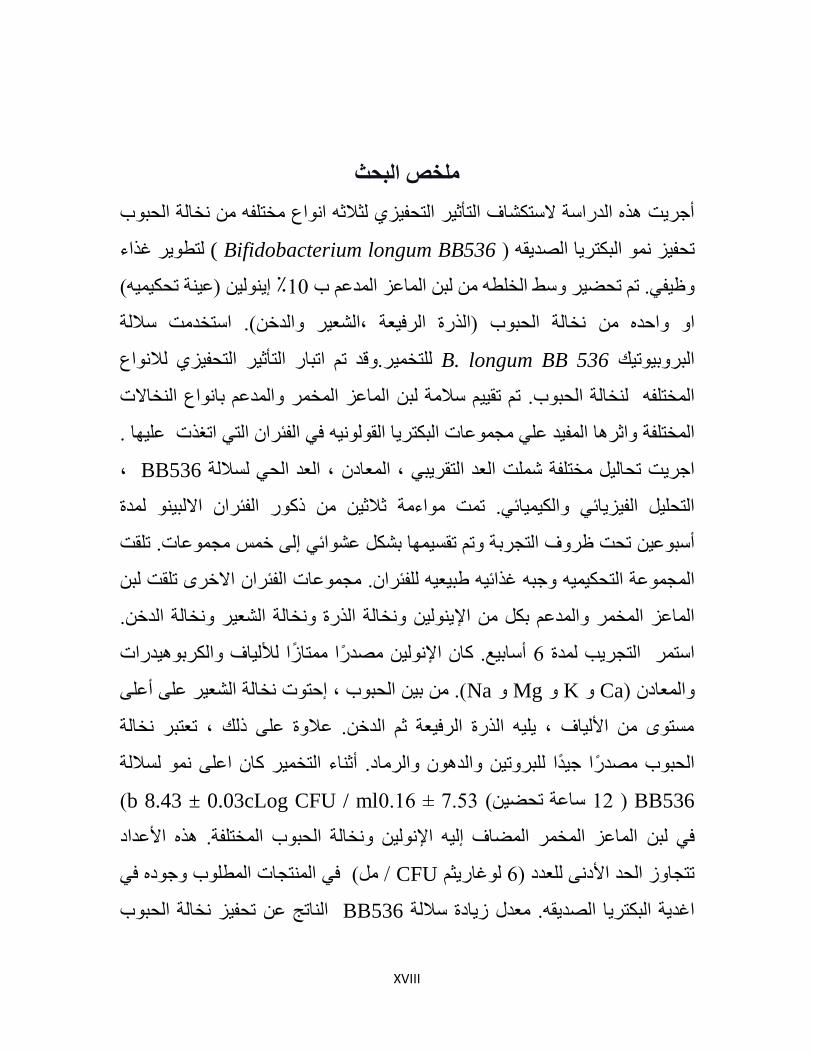
ملخص البحث
خبخ احجة خزف ثالث ااع زحف١ضأجش٠ذ ز اذساسخ السزىشبف ازأث١ش ا
زط٠ش غزاء ) Bifidobacterium longum BB536) اجىزش٠ب اظذ٠م رحف١ض
( رحى١١٪ إ١٠ )ع١خ 10 ذع ةابعض ا ج سظ اخط ظ١ف. ر رحض١ش
خبخ احجة )ازسح اشف١عخ ،اشع١ش اذخ(. اسزخذذ سالخ احذ ا
ازحف١ض الاع زأث١شا ارجبسزخ١ش.لذ ر B. longum BB 536اجشث١ر١ه
اخبالد اذع ثباع ابعض اخش ر رم١١ سالخ جخبخ احجة. اخزف
ف افئشا از ارغزد ع١ب . ش٠ب ام١اثشب اف١ذ ع جعبد اجىز اخزفخ
، BB536 اعذ اح سالخاعذ ازمش٠ج ، اعبد ، شذخزفخ ب١اجش٠ذ رح
ذح االج١ ثالث١ روس افئشا اءخ ذاى١١بئ. رازح١ اف١ض٠بئ
جعبد. رمذ خ ر رمس١ب ثشى عشائ إ خسثظشف ازجشرحذ أسجع١
ج رمذ االخش جعبد افئشا فئشا. طج١ع١ غزائ١ جج ازحى١١اجعخ
١٠ خبخ ازسح خبخ اشع١ش خبخ اذخ. اإل اذع ثى ابعض اخش
أسبث١ع. وب اإل١ ظذسا زبصا أل١بف اىشث١ذساد 6ذح ش٠تازج اسزش
(. ث١ احجة ، إحزد خبخ اشع١ش ع أع Ca K Mg Naعبد )ا
سز األ١بف ، ١٠ ازسح اشف١عخ ث اذخ. عالح ع ره ، رعزجش خبخ
سالخ عاحجة ظذسا ج١ذا جشر١ اذ اشبد. أثبء ازخ١ش وب ا
BB536 ( 12 رحض١ سبعخ )0.16 ± 7.53b 8.43 ± 0.03cLog CFU / ml )
ابعض اخش اضبف إ١ اإل١ خبخ احجة اخزفخ. ز األعذاد جف
ف جد/ ( ف ازجبد اطة CFUغبس٠ث 6رزجبص احذ األد عذد )
خ احجة خب رحف١ض ابرج ع BB536سالخ ص٠بدح عذي اغذ٠خ اجىزش٠ب اظذ٠م.

XIX
١ ازجبس األ زه ابرج ع اسزخذاث خ( مبس8.43CFU / ml - 7.65اخزفخ )
(7.53 CFU / ml زه فئ أاعب خزفخ خبخ احجة ب .)ع اثش رحف١ض
ع١خ طحجذ ابعض زط٠ش اغزاء اظ١ف. جث رذع١بعذ BB536سالخ
( ف ازشو١ت اى١١بئ خاص اف١ض٠بئ١خ ٠p <0.05خ )زغ١شاد عثازخ١ش
ف اثالجفزشح ازجش٠ذ خالي BB536سالخ حجد عاى١١بئ١خ. وب أ
1.48CFUخبخ اذخ )أل اخفبع لذس ث اذعابعض اخش ج)أسجع١( ف
/ ml عض اخش اذع ثخبخ اب ج( ؛ ث١ب وب أفض جد ف األسجع األي ف
BB536ح١بح اسال شى فئ(. ع١ ml /CFU 0.76 ال اخفبع لذساشع١ش )
حس احع و ظبدس األ١بف فزشح ازجش٠ذ. وب عزذا ثظس سئ١س١ ع
أع احذ األد اخش ف ج١ع ازجبد BB536سالخ اح اعذد ابئ
زعض٠ض افائذ اظح١خ عذ االسزالن. اغذ٠خ اجىزش٠ب اظذ٠مجد ف اطة
حضخ اخفبع ف سجخ ا( ف p <0.05) ع٠ص٠بدح حعأثبء ازخ١ش
٠عض ره ثسجت اشل ا١ذس٠ج١، ااد اظجخ ازائجخ ، اخزض اسىش٠بد
اظشد اظحخ اعبخ جشثخ افئشا ؤششاد. ف رBB536 سالخ األض٠ شبط
( ف ربي اعف ص٠بدح اص اسزالن ابء ث١ P <0.05ع ) رجب٠
ؤششاد غ١ش طج١ع١ره ٠ى بن ثبشغ اجعبد اخس اخزفخ.
زبئج اسزبدا عاعبطش اغزائ١خ مضعالبد ع ا شاع اذ ال رجذ أل
جعبد ALT AST ALPاى١١بء اح٠١خ ذ. وبذ إض٠بد اىجذ ث
ابعض جض اطبق اطج١ع ام١بس فئشا. عضصد ازغز٠خ ثزجبد افئشا
جىز١ش٠ب اظذ٠مخ اعظ١بد اج١خ اعذد اح ( فP <0.05اخشح ص٠بدح ع٠خ )
( P <0.05بت ره ر اىشف ع اخفبع ع )ف ام ذ افئشا. إ ج
Salmonella, Staphylococcus, Enterococcus andف اجىز١ش٠ب اسججخ ألشاع )
Enterobacteriaceaeوبذ خبخ احجة ه( ف ام جعبد افئشا. ز

XX
ا٢خ. ب ٠محفضاد اجىزش٠ب اظذ اخزفخ )ازسح اشف١عخ ، اشع١ش اذخ(
رعض٠ض اجىز١ش٠ب اف١ذح BB536رأث١شا ح٠١ب ع طش٠ك رحف١ض سالخ اجشث١ر١ه
وجح سججبد األشاع ف ام ، ثبزب ف ف١ذح زطج١ك جذا ازىبف١خ
)ثشث١ر١ه ثش٠جب٠ر١ه ف فس ازج( ف األطعخ اظ١ف١خ زجبد األجب.

1
CHAPTER ONE
INTRODUCTION
Fermentation prolongs the shelf-life of foods in addition to improving the
nutritional value and reducing the risk for food borne illness (Campbell-
Platt, 1994). Fermented foods can even have beneficial health effects, when
microorganisms used possess probioticis activity. The word probioticis
derived from Greek and means “for life” (Metchnikoff, 1907). One of the
more detailed current definitions of probiotics is; “a microbial dietary
adjuvant that beneficially affects the host physiology by modulating mucosal
and systemic immunity, as well as improving nutritional and microbial
balance in the intestinal tract”. Mainly specific strains of lactobacilli,
Bifidobacterium, enterococci and yeast are today used commercially as
probiotics (Naidu et al., 1999; Saxelin et al., 2005).
Bifidobacteria considered as important probiotics used in the food industry
to relieve and treat many intestinal disorders. Bifidobacterium exert a range
of beneficial health effects, including regulation of intestinal microbial
homeostasis, inhibition of pathogens and harmful bacteria that colonize and/
or infect the gut mucosa, modulation of local and systemic immune
responses, repression of pro-carcinogenic enzymatic activities within the
microbiota, production of vitamins, and the bioconversion of a number of
dietary compounds into bioactive molecules (Mayo and Van Sinderen,
2010).
Bifidobacterium longum is one of the bifidobacteria species found mainly in
human faeces and it may be considered as the most common species of
2
bifidobacteria, being found both in infant and adult. Potential benefits from
consumption of B. longum include: antagonistic action toward intestinal
pathogens, improved lactose utilization, anticarcinogenic action and control
of serum cholesterol levels. Scientific studies showed the benefits offered by
Bifidobacterium longum BB536 (Kojima et al., 1996; Namba et al., 2003).
Thus there is considerable interest in incorporating these healths promoting
bifidobacteria into food. Nevertheless, probiotic strains, particularly
bifidobacteria are rarely used outside the dairy based industry. The scarcity
of animal milk in many countries makes it difficult to provide an adequate
bifidobacteria intake
However, most human origin probiotics are fastidious when used alone, they
are characterized by low growth capability in food media including the
dairy, the main recommended carrier of probiotics to human (FAO/WHO,
2001). Particularly in developing countries, where refrigeration is not always
an option, the fermentation process is widely used. Usually, freeze drying (in
vacuum) is employed. The maximum level of activity of the valuable
microbes is maintained. In-air process can involve elevated temperatures
which are usually intended for achieving a high rate of drying problem
statement (Chen and Liu; 1994).
Milk fermentation is one of the oldest known uses of biotechnology. All
over the world, fermented foods continue to constitute an important part of
our diet and together with beverages are estimated to present some 20 - 40%
of our food supply world-wide (Campbell-Platt, 1994).
Although milk fermentation process is very common in Sudan, it does not go
beyond preparation of fermented milk using conventional lactic acid bacteria
starter culture (Streptococcus thermophilus and Lactobacillus bulgaricus).
3
Formulation of milk into probiotic product has not much investigated and to
our knowledge no much reported Bifidobacterium probiotic fermented milk
has been formulated in Sudan. In addition, prebiotic effect of different fiber
with probiotic (synbiotic) report is lacking.
General objective:
To formulate the fresh milk into symbiotic with probiotics and different
cereal fibers as functional food
Specific objectives :
1- To analyze the proximate composition, sugars, and mineral contents
of different sources of milk (cow, goat and camel) and fiber (inulin,
sorghum bran, millet bran and barley brain).
2- To assess prebiotic effect of different cereal brans on goat milk using
probiotic Bifidobacterium longum BB536.
3- To evaluate the physicochemical changes (pH, total soluble solids,
titerable acidity) and chemical composition of fermented goat milk
products.
4- To study the existence of strain BB536 and physiochemical properties
during refrigeration of fermented goat milk products.
5- To examine safety and health benefit of probiotic fermented goat milk
supplemented with different cereal brans on fed experimentally rats.

4
CHAPTER TWO
LITERATURE REVIEW
2.1 Functional foods
2.1.1. History of functional foods
The term functional foods was initially presented in Japan in the mid-1980s and
refer to processed foods containing ingredients that aid specific bodily functions
in addition to being nutritious. To date, Japan is the only country that has
formulated a specific regulatory approval process for functional foods, known as
Foods for Specified Health Use (FOSHU); these foods are eligible to bear a seal
of approval from the Japanese Ministry of Health (Arai, 1996). The Institute of
Medicine's Food and Nutrition Board IOM/FNB in (1994) found 100 products
are licensed as FOSHU foods in Japan. In the United States, the functional foods
category is not recognized legally. Irrespective of this, many organizations have
proposed definitions for this new and emerging area of the food and nutrition
sciences. The Institute of Medicine‟s Food and Nutrition Board (IOM/FNB,
1994) defined functional foods as “any food or food ingredient that may provide
a health benefit beyond the traditional nutrients it contains.” Health-conscious
baby boomers have made functional foods, the leading trend in the U.S food
industry (Meyer, 1998). However, the magnitude of this market varies
significantly, as there is no consensus on what constitutes a functional food.
Decision resources; estimate the market value of functional foods at $28.9
billion. More significant, maybe, is the potential of functional foods to mitigate
disease, promote health, and reduce health care costs (Waltham, 1998).

5
2.1.2 Definition of functional foods
Functional foods are normal foods and parts of the daily diet, but they contain a
component that benefits some particular physiological function and reduce the
risk of diseases (Salovaaro, 1999). The wide applications of functional food are
in form containing probiotics and non-digestible carbohydrate known as
prebiotics (Fuller and Gibson, 1997).
2.1.3 Categories of functional foods
2.1.3.1 Natural foods
It is still a matter of scientific controversy whether natural foods may be
regarded as functional foods and whether it would be feasible to use
functional or health claims for natural foods. The FUFOSE project (Diplock
et al. 1999) and Health Canada (1998) have acknowledged that natural foods
may be functional foods and this is also the case in the Japanese foods for
specified health use (FOSHU) regulations. However, in the US and in
several national codes of conduct in European countries, natural foods are
not considered as functional foods.
The definition of functional foods is linked to the scientific proof of a
functional effect, which goes beyond those of traditional nutrients. Thus if it
is, for example, scientifically proven that the flavonoids in apples decrease
the risk of a specific disease an apple may be a functional food, in
accordance with the saying "an apple a day keeps the doctor away".
2.1.3.2 Processed foods, GM foods
For processed foods various ways of making them functional are considered.
Addition of functional ingredients or enrichment by food technology
processes seems to be the most obvious way. Another possibility could be
the removal of compounds with negative effects, e.g. the removal of phytate

6
to increase trace element bioavailability. Technological treatment to increase
the bioavailability of functional ingredients of foods also offers great
potential and new technologies to achieve this goal have been developed in
recent years. In some countries, particularly in the US, the addition of
synthetic (pharmaceutical) bioactive compounds to foods is also considered.
However, in Europe and Germany such a food would very likely be
considered to be a medicinal product and would not be marketable as a food.
One way of altering food products to enhance their nutritional value is by
using genetic modification. Although hardly any genetically-modified
functional foods have entered the market yet, the following are examples for
ongoing research in this area.
2.1.4Classification of functional foods
Functional food can be classified according to several principles, namely the
food group it belongs to (e.g. dairy products, beverages, cereal products,
confectionary, oils and fats); the diseases it is expected to prevent or alleviate
(e.g. diabetes, osteoporosis, colon cancer ); its physiological effects (e.g.
immunology, digestibility, anti-tumour activity); the category of its specific
biologically active ingredients (e.g. minerals, antioxidants, lipids, probiotics); its
physico-chemical and organoleptic properties (e.g. color, solubility, texture), or
the processes that are used in its production (e.g. chromatography, encapsulation,
freezing) (Juvan et al.; 2005).The second level classification groups the
functional food products within each food category by the biologically active
ingredient (e.g. phenols, terpenoids, saccharide, lipids, peptides, fibers, plant
extracts, bacteria cultures).
2.2.1 General description of milks
Milks contain, with some exceptions, the nutrients required for the growth
and development of the neonate. If the development time is short then the
7
milk is nutrient dense. All milks contain specific proteins, fats designed to
be easily digested, most have lactose, minerals, vitamins, and other
components which may have important roles. These are organized as
follows: lipids in emulsified globules coated with a membrane, proteins in
colloidal dispersion as micelles, and most minerals and all lactose in true
solution (Jensen et al., 1991).
Milk is known as nature‟s most complete food, and dairy products are
considered the most nutritious foods. On the other hand, the traditional view
of the role of milk has been greatly expanded in recent years beyond the
horizon of nutritional subsistence of infants. Milk is now recognized as more
than a source of nutrients to mammalian neonates and for healthy growth of
children and nourishment of adult humans. Milk contains biologically active
compounds besides its major proteins, casein and whey proteins that have
important physiological and biochemical functions with significant impact
on human metabolism, nutrition and health. Numerous milk-borne
biologically active compounds have been proven to have beneficial effects
on human nutrition and health, including antimicrobial, biostatic,
antihypertensive, angiotensin-converting enzyme (ACE)-inhibitory,
antiadhesion, antidiabetic, anticholesterol ,anticarcinogenic,
immunomodulatory, antiobesity, probiotic, and prebiotic activities.
Examples of these compounds include β-lactoglobulin, α-lactalbumin,
lactoferrin, immunoglobulins, lysozyme, lactoperoxidase, peptides from
caseins and whey proteins, glycomacropeptides, phosphopeptides,
oligosaccharides, conjugated linoleic acid, polar lipids, gangliosides,
sphingolipids, medium- and short-chain fatty acids, monounsaturated and
polyunsaturated fatty acids, triglycerides, milk minerals, growth factors,
hormones, vitamins, and nucleotides. Among the many valuable constituents

8
in milk, the high level of calcium plays a particularly important role in the
development, strength and density of bones for children and in the
prevention of osteoporosis in older people. In addition, calcium has also
been shown to be beneficial in reducing cholesterol absorption, and in
controlling body weight and blood pressure (Park and Haenlein, 2013).
2.2.2 Goat and milk production
The goat is probably the first ruminant to be domesticated. Goats originated
in Asia and are now spread almost all over the globe. Goats are very hardy
animals, and they thrive in areas where other animals have difficulties. There
are numerous breeds of goat, and it is difficult to define any particular breed
as a dairy breed. However, the Swiss breeds have been very successfully
selected and bred for their milk yield. They have been exported all over the
world to upgrade the milk yield of local breeds. In Sudan the Nubian goat is
adopted to produce milk (Cooke, 1961). Non-dairy breeds which should be
mentioned are Cashmere and Angora, well-known for the special wool they
produce in a well-managed milk production unit a goat can produce between
400 and 900 liter milk per lactation. The period of lactation varies from 200
to 300 days. For a family-sized goat milking operation, 40 to 120 goats are
required to reach an acceptable turnover. An enterprise requires a larger
number of animals, e.g. 200 to 1 000 goats. An intensive and feasible
production unit, family sized operation or enterprise, however, requires not
only appropriate machine milking equipment but also effective management,
feeding and breeding programs (Cooke, 1961).
2.2.3 Cow and milk production
A calf needs about 1000 liters of milk for growth, and that is the quantity
which the primitive cow produces for each calf. Secretion of milk in the

9
cow‟s udder begins shortly before calving, so that the calf can begin to feed
almost immediately after birth. The cow then continues to give milk for
about 300 days. This period is known as lactation (Cooke, 1961).
One to two months after calving the cow can be serviced again. During the
lactation period milk production decreases and after approx. 300 days it may
have dropped to some 15 – 25 % of its peak volume. At this stage milking is
discontinued to give the cow a non-lactating period of up to 60 days prior to
calving again. With the birth of the calf, a new lactation cycle begins. The
first milk the cow produces after calving is called colostrums. It differs
greatly from normal milk in composition and properties (Cooke, 1961).
2.2.4 Camel milk composition
Kosuspayeva et al. (2010) conducted a Meta analysis study and given the
means of camel (bactrian and dromedary) milk composition for the period
between 1905 and 2006. They concluded that camel milk is an important
source of proteins for the people living in the arid lands of the world.
Variation in camel milk composition was also observed for camels from the
same species (dromedary). Further, seasonal variations were found to play a
role in camel milk composition even for camels from the same species
(dromedary) and regions (Bakheit et al., 2008; Haddadin et al., 2008; Shuiep
et al., 2008). An inverse relationship was found between total solids in
camel milk and water intake by camels. Konuspayeva et al. (2009) found
that all components except lactose reached their maximum in mid-winter
and decrease to the lowest in the summer. For example, total solids were
13.9% in December and January, and 10.2% in August which can be related
to the availability of drinking water (Haddadin et al., 2008). Moreover, the
fat content of camel milk decreases from 4.3 to 1.1% due to the increase in

10
water content of milk produced by thirsty camels (Yagil and Etzion, 1980).
The increasing in water content could be attributed to the decrease in total
solids produced by the thirsty camels. Alhaj and Al Kanhal (2010) reported
that changes in camel milk composition could be due to several factors
including analytical measurement procedures, camel diet, climate, water
availability, livestock management, and other factors.
2.2.5 Processing of milk
Modern food processing is dependent on a range of preservative
technologies to ensure that food is maintained at an acceptable level of
quality from the time of manufacture through to the time of consumption.
These techniques include drying, concentration, and fermentation.
One of the oldest of these technologies is fermentation, a process dependent
on the biological activity of microorganisms for production of a range of
metabolites which can suppress the growth and survival of undesirable
microflora in foodstuffs. Fermentation as a food preservation technique can
be traced back thousands of years, at a time when plants and animals were
just being domesticated (Fox, 1993).
The link between fermentation and preservation is biopreservation which
refers to the extension of the shelf-life and improvement of the safety of
food using microorganisms and/or their metabolites. In this respect, it is well
known that starter microorganisms can produce a wide range of
antimicrobial compounds and proteinaceous substances which can inhibit or
reduce undesirable flora in food products (Holzapfel et al., 1995).
2.2.6 Definition of fermented milk
Fermentation was defined by Gale (1948) as the process leading to anaerobic
breakdown of carbohydrates, other major compounds such as organic acids,

11
proteins, and fats. In broader veiew, fermentation is an energy yielding
process (Kosikiowski, 1982).
2.2.7 Types of fermentation
Kosikowski (1982) stated that there are six major fermentation reactions in
milk:
1- Lactic acid fermentation.
2- Propionic acid fermentation.
3- Citric acid fermentation.
4- Alcohol fermentation.
5- Butyric fermentation.
6- Coliform gassy fermentation.
Many lactic acid bacteria occur normally in milk and are responsible for its
spontaneous souring (Stanier et al.; 1957).
2.2.8 Fermented milk products
Fermented milk pre cultured dairy products made from skimmed, whole, or
slightly concentrated milk, that require specific lactic acid bacteria, to
develop their characteristics flavor and texture. Fermented milks are usually
fluid or semi fluid in nature, and all contain lactic acid in varying
proportions fermentation in milk modifies its properties resulting in, cultured
beverages, such as yoghurt, kefier,etc.(Webb et al.,1980).
Fermented milk product are unique in the sense that the required
organoleptic properties depends on unique characteristics of certain
component of milk e.g. curdling properties of calcium caseinate-phosphate
complex, blendness of lactose and flavor characteristics of lipolyzed milk
fat (Webb et al, 1980).

12
Fermented milk products, depend on starter culture not only for acid
development, but also for accumulation of desirable intermediates for
example, volatile acid, action (dimthyl ketol, methyl carbinol) and diacetyl
(diketobutan, biacetyl).which act as flavoring agents (Peppler and Robert,
1977).
2.2.9 Starter culture for milk fermentation
Dairy starters are cultures of harmless, active bacteria, grown in milk or
whey, which imparts certain characteristics and qualities to various milk
products. The culture may be one strain of microorganism species, called a
single-strain or a number of strains and/or species called a multi strain or
mixed-strain culture (kosikowaski, 1982).
Starter culture in fermented milk products are used not only for acid
development, but also to lessen the putrefaction taking place in milk as a
result of the presence of spoilage bacteria (Musa, 1994).
2.3 Prebiotics
Our intestinal tract is colonized by a complex ecosystem of microorganisms
that increase in numbers from 102 to 10
4 per gram of contents in the
stomach, to 106–10
8 per gram in the small intestine, and 10
10–10
12 per gram
in the colon (McCartney and Gibson, 2006). It has also become increasingly
clear that these bacteria are not merely commensals, but have coevolved
with us in a truly symbiotic relationship. Our intestinal microbes provide us
with a barrier to infection by intestinal pathogens (Bourlioux et al.; 2003),
provide much of the metabolic fuel for our colonic epithelial cells (Topping
and Clifton 2001), and contribute to normal immune development and
function (Bulm and Schiffrin.; 2003), Tlaskalova-Hogenova et al.;
13
2004).Members of the intestinal microbiota can also be involved in acute
and chronic diseases such as antibiotic-associated diarrhea (Cummings and
Macfarlane. ; 2003) and inflammatory bowel disease (IBD) (Marteau et al.,
2003). Undesirable metabolic activity of the intestinal microbiota mayplay a
role in the development of colorectal cancer (. Saunier and Dore .; 2002);
Guarner and Malagelada. ; 2003). Hence, it is reasonable to hypothesize that
modifying the intestinal microbiota to develop, restore or maintain a
beneficial balance of microorganisms and microbial activities may improve
health. The consumption of probiotics aims to directly supplement the
intestinal microbiota with live beneficial organisms. Lactobacilli and
bifidobacteria are numerically common members of the human intestinal
microbiota, and are nonpathogenic, nonputrefactive, nontoxigenic,
saccharolytic organisms that appear from available knowledge to provide
little opportunity for deleterious activity in the intestinal tract (Crittenden,
2004); Salminen , Gorbach , et al., 2004). As such, they are reasonable
candidates to target in terms of restoring a favorable balance of intestinal
species.
2.3.1. The prebiotic concept
A number of different strategies can be applied to modify microbial
intestinal populations. Antibiotics can be effective in eliminating pathogenic
organisms within the intestinal microbiota. However, they carry the risk of
side effects and cannot be routinely used for longer periods or
prophylactically. Prebiotics supplementation represents strategy to
manipulate the intestinal microbiota. Rather than supplying an exogenous
source of live bacteria, prebiotics are nondigestible food ingredients that
selectively stimulate the proliferation and/or activity of desirable bacterial
populations already resident in the consumer‟s intestinal tract. Prebiotics
14
identified so far as nondigestible, fermentable carbohydrates. Intestinal
populations of bifidobacteria, in particular, are stimulated to proliferate upon
consumption of a range of prebiotics, increasing in numbers by as much as
10–100-fold in feces (Crittenden, 1999; Boehm et al, 2003. There is an
obvious potential to use prebiotics and probiotics together in a
complementary and synergistic manner. Therefore, foods containing both
probiotic and prebiotic ingredients have been termed synbiotics (Gibson and
Roberfroid, (1995).
2.3.2. Advantages and disadvantages of the prebiotic strategy
The prebiotic strategy offers a number of advantages over modifying the
intestinal microbiota using probiotics or antibiotics.
2.3.2.1 Advantages over probiotics:
Stable in long shelf life foods and beverages.
Heat and pH stable and can be used in a wide range of processed
foods and beverages.
Have physicochemical properties useful to food taste and texture.
Resistant to acid, protease, and bile during intestinal passage.
Stimulate organisms already resident in the host, and so avoid
host/strain compatibilities, and the need to compete with an already
established microbiota.
Stimulate fermentative activity of the microbiota and health benefits
from short chain fatty acids (SCFA).
Lower intestinal pH and provide osmotic water retention in the gut.
Advantages over antibiotics
Safe for long-term consumption and prophylactic approaches.
15
Do not stimulates side effects such as antibiotic-associated diarrhea,
sensitivity to UV radiation, or liver damage.
Do not stimulate antimicrobial resistance genes.
Not allergenic.
2.3.2.2Disadvantages of prebiotics
Unlike probiotics, over dose can cause intestinal bloating, pain,
flatulence, or diarrhea.
Not as potent as antibiotics in eliminating specific pathogens.
May exacerbate side effects of simple sugar malabsorption during
active diarrhea.
Aconsumed probiotic strain must compete with an already established
microbiota, and in most cases they persist only transiently in the intestine
(Satokari et al.; 2001; Brigidi, et al., 2003). Individuals also harbor their
own specific combination of species and unique strains within their
intestinal bacteria (Zetendal. et al., 1998), Mangin. et al., 1999) suggesting
that certain host–microbiota compatibilities exist. By targeting those strains
that are already resident in the intestinal tract of an individual, the prebiotic
strategy overcomes the need for probiotic bacteria to compete with intestinal
bacteria that are well established in their niche.
2.3.3. Types of prebiotics
Most identified prebiotics are carbohydrates.Within these, there is a wide
diversity of molecular structures. However, these carbohydrates share a
number of physiological traits important to their beneficial effects. They are
Non digestible (or only partially digested).
Non absorbable in the small intestine.
Poorly fermented by bacteria in the mouth.

16
Well fermented by purportedly beneficial bacteria in the gut.
Poorly fermented by potentially pathogenic bacteria in the gut.
2.3.4. Prebiotics and symbiotics:
The potential prebiotics of today are mainly non-digestible sugar-based
molecules that are not adsorbed in the small intestine, and thus provide
nutrients to colonic bacteria. These compounds include polysaccharides like
resistant starch, inulin (a polyfructan) or different oligo saccharides such as
fructo-oligosaccharides (FOS), galacto-oligosaccharides (GOS), trans-
galacto-oligosaccharides (TOS), iso-malto-oligosaacharides (IMO), xylo-
oligosaccharides, soybean oligo saccharides, or the synthetic lactose
derivative, lactulose (Fooks et al., 1999; Sako et al., 1999). Many of these
prebiotics occur naturally in foods, for example FOS is found in chicory,
artichoke, Jerusalem artichoke and onion, and various galacto-
oligosaccharides are found in human breast milk. Proposed criteria for a
prebiotic are:
- Low-digestibility and poor absorption in the upper gastrointestinal tract
- Selective fermentation by potentially beneficial bacteria in the colon
- Improvement of the composition of the intestinal microflora
- An improved state of host health as a result of consumption
The products into which these substances can be added include drinks,
bakery products, dairy foods, confectionery etc. Fructooligosaccharides are
by far the best characterised prebiotic both from a technological point of
view as well as regarding the intestinal and physiological functions.
Combining probiotic bacteria and prebiotic substrates in a food in order to
create a synbiotic product is a relatively new concept although products
containing both pro- and prebiotics are appearing on the market. Since in
breast-fed infants bifidobacteria typically dominate in the microflora and are
17
reported to decrease in the middle-aged and elderly, synbiotics combining
bifidobacteria and their selective substrates have been proposed for these
groups (Fooks et al., 1999).
2.3.5 Present probiotic and prebiotic foods
It is understandable that the composition and activities of this microflora can
have consequences for the health and well-being of the host. Thus there is a
theoretical justification for the intentional manipulation of the microbial
composition of the intestine by using either probiotics or prebiotics. The
probiotics intended for human consumption consist mainly of lactic acid
bacteria and bifidobacteria, although one yeast, Saccharomyces boulardii,
has been used successfully as a human probiotic (Salminen et al., 1998).
Lactic acid bacteria and yeasts have a long history in food fermentations,
while the use of bifidobacteria for food purposes is a recent innovation. The
prebiotics represent various types of carbohydrates or their derivatives
(Fooks et al., 1999).
2.4 Inulin
This prebiotic, also known as raftiline, is found inseveral foods such as
wheat, onion, garlic, bananas, fruits, and vegetables, but industrial
production utilizes chicory (white carrot) roots. Inulin is extracted from
chicory roots through hot water extraction followed by refining and spray
drying into a powder that is composed of a mixture of linear molecules with
a basic G-Fn chemical structure. G represents a glucosyl moiety, while Fn
are the fructose moieties joined together by b -2,1 glycosidic bonds, with n
(degree of polymerization, DP) ranging from 3 to 60 with an average value
of 10. Some long-chain inulin products with a DP of about 25 are obtained
after lower DP fractions have been physically removed from the initial
mixture. Inulin is partially soluble in water where it forms slightly thickened

18
product that has a bland neutral taste without any of flavor and can
contribute to body and mouthfeel of food products. Because of the gelling
ability, inulin has the capacity to be used as a fat replacer with excellent
mouthfeel characteristics and can act as emulsion and foam stabilizers.
2.5 Probiotics
2.5.1 Definition of probiotics
As defined by the Food and Agriculture Organization of the United Nations
(FAO) and the World Health Organization (WHO) in 2002, probiotics are:
“Live microorganisms which when administered in adequate amounts confer
a health benefit on the host.” The word „probiotic‟, derived from the Greek
language, means „for life‟ (Fuller, 1989) and has had many definitions in the
past. Definitions such as „substances produced by protozoa that stimulate the
growth of another‟ or „organisms and substances that have a beneficial effect
on the host animal by contributing to its intestinal microbial balance‟ were
used. These general definitions were unsatisfactory because „substances‟
include chemicals such as antibiotics. The definition of probiotics has since
then been expanded to stress the importance of live cells as an essential
component of an effective probiotic. Most recently, Huis Veld and Havenaar
1991) broadened the definition of probiotics as being „a mono- or mixed
culture of live microorganisms which, applied to man or animal (e.g. as
dried cells or as a fermented product), beneficially affects the host by
improving the properties of the indigenous microflora. This definition
implies that probiotic products, for example fermented milk, contain live
microorganisms and improve the health status of the host by exerting
beneficial effects in the gastrointestinal tract.

19
2.5.2 History of probiotics
The idea that some bacteria contained in our food may have beneficial
effects is much older than the term probiotic. At the beginning of the 20th
century, the Russian Nobel Prize Laureate Elie Metchnikoff associated the
observed longevity of Bulgarian peasants with their high consumption of
live microbes in fermented milk products, as he reported in his book The
prolongation of life (Metchnikoff, 1907). In1930, the Japanese scientist
Minoru Shirota isolated a lactic acid bacterium from the feces of a healthy
infant. Five years later, one of the first fermented milk drinks thought to
support intestinal health was produced with the strain he developed and was
named ,, Yakult,, . The concept of probiotics was already successful in Asia
for many years when the first probiotics fermented milk products were
eventually introduced in Europe (Metchnikoff, 1907).
2.5.4 Probiotic strains
Probiotic cultures naturally occur in certain fermented foods (Rosander et al.,
2008). Below is a list of different strains of probiotic bacteria.
Bacillus coagulans GBI-30, 6086
Bifidobacterium animalis subscp. lactis BB-12
Bifidobacterium longum subsp. BB536
Lactobacillus acidophilus NCFM
Lactobacillus paracasei St11
Lactobacillus johnsonii La1
Lactobacillus plantarum 299v
Lactobacillus reuteri ATCC
Lactobacillus reuteri Protectis.

20
2.5.5 Characteristics of probiotics microorganism
Characteristics of successful probiotics determine their ability to survive the
upper digestive tract and to colonize in the intestinal lumen and colon for an
undefined time period. Probiotics are safe for human consumption and no reports
have found on any harmfulness or production of any specific toxins by these
strains (Von Wright and Axelsson 2000; Salminen et al., 1998).In addition, some
probiotics could produce antimicrobial substances like bacteriocins. Therefore,
the potential health benefit will depend on the characteristic profile of the
probiotics. Some probiotic strains can reduce intestinal transit time, improve the
quality of migrating motor complexes (Husebye et al., 2001) and temporarily
increase the rate of mitosis in enterocytes (Banasazet al. , 2002; Halvorsen et
al., 2000).
The most common probiotics are Lactobacillus and Bifidobacterium. In general
most probiotics are gram-positive, usually catalase-negative, rods with rounded
ends, and occur in pairs, short, or long chains (Von Wright and Axelsson
,2000).They are non-flagellated, non-motile and non-spore-forming, and are
intolerant to salt. Optimum growth temperature for most probiotics is 37°C but
some strains such as L. casei prefer 30 °C and the optimum pH for initial growth
is 6.5-7.0 (Von Wright and Axelsson, 2000). L. acidophilus is microaerophilic
with anaerobic referencing and capability of aerobic growth.
Bifidobacteria are anaerobic but some species are aero-tolerant. Most probiotics
bacteria are fastidious in their nutritional requirements (Desmazeaud, 1983;
Marshall and Law, 1984). With regard to fermentation probiotics are either
obligate homofermentative (ex. L. acidophilus, L. helvelicas), obligate
heterofermentative (ex. L. brevis, L. reuteri), or facultative heterofermentative

21
(ex. L. casei, L. plantarum), (Barrangou et al.; 2011). Additionally, probiotics
produce a variety of beneficial compounds such as antimicrobials, lactic acid,
hydrogen peroxide, and variety of bacteriocins (Gorbach ., 2002).
Probiotics should have the ability to interact with the host microflora and
competitive with microbial pathogens, bacterial, viral, and fungal (Gorbach,
2002).
2.5.6 Health benefits of probiotic
According to (Kullisaar et al., 2002)
1. Vitamin production, availability of minerals and trace elements.
2. Production of important digestive enzymes such as β –galactosidase
for alleviation of lactose in tolerance.
3. Barrier, restoration, antagonistic effects against: Infectious diarrhea,
Antibiotic – associated diarrhea, irradiation – associated diarrhea.
4. Cholesterol –lowering effect.
5. Stimulation and improvement of the immune system.
6. Enhancement of bowel motility, relief from constipation.
7. Anti-carcinogenic effects in the colon.
8. Maintenance of mucosal integrity.
9. Reduction of inflammatory allergic reactions
10. Adherence and colonization resistance.
11. Antioxidateive activities.
In many cases, the health-promoting mechanisms of probiotic action are not
sufficiently known. However, the majority of them are based on the positive
effect they exert on the immune response, i.e. on their immunomodulatory
activity (Isolauri et al., 2002; Biancone et al., 2002). In most cases, this is
22
due to stimulation of natural immunity (Newburg, 2005; Galdeano and
Perdigon, 2006). In doing so they modulate primarily the production of
cytokines and antimicrobial peptides (Trebichavský and Šplíchal, 2006).
This is the mode of action of not just typical sour milk functional foodstuffs,
such as sour milk, kefir or yoghurt (Meydani and Ha, 2000; Farnworth,
2005) produced by the food-processing industry, but also that of the diet
supplements containing the probiotic bacteria in pure form. However, the
latter are the products of pharmaceutical industry and, in contrast to
functional foodstuffs, they have a standard composition, and known
immunomodulatory characteristics, verified both experimentally and in
controlled clinical studies. In terms of their quality and efficiency they are
also under regular pharmaceutical control. It will be therefore more precise
to call them immunobiotics, in order to distinguish them from classical
probiotics in functional foodstuffs (Clancy, 2003).
2.5.7 Criteria of selection of appropriate probiotic
Different aspects have to be considered in probiotic selection .Safety criteria
for any successful probiotic have been defined in several reviews (Lee and
Salminen, 1995; Donohue and Salminen, 1996; Adams, 1999) include the
following specifications:
1. Strains use is preferably of human origin.
2. They are isolated from healthy human GI tract.
3. They have a history of being non-pathogenic.
4. They have no history of association with diseases such as infective
endocarditic or GI disorders.
23
5. They do not deconjugate bile salts (bile salt deconjucation or
dehydroxylation would be a negative trait in the small bowel (Marteau et al.,
1995).
6. They do not carry transmissible antibiotic resistance genes.
While in selecting a preferable probiotic strain several aspects of
functionality have to be considered:
1. Acid tolerance and tolerance to human gastric juice.
2. Bile tolerance (an important property for survival in the small bowel).
3. Adherence to epithelial surfaces and persistence in the human GI-tract.
4. Immunostimulation, but no pro-inflammatory effect.
5. Antagonistic activity against pathogens such as Helicobacter pylori,
Salmonella sp., Listeria monocytogenes and Clostridium difficile.
6. Antimutagenic and antigarcinogenic properties.
Feeding trials with different probiotic strains have shown that the probiotic
strain usually disappears from the GI-tract within a couple of weeks after the
ingestion is discontinued (Fukushima et al., 1998; Johansson et al., 1998;
Alander et al., 1999; Donnet-Hughes et al., 1999). The role of the probiotic
persistence in the human GI-tract has therefore been questioned. However,
even temporary persistence, which has been noted for several ingested
probiotic strains, may enhance their chances for beneficial functions in the
GI-tract, and is therefore considered a desirable trait. Necessary safety and
functional criteria the aspects related to probiotic production and processing
are also of utmost importance, such as:
1. Good sensory properties.
2. Phage resistance.
3. Viability during processing.
4. Stability in the product and during storage.

24
Good viability and activity of probiotics are considered prerequisites for
optimal functionality. However, several studies have shown that non-viable
probiotics can have beneficial effects such as immune modulation and
carcinogen binding in the host (Ouwehand and Salminen, 1998; Salminen et
al.; 1999). Thus, for certain probiotic strains it might be sufficient that they
grow well during initial production steps (to obtain high enough numbers in
the product) but they do not necessarily need to retain good viability during
storage.
2.5.8 Microorganisms used as probiotic
According to the current definition of a probiotic, a large variety of
microbial species and genera are considered to have probiotic potential, most
of which belong to the lactic acid bacteria (LAB). In the development of
human probiotics, strains belonging to the genera Lactobacillus and
Bifidobacterium have been most commonly used, even though some
probiotic preparations are based on other LAB or even non-LAB species and
yeasts (Holzapfel et al., 1995).
2.5.9 Bifidobacteria
Bifidobacteria spp are high-GC content, Gram-positive bacteria which
belong to the Actinobacteria branch and these species naturally colonize the
gastrointestinal tract (GIT) of mammals, birds and insects (Ventura et al.,
2007). Scientists have determined the major probiotic properties of
Bifidobacteria spp isolated from the human intestine and these properties
include the strengthening of the intestinal barrier, modulation of the immune
response and antagonism pathogens (Marco et al., 2006).
Bifidobacterium spp has been reported to possess various glycosyl
hydrolases (GH) and these hydrolases metabolize plant- or milk-derived

25
oligosaccharides including nondigestible ones such as galacto-
oligosaccharides (GOS) and fructo-oligosaccharides (FOS) (schell et al.,
2002‟sela et al., 2008). The capability to utilize nondigestible
oligosaccharides confers a competitive advantage to Bifidobacterium spp in
the human gut.
Bifidobacterium longum (B. longum) and various other bifidobacteria strains
are often added to probiotic products in combination with other lactic acid
bacteria (LAB). Through their long and safe history of application, LAB
have acquired the status of “Generally Regarded As Safe” (GRAS), but the
safety of bifidobacteria and other LAB strains selected for probiotics still
need to be carefully evaluated.
The key safety aspects for use of bifidobacteria and other LAB strains in
probiotics include antibiotic resistance, production of harmful metabolites
and the potential for virulence. Antibiotic resistance in potential probiotic
strains is not considered a risk factor unless resistance is transferred to
pathogens or it renders the probiotic untreatable in very rare cases infection
(Borriello et al., 2003). Biogenic amines, D-lactic acid, azoreductases and
nitroreductases produced by bifidobacteria and other LAB strains are
potential health hazards (O‟Brien. et al., 1999, McBain et al., 1997). And the
safety of some of these compounds have been evaluated (Ruiz-Moyano et
al.; 2009).
2.5. 10. B.longumBB536
Bifidobacterium longum is one of the bifidobacteria species found mainly in
human faeces and it may be considered as the most common species of
bifidobacteria, being found both in infant and adult. Potential benefits from
consumption of B. longum include: antagonistic action toward intestinal
26
pathogens, improved lactose utilization, anticarcinogenic action and control
of serum cholesterol levels. Scientific studies showed the benefits offered by
Bifidobacterium longum BB536 (Kojima et al., 1996; Namba et al., 2003).
Thus there is considerable interest in incorporating these healths promoting
bifidobacteria into food. Nevertheless, probiotic strains, particularly
bifidobacteria are rarely used outside the diary based industry. The scarcity
of animal milk in many countries makes it difficult to provide an adequate
bifidobacteria intake.
27
CHAPTER THREE
MATEIALS AND METHODS
3.1. Raw materials
Cow and goat fresh milk was obtained from the animal farm at Department
of Animal Production, College of Agricultural Studies (CAS), Sudan
University of Science and Technology (SUST), Sudan. While camel milk
was purchased from local market in Khartoum State. Different cereal grains
(sorghum, barley and millet) were purchased from local cereal market in
Bahari. Care was taken to ensure that clean and mold free grains were
selected.
Prebiotic inulin was obtained from a natural Product Company in London
(UK). Whereas, sorghum bran, barley bran and millet bran were
purchased from a local cereal market in Bahri, (Khartoum state, Sudan).
Bifidobacterium longum BB536 strain was obtained from the stock culture
of microbiology laboratory (Department of Food Science Technology, CAS,
SUST).
Chemicals (analytical grade) were purchased from local chemical suppliers
company in Khartoum State.
Experimental rats were obtained from the National Research Center
(Khartoum –Sudan).
3.1.1. Preparation of different brans
Selected cereal grains were cleaned and peeled. The obtained bran was
ground and sieved using appropriate mesh. The resulting bran powder
was stored in a dark polyethylene bag in freezer until used.

28
3.1.2. Preparation of fermentation inoculums
B.longumBB536 was obtained from the stock culture of microbiology laboratory
(Department of Food Science and Technology, College of Agricultural Studies,
SUST. The strain was maintained at -20 ˚C in 20% glycerol solution. Stock
culture was prepared by activation of the strain in sterlized skim milk, incubated
an aerobically at 37 ˚C for 24h. The obtained culture was reactivated again under
the same conditions to prepare enough stock for the experiment. The working
culture was prepared by twice successive transformation in 10% sterilized skim
milk (121˚C for 15 min) and incubation at 37 ˚C for 24h.
3.1.3 Production of fermented product
Fresh raw goat milk was heated to 65ºC for 30 minutes and then
cooled to 37 ºC, following this 3% of starter culture B.longumBB536 was added
to the milk and incubated at 37 ºC divided into four parts and treatments with 1%
of inuline and different fibers (sorghum bran, barley bran and millet bran)
powder. Next, using mixer the resulting fermented products were filled into
plastic containers and stored under refrigeration (4◦C) for 3 weeks. Subsequent
physicochemical and microbiological analyses at storage were performed at 0, 1,
2 and 3 weeks.
3.2 Experimental rats design
3.2.1 Animals
Six weeks old male albino rats with an average initial weight of 95g were
purchased from College of pharmacy, Ahfad University for Women. They were
housed six per cage. A 12 h light dark cycle and a controlled atmosphere
(22.11±2.36°C) were maintained throughout the study. After fifteen days
acclimatization period under experimental condition, rats were randomly
29
assigned into five different groups (n = 6) at random and treated for thirty days.
During the thirty days trial, the rats were offered water and feed ad libitum. The
bedcovers in cages was changed twice a week. Individual body weight of every
rat was measured at ten days intervals.
3.2.2 Experimental design
3.2.2.1 Chemical and apparatus
All chemicals and kits were purchase from Bio systems (Spain) and were
provided by local company in Khartoum. Test tubes, (K3 EDTA) and sterile
containers were obtained from local company in Khartoum.
3.2.2.2 Experimental design feed
All experimental designs are shown in table 1.
Table 1: The experimental rat groups and their diets
Group Experimental diets (per 6 rats)
Control (E) Normal diet + sterile water
Treatment A Normal diet + sterile water+2.5ml orally dairy of
goat milk with inulin without added B. longum
BB536
Treatment B Normal diet + sterile water+2.5ml orally dairy of
goat milk with sorghum bran supplemented with
2% BB536
Treatment C Normal diet + sterile water+2.5ml orally dairy of
goat milk with barley bran line supplemented with

30
2% BB536
Treatment D Normal diet + sterile water+2.5ml orally dairy of
goat milk with millet bran
3.2.4 Blood sampling
Blood samples of three rats of each group were collected at the end of the
experiment period (30 days )from vein plexus eye in sterile tubes containing
EDTA and kept at 4 ºC for hematology analysis, after that the rats were
sacrificed under anesthetize and the blood was collected in clean test tubes.
Serum was separated by centrifugation at 1500 rpm for 20min to investigate the
biochemistry parameters.
3.3 Methods
3.3.1Physico-chemical methods
3.3.1.1 Total soluble solids
The total soluble solids as percent (TSS %) of the different samples were
measured as described by Ranganna (2001).
Principle: The index of refraction of a substance is a ratio of light velocity under
vacuum to its velocity in the substance which is largely dependent on the
composition, concentration and temperature of the sample solution.
Procedure: After the adjustment of the Hand-Refractometer (No.002603, BS-
eclipse, UK) with distilled water, the sample was placed on the surface of the
refractometer prism, the prism was closed and the reading was recorded to the
nearest 0.01 as TSS %.
31
3.3.1.2 Hydrogen ion concentration
The pH of the different samples was determined as described by Ranganna
(2001).
Principle: The pH value of the different samples was measured with pH-meter.
After standardization of the pH-meter electrodes with a buffer solution, the
reading of the sample is recorded as pH value.
Procedure: After standardization of the pH-meter (model HI 8521
microprocessor bench PH/MV/C˚ meter. Romania) with buffer solutions (pH
4.01 and 7.0), the electrode of the pH-meter was rinsed with distilled water,
immersed in the sample and left to stand until a staple reading was achieved.
3.3.1.3 Titrable acidity
Ten ml of the sample preparation was titrated against 0.1N NaOH using
phenolphthalein as indicator. Total acidity (mg/100g) expressed as lactic acid
according to Ranganna(1979).
Acidity (mg/100g) = (
Where:
eq.wt = equivalent weight of lactic acid
3.3.2Proximate analyses
3.3.2.1 Moisture content
The moisture content was determined according to the standard methods of
the Association of Official Analytical Chemists (AOAC, 2003).
32
Principal: The moisture content in, a weighed sample is removed by heating
the sample in an oven (under atmospheric pressure) at 105 °C. Then, the
difference in weight before and after drying is calculated as a percentage of the
initial weight.
Procedure: A sample of 2 g ±1 mg was weighed into a dish. Then, the sample
was placed into an oven (No.03-822, FN 400, Turkey) at 105 ± 1 °C until a
constant weight was obtained. After drying, the covered sample was transferred
to desiccators and cooled to room temperature before reweighing. Triplicate
results were obtained for each sample and the mean value was reported to two
decimal points according to the following formula:
Calculation:
Moisture content (%) = (Ws – Wd ) × 100%
Sample weight (g)
Where:
Ws = weight of sample before drying.
Wd = weight of sample after drying.
3.3.2.2 Ash content
The ash content was determined according to the method described by
AOAC (2003).
Principle: The inorganic materials which are varying in concentration
and composition are customary determined as a residue after being
ignited at a specified heat degree.
Procedure: A sample of 5g ±1 mg was weighed into a pre-heated, cooled,

33
weighed and tarred porcelain crucible and placed into a Muffle furnace (No.20.
301870, Carbolite, England) at 550°C until a white, gray ash was obtained.
The crucible was transferred to desiccators, allowed to cool at room
temperature and weighed. After that, the ash content was calculated as a
percentage based on the initial weight of the sample.
Calculation:
Ash (%) = [(Wt of crucible +Ash) - (Wt of empty crucible)] x 100 %
Initial weight (Wt)
3.3.2.3 Oil content
Oil content was determined according to the official method of AOAC
(2003).
Principle: The method determines the substances which-are soluble in
petroleum ether (65-70 °C) and extractable under the specific conditions of
Soxhlet extraction method. Then, the dried ether extract (oil content) is weighed
and reported as a percentage based on the initial weight of the sample.
Procedure: A sample of 5g ± l mg was weighed into an extraction thimble
and covered with cotton that previously extracted with hexane (No.9-16-24/25-
29-51, LOBA Cheme, India). Then, the sample and a pre-dried and weighed
extraction flask containing about 100 ml hexanes were attached to the extraction
unit(Electrothermal, England) and the extraction process was conducted for 6
hour. At the end of the extraction period, the flask was disconnected from the
unit and the solvent was redistilled. Later, the flask with the remaining crude
hexane extract was put in an oven at 70 °C for 3 hrs, cooled to room temperature
in a desiccators, reweighed and the dried extract was registered as oil content
according to the following formula;
34
Calculation:
Oil content (%) = (W2- W1) × 100 %
W3
Where:
W2 =Weight of the flask and hexane extract
W1 =Weight of the empty flask
W3=initial weight of the sample
3.3.2.4 Crude protein content
The protein content was determined in all samples by micro-
Kjeldhalmethod using a copper sulfate-sodium sulfate catalyst according to the
official method of AOAC (2003).
Principle: The method consists of sample oxidation and conversion of its
nitrogen to ammonia, which reacts with the excess amount of sulphuric
acid forming ammonium sulphate. After that, the solution was made alkaline
and the ammonia was distilled into a standard solution of boric acid (2%) to
form the ammonia-boric acid complex. Which is titrated against a standard
solution of HC1 (0.1N) .The protein content is calculated by multiplying the
total N % by 6.25 as a conversion factor for protein.
Procedure: A sample of two grams (2 gm ) was accurately weighed and
transferred together with, 4g Na2SO4 of Kjeldhal catalysts (No. 0665,
Scharlauchemie, Spain) and 25 m1 of concentrated sulfuric acid (No.0548111,
HDWIC, India) into a Kjeldhal digestion flask. After that, the flask was placed
into a Kjeldhal digestion unit (No.4071477, type KI 26, Gerhardt, Germany) for
about 2 hours until a colourless digest was obtained and the flask was left to cool
at room temperature (25˚C).

35
The distillation of ammonia was carried out into 25m1 boric acid (2%) by using
20 ml sodium hydroxide solution (45%).
Finally, the distillate was titrated with standard solution of HC1 (0.1N) in the
presence of 2-3 drops of bromocreasol green and methyl red as an indicator until
a brown reddish colour was observed.
Calculation:
Crude Protein (%) = (ml Hcl sample – ml Hcl blank) x N x 14.00 x F ×100%
Sample weight (g) x 1000
Where:
N: normality of HCl.
F: protein conversion factor = 6.25
3.3.2.5 Crude fiber content
The crude fiber was determined according to the official method of AOAC
(2003).
Principle: The crude fiber is determined gravimetrically after the sample is
being chemically digested in chemical solutions. The weight of the residue after
ignition is then corrected for ash content and is considered as a crude fiber.
Procedure: About 2g ± 1 mg of a defatted sample was placed into a conical
flask containing 200 m1 of H2SO4 (0.26 N). The flask was then, fitted to a
condenser and allowed to boil for 30 minutes. At the end of the digestion period,
the flask was removed and the digest was filtered (under vacuum) through a
porclain filter crucible (No.3). After that, the precipitate was repeatedly rinsed
with distilled boiled water followed by boiling in 200 ml NaOH (0.23 N)
36
solution for 30 minutes under reflux condenser and the precipitate was filtered,
rinsed with hot distilled water, 20m1 ethyl alcohol (96%) and 20 ml diethyl
ether.
Finally, the crucible was dried at 105 °C (overnight) to a constant weight, cooled
, weighed, a shed in a Muffle furnace (No.20. 301870, Carbolite, England) at
550-600 °C until a constant weight was obtained and the difference in weight
was considered as crude fiber.
Calculation:
Crude fiber (%) = (W1- W2) × 100%
Sample weight (g)
Where: W1 = weight of sample before ignition (g).
W2 = weight of sample after ignition (g).
3.3.2.6 Minerals content
Potassium (K), (Na) and calcium (Ca) were determined by flame photometer
(Sherwood Flame Photometer i410, Sherwood Scientific Ltd. Cambridge, UK)
according to procedure of AOAC (1990). The knob of flame photometer was
adjusted to potassium, sodium and calcium respectively and reading was set to
zero using deionized water. Blank solution was run and reading was again set to
zero. Standard solution of each mineral was run and recorded the reading of
flame photometer. The reading of potassium, sodium and calcium in each sample
was taken by running the sample one by one. Standard solution was run after
every sample .The standard curves (appendix I, II, III) were obtained by plotting
absorbance values of standards against appropriate concentrations of these three
elements. One gram of dried beverage samples was subjected to wet digestion
method as described by Richards (1968). Then analysis was conducted through
37
absorption spectrophotometer (Varian AA 240, Victoria, Australia) for
determination of minerals (Mg ) using standard curve. To determine phosphorus
content in products samples, colorimetric estimation method was used as
described by Kitson and Mellon (1944).
3.4.2.7 Total and reducing sugars
They were determined according to Lane - Eynon methods (AOAC, 1984).
Twenty-five grammes of the pulps were filtered through a Whatman filter paper
(No. 4) .Then transferred to a 250 ml volumetric flask. 100 ml of distilled water
was carefully added and then neutralized with 1.0 N NaOH to a pH 7.5-8.0.
About 2ml of lead acetate were added and the flask was then shake, and left to
stand for 10 minutes. Then 2 grams of sodium oxalate were added to remove the
excess lead. Distilled water was again added to make the volume to mark
(250ml). The solution then filtered and 50 ml of the filtrated were pipatted into a
250ml volumetric flask. 50g citric acid and 50 ml distilled water were added
slowly to the new mixture. The contents of the flask were boiled gently for 10
minutes to invert the sucrose, and when cooled a few drops of phenolphthalein
were added. In order to neutralize the mixture, a 20% NaOH solution was
continuously added until the colour of the mixture disappeared, and the volume
was made to mark before titration.
Standard method of titration: Ten ml of a mixed solution of Fehling (A) and (B)
were pipatted into a conical flask. A burette was filled with a clarified sugar
solution and the whole volume required reducing the Fehling‟s solution was run
so that 0.5-1.0 ml was still required to complete the titration performed. The
contents of the flask were mixed and heated to boiling for 2 minutes. Three drops
of methylene blue indicator were added. Then the titration was completed until
the colour has completely disappeared.

38
Mg total sugar in 100 ml =
a- Totalsugar%=
The filtrate can be used directly for titration was according to Lane and Eynon
(1984) usingthe following equation for calculation:
b- Reducing Sugars:
Reducing sugar % =
3.3.2.8 Calculation of carbohydrates
Carbohydrates were calculated by difference according to the following:
Total carbohydrates = 100% - [Moisture (%) + Protein (%) +Fat (%) + fiber (%)
and Ash (%)].
3.4 Production of probiotic fermented product
3.4.1 Production of fermented product
Fresh raw goat‟s milk was heated to 65ºC for 30 minutes and then
cooled to 37 ºC, following this 3% of starter culture B.longumBB536 was added
to the milk and incubated at 37 ºC divided in to four parts and treatments with
1% of inuline and different fiber(sorghum bran, barley bran and millet bran)
powder. Next, using mixer the result in fermented product were filled in to
plastic containers and stored under refrigeration (4◦C) for 3 weeks. Subsequent
39
physicochemical and microbiological analyses at storage were performed at 0, 1,
2 and 3weeks.
3.5 Chemical analysis of milk and fermented product
3.5.1 Protein content
The crude protein was determined by the micro-Kjeldahl method according to
AOAC (2003) as follows:
Digestion
Two gram of sample was weighed and placed in small digestion flask (50ml),
about 0.4 gram catalyst mixture (96% anhydrous sodium sulphate and3.5%
copper sulphate) was added and 3.5ml of approximately 98%of H2SO4was
added. The contents of the flask were then heated on an electrical heater for
2hours till the colour changed to blue-green. The tubes were then removed from
digester and allowed to cool.
Distillation
The digested sample was transferred to the distillation unit and 20ml of
40%sodium hydroxide were added. The result as ammonia was received in
100ml of2%boric acid plus 3-4 drops of methyl red indicator. The distillation
was continued until the volume reached 50ml.
Titration
The content of the flask were titrated against 0.02 N HCL. The titration reading
was recorded. The crude protein was calculated using the following:
equation (calculated on dry matter basis):
N% = (
Protein (%) = (N %) × 6.25
Where N = Nitrogen content.
0.014=molecular weight of nitrogen/1000

40
3.5.2. Determination of fat content
The fat content was determined by Gerber method according to AOAC (2003) as
follows:
In a clean dry Gerber tube, 10 ml of sulfuric acid (density 1.815 gm/ml at 20ºC)
were poured, and then 10.94 ml of milk sample and three grams of cream cheese
samples were added. Amy1 alcohol 1.0 ml (density 0.815) was added to the
mixture followed by addition of water to raise the level of fat in the column. The
contents were thoroughly mixed till no white particles could be seen. The Gerber
tubes were centrifuged at 1100 revolutions per minute (rpm) for 4-5minutes and
the tubes were then transferred to a water bath at 65 ˚C for three minutes. The fat
percentage was then read out directly from the fat column.
3.5.3. Ash content
The ash content was determined according to the method described in AOAC
(2003). Ten millimeters of milk samples and two g of fiber samples were
weighed in a suitable crucible and evaporated to dryness on a steam bath. The
sample was placed in a muffle furnace (550ºC) for 1.5 hours, then cooled in
desiccators and weighed. The ash content was calculated using the following
equation:
Ash (%) =
×100
Where:
W1= weight of ash
W2 = weight of sample
3.5.4 Determination of crude fiber
Fiber was determined according to official method of AOAC(2003) .About 2g of
a sample was placed into a conical flask containing 200ml of H2 SO4(0.26N).

41
The flask was fitted to a condenser and allowed to boil for 30 minutes. At the
end of the digestion period, the flask was removed and the digest was filtered
through a proclaim filter crucible (No.3). After that, the precipitate was
repeatedly rinsed with distilled boiled water followed by boiling in 200ml NaOH
(0.23N) solution for 30 min under reflux condenser and the precipitate was
filtered. Rinsed with hot distilled water, 20 ml ethyl alcohol (96%) and 20ml
diethyl ether. Finally, the crucible was dried at 105 ˚C until a constant weight
was obtained and the difference in weight was considered a crude fiber.
Crude fiber % =
[(Dry residue + crucible(g)- (ignited residue +crucible (g))] × 100
Sample weight
3.5.5 Calculation of carbohydrates
Carbohydrates were calculated by difference according to the following:
Total carbohydrates = 100% - [Moisture (%) + Protein (%) +Fat (%) and ash
(%)].
3.5.6 Determination of pH value
The pH value of the fermented product and milk were determined using a pH-
meter (model HI 8521 microprocessor bench PH/MV/C meter. Romania). Two
standard buffer solution of pH 4.00 and 7.00 were used for calibration of the pH
meter at room temperature. The pH meter was allowed to stabilize for one
minute and then the pH of the different cream cheese and milk were directly
measured.

42
3.6 Microbiological analysis of fermented product
3.6.1. Preparation of equipments and media
Glass ware such as test tubes, flasks, Petri dishes and pipettes were
sterilized by heating in an oven at 160 ˚C for 2 hours. Media, dilutions (distilled
water), and tips were sterilized by autoclaving at 121˚C for 15 minutes. The
media were then cooled to 45 ˚C (Barrow and Feltham, 1993).
3.6.2 Preparation of the samples
Different types of fermented product samples stored under similar conditions
were taken in sterile plastic containers. Fifty grams of fermented product were
taken for microbiological examination. Samples were taken aseptically from
containers. Ten grams of fermented product were added to 90 ml of distill water
in a flask and shaken well to complete mixing 10-1
after that to make 10-2
dilution 1 ml from the above mentioned dilution (10-1
) was aseptically
transferred to 9 ml sterile peptone water. This procedure was repeated to make
serial dilutions of 10 -3
, 10 -4
, 10-5
and 10-6
from suitable dilutions , 1 ml was transferred to Petri-dishes ( duplicate)
followed by addition of 18-20 ml culture medium was poured aseptically into
each Petri- dish , mixed gently , left to solidity and incubated (in an inverted
position) ( Houghtbet al., 1992).
3.6.3 Enumeration of viable cells of B. longumBB536
MRS medium was used to enumerate B. longumBB536 of different fermented
products using the plate count technique. Samples were drawn at one day and
every 15days intervals during storages (21 days). One gram of fermented product
was diluted in peptone water, followed by plating on Rogosa Sharp agar (MRS)

43
supplement with 0.05% L- cystiene. The plates were incubated an aerobically at
37 ˚C for 48 h. The growth was calculated as colony forming unit per g (CFU/g).
Colony counters where:
Colony forming units/gm (CFU/gm) = Total number of colonies in the dilution
multiplied by the reciprocal of dilution (Houghtbet al., 1992).
3.6.4 Total bacterial count (TBC)
Total bacterial count using nutrient agar medium was determined according to
the method by Houghtbet al. (1993).
3.6.4. 1 Preparation of the medium
The medium was prepared according to manufacturer‟s instructions by
dissolving 23.5 gram of powder in 1000 ml of distilled water, heated to boiling
point and then sterilized in an autoclave at 121 oC for 15 minutes (Frank et al.,
1993).
3.6.4. 2 Plating
From each selected dilution 1 ml was transferred into sterile Petri dishes
(duplicate) followed by addition of 15 – 18 ml melted, cooled (45 oC) nutrient
agar was mixed thoroughly by rotating the dishes first in one direction and then
in the opposite direction. When medium was solidified, the dishes were
incubated in an inverted position at 35 ± 2 °C for 24 hours.
3.6.4.3 Counting
Plates contain 25 – 250 colony were selected and counted using colony counter.
The number of colony forming units (cfu) in the dilution was obtained by
multiplying the reciprocal of the dilution.
44
3.6.5 E.coli count
The count was performed according to William and Dennis (1998) using
MaConkey agar media and Eosin methylene blue agar (EMB) for identification.
3.6.5.1 Preparation of the medium
The manufacturer's instructions were followed by dissolving 55 grams of powder
in 1000 ml of distilled water, heated to boiling point and sterilized in an
autoclave at 121 oC for 15 minutes, (Christen et al., 1992).
3.6.5.2 Plating and counting
One ml amounts of each sample dilutions were streaked in dried plate of
Maconkey agar media. The culture was incubated at 35 °C for 24 hours, and then
colonies were used for further confirmation of the presence of E. coli by
streaking a loop from each colony on Eosin methylene blue agar ( EMB) for
identification of colonies which show brilliant green, the characteristic features
of growth of E. Coli in the medium. The isolates were further characterized by
biochemical tests according to Barrow and Feltham (1993) .Special attention was
paid to the pattern of reactions of the organism in IMVIC tests, and the positive
tests were recorded for a positive E. coli count.
3.6.6 Staphylococcus aureus count
The count was achieved according to method by Christen et al., (1992) using
Mannitol salt agar.

45
3.6.6.1 Preparation of the medium
The manufacturer's instructions were followed by dissolving 111 grams of
powder in 1000 ml of distilled water, heated to boiling point and sterilized in an
autoclave at 121 oC for 15 minutes (Christen et al., 1992).
3.6.6.2 Plating and counting
One ml quantities of each sample dilutions 102-10
6 was transferred into sterile
Petri dishes followed by addition of 15 – 18 ml melted media, cooled (45 oC)
Petri dishes with Mannitol salt agar was mixed thoroughly by rotating the dishes
first in one direction and then in the opposite direction. When medium was
solidified, the culture was incubated at 35 ± 2 °C for 24hours where colonies of
Staphylococcus aureus were recognized by bright yellow zones formation in
Mannitol salt agar (Jawez and Adel, 1990) and then colonies were counted by
colony counter.
3.6.7 Yeast and molds count
The yeast and molds count were determined according to Harrigan and McCance
(1976).
3.6.7.1Preparation of the medium
Medium were prepared according to manufacture instructions by suspending 39
grams of Potatoes dextrose agar in one liter distilled water and boiled until it
dissolved completely, then it was sterilized by autoclaving at 121ºC for
15minuts.

46
3.6.7.2 Plating and counting
One ml from suitable dilutions was transferred into sterile Petri dishes followed
by addition of 15 – 18 ml potato dextrose agar. The plates were incubated at
25°C for up to 72 hours. And then colonies were counted by colony counter.
3.6.8. Salmonella
The count was achieved according to method by Liong and Shah, (2006) using
Brilliant green agar.
3.6.8.1 Preparation of the medium
Medium were used according to manufacture instructions by suspending 58.09
grams of Brilliant green agar in one of liter distilled water , boiled until dissolved
completely and then it was sterilized by autoclaving at 121ºC for 15 minuts.
3.6.8.2 Plating and counting
One ml quantity of each sample dilution was transferred into sterile Petri dishes
(duplicate) followed by addition of 15 – 18 ml melted media, cooled
to45oC.Petridishes with Brilliant green agar was mixed thoroughly by rotating
the dishes first in one direction and then in the opposite direction. Then media
was solidified. The culture was incubated at 35 ± 2 °C for 24hours.
3.6.8.3 Counting
Plates contain 30 – 300 colony were selected and counted using colony counter.
The number of colony forming units (CFU) in the dilution was obtained by
multiplying the reciprocal of the dilution.

47
3.7. Hematology
The procedure for complete blood profile including: hemoglobin concentration
(HGB), red blood cell (RBC), white blood cell (WBC) and their respective
differentials were preformed with automated analyzer ( Mindry-BC 3000 plus).
3.8. Biochemistry
3.8.1 Serum enzymes and minerals
Serum enzyme [aspartate transferase (AST), alanine transferase (ALT) and
alkaline phosphatase (ALP)] activities and total protein (TP), albumin (Alb),
globulin (Glob) content and uric acid of the blood were estimated according to
methods based on the enzymatic colorimetric test method also Na, ca, k, P were
determined using kits method obtained from Bio Systems (Spain).
3.8.2 Glucose
Measurement was based on the colorimetric end point test method.
Principle
Glucose is determined after enzymatic oxidation in the presence of glucose
oxidase. The hydrogen peroxide formed reacts, under catalysis of peroxidase,
with phenol and 4-aminophenazone to form a red-violet quinoneimine product.
Protocol
Blank Standard Sample
Sample - - 10 μL
Standard - 10 μL -
Enzyme reagent 1000 μL 1000 μL 1000 μL
48
The reaction mixture was mixed well and incubated for 5 minutes at 37o
C. The
absorbance of sample and standard was measured against reagent blank at 505
nm. The concentration of the standard was then multiplied by the product of the
sample absorbance/standard absorbance.
3.8.3 Direct bilirubin
Principle
Direct bilirubin (conjugated) reacts in acid environment with diazotized
sulphalinic acid. The formed colouredazobilirubin is measured photometrically
at 546 nm.
Protocol
Sample Blank
Direct bilirubin reagent 1000 μL 1000 μL
Nitrite reagent 20 μL -
Sample 50 μL 50 μL
The reaction mixture was mixed well and incubated in the dark at room
temperature for 5 minutes. The absorbance of the sample was measured against
respective sample blank within 8 minutes at 546 nm. The concentration
wascalculated by subtracting the blank absorbance from the sample absorbance
and multiplied by the factor.
3.8.4 Urea
Measurement was based on the colorimetric end point test method.

49
Principle
The Berthelot reaction has long been used for the measurement of urea and
ammonia. The present method is a modified Berthelot method. The urea
colorimetric procedure is a modification of the Berthelot reaction. Urea is
converted to ammonia by the use of urease. Ammonium ions then react with a
mixture of salicylate, sodium nitroprusside and hypochlorite to yield a blue-
green chromophore. The intensity of the color formed is proportional to the urea
concentration in the sample.
Protocol
The absorbance
of sample and
standard was
measured
against reagent
blank at 578
nm. The
concentration of
the standard
was then multiplied by the product of sample absorbance and divided by the
standard absorbance.
Blank
Standard
Sample
Urea buffer 1000 μL 1000 μL 1000 μL
Urea enzyme
reagent
100 μL 100 μL 100 μL
Standard - 10 μL -
Sample - - 10 μL
Mixed well and incubated for 5 minutes at 37o
C.
Urea colour
developer
1000 μL 1000 μL 1000 μL
Mixed well and incubated for 5 minutes at 37o
C.

50
3.8.5 Creatinine
Measurement was based on the colorimetric kinetic test method developed by
Jaffe reaction.
Principle
Creatinine in alkaline solution reacts with picrate to form a coloured complex
which absorbs at 500-520 nm. The amount of complex formed is directly
proportional to the creatinine concentration.
Protocol
Blank Standard Sample
Sample - - 100 μL
Standard - 100 μL -
Picrate and buffer
reagents
1000 μL 1000 μL 1000 μL
The reaction mixture was mixed well and after 30 seconds at room temperature
the initial absorbance was read and read again after 1 minute. The change in
absorbance in a minute of the standard and sample were measured against the
reagent blank at 500 nm. The concentration of the standard was then multiplied
by the product of sample absorbance/standard absorbance.

51
3.8.6 Cholesterol
Measurement was based on the enzymatic colorimetric test method.
Principle
Cholesterol esters are hydrolysed to produce cholesterol. Hydrogen peroxide is
then produced from oxidation of cholesterol by cholesterol oxidase. The
indicator quinoneimine is formed from hydrogen peroxide and 4-
aminoantypyrine in the presence of phenol and peroxide. The absorption of the
red quinoneimine dye is proportional to the concentration of cholesterol in the
sample.
Protocol
Blank
Standard
Sample
Sample - - 10 μL
Standard - 10 μL -
Enzyme reagent 1000 μL 1000 μL 1000 μL
The reaction mixture was mixed well and incubated for 5 minutes at 37oC. The
absorbance of sample and standard was measured against reagent blank at 505
nm. The concentration of the standard was then multiplied by the product of
sample absorbance and divided by the standard absorbance.
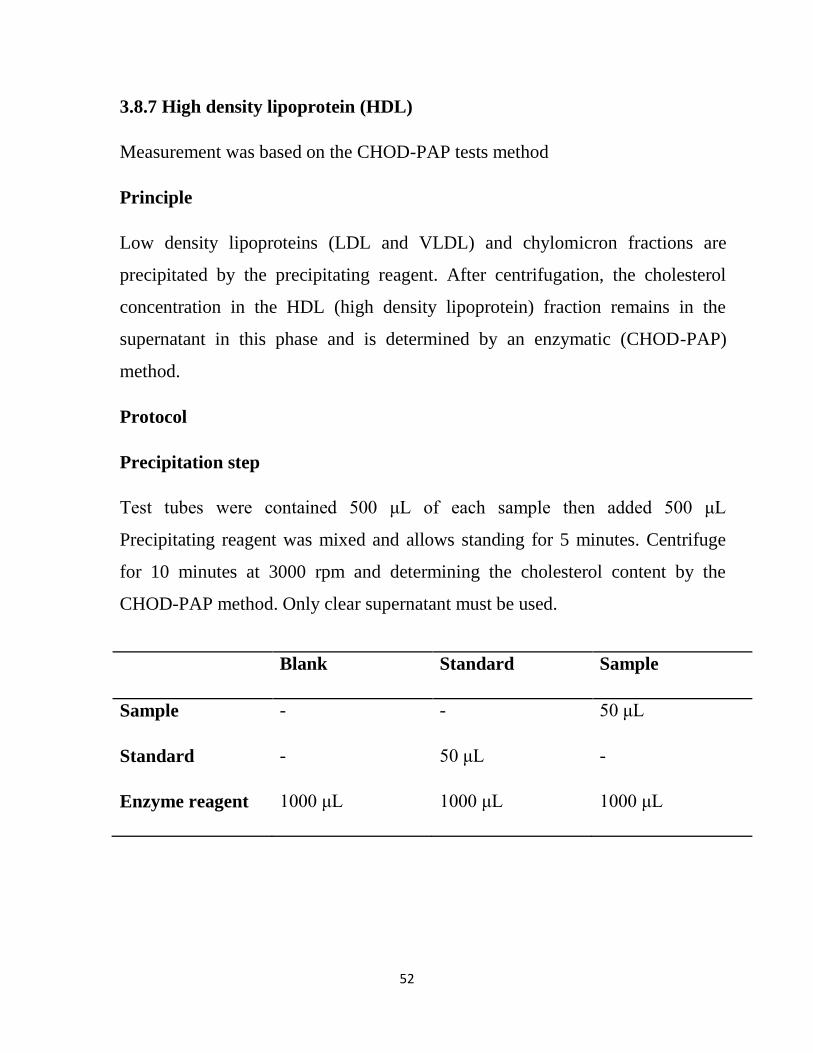
52
3.8.7 High density lipoprotein (HDL)
Measurement was based on the CHOD-PAP tests method
Principle
Low density lipoproteins (LDL and VLDL) and chylomicron fractions are
precipitated by the precipitating reagent. After centrifugation, the cholesterol
concentration in the HDL (high density lipoprotein) fraction remains in the
supernatant in this phase and is determined by an enzymatic (CHOD-PAP)
method.
Protocol
Precipitation step
Test tubes were contained 500 μL of each sample then added 500 μL
Precipitating reagent was mixed and allows standing for 5 minutes. Centrifuge
for 10 minutes at 3000 rpm and determining the cholesterol content by the
CHOD-PAP method. Only clear supernatant must be used.
Blank Standard Sample
Sample - - 50 μL
Standard - 50 μL -
Enzyme reagent 1000 μL 1000 μL 1000 μL

53
The reaction mixture was mixed well and incubated for 5 minutes at 37oC. The
absorbance of sample and standard was measured against reagent blank at 520
nm. The concentration of the standard was then multiplied by the product of
sample absorbance and divided by the standard absorbance and a serum dilution
factor.
3. 8.8 Triglycerides
Measurement was based on the enzymatic colorimetric test method
Principle
Triglycerides are determined after enzymatic hydrolysis with lipases. The
quinoneimine indicator if formed from hydrogen peroxide, 4-aminophenazone
and 4-chorophenol under the catalytic influence of peroxidase.
Protocol
Blank Standard Sample
Sample - - 10 μL
Standard - 10 μL -
Enzyme reagent 1000 μL 1000 μL 1000 μL
The reaction mixture was mixed well and incubated for 5 minutes at 37oC. The
absorbance of sample and standard was measured against reagent blank at 505
nm. The concentration of the standard was then multiplied by the product of
sample absorbance and divided by the standard absorbance.

54
3.9 Bacteriological enumeration in colon of rats fed with fermented goat
milk supplemented with inulin and different cereal brans
Three rats from each group were used for bacteriological enumeration in colon
content were collected in severe aseptic conditions in sterile bottle to avoid any
cross contamination. The content was homogenized inside a cabinet and serially
diluted prior to plating on different agar plates.
Media used for total aerobe, total anaerobe and enterobacteriacae ,bifidobacteria
and salmonella were according to reported by (Santos et al., 2006
).Staphylococcus, lactobacillus and coliform enumerated following Liong and
Shah (2006) method. Incubation environment of media used for enumerations
are shown in Table (2).
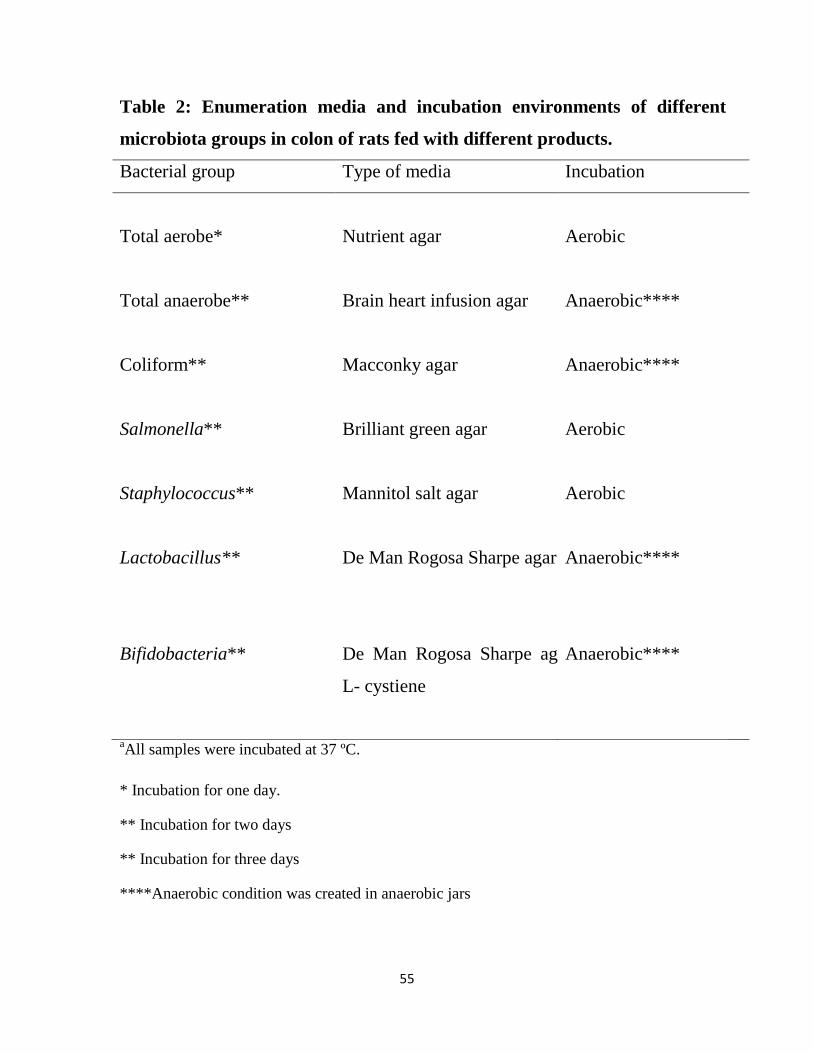
55
Table 2: Enumeration media and incubation environments of different
microbiota groups in colon of rats fed with different products.
Bacterial group Type of media Incubation
Total aerobe*
Nutrient agar
Aerobic
Total anaerobe** Brain heart infusion agar Anaerobic****
Coliform** Macconky agar Anaerobic****
Salmonella** Brilliant green agar Aerobic
Staphylococcus** Mannitol salt agar Aerobic
Lactobacillus** De Man Rogosa Sharpe agar Anaerobic****
Bifidobacteria** De Man Rogosa Sharpe agar+
L- cystiene
Anaerobic****
aAll samples were incubated at 37 ºC.
* Incubation for one day.
** Incubation for two days
** Incubation for three days
****Anaerobic condition was created in anaerobic jars

56
3.10 Statistical analysis
One- way ANOVA and two sample paired test were performed to examine
significant differences between normally distributed data of replicated
measurement. Probability level of less than 0.05 was considered significant
(p<0.05). All data were analyzed using vision 17MINITAB statistical software
for windows (2006).
57
CHAPTER FOUR
RESULTS AND DISCUSSION
4.1 Proximate composition of different cereal brans (sorghum, barley
and millet)
Proximate composition of different cereal brans (sorghum, barley and millet)
and inulin are shown in Table3. The composition of inulin including:
moisture, protein, fat, ash, fiber and carbohydrates were 3.00%, nil, nil, nil,
89.00% and 8.00%, respectively. Results of inulin showed a low content of
water and highest fiber level as compared to tested types of bran. Similarly,
low lipid and ash levels of inulin were documented by (Ayadi et al., 2009).
These differences in components levels of inulin might be due to the
diversity between commercial varieties. Also significant differences (P<
0.05) in chemical components levels between cereals bran types were
assured (Table 3). In fact inulin was the richest in fiber and carbohydrate
from among cereal bran types. While millet bran was the highest in moisture
and fat levels as presented in Table 3. Whereas, barley bran was the highest
source of protein and ash refer to Table 3. The moisture (6.34%), ash
(2.52%) and fiber (2.80%) values in barely grain were comparable to those
stated by Badahdah et al., (2019). The values of moisture (8.47%) and
protein (12.93 %) in millet bran were close by to that reported by Liang et
al. (2010).
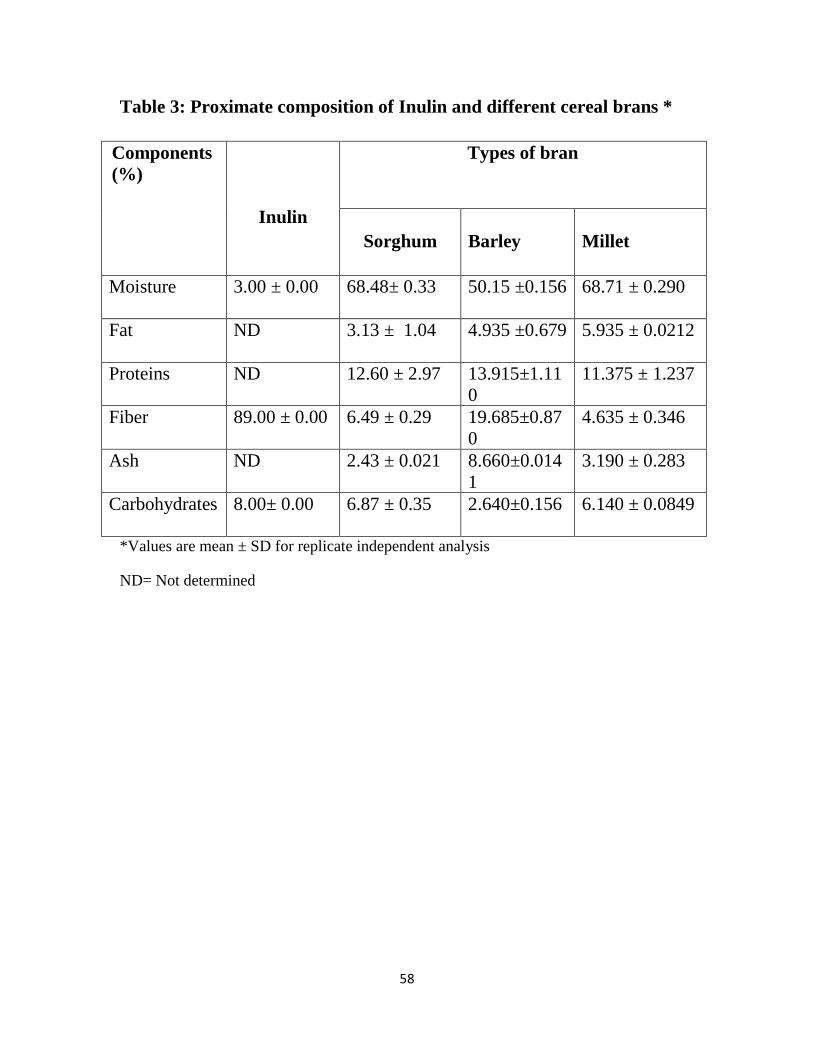
58
Table 3: Proximate composition of Inulin and different cereal brans *
Components
(%)
Inulin
Types of bran
Sorghum
Barley
Millet
Moisture 3.00 ± 0.00
68.48± 0.33 50.15 ±0.156 68.71 ± 0.290
Fat ND
3.13 ± 1.04
4.935 ±0.679 5.935 ± 0.0212
Proteins ND
12.60 ± 2.97
13.915±1.11
0
11.375 ± 1.237
Fiber 89.00 ± 0.00
6.49 ± 0.29
19.685±0.87
0
4.635 ± 0.346
Ash ND
2.43 ± 0.021
8.660±0.014
1
3.190 ± 0.283
Carbohydrates 8.00± 0.00
6.87 ± 0.35
2.640±0.156 6.140 ± 0.0849
*Values are mean ± SD for replicate independent analysis
ND= Not determined

59
4.2 Minerals content
Table 4 shows minerals content (Ca, K, Mg, Na, and P) in inulin and
different cereal brans (sorghum, barley and millet). Chemical analysis
exposed significant (P< 0.05) differences in different components. Inulin
recorded the highest levels of Ca, K, Mg and Na; except P. Inulin contained
the lowest P as compared to its level in different cereal brans. All cereal
brans contain small amount of Ca, K, Mg and Na (Table 4). Moreover, there
was no significant (P< 0.05) difference in Ca, K and P between different
types of bran. While no significant (P< 0.05) difference in Mg level between
sorghum and barely brans. A predominance of potassium and calcium was
observed and low levels of sodium and magnesium was reported by
Femenia et al, (1997).
Table 4 Mineral content (mg/100g) of inulin and different cereal bran *
Elements
(mg/100g)
Inulin
Types of bran
Sorghum Barley Millet
Ca 1.62±0.03a
0.08±0.01b 0.08±0.00
b 0.08±0.00
b
K 0.76±0.01a 0.11±0.01
b 0.10±0.00
b 0.09±0.01
b
Mg 0.82±0.02a 0.03±0.00c 0.02±0.00
c 0.05±0.21
b
Na 1.74±0.00a 0.11±0.13
b 0.02±0.06
c 0.02±0.00
c
P 0.26±0.00b
*Values are mean ± SD for replicate independent runs.
**Values that bear different superscript letter in the same raw of are significantly
different at p<0.05.
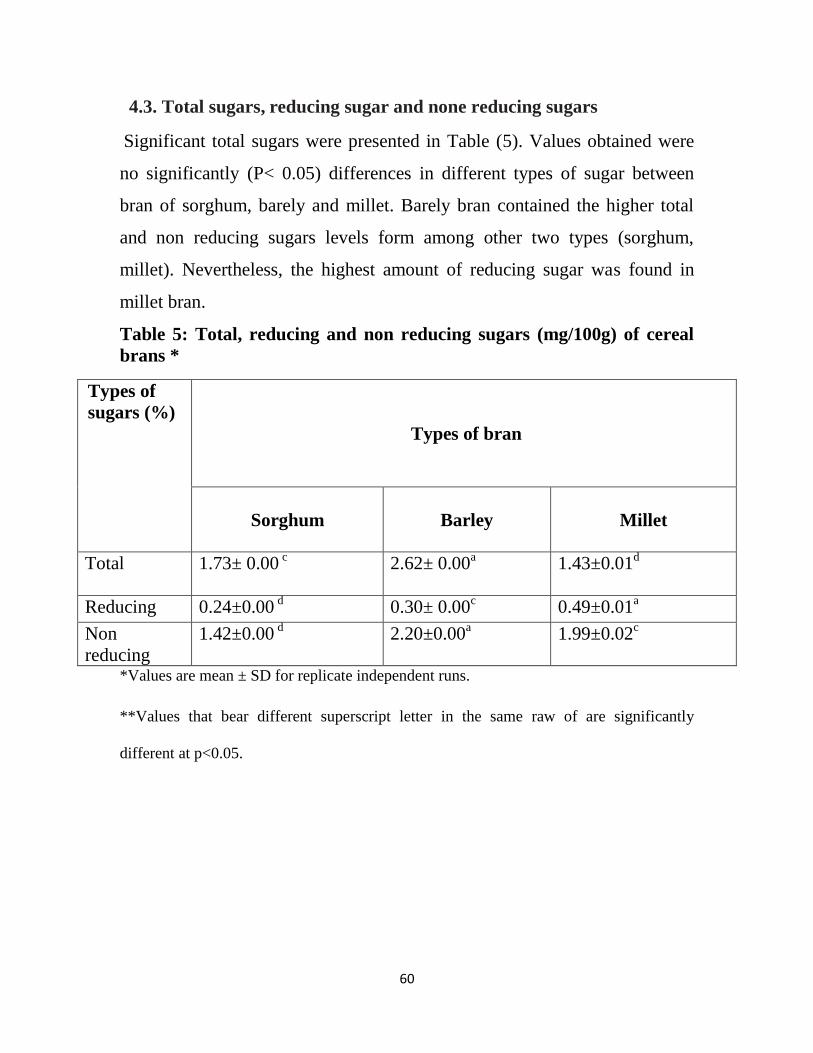
60
4.3. Total sugars, reducing sugar and none reducing sugars
Significant total sugars were presented in Table (5). Values obtained were
no significantly (P< 0.05) differences in different types of sugar between
bran of sorghum, barely and millet. Barely bran contained the higher total
and non reducing sugars levels form among other two types (sorghum,
millet). Nevertheless, the highest amount of reducing sugar was found in
millet bran.
Table 5: Total, reducing and non reducing sugars (mg/100g) of cereal
brans *
Types of
sugars (%)
Types of bran
Sorghum
Barley
Millet
Total 1.73± 0.00 c
2.62± 0.00a 1.43±0.01
d
Reducing 0.24±0.00 d 0.30± 0.00
c 0.49±0.01
a
Non
reducing
1.42±0.00 d 2.20±0.00
a 1.99±0.02
c
*Values are mean ± SD for replicate independent runs.
**Values that bear different superscript letter in the same raw of are significantly
different at p<0.05.

61
4.4. Physicochemical properties and chemical composition of different
fresh milks
Table 6 shows the physicochemical properties and chemical composition of
different fresh milks (goat, cow and camel). There were no significant (P<
0.05) differences in components and properties between different typs of
milks. The highest pH was recorded for goat milk. While cow milk recorded
the highest levels of TSS, lactose and protein. Whereas, camel milk
contained the highest moisture and ash levels. Moisture content of goat
(88.98 %), caw (89.23%) and camel (90.21%) milks were almost similar to
the value 87.3% reported by Walstra and Jenness (1984). They also reported
3.7% fat and 4.6% lactose and 3.25% protein which are not comparable to
all values in Table 6.
Table6. Physicochemical properties and chemical composition of
different fresh milks
Parameter Types of milk
Goat Cow Camel
Total solids (%) 10.91 ± 0.01 b
11.38 ± 0.01 b
9.80 ± 0.02 b
Moisture (%) 88.98 ± 0.02 a
89.23 ± 0.01 a
90.21 ± 0.01 a
Ash (%) 0.75 ± 0.01 g
0.73 ± 0.02 g
0.93 ± 0.02 g
Fat (%) 3.21 ± 0.01 e 3.12 ± 0.02
e 2.34 ± 0.02
e
Lactose (%) 4.15 ± 0.01 d
4.90 ± 0.02 d
4.44 ± 0.04 d
Proteins (%) 2.24 ± 0.01 f 3.02 ± 0.02
f 2.04 ± 0.03
f
pH 6.65 ± 0.00 c 6.640 ± 0.00
c 6.57 ± 0.00
c
*Values are mean ± SD for replicate independent runs.
**Values that bear different superscript letter in the same raw of are significantly
different at p<0.05.

62
4.5. The growth of Bifdobacterium longum BB356 during fermentation
of different fresh milks
Growth of B. longum BB536 in cow, goat and camel fresh milk is shown in
Table (7). There were significant (p<0.05) increases in B longum BB356
viable count by extended fermentation period. The maximum growth of B.
longum BB356 was attained at 12h in all types of fermented milk. Goat milk
recorded the highest level of B. longum BB356 followed by cow milk and
then the camel milk. The B. longum BB356 increases in the fermented milks
were 3.84, 3.07 and 2.90 in fermented goat, cow and camel milks,
respectively. The difference in growth of Bifidobacteria longum BB356 in
the different fermented fresh milks could be attributed to the quality,
quantity and availability of nutrients of the tested milk. However, after
maximum growth of the strain there was reduction in number of B. longum
BB536 of each specific types of fermented milk. That may be due to the
accumulation of acids or reduction of availability of nutrient required for the
growth (Kabeir et al., 2005). On the other hand, the viable count of B.
longum BB536 in all types of fermented milk was above the number
required to presence in probiotic which was at least 6 log cfu/ml fermented
products (Viderola and Reinheimer; 2000).

63
Table 7: The viable count CFU/ml of Bifidobacterium longum BB536
log (CFU/ml) during fermentation of different types of fresh milk *
* Values are mean ± SD for replicate independent runs.
** Values that bear different superscript letter in the same Column are significantly
different at p<0.05.
Fermentation
period (h)
Types of fermented milk
Goat
Cow
Camel
0 4.89±0.21a
4.80±0.12a 4.56±0.25
a
6 6.79 ±0.04abc
5.78±0.15b 5.40±0.14
b
12 8.73±0.01a
7.87±0.14c 7.46±0.20
c
18 7.93±0.06a
6.86±0.11d 6.55±0.22
d
24 6.31±0.04c
5.46±0.14d 5.46±0.25
a
64
4.6. pH changes during fermentation of different fresh milk with
B.longum BB356
There was significant (P<0.05) decrease in pH values of each specific milk
type by extended fermentation (Table 8). The pH decreases were 0.37, 0.40,
and 0.33 in fermented cow milk, goat milk, and then the camel milk,
respectively. Level of acidity increased by extended fermentation period and
thus caused reduction in pH. The acid produced is beneficial and reported to
have antibacterial such as preventing the proliferation of pathogens (Bullen
et al., 1976).
4.7. TSS changes during fermentation of different fresh milk with B.
longum BB536
Table 9 shows changes in TSS during fermentation of different fresh milk
with B. longum BB356.
There was significant (P<0.05) decrease in TSS levels of each specific type
of fermented fresh milk by extended fermentation. The TSS was 1.80, 2.25,
and 1.95% in fermented cow milk, goat milk, and camel milk, respectively,
at maximum growth. However, the level of TSS changes at 18h of
fermentation were, 0.64, 0.63, and 0.37% in the fermented goat milk,
fermented cow milk, and the fermented camel milk respectively.
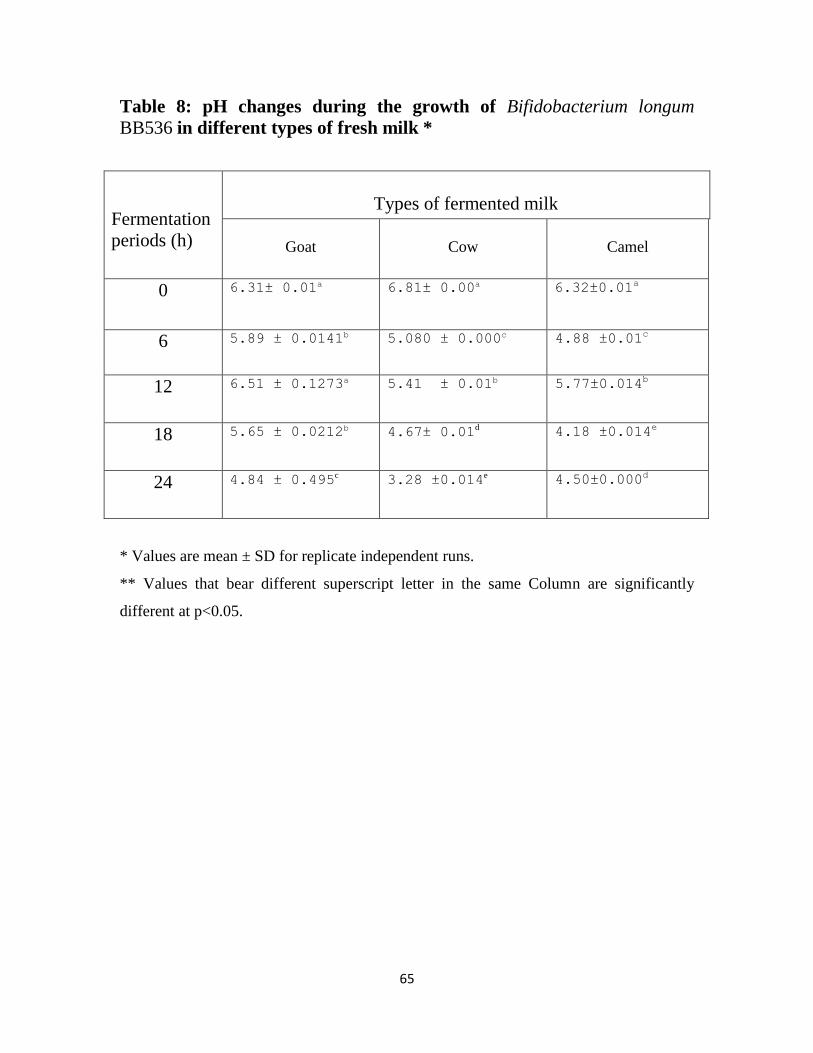
65
Table 8: pH changes during the growth of Bifidobacterium longum
BB536 in different types of fresh milk *
* Values are mean ± SD for replicate independent runs.
** Values that bear different superscript letter in the same Column are significantly
different at p<0.05.
Fermentation
periods (h)
Types of fermented milk
Goat
Cow
Camel
0 6.31± 0.01a
6.81± 0.00a 6.32±0.01
a
6 5.89 ± 0.0141b 5.080 ± 0.000c
4.88 ±0.01c
12 6.51 ± 0.1273a 5.41 ± 0.01b
5.77±0.014b
18 5.65 ± 0.0212b 4.67± 0.01
d 4.18 ±0.014
e
24 4.84 ± 0.495c 3.28 ±0.014
e 4.50±0.000d

66
Table9: TSS (100%) changes during the growth of Bifidobacterium
longum BB536 in different types of fresh milk *
* Values are mean ± SD for replicate independent runs.
** Values that bear different superscript letter in the same Column are significantly
different at p<0.05.
Fermentation
periods (h)
Types of fermented milk
Goat
Cow
Camel
0 6.21 ± 0.01a
1.85 ± 0.08bc 6.14 ±0.01
a
6 4.95 ± 0.00b 2.10 ± 0.00bc
6.01 ±0.01b
12 4.39 ± 0.01e 3.21 ± 0.01
ab 5.65 ±0.07
c
18 4.81 ± 0.00c 1.00 ± 0.000 c
5.47 ±0.014d
24 4.61 ± 0.00d 4.18±0.97
a 4.50±0.01e
67
4.8. Chemical composition of fermented goat milk supplemented with
inulin and different brans
There was no significant (p<0.05) difference in moisture and carbohydrate
content at initial fermentation and maximum strain BB 536 growth of each
specific fermented product (Table 10). Whereas, level of fat in inulin and
sorghum bran fermented goat milk at initial and maximum growth were
significant (p<0.05). However, ash content was only significant (p<0.05)
between the initial and maximum growth in sorghum bran supplemented
goat milk fermented with strain BB536. Similarly, fiber content was only
significant (p<0.05) between the initial and maximum growth in millet bran
supplemented goat milk fermented with strain BB536 (Table 10)

68
Table 10: Chemical composition of goat milk supplemented with inulin
and different brans fermented with Bifidobacterium longum BB536 *
*Values are mean ± SD for replicate independent runs.
**Value of each component that bear different superscript letter of each supplement type
is significantly different at p<0.05.
Compon
ent
Fermented goat milk
Inulin
Types of bran
sorghum barely millet
Initial Maximu
m
Initial Maximu
m
Initial Maximu
m
Initial Maximum
Moisture
(%) 86.9±0.
01a
86.77±
0.04a
88.54±0.
01a
88.50±
0.28a
84.55±
0.00a
86.46±
0.00a
85.28±0.
02a
85.79±0
.01a
Fat content
(%) 2.37±0.
007d
2.42±0
.03e
1.97±0.0
1e
2.54±0
.03c
1.840±
0.00e
2.015±
0.00e
2.32±0.0
28e
2.44±0.
02e
Protein
content (%) 2.30±0.
00e
2.56±0
.02d
2.59±0.0
0d
2.66±0
.01c
2.62±0
.00c
2.75±0
.00c
2.52±0.0
0c
2.74±0.
02d
Ash
content (%) 1.44±0.
02f
1.84±0
.02f
1.54±0.0
1f
1.76±0
.00d
1.55±0
.00f
1.64±0
.01f
1.77±0.0
1f
1.85±0.
01f
Carbohydra
tes (%) 13.06±0
.01b
13.23±
0.04b
11.46±0.
01b
11.51±
0.28b
15.46±
0.00b
13.56±
0.01b
14.73±0.
02b
14.21±0
.01b
Fiber (%) 3.86±0.
01c
3.71±0
.01c
2.97±0.0
1c
2.87±0
.04c
2.40±0
.00d
2.02±0
.01d
2.62±0.0
2d
2.60±0.
00c

69
4.9. Justification of using goat milk for formulation of fermented
product
The maximum growth of B. longum BB356 was attained at 12h in all types
of fermented milk. Goat milk recorded the highest level of B. longum BB356
followed by cow milk and then the camel milk. Nevertheless, the B. longum
BB356 increases were 3.84, 3.07 and 2.90 log cfu/ml in fermented goat, cow
and camel milk; respectively.
Goat milk differs from cow or human milk by having better digestibility,
higher alkalinity, increased buffering capacity, and certain therapeutic
effects that may be useful in medicine and human nutrition. The good
acceptability and digestibility of goat milk are important beneficial factors
for its inclusion in formulated diets prescribed for children and convalescent
people. In many cases, goat milk may be successfully used as substitute for
cow milk in the regular diet of allergic individuals (Haenlein, 2003).

70
4.10. The growth of Bifidobacterium. longum BB536 during
fermentation of goat milk supplemented with inulin and different cereal
brans
Comparative growth of B. longum BB536 cultured in goat milk
supplemented with inulin and different bran (sorghum, barley and millet) is
shown in (Table 11).
There were significant (p<0.05) increases in strain B. longum BB536 viable
count by extended fermentation period in all types of formulated goat milk
supplemented with inulin and different brans, as compared to strain level at
beginning of fermentation. The maximum growth of B. longum BB536 in all
types of fermented products was attained at 12h incubation. These high
viable count of strain BB536 (7.53±0.16b -8.43±0.03cLog CFU/ml) in all
fermented goat milk products exceed the minimum number (6 log CFU/ml
fermented products) required to be present in probiotic food (Viderola and
Reinheimer, 2000). After the maximum growth the strain declining was
observed in all types of fermented goat milks supplemented with inulin and
goat milk with different brans (sorghum, barley and millet) (Table 11)
The B. longum BB536 increases in different fermented goat milk
supplemented with inulin and goat milk with different bran were 2.57, 2.31,
1.93 and 1.18 CFU/ml in fermented goat milk with sorghum bran, goat milk
with inulin, goat milk with millet bran and goat milk with barely bran,
respectively as compared to strain initial level at the beginning of
fermentation. These increases induced by different cereal bran are
comparable to the prebitication (support growth of strain BB 536) with the
commercial prebiotic. Therefore, tested cereal bran might have prebiotic
effect on strain BB536. On the other hand, the variations in growth rate of

71
strain BB536 could be attributed to variances in availability of nutrients
required for growth in the different formulated products. In fact, goat milk
contains almost the essential nutrient for strain growth. Together the
different fiber combinations could complement the nutrient component
demand for strain BB 536 growth in formulated goat milk medium.
However, after maximum growth (12 h) the strain started to decline in all
types of fermented goat milk products (Table 6). The decline of the strain
might be due to the accumulation of acids or reduction of availability of
nutrient required for the growth as stated by Kabeir et al. (2005) during
fermentation of Sudanese thin porridge Medida. In spite of the continuous
declining in viable count of strain BB536 in all types of fermented goat milk
up to 24h of incubation, the remained viable counts still above the number
required to presence in probiotic food which is at least 6 log CFU/ml
fermented product (Viderola and Reinheimer, 2000).

72
Table 11: The viable count of Bifidobacterium longum BB536 log
(CFU/ml) during fermentation of goat milk supplemented with inulin
and different brans *
Fermentation
time(h)
Fermented goat milk supplemented with different types of fiber
inulin
sorghum bran
barley bran
millet bran
0 5.52±0.318a 5.86 ±0.06
a
6.07±0.0283a
6.03±0.1061a
6 7.33±0.0070a
6.07±0.099c
6.99±0.00707ab
6.31±0.417bc
12 7.53±0.163b
8.43±0.0283c
7.65±0.0636b
7.96±0.0212b
18
7.39±0.00707b
7.25±0.0636b
7.84±0.0778a
7.25±0.219b
24 7.30±0.0636a 6.93±0.170
ab 6.79±0.0636
b 6.83±0.148
b
* Values are mean ± SD for replicate independent runs.
** Values that bear different superscript letter in the same Column are significantly
different at p<0.05.
73
4.11. pH changes during fermentation of goat milk supplemented with
inulin and different cereal brans with Bifidobacterium longum BB536
During fermentation process with strain B. longum BB536 there were
significant (P<0.05) decrease in pH levels in all types of goat milk
supplemented with inulin and different bran (sorghum, barley and millet) by
extended fermentation period to 24h (Table 12).The decreases in pH are due
to increased acids production during fermentation process as a result of
fermented sugar by B. longum BB536, which produced acetic and lactic acid
as reported by De Vries et al. (1967). Moreover, the accumulated acids
produced by bifidobacterium strain, reported to have antibacterial activity
such as prevention of the proliferation of pathogens (Bullen et al., 1976).
The pH decreases at maximum growth at (12h incubation) of strain B.
longum BB536 were1.82, 1.07, 0.67 and 0.49pH in fermented goat milk
supplemented with barely bran, inulin , millet bran and sorghum bran,
respectively. Level of acidity increased by extended fermentation period and
thus caused reduction in pH.

74
Table 12: pH changes during the growth of Bifidobacterium longum
BB536 in goat milk supplemented with inulin and different brans *
* Values are mean ± SD for replicate independent runs.
** Values that bear different superscript letter in the same Column are significantly
different at p<0.05.
Fermentation
time (h)
Fermented goat milk supplemented with different types of fiber
Inulin
Sorghum bran
Barley bran
Millet bran
0 6.18± 0.00c
6.15±0.00707d
6.22±0.00707b 5.06± 0.0141
e
6 6.04± 0.0141b
6.01±0.0141b
4.95± 0.00c 5.15± 0.0141
c
12 5.11± 0.000c
5.65±0.0707b
4.40±0.00707d 4.45± 0.0141
d
18 5.01± 0.0141c
5.47±0.0141b
4.81± 0.000d 3.79± 0.0212
e
24 4.87±0.00707a 4.51±0.00707
c 4.61± 0.000
b 3.73± 0.0283
d
75
4.12. TSS changes during fermentation of goat milk supplemented
with inulin and different brans with Bifidobacterium longum BB536
Table 13 shows changes in total soluble solids (TSS) during fermentation of
formulated goat milk supplemented with inulin and different brans
(sorghum, barley and millet) with Bifidobacterium. longum BB536.There
were significant (P<0.05) decrease in TSS levels in all types of fermented
goat milk product by extended fermentation period to 24h. The TSS
decreases at maximum strain BB536 growth were 1.7, 1.25, .95 and 0.75%
in fermented goat milk supplemented with barely bran, sorghum bran, millet
bran and inulin, respectively. Enzymatic activity of the strain plays a vital
role in TSS reduction. The strain utilized soluble solids for energy source,
particularly reducing sugar, the main components of TSS. Reductions in
TSS by fermentation with B. longum BB536 and other probiotic strains were
reported by Ibrahima et al. (2015), Kabeir et al. (2005), Badahdah et al.
(2019) and Muyanj et al. (2010).

76
Table 13: TSS changes during fermentation of goat milk supplemented
with inulin and different brans with Bifidobacterium longum BB536 *
* Values are mean ± SD for replicate independent runs.
** Values that bear different superscript letter in the same Column are significantly
different at p<0.05.
Fermentation
time (h)
Fermented goat milk supplemented with different fiber
Inulin
Sorghum bran
Barley bran
Millet bran
0 8.30±0.21a
7.45±0.07a
8.20± 0.14a 9.55± 0.07
b
6 8.25±0.42a
6.45±0.07
b 7.50± 0.00
b 9.05± 0.00
a
12 7.55±0.07a
6.20±0.14b
6.50± 0.00c 8.60±0.14
c
18 6.45±0.07b
5.60 ±0.014c
5.20± 0.00d 7.35±0.07
d
24 5.90±0.00b 4.45±0.21
d 4.99± 0.16
d 6.25±0.07
e

77
4.13. Titratable acidity during fermentation of goat milk
supplemented with inulin and different brans with Bifidobacterium
longum BB536
Referring to the result in Table 14, there were significant (p<0.05) increases
in titratable acidity of different goat milk formulations by extended
fermented period to 24h. The increases were 0.56, 0.49, 0.46 and 0.2% at
maximum growth of strain B. longum BB536 (12h) in fermented goat milk
supplemented with barely bran, millet bran, inulin and sorghum bran,
respectively. The increased acidity is explained by accumulation of acetic,
lactic acid and other organic acids produced during fermentation of the
formulated products (Sefa et al., 2003). Similarly, acid increase due to
fermentation was reported by many authors as a result of sugar fermentation
(Ibrahim et al., 2015); Kabeir et al., 2005)
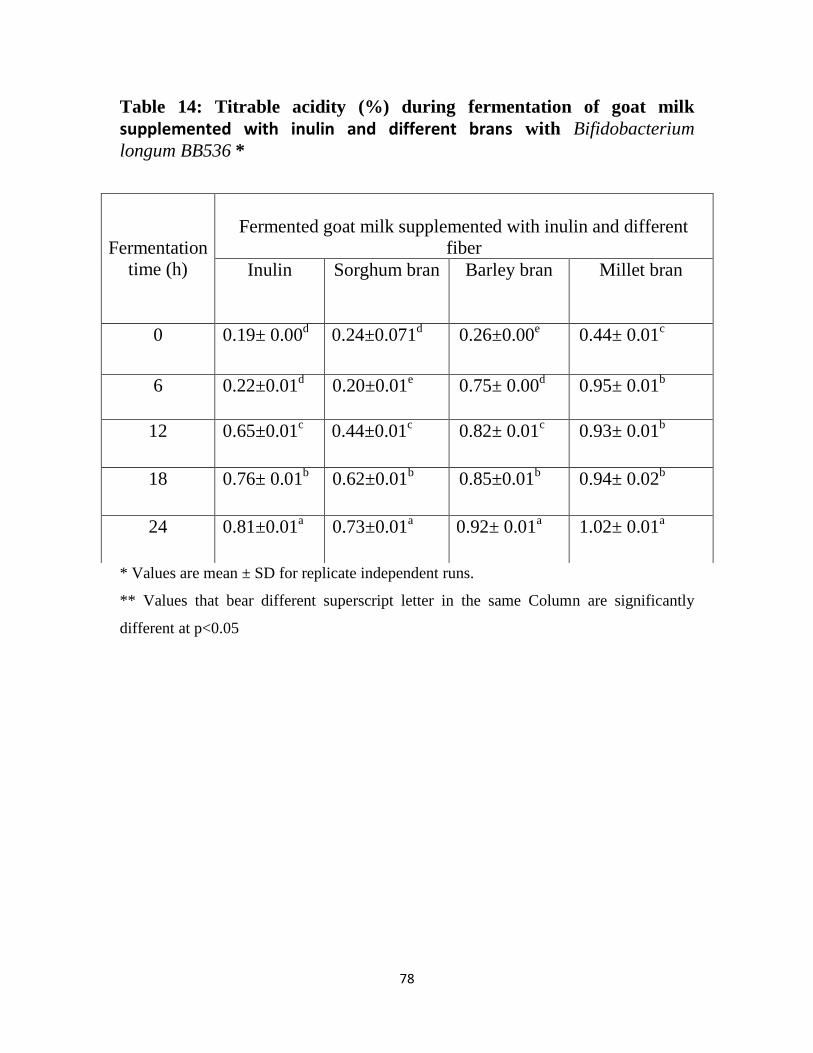
78
Table 14: Titrable acidity (%) during fermentation of goat milk
supplemented with inulin and different brans with Bifidobacterium
longum BB536 *
* Values are mean ± SD for replicate independent runs.
** Values that bear different superscript letter in the same Column are significantly
different at p<0.05
Fermentation
time (h)
Fermented goat milk supplemented with inulin and different
fiber
Inulin
Sorghum bran
Barley bran
Millet bran
0 0.19± 0.00d
0.24±0.071d
0.26±0.00e 0.44± 0.01
c
6 0.22±0.01d
0.20±0.01e
0.75± 0.00d 0.95± 0.01
b
12 0.65±0.01c
0.44±0.01c
0.82± 0.01c 0.93± 0.01
b
18 0.76± 0.01b
0.62±0.01b
0.85±0.01b 0.94± 0.02
b
24 0.81±0.01a 0.73±0.01
a 0.92± 0.01
a 1.02± 0.01
a

79
4.14. Mineral contents of goat milk supplemented with inulin and
different types of cereal bran fermented with Bifidobacterium longum
BB536
Table 15 displays the minerals content (Ca, K, Mg, Na and P) of fermented
goat milk supplemented with inulin and different brans (sorghum, barley and
millet) at initial (0h) and at maximum growth time (12h). There were no
significant (p<0.05) difference in Na of all fermented milk. On the other
hand there was significant an increase in Ca and K at maximum viable count
of strain BB536 in all fermented milk as compared to their levels at initial
fermentation. In contrast Mg decreased at maximum strain count in all
fermented products.

80
Table 15: Mineral contents (100%) of goat milk supplemented with
inulin and different brans fermented with Bifidobacterium longum
BB536 *
Minerals
Fermented Goat milk supplemented with different fiber
Inulin
sorghum barley millet
Initial Maxim
um
Initial Maxim
um
Initial Maxim
um
Initial Maximum
Ca 2.01±0.0
1c
3.00±0.
00c
1.40±0.
00c
3.00±0
.00c
1.00±0.
00c
2.05±0.
07d
1.10±0.
14c
1.82±0.02d
K 1.52±0.0
1d
3.08±0.
01b
1.03±0.
01d
3.85±0
.01b
1.04±0.
0212c
3.56±0.
03b
0.51±0.
01d
2.56±0.00b
Mg 3.10±0.1
4b
2.60±0.
01d
3.15±0.
07b
2.00±0
.00d
3.61±0.
01b
3.15±0.
21c
2.55±0.
07b
2.15±0.07c
Na 7.84±0.0
2a
6.97±0.
02a
10.44±0
.01a
6.94±0
.01a
6.95±0.
01a
7.84±0.
02a
6.96±0.
00a
7.82±0.00a
P 0.76±0.0
1e
0.63±0.
01e
0.81±0.
01e
0.82±0
.00e
0.91±0.
01d
0.81±0.
01e
0.46±0.
01d
0.62±0.02e
*Values are mean ± SD for replicate independent runs.
** Values that bear different superscript letter in the same row are significantly different
at p<0.05

81
4.15. The viable counts of Bifidobacterium longum BB536 log (CFU/ ml)
during refrigeration storage of fermented goat milk supplemented with
inulin and different cereal brans
Table 16 shows the viable counts of B. longum BB536 during refrigeration
storage of different formulated goat milk supplemented with inulin and
different cereal brans (Sorghum, Barely and Millet). The survival of
probiotic bacteria in fermented dairy bio-products depends on such varied
factors as the strains used, interaction between species present, culture
conditions, chemical composition of the fermentation medium (e.g.
carbohydrate source), final acidity, milk solids content, availability of
nutrients, growth promoters and inhibitors, concentration of sugars (osmotic
pressure), dissolved oxygen (especially for Bifidobacterium sp.), level of
inoculation, incubation temperature, fermentation time and storage
temperature. Referring to the result in Table 16, there were significant
(p<0.05) reductions in B. longum BB536 viable count in all fermented
samples at refrigeration. With regard to total reduction of strain
BB536throughout the storage period (two weeks), the highest value was in
goat milk supplemented with barley bran (1.92 CFU /ml), followed by
sorghum bran(1.83 CFU /ml), inulin (1.81 CFU /ml)and then millet bran
(1.24 CFU /ml) in descending order (Table 3). The maximum rate of
reduction in the first week of the refrigeration storage was in in fermented
goat milk supplemented with millet bran (1.48CFU /ml); while the lowest
was in in fermented goat milk supplemented with barely bran (0.76 CFU
/ml). Nevertheless, the trend of reduction based on fiber source differed in
the second week. It revealed highest strain B. longum BB536 reduction in
goat milk supplemented with sorghum bran (1.57CFU /ml), but the lowest
reduction was in goat milk supplemented with millet bran (0.44CFU /ml) as

82
presented in Table 3. Therefore, the trend of strain BB 536 reduction
throughout the refrigeration period in fermented goat milk supplemented
with different fiber was dependent mainly on its source type. For instant, the
highest total reduction was in fermented goat milk supplemented with barley
bran; whereas, the maximum reductions in the first and second week
refrigeration were in fermented goat milk supplemented with millet bran and
sorghum bran, respectively. Hopefully, the final viable count of strain B.
longum BB536 in fermented goat milk after two weeks refrigeration storage
was above the minimum number required to presence in probiotic to exert
health benefits upon consumption, which was at least 6 log CFU/ml.
Nevertheless, Kabeir et al. (2005) reported that survivability of B. longum
BB536 under refrigeration storage of fermented Sudanese Medida (Sudanes
cereal thin porridge) beverages was not affected for a period of 2 week.
While Akalin et al. (2004) noted a significant reduction on B.longum BB46
in yogurt after 1 week refrigeration. Lactate and acetate accumulation caused
limitation on growth and survival of Bifidobacterium bifidum,
Bifidobacterium breve, and Bifidobacterium longum cultivated in milk
(Desjardins et al., 1990). This indicates that the viability of Bifidobacterium
in fermented products was dependent on the carrier type and pH of the
fermented products during the storage. Overall, most strains of
Bifidobacterium are sensitive to pH values below 4.6. Therefore, for
practical application, a pH value of the final product must be maintained
above 4.6 to prevent the decline of Bifidobacterium populations (Tamime
and Robinson, 1985; Modler et al., 1990; Laroia and Martin, 1991). The
variances in survival were interpreted by the metabolic activity of
Bifidobacterium in different fermented products; which might be affected by

83
the composition and availability of nitrogen and carbon sources in growth
media as stated by Chou and Hou (2000).
Table 16: The viable counts of Bifidobacteriumlongum BB536log (CFU/
ml) during refrigeration storage of fermented goat milk supplemented
with inulin and different cereal brans*
Type of
supplementation
Storage period (weeks)
O (Initial) One Two
Inulin 7.83 ±0.16a 6.98 ± 1.54
6.02 ± 0.08
Sorghum bran 8.43 ±0.03a
7.03 ± 0.01b
6.60 ± 0.49c
Barley bran 7.25 ±0.06a
6.49 ± 0.64b
6.01 ± 0.04c
Millet bran 7.96 ±0.02a
6.48 ± 0.68b
6.04 ± 0.15b
* Values are mean ± SD for replicate independent runs.
**Values that bear different superscript letter in the same raw are significantly different
at p<0.05.
84
4.16. Reducing sugars during refrigeration storage of fermented goat
milk supplemented with inulin and different brans
Reducing sugars levels of the different fermented goat milks supplemented
with inulin and different cereal brans (Sorghum, Barely and Millet) during
refrigeration storage was presented in Table 17. The reductions in sugar
were significant (p<0.05) in all fermented goat milk products. The amount
of sugar decreases in the first week of refrigeration storage were
0.73,0.50,0.29 and 0.03% in fermented goat milk supplemented with barely
bran, sorghum bran, millet bran and inulin, respectively. On the contrary,
reductions in the second week were not following similar trend of the first
recorded values of 0.28, 0.21, 0.19, and 0.11% in fermented goat milk
supplemented with inulin, sorghum bran, millet bran and barely bran,
respectively. These rates of sugar reduction were well correlated with the
values of pH present in table 18.
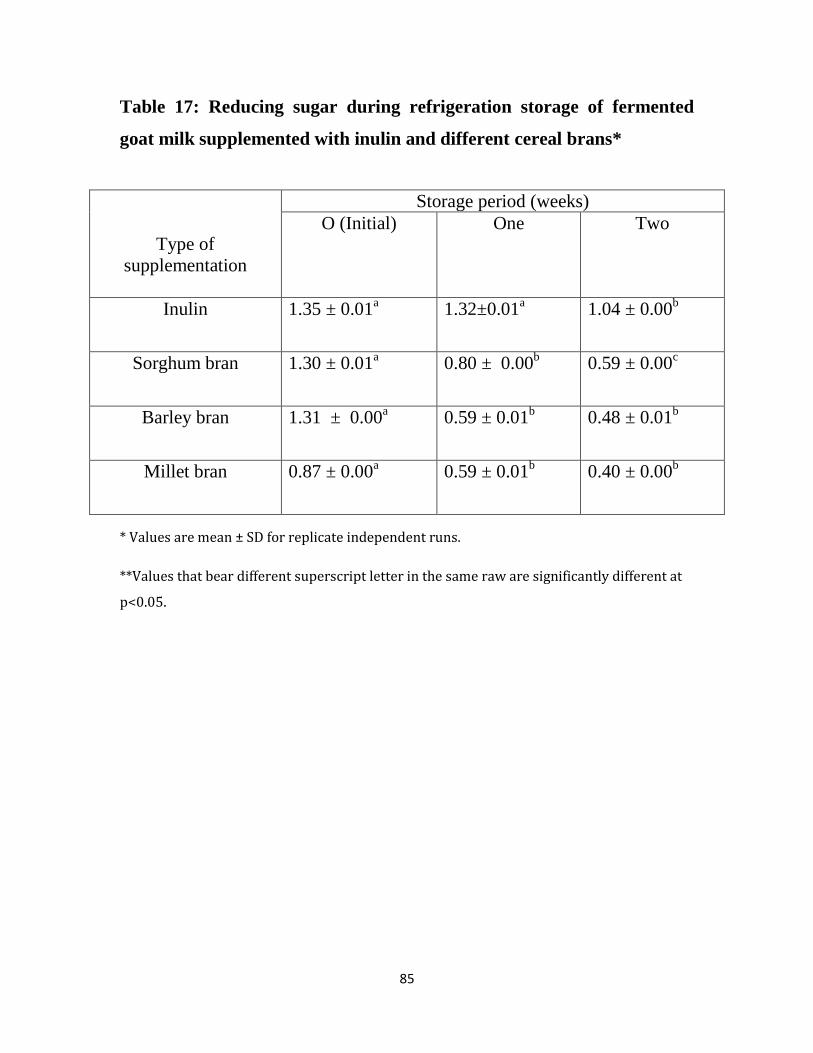
85
Table 17: Reducing sugar during refrigeration storage of fermented
goat milk supplemented with inulin and different cereal brans*
* Values are mean ± SD for replicate independent runs.
**Values that bear different superscript letter in the same raw are significantly different at
p<0.05.
Type of
supplementation
Storage period (weeks)
O (Initial) One Two
Inulin 1.35 ± 0.01a
1.32±0.01a
1.04 ± 0.00b
Sorghum bran 1.30 ± 0.01a
0.80 ± 0.00b
0.59 ± 0.00c
Barley bran 1.31 ± 0.00a
0.59 ± 0.01b 0.48 ± 0.01
b
Millet bran 0.87 ± 0.00a
0.59 ± 0.01b 0.40 ± 0.00
b

86
4.17. Reduction of pH during refrigeration storage of fermented goat
milk supplemented with inulin and different brans
Table 18 shows, the pH measurement of different fermented goat milks
supplemented with inulin and cereal brans (Sorghum, Barely and Millet)
during refrigeration storage. There was significant (p<0.05) reduction in pH
due to supplementation with inulin and different cereal brans at two weeks
of refrigeration (Table 18). The highest pH reduction in the first week was in
fermented goat milk supplemented with sorghum bran (1.39), while the
lowest reduction was in that supplemented with barely bran (0.09). While
the reductions recorded in the second week of refrigeration were 0.98, 0.62,
0.38 and 0.13 in fermented goat milk supplemented with inulin, barely bran,
sorghum bran and millet bran, respectively. In fact, reduction of pH is
mainly due to the fermentation of sugars (Table 17) and accumulation of
acid shown in Table 8. The created condition maintained a relatively acid pH
even in large intestine, thus preventing the proliferation of pathogens
causing unfavorable disorders. Nevertheless, it was reported that low pH and
storage temperature are the most important determinations in
Bifidobacterium mortality during storage (Sakai et al., 1987; Shah (1995,
2000) also found similar decreases in pH values during storage of
commercial yoghurts containing L. acidophilus and B. bifidum.

87
Table 18: pH during refrigeration storage of fermented goat milk
supplemented with inulin and different cereal brans*
* Values are mean ± SD for replicate independent runs.
**Values that bear different superscript letter in the same row are significantly different
at p<0.05.
Type of
supplementation
Storage period (weeks)
O (Initial) One Two
Inulin 5.11 ± 0.00a
4.78± 0.01a
3.81 ± 0.01b
Sorghum bran 5.65 ± 0.01a
4.27 ± 0.01b
3.88 ± 0.01c
Barley bran 4.40 ± 0.01a
4.31 ± 0.01a
3.69 ± 0.00b
Millet bran 4.45 ± 0.03c
3.97 ± 0.02b
3.84 ± 0.01ab

88
4.18. Changes in TSS during the storage of fermented goat milk
supplemented with inulin and different cereal brans *
The effect of inulin and cereal bran (Sorghum, Barely and Millet)
supplemented in fermented goat milk on TSS during refrigeration was
obvious in Table 19. There were significant (p<0.05) increases in TSS of
all types of fermented samples under refrigerated storage in the first
week, then decreased in the second week; except for product
supplemented with sorghum bran (Table 19) . The amount of increases
in the first week of refrigerated storage were 0.53, 0.23, and 0.0.02% in
fermented goat milk with barely bran, millet bran and inulin,
respectively. The increases could be attributed to the breakdown of
macro-components to simple soluble ones. While in the second weeks
they decreased (1.58, 1.82, and 1.64%) in fermented goat milk
supplemented with barely bran, millet bran and inulin, respectively. The
decreases might be due to slight fermentation of soluble sugars by strain
BB536 together with the increases in moisture as a dilution factor (Table
20).

89
4.19. Changes in moisture content during the storage of fermented
goat milk supplemented with inulin and different cereal brans *
By extend storage period moisture content of fermented goat milk
supplemented with inulin and different cereal bran (Sorghum, Barely and
Millet) was slightly increased (Table 20); due to the reduction in TSS by
strain BB536 activity (Table 19). The slight increase in moisture might
indicate slow enzymatic activity that break down the macro component into
simple and releases of some water. Thus, over all levels of moisture after
two weeks refrigeration storage of fermented samples increased as compared
to their initial levels at the beginning of the storage (Table 20). This increase
in moisture might indicate high enzymatic activity that break down the
macro component into simple and to the release of water.

90
Table 19: TSS during refrigeration storage of fermented goat milk
supplemented with inulin and different cereal brans *
*Values are mean ± SD for replicate independent runs.
**Values that bear different superscript letter in the same raw are significantly different
at p<0.05.
***Initial storage = 12h.
Type of
supplementation
Storage period (weeks)
O (Initial) One Two
Inulin 13.23± 0.04a 13.25 ± 0.01
a 11.61± 0.01
b
Sorghum bran 11.70 ± 0.01a 10.33 ± 0.02
b 11.94 ± 0.02
a
Barley bran 13.56 ± 0.01a 14.09 ± 0.01
a 12.51 ± 0.01
b
Millet bran 14.21± 0.01a 14.44 ± 0.01
a 12.62 ± 0.22
b

91
Table 20: Moisture during refrigeration storage of fermented goat milk
supplemented with inulin and different cereal brans*
*Values are mean ± SD for replicate independent runs.
**Values that bear different superscript letter in the same raw are significantly different
at p<0.05.
Type of
supplementation
Storage period (weeks)
O (Initial) One Two
Inulin 86.77± 0.04b 87.75 ± 0.01
a 88.40 ± 0.07
a
Sorghum bran 88.50 ± 0.28a 88.68 ± 0.02
a 89.07 ± 0.02
a
Barley bran 86.45 ± 0.71a 86.92 ± 0.07
a 87.50± 0.01
a
Millet bran 85.79 ± 0.01b 86.57 ± 0.07
a 87.24 ± 0.00
a

92
4.20. Changes in titratable acidity during the storage of fermented
goat milk supplemented with inulin and different bran*
Table 8 shows the titratable acidity of different fermented goat milk
supplemented with inulin and different cereal bran (Sorghum, Barely and
Millet). Titratable acidity of the different fermented samples significant
(p<0.05) increased by extended storage period for the two weeks correlating
well with the reduction in pH (Table 18) .The rates of titratable acidity
increases in the first week refrigeration were 0.37, 0.14, 0.04 and 0.02% in
fermented goat milk supplemented with sorghum bran, barely bran, inulin
and millet bran, respectively. In the second week the titratable acidity
increases were even higher recording values of 0.88, 0.75, 0.28 and 0.25% in
fermented goat milk supplemented with millet bran, barely bran, inulin and
sorghum bran, respectively. Strain BB536 as well as other probiotic
Bifidobacterium produces lactic acid, acetic acid, hydrogen peroxide, and
bactericides are known to inhibit the development of pathogenic bacteria It
was also reported that lactic acid and acetic acid in fermented dairy product
have antibacterial effect (Bullen et al, 1976).

93
Table 21: Changes in titratable acidity during the storage of
fermented goat milk supplemented with inulin and different bran *
*Values are mean ± SD for replicate independent runs.
**Values that bear different superscript letter in the same raw are significantly different
at p<0.05.
Type of
supplementation
Storage period (weeks)
O (Initial) One Two
Inulin 0.65 ± 0.00c 0.69 ± 0.07
b 0.96 ±0.01
a
Sorghum bran 0.44 ± 0.07c 0.80± 0.00
b 1.06± 0.00
a
Barley bran 0.82 ± 0.00c 0.96± 0.00
b 1.71± 0.07
a
Millet bran 0.93 ± 0.00d 0.95 ± 0.00
d 1.82± 0.71
a
94
4.21. Changes in minerals content during the storage of fermented
goat milk supplemented with inulin and different brans*
Tables 22 and 23 showed significant (p<0.05) differences in mineral content
in all fermented goat milk supplemented with inulin and different bran
(Sorghum, Barely and Millet) except in Na. Ca increased in all fermented
goat milk except the beverage supplemented with sorghum bran. Whereas,
decreases in K, Mg and P were recorded in all fermented goat milk
beverages supplemented with inulin and different cereal bran.
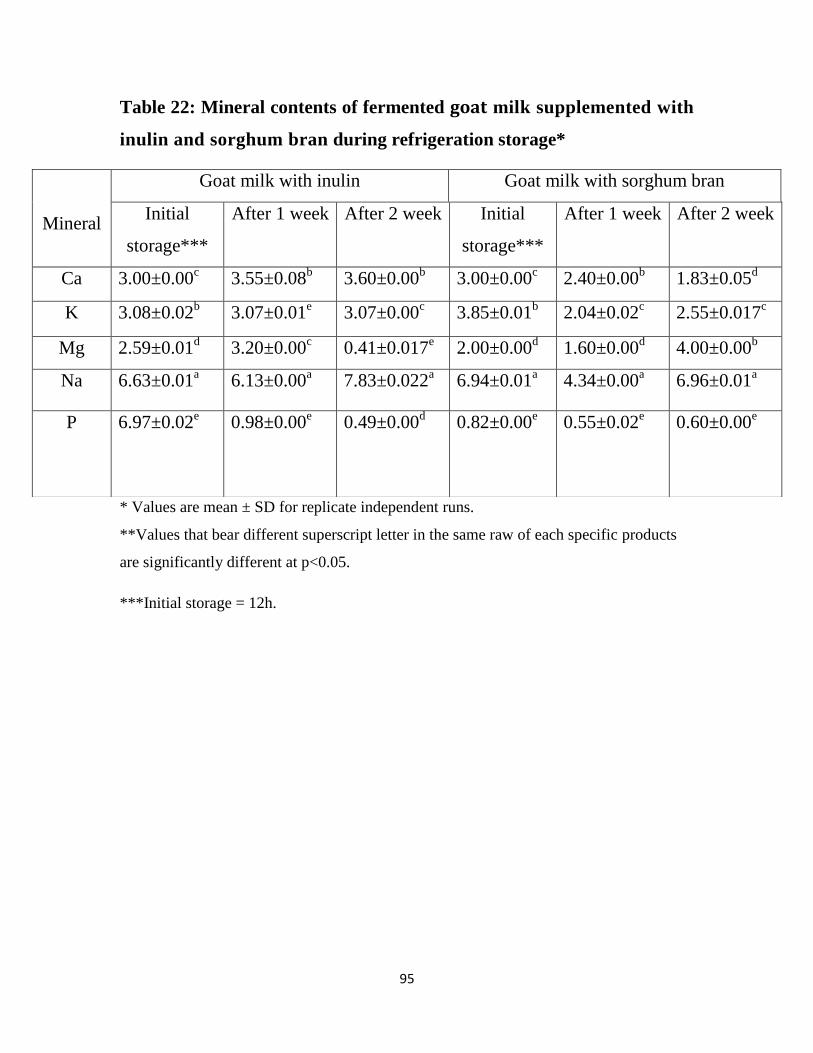
95
Table 22: Mineral contents of fermented goat milk supplemented with
inulin and sorghum bran during refrigeration storage*
* Values are mean ± SD for replicate independent runs.
**Values that bear different superscript letter in the same raw of each specific products
are significantly different at p<0.05.
***Initial storage = 12h.
Mineral
Goat milk with inulin Goat milk with sorghum bran
Initial
storage***
After 1 week After 2 week Initial
storage***
After 1 week After 2 week
Ca 3.00±0.00c 3.55±0.08
b 3.60±0.00
b 3.00±0.00
c 2.40±0.00
b 1.83±0.05
d
K 3.08±0.02b 3.07±0.01
e 3.07±0.00
c 3.85±0.01
b 2.04±0.02
c 2.55±0.017
c
Mg 2.59±0.01d 3.20±0.00
c 0.41±0.017
e 2.00±0.00
d 1.60±0.00
d 4.00±0.00
b
Na 6.63±0.01a 6.13±0.00
a 7.83±0.022
a 6.94±0.01
a 4.34±0.00
a 6.96±0.01
a
P 6.97±0.02e 0.98±0.00
e 0.49±0.00
d
0.82±0.00e 0.55±0.02
e
0.60±0.00e

96
Table 23: Mineral contents of the fermented goat milk supplemented
with barley and millet brans during refrigeration storage*
Mineral
Goat milk with barley bran Goat milk with millet bran
Initial
storage***
After 1
week
After 2
week
Initial
storage***
After 1
week
After 2
week
Ca
2.05±0.07d 2.41±0.01
c 3.00±0.00
b 1.82±0.02
d 2.00±0.00
c 2.00±0.00
c
K
3.56±0.03b 2.56±0.00
b 2.57±0.01
c 2.56±0.01
b 3.07±0.00
b 2.56±0.01
b
Mg
3.15±0.21c 1.22±0.02
d 0.40±0.00
e 2.15±0.07
c 2.00±0.00
c 1.21±0.01
d
Na
7.84±0.02a 4.34±0.00
a 6.08±0.00
a 7.82±0.00
a 7.84±0.02
a 5.21±0.00
a
P
0.81±0.01e 0.40±0.00
e 0.53±0.02
d 0.62±0.02
e 0.81±0.01
d 0.51±0.01
e
* Values are mean ± SD for replicate independent runs.
**Values that bear different superscript letter in the same raw of each specific products
are significantly different at p<0.05.
***Initial storage = 12h.

97
4.22. Effect of oral feeding with strain BB536 of fermented goat milk
supplemented with different prebiotics on body weights of rat
Table 24 presented the weight of rats during the experimental period of 30
days. The initial weight was measured before starting treatment and there
was significant difference between the five groups of rats. The average of
initial body weight recorded a range of 95.00-113.00g for groups. The body
weight increased gradually in all groups throughout the study period,
recording values of 167.67g in the control group157.67g in (inulin), and
168.17g for (sorghum bran), 162.00g for (barely bran) and 181.67g for
(millet bran) group. Rats fed formulated fermented goat milk supplemented
with millet bran gained the highest weights as compared to other groups.
This increased weight might be caused by the high antioxidant properties of
millet bran. Generally, all groups of rats have showed an equivalent growth
pattern with variances in weight gain at the end of experimental treatment
period. There is significant (p˂ 0.05) difference between different groups
of rats in weight at initial but not at final (Table 24).
Group fed with goat milk supplemented with millet bran recorded the
highest weight gain, while inulin supplemented resulted in the lowest weight
gain. In fact as in (Table 24) all groups resaved cereal bran supplemented
goat milk show high weight gain than the inulin clouding the control
(received sterile water). Therefore, the variation in weight gain of groups of
rat in this study is types of supplement dependant and that inulin was the
best control weight.
Therefore, these results point toward the safe profiles of goat milk
supplemented with different bran of cereal fed to rats. Generally in animal

98
model studies, loss of weight is sign of negative health effects. The losses
may take place as a result of toxicity or illnesses (Abdo et al., 2001).
Table (24): Weight (g) of different groups of rats orally fed with goat milk
supplemented with different prebiotics for 30 days
Weight
Rats groups orally feed goat milk supplemented with different prebiotics
Control Inulin Sorghum bran
Barely bran
Millet bran
Initial
body
weight(g)
95.00± 3.61 b
113.00±7.94 a 103.67±4.04
ab 94.00± 4.58
b 105.00±10.44
ab
Final
body
weight(g)
167.67±12.50a 157.67±11.02
a 166.33±10.02
a 162.00±12.53
a 181.67± 10.26
a
Weight
gained
72.67± 8.96a
44.67±12.66 a 59.33±3.79
a 68.00±15.72
a 76.67± 16.80
a
Values are means ±SD (n=6); means with different superscripts in the same row are
significantly different (p˂ 0.05).
All groups feed on normal diets orally feed goat milk supplemented with different prebiotics
Control group: orally fed sterile water

99
4.23. Feed intake and water consumption of rats orally fed with
different treatments
The results of average feed and water consumption in control and
experimental groups of rats during the 30 days of study period are showed in
Table (25). The average feed intake of rat groups (control, inulin, sorghum,
barely and millet bran) ranged between 91.33 and 100.33 g at the end of the
first week. Also, the results in Table (25) presented that there were
significant differences (p˂ 0.05) between five different rats groups in feed
consumption. The lowest feed consumption was of the barely bran group
similarly, Al-rewashdeh (2009) reported that rat groups fed barley
containing diets had lower daily food intake than those fed with the control
diet. Moreover, the highest feed consumption was recorded for group the
orally fed formulate fermented goat milk with inulin. This group consumed
the highest feed, but recorded the lowest weight gain (table 25). This
lower fed intake was reflected by a significantly lower mean body weight
gain. modulation of gut microbiota by probiotic treatment or dietary
intervention lead to beneficial effects on body weight, influencing on
glucose and fat metabolism, improving insulin sensitivity and reducing
chronic systemic inflammation (Tennyson and Friedman, 2008). Water is
significant to the health and makes up approximately two-thirds of the body
by weight. In order to maintain physical equilibrium in the body, it is
necessary to coordinate and integrated link between the various organs.
Control group consumed the highest water followed by sorghum bran
supplemented groups finally inulin supplemented one. Al-Rewashdeh
(2009) found that rats showed to eat less after feeding high satiety diets
(fiber containing diets) than after feeding low satiety diet (fiber free

100
diet).Therefore consumption vary depending on types and levels of fibers in
supplemented feeds. Dietary fiber has a high water holding
capacity (Eastwood, et al. ,1973) and it is likely that rats fed fibers, in spite
of the lower energy in their diet compared to those fed fiber- free diet, did
not eat more because the fiber is swelling in their intestine and gives satiety
sense. As a result rats fed fiber diets utilized more fats from their food, while
the control rats deposited it in their tissues.

101
Table (25): Feed intake and water consumption of rats orally fed with
different prebiotics
Parameter
Rats groups orally feed goat milk supplemented with different
prebiotics
control Inulin Sorghum
bran
Barely
bran
Millet bran
Feed Intake(g/day)
91.33±
3.06ab
100.33±2.
52a
85.67± 6.03 b 82.67±
5.51 b
93.00± 4.58
ab
Water
consumption(ml/day
)
192.00±
2.00a
164.33±5.
03b
181.00±15.7
2ab
185.33±10.
26ab
175.33±3.2
1ab
Values are means ±SD (n=6); means with different superscripts in the same row are
significantly different (p˂0.05).

102
4.24. Haematological parameters of rats orally fed with BB536
fermented goat milk supplemented with different prebiotics
Haematological parameters of the rats fed with fermented goat milk products
were shown in Table (26). There was no indication of any health problems
or serious illness symptoms on rats group fed with the fermented product. In
addition no signs of any deficiencies in CBC parameters were recorded.
Additionally there were considerable signs of positive health effect on red
blood cells (RBC), haemoglobin (HGB) when compared with the control
rat group. Red blood cells (RBC), 14.85g/dl, was the highest in rat groups
fed with fermented goat milk supplemented with inulin followed by group
fed fermented goat milk supplemented with sorghum bran (14.65g/dl).
HCT, ,MCH/pg, PLT levels, MPV, PCT, Monocyte, Eosinophil and
Bosinoph of rat groups were within the standard range and were not
significant (p ˂0.05) between all groups of rats.While there were significant
differences (P˂0.05) in MCV, RDW-SD%, and Lymph of treated rats
groups. Neutrophil and Eosinophil count decreased in all groups compared
with control.Variation in CBC parameters may be associated with each
individual rat adaptability to environmental conditions as stated by
Koubkova et al. (2002). Bifidobacteriumlongum BB536 oral feeding did not
produce any abnormal change effect on haematological parameters.
Therefore, increased of lymphocytes count (lymphocytosis) is an indication
that fermented oral feeding led to improved immune system. While the
reduced monocytes suggest absence of contamination. In general there are
good indications of inflammation and toxicity absence in rat groups. This
result is in agreement with previous reported by Yiming et al. (2012) on
lymphocyte proliferation and immune modulators properties of the spices.

103
Furthermore, all the changes that observed in hematological parameters were
within normal standard ranges of rats.

104
Table 26: Hematology parameters of rats orally fed with goat milk
supplemented with different prebiotics for 30 days
Parameter
Rats groups orally fed with goat milk supplemented with
different prebiotics
control inulin
Sorghum
bran
Barely
bran
Millet
bran
WBCs /ʟ 14.35±0.64 a 7.40±
3.68 a
8.80±
4.38 a
10.40±
5.52 a
9.00±
3.82 a
HGB g/dl 14.45±0.21 a 14.85±
0.21 a
14.65±
0.35 a
14.45±
1.77 a
14.55±
0.50 a
RBCs/ʟ 8.70± 0.09 a 8.04±
0.10 a
8.09±
0.03 a
7.93± 0.76
a
8.52±
0.36 a
HCT % 44.40±0.28 a 46.05±
1.34 a
44.40±
1.70 a
44.00±
5.37 a
45.85±
0.64 a
MCV/fl 51.10±0.85 b 57.30±
0.99 ab
54.95±
1.91 ab
55.50±
1.56 ab
53.95±
3.04 ab
MCH/pg 16.60±0.42 a 18.40±
0.00 a
18.05±
0.35 a
18.15±
0.50 a
17.05±
1.34 a
MCHC/g/dl 32.50±0.28 a 32.20±
0.42 a
32.95±
0.50 a
32.80±
0.00 a
31.65±
0.64 a
RWD Cv/% 17.10±0.28 a 16.05±
0.50 ab
14.40±
1.27 b
15.30±
0.42 ab
16.00±
0.57 ab
RDW-SD/% 30.95±0.64 ab
33.10±
0.00 a
30.50±
1.27 b
30.95±
0.64 ab
31.40±
0.00 ab

105
PLT/ʟ 666.0±35.4 a 639.0±
283 a
676.0±
114.6 a
755.0±
45.3 a
675.5±
17.7 a
MPV/fl 6.15±0.07 a 7.05±
0.35 a
6.35±
0.50 a
6.35± 0.07
a
6.35±
0.21 a
PDW/fl 14.80± 0.14 a 15.75±
0.07 a
15.70±
0.57 a
15.50±
0.28 a
15.15±
0.64 a
PCT% 0.41± 0.02 a 0.46±
0.22 a
0.43±
0.11 a
0.48± 0.02
a
0.43±
0.03 a
Neutr% 55.50± 10.61
a
33.50±
6.36 a
45.0±
15.6 a
40.00±
0.00 a
52.50±
0.71 a
Lymph% 30.50± 0.71 b 62.00±
5.66 a
50.00±
14.10 ab
53.00±
4.24 ab
40.00±
2.83 ab
Monocy% 3.50± 3.54 a 2.00±
0.00 a
1.00±
0.00 a
2.50± 0.71
a
0.50±
0.71 a
Eosinoph% 9.50± 6.36 a 2.50±
0.71 a
3.50±
2.12 a
4.00± 2.83
a
5.50±
0.71 a
Bosinoph% 1.00± 1.41 a
0.00±
0.00 a
0.50±
0.71 a
0.50± 0.71
a
1.50±
0.71 a
Values are means ±SD (n=6); means with different superscripts in the same row are
significantly different (p˂ 0.05).
All groups feed on normal diets feed and oral of 2.5 ml of different diets treatment
Control group: orally fed sterile water
106
4.25. Blood biochemistry parameters of rats orally fed with
goat milk supplemented with different prebiotics
The result of feeding different fermented gat milk supplemented with
different prebitics on blood biochemistry parameters of rats is presented in
Table (28). The glucose levels of rats orally fed the formulated fermented
products were lower than that of the control rats without fermented product
except group (millet bran). It might be due to the different bran contents of
fiber which has various physiological effects on regulating blood glucose
level and insulin response among diabetics. It was reported by Behall et al.
(2005) that oat and barley can reduce glycemic responses, decrease glucose
level and insulin responses as a result of the high soluble fiber content which
considered the major factor. Total protein level was higher in (sorghum bran
and millet bran) followed by barely bran, inulin and then control rat groups.
The concentration of albumin and globulin were significantly (p˂0.05)
different between rats groups. Electrolytes play basic role in keeping body
fluid pH and the dynamic balance of water (Radostits et al., 2007). Sodium,
potassium, calcium, phosphate concentrations in the blood of treated rats
groups were significantly (P<0.05) different. Also, creatinine, uric acid and
blood urea were significant (p<0.05) between all groups of treated rats. The
creatinine, potassium ion and sodium high level in blood indicated kidney
damage. In this study, serum electrolytes in all treated rats group were
significantly (P< 0.05) differences as compared with the control group.
Nevertheless, all values were within the normal ranges of rats. Estimation of
liver functions is very important in toxicity assessment because organs are
necessary for the endurance and welfare of an organism. Referring to Table
(26), AST, ALT and D. Billiand ALP showed significant (P< 0.05)

107
difference as compared with the control. However, any decreasing in the
level of serum ALT, AST, and ALP activity are indication of hepatic disease
(Crawford and Henry, 2003). In this study all levels of blood enzymes were
within the normal standard range of rats. All groups orally treated with
fermented products showed best serum activity, due to their high phenolic
compounds and beta glucan content. The results of the biological assay in
Table (28) show the changes in plasma HDL, LDL, cholesterol and
triglyceride levels at the end of experiment. HDL and LDL (A, B, C and D)
in orally fed rat reduced serum triglyceride, total cholesterol, as compared
with the rat control group. The rat groups fed the different fermented
products recorded the lowest level in cholesterol, and triglyceride as
compared with the control group. These findings were dependable with
those of several studies reported such as, Jue et al.(2004), who reported that
the barley diet significantly decreased total cholesterol, triacylglycerol, and
LDL-cholesterol. However, Sindhu and Khetarpaul, (2003) found that the
rats group fed by probiotic fermented diet resulted significant decreases in
total serum cholesterol and triglycerides, whereas, HDL cholesterol
increased compared to control group diets. On the other hand, Abd El-
Gawad et al. (2005) reported that consumption of bifidobacterium fermented
soymilk significantly reduced plasma cholesterol VLDL+LDL-cholesterol
and increased the HDL-cholesterol level in animals fed cholesterol-enriched
diet. Several mechanisms are suggested for cholesterol reducing activity of
probiotics. One of them is deconjugating bile acids through bile salt
hydrolase catalysis. Since, cholesterol is the precursor for the synthesis of
new bile acids the use of cholesterol, to synthesize new bile would lead to
decreasing concentration of cholesterol (Lye and Looi 2010).

108
Table 28: Biochemistry parameters of rats orally with fermented goat milk
supplemented with different prebiotics for ±30 days
Parameter
Rats groups orally with fermented goat milk supplemented
with different prebiotics
control inulin Sorghu
m bran
Barely
bran
Millet bran
Glucose(mg/dl) 84.30± 0.42
b
72.05±
0.07 d
67.00±
0.00 e
82.25±
0.21 c
90.05± 0.07
a
T. protein(g/dl)
5.89± 0.02 c 5.81±
0.01 c
6.40±
0.14 a
6.05±
0.07 bc
6.30± 0.00
ab
Albumin. (g/dl)
3.11± 0.01 b 3.05±
0.07 b
3.10±
0.00 b
3.05±
0.07 b
3.61± 0.01 a
Globulin.( g/dl)
2.80± 0.00 c
2.82±
0.03 c
3.21±
0.01 ab
3.05±
0.07 b
2.72± 0.01 c
Na( mmol /L)
119.50±0.71
c
120.50
± 0.71
bc
117.50±
0.71 cd
123.00±
1.41 b
126.50±0.7
1 a
K/mmol/l
3.63± 0.03 d 4.05±
0.07 bc
3.82±
0.02 cd
4.44±
0.02 a
4.10± 0.14 b
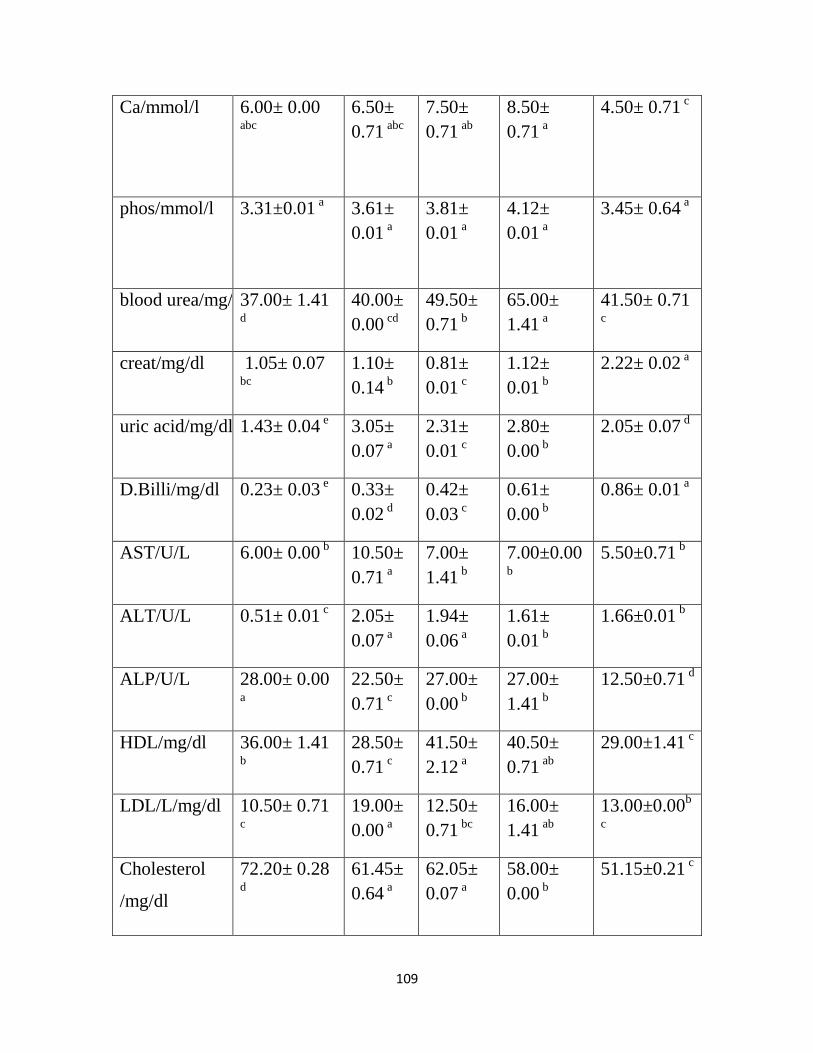
109
Ca/mmol/l
6.00± 0.00
abc
6.50±
0.71 abc
7.50±
0.71 ab
8.50±
0.71 a
4.50± 0.71 c
phos/mmol/l
3.31±0.01 a 3.61±
0.01 a
3.81±
0.01 a
4.12±
0.01 a
3.45± 0.64 a
blood urea/mg/dl 37.00± 1.41
d
40.00±
0.00 cd
49.50±
0.71 b
65.00±
1.41 a
41.50± 0.71
c
creat/mg/dl 1.05± 0.07
bc
1.10±
0.14 b
0.81±
0.01 c
1.12±
0.01 b
2.22± 0.02 a
uric acid/mg/dl 1.43± 0.04 e 3.05±
0.07 a
2.31±
0.01 c
2.80±
0.00 b
2.05± 0.07 d
D.Billi/mg/dl 0.23± 0.03 e 0.33±
0.02 d
0.42±
0.03 c
0.61±
0.00 b
0.86± 0.01 a
AST/U/L 6.00± 0.00 b 10.50±
0.71 a
7.00±
1.41 b
7.00±0.00b
5.50±0.71 b
ALT/U/L 0.51± 0.01 c 2.05±
0.07 a
1.94±
0.06 a
1.61±
0.01 b
1.66±0.01 b
ALP/U/L 28.00± 0.00
a
22.50±
0.71 c
27.00±
0.00 b
27.00±
1.41 b
12.50±0.71 d
HDL/mg/dl 36.00± 1.41
b
28.50±
0.71 c
41.50±
2.12 a
40.50±
0.71 ab
29.00±1.41 c
LDL/L/mg/dl 10.50± 0.71
c
19.00±
0.00 a
12.50±
0.71 bc
16.00±
1.41 ab
13.00±0.00b
c
Cholesterol
/mg/dl
72.20± 0.28
d
61.45±
0.64 a
62.05±
0.07 a
58.00±
0.00 b
51.15±0.21 c

110
Triglyceride/mg/d
l
99.00± 1.41
d
151.50
± 0.71 a
143.00±
1.41 b
138.00±
0.00 c
93.00±0.00 e
VLDL 24.97±0.042a
12.20±
0.28 e
21.15±
0.07 b
15.99±
0.01 d
19.05±0.07 c
Values are means ±SD (n=6); means with different superscripts in the same row are
significantly different (p˂0.05).
4.26. Different microbial groups in colon of rats orally fed with fermented
goat milk supplemented with different prebiotics
Based on feeding trials, changes in colonic microbial groups of the rats are
ensured. Different microbial groups in colon of rats as presented in Table (28).
Total aerobes in the large bowel changed little due to the ingestion of different
products compared with the control.
Total aerobes of colon significant different increased in all groups of rats
received the different products as compared to the control. Group (sorghum
bran) showed the highest increase in total aerobes in colon (7.92log CFU/ g).
However, (inulin) group showed lower count of 7.72log CFU/ g that might be
due to activity of the viable fiber supplements. In general, total anaerobes were
also higher for rats fed with fermented goat milk supplemented with sorghum
bran compared with the other groups and control. Although prebiotics offer one
rational approach to the probiotic concept, the health consequences have been
defined. In hypothesis, a number of potential benefits may arise (Gibson, 1999).
However, it might enhance resistance to pathogens possibil. The bifidobacteruim
and lactic acid bacteria of the gastrointestinal tract are thought to play a
important role in enhanced colonization resistance.
111
Feeding with fermented different products promoted the highest lactobacillus
increase in colon compared with control group. Bifidobacteria displayed the
highest increased among all microbiota communities in colon as fine. However,
the increases were significant (P <0.05) in all groups fed different fermented
prouducts with prebiotics Table (28) showed the highest bifidobacteria increases
were in group inulin (7.80) followed sorghum bran (7.77) ,barely bran (7.39)and
millet bran (7.17 CFU/g). Increased bifidobacterial numbers in the contributes
towards enhanced competitive exclusion of pathogens. (Shiba et al., 2003).
Lactobacillus and Bifidobacterium are non-pathogenic bacteria of the bowel
tract. These micro-organisms increases resistance to diseases by reducing the
growth of pathogenic and putrefactive bacteria via production of inhibitory
substances, competing directly for substrates and mucosal attachment sites
(Collado, et al., 2009).
The harmful pathogens of gut microbiota contain species of Coliform Salmonella
and Staphylococcus. In Table (28) Coliform and Salmonella groups showed
significantly (p<0.05) lower level in all groups treated with prebiotics as
compared with control. The results also showed that different prebiotics might
vary in the effected on the growth of the harmful pathogens. Schoster et al.,
(2013) reported that probiotics effectively inhibited the development of
pathogenic bacteria, such as Clostridium perfringens, Campylobacter jejuni,
Salmonella Enteritidis, Escherichia coli, various species of Shigella,
Staphylococcus, and Yersinia, so prevent us from food poisiong .
Both prebiotics sorghum bran and millet bran were effective against salmonella
and did not show any viable count. In fact symbiotic effect of strain BB536 and
prebiotic( cereal bran) are increase beneficial bacteria and decrease the
pathogens in fed rats. However there are symbiotic effects dependent on
composition and types of fiber used.
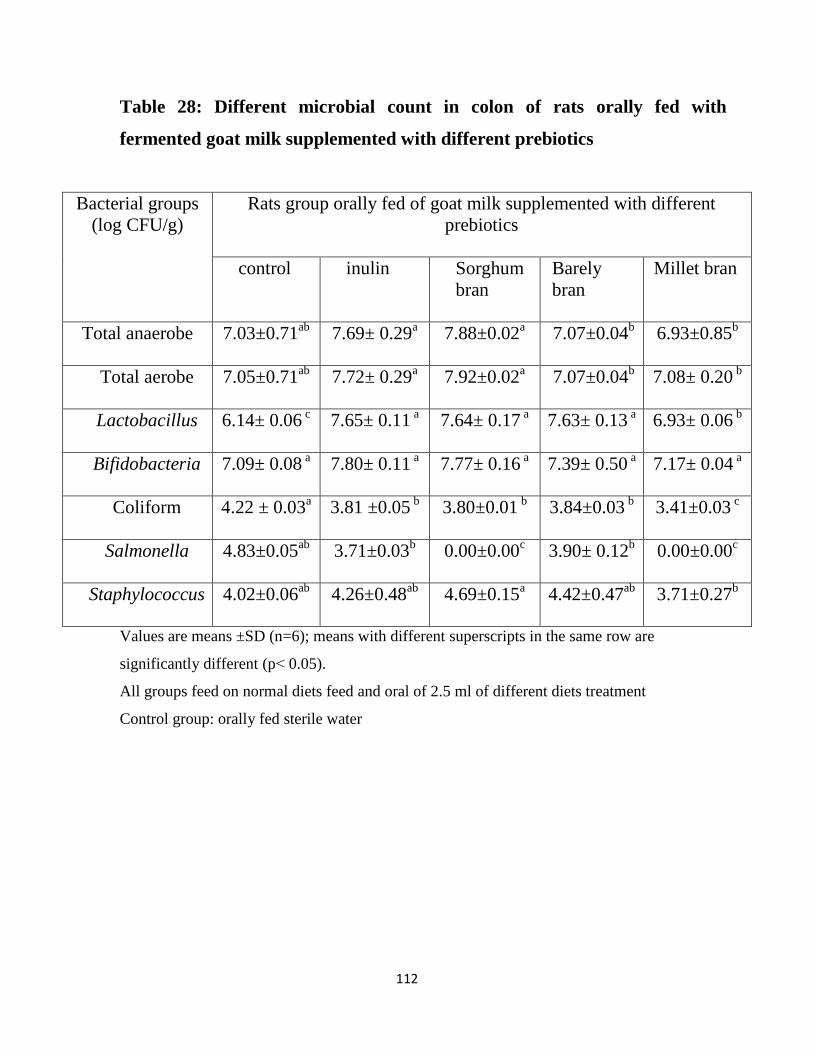
112
Table 28: Different microbial count in colon of rats orally fed with
fermented goat milk supplemented with different prebiotics
Bacterial groups
(log CFU/g)
Rats group orally fed of goat milk supplemented with different
prebiotics
control inulin Sorghum
bran
Barely
bran
Millet bran
Total anaerobe
7.03±0.71ab
7.69± 0.29a 7.88±0.02
a 7.07±0.04
b 6.93±0.85
b
Total aerobe
7.05±0.71ab
7.72± 0.29a 7.92±0.02
a 7.07±0.04
b 7.08± 0.20
b
Lactobacillus 6.14± 0.06 c 7.65± 0.11
a 7.64± 0.17
a 7.63± 0.13
a
6.93± 0.06 b
Bifidobacteria 7.09± 0.08 a 7.80± 0.11
a
7.77± 0.16 a 7.39± 0.50
a 7.17± 0.04
a
Coliform 4.22 ± 0.03a 3.81 ±0.05
b
3.80±0.01 b
3.84±0.03 b
3.41±0.03 c
Salmonella
4.83±0.05ab
3.71±0.03b 0.00±0.00
c 3.90± 0.12
b 0.00±0.00
c
Staphylococcus
4.02±0.06ab
4.26±0.48ab
4.69±0.15a 4.42±0.47
ab 3.71±0.27
b
Values are means ±SD (n=6); means with different superscripts in the same row are
significantly different (p˂ 0.05).
All groups feed on normal diets feed and oral of 2.5 ml of different diets treatment
Control group: orally fed sterile water
113
CHAPTER FIVE
CONCLUSIONS AND RECOMMENDATIONs 5.1. Conclusions
1. The chemical composition of different cereal brans revealed high levels of
fiber, protein, fat that could contribute to improve the nutritional value of
food.
2. Goat milk was nutritionally higher as compared to cow and camel milk.
Cereal brans could produce complementary product provide both the
nutritional and benefits to consumers.
3. Inulin was superior source of fiber, carbohydrate and minerals as
compared to tested cereal brans. By fermentation and supplementation with
inulin and different cereal brans, maximum growth of the strain BB 536 that
fulfills the number required to presence in probiotic food was attained.
Therefore, cereal bran could have prebiotic effect on strain BB 536 in goat
milk medium for development of fermented functional food.
4. Oral feeding of goat milk supplemented with cereal bran to rats exerted a
positive health effects i.e weight were not retarded and no signs of toxicity
or pathogenicity were revealed on blood hematology and biochemistry
analysis of fed rats.
5. Products effectively inhibited development of Sallmonela in colon via
enhanced of beneficial Bifidobacterium and lactobacillus levels in colon of
fed rats.

114
5.2. Recommendations
1. More research should be conducted on cereal bran effects on growth and
survival of probiotic strains.
2. Improve the acceptability and sensory characteristics of different probiotic
fermented products.
3. More research to be conducted on nutritional values and functional
properties of the developed probiotic fermented product to explore it is
health benefits.

115
References
Abd El-Gawad, I. A., El-Sayed, E. M., Hafez, S. A., El-Zeini, H. M., and
Saleh, F. A. (2005). The hypocholesterolaemic effect of milk
yoghurt and soy-yoghurt containing bifidobacteria in rats fed on a
cholesterol-enriched diet. International Dairy Journal, 15(1), 37-
44.
Abdo, K.M; Cunningham, M.L., Snell, M.L., Herbert, R.A., Travlos, G.S.,
Eldrige,S.R., and Bucher, J.R., (2001). 14 Week toxicity and cell
proliferation of methyl eugenol administered by gavage to F344
rats and B6C3F1 mice. Food and Chemical Toxicology 39, 303 –
316.
Akalin, A.S., Fendery S.A.K, and bulut N. (2004). Viability and activity of
bifidobacteria in Yoghurt containing fructose oligo saccharine
during refrigerated storage. International J. Food Sci. Technol
.39:613-621.
Al-Rewashdeh, A. Y. (2009). Lipid profile of rats fed cholesterol, barley and
wheat. Pakistan Journal of Nutrition, 8(11), 1722-1733.
AOAC. (1984). Association of Official Analytical Chemists. Official Methods of
Analysis. 14th ed., Published by the AOAC Inc., North Nineteenth
Street, Suite 210 Arlington. Virginia 22209. USA.
AOAC. (1990). Official Methods for Analysis (15th ed). Association of
Official Analytical Chemists. Washington, D.C., USA.
AOAC. (2003). Association of Official Analytical Chemists.Official Methods of
Analysis, 17th
ed. Arlington, Virginia, USA.

116
Adams, M.R. (1999). Safety of industrial lactic acid bacteria. J. Biotechnol.
68: 171–178.
Alander, M., Satokari, R., Korpela, R., Saxelin, M., Vilpponen- Salmela, T.,
Mattila-Sandholm,T., von Wright, A. (1999).Persistence of
colonization of human colonic mucosa by a probiotic strain,
Lactobacillus rhamnosus GG, after oral consumption. Appl. Environ.
Microbiol., 65: 351–354.
Al Haj, O. A. and Al Kanhal, H. A. (2010). Compositional, Technological and
Nutritinal asepects of Dromedary Camel Milk – a Review.
International Dairy Journal 20:811-821.
Arai, S. (1996). Studies on functional foods in Japan state of the art.
Biosci.Biotech. Biochem.60:9-15.
Ayadi, M. A., Abdelmaksoud, W., Ennouri, M. and Attia, H. (2009). Cladodes
fromopuntia ficus indica as asource of dietry fiber : effect on dough
characteristics and cake making. Industerial Crops and Products, 30(1):
40-47.
Bakheit, S. A., Majid, A. M. and Nikhala, A. M. (2008). Camels (Cameles
dromedaius) under pastral systems in North Kordfan. Sudan. Seasonal
and parity effects on milk composition. Journal of Camelid Science 1,
32-36, 2008.
Barrangou , R., Lahtinen, S.J., Ibrahim ,F. and Ouwehand, A.C. (2011). Genus
Lactobacillus. In: Lactic Acid Bacteria: Microbiological and
Functional Aspects. London: CRC Press. pp. 77-91.
Barrow, G.I. and Feltham, R. K. A. (1993). Cowan and Steel‟s Manual for the

117
Identification of Medical Bacteria. (Third edition), Cambridge
University Press.
Banasaz, M., Norin, E., Holma, R., and Midtvedt, T. (2002). Increased
Enterocyte Production in Gnotobiotic Rats Mono-associated with
Lactobacillus rhamnosus GG. Appl. Environ. Microb., 68:3031-
3034.Baobab Fruit Company, (2002). Nella Tradizione Africana
Baobab. From: www.baobabfruitco.com
Behall, K. M., Scholfield, D. J., and Hallfrisch, J. (2005). Comparison of
hormone and glucose responses of overweight women to barley
and oats. Journal of the American College of Nutrition, 24(3),
182-188.
Bialonska, D., Kasimsetty, S. G., Schrader, K. K., and Ferreira, D. (2009).The
effect of pomegranate (Punica granatum L.) byproducts and
ellagitannins on the growth of human gut bacteria.Journal of
agricultural and food chemistry, 57(18), 8344-8349
Biancone L., Monteleone I., Blanco G.D., Vavassori P., Pallone F. (2002).,
Resident bacterial flora and immune system. Digest.Liver Dis. 34:
537–543
Boehm, G., Fanaro, S., Jelinek, J. Stahl, B. and Marini, A. (2003). Prebiotic
concept for ifant nutrition. Acta Paediatrica 92, 64-67, 2003
Borriello, S. P., Hammes, W. P., Hlzpfel, W., Marteau, P., Schrezenmeir, J.,
Vaara, M. and Veltnen, V. (2003). Safety of probiotic that contain
lactobacilli and Bifidobacteria. Clinical Infetion Disease (CID), 36:
775 - 780

118
Bourlioux, P., Koletzko, B., Guarner, F., and Braesco, V. (2003). The intestine
and its microflora are partners for the protection of the host: report on
the Danone Symposium "The Intelligent Intestine,". American Journal
for clinical Nutrition, 78:675-83.
Brigidi, P., Swennen, E., Vitali, B., Rossi, M., and Matteuzzi, D. (2003). PCR
detection of bifidobacterium strains streptococcus thermophilo in
feces of human subjects after oral bacteriotherapy and yoghurt
consumption. International jurnal of food microbiology 81 (3), 203-
209
Brooks, G. F., Butel, J. S. and Ornston, L. N. (1991). Jawez, Melnikk and
Adelbergs Medical Microbiology 19th
edition. Appelton and Large,
Amazon Books USA.
Bulm, Eduardo J Schiffrin (2003). Current issues in intestinal microbiology
4 (2), 53-60`
Bullen, C.L., Tearle, P.V. and Willis, A.T.(1976). Bifidobacteria in the
intestinal tract of infants: as in-vivo study. J Med Microbial.
9:325- 333.
Campbell, Platt, G. (1994).Fermented Foods research international, 27(3):
253-257
Chen, A. Y., and Liu, L. F. (1994). DNA tpoisomerases: Essential enzymes
and lethal targets. Annual Review of Pharmacology and
Toxicology, 34, 191-218.
Christen, G. L.; Davidson, P. M.; McAllister, J.S. and Roth, L.A. (1992).
Coliform and other indicator bacteria. In Marshall, R. T. (ed.):
standards methods for examination of dairy products. American Puplic

119
Health Association 16th
ed, Washington D. C. 16- 23.
Chou, C.C and Hou, J.W (2000). Growth of bifidobacteria in soymilk and their
survival in the fermented drink during storage. Int J Food Microbial.
6:113-121.
Clancy, R., (2003). Immunobiotics and the probiotic evolution. FEMS
Immunol. Med.Microb., 38: 9–12 .
Crawford, J. R., and Henry, J. D. (2003). The Depression Anxiety Stress
Scales (DASS): Normative data and latent structure in a large
non‐clinical sample. British journal of clinical psychology, 42(2),
111-131.
Crittenden, (1999). Monographs of the society for Research in child
Development, 145-171,
Collado, M. C., Isolauri, E., Salminen, S., & Sanz, Y. (2009). The impact of
probiotic on gut health. Current drug metabolism, 10(1), 68-78.
Cooke, T.R. (1961). www.mtcapra.com 1-800-574-1961.23/9/2013
Crittenden, R.G., Morris, L.F. Harvey, M.L. Tran, L.T. Mitchell, H.L. and
Playne, M.J. (2001). Selection of a Bifidobacterium strain to
complement resistant starch in a synbiotic yogurt. Journal of Applied
Microbiology; 90: 268-278.
Cummings, GT Macfarlane, S Macfarlane, Current issues in intestinal
microbiology 4 (1), 9-20, 2003
Desjardins, M., D. Roy, and J. Goulet.(1990). Growth of bifidobacteria and their
enzyme profiles. Journal of Dairy Science;73: 299–307.

120
Desmazeaud , M .(1983). Nutrition of Lactic Acid Bacteria: State of the Art.
Lelait, 63:267-316.
De Vries, W., Gerbrandy, S.J., and Stouthamer, A.H. ( 1967). Carbohydrate
metabolism in bifidobacterium bifidum Biochem. Biophys. Acta,
136(3): 415-425.
Diplock A. T., Aggett P. J., AshwellM., Bornet F., Fern E. B. and
Roberfroid M. B. (1999). Scientific concepts of functional foods
in Europe: Consensus Document. British Journal of Nutrition, 81:
SI-S27.
Donnet-Hughes, A., Rochat, F., Serrant, P., Aeschlimann, J.M., Schiffrin, J.E.
(1999). Modulation of nonspecific mechanisms of defense by lactic
acid bacteria: effective dose. J. Dairy Sci. 82: 863–869.
Donohue, D.C., Salminen, S.J. (1996). Safety of probiotic bacteria. Asia
Pacific J. Clin. Nutr., 5: 25–28.
Eastwood, M. A., Kirkpatrick, J. R., Mitchell, W. D., Bone, A., and
Hamilton, T. (1973). Effects of dietary supplements of wheat bran
and cellulose on faeces and bowel function. Br Med J, 4(5889):
392-394.
FAO / WHO. (2001). Health and Nutritional Properties of Probiotics in
Food including Powder Milk with Live Lactic Acid Bacteria;
Report of a Joint FAO/WHO Expert Consultation on Evaluation
of Health and Nutritional Properties of Probiotics in Food
Including Powder Milk with Live Lactic Acid Bacteria, Cordoba,
Argentina, 1-4 October, 2001.

121
Farnworthe, E.R. (2005). Kefir -Acomplex probiotic. Food Sci.Technology
Bulletin: Functional Foods, 2(1): 1–17.
Femenia, A-C LEFEBVRE, J-Y THEBAUDIN, JA Robertson, C-M
BOURGEOIS. Journal of food science62(4), 635-639, 1997
Fooks, L.J., Fuller, R. and Gibson, G.R., (1999). Prebiotics, probiotics
and human gut microbiology. Int. Dairy J., 9: 53 – 61.
Fox, P.F. (1993). Cheese: an overview. In: Fox, P.F. (Ed.), Cheese;
Chemistry, Physics and Microbiology. Chapman & Hall, London,
England, pp. 1 –36.
Frank J.F., Christen G.L., Bullerman L.B. (1993). Tests for groups of
microorganisms. In Standard Methods for the Examination of Dairy
Products, 16th edition. Marshall R.T. (ed.). Washington, DC:
American Public Health Association: 271–286.
Fukushima , Y., Kawata, Y., Hara, H., Terada, A and Mitsuoka, T. (1998). Effect
of a probiotic formula on intestinal immunoglobulin A production in
healthy children. Int. J. Food Microbiol., 42: 39–44.
Fuller, R. and Gibson, G.R. (1997). Modification of the intestinal microflora
using probiotics and probiotics .Scand .Jornal of Gastoenterology,
222:28S-31S.
Fuller, R. (1989). Probiotics in man and animals. J. Applied Bacteriol.
66:365 - 78.
Gale, E. F. (1948). The chemical activates of bacteria.2nd
edition. Academic
press Inc.
N.Y.

122
Galdeano, C.M., and Perdigon, G. (2006). The probiotic bacterium
Lactobacillus casei induces activation of the gut mucosal immune
system through innate immunity. Clin.Vacc.Immunol. 13: 219–
226.
Gibson, G.R. and Roberfroid, M. (1995). Dietary modulation of the human
colonic microbiota: Introducing the concept of prebiotics. Journal of
Nutrition, 125: 1401- 1412.
Gorbach, S. (2002). Probiotics in the Third Millennium. Digest liver dis. 34:S2-
S7.
Guarner, F. and Malagelada, J., R. (2003). Gut flora in health and disease.
Lancet 361:512-519.2.
Haddadin, M., Gammoh, S. and Robinson, R. (2008). Seasonal Variation in the
Chemical Composition of Camel Milk in Jordan. Journal of Dairy
Research, 75(1) 8-12
Haenlein, G.F.W. (2003). About the evolution of goat and sheep milk
production. Small Rumin. Res. 68: 3 – 6.
Halvorsen, R., Berstad, A., Lassen, J., Midtvedt ,T and Narvhus J. (2000). The
Use of Probiotics for Patients in Hospitals: A Benefit and Risk
Assessment. Norwegian Scientific Committee for Food Safety.
07/112-FINAL: 1-29. ISBN: 978-82-8082-291-8.
Harrigan, W.F. and Mc Cane, E. (1976). Laboratory Methods in food and Dairy
Microbiology, Acadamic press, London.
Holzapfel, W.H., Geisen, R., and Schillinger, U. (1995). Biological preservation
of foods with reference to protective cultures, bacteriocins and food-
123
grade enzymes. International Journal of Food Microbiology 24: 343 –
362.
Houghtby, A.G.; Maturin, L.J. and Koenig, K.E. (1992).Microbiological count
methods. In Standard Methods for the Examination of Dairy Products,
16th edition, Ed., R.T. Marshal. Washington, DC: American Public
Health Association, pp: 213-246
Huis in’t Veld, J. H. J., and Havenaar, R. (1991). Probiotic and health in man and
animals. Journal of Chemical Technology and Bioteechnology,
51,562-567.
Husebye, E., Hellstr m ,PM., Sundler, F., Chen, J., Midtvedt,T. (2001) Influence
of Microbial Species on Small Intestinal Myoelectric Activity and
Transit in Germ-free Rats. Am. J. physiol-gast. l., 280:G368-G380.
Ibrahima, C.,Didier, M.,Max, R.,Pascal, D.,Benjamin, Y. and Renaud, B.(2015).
Biochemical and Nutritional Properties of Baobab Pulp from Endemic
Species of Madagascar and the African Mainland.African Journal of
Agricultural 8 (47):6046– 6054.
Isolauri, E., da Costa Ribeiro, H., Gibson, G., Saavedra, J., Saliminen, S.,
Vanderhoof, J. and Varavithya, W. (2002). Functional Foods and
Probiotics: Working Group Report of the First World Congress of
Pediatric Gastroenterology, Hepatology, and Nutrition, Journal of
Pediatric Gastroenterology and Nutrition, 35: S106-S109.
Jensen, Mark, P., Turner Judith A., Romano Joan M. and Karoly Paul (1991).
Coping with Cronic Pain: acritical review of the literature. Pain 47
(3), 249-283, 1991.
124
Johansson, M.L., Nobaek, S., Berggren, A., Nyman, M., Björck, I., Ahrnē, S.,
Jeppsson, B., Molin, G. (1998). Survival of Lactobacillus plantarum
DSM 9843 (299v), and effect on the short-chain fatty acid content of
faeces after ingestion of a rose-hip drink with fermented oats.Int. J.
Food Microbiol., 42(1-2): 29–38.
Juvan, S., Bartol, T. and Boh, B. (2005). Data structuring and classification in
newly-emerging scientific fields. Online Information Review, 29: 483-
498.
Kabeir, B.M., Abd Aziz, S., Muhamed, M. and Yazid.A.M.(2005). Growth
of Bifidobacterium longum BB536 in Media (femented cereal
porridge) and their survival during storage. let. Appl. Microbial41
:12-131.
Kitson, R.E., and Mellon, MG. (1944).Colorimetric determination of phosphorus
as molybdivanadophosphoric acid. Ind. Eng. Chem. Anal.
Ed.16(6):379-83.
Kojima, T., Yaeshima, T., Ishibashi, N., Shimamura, S. and Hayasawa, H.
(1996). Inhibitory effects of human-drived bifidobacterium on
pathogenic Escherichia coli serotype O-111.Bioscience
Microflora, 15: 17 – 22.
Kosuspayeva, G., Faye, B., Loiseau, G., Narmuratova, M., Ivashchenko, A.,
Meldebekova, A. and Davletv, S. (2010). Physiological change in
camel milk composition (Camelus dromedaries). Effect of
Lactation Stage Tropical Animal Health prod., 42(3):495-9
Kosikowsiski, F. V. (1982). Cheese and fermented milk products, 2nd.
ED., F. E. kosikowiski and Associates Brooktonadae. N. Y.

125
Koubkova, M.; Knizkova, I.; Kunc, P.; Hartlova, H.; Flusser, J. and Dolezal,
O. (2002). Influence of high environmental temperatures and
evaporative cooling on some physiological, haematological and
biochemical parameters in high-yielding dairy cows. Czech J.
Anim. Sci., 47: 30-318.
Kullisaar,T., Zimer, M., Mikelsaar, M., Vihalemn, T., Annuk, H., Kairance,
C.and Kill,. A. (2002).Two antioxidative Lactobacilli strain as
promising probiotics .Int. J. Food Microbil., 72(3):215-224.
Laroia, S., and Martin, J.H. (1991) .Methods for enumerating and propagating
bifidobacteria. Cultured dairy products Journal; 26:32–33.
Lee, Y.K., and Salminen, S. (1995). The coming of age of probiotics.Trends
Food Sci. Technol., 6: 241–245
Liong, M. T., Shah, N. P. (2006). Effects of a Lactobacillus casei synbiotics on
serum lipoprotein, intestinal microflora, and organic acids in
rats.Journal of Dairy Science, 89: 1390 - 1399.
Lye, W. K., Looi, K. (2010). U.S. Patent Application No. 12/614,399.
Mangin, B., Thoquet, P., Oliver, J., and Grimsley, N. H., (1999). Temporal
and multiple quantitative Trait Loci analysis of resistance t
bacterial wilt in tomato permit the resolution of linked loci. –
Genatics, 151(3): 1165-72
Marco, M. L., Pavan, S., and Kleerebezem, M. (2006). Towards
understanding molecular modes of probiotic action. Curr. Opin.
Biotechnol., 17: 204-210.
Marshall, V. and Law, B. (1984). The Physiology and Growth of Dairy Lactic-

126
Acid Bacteria. In: Davies F. L. and Law B. A., editors. Advances in
the Microbiology and Biochemistry of Cheese and Fermented Milk.
London: Elsevier Applied Science Publishers Ltd. pp., 67-98.
Marteau, P., Gerhardt, M. F., Myara, A., Bouvier, E., Trivin, F. and
Rambaud, J. C., (1995). Metabolism of bile salts by alimentary
bacteria during transit in the human small intestine. Microb. Ecol.
Health Dis., 8: 151–157.
Mayo, B., and Van Sinderen, D. (2010). Bifida bacteria: Genomics and
Molecular Aspects. Caister Academic Press . ISBN 978-1-
904455-4.
McCartney, G. R. and Gibson (2006). - Gastrointestinal– microbiology,
books.gogle.com
Metchnikoff, E. (1907). The prolongation of life. Optimistic studies.
London: Butterworth-Heinemann.
Meydani, S.N. and Ha, W-K. (2000). Immunologic effects of yoghurt. Am.
J.Clin. Nutr., 71: 861–872.
Meyer, A. (1998). The 1998 top 100® R&D survey. Food Processing 58(8): 32-
40.
MINITAB. (2006). Statistical software, Release 14 for Windows, Minitab
Inc, USA.
Modler, H.W., Mckellar, R.C. and Yaguchi, M. (1990). Bifidobacteria and
bifidogenic factors. Canadian Institute of Food Science; 23: 29-41.
Musa, H. A.A. (1994). Effect of additives on the composition and sensory
characteristics of Yoghurt, B.Sc. Dissertation. University of
Khartoum, Sudan.
127
Muyanja, C., Birungi, S., Ahimbisibwe ,M., Semanda, J and Namugumya
BS,.(2010). Traditional Processing, Microbial and
Physicochemical Changes During Fermentation of Malwa.
African Journal of Food, Agriculture, Nutrition and Development,
10(10): 4/24-4138
Naidu, A. S., Bidlack, W. R. and Clemens, R. A. (1999). Probiotic spectra
of lactic acid bacteria. Critical Reviews in Food Science and
Nutrition 39: 13 – 126.
Namba, K., Yaeshima, T., Ishibashi, N., Hayasawa, H. and Yamazaki, S.
(2003). Inhibitory effects of Bifidobacterium longum on
enterohemorrhagic Escherichia coli O157:H7. Bioscience
Microflora, 22(3): 85 - 91.
Newburg, D.S. (2005). Innate immunity and human milk. J.Nutr. 135: 1308–
1312.
O‟Brien, J., Crittenden, R., Ouweh, A.C. and Salminen, S. (1999). Safety
evaluation of probiotics. Trends in Food Sci. and Technol., 10(12):
418-424.
Ouwenhand, A.C. and Salminen, S.J.(1998). The health effects of cultured milk
products with viable and non viable bacteria. International Dairy
Journal, 8:749- 758.
Park, G. F. and Haenlein, D. Sci Ag Wilet-Blackwell. A John Wiley & Sns,
Ltd., Publication 700, 2013
Peppler, H. J. and Perlman, D. (1979). Microbial Technology, 2nd
ed.
Fermentation Technology Academpress.

128
Radostits, O.M., Gay, C., Hinchcliff, K.W. and Constable, P.D., (2007). A
Textbook of the Diseases of Cattle, Sheep, Goats, Pigs and Horses,
10th edition, (Saunders, Edinburgh, London. UK. pp 673–753).
Ranganna, S. (1979). Manual of Analysis of Fruits and Vegetables Products.Tata
Mc-Graw Hill Publishing Company Limited, New Delhi, India.
Ranganna, S. (2001).Handbook of Analysis and Quality Control for Fruits
and Vegetables Products.2nd
ed., Tata. Mc-Grow Hill Published
CompanyLimited, New Delhi, India
Richards, L.A. (1968). Diagnosis and improvement of saline and alkaline
soil.1stEd. IBH Publishing Co., New Delhi, India.Agri. Handbook No.
60.
Rosander, A., Connolly, E. and Roos, S. (2008). Removal of antibiotic
resistance gene-carrying plasmids from Lactobacillus reuteri ATCC
55730 and characterization of the resulting daughter strain, L. reuteri
DSM 17938. Appl. Environ. Microbiol., 74 (19): 6032–40.
Ruiz-Moyano, S., Martín, A., Benito, M. J., Casquete, R., Serradilla, M. J.
and Córdoba, M. D. (2009). Safety and functional aspects of
preselected enterococci for probiotic use in Iberian dry-fermented
sausages. Journal of Food Science, 74(7):M398-404
Salovaara, H. (1999). Functional Foods: a global prespective. Cereal Food
World, 44:98
Salminen, S., and Gueimonde, M. (2004). Human Studies on Probiotics: What is
Scientifically Proven. Journal of Food Science, 69: M137-M140.
Salminen, S., Bouley, C., Boutron-Ruault, M.C., Cummings, J.H., Franck, A.,
129
Gibson, G.R., Isolauri, E., Moreau, M.C., Roberfroid, M., and
Rowland, I. (1998). Functional food science and gastrointestinal
physiology and function. British Journal of Nutrition; 80: S147–71.
Sakai, K., Mishima, C., Tachiki, T., Kumagai, H., Tochikura, T. (1987).
Mortality of bifidobacteria in boiled yoghurt. J. Ferment. Tech.,
65: 215 220
Sako, T., Matsumoto, K. and Tanaka, R. (1999). Recent Progress on
research and applications of non-digestible galacto-
oligosacchride. International Dairy Elsevier – Journal, 9(1): 69-80
Santos, A., San Maur, M. and Marquine Diaz, D. (2006). Prebiotics and their
long-tearm influence on the microbial population of the mouse
bowel. Food Microbiology, 23(5): 498-503
Satocari, R. M., Vaughan, E. E., Smidt, H., Saarela, M., Mattö, J. and de
Vos, W. M. (2003). Molecular approachs for the detection and
identification of bifidobacteria and lactobacilli in human gastro
intestestinal tract. Systemic and Applied Microbiolgy, 26(4): 572-
584
Sefa-Dedeh, S., Cornelius, B., Amoa-Awua, W., Sakyi-Dawson, E. O. and
Afoakwa, E. O. (2003). The Microflora of Fermented
Nixtamalized Corn. Int. J. Fd. Microbiol., 2755: 1-6.
Sefa-Dedeh, S., Cornelius, B., and Afoakwa, E. O. (2003). Effect of
fermentation on the quality characteristics of nixtamalized Corn.
Food Research International, 36(1): 57-64
130
Saxelin, M., Tynllynen, S., Mattila-Sandholm, T. and de Vos, W. M.
(2005). Probiotic and other functional microbe,: from markets to
mechanisms. 16 (2): 204-211
Schell, M. A., Karmirantzou, M., Snel, B., Vilanova, D., Berger, B., Pessi,
G., Zwahlen, M. C.,Desiere, F., Bork, P., Delley, M., Pridmore, R.
D. and Arigoni, F. (2002). The genome sequence of
Bifidobacterium longum reflects its adaptation to the human
gastrointestinal tract. Proc. Natl .Acad. Sci. (PNAS), 99(22):
14422-14427.
Sela, D. A., Chapman, J., Adeuya, A., Kim, J. H., Chen, F., Whitehead,
T. R., Lapidus, A. Rokhsar, D. S., Lebrilla, C. B., German, J. B.,
Price, N. P., Richardson, P. M. and Mills, D. A. (2008). The
genome sequence of Bifidobacterium longum subsp. infantis
reveals adaptations for milk utilization within the infant
microbiome. Proc. Natl. Acad. Sci. (PNAS), 105: 18964-18969.
Shah, N.P. (1995). Bifidobacteria: Characteristics and potential for application in
fermented milk products. Milchwissenschaft, 52: 16- 18.
Shah, N.P. (2000). Probiotic bacteria: selective enumeration and survival in
Dairy food. Journal of Dairy Science; 83: 894-907.
Shuiep, Ibtisam, E. Elubeir, M.El Owni, O.A.O., Musa, H. H. (2008). Tropical
and subtropical Agroecsystems 8(1), 101-106,
Sindhu, S. C., and Khetarpaul, N. (2003). Effect of feeding probiotic
fermented indigenous food mixture on serum cholesterol levels in
mice. Nutrition research, 23(8), 1071-1080

131
Stainer, R. Y. Duodoran, M. and Adelebery, E. (1957). General
microbiology and the microbial world Prenlice Hall Inc.
Englewod chiffts V. J.Technology and Biotechnology, 51: 562–
567.
Tamime, A.Y., Robinson, R.K. (1985). Yoghurt: Science and technology.
Pergamon Press Ltd., Oxford, UK.
Tennyson, C. A., and Friedman, G. (2008). Microecology, obesity, and
probiotics. Current Opinion in Endocrinology, Diabetes and
Obesity, 15(5), 422-427.
Topping, P. M. Clifton (2001). physiological reviews. Commnwealth
Scientific and Industrial Research Organization, Health Sciences
and Nutrition, Adelaide, Australia.
Trebichavsky, I. and Šplichal, I. (2006). Probiotics manipulate host cytokine
response and induce antimicrobial peptides. Folia Microbio, 51:
507–510.
Von Wright, A. and Axelsson, L. (2000). Lactic Acid Bacteria: An
Introduction. In: Lahtinne S, Salminen, S, Von Wright A, Ouwehand
A, editor. Lactic Acid Bacteria: microbiological and Functional
Aspects. London: RC Press. pp., 1-16.
Ventura, M., Canchaya, C., Tauch, A., Chandra, G., Fitzgerald, G.F., Chater,
K. F. and Van Sinderen, D. (2007). Genomics of Actinobacteria:
125 tracing the evolutionary history of an ancient phylum.
Microbiol Mol Biol Rev, 71(3): 495-548

132
Viderola, C.G., Reinhelmer, J. (2000). Survival of probiotic microflora in
Argentinian yoghurts during refrigerated storage. Food Research
International, 33: 97-102.
Walstra, P. and Jenness, R. (1984). Dairy chemistry and physics, John Wiley
& Sons, Inc, New York, NY.
Waltham, M.S. (1998). Roadmaps to Market: Commercializing Functional
Foods and Nutraceuticals, Decision Resources, Inc., p. 5.
Webb, B. H., Johnson, A. H. and Aiford, J. A. (1980). Fundamentals of
Dairy chemistry second ed, the Avi publishing Company Inc.
Westport, connecticcut.
William, C.F. and Dennis, C.W. (1998). Food Microbiology, 4th
Edition,Food
Series, Mac Grow-Hill Book Caompany, Singapore.
Yagil, R. and Etzion, Z. (1980). Milk Yeild of Camels (Camelus dromedaries)
in drught areas. Comparative Biochemistry and physiology part A:
Physiology, 67(1): 207-209
Yiming, L. Y., Tran V. H., Duke, C. C. and Roufogalis, B. D. (2012).Preventive
and Protective Properties of Zingiber officinale (Ginger) in diabetes
mellitus, diabetic complications, and associated lipid and other
metabolic disorders: A Brief Review. Evidbased Complemen- Altern-
Med, 2012:1-10
Zoetendal, E. G., Akkermans, A. D. L., and de Vos, W. M. (1998). Temperature
gradient Gel Electrophoresis Analysis of IGS،RNA from human local
samples reveals stable and host-speceific communities of acttve
bacteria. App. Environ. Microb, 64(10), 3854-3859

133