assessment of different breastfeeding practices - kiu
TRANSCRIPT
ASSESSMENT OF DIFFERENT BREASTFEEDING PRACTICES
AND NUTRITIONALSTATUS OF CHILDREN BELOW THE AGE
OF FIVE YEARS IN SHEEMA DISTRICT, UGANDA
BY
MASIKO KASIGAIRE DENIS
BMS/0011/133/DU
A RESEARCH DISSERTATION SUBMITTED TO
FACULTYOFCLINICAL MEDICINE AND DENTISTRY IN
PARTIAL FULFILLMENT OF THE REQUIREMENT FOR
THE AWARD OF BACHELOR OF MEDICINE
AND SURGERY OF KAMPALA
INTERNATIONAL UNIVERSITY
NOVEMBER 2018

I Masiko Kasigaire Denis
dissertation is my original research
result of my hard work
knowledge and interpretation
the guidance of my supervisor.
been produced or submitted
learning for an academic
I hence present it for
Kampala international university western campus.
Signature……………….
Date 2ND November 2018.
Masiko Kasigaire Denis
Tell: 0773008226/0705316863.
Email: [email protected].
(Researcher)
i
DECLARATION
Kasigaire Denis do here by declare that, to the best of my
my original research work. Everything in this research
work through reading various literature including
interpretation of the contents of the topic in the field
supervisor. I am therefore certain that no work
submitted to this University or any other institution
academic qualification.
the award of Bachelors of medicine and Bachelor of surgery
Kampala international university western campus.
Signature……………….
November 2018.
Kasigaire Denis
: 0773008226/0705316863.
Email: [email protected].
do here by declare that, to the best of my knowledge, this
research paper is as a
including my personal
field of research under
work of this kind has
institution of higher
medicine and Bachelor of surgery
ii
APPROVAL
I hereby declare that the content of this research report has been done through my
supervision and has been submitted to faculty of clinical medicine and dentistry with
my approval as the candidate’s supervisor.
I certify that I have read this research report and that in my opinion it is fully
adequate, in scope and quality, as an undergraduate thesis for the award of a degree of
Bachelor of medicine and Bachelor of surgery Kampala international university
western campus.
2 Nov 2018
Atuheire Collins, PhDc (Supervisor)

iii
DEDICATION
This dissertation is dedicated to my Sponsors Mrs. Joan Rutaroh, my brothers and
sisters for theircontinuous support and encouragement.

iv
ACKNOWLEDGMENTS
All thanks and praises to my Almighty God for helping me through the difficult times,
fulfilling my needs and for keeping me alive to conduct this study, surely he will see
me through. I would like to appreciate and thank my supervisor Atuheire Collins for
his guidance and support for this study and his patience. Also my gratitude to my
colleagues who gave me all the good advice in regards to my proposal. Not forgetting
my dear colleagues in Jinja Regional Referral hospital for helping me with the
information I needed.
v
LIST OF TABLES
Table Page
Table 1: Showing anthropometric indicators for children 4
Table 2: Showing education level of respondents 27
Table 3: A table showing occupation of the respondents 28
Table 4: A table showing duration of each breastfeeding for exclusively
breastfed children 31
Table 5: Table showing foods for complementary feeding 34
Table 6: A table showing immunization status of the child 36
Table 7: A table showing child’s age in months and years 37
Table 8: A table showing Child’s height/lenght in centimeter 38
Table 9: A table showing nutritional status of the children 40
vi
LIST OF FIGURES
Figure Page
Figure 1: Conceptual Framework (Designed by researcher) 11
Figure 2: A Cylindrical graph showing the age distribution of Mothers in
Years 26
Figure 3: A cylindrical graph showing marital status of the Mothers 27
Figure 4: A pie chart showing the religion of the participants 28
Figure 5: Pie chart showing respondent’s source of income 29
Figure 6: A bar graph showing respondents monthly earning in uganda
Shillings 29
Figure 7: A cylindrical graph showing the participant’s number of children30
Figure 8: A pie chart showing exclusive breastfeeding of the respondent’s
Child 30
Figure 9: A cylindrical graph showing number of EBF per day 31
Figure 10: A pie chart showing the time of BF initiation from birth 32
Figure 11: A cylindrical graph showing respondent’s expenditure of time
with the child 32
Figure 12: A pie chart showing child’s complementary feeding 33
Figure 13: A cylindrical graph showing age at complementary 33
Figure 14: A cylindrical graph showing the number of complementary
feeding per 24 hours 34
Figure 15: A pie chart indicating wheather the child has been weaned or
not 35
Figure 16: A pie chart showing age at weaning in years 35
Figure 17: A pie chart showing the method of weaning 36
Figure 18: A cylindrical graph showing immunization status of the children37
Figure 19: A pie chart showing child’s sex 38
Figure 20: A bar graph showing child’s weight in kilograms 39
Figure 21: A pie chart showing degree of edema 39
Figure 22: A bar graph showing mid upper arm circumference 40
Figure 23: A bar graph showing degree of malnutrition 41
vii
ABSTRACT
Background
Globally, nearly half of all deaths in children below the age of 5 years are attributed to
under nutrition as a result of poor breastfeeding practices every year. Under nutrition
is a preventable cause of death among children below the age of 5 years (Sleive
Collins et al 2006). Worldwide the prevalence rate of admitted infants and children to
hospitals with both acute malnutrition and mixed diagnosis ranged from 6.1 to 40.9%
as stated by (Joosten et al., 2008).
Methods
The aim of this study was to assess the effects of the different breastfeeding practices
on the nutritional status of children between the ages of 0 to 5 years. The study was a
descriptive cross-sectional study using quantitative methods. The calculated sample
was 206.Data was collected from the breastfeeding mothers. Data was coded and
tabulated using SPSS program.
Results
The study showed that of the 203 children that were interviewed, 96% were healthy
and only 4% were malnourished this basically indicated that the mothers had adequate
knowledge and information about the different breastfeeding practices to enhance
proper growth and development of their children, the good available antenatal and
child health care services and programs like immunization provided at the health
facility also played a key role in increased prevalence rates of healthy children with a
few malnourished children. The 4% of the children that are malnourished is basically
because of the inadequate and improper breastfeeding practices among children, Poor
balanced diet for those that have started complementary feeding, busy working
schedule for those that are working and yet are mothers who need to breast feed their
children.
Conclusion
Maternal and child care services should be provided to both mothers and their
children at their own times of convenience to reduce on the rates of absenteeism from
these health care services provided like immunization which predispose and increase
the rates of malnutrition.
viii
TABLE OF CONTENTS
DECLARATION ........................................................................................................... I
APPROVAL ................................................................................................................. II
DEDICATION.............................................................................................................III
ACKNOWLEDGMENTS ...........................................................................................IV
LIST OF TABLES........................................................................................................V
LIST OF FIGURES .....................................................................................................VI
ABSTRACT............................................................................................................... VII
TABLE OF CONTENTS..........................................................................................VIII
LIST OF ACRONYMS ............................................................................................XIV
OPERATIONAL DEFINITIONS.............................................................................. XV
CHAPTER ONE ............................................................................................................1
1.0 INTRODUCTION ...................................................................................................1
1.1 BACKGROUND .....................................................................................................2
1.1.1 HISTORICAL BACKGROUND..........................................................................2
1.1.2 THEORETICAL BACKGROUND......…………………………………………3
1.1.3 CONCEPTUAL BACKGROUND...................................................……………3
1.1.4 CONTEXUALBACKGROUND………………………………………………………...7
1.2 PROBLEM STATEMENT......................................................................................8
ix
1.3 OBJECTIVE OF THE STUDY............................................................................8
1.3.1 GENERAL OBJECTIVE......................................................................................8
1.3.2SPECIFIC OBJECTIVES......................................................................................9
1.4 RESEARCH QUESTIONS .....................................................................................9
1.5 SIGNIFICANCE OF THE STUDY.........................................................................9
1.6 SCOPE OF THE STUDY......................................................................................10
1.6.1 TIME SCOPE .....................................................................................................10
1.6.2 CONTENT SCOPE ............................................................................................10
1.7 CONCEPTUAL FRAME WORK .........................................................................11
CHAPTER TWO .........................................................................................................12
LITERATURE REVIEW ............................................................................................12
2.0 INTRODUCTION .................................................................................................12
2.1 ANTHROPOMETRIC INDICATORS TO ASSESS NUTRITIONAL STATUS
OF CHILDREN ...........................................................................................................12
2.1.1 IMPORTANCE OF BIRTH WEIGHT ON NUTRITIONAL STATUS............12
2.1.2 DETERMINANTS OF UNDER NUTRITION IN CHILDREN .......................13
2.1.3 DIETARY PRACTICES AND NUTRITIONAL STATUS OF CHILDREN ...14
2.1.4 INDICATORS OF INFANT/CHILD FEEDING PRACTICES.........................17
2.2 EXCLUSIVE BREASTFEEDING AND COMPLEMENTARY
BREASTFEEDING .....................................................................................................17
x
2.2.1 EXCLUSIVE BREASTFEEDING.....................................................................17
2.2.2 COMPLEMENTARY BREASTFEEDING .......................................................19
2.3 SOCIOECONOMIC AND DEMOGRAPHIC FACTORS AFFECTING
BREASTFEEDING MOTHERS.................................................................................20
CHAPTER THREE .....................................................................................................22
METHODOLOGY ......................................................................................................22
3.0 STUDY DESIGN...................................................................................................22
3.1 STUDY POPULATION ........................................................................................22
3.2 SAMPLING TECHNIQUE ...................................................................................22
3.2.1 SAMPLE SIZE DETERMINATION .................................................................22
3.2.2 SAMPLING PROCEDURE ...............................................................................23
3.2.3 INCLUSION AND EXCLUSION CRITERIA ..................................................23
3.2.3.1 INCLUSION CRITERIA.................................................................................23
3.2.3.2 EXCLUSION CRITERIA ...............................................................................23
3.3 DATA COLLECTION ..........................................................................................23
3.3.1 QUESTIONNAIRE ............................................................................................23
3.3.2 ANTHROPOMETRIC MEASUREMENTS TECHNIQUE ..............................24
3.4 DATA ANALYSIS................................................................................................25
3.4.1 QUANTITATIVE DATA ANALYSIS..............................................................25
3.5 ETHICAL CONSIDERATIONS AND PROCEDURE ........................................25
xi
3.6 ANTICIPATED PROBLEMS...............................................................................25
4.0: DATA ANALYSIS AND INTERPRETATION..................................................26
4.1 THE AGE DISTRIBUTION OF MOTHERS IN YEARS....................................26
4.2: MARITAL STATUS OF THE MOTHERS .........................................................27
4.3 EDUCATION LEVEL OF RESPONDENTS .......................................................27
4.4 RELIGION OF RESPONDENTS .........................................................................28
4.5: OCCUPATION OF THE RESPONDENTS.........................................................28
4.6: RESPONDENT’S SOURCE OF INCOME .........................................................29
4.7: RESPONDENT’S MONTHLY EARNING.........................................................29
4.8: RESPONDENT’S NUMBER OF CHILDREN ...................................................30
4.9: EXCLUSIVE BREASTFEEDING OF THE CHILD...........................................30
4.10: NUMBER OF EXCLUSIVE BREASTFEEDING PER DAY...........................31
4.11: DURATION OF EACH BREASTFEEDING ....................................................31
4.12: TIME OF BF INTIATION FROM BIRTH........................................................32
4.13: RESPONDENT’S EXPENDITURE OF TIME WITH THE CHILD...............32
4.14: IS YOUR CHILD ON COMPLEMENTARY FEEDING?................................33
4.15: AGE AT COMPLEMENTARY FEEDING.......................................................33
4.16: FOODS FOR COMPLEMENATARY FEEDING.............................................34
4.17: NUMBER OF CF PER 24 HOURS ...................................................................34
4.18: IS YOUR CHILD WEANED? ...........................................................................35
xii
4.19: AGE OF WEANING..........................................................................................35
4.20: METHOD OF WEANING .................................................................................36
4.21: IS THE CHILD IMMUNISED...........................................................................36
4.22: IF YES, IMMUNIZATION AGAINST?............................................................37
4.23: CHILD’S AGE IN MONTHS AND YEARS.....................................................37
4.24: CHILD’S SEX ....................................................................................................38
4.25: CHILD’S HEIGHT/LENGTH IN CENTIMETER ............................................38
4.26: CHILD’S WEIGHT IN KILOGRAMS..............................................................39
4.27: EDEMA ASSESSEMENT .................................................................................39
4.28: MID UPPER ARM CIRCUMFERENCE...........................................................40
4.29: NUTRITIONAL STATUS OF THE CHILDREN .............................................40
4.30: DEGREE OF MALNUTRITION.......................................................................41
CHAPTER FIVE .........................................................................................................42
DISCUSSION CONCLUSION AND RECOMMENDATIONS................................42
5.0 INTRODUCTION .................................................................................................42
5.1 DISCUSSION........................................................................................................42
5.1.1 SOCIO-DEMOGRAPHIC CHARACTERISTICS OF THE RESPONDENTS..
......................................................................................................................................42
5.1.2. DIFFERENT BREASTFEEDING PRACTICES OF CHILDREN BELOW
THE AGE OF 5 YEARS. ............................................................................................43
xiii
5.1.3 NUTRITIONAL STATUS OF CHILDREN BELOW THE AGE OF 5 YEARS.
......................................................................................................................................44
5.2 CONCLUSION......................................................................................................44
5.3 RECOMMENDATIONS.......................................................................................45
REFERENCES ............................................................................................................46
APPENDICES .............................................................................................................48
APPENDIX I: CONSENT FORM ..............................................................................48
APPENDIX II: QUESTIONNAIRE............................................................................49
APPENDIX III: BUDGET ..........................................................................................53
APPENDIX IV: LETTER OF INTRODCUTION FROM KIU..................................54
APPENDIX V: LETTER FROM DISTRICT HEALTH OFFICER………………...55
APPENDIX VI: LETTER FROM KITAGATA HOSPITAL MANAGEMENT
AUTHORITIES. ..........................................................................................................56
APPENDIX VII: MAP OF KITAGATA.....................................................................57
APPENDIX VIII: MAP OF UGANDA.......................................................................58
xiv
LIST OF ACRONYMS
BMI: Body Mass Index
DHO: District Health Officer
DHS: Demographic and Health Surveys
EBF: Exclusive Breast Feeding
MOH: Ministry of Health
MUAC: Mid Upper Arm Circumference
NGOs: Non-Governmental Organizations
PEM: Protein Energy Malnutrition
UDHS: Uganda Demographic Health Survey
UNICEF: United Nations International Children’s Emergency Fund
USA: United States of America
VHTs: Village Health Teams
WHO: World Health Organization
xv
OPERATIONAL DEFINITIONS
Colostrum: Itis milk secreted for a few days after parturition and characterized by high
protein and antibody content
Exclusive breastfeeding: Mode of breastfeeding where by the infant only receives breast
milk without any additional food or drink, not even water.
Prelacteal feed: Any food except mother’s milk provided to a new born before initiating
breastfeeding.
Knowledge: Means information that mothers have acquired about the activities and benefits
of exclusive breastfeeding
Practice: Routine activities and actions of individual or group on exclusive breast feeding.
Attitudes: Beliefs on practices of exclusive breastfeeding
1
CHAPTER ONE
1.0 INTRODUCTION
Globally, nearly half of all deaths in children below the age of 5 years are attributed to
under nutrition as a result of poor breastfeeding practices every year. This translates to
about 3 million unnecessary loss of young lives per year (UNICEF, Updated Feb
2016). Under nutrition is a preventable cause of death among children below the age
of 5 years (Sleive Collins et al 2006). Worldwide the prevalence rate of admitted
infants and children to hospitals with both acute malnutrition and mixed diagnosis
ranged from 6.1 to 40.9% as stated by (Joosten et al 2008). In the African continent,
children make up one quarter of the estimated 148 million underweight children
globally with the Sub Saharan region being the most affected with an increment of 43
million people being affected. In Uganda, the persistent high rates of malnutrition in
children below the age of 5 years are a result of inadequate access to food, poor infant
feeding practices, poor sanitation and health practices. 38% suffer from chronic
malnutrition, 16% are under weight and 6% suffer from acute malnutrition. Some of
the core nutrition interventions provided by government do include the following;
Encouraging mothers to exclusively breastfeed, improve maternal nutrition and health
and promotion of nutritional education (UFNP adopted in 2003). The institutional
framework for improving nutrition in Uganda is at different levels. At the National
level; the nutrition unit is based in the division of child health under the department of
community health; At Regional level; MOH staff structure includes a senior
nutritionist and a nutritionist at the referral hospitals with a focus on both curative and
rehabilitation services within the hospital. At District level; DHO coordinates health
and nutrition activities promoted by the government, NGOs and the private sector
partners. At the general hospital there is only one nutritionist. At Community level;
VHTs are used to interface between the community and the health facilities.
In conclusion, there are many related studies that have been done about the different
breastfeeding practices and the nutritional status of children below the age of 5 years
elsewhere in the world but none has been done within Sheema district. This study will
therefore help establish the different breastfeeding practices and the nutritional status
of children below the age of 5 years within Sheema district.
2
1.1 BACKGROUND
1.1.1 Historical background
The first recorded nutritional experiment was recorded in the book of Daniel in the
bible. Daniel objected eating from the king’s court and opted to eat both vegetables
and water. Ten days later along with his colleagues they were compared with the
king’s men and they appeared fitter and healthier hence they were allowed to continue
with their own foods. Hippocrates an Ancient Greek conjectured that since people
were the same, regardless of what they ate, there was one nutrient that everything was
made of. The one nutrient theory persisted for a very long time until almost the
modern era. In the late 1700’s a brilliant young French scientist called Antoine
Lavoisier became the father of nutrition as he designed a calorimeter which measured
the heat produced by the body from work and consumption of the varying amounts
and types of food. He is also famous for the statement “life is a chemical process.” In
1753, Dr James Lind published his treatise on scurvy which was credited with
recognition of the curative effects of fresh fruits on scurvy. Vitamins came from Funk
who erroneously thought all these new things being discovered contained amines
hence combined both vital and amine to form vitamin. Vitamin B12 was discovered in
1948 and reported in 1949. It was the essential animal protein factor. Prior to the
discovery, animal protein foods were essential in the diet to prevent pernicious
anemia. Discovery of the role of trace minerals in diet coincided with the discovery of
vitamins and elucidation of their essentiality, their rules and interactions continues
today. Zinc prevention of Para keratosis was discovered in the 1950’s and 1960’s,
Selenium’s essentiality was discovered in the 1970’s and chromium though
recognized as essential since its part of an enzyme is still controversial today.
3
1.1.2 Theoretical background
” The health belief model” stated by G. Hochbaum is the theory that was used to
conduct the study. The health belief model suggests that a person’s readiness to
change a specific health behavior is dependent on the following;
a) Perceived Susceptibility: Individual’s view of the likelihood of developing the
condition or disease.
b) Perceived Severity: Individual’s views of how serious the condition and its
consequences are.
c) Perceived Benefits: Individual’s view of what was gained by changing the specific
behavior
d) Perceived Barriers: Factors such as cost, inconvenience, time, that make it
difficult for the individual to change the behavior
e) Cues to Action: Events that “trigger” the individual to take action
f) Self Efficacy: Individual’s confidence in ability to take.
1.1.3 Conceptual background
Malnutrition and hunger remain among the most devastating problems facing the
world’s poor countries. Nearly 30 percent of humanity- infants and children suffer
from one or multiple forms of malnutrition from protein-energy malnutrition to
micronutrients deficiencies (WHO, 2003). The tragic consequences of malnutrition
include death, disability, stunted mental and physical growth and as a result, retarded
national socioeconomic development, some 49 percent of the 10million deaths among
children under-five years of age in the developing world are associated with
malnutrition (Pelletier, 1994). Recent research shows evidence that fetal malnutrition
has important immediate and long-term consequences.
4
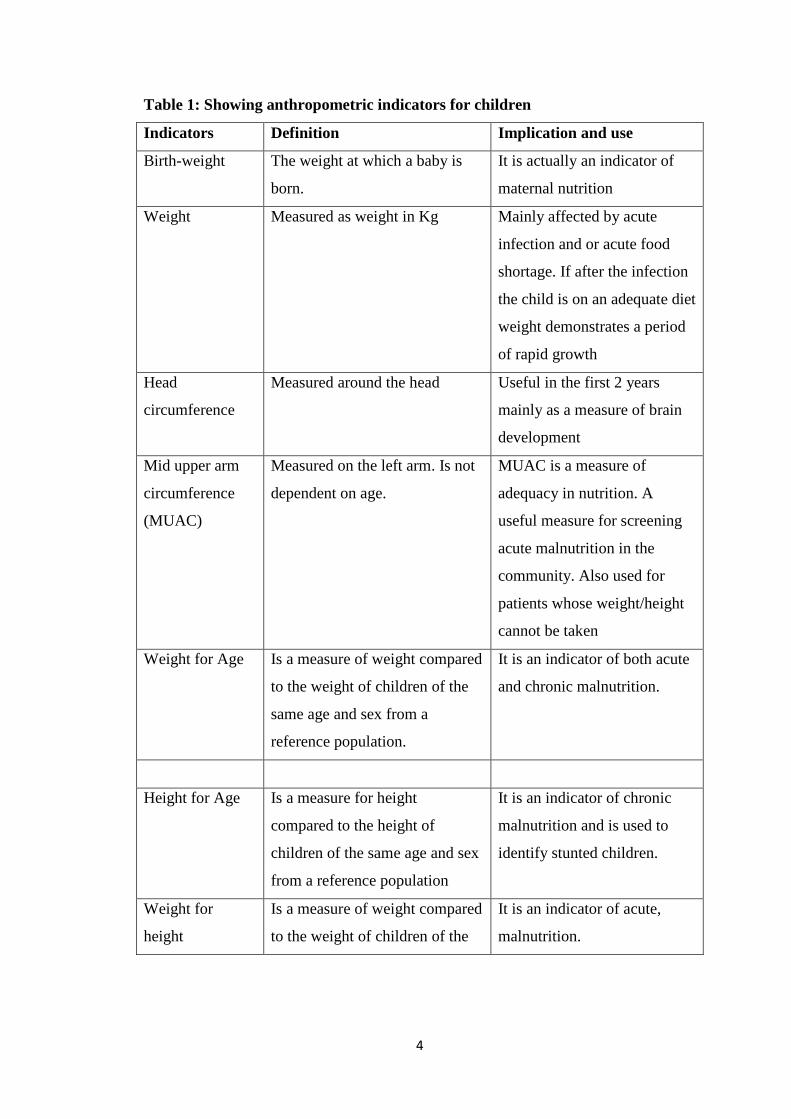
Table 1: Showing anthropometric indicators for children
Indicators Definition Implication and use
Birth-weight The weight at which a baby is
born.
It is actually an indicator of
maternal nutrition
Weight Measured as weight in Kg Mainly affected by acute
infection and or acute food
shortage. If after the infection
the child is on an adequate diet
weight demonstrates a period
of rapid growth
Head
circumference
Measured around the head Useful in the first 2 years
mainly as a measure of brain
development
Mid upper arm
circumference
(MUAC)
Measured on the left arm. Is not
dependent on age.
MUAC is a measure of
adequacy in nutrition. A
useful measure for screening
acute malnutrition in the
community. Also used for
patients whose weight/height
cannot be taken
Weight for Age Is a measure of weight compared
to the weight of children of the
same age and sex from a
reference population.
It is an indicator of both acute
and chronic malnutrition.
Height for Age Is a measure for height
compared to the height of
children of the same age and sex
from a reference population
It is an indicator of chronic
malnutrition and is used to
identify stunted children.
Weight for
height
Is a measure of weight compared
to the weight of children of the
It is an indicator of acute,
malnutrition.
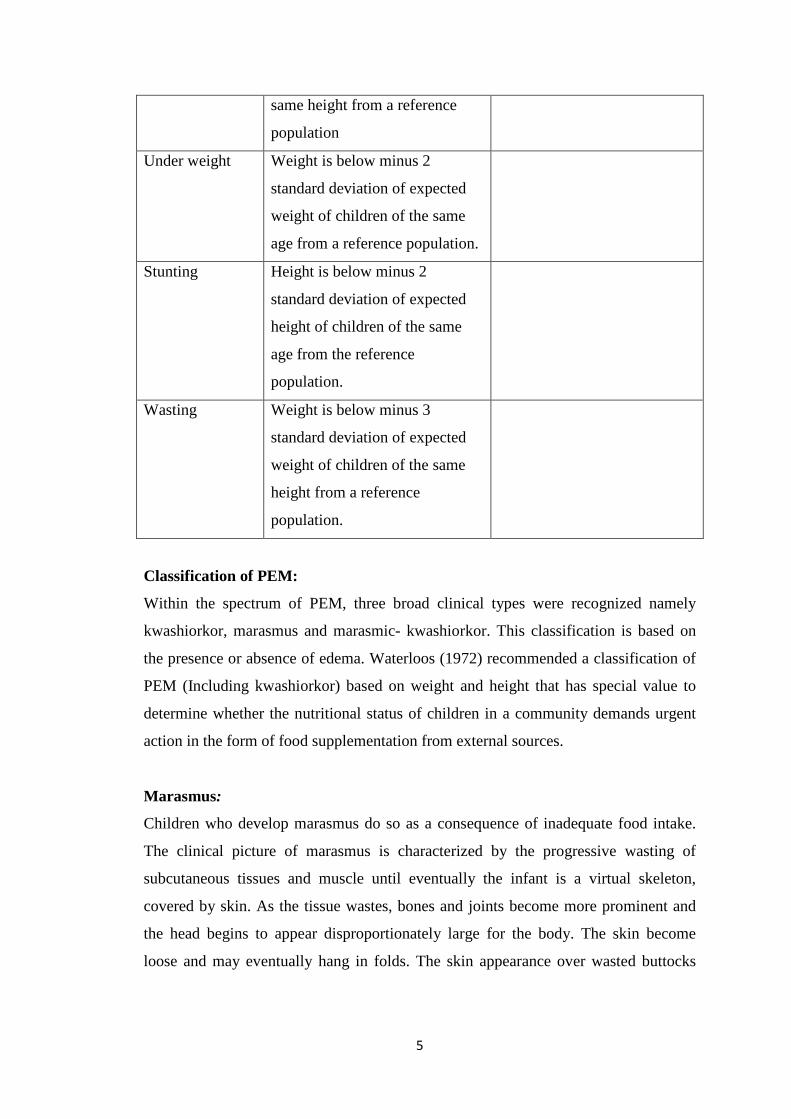
5
same height from a reference
population
Under weight Weight is below minus 2
standard deviation of expected
weight of children of the same
age from a reference population.
Stunting Height is below minus 2
standard deviation of expected
height of children of the same
age from the reference
population.
Wasting Weight is below minus 3
standard deviation of expected
weight of children of the same
height from a reference
population.
Classification of PEM:
Within the spectrum of PEM, three broad clinical types were recognized namely
kwashiorkor, marasmus and marasmic- kwashiorkor. This classification is based on
the presence or absence of edema. Waterloos (1972) recommended a classification of
PEM (Including kwashiorkor) based on weight and height that has special value to
determine whether the nutritional status of children in a community demands urgent
action in the form of food supplementation from external sources.
Marasmus:
Children who develop marasmus do so as a consequence of inadequate food intake.
The clinical picture of marasmus is characterized by the progressive wasting of
subcutaneous tissues and muscle until eventually the infant is a virtual skeleton,
covered by skin. As the tissue wastes, bones and joints become more prominent and
the head begins to appear disproportionately large for the body. The skin become
loose and may eventually hang in folds. The skin appearance over wasted buttocks
6
and thighs is similar to those of a trouser too large for the wearer. In young infants the
buccal pad of fat, which gives the cheeks their full rounded appearance, may persist
long after subcutaneous fat has disappeared from other areas. Disappearance of the
buccal pad of fat in a marasmic infant is a serious Prognostic sign which should never
be ignored. The abdomen may be scaphoid or distended. Wasting of the abdominal
wall is often so marked that the underlying pattern of bowel and peristalsis may be
observed. The liver may be palpable but it is not usually enlarged and structures like
the kidneys may be easily palpated. The skin shows no constant or characteristic
changes but tends to be wrinkled and dry and may be scaly. There are no constant or
characteristic biochemical derangement associated with marasmus. Electrolyte
derangements that may be observed are usually secondary to diarrhea. Plasma
proteins, lipids, enzymes and hormones are usually within the normal range in
nutritional marasmus. Marasmic children are usually unhappy and irritable.
Kwashiorkor:
It arises as a result of protein deficiency. Damage is expressed clinically as edema,
fatty liver and dermatitis. The peak-age incidence of kwashiorkor varies and can be
correlated with weaning practices. The onset is usually insidious with symptoms and
signs evolving over a period of several weeks, but rapid progression of symptoms
may occur over a period of days. Edema is invariable but may not be immediately
apparent in mild cases. It varies in degree and distribution from slight pitting over the
legs or feet to gross generalized edema. The mental state and behavior of these
children are among the most constant and characteristic feature of the disease, they
are objectively miserable, apathetic and desire to be left alone. The skin changes are
very variable and do not show a constant relationship to the degree of edema and
other features of the disease. A classical skin change is the appearance of patchy areas
of intense hyperpigmentation (often with clearly defined margins) that tend to occur
over the buttocks, the back of limb and the trunk They are sometimes referred to as
'black enamel' or 'black paint' dermatitis. The hyper pigmented skin frequently
desquamates leaving raw areas which may ulcerate.
Angular stomatitis, cheilosis and oral thrush are common. Typically, the hair become
sparse and thin, and in African children, loses its tight curliness and become
7
straightened. Some lightening of color is usual but not invariable. A moderate degree
of anemia is usual. When severe anemia occurs it is usually as a result of associated
iron and / or folate deficiency, complicated infections or due to parasites such as
malaria or hook worms. The liver is usually moderately enlarged but may not be
palpable or it may be greatly enlarged. It is typically smooth, non-tender and of a
normal consistency.
1.1.4 Contextual background
Globally, nearly half of all deaths in children below the age of 5 years are attributed to
under nutrition as a result of poor breastfeeding practices every year. This translates to
about 3 million unnecessary loss of young lives per year (UNICEF, Updated Feb
2016). Under nutrition is a preventable cause of death among children below the age
of 5 years (Sleive Collins et al 2006). Worldwide the prevalence rate of admitted
infants and children to hospitals with both acute malnutrition and mixed diagnosis
ranged from 6.1 to 40.9% as stated by (Joosten et al., 2008).
In the African continent, children make up one quarter of the estimated 148 million
underweight children globally with the Sub Saharan region being the most affected
with an increment of 43 million people being affected.
In Uganda, the persistent high rates of malnutrition in children below the age of 5
years are a result of inadequate access to food, poor infant feeding practices, poor
sanitation and health practices. 38% suffer from chronic malnutrition, 16% are under
weight and 6% suffer from acute malnutrition. Some of the core nutrition
interventions provided by government do include the following; Encouraging mothers
to exclusively breastfeed, improve maternal nutrition and health and promotion of
nutritional education (UFNP adopted in 2003).
The institutional framework for improving nutrition in Uganda is at different levels.
At the National level; the nutrition unit is based in the division of child health under
the department of community health; At Regional level; MOH staff structure includes
8
a senior nutritionist and a nutritionist at the referral hospitals with a focus on both
curative and rehabilitation services within the hospital. At District level; DHO
coordinates health and nutrition activities promoted by the government, NGOs and the
private sector partners. At the general hospital there is only one nutritionist. At
Community level; VHTs are used to interface between the community and the health
facilities.
In conclusion, there are many related studies that have been done about the effects of
the different breastfeeding practices on the nutritional status of children below the age
of 5 years elsewhere in the world but none has been done within Sheema district. This
study will therefore help establish the effects of the different breastfeeding practices
on the nutritional status of children below the age of 5 years within Sheema district.
1.2 PROBLEM STATEMENT
In 2016 UDHS data collected on infant and young child feeding practices among
children below the age of 2 years showed that 66% of the children less than 6 months
were exclusively breastfed and the remaining 34% were on supplementary
breastfeeding. Overall 4% of the children are wasted and 1% are severely wasted (-
3SD) with the highest prevalence rate being in Karamoja sub regions and Teso being
the least. As a result of the increased prevalence rate in Uganda specifically in
Karamoja, there has also been an increase in the mortality rate of infants reported.
There has been no research conducted in Sheema district pertainingthe different
breastfeeding practices and the nutritional status of children below the age of 5 years.
1.3 OBJECTIVE OF THE STUDY
1.3.1 General objective
To assess the different breastfeeding practices and nutritional status of children below
the age of 5 years.
1.3.2 Specific Objectives
1. To determine the socioeconomic and demographic characteristics of the
mothers of children below the age of 5 years.
9
2. To determine the differentbreast feeding practices of children below the age of
5 years.
3. To determine the nutritional status of children below the age of 5 years.
1.4 RESEARCH QUESTIONS
1. What are the socioeconomic and demographic characteristics of the mothers of
children below the age of 5 years?
2. What are the different breast feeding practices of children below the age of 5
years?
3. What is the nutritional status of children below the age of 5 years?
1.5 SIGNIFICANCE OF THE STUDY
Due to malnutrition being the cause of mortality and morbidity below the age of 5
years along with the several policies that have been suggested to improve the
nutritional status but unfortunately have either not been well adopted or afforded by
the community has led to the need to conduct this study to assess the different
breastfeeding practices andthe nutritional status of children below the age of 5 years
and why the suggested policies have failed to be adopted and accepted by the
community. Information generated at the end of the research was of both benefit to
the institution and the community where the research was being conducted.
a) Institution
It is anticipated that once this research is completed successfully it will
generate more additional information and knowledge to the already existing
knowledge on issues relating to the different breastfeeding practices on the
nutritional status of children below the age of 5 years.
b) Community
The study could also help the policy makers have a better understanding of the
impact of the different breastfeeding practices on the nutritional status of
children below the age of 5 years and this will further enable them to make
more specific laws and policies concerning the different breastfeeding
practices in order to improve the nutritional status of children below the age of
5 years.
10
Currently in Uganda specifically Sheema district there is no information about
the impact of the different breastfeeding practices andthe nutritional status of
children below the age of 5 years hence the information collected and
analyzed could be kept and used in the future as reference for similar studies
to be conducted within the given region.
1.6 SCOPE OF THE STUDY
1.6.1 Time Scope
The research was done during August 2017 to March 2018 which involved data
collection, analysis and interpretation of the research findings.
1.6.2 Geographical scope
Kitagata General Hospital is located in the central business district of the town of
Kitagata, in Sheema district. The district is found in the Ankole sub region in western
Uganda and it’s about km from Kampala the capital city of Uganda by road. Sheema
is bordered by Buhweju district to the north, Mbarara district to the East, Ntungamo
district to the south, Mitooma district to the southwest and Bushenyi district to the
west. The district covers an area of 699.1km2 with an elevation of 1500m (4,900ft). Its
coordinates are 00 32S, 30 24E with a total population of 220,200 people as per 2012
and a density of 315km2. The hospital has a bed capacity of 120 beds.
1.6.3 Content scope
The study was basically centered on establishing the different breastfeeding practices
andthe nutritional status of children below the age of 5 years.
The study involved breastfeeding mothers of children below the age of 5 years
attending Kitagata general hospital.
11
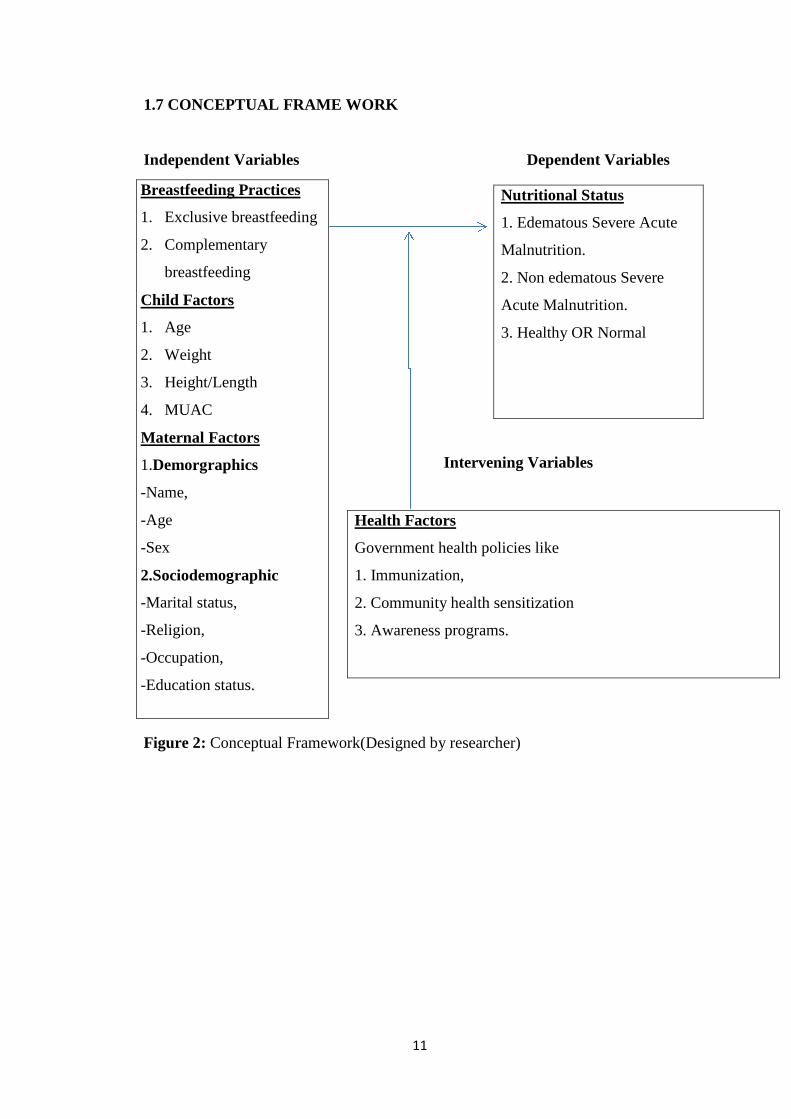
1.7 CONCEPTUAL FRAME WORK
Independent Variables Dependent Variables
Intervening Variables
Figure 2: Conceptual Framework(Designed by researcher)
Breastfeeding Practices
1. Exclusive breastfeeding
2. Complementary
breastfeeding
Child Factors
1. Age
2. Weight
3. Height/Length
4. MUAC
Maternal Factors
1.Demorgraphics
-Name,
-Age
-Sex
2.Sociodemographic
-Marital status,
-Religion,
-Occupation,
-Education status.
Nutritional Status
1. Edematous Severe Acute
Malnutrition.
2. Non edematous Severe
Acute Malnutrition.
3. Healthy OR Normal
Health Factors
Government health policies like
1. Immunization,
2. Community health sensitization
3. Awareness programs.
12
CHAPTER TWO
LITERATURE REVIEW
2.0 INTRODUCTION
This section reviews previous research addressing the nutritional status of children
aged below 5 years and the various factors associated with it. This information is
required to identify and address these issues for improving the health and overall
nutritional status of these children.
2.1 ANTHROPOMETRIC INDICATORS TO ASSESS NUTRITIONAL
STATUS OF CHILDREN
The following section reviews the indicators used to assess the nutritional status of
children less than 5 years. Anthropometric measurements are the most common tool
used to assess the nutritional status of a population and to monitor growth in children.
The anthropometric indices commonly used are weight-for-height, height-for-age and
Weight-for-age expressed as percentiles or z-scores representing the overall
nutritional status of a child. Wasting, stunting and underweight is identified by the
weight-for height, height-for-age and weight-for-age < - 2.0 standard deviation (SD)
respectively, while weight-for-height and weight-for-age > 2.0 SD are also used to
assess overweight in children. The use of body mass index (BMI; weight/height2) is
used to assess overweight status in children 2 years and older with a cutoff > 95th
percentile or 2.0 SD. Longitudinal studies have indicated a significant correlation
between childhood BMI and adult adiposity.
2.1.1 Importance of birth weight on nutritional status
The nutritional status of children is known to be influenced by several factors, of them
birth weight is an important component. As defined by the World Health
Organization, birth weight is the first weight of the newborn obtained within the first
hour of life. A birth weight less than 2500 grams is defined as low birth weight and is
a universally accepted classification. The relationship between birth weight and
nutritional status of children at the end of their first year of life was investigated by
Motta et al. (2015), who reported the significant influence of low birth weight on the
13
incidence of underweight among children, compared to those who had birth weight
above 2500 grams. More recent studies confirmed the importance of birth weight as a
determinant of a child’s nutritional status. A study conducted in Vietnam, to assess
the nutritional status and factors contributing to malnutrition in children less than five
years of age also reported similar findings. Of the 650 children included in the study,
31.8% were underweight, 44.3% were stunted and 11.9% were wasted. Interestingly,
children born low birth weight had higher risks of being malnourished compared to
their normal birth weight counterparts. The odds ratio for underweight, stunting and
wasting were as high as 7.7, 5.6 and ee5.2 respectively in low birth weight children
thereby indicating the negative impact of low birth weight on future weight gain and
linear growth pattern of a child.
2.1.2 Determinants of under nutrition in children
Epidemiological studies conducted in developing countries have identified several
causes of under nutrition in children. The most prominent cause is poverty, followed
by low levels of parental education, poor dietary intake by children and rural
residence. For example, children < 5 years from low socio-economic households were
found to have twice the risk of being stunted than children from rich households in
Ghana.
The association between poverty and under nutrition is mainly due to lack of adequate
and nutritionally balanced diet, health care and poor living conditions. As reported by
JalanandRavallion (2013), children living in households without piped water system
were more susceptible to diarrhea that influenced their overall health status compared
to those with access to piped water. Underweight among these children were also
strongly associated with maternal education, as children of mothers with no formal
education were more likely to be underweight than children of mothers with at least
secondary school education. An examination of the Bangladesh Demographic Health
Survey reported children from households with low socio-economic status and
illiterate mothers were at a greater risk of being undernourished. Other studies have
shown the influence of place of residence on the nutritional status of children. A study
by (Shenet al.2012) revealed that despite economic reforms in both rural and urban
China, higher percentage of rural children aged 2 to 5 years (38.0%) were stunted as
14
compared to urban children (10.0%) this evidence clearly indicates the increased risk
of poor nutritional status for rural children compared to their urban Counterparts. In
addition to the anthropometric indices that reflect optimal growth or growth faltering,
iron supplementation is also indicative of overall nutritional status. Iron deficiency
adversely affects the immune system and increases the onset of diseases in children.
Children from both developing (Kenya and Bangladesh) and industrialized countries
(United Kingdom and United States) were found to benefit from iron supplementation
with respect to growth and reduced incidence of diarrhea and other infections. Among
the various socio-demographic causes, maternal illiteracy and poverty remained
primary causes. A more recent study by (Pasrichaet al.2010) reported low ferritin and
hemoglobin levels in children from households with low socio-economic status.
Maternal and household characteristics are directly associated with feeding and health
care practices received by the child. Poor dietary intakes, lack of health care and
incomplete immunization are immediate causes of under nutrition and have been
identified as potential modifiable risk factors. Several epidemiological studies have
confirmed the importance of dietary pattern and immunization coverage for optimum
growth and nutritional status in children.
2.1.3 Dietary practices and nutritional status of children
On the 16th of November 2011 at about 1: 17pm, New vision released a report that
was organized and presented by BRAC Uganda an NGO offering different services
aimed at creating awareness on the availability of the nutrient rich food crops in
Uganda. The report was indicating over 2 million children in Uganda below the age of
5 years were chronically malnourished. Malnutrition was the underlying cause of
death in nearly 60% of the infants and 25% of mothers especially in the rural areas
where there were high incidences of poverty and malnutrition as compared to their
urban counterparts. It was also revealed that children below the age of 5 years
affected by malnutrition accounted for 38% of which 16% were underweight while
6% were wasted.
The World Health Organization (WHO) has issued guidelines regarding infant and
child feeding practices. These guidelines encourage the promotion of exclusive
15
breastfeeding for the first six months and initiation of complementary feeding
thereafter. The guidelines also promote continued breastfeeding till the child’s second
birthday. Notzon (2011) studied the changing pattern of breastfeeding in 7 developing
countries using data from cross-sectional surveys. His study revealed a notable
decline in average duration of breastfeeding in these countries, by ethnicity and
modernization. More recently, the changing pattern of infant feeding practices in
developing countries was reviewed by King and Ashworth (2012). While extended
breastfeeding and early introduction of complementary feeding were traditional norms
among low-income mothers in Malaysia and the Caribbean, a notable decrease in the
duration of breastfeeding was observed in these countries. Early introduction of
complementary feeding, that is before the age of 6 months is significantly associated
with poorer growth patterns among infants. A longitudinal study of 4 cohorts of
infants in Vietnam examined this association and reported growth faltering in infants
receiving premature complementary feeding compared to exclusive breastfeeding at 3
months. Not only were weight and length gain delayed among infants who were
partially breast-fed or weaned compared to exclusive breastfed infants at 1 to 3
months of age, a similar trend was also observed among infants aged 3 to 6 months,
thereby confirming the negative consequences of early weaning. Additionally,
morbidity from diarrhea and acute respiratory infections was significantly lower in
infants who were exclusively breastfed compared to their weaned counterparts. In
spite of the global guidelines on infant feeding practices, adherence to these
recommendations is limited in developing countries. A longitudinal study of
newborns in Malawi, Africa, highlighted this notion. Although universal
breastfeeding was practiced for 18 months, rates of exclusive breastfeeding were only
19.0%, 8.0%, 2.0% and 0.0% at ages 1, 2, 3 and 4 months, respectively. Moreover,
the average age range of introduction of complementary foods varied from 2.5 to 6.3
months, indicating premature initiation of weaning. Evidence suggests that maternal
characteristics such as age, education, employment and marital status impact infant
feeding practices. Adherence to the feeding recommendations varied with respect to
the mother’s education level and SES. Previous studies have established the impact of
household and community characteristics on infant feeding practices and overall
nutritional status.
16
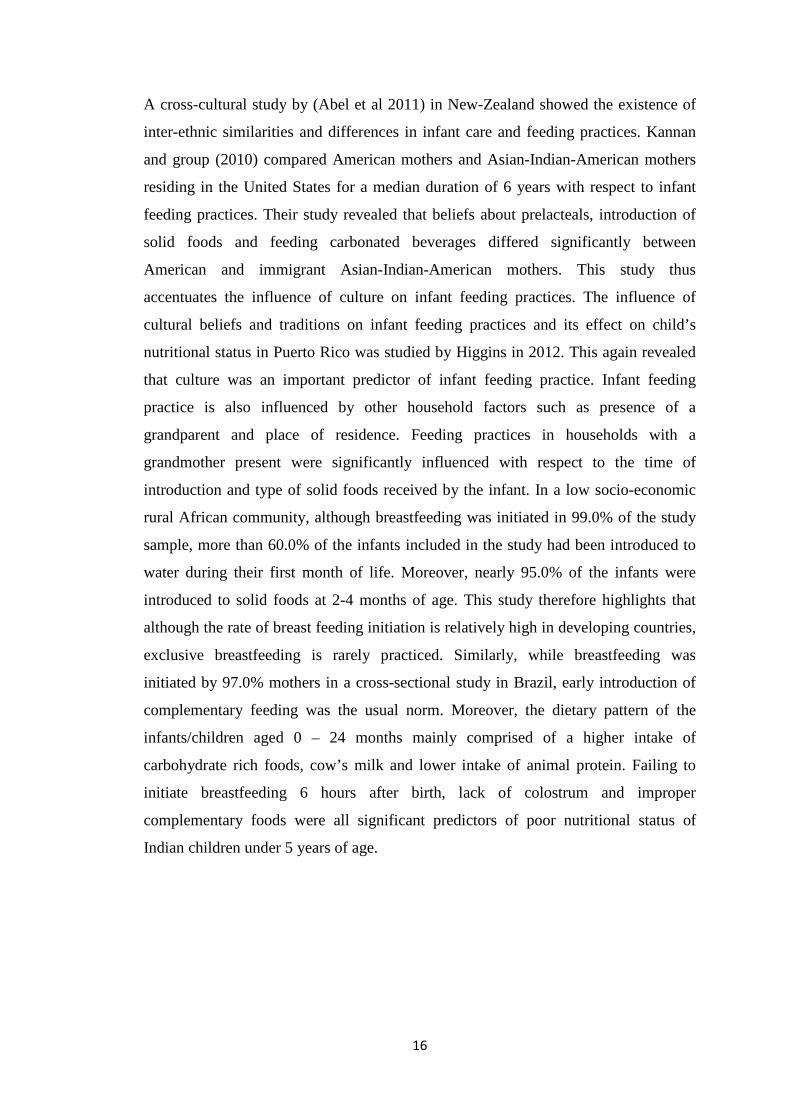
A cross-cultural study by (Abel et al 2011) in New-Zealand showed the existence of
inter-ethnic similarities and differences in infant care and feeding practices. Kannan
and group (2010) compared American mothers and Asian-Indian-American mothers
residing in the United States for a median duration of 6 years with respect to infant
feeding practices. Their study revealed that beliefs about prelacteals, introduction of
solid foods and feeding carbonated beverages differed significantly between
American and immigrant Asian-Indian-American mothers. This study thus
accentuates the influence of culture on infant feeding practices. The influence of
cultural beliefs and traditions on infant feeding practices and its effect on child’s
nutritional status in Puerto Rico was studied by Higgins in 2012. This again revealed
that culture was an important predictor of infant feeding practice. Infant feeding
practice is also influenced by other household factors such as presence of a
grandparent and place of residence. Feeding practices in households with a
grandmother present were significantly influenced with respect to the time of
introduction and type of solid foods received by the infant. In a low socio-economic
rural African community, although breastfeeding was initiated in 99.0% of the study
sample, more than 60.0% of the infants included in the study had been introduced to
water during their first month of life. Moreover, nearly 95.0% of the infants were
introduced to solid foods at 2-4 months of age. This study therefore highlights that
although the rate of breast feeding initiation is relatively high in developing countries,
exclusive breastfeeding is rarely practiced. Similarly, while breastfeeding was
initiated by 97.0% mothers in a cross-sectional study in Brazil, early introduction of
complementary feeding was the usual norm. Moreover, the dietary pattern of the
infants/children aged 0 – 24 months mainly comprised of a higher intake of
carbohydrate rich foods, cow’s milk and lower intake of animal protein. Failing to
initiate breastfeeding 6 hours after birth, lack of colostrum and improper
complementary foods were all significant predictors of poor nutritional status of
Indian children under 5 years of age.
17
2.1.4 Indicators of infant/child feeding practices
This section reviews the indicators in use for assessing infant and child feeding
practices. For the purpose of this research proposal, feeding practices include
breastfeeding for infants < 6 months and dietary diversity for older children (> 6
months). Feeding practices are based on a 24-hour dietary recall by the
mother/caretaker. Researchers have identified differences in the assessment of
exclusive breastfeeding with variability in the methods and breastfeeding definitions.
(Aarts et al, 2012) examined the underlying differences between data pertaining to the
‘current 20 status of breastfeeding’ (based on 24-hour recall) and ‘exclusive
breastfeeding since birth’ (based on daily recording) and reported a discrepancy
between the results. However, epidemiological studies have employed food records
and dietary recall by the infants’/children’s caretakers to assess exclusive
breastfeeding and dietary practices. Information obtained retrospectively by Launer
and group (2012) examined the accuracy of maternal recall regarding infant feeding
practices and reported positive results. Although levels of accuracy were lower for
formula feeding compared to other feeding practices, accuracy rates were
significantly higher for breastfeeding and complementary feeding. The review by (Li
et al., 2015) also documents evidence of validity and reliability of maternal recall for
infant feeding practices. Additionally, WHO has developed indicators for assessing
breastfeeding practices for household surveys using the 24-hour dietary recall? Other
studies have successfully utilized this approach to estimate the duration of exclusive
breastfeeding. The national level Demographic and Health Surveys (DHS) have
therefore incorporated the 24-hour feeding recall method to obtain information on
infant and child feeding practices.
2.2EXCLUSIVE BREASTFEEDING AND COMPLEMENTARY
BREASTFEEDING
2.2.1 Exclusive breastfeeding
Determinants of EBF are the factors or conditions that might lead to some changes in
the practice by for instance encouraging or impeding it. The extent to which these
determinants or factors affect EBF is fairly complex and varies from one country to
another and/or between different groups in the same country. Some are biological and
18
beyond women’s control (e.g. Breast engorgement, nipple problems etc.) while others
are combinations of economic, environmental, cultural, social etc. Albeit with
quantitative approaches, several of these determinants have been extensively studied
and documented in recent years. In a research to examine the perceive, incentives and
barriers to EBF among pre-urban Ghanaian women, Otoo,Larty and Perez-Escamilla
(2011) found supposed milk insufficiency, family pressure, breast and nipple
problems, and maternal employment as barriers to EBF. The risk of diseases resulting
from poor sanitation, ready availability of breast milk after birth and the high cost of
infant formula were also inter alia identified as motivations to EBF. An earlier study
by Perez-Escamillia, et al. (2015) in three Latin American countries (Brazil, Honduras
and Mexico) also revealed that lower socioeconomic status (in Honduras and
Mexico), prior planning on EBF duration (in all the 3 countries), maternal
unemployment (in Brazil and Honduras), hospital delivery facilities that had
breastfeeding promotion services, and having a baby girl (in Brazil and Honduras)
were all positively associated with EBF. In a similar study to assess factors associated
with EBF in Accra, Ghana, Aidam and colleagues (2015) too reported delivery at
hospital/polyclinic, prior intention or planned EBF at birth, higher education,
socioeconomic status, and positive attitudes towards EBF as the most essential
support factors for EBF (P.793). Further research in Mazabuka of Southern Zambia
by Fjeld et al. (2011) similarly found feelings of breast milk inadequacy, perception
of ‘bad milk’, limited knowledge about EBF, and conventional family expectations as
obstructions to EBF. Indeed, several other researchers (Senerath, Dibley and Agho,
2010; Arora, Mcjunkin, Wehrer and Kuhn, 2014; Alemayehu, Haidar and Habte,
2011) have also linked the practice of EBF to factors similar to the aforesaid. Whereas
some of the aforementioned determinants have been consistently recognized as
barriers to EBF (e.g. perception of milk insufficiency, maternal employment,
inadequate knowledge etc.), others have been less straight forward. For instance, the
connection between breastfeeding mothers’ level of education and desirable or
undesirable breastfeeding practices has been wavering from one study to another and
in some cases from one form of behavior to another in the same study. Educated
mothers in Western Uganda for example were on one hand, more inclined to use
prelacteal feeds; and yet on the other hand were also likely to prepare nutritionally
19
good complementary food for their children (Wamaniet al. 2015). The difficulty in
relation to education’s role in this instance is whether education enhances one’s
cooking abilities or it is increased incomes resulting from education that occasions
one’s ability to prepare good complementary foods.
2.2.2 Complementary breastfeeding
When breast milk is no longer enough to meet the nutritional needs of the infant,
complementary foods should be added to the diet of the child. The transition from
EBF to family foods, referred to as complementary feeding, typically covers the
period from 6 to 18-24 months of ages, and is a very vulnerable period. It is the time
when malnutrition starts in many infants, contributing significantly to the high
prevalence of malnutrition in children less than 5 years of age worldwide. WHO
estimates that 2 out of 5 children are stunted in low income countries. Complementary
feeding should be timely, meaning that all infants should start receiving foods in
addition to breast milk from 6 months onwards. It should be adequate, meaning that
complementary foods should be given in amounts, frequency, and consistency and
using a variety of foods to cover the nutritional needs of the growing child while
maintaining breastfeeding. Foods should be prepared and given in a safe manner,
meaning that measures are taken to minimize the risk of contamination with
pathogens. And they should be given in a way that is appropriate. The adequacy of
complementary feeding (adequacy in short for timely, adequate, safe and appropriate)
not only depends on the availability of a variety of foods in the household, but also on
the feeding practices of caregivers. Feeding young infants requires active care and
stimulation, where the caregiver is responsive to the child clues for hunger and also
encourages the child to eat. This is also referred to as active or responsive feeding.
WHO recommends that infants start receiving complementary foods at the age 6
months in addition to breast milk, initially 2-3 times a day between 6-8 months,
increasing to 3-4 times daily between 9-11 months and 12-24 months with additional
nutritious snacks offered 1-2 times per day, as desired. Inappropriate feeding practices
are often a greater determinant of inadequate intakes than the availability of foods in
the households. WHO has developed a protocol for adapting feeding
recommendations that enables program managers to identify local feeding practices,
20
common problems associated with feeding and adequate complementary foods. The
protocol builds upon available information and proposes household trials to test
improved feeding recommendations. WHO recommends that the protocol be used to
design interventions for improved complementary feeding, and is included as part of
adaption process of the integrated management of childhood illness strategy. Research
has shown that caregivers require skilled support to adequately feed their infants.
2.3 SOCIOECONOMIC AND DEMOGRAPHIC FACTORS AFFECTING
BREASTFEEDING MOTHERS
Extensive breastfeeding research has been done to identify factors that influence
breastfeeding initiation and duration. The literature however suggests that predictors
of breastfeeding may vary in the different parts of the world. For instance, studies in
Australia, Iceland, Ireland and Scotland as well as the USA have found that the
breastfeeding rates are higher among women who are older and have high levels of
education (Baghurst et al…2013, Cairney and Barbour 2015, Tarrant and Kearney
2012). Additionally, high incomes have also been associated with increased
breastfeeding rates in areas such as Sweden (Wallby and Hjern 2011) and rural
Jamaica (Chatman et al…2014). A study by Qui Zhao, Binas, Lee and Xie (2011) in
Zhejiang China, which looked at initiation and prevalence of breastfeeding, however
suggested that younger mothers with lower educational levels and family income are
more likely to breastfeed. In Brazil, a mother’s daily contact with their own mother
had a negative impact on breastfeeding (Susin, Giugliani and Kummer 2015) while
the study performed by Grassley and Eschiti (2014) on mother’s in Texas USA
suggested that grandmother’s value regarding breastfeeding was considered to
positively influence their daughter’s breastfeeding practices. In South Asia, an
intervention which involved a leaflet with information on health benefits of
breastfeeding as well as the good practices to educate both mothers and grandmothers
increased the likelihood of breastfeeding (Ingram, Johnson and Hamid 2015.
Meanwhile while/when computing urban versus rural areas, the results of the studies
comparing breastfeeding initiation are not consistent. For example, (Kamudoni,
Maleta, Shi and Halmboe, Ottesen 2011) used the cross-sectional household study
that consisted of 157 rural and 192 Semi Urban mother infant pairs in Malawi and
21
found that the Semi Urban mothers were more likely to engage in exclusive
breastfeeding however, the other studies found that women in the rural areas were
most likely to practice breastfeeding (Qui et al…2013). Economically, China has
undergone a rapid surge and transition. The economic growth may have affected the
practice of breastfeeding and the increased marketing of the breast milk substitutes
could have contributed to the decrease in the breastfeeding (Xul et al…2012). The life
style and socioeconomic levels of individuals in China have also greatly contributed
to the decrease in the breastfeeding of the children.
22
CHAPTER THREE
METHODOLOGY
3.0 STUDY DESIGN
The study was a descriptive cross-sectional study using quantitative methods. The
design aimed at obtaining data about the different breastfeeding practices
andnutritional status of children below the age of 5years in Sheema district, Uganda.
3.1 STUDY POPULATION
The study focused on the sample population of children below the age of 5 years.
3.2 SAMPLING TECHNIQUE
Simple random sampling technique was used.
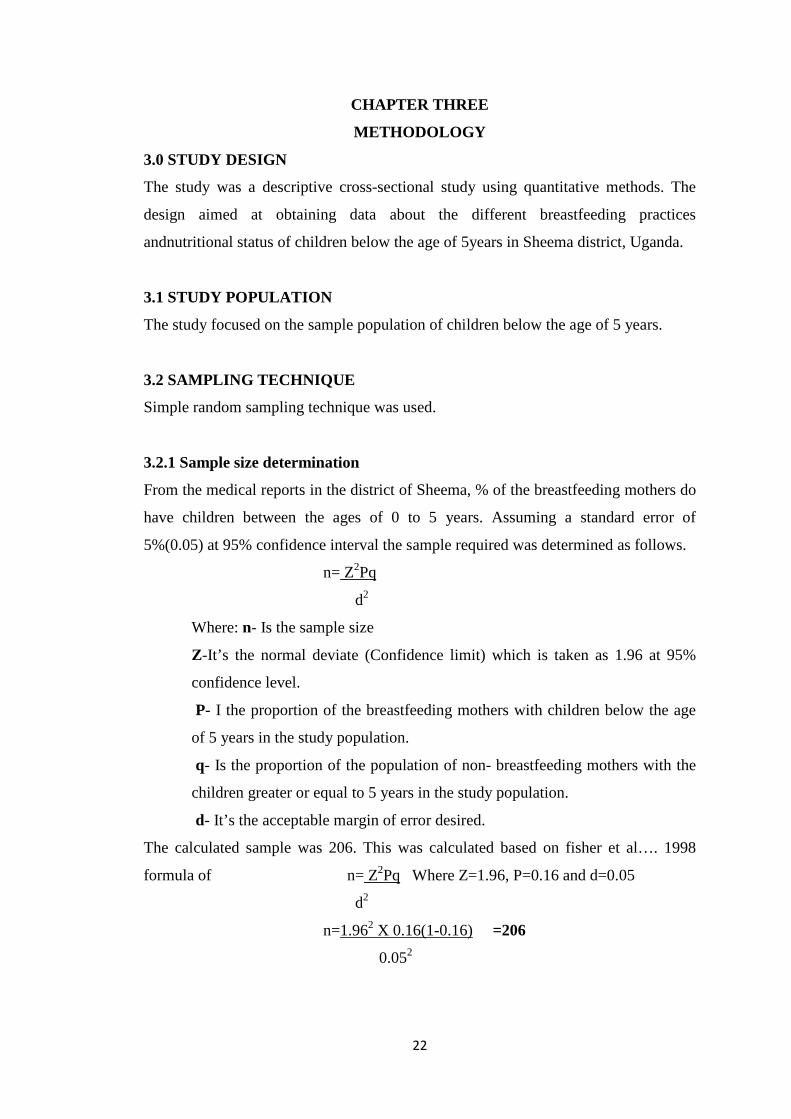
3.2.1 Sample size determination
From the medical reports in the district of Sheema, % of the breastfeeding mothers do
have children between the ages of 0 to 5 years. Assuming a standard error of
5%(0.05) at 95% confidence interval the sample required was determined as follows.
n= Z2Pq
d2
Where: n- Is the sample size
Z-It’s the normal deviate (Confidence limit) which is taken as 1.96 at 95%
confidence level.
P- I the proportion of the breastfeeding mothers with children below the age
of 5 years in the study population.
q- Is the proportion of the population of non- breastfeeding mothers with the
children greater or equal to 5 years in the study population.
d- It’s the acceptable margin of error desired.
The calculated sample was 206. This was calculated based on fisher et al…. 1998
formula of n= Z2Pq Where Z=1.96, P=0.16 and d=0.05
d2
n=1.962 X 0.16(1-0.16) =206
0.052
23
3.2.2 Sampling procedure
Simple random sampling was used. The procedure allowed for convenience of the
patients. All children below the age of 5 years attending Kitagata general hospital and
meet the inclusion criteria were recruited for the study. Simple random sampling was
then being applied to establish the actual sample cases. A number was assigned to
every subject of the study population. These numbers were written on the small pieces
of paper. All the papers were then being put in a box after which the box was shaken
vigorously to ensure randomization. The papers were picked at random from the box
and the numbers recorded. The subjects responding to the numbers picked were also
recruited. The area considered for study wasKitagata general hospital.
3.2.3 Inclusion and exclusion criteria
3.2.3.1 Inclusion criteria
All children below the age of 5years in Kitagata general hospital who
are still breastfeeding.
3.2.3.2 Exclusion criteria
Children above the age of 5 years in Kitagata general hospital.
All children within the age bracket of 0 to 5 years but with congenital
abnormalities or Deformity
Refusal of parents to have their children between the ages of 0 to 5
years to be included in the study.
3.3 DATA COLLECTION
The study applied only quantitative analysis by the use of structured questionnaires
3.3.1 Questionnaire
Data was collected from the breastfeeding mothers with children below the age of 5
years and the questionnaire comprised of the structured questions having both the
closed ended and open ended questions. The questionnaires were used to collect the
following information from the key respondents;
1. Different breastfeeding practices of children below the ages of 5 years.
24
2. Nutritional status of children below the age of 5 years.
3. Socioeconomic and demographic factors affecting breastfeeding mothers.
3.3.2Anthropometric measurements technique
Height, weight and head circumference were obtained for all children
participating in the study by using standard anthropometricprocedures.
a) Weight
Body weight with minimum clothes was obtained and recorded. The children below
5 years were put on a single beam scale.
.
b) Length-
The length for those less than 5 yearswas measured using an infantometer
c) Height
The height for children less than 5 years was obtained in bare footed children using
height anthropometer (standiometer). The anthropometer consist of a measuring tape
attached to a movable plastic triangle comprising the head piece, the measuring tape
stretched to its maximum and placed on a flat wall. The child was made to stand on
the floor with the feet in the parallel position and with the heel, buttocks, shoulders
and back of the head touching the wall while the head in the erect position and the
arms hanging loosely at the side. The head piece of the scale was brought down
perpendicular to the wall and parallel to the top of the head. The measuring scales was
adjusted and checked before each measuring section.
d) Head circumference
This was measured using flexible non-stretch tape which was made to encircle the
child's head at the occipito-frontal diameter.
e) Mid upper arm circumference
The subject was positioned as for the measurements of head circumference with the
left arm completely relaxed and extended by the side. A mark was drawn on the
lateral side of the upper arm midway between the acromion and the olecranon. The
25
tape was then passed around the arm, so that it does touch the skin but not
compressing the tissue, and the measurement read to the last completed unit.
3.4 DATA ANALYSIS
3.4.1 Quantitative Data Analysis
The data was edited before, during and after leaving the respondents. The researcher
checked for uniformity, accuracy, consistency, legibility and comprehensibility. It
was coded and tabulated using SPSS program. Chi-square tests was calculated using
independent variables such as age, sex, level of education and income and the
dependent variable like the nutritional status and consistent deployment of ITNs.
3.5 ETHICAL CONSIDERATIONS AND PROCEDURE
The researcher got an introductory letter from Kampala international University
Teaching Hospital Western campus. The letter was presented to the hospital
administration to seek permission to conduct research within the hospital. The
interviews were conducted at Kitagata general hospital. Each interview lasted about
20 minutes.
In regard to ethical considerations, the rights of individuals and institution were
respected. The researcher first asked consent from of all the respondents prior to the
interviews and respondents was assured of confidentiality of their responses and that
information would not be used for anything else other than that of the study
3.6 ANTICIPATED PROBLEMS
The delimitations of the study included the following; the small geographical area,
one hospital may not be a representation of the nutritional status of breastfeeding
children below the age of 5 years in Sheema district and the other limitation of the
study may include; failure of key informants to fulfill appointments made with them.
DATA ANALYSIS AND INTERPRETATION
4.0: INTRODUCTION
This chapter deals with data analysis and results interpretation. The
conducted in Kitagata hospital of Sheema district in western Uganda
of determining the different breastfeeding practices
between the ages of 5 years
who were randomly selected.
4.1 THE AGE DISTRIBUTION OF MOTHERS IN Y
Figure 2: A Cylindrical graph showing the age distribution of Mothers in years
The age group 25-29 years was the
while the least age group was 15
0
10
20
30
40
50
60
70
80
15
Frequency
Fre
qu
ency
26
CHAPTER FOUR
DATA ANALYSIS AND INTERPRETATION
4.0: INTRODUCTION
This chapter deals with data analysis and results interpretation. The
conducted in Kitagata hospital of Sheema district in western Uganda
of determining the different breastfeeding practices and nutritional status of children
between the ages of 5 years in Sheema district Uganda. There were 203 participants
who were randomly selected.
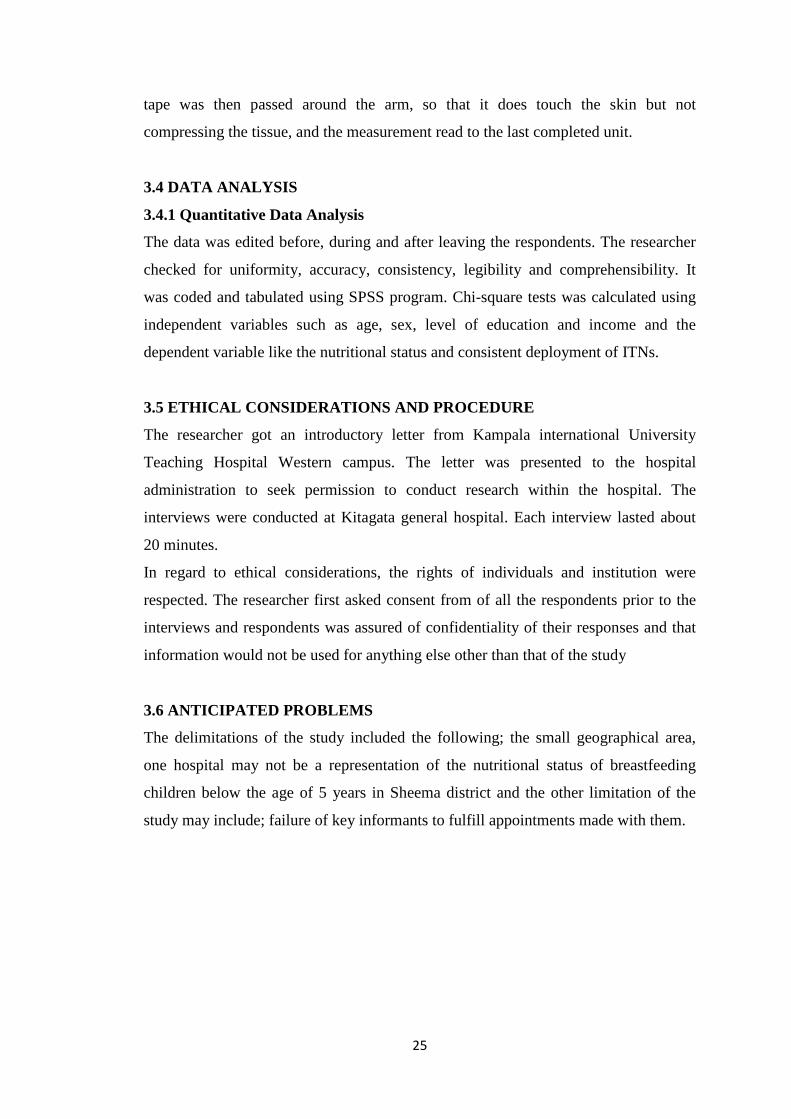
4.1 THE AGE DISTRIBUTION OF MOTHERS IN YEARS
Figure 2: A Cylindrical graph showing the age distribution of Mothers in years
29 years was the most73 (36%), followed by 20
while the least age group was 15-19 years old2 (1%).
15-19 20-24 25-29 30-34
2 48 73 45
2
48
73
45
Mother's age in years
DATA ANALYSIS AND INTERPRETATION
This chapter deals with data analysis and results interpretation. The study was
conducted in Kitagata hospital of Sheema district in western Uganda for the purpose
nutritional status of children
. There were 203 participants
Figure 2: A Cylindrical graph showing the age distribution of Mothers in years
36%), followed by 20-24 years 48(24%)
>34
35
35
4.2: MARITAL STATUS OF THE
Figure 3: A cylindrical graph showing marital status of the Mothers
Most of the participants were Married
single 3(1%). No mother was widowed.
4.3 EDUCATION LEVEL OF RESPONDENTS
Table 2: Showing education
From the table above,
37(18%) attended secondary education,
9(5%) did not attended any level of education.
0
50
100
150
200
MarriedFrequency
Fre
qu
ency
Marital status of the Mothers
Education Level
primary
Secondary
Tertiary
None
Total
27
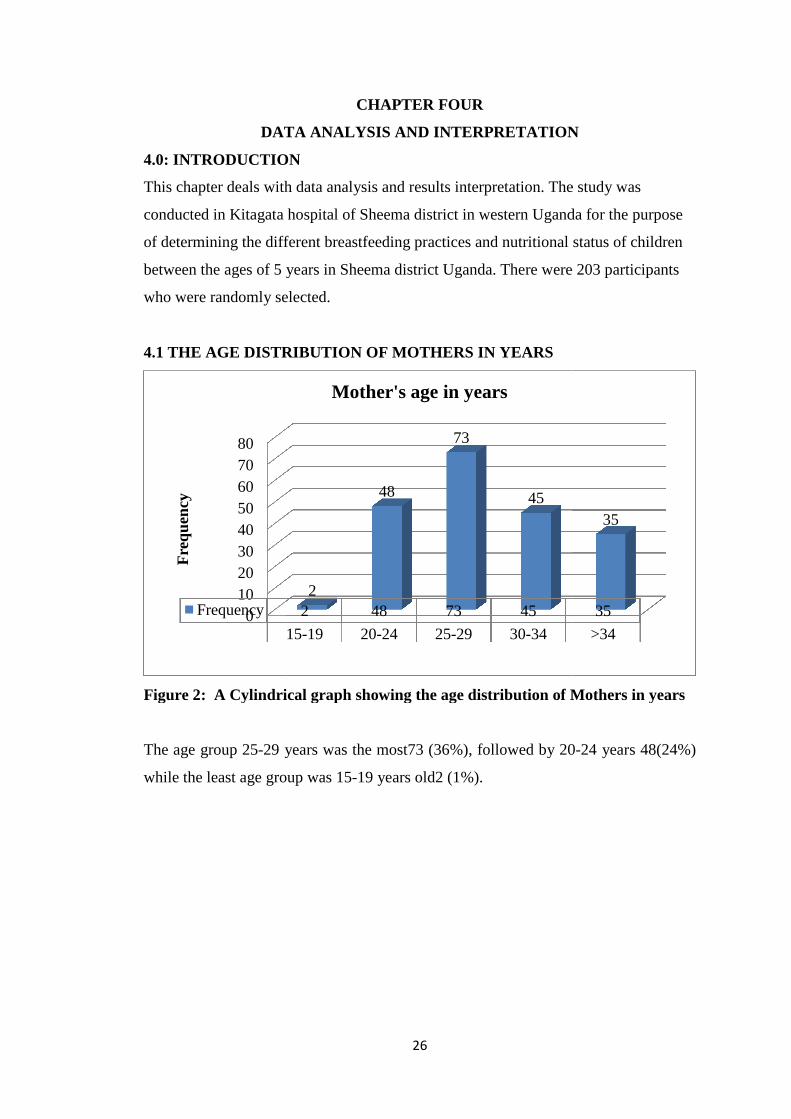
4.2: MARITAL STATUS OF THE MOTHERS
: A cylindrical graph showing marital status of the Mothers
Most of the participants were Married 196(97%) followed by divorced
(1%). No mother was widowed.
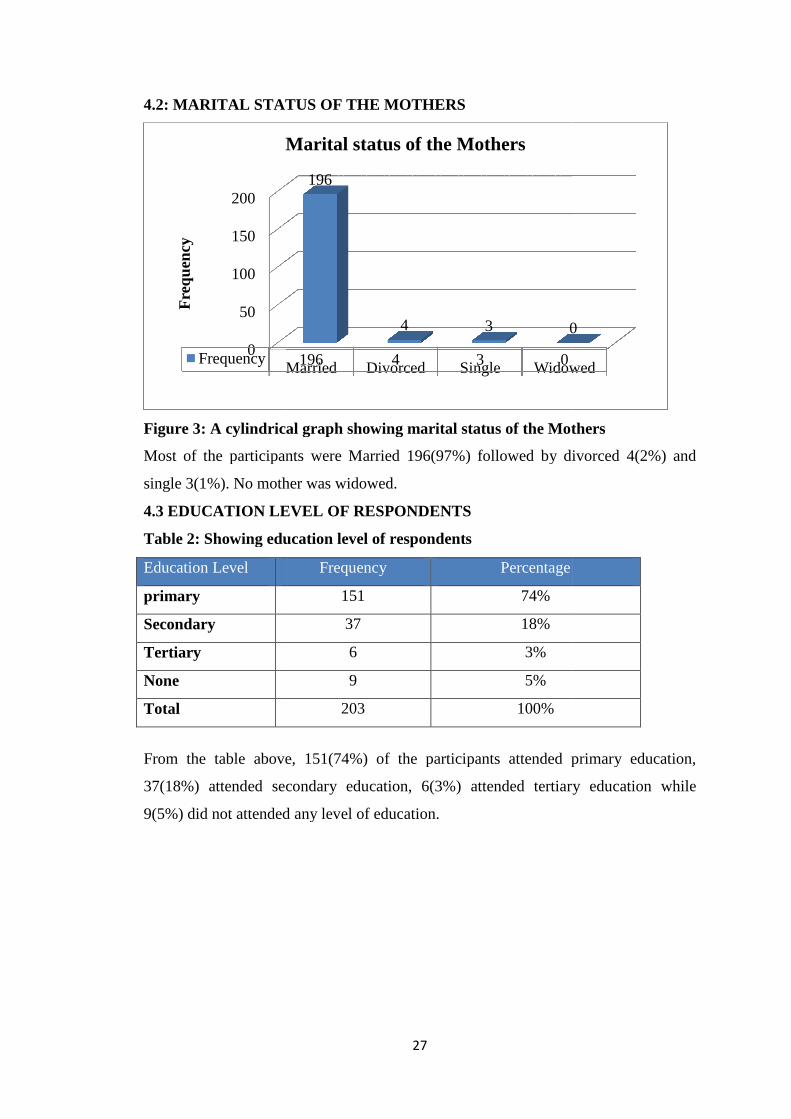
4.3 EDUCATION LEVEL OF RESPONDENTS
Showing education level of respondents
From the table above, 151(74%) of the participants attended primary education,
attended secondary education, 6(3%) attended tertiary education while
did not attended any level of education.
Married Divorced Single Widowed196 4 3 0
196
4 3 0
Marital status of the Mothers
Frequency Percentage
151 74%
37 18%
6 3%
9 5%
203 100%
: A cylindrical graph showing marital status of the Mothers
(97%) followed by divorced 4(2%) and
of the participants attended primary education,
attended tertiary education while
Widowed
0
28
4.4 RELIGION OF RESPONDENTS
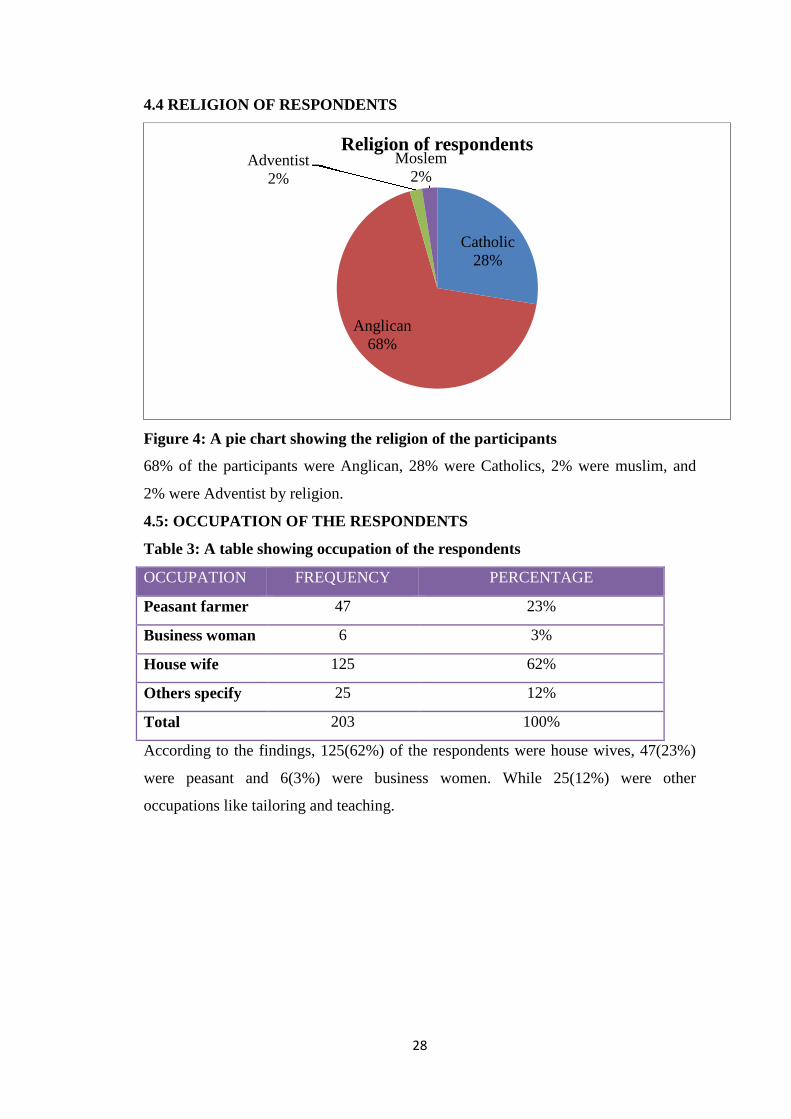
Figure 4: A pie chart showing the religion of the participants
68% of the participants were Anglican, 28% were Catholics, 2% were muslim, and
2% were Adventist by religion.
4.5: OCCUPATION OF THE RESPONDENTS
Table 3: A table showing occupation of the respondents
OCCUPATION FREQUENCY PERCENTAGE
Peasant farmer 47 23%
Business woman 6 3%
House wife 125 62%
Others specify 25 12%
Total 203 100%
According to the findings, 125(62%) of the respondents were house wives, 47(23%)
were peasant and 6(3%) were business women. While 25(12%) were other
occupations like tailoring and teaching.
Catholic28%
Anglican68%
Adventist2%
Moslem2%
Religion of respondents
4.6: RESPONDENT’S SOURCE
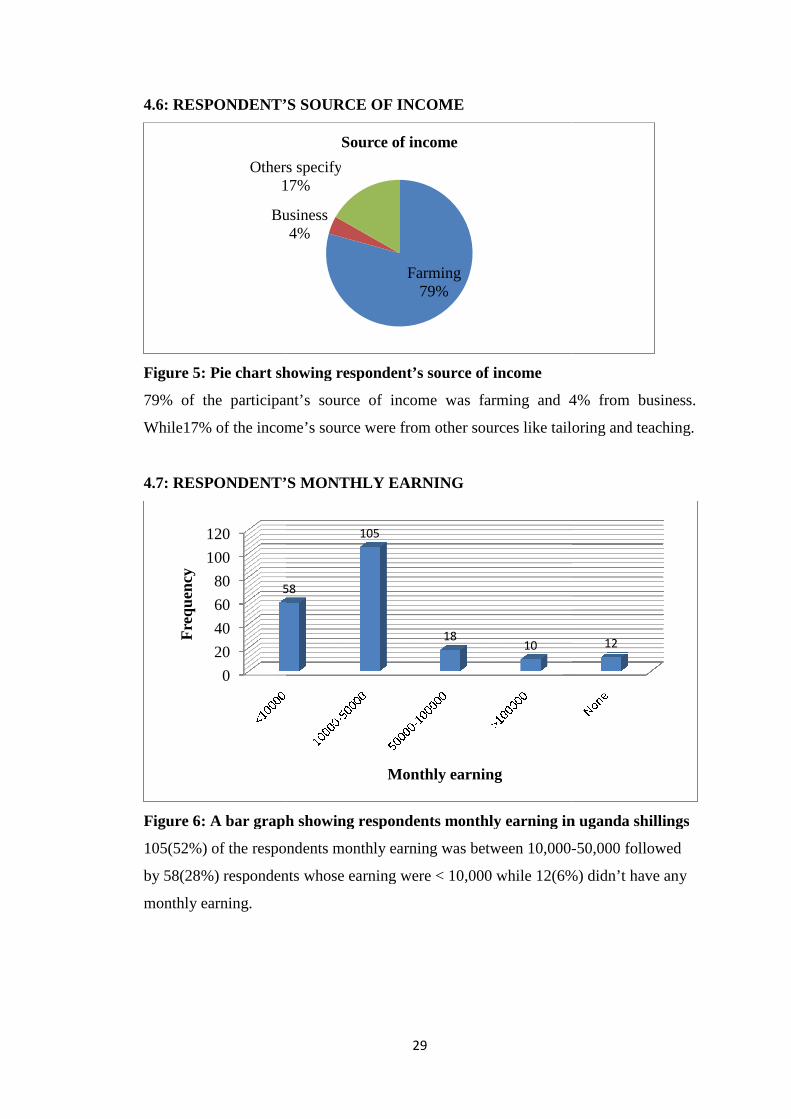
Figure 5: Pie chart showing respondent’s source of income
79% of the participant’s source of income was farm
While17% of the income’s source were from other sources like tailoring and teaching.
4.7: RESPONDENT’S
Figure 6: A bar graph showing respondents monthly earning in uganda shillings
105(52%) of the respondents monthly earning was between 10,000
by 58(28%) respondents whose earning were < 10,000 while
monthly earning.
Business
Others specify17%
0
20
40
60
80
100
120
58
Fre
qu
ency
29
4.6: RESPONDENT’S SOURCE OF INCOME
ie chart showing respondent’s source of income
79% of the participant’s source of income was farming and 4% from business.
17% of the income’s source were from other sources like tailoring and teaching.
4.7: RESPONDENT’S MONTHLY EARNING
: A bar graph showing respondents monthly earning in uganda shillings
of the respondents monthly earning was between 10,000-
respondents whose earning were < 10,000 while 12(6%
Farming79%
Business4%
Others specify17%
Source of income
58
105
1810
Monthly earning
ing and 4% from business.
17% of the income’s source were from other sources like tailoring and teaching.
: A bar graph showing respondents monthly earning in uganda shillings
-50,000 followed
6%) didn’t have any
12
4.8: RESPONDENT’S NUMBER OF CHILDREN
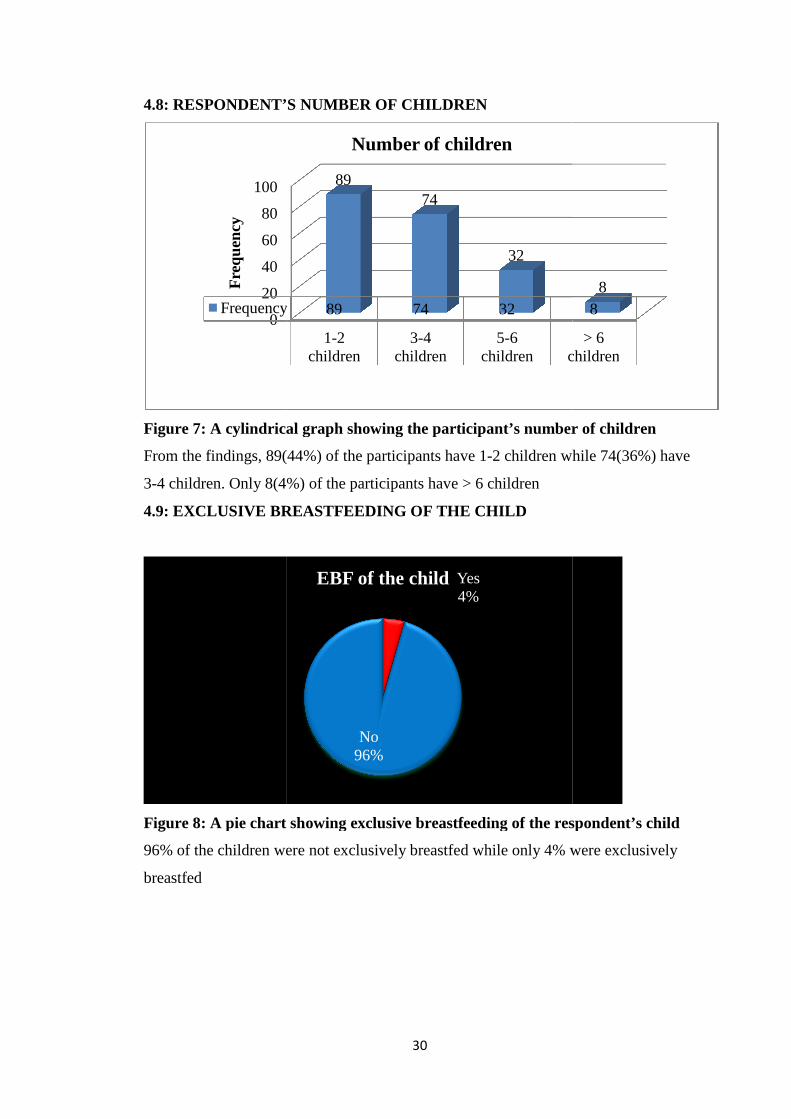
Figure 7: A cylindrical graph showing the participant’s number of children
From the findings, 89(
3-4 children. Only 8(4
4.9: EXCLUSIVE BREASTFEEDING OF THE CHILD
Figure 8: A pie chart showing exclusive breastfeeding of the respondent’s child
96% of the children were not exclusively breastfed while only 4% were exclusively
breastfed
0
20
40
60
80
100
Frequency
Fre
qu
ency
30
4.8: RESPONDENT’S NUMBER OF CHILDREN
: A cylindrical graph showing the participant’s number of children
89(44%) of the participants have 1-2 children while
8(4%) of the participants have > 6 children
4.9: EXCLUSIVE BREASTFEEDING OF THE CHILD
: A pie chart showing exclusive breastfeeding of the respondent’s child
96% of the children were not exclusively breastfed while only 4% were exclusively
1-2children
3-4children
5-6children children
Frequency 89 74 32
8974
32
Number of children
Yes4%
No96%
EBF of the child
: A cylindrical graph showing the participant’s number of children
2 children while 74(36%) have
: A pie chart showing exclusive breastfeeding of the respondent’s child
96% of the children were not exclusively breastfed while only 4% were exclusively
> 6children
8
8
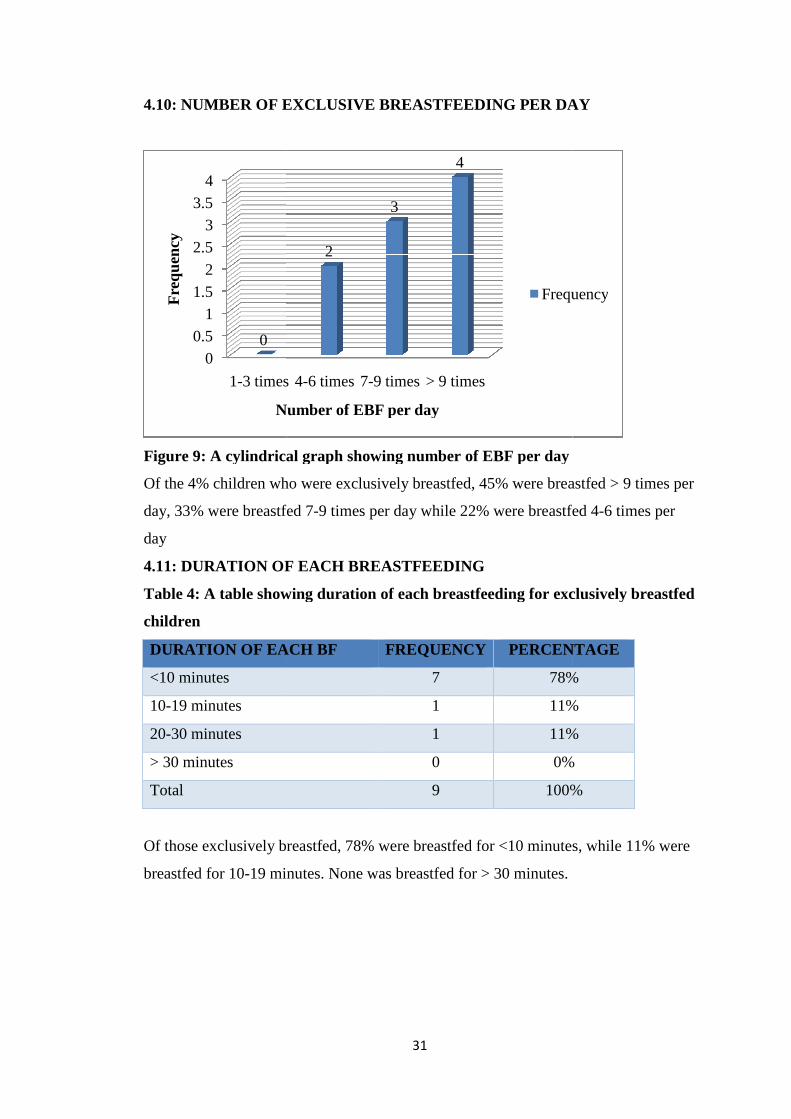
4.10: NUMBER OF EXCLUSIVE BREASTFEEDING PER DAY
Figure 9: A cylindrical graph showing number of EBF per day
Of the 4% children who were exclusively breastfed, 45% were breastfed > 9 times per
day, 33% were breastfed 7
day
4.11: DURATION OF EACH BREASTFEEDING
Table 4: A table showing duration of each breastfeeding for
children
DURATION OF EACH BF
<10 minutes
10-19 minutes
20-30 minutes
> 30 minutes
Total
Of those exclusively breastfed, 78% were breastfed for <10 minutes, while 11% were
breastfed for 10-19 minutes. None was breastfed for > 30 minutes.
0
0.5
1
1.5
2
2.5
3
3.5
4
1-3 times
0
Fre
qu
ency
Number of EBF per day
31
4.10: NUMBER OF EXCLUSIVE BREASTFEEDING PER DAY
: A cylindrical graph showing number of EBF per day
Of the 4% children who were exclusively breastfed, 45% were breastfed > 9 times per
day, 33% were breastfed 7-9 times per day while 22% were breastfed 4
4.11: DURATION OF EACH BREASTFEEDING
: A table showing duration of each breastfeeding for exclusively breastfed
DURATION OF EACH BF FREQUENCY PERCENTAGE
7 78%
1 11%
1 11%
0 0%
9 100%
Of those exclusively breastfed, 78% were breastfed for <10 minutes, while 11% were
19 minutes. None was breastfed for > 30 minutes.
3 times 4-6 times 7-9 times > 9 times
2
3
4
Number of EBF per day
Frequency
4.10: NUMBER OF EXCLUSIVE BREASTFEEDING PER DAY
Of the 4% children who were exclusively breastfed, 45% were breastfed > 9 times per
breastfed 4-6 times per
exclusively breastfed
PERCENTAGE
78%
11%
11%
0%
100%
Of those exclusively breastfed, 78% were breastfed for <10 minutes, while 11% were
Frequency
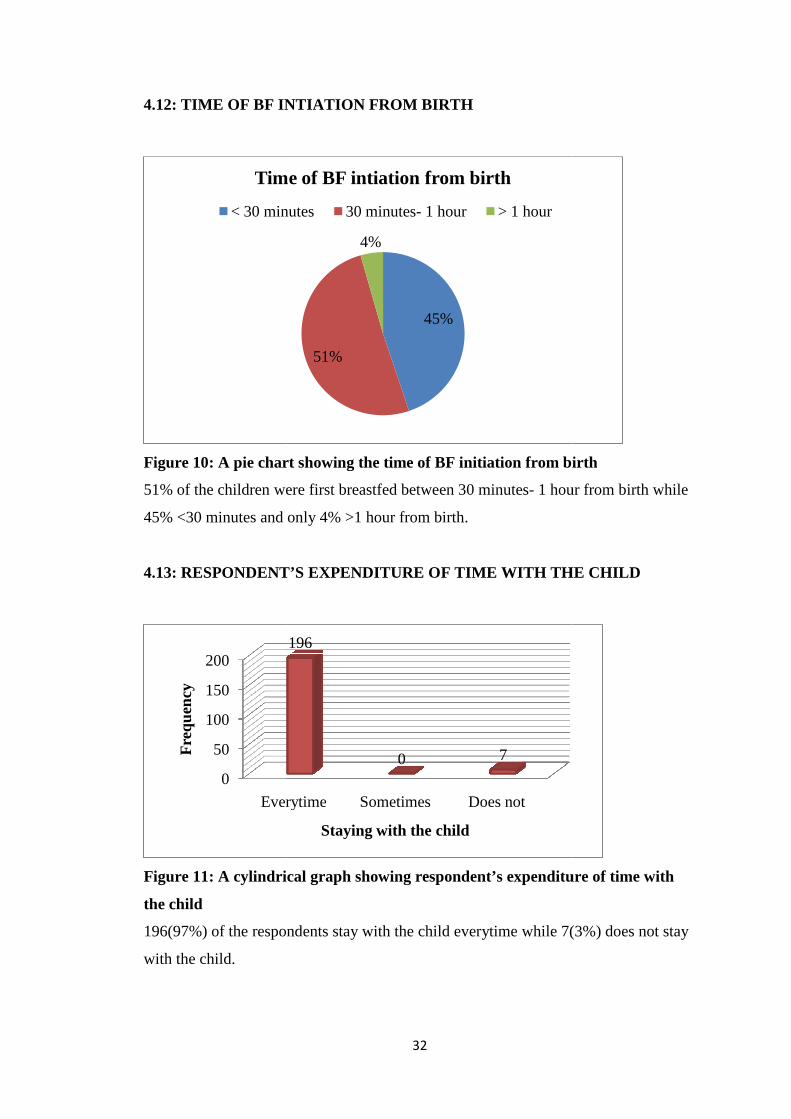
4.12: TIME OF BF INTIATION FROM BIRTH
Figure 10: A pie chart
51% of the children were first breastfed between 30 minutes
45% <30 minutes and only 4% >1 hour from birth.
4.13: RESPONDENT’S EXPENDITURE
Figure 11: A cylindrical graph showing respondent’s expenditure of time with
the child
196(97%) of the respondents stay with the child everytime while
with the child.
Time of BF intiation from birth
< 30 minutes
0
50
100
150
200
Everytime
Fre
qu
ency
32
TIME OF BF INTIATION FROM BIRTH
: A pie chart showing the time of BF initiation from birth
51% of the children were first breastfed between 30 minutes- 1 hour from birth while
45% <30 minutes and only 4% >1 hour from birth.
RESPONDENT’S EXPENDITURE OF TIME WITH THE CHILD
cylindrical graph showing respondent’s expenditure of time with
of the respondents stay with the child everytime while 7(
45%
51%
4%
Time of BF intiation from birth
< 30 minutes 30 minutes- 1 hour > 1 hour
Everytime Sometimes Does not
196
0 7
Staying with the child
showing the time of BF initiation from birth
1 hour from birth while
OF TIME WITH THE CHILD
cylindrical graph showing respondent’s expenditure of time with
7(3%) does not stay
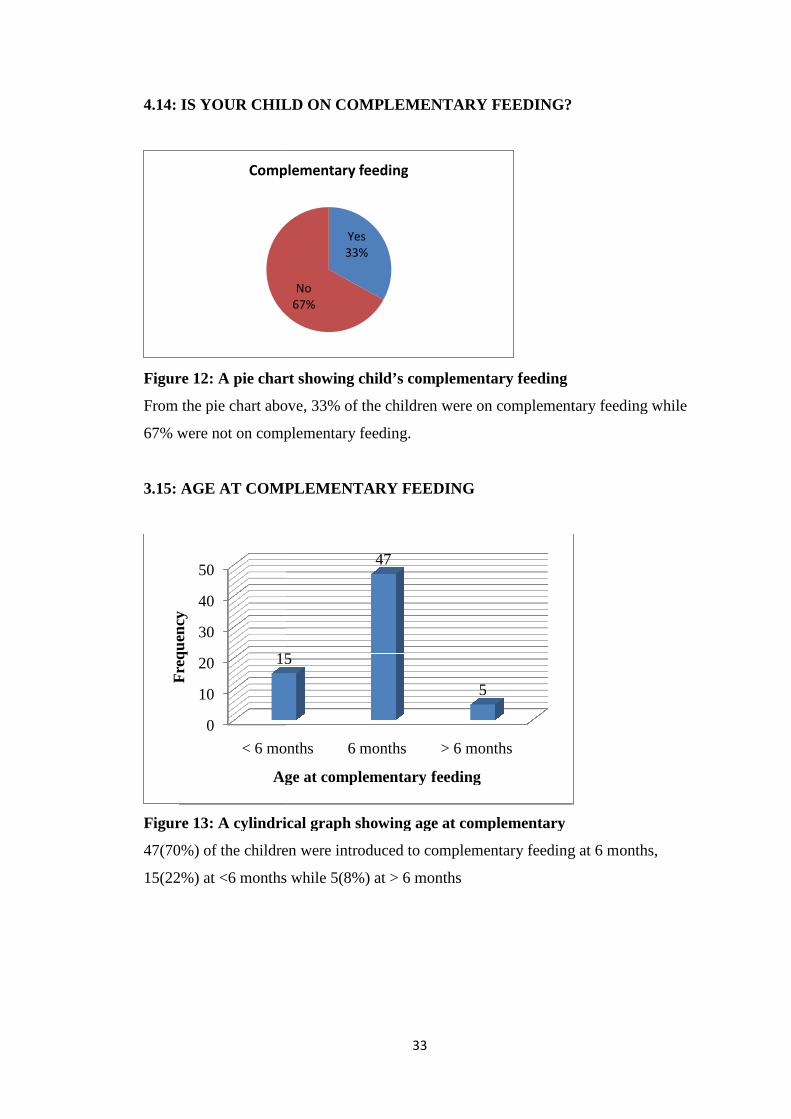
4.14: IS YOUR CHILD ON COMPLEMENTARY FEEDING?
Figure 12: A pie chart showing
From the pie chart above, 33% of the children were on complementary feeding while
67% were not on complementary feeding.
3.15: AGE AT COMPLEMENTARY FEEDING
Figure 13: A cylindrical graph showing age at complementary
47(70%) of the children were introduced to complementary feeding at 6 months,
15(22%) at <6 months while
Complementary feeding
0
10
20
30
40
50
< 6 months
15
Fre
qu
ency
Age at complementary feeding
33
4.14: IS YOUR CHILD ON COMPLEMENTARY FEEDING?
: A pie chart showing child’s complementary feeding
From the pie chart above, 33% of the children were on complementary feeding while
67% were not on complementary feeding.
AGE AT COMPLEMENTARY FEEDING
: A cylindrical graph showing age at complementary
of the children were introduced to complementary feeding at 6 months,
at <6 months while 5(8%) at > 6 months
Yes33%
No67%
Complementary feeding
< 6 months 6 months > 6 months
15
47
5
Age at complementary feeding
4.14: IS YOUR CHILD ON COMPLEMENTARY FEEDING?
From the pie chart above, 33% of the children were on complementary feeding while
of the children were introduced to complementary feeding at 6 months,
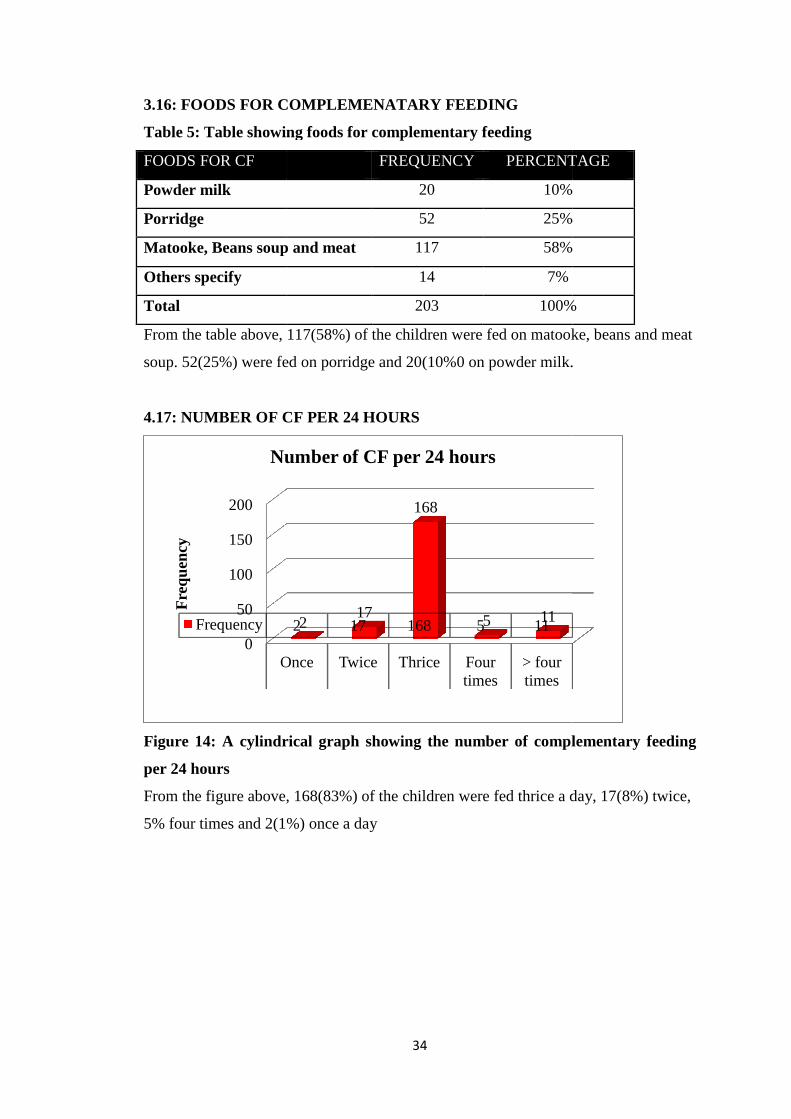
3.16: FOODS FOR COMPLEMENATARY FEEDING
Table 5: Table showing
FOODS FOR CF
Powder milk
Porridge
Matooke, Beans soup and meat
Others specify
Total
From the table above,
soup. 52(25%) were fed on porridge and
4.17: NUMBER OF CF PER 24 HOURS
Figure 14: A cylindrical graph showing the number of complementary feeding
per 24 hours
From the figure above,
5% four times and 2(1%
0
50
100
150
200
Once
Frequency
Fre
qu
ency
Number of CF per 24 hours
34
: FOODS FOR COMPLEMENATARY FEEDING
able showing foods for complementary feeding
FREQUENCY PERCENTAGE
20 10%
52 25%
Matooke, Beans soup and meat 117 58%
14 7%
203 100%
From the table above, 117(58%) of the children were fed on matooke, beans and meat
were fed on porridge and 20(10%0 on powder milk.
NUMBER OF CF PER 24 HOURS
: A cylindrical graph showing the number of complementary feeding
From the figure above, 168(83%) of the children were fed thrice a day,
1%) once a day
Once Twice Thrice Fourtimes
> fourtimes
2 17 168 5 11217
168
5 11
Number of CF per 24 hours
PERCENTAGE
10%
25%
58%
100%
of the children were fed on matooke, beans and meat
on powder milk.
: A cylindrical graph showing the number of complementary feeding
of the children were fed thrice a day, 17(8%) twice,
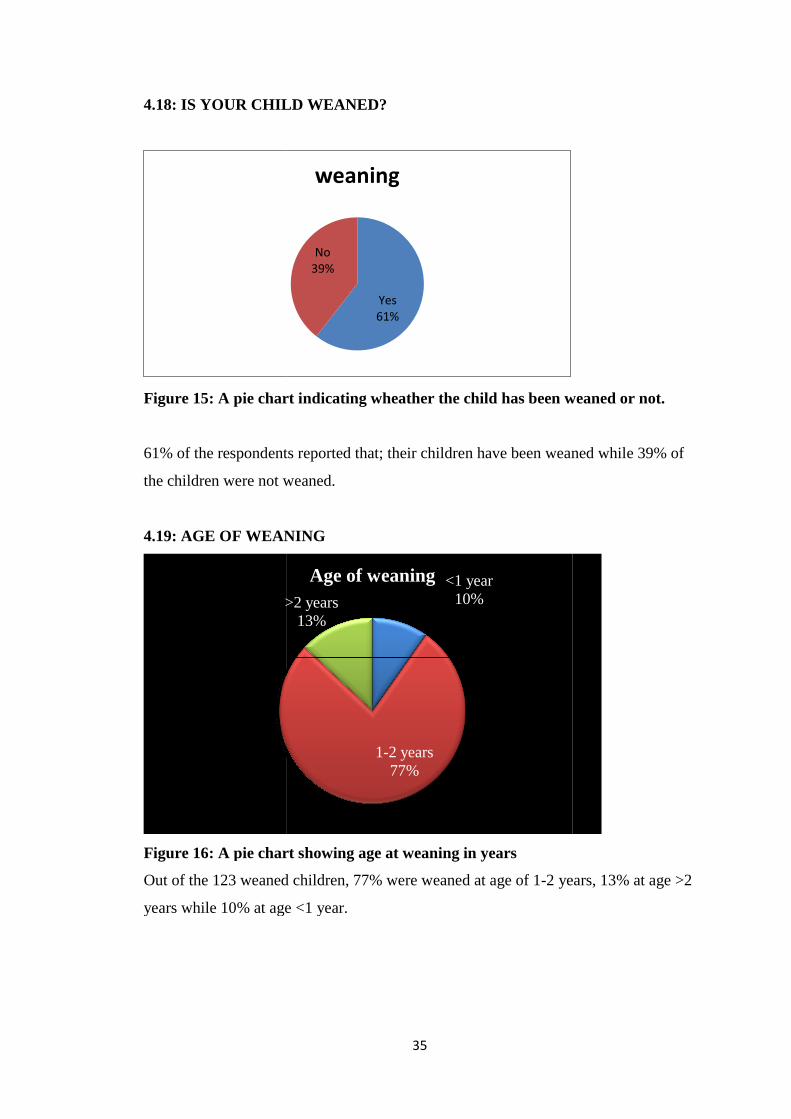
4.18: IS YOUR CHILD WEANED?
Figure 15: A pie chart indicating wheather the child has been weaned or not.
61% of the respondents reported that; their children have been weaned while 39% of
the children were not weaned.
4.19: AGE OF WEANING
Figure 16: A pie chart
Out of the 123 weaned children, 77% were weaned at age of 1
years while 10% at age <1 year.
>2 years
35
CHILD WEANED?
: A pie chart indicating wheather the child has been weaned or not.
61% of the respondents reported that; their children have been weaned while 39% of
the children were not weaned.
4.19: AGE OF WEANING
: A pie chart showing age at weaning in years
Out of the 123 weaned children, 77% were weaned at age of 1-2 years, 13% at age >2
years while 10% at age <1 year.
Yes61%
No39%
weaning
<1 year10%
1-2 years77%
>2 years13%
Age of weaning
: A pie chart indicating wheather the child has been weaned or not.
61% of the respondents reported that; their children have been weaned while 39% of
2 years, 13% at age >2
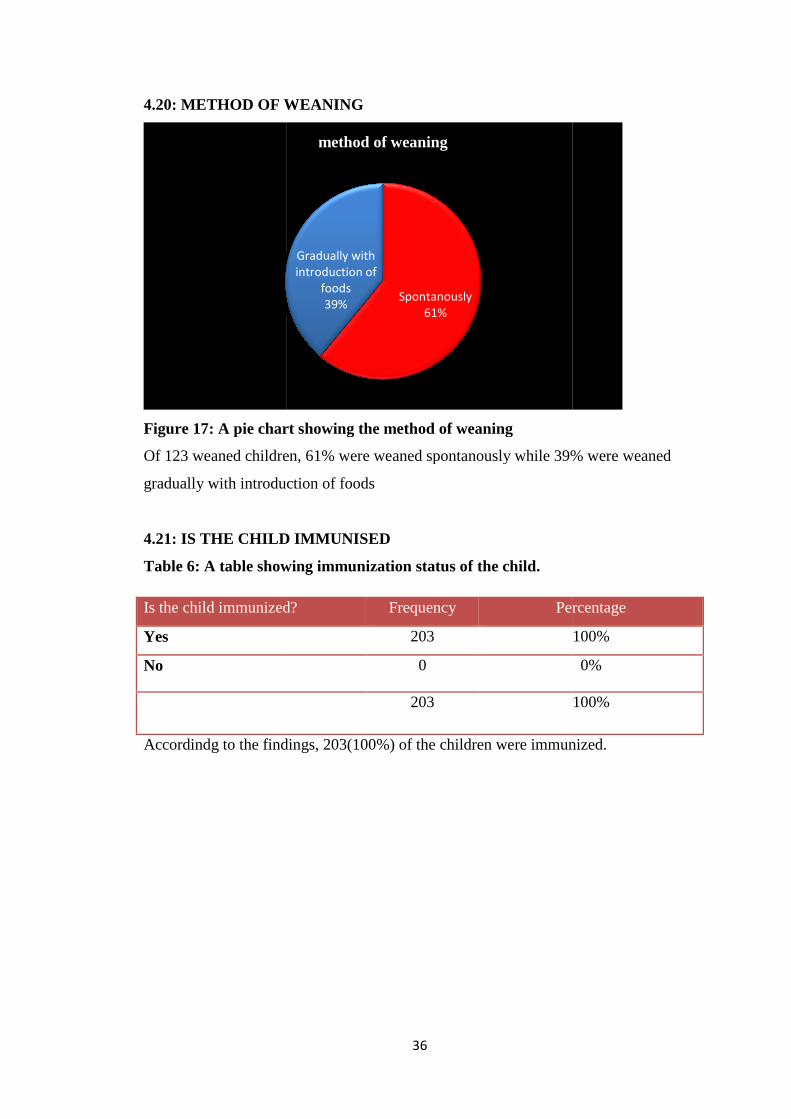
4.20: METHOD OF WEANING
Figure 17: A pie chart showing the method of weaning
Of 123 weaned children, 61%
gradually with introduction of foods
4.21: IS THE CHILD IMMUNISED
Table 6: A table showing im
Accordindg to the findings,
Is the child immunized?
Yes
No
36
4.20: METHOD OF WEANING
: A pie chart showing the method of weaning
Of 123 weaned children, 61% were weaned spontanously while 39% were weaned
gradually with introduction of foods
4.21: IS THE CHILD IMMUNISED
: A table showing immunization status of the child.
Accordindg to the findings, 203(100%) of the children were immunized.
Spontanously61%
Gradually withintroduction of
foods39%
method of weaning
Is the child immunized? Frequency Percentage
203
0
203
were weaned spontanously while 39% were weaned
of the children were immunized.
Percentage
100%
0%
100%
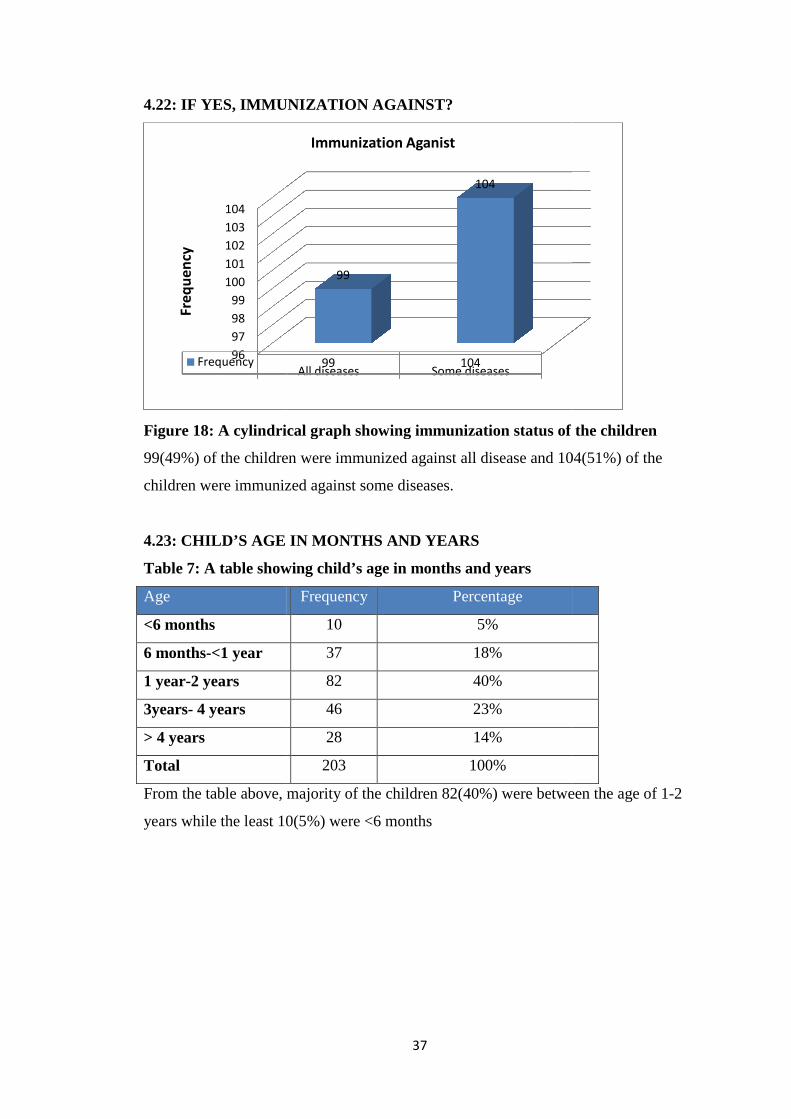
4.22: IF YES, IMMUNIZATION AGAINST?
Figure 18: A cylindrical graph showing immunization status of the children
99(49%) of the children were immunized against all disease and
children were immunized against some diseases.
4.23: CHILD’S AGE IN MONTHS AND YEARS
Table 7: A table showing
Age
<6 months
6 months-<1 year
1 year-2 years
3years- 4 years
> 4 years
Total
From the table above, majority of the children
years while the least 10
96
97
98
99
100
101
102
103
104
Frequency
Freq
uen
cy
37
4.22: IF YES, IMMUNIZATION AGAINST?
: A cylindrical graph showing immunization status of the children
of the children were immunized against all disease and 104(
children were immunized against some diseases.
4.23: CHILD’S AGE IN MONTHS AND YEARS
: A table showing child’s age in months and years
Frequency Percentage
10 5%
37 18%
82 40%
46 23%
28 14%
203 100%
From the table above, majority of the children 82(40%) were between the age of 1
10(5%) were <6 months
All diseases Some diseases99 104
99
104
Immunization Aganist
: A cylindrical graph showing immunization status of the children
104(51%) of the
(40%) were between the age of 1-2
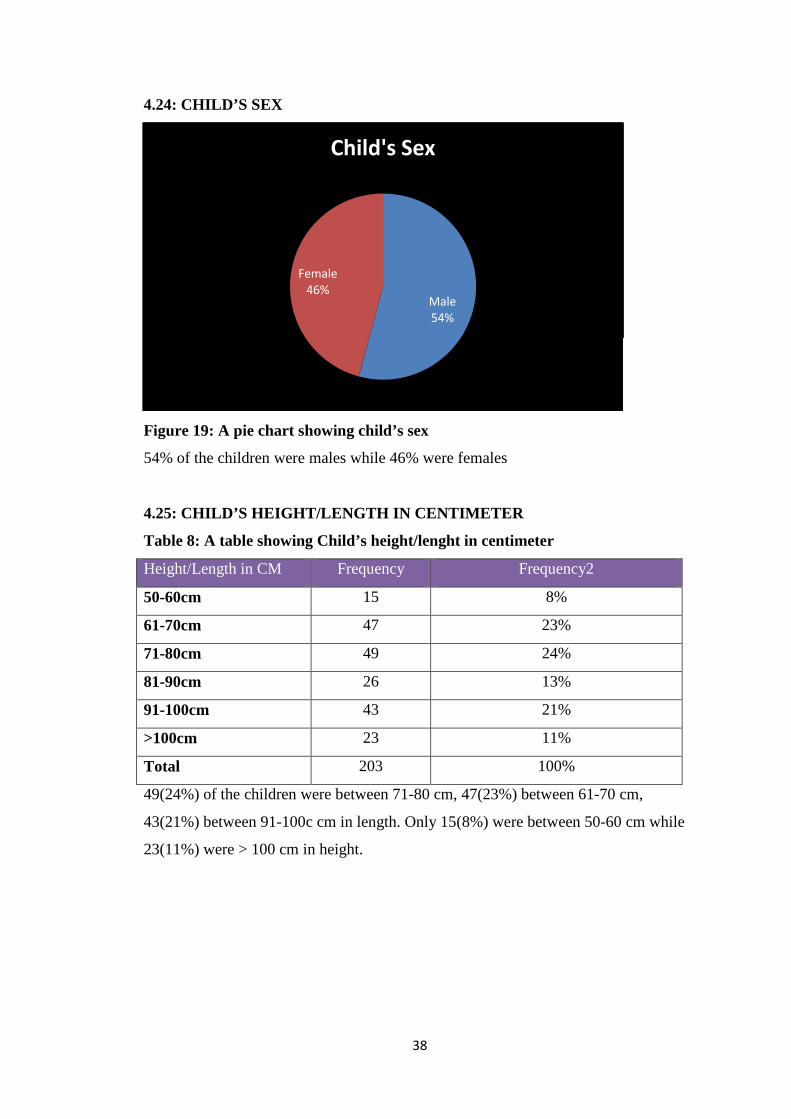
38
4.24: CHILD’S SEX
Figure 19: A pie chart showing child’s sex
54% of the children were males while 46% were females
4.25: CHILD’S HEIGHT/LENGTH IN CENTIMETER
Table 8: A table showing Child’s height/lenght in centimeter
Height/Length in CM Frequency Frequency2
50-60cm 15 8%
61-70cm 47 23%
71-80cm 49 24%
81-90cm 26 13%
91-100cm 43 21%
>100cm 23 11%
Total 203 100%
49(24%) of the children were between 71-80 cm, 47(23%) between 61-70 cm,
43(21%) between 91-100c cm in length. Only 15(8%) were between 50-60 cm while
23(11%) were > 100 cm in height.
Male54%
Female46%
Child's Sex
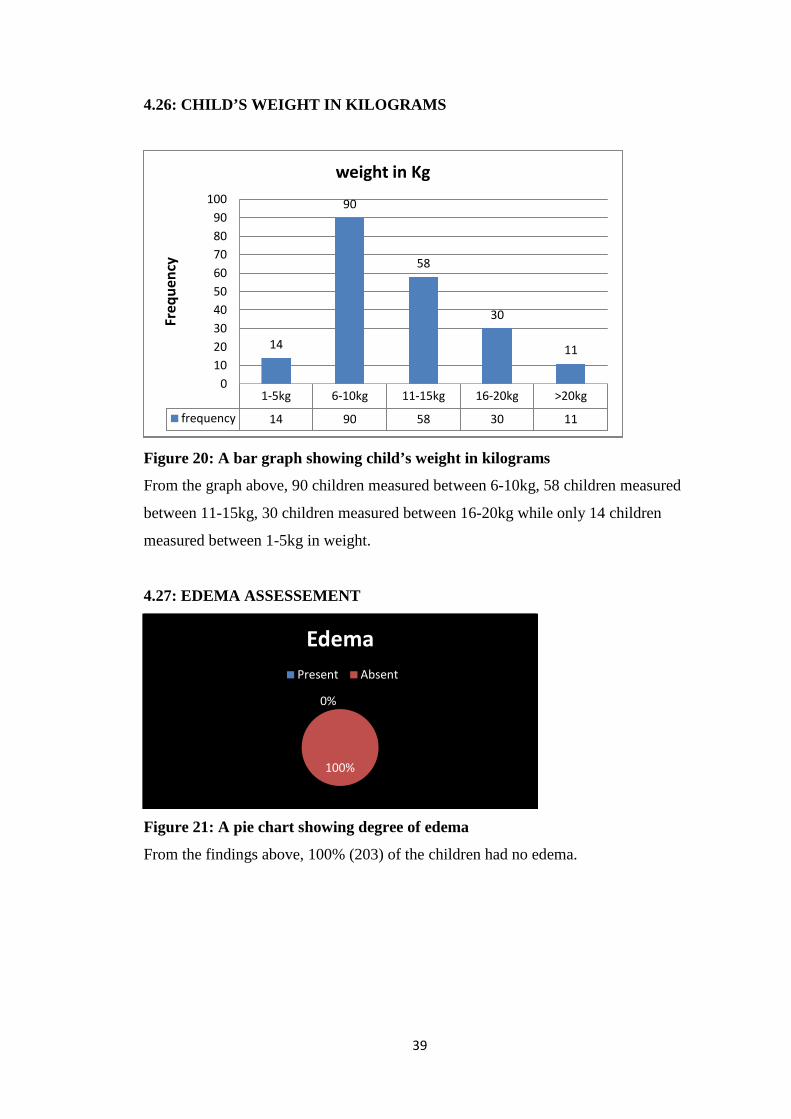
39
4.26: CHILD’S WEIGHT IN KILOGRAMS
Figure 20: A bar graph showing child’s weight in kilograms
From the graph above, 90 children measured between 6-10kg, 58 children measured
between 11-15kg, 30 children measured between 16-20kg while only 14 children
measured between 1-5kg in weight.
4.27: EDEMA ASSESSEMENT
Figure 21: A pie chart showing degree of edema
From the findings above, 100% (203) of the children had no edema.
1-5kg 6-10kg 11-15kg 16-20kg >20kg
frequency 14 90 58 30 11
14
90
58
30
11
0
10
20
30
40
50
60
70
80
90
100
Freq
uen
cyweight in Kg
0%
100%
Edema
Present Absent
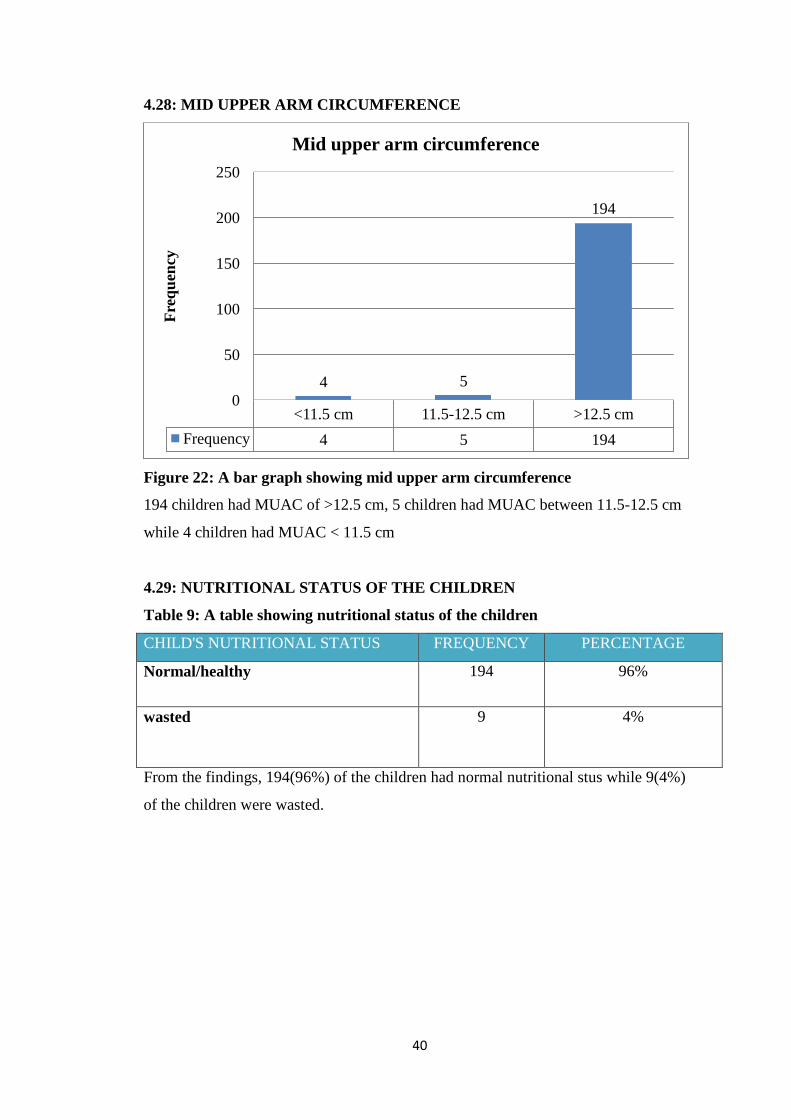
40
4.28: MID UPPER ARM CIRCUMFERENCE
Figure 22: A bar graph showing mid upper arm circumference
194 children had MUAC of >12.5 cm, 5 children had MUAC between 11.5-12.5 cm
while 4 children had MUAC < 11.5 cm
4.29: NUTRITIONAL STATUS OF THE CHILDREN
Table 9: A table showing nutritional status of the children
CHILD'S NUTRITIONAL STATUS FREQUENCY PERCENTAGE
Normal/healthy 194 96%
wasted 9 4%
From the findings, 194(96%) of the children had normal nutritional stus while 9(4%)
of the children were wasted.
<11.5 cm 11.5-12.5 cm >12.5 cm
Frequency 4 5 194
4 5
194
0
50
100
150
200
250F
req
uen
cy
Mid upper arm circumference
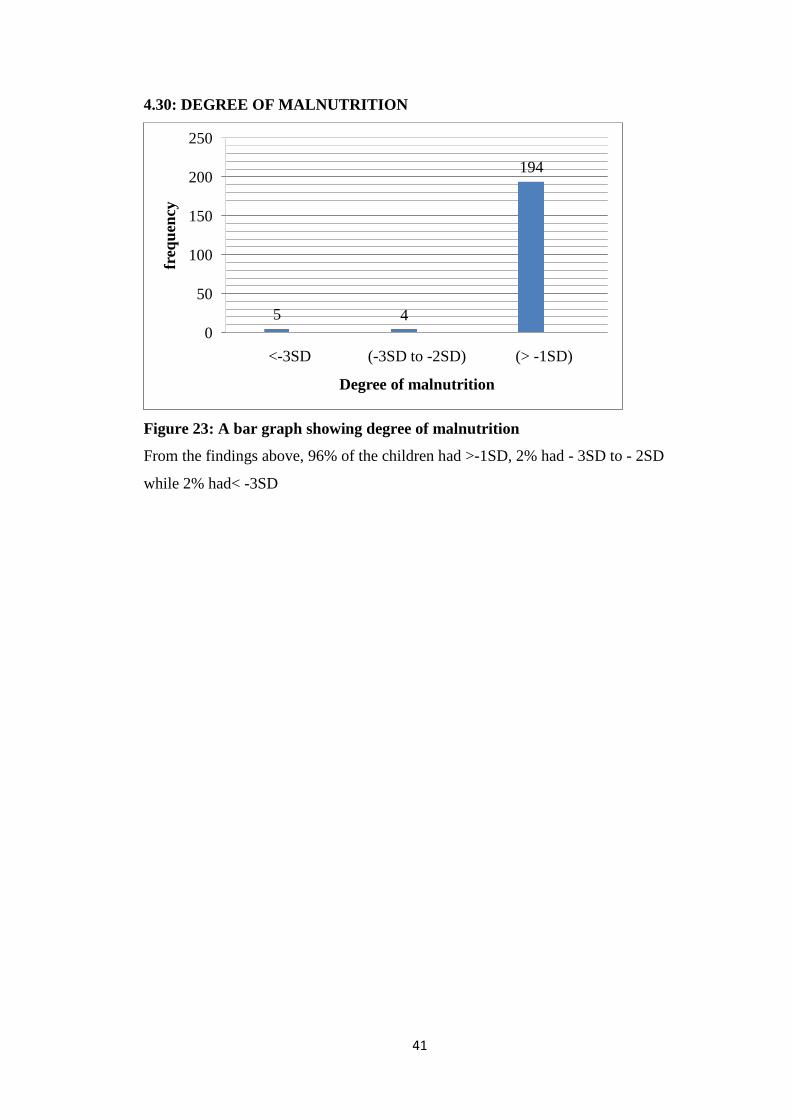
41
4.30: DEGREE OF MALNUTRITION
Figure 23: A bar graph showing degree of malnutrition
From the findings above, 96% of the children had >-1SD, 2% had - 3SD to - 2SD
while 2% had< -3SD
5 4
194
0
50
100
150
200
250
<-3SD (-3SD to -2SD) (> -1SD)
freq
uen
cy
Degree of malnutrition
42
CHAPTER FIVE
DISCUSSIONCONCLUSION AND RECOMMENDATIONS
5.0 INTRODUCTION
This chapter discusses result of the study. The purpose of the study was to determine
the different breastfeeding practices andthe nutritional status of children below the
age of 5 years in Kitagata general hospital in Sheema district. The information was
used to give a recommendation on how to improve and maintain the nutritional status
of children below the age of 5 years in rural areas and reduce the prevalence rates of
malnutrition among children in the rural settings. The objectives of the study were to;
determine the socioeconomic and demographic factors affecting the breastfeeding
mothers, determine the different breastfeeding practices of children below the age of 5
years, determine the nutritional status of children below the age of 5 years.
5.1 DISCUSSION
5.1.1: SOCIO-DEMOGRAPHIC CHARACTERISTICS OF THE
RESPONDENTS.
A structured questionnaire was administered to 203 participants of whom they were
all females and mothers. Most of the respondents were of the age group 25-29 years
(36%), followed by 20-24years (24%). 97% of the respondents were married with 2%
divorced and 1% widowed. Majority of the respondents attended primary education
with 74% and 5% not having attained any level of education. 98% of the mothers
were Christians with the majority being Anglicans 68% followed by Catholics 28%
and Adventists 2% while the Islam was the least denomination with 2% of the
Muslims. Majority of the respondents were housewives contributing to 62% of the
different occupations done with the least being 12% that catered for teaching and
tailoring. 44% of the mothers had 1 to 2 children and 8% had more than 6 children.
This information was in correspondence with two studies that were done and
contradicted by one. A study done by Xul et al in 2012 showed a decreased pattern of
breastfeeding among mothers in China because of the increased economic growth.
Another study which was in correspondence was one that was conducted by Qui
Zhao, Binas Lee and Xie 2011 in Zhejiang China which showed that young mothers
with a lower education level and income are more likely to breastfeed more often. The
43
above information collected from the study that was conducted in Kitagata general
hospital was contradicted by a study which was done Baghurst et al 2013 in USA,
Australia and Scotland which showed an increased prevalence rate of breastfeeding
among the older women with higher levels of education.
5.1.2. DIFFERENT BREASTFEEDING PRACTICES OF CHILDREN BELOW
THE AGE OF 5 YEARS.
Of the 203 children who were interviewed on their behalf by their mothers, 54% were
males and 46% were females. 95% of the children were more than 6months of age
while 5% were less than 6 months of age. 96% of the children were not exclusively
breastfed because they were above the age of 6months while the remaining 4% were
still exclusively breastfeeding because they were less than 6 months of age. Of those
that are exclusively breastfed, 45% were breastfed more than 9 times and 22% less
than 6 times per day. Majority of the breastfed children were breastfed for less than 10
minutes (78%) with none breastfed for more than 30 minutes (0%). Of the 96% that
were not exclusively breastfed, 33% were on complementary feeding and the
remaining 67% were not on complementary feeding. Majority of the children about
70% started complementary feeding at the age of 6 months with 22% before 6 months
and 8% after the age of 6 months. 58% of children were started on carbohydrate foods
with 10% on protein foods. 61% of the children were weaned and 39% were not
weaned. Of those that were weaned, 77% were weaned at the age of 1 to 2 years and
10% were weaned before the age of 1 year. The malnutrition prevalence rates in
Mitooma district are low because of the adequate exclusive breastfeeding practices
which are in correspondence to the study that was conducted by Perez Escamillia et al
which stated the different contributing factors to the increased prevalence rates of
exclusive breastfeeding namely; low socioeconomic status, maternal unemployment,
hospital delivery facilities with breastfeeding promotion and all these had contributed
to the low prevalence rates of malnutrition among children.
44
5.1.3 NUTRITIONAL STATUS OF CHILDREN BELOW THE AGE OF 5
YEARS.
Of the 203 children who were assessed for their nutritional status, 54% were males
and 46% were females. 95% of the children were more than 6months of age while 5%
were less than 6 months of age.194 children were healthy (96%) with the remaining
4% corresponding to 9 children were wasted although there was no edema. Of the 9
children that had non edematous malnutrition (4%), 2% had Moderate acute
malnutrition (MAM) as they were lying between -3SD to -2SD while the other
remaining 2%, they had severe acute malnutrition (SAM) as they were less than -3SD.
This basically implies that in relation to the research and study that were conducted,
the general nutritional status of children below the age of 5 years in Mitooma district
is good although this was contradicted by the study that was conducted by BRAC
Uganda and published in the New vision newspaper on the 16th November 2011
showing that 2 million children in Uganda below the age of 5 years were chronically
malnourished which accounted for 38% of which 16% were underweight while 6%
were wasted. Another study was done by Motta et al in 2015 which showed that
children who were born with a low birth weight had increased chances of becoming
underweight as compared to their counterparts who were born with a birth weight of
2500 grams and above also contraindicated the study which was conducted in
Kitagata general hospital in Mitooma district.
5.2 CONCLUSION
The study showed that of the 203 children that were interviewed, 96% were healthy
and only 4% were malnourished this basically indicated that the mothers had adequate
knowledge and information about the different breastfeeding practices to enhance
proper growth and development of their children, the good available antenatal and
child health care services and programs like immunization provided at the health
facility also played a key role in increased prevalence rates of healthy children with a
few malnourished children. The 4% of the children that are malnourished is basically
because of the inadequate and improper breastfeeding practices among children, Poor
balanced diet for those that have started complementary feeding, busy working
45
schedule for those that are working and yet are mothers who need to breast feed their
children.
5.3 RECOMMENDATIONS
In accordance to the data collected, analyzed and discussed as shown above, this
study makes the following recommendations for the future planning and decision
making in relation to maternal and child health care delivery for children below the
age of 5 years.
1) Conducting more community outreaches to sensitize and educate the
community in particular mothers about the significance of good breastfeeding
practices and proper child health care immediately after birth and during
antenatal period.
2) Extension of child health care services away from the main district hospitals
to the peripheral health facilities like the health centers and the private health
facilities.
3) Intensifying training and support of the health care workers to broaden their
knowledge and skills pertaining good maternal and child health care in order
to properly communicate and educate society thereby reducing the prevalence
rates of malnutrition within the district.
4) Maternal and child care services should be provided to both mothers and their
children at their own times of convenience to reduce on the rates of
absenteeism from these health care services provided like immunization which
predispose and increase the rates of malnutrition.
46
REFERENCES
ACC/SCN (1997a).Nutrition and poverty-nutrition policy discussion paper
no.16.Geneva.24th session symposium. ACC/SCN (accessed at system.
Org/SCN
ACC/SCN (1997b).Third report on the world nutrition situation.Acc /SCN (accessed
at http://www.unsystem .org/scn/archive3s/rwns03/index.htm dated November
25th, 2006).
ACC/SCN (2000).Ending Malnutrition by 2020. An agenda for challenge in the
millennium final report to the acc/SCN by the commission on the nutrition
challenges of the 21st century (accessed at http://
www.unsystem.org/SCN/publications/UN report. PDF dated November 25th,
2006).
AIDS CAP/FHI/USAID (1996). USAID/ AIDSCAP Kenya Strategic and
implementation plan. AIDS Control and prevention programme / Family
Health International. September 1996.
Cogil B (2003).Anthropometric Indicators Measurement Guide.Food and Nutrition
Technical Assistance (FANTA) Project, Academy for Education Development
(AED), Washington DC (available at
http://www.fantaproject.org/downloads/pdfs/anthro2003.pdf).
Chlebowski RT (1985). Significance of Altered Nutritional status in Acquired
Immune Deficiency Syndrome (AIDS). Nutrition and Cancer 7: 85-91.
Cohen RJ, Brown KJ, Canahuati J, Rivera LL, Dewey KG (1994). Effects of age of
introduction of complementary foods on infant’s breast-milk intake, total
energy intake, and growth: A Randomized Intervention study in Honduras.
Eveleth PB. (1987). Population difference in growth: Environmental and genetic
factor. In: Falkner F, Tanner J Meds, editors. Human Growth Neurobiology
and Nutrition 3rd ed. London: Bailliere Tindal; 1987.p.373.
Park S, Park Y. (1997). Prevented medicine in obstetric, paediatrics and geriaterics.
In: Park K, editor. Park’s Text Book of Preventive Medicine, 15th ed. India:
M/S BandaridasBhan of publisher; p.210.
47
Tershakovec AM, Stallings VA (1998). Paediatrics nutrition and nutritional disorder.
In: Behrman RE, Kiliegman, editors. Nelson Essential of Paediatrics, 3rd ed.
London: W.B. Saunders Company; p. 312
Fomon SJ. Infant Nutrition (1974). Topical Paediatrics, 2nd ed. Philadelphia: W.B.
Saunders Company; p. 32.
Cameron M, Fofvander Y. (1976). Manual on Feeding and Young Children, 2nd ed.
New York: Saunders Company; p. 310.
Widdowson EM. Nutrition.(1981). In: Davis JA, Dobbing J, editors. Scientific
Foundation of Paediatrics, 2nd ed. London: William Heinemann Medical
Books Ltd; p. 41-43.
Laurence F. Feeding, the healthy child. In: Julia A, McMillan MD, Catherine D,
DeAnglis MD, Ralph D, Feigin MD, Joseph B,et al, (1999). editors.
Oski’sPaediatrics Principles and Practice, 3rd ed. Philadelphia: Lippincoh
Williams & Wilkins Company; p. 477-78.
Waterlow JC (1972). Classification and definition of protein calorie malnutrition. Br
Med J; 3: /archives/npp16/index.htm dated November 25th, 2006).

48
APPENDICES
APPENDIX I: CONSENT FORM
Good morning/Afternoon/Evening
1 am……………………………………………., a 5th year medical student of
Kampala International University Teaching Hospital Western campus, Ishaka,
Bushenyi district from the faculty of clinical medicine and dentistry. I am here to
conduct a study on the different breastfeeding practices and the nutritional status of
children below the age of 5 years in Sheema district. This will enable me to prepare
and submit a research report to the relevant authorities who will endeavor to employ
proper measures towards improving the nutritional status of children below the age of
5 years.
Since the child is too young to decide on his/her own, I would like to interview you on
his/her behalf. I have a few questions about the different breastfeeding practices and
related issues. Your answers will be written and then used for analysis. All
information you provide will be handled with confidentiality and your individual
answers will only be known to the interviewer and the coordinator of the study.
The results will beused to improve the nutritional status of children below the age of 5
years. We will need at least 20 minutes of your time to discuss and record the
information. You can withdraw from the interview at any stage without any
consequence if you do not wish to continue.
Do you have any question? (0705316863)
If you agree to participate in this study, may you please sign below here
Interviewee’s signature……………………………………
Interviewer’s signature……………………………………
Date……….………….
Thank you.
49
APPENDIX II: QUESTIONNAIRE
ASSESSMENT OF THE DIFFEENT BREASTFEEDING PRACTICES AND
NUTRITIONAL STATUS OF CHILDREN BELOW THE AGE OF 5 YEARS
IN SHEEMA DISTRICT, UGANDA
INTRODUCTION
This questionnaire is designed to obtain information from you regarding the different
breastfeeding practices andthe nutritional status of children below the age of 5 years.
The results of this study were used by the researcher (student) from Kampala
International University Teaching Hospital Western Campus to write his report. The
results will also be useful in designing the appropriate interventions aimed at reducing
the prevalence rates of malnutrition cases. This information was treated with
confidentiality that it deserves and will not be used for any purpose other than those
outlined here. Your participation in this survey was of great value to the researcher
and we appreciate your co-operation.
INSTRUCTIONS
The questionnaire is in four (4) sections. Please answer all questions in all the sections
by circling and filling in the most appropriate response. Some sections will have their
own set of instructions please follow these carefully.
A) SOCIOECONOMIC AND DEMORGRAPHIC FACTORS OF THE
MOTHER
1. Age………………………………………………………………….
2. Marital status
A) Married
B) Divorced
C) Widowed
D) Single
3. Education level

50
A) Primary school
B) Secondary school
C) University
D) Tertiary institution
E) None
4. Mother’s
Religion…………………………………………………………
5. Mother’s
occupation…………………………………………………………
6. What is the family source of income?
................................................................
7. About how much does the mother earn monthly?
..............................................
8. How many children do you have?
……………………………………………..
B) BREASTFEEDING PRACTISES
1. EXCLUSIVE BREASTFEEDING
9. Is the child exclusively breastfeeding?
A) Yes
B) No
10. If yes, how many times a day?
……………………………………………………
11. For how long was/Is the child breastfed?
…………………………………………………….
12. After how long did you introduce the child to breast milk on
delivery?
………………………………………………………
13. How often do you stay together (in the same room) with your new
baby?
…………………………………………….................
2. COMPLEMENTARY BREASTFEEDING

51
14. Is the child on complementary breastfeeding?
A) Yes
B) No
15. If yes in (14) above, then at what age were the complementary
foods started?
……………………………………………………………………
What foods where started on a child?
……………………………………………………………………
How many times is the child fed in 24 hours?
……………………………………………........................................................
3. WEANING
16. Is the child weaned?
A) Yes
B) No
17. At what age do you discontinue breastfeeding?
……………………………………………………
18. How did you discontinue the child from breastfeeding?
…………………………………………………….
C. HEALTH SERVICE
19. Is the child immunized?
A) Yes
B) No
20. If (Yes), what was he/she immunized against? (Look at the
immunization card)
…………………………………………………………….
21. If No as in (21) above, why?
……………………………………………………………..
D. NUTRITIONAL ASSESSMENT
1. CHILD’S DEMORGRAPHICS
a) Age………………………………….
b) Sex………………………………….
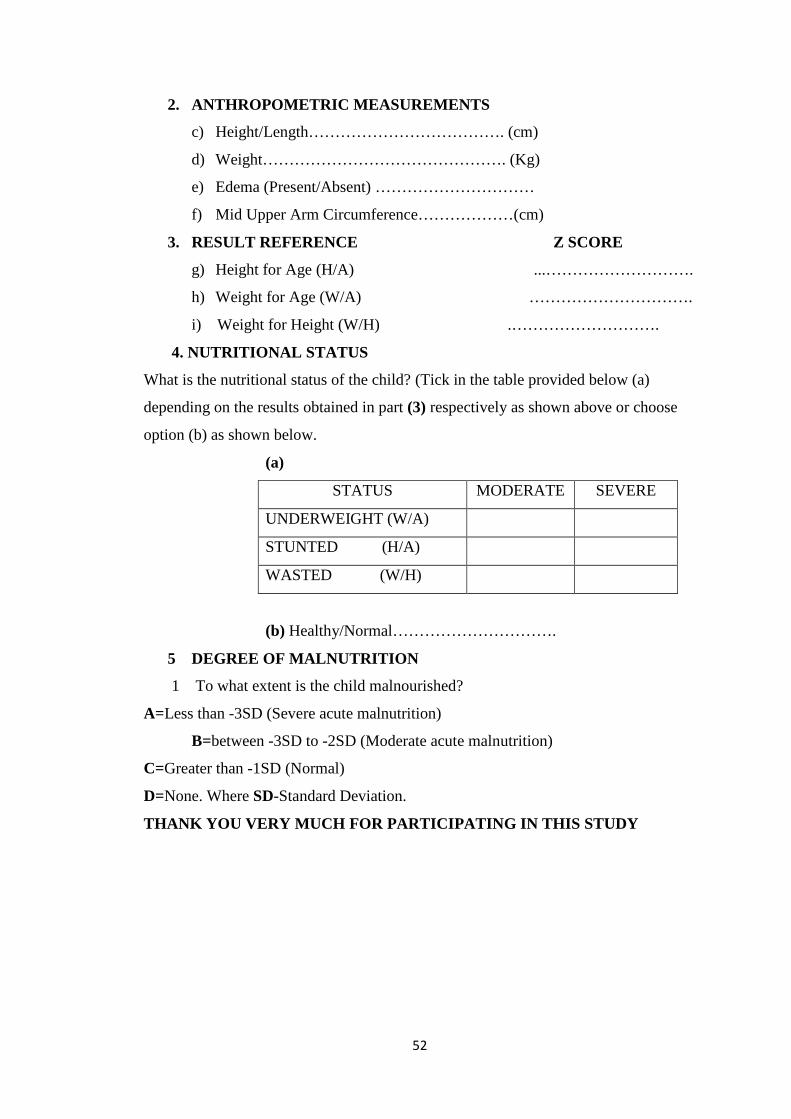
52
2. ANTHROPOMETRIC MEASUREMENTS
c) Height/Length………………………………. (cm)
d) Weight………………………………………. (Kg)
e) Edema (Present/Absent) …………………………
f) Mid Upper Arm Circumference………………(cm)
3. RESULT REFERENCE Z SCORE
g) Height for Age (H/A) ...……………………….
h) Weight for Age (W/A) ………………………….
i) Weight for Height (W/H) .……………………….
4. NUTRITIONAL STATUS
What is the nutritional status of the child? (Tick in the table provided below (a)
depending on the results obtained in part (3) respectively as shown above or choose
option (b) as shown below.
(a)
STATUS MODERATE SEVERE
UNDERWEIGHT (W/A)
STUNTED (H/A)
WASTED (W/H)
(b) Healthy/Normal………………………….
5 DEGREE OF MALNUTRITION
1 To what extent is the child malnourished?
A=Less than -3SD (Severe acute malnutrition)
B=between -3SD to -2SD (Moderate acute malnutrition)
C=Greater than -1SD (Normal)
D=None. Where SD-Standard Deviation.
THANK YOU VERY MUCH FOR PARTICIPATING IN THIS STUDY
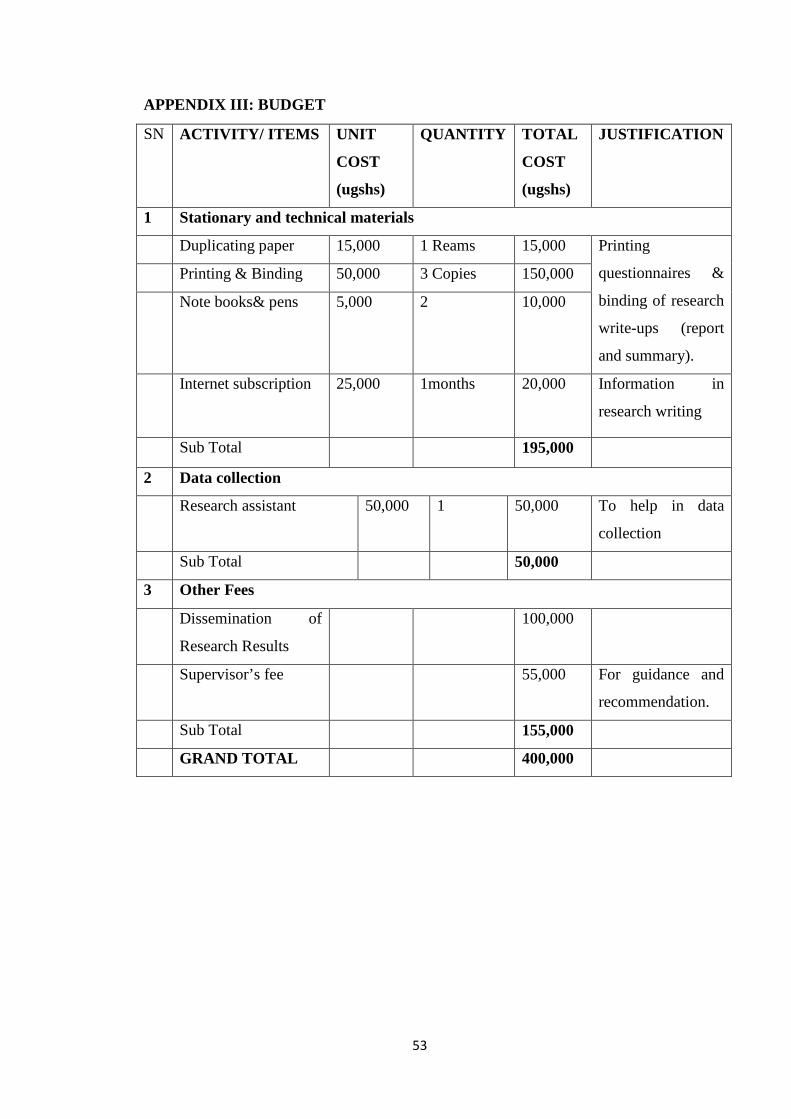
53
APPENDIX III: BUDGET
SN ACTIVITY/ ITEMS UNIT
COST
(ugshs)
QUANTITY TOTAL
COST
(ugshs)
JUSTIFICATION
1 Stationary and technical materials
Duplicating paper 15,000 1 Reams 15,000 Printing
questionnaires &
binding of research
write-ups (report
and summary).
Printing & Binding 50,000 3 Copies 150,000
Note books& pens 5,000 2 10,000
Internet subscription 25,000 1months 20,000 Information in
research writing
Sub Total 195,000
2 Data collection
Research assistant 50,000 1 50,000 To help in data
collection
Sub Total 50,000
3 Other Fees
Dissemination of
Research Results
100,000
Supervisor’s fee 55,000 For guidance and
recommendation.
Sub Total 155,000
GRAND TOTAL 400,000

54
APPENDIX IV: LETTER OF INTRODCUTION FROM KIU
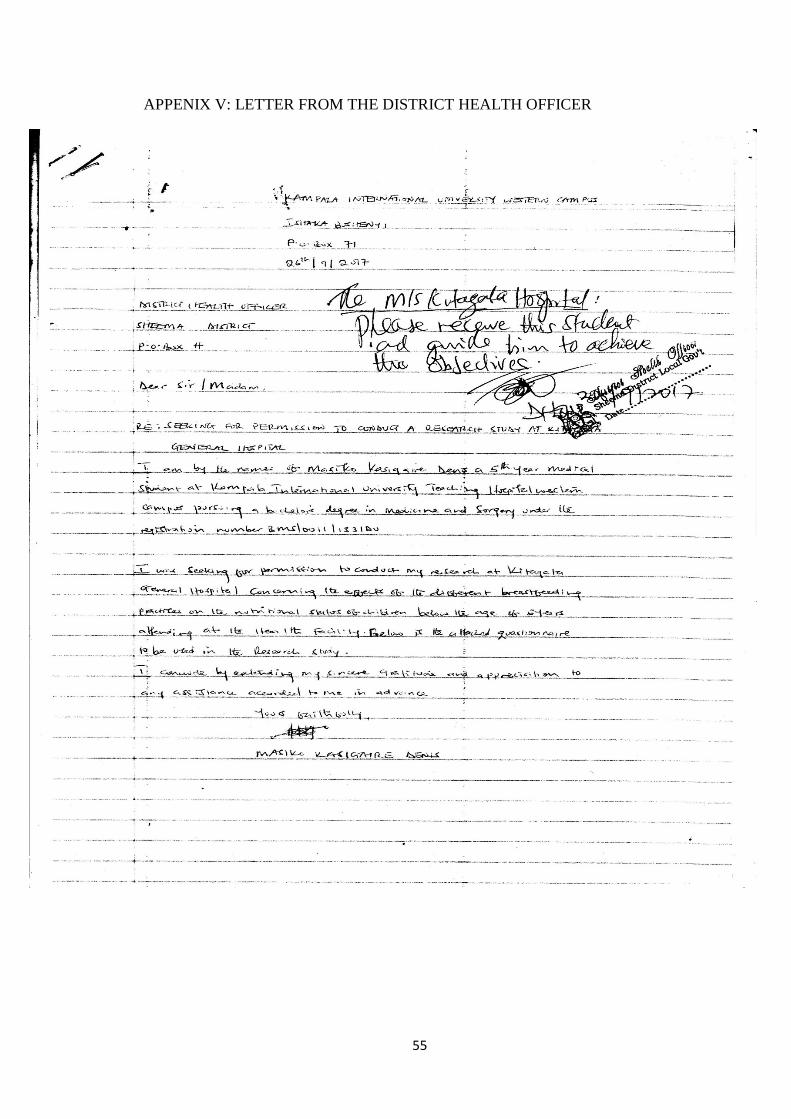
55
APPENIX V: LETTER FROM THE DISTRICT HEALTH OFFICER

56
APPENDIX VI: LETTER FROMKITAGATA HOSPITAL MANAGEMENT

57
APPENDIX VII: MAP OF KITAGATA
58
APPENDIX VIII: MAP OF UGANDA