assessing the relevance of nucleic acid content as an indicator of marine bacterial activity
TRANSCRIPT
AQUATIC MICROBIAL ECOLOGYAquat Microb Ecol
Vol. 46: 141–152, 2007 Published February 2
INTRODUCTION
The variability in the abundance and activity ofplanktonic heterotrophic bacteria is key to the balancebetween production and consumption of organic mat-ter in the oceans. The increased application of flowcytometry (FC) techniques has greatly improved ourcapability to estimate standing stocks of heterotrophicbacterioplankton in marine systems (Gasol & del Gior-gio 2000). Besides a considerable increase in the rate ofsample processing, single-cell characteristics relatedto size, nucleic acid content, activity and physiologicalstatus can be readily provided along with absoluteabundance (Sherr et al. 1999, Troussellier et al. 1999,Gasol & del Giorgio 2000). The existence of prokary-otic cells with differing fluorescence levels after DAPIstaining was first observed in image analysis (Sieracki
& Viles 1992). However, it was the routine use of FCthat permitted the consistent observation in in situsamples of at least 2 distinct clusters of heterotrophicprokaryotes based in their relative fluorescence afternucleic acid dye labeling (e.g. Li et al. 1995, Marie etal. 1996, Troussellier et al. 1999). Frequently, the fluo-rescence level, which is proportional to nucleic acidcontent (Marie et al. 1996), is also associated with agreater size. These 2 groups of bacteria have beentermed HNA and LNA after their high and low nucleicacid content, respectively (Lebaron et al. 2001). In thepresent study, by ‘(relative) nucleic acid content’, wewill commonly refer to these 2 well-defined groups ofcells rather than their actual fluorochrome signal.
Considerable attention has been paid to what HNAand LNA cells represent in terms of bacterial activity(e.g. Gasol et al. 1999, Lebaron et al. 2001, Zubkov et
© Inter-Research 2007 · www.int-res.com*Email: [email protected]
Assessing the relevance of nucleic acid content asan indicator of marine bacterial activity
Xosé Anxelu G. Morán1,*, Antonio Bode2, Luis Ángel Suárez1, Enrique Nogueira1
1Centro Oceanográfico de Xixón, IEO, Camín de L’Arbeyal, s/n, 33212 Xixón, Spain2Centro Oceanográfico de A Coruña, IEO, Muelle de Ánimas, s/n, Apdo. 130, 15080 A Coruña, Spain
ABSTRACT: Current flow cytometry techniques allow the rapid estimation of the abundance of 2distinct groups of heterotrophic bacteria, characterized by their relative nucleic acid content. Highnucleic acid (HNA) bacteria are, at least in coastal environments, usually regarded as more activethan the low nucleic acid (LNA) group. We tested the effects of substrate supply and bacterial cellsize on the relationship between bacterial activity and the abundance of HNA bacteria by simul-taneous measurements of LNA and HNA cell distributions, chlorophyll a and 3H-leucine uptake ratesin temperate shelf waters of the northern Iberian Peninsula. We considered 3 zones based on hydro-logical properties. Significant correlations were found between bacterial activity (range 0.1 to80 pmol Leu l–1 h–1) and both total and relative (range 28 to 84%) HNA cell abundance for pooleddata, but the ready use of HNA bacterial abundance as a proxy for activity in natural systems wasquestioned by the low percentage of variance explained (16%). However, a detailed regional studyof bottom-up effects revealed that the strength of this relationship increased significantly when bac-teria were apparently controlled by phytoplankton substrate supply. Moreover, the relationshipbetween mean biomass (overall range 12.4 to 21.2 fg C cell–1) and abundance-activity correlationcoefficients in the 3 zones (r = 0.94, p = 0.005, n = 6) suggests that only at large cell sizes can weexpect bacterial activity and production to be reasonably predicted by the abundance of HNA cells.
KEY WORDS: Bacterioplankton · Flow cytometry · Nucleic acid content · HNA cells · LNA cells ·Leucine uptake · Bacterial production
Resale or republication not permitted without written consent of the publisher
OPENPEN ACCESSCCESS
Aquat Microb Ecol 46: 141–152, 2007
al. 2004), usually estimated as the incorporation rate ofradiolabeled leucine or thymidine (Zubkov et al. 2001,Servais et al. 2003, Longnecker et al. 2005). A numberof field reports (e.g. Li et al. 1995, Corzo et al. 2005,Calvo-Díaz & Morán 2006) have shown that HNAnumbers are usually more variable, both geographi-cally and vertically, than those of LNA, indirectly sug-gesting that HNA cells are the most dynamic membersof the community. Laboratory experiments with addi-tion of organic substrates and nutrients have demon-strated that HNA bacteria constitute the ‘ready torespond’ fraction, while LNA cells would be dead ordormant (Gasol et al. 1999, Lebaron et al. 2001, Vaquéet al. 2001), but this view has been challenged in thepast few years (e.g. Jochem et al. 2004, Zubkov et al.2004, Sherr et al. 2006). For instance, Zubkov et al.(2001) and Longnecker et al. (2005) have demonstratedthat HNA and LNA bacteria may exhibit similar ratesof leucine incorporation (cf. Servais et al. 2003), and ithas been recently shown that the relationship betweenactivity and nucleic acid content varies with locationalong the inshore–offshore gradient (Sherr et al. 2006)and depth (Scharek & Latasa 2007, this issue), hencesuggesting a more general relationship with thetrophic state of the system. Moreover, little is knownregarding the factors affecting the observed associa-tion of increased HNA bacterial numbers and higheractivity of the whole community in the laboratory.
In view of these unclear results, and in spite of thealready established routine measurement of both HNAand LNA cell distribution in oceanographic surveys, itwould appear questionable to summarize the largevariability of bacterial metabolic states (Smith & delGiorgio 2003) into just 2 groups of cells. Yet, com-prehensive studies in natural environments testing theactual relationship between nucleic acid content andsubstrate uptake, and specifically the usefulness ofHNA abundance as a proxy for bacterial activity, haveseldom been attempted. As total numbers of bacteriaare much less variable than their activity levels (e.g.del Giorgio et al. 1996), employment of the relativecontribution of HNA to total numbers (%HNA) hasbeen proposed as a useful index (Jellett et al. 1996)that sometimes replaces reporting absolute abun-dances (Gasol et al. 1999, 2imek et al. 2005). Typical%HNA values in the field range from 15 to 90% (Li etal. 1995, Jellett et al. 1996, Servais et al. 2003).
In the present study, we gathered an extensive dataset of HNA and LNA bacterial distributions, cell sizesand biomasses and 3H-leucine uptake rates in theupper layers of the north Iberian Peninsula continentalshelf (41 to 44°N, 2 to 9°E), with the following aims:(1) to assess whether HNA cells are consistentlyresponsible for higher bacterial activities under naturalconditions and (2) to explore the factors that determine
the variability in HNA and LNA bacterial abundanceand activity in these waters. Specifically, we looked atwhether the response of bacterioplankton biomass andactivity to substrate supply (bottom-up control) has aneffect on the observed variation in HNA cell abun-dance as a proxy for total leucine uptake. For this pur-pose, we divided the study area into 3 zones based onhydrological properties. Finally, we explored the effectof bacterial cell size on the linkage between highnucleic acid content and activity.
MATERIALS AND METHODS
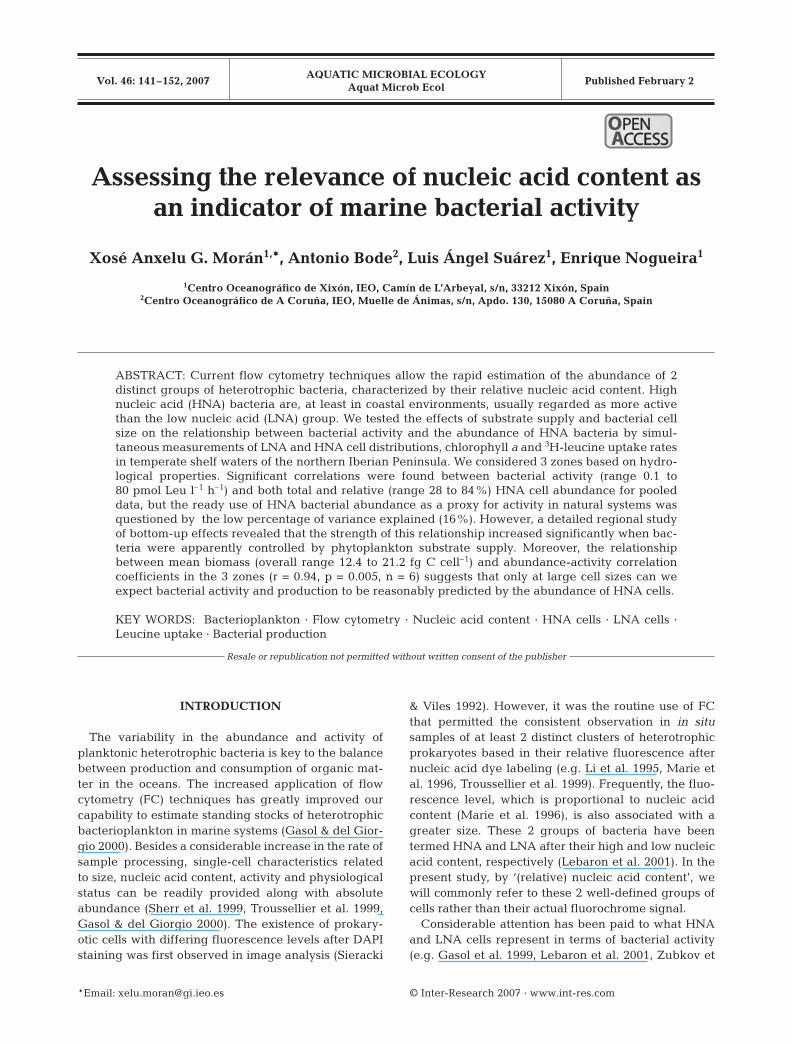
Samples for the simultaneous determination ofheterotrophic bacterial abundance and activity weretaken from 4 to 5 depths (from the surface down to100 m depth or the near-bottom at shallower stations)at 24 stations along the continental shelf and shelf-break of the northwestern and north coasts of theIberian Peninsula (see Fig. 1A) during the PELACUS0303 cruise, on board the RV ‘Thalassa’. Samplingstarted at Stn 1 on 21 March 2003 and finished atStn 24 on 12 April 2003. All stations were locatedover the continental shelf, with water depths rangingfrom 25 to 237 m, except at Stns 10 (305 m), 15(734 m) and 21 (1090 m). At each station vertical pro-files of temperature, salinity and in vivo fluorescencewere taken with a SeaBird 25 CTD equipped with aSea-Point fluorometer. Water samples were takenfrom 5 l Niskin bottles mounted on a rosette samplerattached to the CTD.
Chlorophyll a. Biomass of phytoplankton wasestimated from chlorophyll a (chl a) concentrationsmeasured in 90% acetone extracts of samples col-lected at 5 depth levels between the surface and 100 mdepth. Samples were size fractionated through a seriesof nets (20 µm) and polycarbonate filters (5 and 2 µm)and finally recovered onto Whatman GF/F filters.Photosynthetic pigments were extracted overnight at–20°C, and concentrations of chl a, b and c1 + c2 werecomputed from fluorescence measurements (Neveux &Lantoine 1993). In the present study, however, onlytotal chl a, as the sum of all fractions, is considered.Whenever a chl a measurement was not available (on10 occasions), the in situ fluorometer value was usedafter calibration with the analytical values measuredduring the cruise (chl a = 0.07 + 13.53 in situ fluores-cence, r2 = 0.47, p < 0.001, n = 110).
HNA and LNA bacterial abundance and size. Theabundance of HNA and LNA bacteria was determinedby flow cytometry. Samples (1.8 ml) were immediatelyfixed with 1% paraformaldehyde and 0.05% glutar-aldehyde solution (final concentrations) for 10 min inthe dark before being stored frozen in liquid N2. Once
142
Morán et al.: Nucleic acid content and bacterial activity
in the laboratory, they were kept at –80°C until analy-sis with a FACSCalibur (Becton-Dickinson) bench topflow cytometer, equipped with a laser emitting at488 nm. Samples were then left to thaw at room tem-perature and stained for 10 min with 2.5 µmol l–1 of thenucleic acid fluorochrome SYTO-13 (Ref. S-7575, Mol-ecular Probes). Then, 10 µl of a solution of 1 µm fluor-escent beads (Ref. F-13081, Molecular Probes) of aknown concentration was added as an internalstandard and used to normalize values of single-cellvariables. Aliquots (0.4 ml) were run at low flow rate(~15 µl min–1) until acquisition of 10000 events. HNAand LNA cells were distinguished by their differentsignals of right-angle light scattering (RALS) andgreen fluorescence (FL1). We were able to clearlydifferentiate between HNA and LNA bacteria in allsamples. A third high nucleic acid group of bacteria,characterized by higher RALS and FL1 than HNAcells, was frequently observed in the cytograms. Theirabundance (mean 4.23 × 10³ cells ml–1) was 2 orders ofmagnitude lower than the other 2 groups, with anaverage contribution to total bacterial biomass of 2.8 ±1.0%. Since this group is not always detected in thestudy area, we decided to only focus on the wide-spread HNA and LNA groups of cells. Synechococcuswere easily distinguished from heterotrophic bacteriaby their higher red fluorescence (FL3) signal. Anempirical calibration between RALS and cell diameter(cell diameter = 0.91 + 0.34 log RALS, r2 = 0.57, p =0.049, n = 7; see Calvo-Díaz & Morán 2006 for details)was used to estimate biovolume, which was convertedinto bacterial carbon biomass (BB) using the allometricrelationship of Norland (1993): BB (fg cell–1) = 120(bio-volume)0.7. Given the uncertainties associated withsize and biomass estimates, our values should be con-sidered with caution if they are to be compared withother studies.
Bacterial activity. Bacterial activity was estimatedfrom leucine (Leu) uptake rates. Four replicate sam-ples (1 ml) were placed into polypropylene translucentEppendorf tubes and incubated on board at simulatedin situ temperatures (±0.5°C) after addition of 50 nmoll–1 (final concentration) of 3H-Leu (Kirchman 1993).Samples were incubated under dim light (~20 µmolquanta m–2 s–1), mimicking mixed layer depth levels(Morán et al. 2001). The Eppendorf walls absorbedonly ~8% of incident irradiance. Incubations lasted 0.5to 1 h and were terminated by the addition of 100 µl of50% trichloroacetic acid (TCA). Labeled proteins wererecovered by centrifugation in 2 steps. Liquid wasaspirated after each centrifugation with a Pasteurpipette at low vacuum pressure. Pellets were rinsedwith 1 ml of 5% TCA before the second centrifugation.For each depth 2 TCA-killed controls were also in-oculated with 3H-Leu and incubated as regular sam-
ples. Radioactivity was measured on land within 1 moafter completion of the cruise with a LKB-Wallac liquidscintillation counter. Detailed information on the incu-bation procedures can be found in Valencia et al.(2003).
Bottom-up control of bacteria. Chl a concentrationwas used as a proxy of recent photosynthate availabil-ity for bacteria. However, bacteria may rely on sourcesother than phytoplankton-derived dissolved organiccarbon (DOC). Independent of the origin of the sub-strates used for bacterial growth, resource limitation ofbacteria or bottom-up control can be estimated by themethod of Ducklow (1992), which extended upon theanalysis of Billen et al. (1990). The method assumessteady state and consists in assessing the value andsignificance of the slope of the ordinary least squareslinear regression between log-transformed values ofbacterial production and biomass. According toregression slope values, the strength of bottom-up con-trol would range from weak (<0.4) through moderate(0.4 to 0.6) and strong (>0.6). Since empirical carbon-to-Leu conversion factors were not determined duringthis cruise, the theoretical factor of 1.55 kg C mol–1
Leu, assuming no isotope dilution (Simon & Azam1989), was used to estimate bacterial production. Con-version factors in the central Cantabrian Sea (A. Calvo-Díaz & X. A. G. Morán pers. comm.) show very similarvalues for late winter and early spring (1.26 ± 0.32 SD,average of 6 values obtained at 3 shelf stations rangingfrom 20 to 160 m depth).
Statistical analysis. Statistical analyses were per-formed with STATISTICA software. With the excep-tion of the percentage of HNA cells (%HNA), all vari-ables compared were log-transformed in order toattain normality and homogeneity of variances. Kolmo-gorov-Smirnoff tests confirmed the normal distribu-tions of variables after transformation. Sample sizes forthe different variables measured (n) ranged between101 and 112. Simple Model I linear regression wasused to determine the degree of correlation betweenvariables, as correlation coefficients are not affected bythe choice of the model. Although Model II regressionsare more appropriate when both x and y variableshave errors associated, in its original formulationDucklow (1992) used Model I, so we kept this modelfor discussion on the significance of bottom-up controlin our samples (see above). Since it is not clear whetherBonferroni correction is needed in ecological studies(Moran 2003), statistical results were interpretedaccording to the customarily accepted 0.05 p-level.One-way ANOVAs and Student-Newman-Keuls posthoc tests were performed for the analysis of geo-graphical differences. Data were grouped by locationas explained in the ‘Results; Regional variability’.Finally, we tested whether there was any size depen-
143
Aquat Microb Ecol 46: 141–152, 2007
dence in the relationship between bacterial cell abun-dance and activity. To test this hypothesis we corre-lated mean individual biomass with the respective cor-relation coefficients between HNA and LNA cellabundance and total activity in the 3 zones. This typeof meta-analysis has been used to identify generaltrends of species interactions and mean temperatureamong regions (e.g. Worm & Myers 2003, Richardson& Schoeman 2004). In order to minimize autocor-relation between samples, we used water-columnaverages of individual HNA and LNA cell biomass toestimate mean values at each zone.
RESULTS
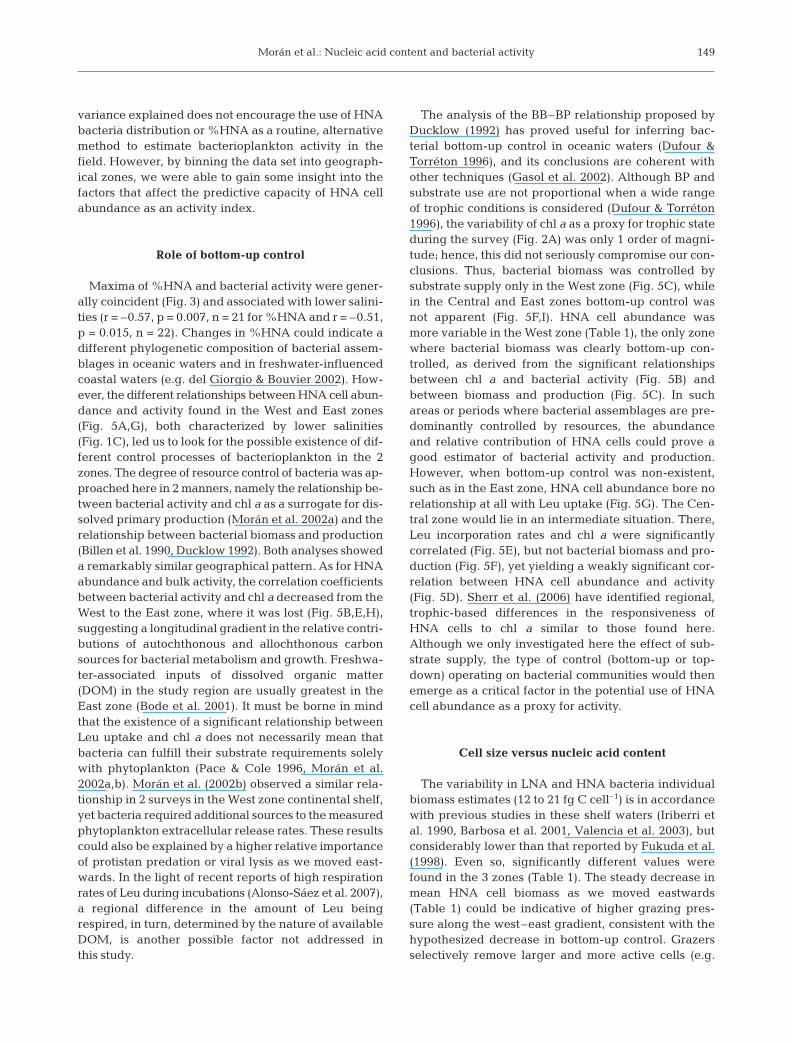
Stratification of the water column was obvious at moststations, with progressively shallower mixed layers as wemoved eastward (~20 m at 2°W compared with ~40 mat 9°W). Fig. 1B shows that vertical gradients of tem-perature were weak (generally <1°C) relative to salinity(Fig. 1C), which attained lower values in areas withhigher continental runoff, from the Rías Baixas in thewestern part and the Adour River in the east.
Chlorophyll a and bacterial abundance
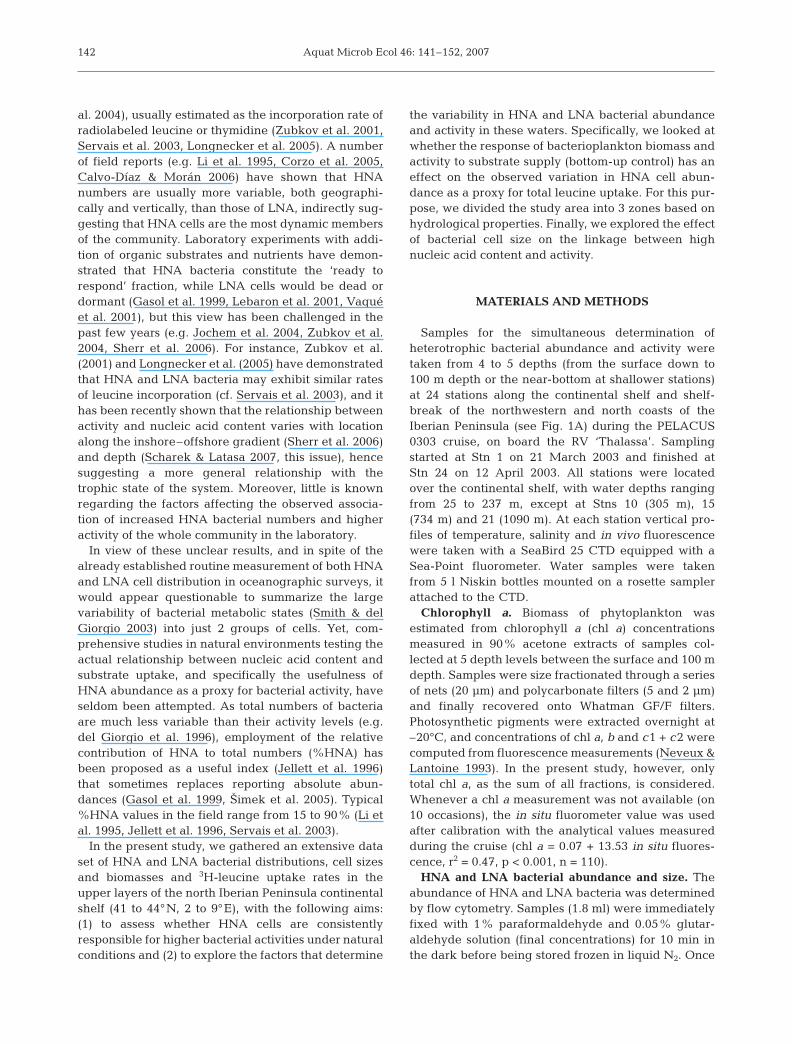
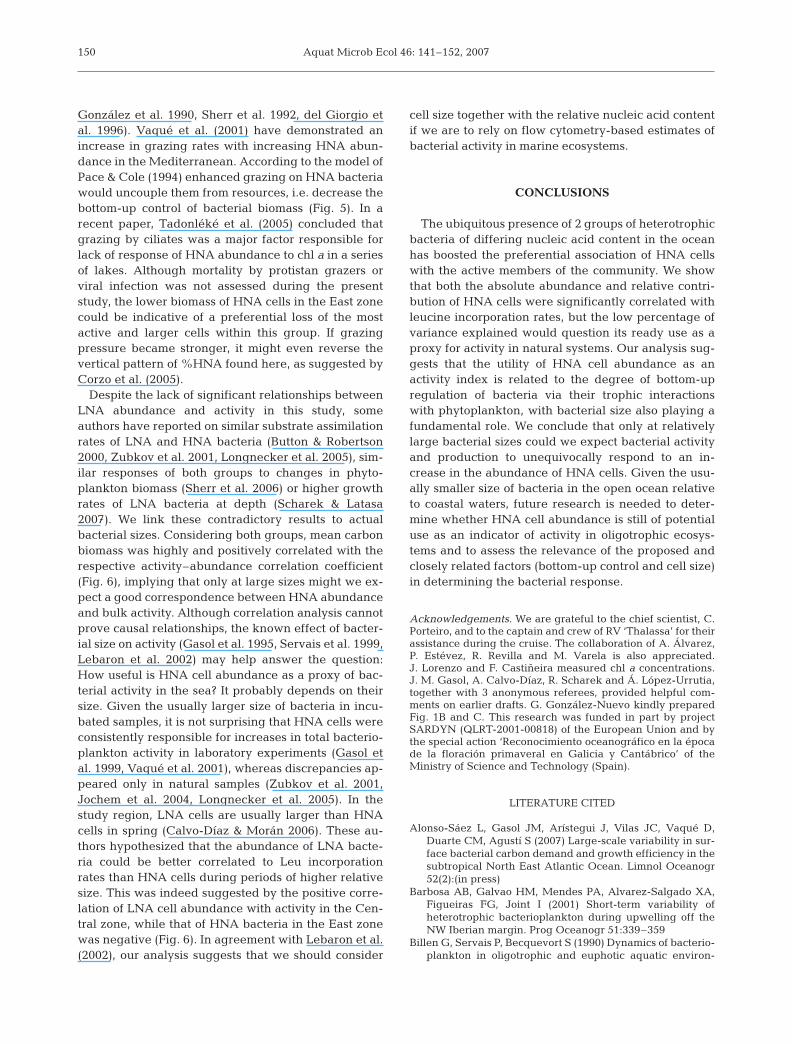
Fig. 2 shows an apparent lack of geographical trendsfor chl a and total bacterial abundance (BN). Mean ± SEvalues were 0.99 ± 0.09 µg chl a l–1 and 5.59 ± 0.30 ×10⁵ cells ml–1, respectively. Relatively low chl a valuesat most of the stations are indicative of not fullydeveloped spring blooms. On average, HNA cells werecharacterized by a 4.3-fold higher relative FL1 fluores-cence than LNA cells, a measure of the relative nucleicacid content of both groups (Marie et al. 1997). Thisratio was similar to the values reported by Lebaron etal. (2001) and varied little across the study region as
144
A
10 9 8 7 6 5 4 3 2 1Longitude (ºW)
41
42
43
44
45
Latit
ude
(ºN
)
1
2
3 45
6 78 9 12
1011 13
14 15 16 172421
18 22
Cantabrian Sea (Bay of Biscay)
Iberian Peninsula
B
0 100200
0 300 400 500 600 700 800100
80
60
40
20
Dep
th (m
)
12.5
13
13.5
C
0 100 200 300 400 500 600 700 800100
80
60
40
20
35.2
35.3
35.4
35.5
35.6
West Central East
Station1 2 34 5 6 7 8 9 10 11 12 13 14 15 16 17 18a 22b
Along shore distance (km)
0 100 200 300 400 500 600 700 800
Dep
th (m
)
Fig. 1. (A) Sampling stations, (B) vertical distribution of tem-perature (°C) and (C) salinity in the geographical region sur-veyed. Dotted lines (A) represent 200 and 1000 m isobaths.The position of each station in the alongshore gradient is in-dicated at the top of (B). Dots indicate sampling depths.Geographical zones are also indicated (18ª: Stns 18 to 21; 22b:
Stns 22 to 24)
0.1
1
10
Chl
orop
hyll
a(µ
gl–1
)
A
105
106
0 100 200 300 400 500 600 700 800 900
Bac
teria
l ab
und
ance
(cel
ls m
l–1)
B
Alongshore distance (km)
Fig. 2. Alongshore distribution of (A) chlorophyll a concentra-tion and (B) total bacterial abundance at all sampling depths
within each station
Morán et al.: Nucleic acid content and bacterial activity
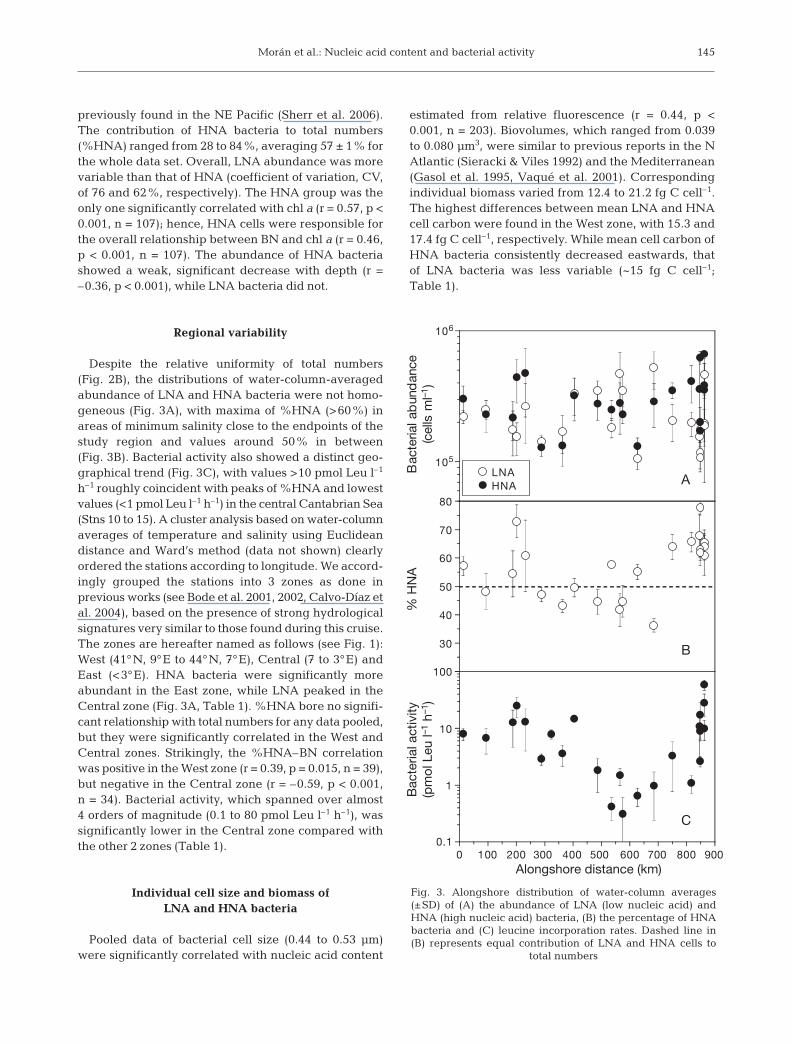
previously found in the NE Pacific (Sherr et al. 2006).The contribution of HNA bacteria to total numbers(%HNA) ranged from 28 to 84%, averaging 57 ± 1% forthe whole data set. Overall, LNA abundance was morevariable than that of HNA (coefficient of variation, CV,of 76 and 62%, respectively). The HNA group was theonly one significantly correlated with chl a (r = 0.57, p <0.001, n = 107); hence, HNA cells were responsible forthe overall relationship between BN and chl a (r = 0.46,p < 0.001, n = 107). The abundance of HNA bacteriashowed a weak, significant decrease with depth (r =–0.36, p < 0.001), while LNA bacteria did not.
Regional variability
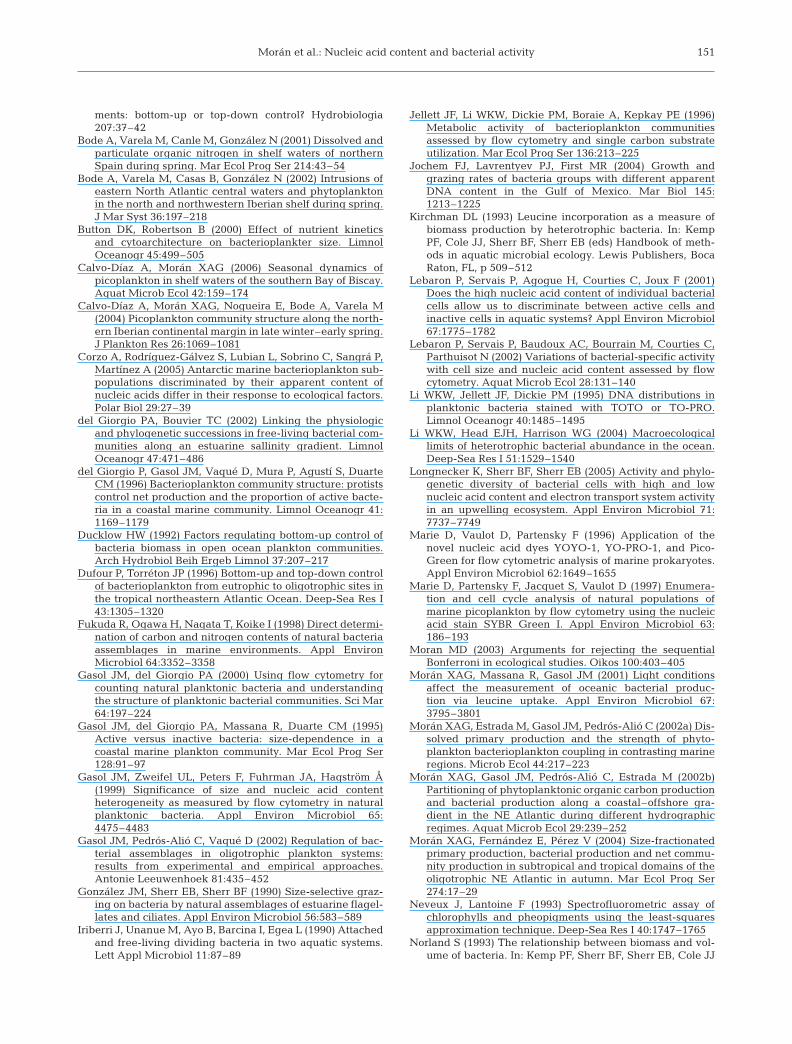
Despite the relative uniformity of total numbers(Fig. 2B), the distributions of water-column-averagedabundance of LNA and HNA bacteria were not homo-geneous (Fig. 3A), with maxima of %HNA (>60%) inareas of minimum salinity close to the endpoints of thestudy region and values around 50% in between(Fig. 3B). Bacterial activity also showed a distinct geo-graphical trend (Fig. 3C), with values >10 pmol Leu l–1
h–1 roughly coincident with peaks of %HNA and lowestvalues (<1 pmol Leu l–1 h–1) in the central Cantabrian Sea(Stns 10 to 15). A cluster analysis based on water-columnaverages of temperature and salinity using Euclideandistance and Ward’s method (data not shown) clearlyordered the stations according to longitude. We accord-ingly grouped the stations into 3 zones as done inprevious works (see Bode et al. 2001, 2002, Calvo-Díaz etal. 2004), based on the presence of strong hydrologicalsignatures very similar to those found during this cruise.The zones are hereafter named as follows (see Fig. 1):West (41°N, 9°E to 44°N, 7°E), Central (7 to 3°E) andEast (<3°E). HNA bacteria were significantly moreabundant in the East zone, while LNA peaked in theCentral zone (Fig. 3A, Table 1). %HNA bore no signifi-cant relationship with total numbers for any data pooled,but they were significantly correlated in the West andCentral zones. Strikingly, the %HNA–BN correlationwas positive in the West zone (r = 0.39, p = 0.015, n = 39),but negative in the Central zone (r = –0.59, p < 0.001,n = 34). Bacterial activity, which spanned over almost4 orders of magnitude (0.1 to 80 pmol Leu l–1 h–1), wassignificantly lower in the Central zone compared withthe other 2 zones (Table 1).
Individual cell size and biomass ofLNA and HNA bacteria
Pooled data of bacterial cell size (0.44 to 0.53 µm)were significantly correlated with nucleic acid content
estimated from relative fluorescence (r = 0.44, p <0.001, n = 203). Biovolumes, which ranged from 0.039to 0.080 µm3, were similar to previous reports in the NAtlantic (Sieracki & Viles 1992) and the Mediterranean(Gasol et al. 1995, Vaqué et al. 2001). Correspondingindividual biomass varied from 12.4 to 21.2 fg C cell–1.The highest differences between mean LNA and HNAcell carbon were found in the West zone, with 15.3 and17.4 fg C cell–1, respectively. While mean cell carbon ofHNA bacteria consistently decreased eastwards, thatof LNA bacteria was less variable (~15 fg C cell–1;Table 1).
145
105
106
LNAHNA
Bac
teria
l ab
und
ance
(cel
ls m
l–1)
A
30
40
50
60
70
80
% H
NA
B
0.1
1
10
100
0 100 200 300 400 500 600 700 800 900
Bac
teria
l act
ivity
(pm
ol L
eu l–1
h–1
)
Alongshore distance (km)
C
Fig. 3. Alongshore distribution of water-column averages(±SD) of (A) the abundance of LNA (low nucleic acid) andHNA (high nucleic acid) bacteria, (B) the percentage of HNAbacteria and (C) leucine incorporation rates. Dashed line in(B) represents equal contribution of LNA and HNA cells to
total numbers
Aquat Microb Ecol 46: 141–152, 2007
Relationships between nucleic acid content,activity and biomass
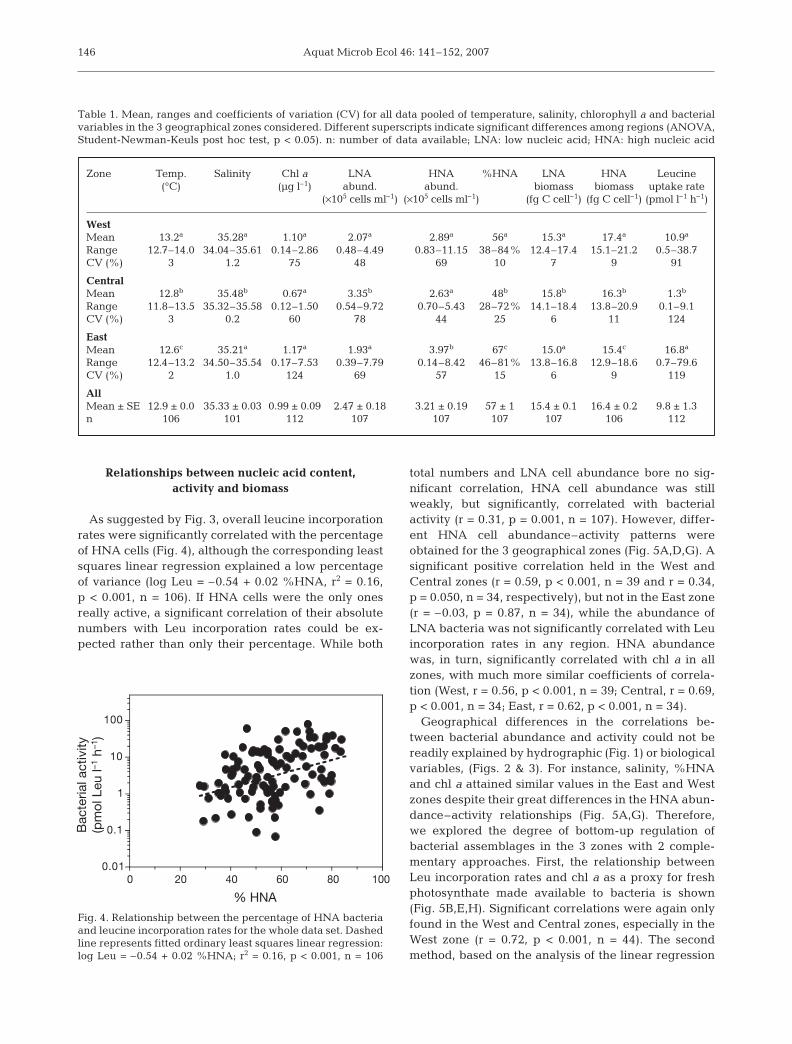
As suggested by Fig. 3, overall leucine incorporationrates were significantly correlated with the percentageof HNA cells (Fig. 4), although the corresponding leastsquares linear regression explained a low percentageof variance (log Leu = –0.54 + 0.02 %HNA, r2 = 0.16,p < 0.001, n = 106). If HNA cells were the only onesreally active, a significant correlation of their absolutenumbers with Leu incorporation rates could be ex-pected rather than only their percentage. While both
total numbers and LNA cell abundance bore no sig-nificant correlation, HNA cell abundance was stillweakly, but significantly, correlated with bacterialactivity (r = 0.31, p = 0.001, n = 107). However, differ-ent HNA cell abundance–activity patterns wereobtained for the 3 geographical zones (Fig. 5A,D,G). Asignificant positive correlation held in the West andCentral zones (r = 0.59, p < 0.001, n = 39 and r = 0.34,p = 0.050, n = 34, respectively), but not in the East zone(r = –0.03, p = 0.87, n = 34), while the abundance ofLNA bacteria was not significantly correlated with Leuincorporation rates in any region. HNA abundancewas, in turn, significantly correlated with chl a in allzones, with much more similar coefficients of correla-tion (West, r = 0.56, p < 0.001, n = 39; Central, r = 0.69,p < 0.001, n = 34; East, r = 0.62, p < 0.001, n = 34).
Geographical differences in the correlations be-tween bacterial abundance and activity could not bereadily explained by hydrographic (Fig. 1) or biologicalvariables, (Figs. 2 & 3). For instance, salinity, %HNAand chl a attained similar values in the East and Westzones despite their great differences in the HNA abun-dance–activity relationships (Fig. 5A,G). Therefore,we explored the degree of bottom-up regulation ofbacterial assemblages in the 3 zones with 2 comple-mentary approaches. First, the relationship betweenLeu incorporation rates and chl a as a proxy for freshphotosynthate made available to bacteria is shown(Fig. 5B,E,H). Significant correlations were again onlyfound in the West and Central zones, especially in theWest zone (r = 0.72, p < 0.001, n = 44). The secondmethod, based on the analysis of the linear regression
146
Zone Temp. Salinity Chl a LNA HNA %HNA LNA HNA Leucine (°C) (µg l–1) abund. abund. biomass biomass uptake rate
(×105 cells ml–1) (×105 cells ml–1) (fg C cell–1) (fg C cell–1) (pmol l–1 h–1)
WestMean 13.2a 35.28a 1.10a 2.07a 2.89a 56a 15.3a 17.4a 10.9a
Range 12.7–14.0 34.04–35.61 0.14–2.86 0.48–4.49 0.83–11.15 38–84% 12.4–17.4 15.1–21.2 0.5–38.7CV (%) 3 1.2 75 48 69 10 7 9 91
CentralMean 12.8b 35.48b 0.67a 3.35b 2.63a 48b 15.8b 16.3b 1.3b
Range 11.8–13.5 35.32–35.58 0.12–1.50 0.54–9.72 0.70–5.43 28–72% 14.1–18.4 13.8–20.9 0.1–9.1CV (%) 3 0.2 60 78 44 25 6 11 124
EastMean 12.6c 35.21a 1.17a 1.93a 3.97b 67c 15.0a 15.4c 16.8a
Range 12.4–13.2 34.50–35.54 0.17–7.53 0.39–7.79 0.14–8.42 46–81% 13.8–16.8 12.9–18.6 0.7–79.6CV (%) 2 1.0 124 69 57 15 6 9 119
AllMean ± SE 12.9 ± 0.0 35.33 ± 0.03 0.99 ± 0.09 2.47 ± 0.18 3.21 ± 0.19 57 ± 1 15.4 ± 0.1 16.4 ± 0.2 9.8 ± 1.3n 106 101 112 107 107 107 107 106 112
Table 1. Mean, ranges and coefficients of variation (CV) for all data pooled of temperature, salinity, chlorophyll a and bacterialvariables in the 3 geographical zones considered. Different superscripts indicate significant differences among regions (ANOVA,Student-Newman-Keuls post hoc test, p < 0.05). n: number of data available; LNA: low nucleic acid; HNA: high nucleic acid
0.01
0.1
1
10
100
0 20 40 60 80 100
Bac
teria
l act
ivity
(pm
ol L
eu l–1
h–1
)
% HNA
Fig. 4. Relationship between the percentage of HNA bacteriaand leucine incorporation rates for the whole data set. Dashedline represents fitted ordinary least squares linear regression:log Leu = –0.54 + 0.02 %HNA; r2 = 0.16, p < 0.001, n = 106
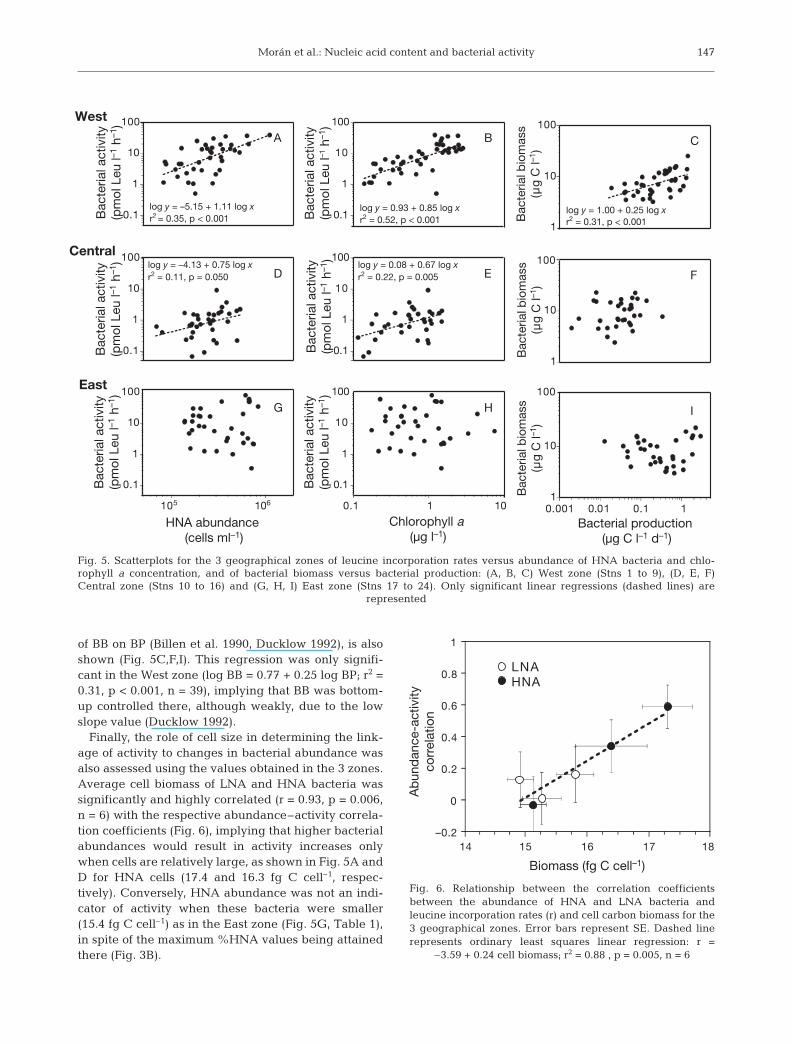
Morán et al.: Nucleic acid content and bacterial activity
of BB on BP (Billen et al. 1990, Ducklow 1992), is alsoshown (Fig. 5C,F,I). This regression was only signifi-cant in the West zone (log BB = 0.77 + 0.25 log BP; r2 =0.31, p < 0.001, n = 39), implying that BB was bottom-up controlled there, although weakly, due to the lowslope value (Ducklow 1992).
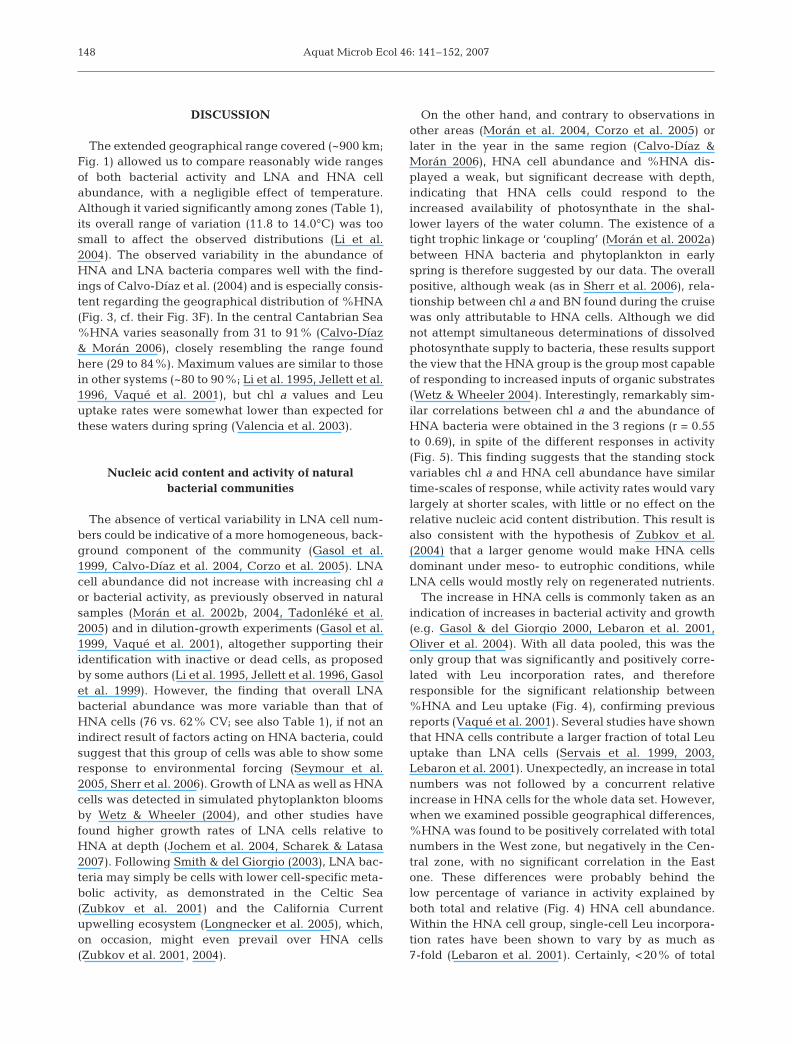
Finally, the role of cell size in determining the link-age of activity to changes in bacterial abundance wasalso assessed using the values obtained in the 3 zones.Average cell biomass of LNA and HNA bacteria wassignificantly and highly correlated (r = 0.93, p = 0.006,n = 6) with the respective abundance–activity correla-tion coefficients (Fig. 6), implying that higher bacterialabundances would result in activity increases onlywhen cells are relatively large, as shown in Fig. 5A andD for HNA cells (17.4 and 16.3 fg C cell–1, respec-tively). Conversely, HNA abundance was not an indi-cator of activity when these bacteria were smaller(15.4 fg C cell–1) as in the East zone (Fig. 5G, Table 1),in spite of the maximum %HNA values being attainedthere (Fig. 3B).
147
0.1
1
10
100
Bac
teria
l act
ivity
(pm
ol L
eu l–1
h–1
)
A
log y = –5.15 + 1.11 log xr2 = 0.35, p < 0.001
0.1
1
10
100
Dlog y = –4.13 + 0.75 log xr2 = 0.11, p = 0.050
0.1
1
10
100
105 106
HNA abundance (cells ml–1)
G
0.1
1
10
100
B
log y = 0.93 + 0.85 log xr2 = 0.52, p < 0.001
0.1
1
10
100
Elog y = 0.08 + 0.67 log x r2 = 0.22, p = 0.005
0.1
1
10
100
0.1 1 10
Chlorophyll a (µg l–1)
H
1
10
100
Bac
teria
l bio
mas
s(µ
gC
l–1)
C
log y = 1.00 + 0.25 log xr2 = 0.31, p < 0.001
1
10
F
1
10
0.001 0.01 0.1 1Bacterial production
(µg C l–1 d–1)
I
West
Central
East
Bac
teria
l act
ivity
(pm
ol L
eu l–1
h–1
)B
acte
rial a
ctiv
ity(p
mol
Leu
l–1 h
–1)
Bac
teria
l act
ivity
(pm
ol L
eu l–1
h–1
)B
acte
rial a
ctiv
ity(p
mol
Leu
l–1 h
–1)
Bac
teria
l act
ivity
(pm
ol L
eu l–1
h–1
)
Bac
teria
l bio
mas
s(µ
gC
l–1)
Bac
teria
l bio
mas
s(µ
gC
l–1)
100
100
Fig. 5. Scatterplots for the 3 geographical zones of leucine incorporation rates versus abundance of HNA bacteria and chlo-rophyll a concentration, and of bacterial biomass versus bacterial production: (A, B, C) West zone (Stns 1 to 9), (D, E, F)Central zone (Stns 10 to 16) and (G, H, I) East zone (Stns 17 to 24). Only significant linear regressions (dashed lines) are
represented
–0.2
0
0.2
0.4
0.6
0.8
1
14 15 16 17 18
LNAHNA
Ab
und
ance
-act
ivity
corr
elat
ion
Biomass (fg C cell–1)
Fig. 6. Relationship between the correlation coefficientsbetween the abundance of HNA and LNA bacteria andleucine incorporation rates (r) and cell carbon biomass for the3 geographical zones. Error bars represent SE. Dashed linerepresents ordinary least squares linear regression: r =
–3.59 + 0.24 cell biomass; r2 = 0.88 , p = 0.005, n = 6
Aquat Microb Ecol 46: 141–152, 2007
DISCUSSION
The extended geographical range covered (~900 km;Fig. 1) allowed us to compare reasonably wide rangesof both bacterial activity and LNA and HNA cellabundance, with a negligible effect of temperature.Although it varied significantly among zones (Table 1),its overall range of variation (11.8 to 14.0°C) was toosmall to affect the observed distributions (Li et al.2004). The observed variability in the abundance ofHNA and LNA bacteria compares well with the find-ings of Calvo-Díaz et al. (2004) and is especially consis-tent regarding the geographical distribution of %HNA(Fig. 3, cf. their Fig. 3F). In the central Cantabrian Sea%HNA varies seasonally from 31 to 91% (Calvo-Díaz& Morán 2006), closely resembling the range foundhere (29 to 84%). Maximum values are similar to thosein other systems (~80 to 90%; Li et al. 1995, Jellett et al.1996, Vaqué et al. 2001), but chl a values and Leuuptake rates were somewhat lower than expected forthese waters during spring (Valencia et al. 2003).
Nucleic acid content and activity of naturalbacterial communities
The absence of vertical variability in LNA cell num-bers could be indicative of a more homogeneous, back-ground component of the community (Gasol et al.1999, Calvo-Díaz et al. 2004, Corzo et al. 2005). LNAcell abundance did not increase with increasing chl aor bacterial activity, as previously observed in naturalsamples (Morán et al. 2002b, 2004, Tadonléké et al.2005) and in dilution-growth experiments (Gasol et al.1999, Vaqué et al. 2001), altogether supporting theiridentification with inactive or dead cells, as proposedby some authors (Li et al. 1995, Jellett et al. 1996, Gasolet al. 1999). However, the finding that overall LNAbacterial abundance was more variable than that ofHNA cells (76 vs. 62% CV; see also Table 1), if not anindirect result of factors acting on HNA bacteria, couldsuggest that this group of cells was able to show someresponse to environmental forcing (Seymour et al.2005, Sherr et al. 2006). Growth of LNA as well as HNAcells was detected in simulated phytoplankton bloomsby Wetz & Wheeler (2004), and other studies havefound higher growth rates of LNA cells relative toHNA at depth (Jochem et al. 2004, Scharek & Latasa2007). Following Smith & del Giorgio (2003), LNA bac-teria may simply be cells with lower cell-specific meta-bolic activity, as demonstrated in the Celtic Sea(Zubkov et al. 2001) and the California Currentupwelling ecosystem (Longnecker et al. 2005), which,on occasion, might even prevail over HNA cells(Zubkov et al. 2001, 2004).
On the other hand, and contrary to observations inother areas (Morán et al. 2004, Corzo et al. 2005) orlater in the year in the same region (Calvo-Díaz &Morán 2006), HNA cell abundance and %HNA dis-played a weak, but significant decrease with depth,indicating that HNA cells could respond to theincreased availability of photosynthate in the shal-lower layers of the water column. The existence of atight trophic linkage or ‘coupling’ (Morán et al. 2002a)between HNA bacteria and phytoplankton in earlyspring is therefore suggested by our data. The overallpositive, although weak (as in Sherr et al. 2006), rela-tionship between chl a and BN found during the cruisewas only attributable to HNA cells. Although we didnot attempt simultaneous determinations of dissolvedphotosynthate supply to bacteria, these results supportthe view that the HNA group is the group most capableof responding to increased inputs of organic substrates(Wetz & Wheeler 2004). Interestingly, remarkably sim-ilar correlations between chl a and the abundance ofHNA bacteria were obtained in the 3 regions (r = 0.55to 0.69), in spite of the different responses in activity(Fig. 5). This finding suggests that the standing stockvariables chl a and HNA cell abundance have similartime-scales of response, while activity rates would varylargely at shorter scales, with little or no effect on therelative nucleic acid content distribution. This result isalso consistent with the hypothesis of Zubkov et al.(2004) that a larger genome would make HNA cellsdominant under meso- to eutrophic conditions, whileLNA cells would mostly rely on regenerated nutrients.
The increase in HNA cells is commonly taken as anindication of increases in bacterial activity and growth(e.g. Gasol & del Giorgio 2000, Lebaron et al. 2001,Oliver et al. 2004). With all data pooled, this was theonly group that was significantly and positively corre-lated with Leu incorporation rates, and thereforeresponsible for the significant relationship between%HNA and Leu uptake (Fig. 4), confirming previousreports (Vaqué et al. 2001). Several studies have shownthat HNA cells contribute a larger fraction of total Leuuptake than LNA cells (Servais et al. 1999, 2003,Lebaron et al. 2001). Unexpectedly, an increase in totalnumbers was not followed by a concurrent relativeincrease in HNA cells for the whole data set. However,when we examined possible geographical differences,%HNA was found to be positively correlated with totalnumbers in the West zone, but negatively in the Cen-tral zone, with no significant correlation in the Eastone. These differences were probably behind thelow percentage of variance in activity explained byboth total and relative (Fig. 4) HNA cell abundance.Within the HNA cell group, single-cell Leu incorpora-tion rates have been shown to vary by as much as 7-fold (Lebaron et al. 2001). Certainly, <20% of total
148
Morán et al.: Nucleic acid content and bacterial activity
variance explained does not encourage the use of HNAbacteria distribution or %HNA as a routine, alternativemethod to estimate bacterioplankton activity in thefield. However, by binning the data set into geograph-ical zones, we were able to gain some insight into thefactors that affect the predictive capacity of HNA cellabundance as an activity index.
Role of bottom-up control
Maxima of %HNA and bacterial activity were gener-ally coincident (Fig. 3) and associated with lower salini-ties (r = –0.57, p = 0.007, n = 21 for %HNA and r = –0.51,p = 0.015, n = 22). Changes in %HNA could indicate adifferent phylogenetic composition of bacterial assem-blages in oceanic waters and in freshwater-influencedcoastal waters (e.g. del Giorgio & Bouvier 2002). How-ever, the different relationships between HNA cell abun-dance and activity found in the West and East zones(Fig. 5A,G), both characterized by lower salinities(Fig. 1C), led us to look for the possible existence of dif-ferent control processes of bacterioplankton in the 2zones. The degree of resource control of bacteria was ap-proached here in 2 manners, namely the relationship be-tween bacterial activity and chl a as a surrogate for dis-solved primary production (Morán et al. 2002a) and therelationship between bacterial biomass and production(Billen et al. 1990, Ducklow 1992). Both analyses showeda remarkably similar geographical pattern. As for HNAabundance and bulk activity, the correlation coefficientsbetween bacterial activity and chl a decreased from theWest to the East zone, where it was lost (Fig. 5B,E,H),suggesting a longitudinal gradient in the relative contri-butions of autochthonous and allochthonous carbonsources for bacterial metabolism and growth. Freshwa-ter-associated inputs of dissolved organic matter(DOM) in the study region are usually greatest in theEast zone (Bode et al. 2001). It must be borne in mindthat the existence of a significant relationship betweenLeu uptake and chl a does not necessarily mean thatbacteria can fulfill their substrate requirements solelywith phytoplankton (Pace & Cole 1996, Morán et al.2002a,b). Morán et al. (2002b) observed a similar rela-tionship in 2 surveys in the West zone continental shelf,yet bacteria required additional sources to the measuredphytoplankton extracellular release rates. These resultscould also be explained by a higher relative importanceof protistan predation or viral lysis as we moved east-wards. In the light of recent reports of high respirationrates of Leu during incubations (Alonso-Sáez et al. 2007),a regional difference in the amount of Leu beingrespired, in turn, determined by the nature of availableDOM, is another possible factor not addressed inthis study.
The analysis of the BB–BP relationship proposed byDucklow (1992) has proved useful for inferring bac-terial bottom-up control in oceanic waters (Dufour &Torréton 1996), and its conclusions are coherent withother techniques (Gasol et al. 2002). Although BP andsubstrate use are not proportional when a wide rangeof trophic conditions is considered (Dufour & Torréton1996), the variability of chl a as a proxy for trophic stateduring the survey (Fig. 2A) was only 1 order of magni-tude; hence, this did not seriously compromise our con-clusions. Thus, bacterial biomass was controlled bysubstrate supply only in the West zone (Fig. 5C), whilein the Central and East zones bottom-up control wasnot apparent (Fig. 5F,I). HNA cell abundance wasmore variable in the West zone (Table 1), the only zonewhere bacterial biomass was clearly bottom-up con-trolled, as derived from the significant relationshipsbetween chl a and bacterial activity (Fig. 5B) andbetween biomass and production (Fig. 5C). In suchareas or periods where bacterial assemblages are pre-dominantly controlled by resources, the abundanceand relative contribution of HNA cells could prove agood estimator of bacterial activity and production.However, when bottom-up control was non-existent,such as in the East zone, HNA cell abundance bore norelationship at all with Leu uptake (Fig. 5G). The Cen-tral zone would lie in an intermediate situation. There,Leu incorporation rates and chl a were significantlycorrelated (Fig. 5E), but not bacterial biomass and pro-duction (Fig. 5F), yet yielding a weakly significant cor-relation between HNA cell abundance and activity(Fig. 5D). Sherr et al. (2006) have identified regional,trophic-based differences in the responsiveness ofHNA cells to chl a similar to those found here.Although we only investigated here the effect of sub-strate supply, the type of control (bottom-up or top-down) operating on bacterial communities would thenemerge as a critical factor in the potential use of HNAcell abundance as a proxy for activity.
Cell size versus nucleic acid content
The variability in LNA and HNA bacteria individualbiomass estimates (12 to 21 fg C cell–1) is in accordancewith previous studies in these shelf waters (Iriberri etal. 1990, Barbosa et al. 2001, Valencia et al. 2003), butconsiderably lower than that reported by Fukuda et al.(1998). Even so, significantly different values werefound in the 3 zones (Table 1). The steady decrease inmean HNA cell biomass as we moved eastwards(Table 1) could be indicative of higher grazing pres-sure along the west–east gradient, consistent with thehypothesized decrease in bottom-up control. Grazersselectively remove larger and more active cells (e.g.
149
Aquat Microb Ecol 46: 141–152, 2007
González et al. 1990, Sherr et al. 1992, del Giorgio etal. 1996). Vaqué et al. (2001) have demonstrated anincrease in grazing rates with increasing HNA abun-dance in the Mediterranean. According to the model ofPace & Cole (1994) enhanced grazing on HNA bacteriawould uncouple them from resources, i.e. decrease thebottom-up control of bacterial biomass (Fig. 5). In arecent paper, Tadonléké et al. (2005) concluded thatgrazing by ciliates was a major factor responsible forlack of response of HNA abundance to chl a in a seriesof lakes. Although mortality by protistan grazers orviral infection was not assessed during the presentstudy, the lower biomass of HNA cells in the East zonecould be indicative of a preferential loss of the mostactive and larger cells within this group. If grazingpressure became stronger, it might even reverse thevertical pattern of %HNA found here, as suggested byCorzo et al. (2005).
Despite the lack of significant relationships betweenLNA abundance and activity in this study, someauthors have reported on similar substrate assimilationrates of LNA and HNA bacteria (Button & Robertson2000, Zubkov et al. 2001, Longnecker et al. 2005), sim-ilar responses of both groups to changes in phyto-plankton biomass (Sherr et al. 2006) or higher growthrates of LNA bacteria at depth (Scharek & Latasa2007). We link these contradictory results to actualbacterial sizes. Considering both groups, mean carbonbiomass was highly and positively correlated with therespective activity–abundance correlation coefficient(Fig. 6), implying that only at large sizes might we ex-pect a good correspondence between HNA abundanceand bulk activity. Although correlation analysis cannotprove causal relationships, the known effect of bacter-ial size on activity (Gasol et al. 1995, Servais et al. 1999,Lebaron et al. 2002) may help answer the question:How useful is HNA cell abundance as a proxy of bac-terial activity in the sea? It probably depends on theirsize. Given the usually larger size of bacteria in incu-bated samples, it is not surprising that HNA cells wereconsistently responsible for increases in total bacterio-plankton activity in laboratory experiments (Gasol etal. 1999, Vaqué et al. 2001), whereas discrepancies ap-peared only in natural samples (Zubkov et al. 2001,Jochem et al. 2004, Longnecker et al. 2005). In thestudy region, LNA cells are usually larger than HNAcells in spring (Calvo-Díaz & Morán 2006). These au-thors hypothesized that the abundance of LNA bacte-ria could be better correlated to Leu incorporationrates than HNA cells during periods of higher relativesize. This was indeed suggested by the positive corre-lation of LNA cell abundance with activity in the Cen-tral zone, while that of HNA bacteria in the East zonewas negative (Fig. 6). In agreement with Lebaron et al.(2002), our analysis suggests that we should consider
cell size together with the relative nucleic acid contentif we are to rely on flow cytometry-based estimates ofbacterial activity in marine ecosystems.
CONCLUSIONS
The ubiquitous presence of 2 groups of heterotrophicbacteria of differing nucleic acid content in the oceanhas boosted the preferential association of HNA cellswith the active members of the community. We showthat both the absolute abundance and relative contri-bution of HNA cells were significantly correlated withleucine incorporation rates, but the low percentage ofvariance explained would question its ready use as aproxy for activity in natural systems. Our analysis sug-gests that the utility of HNA cell abundance as anactivity index is related to the degree of bottom-upregulation of bacteria via their trophic interactionswith phytoplankton, with bacterial size also playing afundamental role. We conclude that only at relativelylarge bacterial sizes could we expect bacterial activityand production to unequivocally respond to an in-crease in the abundance of HNA cells. Given the usu-ally smaller size of bacteria in the open ocean relativeto coastal waters, future research is needed to deter-mine whether HNA cell abundance is still of potentialuse as an indicator of activity in oligotrophic ecosys-tems and to assess the relevance of the proposed andclosely related factors (bottom-up control and cell size)in determining the bacterial response.
Acknowledgements. We are grateful to the chief scientist, C.Porteiro, and to the captain and crew of RV ‘Thalassa’ for theirassistance during the cruise. The collaboration of A. Álvarez,P. Estévez, R. Revilla and M. Varela is also appreciated.J. Lorenzo and F. Castiñeira measured chl a concentrations.J. M. Gasol, A. Calvo-Díaz, R. Scharek and Á. López-Urrutia,together with 3 anonymous referees, provided helpful com-ments on earlier drafts. G. González-Nuevo kindly preparedFig. 1B and C. This research was funded in part by projectSARDYN (QLRT-2001-00818) of the European Union and bythe special action ‘Reconocimiento oceanográfico en la épocade la floración primaveral en Galicia y Cantábrico’ of theMinistry of Science and Technology (Spain).
LITERATURE CITED
Alonso-Sáez L, Gasol JM, Arístegui J, Vilas JC, Vaqué D,Duarte CM, Agustí S (2007) Large-scale variability in sur-face bacterial carbon demand and growth efficiency in thesubtropical North East Atlantic Ocean. Limnol Oceanogr52(2):(in press)
Barbosa AB, Galvao HM, Mendes PA, Alvarez-Salgado XA,Figueiras FG, Joint I (2001) Short-term variability ofheterotrophic bacterioplankton during upwelling off theNW Iberian margin. Prog Oceanogr 51:339–359
Billen G, Servais P, Becquevort S (1990) Dynamics of bacterio-plankton in oligotrophic and euphotic aquatic environ-
150
Morán et al.: Nucleic acid content and bacterial activity
ments: bottom-up or top-down control? Hydrobiologia207:37–42
Bode A, Varela M, Canle M, González N (2001) Dissolved andparticulate organic nitrogen in shelf waters of northernSpain during spring. Mar Ecol Prog Ser 214:43–54
Bode A, Varela M, Casas B, González N (2002) Intrusions ofeastern North Atlantic central waters and phytoplanktonin the north and northwestern Iberian shelf during spring.J Mar Syst 36:197–218
Button DK, Robertson B (2000) Effect of nutrient kineticsand cytoarchitecture on bacterioplankter size. LimnolOceanogr 45:499–505
Calvo-Díaz A, Morán XAG (2006) Seasonal dynamics ofpicoplankton in shelf waters of the southern Bay of Biscay.Aquat Microb Ecol 42:159–174
Calvo-Díaz A, Morán XAG, Nogueira E, Bode A, Varela M(2004) Picoplankton community structure along the north-ern Iberian continental margin in late winter–early spring.J Plankton Res 26:1069–1081
Corzo A, Rodríguez-Gálvez S, Lubian L, Sobrino C, Sangrá P,Martínez A (2005) Antarctic marine bacterioplankton sub-populations discriminated by their apparent content ofnucleic acids differ in their response to ecological factors.Polar Biol 29:27–39
del Giorgio PA, Bouvier TC (2002) Linking the physiologicand phylogenetic successions in free-living bacterial com-munities along an estuarine sallinity gradient. LimnolOceanogr 47:471–486
del Giorgio P, Gasol JM, Vaqué D, Mura P, Agustí S, DuarteCM (1996) Bacterioplankton community structure: protistscontrol net production and the proportion of active bacte-ria in a coastal marine community. Limnol Oceanogr 41:1169–1179
Ducklow HW (1992) Factors regulating bottom-up control ofbacteria biomass in open ocean plankton communities.Arch Hydrobiol Beih Ergeb Limnol 37:207–217
Dufour P, Torréton JP (1996) Bottom-up and top-down controlof bacterioplankton from eutrophic to oligotrophic sites inthe tropical northeastern Atlantic Ocean. Deep-Sea Res I43:1305–1320
Fukuda R, Ogawa H, Nagata T, Koike I (1998) Direct determi-nation of carbon and nitrogen contents of natural bacteriaassemblages in marine environments. Appl EnvironMicrobiol 64:3352–3358
Gasol JM, del Giorgio PA (2000) Using flow cytometry forcounting natural planktonic bacteria and understandingthe structure of planktonic bacterial communities. Sci Mar64:197–224
Gasol JM, del Giorgio PA, Massana R, Duarte CM (1995)Active versus inactive bacteria: size-dependence in acoastal marine plankton community. Mar Ecol Prog Ser128:91–97
Gasol JM, Zweifel UL, Peters F, Fuhrman JA, Hagström Å(1999) Significance of size and nucleic acid contentheterogeneity as measured by flow cytometry in naturalplanktonic bacteria. Appl Environ Microbiol 65:4475–4483
Gasol JM, Pedrós-Alió C, Vaqué D (2002) Regulation of bac-terial assemblages in oligotrophic plankton systems:results from experimental and empirical approaches.Antonie Leeuwenhoek 81:435–452
González JM, Sherr EB, Sherr BF (1990) Size-selective graz-ing on bacteria by natural assemblages of estuarine flagel-lates and ciliates. Appl Environ Microbiol 56:583–589
Iriberri J, Unanue M, Ayo B, Barcina I, Egea L (1990) Attachedand free-living dividing bacteria in two aquatic systems.Lett Appl Microbiol 11:87–89
Jellett JF, Li WKW, Dickie PM, Boraie A, Kepkay PE (1996)Metabolic activity of bacterioplankton communitiesassessed by flow cytometry and single carbon substrateutilization. Mar Ecol Prog Ser 136:213–225
Jochem FJ, Lavrentyev PJ, First MR (2004) Growth andgrazing rates of bacteria groups with different apparentDNA content in the Gulf of Mexico. Mar Biol 145:1213–1225
Kirchman DL (1993) Leucine incorporation as a measure ofbiomass production by heterotrophic bacteria. In: KempPF, Cole JJ, Sherr BF, Sherr EB (eds) Handbook of meth-ods in aquatic microbial ecology. Lewis Publishers, BocaRaton, FL, p 509–512
Lebaron P, Servais P, Agogue H, Courties C, Joux F (2001)Does the high nucleic acid content of individual bacterialcells allow us to discriminate between active cells andinactive cells in aquatic systems? Appl Environ Microbiol67:1775–1782
Lebaron P, Servais P, Baudoux AC, Bourrain M, Courties C,Parthuisot N (2002) Variations of bacterial-specific activitywith cell size and nucleic acid content assessed by flowcytometry. Aquat Microb Ecol 28:131–140
Li WKW, Jellett JF, Dickie PM (1995) DNA distributions inplanktonic bacteria stained with TOTO or TO-PRO.Limnol Oceanogr 40:1485–1495
Li WKW, Head EJH, Harrison WG (2004) Macroecologicallimits of heterotrophic bacterial abundance in the ocean.Deep-Sea Res I 51:1529–1540
Longnecker K, Sherr BF, Sherr EB (2005) Activity and phylo-genetic diversity of bacterial cells with high and lownucleic acid content and electron transport system activityin an upwelling ecosystem. Appl Environ Microbiol 71:7737–7749
Marie D, Vaulot D, Partensky F (1996) Application of thenovel nucleic acid dyes YOYO-1, YO-PRO-1, and Pico-Green for flow cytometric analysis of marine prokaryotes.Appl Environ Microbiol 62:1649–1655
Marie D, Partensky F, Jacquet S, Vaulot D (1997) Enumera-tion and cell cycle analysis of natural populations ofmarine picoplankton by flow cytometry using the nucleicacid stain SYBR Green I. Appl Environ Microbiol 63:186–193
Moran MD (2003) Arguments for rejecting the sequentialBonferroni in ecological studies. Oikos 100:403–405
Morán XAG, Massana R, Gasol JM (2001) Light conditionsaffect the measurement of oceanic bacterial produc-tion via leucine uptake. Appl Environ Microbiol 67:3795–3801
Morán XAG, Estrada M, Gasol JM, Pedrós-Alió C (2002a) Dis-solved primary production and the strength of phyto-plankton bacterioplankton coupling in contrasting marineregions. Microb Ecol 44:217–223
Morán XAG, Gasol JM, Pedrós-Alió C, Estrada M (2002b)Partitioning of phytoplanktonic organic carbon productionand bacterial production along a coastal–offshore gra-dient in the NE Atlantic during different hydrographicregimes. Aquat Microb Ecol 29:239–252
Morán XAG, Fernández E, Pérez V (2004) Size-fractionatedprimary production, bacterial production and net commu-nity production in subtropical and tropical domains of theoligotrophic NE Atlantic in autumn. Mar Ecol Prog Ser274:17–29
Neveux J, Lantoine F (1993) Spectrofluorometric assay ofchlorophylls and pheopigments using the least-squaresapproximation technique. Deep-Sea Res I 40:1747–1765
Norland S (1993) The relationship between biomass and vol-ume of bacteria. In: Kemp PF, Sherr BF, Sherr EB, Cole JJ
151
Aquat Microb Ecol 46: 141–152, 2007
(eds) Handbook of methods in aquatic microbial ecology.Lewis Publishers, Boca Raton, FL, p 303–307
Oliver JL, Barber RT, Smith WO, Ducklow HW (2004) Theheterotrophic bacterial response during the SouthernOcean Iron Experiment (SOFeX). Limnol Oceanogr 49:2129–2140
Pace ML, Cole JJ (1994) Comparative and experimentalapproaches to top-down and bottom-up regulation ofbacteria. Microb Ecol 28:181–193
Pace ML, Cole JJ (1996) Regulation of bacteria by sources andpredation tested in whole-lake experiments. LimnolOceanogr 41:1448–1460
Richardson AJ, Schoeman DS (2004) Climate impact onplankton ecosystems in the Northeast Atlantic. Science305:1609–1612
Scharek R, Latasa M (2007) Growth, grazing and carbon fluxof high and low nucleic acid bacteria differ in surface anddeep chlorophyll maximum layers in the NW Mediter-ranean Sea. Aquat Microb Ecol 46:153–161
Servais P, Courties C, Lebaron P, Troussellier M (1999) Cou-pling bacterial activity measurements with cell sorting byflow cytometry. Microb Ecol 38:180–189
Servais P, Casamayor EO, Courties C, Catala P, Parthuisot N,Lebaron P (2003) Activity and diversity of bacterial cellswith high and low nucleic acid content. Aquat Microb Ecol33:41–51
Seymour JR, Seuront L, Mitchell JG (2005) Microscale andsmall-scale temporal dynamics of a coastal planktonicmicrobial community. Mar Ecol Prog Ser 300:21–37
Sherr BF, Sherr EB, Mcdaniel J (1992) Effect of protistan graz-ing on the frequency of dividing cells in bacterioplanktonassemblages. Appl Environ Microbiol 58:2381–2385
Sherr BF, del Giorgio P, Sherr EB (1999) Estimating abun-dance and single-cell characteristics of respiring bacteriavia the redox dye CTC. Aquat Microb Ecol 18:117–131
Sherr EB, Sherr BF, Longnecker K (2006) Distribution of bac-terial abundance and cell-specific nucleic acid content inthe Northeast Pacific Ocean. Deep-Sea Res I 53:713–725
Sieracki ME, Viles CL (1992) Distributions and fluorochrome-staining properties of submicrometer particles and bacte-ria in the North-Atlantic. Deep-Sea Res I 39:1919–1929
2imek K, Hornák K, Jezbera J, Masin M, Nedoma J, Gasol
JM, Schauer M (2005) Influence of top-down and bottom-up manipulations on the R-BT065 subcluster of beta-proteobacteria, an abundant group in bacterioplankton ofa freshwater reservoir. Appl Environ Microbiol 71:2381–2390
Simon M, Azam F (1989) Protein content and protein synthe-sis rates of planktonic marine bacteria. Mar Ecol Prog Ser51:201–213
Smith EM, del Giorgio PA (2003) Low fractions of active bac-teria in natural aquatic communities? Aquat Microb Ecol31:203–208
Tadonléké RD, Planas D, Lucotte A (2005) Microbial foodwebs in boreal humic lakes and reservoirs: ciliates as amajor factor related to the dynamics of the most activebacteria. Microb Ecol 49:325–341
Troussellier M, Courties C, Lebaron P, Servais P (1999) Flowcytometric discrimination of bacterial populations in sea-water based on SYTO 13 staining of nucleic acids. FEMSMicrobiol Ecol 29:319–330
Valencia J, Abalde J, Bode A, Cid A and 5 others (2003) Vari-ations in planktonic bacterial biomass and production, andphytoplankton blooms off A Coruña (NW Spain). Sci Mar67:143–157
Vaqué D, Casamayor EO, Gasol JM (2001) Dynamics of wholecommunity bacterial production and grazing losses in sea-water incubations as related to the changes in the pro-portions of bacteria with different DNA content. AquatMicrob Ecol 25:163–177
Wetz MS, Wheeler PA (2004) Response of bacteria to simu-lated upwelling phytoplankton blooms. Mar Ecol Prog Ser272:49–57
Worm B, Myers RA (2003) Meta-analysis of cod–shrimp inter-actions reveals top-down control in oceanic food webs.Ecology 84:162–173
Zubkov MV, Fuchs BM, Burkill PH, Amann R (2001) Compar-ison of cellular and biomass specific activities of dominantbacterioplankton groups in stratified waters of the CelticSea. Appl Environ Microbiol 67:5210–5218
Zubkov MV, Allen JI, Fuchs BM (2004) Coexistence of domi-nant groups in marine bacterioplankton community—acombination of experimental and modelling approaches.J Mar Biol Assoc UK 84:519–529
152
Editorial responsibility: Josep Gasol,Barcelona, Spain
Submitted: August 18, 2006; Accepted: November 13, 2006Proofs received from author(s): January 22, 2007