ashok leyland - motilal oswal
TRANSCRIPT
13 May 2015
4QFY15 Results Update | Sector: Automobiles
Ashok Leyland
Jinesh Gandhi ([email protected]); +91 22 3982 5416
Jay Shah ([email protected]); +91 22 3078 4701
BSE SENSEX S&P CNX CMP: INR70 TP: INR84 (+20%) Buy 27,251 8,235
Bloomberg AL IN
Equity Shares (m) 2,845.9 M.Cap. (INR b) / (USD b)
198.1/3.1
52-Week Range (INR) 77/25
1, 6, 12 Rel. Per (%) -2/44/159
AvgVal(INR m)/Vol ‘000 963/19,949
Free float (%) 61.2
Financials & Valuation (INR b)
Y/E MAR 2015 2016E 2017E
Net Sales 135.6 173.6 225.8
EBITDA 10.3 18.1 27.9
Adj PAT 2.3 8.9 16.6
EPS (INR) 0.8 3.1 5.8
Gr. (%) NA NA NA
BV/Sh.(INR) 18.0 19.9 23.9
RoE (%) 4.9 16.6 26.5
RoCE (%) 8.0 17.0 27.1
P/E (x) 84.7 22.2 12.0
EV/EBITDA 21.6 12.1 7.4
P/BV (X) 3.9 3.5 2.9
Estimate change 6%
TP change 6%
Rating change
Operating performance in line; transformed and prepared for the upcycle AL reported third consecutive quarter of positive PAT in 4QFY15, driven by cost cutting and operating leverage. Management’s focused approach is paying off in a) market share gains, b) rising ASPs, c) controlled cost, d) working capital reduction, e) significant control on capex and f) debt reduction. Strong volume recovery, coupled with weak commodity prices, would drive significant margin expansion and EPS growth going growth. Maintain Buy with a TP of ~INR84 (9x FY17E EV/EBITDA). n Net sales grew 46% YoY (+34% QoQ) to INR45b (in line with est.), led by volume
growth of 31.1% YoY (34.5% QoQ) and realization growth of ~12% YoY (flat QoQ). n EBTIDA margin of 10.1% (up 430bp YoY and 300bp QoQ; est. of 9.9%) was aided
by lower RM cost (value engineering and cost-cutting initiative) and higher operating leverage.
n PBT was ~INR2.9b (in line with est.). However, lower tax rate boosted Adj. PAT to ~INR2.4b (v/s est. of INR1.8b).
Key takeaways from the call: a) The management expects domestic M&HCV volumes to grow 10-15% (AL to outgrow at 15-20%) in FY16, b) it is targeting ~ 100bp margins improvement in FY16 (exit margins of ~11% v/s 10% in 4QFY15), c) AL witnessed negative working capital in 4QFY15 (for the first time since FY08), d) standalone net debt reduced to ~INR26b (0.6x equity) from ~INR46.8b in FY14, and e) capex is expected to remain moderate with ~INR3-3.5b for FY16 (~INR1.5b for capex and ~INR2b for investments) v/s ~INR3b in FY14 (incl. ~INR1b for investments in subsidiaries/JVs). Valuation and view: We are downgrading FY16/17E EPS by 14%/6% to ~INR3.1/5.8 (see Pg.5 for details). AL trades at 12x FY17E EPS and EV/EBITDA of 7.4x. Maintain Buy with a target price of ~INR84 (~9x FY17 EV/EBITDA; in line with LPA).
Investors are advised to refer through disclosures made at the end of the Research Report.
Motilal Oswal research is available on www.motilaloswal.com/Institutional-Equities, Bloomberg, Thomson Reuters, Factset and S&P Capital.
13 May 2015 2
Ashok Leyland
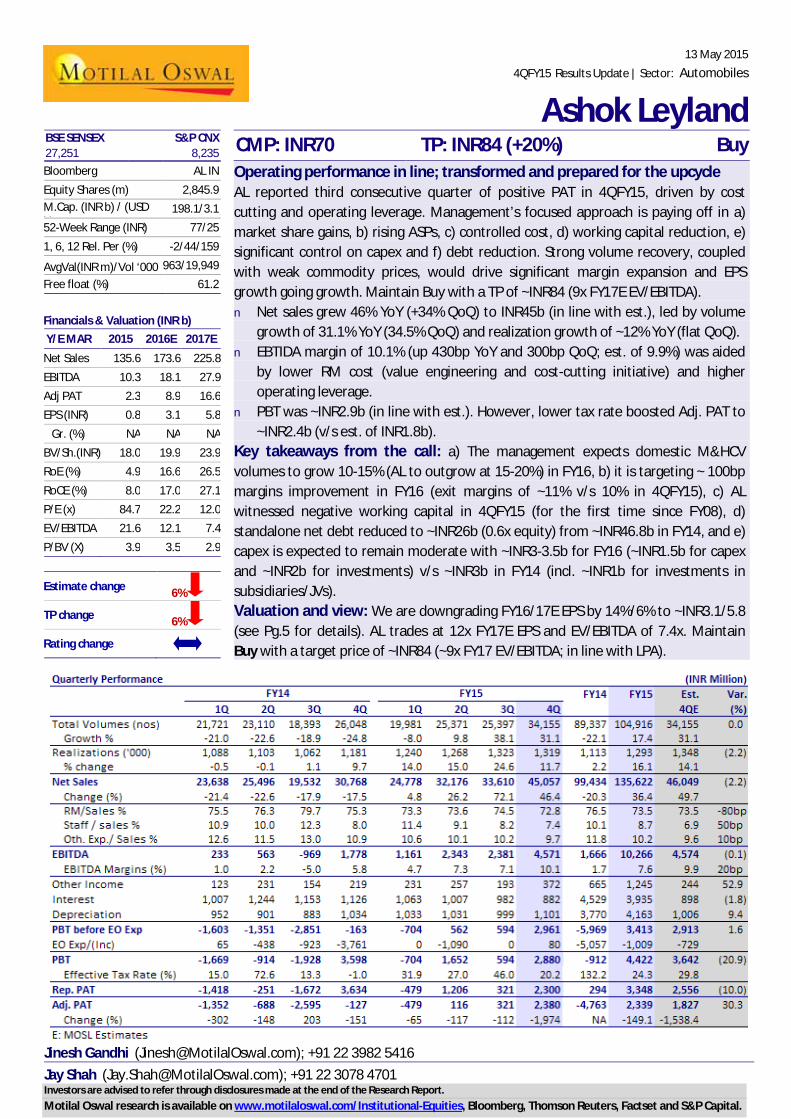
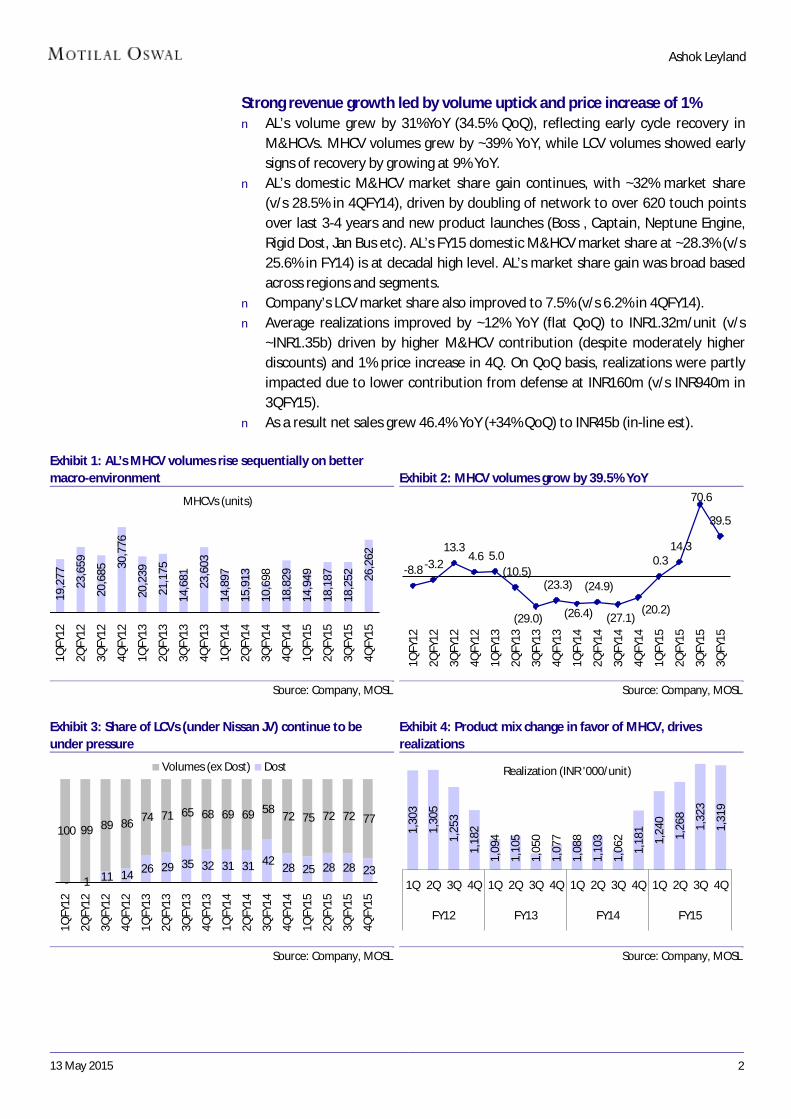
Strong revenue growth led by volume uptick and price increase of 1% n AL’s volume grew by 31%YoY (34.5% QoQ), reflecting early cycle recovery in
M&HCVs. MHCV volumes grew by ~39% YoY, while LCV volumes showed early signs of recovery by growing at 9% YoY.
n AL’s domestic M&HCV market share gain continues, with ~32% market share (v/s 28.5% in 4QFY14), driven by doubling of network to over 620 touch points over last 3-4 years and new product launches (Boss , Captain, Neptune Engine, Rigid Dost, Jan Bus etc). AL’s FY15 domestic M&HCV market share at ~28.3% (v/s 25.6% in FY14) is at decadal high level. AL’s market share gain was broad based across regions and segments.
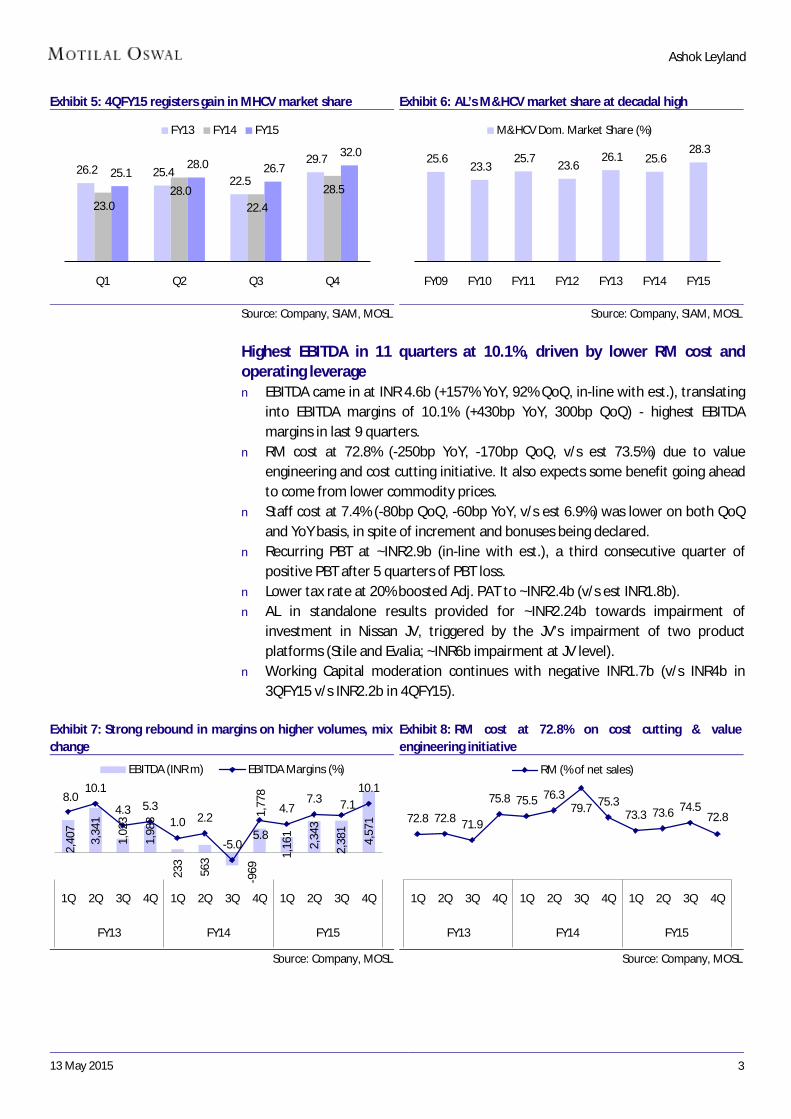
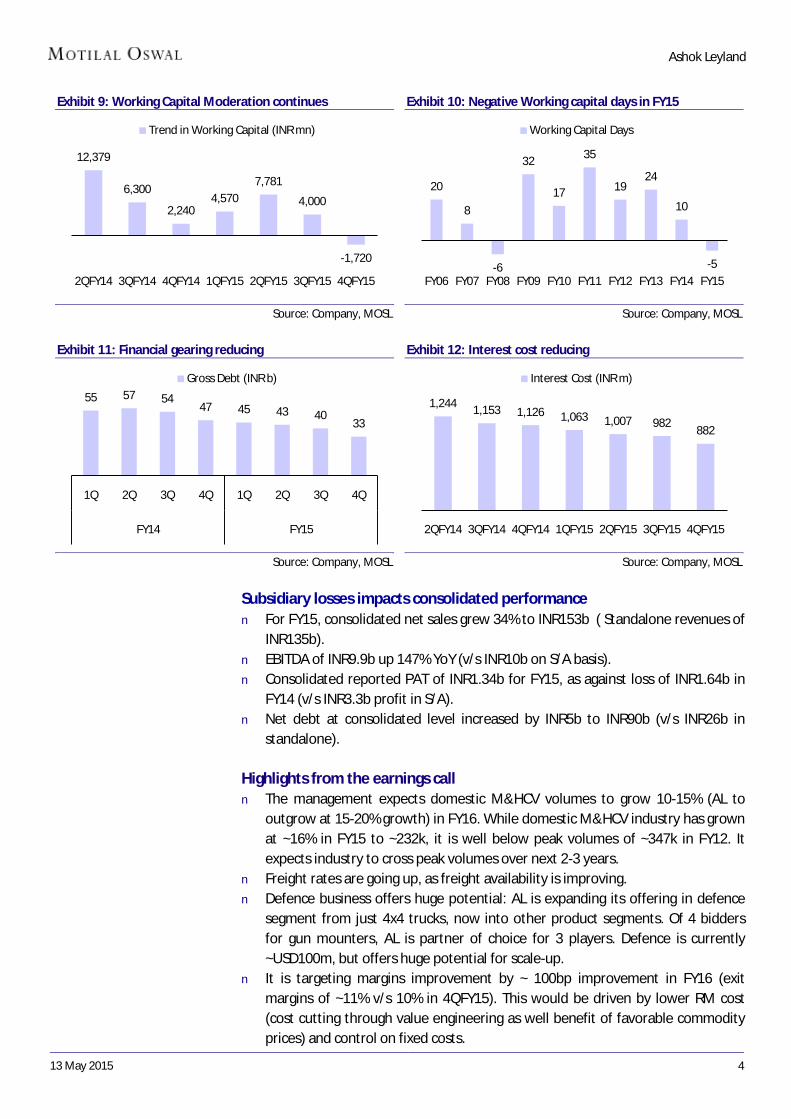
n Company’s LCV market share also improved to 7.5% (v/s 6.2% in 4QFY14). n Average realizations improved by ~12% YoY (flat QoQ) to INR1.32m/unit (v/s
~INR1.35b) driven by higher M&HCV contribution (despite moderately higher discounts) and 1% price increase in 4Q. On QoQ basis, realizations were partly impacted due to lower contribution from defense at INR160m (v/s INR940m in 3QFY15).
n As a result net sales grew 46.4% YoY (+34% QoQ) to INR45b (in-line est).
Exhibit 1: AL’s MHCV volumes rise sequentially on better macro-environment
Source: Company, MOSL
Exhibit 2: MHCV volumes grow by 39.5% YoY
Source: Company, MOSL
Exhibit 3: Share of LCVs (under Nissan JV) continue to be under pressure
Source: Company, MOSL
Exhibit 4: Product mix change in favor of MHCV, drives realizations
Source: Company, MOSL
19,2
77
23,6
59
20,6
85 30
,776
20,2
39
21,1
75
14,6
81
23,6
03
14,8
97
15,9
13
10,6
98
18,8
29
14,9
49
18,1
87
18,2
52
26,2
62
1QFY
12
2QFY
12
3QFY
12
4QFY
12
1QFY
13
2QFY
13
3QFY
13
4QFY
13
1QFY
14
2QFY
14
3QFY
14
4QFY
14
1QFY
15
2QFY
15
3QFY
15
4QFY
15
MHCVs (units)
-8.8 -3.213.3
4.6 5.0 (10.5)
(29.0)
(23.3)
(26.4)
(24.9)
(27.1)(20.2)
0.3 14.3
70.6
39.5
1QFY
12
2QFY
12
3QFY
12
4QFY
12
1QFY
13
2QFY
13
3QFY
13
4QFY
13
1QFY
14
2QFY
14
3QFY
14
4QFY
14
1QFY
15
2QFY
15
3QFY
15
3QFY
15
- 1 11 14 26 29 35 32 31 31 42 28 25 28 28 23
100 99 89 86 74 71 65 68 69 69 58 72 75 72 72 77
1QFY
12
2QFY
12
3QFY
12
4QFY
12
1QFY
13
2QFY
13
3QFY
13
4QFY
13
1QFY
14
2QFY
14
3QFY
14
4QFY
14
1QFY
15
2QFY
15
3QFY
15
4QFY
15
Volumes (ex Dost) Dost
1,30
3
1,30
5
1,25
3
1,18
2
1,09
4
1,10
5
1,05
0
1,07
7
1,08
8
1,10
3
1,06
2
1,18
1
1,24
0
1,26
8
1,32
3
1,31
9
1Q 2Q 3Q 4Q 1Q 2Q 3Q 4Q 1Q 2Q 3Q 4Q 1Q 2Q 3Q 4Q
FY12 FY13 FY14 FY15
Realization (INR '000/unit)
13 May 2015 3
Ashok Leyland
Exhibit 5: 4QFY15 registers gain in MHCV market share
Source: Company, SIAM, MOSL
Exhibit 6: AL’s M&HCV market share at decadal high
Source: Company, SIAM, MOSL
Highest EBITDA in 11 quarters at 10.1%, driven by lower RM cost and operating leverage n EBITDA came in at INR 4.6b (+157% YoY, 92% QoQ, in-line with est.), translating
into EBITDA margins of 10.1% (+430bp YoY, 300bp QoQ) - highest EBITDA margins in last 9 quarters.
n RM cost at 72.8% (-250bp YoY, -170bp QoQ, v/s est 73.5%) due to value engineering and cost cutting initiative. It also expects some benefit going ahead to come from lower commodity prices.
n Staff cost at 7.4% (-80bp QoQ, -60bp YoY, v/s est 6.9%) was lower on both QoQ and YoY basis, in spite of increment and bonuses being declared.
n Recurring PBT at ~INR2.9b (in-line with est.), a third consecutive quarter of positive PBT after 5 quarters of PBT loss.
n Lower tax rate at 20% boosted Adj. PAT to ~INR2.4b (v/s est INR1.8b). n AL in standalone results provided for ~INR2.24b towards impairment of
investment in Nissan JV, triggered by the JV’s impairment of two product platforms (Stile and Evalia; ~INR6b impairment at JV level).
n Working Capital moderation continues with negative INR1.7b (v/s INR4b in 3QFY15 v/s INR2.2b in 4QFY15).
Exhibit 7: Strong rebound in margins on higher volumes, mix change
Source: Company, MOSL
Exhibit 8: RM cost at 72.8% on cost cutting & value engineering initiative
Source: Company, MOSL
26.2 25.4 22.5
29.7
23.0 28.0
22.4
28.5 25.1
28.0 26.7 32.0
Q1 Q2 Q3 Q4
FY13 FY14 FY15
25.6 23.3
25.7 23.6
26.1 25.6 28.3
FY09 FY10 FY11 FY12 FY13 FY14 FY15
M&HCV Dom. Market Share (%)
2,40
7
3,34
1
1,02
3
1,98
3
233
563
-969
1,77
8
1,16
1
2,34
3
2,38
1
4,57
1
8.010.1
4.3 5.31.0 2.2
-5.05.8
4.77.3 7.1
10.1
1Q 2Q 3Q 4Q 1Q 2Q 3Q 4Q 1Q 2Q 3Q 4Q
FY13 FY14 FY15
EBITDA (INR m) EBITDA Margins (%)
72.8 72.8 71.9
75.8 75.5 76.379.7 75.3
73.3 73.6 74.572.8
1Q 2Q 3Q 4Q 1Q 2Q 3Q 4Q 1Q 2Q 3Q 4Q
FY13 FY14 FY15
RM (% of net sales)
13 May 2015 4
Ashok Leyland
Exhibit 9: Working Capital Moderation continues
Source: Company, MOSL
Exhibit 10: Negative Working capital days in FY15
Source: Company, MOSL
Exhibit 11: Financial gearing reducing
Source: Company, MOSL
Exhibit 12: Interest cost reducing
Source: Company, MOSL
Subsidiary losses impacts consolidated performance n For FY15, consolidated net sales grew 34% to INR153b ( Standalone revenues of
INR135b). n EBITDA of INR9.9b up 147% YoY (v/s INR10b on S/A basis). n Consolidated reported PAT of INR1.34b for FY15, as against loss of INR1.64b in
FY14 (v/s INR3.3b profit in S/A). n Net debt at consolidated level increased by INR5b to INR90b (v/s INR26b in
standalone). Highlights from the earnings call n The management expects domestic M&HCV volumes to grow 10-15% (AL to
outgrow at 15-20% growth) in FY16. While domestic M&HCV industry has grown at ~16% in FY15 to ~232k, it is well below peak volumes of ~347k in FY12. It expects industry to cross peak volumes over next 2-3 years.
n Freight rates are going up, as freight availability is improving. n Defence business offers huge potential: AL is expanding its offering in defence
segment from just 4x4 trucks, now into other product segments. Of 4 bidders for gun mounters, AL is partner of choice for 3 players. Defence is currently ~USD100m, but offers huge potential for scale-up.
n It is targeting margins improvement by ~ 100bp improvement in FY16 (exit margins of ~11% v/s 10% in 4QFY15). This would be driven by lower RM cost (cost cutting through value engineering as well benefit of favorable commodity prices) and control on fixed costs.
12,379
6,300
2,2404,570
7,781
4,000
-1,720
2QFY14 3QFY14 4QFY14 1QFY15 2QFY15 3QFY15 4QFY15
Trend in Working Capital (INR mn)
20
8
-6
32
17
35
1924
10
-5FY06 FY07 FY08 FY09 FY10 FY11 FY12 FY13 FY14 FY15
Working Capital Days
55 57 5447 45 43 40
33
1Q 2Q 3Q 4Q 1Q 2Q 3Q 4Q
FY14 FY15
Gross Debt (INR b)
1,2441,153 1,126 1,063 1,007 982
882
2QFY14 3QFY14 4QFY14 1QFY15 2QFY15 3QFY15 4QFY15
Interest Cost (INR m)
13 May 2015 5
Ashok Leyland
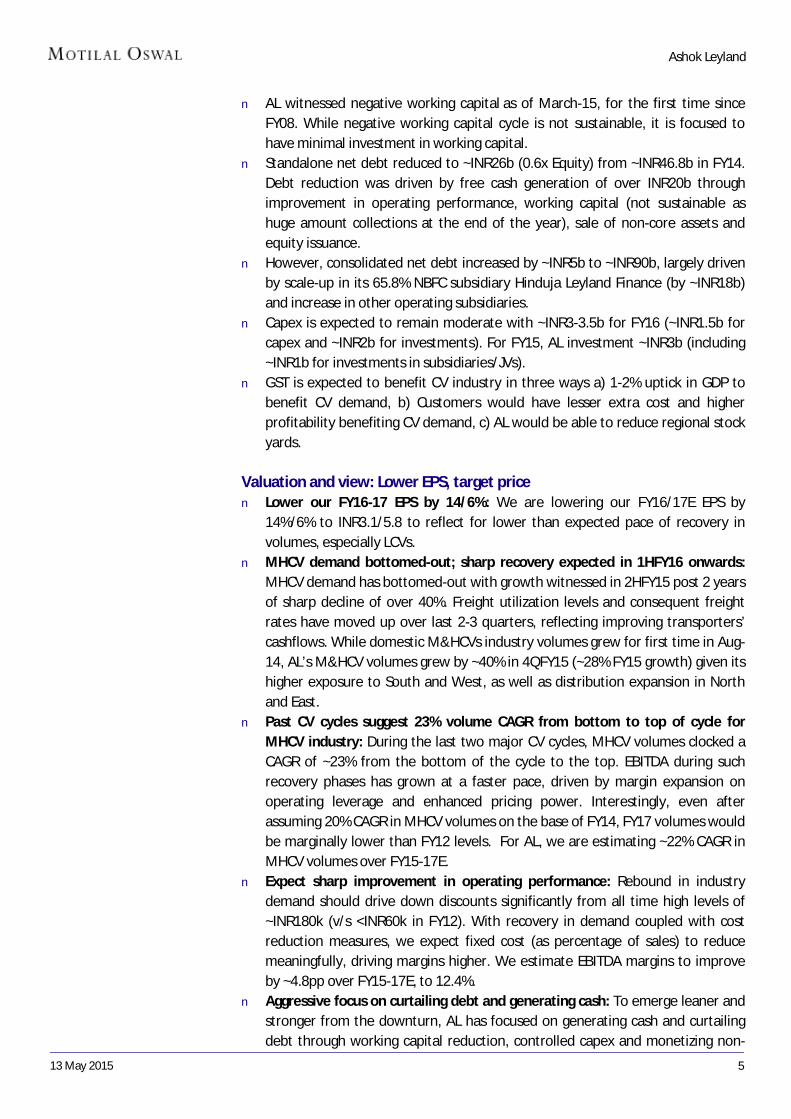
n AL witnessed negative working capital as of March-15, for the first time since FY08. While negative working capital cycle is not sustainable, it is focused to have minimal investment in working capital.
n Standalone net debt reduced to ~INR26b (0.6x Equity) from ~INR46.8b in FY14. Debt reduction was driven by free cash generation of over INR20b through improvement in operating performance, working capital (not sustainable as huge amount collections at the end of the year), sale of non-core assets and equity issuance.
n However, consolidated net debt increased by ~INR5b to ~INR90b, largely driven by scale-up in its 65.8% NBFC subsidiary Hinduja Leyland Finance (by ~INR18b) and increase in other operating subsidiaries.
n Capex is expected to remain moderate with ~INR3-3.5b for FY16 (~INR1.5b for capex and ~INR2b for investments). For FY15, AL investment ~INR3b (including ~INR1b for investments in subsidiaries/JVs).
n GST is expected to benefit CV industry in three ways a) 1-2% uptick in GDP to benefit CV demand, b) Customers would have lesser extra cost and higher profitability benefiting CV demand, c) AL would be able to reduce regional stock yards.
Valuation and view: Lower EPS, target price n Lower our FY16-17 EPS by 14/6%: We are lowering our FY16/17E EPS by
14%/6% to INR3.1/5.8 to reflect for lower than expected pace of recovery in volumes, especially LCVs.
n MHCV demand bottomed-out; sharp recovery expected in 1HFY16 onwards: MHCV demand has bottomed-out with growth witnessed in 2HFY15 post 2 years of sharp decline of over 40%. Freight utilization levels and consequent freight rates have moved up over last 2-3 quarters, reflecting improving transporters’ cashflows. While domestic M&HCVs industry volumes grew for first time in Aug-14, AL’s M&HCV volumes grew by ~40% in 4QFY15 (~28% FY15 growth) given its higher exposure to South and West, as well as distribution expansion in North and East.
n Past CV cycles suggest 23% volume CAGR from bottom to top of cycle for MHCV industry: During the last two major CV cycles, MHCV volumes clocked a CAGR of ~23% from the bottom of the cycle to the top. EBITDA during such recovery phases has grown at a faster pace, driven by margin expansion on operating leverage and enhanced pricing power. Interestingly, even after assuming 20% CAGR in MHCV volumes on the base of FY14, FY17 volumes would be marginally lower than FY12 levels. For AL, we are estimating ~22% CAGR in MHCV volumes over FY15-17E.
n Expect sharp improvement in operating performance: Rebound in industry demand should drive down discounts significantly from all time high levels of ~INR180k (v/s <INR60k in FY12). With recovery in demand coupled with cost reduction measures, we expect fixed cost (as percentage of sales) to reduce meaningfully, driving margins higher. We estimate EBITDA margins to improve by ~4.8pp over FY15-17E, to 12.4%.
n Aggressive focus on curtailing debt and generating cash: To emerge leaner and stronger from the downturn, AL has focused on generating cash and curtailing debt through working capital reduction, controlled capex and monetizing non-
13 May 2015 6
Ashok Leyland
core assets. Further, capex (incl. Investment) for FY16 is expected to be at INR 3b (v/s INR5bin FY15 v/s INR5.5b in FY14 v/s 15.4b in FY13).
n Rerating to continue: Management’s focused approach is paying-off in a) market share gains, b) rising ASPs, c) controlled cost, d) reducing working capital, e) significant control on capex and f) debt reduction. Strong volume recovery coupled with weak commodity prices would drive significant margin expansion and EPS growth. AL trades at 12x FY17E EPS and EV/EBITDA of 7.4x. Maintain Buy with target price of ~INR84 (~9x FY17 EV/EBITDA, in-line with LPA).
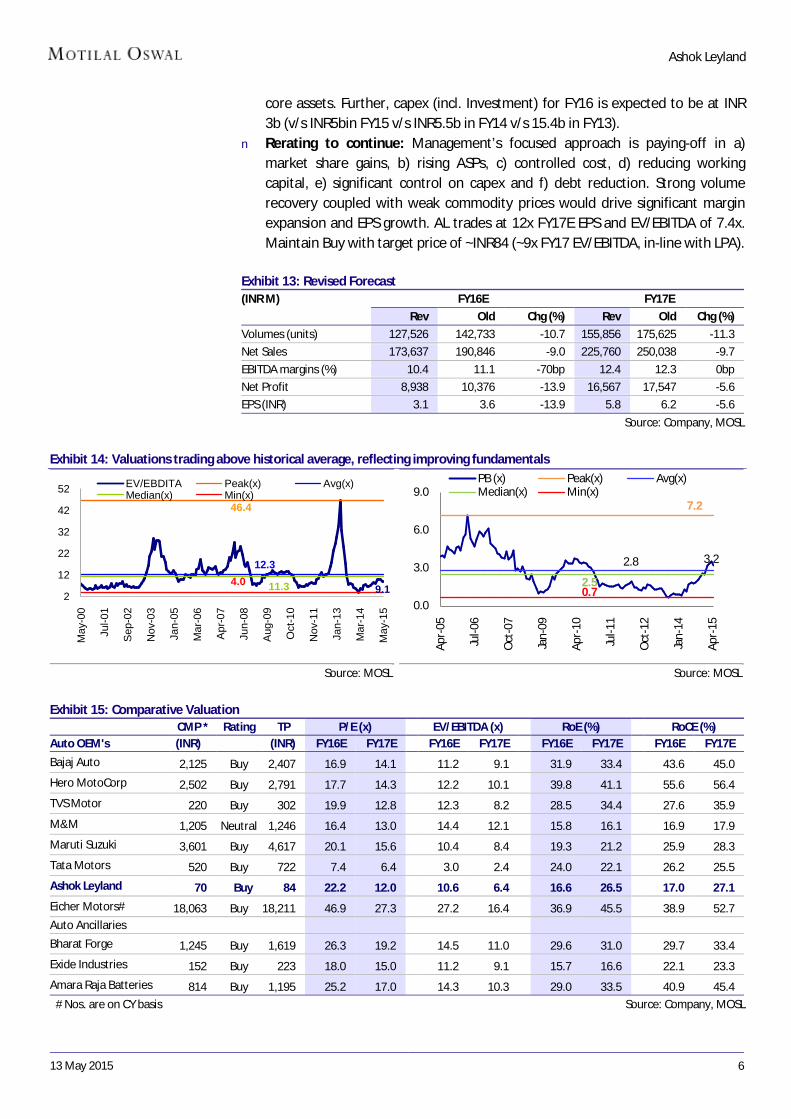
Exhibit 13: Revised Forecast (INR M) FY16E FY17E
Rev Old Chg (%) Rev Old Chg (%)
Volumes (units) 127,526 142,733 -10.7 155,856 175,625 -11.3
Net Sales 173,637 190,846 -9.0 225,760 250,038 -9.7
EBITDA margins (%) 10.4 11.1 -70bp 12.4 12.3 0bp
Net Profit 8,938 10,376 -13.9 16,567 17,547 -5.6
EPS (INR) 3.1 3.6 -13.9 5.8 6.2 -5.6
Source: Company, MOSL
Exhibit 14: Valuations trading above historical average, reflecting improving fundamentals
Source: MOSL
Source: MOSL
Exhibit 15: Comparative Valuation CMP * Rating TP P/E (x)
EV/EBITDA (x)
RoE (%)
RoCE (%)
Auto OEM's (INR)
(INR) FY16E FY17E
FY16E FY17E
FY16E FY17E
FY16E FY17E
Bajaj Auto 2,125 Buy 2,407 16.9 14.1 11.2 9.1 31.9 33.4 43.6 45.0
Hero MotoCorp 2,502 Buy 2,791 17.7 14.3 12.2 10.1 39.8 41.1 55.6 56.4
TVS Motor 220 Buy 302 19.9 12.8 12.3 8.2 28.5 34.4 27.6 35.9
M&M 1,205 Neutral 1,246 16.4 13.0 14.4 12.1 15.8 16.1 16.9 17.9
Maruti Suzuki 3,601 Buy 4,617 20.1 15.6 10.4 8.4 19.3 21.2 25.9 28.3
Tata Motors 520 Buy 722 7.4 6.4 3.0 2.4 24.0 22.1 26.2 25.5
Ashok Leyland 70 Buy 84 22.2 12.0 10.6 6.4 16.6 26.5 17.0 27.1
Eicher Motors# 18,063 Buy 18,211 46.9 27.3 27.2 16.4 36.9 45.5 38.9 52.7 Auto Ancillaries
Bharat Forge 1,245 Buy 1,619 26.3 19.2 14.5 11.0 29.6 31.0 29.7 33.4
Exide Industries 152 Buy 223 18.0 15.0 11.2 9.1 15.7 16.6 22.1 23.3
Amara Raja Batteries 814 Buy 1,195 25.2 17.0 14.3 10.3 29.0 33.5 40.9 45.4
# Nos. are on CY basis Source: Company, MOSL
9.1
46.4
12.3
11.34.02
12
22
32
42
52
May
-00
Jul-0
1
Sep
-02
Nov
-03
Jan-
05
Mar
-06
Apr
-07
Jun-
08
Aug
-09
Oct
-10
Nov
-11
Jan-
13
Mar
-14
May
-15
EV/EBDITA Peak(x) Avg(x)Median(x) Min(x)
3.2
7.2
2.8
2.50.7
0.0
3.0
6.0
9.0
Apr-
05
Jul-0
6
Oct
-07
Jan-
09
Apr-
10
Jul-1
1
Oct
-12
Jan-
14
Apr-
15
PB (x) Peak(x) Avg(x)Median(x) Min(x)
13 May 2015 7
Ashok Leyland
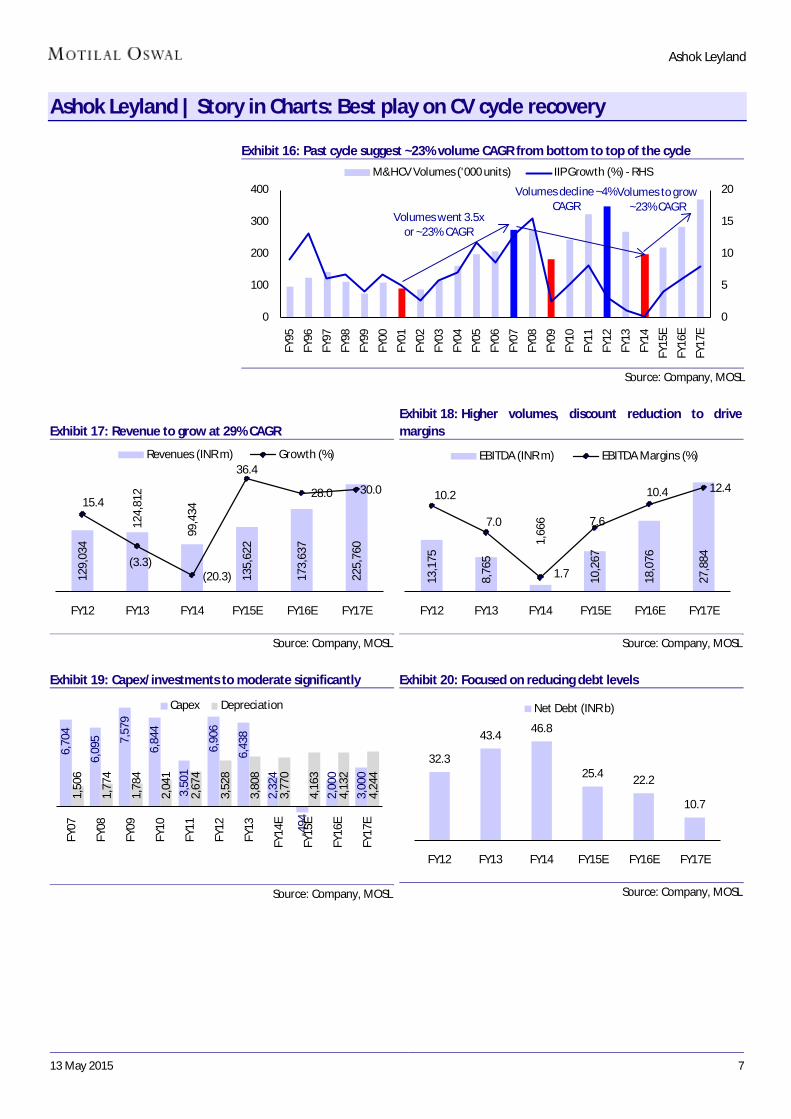
Ashok Leyland | Story in Charts: Best play on CV cycle recovery Exhibit 16: Past cycle suggest ~23% volume CAGR from bottom to top of the cycle
0
5
10
15
20
0
100
200
300
400
FY95
FY96
FY97
FY98
FY99
FY00
FY01
FY02
FY03
FY04
FY05
FY06
FY07
FY08
FY09
FY10
FY11
FY12
FY13
FY14
FY15
E
FY16
E
FY17
E
M&HCV Volumes ('000 units) IIP Growth (%) - RHS
Volumes went 3.5x or ~23% CAGR
Volumes decline ~4% CAGR
Volumes to grow ~23% CAGR
Source: Company, MOSL
Exhibit 17: Revenue to grow at 29% CAGR
Source: Company, MOSL
Exhibit 18: Higher volumes, discount reduction to drive margins
Source: Company, MOSL
Exhibit 19: Capex/investments to moderate significantly
6,70
4
6,09
5 7,57
9
6,84
4
3,50
1
6,90
6
6,43
8
2,32
4
-494
2,00
0
3,00
0
1,50
6
1,77
4
1,78
4
2,04
1
2,67
4
3,52
8
3,80
8
3,77
0
4,16
3
4,13
2
4,24
4
FY07
FY08
FY09
FY10
FY11
FY12
FY13
FY14
E
FY15
E
FY16
E
FY17
E
Capex Depreciation
Source: Company, MOSL
Exhibit 20: Focused on reducing debt levels
Source: Company, MOSL
129,
034
124,
812
99,4
34
135,
622
173,
637
225,
760
15.4
(3.3)(20.3)
36.4
28.0 30.0
FY12 FY13 FY14 FY15E FY16E FY17E
Revenues (INR m) Growth (%)
13,1
75
8,76
5
1,66
6
10,2
67
18,0
76
27,8
84
10.2
7.0
1.7
7.6
10.4 12.4
FY12 FY13 FY14 FY15E FY16E FY17E
EBITDA (INR m) EBITDA Margins (%)
32.3
43.446.8
25.4 22.2
10.7
FY12 FY13 FY14 FY15E FY16E FY17E
Net Debt (INR b)
13 May 2015 8
Ashok Leyland
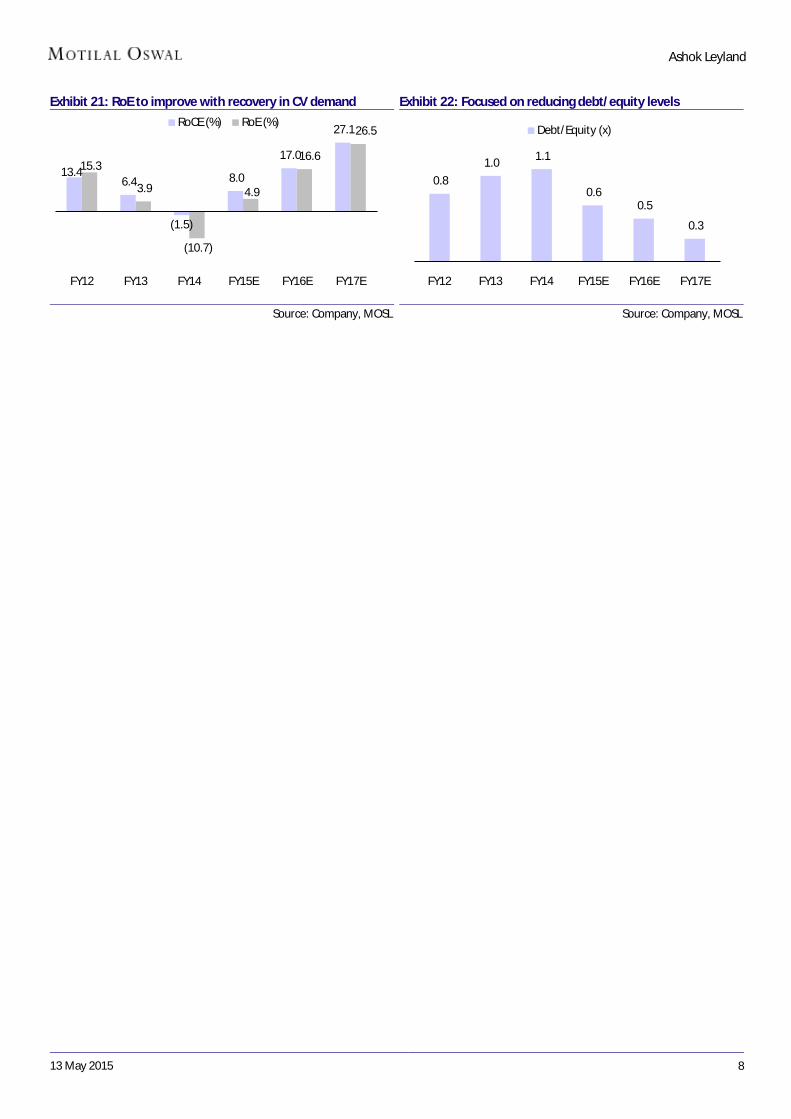
Exhibit 21: RoE to improve with recovery in CV demand
Source: Company, MOSL
Exhibit 22: Focused on reducing debt/equity levels
Source: Company, MOSL
13.4 6.4
(1.5)
8.0
17.0
27.1
15.3
3.9
(10.7)
4.9
16.6
26.5
FY12 FY13 FY14 FY15E FY16E FY17E
RoCE (%) RoE (%)
0.8
1.0 1.1
0.6 0.5
0.3
FY12 FY13 FY14 FY15E FY16E FY17E
Debt/Equity (x)
13 May 2015 9
Ashok Leyland
Key operating metrics
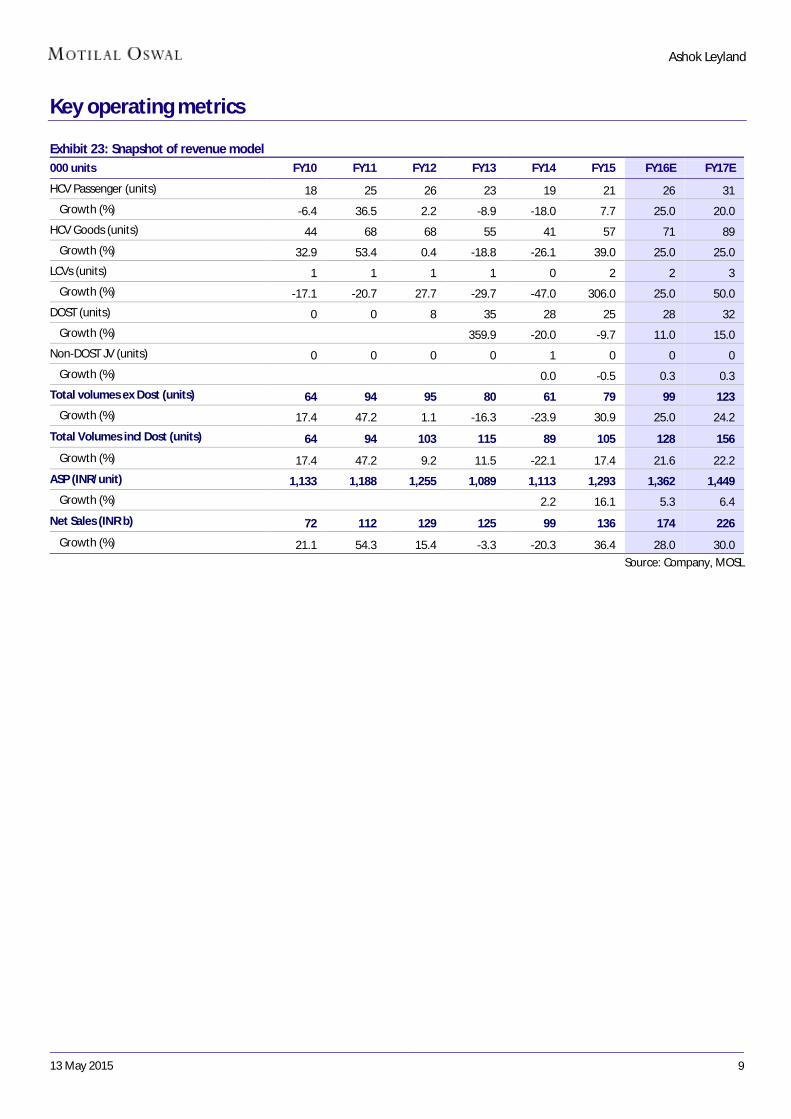
Exhibit 23: Snapshot of revenue model 000 units FY10 FY11 FY12 FY13 FY14 FY15 FY16E FY17E
HCV Passenger (units) 18 25 26 23 19 21 26 31
Growth (%) -6.4 36.5 2.2 -8.9 -18.0 7.7 25.0 20.0
HCV Goods (units) 44 68 68 55 41 57 71 89
Growth (%) 32.9 53.4 0.4 -18.8 -26.1 39.0 25.0 25.0
LCVs (units) 1 1 1 1 0 2 2 3
Growth (%) -17.1 -20.7 27.7 -29.7 -47.0 306.0 25.0 50.0
DOST (units) 0 0 8 35 28 25 28 32
Growth (%) 359.9 -20.0 -9.7 11.0 15.0
Non-DOST JV (units) 0 0 0 0 1 0 0 0
Growth (%) 0.0 -0.5 0.3 0.3
Total volumes ex Dost (units) 64 94 95 80 61 79 99 123
Growth (%) 17.4 47.2 1.1 -16.3 -23.9 30.9 25.0 24.2
Total Volumes incl Dost (units) 64 94 103 115 89 105 128 156
Growth (%) 17.4 47.2 9.2 11.5 -22.1 17.4 21.6 22.2
ASP (INR/unit) 1,133 1,188 1,255 1,089 1,113 1,293 1,362 1,449
Growth (%) 2.2 16.1 5.3 6.4
Net Sales (INR b) 72 112 129 125 99 136 174 226
Growth (%) 21.1 54.3 15.4 -3.3 -20.3 36.4 28.0 30.0
Source: Company, MOSL
13 May 2015 10
Ashok Leyland
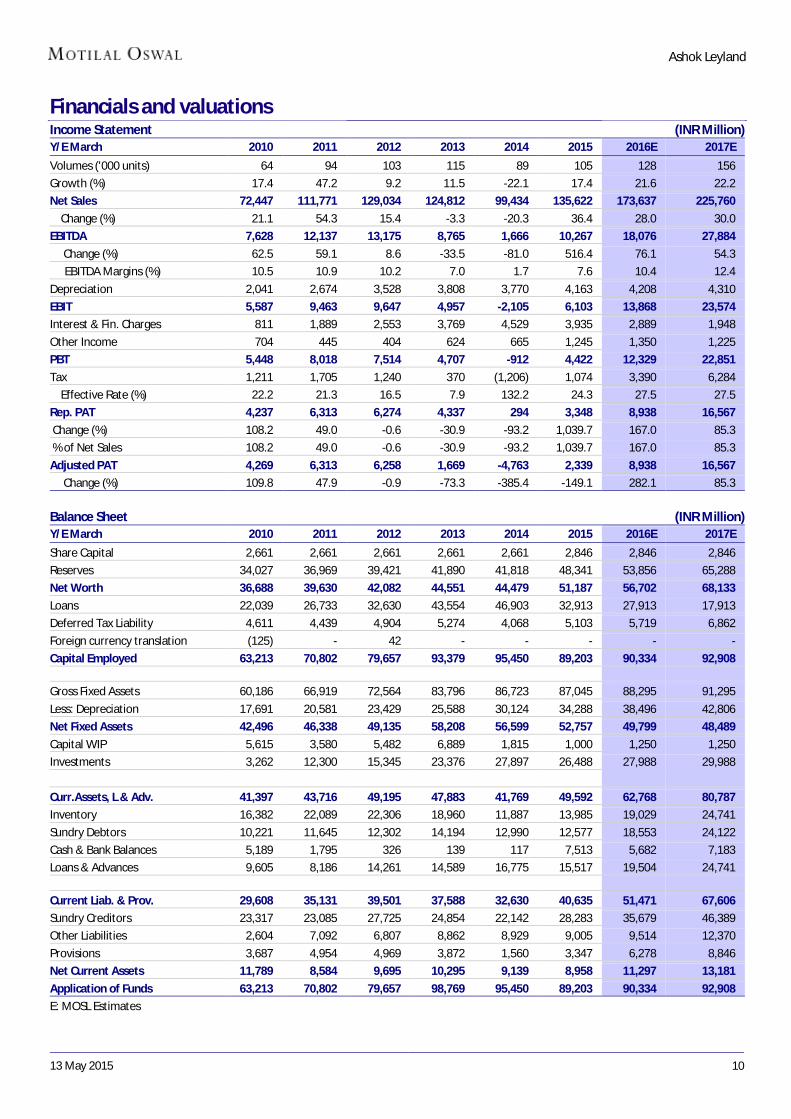
Financials and valuations Income Statement (INR Million) Y/E March 2010 2011 2012 2013 2014 2015 2016E 2017E
Volumes ('000 units) 64 94 103 115 89 105 128 156
Growth (%) 17.4 47.2 9.2 11.5 -22.1 17.4 21.6 22.2
Net Sales 72,447 111,771 129,034 124,812 99,434 135,622 173,637 225,760
Change (%) 21.1 54.3 15.4 -3.3 -20.3 36.4 28.0 30.0
EBITDA 7,628 12,137 13,175 8,765 1,666 10,267 18,076 27,884
Change (%) 62.5 59.1 8.6 -33.5 -81.0 516.4 76.1 54.3
EBITDA Margins (%) 10.5 10.9 10.2 7.0 1.7 7.6 10.4 12.4
Depreciation 2,041 2,674 3,528 3,808 3,770 4,163 4,208 4,310
EBIT 5,587 9,463 9,647 4,957 -2,105 6,103 13,868 23,574
Interest & Fin. Charges 811 1,889 2,553 3,769 4,529 3,935 2,889 1,948
Other Income 704 445 404 624 665 1,245 1,350 1,225
PBT 5,448 8,018 7,514 4,707 -912 4,422 12,329 22,851
Tax 1,211 1,705 1,240 370 (1,206) 1,074 3,390 6,284
Effective Rate (%) 22.2 21.3 16.5 7.9 132.2 24.3 27.5 27.5
Rep. PAT 4,237 6,313 6,274 4,337 294 3,348 8,938 16,567
Change (%) 108.2 49.0 -0.6 -30.9 -93.2 1,039.7 167.0 85.3
% of Net Sales 108.2 49.0 -0.6 -30.9 -93.2 1,039.7 167.0 85.3
Adjusted PAT 4,269 6,313 6,258 1,669 -4,763 2,339 8,938 16,567
Change (%) 109.8 47.9 -0.9 -73.3 -385.4 -149.1 282.1 85.3
Balance Sheet (INR Million) Y/E March 2010 2011 2012 2013 2014 2015 2016E 2017E
Share Capital 2,661 2,661 2,661 2,661 2,661 2,846 2,846 2,846
Reserves 34,027 36,969 39,421 41,890 41,818 48,341 53,856 65,288
Net Worth 36,688 39,630 42,082 44,551 44,479 51,187 56,702 68,133
Loans 22,039 26,733 32,630 43,554 46,903 32,913 27,913 17,913
Deferred Tax Liability 4,611 4,439 4,904 5,274 4,068 5,103 5,719 6,862
Foreign currency translation (125) - 42 - - - - -
Capital Employed 63,213 70,802 79,657 93,379 95,450 89,203 90,334 92,908
Gross Fixed Assets 60,186 66,919 72,564 83,796 86,723 87,045 88,295 91,295
Less: Depreciation 17,691 20,581 23,429 25,588 30,124 34,288 38,496 42,806
Net Fixed Assets 42,496 46,338 49,135 58,208 56,599 52,757 49,799 48,489
Capital WIP 5,615 3,580 5,482 6,889 1,815 1,000 1,250 1,250
Investments 3,262 12,300 15,345 23,376 27,897 26,488 27,988 29,988
Curr.Assets, L & Adv. 41,397 43,716 49,195 47,883 41,769 49,592 62,768 80,787
Inventory 16,382 22,089 22,306 18,960 11,887 13,985 19,029 24,741
Sundry Debtors 10,221 11,645 12,302 14,194 12,990 12,577 18,553 24,122
Cash & Bank Balances 5,189 1,795 326 139 117 7,513 5,682 7,183
Loans & Advances 9,605 8,186 14,261 14,589 16,775 15,517 19,504 24,741
Current Liab. & Prov. 29,608 35,131 39,501 37,588 32,630 40,635 51,471 67,606
Sundry Creditors 23,317 23,085 27,725 24,854 22,142 28,283 35,679 46,389
Other Liabilities 2,604 7,092 6,807 8,862 8,929 9,005 9,514 12,370
Provisions 3,687 4,954 4,969 3,872 1,560 3,347 6,278 8,846
Net Current Assets 11,789 8,584 9,695 10,295 9,139 8,958 11,297 13,181
Application of Funds 63,213 70,802 79,657 98,769 95,450 89,203 90,334 92,908
E: MOSL Estimates
13 May 2015 11
Ashok Leyland
Financials and valuations
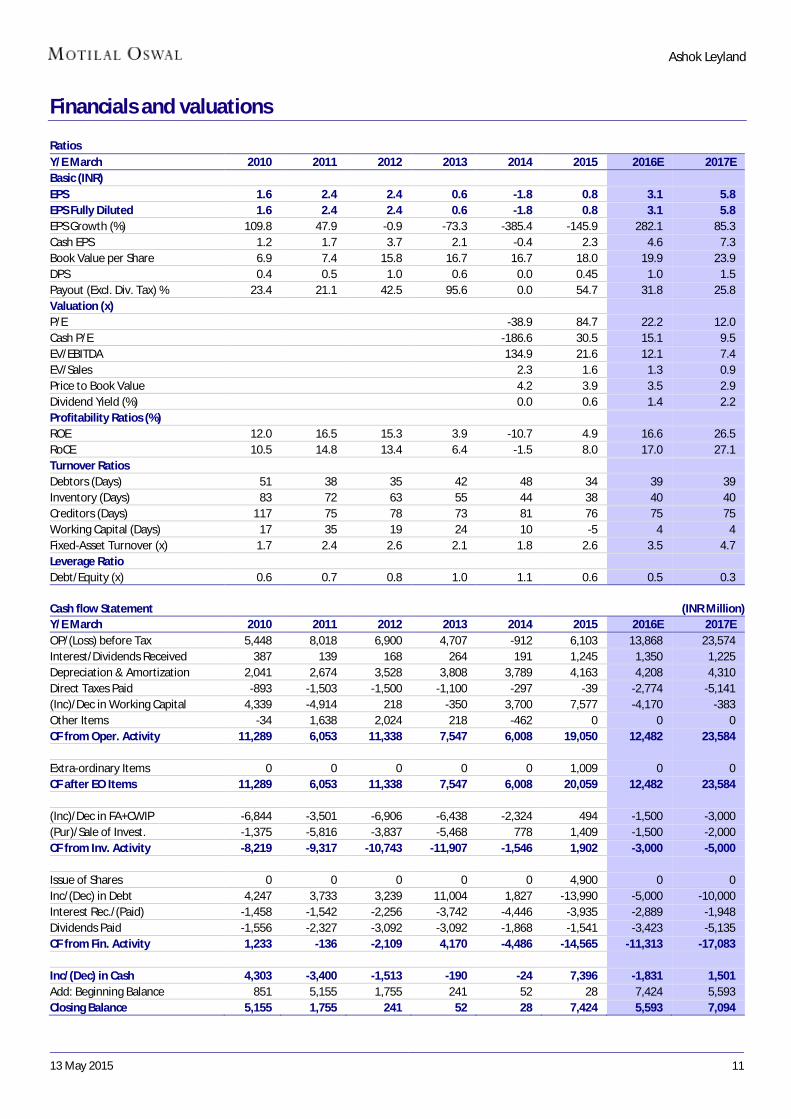
Ratios Y/E March 2010 2011 2012 2013 2014 2015 2016E 2017E Basic (INR)
EPS 1.6 2.4 2.4 0.6 -1.8 0.8 3.1 5.8 EPS Fully Diluted 1.6 2.4 2.4 0.6 -1.8 0.8 3.1 5.8 EPS Growth (%) 109.8 47.9 -0.9 -73.3 -385.4 -145.9 282.1 85.3 Cash EPS 1.2 1.7 3.7 2.1 -0.4 2.3 4.6 7.3 Book Value per Share 6.9 7.4 15.8 16.7 16.7 18.0 19.9 23.9 DPS 0.4 0.5 1.0 0.6 0.0 0.45 1.0 1.5 Payout (Excl. Div. Tax) % 23.4 21.1 42.5 95.6 0.0 54.7 31.8 25.8 Valuation (x)
P/E
-38.9 84.7 22.2 12.0 Cash P/E
-186.6 30.5 15.1 9.5
EV/EBITDA
134.9 21.6 12.1 7.4 EV/Sales
2.3 1.6 1.3 0.9
Price to Book Value
4.2 3.9 3.5 2.9 Dividend Yield (%)
0.0 0.6 1.4 2.2
Profitability Ratios (%)
ROE 12.0 16.5 15.3 3.9 -10.7 4.9 16.6 26.5 RoCE 10.5 14.8 13.4 6.4 -1.5 8.0 17.0 27.1 Turnover Ratios
Debtors (Days) 51 38 35 42 48 34 39 39 Inventory (Days) 83 72 63 55 44 38 40 40 Creditors (Days) 117 75 78 73 81 76 75 75 Working Capital (Days) 17 35 19 24 10 -5 4 4 Fixed-Asset Turnover (x) 1.7 2.4 2.6 2.1 1.8 2.6 3.5 4.7 Leverage Ratio
Debt/Equity (x) 0.6 0.7 0.8 1.0 1.1 0.6 0.5 0.3
Cash flow Statement (INR Million) Y/E March 2010 2011 2012 2013 2014 2015 2016E 2017E OP/(Loss) before Tax 5,448 8,018 6,900 4,707 -912 6,103 13,868 23,574 Interest/Dividends Received 387 139 168 264 191 1,245 1,350 1,225 Depreciation & Amortization 2,041 2,674 3,528 3,808 3,789 4,163 4,208 4,310 Direct Taxes Paid -893 -1,503 -1,500 -1,100 -297 -39 -2,774 -5,141 (Inc)/Dec in Working Capital 4,339 -4,914 218 -350 3,700 7,577 -4,170 -383 Other Items -34 1,638 2,024 218 -462 0 0 0 CF from Oper. Activity 11,289 6,053 11,338 7,547 6,008 19,050 12,482 23,584
Extra-ordinary Items 0 0 0 0 0 1,009 0 0 CF after EO Items 11,289 6,053 11,338 7,547 6,008 20,059 12,482 23,584
(Inc)/Dec in FA+CWIP -6,844 -3,501 -6,906 -6,438 -2,324 494 -1,500 -3,000 (Pur)/Sale of Invest. -1,375 -5,816 -3,837 -5,468 778 1,409 -1,500 -2,000 CF from Inv. Activity -8,219 -9,317 -10,743 -11,907 -1,546 1,902 -3,000 -5,000
Issue of Shares 0 0 0 0 0 4,900 0 0 Inc/(Dec) in Debt 4,247 3,733 3,239 11,004 1,827 -13,990 -5,000 -10,000 Interest Rec./(Paid) -1,458 -1,542 -2,256 -3,742 -4,446 -3,935 -2,889 -1,948 Dividends Paid -1,556 -2,327 -3,092 -3,092 -1,868 -1,541 -3,423 -5,135 CF from Fin. Activity 1,233 -136 -2,109 4,170 -4,486 -14,565 -11,313 -17,083
Inc/(Dec) in Cash 4,303 -3,400 -1,513 -190 -24 7,396 -1,831 1,501 Add: Beginning Balance 851 5,155 1,755 241 52 28 7,424 5,593 Closing Balance 5,155 1,755 241 52 28 7,424 5,593 7,094
13 May 2015 12
Ashok Leyland
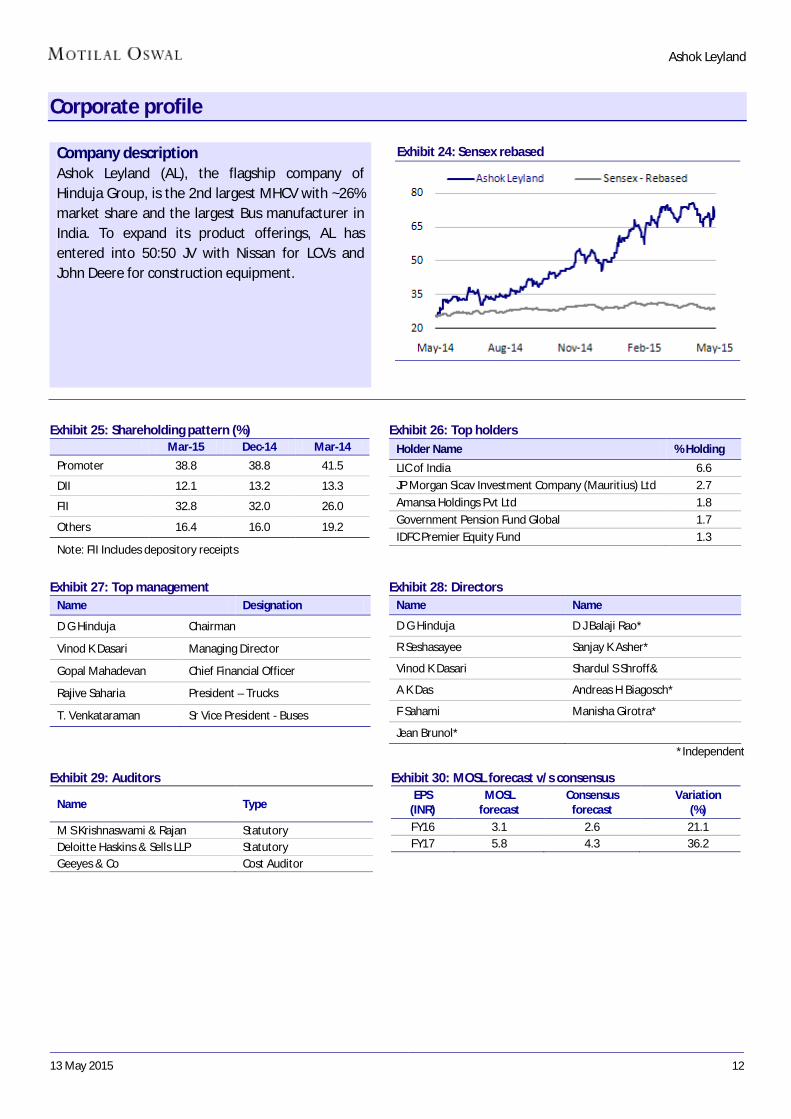
Corporate profile
Exhibit 25: Shareholding pattern (%) Mar-15 Dec-14 Mar-14
Promoter 38.8 38.8 41.5
DII 12.1 13.2 13.3
FII 32.8 32.0 26.0
Others 16.4 16.0 19.2
Note: FII Includes depository receipts
Exhibit 26: Top holders Holder Name % Holding
LIC of India 6.6
JP Morgan Sicav Investment Company (Mauritius) Ltd 2.7
Amansa Holdings Pvt Ltd 1.8
Government Pension Fund Global 1.7
IDFC Premier Equity Fund 1.3
Exhibit 27: Top management Name Designation
D G Hinduja Chairman
Vinod K Dasari Managing Director
Gopal Mahadevan Chief Financial Officer
Rajive Saharia President – Trucks
T. Venkataraman Sr Vice President - Buses
Exhibit 28: Directors Name Name
D G Hinduja D J Balaji Rao*
R Seshasayee Sanjay K Asher*
Vinod K Dasari Shardul S Shroff&
A K Das Andreas H Biagosch*
F Sahami Manisha Girotra*
Jean Brunol*
*Independent
Exhibit 29: Auditors
Name Type
M S Krishnaswami & Rajan Statutory Deloitte Haskins & Sells LLP Statutory Geeyes & Co Cost Auditor
Exhibit 30: MOSL forecast v/s consensus EPS
(INR) MOSL
forecast Consensus
forecast Variation
(%)
FY16 3.1 2.6 21.1 FY17 5.8 4.3 36.2
Company description Ashok Leyland (AL), the flagship company of Hinduja Group, is the 2nd largest MHCV with ~26% market share and the largest Bus manufacturer in India. To expand its product offerings, AL has entered into 50:50 JV with Nissan for LCVs and John Deere for construction equipment.
Exhibit 24: Sensex rebased
13 May 2015 13
Ashok Leyland
N O T E S
13 May 2015 14
Ashok Leyland
Disclosures This document has been prepared by Motilal Oswal Securities Limited (hereinafter referred to as Most) to provide information about the company(ies) and/sector(s), if any, covered in the report and may be distributed by it and/or its affiliated company(ies). This report is for personal information of the selected recipient/s and does not construe to be any investment, legal or taxation advice to you. This research report does not constitute an offer, invitation or inducement to invest in securities or other investments and Motilal Oswal Securities Limited (hereinafter referred as MOSt) is not soliciting any action based upon it. This report is not for public distribution and has been furnished to you solely for your general information and should not be reproduced or redistributed to any other person in any form. This report does not constitute a personal recommendation or take into account the particular investment objectives, financial situations, or needs of individual clients. Before acting on any advice or recommendation in this material, investors should consider whether it is suitable for their particular circumstances and, if necessary, seek professional advice. The price and value of the investments referred to in this material and the income from them may go down as well as up, and investors may realize losses on any investments. Past performance is not a guide for future performance, future returns are not guaranteed and a loss of original capital may occur.
MOSt and its affiliates are a full-service, integrated investment banking, investment management, brokerage and financing group. We and our affiliates have investment banking and other business relationships with a some companies covered by our Research Department. Our research professionals may provide input into our investment banking and other business selection processes. Investors should assume that MOSt and/or its affiliates are seeking or will seek investment banking or other business from the company or companies that are the subject of this material and that the research professionals who were involved in preparing this material may educate investors on investments in such business. The research professionals responsible for the preparation of this document may interact with trading desk personnel, sales personnel and other parties for the purpose of gathering, applying and interpreting information. Our research professionals are paid on the profitability of MOSt which may include earnings from investment banking and other business.
MOSt generally prohibits its analysts, persons reporting to analysts, and members of their households from maintaining a financial interest in the securities or derivatives of any companies that the analysts cover. Additionally, MOSt generally prohibits its analysts and persons reporting to analysts from serving as an officer, director, or advisory board member of any companies that the analysts cover. Our salespeople, traders, and other professionals or affiliates may provide oral or written market commentary or trading strategies to our clients that reflect opinions that are contrary to the opinions expressed herein, and our proprietary trading and investing businesses may make investment decisions that are inconsistent with the recommendations expressed herein. In reviewing these materials, you should be aware that any or all of the foregoing among other things, may give rise to real or potential conflicts of interest. MOSt and its affiliated company(ies), their directors and employees and their relatives may; (a) from time to time, have a long or short position in, act as principal in, and buy or sell the securities or derivatives thereof of companies mentioned herein. (b) be engaged in any other transaction involving such securities and earn brokerage or other compensation or act as a market maker in the financial instruments of the company(ies) discussed herein or act as an advisor or lender/borrower to such company(ies) or may have any other potential conflict of interests with respect to any recommendation and other related information and opinions.; however the same shall have no bearing whatsoever on the specific recommendations made by the analyst(s), as the recommendations made by the analyst(s) are completely independent of the views of the affiliates of MOSt even though there might exist an inherent conflict of interest in some of the stocks mentioned in the research report Reports based on technical and derivative analysis center on studying charts company's price movement, outstanding positions and trading volume, as opposed to focusing on a company's fundamentals and, as such, may not match with a report on a company's fundamental analysis. In addition MOST has different business segments / Divisions with independent research separated by Chinese walls catering to different set of customers having various objectives, risk profiles, investment horizon, etc, and therefore may at times have different contrary views on stocks sectors and markets.
Unauthorized disclosure, use, dissemination or copying (either whole or partial) of this information, is prohibited. The person accessing this information specifically agrees to exempt MOSt or any of its affiliates or employees from, any and all responsibility/liability arising from such misuse and agrees not to hold MOSt or any of its affiliates or employees responsible for any such misuse and further agrees to hold MOSt or any of its affiliates or employees free and harmless from all losses, costs, damages, expenses that may be suffered by the person accessing this information due to any errors and delays. The information contained herein is based on publicly available data or other sources believed to be reliable. Any statements contained in this report attributed to a third party represent MOSt’s interpretation of the data, information and/or opinions provided by that third party either publicly or through a subscription service, and such use and interpretation have not been reviewed by the third party. This Report is not intended to be a complete statement or summary of the securities, markets or developments referred to in the document. While we would endeavor to update the information herein on reasonable basis, MOSt and/or its affiliates are under no obligation to update the information. Also there may be regulatory, compliance, or other reasons that may prevent MOSt and/or its affiliates from doing so. MOSt or any of its affiliates or employees shall not be in any way responsible and liable for any loss or damage that may arise to any person from any inadvertent error in the information contained in this report. MOSt or any of its affiliates or employees do not provide, at any time, any express or implied warranty of any kind, regarding any matter pertaining to this report, including without limitation the implied warranties of merchantability, fitness for a particular purpose, and non-infringement. The recipients of this report should rely on their own investigations.
This report is intended for distribution to institutional investors. Recipients who are not institutional investors should seek advice of their independent financial advisor prior to taking any investment decision based on this report or for any necessary explanation of its contents.
Most and it’s associates may have managed or co-managed public offering of securities, may have received compensation for investment banking or merchant banking or brokerage services, may have received any compensation for products or services other than investment banking or merchant banking or brokerage services from the subject company in the past 12 months. Most and it’s associates have not received any compensation or other benefits from the subject company or third party in connection with the research report. Subject Company may have been a client of Most or its associates during twelve months preceding the date of distribution of the research report
MOSt and/or its affiliates and/or employees may have interests/positions, financial or otherwise of over 1 % at the end of the month immediately preceding the date of publication of the research in the securities mentioned in this report. To enhance transparency, MOSt has incorporated a Disclosure of Interest Statement in this document. This should, however, not be treated as endorsement of the views expressed in the report.
Motilal Oswal Securities Limited is under the process of seeking registration under SEBI (Research Analyst) Regulations, 2014.
There are no material disciplinary action that been taken by any regulatory authority impacting equity research analysis activities
Analyst Certification The views expressed in this research report accurately reflect the personal views of the analyst(s) about the subject securities or issues, and no part of the compensation of the research analyst(s) was, is, or will be directly or indirectly related to the specific recommendations and views expressed by research analyst(s) in this report. The research analysts, strategists, or research associates principally responsible for preparation of MOSt research receive compensation based upon various factors, including quality of research, investor client feedback, stock picking, competitive factors and firm revenues
Disclosure of Interest Statement ASHOK LEYLAND § Analyst ownership of the stock No § Served as an officer, director or employee No
Regional Disclosures (outside India) This report is not directed or intended for distribution to or use by any person or entity resident in a state, country or any jurisdiction, where such distribution, publication, availability or use would be contrary to law, regulation or which would subject MOSt & its group companies to registration or licensing requirements within such jurisdictions.
For U.S. Motilal Oswal Securities Limited (MOSL) is not a registered broker - dealer under the U.S. Securities Exchange Act of 1934, as amended (the"1934 act") and under applicable state laws in the United States. In addition MOSL is not a registered investment adviser under the U.S. Investment Advisers Act of 1940, as amended (the "Advisers Act" and together with the 1934 Act, the "Acts), and under applicable state laws in the United States. Accordingly, in the absence of specific exemption under the Acts, any brokerage and investment services provided by MOSL, including the products and services described herein are not available to or intended for U.S. persons.
This report is intended for distribution only to "Major Institutional Investors" as defined by Rule 15a-6(b)(4) of the Exchange Act and interpretations thereof by SEC (henceforth referred to as "major institutional investors"). This document must not be acted on or relied on by persons who are not major institutional investors. Any investment or investment activity to which this document relates is only available to major institutional investors and will be engaged in only with major institutional investors. In reliance on the exemption from registration provided by Rule 15a-6 of the U.S. Securities Exchange Act of 1934, as amended (the "Exchange Act") and interpretations thereof by the U.S. Securities and Exchange Commission ("SEC") in order to conduct business with Institutional Investors based in the U.S., MOSL has entered into a chaperoning agreement with a U.S. registered broker-dealer, Motilal Oswal Securities International Private Limited. ("MOSIPL"). Any business interaction pursuant to this report will have to be executed within the provisions of this chaperoning agreement.
The Research Analysts contributing to the report may not be registered /qualified as research analyst with FINRA. Such research analyst may not be associated persons of the U.S. registered broker-dealer, MOSIPL, and therefore, may not be subject to NASD rule 2711 and NYSE Rule 472 restrictions on communication with a subject company, public appearances and trading securities held by a research analyst account.
For Singapore Motilal Oswal Capital Markets Singapore Pte Limited is acting as an exempt financial advisor under section 23(1)(f) of the Financial Advisers Act(FAA) read with regulation 17(1)(d) of the Financial Advisors Regulations and is a subsidiary of Motilal Oswal Securities Limited in India. This research is distributed in Singapore by Motilal Oswal Capital Markets Singapore Pte Limited and it is only directed in Singapore to accredited investors, as defined in the Financial Advisers Regulations and the Securities and Futures Act (Chapter 289), as amended from time to time. In respect of any matter arising from or in connection with the research you could contact the following representatives of Motilal Oswal Capital Markets Singapore Pte Limited: Anosh Koppikar Kadambari Balachandran Email : [email protected] Email : [email protected] Contact : (+65)68189232 Contact : (+65) 68189233 / 65249115 Office Address : 21 (Suite 31),16 Collyer Quay,Singapore 04931
Motilal Oswal Securities Ltd
Motilal Oswal Tower, Level 9, Sayani Road, Prabhadevi, Mumbai 400 025 Phone: +91 22 3982 5500 E-mail: [email protected]