most advisor may 2015.pmd - motilal oswal
TRANSCRIPT
AdvisorMOStMonthly Markets Newsletter
In This Issue
• Market Outlook for the month
• Equity Market Outlook
• Derivatives & Commodities Market Outlook
• Large Cap and Mid Cap Investment Ideas
• Model Advisory Portfolios
• Recommended Funds
• Portfolio Restructuring
Dear Investor,
Market performance: Indian Equities continued the
correction for the 2nd Month in a row with the S&P BSE
Sensex down 3.4% while the Midcap and Smallcap
Indices rose 4.5% and 9.3% respectively. The net FII
buying of ~USD2B for Apr'15 is deceptive given their
large participation in the Daichi stake sale. FII selling in
the cash market has been a drag on markets.
Earnings and Sentiments take a hit: Having FY15 with a ~14% S&P BSE Sensex
EPS growth for FY15, we started this result season with a 6% growth with 3
downgrades for every 2 upgrades during 4Q. Earnings downgrades continued with
IT becoming a front-runner in downgrades. FIIs turned sellers as the Taxation (MAT)
issue resurfaced with tax notices issued to FIIs. Also, Chinese Equity market returns
of 19% could have attracted short-term money. Clarifications that FIIs under the DTAA
areas will be exempt did not stem the outflow. This outflow coupled with Data in
India and Strength in USD and crude oil weighed heavy on INR, which has been
stable for some time now. Trade deficit widened to USD11.79B, while crude oil moved
up more than 10% beyond USD60/bbl - both negatives for INR and the economy.
A Below Normal Monsoon prediction by IMD also raises concerns on the agriculture
and inflation fronts. SILVER LININGS, in the form of government taking up oil subsidies
on its books (rather than burdening companies) and upgrade of Outlook to Positive
from Stable by Moody's, should help counter some of these negatives partly.
The Road ahead: Valuations have come off given the 10%+ correction from the
top. Investors can bottom fish selectively. We present here 4 stocks for BUYING -
Maruti Suzuki, Axis Bank, Repco Home Finance and AIA Engineering. QUALITY has
seen a sharper fall in the last one month and we advise adding Asian Paints, HDFC,
Sun Pharma and United Spirits.
Our QUANT Team expects a bounce back before a second round of correction. Hence,
some cash is still advisable. Our Midcap Portfolio is into ~8% cash given lack of
Global Market
Index 30-Apr-15 MoM (%) YoY(%)
Sensex 27,011 -3.4 20.5
Nifty 8,182 -3.6 22.2
FTSE 100 6,961 2.8 2.7
Dow 17,841 0.4 7.6
Nasdaq 4,941 0.8 20.1
Hang Sang 28,133 13.0 27.1
Economic Pulse
Thought for the month
Key Highlights for the Month
� FIIs turn sellers on MAT notices & China's 19% return
� Quality sees a deeper correction, mid\smallcaps outperform
� Monsoon to be below normal - IMD
May 2015
Key Indicators Current Month Change (%)
IIP 5.0% 92.31
WPI -2.33% -
10 Year Yield 7.86% 1.29
USD/ INR 63.42 1.49
Crude ($) 66.78 21.18
Gold (10 gms) 27047 3.11
1
Ravi Shenoy
Vice President
investors (Velocity) continues to hold 15% cash at the end of the month.
attractive buying options in this space. Our Medium term portfolio for Aggressive
AdvisorMOStMonthly Markets Newsletter
Sectoral Highlights
On This Page
Equity Market Outlook
Markets & Our Recommendations
Equity Market Outlook
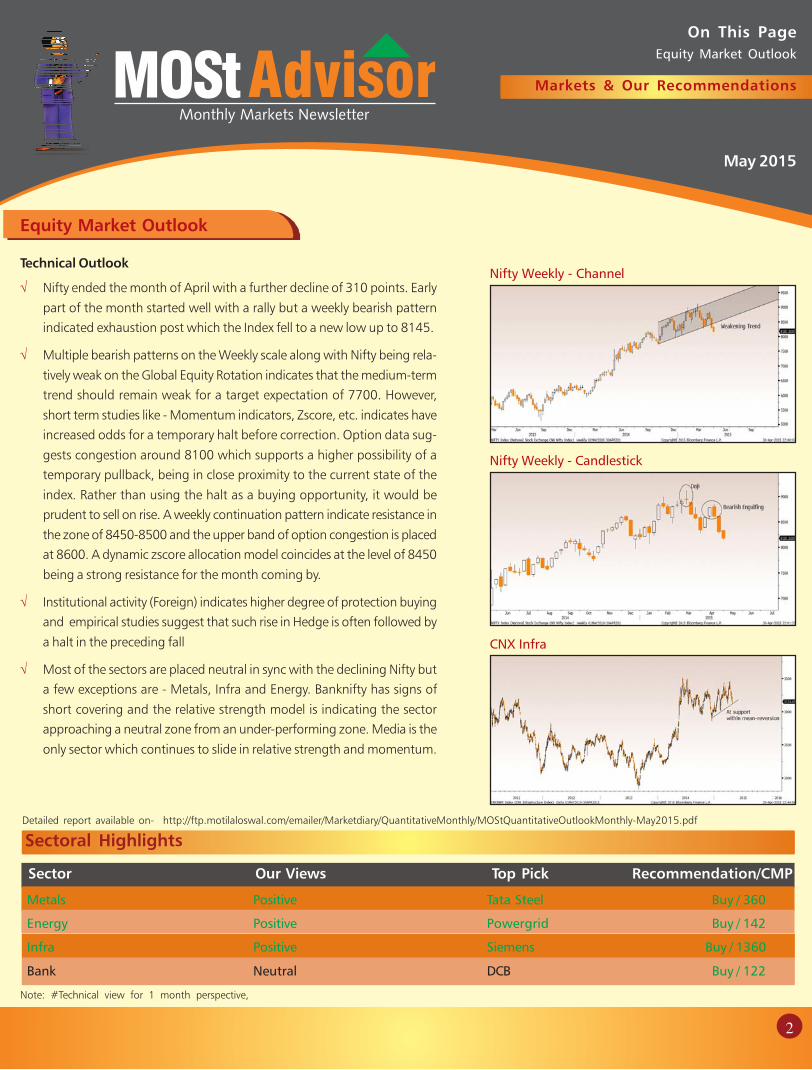
√ Nifty ended the month of April with a further decline of 310 points. Early
part of the month started well with a rally but a weekly bearish pattern
indicated exhaustion post which the Index fell to a new low up to 8145.
√ Multiple bearish patterns on the Weekly scale along with Nifty being rela-
tively weak on the Global Equity Rotation indicates that the medium-term
trend should remain weak for a target expectation of 7700. However,
short term studies like - Momentum indicators, Zscore, etc. indicates have
increased odds for a temporary halt before correction. Option data sug-
gests congestion around 8100 which supports a higher possibility of a
temporary pullback, being in close proximity to the current state of the
index. Rather than using the halt as a buying opportunity, it would be
prudent to sell on rise. A weekly continuation pattern indicate resistance in
the zone of 8450-8500 and the upper band of option congestion is placed
at 8600. A dynamic zscore allocation model coincides at the level of 8450
being a strong resistance for the month coming by.
√ Institutional activity (Foreign) indicates higher degree of protection buying
and empirical studies suggest that such rise in Hedge is often followed by
a halt in the preceding fall
√ Most of the sectors are placed neutral in sync with the declining Nifty but
a few exceptions are - Metals, Infra and Energy. Banknifty has signs of
short covering and the relative strength model is indicating the sector
approaching a neutral zone from an under-performing zone. Media is the
only sector which continues to slide in relative strength and momentum.
Technical Outlook
Metals Positive Tata Steel Buy / 360
Energy Positive Powergrid Buy / 142
Infra Positive Siemens Buy / 1360
Bank Neutral DCB Buy / 122
Sector Our Views Top Pick Recommendation/CMP
Note: #Technical view for 1 month perspective,
Nifty Weekly - Channel
Nifty Weekly - Candlestick
CNX Infra
May 2015
2
Detailed report available on- http://ftp.motilaloswal.com/emailer/Marketdiary/QuantitativeMonthly/MOStQuantitativeOutlookMonthly-May2015.pdf
AdvisorMOStMonthly Markets Newsletter
On This Page
Derivatives Market Outlook,
Commodities Market Outlook
Markets & Our Recommendations
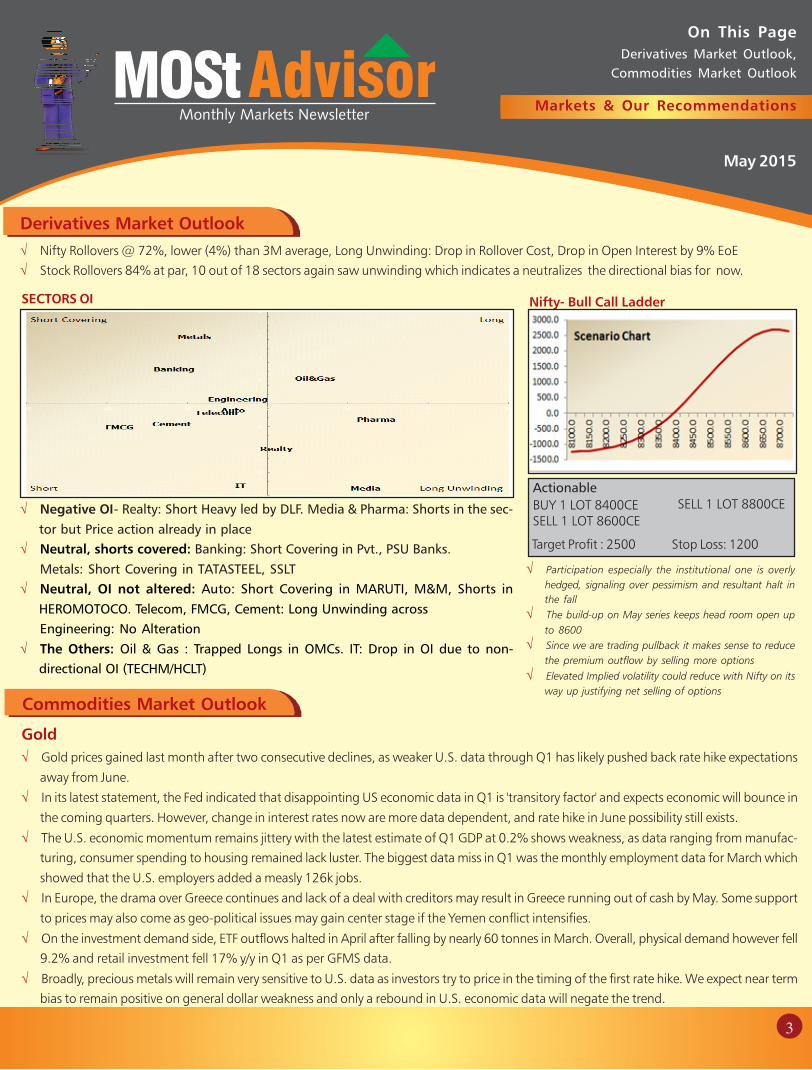
Derivatives Market Outlook
√ Nifty Rollovers @ 72%, lower (4%) than 3M average, Long Unwinding: Drop in Rollover Cost, Drop in Open Interest by 9% EoE
√ Stock Rollovers 84% at par, 10 out of 18 sectors again saw unwinding which indicates a neutralizes the directional bias for now.
√ Negative OI- Realty: Short Heavy led by DLF. Media & Pharma: Shorts in the sec-
tor but Price action already in place
√ Neutral, shorts covered: Banking: Short Covering in Pvt., PSU Banks.
Metals: Short Covering in TATASTEEL, SSLT
√ Neutral, OI not altered: Auto: Short Covering in MARUTI, M&M, Shorts in
HEROMOTOCO. Telecom, FMCG, Cement: Long Unwinding across
Engineering: No Alteration
√ The Others: Oil & Gas : Trapped Longs in OMCs. IT: Drop in OI due to non-
directional OI (TECHM/HCLT)
SECTORS OI Nifty- Bull Call Ladder
Actionable
BUY 1 LOT 8400CESELL 1 LOT 8600CE
√ Participation especially the institutional one is overly
hedged, signaling over pessimism and resultant halt in
the fall
√ The build-up on May series keeps head room open up
to 8600
√ Since we are trading pullback it makes sense to reduce
the premium outflow by selling more options
√ Elevated Implied volatility could reduce with Nifty on its
way up justifying net selling of options
Commodities Market Outlook
√ Gold prices gained last month after two consecutive declines, as weaker U.S. data through Q1 has likely pushed back rate hike expectations
away from June.
√ In its latest statement, the Fed indicated that disappointing US economic data in Q1 is 'transitory factor' and expects economic will bounce in
the coming quarters. However, change in interest rates now are more data dependent, and rate hike in June possibility still exists.
√ The U.S. economic momentum remains jittery with the latest estimate of Q1 GDP at 0.2% shows weakness, as data ranging from manufac-
turing, consumer spending to housing remained lack luster. The biggest data miss in Q1 was the monthly employment data for March which
showed that the U.S. employers added a measly 126k jobs.
√ In Europe, the drama over Greece continues and lack of a deal with creditors may result in Greece running out of cash by May. Some support
to prices may also come as geo-political issues may gain center stage if the Yemen conflict intensifies.
√ On the investment demand side, ETF outflows halted in April after falling by nearly 60 tonnes in March. Overall, physical demand however fell
9.2% and retail investment fell 17% y/y in Q1 as per GFMS data.
√ Broadly, precious metals will remain very sensitive to U.S. data as investors try to price in the timing of the first rate hike. We expect near term
bias to remain positive on general dollar weakness and only a rebound in U.S. economic data will negate the trend.
Gold
May 2015
3
SELL 1 LOT 8800CE
Target Profit : 2500 Stop Loss: 1200
AdvisorMOStMonthly Markets Newsletter
BUY
Axis Bank
CMP*: INR568
Target: INR700
√ AXIS Bank is geared up to ride the next growth cycle with (1) strong capitalization
(13.2% Tier II), healthy ROA (1.8%) and expanding liability franchise (2,558 branches -
18% CAGR over FY12-15).
√ While high exposure to Infra remains a risk, steps by government to clear stalled projects
and RBI (flexible repayment period, 5/25 structure) could ease risk in infra lending.
√ We believe all vectors like well diversified loan book, low dependence on bulk borrow-
ing, improved ALM, strong capitalisation and control over core PPP are in place.
√ Buy for a target of INR700.
On This Page
Large Cap Investment Ideas,
Mid Cap Investment Ideas
Must Act
Large Cap Investment Ideas
Market & Our Recommendation√ Maruti Suzuki (MSIL) is the largest personal mobility vehicle manufacturer in India.
√ It would, therefore, be the biggest beneficiary of impending demand recovery.
√ We estimate MSIL to gain market share, driven by 18.5% CAGR in volumes over
FY15-17E.
√ Coupled with volume growth over FY15-17E, margin expansion should help drive a
36% EPS CAGR.
√ We recommend to BUY for a Target of INR4617.
BUY
Maruti Suzuki
CMP*: INR3725
Target: INR4617
√ Repco Home Finance is catering to the mortgage needs of underpenetrated Low\Middle
Income segment in tier-II and tier-III cities in South India.
√ Repco's focus on Tier 2 & 3 cities, lower ticket size (~INR 10Lac loans), Self-employed
(50% of loans) and Direct sourcing approach, is likely to aid growth with minimal
competition from banks and help enjoy higher spread and margin.
√ Given its high capitalisation (23% capital adequacy ratio) Repco can grow at 25-30%
CAGR for the next three to four years without requiring capital infusion and achieve an
ROE of 20%. We recommend to BUY for a target of INR.750.
Repco Home Finance
CMP*: INR581
Target: INR750
BUY
Mid Cap Investment Ideas
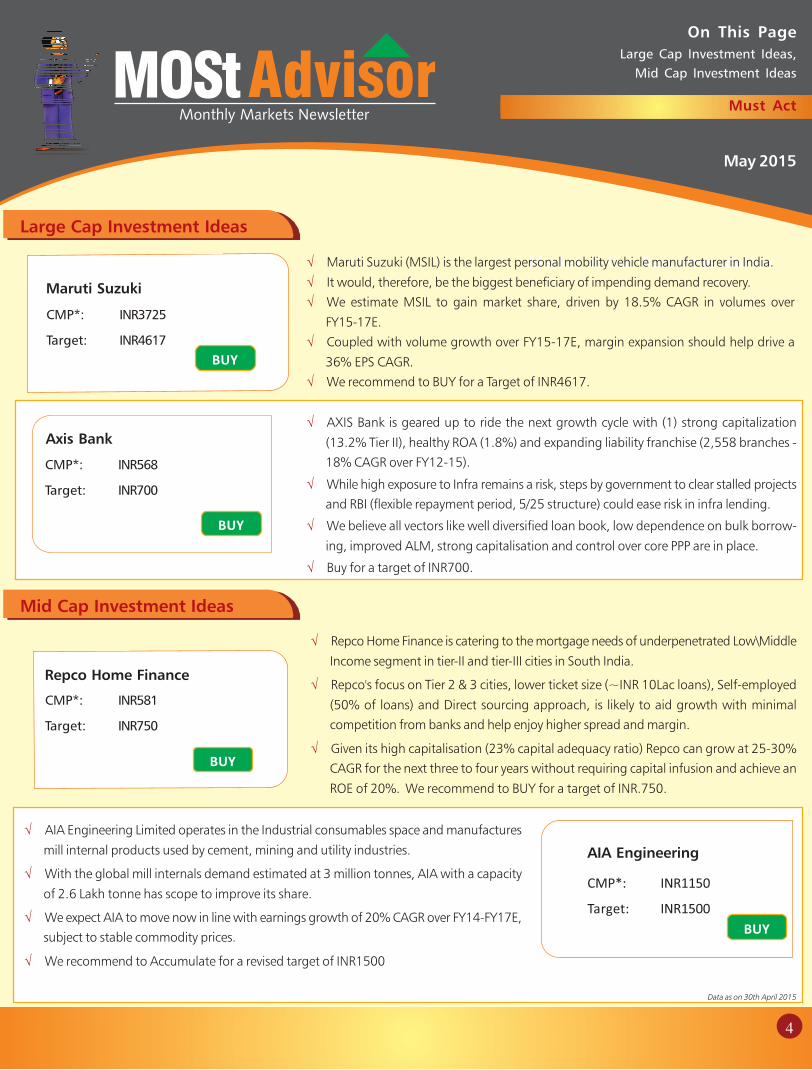
√ AIA Engineering Limited operates in the Industrial consumables space and manufactures
mill internal products used by cement, mining and utility industries.
√ With the global mill internals demand estimated at 3 million tonnes, AIA with a capacity
of 2.6 Lakh tonne has scope to improve its share.
√ We expect AIA to move now in line with earnings growth of 20% CAGR over FY14-FY17E,
subject to stable commodity prices.
√ We recommend to Accumulate for a revised target of INR1500
Data as on 30th April 2015
BUY
AIA Engineering
CMP*: INR1150
Target: INR1500
May 2015
4
AdvisorMOStMonthly Markets Newsletter
On This Page
MOSt Value, MOSt Velocity, MOSt Mid-Cap
Build a Portfolio
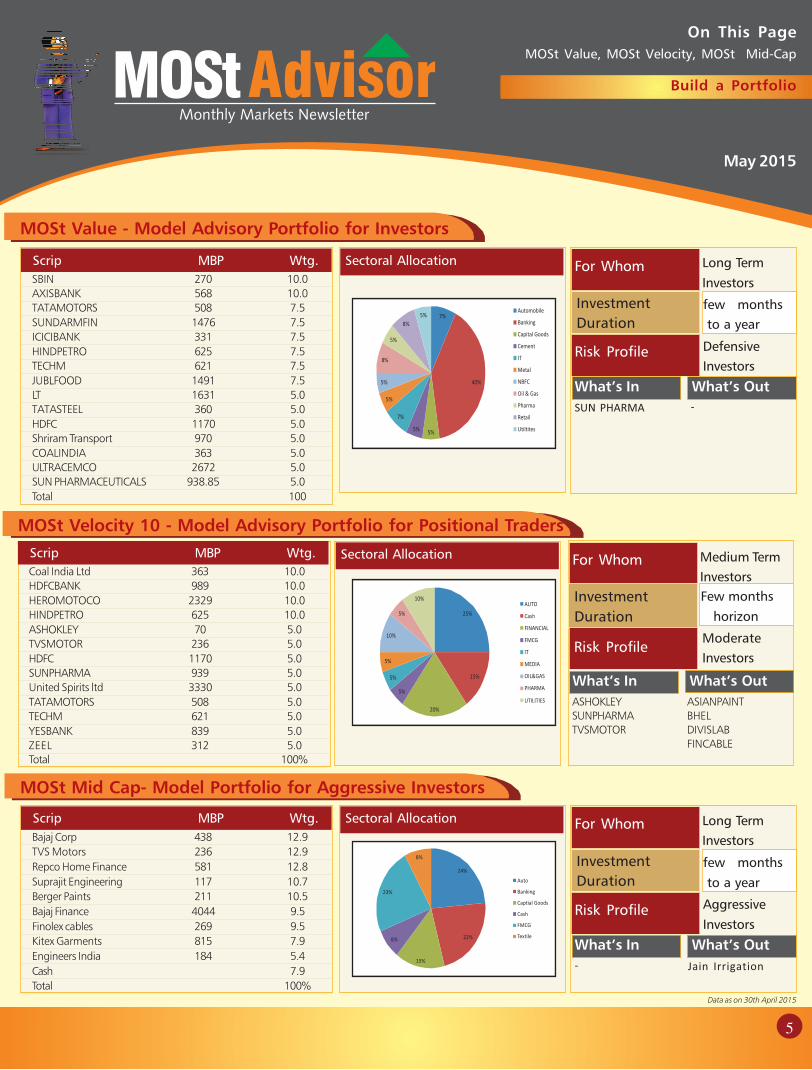
MOSt Value - Model Advisory Portfolio for Investors
Scrip MBP Wtg.
SBIN 270 10.0
AXISBANK 568 10.0
TATAMOTORS 508 7.5
SUNDARMFIN 1476 7.5
ICICIBANK 331 7.5
HINDPETRO 625 7.5
TECHM 621 7.5
JUBLFOOD 1491 7.5
LT 1631 5.0
TATASTEEL 360 5.0
HDFC 1170 5.0
Shriram Transport 970 5.0
COALINDIA 363 5.0
ULTRACEMCO 2672 5.0
SUN PHARMACEUTICALS 938.85 5.0
Total 100
Sectoral Allocation For Whom
Investment
Duration
Risk Profile
few months
to a year
Defensive
Investors
What’s In What’s Out
-
Long Term
Investors
SUN PHARMA
MOSt Velocity 10 - Model Advisory Portfolio for Positional Traders
Scrip MBP Wtg.
Coal India Ltd 363 10.0
HDFCBANK 989 10.0
HEROMOTOCO 2329 10.0
HINDPETRO 625 10.0
ASHOKLEY 70 5.0
TVSMOTOR 236 5.0
HDFC 1170 5.0
SUNPHARMA 939 5.0
United Spirits ltd 3330 5.0
TATAMOTORS 508 5.0
TECHM 621 5.0
YESBANK 839 5.0
ZEEL 312 5.0
Total 100%
Sectoral Allocation For Whom
Investment
Duration
Risk Profile
Few months
horizon
Moderate
Investors
What’s In What’s Out
Medium Term
Investors
ASIANPAINT
BHEL
DIVISLAB
FINCABLE
MOSt Mid Cap- Model Portfolio for Aggressive Investors
Scrip MBP Wtg.
Bajaj Corp 438 12.9
TVS Motors 236 12.9
Repco Home Finance 581 12.8
Suprajit Engineering 117 10.7
Berger Paints 211 10.5
Bajaj Finance 4044 9.5
Finolex cables 269 9.5
Kitex Garments 815 7.9
Engineers India 184 5.4
Cash 7.9
Total 100%
Sectoral Allocation For Whom
Investment
Duration
Risk Profile
few months
to a year
Aggressive
Investors
What’s In What’s Out
Long Term
Investors
- Jain Irrigation
Data as on 30th April 2015
May 2015
5
ASHOKLEY
SUNPHARMA
TVSMOTOR
AdvisorMOStMonthly Markets Newsletter
On This Page
MOSt PMS, MOSt Mutual - Model Portfolio
Managed Funds
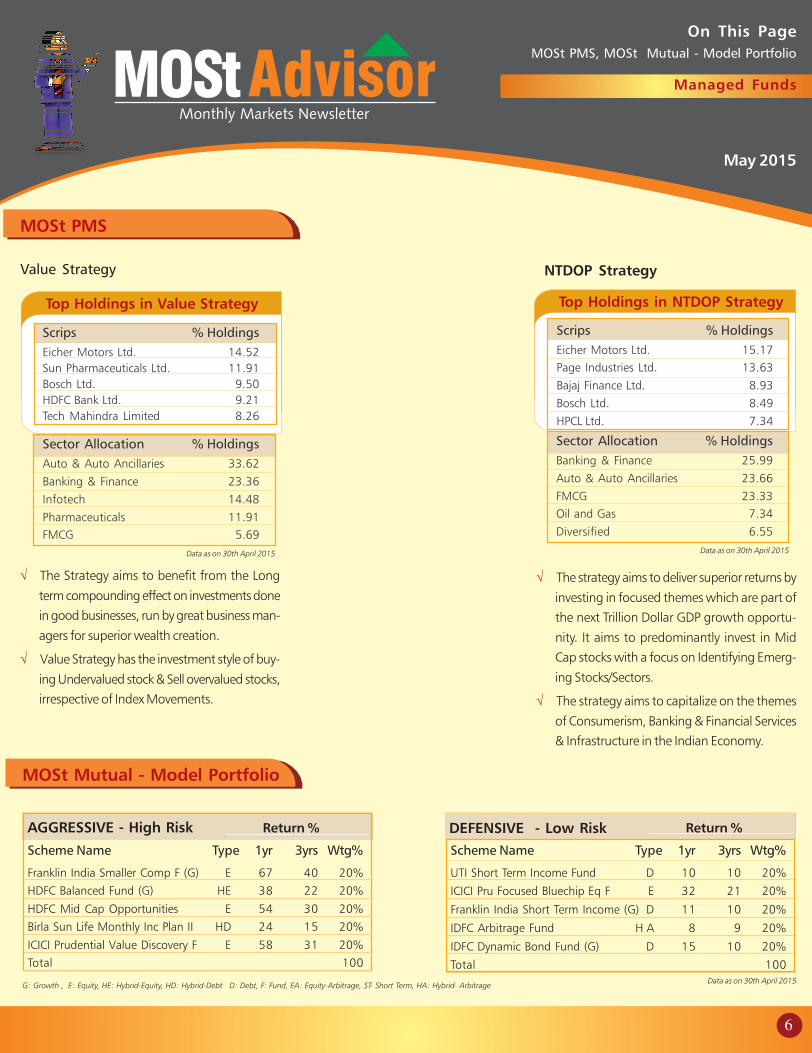
MOSt PMS
Top Holdings in Value Strategy
Value Strategy
Scrips % Holdings
Eicher Motors Ltd. 14.52
Sun Pharmaceuticals Ltd. 11.91
Bosch Ltd. 9.50
HDFC Bank Ltd. 9.21
Tech Mahindra Limited 8.26
Sector Allocation % Holdings
Auto & Auto Ancillaries 33.62
Banking & Finance 23.36
Infotech 14.48
Pharmaceuticals 11.91
FMCG 5.69
Data as on 30th April 2015
NTDOP Strategy
Top Holdings in NTDOP Strategy
Scrips % Holdings
Eicher Motors Ltd. 15.17
Page Industries Ltd. 13.63
Bajaj Finance Ltd. 8.93
Bosch Ltd. 8.49
HPCL Ltd. 7.34
MOSt Mutual - Model Portfolio
G: Growth , E: Equity, HE: Hybrid-Equity, HD: Hybrid-Debt D: Debt, F: Fund, EA: Equity-Arbitrage, ST- Short Term, HA: Hybrid- ArbitrageData as on 30th April 2015
AGGRESSIVE - High Risk Return %
Scheme Name Type 1yr 3yrs Wtg%
Franklin India Smaller Comp F (G) E 67 40 20%
HDFC Balanced Fund (G) HE 38 22 20%
HDFC Mid Cap Opportunities E 54 30 20%
Birla Sun Life Monthly Inc Plan II HD 24 15 20%
ICICI Prudential Value Discovery F E 58 31 20%
Total 100
Return %
Scheme Name Type 1yr 3yrs Wtg%
UTI Short Term Income Fund D 10 10 20%
ICICI Pru Focused Bluechip Eq F E 32 21 20%
Franklin India Short Term Income (G) D 11 10 20%
IDFC Arbitrage Fund H A 8 9 20%
IDFC Dynamic Bond Fund (G) D 15 10 20%
Total 100
DEFENSIVE - Low Risk
May 2015
6
Sector Allocation % Holdings
Banking & Finance 25.99
Auto & Auto Ancillaries 23.66
FMCG 23.33
Oil and Gas 7.34
Diversified 6.55
Data as on 30th April 2015
√ The Strategy aims to benefit from the Long
term compounding effect on investments done
in good businesses, run by great business man-
agers for superior wealth creation.
√ Value Strategy has the investment style of buy-
ing Undervalued stock & Sell overvalued stocks,
irrespective of Index Movements.
√ The strategy aims to deliver superior returns by
investing in focused themes which are part of
the next Trillion Dollar GDP growth opportu-
nity. It aims to predominantly invest in Mid
Cap stocks with a focus on Identifying Emerg-
ing Stocks/Sectors.
√ The strategy aims to capitalize on the themes
of Consumerism, Banking & Financial Services
& Infrastructure in the Indian Economy.

AdvisorMOStMonthly Markets Newsletter
On This Page
Investment Solutions
Portfolio Restructuring
Game Changer
May 2015
7
Motilal Oswal Securities Ltd. (MOSL) Member of NSE, BSE & MCX-SX
Regd Office: Motilal Oswal Tower, Rahimtullah Sayani Road, Opposite Parel ST Depot, Prabhadevi, Mumbai-400025; CIN no.: U65990MH1994PLC079418; Tel No.: 022 3980 4263; www.motilaloswal.com
Registration Nos: NSE(Cash) INB231041238; NSE(F&O): INF231041238; NSE(CD): INE231041238; BSE(Cash): INB011041257; BSE(F&O) INF011041257; BSE(CD); MCX-SX (Cash) : INB261041231; MCX-SX (F&O): INF261041231; MCX-SX
(CD): INE261041231; CDSL: IN-DP-CDSL-09-99; NSDL: IN-DP-NSDL-152-2000; AMFI:ARN 17397. PMS: INP000000670; PMS & Mutual Funds are offered through Motilal Oswal Asset Management Company Ltd(MOAMC) which is group
company of MOSL. PMS (Regn No. INP000004409) is offered through Motilal Oswal Wealth Management Ltd. (MOWML) which is a group company of MOSL. Motilal Oswal Commodities Broker Pvt Ltd. (MOCBPL) member of MCX,
NCDEX and NCDEX Spot. MCX Member ID 29500, NCDEX-NCEDX-CO-04-00114, NCDEX Spot Exchange Limited 10014. FMC Unique membership code: MCX: MCX/TCM/CORP/0725, NCDEX: NCDEX/TCM/CORP/0033, Commodity
Services are offered through MOCBPL which a group company of Motilal Oswal Securities Ltd. Motilal Oswal Securities Ltd is a distributor of Mutual Fund & IPOs. Investment in Securities is subject to market risk.
Disclaimer: This document has been prepared by Motilal Oswal Securities Limited (hereinafter referred to as Most) to provide information about the company(ies) and/
sector(s), if any, covered in the report and may be distributed by it and/or its affiliated company(ies). This report is for personal information of the selected recipient/s and does
not construe to be any investment, legal or taxation advice to you. This research report does not constitute an offer, invitation or inducement to invest in securities or other
investments and Motilal Oswal Securities Limited (hereinafter referred as MOSt) is not soliciting any action based upon it. This report is not for public distribution and has been
furnished to you solely for your general information and should not be reproduced or redistributed to any other person in any form. This report does not constitute a personal
recommendation or take into account the particular investment objectives, financial situations, or needs of individual clients. Before acting on any advice or recommendation
in this material, investors should consider whether it is suitable for their particular circumstances and, if necessary, seek professional advice. The price and value of the
investments referred to in this material and the income from them may go down as well as up, and investors may realize losses on any investments. Past performance is not
a guide for future performance, future returns are not guaranteed and a loss of original capital may occur.
MOSt and its affiliates are a full-service, integrated investment banking, investment management, brokerage and financing group. We and our affiliates have investment
banking and other business relationships with a some companies covered by our Research Department. Our research professionals may provide input into our investment
banking and other business selection processes. Investors should assume that MOSt and/or its affiliates are seeking or will seek investment banking or other business from the
company or companies that are the subject of this material and that the research professionals who were involved in preparing this material may educate investors on
investments in such business . The research professionals responsible for the preparation of this document may interact with trading desk personnel, sales personnel and other
parties for the purpose of gathering, applying and interpreting information. Our research professionals are paid on the profitability of MOSt which may include earnings from
investment banking and other business.
MOSt generally prohibits its analysts, persons reporting to analysts, and members of their households from maintaining a financial interest in the securities or derivatives of any
companies that the analysts cover. Additionally, MOSt generally prohibits its analysts and persons reporting to analysts from serving as an officer, director, or advisory board
member of any companies that the analysts cover. Our salespeople, traders, and other professionals or affiliates may provide oral or written market commentary or trading
strategies to our clients that reflect opinions that are contrary to the opinions expressed herein, and our proprietary trading and investing businesses may make investment
decisions that are inconsistent with the recommendations expressed herein. In reviewing these materials, you should be aware that any or all of the foregoing among other
things, may give rise to real or potential conflicts of interest. MOSt and its affiliated company(ies), their directors and employees and their relatives may; (a) from time to time,
have a long or short position in, act as principal in, and buy or sell the securities or derivatives thereof of companies mentioned herein. (b) be engaged in any other transaction
involving such securities and earn brokerage or other compensation or act as a market maker in the financial instruments of the company(ies) discussed herein or act as an
advisor or lender/borrower to such company(ies) or may have any other potential conflict of interests with respect to any recommendation and other related information and
opinions.; however the same shall have no bearing whatsoever on the specific recommendations made by the analyst(s), as the recommendations made by the analyst(s) are
completely independent of the views of the affiliates of MOSt even though there might exist an inherent conflict of interest in some of the stocks mentioned in the research
report
Reports based on technical and derivative analysis center on studying charts company's price movement, outstanding positions and trading volume, as opposed to focusing
on a company's fundamentals and, as such, may not match with a report on a company's fundamental analysis. In addition MOST has different business segments / Divisions
with independent research separated by Chinese walls catering to different set of customers having various objectives, risk profiles, investment horizon, etc, and therefore may
at times have different contrary views on stocks sectors and markets.
Unauthorized disclosure, use, dissemination or copying (either whole or partial) of this information, is prohibited. The person accessing this information specifically agrees to
exempt MOSt or any of its affiliates or employees from, any and all responsibility/liability arising from such misuse and agrees not to hold MOSt or any of its affiliates or
employees responsible for any such misuse and further agrees to hold MOSt or any of its affiliates or employees free and harmless from all losses, costs, damages, expenses that
may be suffered by the person accessing this information due to any errors and delays. The information contained herein is based on publicly available data or other sources
believed to be reliable. Any statements contained in this report attributed to a third party represent MOSt's interpretation of the data, information and/or opinions provided
by that third party either publicly or through a subscription service, and such use and interpretation have not been reviewed by the third party. This Report is not intended to
be a complete statement or summary of the securities, markets or developments referred to in the document. While we would endeavor to update the information herein on
reasonable basis, MOSt and/or its affiliates are under no obligation to update the information. Also there may be regulatory, compliance, or other reasons that may prevent
MOSt and/or its affiliates from doing so. MOSt or any of its affiliates or employees shall not be in any way responsible and liable for any loss or damage that may arise to any
person from any inadvertent error in the information contained in this report. MOSt or any of its affiliates or employees do not provide, at any time, any express or implied
warranty of any kind, regarding any matter pertaining to this report, including without limitation the implied warranties of merchantability, fitness for a particular purpose, and
non-infringement. The recipients of this report should rely on their own investigations.
This report is intended for distribution to institutional investors. Recipients who are not institutional investors should seek advice of their independent financial advisor prior to
taking any investment decision based on this report or for any necessary explanation of its contents.
Most and it's associates may have managed or co-managed public offering of securities, may have received compensation for investment banking or merchant banking or
brokerage services, may have received any compensation for products or services other than investment banking or merchant banking or brokerage services from the subject
company in the past 12 months.
Most and it's associates have not received any compensation or other benefits from the subject company or third party in connection with the research report.
Subject Company may have been a client of Most or its associates during twelve months preceding the date of distribution of the research report
MOSt and/or its affiliates and/or employees may have interests/positions, financial or otherwise of over 1 % at the end of the month immediately preceding the date of
publication of the research in the securities mentioned in this report. To enhance transparency, MOSt has incorporated a Disclosure of Interest Statement in this document.
This should, however, not be treated as endorsement of the views expressed in the report.
Motilal Oswal Securities Limited is under the process of seeking registration under SEBI (Research Analyst) Regulations, 2014.
There are no material disciplinary action that been taken by any regulatory authority impacting equity research analysis activities
Analyst Certification
The views expressed in this research report accurately reflect the personal views of the analyst(s) about the subject securities or issues, and no part of the compensation of the
research analyst(s) was, is, or will be directly or indirectly related to the specific recommendations and views expressed by research analyst(s) in this report. The research analysts,
strategists, or research associates principally responsible for preparation of MOSt research receive compensation based upon various factors, including quality of research,
investor client feedback, stock picking, competitive factors and firm revenues
Regional Disclosures (outside India)
This report is not directed or intended for distribution to or use by any person or entity resident in a state, country or any jurisdiction, where such distribution, publication,
availability or use would be contrary to law, regulation or which would subject MOSt & its group companies to registration or licensing requirements within such jurisdictions.
Disclosure of Interest Statement1.Analyst ownership of the stocks mentioned above No2.Served as an officer, director or employee No
Motilal Oswal Securities LtdMotilal Oswal Tower, Level 6, Sayani Road, Prabhadevi, Mumbai 400 025
Phone: (91-22) 30894200 Fax: (91-22) 22885038. E-mail: [email protected] CDL00071_50412_003