arthrobacter arilaitensis strains isolated from ripened cheeses: characterization of their...
TRANSCRIPT

Food Research International 65 (2014) 184–192
Contents lists available at ScienceDirect
Food Research International
j ourna l homepage: www.e lsev ie r .com/ locate / foodres
Arthrobacter arilaitensis strains isolated from ripened cheeses:Characterization of their pigmentation using spectrocolorimetry
Nuthathai Sutthiwong a,b, Yanis Caro a, Cathie Milhau a, Alain Valla c, Mireille Fouillaud a, Laurent Dufossé a,d,⁎a Laboratoire de Chimie des Substances Naturelles et des Sciences des Aliments, ESIROI Agroalimentaire, Université de La Réunion, F-97490 Sainte-Clotilde, Ile de La Réunion, Franceb Agricultural Technology Department, Thailand Institute of Scientific and Technological Research, 35 Mu 3, Klong 5, Klong Luang, Pathum Thani 12120, Thailandc CNRS, Chimie et Biologie des Substances Naturelles, F-29000 Quimper, Franced Laboratoire ANTiOX, Université de Bretagne Occidentale, Pôle Universitaire Pierre-Jakez Hélias, F-29000 Quimper, France
⁎ Corresponding author at: Laboratoire de Chimie deSciences des Aliments, ESIROI Agroalimentaire, UniveSainte-Clotilde, Reunion. Tel.: +262 262 217544; fax: +2
E-mail address: [email protected] (L. D
http://dx.doi.org/10.1016/j.foodres.2014.06.0140963-9969/© 2014 Elsevier Ltd. All rights reserved.
a b s t r a c t
a r t i c l e i n f oArticle history:Received 31 January 2014Received in revised form 30 May 2014Accepted 4 June 2014Available online 13 June 2014
Keywords:Arthrobacter arilaitensisSpectrocolorimetryPigmentationSmear-ripened cheeseColor
Pigmentation of a total 14 strains of Arthrobacter arilaitensis isolated from smear-ripened cheeses was evaluatedusing quantitative spectrocolorimetry. After 14 days of cultivation on milk ingredient-based solid medium onPetri dish, the bacterial biofilms were measured and expressed in the CIE L*a*b colorimetric system. Alignmentsof hue value from each experimental (a*b) pair ranged from 72.39 to 240.83° that could be statistically dividedinto 9 groups (P b .05). Eight strains, out of 14, presented yellow to greenish-yellow pigmented cultures. Theeffect of light exposure against storage in the dark was also investigated using this approach. Three groups de-pending on a coloration behavior affected by lightwere illustrated for these 14 A. arilaitensis strains e.g. positivelysensitive, negatively sensitive and not sensitive to light. This study is the first one describing the color contribu-tion of A. arilaitensis, an emerging industrial dairy bacterium, to cheese ripening.
© 2014 Elsevier Ltd. All rights reserved.
1. Introduction
Red-smear ripened soft cheeses, characterized by their orange-redcolor on rind, are dairy products widely consumed in Europe. Thecolor is due essentially to carotenoids, in combination with other pig-ments, produced by the cheese microflora during ripening (Fig. 1).The microbiology of these cheeses is complex and not entirely well un-derstood yet, as it results in interactions between bacteria and yeaststrains. For a long time, Brevibacterium linens was considered to be themajor microorganism responsible for the color development at the sur-face of the cheeses because of its ability to produce orange carotenoids(Kohl, Achenbach, & Reichenbach, 1983). However, other bacteriahave been recently reported as important as B. linens for the ripeningof the cheese rind (Brennan et al., 2002; Eliskases-Lechner & Ginzinger,1995; Feurer, Vallaeys, Corrieu, & Irlinger, 2004; Mounier et al., 2005;Valdès-Stauber, Scherer, & Seiler, 1997). Furthermore, it is believedthat the coloration of cheese is a consequence of complex interactionsbetween yellow-pigmented Arthrobacter sp. and other microorganisms(Bockelmann & Hoppe-Seyler, 2001; Galaup et al., 2007; Irlinger &
s Substances Naturelles et desrsité de La Réunion, F-9749062 262 938183.ufossé).
Mounier, 2009). One important strain among the genus Arthrobacterfound in ripened-cheeses is Arthrobacter arilaitensis (Feurer et al.,2004; Irlinger, Bimet, Delettre, Lefèvre, & Grimont, 2005; Mounieret al., 2005). The colonies of A. arilaitensis commonly exhibit yellowcolors and these bacteria have been found at different stages of ripening.It is then assumed that A. arilaitensis could be one of themicroorganismsthat would produce pigments on cheese rind, contributing to its charac-teristic overall color (Feurer et al., 2004; Galaup et al., 2007;Larpin-Laborde et al., 2011).
The color is a key element of a consumer's purchasing decision dueto its appearance as a sign of quality including an attractive aspect fornumerous products. A quantitative spectrocolorimetry method is rou-tinely applied for handling the consistency of color for various kinds ofproduct. Indeed a spectrocolorimeter emulates the psychosensorialmechanism of the color perception and interpretation of human beings.It integrates both light source spectrum and the object color spectruminto the reflectance spectrum. The latter is further filtered in orderthat the red, green and blue spectra are extracted as three coordinates,imitating the response of the human eye to light and color. This infor-mation is then processed to provide the three dimension L*a*b*response (Hutchings, 1994).
For a few decades spectrocolorimetry has been broadly used inassociation with food technology, especially in meat science.Spectrocolorimetry in the CIE L*a*b* colorimetric system has beenfully applied by Millar, Moss, McDougall, and Stevenson (1995) to

c
a b
d
Fig. 1. Smear-cheeses with rinds colored by amicroflora including Arthrobacter arilaitensis strains. a. Livarot, b. Rollot in the ripening cellar, c. Hand-madewashing ofMunster, d.Maroilles.
185N. Sutthiwong et al. / Food Research International 65 (2014) 184–192
study ionized chicken meat and by Vorst, Clarke, Allison, and Booren(2004) to determine the effects of radio frequency transponders onbeef muscle. Üren and Babayi it (1996) also used it to measure thecolor of Turkish-type fermented sausage. Furthermore, this apparatushas been used in fishery science to study the color of raw carp fishfilet affected by high pressure processing at a low temperature(Sequeira-Munoz, Chevalier, Le Bail, Ramaswamy, & Simpson, 2006)as well as to investigate the effect of dietary astaxanthin on color ofrainbow trout filet (Choubert, Blanc, & Vallée, 1997; Choubert,Mendes-Pinto, & Morais, 2006). Besides meat and fishery sciences, thecolor measurement using spectrocolorimetry was also used to evaluatethe impact of short wave ultraviolet treatments on liquid eggs products(de Souza & Fernández, 2012).
In the case of cheese coloration, Dufossé, Galaup, Carlet, Flamin, andValla (2005) investigated the rind's color of various ‘Protected Designa-tion of Origin — PDO’ cheeses and also assessed color development atthe surface of cheese versus time for quality control. Marchesini,Balzan, Segato, Novelli, and Andrighetto (2009) also evaluated the effectof ripening period on the color of Asiago cheese, and Ramírez-Navas andRodríguez de Stouvenel (2012) collected the color data of Quesillocheese and used them as a part of quality control in the manufacturingprocess. In addition, spectrocolorimetry has been used as a tool for char-acterizing pigmentation of cheese microflora (Dufossé et al., 2005;Guyomarc'h, Binet, & Dufossé, 2000). The pigmentation of 23 B. linensstrains cultivated under 2 conditions, light and dark, was assessed.Numerous bacterial strains isolated from Munster cheese were alsodetermined and their color coordinates were projected with L*a*b*system. Masoud and Jakobsen (2003) followed the influence of pH,NaCl and interactions with yeast strains on the intensity of pigmenta-tion produced by four coryneform bacteria. Furthermore, this devicehas been used to evaluate the coloring capacity of smear-ripened strainswhen cultivated under various conditions e.g. types of cheese curds, co-
culture with yeast strains used for cheese deacidification, etc.(Leclercq-Perlat, Corrieu, & Spinnler, 2004; Leclercq-Perlat & Spinnler,2010; Mounier et al., 2006).
For the purpose of providing information to cheese-manufacturerswhen selecting A. arilaitensis as a part of ripening flora, this study inves-tigates the use of quantitative spectrocolorimetry for the description ofthe pigmentation provided by different strains from this species.
2. Materials and methods
2.1. Bacterial strains
Fourteen A. arilaitensis strains isolated from smear-ripened cheeseswere used in this study (Table 1). The strainswere isolated fromcheesesin our lab or were kindly provided by the Institut National de laRecherche Agronomique (INRA), France. Usually stored at −80 °C,they were maintained during this study on milk ingredient-basedagar, stored at 4 °C and subcultured monthly.
2.2. Cultivation media and conditions
2.2.1. Milk ingredient-based mediumThe milk ingredient-based medium containing 5 g Casamino acids
(Difco), 1 g yeast extract (BD Bacto), 5 g NaCl, 20 g D-glucose (FisherScientific), 1 g KH2PO4 (Fisher Scientific) and 15 g agar granulated (BDDifco) per liter of deionized water was prepared. Before sterilizing at121 °C, 15 min, the pH of the medium was adjusted to 7.0 ± 0.2.
For the characterization of pigmentation, the culture medium waspoured in 90 mm diameter Petri dishes. Each A. arilaitensis strain wassuspended in peptone saline diluent [1 g casein peptone (Sigma) and8.5 g NaCl (Fisher Scientific), adjusted pH to 7.0 ± 0.2 at 25 °C] and1 ml of a 107 cell suspension was spread over the surface of the solid

Table 1The 14 Arthrobacter arilaitensis strains used in this study.
Strain Cheese origin
A. arilaitensis AA009 Livarot, FranceA. arilaitensis AA012 Livarot, FranceA. arilaitensis AA014 Munster, FranceA. arilaitensis AA015 Pont-l'Evêque, FranceA. arilaitensis AA017 Smear cheese, FranceA. arilaitensis AA020 Munster, FranceA. arilaitensis AA021 Epoisses, FranceA. arilaitensis AA025 Livarot, FranceA. arilaitensis AA028 Saint-Paulin, FranceA. arilaitensis AA030 Reblochon, FranceA. arilaitensis AA035 Livarot, FranceA. arilaitensis AA036 Munster, FranceA. arilaitensis CNRZ923 Smear cheese, Centre National de
Recherches Zootechniques (CNRZ)strain collection, Paris, France
A. arilaitensisWS2230 Smear cheese, Weihenstephan (WS)strain collection, Freising, Germany
186 N. Sutthiwong et al. / Food Research International 65 (2014) 184–192
medium. All Petri-dishes were then incubated at room temperature for14 days.
2.2.2. Light exposureThe trials were carried out in independent triplicates under two dif-
ferent conditions at room temperature, natural daylight and darkness.The plates corresponding to dark conditionwere wrapped in aluminumfoil and incubated in a dark place.
2.3. Color measurements
The color of the milk ingredient-based agar inoculated withA. arilaitensis strainswasmeasured using CM-3500d spectrocolorimeter(Minolta Co., Ltd., Japan) driven with SpectraMagic NX Pro. software(Minolta). The reference illuminant was D65 (standard daylight). Ac-cording to the Compagnie Internationale de l'Eclairage (CIE, 1978) thedata were reported in the L*a*b* colorimetric system. A single-pieceddisk of agar, large enough to cover the entire light spot, was cut ineach Petri dish, from an area of homogeneous colony development.The sample was then held culture-down and layered in the bottom ofa 45 mm diameter CM-A128 glass Petri dish (Minolta) for incidentlight color measurements.
To characterize a color in the CIE L*a*b* color system, 3 colorimetriccoordinates are obtained from the spectrocolorimeter. L* defines light-ness (ranges from 0% to 100%, dark to light), a* indicates the red/green value (from −60 to 60, green to red), and b* denotes the blue/yellow value (from −60 to 60, blue to yellow). The attributes of color,C* and h°, describe the chroma (vividness or dullness) and the hueangle or tone of the color, respectively. The value of chroma C* is 0 atthe center and increases according to the distance from the center.Hue angle h° is defined as starting at the +a* axis and is expressed indegrees: 0° would be +a* (red), 90° would be +b* (yellow), 180°would be −a* (green), and 270° would be −b* (blue). Hue valuescorrespond to the angle of the a*/b* coordinate of the points.
Chroma C� ¼ffiffiffiffiffiffiffiffiffiffiffiffiffiffiffiffiffiffiffiffiffiffiffiffiffiffiffiffia�ð Þ2 þ b�ð Þ2
q
Hue angle hB ¼ tan−1 b�a�
� �
2.4. Statistical analysis
The data were analyzed using SigmaPlot software (Systat Software,Inc., USA). The t-test was performed for comparing mean values of
individual variable of each strain between the 2 conditions at 95% signif-icance level. When comparing data of each variable among 14 strains,one-way analysis of variance (one-way ANOVA) was applied. The dif-ference of considered variable was estimated by Tukey HSD test accord-ing to a α risk of 5%.
3. Results and discussion
3.1. Diversity of A. arilaitensis strains pigmentations
Total 42 natural daylight experimental (a*, b*) pairs displayed in theCIE L*a*b* color space are shown in Fig. 2. Among the whole set of these42 responses, the a* values extended from−3.64 to 0.92, with b* valueranging from −5.36 to 14.64. The hue varied between 72.39 and240.83° that could be statistically divided into 9 groups. One amongthem is composed of 5 strains (AA012, AA015, AA021, AA030, andCNRZ923) showing close responses with hues ranging from 92.61 to98.57° (yellow) (Fig. 3). Two additional minor groups which consistedin only a single or 2 strain(s) including AA020, AA028 and AA035displayed yellow or greenish-yellow pigments, hue angles varyingfrom 84.37 to 112.09. Besides these strains, h° values of the strainAA014 (72.39) and the other 5 strains namely AA009, AA017, AA025,AA036 and WS2230 with hues varying from 118.52 to 240.83° wereidentified as cream or pale (poorly colored).
When inquired to identify the color of an object, however, peoplewillmost likely describe first its hue. Very simply, hue is how anobserv-er perceives an object's color — yellow, orange, pink, green, blue, etc.The colorimetric circle in Fig. 2 shows the continuum of color fromone hue to the next. As the circle illustrates, if two pigments colored yel-low and greenweremixed, a new colored pigmentwould showyellow-green. Add green to blue for green-blue, and so on.
As the dimension of data plots projected onto a (a*, b*) plane wasscattered anddid not completelymatch one ray (hue) of the scale, a cor-relation between the two chromatic coordinates, a* and b*, was not suit-able to explain the whole data. This evidence indicated that the ratio ofpure red (+a*) did not depend on the yellow component (+b*), whichled to a unique occurrence of coloration in each A. arilaitensis culture.Thus, this helped to conclude that hue phenotypes of the cultures are il-lustrations of the diversity among the A. arilaitensis strains.
Average and standard deviation of colorimetric coordinates of eachA. arilaitensis cultures are shown in Table 2. Color measurementsof these 14 A. arilaitensis cultures showed L* values ranging from31.47 to 50.51. They could be divided into 6 significantly differentgroups (P b .05) with A. arilaitensis AA028 presenting the lowest L*,31.47, while A. arilaitensis AA025 and WS2230 are gathered in a grouppresenting the highest L*, 50.36 and 50.51, respectively.
The saturation, C*, responses of 14 A. arilaitensis biofilms widelyranged from 2.08 to 14.80, whereby 9 groups of strains were statisticallyseparated with distinct saturation (P b .05). Among the strains showingpale colored colonies, A. arilaitensis AA014 had the lowest C* value. Be-sides these pale colored strains, 8 others displayed a significantly brighteryellow color (Fig. 2) with A. arilaitensis AA015 exhibited the brightestone. According to the analysis of pigment productions by the 14A. arilaitensis strains (data not shown), 8 strains whose cultures present-ed high saturation values e.g. A. arilaitensisAA012, AA015, AA020, AA021,AA028, AA030, AA035 andCNRZ923, produced significantly higher quan-tities of pigments than the strains forwhich theC* values of cultureswerelow. As pigments were encapsulated beneath cell-wall, this proof led usto conclude that C*was responsible for interpretation in term of quantityof pigments produced by the A. arilaitensis strains.
As illustrated by colorimetric coordinates, several strains did have asignificantly pale or cream color. This color was likely to be caused bycell material only. The results of pigment analysis using HPLC-DAD(data not shown) found that the extracts of cell biomass from all strainswhose colonies were cream or pale colored, did not present the chro-matographic profiles of carotenoids. For this reason, there is a possibility

0 5 10 15 20
0
5
10
15
20
05101520
0
5
10
15
20
0
30
60
90
120
150
180
210
240 300
330
270
- b*
blue
+a*
red
-a*
green
+b*
yellow
Fig. 2. Positions of Arthrobacter arilaitensis 14 strains in the CIE L*a*b* colorimetric system (strains cultivated in natural daylight, three replicates for each).
187N. Sutthiwong et al. / Food Research International 65 (2014) 184–192
that these poorly or non-colored strains e.g. A. arilaitensis AA009,AA014, AA017, AA025, AA036 and WS2230, might be responsible onlyfor producing a flavor but not for the coloration in cheeses due to thefact they do not produce any carotenoids. Deetae, Bonnarme, Spinnler,and Helinck (2007) described A. arilaitensisMu107 as a strain belongingto a variety of ripened-cheese microbial communities and involved inthe flavor formation through the production of volatile aroma com-pounds such as aldehydes, ketones and sulphur compounds. Our
hypothesis from data obtained on milk ingredient-based agar on Petridish should be further confirmed on cheesemodel withmicrobial inter-actions, and also directly on cheeses.
3.2. The effect of light on coloration of A. arilaitensis cultures
After 14 days of simultaneous incubation under either daylight ordark conditions, all replicates of A. arilaitensis strain were measured by

-10 -5 0 5 10 15 20
-10
-5
0
5
10
15
20
AA015
AA021
AA012
AA035
AA030
AA020
CNRZ923
AA028
AA009
AA014
AA025
AA036
AA017
WS2230
agar (blank)
+ a* (red)
+ b* (yellow)
Fig. 3. Detailed positions of the 14 Arthrobacter arilaitensis strains, cultivated in daylight, when projected in the CIE L*a*b* colorimetric scale (bars indicate standard deviations).
188 N. Sutthiwong et al. / Food Research International 65 (2014) 184–192
a spectrocolorimeter as described in Section 2. Table 3 shows averagesof each chromatic coordinates of 14 A. arilaitensis strains in darkness.When cultured in darkness, the a* values ranged from −3.71 to 1.12(versus −3.64 to 0.92 under daylight), and the b* values varied from−3.66 to 3.88 (versus −5.36 to 14.64 under daylight). These couldstatistically significantly be divided into 9 and 7 groups, respectively(P b .05). Due to the scattered coordinates on (a*, b*) plane, an equationfrom correlation analysis could not be used to explain a relation be-tween a* and b* values, as well as for the results under daylightcondition.
When comparing data recorded either under dark or daylight condi-tions, two major qualitative differences could be remarked. First, thesets of experimental (a*, b*) pairs data obtained from A. arilaitensis
Table 2Color coordinate values of the 14 Arthrobacter arilaitensis strains cultivated in daylight.
Strain L* a*
A. arilaitensis AA009 40.15 ± 0.47d −1.61 ± 0.25d
A. arilaitensis AA012 44.74 ± 0.55b −1.85 ± 0.31d,e
A. arilaitensis AA014 46.27 ± 0.11b 0.54 ± 0.02b
A. arilaitensis AA015 42.87 ± 0.26c −1.94 ± 0.13e
A. arilaitensis AA017 40.09 ± 0.77d −2.80 ± 0.16g
A. arilaitensis A020 37.09 ± 1.20e 0.92 ± 0.13a
A. arilaitensis AA021 46.08 ± 0.22b −1.96 ± 0.03e
A. arilaitensis AA025 50.36 ± 0.12a −3.64 ± 0.11h
A. arilaitensis AA028 31.47 ± 2.19f −2.44 ± 0.40f
A. arilaitensis AA030 39.13 ± 1.42d −1.56 ± 0.09d
A. arilaitensis AA035 44.37 ± 0.35b,c −0.58 ± 0.10c
A. arilaitensis AA036 37.43 ± 0.30e −3.01 ± 0.08g
A. arilaitensis CNRZ923 45.49 ± 0.41b −0.73 ± 0.05c
A. arilaitensisWS2230 50.51 ± 0.27a −3.00 ± 0.17g
Values in the same column with a common superscript letter do not significantly differ (P N .0
cultivated in darkness had a more narrow range than the same data re-corded under light condition (Figs. 3 & 4). The plots were located nearthe center of the chromatic plane. It meant that the C* values of individ-ual strains under the same conditionwere less discriminatingwhen cul-tivated in darkness than in daylight; however, they could be separatedinto 9 groups by statistically significant differences (P b .05).
L*values of A. arilaitensis ranged from32.38 to 47.05when cultivatedunder dark condition (against 31.47–50.11 under daylight). They couldbe statistically significantly divided into 9 groups (P b .05). A. arilaitensisAA025 and A. arilaitensis AA028were strainswhich had the highest andthe lowest values of lightness, respectively. Comparison between thetwo conditions demonstrated L* values of cultures grown in daylightslightly wider ranged than those cultivated in darkness.
b* h° C*
3.02 ± 0.50e 118.52 ± 7.57d 3.36 ± 0.30h
13.11 ± 0.61b 98.00 ± 1.06f 13.24 ± 0.64b
1.66 ± 0.05f 72.39 ± 0.33h 2.08 ± 0.14i
14.67 ± 0.57a 97.55 ± 0.78f 14.80 ± 0.55a
−4.03 ± 0.34g 235.09 ± 3.63b 4.91 ± 0.20g
10.08 ± 0.85c 84.80 ± 0.52h 10.12 ± 0.85c,d
13.03 ± 0.19b 98.57 ± 0.25f 13.17 ± 0.19b
−3.98 ± 0.08g 227.62 ± 0.95c 5.39 ± 0.11f,g
6.38 ± 1.56d 112.09 ± 6.92e 6.89 ± 1.35e
10.97 ± 1.93c 98.42 ± 2.09f 11.08 ± 1.88c
12.84 ± 0.44b 92.61 ± 0.51g 12.86 ± 0.44b
−4.20 ± 0.42g,h 233.99 ± 3.59b 5.19 ± 0.29f.g
9.7 ± 0.11c 94.28 ± 1.58f,g 9.73 ± 0.12d
−5.36 ± 0.16h 240.83 ± 1.17a 6.15 ± 0.19e,f
5).

Table 3Color coordinate values of the 14 Arthrobacter arilaitensis strains cultivated in darkness.
Strain L* a* b* h° C*
A. arilaitensis AA009 40.51 ± 0.13f −1.71 ± 0.26e 2.73 ± 0.32a,b 122.23 ± 6.82c,d 3.24 ± 0.14d
A. arilaitensis AA012 44.80 ± 0.07c −0.36 ± 0.15d 3.05 ± 0.07a 96.77 ± 2.96e 3.08 ± 0.05d
A. arilaitensis AA014 42.27 ± 0.33e 0.65 ± 0.07b 1.98 ± 0.13d 72.63 ± 0.31f,g 1.75 ± 0.04h
A. arilaitensis AA015 42.17 ± 0.68e −1.28 ± 0.12f 2.42 ± 0.18b,c,d 118.07 ± 3.90d 2.74 ± 0.11e,f
A. arilaitensis AA017 39.46 ± 0.15g −3.14 ± 0.07h −1.95 ± 0.03f 211.75 ± 1.05b 3.69 ± 0.04c
A. arilaitensis AA020 39.86 ± 0.18f,g 0.64 ± 0.04b 0.71 ± 0.08e 47.67 ± 2.44h 0.96 ± 0.08i
A. arilaitensis AA021 45.02 ± 0.41c 0.41 ± 0.08b,c 2.70 ± 0.12a,b,c 81.43 ± 1.29f 2.74 ± 0.13e,f
A. arilaitensis AA025 49.78 ± 0.47a −3.71 ± 0.14i −3.51 ± 0.50g 223.21 ± 3.19a,b 5.12 ± 0.44a
A. arilaitensis AA028 32.38 ± 0.03i −0.83 ± 0.41e 0.80 ± 0.33e,f 134.45 ± 23.66c 1.25 ± 0.12i
A. arilaitensis AA030 40.26 ± 1.11f,g −0.82 ± 0.26e 2.22 ± 0.05c,d 110.13 ± 5.45d 2.38 ± 0.13g
A. arilaitensis AA035 43.59 ± 0.14d 1.27 ± 0.09a 2.77 ± 0.89a,b 65.30 ± 2.22g 3.05 ± 0.05d,e
A. arilaitensis AA036 36.66 ± 0.76h −3.23 ± 0.19h −3.19 ± 0.58g 224.27 ± 7.02a 4.56 ± 0.26b
A. arilaitensis CNRZ923 45.61 ± 0.41c 0.28 ± 0.08c 2.57 ± 0.15a,b,c 83.83 ± 1.58f 2.59 ± 0.15f,g
A. arilaitensisWS2230 47.19 ± 1.31b −3.61 ± 0.18i −3.66 ± 0.57g 225.12 ± 5.15a 5.16 ± 0.37a
Values in the same column with a common superscript letter do not significantly differ (P N .05).
189N. Sutthiwong et al. / Food Research International 65 (2014) 184–192
In contrast to the lightness, h° values of cultures grown under darkcondition had wider variations than the strains cultivated under light.A. arilaitensis AA020 displayed the lowest hue angle, 47.67°, whileA. arilaitensisWS2230 showed the highest h° value, 225.12°.
The second difference concerns the individual ranks of the 14 strainsbetween cultures grown in daylight and in darkness. Comparison ofFig. 3with Fig. 4 shows that the ranking of the strains changed accordingto the light conditions. The color of the majority of the strains becamepaler when cultivated in darkness whereas one strain was less coloredwhen cultivated under light. The color of cultures between the 2 condi-tions was strongly different for the strains AA012, AA015 (Fig. 5),AA020, AA021, AA028, AA030, AA035 and CNRZ923 with C* valueshigher when cultivated in daylight. Although saturation of the 14
-10 -5 0 5
-10
-5
0
5
10
15
20
AA020
AA025
WS2230
AA036
AA017
AA028
AA014
AA035
AA021
CNRZ923
AA012
AA009
AA015
AA030
+ b* (yellow)
Fig. 4. Detailed positions of the 14 Arthrobacter arilaitensis strains, cultivated in darkness, w
A. arilaitensis strains was statistically significantly different among thesame cultivated condition (daylight or darkness), the C* value differencefor individual strains cultivated in darknesswas excessively lowerwhencomparing with daylight condition.
When considering L* and h° values, light influenced on the change ofsome strains. Light had statistically significant effect on the lightness ofthe cultures of 5 strains, while 10 strains were affected by light on theirhues.
Three different types of color response in term of (a*, b*) pairs werestatistically separated. Group 1 was composed of strains AA012, AA015,AA017, AA020, AA021, AA028, AA030, AA035, AA036, CNRZ923 andWS2230. These displayed brighter pigmentation under daylight condi-tion than in the darkness and were stated to be positively sensitive to
10 15 20
+ a* (red)
hen projected in the CIE L*a*b* colorimetric scale (bars indicate standard deviations).
AA015 (a) AA015 (b)
AA009 (a) AA009 (b)
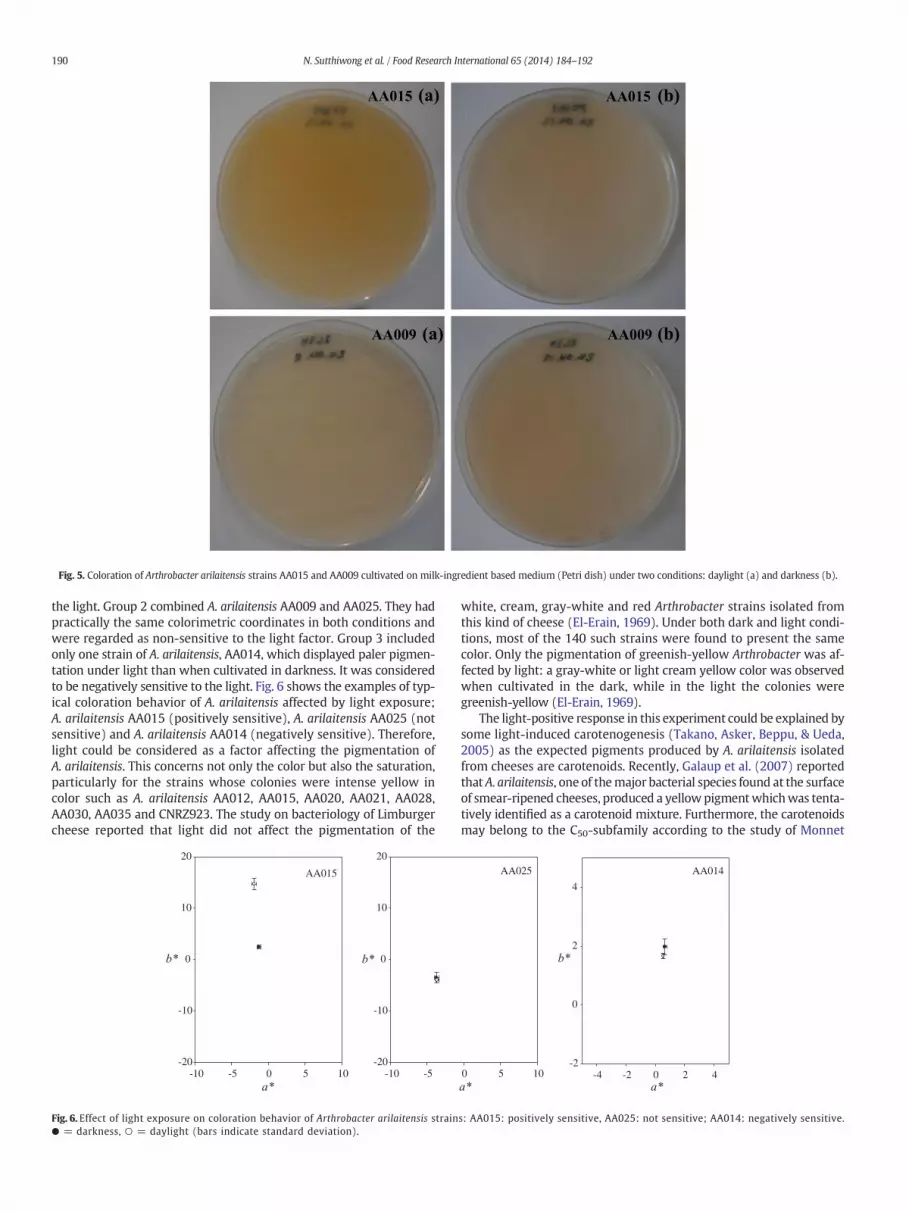
Fig. 5. Coloration of Arthrobacter arilaitensis strains AA015 and AA009 cultivated on milk-ingredient based medium (Petri dish) under two conditions: daylight (a) and darkness (b).
190 N. Sutthiwong et al. / Food Research International 65 (2014) 184–192
the light. Group 2 combined A. arilaitensis AA009 and AA025. They hadpractically the same colorimetric coordinates in both conditions andwere regarded as non-sensitive to the light factor. Group 3 includedonly one strain of A. arilaitensis, AA014, which displayed paler pigmen-tation under light than when cultivated in darkness. It was consideredto be negatively sensitive to the light. Fig. 6 shows the examples of typ-ical coloration behavior of A. arilaitensis affected by light exposure;A. arilaitensis AA015 (positively sensitive), A. arilaitensis AA025 (notsensitive) and A. arilaitensis AA014 (negatively sensitive). Therefore,light could be considered as a factor affecting the pigmentation ofA. arilaitensis. This concerns not only the color but also the saturation,particularly for the strains whose colonies were intense yellow incolor such as A. arilaitensis AA012, AA015, AA020, AA021, AA028,AA030, AA035 and CNRZ923. The study on bacteriology of Limburgercheese reported that light did not affect the pigmentation of the
-10 -5 0 5 10-20
-10
0
10
20
-10 -5-20
-10
0
10
20
a*
b* b*
AA015
Fig. 6. Effect of light exposure on coloration behavior of Arthrobacter arilaitensis strain● = darkness, ○ = daylight (bars indicate standard deviation).
white, cream, gray-white and red Arthrobacter strains isolated fromthis kind of cheese (El-Erain, 1969). Under both dark and light condi-tions, most of the 140 such strains were found to present the samecolor. Only the pigmentation of greenish-yellow Arthrobacter was af-fected by light: a gray-white or light cream yellow color was observedwhen cultivated in the dark, while in the light the colonies weregreenish-yellow (El-Erain, 1969).
The light-positive response in this experiment could be explained bysome light-induced carotenogenesis (Takano, Asker, Beppu, & Ueda,2005) as the expected pigments produced by A. arilaitensis isolatedfrom cheeses are carotenoids. Recently, Galaup et al. (2007) reportedthat A. arilaitensis, one of themajor bacterial species found at the surfaceof smear-ripened cheeses, produced a yellow pigmentwhichwas tenta-tively identified as a carotenoid mixture. Furthermore, the carotenoidsmay belong to the C50-subfamily according to the study of Monnet
0 5 10a* a*
-4 -2 0 2 4-2
0
2
4
b*
AA025 AA014
s: AA015: positively sensitive, AA025: not sensitive; AA014: negatively sensitive.

191N. Sutthiwong et al. / Food Research International 65 (2014) 184–192
et al. (2010). Although the role of carotenoids produced by A. arilaitensishas not been revealed, one function of carotenoids inmicroorganisms isto serve asmembrane integrated antioxidants, protecting cells from ox-idation stress (Krinsky, 1989; Liu, Gai, Tao, Tang, & Xu, 2012). In thegenus Arthrobacter, however, several previous studies have reported arelation between carotenoids produced by some members of this gen-era and their living conditions. According to Fong, Burgess, andBarrow (2001), changes of carotenoids production in response togrowth temperature and salt concentration provided insights into theadaptation to the cold environment of the psychrotrophic Arthrobacteragilis, a bacteria isolated from Antarctic sea ice. Pigments may thereforebe associated to stabilization of cell membrane at low temperature.Moreover, the survival of some microorganisms at low temperaturemay be enhanced by the ability of carotenoid to rigidify membranes(Shivaji & Ray, 1995). Dieser, Greenwood, and Foreman (2010) also in-dicated that carotenoid pigmentation increases the resistance of theheterotrophic bacteria, A. agilis MB8-13, to environmental stressors,being cryo and solar radiation protectants. It is generally recognizedthat carotenoid pigments provide antioxidant protection throughquenching, by being oxidized or through co-oxidization by light-excited photosentizers with strong oxidant power.
The occurrence of one A. arilaitensis strains, AA014, which wasbrighter in the dark than in daylight did not follow this theory. As its col-onies were pale colored and the result of pigment analysis using HPLC(data not shown) did not exhibit any chromatographic profile of carot-enoids (data not shown), it was clear that A. arilaitensis AA014 did notproduce yellow carotenoids. Thus, one possible explanation would bethat the color was likely to be caused by cell material only, and thatlight might affect its growth and biomass production.
4. Conclusions
An obvious diversity of microbial behaviors was discovered throughthis experiment. Alignments of hue value from each experimental (a*b)pair ranged from 72.39 to 240.83° and could be statistically divided into9 groups. The major group was composed of 5 strains showing close h°responses ranging from 92.61 to 98.57 while the remaining groupsconsisted in a single or two strains only. However, 8 strains ofA. arilaitensis, among 14, presented yellow to greenish-yellow pigmentsin their cultures, while the others showed cream or pale color. Lightexposure affected pigmentation of these strains not only hue but alsosaturation and lightness. Three groups depending on colorationbehavior consecutive to light impact were illustrated among the 14A. arilaitensis strains studied e.g. positively sensitive, negatively sensi-tive and not sensitive to light.
Author contributions
N. Sutthiwong and L. Dufossé designed the study. N. Sutthiwongper-formed the experiments. N. Sutthiwong, Y. Caro, C. Milhau, A. Valla, M.Fouillaud and L. Dufossé interpreted the results. N. Sutthiwong draftedthe manuscript. Y. Caro, A. Valla, M. Fouillaud and L. Dufossé participat-ed in revising the article critically.
Acknowledgments
Nuthathai Sutthiwong is grateful to the Royal Thai Government(GVT2010-0042) for research grant obtained for preparing her PhD atthe University of Reunion Island, France.
Our thanks to ChristopheMonnet, INRA—UnitéMixte deRecherche,Génie et Microbiologie des Procédés Alimentaires, Centre de Biotech-nologies Agro-Industrielles, 78850 Thiverval-Grignon, France, for pro-viding part of the A. arilaitensis strains.
Laurent Dufossé, Yanis Caro and Mireille Fouillaud would like tothank the Conseil Régional de La Réunion (AAP2010-RE12R019), Re-union Island, France, for financial support of research activities
dedicated to microbial pigments. The authors are also thankful toValérie Quilici from the Université de La Réunion for critically readingthe manuscript for English language.
References
Bockelmann, W., & Hoppe-Seyler, T. (2001). The surface flora of bacteria smear-ripenedcheese from cow's and goat's milk. International Dairy Journal, 11, 307–314.
Brennan, N., Ward, A.C., Berford, T., Fox, P., Goodfellow, M., & Cogan, T. (2002). Biodiver-sity of the bacterial flora on the surface of a smear cheese. Applied and EnvironmentalMicrobiology, 68, 820–830.
C.I.E. Compagnie Internationale de l’Eclairage (1978). International Commission on Illumi-nation, Recommendations on uniform color spaces. Supplement N°2 to CIE publication N°15.2. PhD thesis in Microbiology. Paris: Bureau central.
Choubert, G., Blanc, J. -M., & Vallée, F. (1997). Color measurement, using the CIELCH colorspace, of muscle of rainbow trout, Oncorhynchus mykiss (Walbaum), fed astaxanthin:Effect of family, ploidy, sex, and location of reading. Aquaculture Research, 28, 15–22.
Choubert, G., Mendes-Pinto, M. M., & Morais, R. (2006). Pigmenting efficacy ofastaxanthin fed to rainbow trout Oncorhynchus mykiss: Effect of dietary astaxanthinand lipid sources. Aquaculture, 257, 429–436.
de Souza, P.M., & Fernández, A. (2012). Consumer acceptance of UV-C treated liquid eggproducts and preparations with UV-C treated eggs. Innovative Food Science andEmerging Technologies, 14, 107–114.
Deetae, P., Bonnarme, P., Spinnler, H. -E., & Helinck, S. (2007). Production of volatilearoma compounds by bacterial strains isolated from different surface-ripened Frenchcheeses. Applied Microbiology and Biotechnology, 76, 1161–1171.
Dieser, M., Greenwood, M., & Foreman, C. M. (2010). Carotenoid pigmentation in Antarc-tic heterotrophic bacteria as a strategy to withstand environmental stresses. Arctic,Antarctic, and Alpine Research, 42, 396–405.
Dufossé, L., Galaup, P., Carlet, E., Flamin, C., & Valla, A. (2005). Spectrocolorimetry in theCIE L*a*b* color space as useful tool for monitoring the ripening process and the qual-ity of PDO red-smear soft cheeses. Food Research International, 38, 919–924.
El-Erain, A. F. M. (1969). Bacteriological studies on Limburger cheese. PhD thesis in Micro-biology. Wageningen University (116 pp.).
Eliskases-Lechner, F., & Ginzinger, W. (1995). The bacterial flora of surface-ripenedcheeses with special regard to coryneforms. Le Lait, 75, 571.
Feurer, C., Vallaeys, T., Corrieu, G., & Irlinger, F. (2004). Does smearing inoculum reflectthe bacterial composition of the smear at the end of the ripening of a French soft,red-smear cheese? American Dairy Science Association, 87, 3189–3197.
Fong, N. J. C., Burgess, M. L., & Barrow, K. D. (2001). Carotenoid accumulation in thepsychrotrophic bacterium Arthrobacter agilis in response to thermal and salt stress.Applied Microbiology and Biotechnology, 56, 750–756.
Galaup, P., Gautier, A., Piriou, Y., de Villeblanche, A., Valla, A., & Dufossé, L. (2007). Firstpigment fingerprints from the rind of French PDO red-smear ripened soft cheesesEpoisses, Mont d'Or and Maroilles. Innovative Food Science and EmergingTechnologies, 8, 373–378.
Guyomarc'h, F., Binet, A., & Dufossé, L. (2000). Characterization of Brevibacterium linenspigmentation using spectrocolorimetry. International Journal of Food Microbiology,57, 201–210.
Hutchings, J. B. (1994). Instrumental specification. In J. B. Hutchings (Ed.), Food Color andAppearance (pp. 199–237). London: Chapman and Hall.
Irlinger, F., Bimet, F., Delettre, J., Lefèvre, M., & Grimont, P. A.D. (2005). Arthrobacterbergerei sp. nov. and Arthrobacter arilaitensis sp. nov., novel coryneform species isolat-ed from the surfaces of cheeses. International Journal of Systematic and EvolutionaryMicrobiology, 55, 457–462.
Irlinger, F., & Mounier, J. (2009). Microbial interactions in cheese: Implications for cheesequality and safety. Current Opinion in Biotechnology, 20, 142–148.
Kohl, W., Achenbach, H., & Reichenbach, H. (1983). The pigments of Brevibacterium linens:Aromatic carotenoids. Phytochemistry, 22, 207–210.
Krinsky, N. I. (1989). Antioxidant functions of carotenoids. Free Radical Biology andMedicine, 7, 617–635.
Larpin-Laborde, S., Imran, M., Bonaïti, C., Bora, N., Gelsomino, R., Goerges, S., et al. (2011).Surface microbial consortia from Livarot, a French smear-ripened cheese. CanadianJournal of Microbiology, 57, 651–660.
Leclercq-Perlat, M. -N., Corrieu, G., & Spinnler, E. (2004). The color of Brevibacterium linensdepends on the yeast used for cheese deacidification. Journal of Dairy Science, 87,1536–1544.
Leclercq-Perlat, M. -N., & Spinnler, H. -E. (2010). The type of cheese curds determined thecolouring capacity of Brevibacterium and Arthrobacter species. Journal of DairyResearch, 77, 1–8.
Liu, X., Gai, Z., Tao, F., Tang, H., & Xu, P. (2012). Carotenoids play a positive role in the deg-radation of heterocycles by Sphingobium yanoikuyae. PLoS ONE, 7(6), e39522, http://dx.doi.org/10.1371/journal.pone.0039522.
Marchesini, G., Balzan, S., Segato, S., Novelli, E., & Andrighetto, I. (2009). Colour traits inthe evaluation of the ripening period of Asiago cheese. Italian Journal of AnimalScience, 8, 411–413.
Masoud, W., & Jakobsen, M. (2003). Surface ripened cheeses: The effects of Debaryomyceshansenii, NaCl and pH on the intensity of pigmentation produced by Brevibacteriumlinens and Corynebacterium flavescens. International Dairy Journal, 13, 231–237.
Millar, S. J., Moss, B. W., McDougall, D. B., & Stevenson, H. (1995). The effect of ionising ra-diation on the CIELAB color coordinates of chicken breastmeat asmeasured by differ-ent instruments. International Journal of Food Science and Technology, 30, 663–674.
Monnet, C., Loux, V., Gilbrat, J. -F., Spinnler, E., Barbe, V., Vacherie, B., et al. (2010). TheArthrobacter arilaitensis Re117 genome sequence reveals its genetic adaptation to

192 N. Sutthiwong et al. / Food Research International 65 (2014) 184–192
the surface cheese. PLoS ONE, 5(11), e15489, http://dx.doi.org/10.1371/journal.pone.0015489.
Mounier, J., Gelsomino, R., Goerges, S., Vancanneyt, M., Vandemeulebroecke, K., Hoste, B.,et al. (2005). Surface microflora of four smear-ripened cheeses. Applied andEnvironmental Microbiology, 71, 6489–6500.
Mounier, J., Irlinger, F., Leclercq-Perlat, M. -N., Sarthou, A. -S., Spinnler, E., Fitzgerald, G. F.,et al. (2006). Growth and colour development of some surface ripening bacteria withDebaryomyces hansenii on aseptic cheese curd. Journal of Dairy Research, 73, 441–448.
Ramírez-Navas, J. S., & Rodríguez de Stouvenel, A. (2012). Characterization of ColombianQuesillo cheese by spectrocolorimetry. Vitae, Revista de la Facultad de QuímicaFarmacéutica, 19, 178–185.
Sequeira-Munoz, A., Chevalier, D., Le Bail, A., Ramaswamy, H. S., & Simpson, B. K. (2006).Physicochemical changes induced in carp (Cyprinus carpio) fillets by high pressureprocessing at low temperature. Innovative Food Science and Emerging Technologies,7, 13–18.
Shivaji, S., & Ray, M. K. (1995). Survival strategies of psychrotrophic bacteria and yeast inAntarctica. Indian Journal of Microbiology, 35, 263–281.
Takano, H., Asker, D., Beppu, T., & Ueda, K. (2005). Genetic control for light-induced carot-enoid production in non-phototrophic bacteria. Journal of Industrial Microbiology andBiotechnology, 33, 88–93.
Üren, A., & Babayi it, D. (1996). Determination of Turkish-type fermented sausage colourby a reflectance method. Food Chemistry, 57, 561–567.
Valdès-Stauber, N., Scherer, S., & Seiler, H. (1997). Identification of yeasts and coryneformbacteria from the surface microflora of brick cheese. International Journal of FoodMicrobiology, 34, 115–129.
Vorst, K. L., Clarke, R. H., Allison, C. P., & Booren, A.M. (2004). A research note on radio fre-quency transponder effects on bloom of beef muscle. Meat Science, 67, 179–182.