are some possums untrappable, unpoisonable, and therefore unmonitorable? animal health board project...
TRANSCRIPT

Animal Health Board Project No. R-10623
Are some possums untrappable, unpoisonable, and therefore
unmonitorable?
D.R. Morgan1 1, G. Nugent , D. Gleeson2, R. Howitt2
1 Landcare Research PO Box 40, Lincoln 7640 New Zealand 2 Landcare Research
Private Bag 92170, Auckland Mail Centre Auckland 1142, New Zealand PREPARED FOR: Animal Health Board PO Box 3412, Wellington DATE: May 2007
Reviewed by: Scientist Landcare Research
Approved for release by: Andrea Byrom Science Leader Wildlife Ecology & Epidemiology
Landcare Research Contract Report: LC0607/143 © Animal Health Board 2007 This report has been produced by Landcare Research New Zealand Ltd for the Animal Health Board. All copyright in this report is the property of the Animal Health Board and any unauthorised publication, reproduction, or adaptation of this report is a breach of that copyright and illegal.

3
Contents
Summary ...........................................................................................................................4
1. Introduction .......................................................................................................................7 2. Background .......................................................................................................................7 3. Objectives ..........................................................................................................................8 4. Methods .............................................................................................................................9
4.1 Overview of experimental design ............................................................................9 4.2 Genotyping methods ..............................................................................................10
5. Field Methods – Assessment of Trappability and Poisonability .....................................12 5.1 Study sites ..............................................................................................................12 5.2 Pre-control surveys ................................................................................................14 5.3 Control operations..................................................................................................16 5.4 Post-control surveys...............................................................................................16 5.5 Canopy vs ground use ............................................................................................17
6. Data Analyses..................................................................................................................17 6.1 Population estimation.............................................................................................17 6.2 Effectiveness of control .........................................................................................18 6.3 Trappability and poisonability ...............................................................................18
7. Results and Discussion....................................................................................................19 7.1 Genotyping methods ..............................................................................................19 7.2 Trappability and poisonability – Catlins site .........................................................24 7.3 Trappability and poisonability – Pureora site ........................................................33
8. Conclusions .....................................................................................................................36 8.1 Trappability and poisonability ...............................................................................36 8.2 Genotyping methods ..............................................................................................39
9. Recommendations ...........................................................................................................40 10. Acknowledgements .........................................................................................................40 11. References .......................................................................................................................41
Appendix 1 Identification of genotyping errors ...........................................................43
Landcare Research
4
Summary
Project and Client The Animal Health Board contracted Landcare Research, Lincoln, to investigate the ‘trappability’ of possums in relation to ‘poisonability’, and the implications for monitoring control efficacy by trap-catch methods. The study involved determining the trappability of known populations of possums by comparing DNA from trapped possums with samples of DNA from faecal pellets collected by extensive searches at two study sites before and after control operations. The field work was completed during June 2004 to May 2006 and genotyping of sample material was completed by December 2006. Objectives The formally contracted objectives for the study were to: ! determine whether all the possums identified from faecal DNA can be trapped. ! determine whether the possums that survive control operations poisoning are also those
that are least trappable. ! determine whether the trappability (and therefore the ‘monitorability’) of survivors of
aerial poisoning differs <1 month, 4–6 months, and 9–12 months after poisoning, in two different habitats or areas.
! determine whether trappability and poisonability are linked to the proportion of time possums spend at ground level.
To achieve these objectives, methodological research was required to refine the faecal genotyping methodology, so two implicit aims were to: ! establish the minimum DNA concentration needed for 99% accuracy of identification. ! validate the accuracy of faecal genotyping using pellets of known origin, and following
field collection and storage procedures. Methods The experimental design consisted of two trials, with each trial being conducted in forest habitat in the Catlins and Pureora Forests. Each trial consisted of possum population surveys on four occasions: before a control operation, and at intervals after control of approximately 3–4 weeks, 4–5 months, and 9–10 months. During each survey, population size was estimated using a variety of estimators, using trapping-based methods, radio-telemetry, and/or new genotyping approaches using both faecal DNA (FDNA) and ear tissue DNA (TDNA). For logistical reasons, the two trials were conducted 12 months apart. Control operations comprised (i) two stages of ground control (Feratox followed by cyanide paste – both prefed) at the Catlins site, and (ii) aerial 1080 baiting at Pureora as part of a much larger control operation conducted over the Hauhungaroa Ranges during winter 2005. Genotyping procedures were refined by (i) calibration of DNA concentration against likely identification error, and (ii) tests to validate the correct identification of DNA from ear tissue and faecal pellets of known possums. Genotyping was done using chemical procedures that targeted seven chromosomal sites.
Landcare Research

Trappability was assessed from the numbers of genotyped individuals present that were trapped. Genotyping permitted the tracking of individual possums throughout the study so mortality or survival during control could be established, and possible linkage between trappability and survival examined. Possum activity in the tree canopy versus the ground was compared by establishing litterfall traps above ground and comparing the numbers of faecal pellets found on and under them during each of the four surveys (Catlins site only). Results The genotyping calibration showed that a minimum of 200 pg of possum DNA per sample was required for >99% accuracy in assigning the correct genotype. No samples were incorrectly genotyped in validation tests. Faecal pellets older than 2–3 days produced few genotypes, limiting the assessment of trappability to only about 35% of the faecal samples collected and processed. Storage in ethanol for longer than 6 months also resulted in a reduction in genotyping success. Of the faecal genotypes used thereafter, about 3% were estimated to be false, due most probably to allelic drop-out where DNA concentration was low. At the Catlins site, 251 possums were estimated to be present and control removed an estimated 78%. Following control, the population was estimated to be around 55, 154, and 159 in successive surveys, with a large proportion of the increase accounted for by summer-time immigration from adjacent forested areas. The average trappability of genotyped individuals was 56% before control, 43, 65, and 84% in successive post-control surveys. Trappability measured over successive nights showed that captured-and-released possums were less trappable for about three nights, indicating a short-lived trap-shyness. Possums present after control were more active in the canopy rather than on the ground with the ratio of pellets on litterfall traps relative to pellets below increasing from 60% before control to 98, 80, and 100% in successive post-control surveys. The distances between recaptures indicated a substantial increase in home-range size after control. At the Pureora site, 130 possums were estimated to be present and control removed more than 90% (despite the withholding of operational prefeeding from the study site). Meaningful assessments of trappability were therefore not possible. However, despite control extending well beyond the study site boundary (as part of the 2005 Hauhungaroa operation), 15 previously unidentified possums were trapped after control and assumed to be immigrants. The population estimation and spatial identification of survivors at both sites enabled calibration of wax-tags for population estimation in a concurrent study reported elsewhere (Thomas et al. 2007). Conclusions The concern that prompted this study (i.e. “are some possums untrappable, unpoisonable, and therefore unmonitorable?”) appears to be largely unfounded. We found that very few possums are intrinsically and permanently untrappable. Secondly, the Pureora replicate, and the major control operation of which it was part, showed that very few possums are intrinsically unpoisonable. The patterns of trappability revealed suggest that: (i) a substantial proportion of possums are difficult to trap in 7 days of trapping with the trapping array used (i.e. traps spaced at 20 m lines on 75 m or more apart); (ii) during monitoring immediately after control, many surviving possums may not encounter traps set in this array due to more restricted movements after control or because they are active mainly in the canopy; (iii) however, on encountering
Landcare Research
6 traps in such an array eventually, virtually all possums can be trapped; (iv) extended trapping sessions tend to remove the most trappable possums first; (v) many possums become trap-shy for about 3 days after initial capture; (vii) previous capture is, however, unlikely to have a major long-lasting effect on the average trappability of the population. The complete coverage achieved by aerial 1080 poisoning resulted in few possums surviving despite the intentional lack of prefeeding. Ground control was less effective, despite two attempts being made using different methods, most probably because of the poorer coverage achieved. Possum ear tissue for obtaining unique genotypes was reliable in most cases, with only three cases (<1% of samples extracted for analysis) of allelic drop-out suspected. We were, however, unable to obtain the number of faecal genotypes planned, probably because of: (i) low recovery of DNA from pellets estimated to be older than 2 days; (ii) low recovery of DNA in fresh pellets that had been stored for long periods before processing; (iii) great difficulty in finding fresh faecal pellets after control, despite exhaustive searching for faecal pellets, at an intensity of three times that planned. Analysis of faecal DNA was still ultimately a key tool in this study, enabling determination of the proportions of possums that were, at each stage, trappable and poisonable. Recommendations ! The most important insight from this project is that a substantial proportion of possums
are difficult to trap or kill at any one time when trap or poison lines are placed 75 m apart, yet many operators use spacings wider than that. We therefore recommend that the key results of this and related trials should be summarized in a plain language fact sheet and made available to contractors, both in hard copy and via the Internet.
! The AHB should operationally trial the cost-effectiveness of short-term (2–3 months) repeat control involving 'half-effort' trapping or poisoning in each of two sessions applied in a cross-hatched or parallel-but-not-overlapping fashion as a way of improving the efficacy of ground control. This should be compared with the cost-effectiveness of control using long-life baits and/or kill traps at a wide spacing of, for example, 150 × 50 m: this approach exploits the longer time possums will have to eventually encounter bait.
! The problems caused by the downward bias in post-control trap-catch indices of possum abundance cannot be easily avoided other than by substantially delaying monitoring, but that is impractical when contractors desire immediate payment. The best solution may be to ensuring that trap-catch lines are always located independently of poisoning lines, and to aim for very high apparent kills through complete coverage with good quality control so that post control estimates are well below the control targets.
! We recommend further investment in the development of FDNA surveys for monitoring of possum survival immediately after control, both as a research tool, and for special-case operational contexts. Further refinement is required to determine the relative effectiveness of different sample storage methods (e.g. chemical preservatives, freezing, drying).
Landcare Research
1. Introduction
The Animal Health Board contracted Landcare Research, Lincoln, to investigate the ‘trappability’ of possums in relation to ‘poisonability’, and the implications for monitoring control efficacy by trap-catch methods. The study involved comparisons of the trappability of known populations of possums by matching DNA from trapped possums against unbiased samples of DNA from faecal pellets collected by extensive searches at two study sites before and after control operations. The field work was completed during June 2004 to May 2006 and genotyping of sample material was completed by December 2007.
2. Background
At present, the effectiveness of possum control is usually assessed using the Residual Trap Catch Index (RTCI) standard trapping method (NPCA 2004). Pest managers rely on this method for generating unbiased indices of population density that are used to assess (i) the need for control, (ii) contractors’ effectiveness in carrying out control, and (iii) long-term population trends in relation to the disease status of neighbouring livestock herds. Intensification of the effort to control possum populations over much of New Zealand has been accompanied by growing evidence that the RTCI may sometimes underestimate residual possum density. Pest managers in some regions have recorded low or even zero RTCI values immediately following control but when trapping was carried out several months or 1–2 years later, possums were surprisingly abundant. In one of the earliest indications of this effect Nugent et al. (2001) recorded RTCI values of 3.1% soon after control in seven sub-areas areas in the Matemateonga Ranges, but 14.9% 20 months later, with similar results in two other areas. Although some of this increase reflected immigration, there was still a >3-fold increase in blocks more than 1 km from an uncontrolled population in which the immigration effect would have been negligible. Allowing for the measured influence of immigration, the rate of increase of all three populations well-exceeded the possum’s reproductive capability, confirming that the RTCI had underestimated the population immediately after control. Subsequently, Forsyth et al. (2003) demonstrated a downward bias in possum trappability immediately after control at two of three sites. Such a bias could result in pest managers wrongly accepting that Tb-control or conservation objectives had been met, and furthermore, wrongly paying pest control contractors for having reduced the possum population below a target RTCI threshhold. It also makes forward planning more difficult, as managers wanting to predict when further control (and therefore the funding for that control) is likely to be required, need not only a measure of residual possum abundance and likely rates of increase but also some indication of how big the bias in post control RTCI is likely to be. Equally importantly, both the bias in RTCI and the at least partial disappearance of that bias over the period of 1–2 years after control suggest a link between possum trappability and ‘controllability’. This (not surprisingly) indicates that control selectively removes the most trappable animals, or, conversely, that the survivors are those that are least trappable, at least temporarily. Modelling of the trapping process illustrates how easily that could occur, if, for
Landcare Research
8 example, possums with small home ranges were less likely to encounter both poison baits and traps than possums that were more wide ranging (Arthur et al. 2002). Based on these results and models, a key question is whether some ‘extreme’ possums are both untrappable and uncontrollable. Most field research is based on possums that have been captured, which automatically excludes detection and monitoring of possums that are untrappable. Detection of such untrappable possums, if they exist, was not practically possible until the development of DNA genotyping tools that can utilise non-invasive samples such as hair and faeces. The use of genotyping as a means of identifying individual animals has developed rapidly in recent years and its applications have been reviewed by Waits and Paetkau (2005). One key advantage of the approach is that it enables identification ‘non-invasively’ from materials such as faeces and hairs without actually having to capture the animal. This technology has been used to identify possums non -invasively from faecal pellets as well as more invasively from tissue such as the tail tips of trapped and killed possums (Nugent et al. 2003). Possums produce large numbers (c. 100) of faecal pellets each night. These tend to be deposited singly or as small clusters throughout the night as possums move around their home range, and the frequent presence of pellets in litter-fall traps (Nugent et al. 1997) indicates many are deposited while the possums are in the forest canopy. The large number and wide distribution of pellets make it difficult to imagine how possums that are difficult to trap could avoid detection using faecal DNA. This study therefore aimed to use genotyping technology in conjunction with trapping to investigate whether significant numbers of possums are difficult to trap, and, if so, whether these same possums are also able to survive control and remain undetected by trapping just after control. The study also aimed to determine whether such possums contributed to the widely observed pattern of a rapid increase in RTCI after control by becoming more trappable over a period of 9 months. We assumed that DNA genotyping of faecal pellets provided a population sampling method that had the lowest potential for extreme bias (i.e. complete non-detection).
3. Objectives
The formally contracted objectives for the study were to: ! determine whether all the possums identified from faecal DNA can be trapped. ! determine whether the possums that survive control operations poisoning are also those
that are least trappable. ! determine whether the trappability (and therefore the ‘monitorability’) of survivors of
aerial poisoning differs <1 month, 4–6 months, and 9–12 months after poisoning, in two different habitats or areas.
! determine whether trappability and poisonability are linked to the proportion of time possums spend at ground level.
To achieve these objectives, considerable methodological research was required to refine the faecal genotyping methodology, so two implicit aims were to: ! establish the minimum DNA concentration needed for 99% accuracy of identification.
Landcare Research

! validate the accuracy of faecal genotyping using pellets of known origin, and following field collection and storage procedures.
4. Methods
4.1 Overview of experimental design
The experimental design consisted of two trials, with each trial being conducted in forest habitat (Catlins and Pureora – Fig. 1, described below). Each trial consisted of possum population surveys on four occasions: before control, and at intervals after control of approximately 3–4 weeks, 4–5 months, and 9–10 months. During each survey, population size was estimated using a variety of estimators, using trapping-based methods and/or new genotyping approaches using both faecal DNA (FDNA) and ear tissue DNA (TDNA). Control was conducted using ground-based method in the first replicate (Catlins) and aerial control in the second (Pureora). Purely for logistical reasons, the two trials were conducted 12 months apart. The primary aim was to determine whether there were significant numbers of untrappable possums that were also surviving control. It was therefore considered more important to look for the presence of such possums under different circumstances than to use a narrower design in which the effects of area, year, and control method were not confounded.
Pureora site
Catlins site
Fig. 1 Map showing the location of the two study sites.
Landcare Research
10 4.2 Genotyping methods
Genotyping is based on the use of a defined set of microsatellite markers. Microsatellite markers are non-coding regions of the genome comprising repeats of short sequences no more than six nucleotide bases long. Each marker occupies a unique chromosome position, or ‘locus’, and by using chemical primers (short, synthetic sequences of DNA) that bind to the DNA regions that flank either end of the microsatellite, the locus is then amplified using PCR (Polymerase Chain Reaction) for identification, as described below. As possums are diploid, inheriting a set of chromosomes from each parent, a single locus consists of two alleles, one maternal, the other paternally derived. Alleles differ at microsatellite loci in the number of repeats, which are then expressed as length polymorphisms. If the two alleles are identical, they are considered to be homozygous for that particular allele. If alleles differ in their length, the possum is considered to be heterozygous for that particular allele. A genotype is a combination of all available loci and their alleles, with more loci and alleles giving a greater chance that an animal has a unique genotype. DNA was extracted from possum faecal pellets and ear tissue, as follows: Faecal pellets: Approximately 100–300 mg of the mucous-rich coating from individual faecal pellets was collected using a sterile scalpel blade, and placed in a 1.5-ml locking tube. We then followed a modified form of the protocol modified from Fernando et al. (2003) that involved enzymic digestion, centrifuging, extraction of the DNA in phenol/alcohol, and purification with a QIAquick Gel Extraction Kit. The final elution volume of 40 µl containing faecal DNA (FDNA) was stored at 4oC. Ear tissue: Samples of ear tissue (~3 x 3 mm) were collected from trapped possums (see below) using a biopsy punch. Possum tissue samples obviously contain many more possum cells than does a similar volume of faecal pellet, so such samples routinely produced far higher concentrations of DNA. Tissue DNA (TDNA) was extracted using the BioRad Quantum Prep Aquapure Genomic DNA Tissue Kit following the manufacturer’s protocol. The final elution volume of 50 µl containing TDNA was stored at 4oC. There is the potential for genotyping error, resulting in misidentification of animal. This can occur when one of the two alleles at heterozygous loci fails to amplify (i.e. “allelic dropout”), or when one amplifies incorrectly (i.e. appears as a false allele) (McKelvey & Schwartz 2004). Such errors tend to be more frequent when the amount of DNA on which the identification is based is very small, as is the case with faecal pellets where the possum DNA comes from a low number of cells sloughed from the lining of the gastro-intestinal tract. To minimise genotyping error, we determined the repeatability of identifications.
Reliability of genotyping To address the difficulty of DNA amplification from the very low quantities of DNA present in faecal pellets, a TaqMan assay was designed to establish the minimum amount of DNA needed in faecal and tissue samples for successful amplification. This enabled us to screen samples for likely amplification failure. We followed the calibration procedure given by Morin et al. (2001), in which the quantity of sample DNA and success of genotyping were used to determine the number of replications per sample required to provide > 99% accuracy of returning the correct genotype using 2 PCR replicate samples. FDNA and TDNA extracted from field-collected samples were used in this procedure.
Landcare Research

A single possum microsatellite sequence (comprising 222 base pairs) was used as the target sequence and appropriate primers were designed for the TaqMan assay. Both the primers and probe used were designed by Applied Biosystems (Assays-by-Design). Analysis was performed using the Rotor-Gene Analysis software v. 5.0. Duplicate sets of standards of known amounts of DNA were included with each set of samples. Standard DNA curves were derived from 5 dilutions of phenol/chloroform-extracted possum ear DNA quantified using a BioSpec-mini spectrophotometer (Shimadzu). A standard curve was rejected if the correlation coefficient of the trendline was <0.95. DNA amounts in the standard were: 10 ng, 2.5 ng, 1.25 ng, 312 pg, and 156 pg. A “no-template control” (NTC) was included with each standard curve. Samples that yielded sufficient DNA were then genotyped using the methods described by Taylor and Cooper (1998) using the 7 microsatellite loci they identified. We recorded between 8 and 119 unique combinations of alleles for each of these microsatellite loci (Table 1). Alleles were sized using GeneMapper v. 3.5 software (Applied Biosystems). Matching was achieved by concatenating the 3 digit numbers identifying the location of each of the paired alleles at each of the 7 microsatellite loci. This resulted in a 42-digit number for each genotype which, when ordered, revealed matching samples. Close similarities were revealed where a pair of alleles failed to amplify. In such cases, matching was based on the 6 remaining loci. The ordered, corrected matches were then sequentially numbered to provide a genotype reference for all other analyses. Table 1 Allelic variability of microsatellites at each of the seven loci used in this study to assign genotypes
Locus no. No. unique combinations
53 119
27 74
19 66
58 48
16 43
54 29
12 8
Validation of sample collection and genotyping procedures Three tests were conducted to ensure that the planned procedures for collection and preservation of faecal pellets and ear tissue resulted in successful amplification of DNA samples and accurate identification of individual possums: Collection and preservation procedure: Fresh faecal pellets (i.e. deposited the previous night) were collected from 20 uniquely identified caged possums held at the Landcare Research animal facility, either as a single pellet per possum (n = 10) or in groups of 3 pellets per possum (n = 10), thereby providing differing amounts of sample DNA. Pellets were placed in 25-ml plastic sample tubes and occasionally shaken over a period of 5 h (to simulate movement after collection in the field) before preserving either by freezing (n = 30) or immersion in 95% alcohol added to the tube (n = 20). One week later further single faecal pellets were collected from 10 possums previously sampled, and from 10 “new” possums.
Landcare Research
12 Success rate of genotyping field samples: The mucous layer on the surface of faecal pellets that contains most of the possum DNA in the faecal pellet can be destroyed rapidly by rainfall and bacteria. Six samples, each of 3 pellets, were collected in the field in each of the 3 faecal pellet "age" classes that were developed for subjectively describing the appearance of samples collected in field surveys (see Table 2). These were transferred to 95% ethanol within 5 h of collection, and stored at room temperature for 3 days. One pellet from each sample was selected for genotyping, the remaining pellets being retained in case insufficient DNA was extracted. Ear tissue was collected from each ear of six trapped possums and placed individually in 95% ethanol within 5 h. A stainless steel ear tag was also placed in one of the vials for one of each pair of samples, to determine whether this affected DNA integrity. To ensure assays were conducted “blind”, sample numbers were independent of sample treatment. Accuracy of genotyping field samples: Fresh faecal pellets were collected from the capture site of 10 trapped possums, and together with ear tissue samples were submitted as unidentified samples to test the accuracy of genotype matching.
5. Field Methods – Assessment of Trappability and Poisonability
5.1 Study sites
The first trial was conducted in the Catlins Forest (near Haldane, Southland), close to an area where a tripling of RTCI over 6 months after control was previously detected (Forsyth et al. 2003). The site was located on a southeast-facing hillside (centred on 2203940E, 5391590N). It was bounded by farmland on three sides but was contiguous with forest along its eastern boundary (Fig. 2). The area was logged in the early 1900s and subsequent regeneration produced a forest canopy dominated by kamahi with remnant podocarps (rimu, miro, and totara) commonly exceeding 25 m in height and 1 m in diameter at breast-height. Preliminary trapping surveys at Catlins during February and May 2004 indicated, respectively, mean RTCI values of (i) 18.8% from four randomly located lines of 10 traps at 20-m spacing set for 2 nights), and (ii) 18.3% from six similar trap-lines set for 1 night. Calibration of RTCI against density (Monks & Ramsey 2005) indicated a mean population density of 2.9 possums/ha (95% CI=1.4 - 9.9). An effective trapping area of 50 ha was therefore selected to encompass 100-200 possums, on the assumption that if 10% or more of the population were untrappable there would be at least 10–20 such possums available for detection.
Landcare Research

Trapping and pellet lines Intermediate pellet lines
Fig. 2 Map of the Catlins study site showing the location of trapping and pellet lines. The hilltop area to the west of the site that is shown on this map as forest had been converted to farmland before the study began. The boundary line around the site indicates the area over which control was conducted. The second replicate was conducted on gently undulating terrain (centred on 2734010E 6296030N) in the Pureora State Forest (25 km west of Lake Taupo) where canopy vegetation was dominated by mature podocarps including rimu, matai, and miro. The site was contiguous with mature native or exotic forest except for one side which bounded with farmland (Fig. 3). Preliminary trapping at Pureora Forest, comprising three randomly located lines of 10 traps set for 3 nights, gave a mean RTCI of 6.6%. A larger trapping area of 144 ha was therefore selected at Pureora. Calibration of the RTCI value (Monks & Ramsey 2005) gave a density of 0.7 possum/ha (95% CI = 0.4 – 2.8). The sites were also chosen because they were: i) vegetated in mature mixed-forest in which possums were likely to spend a lot of time in the canopy as well as at ground level; ii) bounded by farm-land as is typical of most operations conducted for the control of bovine Tb; iii) free of any scheduled possum control programmes additional to that required during the study; and iv) suitable for setting traps at ground level due to the absence of kiwi or weka, thus avoiding the use of more time-consuming and less-effective ‘raised sets’ (Thomas 2001).
Landcare Research

14
Fig 3 Map of the Pureora study site showing the location of lines used for trapping. Intermediate lines were also established for additional faecal pellet searching. The boundary line indicates the area over which the aerial 1080 control operation was done without prefeeding. 5.2 Pre-control surveys
Catlins Marked sampling lines were established throughout the study site at an approximate spacing of 75 m, and sample plots (n = 246) were established at 25-m intervals along lines. Lines comprised 6-36 plots, reflecting their different lengths. GPS coordinates were recorded for all plots. Coverage was achieved by configuring some sampling lines radially (Fig. 2). Pre-control trap-catch and faecal pellet surveys were conducted during mid-June 2004. Trapping was conducted using Victor No. 1 traps, fitted with tension springs between chain-links to reduce the chances of injury (Warburton & Poutu 2002). These were set at the base of the nearest suitable tree to each plot centre. A handful of lure (a 1:4 mix of icing sugar and white flour) scented with approximately 0.5% wt:wt Jaffa orange (Bush, Boake and Allen Ltd, Auckland) was placed in a rapid ‘sweep’ up the trunk of the tree up to a height of about 1 m above the trap. Traps were checked and reset daily, and after 4 days the lure was changed to approximately 0.5% wt:wt cinnamon oil (Bush, Boake and Allen Ltd, Auckland) in an attempt to further increase trapping effectiveness, and trapping continued for a further 3 days giving 7 days of trapping altogether.
Landcare Research
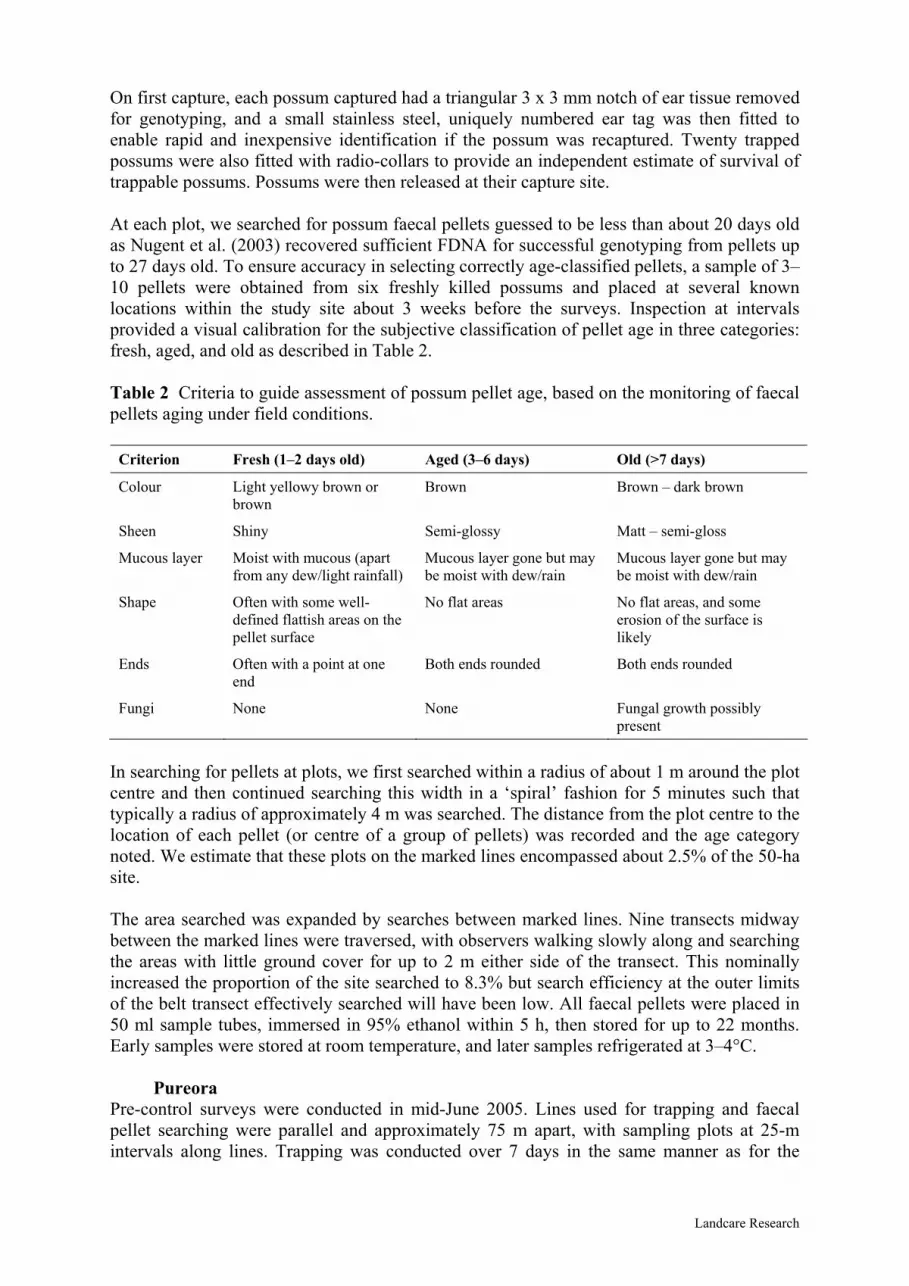
On first capture, each possum captured had a triangular 3 x 3 mm notch of ear tissue removed for genotyping, and a small stainless steel, uniquely numbered ear tag was then fitted to enable rapid and inexpensive identification if the possum was recaptured. Twenty trapped possums were also fitted with radio-collars to provide an independent estimate of survival of trappable possums. Possums were then released at their capture site. At each plot, we searched for possum faecal pellets guessed to be less than about 20 days old as Nugent et al. (2003) recovered sufficient FDNA for successful genotyping from pellets up to 27 days old. To ensure accuracy in selecting correctly age-classified pellets, a sample of 3–10 pellets were obtained from six freshly killed possums and placed at several known locations within the study site about 3 weeks before the surveys. Inspection at intervals provided a visual calibration for the subjective classification of pellet age in three categories: fresh, aged, and old as described in Table 2. Table 2 Criteria to guide assessment of possum pellet age, based on the monitoring of faecal pellets aging under field conditions.
Criterion Fresh (1–2 days old) Aged (3–6 days) Old (>7 days)
Colour Light yellowy brown or brown
Brown Brown – dark brown
Sheen Shiny Semi-glossy Matt – semi-gloss
Mucous layer Moist with mucous (apart from any dew/light rainfall)
Mucous layer gone but may be moist with dew/rain
Mucous layer gone but may be moist with dew/rain
Shape Often with some well-defined flattish areas on the pellet surface
No flat areas No flat areas, and some erosion of the surface is likely
Ends Often with a point at one end
Both ends rounded Both ends rounded
Fungi None None Fungal growth possibly present
In searching for pellets at plots, we first searched within a radius of about 1 m around the plot centre and then continued searching this width in a ‘spiral’ fashion for 5 minutes such that typically a radius of approximately 4 m was searched. The distance from the plot centre to the location of each pellet (or centre of a group of pellets) was recorded and the age category noted. We estimate that these plots on the marked lines encompassed about 2.5% of the 50-ha site. The area searched was expanded by searches between marked lines. Nine transects midway between the marked lines were traversed, with observers walking slowly along and searching the areas with little ground cover for up to 2 m either side of the transect. This nominally increased the proportion of the site searched to 8.3% but search efficiency at the outer limits of the belt transect effectively searched will have been low. All faecal pellets were placed in 50 ml sample tubes, immersed in 95% ethanol within 5 h, then stored for up to 22 months. Early samples were stored at room temperature, and later samples refrigerated at 3–4°C.
Pureora Pre-control surveys were conducted in mid-June 2005. Lines used for trapping and faecal pellet searching were parallel and approximately 75 m apart, with sampling plots at 25-m intervals along lines. Trapping was conducted over 7 days in the same manner as for the
Landcare Research
16 Catlins site. Again, ‘intermediate’ lines were established for further pellet searching in between main lines, and plots were used on these lines also as the belt transect used at the Catlins site had proved less efficient than use of plots. Altogether, between 14 and 53 sampling plots were searched on lines (n = 1068) (Fig. 3), resulting in 5.4% of the 122 ha area being searched. Otherwise, faecal searching and preservation methods were the same as used at the Catlins site. 5.3 Control operations
Catlins Bait spacing was specified to ensure all possums were exposed to baits, but otherwise, contractors were asked to follow their normal procedures, so we consider the operation represented a typical ‘thorough’ operation. Baits were spaced at 25-m intervals along lines running up or downhill, and 50 m apart. Initially, contractors stapled pre-bagged non-toxic Ferafeed baits to trees at a height of 1–2 m and, 1 week later (13–21 July 2004), replaced opened bags with pre-bagged Feratox capsules embedded in Ferafeed paste. All bait was obtained from Connovation Ltd, Auckland. The contractors, with the aid of experienced dogs, then checked the lines to find killed possums. For previously captured possums, the location and ear tag number was recorded. For those not previously capture, ear-tissue was collected as above, the location was recorded, and an ID number assigned by placing a new unused ear-tag in the sample tube with the ear tissue. The number of possums found killed during the initial operation was lower than expected. The contractors conducted a second operation using prefeed icing sugar and flour (1:4 mix) at ground level, followed 1 week later (2–9 August 2004) by the same bait concealing ground-laid cyanide paste (Animal Control Products Ltd, Wanganui) where prefeed had been removed. Bait spacing was similar to that used in the first operation, but with lines placed at 90° to those used initially. The contractors then repeated the search for killed possums, as above. The area treated by contractors was approximately 65 ha extending by approximately equal areas either side of the trapping grid.
Pureora The study site formed a small part of a large operational area (88,000 ha) that was treated by aerial 1080 poisoning. Most of the main operational area was prefed twice to maximise effectiveness, but prefeed was not applied in our study site to increase the likelihood of some survivors being available for detection. Carrot baits with 0.15% 1080 and 0.1% cinnamon oil as a 1080-mask were distributed at a nominal rate of 5 kg/ha over the study site on 22 August 2005. 5.4 Post-control surveys
The trapping and faecal-pellet surveys outlined above were repeated three further times in each trial. For the Catlins site, survey start dates were 31/8/04 (4 weeks after completion of control), 8/1/05 (5 months), and 6/5/05 (9 months). Each survey was completed in 8–10 days depending on weather conditions. At Pureora, start dates were 6/9/05 (3 weeks post control), 9/12/05 (4 months), and 8/5/06 (9 months).
Landcare Research

In the final survey, pellet searches were also conducted on plots half-way between the marked plots on both main and intermediate lines, resulting in a sampling intensity of 10.8% of the site. A contractor was also engaged to search the site for faecal pellets and live or dead possums using a trained dog for two days. 5.5 Canopy vs ground use
Intuitively, possums that spend far less than average time at ground level are also likely to be less trappable or poisonable. To test whether poisoning selectively removed the possums that spent most of their time on the ground, we established 64 ‘litterfall’ traps at the Catlins site. These were designed to collect pellets produced by possums when they were using the canopy, while the area underneath the traps could contain only pellets produced by possums on the ground. Traps comprised 1.5 x 3 m of shadecloth suspended from a wooden stake at each corner at a height of about 1.5 m above the ground. The traps were established on 9–10 June 2004 and then checked and cleared during each of the four surveys. The number of faecal pellets collected by the trap was compared with number found directly underneath the trap as an index of the proportion of the time spent by the population above ground (and thus less likely to be trappable).
6. Data Analyses
6.1 Population estimation
A variety of estimators were used to estimate population size during each survey. These included: i) the ‘Schnabel’ and ‘Schumacher’ Mark-Recapture methods based on the daily recapture in each survey as a proportion of total capture (pages 35-42 in Krebs 1999), ii) ‘Inverse Prediction’ based on the fitting of recapture distances to a ‘detection’ model constructed around estimates of home range size and the probability of detecting possums with a specified trap lay-out (Efford et al. 2004), iii) ‘Rarefaction’ analysis (Kohn et Al. 1999, Wilson et al. 2003), in which the cumulative number of genotypes was plotted against the number of samples to estimate population size as the asymptote of the curve. Because the order in which samples are listed affects the shape of the curve, and hence the value of the asymptote, the sample order was randomised 100 000 times and the regression repeated for each new sample order. These complex estimators generally require large sample sizes, so simple Lincoln estimates were also frequently derived where sample sizes were small or where a simple estimator would suffice when only a broadly indicative estimate was required. We used the formula originally given by Chapman (1951) and its associated variance estimator (as cited by Pollock et al. 1990): Nc = [(n + 1)(n + 1)/(m + 1)] –1 1 2 2
295%CI = 1.96 *! [(n + 1)(n + 1)( n -m ) ( n1 2 1 2 2 -m )/(m + 1) (m +2)] 2 2 2
Landcare Research

18 where Nc = estimated total number present, n = number in the first sample, n1 2 = total number in the second sample, and m = number of 'recaptures' in the second sample. 2 6.2 Effectiveness of control
The reductions in the populations were assessed from the population declines between the pre-control and first post-control surveys using each of the estimators above, the percentage decline in the TCI, the decline in total numbers of faecal pellets recorded on plots, and (for the Catlins site only) the fate of the 20 radio-collared possums. 6.3 Trappability and poisonability
The short-term "within-survey" trappability of possums was assessed in a variety of ways. First, we used an exponential "decay" curve to determine how capture rate during a trapping session declined over successive nights, and, by extrapolation, predicted how many more possums were likely to have been trapped had trapping continued. This provided an estimate of the numbers of trappable possums present. Comparison with the estimate of population size given by rarefaction analysis of cumulative faecal genotypes then provides an indication of the proportion of the population likely to have very low trappability at that time. Comparison with the population estimates based on trapping was not done as the data were not independent. The total number of possums killed was estimated simply by multiplying the estimated population size with the estimates of kill. To determine whether trappability and poisonability were linked, we compared: (i) the trapped and non-trapped proportions of the pre-control population that were subsequently poisoned, (ii) the trapped and non-trapped proportions of the genotypes (both TDNA and FDNA) identified in the pre-control population that were subsequently poisoned. Additionally, we examined the location of FDNA genotypes (from GPS data) to test for association with trapped possums and poisoned possums found during and after control. To test whether poisoning results in a reduction in the average trappability of survivors, we compared the proportions of pre-control FDNA genotypes that were matched to possums trapped in any of the post-control surveys with those trapped before control. Changes in trappability between successive surveys were explored by the comparing the proportions of the total number of genotypes (both FDNA and TDNA) identified during each survey that were recorded from trapped possums. Comparisons of these proportional data were made by Chi-square test using Yates’ correction for small sample sizes (i.e. where combined samples being compared were less than 200).
Landcare Research

7. Results and Discussion
7.1 Genotyping methods
Reliability of genotyping Duplicate PCR amplifications of each locus from a single sample showed that greater than 200 pg of possum DNA was required per faecal sample to return the same genotype from both amplifications (Table 3). As the quantity of DNA recovered in each extraction declined, the percentage of duplicate extractions with at least one genotyping error increased. Samples containing less than 40 pg/reaction required too many repeat extractions for this to be a practical option for obtaining >99% accuracy. Table 3 Effect of DNA quantity on the percentage of duplicate PCR amplifications for which the resulting genotypes differed in the allele pairings recorded at at least one of the seven loci, and the predicted number of extractions needed to achieve >99% confidence of correct identification.
Mean Pg DNA extracted per reaction
Genotyping error (%)
Number of repeat amplifications required for >99% confidence in genotyping accuracy
<40 pg 72 >10
40–150 pg 41 8
150–200 pg 22 4
> 201 pg 4 2
Genotyping accuracy differed greatly between the two DNA sources (Table 4). The first group of ear tissue samples analysed all produced ample (>50 000 pg/µl) DNA for genotyping. There were no instances in which insufficient DNA was obtained from an ear tissue sample. Most subsequent samples were therefore not quantified. In contrast, two-thirds of the faecal samples produced less than the 200 pg/µl of DNA needed to be confident that genotyping was highly unlikely.
Landcare Research
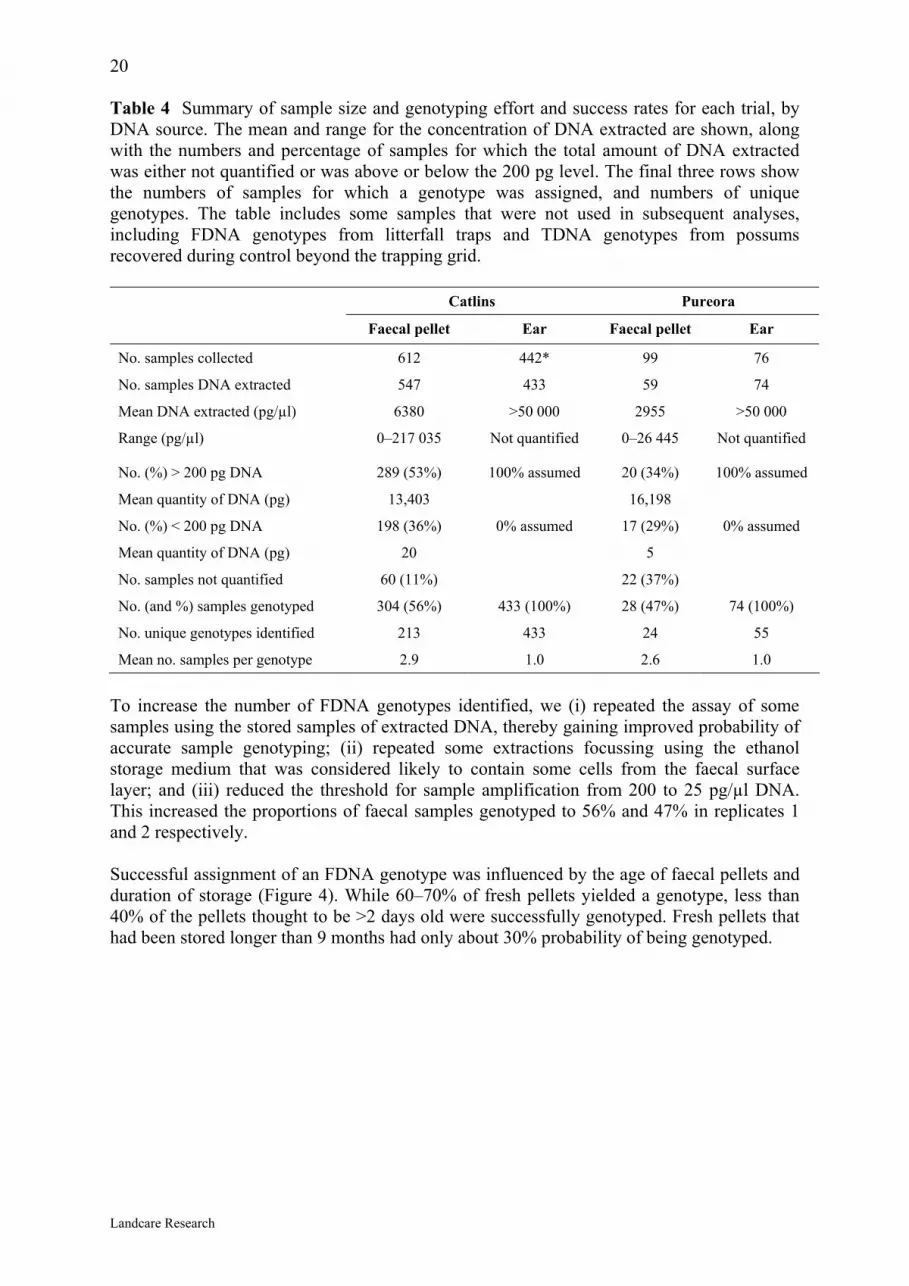
20 Table 4 Summary of sample size and genotyping effort and success rates for each trial, by DNA source. The mean and range for the concentration of DNA extracted are shown, along with the numbers and percentage of samples for which the total amount of DNA extracted was either not quantified or was above or below the 200 pg level. The final three rows show the numbers of samples for which a genotype was assigned, and numbers of unique genotypes. The table includes some samples that were not used in subsequent analyses, including FDNA genotypes from litterfall traps and TDNA genotypes from possums recovered during control beyond the trapping grid.
Catlins Pureora
Faecal pellet Ear Faecal pellet Ear
No. samples collected 612 442* 99 76
No. samples DNA extracted 547 433 59 74
Mean DNA extracted (pg/µl) 6380 >50 000 2955 >50 000
Range (pg/µl) 0–217 035 Not quantified 0–26 445 Not quantified
No. (%) > 200 pg DNA 289 (53%) 100% assumed 20 (34%) 100% assumed
Mean quantity of DNA (pg) 13,403 16,198
No. (%) < 200 pg DNA 198 (36%) 0% assumed 17 (29%) 0% assumed
Mean quantity of DNA (pg) 20 5
No. samples not quantified 60 (11%) 22 (37%)
No. (and %) samples genotyped 304 (56%) 433 (100%) 28 (47%) 74 (100%)
No. unique genotypes identified 213 433 24 55
Mean no. samples per genotype 2.9 1.0 2.6 1.0
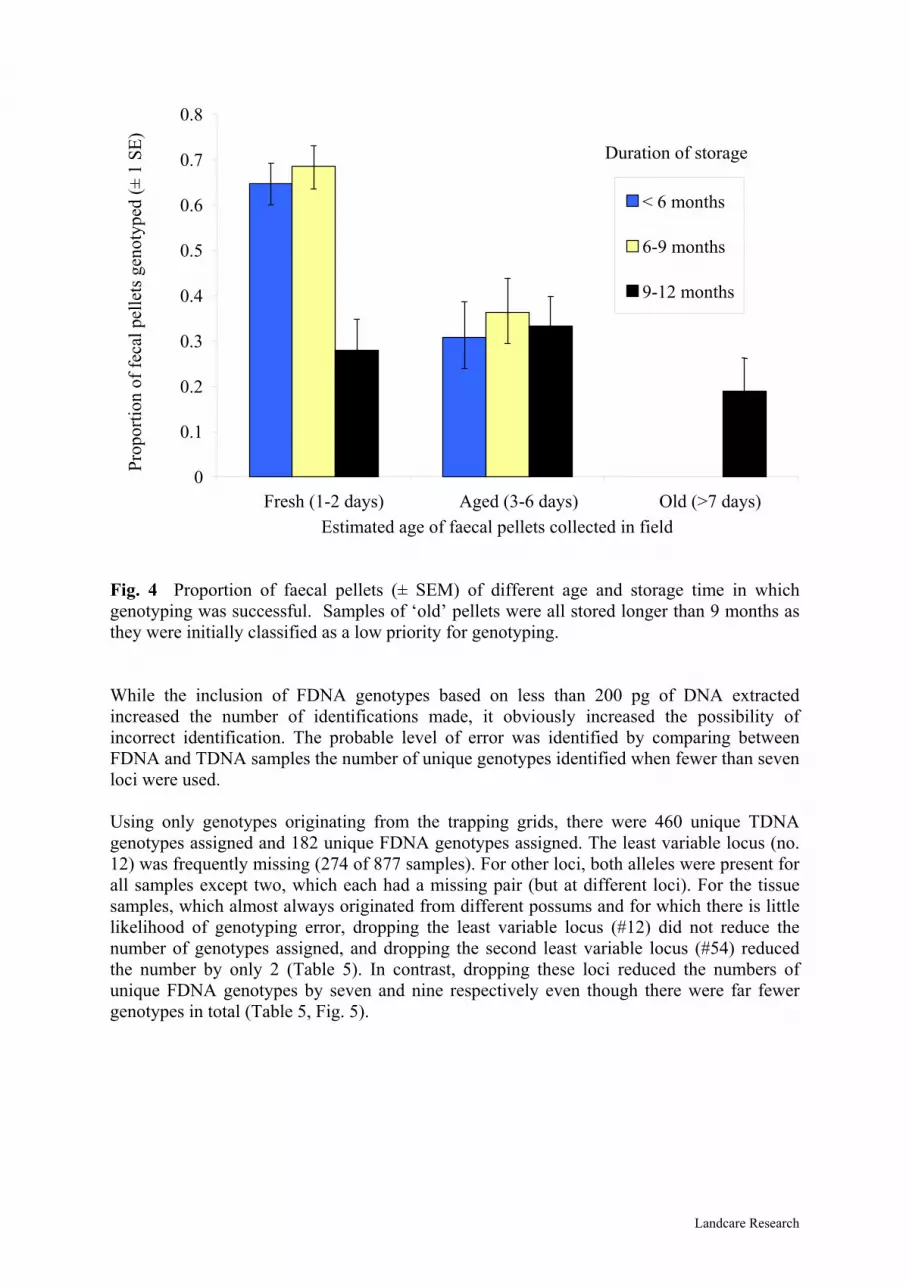
To increase the number of FDNA genotypes identified, we (i) repeated the assay of some samples using the stored samples of extracted DNA, thereby gaining improved probability of accurate sample genotyping; (ii) repeated some extractions focussing using the ethanol storage medium that was considered likely to contain some cells from the faecal surface layer; and (iii) reduced the threshold for sample amplification from 200 to 25 pg/µl DNA. This increased the proportions of faecal samples genotyped to 56% and 47% in replicates 1 and 2 respectively. Successful assignment of an FDNA genotype was influenced by the age of faecal pellets and duration of storage (Figure 4). While 60–70% of fresh pellets yielded a genotype, less than 40% of the pellets thought to be >2 days old were successfully genotyped. Fresh pellets that had been stored longer than 9 months had only about 30% probability of being genotyped.
Landcare Research
0
0.1
0.2
0.3
0.4
0.5
0.6
0.7
0.8
Fresh (1-2 days) Aged (3-6 days) Old (>7 days)Estimated age of faecal pellets collected in field
< 6 months
6-9 months
9-12 months
Duration of storagePr
opor
tion
of fe
cal p
elle
ts g
enot
yped
(± 1
SE)
Fig. 4 Proportion of faecal pellets (± SEM) of different age and storage time in which genotyping was successful. Samples of ‘old’ pellets were all stored longer than 9 months as they were initially classified as a low priority for genotyping. While the inclusion of FDNA genotypes based on less than 200 pg of DNA extracted increased the number of identifications made, it obviously increased the possibility of incorrect identification. The probable level of error was identified by comparing between FDNA and TDNA samples the number of unique genotypes identified when fewer than seven loci were used. Using only genotypes originating from the trapping grids, there were 460 unique TDNA genotypes assigned and 182 unique FDNA genotypes assigned. The least variable locus (no. 12) was frequently missing (274 of 877 samples). For other loci, both alleles were present for all samples except two, which each had a missing pair (but at different loci). For the tissue samples, which almost always originated from different possums and for which there is little likelihood of genotyping error, dropping the least variable locus (#12) did not reduce the number of genotypes assigned, and dropping the second least variable locus (#54) reduced the number by only 2 (Table 5). In contrast, dropping these loci reduced the numbers of unique FDNA genotypes by seven and nine respectively even though there were far fewer genotypes in total (Table 5, Fig. 5).
Landcare Research

22 Table 5 The number of unique genotypes identified from seven combinations of loci, progressively excluding the least variable loci.
Loci included Number of unique genotypes
Ear samples Pellet samples All
53, 27, 19, 58, 16, 54, 12 460 182 504
53, 27, 19, 58, 16, 54 460 175 494
53, 27, 19, 58, 16 458 173 489
53, 27, 19, 58 454 169 483
53, 27, 19 446 167 472
53, 27 385 155 403
53 116 81 119
This disparity is presumed to reflect genotyping errors, mostly as a result of allelic drop out, and comparison of the curves (Fig. 5) provides an indication of the scale of the problem. The difference between the curves was greatest when only the three most variable loci were use. These three were sufficient to distinguish 97% of the 460 TDNA genotypes, but only 94% of all unique 504 genotypes from either FDNA or TDNA suggesting that approximately 3% of the total were false FDNA genotypes. Several cases of misidentification of possums were confirmed or suspected through inconsistencies noted in matching genotypes with captured possums. These are detailed in Appendix 1. Overall, six false TDNA genotypes were corrected by reference to other information (e.g., tag numbers, trap location, date etc.). More FDNA errors, primarily allelic dropout, were identified, as expected due to the low DNA quantity in many samples. While these were resolved, Fig. 5 indicates that at least 6–7 FDNA genotypes remained uncorrected. This ~3% error rate appears not dissimilar to the levels of error resulting from tag loss and transcription error in the captured-and-tag marking system. Indeed, genotyping helped identify and/or resolve five tagging errors that might not otherwise have been noticed. Because it is also clear that we are unlikely to have correctly identified and corrected all of the errors, analysis and interpretation of the final data set used to assess trappability and survival (summarised in Table 6) needed to take into account the likelihood that some of the genotypes recorded did not exist.
Landcare Research

0%
50%
100%
0 1 2 3 4 5 6 7N loci used
TDNAFDNA
Fig. 5 The percentage of genotypes identified using increasing numbers of loci in TDNA and FDNA samples. Loci were added in order of decreasing variability. Table 6 The number of genotypes identified from FDNA and TDNA samples in each survey of the two replicates. The number of TDNA genotypes in post control surveys include those identified from the eartags of recaptured (previously genotyped) but excludes possums that were killed. Not all trapped possums were genotyped, as a few samples were not collected or illegibly labelled.
Replicate FDNA genotypes TDNA genotypes Total genotypes
Pre Post 1
Post 2
Post 3
Post 1
Post 2
Post 3
Post 1
Post 2
Post 3 Pre Pre
Catlins 118 19 9 37 135 30 59 67 174 43 62 81
Pureora 17 0 1 4 55 6 6 10 63 6 2 12
Validation of sample collection and genotyping procedures (i) Collection and preservation procedure: Genotypes were obtained from all 40 of the initial faecal samples collected from caged possums confirming that the collection and preservation procedures did not denature the DNA, and that sufficient DNA could be extracted from a single fresh pellet. Of the fresh faecal pellets collected 1 week later, the 10 previously sampled were correctly matched while the 10 not previously sampled gave unique genotypes. This confirmed the reliability of genotyping from at least one faecal pellet regardless of preservation method.
Landcare Research

24 (ii) Genotyping field samples: Unique genotypes were obtained from all single pellets collected in the field that were designated as "fresh" or "aged". However, none of those classed as "old" pellets were successfully genotyped, confirming rapid degradation of faecal DNA in the field, and indicating that such pellets are likely to be unreliable as sources of DNA. All paired ear-tissue samples that were typed blind were correctly matched, confirming ethanol-preserved ear tissue was suitable for genotyping and showing no problems from the presence of metal ear tags in the sample tubes. (iii) Accuracy of genotyping field samples: All 10 tissue-based DNA identifications (TDNA IDs) from trapped possums matched the FDNA IDs from fresh faecal pellets collected at the trap sites, indicating accurate identification by both types of field-collected sample material. These results provided sufficient confidence in sampling and genotyping methods to proceed with the main study. 7.2 Trappability and poisonability – Catlins site
Overall changes in numbers trapped Trapping data for all surveys at the Catlins site are summarized in Table 7. Of the 141 individual possums captured before control, 13 were euthanased due to trap-injuries or severe hypothermia. Approximately one-third of those released were captured more than once during the pre-control survey, up to a maximum of four times including initial capture. In the first survey after control (i.e. post 1), the number captured declined by 76%, with, again about one-third of animals recaptured at least once. Increasing trap-catches in the next two surveys (i.e. post 2 and 3) suggested either a rapid recovery of the population to 57% of the pre-control level within 10 months of the control, or an increase in the trappability of possums, or a combination of the two. Within each of these two surveys 21% and 30% respectively of the possums caught were captured more than once. There was a trend of increasing distance between subsequent captures after control, suggesting that possums were using larger home ranges after control than before. Table 7 Summary of trap-catch results from all surveys at Catlins. Control was conducted between 13 July and 9 August 2005.
Survey Start date No. captures
No. recaptures
No. unique possums captured
No. killed
No. unique possums released
Lost samples
Mean distance between captures (and 95% CL)
Pre 13/06/04 184 43 141 13 128 6 59.0 (18.0)
Post 1 2/09/04 45 12 34 4 30 3 68.5 (52.1)
Post 2 8/12/04 77 13 63 5 58 1 112.4 (49.0)
Post 3 11/05/05 105 23 82 2 80 5 81.7 (24.8)
Population size, % kill, and rate of recovery
Five of the six population estimation methods gave similar estimates within most surveys, and in particular, Inverse Prediction and Mark-Recapture based on trap catches gave very
Landcare Research
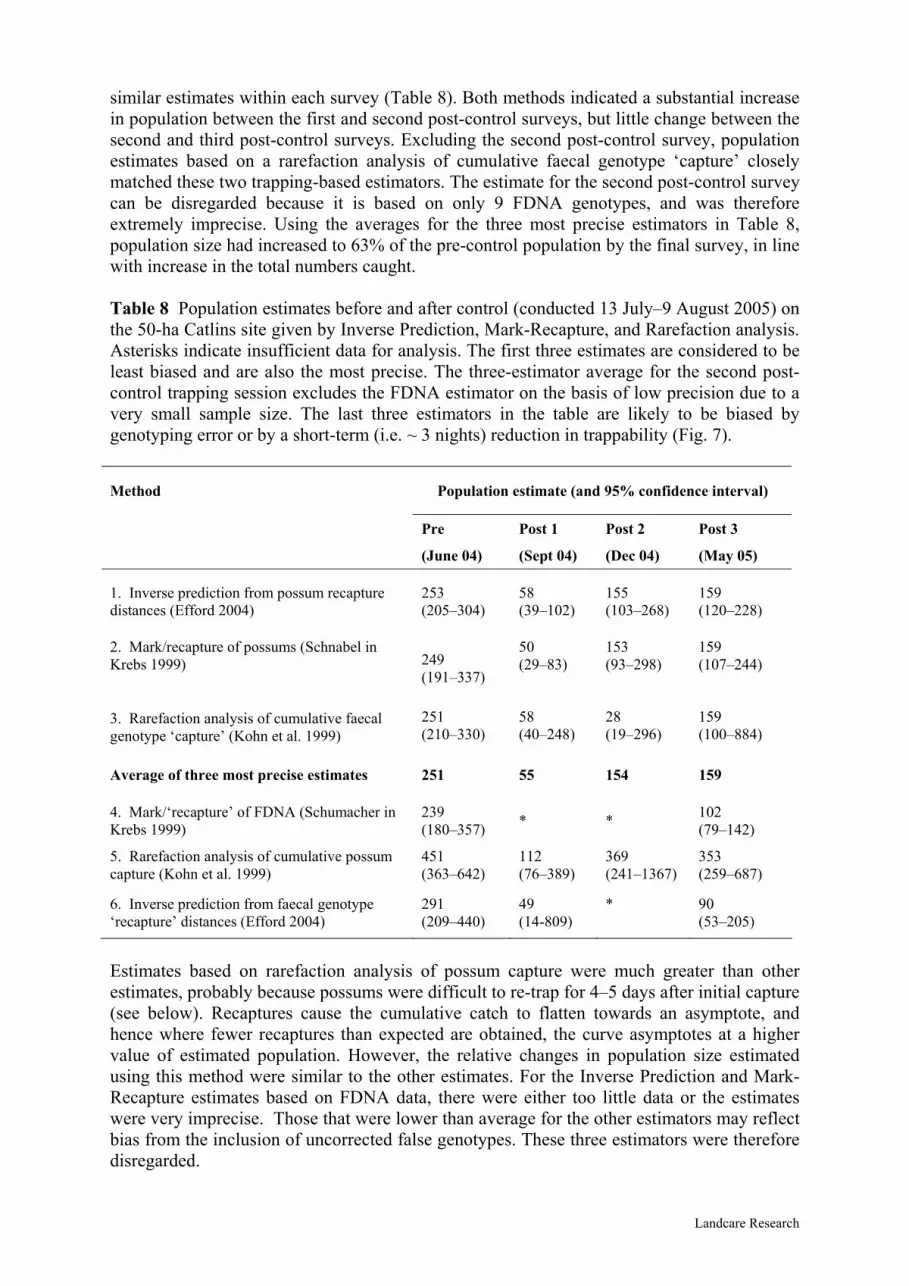
similar estimates within each survey (Table 8). Both methods indicated a substantial increase in population between the first and second post-control surveys, but little change between the second and third post-control surveys. Excluding the second post-control survey, population estimates based on a rarefaction analysis of cumulative faecal genotype ‘capture’ closely matched these two trapping-based estimators. The estimate for the second post-control survey can be disregarded because it is based on only 9 FDNA genotypes, and was therefore extremely imprecise. Using the averages for the three most precise estimators in Table 8, population size had increased to 63% of the pre-control population by the final survey, in line with increase in the total numbers caught. Table 8 Population estimates before and after control (conducted 13 July–9 August 2005) on the 50-ha Catlins site given by Inverse Prediction, Mark-Recapture, and Rarefaction analysis. Asterisks indicate insufficient data for analysis. The first three estimates are considered to be least biased and are also the most precise. The three-estimator average for the second post-control trapping session excludes the FDNA estimator on the basis of low precision due to a very small sample size. The last three estimators in the table are likely to be biased by genotyping error or by a short-term (i.e. ~ 3 nights) reduction in trappability (Fig. 7).
Method Population estimate (and 95% confidence interval)
Pre Post 1 Post 2 Post 3
(June 04) (Sept 04) (Dec 04) (May 05)
1. Inverse prediction from possum recapture distances (Efford 2004)
253 (205–304)
58 (39–102)
155 (103–268)
159 (120–228)
2. Mark/recapture of possums (Schnabel in Krebs 1999)
50 (29–83)
153 (93–298)
159 (107–244) 249
(191–337)
251 (210–330)
58 (40–248)
28 (19–296)
159 (100–884)
3. Rarefaction analysis of cumulative faecal genotype ‘capture’ (Kohn et al. 1999)
Average of three most precise estimates 251 55 154 159
4. Mark/‘recapture’ of FDNA (Schumacher in Krebs 1999)
239 (180–357)
102 (79–142) * *
5. Rarefaction analysis of cumulative possum capture (Kohn et al. 1999)
451 (363–642)
112 (76–389)
369 (241–1367)
353 (259–687)
6. Inverse prediction from faecal genotype ‘recapture’ distances (Efford 2004)
291 (209–440)
49 (14-809)
* 90 (53–205)
Estimates based on rarefaction analysis of possum capture were much greater than other estimates, probably because possums were difficult to re-trap for 4–5 days after initial capture (see below). Recaptures cause the cumulative catch to flatten towards an asymptote, and hence where fewer recaptures than expected are obtained, the curve asymptotes at a higher value of estimated population. However, the relative changes in population size estimated using this method were similar to the other estimates. For the Inverse Prediction and Mark-Recapture estimates based on FDNA data, there were either too little data or the estimates were very imprecise. Those that were lower than average for the other estimators may reflect bias from the inclusion of uncorrected false genotypes. These three estimators were therefore disregarded.
Landcare Research
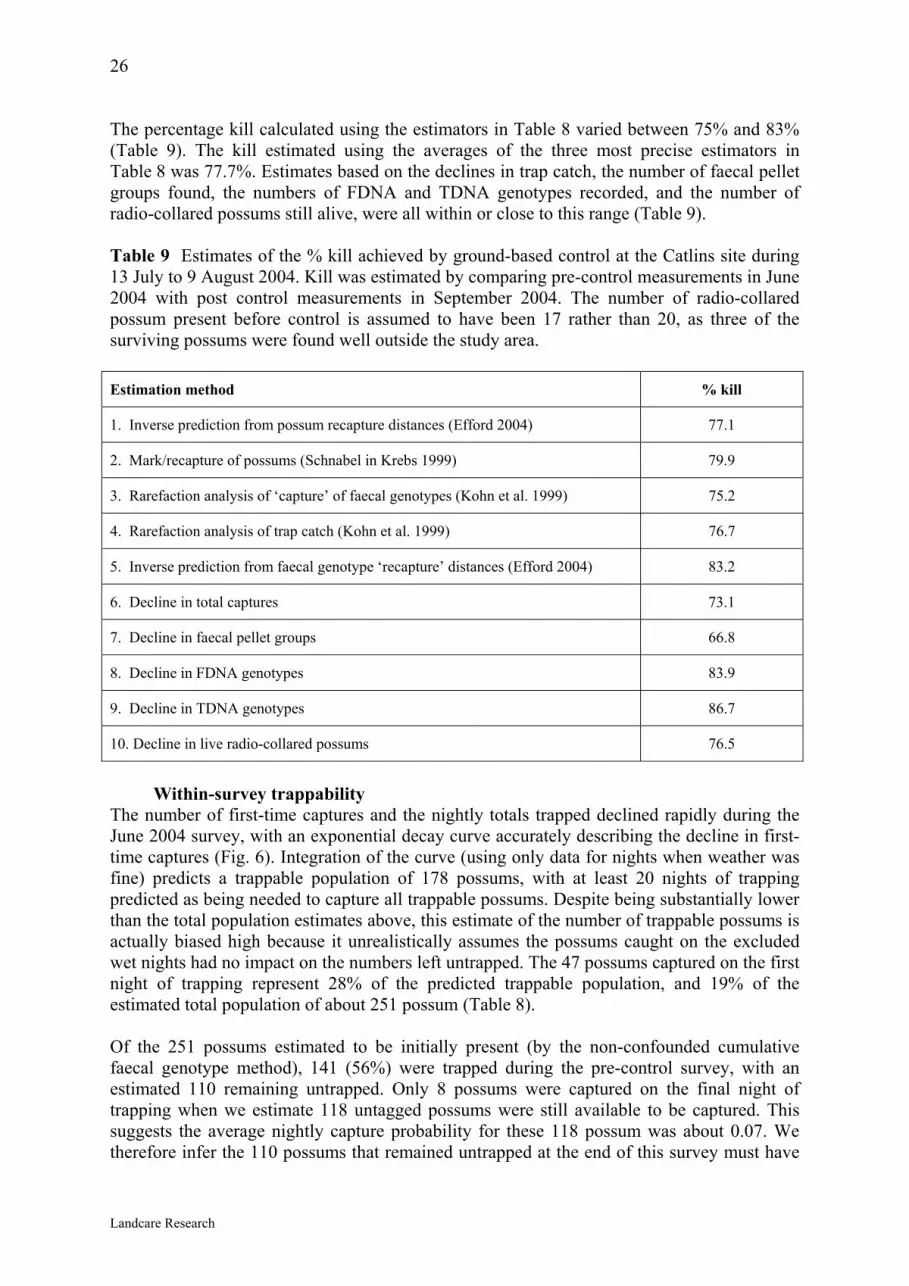
26 The percentage kill calculated using the estimators in Table 8 varied between 75% and 83% (Table 9). The kill estimated using the averages of the three most precise estimators in Table 8 was 77.7%. Estimates based on the declines in trap catch, the number of faecal pellet groups found, the numbers of FDNA and TDNA genotypes recorded, and the number of radio-collared possums still alive, were all within or close to this range (Table 9). Table 9 Estimates of the % kill achieved by ground-based control at the Catlins site during 13 July to 9 August 2004. Kill was estimated by comparing pre-control measurements in June 2004 with post control measurements in September 2004. The number of radio-collared possum present before control is assumed to have been 17 rather than 20, as three of the surviving possums were found well outside the study area. Estimation method % kill
1. Inverse prediction from possum recapture distances (Efford 2004) 77.1
2. Mark/recapture of possums (Schnabel in Krebs 1999) 79.9
3. Rarefaction analysis of ‘capture’ of faecal genotypes (Kohn et al. 1999) 75.2
4. Rarefaction analysis of trap catch (Kohn et al. 1999) 76.7
5. Inverse prediction from faecal genotype ‘recapture’ distances (Efford 2004) 83.2
6. Decline in total captures 73.1
7. Decline in faecal pellet groups 66.8
8. Decline in FDNA genotypes 83.9
9. Decline in TDNA genotypes 86.7
10. Decline in live radio-collared possums 76.5
Within-survey trappability
The number of first-time captures and the nightly totals trapped declined rapidly during the June 2004 survey, with an exponential decay curve accurately describing the decline in first-time captures (Fig. 6). Integration of the curve (using only data for nights when weather was fine) predicts a trappable population of 178 possums, with at least 20 nights of trapping predicted as being needed to capture all trappable possums. Despite being substantially lower than the total population estimates above, this estimate of the number of trappable possums is actually biased high because it unrealistically assumes the possums caught on the excluded wet nights had no impact on the numbers left untrapped. The 47 possums captured on the first night of trapping represent 28% of the predicted trappable population, and 19% of the estimated total population of about 251 possum (Table 8). Of the 251 possums estimated to be initially present (by the non-confounded cumulative faecal genotype method), 141 (56%) were trapped during the pre-control survey, with an estimated 110 remaining untrapped. Only 8 possums were captured on the final night of trapping when we estimate 118 untagged possums were still available to be captured. This suggests the average nightly capture probability for these 118 possum was about 0.07. We therefore infer the 110 possums that remained untrapped at the end of this survey must have
Landcare Research

had an average nightly capture probability lower than this, which is well below the population average of 0.19 (47/251) based on the first night. Of the possums caught and released on the first day of trapping, and which had not been recaptured in the intervening days, 28% were captured on the seventh day. It is clear that the trappability of individual possums varied greatly, and was low for a substantial proportion of the population.
y = 69.7e-0.33x
0
10
20
30
40
50
1 2 3 4 5 6 7
Night
No.
of p
ossu
ms
First capturesTotal captures
Fig. 6 Decline in catch rate over successive nights during the Catlins pre-control survey, in both total captures and in first-time captures. The solid trendline (and associated equation) is fitted to the data for first-time captures during five fine nights (i.e. excluding the rain affected nights #3 and #6). The dotted trendline includes the wet nights. The first-night capture probability estimated for the whole population was broadly similar in each of the post-control surveys (Table 10). Although the sample estimates were somewhat lower for the first two post-control surveys and higher for the third, in line with the observations that prompted this study, the difference is not statistically significant ("2 = 2.82, d.f. = 2, p = 0.24).
Landcare Research

28 Table 10 Estimated whole-population average probability of capture for each of the four Catlins surveys, based on the number of possum captured on the first fine night of each survey as a proportion of the estimated number of possums present (from Table 8). Population size
(3-estimator average) N. possums captured Average capture
probability
Pre control 251 47 0.19
1 month post control 56 9 0.16
4–5 months post control 154 22 0.14
9–10 months post control 159 34 0.21
Captured possums were not readily re-trappable in the first few days following capture. This is shown by an increase in the proportion of released possums being recaptured for the first time (i.e. probability of recapture) with increasing time (within the same survey) since initial capture (Fig. 7). There was a significant relationship (R2 = 0.47, p = 0.002) that was more strongly significant when the outlier from night five was excluded (R2 = 0.66, p<0.001). By about 6 nights after initial capture, the average probability of recapture of the possums caught on the first night of each survey was, in three of four surveys, close to 0.30 or above, substantially above the whole-population-average estimates in Table 10. These results indicate first that possums varied widely in the nightly probability of capture by the particular array of traps used. Importantly, the disparity of ~70 possums between the total number of trappable possums predicted from Fig. 6 and the estimated population size in Table 8 indicates that a substantial proportion of possums would have been very difficult to trap in a single extended session with this fixed array of traps. Second, they indicate, unsurprisingly, that extended trapping sessions tend to remove the most trappable possums first. They also show that previous capture is unlikely to have had a major long-lasting effect on the average trappability of the population in the subsequent re-surveys, as these were all conducted several months apart.
0
10
20
30
40
50
60
0 1 2 3 4 5 6 7
Night after initial capture
Rec
aptu
re p
roba
bilit
y (%
)
y = 6.51x - 2.22
Landcare Research
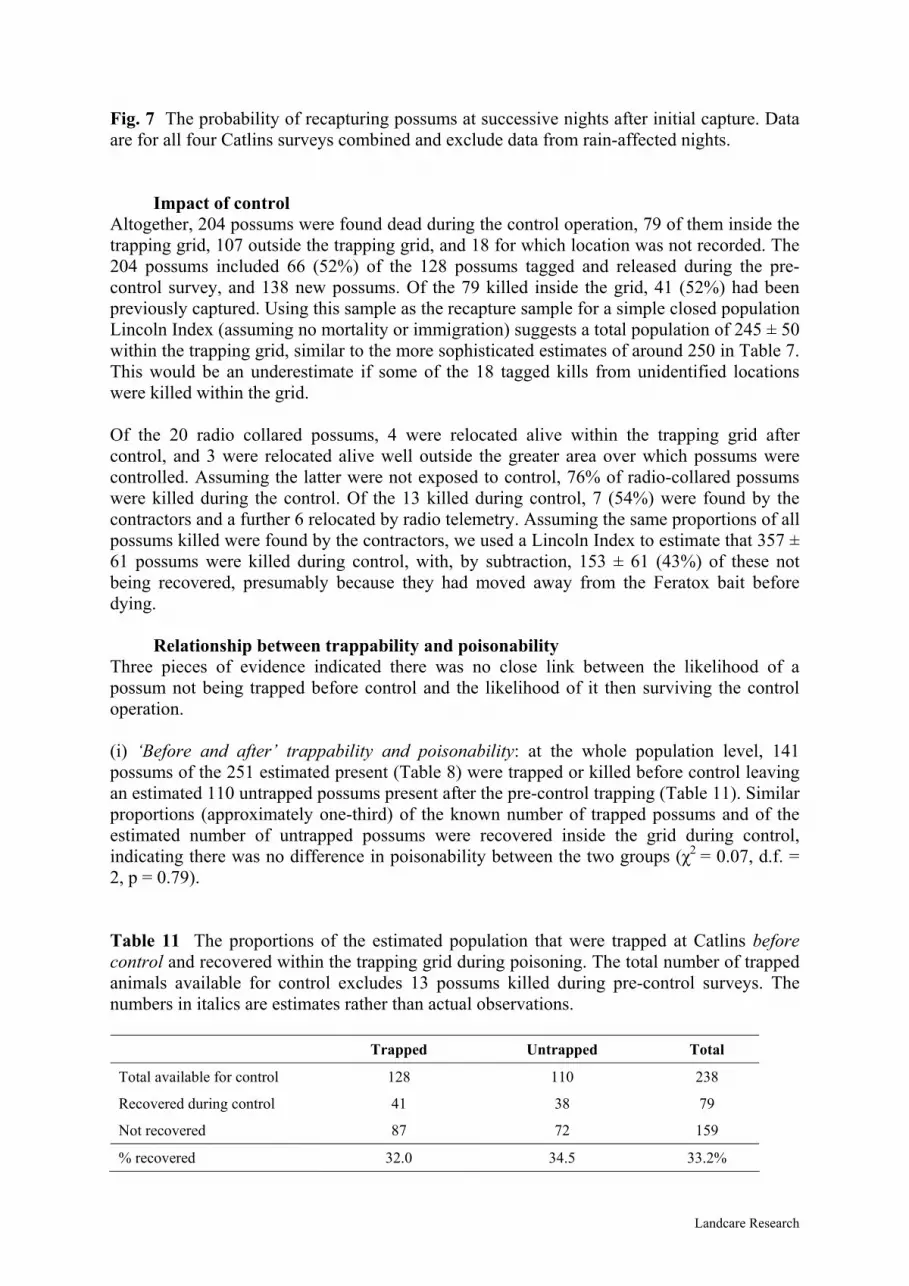
Fig. 7 The probability of recapturing possums at successive nights after initial capture. Data are for all four Catlins surveys combined and exclude data from rain-affected nights.
Impact of control Altogether, 204 possums were found dead during the control operation, 79 of them inside the trapping grid, 107 outside the trapping grid, and 18 for which location was not recorded. The 204 possums included 66 (52%) of the 128 possums tagged and released during the pre-control survey, and 138 new possums. Of the 79 killed inside the grid, 41 (52%) had been previously captured. Using this sample as the recapture sample for a simple closed population Lincoln Index (assuming no mortality or immigration) suggests a total population of 245 ± 50 within the trapping grid, similar to the more sophisticated estimates of around 250 in Table 7. This would be an underestimate if some of the 18 tagged kills from unidentified locations were killed within the grid. Of the 20 radio collared possums, 4 were relocated alive within the trapping grid after control, and 3 were relocated alive well outside the greater area over which possums were controlled. Assuming the latter were not exposed to control, 76% of radio-collared possums were killed during the control. Of the 13 killed during control, 7 (54%) were found by the contractors and a further 6 relocated by radio telemetry. Assuming the same proportions of all possums killed were found by the contractors, we used a Lincoln Index to estimate that 357 ± 61 possums were killed during control, with, by subtraction, 153 ± 61 (43%) of these not being recovered, presumably because they had moved away from the Feratox bait before dying.
Relationship between trappability and poisonability Three pieces of evidence indicated there was no close link between the likelihood of a possum not being trapped before control and the likelihood of it then surviving the control operation. (i) ‘Before and after’ trappability and poisonability: at the whole population level, 141 possums of the 251 estimated present (Table 8) were trapped or killed before control leaving an estimated 110 untrapped possums present after the pre-control trapping (Table 11). Similar proportions (approximately one-third) of the known number of trapped possums and of the estimated number of untrapped possums were recovered inside the grid during control, indicating there was no difference in poisonability between the two groups ("2 = 0.07, d.f. = 2, p = 0.79). Table 11 The proportions of the estimated population that were trapped at Catlins before control and recovered within the trapping grid during poisoning. The total number of trapped animals available for control excludes 13 possums killed during pre-control surveys. The numbers in italics are estimates rather than actual observations.
Trapped Untrapped Total
Total available for control 128 110 238
Recovered during control 41 38 79
Not recovered 87 72 159
% recovered 32.0 34.5 33.2%
Landcare Research
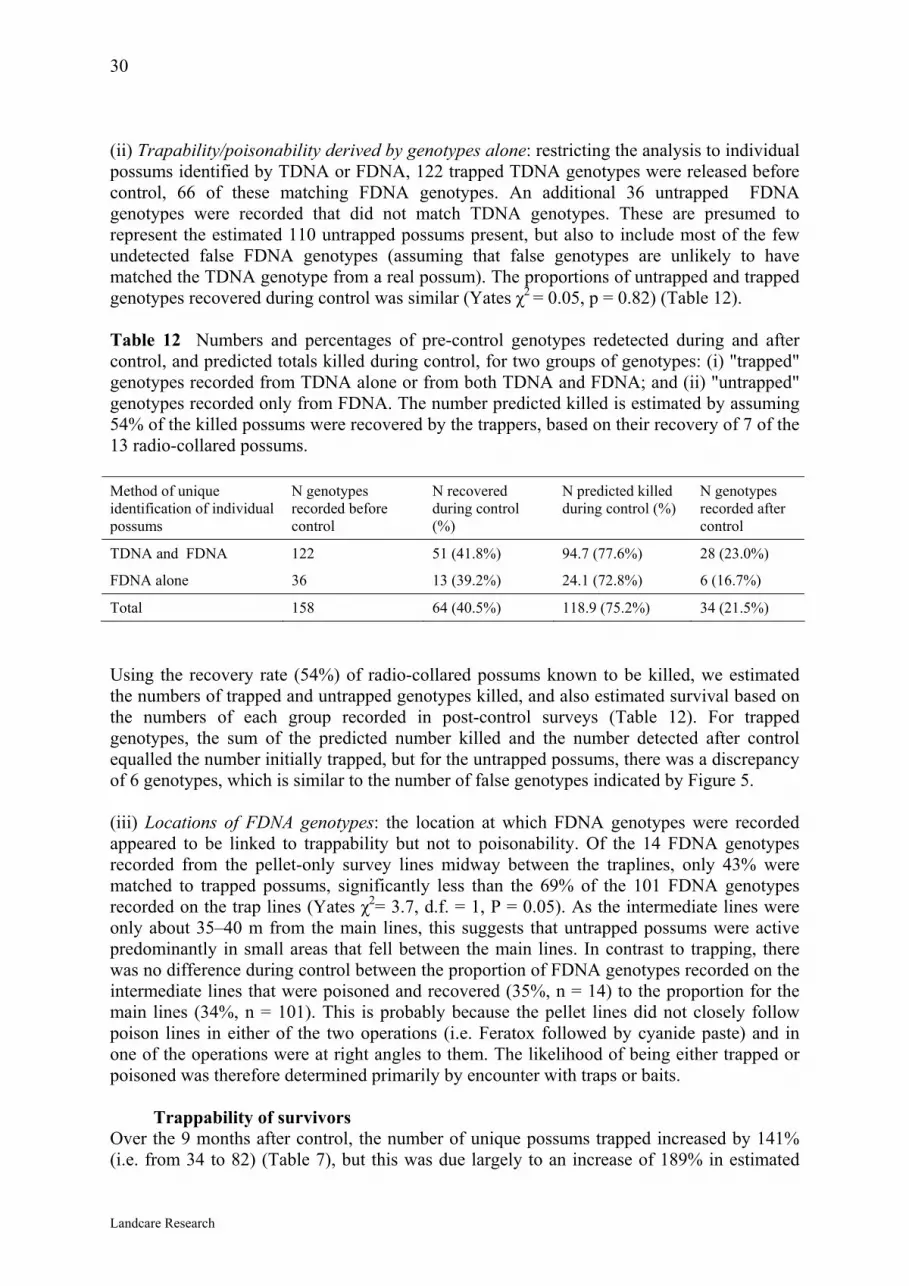
30 (ii) Trapability/poisonability derived by genotypes alone: restricting the analysis to individual possums identified by TDNA or FDNA, 122 trapped TDNA genotypes were released before control, 66 of these matching FDNA genotypes. An additional 36 untrapped FDNA genotypes were recorded that did not match TDNA genotypes. These are presumed to represent the estimated 110 untrapped possums present, but also to include most of the few undetected false FDNA genotypes (assuming that false genotypes are unlikely to have matched the TDNA genotype from a real possum). The proportions of untrapped and trapped genotypes recovered during control was similar (Yates "2 = 0.05, p = 0.82) (Table 12). Table 12 Numbers and percentages of pre-control genotypes redetected during and after control, and predicted totals killed during control, for two groups of genotypes: (i) "trapped" genotypes recorded from TDNA alone or from both TDNA and FDNA; and (ii) "untrapped" genotypes recorded only from FDNA. The number predicted killed is estimated by assuming 54% of the killed possums were recovered by the trappers, based on their recovery of 7 of the 13 radio-collared possums. Method of unique identification of individual possums
N genotypes recorded before control
N recovered during control (%)
N predicted killed during control (%)
N genotypes recorded after control
TDNA and FDNA 122 51 (41.8%) 94.7 (77.6%) 28 (23.0%)
FDNA alone 36 13 (39.2%) 24.1 (72.8%) 6 (16.7%)
Total 158 64 (40.5%) 118.9 (75.2%) 34 (21.5%)
Using the recovery rate (54%) of radio-collared possums known to be killed, we estimated the numbers of trapped and untrapped genotypes killed, and also estimated survival based on the numbers of each group recorded in post-control surveys (Table 12). For trapped genotypes, the sum of the predicted number killed and the number detected after control equalled the number initially trapped, but for the untrapped possums, there was a discrepancy of 6 genotypes, which is similar to the number of false genotypes indicated by Figure 5. (iii) Locations of FDNA genotypes: the location at which FDNA genotypes were recorded appeared to be linked to trappability but not to poisonability. Of the 14 FDNA genotypes recorded from the pellet-only survey lines midway between the traplines, only 43% were matched to trapped possums, significantly less than the 69% of the 101 FDNA genotypes recorded on the trap lines (Yates "2= 3.7, d.f. = 1, P = 0.05). As the intermediate lines were only about 35–40 m from the main lines, this suggests that untrapped possums were active predominantly in small areas that fell between the main lines. In contrast to trapping, there was no difference during control between the proportion of FDNA genotypes recorded on the intermediate lines that were poisoned and recovered (35%, n = 14) to the proportion for the main lines (34%, n = 101). This is probably because the pellet lines did not closely follow poison lines in either of the two operations (i.e. Feratox followed by cyanide paste) and in one of the operations were at right angles to them. The likelihood of being either trapped or poisoned was therefore determined primarily by encounter with traps or baits.
Trappability of survivors Over the 9 months after control, the number of unique possums trapped increased by 141% (i.e. from 34 to 82) (Table 7), but this was due largely to an increase of 189% in estimated
Landcare Research

population size (i.e. from 55 to 159) (Table 8). Since this population increase exceeds the highest published finite rate of annual increase (38%; Keber 1987), it suggests that most of the increase was due to immigration rather than reproductive increase. In line with that, the greatest numbers of possums in the final two surveys were caught on or near the north-eastern boundary of the trapping grid. This was the only part of the study site that adjoined a large block of continuous forest likely to contain high numbers of potential immigrants. A similar concentration of post-control possum activity in this north-eastern corner was independently identified in the pattern of interference in Wax Tag ® surveys run at similar times (Thomas et al. 2007). Furthermore, there was a significant shift toward a male-dominated sex ratio, from 69:69 before control to 112:66 after control (all three post-control surveys combined; ("2 = 5.3, d.f. = 1, p = 0.02). This is indicative of immigration because males disperse more frequently than females (Cowan & Clout 2000). Restricting our analysis of trappability to those possums known from FDNA genotypes to be true survivors, there was no difference in the trappability of the population before control compared with the trappability of survivors in all post-control surveys combined: in both cases, two-thirds of the population was trapped (Table 13). Since only one FDNA genotype was detected that was not also matched to TDNA after control, this indicates that there were very few surviving possums that evaded both trapping and poisoning. Table 13 The proportions of FDNA genotypes that were trapped before and after control at Catlins. Asterisk indicates exclusion of 2 false genotypes and 7 possums killed before control.
Before control After control (three surveys combined)
Trapped 72 14
Not trapped 37 7
Total 109* 21
% trapped 66.1 66.6
This is further supported by 33 of the 34 known surviving genotypes (either TDNA or FDNA) being trapped in at least one of the surveys. Moreover, the number recaptured for the first time since control declined exponentially with each trapping session and by the third trapping session had reached levels that again indicated only 2–3 new survivors would have been found had further trapping surveys been conducted (Table 14). Table 14 Post-control trapping histories for 34 genotype survivors at Catlins (i.e. possums that were detected by TDNA and/or FDNA before control, and then trapped again afterward). The total captured within each session is divided into those detected for the first time since control and those previously captured or recorded after control. Only one survivor remained untrapped.
Post-control survey date
September December May
2004 2004 2005
Landcare Research

32
First recapture of survivors 18 10 5
Survivors caught in a previous post-control survey - 8 16
Total survivors captured 18 18 21
Cumulative total of survivors captured 18 28 33
Although the data are sparse, Lincoln Index estimates of the total number of survivors still present in each successive survey were derived from the proportion of possums detected by FDNA that were also represented in the sample of possums trapped in that survey (Table 15). The estimates show a decline consistent with some degree of population turnover through mortality or emigration. Given the large influx of immigrants, and the dispersal of three of the radio-collared possums, it seems highly likely that at least some emigration will have occurred. Using the number of unique possums captured during the first week of each trapping session to factor out the longer duration (10 days) of the September 2004 trapping session, the proportion of the estimated number of survivors still present that were trapped increased significantly from 43% (14/32) in September 2004 to 84% (21/25) in May 2005 (Table 15, Yates corrected "2 =8.0, d.f. = 1, p<0.005). Importantly, this indicates a marked increase in the trappability of survivors between successive post-control surveys, in line with the observations that prompted this study. Although the effect of time since control is confounded by season, we note that the high trappability estimated for the final survey (84%) is considerably higher than the pre-control estimate (56%) from the same season a year earlier. This is likely to reflect higher trappability of more mobile immigrants. Table 15 Estimation, by Lincoln Index, of the number of pre-control FDNA genotypes surviving during each post-control survey at Catlins. The maximum number of confirmed survivors potentially present in each survey was estimated simply by deducting the numbers killed during trapping. The number of unique possums captured during the first week of trapping is also shown, to factor out the longer duration (10 days) of the trapping session in September 2004 compared to later surveys.
September 2004
December 2004
May 2005
Maximum no. survivors potentially present 34 33 32
Total survivors trapped 18 (1 killed) 18 (1 killed) 21
No. detected by FDNA 13 5 12
FDNA genotypes also trapped 7 (54%) 3 (60%) 10 (83%)
Estimated total surviving genotypes still present (±95CL)
32.3 (± 15.3) 27.5 (± 13.7) 25.0 (± 5.5)
Unique recaptures in first week 14 18 21
% of surviving genotypes trapped 43% 65% 84%
Landcare Research

Ground vs canopy use There was a significant decline in the proportion of faecal pellets found under litterfall traps following control (Table 16; Yates corrected "2 =18.3, d.f. = 3, p<0.001), suggesting that a greater proportion of activity during the post-control surveys occurred in the forest canopy. By Post 2 the proportion of pellets from canopy users had decreased compared with Post 1 (Yates corrected "2 =6.8, d.f. = 1, p<0.01), but this trend was not further supported by the limited data obtained at Post 3. Table 16 Total numbers of pellets collected on and under 64 4.5-m2 litterfall traps during each survey at Catlins.
Survey On Under On as % of total
Pre 33 22 60.0
Post 1 45 1 97.8
Post 2 80 20 80.0
Post 3 19 0 100
7.3 Trappability and poisonability – Pureora site
Changes in numbers trapped Before control, trapping resulted in 75 captures of a total of 60 possums, one of which was killed, and 59 were tagged and released (Table 17). The mean distance between recaptures (165 m) was considerably larger than for the Catlins population (59 m), indicating much bigger home ranges on average. The number captured declined by 90% after control, and then almost doubled over the ensuing 8 months. Table 17 Summary of trap-catch results from all surveys at the Pureora site. Control was conducted on 22 August 2005. Asterisks indicate too few data for estimation.
Survey Start date No. captures
No. killed
No. released
No. recaptures (within survey)
No. unique possums released
Mean distance to recapture (and 95% CL)
Pre 24/06/05 75 1 74 15 59 165 (60.4)
Post 1 6/09/05 6 4 2 0 2 *
Post 2 10/12/05 6 0 6 0 6 *
Post 3 10/05/06 13 0 13 2 11 *
Population size and effectiveness of control Possibly as a consequence of extended storage, very few FDNA genotypes were obtained for the Pureora site (see below). This precluded use of FDNA-based population estimators. Likewise, the small numbers of animals captured and recaptured after control precluded use
Landcare Research

34 of trapping-based estimators for calculating post-control population sizes. However, as for the Catlins site, there was close agreement between the estimates of pre-control population size derived using trapping-based estimators, giving a mean of 130 possums (Table 18). Using programme Density (Efford 2005) and assuming a buffer strip of half the mean maximum recapture distance (i.e. approximating half the mean home-range width), the pre-control density of possums at the 144-ha Pureora site was therefore 0.9 possums/ha (approximate 95% C.I. = 0.65-1.41), much lower than the 5.0 possums/ha (4.2-6.6) at the Catlins site. Table 18 Trapping-based estimates of the pre-control possum population size at the 144-ha Pureora site. The very low numbers of possum captured in the three post control surveys (range 6–11) precludes estimation of population size at those times. Method Population estimate (and 95% CI)
Inverse prediction from possum recapture distances (Efford 2004) 130 (93–203)
Mark/recapture of possums (Schnabel in Krebs 1999) 134 (84–223)
Rarefaction analysis of cumulative possum ‘capture’ (Kohn et al. 1999) 126 (101–177)
Despite deliberately not prefeeding before poisoning, a better kill (89–100% depending on estimator; Table 19) was obtained at Pureora than at the Catlins site (~77%). Only three faecal pellets were found immediately after control compared with 142 found before. There was therefore no evidence of a substantial number of untrappable survivors. This provided an early indication that undetectable possums did not pose any significant management problem at Pureora. Table 19 Estimates of % mortality at Pureora, based on the reductions in five indices of possum abundance between the pre control survey and the first post control survey. Survey effort was similar for the two surveys. Control was conducted on 22 August 2005. Asterisk indicates only ‘fresh’ and ‘aged’ pellets were counted to avoid counting ‘old’ pellets during Post 1 that may have pre-dated control. Cross indicates an overestimate since two of the genotypes were recorded after control by trapping.
Pre Post 1 % mortality Estimation method
(June 05) (Sept 05)
Numbers of possums caught 60 6 90.0
Faecal pellet groups * 142 3 97.9
TDNA genotypes recorded 55 6 89.1
FDNA genotypes recorded 17 0 100 +
Total genotypes recorded 58 6 89.7
Landcare Research

Trappability of FDNA genotypes The proportion of the estimated population captured in 7 nights of trapping before control was 46%, which was less than the 56% for the Catlins population (Yates corrected "2 =3.1, d.f. = 1, p=0.08). Of 17 FDNA genotypes recorded before control, 14 (82.3%) were also recorded among the 60 possums trapped before control. Using these data in a Lincoln Index provides an estimate of the pre-control population size of just 88 ± 38, much lower than the other estimators shown in Table 19. This is assumed to be an underestimate (rather than the other three estimators in Table 19 being overestimates). If so, the underestimation indicates some link between the likelihood of a FDNA being recorded and the likelihood of capture of the possum matched to it. That apparent link possibly reflects the fact that all the 17 pre-control FDNA genotypes recorded had been collected on the traplines, with none from the intermediate lines. At the Catlins site, FDNA genotypes from intermediate transects were less likely to match possums than those from the traplines, which we inferred was because the majority of movements of trapped possums were concentrated in small areas overlapping the main traplines, while movements of untrapped possums were concentrated between traplines. However, at Pureora, the mean distance between recaptures (165 m) was far greater than the distance between traplines, so that explanation seems unlikely as all but 2 of the 14 possums with FDNA and TDNA matches were detected on at least two different traplines. An alternative explanation is that movements are concentrated in a mosaic of multiple but very small activity centres, as around currently favoured food or den trees, spread throughout a large home range. If so, the collection of FDNA exclusively from the traplines will have sampled the same subset of activity centres from which trapped possum were obtained.
Numbers and trappability of survivors Six (10.3%) of the 58 tagged animals were captured immediately post control (three of them having lost their ear tags) (Table 20). The 6 included two (11.8%) of the 17 FDNA genotypes recorded before control. None were detected by FDNA because only three faecal pellets were found (despite the intensive search for faecal pellets of an estimated 10.8% of the study site and the use of a trained dog) and no FDNA was extracted from any of the three pellets. Four of the recaptured possums were killed, so only two were released. One of these was recaptured in both the subsequent surveys. Table 20 The numbers of possums, survivors and FDNA genotypes trapped in each post-control survey at Pureora.
Total no. of unique possums after control Post 1 Post 2 Post 3
No. of possum trapped 6 6 12 21
No. trapped and released 2 6 12 17
No. FDNA genotypes recorded 0 1 4 4
No. new survivors detected 6 0 0 6
No further known-genotype survivors were detected in the subsequent two surveys, even though a further 13 different possums were trapped, and 2 more identified from FDNA genotypes. Clearly there were very few, if any, undetected survivors present. We therefore
Landcare Research

36 infer that most or all of these 15 new possums of unknown identity were immigrants. Again two-thirds of them were male, in contrast to the more equal sex ratio before control. By 9 months after control, the number of possums caught (12) had reached 20% of the number caught before control, with a somewhat slower rate of apparent invasion than at Catlins. This slower rate is likely to reflect the larger size of the site, and the intensive control that was carried out over much of the surrounding area. With possibly as few as only 6 known-identity survivors present during the first post-control survey, and only 2 during the subsequent surveys, there was no point in attempting to measure changes in trappability over time.
8. Conclusions
8.1 Trappability and poisonability
At the Catlins site, only about two-thirds of the population was trapped in any one survey, and it took two control operations to reduce the population by 77%. It was therefore possible that the same group of possums repeatedly avoided being trapped or poisoned. However, this possibility is rejected because similar proportions of trapped and untrapped possum were killed and recovered during control, and there was no evidence of greater survival of untrapped FDNA genotypes (Table 13). In addition, all but one of the 22 FDNA genotypes known to have survived control were eventually trapped. We conclude that the vast majority of Catlins possums could be trapped, and, therefore, monitored using standard trap catch methods. However, it is also clear that there was substantial variability between individuals in the likelihood that they would be trapped on any one night with a 7–10 day survey. For the most easily trapped possums, nightly probability of capture was estimated at 0.3, but much lower for those remaining untrapped at the end of each survey. The curve describing the decline in new captures with increasing number of nights (Fig. 6) is therefore predicted to have a very long tail, consistent with previous studies showing initially high numbers of catches decline quickly but then plateau at low levels with erratic pulses of new captures (Nugent et al. 2003). Although only marginally significant, the much lower trappability (43%) of FDNA genotypes recorded on the intermediate lines inside the grid (that were as far away from traps as was possible) than of those recorded on trap lines (69%) provides a plausible explanation for this pattern. We suggest the least trappable possums tended to concentrate their movements within one or more small activity centres between traplines, but that the location of these activity centres changes over time thereby changing the likelihood of their encountering a trapline and being captured. The sparse Pureora data shows that most possums (82%) known (from FDNA) to be recently present along a trapline could be trapped in a single session, and that few survived control. Those that did survive appeared to be readily trappable, as all known survivors were captured in the first post-control survey. Again, there was no evidence that a substantial number of difficult-to-trap possums survived the control, although the very small number of FDNA genotypes recorded severely limits the robustness of that conclusion. However, strong support for the conclusion is provided by the outcome of the larger 88 000-ha operation that included Pureora site. Most of the operation was pre-fed twice, and resulted in an extremely
Landcare Research
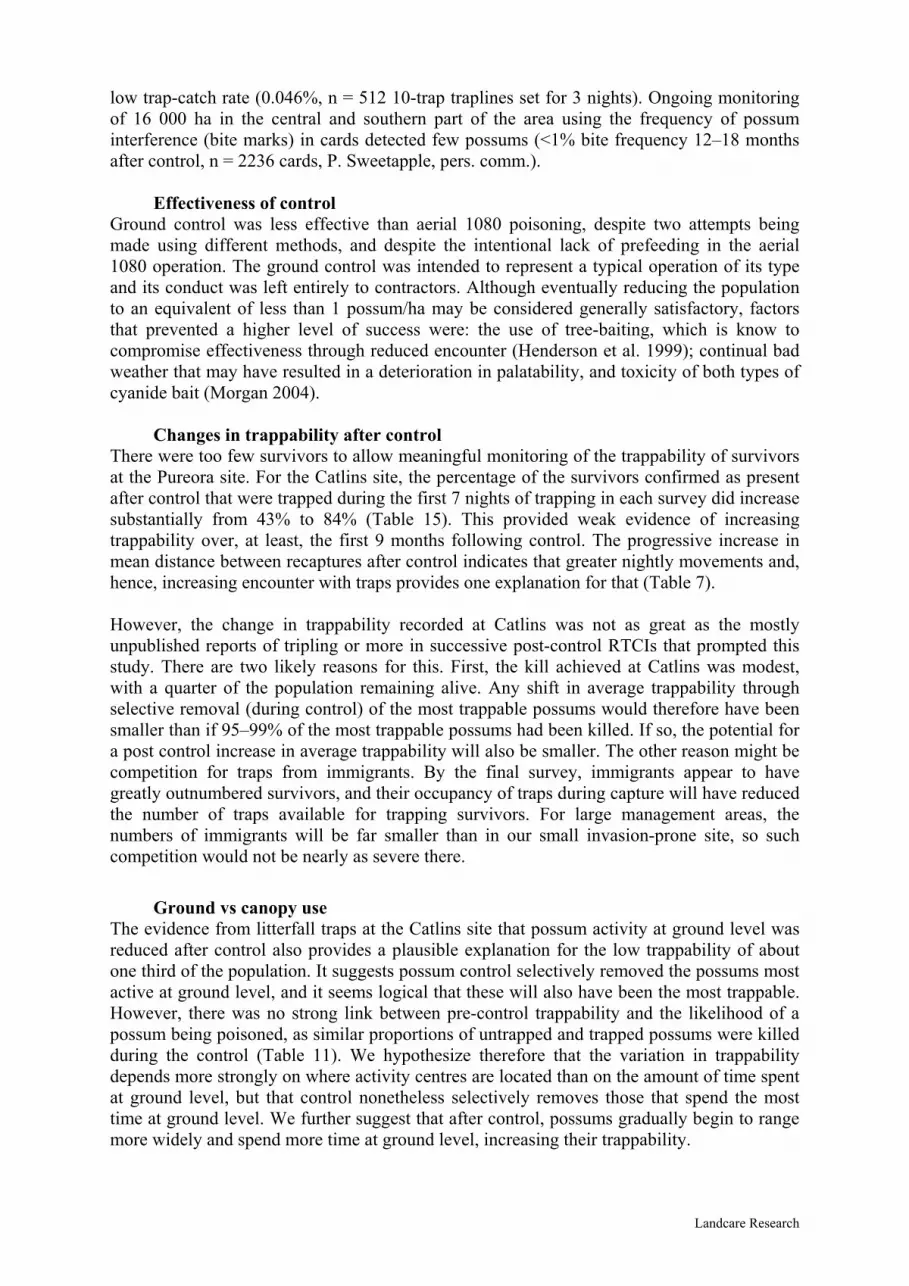
low trap-catch rate (0.046%, n = 512 10-trap traplines set for 3 nights). Ongoing monitoring of 16 000 ha in the central and southern part of the area using the frequency of possum interference (bite marks) in cards detected few possums (<1% bite frequency 12–18 months after control, n = 2236 cards, P. Sweetapple, pers. comm.).
Effectiveness of control Ground control was less effective than aerial 1080 poisoning, despite two attempts being made using different methods, and despite the intentional lack of prefeeding in the aerial 1080 operation. The ground control was intended to represent a typical operation of its type and its conduct was left entirely to contractors. Although eventually reducing the population to an equivalent of less than 1 possum/ha may be considered generally satisfactory, factors that prevented a higher level of success were: the use of tree-baiting, which is know to compromise effectiveness through reduced encounter (Henderson et al. 1999); continual bad weather that may have resulted in a deterioration in palatability, and toxicity of both types of cyanide bait (Morgan 2004).
Changes in trappability after control There were too few survivors to allow meaningful monitoring of the trappability of survivors at the Pureora site. For the Catlins site, the percentage of the survivors confirmed as present after control that were trapped during the first 7 nights of trapping in each survey did increase substantially from 43% to 84% (Table 15). This provided weak evidence of increasing trappability over, at least, the first 9 months following control. The progressive increase in mean distance between recaptures after control indicates that greater nightly movements and, hence, increasing encounter with traps provides one explanation for that (Table 7). However, the change in trappability recorded at Catlins was not as great as the mostly unpublished reports of tripling or more in successive post-control RTCIs that prompted this study. There are two likely reasons for this. First, the kill achieved at Catlins was modest, with a quarter of the population remaining alive. Any shift in average trappability through selective removal (during control) of the most trappable possums would therefore have been smaller than if 95–99% of the most trappable possums had been killed. If so, the potential for a post control increase in average trappability will also be smaller. The other reason might be competition for traps from immigrants. By the final survey, immigrants appear to have greatly outnumbered survivors, and their occupancy of traps during capture will have reduced the number of traps available for trapping survivors. For large management areas, the numbers of immigrants will be far smaller than in our small invasion-prone site, so such competition would not be nearly as severe there.
Ground vs canopy use The evidence from litterfall traps at the Catlins site that possum activity at ground level was reduced after control also provides a plausible explanation for the low trappability of about one third of the population. It suggests possum control selectively removed the possums most active at ground level, and it seems logical that these will also have been the most trappable. However, there was no strong link between pre-control trappability and the likelihood of a possum being poisoned, as similar proportions of untrapped and trapped possums were killed during the control (Table 11). We hypothesize therefore that the variation in trappability depends more strongly on where activity centres are located than on the amount of time spent at ground level, but that control nonetheless selectively removes those that spend the most time at ground level. We further suggest that after control, possums gradually begin to range more widely and spend more time at ground level, increasing their trappability.
Landcare Research
38
Management implications At any one time possums vary widely in their trappability, with most of the variation appearing to reflect the location of their core activity areas at ground level, and, to a lesser extent, the proportion of time spent at ground level. Therefore, changing the location of traps or ground-laid baits changes the likelihood that an individual possum will be captured or killed. Importantly, however, the eventual recapture of almost all confirmed survivors using exactly the same trapping grid indicates that low trappability within any one period of a week or so does not necessarily translate into low trappability several months later. The lower trappability apparent immediately after control is believed to reflect an increased but temporary predominance of possums that have a small number of small ground-level activity centres away from where the traps were placed, and to a lesser extent, possums that spend proportionally more time in the canopy than on the ground. Although the evidence of a subsequent increase in trappability in the 9 months after control is not as striking as has been observed elsewhere, the increase in recapture distance indicates a strong likelihood that this was at least partly a result of changes in encounter rates with traps due to expanding home ranges. We note that an investigation of the effect of control on home range size conducted in an adjacent part of the Catlins Forest did not detect any large increase, but the power of the study was limited by small samples sizes resulting from equipment failure (Monks & Ramsey 2005). The above interpretation fits well with observed outcomes of operational trapping in places such as the Hokonui Ranges. There, contractors were either failing to achieve RTCI targets despite very low operational trap catch rates, or, where RTCI targets were achieved, monitoring a year later indicated the post-control RTCI was biased low (Coleman et al. 2005). However, when aerial broadcast sowing of non-toxic and toxic bait was subsequently used, almost all possums were killed, with none detected in RTCI trapping immediately after control, and with trap catch rates remaining low a year later (G. Knowles, pers. comm.). This ‘model’ has some major management implications: ! First, the concern that prompted this study (i.e. “are some possums untrappable,
unpoisonable, and therefore unmonitorable?”) appears to be largely unfounded. We found that very few possums are intrinsically and permanently untrappable. Secondly, the Pureora replicate, and the major control operation of which it was part, showed that very few possums are intrinsically unpoisonable. This is good news for managers and contractors.
! However, the temporarily low trappability of possums remaining after a week of trapping using a fixed trapping grid makes it unlikely that trapping alone could affordably achieve near total kills unless traps are placed much closer together than in this study. The same is likely to apply to ground-based poisoning. While reducing the spacing between traps and baits should overcome the problem, it would greatly increase costs. Suggested alternatives are:
(i) undertaking ground control in two or more sessions several months apart, placing baits and traps in different locations in each session. The aim would be to increase efficiency by initially targeting the most trappable individuals then waiting for the trappability of survivors to change. (ii) using long-life baits or kill-traps as devices that exploit the high probability that possums will eventually encounter them.
! The apparently strong relationship between home range location and trappability indicates monitoring outcomes will potentially be biased if there is any tendency for monitoring lines to follow the same paths used during ground control as sometimes has
Landcare Research

occurred in difficult country (Coleman et al. 2005). That 'implementation' bias aside, the main implication is that where bias due to home range location bias can be largely eliminated (as with aerial broadcast poisoning), some residual bias due to disproportionate canopy use is likely to remain. That creates difficulties for managers because the importance of this bias will obviously vary widely between unforested areas (little or no bias), areas in which the canopy contains little food (e.g., beech forest), and complex forest with a diverse and fruit-rich canopy. The only tool currently available that might avoid that canopy-use bias would appear to be FDNA sampling, but the problems encountered in this study include not only poor genotyping success (which we believe can be partly overcome) but also great difficulty in finding pellets when possum numbers are extremely low, so it is currently uncertain whether this could be a cost-effective option.
8.2 Genotyping methods
Use of possum ear tissue for obtaining unique (TDNA) genotypes was reliable, and adequate numbers of TDNA genotypes were obtained (except after the highly successful Puroera control operation). The high concentrations of DNA present in all ear tissue samples resulted in successful TDNA genotyping with only a few instances of suspected error. The errors that were detected were due mainly to incorrect sample identification on the field, although allelic drop-out was suspected in three cases. We were, however, unable to obtain the number of FDNA genotypes planned despite preliminary tests indicating that the planned sampling, storage, and genotyping methods were valid, This made analysis and interpretation more complex and difficult. It was probably caused by three main factors: 1. Low recovery of DNA from pellets estimated to be older than 2 days (Fig 3), resulting
in extraction of sufficient DNA for amplification and genotyping from only about half the faecal samples (Table 4). This success rate is lower than in a previous study (Nugent et al. 2003), and possibly reflects more rainfall during most of the surveys in this study than was experienced in the previous one.
2. Low recovery of DNA in fresh pellets that had been stored for long periods before processing. This was unexpected as storage in 95% ethanol at ambient (tropical) temperature was effective for storing samples of baboon for up to 6 months and elephant faeces for up to 1 year (e.g., Buchan et al. 2005). With hindsight, processing the samples immediately, or freezing the samples may have been better, although freezing may result in cell damage during thawing and possible denaturing of DNA.
3. Great difficulty in finding fresh faecal pellets after control. In the first post-control survey at Pureora, for example, only 3 pellets were found despite the increased sampling effort used to try to overcome these difficulties (which became apparent as the study progressed). What is puzzling is that before control, two pellets were found for every possum trapped, whereas after control the ratio was reversed. The reasons for this are not known, but we speculate it may be linked to greater use of the canopy resulting in fewer pellets reaching the ground.
For future studies, FDNA genotyping is likely to be most successful if only fresh pellets are collected, and samples are processed immediately or frozen. Adding to the low rate of FDNA recovery, the low quantity and poor quality of the DNA recovered resulted in genotyping errors. We were able to identify some nominal genotypes that had a high probability of being wrong, and corrected these, but it is clear from Fig. 5 and
Landcare Research

40 from the disparity between predicted kill and measured survival of FDNA genotypes (Table 12) in the Catlins trial, that some false genotypes were still present. This again complicated analysis and interpretation, but we believe nonetheless that FDNA was still ultimately a key tool in this study, enabling confirmation that most, if not all possums, are at some stage trappable and poisonable.
9. Recommendations
! The most important insight from this project is that a substantial proportion of possums
are difficult to trap or kill at any one time when trap or poison lines are placed 75 m apart, yet many operators use spacings wider than that. We therefore recommend that the key results of this and related trials should be summarized in a plain language fact sheet and made available to contractors, both in hard copy and via the Internet.
! The AHB should operationally trial the cost-effectiveness of short-term (2–3 months) repeat control involving 'half-effort' trapping or poisoning in each of two sessions applied in a cross hatched or parallel-but-not-overlapping fashion as a way of improving the efficacy of ground control. This should be compared with the cost-effectiveness of control using long-life baits and/or kill traps at a wide spacing of, for example, 150 × 50 m: this approach exploits the longer time that possums will have to eventually encounter bait.
! The problems caused by the downward bias in post-control trap-catch indices of possum abundance cannot be easily avoided other than by substantially delaying monitoring, but that is impractical when contractors desire immediate payment. The best solution may be to ensuring that trap-catch lines are always located independently of poisoning lines, and to aim for very high apparent kills through complete coverage with good quality control so that post control estimates are well below the control targets.
! We recommend further investment in the development of FDNA surveys for monitoring of possum survival immediately after control, both as a research tool, and for special-case operational contexts. Further refinement is required to determine the relative effectiveness of different sample storage methods (e.g. chemical preservatives, freezing, drying).
10. Acknowledgements
We thank: the AHB for contracting this study; Nick Potu, Jackie Whitford, Steve Hough, Keven Drew, for assistance in the field; Harold, Vincent, Tony and Judy Leith for undertaking control work and logistical help; DOC staff at Pureora for logistical help; Denise Jones and Casey Patten for processing faecal samples; Julie Turner and Karen Washbourne for helping to validate genotyping procedures using captive possums; Andrea Byrom, Guy Forester, and three members of the AHB Technical Advisory Group for helpful comments on earlier drafts; and Anne Austin for editing assistance.
Landcare Research

11. References
Arthur T, Ramsey D, Efford M 2002. Changes in possum behaviour at reduced density: a
review. Landcare Research Contract Report LC0102/102. 28 p.
Buchan JA, Archie EA, Van Horn RC, Moss CJ, Alberts SC 2005. Locus effects and sources of error in non-invasive genotyping. Molecular Ecology Notes 5: 680–683.
Coleman JD, Coleman MC, Nugent, G, Yockney, I 2005. Identifying the causes of, and solutions to, vector-related Tb persistence near Featherstone. Landcare Research Contract Report LC0506/005. 56 p.
Efford M 2004. Density estimation in live-trapping studies. Oikos 106: 598–610.
Fernando P, Vidya TNC, Rajapaske C, Dangolla A, Melnick DJ 2003. Reliable noninvasive genotyping: fantasy or reality. Journal of Heredity 94: 115–123.
Forsyth D, Webster R, Warburton B, Nugent G, Coleman MC, Thomson C, Link WA 2003. Effect of habitat, season, trap shyness and timing on RTCI estimates. Landcare Research Contract Report LC0203/001. 43 p.
Frantzen MAJ, Silk JB, Fergusson JWH, Wayne RK, Kohn MH 1998. Empirical evaluation of preservation methods for faecal DNA. Molecular Ecology 7: 1423–1428.
Keber AW 1987. An enquiry into the economic significance of possum damage in an exotic forest near Taupo. PhD thesis, Lincoln University, Lincoln, New Zealand. 212 p.
Kohn MH, York EC, Kamrat DA, Haught G, Sauvajot M, Wayne RK 1999. Estimating population size by genotyping faeces. Proceedings of the Royal Society of London B 266: 657–663.
Krebs CJ 1999. Ecological methodology. 2nd ed. Benjamin/Cummings, Menlo Park, California, USA. 620 p.
McKelvey KS, Schwartz MK 2004. Genetic errors associated with population estimation using non-invasive molecular tagging: problems and new solutions. Journal of Wildlife Management 68: 439–448.
Mills LS, Citta JJ, Lair KP, Schwartz MK, Tallmon DA 2000. Estimating animal abundance using non-invasive DNA sampling: promise and pitfalls. Ecological Applications. 10: 283–294.
Monks A, Ramsey D 2005. Behaviour of possums at very low population density: implications for residual trap catch monitoring. Landcare Research Contract Report LC0506/039. 31 p.
Morin PA, Chambers KE, Boesch C, Vigilant TL 2001. Quantitative PCR analysis of DNA from noninvasive samples for accurate microsatellite genotyping of wild chimpanzees (Pan troglodytes). Molecular Ecology 10: 1835–1844.
NPCA 2004. Protocol for possum population monitoring using the trap-catch method. National Possum Control Agencies, Wellington, New Zealand. 32 p.
Nugent G, Gleeson D, Howitt R, Thomson C 2003. Improved monitoring by using genotyping to correct biases in the RTC index of possum numbers. Landcare Research Contract Report LC0203/060. 18 p.
Landcare Research

42 Nugent G, Whitford J, Sweetapple P 2001. Intermittent possum control: How long before
next time? Short term (two year) responses in possum density and canopy cover. Landcare Research Contract Report LC0001/069. 38 p.
Nugent G, Fraser KW, Sweetapple PJ 1997. Comparison of red deer and possum diets and impacts in podocarp-hardwood forest, Waihaha Catchment, Pureora Conservation Park. Science for Conservation 50: 1–61.
Piggott MP 2004. Effect of sample age and season of collection on the reliability of microsatellite genotyping of faecal DNA. Wildlife Research 31: 485–493.
Pollock KH, Nichols JD, Brownies C, Hines JE 1990. Statistical inference for mark-recapture experiments. Wildlife Monographs 107: 97 p.
Sunnucks P 2000. Efficient genetic markers for population biology. Trends in Ecology and Evolution 15: 199–203.
Taylor AC, Cooper DW 1998. Microsatellite markers for the Phalangerid marsupial, the common brushtail possum (Trichosurus vulpecula). Molecular Ecology 7: 1780–1782.
Thomas MD, Brown JA 2001. Calibration of possum density estimates from raised leg-hold traps. New Zealand Plant Protection 54: 71–75.
Thomas MD , Morgan DR, Nugent G, Maddigan, F 2007. Accuracy of possum monitoring using wax tags. Pest Control Research Contract Report 2006/7. 45 p.
Waits LP, Paetkau D 2005. Noninvasive genetic sampling tools for wildlife biologists: a review of applications and recommendations for accurate data collection. Journal of Wildlife Management: 69 (4): 1419–1433
Warburton B, Poutu N 2002. Effectiveness of chain-springs on leghold traps for reducing injuries to captured possums. Landcare Research Contract Report LC0203/031. 10 p.
Wilson GJ, Frantz AC, Pope LC, Roper TJ, Burke TA, Cheeseman CL, Delahay RJ 2003. Estimation of badger (Meles meles) abundance using faecal DNA typing. Journal of Applied Ecology 40: 658–666.
Landcare Research

Appendix 1 Identification of genotyping errors While the high concentration of DNA in ear tissue always resulted in the identification of a genotype, some examples of apparent misidentification amongst the TDNA genotypes were detected. One possum (X3314 ) was recorded as homozygous at locus 58 (137/137) when first captured during pre-control trapping, but as heterozygous (133/137) when killed during poisoning about 350 m away. Likewise, another possum (X3171) was homozygous at locus 19 when trapped, but heterozygous when killed at the same location. However, tagged possums killed during control were not usually genotyped again, so these examples of apparent allelic drop out may equally reflect transcription errors in recording the tag number because the distance between locations for one (X3314) was toward the extreme of home range lengths of possums. This uncertainty cannot be resolved. Three genotypes represented two different possums each (Table A1). In one instance (genotype # 15) the two possums were unequivocally different, but for the other two the sex, age class and colour were similar, and the possums differed only slightly in location and weight. However, the two possums with genotype # 47 were caught on the same day, and the two possums with genotype #137 were probably more than one home-range diameter apart. These animals were therefore arbitrarily assigned different genotype numbers. Fortunately none of these three TDNA genotypes matched FDNA genotypes, so no resolution of possum-FDNA matches was required. Table A1 Actual or apparent overlap in genotype between possums for three genotypes. For each genotype there were two different possum tag numbers recorded, with one tag recorded two or three times. Location data (line and plot number and grid reference (in metres)), and possum characteristics are shown and were used to determine the likelihood that the different tags numbers represented completely different possums (see text).
Conversely, 6 genotypes were distinguished from another similar genotype only by the absence of any locus no. 12 alleles. In four instances, the additional genotype arose from a single FDNA sample collected very close to the locations of the 3–6 other TDNA or FDNA near-identical genotypes, and were deemed to be examples of double allelic drop out. For the fifth, the two genotypes were derived from trapped animals with different tag numbers at exactly the same location, so the genotypes were assumed to be different. The sixth was again
Genotype no. Tag Line Plot Easting Northing Sex Status
Pouch young present
Weight (kg) Colour
A5597 A 9 2204026 5391693 F A N 1.675 G 15
S3482 K 13 2203808 5391688 M A - 2.4 Black S3482 K 13.5 2203798 5391691 M A - N/R Black P4690 B 12 2204112 5391522 F A N 2.725 G 47
P4690 B 16.5 2204298 5391433 F A Y 1.95 GR P4690 C 12 2204090 5391410 F A N 2.375 G P4686 C 7.5 2203891 5391495 F A Y 3 GR S3958 A 4 2204253 5391610 F A N 2.15 G 137
R5226 C 14 2204170 5391370 F A N 2 GR S3958 K 6 2204121 5391585 F J N 1.875 G
Landcare Research
44 an FDNA genotype recorded from a single pellet but was found over 300–500 m from the 11 other near matching genotypes so was also assumed to be different. Excluding the number 12 locus, a total of 21 pairs of initial genotypes differed at only one locus. For six of these, the difference was deemed to reflect allelic drop out. To illustrate, genotype #152 was heterozygous at locus number 54 (108/119 alleles ) and was recorded four times, once from a trapped possum, and three times from pellets within 150 m of the trapped possum. Genotype 385 was recorded just once from a pellet found 20 m from where the #152 possum was trapped, and was apparently homozygous (119/119). Where distinction between these pairs of genotypes rested solely on homozygosity in a single FDNA sample from within 200 m of a heterozygous sample or samples from the same site, the genotypes were subjectively judged to be the same. Although some genotypes were subjectively corrected on the basis of single locus differences between pairs of IDs obtained from pellets or tissues from the same location, this was obviously not possible for FDNA IDs based on a single pellet. In line with this, 83% of the 17 pre-control FDNA genotypes that were never matched to a trapped or killed possum were obtained from single pellets, compared with just 56% of the 85 pre-control FDNA genotypes that were matched to live possums. This difference is significant ("2= 5.5, P = 0.02). For the unmatched FDNA genotypes based on single pellets, 54% of 13 had less than 200 pg/µl DNA extracted, compared with just 8% of the 178 FDNA IDs matched to possums, so the likelihood of genotyping error was higher where it was based on use of a single faecal pellet.
Landcare Research