archived -archiving content archivÉe -contenu archivé archived content
TRANSCRIPT
ARCHIVED - Archiving Content ARCHIVÉE - Contenu archivé
Archived Content
Information identified as archived is provided for reference, research or recordkeeping purposes. It is not subject to the Government of Canada Web Standards and has not been altered or updated since it was archived. Please contact us to request a format other than those available.
Contenu archivé
L’information dont il est indiqué qu’elle est archivée est fournie à des fins de référence, de recherche ou de tenue de documents. Elle n’est pas assujettie aux normes Web du gouvernement du Canada et elle n’a pas été modifiée ou mise à jour depuis son archivage. Pour obtenir cette information dans un autre format, veuillez communiquer avec nous.
This document is archival in nature and is intended for those who wish to consult archival documents made available from the collection of Public Safety Canada. Some of these documents are available in only one official language. Translation, to be provided by Public Safety Canada, is available upon request.
Le présent document a une valeur archivistique et fait partie des documents d’archives rendus disponibles par Sécurité publique Canada à ceux qui souhaitent consulter ces documents issus de sa collection. Certains de ces documents ne sont disponibles que dans une langue officielle. Sécurité publique Canada fournira une traduction sur demande.
User Report
SOCIAL DETERMINANTS OF ATTITUDES TOWARDS POLICE:
FINDINGS FROM THE TORONTO COMMUNITY POLICING SURVEY
NO. 1988-01
licitor General Canada nistry Secretariat
HV 8160 .T67
M9s 1988 C . 2
Chris Murphy, Ph.D. Senior Research Officer
à 0
M 95 /93e e • 2
Savvas Lithopoulos, M.A JAN 4 1:'4.4 ■+
ZANADA AL)
K1A Ce3
rio,oeldesetu
oteeeesetwoteÇ ice
1
aueese mete deed
tom te sue ‘oc
\ des Set lee
essed tee eleilete
1..es des
dauec deed\ desest‘i
settee
doceed‘ e
seouvés dçéseenet
disc suet seeded use.
and ,f7 I
SOLICiTOE CAWADA
SOCIAL DETERMINANTS OF ATTITUDES TOWARDS POLICE:
FINDINGS FROM THE TORONTO COMMUNITY POLICING SURVEY
NO. 1988-01
This working paper was prepared in 1988 by the Research Division of the Police and Security Branch of the Solicitor General of Canada in cooperation with the Planning and Research Branch of the Metropolitan Toronto Police Force and is made available as submitted to the Ministry. The views expressed are those of the authors and are not necessarily those of the Ministry of the Solicitor General of Canada nor of the Metropolitan Toronto Police Force.
This working paper is available in French. Ce document de travail est disponible en français.
ACKNOWLEDGEMENT
The authors are pleased to acknowledge the invaluable
cooperation and assistance of Mr. Jacques de Verteuil of the
federal Department of Justice and Dr. Leah Lambert, Staff Inspec-
tor George Tweedy, Staff Sergeant Sam Fairclough, Staff. Sergeant
Jerry Montool and Staff Sergeant Al Robertson of the Metropolitan
Toronto Police Force.
12
13
15
16
17
18
19
20
21
22
23
27
30
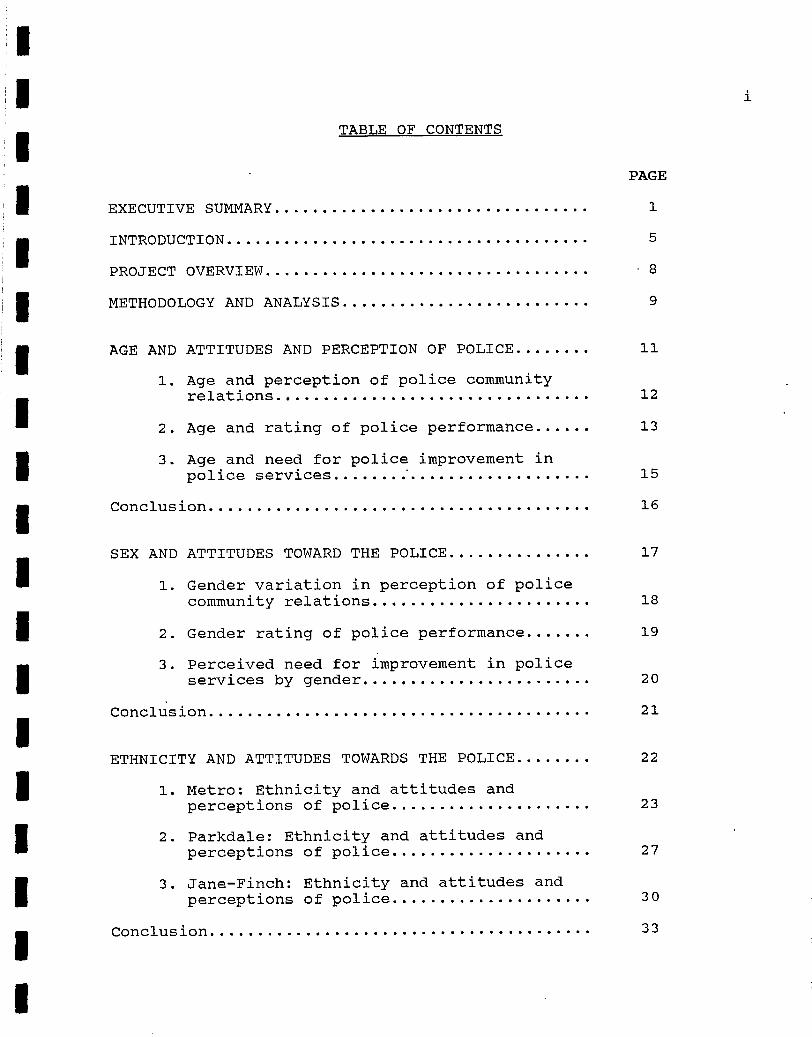
TABLE OF CONTENTS
PAGE
EXECUTIVE SUMMARY 1
INTRODUCTION 5
PROJECT OVERVIEW - 8
METHODOLOGY AND ANALYSIS 9
AGE AND ATTITUDES AND PERCEPTION OF POLICE 11
1. Age and perception of police community relations
2. Age and rating of police performance
3. Age and need for police improvement in police services
Conclusion
SEX AND ATTITUDES TOWARD THE POLICE
1. Gender variation in perception of police community relations
2. Gender rating of police performance
3. Perceived need for improvement in police services by gender
Conclusion
ETHNICITY AND ATTITUDES TOWARDS THE POLICE
1. Metro: Ethnicity and attitudes and perceptions of police
2. Parkdale: Ethnicity and attitudes and perceptions of police
3. Jane-Finch: Ethnicity and attitudes and perceptions of police
Conclusion 33
i
53
57
PAGE
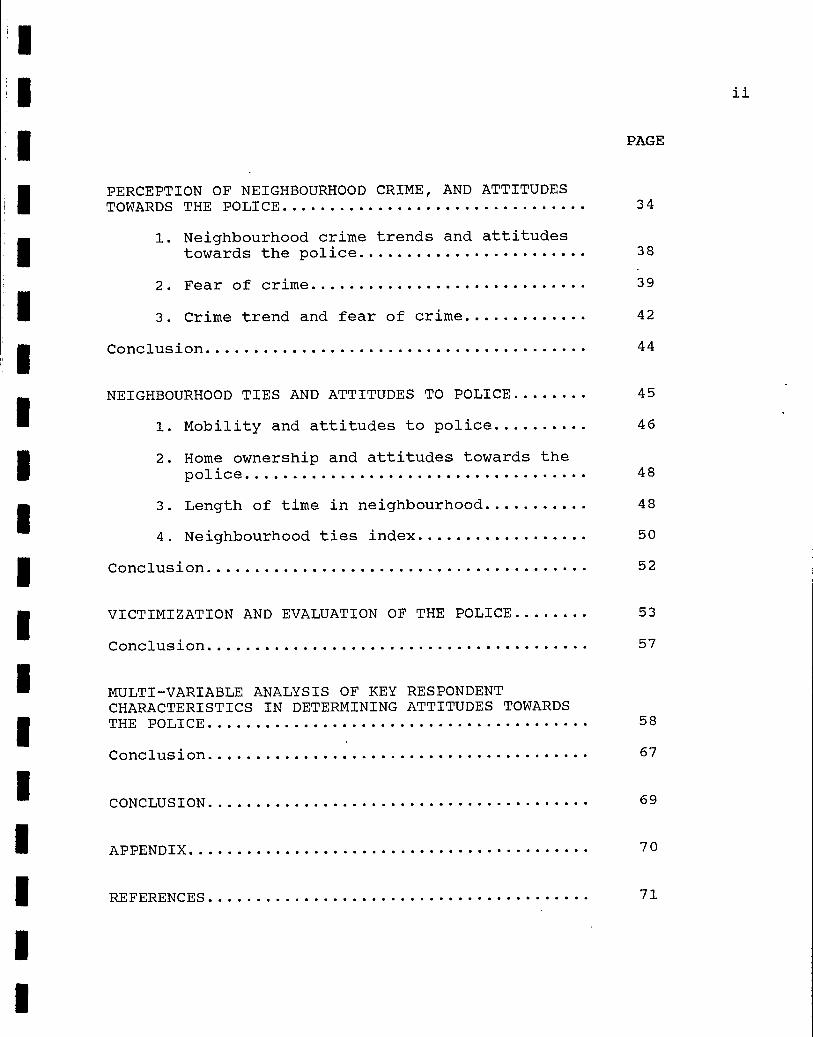
PERCEPTION OF NEIGHBOURHOOD CRIME, AND ATTITUDES TOWARDS THE POLICE 34
1. Neighbourhood crime trends and attitudes towards the police
2. Fear of crime
3. Crime trend and fear of crime
Conclusion
NEIGHBOURHOOD TIES AND ATTITUDES TO POLICE 45
1. Mobility and attitudes to police 46
2. Home ownership and attitudes towards the police 48
3. Length of time in neighbourhood 48
4. Neighbourhood ties index 50
Conclusion 52
VICTIMIZATION AND EVALUATION OF THE POLICE
Conclusion
MULTI-VARIABLE ANALYSIS OF KEY RESPONDENT CHARACTERISTICS IN DETERMINING ATTITUDES TOWARDS THE POLICE 58
Conclusion 67
CONCLUSION 69
APPENDIX 70
REFERENCES 71
ii
38
39
42
44
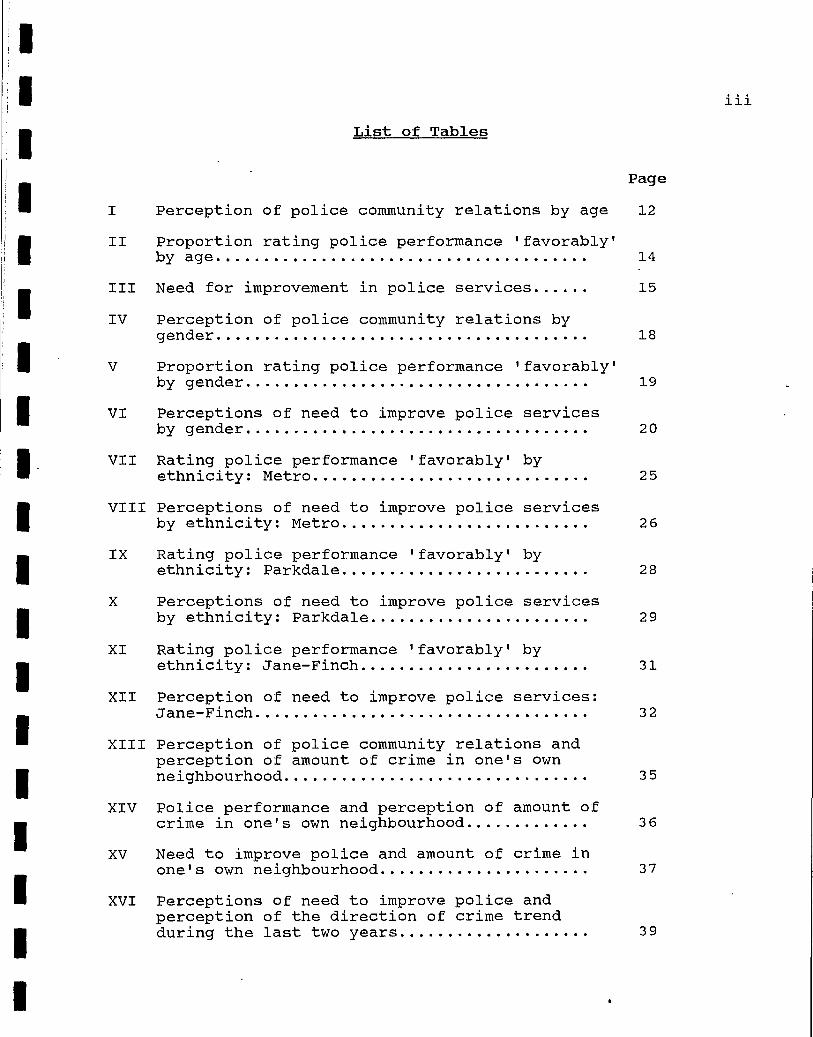
List of Tables
Page
I Perception of police community relations by age 12
II Proportion rating police performance 'favorably' by age 14
III Need for improvement in police services 15
IV Perception of police community relations by gender 18
V Proportion rating police performance 'favorably' by gender 19
VI Perceptions of need to improve police services by gender 20
VII Rating police performance 'favorably' by ethnicity: Metro 25
VIII Perceptions of need to improve police services by ethnicity: Metro 26
IX Rating police performance 'favorably' by ethnicity: Parkdale 28
X Perceptions of need to improve police services by ethnicity: Parkdale 29
XI Rating police performance 'favorably' by ethnicity: Jane-Finch 31
XII Perception of need to improve police services: Jane-Finch 32
XIII Perception of police community relations and perception of amount of crime in one's own neighbourhood 35
XIV Police performance and perception of amount of crime in one's own neighbourhood 36
XV Need to improve police and amount of crime in one's own neighbourhood 37
XVI Perceptions of need to improve police and perception of the direction of crime trend during the last two years 39
iii
Page
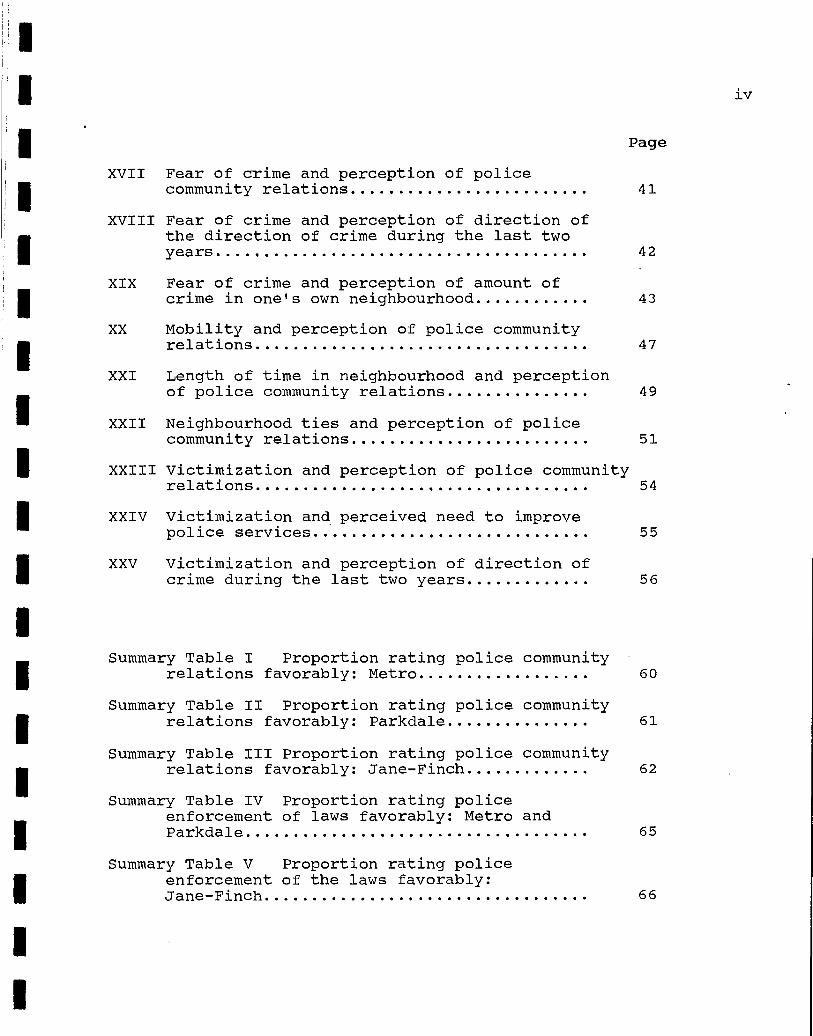
XVII Fear of crime and perception of police community relations 41
XVIII Fear of crime and perception of direction of the direction of crime during the last two years
XIX Fear of crime and perception of amount of crime in one's own neighbourhood 43
XX Mobility and perception of police community relations 47
XXI Length of time in neighbourhood and perception of police community relations 49
XXII Neighbourhood ties and perception of police community relations 51
XXIII Victimization and perception of police community relations 54
XXIV Victimization and perceived need to improve police services 55
XXV Victimization and perception of direction of crime during the last two years 56
Summary Table I Proportion rating police community relations favorably: Metro 60
Summary Table II Proportion rating police community relations favorably: Parkdale 61
Summary Table III Proportion rating police community relations favorably: Jane-Finch 62
Summary Table IV Proportion rating police enforcement of laws favorably: Metro and Parkdale 65
Summary Table V Proportion rating police enforcement of the laws favorably: Jane-Finch
iv
42
66
List of Graphs
Page
Perception of police community relations by ethnicity: Metro 24
II Perception of police community relations by ethnicity: Parkdale 27
III Perception of police community relations by ethnicity: Jane-Finch 30
V
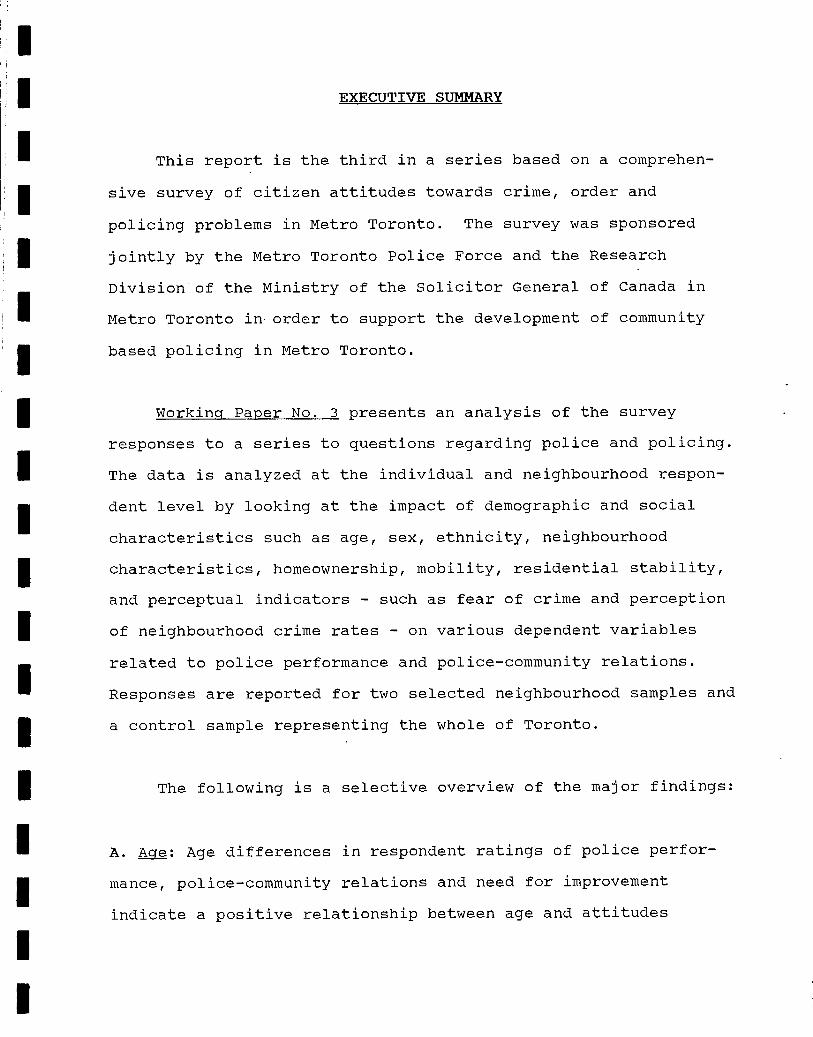
EXECUTIVE SUMMARY
This report is the third in a series based on a comprehen-
sive survey of citizen attitudes towards crime, order and
policing problems in Metro Toronto. The survey was sponsored
jointly by the Metro Toronto Police Force and the Research
Division of the Ministry of the Solicitor General of Canada in
Metro Toronto in order to support the development of community
based policing in Metro Toronto.
Working Paper No. 3 presents an analysis of the survey
responses to a series to questions regarding police and policing.
The data is analyzed at the individual and neighbourhood respon-
dent level by looking at the impact of demographic and social
characteristics such as age, sex, ethnicity, neighbourhood
characteristics, homeownership, mobility, residential stability,
and perceptual indicators - such as fear of crime and perception
of neighbourhood crime rates - on various dependent variables
related to police performance and police-community relations.
Responses are reported for two selected neighbourhood samples and
a control sample representing the whole of Toronto.
The following is a selective overview of the major findings:
A. Age: Age differences in respondent ratings of police perfor-
mance, police-community relations and need for improvement
indicate a positive relationship between age and attitudes
towards police in Metro Toronto. This finding is consistent with
previous studies which indicate that the older the age group the
more positive the rating of the police.
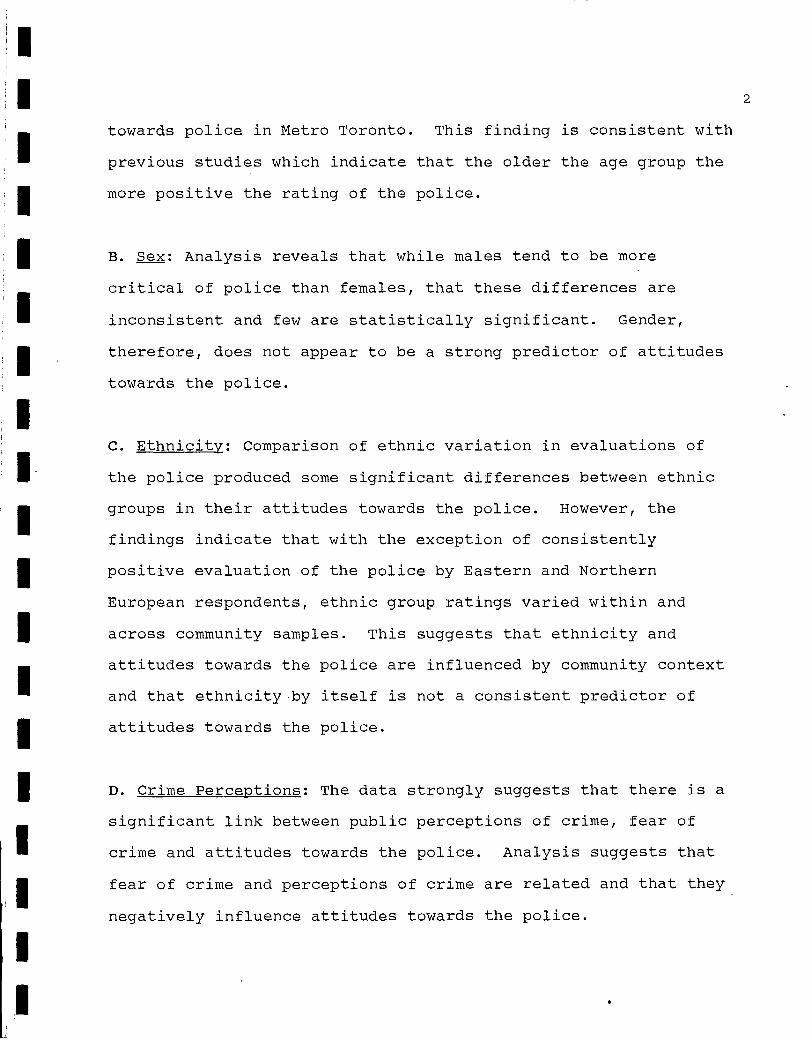
B. Sex: Analysis reveals that while males tend to be more
critical of police than females, that these differences are
inconsistent and few are statistically significant. Gender,
therefore, does not appear to be a strong predictor of attitudes
towards the police.
C. Ethnicity: Comparison of ethnic variation in evaluations of
the police produced some significant differences between ethnic
groups in their attitudes towards the police. However, the
findings indicate that with the exception of consistently
positive evaluation of the police by Eastern and Northern
European respondents, ethnic group ratings varied within and
across community samples. This suggests that ethnicity and
attitudes towards the police are influenced by community context
and that ethnicity-by itself is not a consistent predictor of
attitudes towards the police.
D. Crime Perceptions: The data strongly suggests that there is a
significant link between public perceptions of crime, fear of
crime and attitudes towards the police. Analysis suggests that
fear of crime and perceptions of crime are related and that they
negatively influence attitudes towards the police.
2
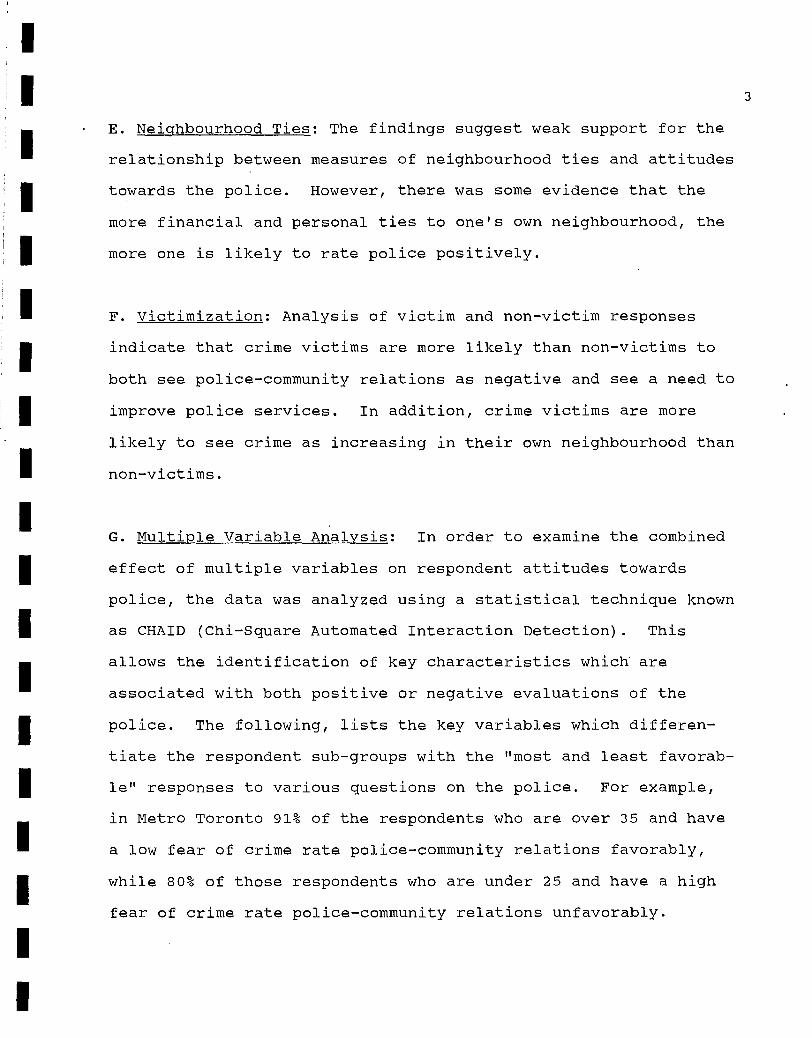
. E. Neighbourhood Ties: The findings suggest weak support for the
relationship between measures of neighbourhood ties and attitudes
towards the police. However, there was some evidence that the
more financial and personal ties to one's own neighbourhood, the
more one is likely to rate police positively.
F. Victimization: Analysis of victim and non-victim responses
indicate that crime victims are more likely than non-victims to
both see police-community relations as negative and see a need to
improve police services. In addition, crime victims are more
likely to see crime as increasing in their own neighbourhood than
non-victims.
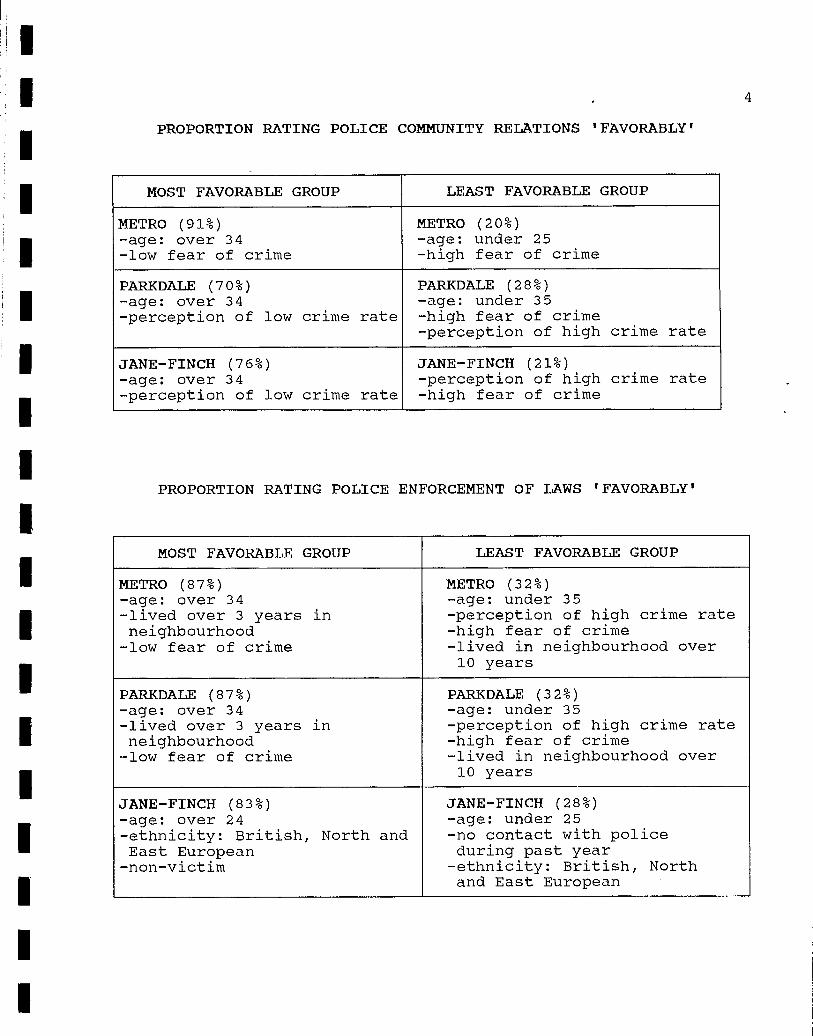
G. Multiple Variable Analysis: In order to examine the combined
effect of multiple variables on respondent attitudes towards
police, the data was analyzed using a statistical technique known
as CHAID (Chi-Square Automated Interaction Detection). This
allows the identification of key characteristics which are
associated with both positive or negative evaluations of the
police. The following, lists the key variables which differen-
tiate the respondent sub-groups with the "most and least favorab-
le" responses to various questions on the police. For example,
in Metro Toronto 91% of the respondents who are over 35 and have
a low fear of crime rate police-community relations favorably,
while 80% of those respondents who are under 25 and have a high
fear of crime rate police-community relations unfavorably.
3
1
1 1 1
1 1
PROPORTION RATING POLICE COMMUNITY RELATIONS 'FAVORABLY'
MOST FAVORABLE GROUP LEAST FAVORABLE GROUP
METRO (91%) METRO (20%) -age: over 34 -age: under 25 -low fear of crime -high fear of crime
PARKDALE (70%) PARKDALE (28%) -age: over 34 -age: under 35 -perception of low crime rate -high fear of crime
-perception of high crime rate
JANE-FINCH (76%) JANE-FINCH (21%) -age: over 34 -perception of high crime rate -perception of low crime rate -high fear of crime
PROPORTION RATING POLICE ENFORCEMENT OF LAWS 'FAVORABLY'
4
1 MOST FAVORABLE GROUP LEAST FAVORABLE GROUP
METRO (87%) METRO (32%) -age: over 34 -age: under 35 -lived over 3 years in -perception of high crime rate neighbourhood -high fear of crime -low fear of crime -lived in neighbourhood over
10 years
PARKDALE (87%) PARKDALE (32%) -age: over 34 -age: under 35 -lived over 3 years in -perception of high crime rate neighbourhood -high fear of crime -low fear of crime -lived in neighbourhood over
10 years
JANE-FINCH (83%) JANE-FINCH (28%) -age: over 24 -age: under 25 -ethnicity: British, North and -no contact with police East European during past year -non-victim -ethnicity: British, North
and East European
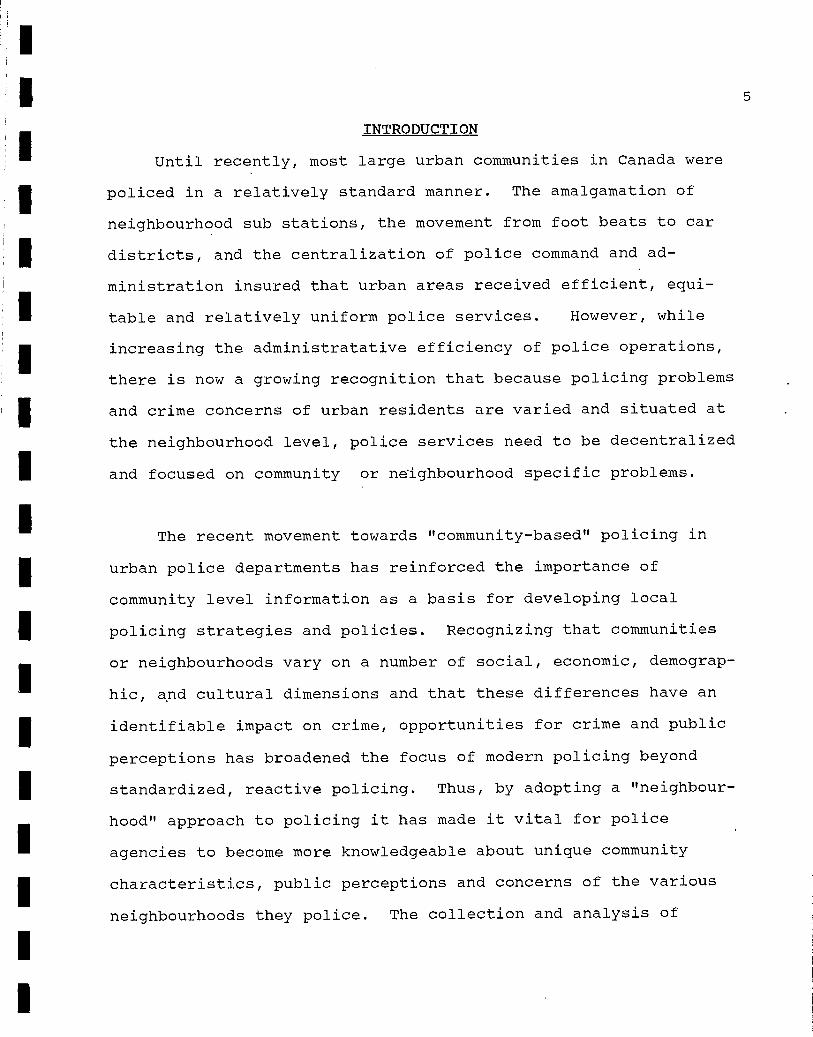
INTRODUCTION
Until recently, most large urban communities in Canada were
policed in a relatively standard manner. The amalgamation of
neighbourhood sub stations, the movement from foot beats to car
districts, and the centralization of police command and ad-
ministration insured that urban areas received efficient, equi-
table and relatively uniform police services. However, while
increasing the administratative efficiency of police operations,
there is now a growing recognition that because policing problems
and crime concerns of urban residents are varied and situated at
the neighbourhood level, police services need to be decentralized
and focused on community or nelghbourhood specific problems.
The recent movement towards "community-based" policing in
urban police departments has reinforced the importance of
community level information as a basis for developing local
policing strategies and policies. Recognizing that communities
or neighbourhoods vary on a number of social, economic, demograp-
hic, and cultural dimensions and that these differences have an
identifiable impact on crime, opportunities for crime and public
perceptions has broadened the focus of modern policing beyond
standardized, reactive policing. Thus, by adopting a "neighbour-
hood" approach to policing it has made it vital for police
agencies to become more knowledgeable about unique community
characteristics, public perceptions and concerns of the various
neighbourhoods they police. The collection and analysis of
5
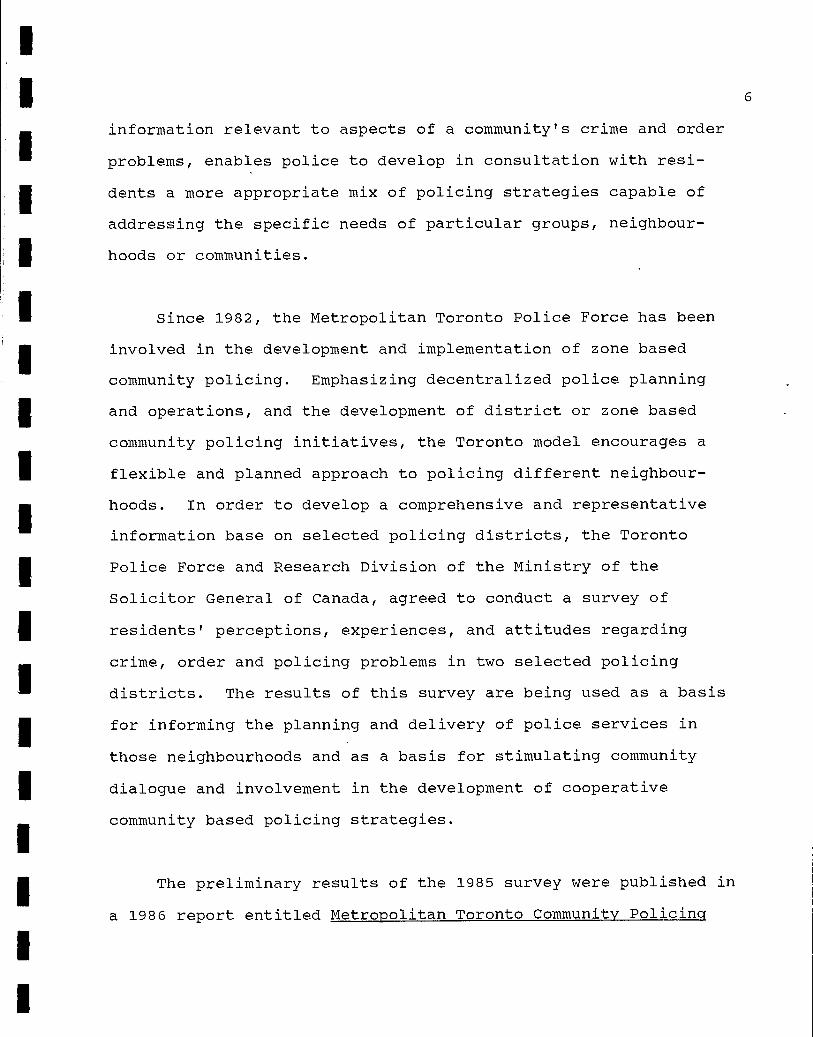
information relevant to aspects of a community's crime and order
problems, enables police to develop in consultation with resi-
dents a more appropriate mix of policing strategies capable of
addressing the specific needs of particular groups, neighbour-
hoods or communities.
Since 1982, the Metropolitan Toronto Police Force has been
involved in the development and implementation of zone based
community policing. Emphasizing decentralized police planning
and operations, and the development of district or zone based
community policing initiatives, the Toronto model encourages a
flexible and planned approach to policing different neighbour-
hoods. In order to develop a comprehensive and representative
information base on selected policing districts, the Toronto
Police Force and Research Division of the Ministry of the
Solicitor General of Canada, agreed to conduct a survey of
residents' perceptions, experiences, and attitudes regarding
crime, order and policing problems in two selected policing
districts. The results of this survey are being used as a basis
for informing the planning and delivery of police services in
those neighbourhoods and as a basis for stimulating community
dialogue and involvement in the development of cooperative
community based policing strategies.
The preliminary results of the 1985 survey were published in
a 1986 report entitled Metropolitan Toronto Community Policing
6
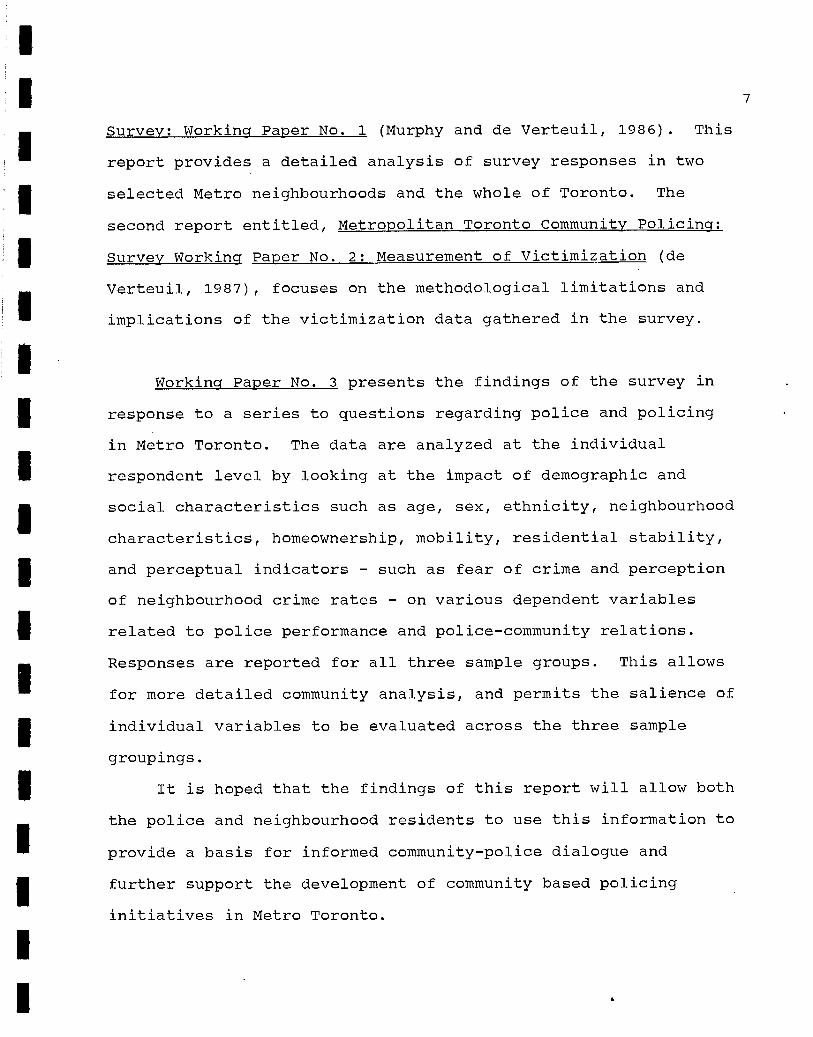
Survey: Working Paper No. 1 (Murphy and de Verteuil, 1986). This
report provides a detailed analysis of survey responses in two
selected Metro neighbourhoods and the whole of Toronto. The
second report entitled, Metropolitan Toronto Community Policing:
Survey Working Paper No. 2: Measurement of Victimization (de
Verteuil, 1987), focuses on the methodological limitations and
implications of the victimization data gathered in the survey.
Working Paper No. 3 presents the findings of the survey in
response to a series to questions regarding police and policing
in Metro Toronto. The data are analyzed at the individual
respondent level by looking at the impact of demographic and
social characteristics such as age, sex, ethnicity, neighbourhood
characteristics, homeownership, mobility, residential stability,
and perceptual indicators - such as fear of crime and perception
of neighbourhood crime rates - on various dependent variables
related to police performance and police-community relations.
Responses are reported for all three sample groups. This allows
for more detailed community analysis, and permits the salience of
individual variables to be evaluated across the three sample
groupings.
It is hoped that the findings of this report will allow both
the police and neighbourhood residents to use this information to
provide a basis for informed community-police dialogue and
further support the development of community based policing
initiatives in Metro Toronto.
7
PROJECT OVERVIEW
Metropolitan Toronto is Canada's largest city with a
population base of approximately 2.2 million people (Hurtig,
1985), and is the capital of the province of Ontario. Toronto is
located in southern Ontario on the north shore of Lake Ontario.
Two urban neighbourhoods within Toronto were selected as sample
or target communities for the survey and subsequent community
policing development. Each of the two neighbourhoods, Parkdale
and Jane-Finch were identified by the Metropolitan Toronto Police
as having persistent policing problems requiring distinctive
service strategies.
The Jane-Finch comMunity is located in the North West sector
of Toronto and is characterized by a high density of public
housing, various ethnic and racial groups, a relatively transient
population, and a higher than average number of young people.
This community has experienced inter-group tensions and a higher
than average crime rate.
Parkdale is an older community with mixed commercial and
residential use located in the south west area of Toronto. It is
characterized by a higher than average proportion of elderly
residents, various ethnic and racial groups and both long term
established families and a transient rooming house population. A
high proportion of mental health outpatients also live in the
area as a result of recent deinstitutionalization policies.
8
METHODOLOGY AND ANALYSIS
A comprehensive questionnaire was jointly developed and
tested by the Ministry of the Solicitor General of Canada and by
the Metro Toronto Police in order to capture distinctive com-
munity attitudes, experiences, perceptions and expectations
regarding various community and policing issues (see User Report
No. 1, Murphy and de Verteuil, 1986).
Interviews were conducted by telephone by Consumer Contact
Ltd. Three separate random samples were drawn for the study, one
from each target community, and a third "control" sample repre-
senting city-wide Metro Toronto. The samples were generated by
random selection of telephone numbers of households in each area.
Within each contacted household, a respondent was chosen accord-
ing to a formula which allowed for the determination of a
representative cross section of the actual composition of each
neighbourhood. The final sample sizes achieved were 466 in Metro
Toronto, 458 in Parkdale and 441 in Jane-Finch. Sample sizes of
this magnitude enable responses to a dichotomous variable to be
accurate to within 5% or a 95% confidence interval.
Where appropriate, the significance of the differences in
the distribution is also presented - significant levels of .05 or
better are denoted by one asterisk (*)•
9
10
POLICE AND POLICING INDICATORS
The focus the analysis concentrates on the responses to
questions regarding public attitudes towards the police. The
questions addressed the following indicators: 1). public
perception of police community relations; 2). perception of the
need to improve police services in one's own neighbourhood; and
3). evaluation of police performance on the following:
(i) how well the police enforce the laws;
(ii) promptness in answering calls;
(iii) approachability of the police;
(iv) police delivery of crime 'prevention information to the
public.
The following analysis simply presents the findings with
appropriate tables. There has been a limited attempt to address
on the policy or policing implications of the findings. The
development and identification of appropriate policing strategies
must take into account not only the survey findings, but also the
in-depth knowledge of these neighbourhoods possessed by the
police and the community, the program resources available to the
police and the level of citizen support for community-based
policing strategies.
AGE AND ATTITUDES AND PERCEPTION OF POLICE
Studies of citizen attitudes toward the police consistently
demonstrate that the age of the respondent has a significant
impact on their attitudes. Most surveys reveal that older
respondents tend to have more positive view of the police than
younger respondents. Garofalo's (1976) comprehensive U.S. study
of citizen attitudes towards the police found that older residen-
ts rated the police more favorably than younger residents (15-25)
on a variety of questions. These results have been substantiated
by other studies using various indicators of attitudes towards
police (Hadar and Snortum,1975; Smith,1984; Flanagan,
1985; Gomme,1986).
In Canada, a study by Koenig (1980) of British Columbia
residents, found a similar relationship between age and police
ratings. Brillon's (1984) study of Canadian attitudes towards
police found that respondents under the age of thirty-one were
the age group most inclined to be critical of the police.
In order to examine the relationship between age and respon-
dents' assessment of police in Toronto, an analysis of the
responses to three questions regarding attitudes toward police
were analyzed in relation to age variation.
1 1
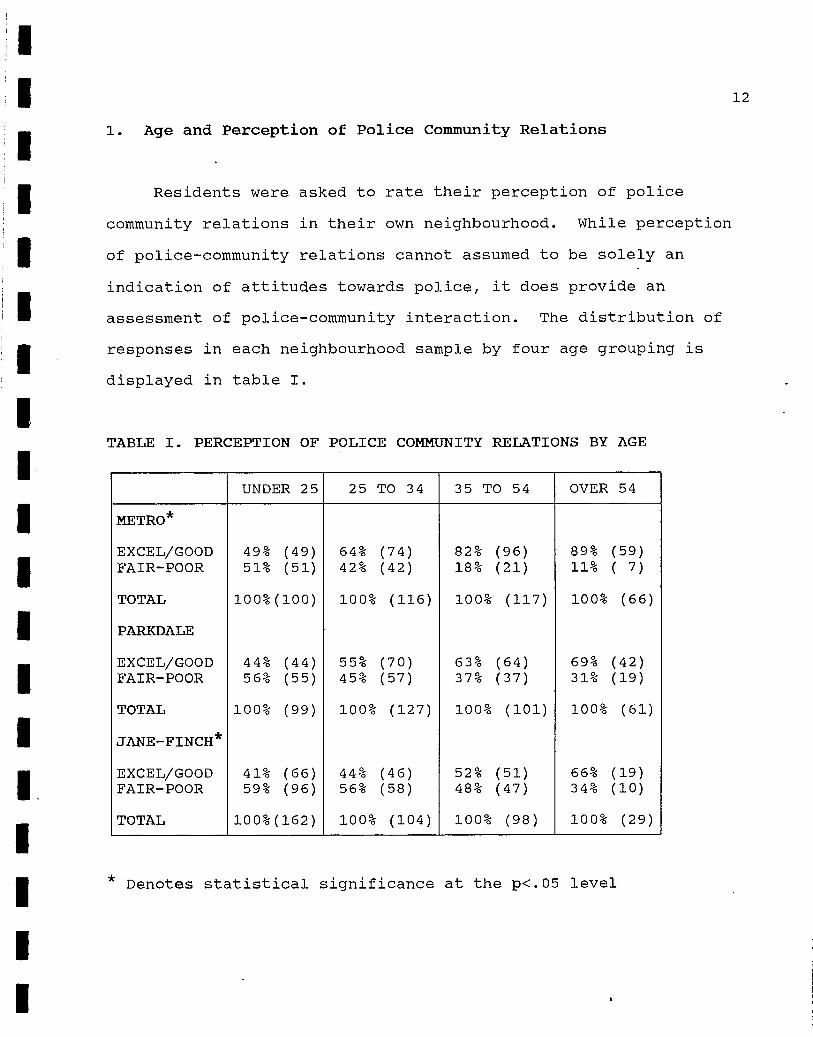
1. Age and Perception of Police Community Relations
Residents were asked to rate their perception of police
community relations in their own neighbourhood. While perception
of police-community relations cannot assumed to be solely an
indication of attitudes towards police, it does provide an
assessment of police-community interaction. The distribution of
responses in each neighbourhood sample by four age grouping is
displayed in table I.
TABLE I. PERCEPTION OF POLICE COMMUNITY RELATIONS BY AGE
UNDER 25 25 TO 34 35 TO 54 OVER 54
METRO*
EXCEL/GOOD 49% (49) 64% (74) 82% (96) 89% (59) FAIR-POOR 51% (51) 42% (42) 18% (21) 11% ( 7)
TOTAL 100%(100) 100% (116) 100% (117) 100% (66)
PARKDALE
EXCEL/GOOD 44% (44) 55% (70) 63% (64) 69% (42) FAIR-POOR 56% (55) 45% (57) 37% (37) 31% (19)
TOTAL 100% (99) 100% (127) 100% (101) 100% (61)
JANE-FINCH*
EXCEL/GOOD 41% (66) 44% (46) 52% (51) 66% (19) FAIR-POOR 59% (96) 56% (58) 48% (47) 34% (10)
TOTAL 100%(162) 100% (104) 100% (98) 100% (29)
Denotes statistical significance at the p<.05 level
The general finding from table one supports clearly the
hypothesized relationship between age and positive assessment of
police. In all three community samples, positive ratings of
police community relations increase with each successive age
group. The contrast is particularly evident when the responses
for the under 25 age group are compared to the responses of the
54 and over age group. The differences for each of the three
sample groups were found to be statistically significant (p<.05).
Of particular note are the age related variations in the
Metro sample, where 52% of those under 25, compared to 10% of the
over 54 group, said police-community relations are fair or poor.
Respondents under 25 are more likely to give similar poor or fair
ratings irrespective of the neighbourhood sample. This suggests
that, in general, youth and negative perceptions of police-
community relations are consistent despite neighbourhood dif-
ferences.
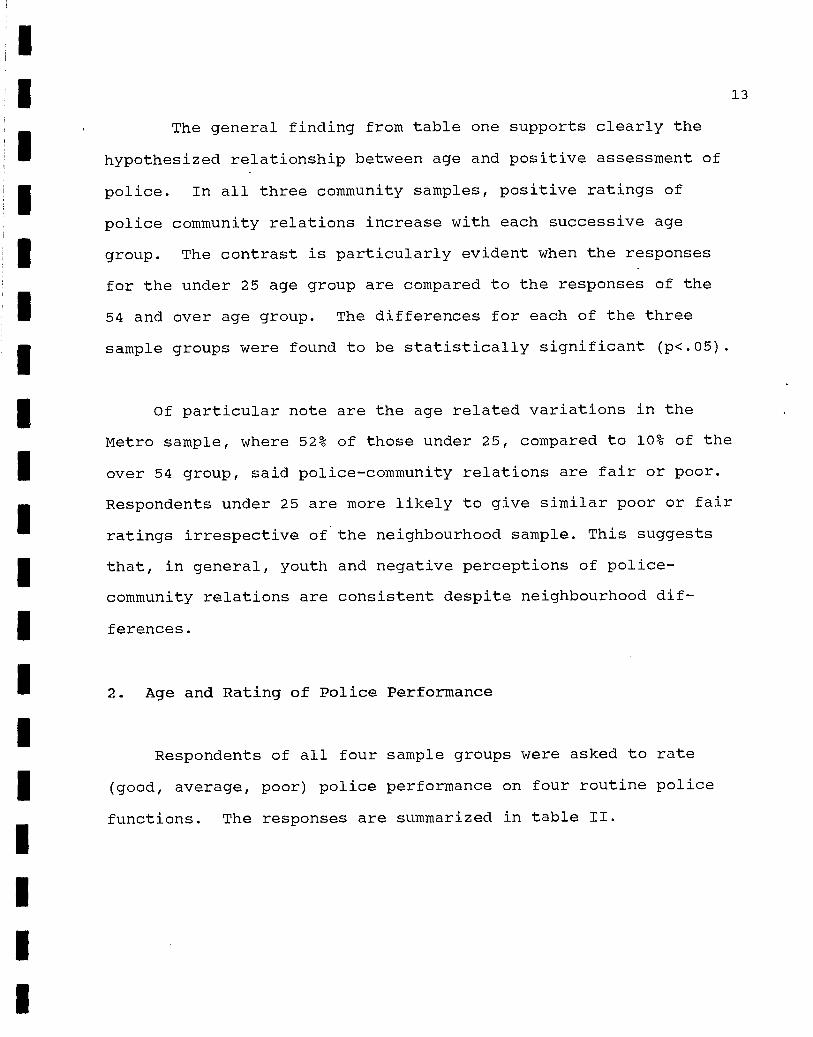
2. Age and Rating of Police Performance
Respondents of all four sample groups were asked to rate
(good, average, poor) police performance on four routine police
functions. The responses are summarized in table II.
13
1 1
1
1 1
1
14
TABLE II. PROPORTION RATING POLICE PERFORMANCE 'FAVORABLY' BY AGE1
UNDER 24 25 TO 34 35 TO 54 OVER 54
POLICE ENFORCING THE LAW
METRO * 60% (59) 71% (85) 77% (95) 82% (62) PARKDALE 57% (58) 61% (84) 71% (75) 70% (49) JANE-FINCH* 46% (74) 62% (71) 70% (66) 88% (30)
POLICE PROMPTNESS
METRO * 58% (49) 72% (74) 77% (91) 82% (60) PARKDALE 55% (48) 58% (67) 73% (69) 68% (45) JANE-FINCH * 51% (70) 62% (58) 72% (62) 89% (24)
POLICE APPROACHABILITY
METRO* 66% (61) 73% (82) 84% (97) 86% (61) PARKDALE 70% (68) 72% (95) 73% (77) 74% (53) JANE-FINCH * 56% (81) 72% (75) 74% (67) 85% (29)
Denotes statistical significance at the p<.05 level
1 Table II only displays 'good' responses
The pattern of responses displayed in table II illustrates
clearly the impact of age on ratings of police performance. On
all three task areas (with the exception of Parkdale), the older
the age grouping the more positive the rating of police perfor-
mance.
Of particular interest, is that variation between age groups
is more dramatic in the general Metro sample than in the two
neighbourhood samples. This is in part explained by the sig-
1
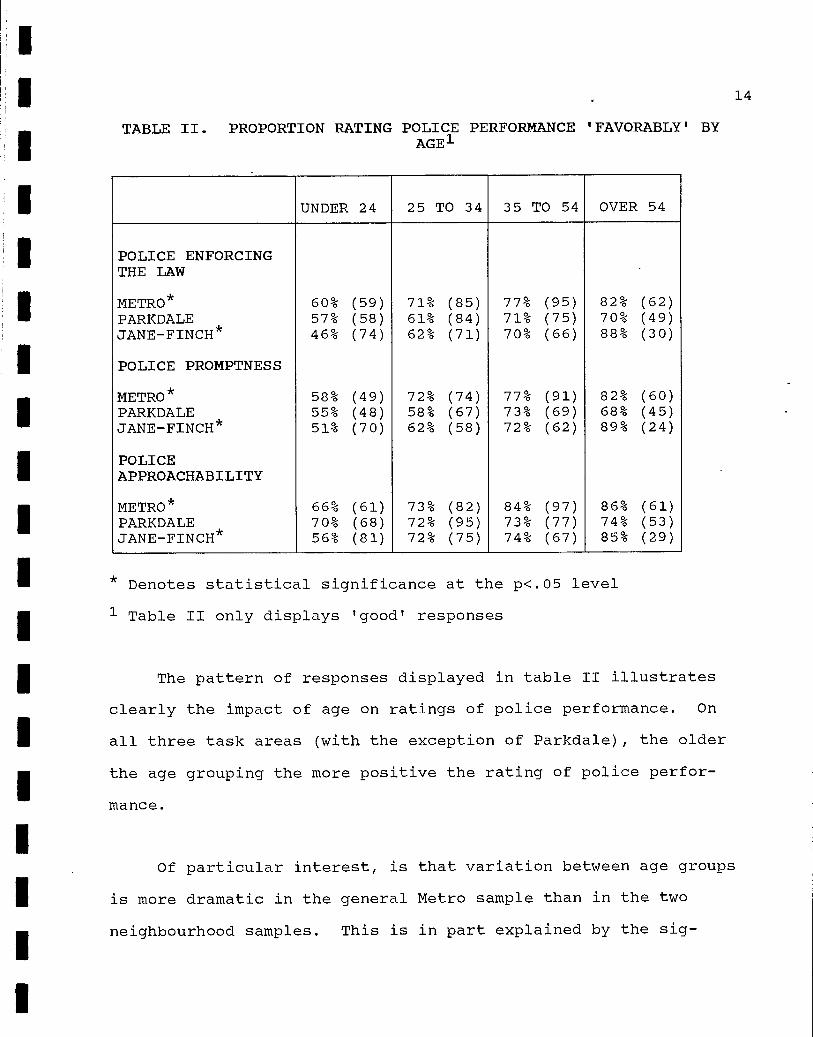
I I I I I I I I 1
nificantly lower ratings accorded police performance in these two
neighbourhoods by all age groups. However, the pattern of
variation within these communities remains consistent with the
general age rating hypothesis.
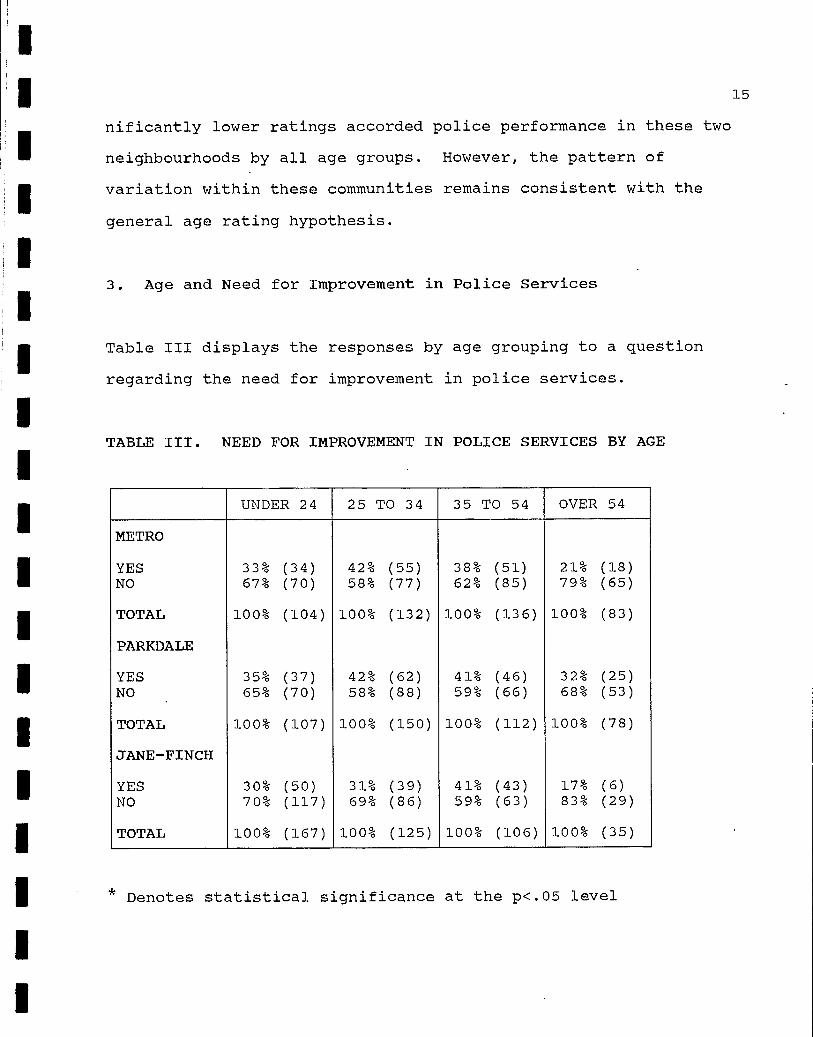
3. Age and Need for Improvement in Police Services
Table III displays the responses by age grouping to a question
regarding the need for improvement in police services.
TABLE III. NEED FOR IMPROVEMENT IN POLICE SERVICES BY AGE
15
I I
UNDER 24 25 TO 34 35 TO 54 OVER 54
METRO
YES 33% (34) 42% (55) 38% (51) 21% (18) NO 67% (70) 58% (77) 62% (85) 79% (65)
TOTAL 100% (104) 100% (132) 100% (136) 100% (83)
PARKDALE
YES 35% (37) 42% (62) 41% (46) 32% (25) NO 65% (70) 58% (88) 59% (66) 68% (53)
TOTAL 100% (107) 100% (150) 100% (112) 100% (78)
JANE-FINCH
YES 30% (50) 31% (39) 41% (43) 17% (6) NO 70% (117) 69% (86) 59% (63) 83% (29)
TOTAL 100% (167) 100% (125) 100% (106) 100% (35)
* Denotes statistical significance at the p<.05 level
I
16
The results in Table III are inconsistent and not statisti-
cally significant. However, the over 54 age group is the least
likely to see a need for improvement in police services in all
three samples.
CONCLUSION
The results of our analysis provide mixed support for the
findings of other studies of age variation and citizen attitudes
towards the police. In general, the older the age grouping the
more positive the evaluation of the police. These findings were
consistent for all three indicators of public attitudes to police
and in most cases the differences were statistically significant.
17
SEX AND ATTITUDES TOWARD THE POLICE
Surveys which have examined the impact of sexual identity on
attitudes toward the police have concluded that sex based
variation is not a powerful predictor of attitudes towards the
police. Winfree and Griffiths' (1971) study of adolescent
attitudes toward the police, and Campbell and Schuman's (1972)
research on inter-racial perceptions of police found that sex
accounted for very little attitude variation. In addition,
Garofalo's (1977) research found no significant differences
between males and female respondents in their evaluation of
police performance. However, a Canadian study by Kleih et.al .
(1977) which examined public experiences with the police dis-
covered that males tended to be less satisfied with police
performance than females.
In order to facilitate analysis of the Toronto data with
regard to the relationship between gender and respondent evalua-
tion of the police, survey responses to the three questions used
as indicators of citizen attitudes toward the police, were
analyzed by sexual identity.
18
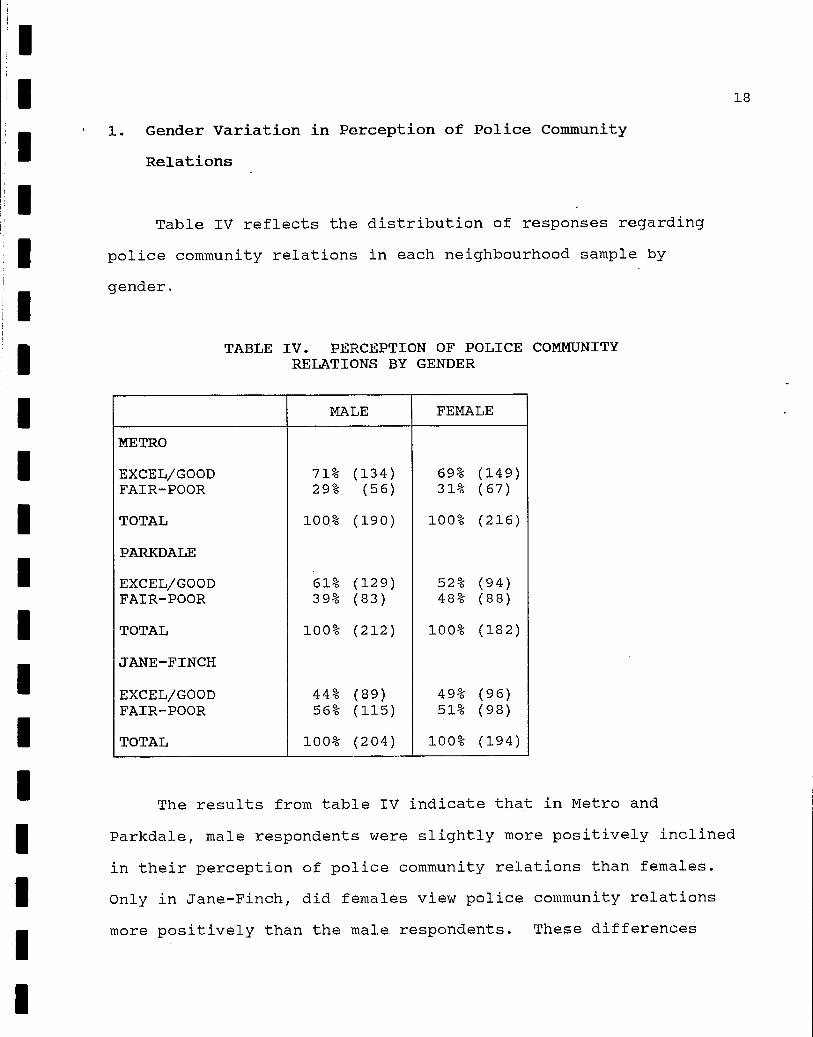
1. Gender Variation in Perception of Police Community
Relations
Table IV reflects the distribution of responses regarding
police community relations in each neighbourhood sample by
gender.
TABLE IV. PERCEPTION OF POLICE COMMUNITY RELATIONS BY GENDER
MALE FEMALE
METRO
EXCEL/GOOD 71% (134) 69% (149) FAIR-POOR 29% (56) 31% (67)
TOTAL 100% (190) 100% (216)
PARKDALE
EXCEL/GOOD 61% (129) 52% (94) FAIR-POOR 39% (83) 48% (88)
TOTAL 100% (212) 100% (182)
JANE-FINCH
EXCEL/GOOD 44% (89) 49% (96) FAIR-POOR 56% (115) 51% (98)
TOTAL 100% (204) 100% (194)
The results from table IV indicate that in Metro and
Parkdale, male respondents were slightly more positively inclined
in their perception of police community relations than females.
Only in Jane-Finch, did females view police community relations
more positively than the male respondents. These differences
1
1 1 1 1 1 1 1
were not statistically significant at the .05 level.
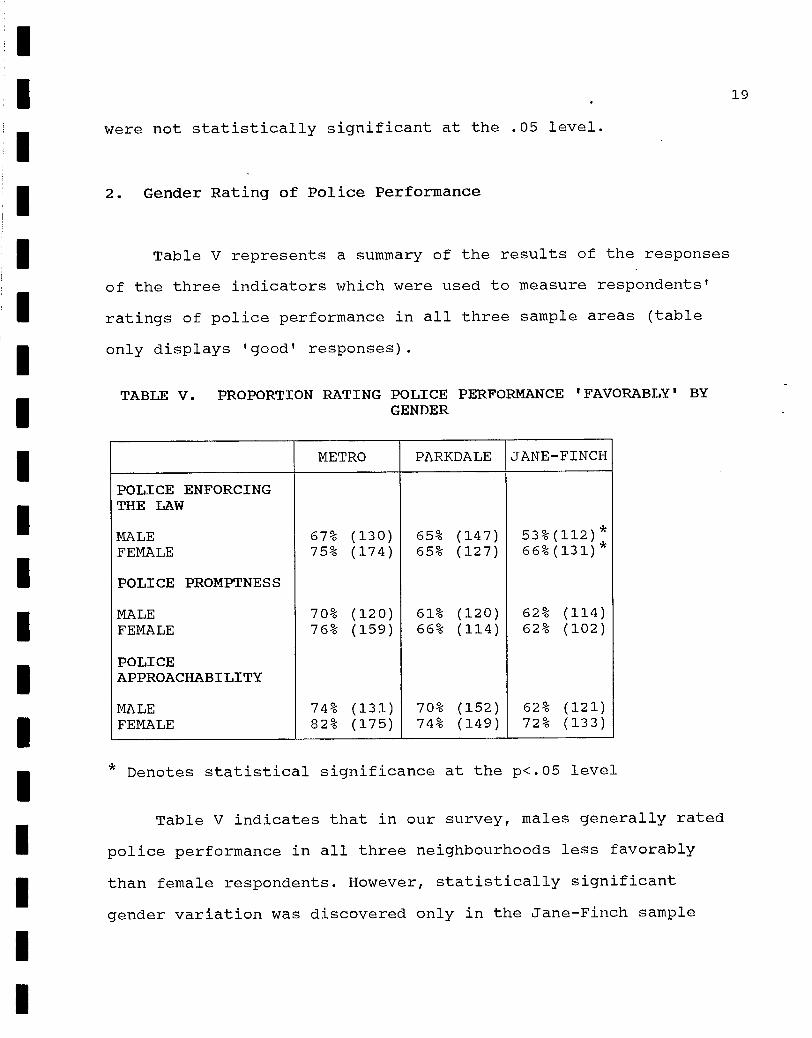
2. Gender Rating of Police Performance
Table V represents a summary of the results of the responses
of the three indicators which were used to measure respondents'
ratings of police performance in all three sample areas (table
only displays 'good' responses).
TABLE V. PROPORTION RATING POLICE PERFORMANCE 'FAVORABLY' BY GENDER
METRO PARKDALE JANE-FINCH
POLICE ENFORCING THE LAW
MALE 67% (130) 65% (147) 53%(112) * FEMALE 75% (174) 65% (127) 66%(131) *
POLICE PROMPTNESS
MALE 70% (120) 61% (120) 62% (114) FEMALE 76% (159) 66% (114) 62% (102)
POLICE APPROACHABILITY
MALE 74% (131) 70% (152) 62% (121) FEMALE 82% (175) 74% (149) 72% (133)
Denotes statistical significance at the p<.05 level
Table V indicates that in our survey, males generally rated
police performance in all three neighbourhoods less favorably
than female respondents. However, statistically significant
gender variation was discovered only in the Jane -Finch sample
19
(p<.05), where male respondents in rated police performance on
enforcing the law significantly lower than female respondents.
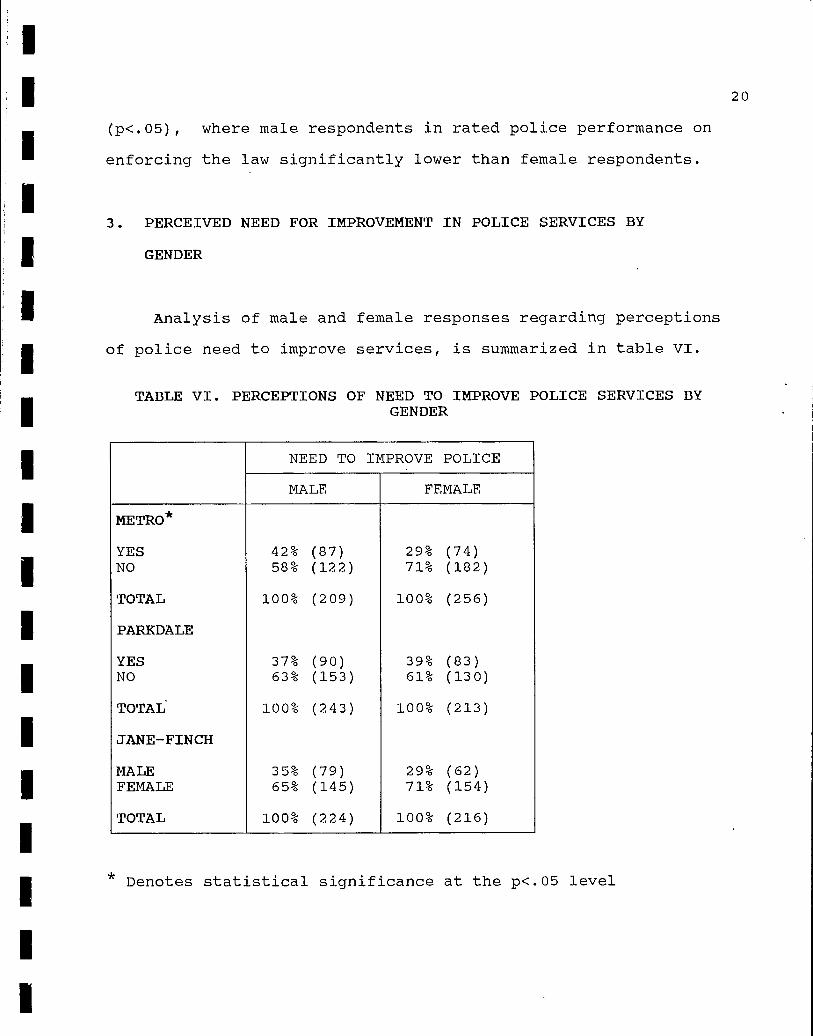
3. PERCEIVED NEED FOR IMPROVEMENT IN POLICE SERVICES BY
GENDER
Analysis of male and female responses regarding perceptions
of police need to improve services, is summarized in table VI.
TABLE VI. PERCEPTIONS OF NEED TO IMPROVE POLICE SERVICES BY GENDER
NEED TO IMPROVE POLICE
MALE FEMALE
METRO*
YES 42% (87) 29% (74) NO 58% (122) 71% (182)
TOTAL 100% (209) 100% (256)
PARKDALE
YES 37% (90) 39% (83) NO 63% (153) 61% (130)
TOTAL 100% (243) 100% (213)
JANE-FINCH
MALE 35% (79) 29% (62) FEMALE 65% (145) 71% (154)
TOTAL 100% (224) 100% (216)
20
Denotes statistical significance at the p<.05 level
Table VI illustrates that more male than female
respondents in Metro and Jane-Finch indicate a need to improve
police services. This difference was statistically significant
only for Metropolitan Toronto sample where 42% of the males as
opposed to only 29% of the females said that the local police
needed to improve their services.
CONCLUSION
The results of our survey analysis suggest that overall,
males tend to have slightly less favorable attitudes towards the
police than females. However, the lack of consistent statisti-
cal significance indicates that sex based variation is not a
strong predictor of citizen attitudes towards police. The
findings are consistent with the results of both Canadian (Kleih
et.a1.1977), and American survey research (Garofalo,1977).
21
22
ETHNICITY AND ATTITUDES TOWARDS THE POLICE
The city of Toronto is characterized by a rich mixture
of different ethnic and cultural groups. Citizens of these
ethnic communities have for a variety of reasons often located in
distinct neighbourhoods throughout Toronto. Given their dif-
ferent historical and cultural backgrounds and experiences with
crime and police it was hypothesized that ethnic affiliation may
have an impact on individual attitudes and perceptions of local
police.
Previous studies have looked at both race and ethnicity as a
predictor of attitudes towards the police. The majority of U.S.
studies have focused primarily on the issue of race and compared
black and white attitudes towards police. These studies indicate
significant differences between black and white attitudes towards
police, with blacks generally holding less favorable attitudes
than whites (Skogan & Maxfield,1981; Skogan,1979; Garofalo,1977;
Hyman & Thomas,1977; Campbell & Schuman,1972).
In Canada, ethnicity rather than race has been the focus of
most empirical studies. Koenig (1974) in a study of British
Columbian residents discovered that while the police were
generally favorably evaluated, certain ethnic minorities (such
as native peoples, French Canadians, and Chinese Canadians) were
more likely than the rest of the population to hold unfavorable
23
opinions of the police. Skoog and Boldt (1980), in a comparative
study of native and white attitudes toward the police, concluded
that ethnicity seems to be a consequential "intervening variable
in the relationship between socio-economic status and attitudes
toward the police." Brillon's (1984) inter-regional study
revealed significant differences between French Canadians (23%
not satisfied with the police), and English Canadians or other
ethnic minorities (where only 10% and 11% percent respectively
held similar views).
In order to examine the relationship and impact of neigh-
bourhood ethnic variation on attitudes towards police in Toronto,
responses to the three police attitude indicators were analyzed
according to the ethnic . category indicated by the respondent
during the interview. The results of this analysis are indi-
cated below. As ethnic composition varies in the three survey
samples, analysis of the data will focus on neighbourhood
ethnicity and attitudes toward the police.
1. Metro: Ethnicity and Attitudes and Perceptions of Police
An analysis of the response data in Metro and consideration
of adequate sample representation identified the following ethnic
groups as statistically most prevalent in the Metro sample:
Caribbean, East Indian, Anglo-Celtic, Italian, North and East
European. The responses to all three indicators of attitudes
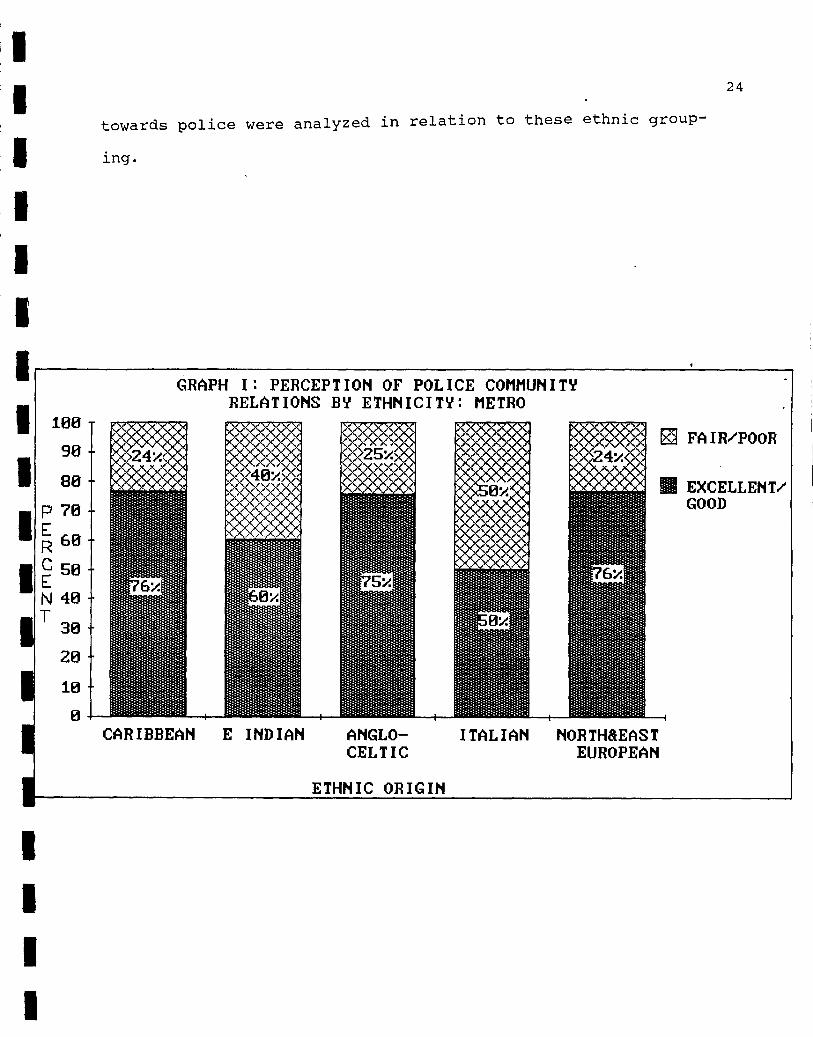
1 24
towards police were analyzed in relation to these ethnic group-
ing.
GRAPH I: PERCEPTION OF POLICE COMMUNITY RELATIONS BY ETHNICITY: METRO
11Graph I indicates significant variation (p<01) between
ethnic groups and rating of police community relations. The
groups that are most likely to perceive police community rela-
tions as excellent or good are those of Anglo-Saxon, North and
East European and Caribbean ethnic origins while those of East
Indian or Italian background were more likely to say fair or
poor.
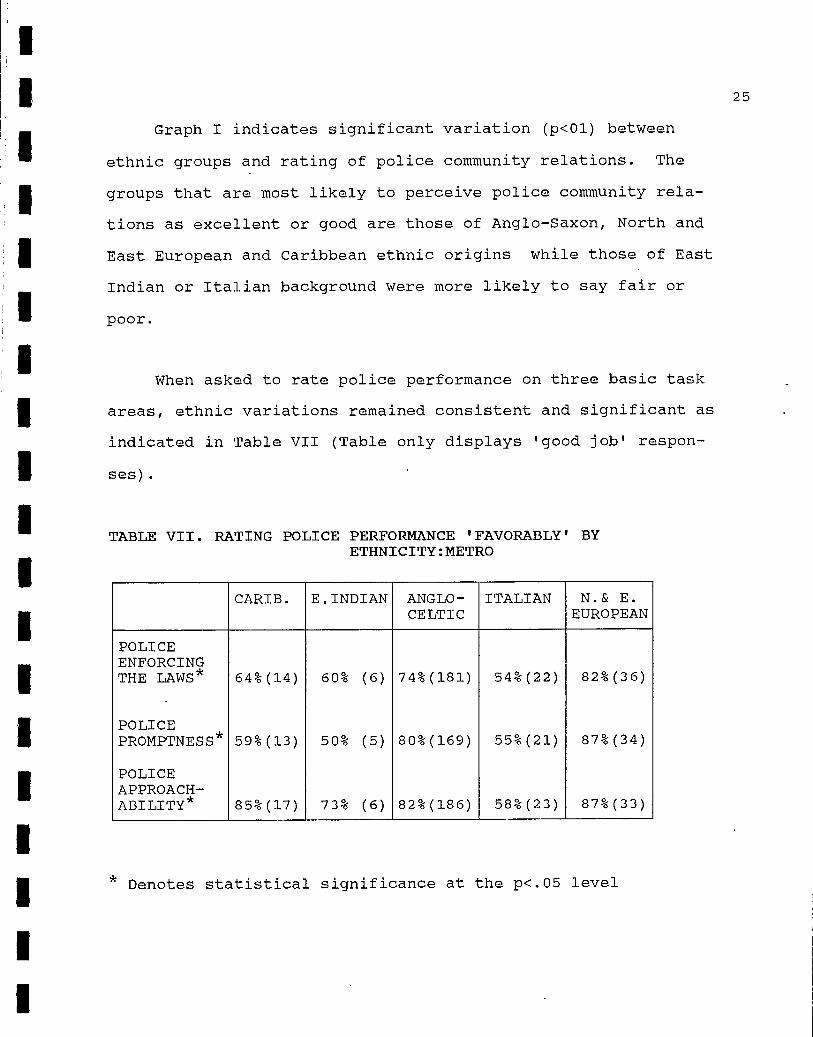
When asked to rate police performance on three basic task
areas, ethnic variations remained consistent and significant as
indicated in Table VII (Table only displays 'good job' respon-
' ses).
TABLE VII. RATING POLICE PERFORMANCE 'FAVORABLY' BY ETHNICITY:METRO
CARIB. E.INDIAN ANGLO- ITALIAN N.& E.
CELTIC EUROPEAN
POLICE ENFORCING THE LAWS * 64%(14) 60% (6) 74%(181) 54%(22) 82%(36)
POLICE PROMPTNESS * 59%(13) 50% (5) 80%(169) 55%(21) 87%(34)
POLICE APPROACH- ABILITY * 85%(17) 73% (6) 82%(186) 58%(23) 87%(33)
Denotes statistical significance at the p<.05 level
1 1 1
a 1
1 1 1
1
1 1
Table VII indicates that once again respondents of European,
Anglo-Celtic and Caribbean origin tend to evaluate police
performance more positively than Italian or East Indian respon-
dents. These differences were statistically significant.
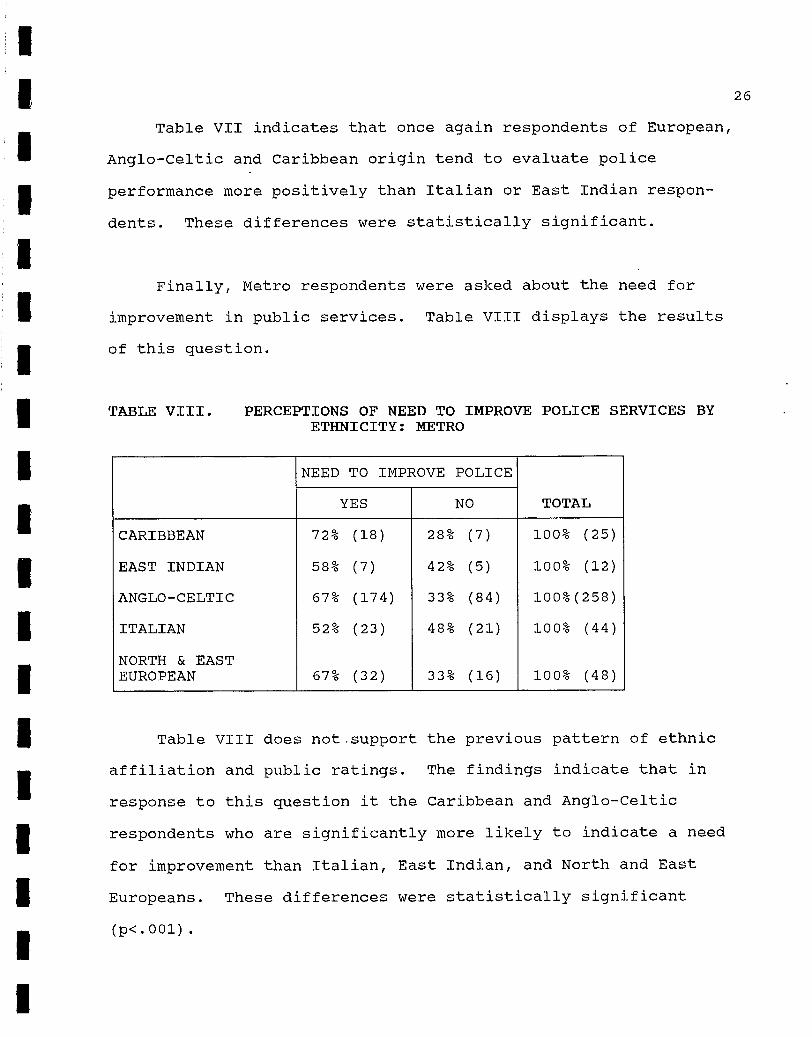
Finally, Metro respondents were asked about the need for
improvement in public services. Table VIII displays the results
of this question.
TABLE VIII. PERCEPTIONS OF NEED TO IMPROVE POLICE SERVICES BY ETHNICITY: METRO
NEED TO IMPROVE POLICE
YES NO TOTAL
CARIBBEAN 72% (18) 28% (7) 100% (25)
EAST INDIAN 58% (7) 42% (5) 100% (12)
ANGLO-CELTIC 67% (174) 33% (84) 100%(258)
ITALIAN 52% (23) 48% (21) 100% (44)
NORTH & EAST EUROPEAN 67% (32) 33% (16) 100% (48)
Table VIII does not.support the previous pattern of ethnic
affiliation and public ratings. The findings indicate that in
response to this question it the Caribbean and Anglo-Celtic
respondents who are significantly more likely to indicate a need
for improvement than Italian, East Indian, and North and East
Europeans. These differences were statistically significant
(p<.001).
26
-0m FAIR/POOR
MI EXCELLENT/ GOOD
› 38m -0m FAIR/POOR
MI EXCELLENT/ GOOD
FAIR/POOR
MI EXCELLENT/ GOOD
per,ln
tilt
CELTIC EUROPEAN
27
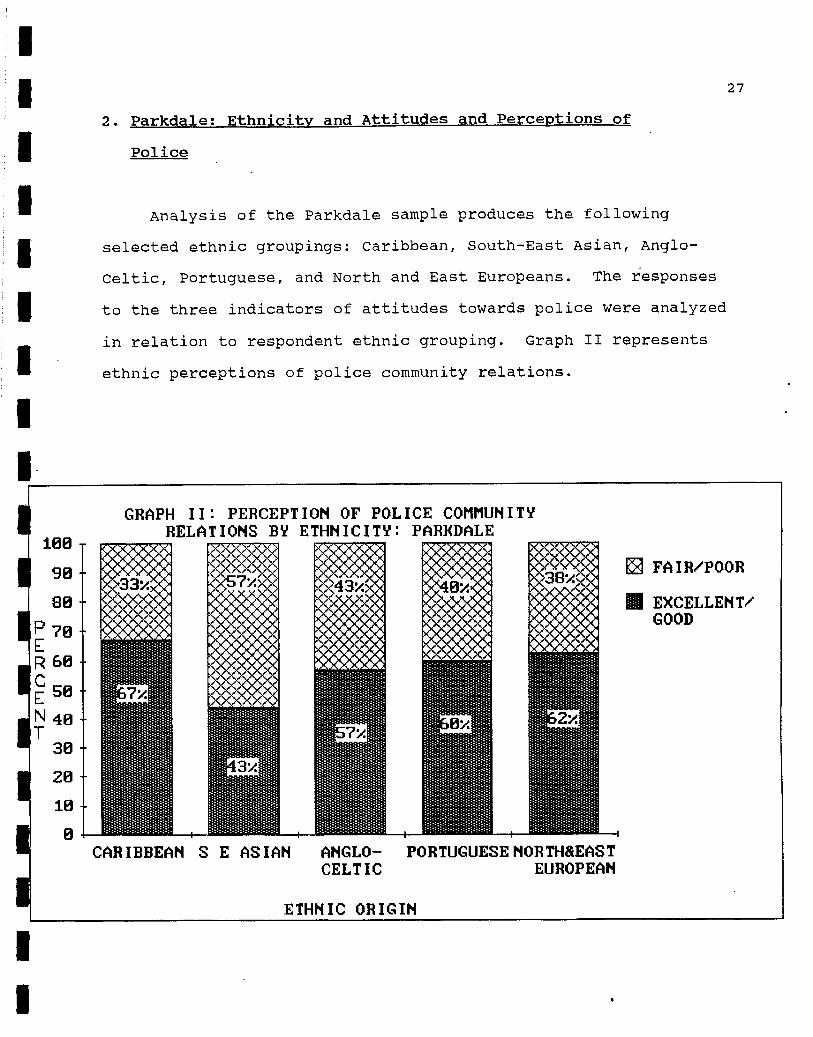
2. Parkdale: Ethnicity and Attitudes and Perceptions of
Police
Analysis of the Parkdale sample produces the following
selected ethnic groupings: Caribbean, South-East Asian, Anglo-
Celtic, Portuguese, and North and East Europeans. The responses
to the three indicators of attitudes towards police were analyzed
in relation to respondent ethnic grouping. Graph II represents
ethnic perceptions of police community relations.
GRAPH II: PERCEPTION OF POLICE COMMUNITY RELATIONS BY ETHNICITY: PAREDALE
100
90 -
80 -
P 70 - E R 68 - C E 50 -
N 40 - T
30 -
20
10 -
0 CARIBBEAN S E ASIAN ANGLO- PORTUGUESENORTH&EAST
ETHNIC ORIGIN
1
1 1
1
28
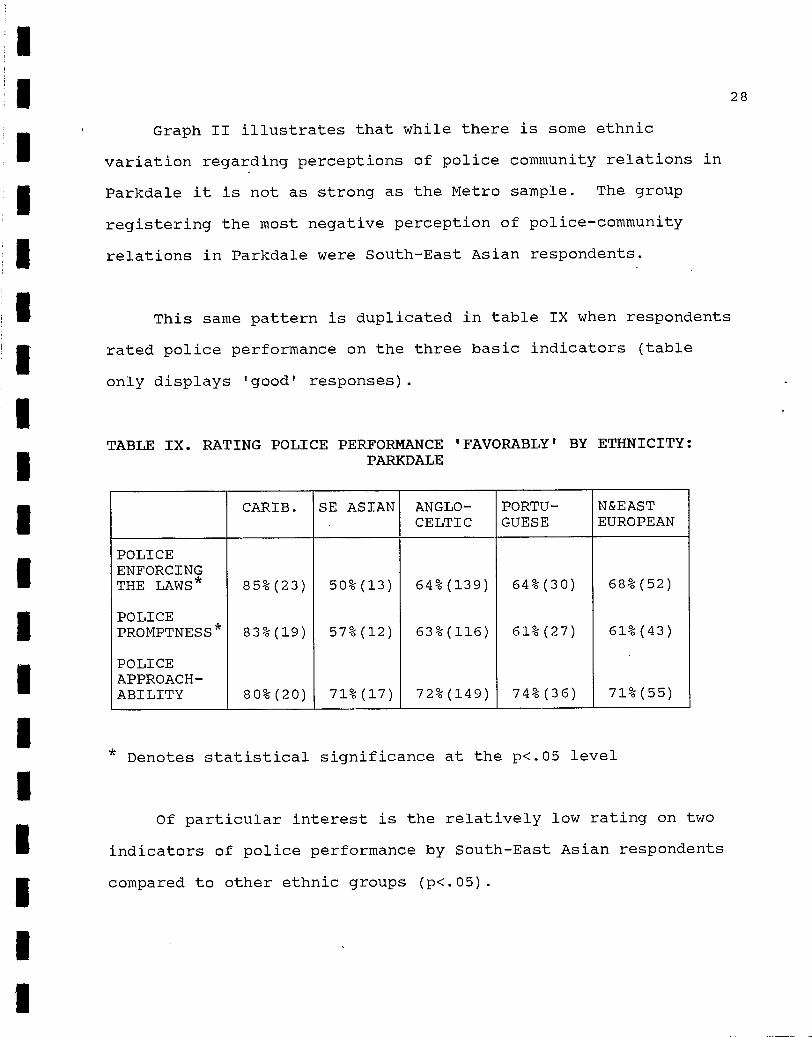
Graph II illustrates that while there is some ethnic
variation regarding perceptions of police community relations in
Parkdale it is not as strong as the Metro sample. The group
registering the most negative perception of police-community
relations in Parkdale were South-East Asian respondents.
This same pattern is duplicated in table IX when respondents
rated police performance on the three basic indicators (table
only displays 'good responses).
TABLE IX. RATING POLICE PERFORMANCE 'FAVORABLY' BY ETHNICITY: PARKDALE
CARIB. SE ASIAN ANGLO- PORTU- N&EAST CELTIC GUESE EUROPEAN
POLICE ENFORCING THE LAWS * 85%(23) 50%(13) 64%(139) 64%(30) 68%(52)
POLICE PROMPTNESS * 83%(19) 57%(12) 63%(116) 61%(27) 61%(43)
POLICE APPROACH- ABILITY 80%(20) 71%(17) 72%(149) 74%(36) 71%(55)
Denotes statistical significance at the p<.05 level
1 Of particular interest is the relatively low rating on two
indicators of police performance by South-East Asian respondents
compared to other ethnic groups (p<.05).
1
1
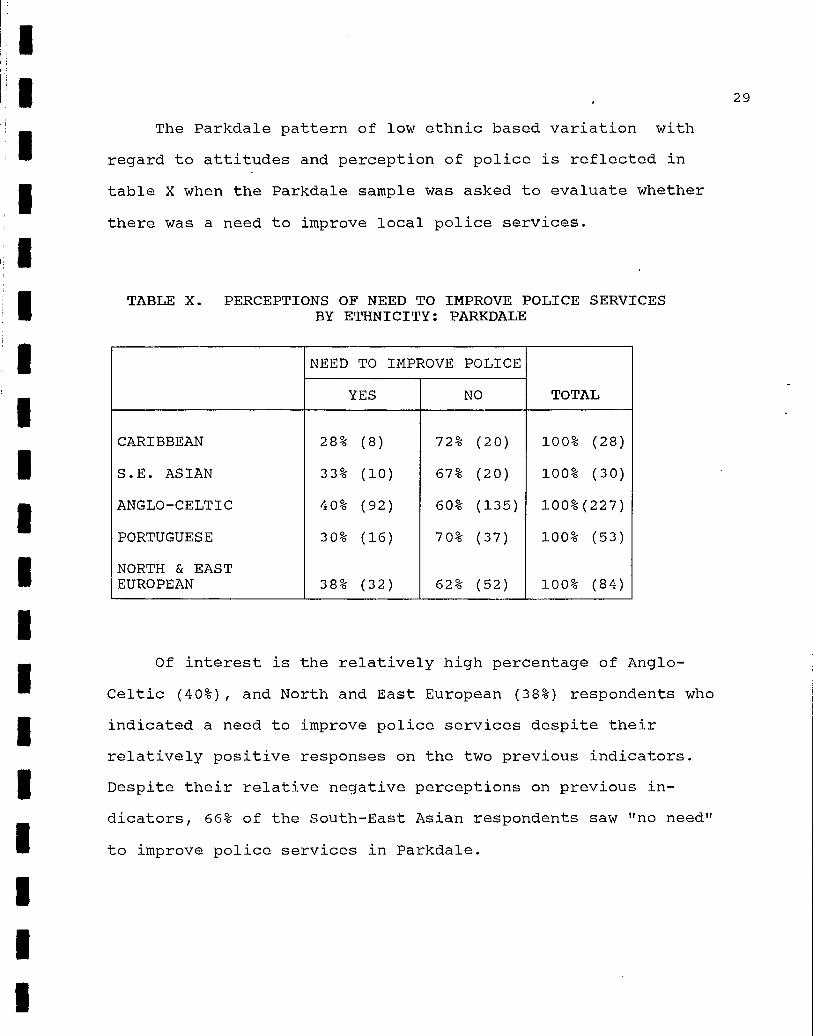
The Parkdale pattern of low ethnic based variation with
regard to attitudes and perception of police is reflected in
table X when the Parkdale sample was asked to evaluate whether
there was a need to improve local police services.
TABLE X. PERCEPTIONS OF NEED TO IMPROVE POLICE SERVICES BY ETHNICITY: PARKDALE
NEED TO IMPROVE POLICE
YES NO TOTAL
CARIBBEAN 28% (8) 72% (20) 100% (28)
S.E. ASIAN 33% (10) 67% (20) 100% (30)
ANGLO-CELTIC 40% (92) 60% (135) 100%(227)
PORTUGUESE 30% (16) 70% (37) 100% (53)
NORTH & EAST EUROPEAN 38% (32) 62% (52) 100% (84)
Of interest is the relatively high percentage of Anglo-
Celtic (40%), and North and East European (38%) respondents who
indicated a need to improve police services despite their
relatively positive responses on the two previous indicators.
Despite their relative negative perceptions on previous in-
dicators, 66% of the South-East Asian respondents saw "no need"
to improve police services in Parkdale.
29
30
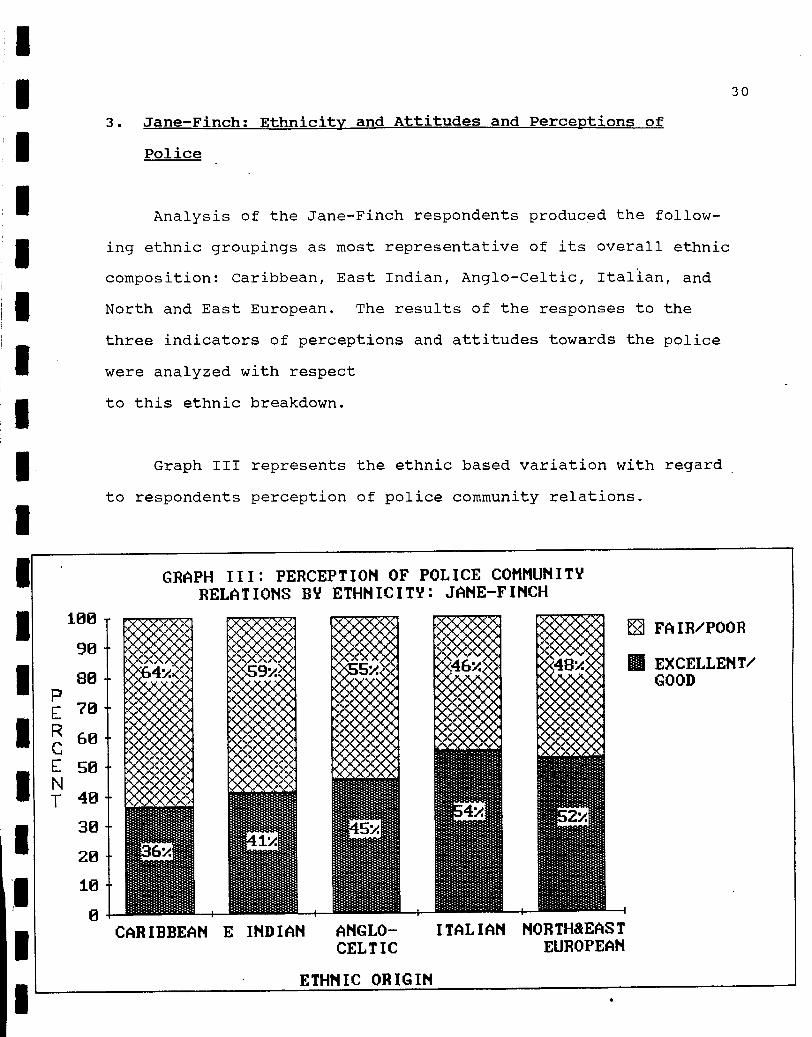
3. Jane-Finch: Ethnicity and Attitudes and Perceptions of
Police
Analysis of the Jane-Finch respondents produced the follow-
ing ethnic groupings as most representative of its overall ethnic
composition: Caribbean, East Indian, Anglo-Celtic, Italian, and
North and East European. The results of the responses to the
three indicators of perceptions and attitudes towards the police
were analyzed with respect
to this ethnic breakdown.
Graph III represents the ethnic based variation with regard
to respondents perception of police community relations.
1
GRAPH III: PERCEPTION OF POLICE COMMUNITY RELATIONS BY ETHNICITY: JANE-FINCH
1
1 1 1 1 1 r 1 1 s 1 1
Graph III indicates that Caribbean and East Indians were
more likely than Anglo-Celtic, Italian, and North and East
Europeans to rate police community relations as being poor or
fair. These sample differences were not statistically sig-
nificant overall.
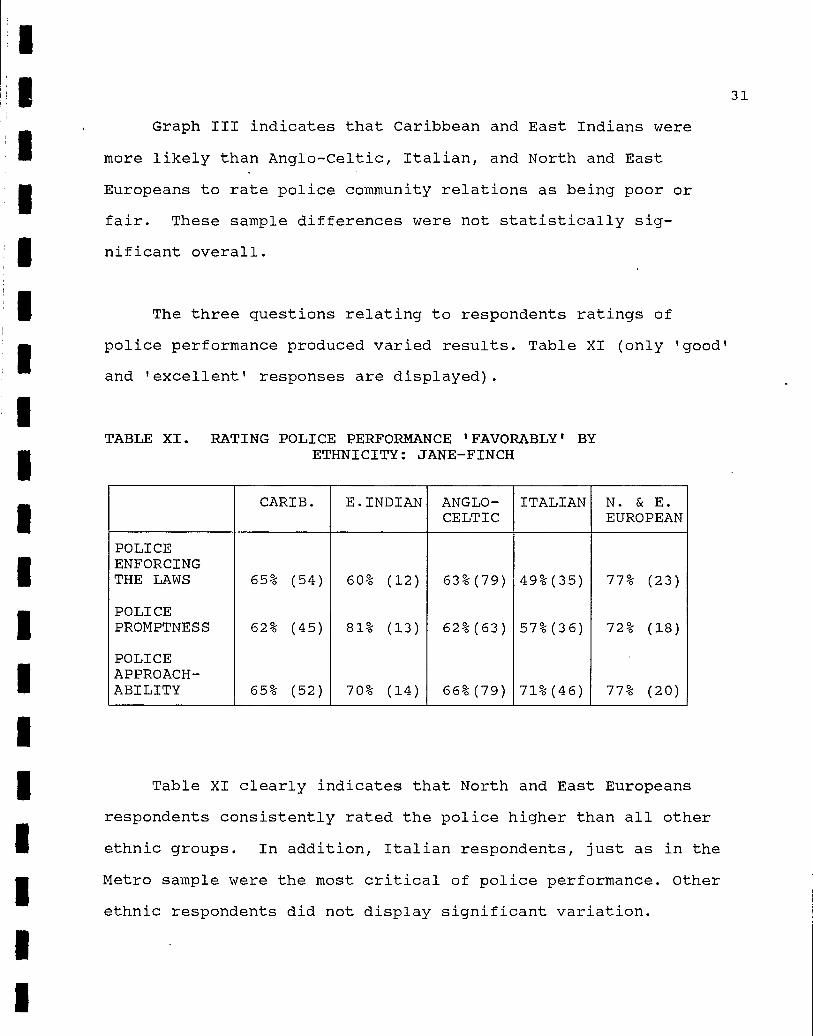
The three questions relating to respondents ratings of
police performance produced varied results. Table XI (only 'good'
and 'excellent' responses are displayed).
TABLE XI. RATING POLICE PERFORMANCE 'FAVORABLY' BY ETHNICITY: JANE-FINCH
CARIB. E.INDIAN ANGLO- ITALIAN N. & E. CELTIC EUROPEAN
POLICE ENFORCING THE LAWS 65% (54) 60% (12) 63%(79) 49%(35) 77% (23)
POLICE PROMPTNESS 62% (45) 81% (13) 62%(63) 57%(36) 72% (18)
POLICE APPROACH- ABILITY 65% (52) 70% (14) 66%(79) 71%(46) 77% (20)
Table XI clearly indicates that North and East Europeans
respondents consistently rated the police higher than all other
ethnic groups. In addition, Italian respondents, just as in the
Metro sample were the most critical of police performance. Other
ethnic respondents did not display significant variation.
31
1
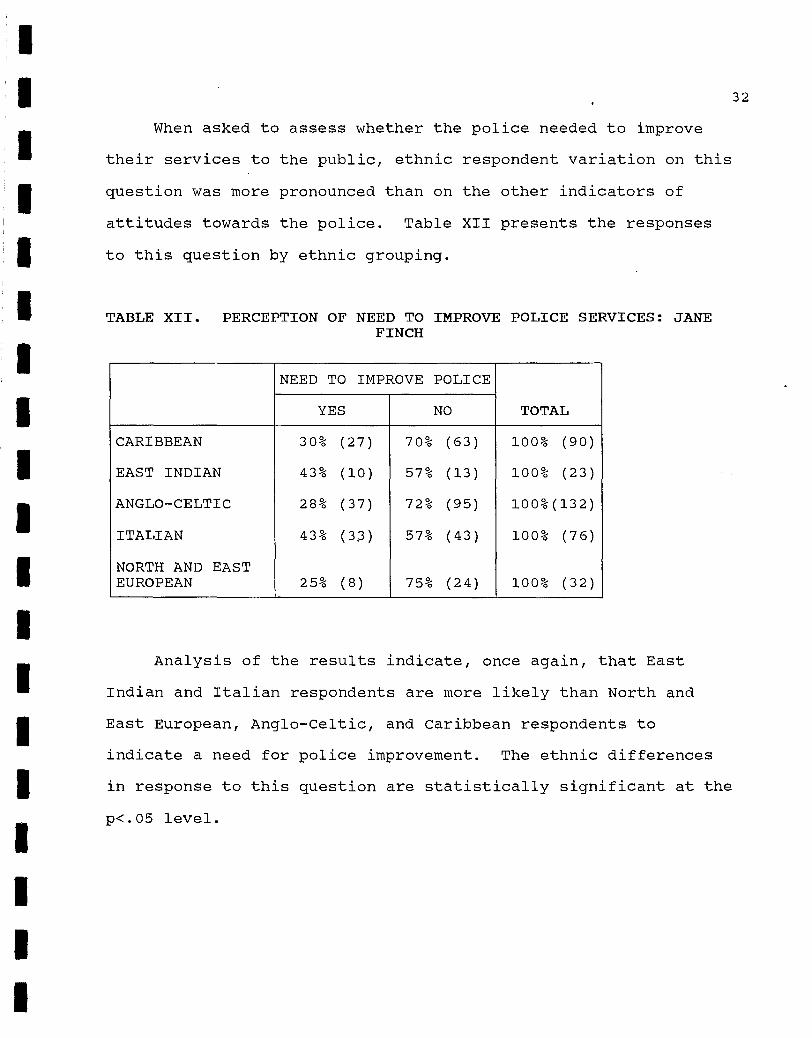
1 When asked to assess whether the police needed to improve
their services to the public, ethnic respondent variation on this
question was more pronounced than on the other indicators of
attitudes towards the police. Table XII presents the responses
to this question by ethnic grouping.
TABLE XII. PERCEPTION OF NEED TO IMPROVE POLICE SERVICES: JANE FINCH
NEED TO IMPROVE POLICE
'LES NO TOTAL
CARIBBEAN 30% (27) 70% (63) 100% (90)
EAST INDIAN 43% (10) 57% (13) 100% (23)
ANGLO-CELTIC 28% (37) 72% (95) 100%(132)
ITALIAN 43% (33) 57% (43) 100% (76)
NORTH AND EAST EUROPEAN 25% (8) 75% (24) 100% (32)
Analysis of the results indicate, once again, that East
Indian and Italian respondents are more likely than North and
East European, Anglo-Celtic, and Caribbean respondents to
indicate a need for police improvement. The ethnic differences
in response to this question are statistically significant at the
p<.05 level.
CONCLUSION
Analysis of the Toronto data indicates that ethnicity does
appear to have an impact on attitudes and perception of police.
Certain ethnic groups in specific neighbourhoods consistently
appear to view the police either more positively or negatively
than other ethnic groups. For example, East and North Europeans,
irrespective of neighbourhood, gave consistently more positive
ratings of police while East Indian and Caribbean and Italian
residents tended to express more critical opinions, but this
varied by neighbourhood. Despite inter-group variations, the
majority of all ethnic groups expressed more positive than
negative attitudes towards the police.
33
PERCEPTION OF NEIGHBOURHOOD CRIME, AND ATTITUDES TOWARDS
POLICE
Residents' perception of their own neighbourhood's crime
rates were examined in relation to their overall attitudes
towards the police. The literature on crime and public at-
titudes tend to view both of these variables as unrelated
(Biderman et.al .,1967; Koenig,1974; Hyman and Thomas,1977).
However, it could be hypothesized that if residents perceived
crime increasing or that crime was particularly high in their own
neighbourhood, this could negatively affect their views or
attitudes towards the police.
Respondent perceptions of neighbourhood crime rates were
sorted according to their response to a question on their rating
of crime in their own neighbourhood (high, medium, and low), and
their evaluations of police performance, police-community
relations, and need for improvement. The following tables (XIII,
XIV, and XV) display the results of the analysis.
34
35
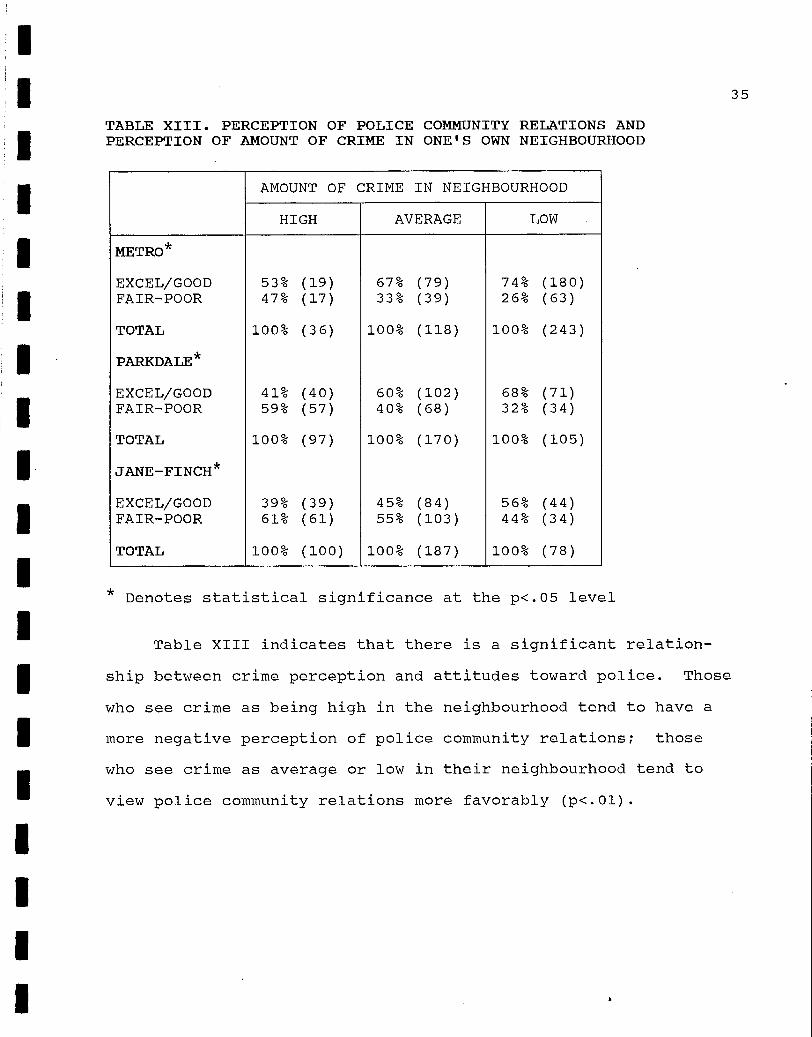
TABLE XIII. PERCEPTION OF POLICE COMMUNITY RELATIONS AND PERCEPTION OF AMOUNT OF CRIME IN ONE'S OWN NEIGHBOURHOOD
AMOUNT OF CRIME IN NEIGHBOURHOOD
HIGH AVERAGE LOW
METRO*
EXCEL/GOOD 53% (19) 67% (79) 74% (180) FAIR-POOR 47% (17) 33% (39) 26% (63)
TOTAL 100% (36) 100% (118) 100% (243)
PARKDALE*
EXCEL/GOOD 41% (40) 60% (102) 68% (71) FAIR-POOR 59% (57) 40% (68) 32% (34)
TOTAL 100% (97) 100% (170) 100% (105)
JANE-FINCH *
EXCEL/GOOD 39% (39) 45% (84) 56% (44) FAIR-POOR 61% (61) 55% (103) 44% (34)
TOTAL 100% (100) 100% (187) 100% (78)
Denotes statistical significance at the p<.05 level
Table XIII indicates that there is a significant relation-
ship between crime perception and attitudes toward police. Those
who see crime as being high in the neighbourhood tend to have a
more negative perception of police community relations; those
who see crime as average or low in their neighbourhood tend to
view police community relations more favorably (p<.01).
36
1
1 1
1
1 1 1
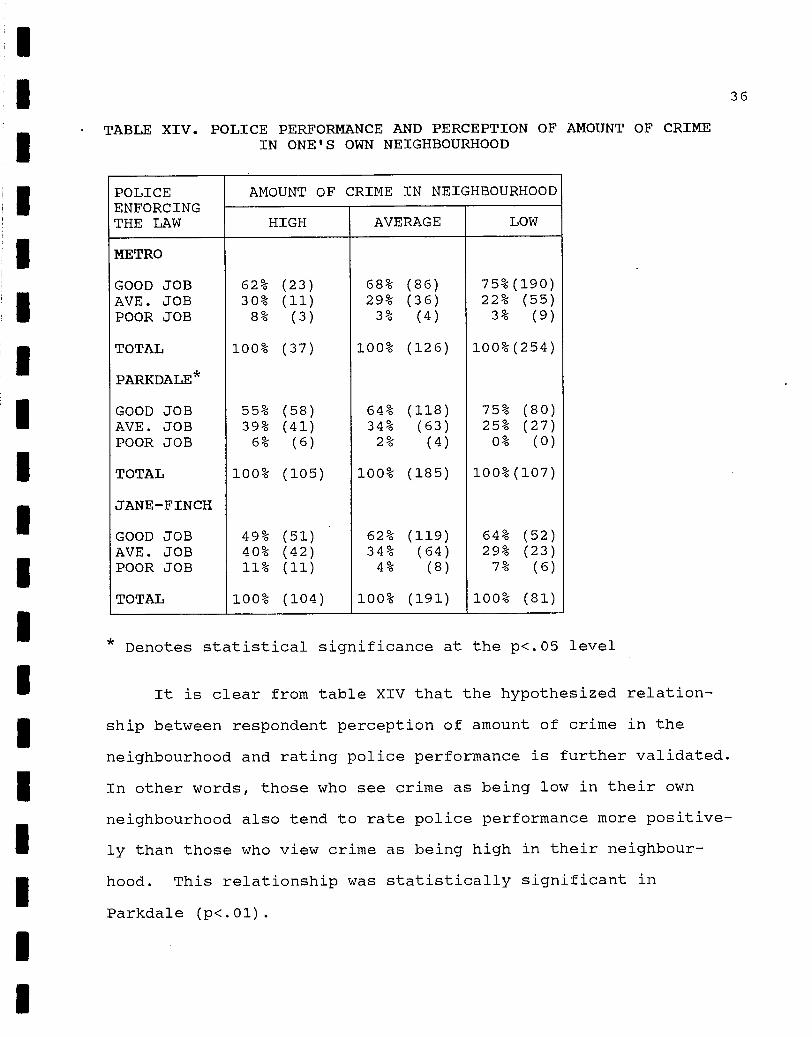
• TABLE XIV. POLICE PERFORMANCE AND PERCEPTION OF AMOUNT OF CRIME IN ONE'S OWN NEIGHBOURHOOD
POLICE AMOUNT OF CRIME IN NEIGHBOURHOOD ENFORCING THE LAW HIGH AVERAGE LOW
METRO
GOOD JOB 62% (23) 68% (86) 75%(190) AVE. JOB 30% (11) 29% (36) 22% (55) POOR JOB 8% (3) 3% (4) 3% (9)
TOTAL 100% (37) 100% (126) 100%(254)
PARKDALE*
GOOD JOB 55% (58) 64% (118) 75% (80) AVE. JOB 39% (41) 34% (63) 25% (27) POOR JOB 6% (6) 2% (4) 0% (0)
TOTAL 100% (105) 100% (185) 100%(107)
JANE-FINCH
GOOD JOB 49% (51) 62% (119) 64% (52) AVE. JOB 40% (42) 34% (64) 29% (23) POOR JOB 11% (11) 4% (8) 7% (6)
TOTAL 100% (104) 100% (191) 100% (81)
Denotes statistical significance at the p<.05 level
It is clear from table XIV that the hypothesized relation-
ship between respondent perception of amount of crime in the
neighbourhood and rating police performance is further validated.
In other words, those who see crime as being low in their own
neighbourhood also tend to rate police performance more positive-
ly than those who view crime as being high in their neighbour-
hood. This relationship was statistically significant in
Parkdale (p<.01).
37
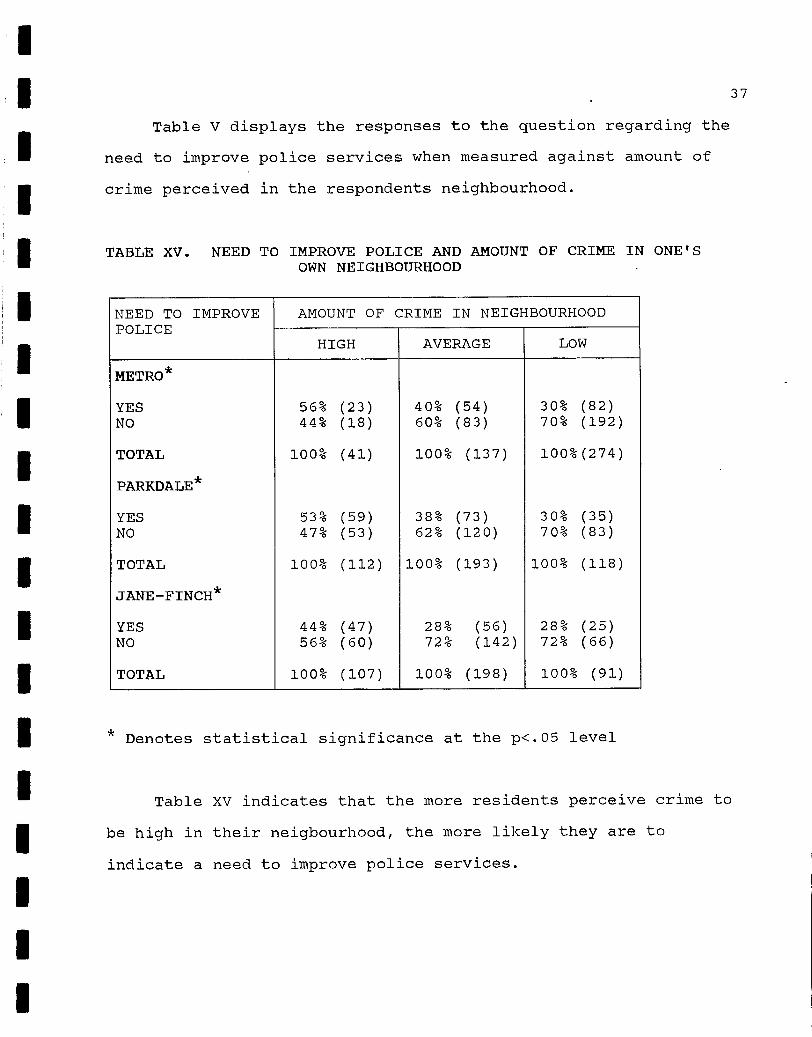
Table V displays the responses to the question regarding the
need to improve police services when measured against amount of
crime perceived in the respondents neighbourhood.
TABLE XV. NEED TO IMPROVE POLICE AND AMOUNT OF CRIME IN ONE'S OWN NEIGHBOURHOOD
NEED TO IMPROVE AMOUNT OF CRIME IN NEIGHBOURHOOD POLICE
HIGH AVERAGE LOW
METRO*
YES 56% (23) 40% (54) 30% (82) NO 44% (18) 60% (83) 70% (192)
TOTAL 100% (41) 100% (137) 100%(274)
PARKDALE*
YES 53% (59) 38% (73) 30% (35) NO 47% (53) 62% (120) 70% (83)
TOTAL 100% (112) 100% (193) 100% (118)
JANE-FINCH*
YES 44% (47) 28% (56) 28% (25) NO 56% (60) 72% (142) 72% (66)
TOTAL 100% (107) 100% (198) 100% (91)
Denotes statistical significance at the p<.05 level
Table XV indicates that the more residents perceive crime to
be high in their neigbourhood, the more likely they are to
indicate a need to improve police services.
38
1. Neighbourhood Crime Trends and Attitudes Towards the
Police
The link between perception of crime and attitudes towards
the police was further examined by analyzing results from a
question concerning residents perceptions of the crime trend in
the past year or two in their neighbourhood. The answers were
analyzed in relation to the three indicators of attitudes towards
the police (perception of police community relations, evaluating
police performance, and evaluating the need to improve police s
ervices).
A relationship between crime perception and police perfor-
mance was statistically significant only in the Metro sample
(p<.01). Respondents who said that crime had remained the same
or decreased tended to rate the police higher on all the three
indicators of police performance (enforcing the law, promptness,
and approachability) than those who saw neighbourhood crime as
increasing (p<01).
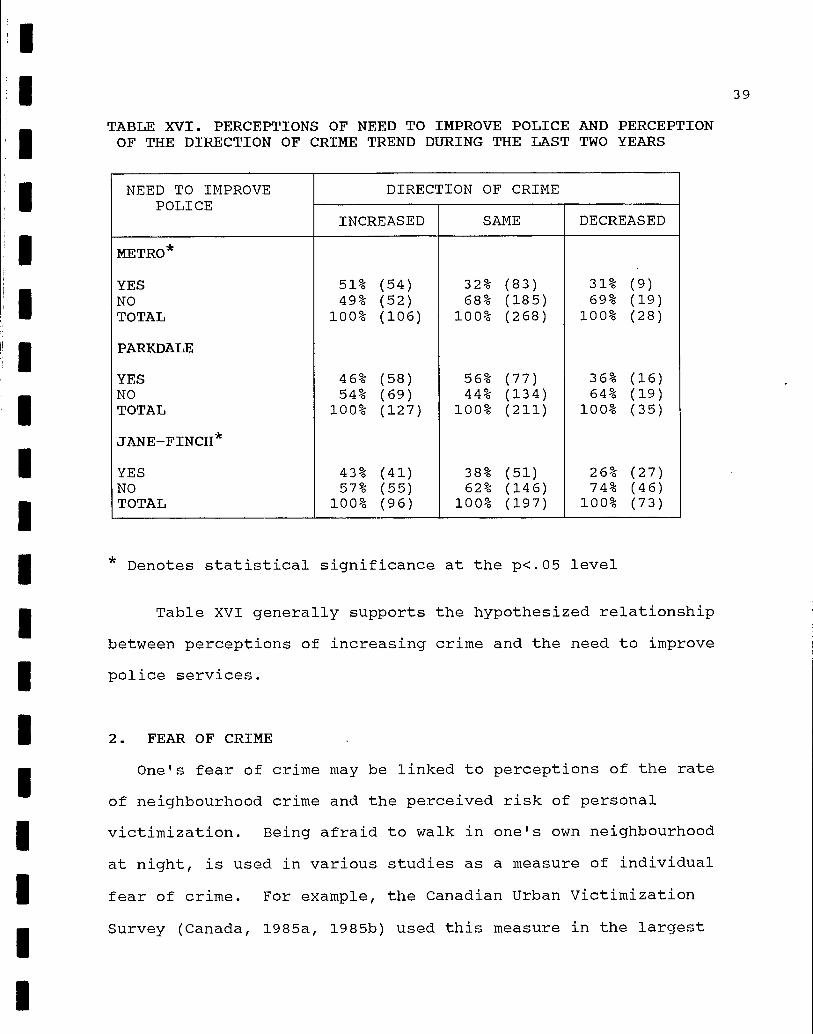
Analysis of respondents perception of crime trends and their
assessment whether the police needed to improve their service was
more pronounced in Jane-Finch and Metro samples. As illustrated
in Table XVI.
1
1
1 1
1
1 1
TABLE XVI. PERCEPTIONS OF NEED TO IMPROVE POLICE AND PERCEPTION OF THE DIRECTION OF CRIME TREND DURING THE LAST TWO YEARS
NEED TO IMPROVE DIRECTION OF CRIME POLICE
INCREASED SAME DECREASED
METRO*
YES 51% (54) 32% (83) 31% (9) NO 49% (52) 68% (185) 69% (19) TOTAL 100% (106) 100% (268) 100% (28)
PARKDALE
YES 46% (58) 56% (77) 36% (16) NO 54% (69) 44% (134) 64% (19) TOTAL 100% (127) 100% (211) 100% (35)
JANE-FINCH*
YES 43% (41) 38% (51) 26% (27) NO 57% (55) 62% (146) 74% (46) TOTAL 100% (96) 100% (197) 100% (73)
Denotes statistical significance at the p<.05 level
Table XVI generally supports the hypothesized relationship
between perceptions of increasing crime and the need to improve
police services.
2. FEAR OF CRIME
One's fear of crime may be linked to perceptions of the rate
of neighbourhood crime and the perceived risk of personal
victimization. Being afraid to walk in one's own neighbourhood
at night, is used in various studies as a measure of individual
fear of crime. For example, the Canadian Urban Victimization
Survey (Canada, 1985a, 1985b) used this measure in the largest
39
1
and most comprehensive victimization survey ever conducted in
Canada. To.assess whether fear of crime is associated with
public attitudes towards the police, analysis was conducted by
comparing those who indicated they felt safe to those who felt
unsafe. The following findings reveal that fear of crime along
with perceptions of crime and crime rate trends, are negatively
correlated with positive attitudes towards the police.
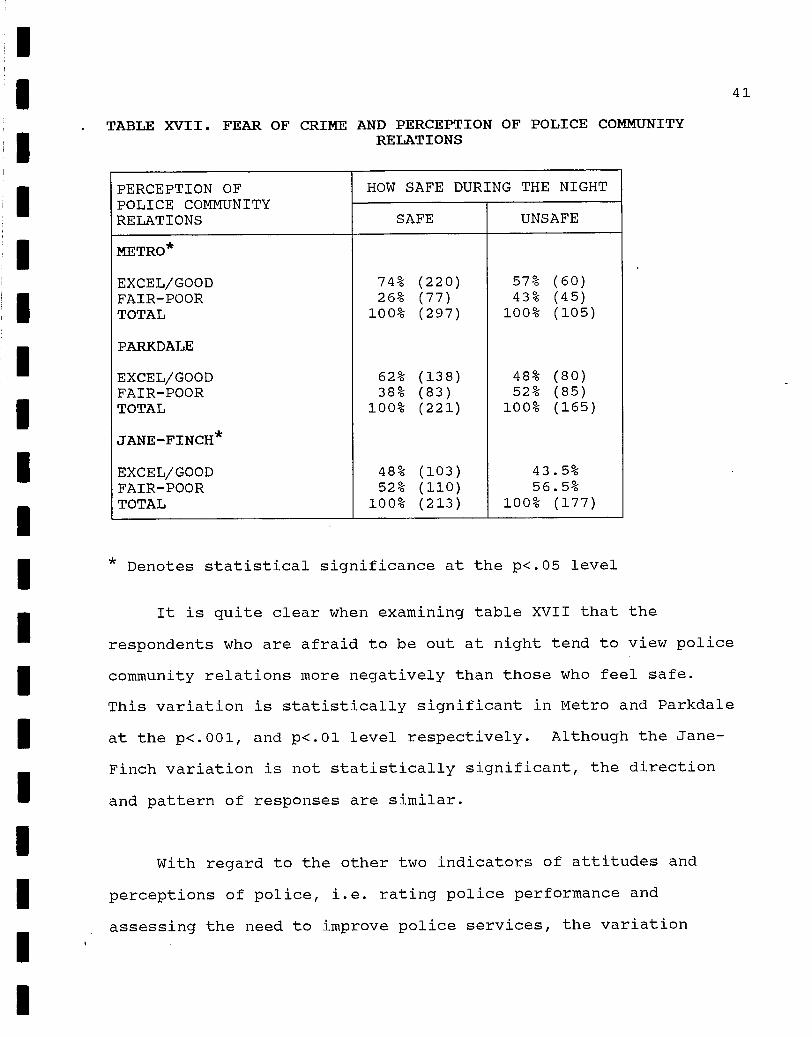
The responses to the three questions on attitudes and
perceptions of police were used in the analysis in order to see
whether the respondents level of crime fear affects their
assessment of the police. Table XVII illustrates the relation
between fear of crime and perception of police community rela-
tions.
40
41
• TABLE XVII. FEAR OF CRIME AND PERCEPTION OF POLICE COMMUNITY RELATIONS
PERCEPTION OF HOW SAFE DURING THE NIGHT POLICE COMMUNITY RELATIONS SAFE UNSAFE
METRO*
EXCEL/GOOD 74% (220) 57% (60) FAIR-POOR 26% (77) 43% (45) TOTAL 100% (297) 100% (105)
PARKDALE
EXCEL/GOOD 62% (138) 48% (80) FAIR-POOR 38% (83) 52% (85) TOTAL 100% (221) 100% (165)
JANE-FINCH*
EXCEL/GOOD 48% (103) 43.5% FAIR-POOR 52% (110) 56.5% TOTAL 100% (213) 100% (177)
Denotes statistical significance at the p<.05 level
It is quite clear when examining table XVII that the
respondents who are afraid to be out at night tend to view police
community relations more negatively than those who feel safe.
This variation is statistically significant in Metro and Parkdale
at the p<.001, and p<.01 level respectively. Although the Jane-
Finch variation is not statistically significant, the direction
and pattern of responses are similar.
With regard to the other two indicators of attitudes and
perceptions of police, i.e. rating police performance and
assessing the need to improve police services, the variation
1 1 1 1
1
1 1 1 1 1
42
between those that respondents who felt 'safe' and 'unsafe' are
not statistically significant nor consistently followed the
predicted pattern.
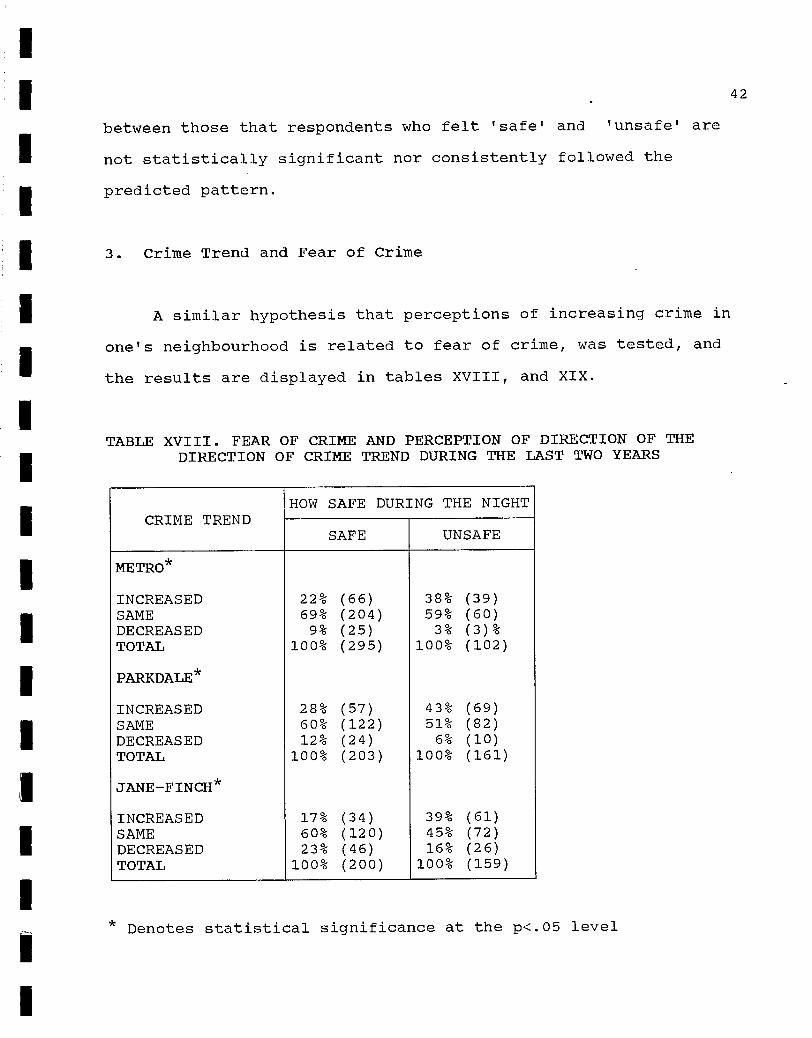
3. Crime Trend and Fear of Crime
A similar hypothesis that perceptions of increasing crime in
one's neighbourhood is related to fear of crime, was tested, and
the results are displayed in tables XVIII, and XIX.
TABLE XVIII. FEAR OF CRIME AND PERCEPTION OF DIRECTION OF THE DIRECTION OF CRIME TREND DURING THE LAST TWO YEARS
HOW SAFE DURING THE NIGHT CRIME TREND
SAFE UNSAFE
METRO*
INCREASED 22% (66) 38% (39) SAME 69% (204) 59% (60) DECREASED 9% (25) 3% (3)% TOTAL 100% (295) 100% (102)
PARKDALE*
INCREASED 28% (57) 43% (69) SAME 60% (122) 51% (82) DECREASED 12% (24) 6% (10) TOTAL 100% (203) 100% (161)
JANE-FINCH*
INCREASED 17% (34) 39% (61) SAME 60% (120) 45% (72) DECREASED 23% (46) 16% (26) TOTAL 100% (200) 100% (159)
Denotes statistical significance at the p<.05 level
1
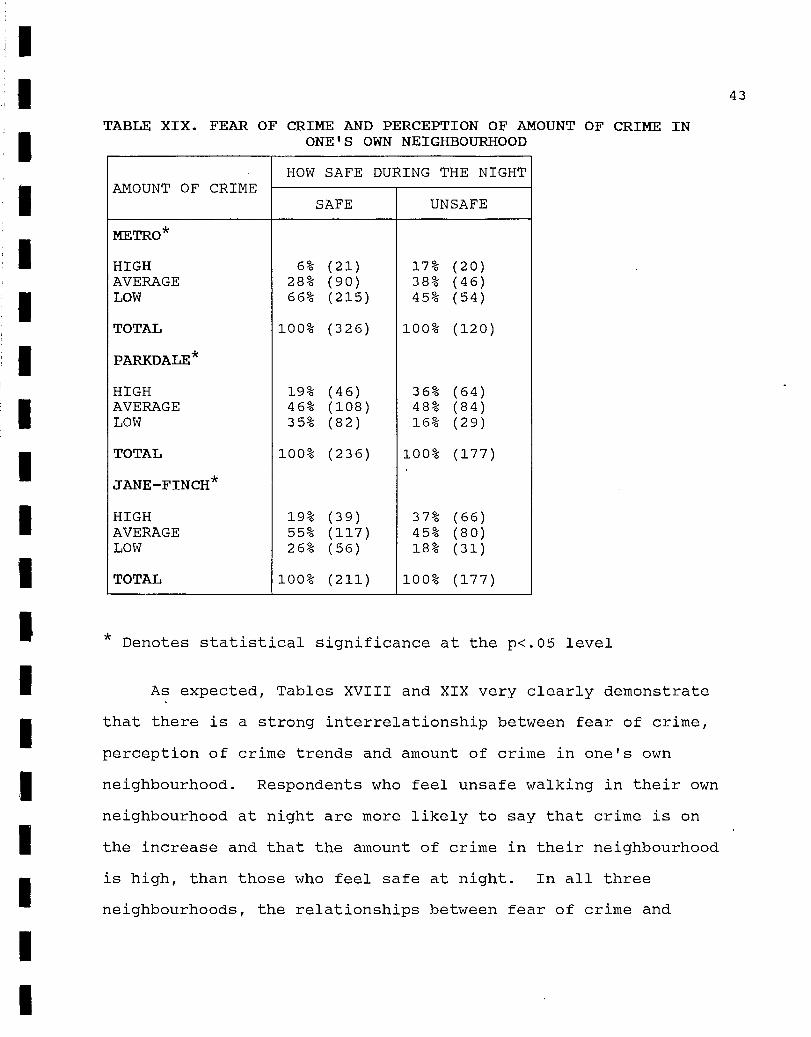
TABLE XIX. FEAR OF CRIME AND PERCEPTION OF AMOUNT OF CRIME IN ONE'S OWN NEIGHBOURHOOD
HOW SAFE DURING THE NIGHT AMOUNT OF CRIME
SAFE UNSAFE
METRO*
HIGH 6% (21) 17% (20) AVERAGE 28% (90) 38% (46) LOW 66% (215) 45% (54)
TOTAL 100% (326) 100% (120)
PARKDALE*
HIGH 19% (46) 36% (64) AVERAGE 46% (108) 48% (84) LOW 35% (82) 16% (29)
TOTAL 100% (236) 100% (177)
JANE-FINCH*
HIGH 19% (39) 37% (66) AVERAGE 55% (117) 45% (80) LOW 26% (56) 18% (31)
TOTAL 100% (211) 100% (177)
Denotes statistical significance at the p<.05 level
As expected, Tables XVIII and XIX very clearly demonstrate
that there is a strong interrelationship between fear of crime,
perception of crime trends and amount of crime in one's own
neighbourhood. Respondents who feel unsafe walking in their own
neighbourhood at night are more likely to say that crime is on
the increase and that the amount of crime in their neighbourhood
is high, than those who feel safe at night. In all three
neighbourhoods, the relationships between fear of crime and
44
perceptions of crime in one's own neighbourhood are statistically
significant.
CONCLUSION
Contrary to most studies of public perception of crime and
attitudes towards police, the previous analysis suggests there is
strong relationship between public perceptions and fear of crime
and attitudes towards police.
The results of this analysis strongly support the linkage
between perceptions of crime, fear of crime and attitudes towards
police. Collectively, the findings of this survey suggest that
the more citizens see crime as high in their neighbourhood,
perceive it to be increasing, and are afraid to walk at night,
the more negatively they will tend to rate police community
relations, police performance and see a need for improvement in
police services. While these findings do not suggest necessarily
that the public blame the police for high crime rates, it does
indicate that, they view the police as having some responsibility
for controlling crime in their neighbourhood, and that fear of
crime and perceptions of crime do have a negative impact on their
attitudes towards the police in general.
45
NEIGHBOURHOOD TIES AND ATTITUDES TO POLICE
The concept of neighbourhood implies a degree of personal
commitment to the area in which one lives. The degree to which a
person is tied to a particular neighbourhood is expressed in
various ways such as length of residence in a neighbourhood,
whether one owns a home or rents and whether one plans to move to
another neighbourhood in the near future (Skogan & Maxfield,
1982). These three indicators of financial and social ties to
one's neighbourhood can be viewed as a positive expression of
commitment and confidence in neighbourhood and may give an
individual a more personal stake in maintaining the quality of
life in that neighbourhood.
Various studies of public attitudes towards police have
attempted to examine the relationship between social integration,
social ties and neighbourhood satisfaction with attitudes towards
police. Brillon's (1984) research found a clear link between
social integration and satisfaction with police. Studies by
Hartnagel (1979) and Toseland's (1982), on fear of crime,
indicate that low social integration tends to produce a reduced
sense of personal security and fear of victimization. Personal
insecurity creates a more critical perception of crime and a more
critical attitude towards the local police.
Skogan and Maxfield's (1982) research on individual and
neighbourhood reactions to crime concluded that social ties have
46
a strong impact on fear of crime. The authors created a
composite index which included home ownership, length of time a
respondent had resided in the neighbourhood, and whether the
respondents planned to move within a year. All three factors
were found to be related to fear of crime, as well as age and
income.
In summary, it appears that the residents who have financial
and social ties to the neighbourhood in which they live will tend
to have more positive attitudes towards the police than more
transient, less committed residents. In order to examine the
impact of neighbourhood ties on attitudes towards the police,
analysis of mobility, length of time of residence in a neighbour-
hood, and home ownership was conducted with the following
results.
1. Mobility and Attitudes to Police
Analysis of respondents who indicated they would move or not
move within the next year revealed that in all three neighbour-
hoods "movers" are more likely to view police community relations
as fair or poor (see table XX). The differences were most
pronounced in the Metro sample (p<.001) where 39% of the movers
see police community relations as either fair or poor as compared
to only 27% for the non-movers. Significant results were also
obtained in Jane-Finch (p<.001) where 62% of movers as opposed to
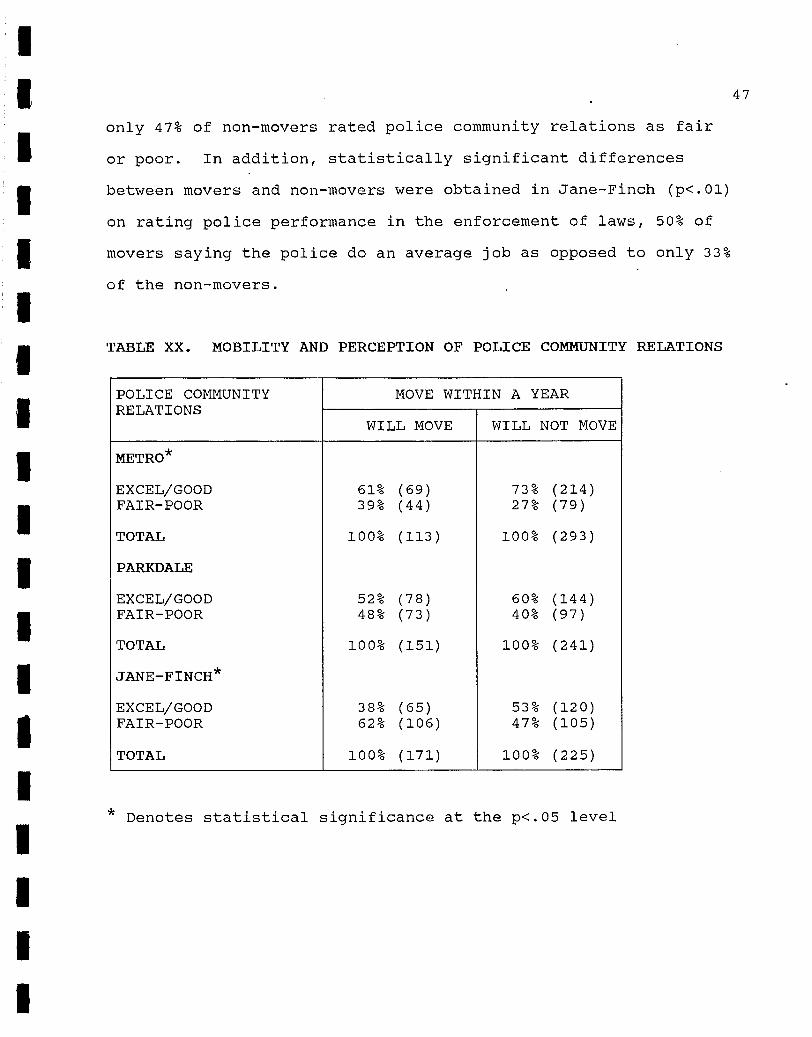
1
only 47% of non-movers rated police community relations as fair
or poor. In addition, statistically significant differences
between movers and non-movers were obtained in Jane-Finch (p<.01)
on rating police performance in the enforcement of laws, 50% of
movers saying the police do an average job as opposed to only 33%
of the non-movers.
TABLE XX. MOBILITY AND PERCEPTION OF POLICE COMMUNITY RELATIONS
POLICE COMMUNITY MOVE WITHIN A YEAR RELATIONS
WILL MOVE WILL NOT MOVE
METRO*
EXCEL/GOOD 61% (69) 73% (214) FAIR-POOR 39% (44) 27% (79)
TOTAL 100% (113) 100% (293)
PARKDALE
EXCEL/GOOD 52% (78) 60% (144) FAIR-POOR 48% (73) 40% (97)
TOTAL 100% (151) 100% (241)
JANE-FINCH*
EXCEL/GOOD 38% (65) 53% (120) FAIR-POOR 62% (106) 47% (105)
TOTAL 100% (171) 100% (225)
Denotes statistical significance at the p<.05 level
47
48
2. Home ownership and Attitudes Towards the Police
Analysis of home ownership reveals that renters tend to
perceive police community relations more negatively than home
owners in all three sample neighbourhoods. This variation,
however, did not prove to be statistically significant at the
.05 level.
Analysis of renters and non-renters' ratings of police
performance and the perceived need for improving local police
services did not yield any notable variation between homeowners
and tenants.
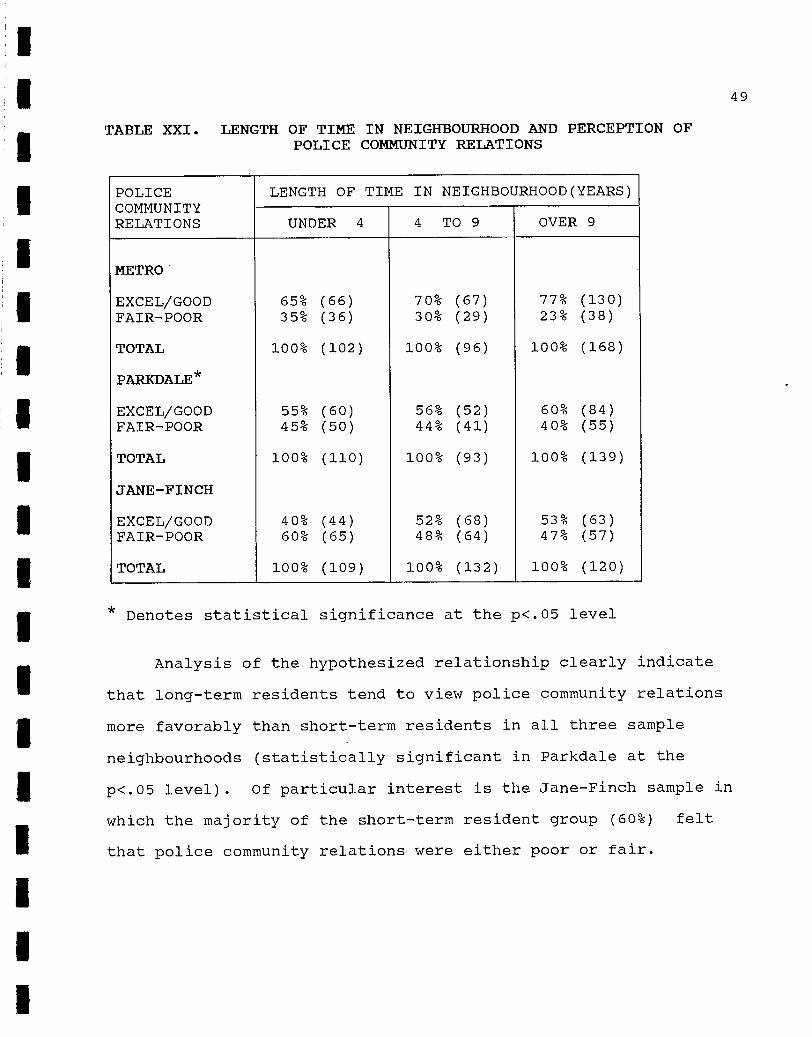
3. Length of Time In Neighbourhood
In order to examine the hypothesized relationship
between the length of time a respondent had lived in a neighbour-
hood and attitudes and perceptions of police, the respondents
were sub-divided into three groups, short-term (under four
years), middle-term (four to nine years), and long-term residents
(over nine years in the same neighbourhood). Table XXI il-
lustrates the results between length of time in a neighbourhood
and perception of police community relations.
49
TABLE XXI. LENGTH OF TIME IN NEIGHBOURHOOD AND PERCEPTION OF POLICE COMMUNITY RELATIONS
POLICE LENGTH OF TIME IN NEIGHBOURHOOD(YEARS) COMMUNITY RELATIONS UNDER 4 4 TO 9 OVER 9
METRO*
EXCEL/GOOD 65% (66) 70% (67) 77% (130) FAIR-POOR 35% (36) 30% (29) 23% (38)
TOTAL 100% (102) 100% (96) 100% (168)
PARKDALE*
EXCEL/GOOD 55% (60) 56% (52) 60% (84) FAIR-POOR 45% (50) 44% (41) 40% (55)
TOTAL 100% (110) 100% (93) 100% (139)
JANE-FINCH
EXCEL/GOOD 40% (44) 52% (68) 53% (63) FAIR-POOR 60% (65) 48% (64) 47% (57)
TOTAL 100% (109) 100% (132) 100% (120)
Denotes statistical significance at the p<.05 level
Analysis of the hypothesized relationship clearly indicate
that long-term residents tend to view police community relations
more favorably than short-term residents in all three sample
neighbourhoods (statistically significant in Parkdale at the
p<.05 level). Of particular interest is the Jane-Finch sample in
which the majority of the short-term resident group (60%) felt
that police community relations were either poor or fair.
50
Similar analysis of ratings of police performance and the
need for improvement with the length of time in neighbourhood did
not produce consistent or statistically significant variability
in all three neighbourhoods.
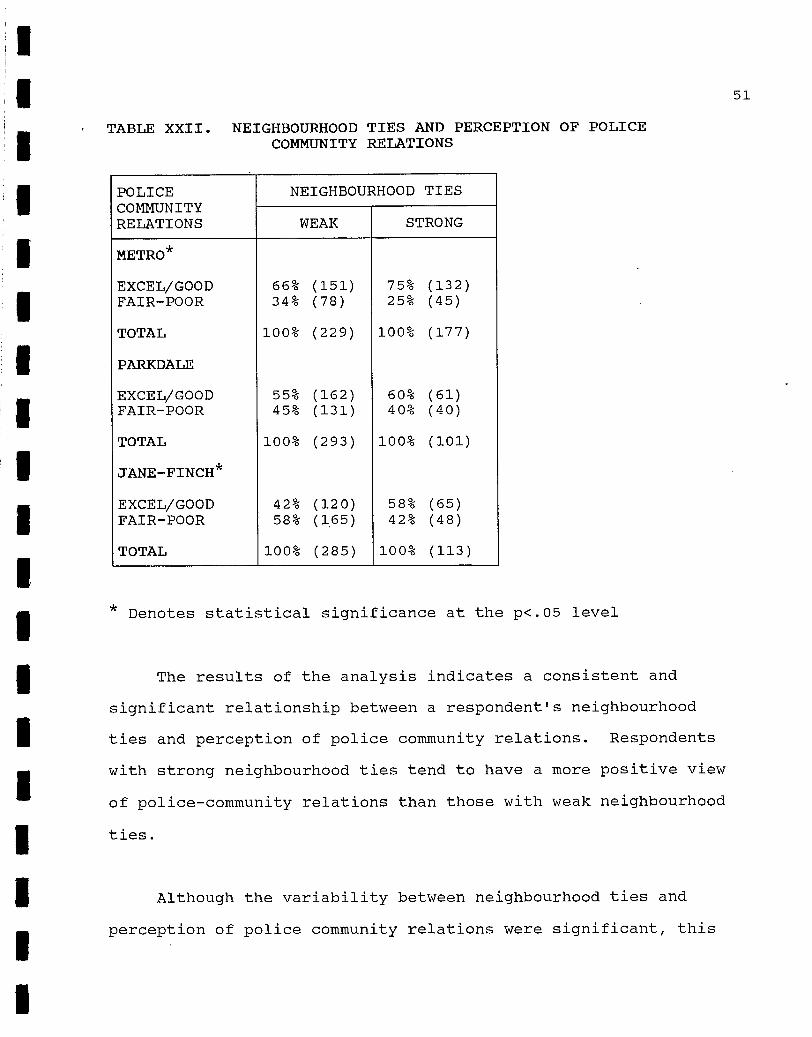
4. Neighbourhood Ties Index
Mobility, home ownership, and number of years respondents
had lived in a neighbourhood were combined to develop a composite
index called 'neighbourhood ties'. Based on the level of
mobility, home ownership, and length of time in a neighbourhood,
a dichotomous variable was created to classify respondents
neighbourhood ties in terms of either 'weak' or 'strong'.
Evaluations of police community relations were analyzed in
relation to strength in neighbourhood ties. The results are
displayed in table XXII.
1
1 1
1 1 1 1 1
1
1 1
TABLE XXII. NEIGHBOURHOOD TIES AND PERCEPTION OF POLICE COMMUNITY RELATIONS
POLICE NEIGHBOURHOOD TIES COMMUNITY RELATIONS WEAK STRONG
METRO*
EXCEL/GOOD 66% (151) 75% (132) FAIR-POOR 34% (78) 25% (45)
TOTAL 100% (229) 100% (177)
PARKDALE
EXCEL/GOOD 55% (162) 60% (61) FAIR-POOR 45% (131) 40% (40)
TOTAL 100% (293) 100% (101)
JANE-FINCH*
EXCEL/GOOD 42% (120) 58% (65) FAIR-POOR 58% (165) 42% (48)
TOTAL 100% (285) 100% (113)
Denotes statistical significance at the p<.05 level
The results of the analysis indicates a consistent and
significant relationship between a respondent's neighbourhood
ties and perception of police community relations. Respondents
with strong neighbourhood ties tend to have a more positive view
of police-community relations than those with weak neighbourhood
ties.
Although the variability between neighbourhood ties and
perception of police community relations were significant, this
52
relationship did not persist using indicators which measure
police performance, or the need to improve police services.
There was no discernible response pattern in all three neighbour-
hood samples which would suggest that the level of respondent's
social integration or ties had a strong effect on ratings of
police effectiveness.
CONCLUSION
The previous findings provide modest support for the
hypothesized relationship between neighbourhood ties and at-
titudes towards the police. Mobility or whether one plans to
move from the neighbourhood appears to be the strongest predictor
of attitudes towards the police. The lack of strong support for
the owner versus renter hypothesis may be in part explained by
the assumption that owners are distinguishable from renters as a
social group with distinctly different policing attitudes. Given
the mix of housing and the expense of home ownership in urban
Toronto, this assumption would appear to be questionable.
Nevertheless the general trend of the data support the generaliz-
ation that those with strongest neighbourhood ties tend to have
more positive and less critical attitudes towards the police.
53
VICTIMIZATION AND EVALUATION OF THE POLICE
Various research studies have explicitly examined how
victimization affects perception of the police. Teske et.al .
(1982) in a study of Texan public opinion discovered that while
victims rated the police favorably on professionalism and
courteousness respectively, less than half were satisfied with
the overall job done by the police. Crime witnesses showed a
similar tendency to rate police officer positively generally, but
expressed dissatisfaction with police handling of their par-
ticular case. A study by Poister and McDavid (1978) done in
Harrisburg Pennsylvania revealed that victim satisfaction with
police performance was lower than non-victims. Similar results
were obtained by Brillon (1984) in a study of Canadian residents
in which victims were more likely to be dissatisfied with police
performance than non-victims. Also, the Canadian Urban Vic-
timization Survey discovered that although most victims rated the
police positively, female victims were more likely than others to
rate overall police performance as poor (Canada, 1985a).
To examine the relationship between victimization and
attitudes towards the police this study examines the following
questions: first, do crime victims perceive police community
relations and police performance more negatively than non-
victims; second, do more victims than non-victims tend to believe
police need to improve their services; and last, does victimiza-
54
tion affects one's perception of the crime trend in one's own
neighbourhood?
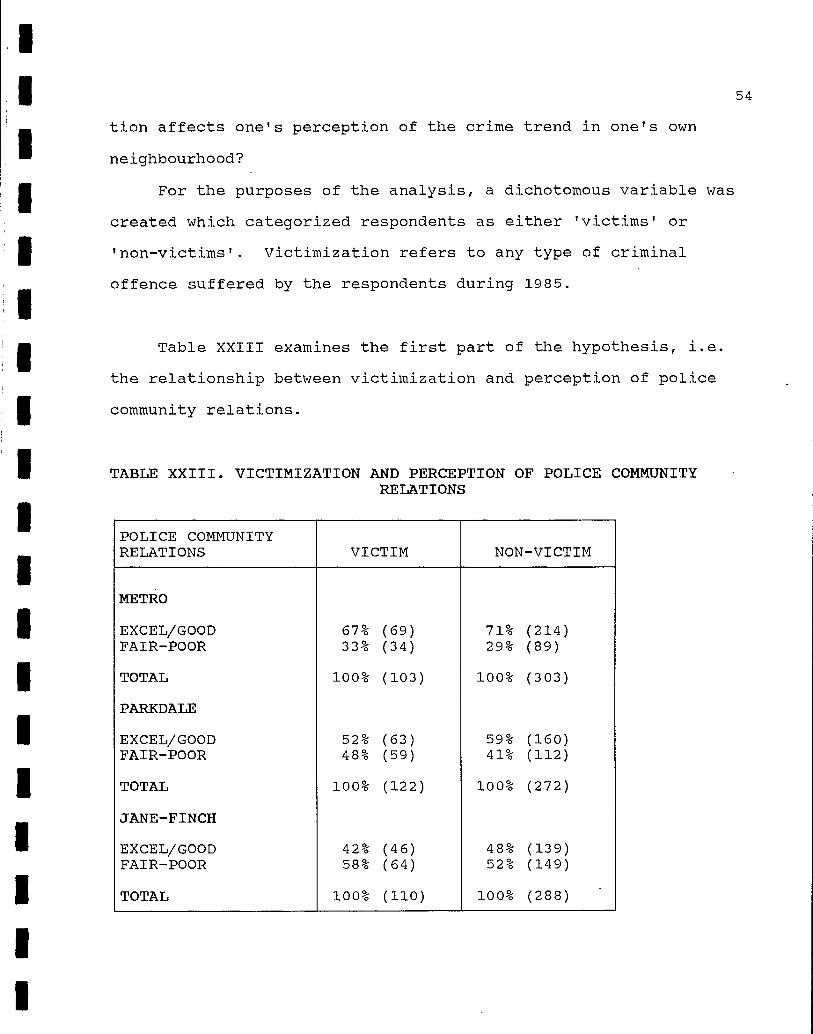
For the purposes of the analysis, a dichotomous variable was
created which categorized respondents as either 'victims' or
'non-victims'. Victimization refers to any type of criminal
offence suffered by the respondents during 1985.
Table XXIII examines the first part of the hypothesis, i.e.
the relationship between victimization and perception of police
community relations.
TABLE XXIII. VICTIMIZATION AND PERCEPTION OF POLICE COMMUNITY RELATIONS
POLICE COMMUNITY RELATIONS VICTIM NON-VICTIM
METRO
EXCEL/GOOD 67% (69) 71% (214) FAIR-POOR 33% (34) 29% (89)
TOTAL 100% (103) 100% (303)
PARKDALE
EXCEL/GOOD 52% (63) 59% (160) FAIR-POOR 48% (59) 41% (112)
TOTAL 100% (122) 100% (272)
JANE-FINCH
EXCEL/GOOD 42% (46) 48% (139) FAIR-POOR 58% (64) 52% (149)
TOTAL 100% (110) 100% (288)
I I I I I I 1 I I I I I I I
Although variations between the victim and non-victim
ratings were not statistically significant, in all three sample
neighbourhoods, the data supports the hypothesized relationship,
victims are more likely to view police community relations
negatively than non-victims. Further analysis of the victimiza-
tion data confirms the proposition that victims also have the
propensity to be more critical of police performance than non-
victims; however, the relationship was not statistically sig-
nificant at the .05 level.
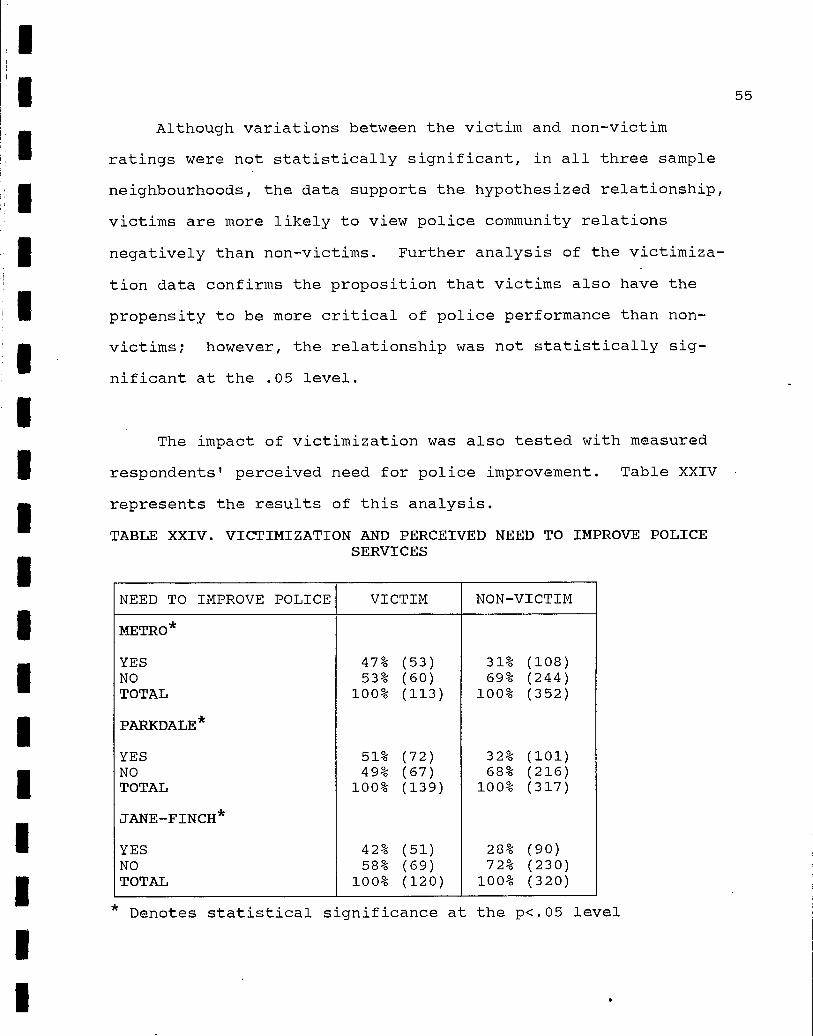
The impact of victimization was also tested with measured
respondents' perceived need for police improvement. Table XXIV
represents the results of this analysis.
TABLE XXIV. VICTIMIZATION AND PERCEIVED NEED TO IMPROVE POLICE SERVICES
NEED TO IMPROVE POLICE VICTIM NON-VICTIM
METRO*
YES 47% (53) 31% (108) NO 53% (60) 69% (244) TOTAL 100% (113) 100% (352)
PARKDALE*
YES 51% (72) 32% (101) NO 49% (67) 68% (216) TOTAL 100% (139) 100% (317)
JANE-FINCH*
YES 42% (51) 28% (90) NO 58% (69) 72% (230) TOTAL 100% (120) 100% (320)
* Denotes statistical significance at the p<.05 level
55
I 1
1 1 1 1 1 1 1 1 1 1 1
Table XXIV indicates that in all three neighbourhoods there
was statistically significant variation between the victims and
non-victims and the need to improve police services (Metro and
Parkdale p<.001; Jane-Finch p<.01). These findings strongly
support the hypothesis that victimization tends to make one more
critical of police services.
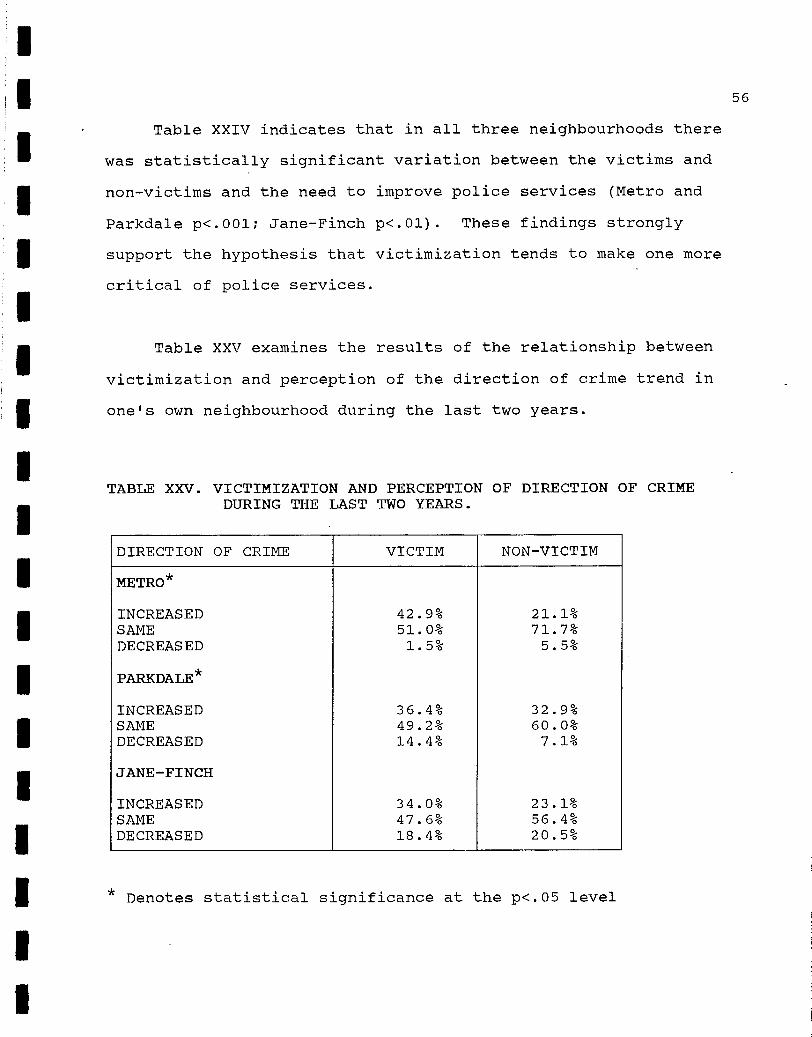
Table XXV examines the results of the relationship between
victimization and perception of the direction of crime trend in
one's own neighbourhood during the last two years.
TABLE XXV. VICTIMIZATION AND PERCEPTION OF DIRECTION OF CRIME DURING THE LAST TWO YEARS.
DIRECTION OF CRIME VICTIM NON-VICTIM
METRO*
INCREASED 42.9% 21.1% SAME 51.0% 71.7% DECREASED 1.5% 5.5%
PARKDALE*
INCREASED 36.4% 32.9% SAME 49.2% 60.0% DECREASED 14.4% 7.1%
JANE-FINCH
INCREASED 34.0% 23.1% SAME 47.6% 56.4% DECREASED 18.4% 20.5%
Denotes statistical significance at the p<.05 level
56
1
The results clearly indicate that respondents' perception of
crime in their community is influenced by the victimization
experience. Thus, personal experience as a crime victim makes it
more likely that respondents will also perceive that crime has
increased in their neighbourhood.
CONCLUSION
Analysis of the results suggests that victimization general-
ly has a negative effect on victim's perception and attitudes
towards the police. It also appears that victimization is linked
with crime victims sense that crime is on the increase in their
neighbourhood. These findings suggest that one of the negative
consequences of criminal victimization is an increased awareness
of crime in one's neighbourhood and more critical attitudes
towards the police.
57
58
MULTI-VARIABLE ANALYSIS OF KEY RESPONDENT CHARACTERISTICS
IN DETERMINING ATTITUDES TOWARDS THE POLICE
This section of the report is based on a multi-variable
examination of police community relations and public evaluation
of local police performance in the three sample neighbourhoods
and presents five classification trees. The aim of the analysis
is to identify different population sub-groups in terms of their
positive or negative attitudes towards police. Sub-groups are
distinguished by a unique combination of predictor variables
which allows the researcher to predict important relationships
between independent and dependeht variables (see the Appendix,
page 70).
The identification of key sub-groups or sub-samples in the
larger survey data set, who have significantly different percep-
tion and attitudes towards the police helps to refine broad
generalizations about community attitudes. More precise consumer
or client information allows for more informed development and
targeting of police information programs and consultative
procedures. For example, it is clear from the following TREE
analysis that many younger respondents tend to have negative
attitudes towards the police. However, these attitudes are
specific to young respondents who perceive their neighbourhood as
having a high crime rate, have lived less than three years in a
community, are under 35, and have a high fear of crime. This
kind of analysis suggests that it is a combination of individual
and neighbourhood characteristics that determine respondent
replies to questions about police and policing not just their
age. Analysis has focused on both favorable and unfavorable
perceptions of policing as the dependent variable. Thus,
findings are reported in terms of the "most likely" or "least
likely" to indicate a favorable or unfavorable response to
various questions regarding policing.
1. MULTIVARIATE ANALYSIS OF PERCEPTION OF POLICE COMMUNITY
RELATIONS
Summary tables I, II, and III presents the tree analysis of
neighbourhood respondents perception of police community rela-
tions in all three sample neighbourhoods (the minimal level of
significance for all splits within the "tree" is p<.05, and for
reasons of clarity, only the "favorable" proportion of responses
are shown).
59
JANE-FINCH
47% n=185
PARKDALE
57% n=223
METRO
70% n=283
AGE-OVER 34
85% n=155
AGE-UNDER 35
57% n=128
LOW FEAR OF CRIME
65% n=107
HIGH FEAR OF CRIME
82% n=105
LOW FEAR OF CRIME*
91% n=50
SUMMARY TABLE I PROPORTION RATING POLICE COMMUNITY
RELATIONS FAVORABLY:METRO
PARENT GROUP
58% n=691
j HIGH FEAR OF CRIME
36% n=21
AGE-UNDER 25**
20% n=6
AGE-25 TO 34
52% n=15
* MOST FAVORABLE GROUP * * MOST UNFAVORABLE GROUP
ETHNICITY OTHERS 55% n=36
ETHNICITY BRIT. N.& E. EUROPEAN
72% n=71
JANE-FINCH
47% n=185
PARKDALE
57% n=223
METRO
70% n=283
AGE-OVER 34
65% n=106
AGE-UNDER 35
50% n=117
SUMMARY TABLE II PROPORTION RATING POLICE COMMUNITY
RELATIONS FAVORABLY: PARKDALE
PARENT GROUP
58% n=691
HIGH FEAR OF CRIME LOW FEAR OF CRIME
HIGH AMOUNT OF CRIME
50% n=19
LOW AMOUNT OF CRIME* 60% n=84 35% n=33
70% n=87
HIGH AMOUNT OF CRIME**
28% n=21
EAST INDIAN
40% n=11
LOW AMOUNT OF CRIME
60% n=12
OTHER ETHNIC GROUPS
73% n=73
* MOST FAVORABLE GROUP ** MOST UNFAVORABLE GROUP
JANE-FINCH
47% n=185
PARKDALE
57% n=223
METRO
70% n=283
LIVED UNDER 3 YEARS IN NEIGHBOURHOOD
35% n=39
LIVED OVER 3 YEARS IN NEIGHBOURHOOD 49% n=106
AGE-UNDER 35
34% n=28
AGE-OVER 34
37% n=11
AGE-UNDER 55
48% n=90
AGE-OVER 54
63% n=16
ETHNICITY EAST INDIAN 40% n=26
HIGH FEAR OF CRIME**
21% n=8
LOW FEAR OF CRIME
45% n=20
ETHNICITY OTHERS
52% n=64
SUMMARY TABLE III PROPORTION RATING POLICE COMMUNITY
RELATIONS FAVORABLY: JANE-FINCH
PARENT GROUP
58% n=691
HIGH AMOUNT OF CRIME
44% n=141
* MOST FAVORABLE GROUP ** MOST UNFAVORABLE GROUP
63
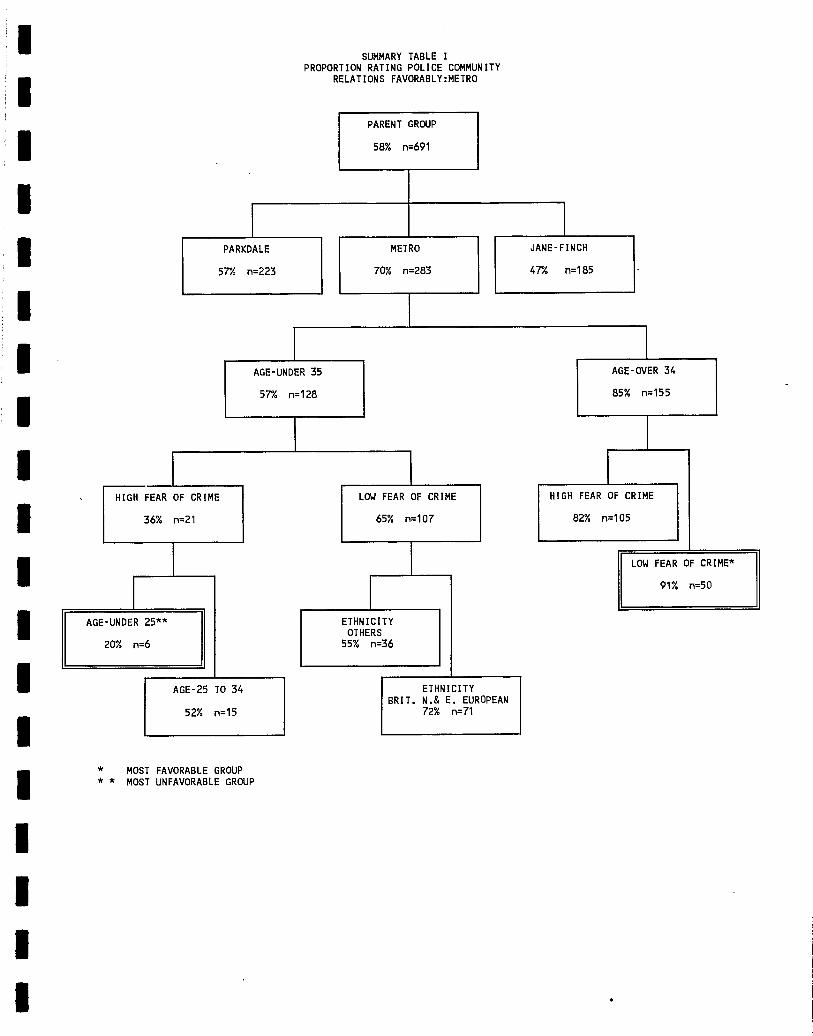
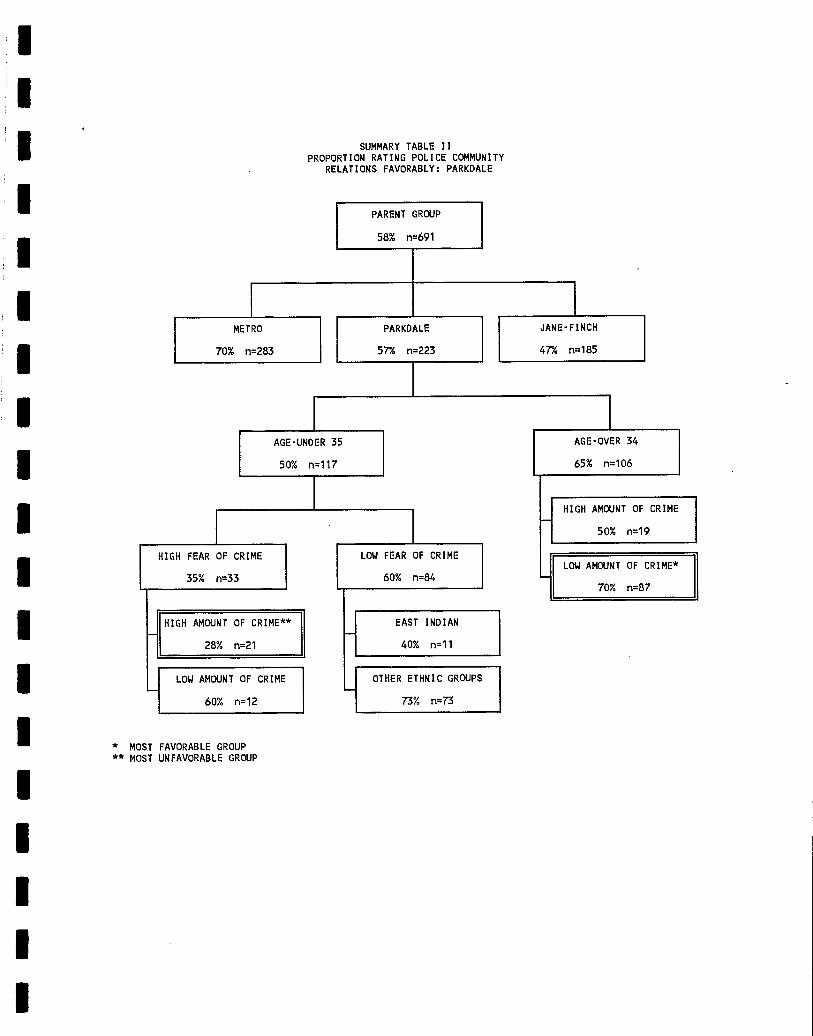
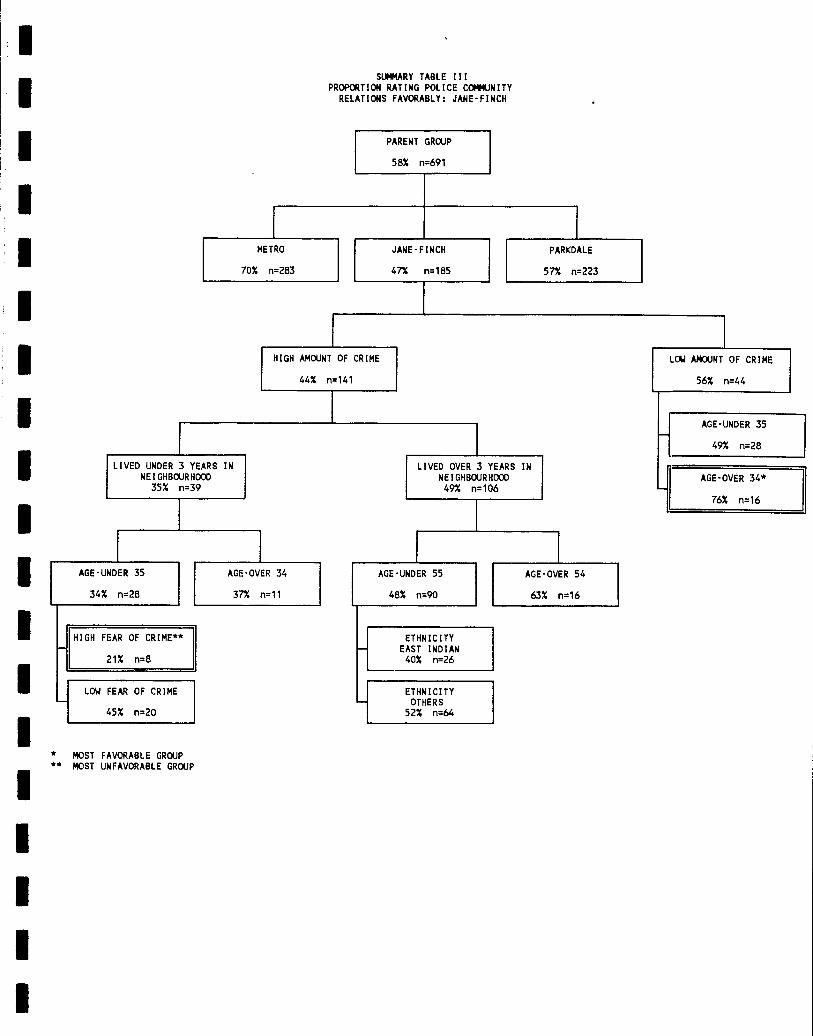
In analyzing the Metro sample (Summary Table I), it was
discovered that the respondents most likely to rate community
relations most favorably, were those over the age of thirty-four
and had a low fear of crime. Of interest is the fact that the
Anglo-Celtic, and North and East European respondents perceived
police community relations less critically than other ethnic
groups. Conversely, the group most critical of police community
relations, were those respondents who were under the age of
twenty-four, and indicate high crime fear.
Analysis of police community relations in Parkdale (Summary
Table II), reveals that he most.favorable group is composed of
those over the age of thirty-four, who perceive crime as being
low in their neighbourhood, and are married. The group most
likely to express a negative opinion of the police is under
thirty-five years of age, exhibits a high fear of crime, and
perceives the amount of crime in their neighbourhood to be high.
Of particular interest is that young East Indian respondents,
despite a low fear of crime, held a more critical view of police
community relations than other ethnic groups.
Summary Table III illustrates that, in Jane-Finch, the first
"best" predictor of police community relations is the respon-
dents' perception of the perceived amount of crime in one's own
neighbourhood rather than age variability as in the Metro and
Parkdale samples. Consequently, the most favorable group of
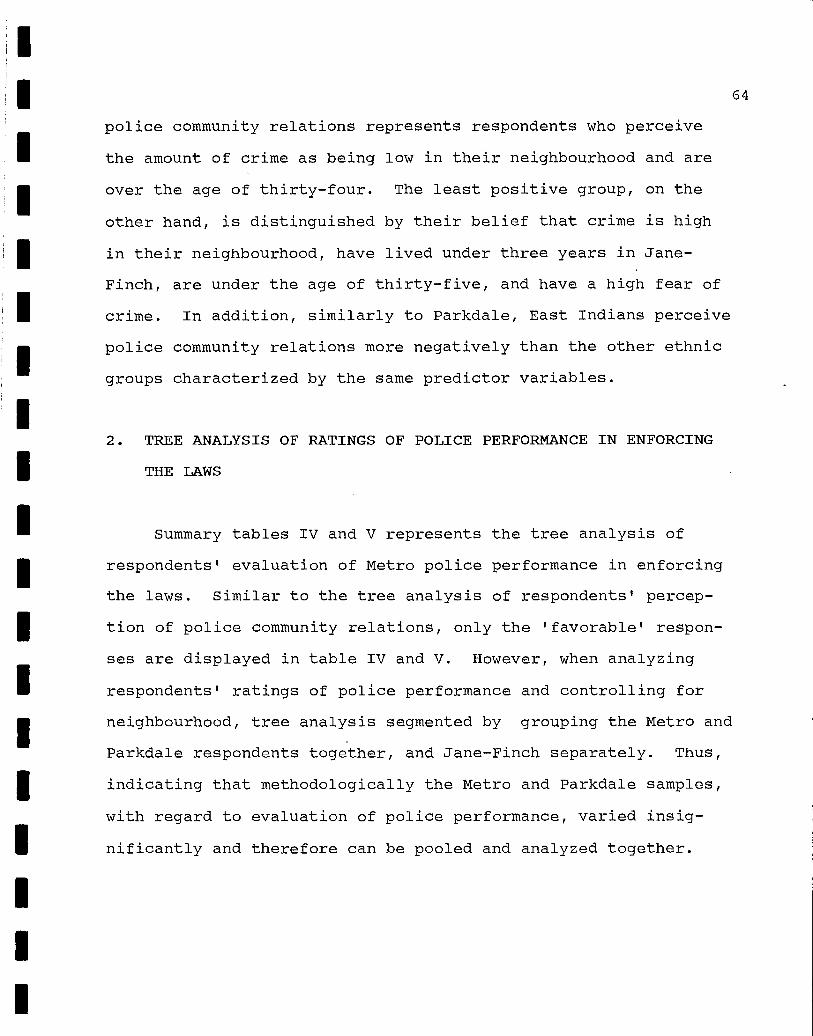
64
police community relations represents respondents who perceive
the amount of crime as being low in their neighbourhood and are
over the age of thirty-four. The least positive group, on the
other hand, is distinguished by their belief that crime is high
in their neighbourhood, have lived under three years in Jane-
Finch, are under the age of thirty-five, and have a high fear of
crime. In addition, similarly to Parkdale, East Indians perceive
police community relations more negatively than the other ethnic
groups characterized by the saine predictor variables.
2. TREE ANALYSIS OF RATINGS OF POLICE PERFORMANCE IN ENFORCING
THE LAWS
Summary tables IV and V represents the tree analysis of
respondents' evaluation of Metro police performance in enforcing
the laws. Similar to the tree analysis of respondents' percep-
tion of police community relations, only the 'favorable' respon-
ses are displayed in table IV and V. However, when analyzing
respondents' ratings of police performance and controlling for
neighbourhood, tree analysis segmented by grouping the Metro and
Parkdale respondents together, and Jane-Finch separately. Thus,
indicating that methodologically the Metro and Parkdale samples,
with regard to evaluation of police performance, varied insig-
nificantly and therefore can be pooled and analyzed together.
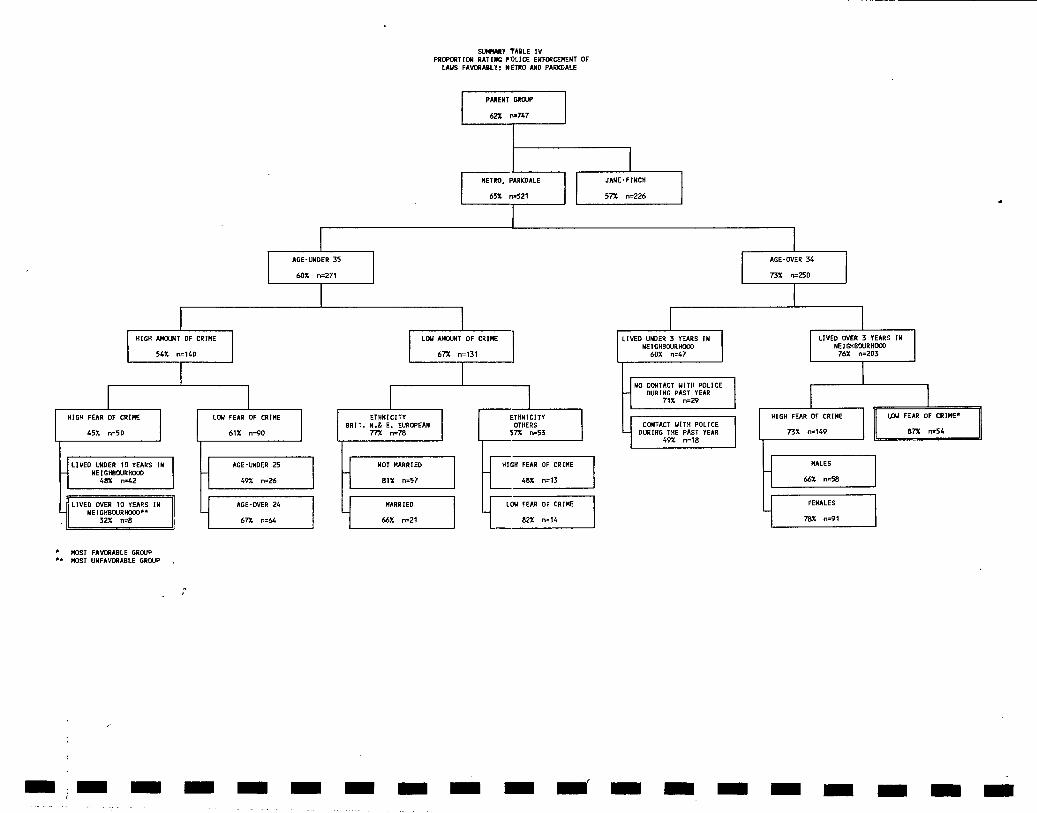
JANE-FINCH
57% n=226
METRO, PARKDALE
65% n.521
AGE-UNDER 35 AGE-OVER 34
60% n=271 73% n=250
HIGH AMOUNT OF CRIME
54% n=140
LORI AMOUNT OF CRIME
67% n=131
LIVED URGER 3 YEARS IN NEIGHBOURHOOD
60% n=47
LIVED OVER 3 YEARS IN NEIGHBOURHOOD 76% n=203
HIGH FEAR OF CRIME LOW FEAR OF CRIME*
87% n=54
NO CONTACT WITH POLICE SURINS PAST YEAR
71% n=29
CONTACT WITH POLICE DURING THE PAST YEAR
49% n=18
HIGH FEAR OF CRIME
73% n=149
MALES
66% n=58
FEMALES
78% n=91
ETHNICITY BRIT. N.& E. EUROPEAN
77% n=78
NOT MARRIED
81% n=57
MARRIED
66% n=21
ETHNICITY OTHERS
57% n.53
HIGH FEAR OF CRIME
48% n=13
LOW FEAR OF CRIME
82% n=14
LOW FEAR OF CRIME
61% n=90
AGE-UNDER 25
49% n=26
AGE-OVER 24
67% n=64
45% n=50
LIVED UNDER 10 YEARS IN NEIGHBOURHOOD
48% n=42
LIVED OVER 10 YEARS IN NEIGHBOURHOOD**
32% n=8
• MOST FAVORABLE GROUP ** MOST UNFAVORABLE GROUP ,
SUMMARY TABLE IV PROPORTION RATING POLICE ENFONCEMENT OF
LAWS FAVORABLY: METRO AND PARKDALE
PARENT GROUP
62% n.747
im ma um mu mu ma mu um ma' mu ma ma ma 1.1 am mul
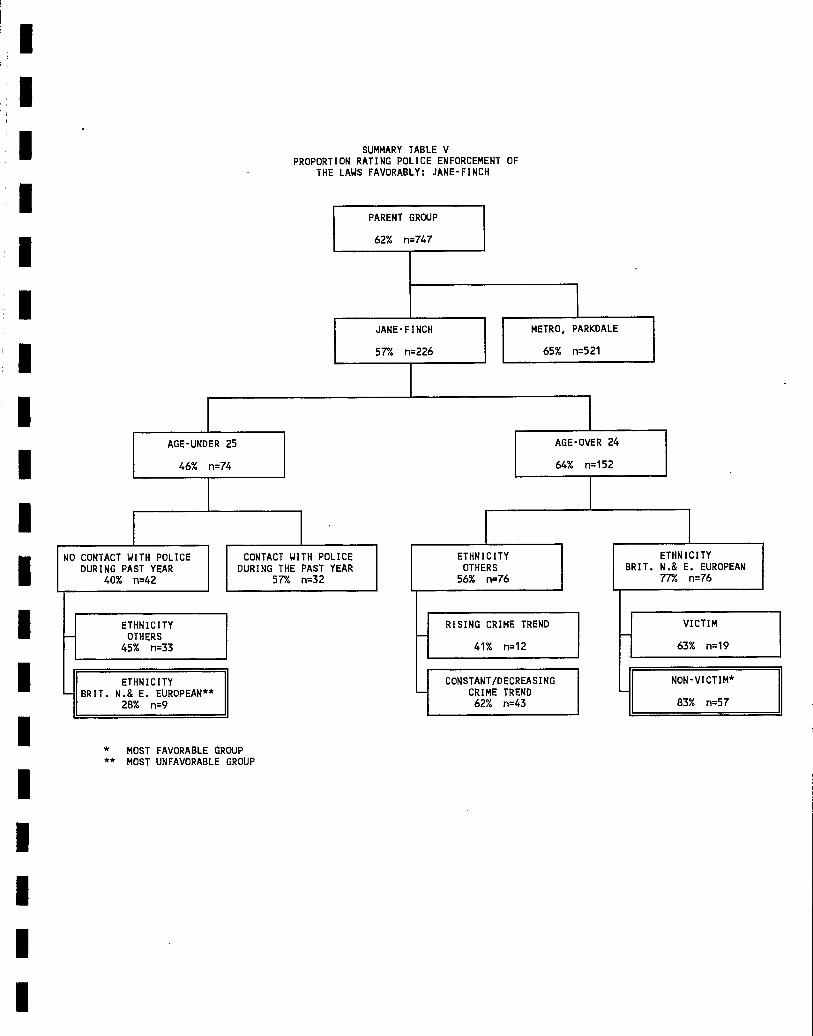
METRO, PARKDALE
65% n=521
JANE-FINCH
57% n=226
AGE-OVER 24
64% n=152
AGE-UNDER 25
46% n=74
ETHNICITY OTHERS
45% n=33
RISING CRIME TREND
41% n=12
CONSTANT/DECREASING CRIME TREND 62% n=43
NON-VICTIM*
83% n=57
VICTIM
63% n=19
SUMMARY TABLE V PROPORTION RATING POLICE ENFORCEMENT OF
THE LAWS FAVORABLY: JANE-FINCH
PARENT GROUP
62% n=747
NO CONTACT WITH POLICE DURING PAST YEAR
40% n=42
CONTACT WITH POLICE DURING THE PAST YEAR
57% n=32
ETHNICITY OTHERS
56% n=76
ETHNICITY BRIT. N.& E. EUROPEAN
77% n=76
ETHNICITY BRIT. N.& E. EUROPEAN**
28% n=9
* MOST FAVORABLE GROUP ** MOST UNFAVORABLE GROUP
In the pooled Metro and Parkdale (Summary Table IV) samples
the sub-group with the most positive attitudes towards police
performance is characterized as being over the age of thirty-
four, having lived over three years in their neighbourhood, and
having a low fear of crime. The most statistically significant
least positive sub-group is under the age of thirty-five,
perceives crime to be high in its neighbourhood, is afraid of
crime, and has lived in its neighbourhood for over ten years.
Summary Table V indicates that in Jane-Finch the respondent
sub-group which rates police performance highest is: first, over
twenty-four years old; second, is of British, or Northern and
East European background; and third, had not been victimized
during the previous year. The most critical group, however, is
characterized by being: first, under the age of twenty-five;
second, had no contact with the police during the past year; and
third, is of British, or Northern and East European background.
The fact that those of British or Northern and East European
background were in both the "most favorable" and "least favorab-
le" sub-groups, points to the fact that in Jane-Finch age is a
more powerful predictor of respondent evaluations of police
performance than ethnicity.
67
CONCLUSION
The results of multi-variable analysis of the data suggest
68
that citizen attitudes towards the police can vary significantly
across different neighbourhoods in the same city. More impor-
tantly, public attitudes towards the police can vary across sub-
groups within the same neighbourhood. The most common predictive
characteristics that distinguish respondent sub-groups from the
rest of the sample, appears to be age, fear of crime, perception
of crime, crime trends in one's own neighbourhood, ethnicity,
victimization, police contact, and the number of years one has
lived in the same neighbourhood.
Generally, it appears the individual sub-group which holds
the most negative attitudes towards the police are young people
(under thirty-five), who are afraid of crime and perceive that
crime is high in their neighbourhood. The group with the most
favorable opinion of the police are older respondents (over
thirty-four) who are not afraid of crime. However, even older
respondents, who fear crime, or perceive crime to be high in
their neighbourhood, tend to be more critical of police-community
relations and police performance. Therefore, one can conclude
that public attitudes towards the police are strongly influenced
not only by the standard socio-demographic variables (such as
age, ethnicity, neighbourhood, etc.), but also by crime related
perceptive factors such as fear of crime, amount of crime and
crime trend in one's own neighbourhood. This finding suggests
that the perceived level of crime and crime fear has definite
negative effect on some residents perception of police.
69
CONCLUSION
The previous analysis of survey respondents to questions
regarding attitudes and perceptions of police in Toronto further
develops the community level findings presented in Report No. 1.
Just as community or neighbourhood level analysis reveals
important variations between neighbourhoods on various crime and
policing problems, analysis of individual citizen attitudes
towards the police has revealed how important individual or group
differences within a neighbourhood have an impact on attitudes
towards the police. This kind of information is important
because public perception and attitudes towards local police are
a good predictor of possible citizen cooperation, support and
involvement in community policing efforts. By refining our
understanding of how certain experiences such as victimization,
fear of crime, and group affiliation (e.g. ethnicity) affect
attitudes towards the police, it is possible for police and
community to direct community or policing strategies more
effectively. Analysis of the inter-relationship between various
social and demographic factors which influence attitudes and
perceptions also adds to our understanding of the complex nature
of modern community and its varied policing problems.
70
APPENDIX
The statistical technique employed in the analysis is based
on CHAID (Chi-Square Automated Interaction Detection - Kass,
1980) by a new automatic data analysis software called TEASE 1 In
this type of statistical analysis every independent variable is
crosstabulatated with the dependent variable. The variable with
the highest chi-square significance level is selected first and
is split into mutually exclusive sub-groups. The same procedure
is applied to the new sub-groups segmenting the data further
until the splits are no longer statistically significant.
However, unlike other statistical techniques, such as Multiple
Regression, Discriminant Analysis, or ANOVA, CHAID makes minimal
statistical assumptions (e.g. linearity or normal sample dis-
tribution with constant variance). This makes CHAID a more
appropriate statistical technique for the analysis of categorical
data where the observations are not from populations that are
normally distributed with a constant variance. Therefore,
allowing the identification of sub-groups and complex interactive
effects with categorical data that other techniques, such as
Multiple Regression or ANOVA, often miss.
1 KnowledgeWorks Research Systems Ltd., 57 Stevenson Av., Ottawa,
Ont.
REFERENCES
Biderman, A.D., Johnson, L.A., McIntyre, J., Weir, A.W.
(1967) Report on a Pilot Study in the
District of Columbia on Victimization and
Attitudes Toward Law Enforcement.
Washington: Bureau of Social Science
Research, Inc.
Brillon, Y. (1984) "Attitudes des Canadiens vis-à-vis de la
police", Canadian Journal of Criminology.
26(2):133-146.
Campbell, A. and Schuman, H. (1972) "A Comparison of Black
and White Attitudes and Experiences in the
City", in Charles M. Haar (ed.) The End of
Innocence: A Suburban Reader. Glenview,
Il: Scott Foresman:97-110.
Canada (1985a) Criminal Urban Victimization Survey:
Bulletin 4. Ottawa: Solicitor General of
Canada, Programs Branch, Research and
Statistics Group.
Canada (1985b) Criminal Urban Victimization Survey:
Bulletin 6. Ottawa: Solicitor General of
Canada, Programs Branch, Research and
Statistics Group.
72
Decker, Scott H. (1981) "Citizen Attitudes Toward the Police:
A Review of Past Findings and Suggestions
for Future Policy", Journal of Police
Science and Administration. 9(1):80-87.
de Verteuil, Jacques (1987) METROPOLITAN TORONTO COMMUNITY
POLICING SURVEY WORKING PAPER NO. 2:
MEASUREMENT OF VICTIMIZATION. Ottawa:
Statistics Division of the Solicitor
General of Canada.
Flanagan, T.J. (1985) "Consumer Perspectives on Police
Operational Strategy", Journal of Police
Science and Administration. 13(1):10-21.
Garofalo, James (1977) The Police and Public Opinion.
Washington D.C.: National Criminal Justice
Information and Statistics Service.
Gomme, Ian, M. (1986) "Fear of Crime Among Canadians: A
Multi-Variate Analysis", Journal
of Criminal Justice. 14(3):249-258.
Hadar, I., and Snortum, J.R. (1975) "The Eye of the Beholder:
Differential Perceptions of Police by' the
Police and the Public", Criminal Justice
and Behavior. 2(1):37-54.
Hartnagel, T. (1979) "The Perception and Fear of Crime",
Social Forces. 58:176-93.
Hurtig Publishers Ltd. (1985) The Canadian Encyclopedia.
Edmonton, Alberta.
Hyman, J.M. and Thomas, C.W. (1977) "Perceptions of Crime,
Fear of Victimization, and Public
Perceptions Police Performance",
Journal of Police Science and
Administration. 5(3):305-317.
Kass, G.V.(1980) "An Exploratory Technique for Investigating
Large Quantities of Categorical Data,"
Applied Statistics. 29(2): 119-127.
73
Kleih, J., Webb, J.R., and DiSanto, J.E. (1978) "Experience
With the Police and Attitude Toward the
Police", Canadian Journal of Sociology.
3(4):441-456.
Koenig, Daniel J. (1980) "The Effects of Criminal
Victimization Judicial or Police Contacts
on Public Attitudes Toward Local Police",
Journal of Criminal Justice. 8:243-249.
(1974) British Columbians Attitudes and
Experiences Relevant to the Police, Law,
and Crime. Victoria: University of
Victoria Press.
Murphy, C. and de Verteuil, J. (1986) Metropolitan Toronto
Community Survey: Working Paper No.l.
Ottawa: Ministry of the Solicitor General,
Research and Statistics Group.
Percy, Stephen L. (1980) "Response Time and Citizen
Evaluation of Police", Journal of Police
Science and Administration. 8(1):75-86.
74
Poister, T.H. and McDavid (1978) "Victims Evaluation of
Police Performance", Journal of Criminal
Justice. 6(2):133-149.
Skogan, W.G. and Maxfield, M.G. (1981) Coping with Crime:
Individual and Neighborhood Reactions.
Beverly Hills: Sage Publications.
Skogan, Wesley G. (1979) "Citizen Satisfaction with Police
Services", in R. Baker and Fred A. Meyer,
Jr. (eds.) Evaluating Alternative Law
Enforcement Policies. Lexington MA:
Lexington Books.
Smith, Brent (1984) "Rural Victimization and Perceptions of
Police Performance", Victimology: An
International Journal. 9(1):159-165.
Skoog, D. and Boldt, E.D. (1980) "Native Attitudes Toward the
Police", Canadian Journal of Criminology.
22(3):354-359.
Teske, R.H.C., Hoover, L.T., Meyer, R.H. (1982) Public
Perceptions of the Police in Texas.
Sam Houston State University Criminal
Justice Centre.
75
Toseland, R. (1982) "Fear of Crime: Who is Most Vulnerable?",
Journal of Criminal Justice. 10:199-209.
Tyler, T.R. (1984) "Influence of Citizen Satisfaction With
Police Behavior Upon Public Support for
Increases in Police Authority", Law and
Policy. 6(3):329-338.
Winfree, T.L. and Griffiths, C.T. (1971) "Adolescent
Attitudes Toward the Police", in
Ted Ferdinand (ed.) Juvenile delinquency:
Little brother grows up. Beverly Hills:
Sage:79-99.
Wolfgang, P., Nadkarni, A., Jones, J. (1980) Virginia Beach
Police Officer Direct Contact Survey.
Virginia Beach Division of Police,
Virginia Beach: U.S. Dept. of Justice
Law Enforcement Assistance Administration.
76
-
••••• , •
Government GOuvernement of Canada du Canada
• READ IINTRUCTIOINI OIMILEAF.
• AU. REQUESTS FOR TRANSLATION PNOM ONE OFFICIAL LANQUAGE TO THE OTHER MUST ME SUNAITTED TO THE TRANSLATION COORDINATOR Fon APPROVAL
• PLEASE SUPPLY TWO COPIES OF TEXT TO SE TRANSLATED, NO OINGINAL
• DO NOT WNTE IN SHADED AREAL
6. Division
Research
Cal for pkdt-up Téiéphonez pour faire prendre la traduction n Mail to addreea in Box 10
Postez à l'adresse 81 1. Case 10
15. TentaMve refum Retors souhaité le
em J 0;t 8
TeL no. — N• de tél.
993-5575
14. Date submitted — SCUMiee iar
et3 I 03 J r-,t)
Sucrerai instructions — Instructions spéciales Trenalete Indicated
I changes °oh, I Ne traduire que tee modthcations Indiquées
Draft copy acceptabie Copie brouillon acceptable
1
I I I Use attached diskette(s) Utiliser dequette(s) cl-jointe(s) 4—EX
22. SIGNING Name (Print) — Nom (Lettres moulées) AMRITY
POUVOIRS DE SeNATURE J.G. Woods
23. SCIENTIFIC OR TECHNICAL TEXT IN A NON-OFFICIAL LANGUAGE TEXTE SCIENTIFIQUE OU TECHNIQUE EN LANGUE NON OFFICIELLE 1/
Number of worde or mes Nombre de mots Outil plages
lit 111111 «. «r 110 411 •- e.,•.-e4ik4-e.ruaiingLue.---.4zAke,41pe-404efaàmierel,eite
REQUIS:ST FOR DEMANDÉ DE TRANSLATION TRADUCTION
• Lm LES INSTRUCTIONS AU VERSO.
• TOUTES LES DEleANDES DE moucnoe D'UNE LANGUE OFFICIELLE A L'AUTRE DOIVENT ÊTRE soumises À L'APPROSATION DU 000ROON/UITEUR DE LA TRADUCTION.
• !RIME DE FOURNIR DEUX EXEMPLAIRES OU TEXTE A TRADUIRE. JAMAIS VORPINAL.
• NE PAS REMPLIR LES CXSITS MIMÉES.
PLEASE TYPE OR PRINT FIRMLY IN BLOCK LETTERS — PRIÈRE D'ÉCRIRE À à MACHINE OU EN LETTRES MOULÉES EN APPUYANT FERMEMENT
4. Branch — Direction
PSB 3. Department — Mlnistère
Sol.Gen.
n mn. n ms M. MME E] te .R . CI uzE
Auttior or %source pemon (If differen 1. Auttior or Resource pert
Chris Murphy Room — Pièce
8B
8. Originel:rie nuniber Référence du demandeur
i
IL Position title — Tee du poste
Sr. Research Off. CITY — %Me
Ottawa
7. Originator — Demerxieur
340 Lau:
7. Originator — Demandeur [id 144 R. D
Street — Rue
340 Laurier Ave. W. t from Box 7) — Auteur ou personne-reseource (Si différent de Case 7)
9.Areacode Tel. no. — N• de Mt
Province
Ont. --F -Ar« code Ind. rég.
6ndill , 3 1 9, 9 , 12 , 6 9 ,9 Postai Code postai
I K 1 A10 P 8 1 I Tel. no. — fil* de MI.
1 I 1 1 I I 13. Document MN or description — TItre ou description du document User Report 1988-01 - Social Deternànants of Attitudes
ds Police: Findings fram the Torant Commnity . D. LANGUAGES — LANGUES
Source — Départ English • ,'11 Target — Arrivée Il>
TELECOMMUNICATE BY E Facilinlle (CHECK ONE ONLY) Fouinai
TÉLECOMMUNIQUE2 PAR 110. Telex (COCHER UNE SEULE CASE) D TMex
17. DEUVERY OF TRANSLATION — MODE DE UVRAISON
3°,1)
1:::71 Modern
System moka — Marque du système
French
8. REFERENCE MATERIAL Inckided n Not included but let attached DOCUMENTS DE RÉFÉFtENCE D Inclus Non inclus mais liste cl-(ointe
Outekle the 19 INTENDED USE p.
la 1 Public Service AND/OR
DESTINATION l'extérieur de le ET/OU fonction publique
witbe de Putdc Service A lintteleur de la fonction publique
Request No. — de la demande [ Y•A
NO. NBRE
&remit moka ktf:tlitretief
IF TErT IS A CONTINUATION OF OR AN AMENDMENT TO A PREVIOUS TRANSLATION, ENTER ORIGINAL REQUEST NUMBER AND DATE SUBMITTED. SIL S'AGIT D'UNE MOOW1CATION OU DE LA SUITE D'UNE TRADUCTION ANTÉRIEURE, INSCRIRE LE NUMEBO ET Lit DATE DE CETTE DEMANDE.
&marte ln target language shoym in Box 18 Résumer dans Is langue d'arrivée de le Ceee 18
Date I ta D-J
1 1 I
Amidon — Révision II
Position title — Titre du poste ISignature
Director, ResearchkCrl- I certffy that this text hue nOt been Prmiousfy tranalehml according to Ciel Je certifie que ce texte n'a pea dei été traduit dnctsr
flerrii of departmentai abrarian (Print)
I Nom du bibliothécaire du ministère (Lettres moulées)
FOR TRANSLATION COORDINATOR USE ONLY — RÉSERVÉ AU COORDONNATEUR DE LA TRADUCTION 24. TYPE OF DOCUMENT — NATURE DU DOCUMENT 27. REMAFIKS — OBSERVATIONS
Correscondence 1 e i Agenda or minutes [ 3 I I
Correspondence 0„. du jour ou compte rendu
H1 Circuler or directive Circulaire ou directive H ' I Gituale ou manuei
J i ] I ..... description Description de fonctions Publication
28. This request complies Wiltl pcicy Report 1 5 [ Other (Specify in Box 27) Cette demande est conforme à la pcattique
1 1 I I Rapport Autre (Préciser à la Case 27) Coorcinator name (Prit) — Nom du coordonnateur (Lettres moulées) I
25. Date received — Reçue le 28. PSORITY — monsit Y• A hl D•J
I I I I I I I I I aU i i J a• 1:61 SIGNATURE ›
FOR DEPARTMENT OF THE SECRETARY OF STATE USE ONLY — RÉSERVÉ AU SECRÉTARIAT D'ÉTAT
DEPARTMENT OF THE SECRETARY OF STATE - eseirle•F mi a,. ester a.,
soLGEN CANADA LIB/9111
11111111 11111 0000024789
71. itie.F.Y
SOLIGiTOR Ztre:r:g. cANADA
JAN 4 1994
•-niteCE
S01.11r1*" • „ 2- rellADA
. - *
e.
•
• 8
I I 1