ar 1999 financial final2 - annualreports.com
TRANSCRIPT
Market for the Registrant’s Common Stock and Related Stockholder Matters
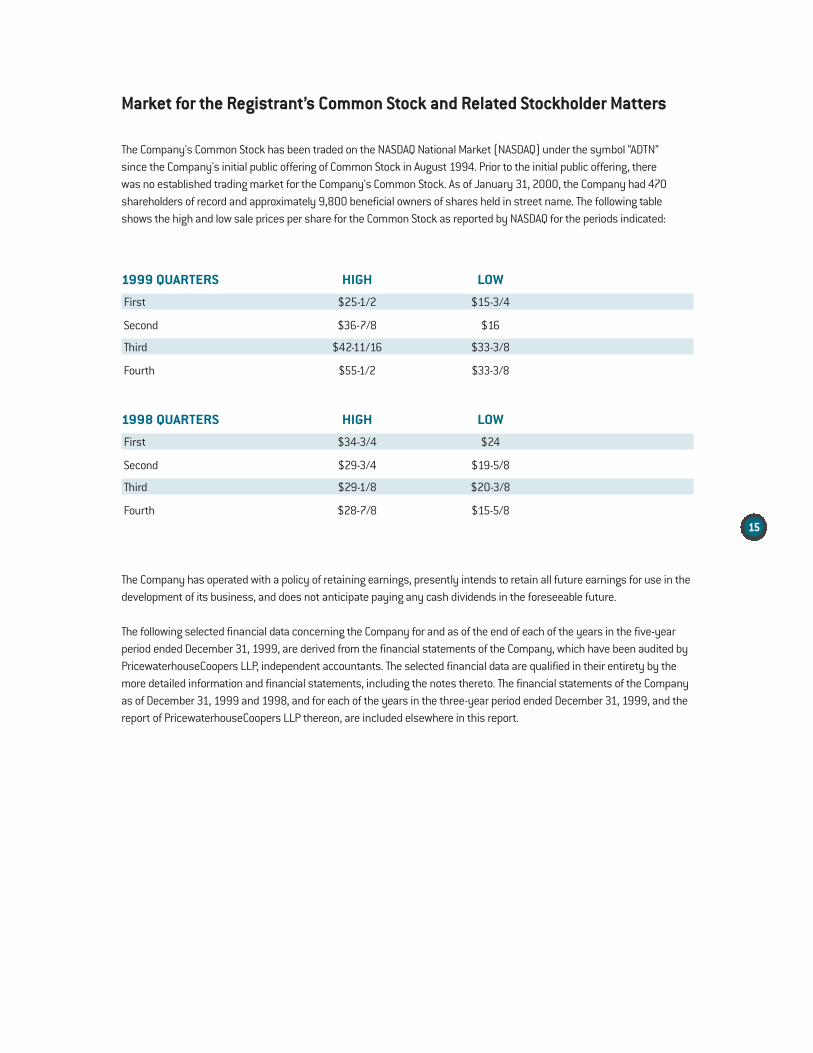
The Company's Common Stock has been traded on the NASDAQ National Market (NASDAQ) under the symbol “ADTN” since the Company's initial public offering of Common Stock in August 1994. Prior to the initial public offering, there was no established trading market for the Company's Common Stock. As of January 31, 2000, the Company had 470shareholders of record and approximately 9,800 beneficial owners of shares held in street name. The following tableshows the high and low sale prices per share for the Common Stock as reported by NASDAQ for the periods indicated:
1999 QUARTERS HIGH LOW
First $25-1/2 $15-3/4
Second $36-7/8 $16
Third $42-11/16 $33-3/8
Fourth $55-1/2 $33-3/8
1998 QUARTERS HIGH LOW
First $34-3/4 $24
Second $29-3/4 $19-5/8
Third $29-1/8 $20-3/8
Fourth $28-7/8 $15-5/8
The Company has operated with a policy of retaining earnings, presently intends to retain all future earnings for use in thedevelopment of its business, and does not anticipate paying any cash dividends in the foreseeable future.
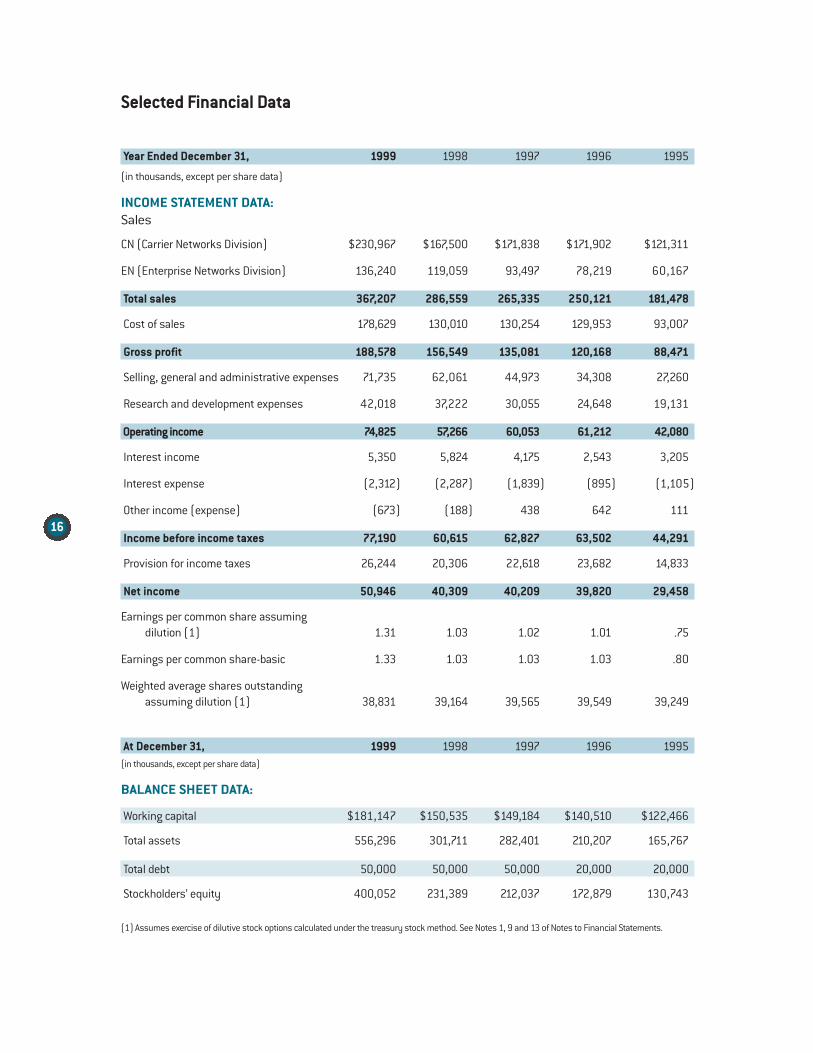
The following selected financial data concerning the Company for and as of the end of each of the years in the five-yearperiod ended December 31, 1999, are derived from the financial statements of the Company, which have been audited byPricewaterhouseCoopers LLP, independent accountants. The selected financial data are qualified in their entirety by themore detailed information and financial statements, including the notes thereto. The financial statements of the Companyas of December 31, 1999 and 1998, and for each of the years in the three-year period ended December 31, 1999, and thereport of PricewaterhouseCoopers LLP thereon, are included elsewhere in this report.
15
16
Selected Financial Data
Year Ended December 31, 1999 1998 1997 1996 1995
(in thousands, except per share data)
INCOME STATEMENT DATA:Sales
CN (Carrier Networks Division) $230,967 $167,500 $171,838 $171,902 $121,311
EN (Enterprise Networks Division) 136,240 119,059 93,497 78,219 60,167
Total sales 367,207 286,559 265,335 250,121 181,478
Cost of sales 178,629 130,010 130,254 129,953 93,007
Gross profit 188,578 156,549 135,081 120,168 88,471
Selling, general and administrative expenses 71,735 62,061 44,973 34,308 27,260
Research and development expenses 42,018 37,222 30,055 24,648 19,131
Operating income 74,825 57,266 60,053 61,212 42,080
Interest income 5,350 5,824 4,175 2,543 3,205
Interest expense (2,312) (2,287) (1,839) (895) (1,105)
Other income (expense) (673) (188) 438 642 111
Income before income taxes 77,190 60,615 62,827 63,502 44,291
Provision for income taxes 26,244 20,306 22,618 23,682 14,833
Net income 50,946 40,309 40,209 39,820 29,458
Earnings per common share assumingdilution (1) 1.31 1.03 1.02 1.01 .75
Earnings per common share-basic 1.33 1.03 1.03 1.03 .80
Weighted average shares outstanding assuming dilution (1) 38,831 39,164 39,565 39,549 39,249
At December 31, 1999 1998 1997 1996 1995(in thousands, except per share data)
BALANCE SHEET DATA:
Working capital $181,147 $150,535 $149,184 $140,510 $122,466
Total assets 556,296 301,711 282,401 210,207 165,767
Total debt 50,000 50,000 50,000 20,000 20,000
Stockholders’ equity 400,052 231,389 212,037 172,879 130,743
(1) Assumes exercise of dilutive stock options calculated under the treasury stock method. See Notes 1, 9 and 13 of Notes to Financial Statements.
Management’s Discussion and Analysis of Financial Condition and Results of Operations
OVERVIEWThe Company designs, develops, manufactures, markets and services a broad range of high-speed digital transmissionproducts utilized by providers of telecommunications services (serviced by ADTRAN’s Carrier Networks Division or CN), and corporate end-users (serviced by ADTRAN’s Enterprise Networks Division or EN) to implement advanced digital dataservices over existing telephone networks. The Company currently sells its products to a large number of carriers, including all Regional Bell Operating Companies (“RBOCs”), and to private and public enterprises worldwide.
The Company has increased its sales in each year primarily by increasing the number of units sold to both new and existingcustomers. These annual sales increases reflect the Company's strategy of increasing unit volume and market sharethrough the introduction of succeeding generations of products having lower selling prices and increased functionality ascompared both to the prior generation of a product and to the products of competitors. An important part of the Company'sstrategy is to engineer the reduction of the product cost of each succeeding product generation and then to lower theproduct's price based on the cost savings achieved. As a part of this strategy, the Company seeks in most instances to be alow-cost, high-quality provider of products in its markets. The Company's success to-date is attributable in large measure toits ability to design its products initially with a view to their subsequent re-design, allowing both increased functionality andreduced manufacturing costs in each succeeding product generation. This strategy has enabled the Company to sellsucceeding generations of products to existing customers, as well as to increase its market share by selling these enhancedproducts to new customers.
While the Company has experienced increased sales in each year, the Company's operating results have fluctuated on aquarterly basis in the past, and operating results may vary significantly in future periods due to a number of factors. TheCompany operates with very little order backlog. A substantial majority of its sales in each quarter results from ordersbooked in that quarter and firm purchase orders released in that quarter by customers under agreements containing non-binding purchase commitments. Furthermore, a majority of customers typically require prompt delivery of products. Thisresults in a limited backlog of orders for these products and requires the Company to maintain sufficient inventory levelsto satisfy anticipated customer demand. If near-term demand for the Company's products declines, or if potential sales inany quarter do not occur as anticipated, the Company's financial results may be adversely affected. Operating expensesare relatively fixed in the short term; therefore, a shortfall in quarterly revenues could impact the Company's financialresults significantly in a given quarter. Further, maintaining sufficient inventory levels to assure prompt delivery of theCompany's products increases the amount of inventory which may become obsolete and increases the risk that theobsolescence of such inventory may have an adverse effect on the Company's business and operating results. TheCompany's operating results may also fluctuate as a result of a number of other factors, including increased competition,customer order patterns, changes in product mix, product warranty returns and announcements of new products by theCompany or its competitors. Accordingly, the Company's historical financial performance is not necessarily a meaningfulindicator of future results, and, in general, management expects that the Company's financial results may vary from periodto period. See Note 14 of Notes to Financial Statements.
17
18
This 1999 Annual Report contains “forward-looking statements” within the meaning of Section 21E of the SecuritiesExchange Act of 1934, as amended, which represent the Company’s expectations or beliefs, including, but not limited to,statements concerning (i) the business and financial outlook of the Company, (ii) the Company’s business, financial condition or results of operations, and (iii) the Company’s business strategy. When used in this 1999 Annual Report, thewords “believe,” “anticipate,” “think,” “intend,” “will be,” and similar expressions identify forward-looking statements. Suchstatements are subject to certain risks and uncertainties which could cause actual results to differ materially from thoseprojected. Readers are cautioned not to place undue reliance on these forward-looking statements which speak only as ofthe date hereof. Readers are also urged to carefully review and consider the various disclosures, including, but not limitedto, the disclosures described under the captions “Management’s Discussion and Analysis of Financial Condition andResults of Operations,” “1999 Compared to 1998,” and “Liquidity and Capital Resources,” and those discussed in theCompany’s filings with the Securities and Exchange Commission, as well as the general economic conditions and industrytrends which could cause actual results or outcomes to differ materially from those expressed in any forward-lookingstatement of the Company.
Results of Operations
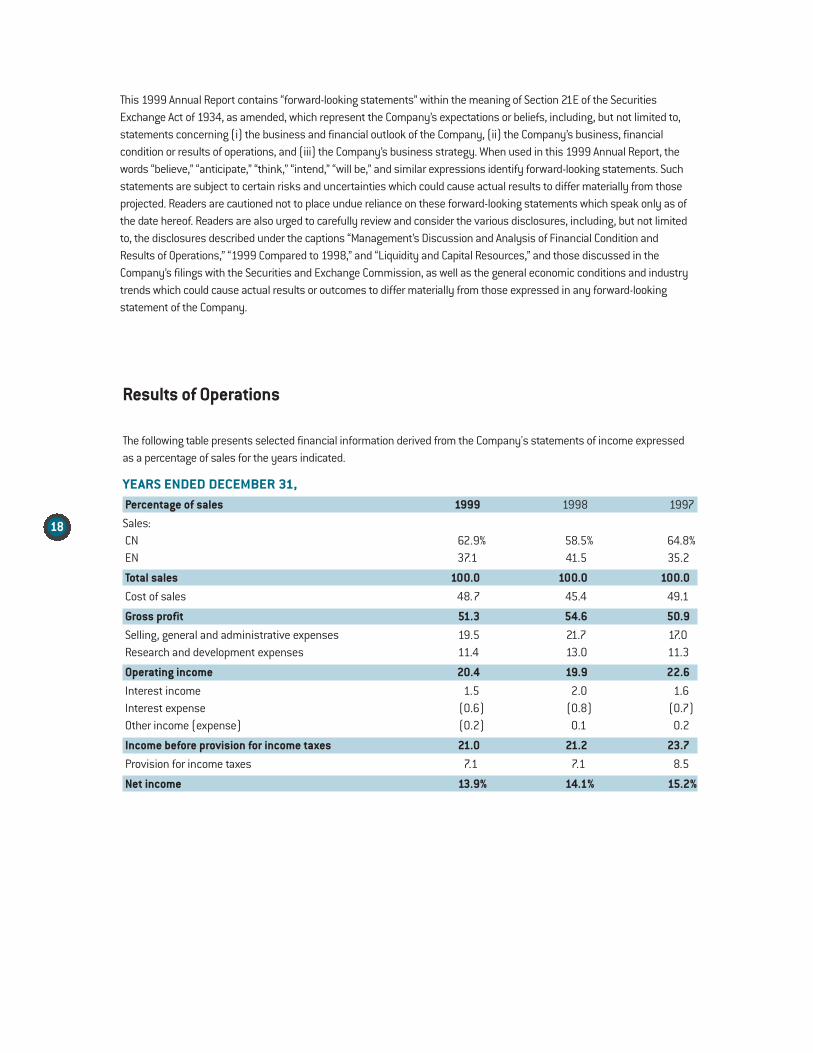
The following table presents selected financial information derived from the Company's statements of income expressedas a percentage of sales for the years indicated.
YEARS ENDED DECEMBER 31,Percentage of sales 1999 1998 1997
Sales:CN 62.9% 58.5% 64.8%EN 37.1 41.5 35.2
Total sales 100.0 100.0 100.0Cost of sales 48.7 45.4 49.1
Gross profit 51.3 54.6 50.9Selling, general and administrative expenses 19.5 21.7 17.0Research and development expenses 11.4 13.0 11.3
Operating income 20.4 19.9 22.6Interest income 1.5 2.0 1.6Interest expense (0.6) (0.8) (0.7)Other income (expense) (0.2) 0.1 0.2
Income before provision for income taxes 21.0 21.2 23.7Provision for income taxes 7.1 7.1 8.5
Net income 13.9% 14.1% 15.2%
19
1999 Compared to 1998
SALESThe Company’s sales increased 28.0% from $286,559,000 in 1998 to $367,207,000 in 1999. The increased sales resultedfrom increased sales volume to existing customers and from increased market penetration. Sales for the CN divisionincreased 37.9% from $167,500,000 in 1998 to $230,967,000 in 1999. CN sales as a percentage of total sales increasedfrom 58.5% in 1998 to 62.9% in 1999. Sales of EN products increased 14.4% from $119,059,000 in 1998 to $136,240,000in 1999. As a percentage of total sales, EN sales decreased from 41.5% in 1998 to 37.1% in 1999. The primary factors lead-ing to the increase in sales in 1999 were (i) additional market penetration for the Company’s HDSL products, (ii) continuinggrowth in demand for T1 products, (iii) continuing growth in sales of the ATLAS integrated access device, and (iv) the intro-duction of the Total Access™ product line (primarily directed to the CLEC market).
COST OF SALESCost of sales increased from $130,010,000 in 1998 to $178,629,000 in 1999. As a percentage of sales, cost of salesincreased only from 45.4% in 1998 to 48.7% in 1999. This increase was due primarily to a rise in material cost as a percentage of sales. CN cost of sales increased from $75,926,000 in 1998 to $122,157,000 in 1999. CN cost of sales asa percentage of CN sales increased from 45.3% in 1998 to 52.9% in 1999. This increase resulted from an increase in theimportance of sales of HDSL products which, for a portion of 1999, were at a lower margin due to a delay in the transitionfrom one generation of HDSL products to the succeeding generation. EN cost of sales increased from $54,084,000 in1998 to $56,472,000 in 1999. As a percentage of EN sales, EN cost of sales decreased from 45.4% in 1998 to 41.6% in1999. An important part of the Company’s strategy is to reduce the product cost of each succeeding product generationand then to lower the product’s price based on the cost savings achieved. This strategy sometimes results in variations inthe Company’s gross profit margin due to timing differences between the lowering of product selling prices and the real-ization of cost reductions. In view of the rapid pace of new product introductions by the Company, this strategy mayresult in variations in gross profit margins that, for any particular financial period, can be difficult to predict.
SELLING, GENERAL AND ADMINISTRATIVE EXPENSESSelling, general and administrative expenses increased 15.6% from $62,061,000 in 1998 to $71,735,000 in 1999.Beginning in the first quarter of 1997, the Company embarked on a program of expanding infrastructure in both sales andsupport personnel for its expanded customer base and for increased initiatives in the EN and international markets, as wellas for the introduction and marketing of more technically enhanced products. This expansion program continued through-out 1997 and through the third quarter of 1998, at which point the Company determined that it had developed the salesand support capacity necessary to service its expanded revenue base. As a result, sales, general and administrativeexpense increased as a percentage of sales in 1998 compared to 1997 and decreased as a percentage of sales in 1999compared to 1998. As a percentage of sales, selling, general and administrative expenses decreased from 21.7% in 1998 to19.5% in 1999 because of operating efficiencies due to the larger sales base.
RESEARCH AND DEVELOPMENT EXPENSESResearch and development expenses increased 12.9% from $37,222,000 in 1998 to $42,018,000 in 1999. This increasewas due to increased engineering costs associated with new product introductions and feature enhancement activities. Asa percentage of sales, research and development expenses decreased from 13.0% in 1998 to 11.4% in 1999. The Companycontinually evaluates new product opportunities and engages in intensive research and product development efforts. Todate, the Company has expensed all product research and development costs as incurred. Additionally, the Company fre-quently invests heavily in up-front market development efforts prior to the actual commencement of sales of a major newproduct. As a result, the Company may incur significant research and development expenses and selling, general andadministrative expenses prior to the receipt of revenues from a major new product group. The Company is presently incur-ring both research and development expenses and selling, general and administrative expenses in connection with its newproducts and its expansion into international markets.
20
INTEREST EXPENSEInterest expense increased 1.1% from $2,287,000 in 1998 to $2,312,000 in 1999. The Company currently pays interest ona $50,000,000 revenue bond, the proceeds of which were used to expand the Company’s facilities in Huntsville, Alabama.
NET INCOMEAs a result of the above factors, net income increased by 26.4% from $40,310,000 in 1998 to $50,946,000 in 1999. As apercentage of sales, net income decreased from 14.1% in 1998 to 13.9% in 1999.
1998 Compared to 1997SALESThe Company’s sales increased 8% from $265,335,000 in 1997 to $286,559,000 in 1998. The increased sales resultedfrom increased sales volume to existing customers and from increased market penetration. CN sales decreased from$171,838,000 in 1997 to $167,500,000 in 1998 primarily because of a decline in international revenue. CN sales as apercentage of total sales decreased from 64.8% in 1997 to 58.5% in 1998. Sales of EN products increased 27.3% from
$93,497,000 in 1997 to $119,059,000 in 1998. As a percentage of total sales, EN sales increased from 35.2% in 1997 to41.5% in 1998. The increase in sales of EN products is attributable to increased demand for T1 Service Unit (TSU) productsand Digital Data Service (DDS) products.
COST OF SALESCost of sales decreased from $130,254,000 in 1997 to $130,010,000 in 1998. As a percentage of sales, cost of salesdecreased from 49.1% in 1997 to 45.4% in 1998. This decrease was due primarily to reductions in component cost andproduct design enhancements. CN cost of sales decreased from $87,270,000 in 1997 to $75,926,000 in 1998. CN cost ofsales as a percentage of CN sales decreased from 50.8% in 1997 to 45.3% in 1998. EN cost of sales increased from$42,984,000 in 1997 to $54,084,000 in 1998. As a percentage of EN sales, EN cost of sales decreased from 46.0% in1997 to 45.4% in 1998.
SELLING, GENERAL AND ADMINISTRATIVE EXPENSESSelling, general and administrative expenses increased 38.0% from $44,973,000 in 1997 to $62,061,000 in 1998.Beginning in the first quarter of 1997, the Company embarked on a program of expanding infrastructure in both sales andsupport personnel for its expanded customer base and for increased initiatives in the EN and international markets, as wellas for the introduction and marketing of more technically enhanced products. This expansion program continued through-out 1997 and through the third quarter of 1998, at which point the Company determined that it had developed the salesand support capacity necessary to service its expanded revenue base. As a result, sales, general and administrativeexpense increased as a percentage of sales in 1998 compared to 1997 and decreased as a percentage of sales in 1999compared to 1998. As a percentage of sales, selling, general and administrative expenses increased from 17.0% in 1997to 21.7% in 1998.
RESEARCH AND DEVELOPMENT EXPENSESResearch and development expenses increased 23.8% from $30,055,000 in 1997 to $37,222,000 in 1998. This increasewas due to increased engineering costs associated with new product introductions and feature enhancement activities. As a percentage of sales, research and development expenses increased from 11.3% in 1997 to 13.0% in 1998.
INTEREST EXPENSEInterest expense increased 24.4% from $1,839,000 in 1997 to $2,287,000 in 1998. The Company currently pays intereston $50,000,000 of revenue bond proceeds of which $20,000,000 was loaned to the Company in January 1995, and$30,000,000 was loaned to the Company in April 1997. The proceeds were used to expand the Company’s facilities inHuntsville, Alabama. The increase in interest expense in 1998 was due primarily to a full year’s interest being incurred in1998 on the additional $30,000,000 borrowed in April 1997 versus only a partial year in 1997.
NET INCOMEAs a result of the above factors, net income increased from $40,209,000 in 1997 to $40,310,000 in 1998. As a percentageof sales, net income decreased from 15.2% in 1997 to 14.1% in 1998.
21
Liquidity and Capital Resources
The Company is committed to spend approximately an additional $15,000,000 completing the construction of Phase IV ofits corporate headquarters in Huntsville, Alabama, with the expected completion date of June 30, 2000. Over the next sev-eral years, the Company expects to spend approximately an additional $25,000,000 to equip Phase IV. Fifty million dollarsof the Company’s Phase III expansion was approved for participation in an incentive program offered by the Alabama StateIndustrial Development Authority (the “Authority”). The incentive program enables participating companies to generateAlabama corporate income tax credits that can be used to reduce the amount of Alabama corporate income taxes thatwould otherwise be payable. There can be no assurance that the State of Alabama will continue to make these corporateincome tax credits available in the future, and the Company therefore may not realize the full benefit of these incentives.Through December 31, 1999, the Authority had issued $50,000,000 of its taxable revenue bonds pursuant to the incentiveprogram and loaned the proceeds from the sale of the bonds to the Company. The Company is required to make paymentsto the Authority in amounts necessary to pay the principal of and interest on the Authority’s Taxable Revenue Bond, Series1995, as amended, currently outstanding in the aggregate principal amount of $50,000,000. The bond matures onJanuary 1, 2020, and bears interest at the rate of 45 basis points over the money market rate of First Union National Bankof Tennessee.
The Company’s working capital position improved from $150,535,000 as of December 31, 1998 to $181,147,000 as ofDecember 31, 1999. This improvement was due primarily to earnings and the receipt of cash generated from operations.The Company has used, and expects to continue to use, the cash generated from operations for working capital and othergeneral corporate purposes, including (i) product development activities to enhance its existing products and develop newproducts and (ii) expansion of sales and marketing activities. Inventory decreased 10.8% from December 31, 1998 toDecember 31, 1999.
On March 31, 1997, the Board of Directors authorized the Company to re-purchase up to 1,000,000 shares of theCompany’s outstanding common stock. In October 1998, the Board approved the re-purchase of an additional 2,000,000shares. As of December 31, 1999, the Company had re-purchased 1,120,136 shares of its common stock at a total cost of$23,537,000.
Capital expenditures totaling $36,237,000, $23,096,000, and $18,221,000 in 1999, 1998 and 1997, respectively, wereused to expand the Company’s headquarters and to purchase equipment.
At December 31, 1999, the Company’s cash on hand of $37,501,000, short-term investments of $41,081,000 and$10,000,000 available under a bank line of credit placed the Company’s potential cash availability at $88,581,000. The Company’s $10,000,000 bank line of credit bears interest at the rate of 87.5 basis points over the 30-day London inter-bank offered rate and expires on March 29, 2000. The Company anticipates renewing the $10,000,000 bank line ofcredit upon its expiration. The Company intends to finance its operations in the future with cash flow from operations andamounts available under the bank line of credit. These available sources of funds are expected to be adequate to meet theCompany’s operating and capital needs for the foreseeable future.
Management’s Responsibility for Financial Reporting
The accompanying financial statements and related notes of ADTRAN, Inc. were prepared by management, which has theprimary responsibility for the integrity of the financial information therein. The statements were prepared in conformitywith generally accepted accounting principles in the United States appropriate in the circumstances and include amountswhich necessarily are based on management’s judgment. Financial information presented elsewhere in this report is con-sistent with that in the financial statements.
Management maintains a comprehensive system of internal accounting controls and relies on the system to discharge itsresponsibility for the integrity of the financial statements. This system provides reasonable assurance that corporateassets are safeguarded, and that transactions are recorded in such a manner as to permit the preparation of reliable finan-cial information. Reasonable assurance recognizes that the cost of a system of internal accounting controls should notexceed the related benefits. This system of internal accounting controls is augmented by written policies and proceduresand the careful selection and training of qualified personnel. As of December 31, 1999, management was aware of nomaterial weaknesses in the ADTRAN system of internal accounting controls.
The financial statements have been audited by the Company’s independent certified public accountants, whose opinion isexpressed on the following page. Their audit was conducted in accordance with generally accepted auditing standards inthe United States, and as such, they obtained an understanding of the Company’s systems of internal accounting controlsand conducted such tests and related procedures as they deemed necessary to arrive at an opinion on the fairness of pre-sentation of the financial statements.
Mark C. Smith John R. CooperChairman and CEO Vice President and CFO
22
23
Report of Independent Accountants
TO THE BOARD OF DIRECTORS AND STOCKHOLDERS OF ADTRAN, INC.
In our opinion, the accompanying balance sheet and the related statements of income, changes in stockholders’ equityand cash flows present fairly, in all material respects, the financial position of ADTRAN, Inc. (the Company) at December 31,1999 and 1998, and the results of its operations and cash flows for each of the three years in the period ending December31, 1999, in conformity with generally accepted accounting principles in the United States. These financial statements arethe responsibility of the Company’s management; our responsibility is to express an opinion on these financial statementsbased on our audits. We conducted our audits in accordance with generally accepted auditing standards in the UnitedStates which require that we plan and perform the audit to obtain reasonable assurance about whether the financial state-ments are free of material misstatement. An audit includes examining, on a test basis, evidence supporting the amountsand disclosures in the financial statements, assessing the accounting principles used and significant estimates made bymanagement, and evaluating the overall financial statement presentation. We believe that our audit provides a reasonablebasis for the opinion expressed above.
PricewaterhouseCoopers LLPBirmingham, AlabamaJanuary 12, 2000
24
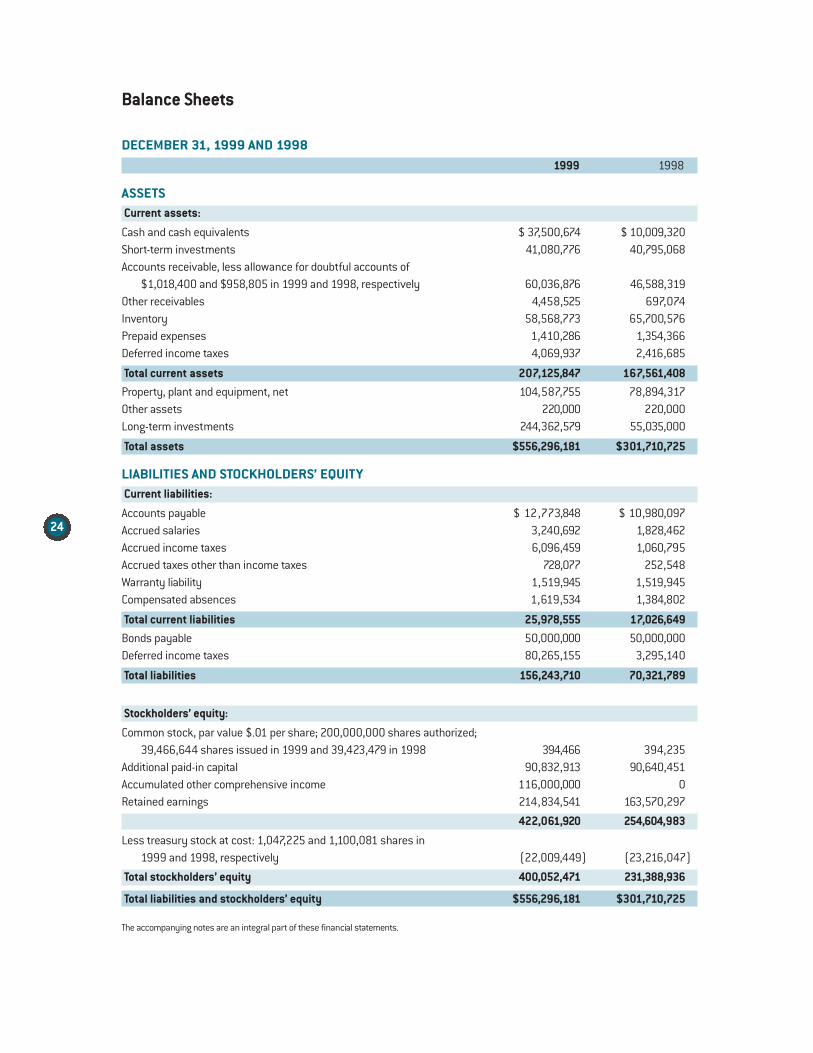
Balance Sheets
DECEMBER 31, 1999 AND 19981999 1998
ASSETSCurrent assets:
Cash and cash equivalents $ 37,500,674 $ 10,009,320Short-term investments 41,080,776 40,795,068Accounts receivable, less allowance for doubtful accounts of
$1,018,400 and $958,805 in 1999 and 1998, respectively 60,036,876 46,588,319Other receivables 4,458,525 697,074Inventory 58,568,773 65,700,576Prepaid expenses 1,410,286 1,354,366Deferred income taxes 4,069,937 2,416,685
Total current assets 207,125,847 167,561,408Property, plant and equipment, net 104,587,755 78,894,317Other assets 220,000 220,000Long-term investments 244,362,579 55,035,000
Total assets $556,296,181 $301,710,725
LIABILITIES AND STOCKHOLDERS’ EQUITYCurrent liabilities:
Accounts payable $ 12,773,848 $ 10,980,097Accrued salaries 3,240,692 1,828,462Accrued income taxes 6,096,459 1,060,795Accrued taxes other than income taxes 728,077 252,548Warranty liability 1,519,945 1,519,945Compensated absences 1,619,534 1,384,802
Total current liabilities 25,978,555 17,026,649Bonds payable 50,000,000 50,000,000Deferred income taxes 80,265,155 3,295,140
Total liabilities 156,243,710 70,321,789
Stockholders’ equity:
Common stock, par value $.01 per share; 200,000,000 shares authorized; 39,466,644 shares issued in 1999 and 39,423,479 in 1998 394,466 394,235
Additional paid-in capital 90,832,913 90,640,451Accumulated other comprehensive income 116,000,000 0Retained earnings 214,834,541 163,570,297
422,061,920 254,604,983
Less treasury stock at cost: 1,047,225 and 1,100,081 shares in 1999 and 1998, respectively (22,009,449) (23,216,047)
Total stockholders’ equity 400,052,471 231,388,936
Total liabilities and stockholders’ equity $556,296,181 $301,710,725
The accompanying notes are an integral part of these financial statements.
25
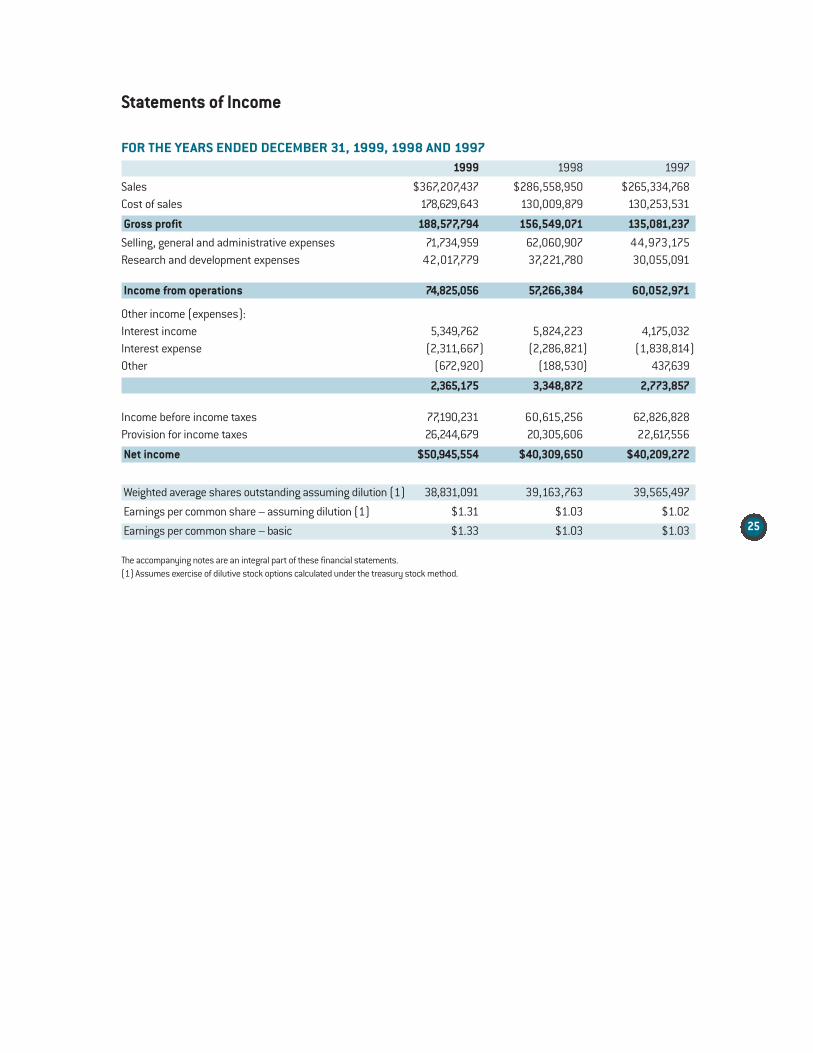
Statements of Income
FOR THE YEARS ENDED DECEMBER 31, 1999, 1998 AND 19971999 1998 1997
Sales $367,207,437 $286,558,950 $265,334,768Cost of sales 178,629,643 130,009,879 130,253,531
Gross profit 188,577,794 156,549,071 135,081,237Selling, general and administrative expenses 71,734,959 62,060,907 44,973,175Research and development expenses 42,017,779 37,221,780 30,055,091
Income from operations 74,825,056 57,266,384 60,052,971
Other income (expenses):Interest income 5,349,762 5,824,223 4,175,032Interest expense (2,311,667) (2,286,821) (1,838,814)Other (672,920) (188,530) 437,639
2,365,175 3,348,872 2,773,857
Income before income taxes 77,190,231 60,615,256 62,826,828Provision for income taxes 26,244,679 20,305,606 22,617,556
Net income $50,945,554 $40,309,650 $40,209,272
Weighted average shares outstanding assuming dilution (1) 38,831,091 39,163,763 39,565,497
Earnings per common share – assuming dilution (1) $1.31 $1.03 $1.02
Earnings per common share – basic $1.33 $1.03 $1.03
The accompanying notes are an integral part of these financial statements.(1) Assumes exercise of dilutive stock options calculated under the treasury stock method.
26
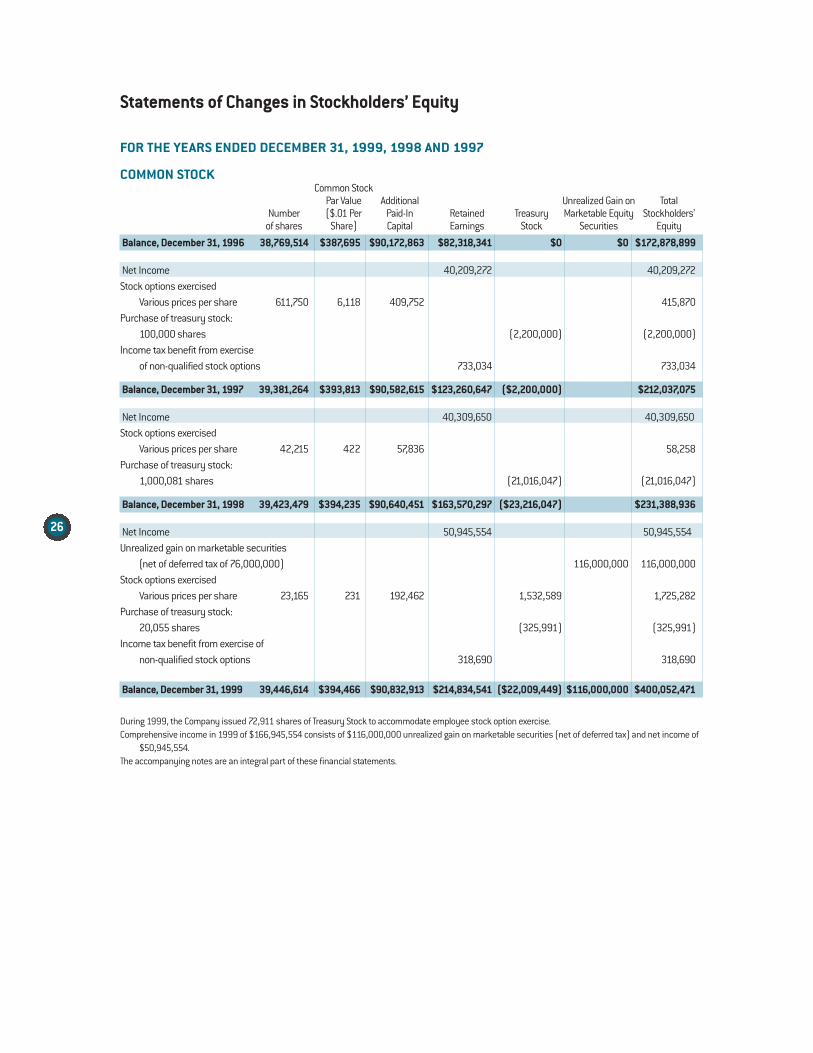
Statements of Changes in Stockholders’ Equity
FOR THE YEARS ENDED DECEMBER 31, 1999, 1998 AND 1997
COMMON STOCKCommon Stock
Par Value Additional Unrealized Gain on TotalNumber ($.01 Per Paid-In Retained Treasury Marketable Equity Stockholders’
of shares Share) Capital Earnings Stock Securities Equity
Balance, December 31, 1996 38,769,514 $387,695 $90,172,863 $82,318,341 $0 $0 $172,878,899
Net Income 40,209,272 40,209,272Stock options exercised
Various prices per share 611,750 6,118 409,752 415,870Purchase of treasury stock:
100,000 shares (2,200,000) (2,200,000)Income tax benefit from exercise
of non-qualified stock options 733,034 733,034
Balance, December 31, 1997 39,381,264 $393,813 $90,582,615 $123,260,647 ($2,200,000) $212,037,075
Net Income 40,309,650 40,309,650Stock options exercised
Various prices per share 42,215 422 57,836 58,258Purchase of treasury stock:
1,000,081 shares (21,016,047) (21,016,047)
Balance, December 31, 1998 39,423,479 $394,235 $90,640,451 $163,570,297 ($23,216,047) $231,388,936
Net Income 50,945,554 50,945,554Unrealized gain on marketable securities
(net of deferred tax of 76,000,000) 116,000,000 116,000,000Stock options exercised
Various prices per share 23,165 231 192,462 1,532,589 1,725,282Purchase of treasury stock:
20,055 shares (325,991) (325,991)Income tax benefit from exercise of
non-qualified stock options 318,690 318,690
Balance, December 31, 1999 39,446,614 $394,466 $90,832,913 $214,834,541 ($22,009,449) $116,000,000 $400,052,471
During 1999, the Company issued 72,911 shares of Treasury Stock to accommodate employee stock option exercise.Comprehensive income in 1999 of $166,945,554 consists of $116,000,000 unrealized gain on marketable securities (net of deferred tax) and net income of
$50,945,554.The accompanying notes are an integral part of these financial statements.
27
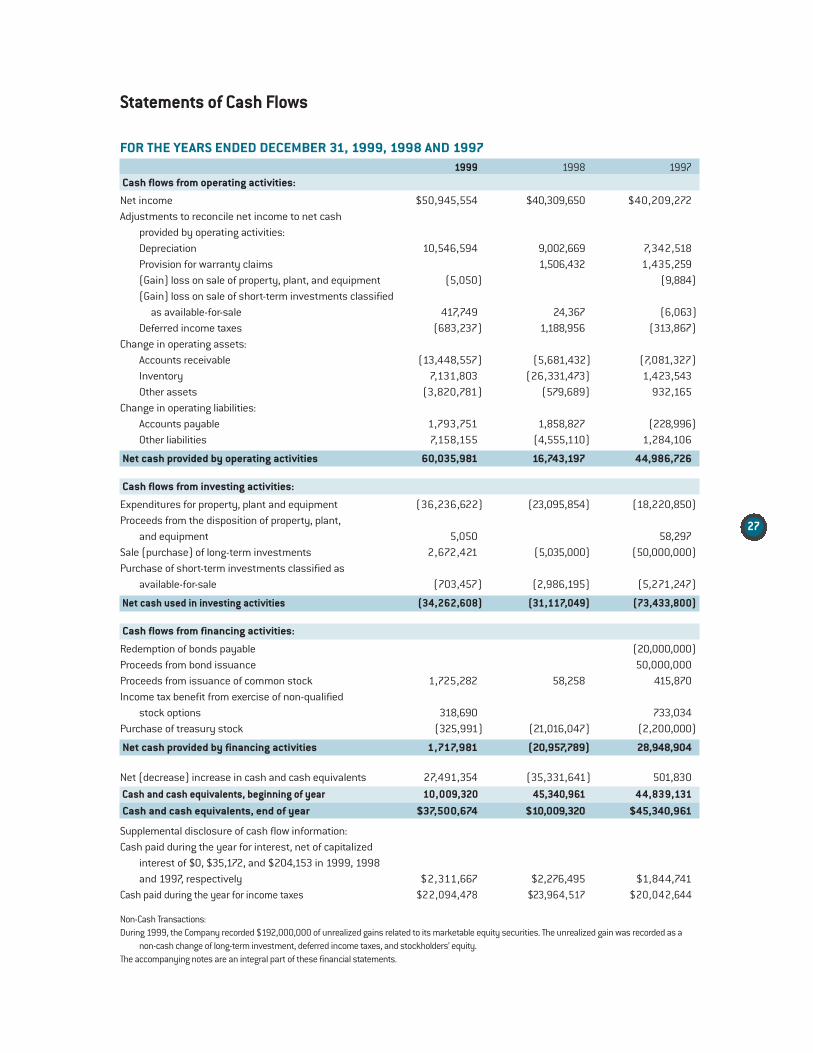
Statements of Cash Flows
FOR THE YEARS ENDED DECEMBER 31, 1999, 1998 AND 19971999 1998 1997
Cash flows from operating activities:
Net income $50,945,554 $40,309,650 $40,209,272Adjustments to reconcile net income to net cash
provided by operating activities:Depreciation 10,546,594 9,002,669 7,342,518Provision for warranty claims 1,506,432 1,435,259(Gain) loss on sale of property, plant, and equipment (5,050) (9,884)(Gain) loss on sale of short-term investments classified
as available-for-sale 417,749 24,367 (6,063)Deferred income taxes (683,237) 1,188,956 (313,867)
Change in operating assets:Accounts receivable (13,448,557) (5,681,432) (7,081,327)Inventory 7,131,803 (26,331,473) 1,423,543Other assets (3,820,781) (579,689) 932,165
Change in operating liabilities:Accounts payable 1,793,751 1,858,827 (228,996)Other liabilities 7,158,155 (4,555,110) 1,284,106
Net cash provided by operating activities 60,035,981 16,743,197 44,986,726
Cash flows from investing activities:
Expenditures for property, plant and equipment (36,236,622) (23,095,854) (18,220,850)Proceeds from the disposition of property, plant,
and equipment 5,050 58,297Sale (purchase) of long-term investments 2,672,421 (5,035,000) (50,000,000)Purchase of short-term investments classified as
available-for-sale (703,457) (2,986,195) (5,271,247)
Net cash used in investing activities (34,262,608) (31,117,049) (73,433,800)
Cash flows from financing activities:
Redemption of bonds payable (20,000,000)Proceeds from bond issuance 50,000,000Proceeds from issuance of common stock 1,725,282 58,258 415,870Income tax benefit from exercise of non-qualified
stock options 318,690 733,034Purchase of treasury stock (325,991) (21,016,047) (2,200,000)
Net cash provided by financing activities 1,717,981 (20,957,789) 28,948,904
Net (decrease) increase in cash and cash equivalents 27,491,354 (35,331,641) 501,830
Cash and cash equivalents, beginning of year 10,009,320 45,340,961 44,839,131Cash and cash equivalents, end of year $37,500,674 $10,009,320 $45,340,961
Supplemental disclosure of cash flow information:Cash paid during the year for interest, net of capitalized
interest of $0, $35,172, and $204,153 in 1999, 1998and 1997, respectively $2,311,667 $2,276,495 $1,844,741
Cash paid during the year for income taxes $22,094,478 $23,964,517 $20,042,644
Non-Cash Transactions:During 1999, the Company recorded $192,000,000 of unrealized gains related to its marketable equity securities. The unrealized gain was recorded as a
non-cash change of long-term investment, deferred income taxes, and stockholders’ equity.The accompanying notes are an integral part of these financial statements.
28
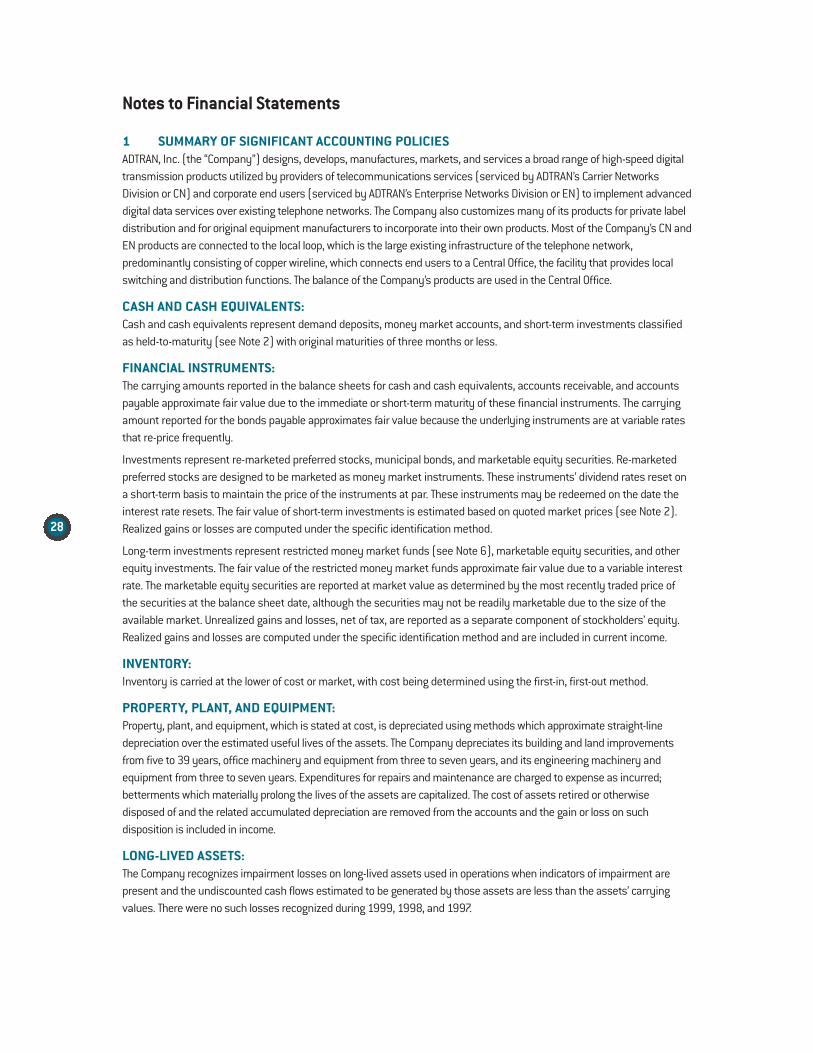
Notes to Financial Statements
1 SUMMARY OF SIGNIFICANT ACCOUNTING POLICIESADTRAN, Inc. (the “Company”) designs, develops, manufactures, markets, and services a broad range of high-speed digitaltransmission products utilized by providers of telecommunications services (serviced by ADTRAN’s Carrier NetworksDivision or CN) and corporate end users (serviced by ADTRAN’s Enterprise Networks Division or EN) to implement advanceddigital data services over existing telephone networks. The Company also customizes many of its products for private labeldistribution and for original equipment manufacturers to incorporate into their own products. Most of the Company’s CN andEN products are connected to the local loop, which is the large existing infrastructure of the telephone network, predominantly consisting of copper wireline, which connects end users to a Central Office, the facility that provides localswitching and distribution functions. The balance of the Company’s products are used in the Central Office.
CASH AND CASH EQUIVALENTS: Cash and cash equivalents represent demand deposits, money market accounts, and short-term investments classifiedas held-to-maturity (see Note 2) with original maturities of three months or less.
FINANCIAL INSTRUMENTS:The carrying amounts reported in the balance sheets for cash and cash equivalents, accounts receivable, and accountspayable approximate fair value due to the immediate or short-term maturity of these financial instruments. The carryingamount reported for the bonds payable approximates fair value because the underlying instruments are at variable ratesthat re-price frequently.
Investments represent re-marketed preferred stocks, municipal bonds, and marketable equity securities. Re-marketedpreferred stocks are designed to be marketed as money market instruments. These instruments’ dividend rates reset ona short-term basis to maintain the price of the instruments at par. These instruments may be redeemed on the date theinterest rate resets. The fair value of short-term investments is estimated based on quoted market prices (see Note 2).Realized gains or losses are computed under the specific identification method.
Long-term investments represent restricted money market funds (see Note 6), marketable equity securities, and otherequity investments. The fair value of the restricted money market funds approximate fair value due to a variable interestrate. The marketable equity securities are reported at market value as determined by the most recently traded price of the securities at the balance sheet date, although the securities may not be readily marketable due to the size of the available market. Unrealized gains and losses, net of tax, are reported as a separate component of stockholders’ equity.Realized gains and losses are computed under the specific identification method and are included in current income.
INVENTORY:Inventory is carried at the lower of cost or market, with cost being determined using the first-in, first-out method.
PROPERTY, PLANT, AND EQUIPMENT:Property, plant, and equipment, which is stated at cost, is depreciated using methods which approximate straight-linedepreciation over the estimated useful lives of the assets. The Company depreciates its building and land improvementsfrom five to 39 years, office machinery and equipment from three to seven years, and its engineering machinery and equipment from three to seven years. Expenditures for repairs and maintenance are charged to expense as incurred; betterments which materially prolong the lives of the assets are capitalized. The cost of assets retired or otherwise disposed of and the related accumulated depreciation are removed from the accounts and the gain or loss on such disposition is included in income.
LONG-LIVED ASSETS:The Company recognizes impairment losses on long-lived assets used in operations when indicators of impairment are present and the undiscounted cash flows estimated to be generated by those assets are less than the assets’ carrying values. There were no such losses recognized during 1999, 1998, and 1997.
29
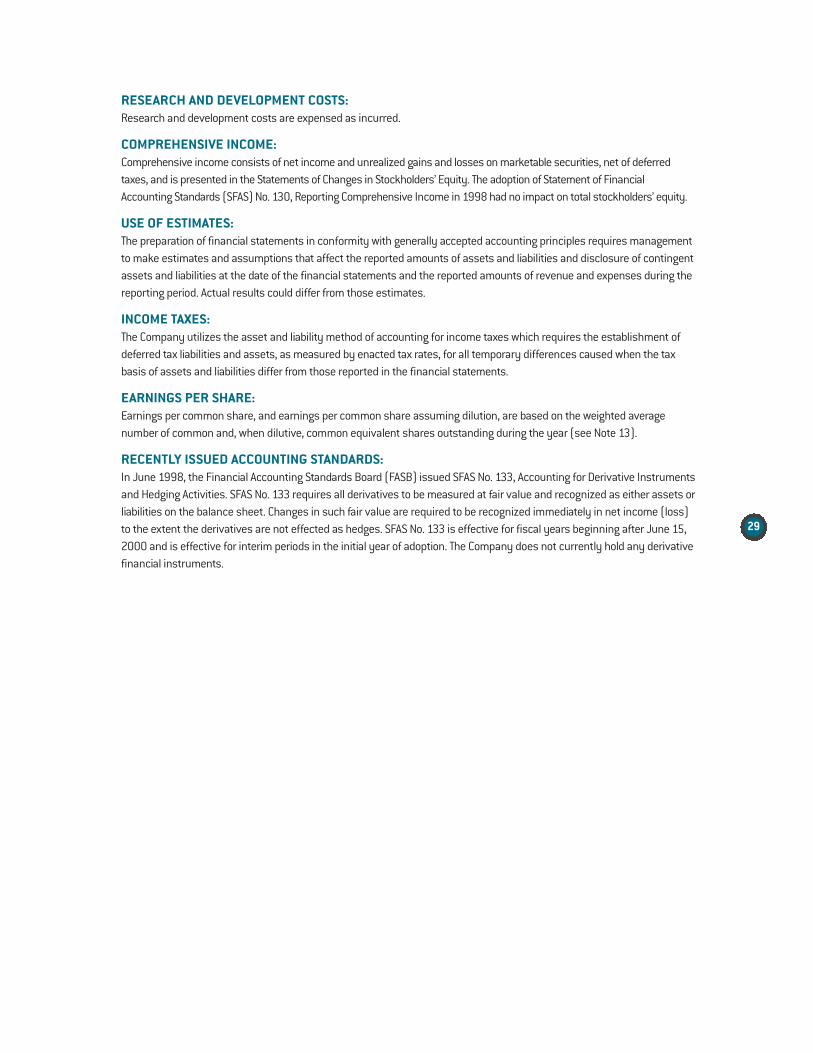
RESEARCH AND DEVELOPMENT COSTS:Research and development costs are expensed as incurred.
COMPREHENSIVE INCOME:Comprehensive income consists of net income and unrealized gains and losses on marketable securities, net of deferredtaxes, and is presented in the Statements of Changes in Stockholders’ Equity. The adoption of Statement of FinancialAccounting Standards (SFAS) No. 130, Reporting Comprehensive Income in 1998 had no impact on total stockholders’ equity.
USE OF ESTIMATES: The preparation of financial statements in conformity with generally accepted accounting principles requires managementto make estimates and assumptions that affect the reported amounts of assets and liabilities and disclosure of contingentassets and liabilities at the date of the financial statements and the reported amounts of revenue and expenses during thereporting period. Actual results could differ from those estimates.
INCOME TAXES: The Company utilizes the asset and liability method of accounting for income taxes which requires the establishment ofdeferred tax liabilities and assets, as measured by enacted tax rates, for all temporary differences caused when the taxbasis of assets and liabilities differ from those reported in the financial statements.
EARNINGS PER SHARE: Earnings per common share, and earnings per common share assuming dilution, are based on the weighted average number of common and, when dilutive, common equivalent shares outstanding during the year (see Note 13).
RECENTLY ISSUED ACCOUNTING STANDARDS: In June 1998, the Financial Accounting Standards Board (FASB) issued SFAS No. 133, Accounting for Derivative Instrumentsand Hedging Activities. SFAS No. 133 requires all derivatives to be measured at fair value and recognized as either assets orliabilities on the balance sheet. Changes in such fair value are required to be recognized immediately in net income (loss)to the extent the derivatives are not effected as hedges. SFAS No. 133 is effective for fiscal years beginning after June 15,2000 and is effective for interim periods in the initial year of adoption. The Company does not currently hold any derivativefinancial instruments.
30
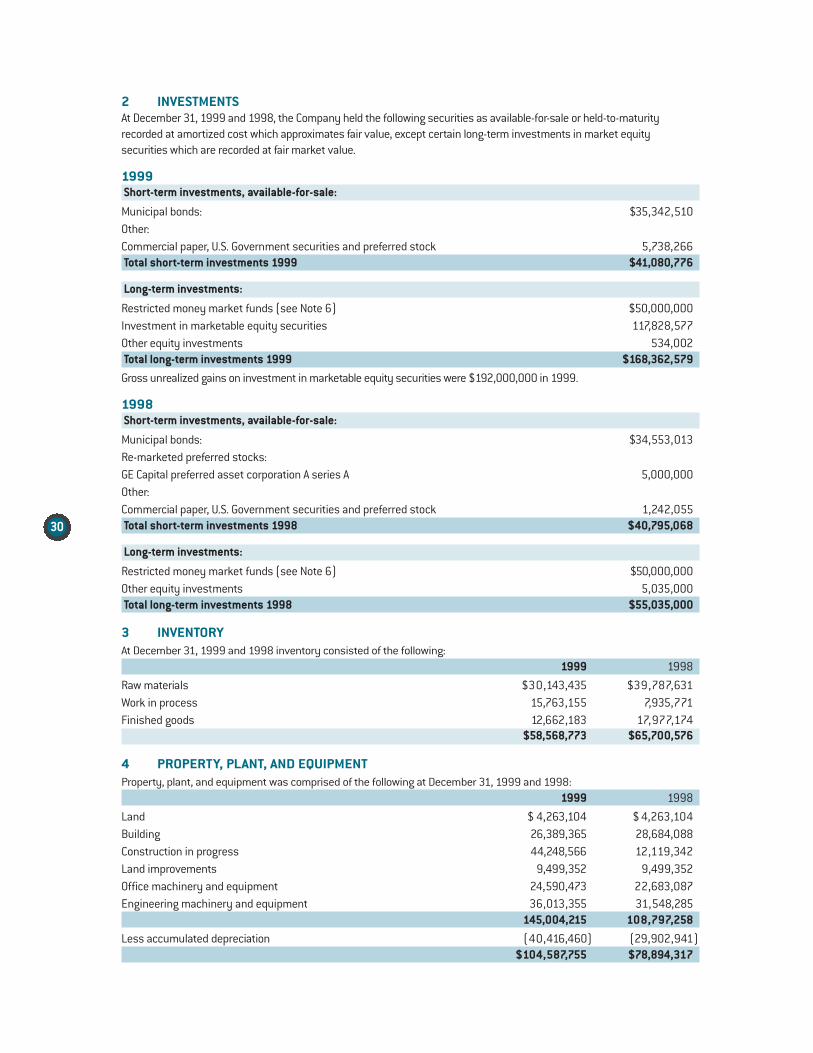
2 INVESTMENTSAt December 31, 1999 and 1998, the Company held the following securities as available-for-sale or held-to-maturityrecorded at amortized cost which approximates fair value, except certain long-term investments in market equitysecurities which are recorded at fair market value.
1999Short-term investments, available-for-sale:
Municipal bonds: $35,342,510Other:Commercial paper, U.S. Government securities and preferred stock 5,738,266Total short-term investments 1999 $41,080,776
Long-term investments:
Restricted money market funds (see Note 6) $50,000,000Investment in marketable equity securities 117,828,577Other equity investments 534,002Total long-term investments 1999 $168,362,579
Gross unrealized gains on investment in marketable equity securities were $192,000,000 in 1999.
1998Short-term investments, available-for-sale:
Municipal bonds: $34,553,013Re-marketed preferred stocks:GE Capital preferred asset corporation A series A 5,000,000Other:Commercial paper, U.S. Government securities and preferred stock 1,242,055Total short-term investments 1998 $40,795,068
Long-term investments:
Restricted money market funds (see Note 6) $50,000,000Other equity investments 5,035,000Total long-term investments 1998 $55,035,000
3 INVENTORYAt December 31, 1999 and 1998 inventory consisted of the following:
1999 1998
Raw materials $30,143,435 $39,787,631Work in process 15,763,155 7,935,771Finished goods 12,662,183 17,977,174
$58,568,773 $65,700,576
4 PROPERTY, PLANT, AND EQUIPMENTProperty, plant, and equipment was comprised of the following at December 31, 1999 and 1998:
1999 1998
Land $ 4,263,104 $ 4,263,104Building 26,389,365 28,684,088Construction in progress 44,248,566 12,119,342Land improvements 9,499,352 9,499,352Office machinery and equipment 24,590,473 22,683,087Engineering machinery and equipment 36,013,355 31,548,285
145,004,215 108,797,258Less accumulated depreciation (40,416,460) (29,902,941)
$104,587,755 $78,894,317
31
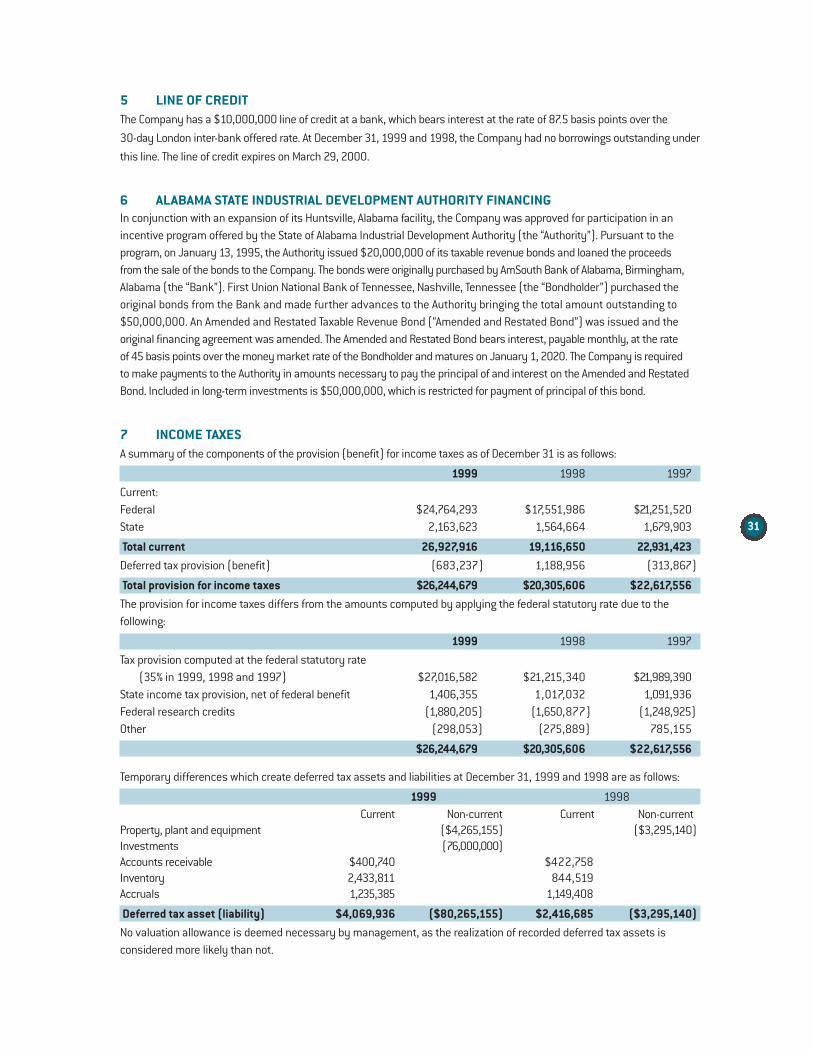
5 LINE OF CREDITThe Company has a $10,000,000 line of credit at a bank, which bears interest at the rate of 87.5 basis points over the
30-day London inter-bank offered rate. At December 31, 1999 and 1998, the Company had no borrowings outstanding under
this line. The line of credit expires on March 29, 2000.
6 ALABAMA STATE INDUSTRIAL DEVELOPMENT AUTHORITY FINANCINGIn conjunction with an expansion of its Huntsville, Alabama facility, the Company was approved for participation in anincentive program offered by the State of Alabama Industrial Development Authority (the “Authority”). Pursuant to the program, on January 13, 1995, the Authority issued $20,000,000 of its taxable revenue bonds and loaned the proceeds from the sale of the bonds to the Company. The bonds were originally purchased by AmSouth Bank of Alabama, Birmingham,Alabama (the “Bank”). First Union National Bank of Tennessee, Nashville, Tennessee (the “Bondholder”) purchased the original bonds from the Bank and made further advances to the Authority bringing the total amount outstanding to$50,000,000. An Amended and Restated Taxable Revenue Bond (“Amended and Restated Bond”) was issued and the original financing agreement was amended. The Amended and Restated Bond bears interest, payable monthly, at the rate of 45 basis points over the money market rate of the Bondholder and matures on January 1, 2020. The Company is required to make payments to the Authority in amounts necessary to pay the principal of and interest on the Amended and RestatedBond. Included in long-term investments is $50,000,000, which is restricted for payment of principal of this bond.
7 INCOME TAXESA summary of the components of the provision (benefit) for income taxes as of December 31 is as follows:
1999 1998 1997
Current:Federal $24,764,293 $17,551,986 $21,251,520State 2,163,623 1,564,664 1,679,903
Total current 26,927,916 19,116,650 22,931,423Deferred tax provision (benefit) (683,237) 1,188,956 (313,867)
Total provision for income taxes $26,244,679 $20,305,606 $22,617,556The provision for income taxes differs from the amounts computed by applying the federal statutory rate due to the following:
1999 1998 1997
Tax provision computed at the federal statutory rate(35% in 1999, 1998 and 1997) $27,016,582 $21,215,340 $21,989,390
State income tax provision, net of federal benefit 1,406,355 1,017,032 1,091,936Federal research credits (1,880,205) (1,650,877) (1,248,925)Other (298,053) (275,889) 785,155
$26,244,679 $20,305,606 $22,617,556
Temporary differences which create deferred tax assets and liabilities at December 31, 1999 and 1998 are as follows:
1999 1998Current Non-current Current Non-current
Property, plant and equipment ($4,265,155) ($3,295,140)Investments (76,000,000)Accounts receivable $400,740 $422,758Inventory 2,433,811 844,519Accruals 1,235,385 1,149,408
Deferred tax asset (liability) $4,069,936 ($80,265,155) $2,416,685 ($3,295,140)No valuation allowance is deemed necessary by management, as the realization of recorded deferred tax assets is considered more likely than not.
32
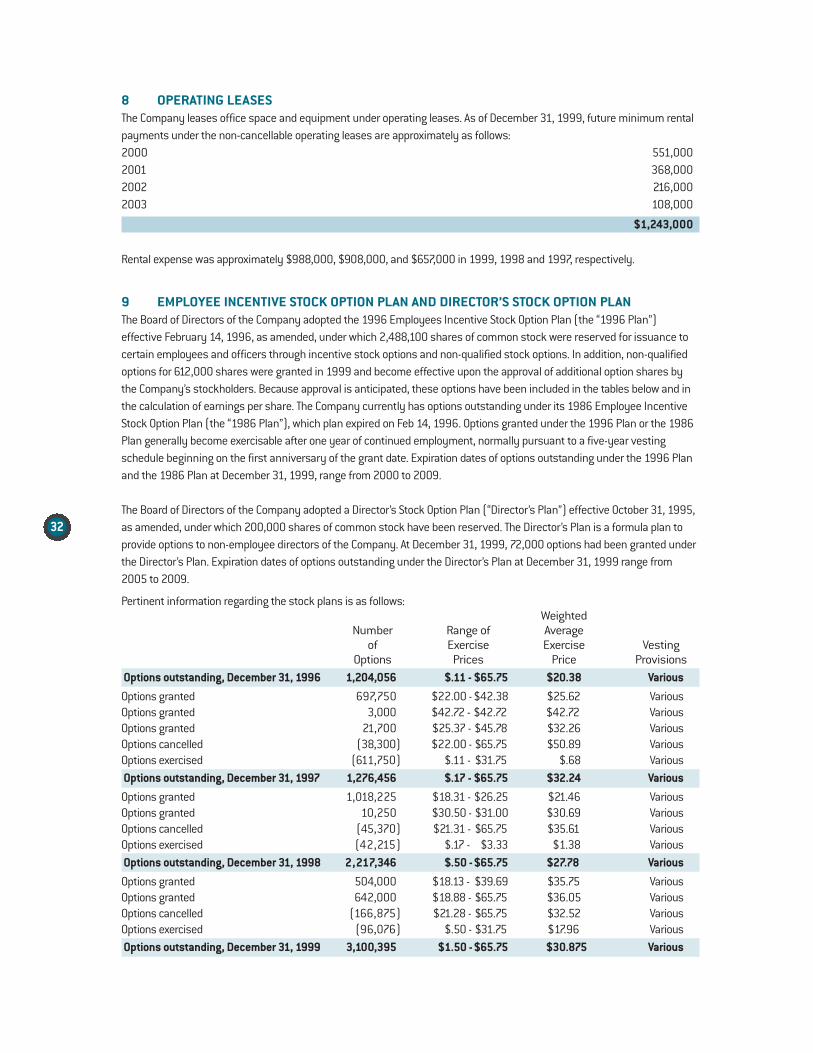
8 OPERATING LEASESThe Company leases office space and equipment under operating leases. As of December 31, 1999, future minimum rentalpayments under the non-cancellable operating leases are approximately as follows:2000 551,0002001 368,0002002 216,0002003 108,000
$1,243,000
Rental expense was approximately $988,000, $908,000, and $657,000 in 1999, 1998 and 1997, respectively.
9 EMPLOYEE INCENTIVE STOCK OPTION PLAN AND DIRECTOR’S STOCK OPTION PLANThe Board of Directors of the Company adopted the 1996 Employees Incentive Stock Option Plan (the “1996 Plan”) effective February 14, 1996, as amended, under which 2,488,100 shares of common stock were reserved for issuance tocertain employees and officers through incentive stock options and non-qualified stock options. In addition, non-qualifiedoptions for 612,000 shares were granted in 1999 and become effective upon the approval of additional option shares bythe Company’s stockholders. Because approval is anticipated, these options have been included in the tables below and inthe calculation of earnings per share. The Company currently has options outstanding under its 1986 Employee IncentiveStock Option Plan (the “1986 Plan”), which plan expired on Feb 14, 1996. Options granted under the 1996 Plan or the 1986Plan generally become exercisable after one year of continued employment, normally pursuant to a five-year vestingschedule beginning on the first anniversary of the grant date. Expiration dates of options outstanding under the 1996 Planand the 1986 Plan at December 31, 1999, range from 2000 to 2009.
The Board of Directors of the Company adopted a Director’s Stock Option Plan (“Director’s Plan”) effective October 31, 1995,as amended, under which 200,000 shares of common stock have been reserved. The Director’s Plan is a formula plan toprovide options to non-employee directors of the Company. At December 31, 1999, 72,000 options had been granted underthe Director’s Plan. Expiration dates of options outstanding under the Director’s Plan at December 31, 1999 range from2005 to 2009.
Pertinent information regarding the stock plans is as follows:Weighted
Number Range of Averageof Exercise Exercise Vesting
Options Prices Price ProvisionsOptions outstanding, December 31, 1996 1,204,056 $.11 - $65.75 $20.38 Various
Options granted 697,750 $22.00 - $42.38 $25.62 VariousOptions granted 3,000 $42.72 - $42.72 $42.72 VariousOptions granted 21,700 $25.37 - $45.78 $32.26 VariousOptions cancelled (38,300) $22.00 - $65.75 $50.89 VariousOptions exercised (611,750) $.11 - $31.75 $.68 VariousOptions outstanding, December 31, 1997 1,276,456 $.17 - $65.75 $32.24 Various
Options granted 1,018,225 $18.31 - $26.25 $21.46 VariousOptions granted 10,250 $30.50 - $31.00 $30.69 VariousOptions cancelled (45,370) $21.31 - $65.75 $35.61 VariousOptions exercised (42,215) $.17 - $3.33 $1.38 VariousOptions outstanding, December 31, 1998 2,217,346 $.50 - $65.75 $27.78 Various
Options granted 504,000 $18.13 - $39.69 $35.75 VariousOptions granted 642,000 $18.88 - $65.75 $36.05 VariousOptions cancelled (166,875) $21.28 - $65.75 $32.52 VariousOptions exercised (96,076) $.50 - $31.75 $17.96 VariousOptions outstanding, December 31, 1999 3,100,395 $1.50 - $65.75 $30.875 Various
33
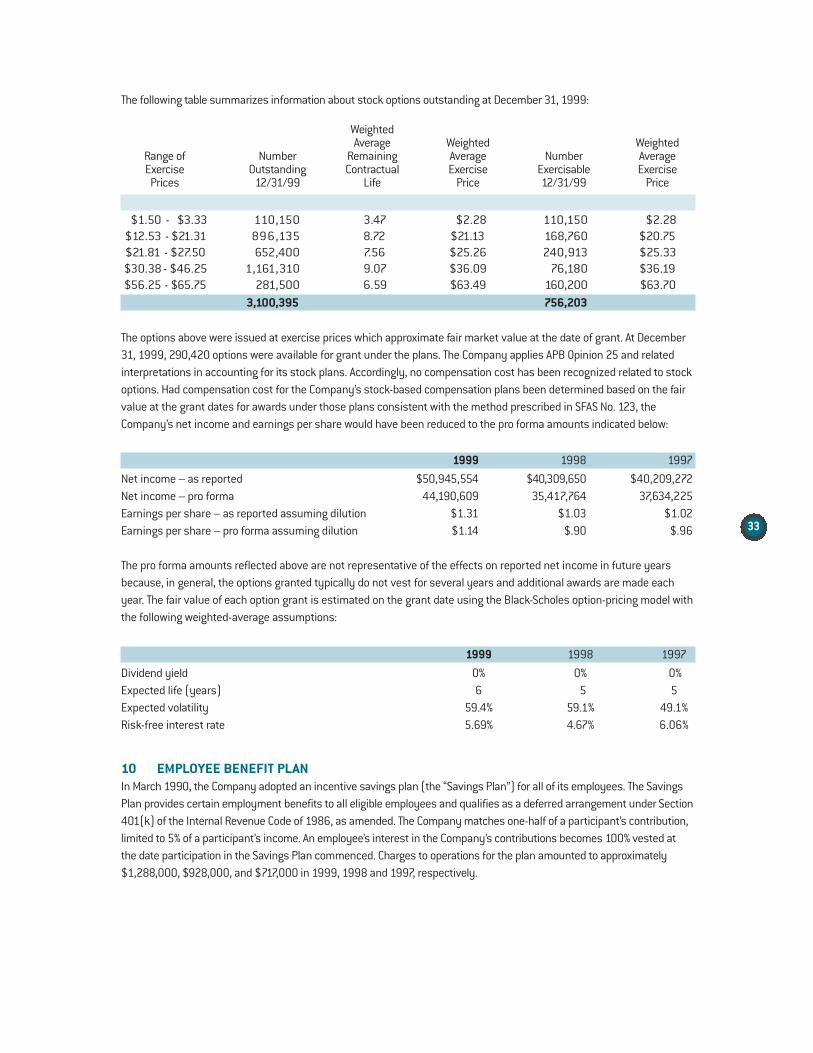
The following table summarizes information about stock options outstanding at December 31, 1999:
WeightedAverage Weighted Weighted
Range of Number Remaining Average Number AverageExercise Outstanding Contractual Exercise Exercisable Exercise
Prices 12/31/99 Life Price 12/31/99 Price
$1.50 - $3.33 110,150 3.47 $2.28 110,150 $2.28$12.53 - $21.31 896,135 8.72 $21.13 168,760 $20.75$21.81 - $27.50 652,400 7.56 $25.26 240,913 $25.33$30.38 - $46.25 1,161,310 9.07 $36.09 76,180 $36.19$56.25 - $65.75 281,500 6.59 $63.49 160,200 $63.70
3,100,395 756,203
The options above were issued at exercise prices which approximate fair market value at the date of grant. At December31, 1999, 290,420 options were available for grant under the plans. The Company applies APB Opinion 25 and relatedinterpretations in accounting for its stock plans. Accordingly, no compensation cost has been recognized related to stockoptions. Had compensation cost for the Company’s stock-based compensation plans been determined based on the fairvalue at the grant dates for awards under those plans consistent with the method prescribed in SFAS No. 123, theCompany’s net income and earnings per share would have been reduced to the pro forma amounts indicated below:
1999 1998 1997
Net income – as reported $50,945,554 $40,309,650 $40,209,272Net income – pro forma 44,190,609 35,417,764 37,634,225Earnings per share – as reported assuming dilution $1.31 $1.03 $1.02Earnings per share – pro forma assuming dilution $1.14 $.90 $.96
The pro forma amounts reflected above are not representative of the effects on reported net income in future yearsbecause, in general, the options granted typically do not vest for several years and additional awards are made eachyear. The fair value of each option grant is estimated on the grant date using the Black-Scholes option-pricing model withthe following weighted-average assumptions:
1999 1998 1997
Dividend yield 0% 0% 0%Expected life (years) 6 5 5Expected volatility 59.4% 59.1% 49.1%Risk-free interest rate 5.69% 4.67% 6.06%
10 EMPLOYEE BENEFIT PLANIn March 1990, the Company adopted an incentive savings plan (the “Savings Plan”) for all of its employees. The SavingsPlan provides certain employment benefits to all eligible employees and qualifies as a deferred arrangement under Section401(k) of the Internal Revenue Code of 1986, as amended. The Company matches one-half of a participant’s contribution,limited to 5% of a participant’s income. An employee’s interest in the Company’s contributions becomes 100% vested at the date participation in the Savings Plan commenced. Charges to operations for the plan amounted to approximately$1,288,000, $928,000, and $717,000 in 1999, 1998 and 1997, respectively.
34
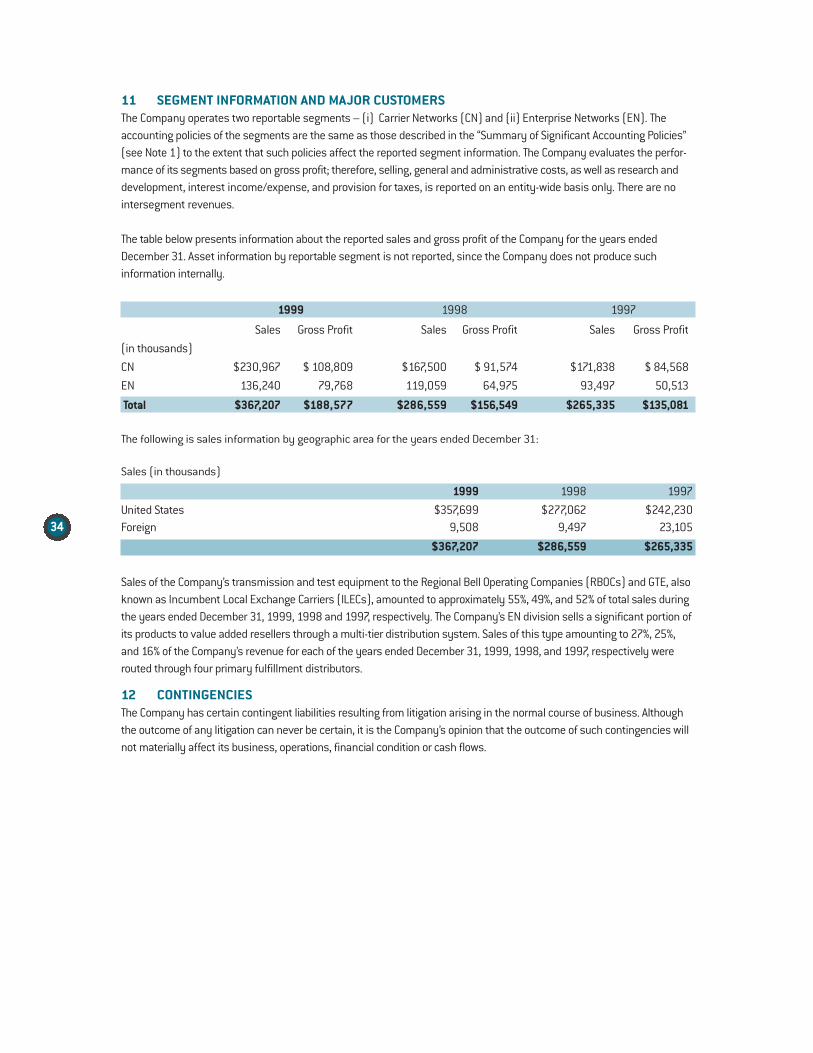
11 SEGMENT INFORMATION AND MAJOR CUSTOMERSThe Company operates two reportable segments – (i) Carrier Networks (CN) and (ii) Enterprise Networks (EN). Theaccounting policies of the segments are the same as those described in the “Summary of Significant Accounting Policies”(see Note 1) to the extent that such policies affect the reported segment information. The Company evaluates the perfor-mance of its segments based on gross profit; therefore, selling, general and administrative costs, as well as research anddevelopment, interest income/expense, and provision for taxes, is reported on an entity-wide basis only. There are nointersegment revenues.
The table below presents information about the reported sales and gross profit of the Company for the years endedDecember 31. Asset information by reportable segment is not reported, since the Company does not produce such information internally.
1999 1998 1997
Sales Gross Profit Sales Gross Profit Sales Gross Profit
(in thousands)
CN $230,967 $ 108,809 $167,500 $ 91,574 $171,838 $ 84,568
EN 136,240 79,768 119,059 64,975 93,497 50,513
Total $367,207 $188,577 $286,559 $156,549 $265,335 $135,081
The following is sales information by geographic area for the years ended December 31:
Sales (in thousands)
1999 1998 1997
United States $357,699 $277,062 $242,230Foreign 9,508 9,497 23,105
$367,207 $286,559 $265,335
Sales of the Company’s transmission and test equipment to the Regional Bell Operating Companies (RBOCs) and GTE, alsoknown as Incumbent Local Exchange Carriers (ILECs), amounted to approximately 55%, 49%, and 52% of total sales duringthe years ended December 31, 1999, 1998 and 1997, respectively. The Company’s EN division sells a significant portion ofits products to value added resellers through a multi-tier distribution system. Sales of this type amounting to 27%, 25%,and 16% of the Company’s revenue for each of the years ended December 31, 1999, 1998, and 1997, respectively wererouted through four primary fulfillment distributors.
12 CONTINGENCIESThe Company has certain contingent liabilities resulting from litigation arising in the normal course of business. Althoughthe outcome of any litigation can never be certain, it is the Company’s opinion that the outcome of such contingencies willnot materially affect its business, operations, financial condition or cash flows.
35
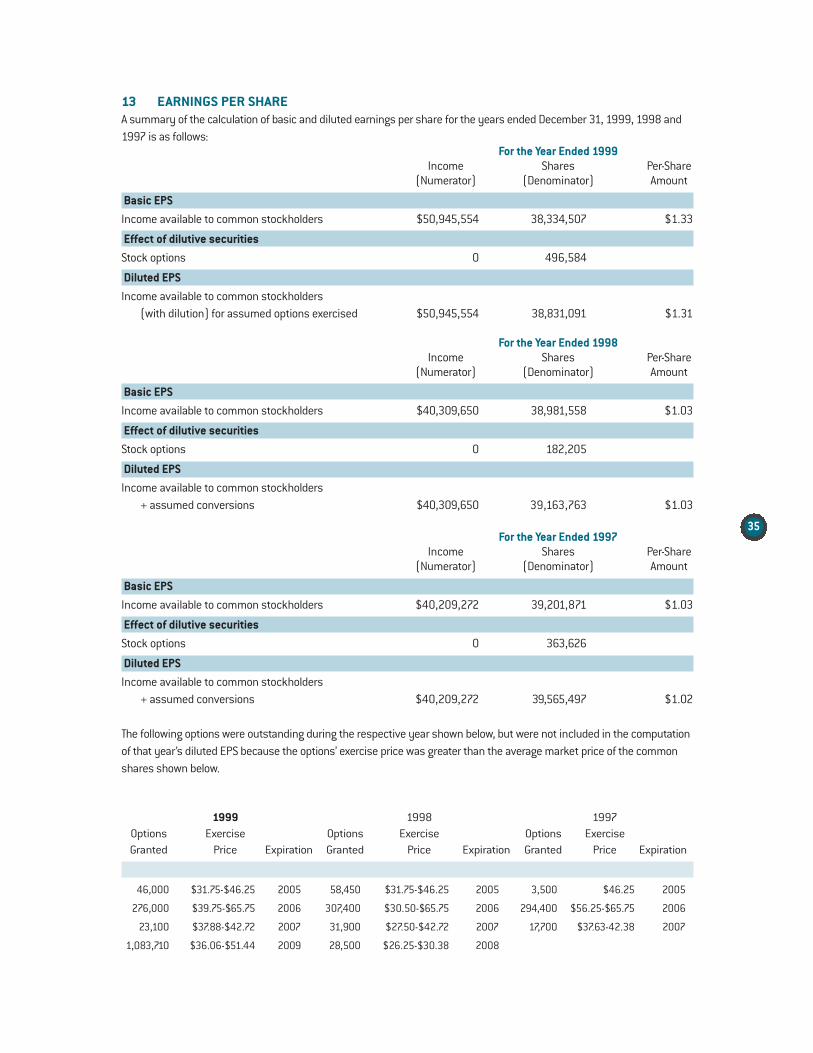
13 EARNINGS PER SHAREA summary of the calculation of basic and diluted earnings per share for the years ended December 31, 1999, 1998 and1997 is as follows:
For the Year Ended 1999Income Shares Per-Share
(Numerator) (Denominator) Amount
Basic EPSIncome available to common stockholders $50,945,554 38,334,507 $1.33
Effect of dilutive securitiesStock options 0 496,584
Diluted EPSIncome available to common stockholders
(with dilution) for assumed options exercised $50,945,554 38,831,091 $1.31
For the Year Ended 1998Income Shares Per-Share
(Numerator) (Denominator) Amount
Basic EPSIncome available to common stockholders $40,309,650 38,981,558 $1.03
Effect of dilutive securitiesStock options 0 182,205
Diluted EPSIncome available to common stockholders
+ assumed conversions $40,309,650 39,163,763 $1.03
For the Year Ended 1997Income Shares Per-Share
(Numerator) (Denominator) Amount
Basic EPSIncome available to common stockholders $40,209,272 39,201,871 $1.03
Effect of dilutive securitiesStock options 0 363,626
Diluted EPSIncome available to common stockholders
+ assumed conversions $40,209,272 39,565,497 $1.02
The following options were outstanding during the respective year shown below, but were not included in the computationof that year’s diluted EPS because the options’ exercise price was greater than the average market price of the commonshares shown below.
1999 1998 1997Options Exercise Options Exercise Options ExerciseGranted Price Expiration Granted Price Expiration Granted Price Expiration
46,000 $31.75-$46.25 2005 58,450 $31.75-$46.25 2005 3,500 $46.25 2005
276,000 $39.75-$65.75 2006 307,400 $30.50-$65.75 2006 294,400 $56.25-$65.75 2006
23,100 $37.88-$42.72 2007 31,900 $27.50-$42.72 2007 17,700 $37.63-42.38 2007
1,083,710 $36.06-$51.44 2009 28,500 $26.25-$30.38 2008
36
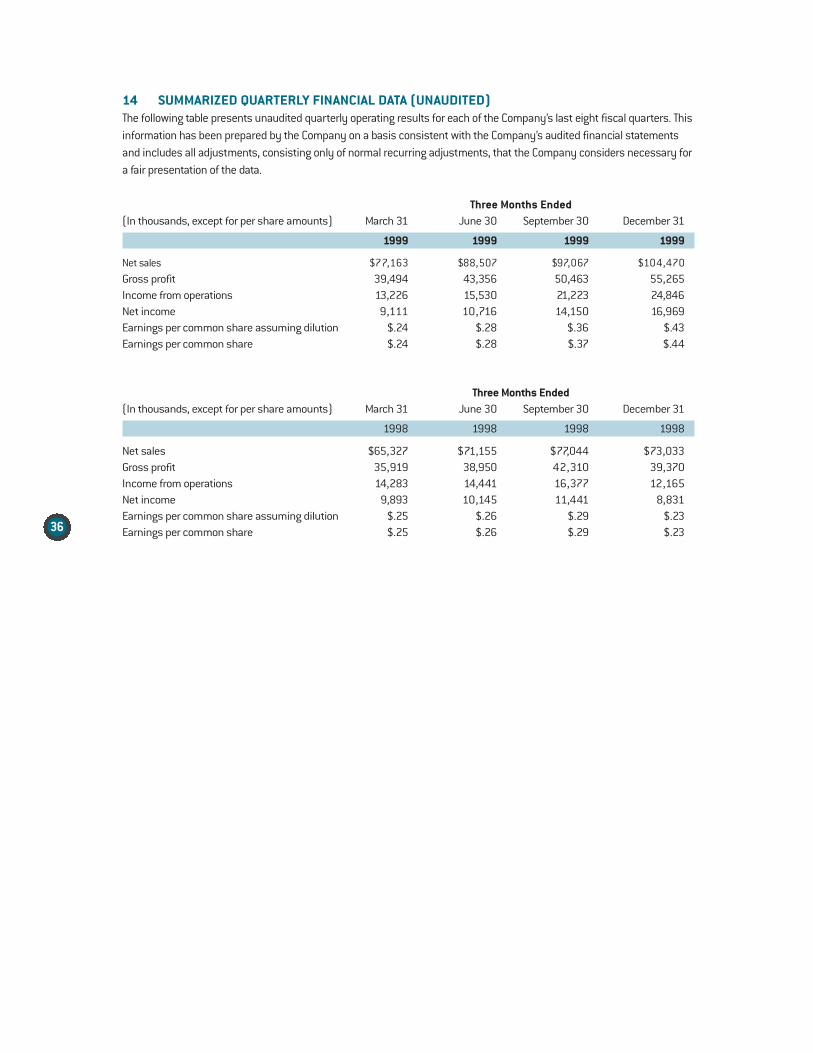
14 SUMMARIZED QUARTERLY FINANCIAL DATA (UNAUDITED)The following table presents unaudited quarterly operating results for each of the Company’s last eight fiscal quarters. Thisinformation has been prepared by the Company on a basis consistent with the Company’s audited financial statementsand includes all adjustments, consisting only of normal recurring adjustments, that the Company considers necessary fora fair presentation of the data.
Three Months Ended(In thousands, except for per share amounts) March 31 June 30 September 30 December 31
1999 1999 1999 1999
Net sales $77,163 $88,507 $97,067 $104,470Gross profit 39,494 43,356 50,463 55,265Income from operations 13,226 15,530 21,223 24,846Net income 9,111 10,716 14,150 16,969Earnings per common share assuming dilution $.24 $.28 $.36 $.43Earnings per common share $.24 $.28 $.37 $.44
Three Months Ended(In thousands, except for per share amounts) March 31 June 30 September 30 December 31
1998 1998 1998 1998
Net sales $65,327 $71,155 $77,044 $73,033Gross profit 35,919 38,950 42,310 39,370Income from operations 14,283 14,441 16,377 12,165Net income 9,893 10,145 11,441 8,831Earnings per common share assuming dilution $.25 $.26 $.29 $.23Earnings per common share $.25 $.26 $.29 $.23
37
Directors & Executive Officers
Mark C. SmithChairman of the Board and Chief Executive Officer of the Company
Lonnie S. McMillianSenior Vice President – Engineering, Secretary and Director of the Company
Howard A. ThrailkillPresident, Chief Operating Officer and Director of the Company
W. Frank BlountDirector of the Company, Retired Chief Executive Officer to Telstra Corporation, LTD, Australia’s principaltelecommunications company
William L. MarksDirector of the Company, Chairman of the Board and Chief Executive Officer of Whitney Holding Corp., the holding company for Whitney National Bank of New Orleans
Roy J. NicholsDirector of the Company, Vice Chairman of the Board and Chief Technical Officer of Nichols Research Corporation, a defense and information systems company, Huntsville, Alabama
James L. NorthDirector of the Company, Counsel to the Company since it commenced operations in 1986, attorney with James L. North & Associates, Birmingham, Alabama
John R. CooperVice President – Finance, Chief Financial Officer, and Treasurer
Danny J. WindhamVice President and General Manager – Enterprise Networks
Thomas R. StantonVice President and General Manager – Carrier Networks
M. Melvin BruceVice President – Carrier Networks Engineering
James D. ButlerVice President – Enterprise Networks Sales
Robert A. FredricksonVice President – Carrier Networks Sales
Steven L. HarveyVice President – Competitive Service Providers Sales
Charles A. O’DonnellVice President – Quality
Jude T. PanettaVice President – Operations
Everette R. RamageVice President – Enterprise Networks Engineering
Kevin W. SchneiderVice President – Technology
38
TRANSFER AGENTFirst Union National BankCharlotte, North Carolina
INDEPENDENT AUDITORSPricewaterhouseCoopers LLPBirmingham, Alabama
GENERAL COUNSELJames L. North, Attorney at LawBirmingham, Alabama
SPECIAL COUNSELLong Aldridge & Norman LLPAtlanta, Georgia
FORM 10-KThe Company’s 1999 Annual Report on Form 10-K (without exhibits) as filed with the Securities andExchange Commission is available to stockholders without charge upon written request to:
Investor RelationsADTRAN, Inc.901 Explorer Blvd.P.O. Box 140000Huntsville, Alabama 35814-4000256 963-8611 or256 963-8220
ANNUAL MEETINGThe 2000 Annual Meeting of Shareholders will be held at the Company headquarters, 901 Explorer Boulevard,Huntsville, Alabama, on Friday, April 21, 2000 at 10:30 a.m. Central time.
CORPORATE HEADQUARTERSADTRAN, Inc.901 Explorer BoulevardHuntsville, AL 35806
P.O. Box 140000Huntsville, AL 35814-4000
800 9ADTRAN256 963-8000 voice256 963-8004 fax256 963-8200 fax [email protected] e-mail
www.adtran.com
DOMESTIC OFFICESAtlanta, GABoston, MAChicago, ILDallas, TXDenver, COKansas City, KSLos Angeles, CAMinneapolis, MNNashville, TNNew York, NYPhiladelphia, PAPhoenix, AZPittsburgh, PAPortland, ORRichmond, VASan Antonio, TXSan Francisco, CASeattle, WATampa, FLWashington, D.C.
INTERNATIONAL OFFICESAsia Pacific—Hong Kong (852) 2824-8283Europe—Zürich, Switzerland (41) 1 880 27 77Mexico/Caribbean* 954 577-0357Latin America*954 746-5355Canada—Quebec877 923 8726Canada—Ontario416 290-1999 Canada—Other800 232-6811 (Within the U.S. and Canada)*Gateway offices located in South Florida, USA.
ADTRAN is an ISO 9001 registered company.
ADTRAN is a TL 9000 registered company.
ADTRAN, Inc. is committed to utilize Minority Business Enterprises (MBE),Woman-Owned Business Enterprises (WBE) and Disabled Veteran BusinessEnterprises (DVBE) whenever possible and practical forprocurements supporting ADTRAN and our customers.
© 2000 ADTRAN, Inc. All rights reserved. A1AR9911ADTRAN and Total Reach are registered trademarks of ADTRAN, Inc. Total Access, MX2800, T3SU 300, FramePort, HTU-C, HTU-R, TSU 600e, TSU 120e, and TSU LT are trademarks of ADTRAN, Inc. All other trademarksand registered trademarks are the property of their respective owners.