aptitude-related differences in auditory recognition masking
TRANSCRIPT
INTELLIGENCE 7, 71-90 (1983)
Aptitude-Related Differences in Auditory Recognition Masking*
NAFTALI RAZ, LEE WILLERMAN, PAUL [NGMUNDSON,
AND MICHAEL HANLON
University of Texas at Austin
An auditory backward recognition masking task (Massaro, 1970) was adminis- tered to undergraduates selected for extreme scores on the Scholastic Aptitude Test and the Cattell Culture Fair Intelligence Test. In two experiments, significant group differences were found in threshold interstimulus intervals (ISis) required for 75% cor- rect tone recognition. High-aptitude subjects required less time for correct identifica- tion of target tones as "high" or "low". They were more able to overcome the con- straints imposed on time-dependent information processing by a masking tone. These group differences were interpreted as indicating better information processing effi- ciency (higher signal-to-noise ratio) in the high-aptitude subjects.
The idea of an intimate relationship between intelligence and sensory-perceptual processing is hardly new. Galton's (1869, 1883) pioneering work attempted to relate intelligence to various anthropometric measures, sensory acuity, and viv- idness of mental imagery. He asserted that " . . . the only information that reaches us concerning outward events appears to pass through the avenue of our senses; and the more perceptive the senses are of difference, the larger is the field upon which our judgement and intelligence can act" (Galton, 1883, p. 19).
Tests of Galton's idea were carried out by Sir Francis himself and by Cattell (1890). Both enterprises failed to reveal any meaningful connection between judgments of intelligence and motor speed, auditory reaction time, pain discrimi- nation threshold, color naming speed, or other sensory measures.
Spearman (1904), trying to revive Galton's programmatic undertaking, tested several groups of British preparatory school students on a variety of sensory dis- crimination tasks in several modalities. He estimated their intellectual capabilities via informal assessments and school achievement records, and meas- ured their sensory acuity with the best available psychophysical instrumentation (e.g., a monochord built especially for Spearman's pitch discrimination experi-
*We thank D. B. Cohen, M. Lewis, D. McFadden, E. Pasanen, D. Vaughn, and M. Yama for help with various aspects of these experiments and for review of an early version of this manuscript, and J. Hayes, L. Rosenbaum, and D. Fogelman for their assistance in conducting the experiments. We also thank a referee who alerted us to the work of Hawkins and associates.
71
RAZ ET AL.
ments had a precision of V3 Hz). The observed correlations were corrected using Spearman's newly developed formula for correction of attenuation.
The results were quite surprising: Spearman found pitch discrimination to cor- relate with various measures of general intelligence (school cleverness, rank in class) in the range of .41 to .72 after correction for attenuation. In attempts to replicate these findings Burt (1909) and Carey (1915) found considerably lower correlations between intelligence and auditory discrimination (.37 to .4 in Burt's, and . 19 to .24 in Carey's studies).
Spearman's scientific interests took a new psychometric tack, away from the idea of a relationship between general sensory discrimination and general intelli- gence. The concept of intelligence as a positive manifold of basic sensory quali- ties lay dormant for several decades, until recent developments in human infor- mation processing revived scientific interest in the old hypothesis.
A quest for the "mechanics" of abilities (Hunt, 1978) led to ingenious experi- ments aimed at understanding the putative information processing correlates of intellectual performance. Three major paradigms for chronometric analysis of in- telligence were reviewed by Jensen (1981): Hick's multiple reaction time (Hick, 1952), Posner's semantic vs. physical letter matching (Posner, 1969), and Sternberg's memory scanning (Sternberg, 1966).
Jensen and Munro (1979) investigated intelligence-related individual differ- ences in visual information processing speed using Hick's paradigm. They meas- ured choice reaction time to visual signals consisting of 2, 4, or 8 alternative lights (1, 2, and 3 bits of information, respectively), and found intelligence to be correlated in the range of .2 to .5 with the slope of the regression of reaction time on number of bits.
The other two paradigms employed stimuli that appear to be more closely re- lated to verbal reasoning, problem solving, and memory: letters and digits. Al- though most expected to find an even stronger relationship between performance on these tasks and intelligence, paradoxically, these more complex tasks yielded lower correlations. This outcome only reinforced the opinion that information processing tasks would correlate only .3 with intellectual performance (Hunt, 1980; Hunt, Lunneborg, & Lewis, 1975; Kroll & Madden, 1978; G. Smith & Stanley, 1980; J. Smith & Baron, 1981). This "10% variance barrier" led Hunt (1980) to a rather pessimistic conclusion about the potential usefulness of such investigations.
However, recent evidence from laboratories in Adelaide and Edinburgh pres- ent a challenge to this verdict. Ten experiments reviewed by Brand and Deary (1982) yielded correlations o f - . 3 7 to - .92 (median correlations -.72, mean weighted by sample size -.75) between psychometric intelligence and visual in- spection time (VIT) (Brand, 1981; Lally & Nettelbeck, 1977, 1980; Nettelbeck & Lally, 1976, 1979).
Inspection time as a measure of perceptual efficiency was introduced by Vickers, Nettelbeck, and Willson (1972). It refers to the minimal stimulus expo-
AUDITORY RECOGNITION MASKING 73
sure time required to make 97.5% accurate forced-choice discriminations of the relative lengths of two short lines presented tachistoscopically and followed by a pattern mask.
Deary (1980) reported confirmation of these findings in the auditory modality. He presented two tones of markedly different frequency, each preceded and fol- lowed by white noise. Tone durations were varied and subjects were required to identify the temporal order of the tones. This study yielded correlations of - .66 and - .70 between IQ (verbal and non-verbal, respectively) and auditory inspec- tion time (AIT, the minimal tone duration at which subjects were able to cor- rectly identify the temporal order of the signals at 95% accuracy). The correla- tion between AIT and VIT was .99 (Brand, 1981), although this high correlation depended heavily on the inclusion of some mentally retarded subjects.
Both the Adelaide and Edinburgh groups reported that correlations between IQ and VIT were substantially higher at the lower end of the intelligence distribu- tion (Brand, 1981). The use of mentally retarded subjects in some of those stud- ies was problematic, since it is hard to rule out the presence of CNS damage in this population. Possible neural defects, rather than low general intelligence, might have affected their performance.
There is more support for these concerns. In the most recent publication from Adelaide (Nettelbeck, 1982), an experiment was reported in which 46 upper di- vision psychology students were administered a scholastic aptitude test and Ra- ven Advanced Progressive Matrices along with a visual inspection task. Correla- tions of visual inspection time with scholastic aptitude and IQ were - .34 (p <.05) and - .20 (p = ns), respectively. Although these correlations are in the same direction as those obtained earlier, they are much smaller than previously reported. In Nettelbeck's (1982) study there is an extreme restriction of range. IQ equivalents for this sample ranged from 104 to 135 ÷ with standard deviation not given. This range suggests, however, that, assuming normal distribution, the standard deviation was about 8 IQ points. This represents approximately one-half of the standard deviation of most standardized IQ tests.
The two experiments presented below were undertaken to explore the rela- tionship between psychometric intelligence and performance on a task requiring rapid acoustic information processing in a normal college population with a rea- sonably wide range of aptitude.
The paradigm for manipulating constraints on information processing was borrowed from Massaro's (1970) auditory backward recognition masking proce- dure. In this paradigm a subject is presented with a pair of tones: a target (probe) tone followed by a masking tone. The target tone can be classified in a dichoto- mous fashion as high/low, loud/soft, or sharp/dull (Massaro, 1970, 1973; Massaro & Kahn, 1973). The subject's task is to identify the target correctly. The interval between the target and the masking tone, the inter-stimulus interval (ISI), varies from trial to trial, and the relationship between the ISI and the prob- ability of correct identification of the target (the masking function) is produced.
74 RAZ ET AL.
The explanation of the backward masking phenomenon offered by Massaro (1970) was that the masker terminated the processing of an unstable auditory im- age. If the silent interval is too short, then the masking tone forces "underprocessing" of the target. Therefore, accuracy of tone recognition is a function of the time elapsed between the termination of the tone and the arrival of the masker. According to Massaro (1970), masking is central and not peripheral because presentations of the masker contralateral or ipsilateral to the target tone produced similar effects.
The performance curves presented in reports by Massaro and associates (Kallman & Massaro, 1979; Massaro, 1970, 1973, 1976; Massaro & Kahn, 1973) suggested gross individual differences in the ability of highly practiced subjects to make correct tone recognitions under the time constraints imposed by the masker. For example, Massaro (1970) reports asymptotic performance of three subjects; after fifteen hours of training the subjects achieved 99%, 91%, and 81% correct. It was also reported by Massaro (1976) and Kallman and Massaro (1979) that in certain experiments up to 42% of subjects were unable to perform above 65% correct after extensive training.
We hypothesized that the large individual differences among highly trained subjects might stem from variation in abilities not directly related to simple sen- sory characteristics of the auditory system. Our prediction was that subjects of superior intellectual ability would show lower recognition thresholds (shorter threshold ISis) than those of average intelligence.
Based on Massaro's performance curves, we also predicted that if high- intelligence subjects were superior in rapid auditory processing, it would be greater at short ISis. At longer ISis (250-1000 msec), both groups would reach nearly equal asymptotic levels of performance, provided that the ISI was long enough to allow the slowest processor to complete the stimulus processing as accurately as would be possible in the time-unlimited condition (i.e., with no masker present).
We believe that the mechanism, or mechanisms, to account for group differ- ences in auditory recognition would have to reflect differences in efficiency of information processing and specifically, higher signal-to-noise ratios in the high- aptitude subjects. We expected differences in signal-to-noise ratio to be accentu- ated under conditions in which the probability of flawless transmission is reduced by external manipulation (e.g., rapid-onset masking).
EXPERIMENT I
Method
Subjects.
Seventeen Caucasian students were recruited from an eligibility list in the context of fulfilling a course requirement for introductory psychology at the Uni- versity of Texas at Austin. Scholastic Aptitude Test (SAT) scores, obtained from
AUDITORY RECOGNITION MASKING 75
school records after informed consent, were used as a measure of aptitude in this experiment. On the basis of SAT scores subjects were divided into two extreme groups: a high SAT group (cut-off total SAT scores for Verbal and Quantitative parts combined was 1200, n = 8) and a low SAT group (cut-off total SAT score 800, n = 9).
One subject in the low group reported a history of severe hearing problems, and two others (one in each group) failed to perform the experimental task above chance (66% correct). They are not considered here. The final high SAT group consisted of four males and three females, mean age 19; and the low SAT group consisted of one male and six females, mean age 18. Mean total SAT scores in high- and low-aptitude groups were 1303 and 754, respectively.
Procedure.
Subjects were presented with pairs of tones (target and masker) as in Massaro's (1970) backward recognition masking paradigm. They were in- structed to attend to the first tone of each pair and to classify it as "high" or " low." The instructions were explicitly accuracy-biased. A time limit of 3 sec was imposed for each response, however, all subjects responded after 1-2 sec.
All tonal stimuli in this and the subsequent experiment were sine waves gener- ated by a Wavetek oscillator controlled by a SYM-1 microcomputer. Target tones had frequencies of 870 Hz (high) or 770 Hz (low) and a duration of 20-msec in this experiment. The masking tone was always 500 msec long and had a frequency of 820 Hz making it a frequency midway between high and low tones. Rise and fall times for all envelopes were 5 msec.
Target tones of both kinds (high and low) were presented equiprobably. The interstimulus intervals (ISis) were measured between the offset of the target tone and the onset of the masker. Twelve ISis (0, 10, 20, 30, 40, 60, 80, 120, 160, 250, 350, 500, and 1000 msec) were arranged in three blocks. Each of these blocks was a balanced 12 x 12 Latin square, allowing 36 repetitions of each ISI per subject.
All the target-masker pairs were recorded on audiotape and presented on a TEAC-A2300SX recorder. The stimuli were presented diotically via Permaflux PDRI0 headphones as 80 dB SPL.
Before the experiment, all subjects were given demonstration and practice trials (24-72 practice trials per subject). During the practice session corrective feedback was provided verbally trial-by-trial.
During the experimental session a target-masker pair was presented with a 3-sec intertrial interval allowed for response. Subjects were instructed to indicate with a thumb up or down whether the target tone was high or low, respectively. No corrective feedback was provided.
After the session subjects were asked five questions about their musical back- ground (whether they played any musical instrument and how well; whether they had ever sung in a choir; whether they could sight read music; whether they came
76 RAZ ET AL.
from a musical family; whether they had perfect pitch). None reported having perfect pitch, and this item was omitted from subsequent analyses. Subjects' re- sponses to the items could range from 0 to 2 ("not at all" to "very much so").
Results and Discussion
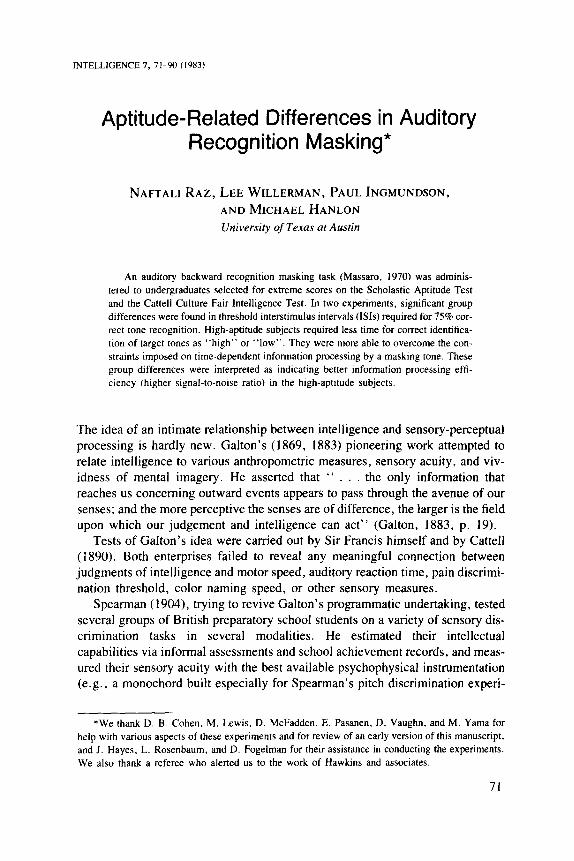
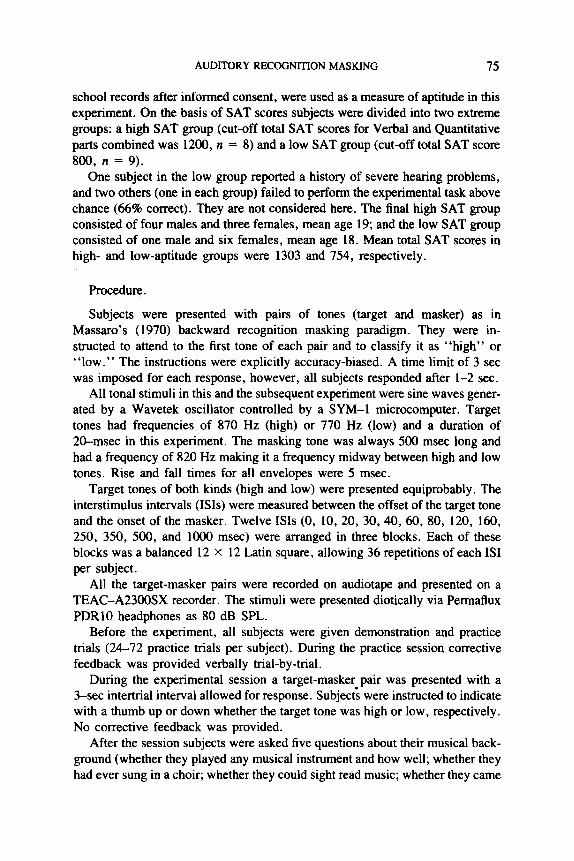
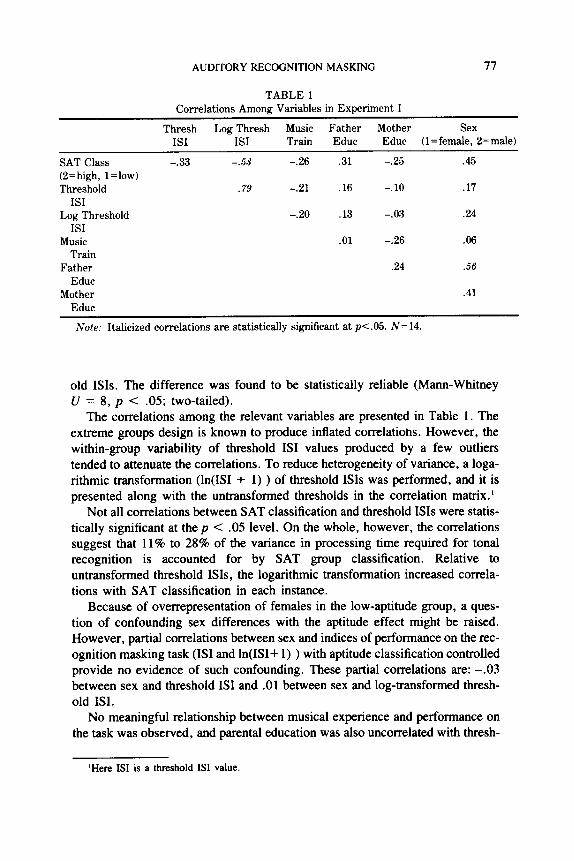
The performance of each subject across the ISis was described by fitting a probit function to the individual response sets (Finney, 1971). Threshold values obtained from the probits for individual subjects predicted the IS1 at which accu- racy levels of 75% were attained. These threshold values are presented in Figure 1.
The median thresholds for the high and low SAT groups were 16.62 msec and 67.84 msec, respectively. Because of great intersubject variability and skewing, a nonparametric statistic was used for the analysis of group differences in thresh-
~ °
g
2 t s l
g.
o
0
• J a i .
Ca
LOw
FIG. 1. Threshold ISis for high and low SAT groups in Experiment I.
AUDITORY RECOGNITION MASKING
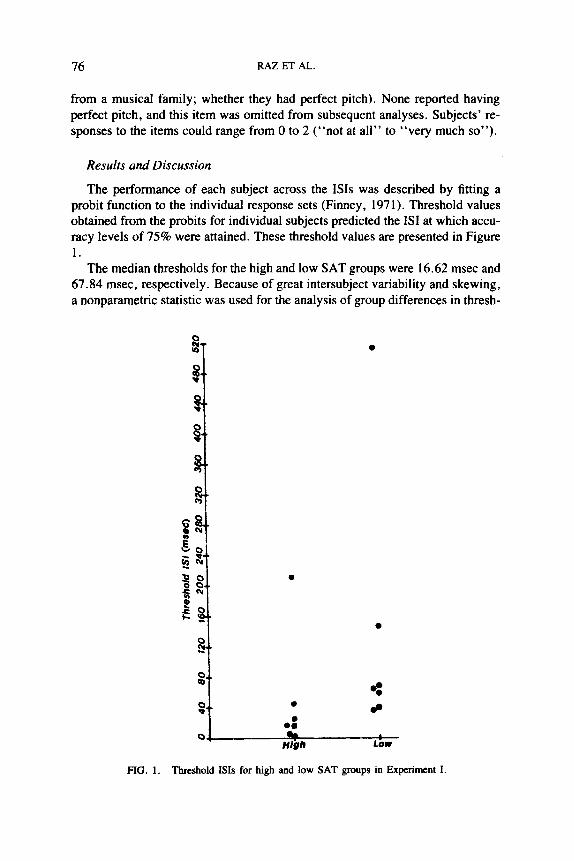
TABLE 1 Correlations Among Variables in Experiment I
77
Thresh Log Thresh Music Father Mother Sex ISI ISI Train Educ Educ (l=female, 2=male)
SAT Class -.33 -.53 -.26 .31 -.25 .45 (2=high, 1 =low) Threshold .79 -.21 .16 -. 10 .17
ISI Log Threshold -.20 .13 -.03 .24
ISI Music .01 -.26 .06
Train Father .24 .56
Educ Mother .41
Educ
Note: Italicized correlations are statistically significant at p<.05. N= 14.
old ISis. The difference was found to be statistically reliable (Mann-Whitney U = 8, p < .05; two-tailed).
The correlations among the relevant variables are presented in Table 1. The extreme groups design is known to produce inflated correlations. However, the within-group variability of threshold ISI values produced by a few outliers tended to attenuate the correlations. To reduce heterogeneity of variance, a loga- rithmic transformation (ln(ISI + 1) ) of threshold ISis was performed, and it is presented along with the untransformed thresholds in the correlation matrix. ~
Not all correlations between SAT classification and threshold ISis were statis- tically significant at the p < .05 level. On the whole, however, the correlations suggest that 11% to 28% of the variance in processing time required for tonal recognition is accounted for by SAT group classification. Relative to untransformed threshold ISis, the logarithmic transformation increased correla- tions with SAT classification in each instance.
Because of overrepresentation of females in the low-aptitude group, a ques- tion of confounding sex differences with the aptitude effect might be raised. However, partial correlations between sex and indices of performance on the rec- ognition masking task (ISI and ln(ISI+ 1) ) with aptitude classification controlled provide no evidence of such confounding. These partial correlations are: - .03 between sex and threshold ISI and .01 between sex and log-transformed thresh- old ISI.
No meaningful relationship between musical experience and performance on the task was observed, and parental education was also uncorrelated with thresh-
~Here ISI is a threshold ISI value.
78 RAZ ET AL.
old ISls. The unusually low correlations between SAT scores and parental edu- cation may be due to an ascertainment bias: low aptitude children were appar- ently more likely to enroll in college if they had highly educated parents.
The logarithmically transformed percent correct at each ISI was used as a de- pendent variable in a repeated measures ANOVA: GROUP x BLOCK x ISI (2 x 3 x 12). In this analysis a least-squares mixed model approach was employed (Overall, Spiegel, & Cohen, 1975). GROUP was a grouping factor with two lev- els (high vs. low SAT), and repeated measures factors were BLOCK (three blocks of trials) and ISI (12 interstimulus intervals).
The results of this analysis revealed a significant main effect for GROUP (F(1,12) = 5.14, p < .05). High SAT subjects performed reliably better than low SAT subjects. A significant ISI effect (F(I 1,132) = 34.82, p <.001) indi- cated that performance was better when ISis increased. The GROUP x ISI inter- action was also significant (F(I, 132) = 2.48, p < .05), suggesting that subjects from the high SAT group were especially superior at shorter ISis.
Trend analysis also indicated a small, but statistically reliable quadratic trend for the BLOCK factor (F(I, 12) = 8.01, p < .025). The averages for actual per- cent correct in blocks 1 through 3 were 79.2, 82.4, and 79.3, respectively. This trend may be due to a learning effect from the first to second block, and fatigue or boredom on the last block. Whatever the causes, this effect is irrelevant to the main hypothesis because no significant BLOCK × GROUP interaction was ob- served. This suggests that uneven performance across blocks of trials affected both groups to the same extent.
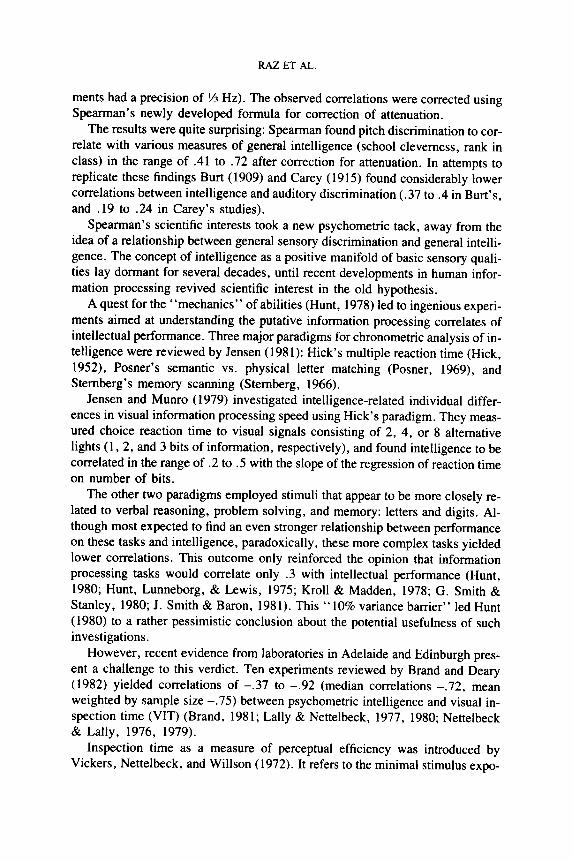
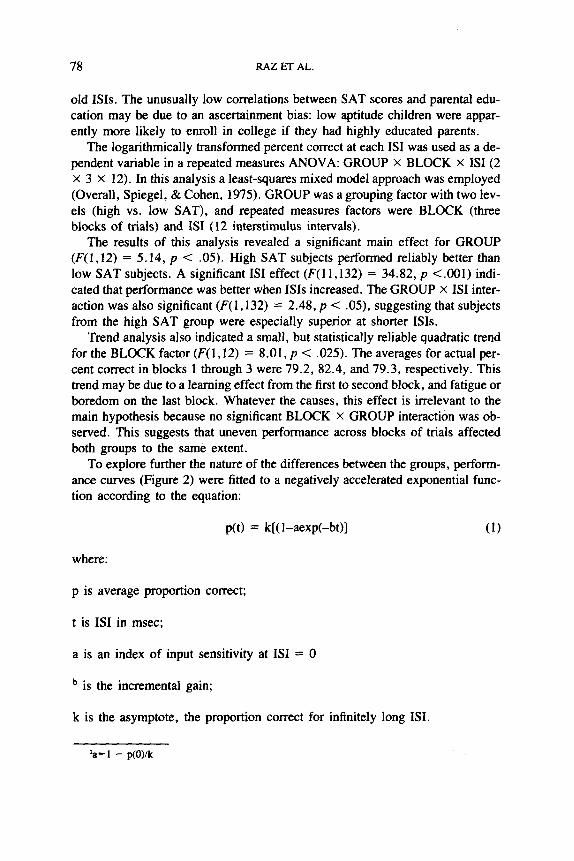
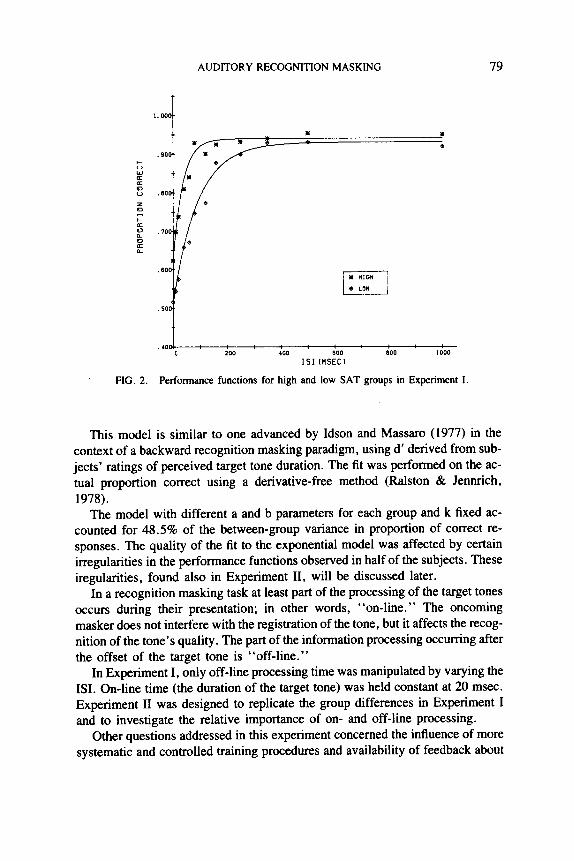
To explore further the nature of the differences between the groups, perform- ance curves (Figure 2) were fitted to a negatively accelerated exponential func- tion according to the equation:
p(t) = k[(1-aexp(-bt)] (I)
where:
p is average proportion correct;
t is ISI in msec;
a is an index of input sensitivity at ISI = 0
b is the incremental gain;
k is the asymptote, the proportion correct for infinitely long ISI.
2 a = 1 - p ( O ) / k
AUDITORY RECOGNITION MASKING 79
• °OO
, °O0
, "/OC
O-
• 6 0 C
• S O C
FIG. 2.
I
M
M •
J i • La. I
, . 0 0 , 200 , ' 0 0 ' . 0 0 ' ' ! 000
ISI {MSEC}
Performance functioIIs for high and low SAT groups in Experiment I.
This model is similar to one advanced by Idson and Massaro (1977) in the context of a backward recognition masking paradigm, using d' derived from sub- jects' ratings of perceived target tone duration. The fit was performed on the ac- tual proportion correct using a derivative-free method (Ralston & Jennrich, 1978).
The model with different a and b parameters for each group and k fixed ac- counted for 48.5% of the between-group variance in proportion of correct re- sponses. The quality of the fit to the exponential model was affected by certain irregularities in the performance functions observed in half of the subjects. These iregularities, found also in Experiment II, will be discussed later.
In a recognition masking task at least part of the processing of the target tones occurs during their presentation; in other words, "on-line." The oncoming masker does not interfere with the registration of the tone, but it affects the recog- nition of the tone's quality. The part of the information processing occurring after the offset of the target tone is "off-l ine."
In Experiment I, only off-line processing time was manipulated by varying the ISI. On-line time (the duration of the target tone) was held constant at 20 msec. Experiment II was designed to replicate the group differences in Experiment I and to investigate the relative importance of on- and off-line processing.
Other questions addressed in this experiment concerned the influence of more systematic and controlled training procedures and availability of feedback about
80 RAZ ET AL.
correctness of response. These questions were raised after considering the possi- bility that subjects of lower intelligence might be slower learners and also might be less able to perform well under conditions of uncertainty created by the lack of corrective feedback.
EXPERIMENT II
Method
Subjects.
Thirty-two Caucasian students were recruited from a new eligibility list for fulfilling a course requirement. This time SAT scores were used as a screening device to obtain subjects expected to differ considerably in their performance on an intelligence test.
Since there is evidence that individuals with mixed cerebral dominance might have an advantage on tasks related to tonal memory and tonal processing (Deutsch, 1980), only right-handers with no family history of sinistrality were eligible. Handedness was determined from the Edinburgh Handedness Inventory (Oldfield, 1971). Only subjects with lateralization quotients of 20 and above and without lefthanded first degree relatives participated.
Two extreme SAT groups (selected by the same criteria as in Experiment I) were individually administerd the nonverbal Cattell Culture Fair Intelligence Test (Cattell & Cattell, 1959). The cut-off scores for selection of the high and average IQ groups were arbitrarily set in advance at Cattell raw scores of 33 and above, and 25 and below. As a result of this two-step selection process, two groups were formed: a high aptitude group (mean Cattell raw score 34.8, mean Cattell IQ 151.3, n=9 , four males and five females, mean age 19.9) and an aver- age aptitude group (n.*.an Cattell raw score 22.1, mean Cattell IQ 96.5, n= 11, two males and nine females, mean age 18.4). Since the Cattell test has a mean of 100 and a standard deviation of 24, an IQ of 151.3 on this test corresponds roughly to a Wechsler Adult Intelligence Scale (WAIS) IQ of 132, and a mean Cattell IQ of 96.5 to a WAIS IQ of 97.8 (Wechsler, 1955).
Twelve subjects, who met the SAT score selection criterion, did not fall within the desired range on the Cattell test. Three high SAT subjects scored be- tow 33, and nine low SAT subjects scored above 25. The overall correlation be- tween total SAT and Cattell IQ in the full sample (n=32) was .81.
The hearing of all subjects was tested on a Tracor pure-tone audiometer and found to be within normal limits (-10 to 10 dB) for the range of frequencies used in this experiment.
Procedure.
Procedural differences between the first and second experiment were as fol- lows:
AUDITORY RECOGNITION MASKING 81
1. Although parameters of target tones and the masker were identical, an additional target tone duration (30 msec) was introduced. The masking tone followed the target after 0, 10, 20, 70, 120, or 250 msec. All ISis were presented in six 6 x 6 replicated balanced squares. This six-block sequence was repeated for the 20 msec target tone as well as for the 30 msec target tone. Order of task presentation (20 msec target task first or 30 msec target task first) was counterbalanced across subjects within the groups, and subjects completed one tone duration condition before start- ing the other. Thus, the design of this experiment was GROUP x TASK ORDER x TONE DURATION x BLOCK x ISI (2 x 2 x 2 × 6 x 6). The first two factors were grouping factors and the last three were repeated measures.
2. Tones were not prerecorded, but administered directly from the Wavetek oscillator under the control of the microcomputer.
3. Subjects sat in front of a CRT screen. On each trial a warning signal char- acter (*) appeared on the screen and .5 sec later a target tone followed. The subject responded by typing H for a high or L for a low tone. This response was echoed by the screen, and a feedback message (CORRECT or INCORRECT) was displayed.
4. The training procedure was modified. At the beginning of the experimen- tal session, each subject listened several times to examples of the high and low target tones and the masking tone. Next the subject was tested on identification of 30 high and low unmasked target tones presented ran- domly. 3 Finally, the subject was trained on the experimental task. Only after reaching at least 75% correct at an ISI of 250 msec was the subject allowed to proceed with the actual experiment. The demonstration- pretraining-training sequence was identical for target tones of 20 and 30 msec. Test-retest reliability of the threshold ISis determined in this procedure was assessed in a separate experiment on 17 students unselected for intel- ligence. The correlations between threshold ISis obtained on two differ- ent administrations at least 12 hours apart was .91 for the 20 msec tone.
Results and Discussion
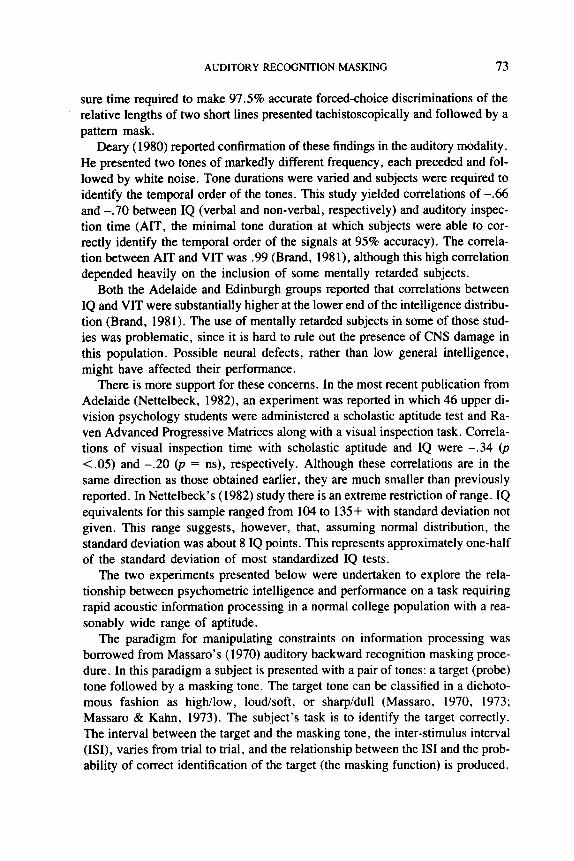
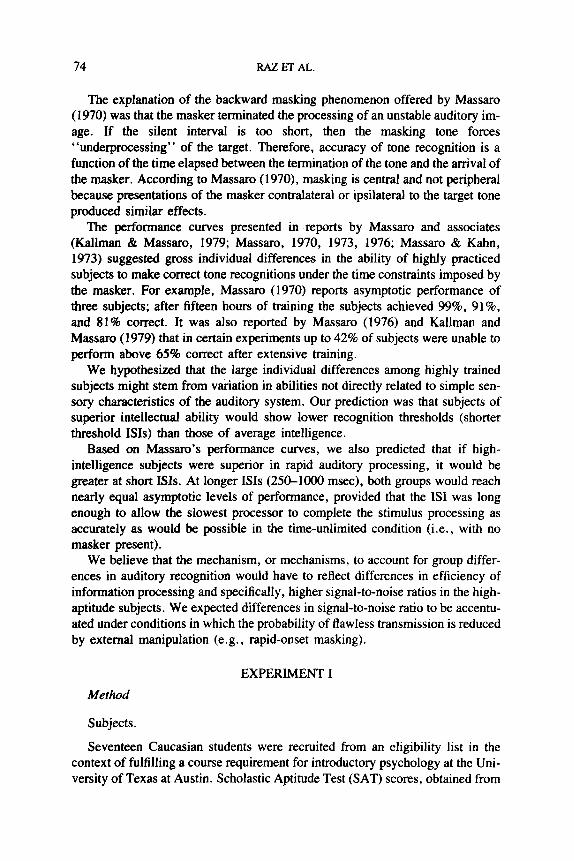
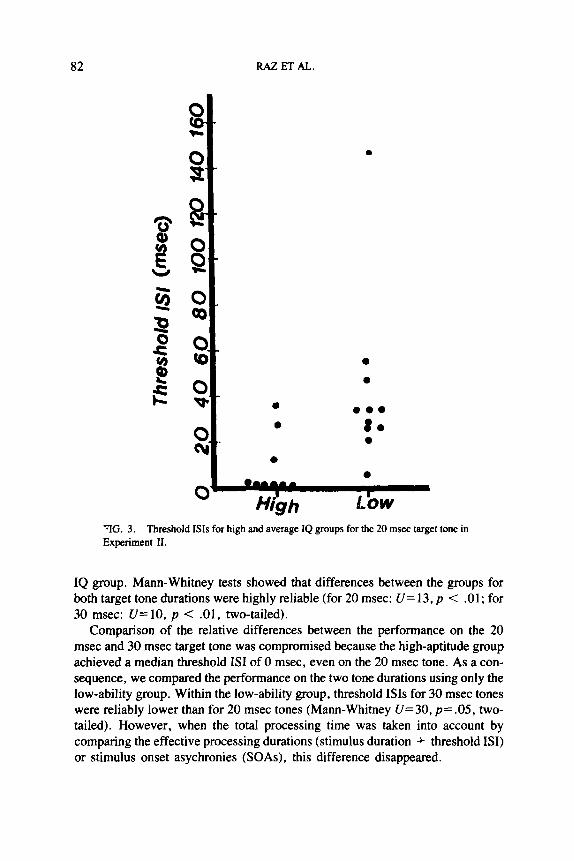
Threshold ISis were computed for each subject for both 20 msec and 30 msec target tone durations using probit analysis. Threshold distributions for 20 and 30 msec tones are presented in Figures 3 and 4, respectively. The median thresholds were 0 msec for both target tone durations in the high IQ group, and 34 msec and 13.6 msec for 20 and 30 msec target tone durations, respectively, in the average
3All subjects were able to perform at an accuracy level of at least 90%. This is hardly surprising, since well-trained listeners can distinguish between tones differing by only 3 Hz in this frequency region (Moore, 1977).
82 RAZ ET AL.
0
• 0 0 0
• | •
• ab~AA A
o H/gh "riG. 3. Threshold ISis for high and average IQ groups for the 20 msec target tone in Experiment II.
IQ group. Mann-Whitney tests showed that differences between the groups for both target tone durations were highly reliable (for 20 msec: U = 13, p < .01; for 30 msec: U = I 0 , p < .01, two-tailed).
Comparison of the relative differences between the performance on the 20 msec and 30 msec target tone was compromised because the high-aptitude group achieved a median threshold ISI of 0 msec, even on the 20 msec tone. As a con- sequence, we compared the performance on the two tone durations using only the low-ability group. Within the low-ability group, threshold ISis for 30 msec tones were reliably lower than for 20 msec tones (Mann-Whitney U=30, p = .05, two- tailed). However, when the total processing time was taken into account by comparing the effective processing durations (stimulus duration + threshold ISI) or stimulus onset asychronies (SOAs), this difference disappeared.
AUDITORY RECOGNITION MASKING 83
o
it"
~ q
a
I
it t
• o l o . . . . Ih_
• - .i~h- tgw
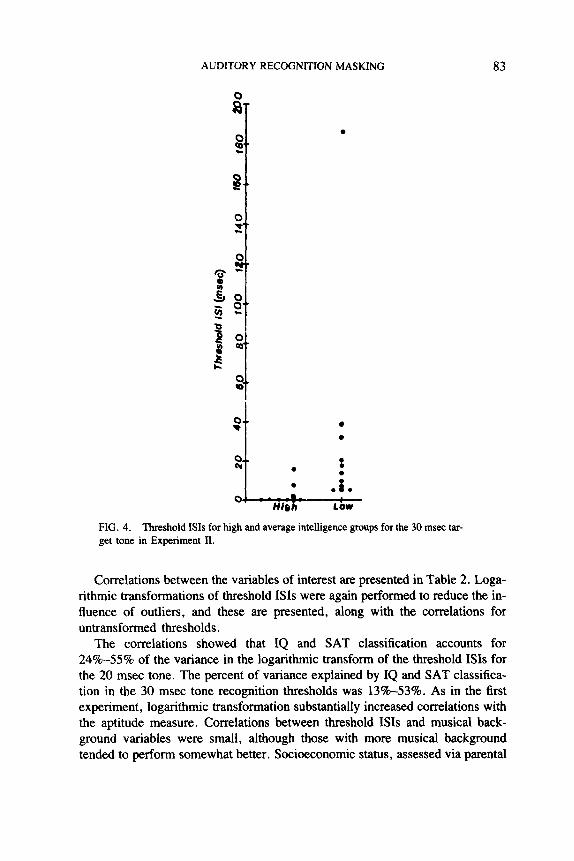
FIG, 4. Threshold ISis for high and average intelligence groups for the 30 msec tar- get tone in Experiment If.
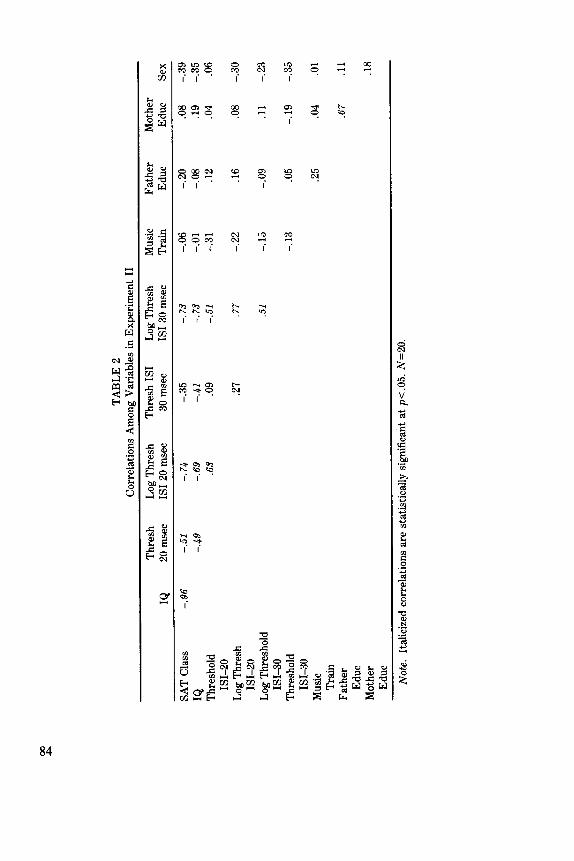
Correlations between the variables of interest are presented in Table 2. Loga- rithmic transformations of threshold ISis were again performed to reduce the in- fluence of outliers, and these are presented, along with the correlations for untransformed thresholds.
The correlations showed that IQ and SAT classification accounts for 24%-55% of the variance in the logarithmic transform of the threshold ISis for the 20 msec tone. The percent of variance explained by IQ and SAT classifica- tion in the 30 msec tone recognition thresholds was 13%--53%. As in the first experiment, logarithmic transformation substantially increased correlations with the aptitude measure. Correlations between threshold ISis and musical back- ground variables were small, although those with more musical background tended to perform somewhat better. Socioeconomic status, assessed via parental
4~
TA
BL
E 2
C
orre
lati
ons
Am
on
g V
aria
bles
in
Ex
per
imen
t II
Th
resh
L
og T
hre
sh
Th
resh
IS
I L
og T
hre
sh
Mus
ic
Fat
her
M
oth
er
IQ
20 m
sec
ISI
20 m
sec
30 m
sec
ISI
30 m
sec
Tra
in
Edu
c E
du
c S
ex
SA
T C
lass
-.
96
-.
51
-.
74
-.3
5
-. 7
3 -.
06
-.
20
.0
8 -.
39
IQ
-.
49
-.
69
-.
41
-.
73
-.
01
-.0
8
.19
-.3
5
Thr
esho
ld
.63
.09
-.
51
-.
31
.12
.04
.06
ISI-
20
L
og T
hre
sh
.27
.77
-.
22
.1
6 .0
8 -.
30
IS
I-2
0
Log
Thr
esho
ld
.51
-.1
5
-.0
9
.11
-.2
3
ISI-
-30
Thr
esho
ld
-. 1
3 .0
5 -.
19
-.3
5
ISI-
30
M
usic
.2
5 .0
4 .0
1 T
rain
F
ath
er
.67
.1
1 E
du
c M
oth
er
.18
Edu
c
No
te.
Ital
iciz
ed c
orre
lati
ons
are
stat
isti
call
y si
gnif
ican
t at
p<
.05
. N
=2
0.
AUDITORY RECOGNITION MASKING 85
education, appeared to play no role in performance on the backward masking task. The results concerning musical training and parental education are virtually identical to those obtained in the first experiment and are in agreement with an absence of any relationship between music aptitude level and intelligence (Karlin, 1941).
In this experiment, as in the previous one, females were overrepresented in the low-aptitude group. After controlling for aptitude classification or IQ, the highest partial correlation between sex and threshold values was found to be only - . 15. Possible sex differences in auditory information processing merit further investigation, but in the experiments presented here they were not important.
The data were submitted to a repeated measures ANOVA similar to the one performed in Experiment I, Because there were only 6 trials per block, correct responses were summed across adjacent pairs of blocks, thus changing the design t o a 2 × 2 x 2 x 3 × 6 .
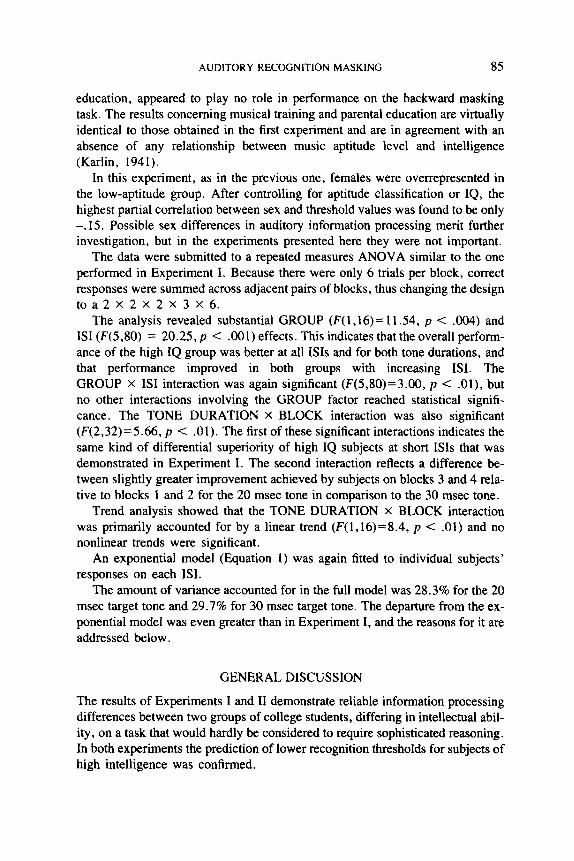
The analysis revealed substantial GROUP (F(I,16)= 11.54, p < .004) and ISI (F(5,80) = 20.25, p < .001) effects. This indicates that the overall perform- ance of the high IQ group was better at all ISis and for both tone durations, and that performance improved in both groups with increasing ISI. The GROUP x ISI interaction was again significant (F(5,80)=3.00, p < .01), but no other interactions involving the GROUP factor reached statistical signifi- cance. The TONE DURATION x BLOCK interaction was also significant (F(2,32) = 5.66, p < .01). The first of these significant interactions indicates the same kind of differential superiority of high IQ subjects at short ISis that was demonstrated in Experiment I. The second interaction reflects a difference be- tween slightly greater improvement achieved by subjects on blocks 3 and 4 rela- tive to blocks 1 and 2 for the 20 msec tone in comparison to the 30 msec tone.
Trend analysis showed that the TONE DURATION x BLOCK interaction was primarily accounted for by a linear trend (F(1,16)=8.4, p < .01) and no nonlinear trends were significant.
An exponential model (Equation 1) was again fitted to individual subjects' responses on each ISI.
The amount of variance accounted for in the full model was 28.3% for the 20 msec target tone and 29.7% for 30 msec target tone. The departure from the ex- ponential model was even greater than in Experiment I, and the reasons for it are addressed below.
GENERAL DISCUSSION
The results of Experiments I and II demonstrate reliable information processing differences between two groups of college students, differing in intellectual abil- ity, on a task that would hardly be considered to require sophisticated reasoning. In both experiments the prediction of lower recognition thresholds for subjects of high intelligence was confirmed.
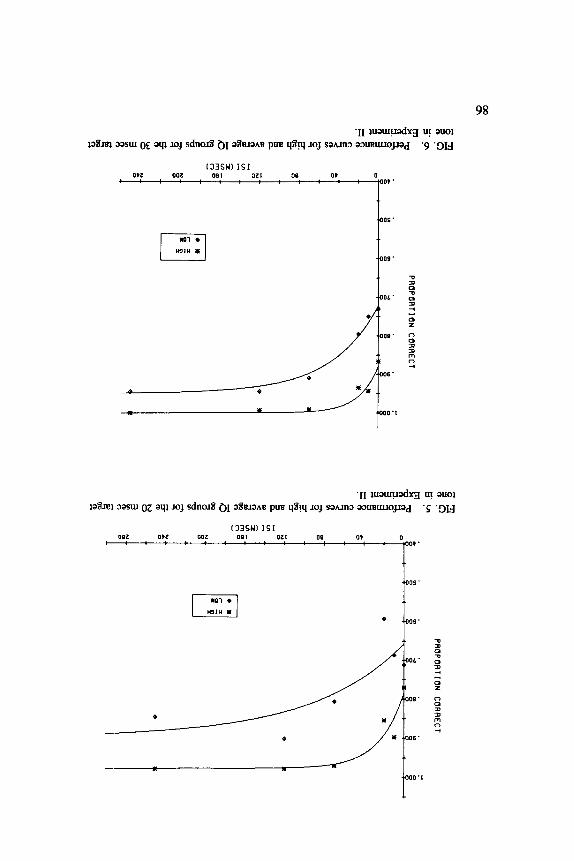
"II mo muo dx q u! ouoz lo3ml oosm 0£ oq:l Joj s d n o ~ ~)I 0ffeJOAe pu~ q$!q ZOJ s o . n o ooueuuoJzo d '9 "DH
(03SW) I~I OP~ 00;~ 0 9 1 0 ~ | OQ 01'
I I : : : : " : : : : : :09 *
DOS "
HO]H
D o g "
DOL "
D o g "
mS O0 ' !
98
'II luom.uodx~/t u! ouoz 1oI~1 3osm 0i~ oql JOj sdno.~ ~)I o~eJo^e pLre qi~!q 1oj S0Azn0 oouemao~o d "~ "OH
[33gH) Igl 0 9 ~ O~'~ 001~ 0911 0~1[ 0 0 O t
I I I I I I I I I I : '
.°I:1 H'91H
M
OOS "
D 0 9 "
DOt. "
Dog "
DO6 "
DO0 ' !
AUDITORY RECOGNITION MASKING 87
The relative importance of on-line vs. off-line processing was not resolved. The analysis of performance function parameters for 20 and 30 msec target tones would suggest that the 20 msec tone was so easy for the high-intelligence group that there was little room left for improvement of recognition with increased processing time.
We offer an interpretation of these group differences based on information theory. The amount of information extracted from a noisy communication chan- nel is determined mainly by its capacity, which in turn depends on its signal-to- noise ratio. If the time allowed for processing is "sufficiently large," enough information can be processed, even in a channel with a high level of noise (Shannon & Weaver, 1949). If time constraints are imposed on processing, a system with a lower signal-to-noise ratio may be at a disadvantage for some tasks. This disadvantage may not become apparent unless processing time is re- stricted because more noisy systems can compensate for high error rates by pro- longing processing time, thereby increasing redundancy. This is impossible un- der time restrictions.
It seems plausible that higher aptitude subjects might have better memory for target tones, consequently requiring less time for their retrieval. Our limited data suggest, however, that this hypothesis is probably wrong. Recall that every sub- ject was able to label unmasked tones at a rate of at least 90% correct before starting the experiment proper.
Visual inspection of the individual performance functions for each subject re- vealed that some had a U-shaped region in the vicinity of very short ISis. This trough, in an otherwise reasonably exponential curve, also is noticeable in some of the masking functions presented in Massaro's work (1970, 1972, 1976).
Superior performance before the trough is believed to result from enhance- ment of tone recognition due to a peripheral pitch shift of the target tone away from the masking tone. This makes the target tones more discriminable (Hawkins & Presson, 1977). According to Hawkins and Presson, the trough, more pro- nounced at brief ISis, represents the start of central processing proper, unassisted by any peripheral contrast effects. Events prior to the trough are presumed to reflect peripheral mechanisms.
In order to assess the possible influence of peripheral enhancement on the per- formance of high- and low-aptitude subjects, we examined each individual per- formance curve for troughs. Our criterion for a trough was as follows: a drop from non-chance performance (66% correct or above) to chance performance at the next longer ISI. When this pattern was observed, all ISis before the chance level of performance were discarded and a new probit function was calculated starting at the dip (local minimum).
The location of this minimum varied among the subjects, but most of the drops occurred at l0 or 20 msec. Not all subjects showed this dip, but the major- ity of U-shaped functions belonged to low ability subjects. Across both experi- ments, 67% of the low ability subjects and only 19% of the high ability subjects
88 RAZ ET AL.
had this U-shaped region in their performance functions (X 2 = 8, p < .01). The drops averaged 23.7% correct for the 3 high ability and 18.6% correct for the 12 low ability subjects (Mann-Whitney U = 11.5, p=ns). After the new thresholds were computed, the correlations with ability remained essentially unchanged in both experiments. The results of this reanalysis suggest that central, and not pe- ripheral mechanisms, appear to be differentiating the high and low aptitude groups.
The quality of the exponential fit was greater in the first than in the second experiment. The first experiment had 12 ISis and the second only 6. Since the second experiment had a fewer number of ISis, dips, which reduced the quality of the fit, accounted for a greater fraction of the total performance curve.
We would like to suggest an interesting connection between our experiment and recent theorizing by Hendrickson and Hendrickson (1980). Our results dem- onstrate that imposing increased demands on information processing efficiency brings to light differences that otherwise would remain unrevealed. The Hendricksons emphasized the relationship between intelligence and subtle differ- ences in the organism's ability to transmit information with minimal error. They pointed out, if R is the probability of errorless transmission of a signal and I - -R is the probability of a transmission failure, then the expected number of steps (E [N] ) that a message will propagate within the network before complete decay is:
E [N]=I / 1 - - R (2) The implication of this formula is that two individuals, differing in neural effi- ciency (probability of flawless transmission of a signal through a neuronal net- work) by about 1% (e.g., R1 - .99 vs. R2 = .999), will demonstrate a tenfold difference in E IN]! These differences in neural efficiency can create noticeable variations in performance on more elaborate problem-solving tasks, provided in- sufficient redundancy in the message.
REFERENCES
Brand, C. R. General intelligence and mental speed. In M. Friedman, J. P. Das, & N. O'Connor (Eds.), Intelligence and learning. New York: Plenum Press, 1981.
Brand, C. R., & Deary, I. J. Intelligence and inspection time. In H. J. Eysenck (Ed.), A model for intelligence. New York: Springer--Verlag, 1982.
Burt, C. Experimental tests of general intelligence. British Journal ofP~vchology, 1909, 3, 94-178. Carey, N. Factors in the mental processes of school children. British Journal of Psychology, 1915, 8,
70-92. Cattell, J. McK. Mental tests and measurements. Mind, 1890, 15, 373-380. Cattell, R. B., & Cattell, A. K. S. Handbook for the individual or group culture-fair intelligence
test. Scale 3. Champaign, IL: IPAT, 1959. Deary, I. J. How general is the mental speed factor in "general" intelligence. Abstract of B.Sc.
(Med. Sc.) honors thesis, University of Edinburgh, 1980. Deutsch, D. Handedness and memory for tonal pitch. In J. Heron (Ed.), Neuropsvchology of left-
handedness. Academic Press, 1980. Finney, D. J. Statistical methods in biological assay. London: Griffin Press, 1971.
AUDITORY RECOGNITION MASKING 89
Galton, F. Hereditary genius. New York: World Publishing Co., 1869 (reprinted in 1962). Galton, F. Inquiries into human faculty and its development. London: MacMillan, 1883. Hawkins, H. L., & Presson, J. C. Masking and preperceptual selectivity in auditory recognition. In
S. Domic (Ed.), Attention and performance VI. Hillsdale NJ: Lawrence Erlbaum Associates, 1977.
Hendrickson, D. E., & Hendrickson, A. E. The biological basis of individual differences in intelli- gence. Personality and Individual Differences, 1980, 1, 3-33.
Hick, W. E. On the rate of gain of information. Quarterly Journal of Experimental Psychology, 1952, 4, 11-26.
Hunt, E. Mechanics of verbal ability. Psychological Review, 1978, 85, 109-130. Hunt, E. Intelligence as an information-processing concept. British Journal of Psychology, 1980, 71,
449-474. Hunt, E., Lunneborg, C., & Lewis, J. What does it mean to be high verbal? Cognitive Psychology,
1975, 7, 194--227. Idson, W. L., & Massaro, D. W. Perceptual processing experience of auditory duration. Sensory
Processes, 1977, 1, 316-338. Jensen, A. R. Chronometric analysis of intelligence. Journal of Social and Biological Structures,
1981, 3, 103-122. Jensen, A. R., & Munro, E. Reaction time, movement time, and intelligence. Intelligence, 1979, 3.
121-126. Kallman, H. J., & Massaro, D. W. Similarity effect in backward recognition masking. Journal of
Experimental Psychology: Human Perception and Performance, 1979, 5, 110-128. Karlin, J. E. Music ability. Psychometrika, 1941, 6, 61-65. Kroll, N. E. A., & Madden, D. J. Verbal and pictorial processing by hemisphere as a function of the
subject's verbal Scholastic Aptitude Test score. In J. Requin (Ed.), Attention and performance VII. New York: Academic Press, 1978.
Lally, M., & Nettelbeck, T. Intelligence, reaction time, and inspection time. American Journal of Mental Deficiency, 1977, 82, 273-281.
Lally, M., & Nettelbeck, T. Inspection time, intelligence, and response strategy. American Journal of Mental Deficiency, 1980, 84, 553-560.
Leshowitz, B., & Cudahy, E. Frequency reduction in the presence of another tone. Journal of Ameri- can Acoustic Society, 1973, 54, 882-887.
Massaro, D. W. Perceptual auditory images. Journal of Experimental Psychology, 1970, 85, 411-417.
Massaro, D. W. A comparison of forward versus backward recognition masking. Journal of Experi- mental Psychology, 1973, 100. 434-436.
Massaro, D. W. Auditory information processing. In W. K. Estes (Ed.), Handbook of learning and cognitive processes (Vol. 4). Hillsdale, NJ: Lawrence Erlbaum Associates, 1976.
Massaro, D. W., & Kahn, B. J. Effects of central processing on auditory recognition. Journal of Experimental Psychology, 1973, 97, 51-58.
Moore, B. C. J. Introduction to hearing. Baltimore, MD: University Park Press, 1977. Nettelbeck, T. Inspection time: An index for intelligence? Quarterly Journal of Experimental Psy-
chology. 1982, 34A, 299-312. Nettelbeck, T., & Lally, M. Inspection time and measurement of intelligence. British Journal of
Psychology, 1976, 67, 17-22. Nettelbeck, T., & Lally, M. Age, intelligence, and inspection time. American Journal of Mental
Deficiency', 1979, 83, 398-401. Oldfield, R. C. The assessment of handedness: The Edinburgh inventory. Neuropsychologia, 1971,
9, 97-111. Overall, J. E., Spiegel, D. K., & Cohen, J. Equivalence of orthogonal and nonorthogonal analyses of
variance. Psychological Bulletin, 1975, 82, 182-186.
90 RAZ ET AL.
Posner, M. I. Abstraction and the process of recognition. In G. Bower & J. T. Spence (Eds.), Psy- chology of learning and motivation (Vol. 3). New York: Academic Press, 1969.
Ralston, M. L., & Jennrich, R. J. Dud, a derivative-free algorithm for nonlinear squares. Technometrics, 1978, 20, %14.
Shannon, C. E., & Weaver, W. The mathematical theory of communication. Urbana, It,: The Uni- versity of Illinois Press, 1949.
Smith, G., & Stanley, G. Relationship between measures of intelligence and choice reaction time. Bulletin of the Psychonomic Society, 1980, 16, 8-10.
Smith, J. D., & Baron, J. Individual differences in the classification of stimuli by dimensions. Jour- nal of Experimental Psychology: Human Perception and Performance, 1981, 7, 1132-1145.
Spearman, C. General intelligence, objectively determined and measured. American Journal of Psy- chology, 1904, 15, 72-101.
Steinberg, S. High speed scanning in human memory. Science, 1966, 153, 652-654. Vickers, D., Nettelbeck, T., & Willson, R. J. Perceptual indices of performance: The measurement
of "inspection time" and "noise" in the visual system. Perception, 1972, 1, 263-295. Wechsler, D. Manual for the Wechsler adult intelligence scale. New York: Psychological Corpora-
tion, 1955.