applying quantitative fluorescence techniques to investigate petroleum charge history of sedimentary...
TRANSCRIPT
ngineering 57 (2007) 139–151www.elsevier.com/locate/petrol
Journal of Petroleum Science and E
Applying quantitative fluorescence techniques to investigatepetroleum charge history of sedimentary basins in Australia
and Papuan New Guinea
Keyu Liu a,⁎, Peter Eadington a, Heather Middleton b, Stephen Fenton a, Tyson Cable a
a CSIRO Petroleum, P.O. Box 1130, Bentley WA 6102, Australiab CSIRO Petroleum, P.O. Box 136, North Ryde, NSW 1670, Australia
Received 1 July 2005; accepted 7 November 2005
Abstract
Two fluorescence techniques namely Quantitative Grain Fluorescence (QGF) and QGF on Extract (QGF-E) were employed toinvestigate hydrocarbon charge history in 17 wells from seven sedimentary basins in Australia and Papua New Guinea includingthe Exmouth, Barrow, Vulcan, Timor Sea (joint petroleum development area), Cooper, Gippsland, and Papuan basins.
The investigation has delineated a widespread occurrence of residual and palaeo oils in all seven basins including (1) residualoil columns below current oil–water contacts (OWCs) and in currently water-bearing “dry” wells; (2) palaeo oil accumulationwithin current gas zone; (3) palaeo oil columns below current OWCs, and (4) palaeo oil in currently water-bearing “dry” wells. TheQGF and QGF-E methods, which provide information on both current and palaeo oil saturation, have been shown to be veryeffective in unravelling hydrocarbon charge history in the wells investigated.© 2006 Elsevier B.V. All rights reserved.
Keywords: Quantitative Grain Fluorescence; Petroleum charge history; Sedimentary basins; Residual oil; Palaeo oil; Australia; Papua New Guinea
1. Introduction
Two new fluorescence techniques, namely QGF andQGF-E, have been developed by CSIRO Petroleum (Liuet al., 2003a; Liu and Eadington, 2005). QGF is Quan-titative Grain Fluorescence, which measures fluores-cence emission spectra from reservoir grains, after acleaning procedure involving solvent, hydrogen perox-ide and hydrochloric acid. QGF-E stands for Quantita-tive Grain Fluorescence on solvent Extractablehydrocarbons, which measures fluorescence emission
⁎ Corresponding author. Tel.: +61 8 64368783; fax: +61 8 64368555.E-mail address: [email protected] (K. Liu).
0920-4105/$ - see front matter © 2006 Elsevier B.V. All rights reserved.doi:10.1016/j.petrol.2005.11.019
spectra from the solvent extract from reservoir grainsafter the QGF cleaning procedure.
Reservoir rocks from current oil and residual oilzones are found to yield relatively high QGF-E responsecompared with rocks from known water zones, whichnormally have low, baseline fluorescence (Liu andEadington, 2005). Reservoir rocks from current oilzones and from reservoir intervals that once containedoil (palaeo oil) yield relatively high QGF responsecompared with reservoir rocks that have never been incontact with oils. QGF can only be applied to investigateadsorbed and included oils in clastic reservoir rocks thatcontain primarily quartz and feldspar, because carbonateminerals fluorescence. QGF-E is suitable to investigate
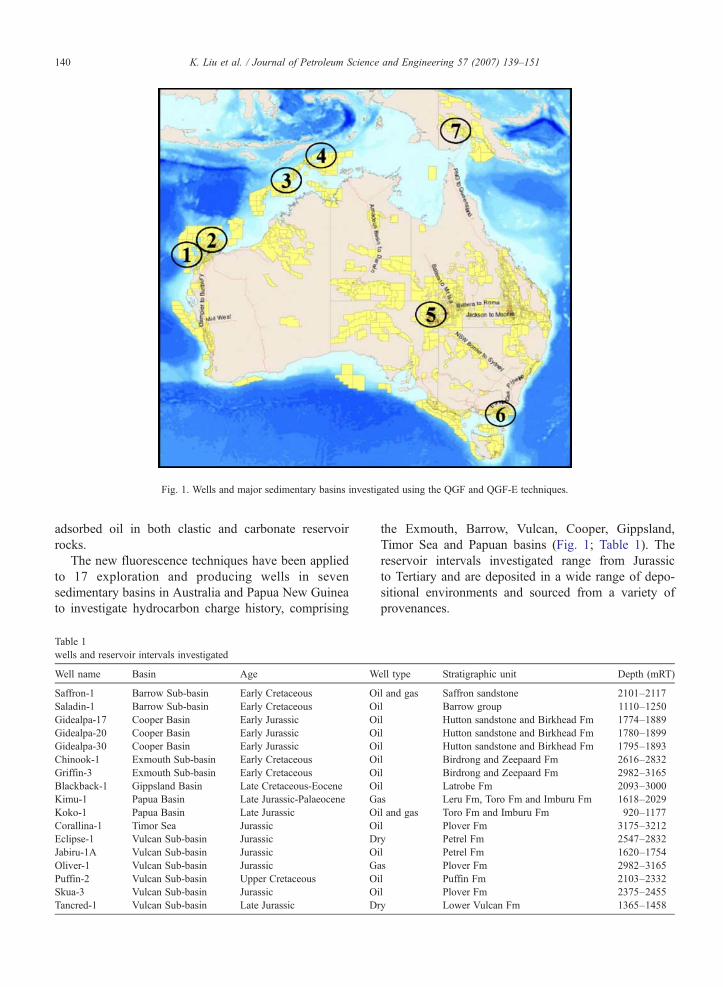
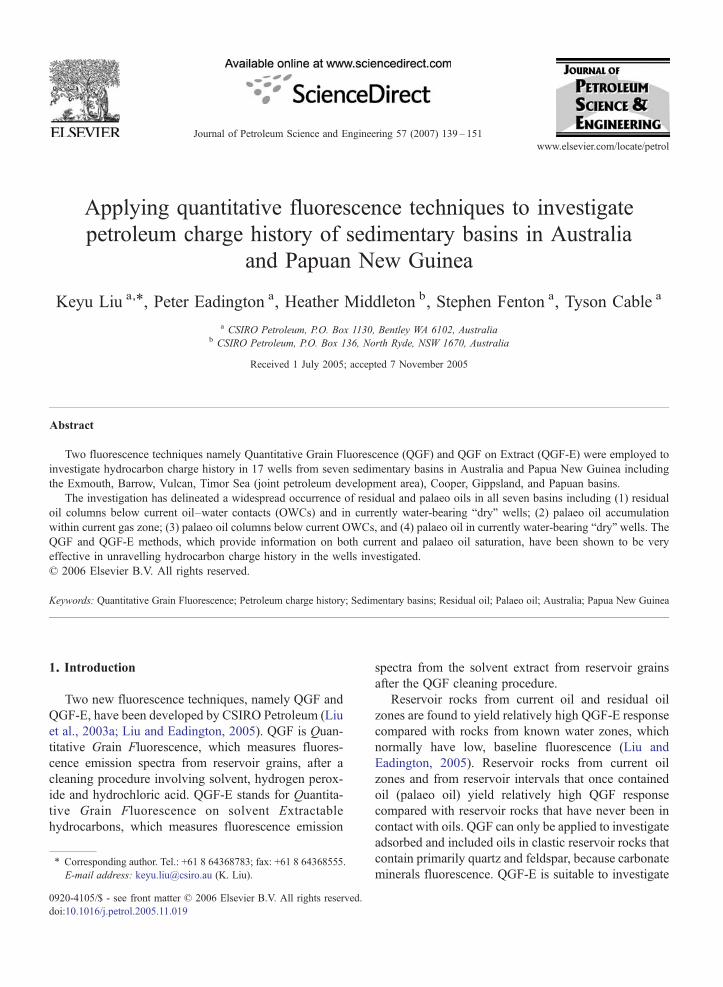
Fig. 1. Wells and major sedimentary basins investigated using the QGF and QGF-E techniques.
140 K. Liu et al. / Journal of Petroleum Science and Engineering 57 (2007) 139–151
adsorbed oil in both clastic and carbonate reservoirrocks.
The new fluorescence techniques have been appliedto 17 exploration and producing wells in sevensedimentary basins in Australia and Papua New Guineato investigate hydrocarbon charge history, comprising
Table 1wells and reservoir intervals investigated
Well name Basin Age W
Saffron-1 Barrow Sub-basin Early Cretaceous OSaladin-1 Barrow Sub-basin Early Cretaceous OGidealpa-17 Cooper Basin Early Jurassic OGidealpa-20 Cooper Basin Early Jurassic OGidealpa-30 Cooper Basin Early Jurassic OChinook-1 Exmouth Sub-basin Early Cretaceous OGriffin-3 Exmouth Sub-basin Early Cretaceous OBlackback-1 Gippsland Basin Late Cretaceous-Eocene OKimu-1 Papua Basin Late Jurassic-Palaeocene GKoko-1 Papua Basin Late Jurassic OCorallina-1 Timor Sea Jurassic OEclipse-1 Vulcan Sub-basin Jurassic DJabiru-1A Vulcan Sub-basin Jurassic OOliver-1 Vulcan Sub-basin Jurassic GPuffin-2 Vulcan Sub-basin Upper Cretaceous OSkua-3 Vulcan Sub-basin Jurassic OTancred-1 Vulcan Sub-basin Late Jurassic D
the Exmouth, Barrow, Vulcan, Cooper, Gippsland,Timor Sea and Papuan basins (Fig. 1; Table 1). Thereservoir intervals investigated range from Jurassicto Tertiary and are deposited in a wide range of depo-sitional environments and sourced from a variety ofprovenances.
ell type Stratigraphic unit Depth (mRT)
il and gas Saffron sandstone 2101–2117il Barrow group 1110–1250il Hutton sandstone and Birkhead Fm 1774–1889il Hutton sandstone and Birkhead Fm 1780–1899il Hutton sandstone and Birkhead Fm 1795–1893il Birdrong and Zeepaard Fm 2616–2832il Birdrong and Zeepaard Fm 2982–3165il Latrobe Fm 2093–3000as Leru Fm, Toro Fm and Imburu Fm 1618–2029il and gas Toro Fm and Imburu Fm 920–1177il Plover Fm 3175–3212ry Petrel Fm 2547–2832il Petrel Fm 1620–1754as Plover Fm 2982–3165il Puffin Fm 2103–2332il Plover Fm 2375–2455ry Lower Vulcan Fm 1365–1458
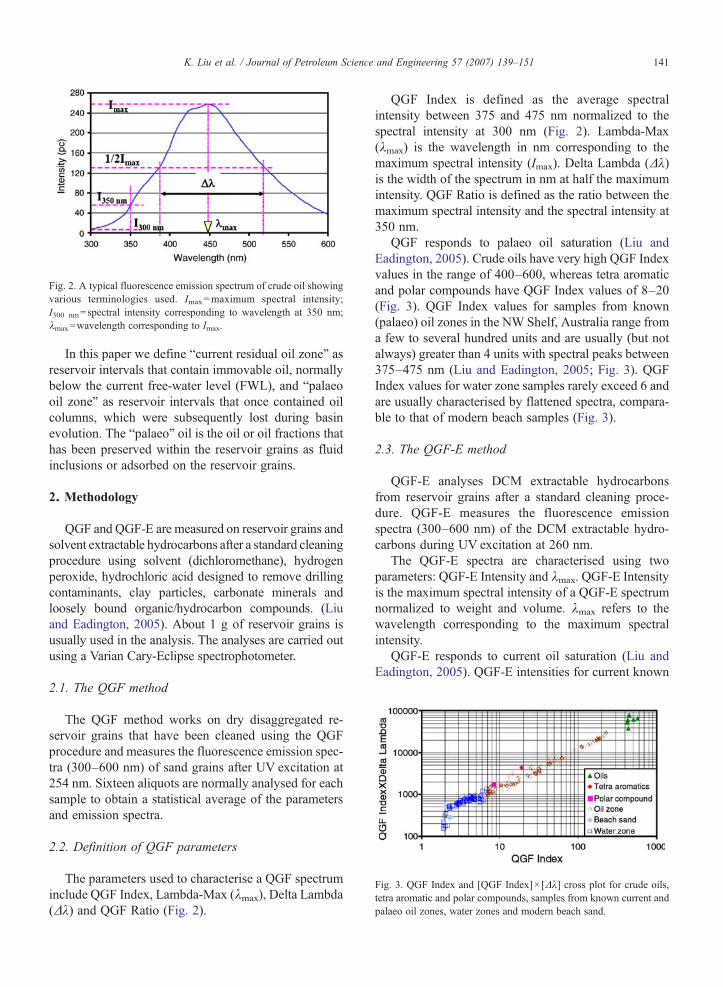
Fig. 2. A typical fluorescence emission spectrum of crude oil showingvarious terminologies used. Imax=maximum spectral intensity;I300 nm=spectral intensity corresponding to wavelength at 350 nm;λmax=wavelength corresponding to Imax.
Fig. 3. QGF Index and [QGF Index]× [Δλ] cross plot for crude oils,tetra aromatic and polar compounds, samples from known current andpalaeo oil zones, water zones and modern beach sand.
141K. Liu et al. / Journal of Petroleum Science and Engineering 57 (2007) 139–151
In this paper we define “current residual oil zone” asreservoir intervals that contain immovable oil, normallybelow the current free-water level (FWL), and “palaeooil zone” as reservoir intervals that once contained oilcolumns, which were subsequently lost during basinevolution. The “palaeo” oil is the oil or oil fractions thathas been preserved within the reservoir grains as fluidinclusions or adsorbed on the reservoir grains.
2. Methodology
QGF and QGF-E are measured on reservoir grains andsolvent extractable hydrocarbons after a standard cleaningprocedure using solvent (dichloromethane), hydrogenperoxide, hydrochloric acid designed to remove drillingcontaminants, clay particles, carbonate minerals andloosely bound organic/hydrocarbon compounds. (Liuand Eadington, 2005). About 1 g of reservoir grains isusually used in the analysis. The analyses are carried outusing a Varian Cary-Eclipse spectrophotometer.
2.1. The QGF method
The QGF method works on dry disaggregated re-servoir grains that have been cleaned using the QGFprocedure and measures the fluorescence emission spec-tra (300–600 nm) of sand grains after UV excitation at254 nm. Sixteen aliquots are normally analysed for eachsample to obtain a statistical average of the parametersand emission spectra.
2.2. Definition of QGF parameters
The parameters used to characterise a QGF spectruminclude QGF Index, Lambda-Max (λmax), Delta Lambda(Δλ) and QGF Ratio (Fig. 2).
QGF Index is defined as the average spectralintensity between 375 and 475 nm normalized to thespectral intensity at 300 nm (Fig. 2). Lambda-Max(λmax) is the wavelength in nm corresponding to themaximum spectral intensity (Imax). Delta Lambda (Δλ)is the width of the spectrum in nm at half the maximumintensity. QGF Ratio is defined as the ratio between themaximum spectral intensity and the spectral intensity at350 nm.
QGF responds to palaeo oil saturation (Liu andEadington, 2005). Crude oils have very high QGF Indexvalues in the range of 400–600, whereas tetra aromaticand polar compounds have QGF Index values of 8–20(Fig. 3). QGF Index values for samples from known(palaeo) oil zones in the NW Shelf, Australia range froma few to several hundred units and are usually (but notalways) greater than 4 units with spectral peaks between375–475 nm (Liu and Eadington, 2005; Fig. 3). QGFIndex values for water zone samples rarely exceed 6 andare usually characterised by flattened spectra, compara-ble to that of modern beach samples (Fig. 3).
2.3. The QGF-E method
QGF-E analyses DCM extractable hydrocarbonsfrom reservoir grains after a standard cleaning proce-dure. QGF-E measures the fluorescence emissionspectra (300–600 nm) of the DCM extractable hydro-carbons during UV excitation at 260 nm.
The QGF-E spectra are characterised using twoparameters: QGF-E Intensity and λmax. QGF-E Intensityis the maximum spectral intensity of a QGF-E spectrumnormalized to weight and volume. λmax refers to thewavelength corresponding to the maximum spectralintensity.
QGF-E responds to current oil saturation (Liu andEadington, 2005). QGF-E intensities for current known
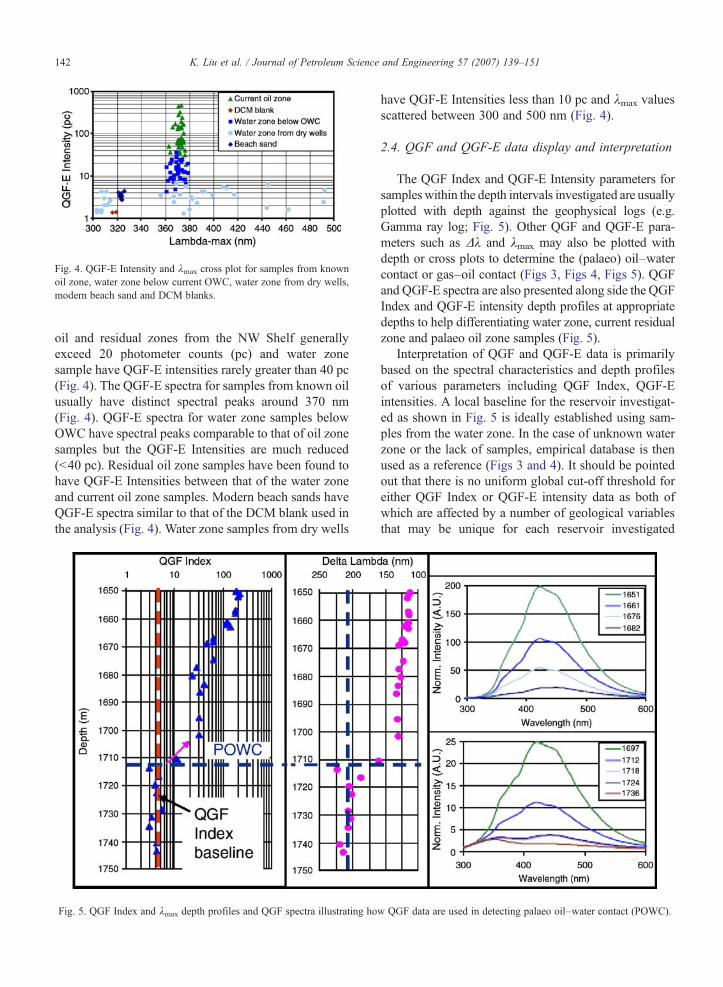
Fig. 4. QGF-E Intensity and λmax cross plot for samples from knownoil zone, water zone below current OWC, water zone from dry wells,modern beach sand and DCM blanks.
142 K. Liu et al. / Journal of Petroleum Science and Engineering 57 (2007) 139–151
oil and residual zones from the NW Shelf generallyexceed 20 photometer counts (pc) and water zonesample have QGF-E intensities rarely greater than 40 pc(Fig. 4). The QGF-E spectra for samples from known oilusually have distinct spectral peaks around 370 nm(Fig. 4). QGF-E spectra for water zone samples belowOWC have spectral peaks comparable to that of oil zonesamples but the QGF-E Intensities are much reduced(b40 pc). Residual oil zone samples have been found tohave QGF-E Intensities between that of the water zoneand current oil zone samples. Modern beach sands haveQGF-E spectra similar to that of the DCM blank used inthe analysis (Fig. 4). Water zone samples from dry wells
Fig. 5. QGF Index and λmax depth profiles and QGF spectra illustrating ho
have QGF-E Intensities less than 10 pc and λmax valuesscattered between 300 and 500 nm (Fig. 4).
2.4. QGF and QGF-E data display and interpretation
The QGF Index and QGF-E Intensity parameters forsampleswithin the depth intervals investigated are usuallyplotted with depth against the geophysical logs (e.g.Gamma ray log; Fig. 5). Other QGF and QGF-E para-meters such as Δλ and λmax may also be plotted withdepth or cross plots to determine the (palaeo) oil–watercontact or gas–oil contact (Figs 3, Figs 4, Figs 5). QGFand QGF-E spectra are also presented along side the QGFIndex and QGF-E intensity depth profiles at appropriatedepths to help differentiating water zone, current residualzone and palaeo oil zone samples (Fig. 5).
Interpretation of QGF and QGF-E data is primarilybased on the spectral characteristics and depth profilesof various parameters including QGF Index, QGF-Eintensities. A local baseline for the reservoir investigat-ed as shown in Fig. 5 is ideally established using sam-ples from the water zone. In the case of unknown waterzone or the lack of samples, empirical database is thenused as a reference (Figs 3 and 4). It should be pointedout that there is no uniform global cut-off threshold foreither QGF Index or QGF-E intensity data as both ofwhich are affected by a number of geological variablesthat may be unique for each reservoir investigated
w QGF data are used in detecting palaeo oil–water contact (POWC).
143K. Liu et al. / Journal of Petroleum Science and Engineering 57 (2007) 139–151
including the age and provenance of the reservoir grains,the composition of the oils, reservoir wettability, du-ration of oil-reservoir interaction and the duration afterthe original hydrocarbons have been lost. However, theQGF and QGF-E spectra for reservoir grains containingoil inclusions and reservoir rock that contain oils withinits pores have distinct spectral features compared withthe background fluorescence of quartz and feldspargrains that have never been in contact with oils.
The QGF spectra for reservoir rocks from known oiland palaeo oil zones are characterised by broad emissionspectra with peak between 375–475 nm; elevated QGFIndex values generally greater than 4; and a Δλ valuesranging from ∼100 nm to 200 nm (Fig. 5).
The QGF-E spectra for reservoir rocks from knownoil and residual oil zone are usually characterised bysharp asymmetrical spectra skewed toward the shortwavelength with spectral peaks around 370 nm (Liu andEadington, 2005; Fig. 4); elevated QGF-E Intensitiesgenerally greater than 20 pc.
3. Hydrocarbon charge history reconstructed fromQGF and QGF-E data
The QGF and QGF-E techniques have been appliedto address various issues relating to hydrocarbon chargehistory and to provide evidence of oil migration on 17wells in seven petroleum producing basins in Australiaand Papua New Guinea (Fig. 1; Table 1). Core andcutting samples from each well were sampled at closelyspaced intervals to delineate possible current residualand palaeo OWCs and detect oil migration pathways.
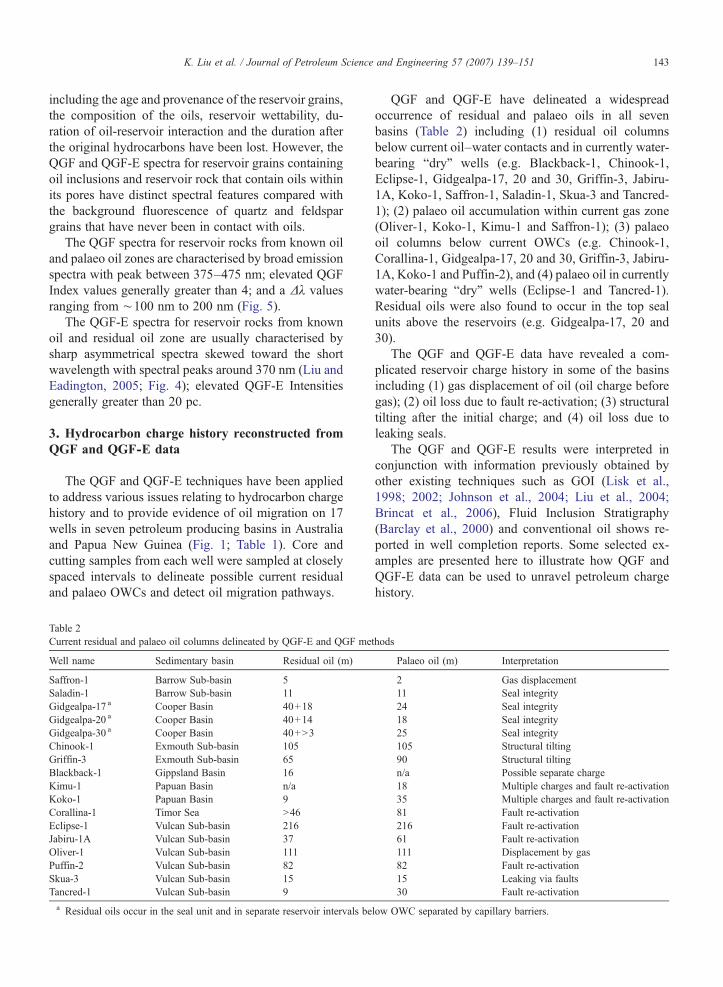
Table 2Current residual and palaeo oil columns delineated by QGF-E and QGF me
Well name Sedimentary basin Residual oil (m)
Saffron-1 Barrow Sub-basin 5Saladin-1 Barrow Sub-basin 11Gidgealpa-17 a Cooper Basin 40+18Gidgealpa-20 a Cooper Basin 40+14Gidgealpa-30 a Cooper Basin 40+N3Chinook-1 Exmouth Sub-basin 105Griffin-3 Exmouth Sub-basin 65Blackback-1 Gippsland Basin 16Kimu-1 Papuan Basin n/aKoko-1 Papuan Basin 9Corallina-1 Timor Sea N46Eclipse-1 Vulcan Sub-basin 216Jabiru-1A Vulcan Sub-basin 37Oliver-1 Vulcan Sub-basin 111Puffin-2 Vulcan Sub-basin 82Skua-3 Vulcan Sub-basin 15Tancred-1 Vulcan Sub-basin 9
a Residual oils occur in the seal unit and in separate reservoir intervals be
QGF and QGF-E have delineated a widespreadoccurrence of residual and palaeo oils in all sevenbasins (Table 2) including (1) residual oil columnsbelow current oil–water contacts and in currently water-bearing “dry” wells (e.g. Blackback-1, Chinook-1,Eclipse-1, Gidgealpa-17, 20 and 30, Griffin-3, Jabiru-1A, Koko-1, Saffron-1, Saladin-1, Skua-3 and Tancred-1); (2) palaeo oil accumulation within current gas zone(Oliver-1, Koko-1, Kimu-1 and Saffron-1); (3) palaeooil columns below current OWCs (e.g. Chinook-1,Corallina-1, Gidgealpa-17, 20 and 30, Griffin-3, Jabiru-1A, Koko-1 and Puffin-2), and (4) palaeo oil in currentlywater-bearing “dry” wells (Eclipse-1 and Tancred-1).Residual oils were also found to occur in the top sealunits above the reservoirs (e.g. Gidgealpa-17, 20 and30).
The QGF and QGF-E data have revealed a com-plicated reservoir charge history in some of the basinsincluding (1) gas displacement of oil (oil charge beforegas); (2) oil loss due to fault re-activation; (3) structuraltilting after the initial charge; and (4) oil loss due toleaking seals.
The QGF and QGF-E results were interpreted inconjunction with information previously obtained byother existing techniques such as GOI (Lisk et al.,1998; 2002; Johnson et al., 2004; Liu et al., 2004;Brincat et al., 2006), Fluid Inclusion Stratigraphy(Barclay et al., 2000) and conventional oil shows re-ported in well completion reports. Some selected ex-amples are presented here to illustrate how QGF andQGF-E data can be used to unravel petroleum chargehistory.
thods
Palaeo oil (m) Interpretation
2 Gas displacement11 Seal integrity24 Seal integrity18 Seal integrity25 Seal integrity105 Structural tilting90 Structural tiltingn/a Possible separate charge18 Multiple charges and fault re-activation35 Multiple charges and fault re-activation81 Fault re-activation216 Fault re-activation61 Fault re-activation111 Displacement by gas82 Fault re-activation15 Leaking via faults30 Fault re-activation
low OWC separated by capillary barriers.
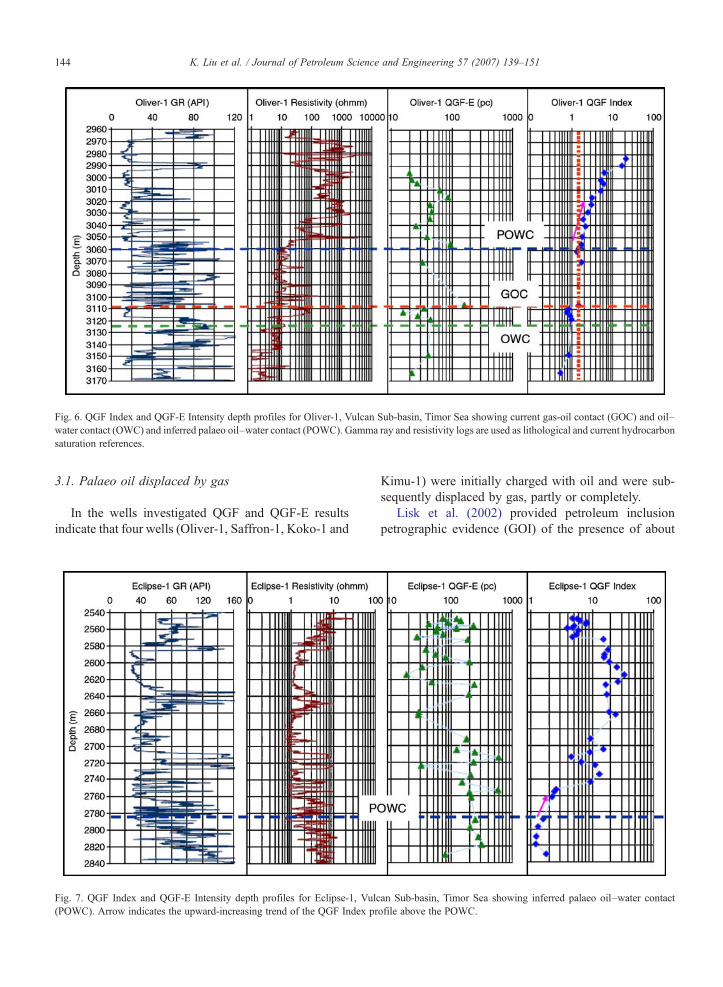
Fig. 6. QGF Index and QGF-E Intensity depth profiles for Oliver-1, Vulcan Sub-basin, Timor Sea showing current gas-oil contact (GOC) and oil–water contact (OWC) and inferred palaeo oil–water contact (POWC). Gamma ray and resistivity logs are used as lithological and current hydrocarbonsaturation references.
144 K. Liu et al. / Journal of Petroleum Science and Engineering 57 (2007) 139–151
3.1. Palaeo oil displaced by gas
In the wells investigated QGF and QGF-E resultsindicate that four wells (Oliver-1, Saffron-1, Koko-1 and
Fig. 7. QGF Index and QGF-E Intensity depth profiles for Eclipse-1, Vulc(POWC). Arrow indicates the upward-increasing trend of the QGF Index pr
Kimu-1) were initially charged with oil and were sub-sequently displaced by gas, partly or completely.
Lisk et al. (2002) provided petroleum inclusionpetrographic evidence (GOI) of the presence of about
an Sub-basin, Timor Sea showing inferred palaeo oil–water contactofile above the POWC.
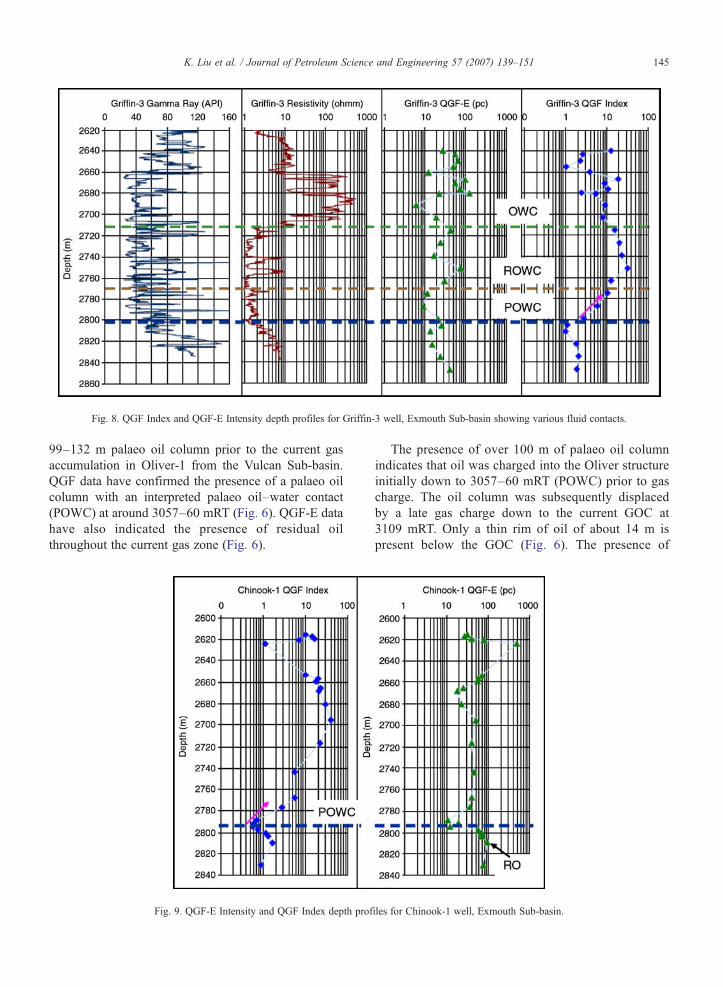
Fig. 8. QGF Index and QGF-E Intensity depth profiles for Griffin-3 well, Exmouth Sub-basin showing various fluid contacts.
145K. Liu et al. / Journal of Petroleum Science and Engineering 57 (2007) 139–151
99–132 m palaeo oil column prior to the current gasaccumulation in Oliver-1 from the Vulcan Sub-basin.QGF data have confirmed the presence of a palaeo oilcolumn with an interpreted palaeo oil–water contact(POWC) at around 3057–60 mRT (Fig. 6). QGF-E datahave also indicated the presence of residual oilthroughout the current gas zone (Fig. 6).
Fig. 9. QGF-E Intensity and QGF Index depth prof
The presence of over 100 m of palaeo oil columnindicates that oil was charged into the Oliver structureinitially down to 3057–60 mRT (POWC) prior to gascharge. The oil column was subsequently displacedby a late gas charge down to the current GOC at3109 mRT. Only a thin rim of oil of about 14 m ispresent below the GOC (Fig. 6). The presence of
iles for Chinook-1 well, Exmouth Sub-basin.
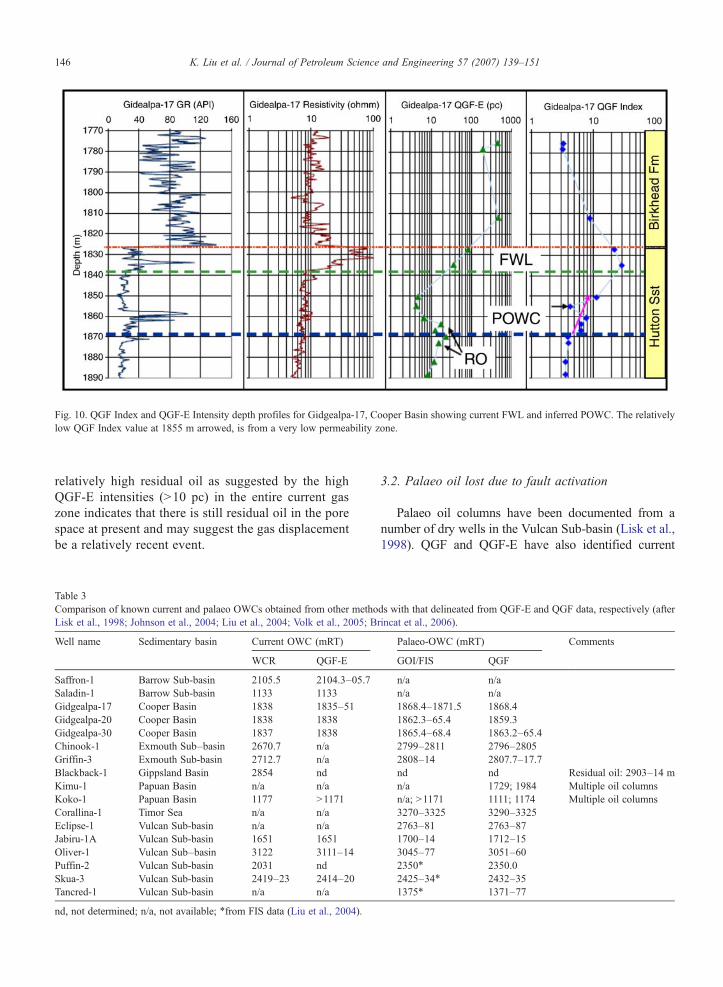
Fig. 10. QGF Index and QGF-E Intensity depth profiles for Gidgealpa-17, Cooper Basin showing current FWL and inferred POWC. The relativelylow QGF Index value at 1855 m arrowed, is from a very low permeability zone.
146 K. Liu et al. / Journal of Petroleum Science and Engineering 57 (2007) 139–151
relatively high residual oil as suggested by the highQGF-E intensities (N10 pc) in the entire current gaszone indicates that there is still residual oil in the porespace at present and may suggest the gas displacementbe a relatively recent event.
Table 3Comparison of known current and palaeo OWCs obtained from other methoLisk et al., 1998; Johnson et al., 2004; Liu et al., 2004; Volk et al., 2005; B
Well name Sedimentary basin Current OWC (mRT)
WCR QGF-E
Saffron-1 Barrow Sub-basin 2105.5 2104.3–05.7Saladin-1 Barrow Sub-basin 1133 1133Gidgealpa-17 Cooper Basin 1838 1835–51Gidgealpa-20 Cooper Basin 1838 1838Gidgealpa-30 Cooper Basin 1837 1838Chinook-1 Exmouth Sub–basin 2670.7 n/aGriffin-3 Exmouth Sub-basin 2712.7 n/aBlackback-1 Gippsland Basin 2854 ndKimu-1 Papuan Basin n/a n/aKoko-1 Papuan Basin 1177 N1171Corallina-1 Timor Sea n/a n/aEclipse-1 Vulcan Sub-basin n/a n/aJabiru-1A Vulcan Sub-basin 1651 1651Oliver-1 Vulcan Sub–basin 3122 3111–14Puffin-2 Vulcan Sub-basin 2031 ndSkua-3 Vulcan Sub-basin 2419–23 2414–20Tancred-1 Vulcan Sub-basin n/a n/a
nd, not determined; n/a, not available; ⁎from FIS data (Liu et al., 2004).
3.2. Palaeo oil lost due to fault activation
Palaeo oil columns have been documented from anumber of dry wells in the Vulcan Sub-basin (Lisk et al.,1998). QGF and QGF-E have also identified current
ds with that delineated from QGF-E and QGF data, respectively (afterrincat et al., 2006).
Palaeo-OWC (mRT) Comments
GOI/FIS QGF
n/a n/an/a n/a1868.4–1871.5 1868.41862.3–65.4 1859.31865.4–68.4 1863.2–65.42799–2811 2796–28052808–14 2807.7–17.7nd nd Residual oil: 2903–14 mn/a 1729; 1984 Multiple oil columnsn/a; N1171 1111; 1174 Multiple oil columns3270–3325 3290–33252763–81 2763–871700–14 1712–153045–77 3051–602350⁎ 2350.02425–34⁎ 2432–351375⁎ 1371–77
147K. Liu et al. / Journal of Petroleum Science and Engineering 57 (2007) 139–151
residual oil and palaeo oil columns in Eclipse-1, Tancred-1 and Puffin-2.
QGF data from Eclipse-1, Vulcan Sub-basin haveconfirmed the presence of a huge (∼216 m) palaeo oilcolumn previously identified using GOI (Lisk et al.,1998) with the palaeo OWC constrained to 2763–2787 mRT. Furthermore, the QGF-E data has revealedthe presence of current residual oil throughout the entirereservoir sequence investigated (Fig. 7).
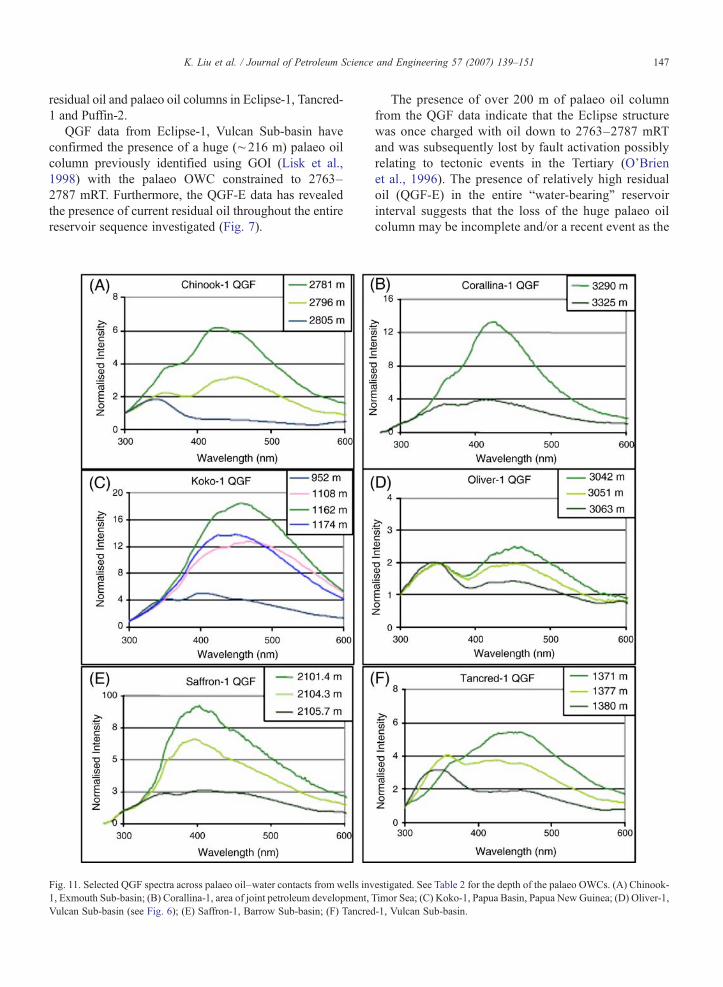
Fig. 11. Selected QGF spectra across palaeo oil–water contacts from wells inv1, Exmouth Sub-basin; (B) Corallina-1, area of joint petroleum development,Vulcan Sub-basin (see Fig. 6); (E) Saffron-1, Barrow Sub-basin; (F) Tancred
The presence of over 200 m of palaeo oil columnfrom the QGF data indicate that the Eclipse structurewas once charged with oil down to 2763–2787 mRTand was subsequently lost by fault activation possiblyrelating to tectonic events in the Tertiary (O'Brienet al., 1996). The presence of relatively high residualoil (QGF-E) in the entire “water-bearing” reservoirinterval suggests that the loss of the huge palaeo oilcolumn may be incomplete and/or a recent event as the
estigated. See Table 2 for the depth of the palaeo OWCs. (A) Chinook-Timor Sea; (C) Koko-1, Papua Basin, Papua New Guinea; (D) Oliver-1,-1, Vulcan Sub-basin.
148 K. Liu et al. / Journal of Petroleum Science and Engineering 57 (2007) 139–151
residual oils in the pore space have not yet been“washed” away by formation water. This is in contrastto the lower part of the Jabiru-1A palaeo oil zone(1688–1712 mRT) which yielded baseline QGF-Eintensities less than 10 pc (Liu and Eadington, 2005)despite the high QGF response.
3.3. Palaeo oil due to structural tilting
Brincat et al. (2006) has identified a palaeo oil columnof∼90 m or more in the Griffin and Chinook oilfields inthe Exmouth Sub-basin using the GOI technique. QGFand QGF-E analyses of two wells (Griffin-3 andChinook-1) have confirmed the presence of palaeo oil–water contacts at 2808–18 m RT and 2796–2805 mRT,respectively at Griffin-3 and Chinook-1 wells. The QGF-E data have delineated approximately 65 m and 105 mcurrent residual oil columns in the two wells (Table 2;Figs 8 and 9).
The cause for the loss of the palaeo oil columns wasinterpreted to be structural tilting in the region after theinitial oil charge (Workman et al., 2002; Brincat et al.,2006). Compared with the positions of palaeo oil–
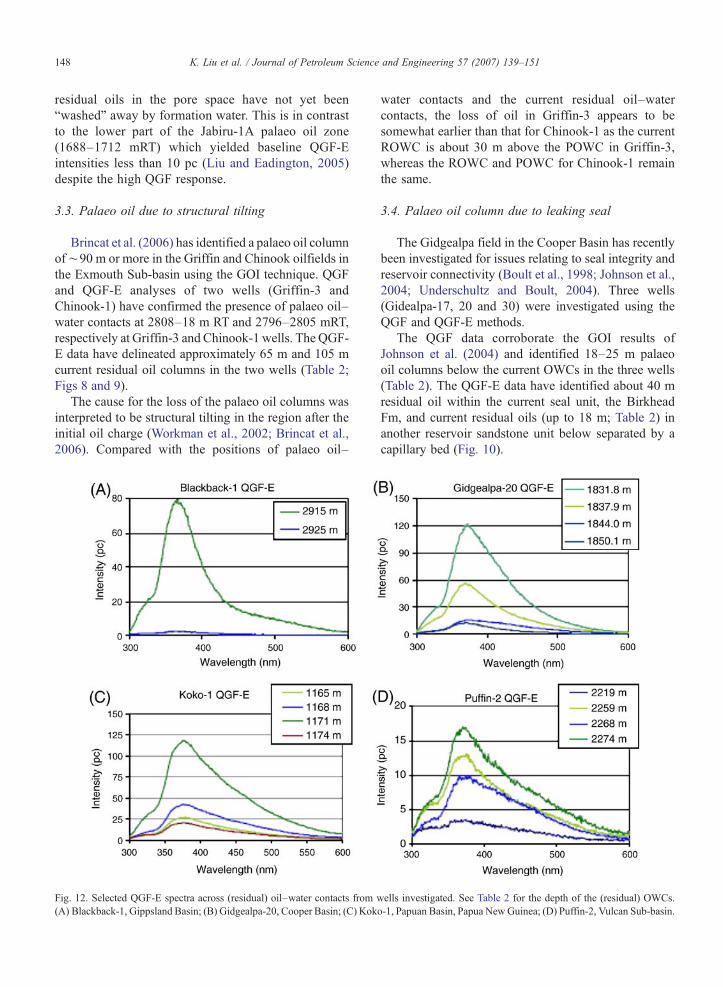
Fig. 12. Selected QGF-E spectra across (residual) oil–water contacts from(A) Blackback-1, Gippsland Basin; (B) Gidgealpa-20, Cooper Basin; (C) Kok
water contacts and the current residual oil–watercontacts, the loss of oil in Griffin-3 appears to besomewhat earlier than that for Chinook-1 as the currentROWC is about 30 m above the POWC in Griffin-3,whereas the ROWC and POWC for Chinook-1 remainthe same.
3.4. Palaeo oil column due to leaking seal
The Gidgealpa field in the Cooper Basin has recentlybeen investigated for issues relating to seal integrity andreservoir connectivity (Boult et al., 1998; Johnson et al.,2004; Underschultz and Boult, 2004). Three wells(Gidealpa-17, 20 and 30) were investigated using theQGF and QGF-E methods.
The QGF data corroborate the GOI results ofJohnson et al. (2004) and identified 18–25 m palaeooil columns below the current OWCs in the three wells(Table 2). The QGF-E data have identified about 40 mresidual oil within the current seal unit, the BirkheadFm, and current residual oils (up to 18 m; Table 2) inanother reservoir sandstone unit below separated by acapillary bed (Fig. 10).
wells investigated. See Table 2 for the depth of the (residual) OWCs.o-1, Papuan Basin, Papua NewGuinea; (D) Puffin-2, Vulcan Sub-basin.
149K. Liu et al. / Journal of Petroleum Science and Engineering 57 (2007) 139–151
The offset of the current free water level (FWL) andthe palaeo oil–water contact suggests that oil was lostafter the initial charge in the Gidealpa field. Themechanism for the loss of the palaeo oil is inferred tobe due to the “leaking” seal in the field as indicated bythe presence of extensive residual oils (40 m) within theseal unit. The relatively low QGF response (low QGFIndex values) within the top seal unit at around1775 mRT suggest that oil did not enter into that partof the seal during the initial charge and the presence ofthe current residual oil as indicated by the high QGF-Eintensity is only a recent event and possibly post-datethe major diagenetic event.
3.5. Summary
In the 17 wells investigated QGF and QGF-E havedelineated current (residual) and/or palaeo contacts(Table 3) that are comparable to that identified byother techniques such as the fluid inclusion petrography(GOI), Fluid Inclusion Stratigraphy (FIS) and conven-tional core and log analysis methods (Lisk et al., 1998;Johnson et al., 2004; Liu et al., 2004; Volk et al., 2005;Brincat et al., 2006). The combined QGF and QGF-Edata provide both current and palaeo oil saturation,which is critical in understanding hydrocarbon chargehistory in the basins.
The delineation of the current and palaeo oil–watercontact has been facilitated by examining the QGFIntensity and QGF Index depth profiles and the changesin spectral characteristics across the inferred fluid con-tacts. In all the cases investigated the QGF Index depthprofiles display distinct upward increasing trends abovethe palaeo oil–water contacts (arrowed in all the QGFIndex profiles). The QGF spectra display distinct differ-ence across the palaeo oil–water contact (Fig. 11). QGFspectra from palaeo oil zone have the signature ofcrude oil or oil inclusions (Liu et al., 2003b; Liu andEadington, 2005) with a distinct broad spectral peakbetween 375–475 nm. QGF spectra for water zonesamples are generally flat and often have a peak around350 nm or a very narrow peak around 400 nm reflectingthe intrinsic fluorescence of quartz and feldspars,respectively.
Above the current residual oil contact, the QGF-Espectral intensities usually show upward-increasingprofiles and the spectra skew towards the shortwavelength and exhibit distinct spectral peak at around370 nm. Below the residual oil–water contact in thewater zone the QGF-E intensities remain low, and theQGF-E spectra display features comparable to that ofmodern beach sand and the DCM blank (Fig. 12).
4. Discussion and conclusions
In the basins investigated the QGF and QGF-Etechniques have identified (1) residual oil columnsbelow current OWCs and in currently water-bearing“dry” wells; (2) palaeo oil accumulation within currentgas zone; (3) palaeo oil columns below current OWCs,and (4) palaeo oil in currently water-bearing “dry”wells.
The QGF and QGF-E results enable the interpreta-tion and reconstruction of the charge history regardingthe relative timing of hydrocarbon charge and subse-quent loss and provide models for future exploration.Specifically the investigation has identified the loss ofthe original oil accumulation (palaeo oil; QGF) by
1) displacement of a late gas charge (e.g. Oliver-1,Saffron-1 and Koko-1)
2) structural (fault) activation (e.g. Eclipse-1, Jabiru-1A, Skua-3, Puffin-2 and Tancred-1)
3) structural tilting (e.g. Chinook-1 and Griffin-3)4) leaking seal (e.g. Gidgealpa-17, 20 and 30).
The presence of current residual oils (QGF-E) belowthe current oil–water contact, in the current gas zone andin some of the dry wells suggests that the loss of most ofthe oils may be a relatively recent event. Therefore it ispossible to provide predictive models for further drillingwhen combined the hydrocarbon charge history modeland prospect-scale geology as recently demonstrated byLisk et al. (2002); Gartrell et al. (2004) and Brincat et al.(2006) using the GOI technique.
The QGF and QGF-E techniques developed byCSIRO Petroleum provide both present day and palaeooil saturation in a reservoir in a single analyticalprocedure. Field application of the techniques to sevenbasins in Australia and Papua New Guinea has shownthat the techniques can provide useful information forunravelling hydrocarbon charge history. They arecomplimentary to the existing fluid inclusion methodsand some geochemical techniques in regional chargehistory study and provide the petroleum industry with arapid and cost-effective screening tool for petroleumexploration.
When apply QGF and QGF-E in hydrocarbon historyanalysis, it should be pointed out that the values of QGFIndex for palaeo oil zones may vary up to an order ofmagnitude for different wells or basins as demonstratedin this study. The QGF Index value reflects primarily theabundance of oil inclusions (Liu et al., 2003b; Liu andEadington, 2005), which are dependent upon a numberof geological variables of the particular reservoirsinvestigated. Therefore a universal cut-off threshold of
150 K. Liu et al. / Journal of Petroleum Science and Engineering 57 (2007) 139–151
QGF Index value for defining palaeo oil–water zonesshould not be used. The QGF spectral signatures (Fig.12) and depth profiles (Figs 5–10) provide very usefulcriteria for delineating the palaeo oil–water contact.QGF Index profiles appear to increase upwards from thepalaeo oil–water contact, consistent with the oilsaturation profile expected under a capillary-buoyancysystem. Below the palaeo oil–water contact in the waterzone QGF Index values are low and remain constant,and the QGF spectra resemble that of quartz andfeldspar.
Residual oil–water contacts are recognised by QGF-E intensity depth profiles and spectral signatures. TheQGF-E intensity profiles usually increase upwardsabove the residual oil–water contact. Below the residualoil–water contact QGF-E intensities are low and theQGF-E spectra resemble that of the DCM blank.
NomenclatureGOI ratio between Grains containing Oil Inclusion
over total grains counted.FIS Fluid Inclusion StratigraphyQGF Quantitative Grain FluorescenceQGF-E Quantitative Grain Fluorescence on solvent
Extractable hydrocarbonsQGF Index ratio between the average spectral intensity
of 375,475 nm and the spectral intensity at300 nm
QGF-E Intensity weight and volume-normalised spec-tral intensity maximum
Lambda-Max (λmax) the wavelength corresponding tothe maximum spectral intensity
Delta Lambda (Δλ) the width of the spectrum in nm athalf the maximum intensity
mRT metre below rotary tableGOC gas–water contactOWC oil–water contactPOWC palaeo oil–water contactROWC residual oil–water contactFWL free water levelDCM Dichloromethane
Acknowledgements
Many people have contributed to the work directlyand indirectly. We would like to acknowledge thecontribution and support of our colleagues in CSIROPetroleum to the QGF project. Dr Joseph Kurusingalhelped with the initial project planning and instrumentsetup. Some of the laboratory analyses were carried outby David Coghlan (2000–2001) and Luke Johnson
(2003). Dr David Whitford and Dr Anita Andrew ofCSIRO Exploration and Mining are thanked for theirsupport and encouragement from the inception of theproject. Dr Simon George, Manzur Ahmed and HerbertVolk are thanked for access to the petroleum geochem-istry facilities and for advice on sample preparation.Mark Brincat, Luke Johnson, Jim Underschultz andMark Lisk are thanked for useful discussion on thecharge history Griffin and Gidealpa fields. We thank DrDon Hall of the Fluid Inclusion Technology, Tulsa, USAand an anonymous reviewer for constructive commentsand suggestions.
References
Barclay, S.A., Worden, R.H., Parnell, J., Hall, D., Sterner, M., 2000.Assessment of fluid contacts and compartmentalisation insandstone reservoirs using fluid inclusions: an example from theMagnus oil field, North Sea. AAPG Bulletin 84, 489–504.
Boult, P.J., Lanzilli, E., Michaelsen, B.H., McKirdy, D.M., Ryan, M.J.,1998. A new model for the Hutton/Birkhead reservoir/seal coupletand the associated Birkhead-Hutton petroleum system. TheAPPEA Journal 38, 742–744.
Brincat, M.P., Gartrell, A., Bailey, W., Lisk, M., Johnson, L.,Dewhurst, D., 2006. An integrated evaluation of hydrocarboncharge and retention at the Griffin, Chinook and Scindian oil andgas fields, Barrow Sub-basin, North West Shelf, Australia. AAPG90, 1359–1380.
Gartrell, A., Zhang, Y.H., Lisk, M., Dewhurst, D., 2004. Faultintersections as critical hydrocarbon leakage zones: integrated fieldstudy and numerical modelling of an example from the Timor Sea,Australia. Marine and Petroleum Geology 21, 1165–1179.
Johnson, L., Lisk, M., Gartrell, A., Boult, P., 2004. Calibration of chargeand retentionmodels for the Gidgealpa Oilfield: implications for sealpotential in the Eromanga Basin. PESA Eastern Australasian BasinSymposium II, Adelaide, 19–20, Sept., 2004, pp. 461–471.
Lisk, M., Brincat, M.P., Eadington, P.J., O'Brien, G.W., 1998.Hydrocarbon charge in the Vulcan Sub-basin. In: Purcell, P.G.,Purcell, R.R. (Eds.), The Sedimentary Basins of Western Australia2. Proceedings of Petroleum Exploration Society of AustraliaSymposium, Perth, WA, pp. 287–303.
Lisk, M., O'Brien, G.W., Eadington, P.J., 2002. Quantitativeevaluation of the oil-leg potential in the Oliver gas field, TimorSea, Australia. AAPG Bulletin 86, 1531–1542.
Liu, K., Eadington, P., 2005. Quantitative fluorescence techniques fordetecting residual oils and reconstructing hydrocarbon chargehistory. Organic Geochemistry 36, 1023–1036.
Liu, K., Eadington, P.J., Coghlan, D., 2003a. Fluorescence evidence ofpolar hydrocarbon interaction on mineral surfaces and implicationsto alteration of reservoir wettability. Journal of Petroleum Scienceand Engineering 39, 275–285.
Liu, K., George, S., Eadington, P.J., 2003b. Predicting abundances andn-alkane profiles of oil inclusions from bulk fluorescencespectrophotometry. 21st Meeting of Organic Geochemistry,Krakow, Poland, Part II, pp. 177–178.
Liu, K., Eadington, P., Kennard, J., Middleton, H., George, G.C.,Ahmed, M., Cope, P., 2004. Oil migration in the Vulcan Sub-basin,Timor Sea, investigated using GOI and FIS data. In: Ellis, G.,Baillie, P.W., Munson, T.J. (Eds.) 2004, Timor Sea Petroleum

151K. Liu et al. / Journal of Petroleum Science and Engineering 57 (2007) 139–151
Geoscience, Proceedings of the Timor Sea Symposium, Darwin,NT, June, 2003, pp. 233–351.
O'Brien, G.W., Lisk, M., Duddy, I., Eadington, P.J., Cadman, S.,Fellow, M., 1996. Late tertiary fluid migration in the Timor Sea: akey control on thermal and diagenetic histories? APPEA Journal36, 399–427.
Underschultz, J., Boult, P.J., 2004. Top seal and reservoir continuity:hydrodynamic evaluation of the Hutton-Birkhead Reservoir,Gidgealpa Oilfield. PESA Eastern Australasian Basin SymposiumII, Adelaide, 19–20, Sept., 2004, pp. 473–482.
Volk, H., George, S.C., Middleton, H., Schofield, S., 2005.Geochemical comparison of fluid inclusion and present-day oilaccumulations in the Papuan Foreland — evidence for previouslyunrecognised petroleum source rocks. Organic Geochemistry 36,29–51.
Workman, L.J., Slate, T.V., Oke, B.F., 2002. The Griffin development—flying high on infill success. SPE 77920, 1–10.