appendix f - apec project completion report
TRANSCRIPT

1
Appendix F
APEC Project Completion Report Please submit through your APEC Secretariat Program Director within 2 months of project
completion. Reports should be 3-4 pages. Please append participants list.
SECTION A: Project profile
Project number & title: EWG 13 2016A – Supporting the Development and Implementation of Low-Emission Development Strategies (LEDs) in Transport Sector
Project time period: January 2018 – July 2018 Date submitted: 25 July 2018
Committee / WG / Fora: EWG
Project Overseer Name / Organization / Economy:
Ms Sanjini Nanayakkara, National Renewable Energy Laboratory, USA
SECTION B: Project report and reflection 1. Project description: In 3-4 sentences, please describe the project and its main objectives.
This project aims facilitate dialogue between national and subnational authorities and provide technical assistance and capacity-building support to governments to integrate transport into their national planning strategies through the approach of conducting peer-to-peer workshops, offering technical assistance and developing training packages to disseminate knowledge. Our project objectives are to strengthen the capacity of at least 3 APEC economies (OBJ1), to build up knowledge of implementable solutions through technical assistance/capacity building via in-person workshops (OBJ2) and to develop a customized training package and a roadmap of design instruments for implementation (OBJ3). 2. Meeting objectives: Describe how the project met each of its proposed objectives. Please outline any challenges you may have encountered in delivering the activity. OBJ1: Designed and implemented 3 workshops around 3 APEC economies, which were open to participation from all APEC economies. We picked an economy in LAC and two in Asia; Peru, Viet Nam and Papua New Guinea (PNG). We successfully implemented two workshops, where the agenda was designed around the priorities of each economy, e.g. Peru prioritized a desire to learn about cross-sectoral collaborations for the implementation of energy efficiency policies in transport; and Viet Nam prioritized a need to learn about bus rapid transit projects and reform approaches in organizing transport governance. Originally, PNG was one of our selected economies, and we had early conversations with PNG EWG Representative as well as representatives from PNG’s Transport Ministry about a potential workshop in PNG during their host year. Due to the timing of this project, and PNG’s current commitments, it would not be feasible to host a workshop in PNG in 2018. Therefore, we decided to implement a “Study Tour” workshop as our 3rd workshop, to showcase Singapore’s priorities, and success stories and future plans. The study tour aimed to provide a learning experience for decision makers and senior technical staff involved with planning or policy making for sustainable, energy efficient urban mobility. One of the critical challenges we faced was that it took much longer than anticipated to coordinate and design support with the three targeted APEC economies. There was difficulty identifying the appropriate point of contact responsible for this scope of work in Viet Nam and Peru. Therefore, on July 24, 2017, the APEC Secretariat approved a request for a project extension to 30 July 2018. OBJ2: For the 3 workshops, we designed the agenda and participant engagement via group activities such that we enabled participants to learn from each other’s lessons and success stories. Through successfully facilitated dialogue between key stakeholders – including notable local authorities, key technical institutes, and international partners – as well as through peer-to-peer sharing and learning, and practical technical training (e.g. methodologies, tools, roadmaps, and study tours), and have increased confidence and capacity to implement LEDS in the transportation sector.

2
Knowledge of implementable solutions were taken home as key messages and through our LEDS GP Community of Practice peer-learning platform, the learnings will continue beyond the time period of this project. OBJ3: We have developed a customized training package and a roadmap with design instruments for implementation of efficient, low-carbon transportation priorities. Both of these were designed with priorities of APEC economies, and specifically those that we held workshops at. 3. Evaluation: Describe the process undertaken to evaluate the project upon completion. (e.g. evaluation through participant surveys, peer reviews of outputs, assessments against indicators, statistics demonstrating use of outputs etc.). Provide analysis of results of evaluations conducted and where possible include information on impacts on gender. How has the project contributed to APEC’s capacity building goals, objectives and operational principles? Evaluation data needs to be included as an appendix.
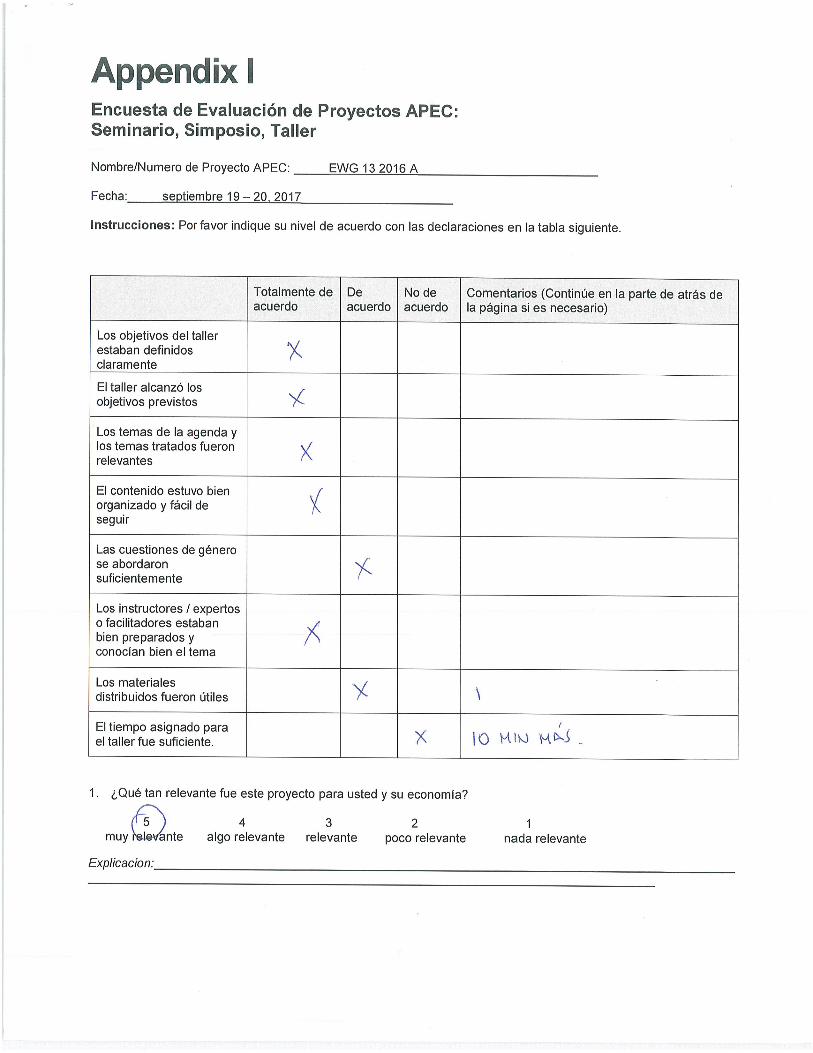
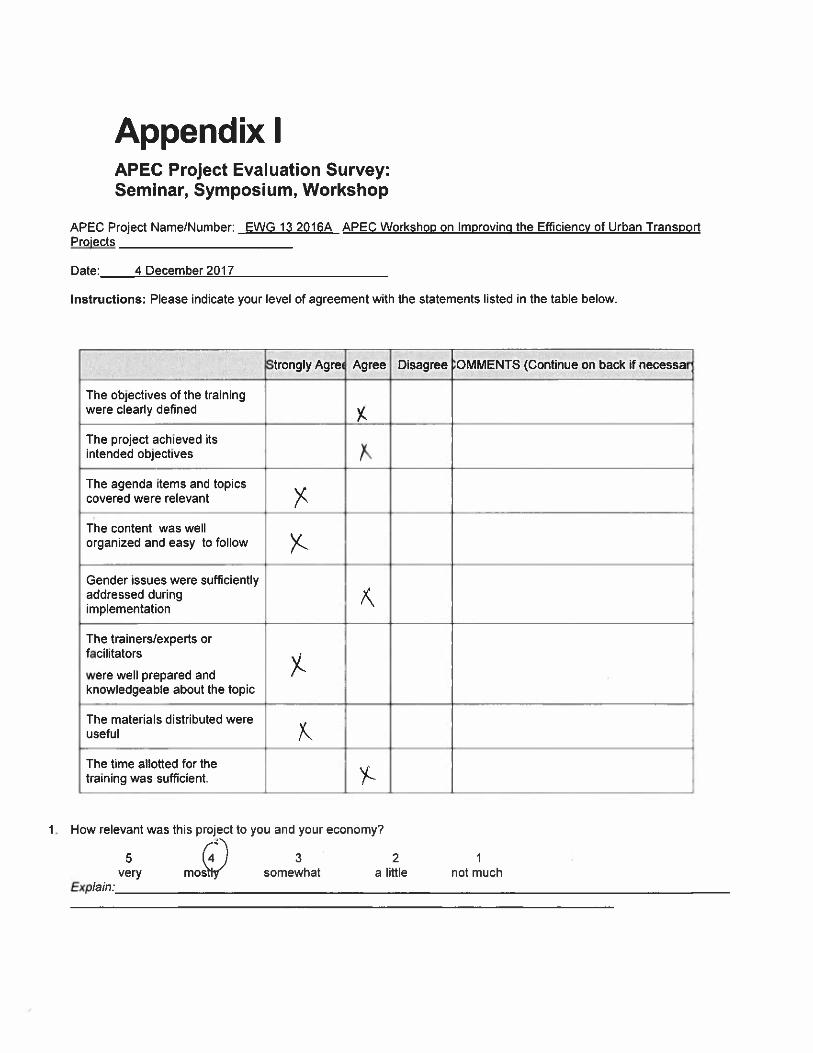
We implemented a brief, four-question survey to all participants towards the end of the project to evaluate the impact of each workshop. Responses are shown in Section 7(iv) and the complete survey/responses are added as an annex. One significant challenge faced in evaluating impacts is the lack of response from a majority of participants. We will continue to evaluate the impacts and future needs of all the participants in our events. We have lists of participants from Peru, Viet Nam and Singapore and plan to systematically and consistently evaluate by implementing questionnaires. This not only assess impact, but also enables us to formulate new concept notes and plans for future APEC projects. Our immediate plans include the use of:
(i) Informational questionnaires (ii) Using Asia’s Clean Mobility Community of Practice and a continuous platform for peer-learning (iii) Linked in group by invitation
We plan to disseminate our roadmap and training packages to all participants upon completion and setup an evaluation and assessment method (bi-annual questionnaires) to track the usage of the training package in capacity building efforts. Our project completes on 30 July of 2018 and evaluations will continue beyond and results will be shared with APEC. Attached is the results of our informational questionnaire implements during the Study Tour in Singapore, for your perusal. Our future evaluations will be similar.
4. Output indicators: Describe the main project outputs below. This may include workshops, tools, research papers, reports, recommendations, best practices, action plans. The main outputs of this project are: (i) 3 in-person workshops; (ii) Training package and (iii) Roadmap of design instruments for LEDS implementation. Once filled out, these 3 tables need to be complied into one.
Indicators (aggregate for three workshops)
# planned # actual Details or notes
# workshops 3 3 Successfully implemented # participants (M/F) 10F for each
Workshop 26 F In Viet Nam and Singapore, we reached our goal and in Lima we had 6 female participants
# economies attending NA 21 Lima-6 ; VN-6 ; SG-9 # speakers engaged NA 21 High level of interest in our workshops
# other organizations engaged NA 8 Exceeded expectations in our collaborations # publications distributed NA NA
# recommendations agreed on NA NA Other: NA NA
Comments: This includes data from 3 workshops; (i) 2-day workshop held in Lima, Peru from Sept. 19-20 of 2017; (ii) 1-day workshop in Viet Nam on Dec. 04 of 2017 and (iii) a 3-day workshop in Singapore from May 7-9 of 2018.
5. Outcomes: Describe any specific medium-term changes to policy, processes or behaviour that can be attributed to result from this activity. Please include details on:

3
• What indicators were used to measure medium-term impact? (Example indicators: type/number of policies/ regulations/processes changed, % of businesses conforming to new standards, change in sector’s commercial activity, # individual action plans developed, # agencies using resource or tools etc.)
• How capacity has been built through the project. • Monitoring plans in place and proposed indicators to measure impacts, including any impacts on gender.
Please summarise relevant information. Medium-term impact: Policy and Regulation Change: As stated by a participant from PNG who attended the workshop in Viet Nam, change is under discussion to their bus operator system, from single/individual owned to a franchise (inclusive of all previous operators)” Capacity has been built through the project: We aimed to build confidence in participants to enable changes in their respective economies by providing them positive examples and peer-learning oppurtunities. We believe we have achieved this goal, but we cannot at this point in time measure the impact on a large-scale. This evaluation will continue after the end of this project. Monitoring Plans: Informational questionnaires, CoP peer-learning platform, LinkedIn, Direct communications
6. Participants/ Speakers Summary Table (compulsory for events): Must be gender-disaggregated.
Economy (Insert rows as needed) # male # female Total
Speakers at Peru 3 1 4 Speakers at Viet Nam 3 0 3 Speakers at Singapore 4 9 14
Comments: What was the approach undertaken for participant nomination/selection and targeting? Please provide details. What follow-up actions are expected? How will participants/beneficiaries continue to be engaged and supported to progress this work? Participant selection process: We targeted Public sector participants (e.g. officials from government ministries: environment, transport, urban development, finance and energy); (ii) Mayors and planning officials in rapidly developing urban areas of APEC economies; (iii) Researchers (e.g. academe, technical institutions), (iv) Private sector (e.g. stakeholders with interests to increase the flow of transport-related environmental goods and services) – folks capable of using the provided knowledge base and intiating/implementing changes. Participants and beneficiaries will be continued to be engaged through: (i) direct one-on-one communications; (ii) Through our CoP Peer learning platform and (iii) LinkedIn Group and other pages. 7. Key findings: Describe 1-3 examples of key findings, challenges or success stories arising from the project (e.g. research or case studies results, policy recommendations, roadblocks to progress on an issue, impacts on gender).
(i) Priority - Capacity building is a critical need and priority for LEDS strategies in the Transport Sector: Short-term projects such as this one mitigates this critical need by highlighting learnings and directing corporation/coordination between agencies and sectors, but consistent and long-term strategic projects and commitments are needed as well.
(ii) Priority- Inter-agency communications and coordination is a critical factor: Synergistic planning and coordination across agencies/ministries is critical. The “Study Tour” held in Singapore highlighted the success of their effective cross-agency communications and planning.
(iii) Challenge – Planning for a disruptive technology is difficult and requires leadership and capacity building. Many participants conveyed concerns over the difficulty of planning ahead for possible economic and technological disruptions. However, by anticipating a future demand or a significant change in how society functions (i.e. electric vehicles and mobility), capacity building efforts should address anticipated needs. As such, leadership plays a key role as well. For example, in our Singapore workshop, we asked the question to participants: “Is your economy ready with vehicle maintenance shops preparing to meet future demands of EVs”. About 50% of the participants said that they needed further support in this area. We also asked the following questions: “Are city officials and educational facilities aware of the potential of future job growth in

4
this sector and economic benefits in EVs?”. Again, about 50% of the participants said that they needed further support. Survey results are attached in the Annex.
(iv) Impact-participant action after workshop: One participants action after the Viet Nam workshop said: “The workshop has helped us a lot as we are undertaking some steps towards improving the public transport in our capital city, Port Moresby. The workshop has helped us in the areas of public transport franchising, a model/concept discussed in the workshop. Our city's existing public transport (bus operations) are all individually owned and operated hence this has become a huge issue. As part of our review for the public transport system, we are looking into franchising bus operations but inclusive of the current operators. the second benefit we got is in the electric vehicles. Our municipal authority is in talks with a Thailand based company for supplying electric buses. Our knowledge gained in the workshop is helping us to be positioned better to discuss potential benefits as well as costs.” Another participant action, after the workshop in Peru, said: “I have been working in the design of a new policy on trucks efficiency (a “Green Freight Program). It was very useful to learn how other countries deal with coordination challenges among different ministries. Furthermore, I was part of the National Transportation Plan oriented to reduce GHG emissions and it was also very useful for that work, where coordination was also a main topic. Finally, a participant action after the recent workshop in Singapore, said:” Through these workshops, I have more relationships with international colleagues and I think that it is very important because we can exchange experiences/ solutions in more detail in future.”
8. Next steps: Describe any planned follow-up steps or projects, such as workshops, post-activity evaluations, or research to assess the impact of this activity. How will the indicators from Question 5 be tracked? How will this activity inform any future APEC activities?
(i) We have another APEC concept note submitted (yet to be approved for full proposal) that aims to integrate the energy and transport sector, with an emphasis on island APEC economies. We will leverage our understanding of APEC economies from this project to further increase capacity building and enhance collaboration across the energy and transport sectors.
(ii) The Low Emissions Development Strategies Global Partnership (LEDS GP) recently launched a Community of Practice (CoP) in Asia with “Clean Mobilty” as the theme and one in Latin America and the Caribbean focused on Electric Mobility. Some of our APEC projects participants are active members in this CoP, which will result in; (i) continued learning and (ii) provide us an opportunity to monitor long-term impact of this APEC project.
(iii) These Communities of Practice have a LinkedIn group page through which we plan to continue engaging, and potentially implement post-project evaluations that track impacts.
(iv) Activities within the communities of pratice, such as webinars and online sessions are providing us with deeper information about APEC economies that could generate future APEC concept notes.
9. Feedback for the Secretariat: Do you have suggestions for more effective support by APEC fora or the Secretariat? Any assessment of consultants, experts or other stakeholders to share? The Secretariat examines feedback trends to identify ways to improve our systems.
(i) Create a platform for multi-year funding to induce synergy and cohesiveness of goals that need more than 1 year to visualize implementation. To achieve deep learning , long-term capacity building support is critical.
(ii) Upon successful completion of a 1-year project, encourage continuation of the effort with deeper dive into the subject matter to benefit the APEC economies through sustained engagement. E.g. Strongly encourage using successful projects as building blocks for future projects.
(iii) Strategy for studying and measuring long-term impact of project. One year is not enough to implement and measure changes/impact that have been just learnt.
(iv) Separate the project completion date and final document delivery dates. Documents such as publications and final surveys and results can only be analysed once the project is completed, so possibly, maybe a 30-day window in which all documents need to be delivered, after the projects ends.
(v) Continue to facilitate the collaboration across APEC programs with similar goals to learn from each other and combine efforts when feasible.

5
SECTION C: Budget Attach a detailed breakdown of the APEC- provided project budget, including:
• Planned costs: (using most recently approved budget figures) – see below • Actual expenditures: Balance is as of 12 July, not yet paid labor and event charges • Variance notes: An explanation of any budget line under- or over-spent by 20% or more.
SECTION D: Appendices Please attach the following documentation to the report. Note that the contact list for participants/ experts/ consultants is a mandatory requirement for all Project Completion Reports. Appendices Notes Participant contact list, including name, email address, gender,
organization (mandatory) Both APEC and non-APEC lists are attached
Experts / consultants list, including name, email address, gender, organization (mandatory)
Event Agenda 3 agendas attached
Reports, websites or resources created: links or soft copies Draft Publication, with Draft Roadmap and Training package
Post activity survey or other evaluation data (raw and/or aggregated) Workshop surveys

6
Other information or resources Informational survey results
FOR APEC SECRETARIAT USE ONLY APEC comments: Were APEC project guidelines followed? Could the project have been managed more effectively or easily by the PO?

WorkshopSpeakersandParticipantsList('BudgetTable')*ThislistmustincludebothAPEC-fundedandSelf-fundedatendeesproposedbytheProjectOverseer
ProjectNo: EWG132016A 2ProjectTitle: 10 ActualnumberofTravelEligibleeconomyparticipantsproposedforAPECfunding,asperbelowlist
EventVenue: Singapore SubmittedbyProjectOverseer:
SanjiniNanyakkaraEventDate: 07-09May2016 DateSubmittedto
APECSecretariat:2/26/18 NB:ThisformmustbesubmittedtothePDandPEatleast6weekspriortotheevent
CategoryAPEC-fundedORSelf-funded(selectone)
Name Title Organisation Economy Email M F GovernmentOfficial
Speakerhonorariumamount(if
applicable)***
Tasks
1 Speaker APEC-funded MintaPoowatanavong Ms Department of Alternative Energy Development and
1 Yes Speaker
2 Speaker APEC-funded JoneOrbea Ms WRIMexico MEX [email protected]
1 No Speaker
3 Speaker APEC-funded ThiThuHangNguyen Ms Department of Environment, Ministry of Transport
1 Yes Speaker
4 Speaker APEC-funded VanHienMai Mr Department of Environment, Ministry of Transport
1 Yes Speaker
5 Speaker Self-funded ChristianMettke Mr GIZ Others [email protected]
1 No Speaker
6 Speaker APEC-funded AngelaEnriquez Ms WRI US [email protected]
1 No Speaker
7 Speaker APEC-funded EnriqueAdameLlamas Mr MinistryforAgricultural,TerritorialandUrban
1 Yes Speaker
Sub-Total 3 41 Activeparticipants APEC-funded JakkritPhetnadee Mr Department of
Alternative Energy THA jakkrit_p@dede.
go.th1 Yes ActiveParticipant
2 Activeparticipants APEC-funded ThiHienBui Ms Ministry of Industry and Trade, Department of Energy
1 Yes ActiveParticipant
3 Activeparticipants APEC-funded NguyenVietHungDo Mr Ministry of Transport VN [email protected]
1 Yes ActiveParticipant
4 Activeparticipants APEC-funded LuzElenaUbillaBórquez
Ms Ministry of Energy CHL [email protected]
1 Yes ActiveParticipant
5 Activeparticipants APEC-funded FranciscoQuiñones Mr PROTRAM/BANOBRAS(National
1 Yes ActiveParticipant insteadofCarlos
6 Activeparticipants APEC-funded MarianOlveraLucas Ms MinistryofEnergy MEX [email protected]
1 Yes ActiveParticipant
7 Activeparticipants APEC-funded GuillermoFrancisco Mr DepartmentofTransportation
1 Yes ActiveParticipant
8 Activeparticipants APEC-funded SandyMaeGaspay Ms DepartmentofTransportation
1 Yes ActiveParticipant
9 Activeparticipants APEC-funded NoranisBintiSadikun Ms MinistryofEnergy,GreenTechnologyandWater
1 Yes ActiveParticipant
10 Activeparticipants APEC-funded HuzaimiNorOmar Mr MalaysianGreenTechnologyCorporation
1 Yes ActiveParticipant
11 Activeparticipants Self-funded SanjiniNanyakkara Ms NREL US [email protected]
1 ActiveParticipant
12 Activeparticipants Self-funded LinusPlatzer Mr WRI Others [email protected]
1 No ActiveParticipant/LogisticalSupport
13 Activeparticipants Self-funded MelissaCruz Ms GIZ RP [email protected]
1 No ActiveParticipant/LogisticalSupport
15 Activeparticipants Self-funded PatriciaMariano Ms GIZ RP [email protected]
1 No ActiveParticipant/LogisticalSupport
16 Activeparticipants Self-funded MinhNguyenAnh GIZ VN [email protected]
1 ActiveParticipant/LogisticalSupport
17 Activeparticipants APEC-funded WipadaUnlumlert Ms OfficeofTransportandTrafficPolicyandPlanning
1 Yes ActiveParticipant
18 Activeparticipants APEC-funded ClaudiaEspinozaZegarra
Ms MinistryofEnergy PE [email protected]@minem.gob.pe
1 Yes ActiveParticipant TBD-needtohearback
19 Active participants APEC-funded Imam Apriyana Mr Center For Sustainable, Ministry Of TransportationINA [email protected] Yes Active Participant20 Active participants APEC-funded Linda Evans Mrs Center For Sustainable, Ministry Of Transportation INA [email protected] 1 Yes Active Participant
21 Activeparticipants APEC-funded Roberto Carlos Álvarez Cisneros
Mr.
Instituto Municipal de Planeación IMPLAN, City of León
1 Yes ActiveParticipant
22 ActiveparticipantsSub-Total 8 12
TotalTravel 11 16 Total# 27
*TobeprovidedbyProjectOverseertoAPECSecretariatforreviewandApprovalbyProgramDirectorbeforeTravel/AdvanceUndertakingsforAPECfundedTravellersareissuedToproducethislistthePOreviewsallnominationsfromWorkingGroupmembers,aswellasnominationsfromothersources(suchasOrganisationshighlightedinthe'Linkages'sectionoftheProjectProposal,appropriateexpertsnominatedbythePOfromtheirownresearchandprofessionalnetworks).ThePOchoosesforAPECfundingthenomineesmostrelevantfortheachievementoftheproject'sobjectives(whodonothavefundingavailablefromanothersource),andmaychosetoofferself-fundedplacestoothernominess.NB:AllfieldsonSectionAofthisformmustbecompletedbythePObeforeApprovalcanbegranted**GenderbalanceshouldbesoughtinlinewithAPECProjectGuidelines***Ifyourprojecthasabudgetforhonorariumandyouwishtopayitforspeakersatthisevent,pleaseindicatetheamountforeachspeaker(maximum$1500).Ifyoudonotindicateanamountherethennohonorariumwillbepaid.
Budget Committed Balance
Airfare(speakers) 12,000.00 4,113.74 7,886.26Perdiem(Maximum6speakers/day) 10,000.00 1,774.50 8,225.50Airfare(activeparticipants) 22,500.00 13,992.90 8,507.10Perdiem(activeparticipants) 23,534.83 6,223.50 17,311.33
Total 68,034.83 26,104.64 41,930.19
Gender**Insert'1'intheapplicable
Speaker'sHonorarium
SupportingtheDevelopmentandImplementationofLow-EmissionDevelopmentStrategies(LEDs)inTransportSector
NumberofTravelEligibleeconomyparticipantsasperAPECProjectBudgetinProjectProposal(this
Particulars
TobeprovidedbyProjectOverseer(SectionA)

ToproducethislistthePOreviewsallnominationsfromWorkingGroupmembers,aswellasnominationsfromothersources(suchasOrganisationshighlightedinthe'Linkages'sectionoftheProjectProposal,appropriateexpertsnominatedbythePOfromtheirownresearchandprofessionalnetworks).ThePOchoosesforAPECfundingthenomineesmostrelevantfortheachievementoftheproject'sobjectives(whodonothavefundingavailablefromanothersource),andmaychosetoofferself-fundedplacestoothernominess.

Participant Speaker Others (pls indicate)
E.G. Kartika Abdurahman Indonesia Director Jakarta Property Institute [email protected] ✔
E.G. Fred Smith UK Senior Adviser Ministry for Women [email protected] ✔
E.G. Yasmin Choo n/a Director UN Women [email protected] ✔
1 Sanjini Nanyakkara USA Project Overseer NREL [email protected] ✔
2 Angela Enriquez USA Research Associate WRI [email protected] ✔
3 Linus Platzer USA Research Assistant WRI [email protected] ✔
4 Jone Orbea MEX Coordinator of Mobility Economics
WRI Mexico [email protected] ✔
5 Melissa Cruz PH Senior Adviser GIZ [email protected] ✔
6 Patricia Mariano PH Project Adviser GIZ [email protected] ✔
7 Christian Mettke Others Senior Adviser GIZ [email protected] ✔
8 Minh Nguyen Anh VN Project Adviser GIZ [email protected] ✔
9 Janthorn Dilokkomol THA Project Adviser GIZ [email protected] ✔
10 Ashish Rao Ghorpade India Deputy Director ICLEI South Asia/ALP Secretariat [email protected] ✔
10b Avantika Arjuna India Manager (Urban) ICLEI South Asia/ALP Secretariat [email protected] ✔
11 Leki Choda Bhutan Planning Officer Road Safety Transport Authority [email protected] ✔
12 S.S.A.Kularatne Sri Lanka Director of Planning Ministry of Transport & Civil Aviation
13 Banchhanidhi Pani India Municipal Commissioner, Rajkot Municipal Corporation [email protected] ✔
14 Irshad Ahmed India Junior Engineer Udaipur Municipal Corporation [email protected] ✔
15161718192021
No. Organisation
Role of Non-Member (Put a tick)
Name of Non-Member Job Title Economy Email
Who to be included on the Non-Member Participation (NMP) list?Non-members include speakers and participants (self-funded or APEC-funded) who are NOT registered under an economy delegation. These will include:
S Private sector, civil society or academic institutions (e.g. Yale University) of APEC economies;S International organizations: World Bank, IMF, OECD, UN, etc;
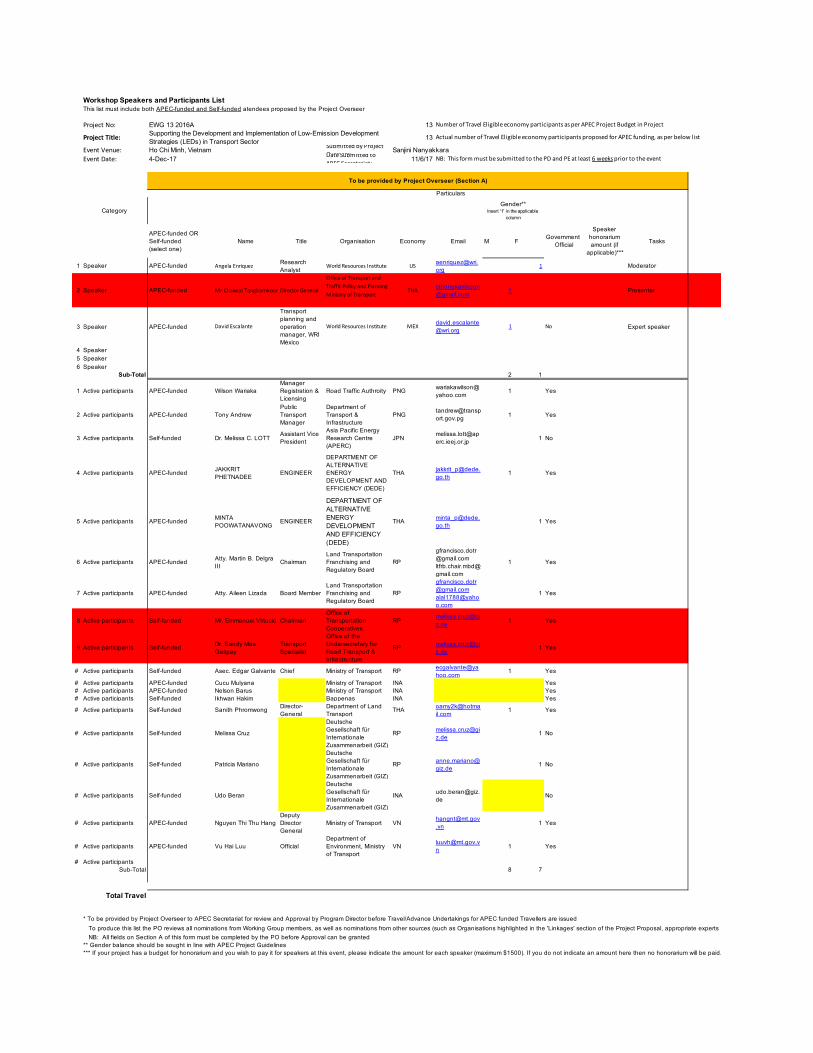
Workshop Speakers and Participants List This list must include both APEC-funded and Self-funded atendees proposed by the Project Overseer
Project No: EWG 13 2016A 13
Project Title: 13 Actual number of Travel Eligible economy participants proposed for APEC funding, as per below list
Event Venue: Ho Chi Minh, Vietnam Submitted by Project Overseer: Sanjini Nanyakkara
Event Date: 4-Dec-17 Date Submitted to APEC Secretariat: 11/6/17 NB: This form must be submitted to the PD and PE at least 6 weeks prior to the event
Category
APEC-funded OR Self-funded(select one)
Name Title Organisation Economy Email M FGovernment
Official
Speaker honorarium amount (if
applicable)***
Tasks
1 Speaker APEC-funded Angela Enriquez Research Analyst
World Resources Institute US [email protected]
1 Moderator
2 Speaker APEC-funded Mr.Chaiwat Tongkamkoon Director General
Office of Transport and Traffic Policy and PlanningMinistry of Transport
1 Presenter
3 Speaker APEC-funded David Escalante
Transport planning and operation manager, WRI México
World Resources Institute MEX [email protected]
1 No Expert speaker
4 Speaker5 Speaker6 Speaker
Sub-Total 2 1
1 Active participants APEC-funded Wilson WariakaManager Registration & Licensing
Road Traffic Authroity PNG [email protected]
1 Yes
2 Active participants APEC-funded Tony AndrewPublic Transport Manager
Department of Transport & Infrastructure
[email protected] 1 Yes
3 Active participants Self-funded Dr. Melissa C. LOTTAssistant Vice President
Asia Pacific Energy Research Centre (APERC)
[email protected] 1 No
4 Active participants APEC-funded JAKKRIT PHETNADEE
ENGINEER
DEPARTMENT OF ALTERNATIVE ENERGY DEVELOPMENT AND EFFICIENCY (DEDE)
1 Yes
5 Active participants APEC-funded MINTA POOWATANAVONG
ENGINEER
DEPARTMENT OF ALTERNATIVE ENERGY DEVELOPMENT AND EFFICIENCY (DEDE)
1 Yes
6 Active participants APEC-funded Atty. Martin B. Delgra III
ChairmanLand Transportation Franchising and Regulatory Board
RP
[email protected]@gmail.com
1 Yes
7 Active participants APEC-funded Atty. Aileen Lizada Board MemberLand Transportation Franchising and Regulatory Board
RP
[email protected]@yahoo.com
1 Yes
8 Active participants Self-funded Mr. Emmanuel Virtucio ChairmanOffice of Transportation Cooperatives
[email protected] 1 Yes
9 Active participants Self-funded Dr. Sandy Mae Gaspay
Transport Specialist
Office of the Undersecretary for Road Transport & Infrastructure
1 Yes
# Active participants Self-funded Asec. Edgar Galvante Chief Ministry of Transport RP [email protected]
1 Yes
# Active participants APEC-funded Cucu Mulyana Ministry of Transport INA Yes# Active participants APEC-funded Nelson Barus Ministry of Transport INA Yes# Active participants Self-funded Ikhwan Hakim Bappenas INA Yes
# Active participants Self-funded Sanith Phromwong Director-General
Department of Land Transport
1 Yes
# Active participants Self-funded Melissa Cruz
Deutsche Gesellschaft für Internationale Zusammenarbeit (GIZ)
1 No
# Active participants Self-funded Patricia Mariano
Deutsche Gesellschaft für Internationale Zusammenarbeit (GIZ)
1 No
# Active participants Self-funded Udo Beran
Deutsche Gesellschaft für Internationale Zusammenarbeit (GIZ)
No
# Active participants APEC-funded Nguyen Thi Thu HangDeputy Director General
Ministry of Transport [email protected] 1 Yes
# Active participants APEC-funded Vu Hai Luu OfficialDepartment of Environment, Ministry of Transport
[email protected] 1 Yes
# Active participantsSub-Total 8 7
Total Travel
* To be provided by Project Overseer to APEC Secretariat for review and Approval by Program Director before Travel/Advance Undertakings for APEC funded Travellers are issued To produce this list the PO reviews all nominations from Working Group members, as well as nominations from other sources (such as Organisations highlighted in the 'Linkages' section of the Project Proposal, appropriate experts nominated by the POfrom their own research and professional networks). The PO chooses for APEC funding the nominees most relevant for the achievement of the project's objectives (who do not have funding available from another source), and may chose to offer self-funded places to other nominess. NB: All fields on Section A of this form must be completed by the PO before Approval can be granted** Gender balance should be sought in line with APEC Project Guidelines*** If your project has a budget for honorarium and you wish to pay it for speakers at this event, please indicate the amount for each speaker (maximum $1500). If you do not indicate an amount here then no honorarium will be paid.
Supporting the Development and Implementation of Low-Emission Development Strategies (LEDs) in Transport Sector
Number of Travel Eligible economy participants as per APEC Project Budget in Project
Particulars
To be provided by Project Overseer (Section A)
Gender**Insert '1' in the applicable
column

To produce this list the PO reviews all nominations from Working Group members, as well as nominations from other sources (such as Organisations highlighted in the 'Linkages' section of the Project Proposal, appropriate experts nominated by the POfrom their own research and professional networks). The PO chooses for APEC funding the nominees most relevant for the achievement of the project's objectives (who do not have funding available from another source), and may chose to offer self-funded places to other nominess.
*** If your project has a budget for honorarium and you wish to pay it for speakers at this event, please indicate the amount for each speaker (maximum $1500). If you do not indicate an amount here then no honorarium will be paid.

To produce this list the PO reviews all nominations from Working Group members, as well as nominations from other sources (such as Organisations highlighted in the 'Linkages' section of the Project Proposal, appropriate experts nominated by the POfrom their own research and professional networks). The PO chooses for APEC funding the nominees most relevant for the achievement of the project's objectives (who do not have funding available from another source), and may chose to offer self-funded places to other nominess.

Participant Speaker Others (pls indicate)
E.G. Kartika Abdurahman Indonesia Director Jakarta Property Institute [email protected] ✔
E.G. Fred Smith UK Senior Adviser Ministry for Women [email protected] ✔
E.G. Yasmin Choo n/a Director UN Women [email protected] ✔
1 Mukund Kumar Sinha India Officer on Special Duty Ministry of Housing and Urban Affairs, Govt. of India
2 Christian Mettke Deutsche Gesellschaft für Internationale Zusammenarbeit
3 Robin Kaenzig UK Associate Integrated Transport Planning [email protected] ✔
4 Elena Scherer Transport and Climate Change Advisor
Deutsche Gesellschaft für Internationale Zusammenarbeit
56789
1011121314151617181920
No. Organisation
Role of Non-Member (Put a tick)
Name of Non-Member Job Title Economy Email
Who to be included on the Non-Member Participation (NMP) list?Non-members include speakers and participants (self-funded or APEC-funded) who are NOT registered under an economy delegation. These will include:
S Private sector, civil society or academic institutions (e.g. Yale University) of APEC economies;S International organizations: World Bank, IMF, OECD, UN, etc;

Proposed Workshop Speakers and Participants List ('Budget Table')* This list must include both APEC-funded and Self-funded atendees proposed by the Project Overseer
Project No: EWG 13 2016A [INSERT]Project Title: Supporting the [INSERT] Actual number of Travel Eligible economy participants proposed for APEC funding, as per below listEvent Venue: Lima, Peru Submitted by Project
Overseer:[INSERT NAME]
Event Date: September 19 -20, 2017 Date Submitted to APEC Secretariat:
[INSERT] NB: This form must be submitted to the PD and PE at least 6 weeks prior to the event
Category Class of Travel
Airfare Per Diem Additional Payment
Others (Hotel, extra nights, etc)
APEC-funded OR Self-funded(select one)
Name Title Organisation Economy Email M F Government Official
Speaker honorarium amount (if
applicable)***
Tasks (a) (b) (c ) (d)
1 Speaker APEC-funded Rodrigo Rodriguez Tornquist
Executive Committee President
LEDS LAC [email protected]
1
No
Moderator
2 Speaker APEC-funded Andrés Pica Head of the Air Quality Division
Ministry of Environment CHL [email protected]
1Yes
Presenter
3 Speaker Self-funded Aida Figari Secretariat Libelula / LEDS LAC PE [email protected]
1No
Organizer
4 Speaker Self-funded Sebastian Juan Castellanos
LEDS Transport Working Group
WRI / LEDS LAC US [email protected]
1No
Presenter
5 Speaker APEC-funded Jorge Andres MACIAS MORA
Director of urban development and accesibility
WRI Mexico MEX
[email protected] M No
Presenter
6 SpeakerSub-Total 3 1 -
1 Active participants Self-funded Ariel Alberto Filadoro Consultant - Interministerial Office of Climate Change
Ministry of Transport Others [email protected]
1 Yes
2 Active participants Self-funded Rodolfo Norberto Fiadone
Consultant - Interministerial Office of Climate Change
Ministry of Transport Others [email protected]
1 Yes
3 Active participants Self-funded Fernando Lía Energy Efficiency in Transportation Coordinator
Undersecretariat of Energy Saving and EfficiencySecretariat of Strategic Energy Planning
Others [email protected]
1 Yes
4 Active participants APEC-funded María Cristina Victoriano Bugueño
Professional, Energy Efficiency Division
Ministry of Energy CHL [email protected]
1 Yes
5 Active participants Self-funded Carolina Obando Energy-Mining Planning Unit
Ministry of Energy and Mines
Others [email protected]
1 Yes
6 Active participants Self-funded Juan Camilo Florentino Marquez
UMUS Advisor Ministry of Transport Others [email protected]
1 Yes
7 Active participants Self-funded Susana Ricaurte MRV Expert Others [email protected]
1 No
8 Active participants APEC-funded Husain Raudhatul Akmal
Special Officer to Group CEO
GreenTech Malaysia MAS [email protected]
1
9 Active participants APEC-funded Eduardo Olivares Lechuga
Consultants' Coordinator
SEMARNAT MEX [email protected]
1 Yes
# Active participants Self-funded Ana Dominguez Mitigation Coordinator
NAMA de Movilidad Sostenible
Others [email protected]
1 Yes
# Active participants Self-funded Luis Pinzon Director of Planning
Mi Bus Others [email protected]
1 Yes
# Active participants Self-funded Daniel Galvan UNFCCC Focal Point
UNFCCC-RC Others [email protected]
1 No
# Active participants Self-funded Daniella Rough NAMAs Energy Project Coordinator
Dirección General de Eficiencia Energética - MEM
1 Yes
# Active participants Self-funded Fanny Enciso NDCs lead MEM PE [email protected]
1 Yes
# Active participants Self-funded Clauida Espinoza Zegarra
Energy efficiency and renewable energies coordinator
Ministry of energy and mines
1 Yes
# Active participants Self-funded Melissa del Rosario Zarate Moran
Economic analyst of hydrocarbons
Ministry of energy and minesPE temp_dgh63@
minem.gob.pe1 Yes
# Active participants Self-funded Carolina Chambi Project Manager
Libelula / LEDS LAC PE [email protected]
1 No
# Active participants APEC-funded Borwarnpong Sunipasa
Plan and policy Analyst
Bureau of Energy Efficiency Promotion
1 Yes
# Active participants Self-funded Steven John Rogers Global Transport Working Group
WRI / LEDS LAC US [email protected]
1 No
# Active participants Self-funded Angela Enriquez LEDs Transport Working Group
WRI / LEDS LAC US [email protected]
1 No
# Active participants Self-funded Andrea Watson Manager II-Technical
NREL US [email protected]
1 No
# Active participantsSub-Total 10 11 -
Total Travel
* To be provided by Project Overseer to APEC Secretariat for review and Approval by Program Director before Travel/Advance Undertakings for APEC funded Travellers are issued To produce this list the PO reviews all nominations from Working Group members, as well as nominations from other sources (such as Organisations highlighted in the 'Linkages' section of the Project Proposal, appropriate experts nominated by the POfrom their own research and professional networks). The PO chooses for APEC funding the nominees most relevant for the achievement of the project's objectives (who do not have funding available from another source), and may chose to offer self-funded places to other nominess. NB: All fields on Section A of this form must be completed by the PO before Approval can be granted** Gender balance should be sought in line with APEC Project Guidelines*** If your project has a budget for honorarium and you wish to pay it for speakers at this event, please indicate the amount for each speaker (maximum $1500). If you do not indicate an amount here then no honorarium will be paid.
Budget Committed Balance
- - - Airfare (speakers) - - Per diem (Maximum 6 speakers/day) - - Airfare (active participants) - - Per diem (active participants) - -
Total - - -
Speaker's Honorarium
Particulars Travel Entitlement
To be filled up by Program Executive (Section B)To be provided by Project Overseer (Section A)
Number of Travel Eligible economy participants as per APEC Project Budget in Project Proposal (this will usually be either 11 or 22).
-
-
Gender**Insert '1' in the applicable
column

To be from PE/PD or PO
Honorarium Total Committed Advance undertaking sent
to traveler
Signed advance undertaking rec'd
from traveler
Complete Supporting Documents rec'd from traveler for advance
payment made
Remarks
(e) (a) + (b) + '( c) +(d) +(e) = (F)
Date (DD/MM/YY) Date (DD/MM/YY)
Payment Date (TT form)
(DD/MM/YY) Amount (F)
Date submitted to Finance
(DD/MM/YY) Amount (F) Date (DD/MM/YY)
- 0.00 0.00
- 0.00 0.00
- 0.00 0.00
- 0.00 0.00
- 0.00 0.00
- 0.00 0.00 - -
- 0.00
- 0.00
- 0.00
- 0.00
- 0.00
- 0.00
- 0.00
- 0.00
- 0.00
- 0.00
- 0.00
- 0.00
- 0.00
- 0.00
- 0.00
- 0.00
- 0.00
- 0.00
- 0.00
- 0.00
- 0.00
- 0.00 - -
- - 0.00 0.00
To produce this list the PO reviews all nominations from Working Group members, as well as nominations from other sources (such as Organisations highlighted in the 'Linkages' section of the Project Proposal, appropriate experts nominated by the POfrom their own research and professional networks). The PO chooses for APEC funding the nominees most relevant for the achievement of the project's objectives (who do not have funding available from another source), and may chose to offer self-funded places to other nominess.
Travel Entitlement
To be filled up by Program Executive (Section B) To be Updated by Program Exective (Section C)
Advance Payment Made by Finance Reimbursement claim submitted to Finance (applicable to non-advance
payment - Honorarium)

Name Gender Institution Economy Email AddressJone Orbea F WRI Mexico MEX [email protected]
Christian Mettke M GIZ Others [email protected] Cruz F GIZ RP [email protected]
Mr.Chaiwat Tongkamkoon
M Office of Transport and Traffic Policy and Planning
Ministry of Transport THA [email protected]
David Escalante M World Resources Institute MEX [email protected] Rodriguez Tornquist M LEDS LAC
[email protected]és Pica M Ministry of Environment CHL [email protected] Figari F Libelula / LEDS LAC PE [email protected]
Sebastian Juan Castellanos M WRI / LEDS LACUS
Jorge Andres MACIAS MORA M WRI Mexico [email protected]
List of Experts

Experts’ Workshop
Strengthening of energy efficiency policies in the transport sector Opportunities, challenges and lessons learned from intersectoral articulation and measurement and reporting systems in Latin America
Place and date
Tuesday 19th and Wednesday 20th September 2019 CAF offices in Lima Av. Canaval y Moreyra 380, piso 13. Torre Siglo XXI San Isidro, Lima - Perú
Sponsors:

“Strengthening of energy efficiency policies in the transport sector” workshop. Opportunities, challenges and lessons learned from intersectoral articulation and measurement and reporting systems in Latin America
Introduction Under the priority theme of the LEDS LAC platform and the Centro Regional de Colaboración Panamá UNFCCC- CAF on strengthening the transport components of the NDCs, the third thematic workshop on transport issues will be held on September 19 and 20, in the city of Lima, Peru. The workshop focuses on "Strengthening energy efficiency policies in the transport sector" with the objective of addressing the opportunities, challenges and lessons learned from intersectoral coordination and measurement and reporting systems in Latin America.
Organizers and sponsors The workshop is organized by the LEDS LAC platform with the collaboration of the LEDS GP Transport Task Force (led by WRI) and the UNFCCC-CAF Panama Regional Collaboration Center. It is sponsored by the Asia-Pacific Economic Cooperation Forum (APEC) and the Inter-American Development Bank (IDB).
Methodology The workshops organized by LEDS LAC built upon the assumption that all participants are experts in the subject and can contribute to the learning of others in the workshop.
The thematic workshops are designed for small groups and are meant to be participatory, with all sections(?) being used to answer questions and help solve the needs of the participants (as identified in anticipation to the event). The help includes everything from the definition of conceptual frameworks, to the use of tools and the identification of specific lessons learned.
It is intended that all the countries represented in the workshop have the opportunity to share their case, having identified the sessions that are of greatest relevance (based on the experiences to be presented). Dialogues are facilitated so to determine key messages which are then systematized in a final document available for sharing.
Themes This workshop seeks to promote exchanging of experiences, good practices and lessons learned on:
• Developments and experiences on GHG emissions reduction projects in the transport sector based on the implementation of policies such as: energy efficiency of vehicles and / or introduction of hybrid or electric vehicles.
• The implementation, operation and development of an MRV system (monitoring, reporting and verification) in mitigation projects within the transport sector, and within the framework of the NDCs. More specifically, what can we learn from the experiences of CDM projects?
• In a transversal way, what are the challenges and opportunities of intersectoral and subnational articulation in order to achieve the objectives set out in the two previous themes.

“Strengthening of energy efficiency policies in the transport sector” workshop. Opportunities, challenges and lessons learned from intersectoral articulation and measurement and reporting systems in Latin America
Agenda Tuesday September 19 Wednesday September 20 8:30-9:00 Registration 9:00-10:30 Topic 1 - Linking energy efficiency
policies in transport and NDCs Presentation from countries • México: Fuel Economy Standard
Jorge Macías, WRI México • Chile: Vehicle labelling
Cristina Victoriano, Ministerio de Energía
Discussion
Topic 3 – Information, measurement and reporting systems Experiences in CDM projects: What can we learn? Susana Ricaurte, Colombia
10:30-11:00 Coffee Break Coffee Break 11:00-13:00 Topic 1 – continued
Group work Topic 3 – continued Group work
13:00-14:30 Lunch Lunch 14:30-16:00 Topic 2 - Cross-sectoral articulation
for the implementation of energy efficiency policies in transport Presentation from countries • Experiences in Argentina
Fernando Lía, Secretaría de Planeamiento Energético Estratégico
• Experiences in Thailand – Borwornpong Sunipasa, Oficina de Promoción de Eficiencia Energética
Discussion
Topic 4 – Electrical Mobility / Electric Vehicles Presentation from countries Enabling conditions • Advances in México
Eduardo Olivares, SEMARNAT • Advances in Chile
Andrés Pica, Ministerio de Medio Ambiente
• Advances in Perú Daniella Rough, Ministerio de Energía y Minas
16:00-16:30 Coffee Break Coffee Break 16:30-17:30 Incorporating gender topics into
transport policies Presentation and discussion
Group Work End of workshop

“Strengthening of energy efficiency policies in the transport sector” workshop. Opportunities, challenges and lessons learned from intersectoral articulation and measurement and reporting systems in Latin America
Participants País Nombre Apellido Cargo Organismo
Argentina Ariel Alberto Filadoro Consultor - Gabinete Interministerial de Cambio Climático
Ministerio de Transporte de Nación
Argentina Fernando Lía Coordinador de Eficiencia Energética en Transporte
Subsecretaría de Ahorro y Eficiencia Energética Secretaría de Planeamiento Energético Estratégico
Chile Andrés Pica Jefe de la División de Calidad del Aire
Ministerio de Medio Ambiente
Chile María Cristina Victoriano Profesional división de eficiencia energética
Ministerio de Energía
Colombia Claudia Cuentas Advisor on Short-Lived Climate Pollutants and Climate Change
Dirección de Asuntos Ambientales Sectorial y Urbana, Climate and Clean Air Institute (CCAC)
Colombia Susana Ricaurte Consultor en proyectos MRV
Colombia Mauricio Gaitán Coordinador de Gestión Ambiental Urbana
Ministerio del Medio Ambiente y Desarrollo Sostenible
Colombia Camilo Rojas Ejecutivo Principal CAF
Malasia Husain Raudhatul Akmal
Special Officer to Group CEO
GreenTech Malaysia
México Eduardo Olivares Lechuga
Coordinador de Asesores Subsecretaría de Planeación y Política Ambiental
SEMARNAT
México Jorge Andrés Macías Director de Desarrollo Urbano
WRI México
Panamá Daniel Galvan
UNFCCC-RC
Perú Daniella Rough Coordinadora del Proyecto de NAMAs de Energía
Dirección General de Eficiencia Energética - MEM
Perú Claudia Espinoza Zegarra
Coordinadora de Eficiencia Energética y Energías Renovables
MEM
Perú Fanny Enciso Encargada de las NDCs MEM
Perú Aida Figari
Libélula / LEDS LAC
Perú Ximena Gómez
Libélula / LEDS LAC
Tailandia Borwornpong Sunipasa
Plan and policy analyst Bureau of Energy Efficiency Promotion
EEUU Sebastián Castellanos Grupo de trabajo global de transporte
WRI / LEDS LAC
EEUU Steven Rogers
WRI
EEUU Andrea Watson Integrated Applications Center
National Renewable Energy Laboratory (NREL)

Experts’ Workshop
Improving the efficiency of urban transport projects
4 December 2017 Sheraton Saigon Hotel & Towers 88 Dong Khoi, District 1, Ho Chi Minh City, VN-SG, Vietnam Followed by the ALP Annual Forum 5-6 December 2017
Sponsors:

Experts’ Workshop: Improving the efficiency of urban transport projects
Introduction
This event is held under APEC Project: EWG 13 2016A – Supporting the Development and Implementation of Low-Emission Development Strategies (LEDs) in Transport Sector. Under the Asia-Pacific Economic Cooperation (APEC) Energy Smart Communities’ Initiative (ESCI), this project will facilitate dialogue between domestic and regional authorities and provide technical assistance and capacity-building support to governments to integrate transport into their high level (e.g. domestic planning strategies (i.e. LEDS and NDCs) to promote energy efficient, low carbon transport actions through the approach of conducting peer-to-peer workshops and knowledge sharing.
Organizers and sponsors This APEC expert’s workshop is organized by the LEDS Transport Working Group and the Deutsche Gesellschaft für Internationale Zusammenarbeit (GIZ) in coordination with the Asia LEDS Platform (ALP).
Objectives This workshop is part of a series of trainings that will be spread over three days.
On 4 December, a one-day event tailored to provide capacity building on operational and energy efficiency of urban bus systems. The workshop will include participants sharing experiences on the topic and providing a platform for peer-to-peer knowledge exchange with experts providing inputs to maximize learning and retention.
Following the conclusion of the APEC workshop, attendees will continue the discussions focusing on energy efficient transport at the Asia LEDS Platform Forum (5-6 December).
On 5 December, there will be one session dedicated to continuing the discussion from first day of workshop activities during of the Asia LEDS Platform Forum. Session one will provide an overview of how the activities from the first day fit into development of policies related to low emission development in transport sector and the NDCs.
On 6 December, to complete the series of trainings, Session two will be an interactive training session focusing national urban mobility programmes (NUMPs) as a tool to implement transformational transport actions as part of NDCs.
By attending in the series of trainings, participants will have gained knowledge on the topic by learning from the experiences of their peers and learned new approaches to developing solutions to implementing energy efficient urban transport systems from experts.
Methodology The workshop as part of the training series is built upon the assumption that all participants are experts in the subject and can contribute to the learning of others in the workshop. The workshop is designed for small groups and are meant to be participatory.

Experts’ Workshop: Improving the efficiency of urban transport projects
It is intended that all the economies represented in the workshop have the opportunity to share their case, having identified the sessions that are of greatest relevance (based on the experiences to be presented). Dialogues are facilitated so to determine key messages which are then systematized in a final document available for sharing.
Agenda Monday, 4 December 8:30-9:00 Registration 9:00 – 9:10 Overview 9:10 – 9:50 Country Introductions
• Thailand • The Philippines • Papua New Guinea • Viet Nam
9:50 – 10:00 Discussion 10:00-10:30 Topic 1 – Key Performance Indicators: Introducing Service
Contracts to Bus Services Modern bus operations require a strong regulatory framework with clear policy and franchising guidelines but also a formalized (company-based) industry that meets the service requirements set by the Government. The morning session will explore the transition towards the implementation of key performance indicators as a strategy to gradually move towards service contracting in bus services, both preconditions to successful BRT operations. The session will look into basic principles, transition strategies and expected outcomes of such transition, building upon international examples.
10:30-10:45 Coffee Break 10:45-12:00 Topic 1 – continued 12:00-13:30 Lunch 13:30-15:00 Topic 2 – Transitioning to electrifying public transport fleets
The afternoon session will present the state of affairs of zero-emission buses around the world and key findings of the research on the topic. Participants will be introduced to an implementation framework and explanation of its components. The framework will help participants identify challenges and opportunities for zero-emission bus implementation by breaking down complex components related to electric bus implementation. This session aims to increase technical understanding of all the building blocks of an electric bus implementation.
15:00-15:15 Coffee Break 15:15 – 16:15 Topic 2 – continued 16:15-17:30 Closing

Community of Practice - Study Tour 2018
MobiliseYourCity – Moving towards sustainable, energy efficient, urban mobility in emerging cities
7-9 May 2018 Hotel Mercure Singapore Bugis 122 Middle Road, Singapore 188973 Singapore
Sponsors:

Community of Practice - Study Tour 2018 MobiliseYourCity – Moving towards sustainable, energy efficient, urban mobility in emerging cities
2
Introduction This event is held under APEC Project: EWG 13 2016A – Supporting the Development and Implementation of Low-Emission Development Strategies (LEDs) in Transport Sector. Under the Asia-Pacific Economic Cooperation (APEC) Energy Smart Communities’ Initiative (ESCI), this project will facilitate dialogue between domestic and regional authorities and provide technical assistance and capacity-building support to governments to integrate transport into their high level (e.g. domestic planning strategies (i.e. LEDS and NDCs) to promote energy efficient, low carbon transport actions through the approach of conducting peer-to-peer workshops and knowledge sharing.
The convening organizations, the Low Emissions Development Strategies Global Partnership (LEDS GP) Transport Working Group (TWG) and the Deutsche Gesellschaft für Internationale Zusammenarbeit (GIZ), will design and conduct this study tour in the context of the international MobiliseYourCity Partnership and a LEDS Community of Practice striving to learn and disseminate knowledge on best practices, policy reform, finance tools and infrastructure to facilitate implementation of sustainable urban mobility.*
* We would also like to acknowledge funding from the US State Department and the German Government (German Ministry for the Environment, Nature Conversation, and Nuclear Safety (BMU)), which was used for facilitating the organization and implementation of this workshop.
Objectives • Participants learn from the experiences and best practices of Singapore in terms of
sustainable urban transport policies, financing and governance & management. • Participants understand the processes involved in bringing market transformation into
fruition from the perspective of Singapore’ success factors. • Learn from the experiences of Singapore and other participant experiences in regard
to sustainable urban mobility incl. urban design and planning, construction, project implementation, and disaster risk reduction.
• The participants take home best practices from Singapore and peers in regard to urban mobility planning, financing and public transport operations.
• Foster a close working relationship with Singapore agencies and individuals for continued knowledge sharing and possible future collaboration.
• Participants engage in peer-to-peer knowledge exchange and disseminate knowledge and lessons learnt from other APEC economies and beyond.
Target Group The study tour aims to provide a learning experience for political decision makers from the national or local level or senior technical staff. Participants should be responsible for significant planning or policy making in (sustainable) urban mobility.
Key Topics • National and subnational institutional set-up towards sustainable urban transport • Sustainable urban land use and mobility planning • Financing mechanisms and funding sources of sustainable urban mobility

Community of Practice - Study Tour 2018 MobiliseYourCity – Moving towards sustainable, energy efficient, urban mobility in emerging cities
3
• Lessons learnt on reform projects in Singapore and other APEC economies • Planning and implementation of new transport technologies
Methodology The workshop as part of the training series is built upon the assumption that all participants are experts in the subject and can contribute to the learning of others in the workshop. The workshop is designed for small groups and is meant to be participatory.
It is intended that all the economies represented in the workshop have the opportunity to share their case, having identified the sessions that are of greatest relevance (based on the experiences to be presented). Dialogues are facilitated so to determine key messages which are then systematized in a final document available for sharing.
Agenda Monday, 7 May 9:00-9:30 Hotel Mercure Singapore Bugis 122 Middle Road, Singapore 188973
Registration Meeting room Queen I & II
9:30-10:00 Welcome and Overview Angela Enriquez (WRI/LEDS), Christian Mettke (GIZ)
• Setting the agenda • Study tour objectives
10:00-11:30 Introductions to Urban Mobility Contexts Melissa Cruz (GIZ)
• Introductions • Brief presentations by economies with focus on urban
mobility status and challenges 11:30-12:30 Identification of Priorities and Needs
Melissa Cruz (GIZ) • Discussion of common priorities and interests • Exchange of findings
12:30-13:30 Lunch 13:30-15:30 Governance and Financing of Public Transport
Eu Jin Toh, Sharon Wong (Land Transportation Authority (LTA) • Singapore’s early public transport financing principles
and regulatory framework • Transitioning to new contracting model for buses • Transitioning to new rail financing framework • Discussion
15:30-17:00 Smart Urban Freight Ann Bernal (Green Freight Asia)
• Green freight and smart logistic transportation initiatives • Outlook to intelligent transport system applications
19:00-21:00
Networking Dinner (hosted by GIZ)

Community of Practice - Study Tour 2018 MobiliseYourCity – Moving towards sustainable, energy efficient, urban mobility in emerging cities
4
Tuesday, 8 May 9:00-9:30 Review Day 1 and Logistics Day 2
9:30-10:00 Bus transfer to site10:00-11:30 Urban Redevelopment Authority, 45 Maxwell Rd, Singapore 069118
Planning: Field Visit Urban Redevelopment Authority (URA) Daveen Koh, URA Meet at: 1st storey entrance along Kadayanallur Street Land Use Planning in Singapore
• Singapore’s planning context • Singapore’s planning and development system • Planning strategies
11:30-12:00 Bus transfer to hotel 12:00-13:00 Hotel Mercure Singapore Bugis 122 Middle Road, Singapore 188973
Lunch
13:00-13:30 Bus transfer to site 13:30-15:30 CREATE Tower, 1 College Ave E, Singapore 049374
Future Mobility: Field Visit TUMCREATE (TUMCREATE)
• TUMCREATE presentation – Dr. Andreas Rau, Principal Investigator of the team “Rapid Road Transport”
• Concepts for creating a seamless public transport experience – Dr. Andreas Rau, Principal Investigator of the team “Rapid Road Transport”
• Simulating Smart Cities – Daniel Zehe, Research Fellow of the team “Area-Interlinking Design Analysis”
• Making road transport electric and sustainable – Dr. Tobias Massier, Principal Investigator of the team “Electrification Suite & Test Lab”
• Design of Autonomous Vehicles for public transportation – Dr. Henriette Cornet, Principal Investigator of the team “Design for Autonomous Mobility”
15:30-16:00 Bus transfer to site 16:00-18:00 21 Bulim Drive, Bulim Bus Depot, Singapore 648170
Operations: Field Visit Tower TransitDiana Mohd Noor (Tower Transit)
• Tour of Bulim Bus Depot • Tower Transit: history, operational insights, business
models of electric buses • Q&A
18:00-19:00 Bus transfer to hotel 19:00-20:00 Last Mile Connectivity Stroll & Mobility Challenge (optional)
• Opportunity to explore and connect

Community of Practice - Study Tour 2018 MobiliseYourCity – Moving towards sustainable, energy efficient, urban mobility in emerging cities
5
Wednesday, 9 May 10:00-10:30 Review Day 2 and Logistics Day 310:30-12:00 Hotel Mercure Singapore Bugis 122 Middle Road, Singapore 188973
Decision-Making on Fleet Renewal Jone Orbea (WRI)
• Presentation of tool that provides technical information to support fleet technology decisions
• Discussion on moving transport from national agenda to local implementation
12:00-13:00 Lunch 13:00-14:30 Knowledge: LEDS Community of Practice (CoP)
Sanjini Nanyakkara (NREL/LEDS), Avantika Arjuna (ICLEI/ALP) • LEDS objectives • Benefits of CoP for urban mobility stakeholders
14:30-15:00 Final Reflections Angela Enriquez (WRI/LEDS), Christian Mettke (GIZ) Short reflection by participants on
• Lessons learned • Next steps
15:00-15:45 MRT Transfer to site 15:45-18:00 9 Straits View, Marina One West Tower, Singapore
Future Mobility: Field visit to Grab (Grab)
• Introduction to Grab vision and business • Presentation of recent and future applications of Grab • Potential of collaboration (regulation, data, planning)

1
Training Package: Improving the Operational Efficiency and Energy Efficiency in Public Transport
1. Introduction: Getting transport right as a system Across the world, transport experts are wondering how to “future-proof” their sector ahead of large challenges. High on the agenda stands the goal of building better cities, but also reducing global greenhouse gas emissions, expanding access to opportunities for citizens (such as jobs, education, health services, etc.) via better mobility, making transport more inclusive, and improving the efficiency of vehicles and systems.
At the same time, new mobility services and electric vehicles are disrupting the way transport is organized in unprecedented ways.1 This means many challenges are coming the way of urban planners, decision-makers, entrepreneurs, and governments. Getting transport ready for the 21st century and avoiding mistakes of the past (like urban sprawl, induced traffic demand, or segregated access to mobility) will be crucial.2
Generally, transport is best thought of as a system, not just a toolbox. Electrifying the means of transportation will produce certain benefits but might leave transport systems as unsustainable as they sometimes are. Consequently, the disruption and development will have to go beyond improving cars to shifting to more efficient transport systems. Fortunately, innovations in sustainable transport have spread rapidly and exponentially in past decades (see Figure 1).
Figure 1: We have seen a rapid spread of sustainable transport options (Source: EMBARQ 2013)
Public transport plays an integral role in this undertaking. According to UN-Habitat, “Public transport is defined as a shared passenger transport service that is available to the public. It includes cars, buses, trolleys, trams, trains, subways, and ferries that are shared by strangers without prior arrangement.”3 The success of public transport, however, also depends on complementary considerations and policies in road safety, non-motorized mobility, urban planning, and governance, to name just a few. Ideally, public transport should be able to provide an integrated mobility system.
In the following sections, we will explore the topics of energy efficiency and efficient operations in detail.

2
Box: Getting familiar with the global context of urban transport
Take a look at the publication Changing Course in Urban Transport by the Asian Development Bank and GIZ. It provides an interesting and illustrative introduction to today’s challenges and options for urban mobility. Public transport such as formalized bus services and Bus Rapid Transit (BRT), metro or commuter rail are required to make mass mobility in growing cities a reality.
2. The Avoid-Shift-Improve framework is the clearest and most effective conceptual framework for addressing transport policy
Watch: The "Avoid, Shift, Improve" Strategy (12 mins)
Much of human mobility is dependent on the infrastructure as well as the use and performance of available modes of transport. A comprehensive framework that strives for sustainability in transport sector is the Avoid-Shift-Improve (A-S-I) approach, which aims to simultaneously encourage higher system, trip and vehicle efficiency.4
“Avoid” refers to minimizing motorized trips through changes in land use by creating compact and less-sprawling cities. “Shift” refers to tilting the modal split toward more public transport and non-motorized travel. “Improve” focuses on technological advances to reduce emissions, such as improving fuel quality and vehicle electrification. Most relevantly, shifting mobility services from less efficient uses to more efficient uses is the idea of public transport.
Figure 2: A visual example of Shift actions consistent with the A-S-I framework demonstrated by the Sustainable Transport Pyramid (Source: SUTP/TUMI)

3
The A-S-I framework is an important concept to make sustainable mobility equitable, efficient, safe and green. Changing the course of transport towards more efficiency is urgent. Currently the environmental impacts of the transport sector are wide-ranging. The sector is responsible for 23 percent of energy-related greenhouse gas (GHG) emissions worldwide, increasing at a faster rate than any other sector. Additionally,
73.6% of transport emissions and 17% of global emissions come from road transport.5 These global trends are especially true for the Global South, where annual growth in transport sector emissions is increasing at an average of 4.8 percent. 6
Figure 3: Contributions of passenger vehicles to global CO2 emissions (Source: International Council on Clean Transportation 2014, 6)
The Partnership on Sustainable Low Carbon Transport (SLoCaT) has recognized 20 “Quick Wins on Transport, Sustainable Development and Climate Change” actions which can be implemented immediately before 2020 that would contribute to reducing GHG emissions and making progress on the Sustainable Development Goals (SDGs) within an A-S-I framework (Peet et al. 2016).
Box: LEDS TWG Toolkit
The Low Emissions Development Strategies Global Partnership (LEDS GP) convenes experts and practitioners to facilitate learning and cooperation for climate change mitigation, adaptation, and sustainable development. Enabling mass mobility through public transport is a cornerstone of low emissions development.
The LEDS GP Transport Working Group (TWG) has devised an online database of transport policies for cleaner and more efficient transport. It features over 350 tools, classified into Avoid - Shift – Improve, that can be used for implementation. The TWG also published a series of briefs outlining the social and environmental dimensions of sustainable transport policy. Each publication presents two case studies highlighting how action in the transport sector can lead to many co-benefits for people and the planet.1
3. The economic case for improving public transport is strong To achieve sustainable development, cities and economies need to shift their current course toward a growth pathway of compact urban growth, connected infrastructure, and coordinated governance (also known as the 3Cs model).7 From the urban mobility perspective, evidences have shown that higher public transport maturity is highly correlated with higher city competitiveness, quality of life, and

4
productivity.8 Through forward-looking decisions and implementation of new programs, economies will be able to realize the multiple benefits of sustainable transport.
If designed and planned properly, public transport systems can provide mass mobility in the most cost-effective manner. This is best done in dense urban contexts where economies of scale enable high system efficiency. Again, long-term policies that consider the Avoid-Shift-Improve framework and begin with Avoid measures like transit-oriented development (TOD) yield greatest benefits. Public transport also can contribute to fostering overall social cohesion in denser cities.9
While the specific costs of public transport vary in each case, projects overall make economic sense when factors are considered comprehensively.10 Per capita costs of public transport infrastructure projects are often lower or equal than private transport projects.11 The International Energy Agency (IEA) estimated in 2013 that by simply shifting infrastructure expenditures from private transport to public transport, costs over the next 30 years could be reduced by US$20 trillion while contributing to climate targets.12 This would carry the additional benefit of creating more and more long-term jobs, roughly about three times as many as through funding road infrastructure for car use.13 At the same time, investments in improved public transport systems also significantly reduce congestion-related costs resulting from time savings.14
Improving the efficiency of public transport also contributes to social and environmental goals. Of the numerous co-benefits, perhaps the most important ones are the improvements in public health due to reduced air pollution and improved road safety as well as the reduction of greenhouse gas emissions due to lowering vehicle-kilometers travelled (VKT) and consolidation and replacement of the fleet with cleaner vehicles.15 Research on air quality of buses has shown that technologies have to be viewed in their in-system use, and that context-specific factors matter.16
Usually, achieving operational efficiency and energy efficiency goals goes hand in hand. As the International Council on Clean Transportation notes: “For all regions analyzed, expanding public transit systems will only bring significant health benefits if coupled with regulations that assure improvement in bus emission controls. More broadly, integrated policies aiming to mitigate both climate and health impacts work best.”17 The topic of increasing energy efficiency and switching to cleaner vehicle fleets will be explored further in section 5.
Box UITP advocacy paper:
The International Association of Public Transport (UITP) has created the advocacy paper “Public Transport: Creating Green Jobs and Stimulating Inclusive Growth” which elaborates how public transport benefits the economy, various stakeholders, and the environment. Among others, it offers overview guidance on how to professionalize and promote the work of public transport operators. Particularly impressive is the listing of impacts of investment on the creation of local jobs. For example, case studies show a five-fold return on investment and one to three additionally induced jobs for public transport. If you are interested in training provided by UITP, please see here.

5
4. We can encourage the shift to public transport by creating efficient and reliable systems
At the 2018 Transforming Transportation event, the Mayor of Bogota (Colombia), Enrique Penalosa, asked why a citizen using public transport should have a slower commute than a private vehicle owner.
18 He also once eloquently stated that, “an advanced city is not a place where the poor move about in cars, rather it’s where even the rich use public transportation.”19
Ideally, public transport, which can be a great equalizer for citizens from different walks of life, should significantly contribute to or wholly provide an integrated mobility system. Despite its high potential for enabling mass transit, public transport has in recent decades lost popularity due to the spread of individually owned vehicles and due to perceived and real deficiencies in providing services for passengers safely and conveniently. Moreover, in terms of governance, there can be multiple competing policies among different planning and transportation departments that are only partially reconcilable, thereby resulting in lack of offering the public with comprehensive sustainable transport options.
Overcoming these conflicts requires comprehensive reforms by governments, operators, intermediaries, and the public. The common goal would be to boost ridership of public transport systems while mitigating negative social, economic, and environmental effects.
Comparing Public Transport Modes: Operations and Emissions
Based on the urban context, population density and characteristics of activities in the region, cities are often required to formulate and design multi-modal transport systems—which include walking, biking, and public transit—to be able to satisfy the various travel needs of its citizens, and to avoid excluding its most vulnerable citizens. Thus, the purpose of comparing different public transport modes is not to identify “the best” transit mode, but to better understand the nuances of the modes so that government officials can make an informed decision when selecting a suitable system, especially when they are fiscally limited.
In academia, there is an ongoing debate and research on the conditions and impacts of various transport modes.20 “Comparing the effects obtained by 86 transit systems around the world including Bus Rapid Transit (BRT), Light Rail Transit (LRT), metro, and heavy-rail transit systems”21 shows that metro and BRT systems can generate similar results in terms of travel time savings and value creation. To a large extent, this depends on the capacity and average occupancy of mass transit systems (as well as the range or diversity of these values). Good research has been done for BRT systems but could be improved for comparisons across public transport.22
The type of public transport system the city governments can actually implement would be greatly contingent upon the city’s financial, technical, and institutional capacities. For many cities in the Global South, while officials often have lavish ambition to build light rails and metros for the image of their cities, larger infrastructure projects usually mean longer completion time with greater expenses. Therefore, when choosing transport modes, cities need to carefully examine the long-term financing mechanisms and financial sustainability for the appropriate mega-projects.

6
Figure 4: Initial Cost vs. Capacity and Speed of Different Transport Modes (Source: Hidalgo, 2007)
The lifecycle emissions of different modes also depend on many factors, and sometimes public transport can be less efficient, especially outside of dense areas.23 However, in general, public transport with average occupancy tends to be at least twice as efficient as private vehicle use, based on their energy intensity and absolute consumption.24 Passenger vehicles are overall quite inefficient in their use of energy since only a fraction is actually used to achieve mobility as a result of idling, engine losses and transmission losses, etc.25
The environmental impact of public transport also depends on the technology choices: There is evidence that though there may be operational differences between hybrids, electrics and internal combustion vehicles, they are all viable technologies (Cordeiro, Schipper, and Noriega 2008). However, a common recommendation is for testing and piloting of new technologies until operators are more familiar with them. Also, many bus systems now have a mix of technologies to suit different operational needs, and planning for the mix of technologies should be part of system planning.
Figure 5: Illustrates the energy intensity of different transport modes and the carbon intensity of their fuels (Source: Rode and Floater 2014, 9).

7
Bus Systems Improvement for Operation Efficiency
Buses serve as the most common example for public transport, especially in the developing world. In many cities of the Global South, the status quo of the surface transport is often characterized by:
1. Informal operations/Paratransit 2. A fragmented industry 3. Poor service standards – old vehicles, minimal maintenance, uncomfortable, lack of timetable,
disjointed network 4. On-street competition 5. Undesirable ‘externalities’
(Source: GIZ Transfer, Presentation Robin Kaenzig, December 2017, Ho Chi Minh City)
Governments around the world have used various means to improve the operation of bus systems in the city—ranging from deploying softer improvement techniques such as bus fleet renewals and bus reorganization, to full-scale replacement of the existing systems with a brand-new system. To date, these global public transport improvement and reform projects have varying degrees of success, though no clear pathway, which can placate all involved stakeholders (officials, operators, passengers, etc.) and be sustainable in a longer timeframe (10-20 years), has emerged—perhaps, as a result of changes in political, financial, and demographic aspects over the years.
Nevertheless, one common approach to improve operation efficiency many city governments in the developing world have pursued, albeit with its advantages and disadvantages, is by introducing bus rapid transit (BRT) system as a catalytic project. Pioneered in 1974 in Curitiba, Brazil, the concept of BRT has proliferated from Latin American cities to the global stage, especially in places where there are no historic light rail and metro structures in place.26
Attractive to planners and policymakers are the social benefits of BRT systems and the significantly lower capital expenses than with rail systems. In comparison to a Metro system, a BRT system can be over 100 times less expensive. Some sources even proclaim, “there is little doubt that BRT in developing cities will be profitable.”27 In an evaluation of 13 BRT systems by the World Resources Institute’s (WRI) transport center EMBARQ it was evident that “capital costs and bus operating costs were the most significant portion of project costs in the cities.”28
(GIZ-SUTP 2004) or Meakin 2004: Training Course: Bus Regulation and Planning – Bus Sector Reform
Box: BRT research and EMBARQ
To learn more about how to create successful BRT projects, please see the EMBARQ-WRI report Modernizing Public Transportation or this video on the social, environmental and economic impacts of BRT. Founded in 2002 with the help of Shell Foundation, EMBARQ is now part of WRI Ross Center for Sustainable Cities, focusing on sustainable urban mobility as part of WRI's broader sustainable cities program. EMBARQ has over 15 years of experience making sustainable transport a reality in cities,

8
through continuous on-the-ground presence in Brazil, China, India, Mexico, Turkey, and the United States. Please also refer to Dr. Dario Hidalgo’s research.
To provide metro-like service at the surface, BRT systems strive to achieve four elements or attributes— fast, low waits, comfort, and reliable—by improving operation efficiency. One of the scenarios/frameworks to achieve desirable attributes through operational features is summarized below.
Figure 6: Influence Diagram: Desirable attributes in a BRT system and factors to achieve them (Source: Muñoz 2015)
- To have a fast transport service, the increase in operating speed is needed. - To reduce waiting time, vehicles need to provide frequent and regular (same headway) services. - To ensure comfortable system for a given demand level, increase in passenger capacity is
needed. - To have a more reliable service, regular headways, which often mean low headways through
increase in frequency and capacity, are needed.
It is of paramount importance to note that there can be tradeoffs between operation efficiency and accessibility. For example, access to bus station might be reduced when the system favors speed and frequency for high ridership and decreases the number of stops.29
5. Improving the energy efficiency of public transport yields crucial co-benefits (energy efficiency)
Ultimately, energy efficiency in transport relates back to the Avoid-Shift-Improve framework which aims to improve system efficiency, travel efficiency, and vehicle efficiency. Including the several co-benefits of transport, this allows to get a general understanding of the energy efficiency of different transport modes. Co-benefits of improving the emissions quality of public transport fleets include higher economic development, higher quality of life, better energy security and fewer negative externalities.30 Efficiency improvements can also spur economic growth since “fuel-efficiency improvements are essential for competitiveness in an increasingly global market.”31
Below, we provided three approaches to improve energy efficiency: (1) Bus route reorganization; (2) Air quality standards and policy, and (3) electrification of bus fleets.

9
Bus Route Reorganization
Given the impact on vehicle-km, bus reorganization appears to have larger impacts than just replacing a fraction of the bus fleet with cleaner technology. An analysis of the case of Queretaro, Mexico (Cordeiro, Schipper and Noriega 2008), shows how the expected reduction in vehicle-km resulting from bus route reorganization has the largest potential impact on emissions reduction, yielding a 64% reduction of yearly emissions. Adding a BRT corridor also provides additional reduction in GHG emissions. This goes to show that only applying different vehicle and fuel technologies for the BRT corridor, such as low Sulphur diesel, CNG and hybrid buses, provide comparatively small emissions reductions.
Figure 7: CO2 Emissions of Bus System Formalization and BRT Implementation in Queretaro (Source: Cordeiro, Schipper, and Noriega 2008)
In general, bus route reorganization is a process combining several measures. Measures can include a mixture of institutional, design and capital investment, and operational actions in the system, such as modifications in the regulatory regime for service provision, removing duplication of routes, adjusting frequency of buses, and improving routing, among other. Bus reorganization can be enhanced if packaged with other measures that will facilitate service integration, such as incorporating branding, infrastructure, traffic control technology and user information systems.
Air Quality Standards & Policy
Energy efficiency of vehicles can be improved through standards and legislation for minimum performance, through incentives and support schemes towards improved design, or the promotion of voluntary measures, awareness campaigns and behavior changes.32 The average age of the fleet also influences the vehicle efficiency, which is why scrapping incentive programs can be useful.33
0
20
40
60
80
100
120
140
160
180
Baseline BusReorganization
(BR)
BR + BRT +D350
BR + BRT +D50
BR + BRT +D50 DPF
BR + BRT +D15
BR + BRT +CNG
BR + BRT +Hybrid D15
Thou
sand
tonn
es of
CO 2
/year
Scenarios
CO2 Emissions under Different Scenarios

10
Electric Vehicles
The rapid spread of electric vehicles makes the topic of electric mobility particularly popular among policy makers and entrepreneurs. The worldwide shift to electric vehicles will most likely have wide-reaching consequences for policy and technology. With their rapid diffusion and uptake, electric vehicles will pose a challenge for policymakers to keep suit and manage the disruption. The Global Fuel Economy Initiative (GFEI) has proposed reaching a 100 million electric vehicles by 2030, while acknowledging that the path towards this ambitious target is difficult and uncertain (Global Fuel Economy Initiative 2017). There are several barriers standing in the way of a quicker and more widespread uptake of electric vehicles such as a lack of charging infrastructure and customer awareness, long charging times, and expensive (though decreasingly so) batteries.34 Storage and charging technologies are the central focus of innovation activities, which have led to significant improvement in size, weight, battery capacity and overall cost. Battery costs have fallen from US$1000/kWh in 2008 to US$400/kWh in 2013.35
It is clear that electric vehicles will soon become a regular component of the global fleet. This is especially true for electric buses, who can make an even heavier dent on air pollution, GHG emissions, and congestion. Multiple cities are leading these efforts worldwide. Shenzhen, for example, built the world’s first and largest 100 percent electric bus fleet.36 This development must go hand in hand with decarbonizing the electricity sector.37
Figure 8: Carbon dioxide emissions from a Euro V bus (tailpipe) compared to an electric bus (upstream) in multiple countries (Source: TheCityFix, Castellanos and Orjuela)
To spur efficiency improvements and support the transition to electric vehicles, fuel economy and air quality standards can help prepare the path for innovation.38 Researchers found that, “recent changes in US and European standards have both increased the rate of technology adoption and affected the direction of technology adoption.”39

11
Box: Sustainable Urban Transport Project
Since 2003, the Sustainable Urban Transport Project (SUTP) by GIZ has generated a variety of publications to assist cities achieve their sustainable transport goals. Of special interest are the SUTP Sourcebook Modules, a comprehensive knowledge series on many aspects of urban transport, as well as their Readings Lists on various topics.
Spotlight: The 2012 Sourcebook Module 5h, Urban Transport and Energy Efficiency, defines and elaborates on energy efficiency actions for local and national policymakers. It features explanatory frameworks and 15 case studies from around the world.
If interested in more visual resources, consider the YouTube channel of the SUTP project.
6. Conclusion: Operational and energy efficiency will make cities sustainable and prosperous
There are many reasons to encourage a stronger shift to public transport systems. Only efficient mass transit will be able to allow a growing number of people to live in sustainable cities of the future. Shared traveling is necessary to use limited space and resources in the most efficient way. For this to happen, there are numerous components to consider, from urban planning to financing and fleet technology.
A clean and functioning public transport fleet also depend on how new and emerging trends in the transport sector will develop. The UITP has identified four trends in 2017: new mobility services, reorganization of the public transport market, shifts to low-carbon or zero-carbon vehicles, and the rise of two-wheelers.40 All these changes simultaneously pose challenges and opportunities to the organization of public transport. What stays the same is that public transport services will continue to form the backbone of people-centered mobility. Transport planners and researchers need to employ all the tools available to make efficient mobility a reality for the 21st century.
Additional Resources - Bus Rapid Transit in China: A Comparison of Design Features with International Standards - The Economic and Social Benefits of Low-Carbon Cities: A Systematic Review of the Evidence - How did Shenzhen, China Build World’s Largest Electric Bus Fleet? - Shared Mobility Principles for Livable Cities - Transport Initiatives Proposed in the Context of An Action Agenda on Transport and Climate Change - Don’t Drive Here – Manila (Video) - LTA Singapore: A People-centered Land Transport System (Video) - TfL’s Dave Wetzel on Why London’s Congestion Charging System Took Off (Video) - Three Revolutions in Urban Transportation (Video) - Transportation in the City – Options for Urban Mobility – Hong Kong MTR (Video) - Transportation in the City – Options for Urban Mobility – Trains vs. Buses: The Rise of BRT (Video)

12
- What is low-carbon development and why is it important? (Video) - Why buses represent democracy in action? (Video)
References (Created using Zotero)
Appleyard, Donald, M. Sue Gerson, and Mark Lintell. 1981. Livable Streets, Protected Neighborhoods. University of California Press.
Carrigan, Aileen, Robin King, Juan Miguel Velásquez, Nicolae Duduta, and Matthew Raifman. 2013. Social, Environmental and Economic Impacts of Bus Rapid Transit. Text. WRI Ross Center for Sustainable Cities. http://www.wrirosscities.org/research/publication/social-environmental-and-economic-impacts-bus-rapid-transit.
Chester, Mikhail, Stephanie Pincetl, Zoe Elizabeth, William Eisenstein, and Juan Matute. 2013. “Infrastructure and Automobile Shifts: Positioning Transit to Reduce Life-Cycle Environmental Impacts for Urban Sustainability Goals.” Environmental Research Letters 8 (1): 015041.
Chester, Mikhail V. 2008. “Life-Cycle Environmental Inventory of Passenger Transportation in the United States.” Berkeley: Institute of Transportation Studies, University of California. https://escholarship.org/uc/item/7n29n303.
Chester, Mikhail V., and Alex Cano. 2016. “Time-Based Life-Cycle Assessment for Environmental Policymaking: Greenhouse Gas Reduction Goals and Public Transit.” Transportation Research Part D: Transport and Environment 43 (March): 49–58. doi:10.1016/j.trd.2015.12.003.
Chester, Mikhail V., and Arpad Horvath. 2009. “Environmental Assessment of Passenger Transportation Should Include Infrastructure and Supply Chains.” Environmental Research Letters 4 (2): 024008.
Chester, Mikhail V., Arpad Horvath, and Samer Madanat. 2010. “Comparison of Life-Cycle Energy and Emissions Footprints of Passenger Transportation in Metropolitan Regions.” Atmospheric Environment 44 (8): 1071–1079.
Cooper, Erin, Magdala Satt Arioli, Aileen Carrigan, and Umang Jain. 2012. Exhaust Emissions of Transit Buses. Text. WRI Ross Center for Sustainable Cities. https://wrirosscities.org/research/publication/exhaust-emissions-transit-buses.
Dalkmann, Holger, and Charlotte Brannigan. 2007. “Transport and Climate Change: Module 5e.” In Sustainable Transport: A Sourcebook for Policy-Makers in Developing Cities. Deutsche Gesellschaft für Technische Zusammenarbeit (GTZ). http://www.sutp.org/files/contents/documents/resources/A_Sourcebook/SB5_Environment%20and%20Health/GIZ_SUTP_SB5e_Transport-and-Climate-Change_EN.pdf.
GIZ-SUTP. 2004. SUTP Module 3c - Bus Regulation and Planning. SUTP Sourcebook Modules. https://www.sutp.org/files/contents/documents/resources/A_Sourcebook/SB3_Transit-Walking-and-Cycling/GIZ_SUTP_SB3C_Bus-Regulation+Planning_EN.pdf.
GIZ-SUTP. 2005. SUTP Module 3a - Mass Transit Options. SUTP Sourcebook Modules. http://www.sutp.org/files/contents/documents/resources/A_Sourcebook/SB3_Transit-Walking-and-Cycling/GIZ_SUTP_SB3a_Mass-Transit-Options_EN.pdf.
GIZ-SUTP. 2012. SUTP Module 5h - Urban Transport and Energy Efficiency. SUTP Sourcebook Modules. http://www2.giz.de/wbf/4tDx9kw63gma/SUT_module5h.pdf.
Global Fuel Economy Initiative. 2017. Can We Reach 100 Million Electric Cars Worldwide by 2030? A Modelling/Scenario Analysis.
Gouldson, Andy, Andrew Sudmant, Haneen Khreis, and Effie Papargyropoulou. 2018. The Economic and Social Benefits of Low-Carbon Cities: A Systematic Review of the Evidence. London and

13
Washington, DC.: New Climate Economy. Coalition for Urban Transitions. https://newclimateeconomy.report/workingpapers/workingpaper/the-economic-and-social-benefits-of-low-carbon-cities-a-systematic-review-of-the-evidence/.
Heck, Stefan, Matt Rogers, and Paul Carroll. 2014. Resource Revolution: How to Capture the Biggest Business Opportunity in a Century. Houghton Mifflin Harcourt.
Hidalgo, D. (2007) ‘High level bus rapid transit systems (HBRT): An option to consider even at high demand levels’, Presentation in 5th International Bus Conference UITP Bogotá, Colombia, 14–16 February, http://www.880cities.org/Articles/ComparativeTransitSystems%20PP%20Hidalgo%20%20UITP.pdf, last accessed 21 May2013
Hidalgo, Dario, and Aileen Carrigan. 2010a. Modernizing Public Transportation. Text. WRI Ross Center for Sustainable Cities. https://wrirosscities.org/research/publication/modernizing-public-transportation.
Hidalgo, Dario, and Aileen Carrigan. 2010b. “BRT in Latin America High Capacity and Performance, Rapid Implementation and Low Cost.” Built Environment 36 (3): 283–297. doi:10.2148/benv.36.3.283.
Hidalgo, Dario, Germán Lleras, and Enrique Hernández. 2013. “Methodology for Calculating Passenger Capacity in Bus Rapid Transit Systems: Application to the TransMilenio System in Bogotá, Colombia.” Research in Transportation Economics, THREDBO 12: Recent developments in the reform of land passenger transport, 39 (1): 139–142. doi:10.1016/j.retrec.2012.06.006.
Ingvardson, Jesper Bláfoss, and Otto Anker Nielsen. 2017. “Effects of New Bus and Rail Rapid Transit Systems – an International Review.” Transport Reviews 38 (1): 96–116. doi:10.1080/01441647.2017.1301594.
International Council on Clean Transportation. 2014. The State of Clean Transport Policy. International Council on Clean Transportation. https://www.theicct.org/publications/state-clean-transport-policy-2014-synthesis-vehicle-and-fuel-policy-developments.
International Council on Clean Transportation. 2015. “Exploring the Climate and Health Benefits from Public Transit | International Council on Clean Transportation.” https://www.theicct.org/blog/staff/exploring-climate-and-health-benefits-public-transit.
International Energy Agency. 2012. Technology Roadmap: Fuel Economy of Road Vehicles. https://www.iea.org/publications/freepublications/publication/technology-roadmap-fuel-economy-of-road-vehicles.html.
International Energy Agency. 2013a. A Tale of Renewed Cities. Energy Efficiency in Urban Transport Systems. Policy Pathways. International Energy Agency. http://www.iea.org/publications/freepublications/publication/policy-pathways---energy-efficiency-in-urban-transport-systems.html.
International Energy Agency. 2013b. Global Land Transport Infrastructure Requirements. Paris: International Energy Agency. https://webstore.iea.org/global-land-transport-infrastructure-requirements.
Klier, Thomas, and Joshua Linn. 2016. “The Effect of Vehicle Fuel Economy Standards on Technology Adoption.” Journal of Public Economics 133: 41–63.
Lefevre, Benoit, Katrin Eisenbeiss, Neha Yadav, and Angela Enriquez. 2016. LEDS in Practice: Create Jobs by Reducing Greenhouse Gas Emissions from Urban Transport. LEDS in Practice. Low Emission Development Strategies Global Partnership (LEDS GP). http://ledsgp.org/resource/leds-practice-create-jobs/?loclang=en_gb.
Litman, Todd. 2013. “Measuring Transport System Efficiency.” Planetizen - Urban Planning News, Jobs, and Education. https://www.planetizen.com/node/59995.
Litman, Todd. 2018. Evaluating Public Transit Benefits and Costs. Victoria Transport Policy Institute.

14
Mahendra, Anjali, Holger Dalkmann, and Matthew Raifman. 2013. Financing Needs for Sustainable Transport Systems for the 21st Century. Text. https://wrirosscities.org/research/publication/financing-needs-sustainable-transport-systems-21st-century.
Mulley, Corinne, David A. Hensher, and David Cosgrove. 2017. “Is Rail Cleaner and Greener than Bus?” Transportation Research Part D: Transport and Environment 51 (March): 14–28. doi:10.1016/j.trd.2016.12.004.
Muñoz, Juan Carlos. 2015. “BRT in the Americas: New Trends and Opportunities.” Meeting of the Minds webinar series 2015, March 10. http:// cityminded.org/cal/brt-americas-new-trends-opportunities.
Nash, Andrew, and Ulrich Weidmann. 2006. “Improving the Operational Efficiency of Public Transport.” ETH Zurich.
Null, Schuyler, and Talia Rubnitz. 2018. Live from Transforming Transportation 2018: "A New Idea of Liberty." http://thecityfix.com/blog/live-from-transforming-transportation-2018-a-new-idea-of-liberty-schuyler-null-talia-rubnitz/
Peet, Karl, Sudhir Gota, Cornie Huizenga, and Mark Major. 2016. Quick Wins on Transport, Sustainable Development and Climate Change. Kick-Starting the Transformation of the Transport Sector. Partnership on Sustainable, Low Carbon Transport (SLoCaT). http://www.ppmc-transport.org/wp-content/uploads/2016/11/SLoCaT-Quick-Wins-Report-1.pdf.
Penalosa, Enrique. Why Buses Represent Democracy in Action? https://www.ted.com/talks/enrique_penalosa_why_buses_represent_democracy_in_action
PricewaterhouseCoopers. 2016. Cities of Opportunity. https://www.pwc.com/us/en/library/cities-of-opportunity.html.
Rode, Philipp, and Graham Floater. 2014. Accessibility in Cities: Transport & Urban Form. http://newclimateeconomy.report/workingpapers/workingpaper/accessibility-in-cities-transport-urban-form/.
Springer, Cecilia, Nigel Purvis, Pete Ogden, and Andreas Dahl-Joergensen. 2014. Accelerating Global Vehicle Efficiency | Climate Advisers. Center for American Progress. https://www.climateadvisers.com/publications/accelerating-global-vehicle-efficiency/.
Stockholm Environment Institute, and Material Economics. 2018. Framing Stranded Assets in an Age of Disruption. Stockholm Environment Institute. https://www.sei-international.org/publications.
UITP (International Association of Public Transport). 2017. Public Transport Trends. http://www.uitp.org/public-transport-trends.
Watkins, Kari. 2018. “Does the Future of Mobility Depend on Public Transportation?” Journal of Public Transportation 21 (1). doi:http://doi.org/10.5038/2375-0901.21.1.6.
Wei, Ran, Xiaoyue Liu, Yongjian Mu, Liming Wang, Aaron Golub, and Steven Farber. 2017. “Evaluating Public Transit Services for Operational Efficiency and Access Equity.” Journal of Transport Geography 65 (December): 70–79. doi:10.1016/j.jtrangeo.2017.10.010.
Zhao, X., A. Mahendra, N. Godfrey, H. Dalkmann, P. Rode, and G. Floater. 2016. Unlocking the Power of Urban Transit Systems for Better Growth and a Better Climate. Technical note. London and Washington, DC.: New Climate Economy. http://newclimateeconomy.report/workingpapers/.
1 (Watkins 2018) 2 (Mahendra, Dalkmann, and Raifman 2013) 3 https://unstats.un.org/sdgs/metadata/files/Metadata-11-02-01.pdf 4 (Dalkmann and Brannigan 2007)

15
5 (International Council on Clean Transportation 2014, 6) 6 http://www.ppmc-transport.org/wp-content/uploads/2015/08/Analysis-on-National-Transport-Sector-Emissions-1990-2012.pdf 7 (Zhao et al. 2016) 8 (PricewaterhouseCoopers 2016) 9 (Appleyard, Gerson, and Lintell 1981) 10 (Litman 2018) 11 (Rode and Floater 2014, 12) 12 (International Energy Agency 2013b) 13 (Lefevre et al. 2016) 14 (Rode and Floater 2014, 13) 15 (Carrigan et al. 2013) 16 (Cooper et al. 2012) 17 (International Council on Clean Transportation 2015) 18 (Null and Rubnitz 2018) 19 (Penalosa, 2013) 20 See for example http://thecityfix.com/blog/are-trains-better-than-bus-rapid-transit-systems-a-look-at-the-evidence-dario-hidalgo/ (Mulley, Hensher, and Cosgrove 2017) http://humantransit.org/2012/09/the-photo-that-explains-almost-everything.html 21 (Ingvardson and Nielsen 2017, 96) 22 (Hidalgo and Carrigan 2010b; Hidalgo, Lleras, and Hernández 2013) 23 (Litman 2018, 26) 24 (M. V. Chester 2008; M. V. Chester and Horvath 2009; M. V. Chester, Horvath, and Madanat 2010; M. Chester et al. 2013; M. V. Chester and Cano 2016) 25 (Stockholm Environment Institute and Material Economics 2018, 39). 26 http://thecityfix.com/blog/where-brt-came-from-and-where-its-going-dario-hidalgo/ 27 (GIZ-SUTP 2005, 18) 28 (Carrigan et al. 2013, 97) 29 (Wei et al. 2017) 30 (Gouldson et al. 2018) 31 (Springer et al. 2014, 11) 32 (International Energy Agency 2012) 33 (GIZ-SUTP 2012) 34 Q&A from Bloomberg New Energy Finance 35 (Heck and Rogers 2014) (New Climate Economy 2014, 30) 36 http://www.wri.org/blog/2018/04/how-did-shenzhen-china-build-world-s-largest-electric-bus-fleet 37 http://www.irena.org/publications/2017/Feb/Electric-vehicles-Technology-brief 38 (International Energy Agency 2012; Springer et al. 2014, 11) 39 (Klier and Linn 2016) https://climateactiontracker.org/documents/46/CAT_2016-08-26_DecarbTransportations_CATAnalysis.pdf 40 (UITP (International Association of Public Transport) 2017)

DRAFT
1
ROAD MAP: Report on fiscal policies for vehicle fuel economy
Report on fiscal policies for vehicle fuel economy ....................................................................................... 1
1. Introduction: The transport sector needs vehicle fuel economy policies ............................................ 2
1.1. The status quo of transport is unsustainable ........................................................................... 2
Energy security and oil prices ........................................................................................................... 3
Air quality, local pollution and health hazards ................................................................................. 4
Climate change and low carbon visions for the transport sector ..................................................... 6
Addressing transport problems ........................................................................................................ 8
Improving fuel economy has great potential for improving economic prosperity and mobility ..... 9
1.2. Public policy is key to save fuel and emissions ............................................................................ 10
The goals and types of fuel economy policies ................................................................................ 10
Policy instrument choice ................................................................................................................. 13
Limitations of fuel economy policies (new vehicles, rebound effect, unintended consequences) 14
Not considered further in this analysis ........................................................................................... 15
2. Policies for vehicle fuel economy: standards, incentives, and information measures ....................... 16
2.1. Introduction to different policy types .......................................................................................... 16
2.2. Fuel economy standards .............................................................................................................. 17
2.3. Economic Instruments ................................................................................................................. 18
2.4. Examples of Fiscal Policies ........................................................................................................... 19
2.4.1. Fuel taxes .................................................................................................................................. 20
2.4.2. Differentiated Vehicle taxes...................................................................................................... 21
Purchase & registration taxes ......................................................................................................... 22
Circulation taxes / excise duties...................................................................................................... 22
Example of The Netherlands ........................................................................................................... 23
2.4.3. Feebates .................................................................................................................................... 25
Example of France: .......................................................................................................................... 26
Example of Singapore: .................................................................................................................... 27

DRAFT
2
3. Lessons learned from national experiences & application potential for APEC .............................. 27
3.1. An imperfect policy is usually better than no policy ............................................................... 27
3.2. Tax policies may be easier to implement than other public policies ...................................... 28
3.3. Fuel taxes may be the most effective policy measure ............................................................ 28
3.4. Policies need to be politically feasible .................................................................................... 29
4. Conclusion ....................................................................................................................................... 30
References .............................................................................................................................................. 31
1. Introduction: The transport sector needs vehicle fuel economy policies
1.1. The status quo of transport is unsustainable As economies grow rapidly in Asia and the Pacific, there is a trend towards increased use of motorized vehicles (International Organization of Motor Vehicle Manufacturers (OICA) 2016). The world already has over 1.2 billion vehicles, and this number is expected to double by 2030 under current scenarios (Sims et al. 2014). About 90% of the growth of passenger light-duty vehicles (LDVs, standard 4-wheel private automobiles) is expected to occur in non-OECD countries (Global Fuel Economy Initiative 2016a, 5).
From 2013 to 2040, the total vehicle stock in APEC countries is expected to grow from 663 million to 1.27 billion (APEC 2016, 7), with 453 million new vehicles in China and South-East Asia alone (APEC 2016, 7). In the APEC area, light-duty vehicles (LDVs) account for 73% of final energy consumption in the transport sector; the number of LDVs is expected to grow by an additional 900 million by 2040 (APEC 2017a, 63). Especially in Asian and Pacific cities, more and more people drive more and more vehicles at an astonishing pace. Key factors of this surge are rapid industrialization and urbanization as well as rising income levels (APEC 2016, 13). As reported by the International Council on Clean Transportation, 76% of global vehicles sales take place in APEC member economies (International Council on Clean Transportation 2015, 15).
This development brings various opportunities, but it does not come without challenges. Among the foremost are the anticipated costs from the impacts of climate change. The transport sector’s amount and share of greenhouse gas emissions has grown continuously. Carbon emissions are expected to rise steeply under a business-as-usual scenario, and somewhat moderately under an NDC scenario (Silitonga, Atabani, and Mahlia 2012, 1688; Global Fuel Economy Initiative 2017a). Climate change carries huge economic costs, as the United Nations Economic and Social Commission for Asia and the Pacific (UN ESCAP) has reported likely negative growth of, “as much as 3.3 per cent by 2050 and 10 per cent by 2100 relative to the base case” (UNESCAP 2016, 3). Already half of disaster-related losses are occurring in the region (UNESCAP 2016, 2).

DRAFT
3
Among the key tasks for policymakers is to enhance the efficiency of land transport and to address the economic, social, and environmental costs of transport. Fortunately, there are mature and proven policies that can accomplish the triple win of (1) increasing economic productivity, (2) improving human health, and (3) reducing emissions (New Climate Economy 2014a). As noted in the 2016 APEC Energy Demand and Supply Outlook, “fuel economy policies for new vehicles are vital to energy efficiency in transport; fuel efficiency standards must be implemented in APEC economies in which they are currently lacking, and strengthened where they do exist. In addition, governments should introduce―at the earliest stage possible to realize long-term impacts sooner―new concepts of urban design and transport planning” (APEC 2016, 2). Raising the fuel economy of passenger vehicles could generate a $3 trillion investment in new technologies as well as $5 trillion fuel savings until 2025 (Springer et al. 2014; Global Fuel Economy Initiative 2016a).
Figure XXX: Expected Vehicles per 1,000 People in APEC Countries (APEC 2016)
Energy security and oil prices APEC economies are net importers of petroleum, and imports are expected to grow under all scenarios (APEC 2016). While energy diversification is also increasing due to higher rates of renewable energy, continued reliance on fossil fuels makes both economies and their consumers sensitive to fluctuations in the international demand and supply of oil and other fuels. Overall, energy self-sufficiency among APEC economies declines as energy imports rise, particularly in South-East Asia (APEC 2016, 179)
050
100150200250300350400450
2013 2018 2023 2028 2033 2038
Vehi
cles
per
1,0
00 P
eopl
e
Year
Expected Vehicles per 1,000 People in APEC Countries

DRAFT
4
Figure XXX: Historical and projected et oil imports (APEC 2016, 52)
Road transport currently consumes more than half of the world’s petroleum supply, with demand growing particularly for heavy duty vehicles and in non-OECD countries (International Energy Agency 2017a). Among APEC economies, transport accounted for 26% of total energy demand in 2013 (APEC 2016, 99). Scarce oil supplies can severely impact and curtail economic activity, and energy security1 concerns continue to play a major role in national planning (Asian Development Bank 2009). Curbing the dependence on petroleum can serve the double purpose of buffering supply interruptions and promoting energy efficiency. Energy conservation and efficiency programs can allow investments in other key sectors, like education and health (APEC 2017b).
Energy security weighs even heavier when they are coupled with concerns about fiscal stability, for example when energy consumption is highly subsidized. APEC economies recently have utilized lower oil prices to successfully implement subsidy reforms (International Energy Agency 2017b). Government fuel subsidies are highly inefficient instruments and can hamper economic liberalization and trade (Global Subsidies Initiative 2009; Van de Graaf and van Asselt 2017). In addition, they are unequally distributed and do overwhelmingly not favor the poor, thereby disqualifying as social assistance (Arze del Granado, Coady, and Gillingham 2012). APEC economies already have successfully reduced their fossil fuel consumption subsidies by 50 percent since 2011 which shows the impact of coordinated commitment and effective pricing strategies (APEC 2017c, 1). Here fuel economy policies could create significant economic value and generate consumer savings.
Air quality, local pollution and health hazards Globally, transportation accounts for a larger percentage of urban ambient air pollution from PM2.5 (25%) than any other source (Karagulian et al. 2015). Today, the highest levels of air pollutants are
1 Energy security definitions vary, see (APEC 2016, 175).

DRAFT
5
concentrated in developing cities, where transportation often accounts for a disproportionately higher share of PM2.5 than the global average (Karagulian et al. 2015). For reducing health impacts from air pollution, it is important to know the sources contributing to human exposure. This study systematically reviewed and analyzed available source apportionment studies on particulate matter (of diameter of 10 and 2.5 microns, PM10 and PM2.5) performed in cities to estimate typical shares of the sources of pollution by country and by region. A database with city source apportionment records, estimated with the use of receptor models, was also developed and available at the website of the World Health Organization.
In combination with rapid population growth and subsequent congestion, rising incomes, and economic development, less efficient vehicles create huge economic losses. The OECD estimates that road transport accounts for about half of the costs of the health impact of air pollution in OECD countries in 2010; which is most likely higher or comparable for non-OECD members as well. The estimated impact for China and India alone was almost twice as high as for all OECD countries, calculated at USD 1.9 trillion (Organisation for Economic Co-operation and Development (OECD) 2014). Emissions from diesel engines have a particularly negative economic impact (Brand 2016).
Some of the most impactful air pollutants are particulate matter (PM 2.5 and black carbon), carbon monoxide, nitrogen oxides, sulfur dioxide, ozone, methane, and lead. While phasing out the most severe health hazards, like lead and sulfur, ranks higher on immediate priority when emission standards are still lacking, it is important to address all persistent as well as manageable factors for air pollution (World Health Organization 2016; OECD 2014).
According to the World Health Organization (WHO), 3 million pre-mature deaths in 2012 were associated with outdoor air pollution. Of these, 87% occurred in low- and middle-income countries, with the greatest burden in the WHO Western Pacific and South-East Asia regions (World Health Organization 2016). A more recent study suggests that in the most affected places, more than 25% of deaths are due to pollution. According to the Lancet report, overall air pollution is responsible for an estimated 9 million premature deaths, costing the global economy an equivalent of 6.2 % of its economic output (Landrigan et al. 2017).
Health impacts of vehicles are also acknowledged by organizations working to improve the fuel economy through policies, especially, “in India, China, Brazil, Mexico, and the countries in the Asia-Pacific region, Latin America, the Middle East, and Africa” (International Council on Clean Transportation 2014a, 3).
It is important to note that, as transport should be thought of as a system, improvements in emissions control, fuel quality, and vehicle efficiency are not independent projects, but can go hand in hand, as noted by the UNEP Partnership for Clean Fuels and Vehicles: “A long term strategy that focuses on cleaning the fuels and vehicles in an integrated manner will result in optimal benefits to the countries. For in-use vehicles, effective inspection and maintenance programs will ensure vehicles emit fewer pollutants.” (Partnership for Clean Fuels and Vehicles (PCFV)

DRAFT
6
Climate change and low carbon visions for the transport sector Transport emissions contribute chiefly to air pollution and climate change and thereby pose a threat to the sustainable development of global economies (Pachauri et al. 2014). Alarmingly, transport sector emissions are growing faster than those from any other sector (Sims et al. 2014). Transport contributes about 23 % of global energy-related greenhouse gas emissions, whereof 17% or 73.6% of total transport emissions come from road transport (Sims et al. 2014). In sum, LDVs are responsible for 9% of global emissions (Yang et al. 2017). Exacerbated by accelerating urbanization and rising levels of income, the developing world particularly is impacted by the growth of inefficient vehicles. For example, Asia’s share of global CO2 transport emissions is projected to increase to 31% by 2030 and a large share of air pollution in Asia comes from traffic (Asian Development Bank 2017).
Parties to the United Nations Framework Convention on Climate Change (UNFCCC) agreed on limiting climate change to a rise below 2 degrees Celsius in 2009, and have subsequently committed to action to reduce national GHG emissions. With this intention, almost every party to the UNFCCC has submitted nationally determined contributions (NDCs) which became relevant with the Paris Agreement entering into force on November 4, 2016. All APEC member economies except for Chinese Taipei are parties to the UNFCCC and have signed and ratified the Paris Agreement.2 The Paris Agreement is generally seen as an important framework for ensuring global cooperation and driving low carbon investment. APEC leaders reaffirmed their commitment to the Paris Agreement and to “transparent and effective implementation in order to transition towards a low carbon, climate resilient economy” in the 2016 Leaders’ Declaration in Lima, Peru.
2 Taiwan has still published their INDCs and stated its interest in participating in the global climate change process https://www.taiwanembassy.org/nl_nl/post/1411.html

DRAFT
7
Figure XXX: Contributions of passenger vehicles to global CO2 emissions (International Council on Clean Transportation 2014a, 6)
Fuel economy policies are highly relevant for achieving the NDCs. However, the global vehicle fuel economy is not improving at a rapid enough pace to meet the 2 degree goal (Cooper et al. 2016). Consequently, increasing the stringency and scope of fuel economy regulations and pricing schemes are a key action to achieve a global 2 degree or 1.5 degree target. It stands out that doubling the fuel economy of passenger vehicles would reduce carbon emissions by about 1.5 Gt/year by 2050 (SLocat 2016, 45). “Achieving the Global Fuel Economy Initiative (GFEI) target is estimated to account for almost one third of the CO2 reductions necessary to switch individual motorized passenger transport from a 6 degree Celsius (6DS) to a 2DS emission trajectory” (SloCaT 2016, 45).
Curiously enough, non-OECD countries have recently been similar or even more ambitious in improving their fuel economy (Global Fuel Economy Initiative 2017a). Given that many NDCs of APEC economies fall in the category of “Tighten fuel economy standards for passenger vehicles” (Peet et al. 2016), these actions may be particularly appropriate for implementation. Projections from the latest APEC Energy Supply and Demand Outlook show that “fuel efficiency improvements deliver most (194 Mtoe) of the savings” (APEC 2016, 100) under an Improved Efficiency Scenario, which has transport energy demand

DRAFT
8
peaking in 2025.3 In line with the most relevant scenarios, global energy related CO2 emissions have to be reduced by 50% by 2050 to meet the 2 degree scenario (2DS)4. Importantly, the 2DS acknowledges that transforming the energy sector is vital, but not the sole solution as non-energy sectors also needs to make significant contribution in support of a 2DS.” (Peet et al. 2015, 6)
The rapid rise of electric vehicles in recent years illustrates the difficulty of accurately predicting the future gains resulting from new policies and technologies.
Addressing transport problems
Given the above-stated issues regarding energy dependence, the health implications of air pollution, and the implications of (and commitments to abate) climate change, there is a clear need to reform the status quo of the transport sector. Such changes to provide a low-carbon, sustainable urban transport network will require a paradigm shift. To help guide and coordinate strategies, a planning framework can be used to address these transportation issues. In particular, “Avoid-Shift-Improve” is an effective implementation strategy specifically designed for the transport sector:
• Avoid: refers to the need to minimize motorized trips. This can be achieved in several ways such as integrated urban planning, transit-oriented development, or changes in land-use. Avoid also encompasses the need to reduce travel time and length.
• Shift: refers to a shift in the way the trips are done and to an increased in travel efficiency. Shift can be visualized as a shift from privately own vehicles to public transport or more environmentally friendly modes of transportation.
• Improve: focuses on vehicle, fuel efficiency, infrastructure and technological improvements. It seeks to optimize technologies as to make them more efficient and cleaner.
Efforts to improve vehicle fuel economy generally fall in the “Improve” category of the “Avoid-Shift-Improve” framework. Within the suit of fuel efficient vehicle technologies, electric vehicles, with zero tailpipe emissions and increasing battery affordability, are emerging as an effective and pragmatic option for improving emissions (Bloomberg New Energy Finance 2018). The nascent stages of electric vehicle adoption have started to take root, and it is widely believed that electric vehicles technology will emerge as the leading technology in the global effort to improve fuel economy ((Bloomberg New Energy Finance 2018; Egbue and Long 2012; OECD/IEA 2018)).
The worldwide shift to electric vehicles will most likely have wide-reaching consequences for policy and technology. With their rapid diffusion and uptake, electric vehicles will pose a challenge for policymakers to keep suit and manage the disruption. The GFEI has proposed reaching a 100 million
3 Not considered in this scenario are urban planning and demand management solutions as well as a high penetration of alternative fuels. 4 Note that the 2DS calculates with probability: The two-degree scenario (2DS) plans an emissions trajectory which would result in a 50% chance of limiting average global temperature increase to 2°C.

DRAFT
9
electric vehicles by 2030, while acknowledging that the path towards this ambitious target is difficult and uncertain (Global Fuel Economy Initiative 2017b). But it is clear that electric vehicles will soon become a regular component of the global fleet. For APEC economies, under an Improved Efficiency Scenario, “policies aimed at promoting green vehicles or new vehicle technologies boost deployment of hybrids, PHEVs, EVs to 29% of the fleet, up from 22% in the BAU.” (APEC 2016, 101)
Storage and charging technologies are the central focus of innovation activities, which have led to significant improvement in size, weight, battery capacity and overall cost. Battery costs have fallen from US$1000/kWh in 2010 to US$599/kWh in 2013 to $209 in 2017 (Bloomberg New Energy Finance 2018).
In this context, it is important for car companies to innovate and not be left behind by continuous progress. Recent decisions in the aftermath of ‘Dieselgate’ in North America and Europe indicate that inefficient vehicles run the danger of being banned due to their costs to society, which are ascertained with increasing precision (Guardian 2018; Burch 2018). Just in 2017, France, the Netherlands, California, and major global cities announced steps to phase out the internal combustion engine in favor of electric vehicles. Such disruptive changes can leave certain vehicle groups as stranded assets and destroy economic value (Stockholm Environment Institute and Material Economics 2018).5 The best way to avoid this development in the transport sector is for policy to give clear performance guidelines in the form of fuel economy policies for markets and consumers to choose (ClimateWorks 2014).
Efficiency improvements can spur economic growth There is wide agreement that “fuel-efficiency improvements are essential for competitiveness in an increasingly global market” (Springer et al. 2014, 11). Therefore, many auto industries accept (and often surpass) tighter fuel economy standards and recognize the benefits for the rate with which they innovate (Nidumolu, et al.). Researchers also found that “recent changes in US and European standards have both increased the rate of technology adoption and affected the direction of technology adoption” (Klier and Linn 2016).
Improving fuel economy has great potential for improving economic prosperity and mobility The demands for sustainable development are urgent and enormous. At the same time, transport systems form the backbone for economic cooperation and prosperity of nations. The crucial question for APEC economies is how they will address the challenges and opportunities of economic growth and prosperity in the 21st century. Among the measures available, fuel economy improvements have very bright prospects to contribute positively to the economy. As a ClimateWorks report notes, the U.S. Environmental Protection Agency already established in 1999 that the quantifiable social benefits of fuel economy policies for passenger vehicles outweigh the additional costs “on the order of two to five times” (ClimateWorks 2014). This usually comes at a cost of less than 2% of the new car to the consumer.
Research by the New Climate Economy shows that economies can follow a prosperous growth pathway by utilizing efficiency and connectivity to achieve a higher economic output, productive investments in transport and infrastructure, as well as realizing health benefits, and reductions in carbon emissions (Zhao et al. 2016). Research on the economic potential of emerging cities demonstrates that
5 Fuel economy taxes are also debated with regard to the import of vehicles, and their implications for international trade and industry competitiveness; see e.g. (Resources for the Future 2016; Levinson 2017).

DRAFT
10
agglomeration effects and a high quality of life would also be able to attract direct investment (PricewaterhouseCoopers 2016). The productivity and competitiveness of vehicle fleets will no doubt play a large role in this undertaking.
Passenger vehicles are overall quite inefficient in their use of energy as only a fraction - due to idling, engine losses and transmission losses - is actually used to achieve mobility (Heck, Rogers, and Carroll 2014; Stockholm Environment Institute and Material Economics 2018, 39). However, the overarching goal of efficient and sustainable transport systems is to enable people to move towards better human development and economic opportunity. With the vast majority of fuel used inefficiently, the opportunity to capture the economic potential of fuel economy policies is now larger than ever.
1.2. Public policy is key to save fuel and emissions The goals and types of fuel economy policies Public policies can influence the fuel economy of land transport in various ways. Fuel economy of vehicles is defined as “the efficiency of the conversion of energy contained in the fuel to mechanical energy at the wheels that drive the vehicle (measured as distance travelled)” (International Energy Agency 2012a, 9). Fuel economy policies influence the characteristics of vehicles in their consumption of fuel, not the quality of the fuel or driving behavior.
The ultimate objective of fuel economy policies is to increase the fuel efficiency of the overall vehicle fleet on the roadway network. To achieve this goal, Anderson et al. (2011) notes that there are two chief reasons that governments enact fuel economy standards: (1) to ensure automakers produce more efficient vehicles and shift sales towards more fuel-efficient models, and (2) to allow consumers to better identify and rank the fuel efficiency of different makes and models of vehicles. Fuel economy policies aim at encouraging vehicle producers to develop more efficient vehicle fleets and invest in efficiency-related innovation. These fuel economy policies also may aim to educate consumers, and encourage them to buy more efficient vehicles that reduce relative fuel costs (International Council on Clean Transportation 2015).
--- BOX ---

DRAFT
11
1. Fuel economy is usually expressed in forms of “specific fuel consumption (Lge/100 km) or fuel economy (MPG or km/Lge)” (Global Fuel Economy Initiative 2016b, 15). The most consistent way of measuring fuel consumption would be by target unit per unit of distance, e.g. l/ 100km (often written as liter of gasoline equivalent (lge)) or g/km. In accordance with IEA and ICCT reporting, the terms fuel efficiency and fuel intensity can be used identically with fuel economy (International Energy Agency 2012a, 9; International Council on Clean Transportation 2007; Posada, Yang, and Blumberg 2017, 7) (see Box).
Technically, a difference between fuel consumption (input/distance) and fuel economy (distance/input) exists, where fuel consumption (equivalent) presents the better metric to evaluate fuel efficiency improvements to the consumer, to engineers or regulators. (With different vehicle technologies on the market, it is advisable to continue using the term fuel economy as to avoid confusion with the thermal efficiency of fuel combustion which does not apply to electric vehicles.) However, due to its longer-standing use, the term fuel economy often refers to policies which aim at reducing the fuel consumption or improving the fuel economy of cars.
The US approach to measure in miles per gallon is not recommendable as it represents a non-linear relationship and users regularly undervalue the value of fuel savings (Transportation Research Board and National Research Council 2010, 39).
2. Carbon emissions are highly correlated with fuel efficiency of vehicles, which is why both can be chosen as a target for policies (International Energy Agency 2012a, 9). As already noted in the 2008 APEC Survey of Policies and Programs that Promote Fuel-Efficient Transport in APEC Economies, many policies either address GHG emissions or fuel economy with the implicit understanding that the other target will be impacted indirectly as well (APEC 2008).
When measuring the emissions resulting from internal combustion (or other) technologies, different methodologies can be used, but usually the full lifecycle of fuel should be considered. The ICCT and GFEI in its publications estimate the full, or “well-to-wheel”, impacts of fuel production and use: “Many sources estimate direct CO2 emissions from fuel combustion, also known as tank-to-wheel (TTW) emissions; however, it is also important to consider the upstream, or well-to-tank (WTT) emissions that
Definitions: explainer box (see below)
1.
2.
3.

DRAFT
12
are generated from the extraction, refining, and distribution of transport fuels. The estimates in this report consider the full fuel lifecycle, or well-to-wheel (WTW) and include both combustion and upstream emissions” (International Council on Clean Transportation 2014a, 7). However, tank-to-wheel emissions constitute the larger share, with about 80% of total emissions. This reinforces the emphasis on fuel efficient vehicles.
Fuel quality also impacts the efficiency and emissions of a vehicle. Diesel engines emit less CO2 than gasoline engines, although at the expense of more local air pollutants (Brand 2016). The emissions intensity of new vehicles might change with the introduction of more electric and alternatively-fueled vehicles. Yet all relevant policy studies and scenarios attribute large significance to fuel economy measures that reduce gasoline or diesel consumption (Asian Development Bank 2017; Gallagher and Muehlegger 2011; Global Fuel Economy Initiative 2016b; International Energy Agency 2012b).
3. Passenger vehicles, also characterized as light-duty vehicles (LDVs) differ in their classification across regions and economies. National regulations and market segmentation within economies have produced differing shares of more fuel intensive light trucks. The different vehicle segmentation in economic markets impacts fuel economy, although it is not the only factor (Global Fuel Economy Initiative 2016b, 21).
With the different vehicle types on the market, some are classified according to their weight, others to their overall size, or footprint, others again due to their power or engine displacement (International Council on Clean Transportation 2017a). Recent methodological updates in fuel economy research allow to compare them consistently (Global Fuel Economy Initiative 2016b, 15).
Another change in methodology comes with the harmonization of fuel economy test cycles to the WLTC. So far, three test cycles have been applied to measure fuel efficiency: the European NEDC, the US Corporate Average Fuel Economy (CAFE) and the Japanese JC08. “Globally, the changes in methodology result in an increase in average specific fuel consumption of 13%” (Global Fuel Economy Initiative 2016b, 16), which renders the GFEI target of halving global fuel consumption per km of new LDVs by 2030 more difficult than previously assumed.
--- END BOX ---
Fuel economy policies can generally be distinguished in three categories: (1) normative measures such as standards or import restrictions, (2) economic instruments or incentive measures such as tradable permits, fees, and taxes, and (3) information measures such as labels, and information campaigns. The most common distinction is made between standards and economic instruments. In this publication, special emphasis will be paid to fiscal instruments, which form a subgroup of economic instruments. Fiscal instruments include taxes, fees and subsidies, and exclude quantity instruments such as permits and quotas.
Among APEC economies, both normative and information measures like fuel economy/CO2 standards and efficiency labels are in place in Australia, Canada, Japan, Korea, China and the United States. In addition, Chile, Mexico, New Zealand, Singapore, Chinese Taipei have implemented mandatory fuel efficiency labels (APEC 2016, 40). Development of fuel economy policies is under way in countries such as the Philippines, Singapore, Malaysia, Vietnam, Indonesia, and Thailand (Silitonga et al. 2012).

DRAFT
13
Policy instrument choice Academic research on fuel economy policy is now about two decades old (Greene 1998; Portney et al. 2003). Additionally, international institutions and think tanks like the World Resources Institute, the World Bank, the International Energy Agency, and the International Council on Clean Transportation also have produced early policy-oriented publications on international fuel economy policies (Faiz, Weaver, and Walsh 1996; An and Sauer 2004; Schipper 2008; Onoda 2008; International Council on Clean Transportation 2007). Currently, international efforts are coordinated in the Global Fuel Economy Initiative (GFEI).
Policy instruments differ in their effect in many ways, which can lead to confusion in their classification. For example, labeling policies typically mandate the disclosure and comparison of fuel economy values for vehicles. While this is a standard, it does not by itself have a direct effect on fuel economy, and is therefore characterized as an information measure. This policy rather enables more informed decision-making by buyers, which can lead to fuel savings and emission reductions. Consequently, testing and publishing fuel economy values to develop a fleet-wide baseline analysis is usually one of the first actions that governments undertake. This topic will be explored in more depth in Section 2.
Economic instruments are said to be more cost-efficient, while command-and-control instruments are more commonly implemented by policymakers (Santos et al. 2010). For a relevant overview of the discussion on economic efficiency of vehicle policies, see the recent literature review by Anderson and Sallee (2016).
For non-producing countries (‘technology takers’) without resources for enforcing a standard, a feebate system might be the best choice. “If the technical capacity does not exist, then clear fuel economy labeling combined with the good design of vehicle taxes based on the CO 2 emissions or fuel economy values can have a strong influence on ensuring manufacturers deliver better vehicles to the market.” (International Energy Agency 2012b, 25). For countries without domestic car industries, standards are less useful since they have to import. Therefore, they depend on the emission and fuel standards of others. Economic incentives can generate a shift towards importing only the more efficient vehicles.
Comparatively little attention has been paid to the effectiveness of economic instruments versus standards. There is a debate whether standards or economic instruments are easier to implement (measuring/labeling the vehicle fleet is always a prerequisite). ICCT (2010) and IEA (2012a) suggest that it might be easier, especially for developing countries, to implement economic instruments, since they carry a lower budgetary and administrative burden. “For countries where programs do not already exist, or for vehicle types that have not been regulated, feebates offer a quick and relatively easy way to begin reductions in fuel consumption and CO2” (International Council on Clean Transportation 2010, 16).
Grey literature has shifted more towards finding the appropriate policy mix, and enabling what is politically feasible for decarbonizing the transport sector (van der Vooren and Brouillat 2015; Yang et al. 2017; Lah 2017). Apart from economic optimality, this discussion increasingly considers revenue-neutrality and political feasibility as important components. A number of impact studies, for example, which econometrically measure the effects of introduced policies, are about one decade old. The

DRAFT
14
research on early fuel economy policies allows deriving best practices and inform successful policy in new contexts (Ryan, Ferreira, and Convery 2009; de Haan, Mueller, and Scholz 2009).
Limitations of fuel economy policies (new vehicles, rebound effect, unintended consequences) About 80% of new passenger vehicles globally are covered by an emissions or fuel economy regulation (International Council on Clean Transportation 2017a, 1). Fuel economy policies generally concern new vehicles only. This is mostly because the assessment of their characteristics is easier at the point of production and sale than measuring the existing fleet. For example, the Global Fuel Economy Initiative (GFEI) has set a target of halving the fuel consumption per km of new LDVs by 2030 (compared with 2005) (Global Fuel Economy Initiative 2017). However, this means that the fuel economy of the sum of vehicles on the road is worse than the specified values for new vehicles indicate. It is hard to obtain a global number for the share of new vehicles, but based on estimates from the OECD, one could assume that about 10% of the vehicle fleet is new (Gordon 2005; OECD 2009a, 11).
Four-wheel passenger vehicles are more uniform in nature and therefore easier to address. Only China has fuel economy regulations for two- and four-wheelers in place (Yang 2017). While regional contexts differ in their use of vehicle modes, for reasons of comparison (and of higher fuel and emissions impact), we will only compare light-duty passenger vehicles.
A similar limitation is the discrepancy in taxation between private and company cars. In Europe, about 50% of vehicles are owned by incorporated entities with lower tax burdens, which might reduce the impact of consumer-oriented fuel economy policies.6
Plotkin noted that, for the US market, within a “30–50% improvement over a 12–15 year period” (Plotkin 2009, 3848) is possible and economically rational. However, large fuel economy improvements have not materialized “mainly because of a shift towards bigger, more powerful vehicles” (International Energy Agency 2012a, 8). This phenomenon of increasing consumer demand for more emitting vehicles is explored by the literature in detail and negates some of the fuel savings of higher fuel economy (Ó Gallachóir et al. 2009; Knittel 2011)
One effect of every energy efficiency improvement is that the use of the tool has become less energy-intensive, thereby incentivizing more frequent use of it, effectively negating the savings. This rebound effect also occurs with more efficient vehicles, which allow consumers to travel greater distances at the same fuel consumption. There is some debate in the fuel economy literature and in environmental policy in general about the scope of the rebound effect, while recent analysis suggests only a minor rebound effect of 10-20% is likely (Hymel and Small 2015; Gillingham et al. 2016).
Notwithstanding the actual reduction in fuel consumption spurred by efficiency measures, it is useful to adopt a wider perspective on solutions for the transport sector. Much of human mobility is dependent on the infrastructure and available modes of transport. A comprehensive implementation strategy
6 “Company cars represent half of the entire passenger car fleet in Europe, and their purchase is subsidized. This subsidy has the effect of greatly diminishing the effect of existing fiscal policies, and substantially greater CO2 reduction can be realized if this incentive-distorting subsidy is removed. Both company and private car taxes should be linked to vehicle CO2 performance.” (International Council on Clean Transportation 2011, 11)

DRAFT
15
specifically designed for the transport sector is the Avoid-Shift-Improve approach (mentioned at the beginning of this paper), which aims to simultaneously encourage higher system, trip and vehicle efficiency (Dalkmann and Brannigan 2007). “Avoid” refers to minimizing motorized trips through changes in land use or policies like congestion pricing. “Shift” refers to tilting the modal split toward more public transport and non-motorized travel. “Improve” focuses on technological advances to reduce emissions, such as improving fuel quality and vehicle electrification.
In its analysis of requirements for a decarbonization of the transport sector, the Partnership on Sustainable Low Carbon Transport (SLoCaT) identified 20 actions which can be implemented immediately before 2020. These steps would contribute to reducing GHG emissions and making progress on the Sustainable Development Goals (SDGs), within an Avoid-Shift-Improve framework.
Lastly, the difficulties in selecting the right attributes and targets for measuring fuel economy can lead to unintended consequences and even perverse incentives. Examples for this are the comparatively less stringent CAFE standards for the class of light-duty trucks and sport utility vehicles (SUVs) in the United States, which have enabled the rapid expansion of this vehicle class (Plotkin 2009; Carley et al. 2017; Yacobucci and Bamberger 2006; International Council on Clean Transportation 2017a). Another example is visible in the (assumed) benefits of lower GHG emissions for diesel vehicles, which have created pathways for large shares of diesel vehicles in the European Union (Leinert et al. 2013). As revealed by the ‘Dieselgate’ emissions scandal, the discrepancy between ‘real world’ and ‘official’ emissions is much larger than assumed, and so are the impacts on human health (Brand 2016).
Not considered further in this analysis
There is a number of additional policies that are not part of the investigation. While they are traditionally not considered fuel economy policies, they can serve to support fuel efficiency and facilitate the uptake of better fuel economy.
• Scrappage schemes have played a large economic role as stimuli during the financial recession, inter alia justified on environmental terms. However, the evidence of their effect in improving fuel efficiency is limited (Hsu and Sperling 1994; Jacobsen and Van Benthem 2015; Grigolon, Leheyda, and Verboven 2016).
• Infrastructure policy, which incorporates building preferential HOV (high occupancy vehicles) lanes for buses or electric cars, parking restrictions, and other transit-oriented development (TOD) measures have a huge impact on the transport mode share, but less directly on vehicle efficiency improvements (Cervero and Sullivan 2011).
• Technology-specific measures (e.g. requirements for providing charging infrastructure for electric vehicles) or government investment in research and development can work in support of more efficient vehicles.
• Increased public attention has been paid to monitoring and enforcement of testing protocols following the 2015 Volkswagen scandal, with consequences that point toward more international standardization on emission and consumption values (International Council on Clean Transportation 2017b). This development makes it more difficult for European fuel

DRAFT
16
economy targets to be met, but at the same time has spurred harmonization of global tests and targets (Resources for the Future 2016).
2. Policies for vehicle fuel economy: standards, incentives, and information measures
2.1. Introduction to different policy types “Most industrialized countries have established programmes to address transportation-related GHG emissions. Fuel economy programmes and GHG emission targets, either mandatory or voluntary, have proven to be among the most cost-effective tools” (An, Earley, and Green-Weiskel 2011, 1)
Both in theory and in practice, there exist many public policies to achieve a more efficient fuel use in the transport sector. In the context of established vehicle policies, there are a number of relevant measures to improve fuel economy.7 The most common ones can generally be distinguished in three categories: (1) normative measures such as standards or import restrictions, (2) incentive measures such as taxes, fees, or tradable permits, and (3) information measures such as fuel efficiency labels.
Fuel economy policies have proven to be successful policy tools to reduce fuel consumption on a per-vehicle base and generally made vehicle fleets more efficient (An and Sauer 2004; International Council on Clean Transportation 2017a). This does not mean that they are necessarily the best or most efficient policy tools to achieve the goals of fuel and emissions reduction (Goulder and Parry 2008).
---BOX
The Global Fuel Economy Initiative (GFEI) is a partnership of the International Energy Agency (IEA), United Nations Environment Programme (UNEP), International Transport Forum of the OECD (ITF), International Council on Clean Transportation (ICCT), Institute for Transportation Studies at UC Davis, and the FIA Foundation. Since its establishment in 2009, GFEI has become a global initiative to drive policy processes for increased fuel economy as part of energy efficiency.
The idea of the initiative is to coordinate global fuel economy developments and provide a unified platform for the process of maximizing fuel efficiency and reducing transport emissions. Its members engage in global and regional research and data analysis, provide on-the-ground support for national and regional policy-making, and promote fuel economy through outreach and awareness campaigns raising to public and private stakeholders. GFEI’s targets are to improve worldwide new car fuel economy by 30% by 2020, by 50% by 2030, and by 50% for all vehicles by 2050 (Global Fuel Economy Initiative 2016a).
7 No uniform way of categorizing them exists, which can be challenging for policy advisors. On first impression, these definitional issues may seem unimportant and even unnecessarily confusing. They do, however, precede some important considerations on policy choice and consequences, and therefore validate the attempt to establish a comprehensive and systematic understanding.

DRAFT
17
The GFEI also supports efforts towards significant fuel economy policies in such diverse places like Indonesia, Kenya, Ethiopia and Chile. An important step prior to the adoption of a policy is the analysis and development of national fuel economy baselines. (https://www.globalfueleconomy.org/about-gfei)
--- END BOX
There are five different categories of fuel economy measures identified by the GFEI: regulatory policies, economic instruments, traffic control measures, information, and technology. Viewed holistically, efficiency improvements could happen in every one of four target areas of “Improve vehicles, Improve fuels, Improve driving habits, Optimise infrastructure/systems to reduce congestion and delays” (Global Fuel Economy Initiative 2011). However, the most impactful intervention in the transport sector for now lies in the improvement of fuel economy of vehicles, where existing technology could cut transport emissions in half by 2050 (Global Fuel Economy Initiative 2016a).
For the scope of this analysis, we will only consider regulatory, economic, and informational fuel economy measures, with a special emphasis on economic measures. These three policy types directly influence consumers or producers to buy or produce vehicles with improved fuel efficiency. On the other side, traffic and congestion control only impact fuel economy decisions very indirectly, while technology measures usually follow economic considerations induced prior by policies. We will put special emphasis to fiscal instruments, which form a subgroup of economic instruments. Fiscal instruments include taxes, fees and subsidies, and exclude quantity instruments such as permits and quotas.
An exception to the covered vehicle policies are fuel standards or taxes, since they regulate the quality or price of fuel consumed by vehicles, not its application in the vehicle. Since fuel tax policy is very efficient in influencing fuel use and comes close to the idea of a carbon tax, we will include it in the analysis. Fuel taxes and subsidy reform count among the most effective tools to reduce inefficient emissions from vehicles, since they are applicable to all vehicles (not just new vehicles) driving on the roads (Anderson and Sallee 2016).
Both economic and informational instruments receive only secondary treatment in the most recent ICCT publication as “Complementary Vehicle Fuel Economy Policies” (International Council on Clean Transportation 2017a, 24). For that reason, it is useful to start with a brief synopsis of fuel economy standards.
2.2. Fuel economy standards Traditionally, standards have been the oldest regulatory measure to promote efficient use of fuels. The US were the first country to introduce vehicle emission standards with Congress enacting the Corporate Average Fuel Economy (CAFE) standards in 1975. The main aim of the standards was to reduce energy consumption by increasing the fuel economy of vehicles after the oil crisis (Santos et al. 2010, 10). They also serve to make consumer decisions more rational and internalize social costs/reduce GHG emissions (Greene 1998; Plotkin 2009).CAFE standards subsequently improved fuel economy and were increased over the first years, although they saw little increase in stringency until 2009, when the Obama

DRAFT
18
administration introduced more ambitious targets. Overall, the CAFE program can be seen as a success, although a limited one (Greene 1998; Anderson and Sallee 2016; Carley et al. 2017).
Other economies followed the US much later. The European Union settled for voluntary agreements with auto maker associations on CO2 standards for passenger vehicles in 1998. When it became apparent that the industry was not going to achieve the agreed targets, the EU set mandatory standards from 2009 on. Most standards today result in mandatory improvements or tradeoffs for car makers. Japan, China, and South Korea also developed fuel economy standards in 1999, 2004, and 2004 respectively.
In 2017, there were 9 economies (Brazil, Canada, China, India, Japan, Mexico, Saudi Arabia, South Korea, and the United States) and the European Union that have established fuel economy or GHG emission standards for light-duty vehicles (LDV) (International Council on Clean Transportation 2017a, 1).
Standards usually come in the form of fleet-wide standards that allow manufacturers to trade of more efficient vehicles against higher consuming ones. Allowing flexible systems, e.g. with tradable credits encourages early adoption and technology innovation and reduces the cost of compliance for manufacturers (ICCT 2017, 17). In some regions (notably the United States and Europe) attribute-based strategies, with standards based on vehicle weight or size, are being considered in fuel economy policies.
Frequent criticisms of standards state that they are costlier and that they are not as efficient as taxes, because they induce a “rebound effect” by lowering the cost of driving (Plotkin 2009, 3843–3844). (Research related to fuel efficiency rebound effects is discussed above, in Section 1.2.) However, the program efficiency depends as much on the stringency as on the specific structure a of the program; for example, the different categorization of cars and (light-duty) trucks in the US CAFE standards for a long time was a major market distortion and barrier to improved fuel economy (Fischer, Harrington, and Parry 2007; Killeen and Levinson 2017).
2.3. Economic Instruments Economic instruments utilize incentives to generate a change in the behavior of individuals, e.g. to purchase more efficient vehicles. These policies, also known as incentive-based (IB) or market-based (MB) instruments, generally operate better in market economies where supply and demand are strong determinants of prices and quantities of goods and services (Goulder and Parry 2008). The most prominent economic instruments are taxes and quotas in different variations.
Taxes (and other fiscal instruments) apply a price signal to a non-intended (or intended) activity, such as emissions or congestion, and thereby make this behavior costlier to the end-user. There exist various names for the application of tax policies for fuel economy (e.g. Vehicle Tax Incentives Promoting Higher Fuel Economy; price-based instruments), but it is most correct to describe them as levies or taxes.8 Fuel taxation, for example, raises the final price of fuels to include externalities not accounted for in the wholesale price.
8 Although there are certain differences between the effects of taxes and subsidies on individual behavior and political economy, it is conceptually correct to classify subsidies as negative taxes (Jaffe and Stavins 1995).

DRAFT
19
In transport, taxes can help consumers appreciate fuel efficiency savings over the full lifecycle of a vehicle. Vehicle taxes commonly are levied either at the point of sale or registration, or recurrently during the ownership and usage of the vehicle (Plotkin 2016). Taxes are most efficient when they constitute non-fixed, ownership charges (International Council on Clean Transportation 2011).
To promote fuel economy, policies that address the characteristics of vehicles are more (GHG-) relevant than those addressing the characteristics of fuels and driving behavior.9 One example of the former is a vehicle registration tax, which adds a usually one-time fee for the licensing of a new vehicle. On the other side, subsidies for electric vehicles add incentives to the purchase of less-emitting engines.
The IEA and ICCT provide regular updates on standards, but not on incentive instruments. Recently, though, assessments have recommended a combination of tax policy and regulatory measures to stimulate energy efficiency in transportation (Global Fuel Economy Initiative 2016b; Yang et al. 2017). Particularly differentiated vehicle taxes, feebates, and green vehicle taxes have garnered more prominence over the past decade (Greene et al. 2005; Anderson et al. 2011; Durrmeyer and Samano 2017). They are accompanied by a growing literature on fuel tax reform, consumer behavior, and subsidies for alternative and electric vehicles (Greene et al. 2005; Sterner 2007; Arze del Granado, Coady, and Gillingham 2012; International Energy Agency 2017b).
Quotas or permits regulate a specific amount of an activity in a location that is permitted and whose violation will be penalized. Allowances function similarly, although they provide transferable permissions. Marketable allowances can be either auctioned off or grandfathered (given out for free) by a government (Santos et al. 2010, 8).
A market regulator can issue a specific number of permits that permits market participants to conduct an activity, incl. transferring their permits. Permits can be auctioned or grandfathered based on past performance. As (Santos et al. 2010, 9) describe, taxes are mostly preferable to permits since they provide a more certain price signal, have a better fiscal impact, and can be designed better for purpose. Generally, permits do not find wide-ranging application in the transport sector, although transport has been included in various environmental trading systems (Han et al. 2017; Flachsland et al. 2011).
2.4. Examples of Fiscal Policies Fiscal policies exist in a growing number of economies (ICCT 2017a, 24). In 2010, 17 European countries (covering all major car manufacturing countries in western Europe) had installed fiscal policies (International Council on Clean Transportation 2011, 12). Based on OECD classification, there are as many as 46 economies that have vehicle taxes in place (based on count in OECD Database on Environmental Taxation, with revenue in %GDP >0, category defined as “one-off import or sales taxes on transport equipment, recurrent taxes on ownership, registration or road use of motor vehicles, and other transport-related taxes, excluding excise taxes on automotive fuels”) http://www.oecd.org/env/tools-evaluation/environmentaltaxation.htm
9 Fuel taxes are very relevant to saving fuel, and might even be the more direct instrument to reduce emissions; however, they do not directly influence the decisions of producers and consumers regarding more efficient vehicles (see e.g. Montag 2015; Frondel et al. 2013; Dineen et al 2017).

DRAFT
20
In a 2014 working paper on early promotion schemes for electric vehicles, the ICCT describes four tax measures in addition to subsidies or hybrid measures like feebates: sales taxes/VAT, one-time purchase/registration taxes, annual circulation taxes, and company car taxes (International Council on Clean Transportation 2014b, 8–9). The focus of the ICCT paper on electric vehicles allows for direct comparison to fuel economy policies for all vehicles.
Taxes and fees for fuel economy thus can be generally grouped in four categories (Dineen, Ryan, and Ó Gallachóir 2017, 3):
1. Fuel taxes: Also called a “gas tax,” these are taxes levied per unit of fuel sold. 2. Purchase and Registration Taxes: Taxes on acquisitions, at the time of purchase of the vehicle:
value-added tax (VAT) and registration tax (RT) 3. Annual Circulation Taxes/Excise Duties: Taxes on vehicle ownership, such as annual motor
taxes, termed here circulation tax 4. Feebates: A combination of purchase fees and rebates, known as feebates.
These four policy types will be explored in more detail in the section below. (Please note that in the section below, Purchase and Registration Taxes and Annual Circulation Taxes/Excise Duties are both discussed under the umbrella of Differentiated Vehicle taxes.
2.4.1. Fuel taxes Fuel taxes are a common measure for governments to gain revenue, e.g. to finance transport infrastructure. In the past decade, they have also garnered recognition as the “single most powerful climate policy instrument implemented to date” (Sterner 2007, 3194). Fuel taxes can account for the gap between the private and the social costs of driving by increasing the price of consumed fuel (UNDP 2018; Montag 2015). In contrast to fuel economy standards and other measures intended to raise the efficiency of vehicles, fuel taxes provide incentives to drive less to all drivers. Fuel taxation therefore comes closer to an optimal policy than conventional standards (Parry, Walls, and Harrington 2007). Montag (2015, 148) summarizes that “other policies, such as a car tax, may complement fuel taxes but are not substitutes.” This also follows from the theory on externality pricing: “In most cases, a correctly calculated externality tax on the purchase price of a new vehicle is likely to be a small fraction of that purchase price whereas a correctly calculated externality tax at the point of use is likely to be a relatively larger fraction of the price of use. Hence, the latter is likely to have a greater impact on the consumer’s decision than the former.” (OECD 2009a, 12). For a discussion on the rebound effect, see Section 1.2 and Gillingham et al (2016).
Recent research has compared the value of taxing fuels versus pricing the efficiency characteristics of cars. Despite the short-term thinking of consumers when buying a car (Greene et al. 2005; Greene, German, and Delucchi 2009), fuel taxes are a more effective instrument than vehicle taxes in reducing emissions (Grigolon, Reynaert, and Verboven 2017). The reason is consumer heterogeneity in annual mileage – fuel taxes have a bigger impact on those drivers with a higher mileage, thereby curbing emissions more. Fuel taxes are elastic in the long run but quite inelastic in the short run (Sterner 2007), although a higher elasticity is assumed outside of the US (Plotkin 2016). If the goal itself was to increase fuel efficiency of the fleet alone, disregarding aggregate emissions, measures to increase the upfront price of inefficient vehicles like purchase or registration taxes would be better suited.

DRAFT
21
However, unfortunately some governments also subsidize fuel use with the aim to support other development agendas (Global Subsidies Initiative 2009). Suffice to say that the starting point for increasing fuel taxes to account for externalities is to ensure no adverse fuel subsidies are in place. Where relevant, equity concerns can be addressed through policy design (Jakob et al. 2015; Van de Graaf and van Asselt 2017).
Fuel taxes widely differ across economies (Ley and Boccardo 2010). Many members of the European Union like the Netherlands, the United Kingdom, and Germany have traditionally had high fuel taxation, which has impacted the fuel efficiency of passenger vehicles (Ryan, Ferreira, and Convery 2009; Frondel and Vance 2013; Santos 2017). However, there is no uniform or coordinated fuel taxation within the EU, and member states have been reluctant to surrender national tax authority despite benefits from a green fiscal policy standpoint (Frondel and Vance 2013). Among non-EU-economies, Hong Kong, Brazil, South Korea and Uganda have relatively high fuel taxes (Ley and Boccardo 2010). India, China, and Indonesia have recently made strides in reducing fuel subsidies (Dartanto 2013; Dansie et al 2010).
There are both advantages and challenges to introducing higher fuel taxes, the main difficulty being political acceptability (Aldy 2017). The case of British Columbia, the Canadian province that introduced a revenue-neutral carbon tax, has therefore drawn much attention. Here revenues generated from a tax specified based on the carbon intensity on activities were used to reduce income taxes and offset particularly affected sectors (Murray and Rivers 2015). Santos (2017) finds that fuel taxes already work to a varying level as corrective taxes of European road transport externalities. However, particularly externalities from diesel fuel are less accounted for. Besides, fuel taxes in EU member states have effectively decreased since they are not automatically updated for inflation (Transport & Environment 2011). In addition, addressing the full costs of congestion and crashes requires further policies.
2.4.2. Differentiated Vehicle taxes There is a number of vehicle-related taxation measures that impact the fuel economy of vehicles (Yang et al. 2017). An overview on fiscal instruments for vehicle efficiency can be found in Review and Comparative Analysis of Fiscal Policies (International Council on Clean Transportation 2011).
In 2010, there were 16 economies with CO2 emissions- or fuel consumption-related taxes on light-duty vehicles that were applied at either purchase and registration or annually during the use (OECD 2009b). Most of them were in Europe, where vehicle taxes have been in place prior to mandatory standards (see TABLE XXX below). When it was clear that the policy mix did not have the intended effect, the EU additionally introduced emissions standards (Ryan, Ferreira, and Convery 2009, 365). In the meantime, ownership of light duty vehicles in relationship to their efficiency has become subject to taxation in other parts of the world, like in China, India, South Africa and Turkey (International Council on Clean Transportation 2017a, 24).
Most of the taxes in place were directly dependent on the CO2 emissions per km of the vehicles driven, with a roughly equal split between upfront and recurring taxes. Differentiated, or non-fixed charges (fixed charges are all those applied to vehicles independently of their fuel consumption or emissions, such as sales taxes (International Council on Clean Transportation 2011, 13)) are most relevant to fuel economy and emissions efforts. Ideally, there is a continuous rate that correlates the efficiency to the monetary charge applied.

DRAFT
22
There is sufficient evidence to reasonably claim that direct CO2-based taxation is more effective in lowering emissions and reducing fuel costs than indirect taxation (Dineen, Ryan, and Ó Gallachóir 2017). Of particular relevance is that vehicle taxes can be a standalone measure to improve fuel economy: “Differentiated vehicle taxation was effective even when not coupled with fuel economy standards, especially in markets with lower purchasing power due to low average income levels (the case of South Africa is especially interesting in this respect).” (Global Fuel Economy Initiative 2016c, 9) Indirect CO2 taxation, e.g. through taxation of vehicle attributes such as engine size or vehicle weight, has a more varied effect (Yang et al. 2017, 14). As shown by (OECD 2009b), both upfront and recurring taxes vary widely in their effectiveness. For example, Portugal, Norway, and Ireland have quite steeply differentiated taxes that incentivize lower emission vehicles, while Canada’s and Austria’s taxes do not discriminate among vehicles that differ by 100g CO2 per km. Additionally, tax effects on the relationship between petrol and diesel vehicles can sometimes, as in the case of Ireland, have perverse/unintended outcomes (Leinert et al. 2013).
There seems to exist some disagreement in the literature on whether upfront purchase and registration taxes or annual ownership taxes have a higher efficiency potential (Gerlagh et al. 2016; Brand, Anable, and Tran 2013; Ryan, Ferreira, and Convery 2009; Montag 2015). Many studies investigate the impacts of vehicle taxation schemes (Vance and Mehlin 2009; Gallagher and Muehlegger 2011; Huse and Lucinda 2013; Gerlagh et al. 2016; Malina 2016; Dineen, Ryan, and Ó Gallachóir 2017; Fridstrøm and Østli 2017), without coming to a clear decision between different tax schemes.
The question is partly what instrument will have a higher effect on the consumer – an upfront tax that counters myopic discounting or a recurring tax that encourages switching to a more efficient vehicle sooner. Tax rates per ton of CO2 over the (estimated) lifetime of a vehicle are higher for recurrent than for upfront taxes (OECD 2009b, 14), which would speak to their higher potential for fuel economy. Some early researchers indicated a higher impact for annual circulation taxes (Ryan et al 2009) (Santos et al 2010, 30). But realistically applying a discount rate reduces the value of recurrent taxes to a small difference to upfront taxes. Speaking in favor of upfront taxes, they present a higher potential for internalization, which would make upfront registration taxes more effective than that annual circulation taxes (Gerlagh et al. 2016, 106).
Purchase & registration taxes The impact of registration taxes on average vehicle emissions is not significant when country-specific characteristics are considered (Ryan, Ferreira, and Convery 2009; Santos et al. 2010, 29). To further complicate the picture, there might be fine-grained differences whether a tax is levied at purchase point through sales or by the customer at point of registration. Evaluations of sales tax waivers and other tax policies indicate that higher, fuel economy-dependent purchase fees or feebates may steer consumers more effectively towards efficient vehicles than higher fees at the point of registration (Gallagher and Muehlegger 2011).
Circulation taxes / excise duties Circulation or road taxes, also known as excise duties, are taxes which are paid on a continuous basis (usually annually or monthly). These taxes are often paid in conjuncture with annual registration fees, and are traditionally justified as a tax on vehicles to utilize a public road (Gass et al 2011). While the concept

DRAFT
23
of taxing for the privilege of using a vehicle on a public right-of-way is not new, circulation taxes are increasingly being weighted by emissions and fuel efficiency standards in some countries (Ajanovic and Haas 2016; Malina 2016). For example, Malina (2016) finds that at least 13 countries Europe now levy an adjustable circulation tax which is dependent on vehicle efficiency characteristics – mainly based on CO2 emissions, but also commonly on factors such as engine size, vehicle weight, and fuel type.
Example of The Netherlands The Netherlands provide a positive example of an economy that has focused its tax policies towards more efficient vehicles since 2010. Previously a fixed percentage of the purchase price, the vehicle registration tax now proportionately reflects the CO2 emissions of a new vehicle. Similarly, a higher annual circulation tax applies to high-emitting vehicles, while zero or low emission vehicles are exempt. Additionally, there exist incentives to stimulate a quicker adoption of hybrid and electric cars (Smit 2016).
The Netherlands provide a case where fuel economy and emissions intensity of vehicles was worse-than-average in the comparison to European neighbor, but saw the biggest improvement due to CO2-differentiated taxes (Dineen, Ryan, and Ó Gallachóir 2017).
Figure XXX: European examples of differentiated vehicle taxes (OECD 2009b, 6)

DRAFT
24
Figure XXX: Global schemes of differentiated vehicle taxes https://www.cesifo-group.de/ifoHome/facts/DICE/Infrastructure/Transportation/General-Transport-Policy/overview-vehicle-taxation-scheme/fileBinary/Overview-vehicle-taxation-schemes.pdf

DRAFT
25
2.4.3. Feebates Feebates are a combination between fees for less efficient and rebates, or discounts, for the purchase of more efficient vehicles. “The basic idea of a feebate is simple. Buyers of inefficient vehicles are levied a surcharge (the “fee”), while buyers of efficient vehicles are awarded a rebate (the “bate”).” (RMI 2010 blog). The ICCT 2010 report defines feebates as a “program that imposes a fee on vehicles that perform worse than a specified benchmark and awards a rebate to vehicles that perform better than the specified benchmark” (International Council on Clean Transportation 2010, 8).
Feebates aim at correcting market failures and providing incentives for both the reduction of inefficient and the accelerated adoption of efficient vehicles. While feebates can make consumer decisions more rational by pricing in myopia, the largest impact of a feebate system is a longer-term manufacturer response (International Council on Clean Transportation 2010, 38). However, feebates can be beneficial for consumers and producers alike, e.g. providing better consumer information, encouraging more innovation, saving fuel and money, and reducing environmental impact (Greene et al. 2005; D’Haultfœuille, Givord, and Boutin 2014).
Feebates, if designed properly, can have a high impact and provide additional price signals (Greene et al 2005; Santos et al 2010, 20). In contrast to a tax, the feebate incorporates a visible incentive to the consumer for purchasing the more efficient vehicle, rendering an overall more effective price signal and efficient GHG mitigation approach. However, many considerations relevant to differentiated vehicle taxes also apply to feebates.
Feebates require prior analysis and clear labeling of fuel economy classes to determine where to set the pivot point, as a marker between the bonus and the malus vehicles receive. This classification can be independent of vehicle size and do not need to discriminate against, only within a larger vehicle class (RMI 2010 blog). As with vehicle taxes, discontinuities and step functions always reduce the effectiveness of a feebate system, but might be easier to introduce initially (see e.g. France and Singapore) (International Council on Clean Transportation 2010, 38).
According to the ICCT, there are five features of a good feebate design (International Council on Clean Transportation 2010, 38):
1. Continuous incentive: a slightly more efficient vehicle looks slightly better from a financial perspective, even beyond a required minimum standard
2. Informing consumer decision-making upfront: more life-time costs are made visible at buying point 3. Technology-neutral price signal: no matter what kind of brand or fuel type, the feebate does not
discriminate 4. Dynamically improving pivot point: ambitions and rate rise over time, and formerly incentivized
vehicles get penalized after a while10 5. Long-term, few revisions: the overall structure remains stable and allows for planning
10 “A "benchmark" (also known as a pivot point) defines who pays and who receives benefits by setting a level of fuel economy or emissions (e.g. in gCO2/km). A "rate" determines the marginal costs and benefits (usually priced in cost per g/CO2). Depending on the choice of benchmark, feebates can produce revenue, be revenue neutral or be a net subsidy to cleaner, fuel efficient car purchases.” https://www.globalfueleconomy.org/transport/gfei/autotool/approaches/economic_instruments/fee_bate.asp

DRAFT
26
Detailed research on feebate systems exist for France, Norway, Denmark, Singapore and the US state of California. “For countries where programs do not already exist, or for vehicle types that have not been regulated, feebates offer a quick and relatively easy way to begin reductions in fuel consumption and CO2” (International Council on Clean Transportation 2010, 16).
Initial reviews of this fairly recent policy show a promising impact: “[…] car purchase feebate policies are shown to be the most effective in accelerating low carbon technology uptake, reducing life cycle greenhouse gas emissions and, if designed carefully and adjusted over time, can avoid overburdening consumers with ever more taxation whilst ensuring revenue neutrality. […] in order to achieve the transition to a low carbon transport system governments should focus on designing incentive schemes with strong up-front price signals that reward ‘low carbon’ and penalize ‘high carbon’ “(Brand, Anable, and Tran 2013, 146).
Example of France: Various countries have implemented feebate programs, although none have met all these design criteria. Out of the European examples, the French feebate system is often deemed the most effective one. In 2008, fleet-wide emissions intensity was reduced by 9 gCO2/km, equivalent to a marginal CO2 cost rate of US$29 per gCO2/km (International Council on Clean Transportation 2011, 22).
The feebate program in France, also known as the “bonus/malus" policy, was launched in 2008. This policy directly aimed to influence consumer decisions, with a scheme of taxes and rebates which varied depending on the CO2 emissions of new cars. To navigate political barriers, the feebate policy was initially designed to be revenue-neutral, with the amount of revenue collected by the fees matching the amount of subsidies dispersed through the rebates. Originally, rebates ranged from 200 to 1,000 Euros for low-emission vehicles (defined as emitting less than 130 g/km) and fees ranged from 200 to 2,600 Euros for high-emission vehicles (defined as emitting more than 160 g/km). The feebate chiefly affected the consumer side of the automobile industry, since the feebate was paid or received only once, at the time of sale of a vehicle, and covered all new vehicles (including those purchased or manufactured abroad) (Zifei Yang 2018; Durrmeyer and Samano 2017). Since the French feebate policy was established in 2008, (as well as other standards within France and across the EU), the French vehicle fleet average CO2 emissions have steadily declined. While this result is promising, lower average CO2 emissions made it increasingly difficult for the feebate system to stay revenue neutral, since cleaner vehicle averages meant less fees were collected and more rebates were provided. The policy did include a stepwise fee structure to account for cleaner future emission norms, however this function did not adequately maintain parity between the feebate system and emission trends. To address this issue, in 2017, a continuous function was introduced to dictate the emissions standards to set the fees for the policy. This continuous fee structure allows for a constant impetus to increase vehicle efficiency, as opposed to the incremental incentives provided under the stepwise model (Zifei Yang 2018). Comparative analysis suggests that the French feebate program could be further improved by instituting higher fees (as in Ireland), in addition to a continuous fee structure (International Council on Clean Transportation 2010; Brand, Anable, and Tran 2013; Durrmeyer and Samano 2017; Rivers and Schaufele 2017)

DRAFT
27
Example of Singapore: The city-state of Singapore introduced a feebate under the name of Carbon Emissions-Based Vehicle Scheme (CEVS) to encourage the purchasing of more fuel-efficient vehicles. Vehicles emitting 135g CO2 per kilometer will receive a rebate on their registration fee, while vehicles with emissions beyond 185g CO2/km will be charged an additional fee. The monetary incentive ranges from $5,000 to $30,000 (Singaporean dollars, roughly equivalent US $3,750 to $15,000) (GFEI 2018).
More stringent rules (up to 50% higher rate) applies to taxis in order to induce a shift to low-carbon fleets for vehicles with more kilometers travelled. Diesel vehicles are excluded from the feebate benefits due to the high emittance of fine particular matter (GFEI 2018).
The CEVS was in place from January 2013 until June 2017. The CEVS has now been succeeded by the Vehicular Emissions Scheme (VES), which also covers other pollutants (hydrocarbons (HC), carbon monoxide (CO), nitrogen oxides (NOx) and particulate matter (PM)). The feebate will be determined by the worst-performing pollutant to encourage low emission vehicle selection. The reform is accompanied by a re-designed fuel economy label that includes better consumer information (Singapore Land Transport Authority 2017).
3. Lessons learned from national experiences & application potential for APEC
The existing literature and international experiences offer a wealth of knowledge which can help guide APEC countries and cities in their endeavors to improve vehicle fuel economy. While there is a constant need to conduct more research and to reevaluate case studies, the existing sources can provide valuable insight on how to create and improve fiscal policies. Below are some of the key lessons learned from the international experiences with fiscal fuel economy policies.
3.1. An imperfect policy is usually better than no policy
The first step towards improving fuel economy and lowing emissions through fiscal policies is simply to establish some sort of fiscal policy. Policy makers that have no experience or history with fuel economy policies need to overcome their tendency to take inaction in the face of uncertainty. One way for a government to spur the creation of policies is to test and publish fuel economy values to develop a fleet-wide baseline analysis.
Initial policies are essential and act as building blocks for future improvements. Programs to address fuel emissions and fuel economy have shown to be important and cost-effective ways to improve sustainability (An, Earley, and Green-Weiskel 2011; An and Sauer 2004; International Council on Clean Transportation 2017a) Therefore, it is important for governments to establish polices, even if there are imperfect.
Even if a fiscal policy is unable to achieve its desired sustainability targets at its inception, it can provide valuable experience for creating strong future policy. Many of the most publicized and successful case

DRAFT
28
studies often faced adversity and challenges. The feebate system in France, for example, needed to completely overhaul its fee structure to stay relevant and financially viable (Varun Sivaram 2013; Zifei Yang 2018). Likewise, the CAFE standards in the United States initially created a perverse incentive for manufactures to expand their production of light-duty trucks and sports utility vehicles (Plotkin 2009; Carley et al. 2017; Yacobucci and Bamberger 2006). Despite these challenges, both of these case studies implemented changes (to varying degrees of effectiveness) to address the problems they faced. The success of a program to address fuel emissions and/or fuel economy often lies not in its creation, but in its ability to adapt to identified issues.
3.2. Tax policies may be easier to implement than other public policies
For policy makers and countries at the nascent stages of their fiscal policy endeavor, one lesson to consider is that it might be most feasible for new economies to begin with CO2-based taxation of vehicles, beginning with new and currently-used vehicles. In accordance with most observations, “the introduction and enforcement of taxation schemes is generally easier than compared to the enforcement of vehicle CO2 emission standards.” (Yang et al. 2017, 14), and the lowest threshold for effective fuel economy measures should be chosen. Unlike emission standards, taxes can help consumers appreciate fuel efficiency savings over the full lifecycle of a vehicle, especially when they constitute direct, non-fixed, ownership charges (International Council on Clean Transportation 2011). This is especially true for countries without domestic car industries, where standards are difficult to enact since all automobiles are imported. For these so called “technology taker” countries, tax incentives can generate a shift towards importing only the more efficient vehicles. Taxes are also mostly preferable to permits, since taxes provide a more certain price signal, have a better fiscal impact, and can be designed better for purpose (Han et al. 2017; Flachsland et al. 2011).
Within the realm of tax policy options, feebates may be one of the best initial options for countries starting a program to address fuel economy and emission issues. “For countries where programs do not already exist, or for vehicle types that have not been regulated, feebates offer a quick and relatively easy way to begin reductions in fuel consumption and CO2” (International Council on Clean Transportation 2010, 16). Unlike other tax methods, a feebate incorporates a visible incentive to the consumer for purchasing the more efficient vehicle, providing an overall more effective price signal and efficient GHG mitigation approach. Examples of feebate programs in France and Singapore demonstrate that feebates can target consumers directly, by primarily affecting the demand side of the vehicle market (Durrmeyer and Samano 2017).
3.3. Fuel taxes may be the most effective policy measure
While feebates may be easy to implement for countries who are commencing on their fuel economy and emission programs, many case studies and literature have concluded that fuel taxes are the most effective fiscal policy. Fuel taxes, dubbed the “single most powerful climate policy instrument implemented to date” (Sterner 2007, 3194), are often viewed as the tax measure with the most impact

DRAFT
29
on emission reductions (Grigolon, Reynaert, and Verboven 2017; Sterner 2007). Although fuel emissions and fuel consumption are not synonymous terms, fuel taxes provide incentives to drive less to all drivers, which provides a positive outcome for all consumption- and emission-related transportation goals. Fuel taxes are also effective tools because they are applicable to all vehicles (not just new vehicles) driving on the roads (Anderson and Sallee 2016). Fuel taxation therefore comes closer to an optimal policy than other conventional standards and taxes (Parry, Walls, and Harrington 2007). Fuel taxes are also simple to implement from a technical perspective (although perhaps not for a political perspective, as discussed in the next section), since these taxes do not require detailed knowledge of the sustainability characteristics of the vehicle fleet.
Although fuel taxes may be difficult to implement due to economic and political (see section below) factors, there are actions even the most intransigent countries can take to work towards the implementation of fuel taxes. In many countries, fuels are subsidized in an attempt to spur development. While there is evidence that low fuel prices can facilitate economic development, particularly as it relates to trade (Hummels 2007), other literature demonstrates that fuel subsidies are highly inefficient instruments which can hamper economic liberalization and trade (Global Subsidies Initiative 2009; Van de Graaf and van Asselt 2017). Perhaps most importantly, fuel subsidies greatly diminish the efficacy of existing fuel- and emissions-related fiscal policies, and substantially greater CO2 reduction can be realized if incentive-distorting subsidies are removed (International Council on Clean Transportation 2011). Additionally, sustainability efforts themselves, may provide a source of economic growth (Springer et al. 2014). Therefore, one major way countries can work towards improving their sustainability policies is to reduce and/or eliminate fuel subsidies.
3.4. Policies need to be politically feasible Effective policies require political support, since a policy is only as good as its ability to be implemented. A proposed fuel tax, for example, may be an ideal way to curb emissions, but it may be vulnerable to political opposition, both by other sectors or government as well as public motorists (Aldy 2017). Not only can political opposition to a new policy stall its implementation, it may also exacerbate public mistrust towards future policy endeavors (Owens 2000). Regardless of the types of fiscal attempts made by a country to increase transportation sustainability, the political implications, both from internal branches of the government and the general population, need to be considered in the planning process.
The most impactful policies are often the most disruptive policies. Therefore, decisionmakers may find themselves in a dilemma, where the actions which are the most effective are also the actions which are the least popular. Some literature has attempted to determine the appropriate policy mix, by enabling what is politically feasible for decarbonizing the transport sector (van der Vooren and Brouillat 2015; Yang et al. 2017; Lah 2017). It is important for policymakers to acknowledge and consider the tradeoff between effective and admissible fiscal actions when deciding which policies to promote.
One way to help make a policy politically acceptable may be to make that policy revenue-neutral, with new taxes offset by new subsidies or tax cuts. Since revenue-neutral policies promote new sustainability practices without influencing the net tax burden, such policies have the potential to improve general economic growth more than standard fiscal policies (Murray and Rivers 2015). Revenue-neutral programs may also gain popularity because they can directly and financially benefit the general

DRAFT
30
population in a visible way. For example, the proceeds of the carbon tax in British Colombia were used to reduce income taxes, and this program has witnessed a steady increase of public support (Murray and Rivers 2015). Revenue-neutrality was also key to the political success of the feebate program in France (Zifei Yang 2018; Varun Sivaram 2013). While political acceptance is contingent upon a variety of factors, revenue-neutrality may help placate some of the major political barriers that policies may face.
4. Conclusion
Current trends in the transport industry must change if countries wish to achieve their national climate objectives and if the international community wishes to limit climate change impacts to 2 degrees Celsius. Vehicle use is increasing around the world, particularly in APEC economies. As APEC economies grow, inefficient vehicles exacerbate negative trends related to green-house gas emissions, public health issues, and energy security.
Given the large and increasing stake that the transportation sector has in many sustainability-related issues, the “greening” of transportation has tremendous potential to benefit populations in every APEC country (as well as other countries around the world). Public policy programs are essential in this effort, since fuel economy policies represent the organized effort to increase the overall efficiency of the vehicle fleet on the roadway network. Therefore, a key task for policymakers is to enhance the efficiency of land transport and to address the economic, social, and environmental cost of transport.
Decisionmakers have a large vocabulary of policies to consider when shaping sustainability programs for their countries. This roadmap highlights several specific fiscal policies which may prove most advantageous to APEC member states who are attempting to create or strengthen their fuel economy policies. The appropriate fiscal tools to enact will depend on the specific characteristics and the culture of political acceptability within a given country. Ultimately, fiscal policy measures should be at the heart of a robust national policy program, which also consists of a mix of fuel economy standards, incentives, and informational measures.
DRAFT
31
References
(Created using Zotero)
Ajanovic, Amela, and Reinhard Haas. 2016. “Dissemination of Electric Vehicles in Urban Areas: Major Factors for Success.” Energy 115 (November): 1451–1458. doi:10.1016/j.energy.2016.05.040.
Aldy, Joseph E. 2017. “The Political Economy of Carbon Pricing Policy Design.” Harvard Project on Climate Agreements. https://www.belfercenter.org/sites/default/files/files/publication/aldy-ets-tax-final.pdf.
An, Feng, Robert Earley, and Lucia Green-Weiskel. 2011. Global Overview on Fuel Efficiency and Motor Vehicle Emission Standards: Policy Options and Perspectives for International Cooperation. United Nations background paper. Nineteenth Session New York, 2-13 May 2011: United Nations Department of Economic and Social Affairs Commission on Sustainable Development.
An, Feng, and Amanda Sauer. 2004. Comparison of Passenger Vehicle Fuel Economy and Greenhouse Gas Emission Standards Around the World. http://www.icet.org.cn/adminis/uploadfile/20106208341514201.pdf.
Anderson, Soren T., Ian W. H. Parry, James M. Sallee, and Carolyn Fischer. 2011. “Automobile Fuel Economy Standards: Impacts, Efficiency, and Alternatives.” Review of Environmental Economics and Policy 5 (1): 89–108. doi:10.1093/reep/req021.
Anderson, Soren T., and James M. Sallee. 2016. “Designing Policies to Make Cars Greener.” Annual Review of Resource Economics 8 (1): 157–180. doi:10.1146/annurev-resource-100815-095220.
APEC. 2008. Survey of Policies and Programs That Promote Fuel-Efficient Transport in APEC Economies. APEC SOM Steering Committee on Economic and Technical Cooperation(SCE), Energy Working Group(EWG) APEC#208-RE-01.10. Asia-Pacific Economic Cooperation. https://www.apec.org:443/Publications/2008/09/Survey-of-Policies-and-Programs-that-Promote-FuelEfficient-Transport-in-APEC-Economies-May-2008-Publ.
APEC. 2016. APEC Energy Demand and Supply Outlook (6th Edition) - Volume 1. http://aperc.ieej.or.jp/publications/reports/outlook.php.
APEC. 2017a. Gaps Assessment on APEC Energy Efficiency and Conservation Work toward Fulfilling the Leaders’ Energy Intensity Reduction Goal. APEC SOM Steering Committee on Economic and Technical Cooperation(SCE), Energy Working Group(EWG). APEC. https://www.apec.org:443/Publications/2017/12/Gaps-Assessment--on-APEC-Energy-Efficiency-and-Conservation-Work.
APEC. 2017b. Impact of Low Oil Price on Energy Security. APEC SOM Steering Committee on Economic and Technical Cooperation(SCE), Energy Working Group(EWG). APEC Oil and Gas Security Studies. Asia-Pacific Economic Cooperation. https://www.apec.org/Publications/2017/07/Impact-of-Low-Oil-Price-on-Energy-Security.
APEC. 2017c. APEC Fossil Fuel Subsidy Reform Capacity Building Workshop. Effective Pricing Mechanisms and Mitigation Strategies. https://www.apec.org:443/Publications/2017/10/APEC-Fossil-Fuel-Subsidy-Reform--CapacityBuilding-Workshop-Effective-Pricing-Mechanisms-and--Mitigat.
Arze del Granado, Francisco Javier, David Coady, and Robert Gillingham. 2012. “The Unequal Benefits of Fuel Subsidies: A Review of Evidence for Developing Countries.” World Development 40 (11): 2234–2248. doi:10.1016/j.worlddev.2012.05.005.

DRAFT
32
Asian Development Bank. 2009. Improving Energy Security and Reducing Carbon Intensity in Asia and the Pacific. Asian Development Bank. https://www.adb.org/publications/improving-energy-security-and-reducing-carbon-intensity-asia-and-pacific.
Asian Development Bank. 2017. “Addressing Climate Change in Transport.” Text. Asian Development Bank. https://www.adb.org/sectors/transport/key-priorities/climate-change.
Bloomberg New Energy Finance. 2018. “Electric Buses in Cities: Driving Towards Cleaner Air and Lower CO2.” Bloomberg New Energy Finance. https://data.bloomberglp.com/bnef/sites/14/2018/05/Electric-Buses-in-Cities-Report-BNEF-C40-Citi.pdf.
Brand, Christian. 2016. “Beyond ‘Dieselgate’: Implications of Unaccounted and Future Air Pollutant Emissions and Energy Use for Cars in the United Kingdom.” Energy Policy 97 (October): 1–12. doi:10.1016/j.enpol.2016.06.036.
Brand, Christian, Jillian Anable, and Martino Tran. 2013. “Accelerating the Transformation to a Low Carbon Passenger Transport System: The Role of Car Purchase Taxes, Feebates, Road Taxes and Scrappage Incentives in the UK.” Transportation Research Part A: Policy and Practice 49 (Supplement C): 132–148. doi:10.1016/j.tra.2013.01.010.
Burch, Isabella. 2018. Survey of Global Activity to Phase Out Internal Combustion Engine Vehicles. Policy Brief. Center for Climate Protection. https://climateprotection.org/center-releases-survey-global-activities-phase-internal-combustion-engine-vehicles/.
Carley, Sanya, Denvil Duncan, John D. Graham, Saba Siddiki, and Nikolaos Zirogiannis. 2017. A Macroeconomic Study of Federal and State Automotive Regulations. Indiana University. https://spea.indiana.edu/doc/research/working-groups/auto-report-032017.pdf.
Cervero, Robert, and Cathleen Sullivan. 2011. “Green TODs: Marrying Transit-Oriented Development and Green Urbanism.” International Journal of Sustainable Development & World Ecology 18 (3): 210–218. doi:10.1080/13504509.2011.570801.
ClimateWorks. 2014. Policies That Work. http://energyinnovation.org/wp-content/uploads/2014/11/Policies-That-Work_Overview-Report.pdf.
Cooper, Erin, Benoit Lefevre, and Xianghi Li. 2016. Can Transport Deliver GHG Reductions at Scale? An Analysis of Global Transport Initiatives. Working Paper. Washington, DC: World Resources Institute. http://www.wri.org/publication/transport-ghg-initiatives.
Dalkmann, Holger, and Charlotte Brannigan. 2007. “Transport and Climate Change: Module 5e.” In Sustainable Transport: A Sourcebook for Policy-Makers in Developing Cities. Deutsche Gesellschaft für Technische Zusammenarbeit (GTZ). http://www.sutp.org/files/contents/documents/resources/A_Sourcebook/SB5_Environment%20and%20Health/GIZ_SUTP_SB5e_Transport-and-Climate-Change_EN.pdf.
Dansie, Grant, Marc Lanteigne, and Indra Overland. 2010. “Reducing Energy Subsidies in China, India and Russia: Dilemmas for Decision Makers.” Sustainability 2 (2): 475–493. doi:10.3390/su2020475.
Dartanto, Teguh. 2013. “Reducing Fuel Subsidies and the Implication on Fiscal Balance and Poverty in Indonesia: A Simulation Analysis.” Energy Policy 58 (July): 117–134. doi:10.1016/j.enpol.2013.02.040.
de Haan, Peter, Michel G. Mueller, and Roland W. Scholz. 2009. “How Much Do Incentives Affect Car Purchase? Agent-Based Microsimulation of Consumer Choice of New Cars—Part II: Forecasting Effects of Feebates Based on Energy-Efficiency.” Energy Policy 37 (3): 1083–1094. doi:10.1016/j.enpol.2008.11.003.
D’Haultfœuille, Xavier, Pauline Givord, and Xavier Boutin. 2014. “The Environmental Effect of Green Taxation: The Case of the French Bonus/Malus.” The Economic Journal 124 (578): F444–F480. doi:10.1111/ecoj.12089.

DRAFT
33
Dineen, Denis, Lisa Ryan, and Brian Ó Gallachóir. 2017. “Vehicle Tax Policies and New Passenger Car CO2 Performance in EU Member States.” Climate Policy, 1–17.
Durrmeyer, Isis, and Mario Samano. 2017. To Rebate or Not to Rebate: Fuel Economy Standards vs. Feebates. Toulouse School of Economics.
Egbue, Ona, and Suzanna Long. 2012. “Barriers to Widespread Adoption of Electric Vehicles: An Analysis of Consumer Attitudes and Perceptions.” Energy Policy 48 (September): 717–729. doi:10.1016/j.enpol.2012.06.009.
Faiz, Asif, Christopher S. Weaver, and Michael P. Walsh. 1996. Air Pollution from Motor Vehicles: Standards and Technologies for Controlling Emissions. World Bank Publications. http://siteresources.worldbank.org/INTURBANTRANSPORT/Resources/b02airpolution.pdf.
Fischer, Carolyn, Winston Harrington, and Ian W.H. Parry. 2007. “Should Automobile Fuel Economy Standards Be Tightened?” The Energy Journal 28 (4): 1–29.
Flachsland, Christian, Steffen Brunner, Ottmar Edenhofer, and Felix Creutzig. 2011. “Climate Policies for Road Transport Revisited (II): Closing the Policy Gap with Cap-and-Trade.” Energy Policy 39 (4): 2100–2110. doi:10.1016/j.enpol.2011.01.053.
Fridstrøm, Lasse, and Vegard Østli. 2017. “The Vehicle Purchase Tax as a Climate Policy Instrument.” Transportation Research Part A: Policy and Practice 96 (February): 168–189. doi:10.1016/j.tra.2016.12.011.
Frondel, Manuel, and Colin Vance. 2013. Fuel Taxes versus Efficiency Standards – An Instrumental Variable Approach. SSRN Scholarly Paper ID 2351755. Rochester, NY: Social Science Research Network. https://papers.ssrn.com/abstract=2351755.
Gallagher, Kelly Sims, and Erich Muehlegger. 2011. “Giving Green to Get Green? Incentives and Consumer Adoption of Hybrid Vehicle Technology.” Journal of Environmental Economics and Management 61 (1): 1–15. doi:10.1016/j.jeem.2010.05.004.
Gass, Viktoria, Johannes Schmidt, and Erwin Schmid. 2011. “Analysis of Alternative Policy Instruments to Promote Electric Vehicles in Austria,” May, 8.
Gerlagh, Reyer, Inge van den Bijgaart, Hans Nijland, and Thomas Michielsen. 2016. “Fiscal Policy and CO2 Emissions of New Passenger Cars in the EU.” Environmental and Resource Economics 69 (1): 103–134. doi:10.1007/s10640-016-0067-6.
GFEI. 2018. “Cleaner, More Efficient Vehicles: Feebates.” https://www.globalfueleconomy.org/transport/gfei/autotool/approaches/economic_instruments/fee_bate.asp.
Gillingham, Kenneth, David Rapson, and Gernot Wagner. 2016. “The Rebound Effect and Energy Efficiency Policy.” Review of Environmental Economics and Policy 10 (1): 68–88. doi:10.1093/reep/rev017.
Global Fuel Economy Initiative. 2011. Accessing International Financial Support Mechanisms for Vehicle Fuel Economy: A Guide for Developing Country Governments. https://www.globalfueleconomy.org/data-and-research/publications/gfei-working-paper-6.
Global Fuel Economy Initiative. 2016a. Fuel Economy State of the World Report 2016. https://www.globalfueleconomy.org/data-and-research/publications/state-of-the-world-report-2016.
Global Fuel Economy Initiative. 2016b. Technology and Policy Drivers of the Fuel Economy of New Light-Duty Vehicles. Global Fuel Economy Initiative. https://www.globalfueleconomy.org/data-and-research/publications/gfei-working-paper-12.
Global Fuel Economy Initiative. 2016c. Technology and Policy Drivers of the Fuel Economy of New Light-Duty Vehicles. Global Fuel Economy Initiative. https://www.globalfueleconomy.org/data-and-research/publications/gfei-working-paper-12.

DRAFT
34
Global Fuel Economy Initiative. 2017a. International Comparison of Light-Duty Vehicle Fuel Economy 2005-2015: Ten Years of Fuel Economy Benchmarking. GFEI Working Paper 15. https://www.globalfueleconomy.org/data-and-research/publications/gfei-working-paper-15.
Global Fuel Economy Initiative. 2017b. Can We Reach 100 Million Electric Cars Worldwide by 2030? A Modelling/Scenario Analysis.
Global Fuel Economy Initiative. 2017. “Fuel Economy Policies.” Accessed December 4. https://www.globalfueleconomy.org/transport/gfei/autotool/approaches/regulatory_policy/fuel_economy.asp.
Global Subsidies Initiative. 2009. Untold Billions: Fossil-Fuel Subsidies, Their Impacts and the Path to Reform. Geneva: International Institute for Sustainable Development (IISD).
Gordon, Deborah. 2005. “Fiscal Policies for Sustainable Transportation: International Best Practices.” Energy Foundation and the Hewlett Foundation.
Goulder, Lawrence H., and Ian W. H. Parry. 2008. “Instrument Choice in Environmental Policy.” Review of Environmental Economics and Policy 2 (2): 152–174. doi:10.1093/reep/ren005.
Greene, David L. 1998. “Why CAFE Worked.” Energy Policy 26 (8): 595–613. doi:10.1016/S0301-4215(98)00016-0.
Greene, David L., John German, and Mark A. Delucchi. 2009. “Fuel Economy: The Case for Market Failure.” In Reducing Climate Impacts in the Transportation Sector, edited by James S. Cannon and Daniel Sperling, 181–205. Dordrecht: Springer Netherlands. doi:10.1007/978-1-4020-6979-6_11.
Greene, David L., Philip D. Patterson, Margaret Singh, and Jia Li. 2005. “Feebates, Rebates and Gas-Guzzler Taxes: A Study of Incentives for Increased Fuel Economy.” Energy Policy 33 (6): 757–775. doi:10.1016/j.enpol.2003.10.003.
Grigolon, Laura, Nina Leheyda, and Frank Verboven. 2016. “Scrapping Subsidies during the Financial Crisis — Evidence from Europe.” International Journal of Industrial Organization 44 (January): 41–59. doi:10.1016/j.ijindorg.2015.10.004.
Grigolon, Laura, Mathias Reynaert, and Frank Verboven. 2017. “Consumer Valuation of Fuel Costs and Tax Policy: Evidence from the European Car Market.”
Han, Rong, Bi-Ying Yu, Bao-Jun Tang, Hua Liao, and Yi-Ming Wei. 2017. “Carbon Emissions Quotas in the Chinese Road Transport Sector: A Carbon Trading Perspective.” Energy Policy 106 (July): 298–309. doi:10.1016/j.enpol.2017.03.071.
Heck, Stefan, Matt Rogers, and Paul Carroll. 2014. Resource Revolution: How to Capture the Biggest Business Opportunity in a Century. Houghton Mifflin Harcourt.
Hsu, Shi-Ling, and Daniel Sperling. 1994. “Uncertain Air Quality Impacts of Automobile Retirement Programs.” Transportation Research Record, no. 1444: 90–98.
Hummels, David. 2007. “Transportation Costs and International Trade in the Second Era of Globalization.” Journal of Economic Perspectives 21 (3): 131–154. doi:10.1257/jep.21.3.131.
Huse, Cristian, and Claudio Lucinda. 2013. “The Market Impact and the Cost of Environmental Policy: Evidence from the Swedish Green Car Rebate.” The Economic Journal 124 (578): F393–F419. doi:10.1111/ecoj.12060.
Hymel, Kent M., and Kenneth A. Small. 2015. “The Rebound Effect for Automobile Travel: Asymmetric Response to Price Changes and Novel Features of the 2000s.” Energy Economics 49 (May): 93–103. doi:10.1016/j.eneco.2014.12.016.
International Council on Clean Transportation. 2007. Passenger Vehicle Greenhouse Gas and Fuel Economy Standards | International Council on Clean Transportation. International Council on Clean Transportation. http://www.theicct.org/publications/passenger-vehicle-greenhouse-gas-and-fuel-economy-standards.

DRAFT
35
International Council on Clean Transportation. 2010. Best Practices for Feebate Program Design and Implementation. http://www.theicct.org/publications/best-practices-feebate-program-design-and-implementation.
International Council on Clean Transportation. 2011. Review and Comparative Analysis of Fiscal Policies | International Council on Clean Transportation. http://www.theicct.org/publications/review-and-comparative-analysis-fiscal-policies.
International Council on Clean Transportation. 2014a. The State of Clean Transport Policy. International Council on Clean Transportation. 2014b. Driving Electrification: A Global Comparison of
Fiscal Policy for Electric Vehicles. https://www.theicct.org/publications/driving-electrification-global-comparison-fiscal-policy-electric-vehicles.
International Council on Clean Transportation. 2015. Review and Evaluation of Vehicle Fuel Efficiency Labeling and Consumer Information Programs. APEC. http://www.theicct.org/publications/review-and-evaluation-vehicle-fuel-efficiency-labeling-and-consumer-information.
International Council on Clean Transportation. 2017a. 2017 Global Update: Light-Duty Vehicle Greenhouse Gas and Fuel Economy Standards. International Council on Clean Transportation. http://www.theicct.org/publications/2017-global-update-LDV-GHG-FE-standards.
International Council on Clean Transportation. 2017b. Global Baseline Assessment of Compliance and Enforcement Programs for Vehicle Emissions and Energy Efficiency. International Council on Clean Transportation. http://www.theicct.org/publications/compliance-and-enforcement-global-baseline.
International Energy Agency. 2012a. Technology Roadmap: Fuel Economy of Road Vehicles. https://www.iea.org/publications/freepublications/publication/technology-roadmap-fuel-economy-of-road-vehicles.html.
International Energy Agency. 2012b. Policy Pathways: Improving the Fuel Economy of Road Vehicles - A Policy Package. https://www.iea.org/publications/freepublications/publication/policy-pathways-improving-the-fuel-economy-of-road-vehicles---a-policy-package.html.
International Energy Agency. 2017a. Publication: Key World Energy Statistics. https://www.iea.org/publications/freepublications/publication/key-world-energy-statistics.html.
International Energy Agency. 2017b. Tracking Fossil Fuel Subsidies in APEC Economies. Insight Publications. https://www.iea.org/publications/insights/insightpublications/tracking-fossil-fuel-subsidies-in-apec-economies.html.
International Organization of Motor Vehicle Manufacturers (OICA). 2016. “Sales Statistics 2005-2016.” http://www.oica.net/category/sales-statistics/.
Jacobsen, Mark R., and Arthur A. Van Benthem. 2015. “Vehicle Scrappage and Gasoline Policy.” American Economic Review 105 (3): 1312–1338. doi:10.1257/aer.20130935.
Jaffe, Adam B., and Robert N. Stavins. 1995. “Dynamic Incentives of Environmental Regulations: The Effects of Alternative Policy Instruments on Technology Diffusion.” Journal of Environmental Economics and Management 29 (3): S43–S63.
Jakob, Michael, Claudine Chen, Sabine Fuss, Annika Marxen, and Ottmar Edenhofer. 2015. “Development Incentives for Fossil Fuel Subsidy Reform.” Nature Climate Change 5 (July): 709.
Karagulian, Federico, Claudio A. Belis, Carlos Francisco C. Dora, Annette M. Prüss-Ustün, Sophie Bonjour, Heather Adair-Rohani, and Markus Amann. 2015. “Contributions to Cities’ Ambient Particulate Matter (PM): A Systematic Review of Local Source Contributions at Global Level.” Atmospheric Environment 120 (November): 475–483. doi:10.1016/j.atmosenv.2015.08.087.
Killeen, Grady, and Arik Levinson. 2017. “Automobile Fuel Economy and Greenhouse Gas Emissions Standards.” Case Studies in the Environment, January. doi:10.1525/cse.2017.000380.

DRAFT
36
Klier, Thomas, and Joshua Linn. 2016. “The Effect of Vehicle Fuel Economy Standards on Technology Adoption.” Journal of Public Economics 133: 41–63.
Knittel, Christopher R. 2011. “Automobiles on Steroids: Product Attribute Trade-Offs and Technological Progress in the Automobile Sector.” American Economic Review 101 (7): 3368–3399. doi:10.1257/aer.101.7.3368.
Lah, Oliver. 2017. “Decarbonizing the Transportation Sector: Policy Options, Synergies, and Institutions to Deliver on a Low-Carbon Stabilization Pathway.” Wiley Interdisciplinary Reviews: Energy and Environment 6 (6).
Landrigan, Philip J, Richard Fuller, Nereus J R Acosta, Olusoji Adeyi, Robert Arnold, Niladri (Nil) Basu, Abdoulaye Bibi Baldé, et al. 2017. “The Lancet Commission on Pollution and Health.” The Lancet 391 (10119): 462–512. doi:10.1016/S0140-6736(17)32345-0.
Leinert, Stephan, Hannah Daly, Bernard Hyde, and Brian Ó Gallachóir. 2013. “Co-Benefits? Not Always: Quantifying the Negative Effect of a CO2-Reducing Car Taxation Policy on NOx Emissions.” Energy Policy 63 (December): 1151–1159. doi:10.1016/j.enpol.2013.09.063.
Levinson, Arik. 2017. “The Hidden American Tax on Imported Cars: Fuel Economy Standards Instead of Tariffs.” Economics and Policy in the Age of Trump, 79.
Ley, Eduardo, and Jessica Boccardo. 2010. The Taxation of Motor Fuel : International Comparison. WPS5212. The World Bank. http://documents.worldbank.org/curated/en/512371468336848067/The-taxation-of-motor-fuel-international-comparison.
Malina, Christiane. 2016. The Environmental Impact of Vehicle Circulation Tax Reform in Germany. CAWM Discussion Paper, Centrum für Angewandte Wirtschaftsforschung Münster 86. Münster: CAWM. http://hdl.handle.net/10419/145114.
Montag, Josef. 2015. “The Simple Economics of Motor Vehicle Pollution: A Case for Fuel Tax.” Energy Policy 85 (October): 138–149. doi:10.1016/j.enpol.2015.05.020.
Murray, Brian, and Nicholas Rivers. 2015. “British Columbia’s Revenue-Neutral Carbon Tax: A Review of the Latest ‘Grand Experiment’ in Environmental Policy.” Energy Policy 86 (November): 674–683. doi:10.1016/j.enpol.2015.08.011.
New Climate Economy. 2014. Better Growth, Better Climate: The New Climate Economy Report. http://newclimateeconomy.report/2014/.
Nidumolu, Ram, C K Prahalad, and M R Rangaswami. “Why Sustainability Is Now the Key Driver of Innovation.” Harvard Business Review, 12.
Ó Gallachóir, Brian P., Martin Howley, Stephen Cunningham, and Morgan Bazilian. 2009. “How Private Car Purchasing Trends Offset Efficiency Gains and the Successful Energy Policy Response.” Carbon in Motion: Fuel Economy, Vehicle Use, and Other Factors Affecting CO2 Emissions From Transport 37 (10): 3790–3802. doi:10.1016/j.enpol.2009.07.012.
OECD. 2009a. The Scope for CO2-Based Differentiation in Motor Vehicle Taxes in Equilibrium and in the Context of the Current Global Recession. Organisation for Economic Co-operation and Development (OECD). http://www.oecd.org/officialdocuments/publicdisplaydocumentpdf/?cote=env/epoc/wpnep/t(2009)2/final&doclanguage=en.
OECD. 2009b. Incentives for CO2 Emission Reductions in Current Motor Vehicle Taxes. Organisation for Economic Co-operation and Development (OECD). http://www.oecd.org/officialdocuments/publicdisplaydocumentpdf/?cote=env/epoc/wpnep/t(2009)1/final&doclanguage=en.
OECD/IEA. 2018. “Global EV Outlook 2018.” https://webstore.iea.org/global-ev-outlook-2018. Onoda, Takao. 2008. Review of International Policies for Vehicle Fuel Efficiency. International Energy
Agency.

DRAFT
37
Organisation for Economic Co-operation and Development (OECD). 2014. The Cost of Air Pollution. /content/book/9789264210448-en.
Owens, Susan. 2000. “‘Engaging the Public’: Information and Deliberation in Environmental Policy.” Environment and Planning A 32 (7): 1141–1148. doi:10.1068/a3330.
Pachauri, Rajendra K., Myles R. Allen, Vicente R. Barros, John Broome, Wolfgang Cramer, Renate Christ, John A. Church, Leon Clarke, Qin Dahe, and Purnamita Dasgupta. 2014. Climate Change 2014: Synthesis Report. Contribution of Working Groups I, II and III to the Fifth Assessment Report of the Intergovernmental Panel on Climate Change. IPCC.
Parry, Ian W. H., Margaret Walls, and Winston Harrington. 2007. “Automobile Externalities and Policies.” Journal of Economic Literature 45 (2): 373–399. doi:10.1257/jel.45.2.373.
Peet, Karl, Sudhir Gota, Cornie Huizenga, and Gavin Kaar. 2015. SLoCaT Review of World Energy Outlook Special Report on Energy and Climate Change. Partnership on Sustainable, Low Carbon Transport (SLoCaT). http://www.ppmc-transport.org/slocat-review-of-world-energy-outlook-special-report-on-energy-and-climate-change/.
Peet, Karl, Sudhir Gota, Cornie Huizenga, and Mark Major. 2016. Quick Wins on Transport, Sustainable Development and Climate Change. Kick-Starting the Transformation of the Transport Sector. Partnership on Sustainable, Low Carbon Transport (SLoCaT). http://www.ppmc-transport.org/wp-content/uploads/2016/11/SLoCaT-Quick-Wins-Report-1.pdf.
Plotkin, Steven. 2009. “Examining Fuel Economy and Carbon Standards for Light Vehicles.” Energy Policy, Carbon in Motion: Fuel Economy, Vehicle Use, and Other Factors affecting CO2 Emissions From Transport, 37 (10): 3843–3853. doi:10.1016/j.enpol.2009.07.013.
Plotkin, Steven. 2016. “Fuel Economy Initiatives: A Worldwide Comparison☆.” In Reference Module in Earth Systems and Environmental Sciences. Elsevier. doi:10.1016/B978-0-12-409548-9.01402-0.
Portney, Paul R., Ian WH Parry, Howard K. Gruenspecht, and Winston Harrington. 2003. “Policy Watch: The Economics of Fuel Economy Standards.” The Journal of Economic Perspectives 17 (4): 203–217.
Posada, Francisco, Zifei Yang, and Kate Blumberg. 2017. New Vehicle Fuel Economy and CO2 Emission Standards Emissions Evaluation Guide. Deutsche Gesellschaft für Internationale Zusammenarbeit (GIZ).
PricewaterhouseCoopers. 2016. Cities of Opportunity. https://www.pwc.com/us/en/library/cities-of-opportunity.html.
Resources for the Future. 2016. Comparing US and EU Approaches to Regulating Automotive Emissions and Fuel Economy. Resources for the Future. http://www.rff.org/research/publications/comparing-us-and-eu-approaches-regulating-automotive-emissions-and-fuel.
Rivers, Nicholas, and Brandon Schaufele. 2017. “New Vehicle Feebates.” Canadian Journal of Economics/Revue Canadienne d’économique 50 (1): 201–232. doi:10.1111/caje.12255.
Ryan, Lisa, Susana Ferreira, and Frank Convery. 2009. “The Impact of Fiscal and Other Measures on New Passenger Car Sales and CO2 Emissions Intensity: Evidence from Europe.” Energy Economics 31 (3): 365–374. doi:10.1016/j.eneco.2008.11.011.
Santos, Georgina. 2017. “Road Fuel Taxes in Europe: Do They Internalize Road Transport Externalities?” Transport Policy 53 (January): 120–134. doi:10.1016/j.tranpol.2016.09.009.
Santos, Georgina, Hannah Behrendt, Laura Maconi, Tara Shirvani, and Alexander Teytelboym. 2010. “Part I: Externalities and Economic Policies in Road Transport.” Research in Transportation Economics, Road Transport Externalities, Economic Policies And Other Instruments For Sustainable Road Transport, 28 (1): 2–45. doi:10.1016/j.retrec.2009.11.002.
Schipper, Lee. 2008. “Automobile Fuel; Economy and CO2 Emissions in Industrialized Countries: Troubling Trends through 2005/6.” University of California Transportation Center.

DRAFT
38
Silitonga, A.S., A.E. Atabani, and T.M.I. Mahlia. 2012. “Review on Fuel Economy Standard and Label for Vehicle in Selected ASEAN Countries.” Renewable and Sustainable Energy Reviews 16 (3): 1683–1695. doi:10.1016/j.rser.2011.12.006.
Sims, R., R. Schaeffer, F. Creutzig, X. Cruz-Núñez, M. D’agosto, D. Dimitriu, M. J. Figueroa Meza, L. Fulton, S. Kobayashi, and O. Lah. 2014. “Chapter 8: Transport.” In Climate Change 2014: Mitigation of Climate Change. Contribution of Working Group III to the Fifth Assessment Report of the Intergovernmental Panel on Climate Change. Cambridge, United Kingdom: Cambridge University Press.
Singapore Land Transport Authority. 2017. “Joint Media Release by the Land Transport Authority (LTA) & NEA - New Vehicular Emissions Scheme to Replace Carbon-Based Emissions Vehicle Scheme from 1 January 2018.” https://www.lta.gov.sg/apps/news/page.aspx?c=2&id=08685840-d664-4713-9ccb-96dcd8936d08.
Smit, T. G. J. 2016. “What Is Known about the Influence of CO2 Differentiated Vehicle Taxes on Car Sales in the EU?” Info:eu-repo/semantics/masterThesis. http://essay.utwente.nl/69752/.
Springer, Cecilia, Nigel Purvis, Pete Ogden, and Andreas Dahl-Joergensen. 2014. Accelerating Global Vehicle Efficiency | Climate Advisers. Center for American Progress. https://www.climateadvisers.com/publications/accelerating-global-vehicle-efficiency/.
Sterner, Thomas. 2007. “Fuel Taxes: An Important Instrument for Climate Policy.” Energy Policy 35 (6): 3194–3202. doi:10.1016/j.enpol.2006.10.025.
Stockholm Environment Institute, and Material Economics. 2018. Framing Stranded Assets in an Age of Disruption. Stockholm Environment Institute. https://www.sei-international.org/publications.
Transport & Environment. 2011. Fuelling Oil Demand: What Happened to Fuel Taxation in Europe? Transport & Environment. https://www.transportenvironment.org/publications/report-fuelling-oil-demand-what-happened-fuel-taxation-europe.
Transportation Research Board, and National Research Council. 2010. Technologies and Approaches to Reducing the Fuel Consumption of Medium- and Heavy-Duty Vehicles. Washington, DC: The National Academies Press. doi:10.17226/12845.
UNDP. 2018. “Taxes on Fuel.” UNDP. Accessed March 28. http://www.undp.org/content/sdfinance/en/home/solutions/fuel-tax.html.
UNESCAP. 2016. The Economics of Climate Change in the Asia-Pacific Region. United Nations Economic and Social Commission for Asia and the Pacific (ESCAP). http://www.unescap.org/resources/economics-climate-change-asia-pacific-region.
Van de Graaf, Thijs, and Harro van Asselt. 2017. “Introduction to the Special Issue: Energy Subsidies at the Intersection of Climate, Energy, and Trade Governance.” International Environmental Agreements: Politics, Law and Economics 17 (3): 313–326. doi:10.1007/s10784-017-9359-8.
van der Vooren, A., and E. Brouillat. 2015. “Evaluating CO2 Reduction Policy Mixes in the Automotive Sector.” Environmental Innovation and Societal Transitions 14 (Supplement C): 60–83. doi:10.1016/j.eist.2013.10.001.
Vance, Colin, and Markus Mehlin. 2009. Tax Policy and CO2 Emissions–An Econometric Analysis of the German Automobile Market. RWI-Leibniz-Institut für Wirtschaftsforschung, Ruhr-University Bochum, TU Dortmund University, University of Duisburg-Essen.
Varun Sivaram. 2013. “Combating Climate Change in the Capital of Car Culture.” Next Generation. http://www.thenextgeneration.org/files/LA_Transportation.pdf.
World Health Organization. 2016. WHO | Ambient Air Pollution: A Global Assessment of Exposure and Burden of Disease. http://www.who.int/phe/publications/air-pollution-global-assessment/en/.
Yacobucci, Brent D, and Robert Bamberger. 2006. “Automobile and Light Truck Fuel Economy: The CAFE Standards.” Congressional Research Service, December, 19.

DRAFT
39
Yang, Zifei. 2017. “Proposed Fuel-Consumption Standards for Two- and Three-Wheelers in China,” March, 4.
Yang, Zifei, Peter Mock, John German, Anup Bandivadekar, and Oliver Lah. 2017. “On a Pathway to De-Carbonization – A Comparison of New Passenger Car CO2 Emission Standards and Taxation Measures in the G20 Countries.” Transportation Research Part D: Transport and Environment, June. doi:10.1016/j.trd.2017.06.022.
Zhao, X., A. Mahendra, N. Godfrey, H. Dalkmann, P. Rode, and G. Floater. 2016. Unlocking the Power of Urban Transit Systems for Better Growth and a Better Climate. Technical note. New Climate Economy, London and Washington, DC. Technical note. New Climate Economy, London and Washington, DC. Available at: http://newclimateeconomy. report/misc/working-papers/. This work is licensed under the Creative Commons Attribution-NonCommercial-NoDerivative Works. Available at: http://newclimateeconomy. report/misc/working-papers/.
Zifei Yang. 2018. “Practical Lessons in Vehicle Efficiency Policy: The 10-Year Evolution of France’s CO2-Based Bonus-Malus (Feebate) System.” https://www.theicct.org/blog/staff/practical-lessons-vehicle-efficiency-policy-10-year-evolution-frances-co2-based-bonus.

Singapore Workshop - Project Completion Survey implemented via direct email to participants: Greetings! Hope this email finds you well! I am contacting you as you were a participant of one of our APEC-funded workshops titled “MobiliseYourCity – Moving towards sustainable, energy efficient, urban mobility in emerging cities”, which was held in Singapore from May 7-9 of 2018. I would like to assess how the learnings from this workshop has impacted your work. The goal is to use your answers to improve our workplans and also to plan more effectively in the future, such that we are able to assist you and your economy in your priorities. I hope you will take a few minutes to reply back to the 4 questions written below, and you may write as much detail as you wish. I understand that it has been only a little over 2 months since the workshop, but knowing any work that you may have initiated (or planning/discussing to) since, is of great value to us. If you were not a participant and have received this email by mistake, please disregard this message, Thanks in advance for your time! Hope you have a weekend! Sanjini Project Impact Assessment Questions: (i) How has the learnings from the Singapore workshop influenced your work? Please give an example (or more) of a change implemented as a result of what you learnt? (ii) Have you initiated any new policy initiatives or other actions as a result of your learning from your workshop? Are any new action plans under discussion? (iii) Would you be interested in attending similar workshops in the future? (iv) Is there any other form of learning method (other than an in-person workshop) that you would like to participate in? Response-1: Dear Sanjini, I have attended this workshop and the workshop on "Improving the efficiency of urban transport projects" in Ho Chi Minh city, Viet Nam on the 4th of December of 2017. I find that these workshops are very useful to me. I will apply all knowledge I have learned from international colleagues into my work where suitable. Through these workshops, I have more relationships with international colleagues and I think that it is very important because we can exchange experiences/ solutions in more detail in future. Therefore, I am very interested in attending both similar workshops and other form of learning methods next times Your sincerely, Hang. [[email protected]] Response-2: Dear Madam, Thanks for the email .The impact of the workshop on Mobilize city .... in Singapore has been very useful to me 1. New proposal has come from Hungarian investor to introduce 1000 electric bus to SriLanka transport board and we were able to continue discussion successfully and seeking the cabinet approvals.Once the cabinet approval given we would be able to implement the bus service in Colombo metropolitan area. 2 .Under UNDP Ministry of environment and Ministry of transport jointly implementing a project for transport sector GHG emission reduction- Measuring , reporting and verification ICAT. It supports to facilitate the urban transport planning. Road pricing system has to be introduced. On express ways now it is in progress. The knowledge and experiences obtained in the workshop have been very useful to coordinate transport related discussions and the projects. 3. I want to gain more and more experiences and How to challenge the traffic congestion in urban cities. In Sri Lanka how to form a company operator joining individual private bus operators.So I like to participate for the workshops in the future. 4. Fact finding interviews and discussions with foreign transport investors may be useful . S.S.A.Kularatne [[email protected]] Director planning Ministry of Transport and civil Aviation, SriLanka

Viet Nam Workshop - Project Completion Survey implemented via direct email to participants: Greetings! Hope this email finds you well! I am contacting you as you were a participant of one of our APEC-funded workshops titled “Improving the efficiency of urban transport projects”, which was held in Ho Chi Minh, Viet Nam on the 4th of December of 2017. I am the project overseer and I hope to assess how the learnings from this workshop has impacted your work. The goal is to use your answers to improve our workplans and also to plan more effectively in the future, such that we are able to assist you and your economy in your priorities. I hope you will take a few minutes to reply back to the 4 questions written below, and you may write as much detail as you wish. If you were not a participant and have received this email by mistake, please disregard this message, Thanks in advance for your time! Hope you have a great rest of the week! Sanjini Project Impact Assessment Questions: (i) How has the learnings from the Viet Nam workshop influenced your work? Please give an example (or more) of a change implemented as a result of what you learnt? (ii) Have you initiated any new policy initiatives or other actions as a result of your learning from your workshop? Are any new action plans under discussion? (iii) Would you be interested in attending similar workshops in the future? (iv) Is there any other form of learning method (other than an in-person workshop) that you would like to participate in? Response-1: How has the learnings from the Viet Nam workshop influenced your work? Please give an example (or more) of a change implemented as a result of what you learnt? compare my country to other countries, learn what others are doing and adapt their good ideas into what I'm planning to do in the future (ii) Have you initiated any new policy initiatives or other actions as a result of your learning from your workshop? Are any new action plans under discussion? Currently we are revising energy efficiency plan, the learning from workshop will definitely a tips to create the roadmap (iii) Would you be interested in attending similar workshops in the future? Yes From [email protected] Peru Workshop - Project Completion Survey implemented via direct email to participants: Greetings! Hope this email finds you well! I am contacting you as you were a participant of one of our APEC-funded workshops titled “Strengthening of energy efficiency policies in the transport sector”, which was held in Lima, Peru on 19-20 th of September of 2017. I am the project overseer and I hope to assess how the learnings from this workshop has impacted your work. The goal is to use your answers to improve our workplans and also to plan more effectively in the future, such that we are able to assist you and your economy in your priorities. I hope you will take a few minutes to reply back to the 4 questions written below, and you may write as much detail as you wish. If you were not a participant and have received this email by mistake, please disregard this message, Thanks in advance for your time! Hope you have a great rest of the week! Sanjini Project Impact Assessment Questions: (i) How has the learnings from the Peru workshop influenced your work? Please give an example (or more) of a change implemented as a result of what you learnt?

(ii) Have you initiated any new policy initiatives or other actions as a result of your learning from your workshop? Are any new action plans under discussion? (iii) Would you be interested in attending similar workshops in the future? (iv) Is there any other form of learning method (other than an in-person workshop) that you would like to participate in? Response-1: Dear Sanjini, I had participated in Lima. Here are the answers. (i) How has the learnings from the Peru workshop influenced your work? Please give an example (or more) of a change implemented as a result of what you learnt? I have been working in the design of a new policy on trucks efficiency (a “Green Freight Program). It was very useful to learn how other countries deal with coordination challenges among different ministries. Furthermore, I was part of the National Transportation Plan oriented to reduce GHG emissions and it was also very useful for that work, where coordination was also a main topic. (ii) Have you initiated any new policy initiatives or other actions as a result of your learning from your workshop? Are any new action plans under discussion? We have paid particular attention to some threats related to what I had learnt, especially when we designed the recommendations for the Green Freight Program. (iii) Would you be interested in attending similar workshops in the future? Sure. It was really very useful to know how other countries deal with this challenges related to clean technologies. (iv) Is there any other form of learning method (other than an in-person workshop) that you would like to participate in? Webinars are also useful. I hope my answers accomplish your expectations. Yours, Ariel Filadoro [[email protected]] Ministry of Transportation, Argentina Dear Sanjini: Here you can find my answers to your questions:
(i) How has the learnings from the Lima workshop influenced your work? Please give an example (or more) of a change implemented as a result of what you learnt?
Chile is currently on the path of implementing fuel economy standards and many of the recommendations received in the workshop have been taken into consideration for the formulation of this policy
(ii) Have you initiated any new policy initiatives or other actions as a result of your learning from your workshop? Are any new action plans under discussion?
Chile designed its National Electromobility Strategy after the workshop in Lima, where several countries showed the initiatives they were carrying out in this area
(iii) Would you be interested in attending similar workshops in the future? Yes, because in addition to the learning that is achieved on specific topics, the exchange with professionals from other
countries facing similar challenges is very valuable.
(iv) Is there any other form of learning method (other than an in-person workshop) that you would like to participate in?
Yes, I would probably be interested in some type of distance training on specific topics related to energy efficiency in transport and electromobility Saludos, Cristina Victoriano <[email protected]>