apocynin administration prevents the changes induced by a fructose-rich diet on rat liver metabolism...
TRANSCRIPT
Clinical Science (2012) 123, 681–692 (Printed in Great Britain) doi:10.1042/CS20110665 681
Apocynin administration prevents the changesinduced by a fructose-rich diet on rat liver
metabolism and the antioxidant system
Marıa Cecilia CASTRO∗1, Flavio FRANCINI∗1, Guillermo SCHINELLA†,Claudia Ines CALDIZ‡, Marıa Guillermina ZUBIRIA§, Juan Jose GAGLIARDINO∗1
and Marıa Laura MASSA∗∗CENEXA – Centro de Endocrinologıa Experimental y Aplicada (UNLP-CONICET LA PLATA), Centro Colaborador OPS/OMS paraDiabetes, 1900 La Plata, Argentina, †Farmacologıa Basica, Universidad Nacional de La Plata, 1900 La Plata, Argentina,‡CIC – Centro de Investigaciones Cardiovasculares (UNLP-CONICET LA PLATA), Facultad de Ciencias Medicas, UniversidadNacional de La Plata, 1900 La Plata, Argentina, and §IMBICE – Instituto Multidisciplinario de Biologıa Celular (CONICET LAPLATA-CICPBA), 1900 La Plata, Argentina
A B S T R A C T
In the present study, we investigated the role of NADPH oxidase in F (fructose)-rich-diet-induced hepatic OS (oxidative stress) and metabolic changes, and their prevention by apocyninco-administration. Wistar rats were fed for 21 days on (i) a control diet, (ii) a control dietplus 10% F in the drinking water, (iii) a control diet with apocynin in the drinking water(CA) and (iv) F plus apocynin in the drinking water (FA). Glycaemia, triglyceridaemia, NEFAs(non-esterified fatty acids) and insulinaemia were determined. In the liver, we measured (i)NADPH oxidase activity, and gene and protein expression; (ii) protein carbonyl groups, GSH andTBARSs (thiobarbituric acid-reactive substances); (iii) catalase, CuZn-SOD (superoxide dismutase)and Mn-SOD expression; (iv) liver glycogen and lipid content; (v) GK (glucokinase), G6Pase(glucose-6-phosphatase) and G6PDH (glucose-6-phosphate dehydrogenase) activities; (vi) FAS(fatty acid synthase), GPAT (glycerol-3-phosphate acyltransferase), G6Pase and G6PDH, IL-1β
(interleukin-1β), PAI-1 (plasminogen-activator inhibitor-1) and TNFα (tumour necrosis factorα) gene expression; and (vii) IκBα (inhibitor of nuclear factor κB α) protein expression. F-fedanimals had high serum TAG (triacylglycerol), NEFA and insulin levels, high liver NADPH oxidaseactivity/expression, increased OS markers, reduced antioxidant enzyme expression, and increasedglycogen, TAG storage and GK, G6Pase and G6PDH activities. They also had high G6Pase, G6PDH,FAS, GPAT, TNFα and IL-1β gene expression and decreased IκBα expression. Co-administrationof apocynin to F-fed rats prevented the development of most of these abnormalities. In conclusion,NADPH oxidase plays a key role in F-induced hepatic OS production and probably also in themechanism of liver steatosis, suggesting its potential usefulness for the prevention/treatment ofT2DM (Type 2 diabetes mellitus).
Key words: apocynin, fructose, hepatic metabolic disorder, insulin resistance, NADPH oxidase, pre-diabetes.Abbreviations: C, control; CA, control + apocynin; DAB, diaminobenzidine; DNPH, dinitrophenylhydrazine; DTT, dithiothreitol;F, fructose; FA, fructose + apocynin; FAS, fatty acid synthase; G6Pase, glucose-6-phosphatase; G6PDH, glucose-6-phosphatedehydrogenase; GK, glucokinase; GPAT, glycerol-3-phosphate acyltransferase; HOMA, homoeostasis model assessment; IGT,impaired glucose tolerance; IκBα, inhibitor of nuclear factor κB α; IL-1β, interleukin-1β; IR, insulin resistance; MDA,malondialdehyde; NASH, non-alcoholic steatohepatitis; NEFA, non-esterified fatty acid; OS, oxidative stress; PAI-1, plasminogen-activator inhibitor 1; qPCR, quantitative PCR; ROS, reactive oxygen species; SOD, superoxide dismutase; T2DM, Type 2 diabetesmellitus; TAG, triacylglycerol; TBARS, thiobarbituric acid-reactive substance; TBS, Tris-buffered saline; TNFα, tumour necrosisfactor α.1 These authors contributed equally to this work.Correspondence: Dr Juan J. Gagliardino (email [email protected]).
C© The Authors Journal compilation C© 2012 Biochemical Society
www.clinsci.org
Clin
ical
Sci
ence
682 M. C. Castro and others
INTRODUCTION
The prevalence of T2DM (Type 2 diabetes mellitus) andIGT (impaired glucose tolerance) is growing very fastworldwide, attaining epidemic characteristics [1]. It hasbeen claimed that sedentary habits and the frequent con-sumption of unhealthy high-calorie diets in modern soci-eties are major causes of such epidemics [2]. Since the in-crease in total energy consumption is usually accompan-ied by marked changes in meal nutrient composition [3], ithas been suggested that the increased use of F (fructose)-rich syrups and refined carbohydrates has greatlycontributed to the epidemics of obesity and T2DM [4–7].
The liver is the primary site of F extraction andmetabolism; consequently, many efforts have beendevoted to study the impairing effect of its increasedavailability upon hepatic glucose metabolism [8,9]. Thisimpairment is accompanied by other liver abnormalities,such as increased fat deposits [10] and decreased insulinsensitivity and concentration of its intracellular signallingmediators [11]. We have shown further that normal ratsfed on F for 3 weeks undergo significant changes inhepatic carbohydrate and lipid metabolism [12,13].
Experimental evidence has suggested that OS (oxidat-ive stress) could be the underlying mechanism responsiblefor the detrimental effects of F [14–17]. OS results froman imbalance between ROS (reactive oxygen species)production and antioxidant capacity; F promotes suchimbalance by the simultaneous enhancement of ROSproduction and the down-regulation of the main liverantioxidant enzymes [13]. OS also plays a major role inthe pathogenesis of other pathological entities such as en-dothelial dysfunction, hypertension, increase of inflam-matory markers and CVD (cardiovascular disease) [18].
NADPH oxidase is an important source of ROSproduction in several tissues, including the liver,which has active isoforms of the enzyme [19–24]; thusits inhibition represents an attractive and commontreatment target for many diseases [25]. Accordingly, theaim of the present study was to investigate the role ofNADPH oxidase in OS induced by F feeding to normalrats, and the possible preventive effect of apocyninco-administration, an NADPH oxidase inhibitor. Theresults obtained show that the enzyme is up-regulatedby F overload, and that its inhibition prevented thechanges induced by such a diet. These findings help tobetter understand the adaptive mechanisms involved inF-induced OS and in the development of appropriatestrategies for the prevention and treatment of obesityand T2DM triggered by unhealthy diets.
MATERIALS AND METHODS
Chemicals and drugsReagents of the purest available grade and mousemonoclonal anti-β-actin antibody were obtained from
Sigma. The polyclonal anti-bovine liver catalaseantibody raised in rabbit was purchased fromRockland. Anti-rat-SOD1 [CuZn (copper/zinc)-SOD(superoxide dismutase)] rabbit sera were provided byProfessor Sigurd Lenzen (Medizinische HochschuleHannover, Hannover, Germany). Anti-rat-p22phox andanti-rat-SOD2 [Mn (manganese)-SOD] were purchasedfrom Santa Cruz Biotechnology. Secondary anti-bodies horseradish-peroxidase-conjugated AffiniPuredonkey anti-(rabbit IgG) and horseradish-peroxidase-conjugated anti-(mouse IgG) were purchased from SantaCruz Biotechnology and Abcam respectively.
AnimalsNormal male Wistar rats (150–180 g of body weight) weremaintained in a temperature-controlled room (23 ◦C)with a fixed 12 h light/12 h dark (06.00–18.00 h) cycle.Animals had free access to a standard commercial dietand tap water [C (control)], the same diet plus 10 % F inthe drinking water (F), control diet supplemented with5 mM apocynin in the drinking water (CA), and the Fdiet supplemented with 5 mM apocynin in the drinkingwater (FA respectively). Water intake was measureddaily, whereas individual body weight and food intakewere recorded once a week. The amount of apocyniningested by each rat was calculated based on the apocyninconcentration in the water and the daily water intake. Atotal of 21 animals were used in each condition.
After 21 days of treatment, blood samples were drawnfrom all animals from the retroorbital plexus underlight halothane anaesthesia after a 4 h fasting periodand collected into heparinized tubes to measure plasmaglucose, TAG (triacylglycerol) and immunoreactiveinsulin levels. Afterwards, the animals were killed bydecapitation and a portion of the liver was systematicallyremoved to perform all of the assays.
Animal experiments and handling were performedaccording to the ‘Ethical principles and guidelines forexperimental animals’ of the Swiss Academy of MedicalSciences [26].
Plasma measurementsGlucose was measured with the glucose-oxidase GOD-PAP method (Roche Diagnostics). TAG levels wereassayed using a commercial immunoenzymatic assay kit(TG colour GPO/PAP AA; Wiener Lab) implementedin an automated clinical analyser; NEFAs (non-esterifiedfatty acids) were measured using a colorimetric assay witha commercial kit (Randox Laboratories); immunoreactiveinsulin levels were measured by RIA [27] using anantibody against rat insulin, a rat insulin standard (LincoResearch) and highly purified porcine insulin labelledwith 125I [28]. Serum insulin and fasting blood glucosevalues were used to estimate IR (insulin resistance)by HOMA (homoeostasis model assessment)–IR, using
C© The Authors Journal compilation C© 2012 Biochemical Society
Apocynin prevents fructose-induced disorders 683
the equation: [serum insulin (μ-units/ml)×fasting bloodglucose (mM)]/22.5 [29].
NADPH oxidase activityLiver pieces were rinsed in Krebs buffer to avoidsuperoxide production from blood cells; thereafter,100 mg of liver tissue were homogenized in 1 ml ofice-cold Krebs buffer. The homogenate was centrifugedat 3655 g for 10 min at 4 ◦C. For assay purposes,this crude homogenate was diluted 1:2 in the samebuffer. The protein concentration in the samplewas determined using the Bradford method [30].Aliquots of the homogenates (100 μg of protein) wereincubated for 5 min at 37 ◦C in Krebs–Hepes buffer[118.3 mmol/l NaCl, 4.7 mmol/l KCl, 1.8 mmol/l CaCl2,1.2 mmol/l Mg2SO4, 1.0 mmol/l K2HPO4, 25 mmol/lNaHCO3, 11 mmol/l glucose and 20 mmol/l Hepes,pH 7.4, at 37 ◦C]. Lucigenin-enhanced chemilumines-cence was used to measure O2 production with 5 μmol/llucigenin. The chemiluminescence measured in arbitraryunits was recorded with a luminometer (Chameleon;Hidex) over 15 min at 30 s intervals. Samples containingall of the reaction components but without tissuehomogenate were previously counted (blank), and thesevalues were subtracted from the chemiluminescencesignals obtained in the presence of the tissue. Additionalnegative controls were prepared adding 4 μl of apocyninto the mixture. NADPH oxidase activity was measuredin the presence of 100 μmol/l NADPH and expressed asc.p.m./mg of liver protein.
Protein carbonyl groups, GSH and TBARSs(thiobarbituric acid-reactive substances)Protein carbonyl content was assayed by the proceduredescribed by Levine et al. [31]. Liver homogenates werecentrifuged and 0.5 ml of the supernatant was mixedwith 10 mM 2,4- DNPH (dinitrophenylhydrazine) in2 M HCl and incubated for 1 h at room temperature(23 ◦C); thereafter, the mixture was precipitated with 20 %trichloroacetic acid. The pelleted protein was washedthree times by resuspension in ethanol/ethyl acetate (1:1,v/v). Proteins were then solubilized in 6 M guanidinehydrochloride and centrifuged at 16 000 g for 5 min toremove any trace of insoluble material. The carbonylcontent was measured spectrophotometrically at 366 nm.A tissue blank incubated with 2 M HCl without DNPHwas included for each sample. Results are expressed asnmol of carbonyl residues/mg of protein based on themolar absorption coefficient (ε) of 21 000 M− 1·cm− 1.GSH in liver was determined using the method ofEllman, as described in [32]. Briefly, liver homogenateswere centrifuged at 1000 g and 1 ml of the supernatantwere mixed with 1 ml of trichloroacetic acid (10 %)and incubated at 4 ◦C for 1 h. The mixture was thencentrifuged for 20 min at 3500 g and 100 μl of the
supernatant was mixed with 900 μl of trichloroaceticacid (5 %), 2 ml of 0.01 M Tris/HCl buffer (pH 8.9)and 50 μl of DTNB [5,5′-dithiobis-(2-nitrobenzoic acid);0.4 % in methanol] and the GSH content was measuredspectrophotometrically at 414 nm. Results are expressedas μmol of GSH/g of tissue.
TBARSs were measured in the liver by the methoddescribed by Pompella et al. [33]. Liver homogenateswere mixed with 10 % trichloroacetic acid and thesamples were cooled on ice and then centrifugedat 3000 g for 10 min. The clear supernatant wasmixed with 0.7 % thiobarbituric acid and heated at100 ◦C for 15 min. Samples were cooled at roomtemperature, and the corresponding absorbance wasmeasured at 535 nm against a blank (reaction mixturewithout liver homogenate but subjected to the sameprocedure). TBARS levels are expressed in nmol of MDA(malondialdehyde)/g of tissue using a molar absorptioncoefficient (ε) of 1.56×10⁵ M− 1·cm− 1.
Isolation of total RNATotal liver RNA was isolated from C-, F-, CA-and FA-fed rats using TRIzol® Reagent (Gibco) [34].The integrity of the isolated RNA was checked by1 % agarose-formaldehyde gel electrophoresis. Possiblecontamination with protein or phenol was tested bymeasuring the 260/280 nm absorbance ratio, while DNAcontamination was avoided using DNAase I digestion(Gibco). RT–PCR (reverse transcription–PCR) wasperformed using the SuperScript III (Gibco) and totalRNA from C-, F-, CA- and FA-fed rat livers was used asa template.
Gene expression by real-time PCR [qPCR(quantitative PCR)]qPCR was performed with a Mini Opticon Real-TimePCR Detector Separate MJR (Bio-Rad Laboratories),using SYBR Green I as a fluorescent dye which bindsonly double-stranded DNA. Then 10 ng of cDNA wasamplified in 25 μl of the reaction mixture containing0.6 μM of each primer, 3 mM MgCl2, 0.2 mM dNTPs and0.15 μl of platinum Taq DNA polymerase (6 units/μl;Invitrogen). Samples were first denatured at 95 ◦C for3 min followed by 40 PCR cycles. Each cycle compriseda melting step at 95 ◦C for 30 s, an annealing stepat 62 ◦C for 45 s and an extension step at 72 ◦C for30 s, followed by a final extension at 72 ◦C for 10 min.The optimal parameters for the PCRs were empiricallydefined. Each PCR amplification was performed intriplicate. The oligonucleotide primers (forward andreverse) (Invitrogen) used are listed in Table 1. Allamplicons were designed in a size range of 90–288 bp.β-Actin was used as a housekeeping gene. SYBR Greenfluorescence emission was determined after each cycle.The purity and specificity of the amplified PCR products
C© The Authors Journal compilation C© 2012 Biochemical Society
684 M. C. Castro and others
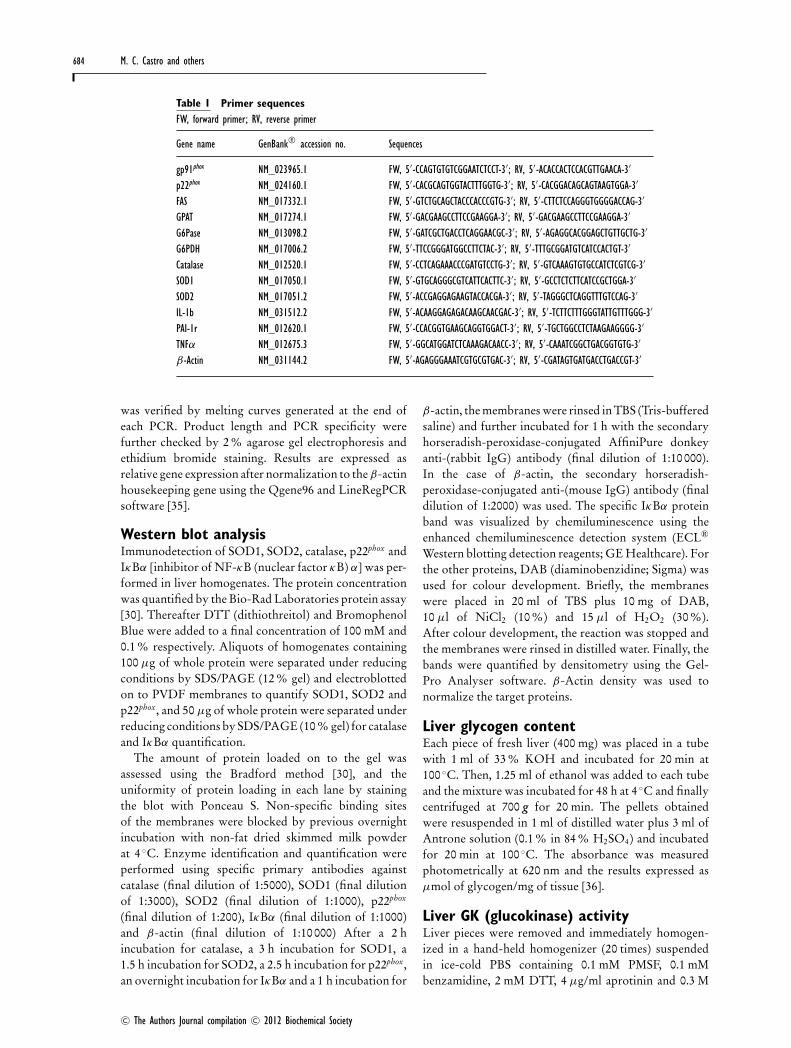
Table 1 Primer sequencesFW, forward primer; RV, reverse primer
Gene name GenBank® accession no. Sequences
gp91phox NM_023965.1 FW, 5′-CCAGTGTGTCGGAATCTCCT-3′ ; RV, 5′-ACACCACTCCACGTTGAACA-3′
p22phox NM_024160.1 FW, 5′-CACGCAGTGGTACTTTGGTG-3′ ; RV, 5′-CACGGACAGCAGTAAGTGGA-3′
FAS NM_017332.1 FW, 5′-GTCTGCAGCTACCCACCCGTG-3′ ; RV, 5′-CTTCTCCAGGGTGGGGACCAG-3′
GPAT NM_017274.1 FW, 5′-GACGAAGCCTTCCGAAGGA-3′ ; RV, 5′-GACGAAGCCTTCCGAAGGA-3′
G6Pase NM_013098.2 FW, 5′-GATCGCTGACCTCAGGAACGC-3′ ; RV, 5′-AGAGGCACGGAGCTGTTGCTG-3′
G6PDH NM_017006.2 FW, 5′-TTCCGGGATGGCCTTCTAC-3′ ; RV, 5′-TTTGCGGATGTCATCCACTGT-3′
Catalase NM_012520.1 FW, 5′-CCTCAGAAACCCGATGTCCTG-3′; RV, 5′-GTCAAAGTGTGCCATCTCGTCG-3′
SOD1 NM_017050.1 FW, 5′-GTGCAGGGCGTCATTCACTTC-3′ ; RV, 5′-GCCTCTCTTCATCCGCTGGA-3′
SOD2 NM_017051.2 FW, 5′-ACCGAGGAGAAGTACCACGA-3′ ; RV, 5′-TAGGGCTCAGGTTTGTCCAG-3′
IL-1b NM_031512.2 FW, 5′-ACAAGGAGAGACAAGCAACGAC-3′ ; RV, 5′-TCTTCTTTGGGTATTGTTTGGG-3′
PAI-1r NM_012620.1 FW, 5′-CCACGGTGAAGCAGGTGGACT-3′ ; RV, 5′-TGCTGGCCTCTAAGAAGGGG-3′
TNFα NM_012675.3 FW, 5′-GGCATGGATCTCAAAGACAACC-3′; RV, 5′-CAAATCGGCTGACGGTGTG-3′
β-Actin NM_031144.2 FW, 5′-AGAGGGAAATCGTGCGTGAC-3′ ; RV, 5′-CGATAGTGATGACCTGACCGT-3′
was verified by melting curves generated at the end ofeach PCR. Product length and PCR specificity werefurther checked by 2 % agarose gel electrophoresis andethidium bromide staining. Results are expressed asrelative gene expression after normalization to the β-actinhousekeeping gene using the Qgene96 and LineRegPCRsoftware [35].
Western blot analysisImmunodetection of SOD1, SOD2, catalase, p22phox andIκBα [inhibitor of NF-κB (nuclear factor κB) α] was per-formed in liver homogenates. The protein concentrationwas quantified by the Bio-Rad Laboratories protein assay[30]. Thereafter DTT (dithiothreitol) and BromophenolBlue were added to a final concentration of 100 mM and0.1 % respectively. Aliquots of homogenates containing100 μg of whole protein were separated under reducingconditions by SDS/PAGE (12 % gel) and electroblottedon to PVDF membranes to quantify SOD1, SOD2 andp22phox, and 50 μg of whole protein were separated underreducing conditions by SDS/PAGE (10 % gel) for catalaseand IκBα quantification.
The amount of protein loaded on to the gel wasassessed using the Bradford method [30], and theuniformity of protein loading in each lane by stainingthe blot with Ponceau S. Non-specific binding sitesof the membranes were blocked by previous overnightincubation with non-fat dried skimmed milk powderat 4 ◦C. Enzyme identification and quantification wereperformed using specific primary antibodies againstcatalase (final dilution of 1:5000), SOD1 (final dilutionof 1:3000), SOD2 (final dilution of 1:1000), p22phox
(final dilution of 1:200), IκBα (final dilution of 1:1000)and β-actin (final dilution of 1:10 000) After a 2 hincubation for catalase, a 3 h incubation for SOD1, a1.5 h incubation for SOD2, a 2.5 h incubation for p22phox,an overnight incubation for IκBα and a 1 h incubation for
β-actin, the membranes were rinsed in TBS (Tris-bufferedsaline) and further incubated for 1 h with the secondaryhorseradish-peroxidase-conjugated AffiniPure donkeyanti-(rabbit IgG) antibody (final dilution of 1:10 000).In the case of β-actin, the secondary horseradish-peroxidase-conjugated anti-(mouse IgG) antibody (finaldilution of 1:2000) was used. The specific IκBα proteinband was visualized by chemiluminescence using theenhanced chemiluminescence detection system (ECL®
Western blotting detection reagents; GE Healthcare). Forthe other proteins, DAB (diaminobenzidine; Sigma) wasused for colour development. Briefly, the membraneswere placed in 20 ml of TBS plus 10 mg of DAB,10 μl of NiCl2 (10 %) and 15 μl of H2O2 (30 %).After colour development, the reaction was stopped andthe membranes were rinsed in distilled water. Finally, thebands were quantified by densitometry using the Gel-Pro Analyser software. β-Actin density was used tonormalize the target proteins.
Liver glycogen contentEach piece of fresh liver (400 mg) was placed in a tubewith 1 ml of 33 % KOH and incubated for 20 min at100 ◦C. Then, 1.25 ml of ethanol was added to each tubeand the mixture was incubated for 48 h at 4 ◦C and finallycentrifuged at 700 g for 20 min. The pellets obtainedwere resuspended in 1 ml of distilled water plus 3 ml ofAntrone solution (0.1 % in 84 % H2SO4) and incubatedfor 20 min at 100 ◦C. The absorbance was measuredphotometrically at 620 nm and the results expressed asμmol of glycogen/mg of tissue [36].
Liver GK (glucokinase) activityLiver pieces were removed and immediately homogen-ized in a hand-held homogenizer (20 times) suspendedin ice-cold PBS containing 0.1 mM PMSF, 0.1 mMbenzamidine, 2 mM DTT, 4 μg/ml aprotinin and 0.3 M
C© The Authors Journal compilation C© 2012 Biochemical Society
Apocynin prevents fructose-induced disorders 685
sucrose, pH 7.5. The homogenate was then passedthrough a 23-gauge needle syringe (five times) toensure appropriate sample mixing. Aliquots of thesehomogenates were centrifuged at 600 g to separateand discard the nuclear fraction. The supernatantwas centrifuged twice at 8000 and 100 000 g at4 ◦C, and the resultant supernatant was collected andidentified as the cytosolic fraction. Rates of glucosephosphorylation in the 100 000 g soluble cytosolicfraction was measured at 37 ◦C, pH 7.4, by recording theincrease in absorbance at 340 nm in a well-establishedenzyme-coupled photometric assay containing G6PDH(glucose-6-phosphate dehydrogenase), ATP and NADP[12,37]. GK activity was obtained by subtracting theactivity measured at 1 mM glucose (hexokinase) fromthat measured at 100 mM glucose. These concentrationswere selected after fitting different curves obtained usinga wide range of glucose concentrations (3.1, 6.25, 12.5,25, 50, 100 and 200 mM). Enzyme activity is expressedas m-units/mg of protein. One unit of enzyme activitywas defined as 1 μmol of glucose 6-phosphate formedfrom glucose and ATP/min at 37 ◦C. For each assay, fivedifferent experiments were performed in triplicate.
Liver G6Pase (glucose-6-phosphatase)activityHomogenization of liver samples and isolation ofmicrosomes were carried out as described byNordlie and Arion [38]. Homogenization mediumwas 0.25 M sucrose/5 mM Tris-acetate/0.5 mM EDTA,pH 7.4 (3 ml/g of tissue). Microsomes were washedonce with 0.25 M sucrose/5 mM Tris-acetate, pH 7.4 andcentrifuged at 100 000 g. Untreated microsomes werediluted to the desired final concentration with thesucrose-buffered solution and assayed without furthertreatment. Fully disrupted microsomes were prepared at0 ◦C by adding 0.1 ml of 0.75 % Triton X-100 to 0.9 ml ofuntreated microsomes (approximately 10 mg of protein)and allowed to stand on ice for 20 min. Then 50 μl ofthe mixture and 50 μl of G6Pase sodium salt (0.8 M)were added and samples were incubated for 10 min at30 ◦C. The reaction was stopped by adding 250 μl of 10 %trichloroacetic acid; then, 2 ml of MoNH4 (diluted in 1 MH2SO4) plus 320 μl of FeSO4 (diluted in 0.15 M H2SO4)were added to 200 μl of each sample. The absorbanceat 660 nm was determined photometrically and resultswere expressed as ‘latency’. Latency was calculatedaccording to the following formula: 100×(activity indisrupted microsomes–activity measured in untreatedmicrosomes)/activity measured in disrupted microsomes[16].
Liver G6PDH activityPieces of liver were homogenized in 0.1 M Tris/HCland 1 mM EDTA, pH 7.6 (10 ml/g of tissue). The
homogenate was centrifuged 15 min at 10 000 g andenzyme activity was measured in the supernatants. Theincrease in absorbance of the NADPH produced wasmeasured photometrically at 340 nm. G6PDH activitywas measured according to the method as described byBeutler [39].
Liver lipid and TAG contentLipid accumulation in the liver of animals from eachexperimental group was measured (histochemistry) withSudan Red staining. For that purpose, samples were fixedwith 5 % formalin solution and frozen tissue was cutwith a freezing microtome. Frozen sections (>5 μm)were stained for 5 min at room temperature with SudanRed, prepared as a saturated solution of the dye inan ethanol (70 %)/acetone mixture (1:1). Thereafter, thesections were washed for 5 min in ethanol (50 %) in orderto remove excess dye. The morphological analysis wasperformed using a Nikon Eclipse 80i light microscopeand photography was carried out with a Nikon digitalSight DS-U1 camera.
Liver TAGs were extracted following the protocoldescribed by Schwartz and Wollins [40], and theenzymatic assay of TAG levels was performed with acommercial kit, as described for serum measurements.
Statistical analysisResults are expressed as means +− S.E.M. for theindicated number of observations or illustrated byan observation representative of results obtained fromseveral different experiments. Statistical analysis wasperformed using ANOVA followed by Dunnet’s test formultiple comparisons using the Prism analysis program(GraphPad). Differences were considered significantwhen P < 0.05.
RESULTS
Body weight and water intakeComparable body weights were recorded in all of theexperimental groups after the 3-week treatment period(Table 2). F- and FA-fed animals drank a larger volumeof water than C- and CA-fed animals. Conversely, theamount of solid food intake was significantly larger inC- and CA-fed animals compared with F- and FA-fed animals (Table 2). Consequently, the groups had adifferent percentage of daily nutrients, but a comparablecalorie intake (Table 2).
The amount of apocynin administered per rat/day was25.4 +− 1.4 and 33.1 +− 3.4 mg for CA- and FA-fed animalsrespectively (P < 0.05).
Plasma measurementsAlthough all groups had comparable serum glucose levels(Table 3), F-fed animals had significantly higher serum
C© The Authors Journal compilation C© 2012 Biochemical Society
686 M. C. Castro and others
Table 2 Body weight and water intakeValues are means+− S.E.M. (n = 15). aP < 0.05 compared with C-fed animals. NS, not significant.
Diet
Parameter C CA F FA ANOVA
Body weight (g) 294.2+− 8.3 269.5+− 4.9 284.3+− 5.7 285.2+− 5.9 NSWater consumption (ml/day) 27.8+− 2.7 25.4+− 1.4 38.6+− 8.2a 33.1 +− 3.4a P < 0.05Food intake (g/day) 20.9+− 1.1 19.4+− 0.5 15.9+− 0.9a 17.8 +− 0.9a P < 0.05Calorie intake (kcal/day) 60.3+− 2.9 55.9+− 1.5 65.3+− 3 61.9 +− 3.7 NS
Table 3 Serum measurementsValues are means+− S.E.M. (n = 21). aP < 0.05 compared with C-fed animals, and bP < 0.05 compared with F-fed animals. NS, not significant.
Diet
Parameter C CA F FA ANOVA
Insulin (ng/ml) 0.90+− 0.11 0.86 +− 0.13 1.78+− 0.16a 1.14 +− 0.2b P < 0.05Glucose (mg/dl) 112+− 3 106+− 1 113+− 3 110+− 3 NSTAG (mg/dl) 114+− 5 89 +− 7 193+− 9a 101+− 9b P < 0.05NEFA (mM) 0.59+− 0.04 0.58 +− 0.08 0.77+− 0.05a 0.43 +− 0.05b P < 0.05HOMA-IR 6.3 +− 0.8 5.5 +− 0.7 12.8+− 1.2a 7.6 +− 1.1b P < 0.05
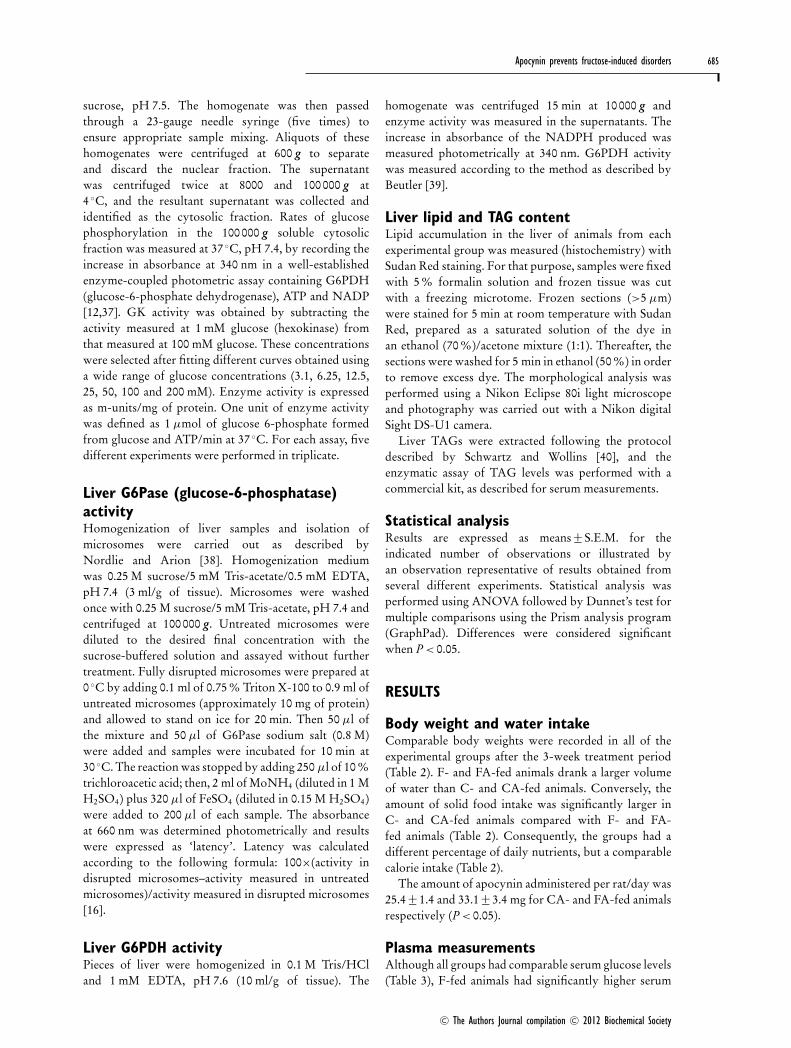
Figure 1 Assessment of protein carbonyl groups (A) andGSH (B)C- (white bars), CA- (white dotted bars), F- (grey bars) and FA- (grey dotted bars)fed rats. Results are means+− S.E.M. (n = 15). For (A) and (B), ANOVA P < 0.05.aP < 0.05 compared with C-fed animals, and bP < 0.05 compared with F-fedanimals.
TAG, NEFA and insulin levels than C rats (Table 3).In FA-fed rats, apocynin co-administration induced asignificant reduction in TAG, NEFA and insulin levels(Table 3).
The higher HOMA–IR values measured in F-fed rats(Table 3) demonstrate the existence of an IR state in theserats, which was controlled in FA-fed animals.
Assessment of protein carbonyl groups,GSH and TBARSsAlthough the protein carbonyl content was significantlyhigher and total GSH content was significantly lower inF-fed rats as compared with C-fed rats (Figure 1), thesechanges were no longer observed in FA-fed animals.
Figure 2 Assessment of NADPH oxidase activityC- (white bars), CA- (white dotted bars), F- (grey bars) and FA- (grey dotted bars)fed rats. Apocynin ( + ) represents additional negative controls prepared by addingapocynin to the reaction mixture. Results are means+− S.E.M. (n = 15). ANOVA,P < 0.05. aP < 0.05 compared with C-fed animals, and bP < 0.05 comparedwith F-fed animals.
Conversely, no significant changes were recor-ded among groups in liver TBARS content (C,6.0 +− 0.8×10− 3; F, 5.5 +− 0.3×10− 3; CA, 5.9 +− 0.5×10− 3;FA, 5.6 +− 0.4×10− 3 nmol of MDA/g of tissue).
NADPH oxidase activityLiver NADPH oxidase activity measured in the presenceof 100 μmol/l NADPH was significantly higher in F-fedrats compared with C-fed rats (Figure 2). Apocynin co-administration to F-fed rats reduced the enzyme’s activityto values comparable with those recorded in C-fed rats(Figure 2).
C© The Authors Journal compilation C© 2012 Biochemical Society
Apocynin prevents fructose-induced disorders 687
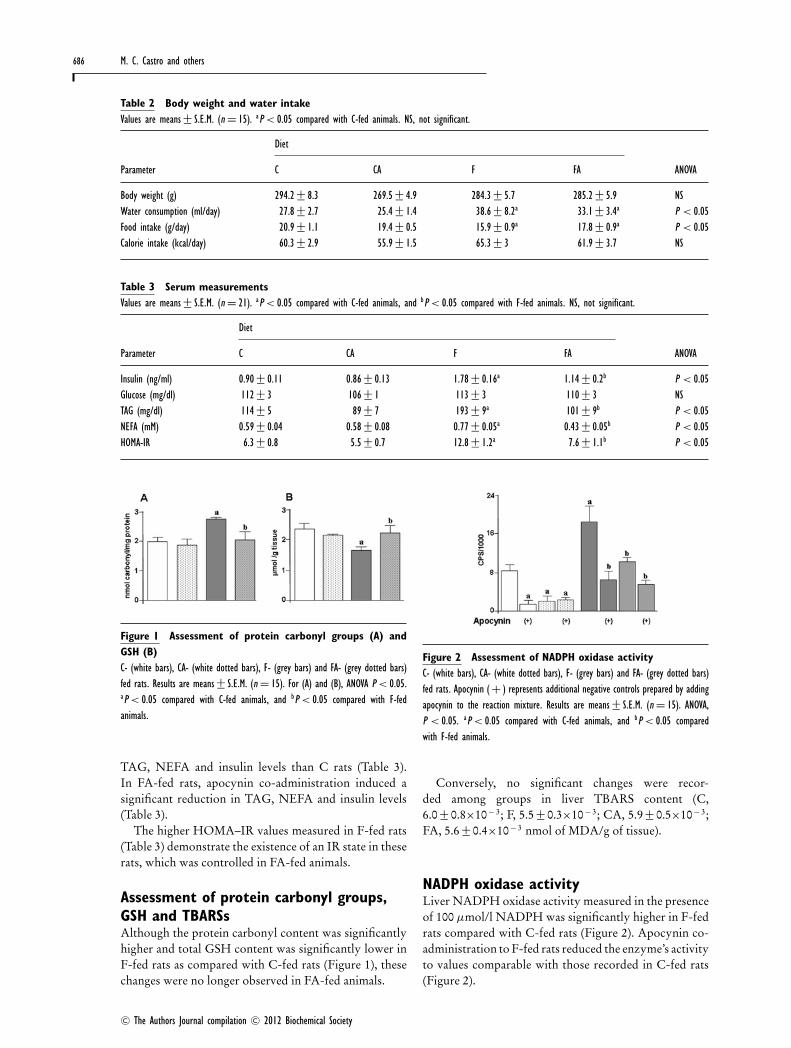
Figure 3 gp91phox and p22phox gene expression (A and B)and p22phox protein expression (C and D)Band intensities were measured in C- (white bar), CA- (white dotted bar), F- (greybar) and FA- (grey dotted bar) fed animals. β-Actin was used as a housekeepinggene and protein. In (C), a representative blot shows the bands correspondingto p22phox protein in C-, CA-, F- and FA-fed animals. Results are means+− S.E.M.(n = 15). For (A, B and D), ANOVA P < 0.05. aP < 0.05 compared with C-fedanimals, and bP < 0.05 compared with F-fed animals.
NADPH oxidase subunits gene (qPCR) andprotein (Western blot) expressionWe recorded significantly higher relative gene expressionlevels of gp91phox and p22phox in F-fed animals thanin C-fed animals (Figures 3A and 3B). Treatmentwith apocynin decreased these high values to numberscomparable with those recorded in C-fed rats (Figures 3Aand 3B). In all cases, values were expressed as a functionof the housekeeping gene β-actin.
Using specific anti-p22phox antibodies a significantincrease in the p22phox protein level (Western blot)was recorded in F-fed animals (a single band ofapproximately 22 kDa, corresponding to the molecularmass of the corresponding enzymes). Once again, thisincrease was prevented by apocynin co-administration(FA) (Figure 3C). The values were normalized using β-actin as a housekeeping protein.
Antioxidant enzyme gene expression(qPCR)Relative gene expression values of catalase, SOD1 andSOD2 were significantly lower in F-fed animals thanin C-fed rats (Figures 4A, 4D and 4G). Catalase andSOD1 expression levels remained within the range ofvalues recorded in C-fed rats when apocynin was co-administered with F (Figures 4D and 4G). In all cases,values were expressed as a function of the housekeepinggene β-actin.
Figure 4 Catalase, SOD1 and SOD2 relative gene (A, D andG) and protein (B, C, E, F, H and I) expression(A, D and G) Catalase, SOD1 and SOD2 relative gene expression in C- (white bar),CA- (white dotted bar), F- (grey bar) and FA- (grey dotted bar) fed animals. (B, Eand H) Representative blots show the bands corresponding to catalase (Cat), SOD1,SOD2 and β-actin (β Act) proteins in C-, CA-, F- and FA-fed animals. (C, F andI) Band intensities were measured in C-, CA-, F- and FA-fed animals. β-Actin wasused as a housekeeping gene and protein. Results are means+− S.E.M. (n = 15).For (A, D, G and C, F, I), ANOVA P < 0.05. aP < 0.05 compared with C-fedanimals, and bP < 0.05 compared with F-fed animals.
Antioxidant enzyme protein analysisWestern blotting performed in samples of animals fromall groups using specific catalase, SOD1 and SOD2antibodies showed a single band of approximately 60, 30and 25 kDa respectively, comparable with the molecularmass of the corresponding enzyme. The intensity ofthe specific bands increased as a function of theprotein concentration used, supporting the reliability andspecificity of the immune measurement used (results notshown).
In liver homogenates from F-fed rats, catalase, SOD1and SOD2 protein expression levels were significantlylower than in C-fed animals (Figures 4B, 4C, 4E, 4F,4H and 4I). In FA-fed rats, values were comparable withthose measured in C-fed animals (Figures 4C and 4D).In all cases, values were normalized using β-actin as ahousekeeping protein.
C© The Authors Journal compilation C© 2012 Biochemical Society
688 M. C. Castro and others
Table 4 Enzymes and metabolites of carbohydrate metabolismValues are means+− S.E.M. (n = 15). aP < 0.05 compared with C-fed animals, and bP < 0.05 compared with F-fed animals.
Diet
Parameter C CA F FA ANOVA
GK (m-units/mg of protein) 2.1+− 0.3 1.6 +− 0.15 5.2+− 0.4a 5.6 +− 0.3 P < 0.05G6Pase (% latency) 4+− 0.7 10 +− 0.4a 12+− 1.6a 12+− 1.7 P < 0.05G6PDH (m-units/mg of protein) 0.05+− 0.002 0.05 +− 0.005 0.08+− 0.007a 0.13+− 0.008b P < 0.05Glycogen (μg/mg of tissue) 3.1+− 0.7 6.1 +− 0.2a 6.2 +− 0.5a 6.8 +− 0.9 P < 0.05
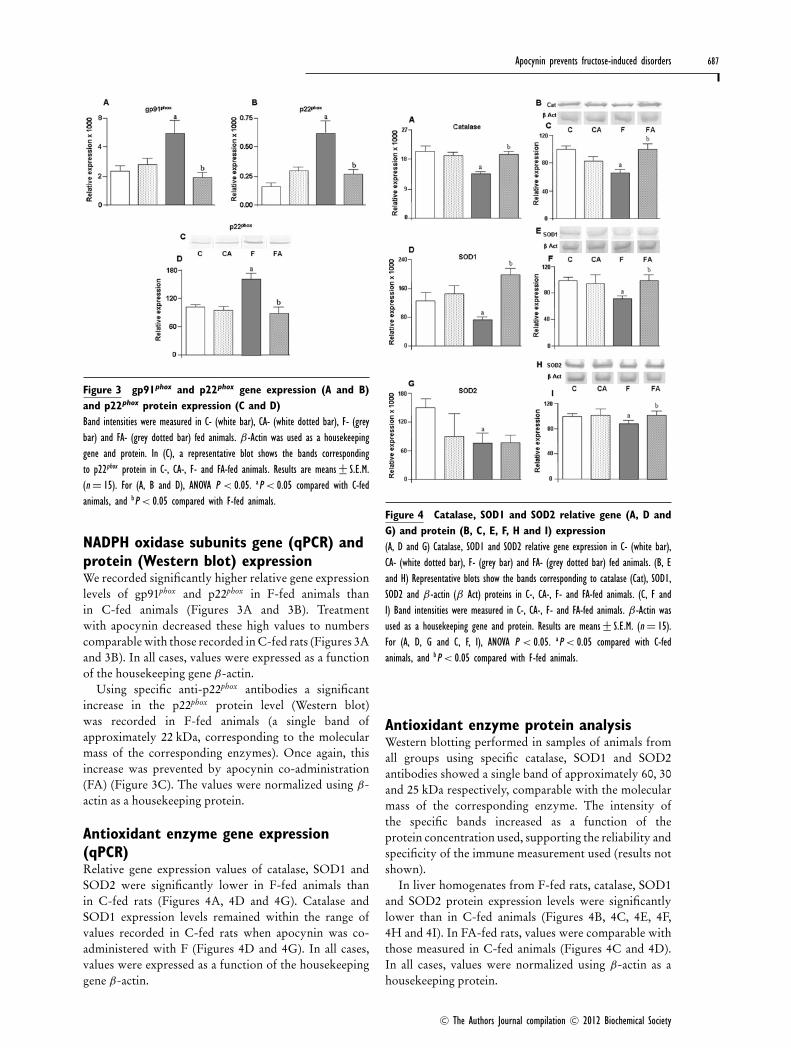
Figure 5 Expression of genes involved in lipid and glucosemetabolism in the liverRelative FAS, GPAT, G6Pase and G6PDH gene expressions were measured in C-(white bar), CA- (white dotted bar), F- (grey bar) and FA- (grey dotted bar) fedanimals. Results are means+− S.E.M. (n = 21). In all cases, β-actin was used asa housekeeping gene. ANOVA P < 0.05. aP < 0.05 compared with C-fed animals,and bP < 0.05 compared with F-fed animals.
Carbohydrate metabolic pathwaysSupporting our previous reports [13,41], F induced asimultaneous and significant increase in the activity ofGK, G6Pase (increase in the futile glucose cycling) andG6PDH, together with an increase in glycogen storage(Table 4). These changes were not prevented by apocyninco-administration (FA-fed rats) (Table 4).
Gene expression (qPCR) of enzymesinvolved in carbohydrate and lipidmetabolismRelative FAS (fatty acid synthase), GPAT (glycerol-3-phosphate acyltransferase), G6Pase and G6PDH geneexpression were significantly higher in F-fed animalsthan in C-fed rats (Figure 5). FAS and GPAT expressionlevels returned to control values when apocynin was co-administered with F. The changes in G6Pase and G6PDHgene expression, however, were not fully prevented byapocynin.
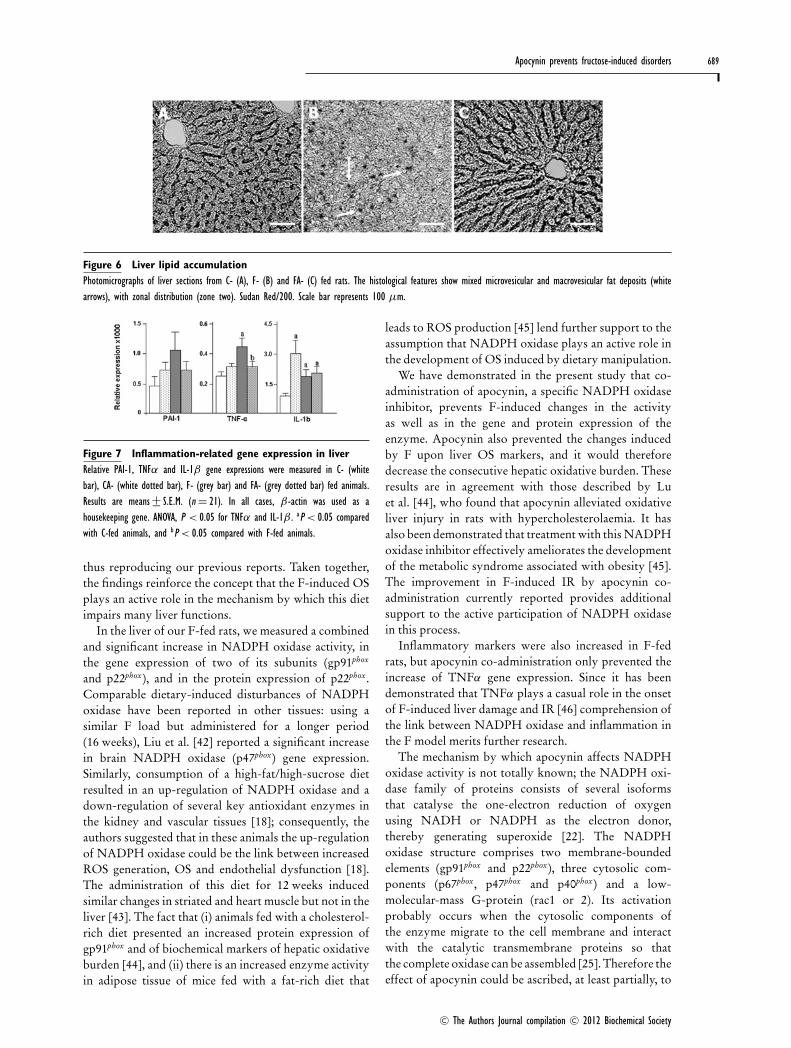
Liver lipid and TAG contentThe histological analysis showed a significant increaseof ectopic fat deposition in the liver of F-fed animalscompared with C-fed rats (Figures 6A and 6B). Thisaccumulation was prevented by apocynin treatment(Figure 6C). F-fed rats also had higher liver TAGcontent than C-fed animals (503 +− 13 compared with
383 +− 21 μg/100 mg of tissue; P<0.001). FA-fed animalshad significantly lower TAG content than F-fed rats(393 +− 20 compared with 503 +− 13 μg/100 mg of tissue;P<0.001). Conversely, apocynin administration didnot modify liver TAG content in C-fed animals(420 +− 16 μg/100 mg of tissue).
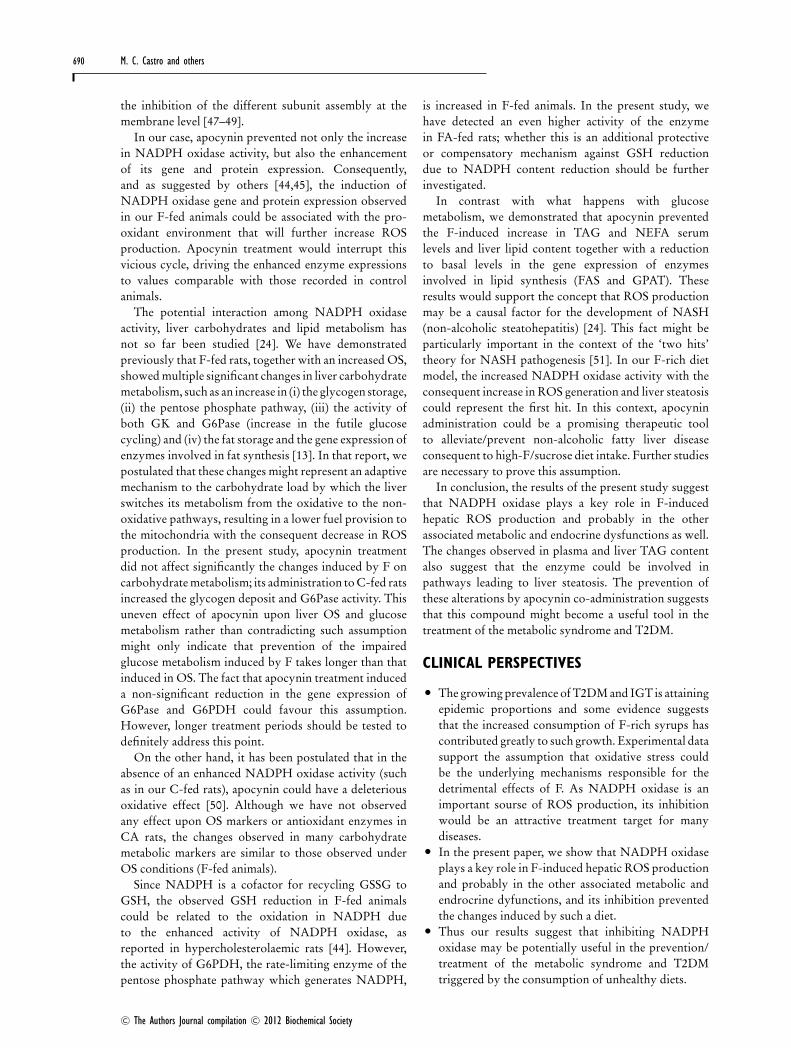
Expression of inflammatory markersThe relative gene expression of both TNFα (tumournecrosis factor α) and IL-1β (interleukin-1β) wassignificantly increased in F-fed animals (Figure 7),but apocynin co-administration only prevented theincreased expression of the former. Even when PAI-1 (plasminogen-activator inhibitor-1) expression alsoincreased in F-fed animals, this change did not attain stat-istical significance. Complementarily, the relative proteinexpression of IκBα decreased significantly in F-fed rats(98.4 +− 2.2) compared with C-fed animals (126.4 +− 7.1;P<0.05). As this compound is a physiological blockerof NF-κB, the results suggest that its activity could beincreased in these animals. Apocynin treatment to FA-fed rats did not restore these values (102.2 +− 9.3) to thosemeasured in C-fed animals.
DISCUSSION
We have shown previously that normal Wistar rats fedwith F for 3 weeks developed multiple metabolic andendocrine disorders: IR (increased HOMA–IR index),IGT, impaired lipid metabolism (high serum NEFA andTAG levels), haemorheologic alterations and increasedserum levels of insulin, leptin, adiponectin and PAI-1[13,41]. We have also reported that in the liver of theseanimals, a significant increase of several OS markers wasassociated with changes in carbohydrate metabolism thatwould switch liver metabolites away from mitochondrialoxidation, i.e. increased substrate cycle GK/G6Pase andpentose phosphate pathway as well as glycogen storage[12,13].
The significant decrease in GSH content and theincrease of carbonyl groups currently observed, togetherwith the decreased gene and protein expression ofcatalase, SOD1 and SOD2, demonstrate an increased OS,
C© The Authors Journal compilation C© 2012 Biochemical Society
Apocynin prevents fructose-induced disorders 689
Figure 6 Liver lipid accumulationPhotomicrographs of liver sections from C- (A), F- (B) and FA- (C) fed rats. The histological features show mixed microvesicular and macrovesicular fat deposits (whitearrows), with zonal distribution (zone two). Sudan Red/200. Scale bar represents 100 μm.
Figure 7 Inflammation-related gene expression in liverRelative PAI-1, TNFα and IL-1β gene expressions were measured in C- (whitebar), CA- (white dotted bar), F- (grey bar) and FA- (grey dotted bar) fed animals.Results are means+− S.E.M. (n = 21). In all cases, β-actin was used as ahousekeeping gene. ANOVA, P < 0.05 for TNFα and IL-1β . aP < 0.05 comparedwith C-fed animals, and bP < 0.05 compared with F-fed animals.
thus reproducing our previous reports. Taken together,the findings reinforce the concept that the F-induced OSplays an active role in the mechanism by which this dietimpairs many liver functions.
In the liver of our F-fed rats, we measured a combinedand significant increase in NADPH oxidase activity, inthe gene expression of two of its subunits (gp91phox
and p22phox), and in the protein expression of p22phox.Comparable dietary-induced disturbances of NADPHoxidase have been reported in other tissues: using asimilar F load but administered for a longer period(16 weeks), Liu et al. [42] reported a significant increasein brain NADPH oxidase (p47phox) gene expression.Similarly, consumption of a high-fat/high-sucrose dietresulted in an up-regulation of NADPH oxidase and adown-regulation of several key antioxidant enzymes inthe kidney and vascular tissues [18]; consequently, theauthors suggested that in these animals the up-regulationof NADPH oxidase could be the link between increasedROS generation, OS and endothelial dysfunction [18].The administration of this diet for 12 weeks inducedsimilar changes in striated and heart muscle but not in theliver [43]. The fact that (i) animals fed with a cholesterol-rich diet presented an increased protein expression ofgp91phox and of biochemical markers of hepatic oxidativeburden [44], and (ii) there is an increased enzyme activityin adipose tissue of mice fed with a fat-rich diet that
leads to ROS production [45] lend further support to theassumption that NADPH oxidase plays an active role inthe development of OS induced by dietary manipulation.
We have demonstrated in the present study that co-administration of apocynin, a specific NADPH oxidaseinhibitor, prevents F-induced changes in the activityas well as in the gene and protein expression of theenzyme. Apocynin also prevented the changes inducedby F upon liver OS markers, and it would thereforedecrease the consecutive hepatic oxidative burden. Theseresults are in agreement with those described by Luet al. [44], who found that apocynin alleviated oxidativeliver injury in rats with hypercholesterolaemia. It hasalso been demonstrated that treatment with this NADPHoxidase inhibitor effectively ameliorates the developmentof the metabolic syndrome associated with obesity [45].The improvement in F-induced IR by apocynin co-administration currently reported provides additionalsupport to the active participation of NADPH oxidasein this process.
Inflammatory markers were also increased in F-fedrats, but apocynin co-administration only prevented theincrease of TNFα gene expression. Since it has beendemonstrated that TNFα plays a casual role in the onsetof F-induced liver damage and IR [46] comprehension ofthe link between NADPH oxidase and inflammation inthe F model merits further research.
The mechanism by which apocynin affects NADPHoxidase activity is not totally known; the NADPH oxi-dase family of proteins consists of several isoformsthat catalyse the one-electron reduction of oxygenusing NADH or NADPH as the electron donor,thereby generating superoxide [22]. The NADPHoxidase structure comprises two membrane-boundedelements (gp91phox and p22phox), three cytosolic com-ponents (p67phox, p47phox and p40phox) and a low-molecular-mass G-protein (rac1 or 2). Its activationprobably occurs when the cytosolic components ofthe enzyme migrate to the cell membrane and interactwith the catalytic transmembrane proteins so thatthe complete oxidase can be assembled [25]. Therefore theeffect of apocynin could be ascribed, at least partially, to
C© The Authors Journal compilation C© 2012 Biochemical Society
690 M. C. Castro and others
the inhibition of the different subunit assembly at themembrane level [47–49].
In our case, apocynin prevented not only the increasein NADPH oxidase activity, but also the enhancementof its gene and protein expression. Consequently,and as suggested by others [44,45], the induction ofNADPH oxidase gene and protein expression observedin our F-fed animals could be associated with the pro-oxidant environment that will further increase ROSproduction. Apocynin treatment would interrupt thisvicious cycle, driving the enhanced enzyme expressionsto values comparable with those recorded in controlanimals.
The potential interaction among NADPH oxidaseactivity, liver carbohydrates and lipid metabolism hasnot so far been studied [24]. We have demonstratedpreviously that F-fed rats, together with an increased OS,showed multiple significant changes in liver carbohydratemetabolism, such as an increase in (i) the glycogen storage,(ii) the pentose phosphate pathway, (iii) the activity ofboth GK and G6Pase (increase in the futile glucosecycling) and (iv) the fat storage and the gene expression ofenzymes involved in fat synthesis [13]. In that report, wepostulated that these changes might represent an adaptivemechanism to the carbohydrate load by which the liverswitches its metabolism from the oxidative to the non-oxidative pathways, resulting in a lower fuel provision tothe mitochondria with the consequent decrease in ROSproduction. In the present study, apocynin treatmentdid not affect significantly the changes induced by F oncarbohydrate metabolism; its administration to C-fed ratsincreased the glycogen deposit and G6Pase activity. Thisuneven effect of apocynin upon liver OS and glucosemetabolism rather than contradicting such assumptionmight only indicate that prevention of the impairedglucose metabolism induced by F takes longer than thatinduced in OS. The fact that apocynin treatment induceda non-significant reduction in the gene expression ofG6Pase and G6PDH could favour this assumption.However, longer treatment periods should be tested todefinitely address this point.
On the other hand, it has been postulated that in theabsence of an enhanced NADPH oxidase activity (suchas in our C-fed rats), apocynin could have a deleteriousoxidative effect [50]. Although we have not observedany effect upon OS markers or antioxidant enzymes inCA rats, the changes observed in many carbohydratemetabolic markers are similar to those observed underOS conditions (F-fed animals).
Since NADPH is a cofactor for recycling GSSG toGSH, the observed GSH reduction in F-fed animalscould be related to the oxidation in NADPH dueto the enhanced activity of NADPH oxidase, asreported in hypercholesterolaemic rats [44]. However,the activity of G6PDH, the rate-limiting enzyme of thepentose phosphate pathway which generates NADPH,
is increased in F-fed animals. In the present study, wehave detected an even higher activity of the enzymein FA-fed rats; whether this is an additional protectiveor compensatory mechanism against GSH reductiondue to NADPH content reduction should be furtherinvestigated.
In contrast with what happens with glucosemetabolism, we demonstrated that apocynin preventedthe F-induced increase in TAG and NEFA serumlevels and liver lipid content together with a reductionto basal levels in the gene expression of enzymesinvolved in lipid synthesis (FAS and GPAT). Theseresults would support the concept that ROS productionmay be a causal factor for the development of NASH(non-alcoholic steatohepatitis) [24]. This fact might beparticularly important in the context of the ‘two hits’theory for NASH pathogenesis [51]. In our F-rich dietmodel, the increased NADPH oxidase activity with theconsequent increase in ROS generation and liver steatosiscould represent the first hit. In this context, apocyninadministration could be a promising therapeutic toolto alleviate/prevent non-alcoholic fatty liver diseaseconsequent to high-F/sucrose diet intake. Further studiesare necessary to prove this assumption.
In conclusion, the results of the present study suggestthat NADPH oxidase plays a key role in F-inducedhepatic ROS production and probably in the otherassociated metabolic and endocrine dysfunctions as well.The changes observed in plasma and liver TAG contentalso suggest that the enzyme could be involved inpathways leading to liver steatosis. The prevention ofthese alterations by apocynin co-administration suggeststhat this compound might become a useful tool in thetreatment of the metabolic syndrome and T2DM.
CLINICAL PERSPECTIVES
� The growing prevalence of T2DM and IGT is attainingepidemic proportions and some evidence suggeststhat the increased consumption of F-rich syrups hascontributed greatly to such growth. Experimental datasupport the assumption that oxidative stress couldbe the underlying mechanisms responsible for thedetrimental effects of F. As NADPH oxidase is animportant sourse of ROS production, its inhibitionwould be an attractive treatment target for manydiseases.
� In the present paper, we show that NADPH oxidaseplays a key role in F-induced hepatic ROS productionand probably in the other associated metabolic andendrocrine dyfunctions, and its inhibition preventedthe changes induced by such a diet.
� Thus our results suggest that inhibiting NADPHoxidase may be potentially useful in the prevention/treatment of the metabolic syndrome and T2DMtriggered by the consumption of unhealthy diets.
C© The Authors Journal compilation C© 2012 Biochemical Society
Apocynin prevents fructose-induced disorders 691
AUTHOR CONTRIBUTION
Marıa Massa, Flavio Francini and Juan Gagliardino con-ceived and designed the study, performed the statisticalanalysis, and drafted the paper. Marıa Castro and MarıaMassa carried out the Western blot analysis and metabolicdeterminations (liver TAG and glycogen contents, andGK, G6Pase and G6PDH activities). Guillermo Schinellaand Flavio Francini determined the protein carbonylgroups, GSH and TBARS. Claudia Caldiz and FlavioFrancini measured NADPH oxidase activity. MarıaCastro and Flavio Francini performed total RNAisolation and gene expression measurements, handled theexperimental animals and carried out the biochemicaldeterminations. Marıa Zubirıa measured NEFA content.All authors read and approved the final paper.
ACKNOWLEDGEMENTS
We are grateful to Adrian Dıaz for the insulin assays andAdriana Di Maggio for careful editing of the paper priorto submission.
FUNDING
This study was partially supported by the ConsejoNacional de Investigaciones Cientıficas y Tecnicas(CONICET) [grant number PIP 2011-0371 (to M.L.M.)]and Universidad Nacional de La Plata, Argentina.M.L.M., F.F. and J.J.G. are members of the Researchcareer of CONICET, G.S. is a member of CICPBA,C.I.C. is a researcher of UNLP, M.C.C. is a fellow ofCONICET, and M.G.Z. is a fellow of FONCyT [grantnumber PICT 2007-1051].
REFERENCES
1 International Diabetes Federation (2009) IDF DiabetesAtlas, 4th edn, IDF, Brussels (http://www.eatlas.idf.org)
2 Guthrie, J. F. and Morton, J. F. (2000) Food sources ofadded sweeteners in the diets of Americans. J. Am. Diet.Assoc. 100, 43–48
3 Putnam, J. and Allshouse, J. (1999) Food consumptionprices and expenditures, 1970–97. Statistical Bulletin No.965. USDA Economic Research Service, Washington,DC
4 Bray, G. A., Nielsen, S. J. and Popkin, B. M. (2004)Consumption of high-fructose corn syrup in beveragesmay play a role in the epidemic of obesity. Am. J. Clin.Nutr. 79, 537–543
5 Elliott, S. S., Keim, N. L., Stern, J. S., Teff, K. and Havel,P. J. (2002) Fructose, weight gain, and the insulin resistancesyndrome. Am. J. Clin. Nutr. 76, 911–922
6 Gross, L. S., Li, L., Ford, E. S. and Liu, S. (2004) Increasedconsumption of refined carbohydrates and the epidemic oftype 2 diabetes in the United States: an ecologicassessment. Am. J. Clin. Nutr. 79, 774–779
7 Hu, F. B. and Malik, V. S. (2010) Sugar-sweetenedbeverages and risk of obesity and type 2 diabetes:epidemiologic evidence. Physiol. Behav. 100, 47–54
8 Bizeau, M. E. and Pagliassotti, M. J. (2005) Hepaticadaptations to sucrose and fructose. Metab. Clin. Exp. 54,1189–1201
9 Pagliassotti, M. and Horton, T. (2004) Sucrose, insulinaction and biologic complexity. In Recent ResearchDevelopments in Physiology (Pandalai, S. G., ed.),pp. 337–353, Research Signpost, Kerala, India
10 Spolarics, Z. and Meyenhofer, M. (2000) Augmentedresistance to oxidative stress in fatty rat livers induced by ashort-term sucrose rich diet. Biochim. Biophys. Acta 1487,190–200
11 Bezerra, R. M., Ueno, M., Silva, M. S., Tavares, D. Q.,Carvalho, C. R. and Saad, M. J. (2000) A high fructose dietaffects the early steps of insulin action in muscle and liverof rats. J. Nutr. 130, 1531–1535
12 Francini, F., Castro, M. C., Gagliardino, J. J. and Massa,M. L. (2009) Regulation of liver glucokinase activity in ratswith fructose-induced insulin resistance and impairedglucose and lipid metabolism. Can. J. Physiol. Pharmacol.87, 702–710
13 Francini, F., Castro, M. C., Schinella, G., Garcıa, M. E.,Maiztegui, B., Raschia, M. A., Gaglairdino, J. J. and Massa,M. L. (2010) Changes induced by a fructose on hepaticmetabolism and the antioxidant system. Life Sci. 86,965–971
14 Busserolles, J., Zimowska, W., Rock, E., Rayssiguier, Y. andMazur, A. (2002) Rats fed a high sucrose diet have alteredheart antioxidant enzyme activity and gene expression.Life Sci. 71, 1303–1312
15 Girard, A., Madani, S., Boukortt, F., Cherkaoui-Maiki, M.,Belleville, J. and Prost, J. (2006) Fructose-enriched dietmodifies antioxidant status and lipid metabolism inspontaneously hypertensive rats. Nutrition 22,758–766
16 Lange, A. J., Arion, W. J. and Beaudet, A. L. (1980) Type Ibglycogen storage disease is caused by a defect inthe glucose-6-phosphate translocase of the microsomalglucose-6-phosphatase system. J. Biol. Chem. 255,8381–8384
17 Thirunavukkarasu, V., Nandhini, A. T. A. and Anuradha,C. V. (2004) Cardiac lipids and antioxidant status in highfructose rats and the effect of β-lipoic acid. Nutr. Metab.Cardiovasc. Dis. 14, 351–357
18 Roberts, C. K., Barnard, J., Sindhu, R. K., Jurczak, M.,Ehdaie, A. and Vaziri, N. D. (2006) Oxidative stress anddysregulation of NAD(P)H oxidase and antioxidantenzymes in diet-induced metabolic syndrome.Metab. Clin. Exp. 55, 928–934
19 Vaziri, N. D. (2004) Roles of oxidative stress and anti-oxidant therapy in chronic renal disease and hypertension.Curr. Opin. Nephrol. Hypertens. 1, 93–99
20 Chabrashvili, T., Tojo, A., Onozato, M. L., Kitiyakara, C.,Quinn, M. T., Fujita, T., Welch, W. J. and Wilcox, C. S.(2002) Expression and cellular localization of classicNADPH oxidase subunits in the spontaneouslyhypertensive rat kidney. Hypertension 39, 269–274
21 Griendling, K. K., Sorescu, D. and Ushio-Fukai, M. (2000)NAD(P)H oxidase: role in cardiovascular biology anddisease. Circ. Res. 86, 269–274
22 Heitzer, T., Wenzel, U., Hink, U., Krollner, D., Skatchkov,M., Stahl, R. A., MacHarzina, R., Brasen, J. H., Meinertz,T. and Munzel, T. (1999) Increased NAD(P)Hoxidase-mediated superoxide production in renovascularhypertension: evidence for an involvement of proteinkinase C. Kidney Int. 55, 252–260
23 Taniyama, Y. and Griendling, K. K. (2003) Reactive oxygenspecies in the vasculature: molecular and cellularmechanisms. Hypertension 42, 1075–1081
24 Guichard, C., Moreau, R., Pessayre, D., Epperson, T. K.and Krause, K. H. (2008) NOX family NADPH oxidasesin liver and in pancreatic islets: a role in the metabolicsyndrome and diabetes? Biochem. Soc. Trans. 36, 920–929
25 Stefanska, J. and Pawliczak, R. (2008) Apocynin: molecularaptitudes. Mediators Inflamm. 2008, 106507
26 Swiss Academy of Medical Sciences (2005) EthicalPrinciples and Guidelines for Experimental Animals, 3rdedn, Swiss Academy of Medical Sciences, Basel
27 Herbert, V., Lau, K. S., Gottlieb, C. W. and Bleicher, S. J.(1965) Coated charcoal immunoassay of insulin. J. Clin.Endocrinol. Metab. 25, 1375–1384
C© The Authors Journal compilation C© 2012 Biochemical Society
692 M. C. Castro and others
28 Linde, S., Hansen, B. and Lermark, A. (1980) Stableiodinated polypeptide hormones prepared bypolyacrylamide gel electrophoresis. Anal. Biochem. 107,165–176
29 Matthews, D. R., Hosker, J. P., Rudenski, A. S., Naylor,B. A., Treacher, D. F. and Turner, R. C. (1985) Homeostasismodel assessment: insulin resistance and β-cell functionfrom fasting plasma glucose and insulin concentrations inman. Diabetologia 28, 412–419
30 Bradford, M. M. (1976) A rapid and sensitive method forthe quantitation of microgram quantities of proteinutilizing the principle of protein-dye binding.Anal. Biochem. 72, 248–254
31 Levine, R. L., Garland, D., Oliver, C. N., Amici, A.,Climent, I., Lenz, A. G., Ahn, B., Shaltiel, S. and Stadtman,E. R. (1990) Determination of carbonyl content inoxidatively modified proteins. Methods Enzymol. 186,464–478
32 Sedlak, J. and Lindsay, R. H. (1968) Estimation of total,protein-bound, and nonprotein sulfhydryl groups intissue with Ellman’s reagent. Anal. Biochem. 25,192–205
33 Pompella, A., Maellaro, E., Casini, A. F., Ferrali, M.,Ciccoli, L. and Comporti, M. (1987) Measurement of lipidperoxidation in vivo: a comparison of different procedures.Lipids 22, 206–211
34 Chomczynski, P. and Sacchi, N. (1987) Single-step methodof RNA isolation by acid guanidinium thiocyanate-phenol-chloroform extraction. Anal. Biochem. 162, 156–159
35 Muller, P. Y., Janovjak, H., Miserez, A. R. and Dobbie, Z.(2002) Processing of gene expression data generated byquantitative real-time RT-PCR. BioTechniques 32,1372–1379
36 Chun, Y. and Yin, Z. D. (1998) Glycogen assay fordiagnosis of female genital Chlamydia trachomatisinfection. J. Clin. Microbiol. 36, 1081–1082
37 Massa, M. L., Baltrusch, S., Okar, D. A., Lange, A. J.,Lenzen, S. and Tiedge, M. (2004) Interaction of6-phosphofructo-2-kinase/fructose-2,6-bisphosphatase(PFK-2/FBPase-2) with glucokinase activates glucosephosphorylation and glucose metabolism in insulin-producing cells. Diabetes 53, 1020–1029
38 Nordlie, R. C. and Arion, W. J. (1966) Glucose-6-phosphatase. Methods Enzymol. 9, 619–625
39 Beutler, E (1975) Chapter 19. In Red Cell Metabolism: aManual of Biochemical Methods, 2nd edn, Grune andStratton, New York
40 Schwartz, D. M. and Wollins, N. E. (2007) A simple andrapid method to assay triacylglycerol in cells and tissues.J. Lipid Res. 48, 2514–2520
41 Alzamendi, A., Giovambattista, A., Raschia, A., Madrid,V., Gaillard, R. C., Rebolledo, O., Gagliardino, J. J. andSpinedi, E. (2009) Fructose-induced abdominal adiposetissue endocrine dysfunction in normal male rats.Endocrine 35, 227–232
42 Liu, X., Luo, D., Zheng, M., Hao, Y., Hou, L. and Zhang,S. (2010) Effect of pioglitazone on insulin resistance infructose-drinking rats correlates with AGEs/RAGEinhibition and block NADPH oxidase and NFκBactivation. Eur. J. Pharmacol. 629, 153–158
43 Feillet-Coudray, C., Sutra, T., Fouret, G., Ramos, J.,Wrutniak-Cabello, C., Cabello, G., Cristol, J. P. andCoudray, C. (2009) Oxidative stress in rats fed a high-fat high-sucrose diet and preventive effect of polyphenols:involvement of mitochondrial and NAD(P)H oxidasesystems. Free Radical Biol. Med. 46, 624–632
44 Lu, L. S., Wu, C. C., Hung, L. M., Chiang, M. T., Lin,C. T., Lin, C. W., Lin, C. W. and Su, M. J. (2007) Apocyninalleviated hepatic oxidative burden and reduced liver injuryin hypercholesterolaemia. Liver Int. 27, 529–537
45 Furukawa, S., Fujita, T., Shimabukuro, M., Iwaki, M.,Yamada, Y., Nakajima, Y., Nakayama, O., Makishima, M.,Matsuda, M. and Shimomura, I. (2004) Increased oxidativestress in obesity and its impact on metabolic syndrome.J. Clin. Invest. 114, 1752–1761
46 Kanuri, G., Spruss, A., Wagnerberger, S., Bischoff, S. C.and Bergheim, I. (2011) Role of tumor necrosis factor α(TNF α) in the onset of fructose-induced nonalcoholicfatty liver disease in mice. J. Nutr. Biochem. 22, 527–534
47 Johnson, D. K., Schillinger, K. J., Kwait, D. M., Hughes,C. V., McNamara, E. J., Ishmael, F., O’Donnell, R. W.,Chang, M. M., Hogg, M. G., Dordick, J. S. et al. (2002)Inhibition of NADPH oxidase activation in endothelialcells by ortho-methoxy-substituted catechols.Endothelium 9, 191–203
48 Barbieri, S. S., Cavalca, V., Eligini, S., Brambilla, M., Caiani,A., Tremoli, E. and Colli, S. (2004) Apocynin preventscyclooxygenase 2 expression in human monocytes throughNADPH oxidase and glutathione redox-dependentmechanisms. Free Radical Biol. Med. 37, 156–165
49 Peters, E. A., Hiltermann, J. T. N. and Stolk, J. (2001)Effect of apocynin on ozone-induced airwayhyperresponsiveness to methacholine in asthmatics. FreeRadical Biol. Med. 31, 1442–1447
50 Riganti, C., Costamagna, C., Bosia, A. and Ghigo, D.(2006) The NADPH oxidase inhibitor apocynin(acetovanillone) induces oxidative stress. Toxicol. Appl.Pharmacol. 212, 179–187
51 Day, C. and James, O. F. (1998) Steatohepatitis: a tale oftwo ‘hits’? Gastroenterology 114, 842–845
Received 16 December 2011/25 June 2012; accepted 28 June 2012Published as Immediate Publication 28 June 2012, doi:10.1042/CS20110665
C© The Authors Journal compilation C© 2012 Biochemical Society