anthocyanin esterification in sangiovese grapes
TRANSCRIPT
ISSN 1120-1770
ITALIAN JOURNALOF
FOOD SCIENCERivista italiana
di scienza degli alimenti
Volume XXVNumber 1
2013
CHIRIOTTI EDITORI
COP IJFS 25 anniversary_Layout 1 05/03/13 18:36 Pagina 1
Volume XXVNumber 2
2013

124 Ital. J. Food Sci., vol. 25 - 2013
ITALIAN JOURNAL OF FOOD SCIENCE (RIVISTA ITALIANA DI SCIENZA DEGLI ALIMENTI) 2nd series
Founded By Paolo Fantozzi under the aeges of the University of PerugiaOfficial Journal of the Italian Society of Food Science and Technology
Società Italiana di Scienze e Tecnologie Alimentari (S.I.S.T.Al)Initially supported in part by the Italian Research Council (CNR) - Rome - Italy
Recognised as a “Journal of High Cultural Level”by the Ministry of Cultural Heritage - Rome - Italy
Editor-in-Chief:Paolo Fantozzi - Dipartimento di Scienze Economico-Estimative e degli Alimenti, Università di Perugia,
S. Costanzo, I-06126 Perugia, Italy - Tel. +39 075 5857910 - Telefax +39 075 5857939-5857943 - e-mail: [email protected]
Co-Editors:Chianese Lina - Università degli Studi di Napoli Federico II, e-mail: [email protected] Paola - Università degli Studi di Teramo, e-mail: [email protected] Carlo - Università degli Studi di Milano, e-mail: [email protected] Milena - SIMTREA - Università degli Studi di Foggia, e-mail: [email protected] Bruno - Università degli Studi di Firenze, e-mail: [email protected]
Publisher:Alberto Chiriotti - Chiriotti Editori srl, Viale Rimembranza 60, I-10064 Pinerolo, Italy - Tel. +39 0121 393127 -
Fax +39 0121 794480 e-mail: [email protected] - URL: www.chiriottieditori.it
Aim: The Italian Journal of Food Science is an international journal publishing original, basic and applied papers, reviews, short communications, surveys and opinions on food science and technology with specific reference to the Mediterranean Region. Its expanded scope includes food production, food engineering, food management, food quality, shelf-life, consumer acceptance of foodstuffs. food safety and nutrition, and environmental aspects of food processing.
Reviews and surveys on specific topics relevant to the advance of the Mediterranean food industry are particularly welcome.
Upon request and free of charge, announcements of congresses, presentations of research institutes, books and proceedings may also be published in a special “News” section.
Review Policy: The Co-Editors with the Editor-in-Chief will select submitted manuscripts in relationship to their
innovative and original content. Referees will be selected from the Advisory Board and/or qualified Italian or foreign scientists. Acceptance of a paper rests with the referees.
Frequency: Quarterly - One volume in four issues. Guide for Authors is published in each number and annual indices are published in number 4 of each volume.
Impact Factor: 5-Year Impact Factor: 0.606 published in 2011 Journal of Citation Reports, Institute for Scientific Information; Index Copernicus Journal Master List 2009 (ICV): 13.19
IJFS is abstracted/indexed in: Chemical Abstracts Service (USA); Foods Adlibra Publ. (USA); Gialine - Ensia (F); Institut Information Sci. Acad. Sciences (Russia); Institute for Scientific Information; CurrentContents®/AB&ES; SciSearch® (USA-GB); Int. Food Information Service - IFIS (D); Int. Food Information Service - IFIS (UK); EBSCO Publishing; Index Copernicus Journal Master List (PL).
IJFS has a page charge of € 25.00 each page.
Subscription Rate: IJFS is available on-line in PDF format only.2013: Volume XXV: PDF for tablet € 60.50 (VAT included) - Supporting € 1,210.00 (VAT included)

Ital. J. Food Sci., vol. 25 - 2013 125
ITALIAN JOURNAL OF FOOD SCIENCE
ADVISORY BOARD
SCIENTISTS
R. AmarowiczEditor-in-Chief Polish J. Food and Nutrition Sci. Olsztyn, Poland
A. BertrandInstitut d’Oenologie Université de Bordeaux Talence Cedex, France
L.B. BullermanDept. of Food Science and Technology University of Nebraska-Lincoln Lincoln, NE, USA
F. DevlieghereDept. Food Technology and Nutrition Faculty of Agricultural and Applied Biological Sciences Gent UniversityGent, Belgium
S. GarattiniIst. di Ricerche Farmacologiche “Mario Negri” Milano, Italy
J.W. KingDept. Chemical Engineering University of Arkansas Fayetteville, AR, USA
T.P. LabuzaDept. of Food and Nutritional Sciences University of Minnesota St. Paul, MN, USA
A. LeclercInstitut Pasteur Paris, France
C. LeeDept. of Food Science and Technology Cornell University, Geneva, NY, USA
G. MazzaAgriculture and Agri-Food Canada Pacific Agri-Food Research Centre Summerland, BC, Canada
J. O’BrienHead, Quality and Safety Dept.Nestle Research CentreLausanne, Switzerland
J. PiggottDepartamento de Alimentos e NutriçãoUniversidade Estadual PaulistaAraraquara, Brasil
J. SamelisDairy Research Institute National Agricultural Research Foundation Ioannina, Greece
M. SumanFood Research Lab Barilla C.R. F.lli spa Parma, Italy
M. TsimidouSchool of Chemistry, Artisotle University Thessaloniki, Greece
Prof. Emeritus J.R. WhitakerDept. of Food Science and Technology University of California Davis, CA, USA
REPRESENTATIVES of CONTRIBUTORS
R. CoppolaDipartimento di Scienze e Tecnologie Agroalimentari e Microbiologiche (DI.S.T.A.A.M.), Università del Molise, Campobasso, Italy
M. FontanaSoremartec Italia, Ferrero GroupAlba, Italy
V. GerbiDipartimento di Valorizzazione e Protezione delle Risorse Agroforestali (DI.VA.P.R.A.)Sezione Microbiologia ed Industrie Agrarie, Università di Torino, Torino, Italy
S. PorrettaAssociazione Italiana di Tecnologie Alimentari (AITA) Milano, Italy
M. RossiDeFENS, Department of Food, Environmental and Nutritional SciencesUniversità di Milano, Milano, Italy

126 Ital. J. Food Sci., vol. 25 - 2013
OPINION
- Keywords: traditional products, acrylamide, organochlorine pesticides, polychlorinated biphenyls, n-methylcarbamates, ochratoxin A, Cu, Mn, Fe, Zn, Ca and Mg -
HEALTH QUALITY AND NUTRITIONAL VALUEOF RYE BREAD PRODUCED ON A SMALL
AND LARGE SCALE IN POLAND
M. RADZYMINSKA*, B. GARBOWSKA and D. JAKUBOWSKAChair of Commodity Science and Food Research, University of Warmia and Mazury in Olsztyn
*Corresponding author: [email protected]
AbStrAct
this study is a small part of a project aimed at performing comprehensive evaluation of the quality of local raw materials and products in the region of Warmia and Mazury in Poland. this study evaluates selected determinants of the health quality and nutritional value of rye bread in relation to origin (small and large scale production). the analytical procedure included determi-nation of the content of acrylamide, organochlorine pesticides and polychlorinated biphenyls, n-methylcarbamates, ochratoxin A, acidity, moisture, protein, glucose, fat, salt, cu, Mn, Fe, Zn, ca, and Mg. the quality of bread produced on a small scale, compared to that produced in large bak-eries, differed only in terms of some determinants. rye bread from local producers contained sta-tistically significantly less (P ≤ 0.05) acrylamide and statistically significantly more copper, man-ganese and zinc.

Ital. J. Food Sci., vol. 25 - 2013 127
INtrODUctION
Now that globalization of the food economy has made the market of food products predom-inated by mass products whose quality param-eters frequently fail to meet consumers’ expec-tations, local agri-food initiatives, proposed as sustainable alternatives, are gaining impor-tance both for small-scale producers and en-vironmentally-aware consumers (SELFA and QAZI, 2005; O’HArA and StAGL, 2001; HINrIcKS, 2000). the level of consumers’ trust in food and perception of risks vary, but purchasing de-cisions are increasingly often associated with seeking safe food products (YEUNG and MOr-rIS, 2001; VErbEKE et al., 2007; ANGULO and GIL, 2007) with well-known and tested places of origin (ESPEJEL et al., 2007; DU PLESSIS and DU rAND 2011). the region of origin is begin-ning to play an important role in decisions of food products purchase (LObb and MAZZOccHI, 2007). those from rural areas are perceived as products of high quality (HENcHION and McI-NtYrE, 2000).
”traditional food” refers to products made from specific raw materials, and/or with a reci-pe known for a long time, and/or with a specif-ic process (cAYOt, 2007). the current EU legal regulations (cOUNcIL rEGULAtION No 2081/92; No 2082/92; No 510/2006; No 509/2006) ena-ble the protection of original agricultural prod-ucts and food characteristic of the place of or-igin and traditional methods of production. these include: Protected Designation of Origin (PDO), Protected Geographical Indication (PGI) and traditional Speciality Guaranteed (tSG). Quality of food, resulting from the method of its production and processing, as well as the raw materials used, should be the most important attribute of regional food and the base its pos-itive image should be built on. the term ‘‘tra-ditional’’ is, however, not adequately defined. Moreover, it is often intentionally or uninten-tionally misused. therefore, the important is-sues of registration and standardization of tra-ditional foods arise in order for these products (1) to be protected against imitations, (2) to be of high quality and (3) to conform to contempo-rary rules of appropriate and safe production. A way to ensure authenticity and high quality of traditional food products is to establish criteria for their registration that will thereafter deter-mine standards for their commercial produc-tion (trIcHOPOULOU et al., 2007). reproduc-tion of traditional food, especially today, in the era of globalisation, entails a number of ques-tions about the possibility of obtaining compo-nents, reconstructing a recipe and a process, the nutritional value, specificity or typicality of the products. cAYOt (2007) has pointed out that the industrialization of food production, European laws on food safety and even the de-velopment of innovative products necessitate
the characterization of even the typical senso-ry traits of the traditional products.
bread made from whole and brown rye flours is a major component of diet in Northern and Eastern European countries (MIcHALSKA et al., 2008). As bread is a staple food to many popula-tions, its quality is of outmost importance. being a component of an everyday diet, bread should have high nutritional quality (DEWEttINcK et al., 2008). It has been shown to be a source of nutrients, especially carbohydrates, fiber, pro-teins and some minerals (magnesium, phospho-rus, iron) (KOPEc et al., 2011). As reported by MIcHALSKA et al. (2008), rye products based on wholemeal rye flour may be considered to be nu-tritious and healthy food.
the chemical composition, nutritional value and sensory quality of bread depend on the type and extract of rye flour used for its production, on the technological process, water content and technological additives (KIHLbErG et al., 2004) which impart the product specific functional properties (JONES and JEW, 2007). Modification of the recipe by the addition of some ingredients, for example, dietary fiber and sour dough, may affect the nutritional value of the finished prod-uct (LOPEZ et al. 2003; POUtANEN et al., 2009; tUcKEr et al., 2010).
An increasing number of products are appear-ing on the market with names given by produc-ers and implying that they were “home-made”. by information provided on packages, the pro-ducers suggest that the food was manufactured with traditional methods, according to tradition-al recipes.
there are only scarce data on local food. Infor-mation about products manufactured on a small scale, from local raw materials and with tradi-tional methods, are frequently only uncorrobo-rated press reports. the aim of this study was to compare: 1) health quality (acrylamide, Σ DDt, γ HcH, Pcb, N-methylcarbamates, ochratoxin A, and 2) nutritional value (protein, glucose, cu, Mn, Fe, Zn, ca and Mg) of rye bread produced by micro-companies and larger producers.
EXPErIMENtAL PrOcEDUrES
Samples
During the first stage, an inventory was per-formed of bread produced by agri-tourist farms and micro-companies in the bakery industry, located in the region of Warmia and Mazury in Poland (Fig. 1). Seventy-five personal inter-views with representatives of the entities under study were conducted. the questionnaire con-tained three groups of questions: 1) concerning the types of products made, 2) focusing on raw materials and methods of production, 3) aimed at providing a qualitative description of prod-ucts made from local raw materials. 20% of the

128 Ital. J. Food Sci., vol. 25 - 2013
Fig. 1 - Map of rye bread collection
companies under study were found to use only flour purchased from local, regional producers. 3% of the companies used materials originating from their own production. the place of origin of materials was an important factor, taken into account in purchasing decisions for 45% of the companies. the analyzed products were those with higher-than-average quality, resulting from traditional methods of production and materials of local origin used in the production process.
Of all the products under study, samples of rye bread from 22 manufacturers were collected (the samples were labelled as traditional food). Moreover, bread labelled as “wholemeal bread” was bought on the Warmia and Mazury market (Poland) from 8 large-scale manufacturers (the samples were labelled as conventional).
Health quality
Health quality of rye bread was determined based on selected indicators: acrylamide, Σ DDt (1.1.1. - trichloro-2.2-bis(4-chlorophenyl)eth-ane - as a total sum of DDt + DDE +DDD), γ HcH (γ-hexachlorocyclohexane), polychlorinat-ed biphenyls (Pcbs), N-methylcarbamates and ochratoxin A.
the content of acrylamide in the samples was determined with the rP-HPLc method (WENZL et al., 2003; ZHANG et al., 2005). the 4.0-g sam-ple after acrylamide extraction using 80% meth-anol in water and de-fatting using hexane was cleaned up by adding acetonitrile (20 mL) and carrez I (500 µL) and carrez II (500 µL). the al-iquot was centrifuged for 10 min at 4,500 g at 4°c and the clear supernatant was cleaned up with Oasis HLb SPE cartridges purchased from Waters (Milford, MA). the final sample was fil-tered through a membrane filter (0.45 µm) and analyzed with the rP-HPLc method. the analy-
ses were carried out using Shimadzu Lc-20AD series for HPLc equipped with UV-Vis 190-600 nm diode array detector (DAD, Shimad-zu) set at 200 nm, a vacuum degasser, binary pumps, thermostated autosampler and tempera-ture-controlled column oven. the column used was c18, 4.0 mm guard column and Synergi 4 Hydro-rP 80 A 250 x 4.6 mm Lc column from Phenomenex (torrance, cA); mobile phase: iso-cratic mixture of 5 mM heptasulfonic acid; flow rate 1.0 mL/min; injection volume: 100 µL, col-umn temperature 25°c, autosampler tempera-ture 4°c; UV-Vis detector set at 200 nm. Acryl-amide elutes near 8-9 min. total time between injections was 30 min. Peak identification was based on the retention time by comparison of the ratio of UV spectra with that of a standard commercial compound. the acrylamide stan-dard was obtained from Sigma-Aldrich chemi-cal company (USA). Stock standards were pre-pared in 80% methanol. the stock solution of the standard was 20, 10, 5, 2, 1, 0.5, 0.25, 0.10, 0.05 and 0.01 µm/mL. All standard solutions were stored at 4°c in glass light-resistant bot-tles. the linearity of the standard curve was ex-pressed in terms of the correlation coefficient (r2), the plot of the integrated peak area (% of UV spectra) against standard concentration. A linear regression equation was found with lin-earity (r2=0.9996, n=6) over the range of 0.01 - 20 µg/mL. this was used to determined acryl-amide concentration in food samples. repeat-ability and precision of the method were deter-mined by repetitive analyses of the content of acrylamide in 10 one-batch samples of rye bread and calculating the rSD (relative standard de-viation). the rSD (n=10) of one-batch samples was 4.7% which is a satisfactory level in food quality control. the mean recovery was 105%.
Organochlorine pesticides (DDt and γ HcH) and polychlorinated biphenyls (Pcbs) were ex-tracted from the samples with petroleum ether and acetone together with fat. the identification and quantitative determination of the analyzed compounds were carried out with gas chroma-tography using a PYE Unicam 4600 apparatus with an Ec detector.
N-methylcarbamates were determined with the HPLc method (DIONEX cOrPOrAtION 2007; ISO 1998). the method of sample preparation in-volves a salting-out extraction step with acetoni-trile, Nacl, and MgSO4; and a SPE clean-up step using primary secondary amine (PSA) resin to extract carbamates and remove interfering sub-stances from the samples. 5 g of the sample were put into a tube and then 5 ml of acetonitrile were added. After 1 min of vortexing, 2 g of MgSO4 and 0.5g Nacl were added and the sample was mixed for 1 min using vortex. then, it was centrifuged for 10 min (rpm 3,000) and 1 mL of supernatant was pipetted into 1.5 mL and 100 mg MgSO4 and 50 mg PSA were added. Afterwards, the sample was vortexed for 1 min and centrifuged for 5 min

Ital. J. Food Sci., vol. 25 - 2013 129
(10,000 rpm). then, 100 µL of the supernatant were mixed with 900 µL of distilled water and an-alyzed with the HPLc. the following separation conditions were applied: Shimadzu Lc-20AD liq-uid chromatograph; column: guard column: c18 Acclaim carbamate 3.0 x 10 mm, 3 µm, analytical column: Acclaim carbamate 3.0 x 150 mm, 3 µm; column temperature: 50°c; mobile phase: meth-anol-water in gradient; flow rate 0.9 mL/min; in-jection volume: 50 µL; detector fluorescent (exci-tation: 330 nm, emission: 465 nm). Peak identi-fication was based on the retention time by com-parison with the standard.
Ochratoxin A was determined with the HPLc method with bicarbonate clean up according to ISO 15141-2 (ISO 1998). Extraction of ochratox-in A was made using SPE-cartridges purchased from Waters (Milford, MA). After extraction, the level of OtA was determined with HPLc using Shimadzu Lc-20AD series for HPLc chromato-graph with reversed phase column (250 x 4.6 mm, 5 µm c18). A mixture of acetonitrile, water and glacial acetic acid at the ratio of 49·5:49·5:1 and the flow rate of 1 mL/min was used in the analysis. A fluorimetric detector was used as well (excitation wavelength 330 nm, emission wavelength 460 nm). Qualitative identification was performed by comparing the retention times of the standard with that of the sample under study and quantitative determination was per-formed by comparing the areas of peaks of the standards with those of the sample under study.
Nutritional value
Nutritional value of rye bread was determined based on selected indicators: protein, glucose, fat, cu, Mn, Fe, Zn, ca, and Mg.
Protein content in bread was determined ac-cording to Kjeldahl’s method. this method con-sists in mineralization (burning) of the examined organic substance in concentrated sulfuric acid, at boiling temperature. the examined substance oxidizes to carbon dioxide and water, and the ni-trogen it contains gets separated in the form of ammonia. About 2 g of the sample were miner-alized and distilled. the mineralization and dis-tillation process was performed in the FOSS ap-paratus. After distillation, the samples were ti-trated with 0.1 M of hydrochloric acid. Protein content in bread was expressed in grams per 100 g of the product.
Glucose content was determined using the Lane-Eynon method. the principle for determin-ing sugars according to this method is copper re-duction in Fehling I and II (because of sugars pre-sent in the examined sample) and complete con-version of bivalent into monovalent copper (by ti-trating with a standard solution of saccharose) in the presence of the indicator (methylene blue).
Determination of fat content was carried out using the Weibull-Stoldt method. the principle of the method consists in extracting fat substanc-
es using petroleum benzine and in gravimetric determination of the amount of fat collected in the receiver of the Soxhlet apparatus.
Determination of calcium and magnesium contents were conducted according to the meth-od described by WHItESIDE and MIMEr (1984). the samples were mineralized in a mixture of ni-tric and perchloric acids (03:01). Mineralization was conducted in an electric aluminium heat-ing block with temperature programming (VELP DK 20, manufactured by VELP Scientifica, Ita-ly). contents of ca and Mg in the mineral resi-due were determined using flame atomic absorp-tion spectroscopy (acetylene-air flame). Meas-urements were carried out with the use of atom-ic absorption spectrometer Unicam 939 Solar - Great britain, equipped with an Optimus data station, background correction (deuterium dis-charge lamp) and an appropriate cathode lamp. A 10% aqueous lanthanum chloride solution, in amounts ensuring a final concentration of La3+ at 1%, was added to all measured solutions to determine ca content. Standards of calcium and magnesium (1 mg/cm3), diluted with 0.1 M so-lution of HNO3, were prepared on the basis of bDH standards (Germany).
In addition, bread was subjected to the evalu-ation of its physicochemical parameters includ-ing: acidity, salt content and moisture content.
Determination of potential acidity was speci-fied by titration of the examined solution with a base of a known concentration, in the presence of phenolphthalein as an indicator.
Determination of salt content in bread was performed with the Mohr’s method. the princi-ple of the method consists in titrating an aque-ous extract of the pulp with silver nitrate, in the presence of potassium chromate as an indicator.
Determination of bread moisture was per-formed with the application of a drying meth-od. Such determination consists in specifying the loss of water from a sample while drying it at 130°c for 60 minutes.
Data analysis
Data obtained were analyzed statistically with the use of basic statistics, i.e. mean and stand-ard deviation and relative standard deviation. Differences between health quality and nutri-tional value categories of bread (traditional and conventional) were determined with the use of one-way analysis of variance (ANOVA). the sig-nificance of differences was tested at a signifi-cance level of 0.05.
rESULtS AND DIScUSSION
Average concentrations of selected indicators of bread quality in all examined samples in rela-tion to their origin (traditional and convention-al) are presented in table 1.

130 Ital. J. Food Sci., vol. 25 - 2013
Health quality
Maillard reactions are the most important chemical events occurring during the manufac-ture of bakery products. During these reactions, healthy and potentially-harmful compounds are produced. Among the harmful ones, acrylamide has received a great attention in recent years. It is classified as a ‘probable human carcino-gen’ and defined as a compound with the poten-tial to cause a spectrum of toxic effects. Acryla-mide was observed to form mainly from aspar-agine and reducing sugar trough Maillard reac-tions. Several factors, such as initial concentra-tion of the precursors, their ratio, heating tem-perature, time of processing, pH, and water ac-tivity of a product, have been reported to influ-ence acrylamide content in heated food (cLAUS et al., 2008; HEDEGAArD et al., 2008; cAPUANO et al., 2009; GÖKMEN et al., 2009; bArtKIENE et al., 2012; SErPEN et al., 2012).
Statistically significant differences in acryl-amide content (table 1) were recorded between bread from small-scale and large-scale produc-tion. A significantly lower content (P ≤ 0.05) was found in samples of traditional bread (119.62 ± 37.11 µg/kg of bread) as compared to the con-ventional samples (163.35 ± 26.22 µg/kg of bread).
SVENSSON et al. (2003) showed that the con-tent of acrylamide in soft wheat bread was in the range of < 30-160 µg/kg of fresh bread. Ac-cording to MUStAFA et al. (2009), the main pre-cursors of acrylamide in cereal products are as-paragine and reducing sugars, with asparagine being the limiting precursor. It was shown that
yeast fermentation had an important role in con-trolling the formation of acrylamide at low lev-els of asparagine, such as those generally pres-ent in bread raw materials. HEDEGAArD et al. (2008) found that rosemary was suppressing acrylamide formation when added to dough pri-or to baking. In an experiment by MUStAFA et al. (2009), it was found that the yield of alkali-ex-tractable acrylamide in rye crisp bread was on average 37% higher than the yield of water-ex-tractable acrylamide. the storage of samples for 20 months led to a decrease in the acrylamide content but did not change the correlation be-tween the acrylamide yield from neutral and al-kaline extraction. According to research con-ducted by cAPUANO et al. (2009), after 30 min of toasting wheat, whole-wheat and rye bread samples at 180°c, the final concentration of acrylamide was 262.3, 291.0 and 301.0 µg/kg, respectively. the higher concentration of acryl-amide in rye bread is due to a higher free aspar-agine content in rye flour, which is one of the factors influencing acrylamide amount in bakery products. A similar correlation between free as-paragine level of flour and acrylamide concentra-tion in rye bread slices was reported by GrANDY et al. (2009). MUStAFA et al. (2008) demonstrat-ed that the concentration of acrylamide was af-fected by asparagine content. In bread produced from flour with a lower (0.44 g/500 g flour) con-tent of asparagine, the content of acrylamide was less than 50 µg/kg, whilst a higher concentra-tion of asparagine (3.08 g/500 g flour) raised acrylamide content to 600 µg/kg product. Ac-cording to the International Agency on research on cancer (1994), acrylamide was classified as
table 1 - Average values of selected determinants in the bread samples under study.
Bread
Traditional n= 66 Conventional n= 40
×− ± SD RSD ××− ± SD RSD
Acrylamide μg/kg 119.62± 37.11b 31.02 163.35±26.22a 16.05Σ DDT mg/kg of fat 0.032±0.034 106.25 0.028±0.029 103.57γ HCH mg/kg of fat 0.001±0.001 100 0.002±0.001 50PCB mg/kg of fat 0.007±0.003 42.86 0.005±0.004 80N-methylcarbamate mg/kg No found No foundOchratoxin A mg/kg No found No foundAcidity ° 8.41±1.02a 12.13 5.55±1.62b 29.19Moisture % 45.69±1.93 4.22 46.90±2.27 4.84Protein % 5.25±0.91 17.33 5.21±0.55 10.56Glucose mg/kg-dw 1.17±0.32 27.35 1.57±0.77 49.04Fat mg/kg 0.91±0.31 34.06 0.96±0.20 20.83Salt mg/kg 2.25±0.37 16.44 2.58±0.51 19.77Cu mg/kg 1.86±0.52a 27.96 1.44±0.17a 11.80Mn mg/kg 18.49±9.32a 50.40 11.24±3.49b 31.05Fe mg/kg 25.15±11.53 45.84 17.58±3.06 17.41Zn mg/kg 17.60±8.24a 46.82 10.67±1.33b 12.46Mg mg/kg 451.42±187.83 41.61 330.77±54.31 16.42Ca mg/kg 403.59±246.93 61.18 321.40±81.30 25.29
n – samples number; ×− ± SD - average value; SD – standard deviation; a,b – statistically significant difference at the level p<0.05; RSD - relative standard deviation.
Ital. J. Food Sci., vol. 25 - 2013 131
a potential factor likely to accelerate cancer de-velopment in man. And although bread does not pose great risk to man, owing to a relatively low content of this compound compared to French fries, chips or crackers, it is consumed every day and therefore measures should be undertaken to reduce acrylamide content of bread.
the average content of chlorinated organic pesticides (Σ DDt, γ HcH) and polychlorinated biphenyls (Pcbs) was low in both traditional and conventional bread. No differences were report-ed in this respect between samples of traditional and conventional bread (P ≤ 0.05). No residuesof N-methylcarbamates or ochratoxin A were found in the analyzed samples. these results seem to suggest that, in the analyzed region, N-methyl-carbamates and OtA contamination is well un-der control and unlikely to represent a threat to consumer health. It has been found that Ochra-toxin A (OtA) has a variety of potentially deadly toxic effects. bread samples collected from com-mercial outlets across Portugal were tested for OtA and all samples were found to be compli-ant with the European commission. OtA con-tent reached a maximum of 0.49 ng/g in Algarve and 0.43 ng/g in bragança, and was thus below the 3 ng/g maximum limit established by Euro-pean legislation for bread (bENtO et al., 2009).
Nutritional value
the average protein content in the bread un-der study was 5.24 ± 0.82% – 5.25 ± 0.91% in samples of traditional bread and 5.21±0.55% in those of conventional bread. A study by MIcHAL-SKA et al. (2008) showed that both carbohydrate and protein concentrations were affected by mill-ing and baking processes. Protein content de-creased from 9.34 ± 0.04 to 7.85 ± 0.02 g/100 g of flour sample during milling, thus lowering its nutritional quality. these results may be ex-plained by a loss of grain material containing protein during milling. baking did not affect the protein concentration as much as milling did. the obtained data did not correspond with re-sults reported by KOPEc et al. (2011). those au-thors showed that baking technology impacted protein quality. the differences in protein qual-ity were due to the baking technology applied.
the content of glucose (1.17±0.32 mg/kg-dw) and fat (0.91±0.31 mg/kg) in traditional bread was similar to that in bread produced by large bakeries. LAPPI et al. (2010) reported lower pro-portions of fibre (3.3) and fat (1.5) in a white wheat bread portion compared with wholemeal bread portions (8.4 and 2.6, respectively).
Samples of traditional bread were found to con-tain slightly (but statistically significantly) more (P ≤0.05) copper, manganese and zinc, equal to 18.6 ± 0.52; 18.49 ± 9.32; 17.60 ± 8.24 mg/kg, respec-tively. Samples of traditional bread contained more iron, calcium and magnesium with varied concen-trations of those elements (for iron SD = 11.53,
rSD = 45.84, for magnesium SD = 187.83, rSD = 41.61, for calcium SD = 246.93, rSD = 61.18). Some data suggest that sourdough bread is a bet-ter source of magnesium, iron and zinc compared to the breads produced with other methods (LOPEZ et al., 2003; cHAOUI et al., 2006). A study by DEMI-rOZU et al. (2003) showed that the mean values of iron, copper, zinc, lead and cadmium levels were 19.2 ± 8.1 mg/kg-dry weight (dw), 2.1 ± 1.0 mg/kg-dw, 10.0 ± 3.0 mg/kg-dw, 86.8±176.0 mg/kg-dw, and 12.2 ± 6.1 mg/kg-dw, respectively.
Acidity, salt and moisture content
the samples’ place of origin (small or large companies) had no impact on values determined for concentration of moisture and salt. Acidity of rye bread in samples of traditional bread (table 1) was significantly higher (8.41° ± 1.02º of acid-ity), compared to the samples of mass-produced bread (5.55° ± 1.62º of acidity). the results sug-gest that the production process of rye bread made on a large scale does not include the fer-mentation phase or that the phase was shortened in order to, for example, reduce production costs.
cONcLUSIONS
In general, the health quality and nutrition-al value of rye bread produced by micro-com-panies localized in the province of Warmia and Mazury (Poland), compared to bread of the same kind manufactured in large bakeries, varied only with respect to some determinants. the only ex-ceptions were the content of acrylamide, cop-per, manganese and zinc. the reported levels of acrylamide were relatively low to pose health risk. the acidity of bread produced by large bak-eries suggests that it does not have the features which are typical of bread made from sourdough, which may imply that the producers who claim their bread is made with traditional methods are misleading consumers.
AcKNOWLEDGEMENtS
this study was financially supported by the Polish Minis-try of Science and Higher Education from sources for sci-ence in the years 2008-2011 under research Project No. N N312 261035.
rEFErENcES
Angulo A.M. and Gil J.M. 2007. risk perception and con-sumer willingness to pay for certified beef in Spain. Food Qual. Prefer. 18: 1106-1117.
bartkiene E., Jakobsone I., Juodeikiene G., Vidmantiene D., Pugajeva I. and bartkevics V. 2012. Study on the re-duction of acrylamide in mixed rye bread by fermenta-tion with bacteriocin-like inhibitory substances produc-ing lactic acid bacteria in combination with Aspergillus niger glucoamylase. Food control 30:35-40.

132 Ital. J. Food Sci., vol. 25 - 2013
bento J.M.V., Pena A., Lino c.M. and Pereira J.A. 2009. Determination of ochratoxin A content in wheat bread samples collected from the Algarve and bragança re-gions, Portugal: Winter 2007, Microchem. J. 91: 165-169.
capuano E., Ferrigno A., Acampa I., Serpen A., Acar Ö.Ç., Gökmen V. and Fogliano V. 2009. Effect of flour type on Maillard reaction and acrylamide formation during toast-ing of bread crisp model systems and mitigation strate-gies. Food resc. Int. 42: 1295-1302.
cayot N. 2007. Sensory quality of traditional foods. Food chem. 101 154-162.
chaoui A., Faid M. and belahsen r. 2006. Making bread with sourdough improves iron bioavailability from re-constituted fortified wheat flour in mice. J. trace Elem. Med. biol. 20: 217-220.
claus A., carle r. and Schieber A. 2008. Acrylamide in ce-real products: A review. J. of cereal Sci. 47: 118-133.
commission of the European communities. council regu-lation (EEc) No 2081/92 of 14 July 1992 on the protec-tion of geographical indications and designations of ori-gin for agricultural products and foodstuffs, Official Jour-nal L208 (1992), 1-8.
commission of the European communities council regu-lation (EEc) No 2082/92 of 14 July 1992 on certificates of specific character for agricultural products and food-stuffs, Official Journal L208 (1992), 9-14.
commission of the European communities council regula-tion (Ec) No 510/2006 of 20 March 2006 on the protec-tion of geographical indications and designations of ori-gin for agricultural and foodstuffs. Official Journal of the European Union L93 (2006), 12-25.
commission of the European communities council regu-lation (Ec) No 509/2006 of 20 March 2006 on agricul-tural products and foodstuffs as traditional specialties guaranteed. Official Journal of the European Union, L93 (2006), 1-11.
Dionex corporation. 2007. Determination of N-Methylcarba-mates by reversed-Pase HPLc, Application Note 96 LPN 1935, Sunnyvale, cA.
Demirözü b., Saldamlı İ, Gürsel b, Uçak A, Çetınyokus F. and Yüzbası N. 2003. Determination of Some Metals Which are Important for Food Quality control in bread. J. ce-real Sci. 37: 171-177.
Dewettinck K., bockstaele F.V., Kuhne b., Walle D.V., cour-tens t.M. and Gellynck X. 2008. Nutritional value of bread: Influence of processing, food interaction and con-sumer perception. J. cereal Sci. 48: 243-257.
Du Plessis H.J. and Du rand G.E. 2011. the significance of traceability in consumer decision making towards Karoo lamb. Food res. Int. doi:10.1016/j.foodres.2011.05.029.
Espejel J., Fandos c. and Flavián c. 2007. Spanish Air-cured Ham with Protected Designation of Origin (PDO): A Study of intrinsic and extrinsic attributes influence on consumer satisfaction and loyalty. J. Int. Food Agribus. Mark. 19: 5-30.
Gökmen V., Morales F.J., Ataçb., Serpen A. and Arribas-Lor-enzo G. 2009. Multiple-stage extraction strategy for the determination of acrylamide in foods. J. Food composi-tion and Analysis. 22: 142-147.
Grandy K., Nielsen N.J., Hedegaard r.V., christensen t., Kann M. and Skibsted L.H. 2009. Acrylamide-asparagine relationship in baked/toasted wheat and rye breads. Food Additives and contaminants 25: 921-929
Hedegaard r., Granby K., Frandsen H., thygesen J. and Skib-sted L.H. 2008. Acrylamide in bread. Effect of prooxidants and antioxidants, Eur. Food res. tech. 227: 519-525.
Henchion M. and McIntyre b. 2000. regional imagery and quality products: the Irish experience. br. Food J. 102: 630-644
Hinricks c.c. 2000. Embeddedness and local food systems: notes on two types of direct agricultural market. J. ru-ral Studies 16: 295-303.
International Agency on research on cancer. 1994. IArc monographs on the evaluation of carcinogenic risks to humans. In some industrial chemicals. 60. IArc 1994, 389-433.
ISO 15141-2. 1998. Foodstuffs. Determination of ochratox-in A in cereals and cereal products – Part 2. High per-
formance liquidchromatographic method with bicarbo-nateclean up.
Jones P.J. and Jew S. 2007. Functional food development: concept to reality. trends Food Sci. tech. 18: 378-390.
Kihlberg I., Johansson L., Kohler A. and risvik E. 2004. Sensory qualities of whole wheat bread – influence of farming system, milling and baking technique. J. cere-al Sci. 39: 67-84.
Kopec A., Pysz M., borczak b., Sikora E., rosell c.M., col-lar c. and Sikora M. 2011. Effects of sourdough and di-etary fibers on the nutritional quality of breads produced by bake-off technology, J. cereal Sci. doi: 10.1016/j.jcs.2011.07.008.
Lappi J., Selinheimo E., Schwab U., Katina K., Lehtinen P., Mykkänen H., Kolehmainen M. and Poutanen K. 2010. Sourdough fermentation of wholemeal wheat bread in-creases solubility of arabinoxylan and protein and de-creases postprandial glucose and insulin responses. J. cereal Sci. 51: 152-158.
Lobb A.E. and Mazzocchi M. 2007. Domestically produced food: consumer perception of origin, safety and issue of trust. Food Econ. 4: 3-12.
Lopez H.W., Duclos V., coudray c., Krespine V., Feillet-cou-dray c., Messager A., Demigné c. and rémésy c. 2003. Making bread with sourdough improves mineral bio-availability from reconstructed whole wheat flour in rats, Nutr. 19: 524-530.
Michalska A., Amigo-benavent A. and Zielinski H. 2008. Dolores del castillo M., Effect of bread making on for-mation of Maillard reaction products contributing to the overall antioxidant activity of rye bread, J. cereal Sci. 48: 123-132.
O’Hara S.U. and Stagl S. 2001. Global Food Markets and their Local Alternatives: A Socio-Ecological Economic Perspective. Population and Environment. J. Interdiscip. Studies 22: 533-554.
Mustafa A., Fink M., Kamal-Eldin A., rosén J., Andersson r. and Ĺman P. 2009. Interaction effects of fermentation time and added asparagine and glycine on acrylamide con-tent in yeast-leavened bread, Food chem. 112: 767-774.
Poutanen K., Flander L. and Katina K. 2009. Sourdough and cereal fermentation in a nutritional perspective. Food Mi-crobiol. 26: 693-699.
Selfa t. and Qazi J. 2005. Place, taste, or face-to-face? Un-derstanding producer–consumer networks in ‘‘local’’ food systems in Washington State. Agric. and Hum. Values 22: 451-464.
Serpen A., Gökmen V. and Mogol b.A. 2012. Effect of dif-ferent grain mixtures on Maillard reaction products and total antioxidant capacities of breads. J. Food composi-tion 26: 160-168.
Svensson K., Abramsson L., becker W., Glynn A. Hellenäs K.E., Lind Y. and rosen J. 2003. Dietary intake of acryla-mide in Sweden. Food chem. toxicol., 41: 1581-1586.
trichopoulou A., Soukara S. and Vasilopoulou E. 2007. tra-ditional foods: a science and society perspective. trends Food Sci. tech. 18: 420-427.
tucker A.J., MacKay K.A., robinson L.E., Graham t.E., ba-kovic M. and Duncan A.M. 2010. the effect of whole grain wheat sourdough bread consumption on serum lipids in healthy normoglycemic/normoinsulinemic and hypergly-cemic/hyperinsulinemic adults depends on presence of the APOE E3/E3 genotype; a randomized controlled 509 trial. Nutr. Metab. 7: 37-49.
Verbeke W., Frewer L.J., Scholderer J. and De brabander H.F. 2007. Why consumers behave as they do with re-spect to food safety and risk information. Anal. chim. Acta 586: 2-7,
Wenzl t., de la calle M.b. and Anklam E. 2003. Analytical methods for determination of acrylamide in food products. A review. Food Addit. contam. 20: 885-902.
Whiteside P. and Miner b. 1984. Atomic Absorption-Data book. Pye Unicam Ltd. cambridge.
Yeung r.M.W. and Morris J. 2001. Food safety risk-con-sumer perception and purchase behavior. br. Food J. 103: 170-186.
Zhang E.Y., Zang G. and Zang Y. 2005. Occurrence and ana-lytical methods of acrylamide in heat- treated foods. review and recent developments. J. chromatogr. A 1075: 1-21.
Paper received June 18, 2012 Accepted October 30, 2012

PaPer
Ital. J. Food Sci., vol. 25 - 2013 133
- Keywords: acylated pigments, anthocyanins, Brunello di Montalcino, origin evaluation, phenotype, Toscana, traceability -
ANTHOCYANIN ESTERIFICATION IN SANGIOVESE GRAPES
L. RUSTIONI*, M. ROSSONI, O. FAILLA and A. SCIENZAUniversità degli Studi di Milano,
CIRIVE, Centro Interdipartimentale di Ricerca per l’Innovazione in Viticoltura ed Enologia, Via Celoria 2, 20133 Milano, Italy
*Corresponding author: [email protected]
AbStrAct
the traceability of the origin of a variety using the anthocyanins profile was recently discussed for Sangiovese wines, producing an important market impact. the variability of the anthocyanin profile of Sangiovese was studied over three years in grapes and wines. In the same vineyard, five clones, two bunch exposure conditions and three ripening times were evaluated following a full factorial experimental design. HPLc profiles showed a wide range in variability, significantly af-fected by environmental and cultural factors. the grapes profile changes obtained in the vineyard were maintained in the wines. Also the relative proportions of the acetic and p-cumaric acids in-volved in the esterification were significantly affected.

134 Ital. J. Food Sci., vol. 25 - 2013
INtrODUctION
the traceability of the varietal origin was re-cently discussed for Sangiovese grapes used for the production of “brunello di Montalcino”, when in 2008 some wine stocks were consid-ered fraudulent due to the higher than expect-ed proportion of acylated pigments. the alarm for the hypothetical scandal had a high impact on the market and on the economy. Following the events, experts and scientists discussed the use of anthocyanin profile as an index of the varietal purity of the wine.
Even though the anthocyanin biosynthetic pathways have a cultivar specificity (MAttIVI et al., 2006), many factors may influence the molecule proportions in ripe berries. Signifi-cant differences related to the varietal clones were observed by rOGGErO et al. (1986) in Syr-ah, by FErrANDINO et al. (2007) in Nebbiolo, and by LA NOttE and ANtONAccI (1985) in Uva di troia grapes. FErrANDINO et al. (2007) also found that the cultivation region has a signifi-cant influence on the acylated anthocyanins in Nebbiolo grapes. Many environmental factors can influence the pigments profile. HILbErt et al. (2003) and DO and cOrMIEr (1991) showed an effect of soil nitrogen availability on the pig-ments accumulation. Light exposure affects the anthocyanin profile as reported by tAr-ArA et al. (2008); DOWNEY et al. (2004); rUS-tIONI et al. (2011); HASELGrOVE et al. (2000); rIStIc et al. (2007). the variation of light ex-posure can be related to the terroir charac-teristics or also to the vineyard management (shoot positioning and defoliation). Other vi-ticultural techniques affecting pigments pro-file are bunch thinning (bUcELLI and GIANNEt-tI, 1996) and harvesting time (HILbErt et al. 2003, rOGGErO et al. 1986). Also the season-al weather course affects the accumulation of anthocyanin (bUcELLI and GIANNEttI, 1996, GUIDONI et al., 2008).
beside the viticultural factors, the impact of the winery technology on the wine’s anthocy-anin profile has been demonstrated. FIScHEr et al. (2007) underlined the impact of enzyme treatment, temperature during thermovinifi-cation and duration of skin contact on the an-thocyanin composition (sum of acylated antho-cyanins and ratio of acetylated/coumaroylated pigments), with the objective of preventing false alarms, and of protecting wine producers, mer-chants and consumers.
Other authors (LA NOttE and ANtONAccI, 1985; VErSArI et al., 1999; GArcÍA-bENEYtEZ et al., 2002) studied the effect of the extraction technique on the pigments profile, concluding that the anthocyanin fingerprints of wines only reflect in part the anthocyanin fingerprints of fresh grapes. Also the effect of SO2 on monomer-ic anthocyanin extraction changes in relation to the molecular structure (DALLAS and LAUrEA-
NO, 1994). the ratios between the different mol-ecules can also change during aging (rEVILLA et al., 2001; LA NOttE and ANtONAccI, 1985; GArcÌA-PUENtE rIVAS et al., 2006).
Finally it is important to consider the antho-cyanin profile variability related to sampling pro-tocols, analytical techniques, molecular stabil-ity and to polymerization/degradation/oxida-tion reactions (cASASSA and cAtANIA, 2006; rIbÉrEAU-GAYON, 2000; GArcÌA-PUENtE rIVA et al., 2006; LA NOttE and ANtONAccI, 1985; DOWNEY et al., 2007; FONG et al., 1971; HOSHI-NO et al., 1980; MOrI et al., 2005).
the knowledge of the anthocyanin profile in relation to its typicality and variability is a useful tool for wine growers and oenologists. the aim of this work was mainly to underline the variability of the anthocyanin esterification, by providing a numerical evaluation of the range of variation of the content of acylated pigments in Sangiovese grapes, to give a contribution for preventing fur-ther crisis in the wine market.
MAtErIALS AND MEtHODS
Plant material
the variability of anthocyanin profile was studied over a period of three years (2008, 2009, 2010), focusing on acylations, in Sangiovese cultivated in Montalcino (toscana, Italy).
the vineyard was located at an elevation of 115 m a.s.l., on an hillside facing South-East. the soil was clay textured. Plants were spaced at 2.4 x 1 m for about 4,160 plants/ha, and trained to the Spur cordon system, leaving 12 buds/vine after winter pruning. the interrow soil was kept weed-free by two glyphosate her-bicide treatments yearly.
In the same vineyard, five clones (one row/clone planted in succession), under two bunch exposure conditions, harvested in three ripen-ing times were studied in triplicate. the clones checked were: Janus 50; tin 10; Janus 10; Ja-nus 20 (grown on 420A rootstock) and Vcr 4 (grown on 1103P rootstock). to evaluate the ef-fect of the harvesting time, anthocyanins profile was analyzed at commercial harvest (0), about 10 days before (-10), and 20 days after the com-mercial ripening (+20). Exposed bunches were obtained managing the canopy, and shaded grapes were obtained closing bunches in white paper bags opened on the bottom. the experi-ments were conducted selecting vines accord-ing to the correct vine balance, evaluated by visual inspection and able to assure a proper grape ripening according to the local experience (generally more than one square meter of ex-posed leaves per expected kilogram of grapes). In order to take into proper consideration the differences due to the individual physiological status of each vine, as well as to minimize the

Ital. J. Food Sci., vol. 25 - 2013 135
possible disturbance of the slight leaf remov-al around the exposed bunches, every treat-ment (i.e. sun exposed and leaf shaded) was replicated on each vine. Air temperature and rainfall data were collected by a standard me-teorological station closely located to the vine-yard. All the treatments were done at veraison (corresponding to the onset of grape ripening), and maintained during the ripening stages un-til late harvesting.
Microvinifications
three clones (Janus 10, Janus 20 and Vcr4), ripened under the two exposure conditions, were selected for microvinification tests in 2009 and 2010, to be analyzed after fermentation, 6 months and 1 year of aging. For winemaking, four rows were selected for each clone and two of them were defoliated, while the others were covered by a white nonwoven fabric applied over the canopy zone of the bunches. All the treatments were done at véraison and main-tained during all the ripening period, until har-vest. Wines were made from 500-1,200 kg of grapes, depending on the productions. Vinifi-cations were controlled concerning yeast inoc-ulation, fermentations, temperature, and wine conservation.
Sample preparation and HPLC analysis
Grape samples for the HPLc analysis were obtained from 20 representative whole berry skins (analyzed in three replications) and ex-tracted in 100 mL of pure methanol for 24 hours at room temperature. the extract was than fil-tered, evaporated and re-suspended in 50 mL of 7% formic acid.
the solvents that were used were HPLc grade methanol, formic acid and acetonitrile obtained from chemsupply (Gillman, SA, Aus-tralia).
Analyses were performed on a Varian Pros-tar 240I HPLc (Mulgrave, Vic, Australia) using a Hypersil ODS 5 µm c18 110A 250 x 4.6 mm column (Lane cove, NSW, Australia), with a Phenomenex Security Guard column, operated at a temperature of 35°c. the modified meth-od of bALDI et al. (1995) involved a gradient elution with a mobile phase comprising by wa-ter:formic acid (93:7 v/v) eluent A, and water:-formic acid:acetonitrile (60:7:30 v/v/v), eluent b, and a gradient program as follows: from 25 to 55% b (30 min), from 55 to 80% b (5 min), constant 80% b (8 min), from 80 to 20% b (7 min). the flow rate was 0.8 ml/min. the elution was monitored by a Varian Prostar 335 photo-diode array detector (Mulgrave, Vic, Australia) at 520 nm. the proportions between the picks were used to define the anthocyanins profile, while their sum indicated the total monomeric anthocyanic quantification.
Statistical analysis
About 300 anthocyanins HPLc profiles (from grapes and wines) were evaluated, and all the data were analyzed with SPSS statistical soft-ware (version PASW Statistics 18, SPSS Inc. chicago, Illinois). the effects were statistically tested by a general linear model which includ-ed year, bunch exposure, clone and harvesting time and their interactions as factors, followed by the expected components of the variance es-timation. treatment means were separated by LSD test (P = 0.05). the possible relationships among anthocyanins accumulation and percent-age of acylation were detected by ordinary Pear-son’s correlation and regression models.
rESULtS AND cONcLUSIONS
As expected, the genetic control of the antho-cyanin biosynthetic pathway produced a typical pigments profile. the average of the 255 grape extracts analyzed by HPLc indicated a medium profile with the following characteristics:- considering the non-esterified pigments, the
proportions between delphinidin-3-O-gluco-side, cyaniding-3-O-glucoside, petunidin-3-O-glucoside, peonidin-3-O-glucoside and mal-vidin-3-O-glucoside were respectively 11.85, 17.75, 13.92, 16.89, and 39.60%;
- the esterification confirmed that Sangiovese is characterized by a low acylated pigments percentage. In particular, our samples showed an average of 96.48% of non-esterified malvi-din, 1.03% of malvidin acetate, and 2.49% of malvidin p-cumarate.Nevertheless it should be noted that San-
giovese is a very unsettled grape cultivar (PONI, 2000), and few papers also reported grape sam-ples with a high percentage of acylated com-pounds (LA NOttE and ANtONAccI 1985; rUS-tIONI et al., 2011). At the same time, according to our survey, Sangiovese demonstrated a wide range of variability in response to environmen-tal and cultural factors.
the total monomeric anthocyanin content ranged between 196.81 and 2262.83 mg/kg of grapes, with an average value of 805.87 mg/kg, a median 731.26 mg/kg, and a standard devi-ation of 395.90.
Sangiovese demonstrated to be a very plastic cultivar considering the anthocyanin profile. re-garding the non-esterified pigments:- the tri-substituted molecules percentage
ranged between 34.53 and 85.38%, with an average value of 65.36% and a standard de-viation of 8.94;
- the methoxylation involved a minimum of 38.10% and a maximum of 89.09% of the mol-ecules, with an average value of 70.40% and a standard deviation of 8.39;
- the ortho-diphenol molecules ranged between

136 Ital. J. Food Sci., vol. 25 - 2013
18.14 and 73.73%, with an average of 43.51% and a standard deviation of 9.79.the HPLc profiles also showed a high vari-
ability in the percentage of acylated malvidin, ranging between 1.00 and 9.84% (Fig. 1), with an average value of 3.52%, a median 3.17%, and a standard deviation of 1.53. the vintage was responsible for 49% of the explained variability, bunch exposure for 8%, harvesting time for 6%, clone for 5%, in addition the interactions vintage-bunch exposure and vintage-harvesting time ex-plained respectively 9 and 14% of the variabili-ty. the characteristics of Sangiovese clones can vary in the environmental and cultural grow-ing conditions (StOrcHI et al., 2000). this is in agreement with the importance shown by the ef-fect of the interactions between different factors considered in our survey.
the three years covered different weather con-ditions during the growing season (Figures 2 and 3): 2009 was the warmest both in spring time (April and May) and during the first part of the grape ripening period (August and September); 2010 was the less warm through all the season; 2008, compared to the other two years showed
Fig. 1 - Frequency distribution of the percentage of acylat-ed anthocyanins recorded in the three years.
Fig. 3 - Active temperature summation (base 10°c) and rainfall from April to October recorded in the three years survey.
Fig. 2 - Monthly average temperature and total rainfall recorded in the three years survey.

Ital. J. Food Sci., vol. 25 - 2013 137
table 1 - Anthocyanin acylation (% esterified malvidin/total malvidin) variability in response to environmental and cultur-al factors.
a) Year effect.
Year Acylated anthocyanins (%)
2008 4.06 ba
2009 4.45 a 2010 2.11 c Average 3.52
aValues followed by the same letter are not statistically different per P = 0.05.
b) Clone per year interaction effect.
Clone
Janus 50 Janus 10 Tin 10 Janus 20 VCR 4
Year Acylated anthocyanins (%)
2008 3.58 ba 4.18 ab 3.70 b 4.62 a 4.21 ab 2009 4.27 b 4.54 b 3.52 c 5.24 a 4.99 a 2010 2.03 bc 1.93 c 1.92 c 2.25 ab 2.34 a Average 3.32 cd 3.52 bc 3.09 d 3.92 a 3.77 ab
aIn each line values followed by the same letter are not statistically different per P = 0.05.
c) Harvest time per year interaction effect.
Harvesting time
Early (- 10 days) Normal (0) Late (+ 20 days)
Year Acylated anthocyanins (%)
2008 3.17 ca 5.25 a 3.77 b 2009 3.78 c 4.67 b 5.06 a 2010 1.92 b 2.16 a 2.25 a Average 2.96 c 4.00 a 3.59 b
aIn each line values followed by the same letter are not statistically different per P = 0.05.
d) Bunch exposure per year interaction effect.
Bunch exposure
Shaded Exposed
Year Acylated anthocyanins (%)
2008 4.22 aa 3.74 b 2009 5.30 a 3.64 b 2010 2.21 a 2.02 b Average 3.92 a 3.03 b
aIn each line values followed by the same letter are not statistically different per P = 0.05.
an alternant course. In August, temperatures were intermediate compared to the other vin-tages, September was similar to 2010 and high-er than 2008. rainfall courses during the grow-ing season were very similar in 2008 and 2010; 2009 had a relatively higher rainfall course. the percentage in acylated forms seemed to be re-lated to the thermal course of the ripening pe-riod (table 1a), with higher values in 2009, the warmest season, intermediate in 2008, and low-er in 2010, the cooler season. Figure 4 shows the correlation between the anthocyanins pro-file indexes (as average of the data obtained each year) and the thermal course expressed in cu-mulative GDD. While the percentage of acylated malvidin shows a direct correlation, the ratio of acetic esters and p-coumaric esters of malvidin
Fig. 4 - relationship between active temperature summa-tion (base 10°c) from August to October and the percentage in acylated forms (o) and rac/cum (·) (ns = not significant).

138 Ital. J. Food Sci., vol. 25 - 2013
table 2 - rac/cum (ratio malvidin acetate/malvidin p-coumarate) variability in response to environmental and cultural factors.
a) Year effect.
Year Rac/cum ratio
2008 0.518 aa
2009 0.376 b 2010 0.329 c Average 0.410
aValues followed by the same letter are not statistically different per P = 0.05.
b) Clone per year interaction effect.
Clone
Year Janus 50 Janus 10 Tin 10 Janus 20 VCR 4
Rac/cum ratio
2008 0.541 aa 0.532 a 0.526 a 0.510 a 0.482 a 2009 0.361 b 0.356 b 0.311 c 0.447 a 0.429 a 2010 0.323 b 0.321 b 0.324 b 0.361 a 0.320 b Average 0.410 ab 0.407 ab 0.390 b 0.440 a 0.407 ab
aIn each line values followed by the same letter are not statistically different per P = 0.05.
c) Harvest time per year interaction effect.
Harvesting time
Year Early (-10 days) Normal (0) Late (+ 20 days)
Rac/cum ratio
2008 0.452 ba 0.841 a 0.261 c 2009 0.424 a 0.353 b 0.344 b 2010 0.345 a 0.324 b 0.318 b Average 0.408 b 0.504 a 0.303 c
aIn each line values followed by the same letter are not statistically different per P = 0.05.
d) Bunch exposure per year interaction effect.
Bunch exposure
Year Shaded Exposed
Rac/cum ratio
2008 0.497 aa 0.560 a 2009 0.354 b 0.398 a 2010 0.308 b 0.349 a Average 0.401 a 0.421 a
aIn each line values followed by the same letter are not statistically different per P = 0.05.
(rac/cum) had the highest values in 2008, the intermediate from the thermal point of view (ta-ble 2a). Anyway, the relative proportions of the acids involved in the esterification were signifi-cantly (P=0.05) affected by the year and by the vineyard management. the percentage of ester-ification with acetic acid compared to the sum of the esterified forms showed a high variability, ranging between 15.84 and 57.00%; the median
was 25.88%, and the standard deviation 8.043. In general, the rac/cum index showed an av-erage of 0.41. the variability of the rac/cum is evidenced in Figure 5 and table 2, showing the effect of the year, the clones, the harvesting time and the bunches exposure on the rac/cum.
the clones Janus 20 and Vcr 4 always showed the highest proportion of acylated mal-vidin, whereas the tin 10 clone had a smaller
Ital. J. Food Sci., vol. 25 - 2013 139
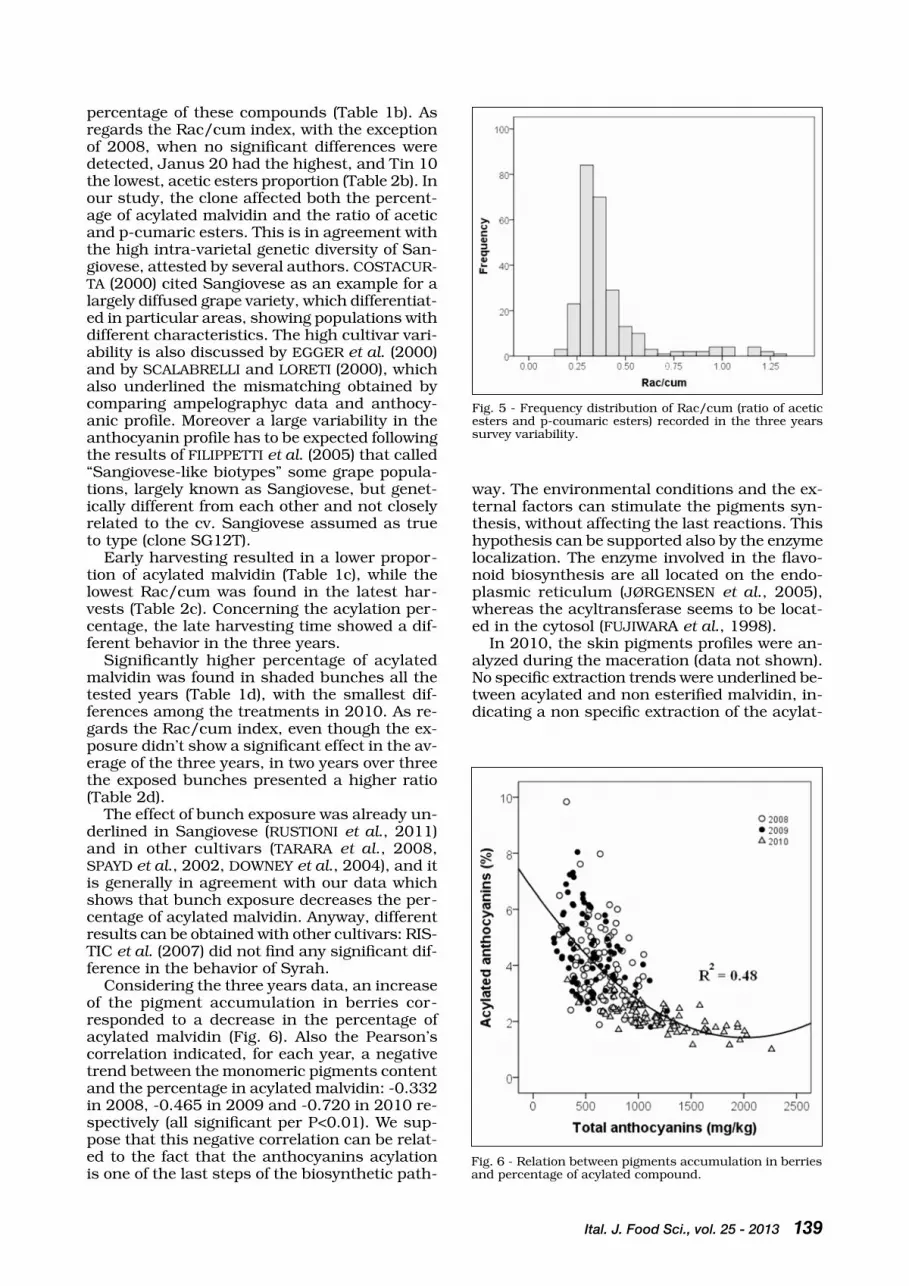
Fig. 5 - Frequency distribution of rac/cum (ratio of acetic esters and p-coumaric esters) recorded in the three years survey variability.
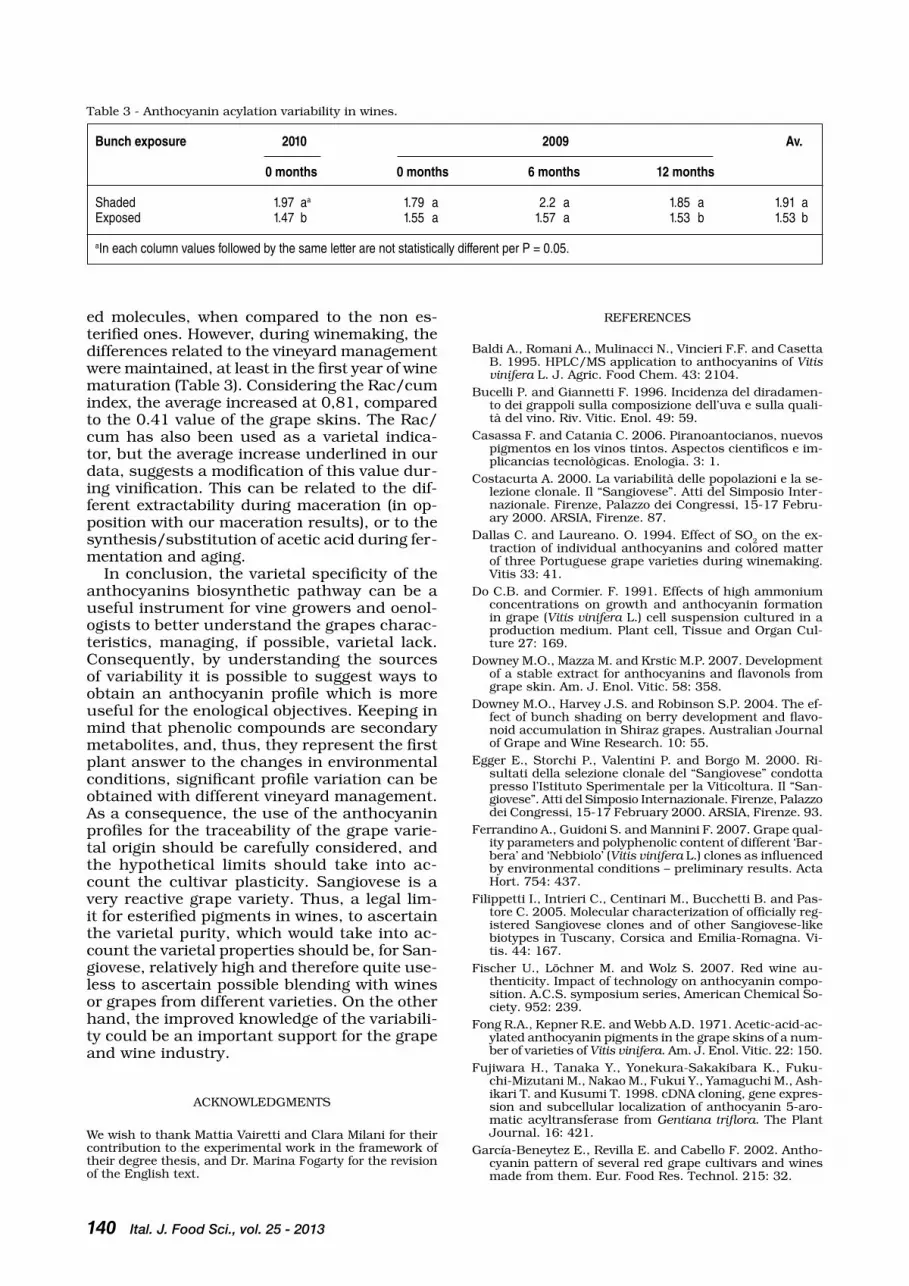
Fig. 6 - relation between pigments accumulation in berries and percentage of acylated compound.
percentage of these compounds (table 1b). As regards the rac/cum index, with the exception of 2008, when no significant differences were detected, Janus 20 had the highest, and tin 10 the lowest, acetic esters proportion (table 2b). In our study, the clone affected both the percent-age of acylated malvidin and the ratio of acetic and p-cumaric esters. this is in agreement with the high intra-varietal genetic diversity of San-giovese, attested by several authors. cOStAcUr-tA (2000) cited Sangiovese as an example for a largely diffused grape variety, which differentiat-ed in particular areas, showing populations with different characteristics. the high cultivar vari-ability is also discussed by EGGEr et al. (2000) and by ScALAbrELLI and LOrEtI (2000), which also underlined the mismatching obtained by comparing ampelographyc data and anthocy-anic profile. Moreover a large variability in the anthocyanin profile has to be expected following the results of FILIPPEttI et al. (2005) that called “Sangiovese-like biotypes” some grape popula-tions, largely known as Sangiovese, but genet-ically different from each other and not closely related to the cv. Sangiovese assumed as true to type (clone SG12t).
Early harvesting resulted in a lower propor-tion of acylated malvidin (table 1c), while the lowest rac/cum was found in the latest har-vests (table 2c). concerning the acylation per-centage, the late harvesting time showed a dif-ferent behavior in the three years.
Significantly higher percentage of acylated malvidin was found in shaded bunches all the tested years (table 1d), with the smallest dif-ferences among the treatments in 2010. As re-gards the rac/cum index, even though the ex-posure didn’t show a significant effect in the av-erage of the three years, in two years over three the exposed bunches presented a higher ratio (table 2d).
the effect of bunch exposure was already un-derlined in Sangiovese (rUStIONI et al., 2011) and in other cultivars (tArArA et al., 2008, SPAYD et al., 2002, DOWNEY et al., 2004), and it is generally in agreement with our data which shows that bunch exposure decreases the per-centage of acylated malvidin. Anyway, different results can be obtained with other cultivars: rIS-tIc et al. (2007) did not find any significant dif-ference in the behavior of Syrah.
considering the three years data, an increase of the pigment accumulation in berries cor-responded to a decrease in the percentage of acylated malvidin (Fig. 6). Also the Pearson’s correlation indicated, for each year, a negative trend between the monomeric pigments content and the percentage in acylated malvidin: -0.332 in 2008, -0.465 in 2009 and -0.720 in 2010 re-spectively (all significant per P<0.01). We sup-pose that this negative correlation can be relat-ed to the fact that the anthocyanins acylation is one of the last steps of the biosynthetic path-
way. the environmental conditions and the ex-ternal factors can stimulate the pigments syn-thesis, without affecting the last reactions. this hypothesis can be supported also by the enzyme localization. the enzyme involved in the flavo-noid biosynthesis are all located on the endo-plasmic reticulum (JØrGENSEN et al., 2005), whereas the acyltransferase seems to be locat-ed in the cytosol (FUJIWArA et al., 1998).
In 2010, the skin pigments profiles were an-alyzed during the maceration (data not shown). No specific extraction trends were underlined be-tween acylated and non esterified malvidin, in-dicating a non specific extraction of the acylat-
140 Ital. J. Food Sci., vol. 25 - 2013
ed molecules, when compared to the non es-terified ones. However, during winemaking, the differences related to the vineyard management were maintained, at least in the first year of wine maturation (table 3). considering the rac/cum index, the average increased at 0,81, compared to the 0.41 value of the grape skins. the rac/cum has also been used as a varietal indica-tor, but the average increase underlined in our data, suggests a modification of this value dur-ing vinification. this can be related to the dif-ferent extractability during maceration (in op-position with our maceration results), or to the synthesis/substitution of acetic acid during fer-mentation and aging.
In conclusion, the varietal specificity of the anthocyanins biosynthetic pathway can be a useful instrument for vine growers and oenol-ogists to better understand the grapes charac-teristics, managing, if possible, varietal lack. consequently, by understanding the sources of variability it is possible to suggest ways to obtain an anthocyanin profile which is more useful for the enological objectives. Keeping in mind that phenolic compounds are secondary metabolites, and, thus, they represent the first plant answer to the changes in environmental conditions, significant profile variation can be obtained with different vineyard management. As a consequence, the use of the anthocyanin profiles for the traceability of the grape varie-tal origin should be carefully considered, and the hypothetical limits should take into ac-count the cultivar plasticity. Sangiovese is a very reactive grape variety. thus, a legal lim-it for esterified pigments in wines, to ascertain the varietal purity, which would take into ac-count the varietal properties should be, for San-giovese, relatively high and therefore quite use-less to ascertain possible blending with wines or grapes from different varieties. On the other hand, the improved knowledge of the variabili-ty could be an important support for the grape and wine industry.
AcKNOWLEDGMENtS
We wish to thank Mattia Vairetti and clara Milani for their contribution to the experimental work in the framework of their degree thesis, and Dr. Marina Fogarty for the revision of the English text.
table 3 - Anthocyanin acylation variability in wines.
Bunch exposure 2010 2009 Av. 0 months 0 months 6 months 12 months
Shaded 1.97 aa 1.79 a 2.2 a 1.85 a 1.91 aExposed 1.47 b 1.55 a 1.57 a 1.53 b 1.53 b
aIn each column values followed by the same letter are not statistically different per P = 0.05.
rEFErENcES
baldi A., romani A., Mulinacci N., Vincieri F.F. and casetta b. 1995. HPLc/MS application to anthocyanins of Vitis vinifera L. J. Agric. Food chem. 43: 2104.
bucelli P. and Giannetti F. 1996. Incidenza del diradamen-to dei grappoli sulla composizione dell’uva e sulla quali-tà del vino. riv. Vitic. Enol. 49: 59.
casassa F. and catania c. 2006. Piranoantocianos, nuevos pigmentos en los vinos tintos. Aspectos cientìficos e im-plicancias tecnològicas. Enologìa. 3: 1.
costacurta A. 2000. La variabilità delle popolazioni e la se-lezione clonale. Il “Sangiovese”. Atti del Simposio Inter-nazionale. Firenze, Palazzo dei congressi, 15-17 Febru-ary 2000. ArSIA, Firenze. 87.
Dallas c. and Laureano. O. 1994. Effect of SO2 on the ex-traction of individual anthocyanins and colored matter of three Portuguese grape varieties during winemaking. Vitis 33: 41.
Do c.b. and cormier. F. 1991. Effects of high ammonium concentrations on growth and anthocyanin formation in grape (Vitis vinifera L.) cell suspension cultured in a production medium. Plant cell, tissue and Organ cul-ture 27: 169.
Downey M.O., Mazza M. and Krstic M.P. 2007. Development of a stable extract for anthocyanins and flavonols from grape skin. Am. J. Enol. Vitic. 58: 358.
Downey M.O., Harvey J.S. and robinson S.P. 2004. the ef-fect of bunch shading on berry development and flavo-noid accumulation in Shiraz grapes. Australian Journal of Grape and Wine research. 10: 55.
Egger E., Storchi P., Valentini P. and borgo M. 2000. ri-sultati della selezione clonale del “Sangiovese” condotta presso l’Istituto Sperimentale per la Viticoltura. Il “San-giovese”. Atti del Simposio Internazionale. Firenze, Palazzo dei congressi, 15-17 February 2000. ArSIA, Firenze. 93.
Ferrandino A., Guidoni S. and Mannini F. 2007. Grape qual-ity parameters and polyphenolic content of different ‘bar-bera’ and ‘Nebbiolo’ (Vitis vinifera L.) clones as influenced by environmental conditions – preliminary results. Acta Hort. 754: 437.
Filippetti I., Intrieri c., centinari M., bucchetti b. and Pas-tore c. 2005. Molecular characterization of officially reg-istered Sangiovese clones and of other Sangiovese-like biotypes in tuscany, corsica and Emilia-romagna. Vi-tis. 44: 167.
Fischer U., Löchner M. and Wolz S. 2007. red wine au-thenticity. Impact of technology on anthocyanin compo-sition. A.c.S. symposium series, American chemical So-ciety. 952: 239.
Fong r.A., Kepner r.E. and Webb A.D. 1971. Acetic-acid-ac-ylated anthocyanin pigments in the grape skins of a num-ber of varieties of Vitis vinifera. Am. J. Enol. Vitic. 22: 150.
Fujiwara H., tanaka Y., Yonekura-Sakakibara K., Fuku-chi-Mizutani M., Nakao M., Fukui Y., Yamaguchi M., Ash-ikari t. and Kusumi t. 1998. cDNA cloning, gene expres-sion and subcellular localization of anthocyanin 5-aro-matic acyltransferase from Gentiana triflora. the Plant Journal. 16: 421.
García-beneytez E., revilla E. and cabello F. 2002. Antho-cyanin pattern of several red grape cultivars and wines made from them. Eur. Food res. technol. 215: 32.

Ital. J. Food Sci., vol. 25 - 2013 141
Garcìa-Puente rivas E., Alcalde-Eon c., Santos-buelga c., rivas-Gonzalo J.c. and Escribano-bailòn M.t. 2006. behaviour and characterisation of the colour during red wine making and maturation. Analytica chimica Acta. 563: 215.
Guidoni S., Ferrandino A. and Novello V. 2008. Effects of Seasonal and Agronomical Practices on Skin Anthocya-nin Profile of Nebbiolo Grapes. Am. J. Enol. Vitic. 59: 22.
Haselgrove L., botting D., Van Heeswijck r., Høj P.b., Dry P.r., Ford c. and Iland P.G. 2000. canopy microclimate and berry composition. the effect of bunch exposure on the phenolics composition of Vitis vinifera L cv. Shiraz grape berries. Australian Journal of Grape and Wine re-search. 6: 141.
Hilbert G., Soyer J.P., Molot c., Giraudon J., Milin S. and Gaudillere J.P. 2003. Effect of nitrogen supply on must quality and anthocyanin accumulation in berries of cv. Merlot. Vitis. 42: 69.
Hoshino t., Matsumoto U. and Goto t., 1980. the stabiliz-ing effect of the acyl group on the co-pigmentation of ac-ylated anthocyanins with c-glucosylflavones. Phytochem-istry. 19: 663.
Jørgensen K., Vinther rasmussen A., Morant M., Nielsen A.H., bjarnholt N., Zagrobelny M., bak S. and Møller L. 2005. Metabolon formation and metabolic channeling in the biosynthesis of plant natural products. current Opin-ion in Plant biology. 8: 280.
La Notte E. and Antonacci D. 1985. composizione polif-enolica del vino rosso castel Del Monte nel corso dell’invecchiamento. rivista di Viticoltura ed Enologia. 38: 367.
Mattivi F., Guzzon r., Vrhovsek U., Stefanini M. and Velas-co r. 2006. Metabolite profiling of grape: flavonols and anthocyanins. J. Agric. Food chem. 54: 7692
Mori K., Saito H., Goto-Yamamoto N., Kitayama M., Kob-ayashi S., Sugaya S. and Gemmaand Hashizume H. 2005. Effects of abscisic acid treatment and night tempera-tures on anthocyanin composition in Pinot noir grapes. Vitis. 44: 161.
Poni S. 2000. Fisiologia di comportamento del Sangiovese. Aspetti di base e considerazioni applicative. Il San-
giovese”. Atti del Simposio Internazionale. Firenze, Palaz-zo dei congressi, 15-17 February 2000. ArSIA, Firen-ze. 101.
ribéreau-Gayon P., Glories Y., Maujean A. and Dubour-dieu D. 2000. Handbook of Enology Vol. 2. the chem-istry of Wine Stabilization and treatments. John Wiley and Sons.
ristic r., Downey M.O., Iland P.G., bindon K., Francis I.L., Hederich M. and robinson S. 2007. Exclusion of sunlight from Shiraz grapes alters wine colour, tannin and sen-sory properties. Australian Journal of Grape and Wine research. 13: 53.
roggero J.P., coen S. and ragonnet b. 1986. High perfor-mance liquid chromatography survey on changes in pig-ment content in ripening grapes of Syrah. An approach to anthocyanin metabolism. Am. J. Enol. Vtic. 37: 77.
rustioni L., rossoni M., cola G., Mariani L. and Failla O. 2011. bunch exposure to direct solar radiation increas-es ortho-diphenol anthocyanins in northern Italy climat-ic condition. J. Int. Sci. Vigne Vin. 45: 85.
Scalabrelli G. and Loreti F. 2000. La selezione clonale del “Sangiovese” nella Maremma toscana. Il “Sangiovese”. Atti del Simposio Internazionale. Firenze, Palazzo dei congres-si, 15-17 February 2000. ArSIA, Firenze. 101.
Spayd S.E., tarara J.M., Mee D.L. and Ferguson J.c. 2002. Separation of sunlight and temperature effects on the composition of Vitis vinifera cv. Merlot berries. Am. J. Enol. Vitic. 53: 171.
Storchi P., Egger E., Armanni A., Lazzara S. and Pierucci M. 2000. Valutazione morfologiche e analitiche dell’uva di cloni diversi del “Sangiovese”. Il “Sangiovese”. Atti del Simposio Internazionale. Firenze, Palazzo dei congressi, 15-17 February 2000. ArSIA, Firenze. 121.
tarara M.J., Lee J., Spayd S.E. and Scagel c.F. 2008. berry temperature and solar radiation alter acylation, propor-tion, and concentration of anthocyanin in Merlot grapes. Am. J. Enol. Vitic. 59 (3): 235.
Versari A., barbanti D. and Galassi S. 1999. Anthocyan-in composition of Montepulciano d’Abruzzo must during industrial fermentation process. Journal of Wine re-search 10: 223.
Paper received March 15, 2012 Accepted September 13, 2012

PaPer
142 Ital. J. Food Sci., vol. 25 - 2013
- Keywords: technological factors, dehydrated potato, glycoalkaloids, nitrates -
EFFECT OF TECHNOLOGICAL FACTORS ON GLYCOALKALOIDS
AND NITRATES CONTENT IN DEHYDRATED POTATO
E. RYTELDepartment of Food Storage and Technology,
Wrocław University of Environmental and Life Science, Chełmonskiego 37/41 Str., 51-630 Wrocław, Poland
Corresponding author: Tel. +4971 207716, Fax +4971 207768,email: [email protected]; [email protected]
AbStrAct
the influence of technological factors such as blanching and pre-drying temperatures applied to dried diced potato was studied. Used parameters influenced on glycoalkaloids and nitrates con-tent in semi- and ready products. the more fine material, the lower content of glycoalkaloids and nitrates. blanching temperatures used in the experiment contributed to further losses of glycoal-kaloids in semi-products. there were no significant changes in the nitrate content in the dice de-pending on the applied temperature of blanching. Dice pre-dried at the lowest temperature (120°c) contained about 5% more glycoalkaloids than the dice dried at 140°c and 12% more than dice dried at 160°c. Whereas the higher the temperature during pre-drying, the lower the nitrate con-tent in the final product. the dice dried at the lowest temperature still had 49% of the initial ni-trate content found in the raw material, at 140ºc – it was 41% and 160ºc - 33%.

Ital. J. Food Sci., vol. 25 - 2013 143
INtrODUctION
Potatoes are the raw material from which we may obtain a wide range of products, e.g. pota-to chips, French fries, and dehydrated potato products. the latter are used as finished prod-ucts or semi-products in the production of fur-ther processed foods such as frozen vegetables, potato concentrates, chips from potato dough such as “Pringels” or “chipsletten”.
In many well-developed countries consump-tion of less-processed food decrease in favor of semi-products and finished products, hence the ever-increasing interest in fried or dehydrated potato products. regardless of the type of prod-uct, processing potatoes in the food industry in-volves a number of similar technological steps. these include the initial processes such as wash-ing, peeling, slicing and rinsing of tubers. this prepared material is then subjected to blanch-ing and processes specific to the type of prod-uct, e.g. drying during the production of dehy-drated potatoes, or frying in the production of chips and French fries (LISINSKA et al., 2009; rYtEL et al., 2011).
Finished potato products contain the same in-gredients as the raw material, only in changed quantities or proportions. Like most plants, these are not only nutritional components but also antinutritional or even toxic substances, e.g. nitrates and glycoalkaloids. In potatoes used for consumption or for food processing, the amount of these compounds generally does not exceed accepted limits: 20 mg 100g-1 fresh weight for glycoalkaloids and 200 mg kg-1 fresh weight for nitrates (HILL 1999; LESZcZYNSKI 2000; MUrAWA et al., 2008; KNUtHSEN et al., 2009; GINZbErG et al., 2009). However, the levels of these com-pounds in potatoes must be constantly moni-tored as they may vary significantly due to ad-verse conditions during the growing season, transport or storage. there are a considerable number of reports on the effects of technologi-cal factors in the production of chips and French fries on the contents of antinutritional and tox-ic compounds in the raw material, intermedi-ates and final products (FrIEDMAN and DAO 1992; cIESLIK 1992; cIESLIK 1997; tAJNEr-cZ-OPEK et al., 2008; rYtEL et al., 2005; ZGÓrSKA et al., 2006; PEKSA et al., 2006; rYtEL, 2012). However, there is little data on dehydrated po-tato products. Differences between dehydrated and fried potato products do not only concern-ing the method of slicing and blanching, but also the applied temperature, time of exposure to high temperatures, drying or frying method, and many others, which to a varying degree may affect the content of toxic compounds.
based on literature data, it can be conclud-ed that the size of the loss of nitrates and gly-coalkaloids in potato processing is related to the specific distribution of these compounds in po-tato tubers. Most anti-nutritional compounds
(nitrates V) and toxins (glycoalkaloids) in pota-toes are located just below the skin or in the vi-cinity of the eyes, which is why pre-treatment, the peeling and additional cleaning of tubers, results in the removal of a considerable propor-tion of these compounds (cIESLIK 1997; PEKSA et al., 2006; FrIEDMAN 2006; tAJNEr-cZOPEK et al., 2008; OStrY 2010; rYtEL, 2010). Depend-ing on the size of the tubers, peeling technique and the potato variety, the decrease in potato total glycoalkaloids (tGA) can reach even 80-96%, while after incomplete removal of the skin it may drop by 20-35% (cIESLIK, 1997; PEKSA et al., 2006; FrIEDMAN, 2006; tAJNEr-cZOPEK et al., 2008; tAJNEr-cZOPEK et al., 2011). How-ever, the process of peeling may be insufficient during the processing of varieties with a bitter taste in the flesh, i.e. large amounts of glycoal-kaloids (LESZcZYNSKI, 2000; rYtEL et al., 2011).
Likewise, the content of nitrate V is signifi-cantly reduced, by about 30%, in the process of peeling the potatoes (bEcKA et al., 1992; cIESLIK, 1992; rYtEL et al., 2005; PEKSA et al., 2006). Further stages of technological processes affect changes in these compounds to a lesser extent. the next stages which may contribute to the loss of toxic or antinutritional compounds are ther-mal processes. the amount of glycoalkaloids de-creases only slightly compared with the process of peeling, which can be explained by the ther-mostability of these compounds (FrIEDMAN and McDONALD, 1997). by contrast, nitrate is water soluble and as a result of blanching, particular-ly in the case of finely fragmented material (e.g. sliced chips) the amount of nitrate in the pro-cessed material may drop by an average of 20% (cIESLIK, 1992; PEKSA et al., 2006).
Understanding all the factors contributing to the reduction in anti-nutritional or toxic com-pounds naturally occurring in potatoes still seems a valid and important problem.
Hence the aim of this study was to determine the effect of grinding the raw material, and dif-ferent temperatures of blanching and drying, on the content of glycoalkaloids (α-chaconine and α-solanine) and nitrates in semi-finished and finished product.
MAtErIAL AND MEtHODS
Raw material
the potatoes used for the study were collected from the store house of a potato food process-ing plant in 2009-2010. Potatoes were stored at 6ºc in the dark. the results represent the aver-age of three technical replicates.
Potato sample preparation for analysis
Potatoes were washed and peeled, using a lab-oratory carborundum peeler (to a depth of 1.5

144 Ital. J. Food Sci., vol. 25 - 2013
mm). In order to study the effect of the dice size on the content of glycoalkaloids and nitrates, the peeled tubers were cut into cubes of three sizes: 5x5x5, 10x10x10, and 15x15x15 mm. then, in order to determine the effect of tem-perature blanching on the content of these sub-stances in the samples, 10x10x10 mm dices were selected for further analysis and blanched for 5 min. at three temperatures: 60°, 75° and 90°c. In order to determine the effect of drying temperature on the content of glycoalkaloids and nitrates in semi-finished potato products, further analysis involved 10x10x10mm dices blanched at 75°c. Dices after blanching were pre-dried for 1 hour, at temperatures of 120°, 140° and 160°c, and redried at 50°c for 12 h to a moisture content of 10-11%.
the diagram of the laboratory studies:
* Samples selected for further analysis.
The concentrations of a-solanine and α-chaconine
Apparatus
A high-pressure liquid chromatograph HPLc (pro Star) was used (Varian, Walnut creek, cA, USA). the HLPc was equipped with a UV detec-tor – 310 type, Microsorb NH2 analytical column (25x46 cm LD) (rainin Instrument, Woburn, Ma, USA), and a computer system for monitor-ing the chromatograph (Varian chromatogra-phy System).
conditions of glycoalkaloid separation
A mixture of tetrahydrofuran (Merck, Germa-ny), acetonitrile and water 50:20:30 + KH2PO4 (1.02 g) per litre was used as an eluent. the pro-cess was carried out at a temperature of 35°c, with a speed of flow of 2 cm3 min–1 and pressure of 11.3 MPa, applying a light wavelength of 208 nm.
Sample preparation for chromatographic analysis
Dried material (1 g) was homogenized with 4 cm3 of water and 30 cm3 of methanol (Lab-scan, Ireland) for 2 minutes, followed by fil-tration. the filtrate was brought to a final vol-ume of 50 cm3 with methanol. A 5 cm3 ali-quot of extract was cleaned up on the SPE col-umn (bond Elut c18; 500mg; 6.0 cm3, Varian, USA). Glycoalkaloids were rinsed with meth-anol and evaporated to dryness in a vacuum at a temperature of 50˚c. the resultant res-idue was dissolved in 1 cc of tHF:AcN:H2O – 50:20:30. before application into the col-umn, the sample was cleaned using 0.45μm filters. the volume of the injection was 10 mL.
Standard solutions (1 mg/cm3) were pre-pared by dissolving 10 mg of α-solanine and α-chaconine (Sigma) in 10 cm3 of methanol. Standard solution was dissolved to obtain sam-ples containing from 1 to 50 mg/cm3 of both a-solanine and α-chaconine. On the column 10 mL of these solutions was injected.
The content of nitrates
A reflectometric method with test strips was used, at a measurement range from 5 to 225 mg kg-1 NO3. According to the principle of reflectom-etry (remission photometry), the reflected light from the strip was measured. In classical pho-tometry, the difference in the intensity of emitted and reflected light allows a quantitative determi-nation of the concentration of specific analysis.
Sample preparation for nitrates analysis
Nitrate concentrations were determined by re-flectometry using a rqflex analyser (Merck). De-terminations were made in 20 g of distilled wa-ter solution containing 5g of a dry sample. In the solution nitrate concentrations were meas-ured using test strips.
Analytical methods
the nitrate content of the potato tubers was determined by reflectometry method in the po-tato tubers, intermediates and finished products (rYtEL et al., 2005). the quantities of α-solanine and α-chaconine were determined using the methods by PEKSA et al. (2002) and SAItO et al. (1990). All the analyses were carried out twice.

Ital. J. Food Sci., vol. 25 - 2013 145
Statistical analysis
the results obtained in the experiment were subjected to statistical calculations using Statis-tica 9.0 software. We applied a multi-way anal-ysis of variance and Duncan’s test (P≤ 0.05) for the determination of the significance of differ-ences between means. All experiments were per-formed in three technological replications from two years of investigation and the present results show the mean of all data combined.
rESULtS AND DIScUSSION
In table 1 are presented results of glycoalka-loids content determination in potatoes before and after peeling. In this study, potatoes were peeled using a laboratory carborundum peeler, removing the skin to a depth of 1.5 mm. After this process there was still about 70% of the ini-tial content of these compounds in the raw ma-terial (table 1).
Glycoalkaloids are located in larger quanti-ties in the area of phellem cells, the parenchy-ma cells of the periderm and outer cortex of the tuber. the content of glycoalkaloids in the cen-tral pith and the inner cortex was very low. More glycoalkaloids are detected in the bud end than in the stem end of the tuber (FrIEDMAN and Mc-DONALD 1997). Generally, higher concentra-tions of these compounds are found in the skin and outer layer of potato tubers (to a depth of about 1.5 mm) which is why the peeling of po-tatoes can remove a considerable proportion of the glycoalkaloids. Depending on the depth of peeling, different amounts of these compounds may remain in the pulp. According to PEKSA et
al. (2006), peeling with a mechanical peeler re-moves about 30% of the initial content of gly-coalkaloids in potato tubers, and hand-peeling about 60% (tAJNEr-cZOPEK et al., 2008)
Subsequent processes such as slicing, blanch-ing or cooking were less intense in lowering content of glycoalkaloids in processed potatoes (tAKADI et al., 1990; PEKSA et al., 2006; FrIED-MAN and LEVIN, 2009; DONALD, 2008). this is mainly due to the nature of these compounds. Glycoalkaloids are welder soluble in water, and according to DONALD (2008) solanine is almost insoluble. In table 2, we presented the results for glycoalkaloid content in potatoes cut into dic-es of different sizes and rinsing in water.
the more fine material, the lower content of glycoalkaloids. the 5x5x5 mm dices contained almost 14% less of these compounds than the large dices (15x15x15 mm) and 10% less than the mid-sized dices (10x10x10 mm) (table 2). During the shredding and rinsing in water of potatoes we observed greater drops in chaco-nine than solanine. In industrial practice, dic-es are usually 10x10x10 mm in size, hence our further analysis concerned this size. the next process was blanching.
blanching is the first stage of thermal prepa-ration of dried potato dices. In the study there were used three different temperatures: 60°, 75°, and 90ºc. blanching temperatures utilized in the experiment contributed to further loss-es of glycoalkaloids in semi-products. Great-er reductions in these compounds occurred af-ter blanching the dice at 90ºc. Dice blanched at this temperature contained on average 20% less glycoalkaloids than the dice blanched at 60° or 75ºc (table 3). α-chaconine to a greater extent than a-solanine reacted to the temperature, and
table 1 - the content of glycoalkaloids and nitrates in dry matter unpeeled and peeled potatoes.
Analyzed compounds 2010 2011
Unpeeled Peeled Unpeeled Peeled
α-chaconie [mg 100 g-1 ] 14.8a 9.92b 17.9a 11.7b
α-solanine [mg 100 g-1 ] 8.18a 6.08b 8.77a 5.85b
nitrate [mg NaNO3 kg-1] 149a 140a 181a 157b
a,b: row indicate significant differences (Duncan test, p<0.05).
table 2 - total glycoalkaloids content (mg 100 g-1 d.m.) in potato dice of different cube sizes.
2010 2011 Cube size α-chaconine α-solanine α-chaconine α-solanine
5x5x5 mm 9.75a 4.64a 9.01a 4.61a
10x10x10 mm 9.90b 5.10b 10.7b 5.31b
15x15x15 mm 10.3b 5.20b 11.4c 5.48b
a,b,c: columns indicate significant differences (Duncan test, p<0.05).

146 Ital. J. Food Sci., vol. 25 - 2013
hence its content dropped more - on average by 28%, with α-solanine decreasing by 19% (table 3) compared with samples after slicing.
there were no significant differences in the content of glycoalkaloids (α-chaconine and α-solanine) in blanched samples at 60° and 75ºc (table 3). Generally, blanching of potato cubes contributes to about a 25% drop in glycoalka-loids compared to samples after cutting. Gly-coalkaloids are thermostable and hydrophobic (bUSHWAY and PONNAMPALAM, 1981; FrIEDMAN and DAO, 1992; cIESLIK, 1997; FrIEDMAN and LEVIN, 2009; DONALD, 2008), hence thermal processes including blanching or cooking de-crease the content of glycoalkaloids by about 20-30% (rYtEL et al., 2005; PEKSA et al., 2006; rY-tEL, 2012). According to cIESLIK (1997) cooking of whole potatoes in water results in a glycoalka-loids drop of only 14% on average; the drop was greater in peeled potatoes than unpeeled ones.
For farther analysis samples blanched in 75°c were chosen. It is enough temperature for en-zyme inactivating, which are active in potato flesh darkening and the improving of final prod-uct colour. Higher temperature of blanching can lead to collapse of dice but lower - 60°c could be not enough for enzyme inactivating.
After blanching, the dice was pre-dried at three different temperatures for 1 hour and redried for 8 hours at 50°c by convection. Pre-drying during the preparation of potato dice is to reduce the total drying time by removing excess water from the surface of the dice and to improve the color and consistency of the fin-ished product. Irrespective of the temperature of pre-drying, losses of the examined compounds
table 3 - total glycoalkaloids content (mg 100 g-1 d.m.) in potato dice of 10x10 mm cube sizes, blanching in different tem-peratures.
2010 2011 Blanching temperatures α-chaconine α-solanine α-chaconine α-solanine
60ºC 7.27b 4.82b 8.10b 4.31b
75ºC 7.93b 4.11a 7.85b 4.09b
90ºC 6.48a 4.20a 6.16a 3.16a
a,b: columns indicate significant differences (Duncan test, p<0.05).
were not significant (table 4). Dice pre-dried at the lowest temperature (120°c, redried in 50°c for 12 hours) contained about 5% more gly-coalkaloids than the dice dried at 140°c (redried in 50°c for 12 hours) and 12% more than dice dried at 160°c (redried in 50°c for 12 hours). this could have resulted from insufficient time (1 hour) of exposure to higher temperature during drying of potato cubes. Glycoalkaloids are thermostable and in a dryer they are sub-ject to only high temperature, with no factor that would result in leaching or degradation of these compounds. the finished product contained on average 7.01 α-chaconine mg 100 g-1 and 3.68 α-solanine mg 100 g-1 (table 4). Larger changes in glycoalkaloid content were observed after fry-ing potatoes. According to PEKSA et al. (2006), frying French fries reduces the amount of gly-coalkaloids by 35% and according to rYtEL et al. (2005) - by 40%. During frying the fragment-ed material is subject not only to high tempera-ture but also to the factor contributing to the leaching of these compounds - oil.
this study also investigated the content of ni-trates. Similar to glycoalkaloids, nitrates accu-mulate mostly in the skins of potatoes. Accord-ing to cIESLIK (1992; 1995), after peeling, 70% of nitrates still remain in the tuber, and according to PEKSA et al. (2006) 72-75%, depending main-ly on the peeling method. In our study, potatoes were peeled mechanically, which resulted in a reduction of nitrate content in the analyzed raw material by 10% (table 1). During technological processing or cooking of potatoes, these com-pounds change their content in tubers. In gen-eral, due to the high solubility of nitrates, their
table 4 - total glycoalkaloids content (mg 100g-1 d.m.) in dried potato dice of 10x10 mm cube sizes, blanching in 75ºc and pre-drying in different temperatures.
2010 2011 Pre-drying temperatures α-chaconine α-solanine α-chaconine α-solanine
120ºC 7.03b 3.98b 7.53b 4.06a
140ºC 6.94a 3.96b 6.70a 4.00a
160ºC 6.51a 2.09a 7.34b 3.99a
a,b: columns indicate significant differences (Duncan test, p<0.05).

Ital. J. Food Sci., vol. 25 - 2013 147
content in solid products decreases and increas-es in brine or broth (cIESLIK, 1995).
After the cutting of raw material and rinsing in water, there were significant changes in the content of these compounds (table 5). the lowest amount of nitrates was found in the smallest dice (5x5x5 mm), which contained on average 14% less nitrates than the thick dice (15x15x15 mm) and 6% less than the mid-sized dice (10x10x10 mm) (table 5). blanching helped further reduce the amount of nitrates in the dice, on average approximately 26% compared with the sam-ples after slicing (table 6). there were no sig-nificant changes in the nitrate content in the dice depending on the applied temperature of blanching. by increasing the temperature from 60° to 90°c, nitrate content dropped by about 17% (table 6). Lengthening the blanching time probably could bring better results, but this in turn could have affected the quality of the final product (breaking-up of the dice during blanch-ing). According to cIESLIK (1997) nitrate drop during potato blanching is the result of many factors such as temperature and time of its op-eration, the amount of water used in relation to raw material, water absorption capacity and the degree of fragmentation. cIESLIK (1997) reports that cooking potato dice using traditional meth-
ods reduces the amount of nitrate by 71% and cooking in a microwave oven by only about 30%. In studies by cIESLIK (1997) cooking whole un-peeled potato tubers decreased nitrate content by only 16%. the presence of skins greatly im-peded the transfer of nitrates to the brew. Ac-cording to PEKSA et al. (2006) blanching of po-tatoes cut into chips resulted in a loss of nitrate by 19-20%, and from rYtEL et al. (2005) blanch-ing potatoes in the form of strips reduced the amount of nitrates by 18%.
In this study, blanching of potato dice gave much better results than drying. the higher the temperature during pre-drying, the lower the ni-trate content in the finished product. Dice dried at 160°c contained 54 mg NaNO3
- and at 120ºc - 82 mgNaNO3
- (table 7). Pre-drying dice for 1 hour at the temperature 40ºc higher (160ºc) than the temperature most frequently used in the food industry (120ºc), contributed to a 34% nitrate drop. the dice dried at the lowest tem-perature still had 49% of the initial nitrate con-tent found in the raw material, at 140ºc – it was 41% and 160ºc - 33% (table 7).
cONcLUSIONS
Used technological parameters influenced on glycoalkaloids and nitrates content in semi- and ready products. the more fine material, the lower content of glycoalkaloids and nitrates. the 5x5x5 mm dices contained almost 14% less of these compounds than the large dices (15x15x15 mm) and about 10% less than the mid-sized dices (10x10x10 mm). blanching temperatures used in the experiment contributed to further losses of glycoalkaloids in semi-products. Diced pota-to blanched at 75°c contained on average 20% less glycoalkaloids than the dice after cutting and rinsing in water. Dice pre-dried at the low-est temperature (120°c), redried in 50°c con-tained about 5% more glycoalkaloids than the dice dried at 140°c (redried in 50°c) and 12% more than dice dried at 160°c (redried in 50°c). Where as the higher the temperature during pre-drying, the lower the nitrate content in the finished product. the dice dried at the lowest temperature still had 49% of the initial nitrate content found in the raw material, at 140ºc – it was 41% and 160ºc - 33%.
rEFErENcES
becka J., Mica b. and Vockal b. 1992.changes in the con-tent of nitrate nitrogen in raw and boiled potatoes. ros. Vyr. 28: 181-188.
bushway r.J. and Ponnampalam r. 1981. a-chaconine and α-solanine content of potato products and their stability during several modes of cooking. J. Agric. Food chem. 29: 814-817.
cieslik E. 1992. the nitrates and nitrites content in pota-toes during culinary process. Przem. Spo·z. 10: 266-267, (in Polish).
table 5 - Nitrates content (mgNaNO3- kg-1 d.m.) in potato dice
of different cube sizes.
Cube sizes 2010 2011 mean
5x5x5 mm 103a 142a 122a
10x10x10 mm 112ab 149ab 130ab
15x15x15 mm 128b 156b 142b
a,b: columns indicate significant differences (Duncan test, p<0.05).
table 6 - Nitrates content (mgNaNO3- kg-1 d.m.) in potato dice
of 10x10 mm cube sizes, blanching in different temperatures.
Blanching temperatures 2010 2011 mean
60ºC 83a 134a 108a
75ºC 79a 114b 96a
90ºC 70a 109b 90a
a,b: columns indicate significant differences (Duncan test, p<0.05).
table 7 - Nitrates content (mgNaNO3- kg-1 d.m.) in dried po-
tato dice of 10x10 mm cube sizes, blanching in 75ºc and pre-drying in different temperatures.
Pre-drying temperatures 2010 2011 mean
120ºC 68b 97b 82b
140ºC 52a 82ab 67ab
160ºC 40a 69a 54a
a,b: columns indicate significant differences (Duncan test, p<0.05).

148 Ital. J. Food Sci., vol. 25 - 2013
cieslik E. 1995. the effect of weather conditions on the lev-el of nitrates in tubers of same potato varieties. Pol. J. Potato Nutr. Sci., 4 /45 (3): 11-19.
cieslik E. 1997. Factors affecting the content of glycoalka-loids in potato tubers. Post. Nauk rol. 5(97): 113-119, (in Polish).
Donald G. 2008. Potatoes, tomatoes, and solanine toxici-ty (Solanum tuberosum L., Solanum lycopersicum L.). In: barcelux DG. Medical toxicology of Natural Substances: Foods, Fungi, Medicinal Herbs, toxic Plants, and Venom-ous Animal (pp. 77-83). Heboken, NJ: John Wiley & Sons.
Friedman M. 2006. Potato Glycoalkaloids and metabolites: roles in the plant and in the diet. J. Agric. Food chem. 54 (23): 8655-8681.
Friedman M. and Dao L. 1992. Distribution of glycoalkaloids in potato plants and commercial potato products. J. Ag-ric. Food chem. 40: 419-423
Friedman M. and Levin c.E. 2009. Analysis and biological Activities of potato glycoalkaloids, calystegine alkaloids, phenolic compounds, and anthocyanins. In: Singh J. and Kaur L. (Eds.): Advances in potato chemistry and technol-ogy, chapter 6 (pp. 127-162). Academic Press, burlington.
Friedman M. and McDonald G. M. 1997. Potato glycoalka-loids: chemistry, analysis, safety and plant physiology, crit. rev. Plant Sci. 16,1: 55-132.
Ginzberg I., tokuhisa J.G. and Veilleux r.E. 2009. Potato steroidal glycoalkaloids: biosynthesis and genetic manip-ulation. Potato res. 52: 1-15.
Hill J.M. 1999. Nitrate toxicity: myth or reality. brom. J. Nutr. 81: 343.
Knuthsen P., Jensen U., Schmidt b. and Larsen K.I. 2009. Glycoalkaloids in potatoes: content of glycoalkaloids in po-tatoes for consumption. J. Food com. Anal. 22: 577-581.
Leszczynski W. 2000. the quality of table potato. ·Zywnosc,
Nauka, technologia, Jakosc 4 (25), 7: 5-27, (in Polish, with English abstract).
Lisinska G., Peksa A., Kita A., rytel E. and tajner-czopek A. 2009. the quality of potato for processing and con-sumption, in: Yee N. (Eds.) bussel W, Potato IV. Food, (Special Issue) 2: 99-104.
Murawa D., banaszkiewicz t., Majewska E., błaszczyk b. and Sulima J. 2008. Nitrate and nitrite content in se-lected vegetables and potatoes commercially available in Olsztyn. brom. chem. toxic. XLI 1: 67-71, (in Polish, with English abstract).
Ostry V., ruprich J. and Skarkova J. 2010. Glycoalkaloids in potato tubers: the effect of peeling and cooking in salt-ed water. Acta Alim. 39, 2: 130-135.
Peksa A., Gołubowska G., Aniołowski K., Lisinska G. and ry-tel E. 2006. changes of glycoalkoaloids and nitrate con-tents in potatoes during chips processing. Food chem. 97: 151-156.
Peksa A., Gołubowska G., rytel E., Lisinska G. and Aniołowski K. 2002. Influence of harvest date on gly-coalkaloid contents of three potato varieties. Food chem. 78: 313-317.
rytel E. 2010. chosen pro- and anti-nutritional substanc-es in potatoes and changes in their content during pota-to processing for food products. Zesz. Probl. Post. Nauk rol. 557: 43-61.
rytel E. 2012. changes in glycoalkaloid and nitrate con-tent in potatoes during dehydrated dice processing. Food contr. 25: 349-354.
rytel E., Gołubowska G., Lisinska G., Peksa A. and Aniołowski K. 2005.changes in glycoalkaloid and nitrate contents in potatoes during French fries processing. J. Sci. Food Agric. 85: 879-882.
rytel E., Peksa A., tajner-czopek A., Kita A. and Lisinska G. 2011. Anti nutritional compounds in potatoes, depending on the type of raw material and conditions of processing potatoes into food products. In: Yee N., bussel W. (Eds.) Potato V. Food (Special Issue) 1: 15-22.
Saito S.L., Sanford L.L. and Webb r.E. 1990. High-per-formance liquid chromatographic determination of gly-coalkaloids in potato products. J. chromat. 508:141-147.
tajner-czopek A., Jarych-Szyszka M. and Lisinska G. 2008. changes in Glycoalkaloids content of potatoes destined for consumption. Food chem. 106: 706-711.
tajner-czopek A., rytel E., Kita A., Peksa A. and Hamouz K. 2012. the influence of thermal process of coloured pota-toes on the content of glycoalkaloids in the potato prod-ucts. Food chem. 133: 1117-1122.
takadi K., toyoda M., Fujiyama Y. and Saito Y. 1990. Effect of cooking on the content of α-chaconine and α-solanine of potatoes. Japanese Society for Food Hygiene and Safe-ty 31: 67-73.
Zgórska K., czerko Z. and Grudzinska M. 2006. the effect of some selected factors on the content of glycoalkaloids in potato tubers.
·Zywnosc, Nauka, technologia, Jakosc.
1(46): 229-234.
Paper received June 15, 2012 Accepted September 14, 2012

PaPer
Ital. J. Food Sci., vol. 25 - 2013 149
- Keywords: lyophilization, jelly, strawberry, sodium alginate, calcium lactate -
INFLUENCE OF CHEMICAL COMPOSITIONAND STRUCTURE OF STRAWBERRY GELS ON THE CHOSEN PHYSICAL PROPERTIES
OF FREEZE-DRIED FINAL PRODUCT
A. CIURZYNSKA, A. LENART and W. TRACZYKFaculty of Food Sciences, Department of Food Engineering and Process Management, Warsaw
University of Life Sciences, SGGW 159c Nowoursynowska St., 02-787 Warsaw, Poland*Corresponding authorTel. +48 22 5937577, Fax +48 22 5937576,
email: [email protected]
AbStrAct
this study undertook an assessment of the influence of the modification of composition on se-lected physical properties of strawberry jellies preserved via lyophilization. Moreover, the study presents an attempt to elaborate the technology of lyophilization-enabled strawberry jelly manu-facture based on strawberry powder.
Six strawberry jelly recipes were obtained. Selected features of the final product were regulat-ed by the addition of glucose and/or chokeberry juice concentrate. the jelly made from 7% straw-berry powder and 5.2% chokeberry juice concentrate was selected as the product with the best quality features, the most profitable color and the highest rehydration degree.

150 Ital. J. Food Sci., vol. 25 - 2013
1. INtrODUctION
Improved living standards and the continu-ously decreasing amount of time spent on meal preparation have meant that consumers very often choose so-called convenience food, which may be quickly and easily prepared for consump-tion. Developments in food technology are be-ing directed at product improvement so that it is both of a constant quality, and convenient and functional at the same time (DHANSEKHArAN et al., 2005).
A large proportion of the ingredients includ-ed in “convenience food” are dried products, e.g. fruits, vegetables, mushrooms or more often meat. therefore, the production of such kinds of food is constantly increasing and, as reported by rZAcA and WItrOWA-rAJcHErt (2007), the production of dried products in Poland increased from 17.7 thousand tons in 2000 to 27.9 thou-sand tons in 2004. Dried fruits and vegetables are characterized by elongated shelf life, high-er stability, and also low mass and decreased volume, which facilitates transport (SAGAr and SUrESH KUMAr, 2010). Additionally, the devel-opment of microorganisms is limited and the course of biochemical reactions is decelerated (cIUrZYNSKA and LENArt, 2010a).
It is commonly known that drying in a vacu-um from frozen state (freeze-drying) allows the product to be obtained with minimal chang-ing, and after moistening it almost entirely re-covers its properties. Such a method of dry-ing is the most effective and progressive man-ner of wet product protection (NOVIKOVA et al., 2003; LIAPIS and brUttINI, 2006). Lyophiliza-tion (freeze-drying) involves water removal from material which has previously been frozen. this process proceeds via ice sublimation, i.e. direct transition from solid to gaseous phase, omit-ting the liquid state. It may proceed properly only at low temperatures and with considera-bly lowered pressure (MArQUES et al., 2006; LIU et al., 2008).
Numerous studies on the application of freeze-drying have been conducted around the world, starting from studies on the application of ly-ophilisation for the preservation of strawber-ries, other fruits and vegetables, the preservation of meat, e.g. from reindeer, hen eggs or orange juice (LIAPIS and brUttINI, 2006; MArQUES et al., 2006; cHAN et al., 2009; HUANG et al., 2009; cIUrZYNSKA and LENArt, 2010a). Lyophilized products are most often encountered as ingre-dients of “instant” type dishes, but also of soup concentrates, breakfast or dinner ready meals and some confectionery (rAttI, 2001; PAN et al., 2008; cHAN et al., 2009).
Strawberries are a good source of vitamin c, folians, potassium and also other mineral com-ponents in smaller amounts, e.g. iron, mag-nesium or phosphorus. Unfortunately, these fruits have low durability and are not suitable
for storing for a longer time without process-ing (cIUrZYNSKA and LENArt, 2009b; HUANG et al., 2009). Processed strawberries in the form of jellies (fruit gels) are used in the production of stuffed bakery products and confectionery, and also as products for direct consumption. Dried strawberries in turn can be used as a filling for dairy products, in cereals, teas or instant des-serts, such as fruit creams or puddings (EL-bELtAGY et al., 2007; HAMINIUK et al., 2007).
A by-product in the form of strawberry pow-der is formed during dried strawberry produc-tion, and especially dried product grinding and this may also be used for the manufacture of valuable products. both the market and con-sumer demand force the creation of new reci-pes (cIUrZYNSKA and LENArt, 2010c).
the jelly is a gel product obtained from a so-lution of sugar and starch syrup with the addi-tion of gelling agents, flavor-aroma, or if required also coloring substances. the consistency of the jelly should be gelatinous, elastic and dry mat-ter content should not be lower than 74% (PN-A-88000:1993/A1 and PN-A-88108:1998).
Fruit gels are used the most often as fruit fillings for the manufacture of various kinds of products. In baked goods they are fillings of confectionery products processed thermally or not subjected to temperature activity. In con-fectionery, fruit fillings are used for pastry and chocolate products. In the dairy industry they are widely used for milk products such as yo-ghurts, milk drinks and desserts. Freeze-dried hydrocolloid gels could be useful as carriers for many food snacks, non-food matrices and bio-technological operations (NUSSINIVItcH and ZVI-tOV-MArAbI, 2008).
Application of various kinds of fruit gel sta-bilizers is used for fruit processing due to the need for their preparation as a product for fur-ther processing. the kind of fruit and the des-tination is conditioned by the additive used for structure formation support. Selecting the gel composition and preparation conditions enables the creation of sponges with controlled micro-structures and mechanical properties (NUSSINO-VItcH et al., 2000).
the aim of the study was to determine the influence of the modification of strawberry jel-ly composition on selected physical properties of the freeze-dried final product. Moreover, the study presents an attempt to elaborate the tech-nology of powder-based strawberry jellies pre-served via lyophilization.
the scope of the study included:- determination of the appropriate amounts of:
lyophilized strawberry powder, sodium algi-nate as a thickener and calcium lactate,
- an attempt at the regulation of strawberry jel-ly properties via the addition of glucose and/or chokeberry juice concentrate,
- an analysis of selected properties of strawber-ry jellies preserved via lyophilization.

Ital. J. Food Sci., vol. 25 - 2013 151
2. MAtErIALS AND MEtHODS
2.1. Materials
the raw material for the study was lyophi-lized strawberry powder obtained from lyophi-lized strawberry mix, stored in a dark place at room temperature manufactured by Depart-ment of Food Engineering and Process Manage-ment in Wuls-SGGW in Warsaw. the composi-tion of the examined jellies also included sodi-um alginate and calcium lactate (both manu-factured by Hortimex). the flavor and color of strawberry jellies were modified by the addition of crystalline glucose manufactured according to the PN-84/A-74771 standard (manufactured by JAr, Jaskulski Aromaty), and 67.5% choke-berry juice concentrate (manufactured by AL-PEX Sp. Z o.o.).
2.2. Technological methods
the first stage of the study included an at-tempt at the determination of lyophilized straw-berry powder content in jelly recipes, which would allow samples of the specified proper-ties and parameters to be obtained (table 1). then, the optimum proportions of sodium algi-nate and calcium lactate were examined. At the next stage of the study, the properties of jellies obtained were regulated by the addition of glu-cose and/or chokeberry concentrate.
then, analysis of strawberry jellies after lyoph-ilisation was conducted. In some of the samples the examined physical properties were regulat-ed by the addition of glucose and/or chokeberry juice concentrate, which were added before the introduction of thickening substances. After gel-ling, the jellies were cut into cubes of 1 cm sides.
the strawberry jellies were frozen in a National Lab GmbH freezer (ProfiMaster Personal Freez-ers PMU series) at a temperature of -70°c for 2 hours. the frozen cubes were next moved to a christ company ALPHA 1 – 4 LDc – 1 m lyophi-lizer with contact heating of the raw material. the process was conducted with constant pa-rameters: pressure 63 Pa, safety pressure 137 Pa, temperature of lyophilizer heating shelves 30°c, time 24 hours.
After the lyophilisation process the jelly cubes were moved to glass vessels which were tightly closed and stored in a dark place at room tem-perature up to the time of analyses.
2.3. Analytical methods
2.3.1. Water activity determination
Water activity was determined in a rotronic Hygroscop Dt apparatus according to the man-ufacturer’s manual at a temperature of 25°±1ºc. Determination was conducted in four repeti-tions.
2.3.2. Dry matter content determination
Dry matter content for strawberry jellies was determined before and after lyophilization. Gel cubes were crumbled in a mortar. the crushed samples were weighed on analytical scales with an accuracy up to 0.001 g, about 3 g of homoge-nate to glass weighing bottles. the drying pro-cess was conducted for about 24 hours in a con-vection dryer at a temperature of 60ºc until sol-id mass was obtained.
2.3.3. color determination
color was determined using a Minolta com-pany (Austria) chroma – Meter cr – 300 appa-ratus in a LAb system. the examination was conducted with diffused lightning at an angle of 0º, the diameter of the measurement hole was 8 mm, standard light of c type. the measurements were conducted in five repetitions. Mean values were determined for the results obtained. Also, color coefficients were calculated. Diagrams were produced for the values obtained and standard deviations were determined as well.
color coefficients were determined on the ba-sis of equations:
H = arctg (b* x a(–1))
H: hue anglea*: red color coefficient b*: yellow color coefficient
2.3.4. rehydration property determination
Determination of rehydration properties in-volved holding strawberry jellies preserved via lyophilization in water for specified periods of time. the measurements were done at temper-atures of 20° and 80°c for 10 minutes for all kinds of strawberry jellies in three replications (WItrOWA-rAJcHErt and LEWIcKI, 2006).
2.3.5. Mechanical properties determination
Determination of mechanical properties in-volved measurement of compressive force us-ing a tA-Xt2i texture Analyzer device at a room temperature of 20°±2ºc in five replications. the cubes were subjected to compression with a con-stant head speed of 6 mm/min up to the mo-ment a 50% deformation in the initial height of the sample was obtained. Diagrams of compres-sion curves were produced, and the work per-formed during 50% cube deformation was deter-mined (cIUrZYNSKA and LENArt, 2010b).
2.4. Statistical methods
the statistics package Statgraphics Plus v. 4.1 and Microsoft Excel 2002 were used to conduct the statistical analysis of the results. Standard

152 Ital. J. Food Sci., vol. 25 - 2013
deviations were determined for the averaged re-sults, and an analysis of variance using the Fis-cher test was conducted to verify the hypothesis of the equality of object means, while the tuk-ey test was used for homogenous group deter-mination.
3. rESULtS AND DIScUSSION
3.1. The influence of the participation and modification of lyophilized strawberry powder and calcium lactate on the properties of straw-berry jellies preserved by freeze-drying
Strawberry jellies preserved by lyophilization of a basic composition, differing only in terms of the amount of lyophilized strawberry powder (jelly 1 and 2) and the amount of calcium lactate (jelly 2 and 6) were compared (table 1).
3.1.1. changes in water content and water activity
It was observed that for strawberry jellies pre-served by freeze-drying a smaller addition of strawberry powder (2) led to a statistically sig-nificant decrease in water content (Fig. 1a).
A decrease in the amount of calcium lactate added up to 0.01% (6) statistically significant-
ly influenced the increase in water content with respect to jelly containing 0.05% of calcium lac-tate (2) (Fig. 1a).
A decrease of up to 7% (2) in the amount of strawberry powder added, resulted in a statisti-cally significant increase in water activity in the samples (2) in comparison to jelly (1) (Fig. 1b).
It was also demonstrated that the jelly pre-served by lyophilization and of a lowered cal-cium lactate content of up to 0.01% (6) result-ed in statistically significantly lower water ac-tivity (Fig. 1b).
3.1.2. changes in color
the amount of strawberry powder added influ-enced the lightness coefficient L* of the surface of the freeze-dried final product. A decrease in the proportion of strawberry powder from 10% (1) to 7% (2) caused a darkening of the sample surface. Differences were not significant statis-tically (Fig. 2a). the results obtained confirm that the color of jellies preserved by lyophiliza-tion and with a lower strawberry powder content (2) is close to the natural color of freeze-dried strawberries (cIUrZYNSKA and LENArt, 2009a).
A decrease in the amount of calcium lactate added of up to 0.01% (6) does not induce statis-tically significant changes in the lightness coef-ficient L* of the surface of the freeze-dried final
Fig. 1 - Water content (a) and water activity (b) of strawberry jellies in dependence on amount of added strawberry powder and calcium lactate. Designations in table 1.
table 1 - recipes of strawberry jellies.
Lp Liophilized strawberry Sodium alginate Calcium lactate Glucose Chokeberry concentrate Water powder [%] [%] [%] [%] [%] [%]
1 10 1.5 0.05 0 0 88.45 2 7 1.5 0.05 0 0 91.45 3 7 1.5 0.05 5.2 0 86.25 4 7 1.5 0.05 0 5.2 86.25 5 7 1.5 0.05 5.2 5.2 81.05 6 7 1.5 0.01 0 0 91.49
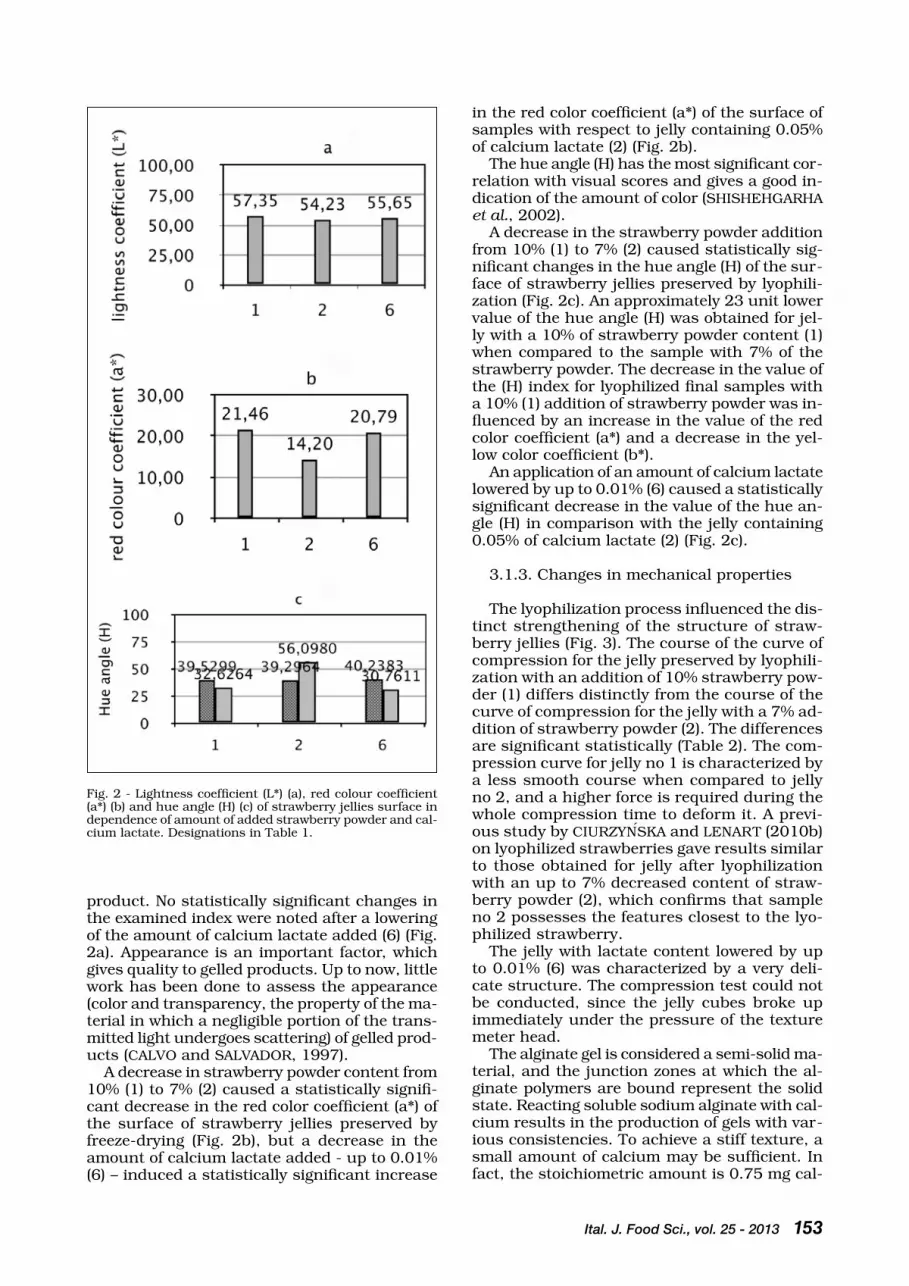
Ital. J. Food Sci., vol. 25 - 2013 153
product. No statistically significant changes in the examined index were noted after a lowering of the amount of calcium lactate added (6) (Fig. 2a). Appearance is an important factor, which gives quality to gelled products. Up to now, little work has been done to assess the appearance (color and transparency, the property of the ma-terial in which a negligible portion of the trans-mitted light undergoes scattering) of gelled prod-ucts (cALVO and SALVADOr, 1997).
A decrease in strawberry powder content from 10% (1) to 7% (2) caused a statistically signifi-cant decrease in the red color coefficient (a*) of the surface of strawberry jellies preserved by freeze-drying (Fig. 2b), but a decrease in the amount of calcium lactate added - up to 0.01% (6) – induced a statistically significant increase
in the red color coefficient (a*) of the surface of samples with respect to jelly containing 0.05% of calcium lactate (2) (Fig. 2b).
the hue angle (H) has the most significant cor-relation with visual scores and gives a good in-dication of the amount of color (SHISHEHGArHA et al., 2002).
A decrease in the strawberry powder addition from 10% (1) to 7% (2) caused statistically sig-nificant changes in the hue angle (H) of the sur-face of strawberry jellies preserved by lyophili-zation (Fig. 2c). An approximately 23 unit lower value of the hue angle (H) was obtained for jel-ly with a 10% of strawberry powder content (1) when compared to the sample with 7% of the strawberry powder. the decrease in the value of the (H) index for lyophilized final samples with a 10% (1) addition of strawberry powder was in-fluenced by an increase in the value of the red color coefficient (a*) and a decrease in the yel-low color coefficient (b*).
An application of an amount of calcium lactate lowered by up to 0.01% (6) caused a statistically significant decrease in the value of the hue an-gle (H) in comparison with the jelly containing 0.05% of calcium lactate (2) (Fig. 2c).
3.1.3. changes in mechanical properties
the lyophilization process influenced the dis-tinct strengthening of the structure of straw-berry jellies (Fig. 3). the course of the curve of compression for the jelly preserved by lyophili-zation with an addition of 10% strawberry pow-der (1) differs distinctly from the course of the curve of compression for the jelly with a 7% ad-dition of strawberry powder (2). the differences are significant statistically (table 2). the com-pression curve for jelly no 1 is characterized by a less smooth course when compared to jelly no 2, and a higher force is required during the whole compression time to deform it. A previ-ous study by cIUrZYNSKA and LENArt (2010b) on lyophilized strawberries gave results similar to those obtained for jelly after lyophilization with an up to 7% decreased content of straw-berry powder (2), which confirms that sample no 2 possesses the features closest to the lyo-philized strawberry.
the jelly with lactate content lowered by up to 0.01% (6) was characterized by a very deli-cate structure. the compression test could not be conducted, since the jelly cubes broke up immediately under the pressure of the texture meter head.
the alginate gel is considered a semi-solid ma-terial, and the junction zones at which the al-ginate polymers are bound represent the solid state. reacting soluble sodium alginate with cal-cium results in the production of gels with var-ious consistencies. to achieve a stiff texture, a small amount of calcium may be sufficient. In fact, the stoichiometric amount is 0.75 mg cal-
Fig. 2 - Lightness coefficient (L*) (a), red colour coefficient (a*) (b) and hue angle (H) (c) of strawberry jellies surface in dependence of amount of added strawberry powder and cal-cium lactate. Designations in table 1.

154 Ital. J. Food Sci., vol. 25 - 2013
cium per gram of algin (depending on the viscos-ity grade of the selected sodium alginate). Op-timal complexing of the alginate and calcium is obtained by using approximately 40% of the stoichiometric amount, which varies with cal-cium source and the presence of other soluble solids and pH, among other things (NUSSINO-VItcH, 1997).
It was observed that when deforming jelly of a basic composition with a 10% strawberry powder content (1) 50% more compression work when compared to the sample containing 7% straw-berry powder (2) must be performed (table 3). A decrease in the lyophilized strawberry powder content from 10% (1) to 7% (2) weakened the structure of the samples and meant that about 50% less work was needed to be performed dur-ing the jelly deformation. the values for the work for the lyophilized jelly containing 7% (2) straw-berry powder are similar to the values for com-pression work for the lyophilized strawberries (cIUrZYNSKA and LENArt, 2010b).
3.1.4. changes in rehydration properties
rehydration capacity and rate, in relation to drying, are the quality attributes which are the most often assessed in the literature (MEDA and rAttI, 2005).
the decrease in a contribution of strawberry powder from 10% (1) to 7% (2) influenced statis-tically significant increase in an amount of wa-ter absorbed by the strawberry jellies preserved by liophilization subjected to rehydration in wa-ter of a temperature of 20° and 80°c (Fig. 4a).
Statistically significant decrease in an ability for rehydration in water of a temperature of 20° and 80°c was noted for the strawberry jellies of lowered calcium lactate content up to 0.01% (6) with respect to the sample containing 0.05% of calcium lactate (2) (Fig. 4a).
Similar relationships were demonstrated dur-ing the examination of an influence of change in strawberry powder addition on the content of dry matter after rehydration of lyophilized final samples in water of a temperature of 20° and 80°c. the decrease in a contribution of straw-berry powder from 10% (1) to 7% (2) influenced statistically significant improvement in rehydra-tion properties of the dried materials. the jel-lies preserved by freeze-drying containing 7% of the strawberry powder absorbed more wa-ter (Fig. 4b).
Decrease in calcium lactate content from 0.05% (2) to 0.01% (6) caused deterioration of rehydration properties of the samples. they ab-sorbed statistically significantly lower amount of water when compared to the sample no 2 dur-ing rehydration in water of a temperature of 20° and 80°c (Fig. 4b).
3.2. An influence of glucose and/or choke-berry juice concentrate addition on the chang-es in properties of strawberry jellies preserved by liophilization
An influence of glucose and/or chokeberry juice concentrate addition on the changes in se-lected physical properties of strawberry jellies was examined for the following samples: of a ba-sic composition (2), with an addition of 5.2% of glucose (3), with an addition of 5.2% of choke-berry juice concentrate (4), and with an addition of 5.2% of glucose and 5.2% of chokberry juice concentrate (5) (table 1).
3.2.1. changes in water content
An increase in water content was obtained for all strawberry jellies preserved by lyophilization after an addition of glucose and/or chokeberry juice concentrate (3-5) with respect to the sam-ple of a basic composition (2) (Fig. 5a), but only for the samples with glucose addition (3) the dif-ferences were statistically significant when com-pared to the sample no 2.
Fig. 3 - Mechanical properties (compression test) of straw-berry jellies in dependence of amount of added strawberry powder. F – force necssery to 50% sample deformation. Des-ignations in table 1.
table 2 - LSD test results for compression curves of straw-berry jellies. Designations in table 1.
LSD test; Statistical significant differences in significant level p < 0,05 bold.
1 2 1 0,00 2 0,00
table 3 - Average work value (Wav) necessary to 50% defor-mation of strawberry jellies. Designations in table 1.
Freeze-dried strawberry jellies Average work, Wav [J]
1 1,12*10-1
2 5,51*10-2

Ital. J. Food Sci., vol. 25 - 2013 155
Fig. 4 - changes in water (a) and dry matter content (b) dur-ing rehydration of strawberry jellies in water in temperature 20° and 80ºc, in dependence of amount of added straw-berry powder and calcium lactate. Designations in table 1.
cIUrZYNSKA and LENArt (2007) in turn, in the study on lyophilized strawberries, demon-strated that an application of an osmotic dehy-dration of fruits in glucose solution influenced an increase in water content in dried materi-al when compared to non dehydrated samples.
Statistically significant decrease in water ac-tivity in all examined gels kinds (3, 4 and 5) was noted in compared to the lyophilized strawberry jelly of a basic composition (2). the lowest val-ue of water activity was obtained for the sample with an addition of 5.2% of glucose and 5.2% of concentrate (5) (Fig. 5b).
cIUrZYNSKA and LENArt (2010c) also ob-served in their study a decrease in water activ-ity value for all strawberry jellies preserved by
lyophilization with an addition of glucose and/or chokeberry concentrate with respect to the sample of a basic composition.
3.2.2. changes in color
An application of an addition of chokeberry juice concentrate (4) or glucose together with concentrate (5) influenced lowering of the ana-lyzed index, the surface of the jellies was dark-er when compared to the jelly of a basic com-position (2). An increase in the lightness coeffi-cient (L*) of the surface was observed for the jel-ly with only a glucose addition (3), but the differ-ences were not significant statistically with re-spect to the jelly of a basic composition (2) (Fig. 6a). cIUrZYN´SKA and LENArt (2010c) demon-strated that the lightness coefficient (L*) is sub-ject to decrease with the addition of glucose and/or chokeberry concentrate to the strawberry jel-lies. For freeze-dried strawberry dehydrated in glucose in turn, cIUrZYN´SKA et al. (2011) noted that the lightness coefficient (L*) was increased when compared to non-dehydrated samples.
A statistically significant influence of glucose and/or chokeberry concentrate addition (3, 4 and 5) on the increase in the red color coefficient (a*) of the surface of strawberry jellies preserved by lyophilization with respect to the sample of a basic composition (1) was demonstrated. the highest value of the examined index, about 24 units, was obtained for the jelly with 5.2% choke-berry concentrate addition (3) (Fig. 6b).
cIUrZYNSKA et al. (2011) demonstrated that the red color coefficient (a*) of lyophilized straw-berries dehydrated in glucose decreases when compared to non-dehydrated, freeze-dried straw-berries. cIUrZYNSKA and LENArt (2010c) con-firmed, for the lyophilized strawberries, that an addition of glucose only to the lyophilized straw-berry jellies causes an increase in the value of the red color coefficient (a*), but the addition of glucose and chokeberry concentrate causes a decrease in the examined coefficient.
It was observed that the addition of glucose and /or chokeberry juice concentrate in the case
Fig. 5 - Water content (a) and water activity (b) of strawberry jellies in dependence on addition of glucose and/or chokeberry juice concentrate. Designations in table 1.

156 Ital. J. Food Sci., vol. 25 - 2013
of the three jellies under consideration (3, 4 and 5) caused statistically significant changes in hue angle (H) when compared to the jelly of a basic composition (2). An addition of glucose and/or chokeberry juice concentrate (3-5) caused a sta-tistically significant decrease in hue angle (H) in comparison to the samples (2). the differences were 20, 42 and 41 units (Fig. 6c).
table 4 - LSD test results for compression curves of straw-berry jellies. Designations in table 1.
LSD test; Statistical significant differences in significant level p < 0,05 bold.
2 3 4 5 2 0,00 0,00 0,00 3 0,00 0,00 0,00 4 0,00 0,00 0,81 5 0,00 0,00 0,81
Modification of strawberry jelly composition by the addition of glucose and/or chokeberry juice concentrate caused the value of hue an-gle of the samples to move towards the value of that index for lyophilized strawberry from the study by cIUrZYNSKA et al. (2011), which was about 20 units.
3.2.3. changes in mechanical properties
Distinct strengthening of the structure of the samples with an addition of glucose (3), choke-berry juice concentrate (4) and glucose with con-centrate (5) was demonstrated for jellies pre-served by lyophilization when compared to the jelly of a basic composition (2) (Fig. 7). It was demonstrated that the course of the curves is not smooth, as in the case of compression for jelly no 2. During the experiment, the jellies of a modified composition cracked and required the application of a higher force to cause 50% sam-ple deformation with respect to the sample of a basic composition (2). the highest strengthening of the structure was noted for the sample with an addition of glucose and chokeberry juice con-centrate (5) (Fig. 7) (table 4).
NUSSINOVItcH et al. (2001) investigated the mechanical and acoustic properties of agar, gellan and kappa carrageenan based dried gels and assessed the effect of admixed sucrose and starch. It was found that the influence of these added ingredients on the dried gel density was well beyond their stochiometric contribution, i.e. their presence had a qualitative effect on the solid matrix properties. As expected, low den-sity dried gels with an open cellular structure with thin walls are very brittle and fragile. con-sequently, their compressive force-displacement curve, or mechanical signature, is irregular (jag-ged) and unreproducible.
Also, NUSSINOVItcH et al. (2000) showed that the incorporation of sugar into three gum matri-ces (agar, K-carrageenan and gellan gels) increas-es the brittleness of their dried gels. this resulted in a measurable increase in the jaggedness of the dried gels’ mechanical signatures. Added sugar increased the dried gel stiffness, as expressed in the stress levels at comparable strains, but this was at least partly due to the higher density of the sugar containing products. the magnitude of the density increase could not have been predict-ed on the basis of stoichiometric relations, which indicates that the sugar in the gum-sugar matrix is not an inert “filler”. It seems that added sug-ar can be a means to control, or produce, a de-sired brittleness. this seems to be a limit to how much sugar can be added, which in this work was around 10%. If greatly exceeded, it will cause the collapse of the sample during the gel drying.
It was observed for the strawberry jellies pre-served by freeze-drying (3, 4, 5) that the work performed during 50% deformation of the sam-ple is about 2 to 6 fold higher than the work
Fig. 6 - Lightness coefficient (L*) (a), red colour coefficient (a*) (b), hue angle (H) (c) of strawberry jellies surface in de-pendence of amont of added glucose and/or chokeberry juice concentrate. Designations in table 1.

Ital. J. Food Sci., vol. 25 - 2013 157
table 5 - Average work value (Wav) necessary to 50% defor-mation of strawberry jellies. Designations in table 1.
Strawberry jellies Average work, Wav [J]
2 5,51*10-2
3 2,02*10-1
4 1,17*10-1
5 3,20*10-1
needed for deformation of the jelly of a basic composition (2) (table 5). An addition of glucose and/or chokeberry juice concentrate (5) caus-es the highest strengthening of the structure of the lyophilized final samples.
In their investigations NUSSINOVItcH et al. (2001) showed that the presence of starch and/or sugar in the solid matrix altered the solid matrix at a molecular level, i.e. it created solids with new mechanical properties. However while the presence of starch, at least at the concen-trations studied, always stiffened the structure, the presence of sucrose could sometimes have the opposite effect.
It may be concluded from the study by cIUrZYNSKA and LENArt (2009b) conducted on the lyophilized strawberries that the osmotic de-hydration of fruits in glucose solution strength-ens the structure of the dried material with re-spect to the strawberries not subjected to os-motic processing.
3.2.4. changes in rehydration properties
Few papers deal with the rehydration of freeze-dried products (MEDA and rAttI, 2005; LEE et al. 2006; cIUrZYN´SKA and LENArt, 2010a). Freeze-dried foods are usually rehydrated by soaking them in water or other liquids, such as fruit or vegetable juices, cider, milk, glucose solution, etc., for a period of up to 2 h. During rehydra-tion, the water uptake was faster during the in-itial stage and then the rate decreased gradual-ly as the moisture content approached equilib-rium when water nearly filled up all the pores and the fruit regained a considerable percent-age of its original moisture content. Dehydrat-ed products are usually rehydrated prior to their use (LEE et al., 2006).
Modification of the composition of jellies pre-served by lyophilization caused a deterioration of the rehydration properties of the samples (3, 4 and 5) when compared to the sample of a ba-sic composition (2). It was demonstrated that the differences were significant statistically for
Fig. 7 - Mechanical properties (compression test) of straw-berry jellies in dependence of addition glucose and/or choke-berry juice concentrate. F – force necssery to 50% sample deformation. Designations in table 1.
those jellies subjected to rehydration in water at a temperature of 20°c. Application of a temper-ature of 80°c in turn led to an improvement in the rehydration degree of the samples with an addition of chokeberry juice (4) and glucose and chokeberry juice (5), between which significant statistically differences were not observed (Fig. 8a). After rehydration in water at temperatures of 20° and 80ºc, the content of water in cubes of jellies no 3, 4 and 5 was to a smaller degree close to the content of water in samples before lyophilisation. the jelly with glucose addition (3) is characterized by the lowest degree of rehydra-tion at temperatures of 20° and 80°c. the most profitable ability for rehydration among the jel-lies after lyophilization of the modified composi-tion was obtained for the sample with the addi-tion of chokeberry juice concentrate (4).
However, NUSSINOVItcH et al. (2000) main-tain that the presence of sugar also increases the dried gel hygroscopicity, but this phenome-non was not investigated in this study.
Analysis of the changes in dry matter content resulting from rehydration also demonstrated a lower degree of reconstruction of final samples preserved via lyophilization with an addition of glucose and/or chokeberry juice concentrate (3-5) with respect to the sample of a basic compo-sition (2) (Fig. 8b). the differences were signifi-cant statistically both for rehydration in water at temperatures of 20° and 80°c. Only the dif-ferences between jellies no 4 and 5 hydrated at a temperature of 80°c were not significant.
4. cONcLUSIONS
A decrease in the addition of strawberry pow-der from 10 to 7% caused higher water activity without significant changes in the water content of strawberry jellies preserved via liophilization. Also, a deterioration of the color coefficients, to-gether with an increase in the ability of sample rehydration was obtained.
A decrease in the addition of calcium lactate from 0.05 to 0.01% to strawberry jellies caused lower values for water activity and an increase in the water content of the final product pre-served via liophilization. Also, a deterioration of the color coefficients and mechanical properties (the samples were breaking up) and a lower re-hydration capacity was obtained.
Modification of composition by the addition

158 Ital. J. Food Sci., vol. 25 - 2013
of glucose and/or chokeberry juice concentrate to strawberry jellies preserved via lyophilization caused lower water activity values and increased water content. Also, a deterioration of the color coefficients was obtained for those jellies with an addition of glucose or an addition of glucose and chokeberry concentrate. Strengthening in the structure and deterioration of rehydration properties was noted for all the examined lyo-philized fruit jellies.
based on the results of this study and obser-vations performed while obtaining strawberry jellies preserved via lyophilization, it was demon-strated that the sample with 7% strawberry pow-der and 0.05% calcium lactate, enriched with an addition of 5.2% chokeberry juice concentrate is the product with the best quality features.
rEFErENcES
calvo c. and Salvador A. 1997. Measurement of the colour and transparency of gels: application to fruit gels. Food Hydrocolloids 11 (4): 443-447.
chan E.W.c., Lim Y.Y., Wong S.K., Lim K.K., tan S.P., Li-anto F.S. and Yong M.Y. 2009. Effect of different drying methods on the antioxidant properties of leaves and tea of ginger species. Food chem. 113: 166-172.
ciurzynsk A. and Lenart A. 2007. Wpływ rodzaju substancji osmotycznej na adsorpcje pary wodnej przez liofilizowane truskawki. In·zynieria rolnicza 5 (93): 53-62.
ciurzynsk A. and Lenart A. 2009a. colour changes of freeze-dried strawberries osmotically dehydrated before drying. ch. 24. In: “Food technology Operations new vistas”. W. Kopec and M. Korzeniowska (Ed.), p. 217-224. Publish-er University of Environmental and Life Sciences in Wro-claw, Wroclaw.
ciurzynsk A. and Lenart A. 2009b. the influence of temper-ature on rehydration and sorption properties of freeze-dried strawberries. croatian J. of Food Sci. and techn. 1 (1): 17-25.
ciurzynsk A. and Lenart A. 2010a. rehydration and sorption properties od osmotically pretreated freeze-dried straw-berries. J. of Food Eng. 97: 267-274.
ciurzynska A. and Lenart A. 2010b. Structural impact of
osmotically pretreated freeze-dried strawberries on their mechanical properties. Int. J. of Food Prop. 13 (05): 1134-1149.
ciurzynsk A. and Lenart A. 2010c. Wybrane własciwosci lio-filizowanych galaretek truskawkowych. Zeszyty Problemo-we Postepów Nauk rolniczych 553: 31-40.
ciurzynsk A., Lenart A. and Siemia tkowska M. 2011. Wpływ odwadniania osmotycznego na barwe i własciwosci me-chaniczne liofilizowanych truskawek. Acta Agroph. 17 (1): 17-32.
Dhansekharan K.M., Grald E.W. and Matur r. 2004. How flow modeling benefits the food industry. Food techn. 58 (3): 32-35.
El-beltagy A., Gamea G.r. and Amer Essa A.H. 2007. So-lar drying characteristics of strawberry. J. of Food Eng. 78: 456-464.
Haminiuk c.W.I., Sierakowski M.r., branco I.G., Maciel G.M. and Masson M.L. 2007. rheological study of ter-nary mixtures and pectic gels of red fruit pulps. Int. J. of Food Sci. and techn. 42: 629-639.
Hammami c. and rene F. 1997. Determination of freeze-dry-ing process variables for strawberries. J. of Food Eng. 32: 133-154.
Huang L.L., Zhang M., Yan W.Q., Mujumdar A.S. and Sun D.F. 2009. Effect of coating on post-drying of freze-dried strawberry pieces. J. of Food Eng. 92: 107-111.
Lee K.t., Farid M. and Nguang S.K. 2006. the mathemati-cal modelling of the rehydration characteristics of fruits. J. of Food Eng. 72: 16-23.
Liapis A.I. and bruttini r. 2006. “Handbook of Industrial Drying” 3th ed. Edited by Arun S. Mujumdar, crc Press.
Liu Y., Zhao Y. and Feng X. 2008. Exergy analysis for a freeze-drying process. App. thermal Eng. 2 (28): 675-690.
Marques L.G., Ferreira M.c. and Freire J.t. 2006. Freeze-drying of acerola (Malpighia glabra L.). chem. Eng. and Proc. 46 (5): 451-457.
Marques L.G., Silveira A.M. and Freire J.t. 2006. Freeze-drying characteristics of tropical fruits. Drying tech. 24 (4): 457-463.
Meda L. and ratti c. 2005. rehydration of freeze-dried strawberries at varying temperatures. J. of Food Proc. and Eng. 28: 233-246.
Novikova V.I., Vasil’ev L.L. and Malenko G.L. 2003. Analy-sis of the main regularities of obtaining frozen granules of products as applied to sublimation drying. J. of Eng. Physics and thermophysics 76 (1): 28-38.
Nussinovitch A. 1997. “Hydrocolloid Applications: Gum tech-nology in the Food and Other Industries” 1th Ed. black-ie Academic and Professional, London, United Kingdom.
Fig. 8 - changes in water content (a) and dry matter content (b) during rehydration of strawberry jellies in water in tempera-ture 20° and 80ºc, in dependence on addition glucose and/or chokeberry juice concentrate. Designations in table 1.

Ital. J. Food Sci., vol. 25 - 2013 159
Nussinovitch A. and Zvitov-Marabi r. 2008. Unique shape, surface and porosity of dried electrified alginate gels. Food Hydrocolloids 22 (3): 364-372.
Nussinovitch A., corradini M.G., Normand M.D. and Peleg M. 2000. Effect of sucrose on the mechanical and K-carra-geenan and gellan gels. J. of texture Studies 31: 205-223.
Nussinovitch A., corradini M.G., Normand M.D. and Peleg M. 2001. Effect of starch, sucrose and their combinations on the mechanical and acoustic properties of freeze-dried alginate gels. Food res. Int. 34: 871-878.
Pan Z., Shih c., McHugh t.H. and Hirschberg E. 2008. Study of banana dehydration using sequential infrared radiation heating and freeze-drying. LWt-Food Sci. and techn. 41: 1944-1951.
PN-A-88000:1993/A1 Wyroby cukiernicze – terminologia.
PN-A-88108:1998 Wyroby cukiernicze – Galaretki i mar-moladki.
ratti c. 2001. Hot air and freeze-drying of high-value foods: a review. J. of Food Eng. 49: 311-319.
rzaca M. and Witrowa-rajchert D. 2007. Suszenie ·zywnosci w niskiej temperaturze. Przemysł Spo·zywczy 61 (4): 30-35.
Sagar V.r. and Suresh Kumar P. 2010. recent advances in drying and dehydration of fruits and vegetables: a review. J. of Food Sci. and techn. 47 (1): 15-26.
Shishehgarha F., Makhlouf J. and ratti c. 2002. Freeze-dry-ing characteristics of strawberries. Drying techn. 20: 131-145.
Witrowa-rajchert D. and Lewicki P.P. 2006. rehydration properties of dried plant tissues. Int.J. of Food Sci. and techn. 41: 1040-1046.
Paper received April 26, 2012 Accepted September 26, 2012
PaPer
160 Ital. J. Food Sci., vol. 25 - 2013
- Keywords: ultrasound, extraction, maceration, phenolic compounds, lees, yeast -
ULTRASOUNDS APPLICATION IN WINEMAKING:GRAPE MACERATION AND YEAST LYSIS
P. FERRARETTO, V. CACCIOLA, I. FERRAN BATLLÓ and E. CELOTTI*Department of Food Science, University of Udine, Via Sondrio 2/A, 33100 Udine, Italy
*Corresponding author: Tel. +39 0432 558140, Fax +39 0432 558130,email: [email protected]
AbStrAct
the chemical and mechanical effects of ultrasound (US) are interesting in the food industry and this work attempts to study new applications on grapes as the raw material and then in the vinification process.
Phenolic compounds extracted from grapes by means of disruption of the cell wall due to pres-sure alternance and cavitation were studied. the tests carried out showed an improvement in the extraction of polyphenolic substances, with a reduction in the duration of classic maceration.
Also the lytic effect of the US on yeast cell structures, in order to accelerate the process of age-ing over lees was evaluated, with the liberation of different fractions in the wine.

Ital. J. Food Sci., vol. 25 - 2013 161
INtrODUctION
the Ultrasound technology is based on me-chanical waves at a frequency higher than the upper limit of human hearing (> 16kHz). being sound waves, ultrasound is transmitted through any substance, solid, liquid or gas, which pos-sesses elastic properties. these waves travel ei-ther through the bulk of a material or on its sur-face at a speed which is characteristic of the na-ture of the wave and the material through which it is propagating (POVEY et al., 1988; MASON, 1998; KNOrr et al., 2004). In the food indus-try, ultrasound can be divided into two frequen-cy ranges: High frequency ultrasound (100 kHz - 1 MHz) and Power ultrasound (16-100 kHz).
High frequency ultrasound is commonly ap-plied as an analytical technique to provide in-formation on the physicochemical properties of food such as ripeness, sugar content, acidity, etc (DEMIrDÖVEN and bAYSAL, 2009). the appli-cation of Power ultrasound is so large that it is used to alter either physical or chemical proper-ties of food instead (MccLEMENtS, 1995). this Power ultrasound has been used for many years to generate emulsions, disrupt cells and disperse aggregated materials; more recently some appli-cations have been identified with greater poten-tial for future development, e.g. modification and control of crystallization processes, degassing of liquid foods, enzymes inactivation, enhanced drying and filtration and the induction of oxida-tion reactions (KNOrr et al., 2004; MccLEMENtS, 1995; rObErtS, 1993, ZHENG and SUN, 2006).
the fundamental effect of ultrasound on a continuum fluid is to impose acoustic pressure (P
a) in addition to the hydrostatic pressure al-
ready acting on the medium. the combination of factors such as heat, pressure and turbulence, is used to accelerate mass transfer in chemical reactions, create new reaction pathways, break down and dislodge particles or even generate dif-ferent products from those obtained under con-ventional conditions (SUSLIcK, 1988).
the use of ultrasonics in industrial process-es requires two main factors: a liquid medium (even if the liquid element forms only 5% of the overall medium) and a source of high-energy vi-brations (the ultrasound).
Over the last few years, ultrasonic devices suitable for characterizing foods have been de-veloped.
the interaction of acoustic energy with a food is mainly substantiated through a liquid medium because the cavitation and cavitation-induced physical and chemical actions play an import-ant role in the food quality alterations in an ul-trasound-processed food.
At a solid and liquid interface, the water jet formed by an imploding transient cavitation is also a factor that may contribute to some chang-es in the overall properties of a food product. It is noteworthy that all the chemical and physical
effects of ultrasounds are microscopic. However, the interplay of these cavitation-induced chem-ical and physical activities with a food, is mani-fested through macroscopic changes that can be perceived by consumers and may be expressed through terms such as texture, color and flavor (FENG and LEE, 2011).
the properties of power ultrasound waves have aroused interest in the food industry, since the promotion of physical and chemical reactions can lead to a strategic advantage in processing. Since the ‘90s, ultrasound treatments have be-come a widely applicable alternative in the pro-cessing industry (bAtES and PAtISt, 2010); ul-trasound is applied in food technology for its me-chanical and/or chemical effects on homogeni-zation, mixing, extraction, filtration, crystalliza-tion, dehydration, fermentation, degassing, de-foaming, particle size reduction, temporary or permanent changes of viscosity, modulation of growth of living cells, cells disruption and aggre-gate materials dispersion, inactivation of microor-ganisms and enzymes, sterilization of equipment (MASON et al., 1996; cHEMAt et al., 2010; cHAN-DrAPALA et al., 2012). For these reasons, the ef-fects of this technology are interesting in the food industry, but there has not been much research done on fermented beverages, especially regard-ing the winemaking process. Some research con-cerning the wine sector has been conducted, but it was not designed for an application in the win-emaking process, considering collateral aspects, such as the antioxidant effects and barrels san-itation (GHAFOOr and cHOI, 2009; PALAcIOS et al., 2012; MOrELLI and PrADO 2012; LIEU and LE, 2010; GONZÁLES et al., 2006; tIWArI et al., 2010). A possible application of ultrasound in the wine industry could be an important technologi-cal innovation that fastens some thermodynam-ically possible, but kinetically slow reactions re-quired in the winemaking process.
this work attempts to study new applications on grapes as the raw material and in the vini-fication process. Firstly, the extraction of phe-nolic compounds from grapes obtained by the disruption of the cell wall due to pressure al-ternance and cavitation was studied. Studying the release of these compounds was the start-ing point of this work. the second part regard-ing application on lees, had the objective of eval-uating the lytic effect of US on yeast cell struc-tures, with liberation of different fractions into the medium in order to accelerate the process of ageing over lees.
MAtErIALS AND MEtHODS
Ultrasound (US) treatment
An ultrasonic processor (SONOPLUS HD 2200, bandelin electronic, berlin, Germany) with 13 mm sonotrode probe made of titanium was

162 Ital. J. Food Sci., vol. 25 - 2013
used for sonication. Samples were processed in a continuous sonication at a constant frequen-cy of 20 kHz. the energy input was controlled by setting the amplitude of the sonicator probe; the total nominal output was 200 W. the ultra-sound probe was submerged to a depth of 50 mm in the sample.
the amplitude levels and processing times were varied on the basis of the experiments, and based on tests carried out prior to this study. the final treatment temperature was measured for all samples.
Phenolics extraction from the grape berry skin
Samples
For the trial regarding the extraction from grapes, a wide set (No. 40) of different varieties of red grapes sampled at technological maturi-ty was evaluated for the tests conducted in lab-oratory. they were sampled directly upon deliv-ery in the cellar, in order to have a representa-tive and real sampling in relation to the ripen-ing degree of the grapes delivered to the cellar. A representative sample (250 g), stalk removed and manually crushed, was put in a 250 mL bea-ker and subjected to the treatment. to obtain a wide statistical basis, it was decided to increase the number of varieties in a single test to assess the extent of the extraction. the polyphenols ex-tracted were evaluated in the liquid obtained by centrifugation from the treated grapes.
treatment conditions
the conditions promising the best results in terms of extraction following a preliminary test (treatment time from 1 to 5 minutes at three different levels of amplitude – 30, 60 and 90%) were chosen for the laboratory tests. the treat-ment conditions selected to study phenolics ex-traction were 3 and 5 minutes at the amplitude of 90%. At 5 minutes of treatment time, the max-imum sample temperature reached was 47.6°c for the amplitude level of 90%.
Micro-vinification trials
Samples
In order to perform maceration and fermenta-tion trials, it was decided to use some crushed samples (800 g) of the same grapevine variety (Merlot), but with a different polyphenolic con-tent, replicated in three series (series 1 and 3 at the same level and series 2 with a higher antho-cyanins content) in the cellar. they were previ-ously subjected to ultrasonic treatment (every sample was divided in 4 parts and treated sep-arately in a 250 mL beaker, in order to allow the use of the probe; after the treatment the 4 parts
were all mixed together), and then micro-vini-fied and racked sequentially.
A reference sample was prepared for all the tests in order to have the sample that simulat-ed the traditional maceration without the US treatment compared to the one that was treated.
All samples, including the reference, were placed in open containers (2 L) and placed in equal conditions of maceration-fermentation in order to make comparable the phenolics ex-traction.
the maceration conditions provided were: a constant temperature of 25°c, 3 manual punch-ing down of the cap a day, 60 ppm SO2, inocu-lum of dry yeast for oenological use Sacch. Cere-visiae on the first day and at the end of fermen-tation the separation of the solid parts was car-ried out with a manual press.
the effect on wine color was studied on mi-cro-vinification trials of the samples performed directly in a cellar due to the easy access to dif-ferent grape samples having reached the tech-nological maturity. the maceration time for the ultrasound (US) treated samples was 2, 3 and 4 days, while for the control sample (untreated) it was 5 days.
Ultrasound treatment conditions
A treatment of 5 minutes at the amplitude lev-el of 80% was carried out to assess ultrasound effects on the maceration kinetics. At 5 minutes of treatment time, the maximum sample tem-perature reached was 46.9°c for the amplitude level of 80%.
Analytical methods
Analysis of total Phenolics Index - Abs 280 nm (ribéreau-Gayon 1970), colour intensity (Glo-ries 1984), hue (Sudraud 1958) and anthocya-nins content (ribéreau-Gayon and Stonestreet 1965) (using 2% chloridric acid, 0.1% acidified Ethanol and 20% Potassium Metabisulphite so-lutions as reagents) were conducted on grape samples right after the crushing (reference val-ue) and right after the treatment (test results) once centrifuged at 3,000 rpm for 10 minutes.
to be able to compare the increase in com-pounds extracted versus the classical vinifica-tion, a reference sample followed extraction with a wine-like solution (5 g/L tartaric Acid (car-lo Erba, Milano, Italy), 12% (v/v) Ethanol (carlo Erba, Milano, Italy), pH was adjusted to 3.2 with NaOH) or Methanol (carlo Erba, Milano, Italy) (1% acidified with chloridric Acid) for 4 hours, then centrifuged and analyzed.
Anthocyanins content (rIbÉrEAU-GAYON and StONEStrEEt, 1965) and total polyphenols in-dex - Abs 280 nm (rIbÉrEAU-GAYON, 1970) of micro-vinified and reference samples were an-alyzed daily. In addition to these analyses, tan-nins content (bate-Smith, 1954) (using Acid bu-

Ital. J. Food Sci., vol. 25 - 2013 163
tanol) and polymerized pigments index (Glories, 1978) (using buffer alcoholic solution, water and 20% Potassium Metabisulphite solution) were analyzed after racking (after 2, 3 and 4 days for the treated sample and 5 days for the control).
Lees treatment
Ultrasound treatment
the same treatment was used for the ex-traction tests, the only difference is that in this case the probe was submerged to a depth of 30 mm in the 250 mL beaker containing the sample.
the optimization of the best conditions of lees extraction (soluble colloids and proteins ex-traction, particle size, surface electrical charge and Peak Height 16.5 kDa (rI)) was carried out using an rMS (response Surface Methodology) design. the experimental design employed was a central composite design for two independent variables each at five levels using Modde sta-tistical software (Modde version 8.0.2). the ex-perimental order was randomized. the levels of independent variables, namely amplitude lev-el and sonication time, were selected based on the values obtained in preliminary experiments. the amplitude level was varied between 30 and 90% and the sonication time between 1 and 5 min. the optimized design described in elev-en experiments (8 + 3 replicates in the center point) the three-dimensional curvature of the response surface.
the validity of the model was determined by comparing the experimental and predicted values.
An analysis of variance (ANOVA) with 95% confidence level was then carried out for each response variable in order to test the model sig-nificance and suitability.
treatment conditions
the conditions provided by the experimental design were 1, 3 and 5 min at 30, 60 and 90% of amplitude, with 3 replicates of the test at 60% for 3 minutes.
Samples
Samples to evaluate the lytic effect caused by ultrasound on yeast cell structures, tests were carried out on lees samples (250 mL) collected after the second racking, three months after vi-nification, from a chardonnay wine fermented with commercial active dry yeast Sacch. Cer. the samples were added to a wine-like solution in order to obtain liquid lees with 50% of humidity.
Analytical methods
After centrifugation (3,000 rpm for 15 min) and microfiltration (0.8 and 0.45 µm), both the reference and the tests were analyzed in terms of
soluble colloids (using chloridric Acid - 1:1 and 96% Ethanol) (Usseglio-tomasset and castino, 1975) and soluble proteins (Lowry method: us-ing 2% Na2cO3 in 0.1 M NaOH, 1% cuSO4×5H2O in distilled water, 2% Sodium tartrate in dis-tilled water and Folin-ciocalteau reagent) (re-genstein and regenstein, 1984), before and af-ter adding PVPP (Sigma-Aldrich LLc, St. Louis, MO, USA) to the sample. Other specific analy-ses were conducted: the particle size distribu-tion of the supernatant directly and filtered at 0.8 µm was determined by laser diffraction us-ing a Submicron Particle Sizer – NIcOMP (San-ta barbara, USA), with 1.33 as the refractive in-dex of the colloidal dispersed phase (celotti et al., 2003); and the surface electrical charge with the Particle charge Detector – MÜtEK PcD-02 (Germany) (FErrArINI et al., 1996).
Molecular mass determination
to evaluate the modification of the composi-tion of the colloidal fraction, molecular mass de-termination was carried out by gel permeation high pressure liquid chromatography (HPLc) using a tSK-GEL G2000SWXL (tosoh biosci-ence LLc, PA, USA) column and pre-column, al-cohol tartaric buffer as eluent with pH 3.2 and flow rate 0.6 mL/min. two detectors were used: UV lamp (JAScO 875) to measure the phenol-ic and protein fraction; refractive index (VArI-AN 350 rI) for the colloidal carbohydrate frac-tion. the samples were filtered on nylon (What-man – Little chalfont, UK) at 0.45 µm and im-mediately injected.
calibration curves were constructed using standard proteins of well defined molecular weight in the range of 14 to 70 kDa for globular proteins (Lisozyme Wt 14 kDa, β-Lactoglobulin 36 kDa, Ovoalbumin 44 kDa e bovine Serum Albumin (bSA) 67kDa, Sigma-Aldrich LLc, St.Louis, MO, USA).
the values were estimated on the basis of the corresponding elution volumes.
rESULtS AND DIScUSSION
Phenolic compounds extraction (from grape)
Ultrasonic treatment, with high-frequency pressure waves and the cavitation phenome-non in a solid-liquid medium, such as pressed crushed grapes, was responsible for accelerat-ing the release and the dissolution of phenolic matrix contained in epidermal tissues.
the total polyphenols index, the anthocy-anins and the colour intensity, related to the control sample extracted in a wine-like solution and in acidified methanol, proportionally in-creased (50% or more) with the time and ampli-tude of treatment for all grapevine varieties in-cluded in this work (Figs. 1 and 2). Under the

164 Ital. J. Food Sci., vol. 25 - 2013
same treatment conditions, the total polyphe-nols index and the anthocyanins proved differ-ent depending probably on the characteristics (cell wall maturity, pectin content) of the differ-ent grapes varieties.
the tests carried out to evaluate the immedi-ate effect on the color showed an important in-teraction between the cavitation phenomena and skin cell wall, leading to a higher color intensity
Fig. 1 - Percentage Increase of Abs 280 nm of some red grapes varieties treated with US (3 and 5 minutes at 90% of ampli-tude) compared to the control extracted in model wine and in acidified methanol, for the phenolics extraction from the grape berry skin trials.
Fig. 2 - Percentage Increase of Anthocyanins of some red grapes varieties treated with US (3 and 5 minutes at 90% of am-plitude) compared to the control extracted in model wine and in acidified methanol, for the phenolics extraction from the grape berry skin trials.
table 1 - change in colour Intensity (cI), hue and anthocy-anins content of the sample treated with ultrasound at dif-ferent amplitudes (20, 40, 60 and 80%) for the same time (2’) for the phenolics extraction from the grape berry skin trials.
Samples C.I. Hue Anthocyanins (mg/kg)
Control (untreated) 2.77 1.52 23 2’ 20% 6.13 1.59 42 2’ 40% 7.50 1.58 60 2’ 60% 9.01 1.49 69 2’ 80% 9.44 1.52 81
and anthocyanins content. the compound ex-traction increases directly with the amplitude level (r2=0.915) (table 1).
Micro-vinification trials
the micro-vinification of samples treated with ultrasound and racked after 2, 3 and 4 days re-spectively, compared to the control sample with classic maceration and racked after 5 days, pro-vided interesting results (Fig. 3).
the crushed treated vinified samples had a higher polyphenol content in comparison with the reference at the beginning of maceration. the same was found at the end of the process and it influenced the total polyphenols index more than the anthocyanins content.
the three different series gave different re-sults, especially series 2 with a higher initial phenolic content. Generally, it is possible to af-firm that the variability of the US treatment ef-fect depends on the quality and the polyphenols content of the raw material. Focusing on process
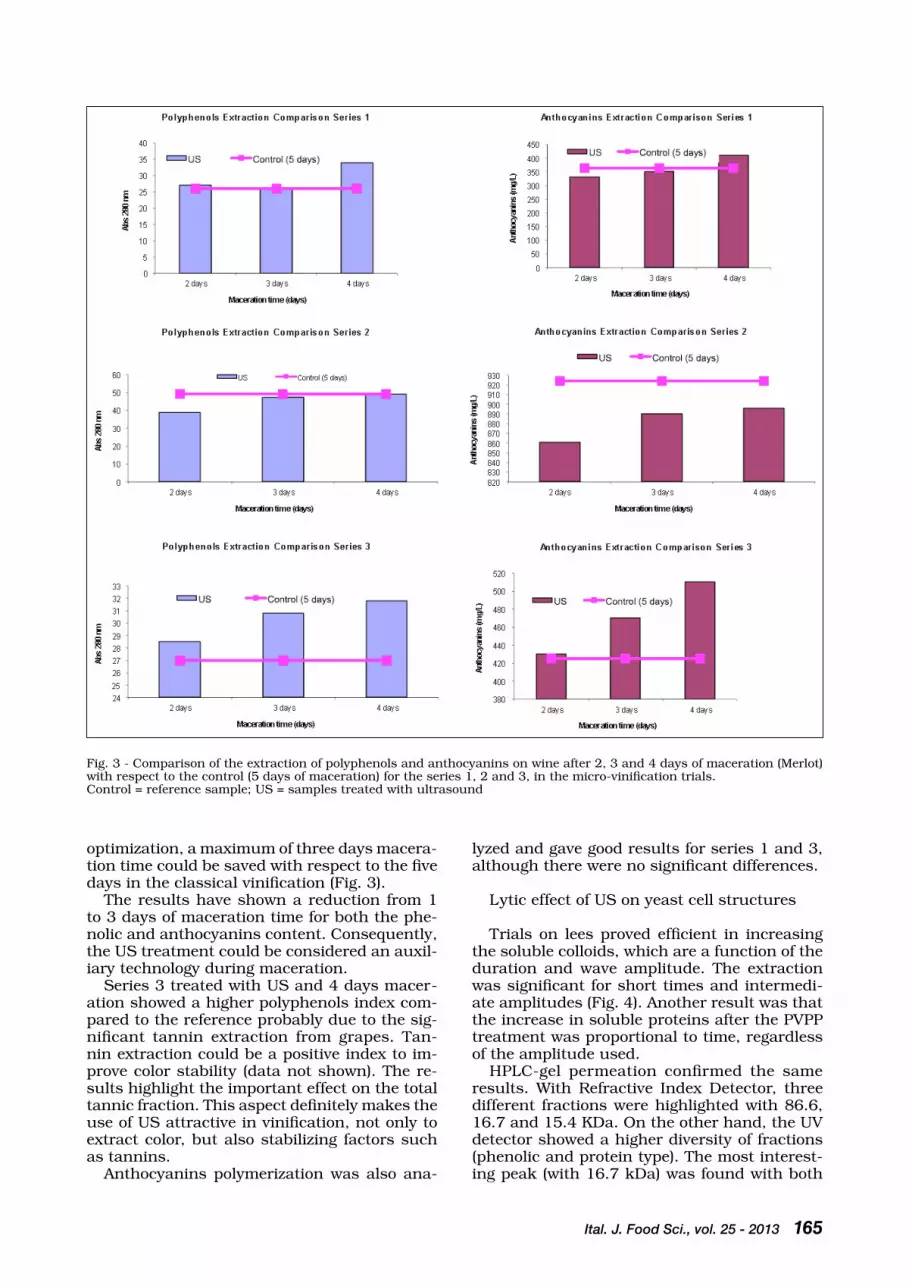
Ital. J. Food Sci., vol. 25 - 2013 165
Fig. 3 - comparison of the extraction of polyphenols and anthocyanins on wine after 2, 3 and 4 days of maceration (Merlot) with respect to the control (5 days of maceration) for the series 1, 2 and 3, in the micro-vinification trials.control = reference sample; US = samples treated with ultrasound
optimization, a maximum of three days macera-tion time could be saved with respect to the five days in the classical vinification (Fig. 3).
the results have shown a reduction from 1 to 3 days of maceration time for both the phe-nolic and anthocyanins content. consequently, the US treatment could be considered an auxil-iary technology during maceration.
Series 3 treated with US and 4 days macer-ation showed a higher polyphenols index com-pared to the reference probably due to the sig-nificant tannin extraction from grapes. tan-nin extraction could be a positive index to im-prove color stability (data not shown). the re-sults highlight the important effect on the total tannic fraction. this aspect definitely makes the use of US attractive in vinification, not only to extract color, but also stabilizing factors such as tannins.
Anthocyanins polymerization was also ana-
lyzed and gave good results for series 1 and 3, although there were no significant differences.
Lytic effect of US on yeast cell structures
trials on lees proved efficient in increasing the soluble colloids, which are a function of the duration and wave amplitude. the extraction was significant for short times and intermedi-ate amplitudes (Fig. 4). Another result was that the increase in soluble proteins after the PVPP treatment was proportional to time, regardless of the amplitude used.
HPLc-gel permeation confirmed the same results. With refractive Index Detector, three different fractions were highlighted with 86.6, 16.7 and 15.4 KDa. On the other hand, the UV detector showed a higher diversity of fractions (phenolic and protein type). the most interest-ing peak (with 16.7 kDa) was found with both
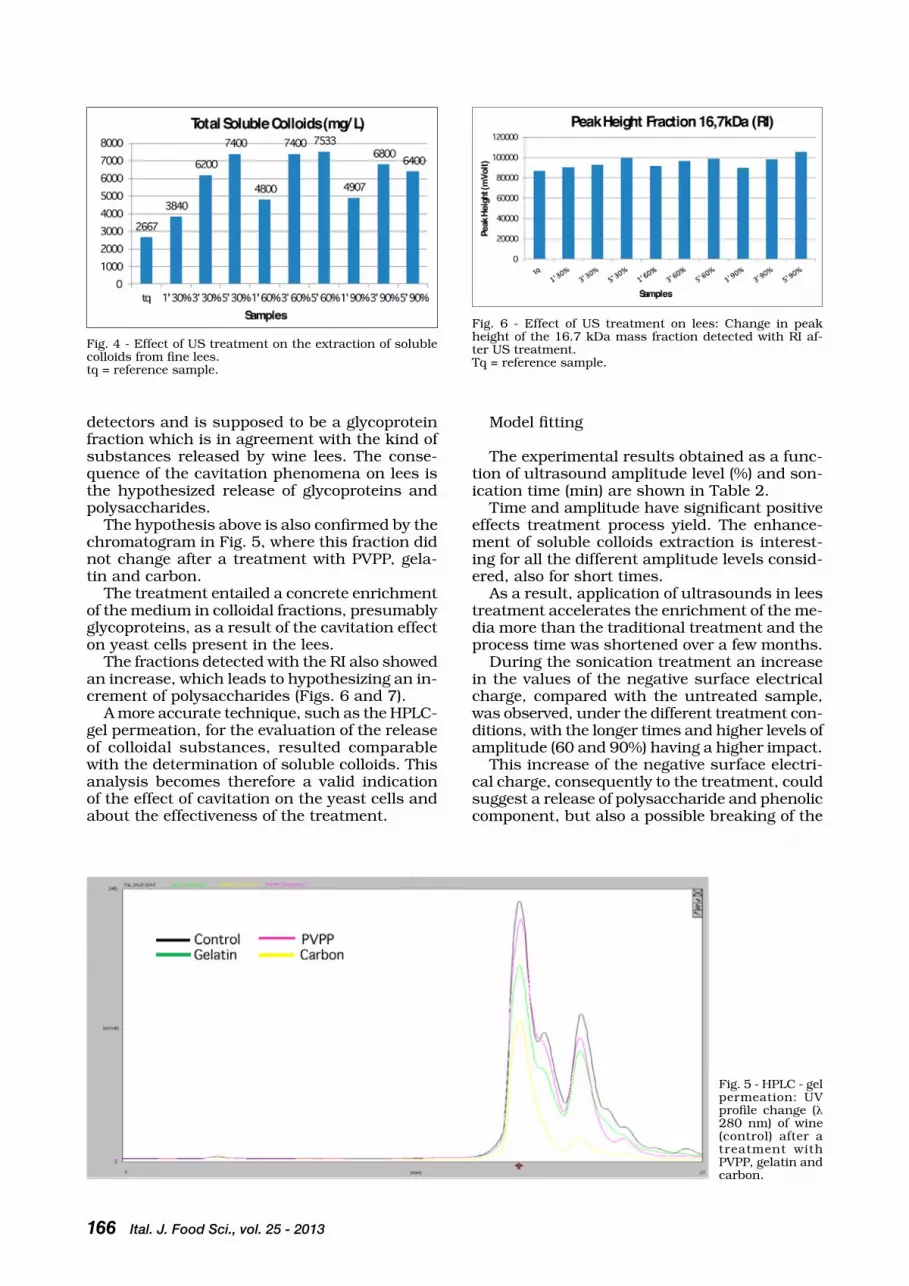
166 Ital. J. Food Sci., vol. 25 - 2013
Fig. 4 - Effect of US treatment on the extraction of soluble colloids from fine lees.tq = reference sample.
Fig. 5 - HPLc - gel permeation: UV profile change (λ 280 nm) of wine (control) after a treatment with PVPP, gelatin and carbon.
detectors and is supposed to be a glycoprotein fraction which is in agreement with the kind of substances released by wine lees. the conse-quence of the cavitation phenomena on lees is the hypothesized release of glycoproteins and polysaccharides.
the hypothesis above is also confirmed by the chromatogram in Fig. 5, where this fraction did not change after a treatment with PVPP, gela-tin and carbon.
the treatment entailed a concrete enrichment of the medium in colloidal fractions, presumably glycoproteins, as a result of the cavitation effect on yeast cells present in the lees.
the fractions detected with the rI also showed an increase, which leads to hypothesizing an in-crement of polysaccharides (Figs. 6 and 7).
A more accurate technique, such as the HPLc-gel permeation, for the evaluation of the release of colloidal substances, resulted comparable with the determination of soluble colloids. this analysis becomes therefore a valid indication of the effect of cavitation on the yeast cells and about the effectiveness of the treatment.
Model fitting
the experimental results obtained as a func-tion of ultrasound amplitude level (%) and son-ication time (min) are shown in table 2.
time and amplitude have significant positive effects treatment process yield. the enhance-ment of soluble colloids extraction is interest-ing for all the different amplitude levels consid-ered, also for short times.
As a result, application of ultrasounds in lees treatment accelerates the enrichment of the me-dia more than the traditional treatment and the process time was shortened over a few months.
During the sonication treatment an increase in the values of the negative surface electrical charge, compared with the untreated sample, was observed, under the different treatment con-ditions, with the longer times and higher levels of amplitude (60 and 90%) having a higher impact.
this increase of the negative surface electri-cal charge, consequently to the treatment, could suggest a release of polysaccharide and phenolic component, but also a possible breaking of the
Fig. 6 - Effect of US treatment on lees: change in peak height of the 16.7 kDa mass fraction detected with rI af-ter US treatment.tq = reference sample.

Ital. J. Food Sci., vol. 25 - 2013 167
Fig. 7 - Effect of US treatment on lees: change in peak height of the 16.7 kDa mass fraction detected with UV af-ter US treatment.tq = reference sample.
table 2 - Experimental design matrix and responses for the lees trial.
Exp No. Run Temperature Amplitude Time Total Colloids Proteins RI Peak Height (-) Surface Size Ø order (°C) (%) (min) (mg/L) (mg/L BSA) (16.5 kDa) electrical charge (mq/L) (nm)
1 11 23.7 30 1 3,840 12,202 92,464 4.39 865 2 7 23.2 90 1 4,907 11,101 94,748 4.10 799 3 5 33.1 30 5 7,400 15,400 98,788 5.69 367 4 1 42.4 90 5 6,400 14,623 112,314 6.02 605 5 2 24.2 30 3 6,200 11,968 96,741 4.72 613 6 8 39.5 90 3 6,800 12,494 98,658 5.80 513 7 9 25.0 60 1 4,800 11,706 94,291 4.24 798 8 3 38.6 60 5 7,533 12,936 103,678 6.18 546 9 6 33.1 60 3 7,440 13,097 97,809 5.65 395 10 10 32.7 60 3 7,280 11,864 100,493 5.74 496 11 4 32.0 60 3 7,480 11,927 99,691 5.70 332Control 2,667 10,475 88,657 0.039 1,140(untreated lees)
table 3 - Statistical parameters related to the experimental design for the lees trial.
Coefficient Total Colloids Proteins RI Peak Height (-) Surface Size Ø (mg/L) (mg/L BSA) (16.5 kDa) electrical charge (mq/L) (nm)
F 336.467 4.33459 11.7391 64.3699 10.9615P 0.000 0.090 0.017 0.001 0.019R2 0.997629 0.845159 0.938178 0.987742 0.942299R2 Adj. 0.994664 0.65161 0.860901 0.972418 0.870172Q2 0.865605 0.331127 0.679921 0.849586 0.599272Model Validity 0.855729 0.758821 0.615231 0.295293 0.917044Reproducibility 0.994003 0.734097 0.940171 0.996695 0.813579
protein polypeptide chains, with a release and an increase in their negative functional groups.
regarding the particle size, the values confirm that the ultrasonic treatment causes a reduc-tion of the particle diameter, as reported in MA-SON et al. (1996) and PAtISt and bAtES (2008) with a minimal impact at the short times, in-dependently from the percentage of amplitude.
the statistical parameters of the response surface model are shown in table 3. the model
presented showed high correlation coefficients for all the parameters considered, except for the protein content. this model demonstrated to be an effective technique for investigating extraction as a function of amplitude level and sonication time for lees. the coefficients of determination for predicted parameters showed good correla-tion with the experimental data at the 95% confi-dence level. the work demonstrates that sonica-tion significantly influences the yield extraction.
cONcLUSIONS
the tests carried out on different grape variet-ies showed how a few minutes of treatment at dif-ferent amplitude levels can achieve an improve-ment in the extraction of polyphenolic substanc-es, and in terms of time, a progressive reduction of up to 30% of the classic maceration duration.
this represents a possibility to optimize fer-mentation technology and, therefore, a better management of red grape vinification. Further-more, application of ultrasound can be consid-ered as a continuous pre-treatment of crushed red grapes before loading the vinification tank, in view of the very short treatment times.
the treatment of fermentation lees due to the yeast cell disorganization and the easier particu-

168 Ital. J. Food Sci., vol. 25 - 2013
late cell leakage promotes the lysis of yeast with a rapid release of colloids, polysaccharides and mannoproteins, providing also a possible reduc-tion in wine ageing on lees.
the results obtained confirm the extractive and lytic effects of the ultrasonic treatment on food matrices and could be applied on a techno-logical level to optimize some technological pro-cesses in the wine industry.
AcKNOWLEDGMENtS
this work was realized also with fundings of the “Gestione Integrata e Sostenibile Vite e Vino” (GISVI) project on inno-vation, regione FVG, Lr 26/2005, Italy.the authors would like to thank Dr Pier rolle, cantina So-ciale di casarsa and Vivai cooperativi rauscedo.
rEFErENcES
bate-Smith E-c 1954. Leucoanthocyanins. I. Detection and identification of anthocyanin formed from leucoanthocy-anins in plant tissues. biochem. J. 11:1153-1156.
bates D. and Patist A. 2010. Industrial applications of high power ultrasonics in the food, beverage and wine indus-try. In: “case studies in novel food processing technolo-gies: innovation in processing, packaging and predictive modeling” Doona c.J., Kustin K., Feeherry F.E. (Ed.), p. 119-138.
celotti E., Ferrarini r., battistutta F. and Zironi r. Impor-tance de la taille et de la charge électrique superficielle des fractions colloïdales des vins rouges. Proceedings of the VII International Oenology Symposium, 2003 June 19-21; Arcachon. p 525-527.
Demirdöven A. and baysal t. 2009. the use of ultrasound and combined technologies in food preservation. Food rev. Int. 25: 1-11.
Ghafoor K. and choi Y.H. 2009. Optimization of ultrasound assisted extraction of phenolic compounds and antiox-idants from grape peel through response surface meth-odology. J. Korean Soc. App. bi. chem. 52 (3): 295-300.
Glories Y. 1978. recherches sur la matière colorante des vins rouges. thèse de Doctorat, Université de bordeaux II.
Glories Y. 1984. La couleur des vins rouges, 1re partie. Les équilibres des anthocyanes et des tanins. conn. Vigne Vin. 18: 195-217.
González-M G., Usaquén-c X., Martínez-r.M. and Aya-baquero H. 2006. Ultrasound-assisted extraction of polyphenols from red-grape (Vitis Vinifera) residues. IUFoSt World congress 13th World congress of Food Science & technology iufost (2006) DOI: 10.1051/IU-FoSt:20060638.
Feng H. and Lee H. 2011. Effect of Power Ultrasound on Food
Quality. In: “Ultrasound technologies for Food and bio-processing”. Springer (Ed.) p 559-582.
Ferrarini r., celotti E. and Zironi r. 1996. Importance des charges électriques superficielles des adjuvants oenolo-giques, des particules et des colloides presents dans les mouts et les vins. rev. Fr. Oe. 13: 5-10.
Knorr D., Zenker M., Heinz V. and Lee DU. 2004. Appli-cations and potential of ultrasonics in food processing. trends Food Sci. technol. 15: 261-266.
Lieu le N. and Le V.V. 2010. Application of ultrasound in grape mash treatment in juice processing. Ultrason. So-nochem. 17(1):273-9. Epub 2009 May 13.
Mason t.J. 1998. Power ultrasound in food processing-the way forward. In: “Ultrasound in food processing”. blackie Academic and Professional, London. P. 105-126.
Mason t.J., Paniwnyk L. and Lorimer J.P. 1996. the uses of ultrasound in food technology. Ultrason. Sonochem. 3: 253-260.
Mcclements D.J. 1995. Advances in the application of ul-trasound in food analysis and processing. trends Food Sci. technol. 6: 293-299.
Morelli L.L. and Prado M.A. 2012. Extraction optimization for antioxidant phenolic compounds in red grape jam using ultrasound with a response surface methodology. Ultrason. Sonochem. 19(6):1144-9. Epub 2012 Mar 29.
Palacios A., borinaga I. and carrillo D. 2012. compara-tive study on wine barrel disinfection systems and their use as alternatives to sulfur treatment. Enologos. 14 (77): 46-54.
Povey M.J.W. and Mcclements D.J. 1998. Ultrasonics in food engineering. Part I: introduction and experimental methods. J. Food Eng. 8: 217-245.
ribéreau-Gayon P. 1970. Les dosage des composés phé-noliques totaux dans les vins rouges. chim. Anal. 52: 627-631.
ribéreau-Gayon P. and Stonestreet E. 1965. Le dosage des anthocyanes dans le vin rouge. bull. Soc. chim. 9: 2649-2652.
regenstein J.M. and regenstein c.E. 1984. Food protein chemistry. b.S. Schweigert and J. Hawthorn (Eds.). Ac-ademic Press, New York, Usa.
roberts r.t. 1993. High intensity ultrasonics in food pro-cessing. chem. Ind. 15: 119-121.
Sudraud P. 1958. Intérpretation des courbes d’absorption des vins rouges. Ann. technol. Agric. 7: 203-208.
Suslick K.S. 1998. Homogeneus sonochemistry. In: “Ultra-sound: Its chemical, Physical, and biological Effects”. VcH Publischers, New York, Usa. P. 123-163.
tiwari b.K., Patras A., brunton N., cullen P.J. and O’Donnell c.P. 2010. Effect of ultrasound processing on anthocy-anins and color of red grape juice Ultrason. Sonochem. 17 (3): 598-604.
Usseglio-tomasset L. and castino M. 1975. I colloidi solu-bili di natura glucidica dei mosti e dei vini. Parte I. riv. Vitic. Enol. 28: 374-391.
Zheng L. and Sun D.-W. 2006. Innovative applications of power ultrasound during food freezing process. A review. trends Food Sci. technol. 17: 16-23.
Paper received May 24, 2012 Accepted September 26, 2012

PaPer
Ital. J. Food Sci., vol. 25 - 2013 169
- Keywords: antioxidant, DPPH, hydrolysis, ovalbumin, peptide -
ANTIOXIDATIVE PEPTIDESDERIVED FROM DENATURATED EGG
WHITE PROTEIN
A. ZAMBROWICZ, M. POKORA, E. ECKERT, J. CHRZANOWSKA, M. SZOŁTYSIK, A. DABROWSKA and T. TRZISZKA
Wroclaw University of Environmental and Life Sciences, Department of Animal Products Technology and Quality Management, Chelmonskiego 37/41, 51-630 Wroclaw, Poland
*Corresponding author: Tel. +48 71 320 7773,email: [email protected]
AbStrAct
the antioxidant activity of denaturated egg white protein preparation (EP) was evaluated by enzymatic hydrolysis. the EP treated with digestive and microbial proteases resulted in different degradation products confirmed by degree of hydrolysis (DH) and free amino groups concentra-tion (FAG) measurement. the highest free radical scavenging activity reached 0.21 µmol troloxeq/mg and was exhibited by tryptic hydrolysate. EP hydrolysates showed significant, enzyme-depend-ent ferric reducing activity. the highest chelating activity was observed for protein preparations hydrolyzed with neutrase (397.0 µg Fe2+/mg). Antioxidative peptide fractions were isolated from tryptic hydrolysate by reserved phase high pressure liquid chromatography (rP-HPLc). Among the obtained fractions, we identified: ISQAVHAHAEINEAGr, SVL, QL and AP, KVr antioxidative peptides corresponded to ovalbumin and ovotransferrin fragments, respectively.
170 Ital. J. Food Sci., vol. 25 - 2013
INtrODUctION
biologically active proteins from eggs, like lysozyme and cystatin which can be used as nu-traceuticals in the production of functional food or therapeutic agents, are very attractive sub-stances for both the food and pharmaceutical in-dustries (MINE and KOVAcS-NOLAN, 2006; trZISZ-KA et al., 2004). In the process of their isolation according to SOKOŁOWSKA et al. (2007), ethanol denaturated egg white protein preparation of low functional properties is produced as by-product.
One of the best methods of modifying such protein is enzymatic hydrolysis (cHEN et al., 2011; SAtYA et al., 2011). this process leads to the improvement of functional and biologi-cal properties of the protein due to release from its sequence a number of peptides which would have a beneficial physiological effect in the or-ganism through interaction with the circula-tory, nervous, digestive and immune systems (IWANIAK and MINKIEWIcZ, 2007; MIGUEL et al., 2006). there are many reports about the bio-logical activity of hydrolysates and peptides ob-tained from ovalbumin, ovotransferrin, ovomu-cin or lysozyme digestion (tSUGE et al., 1997; MINE and KOVAcS-NOLAN, 2006; MIGUEL et al., 2006). Special attention has been given to pep-tides with antioxidant activity as a new source of natural antioxidants that inhibit oxidation both in food and in the human body (GALLEGOS-tIN-tOrÉ et al., 2010; SAKANAKA et al., 2004 and 2006). Antioxidants occurring in the diet play an important role in combating oxidative stress in the body (SUEtSUNA et al., 2000). Due to the participation in lipid peroxidation, protein and DNA modifications, free radicals may damage cells and tissues (SUEtSUNA et al., 2000). It has been shown that they are also involved in the oc-currence of many chronic diseases such as car-diovascular diseases, diabetes, neurological dis-orders and even Alzheimer’s disease.
Lipid oxidation is also a significant problem for the food industry, as it leads to the development of undesirable off-flavors, dark colors and poten-tially toxic reaction products (GrASZKIEWIcZ et al., 2007, SAKANAKA et al., 2004; JE et al., 2007).
therefore, the benefits of antioxidants, which inhibit lipid oxidation in food storage is of great interest in research (SAKANAKA et al., 2004 and 2006).
Non-hydrolyzed proteins, due to their compact design, have minimal antioxidant activity. It is generally observed that the antioxidant potency of proteins drastically increases upon hydroly-sis (KONG and XIONG, 2006). the mechanisms of antioxidative action of proteins, peptides and individual amino acids include radical scaveng-ing or product reduction, metal chelating, and enzyme inhibition (SArMADI and ISMAIL, 2010).
HIrOSE and MIYASHItA (1999) suggested that protein hydrolysates and biopeptides not only stand as an electron donor to free radicals, but
can also create droplets of lipid membrane pro-tecting against oxidation processes.
the egg white protein preparation, a by-prod-uct of lysozyme and cystatin extraction from egg white with ethanol, was characterized by a high degree of denaturation and hence does not have technologically attractive functional properties (GrASZKIEWIcZ et al., 2010).
the aim of the present research was to obtain valuable product exhibiting antioxidant activi-ty from denaturated egg white protein prepara-tion degraded with proteinases of different spec-ificity. Furthermore, the study aimed at the iso-lation and characterization of antioxidant pep-tides from obtained hydrolysates.
MAtErIAL AND MEtHODS
Materials
the egg white protein preparation (EP), a by-product of lysozyme and cystatin isolation, was obtained at our laboratory (SOKOŁOWSKA et al., 2007) and used as a substrate. Proteinases from Aspergillus melleus and Bacillus amylolique-faciens (neutrase), bovine trypsin tPcK-treat-ed, bovine chymotrypsin type II, porcine pepsin type A, 5% picrylsulfonic acid, trinitro-benzene sulfonic acid (tNbS), bovine serum albumin, 1, 1-diphenyl-2-picrylhydrazyl (DPPH)-free radical, trolox™, Nα-benzoyl-DL-arginine-p-nitroanilide, N-succinyl-l-Ala-l-Ala-l-Pro-l-Phe-p-nitroanilide and 2,4,6,tripyridyl-s-triazine (tPtZ) were ob-tained from Sigma chemicals co., trichloroacet-ic acid was obtained from Ubichem, acetonitrile was obtained from Lab-Scan, and trifluoroacetic acid (tFA) was obtained from Fluka.
Determination of protein content
the total protein (N × 6.25) in insoluble sub-strates was determined using the Kjeldahl meth-od. Protein content in hydrolysates was deter-mined by LOWrY et al., method (1951).
Determination of proteolytic activity
Proteolytic activity of microbial proteinases form Aspergillus melleus and from Bacillus am-yloliquefaciens (neutrase) was determined in re-action with 1% casein as a substrate at pH 7.5 and the enzyme to substrate ratio: 1:140 (w/w). the substrate with the enzyme was incubated for 10 minutes at 45°c. After this time, the reac-tion was stopped by the addition of 10% trichlo-roacetic acid (tcA). the tubes were then centri-fuged (3,145 g, 15 min, 20°c). the absorbance of supernatants was measured at λ = 280 nm.
Pepsin activity was determined in a reac-tion with 2% acid-denaturized hemoglobin as a substrate according to cHrZANOWSKA and KOŁAcZKOWSKA (1998) at E:S 1: 250 (w/w), pH

Ital. J. Food Sci., vol. 25 - 2013 171
3.0 and temperature 37°c. After 10 min incu-bation, the reaction was stopped by the addi-tion of 10% trichloroacetic acid. the tubes were then centrifuged (3,145 g, 15 min, 20°c). the absorbance of the supernatants was measured at 280 nm.
Proteolytic activity was determined with the synthetic substrates Nα-benzoyl-DL-arginine-p-nitroanilide (bApNA) (ErLANGEr et al., 1961) and N-succinyl-l-Ala-l-Ala-l-Pro-l-Phe-p-nitroanilide (AAPFpNa) (NAKAJIMA et al., 1979) for trypsin and chymotrypsin, respectively. the enzymes were dissolved in 0.1 mol/L tris; 20 mmol/L cacl2; 5% dimethyl sulfoxide to a final protein concentration of 4 to 20 µg/mL and reaction was started by applying 10 µL 0.1 mol/L sub-strates. the enzyme to substrate ratio was: 1: 170 (w/w) and 1: 220 (w/w) for trypsin and chy-motrypsin, respectively. After 10 min, the reac-tion was stopped by the addition of 33% acetic acid. the absorbance was measured at 410 nm.
One unit of enzymatic activity (U) was defined as the amount of enzyme producing an increase in absorbance at 280 nm of 0.1 under reaction conditions.
Egg white protein hydrolysis
the hydrolysis of egg-white protein precipitate with all enzymes without pepsin was carried out in 0.2 mol/L tris- Hcl buffer, pH 8.0 at 37°c for 24 hours using a dose of enzyme of 10 U/mg. Hydrolysis with pepsin was conducted in Gly- Hcl buffer at pH 3.0. the reactions were termi-nated by heating at 100°c for 15 min. the hy-drolysates were cooled and centrifuged (3,145 g, 10 min, 10°c). the supernatants were lyophi-lized and stored at 4ºc until use.
the degree of hydrolysis (DH)
Degree of hydrolysis (DH%) was expressed as the percentage ratio of protein soluble in 5% trichloroacetic acid (tcA) to total protein con-tent (SPELLMAN, 2003). the samples were mixed with 10% tcA (1:1) (v:v). After 30 min the sam-ples were centrifuged (3,145 g, 10 min, 10°c). the concentration of acid-soluble product in the supernatant was measured spectrophotometri-cally at λ = 280 nm.
the content of free amino acid groups
the concentration of the free amino groups was determined according to KUcHrOO et al. (1983). 2 mL of the hydrolysate diluted with 0.1 mol/L borate buffer was mixed with 50 µL of tNbS reagent (0.03 mol/L). the samples were incubated in the dark for 2 hours at room tem-perature. the reaction was stopped by adding 2 mL of 0.1 mol/L sodium phosphate containing 1.5 mmol/L sodium sulfate and the absorbance was measured at 420 nm. A blank was prepared
with water instead of hydrolysate. the results were expressed as µmol Gly/g hydrolyzed pro-tein by reference to a standard curve prepared with defined concentrations of glycine.
reversed - phase high performance liquid chromatography (rP-HPLc)
Peptide separation was performed using a Zorbax XDb-c18 Agilent column (4.6 x 250 mm) equilibrated with 0.1% tFA in water (trifluoro-acetic acid) (phase A). the samples were dis-solved in phase A, applied on the column and eluted after 5 min analysis with an increasing percentage (2%/min) of phase b (0.1% tFA in acetonitrile). the operative conditions were in-jection volume 100 µL; analysis time 55 min; t = 30°c; flow rate 1 mL/min; ten peptide frac-tions were collected and lyophilized.
rechromatography of collected antioxidant fractions was conduced at the same operative conditions like in below except flow rate and gradient. the flow rate of 0.4 mL/min. Gradi-ent of b presented in Fig. 7 finally reached 25%.
Determination of the molecular weight distribution of the hydrolysates
the molecular weights of the peptides were determined by gel filtration chromatography in a HPLc system equipped with a Zorbax GF-250 Agilent column (4.6 × 250 mm) at 30°c. An al-iquot of 0.1 mL was injected and eluted using 0.02 mol/L phosphate buffer (pH 7.2) contain-ing 0.2% Nacl at 0.5 mL/min. the absorbance was monitored at 230 nm. bovine serum albu-min (66 kDa), chicken egg ovalbumin (45 kDa), trypsinogen (24 kDa), β-lactoglobulin (18.4 kDa), lysozyme from chicken egg white (14.3 kDa), aprotonin (6.5 kDa) and bovine insulin, chain b (3.5 kDa) were obtained from Sigma chemi-cals and used as standards.
Amino acid composition
Amino acid analysis was performed at biocen-trum Ltd. (Kraków, Poland). the protein samples were hydrolyzed in gas phase using 6 mol/L Hcl at 115°c for 24 h. the liberated amino acids were converted into phenylthiocarbamyl (Ptc) deriva-tives and analyzed by high-pressure liquid chro-matography (HPLc) on a Picotag 3.9 x150 mm column (Waters, Milford, MA, USA). the amino acid concentration was expressed as nmol/10 µg of protein.
Molecular mass identification by mass spectrometry (MS) (via the) coupled with electrospray ionization (ESI)
the peptide fractions were analyzed using an Esquire Hct quadrupole ion trap instrument (bruker, Germany). the samples were injected

172 Ital. J. Food Sci., vol. 25 - 2013
into the mass spectrometer via the electrospray interface (activation time: 1 min, flow: 220 µL/min). Spectra were recorded over the m/z range of 100 to 2,200. Analysis was performed in the laboratory of biocentrum Ltd. (Kraków, Poland).
their share in the mixture is expressed as relative concentration (%) of particular peptide in relation to the most intensive peak. If only one peak was detected, the relative concentra-tion was established in relation to the residu-al spectrum.
the amino acid sequence
the amino acid sequence analysis was per-formed at biocentrum Ltd. (Krakow, Poland) by the Edman reaction with phenylisothiocyanate. then the final products: N-terminal phenylthio-hydantoin amino acid derivatives were analyzed by liquid chromatography.
Determination of antioxidant activity as the ability to scavenge DPPH free radicals
Antioxidant activity of obtained hydrolysates was assessed on the basis of the radical scav-enging effect of the stable 1, 1-diphenyl-2-pic-rylhydrazyl (DPPH)-free radical activity accord-ing to YEN and cHEN (1995), with modifications. the tested samples were dissolved in water to a final volume of 1 mL and mixed with 1 mL of ethanol (98%). the reaction was started by add-ing 0.5 mL of 0.3 µmol/L DPPH in ethanol. the mixtures were left for 30 min at room tempera-ture and the absorbance of the resulting solution was measured at 517 nm. Aqueous solutions of known trolox concentration ranged from 2 to 20 µg (able to scavenge 500 µL of 0.3 mmol/L DPPH radical solution) was used for calibration. radical scavenging activity of the peptides was expressed as µmol troloxeq/mg protein.
FrAP method
the FrAP method (Ferric reducing Antioxi-dant Power) was used to determine the antioxi-dative capacity in the hydrolysates according to benzie and Strain (1996). 3 mL of FrAP work-ing solution (300 mmol/L acetate buffer pH 3.6; 10 mmol/L 2,4,6,tripyridyl-s-triazine (tPtZ); 20 mmol/L Fecl3 x 6 H2O (10:1:1 v/v)) was mixed with a 1 mL sample. After 10 min of reaction, the absorbance was measured at 593 nm. Aqueous solution of known Fe (II) concentration was used for calibration (in a arrange of 100 to 1,000 µg). results were expressed as µg Fe2+/mg protein.
Determination of Fe (II) ion chelation
chelation of iron ions by hydrolysates was es-timated by the method of XU et al., 2007, with modifications. A 250 µL sample was mixed with 1,250 µL H2O and 110 µL 1 mmol/L Fecl2. Af-
ter 2 min, 1 mL of 500 µmol/L ferrozine aque-ous solution was added and the mixture was al-lowed to react for 10 min. the absorbance of fer-rous iron-ferrozine complex was measured spec-trophotometrically at 562 nm. A known concen-tration of Fecl2 (0-20 µg) was used as a stand-ard curve and the ability to chelate iron ions was expressed as µg Fe2+/mg protein.
Data analysis
All experiments were carried out in triplicates. the data obtained were subjected to multi-fac-tor variance analysis (ANOVA), followed by the Duncan’s multiple range test to determine the significant difference between sample at p<0.05 level using Statistica v. 9.0.
rESULtS AND DIScUSSION
In this study, the degradation of the EP was carried out using two microbial proteases from Aspergillus melleus and Bacillus amyloliquefa-ciens (neutrase) and digestive enzymes: trypsin, chymotrypsin and pepsin. both types of enzymes were effectively used in hydrolysis of egg white proteins (WANG and WANG, 2009; cHEN et al., 2011, cIGIc and ZELENIK-bLAtNIK, 2004; GrASZ-KIEWIcZ et al., 2007 and 2010). the course of protein degradation was monitored quantitative-ly by determining the degree of hydrolysis (DH) (Fig. 1) and the increment of free amino groups (Fig. 2). the type of enzyme, its specificity and reaction time have the greatest impact on the degree of EP hydrolysis. DH is an important pa-rameter in the enzymatic modification of proteins and might be a factor controlling the composition and properties of the modified proteins (GE and ZHANG, 1993). In all variants, more than 40% DH after 24 h reaction was observed. Pepsin was the most efficient enzyme in EP degradation (DH = 85%). Whereas 24 h hydrolysis of this protein using proteinase from Bacillus amyloliquefaciens and bovine trypsin resulted in lower DH than for pepsin, about 5 and 30% less, respectively.
the highest level of free amino acid groups (5190.1 µmol/g) was also determined in the hy-drolysate obtained with porcine pepsin after 24 h of reaction. the level of free amino groups de-termined in the EP degraded with microbial pro-teases was about two times lower than in the pepsin hydrolysate. the use of bovine trypsin resulted in slower degradation of the EP. the content of amino acid groups released after degradation of EP with this protease was final-ly 671.2 µmol/g.
Our results confirm the observation of other authors that pepsin is an efficient enzyme in egg-white protein degradation. MIGUEL et al. (2004) hydrolyzed whole egg white. In their study, DH was 53.9% after 3 h of enzymatic reaction and increased to 74.3% after 24 h. Moreover, high

Ital. J. Food Sci., vol. 25 - 2013 173
activity of enzymes from microbial sources in-cluding: Bacillus ssp. and Aspergillus ssp. to-wards the protein substrates was also shown by JE et al. (2007) who used hydrolysis as a meth-od of disposing of waste proteins in the fishing industry and achieved almost total degradation of the substrate.
In this study, the antioxidant activity of enzy-matically degraded EP measured by the deter-mination of the ability to scavenge DPPH free radicals (Fig. 3), to reduce the oxidation of Fe (III) (FrAP) (Fig. 4) and to chelate Fe (II) (Fig. 5) was assessed.
It was found that all the analyzed hydrolysates were able to scavenge DPPH radicals. the high-est free radical scavenging activity was observed
Fig. 1 - Effect of time on the degree of hydrolysis (DH) during hydrolysis of egg white protein preparation by proteases from A. melleus (A) and B. amyloliquefaciens (neutrase) (N), bovine trypsin (t), porcine pepsin (P) and bovine chymotrypsin (cHt). a-l – means followed by the same letter in figure do not differ significantly (p ≤ 0.05).
Fig. 2 - Effect of time on the free amino groups contents (FAG) during hydrolysis of egg white protein preparation by pro-teases form A. melleus (A) and B. amyloliquefaciens (neutrase) (N), bovine trypsin (t), porcine pepsin (P) and bovine chymo-trypsin (cHt).
for tryptic hydrolysate (0.21 µmol troloxeq/mg) and for hydrolysate obtained with neutrase (0.17 µmol troloxeq/mg) after 24 h of reaction. It was revealed that even shorter hydrolysis with these enzymes (5 h) generated the protein degradation products that exhibited activity against DPPH radicals at a level of 0.15 and 0.1 µmol troloxeq/mg, respectively. Free radical scavenging activ-ity of final hydrolysates obtained with A. melle-us proteinase, porcine pepsin and chymotrypsin
was two times lower than for trypsin and neu-trase. In previous studies GrASZKIEWIcZ et al. (2007; 2010) also showed that the proteolytic ac-tion of trypsin led to release peptides from egg-white proteins which exhibited stronger free-rad-ical scavenging activity than peptides obtained

174 Ital. J. Food Sci., vol. 25 - 2013
with other proteolytic enzymes. After 7 h degra-dation of EP with trypsin, the peptides exhibit-ed antioxidant activity of 0.38 µmol troloxeq/ mg.
the result of this study also revealed the re-lationship between DPPH radical scavenging ac-tivity, the degree of hydrolysis and the type of enzyme. DPPH activity of investigated hydro-lysates increased with increasing DH. certain-ly, this results from an increase in the availa-bility of hydrogen ions (electron donors) and in-
Fig. 3 - DPPH scavenging activities of egg white preparation hydrolysates.
Fig. 4 - the Ferric reducing Antioxidant Power (FrAP) of egg white protein preparation hydrolysates.
creasing concentrations of carboxyl and amine groups. the evidence of the higher level of an-tioxidant activity (54.3% of scavenged free rad-icals) at DH of 14.7% than the level of antioxi-dant activity (29.2% of scavenged free radicals) at DH of 5.2% from enzymatic hydrolysates ob-tained by cHEN et al. (2012), supports this hy-pothesis. LIU et al., (2010) in their study also showed an increase of antioxidant activity as a result of progress of hydrolysis. Longtime hy-

Ital. J. Food Sci., vol. 25 - 2013 175
drolysis of porcine plasma by alcalase led to ob-tain peptides exhibiting higher antioxidative ac-tivity than products of partial hydrolysis. In that study, the value of scavenging activity expressed in percentage amount of scavenged free radicals by hydrolysates at the concentration 40 mg/mL was 21.7, 31.3, 45.4 and 76.8% corresponding to 0, 6.2, 12.7 and 17.6% of DH, respectively.
Potential antioxidant activity of EP hydro-lysates, in terms of their reducing capacity, was expressed by the ability to decrease oxidation of Fe (III) to Fe (II). the relationship between the re-ducing power as well as time and the degree of protein degradation was observed. these results were similar to the results obtained by MOUrE et al. (2006) who reported that the reducing pow-er showed a clear influence of protein size and degree of hydrolysis. Moreover, all hydrolysates showed enzyme-dependent ferric reducing activ-ity. the highest values of this activity were ob-served for hydrolysates obtained after 24 hours of reaction with use of microbial enzymes. the use of neutrase resulted in a four-fold increase in FrAP activity (21.0 µg Fe3+/mg) compared to A. melleus proteinase, trypsin, pepsin and chy-motrypsin which showed 5.9, 4.5, 4.7 and 2.9 µg Fe3+/mg, respectively.
Enzymatic hydrolysates have also been stud-ied in terms of their ability to chelate on iron ions (II). Owing to this chelating property, pep-tides exert strong antioxidant activity and may be carriers of metals such as ca, Fe and Zn,
which are essential elements in human nutri-tion (tOrrES-FUENtES et al., 2012).
All hydrolysates obtained in this research showed chelating activity, increasing with time and the degree of protein degradation. the high-est ability to bind Fe (II) ions was observed for protein preparations hydrolyzed with neutrase, yielding a maximum level of 397.0 µg Fe2+/mg. In hydrolysates obtained with other enzymes, the iron ion chelation value was lower than in hydrolysates obtained with neutrase, amount-ing to a maximum level of 241.2; 250.3; 278.1 and 282.0 µg Fe2+/mg for pepsin, trypsin, chy-motrypsin and protease from A. melleus, re-spectively. Antioxidant activity of protein hydro-lysates obtained from egg white using a variety of proteolytic enzymes has also been shown by DAVALÕS et al. (2004) and HUANG et al. (2010).
both the enzymatic hydrolysis in vitro and the in situ by microbial fermentation of food pro-teins give rise to mixtures of peptides and, in particular situations, each biopeptide might re-quire a specific process protocol. In our study, 24 h tryptic hydrolysate of EP, which exhibit-ed the strongest free radical scavenging activi-ty, was resolved by means of rP-HPLc accord-ing to procedure described by GrASZKIEWIcZ et al. (2007). the mixture of peptides was applied on Zorbax XDb- c18 column and ten fractions were collected (Fig. 6). Peptides eluted between 20 and 25% acetonitrile exhibited the strongest free radical scavenging activity (0.18 - 0.21 µmol
Fig. 5 - Ferrous ion-chelating activities of egg white protein preparation hydrolysates.

176 Ital. J. Food Sci., vol. 25 - 2013
troloxeq/mg). the rechromatography of this frac-tion was performed on the same column under modified conditions (Fig. 7). the highest levels of free radical scavenging activity were estimat-ed in subfractions No. 1 and No. 2 and approxi-mated 1.2-1.4 and 1.0-1.2 µmol troloxeq/mg, re-
spectively. these levels were 6.7 and 5.7 times higher, respectively, than those reported for 24 h tryptic hydrolysate.
rP-HPLc is widely used as a peptide purifi-cation method (SAIGA et al., 2003; ADEbIYI et al., 2008). ADEbIYI et al. (2008) fractionated rice
Fig. 6 - rP-HPLc – peptide profile of tryptic 24-hour hydrolysate of egg white protein preparation. ten fractions were collected.
Fig. 7 - rP-HPLc peptide profile of fraction (eluted between 25-30 min analysis) isolated from tryptic 24-hour hydrolysate of egg white protein preparation.

Ital. J. Food Sci., vol. 25 - 2013 177
bran hydrolysates to pure, antioxidative pep-tides by rP-HPLc on Kaseigel ODS resin, us-ing a stepwise gradient of aqueous ethanol only.
the molecular masses and amino-acid com-position of the two obtained fractions were an-alyzed (Fig. 8; table 1). the molecular masses analysis by MS-ESI indicated that subfraction No. 1 was relatively homogenous and one pep-tide with molecular mass of 1.77 kDa was con-firmed (Fig. 8). the main component of subfrac-tion No. 2 was the same as peptide in fraction No. 1 (89.3%). Furthermore, the peptide with mo-lecular mass of 7.11 kDa (10.7%) was also de-tected for this subfraction. Generally, many au-thors (PArK et al., 2001; DÁVALOS et al., 2004, tSUGE et al., 1991) demonstrated that the anti-oxidant activity was mainly attributable to pep-tides with low molecular masses. However, nu-merous long- chain peptides with antioxidant activity have been described. For example, pep-tides composed of 13 and 16 amino- acids isolat-ed from Allasca Pollack skin hydrolyzed with Pro-faze E exert antioxidant activity (PILANtO, 2006).
the amino-acid composition of these subfrac-tions was analyzed. Subfraction No.1 had a high concentration of glutamic acid and glutamine (4.85 nmol/10 µg) as well as of alanine (2.88 nmol/10 µg). However, low concentration of his-tidine residues (0.49 nmol/10 µg) in this frac-tion was estimated. Similar contribution of these amino acids concentration for subfraction No. 2 was observed. the concentrations of glutam-ic acid and glutamine, alanine and histidine
Fig. 8 - Molecular mass identification (MS-ESI) (100- 1,800 m/z) of peptide fractions (A- subfraction no 1; b- subfraction no 2) isolated from tryptic 24-hour hydrolysate.
table 1 - Amino acid composition (nmol/10 µg) of peptide fractions isolated from tryptic 24-hour hydrolysate of egg white protein preparation.
Amino acid Composition (nmol/10 µg)
F1 F2
Asx 1.85a 7.37b
Glx 4.85a 23.83b
Ser 2.33a 10.97b
Gly 2.14a 8.5b
His 0.49a 3.19b
Arg 1.94a 8.94b
Thr 1.55a 6.45b
Ala 2.88a 17.04b
Pro 1.46a 6.52b
Tyr 1.08a 4.7b
Val 2.2a 11.92b
Met 0.42a 3.23b
Ile 1.31a 7.31b
Leu 1.5a 7.42b
Phe 0.68a 3.35b
Lys 1.25a 5.91b
a-b, means followed by the same letter in line do not differ significantly (p ≤ 0.05).
amounted to: 23.83, 17.04 and 3.19 nmol/10 µg, respectively. It is known that the main compo-nents of the antioxidative peptides are the ami-no acids known for their antioxidative proper-ties such as histidine, tyrosine, methionione, lysine and tryptophan (PArK et al., 2001). Not only the composition of amino acids, but their
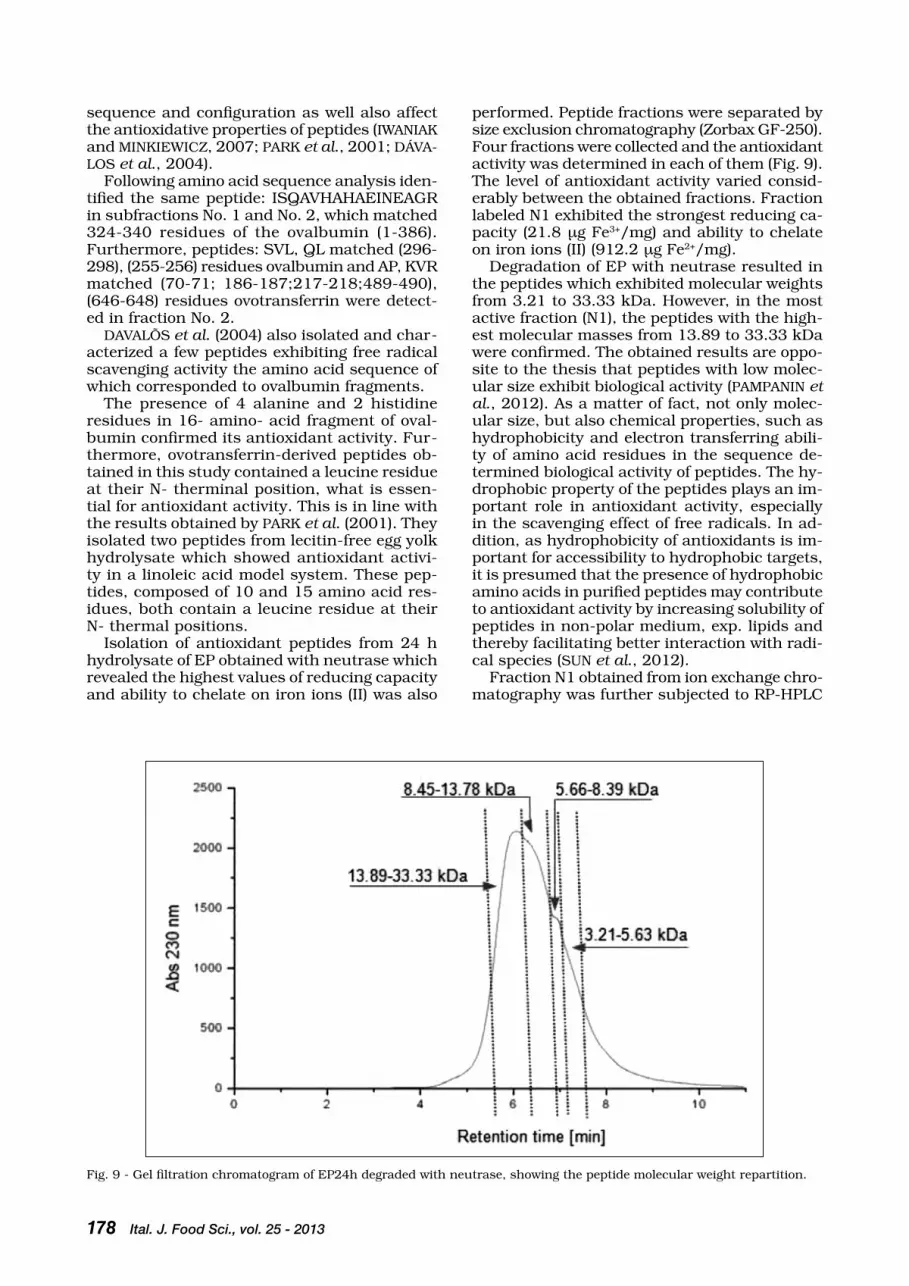
178 Ital. J. Food Sci., vol. 25 - 2013
sequence and configuration as well also affect the antioxidative properties of peptides (IWANIAK and MINKIEWIcZ, 2007; PArK et al., 2001; DÁVA-LOS et al., 2004).
Following amino acid sequence analysis iden-tified the same peptide: ISQAVHAHAEINEAGr in subfractions No. 1 and No. 2, which matched 324-340 residues of the ovalbumin (1-386). Furthermore, peptides: SVL, QL matched (296-298), (255-256) residues ovalbumin and AP, KVr matched (70-71; 186-187;217-218;489-490), (646-648) residues ovotransferrin were detect-ed in fraction No. 2.
DAVALÕS et al. (2004) also isolated and char-acterized a few peptides exhibiting free radical scavenging activity the amino acid sequence of which corresponded to ovalbumin fragments.
the presence of 4 alanine and 2 histidine residues in 16- amino- acid fragment of oval-bumin confirmed its antioxidant activity. Fur-thermore, ovotransferrin-derived peptides ob-tained in this study contained a leucine residue at their N- therminal position, what is essen-tial for antioxidant activity. this is in line with the results obtained by PArK et al. (2001). they isolated two peptides from lecitin-free egg yolk hydrolysate which showed antioxidant activi-ty in a linoleic acid model system. these pep-tides, composed of 10 and 15 amino acid res-idues, both contain a leucine residue at their N- thermal positions.
Isolation of antioxidant peptides from 24 h hydrolysate of EP obtained with neutrase which revealed the highest values of reducing capacity and ability to chelate on iron ions (II) was also
performed. Peptide fractions were separated by size exclusion chromatography (Zorbax GF-250). Four fractions were collected and the antioxidant activity was determined in each of them (Fig. 9). the level of antioxidant activity varied consid-erably between the obtained fractions. Fraction labeled N1 exhibited the strongest reducing ca-pacity (21.8 µg Fe3+/mg) and ability to chelate on iron ions (II) (912.2 µg Fe2+/mg).
Degradation of EP with neutrase resulted in the peptides which exhibited molecular weights from 3.21 to 33.33 kDa. However, in the most active fraction (N1), the peptides with the high-est molecular masses from 13.89 to 33.33 kDa were confirmed. the obtained results are oppo-site to the thesis that peptides with low molec-ular size exhibit biological activity (PAMPANIN et al., 2012). As a matter of fact, not only molec-ular size, but also chemical properties, such as hydrophobicity and electron transferring abili-ty of amino acid residues in the sequence de-termined biological activity of peptides. the hy-drophobic property of the peptides plays an im-portant role in antioxidant activity, especially in the scavenging effect of free radicals. In ad-dition, as hydrophobicity of antioxidants is im-portant for accessibility to hydrophobic targets, it is presumed that the presence of hydrophobic amino acids in purified peptides may contribute to antioxidant activity by increasing solubility of peptides in non-polar medium, exp. lipids and thereby facilitating better interaction with radi-cal species (SUN et al., 2012).
Fraction N1 obtained from ion exchange chro-matography was further subjected to rP-HPLc
Fig. 9 - Gel filtration chromatogram of EP24h degraded with neutrase, showing the peptide molecular weight repartition.

Ital. J. Food Sci., vol. 25 - 2013 179
chromatography. In the obtained peptide pro-files, the presence of numerous peaks, differ-ing in hydrophobicity was observed (data not shown). Further separation of pure peptides us-ing this method would be difficult in this case. It is necessary to carry out another purification protocol to obtain peptides responsible for spe-cific actions.
cONcLUSIONS
A denaturated protein by-product (EP), ob-tained during lysozyme and cystatin isolation from egg white, was converted into more useful products with antioxidant activity through hy-drolysis with the use of proteinases of different specificity. Enzymatic hydrolysis of EP proved that peptides exhibited antioxidant activity. bo-vine trypsin and neutrase were enzymes effective in producing peptides with free radical scaveng-ing activity and Fe2+chelating activity, respective-ly. Peptide fraction isolated from tryptic hydro-lysate by rP-HPLc exhibited strong free radical scavenging activity. Among the obtained frac-tions, we identified ISQAVHAHAEINEAGr, SVL, QL and AP, KVr antioxidative peptides corre-sponding to ovalbumin and ovotransferrin frag-ments, respectively.
AcKNOWLEDGEMENtS
this work was financially supported by the “Innovative tech-nologies of production of biopreparations based on new gen-eration eggs”. Project: POIG.01.03.01-00-133/08. Innova-tive Economy Operational Programme Priority 1.3.1, the-matic area “bio” co-financed by European Union through European regional Development Fund within the Innovative Economy Operational Programme, 2007-2013.
rEFErENcES
1. Adebiyi A.P., Adebiyi A.O., Ogawa t. and Muramoto K. 2008. Purification and characterisation of antioxidative peptides from unfractionated rice bran protein hydro-lysates. Int. J. Food Sci. technol. 43: 35-43.
2. benzie I.F.F. and Strain J.J. 1996. the ferric reducing ability of plasma (FrAP) as a measure of “Antioxidant Power”: the FrAP assay. Anal. biochem. 293: 70-76.
3. chen c., chi J.Y., Zhao M.Y. and Xu W. 2012. Influence of degree of hydrolysis on functional properties, antiox-idant and AcE inhibitory activities of egg white protein hydrolysate Food Sci. biotechnol. 21(1): 27-34.
4. chen c., chi Y.J., Zhao M.Y. and Lv L. 2011. Purifica-tion and identification of antioxidant peptides from egg white protein hydrolysate. Amino Acids. Abstr. In Pub-Med http://www.ncbi.nlm.nih.gov/pubmed/21964984.
5. chiang W.D., tsou M.J., Weng c.H. and tsai t.c. 2008. Production of angiotensin I-converting enzyme inhibi-tor derived from egg white protein hydrolysates using a membrane reactor. J. Food Drug Anal. 2: 54-60.
6. chrzanowska J. and Kołaczkowska M. 1998. Production of extracellular proteolytic enzymes by Beauveria bassi-ana. Acta Mycol. 33: 277-285.
7. cigi´c b. and Zelenik-blatnik M. 2004. Preparation and characterization of chicken egg white hydrolysate. Acta chim. Slov. 51: 177-188.
8. Davalõs A., Miguel M., bartolome b. and López-Fandiˇno r. 2004. Antioxidant activity of peptides derived from egg white proteins by enzymatic hydrolysis. J. Food Prot. 67: 1939-1944.
9. Erlanger b.F., Kokowsky N. and cohen W. 1961. the preparation and properties of two new chromogenic sub-strates of trypsin. Arch. biochem. biophys. 95: 271-278.
10. Gallegos-tintoré S., torres-Fuentes c., Martínez- Ayala A.L., Solorza-Feria J., Alaiz M., Girón-calle J. and Vioque J. 2011. Antioxidant and chelating activity of Jatropha curcas L. protein hydrolysates. J. Sci. Food Agric. 91(9): 1618-1624.
11. Ge S.J. and Zhang L.X. 1993. control of hydrolysis of a protein modification with immobilized protease by the pH-Drop method. Acta biotechnol. 13(2): 151-160.
12. Graszkiewicz A., Zelazko M. and trziszka t. 2010. Appli-cation of pancreatic enzymes in hydrolysis of egg-white proteins. Pol. J. Food Nutr. Sci. 60(1): 57-61.
13. Graszkiewicz A., Zelazko M., trziszka t. and Polanows-ki A. 2007. Antioxidative capacity of hydrolysates of hen egg proteins. Pol. J. Food Nutr. Sci. 57: 195-199.
14. Hatanaka A, Suzuki K.I. and Sato S. 2009. Isolation and identification of antihypertensive peptides from Antarctic krill tail meat hydrolysate. J. Food Sci. 4 (74): 116-120.
15. Hernández-Ledesma b., Miralles b., Amigo b., ramos M. and recio I. 2005. Identification of antioxidant and AcE-inhibitory peptides in fermented milk. J. Sci. Food Agric. 85: 1041-1048.
16. Hirose A. and Miyashita K. 1999. Inhibitory effect of pro-teins and their hydrolysates on the oxidation of triacylg-lycerols containing docosahexaenoic acids in emulsion. J. Jap. Soc. Food Sci. technol. 46: 799-805.
17. Huang W., Majumder K. and Wu J. 2010. Oxygen radi-cal absorbance capacity of peptides from egg white pro-tein ovotransferrin and their interaction with phytochem-icals. Food chem. 123: 635-641.
18. Iwaniak A. and Minkiewicz P. 2007. Proteins as the source of physiologically and functionally active pep-tides. Acta Sci. Pol. technol. Aliment. 6 (3): 5-15.
19. Je J.Y., Qian Z.J., byun H.G. and Kim S.K. 2007. Puri-fication and characterization of an antioxidant peptide obtained from tuna backbone protein by enzymatic hy-drolysis. Process biochem. 42: 840-846.
20. Kong b.H. and Xiong Y.L. 2006. Antioxidant activity of zein hydrolysates in a liposome system and the possible mode of action. J. Agric. Food chem. 54: 6059-6068.
21. Kuchroo c.N., ramilly J. and Fox P.F. 1983. Assessment of proteolysis in cheese of reaction with trinitrobenzene sulphonic-acid. Irish J. Food Sci. technol. 7: 129-133.
22. Lin S.Y., Guo Y, Liu J.b., You Q., Yin Y.G. and cheng S. 2011. Optimized enzymatic hydrolysis and pulsed elec-tric field treatment for production of antioxidant pep-tides from egg white protein. Afr. J. biotechnol. 10(55): 11648-11657.
23. Liu Q., Kong b., Xiong Y.L. and Xia X. 2010. Antioxidant activity and functional properties of porcine plasma pro-tein hydrolysate as influenced by the degree of hydroly-sis. Food chem. 118: 403-410.
24. Lowry O.H., rosebrough N.J., Farr A.L. and randal r.J. 1951. Protein measurement with the Folin-phenol rea-gent. J. biol. chem. 193: 265-275.
25. Miguel M. and Aleixandre A. 2006. Antihypertensive peptides derived from egg proteins. J. Nutri. 136: 1457-1460.
26. Miguel M., recio I., Gomez-ruiz J.A., ramos M. and Lopez-Fandino r. 2004. Angiotensin I-converting enzyme inhibitory activity of peptides derived from egg white pro-teins by enzymatic hydrolysis. J. Food Prot. 67: 1914-1920.
27. Mine Y. and Kovaks-Nolan J. 2006. New insights in bi-ologically active proteins and peptides derived from hen egg. World’s Poult. Sci. J. 62 (1): 87-95.
28. Moure A., Domínguez H. and Parajó J.c. 2006. Antiox-idant properties of ultrafiltration-recovered soy protein fractions from industrial effluents and their hydrolysates. Process biochem. 41: 447-456.
180 Ital. J. Food Sci., vol. 25 - 2013
29. Nakajima K., Powers c.J., Ashe b. and Zimmerman M. 1979. Mapping the extended substrate binding site of cathepsin G and human leukocyte elastase. Studies with peptide substrates related to the alphal- protease inhib-itor reactive site. J. biol. chem. 254: 4027-4032.
30. Pampanina D.M., Larssena E., Provana F., Sivertsvikb M., ruoff P. and Sydnes M.O. 2012. Detection of small bioactive peptides from Atlantic herring (Clupea haren-gus L.). Peptides. 34: 423-426.
31. Park P.J., Jung W.K., Nam K.S., Shahidi F. and Kim S.K. 2001. Purification and characterization of antioxidative peptides from protein hydrolysate of lectin-free egg yolk. J. Am. Oil chem. Soc. 78 (6): 651-656.
32. Pilanto A. 2006. Antioxidative peptides derived from milk proteins. Int. Dairy J. 16: 1306-1314.
33. ruiz-ruiz J., Dávila-Ortíz G., chel-Guerrero L. and betancur-Ancona D. 2011. Angiotensin I-converting en-zyme inhibitory and antioxidant peptide fractions from hard-to-cook bean enzymatic hydrolysates. J. Food bi-ochem. http://onlinelibrary.wiley.com/doi/10.1111/j.1745-4514.2011.00594.x/full
34. Saiga A., tanabe S. and Nishimura t. 2003. Antioxidant activity of peptides obtained from porcine myofibrillar proteins by protease treatment. J. Agric. Food chem. 51: 3661-3667.
35. Sakanaka S. and tachibana Y. 2006. Active oxygen scav-enging activity of egg-yolk protein hydrolysates and their effects on lipid oxidation in beef and tuna homogenates. Food chem. 95: 243-249.
36. Sakanaka S., tachibana Y., Ishihara N. and Juneja L.r. 2004. Antioxidant activity of egg-yolk protein hydro-lysates in a linoleic acid oxidation system. Food chem. 86: 99-103.
37. Sarmadi b.H. and Ismail A. 2010. Antioxidative peptides from food proteins: A review. Peptides. 31:1949-1956.
38. Satya S. Dey, Krushna chandra Dora J. 2011. Optimi-zation of the production of shrimp waste protein hydro-lysate using microbial proteases adopting response sur-face methodology Food Sci. technol. http://www.spring-erlink.com/content/p436370551632l62/
39. Sokołowska A., Kubiak A., trziszka t. and Polanows-ki A. 2007. rapid one step separation of proteinaceous agents of antimicrobial activity from hen’s egg white. Pol. J. Food Nutri. Sci. 57(4c): 499-503.
40. Spellman D., McEvoya E., O’cuinn G and FitzGerald r.J. 2003. Proteinase and exopeptidase hydrolysis of whey protein: comparison of the tNbS, EWA and pH stat methods for quantification of degree of hydrolysis. Int. Dairy J. 13: 447-453.
41. Suetsuna K., Ukeda H. and Ochi H. 2000. Isolation and characterization of free radical scavenging activities pep-tides derived from casein. J. Nutr. biochem. 11: 128-31.
42. Sun Q., Luo Y., Shen H., Li1 X. and Yao L. 2012. Purifi-cation and characterization of a novel antioxidant pep-tide from porcine haemoglobin hydrolysate. Int. J. Food Sci. technol. 47: 148-154.
43. torres-Fuentes c., Alaiz M. and Vioque J. 2012. Iron-chelating activity of chickpea protein hydrolysate pep-tides. Food chem. doi: 10.1016/j.foodchem.2012.03.112.
44. trziszka t., Saleh Y., Kope´c W., Siewi´nski M. and W¸esierska E. 2004. Effects on hen’s age on the level of cystatin in the chicken egg white. Int. J. Poultry Sci. 3: 471-477.
45. tsuge N., Eikawa Y., Nomura Y., Yamamoto M. and Sugi-sawa K. 1991. Antioxidative activity of peptides prepared by enzymatic hydrolysis of egg white albumin. Nippon Nogeikagaku Kaisi. 65(2): 1635-1641.
46. tsuge Y., Shimoyamada M. and Watanabe K. 1997. Structural features of newcastle virus- and anti-ovomu-cin antibody- winding glycopeptydes from pronase- treat-ed ovomucin. J. Agric. Food Chem. 45 (12): 4629-4634.
47. Wang G. and Wang t. 2009. Egg yolk protein modifi-cation by controlled enzymatic hydrolysis for improved functionalities. Inter. J. Food Sci. technol. 44: 763-769.
48. Xu X., Katayama S. and Mine Y. 2007. Antioxidant ac-tivity of tryptic digest of hen egg yolk phosvitin. J. Sci. Food Agric. 87: 2604-2608.
49. Yen G.c. and chen H.Y. 1995. Antioxidant activity of various tea extracts in relation to their antimutagenci-ty. J. Agric. Food chem. 43: 27-32.
Paper received June 14, 2012 Accepted October 18, 2012

PaPer
Ital. J. Food Sci., vol. 25 - 2013 181
- Keywords: antimicrobial peptides, Bacillus cereus, Bacillus subtilis, bacteriocins -
PRELIMINARY CHARACTERIZATION OF A BACTERIOCIN-LIKE SUBSTANCE PRODUCED
BY A BACILLUS SUBTILISISOLATED FROM ARGENTINEAN VEGETABLE FOOD
M.F. FANGIO*1,2 and R. FRITZ2
1CONICET, Consejo Nacional de Investigaciones Científicas y Técnicas, Departamento de Química, Facultad de Ciencia Exactas y Naturales, Universidad Nacional de Mar del Plata, Argentina
2UNMDP, Universidad Nacional de Mar del Plata, Funes 3350, Mar del Plata, Provincia de Buenos Aires, Argentina
*Corresponding author: Fax +54 223 4753150,email: [email protected]
AbStrAct
Bacillus spp. produces a large number of antimicrobial peptides and includes a variety of spe-cies of industrial importance. the aim of this study was to characterize the antimicrobial activ-ity associated with a Bacillus subtilis strain. the activity of the crude bacteriocin-like substance (cbLS) was dependent on the components of the culture media and was detected in the exponen-tial phase of growth. the cbLS was stable at a variable pH range and at 100°c, but it was inac-tivated by sterilization conditions. It was also stable to storage at refrigeration and freezing tem-peratures for a considerable time. the mode of action of the antimicrobial activity was bacterio-static and the effect on the cell membrane was determinated by Fourier transform infrared (FtIr) spectroscopy.

182 Ital. J. Food Sci., vol. 25 - 2013
INtrODUctION
Due the concern on reducing the use of chem-ical additives in food, since some of them have been proven harmful to human health as well as the environment, the necessity of more natural and safe food products has been recognized (XU et al., 2013). bacteriocins are an alternative for natural food preservation, as well as for human therapy as possible additive or replacements for currently used antibiotics (AbO-AMEr, 2007).
bacteriocins are proteinaceous compounds bioactive to other bacteria than the producing strain (JOErGEr, 2003). the activity spectrum of bacteriocins can be narrow and limited to close-ly related species, or it can be relatively exten-sive and comprise many different bacterial spe-cies (OScArIZ and PISAbArrO, 2000).
the isolation of new strains also allows to dis-cover new bacteriocin produced by them, since different kinds of bacteria produce different types of bacteriocins. consequently due to the nascent field of biopreservation there is a de-manding need to explore and isolate more and more bacteria from new sources capable of pro-ducing novel bacteriocins and characterize them to be added to food (SHArMA and GAUtAM, 2008).
Bacillus spp. is of major interest in bacterioc-in research since this genus produces a diverse array of antimicrobial peptides with several dif-ferent basic chemical structures (cLADErA-OL-IVErA et al., 2004; XIE et al., 2009; AbrIOUEL et al., 2010). the B. subtilis group is one of the major producers of these substances (MArtIrA-NI et al., 2002; cLADErA-OLIVErA et al., 2004; LISbOA et al., 2006; ANtHONY et al., 2009; HAM-MAMI et al., 2009; XIE et al., 2009; KINDOLI et al., 2012), being B. subtilis one of the most pro-lific. In addition, B. subtilis is generally recog-nized as safe organisms (GrAS) by the Federal Drug Administration (FDA) for specific applica-tions such as enzyme production (APEtrOAIE-cONStANtIN et al., 2009).
the extensive screening of nearly 100 strains of Bacillus spp. isolated from vegetable food from Argentina led to the selection of several strains which demonstrated antibacterial activity (FAN-GIO et al., 2010).
this paper reports a preliminary characteriza-tion of the biological and physicochemical prop-erties of the antimicrobial substances produced by a strain isolated from rice, B. subtilis r1.
MAtErIALS AND MEtHODS
Bacterial strains and culture conditions
Bacillus subtilis r1 isolation and bacterioc-in-like identification have been described else-where (FANGIO et al., 2010). Indicator and pro-ducer strains were kept frozen in 20% (v/v) glyc-erol at –20ºc until use. Bacillus spp. were growth
in nutritive agar and Paenibacillus larvae was cultured in Mueller-Hinton, yeast extract, glu-cose, sodium pyruvate and agar (MYPGP) sup-plemented with nalidixic acid at 37ºc for 48 h.
Preparation of crude extracts
the bacteriocin-like producing strain was grown in brain-heart infusion (bHI) at 37ºc for 24 hours. After incubation, the bacterial cells were removed by centrifugation at 10,000 g for 15 min. the supernatant was collected and fil-tered with membrane 0.22 mm (titan syringe fil-ters; Sri Scientific resources Inc., USA). this su-pernatant was designated as crude bacteriocin-like substance (cbLS) (XIE et al., 2009).
Reagents and media
Mueller-Hinton Agar (MH), nutrient broth (Nb) and brain-heart infusion (bHI) were from bri-tania (buenos Aires, Argentina). All other me-dia and reagents were from Merck (Darmstadt, Germany). Mueller-Hinton, yeast extract, glu-cose and piruvato of sodium agar (MYPGP) were prepared according to composition reported by DINGMANN and StAHLY (1983).
Bacteriocin-like activity assay
Antimicrobial activity of the supernatant was evaluated by the agar well-diffusion meth-od (FANGIO et al., 2010). P. larvae was chosen as indicator strain because of its high sensitivi-ty to the antimicrobial substance (FANGIO et al., 2010). In addition, a B. cereus strain was select-ed as indicator strain since it is an important foodborne pathogen. the cbLS titre was deter-mined by the serial two-fold dilution method de-scribed in LISbOA et al. (2006) and expressed as activity units (AU) per milliliter.
Kinetics of growth strains and antimicrobial activity production
to study the kinetics of production of the an-timicrobial substance, the producing strain was seeded in 5 mL of brain heart broth and incubat-ed 18 hours at 35°c. Fifty ml of bHI were inocu-lated with 1 mL (2 %) of the preinoculated broth and incubated at 35°c. Samples were taken at different times. to monitor the cell growth viable cells count was performed on nutrient agar plate, while production of antimicrobial substance of the cbLS was measured by the agar well-diffu-sion method (cHErIF et al., 2001).
Effect of culture media
Different commercial culture media (brain heart infusion (bHI), lactose broth, Mueller-Hinton broth and nutrient broth) were analyzed as substrates for the production of antagonis-

Ital. J. Food Sci., vol. 25 - 2013 183
tic substances. the strain was seeded in 5 mL of bHI and incubated 18 hours at 35°c. An ali-quot of this preinoculated culture was added in every culture media and incubated at 35°c for 18 hours. the antimicrobial activity of the cbLS obtained from every culture media was analyzed using the agar diffusion assay (DOMINGUEZ et al., 2007).
Effects of pH and heat on antimicrobial activity
to determine the stability of the antimicrobi-al substances to pH, cbLS was diluted in dif-ferent buffers and incubated at room tempera-ture for 2 hours. to analyze the heat stability of the substances, cbLS were subjected to the following treatments: 20°, 40°, 60° and 80°c for 30 min, 100°c for 5, 10, 15, 20, 30, 40, 50 and 60 min and 121°c at 1 atm for 15 minutes. Af-ter treatments, the antimicrobial activities were evaluated using the agar diffusion method (LIS-bOA et al., 2006).
Stability in different storage conditions
cbLS was stored under refrigeration (4°c) and freezing (-20°c). At different time intervals (10 and 30 days) the stored material was evalu-ated for antimicrobial activity by agar diffusion method (AbO-AMEr, 2007).
Kinetics of antimicrobial action
to study the mode of action of the antimicro-bial substance, cbLS (75 AU/mL) was added to fresh cultures of B. cereus in brain heart broth in the logarithmic phase of growth. Samples were taken at different times and recorded both cell biomass (measured as OD600nm with a spectro-photometer UV-Vis Spectrophotometer Scanning Shimadzu (UV-2101Pc)) and viable cells count on nutrient agar plate (XIE et al., 2009).
Phospholipase C activity and capacity for erythrocyte hemolysis
Phospholipase c activity and capacity for erythrocyte hemolysis of cbLS were verified ac-cording to bIZANI et al. (2005).
Fourier transform infrared (FTIR)spectroscopy
A bacterial suspension of the indicator bacte-ria Paenibacillus larvae (108 cfu/mL) was add-ed to an equal volume of cbLS. After incuba-tion for 1.5 hours, both treated and control cells were washed three times with sterile distilled wa-ter. twenty µL of each bacterial sample was ap-plied onto a ZnSe optical plate, dried and then analyzed by FtIr spectroscopy. All Ir spectra (4,000-400 cm-1) were obtained according to bI-
ZANI et al., 2005. to minimize the variation due to the difference between different biomass sam-ples, the spectra were normalized according to DEAN et al. (2010).
Concentration of inhibitory substance
cbLS was concentrated by extraction with organics solvent using 1-butanol (bIZANI et al., 2005). After evaporation of the 1-butanol, the extract was suspended in phosphate buffer pH 7.2 and stored at 4°c until use. the measure of the activity of the extract was determined by the agar diffusion method.
Statistical analysis
the antimicrobial activity of strains in the dif-ferent treatments were compared using analy-sis of variance (ANOVA) with tukey’s test (ZAr, 2009) using SPSS 15.0 (SPSS Inc., chicago, Il-linois, USA) for Windows.
rESULtS AND DIScUSSION
In a previous paper (FANGIO et al., 2010) we reported the identification of a new bacterioc-in-like substance produced by B. subtilis r1. In this report, the proteinaceous nature of this substance produced by B. subtilis r1 was es-tablished. However, its biochemical characteri-zation was not completed.
the antibacterial activity was detected in the mid-exponential phase with a maximum in the stationary phase (Fig. 1), which suggests that the antimicrobial peptide is produced as a pri-mary metabolite (cLADErA-OLIVErA et al., 2004). the kinetics of this antimicrobial peptide was similar to the bacteriocin produced by B. subti-
Fig. 1 - Kinetics of antimicrobial substance production dur-ing the growth of B. subtilis r1 in bHI at 37°c for 32 h. Vi-able cell count (log cFU/mL) of B. subtilis r1 (black trian-gles) and antimicrobial activity expressed as inhibition zones (mm) against B. cereus (open circles). An asterisk indicates statistically significant difference (p< 0.05) with initial values.

184 Ital. J. Food Sci., vol. 25 - 2013
lis LFb112 (XIE et al., 2009) which antibacterial activity was detected in half of the rapid growth phase and peaked in early stationary phase. the comparative study of the kinetics of growth of the strain and production of the antimicrobial substance is important to identify the most ef-fective production stage.
Nutrient selection and determination of their concentrations in the culture media is an im-portant step in cell growth and production of useful metabolites produced from microorgan-isms. to optimize the conditions of the culture medium is especially important for products that are required in large amounts as for tech-nological uses (DOMINGUEZ et al., 2007). the in-hibitory activity of cbLS obtained with different culture media showed that cbLS obtained from the growth of B. subtilis r1 in brain heart broth, produced a higher activity (p<0.05) that those obtained from the other culture media studied (Fig. 2). brain heart broth is a rich culture me-dium that differs from other media analyzed for possessing large quantities of beef brain heart infusion. An antimicrobial substance produced by a strain of B. amyloliquefaciens presented important activity when is grown in brain heart broth, but not in peptone broth, suggesting that the biosynthesis of the peptide requires a rich medium (LISbOA et al., 2006). by contrast, pep-tone seems to be a key nutrient for the produc-tion of antifungal compounds by B. amyloliquefa-ciens rc-2 (YOSHIDA et al., 2001). Mueller-Hin-ton broth, also has large quantities of beef ex-tract and caseine hydrolysate, but instead of glu-cose, the main source of carbohydrate is starch. In studies of production of bacteriocins of lactic acid bacteria has been assumed that the supply of amino acids promotes the production of bac-
Fig. 2 - Effect of culture media on the production of antago-nistic substances: brain heart infusion (bHI), lactose broth (Lb), Mueller-Hinton broth (MHb) and nutrient broth (Nb). the antimicrobial activity of different extracts was meas-ured by the agar diffusion method against B. cereus and ex-pressed as inhibition zones (mm). An asterisk indicates sta-tistically significant difference (p< 0.05).
teriocins (AASEN et al., 2000) and also the lack of glucose has been considered a limiting factor for the production of bacteriocins (rUSSELL and MANtOVANI, 2002). In addition, JAtINDEr and JANA (2009) observed that a concentration in-creased from 10 to 15 g/L of starch and from 2 to 5 g/L of peptone has negative effects on cell concentration of a Bacillus licheniformis strain.
cbLS produced by strains of B. subtilis r1 was also active over a wide pH range (Fig. 3), showing not significant differences (p<0.05). It was observed that this cbLS was stable at pH 4 to 11, without showing reductions of activity in the extreme pH. the bacteriocin bac 14b pro-duced by a B. subtilis strain was studied in the pH range 2 to 12, showing an optimal activity at pH 7 and a significantly reduction of the ac-tivity to less than 2.5 times that of the control at pH 9 (HAMMAMI et al., 2009). In some cases, the effect of pH has been associated with chang-es in the activity of enzymes involved in post-translational modification or pH-dependent re-lease of bacteriocins from the cell surface (rUS-SELL and MANtOVANI, 2002). the stability of bac-teriocins at different pHs is a great advantage from the industrial point of view, since the pH of many foods varies from acidic to very basic (MArtIrANI et al., 2002). these observations in-crease the probability that these compounds are suitable for the food conservation and personal care applications, because they can adapt and function in a variety of environments (SUtYAK et al., 2008). the importance of pH on bacterioc-in activity has been explained due to its impact on the stability and solubility of the bacterioc-ins (LIU and HANSEN, 1990). For example, nisin has shown that it is 228 times more soluble at pH 2 than at pH 8 (LISbOA et al., 2006) and has a much higher activity at pH values below 6.
the antimicrobial substance produce by B. subtilis r1 was partially stable to heat treat-ments; the activity was maintained during treat-ments up to 100°c and disappeared only after
Fig. 3 - Effect of pH on the antimicrobial activity of cbLS. the antimicrobial activity is expressed as the percentage of relative activity against B. cereus of the buffered extracts compared with the untreated extracts of pH 7. An asterisk indicates statistically significant difference (p< 0.05).
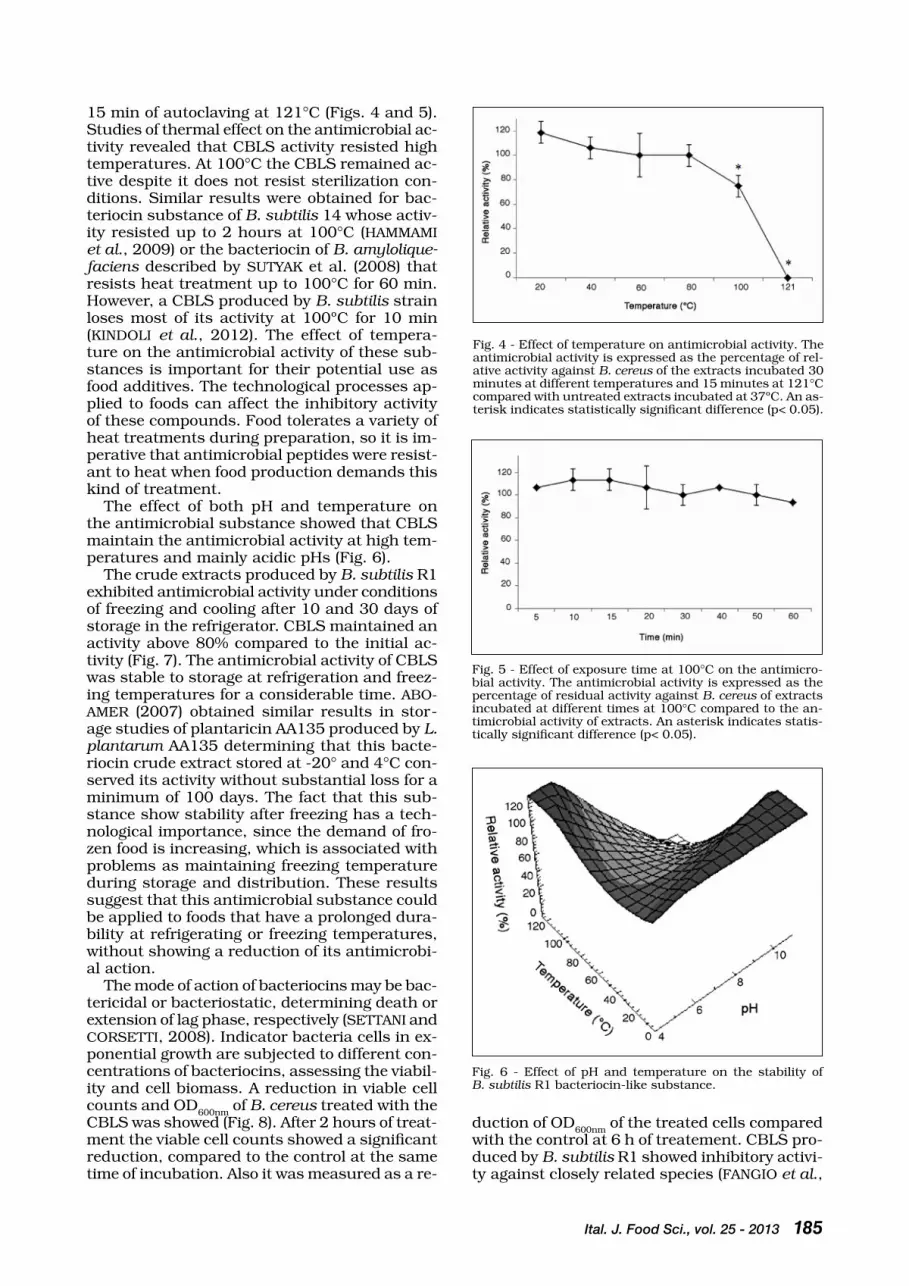
Ital. J. Food Sci., vol. 25 - 2013 185
15 min of autoclaving at 121°c (Figs. 4 and 5). Studies of thermal effect on the antimicrobial ac-tivity revealed that cbLS activity resisted high temperatures. At 100°c the cbLS remained ac-tive despite it does not resist sterilization con-ditions. Similar results were obtained for bac-teriocin substance of B. subtilis 14 whose activ-ity resisted up to 2 hours at 100°c (HAMMAMI et al., 2009) or the bacteriocin of B. amylolique-faciens described by SUtYAK et al. (2008) that resists heat treatment up to 100°c for 60 min. However, a cbLS produced by B. subtilis strain loses most of its activity at 100ºc for 10 min (KINDOLI et al., 2012). the effect of tempera-ture on the antimicrobial activity of these sub-stances is important for their potential use as food additives. the technological processes ap-plied to foods can affect the inhibitory activity of these compounds. Food tolerates a variety of heat treatments during preparation, so it is im-perative that antimicrobial peptides were resist-ant to heat when food production demands this kind of treatment.
the effect of both pH and temperature on the antimicrobial substance showed that cbLS maintain the antimicrobial activity at high tem-peratures and mainly acidic pHs (Fig. 6).
the crude extracts produced by B. subtilis r1 exhibited antimicrobial activity under conditions of freezing and cooling after 10 and 30 days of storage in the refrigerator. cbLS maintained an activity above 80% compared to the initial ac-tivity (Fig. 7). the antimicrobial activity of cbLS was stable to storage at refrigeration and freez-ing temperatures for a considerable time. AbO-AMEr (2007) obtained similar results in stor-age studies of plantaricin AA135 produced by L. plantarum AA135 determining that this bacte-riocin crude extract stored at -20° and 4°c con-served its activity without substantial loss for a minimum of 100 days. the fact that this sub-stance show stability after freezing has a tech-nological importance, since the demand of fro-zen food is increasing, which is associated with problems as maintaining freezing temperature during storage and distribution. these results suggest that this antimicrobial substance could be applied to foods that have a prolonged dura-bility at refrigerating or freezing temperatures, without showing a reduction of its antimicrobi-al action.
the mode of action of bacteriocins may be bac-tericidal or bacteriostatic, determining death or extension of lag phase, respectively (SEttANI and cOrSEttI, 2008). Indicator bacteria cells in ex-ponential growth are subjected to different con-centrations of bacteriocins, assessing the viabil-ity and cell biomass. A reduction in viable cell counts and OD600nm of B. cereus treated with the cbLS was showed (Fig. 8). After 2 hours of treat-ment the viable cell counts showed a significant reduction, compared to the control at the same time of incubation. Also it was measured as a re-
Fig. 4 - Effect of temperature on antimicrobial activity. the antimicrobial activity is expressed as the percentage of rel-ative activity against B. cereus of the extracts incubated 30 minutes at different temperatures and 15 minutes at 121°c compared with untreated extracts incubated at 37ºc. An as-terisk indicates statistically significant difference (p< 0.05).
Fig. 5 - Effect of exposure time at 100°c on the antimicro-bial activity. the antimicrobial activity is expressed as the percentage of residual activity against B. cereus of extracts incubated at different times at 100°c compared to the an-timicrobial activity of extracts. An asterisk indicates statis-tically significant difference (p< 0.05).
Fig. 6 - Effect of pH and temperature on the stability of B. subtilis r1 bacteriocin-like substance.
duction of OD600nm of the treated cells compared with the control at 6 h of treatement. cbLS pro-duced by B. subtilis r1 showed inhibitory activi-ty against closely related species (FANGIO et al.,
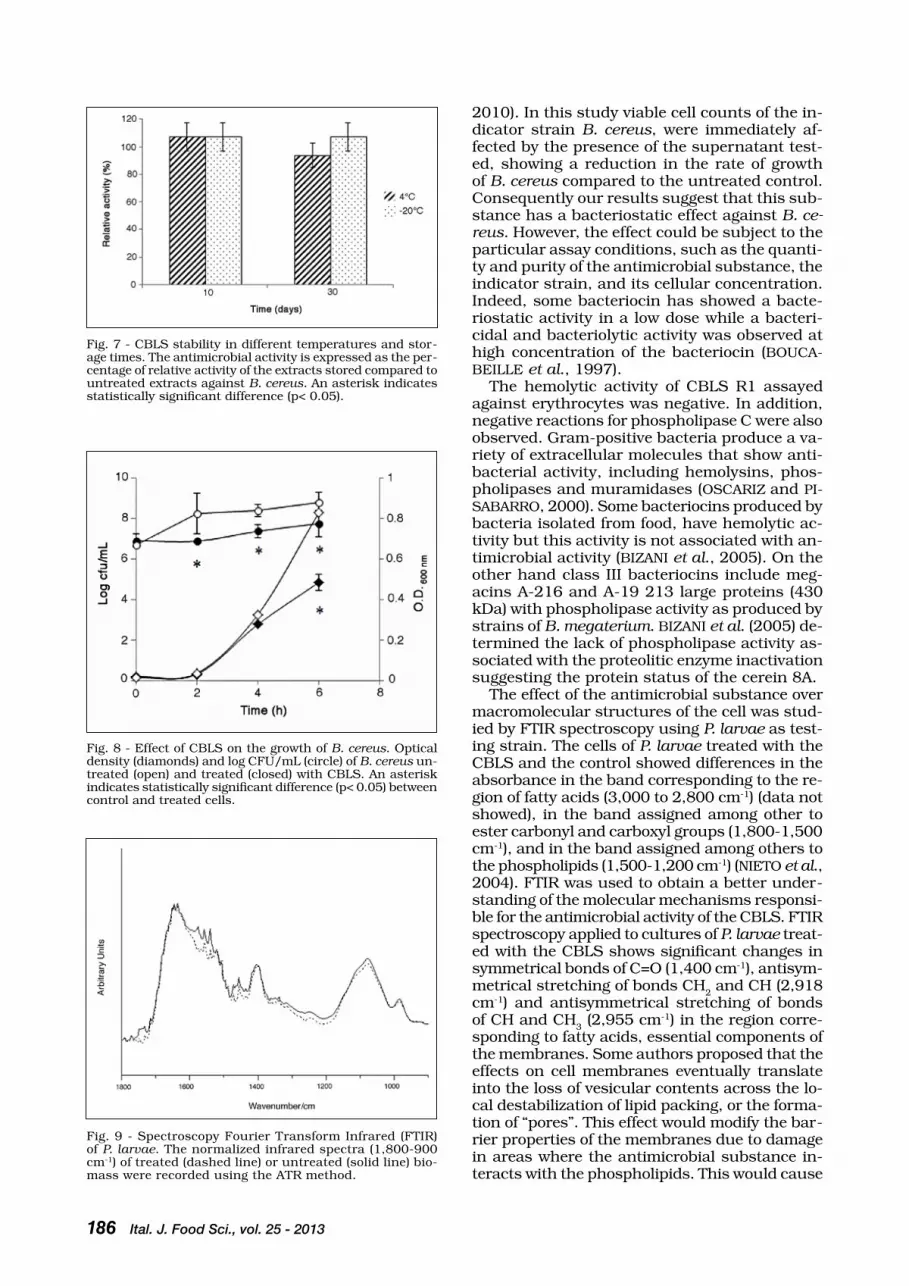
186 Ital. J. Food Sci., vol. 25 - 2013
2010). In this study viable cell counts of the in-dicator strain B. cereus, were immediately af-fected by the presence of the supernatant test-ed, showing a reduction in the rate of growth of B. cereus compared to the untreated control. consequently our results suggest that this sub-stance has a bacteriostatic effect against B. ce-reus. However, the effect could be subject to the particular assay conditions, such as the quanti-ty and purity of the antimicrobial substance, the indicator strain, and its cellular concentration. Indeed, some bacteriocin has showed a bacte-riostatic activity in a low dose while a bacteri-cidal and bacteriolytic activity was observed at high concentration of the bacteriocin (bOUcA-bEILLE et al., 1997).
the hemolytic activity of cbLS r1 assayed against erythrocytes was negative. In addition, negative reactions for phospholipase c were also observed. Gram-positive bacteria produce a va-riety of extracellular molecules that show anti-bacterial activity, including hemolysins, phos-pholipases and muramidases (OScArIZ and PI-SAbArrO, 2000). Some bacteriocins produced by bacteria isolated from food, have hemolytic ac-tivity but this activity is not associated with an-timicrobial activity (bIZANI et al., 2005). On the other hand class III bacteriocins include meg-acins A-216 and A-19 213 large proteins (430 kDa) with phospholipase activity as produced by strains of B. megaterium. bIZANI et al. (2005) de-termined the lack of phospholipase activity as-sociated with the proteolitic enzyme inactivation suggesting the protein status of the cerein 8A.
the effect of the antimicrobial substance over macromolecular structures of the cell was stud-ied by FtIr spectroscopy using P. larvae as test-ing strain. the cells of P. larvae treated with the cbLS and the control showed differences in the absorbance in the band corresponding to the re-gion of fatty acids (3,000 to 2,800 cm-1) (data not showed), in the band assigned among other to ester carbonyl and carboxyl groups (1,800-1,500 cm-1), and in the band assigned among others to the phospholipids (1,500-1,200 cm-1) (NIEtO et al., 2004). FtIr was used to obtain a better under-standing of the molecular mechanisms responsi-ble for the antimicrobial activity of the cbLS. FtIr spectroscopy applied to cultures of P. larvae treat-ed with the cbLS shows significant changes in symmetrical bonds of c=O (1,400 cm-1), antisym-metrical stretching of bonds cH2 and cH (2,918 cm-1) and antisymmetrical stretching of bonds of cH and cH3 (2,955 cm-1) in the region corre-sponding to fatty acids, essential components of the membranes. Some authors proposed that the effects on cell membranes eventually translate into the loss of vesicular contents across the lo-cal destabilization of lipid packing, or the forma-tion of “pores”. this effect would modify the bar-rier properties of the membranes due to damage in areas where the antimicrobial substance in-teracts with the phospholipids. this would cause
Fig. 8 - Effect of cbLS on the growth of B. cereus. Optical density (diamonds) and log cFU/mL (circle) of B. cereus un-treated (open) and treated (closed) with cbLS. An asterisk indicates statistically significant difference (p< 0.05) between control and treated cells.
Fig. 9 - Spectroscopy Fourier transform Infrared (FtIr) of P. larvae. the normalized infrared spectra (1,800-900 cm-1) of treated (dashed line) or untreated (solid line) bio-mass were recorded using the Atr method.
Fig. 7 - cbLS stability in different temperatures and stor-age times. the antimicrobial activity is expressed as the per-centage of relative activity of the extracts stored compared to untreated extracts against B. cereus. An asterisk indicates statistically significant difference (p< 0.05).

Ital. J. Food Sci., vol. 25 - 2013 187
structural fluctuations that may well explain the main mode of action that quickly affects mem-brane integrity instead of other vital processes. Similar results were obtained by bIZANI et al. (2005) when they studied the mechanism of ac-tion of cerein 8A by FtIr, proposed that it could be a peptide that forms pores.
the cbLS was partially purified by extraction with solvents, in this case, 1-butanol, result-ing in a concentrated solution. the concentrat-ed extract showed higher activity that the crude extract against B. cereus and P. larvae (table 1). the titration of the antimicrobial activity of the concentrated extract against B. cereus was measured as 400 AU/mL. Many methods have
table 1 - Antimicrobial activity of extracts.
B. cereus P. larvae
CBLS 8,3±0,6a 15,7±0,6a
Concentrated extract 14,5±0,7b 34±1,41b
*Antimicrobial activity of different extracts is expressed as in-hibition zones (mm). Values against the same indicator strains (vertical columns) with different superscripts differ significant-ly (P < 0.05).
AcKNOWLEDGEMENtS
We gratefully acknowledge the financial supports of the Uni-versidad Nacional de Mar del Plata (Project No. EXA 500/10) and consejo Nacional de Investigaciones científicas y téc-nicas (cONIcEt).
rEFErENcES
Aasen I.M., Møretrø t., Katla t., Axelsson L. and Storrø I. 2000. Influence of complex nutrients, temperature and pH on bacteriocin production by Lactobacillus sakei ccUG 42687. Appl. Microbiol. and biotechnol. 53: 159.
Abo-Amer A.E. 2007. characterization of a bacteriocin-like inhibitory substance produced by Lactobacillus plan-tarum isolated from Egyptian home-made yogurt. Sci. Asia. 33: 313.
Abriouel H., Franz c., Omar N.b. and Gálvez A. 2010. Di-versity and applications of Bacillus bacteriocins. FEMS Microbiol. rev. 35: 1.
Anthony t., rajesh t., Kayalvizhi N. and Gunasekaran P. 2009. Influence of medium components and fermenta-tion conditions on the production of bacteriocin(s) by Ba-cillus licheniformis Anba9. biores. technol. 100(2): 872.
Apetroaie-constantin c., Mikkola r., Andersson M.A., teplo-va V., Suominen I., Johansson t. and Salkinoja-Salonen M. 2009. Bacillus subtilis and B. mojavensis strains con-nected to food poisoning produce the heat stable toxin amylosin. J. Appl. Microbiol. 106: 1976.
bizani D., Motta A.S., Morrissy J.A.c, terra r.M.S., Souto A.A. and brandelli A. 2005. Antibacterial activity of cerein 8A a bacteriocin-like peptide produced by Bacillus cere-us. Int. Microbiol. 8: 125.
boucabeille c., Mengin-Lecreulx D., Henkes G., Simon-et J.M. and van Heijenoort J. 1997. Antibacterial and hemolytic activities of linescin Oc2, a hydrophobic sub-stance produced by Brevibacterium linens. FEMS Micro-biol. Lett. 153: 295.
cherif A., Ouzari H., Daffonchio D., cherif H., ben Slama K., Hassen A., Jaoua S. and boudabous A. 2001. thu-ricin 7, a novel bacteriocin produced by Bacillus thuring-iensis bMG1.7, a new strain isolated from soil. Lett. of Appl. Microbiol. 32: 243.
cladera-Olivera F., caron G.r. and brandelli A. 2004. bacte-riocin-like substance production by Bacillus licheniformis strain P40. Lett. in Appl. Microbiol. 38(4): 251.
Dean A.P., Sigee D.c., Estrada b. and Pittman J.K. 2010. Using FtIr spectroscopy for rapid determination of lipid accumulation in response to nitrogen limitation in fresh-water microalgae. biores. technol. 101: 4499.
Dingmann D.W. and Stahly D.P. 1983. Medium promoting sporulation of Bacillus larvae and metabolism of medi-um components. Appl. and Environ. Microbiol. 46: 860.
Dominguez A.P.M., bizani D., cladera-Olivera F. and bran-delli A. 2007. cerein 8A production in soybean protein using response surface methodology. biochem. Engin. J. 35: 238.
Fangio M.F., Møller Martensen P., roura S.I. and Fritz r. 2010. Antimicrobial activity produced Bacillus spp. isolat-ed from vegetable food. Italian J. of Food Sci. 3(22): 341.
Hammami I., rhouma A., Jaouadi b., rebai A. and Nesme X. 2009. Optimization and biochemical characterization of a bacteriocin from a newly isolated Bacillus subtilis strain 14b for biocontrol of Agrobacterium spp. strains. Lett. in Appl. Microbiol. 48(2): 253.
Jatinder K. and Jana A.K. 2009. cell growth prediction for Bacillus licheniformis through artificial neural network at simultaneous multiple variation in concentration of nu-trients in media. Kathmandu Univ. J. of Sci. Engin. and technol. 5(2): 79.
Joerger r.D. 2003. Alternatives to Antibiotics: bacterio-cins, Antimicrobial Peptides and bacteriophages. Poult. Sci. 82: 640.
Kindoli S., Lee H.A. and Kim J.H. 2012. Properties of bac
been used to concentrate and purify the bacte-riocins, some of which combine several proce-dures (LI et al., 2006), while others use just a few steps of purification (OScArIZ and PISAbArrO, 2000; AbO-AMEr, 2007). When these methods were performed, the recovery of antimicrobial activity should take into account, since in each step of concentration and purification material loss occurs. As a result, we obtain a concentrat-ed extract which antimicrobial activity is greater than the original crude extract. tEN brINK et al. (1994) determined that the bacteriocin acidocin b is a hydrophobic peptide due to recovery with 1-butanol extraction from cell-free neutralized supernatants, being a feature shared with oth-er bacteriocins (KLAENHAMMEr, 1993).
cONcLUSIONS
the activity of the crude bacteriocin-like sub-stance (cbLS) was dependent of the components of the culture media and was detected in the ex-ponential phase of growth. the cbLS was stable at a variable pH range and temperature of pas-teurization, being inactivated by sterilization. In addition, cbLS was stable to storage at temper-ature of refrigeration and freezing. the mode of action of the antimicrobial activity was bacteri-ostatic and changes of the bands in the infra-red region also make evident that the effect oc-curs on the cell membrane by FtIr. these re-sults indicate that the bLS produced by B. sub-tilis r1 would have a technological interest in food preservation.

188 Ital. J. Food Sci., vol. 25 - 2013
W42, a bacteriocin produced by Bacillus subtilis W42 isolated from cheonggukjang. J. Microbiol. biotechnol. 22: 1092.
Klaenhammer t.r. 1993. Genetics of bacteriocins produced by lactic acid bacteria. FEMS Microbiol. rev. 12: 39.
Li Q., Meng X., Wu X., Lin W., Duan c., Feng J. and tang J. 2006. Purification of two antimicrobial substances pro-duced by Bacillus subtilis strain b11 and their proper-ties. Agri. Sci. in china. 5(5): 363.
Lisboa M.P., bonatto D., bizani D., Henriques J.A.P. and brandelli A. 2006. characterization of a bacteriocin-like substance produced by Bacillus amyloliquefaciens isolat-ed from the brazilian Atlantic forest. Int. Microbiol. 9: 111.
Liu W. and Hansen J.N. 1990. Some chemical and phys-ical properties of nisin, a small-protein antibiotic pro-duced by Lactococcus lactis. Appl. Environ. Microbiol. 56: 2551-2558.
Martirani L., Varcamonti M., Naclerio G. and De Felice M. 2002. Purification and partial characterization of bacillocin 490, a novel bacteriocin produced by a thermophilic strain of Bacillus licheniformis. Microbial cell Fact. 1: 1.
Nieto L.I., Donolo A.S., bava A.J. and Yantorno O.M. 2004. Empleo de espectroscopia infrarroja con transformada de Fourier para diferenciar bacterias de importancia clínica. Acta bioquím. clín. Latinoam. 38(3): 289.
Oscáriz J.c. and Pisabarro A.G. 2000. characterization and mechanism of action of cerein 7, a bacteriocin produced by Bacillus cereus bc7. J. of Appl. Microbiol. 89: 361.
russell J.b. and Mantovani H.c. 2002. the bacteriocins of ruminal bacteria and their potential as an alternative to antibiotics. J. of Mol. Microbiol. and biotechnol. 4(4): 347.
Settanni L. and corsetti A. 2008. Application of bacterio-cins in vegetable food biopreservation. Int. J. of Food Mi-crobiol. 121: 123.
Sharma N. and Gautam N. 2008. Antibacterial activity and characterization of bacteriocin of Bacillus mycoides iso-lated from whey. Indian J of biotechnol. 8: 117.
Sutyak K.E., Wirawan r.E., Aroutcheva A.A. and chikindas M.L. 2008. Isolation of the Bacillus subtilis antimicrobi-al peptide subtilosin from the dairy product-derived Ba-cillus amyloliquefaciens. J. of Appl. Microbiol. 104: 1067.
ten brink b., Minekus M., van der Vossen J.M., Leer r.J. and Huis in’t Veld J.H. 1994. Antimicrobial activity of lactobacilli: preliminary characterization and optimiza-tion of production of acidocin b, a novel bacteriocin pro-duced by Lactobacillus acidophilus M46. J. of Appl. bac-teriol. 77: 140.
Xie J., Zhang r., Shang c. and Guo Y. 2009. Isolation and characterization of a bacteriocin produced by an isolated Bacillus subtilis LFb112 that exhibits antimicrobial ac-tivity against domestic animal pathogens. African J. of biotechnol. 8: 5611.
Xu D., Wang Y., Sun L., Liu H. and Li J. 2013. Inhibitory ac-tivity of a novel antibacterial peptide AMPNt-6 from Ba-cillus subtilis against Vibrio parahaemolyticus in shrimp. Food control. 30: 58.
Yoshida S., Hiradate S., tsukamoto t., Hatakeda K. and Shi-rata A. 2001. Antimicrobial activity of culture filtrate of Bacillus amyloliquefaciens rc-2 isolated from mulberry leaves. Phytopathol. 91: 181.
Zar H. 1998. “biostatistical Analysis”. 4th Ed. Prentice Hall. New Jersey.
Paper received June 26, 2012 Accepted October 18, 2012

PaPer
Ital. J. Food Sci., vol. 25 - 2013 189
- Keywords: Potentilla anserina L., dough property, rheology, bread quality -
QUALITY OF BREAD CONTAINING POTENTILLA ANSERINA L.
CULTIVATED IN CHINA
YING JI, JIE GANG and WENZHONG HU*Key Laboratory of Biotechnology & BioResources Utilization, College of Life Sciences, Dalian
Nationalities University, 18 Liaohe Road West, Dalian 116600, China*Corresponding author: [email protected]
AbStrAct
the Potentilla anserina L. is a traditional chinese functional food. the objective of this study was to exploit the use of this nutrient-rich food in bread by replacing wheat flour at 1-9% level.
breads prepared with P. anserina were analyzed for dough rheology properties, loaf volume, crumb texture, micro-structural and selected sensory attributes. Dough rheological properties were investigated using farinograph. Upon addition of P. anserina, significant increase in water ab-sorption, development time and stability, and decrease in the mixing tolerance index was record-ed. Loaf volumes decreased significantly from 5.32 to 3.85 cm3/g as the P. anserina supplemen-tation increased from 0 to 9%. Hardness and total phenolic contents significantly increased with the addition of P. anserina powder. the microstructure of the breads was characterized by scan-ning electron microscopy (SEM). the addition of P. anserina to wheat flour distinctly destroyed gluten matrix in the SEM images and produced a continuous sheet of gelatinized starch. Senso-ry evaluations revealed that P. anserina can be added to flour at the level of 5%, as did not dete-riorate the bread sensory evaluation.
the acceptable quality bread could be made with up to 5% P. anserina, as did not deteriorate the bread sensory evaluation. therefore, the addition of P. anserina could be an effective way to produce functional wheat flour bread.
As the role of diet in the prevention of non-communicable diseases has become more evident, there is a growing demand for a new generation of healthier food products. Since limited referenc-es are published in the area of P. anserina enriched breads, studies on the development of new products with acceptable physico-chemical characteristics are essential for exploiting value-add-ed uses of P. anserina.
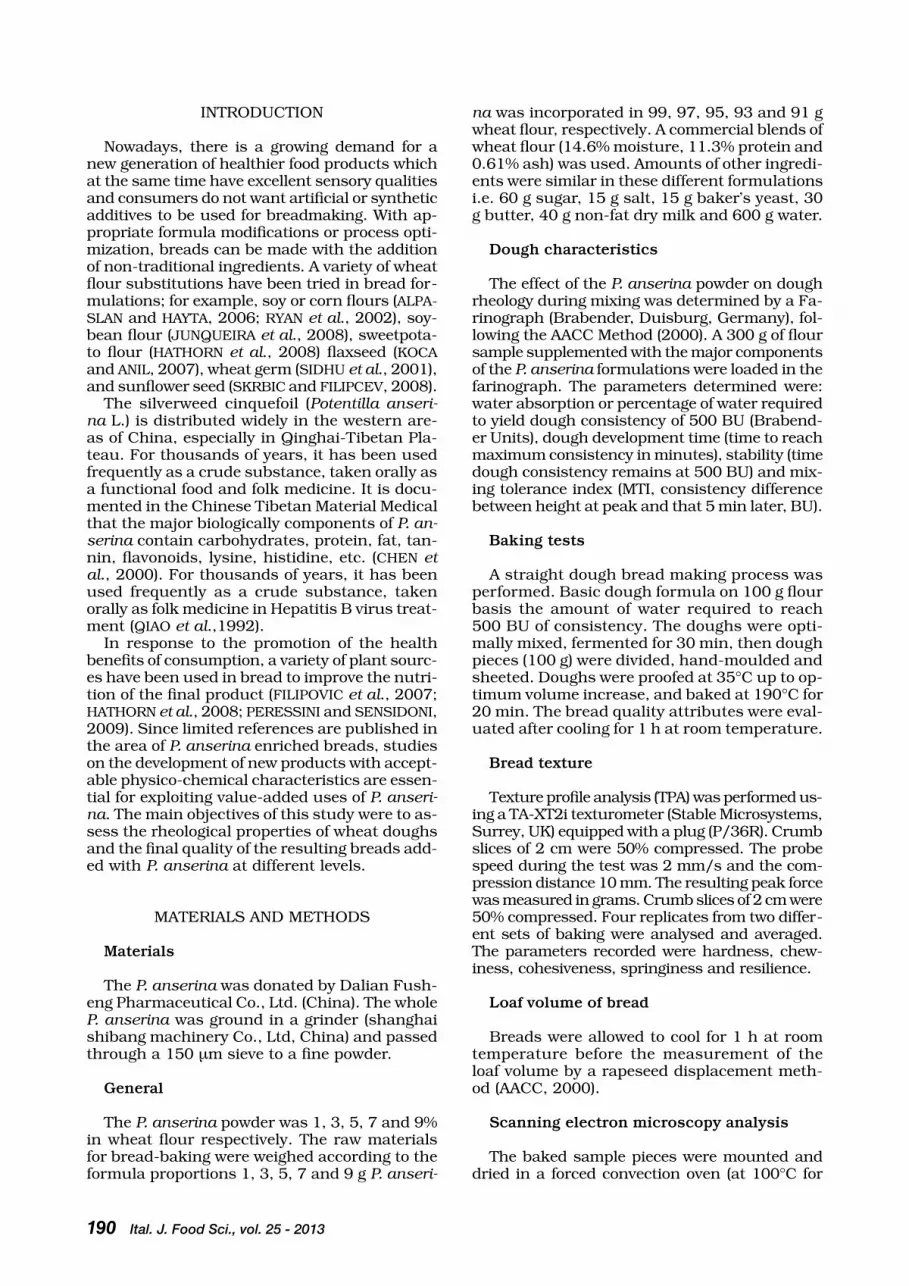
190 Ital. J. Food Sci., vol. 25 - 2013
INtrODUctION
Nowadays, there is a growing demand for a new generation of healthier food products which at the same time have excellent sensory qualities and consumers do not want artificial or synthetic additives to be used for breadmaking. With ap-propriate formula modifications or process opti-mization, breads can be made with the addition of non-traditional ingredients. A variety of wheat flour substitutions have been tried in bread for-mulations; for example, soy or corn flours (ALPA-SLAN and HAYtA, 2006; rYAN et al., 2002), soy-bean flour (JUNQUEIrA et al., 2008), sweetpota-to flour (HAtHOrN et al., 2008) flaxseed (KOcA and ANIL, 2007), wheat germ (SIDHU et al., 2001), and sunflower seed (SKrbIc and FILIPcEV, 2008).
the silverweed cinquefoil (Potentilla anseri-na L.) is distributed widely in the western are-as of china, especially in Qinghai-tibetan Pla-teau. For thousands of years, it has been used frequently as a crude substance, taken orally as a functional food and folk medicine. It is docu-mented in the chinese tibetan Material Medical that the major biologically components of P. an-serina contain carbohydrates, protein, fat, tan-nin, flavonoids, lysine, histidine, etc. (cHEN et al., 2000). For thousands of years, it has been used frequently as a crude substance, taken orally as folk medicine in Hepatitis b virus treat-ment (QIAO et al.,1992).
In response to the promotion of the health benefits of consumption, a variety of plant sourc-es have been used in bread to improve the nutri-tion of the final product (FILIPOVIc et al., 2007; HAtHOrN et al., 2008; PErESSINI and SENSIDONI, 2009). Since limited references are published in the area of P. anserina enriched breads, studies on the development of new products with accept-able physico-chemical characteristics are essen-tial for exploiting value-added uses of P. anseri-na. the main objectives of this study were to as-sess the rheological properties of wheat doughs and the final quality of the resulting breads add-ed with P. anserina at different levels.
MAtErIALS AND MEtHODS
Materials
the P. anserina was donated by Dalian Fush-eng Pharmaceutical co., Ltd. (china). the whole P. anserina was ground in a grinder (shanghai shibang machinery co., Ltd, china) and passed through a 150 µm sieve to a fine powder.
General
the P. anserina powder was 1, 3, 5, 7 and 9% in wheat flour respectively. the raw materials for bread-baking were weighed according to the formula proportions 1, 3, 5, 7 and 9 g P. anseri-
na was incorporated in 99, 97, 95, 93 and 91 g wheat flour, respectively. A commercial blends of wheat flour (14.6% moisture, 11.3% protein and 0.61% ash) was used. Amounts of other ingredi-ents were similar in these different formulations i.e. 60 g sugar, 15 g salt, 15 g baker’s yeast, 30 g butter, 40 g non-fat dry milk and 600 g water.
Dough characteristics
the effect of the P. anserina powder on dough rheology during mixing was determined by a Fa-rinograph (brabender, Duisburg, Germany), fol-lowing the AAcc Method (2000). A 300 g of flour sample supplemented with the major components of the P. anserina formulations were loaded in the farinograph. the parameters determined were: water absorption or percentage of water required to yield dough consistency of 500 bU (brabend-er Units), dough development time (time to reach maximum consistency in minutes), stability (time dough consistency remains at 500 bU) and mix-ing tolerance index (MtI, consistency difference between height at peak and that 5 min later, bU).
Baking tests
A straight dough bread making process was performed. basic dough formula on 100 g flour basis the amount of water required to reach 500 bU of consistency. the doughs were opti-mally mixed, fermented for 30 min, then dough pieces (100 g) were divided, hand-moulded and sheeted. Doughs were proofed at 35°c up to op-timum volume increase, and baked at 190°c for 20 min. the bread quality attributes were eval-uated after cooling for 1 h at room temperature.
Bread texture
texture profile analysis (tPA) was performed us-ing a tA-Xt2i texturometer (Stable Microsystems, Surrey, UK) equipped with a plug (P/36r). crumb slices of 2 cm were 50% compressed. the probe speed during the test was 2 mm/s and the com-pression distance 10 mm. the resulting peak force was measured in grams. crumb slices of 2 cm were 50% compressed. Four replicates from two differ-ent sets of baking were analysed and averaged. the parameters recorded were hardness, chew-iness, cohesiveness, springiness and resilience.
Loaf volume of bread
breads were allowed to cool for 1 h at room temperature before the measurement of the loaf volume by a rapeseed displacement meth-od (AAcc, 2000).
Scanning electron microscopy analysis
the baked sample pieces were mounted and dried in a forced convection oven (at 100°c for

Ital. J. Food Sci., vol. 25 - 2013 191
1h). then, the dried samples were kept in a des-iccator until further use. the samples were spat-ter-coated with palladium: platinum by ion coater (Hitachi, E-1030), and observed by scanning elec-tron microscope (SEM, Hitachi, S-4500). Samples were observed at a magnification level of 600x.
Determination of total phenolic contents
total phenolics were determined using the Fo-lin-ciocalteau method (SINGLEtON, OrtHOFEr and LAMUELA-rAVENtOS, 1999). 1 g turmeric powder or powdered bread was homogenised in 80% ethanol at room temperature, centrifuged at 10,000 g for 15 min and the supernatant was saved, respectively. the residue was extracted twice again with 80% ethanol and supernatants were pooled. Extract was evaporated at room temperature until dry. residue was dissolved in 5 mL distilled water. Hundred microliters of this extract was diluted to 3 mL using distilled wa-ter and mixed with 0.5 mL Folin-ciocalteau re-agent. After 3 min, 2 mL of 20% sodium carbon-ate was added followed by thorough mixing. So-lutions were heated in a 40°c water bath for 30 min. Absorbance was measured at 765 nm us-ing spectrophotometer (Optima 2000DV, Perkin-Elmer, Waltham, MA, USA). Gallic acid was used as a standard and results were expressed as mg gallic acid equivalent/100 g (mg GAE/100 g).
Sensory analysis
Sensory evaluations of bread were conducted by 40 panellists, consisting of Food Engineering college staff and students using a one to nine hedonic rating scale for the overall acceptabili-ty, where nine means extreme satisfaction and one extreme dissatisfaction (1: dislike extreme-ly, 5: neither like nor dislike, 9: like extremely). Samples were placed on white plates and identi-fied with random three-digit numbers. Panellists evaluated the samples in a testing area and were instructed to rinse their mouths with water be-tween samples to minimise any residual effect.
Statistical analysis
the experimental data obtained were analyzed statistically for variance (SOKAL and rOHLF, 1981) and inference reported at the appropri-ate places. For the results, the mean values and standard deviations were calculated.
rESULtS AND DIScUSSION
Effect of P. anserina on the farinograph characteristics of wheat flour
the farinograph results of P. anserina supple-mented dough and the reference dough (without P. anserina addition) were shown in Fig. 1 and ta-
ble 1. As the flours contained P. anserina, these materials were considered to disturb the continu-ous gluten network structure in the wheat dough.
Water absorption was increased by P. anseri-na addition in agreement with previous data (rO-SELL et al., 2006; WANG et al., 2002). the water absorption linearly increased from 63.2% in the reference to 71.9% in the sample with 9% P. anse-rina. this is likely caused by the great number of hydroxyl groups existing in the fibre structure of P. anserina, which allow more water interactions through hydrogen bonding. Dough development time and stability value are indicators of the flour strength, with higher values suggesting strong-er dough. Dough development time and stability value trend to increase as a consequence of ad-dition P. anserina from 0 to 9%, but an increase of the dough stability time and a decrease of the development value when adding 3% P. anseri-na was found, which is in agreement with LAU-rIKAINEN et al. (1998). the addition of P. anseri-na to wheat flours improved the strength of the doughs and the effect was especially prominent in the case of weaker flour. ZAIDUL et al. (2004) thought that dough development time was relat-ed to water absorption percentage of the flours. An increase in water absorption will often in-crease development time. the mixing tolerance index was reduced by the addition of the tested P. anserina, and the extent of the decrease de-pended on the P. anserina considered. these re-sults could be explained by the interactions be-tween fibres of P. anserina and gluten.
Influence of P. anserina on bread quality evaluation
to demonstrate the effect of P. anserina on bread qualities, the additional baking test was conducted using increased amount of P. anse-rina. Loaf volume is regarded as the most im-portant bread characteristic since it provides a quantitative measurement of baking perfor-mance (tronsmo et al., 2003). A significant de-crease in bread volume was noted with an in-crease in the P. anserina powder level. bread loaf volumes decreased significantly (P < 0.05), from 5.32 to 3.85 cm3/g, as the P. anserina powder in-creased from 0 to 9% (table 2). Partial replace-ment of wheat flour with non-glutinous flour has been shown to result in lower bread volumes, as reported by GÓMEZ et al. (2003) who observed a significant decrease in baked volume of bread made with purified dietary fibres. the decrease in loaf volume was expected as a result of glu-ten-free P. anserina powder in bread formulation and the addition of P. anserina powder reduced the ratio of wheat flour responsible for the for-mation of network structure.
the hardness values increased with increas-ing levels of P. anserina, from 509.524 g for the control bread to 2254.205 g in 9% P. anserina bread (table 3). the addition of P. anserina pow-

192 Ital. J. Food Sci., vol. 25 - 2013
table 1 - Effect of P. anserina addition on water absorption, arrival time, peak time, stability time, development time and mix-ing tolerance index of doughs at farinograph.
P. anserina Water absorption Arrival Time Peak Time Stability Time Development time Mixing Tolerance Index (%) (%) (min) (min) (min) (min) (BU)
0 63.2 1.27 2.36 11.2 2.3 38 1 64.2 1.36 3.27 14.1 3.3 35 3 65.5 1.25 2.15 15.1 2.2 27 5 67.7 1.64 3.13 15.0 3.2 23 7 70.0 1.76 3.38 14.5 3.4 27 9 71.9 2.08 5.02 17.7 5.0 12
Fig. 1 - Farinograph curves of wheat flour enriched with P. anserina at 0%(A), 1%(b), 3%(c), 5%(D), 7%(E) e 9(F).
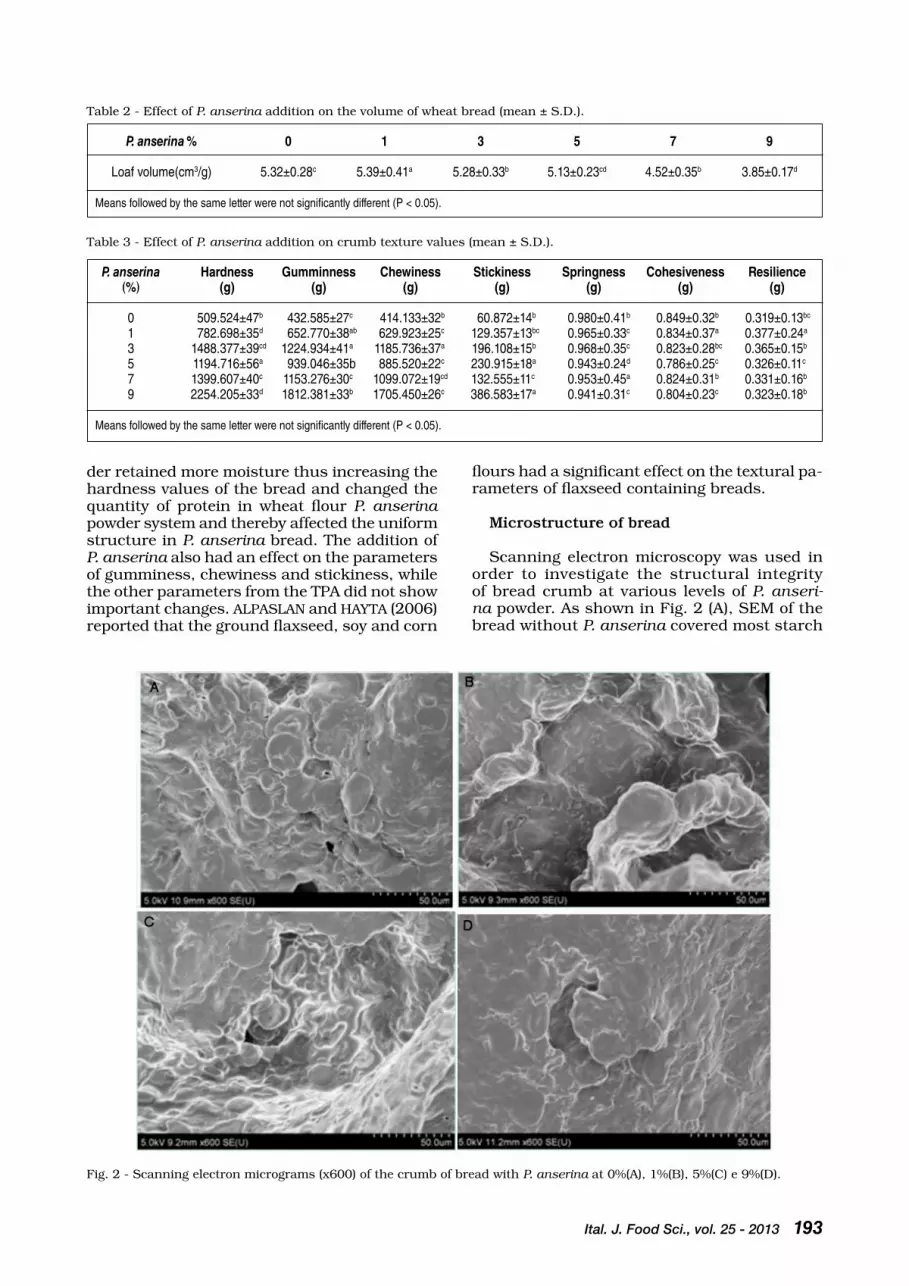
Ital. J. Food Sci., vol. 25 - 2013 193
der retained more moisture thus increasing the hardness values of the bread and changed the quantity of protein in wheat flour P. anserina powder system and thereby affected the uniform structure in P. anserina bread. the addition of P. anserina also had an effect on the parameters of gumminess, chewiness and stickiness, while the other parameters from the tPA did not show important changes. ALPASLAN and HAYtA (2006) reported that the ground flaxseed, soy and corn
flours had a significant effect on the textural pa-rameters of flaxseed containing breads.
Microstructure of bread
Scanning electron microscopy was used in order to investigate the structural integrity of bread crumb at various levels of P. anseri-na powder. As shown in Fig. 2 (A), SEM of the bread without P. anserina covered most starch
table 2 - Effect of P. anserina addition on the volume of wheat bread (mean ± S.D.).
P. anserina % 0 1 3 5 7 9
Loaf volume(cm3/g) 5.32±0.28c 5.39±0.41a 5.28±0.33b 5.13±0.23cd 4.52±0.35b 3.85±0.17d
Means followed by the same letter were not significantly different (P < 0.05).
table 3 - Effect of P. anserina addition on crumb texture values (mean ± S.D.).
P. anserina Hardness Gumminness Chewiness Stickiness Springness Cohesiveness Resilience (%) (g) (g) (g) (g) (g) (g) (g)
0 509.524±47b 432.585±27c 414.133±32b 60.872±14b 0.980±0.41b 0.849±0.32b 0.319±0.13bc
1 782.698±35d 652.770±38ab 629.923±25c 129.357±13bc 0.965±0.33c 0.834±0.37a 0.377±0.24a
3 1488.377±39cd 1224.934±41a 1185.736±37a 196.108±15b 0.968±0.35c 0.823±0.28bc 0.365±0.15b
5 1194.716±56a 939.046±35b 885.520±22c 230.915±18a 0.943±0.24d 0.786±0.25c 0.326±0.11c
7 1399.607±40c 1153.276±30c 1099.072±19cd 132.555±11c 0.953±0.45a 0.824±0.31b 0.331±0.16b
9 2254.205±33d 1812.381±33b 1705.450±26c 386.583±17a 0.941±0.31c 0.804±0.23c 0.323±0.18b
Means followed by the same letter were not significantly different (P < 0.05).
Fig. 2 - Scanning electron micrograms (x600) of the crumb of bread with P. anserina at 0%(A), 1%(b), 5%(c) e 9%(D).

194 Ital. J. Food Sci., vol. 25 - 2013
granules coated by gluten network to form a continuous film. the addition of 1% P. anseri-na had no detectable effects on the microstruc-ture observed in the bread samples as shown in Fig. 2(b). Fig. 2(c) shows the samples with a P. anserina level of 5%. As shown in figure 2(c), some granules in the breads also appeared to be swollen and slightly elongated, possibly due to gelatinization during the baking process. Fig. 2(D) shows 9% P. anserina powder-supplement-ed bread. the inner surface starch granules of P. anserina bread have being completely distort-ed and having lost their identity and formed a continuous sheet of gelatinized starch, suggest-ing a greater starch gelatinisation and amyl-ose/amylopectin leakage. Furthermore, a con-tinuous gluten film was not observed. Accord-ing to SEEtHArAMAN et al. (1997) doughs con-taining 8% of soluble fiber had poor gluten de-velopment and extensive starch gelatinization during baking.
Total phenolics contents
the total phenolic contents of P. anserina powder and bread samples were analysed and results are shown in Fig. 3. the phenolic con-tent increased significantly with increasing P. anserina powder levels in bread and the high-est was found in bread with 9% substitution with P. anserina powder. the phenolic content
Sensory evaluation of bread
the effects of P. anserina addition on bread overall sensory score are presented in Fig. 4. the overall acceptability of breads with P. anserina at substitution is quite evident in breads with up to 9% P. anserina. In general, panellists preferred bread without P. anserina added. Nevertheless, all the breads were acceptable except when the P. anserina powder addition at the level of 7 and 9%. Scores were markedly lower in these cas-es probably due to the original properties of the P. anserina, since the colour of P. anserina was dark yellow. As can be seen in Fig. 4, Senso-ry expert analysis carried out in bread texture showed that wheat bread with up to at least 5% wheat flour by P. anserina could be substitut-ed without any detrimental effect on the texture characteristics of bread. We may explain that a daily intake of 50 g P. anserina bread having 5% wheat flour substitution with P. anserina pow-der can deliver approximately 64.63 mg GAE of total phenolic compounds which can render ad-ditional health benefits to human body.
cONcLUSIONS
From the overall results, it could be conclud-ed that the addition of P. anserina to wheat flour modifies the rheological properties of the dough. As a result, the substitution of P. anserina signif-icantly decreased the loaf volume as compared with the wheat bread. the results of this study showed that bread hardness increased as the level of P. anserina increased from 0 to 9%. Our results further support that acceptable quality bread could be made with up to 5% P. anseri-na, as did not detrimental effect on the texture characteristics of bread. the higher levels (>5%) of P. anserina powder addition are not recom-mended as most quality attributes were shown to have affected negatively at the level of 7 and 9%. Optimizing the bread formulations and/or altering processing conditions could overcome any of the negative effects of P. anserina powder
Fig. 4 - Sensory scores for overall acceptability of bread sup-plemented with P. anserina.
Fig. 3 - total phenolic contents of breads containing P. anserina.
of P. anserina powder was 3,365 mg GAE/100 g (data not shown). Whereas the bread prepared with 9% P. anserina powder had 208.86 mg GAE/100 g of those. Phenolics are quite heat unstable and reactive compounds (cHEYNIEr, 2005) and the baking process might have re-sulted in some heat damage to phenolic com-pounds. However, despite the loss of total phe-nol content after baking, all breads containing P. anserina showed significantly higher phenol-ic compounds when compared with the con-trol. ALVArEZ-JUbEtE et al. (2010) reported that wheat seeds and wheat bread contained 53.1 and 29.1 mg GAE/100 g of total phenols, respectively.
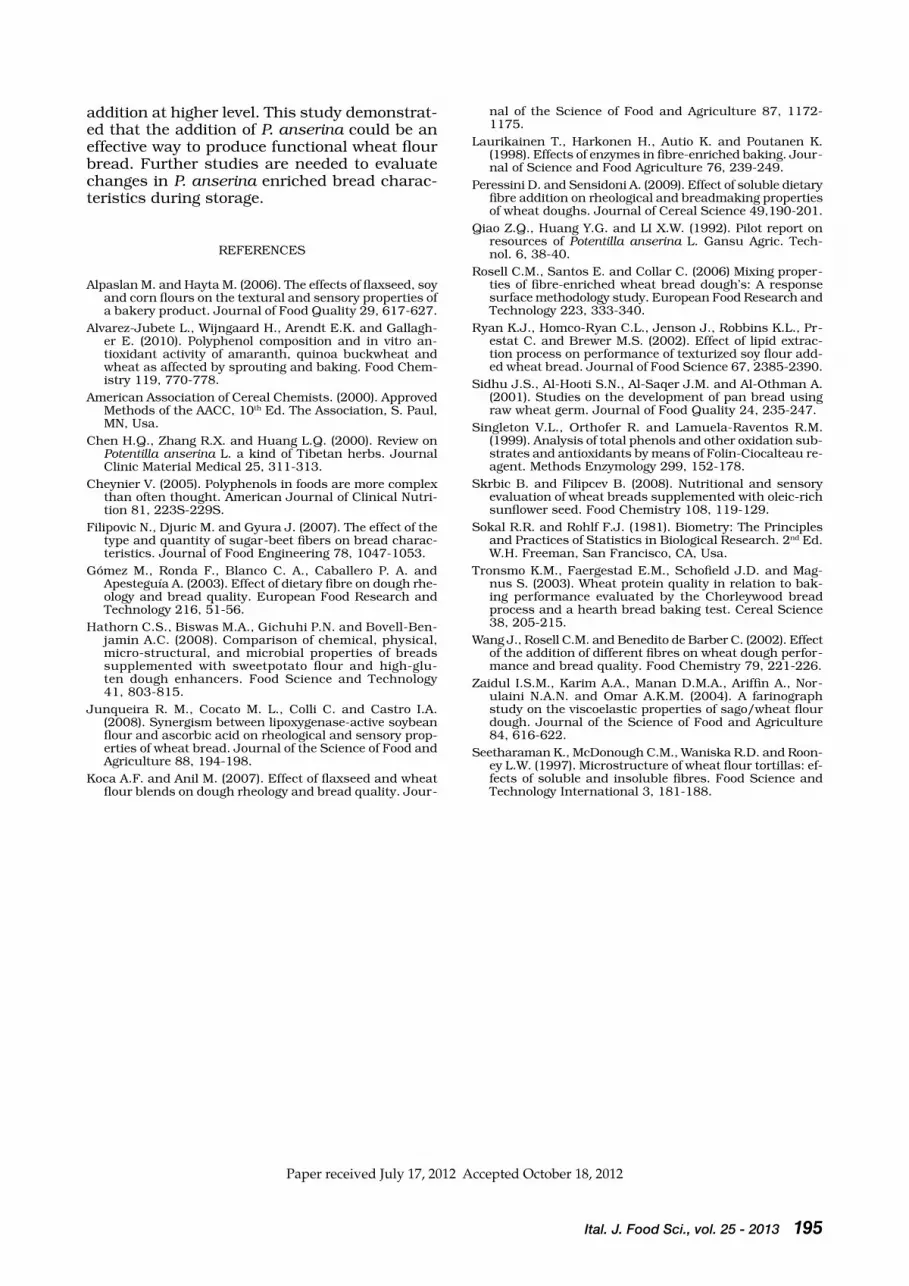
Ital. J. Food Sci., vol. 25 - 2013 195
addition at higher level. this study demonstrat-ed that the addition of P. anserina could be an effective way to produce functional wheat flour bread. Further studies are needed to evaluate changes in P. anserina enriched bread charac-teristics during storage.
rEFErENcES
Alpaslan M. and Hayta M. (2006). the effects of flaxseed, soy and corn flours on the textural and sensory properties of a bakery product. Journal of Food Quality 29, 617-627.
Alvarez-Jubete L., Wijngaard H., Arendt E.K. and Gallagh-er E. (2010). Polyphenol composition and in vitro an-tioxidant activity of amaranth, quinoa buckwheat and wheat as affected by sprouting and baking. Food chem-istry 119, 770-778.
American Association of cereal chemists. (2000). Approved Methods of the AAcc, 10th Ed. the Association, S. Paul, MN, Usa.
chen H.Q., Zhang r.X. and Huang L.Q. (2000). review on Potentilla anserina L. a kind of tibetan herbs. Journal clinic Material Medical 25, 311-313.
cheynier V. (2005). Polyphenols in foods are more complex than often thought. American Journal of clinical Nutri-tion 81, 223S-229S.
Filipovic N., Djuric M. and Gyura J. (2007). the effect of the type and quantity of sugar-beet fibers on bread charac-teristics. Journal of Food Engineering 78, 1047-1053.
Gómez M., ronda F., blanco c. A., caballero P. A. and Apesteguía A. (2003). Effect of dietary fibre on dough rhe-ology and bread quality. European Food research and technology 216, 51-56.
Hathorn c.S., biswas M.A., Gichuhi P.N. and bovell-ben-jamin A.c. (2008). comparison of chemical, physical, micro-structural, and microbial properties of breads supplemented with sweetpotato flour and high-glu-ten dough enhancers. Food Science and technology 41, 803-815.
Junqueira r. M., cocato M. L., colli c. and castro I.A. (2008). Synergism between lipoxygenase-active soybean flour and ascorbic acid on rheological and sensory prop-erties of wheat bread. Journal of the Science of Food and Agriculture 88, 194-198.
Koca A.F. and Anil M. (2007). Effect of flaxseed and wheat flour blends on dough rheology and bread quality. Jour-
nal of the Science of Food and Agriculture 87, 1172-1175.
Laurikainen t., Harkonen H., Autio K. and Poutanen K. (1998). Effects of enzymes in fibre-enriched baking. Jour-nal of Science and Food Agriculture 76, 239-249.
Peressini D. and Sensidoni A. (2009). Effect of soluble dietary fibre addition on rheological and breadmaking properties of wheat doughs. Journal of cereal Science 49,190-201.
Qiao Z.Q., Huang Y.G. and LI X.W. (1992). Pilot report on resources of Potentilla anserina L. Gansu Agric. tech-nol. 6, 38-40.
rosell c.M., Santos E. and collar c. (2006) Mixing proper-ties of fibre-enriched wheat bread dough’s: A response surface methodology study. European Food research and technology 223, 333-340.
ryan K.J., Homco-ryan c.L., Jenson J., robbins K.L., Pr-estat c. and brewer M.S. (2002). Effect of lipid extrac-tion process on performance of texturized soy flour add-ed wheat bread. Journal of Food Science 67, 2385-2390.
Sidhu J.S., Al-Hooti S.N., Al-Saqer J.M. and Al-Othman A. (2001). Studies on the development of pan bread using raw wheat germ. Journal of Food Quality 24, 235-247.
Singleton V.L., Orthofer r. and Lamuela-raventos r.M. (1999). Analysis of total phenols and other oxidation sub-strates and antioxidants by means of Folin-ciocalteau re-agent. Methods Enzymology 299, 152-178.
Skrbic b. and Filipcev b. (2008). Nutritional and sensory evaluation of wheat breads supplemented with oleic-rich sunflower seed. Food chemistry 108, 119-129.
Sokal r.r. and rohlf F.J. (1981). biometry: the Principles and Practices of Statistics in biological research. 2nd Ed. W.H. Freeman, San Francisco, cA, Usa.
tronsmo K.M., Faergestad E.M., Schofield J.D. and Mag-nus S. (2003). Wheat protein quality in relation to bak-ing performance evaluated by the chorleywood bread process and a hearth bread baking test. cereal Science 38, 205-215.
Wang J., rosell c.M. and benedito de barber c. (2002). Effect of the addition of different fibres on wheat dough perfor-mance and bread quality. Food chemistry 79, 221-226.
Zaidul I.S.M., Karim A.A., Manan D.M.A., Ariffin A., Nor-ulaini N.A.N. and Omar A.K.M. (2004). A farinograph study on the viscoelastic properties of sago/wheat flour dough. Journal of the Science of Food and Agriculture 84, 616-622.
Seetharaman K., McDonough c.M., Waniska r.D. and roon-ey L.W. (1997). Microstructure of wheat flour tortillas: ef-fects of soluble and insoluble fibres. Food Science and technology International 3, 181-188.
Paper received July 17, 2012 Accepted October 18, 2012

PaPer
196 Ital. J. Food Sci., vol. 25 - 2013
- Keywords: alginate, chitosan, electrolyte, rheology, shear thinning -
MODIFICATION OF THE RHEOLOGICAL BEHAVIOUR OF SODIUM ALGINATE
BY CHITOSAN AND MULTIVALENT ELECTROLYTES
BASIM ABU-JDAYIL1* and DEEB ABU FARA2
1Chemical & Petroleum Engineering Department, U.A.E. University, Al-Ain, P.O. Box 17555, U.A.E.2Chemical Engineering Department, University of Jordan, Amman, 11942, Jordan
*Corresponding author: [email protected]
AbStrAct
the rheological behaviour of sodium alginate/chitosan blends was examined at several mix-ture ratios. While both polymers exhibited nearly the same viscosity at low concentrations (1.0 and 2.0 w%), chitosan solutions had higher viscosity and greater deviation from Newtonian be-haviour at high solution concentrations (3.0-5.0 w%). the viscosity of alginate/chitosan mixtures was substantially increased. blends containing predominantly one component were of higher vis-cosity than blends with approximately equal proportions of both polymers. the viscosity of algi-nate solutions was strongly affected by the addition of electrolytes, with BaCl
2 exerting the great-
est effect on the alginate viscosity and shear thinning behaviour.

Ital. J. Food Sci., vol. 25 - 2013 197
1. INtrODUctION
Over the past decade, there has been a surge of interest in natural polymers obtained from renew-able sources. Approximately 30,000 metric tons/year of sodium alginates are currently used in the food, cosmetic, pharmaceutical, textile, and pa-per industries as thickening, stabilizing, and gel-ling agents. Alginate is a structural biopolymer ob-tained from brown seaweeds, with a wide range of applications in food, pharmacy, agriculture, and environmental science due to its natural origin and non-toxicity (PAMIES et al., 2010). Alginates are naturally derived linear copolymers of 1,4-linked β-D-mannuronic acid (M) and α-L-guluronic acid residues (G). the way in which these M and G units are arranged in the chain and the overall M/G ra-tio in a chain varies between seaweed species (OU-WErX et al., 1998; LU et al., 2006).
the utility of alginates is based on three main properties. the first is their ability, when dissolved in water, to increase the viscosity of aqueous solutions. the second is their ability to form gels when a calcium salt is added to a so-lution of sodium alginate in water (MOE et al., 1995; LU et al., 2006). the third property is the ability to form films of sodium or calcium algi-nate and fibers of calcium alginate (rIbEIrO et al, 2011). Alginates have a wide range of appli-cations, including the controlled release of me-dicinal drugs and other chemicals (AL-MUSAA et al., 1999; ALbArGHOUtHI et al., 2000, JOSEF et al., 2010) and as thickeners in the food indus-try (GOMEZ-DIAZ and NAVAZA, 2004).
chitosan is a derivative of chitin (a natural polysaccharide) which may be prepared by N-deacetylation of chitin in an alkaline medium (rINAUDO, 2006; KEMPE et al., 2008). chitin is the second most abundant natural polymer in the world and is biorenewable, biocompatible, environmentally friendly, biodegradable, and bi-ofunctional (rINAUDO, 2006; HUE et al., 2010). chitosan is frequently used in biomedical, food, drug, and cosmetic applications (cHO et al., 2006; KEMPE et al., 2008; PHUOc et al., 2011).
When alginate is mixed with chitosan, strong ionic interactions occur between the carboxyl res-idues of the alginate and the amino terminals of the chitosan, forming a polyelectrolyte complex. this complex does not dissolve in the presence of anti-gelling cations, and thus may be used to stabilize the gel and reduce the porosity of al-ginate beads (ALbArGHOUtHI et al., 2000). re-cently, oral controlled-release systems involving alginate microspheres, sometimes coated with chitosan to improve mechanical strength, have been tested as a way of delivering various drugs (cHAtcHAWALSAISIN et al., 2004; cOPPI and IAN-NUccELLI, 2009; FINOtELLI et al., 2010; cHÁVAr-rI et al., 2010; LUcINDA-SILVA et al., 2010; XING et al., 2010). In addition, the alginate/chitosan polyelectrolyte system has been used to produce fibrous scaffolds (WANG et al., 2010).
the application and acceptability of foods and pharmaceuticals are often dependent on the flow properties of the final product. rheological measurements are an important means of de-termining the flow and deformation behaviour of materials and can not only improve efficien-cy in processing but can also help formulators and end users design products that are optimal for their individual needs.
Although many researchers have investigat-ed the rheology and flow properties of alginate-based (cLEMENtI et al., 1998; OUWErX et al., 1998; GOMEZ-DIAZ and NAVAZA, 2004; SIME-ONE and GUIDO, 2004; tAYLOr et al., 2005; FU-NAMI et al., 2009; VALLÉE et al., 2009; De cE-LIS ALONSO et al., 2010; PAMIES et al., 2010; rIbEIrO et al., 2011) and chitosan-based (JI-ANG et al., 1999; MONtEMbAULt et al., 2005; cHO et al., 2006; KEMPE et al., 2008; HU et al., 2011; LI et al., 2010; MIr et al., 2011) materi-als, only limited studies of the flow properties of alginate/chitosan blends have been reported (SHON et al., 2007).
In this study, the flow properties of sodium alginate, chitosan, and their blends at several ratios were studied. In addition, the effect of di-valent and trivalent electrolytes (CaCl
2, BaCl
2,
and AlCl3) on the flow behaviour of alginate was
characterized.
2. MAtErIALS AND MEtHODS
2.1 Materials
the materials used in this study were supplied by the Jordanian Pharmaceutical Manufactur-ing co. (Naor, Jordan). Sodium alginate with a molecular weight of 14,000-200,000 (Protanal LF120, C
6O
7H
6Na) was obtained from Protan bi-
opolymers. chitosan (molecular weight 8,000-12,000) was obtained from Qingdao rich Wa-ters Industrial Ltd, china. the metal salts used as crosslinking materials were calcium chloride dihydrate (riedel de Haen analytical grade), bar-ium chloride dihydrate (Merck analytical grade bacl2 · 2H2O), and aluminium chloride hexa-hydrate (Merck analytical grade Alcl3 · 6H2O).
2.2 Rheological measurements
the rheological properties of the prepared gel solutions were determined using a concentric cylinder chan 35 viscometer, which is equipped with an inner cylinder rotating inside a station-ary outer cylinder. the shear stress (τ) of the samples was measured as a function of shear rate (γ⋅) at a constant temperature of 25°±0.1°c. the shear rate was varied from 1.70 to 1002 s-1. to predict the apparent viscosity (η) the follow-ing equation was used:
τ = ηγ⋅ (1)

198 Ital. J. Food Sci., vol. 25 - 2013
rheological experiments were carried out in duplicate with an average reproducibili-ty of ±5%. the average values were used for analysis.
2.3 Preparation of solutions
Solutions of alginate and chitosan were pre-pared based on mass/volume percentage (0.5 – 5.0% w/v) using an electronic balance (MEt-tLEr, 200) with a precision of ± 0.1 mg. the al-ginate was dissolved in distilled water while the chitosan was prepared in an acidic medium. the chitosan solution was prepared by mixing an ap-propriate amount of chitosan into distilled wa-ter containing 1.0 vol.% acetic acid and stirring using a magnetic stirrer until the solutes were completely dissolved. Alginate-chitosan (ALG-cS) blends were prepared at various volume ra-tios (4:1, 3:2, 2:3, and 1:4) by mixing appropri-ate volumes of 1.0 wt % alginate and chitosan solutions.
In the crosslinking experiments, 1.0 g of al-ginate was dissolved in 80 mL of distilled wa-ter and various amounts of salt (0.05-0.50 g) were dissolved in 20 mL of water. the salt so-lution was added dropwise to the alginate so-lution to obtain a concentration of 0.05-0.5 g electrolyte/g alginate.
3. rESULtS AND DIScUSSION
Pure solutions of alginate and chitosan dis-played shear thinning behaviour at all concen-trations studied, in which the apparent viscosi-ty decreased with increasing shear rate (Figs. 1 and 2). this behaviour is expected as the shear-ing of the polymer chains causes disruption of the three dimensional structure through break-ing of primary and secondary bonds. In addition, Figs. 1 and 2 indicate the increase in alginate and chitosan solution viscosity with increasing polymer concentration.
the non-Newtonian behaviour of alginate and
chitosan solutions was modelled using the two-parameter power-law model, which is the most frequently used model for alginate (MANcINI et al., 1996; cLEMENtI et al., 1998; GOMEZ-DIAZ and NAVAZA, 2004) solutions. It is given by:
η = mγ⋅ n-1 (2)
where η is the apparent viscosity, m is the con-sistency coefficient, γ⋅ is the shear rate, and n is the flow behaviour index.
As shown in Figs. 1 and 2, the rheological be-haviour of alginate and chitosan can be well de-scribed by the power law model. the parameters of power-law model obtained by non-linear re-gression at different polymer concentrations are reported in table 1.
referring to table 1, the chitosan solutions displayed greater deviation from Newtonian be-haviour (n = 1) than the alginate solutions at high concentrations. In addition, the shear thin-ning behaviour of chitosan increased with con-centration, while it was nearly constant in the case of alginate solutions. PAMIES et al. (2010) observed that the shear thinning effect in algi-nate solutions is due to disentanglement of the polymer chains. both solutions have compara-ble viscosity at low concentration, while chitosan solutions had greater viscosity at concentrations of 4.0 and 5.0 wt %. this is also apparent in the m values reported in table 1 and plotted in Fig. 3 as a function of concentration, where a signif-
Fig. 1 - the apparent viscosity of alginate solution at differ-ent concentrations.
Fig. 2 - the apparent viscosity of chitosan solution at dif-ferent concentrations.
table 1 - regressed parameters of power-law model for al-ginate and chitosan solutions.
Solution m (mPa ) n (-) R2
Conc. (w/v %) Alginate Chitosan Alginate Chitosan Alginate Chitosan
1.0 2,753 1,296 0.61 0.90 0.965 0.9972.0 5,972 8,203 0.80 0.86 0.998 0.9913.0 44,945 37,603 0.82 0.80 0.998 0.9984.0 71,459 122,552 0.82 0.70 0.999 0.9965.0 90,193 488,860 0.82 0.62 0.996 0.999

Ital. J. Food Sci., vol. 25 - 2013 199
icant increase in m values was detected in the chitosan solutions. Fig. 3 also indicates that the consistency coefficient of the alginate solutions increased linearly with increasing solution con-centration, while the dependence of the m val-ue of chitosan on the solution concentration is described by an exponential relationship. this is because for very dilute solutions, the polymer coils are widely separated and do not overlap. At a critical concentration marking the transition from the extremely dilute to the dilute concen-tration region, the hydrodynamic volumes of in-dividual coils begin to touch. As the concentra-tion is increased further, the coils begin to over-lap, eventually resulting in the formation of en-tanglements that significantly increase viscosity.
In the second part of this study, alginate-chi-tosan blends containing 1.0 wt % total polymer concentration were prepared and their rheologi-cal behaviour was compared with the behaviour of pure solutions (Fig. 4). All blends exhibited higher viscosity than the pure solutions. there was no general trend in the viscosity increase, but blends predominantly containing either al-ginate or chitosan were of higher viscosity than blends with approximately equal proportions of
both polymers. SHON et al. (2007) reported that mixtures of alginate and chitosan had substan-tially increased viscosities, and that this increase is related to the formation of a polyelectrolyte complex (PEc). this theory explains the light tur-bidity observed upon mixing the two polymers. A polyelectrolyte complex is formed by the as-sociation of two or more polymers through elec-trostatic interactions, for example the polyca-tionic chitosan interacting with polyanionic algi-nate through proton transfer (SHON et al., 2007). MENG et al. (2009) observed that films formed from alginate-chitosan blends exhibited differ-ent mechanical properties depending upon the composition ratio of the two polysaccharides.
table 2 reveals a significant enhancement in m values in the alginate/chitosan blends. In ad-dition, the mixing process alters the rheological behaviour of the solution, with the flow behav-iour indices (n) of the blends varying between those of pure chitosan and pure alginate. this phenomenon indicates that crosslinking of al-ginate with chitosan significantly increases the viscosity of the solution while at the same time reducing the shear thinning behaviour.
It is known that alginates exhibit character-istic ion binding to multivalent cations and that this forms the basis for their gelling properties. cation binding leads to the formation of covalent bonds and precipitation of an insoluble hydrogel. the crosslinking process stiffens and roughens the polymer and reduces swelling in solvents (AL-MUSAA et al., 1999). In the final portion of this investigation, 1.0 wt % pure alginate solutions were crosslinked using various concentrations (0.05 – 0.50 g crosslinker/g alginate) of cacl2, bacl2, and Alcl3. Adding salts to alginate solu-tions resulted in an increase in the solution vis-cosity. PAMIES et al. (2010) demonstrated that addition of salts produces large changes in the viscosity of alginate solutions. the viscosity in-creased with the addition of small amounts of.... due to hydrogel formation, but this effect was reduced when Nacl was added instead. In this study, barium chloride exerted the greatest ef-fect on alginate viscosity in the concentration range under examination (Fig. 5). the addition of 0.05 g of bacl2 to one gram of alginate in-creased the solution viscosity by a factor of 2.5,
Fig. 3 - Dependence of m values of alginate and chitosan on solution concentration.
Fig. 4 - the apparent viscosity of alginate-chitosan blends.
table 2 - regressed values of power law model for alginate – chitosan blends of 1.0 w % polymer solutions.
Blend Ratio m (mPa ) n (-) R2
Alginate/Chitosan
Pure alginate (1.0 w %) 2,753 0.61 0.965Pure chitosan (1.0 w %) 1,296 0.90 0.9974/1 14,322 0.73 0.9903/2 6,032 0.81 0.9892/3 5,466 0.81 0.9711/4 9,222 0.75 0.986
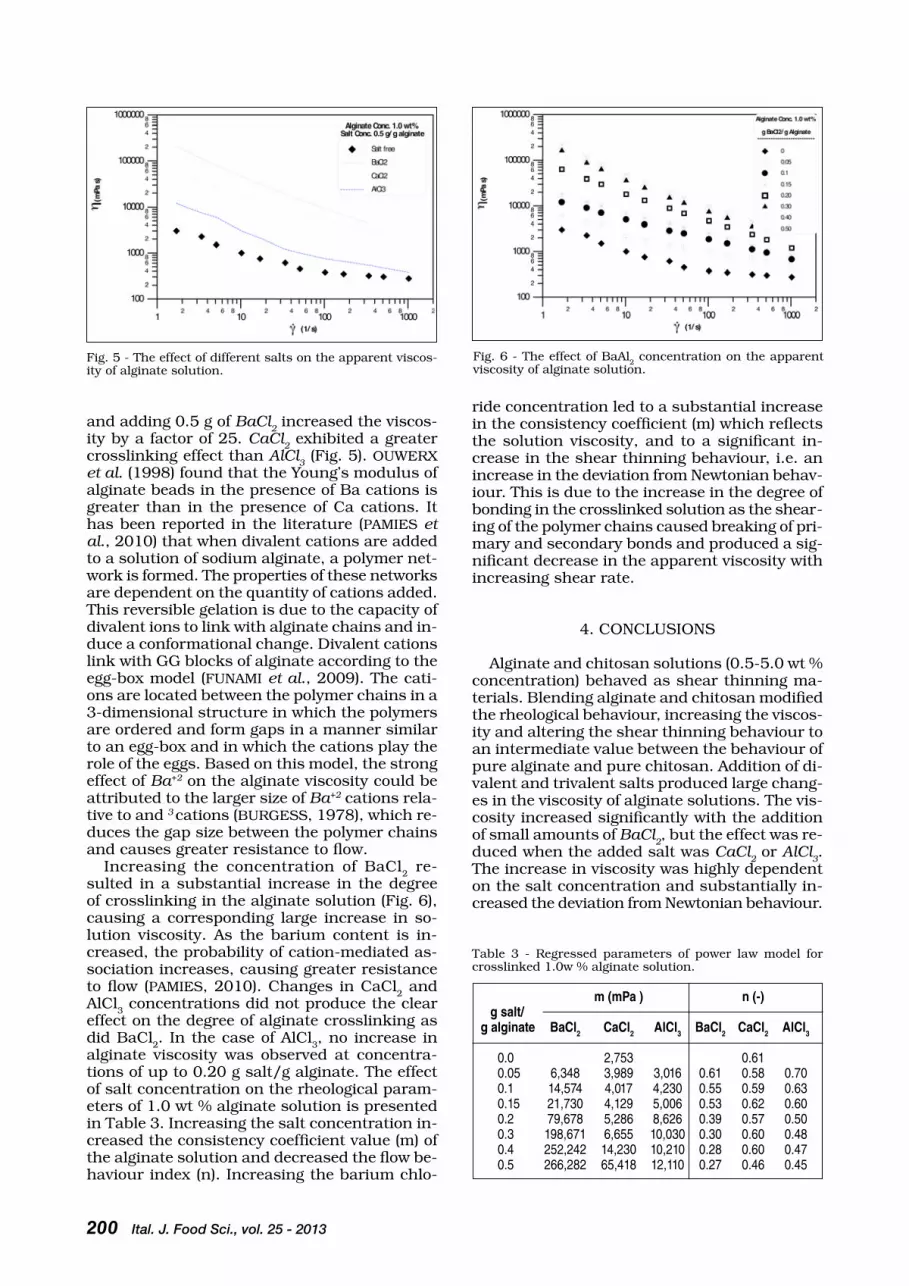
200 Ital. J. Food Sci., vol. 25 - 2013
Fig. 6 - the effect of baAl2 concentration on the apparent viscosity of alginate solution.
Fig. 5 - the effect of different salts on the apparent viscos-ity of alginate solution.
and adding 0.5 g of BaCl2 increased the viscos-
ity by a factor of 25. CaCl2 exhibited a greater
crosslinking effect than AlCl3 (Fig. 5). OUWErX
et al. (1998) found that the Young’s modulus of alginate beads in the presence of ba cations is greater than in the presence of ca cations. It has been reported in the literature (PAMIES et al., 2010) that when divalent cations are added to a solution of sodium alginate, a polymer net-work is formed. the properties of these networks are dependent on the quantity of cations added. this reversible gelation is due to the capacity of divalent ions to link with alginate chains and in-duce a conformational change. Divalent cations link with GG blocks of alginate according to the egg-box model (FUNAMI et al., 2009). the cati-ons are located between the polymer chains in a 3-dimensional structure in which the polymers are ordered and form gaps in a manner similar to an egg-box and in which the cations play the role of the eggs. based on this model, the strong effect of Ba+2 on the alginate viscosity could be attributed to the larger size of Ba+2 cations rela-tive to and 3 cations (bUrGESS, 1978), which re-duces the gap size between the polymer chains and causes greater resistance to flow.
Increasing the concentration of bacl2 re-sulted in a substantial increase in the degree of crosslinking in the alginate solution (Fig. 6), causing a corresponding large increase in so-lution viscosity. As the barium content is in-creased, the probability of cation-mediated as-sociation increases, causing greater resistance to flow (PAMIES, 2010). changes in cacl2 and Alcl3 concentrations did not produce the clear effect on the degree of alginate crosslinking as did bacl2. In the case of Alcl3, no increase in alginate viscosity was observed at concentra-tions of up to 0.20 g salt/g alginate. the effect of salt concentration on the rheological param-eters of 1.0 wt % alginate solution is presented in table 3. Increasing the salt concentration in-creased the consistency coefficient value (m) of the alginate solution and decreased the flow be-haviour index (n). Increasing the barium chlo-
ride concentration led to a substantial increase in the consistency coefficient (m) which reflects the solution viscosity, and to a significant in-crease in the shear thinning behaviour, i.e. an increase in the deviation from Newtonian behav-iour. this is due to the increase in the degree of bonding in the crosslinked solution as the shear-ing of the polymer chains caused breaking of pri-mary and secondary bonds and produced a sig-nificant decrease in the apparent viscosity with increasing shear rate.
4. cONcLUSIONS
Alginate and chitosan solutions (0.5-5.0 wt % concentration) behaved as shear thinning ma-terials. blending alginate and chitosan modified the rheological behaviour, increasing the viscos-ity and altering the shear thinning behaviour to an intermediate value between the behaviour of pure alginate and pure chitosan. Addition of di-valent and trivalent salts produced large chang-es in the viscosity of alginate solutions. the vis-cosity increased significantly with the addition of small amounts of BaCl
2, but the effect was re-
duced when the added salt was CaCl2 or AlCl
3.
the increase in viscosity was highly dependent on the salt concentration and substantially in-creased the deviation from Newtonian behaviour.
table 3 - regressed parameters of power law model for crosslinked 1.0w % alginate solution.
m (mPa ) n (-) g salt/g alginate BaCl2 CaCl2 AlCl3 BaCl2 CaCl2 AlCl3
0.0 2,753 0.61 0.05 6,348 3,989 3,016 0.61 0.58 0.70 0.1 14,574 4,017 4,230 0.55 0.59 0.63 0.15 21,730 4,129 5,006 0.53 0.62 0.60 0.2 79,678 5,286 8,626 0.39 0.57 0.50 0.3 198,671 6,655 10,030 0.30 0.60 0.48 0.4 252,242 14,230 10,210 0.28 0.60 0.47 0.5 266,282 65,418 12,110 0.27 0.46 0.45

Ital. J. Food Sci., vol. 25 - 2013 201
AcKNOWLEDGEMENtS
this work was financially supported by the research Affairs of UAE University under contract No. 06-02-7-11/07 and the University of Jordan as sabbatical leave support to the second author. the authors are grateful to the Jordanian Pharmaceutical Manufacturing co. (Naor, Jordan) for their kind cooperation and material supply.
rEFErENcES
Al-Musaa S., Abu Farab D. and badwana A.A. 1999. Eval-uation of parameters involved in preparation and release of drug loaded in crosslinked matrices of alginate. Jour-nal of controlled release. 57: 223-232.
Albarghouthi M., Abu Fara D., Saleem M., El-thaher t., Matalka, K. and badwan A. 2000. Immobilization of an-tibodies on alginate-chitosan beads. International Jour-nal of Pharmaceutics. 206: 23-34.
burgess J. 1978. Metal Ions in Solution, First Ed., Ellis Horwood, England. pp. 137-195.
chatchawalsaisin J., Podczeck F. and Newton J.M. 2004. the influence of chitosan and sodium alginate and formu-lation variables on the formation and drug release from pellets prepared by extrusion/spheronisation. Interna-tional Journal of Pharmaceutics. 275: 41-60.
chávarri M., Marañón I., Ares r., Ibáñez F.c., Marzo F. and del carmen Villarán M. 2010. Microencapsulation of a probiotic and prebiotic in alginate-chitosan capsules im-proves survival in simulated gastro-intestinal conditions. International Journal of Food Microbiology. 142: 185-189.
cho J., Heuzey M.c., be´gin A. and carreau P.J. 2006. Vis-coelastic properties of chitosan solutions: Effect of con-centration and ionic strength. Journal of Food Engineer-ing. 74: 500-515.
clementi F., Mancin M. and Moresih M. 1998. rheology of Alginate from Azotobacter vinelandii in Aqueous Disper-sions. Journal of Food Engineering. 36: 51-62.
coppi G. and Iannuccelli V. 2009. Alginate/chitosan micro-particles for tamoxifen delivery to the lymphatic system. International Journal of Pharmaceutics. 367: 127-132.
de celis Alonso b., rayment P., ciampi E., Ablett S., Marci-anic L., Spiller r.c., Norton I. t. and Gowland P.A. 2010. NMr relaxometry and rheology of ionic and acid alginate gels. carbohydrate Polymers, 82: 663-669.
Finotelli P.V., Da Silva D., Sola-Pennab M., Malta rossic A.M., Farinad M., Andraded L. r., takeuchie A.Y. and rocha-Leãof M.H. 2010. Microcapsules of alginate/chi-tosan containing magnetic nanoparticles for controlled release of insulin. colloids and Surfaces b: biointerfac-es. 81: 206-211.
Funami t., Fang Y., Noda S., Ishihara S., Nakauma M., Dra-get K. I., Nishinari K. and Phillips G.O. 2009. rheologi-cal properties of sodium alginate in an aqueous system during gelation in relation to supermolecular structures and ca2þ binding. Food Hydrocolloids. 23: 1746-1755.
Gómez-Díaz D. and Navaza J.M. 2004. rheology of food sta-bilizers blends. Journal of Food Engineering. 62: 143-149.
Hu X., tang Y., Wang Q., Li Y., Yang J., Du Y. and Kennedy J.F. 2010. rheological behaviour of chitin in NaOH/urea aqueous solution. carbohydrate Polymers. 83: 1128-1133.
Jiang H., Su W., Mather P.t. and bunning t.J. 1999. rhe-ology of highly swollen chitosan/polyacrylate hydrogels. Polymer. 40: 4593-4602.
Kempe S., Metz H., bastrop M., Hvilsom A., contri r.V. and Mäder K. 2008. characterization of thermosensitive chi-tosan-based hydrogels by rheology and electron paramag-netic resonance spectroscopy. European Journal of Phar-maceutics and biopharmaceutics. 68: 26-33.
Li X.Y., Kong X.Y., Wang X.H., Shi S., Guo G., Luo F., Zhao X., Wei Y.Q. and Qian Z.Y. 2010. Gel-sol-gel thermo-gela-tion behavior study of chitosan-inorganic phosphate so-lutions. European Journal of Pharmaceutics and biop-harmaceutics. 75: 388-392.
Lu L., Liu X. and tong Z. 2006. critical exponents for sol–gel transition in aqueous alginate solutions induced by cupric cations. carbohydrate Polymers. 65: 544-551.
Lucinda-Silva r.M., Salgado H.r.N. and Evangelista r.c. 2010. Alginate–chitosan systems: In vitro controlled re-lease of triamcinolone and in vivo gastrointestinal tran-sit. carbohydrate Polymers. 81: 260-268.
Mancini M., Moresi M. and Sappino F. 1996. rheological behaviour of aqueous dispersions of alga1 sodium algi-nates. J. of Food Engineering. 28: 283-295.
Mir S., Yasin t., Halley P.J., Siddiqi H.M. and Nicholsonc t. 2011. thermal, rheological, mechanical and morpho-logical behavior of HDPE/chitosan blend. carbohydrate Polymers. 83: 414-421.
Moe S.t., Dragel K.I. and Smidsrød O. 1995. Alginates. In: A.M. Stephen (Ed. Food polysaccharides and their appli-cations), New York: Marcel Dekker.
Montembault A., Viton c. and Domard A. 2005. rheomet-ric study of the gelation of chitosan in a hydroalcoholic medium. biomaterials. 26: 1633-1643.
Ouwerx O., Velings N., Mestdagh M.M. and Axelos M.A.V. 1998. Physico-chemical properties and rheology of algi-nate gel beads formed with various divalent cations. Pol-ymer Gels and Networks. 6: 393-408.
Pamies r., Schmidt r.r., Martínez M. and de la torre J. 2010. the influence of mono and divalent cations on di-lute and non-dilute aqueous solutions of sodium algi-nates. carbohydrate Polymers. 80: 248-253.
Phuoc t.X., Massoudi M. and chen r.H. 2011. Viscosity and thermal conductivity of nanofluids containing multi-walled carbon nanotubes stabilized by chitosan. Interna-tional Journal of thermal Sciences. 50: 12-18.
ribeiro A.c.F., Sobral A.J.F.N., Simões S.M.N., barros M.c.F., Lobo V.M.M., cabral A.M.t.D.P.V., Veiga F.J.b., Santos c.I.A.V. and Esteso M.A. 2011. transport prop-erties of aqueous solutions of sodium alginate at 298.15 K. Food chemistry. 125: 1213-1218.
rinaudo M. 2006. chitin and chitosan: Properties and ap-plications. Progress in Polymer Science. 31: 603-632.
Shon S.O., Ji b.c., Han Y.A., Park D.J., Kim I.S. and choi J.H. 2007. Viscoelastic Sol-Gel State of the chitosan and Alginate Solution Mixture. Journal of Applied Polymer Science. 104: 1408-1414.
Simeone M., Alfani A. and Guido S. 2004. Phase diagram, rheology and interfacial tension of aqueous mixtures of Na-caseinate and Na-alginate. Food Hydrocolloids. 18: 463-470.
taylor c., Pearson J.P., Draget K.I., Dettmar P.W. and Smid-srøda O. 2005. rheological characterisation of mixed gels of mucin and alginate. carbohydrate Polymers. 59: 189-195.
Vallée F., Müller c., Durand A., Schimchowitsch S., Del-lacherie E., Kelche c., casse J.c. and Leonard M. 2009. Synthesis and rheological properties of hydrogels based on amphiphilic alginate-amide derivatives. carbohydrate research. 344: 223-228.
Wang J.Z., Huang X.b., Xiao J., Li N., Yu W.t., Wang W., Xie W.Y., Ma X.J. and teng Y.L. 2010. Spray-spinning: a novel method for making alginate/chitosan fibrous scaf-fold. J. Mater Sci. Mater Med. 21:497-506.
Xing J., Deng L. and Dong A. 2010. chitosan/Alginate Nan-oparticles Stabilized by Poloxamer for the controlled re-lease of 5-Fluorouracil. Journal of Applied Polymer Sci-ence. 117: 2354-2359.
Paper received December 15, 2011 Accepted October 29, 2012

PaPer
202 Ital. J. Food Sci., vol. 25 - 2013
- Keywords: agri-food, citrus fruit production, Life Cycle Assessment, environmental hotspots -
ENVIRONMENTAL ASSESSMENT OF THE CITRUS FRUIT PRODUCTION
IN SICILY USING LCA
A. LO GIUDICE1*, C. MBOHWA1, M.T. CLASADONTE2 and C. INGRAO3
1Department of Quality and Operations Management, Faculty of Engineering and the Built Environment, University of Johannesburg,
South Africa Doornfontein 2028, Johannesburg, South Africa2Department of Economics and Business, University of Catania, Corso Italia 55,
95129, Catania, Italy3External collaborator of the Department of Economics and Business, University of Catania, Italy
*Corresponding author: [email protected]
AbStrAct
citrus production is one of the most important sectors of Sicilian agriculture. In particular, Si-cilian orange production is of the best quality, producing mainly pigmented or blood oranges (cv tarocco, Moro, and Sanguinello). No other region in the Mediterranean area or on the American continent produces, on a large scale, blood oranges. the Sicilian blood oranges have some spe-cial flavours and organoleptic and functional characteristics. the aim of this paper is to quantify the total environmental impacts of the life cycle of Tarocco oranges - integrated production. the study was conducted in accordance with the ISO standards 14040:2006 and 14044:2006. the analysis of the input and output materials and energy flows indicates that the production phase has the most environmental impacts, causing almost half of the total damage. In terms of the substances having the most environmental impacts, the study shows that: the emission to air of Nitrogen oxides, particulates, Sulphur dioxide and carbon dioxide; the emission into soil of zinc; and the consumption of resources such as crude oil, uranium and natural gas have the most im-pacts. these results enable us to propose different ways to reduce the impact of the production of the oranges on the environment.

Ital. J. Food Sci., vol. 25 - 2013 203
INtrODUctION
the worldwide citrus fruit production in 2010 was about 122 million tons, with oranges repre-senting 56% of that production. In particular, the greatest citrus producers were china and bra-zil with a share of about 36% of the world total. As far as Europe is concerned, the areas of pro-duction are concentrated in the Mediterranean countries: Spain and Italy accounted for 86% of the total European production, in 2010, at 10 million tons. Italy occupied the second place af-ter Spain (FAOStAt, 2010).
In Italy citrus fruit production was more than 3.8 million tons, produced mainly in Sicily and calabria. Out of this total, almost 2.4 million tons were oranges (IStAt, 2010; cSO, 2010; INEA, 2011). Most of the oranges produced were the pigmented ones or the bood oranges (cv tarocco, Moro, and Sanguinello).
Pigmented oranges are mostly produced in eastern Sicily where they account for around 60-70% of the total oranges harvested (LO GI-UDIcE, 2002; INGALLINErA et al., 2004; cOrE-rAS, 2006; GIArÈ et al., 2008). this is the area (in the south and south-west of Mount Etna), characterized by special pedoclimatic features, where the production of high quality pigment-ed oranges is most suitable. these oranges have high aroma and antioxidant activity. their most striking feature is the red colour which is of var-ying intensity and prevalence. It is caused by the anthocyanins whose accumulation depends on the environment in which they are grown. the intensity of the colour depends on the cultivar but also on the ripeness and climatic conditions. the blood orange varieties require strong day-night temperature to enable intense colour for-mation in the fruit flesh. Although blood orang-es are grown in other countries, in some years entire harvests are lost due to the non-optimal conditions during the ripening phase of the fruit. When they are cultivated in brazil or Florida cou-loration is generally weak, absent and unreliable (INGALLINErA et al., 2004; bUtELLI et al., 2012).
It has recently been discovered that a gene called “ruby” plays a key role in the pigmenta-tion of the blood orange (bUtELLI et al., 2012).
the application of the Life cycle Assessment (LcA) methodology in the food-processing field has increased in the last decade because it can be used to find new and alternative methods of agricultural production which can reduce en-vironmental impacts, thus increasing product sustainability (MILÀ I. cANALS et al., 2006; FFtc 2007; cLASADONtE et al., 2010). three studies carried out respectively in 2007 (FFtc 2007), in 2008 (MEISSNEr ScHAU et al., 2008) and in 2009 (rOY et al., 2009) are some of the main LcA studies of agricultural and food production con-ducted between 1998 and 2008.
In particular, with regard to the assessment of the environmental profile of the citrus fruit sec-
tor, on an international level a number of studies have been conducted (SANJUAN et al., 2005; YO-SHIKAWA et al., 2008; cOLtrO et al., 2009, rIb-AL et al., 2009; MOrDINI et al., 2009; rUVIArO et al., 2012). Some studies have also been con-ducted on the environmental impacts of orange juice production (cOLtrO et al., 2008; MOrDI-NI et al., 2009; SPrEEN et al., 2010; KNUDSEN et al., 2011; DWIVEDI et al., 2012).
In Italy, a number of studies have also been done on the same subject (LA rOSA et al., 2008; bEccALI et al., 2009 and 2010).
It is in this regard that this paper discuss-es the life cycle assessment with a view to con-tributing to the field within the Italian orange production industry and adding value to inter-national discourse. the aim of this paper is to quantify the total environmental impacts asso-ciated with the life cycle of the integrated pro-duction of oranges cv tarocco.
MAtErIALS AND MEtHODS
1. Goal and scope and system boundaries
the aim of this work was to quantify the to-tal environmental impacts of oranges cv tarocco - integrated production using a LcA approach. the study scope included the evaluation of pos-sible improvements in the production methodol-ogy on the basis of the obtained results.
the idea was not to study the complete cur-rent Sicilian oranges integrated cultivation or to develop a study by using average data on a re-gional scale, but to conduct oranges production life cycle assessment based on a chosen pieces of land with a view to refine and improve LcA ap-plication to this type of study. this was done by clearly defining the system boundaries and us-ing specific data provided by a few firms, which showed an interest in taking part in the study.
the main system boundaries include the phases of production, processing and end of life of the oranges, as well as the transportation by trucks of these oranges from the field to the pro-cessing plant and from the processing plant to the distribution centre in the north of Italy. this essentially follows the ‘‘cradle-to-gate’’ approach (cErUttI et al., 2001). the cultivation phase in the nursery was excluded from the system boundaries. this was outside the scope intend-ed for the study and would enabled comparison of methods and results with other studies (bEc-cALI et al., 2009).
Details of the production system studied are shown in Fig. 1, with the functional unit repre-sented by 1 ton of oranges. this functional unit was chosen because it enables measurements of inventories to be easier so that the cut-off point of inventories to be considered is higher than when a kilogram or 100 kilograms was consid-ered. that way a broader spectrum of invento-

204 Ital. J. Food Sci., vol. 25 - 2013
ries could be considered. A co-product of 100 kg of non-edible parts of oranges, to be compost-ed, was also considered. this approach is also in agreement with a previous research as reported by cErUttI et al. (2011) in which, for fruit prod-ucts, typical functional units of 1 kg or 1 ton of fruit were used.
2. Inventory analysis
the Life cycle Inventory (LcI) analysis quan-tifies the use of resources and energy and envi-ronmental releases associated with the system being evaluated. In the following tables LcI data have been listed, displaying the results obtained for raw materials and water consumption, elec-tricity, and solid waste generation. the related inventory data are shown in table 1.
citrus production phase
the production phase was considered for a citrus grove of a reference farm (part of an as-sociation of citrus producers) in full production located in the province of catania (Italy).
the farm demonstrated a high level of envi-ronmental awareness since it has already ad-
hered for a long time to the Global Gap stand-ard for producing and marketing certified and guaranteed products.
the plantation for cv tarocco oranges con-sidered has a frame of 5x5 m, thus resulting in a density of 400 trees/ha. It was assumed that the citrus grove cultivation lasts about 50 years, during which there is full production for 30 years and that the production is conducted using the common techniques of Integrated Production (IP). Integrated Production/Farming is a farm-ing system that produces high quality food and other products by using natural resources and regulating mechanisms to replace polluting in-puts in order to ensure sustainable farming. Em-phasis is placed on a holistic systems approach regarding involving the entire farm as the ba-sic unit; on the central role of agro-ecosystems; on balanced nutrient cycles, and on the welfare of all species in animal husbandry. the preser-vation and improvement of soil fertility and of a diversified environment in ensured. In addic-tion the observation of ethical and social crite-ria is an essential component. biological, techni-cal and chemical methods are balanced careful-ly taking into account the protection of the en-vironment, profitability and social requirements
Fig. 1 - Flow chart related to citrus life cycle.

Ital. J. Food Sci., vol. 25 - 2013 205
(IObc/WPrS commission “IP-Guidelines and Endorsement, 2004).
the citrus grove has an average yield of 270 tons (t) per year (corresponding to an average yield of 25 ton/ha) and the irrigation of the field occurs by drip irrigation with an average yearly consumption of about 4,600 m3/ha of water. the water is phreatic that is ground wa-ter below the water-table and it is brought to the surface using an electric pump. the yearly treatments done to the soil consist of the fol-lowing: two fertilization treatments using, as the main nutrients, Nitrogen (N), Phosphorus (P) and Potassium (K); three pesticide treat-ments (phosphorus compounds); two treat-ments with herbicides (glyphosate and McPA). the data collected almost agrees with the ones reported by SANJUAN et al. (2005) and bEccA-LI et al. (2009).
the pruning of the trees is done once or twice on alternate years using a chain saw and prun-ing scissors, according to the Integrated Produc-tion normative. the fronds, after being ground, are left on the soil surface so to be decomposed and become organic fertilizer, while the branch-es are used as firewood.
the picking of the fruit is done by hand; the product is put into crates and is transported to the loading areas using a towed vehicle.
the cultivation phase data was taken into ac-count considering the “citrus grove life cycle”. For the citrus grove life cycle a Functional Unit (FU) of 1 p it was chosen. this is equal to a pro-
duction of oranges in the orchard life time of 50 years, which for the same period is equal to a total production of 13,500 t.
the citrus grove life cycle was considered including, inside the system boundaries, the phases of: Planting; cultivation; Harvesting and transportation; and the Uprooting of the trees and the end of life of the citrus orchard. In par-ticular, the following phases have been taken into consideration: the production of chemical products for input such as fertilizers, pesticides and herbicides and their transportation into the farm; irrigation, fertilization, herbicide, insecti-cide as well as fungicide treatments. the prun-ing of the trees and the harvesting of the orang-es, including the machinery and the related con-sumption of resources, raw materials and elec-tric power were also considered; incineration of the special waste produced; the transportation of oranges to the specific plant; the uprooting of grove, the recovery of the tree trunks as fire-wood, and of the fronds, branches and roots as compost.
the “Inventory data of citrus grove life cycle” are shown in table 2.
In this assessment it was also necessary to create the “citrus grove end of life” choosing, as the FU, 1 p. It was considered that this phase occurs in the 50th year of the citrus grove life-time and it is composed of by three processes: pruning, eradication and trunks cutting.
table 3 shows the inventories for the input data for citrus grove orchard end of life.
table 1 - Input data 1 ton oranges life cycle.
Functional Unit 1 ton OrangesCo-product 100 kg Oranges Non-edible part to be composted
Input flow Physic Measure Comment amount unit
Production 8.148E-5 p This phase has been represented by creating the oranges orchard life cycle and then computing it within the oranges life cycle for the share associated to 1 ton of them.
Processing 7.628E-6 p Even in this case, the warehouse life cycle has been implemented considering the amount of oranges processed every year. Then, the warehouse life cycle has been computed within the oranges one for the share associated to 1 ton of them.
End of life 100 kg This phase is simply represented by the oranges eating and the peel discarding. In developing this phase, it has been decided to make the assumption that, being in a context of separate waste collection, the peel, together with the other organic waste, is treated by composting. As a matter of fact, in the inventory phase has been considered the compost plant with the association of the amount of peels in 1 ton of oranges.
Transport A 55 ton*km Transport from the field to the processing plant. Knowing the kind of trucks commonly used for such operations, in order to develop a study being as real as possible, an euro 3 truck with a lorry of 3.5-7.5 ton has been computed (EURO 3). B 80 ton*km Transport from the processing plant to the distribution plant around Sicily. Euro 4 truck with a lorry 16-32 ton (EURO 4). C 600 ton*km Transport from the processing plant to the distribution plant in the North of Italy. By the provided data it results that the truck used is an euro 5 having a 16-32 ton lorry (EURO 4).

206 Ital. J. Food Sci., vol. 25 - 2013
table 2 - Input data oranges orchard life cycle.
Functional Unit 1 p 1 p corresponds to a production of oranges in the orchard life time (50 years) equal to 13,500 tonCo-product 420 ton Leaves from the orchard end of life phase to be composted
Input flow Physic Measure Comment amount unit
ResourcesOccupation, permanent crop,fruit, extensive 10.8 ha*yrTransformation, to permanentcrop, fruit, extensive 10.8 haTransformation, from pastureand meadow 10.8 haWater, process, unspecifiednatural origin 2723.25 m3 Water requirements for all the fertilization and pesticide treatments in the orchard life time.
Raw materials and fossil fuels
Fertilizer N 127.44 tonFertilizer P2O5 94.5 tonFertilizer K2O 94.5 tonPesticides, unspecified atregional storehouse 2.572 ton
Electric and thermal energy
Planting 11.32 ha The planting phase occurs after five years in the nursery. The transport of plants from the nursery to the orchard has not been taken into account, because the nursery phase has not been included in the system boundaries.Irrigating 2484000 m3 The amount of water used for irrigating has been taken into account and is equal to 2484000 m3 in the citrus grove life time. Fertilizing 2700 haPesticide treatments 1620 haTransport 3.2 kton*km Transport of the raw materials for the orchard maintenance treatments (distance= 10 km).Power saw 3 p Tree pruning phase. No waste treatments considered as in this case the leaves are burned on-site at the citrus grove edges; non calculable carbon dioxide emissions in air.Petrol unleaded at refinery 367.2 kg Petrol unleaded consumption for the pruning treatmentDiesel at refinery 11560 kg Diesel amount for pneumatic shears and for millingLubricating oil 226.95 kg Lubricating oil for pneumatic shearsSawmill 4.2E-5 p It is used for the brunches crushing after the pruning phaseTransport, lorry 16-32 ton, 15 ton*km Special wasteEURO 3Orchard end of life 1 p
Emission in water
Nitrogen, total 38.232 tonPhosphorus, total 4.123 tonPotassium 23.535 ton
Waste treatments
Disposal, hazardous waste, 600 kg Cultivation phase hazardous waste25 % water, to hazardouswaste incineration
citrus processing phase
the processing warehouse assessed is a small and medium scale enterprise located in Palago-nia, in the province of catania, which was used to consider the processing stage of the Sicilian oranges. Starting from the life time of the plant and the average quantity of oranges processed in a year, the life cycle of the processing ware-
house has been constructed taking, as the func-tional unit 1 p which corresponds to the amount of oranges processed during the warehouse life time of 30 years. this gives an amount of about 144,000 t.
In particular, the following were taken into con-sideration: all the processing phases, starting from the moment when the oranges are received from the farm till they are packaged and trans-

Ital. J. Food Sci., vol. 25 - 2013 207
table 3 - Input data oranges orchard end of life.
Functional Unit 1 p This phase occurs at the 50th year of the citrus grove life time and it is composed by three treatments: pruning, eradication and trunks cuttingAvoided product 346 m3 Logs obtained by the citrus grove end of life at disposal for every possible use
Input flow Physic Measure Comment amount unit
Raw materials and fossil fuels
Power saw 4 p For pruning and trunks cuttingExcavation, hydraulic digger 14175 m3 Tree eradicationCompost at plant 420 ton Leaves composting
table 4 - Input data oranges warehouse life cycle.
Functional Unit 1 p 1 p is associated to the amount of oranges being processed during the warehouse life time (30 years); it is equal to about 144,000 ton. All the input data, listed in the present table, has been referred to the warehouse life cycle and so multiplied per 30 years.Co-product 1350 ton Low quality oranges not to be able to be processed and then treated by composting
Input flow Physic Measure Comment amount unit
Resources
Water, process, unspecified 6,000 m3 Firm water requirementsnatural origin
Raw materials and fossil fuels
Propane/butane at refinery 52.83 ton Polypropylene, granulate, 1009.26 ton Oranges plastic packaging bagsat plantCardboard cellulose 26100 kg Cardboard labels matched to the oranges plastic packaging bagsPackaging carton 1204.83 ton Carton box
Electric and thermal energy
Electricity HV use in I + import 2,040 MWh Every year, firm electric energy requirements is equal to 68,000 kWhConveyor belt, at plant 157 mWooden platforms life cycle 15 pPrinting colour, offset, 1,500 kg47,5% solvent, at plantTanker 55.50 ton*km Transport of propane (distance = 35 km)Transport, lorry 3.5-7.5t, EURO 4 34.65 ton*km Transport of the oranges plastic packaging bags (distance = 35 km)Transport, lorry 3.5-7.5t, EURO 4 2400 ton*km Transport of the oranges carton packaging box (distance = 2 km)Transport, lorry 3.5-7.5t, EURO 4 39150 ton*km Cardboard labels transportTransport, lorry 3.5-7.5t, EURO 4 550 ton*km Wooden platformPlastic box life cycle 1934598.75 p 1 p represents one box in its life cycle. Every year, 515893 plastic boxes are used within the processing phase; every box useful life is equal to 8 years, which means that in 30 years 1934598.75 units are used.Transport, lorry 7.5-16t, EURO4 162.51 kt*km Transport of the plastic boxes used in all the processing system life cycleConveyor belt, at plant 157 m Replacing of the conveyor belt after 15 years of lifeCompost at plant 1350 ton Low quality oranges being treated in an industrial compost plantBuilding, multi-storey 400 m3 Shed where the oranges processing takes place. The physic amount is referred to the concrete used in the shed construction phase
Waste treatments
Sanitary landfill 1204.83 ton Carton box 26100 kg Carton labelsPolypropylene recycling 1009.26 ton Oranges plastic packaging bagsWood recycling 1854 ton Wooden platforms

208 Ital. J. Food Sci., vol. 25 - 2013
ferred to the distribution centre. these steps were considered taking into account the consumption of raw materials, resources and electric power associated with them. the warehouse is made of reinforced concrete. the waste associated with this process was noted. It is necessary to speci-fy that the machinery and equipment used, with the exception of the conveyor belts, are specifi-cally made for the processing of citrus fruit and, as a result, they are not present in the database of the software used. It was therefore considered within the calculation of the total consumption of electric power. table 4 shows the inventory data of oranges warehouse life cycle.
Functional unit end of life phase
the end of life phase is simply represented by the consumption of oranges and the composting or disposal of the peel. In developing this phase, it was decided to make the assumption that, be-ing in a context of separate waste collection, the peel and the other organic waste are treated by composting. As a matter of fact, the inventory phase has considered the compost plant using peels from 1 ton of oranges.
Data quality
the inventory data were collected from vari-ous sources. the data regarding the agriculture phase were collected from people working in the sector and also from publications. It was thus possible to measure the quantity of fertilizers, water and plant protection products used and to know exactly which methods of cultivation were used. Furthermore it was possible to esti-mate the consumption of fuel and electricity. the Ecoinvent database was also used for assessing the impact of fertilizer and pesticides-production
table 5 - Damage and impact categories (IMPAct 2002+).
Damage category Impact category
Human Health Human toxicity Respiratory inorganics Ionizing radiations Ozone layer depletivo Photochemical oxidation
Ecosystem Quality Acquatic ecotoxicity Terrestrial ecotoxicity Terrestrial acidification/nutrification Acquatic acidification Acquatic eutrophication Land occupation
Climate Change Global warming
Resources No-renewable Energy Mineral extraction
Source: Joillet et al., 2003.
and fuel production. the data for the processing phase were collected directly from a processing warehouse, which processes citrus fruit. It was thus possible to obtain information about elec-tricity and water consumption and the amount of input resources and quantities related to the packaging. We made sure that the quality of the data also complied with the quality requirements of the European Platform on Life cycle Assess-ment (EUrOPEAN cOMMISSSION, 2006). It is also noted that all the collected data were compared with that from literature and with that evaluat-ed by experts in terms of quality and reliability.
rESULtS AND DIScUSSION
1. Life cycle impact assessment (LCIA)
the study was conducted in accordance with the guidelines and requirements of the ISO Stand-ards 14040:2006 and ISO 14044:2006. the dam-age assessment phase was carried out includ-ing both the mandatory elements (classification, characterization and Damages Evaluation) and the optional ones (Normalization and Weighing), as indicated in the standards, in order to express the results with equivalent numerical parame-ters so as to be able to represent quantitatively the environmental effects of the system analysed.
the environmental effects were given in quan-titative measure. All the collected data were pro-cessed by Simapro 7.0, the most internation-ally used and widespread software, while Im-pact 2002+ was chosen as the impact assess-ment method. this method has the following ad-vantages: it calculates the non-renewable ener-gy consumption which, in the agricultural sec-tor, represents a fundamental aspect to be con-sidered. It recognizes carbon dioxide as having the greatest responsibility for the greenhouse effect and climate change, during characteri-zation. table 5 shows the damage and the im-pact categories. the impact categories represent the negative effects to the environment rang-ing from damage due to an emitted substance to resource usage level. the damage categories are obtained by grouping the impact categories and represent the environmental compartments suffering from the damage (JOLLIEt et al., 2003, ArPA Sicilia, 2009).
It was found that the total damage corre-sponds to 0.101 pt and it can be attributed to the following:
35.60% to the cultivation phase;25.50% to the processing phase;23.00% to the transportation of the oranges
from the warehouse to the distribution platform in the North of Italy;
10.10% to the transportation of the oranges form the field to the warehouse;
3.23% to the transportation of the oranges from the warehouse to Sicilian platform;
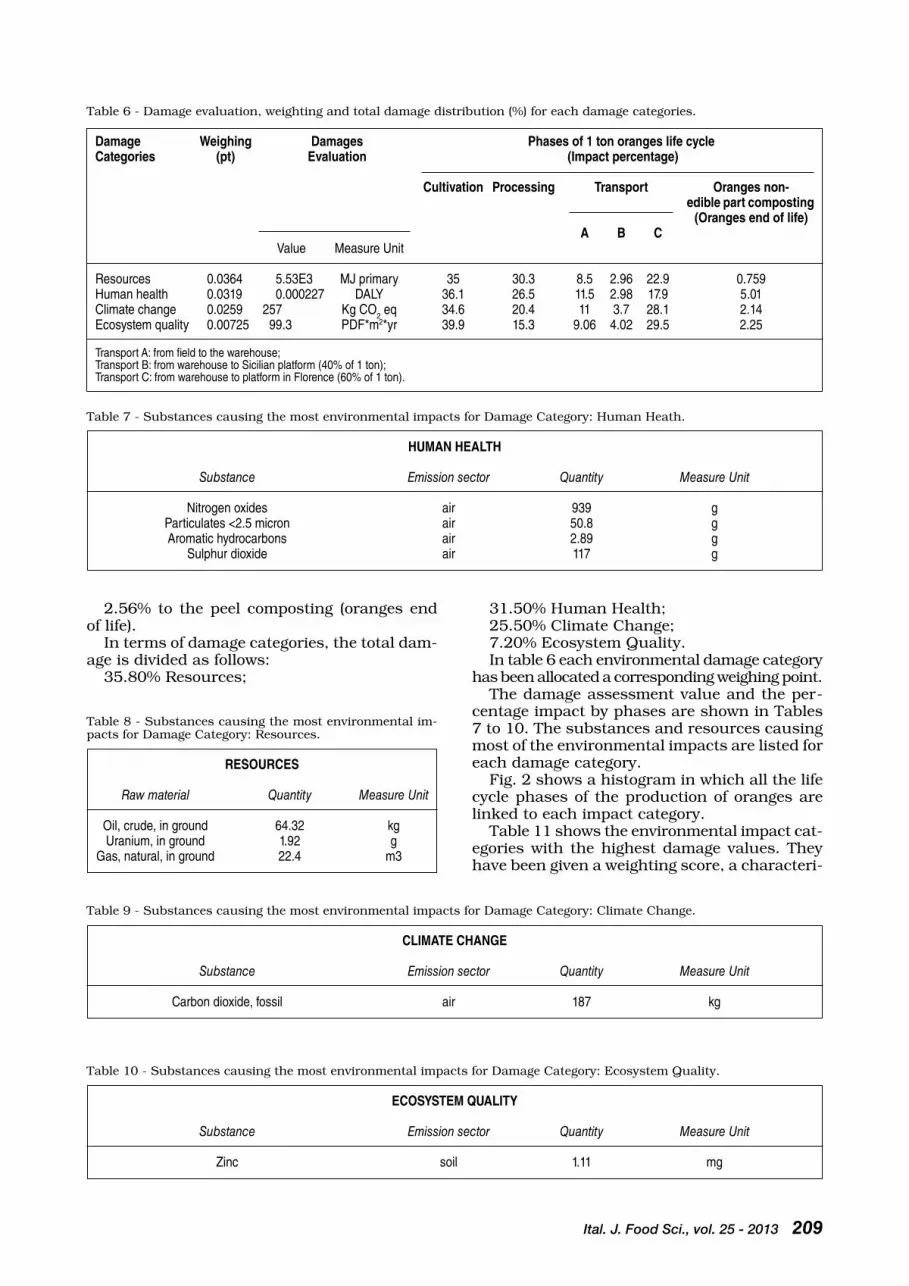
Ital. J. Food Sci., vol. 25 - 2013 209
table 8 - Substances causing the most environmental im-pacts for Damage category: resources.
RESOURCES
Raw material Quantity Measure Unit
Oil, crude, in ground 64.32 kg Uranium, in ground 1.92 g Gas, natural, in ground 22.4 m3
table 9 - Substances causing the most environmental impacts for Damage category: climate change.
CLIMATE CHANGE
Substance Emission sector Quantity Measure Unit
Carbon dioxide, fossil air 187 kg
table 10 - Substances causing the most environmental impacts for Damage category: Ecosystem Quality.
ECOSYSTEM QUALITY
Substance Emission sector Quantity Measure Unit
Zinc soil 1.11 mg
2.56% to the peel composting (oranges end of life).
In terms of damage categories, the total dam-age is divided as follows:
35.80% resources;
table 6 - Damage evaluation, weighting and total damage distribution (%) for each damage categories.
Damage Weighing Damages Phases of 1 ton oranges life cycleCategories (pt) Evaluation (Impact percentage)
Cultivation Processing Transport Oranges non- edible part composting (Oranges end of life) A B C Value Measure Unit
Resources 0.0364 5.53E3 MJ primary 35 30.3 8.5 2.96 22.9 0.759Human health 0.0319 0.000227 DALY 36.1 26.5 11.5 2.98 17.9 5.01Climate change 0.0259 257 Kg CO2 eq 34.6 20.4 11 3.7 28.1 2.14Ecosystem quality 0.00725 99.3 PDF*m2*yr 39.9 15.3 9.06 4.02 29.5 2.25
Transport A: from field to the warehouse;Transport B: from warehouse to Sicilian platform (40% of 1 ton);Transport C: from warehouse to platform in Florence (60% of 1 ton).
table 7 - Substances causing the most environmental impacts for Damage category: Human Heath.
HUMAN HEALTH Substance Emission sector Quantity Measure Unit
Nitrogen oxides air 939 g Particulates <2.5 micron air 50.8 g Aromatic hydrocarbons air 2.89 g Sulphur dioxide air 117 g
31.50% Human Health;25.50% climate change;7.20% Ecosystem Quality.In table 6 each environmental damage category
has been allocated a corresponding weighing point. the damage assessment value and the per-
centage impact by phases are shown in tables 7 to 10. the substances and resources causing most of the environmental impacts are listed for each damage category.
Fig. 2 shows a histogram in which all the life cycle phases of the production of oranges are linked to each impact category.
table 11 shows the environmental impact cat-egories with the highest damage values. they have been given a weighting score, a characteri-

210 Ital. J. Food Sci., vol. 25 - 2013
table 11 - characterization, weighting and total damage distribution (%) for the most relevant impact categories.
Impact Categories Weighing Characterization Phases of 1 ton oranges life cycle (pt) (Impact percentage)
Cultivation Processing Transport Oranges non- edible part composting (Oranges end of life) A B C
Value Measure Unit
Non renewable energy 0.0364 5.52E3 MJ Primary 35 30.3 8.5 2.96 22.4 0.759Respiratory Inorganics 0.024 0.244 Kg PM2.5 eq 34.6 19.2 14.5 3.65 21.5 6.52Global warming 0.0259 257 Kg CO2 eq 34.6 20.4 11 3.7 29.1 2.14
Transport A: from field to warehouse;Transport B: from warehouse to Sicilian platform (40% of 1 ton);Transport C: from warehouse to platform in Florence (60% of 1 ton).
Fig. 2 - Oranges life cycle – single score evaluation per impact categories (Impact 2002+).
zation value and a damage percentage also clas-sified according the life cycle phase of the orange production process.
2. Improvement hypothesis
by assessing the oranges life cycle, it can be asserted that the oranges production and the oranges processing phase, as well as the pro-cessed oranges transportation to the north of Italy, contribute most of the environmental im-pacts causing about 80% of the total damage. based on these results, the following solutions
are proposed in order to reduce, as much as pos-sible, the total damage associated with the or-anges life cycle.
Orange production phase
this phase is characterized by high consump-tions of resources, principally due to the irri-gation process. the most consumed resources are crude oil, uranium and natural gas. these are all raw materials associated with the culti-vation treatments. Efforts to minimize the en-vironmental impact should concentrate on im-

Ital. J. Food Sci., vol. 25 - 2013 211
proving the necessary cultivation techniques. Attention can be paid to the reduction of waste and the optimization of water consumption. the optimization of water is fundamental objective, given that Sicily is characterized by long peri-ods of drought. Water wastage and optimization can be achieved by use of more efficient irriga-tion techniques, such as localized underground irrigation carried out by means of micro-drop-pers under the soil. Using manure for fertilizing the orange trees can reduce the environmental impacts that are associated with the production of nitrogen and phosphorus based mineral ferti-lizers. concurrently, more rational use of chem-icals could lead to a reduction of the amount of pesticides used. this reduction of the use of plant protection products can improve the nat-ural defence systems of the crop in addition to reducing environmental impacts.
Oranges processing phase
concerning the oranges processing phase, the Life cycle Impact Assessment (LcIA) shows that the production of the plastic boxes required for the packaging and transportation of oranges contributes most (70%) of the environmental im-pacts. the use of the 100% recycled polypropyl-ene (PP) granulate for these containers, in accord-ance with the new Italian standards, can reduce the total impact by 40-50%. Additional environ-mental reductions can be obtained by the instal-lation of a photovoltaic plant. this can guaran-tee a total impact reduction of about 50% when the environmental impact of this plant is meas-ured and analysed from a life cycle perspective.
transportation of oranges was found to cause environmental impacts which, as shown by this assessment, are significant. these are due to the consumption of diesel; the construction and maintenance of the vehicles used; and the envi-ronmental impacts of building and maintaining the infrastructure necessary for transportation. therefore, in light of the significant environmen-tal impacts attributable to the transportation of oranges to the North of Italy, it is suggested that rail transportation be considered. rail transpor-tation is the second most energy efficient mode of both passenger and freight transportation after maritime transportation. Specific cO2 emissions of rail transport have decreased by about 14% from 1995 to 2009 mainly due to shifting from diesel to electric trains, as a result of technologi-cal improvements and due to increased load fac-tors. (EEA, 2010). It is estimated that the use of rail transportation can results in about 75% cO2 emission reductions (AIcQ, 2008).
INtErPrEtAtION
the study results show that:the most environmental impacts are due to
the production and processing phases as well as the transportation of oranges, especially the transportation to the north of Italy):
the most environmental impact damages are from the category “resources”:
the most significant impact categories for the environmental assessment are: “Non renewable Energy (NrE)”, respiratory Inorganics (rI) and Global Warming (GW):
In the category NrE, the main contributions (35 and 30.3%) are due to the “oranges cultiva-tion and processing phases”; in the category rI the main contribution (34.6%) is due to the “cul-tivation phase”; the last category (GW) the main contributions (34.6 and 29.1%) are due to the “cultivation phases” and to the “transportation c”.
cONcLUSIONS
the analysis has highlighted the main envi-ronmental hot spots to be linked to the cultiva-tion and processing phases within the oranges life cycle, painting a clearer picture of their envi-ronmental performance. regarding the produc-tion phase, the most important environmental problem can be attributed to the fertilizers and pesticides used in the cultivation phasel. Fur-thermore, the results obtained in the LcIA phase show that the orchard life cycle consumes a lot of water due to irrigation. this also consumes a lot of electricity and fossil fuels to power agri-cultural machinery further contributing to en-vironmental degradation.
these environmental impacts and resource consumption patterns are a major concern. bEc-cALI et al. (2009) and MUELLEr et al. (2012) have also stated similar concerns about the increased consumption of fertilizers and water due to the intensification of agricultural practises linked to the increasing human demand for food. Meeting the food security and sustainability challenges of the coming decades is possible, but will re-quire considerable changes in nutrient and wa-ter management.
Food production is so wholly dependent on water that agriculture can use 75 to 90% of freshwater (tHE WOrLD WAtEr OrGANIZAtION, 2010). In particular, water is a fundamental resource for the cultivation of oranges. It is important, therefore, to find alternative and more sustainable ways of irrigation in order to conserve water. For example using treated wastewater from neighbouring plants or puri-fied water can be considered in future (bEccA-LI et al., 2010).
concerning the oranges processing phase, the most serious problem is the use of a large amount of plastic packaging systems which cause non - renewable energy consumption as well as a con-sequent greenhouse gas emissions. In this con-text, the solution of replacing PP granulate with 100% recycled container has been proposed.

212 Ital. J. Food Sci., vol. 25 - 2013
AcKNOWLEDGEMENtS
this paper has been thought, discussed and written by the four authors and it is the results of their common commit-ment; in particular A. Lo Giudice and c. Ingrao contributed to bibliographical research, data collection - classification - eval-uation, LcA development. M.t. clasadonte and c. Mbohwa have contributed to planning and final review of the research study. Furthermore the study is part of the Eco-Management for Food (EMAF) Project (PrIN 2008 No. 2008tXFbYt - http://www2.unime.it/emaf) co-funded by the Italian Ministry of Ed-ucation, University and research (MIUr).
rEFErENcES
Arpa Sicilia. 2009. L’analisi ambientale dei prodotti agroal-imentari con il metodo del Life cycle Assessment. Arpa Sicilia – Agenzia per la protezione dell’ambiente del-la Sicilia.
beccali M., cellura M., Iudicello M. and Mistretta M. 2009. resource consumption and Environmental Impacts of the Agrofood Sector: Life cycle assessment of Italian citrus-based products. Environmental Management. 43 (4): 707.
beccali M., cellura M., Iudicello M. and Mistretta M. 2010. Life cycle Assessment of Italian citrus-based products. Sensitivity analysis and improvement scenarios. Journal of Environmental Management. 91 (7): 1415.
butelli E., Licciardello c, Zhang Y., Mackay S., bailey P., re-forgiato - recupero G. and Martin c. 2012. retrotranspo-sons control Fruit-specific, cold dependent accumulation of anthocyanins in blood oranges. the Plant cell. 24:1242.
cerutti A.K., bruun S., beccaro G.L. and bounous G. 2011. A review of studies applying environmental impact assess-ment methods on fruit production systems. J. of Envi-ronmental Management. 92 (2011): 2277.
clasadonte M.t., Lo Giudice A. and Ingrao c. 2010, Life cy-cle Assessment of the Sicilian citrus fruit field. Proceed-ings of the lcafood2010 VII international conference on life cycle assessment in the agri-food sector, bari, Italy, September 22-24.
coltro L., Mourad A.L., Germer S.P.M., Mendonça t.A. and Kletecke r.M. 2008. Energy use in the life cycle of frozen concentrated orange juice produced in brazil. Proceedings of the 6th International conference on Life cycle Assess-ment in the Agri-Foof Sector, Zurich, November 12-14.
coltro L., Mourad A.L., Kletecke r.M., Mendonça t.A. and Germer S.P.M. 2009. Assessing the environmental profile of orange production in brazil. Int. J. of LcA. 14 (7): 656.
coresas. 2006. La filiela agrumicola in Sicilia. Elaborazione dei dati Istat e Assessorato Agricoltura e foreste della re-gione Sicilia. coresas. Palermo.
Dwivedi P., Spreenb t. and Goodrich-Schneider r. 2012. Global warming impact of Florida’s Not-From-concentrate (NFc) orange juice. Agricultural System. 108 (2012): 104.
European commission. 2006. Documentation and Quality requirements of the European Platform on Life cycle As-sessmentfor LcI Data Sets of research Projects v. 1.0.1. European Platform on LcA, 22nd December.
FFtc (Food and Fertilizer technology center), 2007. Life cycle Assessment of agricultural production sys-tems: current issues and future perspectives. re-trieved from http://www.agnet.org/htmlarea_file/li-brary/20110721140039/bc54011.pdf.
Yoshikawa N., Amano K. and Shimada K. 2008. Evaluation of environmental loads related to fruit and vegetable con-sumption using the hybrid LcA method: Japanese case study. Paper presented to the LcA VIII, calculating con-sequences beyond the box, Seattle, Washington, Septem-ber 30-october 2.
Giarè F. and Giuca S. 2008. cultura, tradizioni e qualità de-gli agrumi. INEA.
Ingallinera b., barbagallo rN., Spagna G.M., Palmeri r. and todaro A. 2004. Effects of thermal treatments on pectinesterase activity determined in blood oranges juic-es. Enzyme and microbial technology. 38 (2005): 258.
INEA (2011), Annuario dell’agricoltura italiana. 2010 - Sin-tesi. Vol. LXiV, roma.
IObc/WPrS commission “IP-Guidelines and Endorsement, 2004. Integrated Production Principles and technical Guidelines, 3rd Edition. retrieved from http://www.iobc.ch/iobc_bas.pdf.
ISO 14040, 2006. Environmental Management: Life cycle Assessment. Principles and Framework. International Or-ganisation for Standardisation. October.
ISO 14044, 2006. Environmental Management: Life cycle Assessment. requirements and Guidelines. Internation-al Organisation for Standardisation. October.
Joillet O., Margni M., charles r., Humbert S., Payet J. re-bitzer G. and rosenbaum r. 2003. “IMPAct 2002+: a new life cycle impact assessment methodology”. Int. J. of LcA. 8: 324.
Knudsen M.t., Fonseca de Almeida G., Langer V., Santiago de Abreu L. and Halberg N. 2011. Environmental assess-ment of organic juice imported to Denmark: a case study on oranges (Citrus sinensis) from brazil. Org. Agr. (1): 167.
La rosa A.D., Siracusa G. and cavallaro r. 2008. Emer-gy evaluation of Sicilian red orange production. A com-parison between organic and conventional farming. J. of cleaner production. 16 (2008): 1907.
Lo Giudice A. 2002. Arancio dolce cv. tarocco: indici di mat-urazione nella Sicilia orientale. tecnica Agricola. LV (3-4): 169.
Meissner Schau E. and Magerholm Fet. A. 2008. LcA studies of Food Products as background for environmental prod-ucts declarations. Int. J. of LcA. 13 (3): 255.
Milà i canals L., burnip G.M. and cowell S.J. 2006. Eval-uation of the environmental impacts of apple produc-tion using Life cycle Assessment (LcA): case study in New Zealand. Agriculture, Ecosystems & Environment. 114 (2-4): 226.
Mordini M., Nemecek t. and Gaillard G. 2009. carbon & Wa-ter Footprint of Oranges and Strawberries. A literature review. FDEA (Federal Department of Economic Affairs).
Mueller N.D., Gerber J.S., Johnston M., ray D.K., raman-kutty N. and Foley J.A. 2012. closing yield gaps through nutrient and water management. Nature (2012).
ribal J., Sanjuanb N., clementec G. and Fenollosad M.L. 2009. Medición de la eco-eficiencia en procesos produc-tivos en el sector agrario. caso de estudio sobe produc-ción de cítricos. Economía Agraria y recursos Naturales. 9 (1): 125.
roy P., Nei D., Orikasa t., Xu Q., Okadome H., Nakamu-ra N. and Shiina t. 2009. A review of life cycle assess-ment (LcA) on some food products. J. of Food Engineer-ing 90 (1): 1.
ruviaro c.F., Gianezini M., brandão F.S., Winck c.A. and Dewes H. 2012. Life cycle assessment in brazilian agri-culture facing worldwide trends. J. of cleaner produc-tion. 28 (June 2012): 9.
Sanjuan N., Ubeda L., clemente G., Mulet A. and Giro-na F. 2005. LcA of integrated orange production in the comunidad valenciana (Spain). International Jour-nal of Agriculture resources, Governance and Ecolo-gy. 4 (2): 163.
Spreen t., Dwivedib P. and Goodrich-Schneider r. 2010. Es-timating the carbon Footprint of Florida Orange Juice. Paper presented to the International European Forum on System Dynamics and Innovation in Food Networks. In-ternational European Forum, February 8-12, 2010, Inns-bruck-Igls, Austria.
Websites:AIcQ, http://www.aicqtv.net/nazionale/rivista-on-
line/2008_3/carrabba.pdf (web site consulted the 1st Oct. 2012)
cSO, http://www.csoservizi.com (web site consulted the 1st Oct 2012)
FAOStAt, http://faostat.fao.org/site/291/default.aspx (web site consulted the 1st Oct. 2012)
IStAt, http://agri.istat.it/(web site consulted the 1st Oct 2012)
tHE WOrLD WAtEr OrGANIZAtION. http://www.theworldwater.org (web site consulted the 1st Oct. 2012)
European Environmental Agency, http://www.eea.europa.eu/data-and-maps/indicators/energy-efficiency-and-specific-co2-emissions/energy-efficiency-and-specific-co2-3 (web site consulted the 1st Oct. 2012).
Paper received January 9, 2012 Accepted October 29, 2012

PaPer
Ital. J. Food Sci., vol. 25 - 2013 213
- Keywords: fermented beverages, lactic acid bacteria, mild technologies, molecular typing, post-acidification, ultraviolet thin film system -
EFFECT OF UV-C LIGHT IN THE PRESERVATIONOF RAW FERMENTED BEVERAGES
M. BORCAKLI1, J. LUCAS2, L. CAPUTO3*, T. OZTURK1, F. BARUZZI3, V. FUSCO3, G.M. QUERO3, L. QUINTIERI3 and M. HOUGHTON2
1TÜBI.TAK Marmara Research Center, Food Institute, P.O. Box 21,
41470 Gebze/Kocaeli, Turkey2Department of Electrical Engineering & Electronics,
University of Liverpool, Brownlow Hill, L69 3GJ, Liverpool, United Kingdom3Institute of Sciences of Food Production, National Council of Research of Italy,
Via G. Amendola 122/O, 70126 Bari, Italy*Corresponding author: Tel. +39 080 5929323, Fax +39 080 5929374,
email: [email protected]
AbStrAct
the aim of this work was to check the efficacy of an annular ultraviolet reactor for stabilizing the growth of lactic acid bacteria (LAb), the main components of the microbiota of three raw fer-mented beverages, boza, Ayran and Matsoni during cold storage. the ultraviolet (UV) dose of 260 mJ cm-2 caused a reduction of 2.6 and 1 log cFU mL-1 in the LAb loads of boza and Ayran sam-ples, respectively, whereas multiple UV treatments were required for Matsoni; they caused the decrease of 3 log cFU mL-1 in LAb counts. twenty-two bacterial strains, belonging to 11 species, were identified in the natural microflora of the three beverages before and after the UV treatments. Only a minimal post-acidification process was registered up to day 30 in all the three beverages. this ultraviolet device is at disposal of beverage manufacturers, who could apply it for producing microbially-stable drinks with an extended shelf-life.

214 Ital. J. Food Sci., vol. 25 - 2013
INtrODUctION
Many fermented foods are still produced around the world by empirical processes based on spontaneous fermentation of different raw materials.
Some raw fermented beverages produced in Eastern European countries as boza, Ayran and Matsoni have a very short shelf-life.
boza is an ancient cereal-based fermented beverage originating in Mesopotamia 8000-9000 years ago and still produced in turkey, bulgar-ia, Albania and romania under traditional pro-cessing conditions. recent papers have investi-gated the production of bacteriocins from natu-ral LAb occurring in boza (tODOrOV and DIcKS, 2004; 2005; tODOrOV, 2010) and their probi-otic properties (tODOrOV et al., 2008). Howev-er, some interactions among the autochthonous microorganisms could cause uncontrolled fer-mentations that lead to a variable product qual-ity and a shelf-life less than two weeks under refrigeration condition (HANcIOGLU and KArAP-INAr 1997; GOtcHEVA et al., 2000; GENÇ et al., 2002; bOtES et al., 2007). currently, producer companies do not apply any preservation meth-ods other than sorbate amendment.
Ayran is a yoghurt beverage produced in tur-key, traditionally manufactured by adding salt-ed water to yoghurt at a level of 30-50% (ANON-YMOUS, 1982). Quality of Ayran deteriorates during storage, due to acidity development and whey syneresis, thus limiting its shelf-life to 10-15 days at refrigeration temperatures (ANONY-MOUS, 1982).
Matsoni is a Georgian bottle-fermented bev-erage based on pasteurized milk, back-slopped with an inoculum made up of thermophilic strep-tococci and different species of lactobacilli, lead-ing to traces of alcohol and carbon dioxide (UcHI-DA et al., 2007). the shelf-life of Matsoni is 5-7 days at refrigeration temperatures, after which the product becomes too sparkling and sour.
In these circumstances manufacturers need procedures suitable for stabilizing microbial loads and extending the shelf-life of these drinks without completely suppressing their inherent microorganisms, and yet still preserving their taste and texture. Moreover, these drinks are not suitable for severe procedures (heat, high pressure) and for the addition of preservatives and stabilizers, subjected to public concern and ever tighter legislative control.
Interest is being shown in alternative, so-called “physical” treatments such as UV-light as a result of increasing consumer demands for fresh-like quality food products (ZHU et al., 2005).
Many studies, carried out on disinfection of apple juice and microbial inactivation of beers and ciders using UV-light equipment, have shown the reduction of bacterial populations to undetectable limits (KOUtcHMA et al., 2004;
GEVEKE, 2005; LU et al., 2010a; 2010b). re-cently, LU et al. (2011) set up a novel UV appa-ratus based on the Dean vortex technology for sanitizing milk highly contaminated by patho-genic bacteria. MANZOccO et al. (2011) applied a UV-c light treatment to fresh-cut melons and showed that UV-light exposure could be a po-tential novel technology for surface decontami-nation of ready-to-eat foods.
For these reasons, a UV-c light system was applied in this study with the aim of prevent-ing the outgrowth of lactic acid bacteria in raw fermented beverages as boza, Ayran and Mat-soni during their cold storage. Molecular analy-ses were performed on bacterial populations to understand how UV-c treatments affect the mi-crobial composition of these beverages.
MAtErIALS AND MEtHODS
Beverage samples
boza was manufactured following the turk-ish recipe reported by HANcIOGLU and KArAPI-NAr (1997) requiring 2% inoculum with a back-slopping starter obtained from the previous pro-duction. boza samples were provided by Deniz ticaret A.S. (bursa, turkey).
Ayran was produced by mixing home-made yoghurt and 0.5-1% Nacl solution according to the validated turkish method of the turkish In-stitute of Standards (ANONYMOUS, 1982). Ay-ran samples were provided by Aygın Süt A.S. (Konya, turkey).
Matsoni was manufactured following the tra-ditional Georgian recipe using cow’s milk pas-teurized at 90°c for ten min, cooled up to 45°c and inoculated with a 3% back-slopping ob-tained from the batch production of the previous day. Fermentation was carried out in glass bot-tles at 45°c until reaching the pH value of 4.6 (after 5-7 hours). then, samples were placed in a cooling cell and stored at 6°c. Matsoni sam-ples analyzed in this work were manufactured by Amaltea-Didube Milk (tbilisi, Georgia).
All beverage samples were immediately trans-ported under refrigerated condition to the lab-oratory where they were processed by the UV-system described below and then kept at 4°c for sixty days.
The UV-light system
the system consisted of a UV ozone-free lamp (LUcAS and AL-SHAMMA’A, 2003), which emitted energy at two wavelengths (254 and 185 nm) at high power levels (1 kW). the lamp was operat-ed at a constant power of 30 W and was covered by a quartz sleeve situated in a stainless steel chamber. the liquid to be treated was placed into the liquid sample tank which held up to 3 L and had a liquid level indicator. As shown in Fig. 1,

Ital. J. Food Sci., vol. 25 - 2013 215
the liquid was flowed vertically from the sample tank into the UV reactor, as a thin film well ex-posed to the UV-light, and finally pumped to a receiver tank. the flow rate was set and altered by varying the gas pressure (P) within the liquid tank and allowing the liquid to flow through an adjustable needle valve. the gas pressure was fed from the laboratory source (5 bar) and was regulated to about 1 bar.
Cleaning of the system
the system was cleaned between each trial by running tap water 3 times through the instru-ment at a flow rate of 0.5 L min-1, then passing 2 L of 5% hypochloride 3 times at room tempe-rature for disinfection. Finally, sterile distilled water was passed through the system until mi-crobial growth was no longer detected.
Single UV-C treatments
two different doses of UV-light (66 mJ cm-2, flow rate 2 L min-1 and 260 mJ cm-2, flow rate 0.47 L min-1) were applied to 2-litre samples of boza, Ayran and Matsoni 1 day after their pro-duction. During UV treatments, the beverage temperature did not undergo any appreciable changes.
Microbial loads, pH and total titratable acid-ity (ttA) were recorded for all samples immedi-ately before, after UV treatment and during cold storage at 7, 14, 30 and 60 days. Each experi-ment was carried out in triplicate.
Serial UV-C treatments of Matsoni
As single UV doses resulted ineffective in de-creasing microbial loads in Matsoni, multiple UV-c light treatments were applied to these drink samples. In particular, two different ex-periments were carried out. In the first experi-ment, samples were treated with three succes-sive increasing doses of UV-light (87, 135 and
206 mJ cm-2), whereas in the second trial, six successive UV doses (266, 223, 238, 166, 231 and 240 mJ cm-2) were applied. Microbial loads were determined at the end of each treatment. Each experiment was carried out in triplicate. UV treatment of beverages did not cause any ap-preciable changes in temperature.
Microbiological analyses of beverage samples
Samples were collected from each beverage before and after UV treatment in glass vials and used immediately for counting the microbial vi-able cells. these samples were stored at 4°c for further analysis. ten grams of each beverage sample were dispersed in 90 g of 2% sodium cit-rate solution, homogenised in sterile bags via a stomacher, and serially diluted in sterile 0.1% buffered peptone water. the appropriate dilu-tions were plated in triplicate on different me-dia: M17 with 0.5% lactose (LM17, Oxoid S.p.A., Garbagnate, Milan, Italy) and de Man, rogosa and Sharpe (MrS, Oxoid) agar for counting pre-sumptive Gram positive cocci and rods, respec-tively; Violet red bile lactose Agar (VrbA, Difco, Difco Laboratories, Detroit, MI) for enumerating total coliforms; Potato Dextrose Agar (PDA, Dif-co), supplemented with chloramphenicol (0.1 g L-1) for isolating yeasts and moulds. LM17 and MrS plates were incubated for 48 h under an-aerobic conditions (AnaeroGene, Oxoid S.p.A.) at 30°c (for boza sample) or 37°c (for Ayran and Matsoni samples), whereas VrbA plates were incubated at 37°c for 48 h and PDA plates at 25°c for 7 days under aerobic conditions. the microbial content of each experiment was ana-lyzed in triplicate.
For each beverage sample, 10-15 well-isolat-ed bacterial colonies, randomly picked up from MrS and LM17 agar plates seeded with the high-est sample dilutions, were inoculated in MrS and M17 broths, respectively, and incubated under appropriate conditions. All isolates, har-vested by centrifugation (6,000 x g for 5 min), were suspended in the same medium contain-ing 20% glycerol, frozen at - 80°c and stored for further characterization.
Molecular analyses of microbial isolates
total DNA for molecular analyses was ex-tracted from bacterial isolates using the Wiz-ard-Genomic DNA Purification kit (Promega, Madison, WI, USA), according to the manufac-turer’s instructions. DNA quantity and quality were determined by electrophoresis with known amounts of a molecular weight marker (Marker VI, roche Diagnostics, Milan, Italy) as a stand-ard.
bacteria strain typing was performed using the ‘‘two-step rAPD Pcr’’ protocol, as described by bArUZZI et al. (2000), including control re-action mixtures lacking DNA template in each
Fig. 1 - Schematic diagram of the annular UV-light system and cross section of the UV tube. Drawings are not to scale.

216 Ital. J. Food Sci., vol. 25 - 2013
experiment. XD9 (MOScHEttI et al., 1998) and coc1 (cOccONcELLI et al., 1995) primers were used, respectively, for rod- and cocci-shaped LAb.
Pcr amplifications were carried out in a thermal cycler 9700 (Perkin-Elmer, Alameda, cA, USA). taq polymerase and deoxynucleo-side triphosphates were purchased from Sig-ma-Aldrich S.r.l. (Milan, Italy), gel-filtration pu-rified oligonucleotides from Sigma-Genosys Ltd. (cambridge, UK), whereas DNA molecular weight markers were purchased from Qiagen SpA (Mi-lan, Italy). the amplified fragments, separated by electrophoresis in 2.0% agarose gel, were sized using the Quantity One 4.3.1 software (bio-rad Laboratories S.r.l., Milan, Italy). When different isolates gave the same electrophoretic pattern, they were grouped. the ratio (P = n/t) between the number of colonies grouped for each strain (n) and total colonies, analyzed (t) from the same medium for each sample, represented the per-centage (P) of the presence of that strain in the total population. the product of viable cell count value and the percentage (P) of each isolate made it feasible to calculate the viable cell count for each strain. One isolate from each group was chosen as the representative strain and stored for further analyses.
Each representative strain from rAPD-Pcr groups was identified by amplifying and se-quencing the 16S rrNA gene, as previously re-ported (WIESbUrG et al., 1991). the DNA se-quences were obtained using an AbI PrISM big Dye terminator cycle Sequencing Kit ver3.1 (PE Applied biosystems, Inc., Foster city, cA, USA) with both the forward and reverse primers being used. the reaction products were analyzed with an AbI PrISM 310 Genetic Analyzer (Applied biosystems). the Applied biosystems software package (Sequencing Analysis ver. 3.3 and Mt Navigator PPc ver. 1.0.2) was used for the anal-ysis and comparison of DNA sequences. taxo-nomic strain identification was performed, com-paring the rDNA sequences of beverage isolates with the sequences present in the basic bLASt Search, as described by ALtScHUL et al. (1997). taxonomic identification of Lactobacillus plan-tarum, Lactobacillus paracasei, Lactobacillus del-brueckii subsp. bulgaricus, Enterococcus faeci-um, Leuconostoc mesenteroides and Streptococ-cus thermophilus was confirmed by species-spe-cific Pcrs (LIcK et al., 1996; SONG et al., 2000; tOrrIANI et al., 2001; FUrEt et al., 2004; bEN-SALAH et al., 2006).
pH value and total titratable acidity determinations
the pH of beverage samples was determined by direct insertion of a pHmeter (Oakton bench-top pH 510 meter, cole-Parmer, Vernon Hills, Il-linois, USA).
total titratable acidity (ttA) was measured
in the following way: 10 g of beverage sample were weighed in a 250 mL Erlenmeyer flask, and distilled water was added up to 50 mL includ-ing a few drops of phenolphthalein. the mix-ture was titrated with 0.1 N NaOH according to the AOAc method no. 947.05 (AOAc 2000) and expressed as percentage of lactic acid in 100 grams of sample.
Statistical analysis
Statistical analysis of data was carried out us-ing the Statistica 6 software package (StatSoft Italia, Vigonza, Italy). Unpaired two-tailed Stu-dent’s t test was used to analyze statistical dif-ferences in incidence ratios of bacterial biotypes and in the total viable cell counts of the treat-ed beverage samples and controls with respect to each beverage, taking P ≤ 0.05 as significant. One-way analysis of variance (ANOVA) followed by the Duncan’s multiple test range method was applied to verify whether there were significant differences (P ≤ 0.05) in pH and ttA mean val-ues for each beverage before UV treatment and throughout its cold storage.
rESULtS AND DIScUSSION
the first practical applications of UV-c were in disinfection of surfaces and water sterilisa-tion by setting up suitable UV equipment that are currently well accepted in the food industry (AL-SHAMMA’A et al., 2001; HOYEr, 1998).
In the last 20 years, UV-light has been widely used for controlling foodborne pathogens as Es-cherichia coli O157:H7 and enterotoxigenic Stap-hylococcus aureus, Salmonella typhimurium and Listeria monocytogenes in pure culture suspen-sions, stainless steel and foods (McKILLIP et al., 1998; KIM et al., 2002; KrISHNAMUrtHY et al., 2004; YAUN et al., 2004).
A lab-scale UV apparatus was applied to three raw fermented beverages (boza, Ayran and Mat-soni) in order to stabilize the viable counts of microbial groups such as lactic acid bacteria (LAb) responsible for the phenomenon of bev-erage post-processing acidification during cold storage.
Microbiological and molecular analyses of untreated fermented beverages
Since UV-c light treatments were applied in order to reduce but not destroy the natural mi-croflora of each beverage, it was necessary to monitor the dominant bacterial strains occurring before and after UV-c light treatments.
At the end of the manufacturing process, all beverage samples contained high microbial loads of lactic acid bacteria (7.8 log cFU/mL, on av-erage); while fungi and yeasts were undetecta-ble; during cold storage, bacterial counts in the

Ital. J. Food Sci., vol. 25 - 2013 217
untreated samples of the three drinks re-mained quite stable till day 60 (Fig. 2). the coliform counts in the three beverage sam-ples were below the detection threshold.
Molecular analyses in the untreated boza samples revealed complex and het-erogeneous populations made up of nine different bacterial strains belonging to sev-en species (table 1). these results are in accordance with those reported by oth-er authors (GOtcHEVA, 2000; HANcIOGLU and KArAPINAr, 1997; bOtES et al., 2007).
Microbiological and molecular analyses of Ayran showed, in addition to the char-acteristic microflora of yoghurt, Strep-tococcus thermophilus and Lactobacillus delbrueckii subsp. bulgaricus, as previ-ously reported (ANONYMOUS, 1982), even one single strain of Lactobacillus plantar-um (table 2).
As concerns Matsoni, microbiological analyses allowed to ascertain that, in the untreated samples, Gram-positive cocci vi-able counts resulted dominant, account-ing for more than 8 log cFU mL-1, followed by Gram-positive rods with more than 5 log cFU mL-1 (Fig. 2). Molecular analyses confirmed the results previously reported by UcHIDA et al. (2007), who, analysing 26 Matsoni samples collected throughout Georgia, found that the microbiota of this beverage was mainly made up of S. ther-mophilus and L. delbrueckii spp. bulga-ricus. In addition, our molecular analy-ses revealed the dominance of S. thermo-philus on L. delbrueckii subsp. bulgaricus strains in the samples (table 3), confirm-ing the results of the microbiological in-vestigations (Fig. 2).
Effect of UV-C light treatment on beverages
the UV-c dose of 66 mJ cm-2 was in-effective on all beverages, whereas prom-ising results were obtained treating boza and Ayran samples with the UV-c dose of 260 mJ cm-2 and 0.47 L/min. A reduc-tion of about 2 log cFU mL-1 was regis-tered in both Gram-positive rods and coc-ci of boza samples immediately after UV treatment (Fig. 2); the same values of mi-crobial counts were registered at the end of cold storage.
Molecular analyses showed that some strains, occurring at high amounts before the UV-light treatment, were not isolated from the same sample after UV treatment; on the other hand, some new strains were recovered after UV-light treatment, sug-gesting they occurred as sub-populations in the untreated boza samples (table 1).
In Ayran samples, the 260 mJ cm-2 UV
Fig. 2 - total viable cell counts of presumptive lactobacilli and lacto-cocci/streptococci from untreated (Lb-control and Lc/St-control, re-spectively) and UV-treated (Lb-treated and Lc/St-treated, respective-ly) fermented beverages: boza and Ayran treated with UV dose of 260 mJ cm-2; Matsoni treated with multiple UV doses (87, 135 and 206 mJ cm-2). Values are means of three replicates ± SD.

218 Ital. J. Food Sci., vol. 25 - 2013
c dose caused a decrease of about 1 log cycle in both Gram-positive rods and cocci viable loads; lactic acid bacteria (LAb) counts remained quite stable till day 60 (Fig. 2). LU et al. (2010b) reg-istered a similar reduction value in total LAb by applying the 4.8 mJ cm-2 UV dose to beer samples, using a thin film apparatus equipped with quartz optical fibres. Molecular analyses of Ayran UV-treated samples revealed that LAb
table 1 - Percentage of dominant strains within bacterial populations from boza samples before and after ultraviolet treatmenta.
Boza Strains (%)
Medium Strain Species Before After Sig. b
UV treatment UV treatment
MRS B41 Lactobacillus plantarum 25.00 50.00 ** B44 Weissella confusa 25.00 16.67 * B34 Lactobacillus paracasei 25.00 16.66 * B38 Lactobacillus plantarum 25.00 0 ** B23 Leuconostoc mesenteroides 0 16.67 ** Total 100.00 100 n.s. Total viable cell counts 7.26±0.25 5.02±0.10 ** (log CFU mL-1)
M17 B2(b) Enterococcus faecium 12.50 8.25 * B3 Enterococcus durans 25.00 8.25 ** B5 Weissella confusa 12.50 24.75 * B19 Leuconostoc lactis 37.50 0 ** B18 Lactococcus lactis subsp. cremoris 12.50 0 ** B4 Leuconostoc lactis 0 34.00 ** B1 Lactobacillus plantarum 0 8.25 ** B2(a) Lactobacillus coryniformis 0 8.25 ** B11 Lactobacillus paracasei 0 8.25 ** Total 100.00 100.00 n.s. Total viable cell counts (log CFU mL1) 6.99 5.00 **
aValues represent the average ratios between each strain and the total viable cell counts grown on MRS or M17 agar.bSignificant differences in incidence percentages of biotypes and in total viable cell counts before and after UV treatment (*: P ≤ 0.05; **: P < 0.01; n.s.: not sig-nificant; two-tailed Student’s test, N = 3).
strains belonged to S. thermophilus and L. plan-tarum, whereas L. delbrueckii subsp. bulgaricus 401, recovered from the untreated samples, was not retrieved (table 2).
Single UV doses were ineffective in decreasing microbial loads in Matsoni. GUErrErO- bELt-rÀN and bArbOSA-cÀNOVAS (2004) found that milk solids may limit UV penetration and there-by decrease the efficiency of UV treatments.
table 2 - Percentage of dominant strains within bacterial populations from Ayran samples before and after ultraviolet treatmenta.
Ayran Strains (%)
Medium Strain Species Before After Sig. b
UV treatment UV treatment
MRS A4 Lactobacillus plantarum 12.51 50.00 ** A13 Streptococcus thermophilus 85.32 50.00 * 401 Lactobacillus delbrueckii subsp. bulgaricus 2.17 0 ** Total 100.00 100 n.s. Total viable cell counts 7.84 6.93 * (log CFU mL-1)
M17 A13 Streptococcus thermophilus 100.00 100.00 n.s. Total 100.00 100.00 n.s. Total viable cell counts (log CFU mL-1) 7.81 6.93 *
aValues represent the average ratios between each strain and the total viable cell counts grown on MRS or M17 agar. bSignificant difference in incidence ratios of biotypes and in total viable cell counts before and after UV treatment (*: P ≤ 0.05; **: P < 0.01; n.s.: not significant; two-tailed Student’s test, N = 3).

Ital. J. Food Sci., vol. 25 - 2013 219
this behaviour could explain why one single UV-c treatment was more effective in reduc-ing LAb loads in boza than in Ayran. thus, in the milk-based beverage Matsoni two different experiments were carried out: in the first one, samples were subjected to three successive UV-light treatments with increasing doses, where-as in the latter experiment six successive UV-c doses were applied to the drink samples, as pre-viously described. As concerns the first UV ex-periment, Gram-positive rods were more resist-ant to UV-c treatment in comparison with coc-ci during cold storage (Fig. 2, bOZA and AYrAN). A reduction of more than 3.5 log cFU mL-1 was registered in Gram-positive cocci viable counts immediately after UV treatment; they increased by 1 log after one week of cold storage, decreas-ing to 2.8 log at day 60 (Fig. 2). the same UV-c dose caused a reduction of about 2.5 log cFU mL-1 in Gram-positive rod viable counts imme-diately after UV treatment; this bacterial pop-ulation increased to over 4 log at day 15, de-creasing to about 3 log at day 60 of cold stor-age (Fig. 2). Molecular analyses revealed that the UV-treated samples contained the same two strains of L. delbrueckii subsp. bulgaricus re-trieved in the original sample, with one domi-nant biotype, suggesting that this latter strain was more resistant to UV treatment (table 3); as concerns St. thermophilus biotypes, the same rAPD-Pcr pattern found in the untreated sam-ple was retrieved as dominant, together with a second profile. In addition, one single Lactococ-cus lactis biotype was found after UV treatment (table 3). the second UV-c experiment carried out on Matsoni samples caused the complete disappearance of LAb (data not shown); there-fore this treatment was considered too drastic for the purpose of the present work.
Values of pH and total titratable acidity determinations of untreated and treated beverage samples
In accordance with the increase in microbial counts, pH decreased markedly while ttA in-creased in the untreated cold-stored boza and Matsoni samples (table 4). the marked de-crease in pH in both untreated beverages dur-ing cold storage was probably due to the in-crease in ttA, which in turn depends on mi-crobial fermentation (rObINSON et al., 2006). Some bacterial species isolated from boza as Leuconostoc lactis and Leuconostoc lactis sub-sp. cremoris displayed a psychrophilic behav-iour that allowed them to grow at low temper-atures and produce different types of organic acids (lactic and acetic acids) that have a di-rect influence on acidity and the final flavour of the beverage. ZOrbA et al. (2003) reported the results of pH and ttA values in boza during fermentation time; however, to the best of our knowledge, no reports on the analysis of these values during cold storage of this beverage are available so far.
Interestingly, in our work, pH and ttA in UV-treated boza samples changed slightly dur-ing cold storage unlike the pH of the untreated samples (table 4).
As in yoghurt, in the milk-based beverages Ay-ran and Matsoni heterofermentative bacteria as L. delbrueckii subsp. bulgaricus are responsible for the phenomenon of post-processing acidifi-cation, causing a dangerous drop in pH below 4.3, which destabilizes the casein clot and weav-ing of beverages in retail (rObINSON et al., 2006).
No increase in ttA values was registered in all three UV-treated beverages after 2 months of cold storage. thus, the phenomenon of beverage
table 3 - Percentage of dominant strains within bacterial populations from Matsoni samples before and after the ultraviolet treatmenta with multiple UV doses (87, 135 and 206 mJ cm-2).
Ayran Strains (%)
Medium Strain Species Before After Sig. b
UV treatment UV treatment
MRS A Lactobacillus delbrueckii subsp. bulgaricus 90.00 60.00 ** B Lactobacillus delbrueckii subsp. bulgaricus 10.00 40.00 * Total 100.00 0 ** Total viable cell counts 5.26 2.71 ** (log CFU mL-1)
M17 C Streptococcus thermophilus 100.00 70.00 ** D Streptococcus thermophilus 0 20.00 ** E Lactococcus lactis 0 10.00 ** Total 100.00 100.00 n.s. Total viable cell counts 8.34 4.66 ** (log CFU mL-1)
aValues represent the average ratios between each strain and the total viable cell counts grown on MRS or M17 agar. bSignificant differences in incidence percentages of biotypes and in total viable cell counts before and after UV treatment (*: P ≤ 0.05; **: P < 0.01; n.s.: not sig-nificant; two-tailed Student’s test, N = 3).
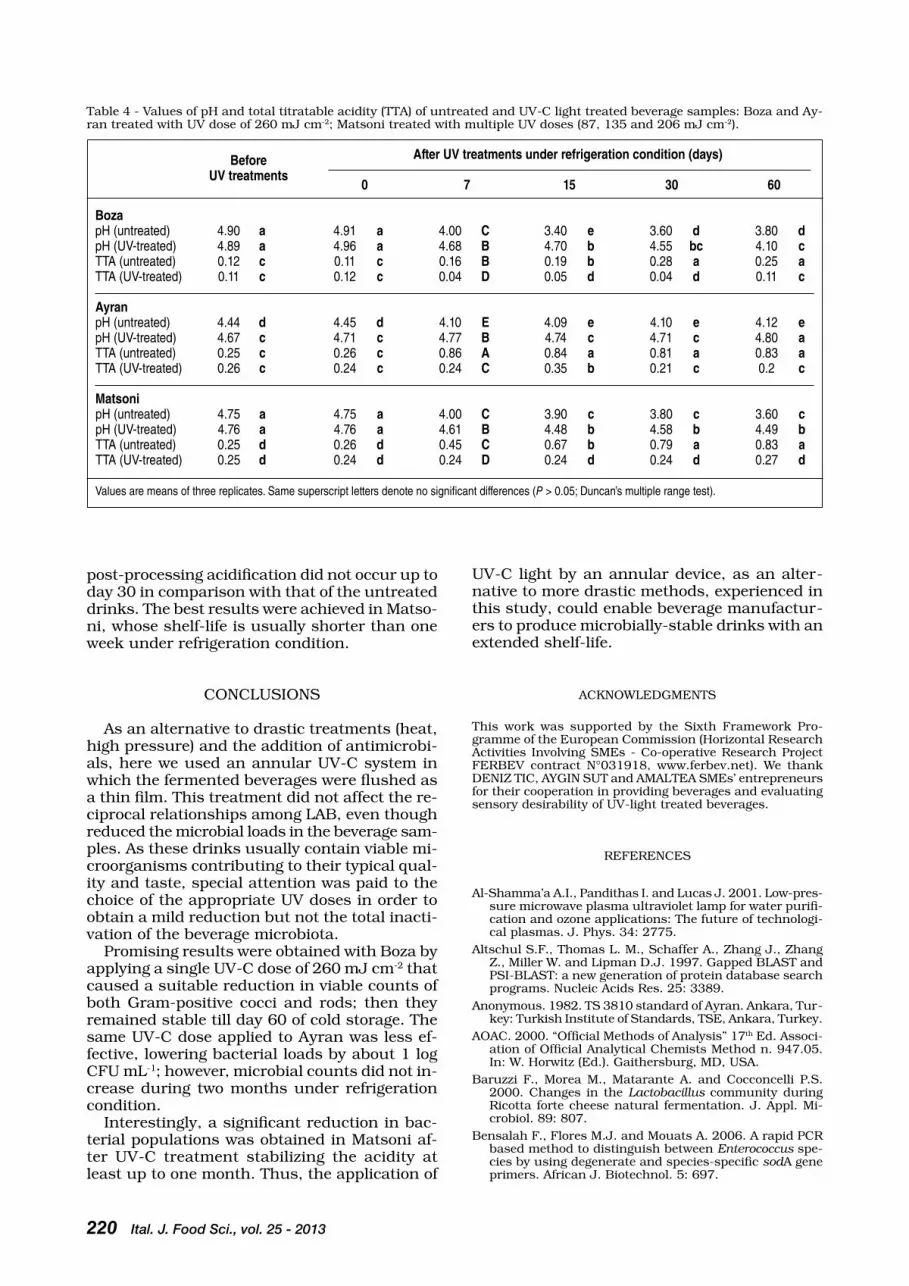
220 Ital. J. Food Sci., vol. 25 - 2013
post-processing acidification did not occur up to day 30 in comparison with that of the untreated drinks. the best results were achieved in Matso-ni, whose shelf-life is usually shorter than one week under refrigeration condition.
cONcLUSIONS
As an alternative to drastic treatments (heat, high pressure) and the addition of antimicrobi-als, here we used an annular UV-c system in which the fermented beverages were flushed as a thin film. this treatment did not affect the re-ciprocal relationships among LAb, even though reduced the microbial loads in the beverage sam-ples. As these drinks usually contain viable mi-croorganisms contributing to their typical qual-ity and taste, special attention was paid to the choice of the appropriate UV doses in order to obtain a mild reduction but not the total inacti-vation of the beverage microbiota.
Promising results were obtained with boza by applying a single UV-c dose of 260 mJ cm-2 that caused a suitable reduction in viable counts of both Gram-positive cocci and rods; then they remained stable till day 60 of cold storage. the same UV-c dose applied to Ayran was less ef-fective, lowering bacterial loads by about 1 log cFU mL-1; however, microbial counts did not in-crease during two months under refrigeration condition.
Interestingly, a significant reduction in bac-terial populations was obtained in Matsoni af-ter UV-c treatment stabilizing the acidity at least up to one month. thus, the application of
table 4 - Values of pH and total titratable acidity (ttA) of untreated and UV-c light treated beverage samples: boza and Ay-ran treated with UV dose of 260 mJ cm-2; Matsoni treated with multiple UV doses (87, 135 and 206 mJ cm-2).
Before After UV treatments under refrigeration condition (days) UV treatments 0 7 15 30 60
Boza pH (untreated) 4.90 a 4.91 a 4.00 C 3.40 e 3.60 d 3.80 dpH (UV-treated) 4.89 a 4.96 a 4.68 B 4.70 b 4.55 bc 4.10 cTTA (untreated) 0.12 c 0.11 c 0.16 B 0.19 b 0.28 a 0.25 aTTA (UV-treated) 0.11 c 0.12 c 0.04 D 0.05 d 0.04 d 0.11 c
Ayran pH (untreated) 4.44 d 4.45 d 4.10 E 4.09 e 4.10 e 4.12 epH (UV-treated) 4.67 c 4.71 c 4.77 B 4.74 c 4.71 c 4.80 aTTA (untreated) 0.25 c 0.26 c 0.86 A 0.84 a 0.81 a 0.83 aTTA (UV-treated) 0.26 c 0.24 c 0.24 C 0.35 b 0.21 c 0.2 c
Matsoni pH (untreated) 4.75 a 4.75 a 4.00 C 3.90 c 3.80 c 3.60 cpH (UV-treated) 4.76 a 4.76 a 4.61 B 4.48 b 4.58 b 4.49 bTTA (untreated) 0.25 d 0.26 d 0.45 C 0.67 b 0.79 a 0.83 aTTA (UV-treated) 0.25 d 0.24 d 0.24 D 0.24 d 0.24 d 0.27 d
Values are means of three replicates. Same superscript letters denote no significant differences (P > 0.05; Duncan’s multiple range test).
UV-c light by an annular device, as an alter-native to more drastic methods, experienced in this study, could enable beverage manufactur-ers to produce microbially-stable drinks with an extended shelf-life.
AcKNOWLEDGMENtS
this work was supported by the Sixth Framework Pro-gramme of the European commission (Horizontal research Activities Involving SMEs - co-operative research Project FErbEV contract N°031918, www.ferbev.net). We thank DENIZ tIc, AYGIN SUt and AMALtEA SMEs’ entrepreneurs for their cooperation in providing beverages and evaluating sensory desirability of UV-light treated beverages.
rEFErENcES
Al-Shamma’a A.I., Pandithas I. and Lucas J. 2001. Low-pres-sure microwave plasma ultraviolet lamp for water purifi-cation and ozone applications: the future of technologi-cal plasmas. J. Phys. 34: 2775.
Altschul S.F., thomas L. M., Schaffer A., Zhang J., Zhang Z., Miller W. and Lipman D.J. 1997. Gapped bLASt and PSI-bLASt: a new generation of protein database search programs. Nucleic Acids res. 25: 3389.
Anonymous. 1982. tS 3810 standard of Ayran. Ankara, tur-key: turkish Institute of Standards, tSE, Ankara, turkey.
AOAc. 2000. “Official Methods of Analysis” 17th Ed. Associ-ation of Official Analytical chemists Method n. 947.05. In: W. Horwitz (Ed.). Gaithersburg, MD, USA.
baruzzi F., Morea M., Matarante A. and cocconcelli P.S. 2000. changes in the Lactobacillus community during ricotta forte cheese natural fermentation. J. Appl. Mi-crobiol. 89: 807.
bensalah F., Flores M.J. and Mouats A. 2006. A rapid Pcr based method to distinguish between Enterococcus spe-cies by using degenerate and species-specific sodA gene primers. African J. biotechnol. 5: 697.

Ital. J. Food Sci., vol. 25 - 2013 221
botes A., todorov S.D., Von Mollendorff J.W., botha A. and Dicks L.M. 2007. Identification of lactic acid bacteria and yeast from boza. Process biochem. 42: 267.
cocconcelli P.S., Porro D., Galandini S. and Senini L. 1995. Development of rAPD protocol for typing of strains of lactic acid bacteria and enterococci. Lett. Appl. Micro-biol. 21: 376.
Furet J.P., Quénée P. and tailliez P. 2004. Molecular quan-tification of lactic acid bacteria in fermented milk prod-ucts using real-time quantitative Pcr. Int. J. Food Mi-crobiol. 97: 197.
Genç M., Zorba M. and Ova G. 2002. Determination of rhe-ological properties of boza by using physical and senso-ry analysis. J. Food Eng. 52: 95.
Geveke D.J. 2005. UV inactivation of bacteria in apple ci-der. J. Food Protect. 68: 1739.
Gotcheva V., Pandiella S.S., Angelov A., roshkova Z.G. and Webb c. 2000. Microflora identification of the bulgari-an cereal-based fermented beverage boza. Process bio-chem. 36: 127.
Guerrero-beltràn J.A. and barbosa-cànovas G.V. 2004. re-view: advantages and limitations on processing foods by UV light. Food Sci. technol. Int. 10: 137.
Hancioglu O. and Karapinar M. 1997. Microflora of boza, a traditional fermented turkish beverage. Int. J. Food Mi-crobiol. 35: 271.
Hoyer O. 1998. testing performance and monitoring of UV systems for drinking water disinfection. Water Supply 16: 424.
Kim t., Silva J.L. and chen t.c. 2002. Effects of UV ir-radiation on selected pathogens in peptone water and on stainless steel and chicken meat. J. Food Protect. 65: 1142.
Koutchma t., Keller S., chirtel S. and Parisi b. 2004. Ul-traviolet disinfection of juice products in laminar and turbulent flow reactors. Innov. Food Sci. Emerg. tech-nol. 5: 179.
Krishnamurthy K., Demirci A. and Irudayaraj J. 2004. In-activation of Staphylococcus aureus by pulsed UV-light sterilization. J. Food Protect. 67: 1027.
Lick S., Keller M., bockelmann W. and Heller J. 1996. rap-id identification of Streptococcus thermophilus by primer-specific Pcr amplification based on its lacZ gene. Syst. Appl. Microbiol. 19: 74.
Lu G., Li c. and Liu P. 2011. UV inactivation of milk-relat-ed microorganisms with a novel electrodeless lamp ap-paratus. Eur. Food res. technol. 233: 79.
Lu G., Li c., Liu P. cu H., Xia, Y. and Wang J. 2010a. Inac-tivation of microorganisms in apple juice using an ultra-violet silica-fiber optical device. J. Photochem. Photobi-ol. b: biol. 100: 167.
Lu G., Li c., Liu P., cu H., Yao Y. and Zhang Q. 2010b. UV inactivation of microorganisms in beer by a novel thin-film apparatus. Food control 21: 1312.
Lucas J. and Al-Shamma’a A.I. 2003.Germicidal modified-atmosphere packaging for food products and water puri-fication. british patent 407725 Gb, October.
Manzocco L., Da Pieve S. and Maifreni M. 2011. Impact of UV-c light on safety and quality of fresh cut melon. In-nov. Food Sci. Emerg. technolog. 12: 13.
McKillip J.L., Jaykus L.A. and Drake M. 1998. rrNA Stability in heat-killed and UV-irradiated enterotoxigenic Staphy-lococcus aureus and Escherichia coli O157:H7. Appl. En-viron. Microbiol. 64: 4264.
Moschetti G., blaiotta G., Aponte M., catzeddu P., Villani F., Deiana P. and coppola S. 1998. random amplified polymorphic DNA and amplified ribosomal DNA spacer polymorphism: powerful methods to differentiate Strep-tococcus thermophilus strains. J. Appl. Microbiol. 85: 25.
robinson r.K., Lucey J.A. and tamine A.Y. 2006. Manufac-ture of yoghurt. In ”Fermented Milks”. A.Y. tamime (Ed.), pp. 53-75. blackwell Science Ltd, Oxford.
Song Y., Kato N., Liu c., Matsumiya Y., Kato H. and Wata-nabe K. 2000. rapid identification of 11 human intes-tinal Lactobacillus species by multiplex Pcr assays us-ing group- and species-specific primers derived from the 16S-23S rrNA intergenic spacer region and its flanking 23S rrNA. FEMS Microbiol. Lett. 187: 167.
todorov S.D. 2010. Diversity of bacteriocinogenic lactic acid bacteria isolated from boza, a cereal-based fermented bev-erage from bulgaria. Food control 21: 1011.
todorov S.D. and Dicks L.M.t. 2004. characterization of mesentericin St99, a bacteriocin produced by Leuconos-toc mesenteroides subsp. dextranicum St99 isolated from boza. J. Ind. Microbiol. biotechnol. 31: 323.
todorov S.D. and Dicks L.M.t. 2005. Pediocin St18, an an-ti-listerial bacteriocins produced by Pediococcus pentosa-ceus St18 isolated from boza, a traditional cereal bever-age from bulgaria. Process biochem. 40: 365.
todorov S.D., botes M., Guigas c., Schillinger U., Wiid I., Wachsman M.b., Holzapfel W.H. and Dicks L.M. 2008. boza, a natural source of probiotic lactic acid bacteria. J. Appl. Microbiol.104: 465.
torriani S., Felis G.E and Dellaglio F. 2001. Differentiation of Lactobacillus plantarum, L. pentosus, and L. paraplan-tarum by recA Gene Sequence Analysis and Multiplex Pcr Assay with recA Gene-Derived Primers. Appl. Envi-ron. Microbiol. 67: 3450.
Uchida K., Urashima t., chanishvili N., Arai I. and Mo-toshima H. 2007. Major microbiota of lactic acid bacte-ria from Matsoni, a traditional Georgian fermented milk. Anim. Sci. J. 78: 85.
Wiesburg G.W., barns S.M., Pelletier D.A. and Lane D.J. 1991.16S ribosomal DNA amplification for phylogenetic study. J. bacteriol. 173: 697.
Yaun b.r., Sumner S.S., Eifert J.D. and Marcy J.E. 2004. Inhibition of pathogens on fresh produce by ultraviolet energy. Int. J. Food Microbiol. 90: 1.
Zhu M., Du M., cordray J. and Ahn D.U. 2005. control of Listeria monocytogenes contamination in ready-to-eat meat products. compr. rev. Food Sci. F. 4: 34.
Zorba M., Hancioglu O., Genç M., Karapinar M. and Ova G. 2003. the use of starter cultures in the fermentation of boza, a traditional turkish beverage. Process bio chem. 38:1405.
Paper received July 26, 2012 Accepted November 16, 2012

PaPer
222 Ital. J. Food Sci., vol. 25 - 2013
- Keywords: rice bran, stabilization, partially baked, wheat bread -
DIFFERENT STABILIZATION TREATMENTS OF RICE BRAN
ADDED TO WHEAT FLOUR DETERMINE DIFFERENT PROPERTIESIN PARTIALLY BAKED WHEAT BREAD
J. QUILEZ1,2,*, M. ZATOR3, J. SALAS-SALVADÓ1,2 and L. ALVAREZ4
1Human Nutrition Unit, School of Medicine, IISPV, Universitat Rovira i Virgili, Sant Llorenç 21, 43201-Reus, Spain
2CIBER Fisiopatologia de la Obesidad y Nutrición (CIBEROBN), Instituto de Salud Carlos III, Madrid, Spain
3Departament de Tecnologia, EUROPASTRY S.A., Xavier Cugat 2, 08174-Sant Cugat del Vallès, Spain
4Departament d’Enginyeria Agroalimentària i Biotecnologia, Universitat Politècnica de Catalunya, Castelldefels, Spain
*Corresponding author: [email protected]
AbStrAct
In the present study, wheat flour was replaced by 3, 6 and 9% of rice bran (rb) previously ex-posed to two types of heat treatment: extrusion (EXt) and steam cooking (Stc). the aim was to investigate how rb affected the properties of wheat-flour dough and partially baked wheat bread, as a final product. the results of the study indicate that neither of the rb treatments had a neg-ative influence on the rheological characteristics of the dough, but that its fermentation capaci-ty and gas retention improved, especially in case of EXt-rb, which was exposed to more inten-sive heat treatment. In the final bread product, there was also a positive increase in the specific total volume for the EXt-rb bread, and a decrease for the Stc-rb bread. Nevertheless, sensory analysis showed that the score for the rb-enriched bread decreased when rb content increased. We concluded that low concentrations of rb exposed to a more intensive heat stabilization pro-cess improves several rheological properties of the dough and the physical properties of the par-tially wheat bread.

Ital. J. Food Sci., vol. 25 - 2013 223
INtrODUctION
rice is the second most cultivated cereal grain in the world, and the most important cereal crop of Asia, Australia and South America. In Europe rice is grown mainly in Italy and Spain. rice bran (rb), which amounts to 8% of the to-tal rice grain, is a by-product of white rice, the most common form for consumption. After its production, rb deteriorates very rapidly because of lipid hydrolysis caused by the action of endog-enous lipases. this poses a serious problem if it is to be consumed by both animals and humans and means that widespread consumption of rb is unacceptable. In order to disable the enzyme action and ensure that rb is not damaged, dif-ferent types and intensities of heat stabilization treatment have been assayed (DA SILVA et al., 2006). the annual production of rice in Spain is around 750 million kg, which means approxi-mately 60 million kg of rb. Since rb is not sub-jected to stabilization processes and cannot be consumed immediately, there is an enormous amount of potential waste and its disposal is an environmental problem.
Unlike other brans consisting mainly of fiber, rb does contain insoluble fiber but also signif-icant amounts of protein and fat. rb has been extensively characterized in the past, especial-ly in its lipid fraction (WArrEN and FArrELL, 1990), and it has shown interesting properties from the nutritional point of view. rb is rich in tocopherols and especially in γ-oryzanol. It mainly consists of ferulic acid esters, sterols and triterpenic alcohols (GArcIA-LErMA et al., 2009), all the important nutrients with potential health properties. rb intake has been shown to be effective at decreasing plasma LDL-choles-terol in hypercholesterolemic individuals (GEr-HArDt and GALLO, 1998). the lipid fraction of rb has also been shown to be responsible for decreasing cholesterol in humans (MOSt et al., 2005). No differences in the glycemic index have been observed after the consumption of corn bread and corn bread supplemented with rb (ScHNELL et al., 2005). However, after the long-term consumption of whole rb or its frac-tions, the glucose metabolism in patients with type I and II diabetes mellitus has been shown to improve (QUrESHI et al., 2002). Finally, the antioxidant activity of rb is high in both lipo-philic and hydrophilic fractions, much higher than has been observed for most other plant products (WU et al., 2004).
For many years, there has been increasing interest in adding rb to bread (cArrOLL, 1990; SHArP and KItcHENS, 1990). Most research has focused on increasing the nutritional value of bread, basically the protein, fiber and mineral content (AJMAL et al., 2006; SADAWArtE et al., 2007). Nevertheless, the reported levels of rb added were generally very high and many dif-ferent types of bread were used, so it is difficult
to extrapolate these data to other sorts of bread. In the present study, small doses of rb, exposed to two types of heat treatment were added to wheat flour so that we could assess the effects of rb addition on the properties of wheat flour dough and partially baked wheat bread, widely consumed in Europe.
MAtErIALS AND MEtHODS
the rb used was of the bomba variety and cultivated in the delta of the Ebro river (Spain). the rb obtained was ground and thermal-ly treated by two different methods within 24 hours of procurement. One of the methods was an extrusion cooking (EXt) procedure (bühler AG, Switzertland) and rb was extruded at 115ºc and an end-plate pressure of 12.1 bar. the oth-er method was a steam cooking (Stc) procedure (FSH; bühler AG, Switzerland) in which rb was stabilized by being subjected to steam at 100 ºc and a subsequent residence time of at least 1 minute. After stabilization and cooling, rb was stored in closed paper bags until it was used.
Analysis of wheat flour and rice bran
the proximate composition of wheat flour (La Meta, Lleida, Spain) and the two types of rb (EXt and Stc) was analyzed. Humidity was determined by drying the sample at 130°c for 2 h. Ash was analyzed by burning the sample at 525°c for 5 h. Protein was analyzed by the Kjeldahl AOAc method 920.87 (AOAc, 2005) in a semiautomatic system (büchi, Switzerland). total lipid content was determined by the Sox-hlet AOAc method 920.39c (AOAc, 2005). to-tal, insoluble and soluble dietary fiber was an-alyzed using the AOAc Official Method 991.43 (AOAc, 2005). the protein solubility of rb was determined according to SHArMA et al. (2004).
the particle size distribution of wheat flour and two types of rb (EXt and Stc) was analyzed using an electromagnetic sieve shaker (cISA, barcelona, Spain) with four meshed sieves with size openings of 500, 300, 150, and 125 µm. In each case 500 g of the sample was placed on the top screen (500 µm openings) and then shaken for 20 minutes. In order to determine the amount of sample retained on each screen, the screens were subsequently weighed.
All analyses were run in triplicate, and the av-erage values were adopted.
Experimental conditions
In order to investigate the properties of dough and baked bread, mixtures of wheat flour re-placed with 3, 6 and 9% of both types of rb (EXt and Stc) were prepared. the dough and baked bread made with wheat flour without added rb were used as a control.

224 Ital. J. Food Sci., vol. 25 - 2013
Dough characteristics
For each experimental condition, the visco-elastic behavior of the dough was determined by the Alveograph MA82 (tripette and renaud, France) according to the AAcc method 54-30.02 (AAcc, 2009). the parameters measured were: the strength or deformation energy (W), tenaci-ty or resistance to extension (P) and dough ex-tensibility (L). Proteolytic degradation was de-termined by comparing the W value right after analysis and after two hours of dough resting time (W2h) (rOSELL et al., 2002)
the mixing behavior of the dough was deter-mined using the Farinograph 810-105 (brabend-er, Germany), according to the AAcc method 54-21.01 (AAcc, 2009). the following parameters were determined: water absorption (%), dough development time (DDt), stability and the de-cay at 10 minutes.
the gelatinization properties, measured as the gelatinization maximum or the peak viscos-ity in AU (Amylographic Units), were analyzed using the Amylograph E (brabender, Duisburg, Germany), according to the AAcc method 22-10.01 (AAcc, 2009).
Fermentation behavior was measured by the rheofermentometer F3 (tripette and renaud, France) according to the supplier’s specifica-tions. the following parameters of dough devel-opment were measured: maximum dough fer-mentation height (Hm) and the time at which dough reaches maximum height (t1). the gas pa-rameters measured were: the time of maximum gas formation (Gt1), dough permeability when gas starts to escape from the dough (tx), the vol-ume of gas produced throughout fermentation (VcO2), and the gas retained in the dough at the end of the assay (r), in both milliliters (ml) and percentage (%) of gas retained.
All assays were performed in triplicate, and the average values were adopted.
Breadmaking process
the wheat bread used for the test was pro-duced industrially using a Sancassiano sin-gle spiral kneading system (15 min; 23ºc fi-nal dough temperature) (Sancassiano, Alba, It-aly) and a Mecatherm production line (Mecath-erm, barembach, France) in a straight process that takes into account the various experimental conditions described above. Water (57%), yeast (2%), salt (1.8%), and commercial bread improv-er (0.5%) with ascorbic acid, DAtEM, α-amy-lase and xylanase (Leag-Eurogerm, barcelona, Spain), were added to the wheat flour or mix-tures of wheat flour with rb (flour basis; see sec-tion on experimental conditions). After kneading and make-up, the dough underwent a 90 min fermentation process and prebaking was per-formed for 12 min at 185°c. After the cooling phase (20 min), the partially baked bread was
deep-frozen at -18°c, packed in plastic bags in a cardboard box, and kept in frozen storage at -18°±2°c. It was then stored in the freezer for 15 days until analyses had been completed. be-fore analysis, the bread was defrosted for 45 min and second baking was performed (16 min at 190ºc) in a Salva convection oven (Salva, Lezo, Spain). Samples were analyzed after cooling at room temperature for two hours.
Bread loaf volume
bread volume was determined using a laser sensor, with the volume analyzer bVM-L 370 (texVol Instruments, Sweden). the value of vol-ume index was measured following the AAcc method 10-91 (AAcc, 2009) according to GO-MEZ et al. (2003). Specific volume was calculat-ed as the ratio between the volume of bread and its weight. the final value obtained for each sub-stitution level was an average of 20 repetitions (5 loaves x 4 pieces).
Sensory analysis
the sensory analysis was carried out follow-ing the ISO-8587 Standards (ISO, 2006). A total of 30 people, habitual consumers of bread, were asked to test seven samples (control sample and six bread samples containing rb) and rank them from the one they liked the most to the one they liked the least. In this case, the high number of samples made the sensory analysis difficult for untrained panelists and the evaluation param-eters had to be simplified to overall taste pref-erences only. Once the samples had been sort-ed according to the panelists’ palatability, they were each scored on a scale of 7 (like the most) to 1 (like the least).
Statistical analysis
Analysis of variance (ANOVA) was applied to specific volume and sensory analysis data to evaluate the differences between the seven kinds of tested bread. the substitution level of wheat flour by two types of rb (EXt and Stc) was con-sidered. In order to discriminate among means, Fisher’s least significant differences (LSD) test was used (95% confidence interval). the soft-ware used for statistical analysis was Statgraph-ics centurion XVI V.16.0.08 provided by Stat-softInc., USA.
rESULtS
Wheat flour and rice bran characteristics
table 1 summarizes the proximate compo-sition of wheat flour and the two types of rb (EXt and Stc). Our results were in agreement with previously reported results for this kind

Ital. J. Food Sci., vol. 25 - 2013 225
table 1 - chemical composition and particle size of wheat flour, extrusion cooking (EXt) and steam cooking (Stc) rice bran.
Wheat EXT STC flour Rice bran Rice bran
Chemical composition (g/100 g)Moisture 13.8 7.3 6.1Protein 9.8 14.9 15.4Fat 1.3 15.9 17.0Ash 0.6 9.4 9.5Total fibre 4.4 23.7 23.5- Insoluble fiber 3.0 21.8 21.5- Soluble fiber 1.4 1.9 2.0Carbohydratesa 70.1 28.8 28.5Bran soluble protein 2.3 3.4Particle size (%)>0.50 mm 0.1 31.7 20.90.50-0.30 mm 11.9 51.7 65.60.30-0.25 mm 18.4 12.5 9.70.25-0.20 mm 31.3 3.7 3.60.20-0.125 mm 35.1 0.4 0.2<0.125 mm 3.2 0.0 0.0
aCalculated by difference. Values are means from triplicate determinations.
of product (cArrOLL, 1990; PAcHEcO DE DE-LAHAYE et al., 2009). rb has a high content of soluble albumins and globulins and their de-naturation during the heat treatment led to a decrease in its soluble form (PrAKASH and rA-MANAtHAN, 1994). According to the findings reported by SHArMA et al. (2004), the very low content of soluble protein in EXt-rb is due to the high temperature applied during the heat treatment.
Influence of rice bran on dough properties
the viscoelastic characteristics of the dough are shown in table 2. the deformation ener-gy (W) tends to decrease when the rb content of the mixture increases. this effect is great-er than expected due to the dilution of gluten, especially in rb-Stc. For a given W value, the P/L ratio is a good predictor of dough behav-ior. this kind of behavior was specific for each mixture and determined by interactions be-tween different components of wheat flour and rb. In studies carried out on mixtures of wheat flour and fibers, the alveographic parameters were observed to depend heavily on the type of fiber (GOMEZ et al., 2003; WANG et al., 2002). Another important aspect is the degradation of dough due to proteolysis, expressed as the loss of dough strength after 2 hours of dough formation (W2h). the value for wheat flour was 22% and was not affected by the addition of rb, which suggests that the heat treatment of rb was intense enough to prevent any proteo-lytic activity.
to study the effect of rb addition on dough mixing properties, the main farinograph pa-rameters were measured. the results in table 2 show that addition of rb to the wheat flour did not substantially change the mixing proper-ties of the dough under the experimental condi-tions outlined above. Water absorption slightly decreased for all the concentrations and types of rb studied, but it was not significant from a functional point of view. therefore, all bread-making trials were conducted at a fixed water concentration (57% wheat flour basis) indepen-
table 2 - Effect of rb addition to the wheat flour on alveographic, farinographic and amylographic analysis of dough (abbre-viations are specified in section Dough characteristics).
Alveograph Farinograph Amylograph
W (J) P (mm) L (mm) P/L W 2 h (%) Absorption (%) DDT Stability Decay 10 m Peak Viscosity (min) (min) (BU) (AU)
Wheat flour 211 82 76 1.08 -22 57.4 2.2 8.2 42 1204
Substitution of 3% wheat flour by rice branEXT 196 89 65 1.37 -19 57.2 1.6 8.5 41 1203STC 194 90 60 1.50 -20 57.1 1.8 9.7 27 1191
Substitution of 6% wheat flour by rice branEXT 191 91 58 1.57 -18 56.8 1.9 8.9 40 1193STC 186 95 52 1.83 -22 57.0 1.5 9.8 31 1181
Substitution of 9% wheat flour by rice branEXT 173 97 47 2.06 -15 56.9 1.6 9.7 32 1154STC 163 96 45 2.13 -19 57.0 1.8 9.6 26 1177
Values are means from triplicate determinations. EXT: Extrusion cooking; STC: Steam cooking.

226 Ital. J. Food Sci., vol. 25 - 2013
dently of the dough formulas used, and always at the same consistency of the dough. It should be pointed out that dough stability, which in-dicates the tolerance of dough to kneading, in-creased with the presence of rb, inversely to the decay value. these results supported the hypothesis that there were no negative inter-actions between the components of wheat flour and rb. these data were similar to those ob-tained by KIM et al. (1997) but not consistent with those of other studies (GHUFrAN-SAEED et al., 2009; SUDHA et al., 2007). However in these latter studies the basic conditions, (e.g. wheat flour characteristics, rb composition and con-centrations) were different.
the amylogram parameters give information about the viscosity generated by the gelatiniza-tion of starch. the most important of these pa-rameters is the peak viscosity shown in table 2. In the case of the wheat flour used in this study, the peak viscosity value was very high (1204 AU). the addition of rb reduced it slightly, although not significantly from functional point of view. Analyzing the Falling Number, another test mea-suring the starch viscosity, GUFrAN-SAEED et al. (2009) made similar findings. the peak viscosity of starch is considerably reduced by a-amylase activity and, in this case, neither rb contribut-ed to any amylase activity. therefore, for all ex-perimental conditions studied, breadmaking tri-als were conducted in which the same dose of bread improver was added as the amylase con-tributor. throughout the fermentation process the dough behavior was recorded by the rheo-fermentometer. the influence of rb addition on the fermentation characteristic is shown in ta-ble 3. the maximum dough height (Hm) increased with the addition of rb, regardless of its type and concentration. the time required to reach the maximum dough height was not affected.
With respect to gas behavior a backlog in poros-ity development (tx) was observed and, except at high concentrations of rb (9%), gas production and retention was higher, and more pronounced in the case of EXt-rb. the only data available for this kind of analysis have been provided by WANG et al. (2002), who added different fibers to the wheat flour and the results depended on the type of fiber used. In the main, it can be as-sumed that adding cellulose or bran to wheat flour decreased the gas holding capacity.
From the overall results it can be concluded that supplementing wheat flour with rb, main-ly at concentrations of 3 and 6%, did not influ-ence the formulation and mixing properties of the dough and improved the fermentation and breadmaking process of the partially baked wheat bread.
Influence of rice bran on bread quality
Apart from shape and color, the specific volume of bread is also an important element in consum-er selection criteria. the specific volume data are shown in Fig. 1. Adding rb-EXt at concentra-tions of 3 and 6% led to a significant increase in the specific volume and only at the highest con-centration (9%) did it slightly decrease, in com-parison to the control. On the contrary, the spe-cific volume obtained for Stc-rb bread at con-centrations of 3 and 6% did not change in com-parison to the control, and decreased sharply at 9%. Several authors have reported a progressive decrease in specific volume when rb content is increased (SEKHON et al., 1997; SHArMA and cHAUAN, 2002; SOArES et al., 2009). However, other authors have observed an increase in spe-cific volume at low concentrations of rb which de-crease at higher concentrations (LIMA et al., 2002; PArK et al., 2008). LIMA et al. (2002) also observed
table 3 - Effect of rb addition on the fermentation characteristics of wheat flour (abbreviations are specified in section “Dough characteristics”).
Dough development Gas behaviour
Hm T1 GT1 Tx VCO2 R R (mm) (min) (min) (min) (mL) (mL) (%)
Wheat Flour 52.5 2.59 1.02 0.57 1576 1235 78.4
Substitution of 3% wheat flour by rice branEXT 60.1 2.41 1.08 1.06 1614 1423 88.2STC 63.5 2.58 1.10 1.21 1630 1302 79.9
Substitution of 6% wheat flour by rice branEXT 58.9 2.20 1.16 1.11 1652 1356 82.1STC 65.8 2.58 1.18 1.21 1582 1268 80.2
Substitution of 9% wheat flour by rice branEXT 66.4 3.00 1.19 1.18 1578 1282 81.2STC 64.5 2.29 1.16 1.15 1574 1225 77.8
Values are means from triplicate determinations. EXT: Extrusion cooking; STC: Steam cooking.

Ital. J. Food Sci., vol. 25 - 2013 227
differences related to the origin, and therefore the fiber content, of the rb variety: lower fiber con-tents result in higher volume. When the rb fiber is added directly to the bread, volume decreases (AbDUL-HAMID and LUAN, 2000). When the hemi-cellulose fraction and insoluble fraction of the rb fiber are added separately, the volume remains unchanged in the first case and decreases in the second (HU et al., 2009). these findings confirm the hypothesis that insoluble rb fiber has an important effect on the specific volume. In the case of wheat bran, the heat treatment counter-act the negative effects mentioned above. Wheat bran added to the flour strengthened the gluten matrix (AMIrKAVEEI et al., 2009) and restored the initial bread volume (DE cOOK et al., 1999).
the results obtained in our study, consistent
Fig. 2 - Effect of rb addition to the wheat flour on the sen-sory evaluation of breads.Means with different letters were significantly different (P<0.05).EXt: Extrusion cooking; Stc: Steam cooking.
with the above, show that a more intensive heat treatment of EXt-rb helps to stabilize the glu-ten network and, therefore, to retain gas, espe-cially at low bran concentrations (3 and 6%). this is probably due to the oxidation of reduc-ing compounds and is consistent with the high-er rate of gas retention in EXt-rb dough. thus, adding low concentrations of rb that has previ-ously been exposed to high heat treatment acts as a bread improver.
Sensory evaluation
Fig. 2 shows the average sensory evaluation of overall acceptability. the bread without rb (control) was given the highest score, which was significantly different from the rest. the score given to breads with added rb decreased when the rb concentration increased and the low-est scores were given to Stc-rb supplemented breads. the difference between the two types of rb becomes significant at concentrations of 6% and 9%. From the qualitative point of view, breads with 9% of rb were described by sever-al panelists as having off-flavors.
Good sensory acceptance is one of the key as-pects of using complementary or alternative in-gredients in wheat bread. Several studies have been made of rb at different concentrations and in different bread types. the findings are in good agreement with those of our study: that is to say, the highest rb concentration was given the low-est score (SEKHON et al., 1997; SHArMA et al., 2004; SUDHA et al., 2007; GHUFrAN-SAEED et al., 2009). the same thing happened for rb deriva-tives (AbDUL-HAMID et al., 2000; SADAWArtE et al., 2007; HU et al., 2009). However, no signifi-cant differences were detected between 7.5% rb bread and the control by SOArES et al. (2009). PAcHEcO DE DELAHAYE et al. (2009) even showed sensory preferences for 5% rb bread. One possi-ble explanation for this is the places these stud-ies were carried out: the former were from Asia while the latter were from South America, so there might be some variations in the suscep-tibility to the flavors added by rb to the bread. this is why sensory evaluation results are dif-ficult to extrapolate, because cultural and cu-linary habits, and the different types of breads consumed need to be taken into account. Our study of a Spanish population indicates that the addition of rb to partially baked wheat bread would be limited to special rb bread with sen-sory characteristics that are different from those of the traditional bread.
cONcLUSIONS
the present paper studies how substituting wheat flour by two types of rb, thermally treat-ed by two different methods (EXt and Stc), at concentrations of 3, 6 and 9%, affects the rhe-
Fig. 1 - Effect of rb addition to the wheat flour on the spe-cific volume of breads.Means with different letters were significantly different (P<0.05).EXt: Extrusion cooking; Stc: Steam cooking.

228 Ital. J. Food Sci., vol. 25 - 2013
ological properties of the dough and the quality of breads obtained in an industrial process of partially baked production. the variables ana-lyzed in the dough showed that rb addition had a very slight or no effect on the wheat flour and even improved gas retention. these findings were more evident at low concentrations of rb, and for EXt-rb addition. the characteristics of the breads obtained depended on the rb type (EXt or Stc) and were clearly superior for EXt-rb. these differences were due to the different heat treatment intensities applied to the two types of rb, in which the destruction of heat-sensitive constituents might lead to less protein-fiber in-terferences during the formation of the gluten network. However, further investigations are re-quired if this hypothesis is to be confirmed.
In conclusion, bread supplemented with low concentrations of EXt-rb may be a way to in-crease the intake of dietary fiber in the popula-tion, as well as of other important compounds present in the lipid fraction of rb. In Spain, how-ever, these breads do not have the same sensorial acceptance as the traditional baguette and should not be treated as a white bread substitute, but as a different specialty with added nutritional value.
AcKNOWLEDGMENtS
this work has been supported by Europastry S.A., Spain.
rEFErENcES
AAcc. 2009. “Approved Methods of the American Associa-tion of cereal chemists”. (11th Ed.). American Associa-tion of cereal chemists. St. Paul, MN.
Abdul-Hamid A. and Luan Y.S. 2000. Functional properties of dietary fibre prepared from deffated rice bran. Food chem. 68: 15.
Ajmal M., butt M.S., Sharif M., Nasir M. and Nadeem M.t. 2006. Preparation of fiber and mineral enriched pan bread by using defatted rice bran. Int. J. Food Prop. 9: 623.
Amirkaveei S.H., Shahedi M., Kabir K.H. and Kadivar M. 2009. Effects of treated and untreated bran in dough dy-namic rheology. Int. J. Food Sci. Nutr. 60(S1): 191.
AOAc. 2005. Official Methods of Analysis. (18th Ed.). As-sociation of Official Analytical chemists. Arlington, VA.
carroll L.E.1990. Functional properties and applications of stabilized rice bran in bakery products. Food tech. 4: 74.
Da Silva M.A., Sanches c. and Amante E.r. 2006. Prevention of hydrolytic rancidity in rice bran. J. Food Eng. 75: 487.
De cook S., taylor J. and taylor J.r.N. 1999. Effect of heat treatment and particle size of different brans on loaf vol-ume of brown bread. Lebensm Wiss tecnol. 32: 349.
Garcia-Lerma M.J., Herrero-Martinez J.M., Simo-Alfonso E.F., Mendonça c.r.b. and ramis-ramos G. 2009. com-position, industrial processing and applications of rice bran γ-oryzanol. Food chem. 115: 389.
Gerhardt A.L. and Gallo N.b. 1998. Full-fat rice bran and oat bran similarly reduce hypercholesterolemia in hu-mans. J. Nutr. 128: 865.
Ghufran Saeed S.M., Saqib A., Mubarak A., rashida A. and Fred S. 2009. Influence of rice bran on rheological prop-
erties of dough and in the new product development. J. Food Sci. tech. 46: 62.
Gomez M., ronda F., blanco c.A., caballero P.A. and Apes-teguia A. 2003. Effect of dietary fibre on dough rheology and bread quality. Eur. Food res. tech. 216: 51.
Hu G., Huang S., cao S. and Ma Z. 2009. Effect of enrich-ment with hemicellulose from rice bran on chemical and functional properties of bread. Food chem. 115: 839.
ISO 8587. 2006. Sensory analysis. Methodology. ranking. International Standard Organization.
Kim Y.S., Ha t.Y., Lee S.H. and Lee H.Y. 1997. Effect of rice bran dietary fiber on flour rheology and quality of wet noodles. Korean J. Food Sci. tech. 29: 90.
Lima I., Guraya H. and champaigne E. 2002. the function-al effectiveness of reprocessed rice bran as an ingredient in bakery products. Nahrung 46: 112.
Most M.M., tulley r., Morales S. and Lefevre M. 2005. rice bran oil, not fiber, lowers cholesterol in humans. Am. J. clin. Nutr. 81: 64.
Pacheco de Delahaye E., Peña J. and Jimenez P. 2009. the rice bran effect on the physical-chemical and sensori-al properties of wheat bread. rev Fac Agronomia (LUZ) 26: 583.
Park H.S., choi K.M. and Han G.D. 2008. changes of bread-making characteristics with the addition of rice bran, fer-mented rice bran and rice bran oil. J. Korean Soc. Food Sci. Nutr. 37: 640.
Prakash J. and ramanathan G. 1994. Effect of stabilization of rice bran on the extractability and yield of proteins. Nahrung. 38: 87.
rosell c.M., Aja S., bean S. and Lookhart G. 2002. Effect of Aelia spp and Eurigaster spp damage on wheat proteins. cereal chem. 80: 52.
Qureshi A.A., Sami S.A. and Khan F.A. 2002. Effects of stabilized rice bran, its soluble and fiber fractions on blood glucose levels and serum lipid parameters in hu-mans with diabetes mellitus types I and II. J Nutr bi-ochem. 13: 175.
Sadawarte S.K., Sawate A.r., Pawar W.D. and Machewad G.M. 2007. Enrichment of bread with rice bran protein concentrate. J. Food Sci. tech. 44: 195.
Schnell M., Pacheco de Delahaye E. and Mezones Y. 2005. Metabolic responses to Venezuelan corn meal and rice bran supplemented Arepas. cereal chem. 82: 77.
Sekhon K.S., Dhillon S.S., Singh N. and Singh b. 1997. Functional suitability of commercially milled rice bran in India for use in different food products. Plant Foods Human Nutr. 50: 127.
Sharma H.r. and chauan G.S. 2002. Effects of stabilized rice bran-fenugreek blends on the quality of breads and cookies. J. Food Sci. tech. 39: 225.
Sharma H.r., chauhan G.S. and Agrawal K. 2004. Physi-co-chemical characteristics of rice bran processed by dry heating and extrusion cooking. Int. J. Food Prop. 7: 603.
Sharp c.Q. and Kitchens K.J. 1990. Using rice bran in yeast bread in a home baker. cereal Foods World 35: 1021.
Soares M.O., bassinello P.Z., caliari M., Gebin P.F.c., Jun-queira t.H., Gomes V.A. and Lacerda D.b.c.L. 2009. Quality of breads with toasted rice bran. ciencia tecno-logia Alimentar 29: 636-641.
Sudha M.L., Vetrimani r. and Leelavathi K. 2007. Influence of fibre from different cereals on the rheological charac-teristics of wheat flour dough and on biscuit quality. Food chem. 100: 1365.
Wang J., rosell c.M. and benedito de barber c. 2002. Effect of the addition of different fibres on wheat dough perfor-mance and bread quality. Food chem. 79: 221.
Warren b.E. and Farrell D.J. 1990. the nutritive value of full-fat and defatted Australian rice bran. I. chemical composition. Animal Feed Sci. tech. 27: 219.
Wu X., Gu L., Holden J., Haytowitz D.b., Gebhardt S.E., beecher G. and Prior r.L. 2004. Development of a data-base for total antioxidant capacity in foods: a preliminary study. J. Food comp. Anal. 17: 407.
Paper received May 15, 2012 Accepted November 30, 2012

PaPer
Ital. J. Food Sci., vol. 25 - 2013 229
- Keywords: backfat, Iberian pig, fatty acids, prediction -
PREDICTION OF THE MAJOR FATTY ACIDS IN THE BACKFAT
FROM IN- AND OUTDOOR IBERIAN PIGS AT SLAUGHTER
A. DAZA1, M.A. LATORRE2* and C.J. LÓPEZ-BOTE3
1Departamento de Producción Animal, Escuela Técnica Superior de Ingenieros Agrónomos, Universidad Politécnica de Madrid, Spain
2Departamento de Producción Animal y Ciencia de los Alimentos, Facultad de Veterinaria, Universidad de Zaragoza, Spain
3Departamento de Producción Animal, Facultad de Veterinaria, Universidad Complutense de Madrid, Spain*Corresponding author: Tel. +34 876554168,
email: [email protected]
AbStrAct
the objective was to predict the proportion of the major fatty acids (FA; c16:0, c18:0, c18:1n-9 and c18:2n-6) at slaughter (approximately 150 kg of body weight, bW) from fat samples taken at the beginning (100 kg bW) of the finishing period in Iberian pigs under indoor (eating feedstuffs) and outdoor (eating acorns and grass) conditions. For each production system, different linear re-gression equations were found between the FA percentages at the beginning of the finishing phase and the variation of the FA proportions with respect to the bW gain during that period. It might be very useful for pig producers.

230 Ital. J. Food Sci., vol. 25 - 2013
INtrODUctION
Iberian is an autochthonous breed of fatty pigs located in the South West of Iberian peninsula. Animals are slaughtered at 150-160 kg of body weight (bW) and can be reared indoor, feeding feedstuffs, or outdoor, making use of the natural resources, mainly acorns and grass (LÓPEZ-bO-tE, 1998). the meat from Iberian pigs is widely known because of high amount of intramuscu-lar fat, great concentrations of heme pigments and high levels of monounsaturated fatty acids (FAs) (rODrÍGUEZ-SÁNcHEZ et al., 2010) show-ing excellent sensorial characteristics (VENtA-NAS et al., 2006). the carcasses from Iberian pigs are valued in the market according to the proportions of the major FAs in subcutaneous backfat; a high quality is related to at least 54% of oleic (c18:1n-9) and a proportion of palmitic (c16:0), stearic (c18:0) and linoleic (c18:2n-6) bellow 21, 9.5 and 9.5%, respectively (DAZA and LÓPEZ-bOtE, 2007). Fresh meat and dry-cured and elaborated products obtained from outdoor Iberian pigs reach higher prices in the market than those from indoor Iberian pigs.
the proportion of the major FAs in subcuta-neous backfat at slaughter depends on factors such as breed and crossbreed, gender, bW gain during the finishing phase (from 100 to 150 kg bW approximately), age and bW at slaughter or feeding system (DAZA et al., 2005a). to know the relationship between the FA percentages at the beginning of the finishing phase and the vari-ation of FA proportions with respect to the bW gain during that phase might be very interest-ing for pig producers. Farmers could estimate the necessary bW gain of the pigs during fatten-ing period to reach the FA proportions required at slaughter by the market (DAZA et al., 2005b). this aspect has not been studied until now.
therefore, the main objective of this trial was to predict the final proportion of the major FAs in backfat of Iberian pigs reared under different systems (indoor vs. outdoor) during finishing pe-riod. Moreover, this work evaluates the differ-ences of rearing-feeding system during the fat-tening phase on FA profile of subcutaneous fat of those pigs.
MAtErIAL AND MEtHODS
Experimental design and sampling
All the experimental procedures used in the trial were in compliance with the Spanish guide-lines for the care and use of animals in research (bOLEtÍN OFIcIAL DEL EStADO, 2007). two tri-als were carried out and are described below.
In the Experiment 1, the aim was to study the relationship between the FA percentages in sub-cutaneous fat at the beginning of the outdoor and indoor fattening period and the variation of
the FA proportions with respect to the bW gain during that period. For it, a total of 96 torbis-cal barrows (cIA “El Dehesón del Encinar”, tole-do, Spain) were used. torbical is a synthetic line from the crossbreed of several lines from Iberi-an breed. A total of 48 pigs were reared outdoor from 100.2±2.7 to 155.1±3.1 kg bW and fed ex-clusively acorns and grass and the other 48 pigs were reared indoor from 99.3±3.5 to 153.9±2.6 kg bW and fed a commercial feedstuff (table 1).
In the experiment 2, the aim was to study the accuracy of the regression equations obtained in the previous trial. For it, other three groups of pigs of the same genetic line were used: i) ten pigs were reared outdoor from 99.6±2.5 to 154.4±2.6 kg bW and fed exclusively acorns and grass, ii) twelve pigs were reared indoor from 101.2±3.0 to 154.7±3.1 kg bW and fed the same feedstuff as described in Experiment 1 (named feedstuff 1), and iii) twenty four pigs were reared indoor from 98.1±2.0 to 152.8±2.8 kg bW and fed a different feedstuff (named feedstuff 2) (table 2).
In both Experiments, during the growing peri-od (approximately from 30 to 100 kg bW, 70 and 74 days for Experiment 1 and 2, respectively), all pigs were reared indoor and ate the same feed-stuff (around 2.0 kg/day, 3,000 kcal of metab-olizable energy/kg and 15.6% of crude protein).
At the beginning of the fattening period, a backfat biopsy sample was taken from each pig using a cylindrical biopsy device with a diame-ter of 8 mm under local anesthesia with 2% li-docaine-HcL (Alphacaine, Fendigo). After the bi-opsy removal, the wound was desinfected local-ly with 2 mL of penicillin (300,000 IU/mL, Dep-ocilline, Mycofarm). When animals achieved the slaughter bW, they were moved to a local abat-toir, electrically stunned, slaughtered and evis-cerated according to standard commercial pro-cedures. Afterwards, a sample of backfat was taken from each carcass and samples were in-dividually identified and stored until de labora-torial analyses.
Chemical analyses
At least 1 kg of acorns was collected from 10 different holm oak trees (Quercus ilex) randomly selected. Approximately 2 kg of grass were tak-en directly from the ground choosing at ran-dom four different areas. the concentrate diets were sampled in the feedstuff plant. the ana-lysed nutrient value (AOAc, 2000) of all feeds used in the Experiments 1 and 2 are shown in tables 1 and 2, respectively. the FAs were ex-tracted and quantified by the one-step procedure as described SUKHIJA and PALMQUISt (1988) in lyophilised samples. Pentadecenoic acid (c15:1) (Sigma, Alcobendas, Madrid) was used as inter-nal standard. Previously methylated FA samples were identified by gas chromatography as de-scribed elsewhere (LÓPEZ-bOtE et al., 1997) us-ing a 6890 Hewlett Packard gas chromatograph

Ital. J. Food Sci., vol. 25 - 2013 231
table 1 - Nutrient content of the feeds used during the fattening period (from 100.2 to 155.1 kg of body weight) in Experiment 1a.
Indoor pigs Outdoor pigs
Feedstuffb Acorns Grass
Dry matter (DM, g/kg) 896.2 661.7 239.8Crude protein (g/kg DM) 140.7 48.3 132.5Ether extract (g/kg DM) 40.3 98.1 36.8Crude fibre (g/kg DM) 44.8 8.5 164.1Ash (g/kg DM) 46.8 20.1 135.7Free-nitrogen extractives (g/kg DM) 727.4 825.0 530.9Fatty acids (g/100 g of total fatty acids)C16:0 13.8 22.5 21.0C18:0 5.4 4.6 2.6C18:1n-9 40.4 59.9 3.2C18:2n-6 37.9 12.4 12.9C18:3n-3 1.8 0.61 51.0
aAnalysed according to AOAC (2000).bSupplied per kg of diet: 532.8 g barley, 310.5 g wheat, 50.2 g high-oleic sunflower seed, 81.0 g soybean meal-44, 8.3 g calcium carbonate, 9.2 dicalcium phos-phate, 4 g sodium chloride, 4 g mineral and vitamin premix.
table 2 - Nutrient content of the feeds used during the fattening period (from 99.6 to 154.4 kg of body weight) in Experiment 2a.
Indoor pigs Indoor pigs Outdoor pigs Feedstuff 1b Feedstuff 2c Acorns Grass
Dry matter (DM, g/kg) 896.2 892.0 649.9 246.2Crude protein (g/kg DM) 140.7 143.1 50.2 142.1Ether extract (g/kg DM) 40.3 70.2 91.9 25.8Crude fibre (g/kg DM) 44.8 61.7 9.5 168.3Ash (g/kg DM) 46.8 55.7 18.1 121.1Free-nitrogen extractives (g/kg DM) 727.4 669.3 830.3 542.7Fatty acids (g/100 g of total fatty acids)C16:0 13.8 9.9 23.1 20.4C18:0 5.4 4.1 5.1 2.2C18:1n-9 40.4 56.8 57.9 2.9C18:2n-6 37.9 20.2 13.0 14.1C18:3n-3 1.8 0.35 0.51 55.3
aAnalysed according to AOAC (2000).bSupplied per kg of diet: 532.8 g barley, 310.5 g wheat, 50.2 g high-oleic sunflower seed, 81.0 g soybean meal-44, 8.3 g calcium carbonate, 9.2 dicalcium phos-phate, 4 g sodium chloride, 4 g mineral and vitamin premix.cSupplied per kg of diet: 472.0 g barley, 200 g wheat, 80 g corn, 160 g sunflower meal, 50 g high-oleic sunflower oil, 12.0 g calcium carbonate, 20 g dicalcium phosphate, 4 g sodium chloride, 2 g mineral and vitamin complex.
and a 30 m x 0.32 mm x 0.25 µm cross-linked polyethylene glycol capillary column. A temper-ature program of 170° to 245ºc was used. the injector and detector were maintained at 250ºc. the carrier gas (helium) flow rate was 3 mL/min.
Lipids from subcutaneous backfat were ex-tracted according to the procedure proposed by bLIGH and DYEr (1959). Fat extracts were meth-ylated in the presence of sulphuric acid and an-alysed as has been described for feeds.
Statistical analyses
Data were analysed using the statistical pack-age SAS (1999).
In Experiment 1, a linear regression procedure was carried out. For each FA evaluated, the in-tercepts and slopes of regression equations ob-
tained from indoor and outdoor pigs were com-pared by Student’s t-test. In Experiment 2, a paired t-test (SWANtEK et al., 1999) was used and the correlation coefficients between actual and predicted values of major FA percentages in subcutaneous backfat were calculated. In both Experiments, ANOVA analyses were carry out to study the average daily gain and the major FA proportions in subcutaneous backfat compar-ing rearing and feeding systems.
rESULtS AND DIScUSSION
the average daily gain during the fatting pe-riod was similar for indoor and outdoor pigs irrespective of the trial because the feed sup-ply for indoor animals was calculated accord-

232 Ital. J. Food Sci., vol. 25 - 2013
ing to the growth rate of outdoor animals (data not shown). the results for the main FA pro-portions found in subcutaneous backfat in Ex-periments 1 and 2 are shown in table 3. As ex-pected, at the beginning of the fattening peri-od, in both trials, no effect of rearing system was detected for any FA because all pigs had eaten the same feedstuff previously, during the growing period. However, at slaughter of the Experiment 1, the fat from outdoor pigs had lower c16:0 (p<0.001) and c18:0 (p<0.01) and higher c18:1n-9 (p<0.001) proportions than that from indoor pigs without any difference in c18:2n-6. At slaughter of the Experiment 2, the fat from indoor pigs fed the feedstuff 1 had higher c18:0 (p<0.05) and lower c18:1n-9 (p<0.001) percentages than that from outdoor pigs with results from indoor pigs fed the feed-stuff 2 (rich in c18:1n-9) being intermediate. In addition, c16:0 content was higher in fat from indoor pigs fed the feedstuff 1 than in fat from the other treatments.
the results of the present trials are in agree-ment with those reported by cArrAPISO et al. (2003), rEY et al. (2006) and DAZA et al. (2007) who observed that, in backfat from Iberian pigs reared under free-range conditions, c16:0 and c18:0 proportions were lower and c18:1n-9 pro-portion was higher than in Iberian pigs reared in confinement eating feedstuff. When indoor pigs received a diet rich in c18:1n-9, the retention of that FA in subcutaneous fat was higher than that in pigs fed the other diet and it also carried out a reduction in c16:0 content. these results agree with data from GONZALEZ et al. (2005). SANZ et al. (2007) showed that it was possible obtain a similar FA profile in indoor Iberian pigs fed feedstuffs rich in c18:1n-9 during the fat-
tening period to that obtained under free-range conditions eating acorns and grass.
According to the t test results, the initial and slaughter bW of pigs used to calculate and val-idate the regression equations were similar in both production systems (p>0.05).
the table 4 shows the relationship between the percentage of the major FAs in the outer sub-cutaneous backfat layer per kg of bW gain (Y) and the proportion of each FA at the beginning of the finishing period (X) under indoor (eating feedstuff) or outdoor (eating acorns and grass) conditions. the relationships between Y and X were linear and significant in both management systems. According to these results, irrespective-ly of the feeding/rearing system, the greatest de-crease rate was observed (p<0.001) for the pro-portions of c16:0, c18:0 and c18:2n-6 acids. In addition, the smallest increase rate was detect-ed (p<0.05) for the proportion of c18:1n-9 dur-ing free-range period. Other authors (FONtANIL-LAS et al., 1998; DAZA et al., 2007) also observed an increase of c16:0, c18:0 and c18:2n-6 and a reduction of the c18:1n-9 proportions with higher levels of those FAS at the beginning of the finishing period.
For outdoor pigs, the initial proportion of c16:0, c18:0, c18:1n-9 and c18:2n-6 acids ob-served in subcutaneous backfat at the begin-ning of fattening period accounted for 47, 56, 20 and 88% of the variation, respectively, which is in agreement with results found by DAZA et al., (2005b) in Iberian pigs raised also under free-range conditions. For indoor pigs, the initial pro-portion of c16:0, c18:0, c18:1n-9 and c18:2n-6 detected in subcutaneous backfat at the begin-ning of fattening period accounted for 24, 25, 51 and 78% of the variation, respectively.
table 3 - the proportions (%) of major fatty acids in subcutaneous backfat at the beginning and at the end of the fattening period (100 and 154 kg of body weight, respectively) of pigs under different feeding-rearing systems.
Experiment 1 Experiment 2
Indoora Outdoorb SEMc pd Indoora Indoore Outdoorb SEMc pd
BeginningC16:0 21.65 21.27 0.16 NS 21.13 21.14 21.60 0.24 NSC18:0 10.58 10.53 0.15 NS 10.21 10.48 10.79 0.26 NSC18:1n-9 44.71 44.59 0.35 NS 43.95 44.56 44.12 0.31 NSC18:2n-6 11.62 11.90 0.32 NS 10.98 11.27 10.89 0.33 NS
EndC16:0 18.25 19.84 0.13 *** 20.09x 18.39y 18.91y 0.30 *C18:0 8.55 9.28 0.13 ** 9.67x 8.87xy 8.70y 0.28 *C18:1n-9 54.34 51.06 0.24 *** 50.69z 52.19y 53.89x 0.38 ***C18:2n-6 9.10 9.10 0.14 NS 9.98 9.24 9.16 0.29 NS
aFeeding based on feedstuff. It supplied per kg of dry matter of the feed: 140.7 g crude protein, 40.3 g ether extract, 44.8 g crude fibre. bFeeding based on acorns and grass. cSEM: Standard Error of the Mean.dp: Level of statistical significance. In Experiment 2, different superscripts (x, y, z) in the same raw indicate differences. NS: Not Significant; *p<0.05; **p<0.01; ***p<0.001.eFeeding based on feedstuff. It supplied per kg of dry matter of the feed: 143.1 g crude protein, 70.2 g ether extract, 61.7 g crude fibre.

Ital. J. Food Sci., vol. 25 - 2013 233
It is interesting to note that the slopes of the regression equations calculated for c16:0 and c18:0 proportions were different (p<0.05) when both fattening systems were compared (0.0245 vs. 0.0143 for c16:0; and 0.0249 vs. 0.0123 for c18:0 for outdoor and indoor, respectively). As in-creased the initial c16:0 and c18:0 proportions, the reduction of c16:0 and c18.0 per kilogram of bW gain was higher in outdoor than in indoor pigs. However, no significant differences (p>0.05) were observed for the c18:2n-6 reduction speed and c18:1n-9 increase speed according to finish-
table 4 - regression equations between the major fatty acids in the subcutaneous backfat at the beginning of the fattening period (X, in %) and their variation with respect to live weight gain during that period (Y, in %/kg) in pigs reared indoor or outdoor (Experiment 1).
Regression equation R2a RSDb pc
OutdoorC16:0 Y = (0.458x ± 0.0975) - (0.0245x ± 0.00445) · X 0.47 0.023 ***C18:0 Y = (0.276x ± 0.0489) - (0.0299x ± 0.00451) · X 0.56 0.020 ***C18:1n-9 Y = (0.932x ± 0.2510) - (0.0164x ± 0,00576) · X 0.20 0.061 *C18:2n-6 Y = (0.154x ± 0.0142) - (0.0173x ± 0.00112) · X 0.88 0.013 ***
IndoorC16:0 Y = (0.261y ± 0.0821) - (0.0143y ± 0.00371) · X 0.24 0.018 ***C18:0 Y = (0.122y ± 0.0327) - (0.0123y ± 0.00310) · X 0.25 0.116 ***C18:1n-9 Y = (0.869y ± 0.0110) - (0.0175x ± 0.00250) · X 0.51 0.031 ***C18:2n-6 Y = (0.212y ± 0.0180) - (0.0179x ± 0.00141) · X 0.78 0.018 ***
aR2: Determination coefficient.bRSD: Residual standard deviation.cp: Level of statistical significance. For each fatty acid, between rearing systems, intercepts and slopes with different superscripts (x, y in lower case letter) are significantly different. *p<0.05; ***p<0.001.
ing system (free-range vs. confinement). It would indicate that, at the beginning of the finishing pe-riod, the c16:0 and c18.0 contents in the sub-cutaneous backfat from pigs finished under out-door conditions can be higher than in pigs fin-ished under indoor conditions. this aspect must be taken into account by the producers in order to formulate adequately the feed to provide dur-ing the growing period (before fattening phase).
the table 5 shows the results obtained, by paired test t and correlation analysis, for each FA under the three kind of feeding systems stud-
table 5 - Predicted vs. actual values (means ± standard deviation) of the major fatty acids (%) in the subcutaneous backfat of pigs reared under different feeding-rearing systems during fattening period (Experiment 2).
Value Predicted value Actual-Predicted t value pa rb pc
value
OutdoorC16:0 0.097 ± 0.040 0.091 ± 0,015 0.006 0.57 NS 0.64 *C18:0 0.053 ± 0.022 0.058 ± 0,013 - 0.005 0.82 NS 0.45 NSC18:1n-9 0.243 ± 0.078 0.216 ± 0,030 0.027 1.29 NS 0.58 NSC18:2n-6 0.054 ± 0.047 0.057 ± 0,033 - 0.003 0.48 NS 0.93 ***
Indoord
C16:0 -0.059 ± 0.014 -0.062 ± 0.007 0.003 0.088 NS 0.38 NSC18:0 -0.017 ± 0.004 - 0.015 ± 0.005 - 0.002 1.31 NS 0.25 NSC18:1n-9 0.082 ± 0.043 0.089 ± 0.018 - 0.007 0.83 NS 0.84 ***C18:2n-6 0.017 ± 0.030 0.009 ± 0.002 0.008 1.42 0.09 0.71 **
Indoore
C16:0 - 0.026 ± 0.014 - 0.044 ± 0.014 0.018 9.7 *** 0.79 ***C18:0 - 0.023 ± 0.016 -0.008 ±0.012 -0.015 5.7 *** 0.64 ***C18:1n-9 0.120 ± 0.029 0.092 ± 0.017 0.028 6.7 *** 0.74 ***C18:2n-6 -0.052 ± 0.019 - 0.003 ± 0.017 -0.049 21.2 *** 0.81 ***
ap: Level of statistical significance between actual vs. predicted means. NS: Not Significant; ***p<0.001. br: Correlation coefficient between actual and predicted values.cp: Level of statistical significance of r. NS: not significant, *p<0.05; **p<0.01; ***p<0.001. dData obtained from pigs which fed feedstuff 1.
eData obtained from pigs which fed feedstuff 2.

234 Ital. J. Food Sci., vol. 25 - 2013
ied. For the outdoor pigs, the regression equa-tions calculated were especially accurate for c16:0 (p<0.05) and c18:2n-6 (p<0.001). No sig-nificant differences (p>0.05) between actual and predicted values were observed for any of the four FAs studied.
For the indoor pigs that consumed the diet with same feed composition as that fed by the pigs used to calculate the regression equations pattern, the regression equations obtained were also accurate, although a high t value for c18:2n-6 was detected (t =1.42, p<0.09). For this group of pigs, no difference between actual and predicted values of the FA proportions was found. Nevertheless, for the indoor pigs that ate different concentrate diet as that consumed by the pigs used to calculate the regression equa-tions pattern, the regression equations obtained were not accurate for the four major FAs studied. the paired test t detected differences (p<0.0001) between actual and predictedvalues for c16:0, c18:0, c18:1n-9 and c18:2 n-6 acids.
cONcLUSIONS
It is concluded that fat from outdoor pigs had higher proportion of c18:1n-9 and lower of c16:0 than fat from indoor pigs. the supply of a feedstuff rich in c18:1n-9 led a higher depo-sition of that FA and lower of c16:0 proportion in backfat. the use of the regression equations obtained in the present study might be very use-ful for the producers of indoor and outdoor Ibe-rian pigs because knowing the FAs at the be-ginning of the finishing period and the FAs re-quired at slaughter, the bW gain can be calcu-lated and put in practice.
AcKNOWLEDGEMENtS
this research was supported by INIA (project rtA 2004-053). Authors are grateful to remedios Prieto for techni-cal assistance.
rEFErENcES
AOAc 2000. Official methods of analysis. Association of Of-ficial Analytical chemist, Washinton, Dc.
bligh E.G. and Dyer J. 1959. A rapid method of total li-pid extraction and purification. can. J. biochem. Phys-iol. 37: 911-917.
boletin Oficial del Estado. 2007. Ley 32/2007 de 7 de Noviembre para el cuidado de los animales, en su ex-plotación, transporte, experimentación y sacrificio. bOE 268: 45914-45920.
carrapiso A.I., bonilla F., García c. 2003. Effect of cross-breeding and rearing system on sensory characteristics in Iberian ham. Meat Sci. 65: 623-629.
Daza A., ruíz J., Olivares A. and López-bote c.J. 2005a. Evolution of production system in Iberian pigs. In: ra-malho J.M.c., Horta A.E.M., Mosconi c. and rosati A. (Eds.). Animal products from the Mediterranean area. EEAP. Wageningen Academic Publishers. 118: 177-184.
Daza A., Mateos A., rey A.I. and López-bote c.J. 2005b. Feeding level in the period previous to the late fattening phase influences fat composition at slaughter in free-ranged Iberian pigs. Arch. Anim. Nut. 59: 227-236.
Daza A. and López-bote c.J. 2007. Modéles de produc-tion pour l’obtention de produits secs de qualité en Es-pagne. In: 39èmes Jour. recher. Porc. Paris (France), pp. 325-330.
Daza A., rey A.I., Menoyo D., bautista J.M., Olivares A. and López-bote c.J. 2007. Effect of level of feed restriction during growth and/or fattening on fatty acid composition and lipogenic enzyme activity in heavy pigs. Anim. Feed Sci. technol. 138: 61-74.
Daza A., Mateos A., rey A.I., Ovejero I. and López bote c.J. 2007. Effect of duration of feeding Ander free-range con-ditions on production results and carcass and fat quali-ty in Iberian pigs. Meat Sci. 76: 411-416.
Fontanillas r., barroeta A., baucells M.D. and Guardiola A.F. 1998. backfat fatty acids evolution in swine fed di-ets high in either cis-monounsaturated, trans, or (n-3) fats. J. Anim. Sci. 76: 1045-1055.
González E., Olivares A. and tejeda J.F. 2005. Usos de pien-sos engrasados ricos en ácido oleico en la alimentación del cerdo ibérico. Proceedings of III Dry cured Ham World congress. teruel (Spain), pp. 375-377.
López-bote c.J. 1998. Sustained utilization of the Iberian pig breed. Meat Sci. 49: 17-27.
López-bote c.J., rey A.I., ruíz J., Isabel b. and Sanz Ari-as r. 1997. Effect of feeding diets high in monounsatu-rated fatty acids and a-tocopheryl acetate to rabbits on resulting carcass fatty acid profile and lipid oxidation. Anim. Sci. 64: 177-186.
rey A.I., Daza A., López carrasco c. and López bote c.J. 2006. Feeding Iberian pig with acorn and grass in Esther free-range or confinement affects the carcass characteris-tics and fatty acids and tocopherols accumulation in Lon-gissimus dorsi muscle and backfat. Meat Sci. 73: 66-74.
rodríguez-Sánchez J.A., ripoll G. and Latorre M.A. 2010. the influence of age at the beginning of Montanera peri-od on meat characteristics and fat quality of outdoor Ibe-rian pigs. Anim. 4: 289-294.
Sanz E., Martín c., Lizaso J., Mallo J.L., López c., Gómez E., rodríguez A., De Mercado E. and carrasco J.A. 2007. Estudios de distintos programas de alimentación en cer-do Ibérico. Influencia en los rendimientos zootécnicos y el perfil de ácidos grasos. Proceedings of IV Dry cured Ham World congress. Salamanca (Spain), pp. 383-384.
SAS. 1999. SAS User’s guide: statistics. Statistical Analysis System Institute Inc., cary, North caroline.
Sukhija P.S. and Palmquist D.L. 1988. rapid method for determination of total fatty acid content and composi-tion of feedstuffs and feces. J. Agri. Food chemist. 36: 1202-1206.
Swantek P.M., Marchello M.J., tilton J.E. and crenshaw J.D. 1999. Prediction of fat-free mass of pigs from 50 to 130 kilograms live weight. J. Anim. Sci. 77: 893-897.
Ventanas S., Ventanas J., Jurado A. and Estévez M. 2006. Quality traits in muscle biceps femoris and back-fat from purebred Iberian and reciprocal Iberian x Duroc cross-bred pigs. Meat Sci. 73: 651-659.
Paper received May 22, 2012 Accepted November 30, 2012

short communication
Ital. J. Food Sci., vol. 25 - 2013 235
- Keywords: heart disease, minerals, potassium, Rhodobryum ontariense, traditional Chinese medicine -
MINERAL CONTENT OF A MOSS TEA FOR HYPERTENSION
B. PEJIN1*, D. BELIC2, G. VUCKOVIC2, Y. KIEN-THAI3 and B. STANIMIROVIC2
1Department of Life Sciences, Institute for Multidisciplinary Research, University of Belgrade, Serbia
2MOL a.d., Belgrade, Serbia3Institute of Biological Sciences, Faculty of Science, University of Malaya, Malaysia
*Corresponding author: [email protected], [email protected]
AbStrAct
the content of sodium, potassium, magnesium, calcium, selenium, phosphorus, nitrite and ni-trate in the moss Rhodobryum ontariense and its tea was investigated for medicinal reason. the aim of this study was preliminary estimation of R. ontariense minerals’ contribution to the treat-ment of hypertension, claimed for the moss tea by traditional chinese Medicine. Majority of cati-ons were determined by EPA methods, while phosphorus was determined with an appropriate ISO method. the anions nitrite and nitrate were determined by ion chromatography. Potassium was the most abundant mineral in the investigated tea (5895.20 ± 1.22 mg/kg) and might be specu-lated as one of its beneficial ingredients for the treatment of elevated blood pressure conditions.

236 Ital. J. Food Sci., vol. 25 - 2013
Hypertension is a major contributing factor for cardiovascular and cerebrovascular diseas-es. Optimal blood pressure is therefore of great importance and can be regulated with the reduc-tion of alcohol intake, weight loss, and limiting dietary sodium to <100 mmol/day (SArAFIDIS and bAKrIS, 2008). However, the present aver-age sodium intakes, approximately 3,000-4,500 mg/day in various industrialised populations, are 2-3-fold higher in comparison with the cur-rent Dietary reference Intake (DrI) of 1,500 mg. the sodium intakes markedly exceed even the level of 2,500 mg, which has been recently giv-en as the maximum that is likely to have no ef-fects on blood pressure or otherwise. by con-trast, the present average potassium, calcium, and magnesium intakes are remarkably lower than the recommended intake levels (DrI). In-deed, there is convincing evidence which indi-cates that such intakes of the aforementioned minerals produce and maintain elevated blood pressure in a big proportion of the population. Hence, the so-called Dietary Approaches to stop Hypertension, which has shown an excellent blood pressure lowering effect, insists on de-creased intakes of sodium and increased intakes of potassium, calcium, and magnesium (KArP-PANEN et al., 2005).
On the other hand, it is known that under specific conditions inorganic nitrite and nitrate can be recycled in vivo to form nitric oxide which induces hypotension. Furthermore, nitrate it-self reduces blood pressure as well (tANG et al., 2009).
traditional chinese Medicine (tcM) suggests that mosses of Rhodobryum species can cure cardiovascular diseases as crude drugs in form of medicinal tea (ASAKAWA, 2008; HArrIS and YANG, 2009). the name for the genus Rhodobry-um in Yunnan Province is HuiXincao ( ), a name referring to the heart-healing properties of this plant; the name literally means ‘’return-the-heart-herb’’ (HArrIS, 2008). PEJIN et al. (2011a,b; 2012a,b,c,d,e) investigated chemical composition and biological activity of the moss Rhodobryum ontariense for the first time finding that its lyophilised aqueous extract (100 mg/kg b.w. dissolved in 0.2 mL of saline and injected intravenously) significantly and quickly normal-ised arterial blood pressure and reduced pulse pressure, thus decreasing the risk for cardio-vascular events in the group of spontaneously hypertensive rats (PEJIN, 2011b). therefore, the aim of this study was preliminary estimation of R. ontariense minerals’ contribution to the treat-ment of hypertension.
the sample of Rhodobryum ontariense (Kindb.) Kindb. (bryaceae) originated from the Fraser’s Hill (Malaysia, August 2010). Voucher specimen has been deposited in the Herbarium of the In-stitute of biological Sciences, Faculty of Science, University of Malaya (Kt Yong 7635).
before extraction the moss was carefully in-
spected for contaminants: soil and plant mate-rial were completely removed. the gametophyte tips were used for the extraction. Air-dried parts of R. ontariense (2 g) were ground and extracted with hot water for 30 min at room temperature. the extract (tea) was filtered and concentrated by lyophilisation to give 0.14 g of residue (yield, 7 %) which was stored at +4°c for further use.
the cations were determined by adequate EPA/sodium (EPA M 273.1), potassium (EPA M 258.1), magnesium (EPA M 242.1), calcium (EPA M 215.1) and selenium (EPA M 270.2)/and ISO/phosphorus (SrPS EN ISO 6878)/methods, while the anions nitrite and nitrate were deter-mined by ion chromatography. All analyses were done in triplicate. the data are given as mean ± uncertainty of measurement (table 1).
the content of all examined minerals in both moss samples were below the safety levels for human consumption (HAtcHOcK, 2004). Potas-sium, calcium and magnesium were the most abundant cations in R. ontariense tea (5895.20
table 1 - Mineral content of Rhodobryum ontariense samples.
Mineral Moss (mg/kg) Teaa (mg/kg)
Na 254.73±0.62 224.34±0.53 K 13868.49±1.75 5895.20±1.22 Mg 1080.00±0.85 259.28±0.48 Ca 3420.92±1.18 803.57±0.85 P 310.22±0.15 102.95±0.10 Se 3.32±0.03 2.13±0.02 NO2
- <0.05 <0.05 NO3
- 214.07±0.016 147.86±0.014
a calculated on dried moss material.
± 1.22 mg/kg, 803.57 ± 0.85 mg/kg and 259.28 ± 0.48 mg/kg, respectively), while selenium was the least abundant one (2.13 ± 0.02 mg/kg). Moreover, the content of sodium in the same sample (224.34 ± 0.53 mg/kg) was much lower than potassium one. On the other hand, nitrates in the tea (147.86 ± 0.014 mg/kg) were higher than nitrites (< 0.05 mg/kg). Notably, many clin-ical studies support the blood pressure-lowering effects of potassium supplementation (FrANZO-NI et al., 2005; WHELtON et al., 1997). Indeed, maintenance of adequate dietary potassium in-take shows promise in the prevention and treat-ment of hypertension and should be thought as part of the armamentarium of lifestyle changes. concerning hypertension, the obtained results primarily indicate a potential importance of po-tassium. Furthermore, the nitrate content can be hypothesised to contribute to nitric oxide bioac-tivity potential of R. ontariense tea (tANG et al., 2009). However, new analyses of various sam-ples of the moss should be performed in order to claim the beneficial role of any mineral for the treatment of elevated blood pressure conditions.

Ital. J. Food Sci., vol. 25 - 2013 237
AcKNOWLEDGEMENtS
this work was supported by the Ministry of Science and technological Development of the republic of Serbia (re-search grant No. 173040).
rEFErENcES
Asakawa Y. 2008. Liverworts-potential source of medicinal compounds. curr. Pharm. Des. 14: 3067.
Franzoni F., Santoro G., carpi A., Da Prato F., Femia F.r., Prattichizzo F. and Galetta F. 2005. Antihypertensive ef-fect of oral potassium aspartate supplementation in mild to moderate arterial hypertension. biomed. Pharmaco-ther. 59: 25.
Harris E.S.J. 2008. Ethnobryology: traditional uses and folk classification of bryophytes. the bryologist 111: 169.
Harris E.S.J. and Yang b. 2009. Variation and standard-ization in the use of a chinese medicinal moss. Econ. bot. 63: 190.
Hatchock J.N. 2004. Vitamin and mineral safety 2nd Ed. council for responsible Nutrition, Washington, Dc.
Karppanen H., Karppanen P. and Mervaala E.M. 2005. Why and how to implement sodium, potassium, calcium, and magnesium changes in food items and diets? J. Hum. Hypertens. 19: S10.
Pejin b., bianco A., Newmaster S., Sabovljevic M., Vujisic Lj., tesevic V., Vajs V. and De rosa S. 2012c. Fatty acids of Rho-dobryum ontariense (bryaceae), Nat. Prod. res. 26: 696.
Paper received October 1, 2008 Accepted April 23, 2012
Pejin b., Iodice c., tommonaro G., Sabovljevic M., bian-co A., tesevic V., Vajs V. and De rosa S. 2012a. Sugar composition of the moss Rhodobryum ontariense (Kindb.) Kindb. Nat. Prod. res. 26: 209.
Pejin b., Kien-thai Y., Stanimirovic b., Vuckovic G., belic D. and Sabovljevic M. 2012d. Heavy metal content of a me-dicinal moss tea for hypertension. Nat. Prod. res. In press.
Pejin b., Newmaster S., Sabovljevic M., Miloradovic Z., Gru-jic-Milanovic J., Ivanov M., Mihailovic-Stanojevic N., Jo-vovic Dj., tesevic V. and Vajs V. 2011b. Antihypertensive effect of the moss Rhodobryum ontariense in vivo. J. Hy-pertens. 29: e315.
Pejin b., Sabovljevic A., Sokovic M., Glamoclija J., ciric A., Vujicic M. and M. Sabovljevic. 2012e. Antimicrobial activ-ity of Rhodobryum ontariense. Hem. ind. 66: 381.
Pejin b., Sabovljevic M., tesevic V. and Vajs V. 2012b. Fur-ther study on fructooligosaccharides of Rhodobryum on-tariense. cryptogamie bryol. 33: 191.
Pejin b., Vujisic Lj., Sabovljevic M., tesevic V. and Vajs V. 2011a. Preliminary data on essential oil composition of the moss Rhodobryum ontariense (Kindb.) Kindb. cryp-togamie bryol. 32: 113.
Sarafidis P.A. and bakris G.L. 2008. resistant hyperten-sion: an overview of evaluation and treatment. J. Am. coll. cardiol. 52: 1749.
tang Y., Garg H., Geng Y. and bryan S. 2009. Nitric oxide bioactivity of traditional chinese medicines used for car-diovascular indications. Free radical biol. Med. 47: 835.
Whelton P.K., He J., cutler J.A., brancati F.L., Appel L.J., Follmann D. and Klag M.J. 1997. Effects of oral potassi-um on blood pressure. Meta-analysis of randomized con-trolled clinical trials. JAMA 277: 1624.

short communication
238 Ital. J. Food Sci., vol. 25 - 2013
- Keywords: Yucca filamentosa L., antimicrobial activity, yucca extracts -
FIRST DATA ON THE ANTIMICROBIAL ACTIVITYOF YUCCA FILAMENTOSA L. BARK EXTRACTS
M. BONONI, G. GUGLIELMI1, P. ROCCHI1 and F. TATEO*Dipartimento di Scienze Agrarie e Ambientali, Università degli Studi di Milano,
Via Celoria 2, 20133 Milano, Italy1Rocchi dr. Eugenio s.r.l., Via J.F. Kennedy 3, 40053 Bazzano, BO, Italy
*Corresponding author: Tel. +39 02 50316540, Fax +39 02 50316539,email: fernando.tateo@ .it
AbStrAct
the aim of this study was to investigate the antimicrobial activity of two Yucca filamentosa L. extracts produced by hydro-alcoholic extraction under different operational conditions. the ex-tracts were concentrated and de-alcoholised, and were added to media to test their effects on tar-get microorganisms. both extracts displayed equivalent specific growth inhibitory activity against Saccharomyces cerevisiae. No other antimicrobial activity was found. this anti-fermentative ac-tivity may open the doors to new possibilities for using Yucca filamentosa L. extracts in the food industry. these findings are of particular interest, since yucca extracts are already classified as being generally recognized as safe (GrAS).

Ital. J. Food Sci., vol. 25 - 2013 239
INtrODUctION
the various Yucca species (fam. Asparagaceae, sub-fam. Agavoideae) are tropical or sub-tropi-cal plants with a tree-like growth habit. they are found in arid or semi-arid South-Western regions of the US and Mexico (PELLMYr, 2003). In tra-ditional medicine of the Native Americans, yuc-ca-derived extracts were used against a variety of diseases, including arthritis and rheumatism (MUKHErJEE et al., 2001); these extracts have GrAS (generally recognized as safe) status and are therefore accepted by the US FDA for use in humans. Yucca powder and sap are derived from the logs of the plant; such extracts can be pro-duced by mechanical squeezing and subsequent evaporation of the sap, and are widely used in food, cosmetics, and pharmaceutics (MAttIA and cOLUZZI, 2005). Yucca powder and extracts are also used as animal feed additives due to their beneficial anti-inflammatory effects (WENZIG et al., 2008), which have been linked to their high content of phenolic compounds.
Many studies have also examined the sapo-nin-rich extracts of different Yucca species for antibacterial activity (cHEEKE et al., 2006; FAVEL et al., 2005; KILLEN et al., 1998; KOWALcZYK et al., 2011; MILGAtE and rObErtS, 1995; MIYA-KOSHI et al., 2000; MONtOrO et al., 2008; PIA-cENtE et al., 2005; WENZIG et al., 2008). Sap-onins are glycoside compounds of a fat-soluble nucleus (aglycone) that can be either a triterpe-noid (c30), as in soybean, alfa-alfa, quillaja, and guar (HASSAN et al., 2010); or an alkaloid steroid (c27), as in yucca, tomato, and oats. One or more side chains or water-soluble sugars (glycone) are attached through ester linkages to the aglycone nucleus at different carbon sites (KANEDA et al., 1987). Saponins have shown haemolytic (KHALIL and EI-ADAWY, 1994) and antibacterial activities (SEN et al., 1998), but not all saponins have the same biological activities (HASSAN et al., 2010, KANEDA et al., 1987). It has been demonstrated that yucca bark accumulates polar bidesmosid-ic saponins; the bark powder samples are domi-nated by high polarity, while steroidal glycosides with mid- and short-length saccharide chains are predominant in the steam.
A large number of papers have determined that Yucca schidigera contains steroidal sapo-nins with anti-yeast activity, and therefore such extracts have been investigated for use as new agents to prevent food deterioration (MIYAKOSHI et al., 2000). Our preliminary experiments show similar properties exhibited by root extracts of Yucca filamentosa L. from the USA, also studied previously addressing the importance of chem-istry and geographic variation of floral scent (SVENSSON et al., 2005). In the present study, we tested the efficiencies of producing Yucca fil-amentosa L. extract using different extraction solvents, and then tested the antimicrobial ac-tivities of these extracts vs. several target mi-
croorganisms. We found evidence that the ex-tracts had considerable microbicidal activity ex-clusively against Saccharomyces cerevisiae and not against other target microorganisms.
MAtErIAL AND MEtHODS
Extract production for microbiological testing
During the extraction, and particularly during separation of the solid waste, we attempted to avoid introducing technologically differentiated parameters for the various extracts by adopting the simple spontaneous drainage, without affect-ing by pressure the release of active principles from solid. the dry vegetable material of Yucca filamentosa L. was cut into pieces with an aver-age diameter of 10 mm. Preliminary extractions were performed under varying conditions, in or-der to identify the parameters that produced the best results in terms of percentage of the total soluble solids in the extracts.
Extractions were performed by seven days of infusion of dry materials with solvent in a solid:liquid ratio of 1:6.7; the extraction mixture was shaken three times per day. three different solvents were used: (A) water, (b) water/95% eth-anol (50:50 v/v), and (c) 95% ethanol. In theory, derivation using different types of solvents could result in the extracts having different composi-tions of the active substances.
Extraction efficiencies were measured (table 1). Solvent b was determined to produce the best ex-tractive yield. A new extract was produced using solvent b, this time cutting the dry yucca to piec-es with an average diameter of 1-2 mm. this ex-traction product was concentrated in a rotovapor (2:1); the obtained product was named extract b and contained a concentration of total soluble sol-ids equal to 14.0 g 100 mL-1. We also combined the original extracts produced with solvents A, b, and c, in a ratio of 1:1:1. this mixture was concentrated in a rotovapor (4:1) to produce an extract with total soluble solids concentration of 14.2 g 100 mL-1, similar to that of the concentrat-ed extract b. both concentrated products had a residual ethanol content of no more than 0.01%. the concentrated extracts b and Abc were next tested for their activity on microorganisms.
Microbiological verifications
For testing the antimicrobial activity of the yucca extracts, the following species were used as target microorganisms: Aspergillus brasil-iensis (NcPF 2275/Atcc 16404), Escherichia coli (Nctc 12241/Atcc 25922), Staphylococ-cus aureus (Nctc 12981/Atcc 25923), Lis-teria monocytogenes (Nctc 11994), Bacillus ce-reus (Nctc 7464/Atcc 10876), and Saccha-romyces Cerevisiae (NcPF 3178). these strains

240 Ital. J. Food Sci., vol. 25 - 2013
table 1 - Preliminary results of testing three different extraction solvents for Yucca filamentosa L.
Yucca (g) 95% EtOH H20 (mL) Extract Total Soluble (mL) (mL) Solids (g 100 mL-1)
Solvent A 888 6,000 --- 4,330 0.56Solvent B 878 3,000 3,000 3,800 5.32Solvent C 880 --- 6,000 2,400 3.58
table 2 - results concerning growth values as cfu mL-1 derived from sowing stock suspension on undiluted media and media modified with two yucca extracts (Abc and b). counts on tryptone soy agar (t.s.a.) and Sabouraud dextrose agar (s.a.) me-dia are reported. the values are the average of four replicas, calculated according to ISO 8199:2005 Standard (8.4.2); stand-ard deviation (S) and p values are reported for the significant growth reduction of S. cerevisiae.
Medium cfu mL-1 95% Confidence Interval Log 95% Confidence Interval (cfu mL-1) cfu mL-1 (Log cfu mL-1)
Bacillus t.s.a. 1.456 × 10⁶ 1.451 × 10⁶ 1.461 × 10⁶ 6.163 6.162 6.165cereus t.s.a. + ABC 1.475 × 10⁶ 1.470 × 10⁶ 1.480 × 10⁶ 6.169 6.167 6.170 t.s.a. + B 1.341 × 10⁶ 1.337 × 10⁶ 1.346 × 10⁶ 6.127 6.126 6.129
Escherichia t.s.a. 23.249 × 10⁶ 23.159 × 10⁶ 23.339 × 10⁶ 7.366 7.365 7.368coli t.s.a. + ABC 34.424 × 10⁶ 34.290 × 10⁶ 34.558 × 10⁶ 7.537 7.535 7.539 t.s.a. + B 24.324 × 10⁶ 24.236 × 10⁶ 24.411 × 10⁶ 7.386 7.384 7.388
Staphylococcus t.s.a. 4.236 × 10⁶ 4.221 × 10⁶ 4.250 × 10⁶ 6.627 6.625 6.628aureus t.s.a. + ABC 4.252 × 10⁶ 4.237 × 10⁶ 4.268 × 10⁶ 6.629 6.627 6.630 t.s.a. + B 5.026 × 10⁶ 5.005 × 10⁶ 5.047 × 10⁶ 6.701 6.699 6.703
Listeria t.s.a. 26.424 × 10⁶ 26.322 × 10⁶ 26.526 × 10⁶ 7.422 7.420 7.424monocytogenes t.s.a. + ABC 20.999 × 10⁶ 20.916 × 10⁶ 21.082 × 10⁶ 7.322 7.320 7.324 t.s.a. + B 28.126 × 10⁶ 28.013 × 10⁶ 28.238 × 10⁶ 7.449 7.447 7.451
Aspergillus s.a. 31.500 × 10³ 30.706 × 10³ 32.294 × 10³ 4.498 4.487 4.509brasiliensis s.a. + ABC 29.500 × 10³ 28.732 × 10³ 30.268 × 10³ 4.470 4.458 4.481 s.a. + B 33.500 × 10³ 32.681 × 10³ 34.319 × 10³ 4.525 4.514 4.536
Saccharomyces s.a. 68.333 × 10⁴ 67.358 × 10⁴ 69.307 × 10⁴ 5.835 5.828 5.841 S pcerevisiae s.a. + ABC 3.000 × 10² 2.452 × 10² 3.548 × 10² 2.477 2.390 2.550 0.12 <0.00051st test s.a. + B 2.500 × 10² 2.000 ×10² 3.000 × 10² 2.398 2.301 2.477 0.17 <0.0005
Saccharomyces s.a. 19.365 × 10⁵ 19.306 × 10⁵ 19.425 × 10⁵ 6.287 6.286 6.288 S pcerevisiae s.a. + ABC 5.500 × 10³ 5.265 × 10³ 5.735 × 10³ 3.740 3.721 3.758 0.10 <0.00052nd test s.a. + B 25.250 × 10³ 24.748 × 10³ 25.752 × 10³ 4.402 4.394 4.411 0.29 <0.0005
were obtained from tcS biosciences Ltd. (bo-tolph claydon, buckingham, UK), and are the standards used for quality control testing in the Laboratory “rocchi dr. Eugenio s.r.l”, baz-zano (bologna, Italy).
Solid media used included Sabouraud dex-trose agar (biokar diagnostic) for Aspergillus brasiliensis and Saccharomyces cerevisiae, and tryptone soy agar (Oxoid) for all other target microorganisms. Each solid medium was pre-pared in the following different versions: undi-luted, with the addition of 1 mL Abc extract 100 mL-1 of medium, and with the addition of 1 mL b extract 100 mL-1 of medium. testing veri-fied that the addition of extracts did not signif-icantly modify the pH of the medium; the pH remained in the interval of 7.1 ± 0.02 for tryp-tone soy agar, and of 5.5 ± 0.05 for Sabouraud dextrose agar.
the stock suspensions for the inoculum were produced by collecting a loopful (with a 1 µL loop) of target microorganisms from slant cul-tures, and dispersing the microorganisms into 10 mL of sterile ringer 1\4 solution (biokar di-agnostic). From these stock suspensions, dec-imal dilutions were prepared up to the third. then 50 µL of the third and the second deci-mal dilutions were used to inoculate four rep-lica plates, undiluted on the surface of the me-dia with a Don Whitley spiral plater. Incubation conditions were chosen in accordance with the nature of each target microorganisms as fol-lows: Aspergillus brasiliensis, 25°c for 5 days; Escherichia coli, 37°c for 24 hours; Staphylo-coccus aureus, 37°c for 48 hours; Listeria mono-cytogenes, 37°c for 48 hours; Bacillus cereus, 30°c for 48 hours; Saccharomyces cerevisiae, 25°c for 5 days.

Ital. J. Food Sci., vol. 25 - 2013 241
rESULtS AND cONcLUSIONS
At the end of the incubation, a relative count was performed for each microorganism, enabling comparison of the growth on control media with that on media modified by adding the two ex-tracts, Abc and b. the calculations took into ac-count the results obtained from all dilutions and replicas sown with each target microorganism, and applied the formula as per the ISO 8199:2005 standard at point 8.4.2. the 95% confidence in-terval was also determined for each count, as in-dicated by the aforementioned ISO standard. Pre-liminary sterility evaluations were made on media loaded with the extracts Abc and b, and showed that the extracts had negligible bacteria content of 560 cfu mL-1 for the Abc extract and 640 cfu mL-1 for the b extract. Such values confirm the non-existence of interference from microbial con-tent peculiar to the extracts.
table 2 reports the results for each target mi-croorganism; values express the growth as colo-ny forming units (cfu) per mL, derived from sow-ing the stock suspensions on either the undi-luted media or the media modified with the two examined yucca extracts. table 2 also presents the data expressed in log cfu mL-1 and the 95% confidence intervals. Data show that yucca ex-tracts had a significant microbial growth reduc-tion effect only on S. Cerevisiae, statistically con-firmed by p-values (<0.0005) as reported in ta-ble 2; it is very clear that the effect of Abc and b extracts doesn’t exist against other target mi-croorganisms at the applied 1% concentration (no inhibition is readable on logarithmic scale). Data clearly show the effects of both extracts on Saccharomyces cerevisiae compared to the un-altered media; the activity of the two Yucca fil-amentosa L. extracts led to inhibition by more than 3 logarithmic scales. the activity is con-firmed by a 2nd test performed ten days later: the results are reported in table 2.
the Student’s t-test was used to analyse the data, confirming that a normal distribution could be assumed. this statistical analysis showed that except in the case of S. cerevisiae, non-signifi-cant differences were detected in the target mi-croorganism counts among the undiluted media and the media modified with extracts Abc and b. the statistically significant effect on S. cerevisiae growth was repeatable between the four replicas, in two quantitative tests performed using a basic medium from two different batches.
the present reported, specifically growth in-hibitory activity of Yucca filamentosa L. extracts against yeast opens a wide range of possible ap-plications for using these extracts in the food sec-tor. Further studies should be performed to inves-tigate the effectiveness of these extracts on other microorganisms with a fermentative metabolism.
AcKNOWLEDGEMENtS
this research has been supported by “real Aromi S.p.A. – Di.S.A.A., University of Milan” project USM 14732. the Authors thank Dr. Valeria Mazzoni for technical support.
rEFErENcES
cheeke P.r., Piacente S. and Oleszek W. 2006. Anti-in-flammatory and anti-arthritic effects of Yucca schidig-era: a review. J. Inflammation, 3: 1.
Favel A., Kemertelidze E., benidze M., Fallague K. and regli P. 2005. Antifungal Activity of Steroidal Glyco-sides from Yucca gloriosa L. Phytother. res., 19: 158.
Hassan S.M., byrd J.A., cartwright A.L. and bailey c.A. 2010. Hemolytic and Antimicrobial Activities Dif-fer Among Saponin-rich Extracts From Guar, Quilla-ja, Yucca, and Soybean. Appl. biochem. biotechnol., 162:1008.
Khalil A.H. and EI-Adawy t.A. 1994. Isolation, identifi-cation and toxicity of saponin from different legumes. Food chem., 50: 197.
Kaneda N., Nakanishi H. and Staba J. 1987. Steroidal constituents of Yucca schidigera plants and tissue cul-tures. Phytochemistry, 26: 1425.
Killeen G.F., Madigan c.A., connolly c.r., Walsh G.A., clark c., Hynes M.J., timmins b.F., James P., Headon D.r. and Power r.F. 1998. Antimicrobial saponins of Yucca schidigera and the implications of their in vi-tro properties for their in vivo impact. J. Agric. Food chem., 46:3178.
Kowalczyk M., Pecio L., Stochmal A. and Oleszek W. 2011.Qualitative and Quantitative Analysis of Steroidal Sapo-nins in crude Extract and bark Powder of Yucca schi-digera roezl. J. Agric. Food chem., 59: 8058.
Mattia c. and coluzzi F. 2005. cOX-2 inhibitors: phar-macological data and adverse effects. Minerva Aneste-siol., 71: 461.
Milgate J. and roberts D.c.K. 1995. the nutritional and biological significance of saponins. Nutr. res., 15: 1223.
Miyakoshi M., tamura Y., Masuda H., Mizutani K., ta-naka O., Ikeda t., Ohtani K., Kasai r. and Yamasaki K. 2000. Antiyeast steroidal saponins from Yucca schi-digera (Mohave Yucca), a new anti-food deteriorating agent. J. Nat. Prod., 63: 332.
Montoro P., Skhirtladze A., bassarello c., Perrone A., Kemertelidze E., Pizza c. and Piacente S. 2008. De-termination of phenolic compounds in Yucca glorio-sa bark and root by Lc-MS/MS. J. Pharm. biomed. Anal., 47: 854.
Mukherjee D., Nissen S.E. and topol E.J. 2001. risk of cardiovascular events associated with selective cOX-2 inhibitors. J. Am. Med. Assoc., 286: 954.
Pellmyr O. 2003. Yuccas, yucca moths, and coevolution: a review. Ann. Missouri bot. Gard., 90: 35.
Piacente S., Pizza c. and Oleszek W. 2005. Saponins and phenolics of Yucca schidigera roezl: chemistry and bio-activity. Phytochem. rev. 4: 177.
Sen S., Makkar H.P.S., Muetzel S. and becker K. 1998. Effect of Quillaja saponaria saponins and Yucca schi-digera plant extract on growth of Escherichia coli. Lett. Appl. Microbiol., 27:35.
Svensson G.P., Hickman M.O. Jr., bartram S., boland W., Pellmyr O. and. raguso r.A. 2005. chemistry and geo-graphic variation of floral scent in Yucca filamentosa (Agavaceae). Am. J. bot. 92: 1624.
Wenzig E.M., Oleszek W., Stochmal A., Kunert O. and bau-er r. 2008. Influence of phenolic constituents from Yuc-ca schidigera bark on arachidonate metabolism in vi-tro. J. Agric. Food chem., 56: 8885.
Paper received June 23, 2012 Accepted October 30,2012

242 Ital. J. Food Sci., vol. 25 - 2013
PREVIEW ON VOLUME XXV No. 3, 2013
PAPErS
cFD Simulations as a Supporting tool for Process and construction Optimization in Food Industry Production Practice: A case Study of a Single truck Smoking chamberM.S. Kubiak and M. Jakubowski
Evaluation of Different Stunning Methods on Aspects of Animal Welfare and Meat Quality of Matrinxã (Brycon Cephalus)S.C. Vargas, P.R.C. Oliveira Filho, M.M. Natori, C.G. Lima and E.M. Macedo Viegas
Employing Artificial Neural Networks and regression in Analysis on Knowledge About Sweet Potato (Ipomoea Batatas L.) in SloveniaN. Kunstelj, D. Žnidarcic and B. Šter
Honey-based “Água-Mel” chemical characterization and Microbiological QualityMiguel M. Graça, Antunes M. Dulce, A. Smail, J. Duarte and M.L. Faleiro
Maize Variants’ Susceptibility to Plodia InterpunctellaL. Limonta, D.P. Locatelli, S. Sangiorgio and G. Consonni
the Hedonic Price for an Italian Grape VarietyF. Caracciolo, L. Cembalo and E. Pomarici
compositional Studies of Some Pea (Pisum Sativum L.) Seed cultivars commonly consumed in PakistanM. Zia-Ul-Haq, S. Ahmad, R. Amarowicz and S. Ercisli
Species, Salt Level, and Dietary Fibre Effect on Fish HamC. Cardoso, R. Mendes and M.L. Nunes
Physical and Micro Structural changes in carrot Pomace-based ExtrudatesA.H. Dar, N. Kumar and H.K. Sharma
Polyphenol content and Antiradical Activity of “Sarconi” beans (Phaseolus Vulgaris L.) EcotypeA. Romani, P. Vignolini, M.A. Favino and D. Heimler
Volatile Fingerprint and Physico-Mechanical Properties of “Muscat blanc” Grapes Grown in Mountain Area: a First Evidence of the Influence of Water regimesM. Giordano, O. Zecca, S. Belviso, M. Reinotti, V. Gerbi and L. RolleaAn Evaluation of Fish Freshness: a Proposal for a New IndexL. Cianti, C. Lorini, F. Santomauro, P. Bavazzano, A. Perico, A. Colzi and G. Bonaccorsi
Effect of Harvesting time and Storage temperature on the Duration of balash Stage of “barhi” DatesA.K. Alsaed, G.F. Mehyar and A. Arar
Antioxidant Activity and Phenolic content of Mapo tangeloU.G. Spizzirri, D. Restuccia, F. Puoci, M. Curcio, G. Cirillo and N. Picci
Post-Harvest Quality, Phytochemicals and Antioxidant Activity in Organic and conventional Kiwifruit (Actinidia Deliciosa, cv. Hayward)L. D’Evoli, S. Moscatello, A. Baldicchi, M. Lucarini, J.G. Cruz-Castillo, A. Aguzzi, P. Gabrielli, S. Proietti, A. Battistelli, F. Famiani, V. Bohm and G. Lombardi-Boccia

Ital. J. Food Sci., vol. 25 - 2013 243
GUIDE FOR AUTHORSITALIAN JOURNAL OF FOOD SCIENCE -IJFS
Publication Ethics and Publication Malpractice
Italian Journal of Food Science is committed to upholding the highest standards of publica-tion ethics and takes all possible measures against any publication malpractices. All Authors submitting their works to Italian Journal of Food Science for publication as original articles at-test that the submitted works represent their Authors’ contributions and have not been copied or plagiarized in whole or in part from other works. the Authors acknowledge that they have disclosed all and any actual or potential conflicts of interest with their work or partial benefits associated with it. In the same manner, Italian Journal of Food Science is committed to objec-tive and fair Editor(s) review of the submitted for publication works and to prevent any actual or potential conflict of interests between the editorial personnel and the reviewed material. Any departures from the above-defined rules should be reported directly to the Editor-in-chief, who is unequivocally committed to providing swift resolutions to any of such a type of problems.
1. Manuscript Submission
Manuscripts must submitted as an electronic version by e-mail to [email protected]. the word processor used to generate the file should be indicated and the files should be saved in format “text only”; graphs, pictures and diagrams must be saved at 300 dpi in TIF, JPG or EPS formats (not included in MsWord documents).
Manuscripts must be typed, double-spaced and pages should be in A4 format using times New roman 12 pt as the advised font. top, bottom and side margins should be 25 mm. Pages and lines on all pages, including those for references and figure legends, must be electroni-cally numbered in the left margin.
English is the official language. the Editor-in-chief and/or co-Editors reserve the right to make literary corrections and to make suggestions to improve brevity, but the paper must be previously revised for English by the authors. If English is not the mother tongue of authors, they must seek help from one of the following agencies (or other similar official agencies):
www.journalexperts.comwww.sciencedocs.comwww.internationalscienceediting.comwww.writescienceright.comwww.genedits.com
2. Manuscript Preparation
(1) the paper should be divided under the following headings in this order:Title. Informative of the content of the article (<50 characters + spaces).Author(s). Initials and Surname, omit professional and official titles. the institute and ad-
dress where the research was carried out and the current address of each author should be given on the title page.
Abstract. clearly state the objective of the study, give a concise description of experiment(s), observations, results and conclusions. No references should be cited. Do not exceed 100 words.
Key words. Up to six words, in alphabetical order, which describe the document must be given to aid data retrieval and indexing.
Introduction. review pertinent previous work and cite appropriate references. State the purpose of the investigation.
Materials and Methods. Indicate apparatus, instruments, reagents, etc., giving sufficient detail to allow the work to be repeated.
Results and Conclusions. results and conclusions may be presented together or separate-ly. concisely present results using tables and figures to help justify conclusions (do not present the same information in both forms). Use statistical analysis when appropriate. Unsupported hypotheses should be avoided. conclusions should point out the significance of the findings and, if possible, relate the new findings to some problem in Food Science and technology.
Acknowledgments. Acknowledgments of assistance are appropriate provided they are not related to analyses or other services performed for a fee. Financial support, thanks for assist-ance, artic1e number or thesis fulfilment may be included.
Units. A list of units particular to the paper may be included.

244 Ital. J. Food Sci., vol. 25 - 2013
References. references in the reference list should be arranged alphabetically (initials of first name, only), and, for the same author, should be arranged consecutively by year, typed double-spaced. Each individual reference should begin flush left (no indentation). refer to at-tached examples taken from “Style Guide for research Papers” by the Institute of Food tech-nologists (chicago - I1linois - USA). Literature citations in the text should be referred to by Surname and year in parentheses. If there are more than two authors, give the surname of the first author and add et al. and the year in parentheses. Examples: (SMItH, 2007), (SMItH and JONES, 2008) (SMItH et al., 2008).
(2) tables should be as few and as simple as possible and include only essential data. Each table must be saved and printed on a separate sheet and have an Arabic number, e.g. table 4 NOt tab.
4. Legends must be self-explanatory and on a separate sheet. Use lower-case letters for foot-notes in tables and explain below the table in the order in which they appear in the table.
(3) Figures must be prepared and saved separately in TIF, JPEG, EPS (300 dpi resolu-tion). they should be prepared so that on 50% reduction, lines, figures and symbols will be clearly legible and not overcrowded. All figures must be given Arabic numbers, e.g. Fig. 3. Legends for figures must be self-explanatory and should be typed on a separate sheet under “Legends to Figures”.
(4) Standard Usage, Abbreviations and Units. the concise Oxford and Webster’s English Dic-tionaries are the references for spelling and hyphenation. Statistics and measurements should always be given in figures, e.g. 10 min, except when the number begins a sentence. When the number does not refer to a unit of measurement it should be spelled out unless it is 100 or greater. Abbreviations should be used sparingly, only when long or unwieldy names occur frequently, and never in the title; they should be given at the first mention of the name. International Standard abbreviations should generally be used except where they conflict with current practice or are con-fusing. For example, 3 mm rather than 3x10⁻³ m. Abbreviations should be defined the first time they are used in the text and they should be used consistently thereafter. temperatures should be expressed in the celsius (centigrade) scale. chemical formulae and solutions must specify the form used, e.g. anhydrous or hydrated, and the concentration must be in c1early defined units.
common species names should be followed by the Latin binomial (italics) at the first men-tion. For subsequent use, the generic name should be contracted to a single letter if it is un-ambiguous.
3. Editorial and Review Policy
Scientific contributions in one of the following forms may be submitted:Reviews –they can be submitted directly to the Editor-in-chief or articles can be requested
directly by the Editor-in-chief.Short Communications, Surveys and Opinions – they do not need to have the formal or-
ganization of a research paper; they will receive priority in publication; maximum of five pages allowed.
Papers – the paper must follow the guidelines as specified under the section Manuscript Preparation.
reviews, Papers, Short communications and Surveys will be subjected to critical review by referees.
(1) Manuscripts will be processed in the order received. the Editor-in-chief will select papers to enter into the reviewing system based on originality and innovation. A letter will be sent to the authors acknowledging receipt of the manuscript along with a Declaration form stating that it has NOt been previously published, accepted or submitted for publication elsewhere and agree-ing to the page charges upon acceptance of the paper. On receipt of the signed Declaration form, the Editor-in-chief will send the manuscript to a co-Editor and/or referees for evaluation.
(2) Authors may suggest to IJFS possible referees. the Editor-in-chief and co-Editors re-serve the right of their utilization.
(3) referees may not be from the same institution as the author. referees should make their comments and questions in detail and return the paper to the Editor-in-chief and/or co-Editor as soon as possible, usually within two weeks. the identity and report of the referees are made know to the Editor-in-chief, but only the anonymous referee report is sent to the author(s). If all referees recommend acceptance or rejection, the decision stands. If the opin-ions of the referees tie, the Editor-in-chief and/or co-Editors have the freedom to decide upon acceptance or rejection of the paper.

Ital. J. Food Sci., vol. 25 - 2013 245
(4) the results of the refereeing process, accompanied by a letter from the Editor-in-chief or the co-Editor, will be sent to the author(s). Papers needing revision must be returned to the co-Editor within the timeframe suggested, otherwise the paper will be considered as with-drawn. A letter announcing acceptance of the manuscript will be sent to the author(s) upon acceptance by the referees.
(5) the authors will receive galley proofs of the manuscript along with the invoice for the page charges (stated on the first page of each issue) which must be paid in order to allow for publication. the proofs will be sent to the corresponding author as a PDF file by e-mail, only. A hard copy will be sent by mail only if the author makes this request when the paper is accepted for publication.
the revised galley proofs must be returned by fax or mail to chiriotti Editori – 10064 Pinerolo (tO) – Italy –Fax: +39 0121 794480; e-mail: [email protected]
Italian Journal of Food Science would like to thank all the referees who have contributed to keep up the value of the journal with their important work.
For this reason, all the referees can download free of charge all the issues of the Italian Jour-nal of Food Science from our website.
rEFErENcE EXAMPLES
EXAMPLES of use in a Reference list are given below. the bold-faced parenthetical type of citation above the example is indicated ONLY for information and is NOt to be included in the reference list.
(Anonymous)Anonymous. 1982. tomato product invention merits
ctrI Award. Food technol. 36(9): 23.
(Book)AOAc. 1980. “Official Methods of Analysis” 13th ed.
Association of Official Analytical chemists, Wash-ington, Dc.
Weast, r.c. (Ed.). 1981 “Handbook of chemistry and Physics” 62nd ed. the chemical rubber co. cleveland, OH.
(Bulletin, circular)Willets c.O. and Hill, c.H. 1976. Maple syrup pro-
ducers manual Agric. Handbook No. 134, U.S. Dept. of Agriculture, Washington, Dc.
(Chapter of book)Hood L.F. 1982. current concepts of starch struc-
ture. ch. 13. In “Food carbohydrates”. D.r. Line-back and G.E. Inglett (Ed.), p. 217. AVI Publishing co., Westport, ct.
(Journal)cardello A.V. and Maller O. 1982. Acceptability of
water, selected beverages and foods as a function of serving temperature. J. Food Sci. 47: 1549.
IFt Sensory Evaluation Div. 1981a. Sensory evalua-tion guide for testing food and beverage products. Food technol. 35 (11): 50.
IFt Sensory Evaluation Div. 1981b. Guidelines for the prepaation and review of papers reporting sensory evaluation data. Food technol. 35(4): 16.
(Non-English reference)Minguez-Mosquera M.I., Franquelo camacho A, and
Fernandez Diez M.J. 1981. Pastas de pimiento. Normalizacion de la medida del color. Grasas y Aceites 33 (1): 1.
(Paper accepted)bhowmik S.r. and Hayakawa, K. 1983. Influence of
selected thermal processing conditions on steam consumption and on mass average sterilizing val-ues. J. Food Sci. In press.
(Paper presented)takeguchi c.A. 1982. regulatory aspects of food ir-
radiation. Paper No. 8, presented at 42nd An-nual Meeting of Inst. of Food technologists, Las Vegas, NV, June 22-25.
(Patent)Nezbed r.I. 1974. Amorphous beta lactose for tablet-
ing U.S. patent 3,802,911, April 9.
(Secondary source)Sakata r., Ohso M. and Nagata Y. 1981. Effect of
porcine muscle conditions on the color of cooked cured meat. Agric. & biol. chem. 45 (9): 2077. (In Food Sci. technol. Abstr. (1982) 14 (5): 5S877).
Wehrmann K.H. 1961. Apple flavor. Ph. D. thesis. Michigan State Univ., East Lansing. Quoted in Wehrmann, K.H. (1966). “Newer Knowledge of Ap-ple constitution”, p. 141, Academic Press, New York.
(Thesis)Gejl-Hansen F. 1977. Microstructure and stability of
Freeze dried solute containing oil-in-water emul-sions Sc. D. thesis, Massachusetts Inst. of tech-nology, cambridge.
(Unpublished data/letter)Peleg M. 1982. Unpublished data. Dept. of Food En-
gineering., Univ. of Massachusetts, Amherst.bills D.D. 1982. Private communication. USDA-ArS.
Eastern regional research center, Philadelphia, PA.

246 Ital. J. Food Sci., vol. 25 - 2013
CONTRIBUTORS
Gratitude is expressed to the following entities for contributing to the realization
of the Journal by being supporting subscribers for 2012.
ASSOCIATIONS and COMPANIES
Associazione Italiana di Tecnologia Alimentare (A.I.T.A.) - Parma Fax +39-0521-230507 www.aita-nazionale.it
Società Italiana di Scienze e Tecnologie Alimentari (S.I.S.T.Al) - Perugia Fax +39-075-5857939 www.sistal.org
Soremartec Italia srl - Alba Fax +39-0173-313966

Ital. J. Food Sci., vol. 25 - 2013 247
CONTRIBUTORS
Gratitude is expressed to the following entities for contributing to the realization
of the Journal by being supporting subscribers for 2012.
RESEARCH INSTITUTES
Dipartimento di Scienze e Tecnologie Agroalimentari e
Microbiologiche (DI.S.T.A.A.M.),
Università del Molise, Campobasso Fax +39-0874-404652
DeFENS, Department of Food, Environmental
and Nutritional Sciences, Università di Milano, Milano Fax +39-02-50316601
Dipartimento di Valorizzazione e Protezione delle Risorse
Agroforestali (DI.VA.P.R.A.), Sezione Microbiologia
ed Industrie Agrarie, Università di Torino, Grugliasco Fax +39-011-6708549
Dipartimento di Medicina e Sanità Pubblica
Università di Bologna, Bologna Fax +39-051-2094828

248 Ital. J. Food Sci., vol. 25 - 2013
ITALIAN JOURNAL OF FOOD SCIENCERivista Italiana di Scienza degli Alimenti
DIRETTORE RESPONSABILE: Alberto ChiriottiAUTORIZZAZIONE: n. 3/89 in data 31/1/1989
del Tribunale di PerugiaTIPOGRAFIA Giuseppini - Pinerolo
ISSN 1120-1770 © 2013
CHIRIOTTI EDITORI srl - 10064 Pinerolo - Italy
publishes the technical magazines:

VOLUME XXV No. 2, 2013
CONTENTS
OPINION
Health Quality and Nutritional Value of rye bread Produced on a Small and Large Scale in PolandM. Radzyminska, B. Garbowska and D. Jakubowska ............................................................................. 126
PAPErS
Anthocyanin Esterification in Sangiovese GrapesL. Rustioni, M. Rossoni, O. Failla and A. Scienza ................................................................................... 133
Effect of technological Factors on Glycoalkaloids and Nitrates contentin Dehydrated PotatoE. Rythel ................................................................................................................................................. 142
Influence of chemical composition and Structure of Strawberry Gelson the chosen Physical Properties of Freeze-Dried Final ProductA. Ciurzyñska, A. Lenart and W. Traczyk ................................................................................................ 149
Ultrasound Application in Winemaking: Grape Maceration and Yeast LysisP. Ferraretto, V. Cacciola, I. Ferran Batlló and E. Celotti ......................................................................... 160
Antioxidative Peptides Derived from Denaturated Egg White ProteinA. Zambrowicz, M. Pokora, E. Eckert, J. Chrzanowska, M. Szołtysik, A. Dabrowskaand T. Trziszka ........................................................................................................................................ 169
Preliminary characterization of a bacteriocin-Like Substance Producedby a Bacillus Subtilis Isolated from Argentinean Vegetable FoodM.F. Fangio and R. Fritz .......................................................................................................................... 181
Quality of bread containing Potentilla Anserina L. cultivated in chinaYing Ji, Jie Gang and Wenzhong Hu .............................................................................................................. 189
Modification of the rheological behavior of Sodium Alginate by chitosanand Multivalent ElectrolytesBasim Abu-Jdayil and Deeb Abu Fara .................................................................................................... 196
Environmental Assessment of the citrus Fruit Production in Sicily Using LcAA. Lo Giudice, C. Mbohwa, M.T. Clasadonte and C. Ingrao ...................................................................... 202
Effect of UV-c Light in the Preservation of raw Fermented beveragesM. Borcakli, J. Lucas, L. Caputo, T. Ozturk, F. Baruzzi, V. Fusco, G.M. Quero,L. Quintieri and M. Houghton ................................................................................................................. 213
Different Stabilization treatments of rice bran Added to Wheat Flour Determine Different Properties in Partially baked Wheat breadJ. Quilez, M. Zator, J. Salas-Salvado and L. Alvarez ............................................................................... 222
Prediction of the Major Fatty Acids in the backfat From In- and Outdoor Iberian Pigs at SlaughterA. Daza, M.A. Latorre and C.J. López-Bote ............................................................................................. 229
SHOrt cOMMUNIcAtIONS
Mineral content of a Moss tea for HypertensionB. Pejin, D. Belic, G. Vuckovic, Y. Kien-Thai and B. Stanimirovic ............................................................. 235
First Data on the Antimicrobial Activity of Yucca Filamentosa L. bark ExtractsM. Bononi, G. Guglielmi, P. Rocchi and F. Tateo ...................................................................................... 238
PrEVIEW ON VOLUME XXIV No. 3, 2013 ................................................................................................ 242GUIDE FOr AUtHOrS ............................................................................................................................ 243cONtrIbUtOrS ...................................................................................................................................... 246