strigolactone regulates anthocyanin accumulation, acid
TRANSCRIPT
RESEARCH ARTICLE
Strigolactone Regulates AnthocyaninAccumulation, Acid Phosphatases Productionand Plant Growth under Low PhosphateCondition in ArabidopsisShinsaku Ito1,2, Tomoko Nozoye1, Eriko Sasaki3, Misaki Imai4, Yuh Shiwa4, Mari Shibata-Hatta4, Taichiro Ishige4, Kosuke Fukui1, Ken Ito2, Hiromi Nakanishi1, Naoko K. Nishizawa1,Shunsuke Yajima2, Tadao Asami1,5*
1 Graduate School of Agricultural and Life Sciences, The University of Tokyo, 1-1-1 Yayoi, Bunkyo, Tokyo,Japan, 2 Department of Bioscience, Faculty of Applied Bioscience, Tokyo University of Agriculture, 1-1-1Sakuragaoka, Setagaya, Tokyo, Japan, 3 Gregor Mendel Institute of Molecular Plant Biology, Vienna,Austria, 4 Genome Research Center, Tokyo University of Agriculture, 1-1-1 Sakuragaoka, Setagaya, Tokyo,Japan, 5 Department of Biochemistry, King Abdulaziz University, Jeddah, Saudi Arabia
AbstractPhosphate is an essential macronutrient in plant growth and development; however, the
concentration of inorganic phosphate (Pi) in soil is often suboptimal for crop performance.
Accordingly, plants have developed physiological strategies to adapt to low Pi availability.
Here, we report that typical Pi starvation responses in Arabidopsis are partially dependent
on the strigolactone (SL) signaling pathway. SL treatment induced root hair elongation, an-
thocyanin accumulation, activation of acid phosphatase, and reduced plant weight, which
are characteristic responses to phosphate starvation. Furthermore, the expression profile of
SL-response genes correlated with the expression of genes induced by Pi starvation.
These results suggest a potential overlap between SL signaling and Pi starvation signaling
pathways in plants.
IntroductionPhosphate (Pi) is an essential macronutrient for plants and plays an important role in majormetabolic processes; however, a large component of Pi in soil is present in organic compounds,meaning that much of the Pi is insoluble and not readily available to plants. Thus, plants havedeveloped various alternative systems to adapt to low Pi, including symbiotic interactions withmycorrhizae, the secretion of acid phosphatases, root hair elongation, the accumulation of an-thocyanins, reduced plant growth, and the up-regulation of phosphate starvation-inducing(PSI) genes [1].
PSI genes are commonly used as markers for the Pi starvation response. Purple acid phos-phatases (PAPs), which are important members of PSI gene families, hydrolyze organic
PLOSONE | DOI:10.1371/journal.pone.0119724 March 20, 2015 1 / 17
OPEN ACCESS
Citation: Ito S, Nozoye T, Sasaki E, Imai M, Shiwa Y,Shibata-Hatta M, et al. (2015) StrigolactoneRegulates Anthocyanin Accumulation, AcidPhosphatases Production and Plant Growth underLow Phosphate Condition in Arabidopsis. PLoS ONE10(3): e0119724. doi:10.1371/journal.pone.0119724
Academic Editor: Girdhar K. Pandey, University ofDelhi South Campus, INDIA
Received: June 13, 2014
Accepted: January 19, 2015
Published: March 20, 2015
Copyright: © 2015 Ito et al. This is an open accessarticle distributed under the terms of the CreativeCommons Attribution License, which permitsunrestricted use, distribution, and reproduction in anymedium, provided the original author and source arecredited.
Data Availability Statement: All RNAseq data filesare available from the DDBJ database (accessionnumber DRA001683).
Funding: This work was supported in part by grantsfrom the Core Research for Evolutional Science andTechnology (CREST) (T.A.), the Kato MemorialBioscience Foundation (S.I.) and MEXT-SupportedProgram for the Strategic Research Foundation atPrivate Universities, 2013–2017 (S1311017). Thefunders had no role in study design, data collectionand analysis, decision to publish, or preparation ofthe manuscript.
phosphates into Pi. Intracellular acid phosphatases play an important role in P homeostasis inplanta, whereas secreted acid phosphatases are intimately related to the utilization of organicphosphate in soils, which cannot be readily assimilated by plants in their organic form [2].PHOSPHATE2 (PHO2), which encodes a ubiquitin-conjugating E2 enzyme (UBC24), func-tions as a repressor and prevents excessive accumulation of Pi by controlling Pi uptake androot-to-shoot Pi translocation[3,4]. The PHOSPHATE TRANSPORTER1 (PHT1) family, agroup of nine closely related members, mediates external Pi uptake. Transcriptional analysis ofPHT genes indicated that PHT1 is highly expressed under low-Pi conditions [5,6]. The non-protein encoding gene IPS1 (INDUCED BY PHOSPHATE STARVATION1) is also considereda PSI gene and contains a motif with sequence complementarity to miR-399, a Pi starvation in-duced miRNA that regulates PHO2 transcription [7].
Strigolactones (SLs) are terpenoid lactones produced by many plant species and have vari-ous roles including: promoting the germination of parasitic weeds, signaling hyphal branchingin mycorrhizal fungi, and functioning in shoot branching, root morphology, and secondarygrowth [8–12]. To date, several mutants with aberrant branching patterns such asmore axillarygrowth (max) in Arabidopsis, semi-dwarf (d) in rice, decreased apical dominance (dad) in petu-nia and ramosus (rms) in pea, have been characterized as SL biosynthesis and/or signaling mu-tants. At present, two carotenoid cleavage dioxygenases (AtMAX3 and AtMAX4), a carotenoidisomerase (AtD27), and a cytochrome P450 (AtMAX1: CYP711A1) are known to be involvedin the biosynthesis of SLs in Arabidopsis. AtMAX2 encodes an F-box protein and a petunia(PhMAX2) and rice (D3) homologs of AtMAX2 interact with D14, a putative SL receptor, inthe presence of SL [13,14,15]). Recently, D53, which encodes a substrate of the SCFD3 complex,was reported as a repressor of SL signaling in rice [16,17] and it was proposed that the regula-tion of SL signaling was triggered by the proteasome-mediated degradation of D53 by theSCFD3 complex. In the SL biosynthetic pathway, D27 catalyzes the isomerization of all-trans-ß-carotene to 9-cis-ß-carotene, which is sequentially cleaved by CCD7 to form 9-cis-ß-apo-10’-carotenal and then by CCD8 to yield the carlactone (CL) [18]. A rice homolog of AtMAX1acts as a CL oxidase to stereoselectively convert CL into ent-2’-epi-5-deoxystrigol, which is themajor SL in rice [19].max1-1 andmax2-1mutants show the aberrant branching pattern, defectof normal root formation, delay of leaf senescence and so on [12]. These phenotypes ofmax1-1mutant were rescued by SL treatment, while those ofmax2-1mutant were not. That is,max1-1is SL responsive mutant andmax2-1 is SL insensitive mutant. In addition, onlymax2, but notother SL mutants, shows the phenotypes of reduced germination efficiency, longer hypocotyls,and hooked epinastic cotyledons [14,20,21].
SLs have been shown to regulate diverse physiological phenomena including shoot branch-ing, root hair elongation, lateral root formation, and PSI gene expression [22–25]. Pi deficiencyalso regulates these phenomena and increases SL levels. Furthermore, SLs are involved in roothair development under low-Pi conditions, because the number of root hairs was reduced inSL biosynthesis (max4-1) and signaling (max2-1) mutants under low Pi condition during theearly stage of seedling development [25]. These observations suggest that SLs could be a media-tor of low phosphate responses; however, the effects of SLs on typical phosphate starvation re-sponses are poorly understood.
In this study, we evaluated the effects of SLs on phenomena induced by phosphate starva-tion under low- and high-Pi conditions; we discovered that SLs induce various phosphate star-vation-inducing events, induction of anthocyanin accumulation and acid phosphataseproduction, and the reduction of plant growth, in wild-type (WT) and SL-biosynthetic mutantsbut not in SL-insensitive mutants. Furthermore, SL-biosynthetic and-insensitive mutantsshowed altered responses to Pi starvation in comparison with WT plants. RNA sequencing(RNAseq) of the SL biosynthetic-mutant (max1-1) revealed that gene expression profiles of
Strigolactones and Phosphate Starvation-Induced Morphology
PLOS ONE | DOI:10.1371/journal.pone.0119724 March 20, 2015 2 / 17
Competing Interests: The authors have declaredthat no competing interests exist.
max1-1 showed a negative correlation with those of previously reported low phosphate condi-tion [26]. Collectively, our results show that SLs function as key regulators in the perception ofphosphate deficiency and subsequent signaling.
Materials and Methods
Plant Materials and Growth ConditionsAll WT and mutant lines used in this report were derived from Arabidopsis thaliana ecotypeColumbia Col-0.max1-1 andmax2-1mutants are in the Col-0 background. Arabidopsis seedswere surface-sterilized and grown on Arabidopsis culture agar media (5 mM KNO3, 1 mMMgSO4, 1.5 mM Ca(NO3)2, 1 mMNH4Cl, 50 μM Fe-EDTA, 46 μMHBO3, 10 μMMnSO4,0.77 μMZnSO4, 0.32 μMCuSO4, 0.58 μMNa2MoO4, 0.25 μMNH4VO3, 0.7% agar) supple-mented with or without 1 mM KH2PO4. The agar concentration used here contains approxi-mately 4.0 ± 0.2 μM phosphorus in the final medium, determined by the phosphomolybdatemethod. Plants were cultivated at 23°C under continuous light after an initial chilling period(4°C for two days). For SL application experiments, we used the GR24, which is the most popu-lar and widely used synthetic SL analog. All experiments were performed with the exception ofplants showing abnormal growth such as extreme growth delay.
RNA Preparation and Gene Expression AnalysisTotal RNA was isolated and purified from the roots of three-week-old plants using Plant RNAIsolation reagent (Invitrogen, USA). For RNAseq analysis, the quality of total RNA was evalu-ated using the Agilent 2100 Bioanalyzer (Agilent, USA). Two micrograms of total RNA fromroots of three-week-old plants of the WT andmax1-1 were used to make separate librariesusing TruSeq RNA and TruSeq DNA Sample Prep kits as according to the manufacturer’s in-structions (Illumina, USA). The quality of each library was assessed using the Agilent 2100Bioanalyzer (Agilent) and then sequenced using an Illumina HiSeq 2000 Sequencer (paired-end sequencing, 100 bp). The data sets supporting the results of this article are available in theDDBJ database (accession: DRA001683). Data analysis was performed using the CLC Geno-mics Workbench (version 6.5). The experiment was performed twice (WT) or three times(max1-1) using independently prepared Arabidopsis seedlings. The complete list of regulatedgenes is provided in S1 Table. Common genes significantly up- or down-regulated betweenthis experiment and previously reported experiments on phosphate deprivation [26] were plot-ted according to the log2 signal ratio (SR). The Spearman’s rank-order correlation coefficient(SCC) of SR was used to estimate the relationship between these experiments.
For the comparison of gene expression profiles between this RNAseq analysis and DNA mi-croarray experiments, we used the DNAmicroarray analysis tool, AtCAST (http://atpbsmd.yokohama-cu.ac.jp/cgi/network/home.cgi) [27]. RNAseq data (WT vs. max1-1) was used asquery data. Experiments showing correlations (|Spearman’s correlation coefficient|> 0.3) withquery were detected.
For qRT-PCR analysis, cDNA synthesis was performed using the PrimeScript RT reagentKit and gDNA eraser (Takara, Japan). qRT-PCR was performed on a Takara Thermal CyclerDice Real Time System using a SYBR premix and Ex Taq (Takara). Specific primers used forqRT-PCR are listed in S2 Table. The expression of UBC (encoding ubiquitin C) was used as aninternal standard.
Strigolactones and Phosphate Starvation-Induced Morphology
PLOS ONE | DOI:10.1371/journal.pone.0119724 March 20, 2015 3 / 17
Determination of Root Hair LengthPlants were grown on Arabidopsis culture agar media for 5 days. Each seedling was transferredto fresh agar containing 1 μMGR24 or 1 mM KH2PO4. After 5 days, root hair length was mea-sured using a stereomicroscope (SZX12, Olympus, Japan). Measurements were performedusing at least ten images per treatment, employing the software IMAGEJ (http://imagej.nih.gov/ij/download.html); 20–30 root hairs were measured per image.
Detection and Quantification of Acid Phosphatase ActivityPlants were grown on Arabidopsis culture agar media with or without GR24 for 10 days andthen stained for acid phosphatase activity according to Lei et al. (2011) [28]. Seedlings weretransferred to 0.5% (w/v) agar containg 0.01% (w/v) 5-bromo-4-chloro-3-indolyl phosphate p-toluidine salt (BCIP). After blue color development, photographs were taken using a camera at-tached to a stereo-microscope (SZX12, Olympus, Japan). Acid phosphatase activity was quanti-fied as described by Richardson et al. (2001) [29]. Seedlings (4 to 6 replicates, six seedlings perreplicate) were transferred to 1.0 ml of 15mMMES buffer (pH5.5) containing 0.5mM CaCl2and 10 mM p-nitrophenyl phosphate (pNPP) and incubated at 25°C for 2 h. reactions were ter-minated by the addition of an equal volume of 0.25 M NaOH and activity was calculated fromthe production of p-nitrophenol, as determined spectrophotometrically at 405 nm relative tostandard solutions.
Determination of Metal Concentration and Anthocyanin ContentThe basal stems of three- or four-week-old plants were collected and anthocyanin content wasmeasured as described previously [30]. Anthocyanin was extracted by incubating at least tenseedlings (three or more replicates) in 300 μl of extraction solution (methanol containing 1%HCl) overnight at 4°C. After the extraction, 200 μl of water and 200μl of chloroform wereadded, and the mixture was centrifuged. The amount of anthocyanin was calculated as A530.For measurement of Pi content, seedlings grown on Arabidopsis culture agar media containing100 μM phosphate were collected and dried at 80°C for 48 h. Samples were weighed and di-gested with 3 ml of 13 M HNO3 at 220°C for 1 h using MARS Xpress (CEM, USA). The plantswere digested in six replicate subsamples from each replication. After digestion, the sampleswere collected, diluted to 5 ml, and analyzed using inductively coupled plasma–atomic emis-sion spectroscopy (ICP–OES, Seiko, Japan). The total metal concentration of each plant wasthen calculated.
Results
Effect of SL on Phosphate Starvation ResponsesDuring the early stages of root development, SLs were shown to be involved in root hair devel-opment under low-Pi conditions [25]. To better understand the effect of low Pi (10 μM) onroot hair development, we measured the length of root hairs in mutants defective in SL biosyn-thesis and signaling (e.g.,max1-1 andmax2-1, respectively). The synthetic SL analog, GR24,was used in these studies. In contrast to the WT Arabidopsis Col-0 andmax1-1 seedlings, roothair length was reduced inmax2-1 plants treated with 1 μMGR24 (P< 0.01) under high-Pi(1 mM) condition (Fig. 1A and B). The length of root hairs was similar for WT,max1-1, andmax2-1 seedlings grown on high-Pi (1 mM) plates; however, root hair length was significantlyreduced (P< 0.01) in mutant seedlings cultivated under low-Pi (10 μM) conditions (Fig. 1Cand D). The results obtained with the mutants indicate that SLs are key regulators of root hairdevelopment in the vegetative stage.
Strigolactones and Phosphate Starvation-Induced Morphology
PLOS ONE | DOI:10.1371/journal.pone.0119724 March 20, 2015 4 / 17
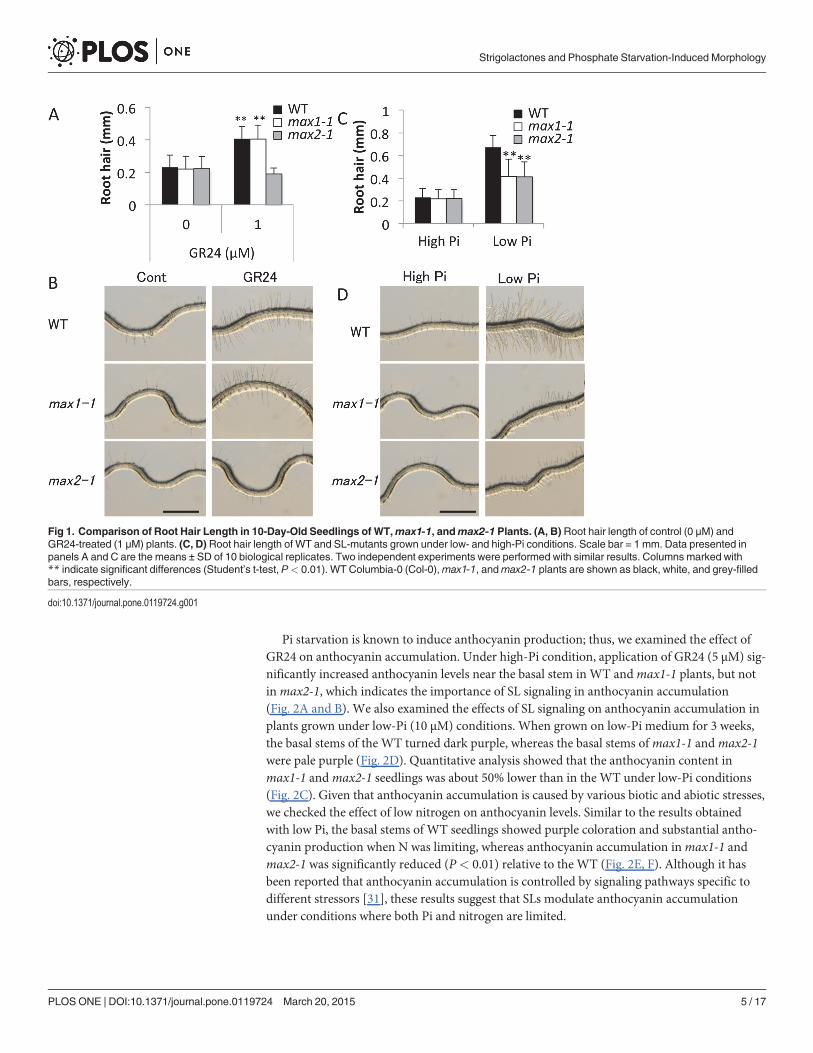
Pi starvation is known to induce anthocyanin production; thus, we examined the effect ofGR24 on anthocyanin accumulation. Under high-Pi condition, application of GR24 (5 μM) sig-nificantly increased anthocyanin levels near the basal stem in WT andmax1-1 plants, but notinmax2-1, which indicates the importance of SL signaling in anthocyanin accumulation(Fig. 2A and B). We also examined the effects of SL signaling on anthocyanin accumulation inplants grown under low-Pi (10 μM) conditions. When grown on low-Pi medium for 3 weeks,the basal stems of the WT turned dark purple, whereas the basal stems ofmax1-1 andmax2-1were pale purple (Fig. 2D). Quantitative analysis showed that the anthocyanin content inmax1-1 andmax2-1 seedlings was about 50% lower than in the WT under low-Pi conditions(Fig. 2C). Given that anthocyanin accumulation is caused by various biotic and abiotic stresses,we checked the effect of low nitrogen on anthocyanin levels. Similar to the results obtainedwith low Pi, the basal stems of WT seedlings showed purple coloration and substantial antho-cyanin production when N was limiting, whereas anthocyanin accumulation inmax1-1 andmax2-1 was significantly reduced (P< 0.01) relative to the WT (Fig. 2E, F). Although it hasbeen reported that anthocyanin accumulation is controlled by signaling pathways specific todifferent stressors [31], these results suggest that SLs modulate anthocyanin accumulationunder conditions where both Pi and nitrogen are limited.
Fig 1. Comparison of Root Hair Length in 10-Day-Old Seedlings of WT,max1-1, andmax2-1 Plants. (A, B) Root hair length of control (0 μM) andGR24-treated (1 μM) plants. (C, D) Root hair length of WT and SL-mutants grown under low- and high-Pi conditions. Scale bar = 1 mm. Data presented inpanels A and C are the means ± SD of 10 biological replicates. Two independent experiments were performed with similar results. Columns marked with** indicate significant differences (Student’s t-test, P< 0.01). WT Columbia-0 (Col-0),max1-1, andmax2-1 plants are shown as black, white, and grey-filledbars, respectively.
doi:10.1371/journal.pone.0119724.g001
Strigolactones and Phosphate Starvation-Induced Morphology
PLOS ONE | DOI:10.1371/journal.pone.0119724 March 20, 2015 5 / 17
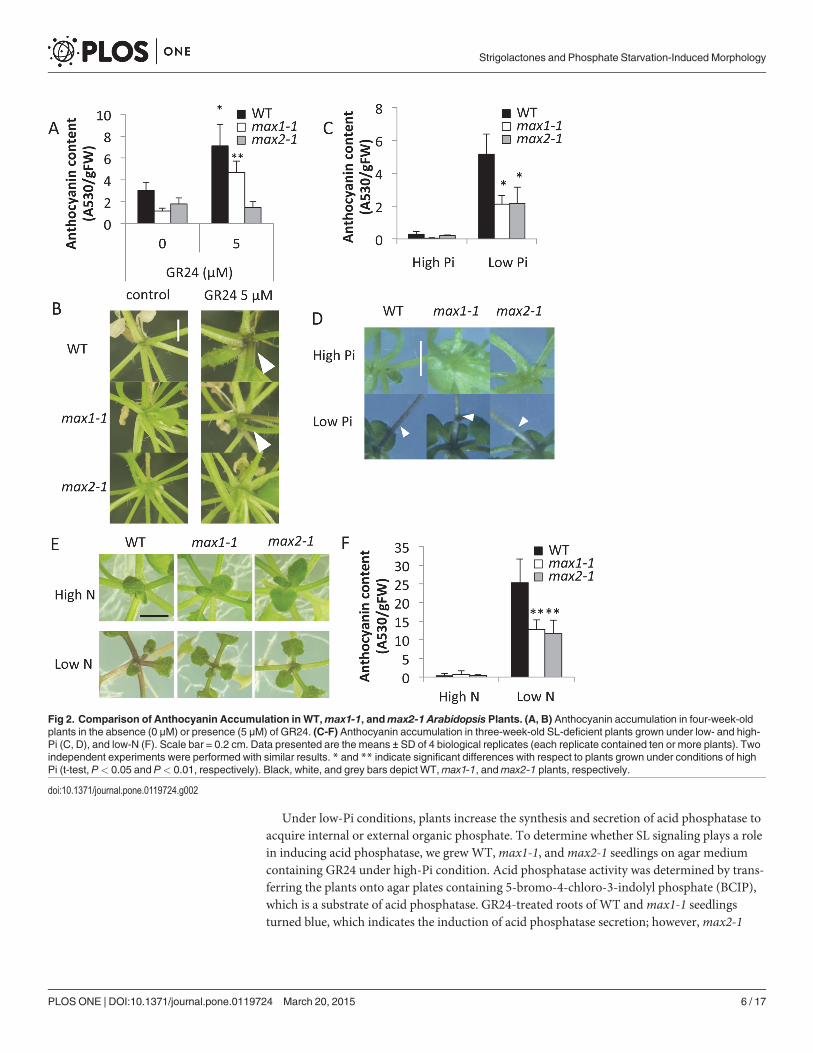
Under low-Pi conditions, plants increase the synthesis and secretion of acid phosphatase toacquire internal or external organic phosphate. To determine whether SL signaling plays a rolein inducing acid phosphatase, we grew WT,max1-1, andmax2-1 seedlings on agar mediumcontaining GR24 under high-Pi condition. Acid phosphatase activity was determined by trans-ferring the plants onto agar plates containing 5-bromo-4-chloro-3-indolyl phosphate (BCIP),which is a substrate of acid phosphatase. GR24-treated roots of WT andmax1-1 seedlingsturned blue, which indicates the induction of acid phosphatase secretion; however,max2-1
Fig 2. Comparison of Anthocyanin Accumulation in WT,max1-1, andmax2-1 Arabidopsis Plants. (A, B) Anthocyanin accumulation in four-week-oldplants in the absence (0 μM) or presence (5 μM) of GR24. (C-F) Anthocyanin accumulation in three-week-old SL-deficient plants grown under low- and high-Pi (C, D), and low-N (F). Scale bar = 0.2 cm. Data presented are the means ± SD of 4 biological replicates (each replicate contained ten or more plants). Twoindependent experiments were performed with similar results. * and ** indicate significant differences with respect to plants grown under conditions of highPi (t-test, P< 0.05 and P< 0.01, respectively). Black, white, and grey bars depict WT,max1-1, andmax2-1 plants, respectively.
doi:10.1371/journal.pone.0119724.g002
Strigolactones and Phosphate Starvation-Induced Morphology
PLOS ONE | DOI:10.1371/journal.pone.0119724 March 20, 2015 6 / 17
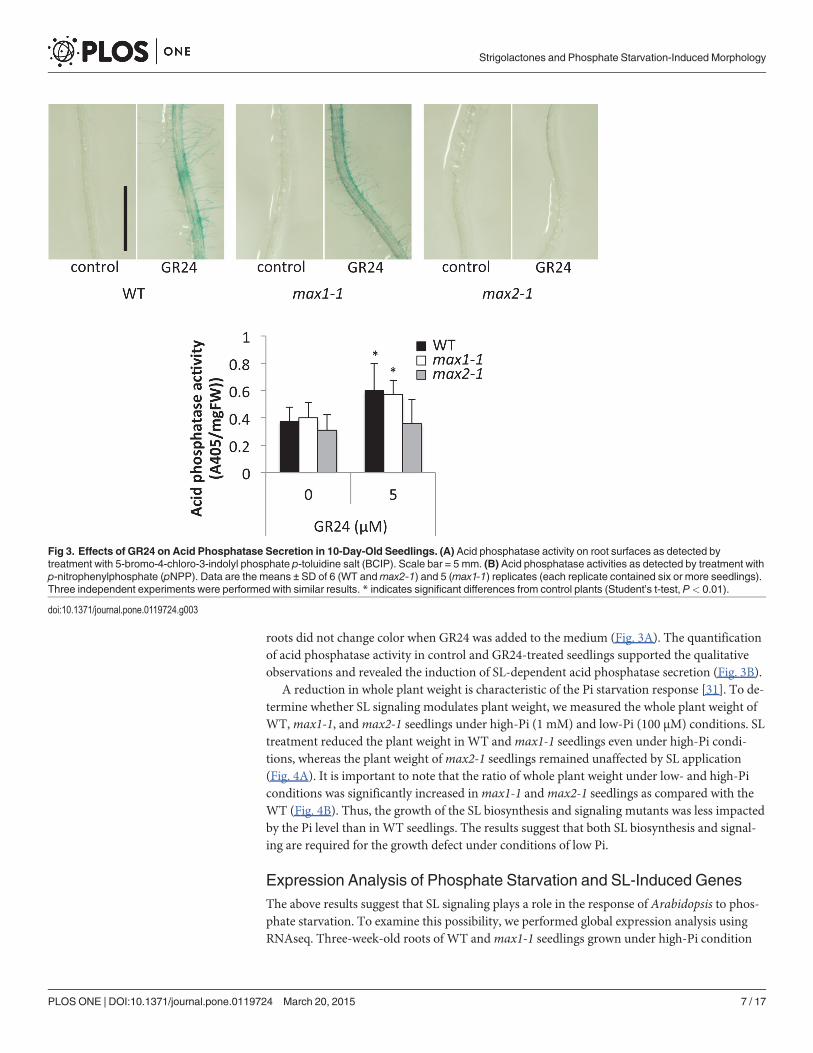
roots did not change color when GR24 was added to the medium (Fig. 3A). The quantificationof acid phosphatase activity in control and GR24-treated seedlings supported the qualitativeobservations and revealed the induction of SL-dependent acid phosphatase secretion (Fig. 3B).
A reduction in whole plant weight is characteristic of the Pi starvation response [31]. To de-termine whether SL signaling modulates plant weight, we measured the whole plant weight ofWT,max1-1, andmax2-1 seedlings under high-Pi (1 mM) and low-Pi (100 μM) conditions. SLtreatment reduced the plant weight in WT andmax1-1 seedlings even under high-Pi condi-tions, whereas the plant weight ofmax2-1 seedlings remained unaffected by SL application(Fig. 4A). It is important to note that the ratio of whole plant weight under low- and high-Piconditions was significantly increased inmax1-1 andmax2-1 seedlings as compared with theWT (Fig. 4B). Thus, the growth of the SL biosynthesis and signaling mutants was less impactedby the Pi level than in WT seedlings. The results suggest that both SL biosynthesis and signal-ing are required for the growth defect under conditions of low Pi.
Expression Analysis of Phosphate Starvation and SL-Induced GenesThe above results suggest that SL signaling plays a role in the response of Arabidopsis to phos-phate starvation. To examine this possibility, we performed global expression analysis usingRNAseq. Three-week-old roots of WT andmax1-1 seedlings grown under high-Pi condition
Fig 3. Effects of GR24 on Acid Phosphatase Secretion in 10-Day-Old Seedlings. (A) Acid phosphatase activity on root surfaces as detected bytreatment with 5-bromo-4-chloro-3-indolyl phosphate p-toluidine salt (BCIP). Scale bar = 5 mm. (B) Acid phosphatase activities as detected by treatment withp-nitrophenylphosphate (pNPP). Data are the means ± SD of 6 (WT andmax2-1) and 5 (max1-1) replicates (each replicate contained six or more seedlings).Three independent experiments were performed with similar results. * indicates significant differences from control plants (Student’s t-test, P< 0.01).
doi:10.1371/journal.pone.0119724.g003
Strigolactones and Phosphate Starvation-Induced Morphology
PLOS ONE | DOI:10.1371/journal.pone.0119724 March 20, 2015 7 / 17
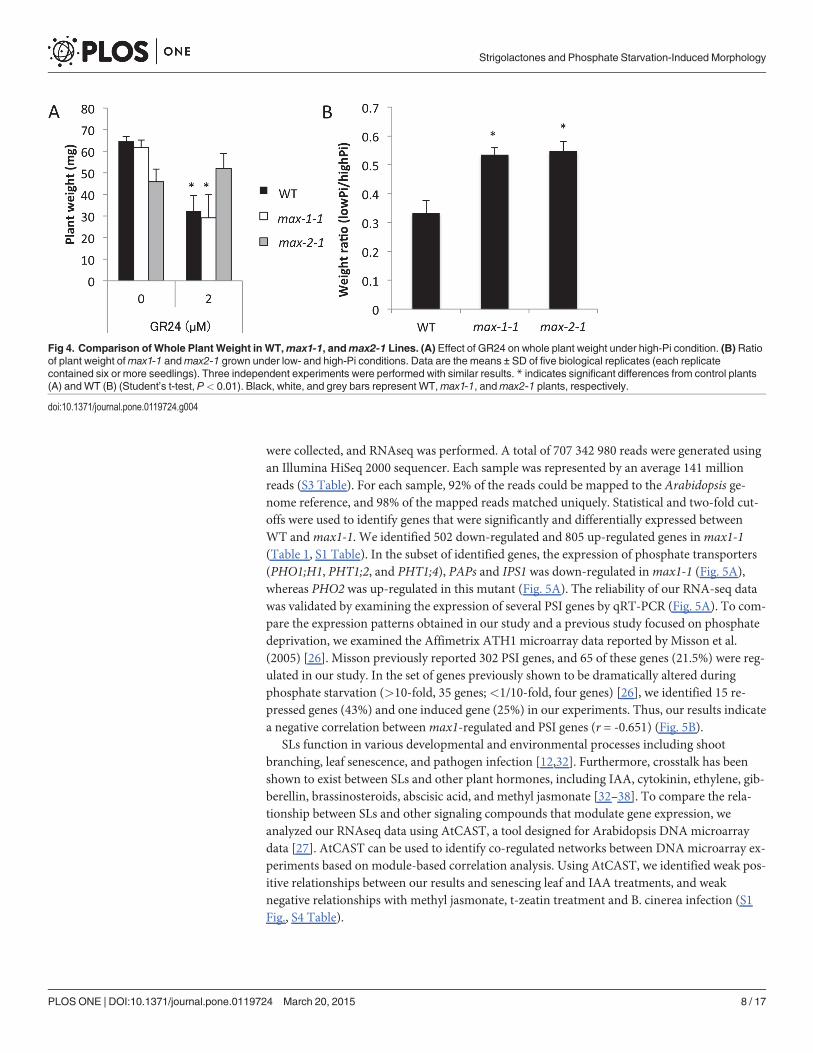
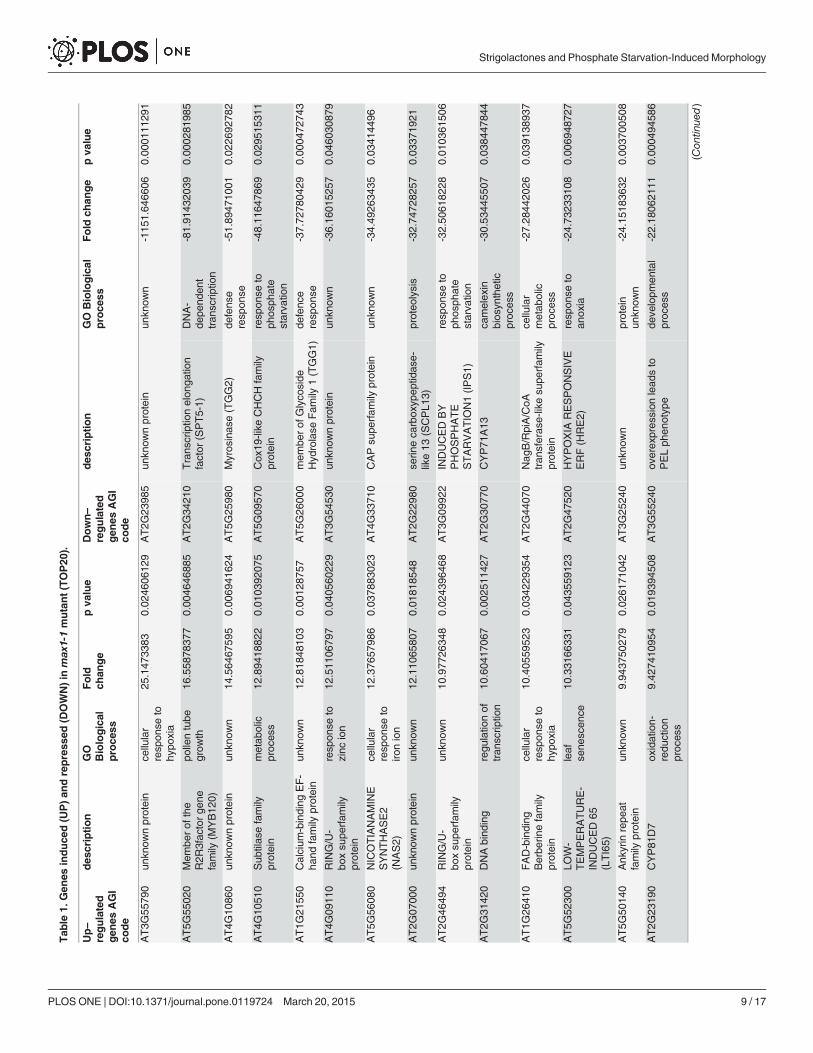
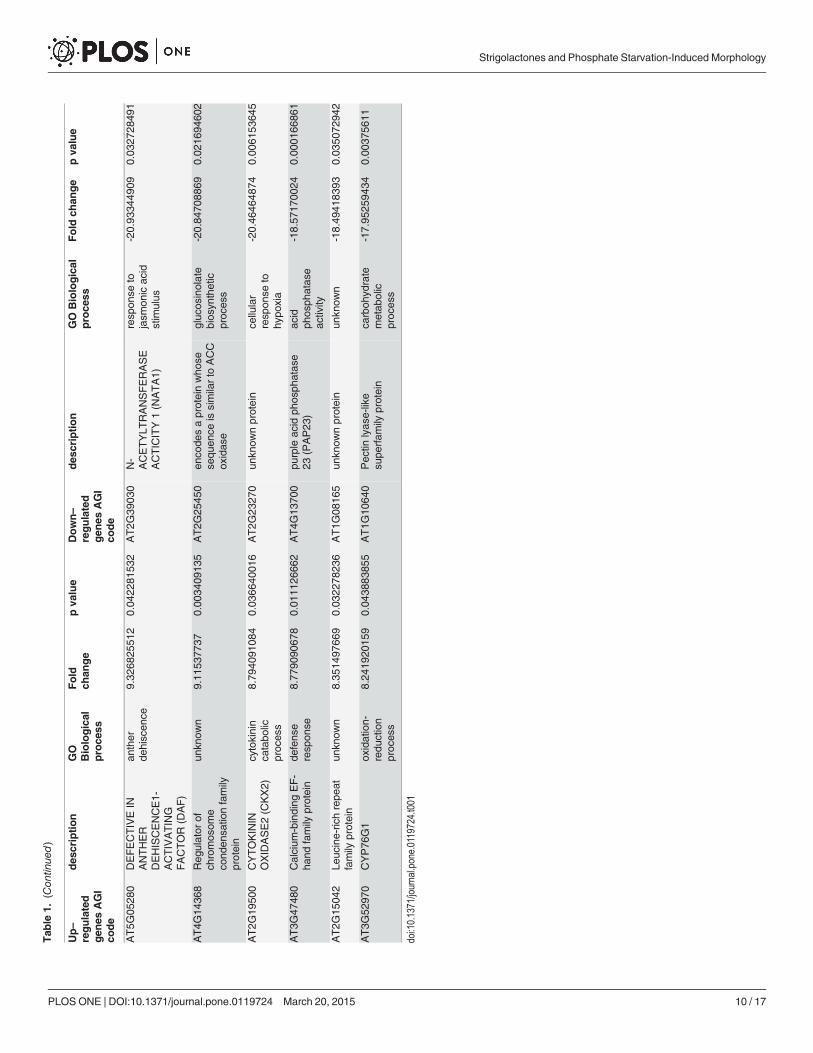
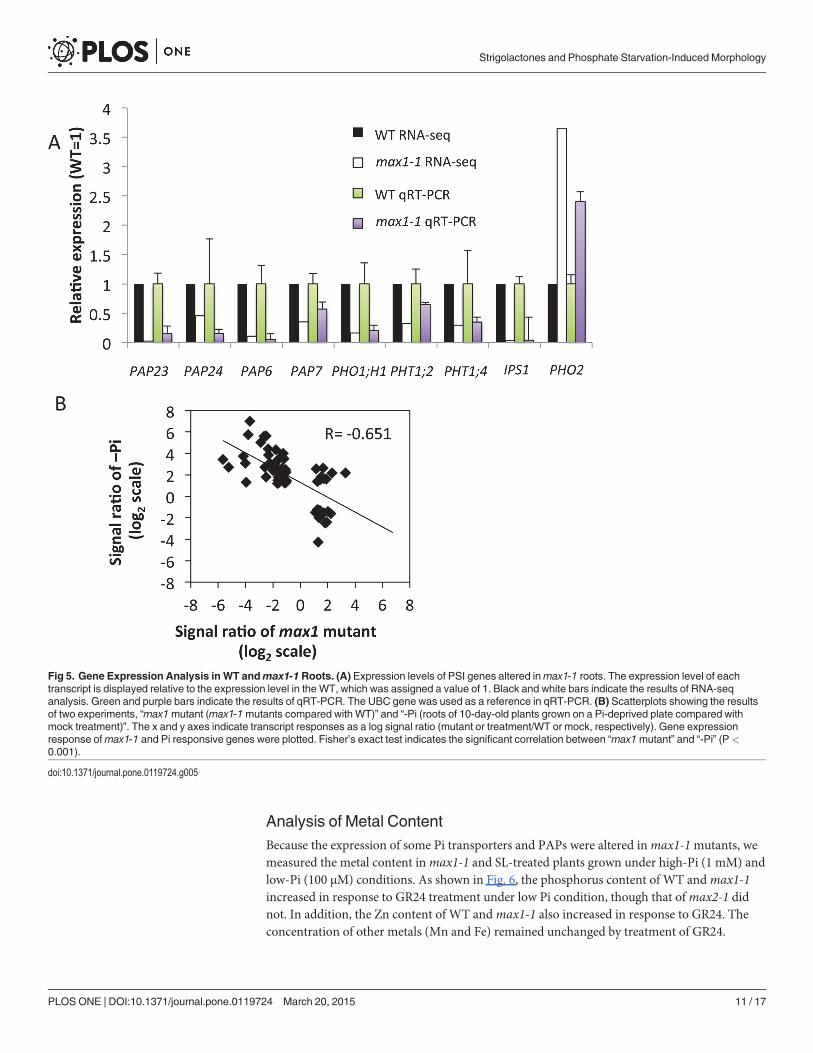
were collected, and RNAseq was performed. A total of 707 342 980 reads were generated usingan Illumina HiSeq 2000 sequencer. Each sample was represented by an average 141 millionreads (S3 Table). For each sample, 92% of the reads could be mapped to the Arabidopsis ge-nome reference, and 98% of the mapped reads matched uniquely. Statistical and two-fold cut-offs were used to identify genes that were significantly and differentially expressed betweenWT andmax1-1. We identified 502 down-regulated and 805 up-regulated genes inmax1-1(Table 1, S1 Table). In the subset of identified genes, the expression of phosphate transporters(PHO1;H1, PHT1;2, and PHT1;4), PAPs and IPS1 was down-regulated inmax1-1 (Fig. 5A),whereas PHO2 was up-regulated in this mutant (Fig. 5A). The reliability of our RNA-seq datawas validated by examining the expression of several PSI genes by qRT-PCR (Fig. 5A). To com-pare the expression patterns obtained in our study and a previous study focused on phosphatedeprivation, we examined the Affimetrix ATH1 microarray data reported by Misson et al.(2005) [26]. Misson previously reported 302 PSI genes, and 65 of these genes (21.5%) were reg-ulated in our study. In the set of genes previously shown to be dramatically altered duringphosphate starvation (>10-fold, 35 genes;<1/10-fold, four genes) [26], we identified 15 re-pressed genes (43%) and one induced gene (25%) in our experiments. Thus, our results indicatea negative correlation betweenmax1-regulated and PSI genes (r = -0.651) (Fig. 5B).
SLs function in various developmental and environmental processes including shootbranching, leaf senescence, and pathogen infection [12,32]. Furthermore, crosstalk has beenshown to exist between SLs and other plant hormones, including IAA, cytokinin, ethylene, gib-berellin, brassinosteroids, abscisic acid, and methyl jasmonate [32–38]. To compare the rela-tionship between SLs and other signaling compounds that modulate gene expression, weanalyzed our RNAseq data using AtCAST, a tool designed for Arabidopsis DNA microarraydata [27]. AtCAST can be used to identify co-regulated networks between DNAmicroarray ex-periments based on module-based correlation analysis. Using AtCAST, we identified weak pos-itive relationships between our results and senescing leaf and IAA treatments, and weaknegative relationships with methyl jasmonate, t-zeatin treatment and B. cinerea infection (S1Fig., S4 Table).
Fig 4. Comparison of Whole Plant Weight in WT,max1-1, andmax2-1 Lines. (A) Effect of GR24 on whole plant weight under high-Pi condition. (B) Ratioof plant weight ofmax1-1 andmax2-1 grown under low- and high-Pi conditions. Data are the means ± SD of five biological replicates (each replicatecontained six or more seedlings). Three independent experiments were performed with similar results. * indicates significant differences from control plants(A) andWT (B) (Student’s t-test, P< 0.01). Black, white, and grey bars represent WT,max1-1, andmax2-1 plants, respectively.
doi:10.1371/journal.pone.0119724.g004
Strigolactones and Phosphate Starvation-Induced Morphology
PLOS ONE | DOI:10.1371/journal.pone.0119724 March 20, 2015 8 / 17
Tab
le1.
Gen
esinduce
d(U
P)an
drepress
ed(D
OWN)in
max
1-1mutant(TOP20
).
Up–
regulated
gen
esAGI
code
des
cription
GO
Biological
proce
ss
Fold
chan
ge
pva
lue
Down–
regulated
gen
esAGI
code
des
criptio
nGO
Biological
proce
ssFold
chan
ge
pva
lue
AT3G
5579
0un
know
nprotein
cellular
resp
onse
tohy
poxia
25.147
3383
0.02
4606
129
AT2G
2398
5un
know
nprotein
unkn
own
-115
1.64
6606
0.00
0111
291
AT5G
5502
0Mem
berof
the
R2R
3fac
torge
nefamily
(MYB12
0)
pollentube
grow
th16
.558
7837
70.00
4646
885
AT2G
3421
0Trans
criptio
nelon
gatio
nfactor
(SPT5-1)
DNA-
depe
nden
ttran
scrip
tion
-81.91
4320
390.00
0281
985
AT4G
1086
0un
know
nprotein
unkn
own
14.564
6759
50.00
6941
624
AT5G
2598
0Myros
inas
e(TGG2)
defens
eresp
onse
-51.89
4710
010.02
2692
782
AT4G
1051
0Sub
tilas
efamily
protein
metab
olic
proc
ess
12.894
1882
20.01
0392
075
AT5G
0957
0Cox
19-like
CHCHfamily
protein
resp
onse
toph
osph
ate
starva
tion
-48.11
6478
690.02
9515
311
AT1G
2155
0Calcium
-binding
EF-
hand
family
protein
unkn
own
12.818
4810
30.00
1287
57AT5G
2600
0mem
berof
Glyco
side
Hyd
rolase
Fam
ily1(TGG1)
defenc
eresp
onse
-37.72
7804
290.00
0472
743
AT4G
0911
0RING/U-
boxsu
perfam
ilyprotein
resp
onse
tozinc
ion
12.511
0679
70.04
0560
229
AT3G
5453
0un
know
nprotein
unkn
own
-36.16
0152
570.04
6030
879
AT5G
5608
0NICOTIANAMINE
SYNTHASE2
(NAS2)
cellular
resp
onse
toiro
nion
12.376
5798
60.03
7883
023
AT4G
3371
0CAPsu
perfam
ilyprotein
unkn
own
-34.49
2634
350.03
4144
96
AT2G
0700
0un
know
nprotein
unkn
own
12.110
6580
70.01
8185
48AT2G
2298
0se
rineca
rbox
ypep
tidas
e-like13
(SCPL1
3)proteo
lysis
-32.74
7282
570.03
3719
21
AT2G
4649
4RING/U-
boxsu
perfam
ilyprotein
unkn
own
10.977
2634
80.02
4396
468
AT3G
0992
2INDUCEDBY
PHOSPHATE
STARVATIO
N1(IPS1)
resp
onse
toph
osph
ate
starva
tion
-32.50
6182
280.01
0361
506
AT2G
3142
0DNAbind
ing
regu
latio
nof
tran
scrip
tion
10.604
1706
70.00
2511
427
AT2G
3077
0CYP71
A13
camelex
inbios
ynthetic
proc
ess
-30.53
4455
070.03
8447
844
AT1G
2641
0FAD-binding
Berbe
rinefamily
protein
cellular
resp
onse
tohy
poxia
10.405
5952
30.03
4229
354
AT2G
4407
0Nag
B/RpiA/CoA
tran
sferas
e-likesu
perfam
ilyprotein
cellular
metab
olic
proc
ess
-27.28
4420
260.03
9138
937
AT5G
5230
0LO
W-
TEMPERATURE-
INDUCED65
(LTI65)
leaf
sene
scen
ce10
.331
6633
10.04
3559
123
AT2G
4752
0HYPOXIA
RESPONSIVE
ERF(H
RE2)
resp
onse
toan
oxia
-24.73
2331
080.00
6948
727
AT5G
5014
0Ank
yrin
repe
atfamily
protein
unkn
own
9.94
3750
279
0.02
6171
042
AT3G
2524
0un
know
nprotein
unkn
own
-24.15
1836
320.00
3700
508
AT2G
2319
0CYP81
D7
oxidation-
redu
ction
proc
ess
9.42
7410
954
0.01
9394
508
AT3G
5524
0ov
erex
pres
sion
lead
sto
PELph
enotyp
ede
velopm
ental
proc
ess
-22.18
0621
110.00
0494
586
(Con
tinue
d)
Strigolactones and Phosphate Starvation-Induced Morphology
PLOS ONE | DOI:10.1371/journal.pone.0119724 March 20, 2015 9 / 17
Tab
le1.
(Con
tinue
d)
Up–
regulated
gen
esAGI
code
des
cription
GO
Biological
proce
ss
Fold
chan
ge
pva
lue
Down–
regulated
gen
esAGI
code
des
criptio
nGO
Biological
proce
ssFold
chan
ge
pva
lue
AT5G
0528
0DEFECTIVEIN
ANTHER
DEHISCENCE1-
ACTIVATING
FACTOR(D
AF)
anther
dehiscen
ce9.32
6825
512
0.04
2281
532
AT2G
3903
0N-
ACETYLT
RANSFERASE
ACTICITY1(N
ATA1)
resp
onse
tojasm
onicac
idstim
ulus
-20.93
3449
090.03
2728
491
AT4G
1436
8Reg
ulator
ofch
romos
ome
cond
ensa
tionfamily
protein
unkn
own
9.11
5377
370.00
3409
135
AT2G
2545
0en
code
saproteinwho
sese
quen
ceissimilarto
ACC
oxidas
e
gluc
osinolate
bios
ynthetic
proc
ess
-20.84
7088
690.02
1694
602
AT2G
1950
0CYTOKININ
OXIDASE2(C
KX2)
cytokinin
catabo
licproc
ess
8.79
4091
084
0.03
6640
016
AT2G
2327
0un
know
nprotein
cellular
resp
onse
tohy
poxia
-20.46
4648
740.00
6153
645
AT3G
4748
0Calcium
-binding
EF-
hand
family
protein
defens
eresp
onse
8.77
9090
678
0.01
1126
662
AT4G
1370
0pu
rple
acid
phos
phatas
e23
(PAP23
)ac
idph
osph
atas
eac
tivity
-18.57
1700
240.00
0166
861
AT2G
1504
2Le
ucine-ric
hrepe
atfamily
protein
unkn
own
8.35
1497
669
0.03
2278
236
AT1G
0816
5un
know
nprotein
unkn
own
-18.49
4183
930.03
5072
942
AT3G
5297
0CYP76
G1
oxidation-
redu
ction
proc
ess
8.24
1920
159
0.04
3883
855
AT1G
1064
0Pec
tinlyas
e-like
supe
rfam
ilyprotein
carboh
ydrate
metab
olic
proc
ess
-17.95
2594
340.00
3756
11
doi:10.1371/journal.pone.0119724.t001
Strigolactones and Phosphate Starvation-Induced Morphology
PLOS ONE | DOI:10.1371/journal.pone.0119724 March 20, 2015 10 / 17
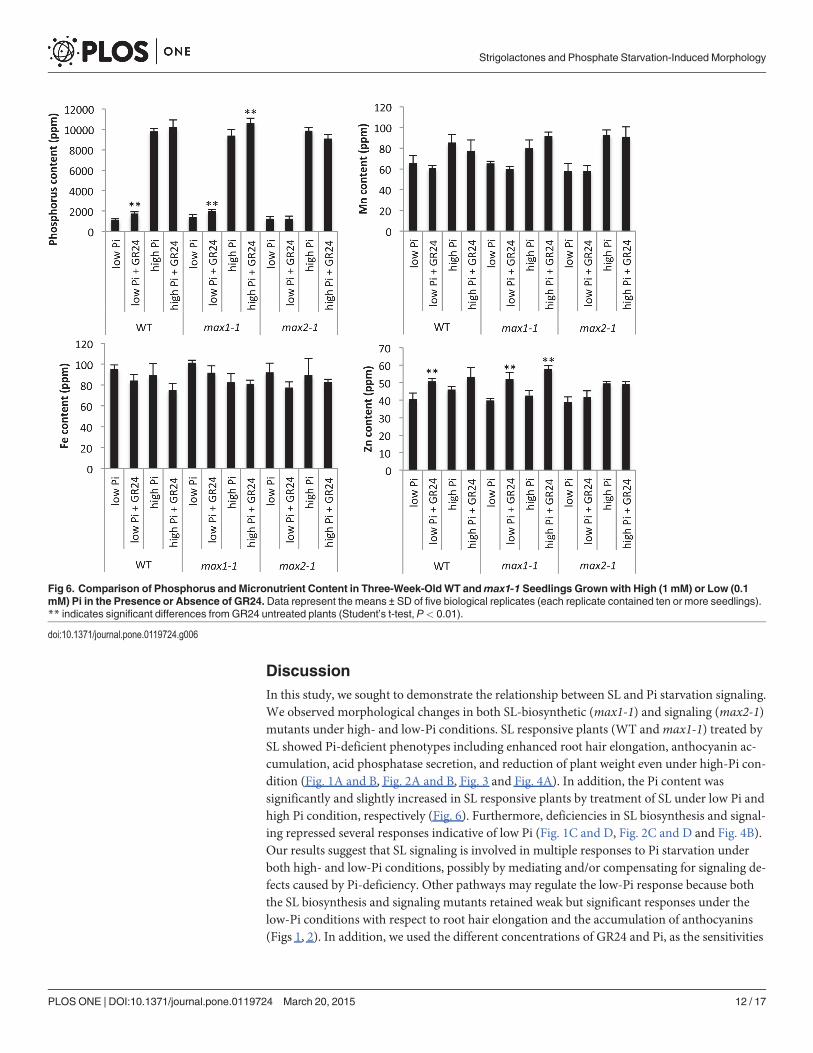
Analysis of Metal ContentBecause the expression of some Pi transporters and PAPs were altered inmax1-1mutants, wemeasured the metal content inmax1-1 and SL-treated plants grown under high-Pi (1 mM) andlow-Pi (100 μM) conditions. As shown in Fig. 6, the phosphorus content of WT andmax1-1increased in response to GR24 treatment under low Pi condition, though that ofmax2-1 didnot. In addition, the Zn content of WT andmax1-1 also increased in response to GR24. Theconcentration of other metals (Mn and Fe) remained unchanged by treatment of GR24.
Fig 5. Gene Expression Analysis in WT andmax1-1 Roots. (A) Expression levels of PSI genes altered inmax1-1 roots. The expression level of eachtranscript is displayed relative to the expression level in the WT, which was assigned a value of 1. Black and white bars indicate the results of RNA-seqanalysis. Green and purple bars indicate the results of qRT-PCR. The UBC gene was used as a reference in qRT-PCR. (B) Scatterplots showing the resultsof two experiments, “max1mutant (max1-1mutants compared with WT)” and “-Pi (roots of 10-day-old plants grown on a Pi-deprived plate compared withmock treatment)”. The x and y axes indicate transcript responses as a log signal ratio (mutant or treatment/WT or mock, respectively). Gene expressionresponse ofmax1-1 and Pi responsive genes were plotted. Fisher’s exact test indicates the significant correlation between “max1mutant” and “-Pi” (P<0.001).
doi:10.1371/journal.pone.0119724.g005
Strigolactones and Phosphate Starvation-Induced Morphology
PLOS ONE | DOI:10.1371/journal.pone.0119724 March 20, 2015 11 / 17
DiscussionIn this study, we sought to demonstrate the relationship between SL and Pi starvation signaling.We observed morphological changes in both SL-biosynthetic (max1-1) and signaling (max2-1)mutants under high- and low-Pi conditions. SL responsive plants (WT andmax1-1) treated bySL showed Pi-deficient phenotypes including enhanced root hair elongation, anthocyanin ac-cumulation, acid phosphatase secretion, and reduction of plant weight even under high-Pi con-dition (Fig. 1A and B, Fig. 2A and B, Fig. 3 and Fig. 4A). In addition, the Pi content wassignificantly and slightly increased in SL responsive plants by treatment of SL under low Pi andhigh Pi condition, respectively (Fig. 6). Furthermore, deficiencies in SL biosynthesis and signal-ing repressed several responses indicative of low Pi (Fig. 1C and D, Fig. 2C and D and Fig. 4B).Our results suggest that SL signaling is involved in multiple responses to Pi starvation underboth high- and low-Pi conditions, possibly by mediating and/or compensating for signaling de-fects caused by Pi-deficiency. Other pathways may regulate the low-Pi response because boththe SL biosynthesis and signaling mutants retained weak but significant responses under thelow-Pi conditions with respect to root hair elongation and the accumulation of anthocyanins(Figs 1, 2). In addition, we used the different concentrations of GR24 and Pi, as the sensitivities
Fig 6. Comparison of Phosphorus andMicronutrient Content in Three-Week-OldWT andmax1-1 Seedlings Grown with High (1 mM) or Low (0.1mM) Pi in the Presence or Absence of GR24.Data represent the means ± SD of five biological replicates (each replicate contained ten or more seedlings).** indicates significant differences from GR24 untreated plants (Student’s t-test, P< 0.01).
doi:10.1371/journal.pone.0119724.g006
Strigolactones and Phosphate Starvation-Induced Morphology
PLOS ONE | DOI:10.1371/journal.pone.0119724 March 20, 2015 12 / 17
of GR24 and Pi in each assay were different in our preliminary tests. Possibly, effects of GR24and Pi may vary with their concentration.
It is known that GR24 could increase abiotic stress resistance in Arabidopsis [37]. As shownin Fig. 4B, the weight ratio (low Pi/high Pi) was increased in SL biosynthesis (max1-1) and sig-naling (max2-1) mutants. In addition, GR24 reduced the weight in WT andmax1-1 underhigh Pi condition (Fig. 4A). As reduction of plant weight was considered as a strategy to adaptto the low-Pi condition, these results suggest that SLs could also increase low-Pi resistance inArabidopsis.
In contrast to the reduced expression of PHTs (PHT1;2, PHT1;4) and PAPs (PAP6, PAP7,PAP23, PAP24), the expression of PHO2 inmax1-1 was increased. PHO2 encodes ubiquitin-conjugating enzyme UBC24, which regulates protein degradation and gene expression of PHTsand PHO1 [4,39]. As the expression of PHO2 is necessary to maintain Pi homeostasis, SLs maymodulate the signals induced by low-Pi conditions to regulate PHO2 expression. In addition,the expression level of CHS and FLS was reduced inmax1-1 in accordance with the results ofanthocyanin accumulation, though that of CHI was not (S5 Table). Expression analysis wasperformed using genes in the root, while anthocyanin content was estimated using pigments inthe shoot. This might be the reason why the expression of CHI was up-regulated inmax1-1.
The defect in SL signaling might impact other responses in addition to those associated withPi starvation. For example, regarding anthocyanin accumulation, nitrogen starvation mim-icked P starvation (Fig. 2). It has been reported that nitrogen deficiency promotes the produc-tion of SLs in sorghum [40]. In Arabidopsis, there may be a regulatory network foranthocyanin accumulation controlled by SLs under nitrogen-deficient conditions. Further-more, the expression pattern ofmax1-1 showed a weak correlation with several stress responses(S1 Fig.); thus, SLs may be involved in modulating various stress signaling pathways that are as-sociated with anthocyanin accumulation.
SLs modulate plant architecture, various defense responses, and salt stress through inter-actions with other plant hormones including auxin, cytokinin, ethylene, jasmonic acid, andabscisic acid [12,32–34,37]. Our analysis of the RNAseq data with that obtained in microar-ray experiments of various hormone treatments (e.g., t-zeatin, IAA, methyl jasmonate)showed the existence of weak correlations between SL and hormone treatments (S1 Fig.,S4 Table). Our analysis also supports previous observations in gene expression profiling[12,32–34].
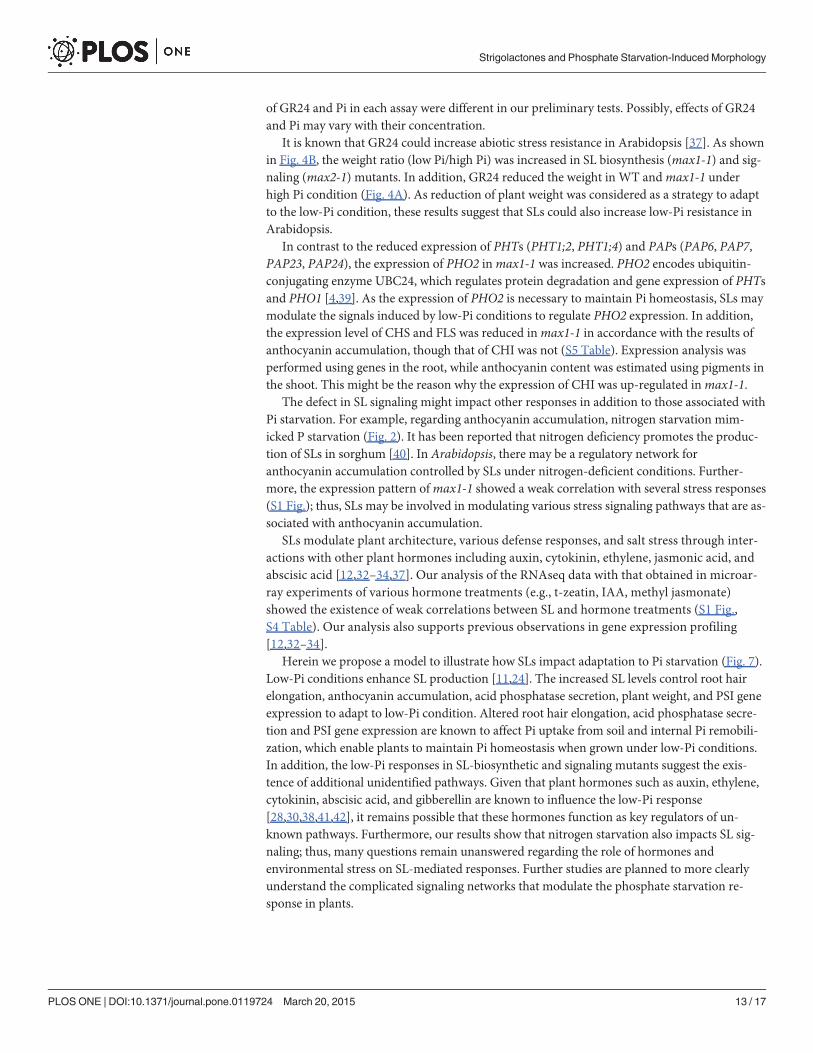
Herein we propose a model to illustrate how SLs impact adaptation to Pi starvation (Fig. 7).Low-Pi conditions enhance SL production [11,24]. The increased SL levels control root hairelongation, anthocyanin accumulation, acid phosphatase secretion, plant weight, and PSI geneexpression to adapt to low-Pi condition. Altered root hair elongation, acid phosphatase secre-tion and PSI gene expression are known to affect Pi uptake from soil and internal Pi remobili-zation, which enable plants to maintain Pi homeostasis when grown under low-Pi conditions.In addition, the low-Pi responses in SL-biosynthetic and signaling mutants suggest the exis-tence of additional unidentified pathways. Given that plant hormones such as auxin, ethylene,cytokinin, abscisic acid, and gibberellin are known to influence the low-Pi response[28,30,38,41,42], it remains possible that these hormones function as key regulators of un-known pathways. Furthermore, our results show that nitrogen starvation also impacts SL sig-naling; thus, many questions remain unanswered regarding the role of hormones andenvironmental stress on SL-mediated responses. Further studies are planned to more clearlyunderstand the complicated signaling networks that modulate the phosphate starvation re-sponse in plants.
Strigolactones and Phosphate Starvation-Induced Morphology
PLOS ONE | DOI:10.1371/journal.pone.0119724 March 20, 2015 13 / 17
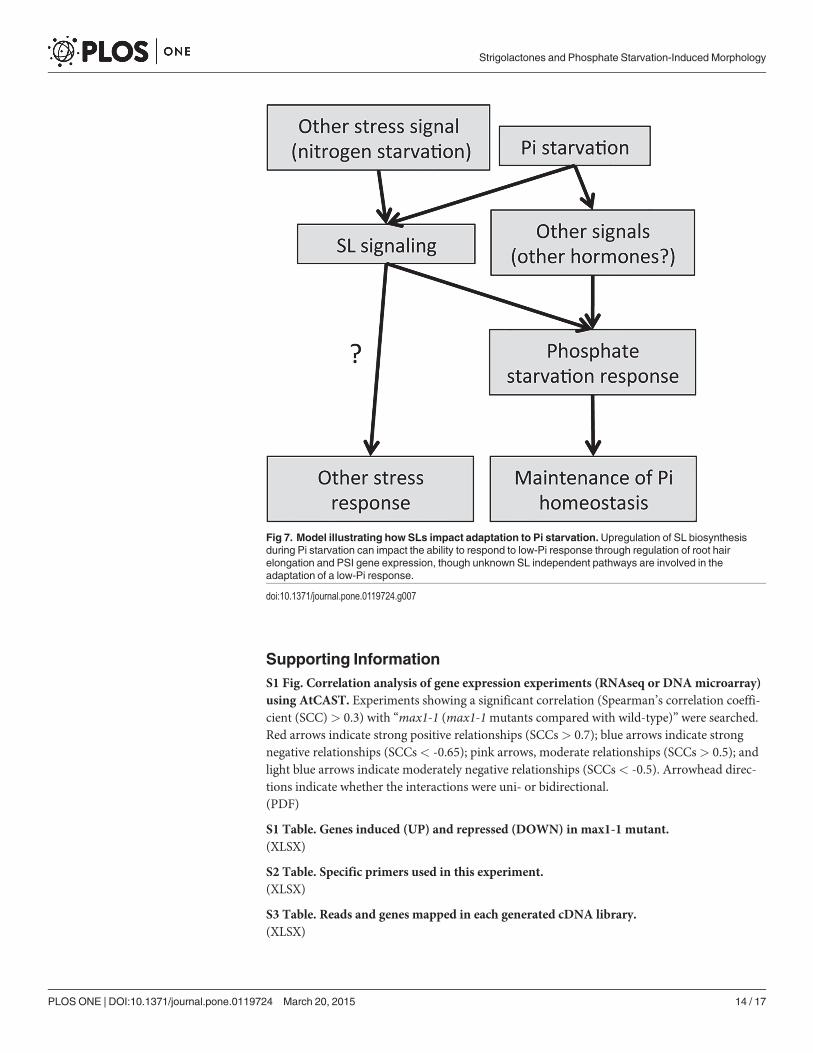
Supporting InformationS1 Fig. Correlation analysis of gene expression experiments (RNAseq or DNAmicroarray)using AtCAST. Experiments showing a significant correlation (Spearman’s correlation coeffi-cient (SCC)> 0.3) with “max1-1 (max1-1mutants compared with wild-type)” were searched.Red arrows indicate strong positive relationships (SCCs> 0.7); blue arrows indicate strongnegative relationships (SCCs< -0.65); pink arrows, moderate relationships (SCCs> 0.5); andlight blue arrows indicate moderately negative relationships (SCCs< -0.5). Arrowhead direc-tions indicate whether the interactions were uni- or bidirectional.(PDF)
S1 Table. Genes induced (UP) and repressed (DOWN) in max1-1 mutant.(XLSX)
S2 Table. Specific primers used in this experiment.(XLSX)
S3 Table. Reads and genes mapped in each generated cDNA library.(XLSX)
Fig 7. Model illustrating how SLs impact adaptation to Pi starvation.Upregulation of SL biosynthesisduring Pi starvation can impact the ability to respond to low-Pi response through regulation of root hairelongation and PSI gene expression, though unknown SL independent pathways are involved in theadaptation of a low-Pi response.
doi:10.1371/journal.pone.0119724.g007
Strigolactones and Phosphate Starvation-Induced Morphology
PLOS ONE | DOI:10.1371/journal.pone.0119724 March 20, 2015 14 / 17
S4 Table. List of experiments included in the module base correlation network ofmax1-1mutant. Experiments showing a significant correlation (Spearman’s correlation coefficient(SCC)> 0.3) with “max1-1 (max1-1 mutants compared with wild-type)” were searched.(XLS)
S5 Table. List and expression of anthocyanin synthesis genes.(XLSX)
Author ContributionsConceived and designed the experiments: SI TA. Performed the experiments: SI TN ES MI YSMSH TI KF KI. Analyzed the data: SI TN ES HN NKN SY. Contributed reagents/materials/analysis tools: KF. Wrote the paper: SI TN TA.
References1. Raghothama KG. Phosphate transport and signaling. Curr Opin Plant Biol. 2000; 3: 182–187. PMID:
10837272
2. Lung SC, Leung A, Kuang R, Wang Y, Leung P, Lim BL. Phytase activity in tobacco (Nicotiana taba-cum) root exudates is exhibited by a purple acid phosphatase. Phytochemistry. 2008; 69: 365–373.PMID: 17897689
3. Aung K, Lin SI, Wu CC, Huang YT, Su CL, Chiou TJ. pho2, a phosphate overaccumulator, is caused bya nonsense mutation in a microRNA399 target gene. Plant Physiol. 2006; 141: 1000–1011. PMID:16679417
4. Bari R, Datt Pant B, Stitt M, Scheible WR. PHO2, microRNA399, and PHR1 define a phosphate-signal-ing pathway in plants. Plant Physiol. 2006; 141: 988–999. PMID: 16679424
5. Mudge SR, Rae AL, Diatloff E, Smith FW. Expression analysis suggests novel roles for members of thePht1 family of phosphate transporters in Arabidopsis. Plant J. 2002; 31: 341–353. PMID: 12164813
6. Misson J, Thibaud MC, Bechtold N, Raghothama K, Nussaume L. Transcriptional regulation and func-tional properties of Arabidopsis Pht1;4, a high affinity transporter contributing greatly to phosphate up-take in phosphate deprived plants. Plant Mol Biol. 2004; 55: 727–741. PMID: 15604713
7. Franco-Zorrilla JM, Valli A, Todesco M, Mateos I, Puga MI, Rubio-Somoza I, et al. Target mimicry pro-vides a newmechanism for regulation of microRNA activity. Nat Genet. 2007; 39: 1033–1037. PMID:17643101
8. Cook CE, Whichard LP, Turner B, Wall ME, Egley GH. Germination of Witchweed (Striga lutea Lour.):Isolation and Properties of a Potent Stimulant. Science. 1966; 154: 1189–1190. PMID: 17780042
9. Akiyama K, Matsuzaki K, Hayashi H. Plant sesquiterpenes induce hyphal branching in arbuscular my-corrhizal fungi. Nature. 2005; 435: 824–827. PMID: 15944706
10. Gomez-Roldan V, Fermas S, Brewer PB, Puech-Pagès V, Dun EA, Pillot JP, et al. Strigolactone inhibi-tion of shoot branching. Nature. 2008; 455: 189–194. doi: 10.1038/nature07271 PMID: 18690209
11. Umehara M, Hanada A, Yoshida S, Akiyama K, Arite T, Thakeda-Kamiya N, et al. Inhibition of shootbranching by new terpenoid plant hormones. Nature. 2008; 455: 195–200. doi: 10.1038/nature07272PMID: 18690207
12. Seto Y, Kameoka H, Yamaguchi S, Kyozuka J. Recent advances in strigolactone research: chemicaland biological aspects. Plant Cell Physiol. 2012; 53: 1843–1853. doi: 10.1093/pcp/pcs142 PMID:23054391
13. Waters MT, Brewer PB, Bussell JD, Smith SM, Beveridge CA. The Arabidopsis ortholog of riceDWARF27 acts upstream of MAX1 in the control of plant development by strigolactones. Plant Physiol.2012; 159: 1073–1085. doi: 10.1104/pp.112.196253 PMID: 22623516
14. Waters MT, Nelson DC, Scaffidi A, Flematti GR, Sun YK, Dixon K, et al. Specialisation within theDWARF14 protein family confers distinct responses to karrikins and strigolactones in Arabidopsis. De-velopment. 2012; 139: 1285–1295. doi: 10.1242/dev.074567 PMID: 22357928
15. Hamiaux C, Drummond RS, Janssen BJ, Ledger SE, Cooney JM, Newcomb RD, et al. DAD2 is an α/βhydrolase likely to be involved in the perception of the plant branching hormone, strigolactone. CurrBiol. 2012; 22: 2032–2036. doi: 10.1016/j.cub.2012.08.007 PMID: 22959345
16. Jiang L, Liu X, Xiong G, Liu H, Chen F, Wang L, et al. DWARF 53 acts as a repressor of strigolactonesignalling in rice. Nature. 2013; 504: 401–405. doi: 10.1038/nature12870 PMID: 24336200
Strigolactones and Phosphate Starvation-Induced Morphology
PLOS ONE | DOI:10.1371/journal.pone.0119724 March 20, 2015 15 / 17
17. Zhou F, Lin Q, Zhu L, Ren Y, Zhou K, Shabek N, et al. D14-SCFD3-dependent degradation of D53 reg-ulates strigolactone signalling. Nature. 2013; 504: 406–410. doi: 10.1038/nature12878 PMID:24336215
18. Alder A, Jamil M, Marzorati M, Bruno M, Vermathen M, Bigler P, et al. The path from β-carotene to car-lactone, a strigolactone-like plant hormone. Science. 2012; 335: 1348–1351. doi: 10.1126/science.1218094 PMID: 22422982
19. Zhang Y, van Dijk AD, Scaffidi A, Flematti GR, Hofmann M, Charnikhova T, et al. Rice cytochromeP450 MAX1 homologs catalyze distinct steps in strigolactone biosynthesis. Nat Chem Biol. 2014; 10:1028–1033. doi: 10.1038/nchembio.1660 PMID: 25344813
20. Nelson DC, Scaffidi A, Dun EA, Waters MT, Flematti GR, Dixon K, et al. F-box protein MAX2 has dualroles in karrikin and strigolactone signaling in Arabidopsis thaliana. Proc Natl Acad Sci U S A. 2011;108: 8897–8902. doi: 10.1073/pnas.1100987108 PMID: 21555559
21. Stanga JP, Smith SM, BriggsWR, Nelson DC. SUPPRESSOROFMORE AXILLARYGROWTH2 1controls seed germination and seedling development in Arabidopsis. Plant Physiol. 2013; 163: 318–330. doi: 10.1104/pp.113.221259 PMID: 23893171
22. Umehara M, Hanada A, Magome H, Takeda-Kamiya N, Yamaguchi S. Contribution of strigolactones tothe inhibition of tiller bud outgrowth under phosphate deficiency in rice. Plant Cell Physiol. 2010; 51:1118–1126. doi: 10.1093/pcp/pcq084 PMID: 20542891
23. Kapulnik Y, Delaux PM, Resnick N, Mayzlish-Gati E, Wininger S, Bhattacharya C, et al. Strigolactonesaffect lateral root formation and root-hair elongation in Arabidopsis. Planta. 2011; 233: 209–216. doi:10.1007/s00425-010-1310-y PMID: 21080198
24. Ruyter-Spira C, Kohlen W, Charnikhova T, van Zeijl A, van Bezouwen L, de Ruijter, et al. Physiologicaleffects of the synthetic strigolactone analog GR24 on root system architecture in Arabidopsis: anotherbelowground role for strigolactones? Plant Physiol. 2011; 155: 721–734 doi: 10.1104/pp.110.166645PMID: 21119044
25. Mayzlish-Gati E, De-Cuyper C, Goormachtig S, Beeckman T, Vuylsteke M, Brewer PB, et al. Strigolac-tones are involved in root response to low phosphate conditions in Arabidopsis. Plant Physiol. 2012;160: 1329–1341. doi: 10.1104/pp.112.202358 PMID: 22968830
26. Misson J, Raghothama KG, Jain A, Jouhet J, Block MA, Bligny R, et al. A genome-wide transcriptionalanalysis using Arabidopsis thaliana Affymetrix gene chips determined plant responses to phosphatedeprivation. Proc Natl Acad Sci U S A. 2005; 102: 11934–11939. PMID: 16085708
27. Sasaki E, Takahashi C, Asami T, Shimada Y. AtCAST, a tool for exploring gene expression similaritiesamong DNAmicroarray experiments using networks. Plant Cell Physiol. 2011; 52: 169–180. doi: 10.1093/pcp/pcq185 PMID: 21113043
28. Lei M, Zhu C, Liu Y, Karthikeyan AS, Bressan RA, Raghothama KG, et al. Ethylene signalling is in-volved in regulation of phosphate starvation-induced gene expression and production of acid phospha-tases and anthocyanin in Arabidopsis. New Phytol. 2011; 189: 1084–1095. doi: 10.1111/j.1469-8137.2010.03555.x PMID: 21118263
29. Richardson AE, Hadobas PA, Hayes JE. Extracellular secretion of Aspergillus phytase from Arabidop-sis roots enables plants to obtain phosphorus from phytate. Plant J. 2001; 25: 641–649. PMID:11319031
30. Jiang C, Gao X, Liao L, Harberd NP, Fu X. Phosphate starvation root architecture and anthocyanin ac-cumulation responses are modulated by the gibberellin-DELLA signaling pathway in Arabidopsis. PlantPhysiol. 2007; 145: 1460–1470. PMID: 17932308
31. Rubio V, Linhares F, Solano R, Martín AC, Iglesias J, Leyva A, et al. A conserved MYB transcriptionfactor involved in phosphate starvation signaling both in vascular plants and in unicellular algae. GenesDev. 2001; 15: 2122–2133. PMID: 11511543
32. Torres-Vera R, García JM, Pozo MJ, López-Ráez JA. Do strigolactones contribute to plant defence?Mol Plant Pathol. 2013; 15: 211–216. doi: 10.1111/mpp.12074 PMID: 24112811
33. Kapulnik Y, Resnick N, Mayzlish-Gati E, Kaplan Y, Wininger S, Hershenhorn J, et al. Strigolactones in-teract with ethylene and auxin in regulating root-hair elongation in Arabidopsis. J Exp Bot. 2011; 62:2915–2924. doi: 10.1093/jxb/erq464 PMID: 21307387
34. Dun EA, de Saint Germain A, Rameau C, Beveridge CA. Antagonistic action of strigolactone and cyto-kinin in bud outgrowth control. Plant Physiol. 2012; 158: 487–498. doi: 10.1104/pp.111.186783 PMID:22042819
35. Nakamura H, Xue YL, Miyakawa T, Hou F, Qin HM, Fukui K, et al. Molecular mechanism of strigolac-tone perception by DWARF14. Nat Commun. 2013; 4: 2613. doi: 10.1038/ncomms3613 PMID:24131983
Strigolactones and Phosphate Starvation-Induced Morphology
PLOS ONE | DOI:10.1371/journal.pone.0119724 March 20, 2015 16 / 17
36. Wang Y, Sun S, ZhuW, Jia K, Yang H, Wang X. Strigolactone/MAX2-Induced Degradation of Brassi-nosteroid Transcriptional Effector BES1 Regulates Shoot Branching. Dev Cell. 2013; 27: 681–688. doi:10.1016/j.devcel.2013.11.010 PMID: 24369836
37. Ha CV, Leyva-González MA, Osakabe Y, Tran UT, Nishiyama R, Watanabe Y, et al. Positive regulatoryrole of strigolactone in plant responses to drought and salt stress. Proc Natl Acad Sci U S A. 2014; 111:851–856. doi: 10.1073/pnas.1322135111 PMID: 24379380
38. Wang L, Dong J, Gao Z, Liu D. The Arabidopsis gene hypersensitive to phosphate starvation 3 encodesethylene overproduction 1. Plant Cell Physiol. 2012; 53: 1093–1105. doi: 10.1093/pcp/pcs072 PMID:22623414
39. Huang TK, Han CL, Lin SI, Chen YJ, Tsai YC, Chen YR, et al. Identification of DownstreamCompo-nents of Ubiquitin-Conjugating Enzyme PHOSPHATE2 by Quantitative Membrane Proteomics in Ara-bidopsis Roots. Plant Cell. 2013; 25: 4044–4060. doi: 10.1105/tpc.113.115998 PMID: 24122829
40. Yoneyama K, Xie X, Kusumoto D, Sekimoto H, Sugimoto Y, Takeuchi Y, et al. Nitrogen deficiency aswell as phosphorus deficiency in sorghum promotes the production and exudation of 5-deoxystrigol,the host recognition signal for arbuscular mycorrhizal fungi and root parasites. Planta. 2007; 227: 125–132. PMID: 17684758
41. Ribot C, Zimmerli C, Farmer EE, Reymond P, Poirier Y. Induction of the Arabidopsis PHO1;H10 geneby 12-oxo-phytodienoic acid but not jasmonic acid via a CORONATINE INSENSITIVE1-dependentpathway. Plant Physiol. 2008; 147: 696–706. doi: 10.1104/pp.108.119321 PMID: 18434606
42. Devaiah BN, Madhuvanthi R, Karthikeyan AS, Raghothama KG. Phosphate starvation responses andgibberellic acid biosynthesis are regulated by the MYB62 transcription factor in Arabidopsis. Mol Plant.2009; 2: 43–58. doi: 10.1093/mp/ssn081 PMID: 19529828
Strigolactones and Phosphate Starvation-Induced Morphology
PLOS ONE | DOI:10.1371/journal.pone.0119724 March 20, 2015 17 / 17