anomalous pressure dependence of magnetic ordering temperature in tb revealed by resistivity...
TRANSCRIPT
PHYSICAL REVIEW B 91, 174428 (2015)
Anomalous pressure dependence of magnetic ordering temperature in Tb revealed by resistivitymeasurements to 141 GPa: Comparison with Gd and Dy
J. Lim,1 G. Fabbris,1,2,* D. Haskel,2 and J. S. Schilling1,†1Department of Physics, Washington University, St. Louis, Missouri 63130, USA
2Advanced Photon Source, Argonne National Laboratory, Argonne, Illinois 60439, USA(Received 31 January 2015; revised manuscript received 3 April 2015; published 26 May 2015)
In previous studies, the pressure dependence of the magnetic ordering temperature To of Dy was found toexhibit a sharp increase above its volume collapse pressure of 73 GPa, appearing to reach temperatures well aboveambient at 157 GPa. In a search for a second such lanthanide, electrical resistivity measurements were carriedout on neighboring Tb to 141 GPa over the temperature range 3.8–295 K. Below Tb’s volume collapse pressureof 53 GPa, the pressure dependence To(P ) mirrors that of both Dy and Gd. However, at higher pressures To(P )for Tb becomes highly anomalous. This result, together with the very strong suppression of superconductivityby dilute Tb ions in Y, suggests that extreme pressure transports Tb into an unconventional magnetic state withan anomalously high magnetic ordering temperature.
DOI: 10.1103/PhysRevB.91.174428 PACS number(s): 75.30.Mb, 64.70.K−, 72.10.Di, 74.62.Fj
I. INTRODUCTION
The magnetic ordering temperatures To of Gd and Dyhave been recently shown to track each other in a highlynonmonotonic fashion as a function of pressure to ∼70 GPa;at higher pressures they deviate markedly, To for Dy risingrapidly to temperatures well above ambient at 157 GPa [1].Parallel experiments on dilute magnetic alloys of Gd andDy with superconducting Y suggest that for pressures above∼70 GPa, Dy is transformed from a magnetically conventionallanthanide into one with an unconventional magnetic state withmarked deviations from de Gennes scaling [2], a state perhapsgoverned by Kondo physics, indicating that the Dy ion isnearing a magnetic instability [1]. An alternate explanationis that the strong enhancement of To in Dy arises throughchanges in the crystalline electric field at extreme pressure [1].Analogous studies on additional lanthanides are recommendedto help identify the origin of this anomalous behavior.
The lanthanide Tb, which lies between Gd and Dy in theperiodic table, has one fewer 4f electron than Dy, and isprobably less stable magnetically than Dy due to its directproximity to Gd, by far the most stable of all magneticlanthanides. Tb orders antiferromagnetically (AFM) at To �230 K followed by a ferromagnetic (FM) transition at To �220 K [3]. Both transition temperatures initially decreaserapidly with pressure at the rate −10 to −12 K/GPa, but above∼7 GPa neither transition can be clearly detected in eitherthe ac or dc magnetic susceptibility [4–6]. The disappearanceof the ordered moment in the susceptibility measurementindicates a transition to either an AFM or paramagnetic stateabove 7 GPa. Electrical resistivity studies should reveal whichscenario is correct since both FM and AFM order normallylead to a distinct kink in the temperature dependence of theresistivity. However, recent resistivity and neutron diffractionexperiments on Tb find that the FM transition decreases with
*Current address: Department of Condensed Matter Physics andMaterial Science, Brookhaven National Laboratory, Upton, NY11973, USA.
pressure at the rate −16.7 K/GPa to 3.6 GPa [7]; that thetransition could no longer be resolved above 3.6 GPa maybe due to appreciable pressure-gradient broadening in the cellwhich contained no pressure medium. That magnetic order inTb disappears above 7 GPa seems highly unlikely since both x-ray absorption near-edge structure (XANES) and nonresonantx-ray emission spectroscopy (XES) measurements detect nochange in Tb’s valence to 65 and 70 GPa, respectively [8]. Infact, the XES studies show that Tb retains its strong, highlylocalized magnetic moment (J = 6) to at least 70 GPa [8].
In this paper, we present the results of dc electricalresistivity measurements on Tb over the temperature range3.8–295 K to pressures as high as 141 GPa, well above thepressure of 53 GPa where Tb suffers a 5% volume collapseat the phase transition from hexagonal hR24 to body-centeredmonoclinic (bcm) [9]. Magnetic order is indeed observed in Tbfor pressures above 7 GPa. In fact, to 53 GPa To(P ) followsnearly the same highly nonmonotonic pressure dependencefound earlier in Gd and Dy [1], but deviates markedly at higherpressures. As the applied pressure passes through 53 GPa,To(P ) for Tb first decreases, but then begins to increase rapidlyabove 80 GPa. As suggested for Dy [1], extreme pressureappears to transport Tb into an unconventional magnetic statewith an anomalously high magnetic ordering temperature, wellabove that anticipated from conventional de Gennes scaling.
II. EXPERIMENTAL TECHNIQUES
Resistivity samples were cut from a Tb ingot (99.9% pure,Material Preparation Center of the Ames Laboratory [10]).To generate pressures well beyond the volume collapsepressure of Tb at 53 GPa, a diamond anvil cell (DAC) madeof CuBe alloy was used [11]. Two separate high-pressureexperiments were carried out where pressure was generatedby two opposing diamond anvils ( 1
6 carat, type Ia) with0.35-mm-diameter culets beveled at 7◦ to 0.18-mm centralflats.
The Re gasket (6–7 mm diameter, 250 μm thick) waspreindented to 30 μm and a 80-μm-diameter hole electrosparkdrilled through the center. The center section of the preindented
1098-0121/2015/91(17)/174428(7) 174428-1 ©2015 American Physical Society

J. LIM, G. FABBRIS, D. HASKEL, AND J. S. SCHILLING PHYSICAL REVIEW B 91, 174428 (2015)
FIG. 1. (Color online) Resistance of Tb versus temperature to 295 K for (a) run 1 and (b) run 2 at various pressures. Insets show photographof (a) elongated sample in run 1 and (b) square sample in run 2.
gasket surface was filled with a 4:1 cBN-epoxy mixture toinsulate the gasket and serve as pressure medium. The thin Tbsample was then placed on top of four thin (4-μm) Pt leadsfor a four-point dc electrical resistivity measurement. In anattempt to minimize the effect of the pressure gradient acrossthe sample in this nonhydrostatic pressure environment, inrun 1 an elongated sample (dimensions ∼8 × 80 × 3 μm3)was used with the two voltage leads spaced only 5 μmapart [see inset to Fig. 1(a)]. In run 2, all four Pt leadswere placed near the corners of the square-shaped sample(dimensions ∼30 × 30 × 5 μm) [see inset to Fig. 1(b)], asin the previous resistivity measurements on Dy [1]. However,from the temperature-dependent resistivity data the pressuregradient was estimated to be approximately the same inboth runs. Further details of the nonhydrostatic high-pressureresistivity technique are given in a paper by Shimizu et al. [12].
A He-gas driven membrane was utilized to change pres-sure at any temperature [13]. The value of the pressurewas determined using both the fluorescence [14] from asmall ruby sphere positioned at the edge of the sampleand the frequency shift of the diamond vibron via Ramanspectroscopy [15]. The ruby pressure was determined atboth ambient temperature and a temperature within 20 Kof To; the vibron pressure was determined only at ambienttemperature. The values of the pressure given are averagedover the sample to an estimated accuracy of ±10%. In theseexperiments, temperatures from 3.8 to 295 K were availableusing an Oxford flow cryostat. All measurements shown inthis paper were carried out with increasing pressure; diamondanvil failure at the highest pressure ended the experiment.Further experimental details of the DAC and cryostat are givenelsewhere [8,11,16,17].
174428-2

ANOMALOUS PRESSURE DEPENDENCE OF MAGNETIC . . . PHYSICAL REVIEW B 91, 174428 (2015)
III. RESULTS OF EXPERIMENT
The present resistivity studies on Tb were carried out intwo separate experiments. In Fig. 1(a), the electrical resistanceR(T ) from run 1 is plotted versus temperature at 18 differentpressures to 135 GPa. The results from run 2 are shownin Fig. 1(b) and span the pressure range 2–141 GPa with17 values. The onset of magnetic ordering is identified bythe kink in the R(T ) dependence clearly seen near 200 Kat 2 GPa, the lowest pressure in each run. The kink inR(T ) upon cooling marks the beginning of the suppressionof spin-disorder scattering Rsd (T ) as magnetic ordering setsin [18]. At higher pressures, this kink broadens somewhat intoa “knee” due to an increasing pressure gradient across thesample, but remains clearly visible to ∼115 GPa.
FIG. 2. (Color online) Selection of resistance versus temperaturecurves for Tb from run 2 in Fig. 1(b) where, except at 2 GPa, thecurves have been shifted vertically for clarity. Red lines with smallpositive slope give temperature dependence of phonon resistance forT � Tx except at 16 GPa where the phonon resistance extends to 0 K(see text).
In Fig. 2, selected data from Fig. 1(b) are replotted butshifted vertically for clarity so that no curves intersect. In thisgraph, the red line through the data above the knee gives thephonon contribution Rph(T ) to the total measured resistanceR(T ) estimated in the same manner as in our previous workon Dy [1], as outlined in the next paragraph. The paramagneticstate of Tb yields the relatively flat region of R(T ) at highertemperature where the red (phonon) line overlaps the data.Where the red line begins to separate from the data marks theonset of magnetic ordering in some region of the sample.Because of the pressure gradient across the sample, otherregions of the sample will have a lower onset temperature,thus broadening the kink into a knee. The intersection of thephonon resistance (red curve) with the red low-temperaturetangent curve defines the temperature Tx in Fig. 2.
The total measured resistance is the sum of threeterms R(T ) = Rd + Rph(T ) + Rsd (T ), where Rd
is the temperature-independent defect resistance, Rph(T )the temperature-dependent phonon resistance, and Rsd (T )the temperature-dependent spin-disorder resistance. Attemperatures where there is no magnetic ordering in thesample, Rsd (T ) is independent of temperature. Above theonset temperature of the knee, the temperature dependence ofR(T ) is, therefore, due solely to that of Rph(T ). Thetemperature dependence of the phonon resistance is visibleover the widest temperature range at that pressure (16 GPa inFig. 2) where the knee begins at the lowest temperature. Weextrapolate this dependence to 0 K in the temperature regionbelow the knee to yield the temperature-dependent functionR16
ph(T ), the estimated phonon resistance at 16 GPa in run 2.In run 1, the data at 18 GPa were used in the same way toobtain R18
ph(T ). Since the functional dependence of Rph(T ) ontemperatures above Tx is seen in Fig. 2 to change only slowlywith pressure, we estimate Rph(T ) for the other pressuresin run 2 by simply multiplying the function R16
ph(T ) by a“phonon factor” α chosen such that for temperatures abovethe knee the quantity R(T ) − αR16
ph(T ) becomes temperatureindependent for T > Tx. The values of α required are listed inTable I at all pressures in run 2 to 141 GPa. For pressures of120 GPa and above, the knee in R(T ) apparently begins above295 K, so that α can no longer be estimated directly fromthe resistance data. For P � 120 GPa, therefore, the valueα = 0.41 is assumed in Table I for run 2 and α = 0.69 in run1. This is admittedly an oversimplified way to estimate thephonon contribution, but is superior to the assumption madein an earlier study that for many lanthanides Rph is simply alinear function of temperature to 0 K [19].
In Fig. 3, the extracted spin-disorder resistance Rsd (T ) =R(T ) − αR16
ph(T ) − Rd is plotted for pressures 5, 35, and86 GPa in run 2. The saturation (maximum) value of theso-obtained spin-disorder resistance Rmax
sd in the paramagneticphase at each pressure is listed in Table I for run 2. At 86 GPa,for example, Rmax
sd � 152 m� as seen in Fig. 3. A similarprocedure was used to obtain Rmax
sd in run 1.As illustrated in Fig. 3, the average magnetic ordering
temperature To in the Tb sample is estimated from the pointof intersection of two straight (red) lines, a horizontal linefor temperatures above the onset of the knee, and a linetangent to Rsd (T ) at lower temperatures. For 86 GPa, it is seenthat To � 69 K. This temperature differs by only 1 K from
174428-3

J. LIM, G. FABBRIS, D. HASKEL, AND J. S. SCHILLING PHYSICAL REVIEW B 91, 174428 (2015)
TABLE I. Values for Tb of the average To and maximum T maxo
magnetic ordering temperatures, spin-disorder resistance Rmaxsd for
T > T maxo , and phonon factor α as a function of pressure from runs 1
and 2 (see text).
Run P (GPa) To (K) T maxo (K) Rmax
sd (m�) α
1 2 211 214 881 1.161 5 117 163 523 1.241 8 73 84 380 1.241 18 64 70 154 1.01 27 95 145 513 0.661 34 101 165 721 0.721 44 112 188 769 1.021 53 105 196 746 1.111 61 101 179 518 1.051 68 86 154 479 0.891 77 72 105 469 0.741 88 73 145 1001 0.691 97 83 173 1140 0.691 109 107 206 1165 0.691 114 131 230 1189 0.691 119 150 253 1201 0.691 126 172 291 1211 0.691 135 192 323 1214 0.69
2 2 208 210 83 0.982 5 103 142 43 0.982 9 57 66 36 0.982 16 52 66 13 1.02 35 106 177 111 0.582 52 111 199 138 0.922 61 101 183 103 0.792 73 82 159 91 0.562 86 69 113 152 0.412 94 76 154 219 0.412 99 88 180 234 0.412 106 111 205 239 0.412 112 133 232 247 0.412 116 148 249 250 0.412 120 163 274 252 0.412 126 183 306 252 0.412 141 203 341 243 0.41
Tx � 68 K, the intersection point of the phonon resistanceand the low-temperature tangent lines in Fig. 2 at the samepressure. Here, we regard To to be the average magneticordering temperature (in our previous paper on Dy, Tx was usedas the ordering temperature [1]). Since the pressure gradientleads to a variation in the value of the magnetic orderingtemperature across the sample, we define the “maximum”ordering temperature T max
o as the temperature at which thespin-disorder resistance has decreased by 1%. In Fig. 3, it isseen that T max
o � 113 K at 86 GPa. If dTo/dP > 0, T maxo gives
the value of the magnetic ordering temperature at the center ofthe cell (sample) where the pressure is highest. In Fig. 3, it isseen that T max
o lies 44 K higher than To at 86 GPa. All valuesof To and T max
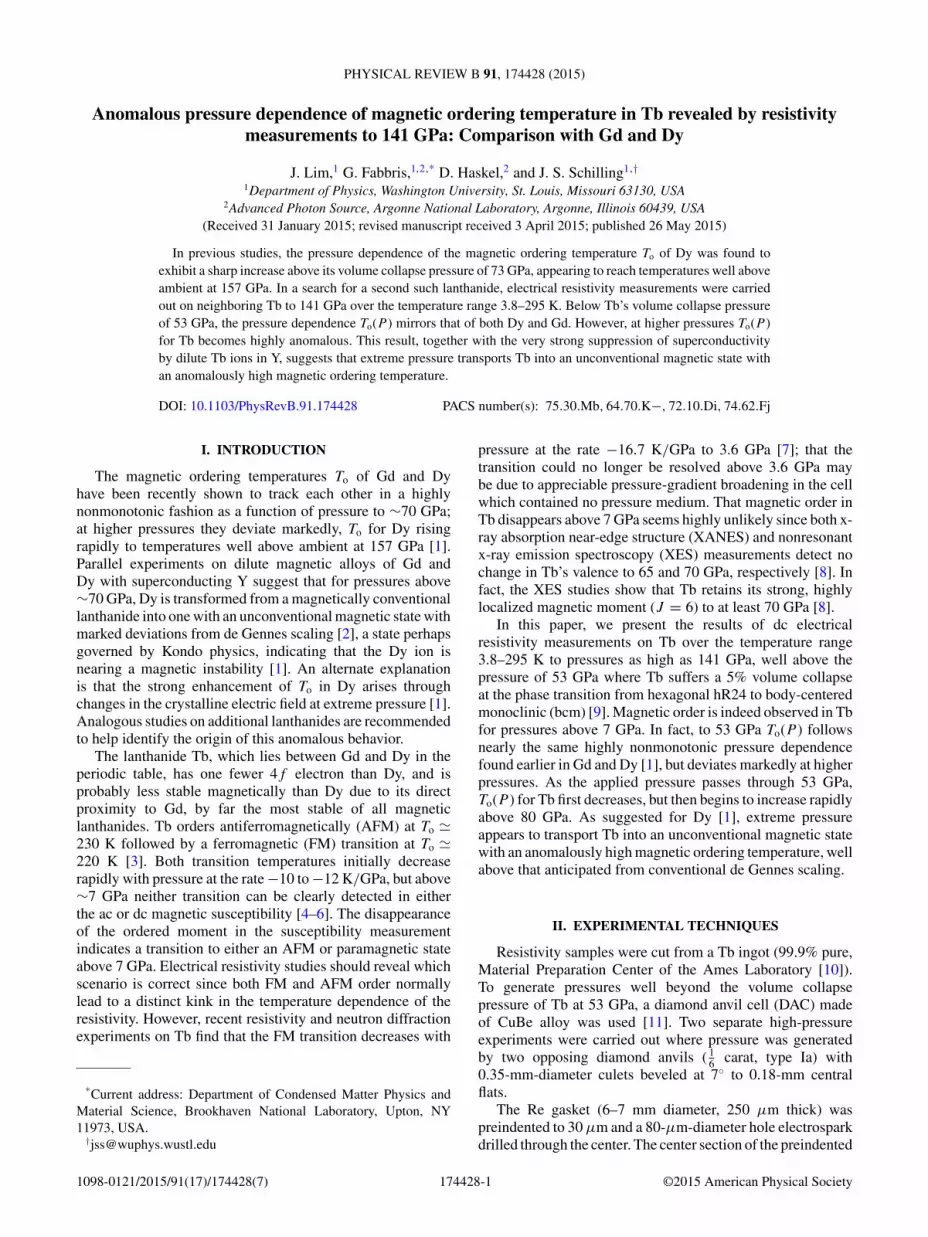
o in run 2 are listed in Table I.In Fig. 4, To and T max
o are plotted versus pressure to141 GPa for runs 1 and 2 on Tb; values for P � 120 GPaare estimated using a procedure from Ref. [1], as outlinedbelow. Where they can be compared, the present results are in
FIG. 3. (Color online) Spin-disorder resistance Rsd (T ) versustemperature at three pressures from run 2. The phonon Rph(T ) anddefect Rd resistances have been subtracted off. The average magneticordering temperature To is defined by intersection point of two tangentlines. T max
o gives temperature at which spin-disorder resistance hasdecreased by 1% (see text).
reasonable agreement with earlier ac magnetic susceptibilitymeasurements of Jackson et al. to 6.3 GPa [5]. The pressuredependence To(P ) at higher pressures is seen to be highlynonmonotonic, presumably in response to multiple structuralphase transitions [9] (see top of the graph). Note that thephase boundaries were determined from x-ray diffractionstudies at ambient temperature and may shift somewhat asthe temperature is lowered.
A comparison of To(P ) for Tb from Fig. 4 to comparablegraphs for Gd and Dy in Ref. [1] reveals a remarkable similarityto 53 GPa, the pressure at which the 5% volume collapse inTb occurs [9]. Also plotted in Fig. 4 are the values of T max
ofor Tb given by the upper (blue) symbols connected to thevalues of To at each pressure by a light (blue) vertical line.Particularly intriguing is the decrease in To following the hR24to body-centered monoclinic (bcm) transition at 53 GPa [9],followed by a rapid increase above 80 GPa. In contrast to thefindings for P � 53 GPa, at higher pressures To(P ) for Tbthus differs significantly from that found earlier for either Gdor Dy [1]. Plotted versus relative volume V/Vo, the increase ofTo above 80 GPa for Tb is found to be much more rapid thanthe initial decrease of To to 6.3 GPa. A similar result was foundfor Dy [1]. Extrapolating To versus V/Vo for Tb linearly toV/Vo = 0.40 (141 GPa) yields the values To ≈ 250 K andT max
o ≈ 350 K.We now attempt a more quantitative estimate of the pressure
dependence of To, T maxo , and Rmax
sd in the pressure range above116 GPa where the onset of the knee appears to lie at orabove ambient temperature. We first consider the spin-disorder
174428-4
ANOMALOUS PRESSURE DEPENDENCE OF MAGNETIC . . . PHYSICAL REVIEW B 91, 174428 (2015)
FIG. 4. (Color online) Average magnetic ordering temperaturesTo of Tb versus pressure: (+) earlier susceptibility studies to 6.3GPa with slope dTc/dP = −11 K/GPa [5]; present resistancemeasurements to 141 GPa from (�) run 1, (•) run 2. Upper (blue)symbols connected vertically to each value of To gives maximumordering temperature T max
o at that pressure. Open symbols indicateextrapolated values (see text). Vertical dashed line marks pressure ofvolume collapse for Tb at 53 GPa. Crystal structures for Tb are givenat top of graph [9]. Rmax
sd versus pressure is plotted in lower part offigure from run 2 where it is seen to roughly track To(P).
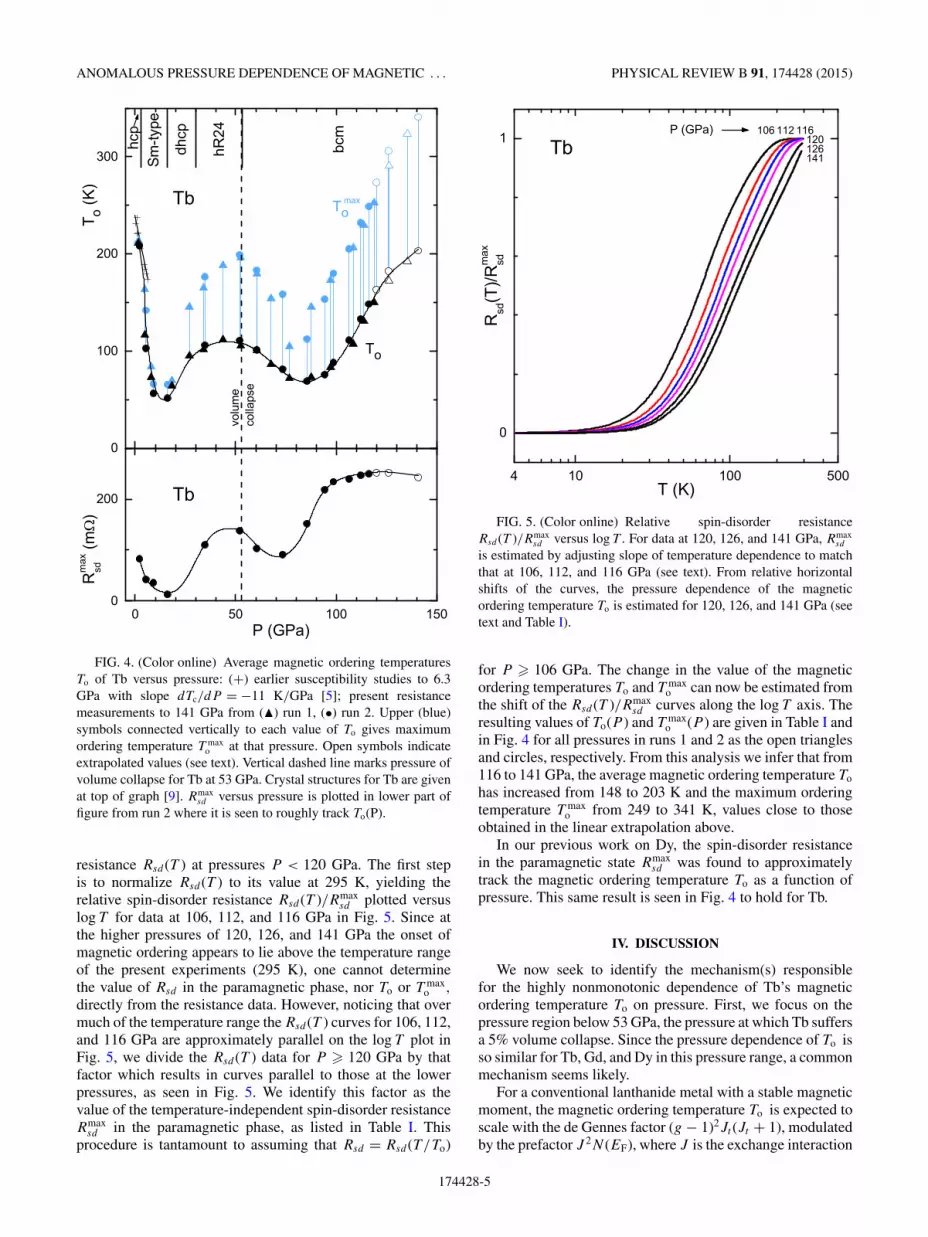
resistance Rsd (T ) at pressures P < 120 GPa. The first stepis to normalize Rsd (T ) to its value at 295 K, yielding therelative spin-disorder resistance Rsd (T )/Rmax
sd plotted versuslog T for data at 106, 112, and 116 GPa in Fig. 5. Since atthe higher pressures of 120, 126, and 141 GPa the onset ofmagnetic ordering appears to lie above the temperature rangeof the present experiments (295 K), one cannot determinethe value of Rsd in the paramagnetic phase, nor To or T max
o ,
directly from the resistance data. However, noticing that overmuch of the temperature range the Rsd (T ) curves for 106, 112,and 116 GPa are approximately parallel on the log T plot inFig. 5, we divide the Rsd (T ) data for P � 120 GPa by thatfactor which results in curves parallel to those at the lowerpressures, as seen in Fig. 5. We identify this factor as thevalue of the temperature-independent spin-disorder resistanceRmax
sd in the paramagnetic phase, as listed in Table I. Thisprocedure is tantamount to assuming that Rsd = Rsd (T/To)
FIG. 5. (Color online) Relative spin-disorder resistanceRsd (T )/Rmax
sd versus log T . For data at 120, 126, and 141 GPa, Rmaxsd
is estimated by adjusting slope of temperature dependence to matchthat at 106, 112, and 116 GPa (see text). From relative horizontalshifts of the curves, the pressure dependence of the magneticordering temperature To is estimated for 120, 126, and 141 GPa (seetext and Table I).
for P � 106 GPa. The change in the value of the magneticordering temperatures To and T max
o can now be estimated fromthe shift of the Rsd (T )/Rmax
sd curves along the log T axis. Theresulting values of To(P ) and T max
o (P ) are given in Table I andin Fig. 4 for all pressures in runs 1 and 2 as the open trianglesand circles, respectively. From this analysis we infer that from116 to 141 GPa, the average magnetic ordering temperature To
has increased from 148 to 203 K and the maximum orderingtemperature T max
o from 249 to 341 K, values close to thoseobtained in the linear extrapolation above.
In our previous work on Dy, the spin-disorder resistancein the paramagnetic state Rmax
sd was found to approximatelytrack the magnetic ordering temperature To as a function ofpressure. This same result is seen in Fig. 4 to hold for Tb.
IV. DISCUSSION
We now seek to identify the mechanism(s) responsiblefor the highly nonmonotonic dependence of Tb’s magneticordering temperature To on pressure. First, we focus on thepressure region below 53 GPa, the pressure at which Tb suffersa 5% volume collapse. Since the pressure dependence of To isso similar for Tb, Gd, and Dy in this pressure range, a commonmechanism seems likely.
For a conventional lanthanide metal with a stable magneticmoment, the magnetic ordering temperature To is expected toscale with the de Gennes factor (g − 1)2Jt (Jt + 1), modulatedby the prefactor J 2N (EF), where J is the exchange interaction
174428-5

J. LIM, G. FABBRIS, D. HASKEL, AND J. S. SCHILLING PHYSICAL REVIEW B 91, 174428 (2015)
between the 4f ion and the conduction electrons, N (EF) thedensity of states at the Fermi energy, g the Lande-g factor,and Jt the total angular momentum quantum number [2].Since the de Gennes factor is constant under pressure,unless the magnetic state becomes unstable and/or a valencetransition occurs, the marked similarity between the highlynonmonotonic pressure dependencies of To for Tb, Dy, andGd to 53 GPa likely originates in the pressure dependenceof the prefactor J 2N (EF), facilitated by a series of nearlyidentical structural phase transitions in Tb [9], Dy [20], andGd [21,22]. These phase transitions are likely driven byincreasing 5d-electron occupation with pressure [23]. Indeed,electronic-structure calculations for Dy suggest that its largenegative initial pressure derivative dTo/dP � −6.7 K/GParesults from a strong decrease in J 2N (EF) [5,24].
We now consider the pressure region P > 53 GPa wherethe pressure dependence To(P ) for Tb is highly anomalous,deviating markedly from that of the model conventionallanthanide Gd to at least 127 GPa [1]. The absence of magneticinstabilities in Gd, even at extreme pressures, is expectedsince the local magnetic state of Gd with its half-filled 4f 7
shell is the most stable of all elements, its 4f 7 level lying∼9 eV below the Fermi level [25]. Why is To(P ) in Tbanomalous for P > 53 GPa? A long-standing strategy [26,27]to probe the magnetic state of a given ion is to alloy thision in dilute concentration with a host superconductor anddetermine �Tc, the degree of suppression of the host’ssuperconducting transition temperature. Yttrium (Y) is theideal host superconductor for Tb since the character of itsspd-electron conduction band closely matches that of theheavy lanthanides, Y even exhibiting nearly the same sequenceof structural transitions under pressure [28]. One may thusanticipate that changes in the magnetic state of the Tb ion inthe dilute alloy will be mirrored in the changes occurring inthe magnetic state of Tb metal.
The efficacy of this strategy is supported by previous studiesof the pressure dependencies To(P ) for Dy metal and �Tc(P )for Y(Dy) where both experience a dramatic enhancementbeginning just above the pressure of Dy’s volume collapse at73 GPa [1]. It was argued that this anomalous behavior mightbe the result of the Dy ion exhibiting Kondo physics at elevatedpressures where both To and �Tc are proportional to |J−|2,the square of the negative exchange parameter leading to theKondo effect. Dy’s volume collapse itself has been suggestedto have its origin in the Kondo volume collapse model of Allenand Martin [29].
Does perhaps the same scenario apply for Tb? In Fig. 6,the pressure dependence of the superconducting transitiontemperature Tc(P ) of the dilute magnetic alloy Y(0.5 at.% Tb)from our previous work [8] is compared to that for elemental Ymetal [30]. To a pressure of ∼50 GPa, Tc for the dilute magneticalloy is seen to increase with pressure at the same rate as forY. However, just above the pressure of Tb’s volume collapseat 53 GPa, the Tc(P ) dependence for the alloy begins to pullaway rapidly from that of Y, reaching a maximum suppression�Tc ≈ 5 K at 81 GPa, the highest pressure of the experiment.This strong suppression of Y’s superconductivity by dilute Tbions points to giant Kondo pair breaking, as has previouslybeen observed in high-pressure studies on the dilute magneticalloys La(Ce) [31], La(Pr) [32], Y(Pr) [8,33], and, most
FIG. 6. (Color online) Tc versus pressure for Y(0.5 at.% Tb)compared to that for Y, inset showing similar graph for Y(0.5 at.%Gd) [8]. Vertical dashed line marks pressure of volume collapse forTb at 53 GPa [9] and in inset for Gd at 59 GPa [21,22]. At top ofgraph are crystal structures taken on by superconducting host Y [28].
recently, Y(Dy) [8]. In contrast, as seen in the inset to Fig. 6,Tc(P ) for Y(0.5 at.% Gd) does not begin to deviate markedlyfrom that of Y metal near 59 GPa, where Gd’s volume collapseoccurs, but rather faithfully tracks Y’s value of Tc to 127 GPa,the maximum pressure of the experiment. Unlike for Tb, themagnetic state for Gd ions in Y remains stable to 127 GPa,so that no Kondo phenomena are expected. We thus suggestthat the anomalous pressure dependencies To(P ) and �Tc(P )in Tb and Y(Tb) alloy, respectively, have their origin in Kondophysics, as does Tb’s volume collapse itself. In support of thesesuggestions, we point out that XANES and XES experimentson Tb to extreme pressure reveal that neither a change invalence nor a magnetic local-itinerant transition occur to apressure of ∼70 GPa, well above the volume collapse pressurefor Tb at 53 GPa [8].
Could perhaps an alternative explanation for the anoma-lously high magnetic ordering temperatures To in Tb be theeffect of crystalline electric fields? It has been argued that suchfields are likely responsible for the significant enhancement ofTo over de Gennes scaling in a series of RRh4B4 compounds,where R is a lanthanide [34,35]. If the magnetic anisotropyis strong, it has been shown [34,35] that the crystal-fieldenhancement can be as large as the factor 3Jt/(Jt + 1) =2.6 for trivalent Tb where L = 3, S = 3, and Jt = 6. Nocrystal-field effects are possible for Gd since it carries noorbital moment (L = 0). The lack of a sharp upturn or otheranomalies in To and �Tcin the pressure region 60–127 GPawould be consistent with the certain absence of crystal-fieldeffects in Gd. The fact that the pressure dependence of To
174428-6
ANOMALOUS PRESSURE DEPENDENCE OF MAGNETIC . . . PHYSICAL REVIEW B 91, 174428 (2015)
is very similar for both Gd and Tb to 53 GPa indicates thatcrystal-field effects in Tb, if present, are only significant forpressures above 53 GPa where the To(P ) dependence becomesanomalous. In a crystal-field scenario, however, it would bedifficult to understand the sharp upturn in the suppression ofsuperconductivity �Tc in the dilute magnetic alloy Y(0.5 at.%Tb) for pressures above 53 GPa. This strong suppression ofsuperconductivity points rather to a Kondo physics scenariowith strong Kondo pair breaking.
Further experimentation is necessary to unequivocallyestablish the origin of the anomalous behavior of To and�Tc in Tb and Y(Tb) alloy, respectively, for the pressureregion above 53 GPa. Such experiments could include anextension of the pressure range to 200 GPa (2 Mbar) to searchfor the characteristic “Kondo sinkhole behavior” in Tc(P )observed for Y(Pr) [8,33], La(Ce) [31], and La(Pr) [32] wherethe Tc suppression �Tc reaches a maximum as the Kondotemperature TK passes through the experimental temperaturerange, but falls off again at higher pressures where TK farexceeds Tc. Inelastic neutron or x-ray scattering studies toextreme pressures would help establish whether crystal-fieldsplittings play a role in the anomalously high values of To
for Tb.
In summary, measurements of the electrical resistivity of Tbmetal to extreme pressures reveal that the magnetic orderingtemperature To exhibits a highly nonmonotonic pressuredependence, appearing to rise for P > 80 GPa to anomalouslyhigh values. Parallel experiments on Gd and dilute magneticalloys of Gd and Tb with Y suggest that under extremepressures, Tb is transformed from a magnetically conventionallanthanide into one with an unconventional magnetic state, per-haps involving Kondo physics, with anomalously high valuesof To. In contrast, Gd remains a magnetically conventionallanthanide to pressures of at least 127 GPa.
ACKNOWLEDGMENTS
The authors would like to thank T. Matsuoka and K.Shimizu for sharing information on their high-pressure elec-trical resistivity techniques used in this study. This workwas supported by the National Science Foundation (NSF)through Grant No. DMR-1104742 and by the Carnegie/DOEAlliance Center (CDAC) through NNSA/DOE Grant No.DE-FC52-08NA28554. Work at Argonne National Laboratoryis supported by the U.S. Department of Energy, Office ofScience, under Contract No. DE-AC02-06CH11357.
[1] J. Lim, G. Fabbris, D. Haskel, and J. S. Schilling, Phys. Rev. B91, 045116 (2015).
[2] See: K. N. R. Taylor and M. I. Darby, Physics of Rare EarthSolids (Chapman and Hall, London, 1972).
[3] W. C. Koehler, J. Appl. Phys. 36, 1078 (1965).[4] D. B. McWhan and A. L. Stevens, Phys. Rev. 139, A682 (1965).[5] D. D. Jackson, V. Malba, S. T. Weir, P. A. Baker, and Y. K.
Vohra, Phys. Rev. B 71, 184416 (2005).[6] M. Mito, K. Matsumoto, Y. Komorida, H. Deguchi, S. Takagi,
T. Tajiri, T. Iwamoto, T. Kawae, M. Tokita, and K. Takeda, J.Phys. Chem. Solids 70, 1290 (2009).
[7] S. A. Thomas, J. M. Montgomery, G. M. Tsoi, Y. K. Vohra, G.N. Chesnut, S. T. Weir, C. A. Tulk, and A. M. dos Santos, HighPressure Res. 33, 555 (2013).
[8] G. Fabbris, T. Matsuoka, J. Lim, J. R. L. Mardegan, K. Shimizu,D. Haskel, and J. S. Schilling, Phys. Rev. B 88, 245103 (2013).
[9] N. C. Cunningham, W. Qiu, K. M. Hope, H.-P. Liermann, andY. K. Vohra, Phys. Rev. B 76, 212101 (2007).
[10] Material Preparation Center, Ames Lab, US DOE, Ames, Iowawww.mpc.ameslab.gov.
[11] James S. Schilling, Mater. Res. Soc. Symp. Proc. 22, 79 (1984).[12] K. Shimizu, K. Amaya, and N. Suzuki, J. Phys. Soc. Jpn. 74,
1345 (2005).[13] W. B. Daniels and W. Ryschkewitsch, Rev. Sci. Instrum. 54, 115
(1983).[14] A. D. Chijioke, W. J. Nellis, A. Soldatov, and I. F. Silvera, J.
Appl. Phys. 98, 114905 (2005).[15] Y. Akahama and H. Kawamura, J. Appl. Phys. 100, 043516
(2006).[16] S. Klotz, J. S. Schilling, and P. Muller, in Frontiers of High
Pressure Research, edited by H. D. Hochheimer and R. D. Etters(Plenum, New York, 1991), p. 473.
[17] M. Debessai, J. J. Hamlin, and J. S. Schilling, Phys. Rev. B 78,064519 (2008).
[18] B. R. Coles, Adv. Phys. 7, 40 (1958).[19] R. V. Colvin, S. Legvold, and F. H. Spedding, Phys. Rev. 120,
741 (1960).[20] R. Patterson, C. K. Saw, and J. Akella, J. Appl. Phys. 95, 5443
(2004).[21] H. Hua, Y. K. Vohra, J. Akella, S. T. Weir, R. Ahuja, and B.
Johansson, Rev. High Pressure Sci. Technol. 7, 233 (1998).[22] D. Errandonea, R. Boehler, B. Schwager, and M. Mezouar, Phys.
Rev. B 75, 014103 (2007).[23] J. C. Duthie and D. G. Pettifor, Phys. Rev. Lett. 38, 564 (1977).[24] G. S. Fleming and S. H. Liu, Phys. Rev. B 2, 164 (1970); S. H.
Liu, Phys. Rev. 127, 1889 (1962).[25] Z. P. Yin and W. E. Pickett, Phys. Rev. B 74, 205106 (2006).[26] B. T. Matthias, H. Suhl, and E. Corenzwit, Phys. Rev. Lett. 1,
92 (1958).[27] M. B. Maple, Appl. Phys. 9, 179 (1976).[28] G. K. Samudrala, G. M. Tsoi, and Y. K. Vohra, J. Phys.: Condens.
Matter 24, 362201 (2012).[29] J. W. Allen and R. M. Martin, Phys. Rev. Lett. 49, 1106
(1982).[30] J. J. Hamlin, V. G. Tissen, and J. S. Schilling, Phys. C
(Amsterdam) 451, 82 (2007).[31] M. B. Maple, J. Wittig, and K. S. Kim, Phys. Rev. Lett. 23, 1375
(1969).[32] J. Wittig, Phys. Rev. Lett. 46, 1431 (1981).[33] J. Wittig, in Valencies Instabilities, edited by P. Wachter and H.
Boppart (North-Holland, Amsterdam, 1982), p. 427.[34] D. R. Noakes and G. K. Shenoy, Phys. Lett. A 91, 35 (1982).[35] B. D. Dunlap, L. N. Hall, F. Behroozi, G. W. Crabtree, and D.
G. Niarchos, Phys. Rev. B 29, 6244 (1984).
174428-7