annual report - sit mutual funds - bright directions
TRANSCRIPT
Annual ReportJune 30, 2021
Balanced Fund
Dividend Growth Fund
Global Dividend Growth Fund
Large Cap Growth Fund
ESG Growth Fund
Mid Cap Growth Fund
Small Cap Dividend Growth Fund
Small Cap Growth Fund
International Growth Fund
Developing Markets Growth Fund
Sit Mutual Funds

Chairman’s Letter 2
Fund Reviews and Schedules of Investments
Balanced Fund 4
Dividend Growth Fund 12
Global Dividend Growth Fund 16
Large Cap Growth Fund 20
ESG Growth Fund 24
Mid Cap Growth Fund 28
Small Cap Dividend Growth Fund 32
Small Cap Growth Fund 36
International Growth Fund 40
Developing Markets Growth Fund 46
Statements of Assets and Liabilities 50
Statements of Operations 52
Statements of Changes in Net Assets 54
Financial Highlights 58
Notes to Financial Statements 72
Report of Independent Registered Public Accounting Firm 80
Expense Example 81
Federal Tax Information 83
Information About Directors and Officers 84
Additional Information 86
Si t Mutual FundsSTOCK FUNDS ANNUAL REPORT
TABLE OF CONTENTS
Page
This document must be preceded or accompanied by a Prospectus.
August 4, 2021
Dear Fellow Shareholders:Stocks posted exceptional returns over the past twelve months
due to a combination of unprecedented fiscal and monetarystimulus, vaccination progress, and a highly resilient and adapt-able U.S. economy. We remain positive on equities going for-ward but recognize elevated valuations and emerging risks maylimit upside potential in the near term.
Economic OutlookU.S. real GDP in 2021 is on pace to expand at the fastest
rate since 1984 as the economy rebounds and reaches new heights.We believe above-trendline growth will persist through at least2022, supported by pent-up demand, employment gains, inven-tory restocking, fixed investment, and favorable governmentpolicies.At last count, almost $31 trillion (or over 35% of worldGDP) in global pandemic-related stimulus has accrued sincespring 2020. The U.S. accounts for two-fifths of this amountand, if the Biden administration has anything to say about it,more is on the way.Accommodative government policies helpedglobal economies avert potential crises in 2020 and, in con-currence with rising COVID-19 vaccination rates, is now under-writing the recovery. A recovery in services, which representsabout 75% of U.S. GDP and nearly 85% of nonfarm privateemployment, is poised to sustain the next stage of the expan-sion.
A multitude of interlinked factors is contributing to a surgein inflation, including a post-lockdown rebound in demand, abackup in global supply chains, massive federal stimulus, aweaker U.S. dollar, and rising commodity prices. We believethat most of the current uptick in inflation will be transitoryand ease as excess demand is satiated, supply chains get unsnarled,and year-over-year comparisons normalize. The recent upshiftin consumer inflation is almost entirely due to a spike in areasseverely impacted by the pandemic. Excess savings has alsobegun to abate, implying demand may diminish some afterthe stimulus-induced surge. Moreover, the froth has started tocome off some commodities, with slowing growth in Chinaand a rising U.S. dollar being headwinds for prices. A mod-eration in “core” inflation will allow the Federal Reserve flex-ibility to stay accommodative, even though it pivoted to a some-what less-dovish stance in June by signaling the possibility oftapering asset purchases (perhaps this year) and two rate increasesin 2023. Still, the Fed must proceed cautiously, or risk unwind-ing the economic gains achieved thus far.
Outside the U.S., the pace of economic recovery generallycorresponds with vaccination progress.The EuroArea’s services-heavy economies are swiftly gathering steam as the pandemicebbs and authorities ease restrictions. A coinciding reboundin demand for services joined an already booming manufac-turing sector to lift the Euro Area Composite PMI to a 15-yearhigh in June. Pent-up demand, excess savings, rising exports,recovering tourism, easing credit, and supportive governmentpolicies underlie continued economic growth. Despite increas-ing inflation, the European Central Bank likely will remain
accommodative and will let the economy run hot. As a result,the Euro Area is well-positioned to achieve GDP growth of+4.0% or more in 2022. In China, growth is moderating, butthe outlook remains positive, supported by consumer spend-ing, manufacturing, and solid export growth. After tighteningearlier this year, fiscal policy should offer support in the monthsahead.
The worst of the COVID-19 pandemic is likely over for manydeveloped nations as vaccination rates improve. However, givenstill-high vaccine hesitancy, the emergence of more transmis-sible variants may cause headaches for policymakers, dent con-fidence, prevent people from re-entering the workforce (or engag-ing in other activities), or require localized lockdowns. TheDelta variant of the COVID-19 virus is the most significantrisk to date for increased global infection rates, even amongfully vaccinated people. The CDC reports the latest COVID-19strain is over 60% more contagious than the original strainand now accounts for 50% of new cases in the U.S. Over 50%of Euro Area residents have received at least one dose of theCOVID-19 vaccine. However, the Delta variant has alreadytaken hold in the U.K., and EuroArea officials project the vari-ant will account for 90% of new infections in the region byAugust.Globally, renewed lockdowns remain the key near-term riskto the outlook, potentially derailing the nascent services recov-ery and being especially harmful to emerging economies.
Equity StrategyThe S&P 500® Index posted a remarkable +41% total return
over the past twelve months, driven by a combination of price-to-earnings multiple expansion and accelerating earnings growth,albeit from depressed levels of one year ago. Investors con-tinue to pour money into stocks, with U.S. equity inflows grow-ing at their fastest pace since 2015 and first half 2021 globalequity inflows the largest on record. Aside from the reboundin earnings, a bevy of factors underpin positive equity flows,including central bank liquidity injections, fiscal stimulus, theT.I.N.A.-effect (i.e., there is no alternative), the return of theday trader, and improving COVID-19 vaccination rates. Increas-ing capital returns, via dividends and share buybacks, and recordM&A activity are also sustaining investor enthusiasm. We areconstructive on stocks, but investor euphoria remains a sourceof concern in the near term. In addition, investors appear com-placent about gathering risks, including impending tax hikes,COVID-19 variants, inflationary/margin pressures, policy tight-ening, and rocketing debt.
Due to the exceptionally strong earnings reports, earningsfor the S&P 500 are now estimated to grow +37% year overyear in 2021, including another round of robust corporate earn-ings reports for the June quarter. However, the focus of inves-tors will likely shift back to earnings quality and sustainabilityas the U.S. economy enters a more moderate state of expan-sion, as year-ago comparisons become more difficult. Eventhough decelerating economic growth does not signal an endto the equity bull market, it typically denotes an inflection point in
CHAIRMAN’S LETTER
2 SIT MUTUAL FUNDS ANNUAL REPORT
sector and style performance. For instance, cyclicals tend tooutperform defensive equities as the manufacturing Purchas-ing Managers Index (PMI) is accelerating but underperformas it decelerates. We do not necessarily believe a decliningmanufacturing PMI is the end of the line for cyclical stocks(especially those exposed to favorable themes). Nonetheless,we think investors will be more discerning and focus on com-panies with specific revenue growth drivers, pricing power,margin enhancement opportunities, and solid balance sheets.In other words, investors are apt to gravitate to quality growthstocks and away from value, particularly with year-over-yearcomparisons in earnings growth about to become more chal-lenging.
We believe dividend-paying stocks remain compelling. Whiledividend payers benefitted from the broadening stock marketthat began late last summer, the more defensive lower betastocks within the dividend-paying universe have lagged. Thissubsection of dividend payers includes companies in the con-sumer staples, pharma, aerospace/defense, utilities, and telecomsectors. The overall weighting of defensive sectors in the S&P500 Index is at an historic low (i.e., 13%, down from 20% in2015), so we see the potential for mean reversion in the monthsahead. We also expect sentiment to improve for stable, low volstocks as market volatility increases. Moreover, dividend-paying stocks offer downside protection if the stock marketpulls back after posting robust gains in recent quarters. Cur-rent high stock market valuations, already low interest rates,and peaking economic growth imply a somewhat muted out-look for equity returns, which raises the appeal of total returnstrategies. Our dividend investments emphasize attractively val-ued, high-quality growth companies that are committed to return-ing capital to shareholders. Although the current yields of ourdividend-based portfolios are already well above benchmarkyields, we anticipate double-digit dividend growth in 2021 foreach of our dividend growth strategies.
With equity valuations fair across most sectors and the mar-ket overall, we believe identifying companies that can sustaingrowth beyond easy pandemic-impacted comparisons will leadto continued stock price appreciation. From a sector stand-point, we advocate a barbell strategy through investments ina combination of traditional and cyclical growth stocks leveredto the reflationary economic backdrop. Based on current stockvaluations, we think technology (traditional growth) and finan-cial stocks (cyclical growth) offer the most compelling invest-ment opportunities on each side of the barbell. Technologyvaluation multiples have contracted in many cases as strongearnings growth has outpaced underlying stock price appre-ciation, presenting attractive investment opportunities through-
out the sector. The semiconductor industry is a preferred invest-ment area based on high demand and constrained supply, leadingto extended forward visibility on revenue, pricing, and mar-gins. We also continue to add selectively to software hold-ings that benefit from several secular growth themes, includ-ing digital transformation, e-commerce, online payments, digitaladvertising, and the post-pandemic shift to work from any-where. On the other side of the barbell, the financial sectorremains the most attractively valued cyclical group and offersa critical hedge should higher interest rates upend the broaderequity market. Banking fundamentals and investor sentimenthave benefited from a rebound in interest rates and a sharpimprovement in the credit picture, owing to monetary stimu-lus and an improving labor market. Rising interest rates, includ-ing an eventual move by the Federal Reserve to boost short-term rates, is the key variable that will drive investor sentiment.Notably, earnings projections do not yet embed higher inter-est rates, and valuations are depressed compared to the over-all market. The outlook for the property-casualty insurancesector is also highly attractive as the combination of COVID-19claims and several years of catastrophe losses have led to themost robust commercial pricing cycle in many years.
In international portfolios, we prefer equities in China, SouthKorea, India, and Europe. While emerging market central bankswill tighten to counter rising inflation, we do not believe policywill become overly restrictive. Moreover, despite a resur-gence in the coronavirus outbreak, we expect the pace of vac-cinations to accelerate, leading to the easing of pandemic restric-tions. We remain somewhat cautious on Chinese equities nearterm, given weakening earnings revisions and the govern-ment crackdown on monopolistic behavior. However, MSCIChina earnings are expected to grow double-digits in 2021amid a post-COVID-19 recovery, making a sharp market declineless likely. Furthermore, with China’s desire to be a world leader,the government will likely allow and facilitate the prosperityof new economy and international Chinese companies.We believea balanced allocation between growth and cyclical stocks pro-vides an optimal risk/reward profile near term. Longer term,we remain optimistic on structural trends, such as consump-tion and digitization of the economy.
Roger J. SitChairman, President, CEO and Global CIO
3JUNE 30, 2021
OBJECTIVE & STRATEGY
The dual objectives of the Sit Balanced Fund are to seek long-term growth of capital consistent with the preservation of principal and to
provide regular income. It pursues its objectives by investing in a diversified portfolio of stocks and bonds. The Fund may emphasize
either equity securities or fixed-income securities, or hold equal amounts of each, dependent upon the Adviser’s analysis of market, finan-
cial and economic conditions.
The Fund’s permissible investment allocation is: 35-65% in equity securities and 35-65% in fixed-income securities. At all times at least
25% of the fixed-income assets will be invested in fixed-income senior securities.
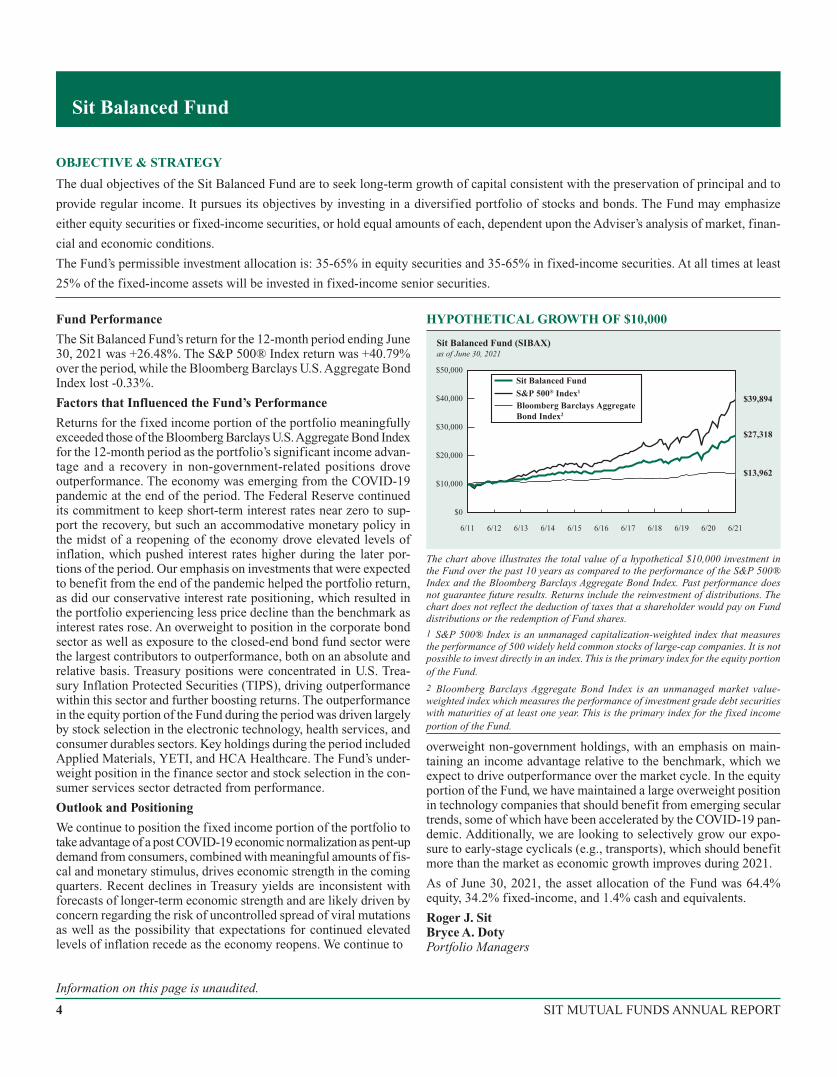
Fund Performance
The Sit Balanced Fund’s return for the 12-month period ending June30, 2021 was +26.48%. The S&P 500® Index return was +40.79%over the period, while the Bloomberg Barclays U.S. Aggregate BondIndex lost -0.33%.
Factors that Influenced the Fund’s Performance
Returns for the fixed income portion of the portfolio meaningfullyexceeded those of the Bloomberg Barclays U.S.Aggregate Bond Indexfor the 12-month period as the portfolio’s significant income advan-tage and a recovery in non-government-related positions droveoutperformance. The economy was emerging from the COVID-19pandemic at the end of the period. The Federal Reserve continuedits commitment to keep short-term interest rates near zero to sup-port the recovery, but such an accommodative monetary policy inthe midst of a reopening of the economy drove elevated levels ofinflation, which pushed interest rates higher during the later por-tions of the period. Our emphasis on investments that were expectedto benefit from the end of the pandemic helped the portfolio return,as did our conservative interest rate positioning, which resulted inthe portfolio experiencing less price decline than the benchmark asinterest rates rose. An overweight to position in the corporate bondsector as well as exposure to the closed-end bond fund sector werethe largest contributors to outperformance, both on an absolute andrelative basis. Treasury positions were concentrated in U.S. Trea-sury Inflation Protected Securities (TIPS), driving outperformancewithin this sector and further boosting returns. The outperformancein the equity portion of the Fund during the period was driven largelyby stock selection in the electronic technology, health services, andconsumer durables sectors. Key holdings during the period includedApplied Materials, YETI, and HCA Healthcare. The Fund’s under-weight position in the finance sector and stock selection in the con-sumer services sector detracted from performance.
Outlook and Positioning
We continue to position the fixed income portion of the portfolio totake advantage of a post COVID-19 economic normalization as pent-updemand from consumers, combined with meaningful amounts of fis-cal and monetary stimulus, drives economic strength in the comingquarters. Recent declines in Treasury yields are inconsistent withforecasts of longer-term economic strength and are likely driven byconcern regarding the risk of uncontrolled spread of viral mutationsas well as the possibility that expectations for continued elevatedlevels of inflation recede as the economy reopens. We continue to
HYPOTHETICAL GROWTH OF $10,000
$0
$10,000
$20,000
$50,000
$40,000
$30,000
Sit Balanced Fund (SIBAX)as of June 30, 2021
Bloomberg Barclays AggregateBond Index2
Sit Balanced FundS&P 500® Index1
$27,318
$39,894
$13,962
6/18 6/19 6/216/206/176/166/11 6/12 6/13 6/14 6/15
The chart above illustrates the total value of a hypothetical $10,000 investment inthe Fund over the past 10 years as compared to the performance of the S&P 500®Index and the Bloomberg Barclays Aggregate Bond Index. Past performance doesnot guarantee future results. Returns include the reinvestment of distributions. Thechart does not reflect the deduction of taxes that a shareholder would pay on Funddistributions or the redemption of Fund shares.
1 S&P 500® Index is an unmanaged capitalization-weighted index that measuresthe performance of 500 widely held common stocks of large-cap companies. It is notpossible to invest directly in an index. This is the primary index for the equity portionof the Fund.
2 Bloomberg Barclays Aggregate Bond Index is an unmanaged market value-weighted index which measures the performance of investment grade debt securitieswith maturities of at least one year. This is the primary index for the fixed incomeportion of the Fund.
overweight non-government holdings, with an emphasis on main-taining an income advantage relative to the benchmark, which weexpect to drive outperformance over the market cycle. In the equityportion of the Fund, we have maintained a large overweight positionin technology companies that should benefit from emerging seculartrends, some of which have been accelerated by the COVID-19 pan-demic. Additionally, we are looking to selectively grow our expo-sure to early-stage cyclicals (e.g., transports), which should benefitmore than the market as economic growth improves during 2021.
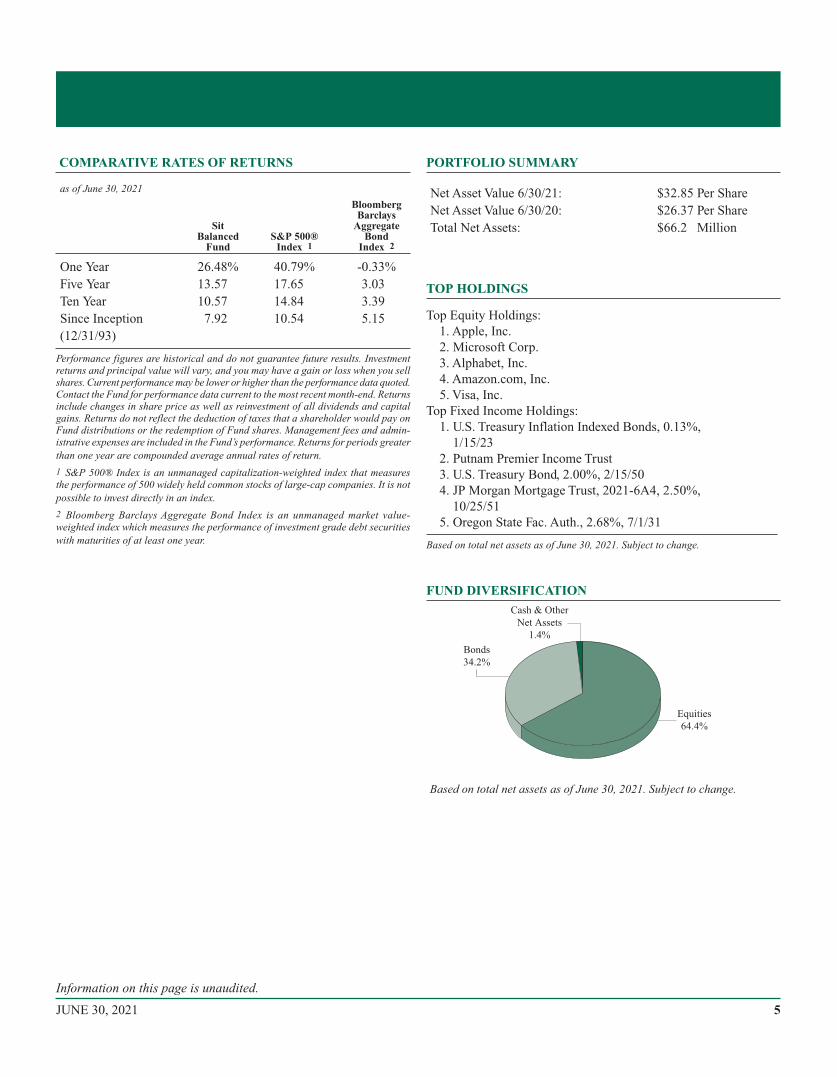
As of June 30, 2021, the asset allocation of the Fund was 64.4%equity, 34.2% fixed-income, and 1.4% cash and equivalents.
Roger J. SitBryce A. DotyPortfolio Managers
Sit Balanced Fund
Information on this page is unaudited.
4 SIT MUTUAL FUNDS ANNUAL REPORT
COMPARATIVE RATES OF RETURNS
as of June 30, 2021
SitBalanced
FundS&P 500®
Index 1
BloombergBarclays
AggregateBond
Index 2
One Year 26.48% 40.79% -0.33%Five Year 13.57 17.65 3.03Ten Year 10.57 14.84 3.39Since Inception 7.92 10.54 5.15(12/31/93)
Performance figures are historical and do not guarantee future results. Investmentreturns and principal value will vary, and you may have a gain or loss when you sellshares. Current performance may be lower or higher than the performance data quoted.Contact the Fund for performance data current to the most recent month-end. Returnsinclude changes in share price as well as reinvestment of all dividends and capitalgains. Returns do not reflect the deduction of taxes that a shareholder would pay onFund distributions or the redemption of Fund shares. Management fees and admin-istrative expenses are included in the Fund’s performance. Returns for periods greaterthan one year are compounded average annual rates of return.
1 S&P 500® Index is an unmanaged capitalization-weighted index that measuresthe performance of 500 widely held common stocks of large-cap companies. It is notpossible to invest directly in an index.
2 Bloomberg Barclays Aggregate Bond Index is an unmanaged market value-weighted index which measures the performance of investment grade debt securitieswith maturities of at least one year.
PORTFOLIO SUMMARY
Net Asset Value 6/30/21: $32.85 Per ShareNet Asset Value 6/30/20: $26.37 Per ShareTotal Net Assets: $66.2 Million
TOP HOLDINGS
Top Equity Holdings:1. Apple, Inc.2. Microsoft Corp.3. Alphabet, Inc.4. Amazon.com, Inc.5. Visa, Inc.
Top Fixed Income Holdings:1. U.S. Treasury Inflation Indexed Bonds, 0.13%,
1/15/232. Putnam Premier Income Trust3. U.S. Treasury Bond, 2.00%, 2/15/504. JP Morgan Mortgage Trust, 2021-6A4, 2.50%,
10/25/515. Oregon State Fac. Auth., 2.68%, 7/1/31
Based on total net assets as of June 30, 2021. Subject to change.
FUND DIVERSIFICATION
Based on total net assets as of June 30, 2021. Subject to change.
Equities
64.4%
Cash & Other
Net Assets
1.4%
Bonds
34.2%
Information on this page is unaudited.
5JUNE 30, 2021
Common Stocks - 64.4%Communications - 1.5%American Tower Corp. 2,300 621,323
Verizon Communications, Inc. 7,100 397,813
1,019,136
Consumer Durables - 1.0%YETI Holdings, Inc. * 7,300 670,286
Consumer Non-Durables - 4.4%Conagra Brands, Inc. 8,900 323,782
Constellation Brands, Inc. 2,275 532,100
Estee Lauder Cos., Inc. - Class A 2,275 723,632
Mondelez International, Inc. 6,300 393,372
NIKE, Inc. 3,575 552,302
PepsiCo, Inc. 2,475 366,721
2,891,909
Consumer Services - 3.4%McDonald’s Corp. 2,300 531,277
Starbucks Corp. 4,850 542,278
Visa, Inc. 5,150 1,204,173
2,277,728
Electronic Technology - 9.4%Apple, Inc. 18,125 2,482,400
Applied Materials, Inc. 7,825 1,114,280
Broadcom, Inc. 1,865 889,307
Keysight Technologies, Inc. * 2,950 455,510
NVIDIA Corp. 1,285 1,028,128
Qualcomm, Inc. 1,625 232,261
6,201,886
Finance - 5.0%Ameriprise Financial, Inc. 2,250 559,980
Aon, PLC 1,650 393,954
Chubb, Ltd. 2,550 405,297
First Republic Bank 1,750 327,548
Goldman Sachs Group, Inc. 2,100 797,013
JPMorgan Chase & Co. 3,425 532,724
T Rowe Price Group, Inc. 1,550 306,854
3,323,370
Health Services - 2.5%HCA Healthcare, Inc. 2,625 542,692
UnitedHealth Group, Inc. 2,825 1,131,243
1,673,935
Health Technology - 6.6%Abbott Laboratories 3,550 411,551
AbbVie, Inc. 3,825 430,848
Bristol-Myers Squibb Co. 7,300 487,786
Dexcom, Inc. * 1,865 796,355
Intuitive Surgical, Inc. * 470 432,231
Johnson & Johnson 3,000 494,220
Medtronic, PLC 4,375 543,069
Thermo Fisher Scientific, Inc. 1,575 794,540
4,390,600
Process Industries - 1.6%Ecolab, Inc. 1,775 365,597
Linde, PLC 625 180,688
Sherwin-Williams Co. 1,800 490,410
1,036,695
Producer Manufacturing - 3.4%Honeywell International, Inc. 2,275 499,021
Motorola Solutions, Inc. 1,400 303,590
Northrop Grumman Corp. 500 181,715
Parker-Hannifin Corp. 450 138,200
Safran SA, ADR 11,550 401,016
Siemens AG, ADR 3,975 316,565
Trane Technologies, PLC 2,175 400,504
2,240,611
Retail Trade - 5.9%Amazon.com, Inc. * 540 1,857,686
CVS Health Corp. 5,800 483,952
Home Depot, Inc. 2,050 653,724
Netflix, Inc. * 375 198,079
TJX Cos., Inc. 6,550 441,601
Ulta Beauty, Inc. * 795 274,887
3,909,929
Technology Services - 17.8%Accenture, PLC 2,025 596,950
Adobe, Inc. * 1,300 761,332
Alphabet, Inc. - Class A * 620 1,513,910
Alphabet, Inc. - Class C * 205 513,796
Atlassian Corp., PLC * 2,500 642,150
Autodesk, Inc. * 1,600 467,040
DocuSign, Inc. * 525 146,774
Dynatrace, Inc. * 5,975 349,059
Facebook, Inc. * 3,065 1,065,731
Intuit, Inc. 1,200 588,204
Microsoft Corp. 7,800 2,113,020
Paycom Software, Inc. * 600 218,082
PayPal Holdings, Inc. * 3,300 961,884
Pinterest, Inc. * 3,225 254,614
RingCentral, Inc. * 150 43,587
salesforce.com, Inc. * 3,650 891,586
ServiceNow, Inc. * 560 307,748
Splunk, Inc. * 1,950 281,931
Twilio, Inc. * 175 68,978
11,786,376
SCHEDULE OF INVESTMENTSJune 30, 2021
Sit Balanced FundInvestments are grouped by economic sectors.
Name of Issuer Quantity Fair Value ($) Name of Issuer Quantity Fair Value ($)
See accompanying notes to financial statements.
6 SIT MUTUAL FUNDS ANNUAL REPORT
Transportation - 1.5%FedEx Corp. 1,750 522,078
Union Pacific Corp. 2,050 450,856
972,934
Utilities - 0.4%NextEra Energy, Inc. 4,140 303,379
Total Common Stocks(cost: $22,270,744) 42,698,774
Bonds - 31.2%
Asset-Backed Securities - 0.9%Bayview Opportunity Master Fund,
2017-SPL1 A, 4.00%, 10/28/64 1, 4 39,049 39,871
New Century Home Equity Loan Trust,2005-A A4W, 4.70%, 8/25/35 14 2,054 2,068
OSCAR US Funding Trust VII, LLC,2017-2A A4, 2.76%, 12/10/24 4 54,579 55,111
Small Business Administration:
2008-20A 1, 5.17%, 1/1/28 27,473 29,827
2007-20H 1, 5.78%, 8/1/27 24,561 26,351
Towd Point Mortgage Trust:
2020-MH1 A1A, 2.18%, 2/25/60 1, 4 142,799 144,320
2019-MH1 A2, 3.00%, 11/25/58 1, 4 100,000 102,938
2019-SJ3 A2, 3.00%, 11/25/59 1, 4 125,000 125,827
2019-SJ1 A2, 4.17%, 11/25/58 1, 4 87,331 87,565
613,878
Collateralized Mortgage Obligations - 4.5%Fannie Mae:
2017-84 JP, 2.75%, 10/25/47 35,778 37,837
2003-34 A1, 6.00%, 4/25/43 30,897 35,129
2004-T1 1A1, 6.00%, 1/25/44 19,017 21,943
1999-17 C, 6.35%, 4/25/29 8,767 9,873
2001-82 ZA, 6.50%, 1/25/32 12,704 14,404
2009-30 AG, 6.50%, 5/25/39 36,811 43,377
2013-28 WD, 6.50%, 5/25/42 37,531 45,203
2004-T1 1A2, 6.50%, 1/25/44 59,735 69,778
2004-W9 2A1, 6.50%, 2/25/44 34,666 40,454
2010-108 AP, 7.00%, 9/25/40 1,155 1,354
2004-T3 1A3, 7.00%, 2/25/44 6,543 7,774
1993-21 KA, 7.70%, 3/25/23 9,950 10,357
Freddie Mac:
4293 BA, 5.27%, 10/15/47 1 11,878 13,720
2122 ZE, 6.00%, 2/15/29 47,141 53,797
2126 C, 6.00%, 2/15/29 29,163 32,905
2485 WG, 6.00%, 8/15/32 30,006 34,638
2480 Z, 6.00%, 8/15/32 29,107 33,308
2575 QE, 6.00%, 2/15/33 14,315 16,432
2980 QA, 6.00%, 5/15/35 15,249 17,401
2283 K, 6.50%, 12/15/23 2,601 2,740
2357 ZJ, 6.50%, 9/15/31 18,140 20,654
4520 HM, 6.50%, 8/15/45 20,608 24,572
3704 CT, 7.00%, 12/15/36 13,225 15,984
2238 PZ, 7.50%, 6/15/30 11,393 13,521
Government National Mortgage Association:
2021-27 CW, 5.00%, 2/20/51 1 171,354 204,531
2021-104 HT, 5.50%, 6/20/51 200,000 238,125
2021-86 WB, 5.52%, 5/20/51 1 198,839 231,442
2021-27 AW, 5.96%, 2/20/51 1 244,802 299,476
2015-80 BA, 6.99%, 6/20/45 1 18,361 21,153
2018-147 AM, 7.00%, 10/20/48 62,483 68,946
2018-160 DA, 7.00%, 11/20/48 52,131 58,748
2014-69 W, 7.20%, 11/20/34 1 21,736 25,337
2013-133 KQ, 7.32%, 8/20/38 1 22,466 26,512
2005-74 HA, 7.50%, 9/16/35 5,255 5,597
JP Morgan Mortgage Trust:
2021-3 A4, 2.50%, 7/1/51 1, 4 188,454 192,981
2021-6 A4, 2.50%, 10/25/51 1, 4 389,956 399,305
2019-HYB1 A5A, 3.00%, 10/25/49 1, 4 72,161 73,373
2020-8 A3, 3.00%, 3/25/51 1, 4 33,731 34,455
2019-8 A4, 3.50%, 3/25/50 1, 4 1,133 1,133
2019-9 A8, 3.50%, 5/25/50 1, 4 82,374 82,563
2020-2 A4, 3.50%, 7/25/50 1, 4 24,956 25,057
New Residential Mortgage Loan Trust:2018-3A A1, 4.50%, 5/25/58 1, 4 56,772 61,582
PMT Loan Trust: 2013-J1 A11, 3.50%,9/25/43 1, 4 45,112 45,872
Sequoia Mortgage Trust:
2020-4 A5, 2.50%, 11/25/50 1, 4 76,297 78,464
2019-5 A4, 3.50%, 12/25/49 1, 4 23,179 23,252
2020-2 A4, 3.50%, 3/25/50 1, 4 38,857 39,167
Vendee Mortgage Trust:
1994-2 2, 5.39%, 5/15/24 1 3,368 3,398
2008-1 B, 6.11%, 3/15/25 1 9,175 10,513
Wells Fargo Mortgaged Backed SecuritiesTrust:
2020-5 A3, 2.50%, 9/25/50 1, 4 59,882 60,629
2020-2 A17, 3.00%, 12/25/49 1, 4 52,487 52,853
2020-2 A3, 3.00%, 12/25/49 1, 4 36,649 37,035
3,018,654
Corporate Bonds - 12.0%American Airlines, 3.20%, 6/15/28 78,700 80,293
American Equity Investment Life HoldingCo., 5.00%, 6/15/27 75,000 84,894
AXIS Specialty Finance, 3.90%, 7/15/29 100,000 109,233
Baker Hughes a GE Co., LLC, 3.34%,12/15/27 200,000 218,882
Bank of America Corp., 3 Mo. Libor + 1.04,3.42%, 12/20/28 1 200,000 217,900
Booking Holdings, Inc., 4.63%, 4/13/30 150,000 179,416
British Airways 2013-1 Class A PassThrough Trust, 4.63%, 6/20/24 4 169,098 178,290
Name of Issuer
Quantity/Principal
Amount ($) Fair Value ($) Name of IssuerPrincipal
Amount ($) Fair Value ($)
See accompanying notes to financial statements.
7JUNE 30, 2021

British Airways 2020-1 Class B PassThrough Trust, 8.38%, 11/15/28 4 57,550 66,551
Cabot Corp., 3.40%, 9/15/26 183,000 195,973
Canadian Pacific Railway Co., 7.13%,10/15/31 100,000 141,794
Charles Stark Draper Laboratory, Inc.,4.39%, 9/1/48 100,000 112,556
CNO Financial Group, Inc., 5.25%, 5/30/29 100,000 118,951
Conagra Brands, Inc., 7.00%, 10/1/28 150,000 200,007
Concho Resources, Inc., 2.40%, 2/15/31 200,000 201,496
ConocoPhillips Co., 6.95%, 4/15/29 125,000 170,380
CVS Pass-Through Trust, 7.51%, 1/10/32 4 132,293 167,671
Delta Air Lines 2015-1 Class A PassThrough Trust, 3.88%, 7/30/27 152,209 159,089
Delta Air Lines, Inc./SkyMiles, 4.75%,10/20/28 4 200,000 222,481
Doric Nimrod Air Alpha 2013-1 Trust,5.25%, 5/30/23 4 23,367 23,468
Doric Nimrod Air Finance Alpha 2012-1Trust, 5.13%, 11/30/22 4 15,982 16,057
Duke Energy Florida, LLC:
2.54%, 9/1/29 50,000 52,730
2.86%, 3/1/33 55,000 58,469
Entergy Louisiana, LLC, 4.95%, 1/15/45 150,000 164,515
Equifax, Inc., 6.90%, 7/1/28 150,000 191,084
Equinor ASA, 7.15%, 11/15/25 150,000 186,773
Fairfax Financial Holdings, Ltd., 7.75%,7/15/37 150,000 208,048
FedEx Corp. 2020-1 Class AA Pass ThroughTrust, 1.88%, 2/20/34 291,979 289,997
Flex, Ltd., 4.88%, 5/12/30 200,000 232,316
Fulton Financial Corp. (Subordinated),4.50%, 11/15/24 72,000 79,242
ITT, LLC, 7.40%, 11/15/25 25,000 30,783
JetBlue Airways, 4.00%, 11/15/32 241,820 266,809
Johnson & Johnson, 3.55%, 3/1/36 150,000 174,849
JPMorgan Chase & Co.:
3 Mo. Libor + 0.95%, 3.51, 1/23/29 1 50,000 55,090
8.75%, 9/1/30 100,000 150,320
Lincoln National Corp., 7.00%, 6/15/40 100,000 152,913
Mercury General Corp., 4.40%, 3/15/27 100,000 112,916
Motorola Solutions, Inc., 2.75%, 5/24/31 225,000 229,416
Northern Trust Corp. (Subordinated), 3 Mo.Libor + 1.13, 3.38%, 5/8/32 1 150,000 163,187
Polar Tankers, Inc., 5.95%, 5/10/37 4 100,000 126,841
Principal Financial Group, Inc., 3 Mo. Libor+ 3.04, 3.20%, 5/15/55 1 100,000 99,450
Schlumberger Investment SA, 2.65%,6/26/30 150,000 157,717
Security Benefit Life Insurance Co.(Subordinated), 7.45%, 10/1/33 4 100,000 125,685
Simon Property Group LP, 2.45%, 9/13/29 150,000 154,485
Southwest Airlines Co., 2.63%, 2/10/30 185,000 189,348
Spirit Airlines 2015-1A Trust, 4.10%,4/1/28 119,691 125,109
Suncor Energy, Inc., 5.35%, 7/15/33 63,000 78,201
Tennessee Gas Pipeline Co., LLC, 7.00%,10/15/28 213,000 276,231
Truist Bank, (Subordinated), 2.25%,3/11/30 100,000 101,498
Tyco Intl. Finance, 3.90%, 2/14/26 200,000 213,309
United Airlines 2013-1 Class A PassThrough Trust, 4.30%, 8/15/25 169,471 179,279
United Airlines 2015-1 Class A PassThrough Trust, 3.70%, 12/1/22 125,000 128,689
Unum Group, 7.25%, 3/15/28 25,000 32,119
Webster Financial Corp., 4.38%, 2/15/24 125,000 133,314
WestRock MWV, LLC, 7.95%, 2/15/31 100,000 142,795
7,928,909
Federal Home Loan Mortgage Corporation - 0.2%6.50%, 2/1/22 177 178
7.50%, 7/1/29 88,798 102,749
8.00%, 2/1/34 10,407 12,200
8.50%, 9/1/24 2,939 2,971
118,098
Federal National Mortgage Association - 0.6%5.50%, 10/1/33 52,128 58,566
6.50%, 2/1/24 8,873 9,211
6.50%, 9/1/27 29,766 33,355
6.50%, 6/1/40 87,050 99,735
7.00%, 1/1/32 9,877 10,758
7.00%, 3/1/33 15,840 17,722
7.00%, 12/1/38 28,309 31,310
8.00%, 6/1/24 5,957 6,329
8.00%, 1/1/31 8,255 8,348
8.00%, 2/1/31 16,872 20,600
8.00%, 9/1/37 40,293 46,191
8.43%, 7/15/26 2,169 2,205
8.50%, 10/1/30 21,512 25,185
10.00%, 6/1/31 22,195 24,644
394,159
Government National Mortgage Association - 0.2%5.00%, 5/20/48 51,191 55,984
5.75%, 12/15/22 7,777 7,889
6.50%, 11/20/38 14,654 16,685
7.00%, 12/15/24 6,247 6,617
7.00%, 11/20/27 9,140 10,285
7.00%, 9/20/29 24,399 27,887
7.00%, 9/20/38 9,097 10,850
SCHEDULE OF INVESTMENTSJune 30, 2021
Sit Balanced Fund (Continued)
Name of IssuerPrincipalAmount ($) Fair Value ($) Name of Issuer
PrincipalAmount ($) Fair Value ($)
See accompanying notes to financial statements.
8 SIT MUTUAL FUNDS ANNUAL REPORT
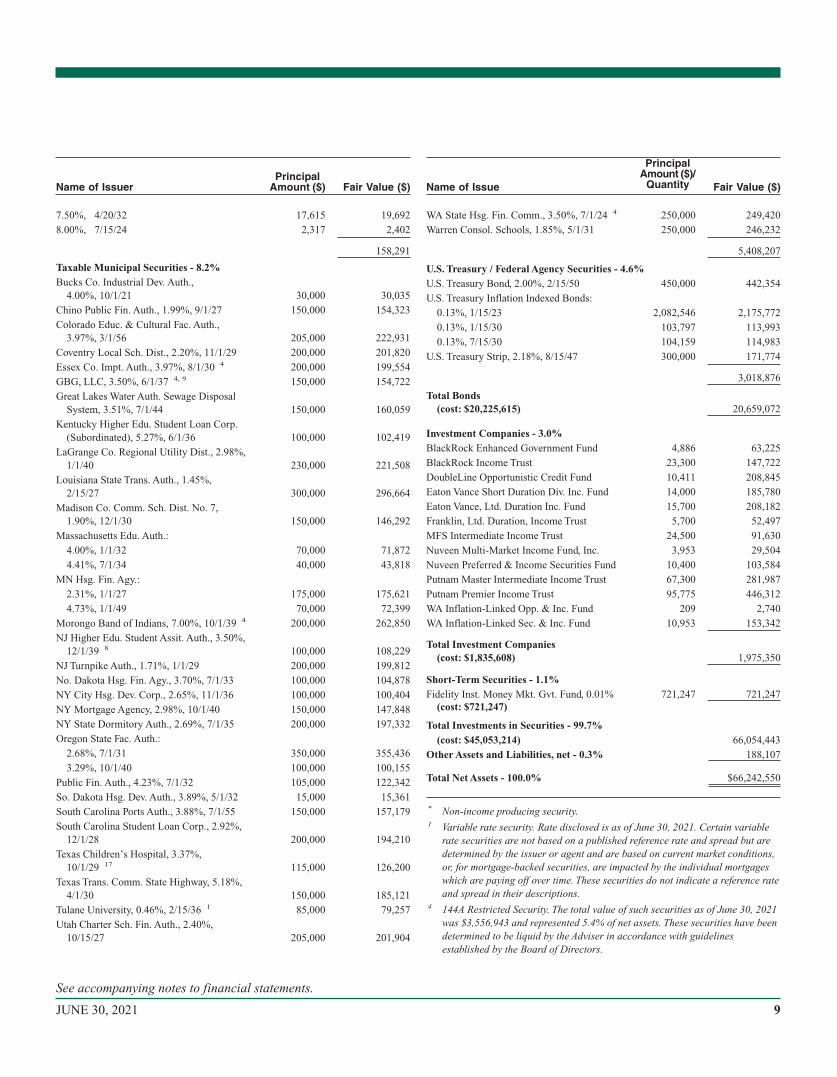
7.50%, 4/20/32 17,615 19,692
8.00%, 7/15/24 2,317 2,402
158,291
Taxable Municipal Securities - 8.2%Bucks Co. Industrial Dev. Auth.,
4.00%, 10/1/21 30,000 30,035
Chino Public Fin. Auth., 1.99%, 9/1/27 150,000 154,323
Colorado Educ. & Cultural Fac. Auth.,3.97%, 3/1/56 205,000 222,931
Coventry Local Sch. Dist., 2.20%, 11/1/29 200,000 201,820
Essex Co. Impt. Auth., 3.97%, 8/1/30 4 200,000 199,554
GBG, LLC, 3.50%, 6/1/37 4, 9 150,000 154,722
Great Lakes Water Auth. Sewage DisposalSystem, 3.51%, 7/1/44 150,000 160,059
Kentucky Higher Edu. Student Loan Corp.(Subordinated), 5.27%, 6/1/36 100,000 102,419
LaGrange Co. Regional Utility Dist., 2.98%,1/1/40 230,000 221,508
Louisiana State Trans. Auth., 1.45%,2/15/27 300,000 296,664
Madison Co. Comm. Sch. Dist. No. 7,1.90%, 12/1/30 150,000 146,292
Massachusetts Edu. Auth.:
4.00%, 1/1/32 70,000 71,872
4.41%, 7/1/34 40,000 43,818
MN Hsg. Fin. Agy.:
2.31%, 1/1/27 175,000 175,621
4.73%, 1/1/49 70,000 72,399
Morongo Band of Indians, 7.00%, 10/1/39 4 200,000 262,850
NJ Higher Edu. Student Assit. Auth., 3.50%,12/1/39 8 100,000 108,229
NJ Turnpike Auth., 1.71%, 1/1/29 200,000 199,812
No. Dakota Hsg. Fin. Agy., 3.70%, 7/1/33 100,000 104,878
NY City Hsg. Dev. Corp., 2.65%, 11/1/36 100,000 100,404
NY Mortgage Agency, 2.98%, 10/1/40 150,000 147,848
NY State Dormitory Auth., 2.69%, 7/1/35 200,000 197,332
Oregon State Fac. Auth.:
2.68%, 7/1/31 350,000 355,436
3.29%, 10/1/40 100,000 100,155
Public Fin. Auth., 4.23%, 7/1/32 105,000 122,342
So. Dakota Hsg. Dev. Auth., 3.89%, 5/1/32 15,000 15,361
South Carolina Ports Auth., 3.88%, 7/1/55 150,000 157,179
South Carolina Student Loan Corp., 2.92%,12/1/28 200,000 194,210
Texas Children’s Hospital, 3.37%,10/1/29 17 115,000 126,200
Texas Trans. Comm. State Highway, 5.18%,4/1/30 150,000 185,121
Tulane University, 0.46%, 2/15/36 1 85,000 79,257
Utah Charter Sch. Fin. Auth., 2.40%,10/15/27 205,000 201,904
WA State Hsg. Fin. Comm., 3.50%, 7/1/24 4 250,000 249,420
Warren Consol. Schools, 1.85%, 5/1/31 250,000 246,232
5,408,207
U.S. Treasury / Federal Agency Securities - 4.6%U.S. Treasury Bond, 2.00%, 2/15/50 450,000 442,354
U.S. Treasury Inflation Indexed Bonds:
0.13%, 1/15/23 2,082,546 2,175,772
0.13%, 1/15/30 103,797 113,993
0.13%, 7/15/30 104,159 114,983
U.S. Treasury Strip, 2.18%, 8/15/47 300,000 171,774
3,018,876
Total Bonds(cost: $20,225,615) 20,659,072
Investment Companies - 3.0%BlackRock Enhanced Government Fund 4,886 63,225
BlackRock Income Trust 23,300 147,722
DoubleLine Opportunistic Credit Fund 10,411 208,845
Eaton Vance Short Duration Div. Inc. Fund 14,000 185,780
Eaton Vance, Ltd. Duration Inc. Fund 15,700 208,182
Franklin, Ltd. Duration, Income Trust 5,700 52,497
MFS Intermediate Income Trust 24,500 91,630
Nuveen Multi-Market Income Fund, Inc. 3,953 29,504
Nuveen Preferred & Income Securities Fund 10,400 103,584
Putnam Master Intermediate Income Trust 67,300 281,987
Putnam Premier Income Trust 95,775 446,312
WA Inflation-Linked Opp. & Inc. Fund 209 2,740
WA Inflation-Linked Sec. & Inc. Fund 10,953 153,342
Total Investment Companies(cost: $1,835,608) 1,975,350
Short-Term Securities - 1.1%Fidelity Inst. Money Mkt. Gvt. Fund, 0.01% 721,247 721,247
(cost: $721,247)
Total Investments in Securities - 99.7%(cost: $45,053,214) 66,054,443
Other Assets and Liabilities, net - 0.3% 188,107
Total Net Assets - 100.0% $66,242,550
* Non-income producing security.1 Variable rate security. Rate disclosed is as of June 30, 2021. Certain variable
rate securities are not based on a published reference rate and spread but aredetermined by the issuer or agent and are based on current market conditions,or, for mortgage-backed securities, are impacted by the individual mortgageswhich are paying off over time. These securities do not indicate a reference rateand spread in their descriptions.
4 144A Restricted Security. The total value of such securities as of June 30, 2021was $3,556,943 and represented 5.4% of net assets. These securities have beendetermined to be liquid by the Adviser in accordance with guidelinesestablished by the Board of Directors.
Name of IssuerPrincipal
Amount ($) Fair Value ($) Name of Issue
PrincipalAmount ($)/
Quantity Fair Value ($)
See accompanying notes to financial statements.
9JUNE 30, 2021
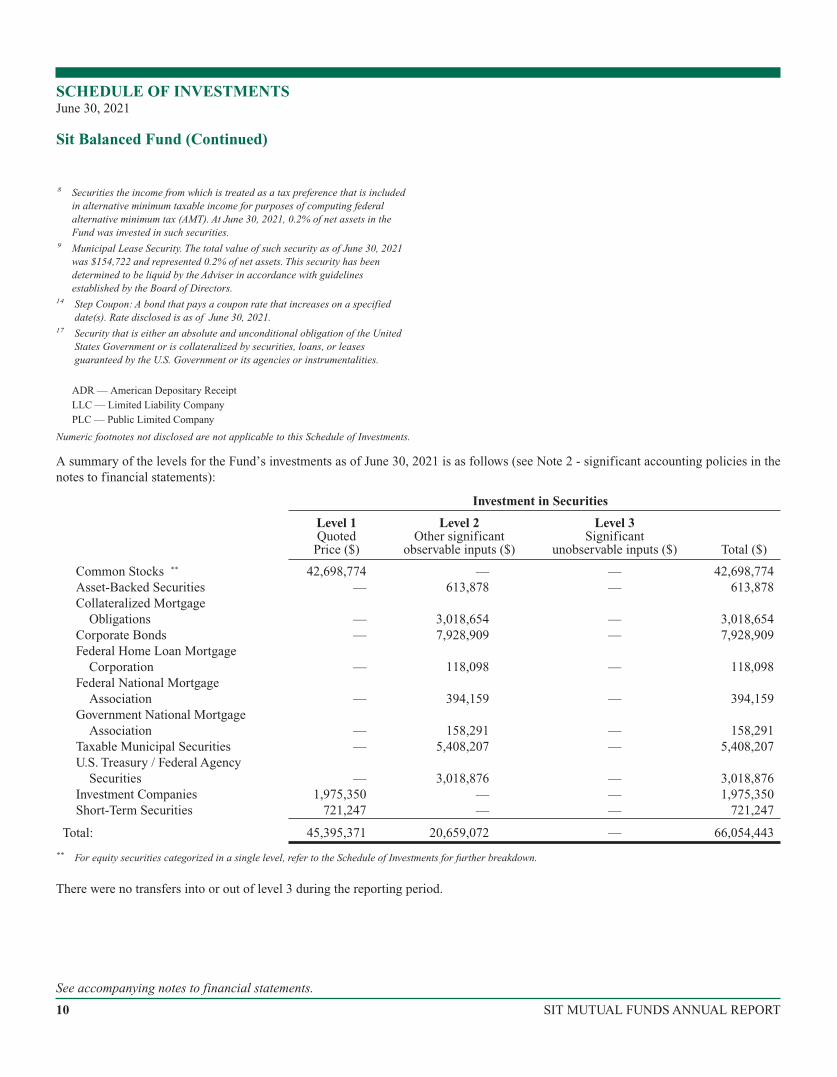
8 Securities the income from which is treated as a tax preference that is includedin alternative minimum taxable income for purposes of computing federalalternative minimum tax (AMT). At June 30, 2021, 0.2% of net assets in theFund was invested in such securities.
9 Municipal Lease Security. The total value of such security as of June 30, 2021was $154,722 and represented 0.2% of net assets. This security has beendetermined to be liquid by the Adviser in accordance with guidelinesestablished by the Board of Directors.
14 Step Coupon: A bond that pays a coupon rate that increases on a specifieddate(s). Rate disclosed is as of June 30, 2021.
17 Security that is either an absolute and unconditional obligation of the UnitedStates Government or is collateralized by securities, loans, or leasesguaranteed by the U.S. Government or its agencies or instrumentalities.
ADR — American Depositary Receipt
LLC — Limited Liability Company
PLC — Public Limited Company
Numeric footnotes not disclosed are not applicable to this Schedule of Investments.
A summary of the levels for the Fund’s investments as of June 30, 2021 is as follows (see Note 2 - significant accounting policies in thenotes to financial statements):
Investment in Securities
Level 1Quoted
Price ($)
Level 2Other significant
observable inputs ($)
Level 3Significant
unobservable inputs ($) Total ($)
Common Stocks ** 42,698,774 — — 42,698,774Asset-Backed Securities — 613,878 — 613,878Collateralized Mortgage
Obligations — 3,018,654 — 3,018,654Corporate Bonds — 7,928,909 — 7,928,909Federal Home Loan Mortgage
Corporation — 118,098 — 118,098Federal National Mortgage
Association — 394,159 — 394,159Government National Mortgage
Association — 158,291 — 158,291Taxable Municipal Securities — 5,408,207 — 5,408,207U.S. Treasury / Federal Agency
Securities — 3,018,876 — 3,018,876Investment Companies 1,975,350 — — 1,975,350Short-Term Securities 721,247 — — 721,247
Total: 45,395,371 20,659,072 — 66,054,443
** For equity securities categorized in a single level, refer to the Schedule of Investments for further breakdown.
There were no transfers into or out of level 3 during the reporting period.
SCHEDULE OF INVESTMENTSJune 30, 2021
Sit Balanced Fund (Continued)
See accompanying notes to financial statements.
10 SIT MUTUAL FUNDS ANNUAL REPORT

[This page intentionally left blank.]
11JUNE 30, 2021
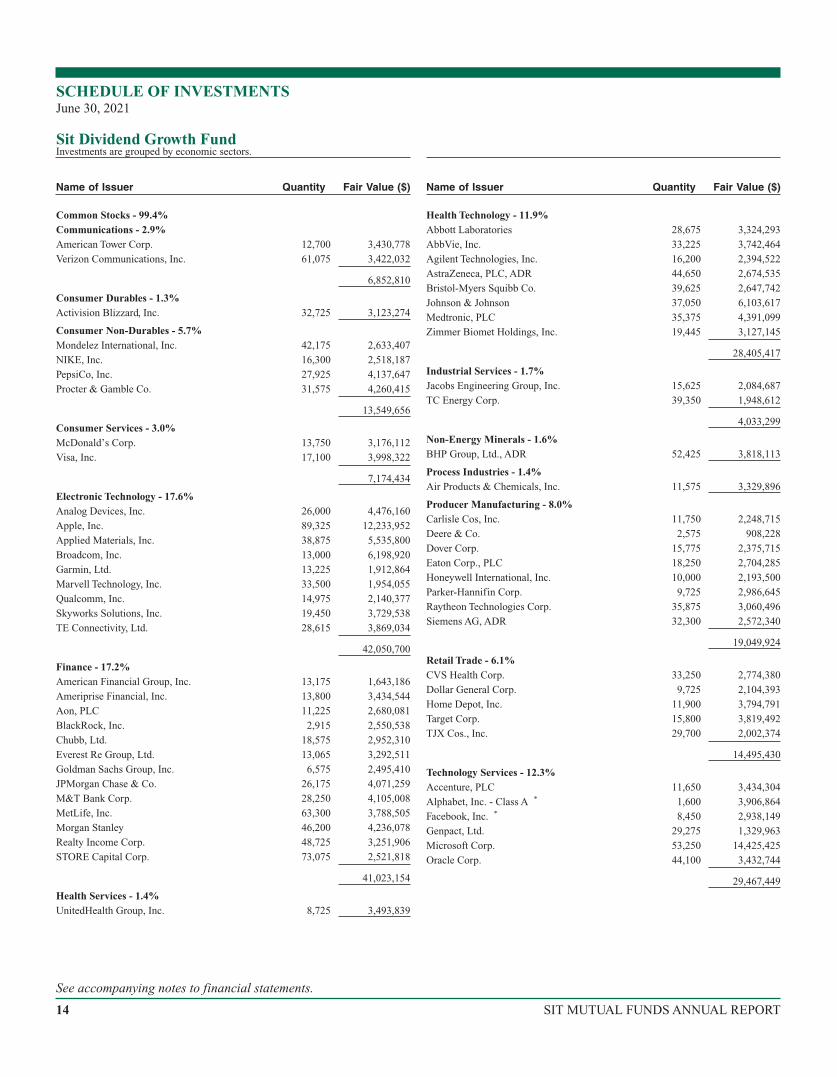
OBJECTIVE & STRATEGY
The objective of the Sit Dividend Growth Fund is to provide current income that exceeds the dividend yield of the S&P 500® Index and
that grows over a period of years. Secondarily, the Fund seeks long-term capital appreciation.
The Fund seeks to achieve its objectives by investing, under normal market conditions, at least 80% of its net assets in dividend-paying
common stocks. The Fund may invest the balance of its assets in preferred stocks, convertible bonds, and U.S. Treasury securities.
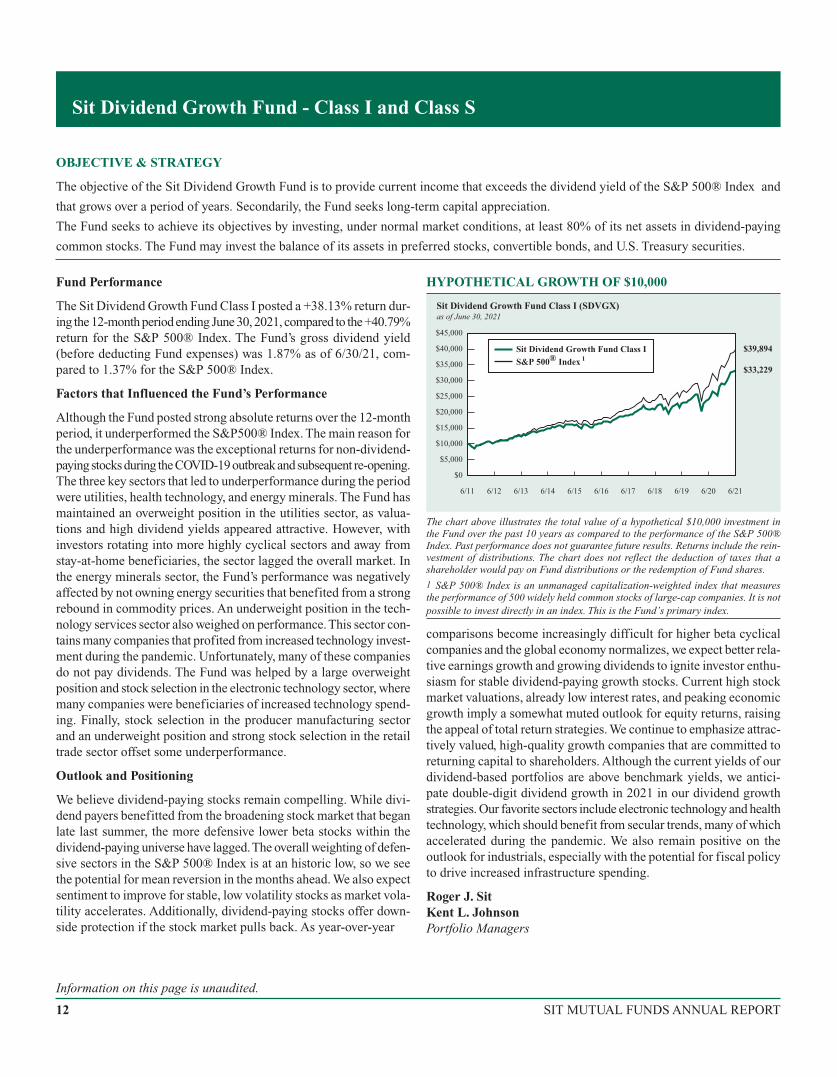
Fund Performance
The Sit Dividend Growth Fund Class I posted a +38.13% return dur-ing the 12-month period ending June 30, 2021, compared to the +40.79%return for the S&P 500® Index. The Fund’s gross dividend yield(before deducting Fund expenses) was 1.87% as of 6/30/21, com-pared to 1.37% for the S&P 500® Index.
Factors that Influenced the Fund’s Performance
Although the Fund posted strong absolute returns over the 12-monthperiod, it underperformed the S&P500® Index. The main reason forthe underperformance was the exceptional returns for non-dividend-payingstocksduring theCOVID-19outbreakandsubsequent re-opening.The three key sectors that led to underperformance during the periodwere utilities, health technology, and energy minerals. The Fund hasmaintained an overweight position in the utilities sector, as valua-tions and high dividend yields appeared attractive. However, withinvestors rotating into more highly cyclical sectors and away fromstay-at-home beneficiaries, the sector lagged the overall market. Inthe energy minerals sector, the Fund’s performance was negativelyaffected by not owning energy securities that benefited from a strongrebound in commodity prices. An underweight position in the tech-nology services sector also weighed on performance.This sector con-tains many companies that profited from increased technology invest-ment during the pandemic. Unfortunately, many of these companiesdo not pay dividends. The Fund was helped by a large overweightposition and stock selection in the electronic technology sector, wheremany companies were beneficiaries of increased technology spend-ing. Finally, stock selection in the producer manufacturing sectorand an underweight position and strong stock selection in the retailtrade sector offset some underperformance.
Outlook and Positioning
We believe dividend-paying stocks remain compelling. While divi-dend payers benefitted from the broadening stock market that beganlate last summer, the more defensive lower beta stocks within thedividend-paying universe have lagged.The overall weighting of defen-sive sectors in the S&P 500® Index is at an historic low, so we seethe potential for mean reversion in the months ahead. We also expectsentiment to improve for stable, low volatility stocks as market vola-tility accelerates. Additionally, dividend-paying stocks offer down-side protection if the stock market pulls back. As year-over-year
HYPOTHETICAL GROWTH OF $10,000
$0
$20,000
$45,000
$40,000
$35,000
$30,000
$33,229
$39,894
Sit Dividend Growth Fund Class I (SDVGX)as of June 30, 2021
$25,000
$10,000
$15,000
$5,000
Sit Dividend Growth Fund Class IS&P 500 Index 1®
6/18 6/19 6/216/206/176/166/11 6/12 6/13 6/14 6/15
The chart above illustrates the total value of a hypothetical $10,000 investment inthe Fund over the past 10 years as compared to the performance of the S&P 500®Index. Past performance does not guarantee future results. Returns include the rein-vestment of distributions. The chart does not reflect the deduction of taxes that ashareholder would pay on Fund distributions or the redemption of Fund shares.
1 S&P 500® Index is an unmanaged capitalization-weighted index that measuresthe performance of 500 widely held common stocks of large-cap companies. It is notpossible to invest directly in an index. This is the Fund’s primary index.
comparisons become increasingly difficult for higher beta cyclicalcompanies and the global economy normalizes, we expect better rela-tive earnings growth and growing dividends to ignite investor enthu-siasm for stable dividend-paying growth stocks. Current high stockmarket valuations, already low interest rates, and peaking economicgrowth imply a somewhat muted outlook for equity returns, raisingthe appeal of total return strategies. We continue to emphasize attrac-tively valued, high-quality growth companies that are committed toreturning capital to shareholders. Although the current yields of ourdividend-based portfolios are above benchmark yields, we antici-pate double-digit dividend growth in 2021 in our dividend growthstrategies. Our favorite sectors include electronic technology and healthtechnology, which should benefit from secular trends, many of whichaccelerated during the pandemic. We also remain positive on theoutlook for industrials, especially with the potential for fiscal policyto drive increased infrastructure spending.
Roger J. SitKent L. JohnsonPortfolio Managers
Sit Dividend Growth Fund - Class I and Class S
Information on this page is unaudited.
12 SIT MUTUAL FUNDS ANNUAL REPORT
COMPARATIVE RATES OF RETURNS
as of June 30, 2021
Sit DividendGrowth Fund
S&P 500®Index 1Class I Class S
One Year 38.13% 37.87% 40.79%Five Year 14.99 14.71 17.65Ten Year 12.76 12.48 14.84Since Inception - Class I 10.69 n/a 10.24(12/31/03)Since Inception - Class S n/a 10.24 10.43(3/31/06)
Performance figures are historical and do not guarantee future results. Investmentreturns and principal value will vary, and you may have a gain or loss when you sellshares. Current performance may be lower or higher than the performance data quoted.Contact the Fund for performance data current to the most recent month-end. Returnsinclude changes in share price as well as reinvestment of all dividends and capitalgains. Returns do not reflect the deduction of the 2% redemption fee imposed if sharesare redeemed or exchanged within 30 calendar days from their date of purchase. Ifimposed, the fee would reduce the performance quoted. Returns do not reflect thededuction of taxes that a shareholder would pay on Fund distributions or the redemp-tion of Fund shares. Management fees and administrative expenses are included inthe Fund’s performance. Returns for periods greater than one year are compounded
average annual rates of return.
1 S&P 500® Index is an unmanaged capitalization-weighted index that measuresthe performance of 500 widely held common stocks of large-cap companies. It is notpossible to invest directly in an index.
PORTFOLIO SUMMARY
Class I:Net Asset Value 6/30/21: $17.37 Per ShareNet Asset Value 6/30/20: $13.48 Per ShareTotal Net Assets: $207.4 MillionClass S:Net Asset Value 6/30/21: $17.27 Per ShareNet Asset Value 6/30/20: $13.40 Per ShareTotal Net Assets: $31.3 Million
Weighted Average Market Cap: $382.5 Billion
TOP 10 HOLDINGS
1. Microsoft Corp.2. Apple, Inc.3. Broadcom, Inc.4. Johnson & Johnson5. Applied Materials, Inc.6. Analog Devices, Inc.7. Medtronic, PLC8. Procter & Gamble Co.9. Morgan Stanley
10. PepsiCo, Inc.
Based on total net assets as of June 30, 2021. Subject to change.
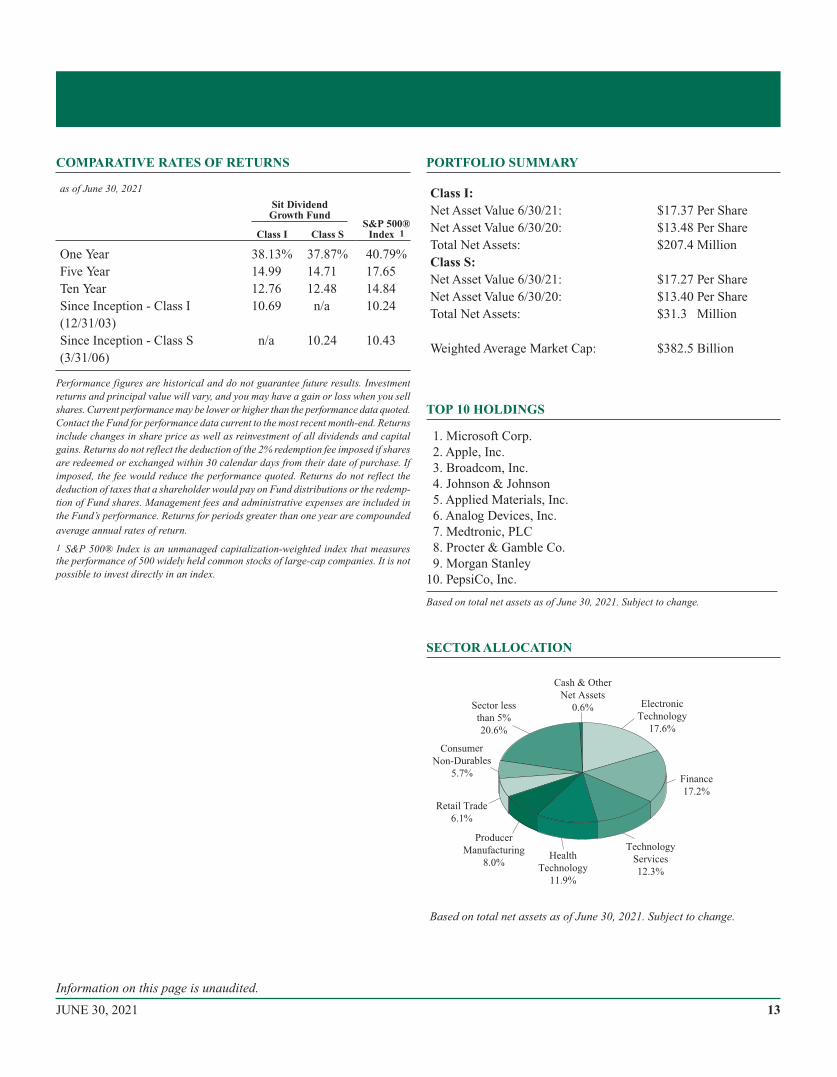
SECTOR ALLOCATION
Based on total net assets as of June 30, 2021. Subject to change.
Health
Technology
11.9%
Sector less
than 5%
20.6%
Cash & Other
Net Assets
0.6% Electronic
Technology
17.6%
Finance
17.2%
Technology
Services
12.3%
Consumer
Non-Durables
5.7%
Retail Trade
6.1%
Producer
Manufacturing
8.0%
Information on this page is unaudited.
13JUNE 30, 2021
Common Stocks - 99.4%Communications - 2.9%American Tower Corp. 12,700 3,430,778
Verizon Communications, Inc. 61,075 3,422,032
6,852,810
Consumer Durables - 1.3%Activision Blizzard, Inc. 32,725 3,123,274
Consumer Non-Durables - 5.7%Mondelez International, Inc. 42,175 2,633,407
NIKE, Inc. 16,300 2,518,187
PepsiCo, Inc. 27,925 4,137,647
Procter & Gamble Co. 31,575 4,260,415
13,549,656
Consumer Services - 3.0%McDonald’s Corp. 13,750 3,176,112
Visa, Inc. 17,100 3,998,322
7,174,434
Electronic Technology - 17.6%Analog Devices, Inc. 26,000 4,476,160
Apple, Inc. 89,325 12,233,952
Applied Materials, Inc. 38,875 5,535,800
Broadcom, Inc. 13,000 6,198,920
Garmin, Ltd. 13,225 1,912,864
Marvell Technology, Inc. 33,500 1,954,055
Qualcomm, Inc. 14,975 2,140,377
Skyworks Solutions, Inc. 19,450 3,729,538
TE Connectivity, Ltd. 28,615 3,869,034
42,050,700
Finance - 17.2%American Financial Group, Inc. 13,175 1,643,186
Ameriprise Financial, Inc. 13,800 3,434,544
Aon, PLC 11,225 2,680,081
BlackRock, Inc. 2,915 2,550,538
Chubb, Ltd. 18,575 2,952,310
Everest Re Group, Ltd. 13,065 3,292,511
Goldman Sachs Group, Inc. 6,575 2,495,410
JPMorgan Chase & Co. 26,175 4,071,259
M&T Bank Corp. 28,250 4,105,008
MetLife, Inc. 63,300 3,788,505
Morgan Stanley 46,200 4,236,078
Realty Income Corp. 48,725 3,251,906
STORE Capital Corp. 73,075 2,521,818
41,023,154
Health Services - 1.4%UnitedHealth Group, Inc. 8,725 3,493,839
Health Technology - 11.9%Abbott Laboratories 28,675 3,324,293
AbbVie, Inc. 33,225 3,742,464
Agilent Technologies, Inc. 16,200 2,394,522
AstraZeneca, PLC, ADR 44,650 2,674,535
Bristol-Myers Squibb Co. 39,625 2,647,742
Johnson & Johnson 37,050 6,103,617
Medtronic, PLC 35,375 4,391,099
Zimmer Biomet Holdings, Inc. 19,445 3,127,145
28,405,417
Industrial Services - 1.7%Jacobs Engineering Group, Inc. 15,625 2,084,687
TC Energy Corp. 39,350 1,948,612
4,033,299
Non-Energy Minerals - 1.6%BHP Group, Ltd., ADR 52,425 3,818,113
Process Industries - 1.4%Air Products & Chemicals, Inc. 11,575 3,329,896
Producer Manufacturing - 8.0%Carlisle Cos, Inc. 11,750 2,248,715
Deere & Co. 2,575 908,228
Dover Corp. 15,775 2,375,715
Eaton Corp., PLC 18,250 2,704,285
Honeywell International, Inc. 10,000 2,193,500
Parker-Hannifin Corp. 9,725 2,986,645
Raytheon Technologies Corp. 35,875 3,060,496
Siemens AG, ADR 32,300 2,572,340
19,049,924
Retail Trade - 6.1%CVS Health Corp. 33,250 2,774,380
Dollar General Corp. 9,725 2,104,393
Home Depot, Inc. 11,900 3,794,791
Target Corp. 15,800 3,819,492
TJX Cos., Inc. 29,700 2,002,374
14,495,430
Technology Services - 12.3%Accenture, PLC 11,650 3,434,304
Alphabet, Inc. - Class A * 1,600 3,906,864
Facebook, Inc. * 8,450 2,938,149
Genpact, Ltd. 29,275 1,329,963
Microsoft Corp. 53,250 14,425,425
Oracle Corp. 44,100 3,432,744
29,467,449
SCHEDULE OF INVESTMENTSJune 30, 2021
Sit Dividend Growth FundInvestments are grouped by economic sectors.
Name of Issuer Quantity Fair Value ($) Name of Issuer Quantity Fair Value ($)
See accompanying notes to financial statements.
14 SIT MUTUAL FUNDS ANNUAL REPORT
Transportation - 2.7%FedEx Corp. 11,125 3,318,921
Union Pacific Corp. 13,950 3,068,024
6,386,945
Utilities - 4.6%Alliant Energy Corp. 43,375 2,418,590
Dominion Energy, Inc. 23,500 1,728,895
Entergy Corp. 39,050 3,893,285
NextEra Energy, Inc. 40,875 2,995,320
11,036,090
Total Common Stocks(cost: $162,006,759) 237,290,430
Short-Term Securities - 0.5%Fidelity Inst. Money Mkt. Gvt. Fund, 0.01% 1,136,759 1,136,759
(cost: $1,136,759)Total Investments in Securities - 99.9%
(cost: $163,143,518) 238,427,189
Other Assets and Liabilities, net - 0.1% 245,469
Total Net Assets - 100.0% $238,672,658
* Non-income producing security.
ADR — American Depositary Receipt
PLC — Public Limited Company
Numeric footnotes not disclosed are not applicable to this Schedule of Investments.
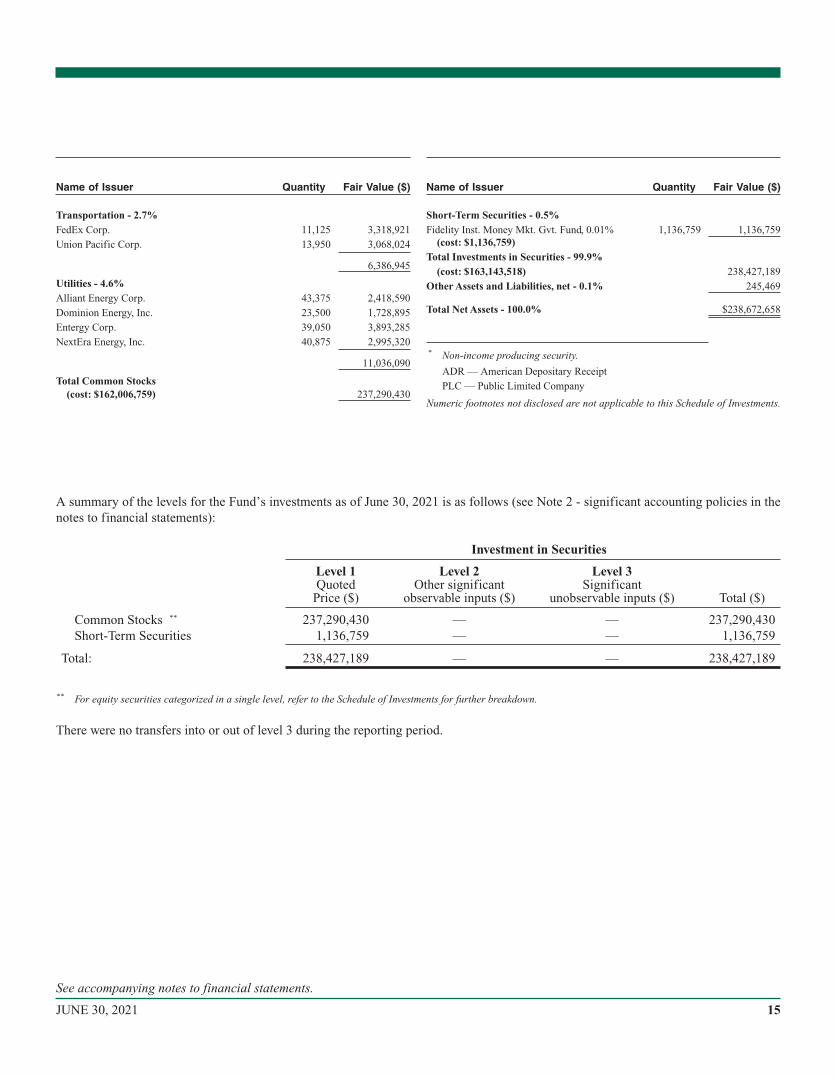
A summary of the levels for the Fund’s investments as of June 30, 2021 is as follows (see Note 2 - significant accounting policies in thenotes to financial statements):
Investment in Securities
Level 1Quoted
Price ($)
Level 2Other significant
observable inputs ($)
Level 3Significant
unobservable inputs ($) Total ($)
Common Stocks ** 237,290,430 — — 237,290,430Short-Term Securities 1,136,759 — — 1,136,759
Total: 238,427,189 — — 238,427,189
** For equity securities categorized in a single level, refer to the Schedule of Investments for further breakdown.
There were no transfers into or out of level 3 during the reporting period.
Name of Issuer Quantity Fair Value ($) Name of Issuer Quantity Fair Value ($)
See accompanying notes to financial statements.
15JUNE 30, 2021
OBJECTIVE & STRATEGY
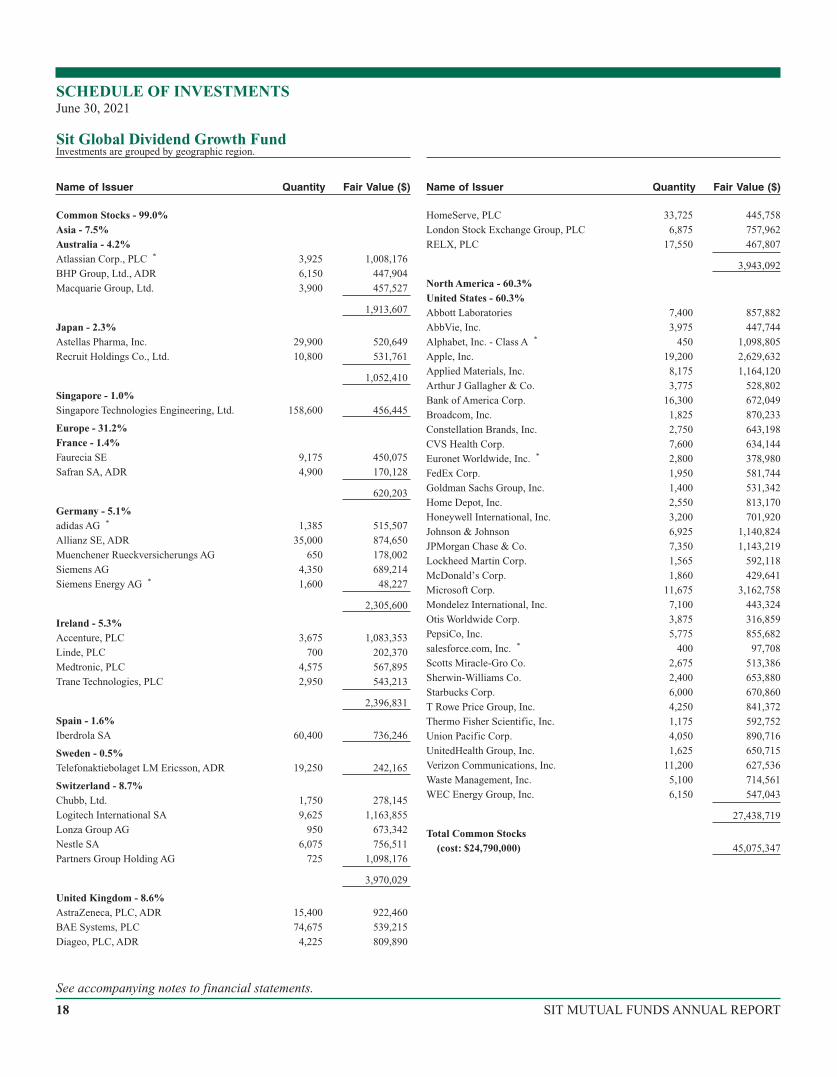
The objective of the Sit Global Dividend Growth Fund is to provide current income that exceeds the dividend yield of the MSCI WorldIndex and that grows over a period of years. Secondarily, the Fund seeks long-term capital appreciation.The Fund seeks to achieve its objectives by investing, under normal market conditions, at least 80% of its net assets in dividend-payingcommon stocks issued by U.S. and foreign companies. The Fund may invest the balance of its assets in preferred stocks, convertible bonds,and U.S. Treasury securities.
Fund Performance
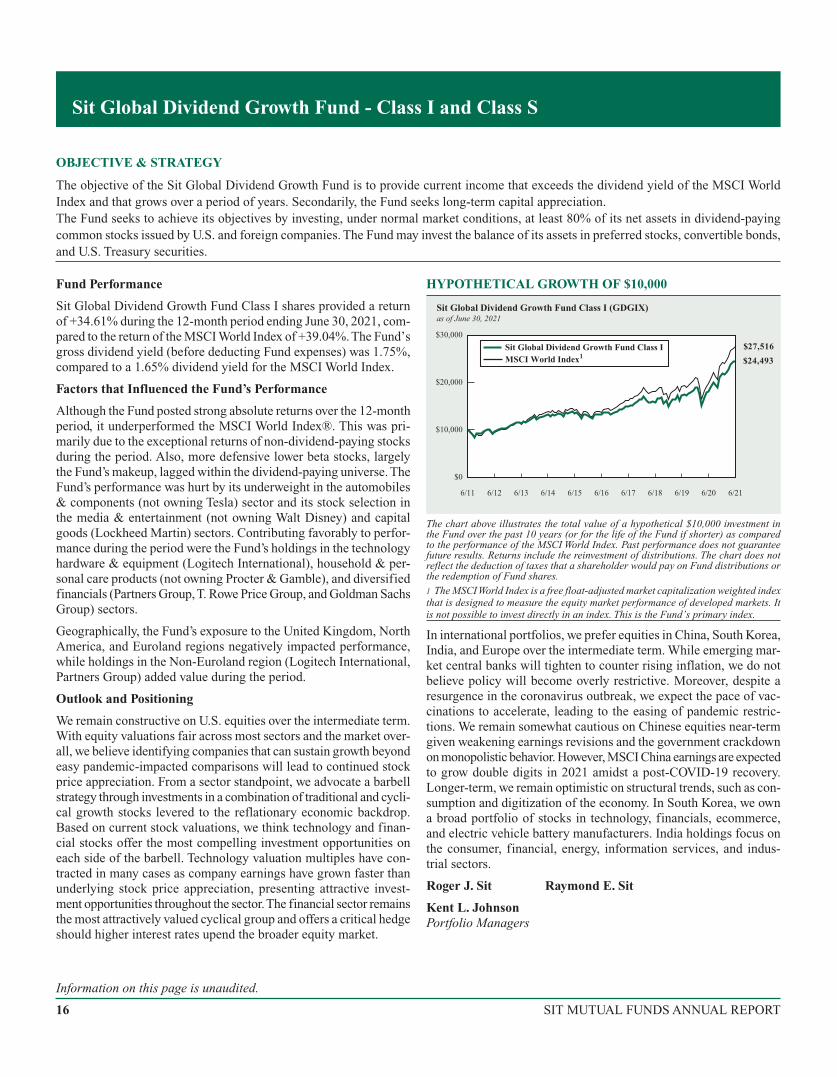
Sit Global Dividend Growth Fund Class I shares provided a returnof +34.61% during the 12-month period ending June 30, 2021, com-pared to the return of the MSCI World Index of +39.04%. The Fund’sgross dividend yield (before deducting Fund expenses) was 1.75%,compared to a 1.65% dividend yield for the MSCI World Index.
Factors that Influenced the Fund’s Performance
Although the Fund posted strong absolute returns over the 12-monthperiod, it underperformed the MSCI World Index®. This was pri-marily due to the exceptional returns of non-dividend-paying stocksduring the period. Also, more defensive lower beta stocks, largelythe Fund’s makeup, lagged within the dividend-paying universe. TheFund’s performance was hurt by its underweight in the automobiles& components (not owning Tesla) sector and its stock selection inthe media & entertainment (not owning Walt Disney) and capitalgoods (Lockheed Martin) sectors. Contributing favorably to perfor-mance during the period were the Fund’s holdings in the technologyhardware & equipment (Logitech International), household & per-sonal care products (not owning Procter & Gamble), and diversifiedfinancials (Partners Group,T. Rowe Price Group, and Goldman SachsGroup) sectors.
Geographically, the Fund’s exposure to the United Kingdom, NorthAmerica, and Euroland regions negatively impacted performance,while holdings in the Non-Euroland region (Logitech International,Partners Group) added value during the period.
Outlook and Positioning
We remain constructive on U.S. equities over the intermediate term.With equity valuations fair across most sectors and the market over-all, we believe identifying companies that can sustain growth beyondeasy pandemic-impacted comparisons will lead to continued stockprice appreciation. From a sector standpoint, we advocate a barbellstrategy through investments in a combination of traditional and cycli-cal growth stocks levered to the reflationary economic backdrop.Based on current stock valuations, we think technology and finan-cial stocks offer the most compelling investment opportunities oneach side of the barbell. Technology valuation multiples have con-tracted in many cases as company earnings have grown faster thanunderlying stock price appreciation, presenting attractive invest-ment opportunities throughout the sector.The financial sector remainsthe most attractively valued cyclical group and offers a critical hedgeshould higher interest rates upend the broader equity market.
HYPOTHETICAL GROWTH OF $10,000
$0
$30,000
6/11
$27,516
Sit Global Dividend Growth Fund Class I (GDGIX)as of June 30, 2021
$20,000
$24,493
6/15 6/16 6/19 6/206/17 6/186/146/136/12
$10,000
6/21
Sit Global Dividend Growth Fund Class IMSCI World Index1
The chart above illustrates the total value of a hypothetical $10,000 investment inthe Fund over the past 10 years (or for the life of the Fund if shorter) as comparedto the performance of the MSCI World Index. Past performance does not guaranteefuture results. Returns include the reinvestment of distributions. The chart does notreflect the deduction of taxes that a shareholder would pay on Fund distributions orthe redemption of Fund shares.1 The MSCI World Index is a free float-adjusted market capitalization weighted indexthat is designed to measure the equity market performance of developed markets. Itis not possible to invest directly in an index. This is the Fund’s primary index.
In international portfolios, we prefer equities in China, South Korea,India, and Europe over the intermediate term. While emerging mar-ket central banks will tighten to counter rising inflation, we do notbelieve policy will become overly restrictive. Moreover, despite aresurgence in the coronavirus outbreak, we expect the pace of vac-cinations to accelerate, leading to the easing of pandemic restric-tions. We remain somewhat cautious on Chinese equities near-termgiven weakening earnings revisions and the government crackdownon monopolistic behavior. However, MSCI China earnings are expectedto grow double digits in 2021 amidst a post-COVID-19 recovery.Longer-term, we remain optimistic on structural trends, such as con-sumption and digitization of the economy. In South Korea, we owna broad portfolio of stocks in technology, financials, ecommerce,and electric vehicle battery manufacturers. India holdings focus onthe consumer, financial, energy, information services, and indus-trial sectors.
Roger J. Sit Raymond E. Sit
Kent L. JohnsonPortfolio Managers
Sit Global Dividend Growth Fund - Class I and Class S
Information on this page is unaudited.
16 SIT MUTUAL FUNDS ANNUAL REPORT
COMPARATIVE RATES OF RETURNS
as of June 30, 2021
Sit GlobalDividend
Growth Fund MSCIWorld
Index 1Class I Class S
One Year 34.61% 34.32% 39.04%Five Year 12.94 12.66 14.83Ten Year 9.37 9.11 10.65Since Inception 10.09 9.81 9.79(9/30/08)
Performance figures are historical and do not guarantee future results. Investmentreturns and principal value will vary, and you may have a gain or loss when you sellshares. Current performance may be lower or higher than the performance data quoted.Contact the Fund for performance data current to the most recent month-end. Returnsinclude changes in share price as well as reinvestment of all dividends and capitalgains. Returns do not reflect the deduction of the 2% redemption fee imposed if sharesare redeemed or exchanged within 30 calendar days from their date of purchase. Ifimposed, the fee would reduce the performance quoted. Returns do not reflect thededuction of taxes that a shareholder would pay on Fund distributions or the redemp-tion of Fund shares. Management fees and administrative expenses are included inthe Fund’s performance. Returns for periods greater than one year are compoundedaverage annual rates of return.
1 The MSCIWorld Index is a free float-adjusted market capitalization weighted indexthat is designed to measure the equity market performance of developed markets. Itis not possible to invest directly in an index.
PORTFOLIO SUMMARY
Class I:Net Asset Value 6/30/21: $22.47 Per ShareNet Asset Value 6/30/20: $16.87 Per ShareTotal Net Assets: $41.5 MillionClass S:Net Asset Value 6/30/21: $22.45 Per ShareNet Asset Value 6/30/20: $16.85 Per ShareTotal Net Assets: $4.1 Million
Weighted Average Market Cap: $409.7 Billion
TOP 10 HOLDINGS
1. Microsoft Corp.2. Apple, Inc.3. Applied Materials, Inc.4. Logitech International SA5. JPMorgan Chase & Co.6. Johnson & Johnson7. Alphabet, Inc. - Class A8. Partners Group Holding AG9. Accenture, PLC
10. Atlassian Corp., PLC
Based on total net assets as of June 30, 2021. Subject to change.
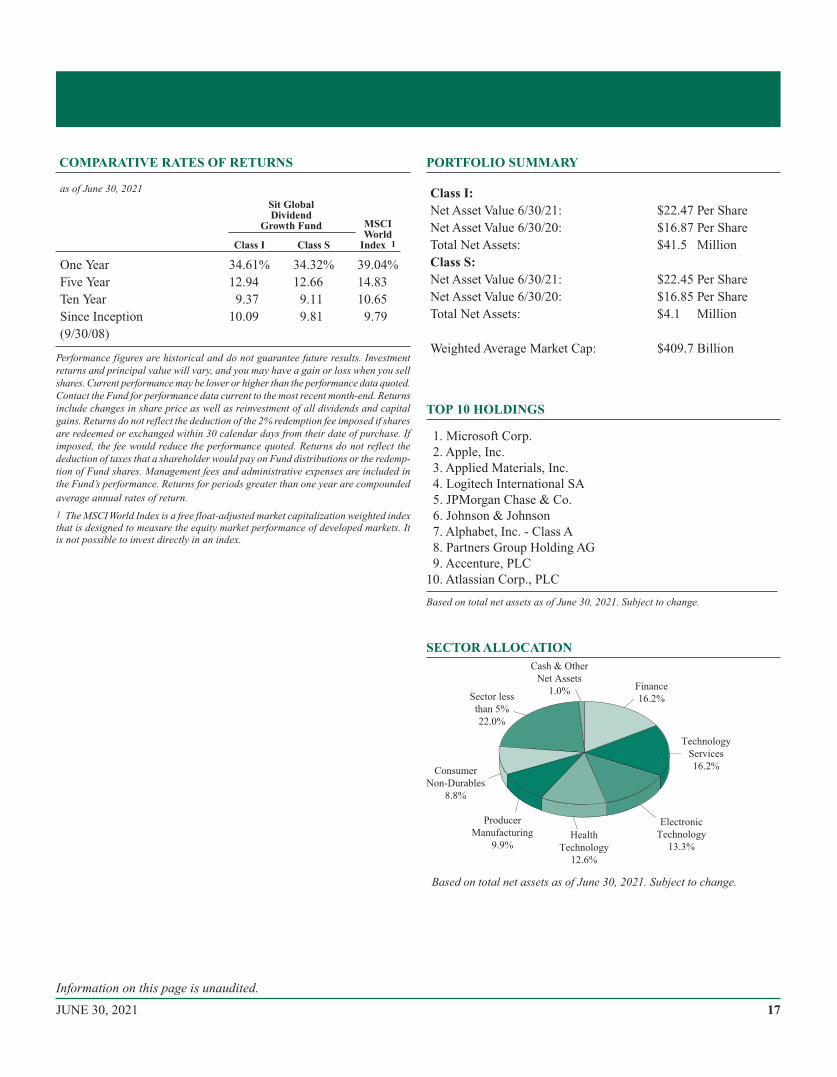
SECTOR ALLOCATION
Based on total net assets as of June 30, 2021. Subject to change.
Finance
16.2%
Health
Technology
12.6%
Electronic
Technology
13.3%
Producer
Manufacturing
9.9%
Consumer
Non-Durables
8.8%
Technology
Services
16.2%
Sector less
than 5%
22.0%
Cash & Other
Net Assets
1.0%
Information on this page is unaudited.
17JUNE 30, 2021
Common Stocks - 99.0%Asia - 7.5%Australia - 4.2%Atlassian Corp., PLC * 3,925 1,008,176
BHP Group, Ltd., ADR 6,150 447,904
Macquarie Group, Ltd. 3,900 457,527
1,913,607
Japan - 2.3%Astellas Pharma, Inc. 29,900 520,649
Recruit Holdings Co., Ltd. 10,800 531,761
1,052,410
Singapore - 1.0%Singapore Technologies Engineering, Ltd. 158,600 456,445
Europe - 31.2%France - 1.4%Faurecia SE 9,175 450,075
Safran SA, ADR 4,900 170,128
620,203
Germany - 5.1%adidas AG * 1,385 515,507
Allianz SE, ADR 35,000 874,650
Muenchener Rueckversicherungs AG 650 178,002
Siemens AG 4,350 689,214
Siemens Energy AG * 1,600 48,227
2,305,600
Ireland - 5.3%Accenture, PLC 3,675 1,083,353
Linde, PLC 700 202,370
Medtronic, PLC 4,575 567,895
Trane Technologies, PLC 2,950 543,213
2,396,831
Spain - 1.6%Iberdrola SA 60,400 736,246
Sweden - 0.5%Telefonaktiebolaget LM Ericsson, ADR 19,250 242,165
Switzerland - 8.7%Chubb, Ltd. 1,750 278,145
Logitech International SA 9,625 1,163,855
Lonza Group AG 950 673,342
Nestle SA 6,075 756,511
Partners Group Holding AG 725 1,098,176
3,970,029
United Kingdom - 8.6%AstraZeneca, PLC, ADR 15,400 922,460
BAE Systems, PLC 74,675 539,215
Diageo, PLC, ADR 4,225 809,890
HomeServe, PLC 33,725 445,758
London Stock Exchange Group, PLC 6,875 757,962
RELX, PLC 17,550 467,807
3,943,092
North America - 60.3%United States - 60.3%Abbott Laboratories 7,400 857,882
AbbVie, Inc. 3,975 447,744
Alphabet, Inc. - Class A * 450 1,098,805
Apple, Inc. 19,200 2,629,632
Applied Materials, Inc. 8,175 1,164,120
Arthur J Gallagher & Co. 3,775 528,802
Bank of America Corp. 16,300 672,049
Broadcom, Inc. 1,825 870,233
Constellation Brands, Inc. 2,750 643,198
CVS Health Corp. 7,600 634,144
Euronet Worldwide, Inc. * 2,800 378,980
FedEx Corp. 1,950 581,744
Goldman Sachs Group, Inc. 1,400 531,342
Home Depot, Inc. 2,550 813,170
Honeywell International, Inc. 3,200 701,920
Johnson & Johnson 6,925 1,140,824
JPMorgan Chase & Co. 7,350 1,143,219
Lockheed Martin Corp. 1,565 592,118
McDonald’s Corp. 1,860 429,641
Microsoft Corp. 11,675 3,162,758
Mondelez International, Inc. 7,100 443,324
Otis Worldwide Corp. 3,875 316,859
PepsiCo, Inc. 5,775 855,682
salesforce.com, Inc. * 400 97,708
Scotts Miracle-Gro Co. 2,675 513,386
Sherwin-Williams Co. 2,400 653,880
Starbucks Corp. 6,000 670,860
T Rowe Price Group, Inc. 4,250 841,372
Thermo Fisher Scientific, Inc. 1,175 592,752
Union Pacific Corp. 4,050 890,716
UnitedHealth Group, Inc. 1,625 650,715
Verizon Communications, Inc. 11,200 627,536
Waste Management, Inc. 5,100 714,561
WEC Energy Group, Inc. 6,150 547,043
27,438,719
Total Common Stocks(cost: $24,790,000) 45,075,347
SCHEDULE OF INVESTMENTSJune 30, 2021
Sit Global Dividend Growth FundInvestments are grouped by geographic region.
Name of Issuer Quantity Fair Value ($) Name of Issuer Quantity Fair Value ($)
See accompanying notes to financial statements.
18 SIT MUTUAL FUNDS ANNUAL REPORT
Short-Term Securities - 0.9%Fidelity Inst. Money Mkt. Gvt. Fund, 0.01% 423,155 423,155
(cost: $423,155)Total Investments in Securities - 99.9%
(cost: $25,213,155) 45,498,502
Other Assets and Liabilities, net - 0.1% 55,715
Total Net Assets - 100.0% $45,554,217
* Non-income producing security.
ADR — American Depositary Receipt
PLC — Public Limited Company
Numeric footnotes not disclosed are not applicable to this Schedule of Investments.
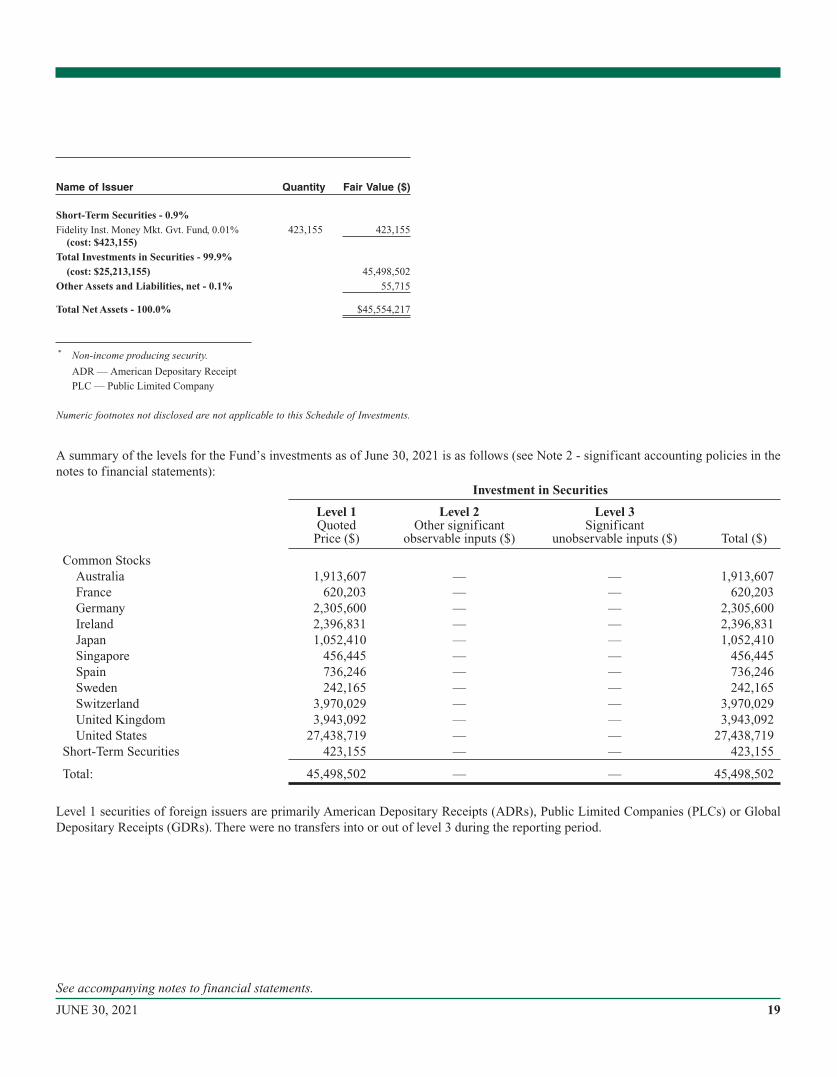
A summary of the levels for the Fund’s investments as of June 30, 2021 is as follows (see Note 2 - significant accounting policies in thenotes to financial statements):
Investment in Securities
Level 1Quoted
Price ($)
Level 2Other significant
observable inputs ($)
Level 3Significant
unobservable inputs ($) Total ($)
Common StocksAustralia 1,913,607 — — 1,913,607France 620,203 — — 620,203Germany 2,305,600 — — 2,305,600Ireland 2,396,831 — — 2,396,831Japan 1,052,410 — — 1,052,410Singapore 456,445 — — 456,445Spain 736,246 — — 736,246Sweden 242,165 — — 242,165Switzerland 3,970,029 — — 3,970,029United Kingdom 3,943,092 — — 3,943,092United States 27,438,719 — — 27,438,719
Short-Term Securities 423,155 — — 423,155
Total: 45,498,502 — — 45,498,502
Level 1 securities of foreign issuers are primarily American Depositary Receipts (ADRs), Public Limited Companies (PLCs) or GlobalDepositary Receipts (GDRs). There were no transfers into or out of level 3 during the reporting period.
Name of Issuer Quantity Fair Value ($)
See accompanying notes to financial statements.
19JUNE 30, 2021
OBJECTIVE & STRATEGY
The objective of the Sit Large Cap Growth Fund is to maximize long-term capital appreciation. The Fund pursues this objective by invest-
ing at least 80% of its net assets in the common stocks of domestic growth companies with capitalizations of $5 billion or more at the time
of purchase.
Fund Performance
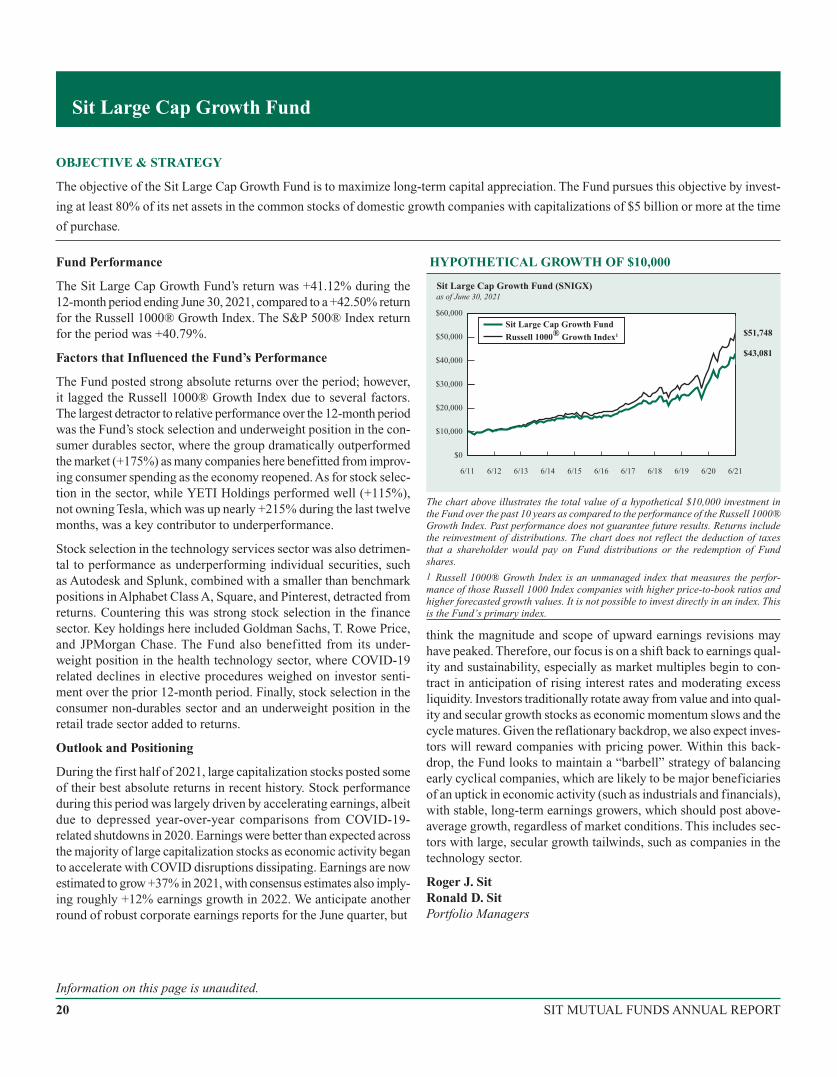
The Sit Large Cap Growth Fund’s return was +41.12% during the12-month period ending June 30, 2021, compared to a +42.50% returnfor the Russell 1000® Growth Index. The S&P 500® Index returnfor the period was +40.79%.
Factors that Influenced the Fund’s Performance
The Fund posted strong absolute returns over the period; however,it lagged the Russell 1000® Growth Index due to several factors.The largest detractor to relative performance over the 12-month periodwas the Fund’s stock selection and underweight position in the con-sumer durables sector, where the group dramatically outperformedthe market (+175%) as many companies here benefitted from improv-ing consumer spending as the economy reopened. As for stock selec-tion in the sector, while YETI Holdings performed well (+115%),not owning Tesla, which was up nearly +215% during the last twelvemonths, was a key contributor to underperformance.
Stock selection in the technology services sector was also detrimen-tal to performance as underperforming individual securities, suchas Autodesk and Splunk, combined with a smaller than benchmarkpositions in Alphabet Class A, Square, and Pinterest, detracted fromreturns. Countering this was strong stock selection in the financesector. Key holdings here included Goldman Sachs, T. Rowe Price,and JPMorgan Chase. The Fund also benefitted from its under-weight position in the health technology sector, where COVID-19related declines in elective procedures weighed on investor senti-ment over the prior 12-month period. Finally, stock selection in theconsumer non-durables sector and an underweight position in theretail trade sector added to returns.
Outlook and Positioning
During the first half of 2021, large capitalization stocks posted someof their best absolute returns in recent history. Stock performanceduring this period was largely driven by accelerating earnings, albeitdue to depressed year-over-year comparisons from COVID-19-related shutdowns in 2020. Earnings were better than expected acrossthe majority of large capitalization stocks as economic activity beganto accelerate with COVID disruptions dissipating. Earnings are nowestimated to grow +37% in 2021, with consensus estimates also imply-ing roughly +12% earnings growth in 2022. We anticipate anotherround of robust corporate earnings reports for the June quarter, but
HYPOTHETICAL GROWTH OF $10,000
$0
$10,000
$60,000
$50,000
$40,000
$20,000
$43,081
$51,748
Sit Large Cap Growth Fund (SNIGX)as of June 30, 2021
$30,000
6/18 6/206/196/176/166/11 6/12 6/13 6/14 6/15 6/21
Sit Large Cap Growth FundRussell 1000® Growth Index1
The chart above illustrates the total value of a hypothetical $10,000 investment inthe Fund over the past 10 years as compared to the performance of the Russell 1000®Growth Index. Past performance does not guarantee future results. Returns includethe reinvestment of distributions. The chart does not reflect the deduction of taxesthat a shareholder would pay on Fund distributions or the redemption of Fundshares.
1 Russell 1000® Growth Index is an unmanaged index that measures the perfor-mance of those Russell 1000 Index companies with higher price-to-book ratios andhigher forecasted growth values. It is not possible to invest directly in an index. Thisis the Fund’s primary index.
think the magnitude and scope of upward earnings revisions mayhave peaked. Therefore, our focus is on a shift back to earnings qual-ity and sustainability, especially as market multiples begin to con-tract in anticipation of rising interest rates and moderating excessliquidity. Investors traditionally rotate away from value and into qual-ity and secular growth stocks as economic momentum slows and thecycle matures. Given the reflationary backdrop, we also expect inves-tors will reward companies with pricing power. Within this back-drop, the Fund looks to maintain a “barbell” strategy of balancingearly cyclical companies, which are likely to be major beneficiariesof an uptick in economic activity (such as industrials and financials),with stable, long-term earnings growers, which should post above-average growth, regardless of market conditions. This includes sec-tors with large, secular growth tailwinds, such as companies in thetechnology sector.
Roger J. SitRonald D. SitPortfolio Managers
Sit Large Cap Growth Fund
Information on this page is unaudited.
20 SIT MUTUAL FUNDS ANNUAL REPORT
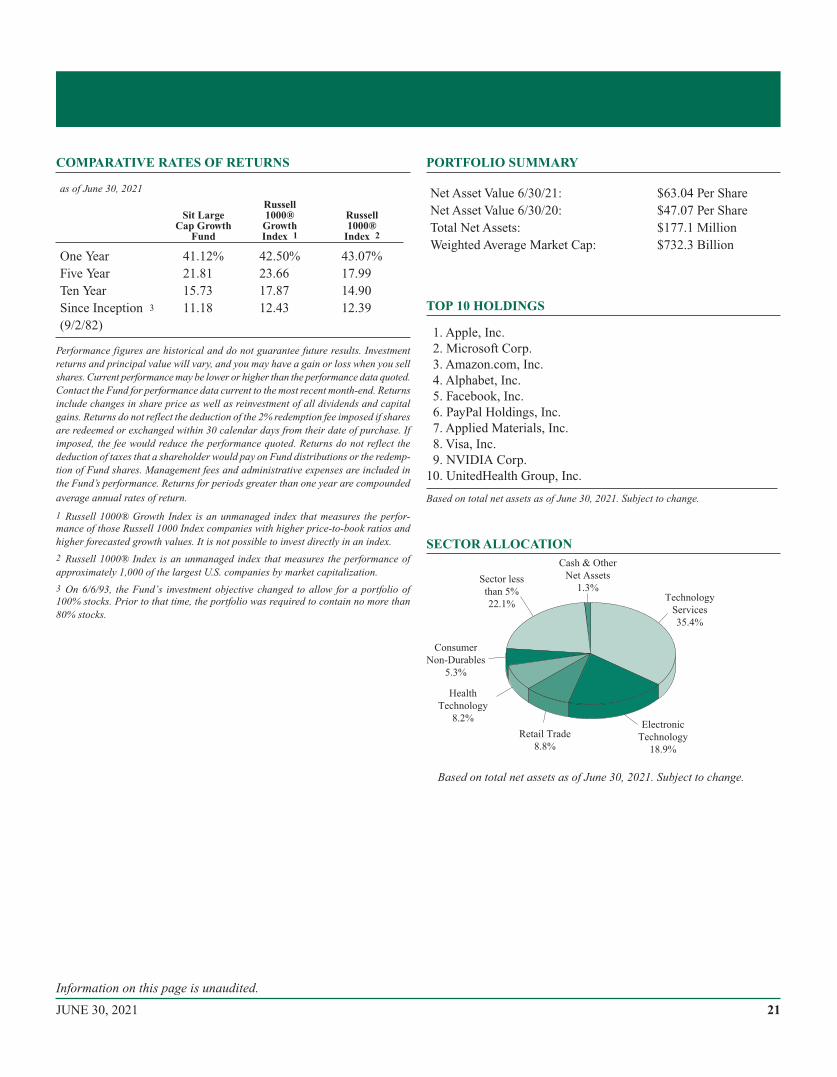
COMPARATIVE RATES OF RETURNS
as of June 30, 2021
Sit LargeCap Growth
Fund
Russell1000®
GrowthIndex 1
Russell1000®
Index 2
One Year 41.12% 42.50% 43.07%Five Year 21.81 23.66 17.99Ten Year 15.73 17.87 14.90Since Inception 3 11.18 12.43 12.39(9/2/82)
Performance figures are historical and do not guarantee future results. Investmentreturns and principal value will vary, and you may have a gain or loss when you sellshares. Current performance may be lower or higher than the performance data quoted.Contact the Fund for performance data current to the most recent month-end. Returnsinclude changes in share price as well as reinvestment of all dividends and capitalgains. Returns do not reflect the deduction of the 2% redemption fee imposed if sharesare redeemed or exchanged within 30 calendar days from their date of purchase. Ifimposed, the fee would reduce the performance quoted. Returns do not reflect thededuction of taxes that a shareholder would pay on Fund distributions or the redemp-tion of Fund shares. Management fees and administrative expenses are included inthe Fund’s performance. Returns for periods greater than one year are compounded
average annual rates of return.
1 Russell 1000® Growth Index is an unmanaged index that measures the perfor-mance of those Russell 1000 Index companies with higher price-to-book ratios andhigher forecasted growth values. It is not possible to invest directly in an index.
2 Russell 1000® Index is an unmanaged index that measures the performance ofapproximately 1,000 of the largest U.S. companies by market capitalization.
3 On 6/6/93, the Fund’s investment objective changed to allow for a portfolio of100% stocks. Prior to that time, the portfolio was required to contain no more than80% stocks.
PORTFOLIO SUMMARY
Net Asset Value 6/30/21: $63.04 Per ShareNet Asset Value 6/30/20: $47.07 Per ShareTotal Net Assets: $177.1 MillionWeighted Average Market Cap: $732.3 Billion
TOP 10 HOLDINGS
1. Apple, Inc.2. Microsoft Corp.3. Amazon.com, Inc.4. Alphabet, Inc.5. Facebook, Inc.6. PayPal Holdings, Inc.7. Applied Materials, Inc.8. Visa, Inc.9. NVIDIA Corp.
10. UnitedHealth Group, Inc.
Based on total net assets as of June 30, 2021. Subject to change.
SECTOR ALLOCATION
Based on total net assets as of June 30, 2021. Subject to change.
Technology
Services
35.4%
Electronic
Technology
18.9%
Retail Trade
8.8%
Health
Technology
8.2%
Cash & Other
Net Assets
1.3%
Consumer
Non-Durables
5.3%
Sector less
than 5%
22.1%
Information on this page is unaudited.
21JUNE 30, 2021
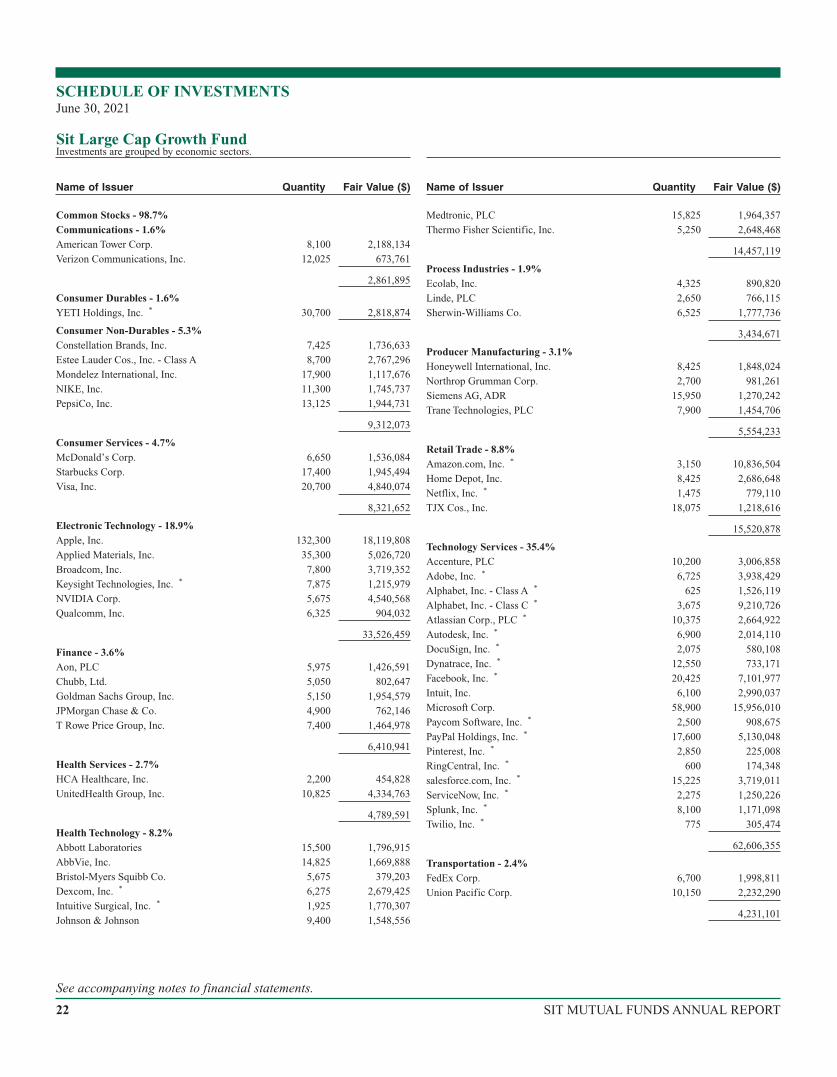
Common Stocks - 98.7%Communications - 1.6%American Tower Corp. 8,100 2,188,134
Verizon Communications, Inc. 12,025 673,761
2,861,895
Consumer Durables - 1.6%YETI Holdings, Inc. * 30,700 2,818,874
Consumer Non-Durables - 5.3%Constellation Brands, Inc. 7,425 1,736,633
Estee Lauder Cos., Inc. - Class A 8,700 2,767,296
Mondelez International, Inc. 17,900 1,117,676
NIKE, Inc. 11,300 1,745,737
PepsiCo, Inc. 13,125 1,944,731
9,312,073
Consumer Services - 4.7%McDonald’s Corp. 6,650 1,536,084
Starbucks Corp. 17,400 1,945,494
Visa, Inc. 20,700 4,840,074
8,321,652
Electronic Technology - 18.9%Apple, Inc. 132,300 18,119,808
Applied Materials, Inc. 35,300 5,026,720
Broadcom, Inc. 7,800 3,719,352
Keysight Technologies, Inc. * 7,875 1,215,979
NVIDIA Corp. 5,675 4,540,568
Qualcomm, Inc. 6,325 904,032
33,526,459
Finance - 3.6%Aon, PLC 5,975 1,426,591
Chubb, Ltd. 5,050 802,647
Goldman Sachs Group, Inc. 5,150 1,954,579
JPMorgan Chase & Co. 4,900 762,146
T Rowe Price Group, Inc. 7,400 1,464,978
6,410,941
Health Services - 2.7%HCA Healthcare, Inc. 2,200 454,828
UnitedHealth Group, Inc. 10,825 4,334,763
4,789,591
Health Technology - 8.2%Abbott Laboratories 15,500 1,796,915
AbbVie, Inc. 14,825 1,669,888
Bristol-Myers Squibb Co. 5,675 379,203
Dexcom, Inc. * 6,275 2,679,425
Intuitive Surgical, Inc. * 1,925 1,770,307
Johnson & Johnson 9,400 1,548,556
Medtronic, PLC 15,825 1,964,357
Thermo Fisher Scientific, Inc. 5,250 2,648,468
14,457,119
Process Industries - 1.9%Ecolab, Inc. 4,325 890,820
Linde, PLC 2,650 766,115
Sherwin-Williams Co. 6,525 1,777,736
3,434,671
Producer Manufacturing - 3.1%Honeywell International, Inc. 8,425 1,848,024
Northrop Grumman Corp. 2,700 981,261
Siemens AG, ADR 15,950 1,270,242
Trane Technologies, PLC 7,900 1,454,706
5,554,233
Retail Trade - 8.8%Amazon.com, Inc. * 3,150 10,836,504
Home Depot, Inc. 8,425 2,686,648
Netflix, Inc. * 1,475 779,110
TJX Cos., Inc. 18,075 1,218,616
15,520,878
Technology Services - 35.4%Accenture, PLC 10,200 3,006,858
Adobe, Inc. * 6,725 3,938,429
Alphabet, Inc. - Class A * 625 1,526,119
Alphabet, Inc. - Class C * 3,675 9,210,726
Atlassian Corp., PLC * 10,375 2,664,922
Autodesk, Inc. * 6,900 2,014,110
DocuSign, Inc. * 2,075 580,108
Dynatrace, Inc. * 12,550 733,171
Facebook, Inc. * 20,425 7,101,977
Intuit, Inc. 6,100 2,990,037
Microsoft Corp. 58,900 15,956,010
Paycom Software, Inc. * 2,500 908,675
PayPal Holdings, Inc. * 17,600 5,130,048
Pinterest, Inc. * 2,850 225,008
RingCentral, Inc. * 600 174,348
salesforce.com, Inc. * 15,225 3,719,011
ServiceNow, Inc. * 2,275 1,250,226
Splunk, Inc. * 8,100 1,171,098
Twilio, Inc. * 775 305,474
62,606,355
Transportation - 2.4%FedEx Corp. 6,700 1,998,811
Union Pacific Corp. 10,150 2,232,290
4,231,101
SCHEDULE OF INVESTMENTSJune 30, 2021
Sit Large Cap Growth FundInvestments are grouped by economic sectors.
Name of Issuer Quantity Fair Value ($) Name of Issuer Quantity Fair Value ($)
See accompanying notes to financial statements.
22 SIT MUTUAL FUNDS ANNUAL REPORT
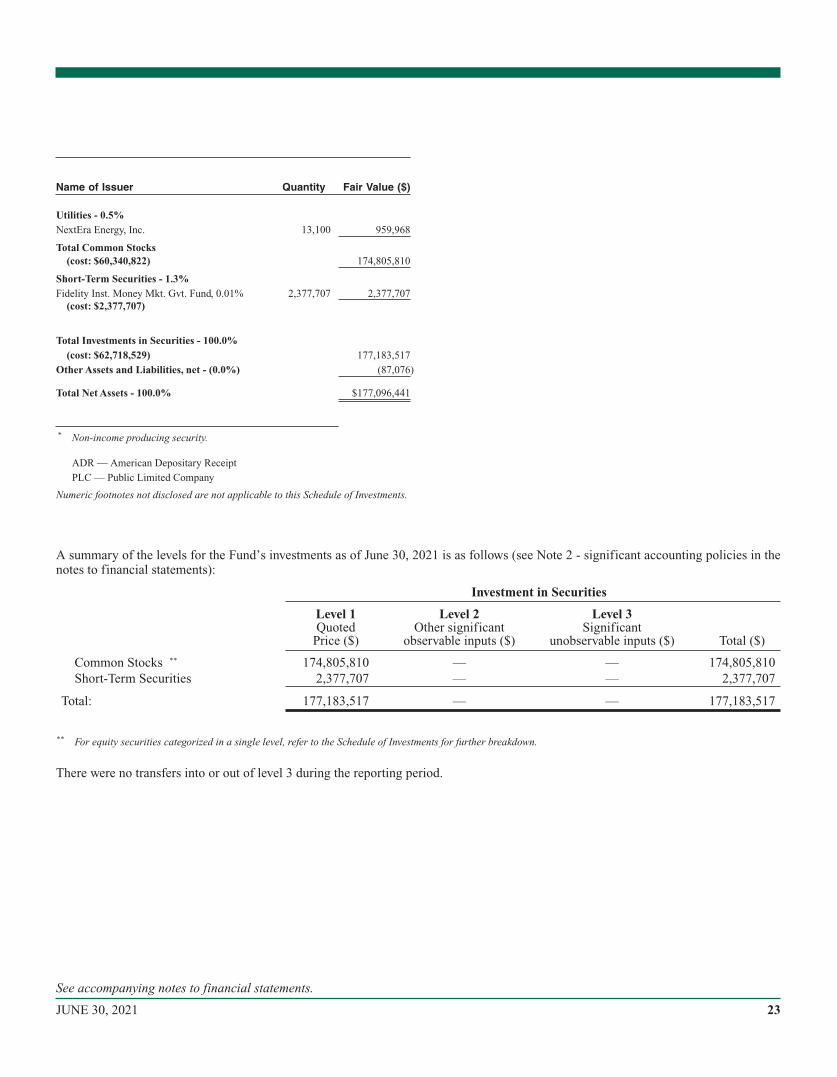
Utilities - 0.5%NextEra Energy, Inc. 13,100 959,968
Total Common Stocks(cost: $60,340,822) 174,805,810
Short-Term Securities - 1.3%Fidelity Inst. Money Mkt. Gvt. Fund, 0.01% 2,377,707 2,377,707
(cost: $2,377,707)
Total Investments in Securities - 100.0%(cost: $62,718,529) 177,183,517
Other Assets and Liabilities, net - (0.0%) (87,076)
Total Net Assets - 100.0% $177,096,441
* Non-income producing security.
ADR — American Depositary Receipt
PLC — Public Limited Company
Numeric footnotes not disclosed are not applicable to this Schedule of Investments.
A summary of the levels for the Fund’s investments as of June 30, 2021 is as follows (see Note 2 - significant accounting policies in thenotes to financial statements):
Investment in Securities
Level 1Quoted
Price ($)
Level 2Other significant
observable inputs ($)
Level 3Significant
unobservable inputs ($) Total ($)
Common Stocks ** 174,805,810 — — 174,805,810Short-Term Securities 2,377,707 — — 2,377,707
Total: 177,183,517 — — 177,183,517
** For equity securities categorized in a single level, refer to the Schedule of Investments for further breakdown.
There were no transfers into or out of level 3 during the reporting period.
Name of Issuer Quantity Fair Value ($)
See accompanying notes to financial statements.
23JUNE 30, 2021
OBJECTIVE & STRATEGY
The objective of the Sit ESG Growth Fund is to maximize long-term capital appreciation. The Fund seeks to achieve its objectives by
investing, under normal market conditions, at least 80% of its net assets in companies that the Adviser believes have strong environmental,
social and corporate governance (ESG) practices at the time of purchase. The Fund invests in common stocks of U.S. and foreign compa-
nies, primarily of large to medium capitalizations (companies with market capitalization in excess of $2 billion).
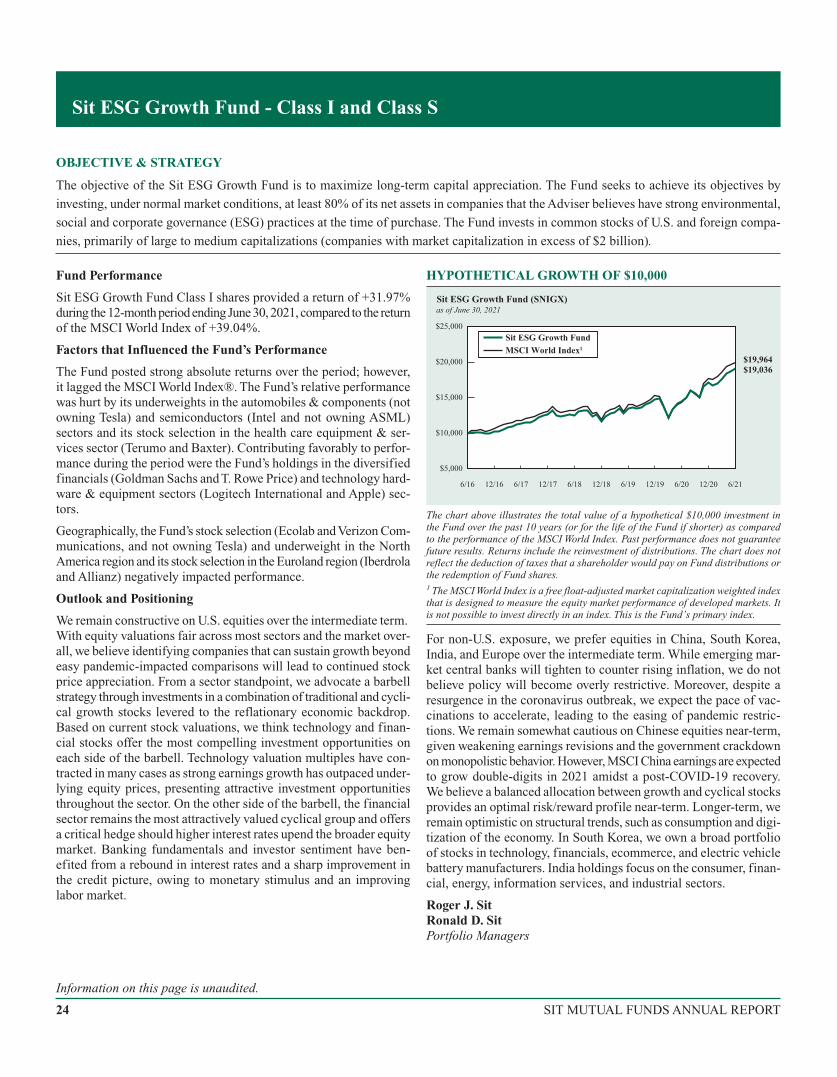
Fund Performance
Sit ESG Growth Fund Class I shares provided a return of +31.97%during the 12-month period ending June 30, 2021, compared to the returnof the MSCI World Index of +39.04%.
Factors that Influenced the Fund’s Performance
The Fund posted strong absolute returns over the period; however,it lagged the MSCI World Index®. The Fund’s relative performancewas hurt by its underweights in the automobiles & components (notowning Tesla) and semiconductors (Intel and not owning ASML)sectors and its stock selection in the health care equipment & ser-vices sector (Terumo and Baxter). Contributing favorably to perfor-mance during the period were the Fund’s holdings in the diversifiedfinancials (Goldman Sachs and T. Rowe Price) and technology hard-ware & equipment sectors (Logitech International and Apple) sec-tors.
Geographically, the Fund’s stock selection (Ecolab andVerizon Com-munications, and not owning Tesla) and underweight in the NorthAmerica region and its stock selection in the Euroland region (Iberdrolaand Allianz) negatively impacted performance.
Outlook and Positioning
We remain constructive on U.S. equities over the intermediate term.With equity valuations fair across most sectors and the market over-all, we believe identifying companies that can sustain growth beyondeasy pandemic-impacted comparisons will lead to continued stockprice appreciation. From a sector standpoint, we advocate a barbellstrategy through investments in a combination of traditional and cycli-cal growth stocks levered to the reflationary economic backdrop.Based on current stock valuations, we think technology and finan-cial stocks offer the most compelling investment opportunities oneach side of the barbell. Technology valuation multiples have con-tracted in many cases as strong earnings growth has outpaced under-lying equity prices, presenting attractive investment opportunitiesthroughout the sector. On the other side of the barbell, the financialsector remains the most attractively valued cyclical group and offersa critical hedge should higher interest rates upend the broader equitymarket. Banking fundamentals and investor sentiment have ben-efited from a rebound in interest rates and a sharp improvement inthe credit picture, owing to monetary stimulus and an improvinglabor market.
HYPOTHETICAL GROWTH OF $10,000
$5,000
$10,000
$15,000
$25,000
$20,000$19,036$19,964
Sit ESG Growth Fund (SNIGX)as of June 30, 2021
12/19 6/216/206/196/16 12/176/17 6/1812/16 12/18 12/20
Sit ESG Growth FundMSCI World Index1
The chart above illustrates the total value of a hypothetical $10,000 investment inthe Fund over the past 10 years (or for the life of the Fund if shorter) as comparedto the performance of the MSCI World Index. Past performance does not guaranteefuture results. Returns include the reinvestment of distributions. The chart does notreflect the deduction of taxes that a shareholder would pay on Fund distributions orthe redemption of Fund shares.1 The MSCI World Index is a free float-adjusted market capitalization weighted indexthat is designed to measure the equity market performance of developed markets. Itis not possible to invest directly in an index. This is the Fund’s primary index.
For non-U.S. exposure, we prefer equities in China, South Korea,India, and Europe over the intermediate term. While emerging mar-ket central banks will tighten to counter rising inflation, we do notbelieve policy will become overly restrictive. Moreover, despite aresurgence in the coronavirus outbreak, we expect the pace of vac-cinations to accelerate, leading to the easing of pandemic restric-tions. We remain somewhat cautious on Chinese equities near-term,given weakening earnings revisions and the government crackdownon monopolistic behavior. However, MSCI China earnings are expectedto grow double-digits in 2021 amidst a post-COVID-19 recovery.We believe a balanced allocation between growth and cyclical stocksprovides an optimal risk/reward profile near-term. Longer-term, weremain optimistic on structural trends, such as consumption and digi-tization of the economy. In South Korea, we own a broad portfolioof stocks in technology, financials, ecommerce, and electric vehiclebattery manufacturers. India holdings focus on the consumer, finan-cial, energy, information services, and industrial sectors.
Roger J. SitRonald D. SitPortfolio Managers
Sit ESG Growth Fund - Class I and Class S
Information on this page is unaudited.
24 SIT MUTUAL FUNDS ANNUAL REPORT
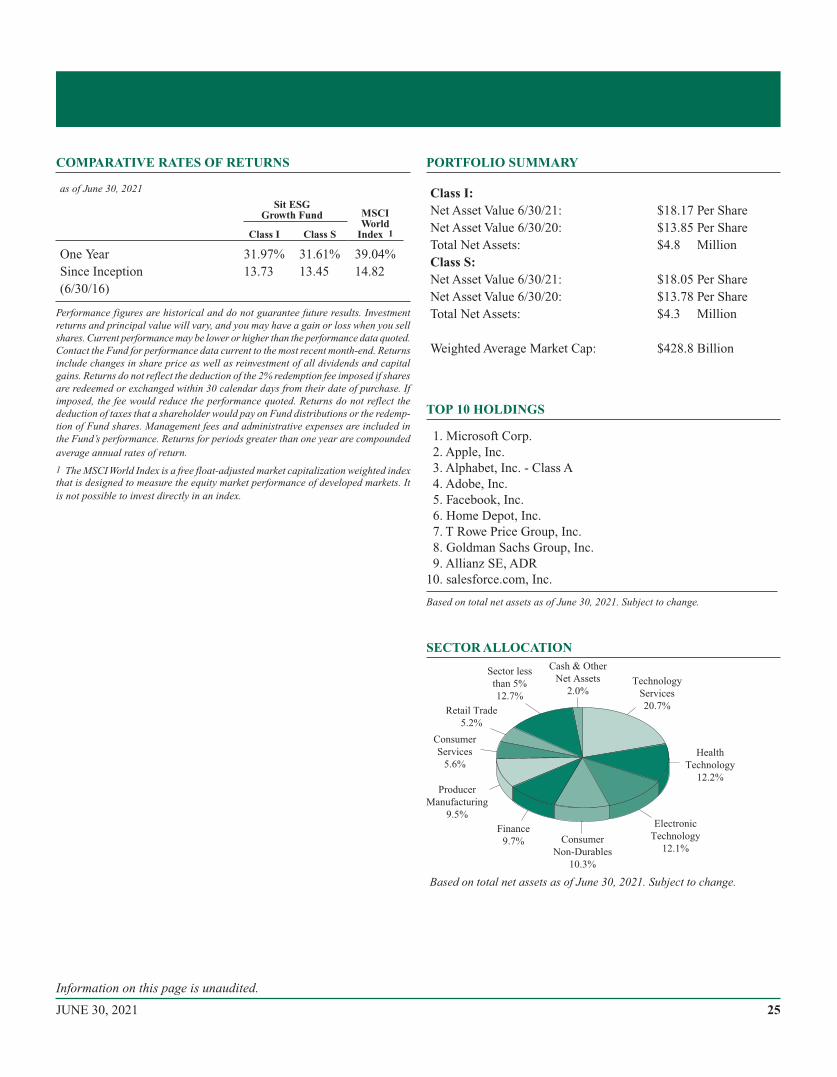
COMPARATIVE RATES OF RETURNS
as of June 30, 2021
Sit ESGGrowth Fund MSCI
WorldIndex 1Class I Class S
One Year 31.97% 31.61% 39.04%Since Inception 13.73 13.45 14.82(6/30/16)
Performance figures are historical and do not guarantee future results. Investmentreturns and principal value will vary, and you may have a gain or loss when you sellshares. Current performance may be lower or higher than the performance data quoted.Contact the Fund for performance data current to the most recent month-end. Returnsinclude changes in share price as well as reinvestment of all dividends and capitalgains. Returns do not reflect the deduction of the 2% redemption fee imposed if sharesare redeemed or exchanged within 30 calendar days from their date of purchase. Ifimposed, the fee would reduce the performance quoted. Returns do not reflect thededuction of taxes that a shareholder would pay on Fund distributions or the redemp-tion of Fund shares. Management fees and administrative expenses are included inthe Fund’s performance. Returns for periods greater than one year are compoundedaverage annual rates of return.
1 The MSCIWorld Index is a free float-adjusted market capitalization weighted indexthat is designed to measure the equity market performance of developed markets. Itis not possible to invest directly in an index.
PORTFOLIO SUMMARY
Class I:Net Asset Value 6/30/21: $18.17 Per ShareNet Asset Value 6/30/20: $13.85 Per ShareTotal Net Assets: $4.8 MillionClass S:Net Asset Value 6/30/21: $18.05 Per ShareNet Asset Value 6/30/20: $13.78 Per ShareTotal Net Assets: $4.3 Million
Weighted Average Market Cap: $428.8 Billion
TOP 10 HOLDINGS
1. Microsoft Corp.2. Apple, Inc.3. Alphabet, Inc. - Class A4. Adobe, Inc.5. Facebook, Inc.6. Home Depot, Inc.7. T Rowe Price Group, Inc.8. Goldman Sachs Group, Inc.9. Allianz SE, ADR
10. salesforce.com, Inc.
Based on total net assets as of June 30, 2021. Subject to change.
SECTOR ALLOCATION
Based on total net assets as of June 30, 2021. Subject to change.
Health
Technology
12.2%
Technology
Services
20.7%
Electronic
Technology
12.1%
Finance
9.7%
Sector less
than 5%
12.7%
Consumer
Non-Durables
10.3%
Cash & Other
Net Assets
2.0%
Producer
Manufacturing
9.5%
Consumer
Services
5.6%
Retail Trade
5.2%
Information on this page is unaudited.
25JUNE 30, 2021
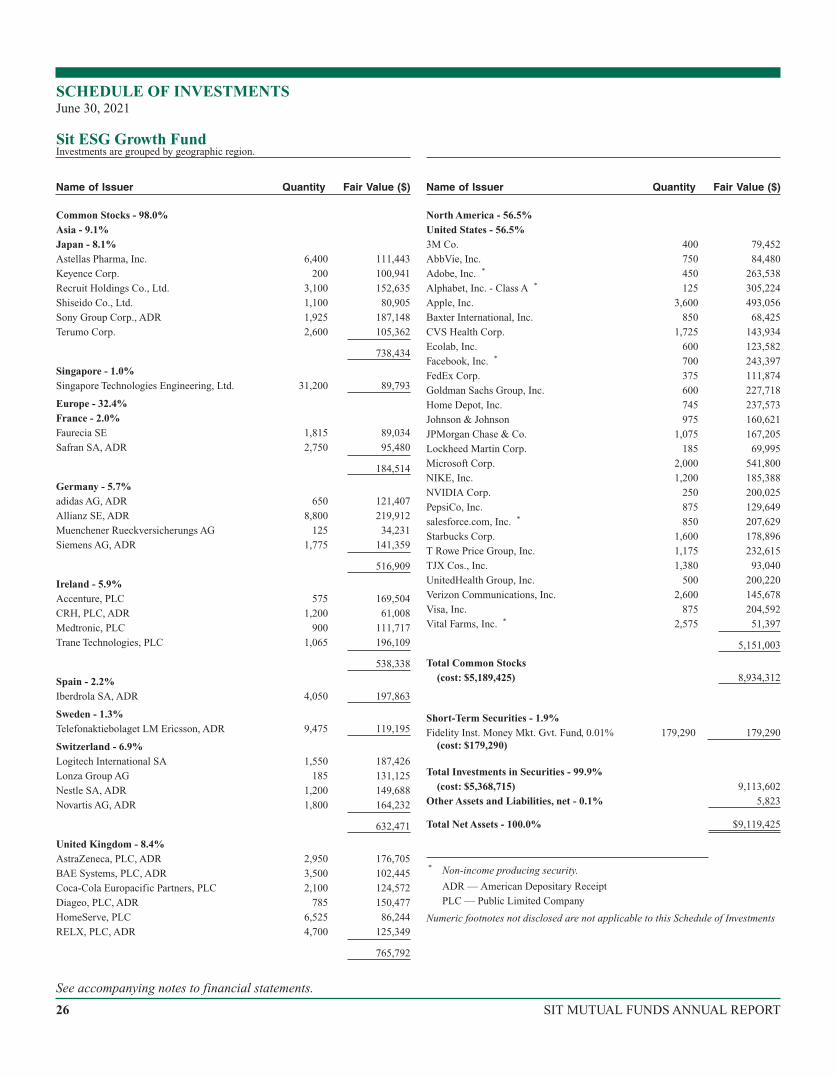
Common Stocks - 98.0%Asia - 9.1%Japan - 8.1%Astellas Pharma, Inc. 6,400 111,443
Keyence Corp. 200 100,941
Recruit Holdings Co., Ltd. 3,100 152,635
Shiseido Co., Ltd. 1,100 80,905
Sony Group Corp., ADR 1,925 187,148
Terumo Corp. 2,600 105,362
738,434
Singapore - 1.0%Singapore Technologies Engineering, Ltd. 31,200 89,793
Europe - 32.4%France - 2.0%Faurecia SE 1,815 89,034
Safran SA, ADR 2,750 95,480
184,514
Germany - 5.7%adidas AG, ADR 650 121,407
Allianz SE, ADR 8,800 219,912
Muenchener Rueckversicherungs AG 125 34,231
Siemens AG, ADR 1,775 141,359
516,909
Ireland - 5.9%Accenture, PLC 575 169,504
CRH, PLC, ADR 1,200 61,008
Medtronic, PLC 900 111,717
Trane Technologies, PLC 1,065 196,109
538,338
Spain - 2.2%Iberdrola SA, ADR 4,050 197,863
Sweden - 1.3%Telefonaktiebolaget LM Ericsson, ADR 9,475 119,195
Switzerland - 6.9%Logitech International SA 1,550 187,426
Lonza Group AG 185 131,125
Nestle SA, ADR 1,200 149,688
Novartis AG, ADR 1,800 164,232
632,471
United Kingdom - 8.4%AstraZeneca, PLC, ADR 2,950 176,705
BAE Systems, PLC, ADR 3,500 102,445
Coca-Cola Europacific Partners, PLC 2,100 124,572
Diageo, PLC, ADR 785 150,477
HomeServe, PLC 6,525 86,244
RELX, PLC, ADR 4,700 125,349
765,792
North America - 56.5%United States - 56.5%3M Co. 400 79,452
AbbVie, Inc. 750 84,480
Adobe, Inc. * 450 263,538
Alphabet, Inc. - Class A * 125 305,224
Apple, Inc. 3,600 493,056
Baxter International, Inc. 850 68,425
CVS Health Corp. 1,725 143,934
Ecolab, Inc. 600 123,582
Facebook, Inc. * 700 243,397
FedEx Corp. 375 111,874
Goldman Sachs Group, Inc. 600 227,718
Home Depot, Inc. 745 237,573
Johnson & Johnson 975 160,621
JPMorgan Chase & Co. 1,075 167,205
Lockheed Martin Corp. 185 69,995
Microsoft Corp. 2,000 541,800
NIKE, Inc. 1,200 185,388
NVIDIA Corp. 250 200,025
PepsiCo, Inc. 875 129,649
salesforce.com, Inc. * 850 207,629
Starbucks Corp. 1,600 178,896
T Rowe Price Group, Inc. 1,175 232,615
TJX Cos., Inc. 1,380 93,040
UnitedHealth Group, Inc. 500 200,220
Verizon Communications, Inc. 2,600 145,678
Visa, Inc. 875 204,592
Vital Farms, Inc. * 2,575 51,397
5,151,003
Total Common Stocks(cost: $5,189,425) 8,934,312
Short-Term Securities - 1.9%Fidelity Inst. Money Mkt. Gvt. Fund, 0.01% 179,290 179,290
(cost: $179,290)
Total Investments in Securities - 99.9%(cost: $5,368,715) 9,113,602
Other Assets and Liabilities, net - 0.1% 5,823
Total Net Assets - 100.0% $9,119,425
* Non-income producing security.
ADR — American Depositary Receipt
PLC — Public Limited Company
Numeric footnotes not disclosed are not applicable to this Schedule of Investments
SCHEDULE OF INVESTMENTSJune 30, 2021
Sit ESG Growth FundInvestments are grouped by geographic region.
Name of Issuer Quantity Fair Value ($) Name of Issuer Quantity Fair Value ($)
See accompanying notes to financial statements.
26 SIT MUTUAL FUNDS ANNUAL REPORT
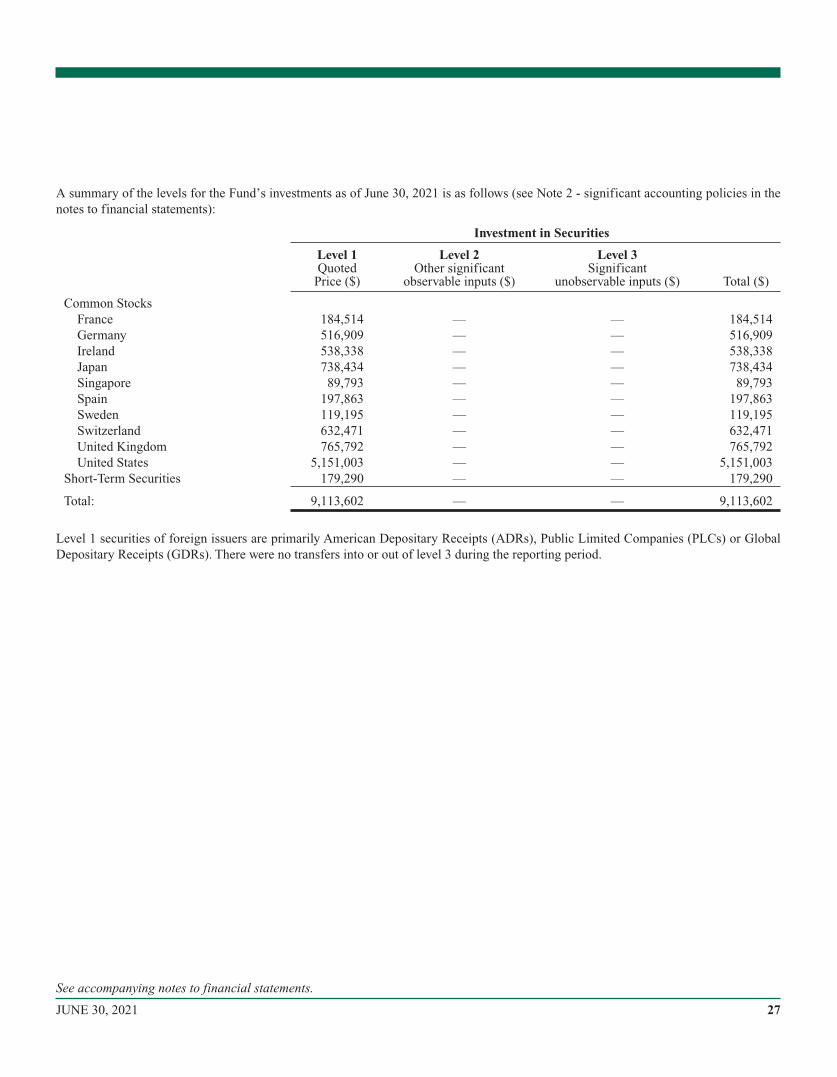
A summary of the levels for the Fund’s investments as of June 30, 2021 is as follows (see Note 2 - significant accounting policies in thenotes to financial statements):
Investment in Securities
Level 1Quoted
Price ($)
Level 2Other significant
observable inputs ($)
Level 3Significant
unobservable inputs ($) Total ($)
Common StocksFrance 184,514 — — 184,514Germany 516,909 — — 516,909Ireland 538,338 — — 538,338Japan 738,434 — — 738,434Singapore 89,793 — — 89,793Spain 197,863 — — 197,863Sweden 119,195 — — 119,195Switzerland 632,471 — — 632,471United Kingdom 765,792 — — 765,792United States 5,151,003 — — 5,151,003
Short-Term Securities 179,290 — — 179,290
Total: 9,113,602 — — 9,113,602
Level 1 securities of foreign issuers are primarily American Depositary Receipts (ADRs), Public Limited Companies (PLCs) or GlobalDepositary Receipts (GDRs). There were no transfers into or out of level 3 during the reporting period.
See accompanying notes to financial statements.
27JUNE 30, 2021
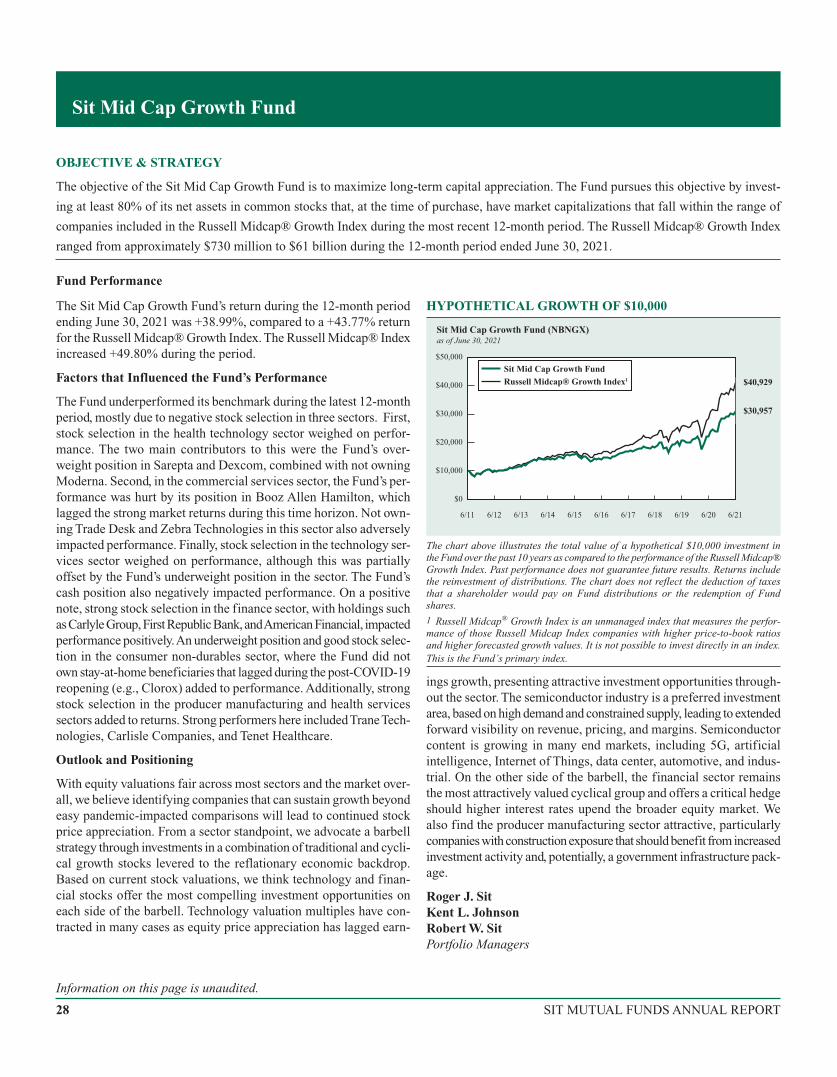
OBJECTIVE & STRATEGY
The objective of the Sit Mid Cap Growth Fund is to maximize long-term capital appreciation. The Fund pursues this objective by invest-
ing at least 80% of its net assets in common stocks that, at the time of purchase, have market capitalizations that fall within the range of
companies included in the Russell Midcap® Growth Index during the most recent 12-month period. The Russell Midcap® Growth Index
ranged from approximately $730 million to $61 billion during the 12-month period ended June 30, 2021.
Fund Performance
The Sit Mid Cap Growth Fund’s return during the 12-month periodending June 30, 2021 was +38.99%, compared to a +43.77% returnfor the Russell Midcap® Growth Index. The Russell Midcap® Indexincreased +49.80% during the period.
Factors that Influenced the Fund’s Performance
The Fund underperformed its benchmark during the latest 12-monthperiod, mostly due to negative stock selection in three sectors. First,stock selection in the health technology sector weighed on perfor-mance. The two main contributors to this were the Fund’s over-weight position in Sarepta and Dexcom, combined with not owningModerna. Second, in the commercial services sector, the Fund’s per-formance was hurt by its position in Booz Allen Hamilton, whichlagged the strong market returns during this time horizon. Not own-ing Trade Desk and Zebra Technologies in this sector also adverselyimpacted performance. Finally, stock selection in the technology ser-vices sector weighed on performance, although this was partiallyoffset by the Fund’s underweight position in the sector. The Fund’scash position also negatively impacted performance. On a positivenote, strong stock selection in the finance sector, with holdings suchasCarlyleGroup,FirstRepublicBank, andAmericanFinancial, impactedperformance positively.An underweight position and good stock selec-tion in the consumer non-durables sector, where the Fund did notown stay-at-home beneficiaries that lagged during the post-COVID-19reopening (e.g., Clorox) added to performance. Additionally, strongstock selection in the producer manufacturing and health servicessectors added to returns. Strong performers here includedTraneTech-nologies, Carlisle Companies, and Tenet Healthcare.
Outlook and Positioning
With equity valuations fair across most sectors and the market over-all, we believe identifying companies that can sustain growth beyondeasy pandemic-impacted comparisons will lead to continued stockprice appreciation. From a sector standpoint, we advocate a barbellstrategy through investments in a combination of traditional and cycli-cal growth stocks levered to the reflationary economic backdrop.Based on current stock valuations, we think technology and finan-cial stocks offer the most compelling investment opportunities oneach side of the barbell. Technology valuation multiples have con-tracted in many cases as equity price appreciation has lagged earn-
HYPOTHETICAL GROWTH OF $10,000
$0
$10,000
$20,000
$40,929
$30,957
Sit Mid Cap Growth Fund (NBNGX)as of June 30, 2021
$40,000
$30,000
$50,000
Sit Mid Cap Growth FundRussell Midcap® Growth Index1
6/18 6/216/206/196/176/166/11 6/12 6/13 6/14 6/15
The chart above illustrates the total value of a hypothetical $10,000 investment inthe Fund over the past 10 years as compared to the performance of the Russell Midcap®Growth Index. Past performance does not guarantee future results. Returns includethe reinvestment of distributions. The chart does not reflect the deduction of taxesthat a shareholder would pay on Fund distributions or the redemption of Fundshares.
1 Russell Midcap® Growth Index is an unmanaged index that measures the perfor-mance of those Russell Midcap Index companies with higher price-to-book ratiosand higher forecasted growth values. It is not possible to invest directly in an index.This is the Fund’s primary index.
ings growth, presenting attractive investment opportunities through-out the sector. The semiconductor industry is a preferred investmentarea, based on high demand and constrained supply, leading to extendedforward visibility on revenue, pricing, and margins. Semiconductorcontent is growing in many end markets, including 5G, artificialintelligence, Internet of Things, data center, automotive, and indus-trial. On the other side of the barbell, the financial sector remainsthe most attractively valued cyclical group and offers a critical hedgeshould higher interest rates upend the broader equity market. Wealso find the producer manufacturing sector attractive, particularlycompanies with construction exposure that should benefit from increasedinvestment activity and, potentially, a government infrastructure pack-age.
Roger J. SitKent L. JohnsonRobert W. SitPortfolio Managers
Sit Mid Cap Growth Fund
Information on this page is unaudited.
28 SIT MUTUAL FUNDS ANNUAL REPORT
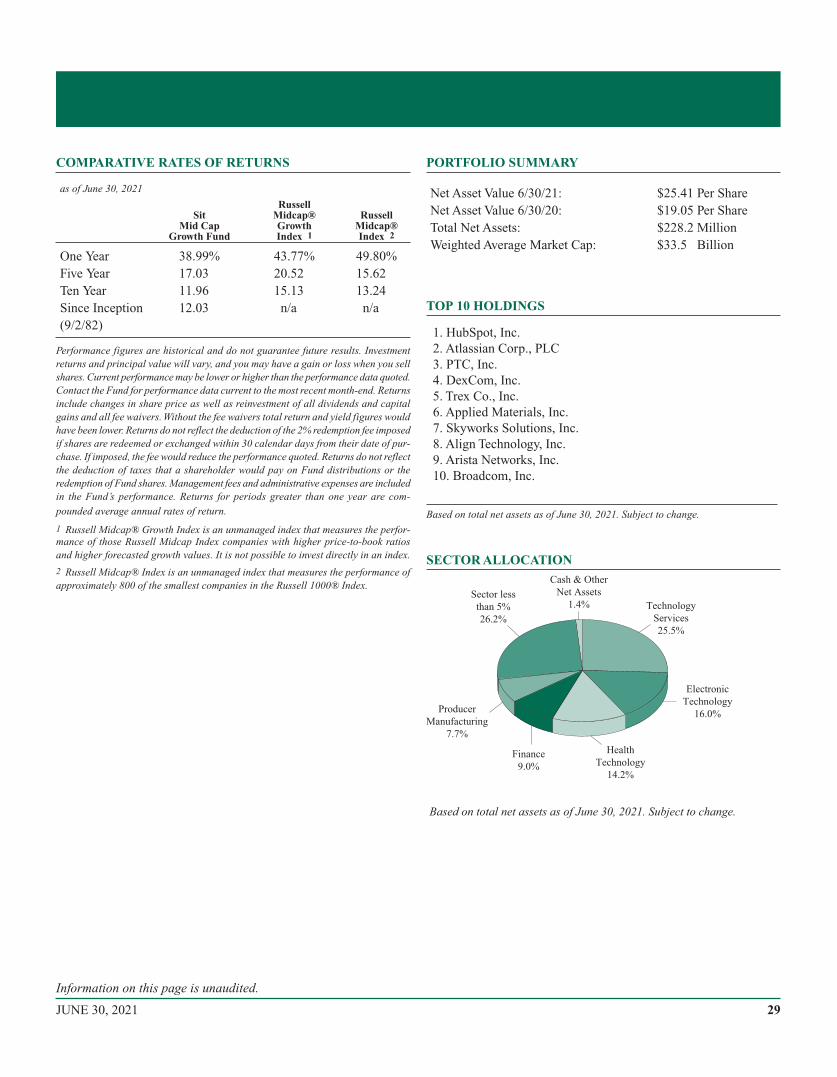
COMPARATIVE RATES OF RETURNS
as of June 30, 2021
SitMid Cap
Growth Fund
RussellMidcap®GrowthIndex 1
RussellMidcap®Index 2
One Year 38.99% 43.77% 49.80%Five Year 17.03 20.52 15.62Ten Year 11.96 15.13 13.24Since Inception 12.03 n/a n/a(9/2/82)
Performance figures are historical and do not guarantee future results. Investmentreturns and principal value will vary, and you may have a gain or loss when you sellshares. Current performance may be lower or higher than the performance data quoted.Contact the Fund for performance data current to the most recent month-end. Returnsinclude changes in share price as well as reinvestment of all dividends and capitalgains and all fee waivers. Without the fee waivers total return and yield figures wouldhave been lower. Returns do not reflect the deduction of the 2% redemption fee imposedif shares are redeemed or exchanged within 30 calendar days from their date of pur-chase. If imposed, the fee would reduce the performance quoted. Returns do not reflectthe deduction of taxes that a shareholder would pay on Fund distributions or theredemption of Fund shares. Management fees and administrative expenses are includedin the Fund’s performance. Returns for periods greater than one year are com-
pounded average annual rates of return.
1 Russell Midcap® Growth Index is an unmanaged index that measures the perfor-mance of those Russell Midcap Index companies with higher price-to-book ratiosand higher forecasted growth values. It is not possible to invest directly in an index.
2 Russell Midcap® Index is an unmanaged index that measures the performance ofapproximately 800 of the smallest companies in the Russell 1000® Index.
PORTFOLIO SUMMARY
Net Asset Value 6/30/21: $25.41 Per ShareNet Asset Value 6/30/20: $19.05 Per ShareTotal Net Assets: $228.2 MillionWeighted Average Market Cap: $33.5 Billion
TOP 10 HOLDINGS
1. HubSpot, Inc.2. Atlassian Corp., PLC3. PTC, Inc.4. DexCom, Inc.5. Trex Co., Inc.6. Applied Materials, Inc.7. Skyworks Solutions, Inc.8. Align Technology, Inc.9. Arista Networks, Inc.10. Broadcom, Inc.
Based on total net assets as of June 30, 2021. Subject to change.
SECTOR ALLOCATION
Based on total net assets as of June 30, 2021. Subject to change.
Cash & Other
Net Assets
1.4%Sector less
than 5%
26.2%
Technology
Services
25.5%
Producer
Manufacturing
7.7%
Finance
9.0%
Electronic
Technology
16.0%
Health
Technology
14.2%
Information on this page is unaudited.
29JUNE 30, 2021
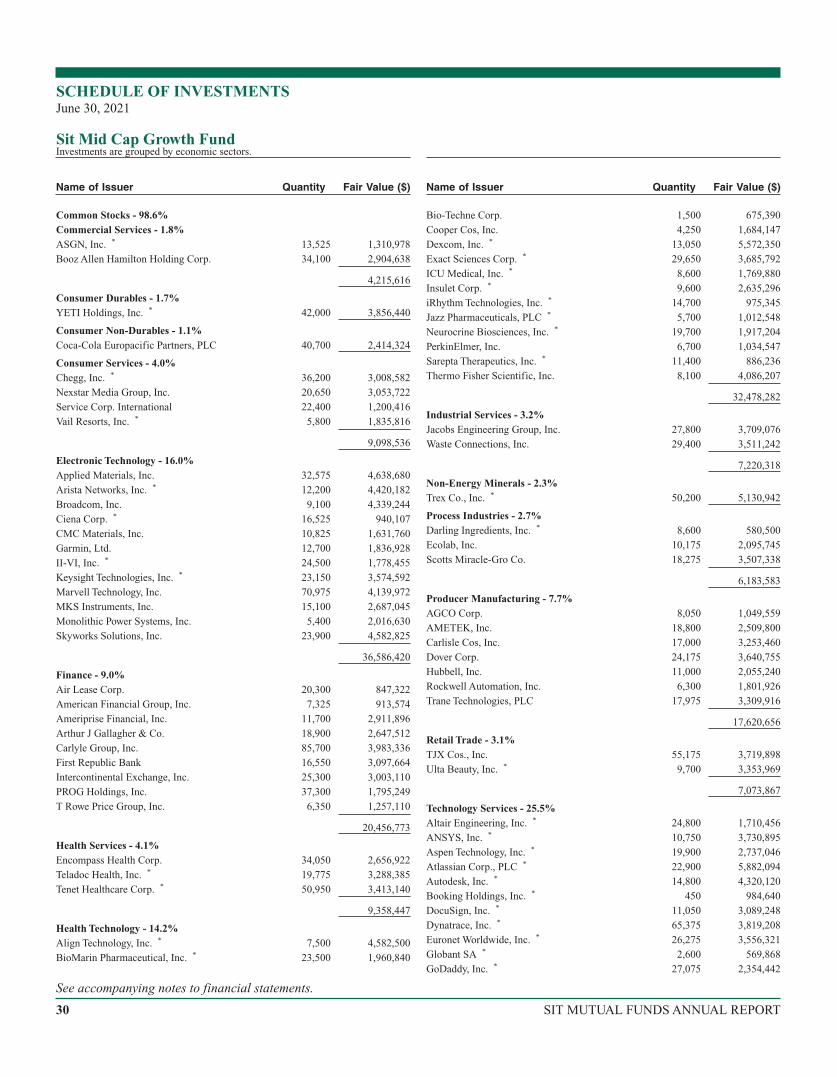
Common Stocks - 98.6%Commercial Services - 1.8%ASGN, Inc. * 13,525 1,310,978
Booz Allen Hamilton Holding Corp. 34,100 2,904,638
4,215,616
Consumer Durables - 1.7%YETI Holdings, Inc. * 42,000 3,856,440
Consumer Non-Durables - 1.1%Coca-Cola Europacific Partners, PLC 40,700 2,414,324
Consumer Services - 4.0%Chegg, Inc. * 36,200 3,008,582
Nexstar Media Group, Inc. 20,650 3,053,722
Service Corp. International 22,400 1,200,416
Vail Resorts, Inc. * 5,800 1,835,816
9,098,536
Electronic Technology - 16.0%Applied Materials, Inc. 32,575 4,638,680
Arista Networks, Inc. * 12,200 4,420,182
Broadcom, Inc. 9,100 4,339,244
Ciena Corp. * 16,525 940,107
CMC Materials, Inc. 10,825 1,631,760
Garmin, Ltd. 12,700 1,836,928
II-VI, Inc. * 24,500 1,778,455
Keysight Technologies, Inc. * 23,150 3,574,592
Marvell Technology, Inc. 70,975 4,139,972
MKS Instruments, Inc. 15,100 2,687,045
Monolithic Power Systems, Inc. 5,400 2,016,630
Skyworks Solutions, Inc. 23,900 4,582,825
36,586,420
Finance - 9.0%Air Lease Corp. 20,300 847,322
American Financial Group, Inc. 7,325 913,574
Ameriprise Financial, Inc. 11,700 2,911,896
Arthur J Gallagher & Co. 18,900 2,647,512
Carlyle Group, Inc. 85,700 3,983,336
First Republic Bank 16,550 3,097,664
Intercontinental Exchange, Inc. 25,300 3,003,110
PROG Holdings, Inc. 37,300 1,795,249
T Rowe Price Group, Inc. 6,350 1,257,110
20,456,773
Health Services - 4.1%Encompass Health Corp. 34,050 2,656,922
Teladoc Health, Inc. * 19,775 3,288,385
Tenet Healthcare Corp. * 50,950 3,413,140
9,358,447
Health Technology - 14.2%Align Technology, Inc. * 7,500 4,582,500
BioMarin Pharmaceutical, Inc. * 23,500 1,960,840
Bio-Techne Corp. 1,500 675,390
Cooper Cos, Inc. 4,250 1,684,147
Dexcom, Inc. * 13,050 5,572,350
Exact Sciences Corp. * 29,650 3,685,792
ICU Medical, Inc. * 8,600 1,769,880
Insulet Corp. * 9,600 2,635,296
iRhythm Technologies, Inc. * 14,700 975,345
Jazz Pharmaceuticals, PLC * 5,700 1,012,548
Neurocrine Biosciences, Inc. * 19,700 1,917,204
PerkinElmer, Inc. 6,700 1,034,547
Sarepta Therapeutics, Inc. * 11,400 886,236
Thermo Fisher Scientific, Inc. 8,100 4,086,207
32,478,282
Industrial Services - 3.2%Jacobs Engineering Group, Inc. 27,800 3,709,076
Waste Connections, Inc. 29,400 3,511,242
7,220,318
Non-Energy Minerals - 2.3%Trex Co., Inc. * 50,200 5,130,942
Process Industries - 2.7%Darling Ingredients, Inc. * 8,600 580,500
Ecolab, Inc. 10,175 2,095,745
Scotts Miracle-Gro Co. 18,275 3,507,338
6,183,583
Producer Manufacturing - 7.7%AGCO Corp. 8,050 1,049,559
AMETEK, Inc. 18,800 2,509,800
Carlisle Cos, Inc. 17,000 3,253,460
Dover Corp. 24,175 3,640,755
Hubbell, Inc. 11,000 2,055,240
Rockwell Automation, Inc. 6,300 1,801,926
Trane Technologies, PLC 17,975 3,309,916
17,620,656
Retail Trade - 3.1%TJX Cos., Inc. 55,175 3,719,898
Ulta Beauty, Inc. * 9,700 3,353,969
7,073,867
Technology Services - 25.5%Altair Engineering, Inc. * 24,800 1,710,456
ANSYS, Inc. * 10,750 3,730,895
Aspen Technology, Inc. * 19,900 2,737,046
Atlassian Corp., PLC * 22,900 5,882,094
Autodesk, Inc. * 14,800 4,320,120
Booking Holdings, Inc. * 450 984,640
DocuSign, Inc. * 11,050 3,089,248
Dynatrace, Inc. * 65,375 3,819,208
Euronet Worldwide, Inc. * 26,275 3,556,321
Globant SA * 2,600 569,868
GoDaddy, Inc. * 27,075 2,354,442
SCHEDULE OF INVESTMENTSJune 30, 2021
Sit Mid Cap Growth FundInvestments are grouped by economic sectors.
Name of Issuer Quantity Fair Value ($) Name of Issuer Quantity Fair Value ($)
See accompanying notes to financial statements.
30 SIT MUTUAL FUNDS ANNUAL REPORT

HubSpot, Inc. * 10,750 6,264,240
nCino, Inc. * 15,400 922,768
Paycom Software, Inc. * 7,600 2,762,372
Pinterest, Inc. * 10,850 856,608
PTC, Inc. * 39,600 5,593,896
RingCentral, Inc. * 5,500 1,598,190
Science Applications International Corp. 25,100 2,202,023
Splunk, Inc. * 20,900 3,021,722
Twilio, Inc. * 5,825 2,295,982
58,272,139
Transportation - 1.7%Alaska Air Group, Inc. * 17,300 1,043,363
Knight-Swift Transportation Holdings, Inc. 64,075 2,912,850
3,956,213
Utilities - 0.5%WEC Energy Group, Inc. 12,800 1,138,560
Total Common Stocks(cost: $102,940,387) 225,061,116
Short-Term Securities - 1.8%Fidelity Inst. Money Mkt. Gvt. Fund, 0.01% 4,118,486 4,118,486
(cost: $4,118,486)Total Investments in Securities - 100.4%
(cost: $107,058,873) 229,179,602
Other Assets and Liabilities, net - (0.4%) (1,009,033)
Total Net Assets - 100.0% $228,170,569
* Non-income producing security.
PLC — Public Limited Company
Numeric footnotes not disclosed are not applicable to this Schedule of Investments.
A summary of the levels for the Fund’s investments as of June 30, 2021 is as follows (see Note 2 - significant accounting policies in thenotes to financial statements):
Investment in Securities
Level 1Quoted
Price ($)
Level 2Other significant
observable inputs ($)
Level 3Significant
unobservable inputs ($) Total ($)
Common Stocks ** 225,061,116 — — 225,061,116Short-Term Securities 4,118,486 — — 4,118,486
Total: 229,179,602 — — 229,179,602
** For equity securities categorized in a single level, refer to the Schedule of Investments for further breakdown.
There were no transfers into or out of level 3 during the reporting period.
Name of Issuer Quantity Fair Value ($) Name of Issuer Quantity Fair Value ($)
See accompanying notes to financial statements.
31JUNE 30, 2021
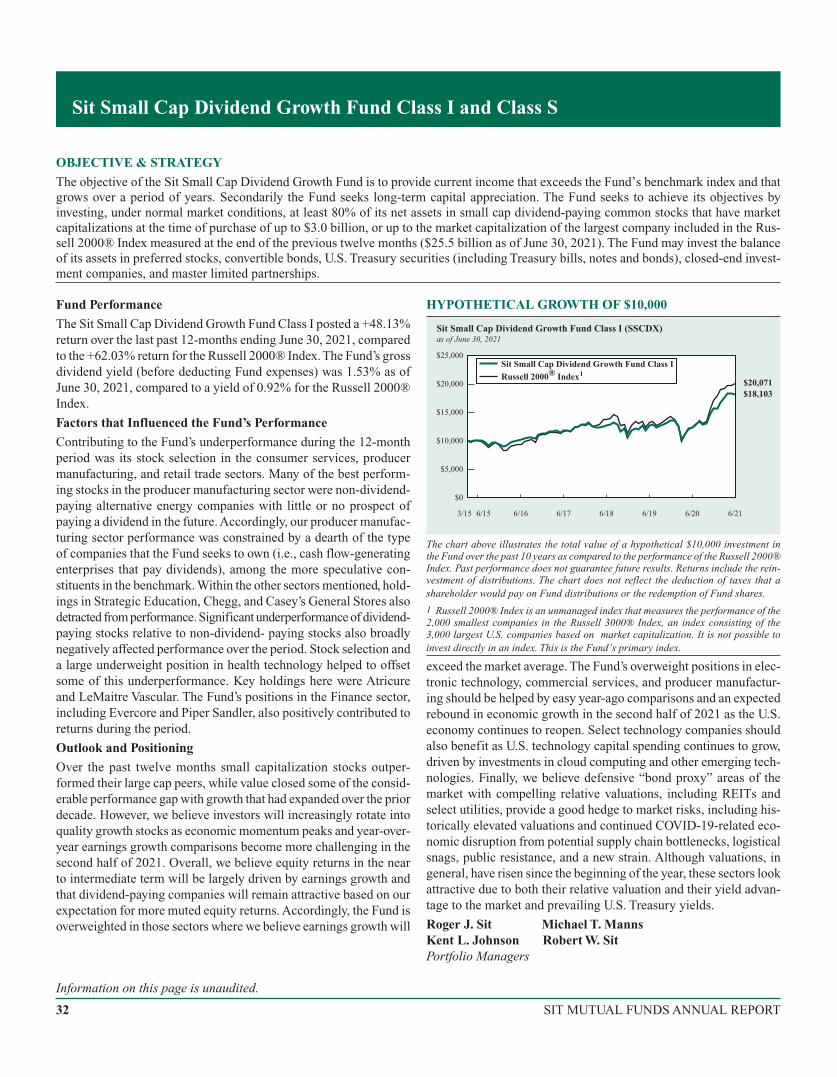
OBJECTIVE & STRATEGY
The objective of the Sit Small Cap Dividend Growth Fund is to provide current income that exceeds the Fund’s benchmark index and thatgrows over a period of years. Secondarily the Fund seeks long-term capital appreciation. The Fund seeks to achieve its objectives byinvesting, under normal market conditions, at least 80% of its net assets in small cap dividend-paying common stocks that have marketcapitalizations at the time of purchase of up to $3.0 billion, or up to the market capitalization of the largest company included in the Rus-sell 2000® Index measured at the end of the previous twelve months ($25.5 billion as of June 30, 2021). The Fund may invest the balanceof its assets in preferred stocks, convertible bonds, U.S. Treasury securities (including Treasury bills, notes and bonds), closed-end invest-ment companies, and master limited partnerships.
Fund Performance
The Sit Small Cap Dividend Growth Fund Class I posted a +48.13%return over the last past 12-months ending June 30, 2021, comparedto the +62.03% return for the Russell 2000® Index. The Fund’s grossdividend yield (before deducting Fund expenses) was 1.53% as ofJune 30, 2021, compared to a yield of 0.92% for the Russell 2000®Index.
Factors that Influenced the Fund’s Performance
Contributing to the Fund’s underperformance during the 12-monthperiod was its stock selection in the consumer services, producermanufacturing, and retail trade sectors. Many of the best perform-ing stocks in the producer manufacturing sector were non-dividend-paying alternative energy companies with little or no prospect ofpaying a dividend in the future. Accordingly, our producer manufac-turing sector performance was constrained by a dearth of the typeof companies that the Fund seeks to own (i.e., cash flow-generatingenterprises that pay dividends), among the more speculative con-stituents in the benchmark. Within the other sectors mentioned, hold-ings in Strategic Education, Chegg, and Casey’s General Stores alsodetracted from performance. Significant underperformance of dividend-paying stocks relative to non-dividend- paying stocks also broadlynegatively affected performance over the period. Stock selection anda large underweight position in health technology helped to offsetsome of this underperformance. Key holdings here were Atricureand LeMaitre Vascular. The Fund’s positions in the Finance sector,including Evercore and Piper Sandler, also positively contributed toreturns during the period.
Outlook and Positioning
Over the past twelve months small capitalization stocks outper-formed their large cap peers, while value closed some of the consid-erable performance gap with growth that had expanded over the priordecade. However, we believe investors will increasingly rotate intoquality growth stocks as economic momentum peaks and year-over-year earnings growth comparisons become more challenging in thesecond half of 2021. Overall, we believe equity returns in the nearto intermediate term will be largely driven by earnings growth andthat dividend-paying companies will remain attractive based on ourexpectation for more muted equity returns. Accordingly, the Fund isoverweighted in those sectors where we believe earnings growth will
HYPOTHETICAL GROWTH OF $10,000
$0
$5,000
$25,000
$20,000
$18,103$20,071
Sit Small Cap Dividend Growth Fund Class I (SSCDX)as of June 30, 2021
Sit Small Cap Dividend Growth Fund Class IRussell 2000® Index
$10,000
$15,000
3/15 6/16 6/18 6/19 6/206/15 6/17
1
6/21
The chart above illustrates the total value of a hypothetical $10,000 investment inthe Fund over the past 10 years as compared to the performance of the Russell 2000®Index. Past performance does not guarantee future results. Returns include the rein-vestment of distributions. The chart does not reflect the deduction of taxes that ashareholder would pay on Fund distributions or the redemption of Fund shares.
1 Russell 2000® Index is an unmanaged index that measures the performance of the2,000 smallest companies in the Russell 3000® Index, an index consisting of the3,000 largest U.S. companies based on market capitalization. It is not possible toinvest directly in an index. This is the Fund’s primary index.
exceed the market average. The Fund’s overweight positions in elec-tronic technology, commercial services, and producer manufactur-ing should be helped by easy year-ago comparisons and an expectedrebound in economic growth in the second half of 2021 as the U.S.economy continues to reopen. Select technology companies shouldalso benefit as U.S. technology capital spending continues to grow,driven by investments in cloud computing and other emerging tech-nologies. Finally, we believe defensive “bond proxy” areas of themarket with compelling relative valuations, including REITs andselect utilities, provide a good hedge to market risks, including his-torically elevated valuations and continued COVID-19-related eco-nomic disruption from potential supply chain bottlenecks, logisticalsnags, public resistance, and a new strain. Although valuations, ingeneral, have risen since the beginning of the year, these sectors lookattractive due to both their relative valuation and their yield advan-tage to the market and prevailing U.S. Treasury yields.
Roger J. Sit Michael T. MannsKent L. Johnson Robert W. SitPortfolio Managers
Sit Small Cap Dividend Growth Fund Class I and Class S
Information on this page is unaudited.
32 SIT MUTUAL FUNDS ANNUAL REPORT
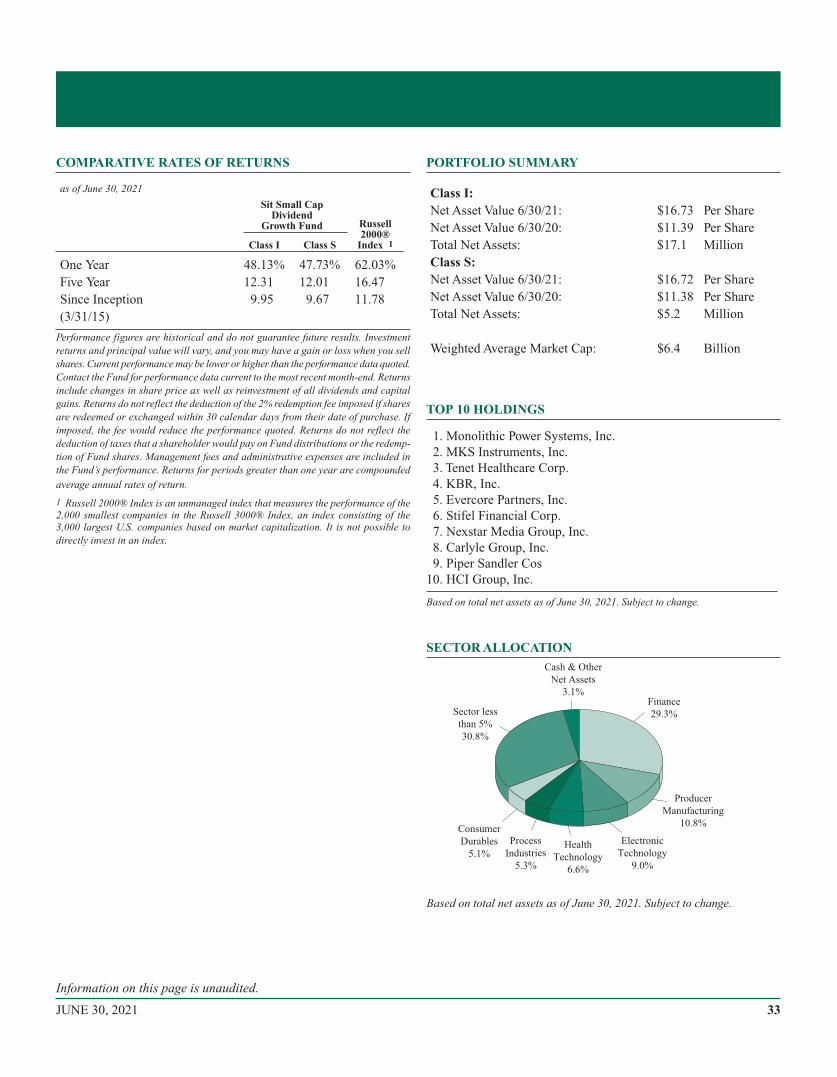
COMPARATIVE RATES OF RETURNS
as of June 30, 2021
Sit Small CapDividend
Growth Fund Russell2000®
Index 1Class I Class S
One Year 48.13% 47.73% 62.03%Five Year 12.31 12.01 16.47Since Inception 9.95 9.67 11.78(3/31/15)
Performance figures are historical and do not guarantee future results. Investmentreturns and principal value will vary, and you may have a gain or loss when you sellshares. Current performance may be lower or higher than the performance data quoted.Contact the Fund for performance data current to the most recent month-end. Returnsinclude changes in share price as well as reinvestment of all dividends and capitalgains. Returns do not reflect the deduction of the 2% redemption fee imposed if sharesare redeemed or exchanged within 30 calendar days from their date of purchase. Ifimposed, the fee would reduce the performance quoted. Returns do not reflect thededuction of taxes that a shareholder would pay on Fund distributions or the redemp-tion of Fund shares. Management fees and administrative expenses are included inthe Fund’s performance. Returns for periods greater than one year are compounded
average annual rates of return.
1 Russell 2000® Index is an unmanaged index that measures the performance of the2,000 smallest companies in the Russell 3000® Index, an index consisting of the3,000 largest U.S. companies based on market capitalization. It is not possible todirectly invest in an index.
PORTFOLIO SUMMARY
Class I:Net Asset Value 6/30/21: $16.73 Per ShareNet Asset Value 6/30/20: $11.39 Per ShareTotal Net Assets: $17.1 MillionClass S:Net Asset Value 6/30/21: $16.72 Per ShareNet Asset Value 6/30/20: $11.38 Per ShareTotal Net Assets: $5.2 Million
Weighted Average Market Cap: $6.4 Billion
TOP 10 HOLDINGS
1. Monolithic Power Systems, Inc.2. MKS Instruments, Inc.3. Tenet Healthcare Corp.4. KBR, Inc.5. Evercore Partners, Inc.6. Stifel Financial Corp.7. Nexstar Media Group, Inc.8. Carlyle Group, Inc.9. Piper Sandler Cos
10. HCI Group, Inc.
Based on total net assets as of June 30, 2021. Subject to change.
SECTOR ALLOCATION
Based on total net assets as of June 30, 2021. Subject to change.
Producer
Manufacturing
10.8%
Cash & Other
Net Assets
3.1%Finance
29.3%
Electronic
Technology
9.0%
Consumer
Durables
5.1%
Process
Industries
5.3%
Health
Technology
6.6%
Sector less
than 5%
30.8%
Information on this page is unaudited.
33JUNE 30, 2021
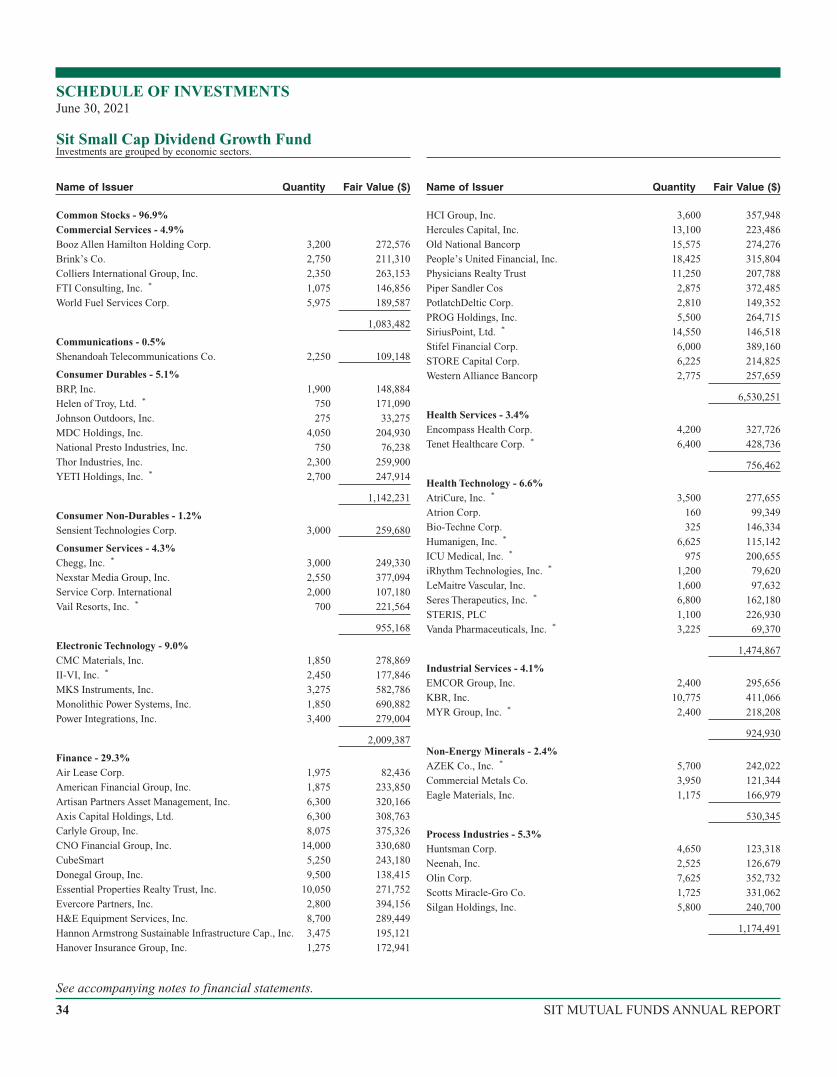
Common Stocks - 96.9%Commercial Services - 4.9%Booz Allen Hamilton Holding Corp. 3,200 272,576
Brink’s Co. 2,750 211,310
Colliers International Group, Inc. 2,350 263,153
FTI Consulting, Inc. * 1,075 146,856
World Fuel Services Corp. 5,975 189,587
1,083,482
Communications - 0.5%Shenandoah Telecommunications Co. 2,250 109,148
Consumer Durables - 5.1%BRP, Inc. 1,900 148,884
Helen of Troy, Ltd. * 750 171,090
Johnson Outdoors, Inc. 275 33,275
MDC Holdings, Inc. 4,050 204,930
National Presto Industries, Inc. 750 76,238
Thor Industries, Inc. 2,300 259,900
YETI Holdings, Inc. * 2,700 247,914
1,142,231
Consumer Non-Durables - 1.2%Sensient Technologies Corp. 3,000 259,680
Consumer Services - 4.3%Chegg, Inc. * 3,000 249,330
Nexstar Media Group, Inc. 2,550 377,094
Service Corp. International 2,000 107,180
Vail Resorts, Inc. * 700 221,564
955,168
Electronic Technology - 9.0%CMC Materials, Inc. 1,850 278,869
II-VI, Inc. * 2,450 177,846
MKS Instruments, Inc. 3,275 582,786
Monolithic Power Systems, Inc. 1,850 690,882
Power Integrations, Inc. 3,400 279,004
2,009,387
Finance - 29.3%Air Lease Corp. 1,975 82,436
American Financial Group, Inc. 1,875 233,850
Artisan Partners Asset Management, Inc. 6,300 320,166
Axis Capital Holdings, Ltd. 6,300 308,763
Carlyle Group, Inc. 8,075 375,326
CNO Financial Group, Inc. 14,000 330,680
CubeSmart 5,250 243,180
Donegal Group, Inc. 9,500 138,415
Essential Properties Realty Trust, Inc. 10,050 271,752
Evercore Partners, Inc. 2,800 394,156
H&E Equipment Services, Inc. 8,700 289,449
Hannon Armstrong Sustainable Infrastructure Cap., Inc. 3,475 195,121
Hanover Insurance Group, Inc. 1,275 172,941
HCI Group, Inc. 3,600 357,948
Hercules Capital, Inc. 13,100 223,486
Old National Bancorp 15,575 274,276
People’s United Financial, Inc. 18,425 315,804
Physicians Realty Trust 11,250 207,788
Piper Sandler Cos 2,875 372,485
PotlatchDeltic Corp. 2,810 149,352
PROG Holdings, Inc. 5,500 264,715
SiriusPoint, Ltd. * 14,550 146,518
Stifel Financial Corp. 6,000 389,160
STORE Capital Corp. 6,225 214,825
Western Alliance Bancorp 2,775 257,659
6,530,251
Health Services - 3.4%Encompass Health Corp. 4,200 327,726
Tenet Healthcare Corp. * 6,400 428,736
756,462
Health Technology - 6.6%AtriCure, Inc. * 3,500 277,655
Atrion Corp. 160 99,349
Bio-Techne Corp. 325 146,334
Humanigen, Inc. * 6,625 115,142
ICU Medical, Inc. * 975 200,655
iRhythm Technologies, Inc. * 1,200 79,620
LeMaitre Vascular, Inc. 1,600 97,632
Seres Therapeutics, Inc. * 6,800 162,180
STERIS, PLC 1,100 226,930
Vanda Pharmaceuticals, Inc. * 3,225 69,370
1,474,867
Industrial Services - 4.1%EMCOR Group, Inc. 2,400 295,656
KBR, Inc. 10,775 411,066
MYR Group, Inc. * 2,400 218,208
924,930
Non-Energy Minerals - 2.4%AZEK Co., Inc. * 5,700 242,022
Commercial Metals Co. 3,950 121,344
Eagle Materials, Inc. 1,175 166,979
530,345
Process Industries - 5.3%Huntsman Corp. 4,650 123,318
Neenah, Inc. 2,525 126,679
Olin Corp. 7,625 352,732
Scotts Miracle-Gro Co. 1,725 331,062
Silgan Holdings, Inc. 5,800 240,700
1,174,491
SCHEDULE OF INVESTMENTSJune 30, 2021
Sit Small Cap Dividend Growth FundInvestments are grouped by economic sectors.
Name of Issuer Quantity Fair Value ($) Name of Issuer Quantity Fair Value ($)
See accompanying notes to financial statements.
34 SIT MUTUAL FUNDS ANNUAL REPORT
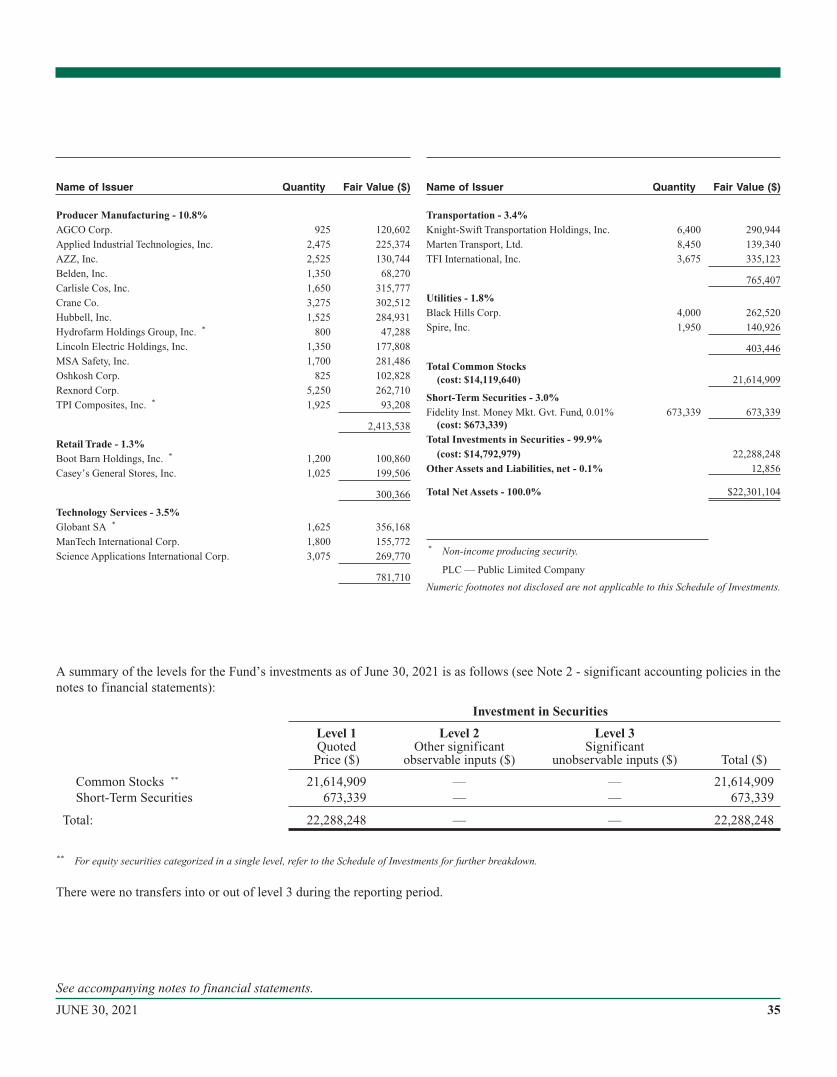
Producer Manufacturing - 10.8%AGCO Corp. 925 120,602
Applied Industrial Technologies, Inc. 2,475 225,374
AZZ, Inc. 2,525 130,744
Belden, Inc. 1,350 68,270
Carlisle Cos, Inc. 1,650 315,777
Crane Co. 3,275 302,512
Hubbell, Inc. 1,525 284,931
Hydrofarm Holdings Group, Inc. * 800 47,288
Lincoln Electric Holdings, Inc. 1,350 177,808
MSA Safety, Inc. 1,700 281,486
Oshkosh Corp. 825 102,828
Rexnord Corp. 5,250 262,710
TPI Composites, Inc. * 1,925 93,208
2,413,538
Retail Trade - 1.3%Boot Barn Holdings, Inc. * 1,200 100,860
Casey’s General Stores, Inc. 1,025 199,506
300,366
Technology Services - 3.5%Globant SA * 1,625 356,168
ManTech International Corp. 1,800 155,772
Science Applications International Corp. 3,075 269,770
781,710
Transportation - 3.4%Knight-Swift Transportation Holdings, Inc. 6,400 290,944
Marten Transport, Ltd. 8,450 139,340
TFI International, Inc. 3,675 335,123
765,407
Utilities - 1.8%Black Hills Corp. 4,000 262,520
Spire, Inc. 1,950 140,926
403,446
Total Common Stocks(cost: $14,119,640) 21,614,909
Short-Term Securities - 3.0%Fidelity Inst. Money Mkt. Gvt. Fund, 0.01% 673,339 673,339
(cost: $673,339)Total Investments in Securities - 99.9%
(cost: $14,792,979) 22,288,248
Other Assets and Liabilities, net - 0.1% 12,856
Total Net Assets - 100.0% $22,301,104
* Non-income producing security.
PLC — Public Limited Company
Numeric footnotes not disclosed are not applicable to this Schedule of Investments.
A summary of the levels for the Fund’s investments as of June 30, 2021 is as follows (see Note 2 - significant accounting policies in thenotes to financial statements):
Investment in Securities
Level 1Quoted
Price ($)
Level 2Other significant
observable inputs ($)
Level 3Significant
unobservable inputs ($) Total ($)
Common Stocks ** 21,614,909 — — 21,614,909Short-Term Securities 673,339 — — 673,339
Total: 22,288,248 — — 22,288,248
** For equity securities categorized in a single level, refer to the Schedule of Investments for further breakdown.
There were no transfers into or out of level 3 during the reporting period.
Name of Issuer Quantity Fair Value ($) Name of Issuer Quantity Fair Value ($)
See accompanying notes to financial statements.
35JUNE 30, 2021
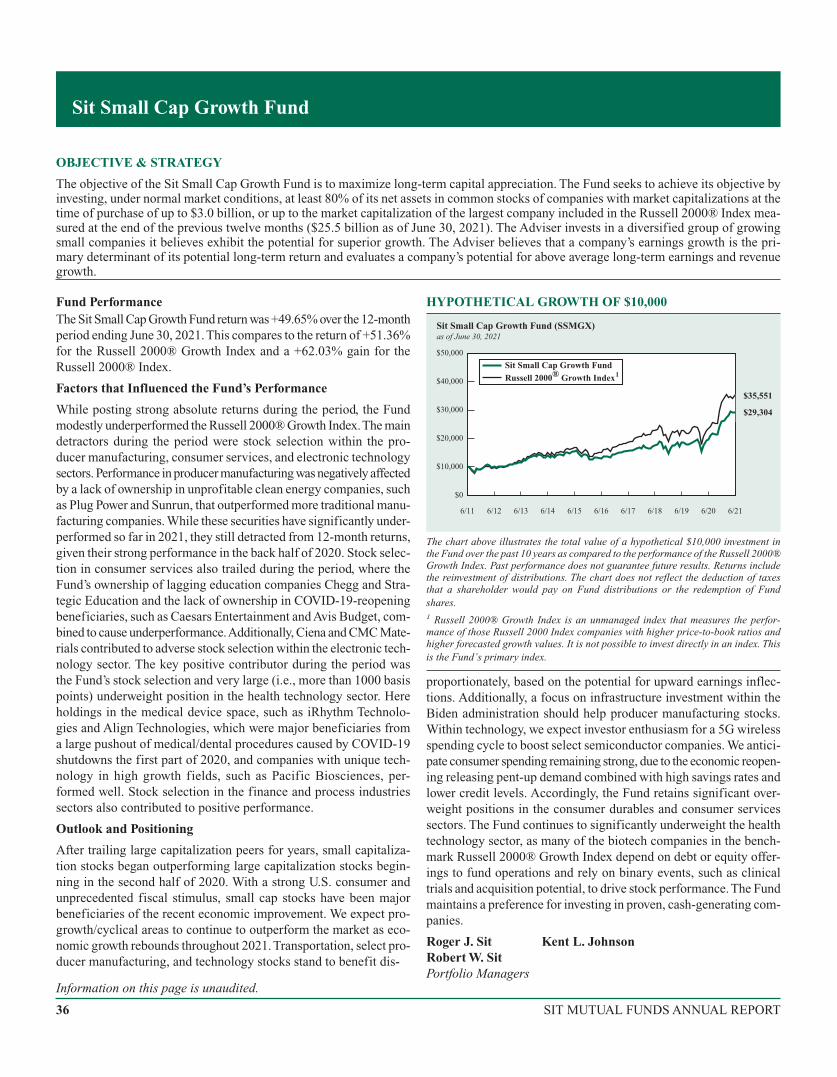
OBJECTIVE & STRATEGY
The objective of the Sit Small Cap Growth Fund is to maximize long-term capital appreciation. The Fund seeks to achieve its objective byinvesting, under normal market conditions, at least 80% of its net assets in common stocks of companies with market capitalizations at thetime of purchase of up to $3.0 billion, or up to the market capitalization of the largest company included in the Russell 2000® Index mea-sured at the end of the previous twelve months ($25.5 billion as of June 30, 2021). The Adviser invests in a diversified group of growingsmall companies it believes exhibit the potential for superior growth. The Adviser believes that a company’s earnings growth is the pri-mary determinant of its potential long-term return and evaluates a company’s potential for above average long-term earnings and revenuegrowth.
Fund PerformanceThe Sit Small Cap Growth Fund return was +49.65% over the 12-monthperiod ending June 30, 2021. This compares to the return of +51.36%for the Russell 2000® Growth Index and a +62.03% gain for theRussell 2000® Index.
Factors that Influenced the Fund’s Performance
While posting strong absolute returns during the period, the Fundmodestly underperformed the Russell 2000® Growth Index.The maindetractors during the period were stock selection within the pro-ducer manufacturing, consumer services, and electronic technologysectors. Performance in producer manufacturing was negatively affectedby a lack of ownership in unprofitable clean energy companies, suchas Plug Power and Sunrun, that outperformed more traditional manu-facturing companies. While these securities have significantly under-performed so far in 2021, they still detracted from 12-month returns,given their strong performance in the back half of 2020. Stock selec-tion in consumer services also trailed during the period, where theFund’s ownership of lagging education companies Chegg and Stra-tegic Education and the lack of ownership in COVID-19-reopeningbeneficiaries, such as Caesars Entertainment and Avis Budget, com-bined to cause underperformance.Additionally, Ciena and CMC Mate-rials contributed to adverse stock selection within the electronic tech-nology sector. The key positive contributor during the period wasthe Fund’s stock selection and very large (i.e., more than 1000 basispoints) underweight position in the health technology sector. Hereholdings in the medical device space, such as iRhythm Technolo-gies and Align Technologies, which were major beneficiaries froma large pushout of medical/dental procedures caused by COVID-19shutdowns the first part of 2020, and companies with unique tech-nology in high growth fields, such as Pacific Biosciences, per-formed well. Stock selection in the finance and process industriessectors also contributed to positive performance.
Outlook and Positioning
After trailing large capitalization peers for years, small capitaliza-tion stocks began outperforming large capitalization stocks begin-ning in the second half of 2020. With a strong U.S. consumer andunprecedented fiscal stimulus, small cap stocks have been majorbeneficiaries of the recent economic improvement. We expect pro-growth/cyclical areas to continue to outperform the market as eco-nomic growth rebounds throughout 2021. Transportation, select pro-ducer manufacturing, and technology stocks stand to benefit dis-
HYPOTHETICAL GROWTH OF $10,000
$0
$50,000
$40,000
$30,000 $29,304
$35,551
Sit Small Cap Growth Fund (SSMGX)as of June 30, 2021
$20,000
$10,000
6/16 6/17 6/216/206/196/186/156/146/11 6/12 6/13
Sit Small Cap Growth FundRussell 2000® Growth Index1
The chart above illustrates the total value of a hypothetical $10,000 investment inthe Fund over the past 10 years as compared to the performance of the Russell 2000®Growth Index. Past performance does not guarantee future results. Returns includethe reinvestment of distributions. The chart does not reflect the deduction of taxesthat a shareholder would pay on Fund distributions or the redemption of Fundshares.1 Russell 2000® Growth Index is an unmanaged index that measures the perfor-mance of those Russell 2000 Index companies with higher price-to-book ratios andhigher forecasted growth values. It is not possible to invest directly in an index. Thisis the Fund’s primary index.
proportionately, based on the potential for upward earnings inflec-tions. Additionally, a focus on infrastructure investment within theBiden administration should help producer manufacturing stocks.Within technology, we expect investor enthusiasm for a 5G wirelessspending cycle to boost select semiconductor companies. We antici-pate consumer spending remaining strong, due to the economic reopen-ing releasing pent-up demand combined with high savings rates andlower credit levels. Accordingly, the Fund retains significant over-weight positions in the consumer durables and consumer servicessectors. The Fund continues to significantly underweight the healthtechnology sector, as many of the biotech companies in the bench-mark Russell 2000® Growth Index depend on debt or equity offer-ings to fund operations and rely on binary events, such as clinicaltrials and acquisition potential, to drive stock performance. The Fundmaintains a preference for investing in proven, cash-generating com-panies.
Roger J. Sit Kent L. JohnsonRobert W. SitPortfolio Managers
Sit Small Cap Growth Fund
Information on this page is unaudited.
36 SIT MUTUAL FUNDS ANNUAL REPORT
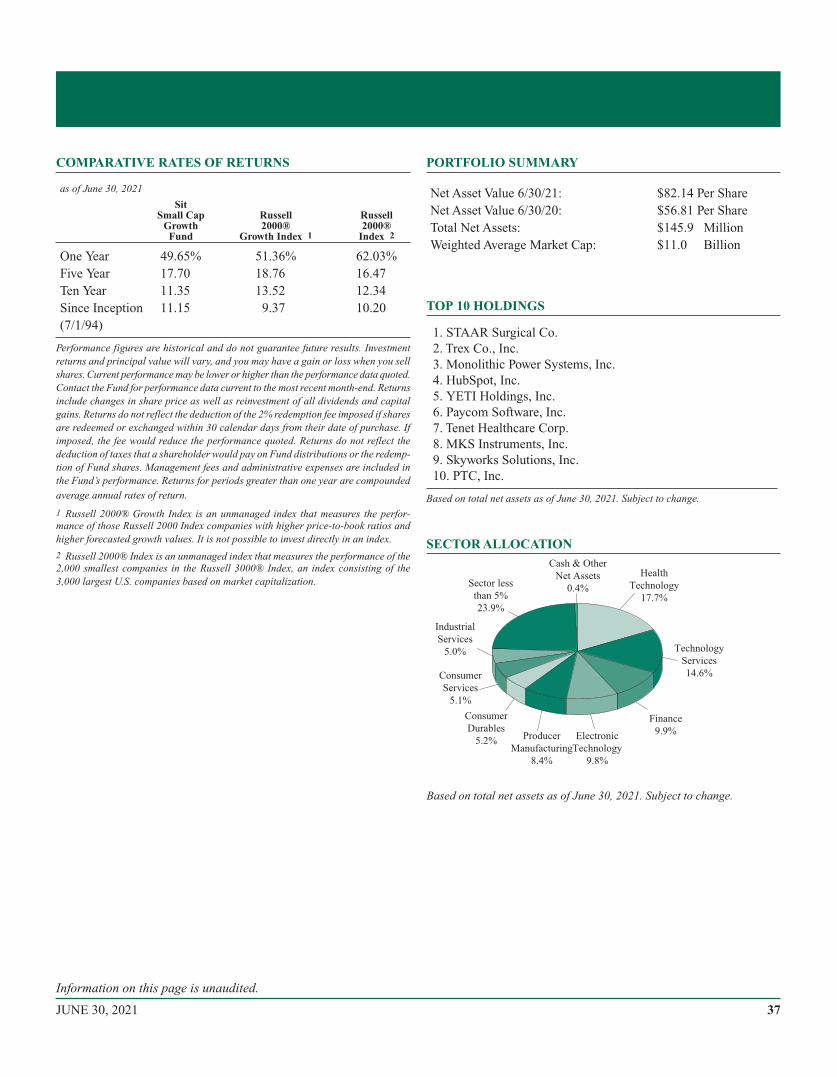
COMPARATIVE RATES OF RETURNS
as of June 30, 2021
SitSmall Cap
GrowthFund
Russell2000®
Growth Index 1
Russell2000®
Index 2
One Year 49.65% 51.36% 62.03%Five Year 17.70 18.76 16.47Ten Year 11.35 13.52 12.34Since Inception 11.15 9.37 10.20(7/1/94)
Performance figures are historical and do not guarantee future results. Investmentreturns and principal value will vary, and you may have a gain or loss when you sellshares. Current performance may be lower or higher than the performance data quoted.Contact the Fund for performance data current to the most recent month-end. Returnsinclude changes in share price as well as reinvestment of all dividends and capitalgains. Returns do not reflect the deduction of the 2% redemption fee imposed if sharesare redeemed or exchanged within 30 calendar days from their date of purchase. Ifimposed, the fee would reduce the performance quoted. Returns do not reflect thededuction of taxes that a shareholder would pay on Fund distributions or the redemp-tion of Fund shares. Management fees and administrative expenses are included inthe Fund’s performance. Returns for periods greater than one year are compounded
average annual rates of return.
1 Russell 2000® Growth Index is an unmanaged index that measures the perfor-mance of those Russell 2000 Index companies with higher price-to-book ratios andhigher forecasted growth values. It is not possible to invest directly in an index.
2 Russell 2000® Index is an unmanaged index that measures the performance of the2,000 smallest companies in the Russell 3000® Index, an index consisting of the3,000 largest U.S. companies based on market capitalization.
PORTFOLIO SUMMARY
Net Asset Value 6/30/21: $82.14 Per ShareNet Asset Value 6/30/20: $56.81 Per ShareTotal Net Assets: $145.9 MillionWeighted Average Market Cap: $11.0 Billion
TOP 10 HOLDINGS
1. STAAR Surgical Co.2. Trex Co., Inc.3. Monolithic Power Systems, Inc.4. HubSpot, Inc.5. YETI Holdings, Inc.6. Paycom Software, Inc.7. Tenet Healthcare Corp.8. MKS Instruments, Inc.9. Skyworks Solutions, Inc.10. PTC, Inc.
Based on total net assets as of June 30, 2021. Subject to change.
SECTOR ALLOCATION
Based on total net assets as of June 30, 2021. Subject to change.
Electronic
Technology
9.8%
Consumer
Services
5.1%
Industrial
Services
5.0% Technology
Services
14.6%
Health
Technology
17.7%
Consumer
Durables
5.2%Producer
Manufacturing
8.4%
Sector less
than 5%
23.9%
Finance
9.9%
Cash & Other
Net Assets
0.4%
Information on this page is unaudited.
37JUNE 30, 2021

Common Stocks - 99.6%Commercial Services - 5.1%ASGN, Inc. * 22,375 2,168,809
Booz Allen Hamilton Holding Corp. 20,000 1,703,600
Colliers International Group, Inc. 12,700 1,422,146
FTI Consulting, Inc. * 6,850 935,778
World Fuel Services Corp. 39,550 1,254,922
7,485,255
Communications - 0.5%Shenandoah Telecommunications Co. 14,475 702,182
Consumer Durables - 5.2%BRP, Inc. 12,150 952,074
Helen of Troy, Ltd. * 4,875 1,112,085
Johnson Outdoors, Inc. 1,775 214,775
Take-Two Interactive Software, Inc. * 6,350 1,124,077
Thor Industries, Inc. 11,200 1,265,600
YETI Holdings, Inc. * 31,900 2,929,058
7,597,669
Consumer Services - 4.1%Chegg, Inc. * 20,800 1,728,688
Nexstar Media Group, Inc. 15,225 2,251,473
Service Corp. International 11,575 620,304
Vail Resorts, Inc. * 4,600 1,455,992
6,056,457
Electronic Technology - 9.8%Arista Networks, Inc. * 6,450 2,336,900
Ciena Corp. * 14,150 804,994
CMC Materials, Inc. 8,825 1,330,280
II-VI, Inc. * 20,075 1,457,244
MKS Instruments, Inc. 14,650 2,606,968
Monolithic Power Systems, Inc. 8,500 3,174,325
Skyworks Solutions, Inc. 13,200 2,531,100
14,241,811
Finance - 9.9%Air Lease Corp. 12,950 540,533
American Financial Group, Inc. 4,800 598,656
Artisan Partners Asset Management, Inc. 31,825 1,617,346
Axis Capital Holdings, Ltd. 22,975 1,126,005
First Republic Bank 6,400 1,197,888
H&E Equipment Services, Inc. 53,175 1,769,132
Hannon Armstrong Sustainable Infrastructure Cap., Inc. 22,100 1,240,915
Physicians Realty Trust 61,600 1,137,752
PROG Holdings, Inc. 35,800 1,723,054
SiriusPoint, Ltd. * 35,425 356,730
SVB Financial Group * 3,250 1,808,398
Western Alliance Bancorp 14,300 1,327,755
14,444,164
Health Services - 4.9%Addus HomeCare Corp. * 16,850 1,469,994
Encompass Health Corp. 19,675 1,535,240
Teladoc Health, Inc. * 8,575 1,425,937
Tenet Healthcare Corp. * 40,100 2,686,299
7,117,470
Health Technology - 17.7%908 Devices, Inc. * 7,400 286,750
Align Technology, Inc. * 2,550 1,558,050
AtriCure, Inc. * 23,225 1,842,439
Bio-Techne Corp. 4,800 2,161,248
Exact Sciences Corp. * 15,700 1,951,667
Humanigen, Inc. * 42,600 740,388
ICU Medical, Inc. * 6,875 1,414,875
Insulet Corp. * 3,525 967,648
iRhythm Technologies, Inc. * 11,675 774,636
LeMaitre Vascular, Inc. 10,475 639,184
NanoString Technologies, Inc. * 25,125 1,627,849
Pacific Biosciences of California, Inc. * 69,475 2,429,541
PerkinElmer, Inc. 8,400 1,297,044
Sarepta Therapeutics, Inc. * 13,400 1,041,716
Seres Therapeutics, Inc. * 43,300 1,032,705
STAAR Surgical Co. * 24,525 3,740,062
STERIS, PLC 9,100 1,877,330
Vanda Pharmaceuticals, Inc. * 21,300 458,163
25,841,295
Industrial Services - 5.0%EMCOR Group, Inc. 15,800 1,946,402
KBR, Inc. 43,500 1,659,525
MYR Group, Inc. * 15,825 1,438,809
Waste Connections, Inc. 19,125 2,284,099
7,328,835
Non-Energy Minerals - 3.8%AZEK Co., Inc. * 24,200 1,027,532
Eagle Materials, Inc. 7,650 1,087,142
Trex Co., Inc. * 33,075 3,380,596
5,495,270
Process Industries - 3.6%Olin Corp. 52,750 2,440,215
Scotts Miracle-Gro Co. 10,275 1,971,978
Vital Farms, Inc. * 41,675 831,833
5,244,026
Producer Manufacturing - 8.4%Applied Industrial Technologies, Inc. 7,000 637,420
AZZ, Inc. 17,025 881,554
Belden, Inc. 8,600 434,902
Carlisle Cos, Inc. 2,200 421,036
Crane Co. 19,075 1,761,958
SCHEDULE OF INVESTMENTSJune 30, 2021
Sit Small Cap Growth FundInvestments are grouped by economic sectors.
Name of Issuer Quantity Fair Value ($) Name of Issuer Quantity Fair Value ($)
See accompanying notes to financial statements.
38 SIT MUTUAL FUNDS ANNUAL REPORT
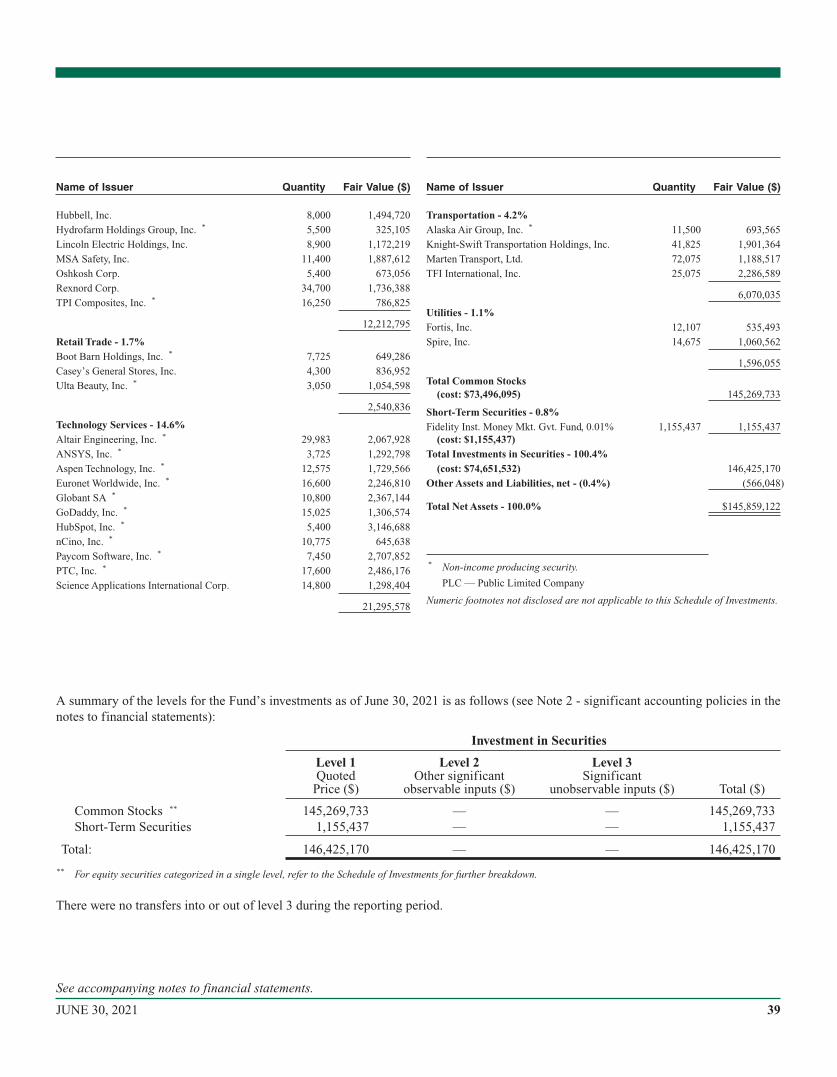
Hubbell, Inc. 8,000 1,494,720
Hydrofarm Holdings Group, Inc. * 5,500 325,105
Lincoln Electric Holdings, Inc. 8,900 1,172,219
MSA Safety, Inc. 11,400 1,887,612
Oshkosh Corp. 5,400 673,056
Rexnord Corp. 34,700 1,736,388
TPI Composites, Inc. * 16,250 786,825
12,212,795
Retail Trade - 1.7%Boot Barn Holdings, Inc. * 7,725 649,286
Casey’s General Stores, Inc. 4,300 836,952
Ulta Beauty, Inc. * 3,050 1,054,598
2,540,836
Technology Services - 14.6%Altair Engineering, Inc. * 29,983 2,067,928
ANSYS, Inc. * 3,725 1,292,798
Aspen Technology, Inc. * 12,575 1,729,566
Euronet Worldwide, Inc. * 16,600 2,246,810
Globant SA * 10,800 2,367,144
GoDaddy, Inc. * 15,025 1,306,574
HubSpot, Inc. * 5,400 3,146,688
nCino, Inc. * 10,775 645,638
Paycom Software, Inc. * 7,450 2,707,852
PTC, Inc. * 17,600 2,486,176
Science Applications International Corp. 14,800 1,298,404
21,295,578
Transportation - 4.2%Alaska Air Group, Inc. * 11,500 693,565
Knight-Swift Transportation Holdings, Inc. 41,825 1,901,364
Marten Transport, Ltd. 72,075 1,188,517
TFI International, Inc. 25,075 2,286,589
6,070,035
Utilities - 1.1%Fortis, Inc. 12,107 535,493
Spire, Inc. 14,675 1,060,562
1,596,055
Total Common Stocks(cost: $73,496,095) 145,269,733
Short-Term Securities - 0.8%Fidelity Inst. Money Mkt. Gvt. Fund, 0.01% 1,155,437 1,155,437
(cost: $1,155,437)Total Investments in Securities - 100.4%
(cost: $74,651,532) 146,425,170
Other Assets and Liabilities, net - (0.4%) (566,048)
Total Net Assets - 100.0% $145,859,122
* Non-income producing security.
PLC — Public Limited Company
Numeric footnotes not disclosed are not applicable to this Schedule of Investments.
A summary of the levels for the Fund’s investments as of June 30, 2021 is as follows (see Note 2 - significant accounting policies in thenotes to financial statements):
Investment in Securities
Level 1Quoted
Price ($)
Level 2Other significant
observable inputs ($)
Level 3Significant
unobservable inputs ($) Total ($)
Common Stocks ** 145,269,733 — — 145,269,733Short-Term Securities 1,155,437 — — 1,155,437
Total: 146,425,170 — — 146,425,170
** For equity securities categorized in a single level, refer to the Schedule of Investments for further breakdown.
There were no transfers into or out of level 3 during the reporting period.
Name of Issuer Quantity Fair Value ($) Name of Issuer Quantity Fair Value ($)
See accompanying notes to financial statements.
39JUNE 30, 2021
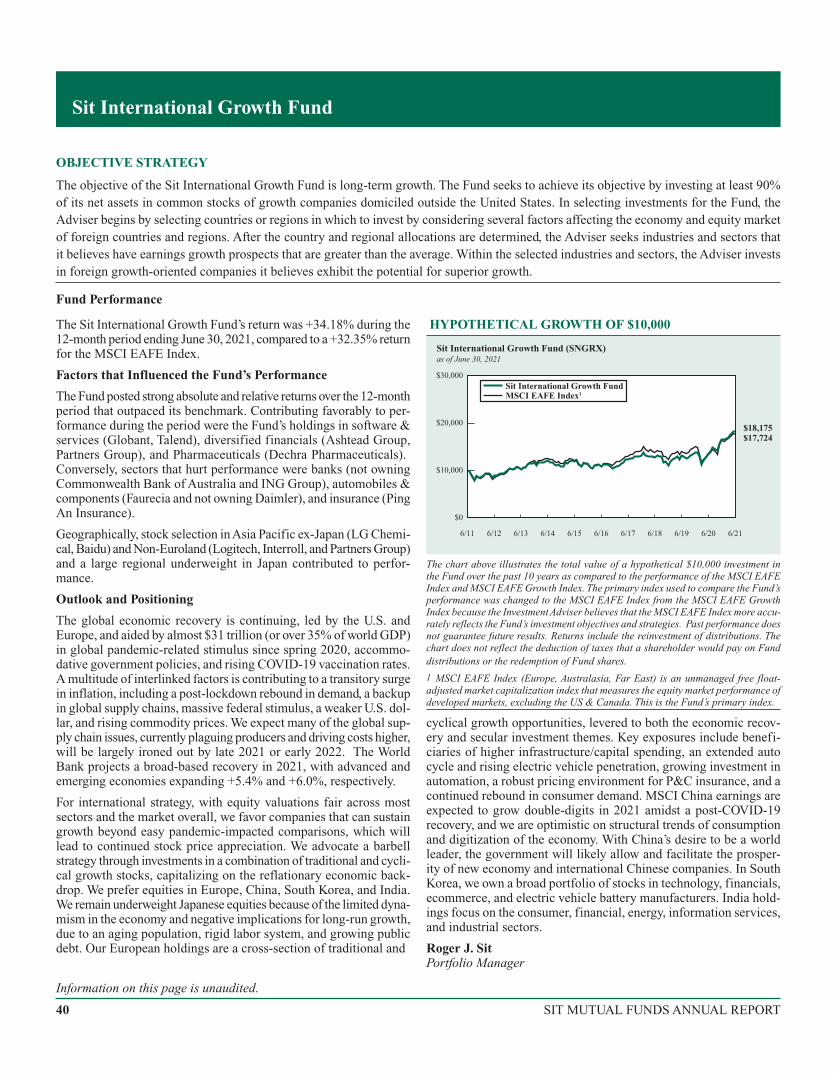
OBJECTIVE STRATEGY
The objective of the Sit International Growth Fund is long-term growth. The Fund seeks to achieve its objective by investing at least 90%of its net assets in common stocks of growth companies domiciled outside the United States. In selecting investments for the Fund, theAdviser begins by selecting countries or regions in which to invest by considering several factors affecting the economy and equity marketof foreign countries and regions. After the country and regional allocations are determined, the Adviser seeks industries and sectors thatit believes have earnings growth prospects that are greater than the average. Within the selected industries and sectors, the Adviser investsin foreign growth-oriented companies it believes exhibit the potential for superior growth.
Fund Performance
The Sit International Growth Fund’s return was +34.18% during the12-month period ending June 30, 2021, compared to a +32.35% returnfor the MSCI EAFE Index.
Factors that Influenced the Fund’s Performance
The Fund posted strong absolute and relative returns over the 12-monthperiod that outpaced its benchmark. Contributing favorably to per-formance during the period were the Fund’s holdings in software &services (Globant, Talend), diversified financials (Ashtead Group,Partners Group), and Pharmaceuticals (Dechra Pharmaceuticals).Conversely, sectors that hurt performance were banks (not owningCommonwealth Bank of Australia and ING Group), automobiles &components (Faurecia and not owning Daimler), and insurance (PingAn Insurance).
Geographically, stock selection inAsia Pacific ex-Japan (LG Chemi-cal, Baidu) and Non-Euroland (Logitech, Interroll, and Partners Group)and a large regional underweight in Japan contributed to perfor-mance.
Outlook and Positioning
The global economic recovery is continuing, led by the U.S. andEurope, and aided by almost $31 trillion (or over 35% of world GDP)in global pandemic-related stimulus since spring 2020, accommo-dative government policies, and rising COVID-19 vaccination rates.A multitude of interlinked factors is contributing to a transitory surgein inflation, including a post-lockdown rebound in demand, a backupin global supply chains, massive federal stimulus, a weaker U.S. dol-lar, and rising commodity prices. We expect many of the global sup-ply chain issues, currently plaguing producers and driving costs higher,will be largely ironed out by late 2021 or early 2022. The WorldBank projects a broad-based recovery in 2021, with advanced andemerging economies expanding +5.4% and +6.0%, respectively.
For international strategy, with equity valuations fair across mostsectors and the market overall, we favor companies that can sustaingrowth beyond easy pandemic-impacted comparisons, which willlead to continued stock price appreciation. We advocate a barbellstrategy through investments in a combination of traditional and cycli-cal growth stocks, capitalizing on the reflationary economic back-drop. We prefer equities in Europe, China, South Korea, and India.We remain underweight Japanese equities because of the limited dyna-mism in the economy and negative implications for long-run growth,due to an aging population, rigid labor system, and growing publicdebt. Our European holdings are a cross-section of traditional and
HYPOTHETICAL GROWTH OF $10,000
$10,000
$30,000
$20,000
$17,724$18,175
Sit International Growth Fund (SNGRX)as of June 30, 2021
Sit International Growth FundMSCI EAFE Index1
6/16 6/17 6/206/196/186/156/146/11 6/12 6/13
$0
6/21
The chart above illustrates the total value of a hypothetical $10,000 investment inthe Fund over the past 10 years as compared to the performance of the MSCI EAFEIndex and MSCI EAFE Growth Index. The primary index used to compare the Fund’sperformance was changed to the MSCI EAFE Index from the MSCI EAFE GrowthIndex because the Investment Adviser believes that the MSCI EAFE Index more accu-rately reflects the Fund’s investment objectives and strategies. Past performance doesnot guarantee future results. Returns include the reinvestment of distributions. Thechart does not reflect the deduction of taxes that a shareholder would pay on Funddistributions or the redemption of Fund shares.
1 MSCI EAFE Index (Europe, Australasia, Far East) is an unmanaged free float-adjusted market capitalization index that measures the equity market performance ofdeveloped markets, excluding the US & Canada. This is the Fund’s primary index.
cyclical growth opportunities, levered to both the economic recov-ery and secular investment themes. Key exposures include benefi-ciaries of higher infrastructure/capital spending, an extended autocycle and rising electric vehicle penetration, growing investment inautomation, a robust pricing environment for P&C insurance, and acontinued rebound in consumer demand. MSCI China earnings areexpected to grow double-digits in 2021 amidst a post-COVID-19recovery, and we are optimistic on structural trends of consumptionand digitization of the economy. With China’s desire to be a worldleader, the government will likely allow and facilitate the prosper-ity of new economy and international Chinese companies. In SouthKorea, we own a broad portfolio of stocks in technology, financials,ecommerce, and electric vehicle battery manufacturers. India hold-ings focus on the consumer, financial, energy, information services,and industrial sectors.
Roger J. SitPortfolio Manager
Sit International Growth Fund
Information on this page is unaudited.
40 SIT MUTUAL FUNDS ANNUAL REPORT
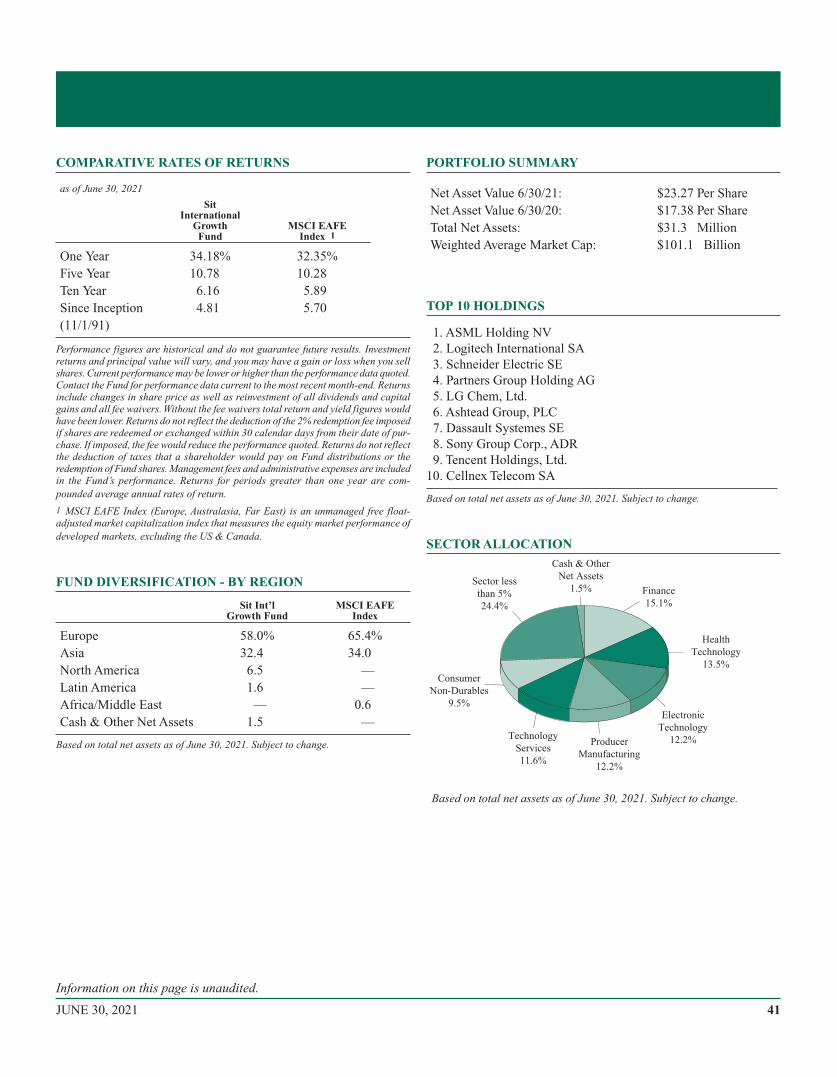
COMPARATIVE RATES OF RETURNS
as of June 30, 2021
SitInternational
GrowthFund
MSCI EAFEIndex 1
One Year 34.18% 32.35%Five Year 10.78 10.28Ten Year 6.16 5.89Since Inception 4.81 5.70(11/1/91)
Performance figures are historical and do not guarantee future results. Investmentreturns and principal value will vary, and you may have a gain or loss when you sellshares. Current performance may be lower or higher than the performance data quoted.Contact the Fund for performance data current to the most recent month-end. Returnsinclude changes in share price as well as reinvestment of all dividends and capitalgains and all fee waivers. Without the fee waivers total return and yield figures wouldhave been lower. Returns do not reflect the deduction of the 2% redemption fee imposedif shares are redeemed or exchanged within 30 calendar days from their date of pur-chase. If imposed, the fee would reduce the performance quoted. Returns do not reflectthe deduction of taxes that a shareholder would pay on Fund distributions or theredemption of Fund shares. Management fees and administrative expenses are includedin the Fund’s performance. Returns for periods greater than one year are com-pounded average annual rates of return.
1 MSCI EAFE Index (Europe, Australasia, Far East) is an unmanaged free float-adjusted market capitalization index that measures the equity market performance ofdeveloped markets, excluding the US & Canada.
FUND DIVERSIFICATION - BY REGION
Sit Int’lGrowth Fund
MSCI EAFEIndex
Europe 58.0% 65.4%Asia 32.4 34.0North America 6.5 —Latin America 1.6 —Africa/Middle East — 0.6Cash & Other Net Assets 1.5 —
Based on total net assets as of June 30, 2021. Subject to change.
PORTFOLIO SUMMARY
Net Asset Value 6/30/21: $23.27 Per ShareNet Asset Value 6/30/20: $17.38 Per ShareTotal Net Assets: $31.3 MillionWeighted Average Market Cap: $101.1 Billion
TOP 10 HOLDINGS
1. ASML Holding NV2. Logitech International SA3. Schneider Electric SE4. Partners Group Holding AG5. LG Chem, Ltd.6. Ashtead Group, PLC7. Dassault Systemes SE8. Sony Group Corp., ADR9. Tencent Holdings, Ltd.
10. Cellnex Telecom SA
Based on total net assets as of June 30, 2021. Subject to change.
SECTOR ALLOCATION
Based on total net assets as of June 30, 2021. Subject to change.
Sector less
than 5%
24.4%
Finance
15.1%
Health
Technology
13.5%
Cash & Other
Net Assets
1.5%
Electronic
Technology
12.2%Producer
Manufacturing
12.2%
Consumer
Non-Durables
9.5%
Technology
Services
11.6%
Information on this page is unaudited.
41JUNE 30, 2021
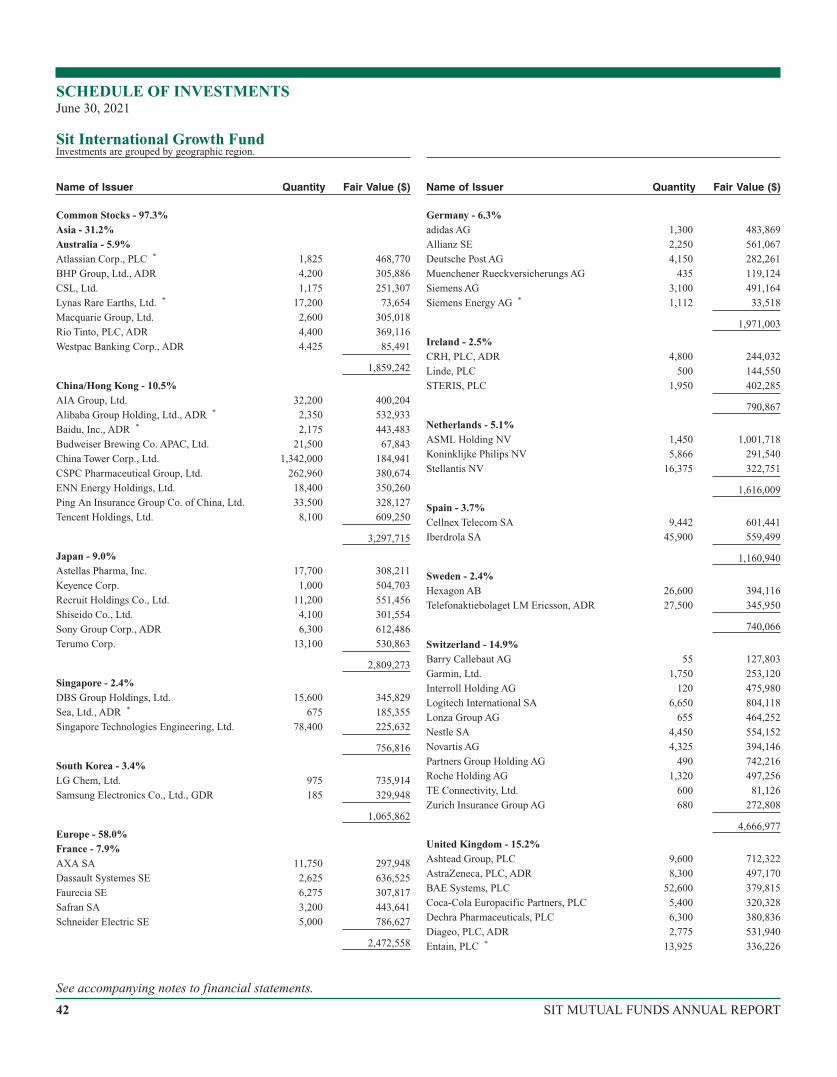
Common Stocks - 97.3%Asia - 31.2%Australia - 5.9%Atlassian Corp., PLC * 1,825 468,770
BHP Group, Ltd., ADR 4,200 305,886
CSL, Ltd. 1,175 251,307
Lynas Rare Earths, Ltd. * 17,200 73,654
Macquarie Group, Ltd. 2,600 305,018
Rio Tinto, PLC, ADR 4,400 369,116
Westpac Banking Corp., ADR 4,425 85,491
1,859,242
China/Hong Kong - 10.5%AIA Group, Ltd. 32,200 400,204
Alibaba Group Holding, Ltd., ADR * 2,350 532,933
Baidu, Inc., ADR * 2,175 443,483
Budweiser Brewing Co. APAC, Ltd. 21,500 67,843
China Tower Corp., Ltd. 1,342,000 184,941
CSPC Pharmaceutical Group, Ltd. 262,960 380,674
ENN Energy Holdings, Ltd. 18,400 350,260
Ping An Insurance Group Co. of China, Ltd. 33,500 328,127
Tencent Holdings, Ltd. 8,100 609,250
3,297,715
Japan - 9.0%Astellas Pharma, Inc. 17,700 308,211
Keyence Corp. 1,000 504,703
Recruit Holdings Co., Ltd. 11,200 551,456
Shiseido Co., Ltd. 4,100 301,554
Sony Group Corp., ADR 6,300 612,486
Terumo Corp. 13,100 530,863
2,809,273
Singapore - 2.4%DBS Group Holdings, Ltd. 15,600 345,829
Sea, Ltd., ADR * 675 185,355
Singapore Technologies Engineering, Ltd. 78,400 225,632
756,816
South Korea - 3.4%LG Chem, Ltd. 975 735,914
Samsung Electronics Co., Ltd., GDR 185 329,948
1,065,862
Europe - 58.0%France - 7.9%AXA SA 11,750 297,948
Dassault Systemes SE 2,625 636,525
Faurecia SE 6,275 307,817
Safran SA 3,200 443,641
Schneider Electric SE 5,000 786,627
2,472,558
Germany - 6.3%adidas AG 1,300 483,869
Allianz SE 2,250 561,067
Deutsche Post AG 4,150 282,261
Muenchener Rueckversicherungs AG 435 119,124
Siemens AG 3,100 491,164
Siemens Energy AG * 1,112 33,518
1,971,003
Ireland - 2.5%CRH, PLC, ADR 4,800 244,032
Linde, PLC 500 144,550
STERIS, PLC 1,950 402,285
790,867
Netherlands - 5.1%ASML Holding NV 1,450 1,001,718
Koninklijke Philips NV 5,866 291,540
Stellantis NV 16,375 322,751
1,616,009
Spain - 3.7%Cellnex Telecom SA 9,442 601,441
Iberdrola SA 45,900 559,499
1,160,940
Sweden - 2.4%Hexagon AB 26,600 394,116
Telefonaktiebolaget LM Ericsson, ADR 27,500 345,950
740,066
Switzerland - 14.9%Barry Callebaut AG 55 127,803
Garmin, Ltd. 1,750 253,120
Interroll Holding AG 120 475,980
Logitech International SA 6,650 804,118
Lonza Group AG 655 464,252
Nestle SA 4,450 554,152
Novartis AG 4,325 394,146
Partners Group Holding AG 490 742,216
Roche Holding AG 1,320 497,256
TE Connectivity, Ltd. 600 81,126
Zurich Insurance Group AG 680 272,808
4,666,977
United Kingdom - 15.2%Ashtead Group, PLC 9,600 712,322
AstraZeneca, PLC, ADR 8,300 497,170
BAE Systems, PLC 52,600 379,815
Coca-Cola Europacific Partners, PLC 5,400 320,328
Dechra Pharmaceuticals, PLC 6,300 380,836
Diageo, PLC, ADR 2,775 531,940
Entain, PLC * 13,925 336,226
SCHEDULE OF INVESTMENTSJune 30, 2021
Sit International Growth FundInvestments are grouped by geographic region.
Name of Issuer Quantity Fair Value ($) Name of Issuer Quantity Fair Value ($)
See accompanying notes to financial statements.
42 SIT MUTUAL FUNDS ANNUAL REPORT
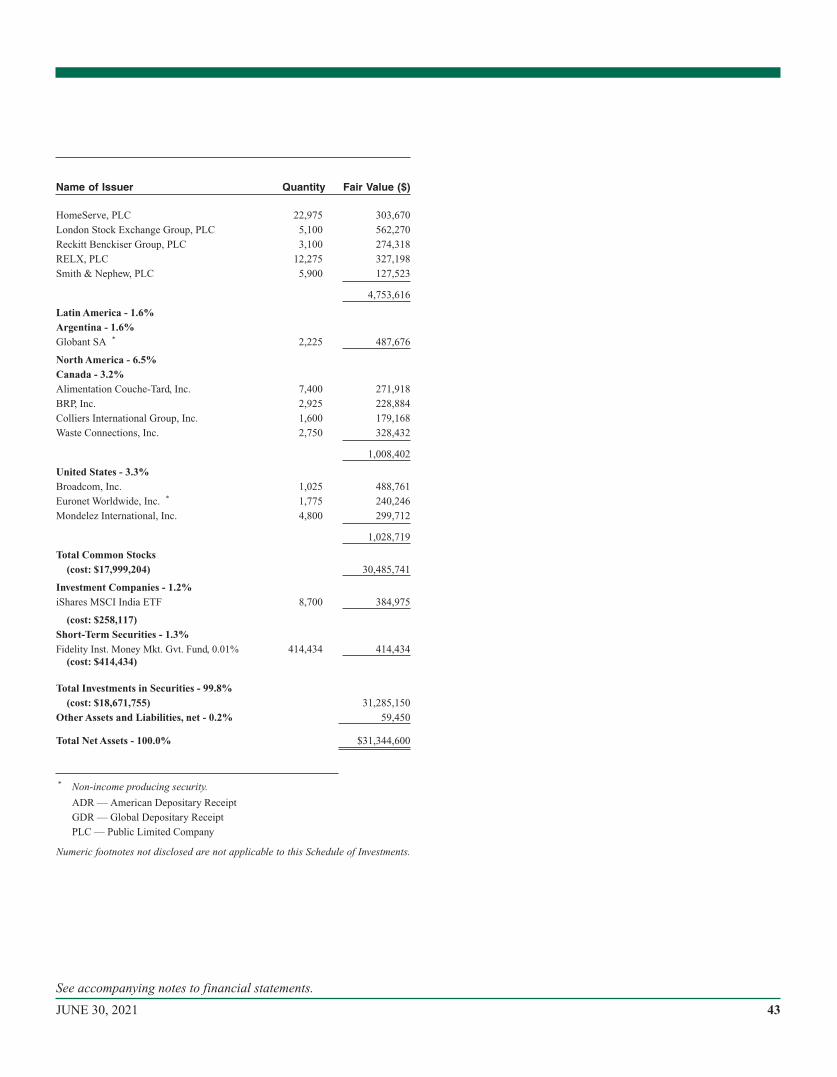
HomeServe, PLC 22,975 303,670
London Stock Exchange Group, PLC 5,100 562,270
Reckitt Benckiser Group, PLC 3,100 274,318
RELX, PLC 12,275 327,198
Smith & Nephew, PLC 5,900 127,523
4,753,616
Latin America - 1.6%Argentina - 1.6%Globant SA * 2,225 487,676
North America - 6.5%Canada - 3.2%Alimentation Couche-Tard, Inc. 7,400 271,918
BRP, Inc. 2,925 228,884
Colliers International Group, Inc. 1,600 179,168
Waste Connections, Inc. 2,750 328,432
1,008,402
United States - 3.3%Broadcom, Inc. 1,025 488,761
Euronet Worldwide, Inc. * 1,775 240,246
Mondelez International, Inc. 4,800 299,712
1,028,719
Total Common Stocks(cost: $17,999,204) 30,485,741
Investment Companies - 1.2%iShares MSCI India ETF 8,700 384,975
(cost: $258,117)Short-Term Securities - 1.3%Fidelity Inst. Money Mkt. Gvt. Fund, 0.01% 414,434 414,434
(cost: $414,434)
Total Investments in Securities - 99.8%(cost: $18,671,755) 31,285,150
Other Assets and Liabilities, net - 0.2% 59,450
Total Net Assets - 100.0% $31,344,600
* Non-income producing security.
ADR — American Depositary Receipt
GDR — Global Depositary Receipt
PLC — Public Limited Company
Numeric footnotes not disclosed are not applicable to this Schedule of Investments.
Name of Issuer Quantity Fair Value ($)
See accompanying notes to financial statements.
43JUNE 30, 2021
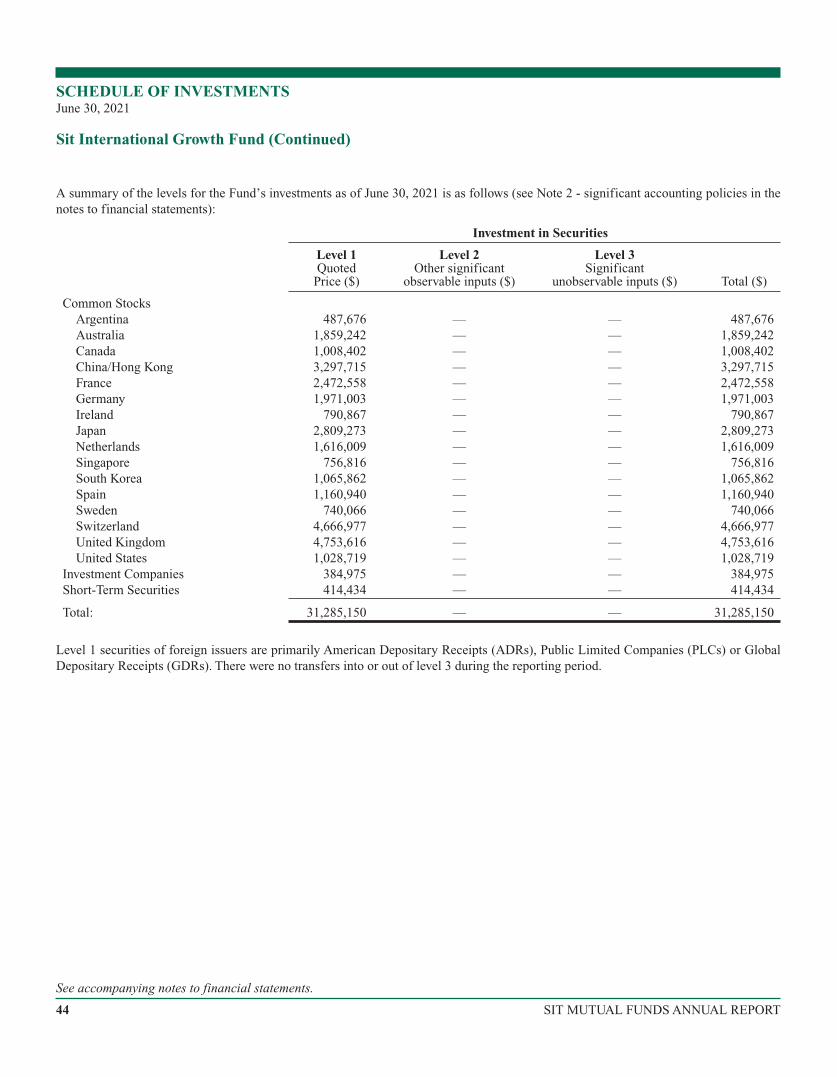
A summary of the levels for the Fund’s investments as of June 30, 2021 is as follows (see Note 2 - significant accounting policies in thenotes to financial statements):
Investment in Securities
Level 1Quoted
Price ($)
Level 2Other significant
observable inputs ($)
Level 3Significant
unobservable inputs ($) Total ($)
Common StocksArgentina 487,676 — — 487,676Australia 1,859,242 — — 1,859,242Canada 1,008,402 — — 1,008,402China/Hong Kong 3,297,715 — — 3,297,715France 2,472,558 — — 2,472,558Germany 1,971,003 — — 1,971,003Ireland 790,867 — — 790,867Japan 2,809,273 — — 2,809,273Netherlands 1,616,009 — — 1,616,009Singapore 756,816 — — 756,816South Korea 1,065,862 — — 1,065,862Spain 1,160,940 — — 1,160,940Sweden 740,066 — — 740,066Switzerland 4,666,977 — — 4,666,977United Kingdom 4,753,616 — — 4,753,616United States 1,028,719 — — 1,028,719
Investment Companies 384,975 — — 384,975Short-Term Securities 414,434 — — 414,434
Total: 31,285,150 — — 31,285,150
Level 1 securities of foreign issuers are primarily American Depositary Receipts (ADRs), Public Limited Companies (PLCs) or GlobalDepositary Receipts (GDRs). There were no transfers into or out of level 3 during the reporting period.
SCHEDULE OF INVESTMENTSJune 30, 2021
Sit International Growth Fund (Continued)
See accompanying notes to financial statements.
44 SIT MUTUAL FUNDS ANNUAL REPORT

[This page intentionally left blank.]
45JUNE 30, 2021
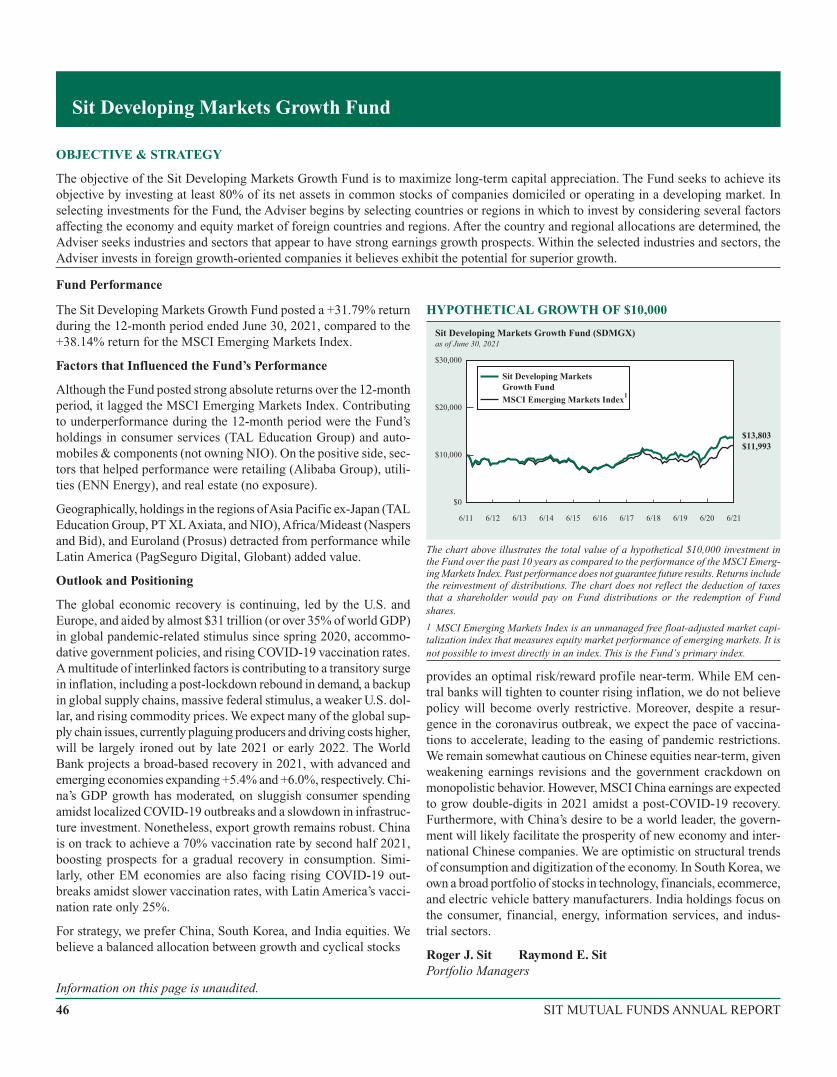
OBJECTIVE & STRATEGY
The objective of the Sit Developing Markets Growth Fund is to maximize long-term capital appreciation. The Fund seeks to achieve itsobjective by investing at least 80% of its net assets in common stocks of companies domiciled or operating in a developing market. Inselecting investments for the Fund, the Adviser begins by selecting countries or regions in which to invest by considering several factorsaffecting the economy and equity market of foreign countries and regions. After the country and regional allocations are determined, theAdviser seeks industries and sectors that appear to have strong earnings growth prospects. Within the selected industries and sectors, theAdviser invests in foreign growth-oriented companies it believes exhibit the potential for superior growth.
Fund Performance
The Sit Developing Markets Growth Fund posted a +31.79% returnduring the 12-month period ended June 30, 2021, compared to the+38.14% return for the MSCI Emerging Markets Index.
Factors that Influenced the Fund’s Performance
Although the Fund posted strong absolute returns over the 12-monthperiod, it lagged the MSCI Emerging Markets Index. Contributingto underperformance during the 12-month period were the Fund’sholdings in consumer services (TAL Education Group) and auto-mobiles & components (not owning NIO). On the positive side, sec-tors that helped performance were retailing (Alibaba Group), utili-ties (ENN Energy), and real estate (no exposure).
Geographically, holdings in the regions ofAsia Pacific ex-Japan (TALEducation Group, PT XLAxiata, and NIO),Africa/Mideast (Naspersand Bid), and Euroland (Prosus) detracted from performance whileLatin America (PagSeguro Digital, Globant) added value.
Outlook and Positioning
The global economic recovery is continuing, led by the U.S. andEurope, and aided by almost $31 trillion (or over 35% of world GDP)in global pandemic-related stimulus since spring 2020, accommo-dative government policies, and rising COVID-19 vaccination rates.A multitude of interlinked factors is contributing to a transitory surgein inflation, including a post-lockdown rebound in demand, a backupin global supply chains, massive federal stimulus, a weaker U.S. dol-lar, and rising commodity prices. We expect many of the global sup-ply chain issues, currently plaguing producers and driving costs higher,will be largely ironed out by late 2021 or early 2022. The WorldBank projects a broad-based recovery in 2021, with advanced andemerging economies expanding +5.4% and +6.0%, respectively. Chi-na’s GDP growth has moderated, on sluggish consumer spendingamidst localized COVID-19 outbreaks and a slowdown in infrastruc-ture investment. Nonetheless, export growth remains robust. Chinais on track to achieve a 70% vaccination rate by second half 2021,boosting prospects for a gradual recovery in consumption. Simi-larly, other EM economies are also facing rising COVID-19 out-breaks amidst slower vaccination rates, with Latin America’s vacci-nation rate only 25%.
For strategy, we prefer China, South Korea, and India equities. Webelieve a balanced allocation between growth and cyclical stocks
HYPOTHETICAL GROWTH OF $10,000
$0
$10,000
$20,000
$30,000
$13,803$11,993
Sit Developing Markets Growth Fund (SDMGX)as of June 30, 2021
6/18 6/19 6/216/206/176/166/11 6/12 6/13 6/14 6/15
1
Sit Developing MarketsGrowth FundMSCI Emerging Markets Index
The chart above illustrates the total value of a hypothetical $10,000 investment inthe Fund over the past 10 years as compared to the performance of the MSCI Emerg-ing Markets Index. Past performance does not guarantee future results. Returns includethe reinvestment of distributions. The chart does not reflect the deduction of taxesthat a shareholder would pay on Fund distributions or the redemption of Fundshares.
1 MSCI Emerging Markets Index is an unmanaged free float-adjusted market capi-talization index that measures equity market performance of emerging markets. It isnot possible to invest directly in an index. This is the Fund’s primary index.
provides an optimal risk/reward profile near-term. While EM cen-tral banks will tighten to counter rising inflation, we do not believepolicy will become overly restrictive. Moreover, despite a resur-gence in the coronavirus outbreak, we expect the pace of vaccina-tions to accelerate, leading to the easing of pandemic restrictions.We remain somewhat cautious on Chinese equities near-term, givenweakening earnings revisions and the government crackdown onmonopolistic behavior. However, MSCI China earnings are expectedto grow double-digits in 2021 amidst a post-COVID-19 recovery.Furthermore, with China’s desire to be a world leader, the govern-ment will likely facilitate the prosperity of new economy and inter-national Chinese companies. We are optimistic on structural trendsof consumption and digitization of the economy. In South Korea, weown a broad portfolio of stocks in technology, financials, ecommerce,and electric vehicle battery manufacturers. India holdings focus onthe consumer, financial, energy, information services, and indus-trial sectors.
Roger J. Sit Raymond E. SitPortfolio Managers
Sit Developing Markets Growth Fund
Information on this page is unaudited.
46 SIT MUTUAL FUNDS ANNUAL REPORT
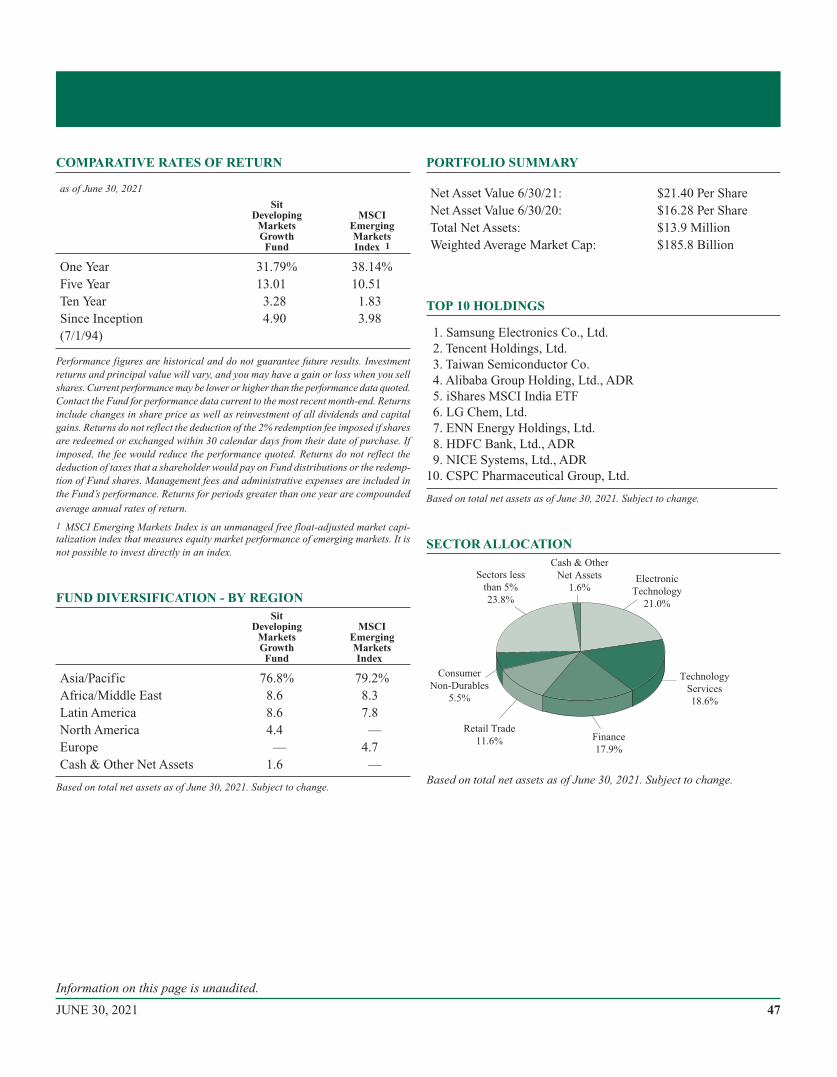
COMPARATIVE RATES OF RETURN
as of June 30, 2021
SitDeveloping
MarketsGrowthFund
MSCIEmergingMarketsIndex 1
One Year 31.79% 38.14%Five Year 13.01 10.51Ten Year 3.28 1.83Since Inception 4.90 3.98(7/1/94)
Performance figures are historical and do not guarantee future results. Investmentreturns and principal value will vary, and you may have a gain or loss when you sellshares. Current performance may be lower or higher than the performance data quoted.Contact the Fund for performance data current to the most recent month-end. Returnsinclude changes in share price as well as reinvestment of all dividends and capitalgains. Returns do not reflect the deduction of the 2% redemption fee imposed if sharesare redeemed or exchanged within 30 calendar days from their date of purchase. Ifimposed, the fee would reduce the performance quoted. Returns do not reflect thededuction of taxes that a shareholder would pay on Fund distributions or the redemp-tion of Fund shares. Management fees and administrative expenses are included inthe Fund’s performance. Returns for periods greater than one year are compounded
average annual rates of return.
1 MSCI Emerging Markets Index is an unmanaged free float-adjusted market capi-talization index that measures equity market performance of emerging markets. It isnot possible to invest directly in an index.
FUND DIVERSIFICATION - BY REGIONSit
DevelopingMarketsGrowthFund
MSCIEmergingMarketsIndex
Asia/Pacific 76.8% 79.2%Africa/Middle East 8.6 8.3Latin America 8.6 7.8North America 4.4 —Europe — 4.7Cash & Other Net Assets 1.6 —
Based on total net assets as of June 30, 2021. Subject to change.
PORTFOLIO SUMMARY
Net Asset Value 6/30/21: $21.40 Per ShareNet Asset Value 6/30/20: $16.28 Per ShareTotal Net Assets: $13.9 MillionWeighted Average Market Cap: $185.8 Billion
TOP 10 HOLDINGS
1. Samsung Electronics Co., Ltd.2. Tencent Holdings, Ltd.3. Taiwan Semiconductor Co.4. Alibaba Group Holding, Ltd., ADR5. iShares MSCI India ETF6. LG Chem, Ltd.7. ENN Energy Holdings, Ltd.8. HDFC Bank, Ltd., ADR9. NICE Systems, Ltd., ADR
10. CSPC Pharmaceutical Group, Ltd.
Based on total net assets as of June 30, 2021. Subject to change.
SECTOR ALLOCATION
Based on total net assets as of June 30, 2021. Subject to change.
Electronic
Technology
21.0%
Technology
Services
18.6%
Finance
17.9%
Retail Trade
11.6%
Consumer
Non-Durables
5.5%
Sectors less
than 5%
23.8%
Cash & Other
Net Assets
1.6%
Information on this page is unaudited.
47JUNE 30, 2021

Common Stocks - 94.9%Africa/Middle East - 8.6%Israel - 2.7%NICE Systems, Ltd., ADR * 1,500 371,190
South Africa - 5.9%Bid Corp., Ltd. * 13,200 286,194
Bidvest Group, Ltd. 5,525 73,690
Naspers, Ltd. 1,425 299,189
Prosus NV 1,700 166,241
825,314
Asia - 73.3%Australia - 2.3%Atlassian Corp., PLC * 450 115,587
Rio Tinto, PLC, ADR 2,475 207,628
323,215
China/Hong Kong - 39.2%AIA Group, Ltd. 21,400 265,974
Alibaba Group Holding, Ltd., ADR * 3,150 714,357
Baidu, Inc., ADR * 1,300 265,070
Budweiser Brewing Co. APAC, Ltd. 46,000 145,152
China Construction Bank Corp. 82,000 64,529
China International Capital Corp., Ltd. 58,400 157,202
China Mengniu Dairy Co., Ltd. 48,000 290,252
China Petroleum & Chemical Corp., ADR 1,400 71,414
China Tower Corp., Ltd. 704,000 97,018
CSPC Pharmaceutical Group, Ltd. 230,400 333,539
ENN Energy Holdings, Ltd. 21,900 416,885
GDS Holdings, Ltd., ADR * 1,000 78,490
Hong Kong Exchanges & Clearing, Ltd. 5,100 303,991
JD.com, Inc., ADR * 4,000 319,240
Meituan Dianping * 6,000 247,595
Ping An Insurance Group Co. of China, Ltd. 19,900 194,917
Sands China, Ltd. * 7,400 31,166
Sinopharm Group Co., Ltd. 44,900 133,584
TAL Education Group, ADR * 4,225 106,597
Tencent Holdings, Ltd. 11,400 857,463
Tencent Music Entertainment Group, ADR * 5,525 85,527
Trip.com Group, Ltd., ADR * 3,900 138,294
WH Group, Ltd. 132,500 119,116
5,437,372
India - 2.8%HDFC Bank, Ltd., ADR * 5,350 391,192
Indonesia - 1.7%Astra International Tbk PT 176,000 59,961
XL Axiata Tbk PT 948,800 174,710
234,671
Singapore - 4.7%DBS Group Holdings, Ltd. 14,500 321,443
Flex, Ltd. * 4,000 71,480
Sea, Ltd., ADR * 475 130,435
Singapore Technologies Engineering, Ltd. 44,000 126,630
649,988
South Korea - 12.5%LG Chem, Ltd. 575 434,001
NAVER Corp. 450 166,829
Samsung Electronics Co., Ltd. 12,250 877,836
Shinhan Financial Group Co., Ltd. 7,200 259,575
1,738,241
Taiwan - 9.2%Cathay Financial Holding Co., Ltd. 82,085 158,793
Hon Hai Precision Industry Co., Ltd., GDR 23,700 191,259
Taiwan Semiconductor Co. 37,482 800,423
Taiwan Semiconductor Co., ADR 1,000 120,160
1,270,635
Thailand - 0.9%Bangkok Bank PCL 36,500 128,690
Latin America - 8.6%Argentina - 1.9%Globant SA * 1,175 257,536
Brazil - 4.2%Ambev SA, ADR 21,575 74,218
Banco Bradesco SA 27,591 142,787
Lojas Renner SA 17,300 154,711
Pagseguro Digital, Ltd. * 3,800 212,496
584,212
Chile - 0.7%Banco Santander Chile, ADR 4,700 93,389
Peru - 1.8%Southern Copper Corp. 3,900 250,848
North America - 4.4%Mexico - 0.9%Fomento Economico Mexicano, ADR 1,575 133,103
United States - 3.5%Broadcom, Inc. 550 262,262
Skyworks Solutions, Inc. 1,150 220,513
482,775
Total Common Stocks(cost: $7,749,028) 13,172,371
Investment Companies - 3.5%iShares MSCI India ETF 11,100 491,175
(cost: $333,062)
SCHEDULE OF INVESTMENTSJune 30, 2021
Sit Developing Markets Growth FundInvestments are grouped by geographic region.
Name of Issuer Quantity Fair Value ($) Name of Issuer Quantity Fair Value ($)
See accompanying notes to financial statements.
48 SIT MUTUAL FUNDS ANNUAL REPORT
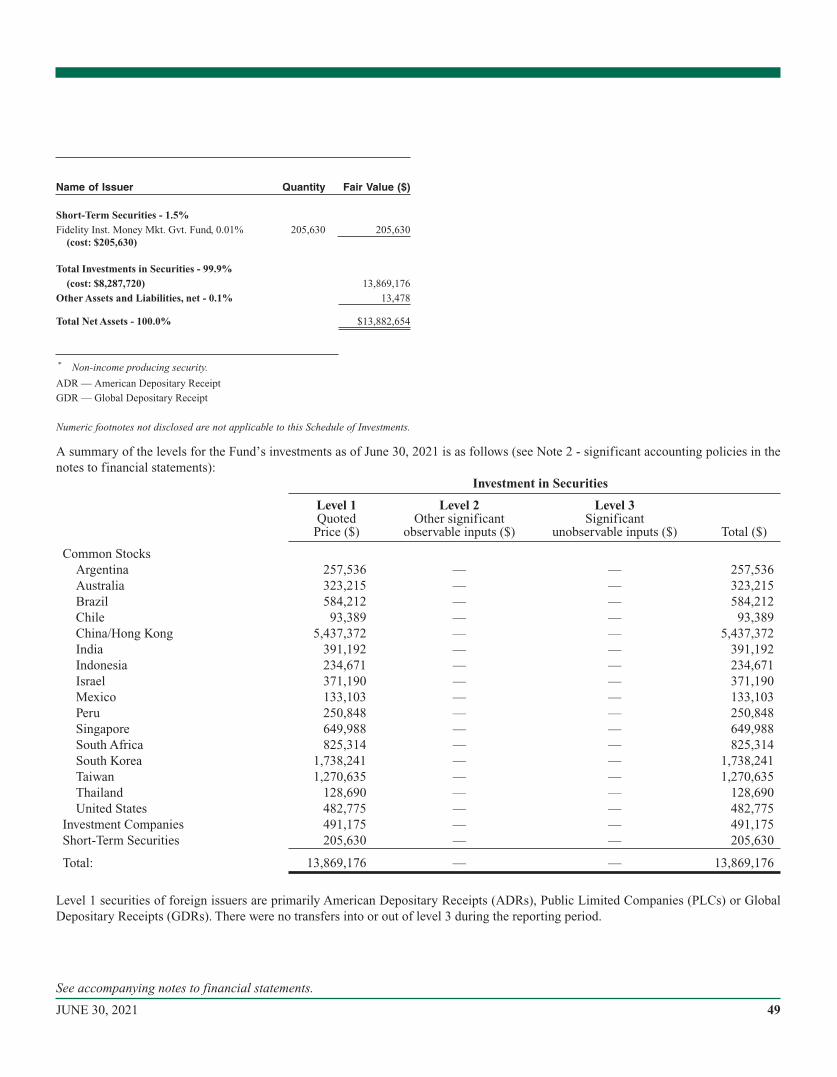
Short-Term Securities - 1.5%Fidelity Inst. Money Mkt. Gvt. Fund, 0.01% 205,630 205,630
(cost: $205,630)
Total Investments in Securities - 99.9%(cost: $8,287,720) 13,869,176
Other Assets and Liabilities, net - 0.1% 13,478
Total Net Assets - 100.0% $13,882,654
* Non-income producing security.
ADR — American Depositary Receipt
GDR — Global Depositary Receipt
Numeric footnotes not disclosed are not applicable to this Schedule of Investments.
A summary of the levels for the Fund’s investments as of June 30, 2021 is as follows (see Note 2 - significant accounting policies in thenotes to financial statements):
Investment in Securities
Level 1Quoted
Price ($)
Level 2Other significant
observable inputs ($)
Level 3Significant
unobservable inputs ($) Total ($)
Common StocksArgentina 257,536 — — 257,536Australia 323,215 — — 323,215Brazil 584,212 — — 584,212Chile 93,389 — — 93,389China/Hong Kong 5,437,372 — — 5,437,372India 391,192 — — 391,192Indonesia 234,671 — — 234,671Israel 371,190 — — 371,190Mexico 133,103 — — 133,103Peru 250,848 — — 250,848Singapore 649,988 — — 649,988South Africa 825,314 — — 825,314South Korea 1,738,241 — — 1,738,241Taiwan 1,270,635 — — 1,270,635Thailand 128,690 — — 128,690United States 482,775 — — 482,775
Investment Companies 491,175 — — 491,175Short-Term Securities 205,630 — — 205,630
Total: 13,869,176 — — 13,869,176
Level 1 securities of foreign issuers are primarily American Depositary Receipts (ADRs), Public Limited Companies (PLCs) or GlobalDepositary Receipts (GDRs). There were no transfers into or out of level 3 during the reporting period.
Name of Issuer Quantity Fair Value ($)
See accompanying notes to financial statements.
49JUNE 30, 2021
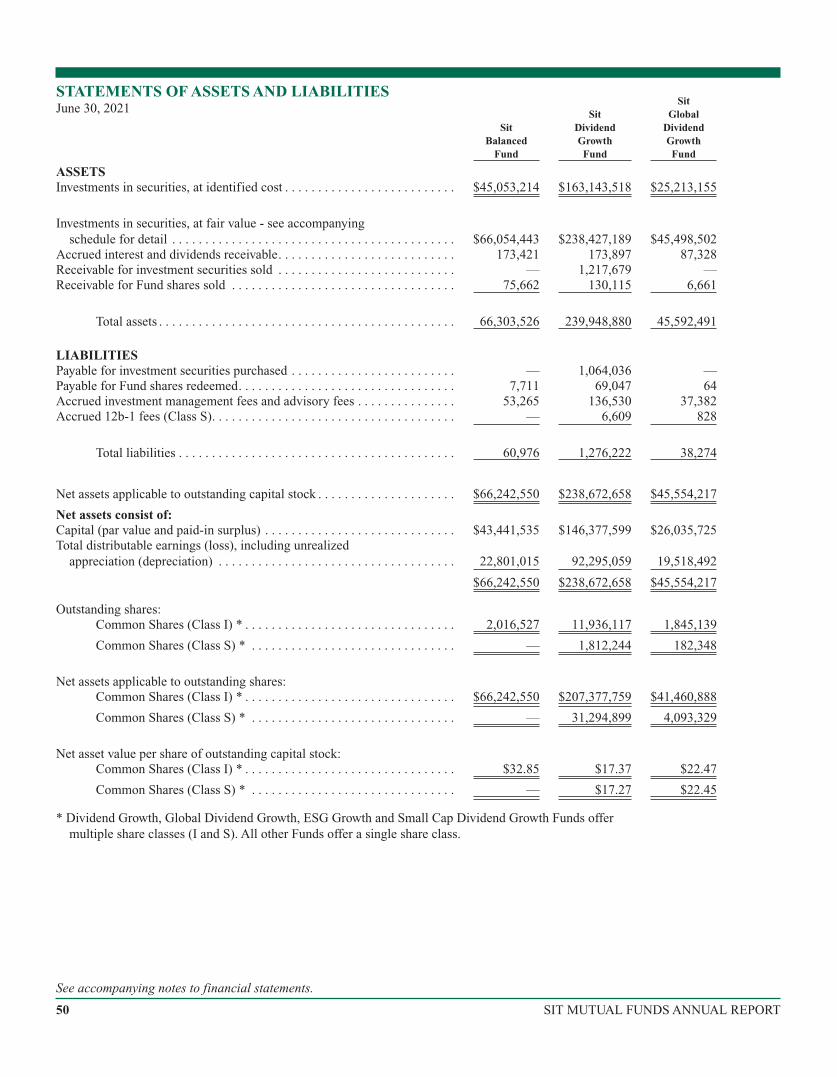
SitBalanced
Fund
SitDividendGrowthFund
SitGlobal
DividendGrowthFund
ASSETSInvestments in securities, at identified cost . . . . . . . . . . . . . . . . . . . . . . . . . . $45,053,214 $163,143,518 $25,213,155
Investments in securities, at fair value - see accompanyingschedule for detail . . . . . . . . . . . . . . . . . . . . . . . . . . . . . . . . . . . . . . . . . . . $66,054,443 $238,427,189 $45,498,502
Accrued interest and dividends receivable. . . . . . . . . . . . . . . . . . . . . . . . . . . 173,421 173,897 87,328Receivable for investment securities sold . . . . . . . . . . . . . . . . . . . . . . . . . . . — 1,217,679 —Receivable for Fund shares sold . . . . . . . . . . . . . . . . . . . . . . . . . . . . . . . . . . 75,662 130,115 6,661
Total assets . . . . . . . . . . . . . . . . . . . . . . . . . . . . . . . . . . . . . . . . . . . . . 66,303,526 239,948,880 45,592,491
LIABILITIESPayable for investment securities purchased . . . . . . . . . . . . . . . . . . . . . . . . . — 1,064,036 —Payable for Fund shares redeemed. . . . . . . . . . . . . . . . . . . . . . . . . . . . . . . . . 7,711 69,047 64Accrued investment management fees and advisory fees . . . . . . . . . . . . . . . 53,265 136,530 37,382Accrued 12b-1 fees (Class S). . . . . . . . . . . . . . . . . . . . . . . . . . . . . . . . . . . . . — 6,609 828
Total liabilities . . . . . . . . . . . . . . . . . . . . . . . . . . . . . . . . . . . . . . . . . . 60,976 1,276,222 38,274
Net assets applicable to outstanding capital stock . . . . . . . . . . . . . . . . . . . . . $66,242,550 $238,672,658 $45,554,217
Net assets consist of:Capital (par value and paid-in surplus) . . . . . . . . . . . . . . . . . . . . . . . . . . . . . $43,441,535 $146,377,599 $26,035,725Total distributable earnings (loss), including unrealized
appreciation (depreciation) . . . . . . . . . . . . . . . . . . . . . . . . . . . . . . . . . . . . 22,801,015 92,295,059 19,518,492
$66,242,550 $238,672,658 $45,554,217
Outstanding shares:Common Shares (Class I) * . . . . . . . . . . . . . . . . . . . . . . . . . . . . . . . . 2,016,527 11,936,117 1,845,139
Common Shares (Class S) * . . . . . . . . . . . . . . . . . . . . . . . . . . . . . . . — 1,812,244 182,348
Net assets applicable to outstanding shares:Common Shares (Class I) * . . . . . . . . . . . . . . . . . . . . . . . . . . . . . . . . $66,242,550 $207,377,759 $41,460,888
Common Shares (Class S) * . . . . . . . . . . . . . . . . . . . . . . . . . . . . . . . — 31,294,899 4,093,329
Net asset value per share of outstanding capital stock:Common Shares (Class I) * . . . . . . . . . . . . . . . . . . . . . . . . . . . . . . . . $32.85 $17.37 $22.47
Common Shares (Class S) * . . . . . . . . . . . . . . . . . . . . . . . . . . . . . . . — $17.27 $22.45
* Dividend Growth, Global Dividend Growth, ESG Growth and Small Cap Dividend Growth Funds offermultiple share classes (I and S). All other Funds offer a single share class.
STATEMENTS OF ASSETS AND LIABILITIESJune 30, 2021
See accompanying notes to financial statements.
50 SIT MUTUAL FUNDS ANNUAL REPORT
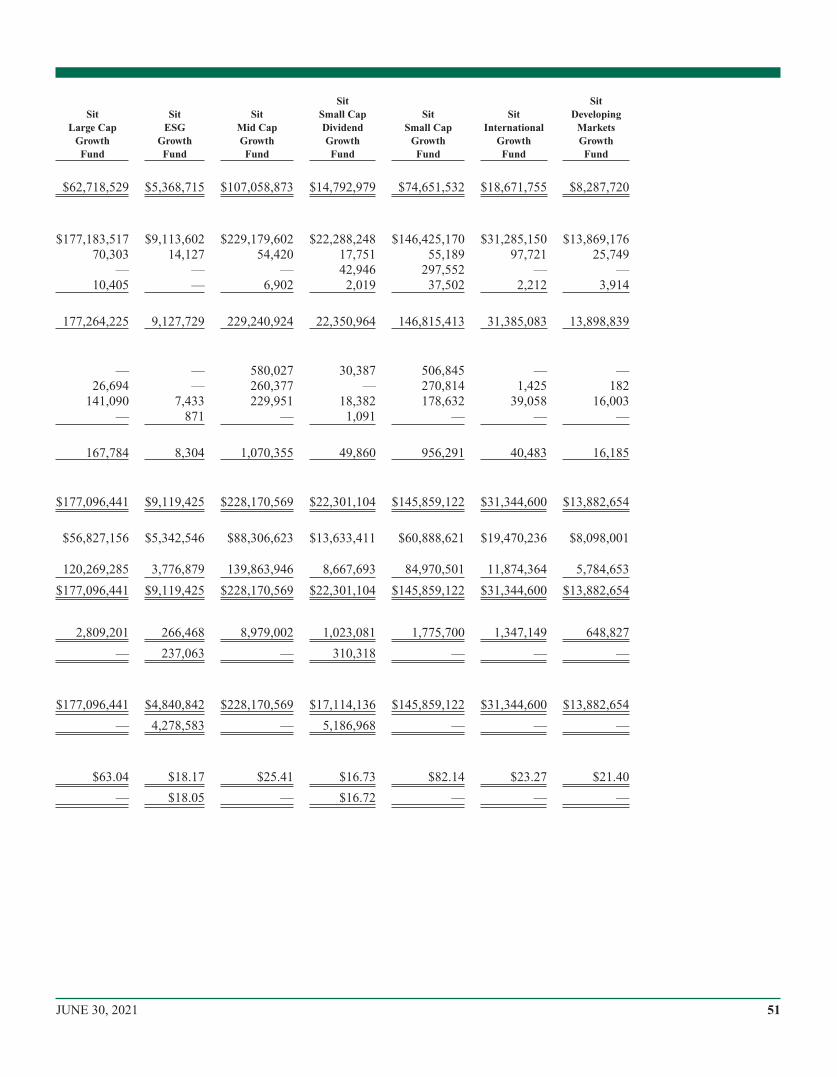
SitLarge Cap
GrowthFund
SitESG
GrowthFund
SitMid CapGrowthFund
SitSmall CapDividendGrowthFund
SitSmall Cap
GrowthFund
SitInternational
GrowthFund
SitDeveloping
MarketsGrowthFund
$62,718,529 $5,368,715 $107,058,873 $14,792,979 $74,651,532 $18,671,755 $8,287,720
$177,183,517 $9,113,602 $229,179,602 $22,288,248 $146,425,170 $31,285,150 $13,869,17670,303 14,127 54,420 17,751 55,189 97,721 25,749
— — — 42,946 297,552 — —10,405 — 6,902 2,019 37,502 2,212 3,914
177,264,225 9,127,729 229,240,924 22,350,964 146,815,413 31,385,083 13,898,839
— — 580,027 30,387 506,845 — —26,694 — 260,377 — 270,814 1,425 182
141,090 7,433 229,951 18,382 178,632 39,058 16,003— 871 — 1,091 — — —
167,784 8,304 1,070,355 49,860 956,291 40,483 16,185
$177,096,441 $9,119,425 $228,170,569 $22,301,104 $145,859,122 $31,344,600 $13,882,654
$56,827,156 $5,342,546 $88,306,623 $13,633,411 $60,888,621 $19,470,236 $8,098,001
120,269,285 3,776,879 139,863,946 8,667,693 84,970,501 11,874,364 5,784,653
$177,096,441 $9,119,425 $228,170,569 $22,301,104 $145,859,122 $31,344,600 $13,882,654
2,809,201 266,468 8,979,002 1,023,081 1,775,700 1,347,149 648,827
— 237,063 — 310,318 — — —
$177,096,441 $4,840,842 $228,170,569 $17,114,136 $145,859,122 $31,344,600 $13,882,654
— 4,278,583 — 5,186,968 — — —
$63.04 $18.17 $25.41 $16.73 $82.14 $23.27 $21.40
— $18.05 — $16.72 — — —
51JUNE 30, 2021

SitBalanced
Fund
SitDividendGrowthFund
SitGlobal
DividendGrowthFund
Investment income:Income:
Dividends* . . . . . . . . . . . . . . . . . . . . . . . . . . . . . . . . . . . . . . . . . . . . . . . $508,920 $4,563,110 $820,243Interest . . . . . . . . . . . . . . . . . . . . . . . . . . . . . . . . . . . . . . . . . . . . . . . . . . 502,747 65 59
Total income. . . . . . . . . . . . . . . . . . . . . . . . . . . . . . . . . . . . . . . . . . . . 1,011,667 4,563,175 820,302
Expenses (note 4):Investment management and advisory service fee. . . . . . . . . . . . . . . . . 580,815 2,197,960 506,46112b-1 fees (Class S) . . . . . . . . . . . . . . . . . . . . . . . . . . . . . . . . . . . . . . . . — 75,524 9,168
Total expenses . . . . . . . . . . . . . . . . . . . . . . . . . . . . . . . . . . . . . . . . . . 580,815 2,273,484 515,629
Less fees and expenses waived by investment adviser. . . . . . . . . . . . — (659,388) (101,292)
Total net expenses . . . . . . . . . . . . . . . . . . . . . . . . . . . . . . . . . . . . . . . 580,815 1,614,096 414,337
Net investment income (loss). . . . . . . . . . . . . . . . . . . . . . . . . . . . . . . 430,852 2,949,079 405,965
Realized and unrealized gain (loss):Net realized gain (loss) on investments . . . . . . . . . . . . . . . . . . . . . . . . . 1,698,152 24,965,923 124,673Net realized gain (loss) on foreign currency transactions . . . . . . . . . . . — — 966
Net change in unrealized appreciation (depreciation) on investmentsand foreign currency transactions . . . . . . . . . . . . . . . . . . . . . . . . . . . 11,329,221 42,687,814 11,262,561
Net gain (loss) . . . . . . . . . . . . . . . . . . . . . . . . . . . . . . . . . . . . . . . . . . 13,027,373 67,653,737 11,388,200
Net increase (decrease) in net assets resulting from operations . . . . . . . . . . $13,458,225 $70,602,816 $11,794,165
* Foreign taxes withheld on dividends received . . . . . . . . . . . . . . . . . . . . . . $575 $21,970 $26,948
STATEMENTS OF OPERATIONSYear Ended June 30, 2021
See accompanying notes to financial statements.
52 SIT MUTUAL FUNDS ANNUAL REPORT
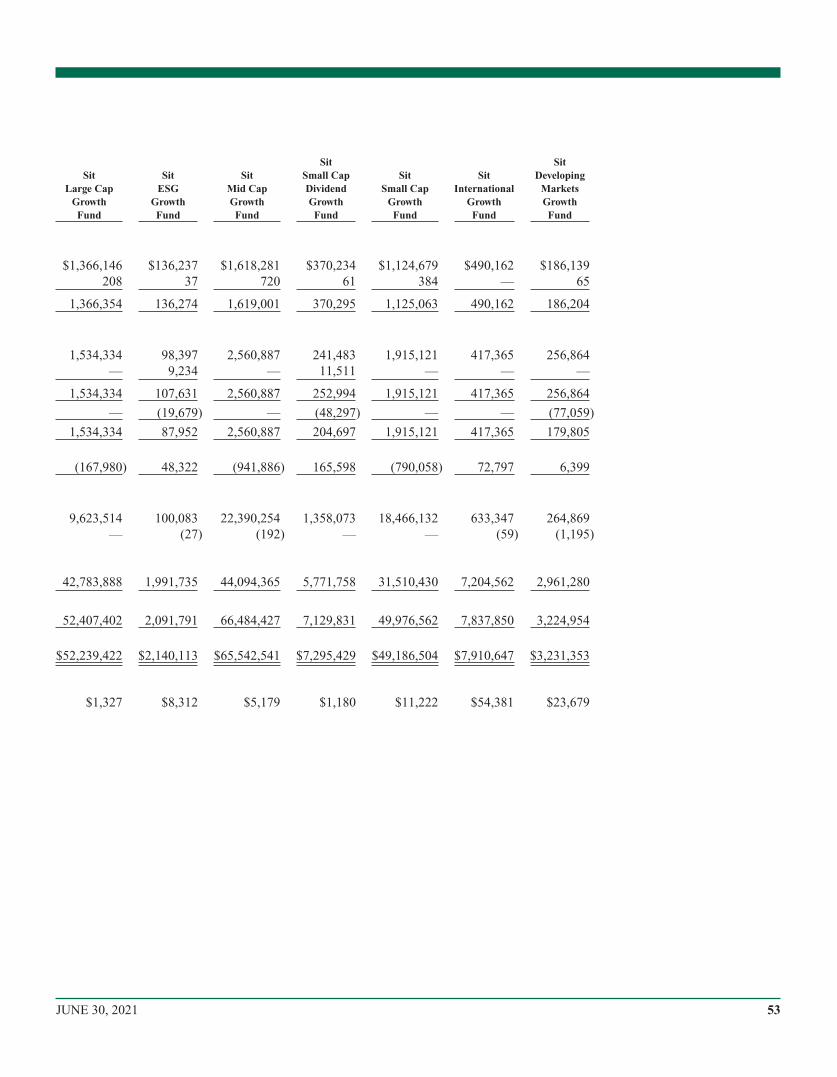
SitLarge Cap
GrowthFund
SitESG
GrowthFund
SitMid CapGrowthFund
SitSmall CapDividendGrowthFund
SitSmall Cap
GrowthFund
SitInternational
GrowthFund
SitDeveloping
MarketsGrowthFund
$1,366,146 $136,237 $1,618,281 $370,234 $1,124,679 $490,162 $186,139208 37 720 61 384 — 65
1,366,354 136,274 1,619,001 370,295 1,125,063 490,162 186,204
1,534,334 98,397 2,560,887 241,483 1,915,121 417,365 256,864— 9,234 — 11,511 — — —
1,534,334 107,631 2,560,887 252,994 1,915,121 417,365 256,864
— (19,679) — (48,297) — — (77,059)
1,534,334 87,952 2,560,887 204,697 1,915,121 417,365 179,805
(167,980) 48,322 (941,886) 165,598 (790,058) 72,797 6,399
9,623,514 100,083 22,390,254 1,358,073 18,466,132 633,347 264,869— (27) (192) — — (59) (1,195)
42,783,888 1,991,735 44,094,365 5,771,758 31,510,430 7,204,562 2,961,280
52,407,402 2,091,791 66,484,427 7,129,831 49,976,562 7,837,850 3,224,954
$52,239,422 $2,140,113 $65,542,541 $7,295,429 $49,186,504 $7,910,647 $3,231,353
$1,327 $8,312 $5,179 $1,180 $11,222 $54,381 $23,679
53JUNE 30, 2021
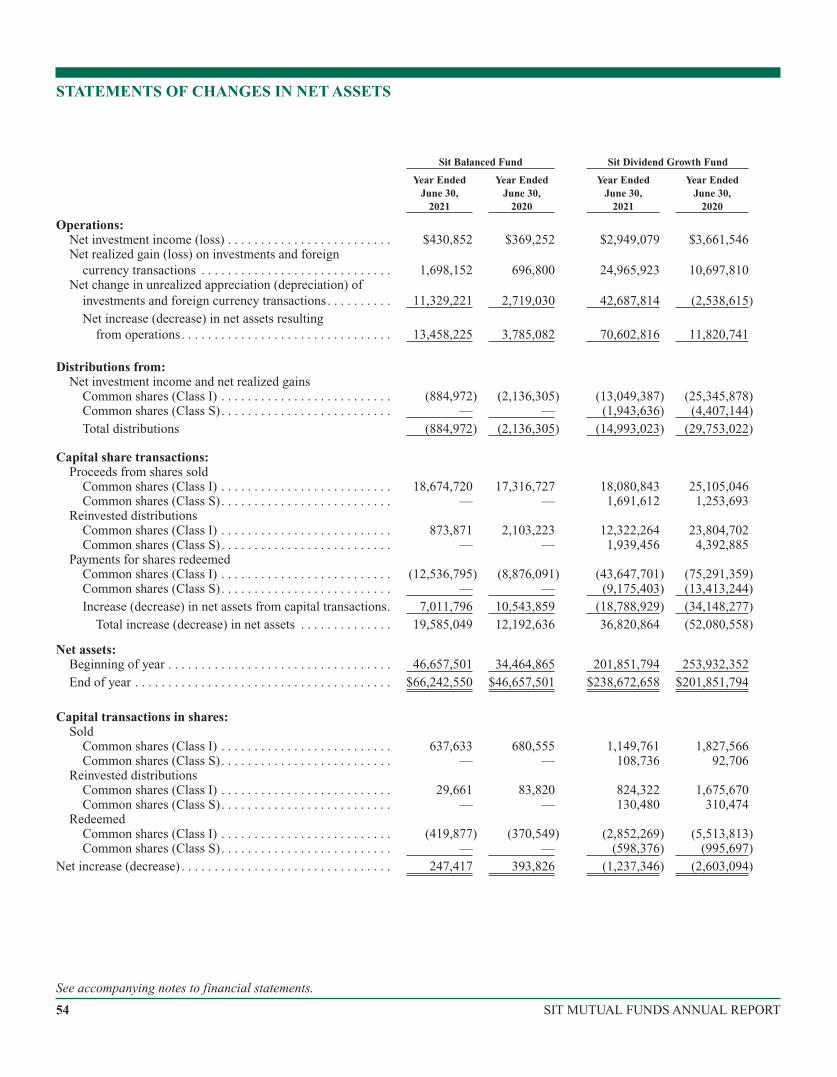
Sit Balanced Fund Sit Dividend Growth Fund
Year EndedJune 30,
2021
Year EndedJune 30,
2020
Year EndedJune 30,
2021
Year EndedJune 30,
2020
Operations:Net investment income (loss) . . . . . . . . . . . . . . . . . . . . . . . . . $430,852 $369,252 $2,949,079 $3,661,546Net realized gain (loss) on investments and foreign
currency transactions . . . . . . . . . . . . . . . . . . . . . . . . . . . . . 1,698,152 696,800 24,965,923 10,697,810Net change in unrealized appreciation (depreciation) of
investments and foreign currency transactions . . . . . . . . . . 11,329,221 2,719,030 42,687,814 (2,538,615)Net increase (decrease) in net assets resulting
from operations. . . . . . . . . . . . . . . . . . . . . . . . . . . . . . . . 13,458,225 3,785,082 70,602,816 11,820,741
Distributions from:Net investment income and net realized gains
Common shares (Class I) . . . . . . . . . . . . . . . . . . . . . . . . . . (884,972) (2,136,305) (13,049,387) (25,345,878)Common shares (Class S). . . . . . . . . . . . . . . . . . . . . . . . . . — — (1,943,636) (4,407,144)Total distributions (884,972) (2,136,305) (14,993,023) (29,753,022)
Capital share transactions:Proceeds from shares sold
Common shares (Class I) . . . . . . . . . . . . . . . . . . . . . . . . . . 18,674,720 17,316,727 18,080,843 25,105,046Common shares (Class S). . . . . . . . . . . . . . . . . . . . . . . . . . — — 1,691,612 1,253,693
Reinvested distributionsCommon shares (Class I) . . . . . . . . . . . . . . . . . . . . . . . . . . 873,871 2,103,223 12,322,264 23,804,702Common shares (Class S). . . . . . . . . . . . . . . . . . . . . . . . . . — — 1,939,456 4,392,885
Payments for shares redeemedCommon shares (Class I) . . . . . . . . . . . . . . . . . . . . . . . . . . (12,536,795) (8,876,091) (43,647,701) (75,291,359)Common shares (Class S). . . . . . . . . . . . . . . . . . . . . . . . . . — — (9,175,403) (13,413,244)Increase (decrease) in net assets from capital transactions. 7,011,796 10,543,859 (18,788,929) (34,148,277)
Total increase (decrease) in net assets . . . . . . . . . . . . . . 19,585,049 12,192,636 36,820,864 (52,080,558)
Net assets:Beginning of year . . . . . . . . . . . . . . . . . . . . . . . . . . . . . . . . . . 46,657,501 34,464,865 201,851,794 253,932,352End of year . . . . . . . . . . . . . . . . . . . . . . . . . . . . . . . . . . . . . . . $66,242,550 $46,657,501 $238,672,658 $201,851,794
Capital transactions in shares:Sold
Common shares (Class I) . . . . . . . . . . . . . . . . . . . . . . . . . . 637,633 680,555 1,149,761 1,827,566Common shares (Class S). . . . . . . . . . . . . . . . . . . . . . . . . . — — 108,736 92,706
Reinvested distributionsCommon shares (Class I) . . . . . . . . . . . . . . . . . . . . . . . . . . 29,661 83,820 824,322 1,675,670Common shares (Class S). . . . . . . . . . . . . . . . . . . . . . . . . . — — 130,480 310,474
RedeemedCommon shares (Class I) . . . . . . . . . . . . . . . . . . . . . . . . . . (419,877) (370,549) (2,852,269) (5,513,813)Common shares (Class S). . . . . . . . . . . . . . . . . . . . . . . . . . — — (598,376) (995,697)
Net increase (decrease) . . . . . . . . . . . . . . . . . . . . . . . . . . . . . . . . 247,417 393,826 (1,237,346) (2,603,094)
STATEMENTS OF CHANGES IN NET ASSETS
See accompanying notes to financial statements.
54 SIT MUTUAL FUNDS ANNUAL REPORT
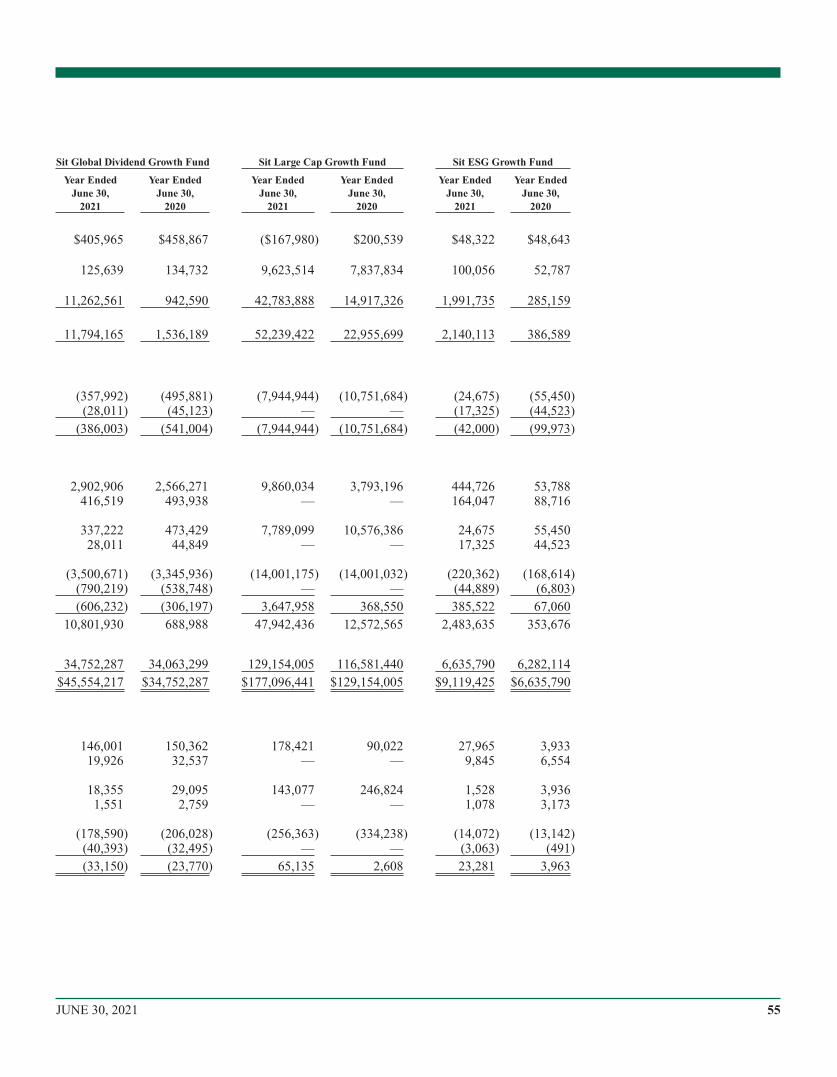
Sit Global Dividend Growth Fund Sit Large Cap Growth Fund Sit ESG Growth Fund
Year EndedJune 30,
2021
Year EndedJune 30,
2020
Year EndedJune 30,
2021
Year EndedJune 30,
2020
Year EndedJune 30,
2021
Year EndedJune 30,
2020
$405,965 $458,867 ($167,980) $200,539 $48,322 $48,643
125,639 134,732 9,623,514 7,837,834 100,056 52,787
11,262,561 942,590 42,783,888 14,917,326 1,991,735 285,159
11,794,165 1,536,189 52,239,422 22,955,699 2,140,113 386,589
(357,992) (495,881) (7,944,944) (10,751,684) (24,675) (55,450)(28,011) (45,123) — — (17,325) (44,523)
(386,003) (541,004) (7,944,944) (10,751,684) (42,000) (99,973)
2,902,906 2,566,271 9,860,034 3,793,196 444,726 53,788416,519 493,938 — — 164,047 88,716
337,222 473,429 7,789,099 10,576,386 24,675 55,45028,011 44,849 — — 17,325 44,523
(3,500,671) (3,345,936) (14,001,175) (14,001,032) (220,362) (168,614)(790,219) (538,748) — — (44,889) (6,803)(606,232) (306,197) 3,647,958 368,550 385,522 67,060
10,801,930 688,988 47,942,436 12,572,565 2,483,635 353,676
34,752,287 34,063,299 129,154,005 116,581,440 6,635,790 6,282,114$45,554,217 $34,752,287 $177,096,441 $129,154,005 $9,119,425 $6,635,790
146,001 150,362 178,421 90,022 27,965 3,93319,926 32,537 — — 9,845 6,554
18,355 29,095 143,077 246,824 1,528 3,9361,551 2,759 — — 1,078 3,173
(178,590) (206,028) (256,363) (334,238) (14,072) (13,142)(40,393) (32,495) — — (3,063) (491)(33,150) (23,770) 65,135 2,608 23,281 3,963
55JUNE 30, 2021
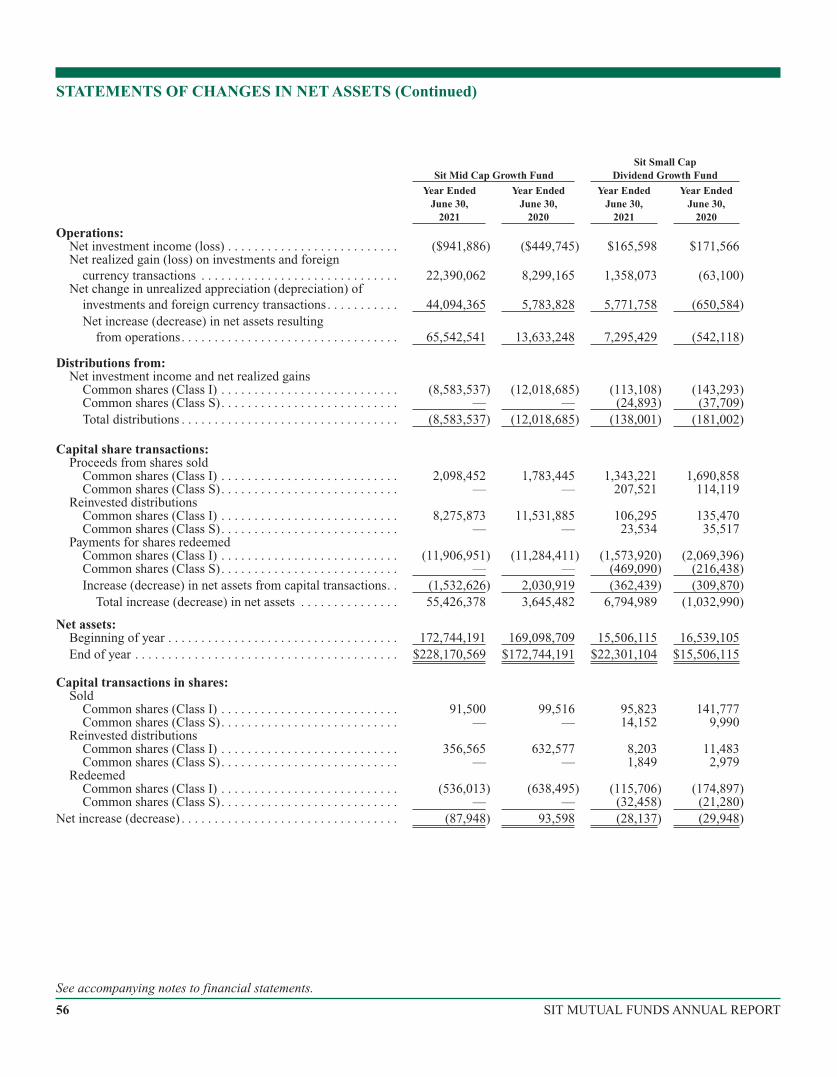
Sit Mid Cap Growth FundSit Small Cap
Dividend Growth Fund
Year EndedJune 30,
2021
Year EndedJune 30,
2020
Year EndedJune 30,
2021
Year EndedJune 30,
2020
Operations:Net investment income (loss) . . . . . . . . . . . . . . . . . . . . . . . . . . ($941,886) ($449,745) $165,598 $171,566Net realized gain (loss) on investments and foreign
currency transactions . . . . . . . . . . . . . . . . . . . . . . . . . . . . . . 22,390,062 8,299,165 1,358,073 (63,100)Net change in unrealized appreciation (depreciation) of
investments and foreign currency transactions . . . . . . . . . . . 44,094,365 5,783,828 5,771,758 (650,584)Net increase (decrease) in net assets resulting
from operations. . . . . . . . . . . . . . . . . . . . . . . . . . . . . . . . . 65,542,541 13,633,248 7,295,429 (542,118)
Distributions from:Net investment income and net realized gains
Common shares (Class I) . . . . . . . . . . . . . . . . . . . . . . . . . . . (8,583,537) (12,018,685) (113,108) (143,293)Common shares (Class S). . . . . . . . . . . . . . . . . . . . . . . . . . . — — (24,893) (37,709)Total distributions . . . . . . . . . . . . . . . . . . . . . . . . . . . . . . . . . (8,583,537) (12,018,685) (138,001) (181,002)
Capital share transactions:Proceeds from shares sold
Common shares (Class I) . . . . . . . . . . . . . . . . . . . . . . . . . . . 2,098,452 1,783,445 1,343,221 1,690,858Common shares (Class S). . . . . . . . . . . . . . . . . . . . . . . . . . . — — 207,521 114,119
Reinvested distributionsCommon shares (Class I) . . . . . . . . . . . . . . . . . . . . . . . . . . . 8,275,873 11,531,885 106,295 135,470Common shares (Class S). . . . . . . . . . . . . . . . . . . . . . . . . . . — — 23,534 35,517
Payments for shares redeemedCommon shares (Class I) . . . . . . . . . . . . . . . . . . . . . . . . . . . (11,906,951) (11,284,411) (1,573,920) (2,069,396)Common shares (Class S). . . . . . . . . . . . . . . . . . . . . . . . . . . — — (469,090) (216,438)Increase (decrease) in net assets from capital transactions. . (1,532,626) 2,030,919 (362,439) (309,870)
Total increase (decrease) in net assets . . . . . . . . . . . . . . . 55,426,378 3,645,482 6,794,989 (1,032,990)
Net assets:Beginning of year . . . . . . . . . . . . . . . . . . . . . . . . . . . . . . . . . . . 172,744,191 169,098,709 15,506,115 16,539,105End of year . . . . . . . . . . . . . . . . . . . . . . . . . . . . . . . . . . . . . . . . $228,170,569 $172,744,191 $22,301,104 $15,506,115
Capital transactions in shares:Sold
Common shares (Class I) . . . . . . . . . . . . . . . . . . . . . . . . . . . 91,500 99,516 95,823 141,777Common shares (Class S). . . . . . . . . . . . . . . . . . . . . . . . . . . — — 14,152 9,990
Reinvested distributionsCommon shares (Class I) . . . . . . . . . . . . . . . . . . . . . . . . . . . 356,565 632,577 8,203 11,483Common shares (Class S). . . . . . . . . . . . . . . . . . . . . . . . . . . — — 1,849 2,979
RedeemedCommon shares (Class I) . . . . . . . . . . . . . . . . . . . . . . . . . . . (536,013) (638,495) (115,706) (174,897)Common shares (Class S). . . . . . . . . . . . . . . . . . . . . . . . . . . — — (32,458) (21,280)
Net increase (decrease) . . . . . . . . . . . . . . . . . . . . . . . . . . . . . . . . . (87,948) 93,598 (28,137) (29,948)
STATEMENTS OF CHANGES IN NET ASSETS (Continued)
See accompanying notes to financial statements.
56 SIT MUTUAL FUNDS ANNUAL REPORT
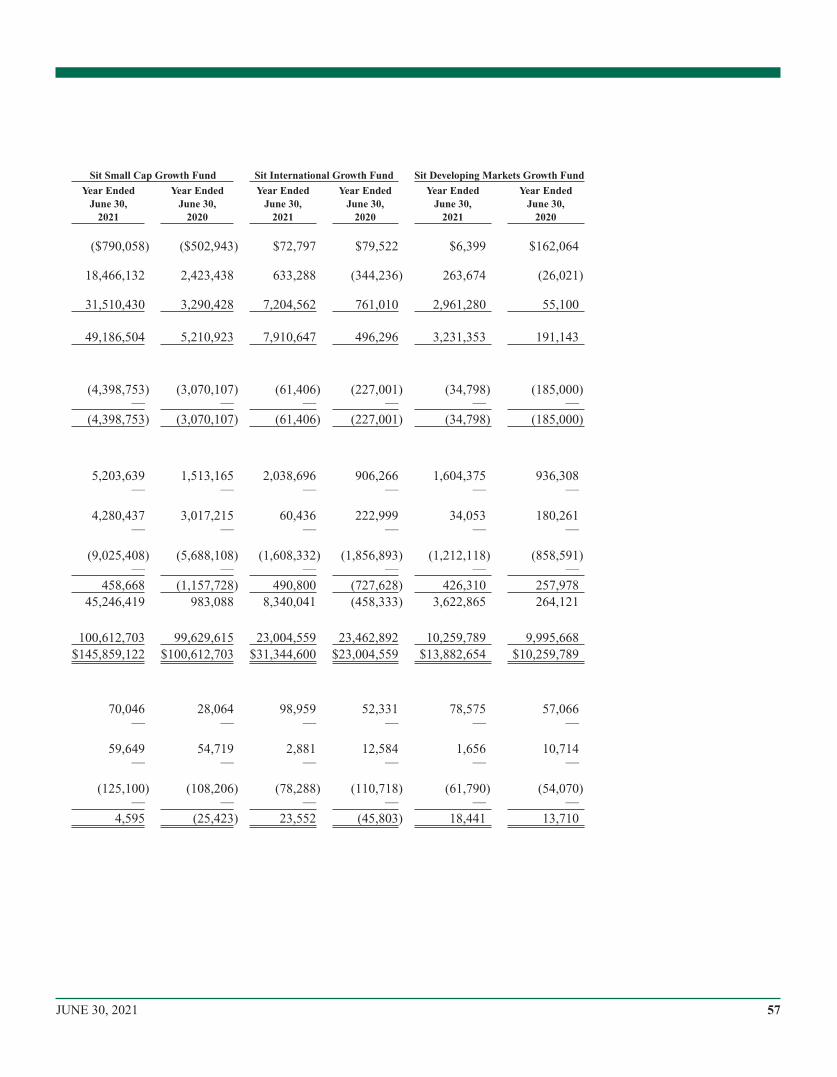
Sit Small Cap Growth Fund Sit International Growth Fund Sit Developing Markets Growth Fund
Year EndedJune 30,
2021
Year EndedJune 30,
2020
Year EndedJune 30,
2021
Year EndedJune 30,
2020
Year EndedJune 30,
2021
Year EndedJune 30,
2020
($790,058) ($502,943) $72,797 $79,522 $6,399 $162,064
18,466,132 2,423,438 633,288 (344,236) 263,674 (26,021)
31,510,430 3,290,428 7,204,562 761,010 2,961,280 55,100
49,186,504 5,210,923 7,910,647 496,296 3,231,353 191,143
(4,398,753) (3,070,107) (61,406) (227,001) (34,798) (185,000)— — — — — —
(4,398,753) (3,070,107) (61,406) (227,001) (34,798) (185,000)
5,203,639 1,513,165 2,038,696 906,266 1,604,375 936,308— — — — — —
4,280,437 3,017,215 60,436 222,999 34,053 180,261— — — — — —
(9,025,408) (5,688,108) (1,608,332) (1,856,893) (1,212,118) (858,591)— — — — — —
458,668 (1,157,728) 490,800 (727,628) 426,310 257,97845,246,419 983,088 8,340,041 (458,333) 3,622,865 264,121
100,612,703 99,629,615 23,004,559 23,462,892 10,259,789 9,995,668$145,859,122 $100,612,703 $31,344,600 $23,004,559 $13,882,654 $10,259,789
70,046 28,064 98,959 52,331 78,575 57,066— — — — — —
59,649 54,719 2,881 12,584 1,656 10,714— — — — — —
(125,100) (108,206) (78,288) (110,718) (61,790) (54,070)— — — — — —
4,595 (25,423) 23,552 (45,803) 18,441 13,710
57JUNE 30, 2021
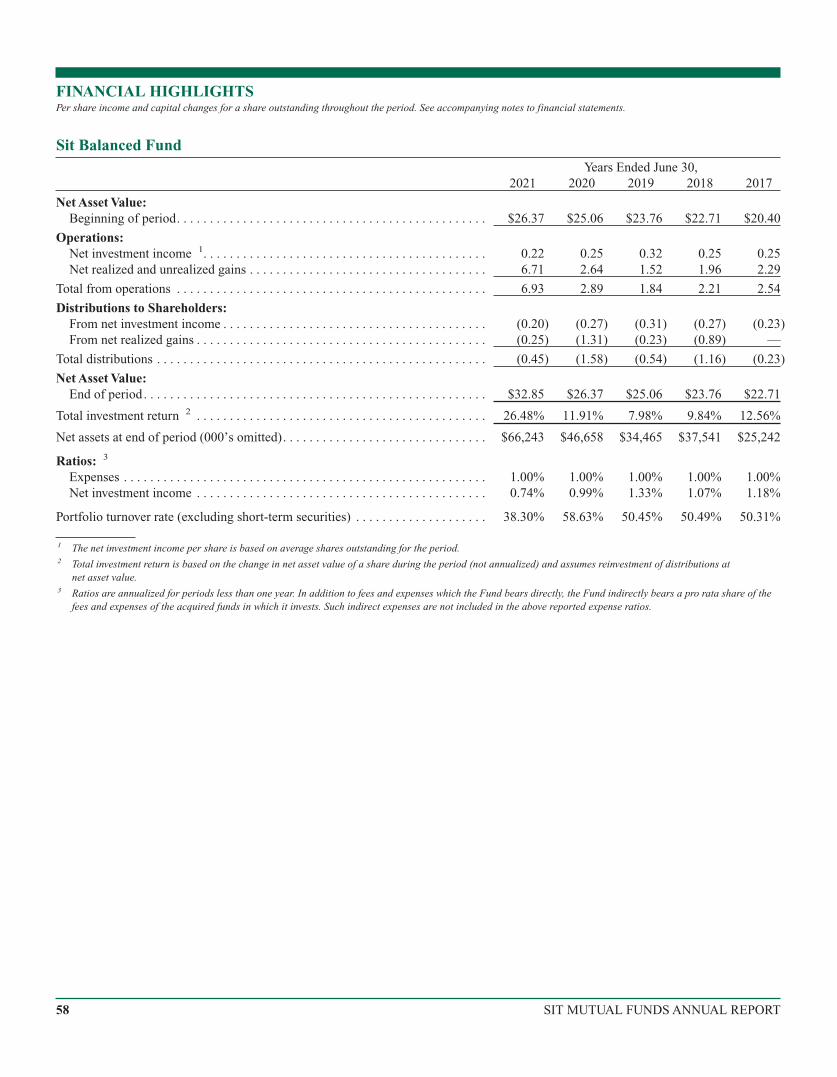
Years Ended June 30,2021 2020 2019 2018 2017
Net Asset Value:Beginning of period. . . . . . . . . . . . . . . . . . . . . . . . . . . . . . . . . . . . . . . . . . . . . . . $26.37 $25.06 $23.76 $22.71 $20.40
Operations:Net investment income 1. . . . . . . . . . . . . . . . . . . . . . . . . . . . . . . . . . . . . . . . . . . 0.22 0.25 0.32 0.25 0.25Net realized and unrealized gains . . . . . . . . . . . . . . . . . . . . . . . . . . . . . . . . . . . . 6.71 2.64 1.52 1.96 2.29
Total from operations . . . . . . . . . . . . . . . . . . . . . . . . . . . . . . . . . . . . . . . . . . . . . . . 6.93 2.89 1.84 2.21 2.54
Distributions to Shareholders:From net investment income . . . . . . . . . . . . . . . . . . . . . . . . . . . . . . . . . . . . . . . . (0.20) (0.27) (0.31) (0.27) (0.23)From net realized gains . . . . . . . . . . . . . . . . . . . . . . . . . . . . . . . . . . . . . . . . . . . . (0.25) (1.31) (0.23) (0.89) —
Total distributions . . . . . . . . . . . . . . . . . . . . . . . . . . . . . . . . . . . . . . . . . . . . . . . . . . (0.45) (1.58) (0.54) (1.16) (0.23)
Net Asset Value:End of period. . . . . . . . . . . . . . . . . . . . . . . . . . . . . . . . . . . . . . . . . . . . . . . . . . . . $32.85 $26.37 $25.06 $23.76 $22.71
Total investment return 2 . . . . . . . . . . . . . . . . . . . . . . . . . . . . . . . . . . . . . . . . . . . . 26.48% 11.91% 7.98% 9.84% 12.56%
Net assets at end of period (000’s omitted). . . . . . . . . . . . . . . . . . . . . . . . . . . . . . . $66,243 $46,658 $34,465 $37,541 $25,242
Ratios: 3
Expenses . . . . . . . . . . . . . . . . . . . . . . . . . . . . . . . . . . . . . . . . . . . . . . . . . . . . . . . 1.00% 1.00% 1.00% 1.00% 1.00%Net investment income . . . . . . . . . . . . . . . . . . . . . . . . . . . . . . . . . . . . . . . . . . . . 0.74% 0.99% 1.33% 1.07% 1.18%
Portfolio turnover rate (excluding short-term securities) . . . . . . . . . . . . . . . . . . . . 38.30% 58.63% 50.45% 50.49% 50.31%
1 The net investment income per share is based on average shares outstanding for the period.2 Total investment return is based on the change in net asset value of a share during the period (not annualized) and assumes reinvestment of distributions at
net asset value.3 Ratios are annualized for periods less than one year. In addition to fees and expenses which the Fund bears directly, the Fund indirectly bears a pro rata share of the
fees and expenses of the acquired funds in which it invests. Such indirect expenses are not included in the above reported expense ratios.
FINANCIAL HIGHLIGHTSPer share income and capital changes for a share outstanding throughout the period. See accompanying notes to financial statements.
Sit Balanced Fund
58 SIT MUTUAL FUNDS ANNUAL REPORT
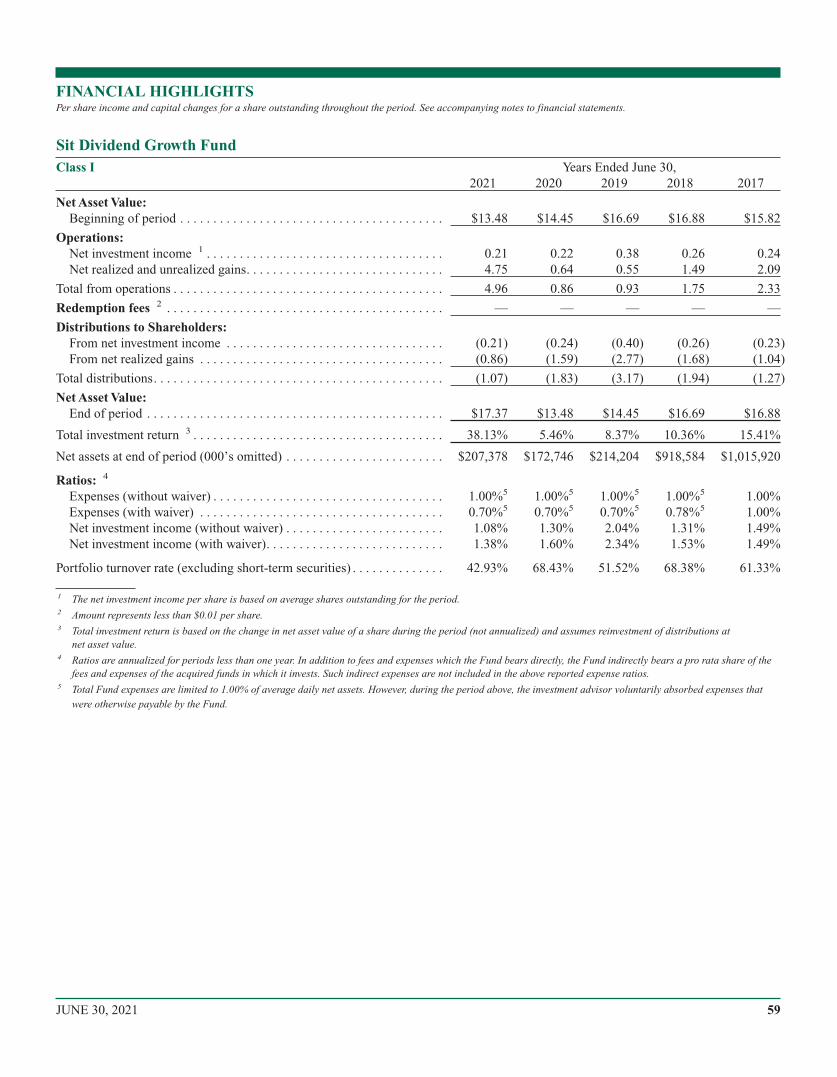
Class I Years Ended June 30,2021 2020 2019 2018 2017
Net Asset Value:Beginning of period . . . . . . . . . . . . . . . . . . . . . . . . . . . . . . . . . . . . . . . . $13.48 $14.45 $16.69 $16.88 $15.82
Operations:Net investment income 1 . . . . . . . . . . . . . . . . . . . . . . . . . . . . . . . . . . . . 0.21 0.22 0.38 0.26 0.24Net realized and unrealized gains. . . . . . . . . . . . . . . . . . . . . . . . . . . . . . 4.75 0.64 0.55 1.49 2.09
Total from operations . . . . . . . . . . . . . . . . . . . . . . . . . . . . . . . . . . . . . . . . . 4.96 0.86 0.93 1.75 2.33
Redemption fees 2 . . . . . . . . . . . . . . . . . . . . . . . . . . . . . . . . . . . . . . . . . . — — — — —
Distributions to Shareholders:From net investment income . . . . . . . . . . . . . . . . . . . . . . . . . . . . . . . . . (0.21) (0.24) (0.40) (0.26) (0.23)From net realized gains . . . . . . . . . . . . . . . . . . . . . . . . . . . . . . . . . . . . . (0.86) (1.59) (2.77) (1.68) (1.04)
Total distributions. . . . . . . . . . . . . . . . . . . . . . . . . . . . . . . . . . . . . . . . . . . . (1.07) (1.83) (3.17) (1.94) (1.27)
Net Asset Value:End of period . . . . . . . . . . . . . . . . . . . . . . . . . . . . . . . . . . . . . . . . . . . . . $17.37 $13.48 $14.45 $16.69 $16.88
Total investment return 3 . . . . . . . . . . . . . . . . . . . . . . . . . . . . . . . . . . . . . . 38.13% 5.46% 8.37% 10.36% 15.41%
Net assets at end of period (000’s omitted) . . . . . . . . . . . . . . . . . . . . . . . . $207,378 $172,746 $214,204 $918,584 $1,015,920
Ratios: 4
Expenses (without waiver) . . . . . . . . . . . . . . . . . . . . . . . . . . . . . . . . . . . 1.00%5 1.00%5 1.00%5 1.00%5 1.00%Expenses (with waiver) . . . . . . . . . . . . . . . . . . . . . . . . . . . . . . . . . . . . . 0.70%5 0.70%5 0.70%5 0.78%5 1.00%Net investment income (without waiver) . . . . . . . . . . . . . . . . . . . . . . . . 1.08% 1.30% 2.04% 1.31% 1.49%Net investment income (with waiver). . . . . . . . . . . . . . . . . . . . . . . . . . . 1.38% 1.60% 2.34% 1.53% 1.49%
Portfolio turnover rate (excluding short-term securities) . . . . . . . . . . . . . . 42.93% 68.43% 51.52% 68.38% 61.33%
1 The net investment income per share is based on average shares outstanding for the period.2 Amount represents less than $0.01 per share.3 Total investment return is based on the change in net asset value of a share during the period (not annualized) and assumes reinvestment of distributions at
net asset value.4 Ratios are annualized for periods less than one year. In addition to fees and expenses which the Fund bears directly, the Fund indirectly bears a pro rata share of the
fees and expenses of the acquired funds in which it invests. Such indirect expenses are not included in the above reported expense ratios.5 Total Fund expenses are limited to 1.00% of average daily net assets. However, during the period above, the investment advisor voluntarily absorbed expenses that
were otherwise payable by the Fund.
FINANCIAL HIGHLIGHTSPer share income and capital changes for a share outstanding throughout the period. See accompanying notes to financial statements.
Sit Dividend Growth Fund
59JUNE 30, 2021
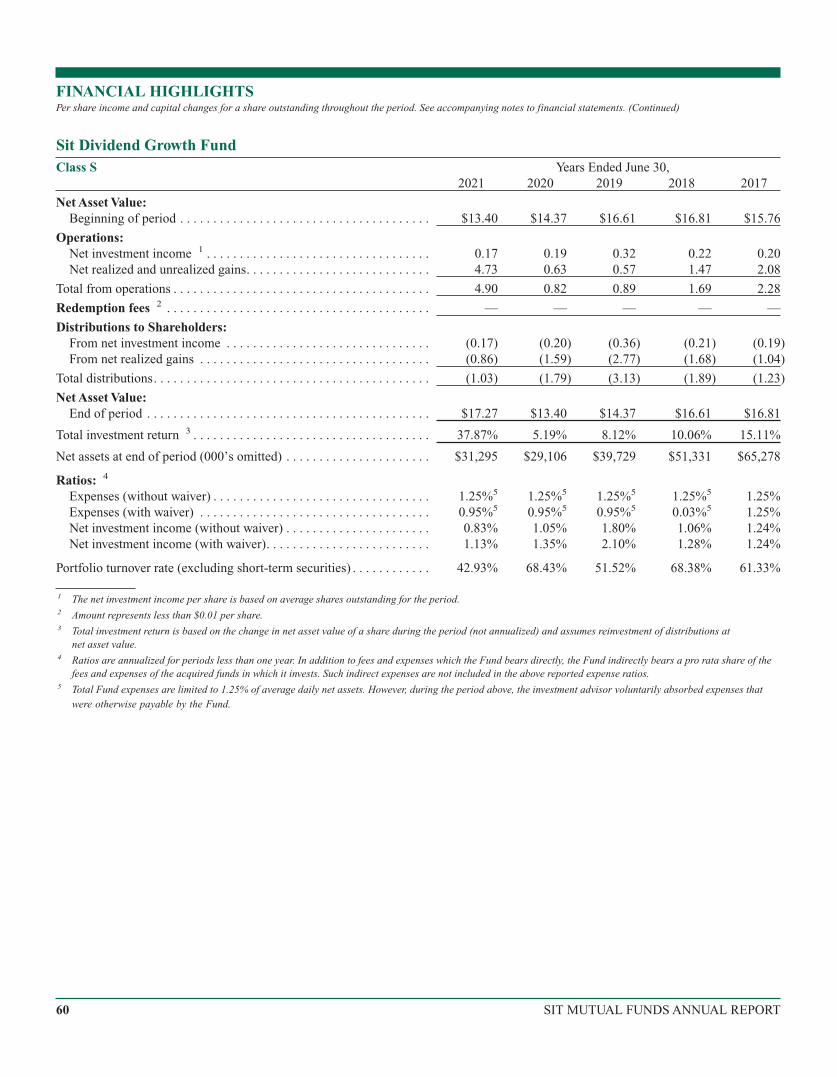
Class S Years Ended June 30,2021 2020 2019 2018 2017
Net Asset Value:Beginning of period . . . . . . . . . . . . . . . . . . . . . . . . . . . . . . . . . . . . . . $13.40 $14.37 $16.61 $16.81 $15.76
Operations:Net investment income 1 . . . . . . . . . . . . . . . . . . . . . . . . . . . . . . . . . . 0.17 0.19 0.32 0.22 0.20Net realized and unrealized gains. . . . . . . . . . . . . . . . . . . . . . . . . . . . 4.73 0.63 0.57 1.47 2.08
Total from operations . . . . . . . . . . . . . . . . . . . . . . . . . . . . . . . . . . . . . . . 4.90 0.82 0.89 1.69 2.28
Redemption fees 2 . . . . . . . . . . . . . . . . . . . . . . . . . . . . . . . . . . . . . . . . — — — — —
Distributions to Shareholders:From net investment income . . . . . . . . . . . . . . . . . . . . . . . . . . . . . . . (0.17) (0.20) (0.36) (0.21) (0.19)From net realized gains . . . . . . . . . . . . . . . . . . . . . . . . . . . . . . . . . . . (0.86) (1.59) (2.77) (1.68) (1.04)
Total distributions. . . . . . . . . . . . . . . . . . . . . . . . . . . . . . . . . . . . . . . . . . (1.03) (1.79) (3.13) (1.89) (1.23)
Net Asset Value:End of period . . . . . . . . . . . . . . . . . . . . . . . . . . . . . . . . . . . . . . . . . . . $17.27 $13.40 $14.37 $16.61 $16.81
Total investment return 3 . . . . . . . . . . . . . . . . . . . . . . . . . . . . . . . . . . . . 37.87% 5.19% 8.12% 10.06% 15.11%
Net assets at end of period (000’s omitted) . . . . . . . . . . . . . . . . . . . . . . $31,295 $29,106 $39,729 $51,331 $65,278
Ratios: 4
Expenses (without waiver) . . . . . . . . . . . . . . . . . . . . . . . . . . . . . . . . . 1.25%5 1.25%5 1.25%5 1.25%5 1.25%Expenses (with waiver) . . . . . . . . . . . . . . . . . . . . . . . . . . . . . . . . . . . 0.95%5 0.95%5 0.95%5 0.03%5 1.25%Net investment income (without waiver) . . . . . . . . . . . . . . . . . . . . . . 0.83% 1.05% 1.80% 1.06% 1.24%Net investment income (with waiver). . . . . . . . . . . . . . . . . . . . . . . . . 1.13% 1.35% 2.10% 1.28% 1.24%
Portfolio turnover rate (excluding short-term securities) . . . . . . . . . . . . 42.93% 68.43% 51.52% 68.38% 61.33%
1 The net investment income per share is based on average shares outstanding for the period.2 Amount represents less than $0.01 per share.3 Total investment return is based on the change in net asset value of a share during the period (not annualized) and assumes reinvestment of distributions at
net asset value.4 Ratios are annualized for periods less than one year. In addition to fees and expenses which the Fund bears directly, the Fund indirectly bears a pro rata share of the
fees and expenses of the acquired funds in which it invests. Such indirect expenses are not included in the above reported expense ratios.5 Total Fund expenses are limited to 1.25% of average daily net assets. However, during the period above, the investment advisor voluntarily absorbed expenses that
were otherwise payable by the Fund.
FINANCIAL HIGHLIGHTSPer share income and capital changes for a share outstanding throughout the period. See accompanying notes to financial statements. (Continued)
Sit Dividend Growth Fund
60 SIT MUTUAL FUNDS ANNUAL REPORT
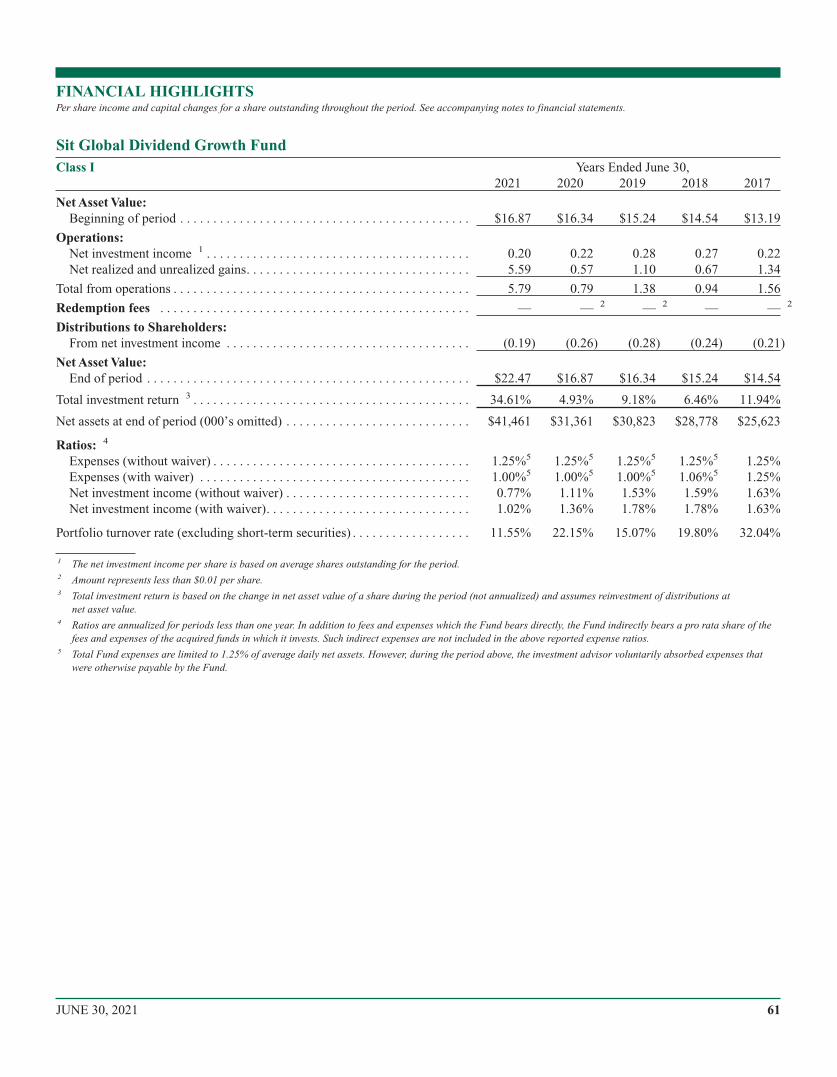
Class I Years Ended June 30,2021 2020 2019 2018 2017
Net Asset Value:Beginning of period . . . . . . . . . . . . . . . . . . . . . . . . . . . . . . . . . . . . . . . . . . . . $16.87 $16.34 $15.24 $14.54 $13.19
Operations:Net investment income 1 . . . . . . . . . . . . . . . . . . . . . . . . . . . . . . . . . . . . . . . . 0.20 0.22 0.28 0.27 0.22Net realized and unrealized gains. . . . . . . . . . . . . . . . . . . . . . . . . . . . . . . . . . 5.59 0.57 1.10 0.67 1.34
Total from operations . . . . . . . . . . . . . . . . . . . . . . . . . . . . . . . . . . . . . . . . . . . . . 5.79 0.79 1.38 0.94 1.56
Redemption fees . . . . . . . . . . . . . . . . . . . . . . . . . . . . . . . . . . . . . . . . . . . . . . . — — 2 — 2 — — 2
Distributions to Shareholders:From net investment income . . . . . . . . . . . . . . . . . . . . . . . . . . . . . . . . . . . . . (0.19) (0.26) (0.28) (0.24) (0.21)
Net Asset Value:End of period . . . . . . . . . . . . . . . . . . . . . . . . . . . . . . . . . . . . . . . . . . . . . . . . . $22.47 $16.87 $16.34 $15.24 $14.54
Total investment return 3 . . . . . . . . . . . . . . . . . . . . . . . . . . . . . . . . . . . . . . . . . . 34.61% 4.93% 9.18% 6.46% 11.94%
Net assets at end of period (000’s omitted) . . . . . . . . . . . . . . . . . . . . . . . . . . . . $41,461 $31,361 $30,823 $28,778 $25,623
Ratios: 4
Expenses (without waiver) . . . . . . . . . . . . . . . . . . . . . . . . . . . . . . . . . . . . . . . 1.25%5 1.25%5 1.25%5 1.25%5 1.25%Expenses (with waiver) . . . . . . . . . . . . . . . . . . . . . . . . . . . . . . . . . . . . . . . . . 1.00%5 1.00%5 1.00%5 1.06%5 1.25%Net investment income (without waiver) . . . . . . . . . . . . . . . . . . . . . . . . . . . . 0.77% 1.11% 1.53% 1.59% 1.63%Net investment income (with waiver). . . . . . . . . . . . . . . . . . . . . . . . . . . . . . . 1.02% 1.36% 1.78% 1.78% 1.63%
Portfolio turnover rate (excluding short-term securities) . . . . . . . . . . . . . . . . . . 11.55% 22.15% 15.07% 19.80% 32.04%
1 The net investment income per share is based on average shares outstanding for the period.2 Amount represents less than $0.01 per share.3 Total investment return is based on the change in net asset value of a share during the period (not annualized) and assumes reinvestment of distributions at
net asset value.4 Ratios are annualized for periods less than one year. In addition to fees and expenses which the Fund bears directly, the Fund indirectly bears a pro rata share of the
fees and expenses of the acquired funds in which it invests. Such indirect expenses are not included in the above reported expense ratios.5 Total Fund expenses are limited to 1.25% of average daily net assets. However, during the period above, the investment advisor voluntarily absorbed expenses that
were otherwise payable by the Fund.
FINANCIAL HIGHLIGHTSPer share income and capital changes for a share outstanding throughout the period. See accompanying notes to financial statements.
Sit Global Dividend Growth Fund
61JUNE 30, 2021
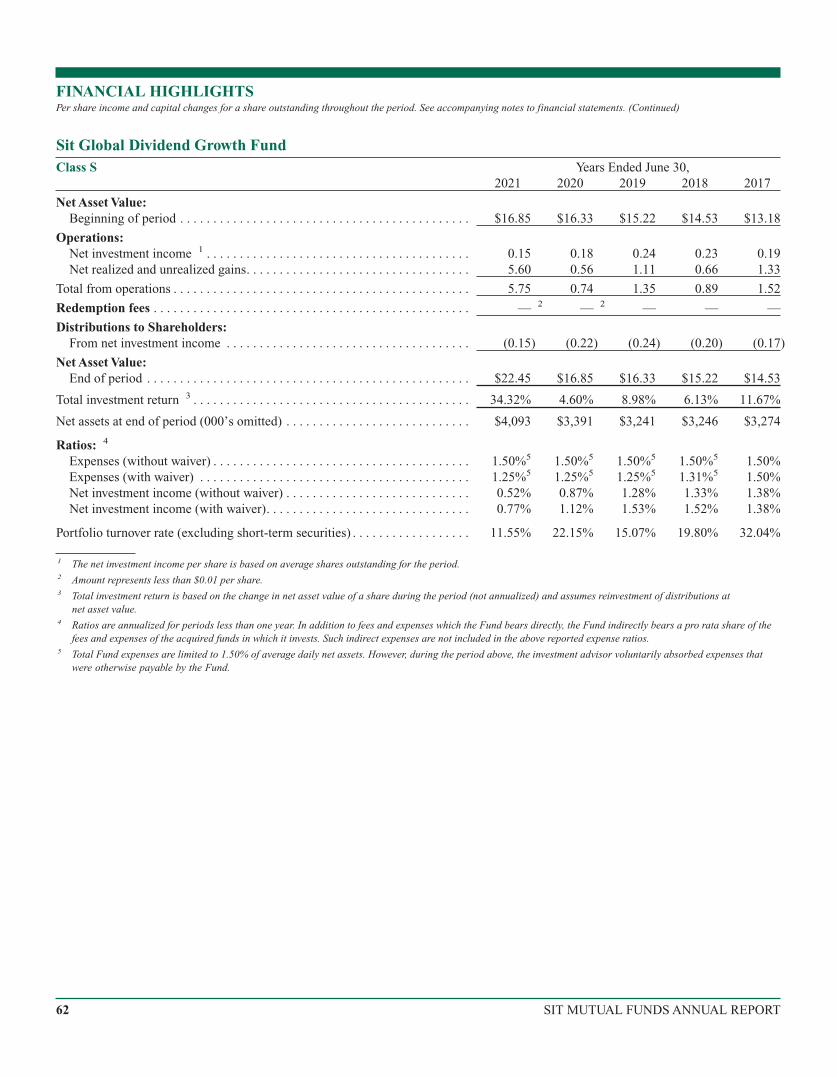
Class S Years Ended June 30,2021 2020 2019 2018 2017
Net Asset Value:Beginning of period . . . . . . . . . . . . . . . . . . . . . . . . . . . . . . . . . . . . . . . . . . . . $16.85 $16.33 $15.22 $14.53 $13.18
Operations:Net investment income 1 . . . . . . . . . . . . . . . . . . . . . . . . . . . . . . . . . . . . . . . . 0.15 0.18 0.24 0.23 0.19Net realized and unrealized gains. . . . . . . . . . . . . . . . . . . . . . . . . . . . . . . . . . 5.60 0.56 1.11 0.66 1.33
Total from operations . . . . . . . . . . . . . . . . . . . . . . . . . . . . . . . . . . . . . . . . . . . . . 5.75 0.74 1.35 0.89 1.52
Redemption fees . . . . . . . . . . . . . . . . . . . . . . . . . . . . . . . . . . . . . . . . . . . . . . . . — 2 — 2 — — —
Distributions to Shareholders:From net investment income . . . . . . . . . . . . . . . . . . . . . . . . . . . . . . . . . . . . . (0.15) (0.22) (0.24) (0.20) (0.17)
Net Asset Value:End of period . . . . . . . . . . . . . . . . . . . . . . . . . . . . . . . . . . . . . . . . . . . . . . . . . $22.45 $16.85 $16.33 $15.22 $14.53
Total investment return 3 . . . . . . . . . . . . . . . . . . . . . . . . . . . . . . . . . . . . . . . . . . 34.32% 4.60% 8.98% 6.13% 11.67%
Net assets at end of period (000’s omitted) . . . . . . . . . . . . . . . . . . . . . . . . . . . . $4,093 $3,391 $3,241 $3,246 $3,274
Ratios: 4
Expenses (without waiver) . . . . . . . . . . . . . . . . . . . . . . . . . . . . . . . . . . . . . . . 1.50%5 1.50%5 1.50%5 1.50%5 1.50%Expenses (with waiver) . . . . . . . . . . . . . . . . . . . . . . . . . . . . . . . . . . . . . . . . . 1.25%5 1.25%5 1.25%5 1.31%5 1.50%Net investment income (without waiver) . . . . . . . . . . . . . . . . . . . . . . . . . . . . 0.52% 0.87% 1.28% 1.33% 1.38%Net investment income (with waiver). . . . . . . . . . . . . . . . . . . . . . . . . . . . . . . 0.77% 1.12% 1.53% 1.52% 1.38%
Portfolio turnover rate (excluding short-term securities) . . . . . . . . . . . . . . . . . . 11.55% 22.15% 15.07% 19.80% 32.04%
1 The net investment income per share is based on average shares outstanding for the period.2 Amount represents less than $0.01 per share.3 Total investment return is based on the change in net asset value of a share during the period (not annualized) and assumes reinvestment of distributions at
net asset value.4 Ratios are annualized for periods less than one year. In addition to fees and expenses which the Fund bears directly, the Fund indirectly bears a pro rata share of the
fees and expenses of the acquired funds in which it invests. Such indirect expenses are not included in the above reported expense ratios.5 Total Fund expenses are limited to 1.50% of average daily net assets. However, during the period above, the investment advisor voluntarily absorbed expenses that
were otherwise payable by the Fund.
FINANCIAL HIGHLIGHTSPer share income and capital changes for a share outstanding throughout the period. See accompanying notes to financial statements. (Continued)
Sit Global Dividend Growth Fund
62 SIT MUTUAL FUNDS ANNUAL REPORT
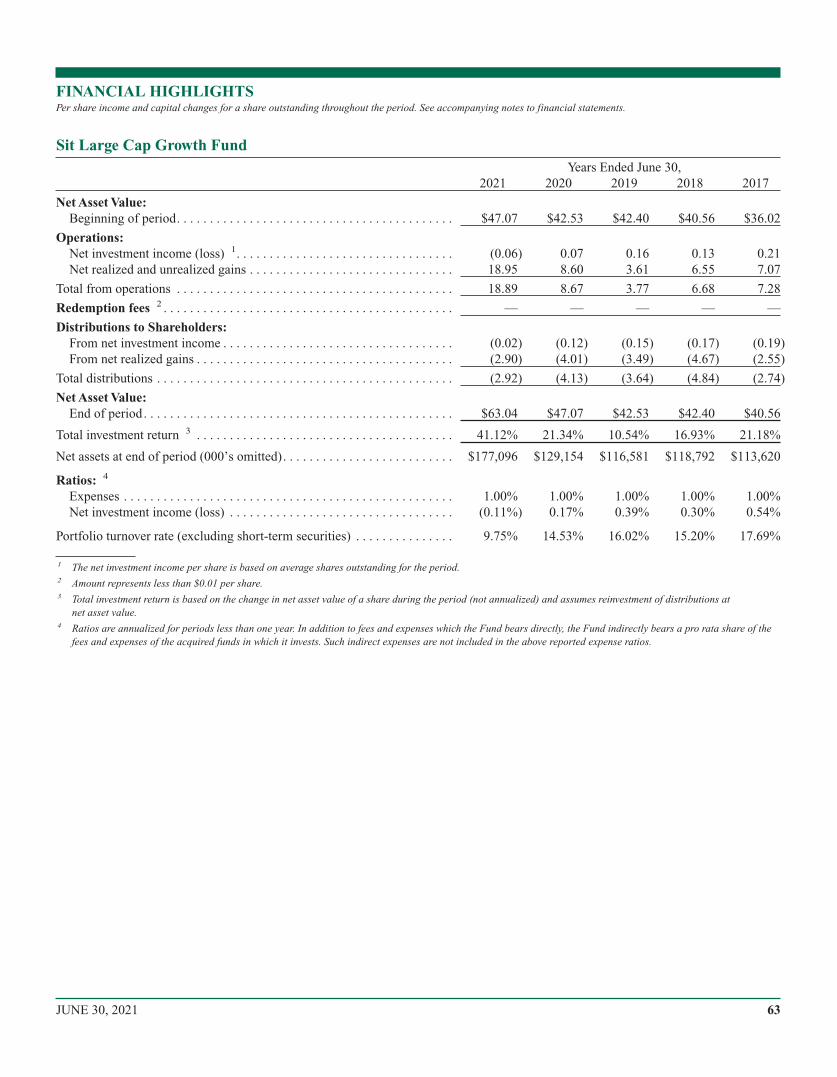
Years Ended June 30,2021 2020 2019 2018 2017
Net Asset Value:Beginning of period. . . . . . . . . . . . . . . . . . . . . . . . . . . . . . . . . . . . . . . . . . $47.07 $42.53 $42.40 $40.56 $36.02
Operations:Net investment income (loss) 1. . . . . . . . . . . . . . . . . . . . . . . . . . . . . . . . . (0.06) 0.07 0.16 0.13 0.21Net realized and unrealized gains . . . . . . . . . . . . . . . . . . . . . . . . . . . . . . . 18.95 8.60 3.61 6.55 7.07
Total from operations . . . . . . . . . . . . . . . . . . . . . . . . . . . . . . . . . . . . . . . . . . 18.89 8.67 3.77 6.68 7.28
Redemption fees 2 . . . . . . . . . . . . . . . . . . . . . . . . . . . . . . . . . . . . . . . . . . . . — — — — —
Distributions to Shareholders:From net investment income . . . . . . . . . . . . . . . . . . . . . . . . . . . . . . . . . . . (0.02) (0.12) (0.15) (0.17) (0.19)From net realized gains . . . . . . . . . . . . . . . . . . . . . . . . . . . . . . . . . . . . . . . (2.90) (4.01) (3.49) (4.67) (2.55)
Total distributions . . . . . . . . . . . . . . . . . . . . . . . . . . . . . . . . . . . . . . . . . . . . . (2.92) (4.13) (3.64) (4.84) (2.74)
Net Asset Value:End of period. . . . . . . . . . . . . . . . . . . . . . . . . . . . . . . . . . . . . . . . . . . . . . . $63.04 $47.07 $42.53 $42.40 $40.56
Total investment return 3 . . . . . . . . . . . . . . . . . . . . . . . . . . . . . . . . . . . . . . . 41.12% 21.34% 10.54% 16.93% 21.18%
Net assets at end of period (000’s omitted). . . . . . . . . . . . . . . . . . . . . . . . . . $177,096 $129,154 $116,581 $118,792 $113,620
Ratios: 4
Expenses . . . . . . . . . . . . . . . . . . . . . . . . . . . . . . . . . . . . . . . . . . . . . . . . . . 1.00% 1.00% 1.00% 1.00% 1.00%Net investment income (loss) . . . . . . . . . . . . . . . . . . . . . . . . . . . . . . . . . . (0.11%) 0.17% 0.39% 0.30% 0.54%
Portfolio turnover rate (excluding short-term securities) . . . . . . . . . . . . . . . 9.75% 14.53% 16.02% 15.20% 17.69%
1 The net investment income per share is based on average shares outstanding for the period.2 Amount represents less than $0.01 per share.3 Total investment return is based on the change in net asset value of a share during the period (not annualized) and assumes reinvestment of distributions at
net asset value.4 Ratios are annualized for periods less than one year. In addition to fees and expenses which the Fund bears directly, the Fund indirectly bears a pro rata share of the
fees and expenses of the acquired funds in which it invests. Such indirect expenses are not included in the above reported expense ratios.
FINANCIAL HIGHLIGHTSPer share income and capital changes for a share outstanding throughout the period. See accompanying notes to financial statements.
Sit Large Cap Growth Fund
63JUNE 30, 2021
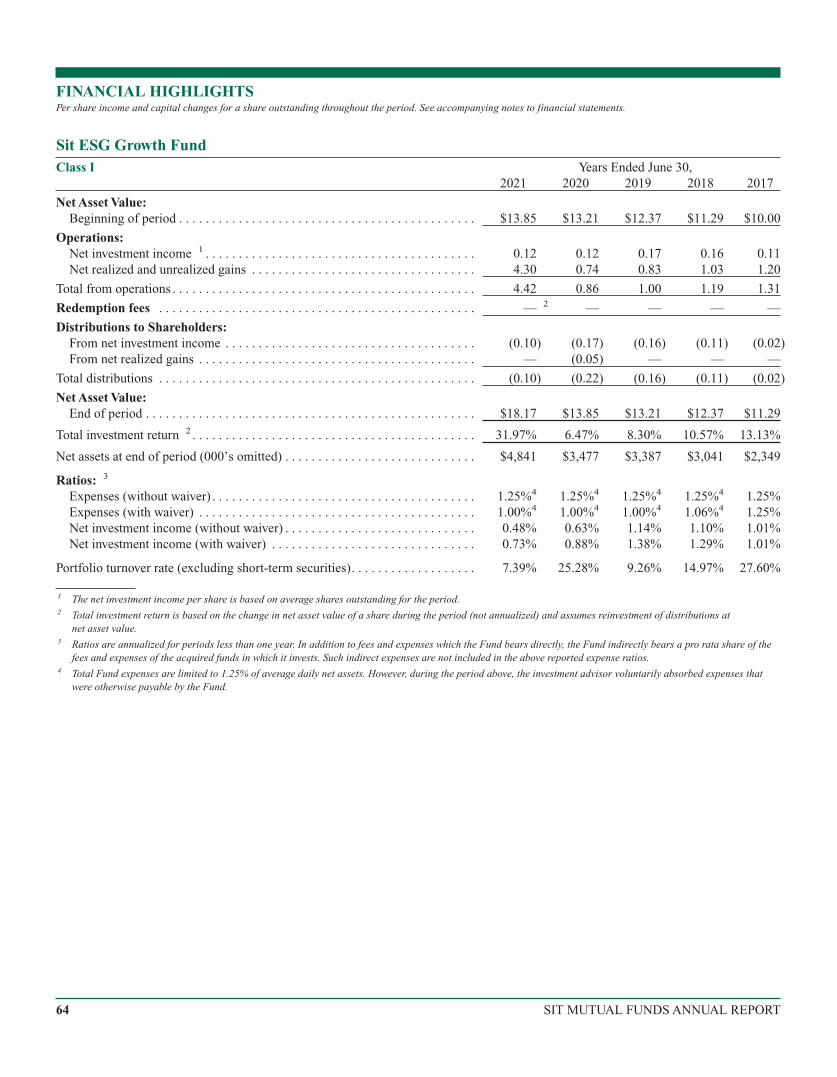
Class I Years Ended June 30,2021 2020 2019 2018 2017
Net Asset Value:Beginning of period . . . . . . . . . . . . . . . . . . . . . . . . . . . . . . . . . . . . . . . . . . . . . $13.85 $13.21 $12.37 $11.29 $10.00
Operations:Net investment income 1 . . . . . . . . . . . . . . . . . . . . . . . . . . . . . . . . . . . . . . . . . 0.12 0.12 0.17 0.16 0.11Net realized and unrealized gains . . . . . . . . . . . . . . . . . . . . . . . . . . . . . . . . . . 4.30 0.74 0.83 1.03 1.20
Total from operations . . . . . . . . . . . . . . . . . . . . . . . . . . . . . . . . . . . . . . . . . . . . . . 4.42 0.86 1.00 1.19 1.31
Redemption fees . . . . . . . . . . . . . . . . . . . . . . . . . . . . . . . . . . . . . . . . . . . . . . . . — 2 — — — —
Distributions to Shareholders:From net investment income . . . . . . . . . . . . . . . . . . . . . . . . . . . . . . . . . . . . . . (0.10) (0.17) (0.16) (0.11) (0.02)From net realized gains . . . . . . . . . . . . . . . . . . . . . . . . . . . . . . . . . . . . . . . . . . — (0.05) — — —
Total distributions . . . . . . . . . . . . . . . . . . . . . . . . . . . . . . . . . . . . . . . . . . . . . . . . (0.10) (0.22) (0.16) (0.11) (0.02)
Net Asset Value:End of period . . . . . . . . . . . . . . . . . . . . . . . . . . . . . . . . . . . . . . . . . . . . . . . . . . $18.17 $13.85 $13.21 $12.37 $11.29
Total investment return 2 . . . . . . . . . . . . . . . . . . . . . . . . . . . . . . . . . . . . . . . . . . . 31.97% 6.47% 8.30% 10.57% 13.13%
Net assets at end of period (000’s omitted) . . . . . . . . . . . . . . . . . . . . . . . . . . . . . $4,841 $3,477 $3,387 $3,041 $2,349
Ratios: 3
Expenses (without waiver) . . . . . . . . . . . . . . . . . . . . . . . . . . . . . . . . . . . . . . . . 1.25%4 1.25%4 1.25%4 1.25%4 1.25%Expenses (with waiver) . . . . . . . . . . . . . . . . . . . . . . . . . . . . . . . . . . . . . . . . . . 1.00%4 1.00%4 1.00%4 1.06%4 1.25%Net investment income (without waiver) . . . . . . . . . . . . . . . . . . . . . . . . . . . . . 0.48% 0.63% 1.14% 1.10% 1.01%Net investment income (with waiver) . . . . . . . . . . . . . . . . . . . . . . . . . . . . . . . 0.73% 0.88% 1.38% 1.29% 1.01%
Portfolio turnover rate (excluding short-term securities). . . . . . . . . . . . . . . . . . . 7.39% 25.28% 9.26% 14.97% 27.60%
1 The net investment income per share is based on average shares outstanding for the period.2 Total investment return is based on the change in net asset value of a share during the period (not annualized) and assumes reinvestment of distributions at
net asset value.3 Ratios are annualized for periods less than one year. In addition to fees and expenses which the Fund bears directly, the Fund indirectly bears a pro rata share of the
fees and expenses of the acquired funds in which it invests. Such indirect expenses are not included in the above reported expense ratios.4 Total Fund expenses are limited to 1.25% of average daily net assets. However, during the period above, the investment advisor voluntarily absorbed expenses that
were otherwise payable by the Fund.
FINANCIAL HIGHLIGHTSPer share income and capital changes for a share outstanding throughout the period. See accompanying notes to financial statements.
Sit ESG Growth Fund
64 SIT MUTUAL FUNDS ANNUAL REPORT
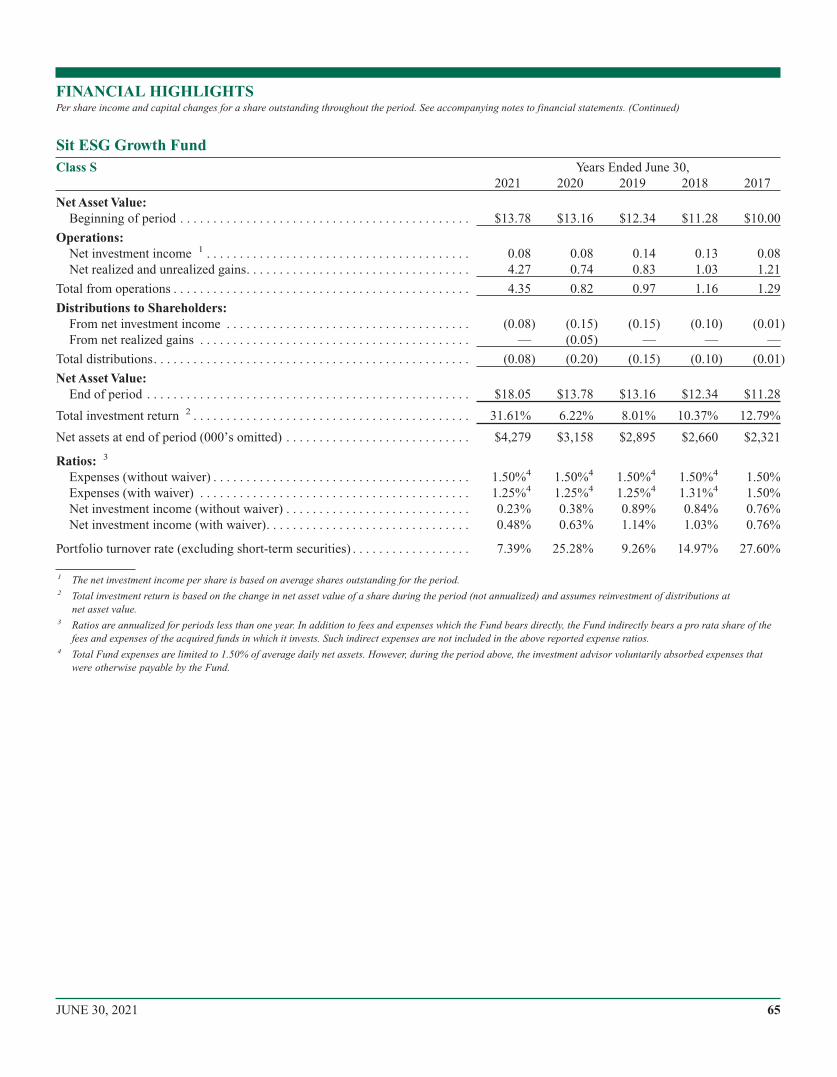
Class S Years Ended June 30,2021 2020 2019 2018 2017
Net Asset Value:Beginning of period . . . . . . . . . . . . . . . . . . . . . . . . . . . . . . . . . . . . . . . . . . . . $13.78 $13.16 $12.34 $11.28 $10.00
Operations:Net investment income 1 . . . . . . . . . . . . . . . . . . . . . . . . . . . . . . . . . . . . . . . . 0.08 0.08 0.14 0.13 0.08Net realized and unrealized gains. . . . . . . . . . . . . . . . . . . . . . . . . . . . . . . . . . 4.27 0.74 0.83 1.03 1.21
Total from operations . . . . . . . . . . . . . . . . . . . . . . . . . . . . . . . . . . . . . . . . . . . . . 4.35 0.82 0.97 1.16 1.29
Distributions to Shareholders:From net investment income . . . . . . . . . . . . . . . . . . . . . . . . . . . . . . . . . . . . . (0.08) (0.15) (0.15) (0.10) (0.01)From net realized gains . . . . . . . . . . . . . . . . . . . . . . . . . . . . . . . . . . . . . . . . . — (0.05) — — —
Total distributions. . . . . . . . . . . . . . . . . . . . . . . . . . . . . . . . . . . . . . . . . . . . . . . . (0.08) (0.20) (0.15) (0.10) (0.01)
Net Asset Value:End of period . . . . . . . . . . . . . . . . . . . . . . . . . . . . . . . . . . . . . . . . . . . . . . . . . $18.05 $13.78 $13.16 $12.34 $11.28
Total investment return 2 . . . . . . . . . . . . . . . . . . . . . . . . . . . . . . . . . . . . . . . . . . 31.61% 6.22% 8.01% 10.37% 12.79%
Net assets at end of period (000’s omitted) . . . . . . . . . . . . . . . . . . . . . . . . . . . . $4,279 $3,158 $2,895 $2,660 $2,321
Ratios: 3
Expenses (without waiver) . . . . . . . . . . . . . . . . . . . . . . . . . . . . . . . . . . . . . . . 1.50%4 1.50%4 1.50%4 1.50%4 1.50%Expenses (with waiver) . . . . . . . . . . . . . . . . . . . . . . . . . . . . . . . . . . . . . . . . . 1.25%4 1.25%4 1.25%4 1.31%4 1.50%Net investment income (without waiver) . . . . . . . . . . . . . . . . . . . . . . . . . . . . 0.23% 0.38% 0.89% 0.84% 0.76%Net investment income (with waiver). . . . . . . . . . . . . . . . . . . . . . . . . . . . . . . 0.48% 0.63% 1.14% 1.03% 0.76%
Portfolio turnover rate (excluding short-term securities) . . . . . . . . . . . . . . . . . . 7.39% 25.28% 9.26% 14.97% 27.60%
1 The net investment income per share is based on average shares outstanding for the period.2 Total investment return is based on the change in net asset value of a share during the period (not annualized) and assumes reinvestment of distributions at
net asset value.3 Ratios are annualized for periods less than one year. In addition to fees and expenses which the Fund bears directly, the Fund indirectly bears a pro rata share of the
fees and expenses of the acquired funds in which it invests. Such indirect expenses are not included in the above reported expense ratios.4 Total Fund expenses are limited to 1.50% of average daily net assets. However, during the period above, the investment advisor voluntarily absorbed expenses that
were otherwise payable by the Fund.
FINANCIAL HIGHLIGHTSPer share income and capital changes for a share outstanding throughout the period. See accompanying notes to financial statements. (Continued)
Sit ESG Growth Fund
65JUNE 30, 2021
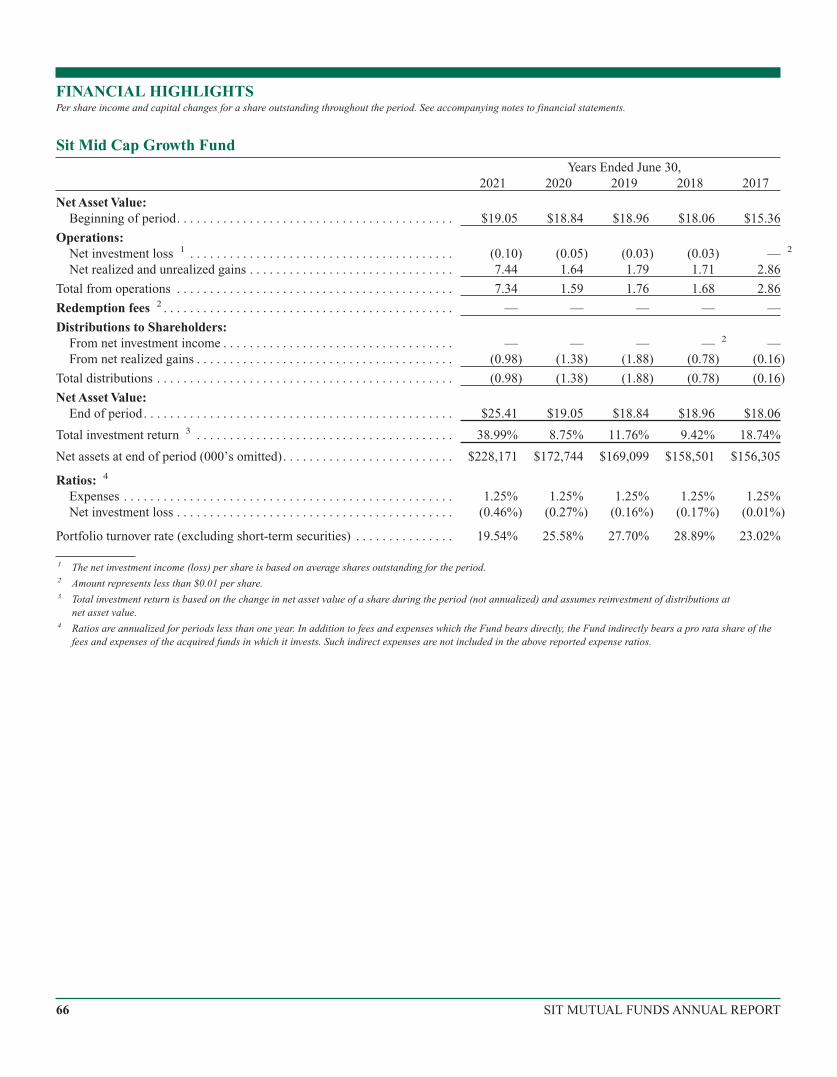
Years Ended June 30,2021 2020 2019 2018 2017
Net Asset Value:Beginning of period. . . . . . . . . . . . . . . . . . . . . . . . . . . . . . . . . . . . . . . . . . $19.05 $18.84 $18.96 $18.06 $15.36
Operations:Net investment loss 1 . . . . . . . . . . . . . . . . . . . . . . . . . . . . . . . . . . . . . . . . (0.10) (0.05) (0.03) (0.03) — 2
Net realized and unrealized gains . . . . . . . . . . . . . . . . . . . . . . . . . . . . . . . 7.44 1.64 1.79 1.71 2.86
Total from operations . . . . . . . . . . . . . . . . . . . . . . . . . . . . . . . . . . . . . . . . . . 7.34 1.59 1.76 1.68 2.86
Redemption fees 2 . . . . . . . . . . . . . . . . . . . . . . . . . . . . . . . . . . . . . . . . . . . . — — — — —
Distributions to Shareholders:From net investment income . . . . . . . . . . . . . . . . . . . . . . . . . . . . . . . . . . . — — — — 2 —From net realized gains . . . . . . . . . . . . . . . . . . . . . . . . . . . . . . . . . . . . . . . (0.98) (1.38) (1.88) (0.78) (0.16)
Total distributions . . . . . . . . . . . . . . . . . . . . . . . . . . . . . . . . . . . . . . . . . . . . . (0.98) (1.38) (1.88) (0.78) (0.16)
Net Asset Value:End of period. . . . . . . . . . . . . . . . . . . . . . . . . . . . . . . . . . . . . . . . . . . . . . . $25.41 $19.05 $18.84 $18.96 $18.06
Total investment return 3 . . . . . . . . . . . . . . . . . . . . . . . . . . . . . . . . . . . . . . . 38.99% 8.75% 11.76% 9.42% 18.74%
Net assets at end of period (000’s omitted). . . . . . . . . . . . . . . . . . . . . . . . . . $228,171 $172,744 $169,099 $158,501 $156,305
Ratios: 4
Expenses . . . . . . . . . . . . . . . . . . . . . . . . . . . . . . . . . . . . . . . . . . . . . . . . . . 1.25% 1.25% 1.25% 1.25% 1.25%Net investment loss . . . . . . . . . . . . . . . . . . . . . . . . . . . . . . . . . . . . . . . . . . (0.46%) (0.27%) (0.16%) (0.17%) (0.01%)
Portfolio turnover rate (excluding short-term securities) . . . . . . . . . . . . . . . 19.54% 25.58% 27.70% 28.89% 23.02%
1 The net investment income (loss) per share is based on average shares outstanding for the period.2 Amount represents less than $0.01 per share.3 Total investment return is based on the change in net asset value of a share during the period (not annualized) and assumes reinvestment of distributions at
net asset value.4 Ratios are annualized for periods less than one year. In addition to fees and expenses which the Fund bears directly, the Fund indirectly bears a pro rata share of the
fees and expenses of the acquired funds in which it invests. Such indirect expenses are not included in the above reported expense ratios.
FINANCIAL HIGHLIGHTSPer share income and capital changes for a share outstanding throughout the period. See accompanying notes to financial statements.
Sit Mid Cap Growth Fund
66 SIT MUTUAL FUNDS ANNUAL REPORT
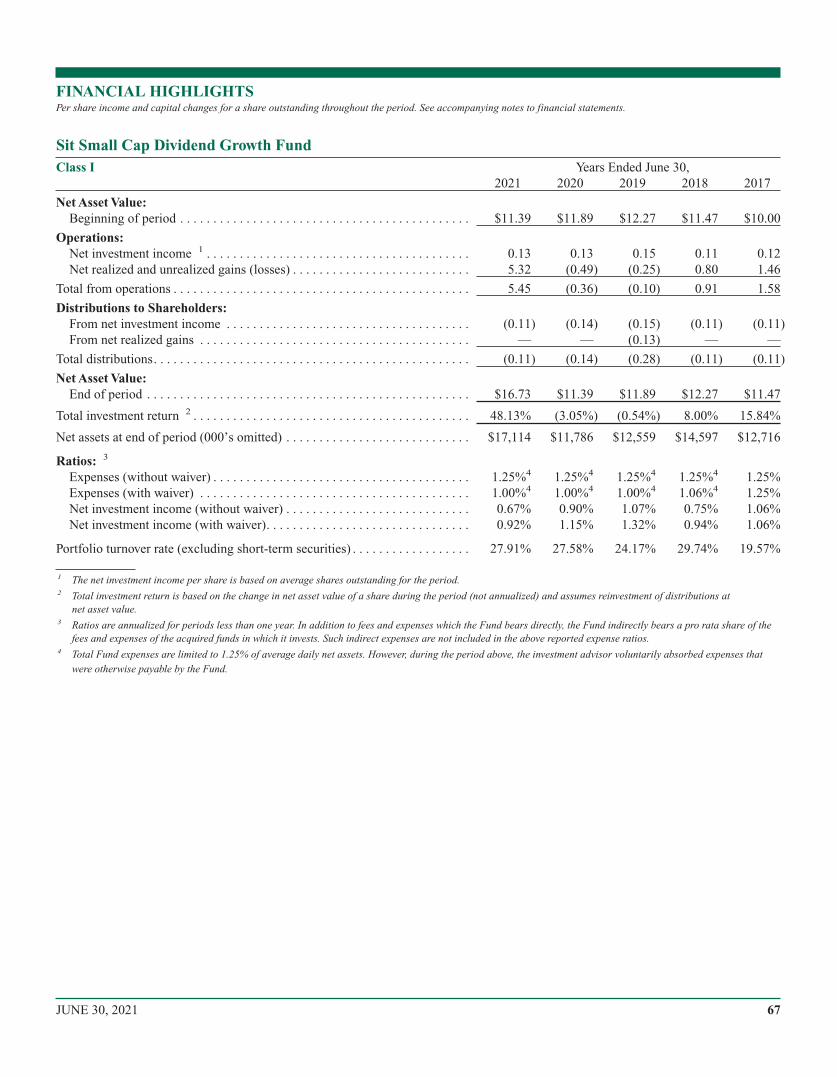
Class I Years Ended June 30,2021 2020 2019 2018 2017
Net Asset Value:Beginning of period . . . . . . . . . . . . . . . . . . . . . . . . . . . . . . . . . . . . . . . . . . . . $11.39 $11.89 $12.27 $11.47 $10.00
Operations:Net investment income 1 . . . . . . . . . . . . . . . . . . . . . . . . . . . . . . . . . . . . . . . . 0.13 0.13 0.15 0.11 0.12Net realized and unrealized gains (losses) . . . . . . . . . . . . . . . . . . . . . . . . . . . 5.32 (0.49) (0.25) 0.80 1.46
Total from operations . . . . . . . . . . . . . . . . . . . . . . . . . . . . . . . . . . . . . . . . . . . . . 5.45 (0.36) (0.10) 0.91 1.58
Distributions to Shareholders:From net investment income . . . . . . . . . . . . . . . . . . . . . . . . . . . . . . . . . . . . . (0.11) (0.14) (0.15) (0.11) (0.11)From net realized gains . . . . . . . . . . . . . . . . . . . . . . . . . . . . . . . . . . . . . . . . . — — (0.13) — —
Total distributions. . . . . . . . . . . . . . . . . . . . . . . . . . . . . . . . . . . . . . . . . . . . . . . . (0.11) (0.14) (0.28) (0.11) (0.11)
Net Asset Value:End of period . . . . . . . . . . . . . . . . . . . . . . . . . . . . . . . . . . . . . . . . . . . . . . . . . $16.73 $11.39 $11.89 $12.27 $11.47
Total investment return 2 . . . . . . . . . . . . . . . . . . . . . . . . . . . . . . . . . . . . . . . . . . 48.13% (3.05%) (0.54%) 8.00% 15.84%
Net assets at end of period (000’s omitted) . . . . . . . . . . . . . . . . . . . . . . . . . . . . $17,114 $11,786 $12,559 $14,597 $12,716
Ratios: 3
Expenses (without waiver) . . . . . . . . . . . . . . . . . . . . . . . . . . . . . . . . . . . . . . . 1.25%4 1.25%4 1.25%4 1.25%4 1.25%Expenses (with waiver) . . . . . . . . . . . . . . . . . . . . . . . . . . . . . . . . . . . . . . . . . 1.00%4 1.00%4 1.00%4 1.06%4 1.25%Net investment income (without waiver) . . . . . . . . . . . . . . . . . . . . . . . . . . . . 0.67% 0.90% 1.07% 0.75% 1.06%Net investment income (with waiver). . . . . . . . . . . . . . . . . . . . . . . . . . . . . . . 0.92% 1.15% 1.32% 0.94% 1.06%
Portfolio turnover rate (excluding short-term securities) . . . . . . . . . . . . . . . . . . 27.91% 27.58% 24.17% 29.74% 19.57%
1 The net investment income per share is based on average shares outstanding for the period.2 Total investment return is based on the change in net asset value of a share during the period (not annualized) and assumes reinvestment of distributions at
net asset value.3 Ratios are annualized for periods less than one year. In addition to fees and expenses which the Fund bears directly, the Fund indirectly bears a pro rata share of the
fees and expenses of the acquired funds in which it invests. Such indirect expenses are not included in the above reported expense ratios.4 Total Fund expenses are limited to 1.25% of average daily net assets. However, during the period above, the investment advisor voluntarily absorbed expenses that
were otherwise payable by the Fund.
FINANCIAL HIGHLIGHTSPer share income and capital changes for a share outstanding throughout the period. See accompanying notes to financial statements.
Sit Small Cap Dividend Growth Fund
67JUNE 30, 2021
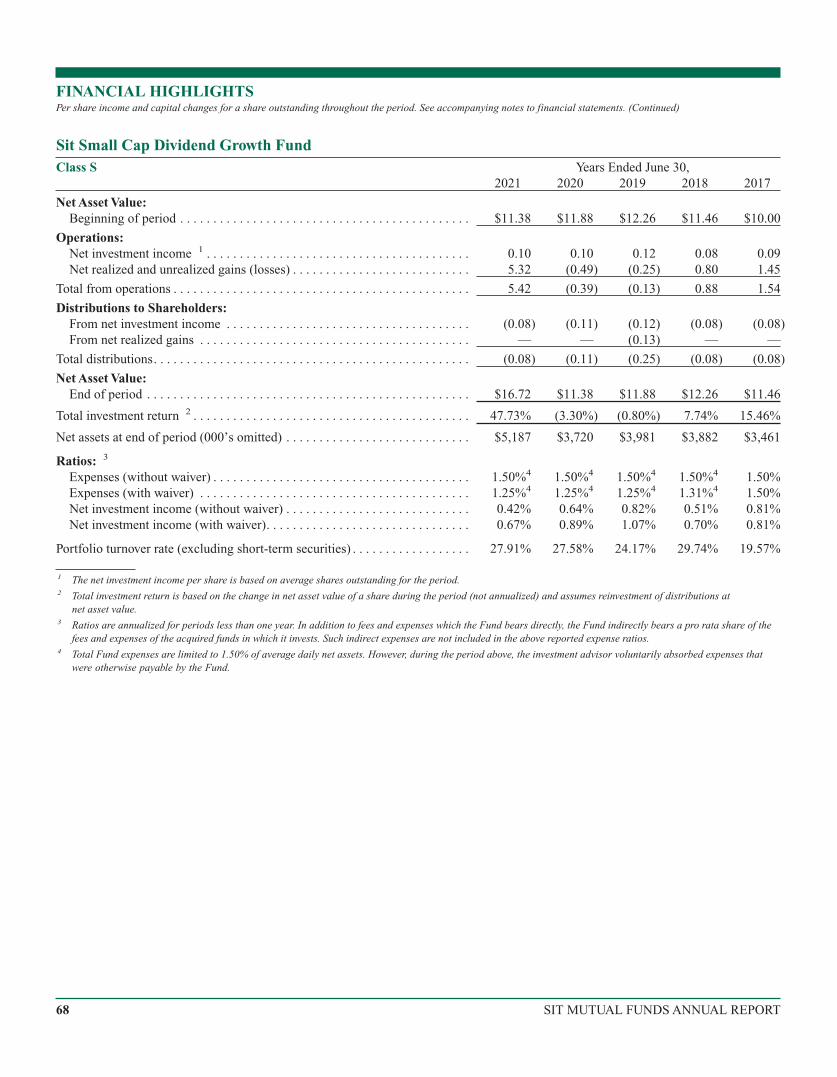
Class S Years Ended June 30,2021 2020 2019 2018 2017
Net Asset Value:Beginning of period . . . . . . . . . . . . . . . . . . . . . . . . . . . . . . . . . . . . . . . . . . . . $11.38 $11.88 $12.26 $11.46 $10.00
Operations:Net investment income 1 . . . . . . . . . . . . . . . . . . . . . . . . . . . . . . . . . . . . . . . . 0.10 0.10 0.12 0.08 0.09Net realized and unrealized gains (losses) . . . . . . . . . . . . . . . . . . . . . . . . . . . 5.32 (0.49) (0.25) 0.80 1.45
Total from operations . . . . . . . . . . . . . . . . . . . . . . . . . . . . . . . . . . . . . . . . . . . . . 5.42 (0.39) (0.13) 0.88 1.54
Distributions to Shareholders:From net investment income . . . . . . . . . . . . . . . . . . . . . . . . . . . . . . . . . . . . . (0.08) (0.11) (0.12) (0.08) (0.08)From net realized gains . . . . . . . . . . . . . . . . . . . . . . . . . . . . . . . . . . . . . . . . . — — (0.13) — —
Total distributions. . . . . . . . . . . . . . . . . . . . . . . . . . . . . . . . . . . . . . . . . . . . . . . . (0.08) (0.11) (0.25) (0.08) (0.08)
Net Asset Value:End of period . . . . . . . . . . . . . . . . . . . . . . . . . . . . . . . . . . . . . . . . . . . . . . . . . $16.72 $11.38 $11.88 $12.26 $11.46
Total investment return 2 . . . . . . . . . . . . . . . . . . . . . . . . . . . . . . . . . . . . . . . . . . 47.73% (3.30%) (0.80%) 7.74% 15.46%
Net assets at end of period (000’s omitted) . . . . . . . . . . . . . . . . . . . . . . . . . . . . $5,187 $3,720 $3,981 $3,882 $3,461
Ratios: 3
Expenses (without waiver) . . . . . . . . . . . . . . . . . . . . . . . . . . . . . . . . . . . . . . . 1.50%4 1.50%4 1.50%4 1.50%4 1.50%Expenses (with waiver) . . . . . . . . . . . . . . . . . . . . . . . . . . . . . . . . . . . . . . . . . 1.25%4 1.25%4 1.25%4 1.31%4 1.50%Net investment income (without waiver) . . . . . . . . . . . . . . . . . . . . . . . . . . . . 0.42% 0.64% 0.82% 0.51% 0.81%Net investment income (with waiver). . . . . . . . . . . . . . . . . . . . . . . . . . . . . . . 0.67% 0.89% 1.07% 0.70% 0.81%
Portfolio turnover rate (excluding short-term securities) . . . . . . . . . . . . . . . . . . 27.91% 27.58% 24.17% 29.74% 19.57%
1 The net investment income per share is based on average shares outstanding for the period.2 Total investment return is based on the change in net asset value of a share during the period (not annualized) and assumes reinvestment of distributions at
net asset value.3 Ratios are annualized for periods less than one year. In addition to fees and expenses which the Fund bears directly, the Fund indirectly bears a pro rata share of the
fees and expenses of the acquired funds in which it invests. Such indirect expenses are not included in the above reported expense ratios.4 Total Fund expenses are limited to 1.50% of average daily net assets. However, during the period above, the investment advisor voluntarily absorbed expenses that
were otherwise payable by the Fund.
FINANCIAL HIGHLIGHTSPer share income and capital changes for a share outstanding throughout the period. See accompanying notes to financial statements. (Continued)
Sit Small Cap Dividend Growth Fund
68 SIT MUTUAL FUNDS ANNUAL REPORT
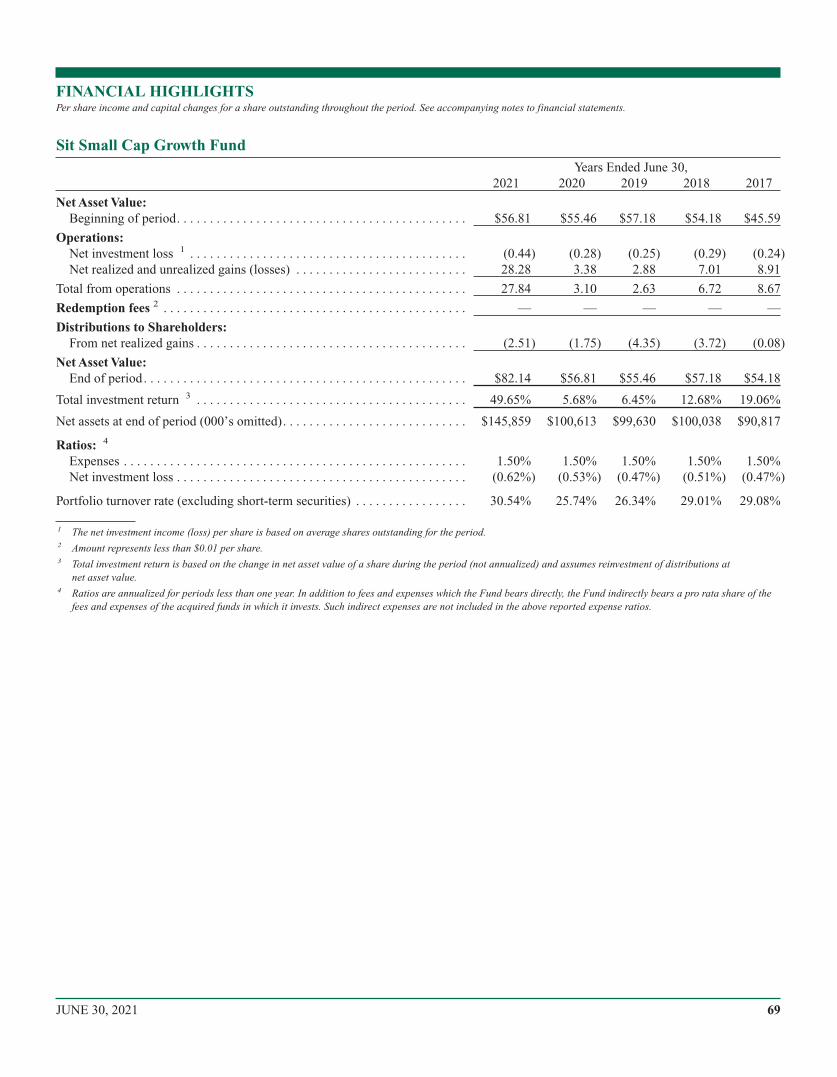
Years Ended June 30,2021 2020 2019 2018 2017
Net Asset Value:Beginning of period. . . . . . . . . . . . . . . . . . . . . . . . . . . . . . . . . . . . . . . . . . . . $56.81 $55.46 $57.18 $54.18 $45.59
Operations:Net investment loss 1 . . . . . . . . . . . . . . . . . . . . . . . . . . . . . . . . . . . . . . . . . . (0.44) (0.28) (0.25) (0.29) (0.24)Net realized and unrealized gains (losses) . . . . . . . . . . . . . . . . . . . . . . . . . . 28.28 3.38 2.88 7.01 8.91
Total from operations . . . . . . . . . . . . . . . . . . . . . . . . . . . . . . . . . . . . . . . . . . . . 27.84 3.10 2.63 6.72 8.67
Redemption fees 2 . . . . . . . . . . . . . . . . . . . . . . . . . . . . . . . . . . . . . . . . . . . . . . — — — — —
Distributions to Shareholders:From net realized gains . . . . . . . . . . . . . . . . . . . . . . . . . . . . . . . . . . . . . . . . . (2.51) (1.75) (4.35) (3.72) (0.08)
Net Asset Value:End of period. . . . . . . . . . . . . . . . . . . . . . . . . . . . . . . . . . . . . . . . . . . . . . . . . $82.14 $56.81 $55.46 $57.18 $54.18
Total investment return 3 . . . . . . . . . . . . . . . . . . . . . . . . . . . . . . . . . . . . . . . . . 49.65% 5.68% 6.45% 12.68% 19.06%
Net assets at end of period (000’s omitted). . . . . . . . . . . . . . . . . . . . . . . . . . . . $145,859 $100,613 $99,630 $100,038 $90,817
Ratios: 4
Expenses . . . . . . . . . . . . . . . . . . . . . . . . . . . . . . . . . . . . . . . . . . . . . . . . . . . . 1.50% 1.50% 1.50% 1.50% 1.50%Net investment loss . . . . . . . . . . . . . . . . . . . . . . . . . . . . . . . . . . . . . . . . . . . . (0.62%) (0.53%) (0.47%) (0.51%) (0.47%)
Portfolio turnover rate (excluding short-term securities) . . . . . . . . . . . . . . . . . 30.54% 25.74% 26.34% 29.01% 29.08%
1 The net investment income (loss) per share is based on average shares outstanding for the period.2 Amount represents less than $0.01 per share.3 Total investment return is based on the change in net asset value of a share during the period (not annualized) and assumes reinvestment of distributions at
net asset value.4 Ratios are annualized for periods less than one year. In addition to fees and expenses which the Fund bears directly, the Fund indirectly bears a pro rata share of the
fees and expenses of the acquired funds in which it invests. Such indirect expenses are not included in the above reported expense ratios.
FINANCIAL HIGHLIGHTSPer share income and capital changes for a share outstanding throughout the period. See accompanying notes to financial statements.
Sit Small Cap Growth Fund
69JUNE 30, 2021
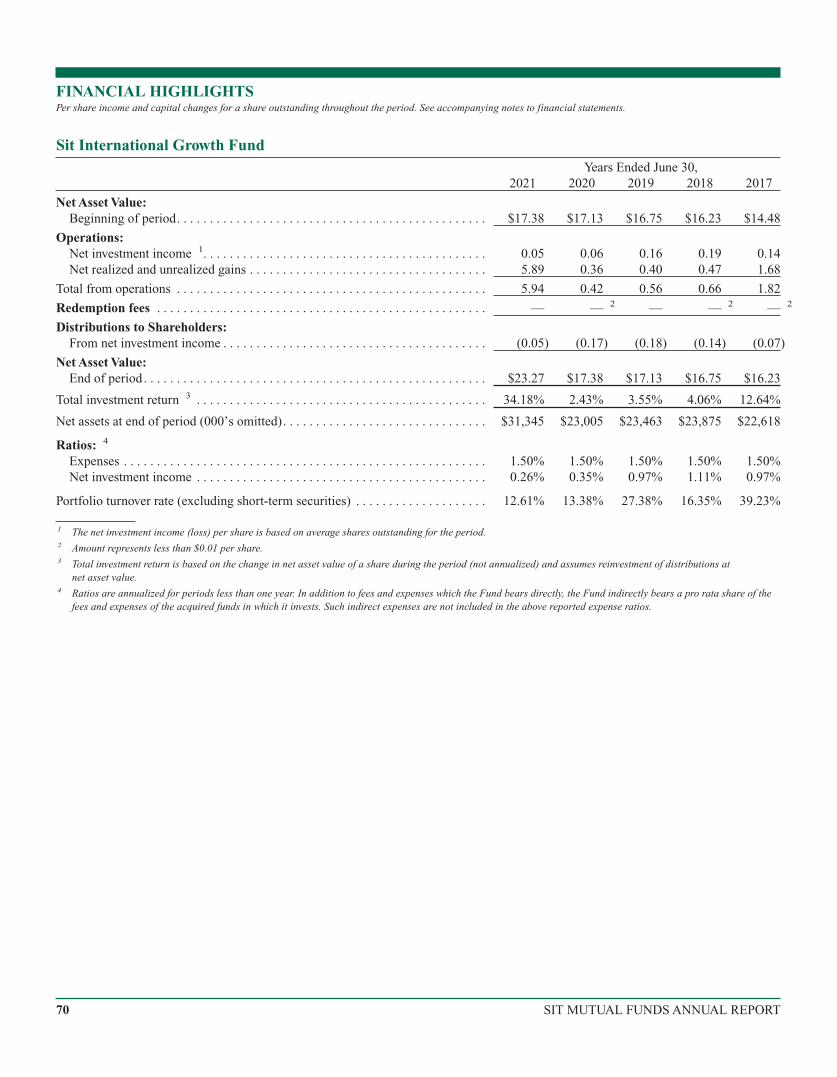
Years Ended June 30,2021 2020 2019 2018 2017
Net Asset Value:Beginning of period. . . . . . . . . . . . . . . . . . . . . . . . . . . . . . . . . . . . . . . . . . . . . . . $17.38 $17.13 $16.75 $16.23 $14.48
Operations:Net investment income 1. . . . . . . . . . . . . . . . . . . . . . . . . . . . . . . . . . . . . . . . . . . 0.05 0.06 0.16 0.19 0.14Net realized and unrealized gains . . . . . . . . . . . . . . . . . . . . . . . . . . . . . . . . . . . . 5.89 0.36 0.40 0.47 1.68
Total from operations . . . . . . . . . . . . . . . . . . . . . . . . . . . . . . . . . . . . . . . . . . . . . . . 5.94 0.42 0.56 0.66 1.82
Redemption fees . . . . . . . . . . . . . . . . . . . . . . . . . . . . . . . . . . . . . . . . . . . . . . . . . . — — 2 — — 2 — 2
Distributions to Shareholders:From net investment income . . . . . . . . . . . . . . . . . . . . . . . . . . . . . . . . . . . . . . . . (0.05) (0.17) (0.18) (0.14) (0.07)
Net Asset Value:End of period. . . . . . . . . . . . . . . . . . . . . . . . . . . . . . . . . . . . . . . . . . . . . . . . . . . . $23.27 $17.38 $17.13 $16.75 $16.23
Total investment return 3 . . . . . . . . . . . . . . . . . . . . . . . . . . . . . . . . . . . . . . . . . . . . 34.18% 2.43% 3.55% 4.06% 12.64%
Net assets at end of period (000’s omitted). . . . . . . . . . . . . . . . . . . . . . . . . . . . . . . $31,345 $23,005 $23,463 $23,875 $22,618
Ratios: 4
Expenses . . . . . . . . . . . . . . . . . . . . . . . . . . . . . . . . . . . . . . . . . . . . . . . . . . . . . . . 1.50% 1.50% 1.50% 1.50% 1.50%Net investment income . . . . . . . . . . . . . . . . . . . . . . . . . . . . . . . . . . . . . . . . . . . . 0.26% 0.35% 0.97% 1.11% 0.97%
Portfolio turnover rate (excluding short-term securities) . . . . . . . . . . . . . . . . . . . . 12.61% 13.38% 27.38% 16.35% 39.23%
1 The net investment income (loss) per share is based on average shares outstanding for the period.2 Amount represents less than $0.01 per share.3 Total investment return is based on the change in net asset value of a share during the period (not annualized) and assumes reinvestment of distributions at
net asset value.4 Ratios are annualized for periods less than one year. In addition to fees and expenses which the Fund bears directly, the Fund indirectly bears a pro rata share of the
fees and expenses of the acquired funds in which it invests. Such indirect expenses are not included in the above reported expense ratios.
FINANCIAL HIGHLIGHTSPer share income and capital changes for a share outstanding throughout the period. See accompanying notes to financial statements.
Sit International Growth Fund
70 SIT MUTUAL FUNDS ANNUAL REPORT
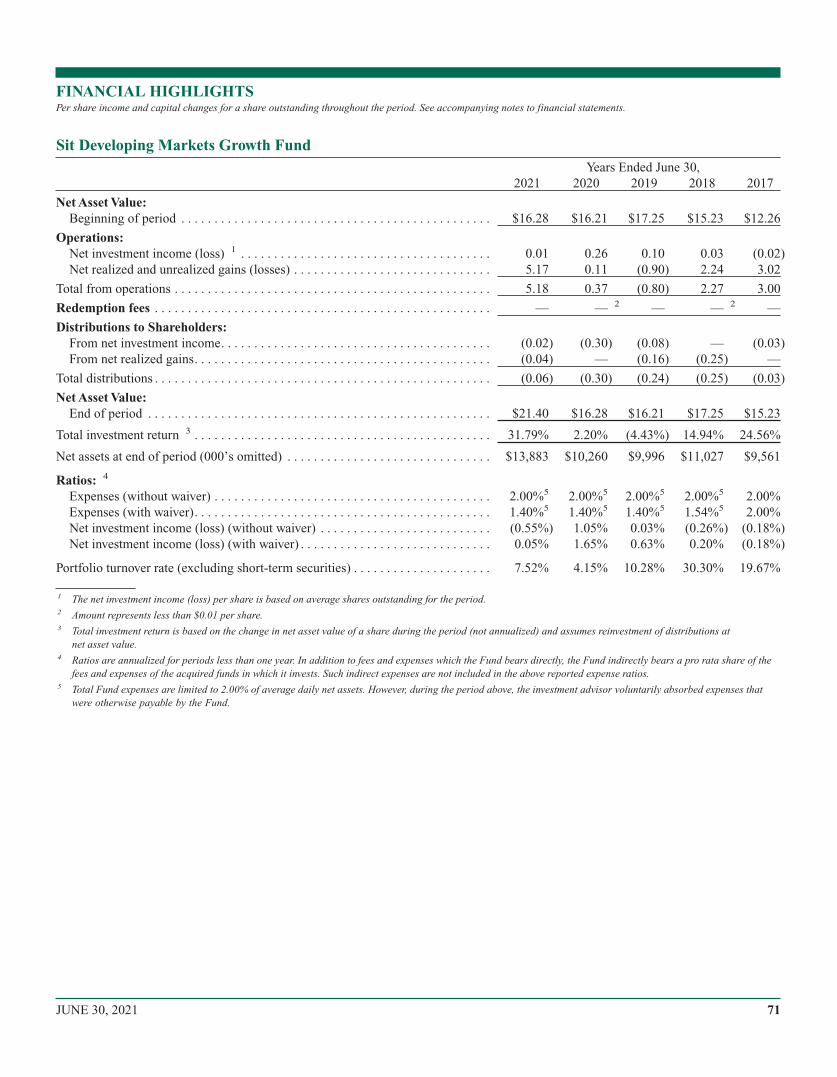
Years Ended June 30,2021 2020 2019 2018 2017
Net Asset Value:Beginning of period . . . . . . . . . . . . . . . . . . . . . . . . . . . . . . . . . . . . . . . . . . . . . . . $16.28 $16.21 $17.25 $15.23 $12.26
Operations:Net investment income (loss) 1 . . . . . . . . . . . . . . . . . . . . . . . . . . . . . . . . . . . . . . 0.01 0.26 0.10 0.03 (0.02)Net realized and unrealized gains (losses) . . . . . . . . . . . . . . . . . . . . . . . . . . . . . . 5.17 0.11 (0.90) 2.24 3.02
Total from operations . . . . . . . . . . . . . . . . . . . . . . . . . . . . . . . . . . . . . . . . . . . . . . . . 5.18 0.37 (0.80) 2.27 3.00
Redemption fees . . . . . . . . . . . . . . . . . . . . . . . . . . . . . . . . . . . . . . . . . . . . . . . . . . . — — 2 — — 2 —
Distributions to Shareholders:From net investment income. . . . . . . . . . . . . . . . . . . . . . . . . . . . . . . . . . . . . . . . . (0.02) (0.30) (0.08) — (0.03)From net realized gains. . . . . . . . . . . . . . . . . . . . . . . . . . . . . . . . . . . . . . . . . . . . . (0.04) — (0.16) (0.25) —
Total distributions . . . . . . . . . . . . . . . . . . . . . . . . . . . . . . . . . . . . . . . . . . . . . . . . . . . (0.06) (0.30) (0.24) (0.25) (0.03)
Net Asset Value:End of period . . . . . . . . . . . . . . . . . . . . . . . . . . . . . . . . . . . . . . . . . . . . . . . . . . . . $21.40 $16.28 $16.21 $17.25 $15.23
Total investment return 3 . . . . . . . . . . . . . . . . . . . . . . . . . . . . . . . . . . . . . . . . . . . . . 31.79% 2.20% (4.43%) 14.94% 24.56%
Net assets at end of period (000’s omitted) . . . . . . . . . . . . . . . . . . . . . . . . . . . . . . . $13,883 $10,260 $9,996 $11,027 $9,561
Ratios: 4
Expenses (without waiver) . . . . . . . . . . . . . . . . . . . . . . . . . . . . . . . . . . . . . . . . . . 2.00%5 2.00%5 2.00%5 2.00%5 2.00%Expenses (with waiver). . . . . . . . . . . . . . . . . . . . . . . . . . . . . . . . . . . . . . . . . . . . . 1.40%5 1.40%5 1.40%5 1.54%5 2.00%Net investment income (loss) (without waiver) . . . . . . . . . . . . . . . . . . . . . . . . . . (0.55%) 1.05% 0.03% (0.26%) (0.18%)Net investment income (loss) (with waiver) . . . . . . . . . . . . . . . . . . . . . . . . . . . . . 0.05% 1.65% 0.63% 0.20% (0.18%)
Portfolio turnover rate (excluding short-term securities) . . . . . . . . . . . . . . . . . . . . . 7.52% 4.15% 10.28% 30.30% 19.67%
1 The net investment income (loss) per share is based on average shares outstanding for the period.2 Amount represents less than $0.01 per share.3 Total investment return is based on the change in net asset value of a share during the period (not annualized) and assumes reinvestment of distributions at
net asset value.4 Ratios are annualized for periods less than one year. In addition to fees and expenses which the Fund bears directly, the Fund indirectly bears a pro rata share of the
fees and expenses of the acquired funds in which it invests. Such indirect expenses are not included in the above reported expense ratios.5 Total Fund expenses are limited to 2.00% of average daily net assets. However, during the period above, the investment advisor voluntarily absorbed expenses that
were otherwise payable by the Fund.
FINANCIAL HIGHLIGHTSPer share income and capital changes for a share outstanding throughout the period. See accompanying notes to financial statements.
Sit Developing Markets Growth Fund
71JUNE 30, 2021
(1) Organization
Sit Mutual Funds are no-load funds, and are registered under the Investment Company Act of 1940 (as amended) as diversified, open-end management investment companies, or series thereof. The Sit Balanced, Sit Dividend Growth, Sit Global Dividend Growth, SitESG Growth, Sit Small Cap Dividend Growth, Sit Small Cap Growth, Sit International Growth, and Sit Developing Markets Growthare series funds of Sit Mutual Funds, Inc.
This report covers the equity funds of the Sit Mutual Funds (the Funds). Each fund has 10 billion authorized shares of capital stockwith a par value of $0.001. The investment objective for each Fund is as follows:
Fund Investment Objective
Balanced Long-term growth consistent with the preservation of principal and to provideregular income.
Dividend Growth Provide current income that exceeds the dividend yield of the S&P 500® Indexand that grows over a period of years. Secondarily, maximize long-term capitalappreciation.
Global Dividend Growth Provide current income that exceeds the dividend yield of the MSCI World Indexthat grows over a period of years. Secondarily, maximize long-term capitalappreciation.
Large Cap Growth Maximize long-term capital appreciation.ESG Growth Maximize long-term capital appreciation.Mid Cap Growth Maximize long-term capital appreciation.Small Cap Dividend Growth Provide current income that exceeds the yield of the Russell 2000® Index and
that grows over a period of years. Secondarily, maximize long-term capitalappreciation.
Small Cap Growth Maximize long-term capital appreciation.International Growth Maximize long-term growth.Developing Markets Growth Maximize long-term capital appreciation.
The Dividend Growth, Global Dividend Growth, ESG Growth and Small Cap Dividend Growth Funds offer Class I and Class S shares.Both classes of shares have identical voting, dividend, and liquidation rights. The distribution fee differs among classes, the Class S shareshave a 0.25% distribution fee, whereas Class I has no distribution fee. Income, expenses (other than class specific expenses) and realizedand unrealized gains or losses on investments are allocated to each class of shares based upon its relative net assets.
(2) Significant Accounting Policies
The Funds are investment companies and follow accounting and reporting guidance under Financial Accounting Standards Board(“FASB”) Accounting Standards Codification (“ASC”) Topic 946, “Financial Services-Investment Companies”. The following is asummary of significant accounting policies consistently followed by the Funds in the preparation of their financial statements in con-formity with U.S. generally accepted accounting principles (“GAAP”).
Investments in SecuritiesInvestments in securities traded on national or international securities exchanges are valued at the last reported sales price prior to thetime when assets are valued. Equity securities traded on the over-the-counter market are valued at the last reported sales price or if thelast sales price is not available, at the last reported bid price. The sale and bid prices or prices deemed best to reflect fair value quotedby dealers who make markets in these securities are obtained from independent pricing services. Consistent with the Funds’ valuationpolicies and procedures, debt securities maturing in more than 60 days are priced by an independent pricing service. The pricing ser-vice may use models that price securities based on current yields and relative security characteristics, such as coupon rate, maturitydate, issuer credit quality, and prepayment speeds as applicable. When market quotations are not readily available, or when the Adviserbecomes aware that a significant event impacting the value of a security or group of securities has occurred after the closing of theexchange on which the security or securities principally trade, but before the calculation of the daily net asset value, securities are val-ued at fair value as determined in good faith using procedures established by the Board of Directors. The procedures consider, among
NOTES TO FINANCIAL STATEMENTSYear Ended June 30, 2021
72 SIT MUTUAL FUNDS ANNUAL REPORT
others, the following factors to determine a security’s fair value: the nature and pricing history (if any) of the security; whether anydealer quotations for the security are available; and possible valuation methodologies that could be used to determine the fair value ofthe security. Debt securities of sufficient credit quality maturing in less than 60 days when acquired, or which subsequently are within60 days of maturity, are valued at amortized cost, which approximates fair value.
Security transactions are accounted for on the date the securities are purchased or sold. Securities gains and losses are calculated onthe identified-cost basis. Dividend income is recorded on the ex-dividend date or upon the receipt of ex-dividend notification in thecase of certain foreign securities. Interest income is recorded on an accrual basis, including level-yield amortization of long-term bondpremium and discount using the effective yield method.
Fair Value MeasurementsThe inputs and valuation techniques used to measure fair value of the Funds’ investments are summarized into three levels as describedin the hierarchy below:
• Level 1 – quoted prices in active markets for identical securities. An active market for the security is a market in which transactionsoccur with sufficient frequency and volume to provide pricing information on an ongoing basis. A quoted price in an active marketprovides the most reliable evidence of fair value.• Level 2 – debt securities are valued based on evaluated prices received from independent pricing services or from dealers who makemarkets in such securities. For corporate bonds, U.S. government and government agency obligations, and municipal securities thepricing services utilize matrix pricing which considers yield or price of bonds of comparable quality, coupon, maturity, and type aswell as dealer supplied prices. For asset-backed securities and mortgage-backed securities, the pricing services utilize matrix pricingwhich considers prepayment speed assumptions, attributes of the collateral, yield or price of bonds of comparable quality, coupon,maturity, and type as well as dealer supplied prices. For foreign equities, the pricing services adjust closing prices by applying a sys-tematic process for events occurring after the close of the foreign exchange by utilizing such inputs as Depositary Receipts, quotedprices for similar securities, exchange rates, and certain indexes. All of these inputs are derived principally from or corroborated byobservable market data. An adjustment to any observable input that is significant to the fair value may render the measurement a Level3 measurement.• Level 3 – significant unobservable inputs, including the Adviser’s own assumptions in determining the fair value of investments.
The inputs or methodology used for valuing securities are not necessarily an indication of the risk associated with investing in thosesecurities.
A summary of the levels for the Funds’ investments as of June 30, 2021 is included with the Funds’ schedule of investments.
Foreign Currency Translations and Forward Foreign Currency ContractsThe fair value of securities and other assets and liabilities denominated in foreign currencies for Global Dividend Growth, ESGGrowth, International Growth and Developing Markets Growth Funds are translated daily into U.S. dollars at the closing rate ofexchange (approximately 4:00 p.m. Eastern Time). Purchases and sales of securities, income and expenses are translated at the exchangerate on the transaction date. Dividend and interest income includes currency exchange gains (losses) realized between the accrual andpayment dates on such income. Exchange gains (losses) may also be realized between the trade and settlement dates on security andforward contract transactions. For securities denominated in foreign currencies, the effect of changes in foreign exchange rates onrealized and unrealized gains or losses is reflected as a component of such gains or losses.
The Global Dividend Growth, ESG Growth, International Growth and Developing Markets Growth Funds may enter into forward for-eign currency exchange contracts generally for operational purposes, but the Adviser may occasionally utilize contracts to protectagainst adverse exchange rate fluctuation. Any gains (losses) generated by these contracts are disclosed separately on the statement ofoperations. The net U.S. dollar value of foreign currency underlying all contractual commitments held by the Funds and the resultingunrealized appreciation or depreciation is determined using foreign currency exchange rates from an independent pricing service. TheFunds are subject to the credit risk that the other party will not complete the obligations of the contract.
73JUNE 30, 2021
Federal TaxesThe Funds’ policy is to comply with the requirements of the Internal Revenue Code applicable to regulated investment companies andto distribute all of their taxable income to shareholders. Therefore, no income tax provision is required. In order to avoid the paymentof any federal excise taxes, the Funds will distribute substantially all of their net investment income and net realized gains on a cal-endar year basis. Also, the Funds may utilize equalization accounting for tax purposes, whereby a portion of redemption payments aretreated as distributions of income or gain for income tax purposes.
Management has analyzed the Funds’ tax positions taken in federal tax returns for all open tax years and has concluded that as of June30, 2021, no provision for income tax would be required in the Funds’ financial statements. The Funds’ federal and state income andfederal excise tax returns remain subject to examination by the Internal Revenue Service and state departments of revenue until suchtime as the applicable statute of limitations for audit has expired. For example, U.S. tax returns are generally subject to audit for threeyears from the date they are filed.
At June 30, 2021, the gross unrealized appreciation (depreciation) on investments and cost of securities on a tax basis for federalincome tax purposes were as follows:
UnrealizedAppreciation
UnrealizedDepreciation
Net UnrealizedAppreciation
(Depreciation)
Cost ofSecurities on a
Tax Basis
Balanced $21,100,142 ($110,197) $20,989,945 $45,064,498Dividend Growth 75,805,865 (1,620,498) 74,185,367 164,241,822Global Dividend Growth 20,487,313 (206,463) 20,280,850 25,218,198Large Cap Growth 114,588,195 (123,771) 114,464,424 62,719,093ESG Growth 3,778,125 (33,242) 3,744,883 5,368,715Mid Cap Growth 123,772,837 (1,819,940) 121,952,897 107,226,705Small Cap Dividend Growth 7,655,072 (157,410) 7,497,662 14,790,586Small Cap Growth 72,876,835 (1,083,652) 71,793,183 74,631,987International Growth 12,861,728 (271,086) 12,590,642 18,696,618Developing Markets Growth 6,023,390 (458,318) 5,565,072 8,304,068
Net investment income and net realized gains differ for financial statement and tax purposes because of corporate actions on shares heldand/or losses deferred due to “wash sale” transactions. A “wash sale” occurs when a Fund sells a security that it has acquired within aperiod beginning thirty days before and ending thirty days after the date of sale (a sixty one day period). The character of distributionsmade during the year from net investment income or net realized gains may also differ from its ultimate characterization for tax purposes.Also, due to the timing of dividend distributions, the fiscal year in which amounts are distributed may differ from the year that the incomeor realized gains (losses) were recorded by the Funds. The tax character of distributions paid during the fiscal years ended June 30,2021 and 2020 were as follows:
NOTES TO FINANCIAL STATEMENTSYear Ended June 30, 2021 (Continued)
74 SIT MUTUAL FUNDS ANNUAL REPORT
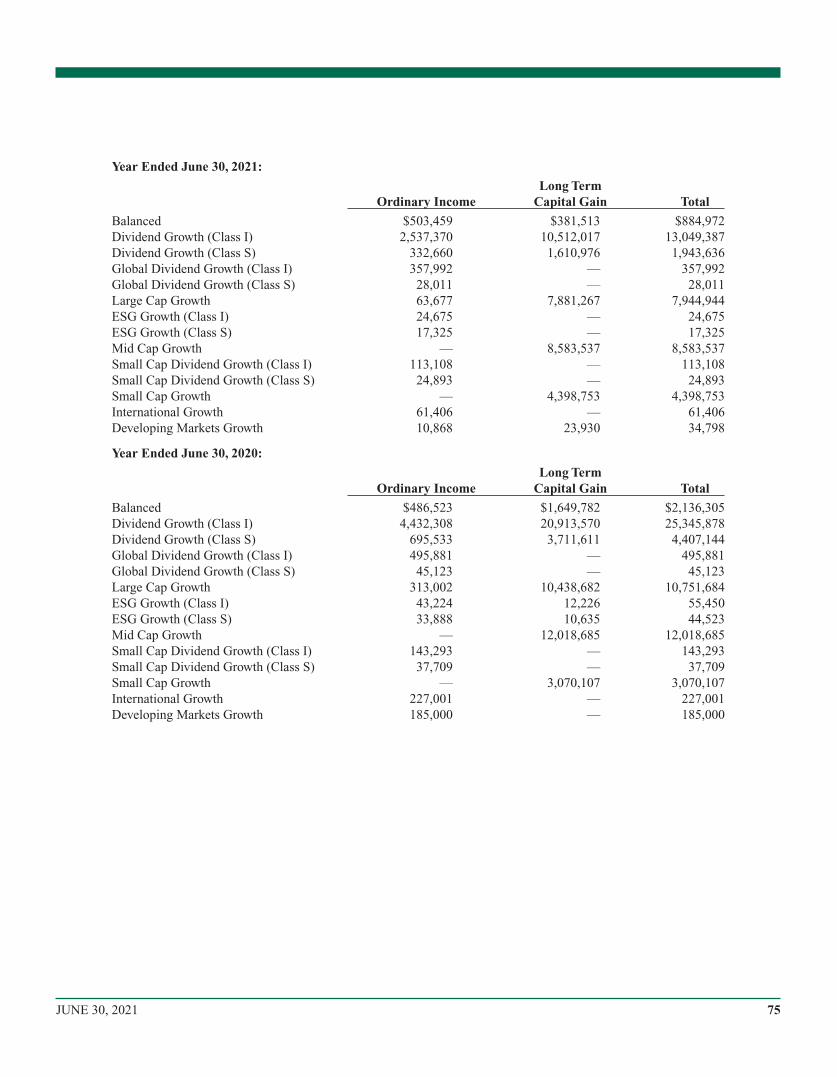
Year Ended June 30, 2021:
Ordinary IncomeLong Term
Capital Gain Total
Balanced $503,459 $381,513 $884,972Dividend Growth (Class I) 2,537,370 10,512,017 13,049,387Dividend Growth (Class S) 332,660 1,610,976 1,943,636Global Dividend Growth (Class I) 357,992 — 357,992Global Dividend Growth (Class S) 28,011 — 28,011Large Cap Growth 63,677 7,881,267 7,944,944ESG Growth (Class I) 24,675 — 24,675ESG Growth (Class S) 17,325 — 17,325Mid Cap Growth — 8,583,537 8,583,537Small Cap Dividend Growth (Class I) 113,108 — 113,108Small Cap Dividend Growth (Class S) 24,893 — 24,893Small Cap Growth — 4,398,753 4,398,753International Growth 61,406 — 61,406Developing Markets Growth 10,868 23,930 34,798
Year Ended June 30, 2020:
Ordinary IncomeLong Term
Capital Gain Total
Balanced $486,523 $1,649,782 $2,136,305Dividend Growth (Class I) 4,432,308 20,913,570 25,345,878Dividend Growth (Class S) 695,533 3,711,611 4,407,144Global Dividend Growth (Class I) 495,881 — 495,881Global Dividend Growth (Class S) 45,123 — 45,123Large Cap Growth 313,002 10,438,682 10,751,684ESG Growth (Class I) 43,224 12,226 55,450ESG Growth (Class S) 33,888 10,635 44,523Mid Cap Growth — 12,018,685 12,018,685Small Cap Dividend Growth (Class I) 143,293 — 143,293Small Cap Dividend Growth (Class S) 37,709 — 37,709Small Cap Growth — 3,070,107 3,070,107International Growth 227,001 — 227,001Developing Markets Growth 185,000 — 185,000
75JUNE 30, 2021
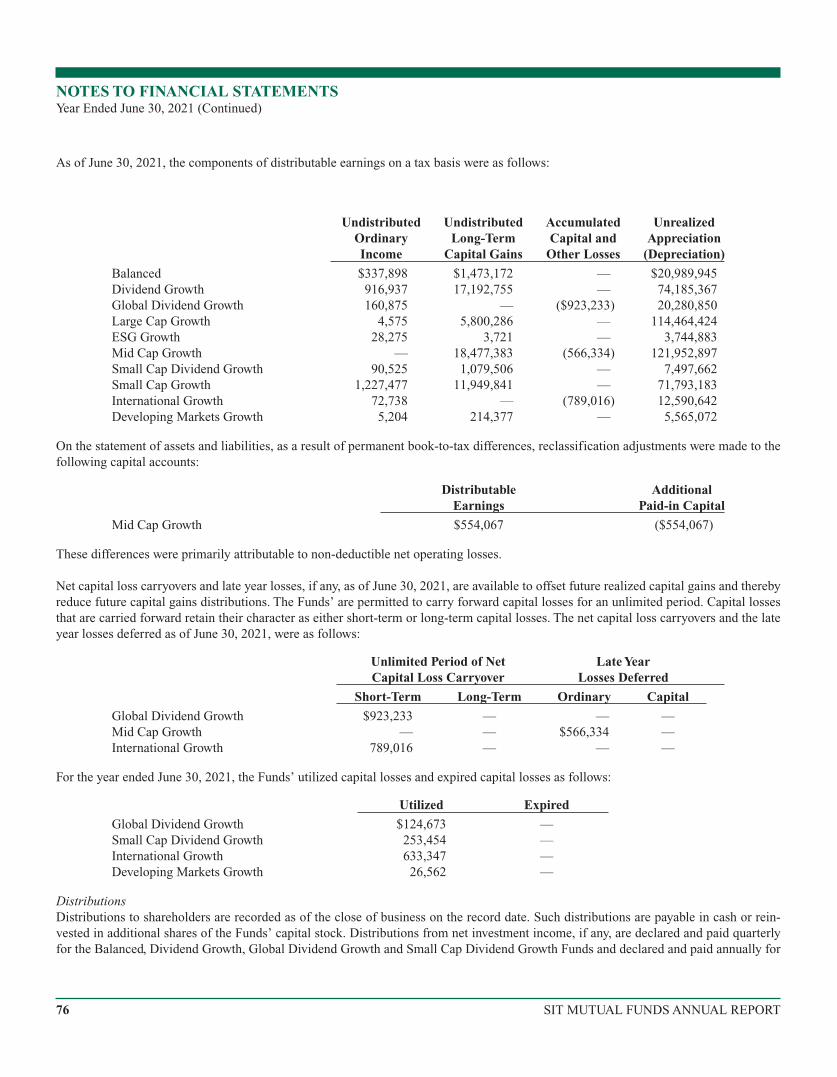
As of June 30, 2021, the components of distributable earnings on a tax basis were as follows:
UndistributedOrdinaryIncome
UndistributedLong-Term
Capital Gains
AccumulatedCapital and
Other Losses
UnrealizedAppreciation
(Depreciation)
Balanced $337,898 $1,473,172 — $20,989,945Dividend Growth 916,937 17,192,755 — 74,185,367Global Dividend Growth 160,875 — ($923,233) 20,280,850Large Cap Growth 4,575 5,800,286 — 114,464,424ESG Growth 28,275 3,721 — 3,744,883Mid Cap Growth — 18,477,383 (566,334) 121,952,897Small Cap Dividend Growth 90,525 1,079,506 — 7,497,662Small Cap Growth 1,227,477 11,949,841 — 71,793,183International Growth 72,738 — (789,016) 12,590,642Developing Markets Growth 5,204 214,377 — 5,565,072
On the statement of assets and liabilities, as a result of permanent book-to-tax differences, reclassification adjustments were made to thefollowing capital accounts:
DistributableEarnings
AdditionalPaid-in Capital
Mid Cap Growth $554,067 ($554,067)
These differences were primarily attributable to non-deductible net operating losses.
Net capital loss carryovers and late year losses, if any, as of June 30, 2021, are available to offset future realized capital gains and therebyreduce future capital gains distributions. The Funds’ are permitted to carry forward capital losses for an unlimited period. Capital lossesthat are carried forward retain their character as either short-term or long-term capital losses. The net capital loss carryovers and the lateyear losses deferred as of June 30, 2021, were as follows:
Unlimited Period of NetCapital Loss Carryover
Late YearLosses Deferred
Short-Term Long-Term Ordinary Capital
Global Dividend Growth $923,233 — — —Mid Cap Growth — — $566,334 —International Growth 789,016 — — —
For the year ended June 30, 2021, the Funds’ utilized capital losses and expired capital losses as follows:
Utilized Expired
Global Dividend Growth $124,673 —Small Cap Dividend Growth 253,454 —International Growth 633,347 —Developing Markets Growth 26,562 —
DistributionsDistributions to shareholders are recorded as of the close of business on the record date. Such distributions are payable in cash or rein-vested in additional shares of the Funds’ capital stock. Distributions from net investment income, if any, are declared and paid quarterlyfor the Balanced, Dividend Growth, Global Dividend Growth and Small Cap Dividend Growth Funds and declared and paid annually for
NOTES TO FINANCIAL STATEMENTSYear Ended June 30, 2021 (Continued)
76 SIT MUTUAL FUNDS ANNUAL REPORT
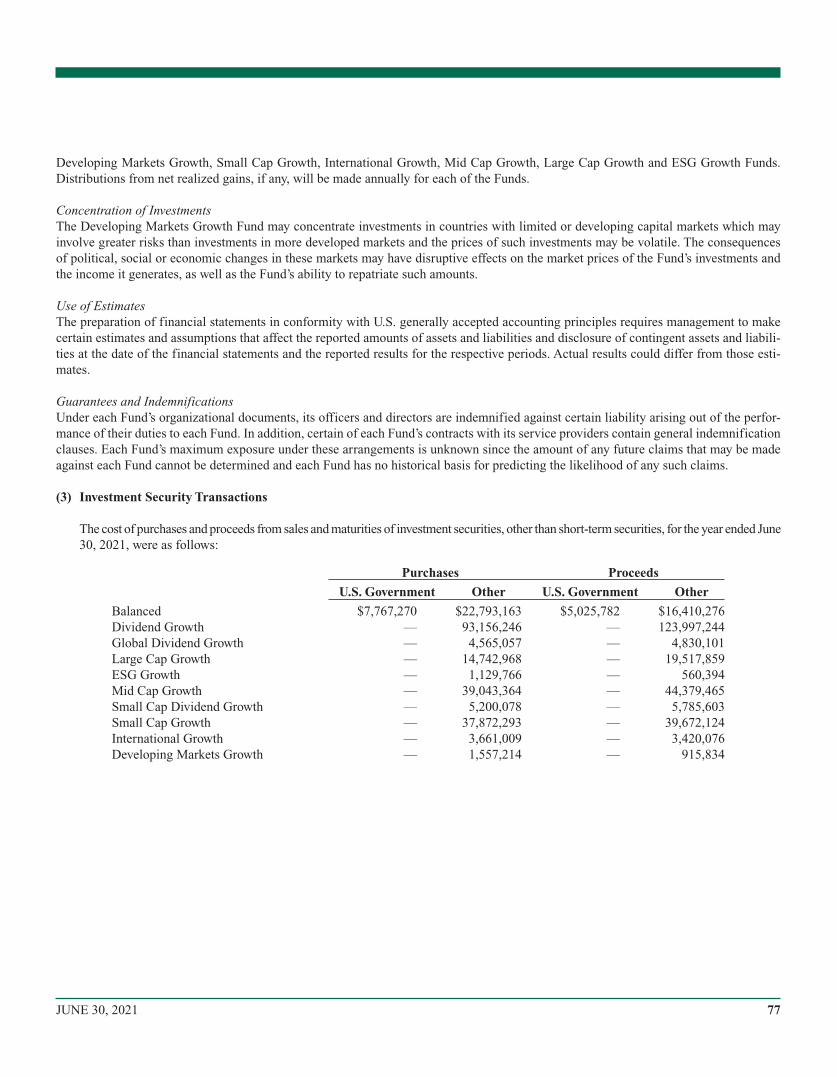
Developing Markets Growth, Small Cap Growth, International Growth, Mid Cap Growth, Large Cap Growth and ESG Growth Funds.Distributions from net realized gains, if any, will be made annually for each of the Funds.
Concentration of InvestmentsThe Developing Markets Growth Fund may concentrate investments in countries with limited or developing capital markets which mayinvolve greater risks than investments in more developed markets and the prices of such investments may be volatile. The consequencesof political, social or economic changes in these markets may have disruptive effects on the market prices of the Fund’s investments andthe income it generates, as well as the Fund’s ability to repatriate such amounts.
Use of EstimatesThe preparation of financial statements in conformity with U.S. generally accepted accounting principles requires management to makecertain estimates and assumptions that affect the reported amounts of assets and liabilities and disclosure of contingent assets and liabili-ties at the date of the financial statements and the reported results for the respective periods. Actual results could differ from those esti-mates.
Guarantees and IndemnificationsUnder each Fund’s organizational documents, its officers and directors are indemnified against certain liability arising out of the perfor-mance of their duties to each Fund. In addition, certain of each Fund’s contracts with its service providers contain general indemnificationclauses. Each Fund’s maximum exposure under these arrangements is unknown since the amount of any future claims that may be madeagainst each Fund cannot be determined and each Fund has no historical basis for predicting the likelihood of any such claims.
(3) Investment Security Transactions
The cost of purchases and proceeds from sales and maturities of investment securities, other than short-term securities, for the year ended June30, 2021, were as follows:
Purchases Proceeds
U.S. Government Other U.S. Government Other
Balanced $7,767,270 $22,793,163 $5,025,782 $16,410,276Dividend Growth — 93,156,246 — 123,997,244Global Dividend Growth — 4,565,057 — 4,830,101Large Cap Growth — 14,742,968 — 19,517,859ESG Growth — 1,129,766 — 560,394Mid Cap Growth — 39,043,364 — 44,379,465Small Cap Dividend Growth — 5,200,078 — 5,785,603Small Cap Growth — 37,872,293 — 39,672,124International Growth — 3,661,009 — 3,420,076Developing Markets Growth — 1,557,214 — 915,834
77JUNE 30, 2021
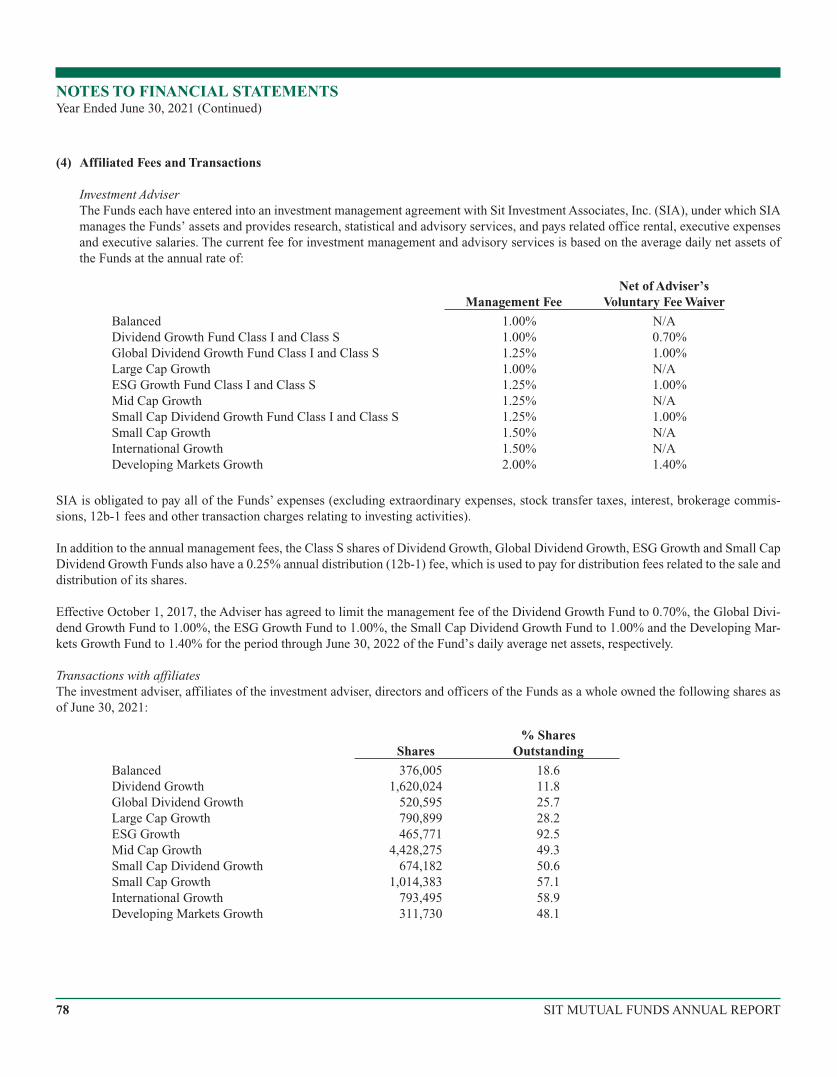
(4) Affiliated Fees and Transactions
Investment AdviserThe Funds each have entered into an investment management agreement with Sit Investment Associates, Inc. (SIA), under which SIAmanages the Funds’ assets and provides research, statistical and advisory services, and pays related office rental, executive expensesand executive salaries. The current fee for investment management and advisory services is based on the average daily net assets ofthe Funds at the annual rate of:
Management FeeNet of Adviser’s
Voluntary Fee Waiver
Balanced 1.00% N/ADividend Growth Fund Class I and Class S 1.00% 0.70%Global Dividend Growth Fund Class I and Class S 1.25% 1.00%Large Cap Growth 1.00% N/AESG Growth Fund Class I and Class S 1.25% 1.00%Mid Cap Growth 1.25% N/ASmall Cap Dividend Growth Fund Class I and Class S 1.25% 1.00%Small Cap Growth 1.50% N/AInternational Growth 1.50% N/ADeveloping Markets Growth 2.00% 1.40%
SIA is obligated to pay all of the Funds’ expenses (excluding extraordinary expenses, stock transfer taxes, interest, brokerage commis-sions, 12b-1 fees and other transaction charges relating to investing activities).
In addition to the annual management fees, the Class S shares of Dividend Growth, Global Dividend Growth, ESG Growth and Small CapDividend Growth Funds also have a 0.25% annual distribution (12b-1) fee, which is used to pay for distribution fees related to the sale anddistribution of its shares.
Effective October 1, 2017, the Adviser has agreed to limit the management fee of the Dividend Growth Fund to 0.70%, the Global Divi-dend Growth Fund to 1.00%, the ESG Growth Fund to 1.00%, the Small Cap Dividend Growth Fund to 1.00% and the Developing Mar-kets Growth Fund to 1.40% for the period through June 30, 2022 of the Fund’s daily average net assets, respectively.
Transactions with affiliatesThe investment adviser, affiliates of the investment adviser, directors and officers of the Funds as a whole owned the following shares asof June 30, 2021:
Shares% Shares
Outstanding
Balanced 376,005 18.6Dividend Growth 1,620,024 11.8Global Dividend Growth 520,595 25.7Large Cap Growth 790,899 28.2ESG Growth 465,771 92.5Mid Cap Growth 4,428,275 49.3Small Cap Dividend Growth 674,182 50.6Small Cap Growth 1,014,383 57.1International Growth 793,495 58.9Developing Markets Growth 311,730 48.1
NOTES TO FINANCIAL STATEMENTSYear Ended June 30, 2021 (Continued)
78 SIT MUTUAL FUNDS ANNUAL REPORT
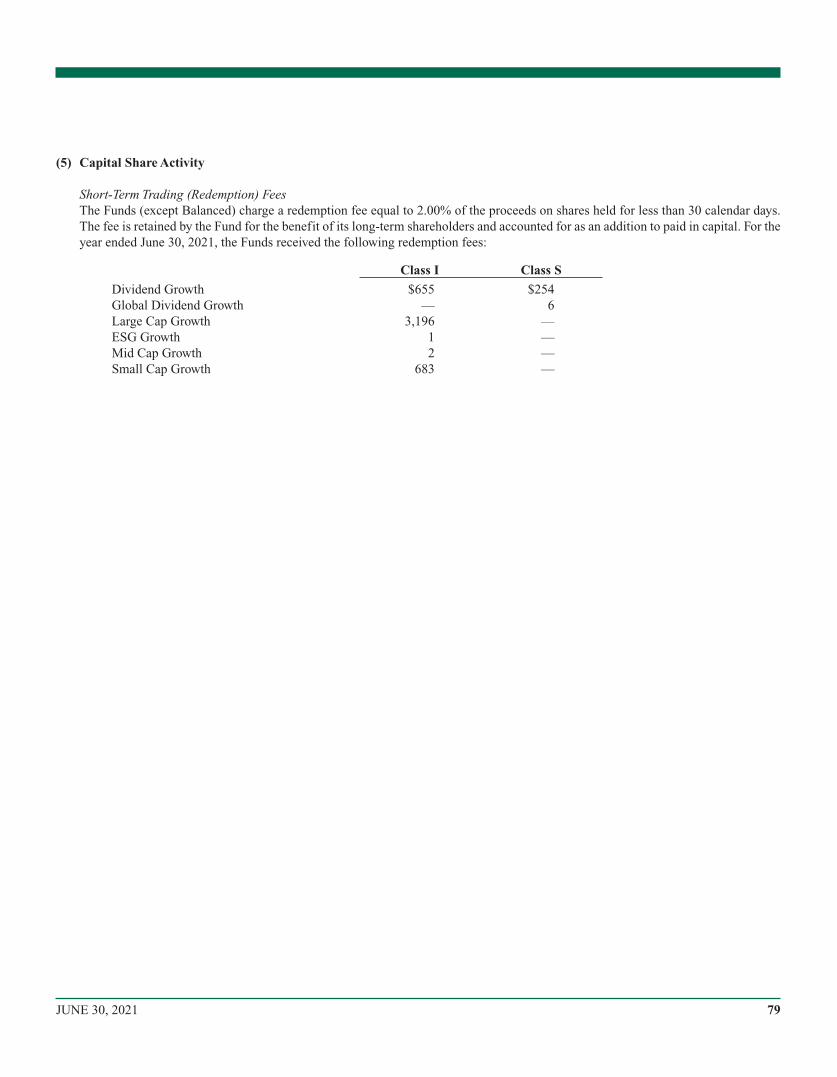
(5) Capital Share Activity
Short-Term Trading (Redemption) FeesThe Funds (except Balanced) charge a redemption fee equal to 2.00% of the proceeds on shares held for less than 30 calendar days.The fee is retained by the Fund for the benefit of its long-term shareholders and accounted for as an addition to paid in capital. For theyear ended June 30, 2021, the Funds received the following redemption fees:
Class I Class S
Dividend Growth $655 $254Global Dividend Growth — 6Large Cap Growth 3,196 —ESG Growth 1 —Mid Cap Growth 2 —Small Cap Growth 683 —
79JUNE 30, 2021
To the Shareholders and Board of DirectorsSit Mutual Funds, Inc.Sit Large Cap Growth FundSit Mid Cap Growth Fund:
Opinion on the Financial Statements
We have audited the accompanying statements of assets and liabilities of the Sit Balanced Fund, Sit Dividend Growth Fund, Sit GlobalDividend Growth Fund, Sit ESG Growth Fund, Sit Small Cap Dividend Growth Fund, Sit Small Cap Growth Fund, Sit International GrowthFund, Sit Developing Markets Growth Fund (each a series of Sit Mutual Funds, Inc.), Sit Large Cap Growth Fund, and Sit Mid Cap GrowthFund (collectively, the Funds), including the schedules of investments, as of June 30, 2021, the related statements of operations for the yearthen ended, the statements of changes in net assets for each of the years in the two year period then ended, and the related notes (collec-tively, the financial statements) and the financial highlights for each of the years in the five year period then ended. In our opinion, thefinancial statements and financial highlights present fairly, in all material respects, the financial position of the Funds as of June 30, 2021,the results of their operations for the year then ended, the changes in their net assets for each of the years in the two year period then ended,and the financial highlights for each of the years in the five year period then ended, in conformity with U.S. generally accepted accountingprinciples.
Basis for Opinion
These financial statements and financial highlights are the responsibility of the Funds’ management. Our responsibility is to express anopinion on these financial statements and financial highlights based on our audits. We are a public accounting firm registered with thePublic Company Accounting Oversight Board (United States) (PCAOB) and are required to be independent with respect to the Companyin accordance with the U.S. federal securities laws and the applicable rules and regulations of the Securities and Exchange Commissionand the PCAOB.
We conducted our audits in accordance with the standards of the PCAOB. Those standards require that we plan and perform the audit toobtain reasonable assurance about whether the financial statements and financial highlights are free of material misstatement, whether dueto error or fraud. Our audits included performing procedures to assess the risks of material misstatement of the financial statements andfinancial highlights, whether due to error or fraud, and performing procedures that respond to those risks. Such procedures included exam-ining, on a test basis, evidence regarding the amounts and disclosures in the financial statements and financial highlights. Such proceduresalso included confirmation of securities owned as of June 30, 2021, by correspondence with custodians and brokers. Our audits alsoincluded evaluating the accounting principles used and significant estimates made by management, as well as evaluating the overall pre-sentation of the financial statements and financial highlights. We believe that our audits provide a reasonable basis for our opinion.
/s/KPMG LLP
We have served as the auditor of one or more Sit Mutual Funds investment companies since 1982.
Minneapolis, MinnesotaAugust 19, 2021
REPORT OF INDEPENDENT REGISTERED PUBLIC ACCOUNTING FIRM
80 SIT MUTUAL FUNDS ANNUAL REPORT
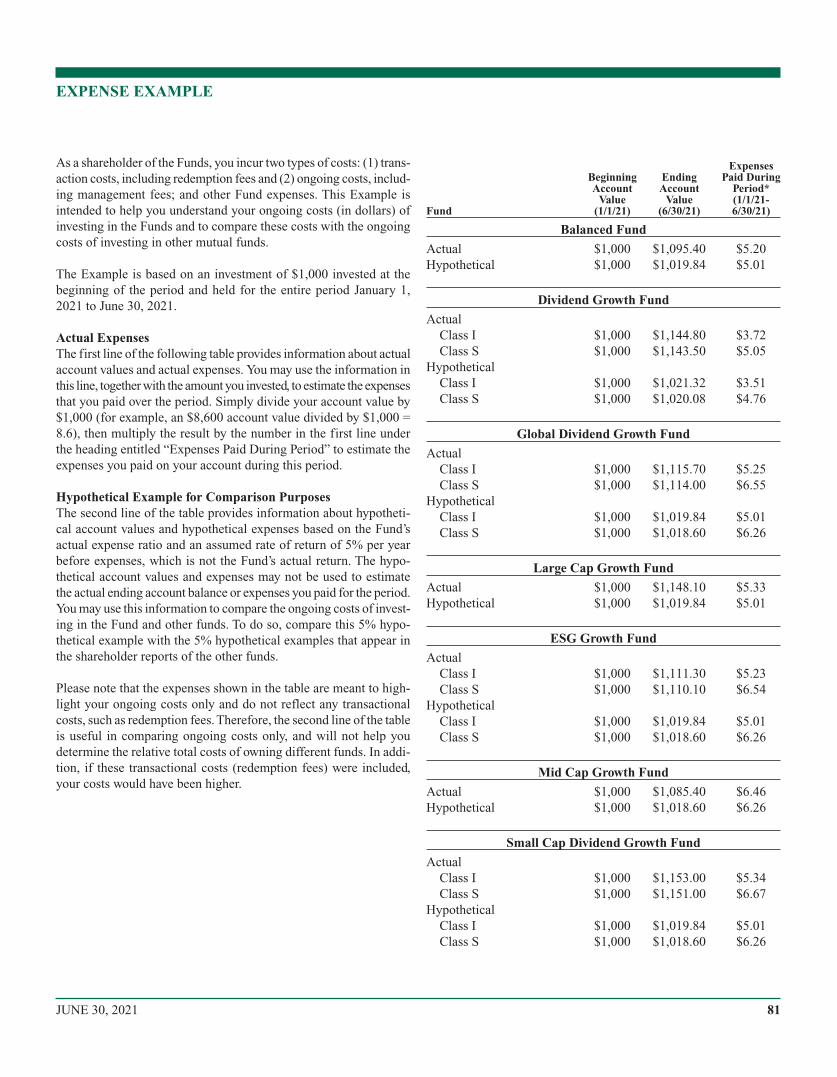
As a shareholder of the Funds, you incur two types of costs: (1) trans-action costs, including redemption fees and (2) ongoing costs, includ-ing management fees; and other Fund expenses. This Example isintended to help you understand your ongoing costs (in dollars) ofinvesting in the Funds and to compare these costs with the ongoingcosts of investing in other mutual funds.
The Example is based on an investment of $1,000 invested at thebeginning of the period and held for the entire period January 1,2021 to June 30, 2021.
Actual ExpensesThe first line of the following table provides information about actualaccount values and actual expenses. You may use the information inthis line, together with the amount you invested, to estimate the expensesthat you paid over the period. Simply divide your account value by$1,000 (for example, an $8,600 account value divided by $1,000 =8.6), then multiply the result by the number in the first line underthe heading entitled “Expenses Paid During Period” to estimate theexpenses you paid on your account during this period.
Hypothetical Example for Comparison PurposesThe second line of the table provides information about hypotheti-cal account values and hypothetical expenses based on the Fund’sactual expense ratio and an assumed rate of return of 5% per yearbefore expenses, which is not the Fund’s actual return. The hypo-thetical account values and expenses may not be used to estimatethe actual ending account balance or expenses you paid for the period.You may use this information to compare the ongoing costs of invest-ing in the Fund and other funds. To do so, compare this 5% hypo-thetical example with the 5% hypothetical examples that appear inthe shareholder reports of the other funds.
Please note that the expenses shown in the table are meant to high-light your ongoing costs only and do not reflect any transactionalcosts, such as redemption fees. Therefore, the second line of the tableis useful in comparing ongoing costs only, and will not help youdetermine the relative total costs of owning different funds. In addi-tion, if these transactional costs (redemption fees) were included,your costs would have been higher.
Fund
BeginningAccount
Value(1/1/21)
EndingAccount
Value(6/30/21)
ExpensesPaid During
Period*(1/1/21-6/30/21)
Balanced Fund
Actual $1,000 $1,095.40 $5.20Hypothetical $1,000 $1,019.84 $5.01
Dividend Growth Fund
ActualClass I $1,000 $1,144.80 $3.72Class S $1,000 $1,143.50 $5.05
HypotheticalClass I $1,000 $1,021.32 $3.51Class S $1,000 $1,020.08 $4.76
Global Dividend Growth Fund
ActualClass I $1,000 $1,115.70 $5.25Class S $1,000 $1,114.00 $6.55
HypotheticalClass I $1,000 $1,019.84 $5.01Class S $1,000 $1,018.60 $6.26
Large Cap Growth Fund
Actual $1,000 $1,148.10 $5.33Hypothetical $1,000 $1,019.84 $5.01
ESG Growth Fund
ActualClass I $1,000 $1,111.30 $5.23Class S $1,000 $1,110.10 $6.54
HypotheticalClass I $1,000 $1,019.84 $5.01Class S $1,000 $1,018.60 $6.26
Mid Cap Growth Fund
Actual $1,000 $1,085.40 $6.46Hypothetical $1,000 $1,018.60 $6.26
Small Cap Dividend Growth Fund
ActualClass I $1,000 $1,153.00 $5.34Class S $1,000 $1,151.00 $6.67
HypotheticalClass I $1,000 $1,019.84 $5.01Class S $1,000 $1,018.60 $6.26
EXPENSE EXAMPLE
81JUNE 30, 2021
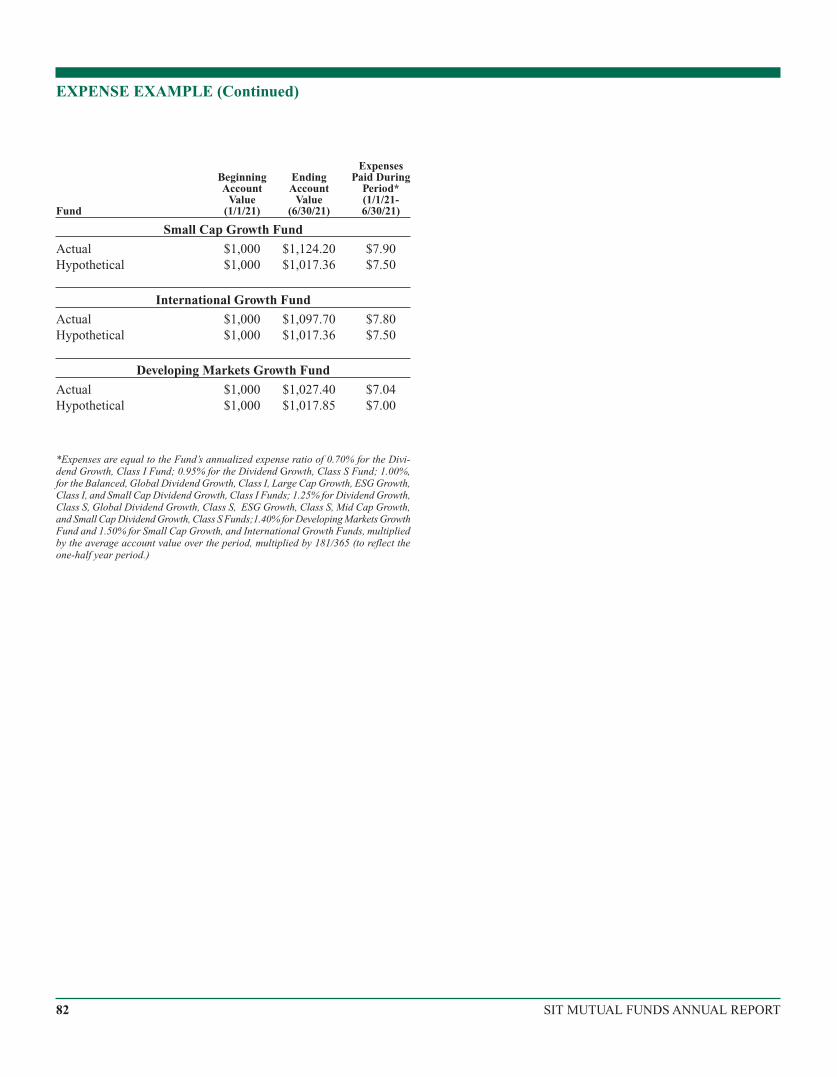
Fund
BeginningAccount
Value(1/1/21)
EndingAccount
Value(6/30/21)
ExpensesPaid During
Period*(1/1/21-6/30/21)
Small Cap Growth Fund
Actual $1,000 $1,124.20 $7.90Hypothetical $1,000 $1,017.36 $7.50
International Growth Fund
Actual $1,000 $1,097.70 $7.80Hypothetical $1,000 $1,017.36 $7.50
Developing Markets Growth Fund
Actual $1,000 $1,027.40 $7.04Hypothetical $1,000 $1,017.85 $7.00
*Expenses are equal to the Fund’s annualized expense ratio of 0.70% for the Divi-dend Growth, Class I Fund; 0.95% for the Dividend Growth, Class S Fund; 1.00%,for the Balanced, Global Dividend Growth, Class I, Large Cap Growth, ESG Growth,Class I, and Small Cap Dividend Growth, Class I Funds; 1.25% for Dividend Growth,Class S, Global Dividend Growth, Class S, ESG Growth, Class S, Mid Cap Growth,and Small Cap Dividend Growth, Class S Funds;1.40% for Developing Markets GrowthFund and 1.50% for Small Cap Growth, and International Growth Funds, multipliedby the average account value over the period, multiplied by 181/365 (to reflect theone-half year period.)
EXPENSE EXAMPLE (Continued)
82 SIT MUTUAL FUNDS ANNUAL REPORT
For corporate shareholders, the percentage of investment income (divi-dend income and short-term gains, if any), for each of the Fundsthat qualify for the Dividends Received Deductions for the periodof July 1, 2020 to June 30, 2021 is as follows:
Fund Percentage
Balanced Fund 55.7%Dividend Growth Fund 98.1Global Dividend Growth Fund 100.0Large Cap Growth Fund 100.0ESG Growth Fund 100.0Small Cap Dividend Growth Fund 100.0International Growth Fund 24.5Developing Markets Growth Fund 9.4
For the year ended June 30, 2021, certain dividends paid by the Fundsmay be subject to a maximum tax rate of 20%, as provided by theAmerican Taxpayer Relief Act of 2012. Of the distributions madeby the following Funds, the corresponding percentages represent theamount of each distribution which may qualify for the lower divi-dend income tax rates.
Fund Percentage
Balanced Fund 60.6%Dividend Growth Fund 100.0Global Dividend Growth Fund 100.0Large Cap Growth Fund 100.0ESG Growth Fund 100.0Small Cap Dividend Growth Fund 100.0International Growth Fund 100.0Developing Markets Growth Fund 79.9
The following Funds designated the listed amounts as long-term capi-tal gain dividends during the year ended June 30, 2021. Distribut-able long-term gains are based on net realized long term gains deter-mined on a tax basis and may differ from such amounts for financialreporting purposes.
Fund Amount
Balanced Fund $1,473,280Dividend Growth Fund 17,192,860Large Cap Growth Fund 9,450,752ESG Growth Fund 3,721Mid Cap Growth Fund 22,166,811Small Cap Dividend Growth Fund 1,079,506Small Cap Growth Fund 15,646,178Developing Markets Growth Fund 238,307
FEDERAL TAX INFORMATION (Unaudited)
Sit Equity Funds
83JUNE 30, 2021
The Sit Mutual Funds are a family of no-load mutual funds. The Stock Funds described in this Annual Report are the Sit Mid Cap GrowthFund, Sit Large Cap Growth Fund, Sit International Growth Fund, Sit Balanced Fund, Sit Developing Markets Growth Fund, Sit ESGGrowth Fund, Sit Small Cap Growth Fund, Sit Dividend Growth Fund, Sit Global Dividend Growth Fund, and Sit Small Cap DividendGrowth Fund (the “Funds” or individually, a “Fund”). The bond funds within the Sit Mutual Fund family are described in a separate BondFunds’ Annual Report. The Sit Mid Cap Growth Fund and Sit Large Cap Growth Fund, and the corporate issuer of the Sit InternationalGrowth Fund, Sit Balanced Fund, Sit Developing Markets Growth Fund, Sit ESG Growth Fund, Sit Small Cap Growth Fund, Sit DividendGrowth Fund, Sit Global Dividend Growth Fund and Sit Small Cap Dividend Growth Fund have a Board of Directors and officers. Pur-suant to Minnesota law, the Boards of Directors are responsible for the management of the Funds and the establishment of the Funds’ poli-cies. The officers of the Funds manage the day-to-day operation of the Funds. Information pertaining to the directors and officers of theFunds is set forth below. The business address is that of the Funds’ investment adviser – 3300 IDS Center, 80 South Eighth Street, Min-neapolis, Minnesota 55402. The Boards have a separate Audit Committee. The Stock Funds’ SAI has additional information about theFund’s directors and is available without charge upon request by calling the Sit Funds at 800-332-5580.
Name, Age, andPosition
with Funds
Term ofOffice (1)
and Length of TimeServed
Principal Occupations DuringPast Five Years
Number of FundsOverseen in
Fund ComplexOther DirectorshipsHeld by Director (3)
INTERESTED DIRECTORS:
Roger J. Sit (2)
Age: 59Chairman andPresident
Chairman since 10/08;Officer since 1998.
Chairman, President, CEO and GlobalCIO of Sit Investment Associates, Inc.(the “Adviser”); Chairman and CEO ofSit Fixed Income Advisors II, LLC (“SF”);Chairman of SIA Securities Corp. (the“Distributor”).
14 TCF FinancialCorporation.
INDEPENDENT DIRECTORS:
Edward M. GilesAge: 85Director
Director since 2012 or theFund’s inception, if later.
Senior Vice President of Peter B.Cannell & Co., July 2011 to present.
14 None.
Sidney L. JonesAge: 87Director
Director from 1988 to 1989and since 1993 or theFund’s inception, if later.
Lecturer, Washington CampusConsortium of 17 Universities.
14 None.
Bruce C. LueckAge: 80Director
Director since 2004 or theFund’s inception, if later.
Consultant for Zephyr Management, L.P.(investment management) andcommittee member of severalinvestment funds and foundations.
14 None.
Donald W. PhillipsAge: 73Director
Director of the InternationalFund since1993, and since1990 or the Fund’sinception, if later for allother Funds.
Chairman and CEO of WP GlobalPartners Inc., July 2005 to present;
14 None.
Barry N. WinslowAge: 73Director
Director since 2010 or theFund’s inception, if later.
Board member, TCF FinancialCorporation, July 2014 to July 2019.
14 TCF FinancialCorporation.
INFORMATION ABOUT DIRECTORS AND OFFICERS (Unaudited)
84 SIT MUTUAL FUNDS ANNUAL REPORT
Name, Age, andPosition
with Funds
Term ofOffice (1)
and Length of TimeServed
Principal Occupations DuringPast Five Years
Number of FundsOverseen in
Fund ComplexOther DirectorshipsHeld by Director (3)
OFFICERS:
Mark H. BookAge: 58Vice President –Investments ofBalanced Fund only
Officer since 2002;Re-Elected by the Boardsannually.
Vice President and Portfolio Manager ofSF.
N/A N/A
Kelly K. BostonAge: 52Assistant Secretary &Assistant Treasurer
Officer since 2000;Re-Elected by the Boardsannually.
Staff Attorney of the Adviser; Secretaryof the Distributor.
N/A N/A
Bryce A. DotyAge: 54Vice President -Investments ofBalanced Fund only.
Officer since 1996;Re-Elected by the Boardsannually.
Senior Vice President and SeniorPortfolio Manager of SF.
N/A N/A
Kent L. JohnsonAge: 55Vice President -Investments
Officer since 2003;Re-Elected by the Boardsannually.
Senior Vice President - Research andInvestment Management of the Adviser.
N/A N/A
Paul E. RasmussenAge: 60Vice President,Treasurer & ChiefCompliance Officer
Officer since 1994;Re-Elected by the Boardsannually.
Vice President, Secretary, Controller andChief Compliance Officer of the Adviser;Vice President, Secretary, and ChiefCompliance Officer of SF; President andTreasurer of the Distributor.
N/A N/A
Carla J. RoseAge: 55Vice President,Assistant Secretary &Assistant Treasurer
Officer since 2000;Re-Elected by the Boardsannually.
Vice President, Administration & DeputyController of the Adviser; Vice President,Controller, Treasurer & AssistantSecretary of SF; Vice President andAssistant Secretary of the Distributor.
N/A N/A
Robert W. SitAge: 52Vice President -Investments
Officer since 1997;Re-Elected by the Boardsannually.
Vice President - Research andInvestment Management of the Adviser.
N/A N/A
Ronald D. SitAge: 61Vice President -Investments
Officer since 1985;Re-Elected by the Boardsannually.
Vice President - Research andInvestment Management of the Adviser.
N/A N/A
1 Each Director serves until their resignation, removal or the next meeting of the shareholders at which election of directors is an agenda item and his successor is dulyelected and shall qualify.
2 Directors who are deemed to be “interested person” of the Funds as that term is defined by the Investment Company Act of 1940. Mr. Sit is considered an “interested per-son” because he is a an officer of Sit Investment Associates, Inc., the Fund’s investment adviser.
3 Includes only directorships of companies required to report under the Securities Exchange Act of 1934 (i.e., public companies) or other investment companies registeredunder the 1940 Act.
85JUNE 30, 2021
PROXY VOTING
A description of the policies and procedures that Sit Investment uses to vote proxies related to the Funds’ portfolio securities is set forthin the Funds’ Statement of Additional Information, which is available on the Funds’ website at www.sitfunds.com, without charge by call-ing 800-332-5580 and on the Securities and Exchange Commission’s (SEC) website at www.sec.gov. The Funds’ proxy voting record isavailable without charge by calling 800-332-5580 and on the SEC’s website at www.sec.gov no later than August 31 for the prior 12 monthsending June.
QUARTERLY SCHEDULE OF INVESTMENTS SCHEDULES
Each Fund files a complete schedule of investments with the SEC for the first and third quarters of each fiscal year on Form N-PORT. TheFunds’ Form N-PORT is available on the SEC’s website at www.sec.gov. Each Fund’s complete schedule of investments, as filed on FormN-PORT, is also available on its website at www.sitfunds.com, or without charge by calling 800-332-5580.
STATEMENT REGARDING LIQUIDITY RISK MANAGEMENT PROGRAM
The Securities and Exchange Commission adopted Rule 22e-4 under the Investment Company Act of 1940, as amended (the “LiquidityRule”) to promote effective liquidity risk management throughout the open-end investment company industry, thereby reducing the riskthat funds will be unable to meet their redemption obligations and mitigating dilution of the interests of fund shareholders.
At their joint meeting held on October 19, 2020, the Boards of Directors (the “Boards”) of the Sit Mutual Funds (the “Funds”) reviewedthe Funds’ liquidity risk management program (the “Program”) pursuant to the Liquidity Rule. Sit Investment Associates, Inc. (“SIA”),the investment adviser to the Funds, serves as the Program Administrator and provided the Boards with a report that addressed the opera-tion of the Program and assessed its adequacy and effectiveness of implementation and any material changes to the Program as of Sep-tember 30, 2020 (the “Report”).
The Report described its liquidity classification methodology and the determination that a Highly Liquid Investment Minimum is not cur-rently necessary for any Fund. The Report also noted that the Program complied with the key factors for consideration under the LiquidityRule for assessing, managing, and periodically reviewing liquidity risk, as follows:
A. Each Fund’s investment strategy and liquidity of investments during both normal and reasonably foreseeable stressed condi-tions: SIA reviewed each Fund’s strategy and the determinations that each strategy remains appropriate for an open-end fund. This deter-mination was based on each Fund’s holding’s liquidity, diversification, and average position size.
B. Short-term and long-term cash flow projections during both normal and reasonably foreseeable stressed conditions: The Reportindicated that it considered historical net redemption activity and shareholder ownership concentration and distribution channels to deter-mine each Fund’s Reasonably Anticipated Trading Size. It was also noted that each Fund has adopted an in-kind redemption policy whichmay be utilized to meet large redemption requests.
C. Holdings of cash and cash equivalents, as well as borrowing arrangements: The report reviewed each Fund’s holdings of cash andcash equivalents, available borrowing arrangements if any, and other funding sources.
There were no material changes to the Program during the past year. The Report stated that SIA concluded that the Program is operatingas intended and is effective in implementing the requirements of the Liquidity Rule.
ADDITIONAL INFORMATION (Unaudited)
86 SIT MUTUAL FUNDS ANNUAL REPORT

[This page intentionally left blank.]
87JUNE 30, 2021

[This page intentionally left blank.]
88

INVESTMENT ADVISER
Sit Investment Associates, Inc.
80 S. Eighth Street
Suite 3300
Minneapolis, MN 55402
CUSTODIAN
The Bank Of New York Mellon
111 Sanders Creek Parkway
Syracuse, NY 13057
TRANSFER AGENT AND
DISBURSING AGENT
BNY Mellon Investment Servicing (US) Inc.
4400 Computer Drive
Westborough, MA 01581
INDEPENDENT REGISTERED PUBLIC
ACCOUNTING FIRM
KPMG LLP
Minneapolis, MN
GENERAL COUNSEL
Faegre Drinker Biddle & Reath LLP
Minneapolis, MN
1-800-332-5580www.sitfunds.com
Sit Stock 6-21
Annual ReportJune 30, 2021
Sit Mutual Funds