annual report on form 20-f - 2013 - relx group
TRANSCRIPT

Annual Reporton Form 20-F 2013

As filed with the Securities and Exchange Commission on March 11, 2014
UNITED STATES SECURITIES AND EXCHANGE COMMISSIONWashington, D.C. 20549
FORM 20-F(Mark One)‘ REGISTRATION STATEMENT PURSUANT TO SECTION 12(b) or 12(g) OF THE SECURITIES EXCHANGE ACT OF 1934
OrÍ ANNUAL REPORT PURSUANT TO SECTION 13 or 15(d) OF THE SECURITIES EXCHANGE ACT OF 1934
For the fiscal year ended December 31, 2013Or
‘ TRANSITION REPORT PURSUANT TO SECTION 13 or 15(d) OF THE SECURITIES EXCHANGE ACT OF 1934For the transition period from to
Or‘ SHELL COMPANY REPORT PURSUANT TO SECTION 13 OR 15(d) OF THE SECURITIES EXCHANGE ACT OF 1934
Commission file number: 1-3334 Commission file number: 1-13688REED ELSEVIER PLC REED ELSEVIER NV
(Exact name of Registrant as specified in its charter) (Exact name of Registrant as specified in its charter)England The Netherlands
(Jurisdiction of incorporation or organisation) (Jurisdiction of incorporation or organisation)1-3 Strand, London, WC2N 5JR, England Radarweg 29, 1043 NX, Amsterdam, The Netherlands
(Address of principal executive offices) (Address of principal executive offices)Henry Udow Jans van der Woude
Company Secretary Company SecretaryReed Elsevier PLC Reed Elsevier NV
1-3 Strand, London, WC2N 5JR, England Radarweg 29, 1043 NX, Amsterdam, The Netherlands011 44 20 7166 5500 011 31 20 485 2222
[email protected] [email protected](Name, telephone, e-mail and/or facsimile number and address of
Company Contact Person)(Name, telephone, e-mail and/or facsimile number and address of
Company Contact Person)Securities registered or to be registered pursuant to Section 12(b) of the Act:
Title of each className of exchange on which
registered
Reed Elsevier PLC:American Depositary Shares
(each representing four Reed Elsevier PLC ordinary shares) New York Stock ExchangeOrdinary shares of 14 51/116p each
(the “Reed Elsevier PLC ordinary shares”) New York Stock Exchange*Reed Elsevier NV:
American Depositary Shares(each representing two Reed Elsevier NV ordinary shares) New York Stock Exchange
Ordinary shares of €0.07 each(the “Reed Elsevier NV ordinary shares”) New York Stock Exchange*
* Listed, not for trading, but only in connection with the listing of the applicable Registrant’s American Depositary Shares issued in respect thereof.Securities registered or to be registered pursuant to Section 12(g) of the Act: None
Securities for which there is a reporting obligation pursuant to Section 15(d) of the Act: None
Indicate the number of outstanding shares of each of the issuers’ classes of capital or common stock as of December 31, 2013:
Reed Elsevier PLC: Number of outstanding shares
Ordinary shares of 14 51/116p each . . . . . . . . . . . . . . . . . . . . . . . . . . . . . . . . . . . . . . . . . . . . . . . . . . . . . . . . . . . . . . . . . . . . . . . . . . . . . . . . . . . 1,267,036,696
Reed Elsevier NV:Ordinary shares of €0.07 each . . . . . . . . . . . . . . . . . . . . . . . . . . . . . . . . . . . . . . . . . . . . . . . . . . . . . . . . . . . . . . . . . . . . . . . . . . . . . . . . . . . . . . . . 734,149,956
R shares of €0.70 each (held by a subsidiary of Reed Elsevier PLC) . . . . . . . . . . . . . . . . . . . . . . . . . . . . . . . . . . . . . . . . . . . . . . . . . . . . . . . . . . 4,303,179
Indicate by check mark if the registrants are well-known seasoned issuers, as defined in Rule 405 of the Securities Act.Yes Í No ‘
If this report is an annual or transition report, indicate by check mark if the registrants are not required to file reports pursuant to Section 13 or 15(d) of the SecuritiesExchange Act of 1934.
Yes ‘ No Í
Indicate by check mark whether the registrants (1) have filed all reports required to be filed by Section 13 or 15(d) of the Securities Exchange Act of 1934 during thepreceding 12 months (or for such shorter period that the registrant was required to file such reports), and (2) have been subject to such filing requirements for the past90 days.
Yes Í No ‘
Indicate by check mark whether the registrant has submitted electronically and posted on its corporate Web site, if any, every Interactive Data File required to besubmitted and posted pursuant to Rule 405 of Regulation S-T during the preceding 12 months (or for such shorter period that the registrant was required to submit andpost such files).
Yes ‘ No ‘
Indicate by check mark whether the registrants are large accelerated filers, accelerated filers, or non-accelerated filers. See definition of “accelerated filer and largeaccelerated filer” in Rule 12b-2 of the Exchange Act.
Large accelerated filer Í Accelerated filer ‘ Non-accelerated filer ‘
Indicate by check mark which basis of accounting the registrants have used to prepare the financial statements included in this filing.‘ US GAAP Í International Financial Reporting Standards as issued by the International Accounting Standards Board ‘ Other
If “Other” has been checked in response to the previous question indicate by check mark which financial statement item the registrants have elected to follow:Item 17 ‘ Item 18 ‘
If this is an annual report, indicate by check mark whether the registrants are shell companies (as defined in Rule 12b-2 of the Exchange Act).Yes ‘ No Í
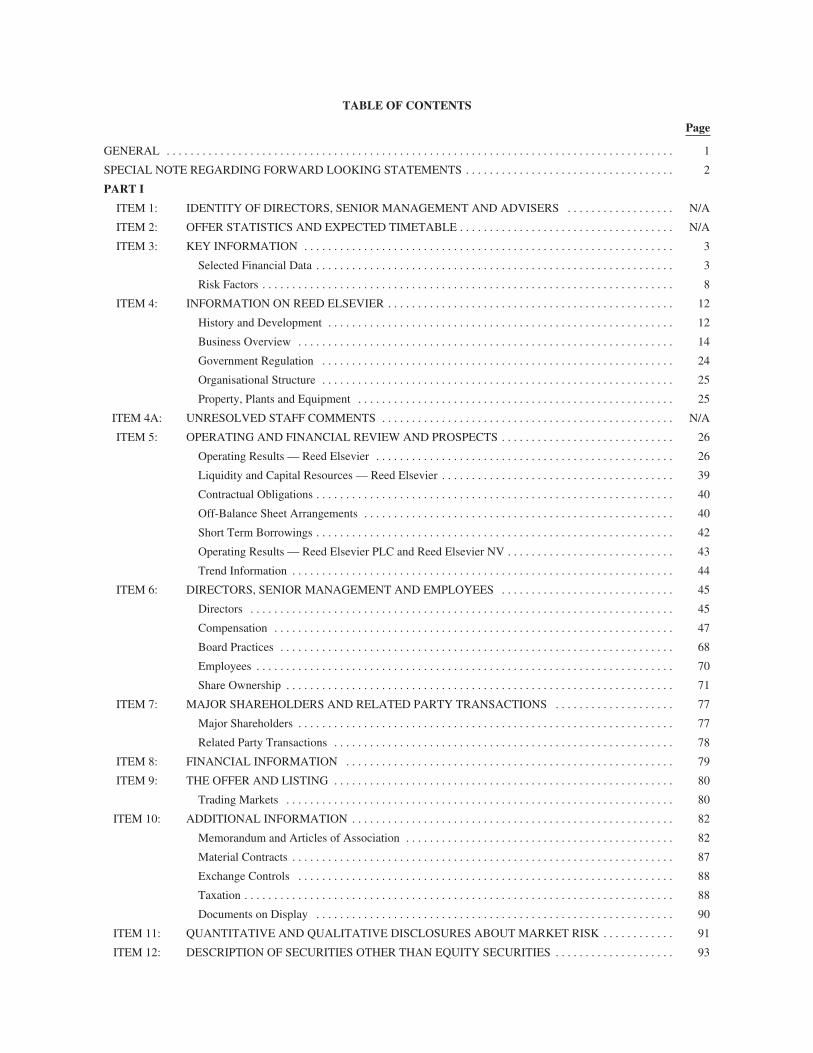
TABLE OF CONTENTS
Page
GENERAL . . . . . . . . . . . . . . . . . . . . . . . . . . . . . . . . . . . . . . . . . . . . . . . . . . . . . . . . . . . . . . . . . . . . . . . . . . . . . . . . . . . . . 1
SPECIAL NOTE REGARDING FORWARD LOOKING STATEMENTS . . . . . . . . . . . . . . . . . . . . . . . . . . . . . . . . . . . 2
PART I
ITEM 1: IDENTITY OF DIRECTORS, SENIOR MANAGEMENT AND ADVISERS . . . . . . . . . . . . . . . . . . N/A
ITEM 2: OFFER STATISTICS AND EXPECTED TIMETABLE . . . . . . . . . . . . . . . . . . . . . . . . . . . . . . . . . . . . N/A
ITEM 3: KEY INFORMATION . . . . . . . . . . . . . . . . . . . . . . . . . . . . . . . . . . . . . . . . . . . . . . . . . . . . . . . . . . . . . . 3
Selected Financial Data . . . . . . . . . . . . . . . . . . . . . . . . . . . . . . . . . . . . . . . . . . . . . . . . . . . . . . . . . . . . 3
Risk Factors . . . . . . . . . . . . . . . . . . . . . . . . . . . . . . . . . . . . . . . . . . . . . . . . . . . . . . . . . . . . . . . . . . . . . 8
ITEM 4: INFORMATION ON REED ELSEVIER . . . . . . . . . . . . . . . . . . . . . . . . . . . . . . . . . . . . . . . . . . . . . . . . 12
History and Development . . . . . . . . . . . . . . . . . . . . . . . . . . . . . . . . . . . . . . . . . . . . . . . . . . . . . . . . . . 12
Business Overview . . . . . . . . . . . . . . . . . . . . . . . . . . . . . . . . . . . . . . . . . . . . . . . . . . . . . . . . . . . . . . . 14
Government Regulation . . . . . . . . . . . . . . . . . . . . . . . . . . . . . . . . . . . . . . . . . . . . . . . . . . . . . . . . . . . 24
Organisational Structure . . . . . . . . . . . . . . . . . . . . . . . . . . . . . . . . . . . . . . . . . . . . . . . . . . . . . . . . . . . 25
Property, Plants and Equipment . . . . . . . . . . . . . . . . . . . . . . . . . . . . . . . . . . . . . . . . . . . . . . . . . . . . . 25
ITEM 4A: UNRESOLVED STAFF COMMENTS . . . . . . . . . . . . . . . . . . . . . . . . . . . . . . . . . . . . . . . . . . . . . . . . . N/A
ITEM 5: OPERATING AND FINANCIAL REVIEW AND PROSPECTS . . . . . . . . . . . . . . . . . . . . . . . . . . . . . 26
Operating Results — Reed Elsevier . . . . . . . . . . . . . . . . . . . . . . . . . . . . . . . . . . . . . . . . . . . . . . . . . . 26
Liquidity and Capital Resources — Reed Elsevier . . . . . . . . . . . . . . . . . . . . . . . . . . . . . . . . . . . . . . . 39
Contractual Obligations . . . . . . . . . . . . . . . . . . . . . . . . . . . . . . . . . . . . . . . . . . . . . . . . . . . . . . . . . . . . 40
Off-Balance Sheet Arrangements . . . . . . . . . . . . . . . . . . . . . . . . . . . . . . . . . . . . . . . . . . . . . . . . . . . . 40
Short Term Borrowings . . . . . . . . . . . . . . . . . . . . . . . . . . . . . . . . . . . . . . . . . . . . . . . . . . . . . . . . . . . . 42
Operating Results — Reed Elsevier PLC and Reed Elsevier NV . . . . . . . . . . . . . . . . . . . . . . . . . . . . 43
Trend Information . . . . . . . . . . . . . . . . . . . . . . . . . . . . . . . . . . . . . . . . . . . . . . . . . . . . . . . . . . . . . . . . 44
ITEM 6: DIRECTORS, SENIOR MANAGEMENT AND EMPLOYEES . . . . . . . . . . . . . . . . . . . . . . . . . . . . . 45
Directors . . . . . . . . . . . . . . . . . . . . . . . . . . . . . . . . . . . . . . . . . . . . . . . . . . . . . . . . . . . . . . . . . . . . . . . 45
Compensation . . . . . . . . . . . . . . . . . . . . . . . . . . . . . . . . . . . . . . . . . . . . . . . . . . . . . . . . . . . . . . . . . . . 47
Board Practices . . . . . . . . . . . . . . . . . . . . . . . . . . . . . . . . . . . . . . . . . . . . . . . . . . . . . . . . . . . . . . . . . . 68
Employees . . . . . . . . . . . . . . . . . . . . . . . . . . . . . . . . . . . . . . . . . . . . . . . . . . . . . . . . . . . . . . . . . . . . . . 70
Share Ownership . . . . . . . . . . . . . . . . . . . . . . . . . . . . . . . . . . . . . . . . . . . . . . . . . . . . . . . . . . . . . . . . . 71
ITEM 7: MAJOR SHAREHOLDERS AND RELATED PARTY TRANSACTIONS . . . . . . . . . . . . . . . . . . . . 77
Major Shareholders . . . . . . . . . . . . . . . . . . . . . . . . . . . . . . . . . . . . . . . . . . . . . . . . . . . . . . . . . . . . . . . 77
Related Party Transactions . . . . . . . . . . . . . . . . . . . . . . . . . . . . . . . . . . . . . . . . . . . . . . . . . . . . . . . . . 78
ITEM 8: FINANCIAL INFORMATION . . . . . . . . . . . . . . . . . . . . . . . . . . . . . . . . . . . . . . . . . . . . . . . . . . . . . . . 79
ITEM 9: THE OFFER AND LISTING . . . . . . . . . . . . . . . . . . . . . . . . . . . . . . . . . . . . . . . . . . . . . . . . . . . . . . . . . 80
Trading Markets . . . . . . . . . . . . . . . . . . . . . . . . . . . . . . . . . . . . . . . . . . . . . . . . . . . . . . . . . . . . . . . . . 80
ITEM 10: ADDITIONAL INFORMATION . . . . . . . . . . . . . . . . . . . . . . . . . . . . . . . . . . . . . . . . . . . . . . . . . . . . . . 82
Memorandum and Articles of Association . . . . . . . . . . . . . . . . . . . . . . . . . . . . . . . . . . . . . . . . . . . . . 82
Material Contracts . . . . . . . . . . . . . . . . . . . . . . . . . . . . . . . . . . . . . . . . . . . . . . . . . . . . . . . . . . . . . . . . 87
Exchange Controls . . . . . . . . . . . . . . . . . . . . . . . . . . . . . . . . . . . . . . . . . . . . . . . . . . . . . . . . . . . . . . . 88
Taxation . . . . . . . . . . . . . . . . . . . . . . . . . . . . . . . . . . . . . . . . . . . . . . . . . . . . . . . . . . . . . . . . . . . . . . . . 88
Documents on Display . . . . . . . . . . . . . . . . . . . . . . . . . . . . . . . . . . . . . . . . . . . . . . . . . . . . . . . . . . . . 90
ITEM 11: QUANTITATIVE AND QUALITATIVE DISCLOSURES ABOUT MARKET RISK . . . . . . . . . . . . 91
ITEM 12: DESCRIPTION OF SECURITIES OTHER THAN EQUITY SECURITIES . . . . . . . . . . . . . . . . . . . . 93
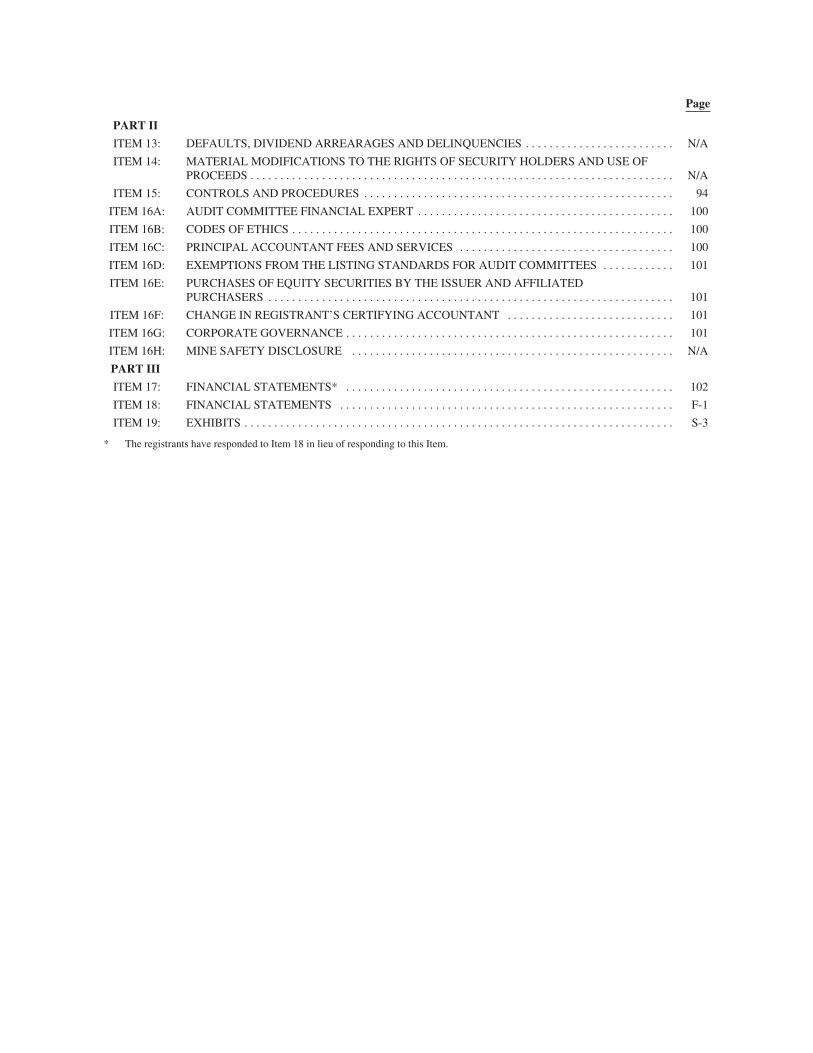
Page
PART II
ITEM 13: DEFAULTS, DIVIDEND ARREARAGES AND DELINQUENCIES . . . . . . . . . . . . . . . . . . . . . . . . . N/A
ITEM 14: MATERIAL MODIFICATIONS TO THE RIGHTS OF SECURITY HOLDERS AND USE OFPROCEEDS . . . . . . . . . . . . . . . . . . . . . . . . . . . . . . . . . . . . . . . . . . . . . . . . . . . . . . . . . . . . . . . . . . . . . . . N/A
ITEM 15: CONTROLS AND PROCEDURES . . . . . . . . . . . . . . . . . . . . . . . . . . . . . . . . . . . . . . . . . . . . . . . . . . . . 94
ITEM 16A: AUDIT COMMITTEE FINANCIAL EXPERT . . . . . . . . . . . . . . . . . . . . . . . . . . . . . . . . . . . . . . . . . . . 100
ITEM 16B: CODES OF ETHICS . . . . . . . . . . . . . . . . . . . . . . . . . . . . . . . . . . . . . . . . . . . . . . . . . . . . . . . . . . . . . . . . 100
ITEM 16C: PRINCIPAL ACCOUNTANT FEES AND SERVICES . . . . . . . . . . . . . . . . . . . . . . . . . . . . . . . . . . . . 100
ITEM 16D: EXEMPTIONS FROM THE LISTING STANDARDS FOR AUDIT COMMITTEES . . . . . . . . . . . . 101
ITEM 16E: PURCHASES OF EQUITY SECURITIES BY THE ISSUER AND AFFILIATEDPURCHASERS . . . . . . . . . . . . . . . . . . . . . . . . . . . . . . . . . . . . . . . . . . . . . . . . . . . . . . . . . . . . . . . . . . . . 101
ITEM 16F: CHANGE IN REGISTRANT’S CERTIFYING ACCOUNTANT . . . . . . . . . . . . . . . . . . . . . . . . . . . . 101
ITEM 16G: CORPORATE GOVERNANCE . . . . . . . . . . . . . . . . . . . . . . . . . . . . . . . . . . . . . . . . . . . . . . . . . . . . . . . 101
ITEM 16H: MINE SAFETY DISCLOSURE . . . . . . . . . . . . . . . . . . . . . . . . . . . . . . . . . . . . . . . . . . . . . . . . . . . . . . N/A
PART III
ITEM 17: FINANCIAL STATEMENTS* . . . . . . . . . . . . . . . . . . . . . . . . . . . . . . . . . . . . . . . . . . . . . . . . . . . . . . . 102
ITEM 18: FINANCIAL STATEMENTS . . . . . . . . . . . . . . . . . . . . . . . . . . . . . . . . . . . . . . . . . . . . . . . . . . . . . . . . F-1
ITEM 19: EXHIBITS . . . . . . . . . . . . . . . . . . . . . . . . . . . . . . . . . . . . . . . . . . . . . . . . . . . . . . . . . . . . . . . . . . . . . . . . S-3
* The registrants have responded to Item 18 in lieu of responding to this Item.

THIS PAGE INTENTIONALLY BLANK
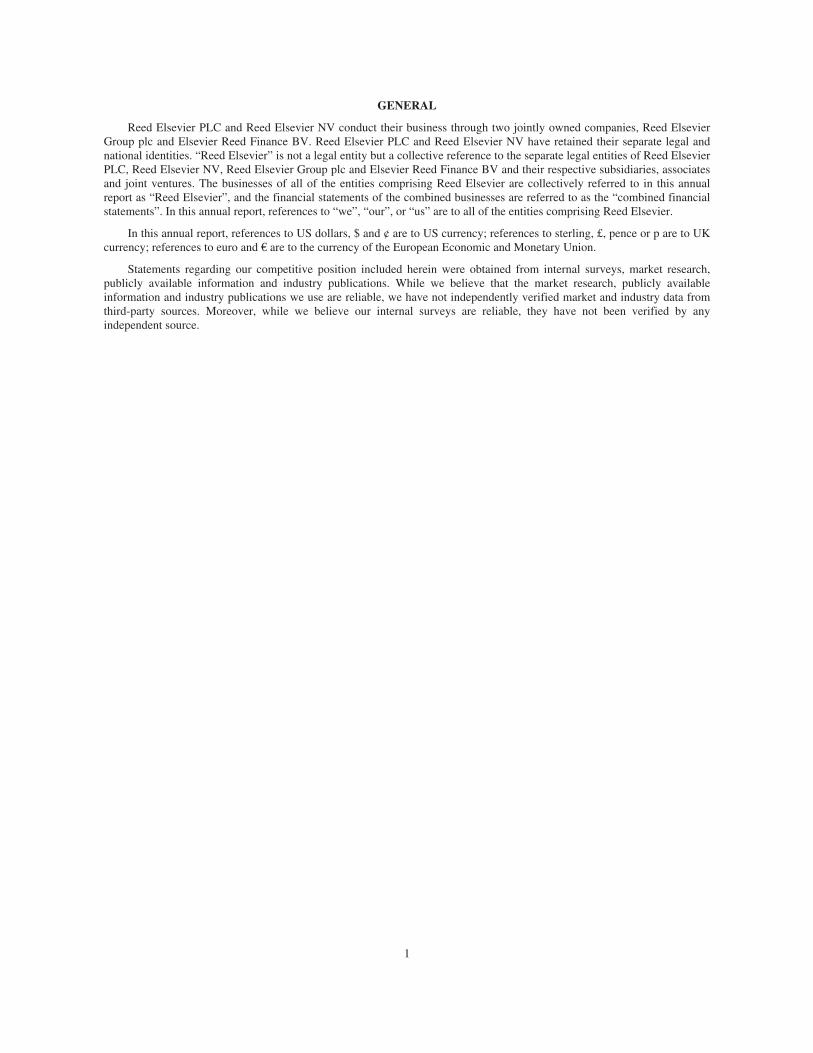
GENERAL
Reed Elsevier PLC and Reed Elsevier NV conduct their business through two jointly owned companies, Reed ElsevierGroup plc and Elsevier Reed Finance BV. Reed Elsevier PLC and Reed Elsevier NV have retained their separate legal andnational identities. “Reed Elsevier” is not a legal entity but a collective reference to the separate legal entities of Reed ElsevierPLC, Reed Elsevier NV, Reed Elsevier Group plc and Elsevier Reed Finance BV and their respective subsidiaries, associatesand joint ventures. The businesses of all of the entities comprising Reed Elsevier are collectively referred to in this annualreport as “Reed Elsevier”, and the financial statements of the combined businesses are referred to as the “combined financialstatements”. In this annual report, references to “we”, “our”, or “us” are to all of the entities comprising Reed Elsevier.
In this annual report, references to US dollars, $ and ¢ are to US currency; references to sterling, £, pence or p are to UKcurrency; references to euro and € are to the currency of the European Economic and Monetary Union.
Statements regarding our competitive position included herein were obtained from internal surveys, market research,publicly available information and industry publications. While we believe that the market research, publicly availableinformation and industry publications we use are reliable, we have not independently verified market and industry data fromthird-party sources. Moreover, while we believe our internal surveys are reliable, they have not been verified by anyindependent source.
1

SPECIAL NOTE REGARDING FORWARD-LOOKING STATEMENTS
This document contains or incorporates by reference a number of forward-looking statements within the meaning ofSection 27A of the United States Securities Act of 1933, as amended, and Section 21E of the United States SecuritiesExchange Act of 1934, as amended, with respect to:
Š financial condition;
Š results of operations;
Š competitive positions;
Š the features and functions of and markets for the products and services we offer; and
Š our business plans and strategies.
We consider any statements that are not historical facts to be “forward-looking statements”. These statements are basedon the current expectations of the management of our businesses and are subject to risks and uncertainties that could causeactual results or outcomes to differ from those expressed in any forward-looking statement. These differences could bematerial; therefore, you should evaluate forward-looking statements in light of various important factors, including those setforth or incorporated by reference in this document.
Important factors that could cause actual results to differ materially from estimates or forecasts contained in the forwardlooking statements include, among others:
Š competitive factors in the industries in which we operate;
Š demand for our products and services;
Š exchange rate fluctuations;
Š general economic, political and business conditions;
Š legislative, fiscal, tax and regulatory developments and political risks;
Š the availability of third party content and data;
Š breaches of our data security systems or other unauthorised access to our databases;
Š our ability to maintain high quality management;
Š changes in law and legal interpretation affecting our intellectual property rights and internet communications;
Š uncertainties as to whether our strategies, business plans and acquisitions will produce the expected returns;
Š significant failures or interruptions of our electronic platforms;
Š failure of third parties to whom we have outsourced business activities;
Š changes in the market values of defined benefit pension scheme assets and in the market related assumptions used tovalue scheme liabilities;
Š downgrades to the credit ratings of our debt;
Š breaches of generally accepted ethical business standards or applicable statutes;
Š our ability to manage our environmental impact; and
Š other risks referenced from time to time in the filings of Reed Elsevier PLC and Reed Elsevier NV with theSecurities and Exchange Commission (the “SEC”).
The terms “estimate”, “project”, “plan”, “intend”, “expect”, “should be”, “will be”, “believe” and similar expressionsidentify forward-looking statements. These forward-looking statements are found at various places throughout this annualreport and the other documents incorporated by reference in this annual report.
You should not place undue reliance on these forward-looking statements, which speak only as of the date of this annualreport. We undertake no obligation to publicly update or release any revisions to these forward-looking statements to reflectevents or circumstances after the date of this annual report or to reflect the occurrence of unanticipated events.
2
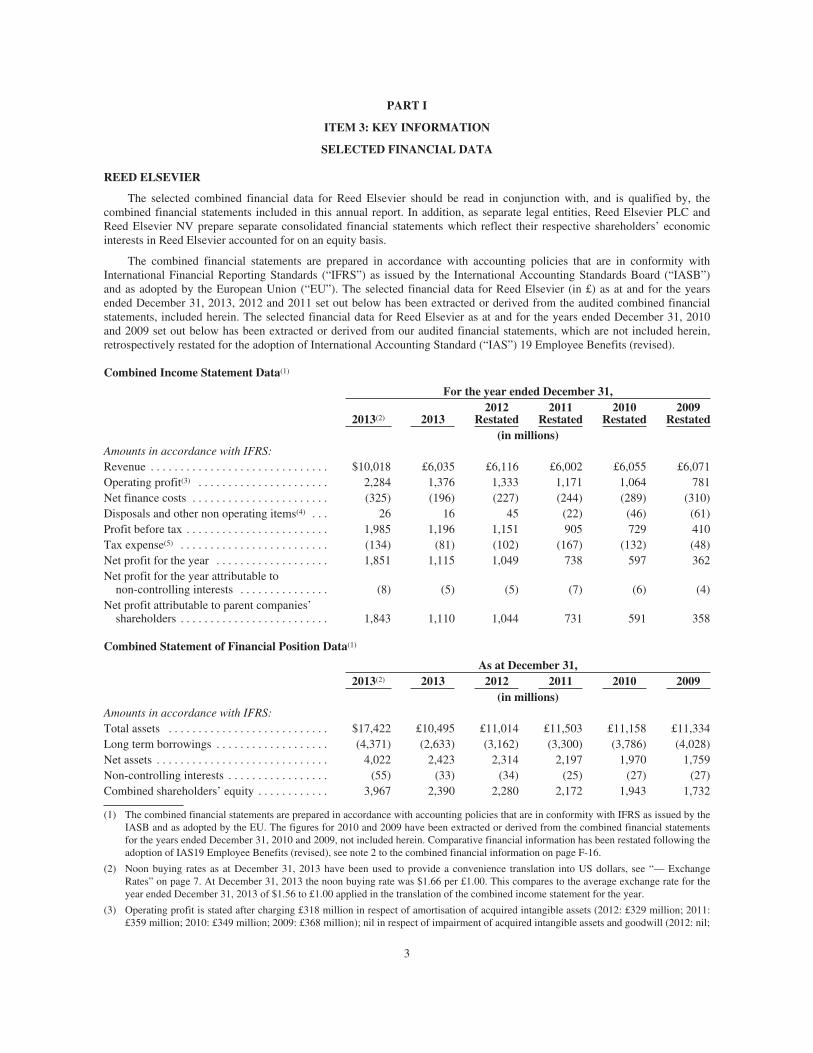
PART I
ITEM 3: KEY INFORMATION
SELECTED FINANCIAL DATA
REED ELSEVIER
The selected combined financial data for Reed Elsevier should be read in conjunction with, and is qualified by, thecombined financial statements included in this annual report. In addition, as separate legal entities, Reed Elsevier PLC andReed Elsevier NV prepare separate consolidated financial statements which reflect their respective shareholders’ economicinterests in Reed Elsevier accounted for on an equity basis.
The combined financial statements are prepared in accordance with accounting policies that are in conformity withInternational Financial Reporting Standards (“IFRS”) as issued by the International Accounting Standards Board (“IASB”)and as adopted by the European Union (“EU”). The selected financial data for Reed Elsevier (in £) as at and for the yearsended December 31, 2013, 2012 and 2011 set out below has been extracted or derived from the audited combined financialstatements, included herein. The selected financial data for Reed Elsevier as at and for the years ended December 31, 2010and 2009 set out below has been extracted or derived from our audited financial statements, which are not included herein,retrospectively restated for the adoption of International Accounting Standard (“IAS”) 19 Employee Benefits (revised).
Combined Income Statement Data(1)
For the year ended December 31,
2013(2) 20132012
Restated2011
Restated2010
Restated2009
Restated(in millions)
Amounts in accordance with IFRS:Revenue . . . . . . . . . . . . . . . . . . . . . . . . . . . . . . $10,018 £6,035 £6,116 £6,002 £6,055 £6,071Operating profit(3) . . . . . . . . . . . . . . . . . . . . . . 2,284 1,376 1,333 1,171 1,064 781Net finance costs . . . . . . . . . . . . . . . . . . . . . . . (325) (196) (227) (244) (289) (310)Disposals and other non operating items(4) . . . 26 16 45 (22) (46) (61)Profit before tax . . . . . . . . . . . . . . . . . . . . . . . . 1,985 1,196 1,151 905 729 410Tax expense(5) . . . . . . . . . . . . . . . . . . . . . . . . . (134) (81) (102) (167) (132) (48)Net profit for the year . . . . . . . . . . . . . . . . . . . 1,851 1,115 1,049 738 597 362Net profit for the year attributable to
non-controlling interests . . . . . . . . . . . . . . . (8) (5) (5) (7) (6) (4)Net profit attributable to parent companies’
shareholders . . . . . . . . . . . . . . . . . . . . . . . . . 1,843 1,110 1,044 731 591 358
Combined Statement of Financial Position Data(1)
As at December 31,2013(2) 2013 2012 2011 2010 2009
(in millions)Amounts in accordance with IFRS:Total assets . . . . . . . . . . . . . . . . . . . . . . . . . . . $17,422 £10,495 £11,014 £11,503 £11,158 £11,334Long term borrowings . . . . . . . . . . . . . . . . . . . (4,371) (2,633) (3,162) (3,300) (3,786) (4,028)Net assets . . . . . . . . . . . . . . . . . . . . . . . . . . . . . 4,022 2,423 2,314 2,197 1,970 1,759Non-controlling interests . . . . . . . . . . . . . . . . . (55) (33) (34) (25) (27) (27)Combined shareholders’ equity . . . . . . . . . . . . 3,967 2,390 2,280 2,172 1,943 1,732
(1) The combined financial statements are prepared in accordance with accounting policies that are in conformity with IFRS as issued by theIASB and as adopted by the EU. The figures for 2010 and 2009 have been extracted or derived from the combined financial statementsfor the years ended December 31, 2010 and 2009, not included herein. Comparative financial information has been restated following theadoption of IAS19 Employee Benefits (revised), see note 2 to the combined financial information on page F-16.
(2) Noon buying rates as at December 31, 2013 have been used to provide a convenience translation into US dollars, see “— ExchangeRates” on page 7. At December 31, 2013 the noon buying rate was $1.66 per £1.00. This compares to the average exchange rate for theyear ended December 31, 2013 of $1.56 to £1.00 applied in the translation of the combined income statement for the year.
(3) Operating profit is stated after charging £318 million in respect of amortisation of acquired intangible assets (2012: £329 million; 2011:£359 million; 2010: £349 million; 2009: £368 million); nil in respect of impairment of acquired intangible assets and goodwill (2012: nil;
3
2011: nil; 2010: nil; 2009: £177 million); nil in respect of exceptional restructuring costs (2012: nil; 2011: nil; 2010: £57 million; 2009:£182 million); £43 million in respect of acquisition related costs (2012: £21 million; 2011: £52 million; 2010: £50 million; 2009: £48million); nil in respect of the share of joint ventures’ profit on disposals (2012: nil; 2011: £1 million credit; 2010: nil; 2009: nil) and£12 million in respect of taxation in joint ventures (2012: £5 million; 2011: £11 million; 2010: £9 million; 2009: £8 million). Impairmentcharges in 2009 relate principally to Business Information. Exceptional restructuring costs in 2010 relate only to the restructuring of theBusiness Information business and in 2009 relate to the exceptional restructuring programmes across Reed Elsevier.
(4) Disposals and other non operating items comprise an £11 million gain on disposal of businesses and assets held for sale (2012:£86 million gain; 2011: £12 million loss; 2010: £32 million loss; 2009: £49 million loss), a charge of nil to property provisions ondisposed businesses (2012: £60 million; 2011: £16 million; 2010: £22 million; 2009: £20 million), and a £5 million gain relating to therevaluation of held for trading investments (2012: £19 million; 2011: £6 million; 2010: £8 million; 2009: £8 million).
(5) Tax expense in 2013 includes a deferred tax credit of £221 million (2012: nil; 2011: nil; 2010: nil; 2009: nil) arising on the alignment ofcertain business assets with their global management structure and an exceptional prior year tax credit of nil (2012: £96 million; 2011:nil; 2010: nil; 2009: nil) relating to the resolution of a number of significant prior year tax matters.
REED ELSEVIER PLC
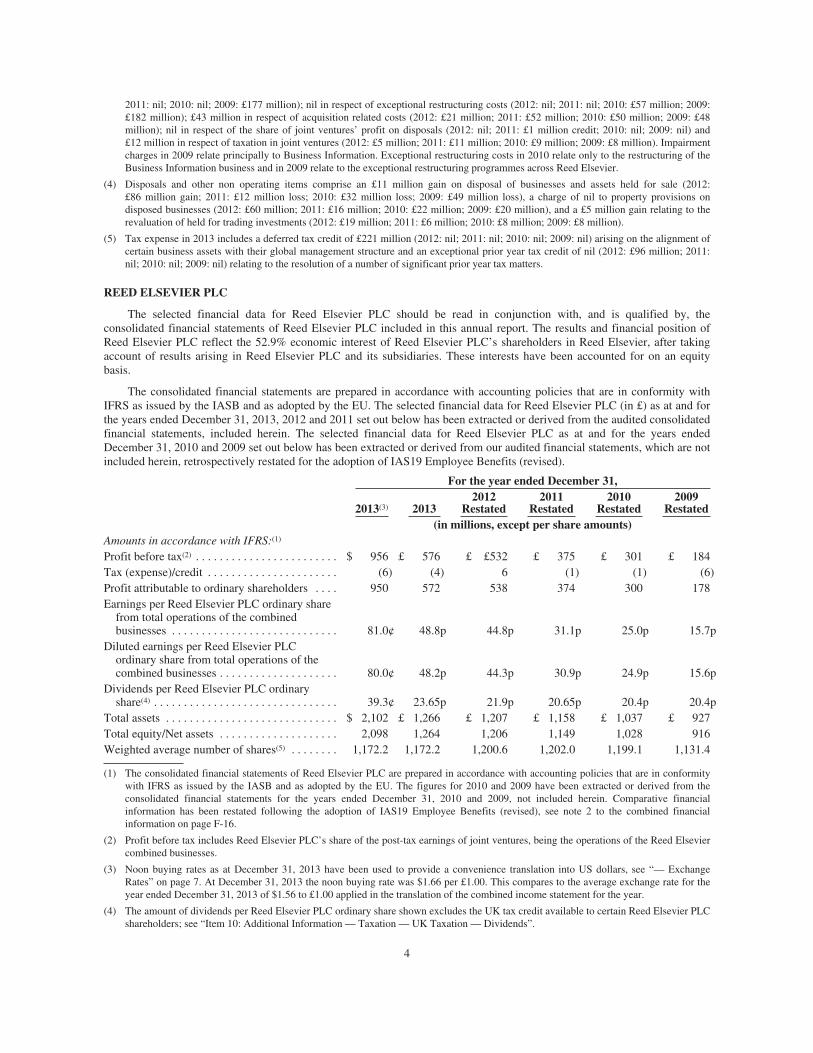
The selected financial data for Reed Elsevier PLC should be read in conjunction with, and is qualified by, theconsolidated financial statements of Reed Elsevier PLC included in this annual report. The results and financial position ofReed Elsevier PLC reflect the 52.9% economic interest of Reed Elsevier PLC’s shareholders in Reed Elsevier, after takingaccount of results arising in Reed Elsevier PLC and its subsidiaries. These interests have been accounted for on an equitybasis.
The consolidated financial statements are prepared in accordance with accounting policies that are in conformity withIFRS as issued by the IASB and as adopted by the EU. The selected financial data for Reed Elsevier PLC (in £) as at and forthe years ended December 31, 2013, 2012 and 2011 set out below has been extracted or derived from the audited consolidatedfinancial statements, included herein. The selected financial data for Reed Elsevier PLC as at and for the years endedDecember 31, 2010 and 2009 set out below has been extracted or derived from our audited financial statements, which are notincluded herein, retrospectively restated for the adoption of IAS19 Employee Benefits (revised).
For the year ended December 31,
2013(3) 20132012
Restated2011
Restated2010
Restated2009
Restated(in millions, except per share amounts)
Amounts in accordance with IFRS:(1)
Profit before tax(2) . . . . . . . . . . . . . . . . . . . . . . . . $ 956 £ 576 £ £532 £ 375 £ 301 £ 184Tax (expense)/credit . . . . . . . . . . . . . . . . . . . . . . (6) (4) 6 (1) (1) (6)Profit attributable to ordinary shareholders . . . . 950 572 538 374 300 178Earnings per Reed Elsevier PLC ordinary share
from total operations of the combinedbusinesses . . . . . . . . . . . . . . . . . . . . . . . . . . . . 81.0¢ 48.8p 44.8p 31.1p 25.0p 15.7p
Diluted earnings per Reed Elsevier PLCordinary share from total operations of thecombined businesses . . . . . . . . . . . . . . . . . . . . 80.0¢ 48.2p 44.3p 30.9p 24.9p 15.6p
Dividends per Reed Elsevier PLC ordinaryshare(4) . . . . . . . . . . . . . . . . . . . . . . . . . . . . . . . 39.3¢ 23.65p 21.9p 20.65p 20.4p 20.4p
Total assets . . . . . . . . . . . . . . . . . . . . . . . . . . . . . $ 2,102 £ 1,266 £ 1,207 £ 1,158 £ 1,037 £ 927Total equity/Net assets . . . . . . . . . . . . . . . . . . . . 2,098 1,264 1,206 1,149 1,028 916Weighted average number of shares(5) . . . . . . . . 1,172.2 1,172.2 1,200.6 1,202.0 1,199.1 1,131.4
(1) The consolidated financial statements of Reed Elsevier PLC are prepared in accordance with accounting policies that are in conformitywith IFRS as issued by the IASB and as adopted by the EU. The figures for 2010 and 2009 have been extracted or derived from theconsolidated financial statements for the years ended December 31, 2010 and 2009, not included herein. Comparative financialinformation has been restated following the adoption of IAS19 Employee Benefits (revised), see note 2 to the combined financialinformation on page F-16.
(2) Profit before tax includes Reed Elsevier PLC’s share of the post-tax earnings of joint ventures, being the operations of the Reed Elseviercombined businesses.
(3) Noon buying rates as at December 31, 2013 have been used to provide a convenience translation into US dollars, see “— ExchangeRates” on page 7. At December 31, 2013 the noon buying rate was $1.66 per £1.00. This compares to the average exchange rate for theyear ended December 31, 2013 of $1.56 to £1.00 applied in the translation of the combined income statement for the year.
(4) The amount of dividends per Reed Elsevier PLC ordinary share shown excludes the UK tax credit available to certain Reed Elsevier PLCshareholders; see “Item 10: Additional Information — Taxation — UK Taxation — Dividends”.
4
Dividends paid in the year, in amounts per ordinary share, comprise a 2012 final dividend of 17.0p and 2013 interim dividend of 6.65pgiving a total of 23.65p. The directors of Reed Elsevier PLC have proposed a 2013 final dividend of 17.95p (2012: 17.0p; 2011: 15.9p;2010: 15.0p; 2009: 15.0p), giving a total ordinary dividend in respect of the financial year of 24.60p (2012: 23.0p; 2011: 21.55p; 2010:20.4p; 2009: 20.4p).
Dividends per Reed Elsevier PLC ordinary share in respect of the financial year ended December 31, 2013 translated into cents at thenoon buying rate on December 31, 2013 were 40.8 cents. See “— Exchange Rates” on page 7.
(5) Weighted average number of shares excludes shares held in treasury and shares held by the Reed Elsevier Group plc Employee BenefitTrust. On July 30, 2009 Reed Elsevier PLC announced a share placing for 109,198,190 new ordinary shares, representing approximately9.9% of the company’s share capital prior to the placing. The shares were fully subscribed at a price of 405p per share, raising£435 million, net of issue costs. This share placing was announced in conjunction with a similar share placing by Reed Elsevier NV.
During 2013, Reed Elsevier PLC repurchased 41,961,920 Reed Elsevier PLC ordinary shares. These shares are held in treasury.
REED ELSEVIER NV
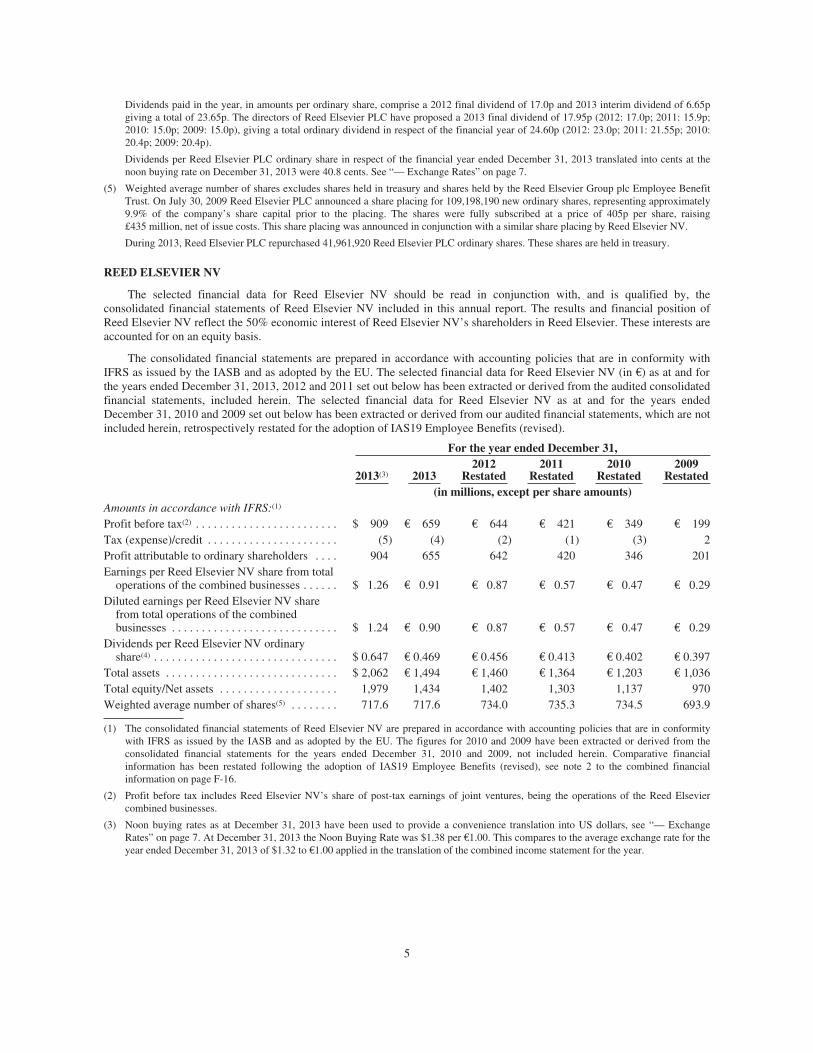
The selected financial data for Reed Elsevier NV should be read in conjunction with, and is qualified by, theconsolidated financial statements of Reed Elsevier NV included in this annual report. The results and financial position ofReed Elsevier NV reflect the 50% economic interest of Reed Elsevier NV’s shareholders in Reed Elsevier. These interests areaccounted for on an equity basis.
The consolidated financial statements are prepared in accordance with accounting policies that are in conformity withIFRS as issued by the IASB and as adopted by the EU. The selected financial data for Reed Elsevier NV (in €) as at and forthe years ended December 31, 2013, 2012 and 2011 set out below has been extracted or derived from the audited consolidatedfinancial statements, included herein. The selected financial data for Reed Elsevier NV as at and for the years endedDecember 31, 2010 and 2009 set out below has been extracted or derived from our audited financial statements, which are notincluded herein, retrospectively restated for the adoption of IAS19 Employee Benefits (revised).
For the year ended December 31,
2013(3) 20132012
Restated2011
Restated2010
Restated2009
Restated(in millions, except per share amounts)
Amounts in accordance with IFRS:(1)
Profit before tax(2) . . . . . . . . . . . . . . . . . . . . . . . . $ 909 € 659 € 644 € 421 € 349 € 199Tax (expense)/credit . . . . . . . . . . . . . . . . . . . . . . (5) (4) (2) (1) (3) 2Profit attributable to ordinary shareholders . . . . 904 655 642 420 346 201Earnings per Reed Elsevier NV share from total
operations of the combined businesses . . . . . . $ 1.26 € 0.91 € 0.87 € 0.57 € 0.47 € 0.29Diluted earnings per Reed Elsevier NV share
from total operations of the combinedbusinesses . . . . . . . . . . . . . . . . . . . . . . . . . . . . $ 1.24 € 0.90 € 0.87 € 0.57 € 0.47 € 0.29
Dividends per Reed Elsevier NV ordinaryshare(4) . . . . . . . . . . . . . . . . . . . . . . . . . . . . . . . $ 0.647 € 0.469 € 0.456 € 0.413 € 0.402 € 0.397
Total assets . . . . . . . . . . . . . . . . . . . . . . . . . . . . . $ 2,062 € 1,494 € 1,460 € 1,364 € 1,203 € 1,036Total equity/Net assets . . . . . . . . . . . . . . . . . . . . 1,979 1,434 1,402 1,303 1,137 970Weighted average number of shares(5) . . . . . . . . 717.6 717.6 734.0 735.3 734.5 693.9
(1) The consolidated financial statements of Reed Elsevier NV are prepared in accordance with accounting policies that are in conformitywith IFRS as issued by the IASB and as adopted by the EU. The figures for 2010 and 2009 have been extracted or derived from theconsolidated financial statements for the years ended December 31, 2010 and 2009, not included herein. Comparative financialinformation has been restated following the adoption of IAS19 Employee Benefits (revised), see note 2 to the combined financialinformation on page F-16.
(2) Profit before tax includes Reed Elsevier NV’s share of post-tax earnings of joint ventures, being the operations of the Reed Elseviercombined businesses.
(3) Noon buying rates as at December 31, 2013 have been used to provide a convenience translation into US dollars, see “— ExchangeRates” on page 7. At December 31, 2013 the Noon Buying Rate was $1.38 per €1.00. This compares to the average exchange rate for theyear ended December 31, 2013 of $1.32 to €1.00 applied in the translation of the combined income statement for the year.
5
(4) Dividends paid in the year, in amounts per ordinary share, comprise a 2012 final dividend of €0.337 and 2013 interim dividend of €0.132giving a total of €0.469. The directors of Reed Elsevier NV have proposed a 2013 final dividend of €0.374 (2012: €0.337; 2011: €0.326;2010: €0.303; 2009: €0.293), giving a total ordinary dividend in respect of the financial year of €0.506 (2012: €0.467; 2011: €0.436;2010: €0.412; 2009: €0.400).
Dividends per Reed Elsevier NV ordinary share in respect of the financial year ended December 31, 2013 translated into dollars at thenoon buying rate on December 31, 2013 were $0.70. See “— Exchange Rates” on page 7.
(5) Weighted average number of shares excludes shares held in treasury and shares held by the Reed Elsevier Group plc Employee BenefitTrust and takes into account the R shares in the company held by a subsidiary of Reed Elsevier PLC, which represent a 5.8% interest inReed Elsevier NV. On July 30, 2009 Reed Elsevier NV announced a share placing for 63,030,989 ordinary shares, representingapproximately 9.9% of the company’s share capital prior to the placing. The shares were fully subscribed at a price of €7.08 per share,raising €441 million, net of issue costs. Correspondingly Reed Elsevier NV also issued 252,459 new R shares and transferred 135,179existing R shares held in treasury to a subsidiary of Reed Elsevier PLC at a price of €73.00 per share for total proceeds of €29 million.This share placing was announced in conjunction with a similar share placing by Reed Elsevier PLC.
During 2013 Reed Elsevier NV repurchased 24,282,106 Reed Elsevier NV ordinary shares and 94,053 R shares (equivalent to 940,530Reed Elsevier NV ordinary shares). These shares are held in treasury.
6
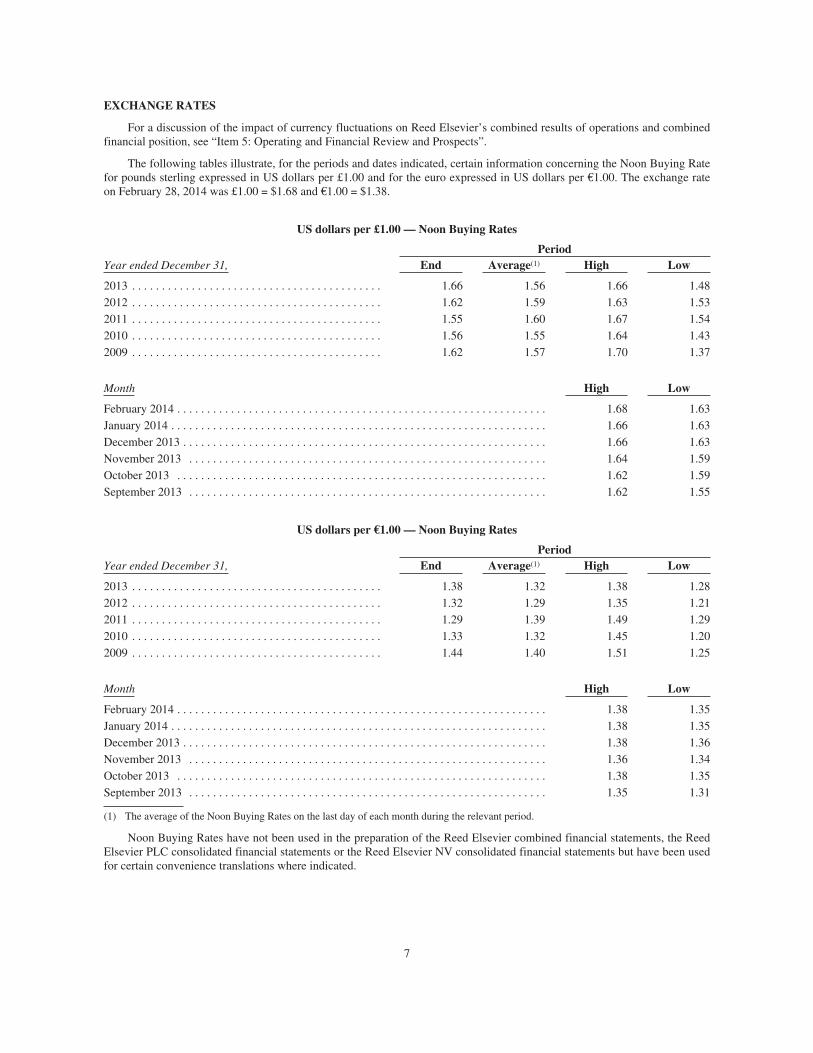
EXCHANGE RATES
For a discussion of the impact of currency fluctuations on Reed Elsevier’s combined results of operations and combinedfinancial position, see “Item 5: Operating and Financial Review and Prospects”.
The following tables illustrate, for the periods and dates indicated, certain information concerning the Noon Buying Ratefor pounds sterling expressed in US dollars per £1.00 and for the euro expressed in US dollars per €1.00. The exchange rateon February 28, 2014 was £1.00 = $1.68 and €1.00 = $1.38.
US dollars per £1.00 — Noon Buying Rates
PeriodYear ended December 31, End Average(1) High Low
2013 . . . . . . . . . . . . . . . . . . . . . . . . . . . . . . . . . . . . . . . . . . 1.66 1.56 1.66 1.482012 . . . . . . . . . . . . . . . . . . . . . . . . . . . . . . . . . . . . . . . . . . 1.62 1.59 1.63 1.532011 . . . . . . . . . . . . . . . . . . . . . . . . . . . . . . . . . . . . . . . . . . 1.55 1.60 1.67 1.542010 . . . . . . . . . . . . . . . . . . . . . . . . . . . . . . . . . . . . . . . . . . 1.56 1.55 1.64 1.432009 . . . . . . . . . . . . . . . . . . . . . . . . . . . . . . . . . . . . . . . . . . 1.62 1.57 1.70 1.37
Month High Low
February 2014 . . . . . . . . . . . . . . . . . . . . . . . . . . . . . . . . . . . . . . . . . . . . . . . . . . . . . . . . . . . . . . 1.68 1.63January 2014 . . . . . . . . . . . . . . . . . . . . . . . . . . . . . . . . . . . . . . . . . . . . . . . . . . . . . . . . . . . . . . . 1.66 1.63December 2013 . . . . . . . . . . . . . . . . . . . . . . . . . . . . . . . . . . . . . . . . . . . . . . . . . . . . . . . . . . . . . 1.66 1.63November 2013 . . . . . . . . . . . . . . . . . . . . . . . . . . . . . . . . . . . . . . . . . . . . . . . . . . . . . . . . . . . . 1.64 1.59October 2013 . . . . . . . . . . . . . . . . . . . . . . . . . . . . . . . . . . . . . . . . . . . . . . . . . . . . . . . . . . . . . . 1.62 1.59September 2013 . . . . . . . . . . . . . . . . . . . . . . . . . . . . . . . . . . . . . . . . . . . . . . . . . . . . . . . . . . . . 1.62 1.55
US dollars per €1.00 — Noon Buying Rates
PeriodYear ended December 31, End Average(1) High Low
2013 . . . . . . . . . . . . . . . . . . . . . . . . . . . . . . . . . . . . . . . . . . 1.38 1.32 1.38 1.282012 . . . . . . . . . . . . . . . . . . . . . . . . . . . . . . . . . . . . . . . . . . 1.32 1.29 1.35 1.212011 . . . . . . . . . . . . . . . . . . . . . . . . . . . . . . . . . . . . . . . . . . 1.29 1.39 1.49 1.292010 . . . . . . . . . . . . . . . . . . . . . . . . . . . . . . . . . . . . . . . . . . 1.33 1.32 1.45 1.202009 . . . . . . . . . . . . . . . . . . . . . . . . . . . . . . . . . . . . . . . . . . 1.44 1.40 1.51 1.25
Month High Low
February 2014 . . . . . . . . . . . . . . . . . . . . . . . . . . . . . . . . . . . . . . . . . . . . . . . . . . . . . . . . . . . . . . 1.38 1.35January 2014 . . . . . . . . . . . . . . . . . . . . . . . . . . . . . . . . . . . . . . . . . . . . . . . . . . . . . . . . . . . . . . . 1.38 1.35December 2013 . . . . . . . . . . . . . . . . . . . . . . . . . . . . . . . . . . . . . . . . . . . . . . . . . . . . . . . . . . . . . 1.38 1.36November 2013 . . . . . . . . . . . . . . . . . . . . . . . . . . . . . . . . . . . . . . . . . . . . . . . . . . . . . . . . . . . . 1.36 1.34October 2013 . . . . . . . . . . . . . . . . . . . . . . . . . . . . . . . . . . . . . . . . . . . . . . . . . . . . . . . . . . . . . . 1.38 1.35September 2013 . . . . . . . . . . . . . . . . . . . . . . . . . . . . . . . . . . . . . . . . . . . . . . . . . . . . . . . . . . . . 1.35 1.31
(1) The average of the Noon Buying Rates on the last day of each month during the relevant period.
Noon Buying Rates have not been used in the preparation of the Reed Elsevier combined financial statements, the ReedElsevier PLC consolidated financial statements or the Reed Elsevier NV consolidated financial statements but have been usedfor certain convenience translations where indicated.
7
RISK FACTORS
The key material risks to our business are included below. Additional risks not presently known to us or that we currentlydeem immaterial may also impair our business.
We operate in a highly competitive environment that is subject to rapid change.
Our businesses operate in highly competitive markets. These markets continue to change in response to technologicalinnovations, changing legislation, regulatory changes, the entrance of new competitors, and other factors. We cannot predictwith certainty the changes that may occur and the effect of those changes on the competitiveness of our businesses. Inparticular, the means of delivering our products and services, and the products and services themselves, may be subject torapid technological and other changes. We cannot predict whether technological innovations, changing legislation or otherfactors will, in the future, make some of our products wholly or partially obsolete or less profitable. Failure to anticipatemarket trends could impact the competitiveness of our products and services and consequently adversely affect our revenueand profit.
We cannot assure you that there will be continued demand for our products and services.
Our businesses are dependent on the continued acceptance by our customers of our products and services and the valueplaced on them. We cannot predict whether there will be changes in the future, either in the market demand or from theactions of competitors, which will affect the acceptability of products, services and prices to our customers. Failure to meetevolving customer needs could impact demand for our products and services and consequently adversely affect our revenue.
Fluctuations in exchange rates may affect our reported results.
Our financial statements are expressed in pounds sterling and euros and are, therefore, subject to movements in exchangerates on the translation of the financial information of businesses whose operational currencies are other than our reportingcurrencies. The United States is our most important market and, accordingly, significant fluctuations in US dollar exchangerates can significantly affect our reported results and financial position from year to year. In addition, in some of ourbusinesses we incur costs in currencies other than those in which revenues are earned. The relative movements between theexchange rates in the currencies in which costs are incurred and the currencies in which revenues are earned can significantlyaffect the results of those businesses.
Current and future economic, political and market forces, and dislocations beyond our control may adversely affectdemand for our products and services.
The demand for our products and services may be impacted by factors that are beyond our control, including macroeconomic, political and market conditions, the availability of short term and long term funding and capital and the level ofvolatility of interest rates, currency exchange rates and inflation. The United States, Europe and other major economies haverecently undergone a period of severe economic turbulence, and the global economic environment has recently been lessfavourable than in prior years and this may continue into the future. Any one or more of these factors may contribute toreduced activity by our customers, may result in a reduction of demand for our products and services, and may adverselyaffect suppliers and third parties to whom we have outsourced business activities.
Changes in tax laws or uncertainty over their application and interpretation may adversely affect our reported results.
Our businesses operate globally and our earnings are subject to taxation in many differing jurisdictions and at differingrates. We seek to organise our affairs in a tax efficient manner, taking account of the jurisdictions in which we operate.However, tax laws that apply to our businesses may be amended or interpreted differently by the relevant authorities, whichcould adversely affect our reported results.
Changes in regulation of information collection and use could adversely affect our business.
Legal regulation relating to internet communications, data protection, e-commerce, direct marketing, credit scoring anddigital advertising, privacy, information governance and use of public records is becoming more prevalent. Existing andproposed legislation and regulations, including changes in the manner in which such legislation and regulations are interpretedby courts in the United States, the European Union and other jurisdictions may impose limits on our collection and use ofcertain kinds of information about individuals and our ability to communicate such information effectively with ourcustomers. For example, many of the products offered by Risk Solutions are governed by the US Fair Credit Reporting Act(“FCRA”), Graham Leach Bliley Act (“GLBA”), Drivers Privacy Protection Act (“DPPA”) and related state laws. Certain ofthese laws further provide for statutory penalties and attorneys fees for non-compliance. We are unable to predict in whatform laws and regulations will be adopted or modified or how they will be construed by the courts, or the extent to which anysuch laws or interpretation changes might adversely affect our business.
8
Changes in provision of third party information to us could adversely affect our businesses.
A number of our businesses rely extensively upon content and data from external sources. Data is obtained from publicrecords, governmental authorities, customers and other information companies, including competitors. In the case of publicrecords, including social security number data which are obtained from public authorities, our access is governed by law. Wealso obtain the credit header data in our databases from consumer credit reporting agencies. The disruption or loss of datasources, either because of changes in the law or because data suppliers decide not to supply them, could adversely affect ourproducts and services.
Our business, operations and reputation could be adversely affected by a failure to comply with FTC Settlement Orders.
Through our Risk Solutions business, we are party to two consent orders and two subsequent related supplemental orders(the “FTC Settlement Orders”) embodying settlements with the US Federal Trade Commission (“FTC”) that resolved FTCinvestigations into our compliance with federal laws governing consumer information security and related issues, includingcertain fraudulent data access incidents. We also entered into an Assurance of Voluntary Compliance and Discontinuance(the “AVC”) with the Attorneys General of 43 states and the District of Columbia in connection with one such FTCinvestigation. The FTC Settlement Orders and the AVC require us to institute and maintain information security, verification,credentialing, audit and compliance, and reporting and record retention programmes and to obtain an assessment from aqualified, independent third party every two years for twenty years (with the FTC having the right to extend such twenty-yearperiod by up to two additional biennial assessment periods) to ensure that our performance under these information securityprogrammes complies with the FTC Settlement Orders. Failure to comply with the FTC Settlement Orders and the AVC couldresult in civil penalties and adversely affect our business, operations and reputation.
Breaches of our data security systems or other unauthorised access to our databases could adversely affect our businessand operations.
Our businesses provide customers with access to database information such as case law, treatises, journals, andpublications as well as other data. Our Risk Solutions business also provides authorised customers with access to publicrecords and other information on US individuals made available in accordance with applicable privacy laws and regulations.There are persons who try to breach our data security systems or gain other unauthorised access to our databases in order tomisappropriate such information for potentially fraudulent purposes and we have previously disclosed incidents of suchunauthorised access. Because the techniques used by such persons change frequently, we may be unable to anticipate orprotect against the threat of breaches of data security or other unauthorised access. Breaches of our data security systems orother unauthorised access to our databases could damage our reputation and expose us to a risk of loss or litigation andpossible liability, as well as increase the likelihood of more extensive governmental regulation of these activities in a way thatcould adversely affect this aspect of our business.
Changes in government funding of, or spending by, academic institutions may adversely affect demand for the productsand services of our scientific, technical and medical (“STM”) businesses.
The principal customers for the information products and services offered by our STM publishing businesses areacademic institutions, which fund purchases of these products and services from limited budgets that may be sensitive tochanges in private and governmental sources of funding. Accordingly, any decreases in budgets of academic institutions orchanges in the spending patterns of academic institutions could negatively impact our business and revenues.
Our intellectual property rights may not be adequately protected under current laws in some jurisdictions, which mayadversely affect our results and our ability to grow.
Our products and services are largely comprised of intellectual property content delivered through a variety of media,including journals, books, compact discs, and online, including the internet. We rely on trademark, copyright, patent, tradesecret and other intellectual property laws to establish and protect our proprietary rights in these products and services.However, we cannot assure you that our proprietary rights will not be challenged, limited, invalidated or circumvented.Despite trademark and copyright protection and similar intellectual property protection laws, third parties may be able tocopy, infringe or otherwise profit from our proprietary rights without our authorisation. These unauthorised activities may befacilitated by the internet.
In addition, whilst there is now certain internet-specific copyright legislation in the United States and in the EuropeanUnion, there remains significant uncertainty as to the date from which such legislation will be enforced and the formcopyright law regulating digital content may ultimately take. In several jurisdictions, including the United States, Australiaand the European Union, copyright laws are increasingly coming under legal review. These factors create additionalchallenges for us in protecting our proprietary rights in content delivered through the internet and electronic platforms.Moreover, whilst non-copyrightable databases are protected in many circumstances by law in the European Union, there is noequivalent legal protection in the United States.
9

We may be unable to implement and execute our strategic and business plans if we cannot maintain high-qualitymanagement.
The implementation and execution of our strategic and business plans depend on our ability to recruit, motivate andretain high-quality people. We compete globally and across business sectors for talented management and skilled individuals,particularly those with technology and data analytics capabilities. An inability to recruit, motivate or retain such people couldadversely affect our business performance.
We may not realise all of the future anticipated benefits of acquisitions.
We regularly make small business acquisitions to strengthen our portfolio. Whilst our acquisitions are made within theframework of our overall strategy, which emphasises organic development, we cannot assure you we will be able to generatethe anticipated benefits such as revenue growth, synergies and/or cost savings associated with these acquisitions. Failure torealize the anticipated benefits of acquisitions could adversely affect our return on invested capital and financial condition.
We cannot assure you whether our substantial investment in electronic product and platform initiatives will producesatisfactory, long term returns.
We are investing significant amounts to develop and promote electronic products and platforms. The provision ofelectronic products and services is very competitive and we may experience difficulties developing this aspect of our businessdue to a variety of factors, many of which are beyond our control. These factors may include competition from comparableand new technologies and changes in regulation.
Our businesses may be adversely affected if their electronic delivery platforms, networks or distribution systems experiencea significant failure or interruption.
Our businesses are dependent on electronic platforms and distribution systems, primarily the internet, for delivery oftheir products and services. From time to time we have experienced verifiable attacks on our platforms and systems byunauthorised parties. To date such attacks have not resulted in any material damage to us, however, our businesses could beadversely affected if their electronic delivery platforms and networks experience a significant failure, interruption or securitybreach.
Our businesses may be adversely affected by the failure of third parties to whom we have outsourced business activities.
Our organisational and operational structures are dependent on outsourced and offshored functions. Poor performance orthe failure of third parties to whom we have outsourced business functions could adversely affect our business performance,reputation and financial condition.
Our scientific, technical and medical primary publications could be adversely affected by changes in the market.
Our STM primary publications, like those of most of our competitors, are published on a paid subscription basis. There isdebate in government, academic and library communities, which are the principal customers for our STM publications,regarding whether such publications should be funded instead through fees charged to authors or authors’ funders and/ormade freely available after a period following publication. If these methods of STM publishing are widely adopted ormandated, it could adversely affect our revenue from our paid subscription publications.
Spending by companies on advertising and other marketing activities, which comprises a significant portion of ourrevenue, has historically been cyclical.
In 2013 4% of our revenue was derived from advertising. In Business Information, 21% of revenue was derived fromadvertising in 2013 compared with 30% in 2012. Total advertising revenues for our businesses in 2013 were £240 millioncompared with £350 million in 2012. Traditionally, spending by companies on advertising and other marketing activities hasbeen cyclical, with companies spending significantly less on advertising in times of economic slowdown or turbulence. Inaddition, there has been a structural shift of advertising and lead generation to Google and other search engines.
Exhibitions is similarly affected by cyclical pressures on spending by companies. Additionally, participation andattendance at exhibitions is affected by the availability of exhibition venues and the propensity of exhibitors and attendees totravel. Our results could be adversely affected if the availability of venues or the demand from exhibitors and attendees werereduced, for example due to international security or public health concerns or acts of terrorism or war.
10
Changes in the market values of defined benefit pension scheme assets and in the assumptions used to value definedbenefit pension scheme obligations may adversely affect our businesses.
We operate a number of pension schemes around the world. Historically, the largest schemes have been of the definedbenefit type in the United Kingdom, the United States and the Netherlands. The assets and obligations associated with definedbenefit pension schemes are sensitive to changes in the market values of assets and the market related assumptions used tovalue scheme liabilities. In particular, adverse changes to asset values, discount rates or inflation could increase future pensioncosts and funding requirements.
Our impairment analysis of goodwill and indefinite lived intangible assets incorporates various assumptions which arehighly judgemental. If these assumptions are not realised, we may be required to recognise a charge in the future forimpairment.
As at December 31, 2013, goodwill on the combined statement of financial position amounted to £4,576 million andintangible assets with an indefinite life amounted to £347 million. We conduct an impairment test at least annually, whichinvolves a comparison of the carrying value of goodwill and indefinite lived intangible assets by cash generating unit withestimated values in use based on latest management cash flow projections. The assumptions used in the estimation of value inuse are, by their very nature, highly judgemental, and include profit growth of the business over a five year forecast period,the long term growth rate of the business thereafter, and related discount rates. There is no guarantee that our businesses willbe able to achieve the forecasted results which have been included in the impairment tests and impairment charges may berequired in future periods if we are unable to meet these assumptions.
Our borrowing costs and access to capital may be adversely affected if the credit ratings assigned to our debt aredowngraded.
Our outstanding debt instruments are, and any of our future debt instruments may be, publicly rated by independentrating agencies such as Moody’s Investors Service Inc., Standard & Poor’s Rating Services and Fitch Ratings. A rating isbased upon information furnished by us or obtained by the relevant rating agency from its own sources and from publiclyavailable information and is subject to revision, suspension or withdrawal by the rating agency at any time. Rating agenciesmay review the assigned ratings due to developments that are beyond our control. Factors cited as a basis for a ratingsdowngrade or an assignment of a negative outlook could include the macro economic environment and the level of ourindebtedness as a consequence of an acquisition. If the ratings of our debt are downgraded in the future, our borrowing costsand access to capital may be adversely affected.
Breaches of generally accepted ethical business standards or applicable statutes concerning bribery could adversely affectour reputation and financial condition.
As a world leading provider of professional information solutions to the science, technical and medical, risk, legal andbusiness sectors, we are expected to adhere to high standards of independence and ethical conduct. Whilst our employees areexpected to abide by the Reed Elsevier Code of Ethics and Business Conduct, employees may still fail to abide by itsguidelines relating to anti-bribery and principled business conduct. Similarly, whilst our major suppliers are expected to abideby our Supplier Code of Conduct, suppliers may still fail to abide by its guidelines relating to anti-bribery and principledbusiness conduct. A breach of generally accepted ethical business standards or applicable statues concerning bribery by ouremployees or our suppliers could adversely affect our business performance, reputation and financial condition.
Failure to manage our environmental impact could adversely affect our businesses.
Our businesses have an impact on the environment, principally through the use of energy and water, waste generationand, in our supply chain, through our paper use and print and production technologies. Whilst we are committed to reducingthese impacts by limiting resource use and by efficiently employing sustainable materials and technologies, we cannot assureyou that these efforts and expenditures incurred by us in order to comply with either new environmental legislation andregulations, new interpretations or existing laws and regulations or more rigorous enforcement of such laws and regulationswill not adversely impact our businesses or reputation.
11
ITEM 4: INFORMATION ON REED ELSEVIER
HISTORY AND DEVELOPMENT
Corporate structure
Reed Elsevier came into existence in January 1993, when Reed Elsevier PLC and Reed Elsevier NV contributed theirrespective businesses to two jointly-owned companies, Reed Elsevier Group plc, a UK registered company which owns thepublishing and information businesses, and Elsevier Reed Finance BV, a Dutch registered company which owns the financingactivities. Reed Elsevier PLC and Reed Elsevier NV have retained their separate legal and national identities and are publiclyheld companies. Reed Elsevier PLC’s securities are listed in London and New York, and Reed Elsevier NV’s securities arelisted in Amsterdam and New York.
Equalisation arrangements
Reed Elsevier PLC and Reed Elsevier NV each hold a 50% interest in Reed Elsevier Group plc. Reed Elsevier PLCholds a 39% interest in Elsevier Reed Finance BV, with Reed Elsevier NV holding a 61% interest. Reed Elsevier PLCadditionally holds a 5.8% indirect equity interest in Reed Elsevier NV, reflecting the arrangements entered into between thetwo companies at the time of the merger, which determined the equalisation ratio whereby one Reed Elsevier NV ordinaryshare is, in broad terms, intended to confer equivalent economic interests to 1.538 Reed Elsevier PLC ordinary shares. Theequalisation ratio is subject to change to reflect share splits and similar events that affect the number of outstanding ordinaryshares of either Reed Elsevier PLC or Reed Elsevier NV.
Under the equalisation arrangements, Reed Elsevier PLC shareholders have a 52.9% economic interest in Reed Elsevier,and Reed Elsevier NV shareholders (other than Reed Elsevier PLC) have a 47.1% economic interest in Reed Elsevier. Holdersof ordinary shares in Reed Elsevier PLC and Reed Elsevier NV enjoy substantially equivalent dividend and capital rights withrespect to their ordinary shares.
The Boards of both Reed Elsevier PLC and Reed Elsevier NV have agreed, other than in special circumstances, torecommend equivalent gross dividends (including, with respect to the dividend on Reed Elsevier PLC ordinary shares, theassociated UK tax credit), based on the equalisation ratio. A Reed Elsevier PLC ordinary share pays dividends in sterling andis subject to UK tax law with respect to dividend and capital rights. A Reed Elsevier NV ordinary share pays dividends ineuros and is subject to Dutch tax law with respect to dividend and capital rights.
The principal assets of Reed Elsevier PLC comprise its 50% interest in Reed Elsevier Group plc, its 39% interest inElsevier Reed Finance BV, its indirect equity interest in Reed Elsevier NV and certain amounts receivable from subsidiariesof Reed Elsevier Group plc. The principal assets of Reed Elsevier NV comprise its 50% interest in Reed Elsevier Group plc,its 61% interest in Elsevier Reed Finance BV and certain amounts receivable from subsidiaries of Reed Elsevier Group plc.Reed Elsevier NV also owns shares, carrying special dividend rights, in Reed Elsevier Overseas BV, a Dutch registeredsubsidiary of Reed Elsevier Group plc.
Material acquisitions and disposals
Total acquisition expenditure in the three years ended December 31, 2013, including the buy out of non-controllinginterests, was £1,120 million, net of cash acquired of £50 million. During 2013, a number of acquisitions were made for totalconsideration of £239 million, net of cash acquired of £14 million. During 2012, a number of acquisitions, including the buyout of non-controlling interests, were made for a total consideration of £341 million, net of cash acquired of £12 million.During 2011, a number of acquisitions were made for a total consideration of £540 million, net of cash acquired of£24 million.
Total consideration from disposal transactions closed in 2013 was £331 million, including £6 million in respect offreehold properties. The net cash received in the calendar year from business disposals, after timing differences and separationand transaction costs, was £195 million (2012: £160 million; 2011: £80 million).
Capital expenditure
Capital expenditure on property, plant, equipment and internally developed intangible assets principally relates toinvestment in systems infrastructure to support electronic publishing activities, computer equipment and office facilities. Totalsuch capital expenditure, which was financed using cash flows generated from operations, amounted to £308 million in 2013(2012: £333 million; 2011: £350 million). In 2013, there was continued investment in new product and related infrastructure,particularly in the Legal segment. Further information on capital expenditure is given in notes 15 and 17 to the combinedfinancial statements.
12

Principal Executive Offices
The principal executive offices of Reed Elsevier PLC are located at 1-3 Strand, London WC2N 5JR, England.Tel: +44 20 7166 5500. The principal executive offices of Reed Elsevier NV are located at Radarweg 29, 1043 NXAmsterdam, the Netherlands. Tel: +31 20 485 2222. The principal executive office located in the United States is at 125 ParkAvenue, 23rd Floor, New York, New York, 10017. Tel: +1 212 309 8100. Our internet address is www.reedelsevier.com. Theinformation on our website is not incorporated by reference into this report.
Our agent in the United States is Kenneth Thompson II, General Counsel Intellectual Property, Privacy and Governance,Reed Elsevier, [email protected], 9443 Springboro Pike, B4/F5/514, Miamisburg, Ohio, 45342.
13
BUSINESS OVERVIEW
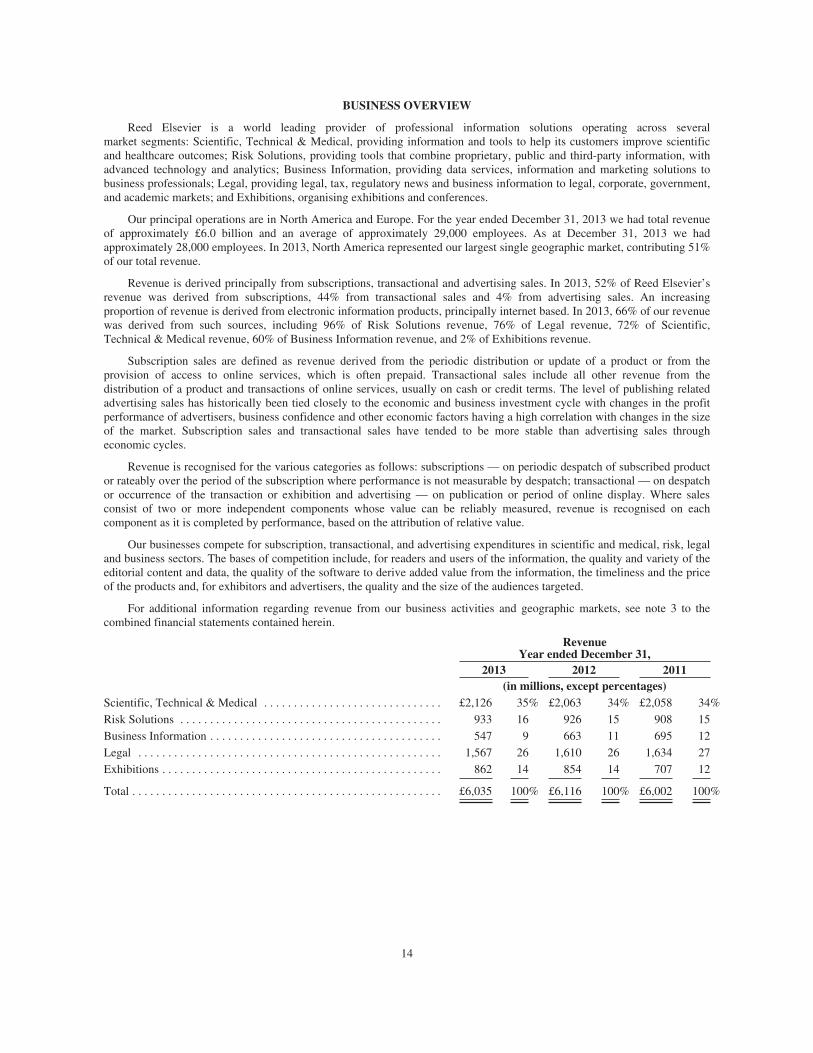
Reed Elsevier is a world leading provider of professional information solutions operating across severalmarket segments: Scientific, Technical & Medical, providing information and tools to help its customers improve scientificand healthcare outcomes; Risk Solutions, providing tools that combine proprietary, public and third-party information, withadvanced technology and analytics; Business Information, providing data services, information and marketing solutions tobusiness professionals; Legal, providing legal, tax, regulatory news and business information to legal, corporate, government,and academic markets; and Exhibitions, organising exhibitions and conferences.
Our principal operations are in North America and Europe. For the year ended December 31, 2013 we had total revenueof approximately £6.0 billion and an average of approximately 29,000 employees. As at December 31, 2013 we hadapproximately 28,000 employees. In 2013, North America represented our largest single geographic market, contributing 51%of our total revenue.
Revenue is derived principally from subscriptions, transactional and advertising sales. In 2013, 52% of Reed Elsevier’srevenue was derived from subscriptions, 44% from transactional sales and 4% from advertising sales. An increasingproportion of revenue is derived from electronic information products, principally internet based. In 2013, 66% of our revenuewas derived from such sources, including 96% of Risk Solutions revenue, 76% of Legal revenue, 72% of Scientific,Technical & Medical revenue, 60% of Business Information revenue, and 2% of Exhibitions revenue.
Subscription sales are defined as revenue derived from the periodic distribution or update of a product or from theprovision of access to online services, which is often prepaid. Transactional sales include all other revenue from thedistribution of a product and transactions of online services, usually on cash or credit terms. The level of publishing relatedadvertising sales has historically been tied closely to the economic and business investment cycle with changes in the profitperformance of advertisers, business confidence and other economic factors having a high correlation with changes in the sizeof the market. Subscription sales and transactional sales have tended to be more stable than advertising sales througheconomic cycles.
Revenue is recognised for the various categories as follows: subscriptions — on periodic despatch of subscribed productor rateably over the period of the subscription where performance is not measurable by despatch; transactional — on despatchor occurrence of the transaction or exhibition and advertising — on publication or period of online display. Where salesconsist of two or more independent components whose value can be reliably measured, revenue is recognised on eachcomponent as it is completed by performance, based on the attribution of relative value.
Our businesses compete for subscription, transactional, and advertising expenditures in scientific and medical, risk, legaland business sectors. The bases of competition include, for readers and users of the information, the quality and variety of theeditorial content and data, the quality of the software to derive added value from the information, the timeliness and the priceof the products and, for exhibitors and advertisers, the quality and the size of the audiences targeted.
For additional information regarding revenue from our business activities and geographic markets, see note 3 to thecombined financial statements contained herein.
RevenueYear ended December 31,
2013 2012 2011(in millions, except percentages)
Scientific, Technical & Medical . . . . . . . . . . . . . . . . . . . . . . . . . . . . . . £2,126 35% £2,063 34% £2,058 34%Risk Solutions . . . . . . . . . . . . . . . . . . . . . . . . . . . . . . . . . . . . . . . . . . . . 933 16 926 15 908 15Business Information . . . . . . . . . . . . . . . . . . . . . . . . . . . . . . . . . . . . . . . 547 9 663 11 695 12Legal . . . . . . . . . . . . . . . . . . . . . . . . . . . . . . . . . . . . . . . . . . . . . . . . . . . 1,567 26 1,610 26 1,634 27Exhibitions . . . . . . . . . . . . . . . . . . . . . . . . . . . . . . . . . . . . . . . . . . . . . . . 862 14 854 14 707 12
Total . . . . . . . . . . . . . . . . . . . . . . . . . . . . . . . . . . . . . . . . . . . . . . . . . . . . £6,035 100% £6,116 100% £6,002 100%
14
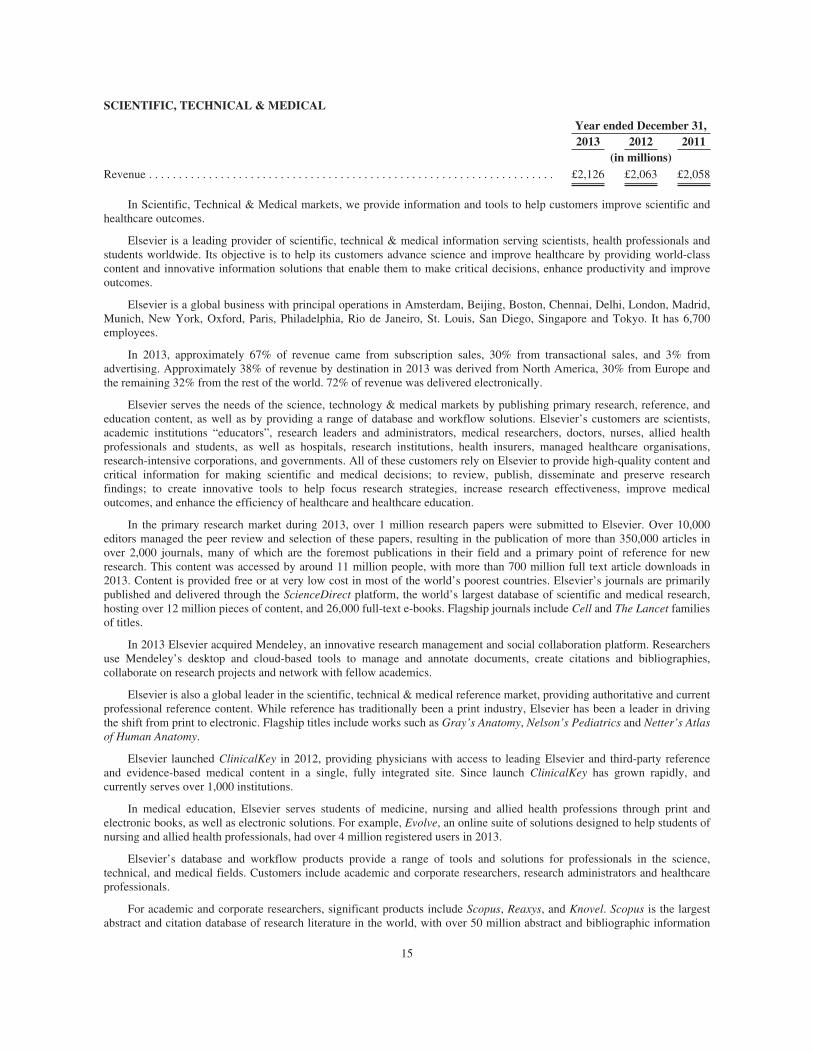
SCIENTIFIC, TECHNICAL & MEDICAL
Year ended December 31,2013 2012 2011
(in millions)Revenue . . . . . . . . . . . . . . . . . . . . . . . . . . . . . . . . . . . . . . . . . . . . . . . . . . . . . . . . . . . . . . . . . . . . £2,126 £2,063 £2,058
In Scientific, Technical & Medical markets, we provide information and tools to help customers improve scientific andhealthcare outcomes.
Elsevier is a leading provider of scientific, technical & medical information serving scientists, health professionals andstudents worldwide. Its objective is to help its customers advance science and improve healthcare by providing world-classcontent and innovative information solutions that enable them to make critical decisions, enhance productivity and improveoutcomes.
Elsevier is a global business with principal operations in Amsterdam, Beijing, Boston, Chennai, Delhi, London, Madrid,Munich, New York, Oxford, Paris, Philadelphia, Rio de Janeiro, St. Louis, San Diego, Singapore and Tokyo. It has 6,700employees.
In 2013, approximately 67% of revenue came from subscription sales, 30% from transactional sales, and 3% fromadvertising. Approximately 38% of revenue by destination in 2013 was derived from North America, 30% from Europe andthe remaining 32% from the rest of the world. 72% of revenue was delivered electronically.
Elsevier serves the needs of the science, technology & medical markets by publishing primary research, reference, andeducation content, as well as by providing a range of database and workflow solutions. Elsevier’s customers are scientists,academic institutions “educators”, research leaders and administrators, medical researchers, doctors, nurses, allied healthprofessionals and students, as well as hospitals, research institutions, health insurers, managed healthcare organisations,research-intensive corporations, and governments. All of these customers rely on Elsevier to provide high-quality content andcritical information for making scientific and medical decisions; to review, publish, disseminate and preserve researchfindings; to create innovative tools to help focus research strategies, increase research effectiveness, improve medicaloutcomes, and enhance the efficiency of healthcare and healthcare education.
In the primary research market during 2013, over 1 million research papers were submitted to Elsevier. Over 10,000editors managed the peer review and selection of these papers, resulting in the publication of more than 350,000 articles inover 2,000 journals, many of which are the foremost publications in their field and a primary point of reference for newresearch. This content was accessed by around 11 million people, with more than 700 million full text article downloads in2013. Content is provided free or at very low cost in most of the world’s poorest countries. Elsevier’s journals are primarilypublished and delivered through the ScienceDirect platform, the world’s largest database of scientific and medical research,hosting over 12 million pieces of content, and 26,000 full-text e-books. Flagship journals include Cell and The Lancet familiesof titles.
In 2013 Elsevier acquired Mendeley, an innovative research management and social collaboration platform. Researchersuse Mendeley’s desktop and cloud-based tools to manage and annotate documents, create citations and bibliographies,collaborate on research projects and network with fellow academics.
Elsevier is also a global leader in the scientific, technical & medical reference market, providing authoritative and currentprofessional reference content. While reference has traditionally been a print industry, Elsevier has been a leader in drivingthe shift from print to electronic. Flagship titles include works such as Gray’s Anatomy, Nelson’s Pediatrics and Netter’s Atlasof Human Anatomy.
Elsevier launched ClinicalKey in 2012, providing physicians with access to leading Elsevier and third-party referenceand evidence-based medical content in a single, fully integrated site. Since launch ClinicalKey has grown rapidly, andcurrently serves over 1,000 institutions.
In medical education, Elsevier serves students of medicine, nursing and allied health professions through print andelectronic books, as well as electronic solutions. For example, Evolve, an online suite of solutions designed to help students ofnursing and allied health professionals, had over 4 million registered users in 2013.
Elsevier’s database and workflow products provide a range of tools and solutions for professionals in the science,technical, and medical fields. Customers include academic and corporate researchers, research administrators and healthcareprofessionals.
For academic and corporate researchers, significant products include Scopus, Reaxys, and Knovel. Scopus is the largestabstract and citation database of research literature in the world, with over 50 million abstract and bibliographic information
15
records from more than 20,000 peer-reviewed journals and 5,000 international publishers. Reaxys is a leading solution forsynthetic chemists, integrating chemical reaction and compound data searching with synthesis planning.
Knovel provides a range of web-based productivity tools for the engineering community, integrating technicalinformation with analytics and search to deliver trusted answers and drive innovation.
Elsevier serves academic and government research administrators through its SciVal suite of products that help themevaluate their institutions’ research performance, determine research strategies and increase institutional efficiencies.Leveraging bibliometric data, such as citations from Scopus, SciVal Spotlight helps institutions and governments to identifytheir distinctive research strengths, evaluate performance and increase the focus of their research and developmentinvestments. SciVal Funding assists researchers and institutions in identifying grants that are most relevant in their researchareas.
For healthcare professionals, Elsevier develops products to deliver patient-specific solutions at the point of care toimprove patient outcomes. Its clinical solutions include Gold Standard, which provides critical information on druginteractions to assist effective treatment and CPM Resource Center, which provides a data-driven framework to supportnurses in undertaking procedures.
Market opportunities
Scientific, technical & medical information markets have good long-term growth characteristics. The importance ofresearch and development to economic performance and competitive positioning is well understood by governments,academic institutions and corporations. This is reflected in the long-term growth in research and development spend and in thenumber of researchers worldwide. Growth in health markets is driven by ageing populations in developed markets, risingprosperity in developing markets and the increasing focus on improving medical outcomes and efficiency. Given that asignificant proportion of scientific research and healthcare is funded directly or indirectly by governments, spending isinfluenced by governmental budgetary considerations. The commitment to research and health provision does, however,remain high, even in more difficult budgetary environments.
Strategic priorities
Elsevier’s strategic goal is to lead the way in providing information solutions that advance science, technology andhealth. To achieve this, Elsevier creates solutions that reflect deep insight into the way its users work and the outcomes theyare seeking to achieve; strives for excellence in content, service and execution; constantly adapts and revitalises its products,business models and technology; and leverages its institutional skills, assets and resources to promote innovation andefficiency.
Elsevier’s strategic priorities are to continue to increase content volume and quality; to expand content coverage,building out integrated solutions combining Elsevier, third-party and customer data; to increase content utility, using “SmartContent” to enable new e-solutions; to combine content with analytics and technology, focused on measurably improvingproductivity and outcomes for customers; and to continue to drive operational efficiency and effectiveness.
In the primary research market, Elsevier aims to grow volume through new journal launches, expansion of author-paysjournals and growth from emerging markets; to enhance quality by building on our premium brands; and to add value to coreplatforms by implementing new capabilities such as advanced recommendations on ScienceDirect and social collaborationthrough Mendeley.
In clinical reference markets, priorities are to expand content coverage, including licensing high-quality third-partycontent for ClinicalKey, as well as ensuring consistent tagging to link content assets across products.
Business model, distribution channels and competition
Science and medical research is principally disseminated on a paid subscription basis to the research facilities ofacademic institutions, government and corporations, and, in the case of medical and healthcare journals, also to individualpractitioners and medical society members. For a number of journals, advertising and promotional income represents a smallproportion of revenues predominantly from pharmaceutical companies in healthcare titles.
Over the past 15 years alternative payment models for the dissemination of research such as “author-pays open access”or “author’s-funder-pays” have emerged. While it is expected that paid subscription will remain the primary distributionmodel, Elsevier has long invested in alternate business models to address the needs of customers and researchers. Over 1,600of Elsevier’s journals now offer the option of funding research publishing and distribution via a sponsored article fee. Inaddition, Elsevier now publishes more than 50 open access journals.
16
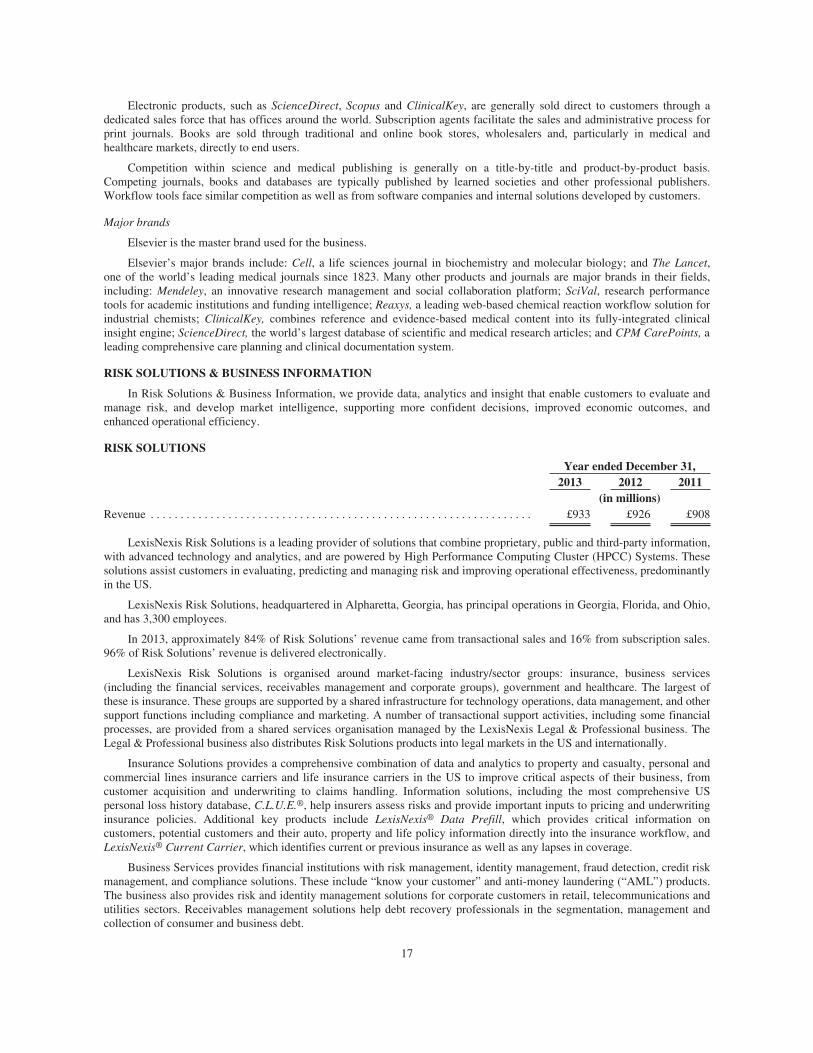
Electronic products, such as ScienceDirect, Scopus and ClinicalKey, are generally sold direct to customers through adedicated sales force that has offices around the world. Subscription agents facilitate the sales and administrative process forprint journals. Books are sold through traditional and online book stores, wholesalers and, particularly in medical andhealthcare markets, directly to end users.
Competition within science and medical publishing is generally on a title-by-title and product-by-product basis.Competing journals, books and databases are typically published by learned societies and other professional publishers.Workflow tools face similar competition as well as from software companies and internal solutions developed by customers.
Major brands
Elsevier is the master brand used for the business.
Elsevier’s major brands include: Cell, a life sciences journal in biochemistry and molecular biology; and The Lancet,one of the world’s leading medical journals since 1823. Many other products and journals are major brands in their fields,including: Mendeley, an innovative research management and social collaboration platform; SciVal, research performancetools for academic institutions and funding intelligence; Reaxys, a leading web-based chemical reaction workflow solution forindustrial chemists; ClinicalKey, combines reference and evidence-based medical content into its fully-integrated clinicalinsight engine; ScienceDirect, the world’s largest database of scientific and medical research articles; and CPM CarePoints, aleading comprehensive care planning and clinical documentation system.
RISK SOLUTIONS & BUSINESS INFORMATION
In Risk Solutions & Business Information, we provide data, analytics and insight that enable customers to evaluate andmanage risk, and develop market intelligence, supporting more confident decisions, improved economic outcomes, andenhanced operational efficiency.
RISK SOLUTIONS
Year ended December 31,2013 2012 2011
(in millions)Revenue . . . . . . . . . . . . . . . . . . . . . . . . . . . . . . . . . . . . . . . . . . . . . . . . . . . . . . . . . . . . . . . . £933 £926 £908
LexisNexis Risk Solutions is a leading provider of solutions that combine proprietary, public and third-party information,with advanced technology and analytics, and are powered by High Performance Computing Cluster (HPCC) Systems. Thesesolutions assist customers in evaluating, predicting and managing risk and improving operational effectiveness, predominantlyin the US.
LexisNexis Risk Solutions, headquartered in Alpharetta, Georgia, has principal operations in Georgia, Florida, and Ohio,and has 3,300 employees.
In 2013, approximately 84% of Risk Solutions’ revenue came from transactional sales and 16% from subscription sales.96% of Risk Solutions’ revenue is delivered electronically.
LexisNexis Risk Solutions is organised around market-facing industry/sector groups: insurance, business services(including the financial services, receivables management and corporate groups), government and healthcare. The largest ofthese is insurance. These groups are supported by a shared infrastructure for technology operations, data management, and othersupport functions including compliance and marketing. A number of transactional support activities, including some financialprocesses, are provided from a shared services organisation managed by the LexisNexis Legal & Professional business. TheLegal & Professional business also distributes Risk Solutions products into legal markets in the US and internationally.
Insurance Solutions provides a comprehensive combination of data and analytics to property and casualty, personal andcommercial lines insurance carriers and life insurance carriers in the US to improve critical aspects of their business, fromcustomer acquisition and underwriting to claims handling. Information solutions, including the most comprehensive USpersonal loss history database, C.L.U.E.®, help insurers assess risks and provide important inputs to pricing and underwritinginsurance policies. Additional key products include LexisNexis® Data Prefill, which provides critical information oncustomers, potential customers and their auto, property and life policy information directly into the insurance workflow, andLexisNexis® Current Carrier, which identifies current or previous insurance as well as any lapses in coverage.
Business Services provides financial institutions with risk management, identity management, fraud detection, credit riskmanagement, and compliance solutions. These include “know your customer” and anti-money laundering (“AML”) products.The business also provides risk and identity management solutions for corporate customers in retail, telecommunications andutilities sectors. Receivables management solutions help debt recovery professionals in the segmentation, management andcollection of consumer and business debt.
17
Government Solutions provides data and analytics to US federal, state and local law enforcement and governmentagencies to help solve criminal and intelligence cases and to identify fraud, waste and abuse in government programmes.
Health Care Solutions provides identity, fraud and clinical analytics solutions across key stages of the healthcareworkflow to enable intelligent decision making for payers and providers.
The LexisNexis Risk Solutions business also provides risk-related information to the legal industry through LexisNexisLegal & Professional.
LexisNexis Risk Solutions continues to focus on developing a pipeline of new solutions to drive growth in existingbusiness segments and selected adjacent markets and geographies. In 2013, this strategy was reinforced with a number offocused acquisitions.
In the Insurance business, LexisNexis Risk Solutions acquired Mapflow, an industry-leading geographic risk assessmenttechnology company based in Dublin, Ireland. Mapflow’s technology combined with Risk Solutions’ comprehensive data,advanced analytics, supercomputing platform (HPCC Systems) and linking capabilities help commercial and home insurersbetter understand property-level geographic peril risk to make more informed underwriting decisions.
In Business Services, LexisNexis Risk Solutions acquired the remaining stake in WorldCompliance, a leading providerof customer and vendor screening content, to complement our existing AML and compliance solutions. LexisNexis RiskSolutions also acquired RSA Security’s consumer Knowledge Based Authentication technology to drive further innovationand strengthen its leadership position in identity management. In Health Care, the acquisition of Enclarity supplements theexisting identity and fraud, waste, and abuse solutions with the most comprehensive provider information available. Thetransition of MEDai from Elsevier to Risk Solutions’ Health Care business was announced, enabling the combination ofMEDai’s clinical expertise with Risk Solutions’ analytics, data, and HPCC technology to create leading clinical analyticssolutions.
The identity management and risk evaluation solutions provided by Risk Solutions utilise comprehensive databaseplatforms of public records and proprietary information with more than 2 petabytes of unique data, which makes it the largestdatabase of its kind in the US market today. LexisNexis Accurint is a flagship product, powered by the HPCC technology.This market-leading technology enables LexisNexis Risk Solutions to provide its customers with highly relevant searchresults swiftly and to create new, low-cost solutions quickly and efficiently. It is also increasingly used across other ReedElsevier markets such as Legal and Scientific, Technical & Medical.
In February 2013, Risk Solutions completed the sale of its Screening business. This allows it to increase its focus onhigher-growth segments leveraging its core data, technology and analytical capabilities. The Screening business presentedlimited opportunities to apply these capabilities to generate unique customer value, sustained growth, and superior margins.
Market opportunities
Risk Solutions operates in markets with strong long-term underlying growth drivers including: insurance underwritingtransactions; insurance, healthcare, tax and entitlement fraud; credit defaults and financial fraud; regulatory compliance anddue diligence requirements surrounding customer enrolment; and security and privacy considerations.
In the insurance segment, growth is supported by increasing transactional activity in the auto, property and life insurancemarkets and the increasing adoption by insurance carriers of more sophisticated data and analytics in the prospecting,underwriting and claims evaluation processes, to assess underwriting risk, increase competitiveness and improve operatingcost efficiency. Transactional activity is driven by growth in insurance quoting and policy switching, as consumers seek betterpolicy terms. This activity is stimulated by increasing competition between insurance companies, high levels of carrieradvertising, and rising levels of internet quoting and policy binding.
A number of factors support growth for risk solutions in the financial services market, including new credit originations,continued high fraud losses, stringent regulatory compliance requirements and increasing anti-money laundering fines. Inreceivables management, demand is driven mainly by levels of consumer debt and the prospect of recovering that debt, whichis impacted by employment conditions in the US. In corporate markets, demand is supported by growth in online retail salesand continued high levels of credit card fraud. Growth in government markets is driven by the increasing use of data andanalytics to combat criminal activity, fraud, and tax evasion and to address security issues. The level and timing of demand inthis market is influenced by government funding and revenue considerations. In Health Care, there are numerous growthdrivers for fraud and analytics solutions including the expansion of insurance coverage under the Affordable Care Act and thefocus on cost containment and better patient outcomes.
Strategic priorities
Risk Solutions’ strategic goal is to make businesses and government more effective, through a better understanding ofthe risks associated with individuals, other businesses and transactions and by providing the highest quality tools to help
18
manage those risks efficiently and cost effectively. To achieve this, Risk Solutions is focused on: delivering innovative newproducts across customer workflows; expanding the range of risk management solutions across adjacent markets; addressinginternational opportunities in selected markets to meet local risk management needs; and continuing to strengthen its content,technology and analytical capabilities.
Business model, distribution channels and competition
LexisNexis Risk Solutions’ products are predominantly sold directly, with pricing mostly on a transactional basis forinsurance carriers and corporations, and primarily on a subscription basis for government entities.
LexisNexis Risk Solutions and Verisk, a competitor, each sell data and analytics solutions to insurance carriers butlargely address different activities. LexisNexis Risk Solutions’ principal competitors in commercial and government sectorsinclude Thomson Reuters and major credit bureaus, which in many cases address different activities in these segments as well.
Major brands
LexisNexis is the master brand used by LexisNexis Risk Solutions.
LexisNexis Risk Solutions’ major brands include: C.L.U.E.®, a comprehensive US personal insurance claims database;LexisNexis®Data Prefill, tools to automate the insurance application process providing critical information insurers need toquote and underwrite a policy; Accurint® for Collections, a leading online US solution to help locate debtors quickly andaccurately; LexisNexis® Identity Management, a range of solutions to help clients verify that an identity exists andauthenticate individuals; LexisNexis® Anti-Money Laundering Solutions, content and information for anti-money launderingcompliance, risk mitigation and enhanced due diligence; LexisNexis® Current Carrier, database that identifies the existence ofcurrent or previous insurance, and whether or not the applicant has had a possible lapse in coverage; LexisNexis® RiskView,comprehensive suite of credit risk management tools to help assess consumer creditworthiness and risk potential; andLexisNexis® Revenue Recovery and Discovery, a suite of tools to enable governments to leverage public records and analyticsto identify instances of fraud and to more efficiently collect on outstanding debts.
BUSINESS INFORMATION
Year ended December 31,2013 2012 2011
(in millions)Revenue . . . . . . . . . . . . . . . . . . . . . . . . . . . . . . . . . . . . . . . . . . . . . . . . . . . . . . . . . . . . . . . . . . . . . £547 £663 £695
Reed Business Information (“RBI”) provides information and online data services to business professionals worldwide.RBI provides its customers with high-value industry critical data services, information and tools as well as producingconferences, websites and business magazines. It has many strong global brands with market-leading positions across a widerange of industry sectors.
RBI is a global business with principal operations in London, Amsterdam, Chicago, Atlanta and Shanghai. RBI has3,900 employees worldwide. Approximately 28% of revenue in 2013 came from North America, 20% from theUnited Kingdom, 39% from Continental Europe and 13% from the rest of the world.
RBI’s customers use its data and online services to help make key strategic decisions, to improve productivity andperformance, to identify new business opportunities and to reduce risk. RBI’s magazines and websites deliver high-valuenews, information and opinion to business professionals across many industry sectors while also providing an effectivemarketing channel for customers.
RBI’s market-leading data services include: ICIS, an information and data service in chemicals, fertilisers and energy;Accuity, a provider of services and solutions to the banking and corporate sectors focused on payment efficiency, “know yourcustomer”, anti-money laundering (“AML”) and compliance; XpertHR, an online service providing regulatory guidance, bestpractices and tools for HR professionals; and Reed Construction Data, a provider of online construction data and informationto the construction industry.
RBI’s other leading brands include FlightGlobal, New Scientist, Farmers Weekly, Estates Gazette, Elsevier andBoerderij.
In 2013, RBI continued to reshape its portfolio, exiting areas not core to its paid content strategy. As part of this strategyRBI has continued to exit its Marketing Solutions businesses. Approved Index was sold in 2013, BuyerZone has been soldsince year end and the sale process of emedia is ongoing. In addition, RBI completed its exit of its publishing businesses inAustralia, France, Spain and Italy. ICIS made a small acquisition in the carbon trading information space, Tschach Solutions.
19
Market opportunities
The growing need for high-quality industry data and information and insight is driving demand for online subscriptiondata services and providing new opportunities.
Strategic priorities
RBI’s strategic goal is to help business professionals achieve better outcomes with information and decision support inits individual markets. Its areas of strategic focus are: further growing the data services businesses; restructuring theadvertising-driven portfolio and focusing other products on paid content; and driving further organisational effectiveness.
Business model, distribution channels and competition
Across the RBI portfolio, user and subscription revenues now account for 78% of the total business with the remaining22% derived from print and online advertising and lead generation. RBI electronic revenue streams now account for 60% oftotal revenue.
Data services are typically sold directly on a subscription or transactional basis. Business magazines are mainlydistributed on a paid basis. Advertising and lead generation revenues are sold directly or through agents.
RBI’s products compete with a number of information providers on a service and title-by-title basis including: IHS,McGraw Hill and Wolters Kluwer as well as many niche and privately owned competitors. RBI competes for onlineadvertising with other business-to-business websites, search engines and social media.
Major brands
RBI’s major brands include: ICIS, a global provider of news, price benchmarks, data, analytics and research to theenergy, chemical and fertiliser industries; Reed Construction Data, a provider of actionable insight for the constructionindustry through cost data, project leads, market intelligence and marketing solutions; Flightglobal, data, news and advisoryservices for professionals working in the global aviation industry; XpertHR, online services with reference data, complianceinformation and good practice guides for HR professionals; Elsevier, a leading news and opinion magazine in theNetherlands; Accuity, payment routing data, AML services and compliance tools for the banking and corporate sectorsworldwide; estatesgazette, news, data and research services for the UK commercial property industry; and Farmers Weekly,news, insight and software solutions for farmers and agricultural businesses.
LEGAL
Year ended December 31,2013 2012 2011
(in millions)Revenue . . . . . . . . . . . . . . . . . . . . . . . . . . . . . . . . . . . . . . . . . . . . . . . . . . . . . . . . . . . . . . . . £1,567 £1,610 £1,634
In Legal markets, we are a world leading provider of legal, regulatory and news & business information and analysis tolaw firm, corporate, government and academic customers.
Serving customers in more than 175 countries, LexisNexis Legal & Professional provides resources and services thatinform decisions, increase productivity and drive new business.
LexisNexis Legal & Professional is headquartered in New York and has principal operations in the New York area, Ohioand North Carolina in the US, Toronto in Canada, London and Paris in Europe, and cities in several other countries in Africaand Asia Pacific. It has 10,000 employees worldwide. In 2013, approximately 77% of Legal’s revenue came fromsubscription sales, 19% from transactional sales and 4% from advertising. Approximately 68% of revenue by destination in2013 was derived from North America, 21% from Europe and the remaining 11% from the rest of the world. 76% of Legal’srevenue was delivered electronically.
LexisNexis Legal & Professional is organised in market-facing groups. These are supported by global shared servicesorganisations providing platform and product development, operational and distribution services, and other support functions.
In the US, in Research & Litigation Solutions, electronic information solutions and innovative workflow tools, developedthrough close collaboration with customers, help legal and business professionals make better informed decisions in thepractice of law and in managing their businesses. Flagship products for legal research are Lexis.com and Lexis Advance,which provide federal and state statutes and case law, together with analysis and expert commentaries from sources such asMatthew Bender and Michie and the leading citation service Shepard’s, which advises on the continuing relevance of case lawprecedents. Research solutions also include news and business information, ranging from daily news to company filings, as
20
well as public records information and analytics. Through its litigation solutions, LexisNexis provides lawyers with a suite oftools covering case preparation to processing and review to trial preparation. LexisNexis partners with law schools to provideservices to students as part of their training.
In 2013, LexisNexis continued to release new versions of Lexis Advance, an innovative web application designed totransform how legal professionals conduct research. Built on an advanced technology platform, Lexis Advance allows primaryresearchers within legal and professional organisations to find highly relevant information more easily and efficiently, helpingthem to drive better outcomes. Future releases will continue to expand content and outreach and add new innovative tools.LexisNexis employs lawyers and trained editors with professional legal backgrounds who review, annotate and update thelegal content to help ensure each document in the collection is current and comprehensive. This domain expertise combinedwith the application of Reed Elsevier’s “big data” HPCC technology means LexisNexis is able to update its entire legalcollection faster and more efficiently, while also identifying and linking content, enabling customers to uncover previouslyundiscovered relationships between documents.
New workflow and analytical tools and content sets are regularly introduced on Lexis Advance. For example, in 2013LexisNexis launched MedMal Navigator, a workflow tool that integrates medical and legal research with case facts, assistingattorneys in determining their course of action. Also, LexisNexis launched new modules for Lexis Practice Advisor, a web-based practical guidance product tailored for attorneys who handle transactional matters. Additionally, LexisNexisstrengthened its core content offering through the acquisitions of Sheshunoff and A.S. Pratt and analytical titles from OxfordUniversity Press — providing attorneys with enhanced information in online and ebooks formats.
In litigation solutions, LexisNexis launched its web-enabled Early Data Analyzer which enables users to determine thenature and amount of relevant data in a lawsuit at its source location. Additionally, LexisNexis released a new version ofConcordance Evolution supporting the direct import of files from LAW PreDiscovery — reducing time, costs and storageneeds by streamlining electronic discovery workflow.
LexisNexis Business of Law Software Solutions provides law firms with practice management solutions, including timeand billing systems, case management, cost recovery and document management services.
In August 2013, LexisNexis Martindale-Hubbell and Internet Brands announced the set-up of a joint venture, bringingtogether Martindale-Hubbell lawyer directory, including Lawyers.com, with Internet Brands’ online marketing services forlawyers.
In International markets outside the US, LexisNexis serves legal, corporate, government, accounting and academicmarkets in Europe, Canada, Africa and Asia Pacific with local and international legal, regulatory and business information.The most significant businesses are in the UK, France, Australia, Canada and South Africa.
LexisNexis focuses on providing customers with leading collections of content and innovative online solutions to helplegal and business professionals make better decisions more efficiently. Penetration of online information services has grownstrongly and electronic solutions now account for 60% of revenue outside the US.
In the UK, LexisNexis is a leading legal information provider offering an unrivalled collection of primary and secondarylegislation, case law, expert commentary, and forms and precedents. Its extensive portfolio includes a number of heritagebrands: Halsbury’s, Tolleys and Butterworths. The content is delivered through multiple formats — from print to online tomobile apps and embedded in customers’ workflow.
In 2013, LexisNexis launched additional modules for the UK LexisPSL product suite which provides lawyers a singledestination for their practical legal information needs with direct links to the relevant cases, legislation, precedents, forms,practical guidance and expert commentary. Similar practical guidance services were launched in Canada, South Africa andAustralia.
In France, LexisNexis is a leading online provider of information to lawyers, notaries and courts. A heritage brandJurisClasseur and leading authoritative content is provided through multiple formats — lexisnexis.fr, mobile and in print.These content sources are, as in the UK, being combined with new content and innovative workflow tools to develop practicalguidance and practice management solutions. In 2013, LexisNexis France continued to enhance Lexis 360, the first semanticsearch online tool combining legal information, practical content and results from the web by providing tailored solutions forthe notary market.
Following the success of Lexis for Microsoft Office (LMO) in the US and Canadian markets, an Australian version waslaunched in 2013. LMO enables customers to access LexisNexis content and services via add-ins/toolbars within MicrosoftWord and Outlook.
In 2013, LexisNexis Legal & Professional strengthened its positions in Asia through acquisitions and enhanced productscreated specifically for legal professionals and practitioners, corporate counsels, legal researchers and government institutionsin markets including India, China and Japan. In China, LexisNexis acquired LegalStudio, a leading provider of modelcontracts and practical guidance, strengthening its position in high-growing Corporate and Intellectual Property practice areas.
21
Market opportunities
Longer-term growth in legal and regulatory markets worldwide is driven by increasing levels of legislation, regulation,regulatory complexity and litigation, and an increasing number of lawyers. Additional market opportunities are presented bythe increasing demand for online information solutions and practice management tools that improve the quality andproductivity of research, deliver better legal outcomes, and improve business performance. Notwithstanding this, legal activityand legal information markets are also influenced by economic conditions and corporate activity, as has been seen with thedampening impact on demand of the recent global recession and the somewhat subdued environment that followed in NorthAmerica and in Europe.
Strategic priorities
LexisNexis Legal & Professional’s strategic goal is to enable better legal outcomes and be the leading provider ofproductivity-enhancing information and information-based workflow solutions in its markets. To achieve this LexisNexis isfocused on introducing next generation products and solutions on the global New Lexis platform and infrastructure;leveraging New Lexis globally to continue to drive print to electronic migration and long-term international growth; andupgrading operational infrastructure, improving process efficiency and gradually improving margins.
In the US, LexisNexis’ focus is on the continuing development of next generation legal research and practice solutions. Itis also conducting a major upgrade in operations infrastructure and customer service and support platforms. This will providecustomers with an integrated and superior experience across multiple products and solutions. Over the next few yearsprogressive product introductions, often based on the New Lexis platform, leveraging big data HPCC technology, willcombine advanced technology with enriched content, sophisticated analytics and applications to enable LexisNexis’customers to make better legal decisions and drive better outcomes for their organisations and clients.
Outside the US, LexisNexis is focused on growing online services and developing further high-quality actionable contentand workflow tools, including the development of practical guidance and practice management applications. In 2014,LexisNexis will continue to introduce New Lexis globally. Additionally, LexisNexis is focusing on the expansion of itsactivities in emerging markets.
Business model, distribution channels and competition
LexisNexis Legal & Professional products and services are generally sold directly to law firms and to corporate,government, accounting and academic customers on a paid subscription basis, with subscriptions with law firms often undermulti-year contracts.
Principal competitors for LexisNexis in US legal markets are West (Thomson Reuters) and CCH (Wolters Kluwer). Innews and business information they are Bloomberg and Factiva (News Corporation). Competitors in litigation solutions alsoinclude software companies. Significant international competitors include Thomson Reuters, Wolters Kluwer and Factiva.
Major brands
LexisNexis is the master brand used by LexisNexis Legal & Professional.
LexisNexis Legal & Professional’s major brands include: Lexis®, legal, news and public records content for legalprofessionals; Matthew Bender®, critical analysis, checklists, forms, and practice guides authored by industry expertscovering over 50 major practice areas; Lexis®Library, LexisNexis® UK flagship legal online product; Lexis®PSL,LexisNexis® UK legal practical guidance service; JurisClasseur, an authoritative online legal resource in France; Shepard’s®,a citation service; Lexis Advance™, a new online legal research tool that transforms the way legal professionals conductresearch; and Lexis® Practice Advisor, a new resource that offers guidance to help attorneys handle transactional matters moreefficiently and effectively.
EXHIBITIONS
Year ended December 31,2013 2012 2011
(in millions)Revenue . . . . . . . . . . . . . . . . . . . . . . . . . . . . . . . . . . . . . . . . . . . . . . . . . . . . . . . . . . . . . . . . . . . . . £862 £854 £707
Reed Exhibitions is a leading exhibitions business, with almost 500 events in over 30 countries.
Reed Exhibitions’ portfolio of exhibitions and conferences serves 43 industry sectors across the globe. In 2013, ReedExhibitions brought together over 6 million event participants from around the world, generating billions of dollars ofbusiness and facilitating entry into new markets for its customers and boosting the local economies where the events arehosted.
22
Reed Exhibitions is a global business headquartered in London and has principal offices in Paris, Vienna, Norwalk(Connecticut), São Paulo, Abu Dhabi, Beijing, Moscow, Tokyo and Sydney. Reed Exhibitions has 3,400 employeesworldwide. Over 70% of Exhibitions’ revenue is derived from exhibitor participation fees, with the balance primarilycomprising of conference fees, online and offline advertising, sponsorship fees and admission charges. In 2013,approximately 16% of Exhibitions’ revenue came from North America, 43% from Europe and the remaining 41% from therest of the world on an event location basis.
Reed Exhibitions organises events which are relevant to industry needs, where participants from around the world meetface-to-face to do business, to network and to learn. Its exhibitions and conferences encompass a wide range of sectors. Theyinclude construction, electronics, energy and alternative energy, engineering, entertainment, gifts and jewellery, healthcare,hospitality, interior design, logistics, manufacturing, pharmaceuticals, real estate, recreation, security and safety, transport andtravel.
Market opportunities
Growth in the exhibitions market is influenced by both business-to-business marketing spend and business investment.Historically, these have been driven by levels of corporate profitability, which in turn has followed overall growth in GDP.Emerging markets and higher growth sectors provide additional opportunities for Reed Exhibitions. As some events are heldother than annually, growth in any one year is affected by the cycle of non-annual exhibitions.
Strategic priorities
Reed Exhibitions’ strategic goal is to understand and respond to its customers’ evolving needs and objectives better thanits competition through deep knowledge of its customers and the markets they serve.
Reed Exhibitions delivers a platform for industry communities to conduct business, to network and to learn through arange of market-leading events in growth sectors, especially in higher growth geographies, enabling exhibitors to target andreach new customers quickly and cost effectively.
Organic growth will be achieved by continuing to generate greater customer value through the intelligent application ofcustomer knowledge, by developing new events, and by building out technology platforms to ensure the rapid deployment ofinnovation and best practices across the organisation. Reed Exhibitions is also shaping its portfolio through a combination ofstrategic partnerships and acquisitions in high-growth sectors and geographies as well as by withdrawing from markets andindustries with lower long-term growth prospects.
Reed Exhibitions is committed to continually improving customer solutions and experience. By providing a variety ofservices, including its integrated web platform, the company continues to drive customer satisfaction. Using customerinsights, Reed Exhibitions has developed an innovative product offering which enhances the value proposition for exhibitorsby broadening their options in terms of the type and location of stand they take and the timing of their commitment to theevent.
In 2013 Reed Exhibitions launched 37 new events. These included events which extended the geographical footprint ofthe luxury travel brand, ILTM, to Africa and the art brand, Paris Photo, to Los Angeles. Reed Exhibitions Japan respondedagain to customer demand by replicating its Tokyo-based World Smart Energy Week in Osaka. The UK-based event,Oceanology International, was successfully launched in China through a collaborative effort between the Chinese andUK teams. Regional strategies remain a key element of building business in China and Brazil, taking more events to China’ssecond tier cities and cloning events from São Paulo to Recife in Brazil’s fast developing north east. Reed Exhibitions noworganises nearly 200 events in emerging markets.
A number of targeted acquisitions were completed during 2013. These included the Capsule portfolio of contemporaryfashion events, located mainly in North America; Travelweek São Paolo, a high-end travel event servicing premium buyersacross Latin America, and Expo Ferretera, the leading hardware event in Mexico. Elsewhere, acquisitions were made toexpand Reed Exhibitions’ footprint in China and its global position in the advanced materials sector. Reed Exhibitions alsoentered into a partnership with Thebe Exhibitions, one of the leading events companies in South Africa, to form Thebe ReedExhibitions, which will run a number of events, primarily in the travel and interior design sectors.
Business model, distribution channels and competition
The substantial majority of Reed Exhibitions’ revenues are from sales of exhibition space. The balance includesconference fees, online and offline advertising, sponsorship fees and, for some shows, admission charges. Exhibition space issold directly or through local agents where applicable. Reed Exhibitions often works in collaboration with trade associations,which use the events to promote access for members to domestic and export markets, and with governments, for whom eventscan provide important support to stimulate foreign investment and promote regional and national enterprise. Increasingly,Reed Exhibitions is offering visitors and exhibitors the opportunity to interact before and after the show through the use ofonline tools such as directories and matchmaking.
23
Reed Exhibitions is the global market leader in a fragmented industry, holding less than a 10% global market share.Other international exhibition organisers include UBM, Informa IIR and some of the larger German Messe, including MesseFrankfurt, Messe Düsseldorf and Messe Munich. Competition also comes from industry trade associations and conventioncentre and exhibition hall owners.
Major brands
Reed Exhibitions’ major brands include: Pollutec, an international exhibition of environmental equipment, technologiesand services; Gifts and Home, one of the largest business gifts and home fairs in China; Feicon Batimat, the internationalconstruction trade fair; Mipim, the world’s property market; World Smart Energy Week, a leading event for smart andrenewable energy; Intercharm, an international perfumery and cosmetics exhibition; World Travel Market, a premier event forthe travel industry; and National Hardware Show, a US home improvement and DIY fair.
ELSEVIER REED FINANCE BV
Elsevier Reed Finance BV, the Dutch parent company of the Elsevier Reed Finance BV group (“ERF”), is directlyowned by Reed Elsevier PLC and Reed Elsevier NV. ERF provides treasury, finance, intellectual property and reinsuranceservices to the Reed Elsevier Group plc businesses through its subsidiaries in Switzerland: Elsevier Finance SA (“EFSA”),Reed Elsevier Properties SA (“REPSA”) and Elsevier Risks SA (“ERSA”). These three Swiss companies are organised underone Swiss holding company, which is in turn owned by Elsevier Reed Finance BV.
EFSA is the principal treasury centre for the Reed Elsevier combined businesses. It is responsible for all aspects oftreasury advice and support for Reed Elsevier Group plc’s businesses operating in Continental Europe, Latin America, thePacific Rim, India, China and certain other territories, and undertakes foreign exchange and derivatives dealing services forthe whole of Reed Elsevier. EFSA also arranges or directly provides Reed Elsevier Group plc businesses with financing foracquisitions, product development and other general requirements and manages cash pools, investments and debt programmeson their behalf.
REPSA actively manages intellectual property assets including trademarks such as The Lancet and databases such asReaxys and PharmaPendium. ERSA is responsible for reinsurance activities for Reed Elsevier.
In 2013, EFSA was active in arranging the financing and foreign currency contracts for Reed Elsevier Group plccompanies related to cross border dividends and acquisitions. In June 2013, EFSA issued $282 million of term debt notes dueDecember 2018. It negotiated and advised Reed Elsevier Group plc companies on a number of banking and cash managementarrangements in Continental Europe and Asia and continued to advise on treasury matters, including interest rate and foreigncurrency management and certain other financial exposures.
The average balance of cash under management by EFSA in 2013, on behalf of Reed Elsevier Group plc and its parentcompanies, was approximately $0.4 billion (2012: $0.5 billion).
At December 31, 2013, 85% (2012: 82%) of ERF’s gross assets were held in US dollars and 10% (2012: 17%) in euros,including $8.2 billion (2012: $8.4 billion) and €0.5 billion (2012: €0.6 billion) in loans to Reed Elsevier Group plcsubsidiaries. Loans made to Reed Elsevier Group plc businesses are funded from equity, long term debt of $1.9 billion andshort term debt of $0.3 billion backed by committed bank facilities. Sources of long term debt include Swiss domestic publicbonds, euro notes, bilateral term loans, private placements and syndicated bank facilities. Short term debt is primarily derivedfrom euro and US commercial paper programmes.
GOVERNMENT REGULATION
Certain of our businesses provide authorised customers with products and services such as access to public records andother information on US individuals. Our businesses that provide such products and services are subject to applicable privacyand consumer information laws and US federal and state and EU and member state regulation. Our compliance obligationsvary from regulator to regulator, and include, among other things, strict data security programs, submissions of regulatoryreports, providing consumers with certain notices and correcting inaccuracies in applicable reports. We are also subject to theterms of consent decrees and other settlements with certain regulators in the U.S. See “Item 8: Financial Information — LegalProceedings” on page 79.
Section 219 of the Iran Threat Reduction and Syrian Human Rights Act of 2012 (the “ITRA”), which addedSection 13(r) to the Securities Exchange Act of 1934, as amended (the “Exchange Act”), requires disclosures regardingcertain activities relating to Iran or with persons designated pursuant to various U.S. Presidential Executive Orders. Thesedisclosures are required even where the activities, transactions or dealings were conducted in compliance with applicable law.The ownership or control of our customers in Iran is often difficult to determine with certainty.
During 2013, Tarbiat Modares University, Urmia University, Masih Daneshvari Hospital, Kharazmi University,Ferdowsi University of Mashad, the Iran Ministry of Science, Research and Technology, the Iran Ministry of Health and
24

Tehran University of Medical Sciences purchased subscription access to our ScienceDirect online platform, and in somecases, also purchased print subscriptions or other publications from our scientific, medical & technical publications business.Petrochemical Commercial Company, National Petrochemical Company, Jam Petrochemical Company, Sepahan OilCompany, Zagros Petrochemical Company, Shazand Petrochemical Co., Bandar Imam Petrochemical Company, TabrizPetrochemical Company, Arya Sasol Polymer Company, Polynar Corporation, Behran Oil Co., Ghaed Bassir PetrochemicalCo., Fanavaran Petrochemical Co. and Farabi Petrochemical Company subscribed to our ICIS price reports relating to theglobal petrochemical, energy and fertilizer markets. Iran Air subscribed to our Flight Global aviation news and informationservice. Our exhibitions business provided exhibition space to the Cultural Centre of the Embassy of the Islamic Republic ofIran located in Japan.
During 2013, our aggregate revenue from the foregoing activities was approximately £4.45 million. We do not normallyallocate net profit on a subscription-by-subscription, individual customer or country-by-country basis. However, we estimatethat our net profit from these activities, after internal cost allocations, amounted to less than 0.075% of our net profit reportedin our combined income statement for the year ended December 31, 2013.
Numerous individuals located in Iran subscribed to or purchased certain of our scientific, medical & technicalpublications. Many of these individuals are researchers, doctors or other professionals who have obtained subscriptions orpurchased publications in their individual capacity, but who may be employed by government agencies in Iran or by hospitals,universities or other entities owned or controlled by the government of Iran. We work with authors, other contributors andjournal editorial board members who are located in Iran, many of whom are employed at hospitals, universities or researchinstitutions that are owned or controlled by the government of Iran. During 2013, we did not pay any fees or receive anyrevenues in connection with this activity. During 2013, numerous attendees at conferences organized by our exhibitionsbusiness were Iran nationals.
We believe these transactions and dealings were lawful under applicable laws and regulations, and anticipate that similartransactions or dealings may occur in the future.
ORGANISATIONAL STRUCTURE
A description of the corporate structure is included under “— History and Development” on page 12. A list of significantsubsidiaries, associates, joint ventures and business units is included as an exhibit, see “Item 19: Exhibits” on pages S-3 andS-4.
PROPERTY, PLANT AND EQUIPMENT
We own or lease approximately 280 properties around the world, the majority of leased space being in the United States.The table below identifies the principal owned and leased properties which we use in our business.
Location Business segment(s) Principal use(s)Floor space(square feet)
Owned propertiesAlpharetta, Georgia . . . . . . . . . . Risk Solutions and Legal Office and data centre 406,000Miamisburg, Ohio . . . . . . . . . . . . Risk Solutions and Legal Office 403,638Linn, Missouri . . . . . . . . . . . . . . Scientific, Technical & Medical Warehouse 236,105Albany, New York . . . . . . . . . . . Risk Solutions and Legal Office 194,780Binghamton, New York . . . . . . . Risk Solutions and Legal Office and warehouse 162,000
Leased propertiesNew York, New York . . . . . . . . . Business Information and Scientific,
Technical & Medical Office 451,800Amsterdam, Netherlands . . . . . . Business Information and Scientific,
Technical & Medical Office 426,036Miamisburg, Ohio . . . . . . . . . . . . Risk Solutions, Legal and Scientific,
Technical & Medical Office and data centre 213,802Sutton, England . . . . . . . . . . . . . Business Information and Legal Office 191,960
All of the above properties are substantially occupied by Reed Elsevier businesses with the exception of the New York,New York property, where Reed Elsevier occupies less than half of the floor space.
No property owned or leased by Reed Elsevier which is considered material to Reed Elsevier taken as a whole ispresently subject to liabilities relating to environmental regulations and none has major encumbrances.
25
ITEM 5: OPERATING AND FINANCIAL REVIEW AND PROSPECTS
OPERATING RESULTS — REED ELSEVIER
The following discussion is based on the combined financial statements of Reed Elsevier for the three years endedDecember 31, 2013 which have been prepared in accordance with International Financial Reporting Standards (“IFRS”) asissued by the International Accounting Standards Board (“IASB”) and as adopted by the European Union.
The following discussion should be read in conjunction with, and is qualified by reference to, the combined financialstatements.
The following tables analyse Reed Elsevier’s revenue in each of the three years ended December 31, 2013, 2012 and2011 by type, format and geographic market. Reed Elsevier derives its revenue principally from subscriptions, transactionaland advertising sales. Transactional sales includes revenue from exhibitions.
Revenue by typeYear ended December 31,
2013 2012 2011(in millions, except percentages)
Subscriptions . . . . . . . . . . . . . . . . . . . . . . . . . . . . . . . . . . . . . . . . . . . . £3112 52% £2,978 49% £2,819 45%Transactional . . . . . . . . . . . . . . . . . . . . . . . . . . . . . . . . . . . . . . . . . . . . 2,683 44 2,788 45 2,746 47Advertising . . . . . . . . . . . . . . . . . . . . . . . . . . . . . . . . . . . . . . . . . . . . . 240 4 350 6 437 8
Total . . . . . . . . . . . . . . . . . . . . . . . . . . . . . . . . . . . . . . . . . . . . . . . . . . £6,035 £100% £6,116 100% £6,002 100%
Revenue by formatYear ended December 31,
2013 2012 2011(in millions, except percentages)
Electronic . . . . . . . . . . . . . . . . . . . . . . . . . . . . . . . . . . . . . . . . . . . . . . . £3,971 66% £3,896 21% £3,767 63%Print . . . . . . . . . . . . . . . . . . . . . . . . . . . . . . . . . . . . . . . . . . . . . . . . . . . . 1,168 19 1,305 64 1,451 22Face to face . . . . . . . . . . . . . . . . . . . . . . . . . . . . . . . . . . . . . . . . . . . . . . 896 15 915 15 783 15
Total . . . . . . . . . . . . . . . . . . . . . . . . . . . . . . . . . . . . . . . . . . . . . . . . . . . £6,035 100% £6,116 100% £6,002 100%
Revenue by geographic marketYear ended December 31,
2013 2012 2011(in millions, except percentages)
North America . . . . . . . . . . . . . . . . . . . . . . . . . . . . . . . . . . . . . . . . . . . . . £3,082 51% £3,154 52% £3,219 54%United Kingdom . . . . . . . . . . . . . . . . . . . . . . . . . . . . . . . . . . . . . . . . . . . 443 7 442 7 485 8The Netherlands . . . . . . . . . . . . . . . . . . . . . . . . . . . . . . . . . . . . . . . . . . . . 166 3 165 3 189 3Rest of Europe . . . . . . . . . . . . . . . . . . . . . . . . . . . . . . . . . . . . . . . . . . . . . 1,074 18 1,176 19 1,095 18Rest of world . . . . . . . . . . . . . . . . . . . . . . . . . . . . . . . . . . . . . . . . . . . . . . 1,270 21 1,179 19 1,014 17
Total . . . . . . . . . . . . . . . . . . . . . . . . . . . . . . . . . . . . . . . . . . . . . . . . . . . . . £6,035 100% £6,116 100% £6,002 100%
The cost profile of individual businesses within Reed Elsevier varies widely and costs are controlled on an individualbusiness unit basis. The most significant cost item for Reed Elsevier as a whole is staff costs of £1,775 million (2012: restated£1,845 million; 2011: restated £1,831 million).
The following tables show revenue, operating profit and adjusted operating profit for each of Reed Elsevier’s businesssegments in each of the three years ended December 31, 2013, 2012 and 2011 together with the percentage change in 2013and 2012 at both actual and constant exchange rates. Adjusted operating profit is included on the basis that it is the keysegmental profit measure used by management to evaluate performance and allocate resources to the business segments, asreported under IFRS8: Operating Segments in note 3 to the combined financial statements. Adjusted operating profitrepresents operating profit before amortisation of acquired intangible assets, acquisition related costs, the share of profit ondisposals in joint ventures, and is grossed up to exclude the equity share of taxes in joint ventures. A reconciliation ofoperating profit to adjusted operating profit is included below. Operating profit by business segment is provided assupplementary information.
26
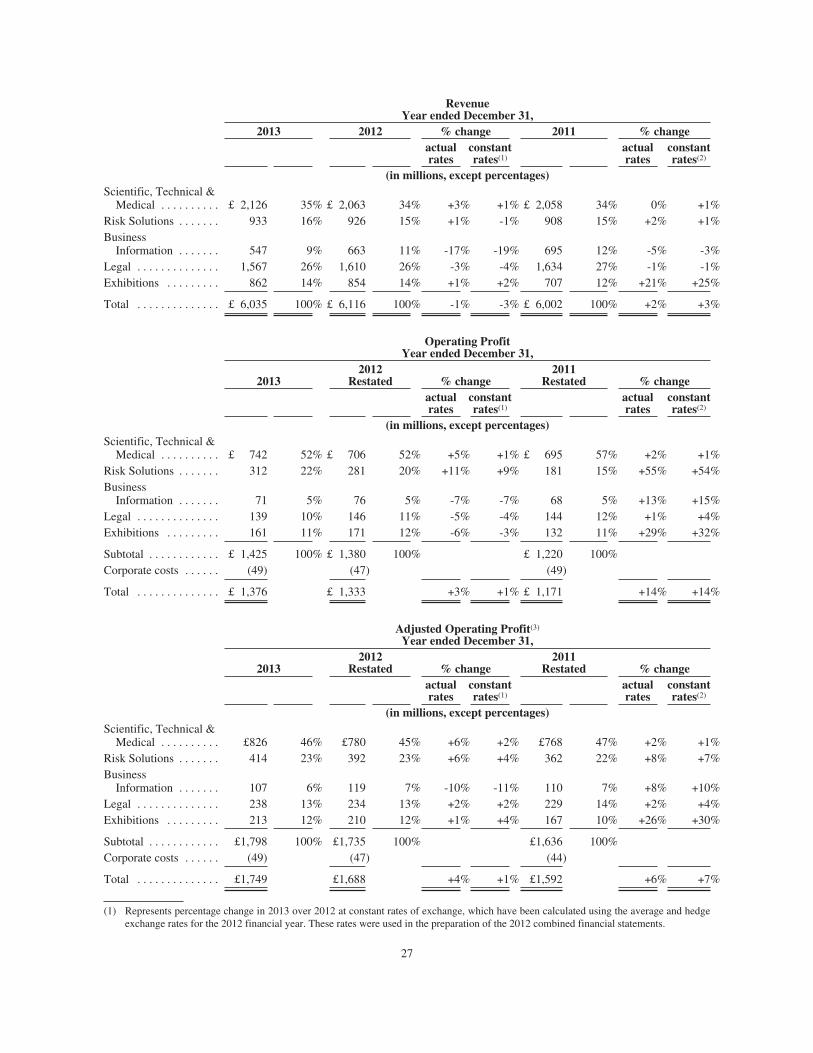
RevenueYear ended December 31,
2013 2012 % change 2011 % changeactualrates
constantrates(1)
actualrates
constantrates(2)
(in millions, except percentages)Scientific, Technical &
Medical . . . . . . . . . . £ 2,126 35% £ 2,063 34% +3% +1% £ 2,058 34% 0% +1%Risk Solutions . . . . . . . 933 16% 926 15% +1% -1% 908 15% +2% +1%Business
Information . . . . . . . 547 9% 663 11% -17% -19% 695 12% -5% -3%Legal . . . . . . . . . . . . . . 1,567 26% 1,610 26% -3% -4% 1,634 27% -1% -1%Exhibitions . . . . . . . . . 862 14% 854 14% +1% +2% 707 12% +21% +25%
Total . . . . . . . . . . . . . . £ 6,035 100% £ 6,116 100% -1% -3% £ 6,002 100% +2% +3%
Operating ProfitYear ended December 31,
20132012
Restated % change2011
Restated % changeactualrates
constantrates(1)
actualrates
constantrates(2)
(in millions, except percentages)Scientific, Technical &
Medical . . . . . . . . . . £ 742 52% £ 706 52% +5% +1% £ 695 57% +2% +1%Risk Solutions . . . . . . . 312 22% 281 20% +11% +9% 181 15% +55% +54%Business
Information . . . . . . . 71 5% 76 5% -7% -7% 68 5% +13% +15%Legal . . . . . . . . . . . . . . 139 10% 146 11% -5% -4% 144 12% +1% +4%Exhibitions . . . . . . . . . 161 11% 171 12% -6% -3% 132 11% +29% +32%
Subtotal . . . . . . . . . . . . £ 1,425 100% £ 1,380 100% £ 1,220 100%Corporate costs . . . . . . (49) (47) (49)
Total . . . . . . . . . . . . . . £ 1,376 £ 1,333 +3% +1% £ 1,171 +14% +14%
Adjusted Operating Profit(3)
Year ended December 31,
20132012
Restated % change2011
Restated % changeactualrates
constantrates(1)
actualrates
constantrates(2)
(in millions, except percentages)Scientific, Technical &
Medical . . . . . . . . . . £826 46% £780 45% +6% +2% £768 47% +2% +1%Risk Solutions . . . . . . . 414 23% 392 23% +6% +4% 362 22% +8% +7%Business
Information . . . . . . . 107 6% 119 7% -10% -11% 110 7% +8% +10%Legal . . . . . . . . . . . . . . 238 13% 234 13% +2% +2% 229 14% +2% +4%Exhibitions . . . . . . . . . 213 12% 210 12% +1% +4% 167 10% +26% +30%
Subtotal . . . . . . . . . . . . £1,798 100% £1,735 100% £1,636 100%Corporate costs . . . . . . (49) (47) (44)
Total . . . . . . . . . . . . . . £1,749 £1,688 +4% +1% £1,592 +6% +7%
(1) Represents percentage change in 2013 over 2012 at constant rates of exchange, which have been calculated using the average and hedgeexchange rates for the 2012 financial year. These rates were used in the preparation of the 2012 combined financial statements.
27
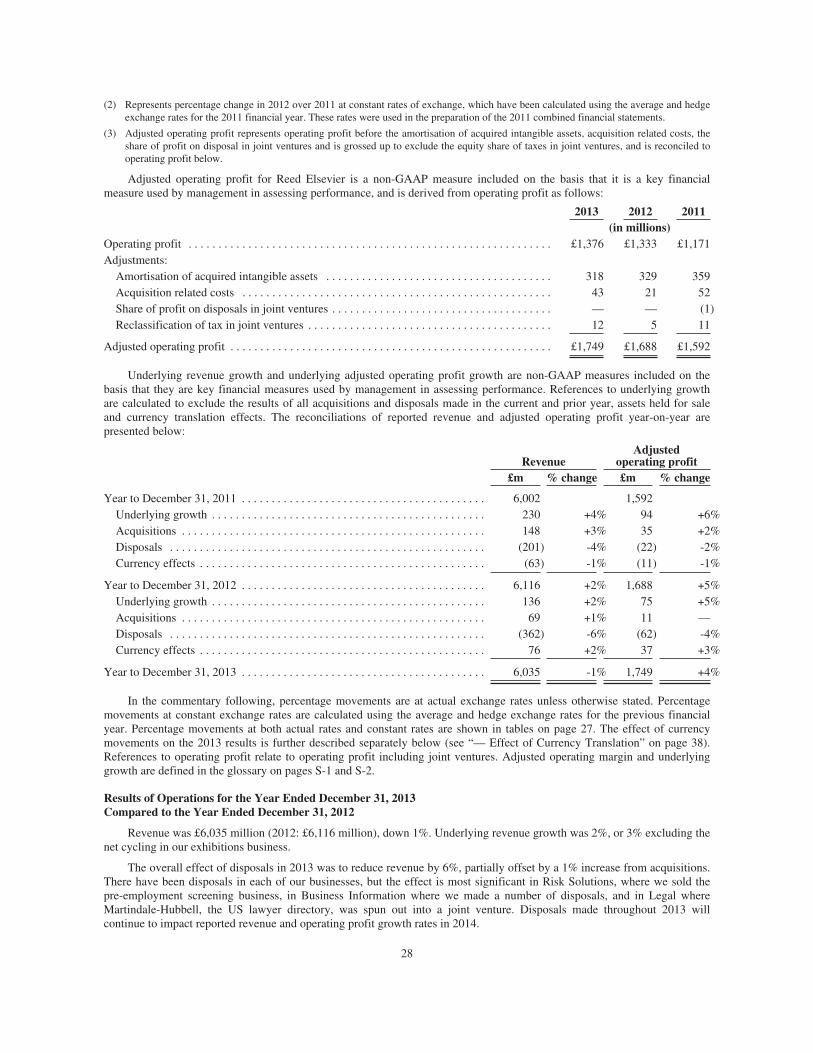
(2) Represents percentage change in 2012 over 2011 at constant rates of exchange, which have been calculated using the average and hedgeexchange rates for the 2011 financial year. These rates were used in the preparation of the 2011 combined financial statements.
(3) Adjusted operating profit represents operating profit before the amortisation of acquired intangible assets, acquisition related costs, theshare of profit on disposal in joint ventures and is grossed up to exclude the equity share of taxes in joint ventures, and is reconciled tooperating profit below.
Adjusted operating profit for Reed Elsevier is a non-GAAP measure included on the basis that it is a key financialmeasure used by management in assessing performance, and is derived from operating profit as follows:
2013 2012 2011(in millions)
Operating profit . . . . . . . . . . . . . . . . . . . . . . . . . . . . . . . . . . . . . . . . . . . . . . . . . . . . . . . . . . . . . £1,376 £1,333 £1,171Adjustments:
Amortisation of acquired intangible assets . . . . . . . . . . . . . . . . . . . . . . . . . . . . . . . . . . . . . . 318 329 359Acquisition related costs . . . . . . . . . . . . . . . . . . . . . . . . . . . . . . . . . . . . . . . . . . . . . . . . . . . . 43 21 52Share of profit on disposals in joint ventures . . . . . . . . . . . . . . . . . . . . . . . . . . . . . . . . . . . . . — — (1)Reclassification of tax in joint ventures . . . . . . . . . . . . . . . . . . . . . . . . . . . . . . . . . . . . . . . . . 12 5 11
Adjusted operating profit . . . . . . . . . . . . . . . . . . . . . . . . . . . . . . . . . . . . . . . . . . . . . . . . . . . . . . £1,749 £1,688 £1,592
Underlying revenue growth and underlying adjusted operating profit growth are non-GAAP measures included on thebasis that they are key financial measures used by management in assessing performance. References to underlying growthare calculated to exclude the results of all acquisitions and disposals made in the current and prior year, assets held for saleand currency translation effects. The reconciliations of reported revenue and adjusted operating profit year-on-year arepresented below:
RevenueAdjusted
operating profit£m % change £m % change
Year to December 31, 2011 . . . . . . . . . . . . . . . . . . . . . . . . . . . . . . . . . . . . . . . . . 6,002 1,592Underlying growth . . . . . . . . . . . . . . . . . . . . . . . . . . . . . . . . . . . . . . . . . . . . . . 230 +4% 94 +6%Acquisitions . . . . . . . . . . . . . . . . . . . . . . . . . . . . . . . . . . . . . . . . . . . . . . . . . . . 148 +3% 35 +2%Disposals . . . . . . . . . . . . . . . . . . . . . . . . . . . . . . . . . . . . . . . . . . . . . . . . . . . . . (201) -4% (22) -2%Currency effects . . . . . . . . . . . . . . . . . . . . . . . . . . . . . . . . . . . . . . . . . . . . . . . . (63) -1% (11) -1%
Year to December 31, 2012 . . . . . . . . . . . . . . . . . . . . . . . . . . . . . . . . . . . . . . . . . 6,116 +2% 1,688 +5%Underlying growth . . . . . . . . . . . . . . . . . . . . . . . . . . . . . . . . . . . . . . . . . . . . . . 136 +2% 75 +5%Acquisitions . . . . . . . . . . . . . . . . . . . . . . . . . . . . . . . . . . . . . . . . . . . . . . . . . . . 69 +1% 11 —Disposals . . . . . . . . . . . . . . . . . . . . . . . . . . . . . . . . . . . . . . . . . . . . . . . . . . . . . (362) -6% (62) -4%Currency effects . . . . . . . . . . . . . . . . . . . . . . . . . . . . . . . . . . . . . . . . . . . . . . . . 76 +2% 37 +3%
Year to December 31, 2013 . . . . . . . . . . . . . . . . . . . . . . . . . . . . . . . . . . . . . . . . . 6,035 -1% 1,749 +4%
In the commentary following, percentage movements are at actual exchange rates unless otherwise stated. Percentagemovements at constant exchange rates are calculated using the average and hedge exchange rates for the previous financialyear. Percentage movements at both actual rates and constant rates are shown in tables on page 27. The effect of currencymovements on the 2013 results is further described separately below (see “— Effect of Currency Translation” on page 38).References to operating profit relate to operating profit including joint ventures. Adjusted operating margin and underlyinggrowth are defined in the glossary on pages S-1 and S-2.
Results of Operations for the Year Ended December 31, 2013Compared to the Year Ended December 31, 2012
Revenue was £6,035 million (2012: £6,116 million), down 1%. Underlying revenue growth was 2%, or 3% excluding thenet cycling in our exhibitions business.
The overall effect of disposals in 2013 was to reduce revenue by 6%, partially offset by a 1% increase from acquisitions.There have been disposals in each of our businesses, but the effect is most significant in Risk Solutions, where we sold thepre-employment screening business, in Business Information where we made a number of disposals, and in Legal whereMartindale-Hubbell, the US lawyer directory, was spun out into a joint venture. Disposals made throughout 2013 willcontinue to impact reported revenue and operating profit growth rates in 2014.
28
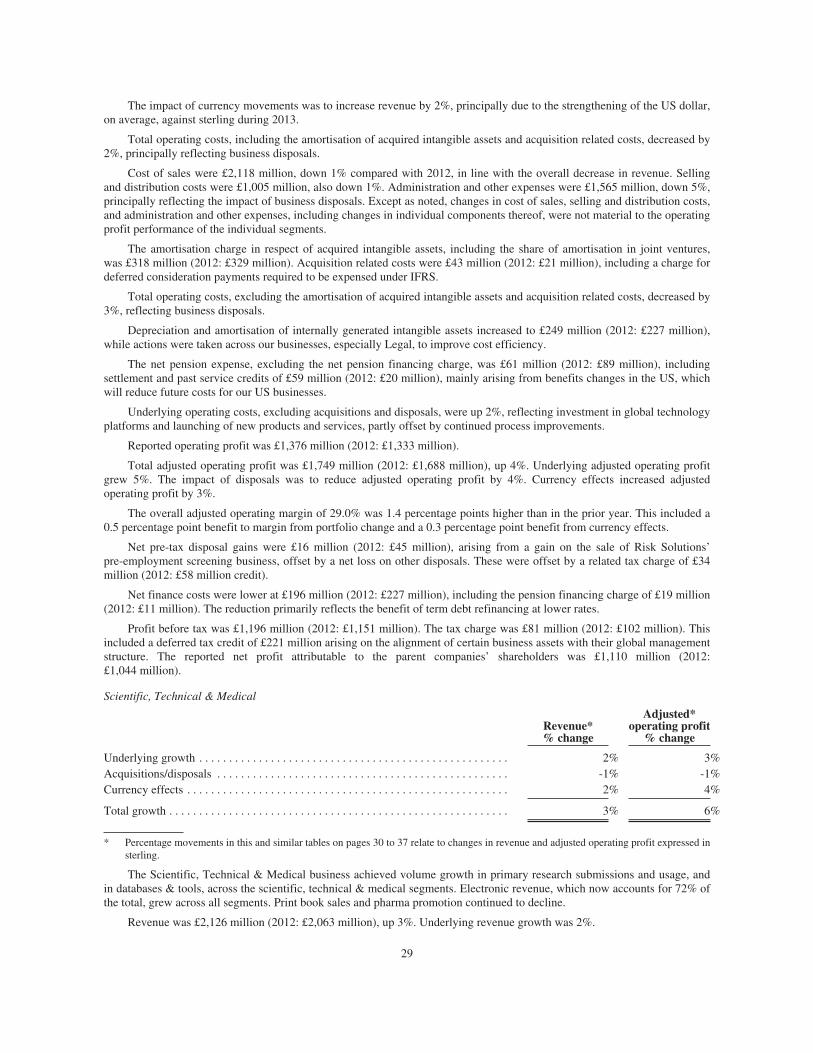
The impact of currency movements was to increase revenue by 2%, principally due to the strengthening of the US dollar,on average, against sterling during 2013.
Total operating costs, including the amortisation of acquired intangible assets and acquisition related costs, decreased by2%, principally reflecting business disposals.
Cost of sales were £2,118 million, down 1% compared with 2012, in line with the overall decrease in revenue. Sellingand distribution costs were £1,005 million, also down 1%. Administration and other expenses were £1,565 million, down 5%,principally reflecting the impact of business disposals. Except as noted, changes in cost of sales, selling and distribution costs,and administration and other expenses, including changes in individual components thereof, were not material to the operatingprofit performance of the individual segments.
The amortisation charge in respect of acquired intangible assets, including the share of amortisation in joint ventures,was £318 million (2012: £329 million). Acquisition related costs were £43 million (2012: £21 million), including a charge fordeferred consideration payments required to be expensed under IFRS.
Total operating costs, excluding the amortisation of acquired intangible assets and acquisition related costs, decreased by3%, reflecting business disposals.
Depreciation and amortisation of internally generated intangible assets increased to £249 million (2012: £227 million),while actions were taken across our businesses, especially Legal, to improve cost efficiency.
The net pension expense, excluding the net pension financing charge, was £61 million (2012: £89 million), includingsettlement and past service credits of £59 million (2012: £20 million), mainly arising from benefits changes in the US, whichwill reduce future costs for our US businesses.
Underlying operating costs, excluding acquisitions and disposals, were up 2%, reflecting investment in global technologyplatforms and launching of new products and services, partly offset by continued process improvements.
Reported operating profit was £1,376 million (2012: £1,333 million).
Total adjusted operating profit was £1,749 million (2012: £1,688 million), up 4%. Underlying adjusted operating profitgrew 5%. The impact of disposals was to reduce adjusted operating profit by 4%. Currency effects increased adjustedoperating profit by 3%.
The overall adjusted operating margin of 29.0% was 1.4 percentage points higher than in the prior year. This included a0.5 percentage point benefit to margin from portfolio change and a 0.3 percentage point benefit from currency effects.
Net pre-tax disposal gains were £16 million (2012: £45 million), arising from a gain on the sale of Risk Solutions’pre-employment screening business, offset by a net loss on other disposals. These were offset by a related tax charge of £34million (2012: £58 million credit).
Net finance costs were lower at £196 million (2012: £227 million), including the pension financing charge of £19 million(2012: £11 million). The reduction primarily reflects the benefit of term debt refinancing at lower rates.
Profit before tax was £1,196 million (2012: £1,151 million). The tax charge was £81 million (2012: £102 million). Thisincluded a deferred tax credit of £221 million arising on the alignment of certain business assets with their global managementstructure. The reported net profit attributable to the parent companies’ shareholders was £1,110 million (2012:£1,044 million).
Scientific, Technical & Medical
Revenue*% change
Adjusted*operating profit
% change
Underlying growth . . . . . . . . . . . . . . . . . . . . . . . . . . . . . . . . . . . . . . . . . . . . . . . . . . . . 2% 3%Acquisitions/disposals . . . . . . . . . . . . . . . . . . . . . . . . . . . . . . . . . . . . . . . . . . . . . . . . . -1% -1%Currency effects . . . . . . . . . . . . . . . . . . . . . . . . . . . . . . . . . . . . . . . . . . . . . . . . . . . . . . 2% 4%
Total growth . . . . . . . . . . . . . . . . . . . . . . . . . . . . . . . . . . . . . . . . . . . . . . . . . . . . . . . . . 3% 6%
* Percentage movements in this and similar tables on pages 30 to 37 relate to changes in revenue and adjusted operating profit expressed insterling.
The Scientific, Technical & Medical business achieved volume growth in primary research submissions and usage, andin databases & tools, across the scientific, technical & medical segments. Electronic revenue, which now accounts for 72% ofthe total, grew across all segments. Print book sales and pharma promotion continued to decline.
Revenue was £2,126 million (2012: £2,063 million), up 3%. Underlying revenue growth was 2%.
29
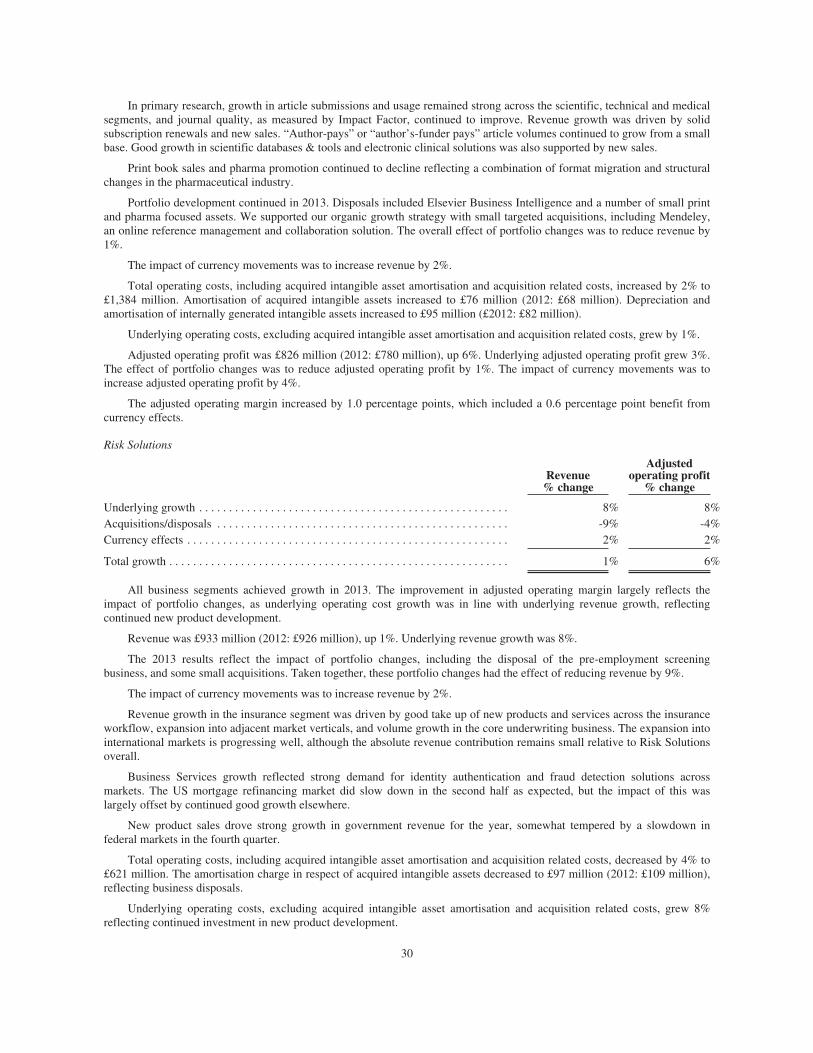
In primary research, growth in article submissions and usage remained strong across the scientific, technical and medicalsegments, and journal quality, as measured by Impact Factor, continued to improve. Revenue growth was driven by solidsubscription renewals and new sales. “Author-pays” or “author’s-funder pays” article volumes continued to grow from a smallbase. Good growth in scientific databases & tools and electronic clinical solutions was also supported by new sales.
Print book sales and pharma promotion continued to decline reflecting a combination of format migration and structuralchanges in the pharmaceutical industry.
Portfolio development continued in 2013. Disposals included Elsevier Business Intelligence and a number of small printand pharma focused assets. We supported our organic growth strategy with small targeted acquisitions, including Mendeley,an online reference management and collaboration solution. The overall effect of portfolio changes was to reduce revenue by1%.
The impact of currency movements was to increase revenue by 2%.
Total operating costs, including acquired intangible asset amortisation and acquisition related costs, increased by 2% to£1,384 million. Amortisation of acquired intangible assets increased to £76 million (2012: £68 million). Depreciation andamortisation of internally generated intangible assets increased to £95 million (£2012: £82 million).
Underlying operating costs, excluding acquired intangible asset amortisation and acquisition related costs, grew by 1%.
Adjusted operating profit was £826 million (2012: £780 million), up 6%. Underlying adjusted operating profit grew 3%.The effect of portfolio changes was to reduce adjusted operating profit by 1%. The impact of currency movements was toincrease adjusted operating profit by 4%.
The adjusted operating margin increased by 1.0 percentage points, which included a 0.6 percentage point benefit fromcurrency effects.
Risk Solutions
Revenue% change
Adjustedoperating profit
% change
Underlying growth . . . . . . . . . . . . . . . . . . . . . . . . . . . . . . . . . . . . . . . . . . . . . . . . . . . . 8% 8%Acquisitions/disposals . . . . . . . . . . . . . . . . . . . . . . . . . . . . . . . . . . . . . . . . . . . . . . . . . -9% -4%Currency effects . . . . . . . . . . . . . . . . . . . . . . . . . . . . . . . . . . . . . . . . . . . . . . . . . . . . . . 2% 2%
Total growth . . . . . . . . . . . . . . . . . . . . . . . . . . . . . . . . . . . . . . . . . . . . . . . . . . . . . . . . . 1% 6%
All business segments achieved growth in 2013. The improvement in adjusted operating margin largely reflects theimpact of portfolio changes, as underlying operating cost growth was in line with underlying revenue growth, reflectingcontinued new product development.
Revenue was £933 million (2012: £926 million), up 1%. Underlying revenue growth was 8%.
The 2013 results reflect the impact of portfolio changes, including the disposal of the pre-employment screeningbusiness, and some small acquisitions. Taken together, these portfolio changes had the effect of reducing revenue by 9%.
The impact of currency movements was to increase revenue by 2%.
Revenue growth in the insurance segment was driven by good take up of new products and services across the insuranceworkflow, expansion into adjacent market verticals, and volume growth in the core underwriting business. The expansion intointernational markets is progressing well, although the absolute revenue contribution remains small relative to Risk Solutionsoverall.
Business Services growth reflected strong demand for identity authentication and fraud detection solutions acrossmarkets. The US mortgage refinancing market did slow down in the second half as expected, but the impact of this waslargely offset by continued good growth elsewhere.
New product sales drove strong growth in government revenue for the year, somewhat tempered by a slowdown infederal markets in the fourth quarter.
Total operating costs, including acquired intangible asset amortisation and acquisition related costs, decreased by 4% to£621 million. The amortisation charge in respect of acquired intangible assets decreased to £97 million (2012: £109 million),reflecting business disposals.
Underlying operating costs, excluding acquired intangible asset amortisation and acquisition related costs, grew 8%reflecting continued investment in new product development.
30
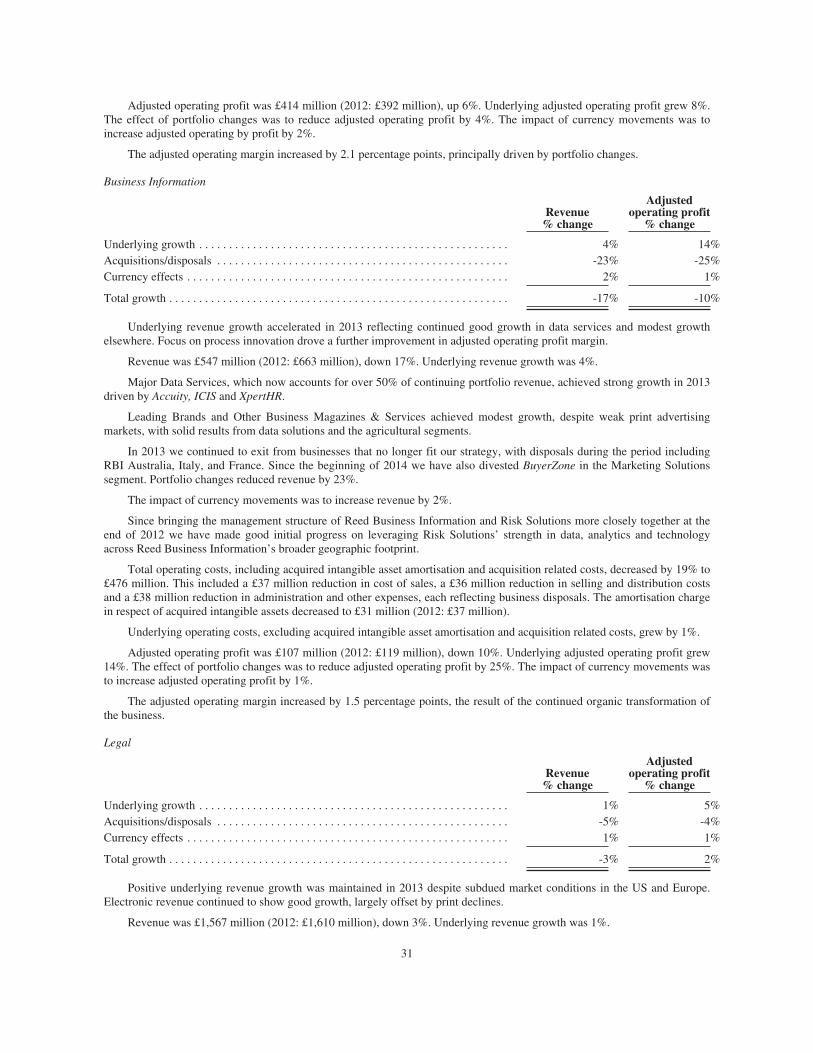
Adjusted operating profit was £414 million (2012: £392 million), up 6%. Underlying adjusted operating profit grew 8%.The effect of portfolio changes was to reduce adjusted operating profit by 4%. The impact of currency movements was toincrease adjusted operating by profit by 2%.
The adjusted operating margin increased by 2.1 percentage points, principally driven by portfolio changes.
Business Information
Revenue% change
Adjustedoperating profit
% change
Underlying growth . . . . . . . . . . . . . . . . . . . . . . . . . . . . . . . . . . . . . . . . . . . . . . . . . . . . 4% 14%Acquisitions/disposals . . . . . . . . . . . . . . . . . . . . . . . . . . . . . . . . . . . . . . . . . . . . . . . . . -23% -25%Currency effects . . . . . . . . . . . . . . . . . . . . . . . . . . . . . . . . . . . . . . . . . . . . . . . . . . . . . . 2% 1%
Total growth . . . . . . . . . . . . . . . . . . . . . . . . . . . . . . . . . . . . . . . . . . . . . . . . . . . . . . . . . -17% -10%
Underlying revenue growth accelerated in 2013 reflecting continued good growth in data services and modest growthelsewhere. Focus on process innovation drove a further improvement in adjusted operating profit margin.
Revenue was £547 million (2012: £663 million), down 17%. Underlying revenue growth was 4%.
Major Data Services, which now accounts for over 50% of continuing portfolio revenue, achieved strong growth in 2013driven by Accuity, ICIS and XpertHR.
Leading Brands and Other Business Magazines & Services achieved modest growth, despite weak print advertisingmarkets, with solid results from data solutions and the agricultural segments.
In 2013 we continued to exit from businesses that no longer fit our strategy, with disposals during the period includingRBI Australia, Italy, and France. Since the beginning of 2014 we have also divested BuyerZone in the Marketing Solutionssegment. Portfolio changes reduced revenue by 23%.
The impact of currency movements was to increase revenue by 2%.
Since bringing the management structure of Reed Business Information and Risk Solutions more closely together at theend of 2012 we have made good initial progress on leveraging Risk Solutions’ strength in data, analytics and technologyacross Reed Business Information’s broader geographic footprint.
Total operating costs, including acquired intangible asset amortisation and acquisition related costs, decreased by 19% to£476 million. This included a £37 million reduction in cost of sales, a £36 million reduction in selling and distribution costsand a £38 million reduction in administration and other expenses, each reflecting business disposals. The amortisation chargein respect of acquired intangible assets decreased to £31 million (2012: £37 million).
Underlying operating costs, excluding acquired intangible asset amortisation and acquisition related costs, grew by 1%.
Adjusted operating profit was £107 million (2012: £119 million), down 10%. Underlying adjusted operating profit grew14%. The effect of portfolio changes was to reduce adjusted operating profit by 25%. The impact of currency movements wasto increase adjusted operating profit by 1%.
The adjusted operating margin increased by 1.5 percentage points, the result of the continued organic transformation ofthe business.
Legal
Revenue% change
Adjustedoperating profit
% change
Underlying growth . . . . . . . . . . . . . . . . . . . . . . . . . . . . . . . . . . . . . . . . . . . . . . . . . . . . 1% 5%Acquisitions/disposals . . . . . . . . . . . . . . . . . . . . . . . . . . . . . . . . . . . . . . . . . . . . . . . . . -5% -4%Currency effects . . . . . . . . . . . . . . . . . . . . . . . . . . . . . . . . . . . . . . . . . . . . . . . . . . . . . . 1% 1%
Total growth . . . . . . . . . . . . . . . . . . . . . . . . . . . . . . . . . . . . . . . . . . . . . . . . . . . . . . . . . -3% 2%
Positive underlying revenue growth was maintained in 2013 despite subdued market conditions in the US and Europe.Electronic revenue continued to show good growth, largely offset by print declines.
Revenue was £1,567 million (2012: £1,610 million), down 3%. Underlying revenue growth was 1%.
31
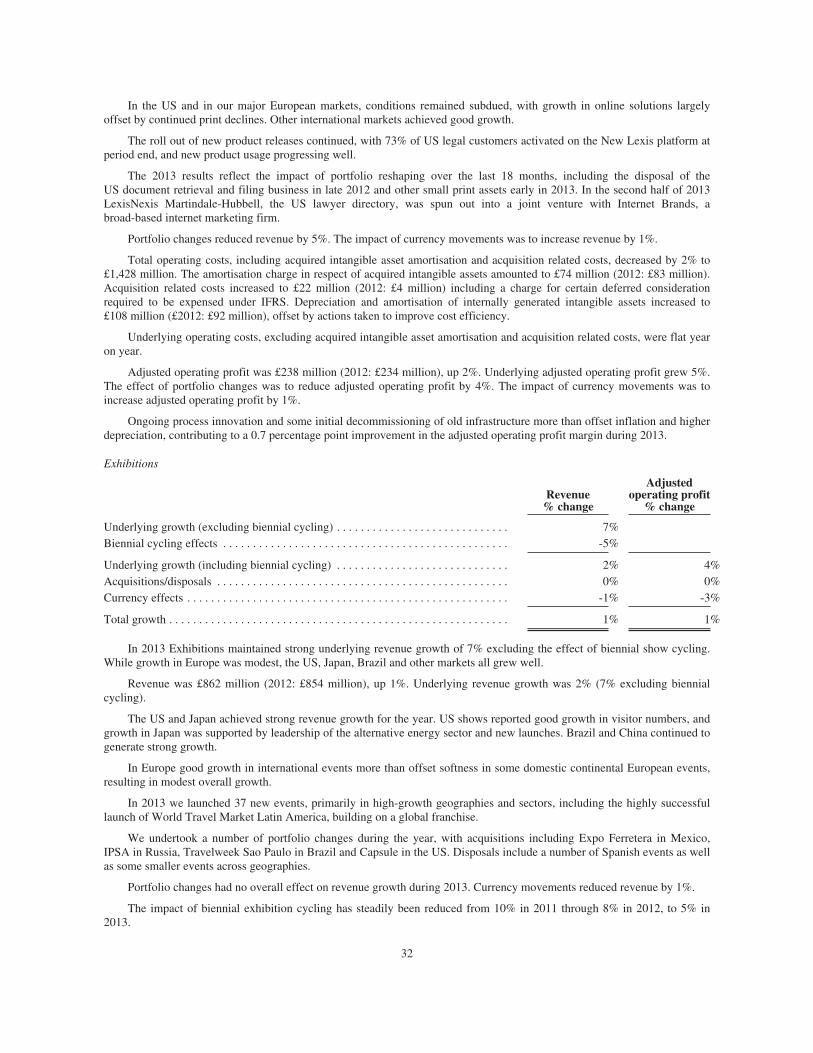
In the US and in our major European markets, conditions remained subdued, with growth in online solutions largelyoffset by continued print declines. Other international markets achieved good growth.
The roll out of new product releases continued, with 73% of US legal customers activated on the New Lexis platform atperiod end, and new product usage progressing well.
The 2013 results reflect the impact of portfolio reshaping over the last 18 months, including the disposal of theUS document retrieval and filing business in late 2012 and other small print assets early in 2013. In the second half of 2013LexisNexis Martindale-Hubbell, the US lawyer directory, was spun out into a joint venture with Internet Brands, abroad-based internet marketing firm.
Portfolio changes reduced revenue by 5%. The impact of currency movements was to increase revenue by 1%.
Total operating costs, including acquired intangible asset amortisation and acquisition related costs, decreased by 2% to£1,428 million. The amortisation charge in respect of acquired intangible assets amounted to £74 million (2012: £83 million).Acquisition related costs increased to £22 million (2012: £4 million) including a charge for certain deferred considerationrequired to be expensed under IFRS. Depreciation and amortisation of internally generated intangible assets increased to£108 million (£2012: £92 million), offset by actions taken to improve cost efficiency.
Underlying operating costs, excluding acquired intangible asset amortisation and acquisition related costs, were flat yearon year.
Adjusted operating profit was £238 million (2012: £234 million), up 2%. Underlying adjusted operating profit grew 5%.The effect of portfolio changes was to reduce adjusted operating profit by 4%. The impact of currency movements was toincrease adjusted operating profit by 1%.
Ongoing process innovation and some initial decommissioning of old infrastructure more than offset inflation and higherdepreciation, contributing to a 0.7 percentage point improvement in the adjusted operating profit margin during 2013.
Exhibitions
Revenue% change
Adjustedoperating profit
% change
Underlying growth (excluding biennial cycling) . . . . . . . . . . . . . . . . . . . . . . . . . . . . . 7%Biennial cycling effects . . . . . . . . . . . . . . . . . . . . . . . . . . . . . . . . . . . . . . . . . . . . . . . . -5%
Underlying growth (including biennial cycling) . . . . . . . . . . . . . . . . . . . . . . . . . . . . . 2% 4%Acquisitions/disposals . . . . . . . . . . . . . . . . . . . . . . . . . . . . . . . . . . . . . . . . . . . . . . . . . 0% 0%Currency effects . . . . . . . . . . . . . . . . . . . . . . . . . . . . . . . . . . . . . . . . . . . . . . . . . . . . . . -1% -3%
Total growth . . . . . . . . . . . . . . . . . . . . . . . . . . . . . . . . . . . . . . . . . . . . . . . . . . . . . . . . . 1% 1%
In 2013 Exhibitions maintained strong underlying revenue growth of 7% excluding the effect of biennial show cycling.While growth in Europe was modest, the US, Japan, Brazil and other markets all grew well.
Revenue was £862 million (2012: £854 million), up 1%. Underlying revenue growth was 2% (7% excluding biennialcycling).
The US and Japan achieved strong revenue growth for the year. US shows reported good growth in visitor numbers, andgrowth in Japan was supported by leadership of the alternative energy sector and new launches. Brazil and China continued togenerate strong growth.
In Europe good growth in international events more than offset softness in some domestic continental European events,resulting in modest overall growth.
In 2013 we launched 37 new events, primarily in high-growth geographies and sectors, including the highly successfullaunch of World Travel Market Latin America, building on a global franchise.
We undertook a number of portfolio changes during the year, with acquisitions including Expo Ferretera in Mexico,IPSA in Russia, Travelweek Sao Paulo in Brazil and Capsule in the US. Disposals include a number of Spanish events as wellas some smaller events across geographies.
Portfolio changes had no overall effect on revenue growth during 2013. Currency movements reduced revenue by 1%.
The impact of biennial exhibition cycling has steadily been reduced from 10% in 2011 through 8% in 2012, to 5% in2013.
32
Total operating costs, including acquired intangible asset amortisation and acquisition related costs, were £701 million,up 3%. The amortisation charge in respect of acquired intangible assets increased to £40 million (2012: £32 million) as aresult of acquisitions completed in 2013 and 2012.
Underlying operating costs, excluding acquired intangible asset amortisation and acquisition related costs, grew 1%,slightly below revenue.
Adjusted operating profit was £213 million (2012: £210 million), up 1%. Underlying adjusted operating profit grew 4%.Portfolio changes had no overall impact on adjusted operating profit growth during 2013. The impact of currency movementswas to reduce adjusted operating profit by 3%.
The adjusted operating margin increased by 0.1 percentage points.
Results of Operations for the Year Ended December 31, 2012Compared to the Year Ended December 31, 2011*
*Comparative financial information has been restated following the adoption of IAS19 Employee Benefits (revised), see note 2 to thecombined financial information on page F-16.
Revenue was £6,116 million (2011: £6,002 million), up 2%. Underlying revenue growth was 4%, or 3% excluding thenet cycling in of biennial exhibitions.
The overall effect of disposals in 2012 was to reduce revenue by 4%, offset by a 3% increase from acquisitions. Theimpact of currency movements was to reduce revenue by 1%.
Total operating costs, including the amortisation of acquired intangible assets and acquisition related costs, decreased by 1%.
Cost of sales were £2,139 million, up 1% compared with 2011, with underlying volume growth and product developmentpartly offset by the impact of disposals. Selling and distribution costs were £1,015 million, down 6%, including the impact ofdisposals. Administration and other expenses were £1,653 million, flat with the prior year, with the impact of disposals,including the lower acquired intangible asset amortisation, offset by technology investments. Except as noted, changes in costof sales, selling and distribution costs, and administration and other expenses, including changes in individual componentsthereof, were not material to the adjusted operating profit performance of the individual segments.
The amortisation charge in respect of acquired intangible assets, including the share of amortisation in joint ventures,decreased to £329 million (2011: £359 million), reflecting business disposals. Acquisition related costs were £21 million(2011: £52 million), reflecting the completion of the ChoicePoint integration programme in 2011.
Total operating costs, excluding the amortisation of acquired intangible assets and acquisition related costs, were flatyear on year.
Depreciation and amortisation of internally generated intangible assets increased to £227 million (2011: £207 million).
The net pension expense, excluding the net pension financing charge, was £89 million (2011: £96 million), includingsettlement and curtailment credits of £20 million (2011: £9 million).
Underlying operating costs, excluding acquisitions and disposals, were up 4%, reflecting volume growth as well asorganic investment in new product development and sales & marketing, partly offset by continued improvements in processefficiency.
Reported operating profit was £1,333 million (2011: £1,171 million), primarily reflecting improved trading performanceas well as lower amortisation and acquisition related costs.
Adjusted operating profit was £1,688 million (2011: £1,592 million), up 6%. Underlying growth was 6%. The overalleffect of disposals in 2012 was to reduce adjusted operating profit by 2%, offset by a 2% increase from acquisitions. Currencyeffects reduced adjusted operating profit by 1%.
The overall adjusted operating margin at 27.6% was 1.1 percentage points higher than in the prior year. This included a0.5 percentage point benefit to margin from portfolio change and a 0.1 percentage point benefit from currency effects.
Disposals and other non operating gains were £45 million (2011: £21 million losses), principally arising from businessdivestments, in particular Totaljobs, offset by property charges relating to disposed businesses.
Net finance costs were lower at £227 million (2011: £244 million), including the pension financing charge of £11 million(2011: £9 million). This reflects the benefit of term debt refinancing.
Profit before tax was £1,151 million (2011: £905 million). The tax charge was £102 million (2011: £167 million). Thisincludes an exceptional tax credit of £96 million resulting from the resolution of a number of significant prior year taxmatters. Net profit attributable to the parent companies’ shareholders was £1,044 million (2011: £731 million).
33

Scientific, Technical & Medical
Revenue% change
Adjustedoperating profit
% change
Underlying growth . . . . . . . . . . . . . . . . . . . . . . . . . . . . . . . . . . . . . . . . . . . . . . . . . . . . 2% 4%Acquisitions/disposals . . . . . . . . . . . . . . . . . . . . . . . . . . . . . . . . . . . . . . . . . . . . . . . . . -1% -3%Currency effects . . . . . . . . . . . . . . . . . . . . . . . . . . . . . . . . . . . . . . . . . . . . . . . . . . . . . . -1% 1%
Total growth . . . . . . . . . . . . . . . . . . . . . . . . . . . . . . . . . . . . . . . . . . . . . . . . . . . . . . . . . 0% 2%
Elsevier achieved revenue growth in primary research and databases & tools across scientific & medical segments, withparticular strength in emerging markets. Research article submissions and usage grew by double digits. Electronic revenue,which now accounts for 68% of total revenue, grew across all segments. Print book and pharma promotion revenuescontinued to decline.
Revenue was £2,063 million (2011: £2,058 million), in line with the prior year. Underlying revenue growth was 2%.
The effect of portfolio changes and currency movements was to reduce revenue by 1% each.
Underlying revenue growth in primary research solutions across the scientific and medical segments was driven bydouble digit growth in both submissions and article downloads, notably in faster growing economies outside Europe and theUS. The number of article submissions to journals exceeded 1 million for the first time in 2012, with over 11 million usersdownloading nearly 700 million articles during the year. Elsevier’s overall relative impact factor and citation share continuedto grow in the year.
In addition to growth in traditional “subscriber-pays” article volumes, “author-pays”, or “author’s-funder-pays” articlevolumes increased during the year, albeit from a small base. A sponsored article option is currently available in 1,500 journalsand 30 stand-alone journals operate under this payment model.
Growth in databases & tools revenue was driven by new sales and usage growth.
Sales of print books to individuals continued to decline in 2012 reflecting format migration and subdued reference andeducation markets. Print pharma promotion revenue also continued to decline, reflecting industry trends.
In August 2012 the management structure of Elsevier was reorganised, combining science & technology and healthsciences. Had these revenue streams still been managed separately, their pro forma underlying revenue growth would havebeen 5% and flat respectively.
Total operating costs, including acquired intangible asset amortisation and acquisition related costs, at £1,357 millionwere flat year on year. The amortisation charge in respect of acquired intangible assets was £68 million (2011: £72 million).Depreciation and amortisation of internally generated intangible assets increased to £82 million (£2011: £69 million).
Underlying operating costs grew by 2%, in line with underlying revenue growth.
Adjusted operating profit was £780 million (2011: £768 million), up 2%. Underlying adjusted operating profit grew 4%.The effect of portfolio changes was to reduce adjusted operating profit by 3%. The impact of currency movements was toincrease adjusted operating profit by 1%.
The adjusted operating margin increased by 0.5 percentage points, which included a 0.4 percentage point benefit fromcurrency effects.
Risk Solutions
Revenue% change
Adjustedoperating profit
% change
Underlying growth . . . . . . . . . . . . . . . . . . . . . . . . . . . . . . . . . . . . . . . . . . . . . . . . . . . . 6% 6%Acquisitions/disposals . . . . . . . . . . . . . . . . . . . . . . . . . . . . . . . . . . . . . . . . . . . . . . . . . -5% 1%Currency effects . . . . . . . . . . . . . . . . . . . . . . . . . . . . . . . . . . . . . . . . . . . . . . . . . . . . . . 1% 1%
Total growth . . . . . . . . . . . . . . . . . . . . . . . . . . . . . . . . . . . . . . . . . . . . . . . . . . . . . . . . . 2% 8%
34
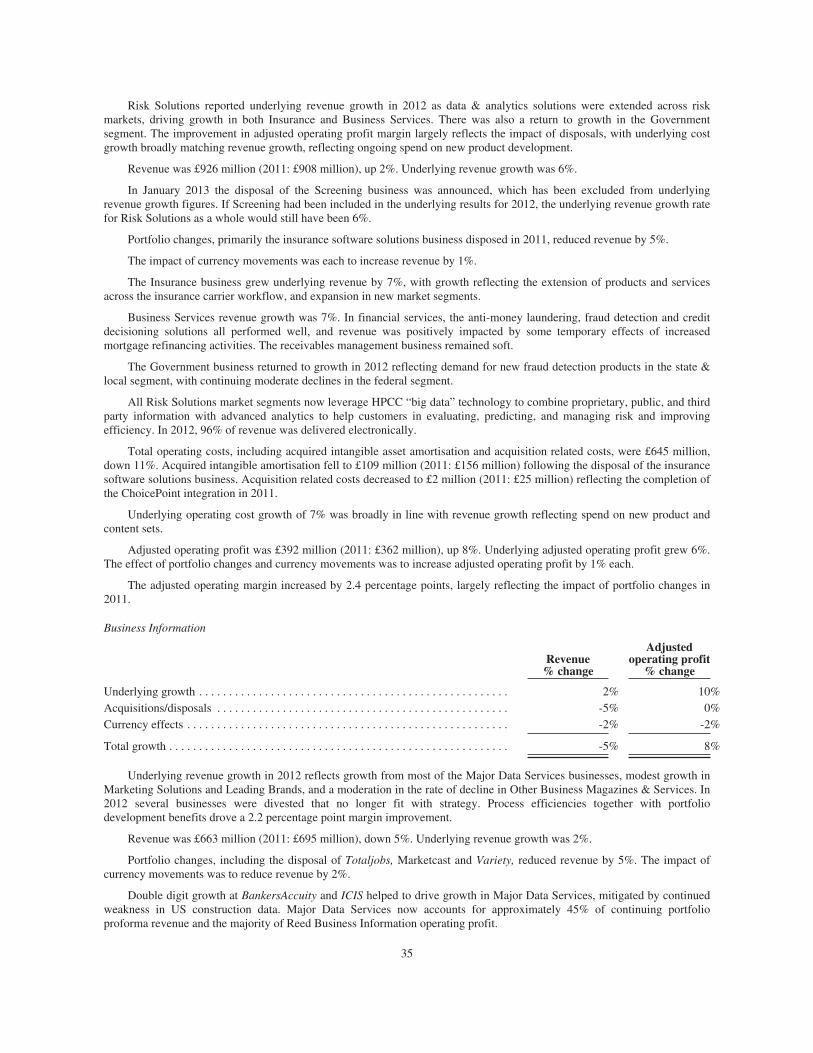
Risk Solutions reported underlying revenue growth in 2012 as data & analytics solutions were extended across riskmarkets, driving growth in both Insurance and Business Services. There was also a return to growth in the Governmentsegment. The improvement in adjusted operating profit margin largely reflects the impact of disposals, with underlying costgrowth broadly matching revenue growth, reflecting ongoing spend on new product development.
Revenue was £926 million (2011: £908 million), up 2%. Underlying revenue growth was 6%.
In January 2013 the disposal of the Screening business was announced, which has been excluded from underlyingrevenue growth figures. If Screening had been included in the underlying results for 2012, the underlying revenue growth ratefor Risk Solutions as a whole would still have been 6%.
Portfolio changes, primarily the insurance software solutions business disposed in 2011, reduced revenue by 5%.
The impact of currency movements was each to increase revenue by 1%.
The Insurance business grew underlying revenue by 7%, with growth reflecting the extension of products and servicesacross the insurance carrier workflow, and expansion in new market segments.
Business Services revenue growth was 7%. In financial services, the anti-money laundering, fraud detection and creditdecisioning solutions all performed well, and revenue was positively impacted by some temporary effects of increasedmortgage refinancing activities. The receivables management business remained soft.
The Government business returned to growth in 2012 reflecting demand for new fraud detection products in the state &local segment, with continuing moderate declines in the federal segment.
All Risk Solutions market segments now leverage HPCC “big data” technology to combine proprietary, public, and thirdparty information with advanced analytics to help customers in evaluating, predicting, and managing risk and improvingefficiency. In 2012, 96% of revenue was delivered electronically.
Total operating costs, including acquired intangible asset amortisation and acquisition related costs, were £645 million,down 11%. Acquired intangible amortisation fell to £109 million (2011: £156 million) following the disposal of the insurancesoftware solutions business. Acquisition related costs decreased to £2 million (2011: £25 million) reflecting the completion ofthe ChoicePoint integration in 2011.
Underlying operating cost growth of 7% was broadly in line with revenue growth reflecting spend on new product andcontent sets.
Adjusted operating profit was £392 million (2011: £362 million), up 8%. Underlying adjusted operating profit grew 6%.The effect of portfolio changes and currency movements was to increase adjusted operating profit by 1% each.
The adjusted operating margin increased by 2.4 percentage points, largely reflecting the impact of portfolio changes in2011.
Business Information
Revenue% change
Adjustedoperating profit
% change
Underlying growth . . . . . . . . . . . . . . . . . . . . . . . . . . . . . . . . . . . . . . . . . . . . . . . . . . . . 2% 10%Acquisitions/disposals . . . . . . . . . . . . . . . . . . . . . . . . . . . . . . . . . . . . . . . . . . . . . . . . . -5% 0%Currency effects . . . . . . . . . . . . . . . . . . . . . . . . . . . . . . . . . . . . . . . . . . . . . . . . . . . . . . -2% -2%
Total growth . . . . . . . . . . . . . . . . . . . . . . . . . . . . . . . . . . . . . . . . . . . . . . . . . . . . . . . . . -5% 8%
Underlying revenue growth in 2012 reflects growth from most of the Major Data Services businesses, modest growth inMarketing Solutions and Leading Brands, and a moderation in the rate of decline in Other Business Magazines & Services. In2012 several businesses were divested that no longer fit with strategy. Process efficiencies together with portfoliodevelopment benefits drove a 2.2 percentage point margin improvement.
Revenue was £663 million (2011: £695 million), down 5%. Underlying revenue growth was 2%.
Portfolio changes, including the disposal of Totaljobs, Marketcast and Variety, reduced revenue by 5%. The impact ofcurrency movements was to reduce revenue by 2%.
Double digit growth at BankersAccuity and ICIS helped to drive growth in Major Data Services, mitigated by continuedweakness in US construction data. Major Data Services now accounts for approximately 45% of continuing portfolioproforma revenue and the majority of Reed Business Information operating profit.
35
Marketing Solutions delivered modest growth in 2012 and, following the disposal of Totaljobs and Hotfrog, accounts foronly a small proportion of continuing portfolio revenue.
Leading Brands also delivered modest underlying revenue growth as solid performances in the UK agriculture andproperty sectors were offset by advertising declines elsewhere.
Other Business Magazines & Services saw moderating underlying revenue declines and continued portfolio reshaping.
Businesses including Totaljobs, Marketcast, Variety, RBI Australia and RBI Spain were disposed of or reclassified asheld for sale during the year. These actions have contributed to the transformation of Reed Business Information’s profile,with user and subscription services now accounting for nearly 70% of revenue, and electronic revenue streams nowaccounting for over half of the total.
In December 2012 the management structure was reorganised to bring LexisNexis Risk Solutions and Reed BusinessInformation together more closely in order to continue to build the Risk Solutions’ business globally. Risk Solutions’ strengthin data, analytics and technology is to be leveraged in combination with Reed Business Information’s broader geographicfootprint and industry specific databases.
Total operating costs, including acquired intangible asset amortisation and acquisition related costs, were £587 million,down 6%, as a result of portfolio changes. Acquired intangible amortisation increased to £37 million (2011: £29 million),reflecting acquisitions completed during 2011, particularly Accuity.
Underlying operating costs, excluding acquired intangible asset amortisation and acquisition related costs, grew by 1%.
Adjusted operating profit was £119 million (2011: £110 million), up 8%. Underlying adjusted operating profit grew10%. Portfolio changes had no effect on adjusted operating profit growth. The impact of currency movements was to reduceadjusted operating profit by 2%.
Focus on process innovation together with the benefits of portfolio development helped to increase the adjusted operatingprofit margin by 2.2 percentage points.
Legal
Revenue% change
Adjustedoperating profit
% change
Underlying growth . . . . . . . . . . . . . . . . . . . . . . . . . . . . . . . . . . . . . . . . . . . . . . . . . . . . 1% 4%Acquisitions/disposals . . . . . . . . . . . . . . . . . . . . . . . . . . . . . . . . . . . . . . . . . . . . . . . . . -2% 0%Currency effects . . . . . . . . . . . . . . . . . . . . . . . . . . . . . . . . . . . . . . . . . . . . . . . . . . . . . . 0% -2%
Total growth . . . . . . . . . . . . . . . . . . . . . . . . . . . . . . . . . . . . . . . . . . . . . . . . . . . . . . . . . -1% 2%
Underlying revenue growth was positive despite subdued legal markets in the US and Europe. Growth was driven byelectronic products and services, which account for over 75% of total revenue. In 2012 new products and services werereleased on the New Lexis platform.
Revenue was £1,610 million (2011: £1,634 million), down 1%. Underlying revenue growth was 1%. Portfolio changesreduced revenue by 2%. Currency movements had no impact on revenue growth.
In the US, usage and sales of online research and litigation solutions to law firms grew despite challenging marketconditions. Underlying revenues from government and corporate customers also grew modestly. Print revenue continued todecline, and News & Business revenue declines moderated.
LexisNexis introduced new releases of Lexis Advance during 2012, combining the business’ domain expertise andcontent with Reed Elsevier’s “big data” HPCC technology to allow researchers within legal and professional organisations tofind highly relevant information more easily and efficiently. The new applications had US customer penetration of 45% by the2012 year end.
In Europe market conditions remain subdued, with growth in online revenue largely offset by declining print revenue.
Total operating costs, including acquired intangible asset amortisation and acquisition related costs, decreased to£1,464 million, down 2%. Depreciation and amortisation of internally generated intangible assets increased to £92 million(2011: £87 million).
Underlying operating, excluding acquired intangible asset amortisation and acquisition related costs, grew by 1% in linewith underlying revenue.
36
Adjusted operating profit was £234 million (2011: £229 million), up 2%. Underlying adjusted operating profit grew 4%.Portfolio changes had no effect on adjusted operating profit growth. The impact of currency movements was to reduceadjusted operating profit by 2%.
The adjusted operating profit margin improved by 0.5 percentage points, with process efficiencies offsetting continuedspend on new product development.
Exhibitions
Revenue% change
Adjustedoperating profit
% change
Underlying growth (excluding biennial cycling) . . . . . . . . . . . . . . . . . . . . . . . . . . . . 7%Biennial cycling effects . . . . . . . . . . . . . . . . . . . . . . . . . . . . . . . . . . . . . . . . . . . . . . . . 8%
Underlying growth (including biennial cycling) . . . . . . . . . . . . . . . . . . . . . . . . . . . . . 15% 20%Acquisitions/disposals . . . . . . . . . . . . . . . . . . . . . . . . . . . . . . . . . . . . . . . . . . . . . . . . . 10% 10%Currency effects . . . . . . . . . . . . . . . . . . . . . . . . . . . . . . . . . . . . . . . . . . . . . . . . . . . . . . -4% -4%
Total growth . . . . . . . . . . . . . . . . . . . . . . . . . . . . . . . . . . . . . . . . . . . . . . . . . . . . . . . . . 21% 26%
Exhibitions saw growth in the US and Japan, moderate growth in Europe, and double digit growth in most emergingmarkets during the year. Investment continued throughout the year, launching 30 new shows in total, including several in highgrowth markets through partnerships and targeted acquisitions.
Revenue was £854 million (2011: £707 million), up 21%. Underlying revenue growth was 15% (7% excluding biennialcycling).
Portfolio changes, including the acquisition of Equipotel, Agenda and Alcantara Machado, increased revenue by 10%.The impact of currency movements was to reduce revenue by 4%.
In the US and Japan underlying revenue increased, and growth in emerging markets was well into double digits. InEurope growth from a number of core events helped to offset some softness in southern European markets, resulting inmoderate underlying revenue growth overall in the region.
During 2012 Exhibitions launched 30 new events, primarily in high growth sectors and geographies, and completed anumber of targeted acquisitions. In Brazil, Exhibitions took full ownership of Alcantara Machado, previously a joint venture,and expanded into hospitality and logistics. In Turkey a new joint venture was created with Tüyap, a Turkish event organiser.
During the year the business rolled out global platforms and processes across geographies and sectors. The integratedweb event platform is now used by more than 70% of events.
Total operating costs, including acquired intangible asset amortisation and acquisition related costs, were £683 millionup 19%, reflecting the investment in new shows and the net cycling. Acquired intangible amortisation increased to£32 million (2011: £24 million). Depreciation and amortisation of acquired intangible assets increased to £16 million(2011: £10 million).
Underlying operating costs grew by 14%, slightly below revenue growth, reflecting the impact of biennial cycling.
Adjusted operating profit was £210 million (2011: £167 million), up 26%. Underlying adjusted operating profit grew20%. The effect of portfolio changes was to increase adjusted operating profit by 10%. The impact of currency movementswas to reduce adjusted operating profit by 4%.
The adjusted operating profit margin improved by 1.0 percentage points, reflecting both process efficiencies and thepositive impact of biennial event cycling.
Critical Accounting Policies
The accounting policies of the Reed Elsevier combined businesses under IFRS as issued by the IASB and as adopted bythe EU are described in note 2 to the combined financial statements. The most critical accounting policies and estimates usedin determining the financial condition and results of the combined businesses, and those requiring the most subjective orcomplex judgments, relate to the valuation of goodwill and acquired intangible assets, capitalisation of development spendand taxation.
The Audit Committees of Reed Elsevier PLC, Reed Elsevier NV and Reed Elsevier Group plc have reviewed thedevelopment and selection of critical accounting estimates, and the disclosure of critical accounting policies in the financialstatements.
37
Effect of Currency Translation
The combined financial statements are expressed in sterling and are therefore subject to the impact of movements inexchange rates on the translation of the financial information of individual businesses whose operational currencies are otherthan sterling. The principal exposures in relation to the results reported in sterling are to the US dollar and the euro, reflectingReed Elsevier’s business exposure to the United States and the euro zone, its most important markets. Some of theseexposures are offset by denominating borrowings in US dollars.
Individual businesses within Reed Elsevier Group plc and ERF are subject to foreign exchange transaction exposurescaused by the effect of exchange rate movements on their revenue and operating costs, to the extent that such revenue andcosts are not denominated in their functional currencies. Individual businesses are required to hedge their exposures at marketrates with the centralised treasury department within ERF. Hedging of foreign exchange transaction exposure is the onlyhedging activity undertaken by the individual businesses. For further details see note 18 to the combined financial statements.
Currency differences increased Reed Elsevier’s revenue by £76 million in 2013 compared to 2012. Excludingamortisation of acquired intangible assets of £318 million and acquisition related costs of £43 million, currency differencesincreased operating profits by £37 million in 2013 compared to 2012. Acquired intangible asset amortisation and acquisitionrelated costs are predominantly denominated in US dollars and, after these charges, currency differences increased operatingprofits by £30 million in 2013 compared to 2012. Borrowings are predominantly denominated in US dollars and, aftercharging net finance costs, currency differences increased profit before tax by £29 million in 2013 compared to 2012.
Recently Issued Accounting Pronouncements
Recently Issued Accounting Pronouncements are set out in note 2 to the combined financial statements.
38
LIQUIDITY AND CAPITAL RESOURCES — REED ELSEVIER
Cash Flow
Reed Elsevier’s cash generated from operations in 2013 amounted to £1,943 million (2012: £1,847 million; 2011:£1,735 million). Included in these net cash inflows are cash outflows of £40 million (2012: £62 million; 2011: £90 million)relating to acquisition related costs and exceptional restructuring costs incurred in prior years. A substantial proportion ofrevenue is received through subscription and similar advanced receipts, principally for scientific and medical journals andexhibition fees. At December 31, 2013 subscriptions and other revenues received in advance totalled£1,403 million (2012: £1,394 million; 2011: £1,412 million).
Reed Elsevier’s cash outflow on the purchase of property, plant and equipment in 2013 was £57 million(2012: £70 million; 2011: £85 million), while proceeds from the sale of property, plant and equipment amounted to £6 million(2012: £7 million; 2011: £7 million). The cash outflow on internally developed intangible assets in 2013 was £251 million(2012: £263 million; 2011: £265 million), reflecting sustained investment in new products and related infrastructure,particularly in the Legal business.
Net cash proceeds from disposals amounted to £195 million, after related separation and transaction costs, and workingcapital and other adjustments in respect of prior year transactions.
During 2013, Reed Elsevier paid a total of £221 million (2012: £316 million; 2011: £529 million) for acquisitions,including deferred consideration of £21 million (2012: £30 million; 2011: £22 million) on past acquisitions and after takingaccount of net cash acquired of £14 million (2012: £12 million; 2011: £24 million). A further £10 million (2012: £7 million;2011: £10 million) was paid on the purchase of investments during the year. During 2013, Reed Elsevier paid tax of£362 million (2012: £216 million; 2011: £218 million).
Share repurchases by the parent companies in 2013 were £600 million (2012: £250 million; 2011: nil), with a further£100 million repurchased in 2014 as at February 26, 2014. On February 27, 2014, Reed Elsevier PLC and Reed Elsevier NVannounced their intention to repurchase further ordinary shares up to the value of £500 million in aggregate over theremainder of 2014. No shares of the parent companies were purchased by the Reed Elsevier Group plc Employee BenefitTrust (2012: nil; 2011: nil). Proceeds from the exercise of share options were £125 million (2012: £48 million; 2011:£9 million).
During 2013, Reed Elsevier paid ordinary dividends totalling £549 million to the shareholders of the parent companies(2012: £521 million; 2011: £497 million). Dividend payments are funded by the operating cash flow of the business aftercapital spend.
Net borrowings, a key indebtedness measure used in assessing Reed Elsevier’s financial position, at December 31, 2013were £3,072 million (2012: £3,127 million; 2011: £3,433 million), comprising gross borrowings of £3,281 million, less£77 million of related derivative financial instrument assets and cash and cash equivalents of £132 million. Excludingcurrency effects, net borrowings decreased by £27 million with acquisitions and share repurchases funded from free cash flowand proceeds from divestments.
Net borrowings are reconciled as follows:
2013 2012 2011£m £m £m
Cash & cash equivalents . . . . . . . . . . . . . . . . . . . . . . . . . . . . . . . . . . . . . . . . . . . . . . . . . . . . . . . . 132 641 726Borrowings . . . . . . . . . . . . . . . . . . . . . . . . . . . . . . . . . . . . . . . . . . . . . . . . . . . . . . . . . . . . . . . . . . (3,281) (3,892) (4,282)Related derivative financial instruments . . . . . . . . . . . . . . . . . . . . . . . . . . . . . . . . . . . . . . . . . . . . 77 124 123
Net borrowings . . . . . . . . . . . . . . . . . . . . . . . . . . . . . . . . . . . . . . . . . . . . . . . . . . . . . . . . . . . . . . . (3,072) (3,127) (3,433)
In July 2013, Reed Elsevier’s committed bank facility, maturing in June 2015, was cancelled and replaced with a new$2.0 billion facility, maturing in July 2018.
In March 2013, $309 million principal amount of term debt maturing in 2019, with a coupon of 8.625%, was exchangedfor $389 million principal amount of the 3.125% term debt maturing in 2022 and cash. The exchange is treated as a debtmodification for accounting purposes. The premium arising is offset against the carrying amount of the newly issued termdebt maturing in 2022 and will be amortised over its life. In June 2013, $282 million of Swiss franc denominated fixed rateterm debt due in 2018 was issued at a coupon of 1.0%. In December 2013, $461 million of US term debt maturing in January2014 was redeemed, taking advantage of the make-whole election.
The directors of Reed Elsevier PLC and Reed Elsevier NV, having made appropriate enquiries, consider that adequateresources exist for the combined businesses to continue in operational existence for the foreseeable future.
39
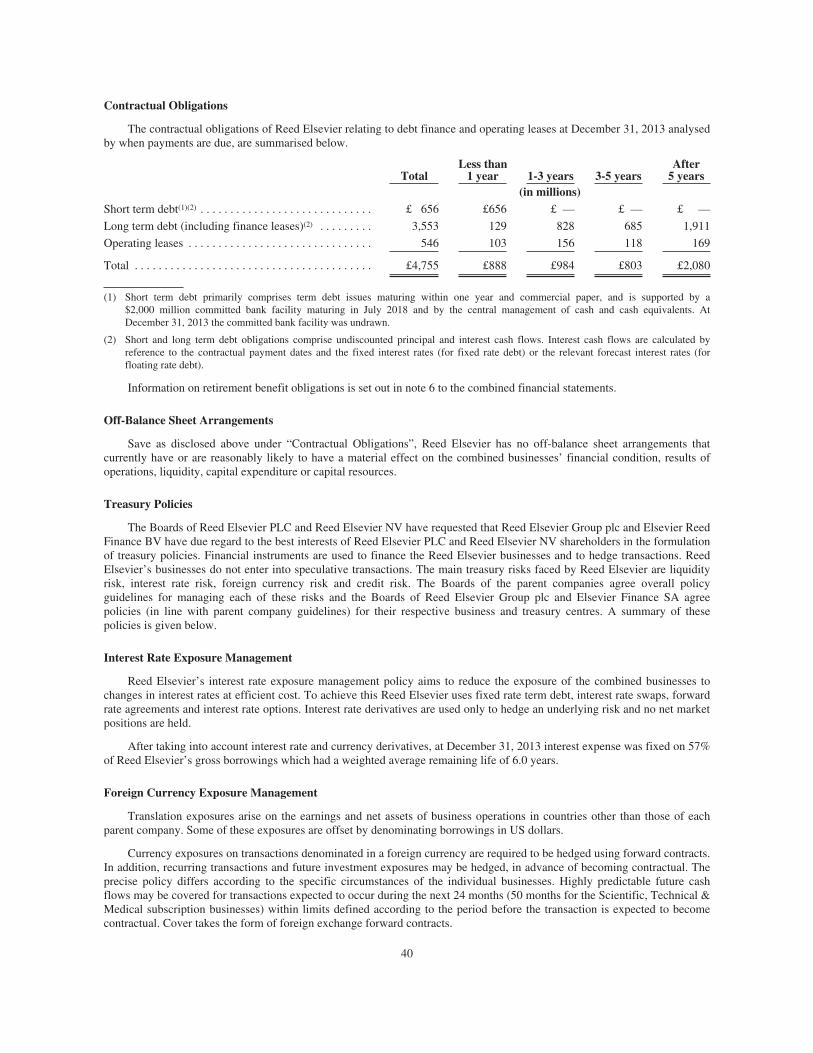
Contractual Obligations
The contractual obligations of Reed Elsevier relating to debt finance and operating leases at December 31, 2013 analysedby when payments are due, are summarised below.
TotalLess than
1 year 1-3 years 3-5 yearsAfter
5 years(in millions)
Short term debt(1)(2) . . . . . . . . . . . . . . . . . . . . . . . . . . . . . £ 656 £656 £ — £ — £ —
Long term debt (including finance leases)(2) . . . . . . . . . 3,553 129 828 685 1,911
Operating leases . . . . . . . . . . . . . . . . . . . . . . . . . . . . . . . 546 103 156 118 169
Total . . . . . . . . . . . . . . . . . . . . . . . . . . . . . . . . . . . . . . . . £4,755 £888 £984 £803 £2,080
(1) Short term debt primarily comprises term debt issues maturing within one year and commercial paper, and is supported by a$2,000 million committed bank facility maturing in July 2018 and by the central management of cash and cash equivalents. AtDecember 31, 2013 the committed bank facility was undrawn.
(2) Short and long term debt obligations comprise undiscounted principal and interest cash flows. Interest cash flows are calculated byreference to the contractual payment dates and the fixed interest rates (for fixed rate debt) or the relevant forecast interest rates (forfloating rate debt).
Information on retirement benefit obligations is set out in note 6 to the combined financial statements.
Off-Balance Sheet Arrangements
Save as disclosed above under “Contractual Obligations”, Reed Elsevier has no off-balance sheet arrangements thatcurrently have or are reasonably likely to have a material effect on the combined businesses’ financial condition, results ofoperations, liquidity, capital expenditure or capital resources.
Treasury Policies
The Boards of Reed Elsevier PLC and Reed Elsevier NV have requested that Reed Elsevier Group plc and Elsevier ReedFinance BV have due regard to the best interests of Reed Elsevier PLC and Reed Elsevier NV shareholders in the formulationof treasury policies. Financial instruments are used to finance the Reed Elsevier businesses and to hedge transactions. ReedElsevier’s businesses do not enter into speculative transactions. The main treasury risks faced by Reed Elsevier are liquidityrisk, interest rate risk, foreign currency risk and credit risk. The Boards of the parent companies agree overall policyguidelines for managing each of these risks and the Boards of Reed Elsevier Group plc and Elsevier Finance SA agreepolicies (in line with parent company guidelines) for their respective business and treasury centres. A summary of thesepolicies is given below.
Interest Rate Exposure Management
Reed Elsevier’s interest rate exposure management policy aims to reduce the exposure of the combined businesses tochanges in interest rates at efficient cost. To achieve this Reed Elsevier uses fixed rate term debt, interest rate swaps, forwardrate agreements and interest rate options. Interest rate derivatives are used only to hedge an underlying risk and no net marketpositions are held.
After taking into account interest rate and currency derivatives, at December 31, 2013 interest expense was fixed on 57%of Reed Elsevier’s gross borrowings which had a weighted average remaining life of 6.0 years.
Foreign Currency Exposure Management
Translation exposures arise on the earnings and net assets of business operations in countries other than those of eachparent company. Some of these exposures are offset by denominating borrowings in US dollars.
Currency exposures on transactions denominated in a foreign currency are required to be hedged using forward contracts.In addition, recurring transactions and future investment exposures may be hedged, in advance of becoming contractual. Theprecise policy differs according to the specific circumstances of the individual businesses. Highly predictable future cashflows may be covered for transactions expected to occur during the next 24 months (50 months for the Scientific, Technical &Medical subscription businesses) within limits defined according to the period before the transaction is expected to becomecontractual. Cover takes the form of foreign exchange forward contracts.
40
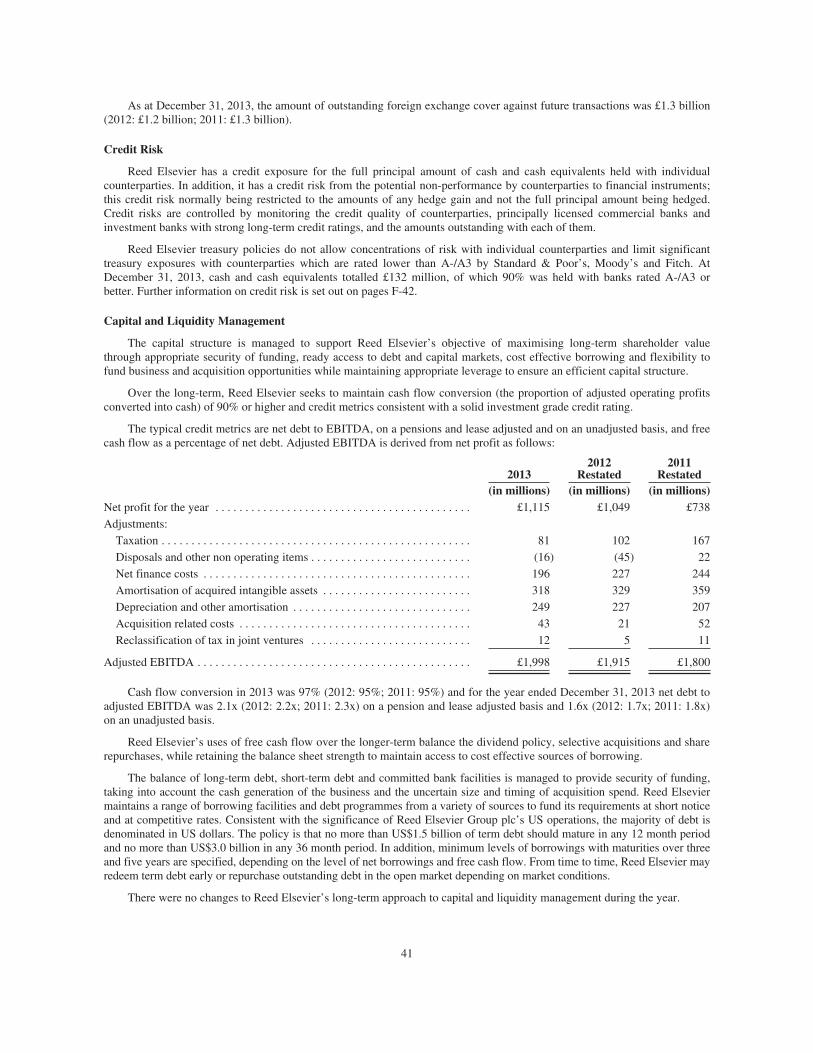
As at December 31, 2013, the amount of outstanding foreign exchange cover against future transactions was £1.3 billion(2012: £1.2 billion; 2011: £1.3 billion).
Credit Risk
Reed Elsevier has a credit exposure for the full principal amount of cash and cash equivalents held with individualcounterparties. In addition, it has a credit risk from the potential non-performance by counterparties to financial instruments;this credit risk normally being restricted to the amounts of any hedge gain and not the full principal amount being hedged.Credit risks are controlled by monitoring the credit quality of counterparties, principally licensed commercial banks andinvestment banks with strong long-term credit ratings, and the amounts outstanding with each of them.
Reed Elsevier treasury policies do not allow concentrations of risk with individual counterparties and limit significanttreasury exposures with counterparties which are rated lower than A-/A3 by Standard & Poor’s, Moody’s and Fitch. AtDecember 31, 2013, cash and cash equivalents totalled £132 million, of which 90% was held with banks rated A-/A3 orbetter. Further information on credit risk is set out on pages F-42.
Capital and Liquidity Management
The capital structure is managed to support Reed Elsevier’s objective of maximising long-term shareholder valuethrough appropriate security of funding, ready access to debt and capital markets, cost effective borrowing and flexibility tofund business and acquisition opportunities while maintaining appropriate leverage to ensure an efficient capital structure.
Over the long-term, Reed Elsevier seeks to maintain cash flow conversion (the proportion of adjusted operating profitsconverted into cash) of 90% or higher and credit metrics consistent with a solid investment grade credit rating.
The typical credit metrics are net debt to EBITDA, on a pensions and lease adjusted and on an unadjusted basis, and freecash flow as a percentage of net debt. Adjusted EBITDA is derived from net profit as follows:
20132012
Restated2011
Restated(in millions) (in millions) (in millions)
Net profit for the year . . . . . . . . . . . . . . . . . . . . . . . . . . . . . . . . . . . . . . . . . . . £1,115 £1,049 £738Adjustments:
Taxation . . . . . . . . . . . . . . . . . . . . . . . . . . . . . . . . . . . . . . . . . . . . . . . . . . . . 81 102 167Disposals and other non operating items . . . . . . . . . . . . . . . . . . . . . . . . . . . (16) (45) 22Net finance costs . . . . . . . . . . . . . . . . . . . . . . . . . . . . . . . . . . . . . . . . . . . . . 196 227 244Amortisation of acquired intangible assets . . . . . . . . . . . . . . . . . . . . . . . . . 318 329 359Depreciation and other amortisation . . . . . . . . . . . . . . . . . . . . . . . . . . . . . . 249 227 207Acquisition related costs . . . . . . . . . . . . . . . . . . . . . . . . . . . . . . . . . . . . . . . 43 21 52Reclassification of tax in joint ventures . . . . . . . . . . . . . . . . . . . . . . . . . . . 12 5 11
Adjusted EBITDA . . . . . . . . . . . . . . . . . . . . . . . . . . . . . . . . . . . . . . . . . . . . . . £1,998 £1,915 £1,800
Cash flow conversion in 2013 was 97% (2012: 95%; 2011: 95%) and for the year ended December 31, 2013 net debt toadjusted EBITDA was 2.1x (2012: 2.2x; 2011: 2.3x) on a pension and lease adjusted basis and 1.6x (2012: 1.7x; 2011: 1.8x)on an unadjusted basis.
Reed Elsevier’s uses of free cash flow over the longer-term balance the dividend policy, selective acquisitions and sharerepurchases, while retaining the balance sheet strength to maintain access to cost effective sources of borrowing.
The balance of long-term debt, short-term debt and committed bank facilities is managed to provide security of funding,taking into account the cash generation of the business and the uncertain size and timing of acquisition spend. Reed Elseviermaintains a range of borrowing facilities and debt programmes from a variety of sources to fund its requirements at short noticeand at competitive rates. Consistent with the significance of Reed Elsevier Group plc’s US operations, the majority of debt isdenominated in US dollars. The policy is that no more than US$1.5 billion of term debt should mature in any 12 month periodand no more than US$3.0 billion in any 36 month period. In addition, minimum levels of borrowings with maturities over threeand five years are specified, depending on the level of net borrowings and free cash flow. From time to time, Reed Elsevier mayredeem term debt early or repurchase outstanding debt in the open market depending on market conditions.
There were no changes to Reed Elsevier’s long-term approach to capital and liquidity management during the year.
41
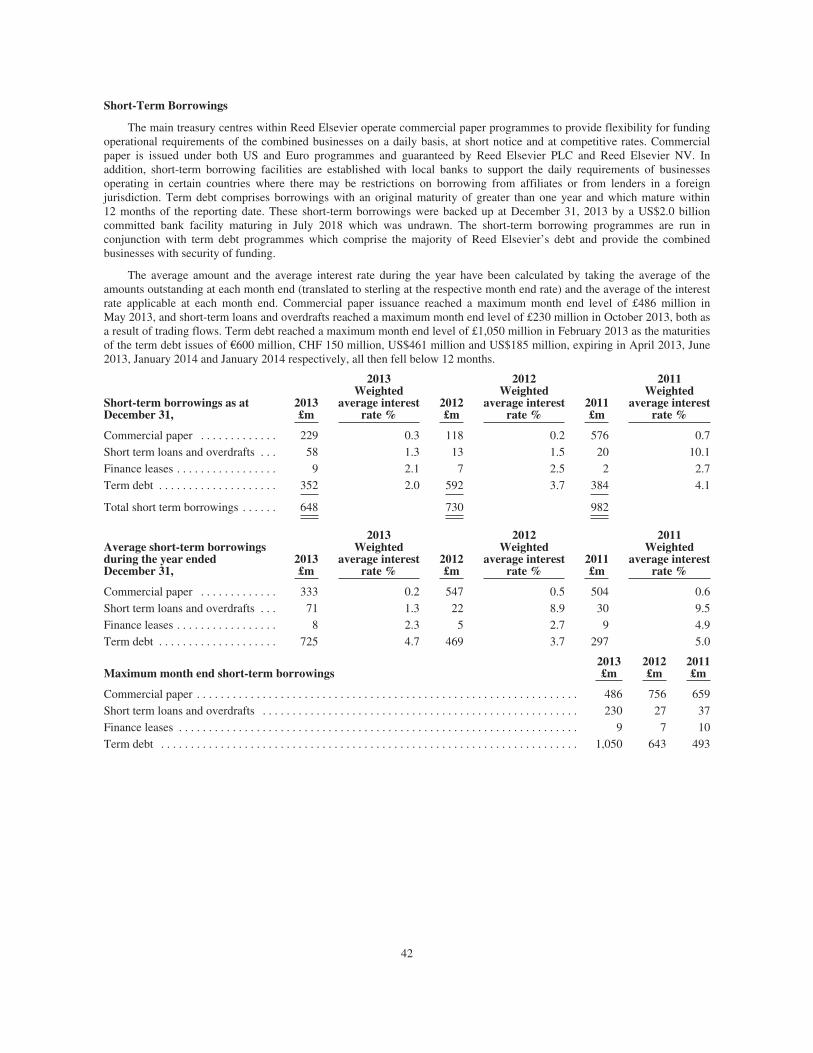
Short-Term Borrowings
The main treasury centres within Reed Elsevier operate commercial paper programmes to provide flexibility for fundingoperational requirements of the combined businesses on a daily basis, at short notice and at competitive rates. Commercialpaper is issued under both US and Euro programmes and guaranteed by Reed Elsevier PLC and Reed Elsevier NV. Inaddition, short-term borrowing facilities are established with local banks to support the daily requirements of businessesoperating in certain countries where there may be restrictions on borrowing from affiliates or from lenders in a foreignjurisdiction. Term debt comprises borrowings with an original maturity of greater than one year and which mature within12 months of the reporting date. These short-term borrowings were backed up at December 31, 2013 by a US$2.0 billioncommitted bank facility maturing in July 2018 which was undrawn. The short-term borrowing programmes are run inconjunction with term debt programmes which comprise the majority of Reed Elsevier’s debt and provide the combinedbusinesses with security of funding.
The average amount and the average interest rate during the year have been calculated by taking the average of theamounts outstanding at each month end (translated to sterling at the respective month end rate) and the average of the interestrate applicable at each month end. Commercial paper issuance reached a maximum month end level of £486 million inMay 2013, and short-term loans and overdrafts reached a maximum month end level of £230 million in October 2013, both asa result of trading flows. Term debt reached a maximum month end level of £1,050 million in February 2013 as the maturitiesof the term debt issues of €600 million, CHF 150 million, US$461 million and US$185 million, expiring in April 2013, June2013, January 2014 and January 2014 respectively, all then fell below 12 months.
Short-term borrowings as atDecember 31,
2013£m
2013Weighted
average interestrate %
2012£m
2012Weighted
average interestrate %
2011£m
2011Weighted
average interestrate %
Commercial paper . . . . . . . . . . . . . 229 0.3 118 0.2 576 0.7Short term loans and overdrafts . . . 58 1.3 13 1.5 20 10.1Finance leases . . . . . . . . . . . . . . . . . 9 2.1 7 2.5 2 2.7Term debt . . . . . . . . . . . . . . . . . . . . 352 2.0 592 3.7 384 4.1
Total short term borrowings . . . . . . 648 730 982
Average short-term borrowingsduring the year endedDecember 31,
2013£m
2013Weighted
average interestrate %
2012£m
2012Weighted
average interestrate %
2011£m
2011Weighted
average interestrate %
Commercial paper . . . . . . . . . . . . . 333 0.2 547 0.5 504 0.6Short term loans and overdrafts . . . 71 1.3 22 8.9 30 9.5Finance leases . . . . . . . . . . . . . . . . . 8 2.3 5 2.7 9 4.9Term debt . . . . . . . . . . . . . . . . . . . . 725 4.7 469 3.7 297 5.0
Maximum month end short-term borrowings2013£m
2012£m
2011£m
Commercial paper . . . . . . . . . . . . . . . . . . . . . . . . . . . . . . . . . . . . . . . . . . . . . . . . . . . . . . . . . . . . . . . . 486 756 659Short term loans and overdrafts . . . . . . . . . . . . . . . . . . . . . . . . . . . . . . . . . . . . . . . . . . . . . . . . . . . . . 230 27 37Finance leases . . . . . . . . . . . . . . . . . . . . . . . . . . . . . . . . . . . . . . . . . . . . . . . . . . . . . . . . . . . . . . . . . . . 9 7 10Term debt . . . . . . . . . . . . . . . . . . . . . . . . . . . . . . . . . . . . . . . . . . . . . . . . . . . . . . . . . . . . . . . . . . . . . . 1,050 643 493
42

OPERATING RESULTS — REED ELSEVIER PLC AND REED ELSEVIER NV
The following discussion is based on the financial statements of Reed Elsevier PLC and Reed Elsevier NV for the threeyears ended December 31, 2013, 2012 and 2011. The results of Reed Elsevier PLC reflect its shareholders’ 52.9% economicinterest in the Reed Elsevier combined businesses. The results of Reed Elsevier NV reflect its shareholders’ 50% economicinterest in the Reed Elsevier combined businesses. The respective economic interests of the Reed Elsevier PLC and ReedElsevier NV shareholders take account of Reed Elsevier PLC’s 5.8% indirect interest in Reed Elsevier NV. Both parentcompanies equity account for their respective share in the Reed Elsevier combined businesses.
Results of Operations for the Year Ended December 31, 2013Compared to the Year Ended December 31, 2012
The earnings per share of Reed Elsevier PLC and Reed Elsevier NV were 48.8p and €0.91 respectively in 2013,compared to 44.8p and €0.87 in 2012. The increase reflects the improved trading performance and deferred tax credits.
Dividends to Reed Elsevier PLC and Reed Elsevier NV shareholders are, other than in special circumstances, equalisedat the gross level, including the benefit of the UK attributable tax credit of 10% received by certain Reed Elsevier PLCshareholders. The exchange rate used for each dividend calculation — as defined in the Reed Elsevier merger agreement — isthe spot euro:sterling exchange rate, averaged over a period of five business days commencing with the tenth business daybefore the announcement of the proposed dividend.
Ordinary dividends paid in the year, in amounts per ordinary share, comprise: a 2012 final dividend of 17.0p and 2013interim dividend of 6.65p giving a total of 23.65p (2012: 21.9p) for Reed Elsevier PLC; and a 2012 final dividend of €0.337and 2013 interim dividend of €0.132 giving a total of €0.469 (2012: €0.456) for Reed Elsevier NV.
The Board of Reed Elsevier PLC has proposed a 2013 final dividend of 17.95p, up 6%, giving a total dividend of 24.60pin respect of the financial year, up 7% on 2012. The Board of Reed Elsevier NV, in accordance with the dividend equalisationarrangements, have proposed a 2013 final dividend of €0.374, up 11%, which results in a total dividend of €0.506 in respectof the financial year, up 8% on 2012. The difference in growth rates in the equalised final dividends reflects changes in theeuro:sterling exchange rate since the respective prior year dividend announcement dates.
During 2013 Reed Elsevier repurchased 41,961,920 Reed Elsevier PLC ordinary shares and 24,282,106 Reed ElsevierNV ordinary shares for consideration of £600 million. Reed Elsevier NV also repurchased 94,053 Reed Elsevier NV R shares(equivalent to 940,530 ordinary shares) from a subsidiary of Reed Elsevier PLC. These shares are held in treasury. OnDecember 16, 2013 Reed Elsevier PLC and Reed Elsevier NV announced an irrevocable, non discretionary programme torepurchase further ordinary shares up to the value of £100 million which was completed by February 26, 2014. On February27, 2014, Reed Elsevier PLC and Reed Elsevier NV announced their intention to repurchase further ordinary shares up to thevalue of £500 million in aggregate over the remainder of 2014.
Results of Operations for the Year Ended December 31, 2012Compared to the Year Ended December 31, 2011
The earnings per share of Reed Elsevier PLC and Reed Elsevier NV were 44.8p and €0.87 respectively in 2012,compared to 31.1p and €0.57 in 2011. The increase reflects the improved trading performance, disposals and other nonoperating items and the exceptional prior year tax credit.
Dividends to Reed Elsevier PLC and Reed Elsevier NV shareholders are, other than in special circumstances, equalisedat the gross level, including the benefit of the UK attributable tax credit of 10% received by certain Reed Elsevier PLCshareholders. The exchange rate used for each dividend calculation — as defined in the Reed Elsevier merger agreement — isthe spot euro:sterling exchange rate, averaged over a period of five business days commencing with the tenth business daybefore the announcement of the proposed dividend.
Ordinary dividends paid in 2012, in amounts per ordinary share, comprised: a 2011 final dividend of 15.9p and 2012interim dividend of 6.0p giving a total of 21.9p (2011: 20.65p) for Reed Elsevier PLC; and a 2011 final dividend of €0.326and 2012 interim dividend of €0.130 giving a total of €0.456 (2011: €0.413) for Reed Elsevier NV.
The Board of Reed Elsevier PLC proposed a 2012 final dividend of 17.0p, up 7%, giving a total dividend of 23.0p inrespect of the financial year, up 7% on 2011. The Boards of Reed Elsevier NV, in accordance with the dividend equalisationarrangements, proposed a 2012 final dividend of €0.337, up 3%, which resulted in a total dividend of €0.467 in respect of thefinancial year, up 7% on 2011. The difference in growth rates in the equalised final dividends reflected changes in theeuro:sterling exchange rate since the respective prior year dividend announcement dates.
During 2012 Reed Elsevier repurchased 23,288,616 Reed Elsevier PLC ordinary shares and 12,660,296 Reed ElsevierNV ordinary shares for consideration of £250 million. These shares are held in treasury.
43

TREND INFORMATION
Trends, uncertainties and events which can affect the revenue, operating profit and liquidity and capital resources of theReed Elsevier combined businesses include the usage, penetration and customer renewal of our print and electronic productsand the prices that customers pay for our products, the migration of print and CD products to online services, investment innew products and services, cost control and the impact of our cost reduction programmes on operational efficiency, the levelsof academic library funding, the impact of economic conditions on corporate and other customer budgets and the level ofadvertising demand, the actions of competitors and regulatory and legislative developments.
Trends, uncertainties and events which could have a material impact on Reed Elsevier’s revenue, operating profit andliquidity and capital resources are discussed in further detail in “Item 3: Key Information — Risk Factors”;“Item 4: Information on Reed Elsevier”; and “Item 5: Operating and Financial Review and Prospects — Operating Results —Reed Elsevier; Liquidity and Capital Resources — Reed Elsevier; Operating Results — Reed Elsevier PLC and Reed ElsevierNV”.
44
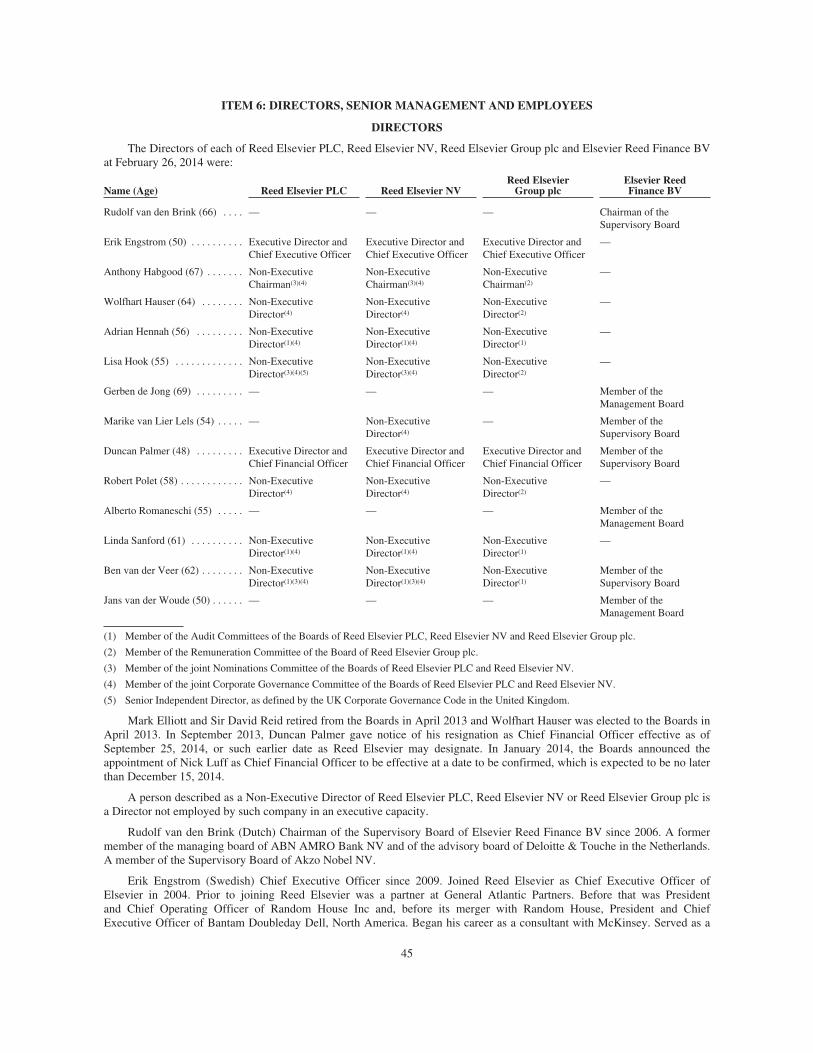
ITEM 6: DIRECTORS, SENIOR MANAGEMENT AND EMPLOYEES
DIRECTORS
The Directors of each of Reed Elsevier PLC, Reed Elsevier NV, Reed Elsevier Group plc and Elsevier Reed Finance BVat February 26, 2014 were:
Name (Age) Reed Elsevier PLC Reed Elsevier NVReed Elsevier
Group plcElsevier ReedFinance BV
Rudolf van den Brink (66) . . . . — — — Chairman of theSupervisory Board
Erik Engstrom (50) . . . . . . . . . . Executive Director andChief Executive Officer
Executive Director andChief Executive Officer
Executive Director andChief Executive Officer
—
Anthony Habgood (67) . . . . . . . Non-ExecutiveChairman(3)(4)
Non-ExecutiveChairman(3)(4)
Non-ExecutiveChairman(2)
—
Wolfhart Hauser (64) . . . . . . . . Non-ExecutiveDirector(4)
Non-ExecutiveDirector(4)
Non-ExecutiveDirector(2)
—
Adrian Hennah (56) . . . . . . . . . Non-ExecutiveDirector(1)(4)
Non-ExecutiveDirector(1)(4)
Non-ExecutiveDirector(1)
—
Lisa Hook (55) . . . . . . . . . . . . . Non-ExecutiveDirector(3)(4)(5)
Non-ExecutiveDirector(3)(4)
Non-ExecutiveDirector(2)
—
Gerben de Jong (69) . . . . . . . . . — — — Member of theManagement Board
Marike van Lier Lels (54) . . . . . — Non-ExecutiveDirector(4)
— Member of theSupervisory Board
Duncan Palmer (48) . . . . . . . . . Executive Director andChief Financial Officer
Executive Director andChief Financial Officer
Executive Director andChief Financial Officer
Member of theSupervisory Board
Robert Polet (58) . . . . . . . . . . . . Non-ExecutiveDirector(4)
Non-ExecutiveDirector(4)
Non-ExecutiveDirector(2)
—
Alberto Romaneschi (55) . . . . . — — — Member of theManagement Board
Linda Sanford (61) . . . . . . . . . . Non-ExecutiveDirector(1)(4)
Non-ExecutiveDirector(1)(4)
Non-ExecutiveDirector(1)
—
Ben van der Veer (62) . . . . . . . . Non-ExecutiveDirector(1)(3)(4)
Non-ExecutiveDirector(1)(3)(4)
Non-ExecutiveDirector(1)
Member of theSupervisory Board
Jans van der Woude (50) . . . . . . — — — Member of theManagement Board
(1) Member of the Audit Committees of the Boards of Reed Elsevier PLC, Reed Elsevier NV and Reed Elsevier Group plc.
(2) Member of the Remuneration Committee of the Board of Reed Elsevier Group plc.
(3) Member of the joint Nominations Committee of the Boards of Reed Elsevier PLC and Reed Elsevier NV.
(4) Member of the joint Corporate Governance Committee of the Boards of Reed Elsevier PLC and Reed Elsevier NV.
(5) Senior Independent Director, as defined by the UK Corporate Governance Code in the United Kingdom.
Mark Elliott and Sir David Reid retired from the Boards in April 2013 and Wolfhart Hauser was elected to the Boards inApril 2013. In September 2013, Duncan Palmer gave notice of his resignation as Chief Financial Officer effective as ofSeptember 25, 2014, or such earlier date as Reed Elsevier may designate. In January 2014, the Boards announced theappointment of Nick Luff as Chief Financial Officer to be effective at a date to be confirmed, which is expected to be no laterthan December 15, 2014.
A person described as a Non-Executive Director of Reed Elsevier PLC, Reed Elsevier NV or Reed Elsevier Group plc isa Director not employed by such company in an executive capacity.
Rudolf van den Brink (Dutch) Chairman of the Supervisory Board of Elsevier Reed Finance BV since 2006. A formermember of the managing board of ABN AMRO Bank NV and of the advisory board of Deloitte & Touche in the Netherlands.A member of the Supervisory Board of Akzo Nobel NV.
Erik Engstrom (Swedish) Chief Executive Officer since 2009. Joined Reed Elsevier as Chief Executive Officer ofElsevier in 2004. Prior to joining Reed Elsevier was a partner at General Atlantic Partners. Before that was Presidentand Chief Operating Officer of Random House Inc and, before its merger with Random House, President and ChiefExecutive Officer of Bantam Doubleday Dell, North America. Began his career as a consultant with McKinsey. Served as a
45
Non-Executive Director of Eniro AB and Svenska Cellulosa Aktiebolaget SCA. Holds a BSc from Stockholm School ofEconomics, an MSc from the Royal Institute of Technology in Stockholm, and gained an MBA from Harvard BusinessSchool as a Fulbright Scholar.
Anthony Habgood (British) Chairman since 2009. Chairman of the Nominations and Corporate Governance Committees.Chairman of Whitbread plc, Preqin Holding Limited and Norwich Research Partners LLP. Was Chairman of Bunzl plc and ofMölnlycke Health Care Limited and served as Chief Executive of Bunzl plc, Chief Executive of Tootal Group plc and aDirector of The Boston Consulting Group. Formerly Non-Executive Director of Geest plc, Marks and Spencer plc, NationalWestminster Bank plc, Norfolk and Norwich University Hospitals Trust, Powergen plc, and SVG Capital plc. Holds an MA inEconomics from Cambridge University and an MS in Industrial Administration from Carnegie Mellon University. He is avisiting Fellow at Oxford University.
Wolfhart Hauser (German) Non-Executive Director since 2013. Chairman of the Remuneration Committee. ChiefExecutive Officer of Intertek Group plc. Was Chairman of Dragenopharm GmbH & Co AG from 2002 to 2006. Prior to thathe was Chief Executive Officer of TÜV Suddeutschland AG between 1998 and 2002 and Chief Executive Officer of TÜVProduct Services GmbH for 10 years. Served as a Non-Executive Director of Logica Plc and Intertek Group plc before hiscurrent position at the company.
Adrian Hennah (British) Non-Executive Director since 2011. He is Chief Financial Officer of Reckitt Benckiser Groupplc having been Chief Financial Officer of Smith & Nephew plc from 2006 to 2012. Before that was Chief Financial Officerof Invensys plc having previously held various senior finance and management positions within GlaxoSmithKline for18 years.
Lisa Hook (American) Non-Executive Director since 2006. Senior Independent Director. President and Chief ExecutiveOfficer of Neustar Inc. and a Director of Island Press. Was President and Chief Executive Officer at Sun Rocket Inc. Beforethat was President of AOL Broadband, Premium and Developer Services. Prior to joining AOL, was a founding partner atBrera Capital Partners LLC. Previously Chief Operating Officer of Time Warner Telecommunications and has served assenior advisor to the Federal Communications Commission Chairman and a senior counsel to Viacom Cable. Formerly aDirector of The Ocean Foundation.
Gerben de Jong (Dutch) member of the Management Board of Elsevier Reed Finance BV since 2007. Previously heldsenior finance positions in Royal Philips Electronics NV Group.
Marike van Lier Lels (Dutch) Non-Executive Director of Reed Elsevier NV since January 2010. Member of theSupervisory Boards of KPN NV, USG People NV, TKH Group NV and Eneco Holding NV, and a member of the executivecommittee of the Aegon Association. A member of various Dutch governmental advisory boards. Previously was a member ofthe Supervisory Board of Maersk BV and Executive Vice President and Chief Operating Officer of the Schiphol Group. Priorto joining Schiphol Group, was a member of the Executive Board of Deutsche Post Euro Express and held various seniorpositions with Nedlloyd.
Duncan Palmer (British and American) Chief Financial Officer since November 2012. Non-Executive Director ofOshkosh Corporation. Prior to joining Reed Elsevier was Chief Financial Officer and Senior Vice President of OwensCorning Inc. from 2007, having previously held various senior finance positions within Royal Dutch Shell for 20 years in theUK, the Netherlands and the US. He holds an MA in mathematics from Cambridge University and an MBA from StanfordUniversity. He is a UK-qualified Chartered Management Accountant.
Robert Polet (Dutch) Non-Executive Director since 2007. Chairman of Safilo Group S.p.A. and a Non-ExecutiveDirector of Philip Morris International Inc, William Grant & Sons Limited, Scotch and Soda NV and Crown Topco Limited,parent company of Vertu. Member of the Supervisory Board of Nyenrode Foundation. Was President and Chief ExecutiveOfficer of Gucci Group from 2004 to 2011, having previously spent 26 years at Unilever working in a variety of marketingand senior executive positions throughout the world, including President of Unilever’s Worldwide Ice Cream and FrozenFoods division. Formerly a Non-Executive Director of Wilderness Holdings Limited.
Alberto Romaneschi (Swiss) Member of the Management Board of Elsevier Reed Finance BV since October 2012.Non-Executive Chairman of QualySense AG. Prior to joining Elsevier Reed Finance was founder and managing partner atRomaneschi & Partners, a treasury and risk management consulting firm. Other previous appointments included ChiefFinancial Officer of the Ascom Group, Chief Financial Officer positions at Dreyer’s Grand Ice Cream Inc. and Cereal PartnersWorldwide S.A. and Group Treasurer with Nestlé. He has been the Managing Director of Elsevier Finance SA since 2012.
Linda Sanford (American) Non-Executive Director since 2012. Senior Vice President, Enterprise Transformation,IBM Corporation. Serves on the board of directors of The Business Council of New York State and the Partnership forNew York City. Also serves on the board of trustees of the State University of New York, St. John’s University, RensselaerPolytechnic Institute and the New York Hall of Science. Was a Non-Executive Director of ITT Corporation until May 2013.
Ben van der Veer (Dutch) Non-Executive Director since 2009. Chairman of the Audit Committees. Member of theSupervisory Boards of Aegon NV, TomTom NV and Koninklijke FrieslandCampina NV. Was Chairman of the Executive
46

Board of KPMG in the Netherlands and a member of the management committee of the KPMG International board until hisretirement in 2008, having joined KPMG in 1976. Formerly a member of the Supervisory Board of Siemens Nederland NV.
Jans van der Woude (Dutch) Member of the Management Board of Elsevier Reed Finance BV since 2009. Is CompanySecretary and Legal Counsel of Reed Elsevier NV. Prior to joining Reed Elsevier in 2009 was legal advisor to CorporateExpress NV. Before that was Corporate Legal Director of TNT NV, having previously been General Counsel at GetronicsNV.
SENIOR MANAGEMENT
The executive officers of Reed Elsevier PLC, Reed Elsevier NV and Reed Elsevier Group plc, other than Directors, atFebruary 26, 2014 were:
Henry Udow: Chief Legal Officer and Company Secretary of Reed Elsevier PLC and Reed Elsevier Group plc. A US andBritish citizen who is admitted to the Bar of New York State. Joined Reed Elsevier in April 2011. Prior to joining ReedElsevier he was Chief Legal Officer and Company Secretary of Cadbury plc.
Ian Fraser: Human Resources Director of Reed Elsevier Group plc. Joined Reed Elsevier in 2005. Prior to joining ReedElsevier, he was Human Resources Director at BHP Billiton plc and, before that, held senior positions in human resources atCharter plc and Woolworths plc.
Jans van der Woude: Company Secretary and Legal Counsel of Reed Elsevier NV. A Dutch lawyer. Joined ReedElsevier in January 2009.
COMPENSATION
Remuneration Policy Report
Set out in this section is the company’s remuneration policy for Directors, which, subject to shareholder approval, willapply from the conclusion of the Reed Elsevier PLC Annual General Meeting to be held on April 24, 2014.
Remuneration policy table — Executive Directors
All footnotes to the policy table can be found on pages 51 and 52.
ANNUAL BASE SALARY
Purpose and link to strategy
To recruit and retain the best executive talent globally to execute our strategic objectives at appropriate cost.
Operation
Salaries for Executive Directors are set and reviewed annually by the Reed Elsevier Group plc Remuneration Committee(the Committee) with changes typically taking effect on January 1. In exceptional circumstances, the Committee may reviewmore frequently. The following factors are considered:
Š The executive’s role and sustained value to the company in terms of skill, experience and overall contribution.
Š Competitiveness with companies which are comparable in respect of industry, size, international scope andcomplexity. Examples of global peers include Thomson Reuters, WPP, Pearson, John Wiley, Wolters Kluwer,Experian, McGraw-Hill and Equifax.
Š The company’s guidelines for salaries for all employees for the year.
For the last two years, Executive Directors’ salary increases have been 2.5% per annum.
Maximum value
Salary increases to Executive Directors are within the range of increases for the wider employee population. However,the Committee has discretion to exceed this to take account of individual circumstances such as change in responsibility,increases in scale or complexity of the business, inflation or alignment to market level.
Performance framework
n/a
Recovery of sums paid
No provision.
47

RETIREMENT BENEFITS
Purpose and link to strategy
Retirement plans are part of remuneration packages designed to recruit and retain the best executive talent at appropriatecost.
Operation
Our policy is to offer competitive long-term sustainable defined contribution plans. Any amount above applicable limits,for example Her Majesty’s Revenue and Customs’ (HMRC’s) annual allowance in the UK, will be paid in cash and will besubject to tax and social security deductions. In certain circumstances, executives can take cash instead of pensioncontributions.
The UK defined benefit scheme is closed to new hires. Continued membership of legacy defined benefit schemesrequires annual increases to contributions or participation fees from all members, who have a choice to switch to the definedcontribution plan at any time.
The CEO is a member of a UK legacy defined benefit pension arrangement, accruing 1/30th of final year pensionableearnings (base salary) for each year (pro-rated for part years) of service, with a normal retirement age of 60. The CEOcontributes 7% of salary up to the scheme earnings cap. In line with all UK defined benefit scheme members, the CEO’scontributions will increase to 8% from April 2014 and then by a further 1% each year to a rate of 11% in April 2017. Inaddition, the CEO currently pays a participation fee equal to 1% of the amount of his base salary in excess of the schemeearnings cap. On April 1, 2014, and each April thereafter, this fee will increase by 2% of the amount of his base salary inexcess of the scheme earnings cap.
Maximum value
Defined benefit scheme — accrual of 1/30th of salary for every year of service up to a maximum of 2/3rds of salary.
Defined contribution plan — maximum company contribution of 30% of salary per annum or equivalent cash in lieu.
Performance framework
n/a
Recovery of sums paid
No provision.
OTHER BENEFITS
Purpose and link to strategy
To provide competitive benefits at appropriate cost.
Operation
Other benefits, subject to periodic review, may include private medical and dental cover, life assurance, tax returnpreparation costs, car benefits, directors’ and officers’ liability insurance, relocation benefits and expatriate allowances andother benefits available to employees generally, including, where appropriate, the tax on such benefits.
Maximum value
Over the past three years, ongoing benefits for Executive Directors (excluding relocation benefits) have amounted tobetween 3% and 5% of salary, in line with our policy that the maximum payable should not exceed 5% of salary. However,the Committee may provide reasonable benefits beyond this amount in unexpected situations, such as a change in theindividual’s circumstances caused by the company, or if there is a significant increase in the cost of the benefit.
Performance framework
n/a
Recovery of sums paid
No provision.
48

AIP (ANNUAL INCENTIVE PLAN)
Purpose and link to strategy
Provides focus on the delivery of annual financial targets and the achievement of annual objectives and milestones whichare chosen to align with the company’s strategy and create a platform for sustainable future performance.
Why performance measures are chosen and how targets are set
Performance measures include a balanced set of financial targets and Key Performance Objectives (KPOs), which areappropriately weighted and which support current strategy and incentivise the Executive Directors to achieve the desiredoutcomes without undue risk of focusing on any one financial measure.
The targets are designed to be challenging. They are set with reference to the previous year’s performance and internaland external forecasts for the following year.
Operation
The Committee reviews and sets the financial targets and KPOs annually, taking into account internal forecasts andstrategic plans.
It approves four to six KPOs for each Executive Director, reflecting critical business priorities for which each isaccountable. At least one KPO will relate to the achievement of sustainability targets.
Following year end, the Committee compares actual performance with the financial targets and assesses the achievementof individual KPOs.
Maximum value
The maximum potential annual incentive for Executive Directors is 150% of annual base salary.
Performance framework
The measures include financial targets, which have a weighting of at least 70%, and individual KPOs, with each elementassessed separately.
Š The minimum payout is zero.Š If the financial measure with the lowest payout at threshold pays out at threshold and the others do not pay out at all,
the overall payout for financial measures is 5% of salary. If threshold is reached for each of the financial measures,the overall payout for the financial measures is 26% of salary. There is no threshold level for KPOs.
Š Payout for target performance (financial measures and KPOs) is 100% of salary.
Following an assessment of achievement and scoring of KPOs, the Committee agrees the overall payout level for eachExecutive Director.
Committee discretion applies.1,2
Recovery of sums paid
Claw-back applies.3
CURRENT MULTI-YEAR INCENTIVE PLANS
Purpose and link to strategy
The multi-year incentive plans are the main component of Executive Directors’ pay. They are designed to provide long-term incentives for Executive Directors to achieve the key performance measures that support the company’s strategy, and toalign their interests with shareholders. The BIP encourages annual personal investment in Reed Elsevier shares.
Why performance measures are chosen and how targets are set
Our strategic focus is on transforming the core business through organic investment and the build out of new productsinto adjacent markets and geographies, supplemented by selective portfolio acquisitions and divestments. The performancemeasures in the multi-year incentives are chosen to support this strategy by focusing on return on capital, returns toshareholders and sustained earnings growth.
49
Targets are set with regard to previous results and internal and external forecasts for the performance period. They aredesigned to provide exceptional reward for exceptional performance, whilst allowing a reasonable expectation that reward atthe lower end of the scale is attainable, subject to robust performance.
BIP (BONUS INVESTMENT PLAN)LTIP (LONG-TERMINCENTIVE PLAN)
ESOS (EXECUTIVE SHAREOPTION SCHEME)
OperationAnnually, Executive Directors may useup to an amount equal to their AIPtarget for investment in Reed Elseviershares. In return, they receive amatching award which vests subject to:
Š performance measured over threefinancial years;
Š continued employment; andŠ retention of the underlying
investment shares.
Dividend equivalents accrued duringthe performance period are payable inrespect of the matching shares that vest.
Vesting may be accelerated on a changeof control.4
Annual awards of performanceshares, with vesting subject to:
Š performance measured over threefinancial years;
Š continued employment; andŠ meeting shareholding requirements.
Executive Directors are required toretain their net vested shares for aperiod of at least six months afterrelease.
Dividend equivalents accrued duringthe performance period are payable inrespect of the performance shares thatvest.
Vesting may be accelerated on achange of control.4
Annual awards of market valueoptions that vest, subject toperformance measured over threefinancial years, and remainexercisable, subject to continuedemployment, until the tenthanniversary of grant.
Vestingmaybeacceleratedonachangeof control.4
Maximum valueUp to 100% of the amount invested. The maximum grant in any year is up
to 250% of base salary for the CEOand up to 200% of base salary forother Executive Directors.
The maximum grant in any year is upto 250% of base salary for the CEOand up to 200% of base salary forother Executive Directors.
Performance framework
The performance measures are earningsper share (EPS) and return on investedcapital (ROIC), weighted equally andassessed independently, such that apayout can be received under either oneof the measures.
Š The minimum payout is zero.Š If one measure pays out at threshold
and the other does not pay out at all,the overall payout is 25%. If bothmeasures pay out at threshold, theoverall payout is 50%.
Š Payout in line with expectations is67%.
Dividend equivalents are not taken intoaccount in the above payout levels.
Committee discretion applies.1, 2
The performance measures arerelative Total Shareholder Return(TSR), EPS and ROIC, weightedequally and assessed independently,such that a payout can be receivedunder any one of the measures (or, forTSR, in respect of one of the threecomparator groups).
Š The minimum payout is zero.Š If the measure with the lowest
payout at threshold pays out atthreshold and the others do not payout at all, the overall payout is 3%.If each of the measures pays out atthreshold, the overall payout is32%.
Š Payout in line with expectations is50%.
Dividend equivalents are not takeninto account in the above payoutlevels.
Committee discretion applies.1, 2
The vesting of options is subject toEPS measured over three years.
Š The minimum payout is zero.Š Payout at threshold performance is
33%.Š Payout in line with expectations is
80%.
Committee discretion applies.1, 2
Recovery of sums paidClaw-back applies.3 Claw-back applies.3 Claw-back applies.3
50
DISCONTINUED/ONE-OFF MULTI-YEAR INCENTIVE PLAN
REGP (REED ELSEVIER GROWTH PLAN)
Purpose and link to strategy
The REGP was introduced in 2010 during a challenging and volatile business environment following the appointment ofthe current CEO. It was designed as a one-off, five-year plan for the Executive Directors instead of LTIP grants in 2010, 2011and 2012.
Operation
The only current participant is the CEO and no further awards will be granted under this plan.
The CEO must retain a personal shareholding in the REGP of 300% of salary (in addition to shares held under the BIP)until vesting in H1 2015.
Initial performance share awards vested, based on performance measured over 2010-2012, at 66.8%. 50% of the vestedshares were released (along with a cash dividend equivalent) and 50% were deferred and will only be released in H1 2015.The full 66.8% has been included in the 2012 Single Total Figure on page 57. Matching awards, equal to the number ofpersonal shares and deferred performance shares, were granted in 2013 and vest, subject to performance, in H1 2015.
Dividend equivalents will be payable in respect of the matching awards and deferred performance shares which vest inH1 2015.
Vesting will be accelerated on a change of control.4
Maximum value
The maximum vesting over the five-year period (2010-14) of the plan (including what has already vested after yearthree) is 150% of the shares comprised in the original performance share award (of 600% of 2010 base salary).
Performance framework
Matching awards – TSR, EPS and ROIC, weighted equally and assessed independently, such that a payout can bereceived under any one of the measures (or, for TSR, in respect of one of the three comparator groups). TSR is measured overthe five-year period 2010-2014, EPS is measured over the two-year period 2013-2014 and ROIC is measured at the end of2014.
Š The minimum payout is zero.Š If the measure with the lowest payout at threshold pays out at threshold and the others do not pay out at all, the
overall payout is 3%. If each of the measures pays out at threshold, the overall payout is 50%.Š Payout in line with expectations is 50%.
Committee discretion applies.1,2
Recovery of sums paid/withholding
Claw-back applies.3
1. Discretion in respect of annual and multi-year incentive plan payout levels: In determining the level of payout under the AIP andvesting under the multi-year incentives, the Committee takes into account Reed Elsevier’s overall business performance and valuecreated for shareholders over the period in review and other relevant factors. It has discretion to adjust the vesting and payout levels if itbelieves this would result in a fairer outcome. This discretion will only be used in exceptional circumstances and the Committee willexplain in the next remuneration report the extent to which it has been exercised and the reasons for doing so.
2. Discretion to vary performance measures applying to existing annual and multi-year incentives: The Committee may vary thefinancial measures applying to a current annual incentive year and performance measures for multi-year incentives if a change incircumstances leads it to believe that the arrangement is no longer a fair measure of performance. Any new measures will not bematerially less, or more, challenging than the original ones.
3. Application of claw-back to annual and multi-year incentives: The Committee has discretion to apply claw-back if the payout wascalculated on the basis of materially misstated financial or other data, in which case it can seek to recover the difference in value betweenthe incorrect award and the amount that would have been paid had the correct data been used. In respect of multi-year incentives, theCommittee also has discretion to apply claw-back if a participant breaches post-termination restrictive covenants, in which case it mayrequire repayment of gains arising during a specified period.
51
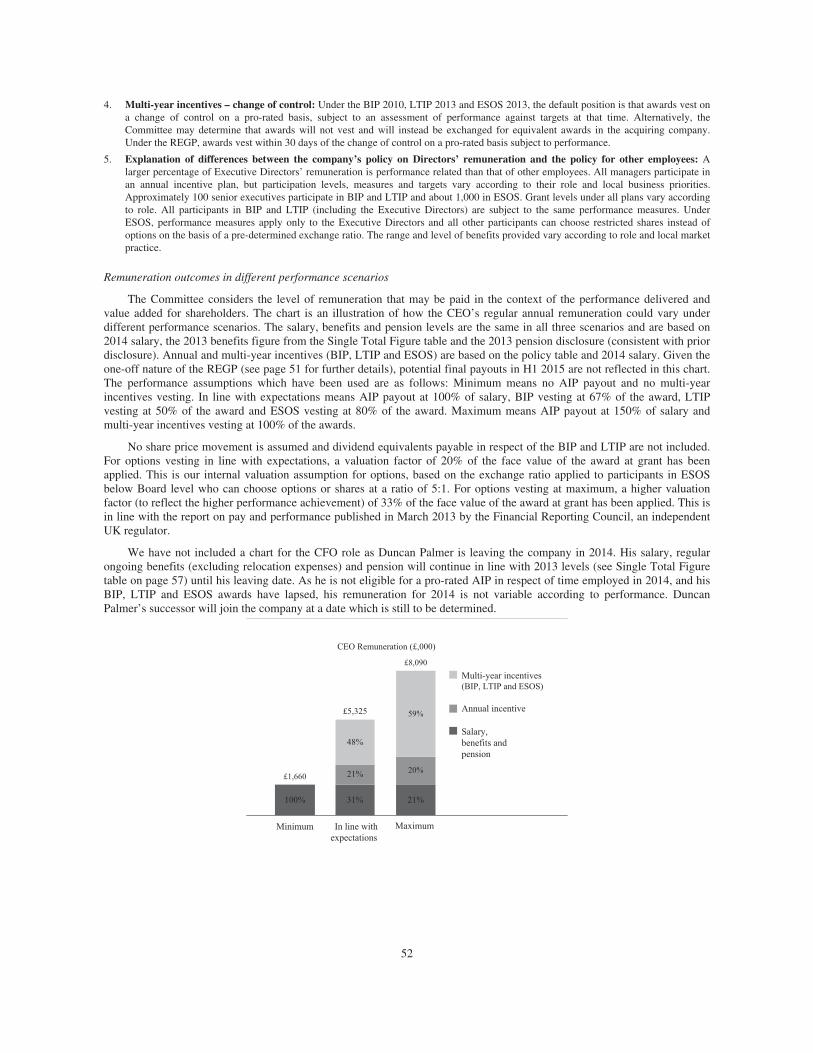
4. Multi-year incentives – change of control: Under the BIP 2010, LTIP 2013 and ESOS 2013, the default position is that awards vest ona change of control on a pro-rated basis, subject to an assessment of performance against targets at that time. Alternatively, theCommittee may determine that awards will not vest and will instead be exchanged for equivalent awards in the acquiring company.Under the REGP, awards vest within 30 days of the change of control on a pro-rated basis subject to performance.
5. Explanation of differences between the company’s policy on Directors’ remuneration and the policy for other employees: Alarger percentage of Executive Directors’ remuneration is performance related than that of other employees. All managers participate inan annual incentive plan, but participation levels, measures and targets vary according to their role and local business priorities.Approximately 100 senior executives participate in BIP and LTIP and about 1,000 in ESOS. Grant levels under all plans vary accordingto role. All participants in BIP and LTIP (including the Executive Directors) are subject to the same performance measures. UnderESOS, performance measures apply only to the Executive Directors and all other participants can choose restricted shares instead ofoptions on the basis of a pre-determined exchange ratio. The range and level of benefits provided vary according to role and local marketpractice.
Remuneration outcomes in different performance scenarios
The Committee considers the level of remuneration that may be paid in the context of the performance delivered andvalue added for shareholders. The chart is an illustration of how the CEO’s regular annual remuneration could vary underdifferent performance scenarios. The salary, benefits and pension levels are the same in all three scenarios and are based on2014 salary, the 2013 benefits figure from the Single Total Figure table and the 2013 pension disclosure (consistent with priordisclosure). Annual and multi-year incentives (BIP, LTIP and ESOS) are based on the policy table and 2014 salary. Given theone-off nature of the REGP (see page 51 for further details), potential final payouts in H1 2015 are not reflected in this chart.The performance assumptions which have been used are as follows: Minimum means no AIP payout and no multi-yearincentives vesting. In line with expectations means AIP payout at 100% of salary, BIP vesting at 67% of the award, LTIPvesting at 50% of the award and ESOS vesting at 80% of the award. Maximum means AIP payout at 150% of salary andmulti-year incentives vesting at 100% of the awards.
No share price movement is assumed and dividend equivalents payable in respect of the BIP and LTIP are not included.For options vesting in line with expectations, a valuation factor of 20% of the face value of the award at grant has beenapplied. This is our internal valuation assumption for options, based on the exchange ratio applied to participants in ESOSbelow Board level who can choose options or shares at a ratio of 5:1. For options vesting at maximum, a higher valuationfactor (to reflect the higher performance achievement) of 33% of the face value of the award at grant has been applied. This isin line with the report on pay and performance published in March 2013 by the Financial Reporting Council, an independentUK regulator.
We have not included a chart for the CFO role as Duncan Palmer is leaving the company in 2014. His salary, regularongoing benefits (excluding relocation expenses) and pension will continue in line with 2013 levels (see Single Total Figuretable on page 57) until his leaving date. As he is not eligible for a pro-rated AIP in respect of time employed in 2014, and hisBIP, LTIP and ESOS awards have lapsed, his remuneration for 2014 is not variable according to performance. DuncanPalmer’s successor will join the company at a date which is still to be determined.
CEO Remuneration (£,000)
£8,090
£5,325 59%
48%
20%
Multi-year incentives(BIP, LTIP and ESOS)
Annual incentive
Salary,benefits andpension
£1,660
100% 31%
21%
21%
Minimum Maximum In line withexpectations
52
Approach to recruitment remuneration — Executive Directors
When agreeing the components of a remuneration package on the appointment of a new Executive Director, or aninternal promotion to the Board, the Committee would seek to align the package with the remuneration policy stated in thepolicy table. However, on an internal promotion to the Board, any existing contractual obligations and commitments maycontinue to be honoured, even if not consistent with the prevailing policy. For example, if the individual is a member of thelegacy defined benefit pension plan, the Committee will consider the pension arrangements in the context of the package as awhole and may allow continued participation.
The Committee’s general principle on recruitment is to offer a competitive remuneration package to attract high-calibrecandidates from a global talent pool. The various components and the company’s approach are as follows:
Standard package on recruitment*
To offer remuneration in line with the policy table (including the limits), taking into account the principles set out above.
Compensation for forfeited entitlements
The Committee may make awards and payments on hiring an external candidate to compensate him or her forentitlements forfeited on leaving the previous employer. If such a decision is made, the Committee will attempt to reflectprevious entitlements as closely as possible using a variety of tools, including cash, share awards and options. Claw-backprovisions will apply where appropriate. If necessary to facilitate the grant of awards, the Committee may rely on the oneperson exemption in the UK Listing Rules.
Relocation allowances and expenses
The type and size of relocation allowances and expenses will be determined by the specific circumstances of the newrecruit.
* The standard package comprises annual base salary, AIP, other benefits, annual awards under BIP, LTIP and ESOS and retirementbenefits.
Shareholding requirement
The Executive Directors are subject to shareholding requirements. These are a minimum of 300% of annual base salaryfor the CEO and 200% of annual base salary for the CFO. On joining or promotion to the Board, Executive Directors aregiven a period of time to build up to their requirement.
Policy on payments for loss of office
In line with the company’s policy, the service contracts of the existing Executive Directors contain 12-month noticeperiods.
The circumstances in which an Executive Director’s employment is terminated will affect the Committee’s determinationof any payment for loss of office, but it expects to apply the principles outlined on pages 54 and 55. The Committee reservesthe right to depart from these principles where appropriate in light of any taxation requirements to which the company or theExecutive Director is subject (including, without limitation, section 409A of the US Internal Revenue Code), or other legalobligations.
Restricted shares were granted to Duncan Palmer on his recruitment in 2012 as compensation for forfeited entitlementsfrom his former employer. This award has been pro-rated for service to the date of notice of resignation, with the result that74,042 PLC ordinary shares and 51,378 NV ordinary shares will vest on leaving. As the pro-rated shares will only be releasedupon his yet to be determined leaving date, rather than the original vesting dates, a cash adjustment may be paid to him ifrequired to ensure that the value of the pro-rated award received on leaving is equivalent to that which would have beenreceived under the original arrangements. Dividend equivalents on the shares will be paid on vesting.
53
Policy on payments for loss of office (continued)1
Mutually agreed termination/termination by the company other than for cause
General
The Executive Director would be entitled to salary, benefits and other contractual payments in the normal way up to thetermination date (including any unpaid annual incentive for any prior year) and would be paid for any accrued but untakenholiday.
Salary: Payment of up to 12 months’ salary.
Annual incentive: Any unpaid annual incentive for the previous year and a pro-rata payment in respect of the part of thefinancial year up to the termination date would generally be payable, with the amount being determined by reference to theoriginal performance criteria. However, the Committee has discretion to decide otherwise depending on the reason fortermination and other specific circumstances. The company would not pay any annual incentive in respect of any part of thefinancial year following the termination date (e.g. for any part of unserved notice). The annual incentive claw-back provisionswould apply.
Other benefits: Where possible, benefits would be continued for up to the duration of the unserved notice period (notexceeding the maximum stated in the policy table) or, the Executive Director would receive a cash payment (not exceedingthe cost to the company of providing those benefits).
Pension: Deferred or immediate pension in accordance with scheme rules, with a credit in respect of, or payment for up to,the full period of any unworked period of notice. There is provision under the defined benefit pension arrangements formembers leaving company service by reason of permanent incapacity to make an application to the scheme trustee for earlypayment of their pension.
Other: The company may pay compensation in respect of any statutory employment rights and may make other appropriateand customary payments.
The company would have due regard to principles of mitigation of loss. Reductions would be applied to reflect any portion ofthe notice period that is worked and/or spent on gardening leave.
On injury, disability, ill health or death, the Committee reserves the right to vary the treatment outlined in this section.
Multi-year incentives2
BIP 2010, LTIP 2013 and ESOS 2013: The default position is that unvested awards will be pro-rated to reflect timeemployed and will vest subject to performance measured at the end of the relevant performance period. Options are typicallyexercisable for a period of two years following vesting. In respect of the BIP, a pro-rata number of investment shares willremain in the plan, with the balance being released on cessation of employment.
The Committee has discretion to allow unvested awards to vest earlier and to adjust the application of time pro-rating,performance conditions and exercise periods subject to the rules of the respective plans.
REGP: The default position is that unvested matching shares will be pro-rated to reflect time employed and will vestsubject to performance measured at the end of the 2013-14 performance period. A pro-rata number of personal shares anddeferred performance shares will remain in the plan, with the balance being released on cessation of employment. TheCommittee has discretion to allow the matching shares to vest earlier.
ESOS 2003: The default position is that options will typically become exercisable for a six-month period (two years onretirement) from the termination date, subject to time pro-rating and performance conditions. The Committee may adjust theapplication of time pro-rating, performance conditions and exercise periods, subject to the rules of the plan.
1 In addition to what is set out in this “Policy on payments for loss of office” section, on termination for any reason, Erik Engstrom will beentitled to payment of amounts held in his “Retirement Account”. Before he joined the company’s UK defined benefit arrangement, hewas not a member of any company pension scheme and Reed Elsevier made annual contributions of 19.5% of base salary to a deferredcompensation plan. Contributions to this Retirement Account ceased when he became a member of the UK defined benefit arrangement.
2 In cases where the approved leaver treatment applies, the multi-year incentive plans have a default position as well as giving theCommittee discretion to adjust the default treatment within certain parameters. The Committee would expect to exercise such discretionwhere the Committee believes the personal circumstances of the Executive Director so require.
54
Employee instigated resignation
General
The Executive Director would not receive any payments for loss of office. The Executive Director would be entitled to salary,benefits and other contractual payments in the normal way up to the termination date and would be paid for any accrued butuntaken holiday. The Executive Director will be entitled to receive an annual incentive for a completed previous year, but nota pro-rated annual incentive in respect of a part year up to the termination date, unless the Committee decides otherwise in thespecific circumstances. Annual incentive claw-back provisions would apply. A deferred or immediate pension would bepayable in accordance with the scheme rules.
Multi-year incentives
All outstanding awards lapse on date of notice. Any related personal or investment shares (e.g. under the REGP and the BIP)will be released.
Dismissal for cause
General
The Executive Director would not receive any payments for loss of office. A deferred or immediate pension would be payablein accordance with the scheme rules.
Multi-year incentives
All outstanding awards lapse on date of dismissal. Any related personal or investment shares (e.g. under the REGP and theBIP) will be released.
Non-Executive Directors
Remuneration policy table — Non-Executive Directors
FEES
Purpose and link to strategy
To enable Reed Elsevier to recruit Non-Executive Directors with the right balance of personal skills and experience tomake a major contribution to the Boards and Committees of a dual-listed global business.
Operation
Reed Elsevier Chairman: Receives an aggregate annual fee with no additional fees, e.g. Committee Chairman fees. Inrespect of Reed Elsevier PLC and Reed Elsevier Group plc, the Committee determines, on the advice of the SeniorIndependent Director, the Chairman’s fee. In respect of Reed Elsevier NV, the Committee makes a recommendation, on theadvice of the Senior Independent Director, to the Board of Reed Elsevier NV, which determines the Chairman’s fee.
Other Non-Executive Directors: Receive an aggregate annual fee in respect of their memberships of the Boards ofReed Elsevier plc, Reed Elsevier NV and Reed Elsevier Group plc.* Additional fees are payable to the Senior IndependentDirector and Committee Chairmen. Since January 1, 2014, fees are also payable for membership of Board Committees. Infuture, attendance fees may be paid. The Boards determine the level of fees, subject to applicable law.
Fees may be reviewed annually, although in practice they have changed on a less frequent basis. When reviewing fees,consideration is given to the time commitment required, the complexity of the role and the calibre of the individual.Comparative market data is also reviewed, the primary source for which is the practice of FTSE 30 companies, with referencealso to the NYSE Euronext Amsterdam (AEX) Index and US-listed companies.
Maximum value
The fees paid to the Chairman and the Non-Executive Directors are in respect of their memberships of the Boards ofReed Elsevier PLC, Reed Elsevier NV and Reed Elsevier Group plc. The shareholders of Reed Elsevier PLC and ReedElsevier Group plc have approved a maximum annual fee limit of £500,000 and £700,000 respectively (excluding additional
* The fees paid to a Non-Executive Director who serves only on the Board of Reed Elsevier NV reflect the time commitment to thatcompany and to other companies within the Reed Elsevier combined businesses.
55

fees for membership of or chairing Board Committees and assuming additional responsibilities such as acting as SeniorIndependent Director, all of which are not subject to a maximum limit). The shareholders of Reed Elsevier NV have approveda maximum annual fee limit of €600,000 for the fees borne by Reed Elsevier NV. The aggregate annual fee limit is thereforeapproximately £1.7m.
OTHER BENEFITS
Purpose and link to strategy
To provide customary benefits at an appropriate cost.
Operation
Other benefits for Non-Executive Directors are reviewed periodically and may include private medical cover, tax returnpreparation costs, secretarial benefits and car benefits, including, where appropriate, the tax on such benefits.
Maximum value
There is no prescribed maximum amount.
Approach to recruitment remuneration — Non-Executive Directors
Following recruitment, a new Non-Executive Director will be entitled to fees and other benefits in accordance with thecompany’s remuneration policy. No additional remuneration is paid on recruitment. However, any reasonable expensesincurred during the recruitment process will be reimbursed.
Policy on payments for loss of office — Non-Executive Directors
In addition to unpaid accrued fees, the Non-Executive Directors are entitled to receive one month’s fees for loss of officeif their appointment is terminated before the end of its term.
Service contracts and letters of appointment
There are no further obligations in the Directors’ service contracts and letters of appointment which are not otherwisedisclosed in this annual report which could give rise to a remuneration payment or loss of office payment. All Directors’service contracts and letters of appointment are available for inspection at the company’s registered office. The ExecutiveDirectors’ service contracts do not have a fixed expiry date.
Consideration of employment conditions elsewhere in the company
When the Committee reviews the Executive Directors’ salaries annually, it takes into account the company’s guidelinesfor salaries for all employees for the forthcoming year. We do not currently use any other remuneration comparison metricswhen determining the quantum and structure of Directors’ pay. We do not think it is appropriate to consult with employees inconnection with our policy on Directors’ remuneration.
Consideration of shareholder views
Our practice is to consult shareholders and consider their views when formulating, or changing, our policy. For example,in early 2013 we consulted with a number of shareholders in connection with the proposals for a new LTIP and the renewal ofthe ESOS. The feedback helped shape the design of the plans.
Prior commitments
The Committee reserves the right to make any remuneration or loss of office payments if the terms were agreed prior toan individual being appointed as a Director or prior to the approval of the policy.
56
Annual Remuneration Report
Single Total Figure of Remuneration – Executive Directors
(a) (b) (c) (d) (e) (f) (g) (h) (i) (j) (k) (l)Short-term employee
benefitsShare-based awards Pension Total
£‘000 Salary Benefits5Annual
IncentiveNew UKbasis1,4,7
DutchCivilCodebasis2
Consistentwith prior
disclosure3,4,7New UK
basis1
DutchCivilCodebasis2
Consistentwith priordisclosure3
New UKbasis1
DutchCivilCodebasis2
Consistentwith priordisclosure3
Erik Engstrom . . . . . . . . . 2013 1,077 28 1,134 2,467 3,300 1,301 719 528 528 5,425 6,067 4,068Erik Engstrom . . . . . . . . . 2012 1,051 28 1,150 8,302 2,744 5,312 614 470 470 11,145 5,443 8,011Duncan Palmer6 . . . . . . . 2013 600 232 609 0 598 0 114 114 114 1,555 2,153 1,555Duncan Palmer6 . . . . . . . 2012 214 10 230 867 268 914 41 41 41 1,362 763 1,409
1. New UK basis (columns (d), (g) and (j)): These figures are calculated in accordance with the methodology set out in the new UKRegulations. They include, for performance related share-based awards, the value attributable to share price appreciation since the datethe award was granted. In the case of the CEO’s figures, the amount included that relates to share price appreciation is £3 million for2012 and £1.2 million for 2013.
2. Dutch Civil Code basis (columns (e), (h) and (k)): These figures comply with the requirements of the Dutch Civil Code. The figuresfor share-based awards comprise the multi-year incentives charges in accordance with IFRS2 – Share-Based Payment. These IFRS2charges do not reflect the actual value received on vesting. The figures for pensions reflect the cost of pension provision, whichcomprises (i) for defined benefit schemes, the transfer value of the increase in accrued pension during the year (net of inflation,Directors’ contributions and participation fee) and (ii) for defined contribution schemes, payments made to the scheme or to theExecutive Director in lieu of pension.
3. Consistent with prior disclosure (columns (f), (i) and (l)): We believe including these figures is helpful for our non-UK shareholdersas the calculation methodology for share-based awards and defined benefit pensions is consistent with what has been used in previousannual reports (although we have reflected amounts in the same year as required by the New UK basis to facilitate comparison).Accordingly, values are calculated as follows: (i) for share-based awards, the value of the vested award at grant excluding anysubsequent share price movement (as shown in the share-based award tables in prior annual reports) and including dividend equivalentsif applicable; (ii) for options, 20% of face value at grant (based on our previously disclosed 5:1 exchange ratio for options to sharesapplicable to ESOS participants below the Board, as described in the 2013 Notices of Annual General Meetings); (iii) for defined benefitpension, the transfer value of the increase in accrued pension during the year (net of inflation, Directors’ contributions and participationfee) and (iv) for defined contribution pensions schemes, payments made to the scheme or to the Executive Director in lieu of pension.
4. Share-based awards for Erik Engstrom (columns (d) and (f)): The 2012 figures reflect the vesting of tranche 1 of the REGP and the2010 BIP, both measured over the 2010-12 period. The vesting percentages under these plans were determined on April 25, 2013 and arein line with estimates in the 2012 annual report (pages 49 and 51). The figures include the related dividend equivalent payments paid outin cash in 2013 in respect of both plans. The 2012 REGP figures reflect the entire amount that was performance tested over the 2010-12period, including the 50% of shares deferred until 2015 in accordance with the plan rules. The 2013 figures represent the 2011-13 cycleof the BIP and ESOS. As the BIP vests after the approval date of this report, and the ESOS vests in May 2014, the average share pricesfor the last quarter of 2013 have been used to arrive at an estimated figure under the New UK basis in respect of both awards. Theproportion of the value of the CEO’s share-based awards under the New UK basis that relates to share price appreciation between thedates of grant and vesting is 36% (or £3 million) for 2012 and 47% (or £1.2 million) for 2013 using, as required, the average share pricesfor the last quarter of 2013.
5. Benefits: Each Executive Director receives a car allowance, private medical/dental insurance and the company meets the cost of taxreturn preparation. In 2013, Duncan Palmer received a one-off cash relocation allowance of £500,000 which was paid to him in May2013 in recognition of him and his family being required to relocate to the UK from the US (see page 53 of last year’s Annual Report onForm 20-F). As a result of his resignation, Duncan Palmer became required to repay this to the company through payroll deductions, bydeduction from his 2013 annual incentive payment, so it has not been included in column (b). He also received reimbursement of directrelocation expenses, under Reed Elsevier’s relocation policy, amounting to £200,907, which is included.
6. Duncan Palmer’s 2012 figures: Columns (a) to (c), (g) and (i) reflect the amount Duncan Palmer received from his date of joining ReedElsevier (August 24, 2012) until the end of the year. The 2012 share-based award figures in columns (d) and (f) relate to the restrictedshares granted to compensate him for the forfeiture of awards from his former employer (as disclosed in last year’s annual report),reduced to reflect time served up to the point of giving notice of resignation. The figure in column (f) includes estimated dividendequivalents of £46,977.
7. Exchange rates used for share-based awards: The exchange rates used to convert share-based awards to pounds sterling are (i) for theNew UK basis, those that applied at the vesting dates or, if vesting has not occurred, the average exchange rates for the last quarter of2013, (ii) for consistent with prior disclosure, those that applied at the grant dates, (iii) for dividend equivalents, the exchange rate at thetime of payment and (iv) for estimated dividend equivalents yet to be paid, the December 31, 2013 Euro to Sterling exchange rate of0.83237.
8. Total remuneration for Directors: This is set out in note 32 to the combined financial statements on page F-54.
57
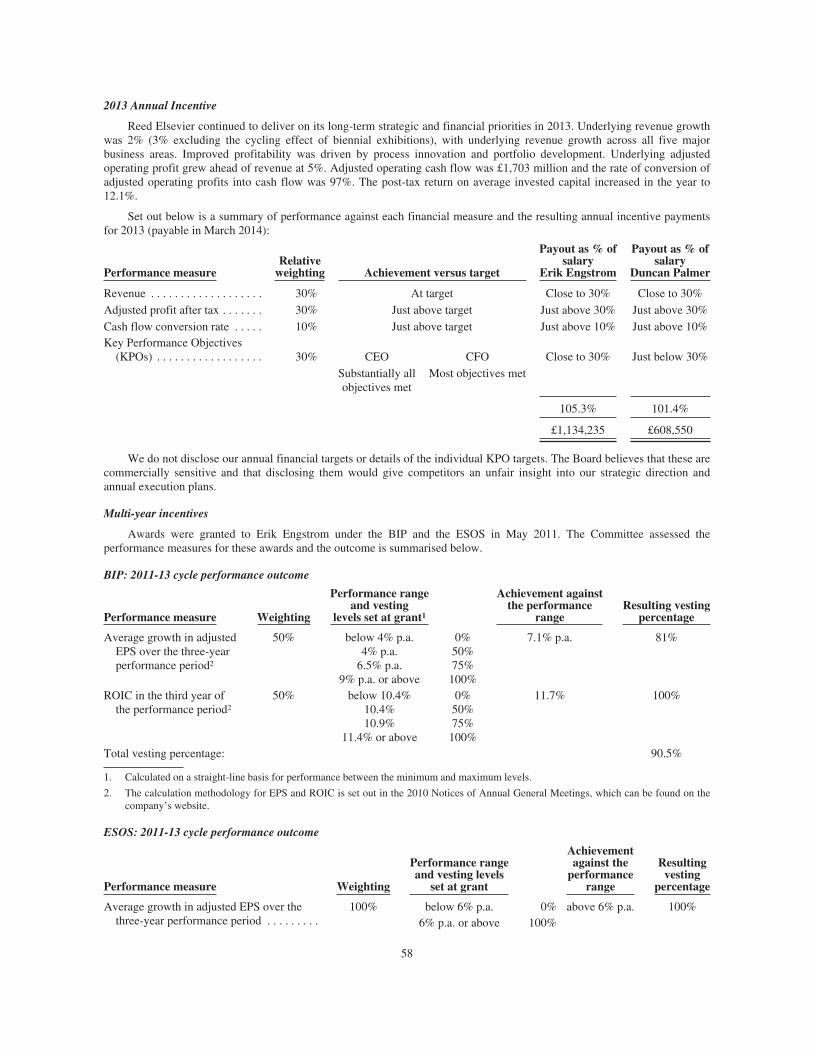
2013 Annual Incentive
Reed Elsevier continued to deliver on its long-term strategic and financial priorities in 2013. Underlying revenue growthwas 2% (3% excluding the cycling effect of biennial exhibitions), with underlying revenue growth across all five majorbusiness areas. Improved profitability was driven by process innovation and portfolio development. Underlying adjustedoperating profit grew ahead of revenue at 5%. Adjusted operating cash flow was £1,703 million and the rate of conversion ofadjusted operating profits into cash flow was 97%. The post-tax return on average invested capital increased in the year to12.1%.
Set out below is a summary of performance against each financial measure and the resulting annual incentive paymentsfor 2013 (payable in March 2014):
Performance measureRelative
weighting Achievement versus target
Payout as % ofsalary
Erik Engstrom
Payout as % ofsalary
Duncan Palmer
Revenue . . . . . . . . . . . . . . . . . . . 30% At target Close to 30% Close to 30%Adjusted profit after tax . . . . . . . 30% Just above target Just above 30% Just above 30%Cash flow conversion rate . . . . . 10% Just above target Just above 10% Just above 10%Key Performance Objectives
(KPOs) . . . . . . . . . . . . . . . . . . 30% CEO CFO Close to 30% Just below 30%Substantially allobjectives met
Most objectives met
105.3% 101.4%
£1,134,235 £608,550
We do not disclose our annual financial targets or details of the individual KPO targets. The Board believes that these arecommercially sensitive and that disclosing them would give competitors an unfair insight into our strategic direction andannual execution plans.
Multi-year incentives
Awards were granted to Erik Engstrom under the BIP and the ESOS in May 2011. The Committee assessed theperformance measures for these awards and the outcome is summarised below.
BIP: 2011-13 cycle performance outcome
Performance measure Weighting
Performance rangeand vesting
levels set at grant1
Achievement againstthe performance
rangeResulting vesting
percentage
Average growth in adjustedEPS over the three-yearperformance period2
50% below 4% p.a.4% p.a.
6.5% p.a.9% p.a. or above
0%50%75%100%
7.1% p.a. 81%
ROIC in the third year ofthe performance period2
50% below 10.4%10.4%10.9%
11.4% or above
0%50%75%100%
11.7% 100%
Total vesting percentage: 90.5%
1. Calculated on a straight-line basis for performance between the minimum and maximum levels.
2. The calculation methodology for EPS and ROIC is set out in the 2010 Notices of Annual General Meetings, which can be found on thecompany’s website.
ESOS: 2011-13 cycle performance outcome
Performance measure Weighting
Performance rangeand vesting levels
set at grant
Achievementagainst the
performancerange
Resultingvesting
percentage
Average growth in adjusted EPS over thethree-year performance period . . . . . . . . .
100% below 6% p.a. 0% above 6% p.a. 100%6% p.a. or above 100%
58
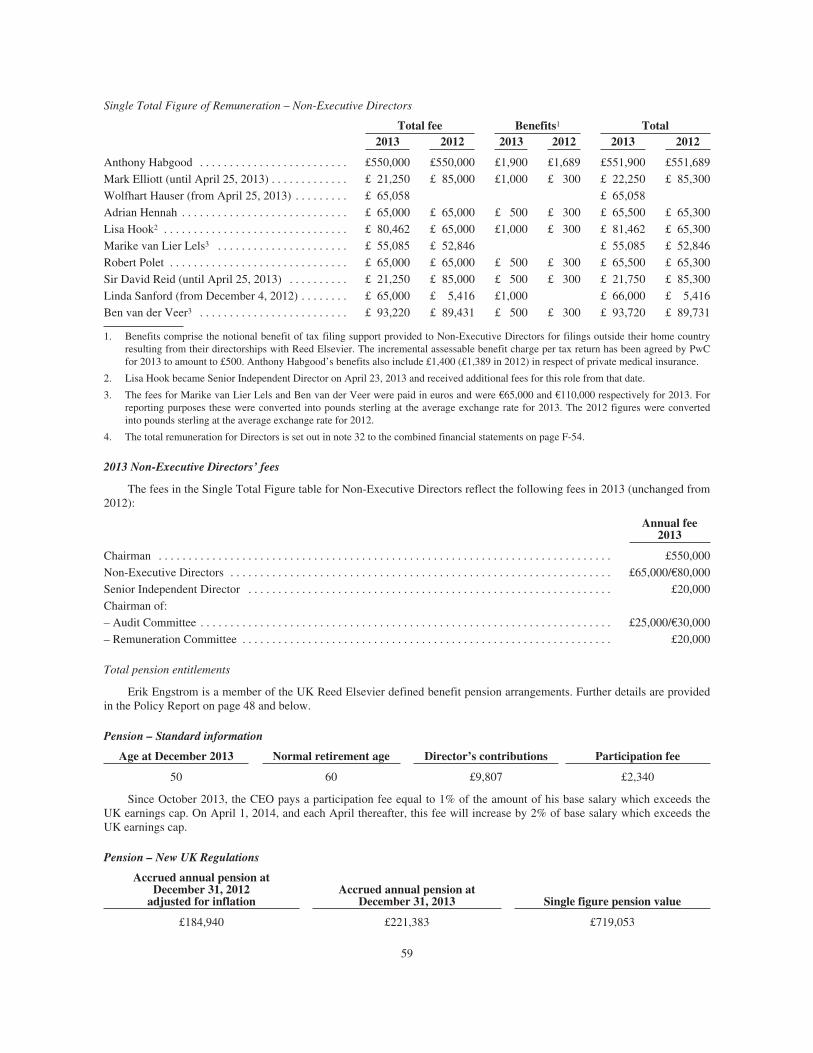
Single Total Figure of Remuneration – Non-Executive Directors
Total fee Benefits1 Total2013 2012 2013 2012 2013 2012
Anthony Habgood . . . . . . . . . . . . . . . . . . . . . . . . . £550,000 £550,000 £1,900 £1,689 £551,900 £551,689Mark Elliott (until April 25, 2013) . . . . . . . . . . . . . £ 21,250 £ 85,000 £1,000 £ 300 £ 22,250 £ 85,300Wolfhart Hauser (from April 25, 2013) . . . . . . . . . £ 65,058 £ 65,058Adrian Hennah . . . . . . . . . . . . . . . . . . . . . . . . . . . . £ 65,000 £ 65,000 £ 500 £ 300 £ 65,500 £ 65,300Lisa Hook2 . . . . . . . . . . . . . . . . . . . . . . . . . . . . . . . £ 80,462 £ 65,000 £1,000 £ 300 £ 81,462 £ 65,300Marike van Lier Lels3 . . . . . . . . . . . . . . . . . . . . . . £ 55,085 £ 52,846 £ 55,085 £ 52,846Robert Polet . . . . . . . . . . . . . . . . . . . . . . . . . . . . . . £ 65,000 £ 65,000 £ 500 £ 300 £ 65,500 £ 65,300Sir David Reid (until April 25, 2013) . . . . . . . . . . £ 21,250 £ 85,000 £ 500 £ 300 £ 21,750 £ 85,300Linda Sanford (from December 4, 2012) . . . . . . . . £ 65,000 £ 5,416 £1,000 £ 66,000 £ 5,416Ben van der Veer3 . . . . . . . . . . . . . . . . . . . . . . . . . £ 93,220 £ 89,431 £ 500 £ 300 £ 93,720 £ 89,731
1. Benefits comprise the notional benefit of tax filing support provided to Non-Executive Directors for filings outside their home countryresulting from their directorships with Reed Elsevier. The incremental assessable benefit charge per tax return has been agreed by PwCfor 2013 to amount to £500. Anthony Habgood’s benefits also include £1,400 (£1,389 in 2012) in respect of private medical insurance.
2. Lisa Hook became Senior Independent Director on April 23, 2013 and received additional fees for this role from that date.
3. The fees for Marike van Lier Lels and Ben van der Veer were paid in euros and were €65,000 and €110,000 respectively for 2013. Forreporting purposes these were converted into pounds sterling at the average exchange rate for 2013. The 2012 figures were convertedinto pounds sterling at the average exchange rate for 2012.
4. The total remuneration for Directors is set out in note 32 to the combined financial statements on page F-54.
2013 Non-Executive Directors’ fees
The fees in the Single Total Figure table for Non-Executive Directors reflect the following fees in 2013 (unchanged from2012):
Annual fee2013
Chairman . . . . . . . . . . . . . . . . . . . . . . . . . . . . . . . . . . . . . . . . . . . . . . . . . . . . . . . . . . . . . . . . . . . . . . . . . . . . £550,000Non-Executive Directors . . . . . . . . . . . . . . . . . . . . . . . . . . . . . . . . . . . . . . . . . . . . . . . . . . . . . . . . . . . . . . . . £65,000/€80,000Senior Independent Director . . . . . . . . . . . . . . . . . . . . . . . . . . . . . . . . . . . . . . . . . . . . . . . . . . . . . . . . . . . . . £20,000Chairman of:– Audit Committee . . . . . . . . . . . . . . . . . . . . . . . . . . . . . . . . . . . . . . . . . . . . . . . . . . . . . . . . . . . . . . . . . . . . . £25,000/€30,000– Remuneration Committee . . . . . . . . . . . . . . . . . . . . . . . . . . . . . . . . . . . . . . . . . . . . . . . . . . . . . . . . . . . . . . £20,000
Total pension entitlements
Erik Engstrom is a member of the UK Reed Elsevier defined benefit pension arrangements. Further details are providedin the Policy Report on page 48 and below.
Pension – Standard information
Age at December 2013 Normal retirement age Director’s contributions Participation fee
50 60 £9,807 £2,340
Since October 2013, the CEO pays a participation fee equal to 1% of the amount of his base salary which exceeds theUK earnings cap. On April 1, 2014, and each April thereafter, this fee will increase by 2% of base salary which exceeds theUK earnings cap.
Pension – New UK Regulations
Accrued annual pension atDecember 31, 2012
adjusted for inflationAccrued annual pension at
December 31, 2013 Single figure pension value
£184,940 £221,383 £719,053
59
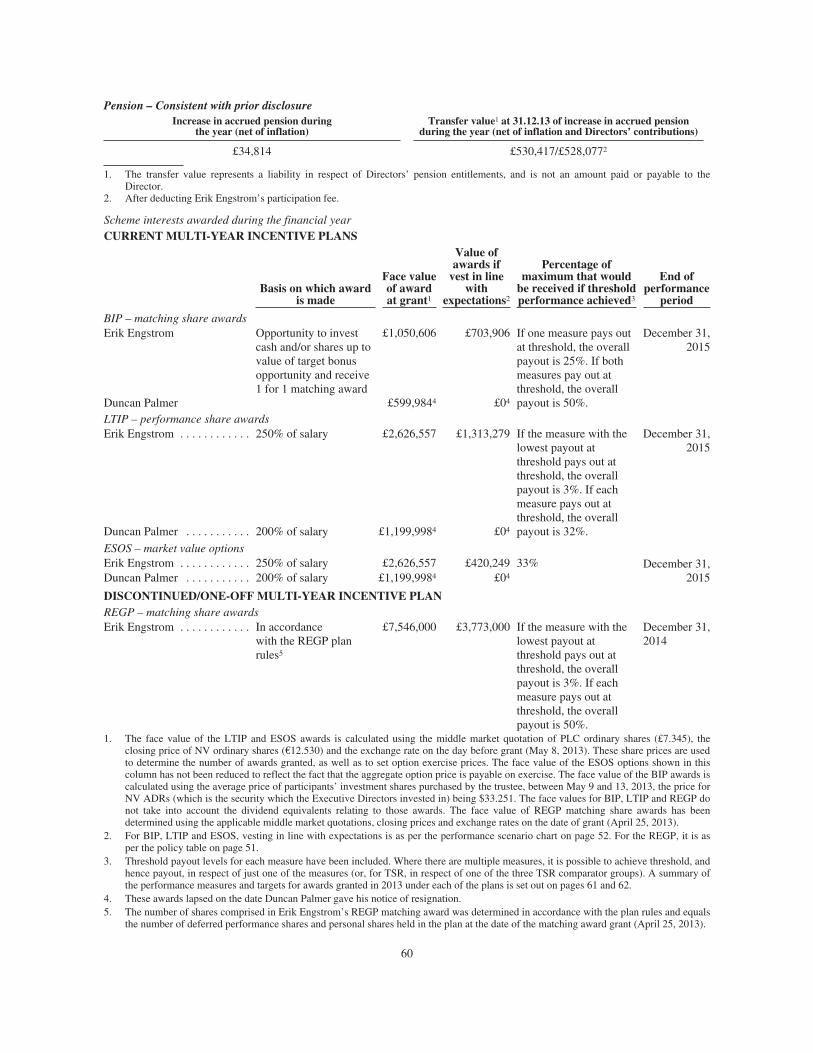
Pension – Consistent with prior disclosureIncrease in accrued pension during
the year (net of inflation)Transfer value1 at 31.12.13 of increase in accrued pension
during the year (net of inflation and Directors’ contributions)
£34,814 £530,417/£528,0772
1. The transfer value represents a liability in respect of Directors’ pension entitlements, and is not an amount paid or payable to theDirector.
2. After deducting Erik Engstrom’s participation fee.
Scheme interests awarded during the financial yearCURRENT MULTI-YEAR INCENTIVE PLANS
Basis on which awardis made
Face valueof awardat grant1
Value ofawards if
vest in linewith
expectations2
Percentage ofmaximum that would
be received if thresholdperformance achieved3
End ofperformance
period
BIP – matching share awardsErik Engstrom
Duncan Palmer
Opportunity to investcash and/or shares up tovalue of target bonusopportunity and receive1 for 1 matching award
£1,050,606
£599,9844
£703,906
£04
If one measure pays outat threshold, the overallpayout is 25%. If bothmeasures pay out atthreshold, the overallpayout is 50%.
December 31,2015
LTIP – performance share awardsErik Engstrom . . . . . . . . . . . . 250% of salary £2,626,557 £1,313,279 If the measure with the
lowest payout atthreshold pays out atthreshold, the overallpayout is 3%. If eachmeasure pays out atthreshold, the overallpayout is 32%.
December 31,2015
Duncan Palmer . . . . . . . . . . . 200% of salary £1,199,9984 £04
ESOS – market value optionsErik Engstrom . . . . . . . . . . . . 250% of salary £2,626,557 £420,249 33% December 31,
2015Duncan Palmer . . . . . . . . . . . 200% of salary £1,199,9984 £04
DISCONTINUED/ONE-OFF MULTI-YEAR INCENTIVE PLANREGP – matching share awardsErik Engstrom . . . . . . . . . . . . In accordance
with the REGP planrules5
£7,546,000 £3,773,000 If the measure with thelowest payout atthreshold pays out atthreshold, the overallpayout is 3%. If eachmeasure pays out atthreshold, the overallpayout is 50%.
December 31,2014
1. The face value of the LTIP and ESOS awards is calculated using the middle market quotation of PLC ordinary shares (£7.345), theclosing price of NV ordinary shares (€12.530) and the exchange rate on the day before grant (May 8, 2013). These share prices are usedto determine the number of awards granted, as well as to set option exercise prices. The face value of the ESOS options shown in thiscolumn has not been reduced to reflect the fact that the aggregate option price is payable on exercise. The face value of the BIP awards iscalculated using the average price of participants’ investment shares purchased by the trustee, between May 9 and 13, 2013, the price forNV ADRs (which is the security which the Executive Directors invested in) being $33.251. The face values for BIP, LTIP and REGP donot take into account the dividend equivalents relating to those awards. The face value of REGP matching share awards has beendetermined using the applicable middle market quotations, closing prices and exchange rates on the date of grant (April 25, 2013).
2. For BIP, LTIP and ESOS, vesting in line with expectations is as per the performance scenario chart on page 52. For the REGP, it is asper the policy table on page 51.
3. Threshold payout levels for each measure have been included. Where there are multiple measures, it is possible to achieve threshold, andhence payout, in respect of just one of the measures (or, for TSR, in respect of one of the three TSR comparator groups). A summary ofthe performance measures and targets for awards granted in 2013 under each of the plans is set out on pages 61 and 62.
4. These awards lapsed on the date Duncan Palmer gave his notice of resignation.5. The number of shares comprised in Erik Engstrom’s REGP matching award was determined in accordance with the plan rules and equals
the number of deferred performance shares and personal shares held in the plan at the date of the matching award grant (April 25, 2013).
60
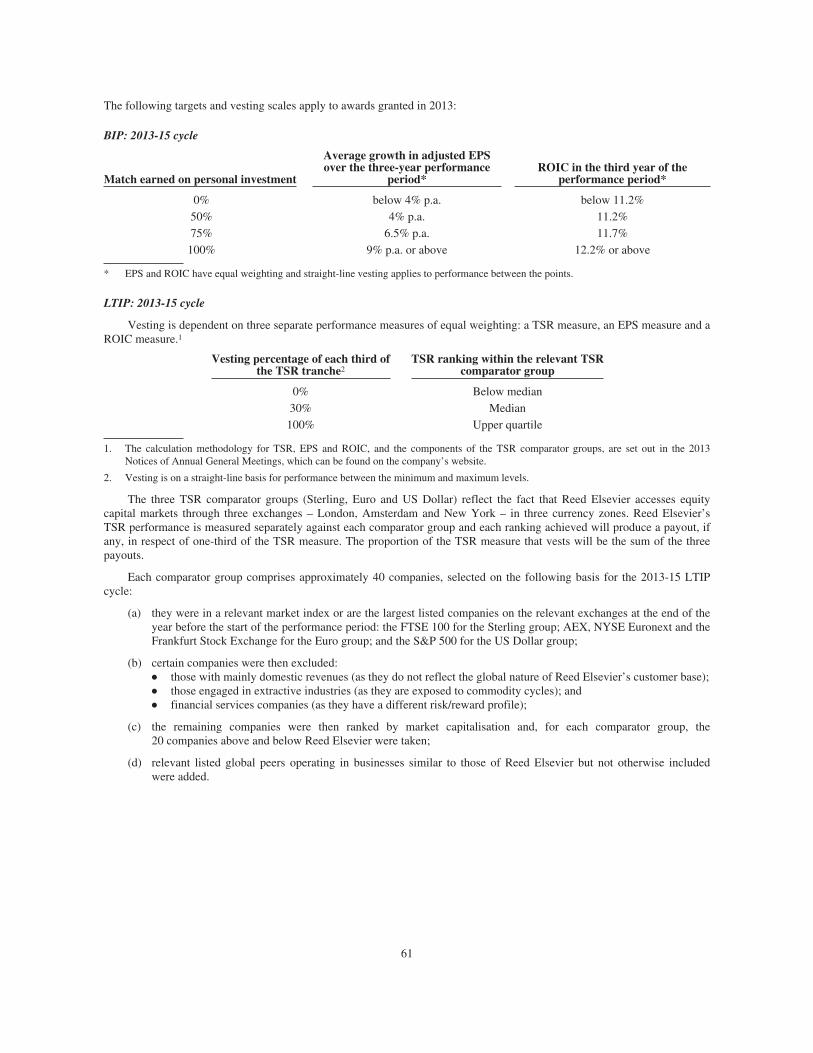
The following targets and vesting scales apply to awards granted in 2013:
BIP: 2013-15 cycle
Match earned on personal investment
Average growth in adjusted EPSover the three-year performance
period*ROIC in the third year of the
performance period*
0% below 4% p.a. below 11.2%50% 4% p.a. 11.2%75% 6.5% p.a. 11.7%100% 9% p.a. or above 12.2% or above
* EPS and ROIC have equal weighting and straight-line vesting applies to performance between the points.
LTIP: 2013-15 cycle
Vesting is dependent on three separate performance measures of equal weighting: a TSR measure, an EPS measure and aROIC measure.1
Vesting percentage of each third ofthe TSR tranche2
TSR ranking within the relevant TSRcomparator group
0% Below median30% Median100% Upper quartile
1. The calculation methodology for TSR, EPS and ROIC, and the components of the TSR comparator groups, are set out in the 2013Notices of Annual General Meetings, which can be found on the company’s website.
2. Vesting is on a straight-line basis for performance between the minimum and maximum levels.
The three TSR comparator groups (Sterling, Euro and US Dollar) reflect the fact that Reed Elsevier accesses equitycapital markets through three exchanges – London, Amsterdam and New York – in three currency zones. Reed Elsevier’sTSR performance is measured separately against each comparator group and each ranking achieved will produce a payout, ifany, in respect of one-third of the TSR measure. The proportion of the TSR measure that vests will be the sum of the threepayouts.
Each comparator group comprises approximately 40 companies, selected on the following basis for the 2013-15 LTIPcycle:
(a) they were in a relevant market index or are the largest listed companies on the relevant exchanges at the end of theyear before the start of the performance period: the FTSE 100 for the Sterling group; AEX, NYSE Euronext and theFrankfurt Stock Exchange for the Euro group; and the S&P 500 for the US Dollar group;
(b) certain companies were then excluded:Š those with mainly domestic revenues (as they do not reflect the global nature of Reed Elsevier’s customer base);Š those engaged in extractive industries (as they are exposed to commodity cycles); andŠ financial services companies (as they have a different risk/reward profile);
(c) the remaining companies were then ranked by market capitalisation and, for each comparator group, the20 companies above and below Reed Elsevier were taken;
(d) relevant listed global peers operating in businesses similar to those of Reed Elsevier but not otherwise includedwere added.
61
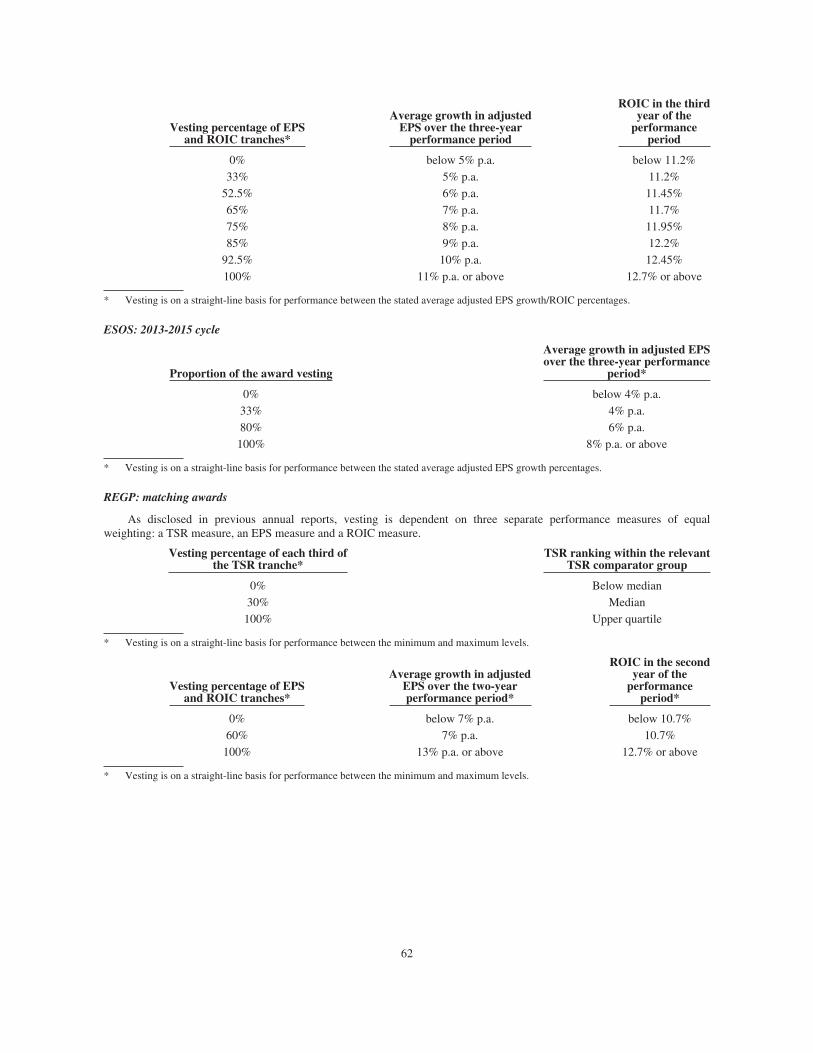
Vesting percentage of EPSand ROIC tranches*
Average growth in adjustedEPS over the three-year
performance period
ROIC in the thirdyear of the
performanceperiod
0% below 5% p.a. below 11.2%33% 5% p.a. 11.2%
52.5% 6% p.a. 11.45%65% 7% p.a. 11.7%75% 8% p.a. 11.95%85% 9% p.a. 12.2%
92.5% 10% p.a. 12.45%100% 11% p.a. or above 12.7% or above
* Vesting is on a straight-line basis for performance between the stated average adjusted EPS growth/ROIC percentages.
ESOS: 2013-2015 cycle
Proportion of the award vesting
Average growth in adjusted EPSover the three-year performance
period*
0% below 4% p.a.33% 4% p.a.80% 6% p.a.100% 8% p.a. or above
* Vesting is on a straight-line basis for performance between the stated average adjusted EPS growth percentages.
REGP: matching awards
As disclosed in previous annual reports, vesting is dependent on three separate performance measures of equalweighting: a TSR measure, an EPS measure and a ROIC measure.
Vesting percentage of each third ofthe TSR tranche*
TSR ranking within the relevantTSR comparator group
0% Below median30% Median100% Upper quartile
* Vesting is on a straight-line basis for performance between the minimum and maximum levels.
Vesting percentage of EPSand ROIC tranches*
Average growth in adjustedEPS over the two-yearperformance period*
ROIC in the secondyear of the
performanceperiod*
0% below 7% p.a. below 10.7%60% 7% p.a. 10.7%100% 13% p.a. or above 12.7% or above
* Vesting is on a straight-line basis for performance between the minimum and maximum levels.
62
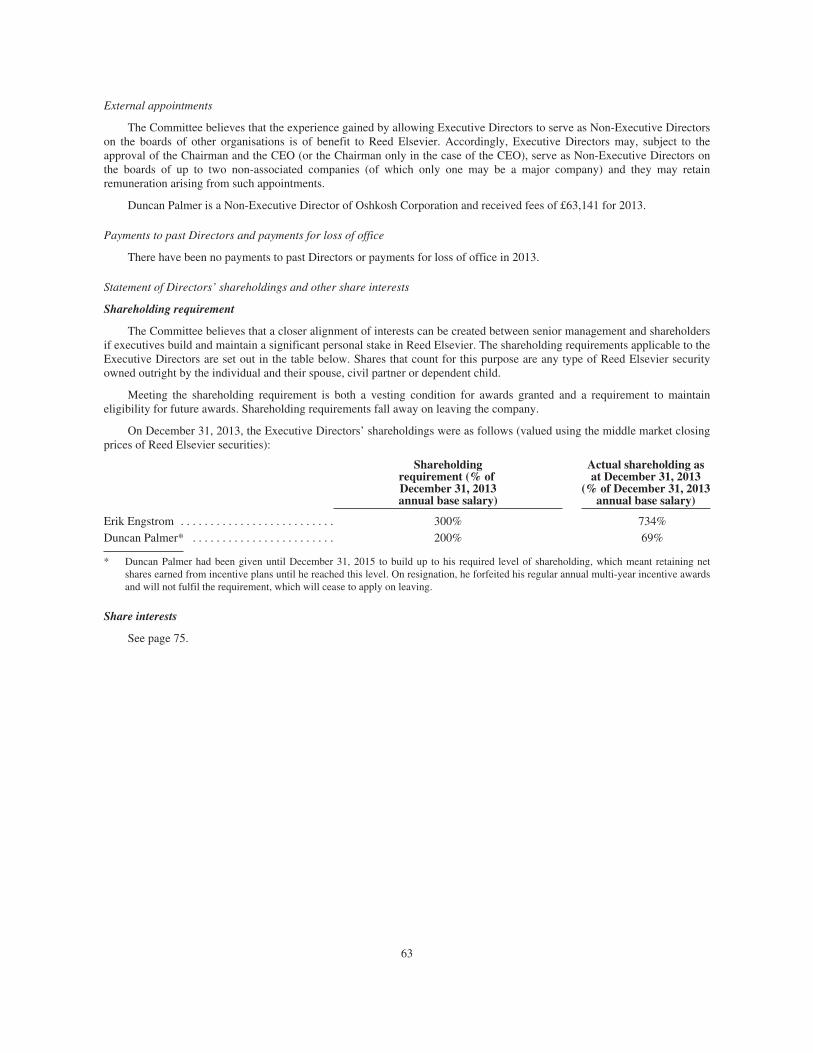
External appointments
The Committee believes that the experience gained by allowing Executive Directors to serve as Non-Executive Directorson the boards of other organisations is of benefit to Reed Elsevier. Accordingly, Executive Directors may, subject to theapproval of the Chairman and the CEO (or the Chairman only in the case of the CEO), serve as Non-Executive Directors onthe boards of up to two non-associated companies (of which only one may be a major company) and they may retainremuneration arising from such appointments.
Duncan Palmer is a Non-Executive Director of Oshkosh Corporation and received fees of £63,141 for 2013.
Payments to past Directors and payments for loss of office
There have been no payments to past Directors or payments for loss of office in 2013.
Statement of Directors’ shareholdings and other share interests
Shareholding requirement
The Committee believes that a closer alignment of interests can be created between senior management and shareholdersif executives build and maintain a significant personal stake in Reed Elsevier. The shareholding requirements applicable to theExecutive Directors are set out in the table below. Shares that count for this purpose are any type of Reed Elsevier securityowned outright by the individual and their spouse, civil partner or dependent child.
Meeting the shareholding requirement is both a vesting condition for awards granted and a requirement to maintaineligibility for future awards. Shareholding requirements fall away on leaving the company.
On December 31, 2013, the Executive Directors’ shareholdings were as follows (valued using the middle market closingprices of Reed Elsevier securities):
Shareholdingrequirement (% ofDecember 31, 2013annual base salary)
Actual shareholding asat December 31, 2013
(% of December 31, 2013annual base salary)
Erik Engstrom . . . . . . . . . . . . . . . . . . . . . . . . . . 300% 734%Duncan Palmer* . . . . . . . . . . . . . . . . . . . . . . . . 200% 69%
* Duncan Palmer had been given until December 31, 2015 to build up to his required level of shareholding, which meant retaining netshares earned from incentive plans until he reached this level. On resignation, he forfeited his regular annual multi-year incentive awardsand will not fulfil the requirement, which will cease to apply on leaving.
Share interests
See page 75.
63
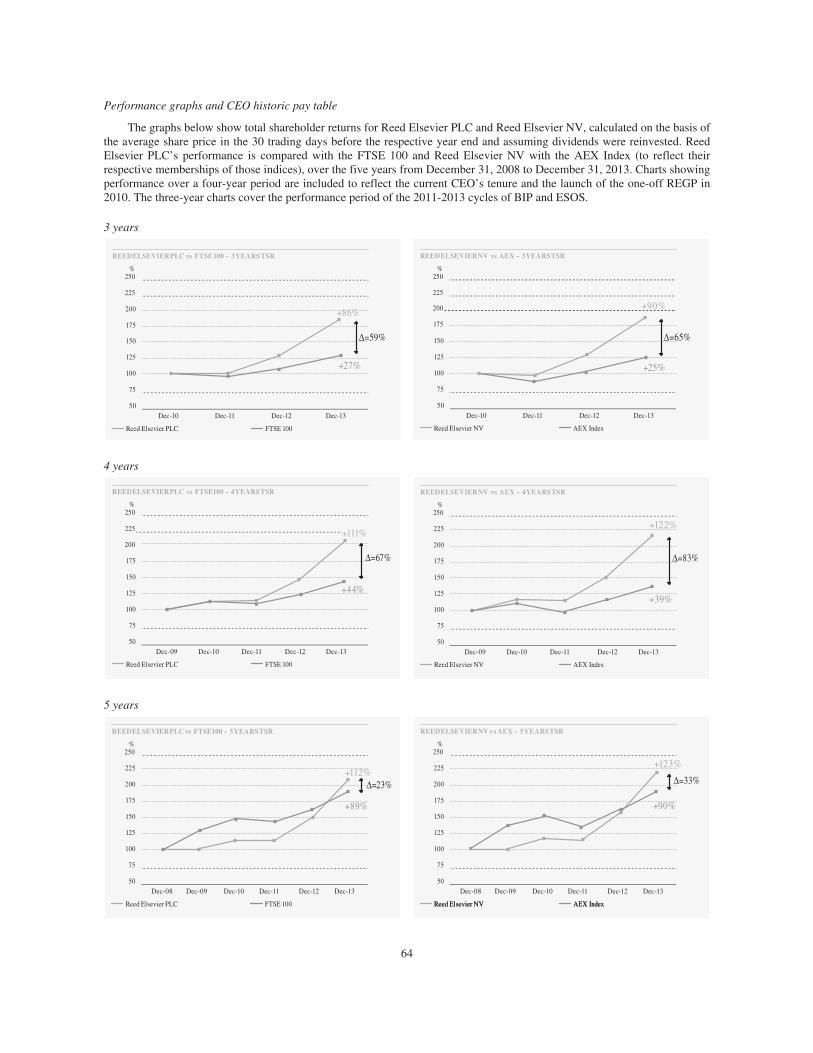
Performance graphs and CEO historic pay table
The graphs below show total shareholder returns for Reed Elsevier PLC and Reed Elsevier NV, calculated on the basis ofthe average share price in the 30 trading days before the respective year end and assuming dividends were reinvested. ReedElsevier PLC’s performance is compared with the FTSE 100 and Reed Elsevier NV with the AEX Index (to reflect theirrespective memberships of those indices), over the five years from December 31, 2008 to December 31, 2013. Charts showingperformance over a four-year period are included to reflect the current CEO’s tenure and the launch of the one-off REGP in2010. The three-year charts cover the performance period of the 2011-2013 cycles of BIP and ESOS.
3 years
REED ELSEVIER PLC vs FTSE 100 - 3 YEARS TSR
%250
225
200
175
+86%
150
125
100
Δ=59%
+27%
75
50Dec-10 Dec-11 Dec-12 Dec-13
Reed Elsevier PLC FTSE 100
REED ELSEVIER NV vs AEX - 3 YEARS TSR
%250
225
200 %09+
175
150
125
100
Δ=65%
+25%
75
50Dec-10 Dec-11 Dec-12 Dec-13
Reed Elsevier NV AEX Index
4 years
REED ELSEVIER PLC v FTSE100 - 4 YEARS TSR
%250
225 +111%200
175
150
125
100
11=67%
+44%
75
50Dec-09 Dec-10 Dec-11 Dec-12 Dec-13
Reed Elsevier PLC FTSE 100
REED ELSEVIER PLC vs FTSE100 - 4 YEARS TSR
%250
225 +111%200
175
150
125
100
Δ=67%
+44%
75
50Dec-09 Dec-10 Dec-11 Dec-12 Dec-13
Reed Elsevier PLC FTSE 100
REED ELSEVIER NV v AEX - 4 YEARS TSR%
250
225
200
+122%
175
150
125
100
11=83%
+39%
75
50Dec-09 Dec-10 Dec-11 Dec-12 Dec-13
Reed Elsevier NV AEX Index
REED ELSEVIER NV vs AEX - 4 YEARS TSR
%250
225
200
+122%
175
150
125
100
Δ=83%
+39%
75
50Dec-09 Dec-10 Dec-11 Dec-12 Dec-13
Reed Elsevier NV AEX Index
5 years
REED ELSEVIER PLC v FTSE100 - 5 YEARS TSR
%250
225
200
175
150
125
100
+112%11=23%
+89%
75
50Dec-08 Dec-09 Dec-10 Dec-11 Dec-12 Dec-13
Reed Elsevier PLC FTSE 100
REED ELSEVIER PLC vs FTSE100 - 5 YEARS TSR
%250
225
200
175
150
125
100
+112%Δ=23%
+89%
75
50Dec-08 Dec-09 Dec-10 Dec-11 Dec-12 Dec-13
Reed Elsevier PLC FTSE 100
REED ELSEVIER NV v AEX - 5 YEARS TSR
%250
225
200
175
150
125
100
+123%
11=33%
+90%
75
50Dec-08 Dec-09 Dec-10 Dec-11 Dec-12 Dec-13
REED ELSEVIER NV v s AEX - 5 YEARS TSR
%250
225
200
175
150
125
100
+123%
Δ=33%
+90%
75
50Dec-08 Dec-09 Dec-10 Dec-11 Dec-12 Dec-13
Reed Elsevier NV AEX IndexReed Elsevier NV AEX Index
64
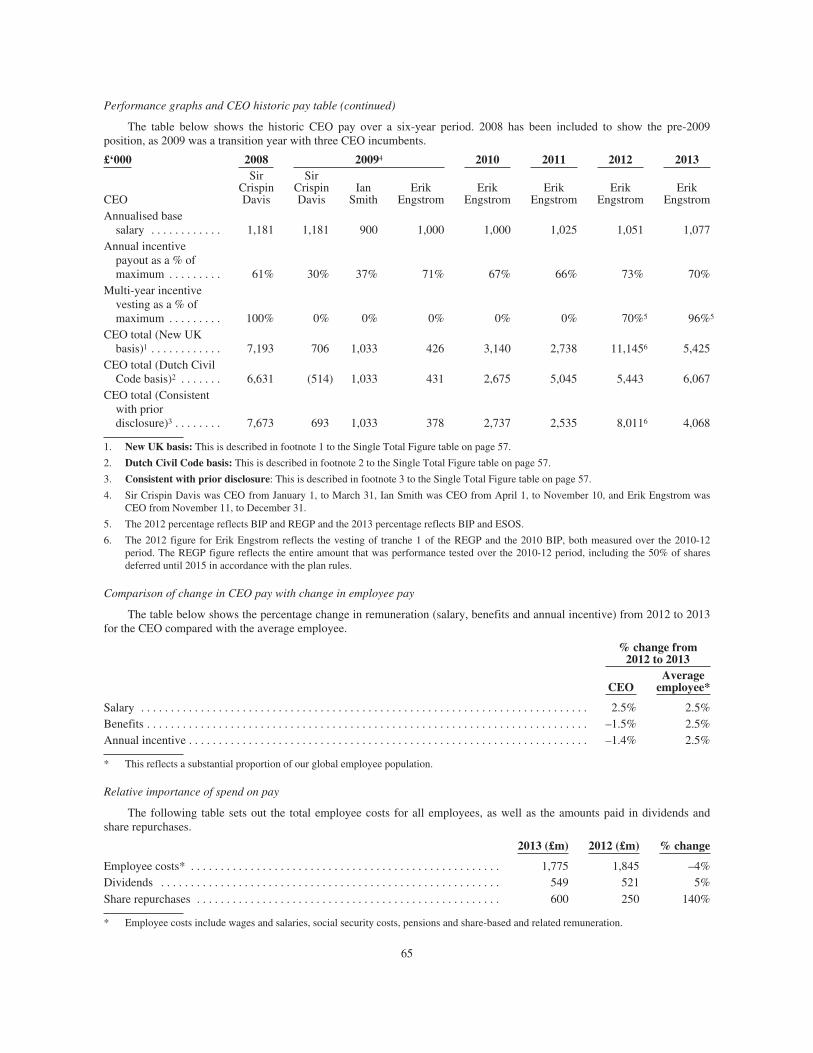
Performance graphs and CEO historic pay table (continued)
The table below shows the historic CEO pay over a six-year period. 2008 has been included to show the pre-2009position, as 2009 was a transition year with three CEO incumbents.
£‘000 2008 20094 2010 2011 2012 2013
CEO
SirCrispinDavis
SirCrispinDavis
IanSmith
ErikEngstrom
ErikEngstrom
ErikEngstrom
ErikEngstrom
ErikEngstrom
Annualised basesalary . . . . . . . . . . . . 1,181 1,181 900 1,000 1,000 1,025 1,051 1,077
Annual incentivepayout as a % ofmaximum . . . . . . . . . 61% 30% 37% 71% 67% 66% 73% 70%
Multi-year incentivevesting as a % ofmaximum . . . . . . . . . 100% 0% 0% 0% 0% 0% 70%5 96%5
CEO total (New UKbasis)1 . . . . . . . . . . . . 7,193 706 1,033 426 3,140 2,738 11,1456 5,425
CEO total (Dutch CivilCode basis)2 . . . . . . . 6,631 (514) 1,033 431 2,675 5,045 5,443 6,067
CEO total (Consistentwith priordisclosure)3 . . . . . . . . 7,673 693 1,033 378 2,737 2,535 8,0116 4,068
1. New UK basis: This is described in footnote 1 to the Single Total Figure table on page 57.
2. Dutch Civil Code basis: This is described in footnote 2 to the Single Total Figure table on page 57.
3. Consistent with prior disclosure: This is described in footnote 3 to the Single Total Figure table on page 57.
4. Sir Crispin Davis was CEO from January 1, to March 31, Ian Smith was CEO from April 1, to November 10, and Erik Engstrom wasCEO from November 11, to December 31.
5. The 2012 percentage reflects BIP and REGP and the 2013 percentage reflects BIP and ESOS.
6. The 2012 figure for Erik Engstrom reflects the vesting of tranche 1 of the REGP and the 2010 BIP, both measured over the 2010-12period. The REGP figure reflects the entire amount that was performance tested over the 2010-12 period, including the 50% of sharesdeferred until 2015 in accordance with the plan rules.
Comparison of change in CEO pay with change in employee pay
The table below shows the percentage change in remuneration (salary, benefits and annual incentive) from 2012 to 2013for the CEO compared with the average employee.
% change from2012 to 2013
CEOAverage
employee*
Salary . . . . . . . . . . . . . . . . . . . . . . . . . . . . . . . . . . . . . . . . . . . . . . . . . . . . . . . . . . . . . . . . . . . . . . . . . . . 2.5% 2.5%Benefits . . . . . . . . . . . . . . . . . . . . . . . . . . . . . . . . . . . . . . . . . . . . . . . . . . . . . . . . . . . . . . . . . . . . . . . . . . –1.5% 2.5%Annual incentive . . . . . . . . . . . . . . . . . . . . . . . . . . . . . . . . . . . . . . . . . . . . . . . . . . . . . . . . . . . . . . . . . . . –1.4% 2.5%
* This reflects a substantial proportion of our global employee population.
Relative importance of spend on pay
The following table sets out the total employee costs for all employees, as well as the amounts paid in dividends andshare repurchases.
2013 (£m) 2012 (£m) % change
Employee costs* . . . . . . . . . . . . . . . . . . . . . . . . . . . . . . . . . . . . . . . . . . . . . . . . . . . . 1,775 1,845 –4%Dividends . . . . . . . . . . . . . . . . . . . . . . . . . . . . . . . . . . . . . . . . . . . . . . . . . . . . . . . . . 549 521 5%Share repurchases . . . . . . . . . . . . . . . . . . . . . . . . . . . . . . . . . . . . . . . . . . . . . . . . . . . 600 250 140%
* Employee costs include wages and salaries, social security costs, pensions and share-based and related remuneration.
65
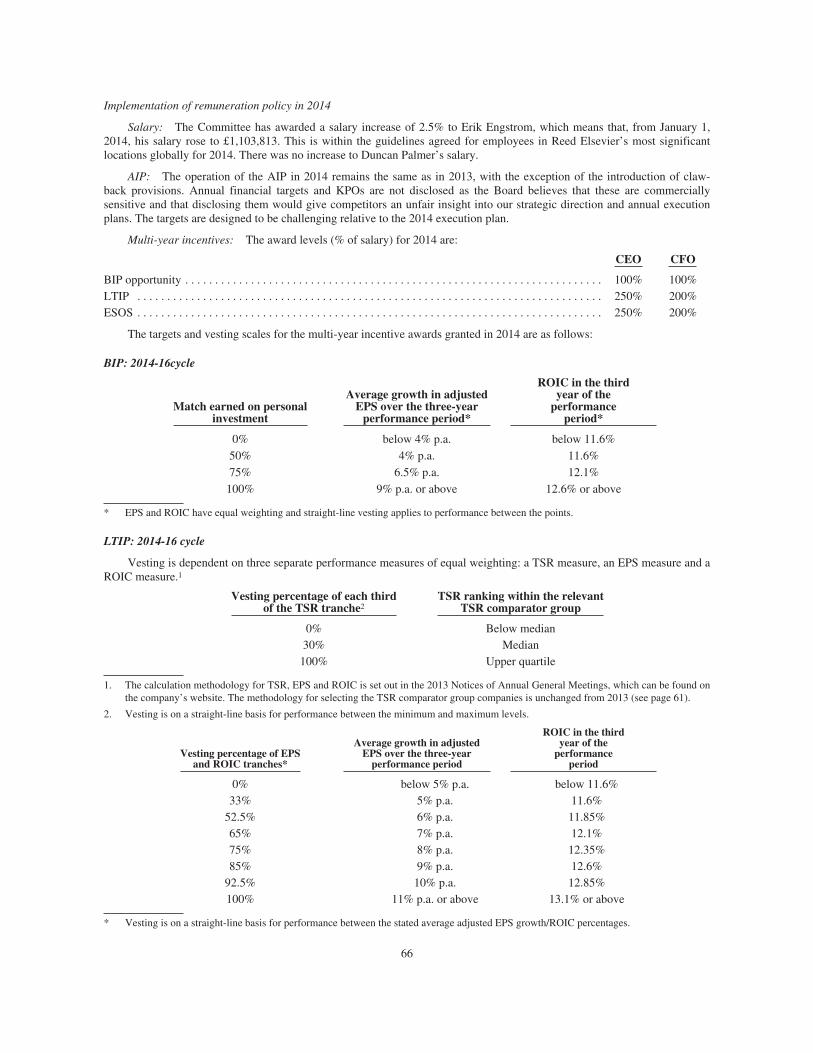
Implementation of remuneration policy in 2014
Salary: The Committee has awarded a salary increase of 2.5% to Erik Engstrom, which means that, from January 1,2014, his salary rose to £1,103,813. This is within the guidelines agreed for employees in Reed Elsevier’s most significantlocations globally for 2014. There was no increase to Duncan Palmer’s salary.
AIP: The operation of the AIP in 2014 remains the same as in 2013, with the exception of the introduction of claw-back provisions. Annual financial targets and KPOs are not disclosed as the Board believes that these are commerciallysensitive and that disclosing them would give competitors an unfair insight into our strategic direction and annual executionplans. The targets are designed to be challenging relative to the 2014 execution plan.
Multi-year incentives: The award levels (% of salary) for 2014 are:
CEO CFO
BIP opportunity . . . . . . . . . . . . . . . . . . . . . . . . . . . . . . . . . . . . . . . . . . . . . . . . . . . . . . . . . . . . . . . . . . . . . . 100% 100%LTIP . . . . . . . . . . . . . . . . . . . . . . . . . . . . . . . . . . . . . . . . . . . . . . . . . . . . . . . . . . . . . . . . . . . . . . . . . . . . . . 250% 200%ESOS . . . . . . . . . . . . . . . . . . . . . . . . . . . . . . . . . . . . . . . . . . . . . . . . . . . . . . . . . . . . . . . . . . . . . . . . . . . . . . 250% 200%
The targets and vesting scales for the multi-year incentive awards granted in 2014 are as follows:
BIP: 2014-16cycle
Match earned on personalinvestment
Average growth in adjustedEPS over the three-year
performance period*
ROIC in the thirdyear of the
performanceperiod*
0% below 4% p.a. below 11.6%50% 4% p.a. 11.6%75% 6.5% p.a. 12.1%100% 9% p.a. or above 12.6% or above
* EPS and ROIC have equal weighting and straight-line vesting applies to performance between the points.
LTIP: 2014-16 cycle
Vesting is dependent on three separate performance measures of equal weighting: a TSR measure, an EPS measure and aROIC measure.1
Vesting percentage of each thirdof the TSR tranche2
TSR ranking within the relevantTSR comparator group
0% Below median30% Median100% Upper quartile
1. The calculation methodology for TSR, EPS and ROIC is set out in the 2013 Notices of Annual General Meetings, which can be found onthe company’s website. The methodology for selecting the TSR comparator group companies is unchanged from 2013 (see page 61).
2. Vesting is on a straight-line basis for performance between the minimum and maximum levels.
Vesting percentage of EPSand ROIC tranches*
Average growth in adjustedEPS over the three-year
performance period
ROIC in the thirdyear of the
performanceperiod
0% below 5% p.a. below 11.6%33% 5% p.a. 11.6%
52.5% 6% p.a. 11.85%65% 7% p.a. 12.1%75% 8% p.a. 12.35%85% 9% p.a. 12.6%
92.5% 10% p.a. 12.85%100% 11% p.a. or above 13.1% or above
* Vesting is on a straight-line basis for performance between the stated average adjusted EPS growth/ROIC percentages.
66
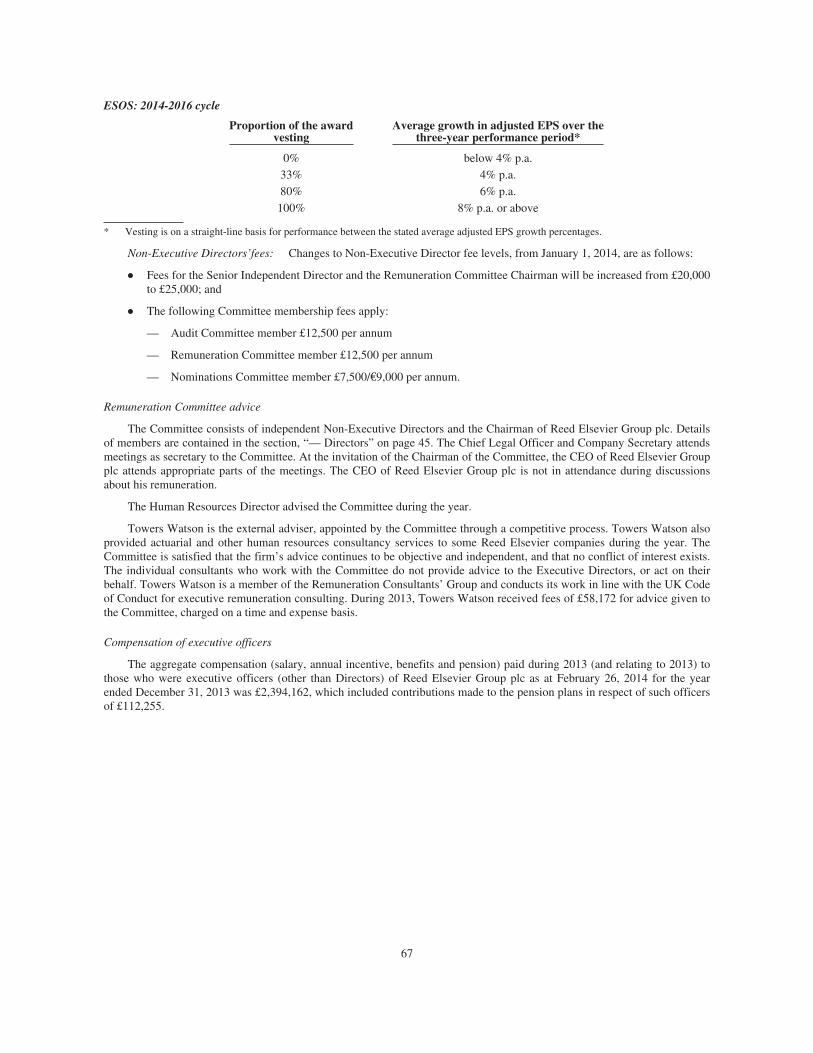
ESOS: 2014-2016 cycle
Proportion of the awardvesting
Average growth in adjusted EPS over thethree-year performance period*
0% below 4% p.a.33% 4% p.a.80% 6% p.a.100% 8% p.a. or above
* Vesting is on a straight-line basis for performance between the stated average adjusted EPS growth percentages.
Non-Executive Directors’fees: Changes to Non-Executive Director fee levels, from January 1, 2014, are as follows:
Š Fees for the Senior Independent Director and the Remuneration Committee Chairman will be increased from £20,000to £25,000; and
Š The following Committee membership fees apply:
— Audit Committee member £12,500 per annum
— Remuneration Committee member £12,500 per annum
— Nominations Committee member £7,500/€9,000 per annum.
Remuneration Committee advice
The Committee consists of independent Non-Executive Directors and the Chairman of Reed Elsevier Group plc. Detailsof members are contained in the section, “— Directors” on page 45. The Chief Legal Officer and Company Secretary attendsmeetings as secretary to the Committee. At the invitation of the Chairman of the Committee, the CEO of Reed Elsevier Groupplc attends appropriate parts of the meetings. The CEO of Reed Elsevier Group plc is not in attendance during discussionsabout his remuneration.
The Human Resources Director advised the Committee during the year.
Towers Watson is the external adviser, appointed by the Committee through a competitive process. Towers Watson alsoprovided actuarial and other human resources consultancy services to some Reed Elsevier companies during the year. TheCommittee is satisfied that the firm’s advice continues to be objective and independent, and that no conflict of interest exists.The individual consultants who work with the Committee do not provide advice to the Executive Directors, or act on theirbehalf. Towers Watson is a member of the Remuneration Consultants’ Group and conducts its work in line with the UK Codeof Conduct for executive remuneration consulting. During 2013, Towers Watson received fees of £58,172 for advice given tothe Committee, charged on a time and expense basis.
Compensation of executive officers
The aggregate compensation (salary, annual incentive, benefits and pension) paid during 2013 (and relating to 2013) tothose who were executive officers (other than Directors) of Reed Elsevier Group plc as at February 26, 2014 for the yearended December 31, 2013 was £2,394,162, which included contributions made to the pension plans in respect of such officersof £112,255.
67
BOARD PRACTICES
REED ELSEVIER
The Boards of Directors of Reed Elsevier PLC and Reed Elsevier NV manage their respective shareholdings in ReedElsevier Group plc and Elsevier Reed Finance BV. The Boards of Reed Elsevier PLC, Reed Elsevier NV and Reed ElsevierGroup plc are harmonised. All of the Directors of Reed Elsevier Group plc are also Directors of Reed Elsevier PLC and ReedElsevier NV. Reed Elsevier NV may nominate for appointment up to two Non-Executive Directors who are not appointed tothe Boards of either Reed Elsevier PLC or Reed Elsevier Group plc. Currently, one such Director has been appointed to theBoard of Reed Elsevier NV. Subject to shareholders of Reed Elsevier PLC and Reed Elsevier NV re-electing retiringDirectors at their respective Annual General Meetings in 2014, all the Directors of Reed Elsevier Group plc will also beDirectors of Reed Elsevier PLC and of Reed Elsevier NV. For a complete description of the Board membership positions andexecutive officer positions within Reed Elsevier, see “— Directors” and “Senior Management” on pages 45 to 47. Details ofthe Audit Committees of Reed Elsevier Group plc, Reed Elsevier PLC and Reed Elsevier NV and details of the RemunerationCommittee are given under “Directors” on page 45.
REED ELSEVIER GROUP PLC
The Reed Elsevier Group plc Board currently consists of two Executive Directors and seven Non-Executive Directors. Aperson may only be appointed or proposed or recommended for appointment to the Board if that person has been nominatedfor that appointment by the joint Nominations Committee of Reed Elsevier PLC and Reed Elsevier NV. Persons nominated bythe Nominations Committee will be required to be approved by the Reed Elsevier Group plc Board, prior to appointment tothe Reed Elsevier Group plc Board.
Decisions of the Board of Directors of Reed Elsevier Group plc require a simple majority, and the quorum required formeetings of the Board of Reed Elsevier Group plc is any two Directors.
The Reed Elsevier Group plc Board has established the following Committees:
— Audit — currently comprising three independent Non-Executive Directors; and
— Remuneration — currently comprising three independent Non-Executive Directors and the Chairman of ReedElsevier Group plc.
Arrangements established at the time of the merger of Reed Elsevier PLC’s and Reed Elsevier NV’s businesses providethat, if any person (together with persons acting in concert with him) acquires shares, or control of the voting rights attachingto shares, carrying more than 50% of the votes ordinarily exercisable at a general meeting of Reed Elsevier PLC or ReedElsevier NV and has not made a comparable takeover offer for the other party, the other party may by notice suspend ormodify the operation of certain provisions of the merger arrangements, such as (i) the right of the party in which control hasbeen acquired (the “Acquired Party”) to appoint or remove directors of Reed Elsevier PLC, Reed Elsevier NV and ReedElsevier Group plc and (ii) the Standstill Obligations (defined below) in relation to the Acquired Party. Such a notice willcease to apply if the person acquiring control makes a comparable offer for all the equity securities of the other within aspecified period or if the person (and persons acting in concert with him) ceases to have control of the other.
In the event of a change of control of one parent company and not the other (where there has been no comparable offerfor the other), the parent company which has not suffered the change in control will effectively have the sole right to removeand appoint directors of Reed Elsevier Group plc. Also, a director removed from the Board of a parent company which hassuffered a change in control will not have to resign from the Board of the other parent company or Reed Elsevier Group plc.
The articles of association of Reed Elsevier Group plc contain certain restrictions on the transfer of shares in ReedElsevier Group plc. In addition, pursuant to arrangements established at the time of the merger, neither Reed Elsevier PLC norReed Elsevier NV may acquire or dispose of any interest in the share capital of the other or otherwise take any action toacquire the other without the prior approval of the other (the “Standstill Obligations”). The Panel on Takeovers and Mergersin the United Kingdom (the “Panel”) has stated that in the event of a change of statutory control of either Reed Elsevier PLCor Reed Elsevier NV, the person or persons acquiring such control will be required to make an offer to acquire the sharecapital of Reed Elsevier Group plc (but not Elsevier Reed Finance BV) held by the other, in accordance with the requirementsof the City Code on Takeovers and Mergers in the United Kingdom. This requirement would not apply if the person acquiringstatutory control of either Reed Elsevier PLC or Reed Elsevier NV made an offer for the other on terms which are consideredby the Panel to be appropriate.
REED ELSEVIER PLC
The Reed Elsevier PLC Board currently consists of two Executive Directors and seven Non-Executive Directors. Aperson may only be appointed or proposed or recommended for appointment to the Board if that person has been nominatedfor that appointment by the joint Nominations Committee of Reed Elsevier PLC and Reed Elsevier NV. Persons nominated by
68
the Nominations Committee will be required to be approved by the Reed Elsevier PLC Board, prior to the appointment to theReed Elsevier PLC Board. A copy of the terms of reference of the Nominations Committee is available on request and can beviewed on the Reed Elsevier website, www.reedelsevier.com. The information on our website is not incorporated by referenceinto this report.
Notwithstanding the provisions outlined above in relation to the appointment to the Board, Reed Elsevier PLCshareholders retain their rights under Reed Elsevier PLC’s articles of association to appoint Directors to the Reed ElsevierPLC Board by ordinary resolution. Reed Elsevier PLC shareholders may also, by ordinary resolution, remove a Director fromthe Board of Reed Elsevier PLC, and in such circumstances that Director will also be required to be removed or resign fromthe Boards of Reed Elsevier NV and Reed Elsevier Group plc (except in circumstances where there has been a change ofcontrol of Reed Elsevier PLC and not Reed Elsevier NV).
The Reed Elsevier PLC Board has also established the following Committees:
— Audit — currently comprising three independent Non-Executive Directors;
— Corporate Governance — a joint Committee of Reed Elsevier PLC and Reed Elsevier NV, comprising allNon-Executive Directors of each company; and
— Nominations — a joint Committee of Reed Elsevier PLC and Reed Elsevier NV, currently comprising threeNon-Executive Directors of the Board including the Chairman of the Board.
Reed Elsevier Group plc has established a Remuneration Committee, which is responsible for determining theremuneration policy (subject to shareholder approval) and monitoring its implementation for the Executive Directors of ReedElsevier PLC and Reed Elsevier Group plc, and considering the remuneration for the Executive Directors of Reed Elsevier NV.
Under the articles of association of Reed Elsevier PLC, one third of the Directors shall retire from office and, if theywish, make themselves available for re-election by shareholders at the Annual General Meeting. Notwithstanding theseprovisions in the articles of association, in accordance with the provisions of the UK Corporate Governance Code allDirectors normally retire and offer themselves for re-election at each Annual General Meeting.
REED ELSEVIER NV
On April 24, 2013, the implementation of the unitary board governance structure at Reed Elsevier NV was approved bythe Annual General Shareholders’ meeting. Subsequently, the articles of association of Reed Elsevier NV were amended bynotarial deed on May 8, 2013 and the unitary board governance structure became effective. Reed Elsevier NV now has aunitary board comprising both Executive and Non-Executive Directors. At the same time, it was determined that ExecutiveBoard members would become Executive Directors and members of the Supervisory Board would become Non-ExecutiveDirectors. The Board currently comprises two Executive Directors and eight Non-Executive Directors. Directors shall beappointed by the General Shareholders’ Meeting upon a proposal of the Non-Executive Directors based on a nomination forappointment by the joint Nominations Committee of Reed Elsevier NV and Reed Elsevier PLC. The articles of association ofReed Elsevier NV provide that a resolution of the General Shareholders’ Meeting to appoint a Director other than inaccordance with a proposal of the Board can only be taken by a majority of at least two-thirds of the votes cast if less thanone-half of Reed Elsevier NV’s issued capital is represented at the meeting.
The General Shareholders’ Meeting of Reed Elsevier NV shareholders may also, by ordinary resolution, resolve tosuspend or dismiss each Director of Reed Elsevier NV. In addition, each Executive Director of the Board can, at any time, besuspended by the Board. In such circumstances that Executive Director will also be required to be removed or resign from theBoards of Reed Elsevier PLC and Reed Elsevier Group plc (except in circumstances where there has been a change of controlof Reed Elsevier NV and not Reed Elsevier PLC).
The Reed Elsevier NV Board has established the following committees:
— Audit — currently comprising three Non-Executive Directors;
— Corporate Governance — a joint Committee of Reed Elsevier NV and Reed Elsevier PLC, comprising all Non-Executive Directors of each company; and
— Nominations — a joint Committee of Reed Elsevier NV and Reed Elsevier PLC, currently comprising three Non-Executive Directors including the Chairman of the Board.
Reed Elsevier Group plc has established a Remuneration Committee, which is responsible for considering theremuneration for the Executive Directors of Reed Elsevier NV, and determining the remuneration policy (subject toshareholder approval) and monitoring its implementation for the Executive Directors of Reed Elsevier Group plc and ReedElsevier PLC.
Under the articles of association of Reed Elsevier NV, a Director of Reed Elsevier NV shall retire no later than on theday on which the first General Meeting of Shareholders’ is held following the lapse of three years after his appointment, with
69
the possibility of re-appointment and shall retire periodically in accordance with a rotation plan drawn up by the Board.Notwithstanding these provisions in the articles of association, in accordance with the provisions of the UK CorporateGovernance Code all Directors retire and seek re-appointment at each Annual General Meeting of Shareholders. To align thearrangements regarding appointment for the Boards of Reed Elsevier NV and Reed Elsevier PLC annual re-appointment shallnot affect the term of their three-year appointment. As a general rule, Non-Executive Directors serve for two three-year terms.The Nominations Committee may recommend that individual Non-Executive Directors serve up to one additional three-yearterm. A schedule with the anticipated dates of retirement of Directors is published on the Reed Elsevier website,www.reedelsevier.com. A copy of the terms of reference of the Nominations Committee is available on request and can beviewed on the Reed Elsevier website. The information on our website is not incorporated by reference into this report.
ELSEVIER REED FINANCE BV
Elsevier Reed Finance BV has a two-tier board structure comprising a Management Board, currently consisting of threemembers, and a Supervisory Board, currently consisting of four members. The members of the Management Board and of theSupervisory Board are appointed by the shareholders of Elsevier Reed Finance BV. The articles of association of ElsevierReed Finance BV provide that certain material resolutions of the Management Board will require the approval of theSupervisory Board. At a meeting of the Supervisory Board valid resolutions can be taken with a simple majority if themajority of the members are present or represented. Pursuant to the articles of association of Elsevier Reed Finance BV, thereare specific provisions governing the appointment and dismissal of managing directors and members of the Supervisory Boardduring periods when a notice of suspension as mentioned in the governing agreement between Reed Elsevier PLC and ReedElsevier NV is in force. These provisions intend to neutralise the influence of a party which has acquired control over eitherReed Elsevier PLC or Reed Elsevier NV without having also acquired control in the other.
EMPLOYEES
The number of people employed is disclosed in note 5 to the combined financial statements.
The Board of Reed Elsevier Group plc is fully committed to the concept of employee involvement and participation, andencourages each of its businesses to formulate its own tailor-made approach with the co-operation of employees. ReedElsevier is an equal opportunity employer, and recruits and promotes employees on the basis of suitability for the job.Appropriate training and development opportunities are available to all employees. A code of ethics and business conductapplicable to employees within Reed Elsevier has been adopted throughout its businesses.
70
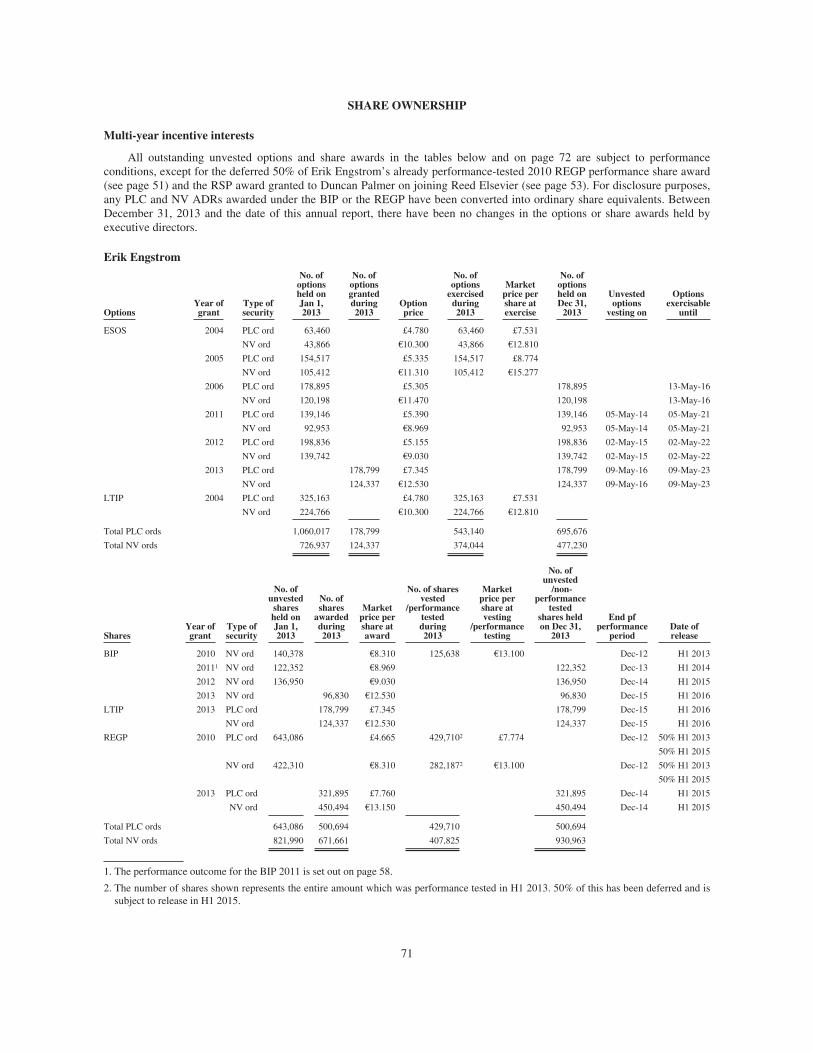
SHARE OWNERSHIP
Multi-year incentive interests
All outstanding unvested options and share awards in the tables below and on page 72 are subject to performanceconditions, except for the deferred 50% of Erik Engstrom’s already performance-tested 2010 REGP performance share award(see page 51) and the RSP award granted to Duncan Palmer on joining Reed Elsevier (see page 53). For disclosure purposes,any PLC and NV ADRs awarded under the BIP or the REGP have been converted into ordinary share equivalents. BetweenDecember 31, 2013 and the date of this annual report, there have been no changes in the options or share awards held byexecutive directors.
Erik Engstrom
OptionsYear ofgrant
Type ofsecurity
No. ofoptionsheld onJan 1,2013
No. ofoptionsgrantedduring2013
Optionprice
No. ofoptions
exercisedduring2013
Marketprice pershare atexercise
No. ofoptionsheld onDec 31,
2013
Unvestedoptions
vesting on
Optionsexercisable
until
ESOS 2004 PLC ord 63,460 £4.780 63,460 £7.531
NV ord 43,866 €10.300 43,866 €12.810
2005 PLC ord 154,517 £5.335 154,517 £8.774
NV ord 105,412 €11.310 105,412 €15.277
2006 PLC ord 178,895 £5.305 178,895 13-May-16
NV ord 120,198 €11.470 120,198 13-May-16
2011 PLC ord 139,146 £5.390 139,146 05-May-14 05-May-21
NV ord 92,953 €8.969 92,953 05-May-14 05-May-21
2012 PLC ord 198,836 £5.155 198,836 02-May-15 02-May-22
NV ord 139,742 €9.030 139,742 02-May-15 02-May-22
2013 PLC ord 178,799 £7.345 178,799 09-May-16 09-May-23
NV ord 124,337 €12.530 124,337 09-May-16 09-May-23
LTIP 2004 PLC ord 325,163 £4.780 325,163 £7.531
NV ord 224,766 €10.300 224,766 €12.810
Total PLC ords 1,060,017 178,799 543,140 695,676
Total NV ords 726,937 124,337 374,044 477,230
SharesYear ofgrant
Type ofsecurity
No. ofunvested
sharesheld onJan 1,2013
No. ofshares
awardedduring2013
Marketprice pershare ataward
No. of sharesvested
/performancetestedduring2013
Marketprice pershare atvesting
/performancetesting
No. ofunvested
/non-performance
testedshares heldon Dec 31,
2013
End pfperformance
periodDate ofrelease
BIP 2010 NV ord 140,378 €8.310 125,638 €13.100 Dec-12 H1 2013
20111 NV ord 122,352 €8.969 122,352 Dec-13 H1 2014
2012 NV ord 136,950 €9.030 136,950 Dec-14 H1 2015
2013 NV ord 96,830 €12.530 96,830 Dec-15 H1 2016
LTIP 2013 PLC ord 178,799 £7.345 178,799 Dec-15 H1 2016
NV ord 124,337 €12.530 124,337 Dec-15 H1 2016
REGP 2010 PLC ord 643,086 £4.665 429,7102 £7.774 Dec-12 50% H1 2013
50% H1 2015
NV ord 422,310 €8.310 282,1872 €13.100 Dec-12 50% H1 2013
50% H1 2015
2013 PLC ord 321,895 £7.760 321,895 Dec-14 H1 2015
NV ord 450,494 €13.150 450,494 Dec-14 H1 2015
Total PLC ords 643,086 500,694 429,710 500,694
Total NV ords 821,990 671,661 407,825 930,963
1. The performance outcome for the BIP 2011 is set out on page 58.
2. The number of shares shown represents the entire amount which was performance tested in H1 2013. 50% of this has been deferred and issubject to release in H1 2015.
71
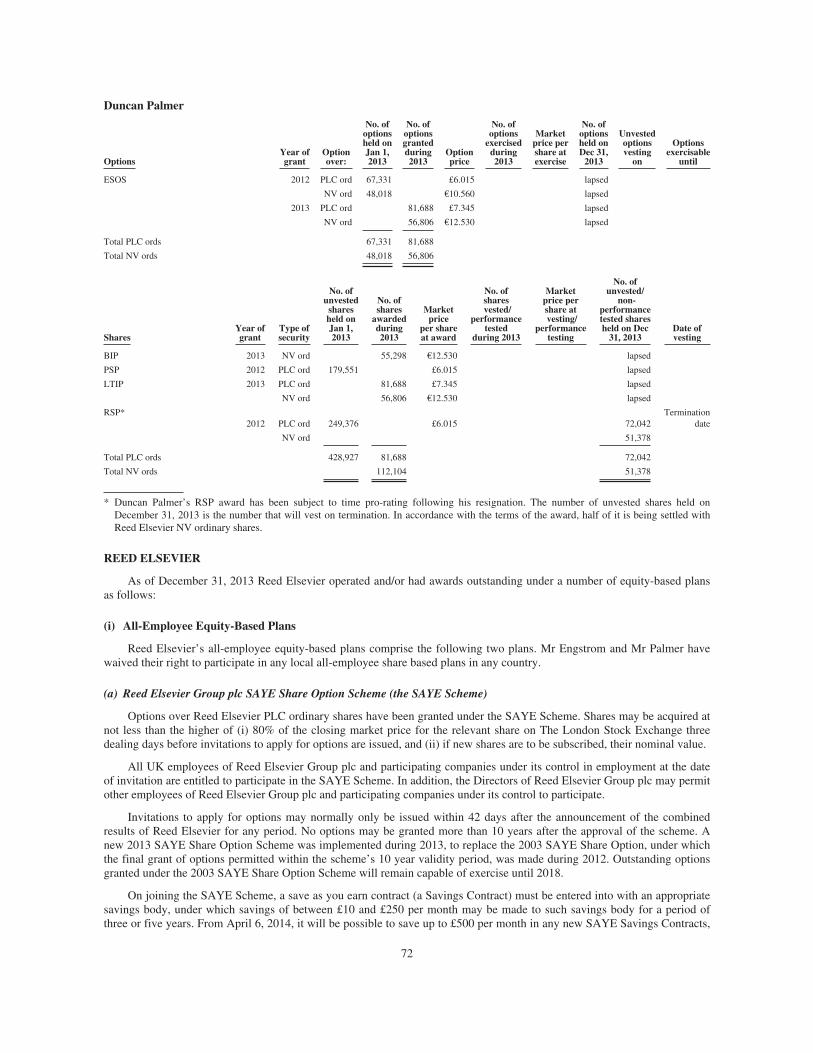
Duncan Palmer
OptionsYear ofgrant
Optionover:
No. ofoptionsheld onJan 1,2013
No. ofoptionsgrantedduring2013
Optionprice
No. ofoptions
exercisedduring2013
Marketprice pershare atexercise
No. ofoptionsheld onDec 31,
2013
Unvestedoptionsvesting
on
Optionsexercisable
until
ESOS 2012 PLC ord 67,331 £6.015 lapsed
NV ord 48,018 €10.560 lapsed
2013 PLC ord 81,688 £7.345 lapsed
NV ord 56,806 €12.530 lapsed
Total PLC ords 67,331 81,688
Total NV ords 48,018 56,806
SharesYear ofgrant
Type ofsecurity
No. ofunvested
sharesheld onJan 1,2013
No. ofshares
awardedduring2013
Marketprice
per shareat award
No. ofsharesvested/
performancetested
during 2013
Marketprice pershare atvesting/
performancetesting
No. ofunvested/
non-performancetested sharesheld on Dec
31, 2013Date ofvesting
BIP 2013 NV ord 55,298 €12.530 lapsed
PSP 2012 PLC ord 179,551 £6.015 lapsed
LTIP 2013 PLC ord 81,688 £7.345 lapsed
NV ord 56,806 €12.530 lapsed
RSP*2012 PLC ord 249,376 £6.015 72,042
Terminationdate
NV ord 51,378
Total PLC ords 428,927 81,688 72,042
Total NV ords 112,104 51,378
* Duncan Palmer’s RSP award has been subject to time pro-rating following his resignation. The number of unvested shares held onDecember 31, 2013 is the number that will vest on termination. In accordance with the terms of the award, half of it is being settled withReed Elsevier NV ordinary shares.
REED ELSEVIER
As of December 31, 2013 Reed Elsevier operated and/or had awards outstanding under a number of equity-based plansas follows:
(i) All-Employee Equity-Based Plans
Reed Elsevier’s all-employee equity-based plans comprise the following two plans. Mr Engstrom and Mr Palmer havewaived their right to participate in any local all-employee share based plans in any country.
(a) Reed Elsevier Group plc SAYE Share Option Scheme (the SAYE Scheme)
Options over Reed Elsevier PLC ordinary shares have been granted under the SAYE Scheme. Shares may be acquired atnot less than the higher of (i) 80% of the closing market price for the relevant share on The London Stock Exchange threedealing days before invitations to apply for options are issued, and (ii) if new shares are to be subscribed, their nominal value.
All UK employees of Reed Elsevier Group plc and participating companies under its control in employment at the dateof invitation are entitled to participate in the SAYE Scheme. In addition, the Directors of Reed Elsevier Group plc may permitother employees of Reed Elsevier Group plc and participating companies under its control to participate.
Invitations to apply for options may normally only be issued within 42 days after the announcement of the combinedresults of Reed Elsevier for any period. No options may be granted more than 10 years after the approval of the scheme. Anew 2013 SAYE Share Option Scheme was implemented during 2013, to replace the 2003 SAYE Share Option, under whichthe final grant of options permitted within the scheme’s 10 year validity period, was made during 2012. Outstanding optionsgranted under the 2003 SAYE Share Option Scheme will remain capable of exercise until 2018.
On joining the SAYE Scheme, a save as you earn contract (a Savings Contract) must be entered into with an appropriatesavings body, under which savings of between £10 and £250 per month may be made to such savings body for a period ofthree or five years. From April 6, 2014, it will be possible to save up to £500 per month in any new SAYE Savings Contracts,
72
following an increase to the maximum contributions limit by HMRC and upon appropriate approval by the Company’s Boardof Directors. A bonus may be payable under the Savings Contract at the end of the savings period. The amount of the monthlycontributions may be reduced if applications exceed the number of Reed Elsevier PLC ordinary shares available for the grantof options on that occasion.
The number of Reed Elsevier PLC ordinary shares over which an option may be granted is limited to that number ofshares which may be acquired at the exercise price out of the repayment proceeds (including any bonus) of the SavingsContract.
Options under the SAYE Scheme may normally only be exercised for a period of six months after the bonus date underthe relevant Savings Contract. However, options may be exercised earlier than the normal exercise date in certain specifiedcircumstances, including death, or on ceasing employment on account of injury, disability, redundancy, reaching contractualretirement age, or the sale of the business or subsidiary for which the participant works, or on ceasing employment for anyother reason, or provided the option has been held for at least three years. Exercise is allowed in the event of anamalgamation, reconstruction or take-over of the company whose shares are under option; alternatively, such options may,with the agreement of an acquiring company or a company associated with it, be exchanged for options over shares in theacquiring company or that associated company. Options may also be exercised in the event of the voluntary winding-up of thecompany whose shares are under option. In the event that options are exercised before the bonus date, the participant mayacquire only the number of shares that can be purchased with the accumulated savings up to the date of exercise, plus interest(if any).
In the event of any capitalisation or rights issue by Reed Elsevier PLC or Reed Elsevier NV, or of any consolidation,subdivision or reduction of their share capital, the number of shares subject to any relevant option and/or the exercise pricemay be adjusted with the approval of the UK HMRC, subject to the independent auditors of Reed Elsevier Group plcconfirming in writing that such adjustment is, in their opinion, fair and reasonable.
(b) Convertible debenture stock arrangements
This facility consists of an annual issue by Reed Elsevier NV of a convertible debenture loan (the NetherlandsConvertible Debenture Stock Scheme) that is open for subscription by staff employed by Reed Elsevier companies in theNetherlands or temporarily seconded to affiliates abroad. The interest rate of the scheme is determined quarterly on the basisof market rates on internet savings accounts which can be withdrawn at a day’s notice in the Netherlands. Employees canannually subscribe for one or more debentures of €200 each, up to a maximum amount equal to 20% of the equivalent of 15times the employee’s fixed gross monthly salary, including any fixed monthly allowances, but excluding any non-monthlysalary components (holiday pay, annual incentives, profit shares etc). Interest is payable in arrears in the month of Januaryfollowing the subscription year. The loans have a term of 10 years. During the 10-year term of the loan employees can decideto convert their claim on Reed Elsevier NV into shares at an exercise price equal to the price of a Reed Elsevier NV ordinaryshare on NYSE Euronext Amsterdam on the last dealing day of the month in which the employee has subscribed for the loan(the exercise price). Each debenture of €200 can be converted into 50 ordinary shares in Reed Elsevier NV against payment of50 times the exercise price, less €200.
(ii) Executive Equity-Based Plans
Reed Elsevier’s executive equity-based plans comprise:
(a) Reed Elsevier Group plc Growth Plan (REGP)
The details of how the REGP operates have been disclosed in previous years’ annual reports and details are also set outon page 51 of this annual report. The performance measures and targets for the matching awards granted in 2013 are disclosedin this annual report on page 62.
(b) Long-term incentive plans (LTIP)
The plans in this category comprise the Reed Elsevier Group plc Long-Term Incentive Plan 2013 (LTIP 2013), the ReedElsevier Group plc Long-Term Incentive Plan 2010 (LTIP 2010) and the Reed Elsevier Group plc Long-Term Incentive ShareOption Scheme 2003 (LTIS 2003). Details of the LTIP 2010 and the LTIS 2003 have been disclosed in previous years’ annualreports.
The LTIP 2013 was implemented in 2013 as the successor plan to the LTIP 2010 and details are set out on page 50 ofthis annual report. The plan applies to senior executives (including executive officers and executive directors). Awards maybe granted as performance share awards or nil-cost options but it is currently intended to only grant performance shareawards. Awards vest subject to performance measured over three financial years. Awards may be satisfied with new issueshares, a transfer of treasury shares or shares purchased in the market, but it is currently intended to continue the existingpractice of satisfying awards with shares purchased in the market. The performance measures and targets applicable to awards
73
granted in 2013 under this plan are set out on pages 61 and 62. The vesting of awards is also subject to participants meeting aminimum shareholding requirement and continued employment (except for certain categories of approved leavers). Dividendequivalents accrue over the performance period and are paid out in cash at the end to the extent that the awards vest.
The LTIP 2010 has awards outstanding which were granted in 2011 and 2012. No awards were granted under this plan in2013 and no awards will be granted under this plan in 2014.
The LTIS 2003 enabled the grant of options and restricted shares. Options previously granted under this plan vestedsubject to performance and will lapse to the extent they remain unexercised, on the tenth anniversary of the date of grant. Noawards were made under the LTIS 2003 in 2013 and no awards will be made under this plan in 2014.
(c) Executive share option schemes (ESOS)
The plans in this category comprise the Reed Elsevier Group plc Executive Share Option Scheme 2013 (ESOS 2013) andthe Reed Elsevier Group plc Share Option Scheme 2003 (ESOS 2003). Details of the ESOS 2003 have been disclosed inprevious annual reports.
The ESOS 2013 was implemented in 2013 and is the successor plan to the ESOS 2003 and details are set out on page 50of this annual report. The plan applies to around 1,000 executives (including executive officers and executive directors).Market value options are granted which vest (subject to performance in the case of executive directors) after three years andremain exercisable, subject to continued employment, until the tenth anniversary of grant. Options may be satisfied with newissue shares, a transfer of treasury shares or shares purchased in the market, but it is currently intended to continue the existingpractice of satisfying options with new issue shares. The performance measure and targets applicable to options granted in2013 under this plan to executive directors are set out on page 62.
ESOS 2003 has options outstanding under it but no options were granted under this plan in 2013 and no options will begranted under this plan in 2014.
(d) Bonus investment plans (BIP)
The Reed Elsevier Group plc Bonus Investment Plan 2010 (BIP 2010) (see page 50 for a description of this plan) is avoluntary plan aimed at encouraging personal investment in, and ongoing holding of, Reed Elsevier shares to promote greateralignment with shareholders and support the retention of key talent. Awards were made in 2013 under BIP 2010 to seniorexecutives (including executive officers and Executive Directors). The performance measures and targets applicable to awardsgranted in 2013 are set out on page 61.
(e) Reed Elsevier Group plc Retention Share Plan 2004 (RSP)
The RSP has been used to facilitate the grant of one-off awards of restricted shares, where appropriate, to senior newhires for example, to buy out share-based awards from previous employment. The restricted shares which have been awardedwill be satisfied by shares purchased in the market and Executive Directors are not eligible to participate.
In addition, since 2006, employees eligible to participate in the ESOS (see (c) above), other than Executive Directors,have been able to choose prior to the date of grant whether to receive all or part of their grant in the form of restricted sharesbased on a pre-determined conversion ratio of one share for every five options that would otherwise be granted to them underESOS. The RSP is the vehicle used to deliver the award of such restricted shares. The restricted shares vest after the expiry ofthree years from the date of grant, subject to the participant remaining employed by Reed Elsevier or a participating companyunder its control. The restricted shares awarded are satisfied by shares purchased in the market.
Note that the RSP award granted to Duncan Palmer on recruitment was not granted under the RSP. The terms of thataward were described in last year’s annual report.
74
Share options and conditional share awards
At February 26, 2014 the total number of ordinary shares subject to outstanding options was:
Number ofoutstanding
optionsOptions over
sharesOption price
range
SAYE Scheme . . . . . . . . . . . . . . . . . . . . . . . . . . . . . . . . . . . . . . . . 1,922,744 Reed Elsevier PLC £4.016 — £5.96Netherlands Convertible Debenture Stock Scheme . . . . . . . . . . . 1,195,300 Reed Elsevier NV €9.00 — €14.865ESOS . . . . . . . . . . . . . . . . . . . . . . . . . . . . . . . . . . . . . . . . . . . . . . . 8,125,483 Reed Elsevier PLC £4.20 — £9.03
6,052,561 Reed Elsevier NV €7.301 — €15.19LTIS 2003 . . . . . . . . . . . . . . . . . . . . . . . . . . . . . . . . . . . . . . . . . . . 147,909 Reed Elsevier PLC £5.115
100,883 Reed Elsevier NV €11.13
Share options are expected, upon exercise, to be met principally by the issue of new ordinary shares, but may also be metfrom shares held by the Reed Elsevier Group plc Employee Benefit Trust.
At February 26, 2014 the following conditional share awards were also outstanding:
Number ofoutstanding
awardsAwards over
shares in
REGP* . . . . . . . . . . . . . . . . . . . . . . . . . . . . . . . . . . . . . . . . . . . . . . . . . . . . . . . . . . . . . . . 536,750 Reed Elsevier PLC591,588 Reed Elsevier NV
LTIP . . . . . . . . . . . . . . . . . . . . . . . . . . . . . . . . . . . . . . . . . . . . . . . . . . . . . . . . . . . . . . . . . 2,397,483 Reed Elsevier PLC1,652,859 Reed Elsevier NV
BIP* . . . . . . . . . . . . . . . . . . . . . . . . . . . . . . . . . . . . . . . . . . . . . . . . . . . . . . . . . . . . . . . . . 3,262,636 Reed Elsevier PLC1,536,524 Reed Elsevier NV
RSP . . . . . . . . . . . . . . . . . . . . . . . . . . . . . . . . . . . . . . . . . . . . . . . . . . . . . . . . . . . . . . . . . 1,889,094 Reed Elsevier PLC1,136,129 Reed Elsevier NV
* For disclosure purposes, any Reed Elsevier PLC and Reed Elsevier NV ADRs awarded under these plans have been converted intoordinary share equivalents.
It is intended that these awards will be satisfied with shares purchased in the market.
REED ELSEVIER
Share ownership
The interests of those individuals who were Directors of Reed Elsevier PLC and Reed Elsevier NV as at December 31,2013 in the issued share capital of the respective companies at the beginning and end of the year are shown below. ReedElsevier PLC and Reed Elsevier NV ADRs are converted into ordinary share equivalents.
Reed Elsevier PLCordinary shares
Reed Elsevier NVordinary shares
January 1,2013
December 31,2013
January 1,2013
December 31,2013
Erik Engstrom . . . . . . . . . . . . . . . . . . . . . . . . . . . . . . . . . . 107,040 114,552 509,556 513,765Anthony Habgood . . . . . . . . . . . . . . . . . . . . . . . . . . . . . . . 50,000 50,000 25,000 25,000Wolfhart Hauser* . . . . . . . . . . . . . . . . . . . . . . . . . . . . . . . . 750Adrian Hennah . . . . . . . . . . . . . . . . . . . . . . . . . . . . . . . . . . 5,163 5,163Lisa Hook . . . . . . . . . . . . . . . . . . . . . . . . . . . . . . . . . . . . . . 4,800 4,800Marike van Lier Lels . . . . . . . . . . . . . . . . . . . . . . . . . . . . .Duncan Palmer . . . . . . . . . . . . . . . . . . . . . . . . . . . . . . . . . . 88 30,022Robert Polet . . . . . . . . . . . . . . . . . . . . . . . . . . . . . . . . . . . . 1,000 1,000Linda Sanford . . . . . . . . . . . . . . . . . . . . . . . . . . . . . . . . . . . 3,600Ben van der Veer . . . . . . . . . . . . . . . . . . . . . . . . . . . . . . . . 5,000 5,000
* Wolfhart Hauser was appointed on April 25, 2013.
As at March 6, 2014, Erik Engstrom’s interest in Reed Elsevier PLC ordinary shares was 118,552 and in Reed ElsevierNV ordinary shares was 516,765 and Ben van der Veer’s interest in Reed Elsevier NV ordinary shares was 7,000.
75
The interests of the current Executive Directors of Reed Elsevier PLC and Reed Elsevier NV in the issued share capitalof the respective companies as at March 6, 2014 were:
Interest inReed ElsevierPLC ordinary
shares*
Interest inReed ElsevierNV ordinary
shares*
Erik Engstrom . . . . . . . . . . . . . . . . . . . . . . . . . . . . . . . . . . . . . . . . . . . . . . . . . . . . . . . . . . . 118,552 516,765Duncan Palmer . . . . . . . . . . . . . . . . . . . . . . . . . . . . . . . . . . . . . . . . . . . . . . . . . . . . . . . . . . 88 30,022
* In the table above, Reed Elsevier PLC and Reed Elsevier NV ADRs are converted into ordinary share equivalents.
Shares and options held by executive officers
The following table indicates the total aggregate number of Reed Elsevier PLC ordinary shares and Reed Elsevier NVordinary shares beneficially owned and the total aggregate number of share options and conditional share awards held by theexecutive officers (other than Directors) of Reed Elsevier Group plc (three persons) in office as of February 26, 2014:
ReedElsevier
PLCordinary
shares
ReedElsevier
PLCordinary
sharessubject to
options
ReedElsevier
PLCconditional
shareawards
ReedElsevier NV
ordinaryshares
ReedElsevier NV
ordinaryshares
subject tooptions
ReedElsevier NVconditional
shareawards
Executive officers (other thanDirectors) . . . . . . . . . . . . . . . 170,900 218,903 664,384 37,241 177,985 308,325
In the table above, Reed Elsevier PLC and Reed Elsevier NV ADRs are converted into ordinary share equivalents.
The options over Reed Elsevier PLC ordinary shares included in the above table are exercisable at prices ranging from£4.665 to £7.345 per share and between the date hereof and 2023. The options over Reed Elsevier NV ordinary sharesincluded in the above table are exercisable at prices ranging from €8.31 to €14.51 per share and between the date hereof and2023. The Reed Elsevier PLC and Reed Elsevier NV conditional share awards included in the above table will vest between2014 and 2016.
76
ITEM 7: MAJOR SHAREHOLDERS AND RELATED PARTY TRANSACTIONS
MAJOR SHAREHOLDERS
REED ELSEVIER PLC
Substantial share interests
As at March 6, 2014, the company had been notified by the following shareholders that they held an interest of 3% ormore in voting rights(1) of the issued share capital of the company:
Identity of Person or Group(2) % of Class
Franklin Mutual Advisors, LLC . . . . . . . . . . . . . . . . . . . . . . . . . . . . . . . . . . . . . . . . . . . . . . . . . . . . . . . . . . . . . . . 5.04BlackRock, Inc . . . . . . . . . . . . . . . . . . . . . . . . . . . . . . . . . . . . . . . . . . . . . . . . . . . . . . . . . . . . . . . . . . . . . . . . . . . . 5.03Invesco Limited . . . . . . . . . . . . . . . . . . . . . . . . . . . . . . . . . . . . . . . . . . . . . . . . . . . . . . . . . . . . . . . . . . . . . . . . . . . 5.03Lloyds Banking Group plc . . . . . . . . . . . . . . . . . . . . . . . . . . . . . . . . . . . . . . . . . . . . . . . . . . . . . . . . . . . . . . . . . . . 3.47Legal & General Group plc . . . . . . . . . . . . . . . . . . . . . . . . . . . . . . . . . . . . . . . . . . . . . . . . . . . . . . . . . . . . . . . . . . . 3.40
The percentage interests stated above are as disclosed at the date on which the interests were notified to the company.
(1) Under the UK Disclosure Rules and Transparency Rules, subject to certain limited exceptions, persons or groups with an interest of 3%or more in voting rights of the issued Reed Elsevier PLC ordinary share capital are required to notify Reed Elsevier PLC of their interest.
(2) Under the UK Large and Medium-sized Companies and Groups (Accounts and Reports) Regulations 2008, Reed Elsevier PLC isrequired to disclose information they are aware of regarding the identity of each person with a significant direct or indirect holding ofsecurities in Reed Elsevier PLC as at the financial year end.
As far as Reed Elsevier PLC is aware, except as disclosed herein, it is neither directly or indirectly owned nor controlledby one or more corporations or by any government.
At December 31, 2013 there were 16,964 ordinary shareholders, including the depositary for Reed Elsevier PLC’s ADRprogramme, with a registered address in the United Kingdom, representing 99.86% of shares issued.
Reed Elsevier PLC is not aware of any arrangements the operation of which may at a subsequent date result in a changein control of Reed Elsevier PLC. The major shareholders of Reed Elsevier PLC do not have different voting rights to otherordinary shareholders.
REED ELSEVIER NV
Substantial share interests
As of March 6, 2014 Reed Elsevier NV is aware of the following disclosable interests of 3% or more in the issued ReedElsevier NV shares based on the public database of and on notification received from the Netherlands Authority for theFinancial Markets(1) or provided as a Schedule 13G filing(2):
Identity of Person or Group % of Class
BlackRock, Inc . . . . . . . . . . . . . . . . . . . . . . . . . . . . . . . . . . . . . . . . . . . . . . . . . . . . . . . . . . . . . . . . . . . . . . . . . . . . 7.30Reed Elsevier PLC(3) . . . . . . . . . . . . . . . . . . . . . . . . . . . . . . . . . . . . . . . . . . . . . . . . . . . . . . . . . . . . . . . . . . . . . . . . 5.89Causeway Capital Management LLC . . . . . . . . . . . . . . . . . . . . . . . . . . . . . . . . . . . . . . . . . . . . . . . . . . . . . . . . . . . 5.01ING Groep N.V. . . . . . . . . . . . . . . . . . . . . . . . . . . . . . . . . . . . . . . . . . . . . . . . . . . . . . . . . . . . . . . . . . . . . . . . . . . . 5.00Credit Suisse Group AG . . . . . . . . . . . . . . . . . . . . . . . . . . . . . . . . . . . . . . . . . . . . . . . . . . . . . . . . . . . . . . . . . . . . . 4.59The Bank of New York Mellon Corporation . . . . . . . . . . . . . . . . . . . . . . . . . . . . . . . . . . . . . . . . . . . . . . . . . . . . . 4.59FIL Limited . . . . . . . . . . . . . . . . . . . . . . . . . . . . . . . . . . . . . . . . . . . . . . . . . . . . . . . . . . . . . . . . . . . . . . . . . . . . . . . 3.72
(1) Under Article 5:38 of the Netherlands Financial Markets Supervision Act, any person acquiring or disposing of shares or voting rights inpublic companies established under the laws of the Netherlands listed on a stock exchange in the European Union, is required to notifythe Netherlands Authority for the Financial Markets (AFM) without delay if such person knows, or should know, that such interesttherein reaches, exceeds or drops below a 3%, 5%, 10%, 15%, 20%, 25%, 30%, 40%, 50%, 60%, 75% and 95% threshold. No interest inthe shares or voting rights of Reed Elsevier NV of 10% or more has been disclosed in the AFM’s registers.
(2) The Securities Exchange Act of 1934 requires any person who has, as at the end of the calendar year, a direct or indirect beneficialinterest in 5% or more of the issued share capital of a company, to file a statement on Schedule 13G with the Securities and ExchangeCommission reporting such interest within 45 days following the end of the calendar year.
(3) Reed Elsevier PLC’s interest comprises a holding of R shares of €0.70 nominal value each held by a subsidiary of Reed Elsevier PLC.The 5.89% indirect equity interest in the total share capital of Reed Elsevier NV was notified to the AFM at the time the 5% thresholdwas reached. The subsequent repurchases of R shares are not reflected in the substantial interest register held by AFM, as the interest didnot drop below the 5% threshold.
77

As far as Reed Elsevier NV is aware, except as disclosed herein, it is neither directly nor indirectly owned or controlledby any single corporation or corporations acting jointly, nor by any government.
Reed Elsevier NV is not aware of any arrangements the operation of which may at a subsequent date result in a change incontrol of Reed Elsevier NV. The major shareholders of Reed Elsevier NV do not have different voting rights to otherordinary shareholders.
RELATED PARTY TRANSACTIONS
Transactions with joint ventures and key management personnel, comprising the Executive and Non-Executive Directorsof Reed Elsevier PLC and Reed Elsevier NV, are set out in note 32 to the combined financial statements. Further details ofremuneration of key management personnel are set out in “Item 6 — Directors, Senior Management and Employees”.
78
ITEM 8: FINANCIAL INFORMATION
FINANCIAL STATEMENTS
See Item 18: Financial Statements.
DIVIDEND POLICY
Dividends to Reed Elsevier PLC and Reed Elsevier NV shareholders are, other than in special circumstances, equalisedat the gross level, including the benefit of the UK attributable tax credit of 10% received by certain Reed Elsevier PLCshareholders. The exchange rate used for each dividend calculation as defined in the Reed Elsevier merger agreement is thespot euro/sterling exchange rate, averaged over a period of five business days commencing with the tenth business day beforethe announcement of the proposed dividend. The Boards of Reed Elsevier PLC and Reed Elsevier NV have adopted dividendpolicies in recent years in respect of their equalised dividends that, subject to currency considerations, more closely aligndividend growth with growth in adjusted earnings, consistent with the dividend normally being covered over the longer termat least two times by adjusted earnings (i.e. before the amortisation of acquired intangible assets, acquisition related costs, netfinancing charge on defined benefit pension schemes, disposal gains and losses and other non operating items, related taxeffects, other deferred tax credits from intangible assets and exceptional prior year tax credits).
Reed Elsevier NV may resolve that the dividend to be paid on each R share shall be lower than the dividend to be paid oneach ordinary share, but not less than 1% of the nominal value of an R share.
LEGAL PROCEEDINGS
Beginning in 2005, various of Reed Elsevier’s subsidiaries in the United States became the subject of legal proceedingsand federal and state regulatory actions relating to data security breaches, pursuant to which unauthorised persons obtainedpersonal identifying information from Reed Elsevier databases, or alleged breaches of federal privacy laws in connection withthe obtaining and disclosure by such subsidiaries of information without the consent of the individuals involved. The principalactions and investigations have been settled, with the substantial portion of cash payments agreed to be paid by thesesubsidiaries being reimbursed by insurance and third-party indemnities. The settlements generally require strict data securityprograms, submissions of regulatory reports and on-going monitoring by independent third parties to ensure Reed Elsevier’scompliance with the terms of those settlements. While the costs of such on-going monitoring will be borne by Reed Elsevier,neither the costs of compliance nor the costs of such on-going monitoring are expected to have a material adverse effect onour financial position or the results of our operations.
Many of the products offered by Risk Solutions is governed by the US Fair Credit Reporting Act (“FCRA”), GrahamLeach Bliley Act (“GLBA”), Drivers Privacy Protection Act (“DPPA”) and related state laws requiring that consumers beprovided certain notices. Certain of these laws further provide for statutory penalties and attorneys fees for non-compliance.In the normal course of its business, Risk Solutions deals with individual and class lawsuits claiming violation of one or moreof these statutes. Other than pending matters, these cases have either been settled or successfully defended to date with asubstantial portion of cash payments agreed to be paid by insurance. These proceedings have not had, and are not expected tohave, a material adverse effect on our financial position or the results of our operations.
We are party to various other legal proceedings arising in the ordinary course of our business, the ultimate resolutions ofwhich are not expected to have a material adverse effect on our financial position or the results of our operations.
79
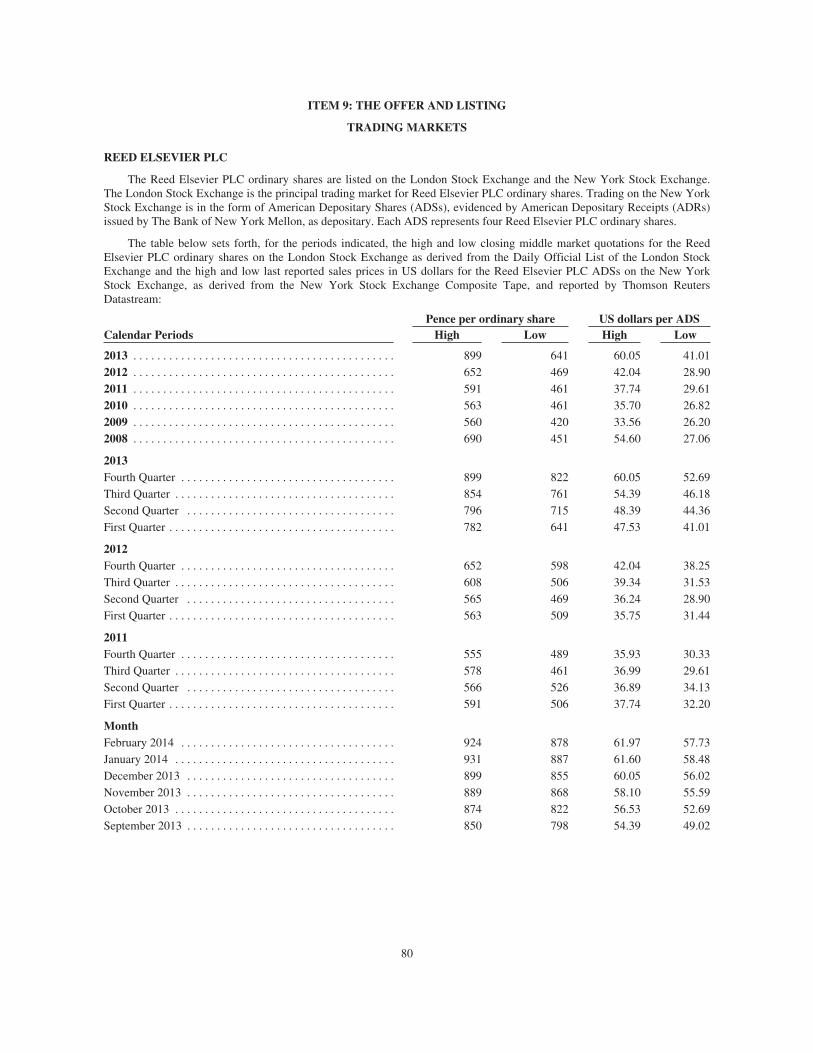
ITEM 9: THE OFFER AND LISTING
TRADING MARKETS
REED ELSEVIER PLC
The Reed Elsevier PLC ordinary shares are listed on the London Stock Exchange and the New York Stock Exchange.The London Stock Exchange is the principal trading market for Reed Elsevier PLC ordinary shares. Trading on the New YorkStock Exchange is in the form of American Depositary Shares (ADSs), evidenced by American Depositary Receipts (ADRs)issued by The Bank of New York Mellon, as depositary. Each ADS represents four Reed Elsevier PLC ordinary shares.
The table below sets forth, for the periods indicated, the high and low closing middle market quotations for the ReedElsevier PLC ordinary shares on the London Stock Exchange as derived from the Daily Official List of the London StockExchange and the high and low last reported sales prices in US dollars for the Reed Elsevier PLC ADSs on the New YorkStock Exchange, as derived from the New York Stock Exchange Composite Tape, and reported by Thomson ReutersDatastream:
Pence per ordinary share US dollars per ADSCalendar Periods High Low High Low
2013 . . . . . . . . . . . . . . . . . . . . . . . . . . . . . . . . . . . . . . . . . . . . 899 641 60.05 41.012012 . . . . . . . . . . . . . . . . . . . . . . . . . . . . . . . . . . . . . . . . . . . . 652 469 42.04 28.902011 . . . . . . . . . . . . . . . . . . . . . . . . . . . . . . . . . . . . . . . . . . . . 591 461 37.74 29.612010 . . . . . . . . . . . . . . . . . . . . . . . . . . . . . . . . . . . . . . . . . . . . 563 461 35.70 26.822009 . . . . . . . . . . . . . . . . . . . . . . . . . . . . . . . . . . . . . . . . . . . . 560 420 33.56 26.202008 . . . . . . . . . . . . . . . . . . . . . . . . . . . . . . . . . . . . . . . . . . . . 690 451 54.60 27.06
2013Fourth Quarter . . . . . . . . . . . . . . . . . . . . . . . . . . . . . . . . . . . . 899 822 60.05 52.69Third Quarter . . . . . . . . . . . . . . . . . . . . . . . . . . . . . . . . . . . . . 854 761 54.39 46.18Second Quarter . . . . . . . . . . . . . . . . . . . . . . . . . . . . . . . . . . . 796 715 48.39 44.36First Quarter . . . . . . . . . . . . . . . . . . . . . . . . . . . . . . . . . . . . . . 782 641 47.53 41.01
2012Fourth Quarter . . . . . . . . . . . . . . . . . . . . . . . . . . . . . . . . . . . . 652 598 42.04 38.25Third Quarter . . . . . . . . . . . . . . . . . . . . . . . . . . . . . . . . . . . . . 608 506 39.34 31.53Second Quarter . . . . . . . . . . . . . . . . . . . . . . . . . . . . . . . . . . . 565 469 36.24 28.90First Quarter . . . . . . . . . . . . . . . . . . . . . . . . . . . . . . . . . . . . . . 563 509 35.75 31.44
2011Fourth Quarter . . . . . . . . . . . . . . . . . . . . . . . . . . . . . . . . . . . . 555 489 35.93 30.33Third Quarter . . . . . . . . . . . . . . . . . . . . . . . . . . . . . . . . . . . . . 578 461 36.99 29.61Second Quarter . . . . . . . . . . . . . . . . . . . . . . . . . . . . . . . . . . . 566 526 36.89 34.13First Quarter . . . . . . . . . . . . . . . . . . . . . . . . . . . . . . . . . . . . . . 591 506 37.74 32.20
MonthFebruary 2014 . . . . . . . . . . . . . . . . . . . . . . . . . . . . . . . . . . . . 924 878 61.97 57.73January 2014 . . . . . . . . . . . . . . . . . . . . . . . . . . . . . . . . . . . . . 931 887 61.60 58.48December 2013 . . . . . . . . . . . . . . . . . . . . . . . . . . . . . . . . . . . 899 855 60.05 56.02November 2013 . . . . . . . . . . . . . . . . . . . . . . . . . . . . . . . . . . . 889 868 58.10 55.59October 2013 . . . . . . . . . . . . . . . . . . . . . . . . . . . . . . . . . . . . . 874 822 56.53 52.69September 2013 . . . . . . . . . . . . . . . . . . . . . . . . . . . . . . . . . . . 850 798 54.39 49.02
80
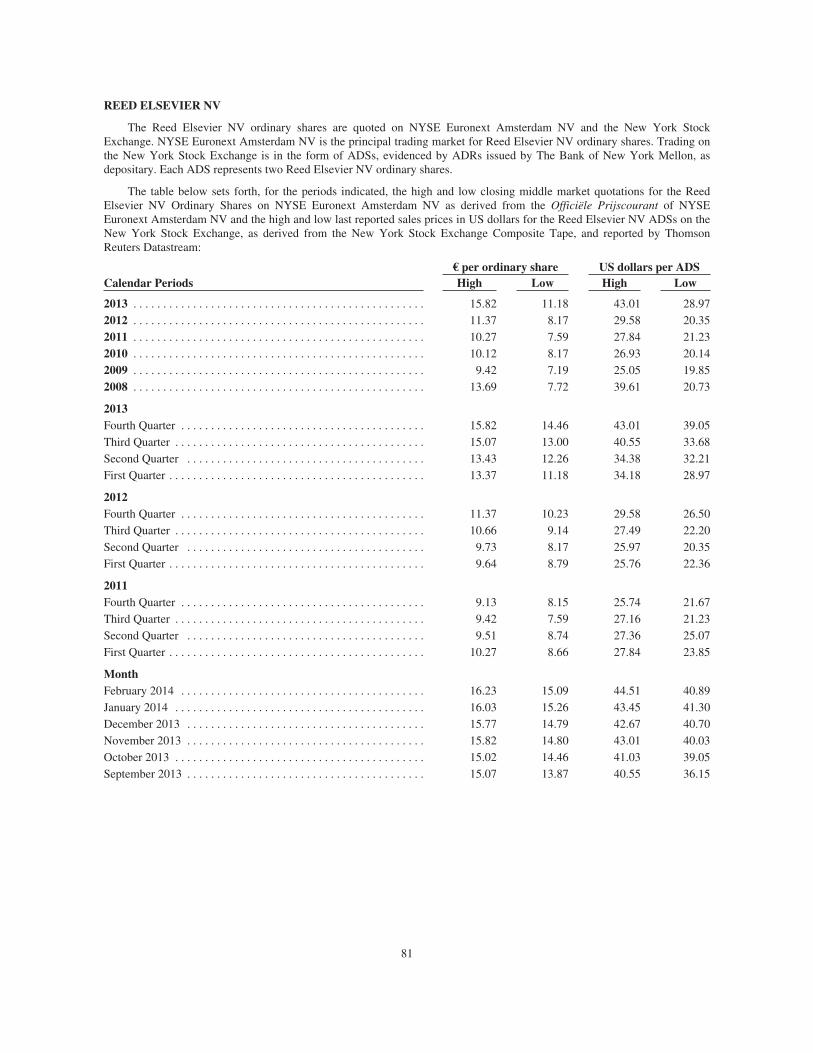
REED ELSEVIER NV
The Reed Elsevier NV ordinary shares are quoted on NYSE Euronext Amsterdam NV and the New York StockExchange. NYSE Euronext Amsterdam NV is the principal trading market for Reed Elsevier NV ordinary shares. Trading onthe New York Stock Exchange is in the form of ADSs, evidenced by ADRs issued by The Bank of New York Mellon, asdepositary. Each ADS represents two Reed Elsevier NV ordinary shares.
The table below sets forth, for the periods indicated, the high and low closing middle market quotations for the ReedElsevier NV Ordinary Shares on NYSE Euronext Amsterdam NV as derived from the Officiële Prijscourant of NYSEEuronext Amsterdam NV and the high and low last reported sales prices in US dollars for the Reed Elsevier NV ADSs on theNew York Stock Exchange, as derived from the New York Stock Exchange Composite Tape, and reported by ThomsonReuters Datastream:
€ per ordinary share US dollars per ADSCalendar Periods High Low High Low
2013 . . . . . . . . . . . . . . . . . . . . . . . . . . . . . . . . . . . . . . . . . . . . . . . . . 15.82 11.18 43.01 28.972012 . . . . . . . . . . . . . . . . . . . . . . . . . . . . . . . . . . . . . . . . . . . . . . . . . 11.37 8.17 29.58 20.352011 . . . . . . . . . . . . . . . . . . . . . . . . . . . . . . . . . . . . . . . . . . . . . . . . . 10.27 7.59 27.84 21.232010 . . . . . . . . . . . . . . . . . . . . . . . . . . . . . . . . . . . . . . . . . . . . . . . . . 10.12 8.17 26.93 20.142009 . . . . . . . . . . . . . . . . . . . . . . . . . . . . . . . . . . . . . . . . . . . . . . . . . 9.42 7.19 25.05 19.852008 . . . . . . . . . . . . . . . . . . . . . . . . . . . . . . . . . . . . . . . . . . . . . . . . . 13.69 7.72 39.61 20.73
2013Fourth Quarter . . . . . . . . . . . . . . . . . . . . . . . . . . . . . . . . . . . . . . . . . 15.82 14.46 43.01 39.05Third Quarter . . . . . . . . . . . . . . . . . . . . . . . . . . . . . . . . . . . . . . . . . . 15.07 13.00 40.55 33.68Second Quarter . . . . . . . . . . . . . . . . . . . . . . . . . . . . . . . . . . . . . . . . 13.43 12.26 34.38 32.21First Quarter . . . . . . . . . . . . . . . . . . . . . . . . . . . . . . . . . . . . . . . . . . . 13.37 11.18 34.18 28.97
2012Fourth Quarter . . . . . . . . . . . . . . . . . . . . . . . . . . . . . . . . . . . . . . . . . 11.37 10.23 29.58 26.50Third Quarter . . . . . . . . . . . . . . . . . . . . . . . . . . . . . . . . . . . . . . . . . . 10.66 9.14 27.49 22.20Second Quarter . . . . . . . . . . . . . . . . . . . . . . . . . . . . . . . . . . . . . . . . 9.73 8.17 25.97 20.35First Quarter . . . . . . . . . . . . . . . . . . . . . . . . . . . . . . . . . . . . . . . . . . . 9.64 8.79 25.76 22.36
2011Fourth Quarter . . . . . . . . . . . . . . . . . . . . . . . . . . . . . . . . . . . . . . . . . 9.13 8.15 25.74 21.67Third Quarter . . . . . . . . . . . . . . . . . . . . . . . . . . . . . . . . . . . . . . . . . . 9.42 7.59 27.16 21.23Second Quarter . . . . . . . . . . . . . . . . . . . . . . . . . . . . . . . . . . . . . . . . 9.51 8.74 27.36 25.07First Quarter . . . . . . . . . . . . . . . . . . . . . . . . . . . . . . . . . . . . . . . . . . . 10.27 8.66 27.84 23.85
MonthFebruary 2014 . . . . . . . . . . . . . . . . . . . . . . . . . . . . . . . . . . . . . . . . . 16.23 15.09 44.51 40.89January 2014 . . . . . . . . . . . . . . . . . . . . . . . . . . . . . . . . . . . . . . . . . . 16.03 15.26 43.45 41.30December 2013 . . . . . . . . . . . . . . . . . . . . . . . . . . . . . . . . . . . . . . . . 15.77 14.79 42.67 40.70November 2013 . . . . . . . . . . . . . . . . . . . . . . . . . . . . . . . . . . . . . . . . 15.82 14.80 43.01 40.03October 2013 . . . . . . . . . . . . . . . . . . . . . . . . . . . . . . . . . . . . . . . . . . 15.02 14.46 41.03 39.05September 2013 . . . . . . . . . . . . . . . . . . . . . . . . . . . . . . . . . . . . . . . . 15.07 13.87 40.55 36.15
81

ITEM 10: ADDITIONAL INFORMATION
ARTICLES OF ASSOCIATION
REED ELSEVIER PLC (the “Company”)
A copy of the Company’s current Articles of Association (the “Articles”) is incorporated by reference from Exhibit 4.1to the Registration Statement on Form S-8 filed with the SEC on May 25, 2010 — see “Item 19: Exhibits” on pages S-3 andS-4.
The following is a summary of the current Articles. As a summary, it is not exhaustive and is qualified in its entirety byreference to UK law and the Articles.
Company’s Objects
The Company’s objects are unrestricted.
Share Capital
As at December 31, 2013 the company’s issued ordinary share capital comprised 1,267,036,696 shares of 14 51/116p. AtDecember 31, 2013 the total shares held in treasury were 109,567,371. Of these 10,120,537 ordinary shares were held by theReed Elsevier Group plc Employee Benefit Trust and 99,446,834 ordinary shares were held in treasury by the Company.During 2013, the Company bought back 41,961,920 ordinary shares pursuant to the authority given by shareholders at theAnnual General Meeting held on April 25, 2013 and the previous authority given by shareholders at the Annual GeneralMeeting held on April 25, 2012. These shares are included in the number of ordinary shares held in treasury.
The Company by ordinary resolution and subject to the UK Companies Act 2006 (the “Act”) may:
1. Allot shares up to a limit of 1/3 of the issued share capital, a further 1/3 of the issued share capital may be allottedbut only in connection with a fully pre-emptive rights issue;
2. Sub-divide all or part of the share capital into shares of a smaller nominal value than the existing shares; and
3. Consolidate and divide all or part of the share capital into shares of a larger nominal value than the existing shares.
All shares created by increase of the Company’s share capital by consolidation, division or sub-division shall be subjectto all the provisions of the Articles.
The Company by special resolution and subject to the Act may:
1. Disapply shareholders pre-emption rights on new issue shares up to a limit of 5% of the issued share capital;
2. Buy back its own shares up to a limit of 10% of the issued share capital; and
3. Reduce its share capital.
Transfer of ordinary shares
A certificated shareholding may be transferred in the usual form or in any other form approved by the Board. The Boardin its discretion may refuse to register the transfer of a certificated share unless the instrument of transfer:
1. is stamped or certified and lodged, at the registered office or other place that the Board decide, accompanied by therelevant share certificate and any other evidence that the Board may reasonably require to prove a legitimate right totransfer;
2. is in respect of only one class of shares;
3. is in favour of not more than four transferees; and
4. is not fully paid.
Where the Board refuses to register a transfer of certificated shares, it must notify the transferee of the refusal within twomonths after the date on which the instrument of transfer was lodged with the Company.
For those members holding uncertificated shares, such transfers must be conducted using a relevant system as defined inthe UK Uncertificated Securities Regulations 2001.
82

Untraced shareholders
The Company is entitled to sell any of its ordinary shares if;
1. during the period of twelve years prior to the publication of any advertisement stating the intent to sell, at least threedividends have become payable on the shares which have remained uncashed; and
2. during the period of three months following the publication of any advertisement stating the intent to sell, thecompany has received no indication of the location, or existence of the member, or the person entitled to the sharesby way of transmission.
Dividend Rights
Subject to the provisions of the Act, the shareholders may by ordinary resolution declare a dividend no larger than theamount recommended by the Board. Interim dividends may also be payable if the Board deems that there is sufficient profitavailable for distribution. Except as otherwise provided by the rights attached to the shares, all dividends shall be declared andpaid according to the amounts paid up on the shares on which the dividend is declared. No dividend payable in respect of ashare shall bear interest against the Company, unless otherwise provided by the rights attached to the share.
Unclaimed dividends
Any dividend which remains unclaimed for 12 years from the date when it became due for payment shall, if the Board soresolves, be forfeited and cease to be owed by the Company to the shareholder. The Company may stop issuing dividendcheques or warrants:
1. Where on at least two consecutive occasions dividend cheques/warrants are left uncashed or returned undelivered;or
2. Where after one such occasion reasonable enquiries have failed to establish an updated address.
If the member goes on to claim a dividend or warrant, the Company must recommence issuing dividend cheques andwarrants.
Distribution of assets on winding up
In the event of the company being wound up, on the authority of a special resolution of the Company and subject to theUK Insolvency Act 1986 (as amended) the liquidator may:
1. Divide among the members the whole or any part of the assets of the Company.
2. Value any assets and determine how the division should be made between the members or different classes ofmembers.
3. Place the whole or any part of the assets in trust for the benefit of the members and determine the scope and termsof these trusts.
A member cannot be compelled to accept an asset with an inherent liability.
Variation of rights
Subject to the Act, where the capital of the Company is divided into different classes of shares, the unique rights attachedto the respective classes may be varied or cancelled:
1. With the written consent of the holders of 75% in nominal value of the issued shares of the class (excluding anytreasury shares held in that class); or
2. By authority of a special resolution passed at a separate general meeting of the holders of the shares of the class.
General meetings of shareholders
Subject to the Act, the company must hold a general meeting every year. The Board may convene a general meetingwhen necessary and must do so promptly upon requisition by the shareholders. The notice period for annual general meetingsis 21 clear days and 14 clear days for other general meetings. Subject to the Act and the Articles, the notice shall be sent toevery member at their registered address. If, on two consecutive occasions notices are sent to a members registered addressand have been returned undelivered the member shall not be entitled to receive any subsequent notice.
83
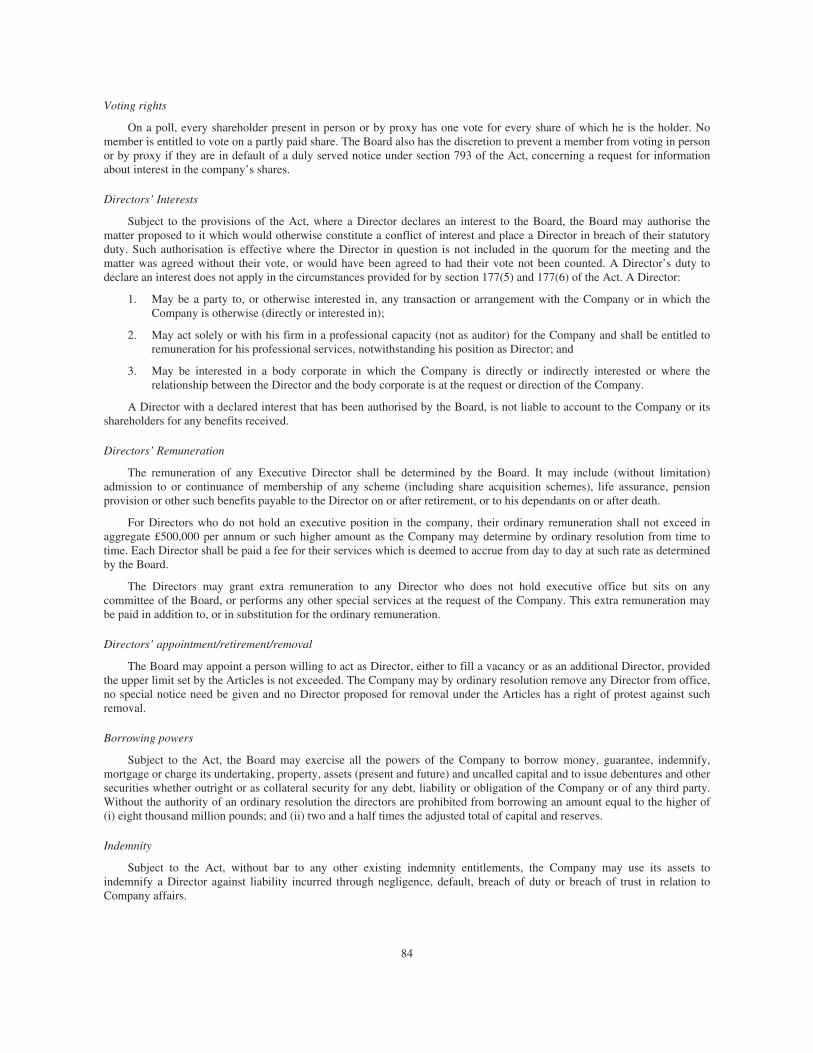
Voting rights
On a poll, every shareholder present in person or by proxy has one vote for every share of which he is the holder. Nomember is entitled to vote on a partly paid share. The Board also has the discretion to prevent a member from voting in personor by proxy if they are in default of a duly served notice under section 793 of the Act, concerning a request for informationabout interest in the company’s shares.
Directors’ Interests
Subject to the provisions of the Act, where a Director declares an interest to the Board, the Board may authorise thematter proposed to it which would otherwise constitute a conflict of interest and place a Director in breach of their statutoryduty. Such authorisation is effective where the Director in question is not included in the quorum for the meeting and thematter was agreed without their vote, or would have been agreed to had their vote not been counted. A Director’s duty todeclare an interest does not apply in the circumstances provided for by section 177(5) and 177(6) of the Act. A Director:
1. May be a party to, or otherwise interested in, any transaction or arrangement with the Company or in which theCompany is otherwise (directly or interested in);
2. May act solely or with his firm in a professional capacity (not as auditor) for the Company and shall be entitled toremuneration for his professional services, notwithstanding his position as Director; and
3. May be interested in a body corporate in which the Company is directly or indirectly interested or where therelationship between the Director and the body corporate is at the request or direction of the Company.
A Director with a declared interest that has been authorised by the Board, is not liable to account to the Company or itsshareholders for any benefits received.
Directors’ Remuneration
The remuneration of any Executive Director shall be determined by the Board. It may include (without limitation)admission to or continuance of membership of any scheme (including share acquisition schemes), life assurance, pensionprovision or other such benefits payable to the Director on or after retirement, or to his dependants on or after death.
For Directors who do not hold an executive position in the company, their ordinary remuneration shall not exceed inaggregate £500,000 per annum or such higher amount as the Company may determine by ordinary resolution from time totime. Each Director shall be paid a fee for their services which is deemed to accrue from day to day at such rate as determinedby the Board.
The Directors may grant extra remuneration to any Director who does not hold executive office but sits on anycommittee of the Board, or performs any other special services at the request of the Company. This extra remuneration maybe paid in addition to, or in substitution for the ordinary remuneration.
Directors’ appointment/retirement/removal
The Board may appoint a person willing to act as Director, either to fill a vacancy or as an additional Director, providedthe upper limit set by the Articles is not exceeded. The Company may by ordinary resolution remove any Director from office,no special notice need be given and no Director proposed for removal under the Articles has a right of protest against suchremoval.
Borrowing powers
Subject to the Act, the Board may exercise all the powers of the Company to borrow money, guarantee, indemnify,mortgage or charge its undertaking, property, assets (present and future) and uncalled capital and to issue debentures and othersecurities whether outright or as collateral security for any debt, liability or obligation of the Company or of any third party.Without the authority of an ordinary resolution the directors are prohibited from borrowing an amount equal to the higher of(i) eight thousand million pounds; and (ii) two and a half times the adjusted total of capital and reserves.
Indemnity
Subject to the Act, without bar to any other existing indemnity entitlements, the Company may use its assets toindemnify a Director against liability incurred through negligence, default, breach of duty or breach of trust in relation toCompany affairs.
84
REED ELSEVIER NV (the “Company”)
The following is a summary of the principal provisions of the Company’s Articles of Association (the “Articles”). As asummary, it is not exhaustive and is qualified in its entirety by reference to Dutch law and the Articles as they read in theDutch language. The Articles were last amended before a civil law notary in Amsterdam on May 8, 2013 after a shareholders’resolution was passed to approve such amendment at the Annual General Shareholders’ Meeting held on April 24, 2013. Acopy of the current Articles is incorporated by reference from the registration statement of securities to be offered toemployees in employee benefit plans on Form S-8 filed with the SEC on September 27, 2013 — see “Item 19: Exhibits” onpages S-3 and S-4.
Share Capital
Reed Elsevier NV has two types of shares: ordinary shares of 0.07 euro nominal value and R shares of 0.70 euro nominalvalue. At the General Shareholders’ Meeting, each ordinary share is entitled to cast one vote. Each R share is convertible into10 ordinary shares and is entitled to cast ten (10) votes. Otherwise it has the same rights as an ordinary share, except that ReedElsevier may pay a lower dividend on an R share, but not less than 1% of the nominal value of an R share. The ordinaryshares are listed at NYSE Euronext Amsterdam and at NYSE New York.
As at December 31, 2013 the Company’s issued share capital comprised 734,149,956 ordinary shares and 4,303,179R shares. At December 31, 2013 the total shares held in treasury were 67,451,493. Of these 4,992,360 ordinary shares wereheld by the Reed Elsevier Group plc Employee Benefit Trust and 60,895,193 ordinary shares and 156,344 R shares(equivalent to 1,563,940 ordinary shares) were held in treasury by the Company.
At the 2013 Annual General Shareholders’ Meeting, shareholders passed a resolution delegating the authority to theBoard to acquire shares in the Company for a period of 18 months from the date of the annual general meeting of shareholdersand therefore up to and including 23 October 2014, for the maximum amount of 10% of the issued capital. During the year,25,222,636 ordinary shares, including 94,053 R shares (equivalent to 940,530 ordinary shares) from Reed Holding B.V., werepurchased under this and the previous delegation of authority.
A resolution to renew the delegation of the authority to the Board will be submitted to the shareholders at the 2014Annual General Shareholders’ Meeting.
Ordinary shares can be registered in a shareholder’s name or held via a book-entry deposit under the Dutch GiroSecurities Trade Act.
Issuance of shares
Shares may be issued on the basis of a resolution of the general meeting of shareholders, which can designate thisauthority to the Board, provided that the aggregate nominal value up to which shares may be issued under this designatedauthority cannot exceed one-third of the sum of (i) the Company’s issued share capital at the time the resolution to make thedesignation is adopted and (ii) the aggregate nominal value of any rights granted by the Company to take up sharesoutstanding at that time.
Pre-emptive rights of existing shareholders may be restricted or excluded by a resolution of the general meeting and inthe event of an issue of shares pursuant to a resolution of the Board, the pre-emptive rights can be restricted or excludedpursuant to a resolution of the Board if the Board is designated competent to do so by the general meeting.
Acquisition of the Company’s own shares
The Company is entitled to acquire its own fully paid-up shares or depositary receipts thereof, provided that either theacquisition is for no consideration or that:
(a) the Company’s equity after the deduction of the acquisition price, is not less than the sum of the paid-up and called-up part of the issued share capital and the reserves which must be maintained by virtue of the law; and
(b) the nominal value of the shares or depositary receipts thereof, which the Company acquires, holds, holds in pledgeor which are held by a Subsidiary, does not exceed one-tenth of the Company’s issued share capital.
An acquisition of the Company’s own shares other than for no consideration is only permitted if the general meeting hasgranted authorisation to the Board. No voting rights may be exercised on shares held by the company or a subsidiary and nodividend shall be paid on these shares.
The general meeting of shareholders may at the proposal of the Board resolve to reduce the Company’s issued sharecapital through cancellation of shares or through reduction of the nominal value of shares by amendment of the Articles ofAssociation, provided that the issued share capital or the paid-up part thereof will not drop below the amount prescribed bythe Dutch Civil Code.
85

Transfer of shares
The transfer of a share shall require an instrument intended for such purpose and the written acknowledgement by theCompany of the transfer. The transfer of the rights of a Euroclear-participant with respect to ordinary shares which areincluded in the securities depositary system of Euroclear Nederland shall be effected in accordance with the provisions of theDutch Giro Securities Trade Act (Wet giraal effectenverkeer).
Dividend Rights
Each year the Board shall determine which part of the profits shown in the adopted profit and loss account shall bereserved. After allocation to reserves, the shareholders’ meeting shall determine the allocation of remaining profits.Distributions may be made only insofar as the Company’s equity exceeds the amount of the paid in and called up part of theissued share capital, increased by the reserves which must be kept by virtue of the law. Dividends shall be paid after adoptionof the annual accounts showing that payment of dividends is permitted. Interim distributions may be payable, provided thereis sufficient profit available for distribution in accordance with the aforementioned requirements as shown by interimaccounts.
The Board
Reed Elsevier NV has a unitary board governance structure, comprising executive and non-executive directors. It isestablished board practice at Reed Elsevier NV that the executive and non-executive directors meet together. In performingtheir duties, the directors shall act in accordance with the interests of the Company and the business connected with it.
The number of directors is determined by the Board. The number of executive directors shall at all times be less than thenumber of non-executive directors.
Directors shall be appointed by the General Shareholders’ Meeting on the basis of a proposal of the Non-ExecutiveDirectors. Under the Articles, directors are appointed for a three-year term, with the possibility of re-appointment.Notwithstanding these provisions in the articles of association and in accordance with the provisions of the UK CorporateGovernance Code, all Directors seek annual re-appointment at the Annual General Meeting to align the arrangementsregarding appointment for the Boards of Reed Elsevier NV and Reed Elsevier PLC.
Executive Directors
The Executive Directors are entrusted with the management of the Company. In performing their duties, the ExecutiveDirectors shall act in accordance with the interests of the Company and the business connected with it. The Board hasestablished rules regarding the decision-making and working methods of the Executive Directors in addition to the Articles. Inthis context, the Board has also determined the duties for which each Executive Director in particular shall be responsible.
Non-Executive Directors
The duties of the Non-Executive Directors are to supervise the management of the Executive Directors and the generalaffairs in the Company and the business connected with it, and to assist the executive directors by providing advice. Inperforming their duties the Non-Executive Directors shall act in accordance with the interests of the Company and thebusiness connected with it. The Non-Executive Directors have established rules regarding their decision-making process andworking methods in addition to the Articles.
The Company pursues a remuneration policy for the Executive Directors, which is determined by the general meetingupon a proposal by the Non-Executive Directors. The Remuneration Committee of Reed Elsevier Group plc makesrecommendations to the Non-Executive Directors of the Company with regard to the remuneration policy for ExecutiveDirectors and the remuneration in all its forms for the Executive Directors.
As a general rule, Non-Executive Directors serve for two three-year terms. Individual Directors may serve up to oneadditional three-year term.
Suspension/dismissal
Each Director can at any time be suspended or dismissed by the General Shareholders’ Meeting. In addition, eachExecutive Director can at any time be suspended by the Board.
Amendment of the Articles
Amendment of the Articles requires a shareholders’ resolution passed with an absolute majority of the votes cast,provided such resolution is passed at the proposal of the Board. Otherwise, a majority of two-thirds of the votes cast is
86

required in a meeting at which at least half of the Company’s issued capital is represented. The notice for such a meeting muststate that amendment of the Articles is on the agenda. A copy of the full text of the proposed amendment of the Articles mustbe made available free of charge to shareholders at the time of notice for the meeting. In accordance with Article 43 of theArticles, only certain provisions in the Articles including provisions governing appointments and dismissals of directors canbe amended upon a proposal of the Board.
General meetings of shareholders
At least once a year, a General Shareholders’ Meeting is held. Notices of a general meeting are posted on the ReedElsevier website and are made in accordance with the relevant provisions of the law. This means that the meeting is called atno less than 42 calendar days notice by an announcement on the Reed Elsevier website. The agenda and explanatory notes forthe General Shareholders’ Meeting are published in advance on the website and are available at the listing agent and at theoffices of Reed Elsevier NV from the day of the notice.
The Articles provide for a record date and this has been used at the recent General Shareholders’ Meetings. Inaccordance with Dutch law, the record date will be the 28th day before the date of the General Shareholders’ Meeting and theholder of shares as per the record date will be entitled to vote, irrespective of any transfer of such shares between the recorddate and the date of the general shareholders’ meeting.
The Annual General Shareholders’ Meeting discusses the annual report, adopts the annual accounts, resolves on aproposal to pay a dividend and votes on release from liability of the directors as separate agenda items in the annual generalshareholders’ meeting.
Conflict of Interest—Directors
A Director shall not participate in the discussions and decision-making if he has a direct or indirect personal interest inthe matter which is conflicting with the interests of the Company and the business connected with it. In case because of thisno resolution can be adopted by the Executive Directors, the Non-Executive Directors will resolve on the matter. In casebecause of this no resolution can be adopted by the Non-Executive Directors, the general meeting will resolve on the matter.
Remuneration
The remuneration policy for Executive Directors is determined by the General Shareholders’ Meeting upon a proposal ofthe Non-Executive Directors. The remuneration of the Executive Directors is determined by the Non-Executive Directors inline with the remuneration policy agreed by the shareholders’ meeting. With respect to remuneration in the form of shares inthe Company and/or rights to subscribe for such shares, the Non-Executive Directors will submit a proposal for approval tothe shareholders’ meeting.
The Non-Executive Directors receive an annual remuneration. The remuneration of each Non-Executive Directorindividually, is determined by the Board, in line with the remuneration policy for non-executive directors. The maximumamount of annual remuneration shall be determined by the shareholders’ meeting and can only be adopted at the proposal ofthe Board. At the Annual General Meeting in 2011 the maximum amount of remuneration for the Non-Executive Directorswas set at €600,000 per annum, for the proportion of the fees borne by the Company.
Dissolution of the Company
A resolution to dissolve the Company requires an absolute majority of the votes cast at the General Meeting ofShareholders. The notice for such a meeting must state that dissolution will be on the agenda. If the Company is dissolved bya resolution of the general meeting, the executive directors shall be charged with the liquidation of the Company and the non-executive directors with the supervision thereof, subject to the relevant provisions of Book 2 of the Dutch Civil Code.
Assets which remain after payment of the debts shall be transferred to the holders of ordinary shares and the holders ofclass R shares in proportion to the nominal value of their shareholdings.
Indemnity
Under the Articles, to the extent permissible by law, the Company shall indemnify and hold harmless each sitting andformer director against the financial consequences of any liabilities or claims, brought by any party other than the Companyitself or its group companies, in relation to acts or omissions performed or committed in that person’s capacity of director.
MATERIAL CONTRACTS
Reed Elsevier has not entered into any material contract within the last two years.
87
EXCHANGE CONTROLS
There is currently no UK or Dutch legislation restricting the import or export of capital or affecting the remittance ofdividends or other payments to holders of, respectively, Reed Elsevier PLC ordinary shares who are non-residents of theUnited Kingdom and Reed Elsevier NV ordinary shares who are non-residents of the Netherlands.
There are no limitations relating only to non-residents of the United Kingdom under UK law or Reed Elsevier PLC’sArticles on the right to be a holder of, and to vote, Reed Elsevier PLC ordinary shares, or to non-residents of the Netherlandsunder Dutch law or Reed Elsevier NV’s Articles on the right to be a holder of, and to vote, Reed Elsevier NV ordinary shares.
TAXATION
The following discussion is a summary under present law and tax authority practice of the material UK, Dutch and USfederal income tax considerations relevant to the purchase, ownership and disposal of Reed Elsevier PLC ordinary shares orADSs and Reed Elsevier NV ordinary shares or ADSs. This discussion applies to you only if you are a US holder, you holdyour ordinary shares or ADSs as capital assets and you use the US dollar as your functional currency. It does not address thetax treatment of US holders subject to special rules, such as banks, dealers or traders in securities or currencies, insurancecompanies, tax-exempt entities, partnerships or other pass-through entities for US federal income tax purposes, holders of10% or more of Reed Elsevier PLC or Reed Elsevier NV voting shares, persons holding ordinary shares or ADSs as part of ahedging, straddle, conversion or constructive sale transaction, persons that are resident or domiciled in the UK (or who haveceased to be resident in or became treated as resident outside the UK for the purpose of a double tax treaty (treaty non-resident) within the past five years of assessment, or, for departures before April 6, 2013, who have ceased to be resident orordinarily resident or become treaty non-resident within the past five years of assessment) and persons that are resident in theNetherlands. The summary also does not discuss the US federal alternative minimum tax or the tax laws of particular states orlocalities in the US.
This summary does not consider your particular circumstances. It is not a substitute for tax advice. We urge you toconsult your own independent tax advisors about the income, capital gains and/or transfer tax consequences to you inlight of your particular circumstances of purchasing, holding and disposing of ordinary shares or ADSs.
As used in this discussion, “US holder” means a beneficial owner of ordinary shares or ADSs that is for US federalincome tax purposes: (i) an individual US citizen or resident, (ii) a corporation, partnership or other business entity created ororganised under the laws of the United States, any state thereof or the District of Columbia, (iii) a trust (a) that is subject to thecontrol of one or more US persons and the primary supervision of a US court or (b) that has a valid election in effect underUS Treasury regulations to be treated as a US person or (iv) an estate the income of which is subject to US federal incometaxation regardless of its source.
UK Taxation
Dividends
Under current UK taxation legislation, no tax is required to be withheld at source from dividends paid on the ReedElsevier PLC ordinary shares or ADSs. A shareholder in Reed Elsevier PLC who is an individual resident for UK taxpurposes in the United Kingdom may be entitled, in calculating their liability to UK income tax, to a tax credit on cashdividends paid by the company. The tax credit is equal to one-ninth of the cash dividend.
Capital Gains
Shareholders may be liable for UK taxation on capital gains realised on the disposal of their Reed Elsevier PLC ordinaryshares or ADSs if at the time of the disposal the shareholder carries on a trade, profession or vocation in the United Kingdomthrough a branch or agency, or in the case of a company a permanent establishment, and such ordinary shares or ADSs are orhave been used, held or acquired for the purposes of such trade, profession, vocation, branch, agency or permanentestablishment.
UK Stamp Duty and Stamp Duty Reserve Tax
Current UK law includes provision whereby UK stamp duty reserve tax (SDRT) or UK stamp duty is payable upon thetransfer or issue of Reed Elsevier PLC ordinary shares to the depositary in exchange for Reed Elsevier PLC ADSs evidencedby ADRs. For this purpose, the current rate of stamp duty and SDRT is 1.5%, applied, in each case, to: (i) the issue pricewhen the ordinary shares are issued; (ii) the amount or value of the consideration where shares are transferred forconsideration in money or money’s worth; or (iii) the value of the ordinary shares in any other case. Following litigationHMRC have accepted that they will no longer seek to apply the 1.5% SDRT charge on an issue of shares into a clearanceservice or depositary receipt system on the basis that the charge is not compatible with EU law. Accordingly no UK SDRT or
88
UK stamp duty is payable upon the issue of Reed Elsevier PLC shares to the depositary in exchange for Reed Elsevier PLCADSs evidenced by ADRs. HMRC’s view is that the 1.5% SDRT or stamp duty charge will continue to apply to transfer ofshares into a clearance service or depositary receipt system, unless they are an integral part of the issue of share capital. Thisview is currently being challenged in further litigation.
Provided that the relevant instrument of transfer is not executed in the UK and remains outside the UK, no UK stampduty will be payable on the acquisition or subsequent transfer of Reed Elsevier PLC ADSs. Under current law, an agreementto transfer Reed Elsevier PLC ADSs will not give rise to a liability to SDRT.
A transfer of Reed Elsevier PLC ordinary shares by the depositary to an ADS holder where there is no transfer ofbeneficial ownership will not be chargeable to UK stamp duty or SDRT.
Purchases of Reed Elsevier PLC ordinary shares, as opposed to ADSs, will generally give rise to UK stamp duty orSDRT at the time of transfer or agreement to transfer, normally at the rate of 0.5% of the amount payable for the ordinaryshares. SDRT and UK stamp duty are usually paid by the purchaser. If the ordinary shares are later transferred to thedepositary, additional UK stamp duty or SDRT may be payable as described above.
Dutch Taxation
Withholding tax
Dividends distributed to you by Reed Elsevier NV are normally subject to a withholding tax imposed by the Netherlandsat a rate of 15%, which rate equals the rate of tax that the Netherlands is generally allowed to levy under the US-Netherlandsincome tax treaty. As a consequence, no administrative procedures for a partial relief at source from or a refund of Dutchdividend withholding tax need be complied with in respect of dividend distributions by Reed Elsevier NV. Dividends include,among other things, stock dividends unless the dividend is distributed out of recognised paid-in share premium for Dutch taxpurposes.
Taxation of dividends and capital gains
You will not be subject to any Dutch taxes on dividends distributed by Reed Elsevier NV (other than the withholding taxdescribed above) or any capital gain realised on the disposal of Reed Elsevier NV ordinary shares or ADSs provided that(i) the Reed Elsevier NV ordinary shares or ADSs are not attributable to an enterprise or an interest in an enterprise that youcarry on, in whole or part through a permanent establishment or a permanent representative in the Netherlands, (ii) you do nothave a substantial interest or a deemed substantial interest in Reed Elsevier NV (generally, 5% or more of either the totalissued and outstanding capital or the issued and outstanding capital of any class of shares) or, if you have such an interest, youdo not hold such interest with the avoidance of Netherlands (or foreign) (withholding) tax as (one of) the main purpose(s) or itforms part of the assets of an enterprise, and (iii) if you are an individual, such dividend or capital gain from your ReedElsevier NV ordinary shares or ADSs does not form benefits from miscellaneous activities (“resultaat uit overigewerkzaamheden”) in the Netherlands. Benefits from miscellaneous activities in the Netherlands include income and gainsderived from the holding, whether directly or indirectly, of (a combination of) shares, debt claims or other rights (together, a“lucrative interest”) that the holder thereof has acquired under such circumstances that such income and gains are intended tobe remuneration for work or services performed by such holder (or a related person) in the Netherlands, whether within oroutside an employment relation, where such lucrative interest provides the holder thereof, economically speaking, with certainbenefits that have a relation to the relevant work or services.
US Federal Income Taxation
Holders of the ADSs generally will be treated for US federal income tax purposes as owners of the ordinary sharesrepresented by the ADSs. Accordingly, deposits of ordinary shares for ADSs and withdrawals of shares for ADSs will not besubject to US federal income tax.
Dividends
Dividends on Reed Elsevier PLC ordinary shares or ADSs or Reed Elsevier NV ordinary shares or ADSs (including anyDutch tax withheld) will generally be included in your gross income as ordinary income from foreign sources. The dollaramount recognised on receiving a dividend in pounds sterling or euros will be based on the exchange rate in effect on the datethe depositary receives the dividend, or in the case of ordinary shares on the date you receive the dividend, as the case may be,whether or not the payment is converted into US dollars at that time. Any gain or loss recognised on a subsequent conversionof pounds sterling or euros for a different amount will be US source ordinary income or loss. Dividends received will not beeligible for the dividends received deduction available to corporations. Dividends received will be included in net investmentincome for purposes of the 3.8% Medicare contribution tax applicable to certain non-corporate US holders.
89
With respect to US holders who are individuals, certain dividends received from a qualified foreign corporation may besubject to reduced rates of taxation. A qualified foreign corporation includes a foreign corporation that is eligible for thebenefits of certain comprehensive income tax treaties with the United States. United States Treasury Department guidanceindicates that the United Kingdom is a country with which the United States has a treaty in force that meets theserequirements, and Reed Elsevier PLC believes it is eligible for the benefits of this treaty. Additionally, the same guidanceindicates that the Netherlands is also a country with which the United States has a treaty in force that meets the aboverequirements, and Reed Elsevier NV believes it is eligible for the benefits of this treaty. Individuals that do not meet aminimum holding period requirement during which they are not protected from the risk of loss or that elect to treat thedividend income as “investment income” pursuant to section 163(d)(4) of the US Internal Revenue Code of 1986, asamended, will not be eligible for the reduced rates of taxation. In addition, the rate reduction will not apply to dividends if therecipient of a dividend is obligated to make related payments with respect to positions in substantially similar or relatedproperty. This disallowance applies even if the minimum holding period has been met. US holders should consult their owntax advisors regarding the application of these rules given their particular circumstances.
Subject to certain conditions and limitations, foreign withholding taxes on dividends withheld at the appropriate rate maybe treated as foreign taxes eligible for credit against your US federal income tax liability. For purposes of calculating theforeign tax credit, dividends paid on the ordinary shares or ADSs will be treated as income from sources outside the US andwill generally constitute passive category income. Further, in certain circumstances, if you have held the ordinary shares orADSs for less than a specified minimum period during which you are not protected from risk of loss, or are obligated to makepayments related to the dividends, you will not be allowed a foreign tax credit for foreign taxes imposed on the dividends onthe ordinary shares or ADSs. Individuals that treat a dividend as qualified dividend income may take into account for foreigntax credit limitation purposes only the portion of the dividend effectively taxed at the highest applicable marginal rate. Therules governing the foreign tax credit are complex. You are urged to consult your tax advisors regarding the availability of theforeign tax credit under your particular circumstances.
Dispositions
You will recognise a gain or loss on the sale or other disposition of ordinary shares or ADSs in an amount equal to thedifference between your basis in the ordinary shares or ADSs and the amount realised. The gain or loss generally will becapital gain or loss. It will be long term capital gain or loss if you have held the ordinary shares or ADSs for more thanone year at the time of sale or other disposition. Long term capital gains of individuals are eligible for reduced rates oftaxation. Deductions for capital losses are subject to limitations. Any gain or loss you recognise generally will be treated asincome from US sources for foreign tax credit limitation purposes.
If you receive pounds sterling or euros on the sale or other disposition of your ordinary shares or ADSs, you will realisean amount equal to the US dollar value of the pounds sterling or euros on the date of sale or other disposition (or in the case ofcash basis and electing accrual basis taxpayers, if the ordinary shares or ADSs are traded on an established securities market,the settlement date for the sale or other disposition). You will have a tax basis in the pounds sterling or the euros that youreceive equal to the US dollar amount received on the settlement date. Any gain or loss realised by a US holder between thesale date and the settlement date or on a subsequent conversion of pounds sterling or euros into US dollars will be US sourceordinary income or loss. Gains recognised will be included in net investment income for purposes of the 3.8% Medicarecontribution tax applicable to certain non-corporate US holders.
Information Reporting and Backup Withholding Tax
Dividends from ordinary shares or ADSs and proceeds from the sale of the ordinary shares or ADSs may be reported tothe Internal Revenue Service (IRS) unless the shareholder is a corporation or other exempt recipient. A backup withholdingtax may apply to such amounts unless the shareholder (i) is a corporation, (ii) provides an accurate taxpayer identificationnumber and otherwise complies with applicable requirements of the backup withholding rules, or (iii) otherwise establishes abasis for exemption. The amount of any backup withholding tax will be allowed as a credit against the holder’s US federalincome tax liability and may entitle the holder to a refund, provided the required information is furnished to the IRS.
Certain US holders are required to report to the IRS information about their investment in ordinary shares or ADSs notheld through an account with a domestic financial institution. Investors who fail to report required information are subject tosubstantial penalties. Investors should consult with their own tax advisers about the effect of this legislation on theirinvestment in the ordinary shares or ADSs.
DOCUMENTS ON DISPLAY
You may read and copy documents referred to in this annual report that have been filed with the SEC at the SEC’s publicreference room located at 100 F Street NE, Washington, DC 20549-2521. Please call the SEC at 1-800-SEC-0330 for furtherinformation on the public reference rooms and their copy charges.
90
ITEM 11: QUANTITATIVE AND QUALITATIVE DISCLOSURES ABOUT MARKET RISK
Market Risk
Reed Elsevier’s primary market risks are to changes in interest rates and exchange rates as well as liquidity and creditrisk.
Net finance costs are exposed to interest rate fluctuations on borrowings, cash and cash equivalents. Upward fluctuationsin interest rates increase the interest cost of floating rate borrowings whereas downward fluctuations in interest rates decreasethe interest return on floating rate cash and cash equivalents. Interest expense payable on fixed rate borrowings is protectedagainst upward fluctuations in interest rates but does not benefit from downward fluctuations. Reed Elsevier companiesengage in foreign currency denominated transactions and are therefore subject to exchange rate risk on such transactions. Netfinance costs are also exposed to changes in the fair value of derivatives (as a result of interest and exchange rate fluctuations)which are not part of a designated hedging relationship under IAS39 — Financial Instruments: Recognition and Measurement,and to ineffectiveness that may arise on designated hedging relationships. Reed Elsevier’s management of this interest raterisk and foreign exchange rate risk is described below.
Reed Elsevier manages a portfolio of long term debt, short term debt and committed bank facilities to support its capitalstructure and is exposed to the risk that relevant markets are closed and debt cannot be refinanced on a timely basis. Inaddition, the credit spread at which Reed Elsevier borrows is exposed to changes in market liquidity and investor demand.Reed Elsevier manages this risk by maintaining a range of borrowing facilities and debt programmes with a maturity profile tofacilitate refinancing.
Reed Elsevier has a credit exposure for the full principal amount of cash and cash equivalents held with individualcounterparties. In addition, it has a credit risk from the potential non performance by counterparties to financial instruments;this credit risk normally being restricted to the amounts of any hedge gain and not the full principal amount being hedged.Credit risks are managed by monitoring the credit quality of counterparties and restricting the amounts outstanding with eachof them.
Reed Elsevier’s management of the above market risks is described in further detail on pages 40 to 41 of Item 5:Operating and Financial Review and Prospects: Liquidity and Capital Resources — Reed Elsevier.
Management of Interest Rate Risk and Foreign Exchange Rate Risk
Reed Elsevier seeks to limit its risk to interest and exchange rates by means of derivative financial instruments, includinginterest rate swaps, interest rate options, forward rate agreements and forward foreign exchange contracts. Reed Elsevier onlyenters into derivative financial instruments to hedge (or reduce) the underlying risks described above.
Reed Elsevier enters into interest rate swaps in order to achieve an appropriate balance between fixed and floating rateborrowings, cash and cash equivalents. They are used to hedge the effects of fluctuating interest rates on floating rateborrowings, cash and cash equivalents by allowing Reed Elsevier to fix the interest rate on a notional principal amount equalto the principal amount of the underlying floating rate cash, cash equivalents or borrowings being hedged. They are also usedto swap fixed interest rates payable on long term borrowings for a floating rate. Such swaps may be used to swap a wholefixed rate bond for floating rate or they may be used to swap a portion of the period or a portion of the principal amount forthe floating rate.
Forward swaps and forward rate agreements are entered into to hedge interest rate exposures known to arise at a futuredate. These exposures may include new borrowings or cash deposits to be entered into at a future date or future rollovers ofexisting borrowings or cash deposits. Interest exposure arises on future, new and rollover borrowings and cash depositsbecause interest rates can fluctuate between the time a decision is made to enter into such transactions and the time thosetransactions are actually entered into. The purpose of forward swaps and forward rate agreements is to fix the interest cost onfuture borrowings or interest return on cash investments at the time it is known such a transaction will be entered into. Thefixed interest rate, the floating rate index (if applicable) and the time period covered by forward swaps and forward rateagreements are known at the time the agreements are entered into. The use of forward swaps and forward rate agreements islimited to hedging activities; consequently no trading position results from their use. The hedging effect of forward swaps andforward rate agreements is the same as interest rate swaps. Similarly, Reed Elsevier utilises forward foreign exchangecontracts to hedge the effects of exchange rate movements on its foreign currency revenue and operating costs.
Interest rate options protect against fluctuating interest rates by enabling Reed Elsevier to fix the interest rate on anotional principal amount of borrowings or cash deposits (in a similar manner to interest rate swaps and forward rateagreements) whilst at the same time allowing Reed Elsevier to improve the fixed rate if the market moves in a certain way.Reed Elsevier uses interest rate options from time to time when it expects interest rates to move in its favour but it is deemedimprudent to leave the interest rate risk completely unhedged. In such cases, Reed Elsevier may use an option to lock in atcertain rates whilst at the same time maintaining some freedom to benefit if rates move in its favour.
91
Where net finance costs are exposed to changes in the fair value of derivatives (as a result of interest and exchange ratefluctuations), Reed Elsevier manages this risk by designating derivatives in a highly effective hedging relationship unless thepotential change in their fair value is deemed to be insignificant.
Derivative financial instruments are utilised to hedge (or reduce) the risks of interest rate or exchange rate movementsand are not entered into unless such risks exist. Derivatives utilised, while appropriate for hedging a particular kind of risk, arenot considered specialised or high-risk and are generally available from numerous sources.
Sensitivity Analysis
The following analysis sets out the sensitivity of the fair value of Reed Elsevier’s financial instruments to selectedchanges in interest rates and exchange rates. The range of changes represents Reed Elsevier’s view of the changes that arereasonably possible over a one year period.
The fair values of interest rate swaps, interest rate options, forward rate agreements and forward foreign exchangecontracts set out below represent the replacement costs calculated using market rates of interest and exchange at December 31,2013. The fair value of long term borrowings has been calculated by discounting expected future cash flows at market rates.
Reed Elsevier’s use of financial instruments and its accounting policies for financial instruments are described more fullyin notes 2 and 18 to the combined financial statements.
(a) Interest Rate Risk
The following sensitivity analysis assumes an immediate 100 basis point change in interest rates for all currencies andmaturities from their levels at December 31, 2013 with all other variables held constant.
Financial Instrument
Fair ValueDecember 31,
2013
Fair Value Change Fair ValueDecember 31,
2012
Fair Value Change+100
basis points-100
basis points+100
basis points-100
basis points(In millions) (In millions)
Short term borrowings . . . . . . . . . . . . . . . £ (287) £ — £ — £ (131) £ — £ —Long term borrowings (including current
portion) . . . . . . . . . . . . . . . . . . . . . . . . . (3,360) 159 (166) (4,231) 190 (187)Interest rate swaps (swapping fixed rate
debt to floating) . . . . . . . . . . . . . . . . . . 92 (47) 44 127 (47) 49Interest rate swaps (swapping floating
rate debt to fixed) . . . . . . . . . . . . . . . . . — 1 — (2) 2 (1)
A 100 basis point change in interest rates would not result in a material change to the fair value of other financialinstruments.
At December 31, 2013, 57% of gross borrowings are either fixed rate or have been fixed through the use of interest rateswaps, forward rate agreements and options. A 100 basis point reduction in interest rates would result in an estimateddecrease in net finance costs of £12 million (2012: £8 million), based on the composition of financial instruments includingcash, cash equivalents, bank loans and commercial paper borrowings at December 31, 2013. A 100 basis points rise in interestrates would result in an estimated increase in net finance costs of £12 million (2012: £8 million).
(b) Foreign Exchange Rate Risk
The following sensitivity analysis assumes an immediate 10% change in all foreign currency exchange rates againststerling from their levels at December 31, 2013 with all other variables held constant. A +10% change indicates astrengthening of the currency against sterling and a -10% change indicates a weakening of the currency against sterling.
Financial Instrument
Fair ValueDecember 31,
2013Fair Value Change
Fair ValueDecember 31,
2012Fair Value Change
+10% -10% +10% -10%(In millions) (In millions)
Cash and cash equivalents . . . . . . . . . . £ 132 £ 13 £(13) £ 641 £ 23 £(23)Short term borrowings . . . . . . . . . . . . . . . (287) (26) 26 (131) (13) 13Long term borrowings (including current
portion) . . . . . . . . . . . . . . . . . . . . . . . . (3,360) (256) 256 (4,231) (339) 339Interest rate swaps (including cross
currency interest rate swaps) . . . . . . . . 79 6 (6) 138 10 (10)Forward foreign exchange contracts . . . . 92 (62) 62 46 (58) 58
A 10% change in foreign currency exchange rates would not result in a material change to the fair value of otherfinancial instruments.
92
ITEM 12: DESCRIPTION OF SECURITIES OTHER THAN EQUITY SECURITIES
Fees and charges for American Depositary Receipt (ADR) holders
The Bank of New York Mellon, as depositary for the Reed Elsevier PLC and Reed Elsevier NV ADR programs, collectsits fees for delivery and surrender of American Depositary Shares (ADSs) directly from investors depositing shares orsurrendering ADSs for the purpose of withdrawal or from intermediaries acting for them. The depositary collects fees formaking distributions to investors by deducting those fees from the amounts distributed or by selling a portion of distributableproperty to pay the fees. The depositary may collect its annual fee for depositary services by deductions from cashdistributions or by directly billing investors or by charging the book-entry system accounts of participants acting for them.The depositary may generally refuse to provide fee-attracting services until its fees for those services are paid.
Persons depositing or withdrawing shares must pay For
$5.00 (or less) per 100 ADSs (or portion of 100 ADSs) Issuance of ADSs, including issuances resulting from adistribution of shares or rights or other property (in certaincircumstances volume discounts may be available)
Cancellation of ADSs for the purpose of withdrawal,including if the deposit agreement terminates
$0.02 (or less) per ADS Any cash distribution to ADS registered holders
A fee equivalent to the fee that would be payable if securitiesdistributed to you had been shares and the shares had beendeposited for issuance of ADSs
Distribution of securities distributed to holders of depositedsecurities which are distributed by the depositary to ADSregistered holders
$0.02 (or less) per ADS per calendar year Depositary services
Registration or transfer fees Transfer and registration of shares on our share register toor from the name of the depositary or its agent when youdeposit or withdraw shares
Expenses of the depositary Cable, telex and facsimile transmissions (when expresslyprovided in the deposit agreement)
Converting foreign currency to US dollars
Taxes and other governmental charges the depositary or thecustodian have to pay on any ADS or share underlying anADS, for example, stock transfer taxes, stamp duty orwithholding taxes
As necessary
Any charges incurred by the depositary or its agents forservicing the deposited securities
As necessary
Fees and other payments made by the depositary to Reed Elsevier
In consideration of acting as depositary, Bank of New York Mellon has agreed to make certain reimbursements andpayments to Reed Elsevier on an annual basis for expenses related to the administration and maintenance of the ADRprograms including, but not limited to, New York Stock Exchange listing fees, investor relations expenses, or any otherprogram related expenses. The depositary has also agreed to pay the standard out-of-pocket administrative, maintenance andshareholder services expenses for providing services to the registered DR holders. It has also agreed with Reed Elsevier towaive certain standard fees associated with promotional services, program visibility campaigns and program analyticreporting. In certain instances, the depositary has agreed to provide additional annual reimbursements and payments to ReedElsevier based on any applicable performance indicators relating to the ADR facility. There are limits on the amount ofexpenses for which the depositary will reimburse Reed Elsevier, but the amount of reimbursement available to Reed Elsevieris not necessarily tied to the amount of fees the depositary collects from investors.
From January 1, 2013 to February 26, 2014, Reed Elsevier received a reimbursement of $225,000, net of withheld taxes,from the depositary for New York Stock Exchange listing fees, investor relations expenses and other program relatedexpenses, in connection with the ADR facility.
93
PART II
ITEM 15: CONTROLS AND PROCEDURES
Evaluation of Disclosure Controls and Procedures
Reed Elsevier PLC and Reed Elsevier NV are required to comply with applicable US regulations, including theSarbanes-Oxley Act, insofar as they apply to foreign private issuers. Accordingly, Reed Elsevier PLC and Reed Elsevier NVhave established a Disclosure Committee comprising the company secretaries of Reed Elsevier PLC and Reed Elsevier NVand other senior Reed Elsevier managers appointed by the Chief Executive Officer and Chief Financial Officer of ReedElsevier PLC and Reed Elsevier NV. The committee has reviewed and evaluated the effectiveness of our disclosure controlsand procedures as of December 31, 2013. Based on that evaluation, the Chief Executive Officer and Chief Financial Officer ofReed Elsevier PLC and Reed Elsevier NV have concluded that the disclosure controls and procedures for the Reed Elseviercombined businesses, Reed Elsevier PLC and Reed Elsevier NV are effective as of the end of the period covered by thisreport.
Management’s Annual Report on Internal Control over Financial Reporting
In accordance with Section 404 of the Sarbanes-Oxley Act, management is responsible for establishing and maintainingadequate internal control over financial reporting as defined in Rules 13a — 15(f) and 15d — 15(f) under the Exchange Act,as amended. The internal controls over financial reporting of the Reed Elsevier combined businesses, Reed Elsevier PLC andReed Elsevier NV, are designed to provide reasonable assurance regarding the reliability of financial reporting and thepreparation of financial statements for external purposes in accordance with IFRS. Because of its inherent limitations, internalcontrol over financial reporting is not intended to provide absolute assurance that a misstatement of the financial statements ofthe Reed Elsevier combined businesses, Reed Elsevier PLC and Reed Elsevier NV would be prevented or detected.
Reed Elsevier management conducted an evaluation of the effectiveness of its internal control over financial reportingbased on the framework in Internal Control-Integrated Framework (1992) issued by the Committee of SponsoringOrganizations of the Treadway Commission. Based on this evaluation, management concluded that the internal controls overfinancial reporting of the Reed Elsevier combined businesses, Reed Elsevier PLC and Reed Elsevier NV were effective as ofDecember 31, 2013.
Certifications by the Chief Executive Officer and Chief Financial Officer of Reed Elsevier PLC and Reed Elsevier NV asrequired by the Sarbanes-Oxley Act are submitted as exhibits to this Form 20-F (see “Item 19: Exhibits” on pages S-3 andS-4).
Deloitte LLP and Deloitte Accountants BV have audited the Reed Elsevier combined financial statements for the fiscalyear ended December 31, 2013 and have audited the effectiveness of internal control over financial reporting. Their report inrespect of the Reed Elsevier combined businesses is included herein. Deloitte LLP have audited the consolidated financialstatements of Reed Elsevier PLC and Deloitte Accountants BV have audited the consolidated financial statements of ReedElsevier NV for the fiscal year ended December 31, 2013. They have also audited the effectiveness of internal control overfinancial reporting; their reports in respect of Reed Elsevier PLC and Reed Elsevier NV, respectively, are included herein.
94
REPORT OF INDEPENDENT REGISTERED PUBLIC ACCOUNTING FIRM
To the Board of Directors and members of Reed Elsevier PLC and to the Board of Directors and shareholders of ReedElsevier NV:
We have audited the internal control over financial reporting of the combined businesses of Reed Elsevier PLC, ReedElsevier NV, Reed Elsevier Group plc and Elsevier Reed Finance BV and their respective subsidiaries, associates and jointventures (together the “Combined Businesses”), as at December 31, 2013, based on criteria established in Internal Control —Integrated Framework (1992) issued by the Committee of Sponsoring Organizations of the Treadway Commission. Themanagement of Reed Elsevier PLC and Reed Elsevier NV are responsible for maintaining effective internal control overfinancial reporting and for its assessment of the effectiveness of internal control over financial reporting included inManagement’s Annual Report on Internal Control over Financial Reporting. Our responsibility is to express an opinion on theCombined Businesses’ internal control over financial reporting based on our audit.
We conducted our audit in accordance with the standards of the Public Company Accounting Oversight Board(United States). Those standards require that we plan and perform the audit to obtain reasonable assurance about whethereffective internal control over financial reporting was maintained in all material respects. Our audit included obtaining anunderstanding of internal control over financial reporting, assessing the risk that a material weakness exists, testing andevaluating the design and operating effectiveness of internal control based on the assessed risk, and performing such otherprocedures as we considered necessary in the circumstances. We believe that our audit provides a reasonable basis for ouropinion.
A company’s internal control over financial reporting is a process designed by, or under the supervision of, thecompany’s principal executive and principal financial officers, or persons performing similar functions, and effected by thecompany’s board of directors, management, and other personnel to provide reasonable assurance regarding the reliability offinancial reporting and the preparation of financial statements for external purposes in accordance with generally acceptedaccounting principles. A company’s internal control over financial reporting includes those policies and procedures that(1) pertain to the maintenance of records that, in reasonable detail, accurately and fairly reflect the transactions anddispositions of the assets of the company; (2) provide reasonable assurance that transactions are recorded as necessary topermit preparation of financial statements in accordance with generally accepted accounting principles, and that receipts andexpenditures of the company are being made only in accordance with authorizations of management and directors of thecompany; and (3) provide reasonable assurance regarding prevention or timely detection of unauthorized acquisition, use, ordisposition of the company’s assets that could have a material effect on the financial statements.
Because of the inherent limitations of internal control over financial reporting, including the possibility of collusion orimproper management override of controls, material misstatements due to error or fraud may not be prevented or detected ona timely basis. Also, projections of any evaluation of the effectiveness of the internal control over financial reporting to futureperiods are subject to the risk that the controls may become inadequate because of changes in conditions, or that the degree ofcompliance with the policies or procedures may deteriorate.
In our opinion, the Combined Businesses maintained, in all material respects, effective internal control over financialreporting as at December 31, 2013, based on the criteria established in Internal Control — Integrated Framework (1992)issued by the Committee of Sponsoring Organizations of the Treadway Commission.
We have also audited, in accordance with the standards of the Public Company Accounting Oversight Board(United States), the combined statement of financial position and the related combined income statement and combinedstatements of comprehensive income, cash flows and changes in equity as at and for the year ended December 31, 2013 of theCombined Businesses and our report dated February 26, 2014 expressed an unqualified opinion on those financial statementsand included an explanatory paragraph regarding the Combined Businesses’ adoption of International Accounting Standards19 Employee Benefits (revised).
/s/ DELOITTE LLPLondon, United KingdomFebruary 26, 2014
/s/ DELOITTE ACCOUNTANTS B.V.Amsterdam, The NetherlandsFebruary 26, 2014
95
REPORT OF INDEPENDENT REGISTERED PUBLIC ACCOUNTING FIRM
To the Board of Directors and members of Reed Elsevier PLC:
We have audited the internal control over financial reporting of Reed Elsevier PLC and its subsidiaries (the “Company”)as at December 31, 2013, based on criteria established in Internal Control — Integrated Framework (1992) issued by theCommittee of Sponsoring Organizations of the Treadway Commission. The Company’s management is responsible formaintaining effective internal control over financial reporting and for its assessment of the effectiveness of internal controlover financial reporting included in Management’s Annual Report on Internal Control over Financial Reporting. Ourresponsibility is to express an opinion on the Company’s internal control over financial reporting based on our audit.
We conducted our audit in accordance with the standards of the Public Company Accounting Oversight Board(United States). Those standards require that we plan and perform the audit to obtain reasonable assurance about whethereffective internal control over financial reporting was maintained in all material respects. Our audit included obtaining anunderstanding of internal control over financial reporting, assessing the risk that a material weakness exists, testing andevaluating the design and operating effectiveness of internal control based on the assessed risk, and performing such otherprocedures as we considered necessary in the circumstances. We believe that our audit provides a reasonable basis for ouropinion.
A company’s internal control over financial reporting is a process designed by, or under the supervision of, thecompany’s principal executive and principal financial officers, or persons performing similar functions, and effected by thecompany’s board of directors, management, and other personnel to provide reasonable assurance regarding the reliability offinancial reporting and the preparation of financial statements for external purposes in accordance with generally acceptedaccounting principles. A company’s internal control over financial reporting includes those policies and procedures that(1) pertain to the maintenance of records that, in reasonable detail, accurately and fairly reflect the transactions anddispositions of the assets of the company; (2) provide reasonable assurance that transactions are recorded as necessary topermit preparation of financial statements in accordance with generally accepted accounting principles, and that receipts andexpenditures of the company are being made only in accordance with authorizations of management and directors of thecompany; and (3) provide reasonable assurance regarding prevention or timely detection of unauthorized acquisition, use, ordisposition of the company’s assets that could have a material effect on the financial statements.
Because of the inherent limitations of internal control over financial reporting, including the possibility of collusion orimproper management override of controls, material misstatements due to error or fraud may not be prevented or detected ona timely basis. Also, projections of any evaluation of the effectiveness of the internal control over financial reporting to futureperiods are subject to the risk that the controls may become inadequate because of changes in conditions, or that the degree ofcompliance with the policies or procedures may deteriorate.
In our opinion, the Company maintained, in all material respects, effective internal control over financial reporting as atDecember 31, 2013, based on the criteria established in Internal Control — Integrated Framework (1992) issued by theCommittee of Sponsoring Organizations of the Treadway Commission.
We have also audited, in accordance with the standards of the Public Company Accounting Oversight Board(United States), the consolidated statement of financial position and the related consolidated income statement and thestatements of comprehensive income, cash flows and changes in equity as at and for the year ended December 31, 2013 of theCompany and our report dated February 26, 2014 expressed an unqualified opinion on those financial statements and includedan explanatory paragraph regarding the Company’s adoption of International Accounting Standards 19 Employee Benefits(revised).
/S/ DELOITTE LLP
London, United KingdomFebruary 26, 2014
96
REPORT OF INDEPENDENT REGISTERED PUBLIC ACCOUNTING FIRM
To the Board of Directors and shareholders of Reed Elsevier NV:
We have audited the internal control over financial reporting of Reed Elsevier NV and its subsidiaries (the “Company”)as at December 31, 2013, based on criteria established in Internal Control — Integrated Framework (1992) issued by theCommittee of Sponsoring Organizations of the Treadway Commission. The Company’s management is responsible formaintaining effective internal control over financial reporting and for its assessment of the effectiveness of internal controlover financial reporting included in Management’s Annual Report on Internal Control over Financial Reporting. Ourresponsibility is to express an opinion on the Company’s internal control over financial reporting based on our audit.
We conducted our audit in accordance with the standards of the Public Company Accounting Oversight Board(United States). Those standards require that we plan and perform the audit to obtain reasonable assurance about whethereffective internal control over financial reporting was maintained in all material respects. Our audit included obtaining anunderstanding of internal control over financial reporting, assessing the risk that a material weakness exists, testing andevaluating the design and operating effectiveness of internal control based on the assessed risk, and performing such otherprocedures as we considered necessary in the circumstances. We believe that our audit provides a reasonable basis for ouropinion.
A company’s internal control over financial reporting is a process designed by, or under the supervision of, thecompany’s principal executive and principal financial officers, or persons performing similar functions, and effected by thecompany’s board of directors, management, and other personnel to provide reasonable assurance regarding the reliability offinancial reporting and the preparation of financial statements for external purposes in accordance with generally acceptedaccounting principles. A company’s internal control over financial reporting includes those policies and procedures that(1) pertain to the maintenance of records that, in reasonable detail, accurately and fairly reflect the transactions anddispositions of the assets of the company; (2) provide reasonable assurance that transactions are recorded as necessary topermit preparation of financial statements in accordance with generally accepted accounting principles, and that receipts andexpenditures of the company are being made only in accordance with authorizations of management and directors of thecompany; and (3) provide reasonable assurance regarding prevention or timely detection of unauthorized acquisition, use, ordisposition of the company’s assets that could have a material effect on the financial statements.
Because of the inherent limitations of internal control over financial reporting, including the possibility of collusion orimproper management override of controls, material misstatements due to error or fraud may not be prevented or detected ona timely basis. Also, projections of any evaluation of the effectiveness of the internal control over financial reporting to futureperiods are subject to the risk that the controls may become inadequate because of changes in conditions, or that the degree ofcompliance with the policies or procedures may deteriorate.
In our opinion, the Company maintained, in all material respects, effective internal control over financial reporting as atDecember 31, 2013, based on the criteria established in Internal Control — Integrated Framework (1992) issued by theCommittee of Sponsoring Organizations of the Treadway Commission.
We have also audited, in accordance with the standards of the Public Company Accounting Oversight Board (UnitedStates), the consolidated statement of financial position and the related consolidated income statement and statements ofcomprehensive income, cash flows and changes in equity as at and for the year ended December 31, 2013 of the Companyand our report dated February 26, 2014 expressed an unqualified opinion on those financial statements and included anexplanatory paragraph regarding the Company’s adoption of International Accounting Standards 19 Employee Benefits(revised).
/s/ DELOITTE ACCOUNTANTS B.V.Amsterdam, The NetherlandsFebruary 26, 2014
97
Internal Control over Financial Reporting
Management, including the Chief Executive Officer and Chief Financial Officer of Reed Elsevier PLC and Reed ElsevierNV, have reviewed whether or not during the period covered by the annual report, there have been any changes in internalcontrol over financial reporting that have materially affected, or are reasonably likely to materially affect, the internal controlsover financial reporting of the Reed Elsevier combined businesses, Reed Elsevier PLC and Reed Elsevier NV. Based on thatreview, the Chief Executive Officer and Chief Financial Officer of Reed Elsevier PLC and Reed Elsevier NV have concludedthat there have been no such changes.
An outline of the internal control structure is set out below.
Parent companies
The Boards of Reed Elsevier PLC and Reed Elsevier NV exercise independent supervisory roles over the activities andsystems of internal control of Reed Elsevier Group plc and Elsevier Reed Finance BV. The Boards of Reed Elsevier PLC andReed Elsevier NV have each adopted a schedule of matters which are required to be brought to them for decision. In relationto Reed Elsevier Group plc and Elsevier Reed Finance BV, the Boards of Reed Elsevier PLC and Reed Elsevier NV approvethe strategy and the annual budgets, and receive regular reports on the operations, including the treasury and risk managementactivities of the two companies. Major transactions proposed by the Boards of Reed Elsevier Group plc or Elsevier ReedFinance BV require the approval of the Boards of both Reed Elsevier PLC and Reed Elsevier NV.
The Reed Elsevier PLC and Reed Elsevier NV Audit Committees meet on a regular basis to review the systems ofinternal control and risk management of Reed Elsevier Group plc and Elsevier Reed Finance BV.
Operating companies
The Board of Reed Elsevier Group plc is responsible for the system of internal control of the Reed Elsevier publishingand information businesses, while the Boards of Elsevier Reed Finance BV are responsible for the system of internal controlin respect of the finance activities. The Boards of Reed Elsevier Group plc and Elsevier Reed Finance BV are also responsiblefor reviewing the effectiveness of their system of internal control.
The Boards of Reed Elsevier Group plc and Elsevier Reed Finance BV have each implemented an ongoing process foridentifying, evaluating, monitoring and managing the more significant risks faced by their respective businesses. This processhas been in place throughout the year ended December 31, 2013 and up to the date of the approvals of this annual report.
Reed Elsevier Group plc
Reed Elsevier Group plc has an established framework of procedures and internal controls, with which the managementof each business is required to comply. Group businesses are required to maintain systems of internal control which areappropriate to the nature and scale of their activities and address all significant operational and financial risks that they face.The Board of Reed Elsevier Group plc has adopted a schedule of matters that are required to be brought to it for decision.
Reed Elsevier Group plc has a Code of Ethics and Business Conduct that provides a guide for achieving its businessgoals and requires officers and employees to behave in an open, honest, ethical and principled manner. The code also outlinesconfidential procedures enabling employees to report any concerns about compliance, or about Reed Elsevier’s financialreporting practice. The code is published on the Reed Elsevier website, www.reedelsevier.com. The information on ourwebsite is not incorporated by reference into this report.
Each division has identified and evaluated its major risks, the controls in place to manage those risks and the level ofresidual risk accepted. Risk management and control procedures are embedded into the operations of the business and includethe monitoring of progress in areas for improvement that come to management and board attention. The major risks identifiedinclude business continuity, protection of IT systems and data, challenges to intellectual property rights, management ofstrategic and operational change, evaluation and integration of acquisitions, and recruitment and retention of personnel.Further detail on the principal risks facing Reed Elsevier is set out on pages 8 to 11.
The major risks facing the Reed Elsevier Group plc businesses are regularly reported to and considered by the Board andAudit Committee. With the close involvement of business management and with the central functions, the risk managementand control procedures ensure that Reed Elsevier is managing its business risks effectively and in a coordinated manner acrossthe business with clarity on the respective responsibilities and interdependencies. Litigation and other legal and regulatorymatters are managed by legal directors in Europe and the United States.
The Reed Elsevier Group plc Audit Committee receives regular reports on the management of material risks and reviewsthese reports. The Audit Committee also receives regular reports from both internal and external auditors on internal controland risk management matters. In addition, each division is required, at the end of the financial year, to review the
98
effectiveness of internal controls and risk management and report its findings on a detailed basis to the management of ReedElsevier Group plc. These reports are summarised and, as part of the annual review of effectiveness, submitted to the AuditCommittee of Reed Elsevier Group plc. The Chairman of the Audit Committee reports to the Board on any significant internalcontrol matters arising.
Elsevier Reed Finance BV
Elsevier Reed Finance BV has established policy guidelines, which are applied for all Elsevier Reed Finance BVcompanies. The Boards of Elsevier Reed Finance BV have adopted schedules of matters that are required to be brought tothem for decision.
Procedures are in place for monitoring the activities of the finance group, including a comprehensive treasury reportingsystem. The major risks affecting the finance group have been identified and evaluated and are subject to regular review. Thecontrols in place to manage these risks and the level of residual risk accepted are monitored by the Boards of Elsevier ReedFinance BV.
Audit Committees
Reed Elsevier Group plc, Reed Elsevier PLC and Reed Elsevier NV have established Audit Committees which compriseonly non-executive directors, all of whom are independent. The Audit Committees, which meet regularly, are chaired by Benvan der Veer, the other members being Linda Sanford and Adrian Hennah.
The main roles and responsibilities of the Audit Committees in relation to the respective companies are set out in writtenterms of reference and include:
(i) to monitor the integrity of the financial statements of the company, and any formal announcements relating to thecompany’s financial performance, reviewing significant financial reporting judgements contained in them;
(ii) to review the company’s internal financial controls and the company’s internal control and risk managementsystems;
(iii) to monitor and review the effectiveness of the company’s internal audit function;
(iv) to make recommendations to the Board, for it to put to the shareholders for their approval in general meeting, inrelation to the appointment, reappointment and removal of the external auditor and to approve the remuneration andterms of engagement of the external auditor;
(v) to review and monitor the external auditors’ independence and objectivity and the effectiveness of the audit process,taking into consideration relevant professional and regulatory requirements; and
(vi) to develop and recommend policy on the engagement of the external auditor to supply non audit services, takinginto account relevant ethical guidance regarding the provision of non audit services by the external audit firm, andto monitor compliance.
The Audit Committees report to the respective boards on their activities identifying any matters in respect of which theyconsider that action or improvement is needed and making recommendations as to the steps to be taken.
The Reed Elsevier Group plc Audit Committee fulfils this role in respect of the publishing and information operatingbusiness. The functions of an audit committee in respect of the financing activities are carried out by the Supervisory Board ofElsevier Reed Finance BV. The Reed Elsevier PLC and Reed Elsevier NV Audit Committees fulfil their roles from theperspective of the parent companies and both Committees have access to the reports to and the work of the Reed ElsevierGroup plc Audit Committee and the Elsevier Reed Finance BV Supervisory Board in this respect.
The Audit Committees have explicit authority to investigate any matters within their terms of reference and have accessto all resources and information that they may require for this purpose. The Audit Committees are entitled to obtain legal andother independent professional advice and have the authority to approve all fees payable to such advisers.
The terms of reference of each Audit Committee are reviewed annually and a copy of each is published on the ReedElsevier website, www.reedelsevier.com. The information on our website is not incorporated by reference into this report.
Compliance with New York Stock Exchange Corporate Governance Rules
Reed Elsevier PLC and Reed Elsevier NV, as companies listed on the New York Stock Exchange (the “NYSE”), aresubject to the listing requirements of the NYSE and the rules of the U.S. Securities and Exchange Commission (the “SEC”).We also continually monitor our compliance with the provisions of the Sarbanes-Oxley Act of 2002 that are applicable toforeign private issuers.
99
In November 2003, the SEC approved new corporate governance standards for companies that are listed on the NYSE.As a foreign private issuer, Reed Elsevier is only required to comply with certain of the NYSE corporate governance rules andis in compliance with all applicable rules. The NYSE’s rules also require disclosure of any significant ways in which ourcorporate governance practices differ from those required of US companies under the NYSE listing standards.
Reed Elsevier follows UK corporate governance practice, which does not differ significantly from the NYSE corporategovernance standards for foreign issuers. We also follow Dutch corporate governance practice. We believe that our corporategovernance practices do not differ in any significant way from those required to be followed by US companies under theNYSE corporate governance listing standards.
The NYSE listing standards provide that US companies must have a nominating/corporate governance committeecomposed entirely of independent directors and with a written charter that addresses the committee’s purpose andresponsibilities which, at a minimum, must be to identify individuals qualified to become board members, develop andrecommend to the Board a set of corporate governance principles and to oversee the evaluation of the board and management.
Reed Elsevier PLC and Reed Elsevier NV have a joint Nominations Committee and a joint Corporate GovernanceCommittee. The written terms of reference adopted by the Reed Elsevier PLC and the Reed Elsevier NV Boards for thesecommittees specify purposes and responsibilities that correspond to those of a US company’s nominating/corporategovernance committee under the NYSE’s listing standards. The Nominations Committee and the Corporate GovernanceCommittee are composed entirely of non executive directors.
ITEM 16A: AUDIT COMMITTEE FINANCIAL EXPERT
Each of Reed Elsevier PLC and Reed Elsevier NV has an Audit Committee, the members of which are identified in“Item 6: Directors, Senior Management and Employees”. The members of the Board of Directors of Reed Elsevier PLC andmembers of the Board of Reed Elsevier NV, have determined that each of their respective Audit Committees contains at leastone Audit Committee financial expert within the meaning of the applicable rules and regulations of the SEC. The AuditCommittee financial experts serving on the Reed Elsevier PLC and the Reed Elsevier NV Audit Committees are AdrianHennah and Ben van der Veer. Each is considered independent.
ITEM 16B: CODES OF ETHICS
Reed Elsevier has adopted a code of ethics (Code of Ethics and Business Conduct) that applies to all directors, officersand employees, and an additional separate code of ethics (Code for Senior Officers) that also applies to the Chief ExecutiveOfficer and Chief Financial Officer of Reed Elsevier PLC and Reed Elsevier NV and the Group Financial Controller of ReedElsevier Group plc. Both these codes of ethics are available on the Reed Elsevier website, www.reedelsevier.com. Theinformation on our website is not incorporated by reference into this report.
ITEM 16C: PRINCIPAL ACCOUNTANT FEES AND SERVICES
The aggregate fees billed by our principal accountants, Deloitte LLP, Deloitte Accountants BV, the member firms ofDeloitte Touche Tohmatsu and their respective affiliates, were as follows:
Year endedDecember 31,
2013
Year endedDecember 31,
2012(in millions)
Audit fees . . . . . . . . . . . . . . . . . . . . . . . . . . . . . . . . . . . . . . . . . . . . . . . . . . . . . . . . . . . . . . . £4.9 £4.9Audit related fees . . . . . . . . . . . . . . . . . . . . . . . . . . . . . . . . . . . . . . . . . . . . . . . . . . . . . . . . . 0.4 0.7Tax fees . . . . . . . . . . . . . . . . . . . . . . . . . . . . . . . . . . . . . . . . . . . . . . . . . . . . . . . . . . . . . . . . 1.8 0.8All other fees . . . . . . . . . . . . . . . . . . . . . . . . . . . . . . . . . . . . . . . . . . . . . . . . . . . . . . . . . . . . — 0.3
Total . . . . . . . . . . . . . . . . . . . . . . . . . . . . . . . . . . . . . . . . . . . . . . . . . . . . . . . . . . . . . . . . . . . £7.1 £6.7
Audit fees of £4.9 million (2012: £4.9 million) comprise £0.6 million (2012: £0.5 million) payable to the auditors of theparent companies and £4.3 million (2012: £4.4 million) payable to the auditors of the parent companies and their associatesfor the audit of the financial statements of the operating and financing businesses, including the review and testing of internalcontrol over financial reporting in accordance with the US Sarbanes-Oxley Act. Audit related fees comprise £0.4 million(2012: £0.7 million) for other audit related assurance services. Tax fees of £1.8 million (2012: £0.8 million) relate to taxadvisory and compliance services. All other fees totalling nil (2012: £0.3 million) relate to due diligence and other transactionrelated services.
100
The Audit Committees of Reed Elsevier PLC and Reed Elsevier NV have adopted policies and procedures for the pre-approval of audit and non audit services provided by the auditors. These policies and procedures are summarised below.
The terms of engagement and scope of the annual audit of the financial statements are agreed by the respective AuditCommittees in advance of the engagement of the auditors in respect of the annual audit. The audit fees are approved by theAudit Committees.
The auditors are not permitted to provide non audit services that would compromise their independence or violate anylaws or regulations that would affect their appointment as auditors. They are eligible for selection to provide non auditservices only to the extent that their skills and experience make them a logical supplier of the services. The respective AuditCommittees must pre-approve the provision of all non audit services by the auditors and will consider SEC rules and otherguidelines in determining the scope of permitted services. The respective Audit Committees have pre-approved non auditservices in respect of individual assignments for permitted services that meet certain criteria. Assignments outside theseparameters must be specifically pre-approved by the Audit Committees in advance of commissioning the work. Aggregatenon audit fees must not exceed the annual audit fees in any given year, unless approved in advance by the Audit Committees.
All of the audit and non audit services carried out in the year ended December 31, 2013 were pre-approved under thepolicies and procedures summarised above.
ITEM 16D: EXEMPTIONS FROM THE LISTING STANDARDS FOR AUDIT COMMITTEESNot applicable.
ITEM 16E: PURCHASES OF EQUITY SECURITIES BY THE ISSUER AND AFFILIATED PURCHASERSDuring 2013 Reed Elsevier repurchased 41,961,920 Reed Elsevier PLC ordinary shares and 24,282,106 Reed Elsevier
NV ordinary shares for total consideration of £600 million. These shares are held in treasury.PLC NV
Number of ordinaryshares
Average pricepaid per share
Number of ordinaryshares
Average price paidper share
pence €
January 2013 . . . . . . . . . . . . . . 6,773,000 670 3,903,969 11.38February 2013 . . . . . . . . . . . . . 1,362,000 703 794,550 11.62March 2013 . . . . . . . . . . . . . . . 3,758,800 753 2,141,800 12.57April 2013 . . . . . . . . . . . . . . . . 3,149,000 761 1,837,000 12.82May 2013 . . . . . . . . . . . . . . . . 3,830,500 754 2,241,000 12.84June 2013 . . . . . . . . . . . . . . . . 3,765,470 737 2,186,087 12.64July 2013 . . . . . . . . . . . . . . . . . 838,000 842 485,000 14.32August 2013 . . . . . . . . . . . . . . 7,028,000 813 4,065,000 13.99September 2013 . . . . . . . . . . . 5,327,000 820 3,082,000 14.48October 2013 . . . . . . . . . . . . . . 3,168,000 841 1,831,500 14.75November 2013 . . . . . . . . . . . . 1,821,200 884 1,053,700 15.61December 2013 . . . . . . . . . . . . 1,140,950 869 660,500 15.33
41,961,920 773 24,282,106 13.29
All shares were purchased under programmes publicly announced on December 28, 2012, February 28, 2013 andJuly 25, 2013. All of these programmes were completed during 2013.
On December 16, 2013 Reed Elsevier PLC and Reed Elsevier NV annouced an irrevocable, non-discretionaryprogramme to repurchase further ordinary shares up to the value of £100 million. A further 6,045,270 Reed Elsevier PLCshares and 3,511,668 Reed Elsevier NV ordinary shares have been repurchased in January and February 2014 under thisprogramme. On February 27, 2014, Reed Elsevier PLC and Reed Elsevier NV annouced their intention to repurchase furtherordinary shares up to the value of £500 million in aggregate over the remainder of 2014.
In December 2013 Reed Elsevier also repurchased 94,053 Reed Elsevier NV R shares (equivalent to 940,530 ReedElsevier NV ordinary shares).
The Reed Elsevier Group plc Employee Benefit Trust (“EBT”) has not made any share purchases during the year.
ITEM 16F: CHANGE IN REGISTRANT’S CERTIFYING ACCOUNTANTNot applicable.
ITEM 16G: CORPORATE GOVERNANCEDetails of Reed Elsevier’s corporate governance practices are set out on pages 94 to 100 of Item 15: Controls and
Procedures.
101

PART III
ITEM 17: FINANCIAL STATEMENTS
The Registrants have responded to Item 18 in lieu of responding to this Item.
102
ITEM 18: FINANCIAL STATEMENTS
Financial Statements filed as part of this annual report
The following financial statements and related schedules, together with reports of independent registered publicaccounting firms thereon, are filed as part of this annual report:
Page
Index to Financial Statements . . . . . . . . . . . . . . . . . . . . . . . . . . . . . . . . . . . . . . . . . . . . . . . . . . . . . . . . . . . . . . . . . . . . . . F-1Reed Elsevier Combined Financial Statements . . . . . . . . . . . . . . . . . . . . . . . . . . . . . . . . . . . . . . . . . . . . . . . . . . . . . . . . F-3
Report of Independent Registered Public Accounting Firm . . . . . . . . . . . . . . . . . . . . . . . . . . . . . . . . . . . . . . . . . . . . . F-5Combined Income Statements . . . . . . . . . . . . . . . . . . . . . . . . . . . . . . . . . . . . . . . . . . . . . . . . . . . . . . . . . . . . . . . . . . . . F-6Combined Statements of Comprehensive Income . . . . . . . . . . . . . . . . . . . . . . . . . . . . . . . . . . . . . . . . . . . . . . . . . . . . F-6Combined Statements of Cash Flows . . . . . . . . . . . . . . . . . . . . . . . . . . . . . . . . . . . . . . . . . . . . . . . . . . . . . . . . . . . . . . F-7Combined Statements of Financial Position . . . . . . . . . . . . . . . . . . . . . . . . . . . . . . . . . . . . . . . . . . . . . . . . . . . . . . . . . F-8Combined Statements of Changes in Equity . . . . . . . . . . . . . . . . . . . . . . . . . . . . . . . . . . . . . . . . . . . . . . . . . . . . . . . . . F-9Notes to the Combined Financial Statements . . . . . . . . . . . . . . . . . . . . . . . . . . . . . . . . . . . . . . . . . . . . . . . . . . . . . . . . F-10
Reed Elsevier PLC Consolidated Financial Statements . . . . . . . . . . . . . . . . . . . . . . . . . . . . . . . . . . . . . . . . . . . . . . . . . . F-56Report of Independent Registered Public Accounting Firm . . . . . . . . . . . . . . . . . . . . . . . . . . . . . . . . . . . . . . . . . . . . . F-57Consolidated Income Statements . . . . . . . . . . . . . . . . . . . . . . . . . . . . . . . . . . . . . . . . . . . . . . . . . . . . . . . . . . . . . . . . . F-58Consolidated Statements of Comprehensive Income . . . . . . . . . . . . . . . . . . . . . . . . . . . . . . . . . . . . . . . . . . . . . . . . . . F-58Consolidated Statements of Cash Flows . . . . . . . . . . . . . . . . . . . . . . . . . . . . . . . . . . . . . . . . . . . . . . . . . . . . . . . . . . . . F-59Consolidated Statements of Financial Position . . . . . . . . . . . . . . . . . . . . . . . . . . . . . . . . . . . . . . . . . . . . . . . . . . . . . . . F-60Consolidated Statements of Changes in Equity . . . . . . . . . . . . . . . . . . . . . . . . . . . . . . . . . . . . . . . . . . . . . . . . . . . . . . F-61Notes to the Consolidated Financial Statements . . . . . . . . . . . . . . . . . . . . . . . . . . . . . . . . . . . . . . . . . . . . . . . . . . . . . . F-62
Reed Elsevier NV Consolidated Financial Statements . . . . . . . . . . . . . . . . . . . . . . . . . . . . . . . . . . . . . . . . . . . . . . . . . . . F-70Report of Independent Registered Public Accounting Firm . . . . . . . . . . . . . . . . . . . . . . . . . . . . . . . . . . . . . . . . . . . . . F-71Consolidated Income Statements . . . . . . . . . . . . . . . . . . . . . . . . . . . . . . . . . . . . . . . . . . . . . . . . . . . . . . . . . . . . . . . . . F-72Consolidated Statements of Comprehensive Income . . . . . . . . . . . . . . . . . . . . . . . . . . . . . . . . . . . . . . . . . . . . . . . . . . F-72Consolidated Statements of Cash Flows . . . . . . . . . . . . . . . . . . . . . . . . . . . . . . . . . . . . . . . . . . . . . . . . . . . . . . . . . . . . F-73Consolidated Statements of Financial Position . . . . . . . . . . . . . . . . . . . . . . . . . . . . . . . . . . . . . . . . . . . . . . . . . . . . . . . F-74Consolidated Statements of Changes in Equity . . . . . . . . . . . . . . . . . . . . . . . . . . . . . . . . . . . . . . . . . . . . . . . . . . . . . . F-75Notes to the Consolidated Financial Statements . . . . . . . . . . . . . . . . . . . . . . . . . . . . . . . . . . . . . . . . . . . . . . . . . . . . . . F-76
F-1

THIS PAGE INTENTIONALLY BLANK
F-2

REED ELSEVIERCOMBINED FINANCIAL STATEMENTS
F-3

THIS PAGE INTENTIONALLY BLANK
F-4
REPORT OF INDEPENDENT REGISTERED PUBLIC ACCOUNTING FIRM
To the Board of Directors and members of Reed Elsevier PLC and to the Board of Directors and shareholders of ReedElsevier NV:
We have audited the accompanying combined statements of financial position of Reed Elsevier PLC, Reed Elsevier NV,Reed Elsevier Group plc and Elsevier Reed Finance BV and their respective subsidiaries, associates and joint ventures(together the “Combined Businesses”) as at December 31, 2013, 2012 and 2011, and the related combined income statementsand combined statements of comprehensive income, cash flows and changes in equity for each of the years then ended. Thesecombined financial statements are the responsibility of the management of Reed Elsevier PLC and Reed Elsevier NV. Ourresponsibility is to express an opinion on the combined financial statements based on our audits.
We conducted our audits in accordance with the standards of the Public Company Accounting Oversight Board(United States). Those standards require that we plan and perform the audit to obtain reasonable assurance about whether thefinancial statements are free of material misstatement. An audit includes examining, on a test basis, evidence supporting theamounts and disclosures in the financial statements. An audit also includes assessing the accounting principles used andsignificant estimates made by management, as well as evaluating the overall financial statement presentation. We believe thatour audits provide a reasonable basis for our opinion.
In our opinion, such combined financial statements present fairly, in all material respects, the combined financialposition of the Combined Businesses as at December 31, 2013, 2012 and 2011, and the combined results of their operationsand their cash flows for each of the years then ended, in conformity with International Financial Reporting Standards as issuedby the International Accounting Standards Board.
As discussed in Accounting policies in the combined financial statements, the accompanying 2012 and 2011 financialstatements have been retrospectively adjusted for the adoption of International Accounting Standards 19 Employee Benefits(revised).
We have also audited, in accordance with the standards of the Public Company Accounting Oversight Board(United States), the Combined Businesses’ internal control over financial reporting as at December 31, 2013, based on thecriteria established in Internal Control — Integrated Framework (1992) issued by the Committee of SponsoringOrganizations of the Treadway Commission and our report dated February 26, 2014 expressed an unqualified opinion on theCombined Businesses’ internal control over financial reporting.
/s/ DELOITTE LLPLondon, United KingdomFebruary 26, 2014
/s/ DELOITTE ACCOUNTANTS B.V.Amsterdam, The NetherlandsFebruary 26, 2014
F-5
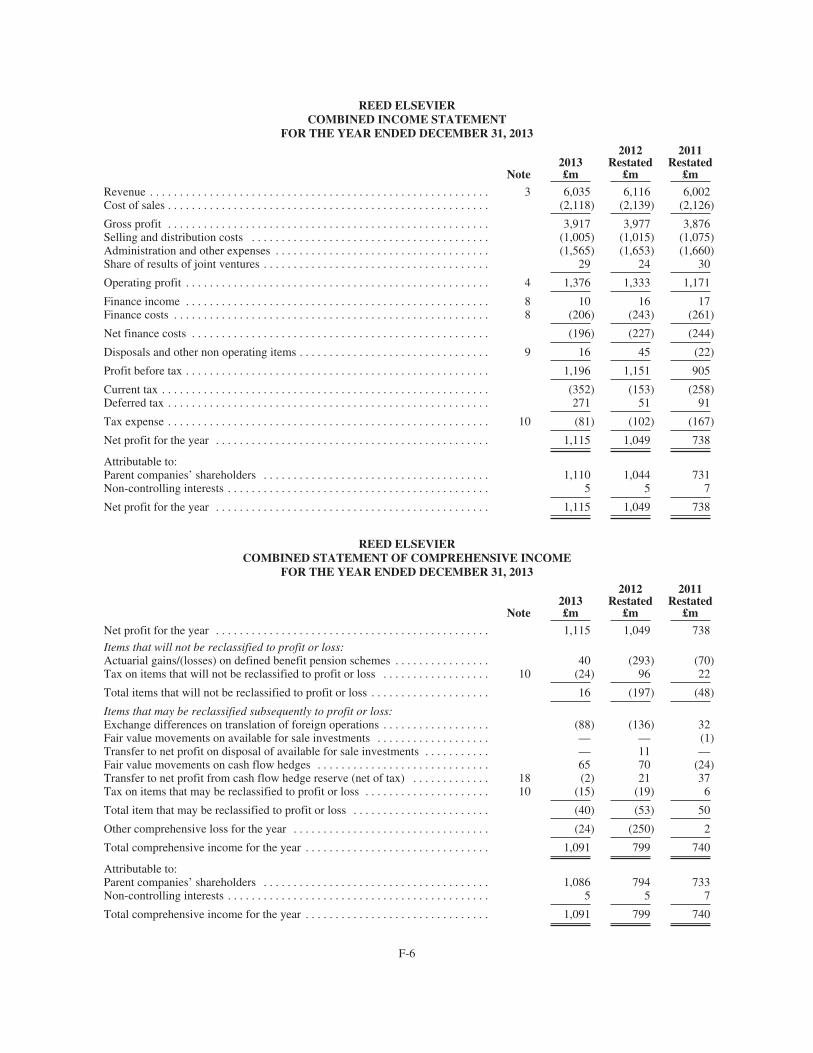
REED ELSEVIERCOMBINED INCOME STATEMENT
FOR THE YEAR ENDED DECEMBER 31, 2013
Note2013£m
2012Restated
£m
2011Restated
£m
Revenue . . . . . . . . . . . . . . . . . . . . . . . . . . . . . . . . . . . . . . . . . . . . . . . . . . . . . . . . . 3 6,035 6,116 6,002Cost of sales . . . . . . . . . . . . . . . . . . . . . . . . . . . . . . . . . . . . . . . . . . . . . . . . . . . . . . (2,118) (2,139) (2,126)
Gross profit . . . . . . . . . . . . . . . . . . . . . . . . . . . . . . . . . . . . . . . . . . . . . . . . . . . . . . 3,917 3,977 3,876Selling and distribution costs . . . . . . . . . . . . . . . . . . . . . . . . . . . . . . . . . . . . . . . . (1,005) (1,015) (1,075)Administration and other expenses . . . . . . . . . . . . . . . . . . . . . . . . . . . . . . . . . . . . (1,565) (1,653) (1,660)Share of results of joint ventures . . . . . . . . . . . . . . . . . . . . . . . . . . . . . . . . . . . . . . 29 24 30
Operating profit . . . . . . . . . . . . . . . . . . . . . . . . . . . . . . . . . . . . . . . . . . . . . . . . . . . 4 1,376 1,333 1,171
Finance income . . . . . . . . . . . . . . . . . . . . . . . . . . . . . . . . . . . . . . . . . . . . . . . . . . . 8 10 16 17Finance costs . . . . . . . . . . . . . . . . . . . . . . . . . . . . . . . . . . . . . . . . . . . . . . . . . . . . . 8 (206) (243) (261)
Net finance costs . . . . . . . . . . . . . . . . . . . . . . . . . . . . . . . . . . . . . . . . . . . . . . . . . . (196) (227) (244)
Disposals and other non operating items . . . . . . . . . . . . . . . . . . . . . . . . . . . . . . . . 9 16 45 (22)
Profit before tax . . . . . . . . . . . . . . . . . . . . . . . . . . . . . . . . . . . . . . . . . . . . . . . . . . . 1,196 1,151 905
Current tax . . . . . . . . . . . . . . . . . . . . . . . . . . . . . . . . . . . . . . . . . . . . . . . . . . . . . . . (352) (153) (258)Deferred tax . . . . . . . . . . . . . . . . . . . . . . . . . . . . . . . . . . . . . . . . . . . . . . . . . . . . . . 271 51 91
Tax expense . . . . . . . . . . . . . . . . . . . . . . . . . . . . . . . . . . . . . . . . . . . . . . . . . . . . . . 10 (81) (102) (167)
Net profit for the year . . . . . . . . . . . . . . . . . . . . . . . . . . . . . . . . . . . . . . . . . . . . . . 1,115 1,049 738
Attributable to:Parent companies’ shareholders . . . . . . . . . . . . . . . . . . . . . . . . . . . . . . . . . . . . . . 1,110 1,044 731Non-controlling interests . . . . . . . . . . . . . . . . . . . . . . . . . . . . . . . . . . . . . . . . . . . . 5 5 7
Net profit for the year . . . . . . . . . . . . . . . . . . . . . . . . . . . . . . . . . . . . . . . . . . . . . . 1,115 1,049 738
REED ELSEVIERCOMBINED STATEMENT OF COMPREHENSIVE INCOME
FOR THE YEAR ENDED DECEMBER 31, 2013
Note2013£m
2012Restated
£m
2011Restated
£m
Net profit for the year . . . . . . . . . . . . . . . . . . . . . . . . . . . . . . . . . . . . . . . . . . . . . . 1,115 1,049 738
Items that will not be reclassified to profit or loss:Actuarial gains/(losses) on defined benefit pension schemes . . . . . . . . . . . . . . . . 40 (293) (70)Tax on items that will not be reclassified to profit or loss . . . . . . . . . . . . . . . . . . 10 (24) 96 22
Total items that will not be reclassified to profit or loss . . . . . . . . . . . . . . . . . . . . 16 (197) (48)
Items that may be reclassified subsequently to profit or loss:Exchange differences on translation of foreign operations . . . . . . . . . . . . . . . . . . (88) (136) 32Fair value movements on available for sale investments . . . . . . . . . . . . . . . . . . . — — (1)Transfer to net profit on disposal of available for sale investments . . . . . . . . . . . — 11 —Fair value movements on cash flow hedges . . . . . . . . . . . . . . . . . . . . . . . . . . . . . 65 70 (24)Transfer to net profit from cash flow hedge reserve (net of tax) . . . . . . . . . . . . . 18 (2) 21 37Tax on items that may be reclassified to profit or loss . . . . . . . . . . . . . . . . . . . . . 10 (15) (19) 6
Total item that may be reclassified to profit or loss . . . . . . . . . . . . . . . . . . . . . . . (40) (53) 50
Other comprehensive loss for the year . . . . . . . . . . . . . . . . . . . . . . . . . . . . . . . . . (24) (250) 2
Total comprehensive income for the year . . . . . . . . . . . . . . . . . . . . . . . . . . . . . . . 1,091 799 740
Attributable to:Parent companies’ shareholders . . . . . . . . . . . . . . . . . . . . . . . . . . . . . . . . . . . . . . 1,086 794 733Non-controlling interests . . . . . . . . . . . . . . . . . . . . . . . . . . . . . . . . . . . . . . . . . . . . 5 5 7
Total comprehensive income for the year . . . . . . . . . . . . . . . . . . . . . . . . . . . . . . . 1,091 799 740
F-6
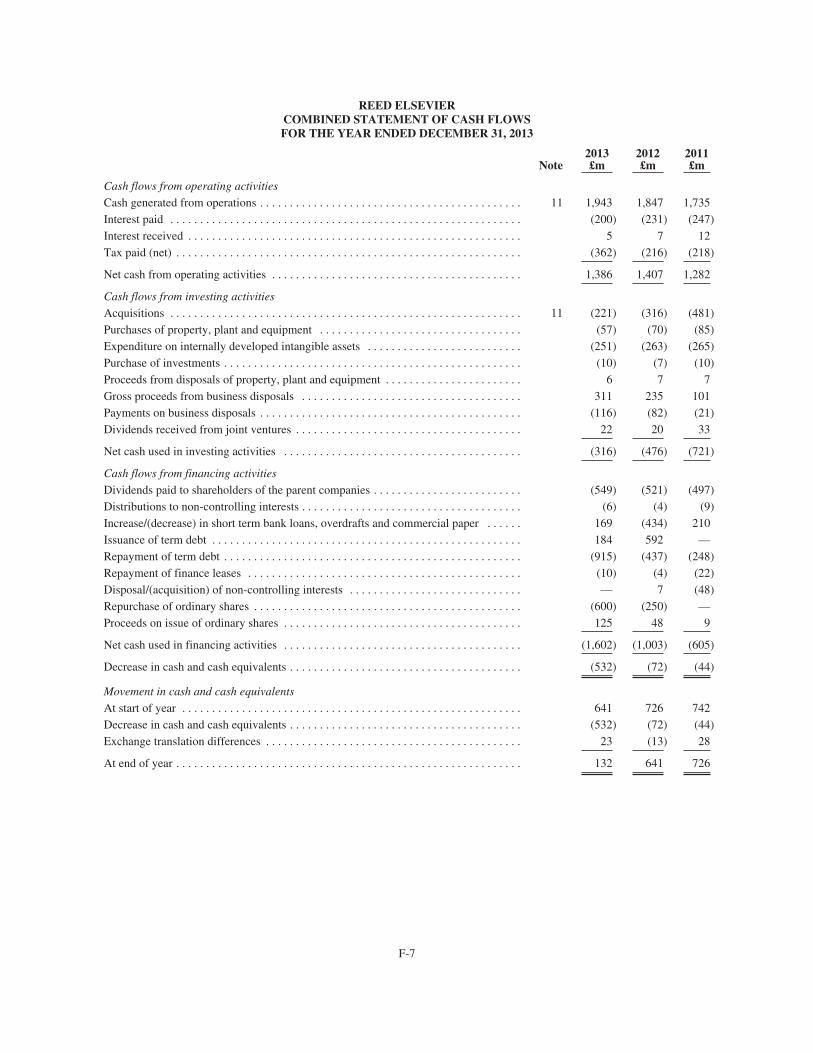
REED ELSEVIERCOMBINED STATEMENT OF CASH FLOWSFOR THE YEAR ENDED DECEMBER 31, 2013
Note2013£m
2012£m
2011£m
Cash flows from operating activities
Cash generated from operations . . . . . . . . . . . . . . . . . . . . . . . . . . . . . . . . . . . . . . . . . . . . 11 1,943 1,847 1,735Interest paid . . . . . . . . . . . . . . . . . . . . . . . . . . . . . . . . . . . . . . . . . . . . . . . . . . . . . . . . . . . (200) (231) (247)Interest received . . . . . . . . . . . . . . . . . . . . . . . . . . . . . . . . . . . . . . . . . . . . . . . . . . . . . . . . 5 7 12Tax paid (net) . . . . . . . . . . . . . . . . . . . . . . . . . . . . . . . . . . . . . . . . . . . . . . . . . . . . . . . . . . (362) (216) (218)
Net cash from operating activities . . . . . . . . . . . . . . . . . . . . . . . . . . . . . . . . . . . . . . . . . . 1,386 1,407 1,282
Cash flows from investing activities
Acquisitions . . . . . . . . . . . . . . . . . . . . . . . . . . . . . . . . . . . . . . . . . . . . . . . . . . . . . . . . . . . 11 (221) (316) (481)Purchases of property, plant and equipment . . . . . . . . . . . . . . . . . . . . . . . . . . . . . . . . . . (57) (70) (85)Expenditure on internally developed intangible assets . . . . . . . . . . . . . . . . . . . . . . . . . . (251) (263) (265)Purchase of investments . . . . . . . . . . . . . . . . . . . . . . . . . . . . . . . . . . . . . . . . . . . . . . . . . . (10) (7) (10)Proceeds from disposals of property, plant and equipment . . . . . . . . . . . . . . . . . . . . . . . 6 7 7Gross proceeds from business disposals . . . . . . . . . . . . . . . . . . . . . . . . . . . . . . . . . . . . . 311 235 101Payments on business disposals . . . . . . . . . . . . . . . . . . . . . . . . . . . . . . . . . . . . . . . . . . . . (116) (82) (21)Dividends received from joint ventures . . . . . . . . . . . . . . . . . . . . . . . . . . . . . . . . . . . . . . 22 20 33
Net cash used in investing activities . . . . . . . . . . . . . . . . . . . . . . . . . . . . . . . . . . . . . . . . (316) (476) (721)
Cash flows from financing activities
Dividends paid to shareholders of the parent companies . . . . . . . . . . . . . . . . . . . . . . . . . (549) (521) (497)Distributions to non-controlling interests . . . . . . . . . . . . . . . . . . . . . . . . . . . . . . . . . . . . . (6) (4) (9)Increase/(decrease) in short term bank loans, overdrafts and commercial paper . . . . . . 169 (434) 210Issuance of term debt . . . . . . . . . . . . . . . . . . . . . . . . . . . . . . . . . . . . . . . . . . . . . . . . . . . . 184 592 —Repayment of term debt . . . . . . . . . . . . . . . . . . . . . . . . . . . . . . . . . . . . . . . . . . . . . . . . . . (915) (437) (248)Repayment of finance leases . . . . . . . . . . . . . . . . . . . . . . . . . . . . . . . . . . . . . . . . . . . . . . (10) (4) (22)Disposal/(acquisition) of non-controlling interests . . . . . . . . . . . . . . . . . . . . . . . . . . . . . — 7 (48)Repurchase of ordinary shares . . . . . . . . . . . . . . . . . . . . . . . . . . . . . . . . . . . . . . . . . . . . . (600) (250) —Proceeds on issue of ordinary shares . . . . . . . . . . . . . . . . . . . . . . . . . . . . . . . . . . . . . . . . 125 48 9
Net cash used in financing activities . . . . . . . . . . . . . . . . . . . . . . . . . . . . . . . . . . . . . . . . (1,602) (1,003) (605)
Decrease in cash and cash equivalents . . . . . . . . . . . . . . . . . . . . . . . . . . . . . . . . . . . . . . . (532) (72) (44)
Movement in cash and cash equivalents
At start of year . . . . . . . . . . . . . . . . . . . . . . . . . . . . . . . . . . . . . . . . . . . . . . . . . . . . . . . . . 641 726 742Decrease in cash and cash equivalents . . . . . . . . . . . . . . . . . . . . . . . . . . . . . . . . . . . . . . . (532) (72) (44)Exchange translation differences . . . . . . . . . . . . . . . . . . . . . . . . . . . . . . . . . . . . . . . . . . . 23 (13) 28
At end of year . . . . . . . . . . . . . . . . . . . . . . . . . . . . . . . . . . . . . . . . . . . . . . . . . . . . . . . . . . 132 641 726
F-7
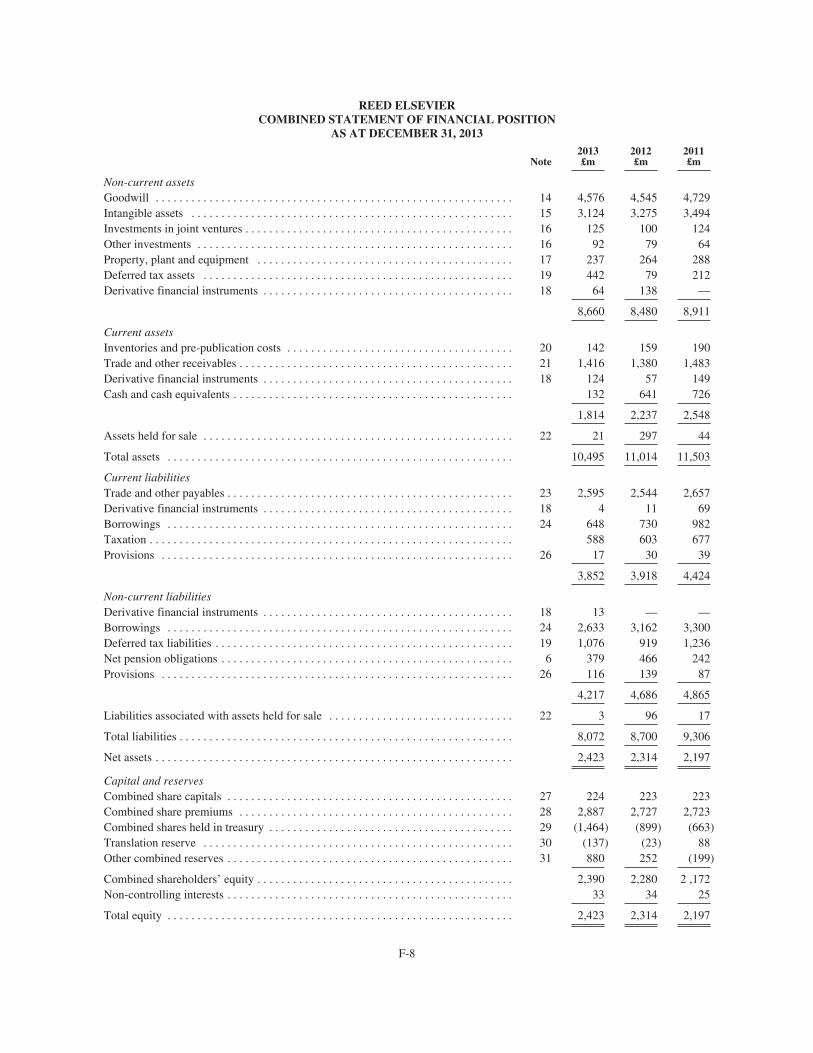
REED ELSEVIERCOMBINED STATEMENT OF FINANCIAL POSITION
AS AT DECEMBER 31, 2013
Note2013£m
2012£m
2011£m
Non-current assetsGoodwill . . . . . . . . . . . . . . . . . . . . . . . . . . . . . . . . . . . . . . . . . . . . . . . . . . . . . . . . . . . . 14 4,576 4,545 4,729Intangible assets . . . . . . . . . . . . . . . . . . . . . . . . . . . . . . . . . . . . . . . . . . . . . . . . . . . . . . 15 3,124 3,275 3,494Investments in joint ventures . . . . . . . . . . . . . . . . . . . . . . . . . . . . . . . . . . . . . . . . . . . . . 16 125 100 124Other investments . . . . . . . . . . . . . . . . . . . . . . . . . . . . . . . . . . . . . . . . . . . . . . . . . . . . . 16 92 79 64Property, plant and equipment . . . . . . . . . . . . . . . . . . . . . . . . . . . . . . . . . . . . . . . . . . . 17 237 264 288Deferred tax assets . . . . . . . . . . . . . . . . . . . . . . . . . . . . . . . . . . . . . . . . . . . . . . . . . . . . 19 442 79 212Derivative financial instruments . . . . . . . . . . . . . . . . . . . . . . . . . . . . . . . . . . . . . . . . . . 18 64 138 —
8,660 8,480 8,911
Current assetsInventories and pre-publication costs . . . . . . . . . . . . . . . . . . . . . . . . . . . . . . . . . . . . . . 20 142 159 190Trade and other receivables . . . . . . . . . . . . . . . . . . . . . . . . . . . . . . . . . . . . . . . . . . . . . . 21 1,416 1,380 1,483Derivative financial instruments . . . . . . . . . . . . . . . . . . . . . . . . . . . . . . . . . . . . . . . . . . 18 124 57 149Cash and cash equivalents . . . . . . . . . . . . . . . . . . . . . . . . . . . . . . . . . . . . . . . . . . . . . . . 132 641 726
1,814 2,237 2,548
Assets held for sale . . . . . . . . . . . . . . . . . . . . . . . . . . . . . . . . . . . . . . . . . . . . . . . . . . . . 22 21 297 44
Total assets . . . . . . . . . . . . . . . . . . . . . . . . . . . . . . . . . . . . . . . . . . . . . . . . . . . . . . . . . . 10,495 11,014 11,503
Current liabilitiesTrade and other payables . . . . . . . . . . . . . . . . . . . . . . . . . . . . . . . . . . . . . . . . . . . . . . . . 23 2,595 2,544 2,657Derivative financial instruments . . . . . . . . . . . . . . . . . . . . . . . . . . . . . . . . . . . . . . . . . . 18 4 11 69Borrowings . . . . . . . . . . . . . . . . . . . . . . . . . . . . . . . . . . . . . . . . . . . . . . . . . . . . . . . . . . 24 648 730 982Taxation . . . . . . . . . . . . . . . . . . . . . . . . . . . . . . . . . . . . . . . . . . . . . . . . . . . . . . . . . . . . . 588 603 677Provisions . . . . . . . . . . . . . . . . . . . . . . . . . . . . . . . . . . . . . . . . . . . . . . . . . . . . . . . . . . . 26 17 30 39
3,852 3,918 4,424
Non-current liabilitiesDerivative financial instruments . . . . . . . . . . . . . . . . . . . . . . . . . . . . . . . . . . . . . . . . . . 18 13 — —Borrowings . . . . . . . . . . . . . . . . . . . . . . . . . . . . . . . . . . . . . . . . . . . . . . . . . . . . . . . . . . 24 2,633 3,162 3,300Deferred tax liabilities . . . . . . . . . . . . . . . . . . . . . . . . . . . . . . . . . . . . . . . . . . . . . . . . . . 19 1,076 919 1,236Net pension obligations . . . . . . . . . . . . . . . . . . . . . . . . . . . . . . . . . . . . . . . . . . . . . . . . . 6 379 466 242Provisions . . . . . . . . . . . . . . . . . . . . . . . . . . . . . . . . . . . . . . . . . . . . . . . . . . . . . . . . . . . 26 116 139 87
4,217 4,686 4,865
Liabilities associated with assets held for sale . . . . . . . . . . . . . . . . . . . . . . . . . . . . . . . 22 3 96 17
Total liabilities . . . . . . . . . . . . . . . . . . . . . . . . . . . . . . . . . . . . . . . . . . . . . . . . . . . . . . . . 8,072 8,700 9,306
Net assets . . . . . . . . . . . . . . . . . . . . . . . . . . . . . . . . . . . . . . . . . . . . . . . . . . . . . . . . . . . . 2,423 2,314 2,197
Capital and reservesCombined share capitals . . . . . . . . . . . . . . . . . . . . . . . . . . . . . . . . . . . . . . . . . . . . . . . . 27 224 223 223Combined share premiums . . . . . . . . . . . . . . . . . . . . . . . . . . . . . . . . . . . . . . . . . . . . . . 28 2,887 2,727 2,723Combined shares held in treasury . . . . . . . . . . . . . . . . . . . . . . . . . . . . . . . . . . . . . . . . . 29 (1,464) (899) (663)Translation reserve . . . . . . . . . . . . . . . . . . . . . . . . . . . . . . . . . . . . . . . . . . . . . . . . . . . . 30 (137) (23) 88Other combined reserves . . . . . . . . . . . . . . . . . . . . . . . . . . . . . . . . . . . . . . . . . . . . . . . . 31 880 252 (199)
Combined shareholders’ equity . . . . . . . . . . . . . . . . . . . . . . . . . . . . . . . . . . . . . . . . . . . 2,390 2,280 2 ,172Non-controlling interests . . . . . . . . . . . . . . . . . . . . . . . . . . . . . . . . . . . . . . . . . . . . . . . . 33 34 25
Total equity . . . . . . . . . . . . . . . . . . . . . . . . . . . . . . . . . . . . . . . . . . . . . . . . . . . . . . . . . . 2,423 2,314 2,197
F-8
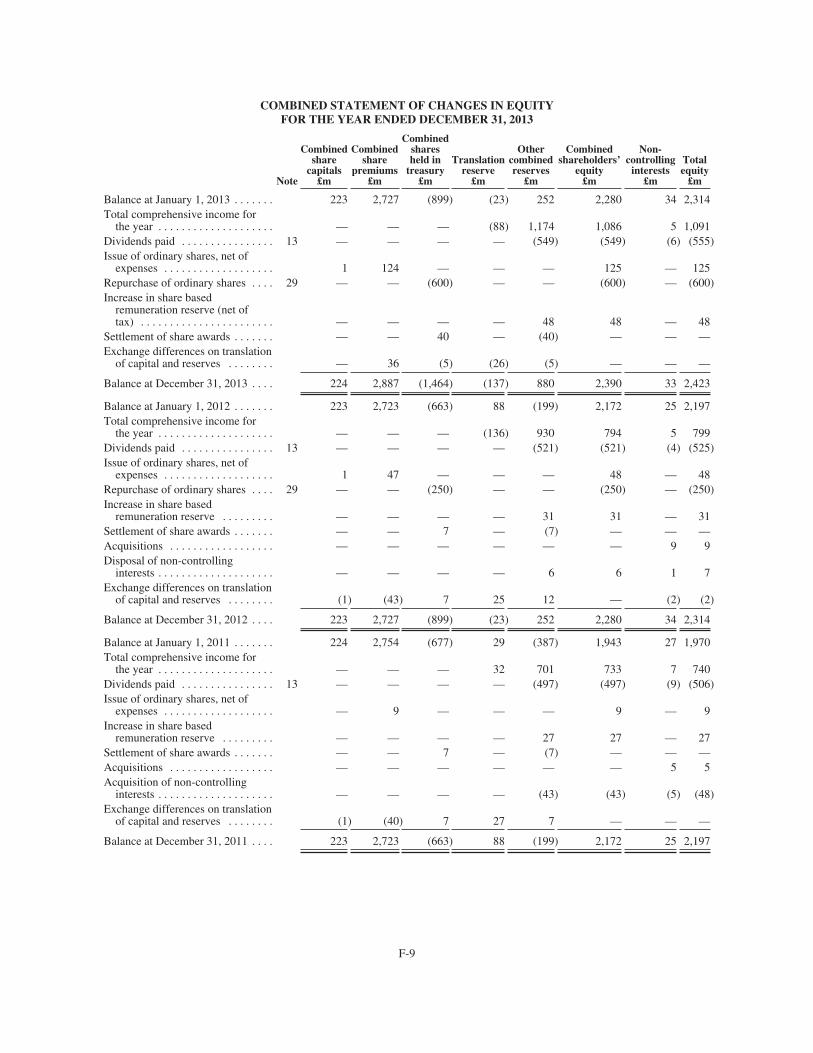
COMBINED STATEMENT OF CHANGES IN EQUITYFOR THE YEAR ENDED DECEMBER 31, 2013
Note
Combinedshare
capitals£m
Combinedshare
premiums£m
Combinedsharesheld in
treasury£m
Translationreserve
£m
Othercombinedreserves
£m
Combinedshareholders’
equity£m
Non-controlling
interests£m
Totalequity
£m
Balance at January 1, 2013 . . . . . . . 223 2,727 (899) (23) 252 2,280 34 2,314Total comprehensive income for
the year . . . . . . . . . . . . . . . . . . . . — — — (88) 1,174 1,086 5 1,091Dividends paid . . . . . . . . . . . . . . . . 13 — — — — (549) (549) (6) (555)Issue of ordinary shares, net of
expenses . . . . . . . . . . . . . . . . . . . 1 124 — — — 125 — 125Repurchase of ordinary shares . . . . 29 — — (600) — — (600) — (600)Increase in share based
remuneration reserve (net oftax) . . . . . . . . . . . . . . . . . . . . . . . — — — — 48 48 — 48
Settlement of share awards . . . . . . . — — 40 — (40) — — —Exchange differences on translation
of capital and reserves . . . . . . . . — 36 (5) (26) (5) — — —
Balance at December 31, 2013 . . . . 224 2,887 (1,464) (137) 880 2,390 33 2,423
Balance at January 1, 2012 . . . . . . . 223 2,723 (663) 88 (199) 2,172 25 2,197Total comprehensive income for
the year . . . . . . . . . . . . . . . . . . . . — — — (136) 930 794 5 799Dividends paid . . . . . . . . . . . . . . . . 13 — — — — (521) (521) (4) (525)Issue of ordinary shares, net of
expenses . . . . . . . . . . . . . . . . . . . 1 47 — — — 48 — 48Repurchase of ordinary shares . . . . 29 — — (250) — — (250) — (250)Increase in share based
remuneration reserve . . . . . . . . . — — — — 31 31 — 31Settlement of share awards . . . . . . . — — 7 — (7) — — —Acquisitions . . . . . . . . . . . . . . . . . . — — — — — — 9 9Disposal of non-controlling
interests . . . . . . . . . . . . . . . . . . . . — — — — 6 6 1 7Exchange differences on translation
of capital and reserves . . . . . . . . (1) (43) 7 25 12 — (2) (2)
Balance at December 31, 2012 . . . . 223 2,727 (899) (23) 252 2,280 34 2,314
Balance at January 1, 2011 . . . . . . . 224 2,754 (677) 29 (387) 1,943 27 1,970Total comprehensive income for
the year . . . . . . . . . . . . . . . . . . . . — — — 32 701 733 7 740Dividends paid . . . . . . . . . . . . . . . . 13 — — — — (497) (497) (9) (506)Issue of ordinary shares, net of
expenses . . . . . . . . . . . . . . . . . . . — 9 — — — 9 — 9Increase in share based
remuneration reserve . . . . . . . . . — — — — 27 27 — 27Settlement of share awards . . . . . . . — — 7 — (7) — — —Acquisitions . . . . . . . . . . . . . . . . . . — — — — — — 5 5Acquisition of non-controlling
interests . . . . . . . . . . . . . . . . . . . . — — — — (43) (43) (5) (48)Exchange differences on translation
of capital and reserves . . . . . . . . (1) (40) 7 27 7 — — —
Balance at December 31, 2011 . . . . 223 2,723 (663) 88 (199) 2,172 25 2,197
F-9
REED ELSEVIERNOTES TO THE COMBINED FINANCIAL STATEMENTS
1. Basis of preparation
The Reed Elsevier combined financial statements are prepared in accordance with International Financial ReportingStandards (“IFRS”) as issued by the International Accounting Standards Board (“IASB”) and as adopted by the EuropeanUnion.
On January 1, 1993 Reed Elsevier PLC and Reed Elsevier NV contributed their businesses to two jointly ownedcompanies, Reed Elsevier Group plc and Elsevier Reed Finance BV. Reed Elsevier Group plc, which owns the publishing andinformation businesses, is incorporated in England and Elsevier Reed Finance BV, which owns the financing companies, isincorporated in the Netherlands. Reed Elsevier PLC and Reed Elsevier NV each hold a 50% interest in Reed Elsevier Groupplc. Reed Elsevier PLC holds a 39% interest in Elsevier Reed Finance BV, with Reed Elsevier NV holding a 61% interest.Reed Elsevier PLC additionally holds an indirect equity interest in Reed Elsevier NV, reflecting the arrangements entered intobetween Reed Elsevier PLC and Reed Elsevier NV at the time of the merger, which determined the equalisation ratio wherebyone Reed Elsevier NV ordinary share is, in broad terms, intended to confer equivalent economic interests to 1.538 ReedElsevier PLC ordinary shares.
The equalisation agreement between Reed Elsevier PLC and Reed Elsevier NV has the effect that their shareholders canbe regarded as having the interests of a single economic group. The Reed Elsevier combined financial statements (“thecombined financial statements”) represent the combined interests of both sets of shareholders and encompass the businessesof Reed Elsevier Group plc and Elsevier Reed Finance BV and their respective subsidiaries, associates and joint ventures,together with the two parent companies, Reed Elsevier PLC and Reed Elsevier NV (“the combined businesses”).
2. Accounting policies
The Reed Elsevier accounting policies are set out below:
Principles of combination
In preparing the combined financial statements, subsidiaries of Reed Elsevier Group plc and Elsevier Reed Finance BVare accounted for under the acquisition method and investments in associates and joint ventures are accounted for under theequity method. All transactions and balances between the combined businesses are eliminated.
On acquisition of a subsidiary, or interest in an associate or joint venture, fair values, reflecting conditions at the date ofacquisition, are attributed to the net assets, including identifiable intangible assets acquired. This includes those adjustmentsmade to bring accounting policies into line with those of the combined businesses. The results of subsidiaries sold or acquiredare included in the combined financial statements up to or from the date that control passes from or to the combinedbusinesses.
Non-controlling interests in the net assets of the combined businesses are identified separately from combinedshareholders’ equity. Non-controlling interests consist of the amount of those interests at the date of the original acquisitionand the non-controlling share of changes in equity since the date of acquisition.
Foreign exchange translation
The combined financial statements are presented in pounds sterling.
Transactions in foreign currencies are recorded at the rate of exchange prevailing on the date of the transaction. At eachstatement of financial position date, monetary assets and liabilities that are denominated in foreign currencies are retranslatedat the rate prevailing on the statement of financial position date. Exchange differences arising are recorded in the incomestatement other than where hedge accounting applies as set out below.
Assets and liabilities of foreign operations are translated at exchange rates prevailing on the statement of financialposition date. Income and expense items and cash flows of foreign operations are translated at the average exchange rate forthe period. Significant individual items of income and expense and cash flows in foreign operations are translated at the rateprevailing on the date of transaction. Exchange differences arising are classified as equity and transferred to the translationreserve. When foreign operations are disposed of, the related cumulative translation differences are recognised within theincome statement in the period.
Reed Elsevier uses derivative financial instruments, primarily forward contracts, to hedge its exposure to certain foreignexchange risks. Details of Reed Elsevier’s accounting policies in respect of derivative financial instruments are set out below.
F-10
2. Accounting policies – (continued)
Revenue
Revenue represents the invoiced value of sales less anticipated returns on transactions completed by performance,excluding customer sales taxes.
Revenues are recognised for the various categories of turnover as follows: subscriptions — on periodic despatch ofsubscribed product or rateably over the period of the subscription where performance is not measurable by despatch;transactional — on despatch or occurrence of the transaction or exhibition and advertising — on publication or over theperiod of online display.
Where sales consist of two or more independent components whose value can be reliably measured, revenue isrecognised on each component as it is completed by performance, based on attribution of relative value.
Employee benefits
The expense of defined benefit pension schemes and other post-retirement employee benefits is determined using theprojected unit credit method and charged in the income statement as an operating expense, based on actuarial assumptionsreflecting market conditions at the beginning of the financial year. Actuarial gains and losses are recognised in full in thestatement of comprehensive income in the period in which they occur.
Past service costs are recognised immediately at the earlier of when plan amendments or curtailments occur and whenrelated restructuring costs or termination benefits are recognised. Settlements are recognised when they occur.
Net pension obligations in respect of defined benefit schemes are included in the statement of financial position at thepresent value of scheme liabilities, less the fair value of scheme assets. Where schemes are in surplus, i.e. assets exceedliabilities, the net pension assets are separately included in the statement of financial position. Any net pension asset is limitedto the extent that the asset is recoverable through reductions in future contributions.
The expense of defined contribution pension schemes and other employee benefits is charged in the income statement asincurred.
Share based remuneration
The fair value of share based remuneration is determined at the date of grant and recognised as an expense in the incomestatement on a straight line basis over the vesting period, taking account of the estimated number of shares that are expected tovest. Market based performance criteria are taken into account when determining the fair value at the date of grant. Non-market based performance criteria are taken into account when estimating the number of shares expected to vest. The fairvalue of share based remuneration is determined by use of a binomial or Monte Carlo simulation model as appropriate. AllReed Elsevier’s share based remuneration is equity settled.
Borrowing costs
Borrowing costs that are directly attributable to the acquisition, construction or production of an asset that takes asubstantial period of time to bring to use are capitalised. All other interest on borrowings is expensed as incurred. The cost ofissuing borrowings is generally expensed over the period of borrowing so as to produce a constant periodic rate of charge.
Taxation
Tax expense comprises current and deferred tax. Current and deferred tax are charged or credited in the incomestatement except to the extent that the tax arises from a transaction or event which is recognised, in the same or a differentperiod, outside profit or loss (either in other comprehensive income, directly in equity, or through a business combination) inwhich case the tax appears in the same statement as the transaction that gave rise to it.
Current tax is the amount of corporate income taxes payable or recoverable based on the profit for the period as adjustedfor items that are not taxable or not deductible, and is calculated using tax rates and laws that were enacted or substantivelyenacted at the date of the statement of financial position. Management periodically evaluates positions taken in tax returnswith respect to situations in which applicable tax regulation is subject to interpretation. Provisions are established whereappropriate on the basis of amounts expected to be paid to the tax authorities.
Deferred tax is recognised on temporary differences arising between the tax bases of assets and liabilities and theircarrying amounts in the statement of financial position. Deferred tax is calculated using tax rates and laws that have beenenacted or substantively enacted at the end of the reporting period, and which are expected to apply when the related deferredtax asset is realized or the deferred tax liability is settled.
F-11
2. Accounting policies – (continued)
Deferred tax liabilities are generally recognised for all taxable temporary differences but not recognised for taxabletemporary differences arising on investments in subsidiaries, associates and joint ventures where the reversal of the temporarydifference can be controlled and it is probable that the difference will not reverse in the foreseeable future. Deferred taxliabilities are not recognised on temporary differences that arise from goodwill which is not deductible for tax purposes.
Deferred tax assets are recognised to the extent it is probable that taxable profits will be available against which thedeductible temporary differences can be utilised and are reviewed at the end of each reporting period and reduced to the extentthat it is no longer probable that sufficient taxable profits will be available to allow all or part of the asset to be recovered.
Deferred tax assets and liabilities are not recognised in respect of temporary differences that arise on initial recognitionof assets and liabilities acquired other than in a business combination. Deferred tax is not discounted.
Goodwill
On the acquisition of a subsidiary or business, the purchase consideration is allocated between the net tangible andintangible assets on a fair value basis, with any excess purchase consideration representing goodwill. Goodwill arising onacquisitions also includes amounts corresponding to deferred tax liabilities recognised in respect of acquired intangible assets.
Goodwill is recognised as an asset and reviewed for impairment when there is an indicator that the asset may be impairedand at least annually. Any impairment is recognised immediately in the income statement and not subsequently reversed.
On disposal of a subsidiary or business, the attributable amount of goodwill is included in the determination of the profitor loss on disposal.
Intangible assets
Intangible assets acquired as part of a business combination are stated in the statement of financial position at their fairvalue as at the date of acquisition, less accumulated amortisation. Internally generated intangible assets are stated in thestatement of financial position at the directly attributable cost of creation of the asset, less accumulated amortisation.
Intangible assets acquired as part of business combinations comprise: market related assets (e.g. trademarks, imprints,brands); customer related assets (e.g. subscription bases, customer lists, customer relationships); editorial content; softwareand systems (e.g. application infrastructure, product delivery platforms, in-process research and development); contract basedassets (e.g. publishing rights, exhibition rights, supply contracts); and other intangible assets. Internally generated intangibleassets typically comprise software and systems development where an identifiable asset is created that is probable to generatefuture economic benefits.
Intangible assets, other than brands and imprints determined to have indefinite lives, are amortised on a straight line basisover their estimated useful lives. The estimated useful lives of intangible assets with finite lives are as follows: market andcustomer related assets — 3 to 40 years; content, software and other acquired intangible assets — 3 to 20 years; and internallydeveloped intangible assets — 3 to 10 years. Brands and imprints determined to have indefinite lives are not amortised andare subject to an impairment review at least annually.
Property, plant and equipment
Property, plant and equipment are stated in the statement of financial position at cost less accumulated depreciation. Nodepreciation is provided on freehold land. Freehold buildings and long leases are depreciated over their estimated useful livesup to a maximum of 50 years. Short leases are written off over the duration of the lease. Depreciation is provided on otherassets on a straight line basis over their estimated useful lives as follows: leasehold improvements — shorter of life of leaseand 10 years; plant — 3 to 20 years; office furniture, fixtures and fittings — 5 to 10 years; computer systems, communicationnetworks and equipment — 3 to 7 years.
Investments
Investments, other than investments in joint arrangements and associates, are stated in the statement of financial positionat fair value. Investments held as part of the venture capital portfolio are classified as held for trading, with changes in fairvalue reported in disposals and other non operating items in the income statement. All other investments are classified asavailable for sale with changes in fair value recognised directly in equity until the investment is disposed of or is determinedto be impaired, at which time the cumulative gain or loss previously recognised in equity is brought into the net profit or lossfor the period. All items recognised in the income statement relating to investments, other than investments in jointarrangements and associates, are reported as disposals and other non operating items.
F-12
2. Accounting policies – (continued)
Available for sale investments and venture capital investments held for trading represent investments in listed andunlisted securities. The fair value of listed securities is determined based on quoted market prices, and of unlisted securities onmanagement’s estimate of fair value based on standard valuation techniques, including market comparisons and discounts offuture cash flows, having regard to maximising the use of observable inputs and adjusting for risk. Advice from valuationexperts is used as appropriate.
All joint arrangements are classified as joint ventures because Reed Elsevier shares joint control and has rights to the netassets of the arrangements. Investments in joint ventures and associates are accounted for under the equity method and statedin the statement of financial position at cost as adjusted for post-acquisition changes in Reed Elsevier’s share of net assets,less any impairment in value.
Impairment
At each statement of financial position date, the carrying amounts of tangible and intangible assets and goodwill arereviewed to determine whether there is any indication that those assets have suffered an impairment loss. If any suchindication exists, the recoverable amount, which is the higher of value in use and fair value less costs to sell, of the asset isestimated in order to determine the extent, if any, of the impairment loss. Where the asset does not generate cash flows thatare independent from other assets, value in use estimates are made based on the cash flows of the cash generating unit towhich the asset belongs. Intangible assets with an indefinite useful life are tested for impairment at least annually andwhenever there is any indication that the asset may be impaired.
If the recoverable amount of an asset or cash generating unit is estimated to be less than its net carrying amount, the netcarrying amount of the asset or cash generating unit is reduced to its recoverable amount. Impairment losses are recognisedimmediately in the income statement in administration and other expenses.
Inventories and pre-publication costs
Inventories and pre-publication costs are stated at the lower of cost, including appropriate attributable overhead, andestimated net realisable value. Pre-publication costs, representing costs incurred in the origination of content prior topublication, are expensed systematically reflecting the expected sales profile over the estimated economic lives of the relatedproducts, generally up to five years.
Leases
Assets held under leases which confer rights and obligations similar to those attaching to owned assets are classified asassets held under finance leases and capitalised within property, plant and equipment or software and the correspondingliability to pay rentals is shown net of interest in the statement of financial position as obligations under finance leases. Thecapitalised value of the assets is depreciated on a straight line basis over the shorter of the periods of the leases or the usefullives of the assets concerned. The interest element of the lease payments is allocated so as to produce a constant periodic rateof charge.
Operating lease rentals are charged to the income statement on a straight line basis over the period of the leases. Rentalincome from operating leases is recognised on a straight line basis over the term of the relevant lease.
Cash and cash equivalents
Cash and cash equivalents comprise cash balances, call deposits and other short term highly liquid investments and areheld in the statement of financial position at fair value.
Assets held for sale
Assets of businesses that are available for immediate sale in their current condition and for which a sales process isconsidered highly probable to complete are classified as assets held for sale, and are carried at the lower of carrying value andfair value less costs to sell. Non-current assets are not amortised or depreciated following their classification as held for sale.Liabilities of businesses held for sale are also separately classified on the statement of financial position. Fair value is basedon anticipated disposal proceeds, typically derived from firm or indicative offers from potential acquirers.
Financial instruments
Financial instruments comprise investments (other than investments in joint ventures or associates), trade receivables,cash and cash equivalents, payables and accruals, borrowings and derivative financial instruments.
F-13
2. Accounting policies – (continued)
Investments (other than investments in joint ventures and associates) are classified as either held for trading or availablefor sale, as described above. (These investments are typically classified as either Level 1 or Level 2 in the IFRS13 fair valuehierarchy.). The fair value of such investments is based on either quoted market prices or other observable market inputs.
Trade receivables are carried in the statement of financial position at invoiced value less allowance for estimatedirrecoverable amounts. Irrecoverable amounts are estimated based on the ageing of trade receivables, experience andcircumstance.
Borrowings, payables and accruals are recorded initially at fair value and subsequently carried at amortised cost (otherthan fixed rate borrowings in designated hedging relationships for which the carrying amount of the hedged portion of theborrowings is subsequently adjusted for the gain or loss attributable to the hedged risk).
Derivative financial instruments are used to hedge interest rate and foreign exchange risks. Changes in the fair value ofderivative financial instruments that are designated and effective as hedges of future cash flows are recognised (net of tax)directly in equity in the hedge reserve. If a hedged firm commitment or forecasted transaction results in the recognition of anon financial asset or liability, then, at the time that the asset or liability is recognised, the associated gains or losses on thederivative that had previously been recognised in equity are included in the initial measurement of the asset or liability. Forhedges that do not result in the recognition of an asset or a liability, amounts deferred in equity are recognised in the incomestatement in the same period in which the hedged item affects net profit or loss. Any ineffective portion of hedges isrecognised immediately in the income statement.
Derivative financial instruments that are not designated as hedging instruments are classified as held for trading andrecorded in the statement of financial position at fair value, with changes in fair value recognised in the income statement.
Where an effective hedge is in place against changes in the fair value of fixed rate borrowings, the hedged borrowingsare adjusted for changes in fair value attributable to the risk being hedged with a corresponding income or expense included inthe income statement within finance costs. The offsetting gains or losses from remeasuring the fair value of the relatedderivatives are also recognised in the income statement within finance costs. When the related derivative expires, is sold orterminated, or no longer qualifies for hedge accounting, the cumulative change in fair value of the hedged borrowing isamortised in the income statement over the period to maturity of the borrowing using the effective interest method.
The fair values of interest rate swaps, interest rate options, forward rate agreements and forward foreign exchangecontracts represent the replacement costs calculated using observable market rates of interest and exchange. The fair value oflong term borrowings is calculated by discounting expected future cash flows at observable market rates. (These instrumentsare accordingly classified as Level 2 in the IFRS13 fair value hierarchy.)
Cash flow hedge accounting is discontinued when a hedging instrument expires or is sold, terminated or exercised, or nolonger qualifies for hedge accounting. At that time, any cumulative gain or loss on the hedging instrument recognised inequity is either retained in equity until the firm commitment or forecasted transaction occurs, or, where a hedged transaction isno longer expected to occur, is immediately credited or expensed in the income statement.
Provisions
Provisions are recognised when a present obligation exists as a result of a past event, the obligation is reasonablyestimable, and it is probable that settlement will be required. Provisions are measured at the best estimate of the expenditurerequired to settle the obligation at the statement of financial position date.
Shares held in treasury
Shares of Reed Elsevier PLC and Reed Elsevier NV that are repurchased by the respective parent companies and notcancelled are classified as shares held in treasury. The consideration paid, including directly attributable costs, is recognisedas a deduction from equity. Shares of the parent companies that are purchased by the Reed Elsevier Group plc EmployeeBenefit Trust are also classified as shares held in treasury, with the cost recognised as a deduction from equity.
Critical judgements and key sources of estimation uncertainty
The most significant accounting policies in determining the financial condition and results of the Reed Elseviercombined businesses, and those requiring the most subjective or complex judgement, relate to the valuation of goodwill andintangible assets, capitalisation of development spend and taxation.
Goodwill and acquired intangible assets
On acquisition of a subsidiary or business, the purchase consideration is allocated between the net tangible and intangibleassets other than goodwill on a fair value basis, with any excess purchase consideration representing goodwill. The valuation
F-14
2. Accounting policies – (continued)
of acquired intangible assets represents the estimated economic value in use, using standard valuation methodologies,including as appropriate, discounted cash flow, relief from royalty and comparable market transactions. Acquired intangibleassets are capitalised and amortised systematically over their estimated useful lives, subject to impairment review.
Appropriate amortisation periods are selected based on assessments of the longevity of the brands and imprints, thestrength and stability of customer relationships, the market positions of the acquired assets and the technological andcompetitive risks that they face. Certain intangible assets in relation to acquired science and medical publishing businesseshave been determined to have indefinite lives. The longevity of these assets is evidenced by their long established and wellregarded brands and imprints, and their characteristically stable market positions.
The carrying amounts of goodwill and indefinite lived intangible assets in each business are reviewed for impairment atleast annually. The carrying amounts of all other intangible assets are reviewed where there are indications of possibleimpairment. An impairment review involves a comparison of the carrying value of the asset with estimated values in usebased on latest management cash flow projections. Key areas of judgement in estimating the values in use of businesses arethe growth in cash flows over a forecast period of up to five years, the long term growth rate assumed thereafter and thediscount rate applied to the forecast cash flows.
The discount rates used are based on the Reed Elsevier weighted average cost of capital, adjusted to reflect a riskpremium specific to each business. The pre-tax discount rates applied are 11.1% for Scientific, Technical & Medical, 11.6%for Risk Solutions, 11.5-12.8% for Business Information, 10.9-12.5% for Legal and 9.5-13.0% for Exhibitions. The nominallong term growth rates, which are based on historical growth rates and the growth prospects for businesses, are 3%. Therewere no charges for impairment of acquired intangible assets and goodwill in 2013 (2012: nil; 2011: nil).
A sensitivity analysis has been performed based on changes in key assumptions considered to be reasonably possible bymanagement: an increase in the discount rate of 0.5%; a decrease in the compound annual growth rate for adjusted operatingcash flow in the five year forecast period of 2.0%; and a decrease in perpetuity growth rates of 0.5%. The sensitivity analysisshows that impairment charges resulting from these scenarios individually would be less than £5 million. Further informationis provided in note 14 to the combined financial statements.
Development spend
Development spend embraces investment in new products and other initiatives, ranging from the building of onlinedelivery platforms, to launch costs of new services, to building new infrastructure applications. Launch costs and otherongoing operating expenses of new products and services are expensed as incurred. The costs of building productapplications, platforms and infrastructure are capitalised as intangible assets where the investment they represent hasdemonstrable value and technical and commercial feasibility is assured. Costs eligible for capitalisation must be incremental,clearly identified and directly attributable to a particular project. The resulting assets are amortised over their estimated usefullives. Impairment reviews are carried out at least annually. Judgement is required in the assessment of the potential value of adevelopment project, the identification of costs eligible for capitalisation and the selection of appropriate asset lives.
Taxation
Reed Elsevier is subject to tax in numerous jurisdictions, giving rise to complex tax issues that require management toexercise judgement in making tax determinations. While Reed Elsevier is confident that tax returns are appropriately preparedand filed, amounts are provided in respect of uncertain tax positions that reflect the risk with respect to tax matters underactive discussion with tax authorities, or which are otherwise considered to involve uncertainty. Amounts are provided usingthe best estimate of tax expected to be paid based on a qualitative assessment of all relevant factors. However, it is possiblethat at some future date liabilities may be adjusted as a result of audits by taxing authorities. Discussions with tax authoritiesrelating to cross-border transactions and other matters are ongoing. Although the outcome of these discussions cannot bepredicted, no significant impact on the financial position of Reed Elsevier is expected.
In addition, estimation of income taxes includes assessments of the recoverability of deferred tax assets. Deferred taxassets are only recognized to the extent that they are considered recoverable based on existing tax laws and forecasts of futuretaxable profits against which the underlying tax deductions can be utilized. The recoverability of these assets is reassessed atthe end of each reporting period, and changes in recognition of deferred tax assets will affect the tax liability in the period ofthat reassessment.
Other significant accounting policies
The accounting policies in respect of revenue recognition, pre-publication costs, property provisioning and pensions arealso significant in determining the financial condition and results of the Reed Elsevier combined businesses, although theapplication of these policies is more straightforward.
F-15
2. Accounting policies – (continued)
Revenue recognition policies, while an area of management focus, are generally straightforward in application as thetiming of product or service delivery and customer acceptance for the various revenue types can be readily determined.Allowances for product returns are deducted from revenues based on historical return rates. Where sales consist of two ormore components that operate independently, revenue is recognised as each component is completed by performance, basedon attribution of relative value.
Pre-publication costs incurred in the creation of content prior to production and publication are typically deferred andexpensed over their estimated useful lives based on sales profiles. Such costs typically comprise direct internal labour costsand externally commissioned editorial and other fees. Estimated useful lives generally do not exceed five years. Annualreviews are carried out to assess the recoverability of carrying amounts.
Reed Elsevier has exposures to sub lease shortfalls in respect of certain property leases for periods up to 2024. Provisionsare recognised for net liabilities expected to arise on these exposures. Estimation of the provisions requires judgement inrespect of future head lease costs, sub lease income and the length of vacancy periods. The charge for property provisions wasnil (2012: £62 million; 2011: £16 million) relating to surplus property arising on the restructuring, sale and closure ofBusiness Information businesses and includes expected losses on sub-leases entered into during 2013 and an estimate ofvacancy periods and future market conditions. Further information is provided in note 26 to the combined financialstatements.
Accounting for defined benefit pension schemes involves judgement about uncertain events, including the lifeexpectancy of the members, salary and pension increases, inflation, the return on scheme assets and the rate at which thefuture pension payments are discounted. Estimates for these factors are used in determining the pension cost and liabilitiesreported in the financial statements. These best estimates of future developments are made in conjunction with independentactuaries. Each scheme is subject to a periodic review by independent actuaries.
Details of key assumptions and sensitivity analysis is provided in note 6 to the financial statements.
Standards and amendments effective for the year
With effect from January 1, 2013, IAS19 – Employee Benefits (revised) inter alia changes the methodology used in thecalculation of the net pension financing credit or charge in relation to defined benefit pension schemes. Under the revisedstandard, pension asset returns included within the net pension financing credit or charge are calculated by reference to thediscount rate of high-quality corporate bonds (being also the discount rate applied in the calculation of pension obligations)and are no longer based on the expected returns on scheme assets. The effect is to reduce the asset returns recognised in theincome statement.
Adoption of IAS19 (revised) has had no impact on Reed Elsevier’s combined statement of financial position andstatement of cash flows. The net pension financing credit or charge is now presented within net finance costs in ReedElsevier’s combined income statement, rather than within operating profit as previously reported.
As required under the revised standard, comparative figures have been restated. For the year ended December 31, 2012,operating profits are £25 million lower and net finance costs are £11 million higher than previously reported. For the yearended December 31, 2011, operating profits are £34 million lower and net finance costs are £9 million higher than previouslyreported.
With effect from January 1, 2013, Reed Elsevier adopted IAS1 – Presentation of Items of Other Comprehensive Income(amendments to IAS1). The standard amends the grouping of items presented in the statement of comprehensive income intoitems that may be reclassified to the profit or loss in a future period and items that will never be reclassified.
With effect from January 1, 2013 Reed Elsevier also adopted IFRS10 Consolidated Financial Statements, IFRS11 JointArrangements, IFRS12 Disclosure of Interests in Other Entities, and IFRS13 Fair Value Measurement, in addition toamendments to IAS27 Consolidated and Separate3 Financial Statements and IAS28 Investments in Associates. Adoption ofthese new accounting standards and amendments has not had a significant impact on Reed Elsevier’s accounting policies orreporting. With the exception of IFRS13, these standards and amendments have been early adopted for the purposes of ReedElsevier’s application of IFRS as adopted by the EU.
F-16
2. Accounting policies – (continued)
Standards, amendments and interpretations not yet effective
New accounting standards and amendments and their expected impact on the future accounting policies and reporting ofReed Elsevier are set out below.
IFRS9 – Financial Instruments (effective for the 2015 financial year). The standard replaces the existing classificationand measurement requirements in IAS39 for financial assets by requiring entities to classify them as being measured either atamortised cost or fair value depending on the business model and contractual cash flow characteristics of the asset. Forfinancial liabilities, IFRS9 requires an entity choosing to measure a liability at fair value to present the portion of the changein its fair value due to changes in the entity’s own credit risk in the other comprehensive income rather than the incomestatement. Adoption of the standard is not expected to have a significant impact on the measurement, presentation ordisclosure of financial assets and liabilities in the combined financial statements.
Amendments to IAS36 – Impairment of Assets (effective for the 2014 financial year). These amendments requiredisclosure of the recoverable amounts for the assets or CGUs for which an impairment loss has been recognised or reversedduring the reporting period and are effective retrospectively. Adoption of the standard is not expected to have a significantimpact on disclosure in the combined financial statements.
Additionally, a number of amendments and interpretations have been issued which are not expected to have anysignificant impact on Reed Elsevier’s accounting policies and reporting.
3. Segment analysis
Reed Elsevier’s reported segments are based on the internal reporting structure and financial information provided to theChief Executive Officer and Boards.
Reed Elsevier is a world leading provider of professional information solutions organised as five business segments:Scientific, Technical & Medical, providing information and tools to help its customers improve scientific and healthcareoutcomes; Risk Solutions, providing tools that combine proprietary, public and third-party information with advancedtechnology and analytics; Business Information, providing data services, information and marketing solutions to businessprofessionals; Legal, providing legal, tax, regulatory news & business information to legal, corporate, government, accountingand academic markets; and Exhibitions, organising exhibitions and conferences.
Adjusted operating profit is the key segmental profit measure used by Reed Elsevier in assessing performance. It is statedbefore amortisation of acquired intangible assets, the share of profit on disposals in joint ventures, acquisition related costs,and is grossed up to exclude the equity share of taxes in joint ventures.
F-17
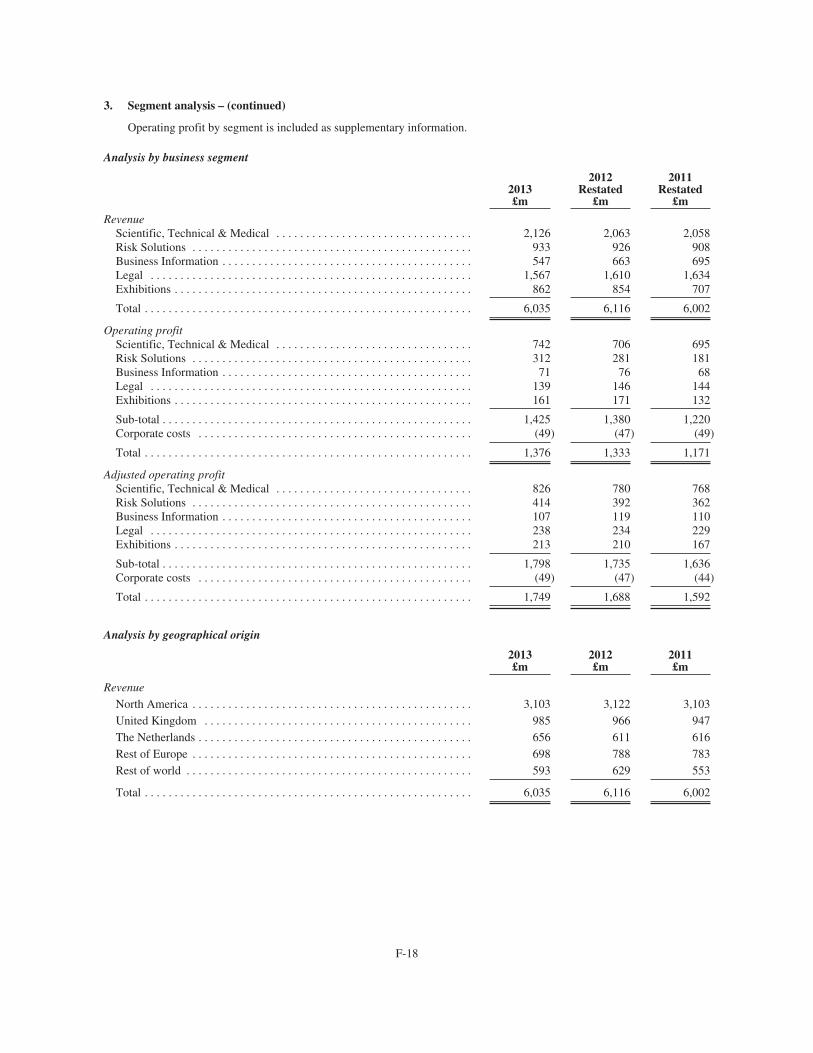
3. Segment analysis – (continued)
Operating profit by segment is included as supplementary information.
Analysis by business segment
2013£m
2012Restated
£m
2011Restated
£m
RevenueScientific, Technical & Medical . . . . . . . . . . . . . . . . . . . . . . . . . . . . . . . . . 2,126 2,063 2,058Risk Solutions . . . . . . . . . . . . . . . . . . . . . . . . . . . . . . . . . . . . . . . . . . . . . . . 933 926 908Business Information . . . . . . . . . . . . . . . . . . . . . . . . . . . . . . . . . . . . . . . . . . 547 663 695Legal . . . . . . . . . . . . . . . . . . . . . . . . . . . . . . . . . . . . . . . . . . . . . . . . . . . . . . 1,567 1,610 1,634Exhibitions . . . . . . . . . . . . . . . . . . . . . . . . . . . . . . . . . . . . . . . . . . . . . . . . . . 862 854 707
Total . . . . . . . . . . . . . . . . . . . . . . . . . . . . . . . . . . . . . . . . . . . . . . . . . . . . . . . 6,035 6,116 6,002
Operating profitScientific, Technical & Medical . . . . . . . . . . . . . . . . . . . . . . . . . . . . . . . . . 742 706 695Risk Solutions . . . . . . . . . . . . . . . . . . . . . . . . . . . . . . . . . . . . . . . . . . . . . . . 312 281 181Business Information . . . . . . . . . . . . . . . . . . . . . . . . . . . . . . . . . . . . . . . . . . 71 76 68Legal . . . . . . . . . . . . . . . . . . . . . . . . . . . . . . . . . . . . . . . . . . . . . . . . . . . . . . 139 146 144Exhibitions . . . . . . . . . . . . . . . . . . . . . . . . . . . . . . . . . . . . . . . . . . . . . . . . . . 161 171 132
Sub-total . . . . . . . . . . . . . . . . . . . . . . . . . . . . . . . . . . . . . . . . . . . . . . . . . . . . 1,425 1,380 1,220Corporate costs . . . . . . . . . . . . . . . . . . . . . . . . . . . . . . . . . . . . . . . . . . . . . . (49) (47) (49)
Total . . . . . . . . . . . . . . . . . . . . . . . . . . . . . . . . . . . . . . . . . . . . . . . . . . . . . . . 1,376 1,333 1,171
Adjusted operating profitScientific, Technical & Medical . . . . . . . . . . . . . . . . . . . . . . . . . . . . . . . . . 826 780 768Risk Solutions . . . . . . . . . . . . . . . . . . . . . . . . . . . . . . . . . . . . . . . . . . . . . . . 414 392 362Business Information . . . . . . . . . . . . . . . . . . . . . . . . . . . . . . . . . . . . . . . . . . 107 119 110Legal . . . . . . . . . . . . . . . . . . . . . . . . . . . . . . . . . . . . . . . . . . . . . . . . . . . . . . 238 234 229Exhibitions . . . . . . . . . . . . . . . . . . . . . . . . . . . . . . . . . . . . . . . . . . . . . . . . . . 213 210 167
Sub-total . . . . . . . . . . . . . . . . . . . . . . . . . . . . . . . . . . . . . . . . . . . . . . . . . . . . 1,798 1,735 1,636Corporate costs . . . . . . . . . . . . . . . . . . . . . . . . . . . . . . . . . . . . . . . . . . . . . . (49) (47) (44)
Total . . . . . . . . . . . . . . . . . . . . . . . . . . . . . . . . . . . . . . . . . . . . . . . . . . . . . . . 1,749 1,688 1,592
Analysis by geographical origin
2013£m
2012£m
2011£m
Revenue
North America . . . . . . . . . . . . . . . . . . . . . . . . . . . . . . . . . . . . . . . . . . . . . . . 3,103 3,122 3,103United Kingdom . . . . . . . . . . . . . . . . . . . . . . . . . . . . . . . . . . . . . . . . . . . . . 985 966 947The Netherlands . . . . . . . . . . . . . . . . . . . . . . . . . . . . . . . . . . . . . . . . . . . . . . 656 611 616Rest of Europe . . . . . . . . . . . . . . . . . . . . . . . . . . . . . . . . . . . . . . . . . . . . . . . 698 788 783Rest of world . . . . . . . . . . . . . . . . . . . . . . . . . . . . . . . . . . . . . . . . . . . . . . . . 593 629 553
Total . . . . . . . . . . . . . . . . . . . . . . . . . . . . . . . . . . . . . . . . . . . . . . . . . . . . . . . 6,035 6,116 6,002
F-18
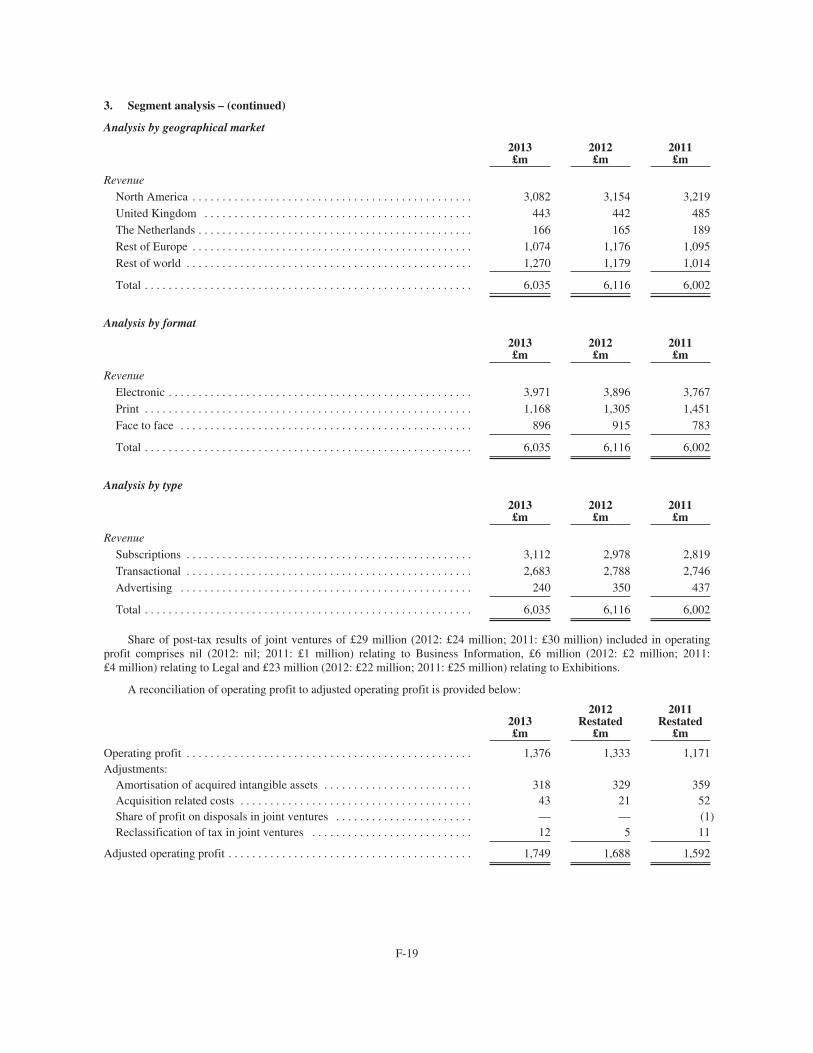
3. Segment analysis – (continued)
Analysis by geographical market
2013£m
2012£m
2011£m
Revenue
North America . . . . . . . . . . . . . . . . . . . . . . . . . . . . . . . . . . . . . . . . . . . . . . . 3,082 3,154 3,219United Kingdom . . . . . . . . . . . . . . . . . . . . . . . . . . . . . . . . . . . . . . . . . . . . . 443 442 485The Netherlands . . . . . . . . . . . . . . . . . . . . . . . . . . . . . . . . . . . . . . . . . . . . . . 166 165 189Rest of Europe . . . . . . . . . . . . . . . . . . . . . . . . . . . . . . . . . . . . . . . . . . . . . . . 1,074 1,176 1,095Rest of world . . . . . . . . . . . . . . . . . . . . . . . . . . . . . . . . . . . . . . . . . . . . . . . . 1,270 1,179 1,014
Total . . . . . . . . . . . . . . . . . . . . . . . . . . . . . . . . . . . . . . . . . . . . . . . . . . . . . . . 6,035 6,116 6,002
Analysis by format
2013£m
2012£m
2011£m
Revenue
Electronic . . . . . . . . . . . . . . . . . . . . . . . . . . . . . . . . . . . . . . . . . . . . . . . . . . . 3,971 3,896 3,767Print . . . . . . . . . . . . . . . . . . . . . . . . . . . . . . . . . . . . . . . . . . . . . . . . . . . . . . . 1,168 1,305 1,451Face to face . . . . . . . . . . . . . . . . . . . . . . . . . . . . . . . . . . . . . . . . . . . . . . . . . 896 915 783
Total . . . . . . . . . . . . . . . . . . . . . . . . . . . . . . . . . . . . . . . . . . . . . . . . . . . . . . . 6,035 6,116 6,002
Analysis by type
2013£m
2012£m
2011£m
Revenue
Subscriptions . . . . . . . . . . . . . . . . . . . . . . . . . . . . . . . . . . . . . . . . . . . . . . . . 3,112 2,978 2,819Transactional . . . . . . . . . . . . . . . . . . . . . . . . . . . . . . . . . . . . . . . . . . . . . . . . 2,683 2,788 2,746Advertising . . . . . . . . . . . . . . . . . . . . . . . . . . . . . . . . . . . . . . . . . . . . . . . . . 240 350 437
Total . . . . . . . . . . . . . . . . . . . . . . . . . . . . . . . . . . . . . . . . . . . . . . . . . . . . . . . 6,035 6,116 6,002
Share of post-tax results of joint ventures of £29 million (2012: £24 million; 2011: £30 million) included in operatingprofit comprises nil (2012: nil; 2011: £1 million) relating to Business Information, £6 million (2012: £2 million; 2011:£4 million) relating to Legal and £23 million (2012: £22 million; 2011: £25 million) relating to Exhibitions.
A reconciliation of operating profit to adjusted operating profit is provided below:
2013£m
2012Restated
£m
2011Restated
£m
Operating profit . . . . . . . . . . . . . . . . . . . . . . . . . . . . . . . . . . . . . . . . . . . . . . . . 1,376 1,333 1,171Adjustments:
Amortisation of acquired intangible assets . . . . . . . . . . . . . . . . . . . . . . . . . 318 329 359Acquisition related costs . . . . . . . . . . . . . . . . . . . . . . . . . . . . . . . . . . . . . . . 43 21 52Share of profit on disposals in joint ventures . . . . . . . . . . . . . . . . . . . . . . . — — (1)Reclassification of tax in joint ventures . . . . . . . . . . . . . . . . . . . . . . . . . . . 12 5 11
Adjusted operating profit . . . . . . . . . . . . . . . . . . . . . . . . . . . . . . . . . . . . . . . . . 1,749 1,688 1,592
F-19
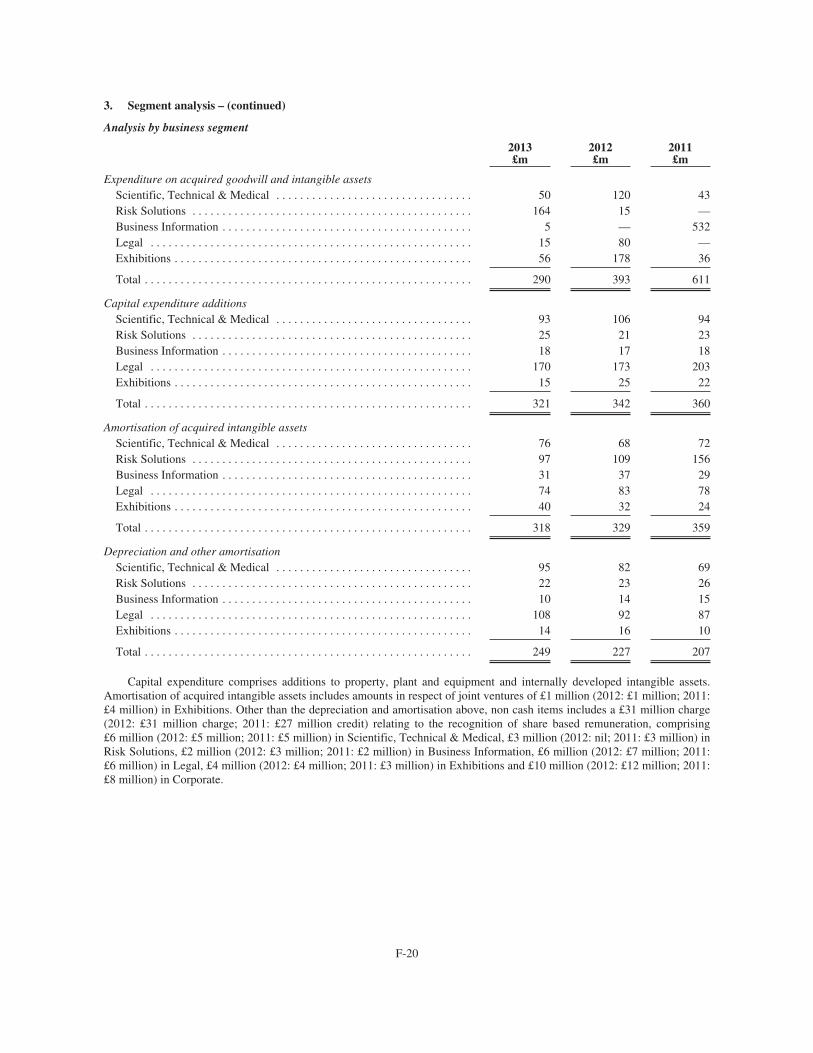
3. Segment analysis – (continued)
Analysis by business segment
2013£m
2012£m
2011£m
Expenditure on acquired goodwill and intangible assetsScientific, Technical & Medical . . . . . . . . . . . . . . . . . . . . . . . . . . . . . . . . . 50 120 43Risk Solutions . . . . . . . . . . . . . . . . . . . . . . . . . . . . . . . . . . . . . . . . . . . . . . . 164 15 —Business Information . . . . . . . . . . . . . . . . . . . . . . . . . . . . . . . . . . . . . . . . . . 5 — 532Legal . . . . . . . . . . . . . . . . . . . . . . . . . . . . . . . . . . . . . . . . . . . . . . . . . . . . . . 15 80 —Exhibitions . . . . . . . . . . . . . . . . . . . . . . . . . . . . . . . . . . . . . . . . . . . . . . . . . . 56 178 36
Total . . . . . . . . . . . . . . . . . . . . . . . . . . . . . . . . . . . . . . . . . . . . . . . . . . . . . . . 290 393 611
Capital expenditure additionsScientific, Technical & Medical . . . . . . . . . . . . . . . . . . . . . . . . . . . . . . . . . 93 106 94Risk Solutions . . . . . . . . . . . . . . . . . . . . . . . . . . . . . . . . . . . . . . . . . . . . . . . 25 21 23Business Information . . . . . . . . . . . . . . . . . . . . . . . . . . . . . . . . . . . . . . . . . . 18 17 18Legal . . . . . . . . . . . . . . . . . . . . . . . . . . . . . . . . . . . . . . . . . . . . . . . . . . . . . . 170 173 203Exhibitions . . . . . . . . . . . . . . . . . . . . . . . . . . . . . . . . . . . . . . . . . . . . . . . . . . 15 25 22
Total . . . . . . . . . . . . . . . . . . . . . . . . . . . . . . . . . . . . . . . . . . . . . . . . . . . . . . . 321 342 360
Amortisation of acquired intangible assetsScientific, Technical & Medical . . . . . . . . . . . . . . . . . . . . . . . . . . . . . . . . . 76 68 72Risk Solutions . . . . . . . . . . . . . . . . . . . . . . . . . . . . . . . . . . . . . . . . . . . . . . . 97 109 156Business Information . . . . . . . . . . . . . . . . . . . . . . . . . . . . . . . . . . . . . . . . . . 31 37 29Legal . . . . . . . . . . . . . . . . . . . . . . . . . . . . . . . . . . . . . . . . . . . . . . . . . . . . . . 74 83 78Exhibitions . . . . . . . . . . . . . . . . . . . . . . . . . . . . . . . . . . . . . . . . . . . . . . . . . . 40 32 24
Total . . . . . . . . . . . . . . . . . . . . . . . . . . . . . . . . . . . . . . . . . . . . . . . . . . . . . . . 318 329 359
Depreciation and other amortisationScientific, Technical & Medical . . . . . . . . . . . . . . . . . . . . . . . . . . . . . . . . . 95 82 69Risk Solutions . . . . . . . . . . . . . . . . . . . . . . . . . . . . . . . . . . . . . . . . . . . . . . . 22 23 26Business Information . . . . . . . . . . . . . . . . . . . . . . . . . . . . . . . . . . . . . . . . . . 10 14 15Legal . . . . . . . . . . . . . . . . . . . . . . . . . . . . . . . . . . . . . . . . . . . . . . . . . . . . . . 108 92 87Exhibitions . . . . . . . . . . . . . . . . . . . . . . . . . . . . . . . . . . . . . . . . . . . . . . . . . . 14 16 10
Total . . . . . . . . . . . . . . . . . . . . . . . . . . . . . . . . . . . . . . . . . . . . . . . . . . . . . . . 249 227 207
Capital expenditure comprises additions to property, plant and equipment and internally developed intangible assets.Amortisation of acquired intangible assets includes amounts in respect of joint ventures of £1 million (2012: £1 million; 2011:£4 million) in Exhibitions. Other than the depreciation and amortisation above, non cash items includes a £31 million charge(2012: £31 million charge; 2011: £27 million credit) relating to the recognition of share based remuneration, comprising£6 million (2012: £5 million; 2011: £5 million) in Scientific, Technical & Medical, £3 million (2012: nil; 2011: £3 million) inRisk Solutions, £2 million (2012: £3 million; 2011: £2 million) in Business Information, £6 million (2012: £7 million; 2011:£6 million) in Legal, £4 million (2012: £4 million; 2011: £3 million) in Exhibitions and £10 million (2012: £12 million; 2011:£8 million) in Corporate.
F-20
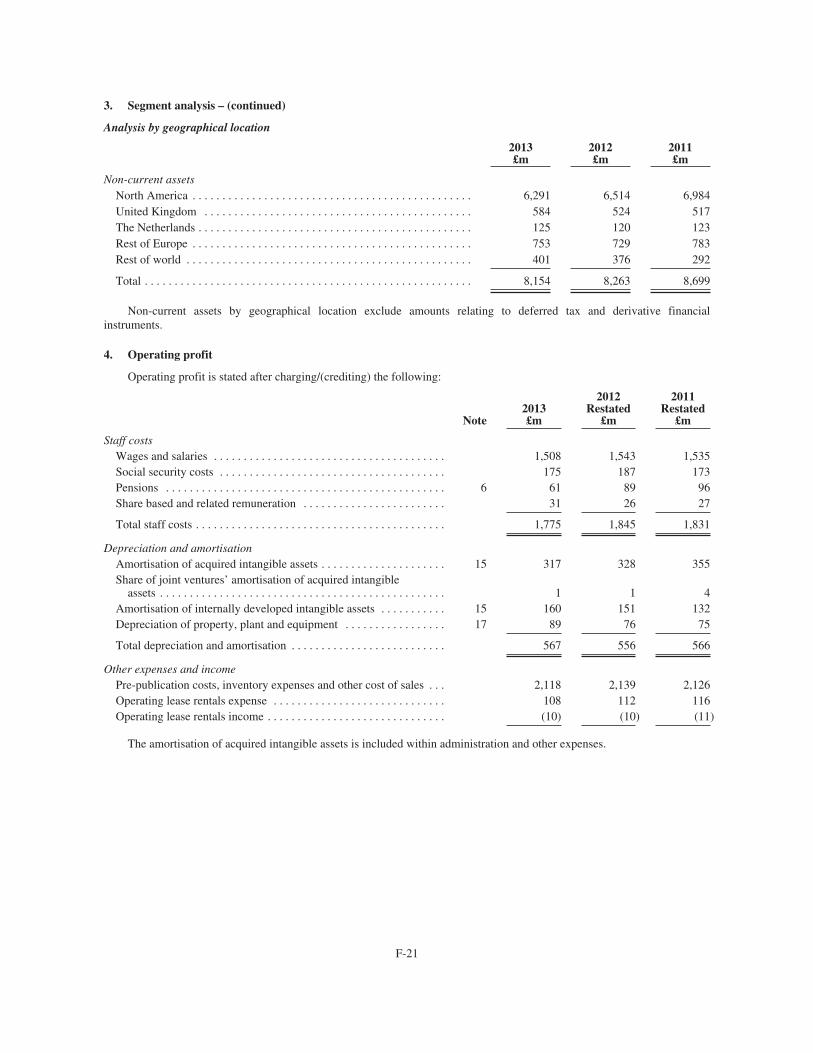
3. Segment analysis – (continued)
Analysis by geographical location
2013£m
2012£m
2011£m
Non-current assetsNorth America . . . . . . . . . . . . . . . . . . . . . . . . . . . . . . . . . . . . . . . . . . . . . . . 6,291 6,514 6,984United Kingdom . . . . . . . . . . . . . . . . . . . . . . . . . . . . . . . . . . . . . . . . . . . . . 584 524 517The Netherlands . . . . . . . . . . . . . . . . . . . . . . . . . . . . . . . . . . . . . . . . . . . . . . 125 120 123Rest of Europe . . . . . . . . . . . . . . . . . . . . . . . . . . . . . . . . . . . . . . . . . . . . . . . 753 729 783Rest of world . . . . . . . . . . . . . . . . . . . . . . . . . . . . . . . . . . . . . . . . . . . . . . . . 401 376 292
Total . . . . . . . . . . . . . . . . . . . . . . . . . . . . . . . . . . . . . . . . . . . . . . . . . . . . . . . 8,154 8,263 8,699
Non-current assets by geographical location exclude amounts relating to deferred tax and derivative financialinstruments.
4. Operating profit
Operating profit is stated after charging/(crediting) the following:
Note2013£m
2012Restated
£m
2011Restated
£m
Staff costsWages and salaries . . . . . . . . . . . . . . . . . . . . . . . . . . . . . . . . . . . . . . . 1,508 1,543 1,535Social security costs . . . . . . . . . . . . . . . . . . . . . . . . . . . . . . . . . . . . . . 175 187 173Pensions . . . . . . . . . . . . . . . . . . . . . . . . . . . . . . . . . . . . . . . . . . . . . . . 6 61 89 96Share based and related remuneration . . . . . . . . . . . . . . . . . . . . . . . . 31 26 27
Total staff costs . . . . . . . . . . . . . . . . . . . . . . . . . . . . . . . . . . . . . . . . . . 1,775 1,845 1,831
Depreciation and amortisationAmortisation of acquired intangible assets . . . . . . . . . . . . . . . . . . . . . 15 317 328 355Share of joint ventures’ amortisation of acquired intangible
assets . . . . . . . . . . . . . . . . . . . . . . . . . . . . . . . . . . . . . . . . . . . . . . . . 1 1 4Amortisation of internally developed intangible assets . . . . . . . . . . . 15 160 151 132Depreciation of property, plant and equipment . . . . . . . . . . . . . . . . . 17 89 76 75
Total depreciation and amortisation . . . . . . . . . . . . . . . . . . . . . . . . . . 567 556 566
Other expenses and incomePre-publication costs, inventory expenses and other cost of sales . . . 2,118 2,139 2,126Operating lease rentals expense . . . . . . . . . . . . . . . . . . . . . . . . . . . . . 108 112 116Operating lease rentals income . . . . . . . . . . . . . . . . . . . . . . . . . . . . . . (10) (10) (11)
The amortisation of acquired intangible assets is included within administration and other expenses.
F-21
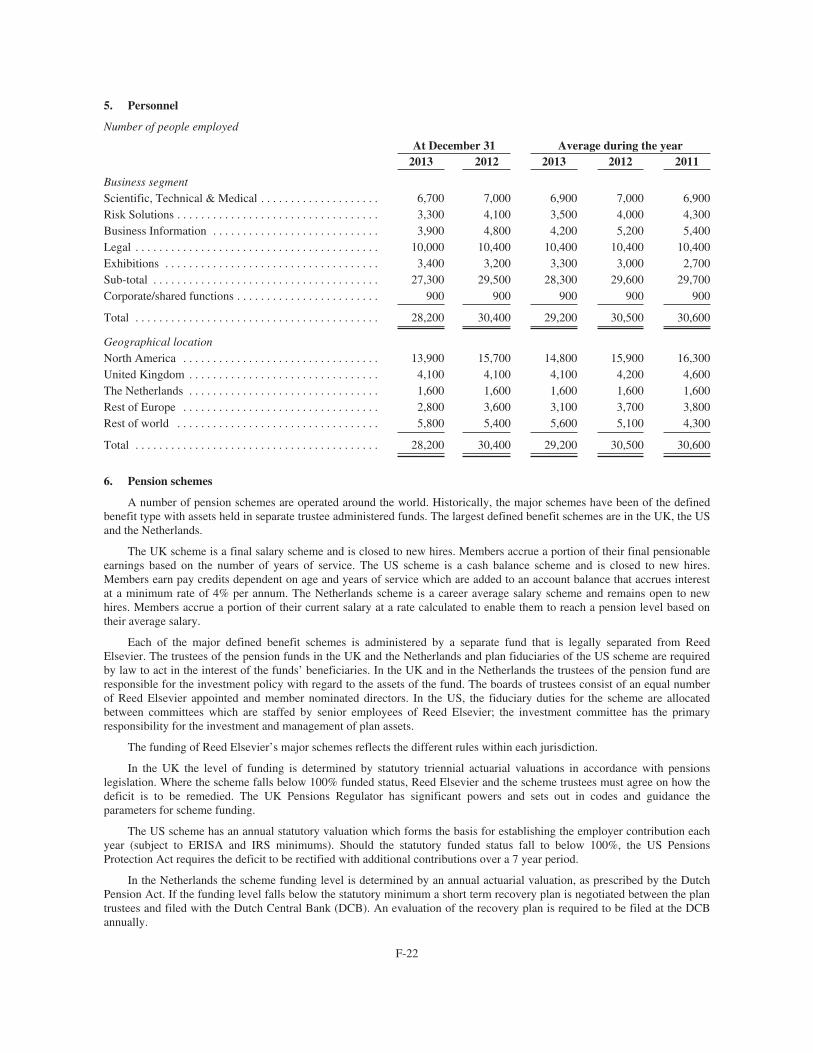
5. Personnel
Number of people employed
At December 31 Average during the year2013 2012 2013 2012 2011
Business segmentScientific, Technical & Medical . . . . . . . . . . . . . . . . . . . . 6,700 7,000 6,900 7,000 6,900Risk Solutions . . . . . . . . . . . . . . . . . . . . . . . . . . . . . . . . . . 3,300 4,100 3,500 4,000 4,300Business Information . . . . . . . . . . . . . . . . . . . . . . . . . . . . 3,900 4,800 4,200 5,200 5,400Legal . . . . . . . . . . . . . . . . . . . . . . . . . . . . . . . . . . . . . . . . . 10,000 10,400 10,400 10,400 10,400Exhibitions . . . . . . . . . . . . . . . . . . . . . . . . . . . . . . . . . . . . 3,400 3,200 3,300 3,000 2,700Sub-total . . . . . . . . . . . . . . . . . . . . . . . . . . . . . . . . . . . . . . 27,300 29,500 28,300 29,600 29,700Corporate/shared functions . . . . . . . . . . . . . . . . . . . . . . . . 900 900 900 900 900
Total . . . . . . . . . . . . . . . . . . . . . . . . . . . . . . . . . . . . . . . . . 28,200 30,400 29,200 30,500 30,600
Geographical locationNorth America . . . . . . . . . . . . . . . . . . . . . . . . . . . . . . . . . 13,900 15,700 14,800 15,900 16,300United Kingdom . . . . . . . . . . . . . . . . . . . . . . . . . . . . . . . . 4,100 4,100 4,100 4,200 4,600The Netherlands . . . . . . . . . . . . . . . . . . . . . . . . . . . . . . . . 1,600 1,600 1,600 1,600 1,600Rest of Europe . . . . . . . . . . . . . . . . . . . . . . . . . . . . . . . . . 2,800 3,600 3,100 3,700 3,800Rest of world . . . . . . . . . . . . . . . . . . . . . . . . . . . . . . . . . . 5,800 5,400 5,600 5,100 4,300
Total . . . . . . . . . . . . . . . . . . . . . . . . . . . . . . . . . . . . . . . . . 28,200 30,400 29,200 30,500 30,600
6. Pension schemes
A number of pension schemes are operated around the world. Historically, the major schemes have been of the definedbenefit type with assets held in separate trustee administered funds. The largest defined benefit schemes are in the UK, the USand the Netherlands.
The UK scheme is a final salary scheme and is closed to new hires. Members accrue a portion of their final pensionableearnings based on the number of years of service. The US scheme is a cash balance scheme and is closed to new hires.Members earn pay credits dependent on age and years of service which are added to an account balance that accrues interestat a minimum rate of 4% per annum. The Netherlands scheme is a career average salary scheme and remains open to newhires. Members accrue a portion of their current salary at a rate calculated to enable them to reach a pension level based ontheir average salary.
Each of the major defined benefit schemes is administered by a separate fund that is legally separated from ReedElsevier. The trustees of the pension funds in the UK and the Netherlands and plan fiduciaries of the US scheme are requiredby law to act in the interest of the funds’ beneficiaries. In the UK and in the Netherlands the trustees of the pension fund areresponsible for the investment policy with regard to the assets of the fund. The boards of trustees consist of an equal numberof Reed Elsevier appointed and member nominated directors. In the US, the fiduciary duties for the scheme are allocatedbetween committees which are staffed by senior employees of Reed Elsevier; the investment committee has the primaryresponsibility for the investment and management of plan assets.
The funding of Reed Elsevier’s major schemes reflects the different rules within each jurisdiction.
In the UK the level of funding is determined by statutory triennial actuarial valuations in accordance with pensionslegislation. Where the scheme falls below 100% funded status, Reed Elsevier and the scheme trustees must agree on how thedeficit is to be remedied. The UK Pensions Regulator has significant powers and sets out in codes and guidance theparameters for scheme funding.
The US scheme has an annual statutory valuation which forms the basis for establishing the employer contribution eachyear (subject to ERISA and IRS minimums). Should the statutory funded status fall to below 100%, the US PensionsProtection Act requires the deficit to be rectified with additional contributions over a 7 year period.
In the Netherlands the scheme funding level is determined by an annual actuarial valuation, as prescribed by the DutchPension Act. If the funding level falls below the statutory minimum a short term recovery plan is negotiated between the plantrustees and filed with the Dutch Central Bank (DCB). An evaluation of the recovery plan is required to be filed at the DCBannually.
F-22

6. Pension schemes – (continued)
Total regular employer contributions to defined benefit pension schemes in respect of 2014 are expected to beapproximately £46 million.
The pension expense recognised within operating expense is:
2013£m
2012Restated
£m
2011Restated
£m
Defined benefit pension expense . . . . . . . . . . . . . . . . . . . . . . . . . . . . . . . . . . . . . . . . . 14 43 57Defined contribution pension expense . . . . . . . . . . . . . . . . . . . . . . . . . . . . . . . . . . . . . 47 46 39
Total . . . . . . . . . . . . . . . . . . . . . . . . . . . . . . . . . . . . . . . . . . . . . . . . . . . . . . . . . . . . . . . 61 89 96
The amounts recognised in the income statement in respect of defined benefit pension schemes during the year arepresented by major scheme as follows:
20132012
Restated2011
RestatedUK£m
US£m
NL£m
Total£m
UK£m
US£m
NL£m
Total£m
UK£m
US£m
NL£m
Total£m
Service cost . . . . . . . . . . . . 29 29 15 73 27 28 8 63 31 27 8 66Settlements, past service
and curtailmentcredits . . . . . . . . . . . . . . . — (51) (8) (59) (1) (19) — (20) — (9) — (9)
Defined benefit pensionexpense . . . . . . . . . . . . . . 29 (22) 7 14 26 9 8 43 31 18 8 57
Net interest on net definedbenefit obligation . . . . . . 6 9 4 19 5 7 (1) 11 — 6 3 9
Net defined benefit pensionexpense . . . . . . . . . . . . . . 35 (13) 11 33 31 16 7 54 62 42 19 123
Net interest on defined benefit pension scheme liabilities is presented within net finance costs in the income statement.Service cost, including settlements, past service credits and curtailments is presented within operating expenses.
Settlements and past service credits in 2013 principally relate to plan design changes and the transfer out of certaindeferred members in the US scheme and a reduction in accrued benefits in respect of the scheme in the Netherlands.Settlements and curtailments recognised in 2012 and 2011 were a result of changes to plan design and staff reductions.
The significant valuation assumptions, determined for each major scheme in conjunction with the respective independentactuaries are presented below. The net defined benefit pension expense for each year is based on the assumptions and schemevaluations set at December 31, of the prior year.
2013 2012 2011As at December 31, UK US NL UK US NL UK US NL
Discount rate . . . . . . . . . . . . . . . . . . . . . . . 4.60% 5.05% 3.60% 4.65% 4.25% 3.50% 5.00% 5.25% 5.70%Inflation . . . . . . . . . . . . . . . . . . . . . . . . . . 3.25% 3.00% 2.00% 2.85% 3.00% 2.00% 3.00% 3.00% 2.00%
Discount rates are set by reference to AA corporate bond yields.
Mortality assumptions make allowance for future improvements in longevity and have been determined by reference toapplicable mortality statistics. The average life expectancy assumptions are set out below:
2013 2012 2011Male average life expectancy (as December 31) UK US NL UK US NL UK US NL
Member currently aged 60 . . . . . . . . . . . . . . . . . . . . . . . . 90 84 86 90 84 86 90 84 86Member currently aged 45 . . . . . . . . . . . . . . . . . . . . . . . . . 92 83 87 92 83 87 92 83 87
F-23
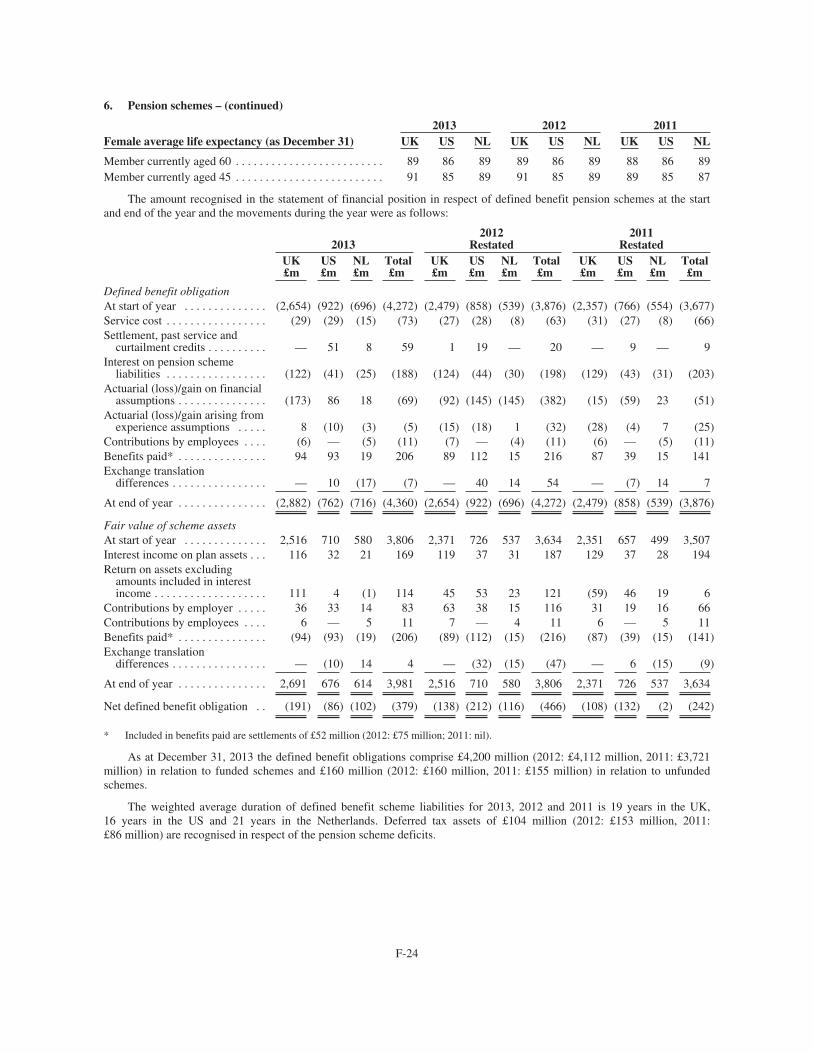
6. Pension schemes – (continued)
2013 2012 2011Female average life expectancy (as December 31) UK US NL UK US NL UK US NL
Member currently aged 60 . . . . . . . . . . . . . . . . . . . . . . . . . 89 86 89 89 86 89 88 86 89Member currently aged 45 . . . . . . . . . . . . . . . . . . . . . . . . . 91 85 89 91 85 89 89 85 87
The amount recognised in the statement of financial position in respect of defined benefit pension schemes at the startand end of the year and the movements during the year were as follows:
20132012
Restated2011
RestatedUK£m
US£m
NL£m
Total£m
UK£m
US£m
NL£m
Total£m
UK£m
US£m
NL£m
Total£m
Defined benefit obligationAt start of year . . . . . . . . . . . . . . (2,654) (922) (696) (4,272) (2,479) (858) (539) (3,876) (2,357) (766) (554) (3,677)Service cost . . . . . . . . . . . . . . . . . (29) (29) (15) (73) (27) (28) (8) (63) (31) (27) (8) (66)Settlement, past service and
curtailment credits . . . . . . . . . . — 51 8 59 1 19 — 20 — 9 — 9Interest on pension scheme
liabilities . . . . . . . . . . . . . . . . . (122) (41) (25) (188) (124) (44) (30) (198) (129) (43) (31) (203)Actuarial (loss)/gain on financial
assumptions . . . . . . . . . . . . . . . (173) 86 18 (69) (92) (145) (145) (382) (15) (59) 23 (51)Actuarial (loss)/gain arising from
experience assumptions . . . . . 8 (10) (3) (5) (15) (18) 1 (32) (28) (4) 7 (25)Contributions by employees . . . . (6) — (5) (11) (7) — (4) (11) (6) — (5) (11)Benefits paid* . . . . . . . . . . . . . . . 94 93 19 206 89 112 15 216 87 39 15 141Exchange translation
differences . . . . . . . . . . . . . . . . — 10 (17) (7) — 40 14 54 — (7) 14 7
At end of year . . . . . . . . . . . . . . . (2,882) (762) (716) (4,360) (2,654) (922) (696) (4,272) (2,479) (858) (539) (3,876)
Fair value of scheme assetsAt start of year . . . . . . . . . . . . . . 2,516 710 580 3,806 2,371 726 537 3,634 2,351 657 499 3,507Interest income on plan assets . . . 116 32 21 169 119 37 31 187 129 37 28 194Return on assets excluding
amounts included in interestincome . . . . . . . . . . . . . . . . . . . 111 4 (1) 114 45 53 23 121 (59) 46 19 6
Contributions by employer . . . . . 36 33 14 83 63 38 15 116 31 19 16 66Contributions by employees . . . . 6 — 5 11 7 — 4 11 6 — 5 11Benefits paid* . . . . . . . . . . . . . . . (94) (93) (19) (206) (89) (112) (15) (216) (87) (39) (15) (141)Exchange translation
differences . . . . . . . . . . . . . . . . — (10) 14 4 — (32) (15) (47) — 6 (15) (9)
At end of year . . . . . . . . . . . . . . . 2,691 676 614 3,981 2,516 710 580 3,806 2,371 726 537 3,634
Net defined benefit obligation . . (191) (86) (102) (379) (138) (212) (116) (466) (108) (132) (2) (242)
* Included in benefits paid are settlements of £52 million (2012: £75 million; 2011: nil).
As at December 31, 2013 the defined benefit obligations comprise £4,200 million (2012: £4,112 million, 2011: £3,721million) in relation to funded schemes and £160 million (2012: £160 million, 2011: £155 million) in relation to unfundedschemes.
The weighted average duration of defined benefit scheme liabilities for 2013, 2012 and 2011 is 19 years in the UK,16 years in the US and 21 years in the Netherlands. Deferred tax assets of £104 million (2012: £153 million, 2011:£86 million) are recognised in respect of the pension scheme deficits.
F-24
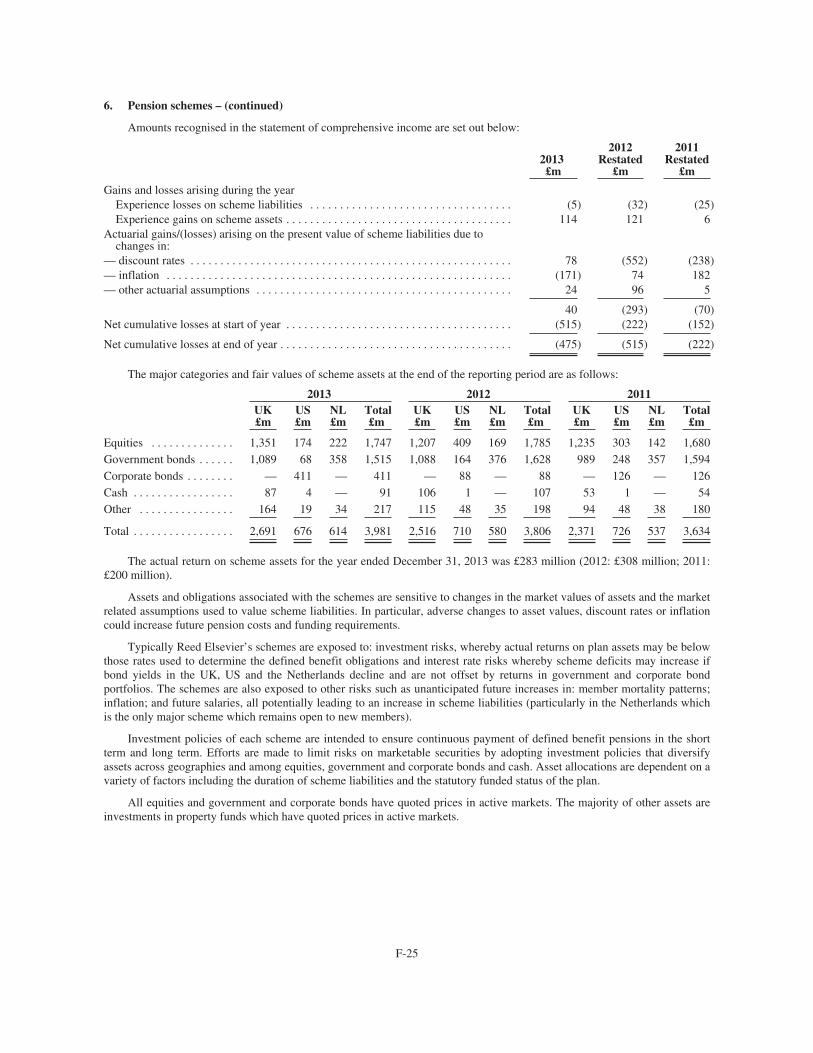
6. Pension schemes – (continued)
Amounts recognised in the statement of comprehensive income are set out below:
2013£m
2012Restated
£m
2011Restated
£m
Gains and losses arising during the yearExperience losses on scheme liabilities . . . . . . . . . . . . . . . . . . . . . . . . . . . . . . . . . . (5) (32) (25)Experience gains on scheme assets . . . . . . . . . . . . . . . . . . . . . . . . . . . . . . . . . . . . . . 114 121 6
Actuarial gains/(losses) arising on the present value of scheme liabilities due tochanges in:
— discount rates . . . . . . . . . . . . . . . . . . . . . . . . . . . . . . . . . . . . . . . . . . . . . . . . . . . . . . 78 (552) (238)— inflation . . . . . . . . . . . . . . . . . . . . . . . . . . . . . . . . . . . . . . . . . . . . . . . . . . . . . . . . . . (171) 74 182— other actuarial assumptions . . . . . . . . . . . . . . . . . . . . . . . . . . . . . . . . . . . . . . . . . . . 24 96 5
40 (293) (70)Net cumulative losses at start of year . . . . . . . . . . . . . . . . . . . . . . . . . . . . . . . . . . . . . . (515) (222) (152)
Net cumulative losses at end of year . . . . . . . . . . . . . . . . . . . . . . . . . . . . . . . . . . . . . . . (475) (515) (222)
The major categories and fair values of scheme assets at the end of the reporting period are as follows:
2013 2012 2011UK£m
US£m
NL£m
Total£m
UK£m
US£m
NL£m
Total£m
UK£m
US£m
NL£m
Total£m
Equities . . . . . . . . . . . . . . 1,351 174 222 1,747 1,207 409 169 1,785 1,235 303 142 1,680Government bonds . . . . . . 1,089 68 358 1,515 1,088 164 376 1,628 989 248 357 1,594Corporate bonds . . . . . . . . — 411 — 411 — 88 — 88 — 126 — 126Cash . . . . . . . . . . . . . . . . . 87 4 — 91 106 1 — 107 53 1 — 54Other . . . . . . . . . . . . . . . . 164 19 34 217 115 48 35 198 94 48 38 180
Total . . . . . . . . . . . . . . . . . 2,691 676 614 3,981 2,516 710 580 3,806 2,371 726 537 3,634
The actual return on scheme assets for the year ended December 31, 2013 was £283 million (2012: £308 million; 2011:£200 million).
Assets and obligations associated with the schemes are sensitive to changes in the market values of assets and the marketrelated assumptions used to value scheme liabilities. In particular, adverse changes to asset values, discount rates or inflationcould increase future pension costs and funding requirements.
Typically Reed Elsevier’s schemes are exposed to: investment risks, whereby actual returns on plan assets may be belowthose rates used to determine the defined benefit obligations and interest rate risks whereby scheme deficits may increase ifbond yields in the UK, US and the Netherlands decline and are not offset by returns in government and corporate bondportfolios. The schemes are also exposed to other risks such as unanticipated future increases in: member mortality patterns;inflation; and future salaries, all potentially leading to an increase in scheme liabilities (particularly in the Netherlands whichis the only major scheme which remains open to new members).
Investment policies of each scheme are intended to ensure continuous payment of defined benefit pensions in the shortterm and long term. Efforts are made to limit risks on marketable securities by adopting investment policies that diversifyassets across geographies and among equities, government and corporate bonds and cash. Asset allocations are dependent on avariety of factors including the duration of scheme liabilities and the statutory funded status of the plan.
All equities and government and corporate bonds have quoted prices in active markets. The majority of other assets areinvestments in property funds which have quoted prices in active markets.
F-25
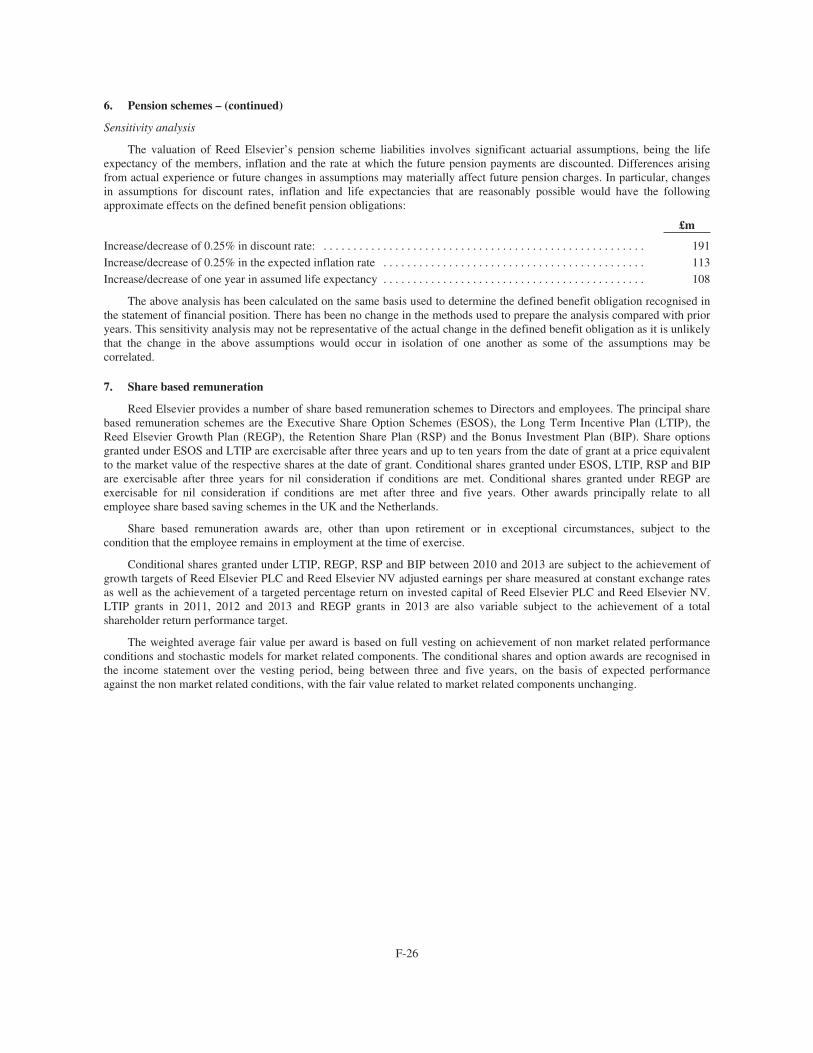
6. Pension schemes – (continued)
Sensitivity analysis
The valuation of Reed Elsevier’s pension scheme liabilities involves significant actuarial assumptions, being the lifeexpectancy of the members, inflation and the rate at which the future pension payments are discounted. Differences arisingfrom actual experience or future changes in assumptions may materially affect future pension charges. In particular, changesin assumptions for discount rates, inflation and life expectancies that are reasonably possible would have the followingapproximate effects on the defined benefit pension obligations:
£m
Increase/decrease of 0.25% in discount rate: . . . . . . . . . . . . . . . . . . . . . . . . . . . . . . . . . . . . . . . . . . . . . . . . . . . . . . 191Increase/decrease of 0.25% in the expected inflation rate . . . . . . . . . . . . . . . . . . . . . . . . . . . . . . . . . . . . . . . . . . . . 113Increase/decrease of one year in assumed life expectancy . . . . . . . . . . . . . . . . . . . . . . . . . . . . . . . . . . . . . . . . . . . . 108
The above analysis has been calculated on the same basis used to determine the defined benefit obligation recognised inthe statement of financial position. There has been no change in the methods used to prepare the analysis compared with prioryears. This sensitivity analysis may not be representative of the actual change in the defined benefit obligation as it is unlikelythat the change in the above assumptions would occur in isolation of one another as some of the assumptions may becorrelated.
7. Share based remuneration
Reed Elsevier provides a number of share based remuneration schemes to Directors and employees. The principal sharebased remuneration schemes are the Executive Share Option Schemes (ESOS), the Long Term Incentive Plan (LTIP), theReed Elsevier Growth Plan (REGP), the Retention Share Plan (RSP) and the Bonus Investment Plan (BIP). Share optionsgranted under ESOS and LTIP are exercisable after three years and up to ten years from the date of grant at a price equivalentto the market value of the respective shares at the date of grant. Conditional shares granted under ESOS, LTIP, RSP and BIPare exercisable after three years for nil consideration if conditions are met. Conditional shares granted under REGP areexercisable for nil consideration if conditions are met after three and five years. Other awards principally relate to allemployee share based saving schemes in the UK and the Netherlands.
Share based remuneration awards are, other than upon retirement or in exceptional circumstances, subject to thecondition that the employee remains in employment at the time of exercise.
Conditional shares granted under LTIP, REGP, RSP and BIP between 2010 and 2013 are subject to the achievement ofgrowth targets of Reed Elsevier PLC and Reed Elsevier NV adjusted earnings per share measured at constant exchange ratesas well as the achievement of a targeted percentage return on invested capital of Reed Elsevier PLC and Reed Elsevier NV.LTIP grants in 2011, 2012 and 2013 and REGP grants in 2013 are also variable subject to the achievement of a totalshareholder return performance target.
The weighted average fair value per award is based on full vesting on achievement of non market related performanceconditions and stochastic models for market related components. The conditional shares and option awards are recognised inthe income statement over the vesting period, being between three and five years, on the basis of expected performanceagainst the non market related conditions, with the fair value related to market related components unchanging.
F-26
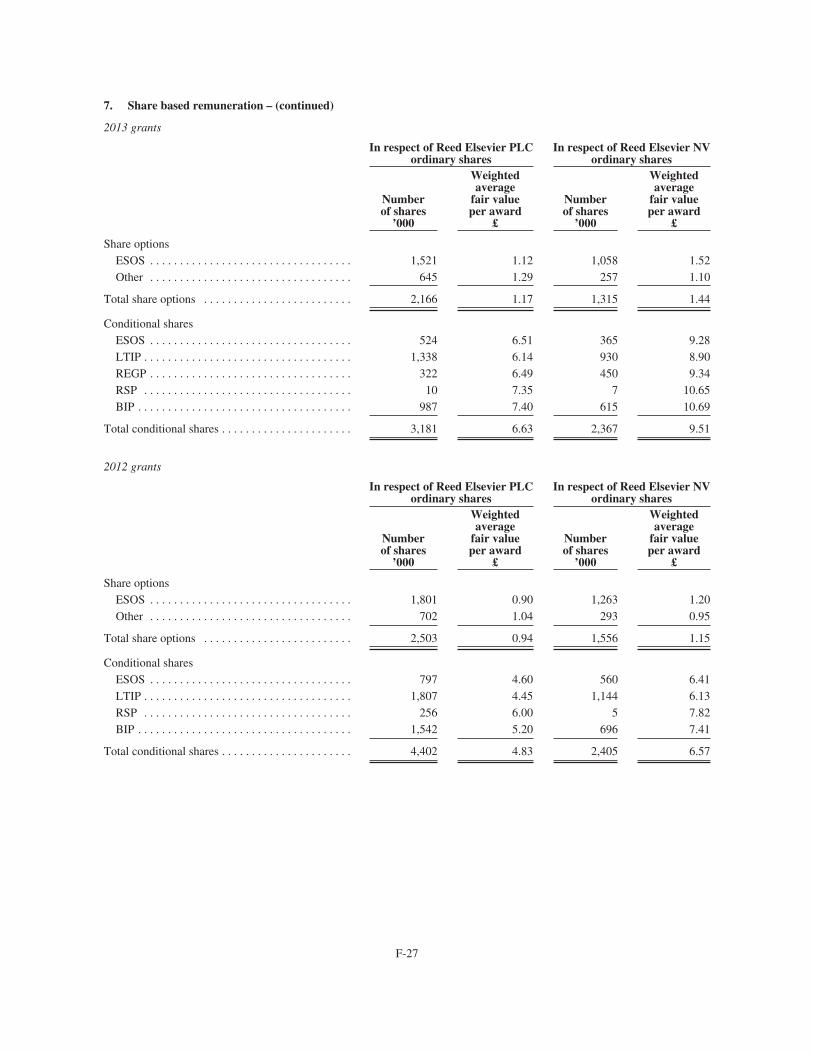
7. Share based remuneration – (continued)
2013 grants
In respect of Reed Elsevier PLCordinary shares
In respect of Reed Elsevier NVordinary shares
Numberof shares
’000
Weightedaverage
fair valueper award
£
Numberof shares
’000
Weightedaverage
fair valueper award
£
Share optionsESOS . . . . . . . . . . . . . . . . . . . . . . . . . . . . . . . . . . 1,521 1.12 1,058 1.52Other . . . . . . . . . . . . . . . . . . . . . . . . . . . . . . . . . . 645 1.29 257 1.10
Total share options . . . . . . . . . . . . . . . . . . . . . . . . . 2,166 1.17 1,315 1.44
Conditional sharesESOS . . . . . . . . . . . . . . . . . . . . . . . . . . . . . . . . . . 524 6.51 365 9.28LTIP . . . . . . . . . . . . . . . . . . . . . . . . . . . . . . . . . . . 1,338 6.14 930 8.90REGP . . . . . . . . . . . . . . . . . . . . . . . . . . . . . . . . . . 322 6.49 450 9.34RSP . . . . . . . . . . . . . . . . . . . . . . . . . . . . . . . . . . . 10 7.35 7 10.65BIP . . . . . . . . . . . . . . . . . . . . . . . . . . . . . . . . . . . . 987 7.40 615 10.69
Total conditional shares . . . . . . . . . . . . . . . . . . . . . . 3,181 6.63 2,367 9.51
2012 grants
In respect of Reed Elsevier PLCordinary shares
In respect of Reed Elsevier NVordinary shares
Numberof shares
’000
Weightedaverage
fair valueper award
£
Numberof shares
’000
Weightedaverage
fair valueper award
£
Share optionsESOS . . . . . . . . . . . . . . . . . . . . . . . . . . . . . . . . . . 1,801 0.90 1,263 1.20Other . . . . . . . . . . . . . . . . . . . . . . . . . . . . . . . . . . 702 1.04 293 0.95
Total share options . . . . . . . . . . . . . . . . . . . . . . . . . 2,503 0.94 1,556 1.15
Conditional sharesESOS . . . . . . . . . . . . . . . . . . . . . . . . . . . . . . . . . . 797 4.60 560 6.41LTIP . . . . . . . . . . . . . . . . . . . . . . . . . . . . . . . . . . . 1,807 4.45 1,144 6.13RSP . . . . . . . . . . . . . . . . . . . . . . . . . . . . . . . . . . . 256 6.00 5 7.82BIP . . . . . . . . . . . . . . . . . . . . . . . . . . . . . . . . . . . . 1,542 5.20 696 7.41
Total conditional shares . . . . . . . . . . . . . . . . . . . . . . 4,402 4.83 2,405 6.57
F-27
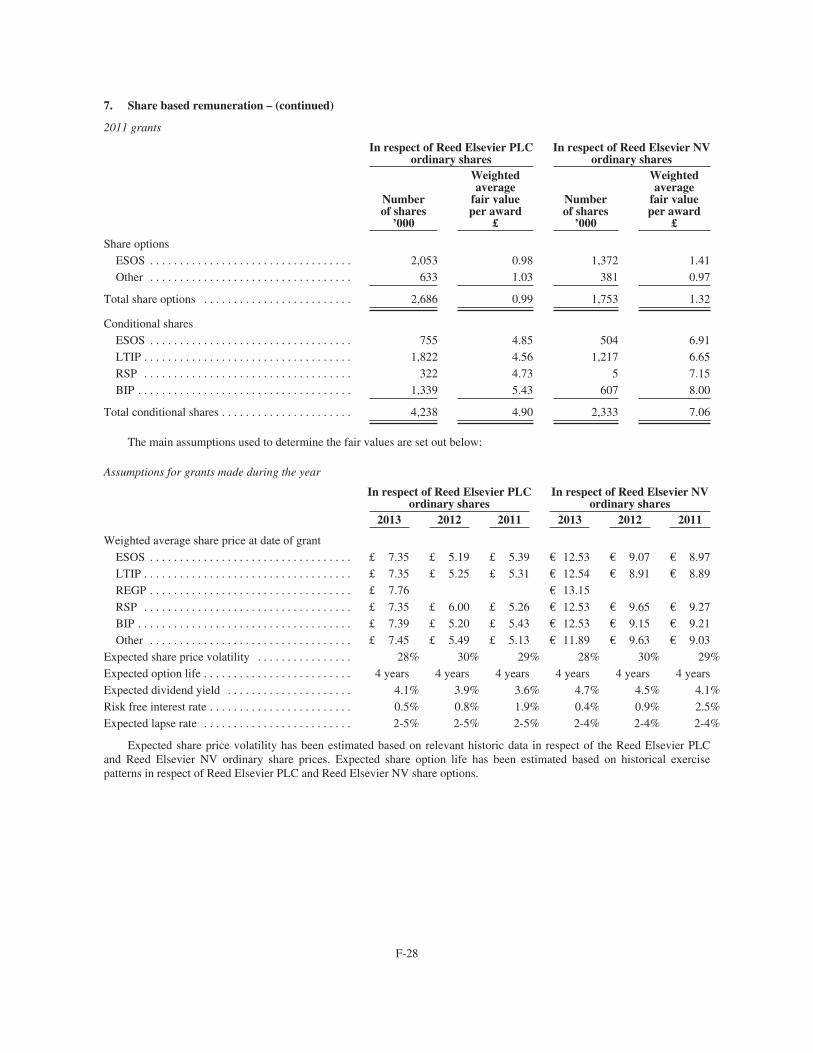
7. Share based remuneration – (continued)
2011 grants
In respect of Reed Elsevier PLCordinary shares
In respect of Reed Elsevier NVordinary shares
Numberof shares
’000
Weightedaverage
fair valueper award
£
Numberof shares
’000
Weightedaverage
fair valueper award
£
Share optionsESOS . . . . . . . . . . . . . . . . . . . . . . . . . . . . . . . . . . 2,053 0.98 1,372 1.41Other . . . . . . . . . . . . . . . . . . . . . . . . . . . . . . . . . . 633 1.03 381 0.97
Total share options . . . . . . . . . . . . . . . . . . . . . . . . . 2,686 0.99 1,753 1.32
Conditional sharesESOS . . . . . . . . . . . . . . . . . . . . . . . . . . . . . . . . . . 755 4.85 504 6.91LTIP . . . . . . . . . . . . . . . . . . . . . . . . . . . . . . . . . . . 1,822 4.56 1,217 6.65RSP . . . . . . . . . . . . . . . . . . . . . . . . . . . . . . . . . . . 322 4.73 5 7.15BIP . . . . . . . . . . . . . . . . . . . . . . . . . . . . . . . . . . . . 1,339 5.43 607 8.00
Total conditional shares . . . . . . . . . . . . . . . . . . . . . . 4,238 4.90 2,333 7.06
The main assumptions used to determine the fair values are set out below:
Assumptions for grants made during the year
In respect of Reed Elsevier PLCordinary shares
In respect of Reed Elsevier NVordinary shares
2013 2012 2011 2013 2012 2011
Weighted average share price at date of grantESOS . . . . . . . . . . . . . . . . . . . . . . . . . . . . . . . . . . £ 7.35 £ 5.19 £ 5.39 € 12.53 € 9.07 € 8.97LTIP . . . . . . . . . . . . . . . . . . . . . . . . . . . . . . . . . . . £ 7.35 £ 5.25 £ 5.31 € 12.54 € 8.91 € 8.89REGP . . . . . . . . . . . . . . . . . . . . . . . . . . . . . . . . . . £ 7.76 € 13.15RSP . . . . . . . . . . . . . . . . . . . . . . . . . . . . . . . . . . . £ 7.35 £ 6.00 £ 5.26 € 12.53 € 9.65 € 9.27BIP . . . . . . . . . . . . . . . . . . . . . . . . . . . . . . . . . . . . £ 7.39 £ 5.20 £ 5.43 € 12.53 € 9.15 € 9.21Other . . . . . . . . . . . . . . . . . . . . . . . . . . . . . . . . . . £ 7.45 £ 5.49 £ 5.13 € 11.89 € 9.63 € 9.03
Expected share price volatility . . . . . . . . . . . . . . . . 28% 30% 29% 28% 30% 29%Expected option life . . . . . . . . . . . . . . . . . . . . . . . . . 4 years 4 years 4 years 4 years 4 years 4 yearsExpected dividend yield . . . . . . . . . . . . . . . . . . . . . 4.1% 3.9% 3.6% 4.7% 4.5% 4.1%Risk free interest rate . . . . . . . . . . . . . . . . . . . . . . . . 0.5% 0.8% 1.9% 0.4% 0.9% 2.5%Expected lapse rate . . . . . . . . . . . . . . . . . . . . . . . . . 2-5% 2-5% 2-5% 2-4% 2-4% 2-4%
Expected share price volatility has been estimated based on relevant historic data in respect of the Reed Elsevier PLCand Reed Elsevier NV ordinary share prices. Expected share option life has been estimated based on historical exercisepatterns in respect of Reed Elsevier PLC and Reed Elsevier NV share options.
F-28
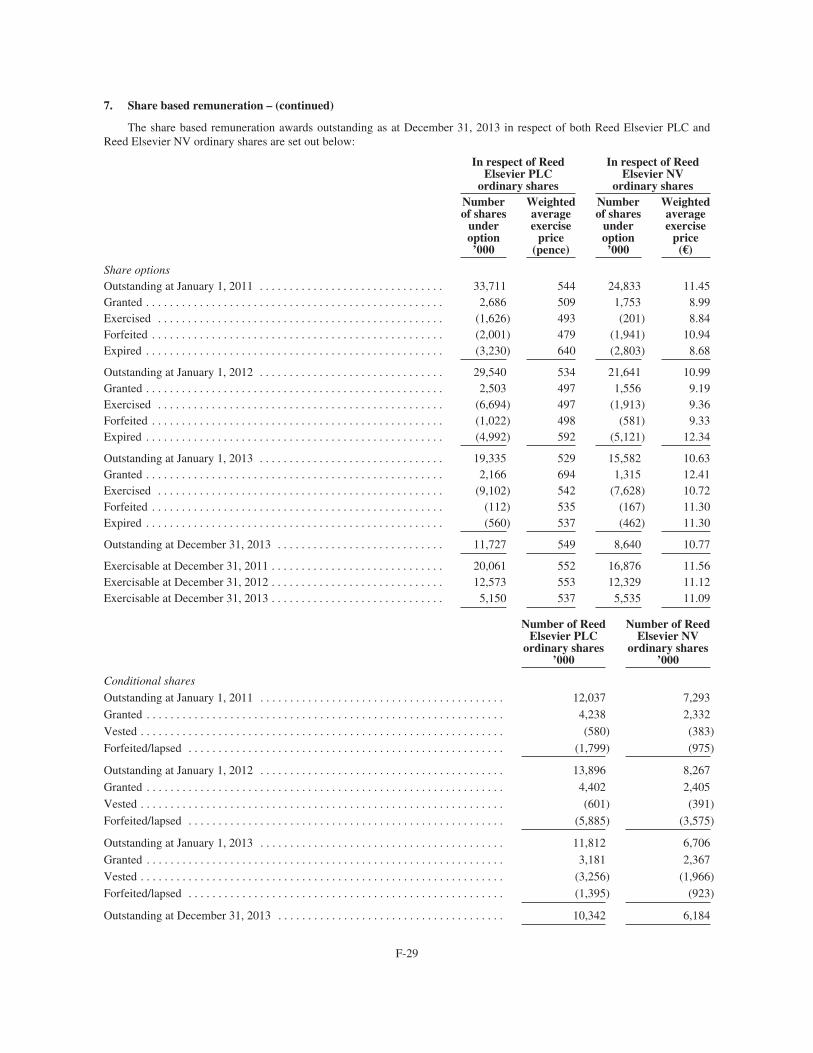
7. Share based remuneration – (continued)
The share based remuneration awards outstanding as at December 31, 2013 in respect of both Reed Elsevier PLC andReed Elsevier NV ordinary shares are set out below:
In respect of ReedElsevier PLC
ordinary shares
In respect of ReedElsevier NV
ordinary sharesNumberof shares
underoption’000
Weightedaverageexercise
price(pence)
Numberof shares
underoption’000
Weightedaverageexercise
price(€)
Share optionsOutstanding at January 1, 2011 . . . . . . . . . . . . . . . . . . . . . . . . . . . . . . . 33,711 544 24,833 11.45Granted . . . . . . . . . . . . . . . . . . . . . . . . . . . . . . . . . . . . . . . . . . . . . . . . . . 2,686 509 1,753 8.99Exercised . . . . . . . . . . . . . . . . . . . . . . . . . . . . . . . . . . . . . . . . . . . . . . . . (1,626) 493 (201) 8.84Forfeited . . . . . . . . . . . . . . . . . . . . . . . . . . . . . . . . . . . . . . . . . . . . . . . . . (2,001) 479 (1,941) 10.94Expired . . . . . . . . . . . . . . . . . . . . . . . . . . . . . . . . . . . . . . . . . . . . . . . . . . (3,230) 640 (2,803) 8.68
Outstanding at January 1, 2012 . . . . . . . . . . . . . . . . . . . . . . . . . . . . . . . 29,540 534 21,641 10.99Granted . . . . . . . . . . . . . . . . . . . . . . . . . . . . . . . . . . . . . . . . . . . . . . . . . . 2,503 497 1,556 9.19Exercised . . . . . . . . . . . . . . . . . . . . . . . . . . . . . . . . . . . . . . . . . . . . . . . . (6,694) 497 (1,913) 9.36Forfeited . . . . . . . . . . . . . . . . . . . . . . . . . . . . . . . . . . . . . . . . . . . . . . . . . (1,022) 498 (581) 9.33Expired . . . . . . . . . . . . . . . . . . . . . . . . . . . . . . . . . . . . . . . . . . . . . . . . . . (4,992) 592 (5,121) 12.34
Outstanding at January 1, 2013 . . . . . . . . . . . . . . . . . . . . . . . . . . . . . . . 19,335 529 15,582 10.63Granted . . . . . . . . . . . . . . . . . . . . . . . . . . . . . . . . . . . . . . . . . . . . . . . . . . 2,166 694 1,315 12.41Exercised . . . . . . . . . . . . . . . . . . . . . . . . . . . . . . . . . . . . . . . . . . . . . . . . (9,102) 542 (7,628) 10.72Forfeited . . . . . . . . . . . . . . . . . . . . . . . . . . . . . . . . . . . . . . . . . . . . . . . . . (112) 535 (167) 11.30Expired . . . . . . . . . . . . . . . . . . . . . . . . . . . . . . . . . . . . . . . . . . . . . . . . . . (560) 537 (462) 11.30
Outstanding at December 31, 2013 . . . . . . . . . . . . . . . . . . . . . . . . . . . . 11,727 549 8,640 10.77
Exercisable at December 31, 2011 . . . . . . . . . . . . . . . . . . . . . . . . . . . . . 20,061 552 16,876 11.56Exercisable at December 31, 2012 . . . . . . . . . . . . . . . . . . . . . . . . . . . . . 12,573 553 12,329 11.12Exercisable at December 31, 2013 . . . . . . . . . . . . . . . . . . . . . . . . . . . . . 5,150 537 5,535 11.09
Number of ReedElsevier PLC
ordinary shares’000
Number of ReedElsevier NV
ordinary shares’000
Conditional shares
Outstanding at January 1, 2011 . . . . . . . . . . . . . . . . . . . . . . . . . . . . . . . . . . . . . . . . . 12,037 7,293
Granted . . . . . . . . . . . . . . . . . . . . . . . . . . . . . . . . . . . . . . . . . . . . . . . . . . . . . . . . . . . . 4,238 2,332
Vested . . . . . . . . . . . . . . . . . . . . . . . . . . . . . . . . . . . . . . . . . . . . . . . . . . . . . . . . . . . . . (580) (383)
Forfeited/lapsed . . . . . . . . . . . . . . . . . . . . . . . . . . . . . . . . . . . . . . . . . . . . . . . . . . . . . (1,799) (975)
Outstanding at January 1, 2012 . . . . . . . . . . . . . . . . . . . . . . . . . . . . . . . . . . . . . . . . . 13,896 8,267
Granted . . . . . . . . . . . . . . . . . . . . . . . . . . . . . . . . . . . . . . . . . . . . . . . . . . . . . . . . . . . . 4,402 2,405
Vested . . . . . . . . . . . . . . . . . . . . . . . . . . . . . . . . . . . . . . . . . . . . . . . . . . . . . . . . . . . . . (601) (391)
Forfeited/lapsed . . . . . . . . . . . . . . . . . . . . . . . . . . . . . . . . . . . . . . . . . . . . . . . . . . . . . (5,885) (3,575)
Outstanding at January 1, 2013 . . . . . . . . . . . . . . . . . . . . . . . . . . . . . . . . . . . . . . . . . 11,812 6,706
Granted . . . . . . . . . . . . . . . . . . . . . . . . . . . . . . . . . . . . . . . . . . . . . . . . . . . . . . . . . . . . 3,181 2,367
Vested . . . . . . . . . . . . . . . . . . . . . . . . . . . . . . . . . . . . . . . . . . . . . . . . . . . . . . . . . . . . . (3,256) (1,966)
Forfeited/lapsed . . . . . . . . . . . . . . . . . . . . . . . . . . . . . . . . . . . . . . . . . . . . . . . . . . . . . (1,395) (923)
Outstanding at December 31, 2013 . . . . . . . . . . . . . . . . . . . . . . . . . . . . . . . . . . . . . . 10,342 6,184
F-29
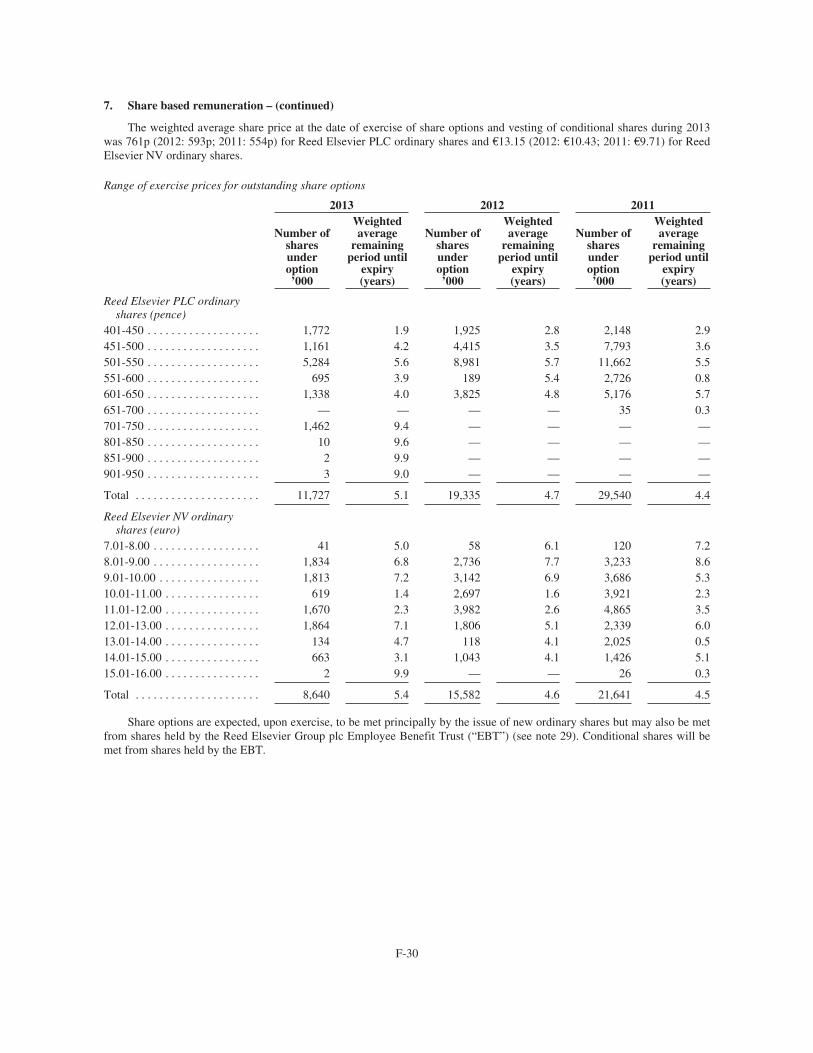
7. Share based remuneration – (continued)
The weighted average share price at the date of exercise of share options and vesting of conditional shares during 2013was 761p (2012: 593p; 2011: 554p) for Reed Elsevier PLC ordinary shares and €13.15 (2012: €10.43; 2011: €9.71) for ReedElsevier NV ordinary shares.
Range of exercise prices for outstanding share options
2013 2012 2011
Number ofsharesunderoption’000
Weightedaverage
remainingperiod until
expiry(years)
Number ofsharesunderoption’000
Weightedaverage
remainingperiod until
expiry(years)
Number ofsharesunderoption’000
Weightedaverage
remainingperiod until
expiry(years)
Reed Elsevier PLC ordinaryshares (pence)
401-450 . . . . . . . . . . . . . . . . . . . 1,772 1.9 1,925 2.8 2,148 2.9451-500 . . . . . . . . . . . . . . . . . . . 1,161 4.2 4,415 3.5 7,793 3.6501-550 . . . . . . . . . . . . . . . . . . . 5,284 5.6 8,981 5.7 11,662 5.5551-600 . . . . . . . . . . . . . . . . . . . 695 3.9 189 5.4 2,726 0.8601-650 . . . . . . . . . . . . . . . . . . . 1,338 4.0 3,825 4.8 5,176 5.7651-700 . . . . . . . . . . . . . . . . . . . — — — — 35 0.3701-750 . . . . . . . . . . . . . . . . . . . 1,462 9.4 — — — —801-850 . . . . . . . . . . . . . . . . . . . 10 9.6 — — — —851-900 . . . . . . . . . . . . . . . . . . . 2 9.9 — — — —901-950 . . . . . . . . . . . . . . . . . . . 3 9.0 — — — —
Total . . . . . . . . . . . . . . . . . . . . . 11,727 5.1 19,335 4.7 29,540 4.4
Reed Elsevier NV ordinaryshares (euro)
7.01-8.00 . . . . . . . . . . . . . . . . . . 41 5.0 58 6.1 120 7.28.01-9.00 . . . . . . . . . . . . . . . . . . 1,834 6.8 2,736 7.7 3,233 8.69.01-10.00 . . . . . . . . . . . . . . . . . 1,813 7.2 3,142 6.9 3,686 5.310.01-11.00 . . . . . . . . . . . . . . . . 619 1.4 2,697 1.6 3,921 2.311.01-12.00 . . . . . . . . . . . . . . . . 1,670 2.3 3,982 2.6 4,865 3.512.01-13.00 . . . . . . . . . . . . . . . . 1,864 7.1 1,806 5.1 2,339 6.013.01-14.00 . . . . . . . . . . . . . . . . 134 4.7 118 4.1 2,025 0.514.01-15.00 . . . . . . . . . . . . . . . . 663 3.1 1,043 4.1 1,426 5.115.01-16.00 . . . . . . . . . . . . . . . . 2 9.9 — — 26 0.3
Total . . . . . . . . . . . . . . . . . . . . . 8,640 5.4 15,582 4.6 21,641 4.5
Share options are expected, upon exercise, to be met principally by the issue of new ordinary shares but may also be metfrom shares held by the Reed Elsevier Group plc Employee Benefit Trust (“EBT”) (see note 29). Conditional shares will bemet from shares held by the EBT.
F-30
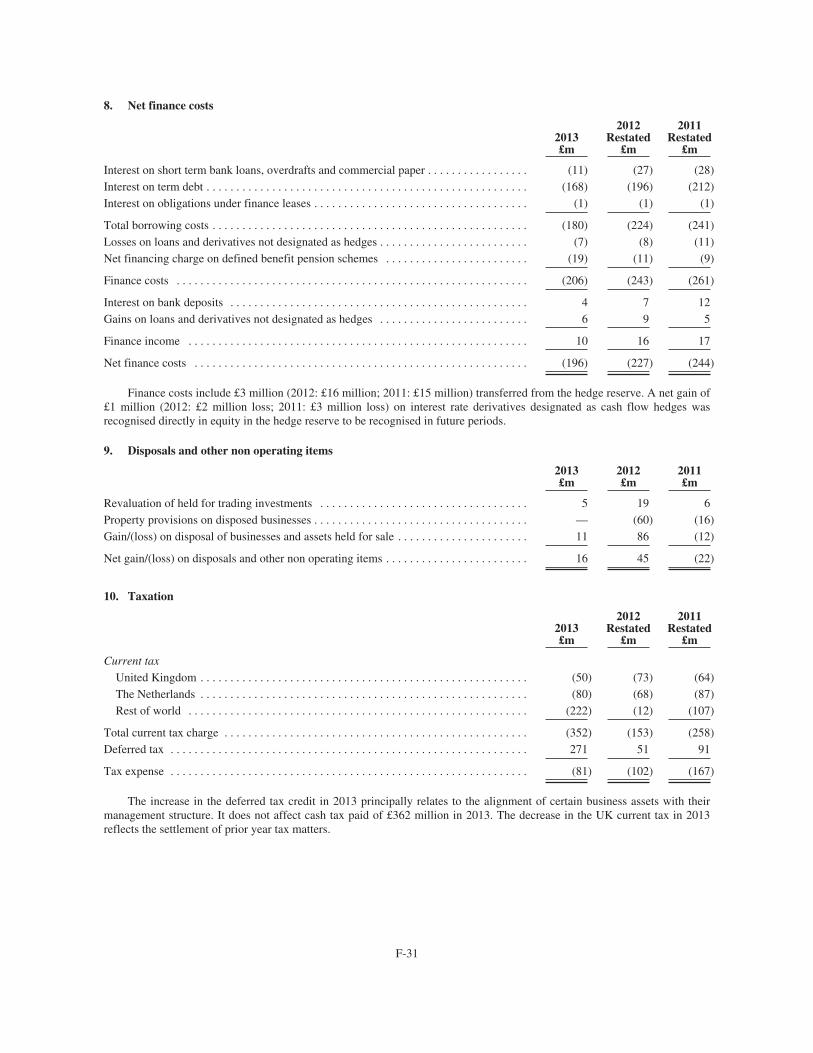
8. Net finance costs
2013£m
2012Restated
£m
2011Restated
£m
Interest on short term bank loans, overdrafts and commercial paper . . . . . . . . . . . . . . . . . (11) (27) (28)Interest on term debt . . . . . . . . . . . . . . . . . . . . . . . . . . . . . . . . . . . . . . . . . . . . . . . . . . . . . . (168) (196) (212)Interest on obligations under finance leases . . . . . . . . . . . . . . . . . . . . . . . . . . . . . . . . . . . . (1) (1) (1)
Total borrowing costs . . . . . . . . . . . . . . . . . . . . . . . . . . . . . . . . . . . . . . . . . . . . . . . . . . . . . (180) (224) (241)Losses on loans and derivatives not designated as hedges . . . . . . . . . . . . . . . . . . . . . . . . . (7) (8) (11)Net financing charge on defined benefit pension schemes . . . . . . . . . . . . . . . . . . . . . . . . (19) (11) (9)
Finance costs . . . . . . . . . . . . . . . . . . . . . . . . . . . . . . . . . . . . . . . . . . . . . . . . . . . . . . . . . . . (206) (243) (261)
Interest on bank deposits . . . . . . . . . . . . . . . . . . . . . . . . . . . . . . . . . . . . . . . . . . . . . . . . . . 4 7 12Gains on loans and derivatives not designated as hedges . . . . . . . . . . . . . . . . . . . . . . . . . 6 9 5
Finance income . . . . . . . . . . . . . . . . . . . . . . . . . . . . . . . . . . . . . . . . . . . . . . . . . . . . . . . . . 10 16 17
Net finance costs . . . . . . . . . . . . . . . . . . . . . . . . . . . . . . . . . . . . . . . . . . . . . . . . . . . . . . . . (196) (227) (244)
Finance costs include £3 million (2012: £16 million; 2011: £15 million) transferred from the hedge reserve. A net gain of£1 million (2012: £2 million loss; 2011: £3 million loss) on interest rate derivatives designated as cash flow hedges wasrecognised directly in equity in the hedge reserve to be recognised in future periods.
9. Disposals and other non operating items
2013£m
2012£m
2011£m
Revaluation of held for trading investments . . . . . . . . . . . . . . . . . . . . . . . . . . . . . . . . . . . 5 19 6Property provisions on disposed businesses . . . . . . . . . . . . . . . . . . . . . . . . . . . . . . . . . . . . — (60) (16)Gain/(loss) on disposal of businesses and assets held for sale . . . . . . . . . . . . . . . . . . . . . . 11 86 (12)
Net gain/(loss) on disposals and other non operating items . . . . . . . . . . . . . . . . . . . . . . . . 16 45 (22)
10. Taxation
2013£m
2012Restated
£m
2011Restated
£m
Current tax
United Kingdom . . . . . . . . . . . . . . . . . . . . . . . . . . . . . . . . . . . . . . . . . . . . . . . . . . . . . . . (50) (73) (64)The Netherlands . . . . . . . . . . . . . . . . . . . . . . . . . . . . . . . . . . . . . . . . . . . . . . . . . . . . . . . (80) (68) (87)Rest of world . . . . . . . . . . . . . . . . . . . . . . . . . . . . . . . . . . . . . . . . . . . . . . . . . . . . . . . . . (222) (12) (107)
Total current tax charge . . . . . . . . . . . . . . . . . . . . . . . . . . . . . . . . . . . . . . . . . . . . . . . . . . . (352) (153) (258)Deferred tax . . . . . . . . . . . . . . . . . . . . . . . . . . . . . . . . . . . . . . . . . . . . . . . . . . . . . . . . . . . . 271 51 91
Tax expense . . . . . . . . . . . . . . . . . . . . . . . . . . . . . . . . . . . . . . . . . . . . . . . . . . . . . . . . . . . . (81) (102) (167)
The increase in the deferred tax credit in 2013 principally relates to the alignment of certain business assets with theirmanagement structure. It does not affect cash tax paid of £362 million in 2013. The decrease in the UK current tax in 2013reflects the settlement of prior year tax matters.
F-31
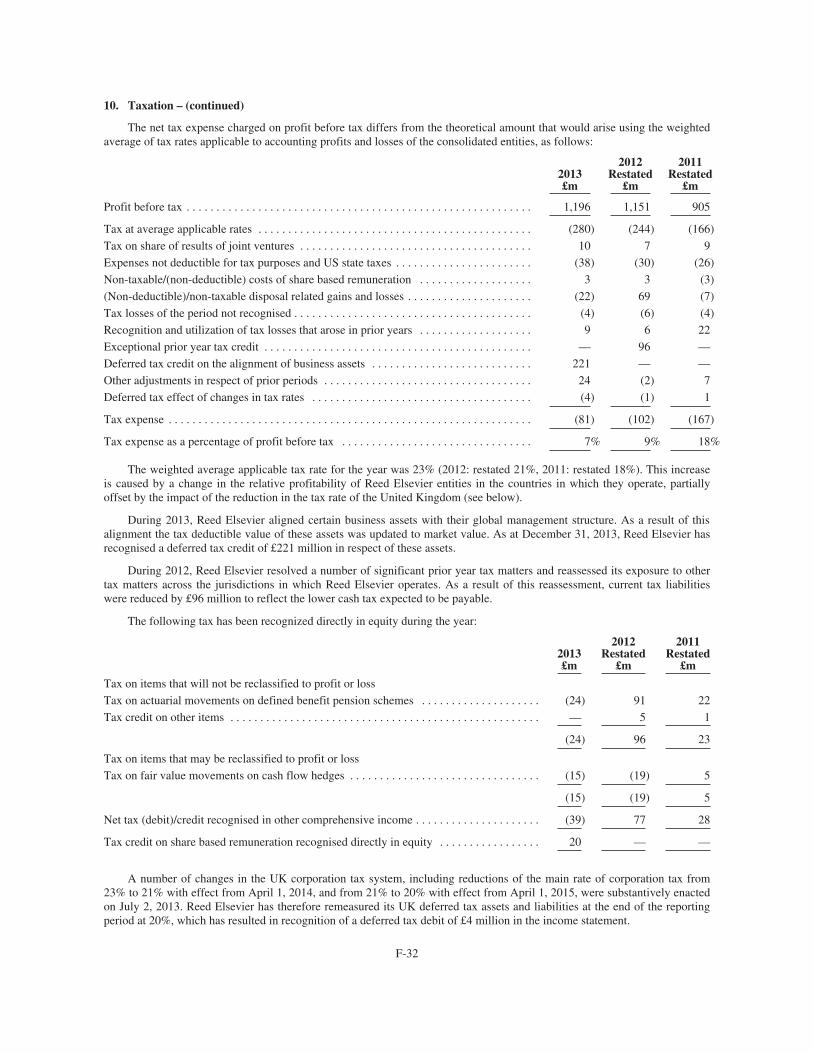
10. Taxation – (continued)
The net tax expense charged on profit before tax differs from the theoretical amount that would arise using the weightedaverage of tax rates applicable to accounting profits and losses of the consolidated entities, as follows:
2013£m
2012Restated
£m
2011Restated
£m
Profit before tax . . . . . . . . . . . . . . . . . . . . . . . . . . . . . . . . . . . . . . . . . . . . . . . . . . . . . . . . . . 1,196 1,151 905
Tax at average applicable rates . . . . . . . . . . . . . . . . . . . . . . . . . . . . . . . . . . . . . . . . . . . . . . (280) (244) (166)
Tax on share of results of joint ventures . . . . . . . . . . . . . . . . . . . . . . . . . . . . . . . . . . . . . . . 10 7 9
Expenses not deductible for tax purposes and US state taxes . . . . . . . . . . . . . . . . . . . . . . . (38) (30) (26)
Non-taxable/(non-deductible) costs of share based remuneration . . . . . . . . . . . . . . . . . . . 3 3 (3)
(Non-deductible)/non-taxable disposal related gains and losses . . . . . . . . . . . . . . . . . . . . . (22) 69 (7)
Tax losses of the period not recognised . . . . . . . . . . . . . . . . . . . . . . . . . . . . . . . . . . . . . . . . (4) (6) (4)
Recognition and utilization of tax losses that arose in prior years . . . . . . . . . . . . . . . . . . . 9 6 22
Exceptional prior year tax credit . . . . . . . . . . . . . . . . . . . . . . . . . . . . . . . . . . . . . . . . . . . . . — 96 —
Deferred tax credit on the alignment of business assets . . . . . . . . . . . . . . . . . . . . . . . . . . . 221 — —
Other adjustments in respect of prior periods . . . . . . . . . . . . . . . . . . . . . . . . . . . . . . . . . . . 24 (2) 7
Deferred tax effect of changes in tax rates . . . . . . . . . . . . . . . . . . . . . . . . . . . . . . . . . . . . . (4) (1) 1
Tax expense . . . . . . . . . . . . . . . . . . . . . . . . . . . . . . . . . . . . . . . . . . . . . . . . . . . . . . . . . . . . . (81) (102) (167)
Tax expense as a percentage of profit before tax . . . . . . . . . . . . . . . . . . . . . . . . . . . . . . . . 7% 9% 18%
The weighted average applicable tax rate for the year was 23% (2012: restated 21%, 2011: restated 18%). This increaseis caused by a change in the relative profitability of Reed Elsevier entities in the countries in which they operate, partiallyoffset by the impact of the reduction in the tax rate of the United Kingdom (see below).
During 2013, Reed Elsevier aligned certain business assets with their global management structure. As a result of thisalignment the tax deductible value of these assets was updated to market value. As at December 31, 2013, Reed Elsevier hasrecognised a deferred tax credit of £221 million in respect of these assets.
During 2012, Reed Elsevier resolved a number of significant prior year tax matters and reassessed its exposure to othertax matters across the jurisdictions in which Reed Elsevier operates. As a result of this reassessment, current tax liabilitieswere reduced by £96 million to reflect the lower cash tax expected to be payable.
The following tax has been recognized directly in equity during the year:
2013£m
2012Restated
£m
2011Restated
£m
Tax on items that will not be reclassified to profit or loss
Tax on actuarial movements on defined benefit pension schemes . . . . . . . . . . . . . . . . . . . . (24) 91 22
Tax credit on other items . . . . . . . . . . . . . . . . . . . . . . . . . . . . . . . . . . . . . . . . . . . . . . . . . . . . — 5 1
(24) 96 23
Tax on items that may be reclassified to profit or loss
Tax on fair value movements on cash flow hedges . . . . . . . . . . . . . . . . . . . . . . . . . . . . . . . . (15) (19) 5
(15) (19) 5
Net tax (debit)/credit recognised in other comprehensive income . . . . . . . . . . . . . . . . . . . . . (39) 77 28
Tax credit on share based remuneration recognised directly in equity . . . . . . . . . . . . . . . . . 20 — —
A number of changes in the UK corporation tax system, including reductions of the main rate of corporation tax from23% to 21% with effect from April 1, 2014, and from 21% to 20% with effect from April 1, 2015, were substantively enactedon July 2, 2013. Reed Elsevier has therefore remeasured its UK deferred tax assets and liabilities at the end of the reportingperiod at 20%, which has resulted in recognition of a deferred tax debit of £4 million in the income statement.
F-32
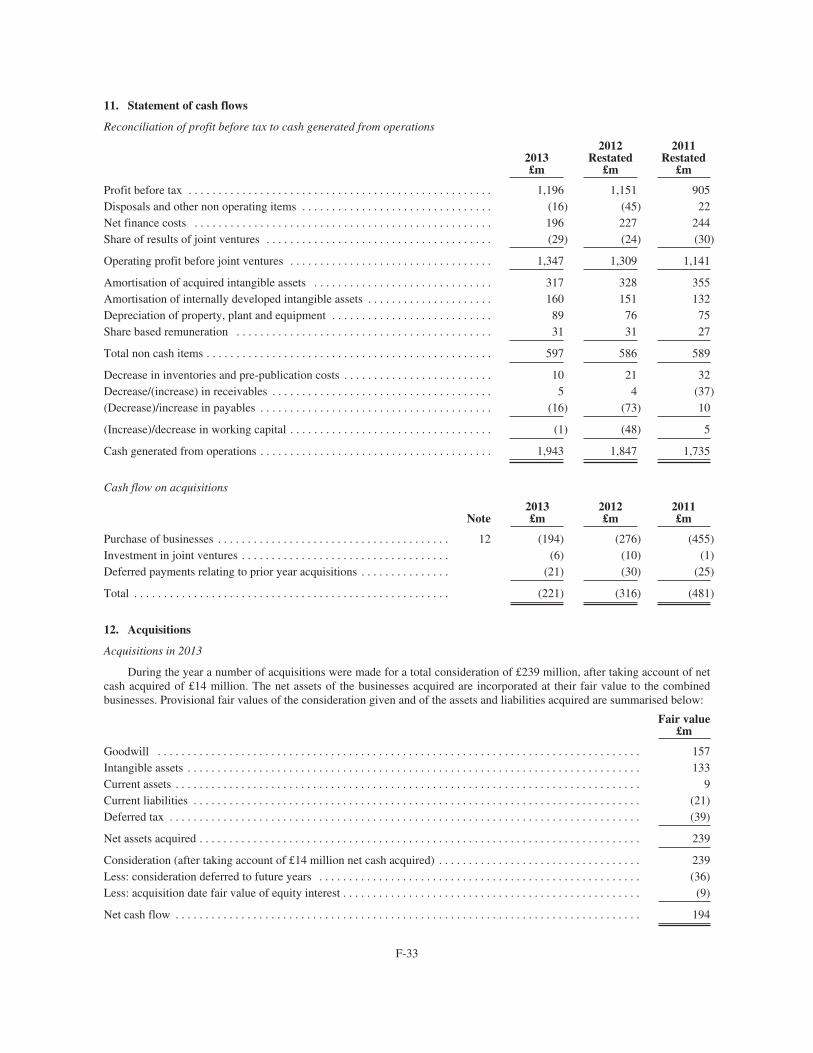
11. Statement of cash flows
Reconciliation of profit before tax to cash generated from operations
2013£m
2012Restated
£m
2011Restated
£m
Profit before tax . . . . . . . . . . . . . . . . . . . . . . . . . . . . . . . . . . . . . . . . . . . . . . . . . . . 1,196 1,151 905Disposals and other non operating items . . . . . . . . . . . . . . . . . . . . . . . . . . . . . . . . (16) (45) 22Net finance costs . . . . . . . . . . . . . . . . . . . . . . . . . . . . . . . . . . . . . . . . . . . . . . . . . . 196 227 244Share of results of joint ventures . . . . . . . . . . . . . . . . . . . . . . . . . . . . . . . . . . . . . . (29) (24) (30)
Operating profit before joint ventures . . . . . . . . . . . . . . . . . . . . . . . . . . . . . . . . . . 1,347 1,309 1,141
Amortisation of acquired intangible assets . . . . . . . . . . . . . . . . . . . . . . . . . . . . . . 317 328 355Amortisation of internally developed intangible assets . . . . . . . . . . . . . . . . . . . . . 160 151 132Depreciation of property, plant and equipment . . . . . . . . . . . . . . . . . . . . . . . . . . . 89 76 75Share based remuneration . . . . . . . . . . . . . . . . . . . . . . . . . . . . . . . . . . . . . . . . . . . 31 31 27
Total non cash items . . . . . . . . . . . . . . . . . . . . . . . . . . . . . . . . . . . . . . . . . . . . . . . . 597 586 589
Decrease in inventories and pre-publication costs . . . . . . . . . . . . . . . . . . . . . . . . . 10 21 32Decrease/(increase) in receivables . . . . . . . . . . . . . . . . . . . . . . . . . . . . . . . . . . . . . 5 4 (37)(Decrease)/increase in payables . . . . . . . . . . . . . . . . . . . . . . . . . . . . . . . . . . . . . . . (16) (73) 10
(Increase)/decrease in working capital . . . . . . . . . . . . . . . . . . . . . . . . . . . . . . . . . . (1) (48) 5
Cash generated from operations . . . . . . . . . . . . . . . . . . . . . . . . . . . . . . . . . . . . . . . 1,943 1,847 1,735
Cash flow on acquisitions
Note2013£m
2012£m
2011£m
Purchase of businesses . . . . . . . . . . . . . . . . . . . . . . . . . . . . . . . . . . . . . . . 12 (194) (276) (455)Investment in joint ventures . . . . . . . . . . . . . . . . . . . . . . . . . . . . . . . . . . . (6) (10) (1)Deferred payments relating to prior year acquisitions . . . . . . . . . . . . . . . (21) (30) (25)
Total . . . . . . . . . . . . . . . . . . . . . . . . . . . . . . . . . . . . . . . . . . . . . . . . . . . . . (221) (316) (481)
12. Acquisitions
Acquisitions in 2013
During the year a number of acquisitions were made for a total consideration of £239 million, after taking account of netcash acquired of £14 million. The net assets of the businesses acquired are incorporated at their fair value to the combinedbusinesses. Provisional fair values of the consideration given and of the assets and liabilities acquired are summarised below:
Fair value£m
Goodwill . . . . . . . . . . . . . . . . . . . . . . . . . . . . . . . . . . . . . . . . . . . . . . . . . . . . . . . . . . . . . . . . . . . . . . . . . . . . . . . . . 157Intangible assets . . . . . . . . . . . . . . . . . . . . . . . . . . . . . . . . . . . . . . . . . . . . . . . . . . . . . . . . . . . . . . . . . . . . . . . . . . . . 133Current assets . . . . . . . . . . . . . . . . . . . . . . . . . . . . . . . . . . . . . . . . . . . . . . . . . . . . . . . . . . . . . . . . . . . . . . . . . . . . . . 9Current liabilities . . . . . . . . . . . . . . . . . . . . . . . . . . . . . . . . . . . . . . . . . . . . . . . . . . . . . . . . . . . . . . . . . . . . . . . . . . . (21)Deferred tax . . . . . . . . . . . . . . . . . . . . . . . . . . . . . . . . . . . . . . . . . . . . . . . . . . . . . . . . . . . . . . . . . . . . . . . . . . . . . . . (39)
Net assets acquired . . . . . . . . . . . . . . . . . . . . . . . . . . . . . . . . . . . . . . . . . . . . . . . . . . . . . . . . . . . . . . . . . . . . . . . . . . 239
Consideration (after taking account of £14 million net cash acquired) . . . . . . . . . . . . . . . . . . . . . . . . . . . . . . . . . . 239Less: consideration deferred to future years . . . . . . . . . . . . . . . . . . . . . . . . . . . . . . . . . . . . . . . . . . . . . . . . . . . . . . (36)Less: acquisition date fair value of equity interest . . . . . . . . . . . . . . . . . . . . . . . . . . . . . . . . . . . . . . . . . . . . . . . . . . (9)
Net cash flow . . . . . . . . . . . . . . . . . . . . . . . . . . . . . . . . . . . . . . . . . . . . . . . . . . . . . . . . . . . . . . . . . . . . . . . . . . . . . . 194
F-33
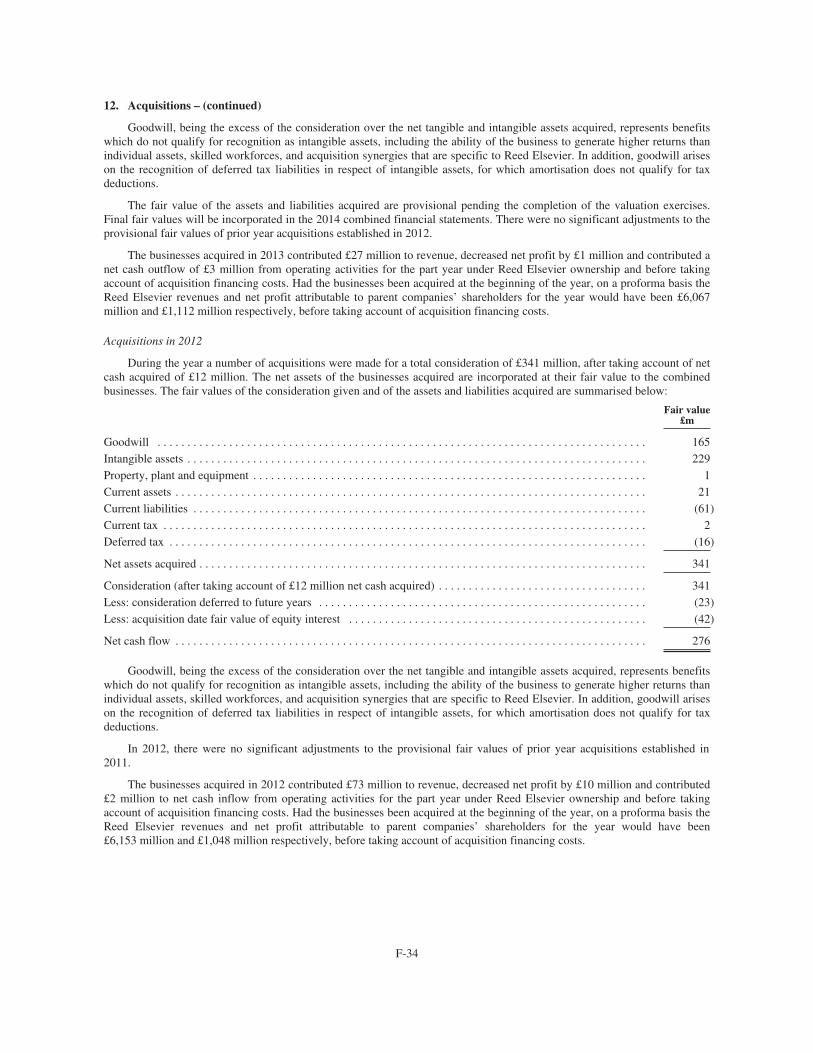
12. Acquisitions – (continued)
Goodwill, being the excess of the consideration over the net tangible and intangible assets acquired, represents benefitswhich do not qualify for recognition as intangible assets, including the ability of the business to generate higher returns thanindividual assets, skilled workforces, and acquisition synergies that are specific to Reed Elsevier. In addition, goodwill ariseson the recognition of deferred tax liabilities in respect of intangible assets, for which amortisation does not qualify for taxdeductions.
The fair value of the assets and liabilities acquired are provisional pending the completion of the valuation exercises.Final fair values will be incorporated in the 2014 combined financial statements. There were no significant adjustments to theprovisional fair values of prior year acquisitions established in 2012.
The businesses acquired in 2013 contributed £27 million to revenue, decreased net profit by £1 million and contributed anet cash outflow of £3 million from operating activities for the part year under Reed Elsevier ownership and before takingaccount of acquisition financing costs. Had the businesses been acquired at the beginning of the year, on a proforma basis theReed Elsevier revenues and net profit attributable to parent companies’ shareholders for the year would have been £6,067million and £1,112 million respectively, before taking account of acquisition financing costs.
Acquisitions in 2012
During the year a number of acquisitions were made for a total consideration of £341 million, after taking account of netcash acquired of £12 million. The net assets of the businesses acquired are incorporated at their fair value to the combinedbusinesses. The fair values of the consideration given and of the assets and liabilities acquired are summarised below:
Fair value£m
Goodwill . . . . . . . . . . . . . . . . . . . . . . . . . . . . . . . . . . . . . . . . . . . . . . . . . . . . . . . . . . . . . . . . . . . . . . . . . . . . . . . . . . 165Intangible assets . . . . . . . . . . . . . . . . . . . . . . . . . . . . . . . . . . . . . . . . . . . . . . . . . . . . . . . . . . . . . . . . . . . . . . . . . . . . . 229Property, plant and equipment . . . . . . . . . . . . . . . . . . . . . . . . . . . . . . . . . . . . . . . . . . . . . . . . . . . . . . . . . . . . . . . . . . 1Current assets . . . . . . . . . . . . . . . . . . . . . . . . . . . . . . . . . . . . . . . . . . . . . . . . . . . . . . . . . . . . . . . . . . . . . . . . . . . . . . . 21Current liabilities . . . . . . . . . . . . . . . . . . . . . . . . . . . . . . . . . . . . . . . . . . . . . . . . . . . . . . . . . . . . . . . . . . . . . . . . . . . . (61)Current tax . . . . . . . . . . . . . . . . . . . . . . . . . . . . . . . . . . . . . . . . . . . . . . . . . . . . . . . . . . . . . . . . . . . . . . . . . . . . . . . . . 2Deferred tax . . . . . . . . . . . . . . . . . . . . . . . . . . . . . . . . . . . . . . . . . . . . . . . . . . . . . . . . . . . . . . . . . . . . . . . . . . . . . . . . (16)
Net assets acquired . . . . . . . . . . . . . . . . . . . . . . . . . . . . . . . . . . . . . . . . . . . . . . . . . . . . . . . . . . . . . . . . . . . . . . . . . . . 341
Consideration (after taking account of £12 million net cash acquired) . . . . . . . . . . . . . . . . . . . . . . . . . . . . . . . . . . . 341Less: consideration deferred to future years . . . . . . . . . . . . . . . . . . . . . . . . . . . . . . . . . . . . . . . . . . . . . . . . . . . . . . . (23)Less: acquisition date fair value of equity interest . . . . . . . . . . . . . . . . . . . . . . . . . . . . . . . . . . . . . . . . . . . . . . . . . . (42)
Net cash flow . . . . . . . . . . . . . . . . . . . . . . . . . . . . . . . . . . . . . . . . . . . . . . . . . . . . . . . . . . . . . . . . . . . . . . . . . . . . . . . 276
Goodwill, being the excess of the consideration over the net tangible and intangible assets acquired, represents benefitswhich do not qualify for recognition as intangible assets, including the ability of the business to generate higher returns thanindividual assets, skilled workforces, and acquisition synergies that are specific to Reed Elsevier. In addition, goodwill ariseson the recognition of deferred tax liabilities in respect of intangible assets, for which amortisation does not qualify for taxdeductions.
In 2012, there were no significant adjustments to the provisional fair values of prior year acquisitions established in2011.
The businesses acquired in 2012 contributed £73 million to revenue, decreased net profit by £10 million and contributed£2 million to net cash inflow from operating activities for the part year under Reed Elsevier ownership and before takingaccount of acquisition financing costs. Had the businesses been acquired at the beginning of the year, on a proforma basis theReed Elsevier revenues and net profit attributable to parent companies’ shareholders for the year would have been£6,153 million and £1,048 million respectively, before taking account of acquisition financing costs.
F-34
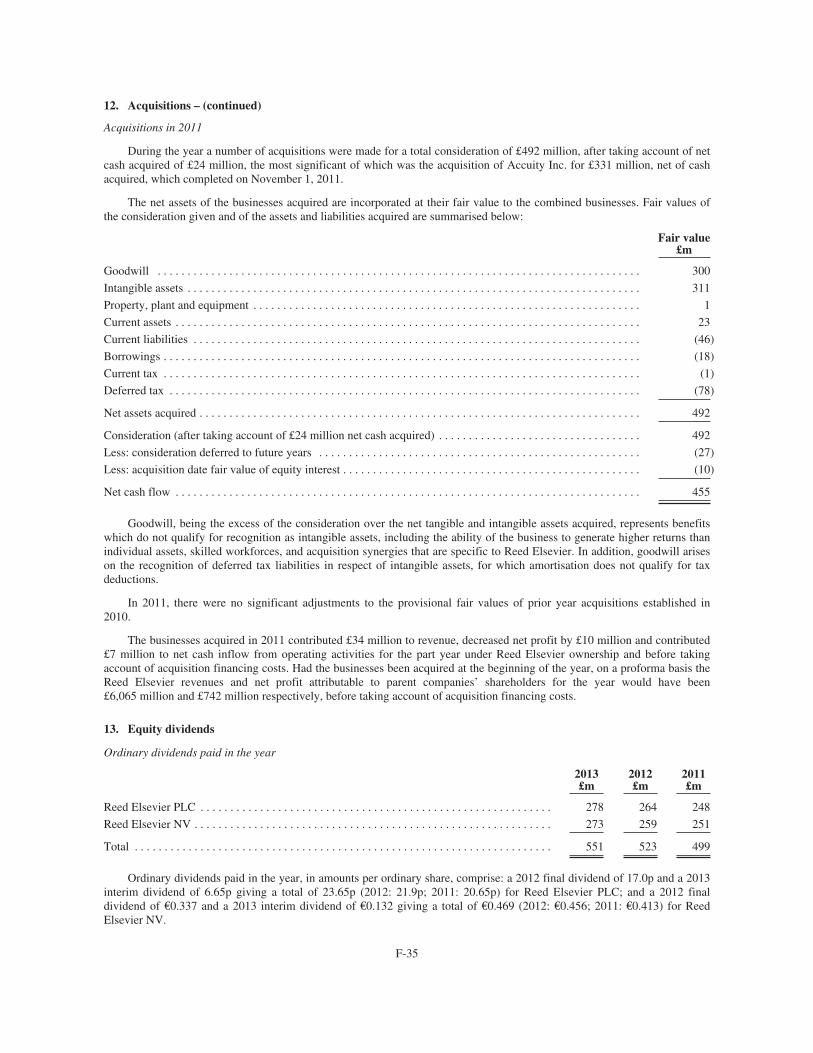
12. Acquisitions – (continued)
Acquisitions in 2011
During the year a number of acquisitions were made for a total consideration of £492 million, after taking account of netcash acquired of £24 million, the most significant of which was the acquisition of Accuity Inc. for £331 million, net of cashacquired, which completed on November 1, 2011.
The net assets of the businesses acquired are incorporated at their fair value to the combined businesses. Fair values ofthe consideration given and of the assets and liabilities acquired are summarised below:
Fair value£m
Goodwill . . . . . . . . . . . . . . . . . . . . . . . . . . . . . . . . . . . . . . . . . . . . . . . . . . . . . . . . . . . . . . . . . . . . . . . . . . . . . . . . . 300
Intangible assets . . . . . . . . . . . . . . . . . . . . . . . . . . . . . . . . . . . . . . . . . . . . . . . . . . . . . . . . . . . . . . . . . . . . . . . . . . . . 311
Property, plant and equipment . . . . . . . . . . . . . . . . . . . . . . . . . . . . . . . . . . . . . . . . . . . . . . . . . . . . . . . . . . . . . . . . . 1
Current assets . . . . . . . . . . . . . . . . . . . . . . . . . . . . . . . . . . . . . . . . . . . . . . . . . . . . . . . . . . . . . . . . . . . . . . . . . . . . . . 23
Current liabilities . . . . . . . . . . . . . . . . . . . . . . . . . . . . . . . . . . . . . . . . . . . . . . . . . . . . . . . . . . . . . . . . . . . . . . . . . . . (46)
Borrowings . . . . . . . . . . . . . . . . . . . . . . . . . . . . . . . . . . . . . . . . . . . . . . . . . . . . . . . . . . . . . . . . . . . . . . . . . . . . . . . . (18)
Current tax . . . . . . . . . . . . . . . . . . . . . . . . . . . . . . . . . . . . . . . . . . . . . . . . . . . . . . . . . . . . . . . . . . . . . . . . . . . . . . . . (1)
Deferred tax . . . . . . . . . . . . . . . . . . . . . . . . . . . . . . . . . . . . . . . . . . . . . . . . . . . . . . . . . . . . . . . . . . . . . . . . . . . . . . . (78)
Net assets acquired . . . . . . . . . . . . . . . . . . . . . . . . . . . . . . . . . . . . . . . . . . . . . . . . . . . . . . . . . . . . . . . . . . . . . . . . . . 492
Consideration (after taking account of £24 million net cash acquired) . . . . . . . . . . . . . . . . . . . . . . . . . . . . . . . . . . 492
Less: consideration deferred to future years . . . . . . . . . . . . . . . . . . . . . . . . . . . . . . . . . . . . . . . . . . . . . . . . . . . . . . (27)
Less: acquisition date fair value of equity interest . . . . . . . . . . . . . . . . . . . . . . . . . . . . . . . . . . . . . . . . . . . . . . . . . . (10)
Net cash flow . . . . . . . . . . . . . . . . . . . . . . . . . . . . . . . . . . . . . . . . . . . . . . . . . . . . . . . . . . . . . . . . . . . . . . . . . . . . . . 455
Goodwill, being the excess of the consideration over the net tangible and intangible assets acquired, represents benefitswhich do not qualify for recognition as intangible assets, including the ability of the business to generate higher returns thanindividual assets, skilled workforces, and acquisition synergies that are specific to Reed Elsevier. In addition, goodwill ariseson the recognition of deferred tax liabilities in respect of intangible assets, for which amortisation does not qualify for taxdeductions.
In 2011, there were no significant adjustments to the provisional fair values of prior year acquisitions established in2010.
The businesses acquired in 2011 contributed £34 million to revenue, decreased net profit by £10 million and contributed£7 million to net cash inflow from operating activities for the part year under Reed Elsevier ownership and before takingaccount of acquisition financing costs. Had the businesses been acquired at the beginning of the year, on a proforma basis theReed Elsevier revenues and net profit attributable to parent companies’ shareholders for the year would have been£6,065 million and £742 million respectively, before taking account of acquisition financing costs.
13. Equity dividends
Ordinary dividends paid in the year
2013£m
2012£m
2011£m
Reed Elsevier PLC . . . . . . . . . . . . . . . . . . . . . . . . . . . . . . . . . . . . . . . . . . . . . . . . . . . . . . . . . . . 278 264 248
Reed Elsevier NV . . . . . . . . . . . . . . . . . . . . . . . . . . . . . . . . . . . . . . . . . . . . . . . . . . . . . . . . . . . . 273 259 251
Total . . . . . . . . . . . . . . . . . . . . . . . . . . . . . . . . . . . . . . . . . . . . . . . . . . . . . . . . . . . . . . . . . . . . . . 551 523 499
Ordinary dividends paid in the year, in amounts per ordinary share, comprise: a 2012 final dividend of 17.0p and a 2013interim dividend of 6.65p giving a total of 23.65p (2012: 21.9p; 2011: 20.65p) for Reed Elsevier PLC; and a 2012 finaldividend of €0.337 and a 2013 interim dividend of €0.132 giving a total of €0.469 (2012: €0.456; 2011: €0.413) for ReedElsevier NV.
F-35
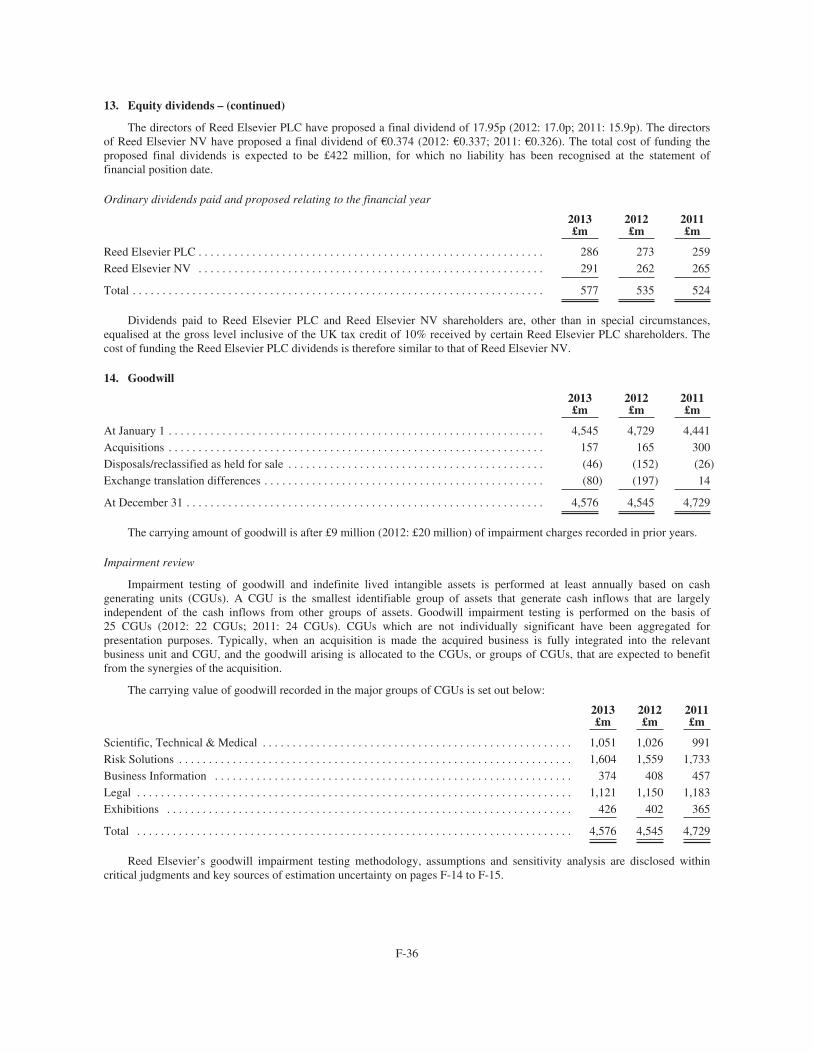
13. Equity dividends – (continued)
The directors of Reed Elsevier PLC have proposed a final dividend of 17.95p (2012: 17.0p; 2011: 15.9p). The directorsof Reed Elsevier NV have proposed a final dividend of €0.374 (2012: €0.337; 2011: €0.326). The total cost of funding theproposed final dividends is expected to be £422 million, for which no liability has been recognised at the statement offinancial position date.
Ordinary dividends paid and proposed relating to the financial year
2013£m
2012£m
2011£m
Reed Elsevier PLC . . . . . . . . . . . . . . . . . . . . . . . . . . . . . . . . . . . . . . . . . . . . . . . . . . . . . . . . . . 286 273 259Reed Elsevier NV . . . . . . . . . . . . . . . . . . . . . . . . . . . . . . . . . . . . . . . . . . . . . . . . . . . . . . . . . . 291 262 265
Total . . . . . . . . . . . . . . . . . . . . . . . . . . . . . . . . . . . . . . . . . . . . . . . . . . . . . . . . . . . . . . . . . . . . . 577 535 524
Dividends paid to Reed Elsevier PLC and Reed Elsevier NV shareholders are, other than in special circumstances,equalised at the gross level inclusive of the UK tax credit of 10% received by certain Reed Elsevier PLC shareholders. Thecost of funding the Reed Elsevier PLC dividends is therefore similar to that of Reed Elsevier NV.
14. Goodwill
2013£m
2012£m
2011£m
At January 1 . . . . . . . . . . . . . . . . . . . . . . . . . . . . . . . . . . . . . . . . . . . . . . . . . . . . . . . . . . . . . . . 4,545 4,729 4,441Acquisitions . . . . . . . . . . . . . . . . . . . . . . . . . . . . . . . . . . . . . . . . . . . . . . . . . . . . . . . . . . . . . . . 157 165 300Disposals/reclassified as held for sale . . . . . . . . . . . . . . . . . . . . . . . . . . . . . . . . . . . . . . . . . . . (46) (152) (26)Exchange translation differences . . . . . . . . . . . . . . . . . . . . . . . . . . . . . . . . . . . . . . . . . . . . . . . (80) (197) 14
At December 31 . . . . . . . . . . . . . . . . . . . . . . . . . . . . . . . . . . . . . . . . . . . . . . . . . . . . . . . . . . . . 4,576 4,545 4,729
The carrying amount of goodwill is after £9 million (2012: £20 million) of impairment charges recorded in prior years.
Impairment review
Impairment testing of goodwill and indefinite lived intangible assets is performed at least annually based on cashgenerating units (CGUs). A CGU is the smallest identifiable group of assets that generate cash inflows that are largelyindependent of the cash inflows from other groups of assets. Goodwill impairment testing is performed on the basis of25 CGUs (2012: 22 CGUs; 2011: 24 CGUs). CGUs which are not individually significant have been aggregated forpresentation purposes. Typically, when an acquisition is made the acquired business is fully integrated into the relevantbusiness unit and CGU, and the goodwill arising is allocated to the CGUs, or groups of CGUs, that are expected to benefitfrom the synergies of the acquisition.
The carrying value of goodwill recorded in the major groups of CGUs is set out below:
2013£m
2012£m
2011£m
Scientific, Technical & Medical . . . . . . . . . . . . . . . . . . . . . . . . . . . . . . . . . . . . . . . . . . . . . . . . . . . . 1,051 1,026 991Risk Solutions . . . . . . . . . . . . . . . . . . . . . . . . . . . . . . . . . . . . . . . . . . . . . . . . . . . . . . . . . . . . . . . . . . 1,604 1,559 1,733Business Information . . . . . . . . . . . . . . . . . . . . . . . . . . . . . . . . . . . . . . . . . . . . . . . . . . . . . . . . . . . . 374 408 457Legal . . . . . . . . . . . . . . . . . . . . . . . . . . . . . . . . . . . . . . . . . . . . . . . . . . . . . . . . . . . . . . . . . . . . . . . . . 1,121 1,150 1,183Exhibitions . . . . . . . . . . . . . . . . . . . . . . . . . . . . . . . . . . . . . . . . . . . . . . . . . . . . . . . . . . . . . . . . . . . . 426 402 365
Total . . . . . . . . . . . . . . . . . . . . . . . . . . . . . . . . . . . . . . . . . . . . . . . . . . . . . . . . . . . . . . . . . . . . . . . . . 4,576 4,545 4,729
Reed Elsevier’s goodwill impairment testing methodology, assumptions and sensitivity analysis are disclosed withincritical judgments and key sources of estimation uncertainty on pages F-14 to F-15.
F-36
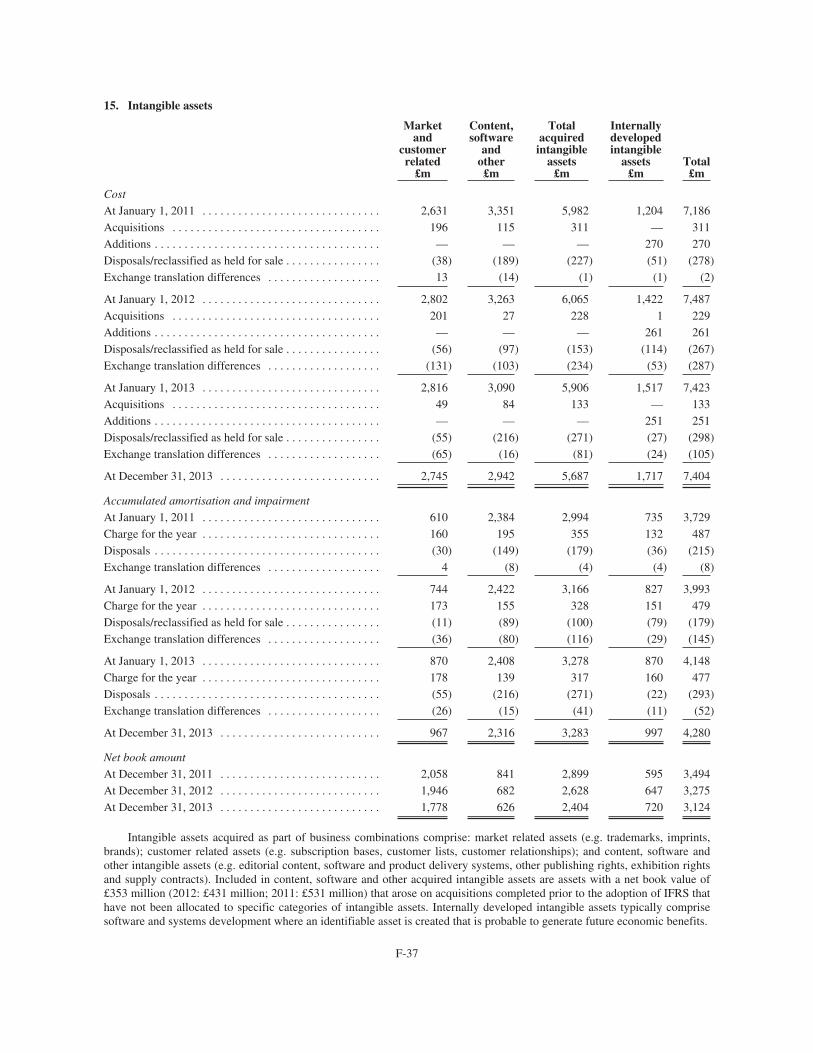
15. Intangible assets
Marketand
customerrelated
£m
Content,software
andother£m
Totalacquiredintangible
assets£m
Internallydevelopedintangible
assets£m
Total£m
Cost
At January 1, 2011 . . . . . . . . . . . . . . . . . . . . . . . . . . . . . . 2,631 3,351 5,982 1,204 7,186Acquisitions . . . . . . . . . . . . . . . . . . . . . . . . . . . . . . . . . . . 196 115 311 — 311Additions . . . . . . . . . . . . . . . . . . . . . . . . . . . . . . . . . . . . . . — — — 270 270Disposals/reclassified as held for sale . . . . . . . . . . . . . . . . (38) (189) (227) (51) (278)Exchange translation differences . . . . . . . . . . . . . . . . . . . 13 (14) (1) (1) (2)
At January 1, 2012 . . . . . . . . . . . . . . . . . . . . . . . . . . . . . . 2,802 3,263 6,065 1,422 7,487Acquisitions . . . . . . . . . . . . . . . . . . . . . . . . . . . . . . . . . . . 201 27 228 1 229Additions . . . . . . . . . . . . . . . . . . . . . . . . . . . . . . . . . . . . . . — — — 261 261Disposals/reclassified as held for sale . . . . . . . . . . . . . . . . (56) (97) (153) (114) (267)Exchange translation differences . . . . . . . . . . . . . . . . . . . (131) (103) (234) (53) (287)
At January 1, 2013 . . . . . . . . . . . . . . . . . . . . . . . . . . . . . . 2,816 3,090 5,906 1,517 7,423Acquisitions . . . . . . . . . . . . . . . . . . . . . . . . . . . . . . . . . . . 49 84 133 — 133Additions . . . . . . . . . . . . . . . . . . . . . . . . . . . . . . . . . . . . . . — — — 251 251Disposals/reclassified as held for sale . . . . . . . . . . . . . . . . (55) (216) (271) (27) (298)Exchange translation differences . . . . . . . . . . . . . . . . . . . (65) (16) (81) (24) (105)
At December 31, 2013 . . . . . . . . . . . . . . . . . . . . . . . . . . . 2,745 2,942 5,687 1,717 7,404
Accumulated amortisation and impairment
At January 1, 2011 . . . . . . . . . . . . . . . . . . . . . . . . . . . . . . 610 2,384 2,994 735 3,729Charge for the year . . . . . . . . . . . . . . . . . . . . . . . . . . . . . . 160 195 355 132 487Disposals . . . . . . . . . . . . . . . . . . . . . . . . . . . . . . . . . . . . . . (30) (149) (179) (36) (215)Exchange translation differences . . . . . . . . . . . . . . . . . . . 4 (8) (4) (4) (8)
At January 1, 2012 . . . . . . . . . . . . . . . . . . . . . . . . . . . . . . 744 2,422 3,166 827 3,993Charge for the year . . . . . . . . . . . . . . . . . . . . . . . . . . . . . . 173 155 328 151 479Disposals/reclassified as held for sale . . . . . . . . . . . . . . . . (11) (89) (100) (79) (179)Exchange translation differences . . . . . . . . . . . . . . . . . . . (36) (80) (116) (29) (145)
At January 1, 2013 . . . . . . . . . . . . . . . . . . . . . . . . . . . . . . 870 2,408 3,278 870 4,148Charge for the year . . . . . . . . . . . . . . . . . . . . . . . . . . . . . . 178 139 317 160 477Disposals . . . . . . . . . . . . . . . . . . . . . . . . . . . . . . . . . . . . . . (55) (216) (271) (22) (293)Exchange translation differences . . . . . . . . . . . . . . . . . . . (26) (15) (41) (11) (52)
At December 31, 2013 . . . . . . . . . . . . . . . . . . . . . . . . . . . 967 2,316 3,283 997 4,280
Net book amount
At December 31, 2011 . . . . . . . . . . . . . . . . . . . . . . . . . . . 2,058 841 2,899 595 3,494At December 31, 2012 . . . . . . . . . . . . . . . . . . . . . . . . . . . 1,946 682 2,628 647 3,275At December 31, 2013 . . . . . . . . . . . . . . . . . . . . . . . . . . . 1,778 626 2,404 720 3,124
Intangible assets acquired as part of business combinations comprise: market related assets (e.g. trademarks, imprints,brands); customer related assets (e.g. subscription bases, customer lists, customer relationships); and content, software andother intangible assets (e.g. editorial content, software and product delivery systems, other publishing rights, exhibition rightsand supply contracts). Included in content, software and other acquired intangible assets are assets with a net book value of£353 million (2012: £431 million; 2011: £531 million) that arose on acquisitions completed prior to the adoption of IFRS thathave not been allocated to specific categories of intangible assets. Internally developed intangible assets typically comprisesoftware and systems development where an identifiable asset is created that is probable to generate future economic benefits.
F-37
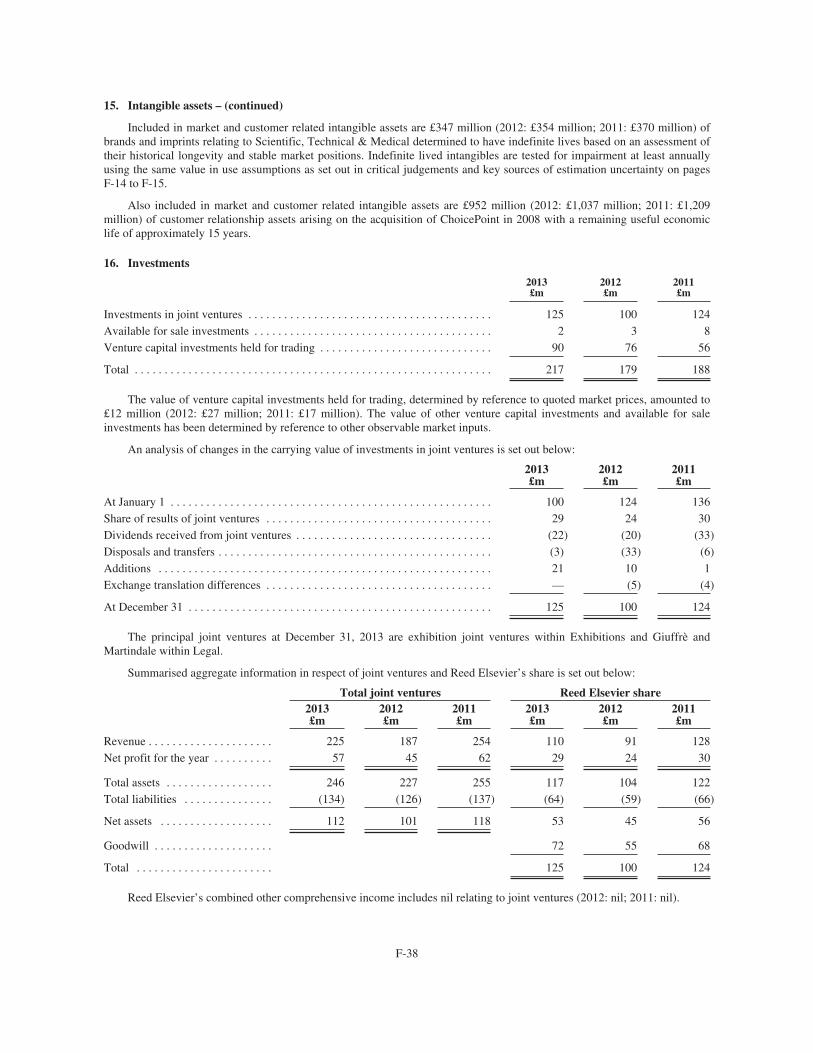
15. Intangible assets – (continued)
Included in market and customer related intangible assets are £347 million (2012: £354 million; 2011: £370 million) ofbrands and imprints relating to Scientific, Technical & Medical determined to have indefinite lives based on an assessment oftheir historical longevity and stable market positions. Indefinite lived intangibles are tested for impairment at least annuallyusing the same value in use assumptions as set out in critical judgements and key sources of estimation uncertainty on pagesF-14 to F-15.
Also included in market and customer related intangible assets are £952 million (2012: £1,037 million; 2011: £1,209million) of customer relationship assets arising on the acquisition of ChoicePoint in 2008 with a remaining useful economiclife of approximately 15 years.
16. Investments
2013£m
2012£m
2011£m
Investments in joint ventures . . . . . . . . . . . . . . . . . . . . . . . . . . . . . . . . . . . . . . . . . 125 100 124Available for sale investments . . . . . . . . . . . . . . . . . . . . . . . . . . . . . . . . . . . . . . . . 2 3 8Venture capital investments held for trading . . . . . . . . . . . . . . . . . . . . . . . . . . . . . 90 76 56
Total . . . . . . . . . . . . . . . . . . . . . . . . . . . . . . . . . . . . . . . . . . . . . . . . . . . . . . . . . . . . 217 179 188
The value of venture capital investments held for trading, determined by reference to quoted market prices, amounted to£12 million (2012: £27 million; 2011: £17 million). The value of other venture capital investments and available for saleinvestments has been determined by reference to other observable market inputs.
An analysis of changes in the carrying value of investments in joint ventures is set out below:
2013£m
2012£m
2011£m
At January 1 . . . . . . . . . . . . . . . . . . . . . . . . . . . . . . . . . . . . . . . . . . . . . . . . . . . . . . 100 124 136Share of results of joint ventures . . . . . . . . . . . . . . . . . . . . . . . . . . . . . . . . . . . . . . 29 24 30Dividends received from joint ventures . . . . . . . . . . . . . . . . . . . . . . . . . . . . . . . . . (22) (20) (33)Disposals and transfers . . . . . . . . . . . . . . . . . . . . . . . . . . . . . . . . . . . . . . . . . . . . . . (3) (33) (6)Additions . . . . . . . . . . . . . . . . . . . . . . . . . . . . . . . . . . . . . . . . . . . . . . . . . . . . . . . . 21 10 1Exchange translation differences . . . . . . . . . . . . . . . . . . . . . . . . . . . . . . . . . . . . . . — (5) (4)
At December 31 . . . . . . . . . . . . . . . . . . . . . . . . . . . . . . . . . . . . . . . . . . . . . . . . . . . 125 100 124
The principal joint ventures at December 31, 2013 are exhibition joint ventures within Exhibitions and Giuffrè andMartindale within Legal.
Summarised aggregate information in respect of joint ventures and Reed Elsevier’s share is set out below:
Total joint ventures Reed Elsevier share2013£m
2012£m
2011£m
2013£m
2012£m
2011£m
Revenue . . . . . . . . . . . . . . . . . . . . . 225 187 254 110 91 128Net profit for the year . . . . . . . . . . 57 45 62 29 24 30
Total assets . . . . . . . . . . . . . . . . . . 246 227 255 117 104 122Total liabilities . . . . . . . . . . . . . . . (134) (126) (137) (64) (59) (66)
Net assets . . . . . . . . . . . . . . . . . . . 112 101 118 53 45 56
Goodwill . . . . . . . . . . . . . . . . . . . . 72 55 68
Total . . . . . . . . . . . . . . . . . . . . . . . 125 100 124
Reed Elsevier’s combined other comprehensive income includes nil relating to joint ventures (2012: nil; 2011: nil).
F-38
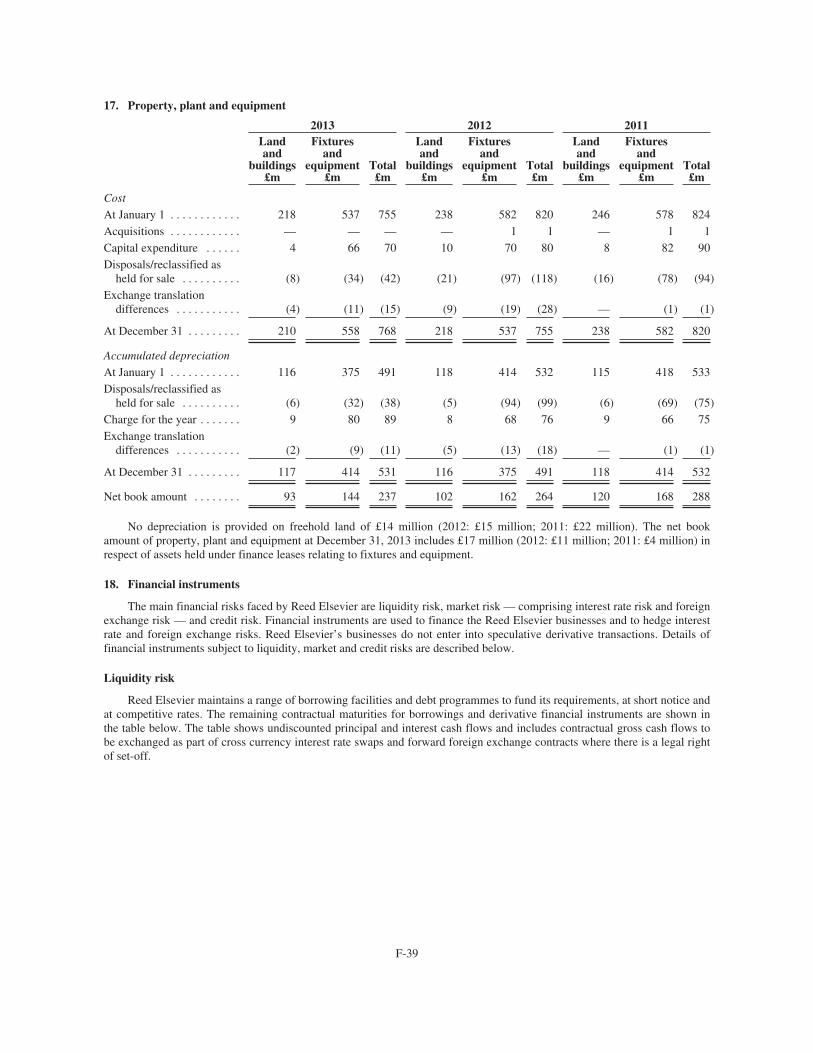
17. Property, plant and equipment
2013 2012 2011Landand
buildings£m
Fixturesand
equipment£m
Total£m
Landand
buildings£m
Fixturesand
equipment£m
Total£m
Landand
buildings£m
Fixturesand
equipment£m
Total£m
Cost
At January 1 . . . . . . . . . . . . 218 537 755 238 582 820 246 578 824Acquisitions . . . . . . . . . . . . — — — — 1 1 — 1 1Capital expenditure . . . . . . 4 66 70 10 70 80 8 82 90Disposals/reclassified as
held for sale . . . . . . . . . . (8) (34) (42) (21) (97) (118) (16) (78) (94)Exchange translation
differences . . . . . . . . . . . (4) (11) (15) (9) (19) (28) — (1) (1)
At December 31 . . . . . . . . . 210 558 768 218 537 755 238 582 820
Accumulated depreciation
At January 1 . . . . . . . . . . . . 116 375 491 118 414 532 115 418 533Disposals/reclassified as
held for sale . . . . . . . . . . (6) (32) (38) (5) (94) (99) (6) (69) (75)Charge for the year . . . . . . . 9 80 89 8 68 76 9 66 75Exchange translation
differences . . . . . . . . . . . (2) (9) (11) (5) (13) (18) — (1) (1)
At December 31 . . . . . . . . . 117 414 531 116 375 491 118 414 532
Net book amount . . . . . . . . 93 144 237 102 162 264 120 168 288
No depreciation is provided on freehold land of £14 million (2012: £15 million; 2011: £22 million). The net bookamount of property, plant and equipment at December 31, 2013 includes £17 million (2012: £11 million; 2011: £4 million) inrespect of assets held under finance leases relating to fixtures and equipment.
18. Financial instruments
The main financial risks faced by Reed Elsevier are liquidity risk, market risk — comprising interest rate risk and foreignexchange risk — and credit risk. Financial instruments are used to finance the Reed Elsevier businesses and to hedge interestrate and foreign exchange risks. Reed Elsevier’s businesses do not enter into speculative derivative transactions. Details offinancial instruments subject to liquidity, market and credit risks are described below.
Liquidity risk
Reed Elsevier maintains a range of borrowing facilities and debt programmes to fund its requirements, at short notice andat competitive rates. The remaining contractual maturities for borrowings and derivative financial instruments are shown inthe table below. The table shows undiscounted principal and interest cash flows and includes contractual gross cash flows tobe exchanged as part of cross currency interest rate swaps and forward foreign exchange contracts where there is a legal rightof set-off.
F-39
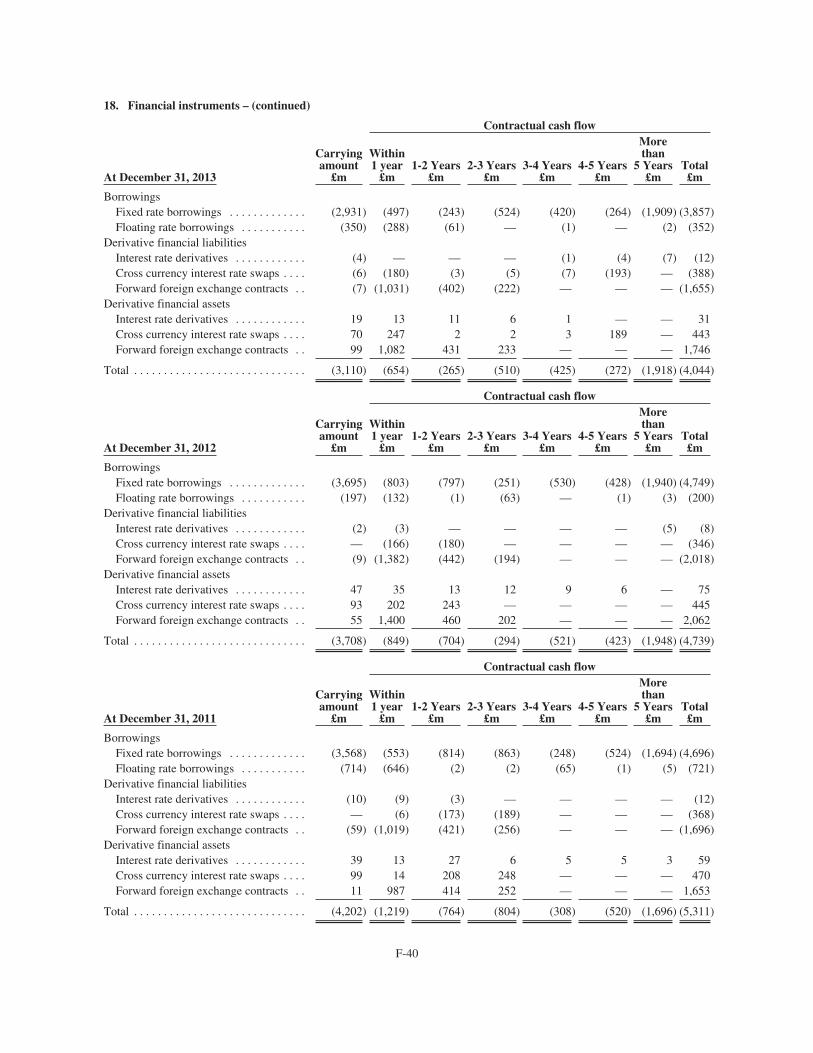
18. Financial instruments – (continued)
Contractual cash flow
At December 31, 2013
Carryingamount
£m
Within1 year
£m1-2 Years
£m2-3 Years
£m3-4 Years
£m4-5 Years
£m
Morethan
5 Years£m
Total£m
BorrowingsFixed rate borrowings . . . . . . . . . . . . . (2,931) (497) (243) (524) (420) (264) (1,909) (3,857)Floating rate borrowings . . . . . . . . . . . (350) (288) (61) — (1) — (2) (352)
Derivative financial liabilitiesInterest rate derivatives . . . . . . . . . . . . (4) — — — (1) (4) (7) (12)Cross currency interest rate swaps . . . . (6) (180) (3) (5) (7) (193) — (388)Forward foreign exchange contracts . . (7) (1,031) (402) (222) — — — (1,655)
Derivative financial assetsInterest rate derivatives . . . . . . . . . . . . 19 13 11 6 1 — — 31Cross currency interest rate swaps . . . . 70 247 2 2 3 189 — 443Forward foreign exchange contracts . . 99 1,082 431 233 — — — 1,746
Total . . . . . . . . . . . . . . . . . . . . . . . . . . . . . (3,110) (654) (265) (510) (425) (272) (1,918) (4,044)
Contractual cash flow
At December 31, 2012
Carryingamount
£m
Within1 year
£m1-2 Years
£m2-3 Years
£m3-4 Years
£m4-5 Years
£m
Morethan
5 Years£m
Total£m
BorrowingsFixed rate borrowings . . . . . . . . . . . . . (3,695) (803) (797) (251) (530) (428) (1,940) (4,749)Floating rate borrowings . . . . . . . . . . . (197) (132) (1) (63) — (1) (3) (200)
Derivative financial liabilitiesInterest rate derivatives . . . . . . . . . . . . (2) (3) — — — — (5) (8)Cross currency interest rate swaps . . . . — (166) (180) — — — — (346)Forward foreign exchange contracts . . (9) (1,382) (442) (194) — — — (2,018)
Derivative financial assetsInterest rate derivatives . . . . . . . . . . . . 47 35 13 12 9 6 — 75Cross currency interest rate swaps . . . . 93 202 243 — — — — 445Forward foreign exchange contracts . . 55 1,400 460 202 — — — 2,062
Total . . . . . . . . . . . . . . . . . . . . . . . . . . . . . (3,708) (849) (704) (294) (521) (423) (1,948) (4,739)
Contractual cash flow
At December 31, 2011
Carryingamount
£m
Within1 year
£m1-2 Years
£m2-3 Years
£m3-4 Years
£m4-5 Years
£m
Morethan
5 Years£m
Total£m
BorrowingsFixed rate borrowings . . . . . . . . . . . . . (3,568) (553) (814) (863) (248) (524) (1,694) (4,696)Floating rate borrowings . . . . . . . . . . . (714) (646) (2) (2) (65) (1) (5) (721)
Derivative financial liabilitiesInterest rate derivatives . . . . . . . . . . . . (10) (9) (3) — — — — (12)Cross currency interest rate swaps . . . . — (6) (173) (189) — — — (368)Forward foreign exchange contracts . . (59) (1,019) (421) (256) — — — (1,696)
Derivative financial assetsInterest rate derivatives . . . . . . . . . . . . 39 13 27 6 5 5 3 59Cross currency interest rate swaps . . . . 99 14 208 248 — — — 470Forward foreign exchange contracts . . 11 987 414 252 — — — 1,653
Total . . . . . . . . . . . . . . . . . . . . . . . . . . . . . (4,202) (1,219) (764) (804) (308) (520) (1,696) (5,311)
F-40
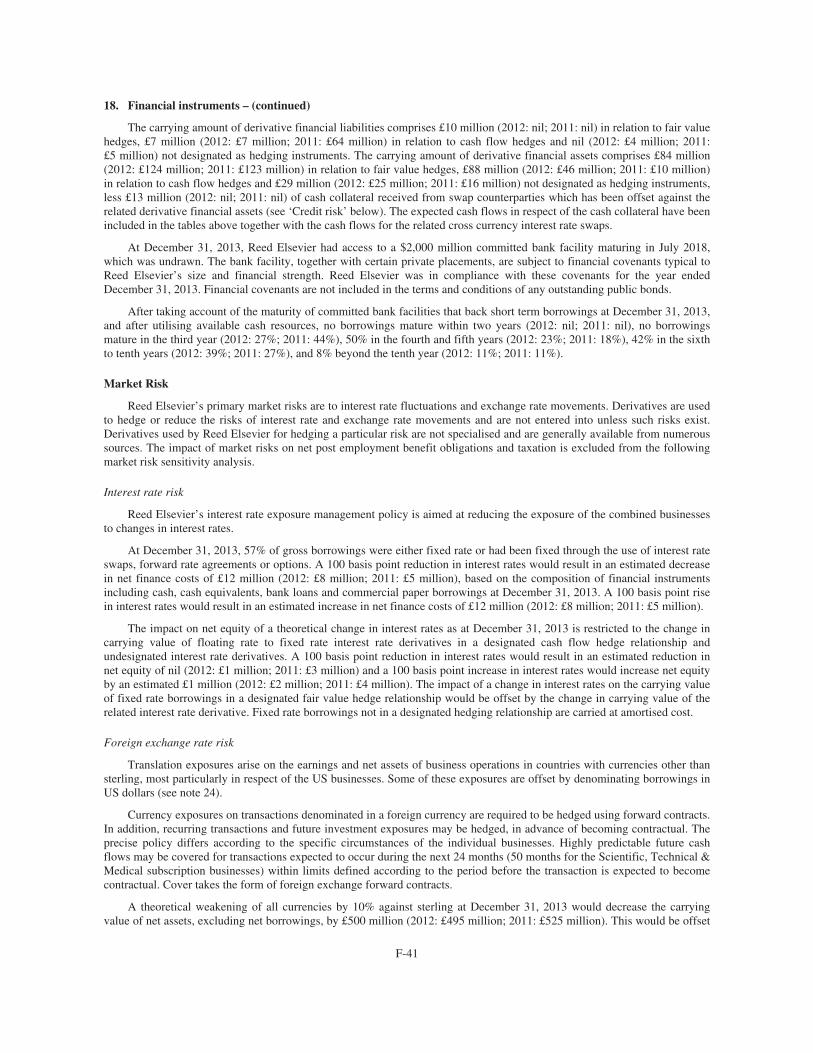
18. Financial instruments – (continued)
The carrying amount of derivative financial liabilities comprises £10 million (2012: nil; 2011: nil) in relation to fair valuehedges, £7 million (2012: £7 million; 2011: £64 million) in relation to cash flow hedges and nil (2012: £4 million; 2011:£5 million) not designated as hedging instruments. The carrying amount of derivative financial assets comprises £84 million(2012: £124 million; 2011: £123 million) in relation to fair value hedges, £88 million (2012: £46 million; 2011: £10 million)in relation to cash flow hedges and £29 million (2012: £25 million; 2011: £16 million) not designated as hedging instruments,less £13 million (2012: nil; 2011: nil) of cash collateral received from swap counterparties which has been offset against therelated derivative financial assets (see ‘Credit risk’ below). The expected cash flows in respect of the cash collateral have beenincluded in the tables above together with the cash flows for the related cross currency interest rate swaps.
At December 31, 2013, Reed Elsevier had access to a $2,000 million committed bank facility maturing in July 2018,which was undrawn. The bank facility, together with certain private placements, are subject to financial covenants typical toReed Elsevier’s size and financial strength. Reed Elsevier was in compliance with these covenants for the year endedDecember 31, 2013. Financial covenants are not included in the terms and conditions of any outstanding public bonds.
After taking account of the maturity of committed bank facilities that back short term borrowings at December 31, 2013,and after utilising available cash resources, no borrowings mature within two years (2012: nil; 2011: nil), no borrowingsmature in the third year (2012: 27%; 2011: 44%), 50% in the fourth and fifth years (2012: 23%; 2011: 18%), 42% in the sixthto tenth years (2012: 39%; 2011: 27%), and 8% beyond the tenth year (2012: 11%; 2011: 11%).
Market Risk
Reed Elsevier’s primary market risks are to interest rate fluctuations and exchange rate movements. Derivatives are usedto hedge or reduce the risks of interest rate and exchange rate movements and are not entered into unless such risks exist.Derivatives used by Reed Elsevier for hedging a particular risk are not specialised and are generally available from numeroussources. The impact of market risks on net post employment benefit obligations and taxation is excluded from the followingmarket risk sensitivity analysis.
Interest rate risk
Reed Elsevier’s interest rate exposure management policy is aimed at reducing the exposure of the combined businessesto changes in interest rates.
At December 31, 2013, 57% of gross borrowings were either fixed rate or had been fixed through the use of interest rateswaps, forward rate agreements or options. A 100 basis point reduction in interest rates would result in an estimated decreasein net finance costs of £12 million (2012: £8 million; 2011: £5 million), based on the composition of financial instrumentsincluding cash, cash equivalents, bank loans and commercial paper borrowings at December 31, 2013. A 100 basis point risein interest rates would result in an estimated increase in net finance costs of £12 million (2012: £8 million; 2011: £5 million).
The impact on net equity of a theoretical change in interest rates as at December 31, 2013 is restricted to the change incarrying value of floating rate to fixed rate interest rate derivatives in a designated cash flow hedge relationship andundesignated interest rate derivatives. A 100 basis point reduction in interest rates would result in an estimated reduction innet equity of nil (2012: £1 million; 2011: £3 million) and a 100 basis point increase in interest rates would increase net equityby an estimated £1 million (2012: £2 million; 2011: £4 million). The impact of a change in interest rates on the carrying valueof fixed rate borrowings in a designated fair value hedge relationship would be offset by the change in carrying value of therelated interest rate derivative. Fixed rate borrowings not in a designated hedging relationship are carried at amortised cost.
Foreign exchange rate risk
Translation exposures arise on the earnings and net assets of business operations in countries with currencies other thansterling, most particularly in respect of the US businesses. Some of these exposures are offset by denominating borrowings inUS dollars (see note 24).
Currency exposures on transactions denominated in a foreign currency are required to be hedged using forward contracts.In addition, recurring transactions and future investment exposures may be hedged, in advance of becoming contractual. Theprecise policy differs according to the specific circumstances of the individual businesses. Highly predictable future cashflows may be covered for transactions expected to occur during the next 24 months (50 months for the Scientific, Technical &Medical subscription businesses) within limits defined according to the period before the transaction is expected to becomecontractual. Cover takes the form of foreign exchange forward contracts.
A theoretical weakening of all currencies by 10% against sterling at December 31, 2013 would decrease the carryingvalue of net assets, excluding net borrowings, by £500 million (2012: £495 million; 2011: £525 million). This would be offset
F-41
18. Financial instruments – (continued)
to a degree by a decrease in net borrowings of £246 million (2012: £286 million; 2011: £297 million). A strengthening of allcurrencies by 10% against sterling at December 31, 2013 would increase the carrying value of net assets, excluding netborrowings, by £500 million (2012: £495 million; 2011: £525 million) and increase net borrowings by £246 million(2012: £286 million; 2011: £297 million).
A retranslation of the combined businesses’ net profit for the year assuming a 10% weakening of all foreign currenciesagainst sterling but excluding transactional exposures would reduce net profit by £92 million (2012: £80 million;2011: £59 million). A 10% strengthening of all foreign currencies against sterling on this basis would increase net profit forthe year by £92 million (2012: £80 million; 2011: £59 million).
Credit risk
Reed Elsevier seeks to limit interest rate and foreign exchange risks described above by the use of financial instrumentsand as a result has a credit risk from the potential non performance by the counterparties to these financial instruments, whichare unsecured. The amount of this credit risk is normally restricted to the amounts of any hedge gain and not the principalamount being hedged. Reed Elsevier also has a credit exposure to counterparties for the full principal amount of cash and cashequivalents. Credit risks are controlled by monitoring the credit quality of these counterparties, principally licensedcommercial banks and investment banks with strong long term credit ratings, and the amounts outstanding with each of them.
In certain situations, Reed Elsevier enters into credit support arrangements with derivative counterparties to mitigate thecredit exposures arising from hedge gains on the related financial instruments. Under these arrangements, Reed Elsevierreceives (or pays) cash collateral equal to the mark to market valuation of the related derivative asset (or liability) on monthlysettlement dates. At December 31, 2013, £13 million (2012: nil; 2011: nil) of cash collateral had been received, and theresulting payable balance was offset against the related derivative assets of £12 million (2012: nil; 2011: nil) in the statementof financial position.
Reed Elsevier has treasury policies in place which do not allow concentrations of risk with individual counterparties anddo not allow significant treasury exposures with counterparties which are rated lower than A-/A3 by Standard & Poor’s,Moody’s and Fitch.
Reed Elsevier also has credit risk with respect to trade receivables due from its customers that include national and stategovernments, academic institutions and large and small enterprises including law firms, book stores and wholesalers. Theconcentration of credit risk from trade receivables is limited due to the large and broad customer base. Trade receivableexposures are managed locally in the business units where they arise. Where appropriate, business units seek to minimise thisexposure by taking payment in advance and through management of credit terms. Allowance is made for bad and doubtfuldebts based on management’s assessment of the risk taking into account the ageing profile, experience and circumstance. Themaximum exposure to credit risk is represented by the carrying amount of each financial asset, including derivative financialinstruments, recorded in the statement of financial position.
Included within trade receivables are the following amounts which are past due but for which no allowance has beenmade. Past due up to one month £156 million (2012: £148 million; 2011: £212 million); past due two to three months£76 million (2012: £58 million; 2011: £54 million); past due four to six months £26 million (2012: £14 million; 2011: £20million); and past due greater than six months £7 million (2012: £1 million; 2011: £5 million.). Examples of trade receivableswhich are past due but for which no allowance has been made include those receivables where there is no concern over thecreditworthiness of the customer and where the history of dealings with the customer indicate the amount will be settled.
Capital and liquidity management
The capital structure is managed to support Reed Elsevier’s objective of maximising long-term shareholder valuethrough appropriate security of funding, ready access to debt and capital markets, cost effective borrowing and flexibility tofund business and acquisition opportunities whilst maintaining appropriate leverage to ensure an efficient capital structure.
Over the long-term Reed Elsevier seeks to maintain cash flow conversion (the proportion of adjusted operating profitsconverted into cash) of 90% or higher and credit metrics consistent with a solid investment grade credit rating. The typicalcredit metrics are net debt to EBITDA, on a pensions and lease adjusted and on an unadjusted basis, and free cash flow as apercentage of net debt.
Reed Elsevier’s uses of free cash flow over the longer-term balance the dividend policy, selective acquisitions and sharerepurchases, whilst retaining the balance sheet strength to maintain access to cost effective sources of borrowing.
The balance of long-term debt, short-term debt and committed bank facilities is managed to provide security of funding,taking into account the cash generation cycle of the business and the uncertain size and timing of acquisition spend. ReedElsevier maintains a range of borrowing facilities and debt programmes from a variety of sources to fund its requirements at
F-42
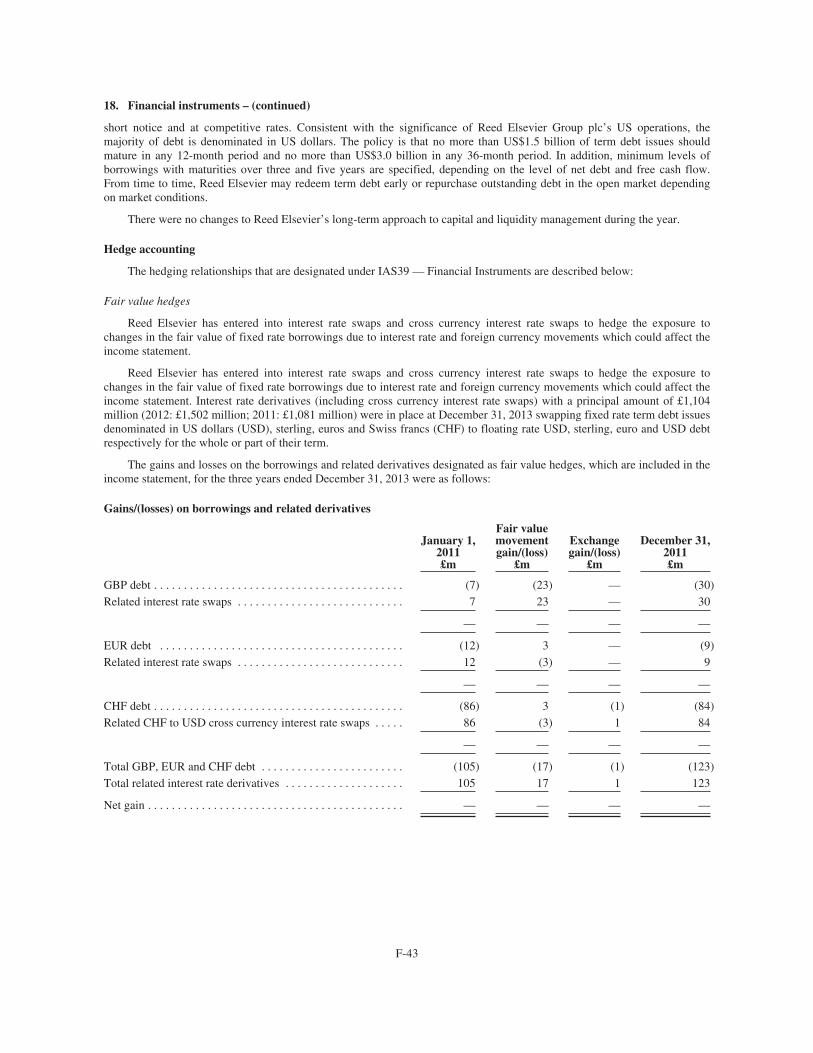
18. Financial instruments – (continued)
short notice and at competitive rates. Consistent with the significance of Reed Elsevier Group plc’s US operations, themajority of debt is denominated in US dollars. The policy is that no more than US$1.5 billion of term debt issues shouldmature in any 12-month period and no more than US$3.0 billion in any 36-month period. In addition, minimum levels ofborrowings with maturities over three and five years are specified, depending on the level of net debt and free cash flow.From time to time, Reed Elsevier may redeem term debt early or repurchase outstanding debt in the open market dependingon market conditions.
There were no changes to Reed Elsevier’s long-term approach to capital and liquidity management during the year.
Hedge accounting
The hedging relationships that are designated under IAS39 — Financial Instruments are described below:
Fair value hedges
Reed Elsevier has entered into interest rate swaps and cross currency interest rate swaps to hedge the exposure tochanges in the fair value of fixed rate borrowings due to interest rate and foreign currency movements which could affect theincome statement.
Reed Elsevier has entered into interest rate swaps and cross currency interest rate swaps to hedge the exposure tochanges in the fair value of fixed rate borrowings due to interest rate and foreign currency movements which could affect theincome statement. Interest rate derivatives (including cross currency interest rate swaps) with a principal amount of £1,104million (2012: £1,502 million; 2011: £1,081 million) were in place at December 31, 2013 swapping fixed rate term debt issuesdenominated in US dollars (USD), sterling, euros and Swiss francs (CHF) to floating rate USD, sterling, euro and USD debtrespectively for the whole or part of their term.
The gains and losses on the borrowings and related derivatives designated as fair value hedges, which are included in theincome statement, for the three years ended December 31, 2013 were as follows:
Gains/(losses) on borrowings and related derivatives
January 1,2011£m
Fair valuemovementgain/(loss)
£m
Exchangegain/(loss)
£m
December 31,2011£m
GBP debt . . . . . . . . . . . . . . . . . . . . . . . . . . . . . . . . . . . . . . . . . . (7) (23) — (30)Related interest rate swaps . . . . . . . . . . . . . . . . . . . . . . . . . . . . 7 23 — 30
— — — —
EUR debt . . . . . . . . . . . . . . . . . . . . . . . . . . . . . . . . . . . . . . . . . (12) 3 — (9)Related interest rate swaps . . . . . . . . . . . . . . . . . . . . . . . . . . . . 12 (3) — 9
— — — —
CHF debt . . . . . . . . . . . . . . . . . . . . . . . . . . . . . . . . . . . . . . . . . . (86) 3 (1) (84)Related CHF to USD cross currency interest rate swaps . . . . . 86 (3) 1 84
— — — —
Total GBP, EUR and CHF debt . . . . . . . . . . . . . . . . . . . . . . . . (105) (17) (1) (123)Total related interest rate derivatives . . . . . . . . . . . . . . . . . . . . 105 17 1 123
Net gain . . . . . . . . . . . . . . . . . . . . . . . . . . . . . . . . . . . . . . . . . . . — — — —
F-43
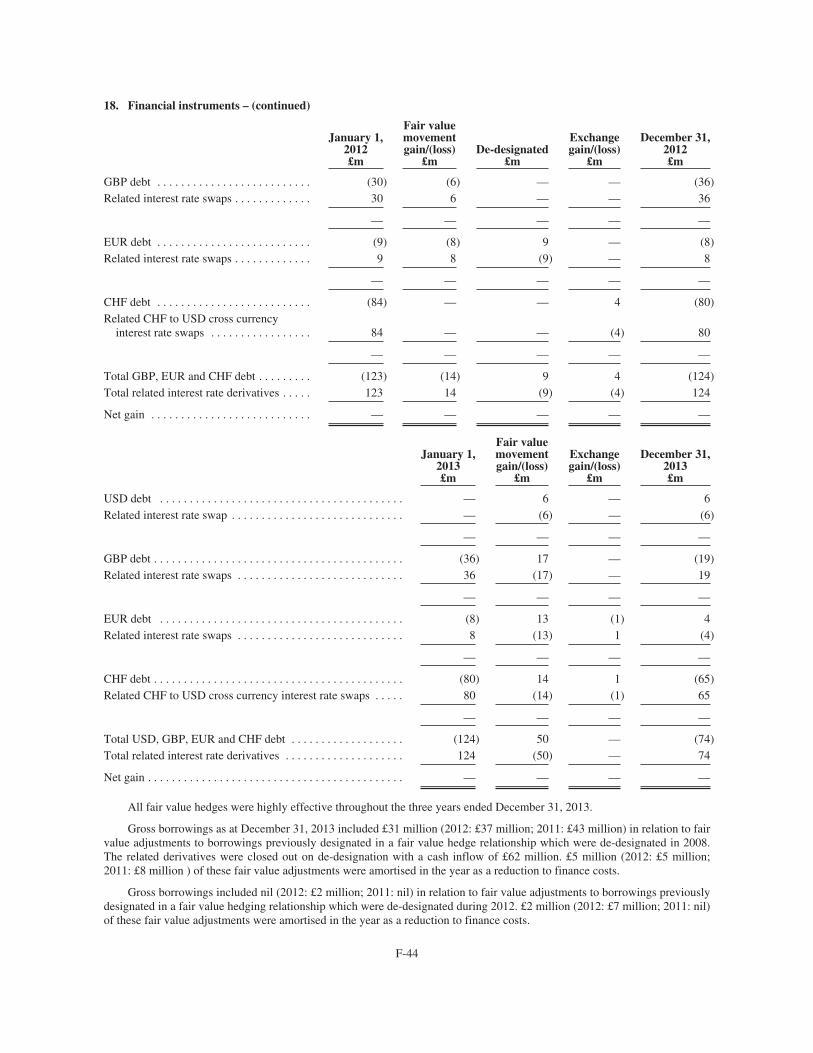
18. Financial instruments – (continued)
January 1,2012£m
Fair valuemovementgain/(loss)
£mDe-designated
£m
Exchangegain/(loss)
£m
December 31,2012£m
GBP debt . . . . . . . . . . . . . . . . . . . . . . . . . . (30) (6) — — (36)Related interest rate swaps . . . . . . . . . . . . . 30 6 — — 36
— — — — —
EUR debt . . . . . . . . . . . . . . . . . . . . . . . . . . (9) (8) 9 — (8)Related interest rate swaps . . . . . . . . . . . . . 9 8 (9) — 8
— — — — —
CHF debt . . . . . . . . . . . . . . . . . . . . . . . . . . (84) — — 4 (80)Related CHF to USD cross currency
interest rate swaps . . . . . . . . . . . . . . . . . 84 — — (4) 80
— — — — —
Total GBP, EUR and CHF debt . . . . . . . . . (123) (14) 9 4 (124)Total related interest rate derivatives . . . . . 123 14 (9) (4) 124
Net gain . . . . . . . . . . . . . . . . . . . . . . . . . . . — — — — —
January 1,2013£m
Fair valuemovementgain/(loss)
£m
Exchangegain/(loss)
£m
December 31,2013£m
USD debt . . . . . . . . . . . . . . . . . . . . . . . . . . . . . . . . . . . . . . . . . — 6 — 6Related interest rate swap . . . . . . . . . . . . . . . . . . . . . . . . . . . . . — (6) — (6)
— — — —
GBP debt . . . . . . . . . . . . . . . . . . . . . . . . . . . . . . . . . . . . . . . . . . (36) 17 — (19)Related interest rate swaps . . . . . . . . . . . . . . . . . . . . . . . . . . . . 36 (17) — 19
— — — —
EUR debt . . . . . . . . . . . . . . . . . . . . . . . . . . . . . . . . . . . . . . . . . (8) 13 (1) 4Related interest rate swaps . . . . . . . . . . . . . . . . . . . . . . . . . . . . 8 (13) 1 (4)
— — — —
CHF debt . . . . . . . . . . . . . . . . . . . . . . . . . . . . . . . . . . . . . . . . . . (80) 14 1 (65)Related CHF to USD cross currency interest rate swaps . . . . . 80 (14) (1) 65
— — — —
Total USD, GBP, EUR and CHF debt . . . . . . . . . . . . . . . . . . . (124) 50 — (74)Total related interest rate derivatives . . . . . . . . . . . . . . . . . . . . 124 (50) — 74
Net gain . . . . . . . . . . . . . . . . . . . . . . . . . . . . . . . . . . . . . . . . . . . — — — —
All fair value hedges were highly effective throughout the three years ended December 31, 2013.
Gross borrowings as at December 31, 2013 included £31 million (2012: £37 million; 2011: £43 million) in relation to fairvalue adjustments to borrowings previously designated in a fair value hedge relationship which were de-designated in 2008.The related derivatives were closed out on de-designation with a cash inflow of £62 million. £5 million (2012: £5 million;2011: £8 million ) of these fair value adjustments were amortised in the year as a reduction to finance costs.
Gross borrowings included nil (2012: £2 million; 2011: nil) in relation to fair value adjustments to borrowings previouslydesignated in a fair value hedging relationship which were de-designated during 2012. £2 million (2012: £7 million; 2011: nil)of these fair value adjustments were amortised in the year as a reduction to finance costs.
F-44

18. Financial instruments – (continued)
Cash flow hedges
Reed Elsevier enters into two types of cash flow hedge:
(1) Debt hedges comprising interest rate derivatives which fix the interest expense on a portion of forecast floating ratedebt (including commercial paper, short term bank loans and floating rate term debt), and cross currency interestrate derivatives which hedge the cash flow exposure arising from foreign currency denominated debt.
(2) Revenue hedges comprising forward foreign exchange contracts which fix the exchange rate on a portion of futureforeign currency subscription revenues forecast by the Scientific, Technical & Medical businesses for up to50 months.
Movements in the hedge reserve (pre-tax) in 2013, 2012 and 2011, including gains and losses on cash flow hedginginstruments, were as follows:
Debthedges
£m
Revenuehedges
£m
Totalhedge
reservepre-tax
£m
Hedge reserve at January 1, 2011: losses deferred . . . . . . . . . . . . . . . . . . . . . . . . . . . . . . . . (29) (59) (88)Losses arising in 2011 . . . . . . . . . . . . . . . . . . . . . . . . . . . . . . . . . . . . . . . . . . . . . . . . . . . . . . (3) (21) (24)Amounts recognised in income statement . . . . . . . . . . . . . . . . . . . . . . . . . . . . . . . . . . . . . . . 15 33 48Exchange translation differences . . . . . . . . . . . . . . . . . . . . . . . . . . . . . . . . . . . . . . . . . . . . . . — 1 1
Hedge reserve at January 1, 2012: losses deferred . . . . . . . . . . . . . . . . . . . . . . . . . . . . . . . . (17) (46) (63)(Losses)/gains arising in 2012 . . . . . . . . . . . . . . . . . . . . . . . . . . . . . . . . . . . . . . . . . . . . . . . . (2) 72 70Amounts recognised in income statement . . . . . . . . . . . . . . . . . . . . . . . . . . . . . . . . . . . . . . . 16 10 26Exchange translation differences . . . . . . . . . . . . . . . . . . . . . . . . . . . . . . . . . . . . . . . . . . . . . . 1 1 2
Hedge reserve at January 1, 2013: (losses)/gains deferred . . . . . . . . . . . . . . . . . . . . . . . . . . (2) 37 35Gains arising in 2013 . . . . . . . . . . . . . . . . . . . . . . . . . . . . . . . . . . . . . . . . . . . . . . . . . . . . . . . 1 64 65Amounts recognised in income statement . . . . . . . . . . . . . . . . . . . . . . . . . . . . . . . . . . . . . . . 3 (6) (3)Exchange translation differences . . . . . . . . . . . . . . . . . . . . . . . . . . . . . . . . . . . . . . . . . . . . . . — (1) (1)
Hedge reserve at December 31, 2013: gains deferred . . . . . . . . . . . . . . . . . . . . . . . . . . . . . . 2 94 96
All cash flow hedges were highly effective throughout the three years ended December 31, 2013.
A tax charge of £23 million (2012: £9 million; 2011: £15 million credit) in respect of the above gains and losses atDecember 31, 2013 was also deferred in the hedge reserve.
Of the amounts recognised in the income statement in the year, gains of £6 million (2012: £10 million loss;2011: £33 million loss) were recognised in revenue, and losses of £3 million (2012: £16 million; 2011: £15 million) wererecognised in finance costs. A tax charge of £1 million (2012: £5 million credit; 2011: £11 million credit) was recognised inrelation to these items.
The deferred gains and losses on cash flow hedges at December 31, 2013 are currently expected to be recognised in theincome statement in future years as follows:
Debthedges
£m
Revenuehedges
£m
Totalhedge
reservepre-tax
£m
2014 . . . . . . . . . . . . . . . . . . . . . . . . . . . . . . . . . . . . . . . . . . . . . . . . . . . . . . . . . . . . . . . . . . . . (2) 38 362015 . . . . . . . . . . . . . . . . . . . . . . . . . . . . . . . . . . . . . . . . . . . . . . . . . . . . . . . . . . . . . . . . . . . . (1) 37 362016 . . . . . . . . . . . . . . . . . . . . . . . . . . . . . . . . . . . . . . . . . . . . . . . . . . . . . . . . . . . . . . . . . . . . — 17 172017 . . . . . . . . . . . . . . . . . . . . . . . . . . . . . . . . . . . . . . . . . . . . . . . . . . . . . . . . . . . . . . . . . . . . — 2 22018 . . . . . . . . . . . . . . . . . . . . . . . . . . . . . . . . . . . . . . . . . . . . . . . . . . . . . . . . . . . . . . . . . . . . 5 — 5
Gains deferred in hedge reserve at end of year . . . . . . . . . . . . . . . . . . . . . . . . . . . . . . . . . . . 2 94 96
F-45
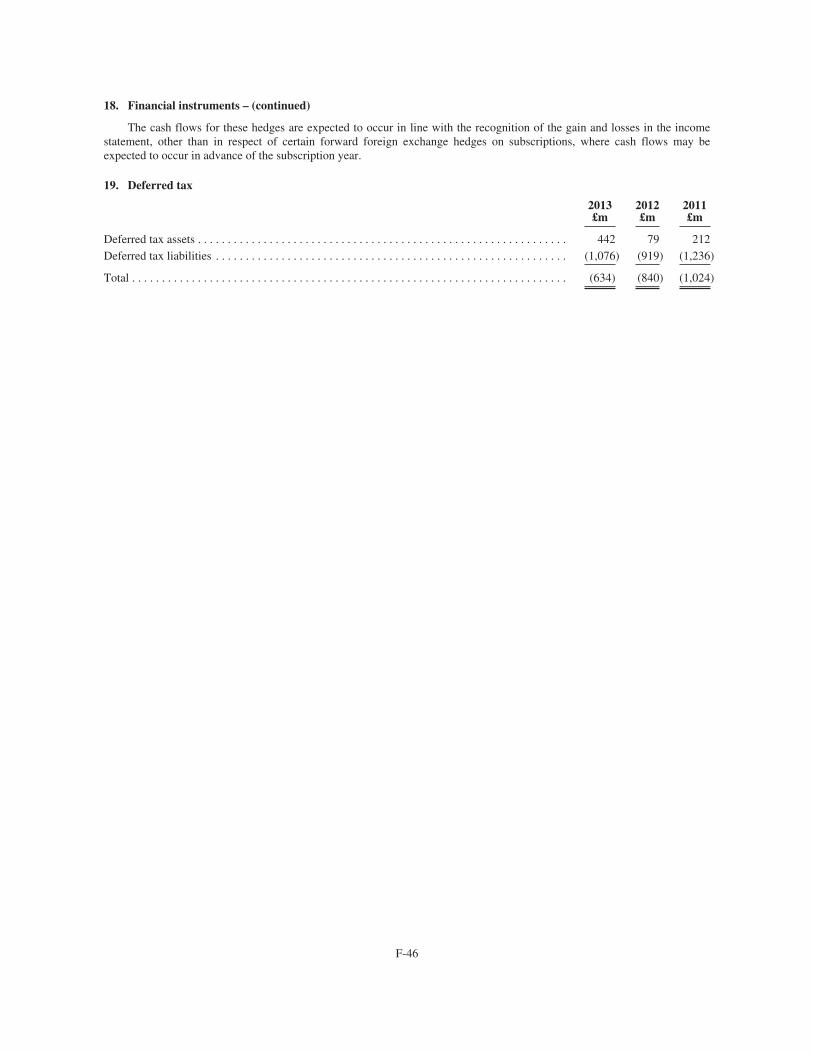
18. Financial instruments – (continued)
The cash flows for these hedges are expected to occur in line with the recognition of the gain and losses in the incomestatement, other than in respect of certain forward foreign exchange hedges on subscriptions, where cash flows may beexpected to occur in advance of the subscription year.
19. Deferred tax
2013£m
2012£m
2011£m
Deferred tax assets . . . . . . . . . . . . . . . . . . . . . . . . . . . . . . . . . . . . . . . . . . . . . . . . . . . . . . . . . . . . . . 442 79 212Deferred tax liabilities . . . . . . . . . . . . . . . . . . . . . . . . . . . . . . . . . . . . . . . . . . . . . . . . . . . . . . . . . . . (1,076) (919) (1,236)
Total . . . . . . . . . . . . . . . . . . . . . . . . . . . . . . . . . . . . . . . . . . . . . . . . . . . . . . . . . . . . . . . . . . . . . . . . . (634) (840) (1,024)
F-46
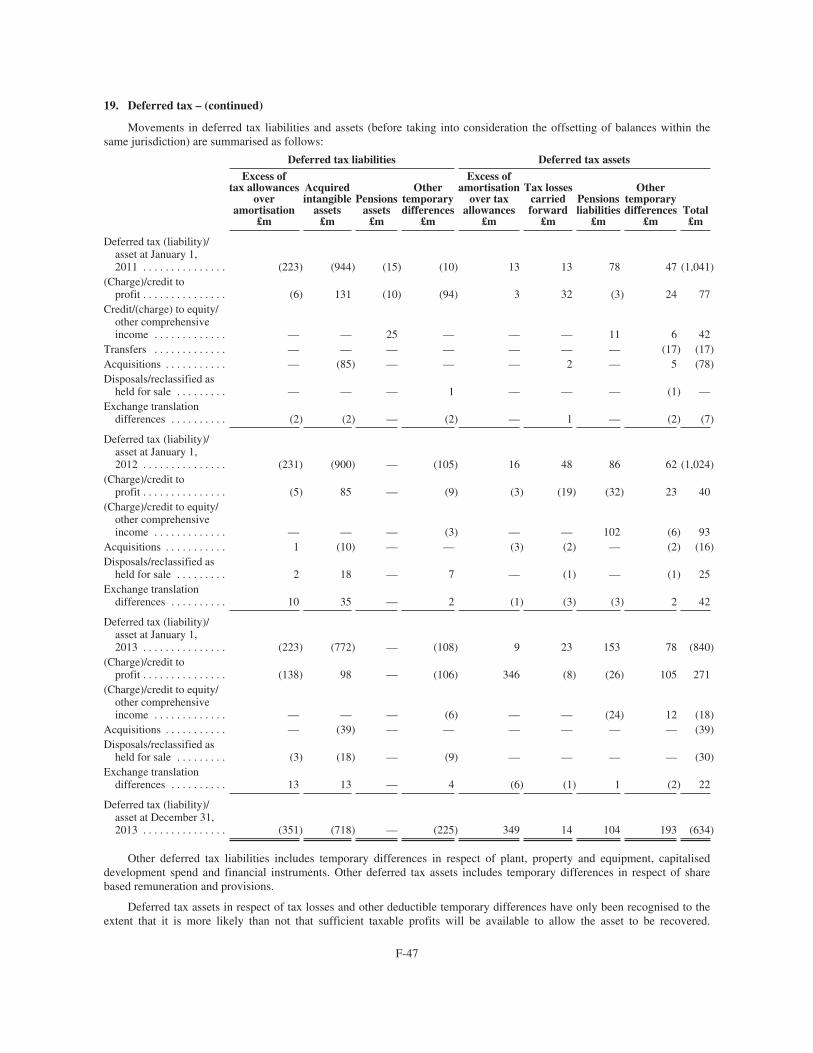
19. Deferred tax – (continued)
Movements in deferred tax liabilities and assets (before taking into consideration the offsetting of balances within thesame jurisdiction) are summarised as follows:
Deferred tax liabilities Deferred tax assets
Excess oftax allowances
overamortisation
£m
Acquiredintangible
assets£m
Pensionsassets
£m
Othertemporarydifferences
£m
Excess ofamortisation
over taxallowances
£m
Tax lossescarriedforward
£m
Pensionsliabilities
£m
Othertemporarydifferences
£mTotal£m
Deferred tax (liability)/asset at January 1,2011 . . . . . . . . . . . . . . . (223) (944) (15) (10) 13 13 78 47 (1,041)
(Charge)/credit toprofit . . . . . . . . . . . . . . . (6) 131 (10) (94) 3 32 (3) 24 77
Credit/(charge) to equity/other comprehensiveincome . . . . . . . . . . . . . — — 25 — — — 11 6 42
Transfers . . . . . . . . . . . . . — — — — — — — (17) (17)Acquisitions . . . . . . . . . . . — (85) — — — 2 — 5 (78)Disposals/reclassified as
held for sale . . . . . . . . . — — — 1 — — — (1) —Exchange translation
differences . . . . . . . . . . (2) (2) — (2) — 1 — (2) (7)
Deferred tax (liability)/asset at January 1,2012 . . . . . . . . . . . . . . . (231) (900) — (105) 16 48 86 62 (1,024)
(Charge)/credit toprofit . . . . . . . . . . . . . . . (5) 85 — (9) (3) (19) (32) 23 40
(Charge)/credit to equity/other comprehensiveincome . . . . . . . . . . . . . — — — (3) — — 102 (6) 93
Acquisitions . . . . . . . . . . . 1 (10) — — (3) (2) — (2) (16)Disposals/reclassified as
held for sale . . . . . . . . . 2 18 — 7 — (1) — (1) 25Exchange translation
differences . . . . . . . . . . 10 35 — 2 (1) (3) (3) 2 42
Deferred tax (liability)/asset at January 1,2013 . . . . . . . . . . . . . . . (223) (772) — (108) 9 23 153 78 (840)
(Charge)/credit toprofit . . . . . . . . . . . . . . . (138) 98 — (106) 346 (8) (26) 105 271
(Charge)/credit to equity/other comprehensiveincome . . . . . . . . . . . . . — — — (6) — — (24) 12 (18)
Acquisitions . . . . . . . . . . . — (39) — — — — — — (39)Disposals/reclassified as
held for sale . . . . . . . . . (3) (18) — (9) — — — — (30)Exchange translation
differences . . . . . . . . . . 13 13 — 4 (6) (1) 1 (2) 22
Deferred tax (liability)/asset at December 31,2013 . . . . . . . . . . . . . . . (351) (718) — (225) 349 14 104 193 (634)
Other deferred tax liabilities includes temporary differences in respect of plant, property and equipment, capitaliseddevelopment spend and financial instruments. Other deferred tax assets includes temporary differences in respect of sharebased remuneration and provisions.
Deferred tax assets in respect of tax losses and other deductible temporary differences have only been recognised to theextent that it is more likely than not that sufficient taxable profits will be available to allow the asset to be recovered.
F-47
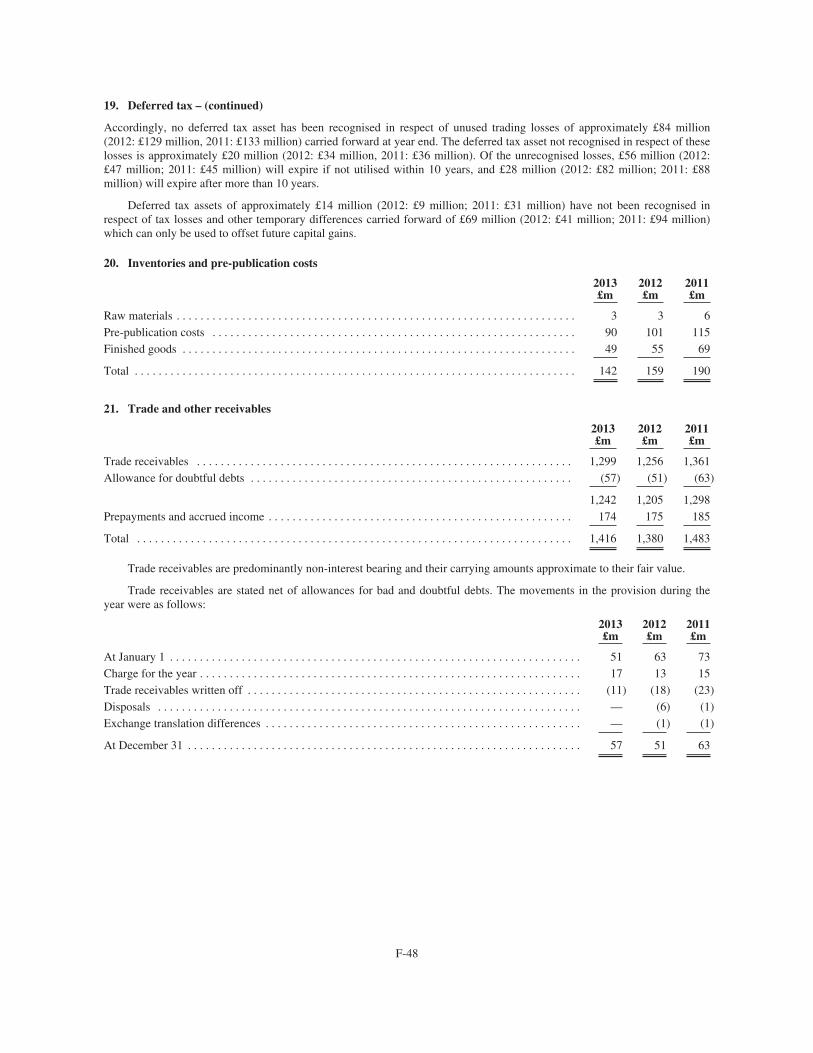
19. Deferred tax – (continued)
Accordingly, no deferred tax asset has been recognised in respect of unused trading losses of approximately £84 million(2012: £129 million, 2011: £133 million) carried forward at year end. The deferred tax asset not recognised in respect of theselosses is approximately £20 million (2012: £34 million, 2011: £36 million). Of the unrecognised losses, £56 million (2012:£47 million; 2011: £45 million) will expire if not utilised within 10 years, and £28 million (2012: £82 million; 2011: £88million) will expire after more than 10 years.
Deferred tax assets of approximately £14 million (2012: £9 million; 2011: £31 million) have not been recognised inrespect of tax losses and other temporary differences carried forward of £69 million (2012: £41 million; 2011: £94 million)which can only be used to offset future capital gains.
20. Inventories and pre-publication costs
2013£m
2012£m
2011£m
Raw materials . . . . . . . . . . . . . . . . . . . . . . . . . . . . . . . . . . . . . . . . . . . . . . . . . . . . . . . . . . . . . . . . . . . 3 3 6Pre-publication costs . . . . . . . . . . . . . . . . . . . . . . . . . . . . . . . . . . . . . . . . . . . . . . . . . . . . . . . . . . . . . 90 101 115Finished goods . . . . . . . . . . . . . . . . . . . . . . . . . . . . . . . . . . . . . . . . . . . . . . . . . . . . . . . . . . . . . . . . . . 49 55 69
Total . . . . . . . . . . . . . . . . . . . . . . . . . . . . . . . . . . . . . . . . . . . . . . . . . . . . . . . . . . . . . . . . . . . . . . . . . . 142 159 190
21. Trade and other receivables
2013£m
2012£m
2011£m
Trade receivables . . . . . . . . . . . . . . . . . . . . . . . . . . . . . . . . . . . . . . . . . . . . . . . . . . . . . . . . . . . . . . . 1,299 1,256 1,361Allowance for doubtful debts . . . . . . . . . . . . . . . . . . . . . . . . . . . . . . . . . . . . . . . . . . . . . . . . . . . . . . (57) (51) (63)
1,242 1,205 1,298Prepayments and accrued income . . . . . . . . . . . . . . . . . . . . . . . . . . . . . . . . . . . . . . . . . . . . . . . . . . . 174 175 185
Total . . . . . . . . . . . . . . . . . . . . . . . . . . . . . . . . . . . . . . . . . . . . . . . . . . . . . . . . . . . . . . . . . . . . . . . . . 1,416 1,380 1,483
Trade receivables are predominantly non-interest bearing and their carrying amounts approximate to their fair value.
Trade receivables are stated net of allowances for bad and doubtful debts. The movements in the provision during theyear were as follows:
2013£m
2012£m
2011£m
At January 1 . . . . . . . . . . . . . . . . . . . . . . . . . . . . . . . . . . . . . . . . . . . . . . . . . . . . . . . . . . . . . . . . . . . . . 51 63 73Charge for the year . . . . . . . . . . . . . . . . . . . . . . . . . . . . . . . . . . . . . . . . . . . . . . . . . . . . . . . . . . . . . . . . 17 13 15Trade receivables written off . . . . . . . . . . . . . . . . . . . . . . . . . . . . . . . . . . . . . . . . . . . . . . . . . . . . . . . . (11) (18) (23)Disposals . . . . . . . . . . . . . . . . . . . . . . . . . . . . . . . . . . . . . . . . . . . . . . . . . . . . . . . . . . . . . . . . . . . . . . . — (6) (1)Exchange translation differences . . . . . . . . . . . . . . . . . . . . . . . . . . . . . . . . . . . . . . . . . . . . . . . . . . . . . — (1) (1)
At December 31 . . . . . . . . . . . . . . . . . . . . . . . . . . . . . . . . . . . . . . . . . . . . . . . . . . . . . . . . . . . . . . . . . . 57 51 63
F-48
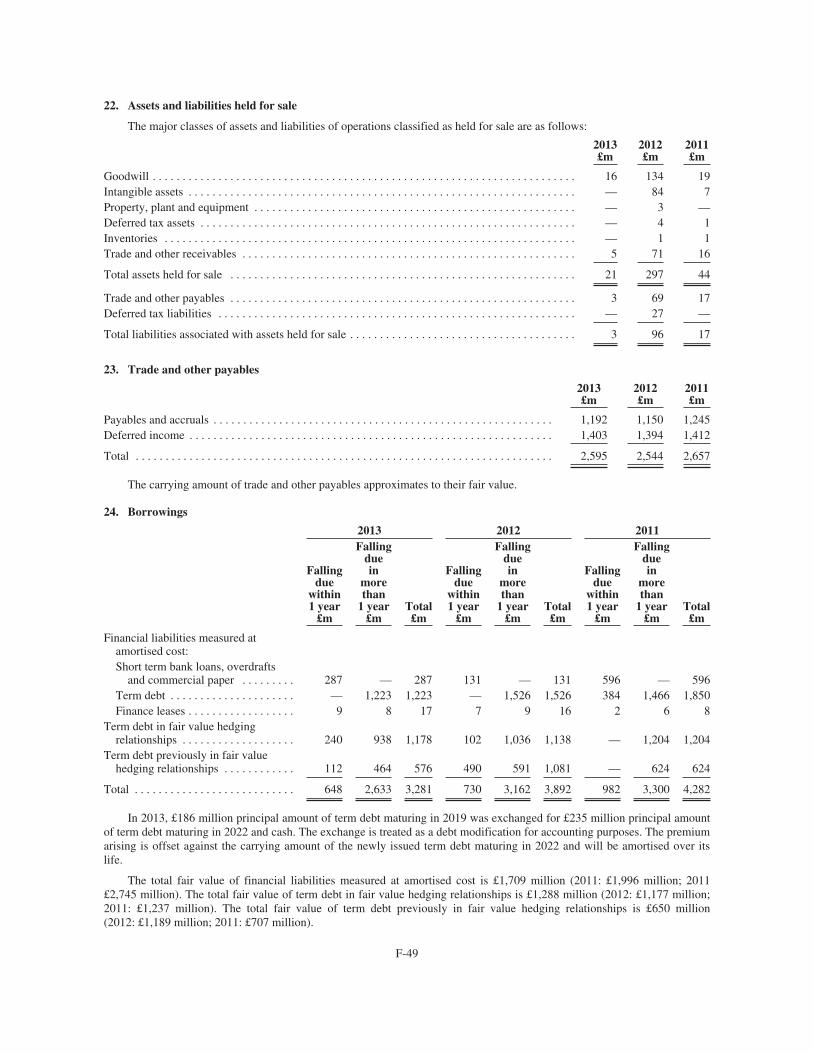
22. Assets and liabilities held for sale
The major classes of assets and liabilities of operations classified as held for sale are as follows:
2013£m
2012£m
2011£m
Goodwill . . . . . . . . . . . . . . . . . . . . . . . . . . . . . . . . . . . . . . . . . . . . . . . . . . . . . . . . . . . . . . . . . . . . . . . 16 134 19Intangible assets . . . . . . . . . . . . . . . . . . . . . . . . . . . . . . . . . . . . . . . . . . . . . . . . . . . . . . . . . . . . . . . . . — 84 7Property, plant and equipment . . . . . . . . . . . . . . . . . . . . . . . . . . . . . . . . . . . . . . . . . . . . . . . . . . . . . . — 3 —Deferred tax assets . . . . . . . . . . . . . . . . . . . . . . . . . . . . . . . . . . . . . . . . . . . . . . . . . . . . . . . . . . . . . . . — 4 1Inventories . . . . . . . . . . . . . . . . . . . . . . . . . . . . . . . . . . . . . . . . . . . . . . . . . . . . . . . . . . . . . . . . . . . . . — 1 1Trade and other receivables . . . . . . . . . . . . . . . . . . . . . . . . . . . . . . . . . . . . . . . . . . . . . . . . . . . . . . . . 5 71 16
Total assets held for sale . . . . . . . . . . . . . . . . . . . . . . . . . . . . . . . . . . . . . . . . . . . . . . . . . . . . . . . . . . 21 297 44
Trade and other payables . . . . . . . . . . . . . . . . . . . . . . . . . . . . . . . . . . . . . . . . . . . . . . . . . . . . . . . . . . 3 69 17Deferred tax liabilities . . . . . . . . . . . . . . . . . . . . . . . . . . . . . . . . . . . . . . . . . . . . . . . . . . . . . . . . . . . . — 27 —
Total liabilities associated with assets held for sale . . . . . . . . . . . . . . . . . . . . . . . . . . . . . . . . . . . . . . 3 96 17
23. Trade and other payables
2013£m
2012£m
2011£m
Payables and accruals . . . . . . . . . . . . . . . . . . . . . . . . . . . . . . . . . . . . . . . . . . . . . . . . . . . . . . . . . 1,192 1,150 1,245Deferred income . . . . . . . . . . . . . . . . . . . . . . . . . . . . . . . . . . . . . . . . . . . . . . . . . . . . . . . . . . . . . 1,403 1,394 1,412
Total . . . . . . . . . . . . . . . . . . . . . . . . . . . . . . . . . . . . . . . . . . . . . . . . . . . . . . . . . . . . . . . . . . . . . . 2,595 2,544 2,657
The carrying amount of trade and other payables approximates to their fair value.
24. Borrowings
2013 2012 2011
Fallingdue
within1 year
£m
Fallingduein
morethan
1 year£m
Total£m
Fallingdue
within1 year
£m
Fallingduein
morethan
1 year£m
Total£m
Fallingdue
within1 year
£m
Fallingduein
morethan
1 year£m
Total£m
Financial liabilities measured atamortised cost:Short term bank loans, overdrafts
and commercial paper . . . . . . . . . 287 — 287 131 — 131 596 — 596Term debt . . . . . . . . . . . . . . . . . . . . . — 1,223 1,223 — 1,526 1,526 384 1,466 1,850Finance leases . . . . . . . . . . . . . . . . . . 9 8 17 7 9 16 2 6 8
Term debt in fair value hedgingrelationships . . . . . . . . . . . . . . . . . . . 240 938 1,178 102 1,036 1,138 — 1,204 1,204
Term debt previously in fair valuehedging relationships . . . . . . . . . . . . 112 464 576 490 591 1,081 — 624 624
Total . . . . . . . . . . . . . . . . . . . . . . . . . . . 648 2,633 3,281 730 3,162 3,892 982 3,300 4,282
In 2013, £186 million principal amount of term debt maturing in 2019 was exchanged for £235 million principal amountof term debt maturing in 2022 and cash. The exchange is treated as a debt modification for accounting purposes. The premiumarising is offset against the carrying amount of the newly issued term debt maturing in 2022 and will be amortised over itslife.
The total fair value of financial liabilities measured at amortised cost is £1,709 million (2011: £1,996 million; 2011£2,745 million). The total fair value of term debt in fair value hedging relationships is £1,288 million (2012: £1,177 million;2011: £1,237 million). The total fair value of term debt previously in fair value hedging relationships is £650 million(2012: £1,189 million; 2011: £707 million).
F-49
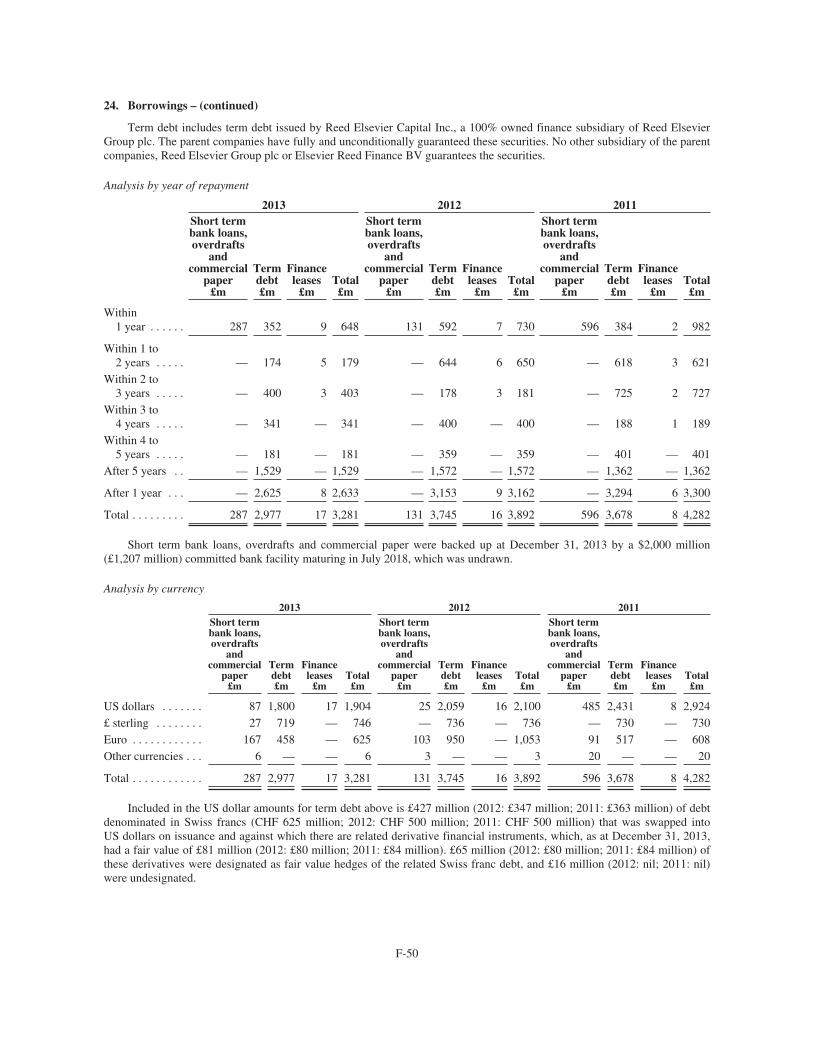
24. Borrowings – (continued)
Term debt includes term debt issued by Reed Elsevier Capital Inc., a 100% owned finance subsidiary of Reed ElsevierGroup plc. The parent companies have fully and unconditionally guaranteed these securities. No other subsidiary of the parentcompanies, Reed Elsevier Group plc or Elsevier Reed Finance BV guarantees the securities.
Analysis by year of repayment
2013 2012 2011Short termbank loans,overdrafts
andcommercial
paper£m
Termdebt£m
Financeleases
£mTotal£m
Short termbank loans,overdrafts
andcommercial
paper£m
Termdebt£m
Financeleases
£mTotal£m
Short termbank loans,overdrafts
andcommercial
paper£m
Termdebt£m
Financeleases
£mTotal£m
Within1 year . . . . . . 287 352 9 648 131 592 7 730 596 384 2 982
Within 1 to2 years . . . . . — 174 5 179 — 644 6 650 — 618 3 621
Within 2 to3 years . . . . . — 400 3 403 — 178 3 181 — 725 2 727
Within 3 to4 years . . . . . — 341 — 341 — 400 — 400 — 188 1 189
Within 4 to5 years . . . . . — 181 — 181 — 359 — 359 — 401 — 401
After 5 years . . — 1,529 — 1,529 — 1,572 — 1,572 — 1,362 — 1,362
After 1 year . . . — 2,625 8 2,633 — 3,153 9 3,162 — 3,294 6 3,300
Total . . . . . . . . . 287 2,977 17 3,281 131 3,745 16 3,892 596 3,678 8 4,282
Short term bank loans, overdrafts and commercial paper were backed up at December 31, 2013 by a $2,000 million(£1,207 million) committed bank facility maturing in July 2018, which was undrawn.
Analysis by currency
2013 2012 2011Short termbank loans,overdrafts
andcommercial
paper£m
Termdebt£m
Financeleases
£mTotal£m
Short termbank loans,overdrafts
andcommercial
paper£m
Termdebt£m
Financeleases
£mTotal£m
Short termbank loans,overdrafts
andcommercial
paper£m
Termdebt£m
Financeleases
£mTotal£m
US dollars . . . . . . . 87 1,800 17 1,904 25 2,059 16 2,100 485 2,431 8 2,924£ sterling . . . . . . . . 27 719 — 746 — 736 — 736 — 730 — 730Euro . . . . . . . . . . . . 167 458 — 625 103 950 — 1,053 91 517 — 608Other currencies . . . 6 — — 6 3 — — 3 20 — — 20
Total . . . . . . . . . . . . 287 2,977 17 3,281 131 3,745 16 3,892 596 3,678 8 4,282
Included in the US dollar amounts for term debt above is £427 million (2012: £347 million; 2011: £363 million) of debtdenominated in Swiss francs (CHF 625 million; 2012: CHF 500 million; 2011: CHF 500 million) that was swapped intoUS dollars on issuance and against which there are related derivative financial instruments, which, as at December 31, 2013,had a fair value of £81 million (2012: £80 million; 2011: £84 million). £65 million (2012: £80 million; 2011: £84 million) ofthese derivatives were designated as fair value hedges of the related Swiss franc debt, and £16 million (2012: nil; 2011: nil)were undesignated.
F-50
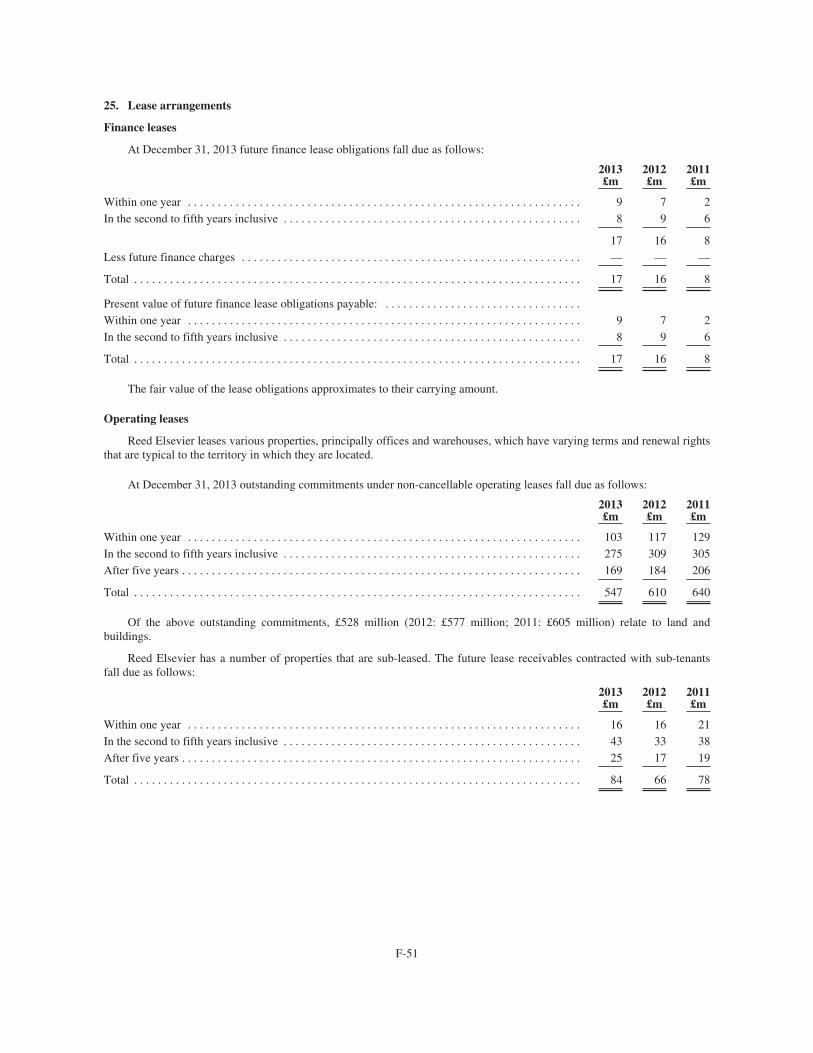
25. Lease arrangements
Finance leases
At December 31, 2013 future finance lease obligations fall due as follows:
2013£m
2012£m
2011£m
Within one year . . . . . . . . . . . . . . . . . . . . . . . . . . . . . . . . . . . . . . . . . . . . . . . . . . . . . . . . . . . . . . . . . . 9 7 2In the second to fifth years inclusive . . . . . . . . . . . . . . . . . . . . . . . . . . . . . . . . . . . . . . . . . . . . . . . . . . 8 9 6
17 16 8Less future finance charges . . . . . . . . . . . . . . . . . . . . . . . . . . . . . . . . . . . . . . . . . . . . . . . . . . . . . . . . . — — —
Total . . . . . . . . . . . . . . . . . . . . . . . . . . . . . . . . . . . . . . . . . . . . . . . . . . . . . . . . . . . . . . . . . . . . . . . . . . . 17 16 8
Present value of future finance lease obligations payable: . . . . . . . . . . . . . . . . . . . . . . . . . . . . . . . . .Within one year . . . . . . . . . . . . . . . . . . . . . . . . . . . . . . . . . . . . . . . . . . . . . . . . . . . . . . . . . . . . . . . . . . 9 7 2In the second to fifth years inclusive . . . . . . . . . . . . . . . . . . . . . . . . . . . . . . . . . . . . . . . . . . . . . . . . . . 8 9 6
Total . . . . . . . . . . . . . . . . . . . . . . . . . . . . . . . . . . . . . . . . . . . . . . . . . . . . . . . . . . . . . . . . . . . . . . . . . . . 17 16 8
The fair value of the lease obligations approximates to their carrying amount.
Operating leases
Reed Elsevier leases various properties, principally offices and warehouses, which have varying terms and renewal rightsthat are typical to the territory in which they are located.
At December 31, 2013 outstanding commitments under non-cancellable operating leases fall due as follows:
2013£m
2012£m
2011£m
Within one year . . . . . . . . . . . . . . . . . . . . . . . . . . . . . . . . . . . . . . . . . . . . . . . . . . . . . . . . . . . . . . . . . . 103 117 129In the second to fifth years inclusive . . . . . . . . . . . . . . . . . . . . . . . . . . . . . . . . . . . . . . . . . . . . . . . . . . 275 309 305After five years . . . . . . . . . . . . . . . . . . . . . . . . . . . . . . . . . . . . . . . . . . . . . . . . . . . . . . . . . . . . . . . . . . . 169 184 206
Total . . . . . . . . . . . . . . . . . . . . . . . . . . . . . . . . . . . . . . . . . . . . . . . . . . . . . . . . . . . . . . . . . . . . . . . . . . . 547 610 640
Of the above outstanding commitments, £528 million (2012: £577 million; 2011: £605 million) relate to land andbuildings.
Reed Elsevier has a number of properties that are sub-leased. The future lease receivables contracted with sub-tenantsfall due as follows:
2013£m
2012£m
2011£m
Within one year . . . . . . . . . . . . . . . . . . . . . . . . . . . . . . . . . . . . . . . . . . . . . . . . . . . . . . . . . . . . . . . . . . 16 16 21In the second to fifth years inclusive . . . . . . . . . . . . . . . . . . . . . . . . . . . . . . . . . . . . . . . . . . . . . . . . . . 43 33 38After five years . . . . . . . . . . . . . . . . . . . . . . . . . . . . . . . . . . . . . . . . . . . . . . . . . . . . . . . . . . . . . . . . . . . 25 17 19
Total . . . . . . . . . . . . . . . . . . . . . . . . . . . . . . . . . . . . . . . . . . . . . . . . . . . . . . . . . . . . . . . . . . . . . . . . . . . 84 66 78
F-51
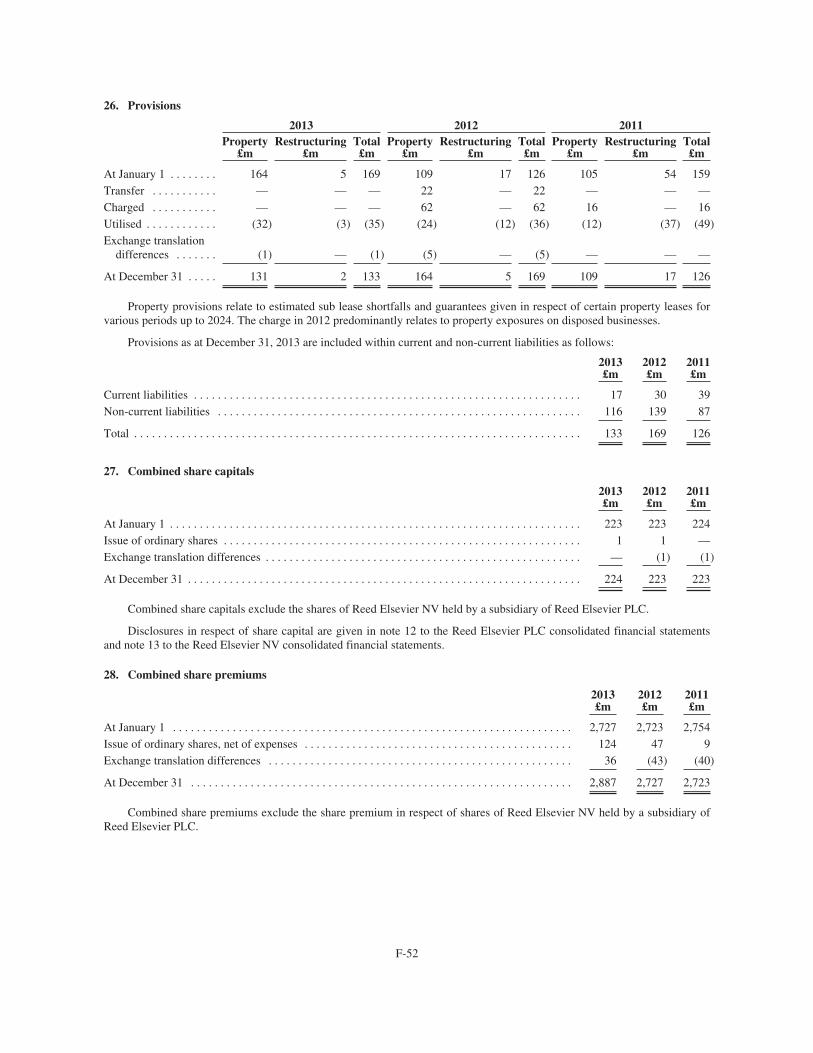
26. Provisions
2013 2012 2011Property
£mRestructuring
£mTotal£m
Property£m
Restructuring£m
Total£m
Property£m
Restructuring£m
Total£m
At January 1 . . . . . . . . 164 5 169 109 17 126 105 54 159Transfer . . . . . . . . . . . — — — 22 — 22 — — —Charged . . . . . . . . . . . — — — 62 — 62 16 — 16Utilised . . . . . . . . . . . . (32) (3) (35) (24) (12) (36) (12) (37) (49)Exchange translation
differences . . . . . . . (1) — (1) (5) — (5) — — —
At December 31 . . . . . 131 2 133 164 5 169 109 17 126
Property provisions relate to estimated sub lease shortfalls and guarantees given in respect of certain property leases forvarious periods up to 2024. The charge in 2012 predominantly relates to property exposures on disposed businesses.
Provisions as at December 31, 2013 are included within current and non-current liabilities as follows:
2013£m
2012£m
2011£m
Current liabilities . . . . . . . . . . . . . . . . . . . . . . . . . . . . . . . . . . . . . . . . . . . . . . . . . . . . . . . . . . . . . . . . . 17 30 39Non-current liabilities . . . . . . . . . . . . . . . . . . . . . . . . . . . . . . . . . . . . . . . . . . . . . . . . . . . . . . . . . . . . . 116 139 87
Total . . . . . . . . . . . . . . . . . . . . . . . . . . . . . . . . . . . . . . . . . . . . . . . . . . . . . . . . . . . . . . . . . . . . . . . . . . . 133 169 126
27. Combined share capitals
2013£m
2012£m
2011£m
At January 1 . . . . . . . . . . . . . . . . . . . . . . . . . . . . . . . . . . . . . . . . . . . . . . . . . . . . . . . . . . . . . . . . . . . . . 223 223 224Issue of ordinary shares . . . . . . . . . . . . . . . . . . . . . . . . . . . . . . . . . . . . . . . . . . . . . . . . . . . . . . . . . . . . 1 1 —Exchange translation differences . . . . . . . . . . . . . . . . . . . . . . . . . . . . . . . . . . . . . . . . . . . . . . . . . . . . . — (1) (1)
At December 31 . . . . . . . . . . . . . . . . . . . . . . . . . . . . . . . . . . . . . . . . . . . . . . . . . . . . . . . . . . . . . . . . . . 224 223 223
Combined share capitals exclude the shares of Reed Elsevier NV held by a subsidiary of Reed Elsevier PLC.
Disclosures in respect of share capital are given in note 12 to the Reed Elsevier PLC consolidated financial statementsand note 13 to the Reed Elsevier NV consolidated financial statements.
28. Combined share premiums
2013£m
2012£m
2011£m
At January 1 . . . . . . . . . . . . . . . . . . . . . . . . . . . . . . . . . . . . . . . . . . . . . . . . . . . . . . . . . . . . . . . . . . . 2,727 2,723 2,754Issue of ordinary shares, net of expenses . . . . . . . . . . . . . . . . . . . . . . . . . . . . . . . . . . . . . . . . . . . . . 124 47 9Exchange translation differences . . . . . . . . . . . . . . . . . . . . . . . . . . . . . . . . . . . . . . . . . . . . . . . . . . . 36 (43) (40)
At December 31 . . . . . . . . . . . . . . . . . . . . . . . . . . . . . . . . . . . . . . . . . . . . . . . . . . . . . . . . . . . . . . . . 2,887 2,727 2,723
Combined share premiums exclude the share premium in respect of shares of Reed Elsevier NV held by a subsidiary ofReed Elsevier PLC.
F-52
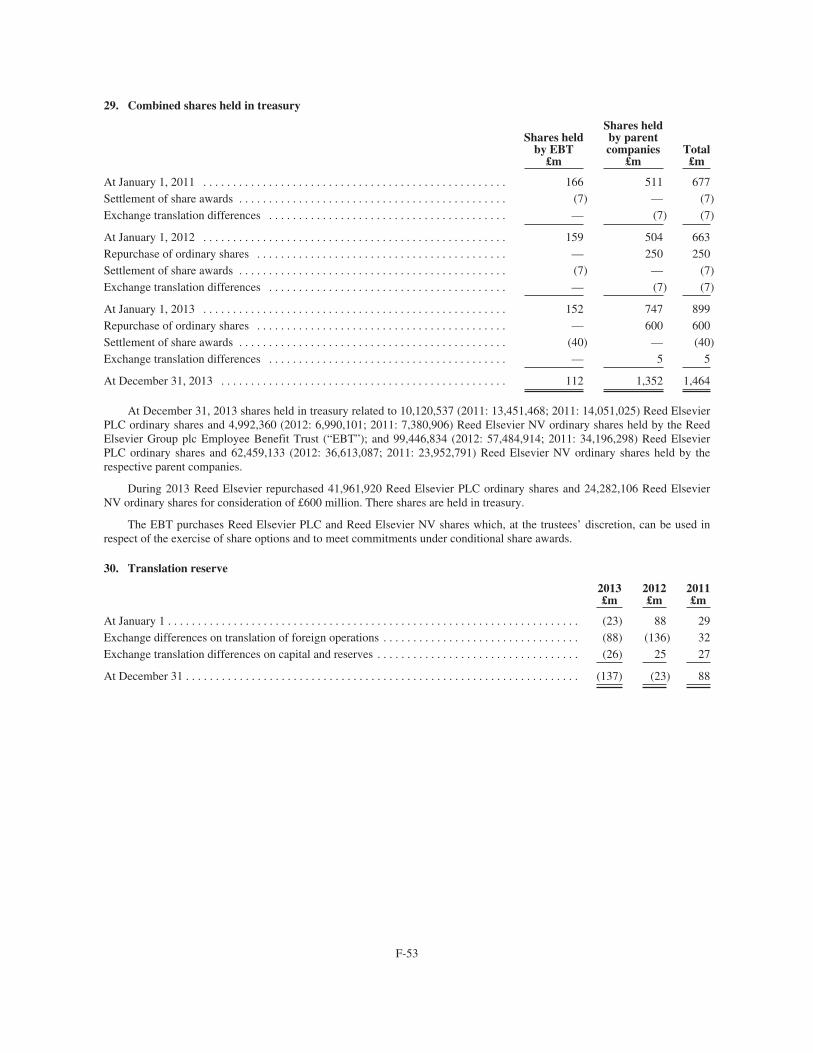
29. Combined shares held in treasury
Shares heldby EBT
£m
Shares heldby parentcompanies
£mTotal£m
At January 1, 2011 . . . . . . . . . . . . . . . . . . . . . . . . . . . . . . . . . . . . . . . . . . . . . . . . . . . 166 511 677Settlement of share awards . . . . . . . . . . . . . . . . . . . . . . . . . . . . . . . . . . . . . . . . . . . . . (7) — (7)Exchange translation differences . . . . . . . . . . . . . . . . . . . . . . . . . . . . . . . . . . . . . . . . — (7) (7)
At January 1, 2012 . . . . . . . . . . . . . . . . . . . . . . . . . . . . . . . . . . . . . . . . . . . . . . . . . . . 159 504 663Repurchase of ordinary shares . . . . . . . . . . . . . . . . . . . . . . . . . . . . . . . . . . . . . . . . . . — 250 250Settlement of share awards . . . . . . . . . . . . . . . . . . . . . . . . . . . . . . . . . . . . . . . . . . . . . (7) — (7)Exchange translation differences . . . . . . . . . . . . . . . . . . . . . . . . . . . . . . . . . . . . . . . . — (7) (7)
At January 1, 2013 . . . . . . . . . . . . . . . . . . . . . . . . . . . . . . . . . . . . . . . . . . . . . . . . . . . 152 747 899Repurchase of ordinary shares . . . . . . . . . . . . . . . . . . . . . . . . . . . . . . . . . . . . . . . . . . — 600 600Settlement of share awards . . . . . . . . . . . . . . . . . . . . . . . . . . . . . . . . . . . . . . . . . . . . . (40) — (40)Exchange translation differences . . . . . . . . . . . . . . . . . . . . . . . . . . . . . . . . . . . . . . . . — 5 5
At December 31, 2013 . . . . . . . . . . . . . . . . . . . . . . . . . . . . . . . . . . . . . . . . . . . . . . . . 112 1,352 1,464
At December 31, 2013 shares held in treasury related to 10,120,537 (2011: 13,451,468; 2011: 14,051,025) Reed ElsevierPLC ordinary shares and 4,992,360 (2012: 6,990,101; 2011: 7,380,906) Reed Elsevier NV ordinary shares held by the ReedElsevier Group plc Employee Benefit Trust (“EBT”); and 99,446,834 (2012: 57,484,914; 2011: 34,196,298) Reed ElsevierPLC ordinary shares and 62,459,133 (2012: 36,613,087; 2011: 23,952,791) Reed Elsevier NV ordinary shares held by therespective parent companies.
During 2013 Reed Elsevier repurchased 41,961,920 Reed Elsevier PLC ordinary shares and 24,282,106 Reed ElsevierNV ordinary shares for consideration of £600 million. There shares are held in treasury.
The EBT purchases Reed Elsevier PLC and Reed Elsevier NV shares which, at the trustees’ discretion, can be used inrespect of the exercise of share options and to meet commitments under conditional share awards.
30. Translation reserve
2013£m
2012£m
2011£m
At January 1 . . . . . . . . . . . . . . . . . . . . . . . . . . . . . . . . . . . . . . . . . . . . . . . . . . . . . . . . . . . . . . . . . . . . . (23) 88 29Exchange differences on translation of foreign operations . . . . . . . . . . . . . . . . . . . . . . . . . . . . . . . . . (88) (136) 32Exchange translation differences on capital and reserves . . . . . . . . . . . . . . . . . . . . . . . . . . . . . . . . . . (26) 25 27
At December 31 . . . . . . . . . . . . . . . . . . . . . . . . . . . . . . . . . . . . . . . . . . . . . . . . . . . . . . . . . . . . . . . . . . (137) (23) 88
F-53
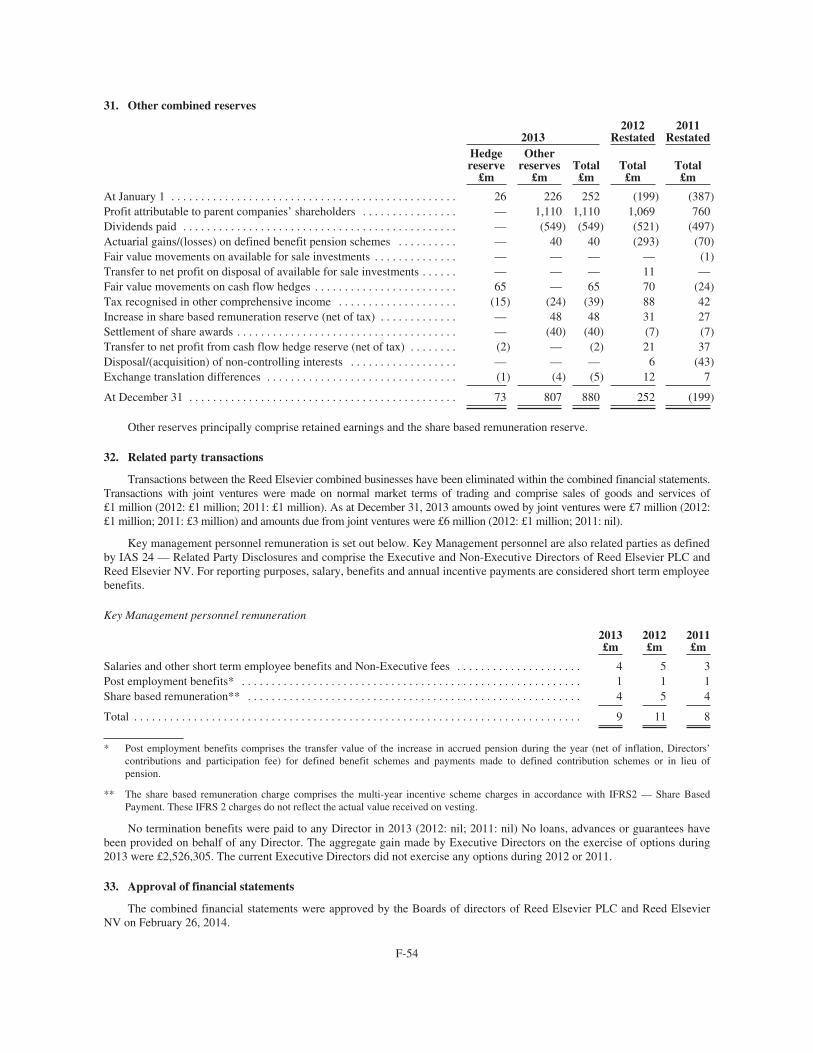
31. Other combined reserves
20132012
Restated2011
RestatedHedgereserve
£m
Otherreserves
£mTotal£m
Total£m
Total£m
At January 1 . . . . . . . . . . . . . . . . . . . . . . . . . . . . . . . . . . . . . . . . . . . . . . . . 26 226 252 (199) (387)Profit attributable to parent companies’ shareholders . . . . . . . . . . . . . . . . — 1,110 1,110 1,069 760Dividends paid . . . . . . . . . . . . . . . . . . . . . . . . . . . . . . . . . . . . . . . . . . . . . . — (549) (549) (521) (497)Actuarial gains/(losses) on defined benefit pension schemes . . . . . . . . . . — 40 40 (293) (70)Fair value movements on available for sale investments . . . . . . . . . . . . . . — — — — (1)Transfer to net profit on disposal of available for sale investments . . . . . . — — — 11 —Fair value movements on cash flow hedges . . . . . . . . . . . . . . . . . . . . . . . . 65 — 65 70 (24)Tax recognised in other comprehensive income . . . . . . . . . . . . . . . . . . . . (15) (24) (39) 88 42Increase in share based remuneration reserve (net of tax) . . . . . . . . . . . . . — 48 48 31 27Settlement of share awards . . . . . . . . . . . . . . . . . . . . . . . . . . . . . . . . . . . . . — (40) (40) (7) (7)Transfer to net profit from cash flow hedge reserve (net of tax) . . . . . . . . (2) — (2) 21 37Disposal/(acquisition) of non-controlling interests . . . . . . . . . . . . . . . . . . — — — 6 (43)Exchange translation differences . . . . . . . . . . . . . . . . . . . . . . . . . . . . . . . . (1) (4) (5) 12 7
At December 31 . . . . . . . . . . . . . . . . . . . . . . . . . . . . . . . . . . . . . . . . . . . . . 73 807 880 252 (199)
Other reserves principally comprise retained earnings and the share based remuneration reserve.
32. Related party transactions
Transactions between the Reed Elsevier combined businesses have been eliminated within the combined financial statements.Transactions with joint ventures were made on normal market terms of trading and comprise sales of goods and services of£1 million (2012: £1 million; 2011: £1 million). As at December 31, 2013 amounts owed by joint ventures were £7 million (2012:£1 million; 2011: £3 million) and amounts due from joint ventures were £6 million (2012: £1 million; 2011: nil).
Key management personnel remuneration is set out below. Key Management personnel are also related parties as definedby IAS 24 — Related Party Disclosures and comprise the Executive and Non-Executive Directors of Reed Elsevier PLC andReed Elsevier NV. For reporting purposes, salary, benefits and annual incentive payments are considered short term employeebenefits.
Key Management personnel remuneration
2013£m
2012£m
2011£m
Salaries and other short term employee benefits and Non-Executive fees . . . . . . . . . . . . . . . . . . . . . 4 5 3Post employment benefits* . . . . . . . . . . . . . . . . . . . . . . . . . . . . . . . . . . . . . . . . . . . . . . . . . . . . . . . . . 1 1 1Share based remuneration** . . . . . . . . . . . . . . . . . . . . . . . . . . . . . . . . . . . . . . . . . . . . . . . . . . . . . . . . 4 5 4
Total . . . . . . . . . . . . . . . . . . . . . . . . . . . . . . . . . . . . . . . . . . . . . . . . . . . . . . . . . . . . . . . . . . . . . . . . . . . 9 11 8
* Post employment benefits comprises the transfer value of the increase in accrued pension during the year (net of inflation, Directors’contributions and participation fee) for defined benefit schemes and payments made to defined contribution schemes or in lieu ofpension.
** The share based remuneration charge comprises the multi-year incentive scheme charges in accordance with IFRS2 — Share BasedPayment. These IFRS 2 charges do not reflect the actual value received on vesting.
No termination benefits were paid to any Director in 2013 (2012: nil; 2011: nil) No loans, advances or guarantees havebeen provided on behalf of any Director. The aggregate gain made by Executive Directors on the exercise of options during2013 were £2,526,305. The current Executive Directors did not exercise any options during 2012 or 2011.
33. Approval of financial statements
The combined financial statements were approved by the Boards of directors of Reed Elsevier PLC and Reed ElsevierNV on February 26, 2014.
F-54

THIS PAGE INTENTIONALLY BLANK
F-55

REED ELSEVIER PLCCONSOLIDATED FINANCIAL STATEMENTS
F-56

REPORT OF INDEPENDENT REGISTERED PUBLIC ACCOUNTING FIRM
To the Board of Directors and members of Reed Elsevier PLC:
We have audited the accompanying consolidated statements of financial position of Reed Elsevier PLC and itssubsidiaries (the “Company”) as at December 31, 2013, 2012 and 2011, and the related consolidated income statements, andconsolidated statements of comprehensive income, cash flows and changes in equity for each of the years then ended. Theseconsolidated financial statements are the responsibility of the Company’s management. Our responsibility is to express anopinion on the financial statements based on our audits.
We conducted our audits in accordance with the standards of the Public Company Accounting Oversight Board(United States). Those standards require that we plan and perform the audit to obtain reasonable assurance about whether thefinancial statements are free of material misstatement. An audit includes examining, on a test basis, evidence supporting theamounts and disclosures in the financial statements. An audit also includes assessing the accounting principles used andsignificant estimates made by management, as well as evaluating the overall financial statement presentation. We believe thatour audits provide a reasonable basis for our opinion.
In our opinion, such consolidated financial statements present fairly, in all material respects, the financial position ofReed Elsevier PLC and its subsidiaries as at December 31, 2013, 2012 and 2011, and the results of their operations and theircash flows for each of the years then ended, in conformity with International Financial Reporting Standards as issued by theInternational Accounting Standards Board.
As discussed in Accounting policies in the consolidated financial statements, the accompanying 2012 and 2011 financialstatements have been retrospectively adjusted for the adoption of International Accounting Standards 19 Employee Benefits(revised).
We have also audited, in accordance with the standards of the Public Company Accounting Oversight Board(United States), the Company’s internal control over financial reporting as at December 31, 2013, based on the criteriaestablished in Internal Control — Integrated Framework (1992) issued by the Committee of Sponsoring Organizations of theTreadway Commission and our report dated February 26, 2014 expressed an unqualified opinion on the Company’s internalcontrol over financial reporting.
/s/ DELOITTE LLPLondon, United KingdomFebruary 26, 2014
F-57
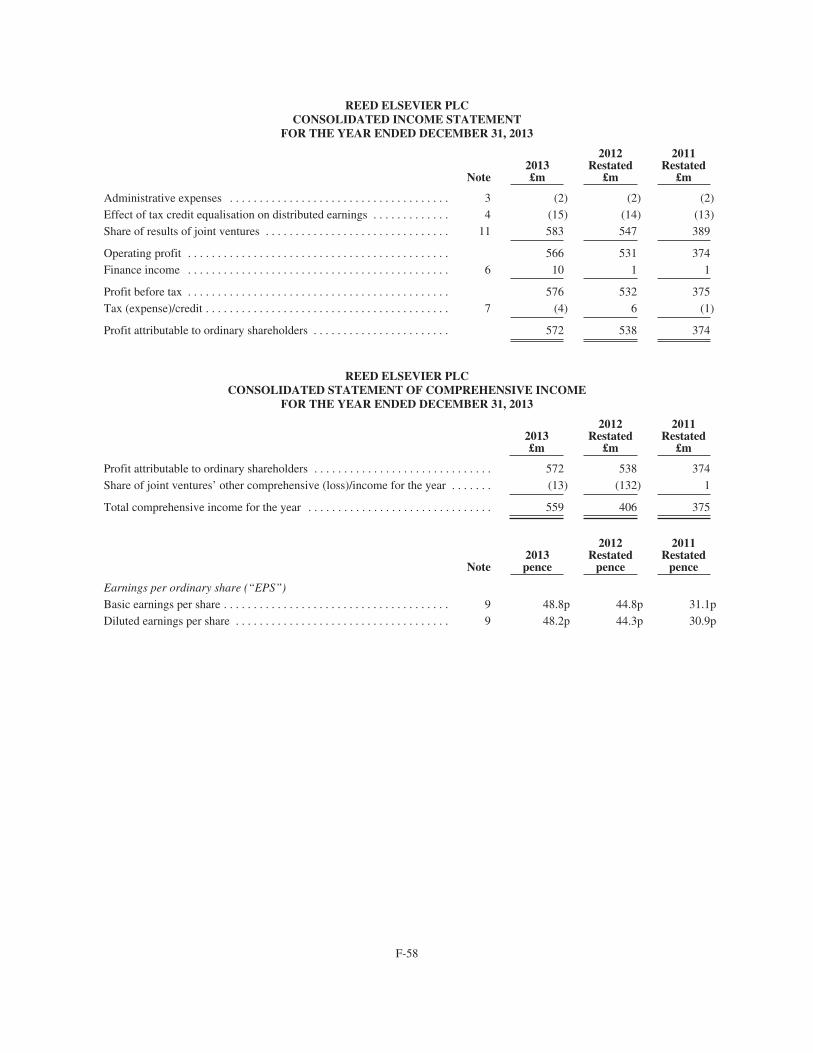
REED ELSEVIER PLCCONSOLIDATED INCOME STATEMENT
FOR THE YEAR ENDED DECEMBER 31, 2013
Note2013£m
2012Restated
£m
2011Restated
£m
Administrative expenses . . . . . . . . . . . . . . . . . . . . . . . . . . . . . . . . . . . . . 3 (2) (2) (2)Effect of tax credit equalisation on distributed earnings . . . . . . . . . . . . . 4 (15) (14) (13)Share of results of joint ventures . . . . . . . . . . . . . . . . . . . . . . . . . . . . . . . 11 583 547 389
Operating profit . . . . . . . . . . . . . . . . . . . . . . . . . . . . . . . . . . . . . . . . . . . . 566 531 374Finance income . . . . . . . . . . . . . . . . . . . . . . . . . . . . . . . . . . . . . . . . . . . . 6 10 1 1
Profit before tax . . . . . . . . . . . . . . . . . . . . . . . . . . . . . . . . . . . . . . . . . . . . 576 532 375Tax (expense)/credit . . . . . . . . . . . . . . . . . . . . . . . . . . . . . . . . . . . . . . . . . 7 (4) 6 (1)
Profit attributable to ordinary shareholders . . . . . . . . . . . . . . . . . . . . . . . 572 538 374
REED ELSEVIER PLCCONSOLIDATED STATEMENT OF COMPREHENSIVE INCOME
FOR THE YEAR ENDED DECEMBER 31, 2013
2013£m
2012Restated
£m
2011Restated
£m
Profit attributable to ordinary shareholders . . . . . . . . . . . . . . . . . . . . . . . . . . . . . . 572 538 374Share of joint ventures’ other comprehensive (loss)/income for the year . . . . . . . (13) (132) 1
Total comprehensive income for the year . . . . . . . . . . . . . . . . . . . . . . . . . . . . . . . 559 406 375
Note2013pence
2012Restated
pence
2011Restated
pence
Earnings per ordinary share (“EPS”)
Basic earnings per share . . . . . . . . . . . . . . . . . . . . . . . . . . . . . . . . . . . . . . 9 48.8p 44.8p 31.1pDiluted earnings per share . . . . . . . . . . . . . . . . . . . . . . . . . . . . . . . . . . . . 9 48.2p 44.3p 30.9p
F-58
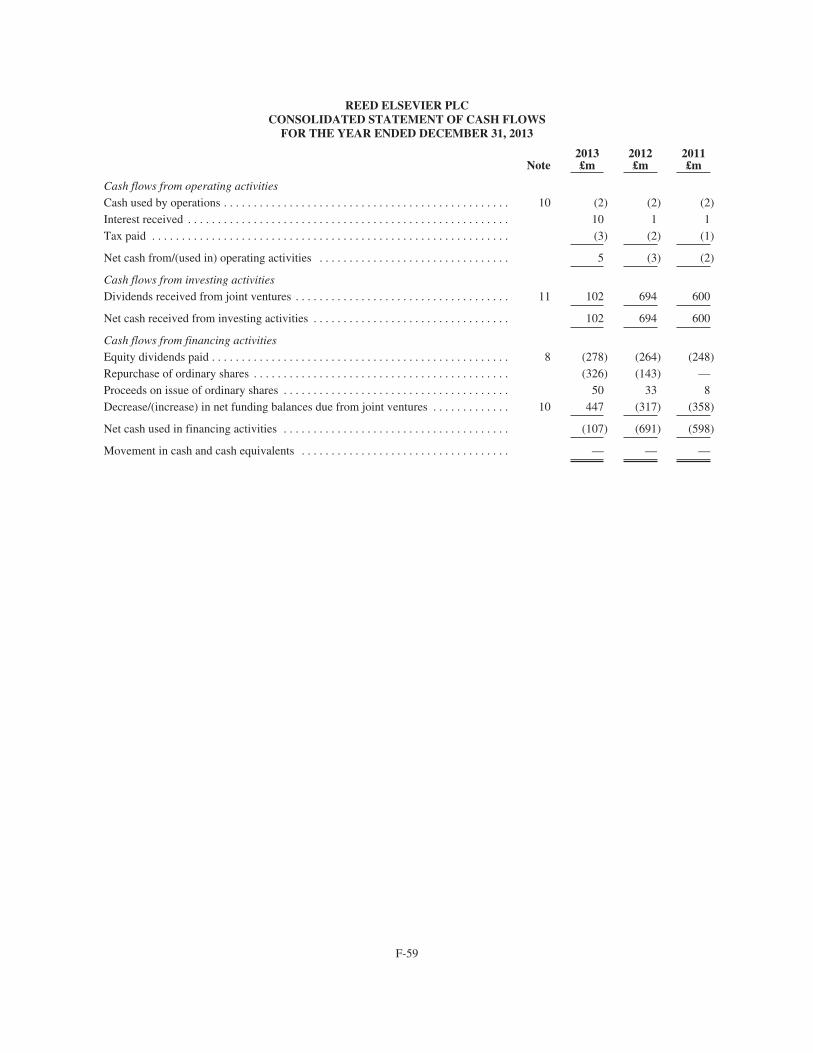
REED ELSEVIER PLCCONSOLIDATED STATEMENT OF CASH FLOWS
FOR THE YEAR ENDED DECEMBER 31, 2013
Note2013£m
2012£m
2011£m
Cash flows from operating activities
Cash used by operations . . . . . . . . . . . . . . . . . . . . . . . . . . . . . . . . . . . . . . . . . . . . . . . . 10 (2) (2) (2)Interest received . . . . . . . . . . . . . . . . . . . . . . . . . . . . . . . . . . . . . . . . . . . . . . . . . . . . . . 10 1 1Tax paid . . . . . . . . . . . . . . . . . . . . . . . . . . . . . . . . . . . . . . . . . . . . . . . . . . . . . . . . . . . . (3) (2) (1)
Net cash from/(used in) operating activities . . . . . . . . . . . . . . . . . . . . . . . . . . . . . . . . 5 (3) (2)
Cash flows from investing activities
Dividends received from joint ventures . . . . . . . . . . . . . . . . . . . . . . . . . . . . . . . . . . . . 11 102 694 600
Net cash received from investing activities . . . . . . . . . . . . . . . . . . . . . . . . . . . . . . . . . 102 694 600
Cash flows from financing activities
Equity dividends paid . . . . . . . . . . . . . . . . . . . . . . . . . . . . . . . . . . . . . . . . . . . . . . . . . . 8 (278) (264) (248)Repurchase of ordinary shares . . . . . . . . . . . . . . . . . . . . . . . . . . . . . . . . . . . . . . . . . . . (326) (143) —Proceeds on issue of ordinary shares . . . . . . . . . . . . . . . . . . . . . . . . . . . . . . . . . . . . . . 50 33 8Decrease/(increase) in net funding balances due from joint ventures . . . . . . . . . . . . . 10 447 (317) (358)
Net cash used in financing activities . . . . . . . . . . . . . . . . . . . . . . . . . . . . . . . . . . . . . . (107) (691) (598)
Movement in cash and cash equivalents . . . . . . . . . . . . . . . . . . . . . . . . . . . . . . . . . . . — — —
F-59
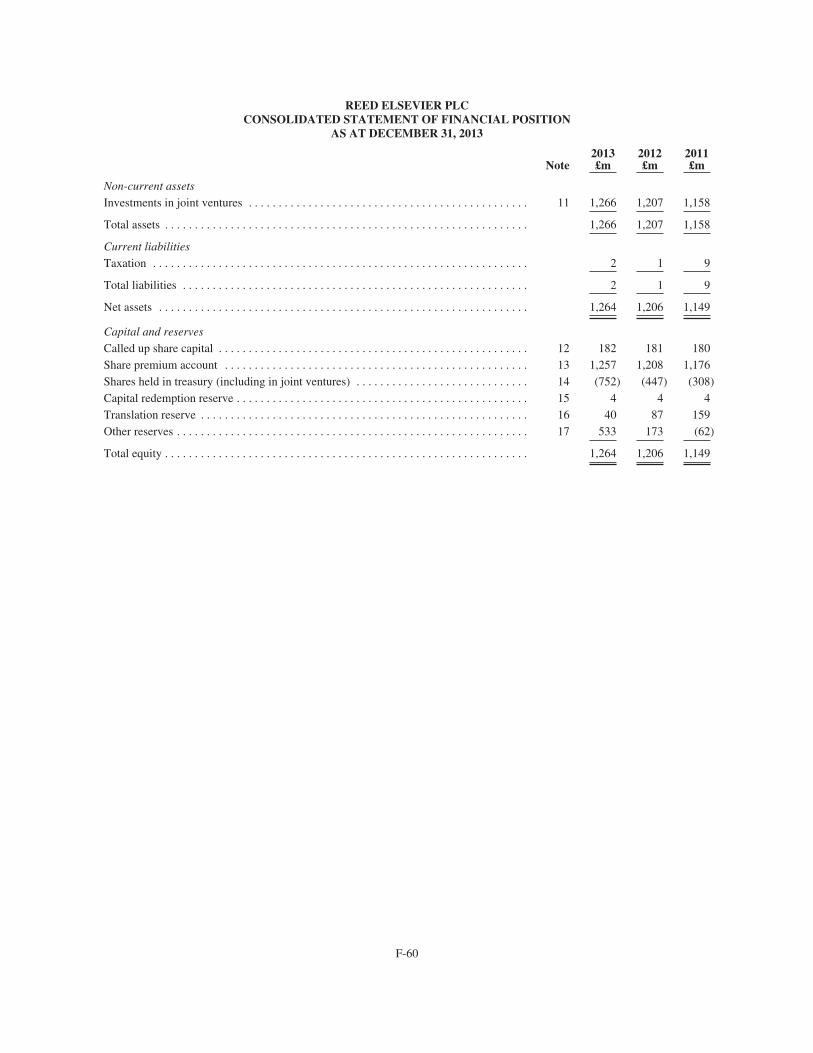
REED ELSEVIER PLCCONSOLIDATED STATEMENT OF FINANCIAL POSITION
AS AT DECEMBER 31, 2013
Note2013£m
2012£m
2011£m
Non-current assets
Investments in joint ventures . . . . . . . . . . . . . . . . . . . . . . . . . . . . . . . . . . . . . . . . . . . . . . . 11 1,266 1,207 1,158
Total assets . . . . . . . . . . . . . . . . . . . . . . . . . . . . . . . . . . . . . . . . . . . . . . . . . . . . . . . . . . . . . 1,266 1,207 1,158
Current liabilities
Taxation . . . . . . . . . . . . . . . . . . . . . . . . . . . . . . . . . . . . . . . . . . . . . . . . . . . . . . . . . . . . . . . 2 1 9
Total liabilities . . . . . . . . . . . . . . . . . . . . . . . . . . . . . . . . . . . . . . . . . . . . . . . . . . . . . . . . . . 2 1 9
Net assets . . . . . . . . . . . . . . . . . . . . . . . . . . . . . . . . . . . . . . . . . . . . . . . . . . . . . . . . . . . . . . 1,264 1,206 1,149
Capital and reserves
Called up share capital . . . . . . . . . . . . . . . . . . . . . . . . . . . . . . . . . . . . . . . . . . . . . . . . . . . . 12 182 181 180Share premium account . . . . . . . . . . . . . . . . . . . . . . . . . . . . . . . . . . . . . . . . . . . . . . . . . . . 13 1,257 1,208 1,176Shares held in treasury (including in joint ventures) . . . . . . . . . . . . . . . . . . . . . . . . . . . . . 14 (752) (447) (308)Capital redemption reserve . . . . . . . . . . . . . . . . . . . . . . . . . . . . . . . . . . . . . . . . . . . . . . . . . 15 4 4 4Translation reserve . . . . . . . . . . . . . . . . . . . . . . . . . . . . . . . . . . . . . . . . . . . . . . . . . . . . . . . 16 40 87 159Other reserves . . . . . . . . . . . . . . . . . . . . . . . . . . . . . . . . . . . . . . . . . . . . . . . . . . . . . . . . . . . 17 533 173 (62)
Total equity . . . . . . . . . . . . . . . . . . . . . . . . . . . . . . . . . . . . . . . . . . . . . . . . . . . . . . . . . . . . . 1,264 1,206 1,149
F-60
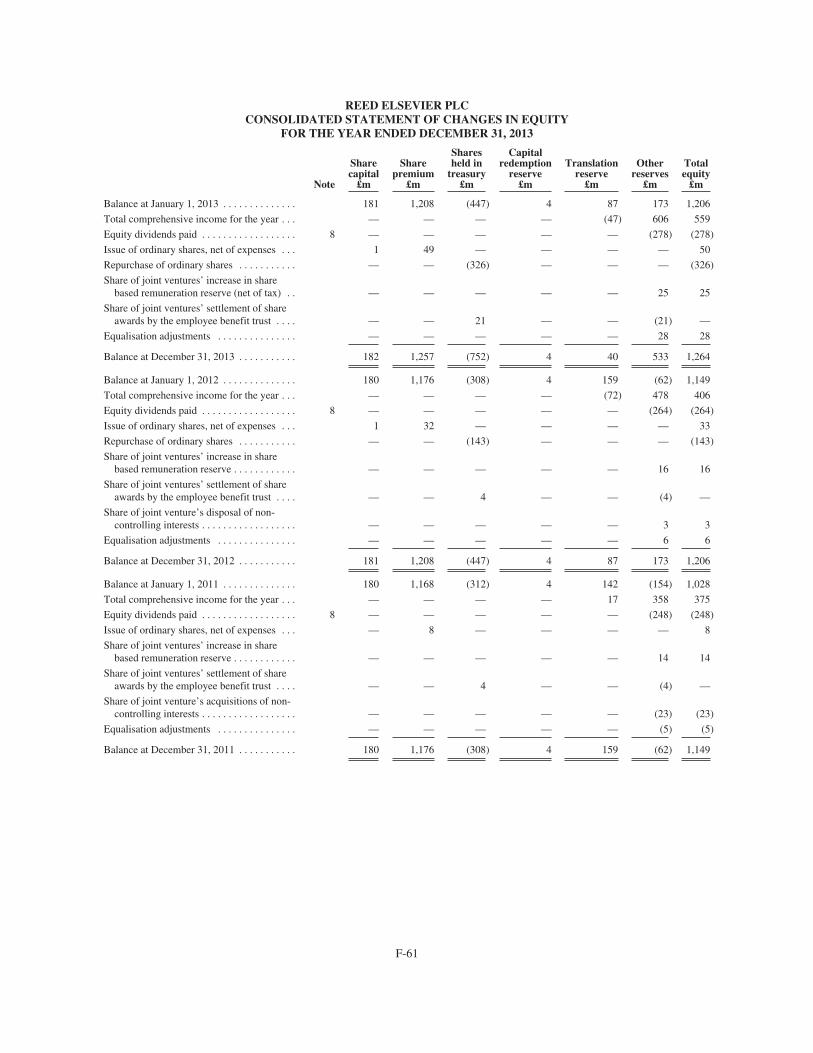
REED ELSEVIER PLCCONSOLIDATED STATEMENT OF CHANGES IN EQUITY
FOR THE YEAR ENDED DECEMBER 31, 2013
Note
Sharecapital
£m
Sharepremium
£m
Sharesheld in
treasury£m
Capitalredemption
reserve£m
Translationreserve
£m
Otherreserves
£m
Totalequity
£m
Balance at January 1, 2013 . . . . . . . . . . . . . . 181 1,208 (447) 4 87 173 1,206
Total comprehensive income for the year . . . — — — — (47) 606 559
Equity dividends paid . . . . . . . . . . . . . . . . . . 8 — — — — — (278) (278)
Issue of ordinary shares, net of expenses . . . 1 49 — — — — 50
Repurchase of ordinary shares . . . . . . . . . . . — — (326) — — — (326)
Share of joint ventures’ increase in sharebased remuneration reserve (net of tax) . . — — — — — 25 25
Share of joint ventures’ settlement of shareawards by the employee benefit trust . . . . — — 21 — — (21) —
Equalisation adjustments . . . . . . . . . . . . . . . — — — — — 28 28
Balance at December 31, 2013 . . . . . . . . . . . 182 1,257 (752) 4 40 533 1,264
Balance at January 1, 2012 . . . . . . . . . . . . . . 180 1,176 (308) 4 159 (62) 1,149
Total comprehensive income for the year . . . — — — — (72) 478 406
Equity dividends paid . . . . . . . . . . . . . . . . . . 8 — — — — — (264) (264)
Issue of ordinary shares, net of expenses . . . 1 32 — — — — 33
Repurchase of ordinary shares . . . . . . . . . . . — — (143) — — — (143)
Share of joint ventures’ increase in sharebased remuneration reserve . . . . . . . . . . . . — — — — — 16 16
Share of joint ventures’ settlement of shareawards by the employee benefit trust . . . . — — 4 — — (4) —
Share of joint venture’s disposal of non-controlling interests . . . . . . . . . . . . . . . . . . — — — — — 3 3
Equalisation adjustments . . . . . . . . . . . . . . . — — — — — 6 6
Balance at December 31, 2012 . . . . . . . . . . . 181 1,208 (447) 4 87 173 1,206
Balance at January 1, 2011 . . . . . . . . . . . . . . 180 1,168 (312) 4 142 (154) 1,028
Total comprehensive income for the year . . . — — — — 17 358 375
Equity dividends paid . . . . . . . . . . . . . . . . . . 8 — — — — — (248) (248)
Issue of ordinary shares, net of expenses . . . — 8 — — — — 8
Share of joint ventures’ increase in sharebased remuneration reserve . . . . . . . . . . . . — — — — — 14 14
Share of joint ventures’ settlement of shareawards by the employee benefit trust . . . . — — 4 — — (4) —
Share of joint venture’s acquisitions of non-controlling interests . . . . . . . . . . . . . . . . . . — — — — — (23) (23)
Equalisation adjustments . . . . . . . . . . . . . . . — — — — — (5) (5)
Balance at December 31, 2011 . . . . . . . . . . . 180 1,176 (308) 4 159 (62) 1,149
F-61
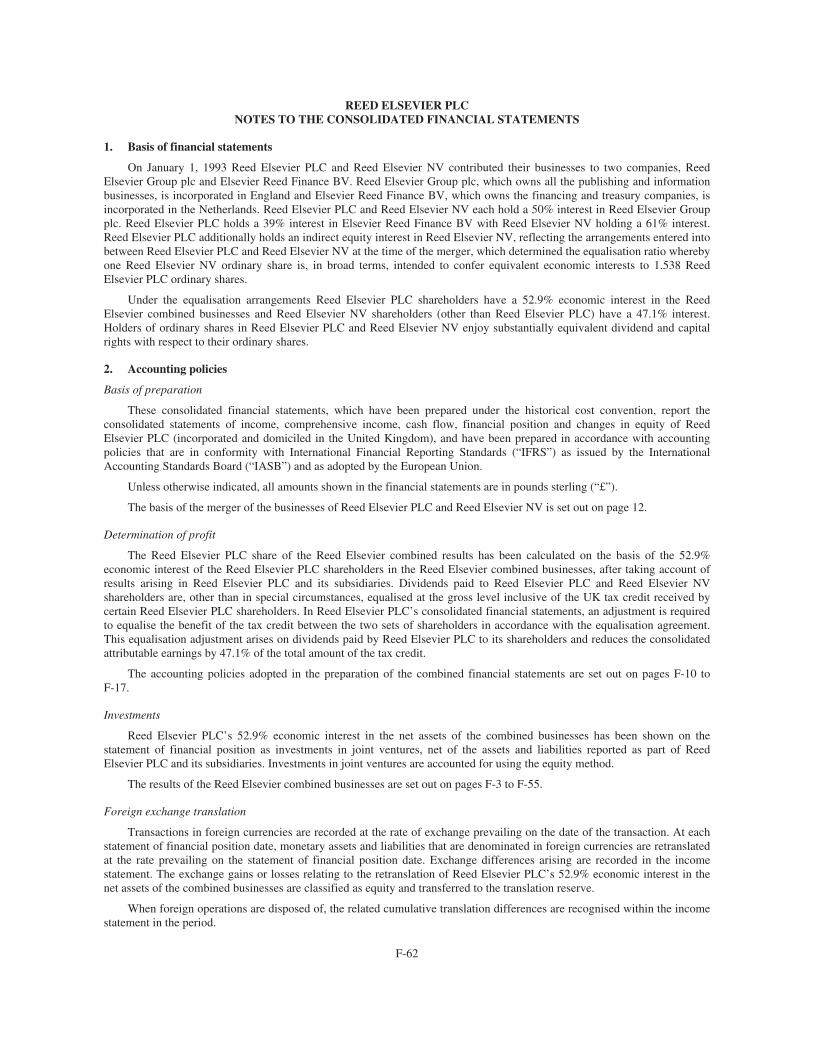
REED ELSEVIER PLCNOTES TO THE CONSOLIDATED FINANCIAL STATEMENTS
1. Basis of financial statements
On January 1, 1993 Reed Elsevier PLC and Reed Elsevier NV contributed their businesses to two companies, ReedElsevier Group plc and Elsevier Reed Finance BV. Reed Elsevier Group plc, which owns all the publishing and informationbusinesses, is incorporated in England and Elsevier Reed Finance BV, which owns the financing and treasury companies, isincorporated in the Netherlands. Reed Elsevier PLC and Reed Elsevier NV each hold a 50% interest in Reed Elsevier Groupplc. Reed Elsevier PLC holds a 39% interest in Elsevier Reed Finance BV with Reed Elsevier NV holding a 61% interest.Reed Elsevier PLC additionally holds an indirect equity interest in Reed Elsevier NV, reflecting the arrangements entered intobetween Reed Elsevier PLC and Reed Elsevier NV at the time of the merger, which determined the equalisation ratio wherebyone Reed Elsevier NV ordinary share is, in broad terms, intended to confer equivalent economic interests to 1.538 ReedElsevier PLC ordinary shares.
Under the equalisation arrangements Reed Elsevier PLC shareholders have a 52.9% economic interest in the ReedElsevier combined businesses and Reed Elsevier NV shareholders (other than Reed Elsevier PLC) have a 47.1% interest.Holders of ordinary shares in Reed Elsevier PLC and Reed Elsevier NV enjoy substantially equivalent dividend and capitalrights with respect to their ordinary shares.
2. Accounting policies
Basis of preparation
These consolidated financial statements, which have been prepared under the historical cost convention, report theconsolidated statements of income, comprehensive income, cash flow, financial position and changes in equity of ReedElsevier PLC (incorporated and domiciled in the United Kingdom), and have been prepared in accordance with accountingpolicies that are in conformity with International Financial Reporting Standards (“IFRS”) as issued by the InternationalAccounting Standards Board (“IASB”) and as adopted by the European Union.
Unless otherwise indicated, all amounts shown in the financial statements are in pounds sterling (“£”).
The basis of the merger of the businesses of Reed Elsevier PLC and Reed Elsevier NV is set out on page 12.
Determination of profit
The Reed Elsevier PLC share of the Reed Elsevier combined results has been calculated on the basis of the 52.9%economic interest of the Reed Elsevier PLC shareholders in the Reed Elsevier combined businesses, after taking account ofresults arising in Reed Elsevier PLC and its subsidiaries. Dividends paid to Reed Elsevier PLC and Reed Elsevier NVshareholders are, other than in special circumstances, equalised at the gross level inclusive of the UK tax credit received bycertain Reed Elsevier PLC shareholders. In Reed Elsevier PLC’s consolidated financial statements, an adjustment is requiredto equalise the benefit of the tax credit between the two sets of shareholders in accordance with the equalisation agreement.This equalisation adjustment arises on dividends paid by Reed Elsevier PLC to its shareholders and reduces the consolidatedattributable earnings by 47.1% of the total amount of the tax credit.
The accounting policies adopted in the preparation of the combined financial statements are set out on pages F-10 toF-17.
Investments
Reed Elsevier PLC’s 52.9% economic interest in the net assets of the combined businesses has been shown on thestatement of financial position as investments in joint ventures, net of the assets and liabilities reported as part of ReedElsevier PLC and its subsidiaries. Investments in joint ventures are accounted for using the equity method.
The results of the Reed Elsevier combined businesses are set out on pages F-3 to F-55.
Foreign exchange translation
Transactions in foreign currencies are recorded at the rate of exchange prevailing on the date of the transaction. At eachstatement of financial position date, monetary assets and liabilities that are denominated in foreign currencies are retranslatedat the rate prevailing on the statement of financial position date. Exchange differences arising are recorded in the incomestatement. The exchange gains or losses relating to the retranslation of Reed Elsevier PLC’s 52.9% economic interest in thenet assets of the combined businesses are classified as equity and transferred to the translation reserve.
When foreign operations are disposed of, the related cumulative translation differences are recognised within the incomestatement in the period.
F-62
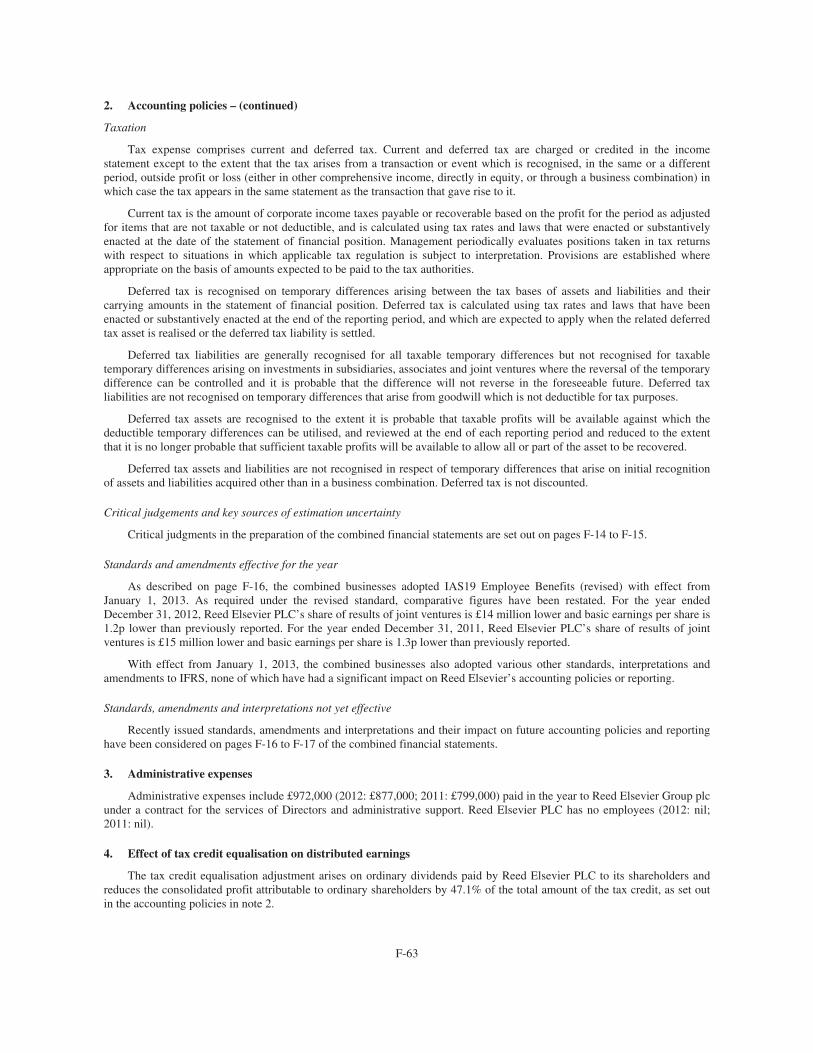
2. Accounting policies – (continued)
Taxation
Tax expense comprises current and deferred tax. Current and deferred tax are charged or credited in the incomestatement except to the extent that the tax arises from a transaction or event which is recognised, in the same or a differentperiod, outside profit or loss (either in other comprehensive income, directly in equity, or through a business combination) inwhich case the tax appears in the same statement as the transaction that gave rise to it.
Current tax is the amount of corporate income taxes payable or recoverable based on the profit for the period as adjustedfor items that are not taxable or not deductible, and is calculated using tax rates and laws that were enacted or substantivelyenacted at the date of the statement of financial position. Management periodically evaluates positions taken in tax returnswith respect to situations in which applicable tax regulation is subject to interpretation. Provisions are established whereappropriate on the basis of amounts expected to be paid to the tax authorities.
Deferred tax is recognised on temporary differences arising between the tax bases of assets and liabilities and theircarrying amounts in the statement of financial position. Deferred tax is calculated using tax rates and laws that have beenenacted or substantively enacted at the end of the reporting period, and which are expected to apply when the related deferredtax asset is realised or the deferred tax liability is settled.
Deferred tax liabilities are generally recognised for all taxable temporary differences but not recognised for taxabletemporary differences arising on investments in subsidiaries, associates and joint ventures where the reversal of the temporarydifference can be controlled and it is probable that the difference will not reverse in the foreseeable future. Deferred taxliabilities are not recognised on temporary differences that arise from goodwill which is not deductible for tax purposes.
Deferred tax assets are recognised to the extent it is probable that taxable profits will be available against which thedeductible temporary differences can be utilised, and reviewed at the end of each reporting period and reduced to the extentthat it is no longer probable that sufficient taxable profits will be available to allow all or part of the asset to be recovered.
Deferred tax assets and liabilities are not recognised in respect of temporary differences that arise on initial recognitionof assets and liabilities acquired other than in a business combination. Deferred tax is not discounted.
Critical judgements and key sources of estimation uncertainty
Critical judgments in the preparation of the combined financial statements are set out on pages F-14 to F-15.
Standards and amendments effective for the year
As described on page F-16, the combined businesses adopted IAS19 Employee Benefits (revised) with effect fromJanuary 1, 2013. As required under the revised standard, comparative figures have been restated. For the year endedDecember 31, 2012, Reed Elsevier PLC’s share of results of joint ventures is £14 million lower and basic earnings per share is1.2p lower than previously reported. For the year ended December 31, 2011, Reed Elsevier PLC’s share of results of jointventures is £15 million lower and basic earnings per share is 1.3p lower than previously reported.
With effect from January 1, 2013, the combined businesses also adopted various other standards, interpretations andamendments to IFRS, none of which have had a significant impact on Reed Elsevier’s accounting policies or reporting.
Standards, amendments and interpretations not yet effective
Recently issued standards, amendments and interpretations and their impact on future accounting policies and reportinghave been considered on pages F-16 to F-17 of the combined financial statements.
3. Administrative expenses
Administrative expenses include £972,000 (2012: £877,000; 2011: £799,000) paid in the year to Reed Elsevier Group plcunder a contract for the services of Directors and administrative support. Reed Elsevier PLC has no employees (2012: nil;2011: nil).
4. Effect of tax credit equalisation on distributed earnings
The tax credit equalisation adjustment arises on ordinary dividends paid by Reed Elsevier PLC to its shareholders andreduces the consolidated profit attributable to ordinary shareholders by 47.1% of the total amount of the tax credit, as set outin the accounting policies in note 2.
F-63
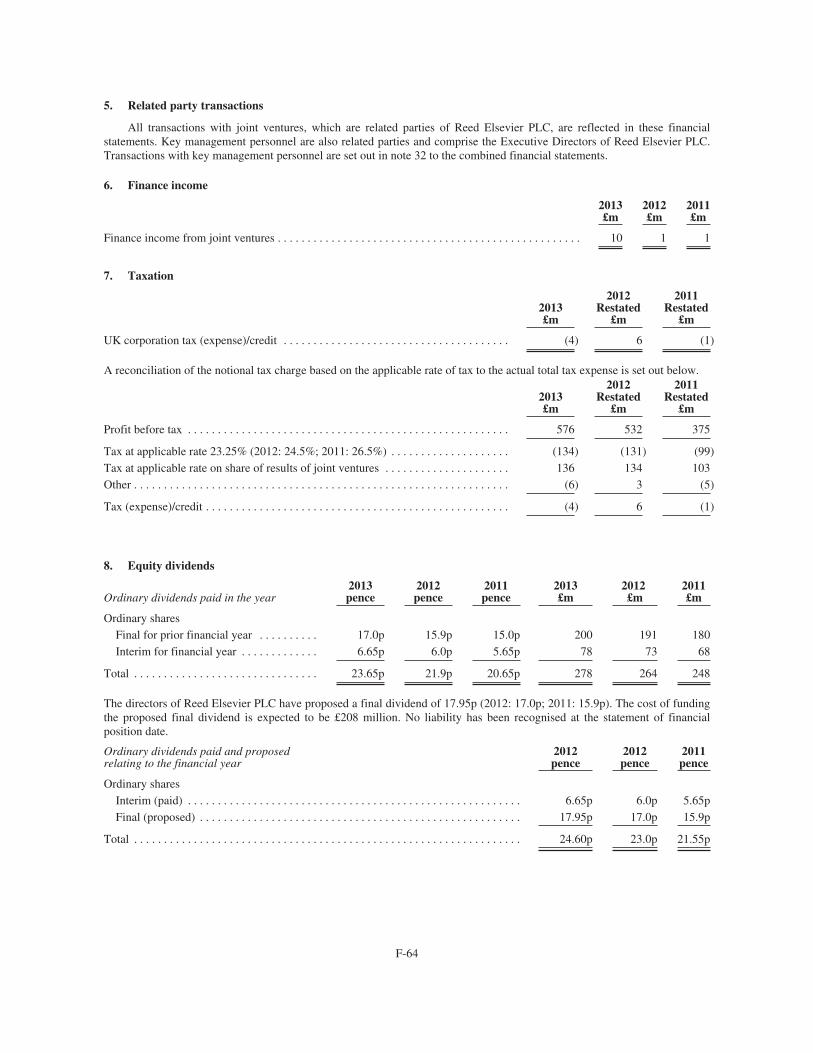
5. Related party transactions
All transactions with joint ventures, which are related parties of Reed Elsevier PLC, are reflected in these financialstatements. Key management personnel are also related parties and comprise the Executive Directors of Reed Elsevier PLC.Transactions with key management personnel are set out in note 32 to the combined financial statements.
6. Finance income
2013£m
2012£m
2011£m
Finance income from joint ventures . . . . . . . . . . . . . . . . . . . . . . . . . . . . . . . . . . . . . . . . . . . . . . . . . . . 10 1 1
7. Taxation
2013£m
2012Restated
£m
2011Restated
£m
UK corporation tax (expense)/credit . . . . . . . . . . . . . . . . . . . . . . . . . . . . . . . . . . . . . . (4) 6 (1)
A reconciliation of the notional tax charge based on the applicable rate of tax to the actual total tax expense is set out below.
2013£m
2012Restated
£m
2011Restated
£m
Profit before tax . . . . . . . . . . . . . . . . . . . . . . . . . . . . . . . . . . . . . . . . . . . . . . . . . . . . . . 576 532 375
Tax at applicable rate 23.25% (2012: 24.5%; 2011: 26.5%) . . . . . . . . . . . . . . . . . . . . (134) (131) (99)Tax at applicable rate on share of results of joint ventures . . . . . . . . . . . . . . . . . . . . . 136 134 103Other . . . . . . . . . . . . . . . . . . . . . . . . . . . . . . . . . . . . . . . . . . . . . . . . . . . . . . . . . . . . . . . (6) 3 (5)
Tax (expense)/credit . . . . . . . . . . . . . . . . . . . . . . . . . . . . . . . . . . . . . . . . . . . . . . . . . . . (4) 6 (1)
8. Equity dividends
Ordinary dividends paid in the year2013pence
2012pence
2011pence
2013£m
2012£m
2011£m
Ordinary sharesFinal for prior financial year . . . . . . . . . . 17.0p 15.9p 15.0p 200 191 180Interim for financial year . . . . . . . . . . . . . 6.65p 6.0p 5.65p 78 73 68
Total . . . . . . . . . . . . . . . . . . . . . . . . . . . . . . . 23.65p 21.9p 20.65p 278 264 248
The directors of Reed Elsevier PLC have proposed a final dividend of 17.95p (2012: 17.0p; 2011: 15.9p). The cost of fundingthe proposed final dividend is expected to be £208 million. No liability has been recognised at the statement of financialposition date.
Ordinary dividends paid and proposedrelating to the financial year
2012pence
2012pence
2011pence
Ordinary sharesInterim (paid) . . . . . . . . . . . . . . . . . . . . . . . . . . . . . . . . . . . . . . . . . . . . . . . . . . . . . . . . 6.65p 6.0p 5.65pFinal (proposed) . . . . . . . . . . . . . . . . . . . . . . . . . . . . . . . . . . . . . . . . . . . . . . . . . . . . . . 17.95p 17.0p 15.9p
Total . . . . . . . . . . . . . . . . . . . . . . . . . . . . . . . . . . . . . . . . . . . . . . . . . . . . . . . . . . . . . . . . . 24.60p 23.0p 21.55p
F-64
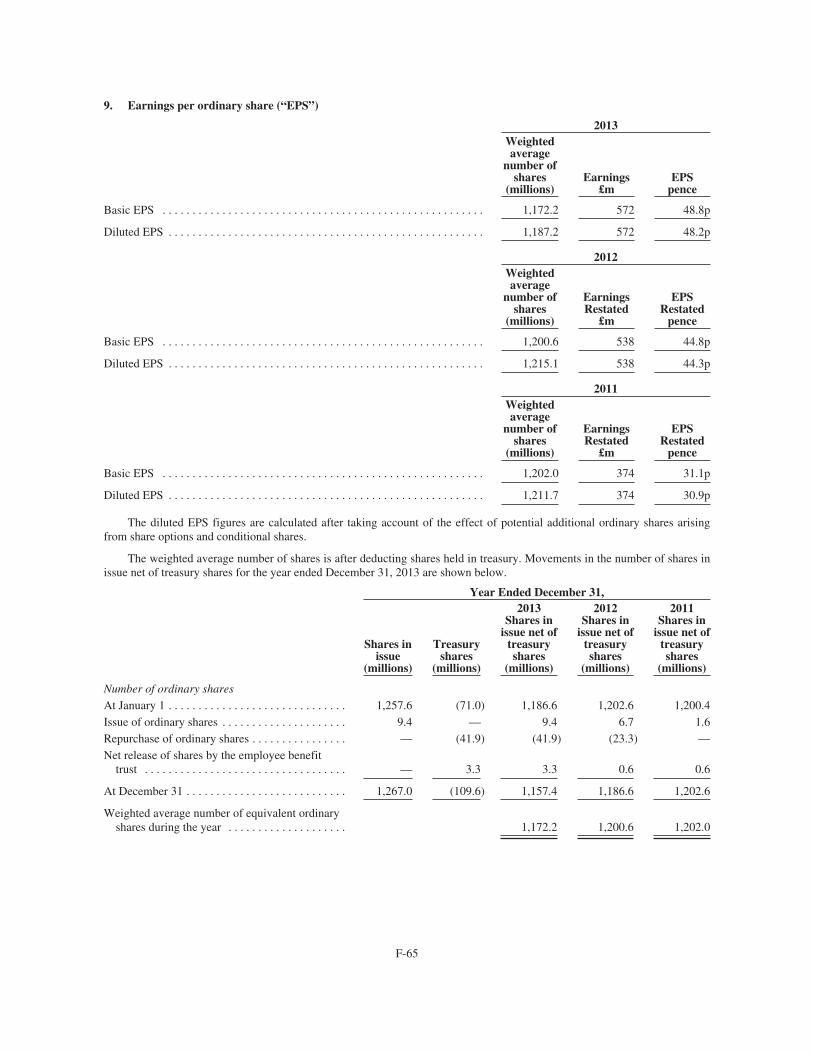
9. Earnings per ordinary share (“EPS”)
2013Weightedaverage
number ofshares
(millions)Earnings
£mEPS
pence
Basic EPS . . . . . . . . . . . . . . . . . . . . . . . . . . . . . . . . . . . . . . . . . . . . . . . . . . . . . . 1,172.2 572 48.8p
Diluted EPS . . . . . . . . . . . . . . . . . . . . . . . . . . . . . . . . . . . . . . . . . . . . . . . . . . . . . 1,187.2 572 48.2p
2012Weightedaverage
number ofshares
(millions)
EarningsRestated
£m
EPSRestated
pence
Basic EPS . . . . . . . . . . . . . . . . . . . . . . . . . . . . . . . . . . . . . . . . . . . . . . . . . . . . . . 1,200.6 538 44.8p
Diluted EPS . . . . . . . . . . . . . . . . . . . . . . . . . . . . . . . . . . . . . . . . . . . . . . . . . . . . . 1,215.1 538 44.3p
2011Weightedaverage
number ofshares
(millions)
EarningsRestated
£m
EPSRestated
pence
Basic EPS . . . . . . . . . . . . . . . . . . . . . . . . . . . . . . . . . . . . . . . . . . . . . . . . . . . . . . 1,202.0 374 31.1p
Diluted EPS . . . . . . . . . . . . . . . . . . . . . . . . . . . . . . . . . . . . . . . . . . . . . . . . . . . . . 1,211.7 374 30.9p
The diluted EPS figures are calculated after taking account of the effect of potential additional ordinary shares arisingfrom share options and conditional shares.
The weighted average number of shares is after deducting shares held in treasury. Movements in the number of shares inissue net of treasury shares for the year ended December 31, 2013 are shown below.
Year Ended December 31,
Shares inissue
(millions)
Treasuryshares
(millions)
2013Shares in
issue net oftreasuryshares
(millions)
2012Shares in
issue net oftreasuryshares
(millions)
2011Shares in
issue net oftreasuryshares
(millions)
Number of ordinary shares
At January 1 . . . . . . . . . . . . . . . . . . . . . . . . . . . . . . 1,257.6 (71.0) 1,186.6 1,202.6 1,200.4Issue of ordinary shares . . . . . . . . . . . . . . . . . . . . . 9.4 — 9.4 6.7 1.6Repurchase of ordinary shares . . . . . . . . . . . . . . . . — (41.9) (41.9) (23.3) —Net release of shares by the employee benefit
trust . . . . . . . . . . . . . . . . . . . . . . . . . . . . . . . . . . — 3.3 3.3 0.6 0.6
At December 31 . . . . . . . . . . . . . . . . . . . . . . . . . . . 1,267.0 (109.6) 1,157.4 1,186.6 1,202.6
Weighted average number of equivalent ordinaryshares during the year . . . . . . . . . . . . . . . . . . . . 1,172.2 1,200.6 1,202.0
F-65
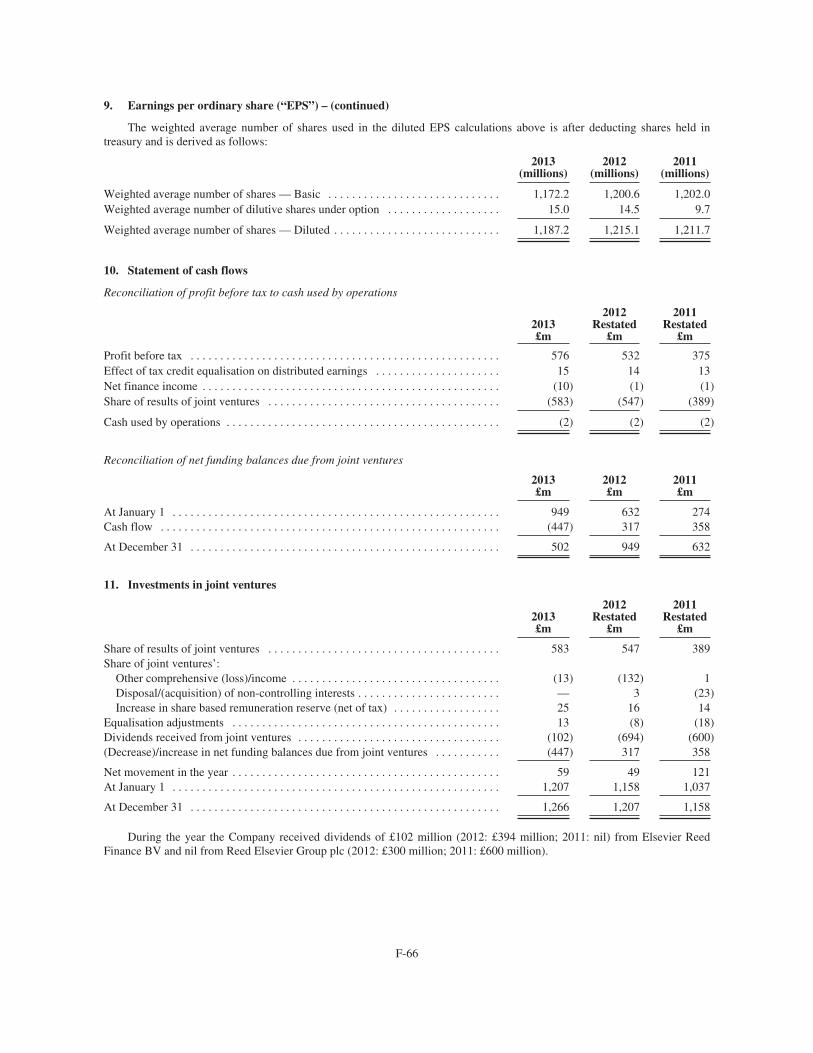
9. Earnings per ordinary share (“EPS”) – (continued)
The weighted average number of shares used in the diluted EPS calculations above is after deducting shares held intreasury and is derived as follows:
2013(millions)
2012(millions)
2011(millions)
Weighted average number of shares — Basic . . . . . . . . . . . . . . . . . . . . . . . . . . . . . 1,172.2 1,200.6 1,202.0Weighted average number of dilutive shares under option . . . . . . . . . . . . . . . . . . . 15.0 14.5 9.7
Weighted average number of shares — Diluted . . . . . . . . . . . . . . . . . . . . . . . . . . . . 1,187.2 1,215.1 1,211.7
10. Statement of cash flows
Reconciliation of profit before tax to cash used by operations
2013£m
2012Restated
£m
2011Restated
£m
Profit before tax . . . . . . . . . . . . . . . . . . . . . . . . . . . . . . . . . . . . . . . . . . . . . . . . . . . . 576 532 375Effect of tax credit equalisation on distributed earnings . . . . . . . . . . . . . . . . . . . . . 15 14 13Net finance income . . . . . . . . . . . . . . . . . . . . . . . . . . . . . . . . . . . . . . . . . . . . . . . . . . (10) (1) (1)Share of results of joint ventures . . . . . . . . . . . . . . . . . . . . . . . . . . . . . . . . . . . . . . . (583) (547) (389)
Cash used by operations . . . . . . . . . . . . . . . . . . . . . . . . . . . . . . . . . . . . . . . . . . . . . . (2) (2) (2)
Reconciliation of net funding balances due from joint ventures
2013£m
2012£m
2011£m
At January 1 . . . . . . . . . . . . . . . . . . . . . . . . . . . . . . . . . . . . . . . . . . . . . . . . . . . . . . . 949 632 274Cash flow . . . . . . . . . . . . . . . . . . . . . . . . . . . . . . . . . . . . . . . . . . . . . . . . . . . . . . . . . (447) 317 358
At December 31 . . . . . . . . . . . . . . . . . . . . . . . . . . . . . . . . . . . . . . . . . . . . . . . . . . . . 502 949 632
11. Investments in joint ventures
2013£m
2012Restated
£m
2011Restated
£m
Share of results of joint ventures . . . . . . . . . . . . . . . . . . . . . . . . . . . . . . . . . . . . . . . 583 547 389Share of joint ventures’:
Other comprehensive (loss)/income . . . . . . . . . . . . . . . . . . . . . . . . . . . . . . . . . . . (13) (132) 1Disposal/(acquisition) of non-controlling interests . . . . . . . . . . . . . . . . . . . . . . . . — 3 (23)Increase in share based remuneration reserve (net of tax) . . . . . . . . . . . . . . . . . . 25 16 14
Equalisation adjustments . . . . . . . . . . . . . . . . . . . . . . . . . . . . . . . . . . . . . . . . . . . . . 13 (8) (18)Dividends received from joint ventures . . . . . . . . . . . . . . . . . . . . . . . . . . . . . . . . . . (102) (694) (600)(Decrease)/increase in net funding balances due from joint ventures . . . . . . . . . . . (447) 317 358
Net movement in the year . . . . . . . . . . . . . . . . . . . . . . . . . . . . . . . . . . . . . . . . . . . . . 59 49 121At January 1 . . . . . . . . . . . . . . . . . . . . . . . . . . . . . . . . . . . . . . . . . . . . . . . . . . . . . . . 1,207 1,158 1,037
At December 31 . . . . . . . . . . . . . . . . . . . . . . . . . . . . . . . . . . . . . . . . . . . . . . . . . . . . 1,266 1,207 1,158
During the year the Company received dividends of £102 million (2012: £394 million; 2011: nil) from Elsevier ReedFinance BV and nil from Reed Elsevier Group plc (2012: £300 million; 2011: £600 million).
F-66
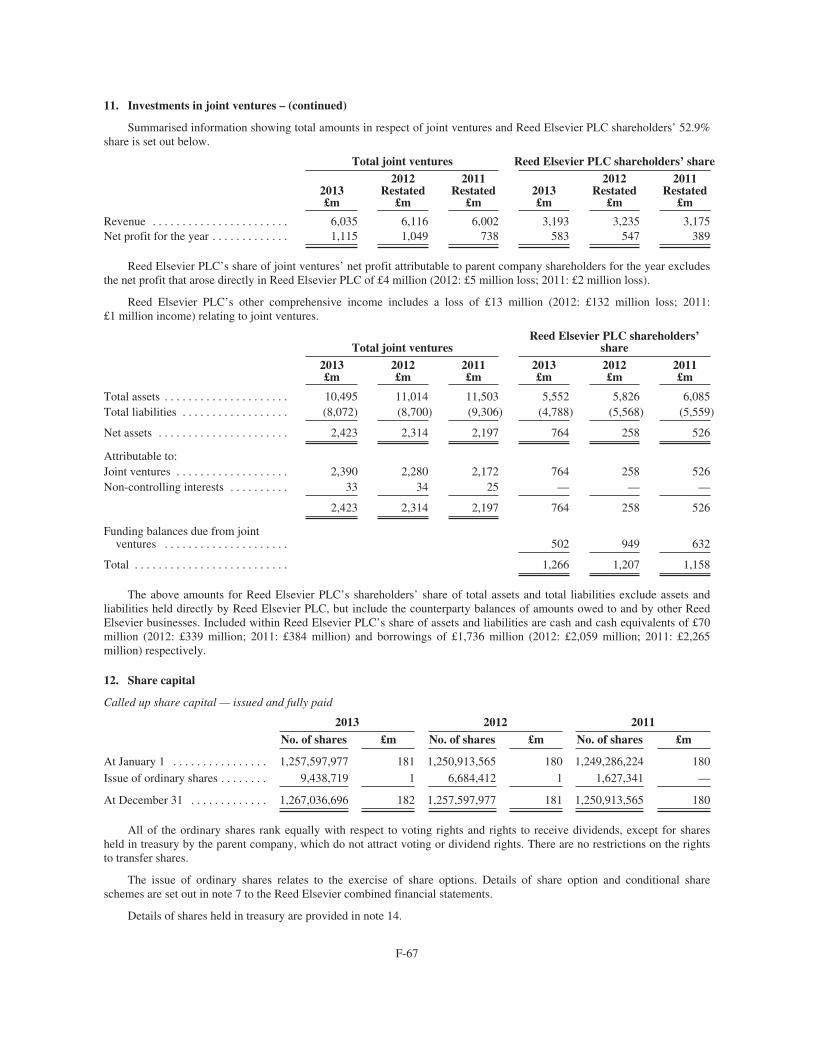
11. Investments in joint ventures – (continued)
Summarised information showing total amounts in respect of joint ventures and Reed Elsevier PLC shareholders’ 52.9%share is set out below.
Total joint ventures Reed Elsevier PLC shareholders’ share
2013£m
2012Restated
£m
2011Restated
£m2013£m
2012Restated
£m
2011Restated
£m
Revenue . . . . . . . . . . . . . . . . . . . . . . . 6,035 6,116 6,002 3,193 3,235 3,175Net profit for the year . . . . . . . . . . . . . 1,115 1,049 738 583 547 389
Reed Elsevier PLC’s share of joint ventures’ net profit attributable to parent company shareholders for the year excludesthe net profit that arose directly in Reed Elsevier PLC of £4 million (2012: £5 million loss; 2011: £2 million loss).
Reed Elsevier PLC’s other comprehensive income includes a loss of £13 million (2012: £132 million loss; 2011:£1 million income) relating to joint ventures.
Total joint venturesReed Elsevier PLC shareholders’
share
2013£m
2012£m
2011£m
2013£m
2012£m
2011£m
Total assets . . . . . . . . . . . . . . . . . . . . . 10,495 11,014 11,503 5,552 5,826 6,085Total liabilities . . . . . . . . . . . . . . . . . . (8,072) (8,700) (9,306) (4,788) (5,568) (5,559)
Net assets . . . . . . . . . . . . . . . . . . . . . . 2,423 2,314 2,197 764 258 526
Attributable to:Joint ventures . . . . . . . . . . . . . . . . . . . 2,390 2,280 2,172 764 258 526Non-controlling interests . . . . . . . . . . 33 34 25 — — —
2,423 2,314 2,197 764 258 526
Funding balances due from jointventures . . . . . . . . . . . . . . . . . . . . . 502 949 632
Total . . . . . . . . . . . . . . . . . . . . . . . . . . 1,266 1,207 1,158
The above amounts for Reed Elsevier PLC’s shareholders’ share of total assets and total liabilities exclude assets andliabilities held directly by Reed Elsevier PLC, but include the counterparty balances of amounts owed to and by other ReedElsevier businesses. Included within Reed Elsevier PLC’s share of assets and liabilities are cash and cash equivalents of £70million (2012: £339 million; 2011: £384 million) and borrowings of £1,736 million (2012: £2,059 million; 2011: £2,265million) respectively.
12. Share capital
Called up share capital — issued and fully paid
2013 2012 2011
No. of shares £m No. of shares £m No. of shares £m
At January 1 . . . . . . . . . . . . . . . . 1,257,597,977 181 1,250,913,565 180 1,249,286,224 180Issue of ordinary shares . . . . . . . . 9,438,719 1 6,684,412 1 1,627,341 —
At December 31 . . . . . . . . . . . . . 1,267,036,696 182 1,257,597,977 181 1,250,913,565 180
All of the ordinary shares rank equally with respect to voting rights and rights to receive dividends, except for sharesheld in treasury by the parent company, which do not attract voting or dividend rights. There are no restrictions on the rightsto transfer shares.
The issue of ordinary shares relates to the exercise of share options. Details of share option and conditional shareschemes are set out in note 7 to the Reed Elsevier combined financial statements.
Details of shares held in treasury are provided in note 14.
F-67
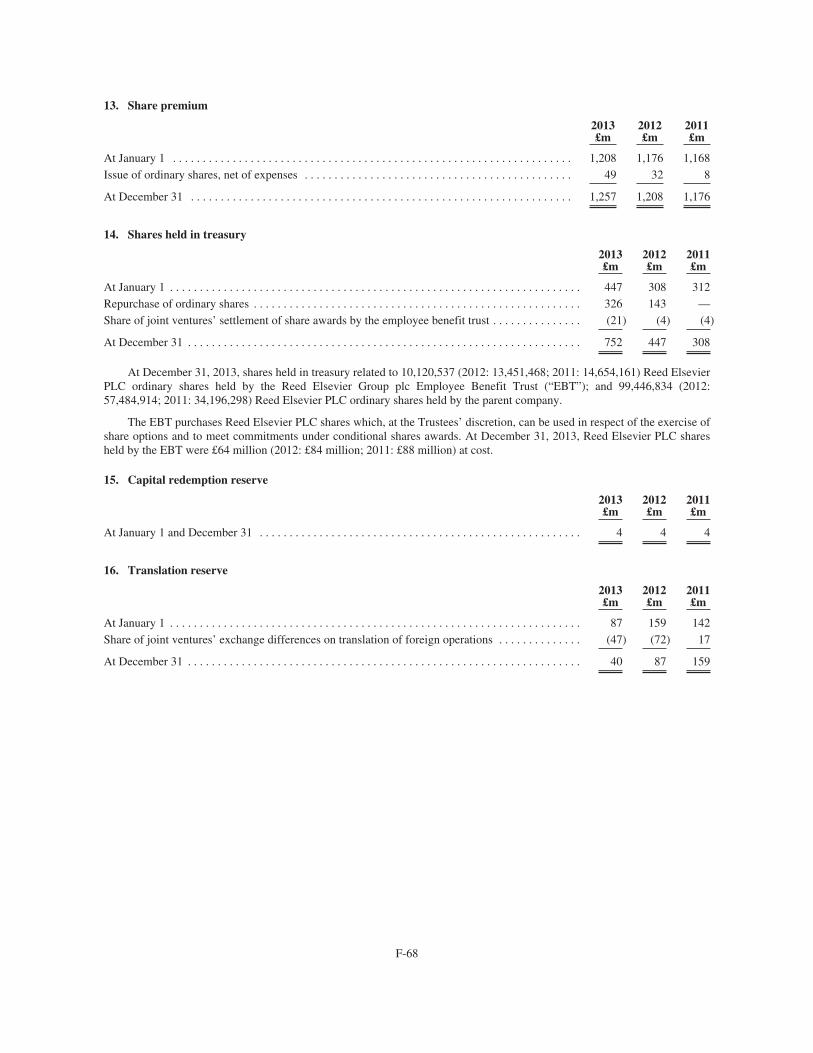
13. Share premium
2013£m
2012£m
2011£m
At January 1 . . . . . . . . . . . . . . . . . . . . . . . . . . . . . . . . . . . . . . . . . . . . . . . . . . . . . . . . . . . . . . . . . . . 1,208 1,176 1,168Issue of ordinary shares, net of expenses . . . . . . . . . . . . . . . . . . . . . . . . . . . . . . . . . . . . . . . . . . . . . 49 32 8
At December 31 . . . . . . . . . . . . . . . . . . . . . . . . . . . . . . . . . . . . . . . . . . . . . . . . . . . . . . . . . . . . . . . . 1,257 1,208 1,176
14. Shares held in treasury
2013£m
2012£m
2011£m
At January 1 . . . . . . . . . . . . . . . . . . . . . . . . . . . . . . . . . . . . . . . . . . . . . . . . . . . . . . . . . . . . . . . . . . . . . 447 308 312Repurchase of ordinary shares . . . . . . . . . . . . . . . . . . . . . . . . . . . . . . . . . . . . . . . . . . . . . . . . . . . . . . . 326 143 —Share of joint ventures’ settlement of share awards by the employee benefit trust . . . . . . . . . . . . . . . (21) (4) (4)
At December 31 . . . . . . . . . . . . . . . . . . . . . . . . . . . . . . . . . . . . . . . . . . . . . . . . . . . . . . . . . . . . . . . . . . 752 447 308
At December 31, 2013, shares held in treasury related to 10,120,537 (2012: 13,451,468; 2011: 14,654,161) Reed ElsevierPLC ordinary shares held by the Reed Elsevier Group plc Employee Benefit Trust (“EBT”); and 99,446,834 (2012:57,484,914; 2011: 34,196,298) Reed Elsevier PLC ordinary shares held by the parent company.
The EBT purchases Reed Elsevier PLC shares which, at the Trustees’ discretion, can be used in respect of the exercise ofshare options and to meet commitments under conditional shares awards. At December 31, 2013, Reed Elsevier PLC sharesheld by the EBT were £64 million (2012: £84 million; 2011: £88 million) at cost.
15. Capital redemption reserve
2013£m
2012£m
2011£m
At January 1 and December 31 . . . . . . . . . . . . . . . . . . . . . . . . . . . . . . . . . . . . . . . . . . . . . . . . . . . . . . 4 4 4
16. Translation reserve
2013£m
2012£m
2011£m
At January 1 . . . . . . . . . . . . . . . . . . . . . . . . . . . . . . . . . . . . . . . . . . . . . . . . . . . . . . . . . . . . . . . . . . . . . 87 159 142Share of joint ventures’ exchange differences on translation of foreign operations . . . . . . . . . . . . . . (47) (72) 17
At December 31 . . . . . . . . . . . . . . . . . . . . . . . . . . . . . . . . . . . . . . . . . . . . . . . . . . . . . . . . . . . . . . . . . . 40 87 159
F-68
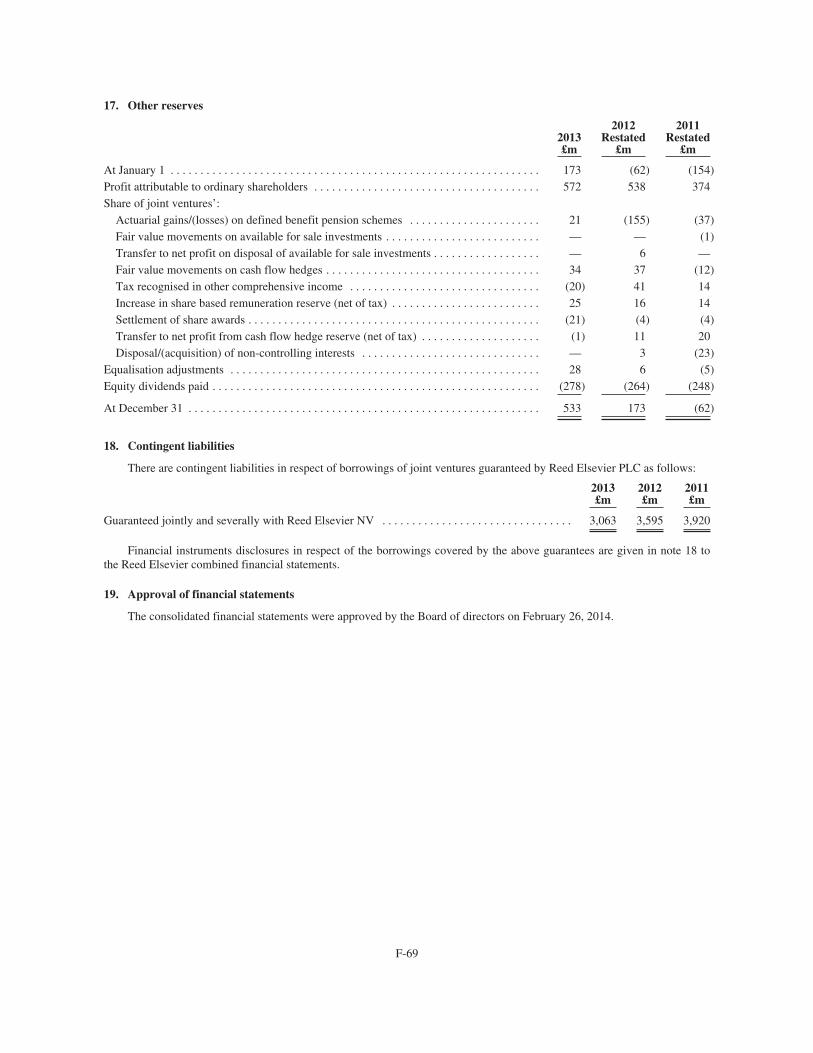
17. Other reserves
2013£m
2012Restated
£m
2011Restated
£m
At January 1 . . . . . . . . . . . . . . . . . . . . . . . . . . . . . . . . . . . . . . . . . . . . . . . . . . . . . . . . . . . . . . 173 (62) (154)Profit attributable to ordinary shareholders . . . . . . . . . . . . . . . . . . . . . . . . . . . . . . . . . . . . . . 572 538 374Share of joint ventures’:
Actuarial gains/(losses) on defined benefit pension schemes . . . . . . . . . . . . . . . . . . . . . . 21 (155) (37)Fair value movements on available for sale investments . . . . . . . . . . . . . . . . . . . . . . . . . . — — (1)Transfer to net profit on disposal of available for sale investments . . . . . . . . . . . . . . . . . . — 6 —Fair value movements on cash flow hedges . . . . . . . . . . . . . . . . . . . . . . . . . . . . . . . . . . . . 34 37 (12)Tax recognised in other comprehensive income . . . . . . . . . . . . . . . . . . . . . . . . . . . . . . . . (20) 41 14Increase in share based remuneration reserve (net of tax) . . . . . . . . . . . . . . . . . . . . . . . . . 25 16 14Settlement of share awards . . . . . . . . . . . . . . . . . . . . . . . . . . . . . . . . . . . . . . . . . . . . . . . . . (21) (4) (4)Transfer to net profit from cash flow hedge reserve (net of tax) . . . . . . . . . . . . . . . . . . . . (1) 11 20Disposal/(acquisition) of non-controlling interests . . . . . . . . . . . . . . . . . . . . . . . . . . . . . . — 3 (23)
Equalisation adjustments . . . . . . . . . . . . . . . . . . . . . . . . . . . . . . . . . . . . . . . . . . . . . . . . . . . . 28 6 (5)Equity dividends paid . . . . . . . . . . . . . . . . . . . . . . . . . . . . . . . . . . . . . . . . . . . . . . . . . . . . . . . (278) (264) (248)
At December 31 . . . . . . . . . . . . . . . . . . . . . . . . . . . . . . . . . . . . . . . . . . . . . . . . . . . . . . . . . . . 533 173 (62)
18. Contingent liabilities
There are contingent liabilities in respect of borrowings of joint ventures guaranteed by Reed Elsevier PLC as follows:
2013£m
2012£m
2011£m
Guaranteed jointly and severally with Reed Elsevier NV . . . . . . . . . . . . . . . . . . . . . . . . . . . . . . . . 3,063 3,595 3,920
Financial instruments disclosures in respect of the borrowings covered by the above guarantees are given in note 18 tothe Reed Elsevier combined financial statements.
19. Approval of financial statements
The consolidated financial statements were approved by the Board of directors on February 26, 2014.
F-69

REED ELSEVIER NVCONSOLIDATED FINANCIAL STATEMENTS
F-70

REPORT OF INDEPENDENT REGISTERED PUBLIC ACCOUNTING FIRM
To the Board of Directors and shareholders of Reed Elsevier NV:
We have audited the accompanying consolidated statements of financial position of Reed Elsevier NV and itssubsidiaries (the “Company”) as at December 31, 2013, 2012 and 2011, and the related consolidated income statements, andconsolidated statements of comprehensive income, cash flows and changes in equity for each of the years then ended. Theseconsolidated financial statements are the responsibility of the Company’s management. Our responsibility is to express anopinion on the financial statements based on our audits.
We conducted our audits in accordance with the standards of the Public Company Accounting Oversight Board(United States). Those standards require that we plan and perform the audit to obtain reasonable assurance about whether thefinancial statements are free of material misstatement. An audit includes examining, on a test basis, evidence supporting theamounts and disclosures in the financial statements. An audit also includes assessing the accounting principles used andsignificant estimates made by management, as well as evaluating the overall financial statement presentation. We believe thatour audits provide a reasonable basis for our opinion.
In our opinion, such consolidated financial statements present fairly, in all material respects, the financial position ofReed Elsevier NV and its subsidiaries as at December 31, 2013, 2012 and 2011, and the results of their operations and theircash flows for each of the years then ended, in conformity with International Financial Reporting Standards as issued by theInternational Accounting Standards Board.
As discussed in Accounting policies in the consolidated financial statements, the accompanying 2012 and 2011 financialstatements have been retrospectively adjusted for the adoption of International Accounting Standards 19 Employee Benefits(revised).
We have also audited, in accordance with the standards of the Public Company Accounting Oversight Board(United States), the Company’s internal control over financial reporting as at December 31, 2013, based on the criteriaestablished in Internal Control — Integrated Framework (1992) issued by the Committee of Sponsoring Organizations of theTreadway Commission and our report dated February 26, 2014 expressed an unqualified opinion on the Company’s internalcontrol over financial reporting.
/s/ DELOITTE ACCOUNTANTS B.V.Amsterdam, The NetherlandsFebruary 26, 2014
F-71
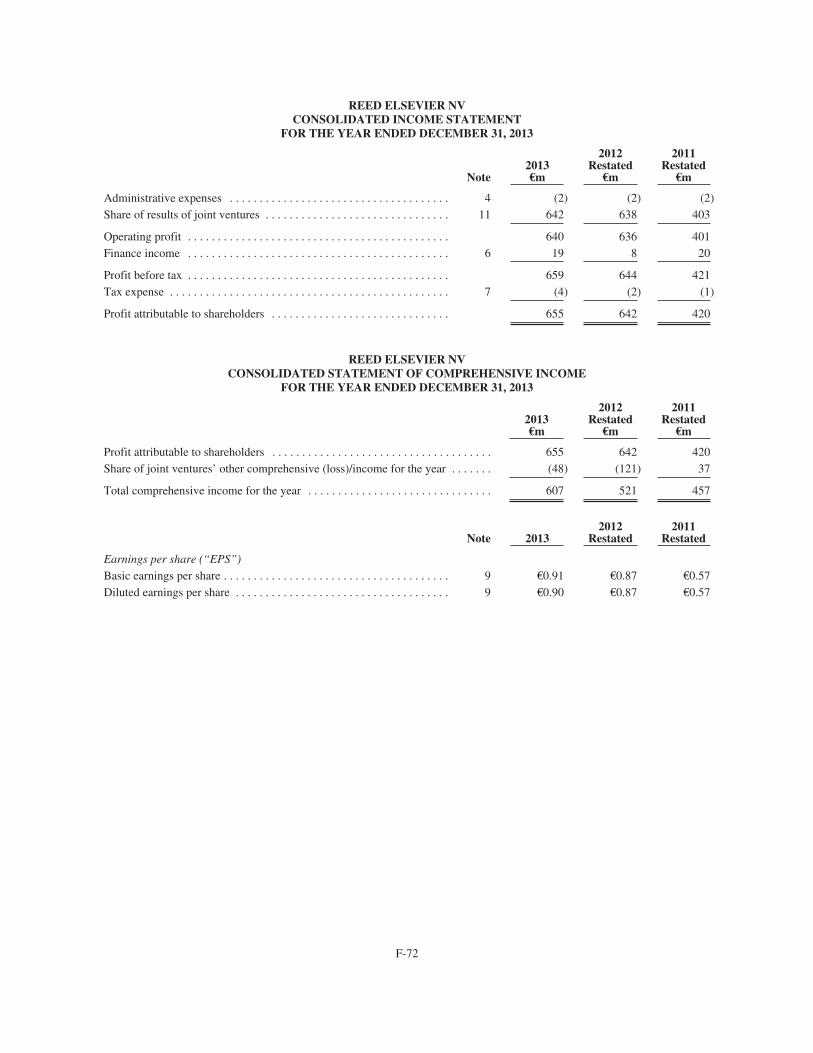
REED ELSEVIER NVCONSOLIDATED INCOME STATEMENT
FOR THE YEAR ENDED DECEMBER 31, 2013
Note2013€m
2012Restated
€m
2011Restated
€m
Administrative expenses . . . . . . . . . . . . . . . . . . . . . . . . . . . . . . . . . . . . . 4 (2) (2) (2)Share of results of joint ventures . . . . . . . . . . . . . . . . . . . . . . . . . . . . . . . 11 642 638 403
Operating profit . . . . . . . . . . . . . . . . . . . . . . . . . . . . . . . . . . . . . . . . . . . . 640 636 401Finance income . . . . . . . . . . . . . . . . . . . . . . . . . . . . . . . . . . . . . . . . . . . . 6 19 8 20
Profit before tax . . . . . . . . . . . . . . . . . . . . . . . . . . . . . . . . . . . . . . . . . . . . 659 644 421Tax expense . . . . . . . . . . . . . . . . . . . . . . . . . . . . . . . . . . . . . . . . . . . . . . . 7 (4) (2) (1)
Profit attributable to shareholders . . . . . . . . . . . . . . . . . . . . . . . . . . . . . . 655 642 420
REED ELSEVIER NVCONSOLIDATED STATEMENT OF COMPREHENSIVE INCOME
FOR THE YEAR ENDED DECEMBER 31, 2013
2013€m
2012Restated
€m
2011Restated
€m
Profit attributable to shareholders . . . . . . . . . . . . . . . . . . . . . . . . . . . . . . . . . . . . . 655 642 420Share of joint ventures’ other comprehensive (loss)/income for the year . . . . . . . (48) (121) 37
Total comprehensive income for the year . . . . . . . . . . . . . . . . . . . . . . . . . . . . . . . 607 521 457
Note 20132012
Restated2011
Restated
Earnings per share (“EPS”)
Basic earnings per share . . . . . . . . . . . . . . . . . . . . . . . . . . . . . . . . . . . . . . 9 €0.91 €0.87 €0.57Diluted earnings per share . . . . . . . . . . . . . . . . . . . . . . . . . . . . . . . . . . . . 9 €0.90 €0.87 €0.57
F-72
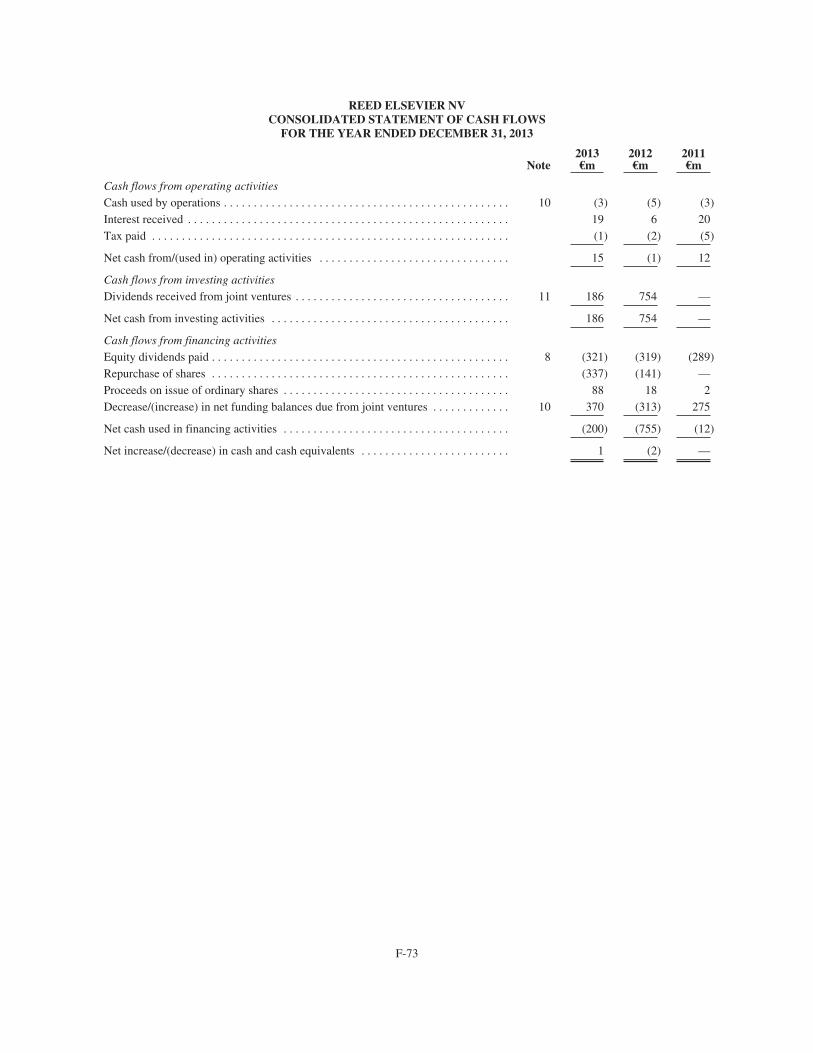
REED ELSEVIER NVCONSOLIDATED STATEMENT OF CASH FLOWS
FOR THE YEAR ENDED DECEMBER 31, 2013
Note2013€m
2012€m
2011€m
Cash flows from operating activities
Cash used by operations . . . . . . . . . . . . . . . . . . . . . . . . . . . . . . . . . . . . . . . . . . . . . . . . 10 (3) (5) (3)Interest received . . . . . . . . . . . . . . . . . . . . . . . . . . . . . . . . . . . . . . . . . . . . . . . . . . . . . . 19 6 20Tax paid . . . . . . . . . . . . . . . . . . . . . . . . . . . . . . . . . . . . . . . . . . . . . . . . . . . . . . . . . . . . (1) (2) (5)
Net cash from/(used in) operating activities . . . . . . . . . . . . . . . . . . . . . . . . . . . . . . . . 15 (1) 12
Cash flows from investing activities
Dividends received from joint ventures . . . . . . . . . . . . . . . . . . . . . . . . . . . . . . . . . . . . 11 186 754 —
Net cash from investing activities . . . . . . . . . . . . . . . . . . . . . . . . . . . . . . . . . . . . . . . . 186 754 —
Cash flows from financing activities
Equity dividends paid . . . . . . . . . . . . . . . . . . . . . . . . . . . . . . . . . . . . . . . . . . . . . . . . . . 8 (321) (319) (289)Repurchase of shares . . . . . . . . . . . . . . . . . . . . . . . . . . . . . . . . . . . . . . . . . . . . . . . . . . (337) (141) —Proceeds on issue of ordinary shares . . . . . . . . . . . . . . . . . . . . . . . . . . . . . . . . . . . . . . 88 18 2Decrease/(increase) in net funding balances due from joint ventures . . . . . . . . . . . . . 10 370 (313) 275
Net cash used in financing activities . . . . . . . . . . . . . . . . . . . . . . . . . . . . . . . . . . . . . . (200) (755) (12)
Net increase/(decrease) in cash and cash equivalents . . . . . . . . . . . . . . . . . . . . . . . . . 1 (2) —
F-73
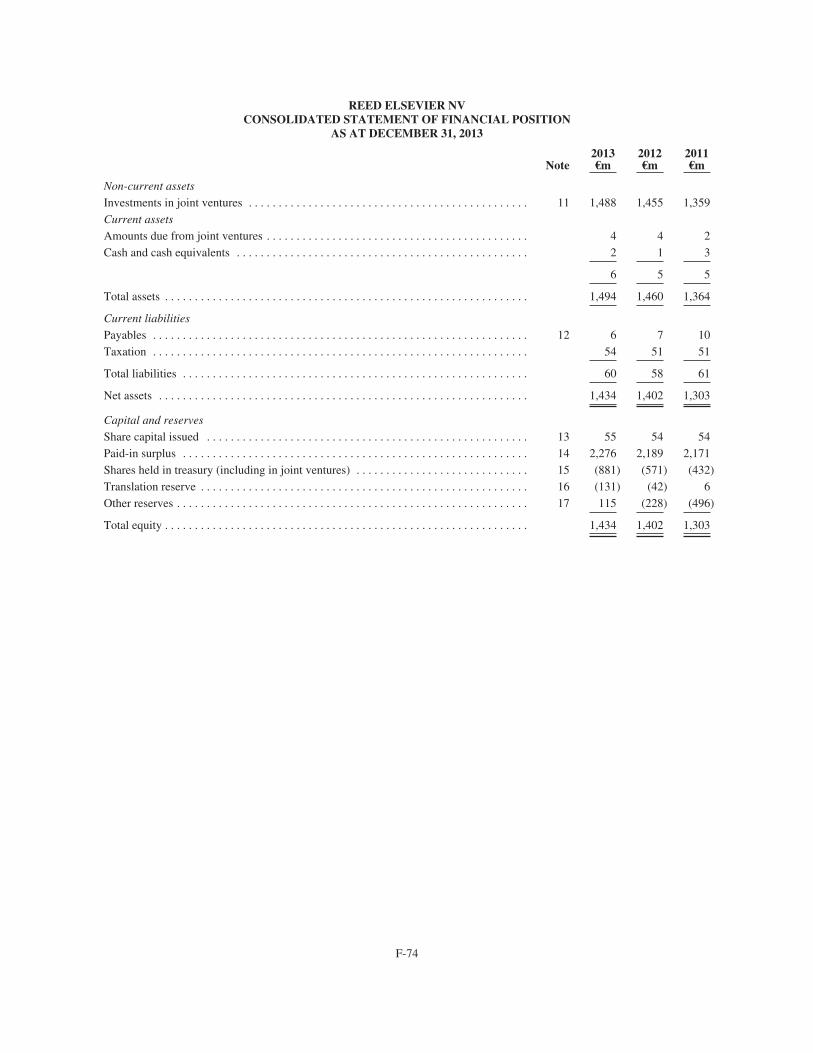
REED ELSEVIER NVCONSOLIDATED STATEMENT OF FINANCIAL POSITION
AS AT DECEMBER 31, 2013
Note2013€m
2012€m
2011€m
Non-current assets
Investments in joint ventures . . . . . . . . . . . . . . . . . . . . . . . . . . . . . . . . . . . . . . . . . . . . . . . 11 1,488 1,455 1,359Current assets
Amounts due from joint ventures . . . . . . . . . . . . . . . . . . . . . . . . . . . . . . . . . . . . . . . . . . . . 4 4 2Cash and cash equivalents . . . . . . . . . . . . . . . . . . . . . . . . . . . . . . . . . . . . . . . . . . . . . . . . . 2 1 3
6 5 5
Total assets . . . . . . . . . . . . . . . . . . . . . . . . . . . . . . . . . . . . . . . . . . . . . . . . . . . . . . . . . . . . . 1,494 1,460 1,364
Current liabilities
Payables . . . . . . . . . . . . . . . . . . . . . . . . . . . . . . . . . . . . . . . . . . . . . . . . . . . . . . . . . . . . . . . 12 6 7 10Taxation . . . . . . . . . . . . . . . . . . . . . . . . . . . . . . . . . . . . . . . . . . . . . . . . . . . . . . . . . . . . . . . 54 51 51
Total liabilities . . . . . . . . . . . . . . . . . . . . . . . . . . . . . . . . . . . . . . . . . . . . . . . . . . . . . . . . . . 60 58 61
Net assets . . . . . . . . . . . . . . . . . . . . . . . . . . . . . . . . . . . . . . . . . . . . . . . . . . . . . . . . . . . . . . 1,434 1,402 1,303
Capital and reserves
Share capital issued . . . . . . . . . . . . . . . . . . . . . . . . . . . . . . . . . . . . . . . . . . . . . . . . . . . . . . 13 55 54 54Paid-in surplus . . . . . . . . . . . . . . . . . . . . . . . . . . . . . . . . . . . . . . . . . . . . . . . . . . . . . . . . . . 14 2,276 2,189 2,171Shares held in treasury (including in joint ventures) . . . . . . . . . . . . . . . . . . . . . . . . . . . . . 15 (881) (571) (432)Translation reserve . . . . . . . . . . . . . . . . . . . . . . . . . . . . . . . . . . . . . . . . . . . . . . . . . . . . . . . 16 (131) (42) 6Other reserves . . . . . . . . . . . . . . . . . . . . . . . . . . . . . . . . . . . . . . . . . . . . . . . . . . . . . . . . . . . 17 115 (228) (496)
Total equity . . . . . . . . . . . . . . . . . . . . . . . . . . . . . . . . . . . . . . . . . . . . . . . . . . . . . . . . . . . . . 1,434 1,402 1,303
F-74
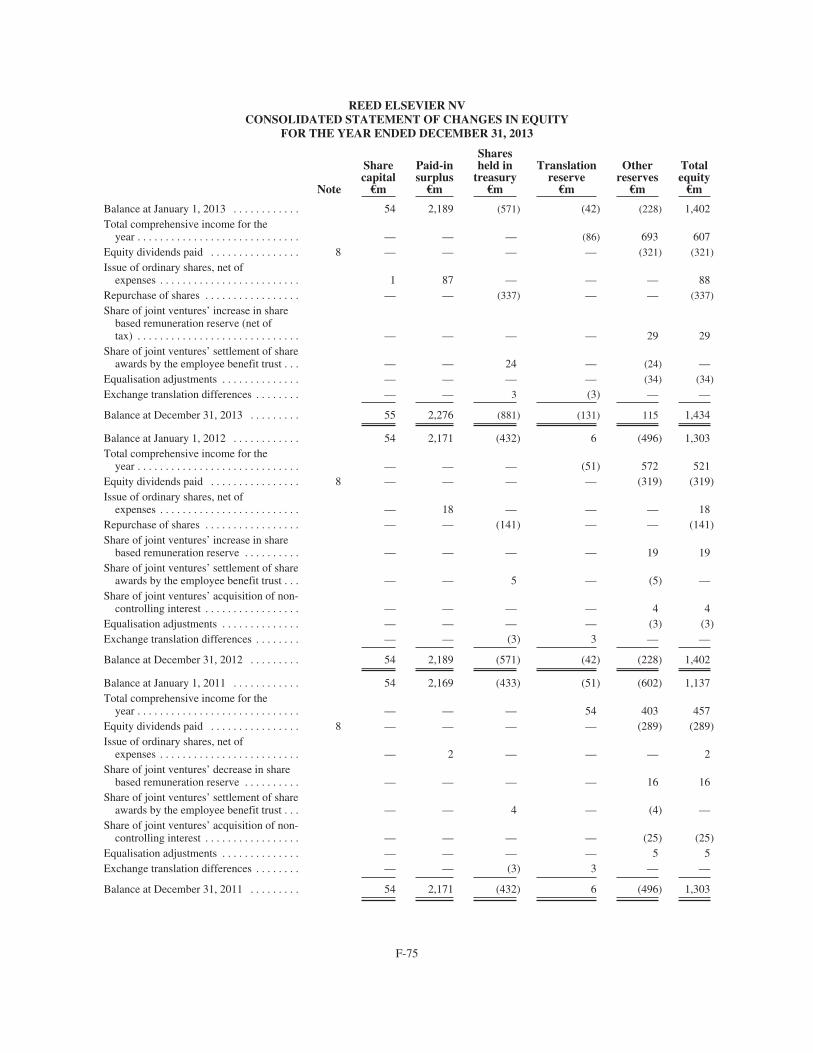
REED ELSEVIER NVCONSOLIDATED STATEMENT OF CHANGES IN EQUITY
FOR THE YEAR ENDED DECEMBER 31, 2013
Note
Sharecapital
€m
Paid-insurplus
€m
Sharesheld in
treasury€m
Translationreserve
€m
Otherreserves
€m
Totalequity
€m
Balance at January 1, 2013 . . . . . . . . . . . . 54 2,189 (571) (42) (228) 1,402Total comprehensive income for the
year . . . . . . . . . . . . . . . . . . . . . . . . . . . . . — — — (86) 693 607Equity dividends paid . . . . . . . . . . . . . . . . 8 — — — — (321) (321)
Issue of ordinary shares, net ofexpenses . . . . . . . . . . . . . . . . . . . . . . . . . 1 87 — — — 88
Repurchase of shares . . . . . . . . . . . . . . . . . — — (337) — — (337)
Share of joint ventures’ increase in sharebased remuneration reserve (net oftax) . . . . . . . . . . . . . . . . . . . . . . . . . . . . . — — — — 29 29
Share of joint ventures’ settlement of shareawards by the employee benefit trust . . . — — 24 — (24) —
Equalisation adjustments . . . . . . . . . . . . . . — — — — (34) (34)
Exchange translation differences . . . . . . . . — — 3 (3) — —
Balance at December 31, 2013 . . . . . . . . . 55 2,276 (881) (131) 115 1,434
Balance at January 1, 2012 . . . . . . . . . . . . 54 2,171 (432) 6 (496) 1,303Total comprehensive income for the
year . . . . . . . . . . . . . . . . . . . . . . . . . . . . . — — — (51) 572 521Equity dividends paid . . . . . . . . . . . . . . . . 8 — — — — (319) (319)Issue of ordinary shares, net of
expenses . . . . . . . . . . . . . . . . . . . . . . . . . — 18 — — — 18Repurchase of shares . . . . . . . . . . . . . . . . . — — (141) — — (141)Share of joint ventures’ increase in share
based remuneration reserve . . . . . . . . . . — — — — 19 19Share of joint ventures’ settlement of share
awards by the employee benefit trust . . . — — 5 — (5) —Share of joint ventures’ acquisition of non-
controlling interest . . . . . . . . . . . . . . . . . — — — — 4 4Equalisation adjustments . . . . . . . . . . . . . . — — — — (3) (3)Exchange translation differences . . . . . . . . — — (3) 3 — —
Balance at December 31, 2012 . . . . . . . . . 54 2,189 (571) (42) (228) 1,402
Balance at January 1, 2011 . . . . . . . . . . . . 54 2,169 (433) (51) (602) 1,137Total comprehensive income for the
year . . . . . . . . . . . . . . . . . . . . . . . . . . . . . — — — 54 403 457Equity dividends paid . . . . . . . . . . . . . . . . 8 — — — — (289) (289)Issue of ordinary shares, net of
expenses . . . . . . . . . . . . . . . . . . . . . . . . . — 2 — — — 2Share of joint ventures’ decrease in share
based remuneration reserve . . . . . . . . . . — — — — 16 16Share of joint ventures’ settlement of share
awards by the employee benefit trust . . . — — 4 — (4) —Share of joint ventures’ acquisition of non-
controlling interest . . . . . . . . . . . . . . . . . — — — — (25) (25)Equalisation adjustments . . . . . . . . . . . . . . — — — — 5 5Exchange translation differences . . . . . . . . — — (3) 3 — —
Balance at December 31, 2011 . . . . . . . . . 54 2,171 (432) 6 (496) 1,303
F-75
REED ELSEVIER NVNOTES TO THE CONSOLIDATED FINANCIAL STATEMENTS
1. Basis of financial statements
On January 1, 1993 Reed Elsevier PLC and Reed Elsevier NV contributed their businesses to two companies, ReedElsevier Group plc and Elsevier Reed Finance BV. Reed Elsevier Group plc, which owns all the publishing and informationbusinesses, is incorporated in England and Elsevier Reed Finance BV, which owns the financing and treasury companies, isincorporated in the Netherlands. Reed Elsevier PLC and Reed Elsevier NV each hold a 50% interest in Reed Elsevier Groupplc. Reed Elsevier PLC holds a 39% interest in Elsevier Reed Finance BV with Reed Elsevier NV holding a 61% interest.Reed Elsevier PLC additionally holds an indirect equity interest in Reed Elsevier NV, reflecting the arrangements entered intobetween Reed Elsevier PLC and Reed Elsevier NV at the time of the merger, which determined the equalisation ratio wherebyone Reed Elsevier NV ordinary share is, in broad terms, intended to confer equivalent economic interests to 1.538 ReedElsevier PLC ordinary shares.
Unless otherwise indicated, all amounts shown in the consolidated financial statements are stated in euros (“€”). Certaindisclosures required to comply with Dutch statutory reporting requirements have been omitted.
The Reed Elsevier combined financial statements on pages F-3 to F-55 form an integral part of the notes to Reed ElsevierNV’s consolidated financial statements.
2. Accounting policies
Basis of Preparation
These consolidated financial statements, which have been prepared under the historical cost convention, report theconsolidated statements of income, comprehensive income, cash flow, financial position and changes in equity of ReedElsevier NV (incorporated and domiciled in the Netherlands), and have been prepared in accordance with accounting policiesthat are in conformity with International Financial Reporting Standards (“IFRS”) as issued by the International AccountingStandards Board (“IASB”) and as adopted by the European Union.
Unless otherwise indicated, all amounts shown in the financial statements are in euros (“€”).
The basis of the merger of the businesses of Reed Elsevier PLC and Reed Elsevier NV is set out on page 12.
As a consequence of the merger of the company’s businesses with those of Reed Elsevier PLC, described on page 12, theshareholders of Reed Elsevier NV and Reed Elsevier PLC can be regarded as having the interests of a single economic group,enjoying substantially equivalent ordinary dividend and capital rights in the earnings and net assets of the Reed ElsevierCombined Businesses. The Combined Businesses are composed of Reed Elsevier Group plc and Elsevier Reed Finance BVand their respective subsidiaries and joint ventures, together with the two parent companies, Reed Elsevier NV and ReedElsevier PLC. The Combined Businesses are jointly controlled by Reed Elsevier NV and Reed Elsevier PLC.
The Reed Elsevier NV consolidated financial statements are presented incorporating Reed Elsevier NV’s investments inthe Reed Elsevier Combined Businesses accounted for using the equity method, as adjusted for the effects of the equalisationarrangement between Reed Elsevier NV and Reed Elsevier PLC. The arrangement lays down the distribution of dividends andnet assets in such a way that Reed Elsevier N.V’s share in the profit and net assets of the Reed Elsevier Combined Businessesequals 50%, with all settlements accruing to shareholders from the equalisation arrangements taken directly to reserves.
Because the dividend paid to shareholders by Reed Elsevier NV is, other than in special circumstances, equivalent to theReed Elsevier PLC dividend plus the UK tax credit received by certain Reed Elsevier PLC shareholders, Reed Elsevier NVnormally distributes a higher proportion of the combined profit attributable than Reed Elsevier PLC. Reed Elsevier PLC’sshare in this difference in dividend distributions is settled with Reed Elsevier NV and is credited directly to consolidatedreserves under equalisation. Reed Elsevier NV can pay a nominal dividend on its R shares held by a subsidiary of ReedElsevier PLC that is lower than the dividend on the ordinary shares. Equally, Reed Elsevier NV has the possibility to receivedividends directly from Dutch affiliates. Reed Elsevier PLC is compensated by direct dividend payments by Reed ElsevierGroup plc. The settlements flowing from these arrangements are also taken directly to consolidated reserves underequalisation.
Combined financial statements
The accounting policies adopted in the preparation of the combined financial statements are set out on pages F-10 toF-17.
F-76
2. Accounting policies – (continued)
Basis of valuation of assets and liabilities
Reed Elsevier NV’s 50% economic interest in the net assets of the combined businesses has been shown on theconsolidated statement of financial position as investments in joint ventures, net of the assets and liabilities reported as part ofReed Elsevier NV. Joint ventures are accounted for using the equity method.
Assets and liabilities are stated at historical cost, less provision, if appropriate, for any impairment in value.
Foreign exchange translation
Transactions in foreign currencies are recorded at the rate of exchange prevailing on the date of the transaction. At eachstatement of financial position date, monetary assets and liabilities that are denominated in foreign currencies are retranslatedat the rate prevailing on the statement of financial position date. Exchange differences arising are recorded in the incomestatement. The gains or losses relating to the retranslation of Reed Elsevier NV’s 50% interest in the net assets of thecombined businesses are classified as equity and transferred to the translation reserve.
When foreign operations are disposed of, the related cumulative translation differences are recognised within the incomestatement in the period.
Taxation
Tax expense comprises current and deferred tax. Current and deferred tax are charged or credited in the incomestatement except to the extent that the tax arises from a transaction or event which is recognised, in the same or a differentperiod, outside profit or loss (either in other comprehensive income, directly in equity, or through a business combination) inwhich case the tax appears in the same statement as the transaction that gave rise to it.
Current tax is the amount of corporate income taxes payable or recoverable based on the profit for the period as adjustedfor items that are not taxable or not deductible, and is calculated using tax rates and laws that were enacted or substantivelyenacted at the date of the statement of financial position. Management periodically evaluates positions taken in tax returnswith respect to situations in which applicable tax regulation is subject to interpretation. Provisions are established whereappropriate on the basis of amounts expected to be paid to the tax authorities.
Deferred tax is recognised on temporary differences arising between the tax bases of assets and liabilities and theircarrying amounts in the statement of financial position. Deferred tax is calculated using tax rates and laws that have beenenacted or substantively enacted at the end of the reporting period, and which are expected to apply when the related deferredtax asset is realised or the deferred tax liability is settled.
Deferred tax liabilities are generally recognised for all taxable temporary differences but not recognised for taxabletemporary differences arising on investments in subsidiaries, associates and joint ventures where the reversal of the temporarydifference can be controlled and it is probable that the difference will not reverse in the foreseeable future. Deferred taxliabilities are not recognised on temporary differences that arise from goodwill which is not deductible for tax purposes.
Deferred tax assets are recognised to the extent it is probable that taxable profits will be available against which thedeductible temporary differences can be utilised, and reviewed at the end of each reporting period and reduced to the extentthat it is no longer probable that sufficient taxable profits will be available to allow all or part of the asset to be recovered.
Deferred tax assets and liabilities are not recognised in respect of temporary differences that arise on initial recognitionof assets and liabilities acquired other than in a business combination. Deferred tax is not discounted.
Critical judgements and key sources of estimation uncertainty
Critical judgments in the preparation of the combined financial statements are set out on pages F-14 to F-15.
Standards and amendments effective for the year
As described on page F-16, the combined businesses adopted IAS19 Employee Benefits (revised) with effect fromJanuary 1, 2013. As required under the revised standard, comparative figures have been restated. For the year endedDecember 31, 2012, Reed Elsevier NV’s share of results of joint ventures is €16 million lower and basic earnings per share is€0.03 lower than previously reported. For the year ended December 31, 2011, Reed Elsevier NV’s share of results of jointventures is €17 million lower and basic earnings per share is €0.02 lower than previously reported.
With effect from January 1, 2013, the combined businesses also adopted various other standards, interpretations andamendments to IFRS, none of which have had a significant impact on Reed Elsevier’s accounting policies or reporting.
F-77
2. Accounting policies – (continued)
Standards, amendments and interpretations not yet effective
Recently issued standards, amendments and interpretations and their impact on future accounting policies and reportinghave been considered on pages F-16 to F-17 of the combined financial statements.
3. Basis of preparation
The consolidated financial statements of Reed Elsevier NV reflect the 50% economic interest that its shareholders haveunder the equalisation arrangements in the Reed Elsevier combined businesses, accounted for on an equity basis.
The Reed Elsevier combined financial statements are presented in pounds sterling, which is the functional currency ofReed Elsevier Group plc, a UK registered company which owns the publishing and information businesses of Reed Elsevier.The following analysis presents how the consolidated financial statements of Reed Elsevier NV, presented in euros, arederived from the Reed Elsevier combined financial statements.
Reed Elsevier NV consolidated profit attributable to shareholders 20132012
Restated2011
Restated
Reed Elsevier combined businesses net profit attributable to parent companyshareholders in pounds sterling . . . . . . . . . . . . . . . . . . . . . . . . . . . . . . . . . . . . . . . . . . £1,110m £1,044m £731m
Reed Elsevier combined businesses net profit attributable to parent companyshareholders translated into euros at year end exchange rates (2013: €1.18 to £1.00;2012: €1.23 to £1.00; 2011: €1.15 to £1.00) . . . . . . . . . . . . . . . . . . . . . . . . . . . . . . . . €1,310m €1,284m €840m
Reed Elsevier NV’s 50% share of combined net profit attributable to shareholders . . . € 655m € 642m €420m
Reed Elsevier NV consolidated total equity 2013 2012 2011
Reed Elsevier combined shareholders’ equity in pounds sterling . . . . . . . . . . . . . . . . . . . £2,390m £2,280m £2,172mReed Elsevier combined shareholders’ equity in pounds sterling translated into euros at
year end exchange rates (2013: €1.20 to £1.00; 2012: €1.23 to £1.00; 2011: €1.15 to£1.00) . . . . . . . . . . . . . . . . . . . . . . . . . . . . . . . . . . . . . . . . . . . . . . . . . . . . . . . . . . . . . . . €2,868m €2,804m €2,606m
Reed Elsevier NV’s 50% share of combined equity . . . . . . . . . . . . . . . . . . . . . . . . . . . . . €1,434m €1,402m €1,303m
4. Administrative expenses
Administrative expenses include the remuneration for present and former Executive and Non-Executive Directors ofReed Elsevier NV in respect of services rendered to Reed Elsevier NV and the combined businesses. Fees for Non-ExecutiveDirectors of Reed Elsevier NV of €0.3 million (2012: €0.3 million; 2011: €0.3 million) are included in remuneration. Insofaras remuneration is related to services rendered to Reed Elsevier Group plc group and Elsevier Reed Finance BV group, it isborne by these groups. Reed Elsevier NV has no employees (2012: nil; 2011: nil).
5. Related party transactions
All transactions with joint ventures, which are related parties of Reed Elsevier NV, are reflected in these financialstatements. Key management personnel are also related parties and comprise the Directors of Reed Elsevier NV. Transactionswith key management personnel are set out in note 32 to the combined financial statements.
6. Finance income
2013€m
2012€m
2011€m
Finance income from joint ventures . . . . . . . . . . . . . . . . . . . . . . . . . . . . . . . . . . . . . . . . . . . . . . . . . . . 19 8 20
F-78
7. Taxation
A reconciliation of the notional tax charge based on the applicable rate of tax to the actual total tax expense is set outbelow.
2013€m
2012Restated
€m
2011Restated
€m
Profit before tax . . . . . . . . . . . . . . . . . . . . . . . . . . . . . . . . . . . . . . . . . . . . . . . . . . . . . . . . . . 659 644 438
Tax at applicable rate 25.0% (2012: 25.0%; 2011: 25.0%) . . . . . . . . . . . . . . . . . . . . . . . . . (165) (161) (110)Tax at applicable rate on share of results of joint ventures . . . . . . . . . . . . . . . . . . . . . . . . . 161 159 105Other . . . . . . . . . . . . . . . . . . . . . . . . . . . . . . . . . . . . . . . . . . . . . . . . . . . . . . . . . . . . . . . . . . . — — 4
Tax expense . . . . . . . . . . . . . . . . . . . . . . . . . . . . . . . . . . . . . . . . . . . . . . . . . . . . . . . . . . . . . (4) (2) (1)
8. Equity dividends
Dividends paid in the year2013
€
2012€
2011€
2013€m
2012€m
2011€m
Ordinary sharesFinal for prior financial year . . . . . . . . . . . . . . . . . . . . . . . . . . . . €0.337 €0.326 €0.303 230 228 212Interim for financial year . . . . . . . . . . . . . . . . . . . . . . . . . . . . . . €0.132 €0.130 €0.110 91 91 77
R shares . . . . . . . . . . . . . . . . . . . . . . . . . . . . . . . . . . . . . . . . . . . . . . — — — — — —
Total . . . . . . . . . . . . . . . . . . . . . . . . . . . . . . . . . . . . . . . . . . . . . . . . €0.469 €0.456 €0.413 321 319 289
The directors of Reed Elsevier NV have proposed a final dividend of €0.374 (2012: €0.337; 2011: €0.326). The cost offunding the proposed final dividend is expected to be €252 million. No liability has been recognised at the statement offinancial position date.
Dividends paid and proposed relating to the financial year2013
€
2012€
2011€
Ordinary sharesInterim (paid) . . . . . . . . . . . . . . . . . . . . . . . . . . . . . . . . . . . . . . . . . . . . . . . . . . . . . . . . . . . . . €0.132 €0.130 €0.110Final (proposed) . . . . . . . . . . . . . . . . . . . . . . . . . . . . . . . . . . . . . . . . . . . . . . . . . . . . . . . . . . . €0.374 €0.337 €0.326R shares . . . . . . . . . . . . . . . . . . . . . . . . . . . . . . . . . . . . . . . . . . . . . . . . . . . . . . . . . . . . . . . . . . — — —
Total . . . . . . . . . . . . . . . . . . . . . . . . . . . . . . . . . . . . . . . . . . . . . . . . . . . . . . . . . . . . . . . . . . . . . . €0.506 €0.467 €0.436
9. Earnings per share (“EPS”)
2013Weightedaverage
number ofshares
(millions)Earnings
€mEPS
€
Basic EPS . . . . . . . . . . . . . . . . . . . . . . . . . . . . . . . . . . . . . . . . . . . . . . . . . . . . . . . . . . . . . 717.6 655 €0.91
Diluted EPS . . . . . . . . . . . . . . . . . . . . . . . . . . . . . . . . . . . . . . . . . . . . . . . . . . . . . . . . . . . 726.9 655 €0.90
2012Weightedaverage
number ofshares
(millions)
EarningsRestated
€m
EPSRestated
€
Basic EPS . . . . . . . . . . . . . . . . . . . . . . . . . . . . . . . . . . . . . . . . . . . . . . . . . . . . . . . . . . . . . 734.0 642 €0.87
Diluted EPS . . . . . . . . . . . . . . . . . . . . . . . . . . . . . . . . . . . . . . . . . . . . . . . . . . . . . . . . . . . 742.1 642 €0.87
F-79
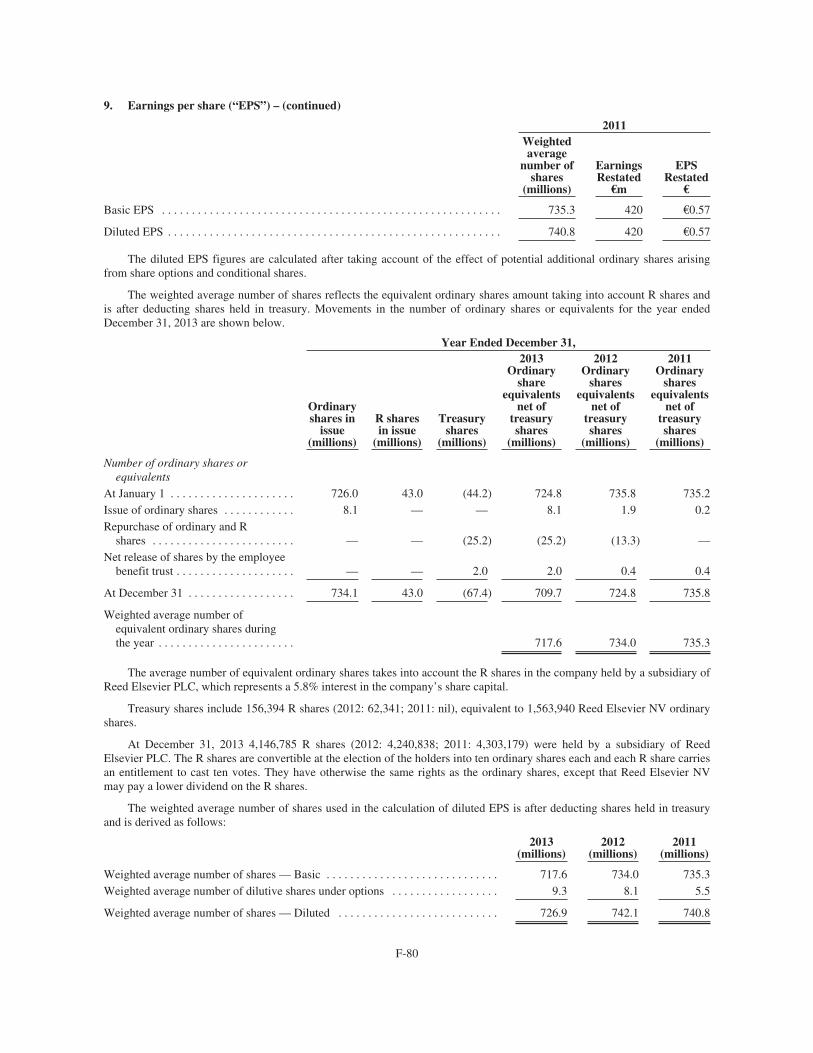
9. Earnings per share (“EPS”) – (continued)
2011Weightedaverage
number ofshares
(millions)
EarningsRestated
€m
EPSRestated
€
Basic EPS . . . . . . . . . . . . . . . . . . . . . . . . . . . . . . . . . . . . . . . . . . . . . . . . . . . . . . . . . 735.3 420 €0.57
Diluted EPS . . . . . . . . . . . . . . . . . . . . . . . . . . . . . . . . . . . . . . . . . . . . . . . . . . . . . . . . 740.8 420 €0.57
The diluted EPS figures are calculated after taking account of the effect of potential additional ordinary shares arisingfrom share options and conditional shares.
The weighted average number of shares reflects the equivalent ordinary shares amount taking into account R shares andis after deducting shares held in treasury. Movements in the number of ordinary shares or equivalents for the year endedDecember 31, 2013 are shown below.
Year Ended December 31,
Ordinaryshares in
issue(millions)
R sharesin issue
(millions)
Treasuryshares
(millions)
2013Ordinary
shareequivalents
net oftreasuryshares
(millions)
2012Ordinary
sharesequivalents
net oftreasuryshares
(millions)
2011Ordinary
sharesequivalents
net oftreasuryshares
(millions)
Number of ordinary shares orequivalents
At January 1 . . . . . . . . . . . . . . . . . . . . . 726.0 43.0 (44.2) 724.8 735.8 735.2Issue of ordinary shares . . . . . . . . . . . . 8.1 — — 8.1 1.9 0.2Repurchase of ordinary and R
shares . . . . . . . . . . . . . . . . . . . . . . . . — — (25.2) (25.2) (13.3) —Net release of shares by the employee
benefit trust . . . . . . . . . . . . . . . . . . . . — — 2.0 2.0 0.4 0.4
At December 31 . . . . . . . . . . . . . . . . . . 734.1 43.0 (67.4) 709.7 724.8 735.8
Weighted average number ofequivalent ordinary shares duringthe year . . . . . . . . . . . . . . . . . . . . . . . 717.6 734.0 735.3
The average number of equivalent ordinary shares takes into account the R shares in the company held by a subsidiary ofReed Elsevier PLC, which represents a 5.8% interest in the company’s share capital.
Treasury shares include 156,394 R shares (2012: 62,341; 2011: nil), equivalent to 1,563,940 Reed Elsevier NV ordinaryshares.
At December 31, 2013 4,146,785 R shares (2012: 4,240,838; 2011: 4,303,179) were held by a subsidiary of ReedElsevier PLC. The R shares are convertible at the election of the holders into ten ordinary shares each and each R share carriesan entitlement to cast ten votes. They have otherwise the same rights as the ordinary shares, except that Reed Elsevier NVmay pay a lower dividend on the R shares.
The weighted average number of shares used in the calculation of diluted EPS is after deducting shares held in treasuryand is derived as follows:
2013(millions)
2012(millions)
2011(millions)
Weighted average number of shares — Basic . . . . . . . . . . . . . . . . . . . . . . . . . . . . . 717.6 734.0 735.3Weighted average number of dilutive shares under options . . . . . . . . . . . . . . . . . . 9.3 8.1 5.5
Weighted average number of shares — Diluted . . . . . . . . . . . . . . . . . . . . . . . . . . . 726.9 742.1 740.8
F-80
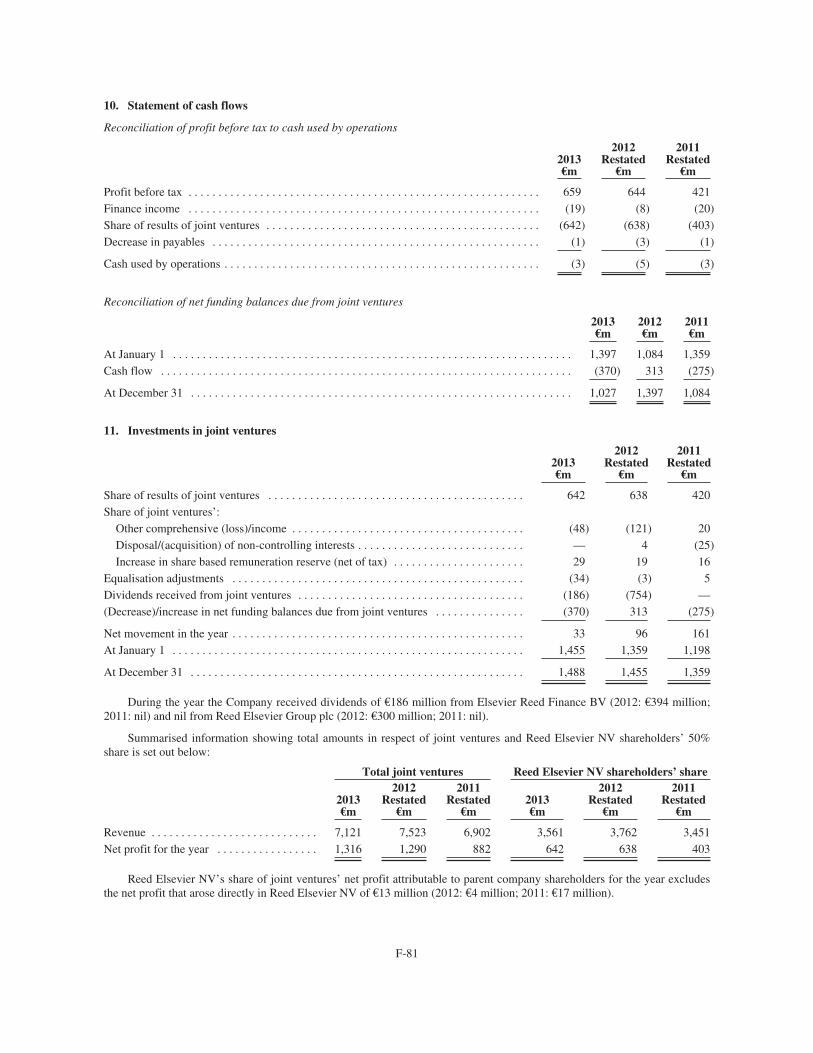
10. Statement of cash flows
Reconciliation of profit before tax to cash used by operations
2013€m
2012Restated
€m
2011Restated
€m
Profit before tax . . . . . . . . . . . . . . . . . . . . . . . . . . . . . . . . . . . . . . . . . . . . . . . . . . . . . . . . . . . 659 644 421Finance income . . . . . . . . . . . . . . . . . . . . . . . . . . . . . . . . . . . . . . . . . . . . . . . . . . . . . . . . . . . (19) (8) (20)Share of results of joint ventures . . . . . . . . . . . . . . . . . . . . . . . . . . . . . . . . . . . . . . . . . . . . . . (642) (638) (403)Decrease in payables . . . . . . . . . . . . . . . . . . . . . . . . . . . . . . . . . . . . . . . . . . . . . . . . . . . . . . . (1) (3) (1)
Cash used by operations . . . . . . . . . . . . . . . . . . . . . . . . . . . . . . . . . . . . . . . . . . . . . . . . . . . . . (3) (5) (3)
Reconciliation of net funding balances due from joint ventures
2013€m
2012€m
2011€m
At January 1 . . . . . . . . . . . . . . . . . . . . . . . . . . . . . . . . . . . . . . . . . . . . . . . . . . . . . . . . . . . . . . . . . . . 1,397 1,084 1,359Cash flow . . . . . . . . . . . . . . . . . . . . . . . . . . . . . . . . . . . . . . . . . . . . . . . . . . . . . . . . . . . . . . . . . . . . . (370) 313 (275)
At December 31 . . . . . . . . . . . . . . . . . . . . . . . . . . . . . . . . . . . . . . . . . . . . . . . . . . . . . . . . . . . . . . . . 1,027 1,397 1,084
11. Investments in joint ventures
2013€m
2012Restated
€m
2011Restated
€m
Share of results of joint ventures . . . . . . . . . . . . . . . . . . . . . . . . . . . . . . . . . . . . . . . . . . . 642 638 420Share of joint ventures’:
Other comprehensive (loss)/income . . . . . . . . . . . . . . . . . . . . . . . . . . . . . . . . . . . . . . . (48) (121) 20Disposal/(acquisition) of non-controlling interests . . . . . . . . . . . . . . . . . . . . . . . . . . . . — 4 (25)Increase in share based remuneration reserve (net of tax) . . . . . . . . . . . . . . . . . . . . . . 29 19 16
Equalisation adjustments . . . . . . . . . . . . . . . . . . . . . . . . . . . . . . . . . . . . . . . . . . . . . . . . . (34) (3) 5Dividends received from joint ventures . . . . . . . . . . . . . . . . . . . . . . . . . . . . . . . . . . . . . . (186) (754) —(Decrease)/increase in net funding balances due from joint ventures . . . . . . . . . . . . . . . (370) 313 (275)
Net movement in the year . . . . . . . . . . . . . . . . . . . . . . . . . . . . . . . . . . . . . . . . . . . . . . . . . 33 96 161At January 1 . . . . . . . . . . . . . . . . . . . . . . . . . . . . . . . . . . . . . . . . . . . . . . . . . . . . . . . . . . . 1,455 1,359 1,198
At December 31 . . . . . . . . . . . . . . . . . . . . . . . . . . . . . . . . . . . . . . . . . . . . . . . . . . . . . . . . 1,488 1,455 1,359
During the year the Company received dividends of €186 million from Elsevier Reed Finance BV (2012: €394 million;2011: nil) and nil from Reed Elsevier Group plc (2012: €300 million; 2011: nil).
Summarised information showing total amounts in respect of joint ventures and Reed Elsevier NV shareholders’ 50%share is set out below:
Total joint ventures Reed Elsevier NV shareholders’ share
2013€m
2012Restated
€m
2011Restated
€m2013€m
2012Restated
€m
2011Restated
€m
Revenue . . . . . . . . . . . . . . . . . . . . . . . . . . . . 7,121 7,523 6,902 3,561 3,762 3,451Net profit for the year . . . . . . . . . . . . . . . . . 1,316 1,290 882 642 638 403
Reed Elsevier NV’s share of joint ventures’ net profit attributable to parent company shareholders for the year excludesthe net profit that arose directly in Reed Elsevier NV of €13 million (2012: €4 million; 2011: €17 million).
F-81
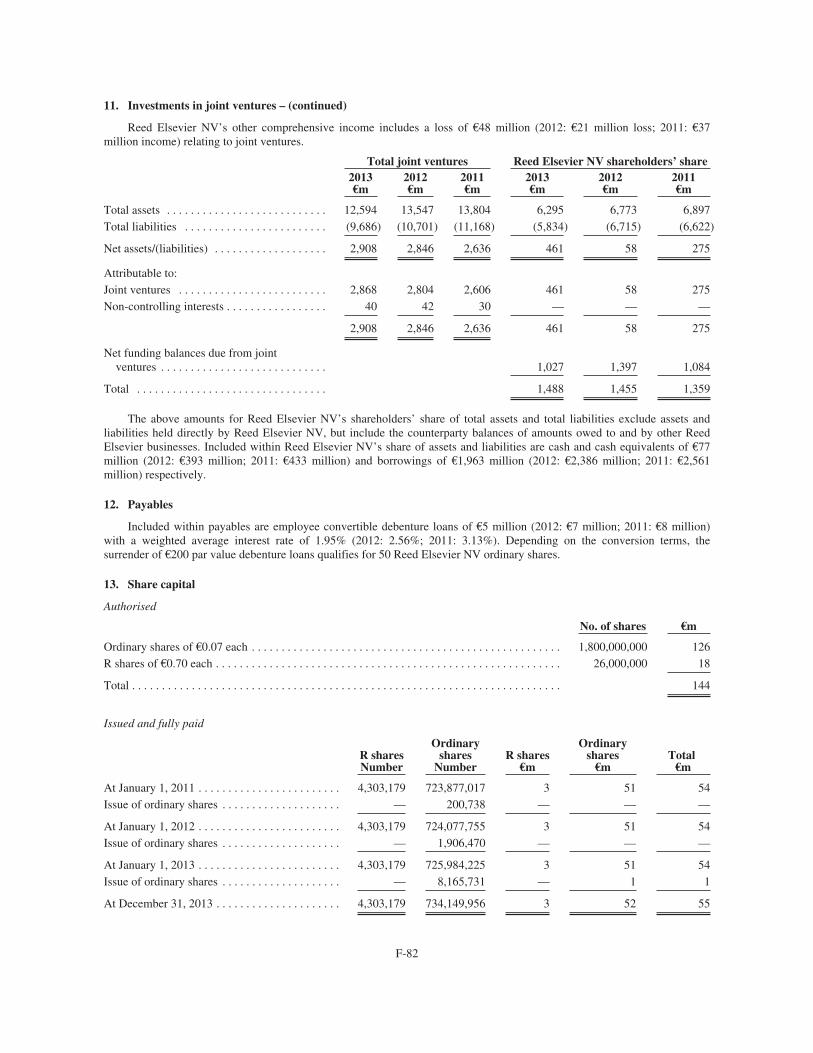
11. Investments in joint ventures – (continued)
Reed Elsevier NV’s other comprehensive income includes a loss of €48 million (2012: €21 million loss; 2011: €37million income) relating to joint ventures.
Total joint ventures Reed Elsevier NV shareholders’ share2013€m
2012€m
2011€m
2013€m
2012€m
2011€m
Total assets . . . . . . . . . . . . . . . . . . . . . . . . . . . 12,594 13,547 13,804 6,295 6,773 6,897Total liabilities . . . . . . . . . . . . . . . . . . . . . . . . (9,686) (10,701) (11,168) (5,834) (6,715) (6,622)
Net assets/(liabilities) . . . . . . . . . . . . . . . . . . . 2,908 2,846 2,636 461 58 275
Attributable to:Joint ventures . . . . . . . . . . . . . . . . . . . . . . . . . 2,868 2,804 2,606 461 58 275Non-controlling interests . . . . . . . . . . . . . . . . . 40 42 30 — — —
2,908 2,846 2,636 461 58 275
Net funding balances due from jointventures . . . . . . . . . . . . . . . . . . . . . . . . . . . . 1,027 1,397 1,084
Total . . . . . . . . . . . . . . . . . . . . . . . . . . . . . . . . 1,488 1,455 1,359
The above amounts for Reed Elsevier NV’s shareholders’ share of total assets and total liabilities exclude assets andliabilities held directly by Reed Elsevier NV, but include the counterparty balances of amounts owed to and by other ReedElsevier businesses. Included within Reed Elsevier NV’s share of assets and liabilities are cash and cash equivalents of €77million (2012: €393 million; 2011: €433 million) and borrowings of €1,963 million (2012: €2,386 million; 2011: €2,561million) respectively.
12. Payables
Included within payables are employee convertible debenture loans of €5 million (2012: €7 million; 2011: €8 million)with a weighted average interest rate of 1.95% (2012: 2.56%; 2011: 3.13%). Depending on the conversion terms, thesurrender of €200 par value debenture loans qualifies for 50 Reed Elsevier NV ordinary shares.
13. Share capital
Authorised
No. of shares €m
Ordinary shares of €0.07 each . . . . . . . . . . . . . . . . . . . . . . . . . . . . . . . . . . . . . . . . . . . . . . . . . . . . 1,800,000,000 126R shares of €0.70 each . . . . . . . . . . . . . . . . . . . . . . . . . . . . . . . . . . . . . . . . . . . . . . . . . . . . . . . . . . 26,000,000 18
Total . . . . . . . . . . . . . . . . . . . . . . . . . . . . . . . . . . . . . . . . . . . . . . . . . . . . . . . . . . . . . . . . . . . . . . . . 144
Issued and fully paid
R sharesNumber
Ordinaryshares
NumberR shares
€m
Ordinaryshares
€mTotal
€m
At January 1, 2011 . . . . . . . . . . . . . . . . . . . . . . . . 4,303,179 723,877,017 3 51 54Issue of ordinary shares . . . . . . . . . . . . . . . . . . . . — 200,738 — — —
At January 1, 2012 . . . . . . . . . . . . . . . . . . . . . . . . 4,303,179 724,077,755 3 51 54Issue of ordinary shares . . . . . . . . . . . . . . . . . . . . — 1,906,470 — — —
At January 1, 2013 . . . . . . . . . . . . . . . . . . . . . . . . 4,303,179 725,984,225 3 51 54Issue of ordinary shares . . . . . . . . . . . . . . . . . . . . — 8,165,731 — 1 1
At December 31, 2013 . . . . . . . . . . . . . . . . . . . . . 4,303,179 734,149,956 3 52 55
F-82
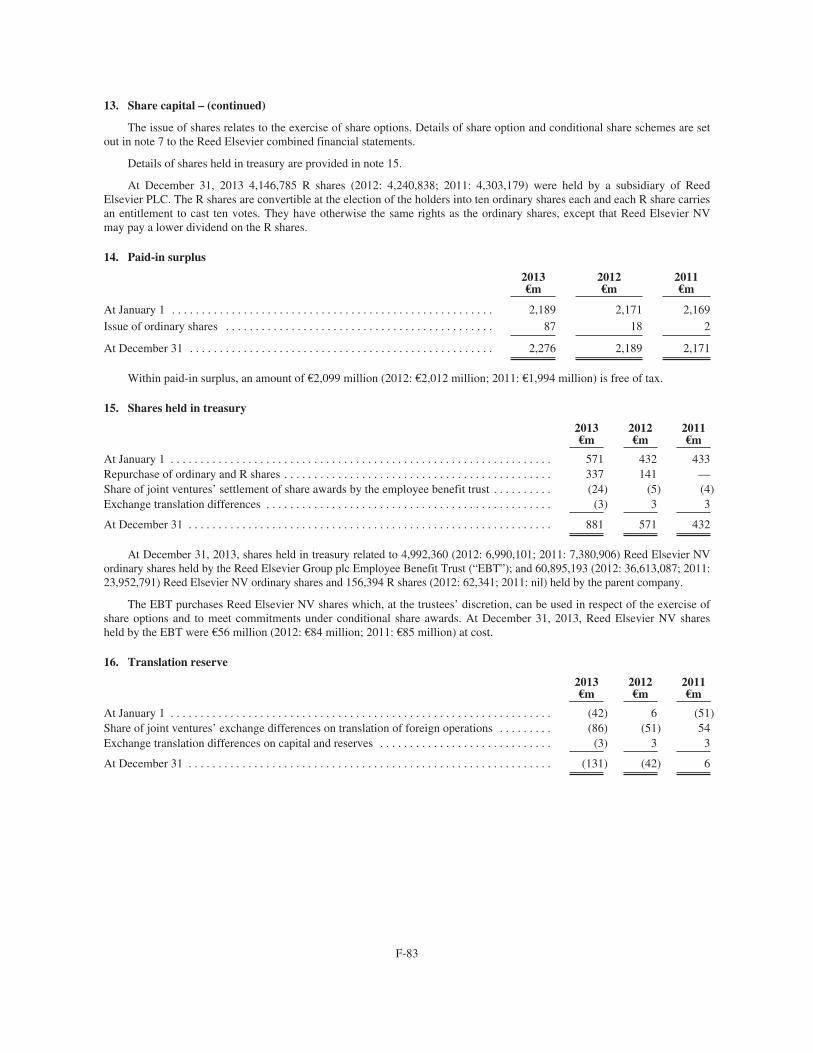
13. Share capital – (continued)
The issue of shares relates to the exercise of share options. Details of share option and conditional share schemes are setout in note 7 to the Reed Elsevier combined financial statements.
Details of shares held in treasury are provided in note 15.
At December 31, 2013 4,146,785 R shares (2012: 4,240,838; 2011: 4,303,179) were held by a subsidiary of ReedElsevier PLC. The R shares are convertible at the election of the holders into ten ordinary shares each and each R share carriesan entitlement to cast ten votes. They have otherwise the same rights as the ordinary shares, except that Reed Elsevier NVmay pay a lower dividend on the R shares.
14. Paid-in surplus
2013€m
2012€m
2011€m
At January 1 . . . . . . . . . . . . . . . . . . . . . . . . . . . . . . . . . . . . . . . . . . . . . . . . . . . . . . 2,189 2,171 2,169Issue of ordinary shares . . . . . . . . . . . . . . . . . . . . . . . . . . . . . . . . . . . . . . . . . . . . . 87 18 2
At December 31 . . . . . . . . . . . . . . . . . . . . . . . . . . . . . . . . . . . . . . . . . . . . . . . . . . . 2,276 2,189 2,171
Within paid-in surplus, an amount of €2,099 million (2012: €2,012 million; 2011: €1,994 million) is free of tax.
15. Shares held in treasury
2013€m
2012€m
2011€m
At January 1 . . . . . . . . . . . . . . . . . . . . . . . . . . . . . . . . . . . . . . . . . . . . . . . . . . . . . . . . . . . . . . . . 571 432 433Repurchase of ordinary and R shares . . . . . . . . . . . . . . . . . . . . . . . . . . . . . . . . . . . . . . . . . . . . . 337 141 —Share of joint ventures’ settlement of share awards by the employee benefit trust . . . . . . . . . . (24) (5) (4)Exchange translation differences . . . . . . . . . . . . . . . . . . . . . . . . . . . . . . . . . . . . . . . . . . . . . . . . (3) 3 3
At December 31 . . . . . . . . . . . . . . . . . . . . . . . . . . . . . . . . . . . . . . . . . . . . . . . . . . . . . . . . . . . . . 881 571 432
At December 31, 2013, shares held in treasury related to 4,992,360 (2012: 6,990,101; 2011: 7,380,906) Reed Elsevier NVordinary shares held by the Reed Elsevier Group plc Employee Benefit Trust (“EBT”); and 60,895,193 (2012: 36,613,087; 2011:23,952,791) Reed Elsevier NV ordinary shares and 156,394 R shares (2012: 62,341; 2011: nil) held by the parent company.
The EBT purchases Reed Elsevier NV shares which, at the trustees’ discretion, can be used in respect of the exercise ofshare options and to meet commitments under conditional share awards. At December 31, 2013, Reed Elsevier NV sharesheld by the EBT were €56 million (2012: €84 million; 2011: €85 million) at cost.
16. Translation reserve
2013€m
2012€m
2011€m
At January 1 . . . . . . . . . . . . . . . . . . . . . . . . . . . . . . . . . . . . . . . . . . . . . . . . . . . . . . . . . . . . . . . . (42) 6 (51)Share of joint ventures’ exchange differences on translation of foreign operations . . . . . . . . . (86) (51) 54Exchange translation differences on capital and reserves . . . . . . . . . . . . . . . . . . . . . . . . . . . . . (3) 3 3
At December 31 . . . . . . . . . . . . . . . . . . . . . . . . . . . . . . . . . . . . . . . . . . . . . . . . . . . . . . . . . . . . . (131) (42) 6
F-83
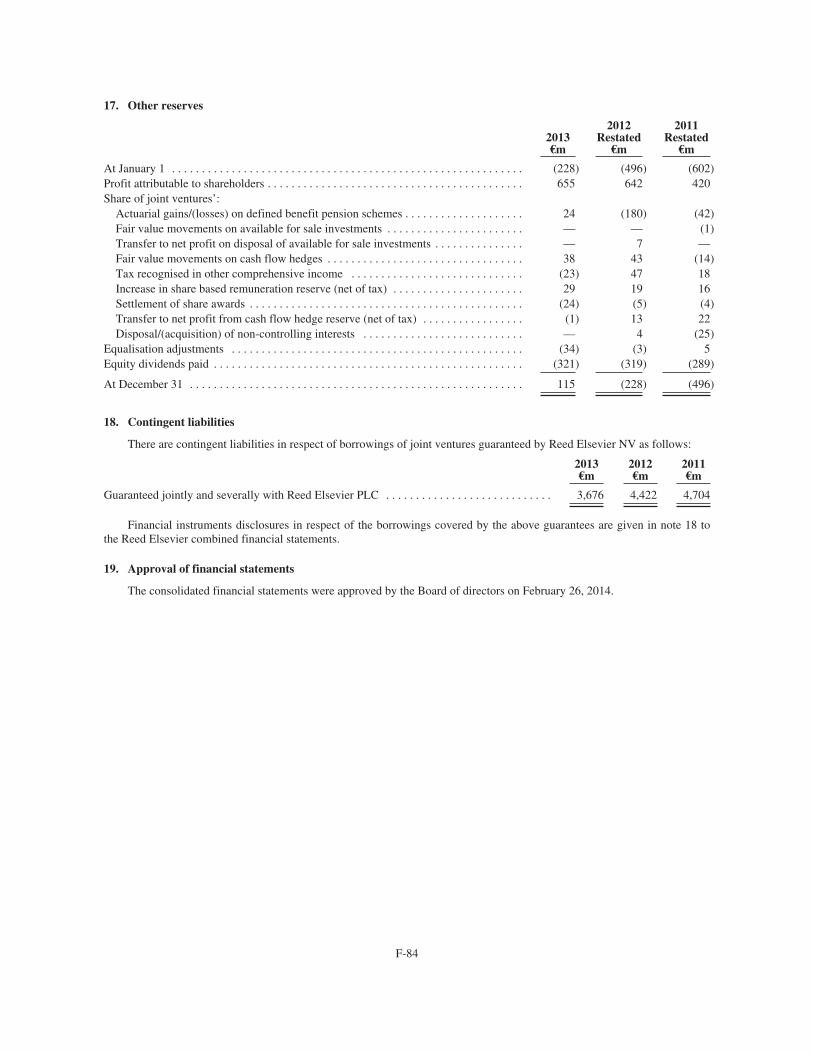
17. Other reserves
2013€m
2012Restated
€m
2011Restated
€m
At January 1 . . . . . . . . . . . . . . . . . . . . . . . . . . . . . . . . . . . . . . . . . . . . . . . . . . . . . . . . . . . (228) (496) (602)Profit attributable to shareholders . . . . . . . . . . . . . . . . . . . . . . . . . . . . . . . . . . . . . . . . . . . 655 642 420Share of joint ventures’:
Actuarial gains/(losses) on defined benefit pension schemes . . . . . . . . . . . . . . . . . . . . 24 (180) (42)Fair value movements on available for sale investments . . . . . . . . . . . . . . . . . . . . . . . — — (1)Transfer to net profit on disposal of available for sale investments . . . . . . . . . . . . . . . — 7 —Fair value movements on cash flow hedges . . . . . . . . . . . . . . . . . . . . . . . . . . . . . . . . . 38 43 (14)Tax recognised in other comprehensive income . . . . . . . . . . . . . . . . . . . . . . . . . . . . . (23) 47 18Increase in share based remuneration reserve (net of tax) . . . . . . . . . . . . . . . . . . . . . . 29 19 16Settlement of share awards . . . . . . . . . . . . . . . . . . . . . . . . . . . . . . . . . . . . . . . . . . . . . . (24) (5) (4)Transfer to net profit from cash flow hedge reserve (net of tax) . . . . . . . . . . . . . . . . . (1) 13 22Disposal/(acquisition) of non-controlling interests . . . . . . . . . . . . . . . . . . . . . . . . . . . — 4 (25)
Equalisation adjustments . . . . . . . . . . . . . . . . . . . . . . . . . . . . . . . . . . . . . . . . . . . . . . . . . (34) (3) 5Equity dividends paid . . . . . . . . . . . . . . . . . . . . . . . . . . . . . . . . . . . . . . . . . . . . . . . . . . . . (321) (319) (289)
At December 31 . . . . . . . . . . . . . . . . . . . . . . . . . . . . . . . . . . . . . . . . . . . . . . . . . . . . . . . . 115 (228) (496)
18. Contingent liabilities
There are contingent liabilities in respect of borrowings of joint ventures guaranteed by Reed Elsevier NV as follows:
2013€m
2012€m
2011€m
Guaranteed jointly and severally with Reed Elsevier PLC . . . . . . . . . . . . . . . . . . . . . . . . . . . . 3,676 4,422 4,704
Financial instruments disclosures in respect of the borrowings covered by the above guarantees are given in note 18 tothe Reed Elsevier combined financial statements.
19. Approval of financial statements
The consolidated financial statements were approved by the Board of directors on February 26, 2014.
F-84

THIS PAGE INTENTIONALLY BLANK
F-85
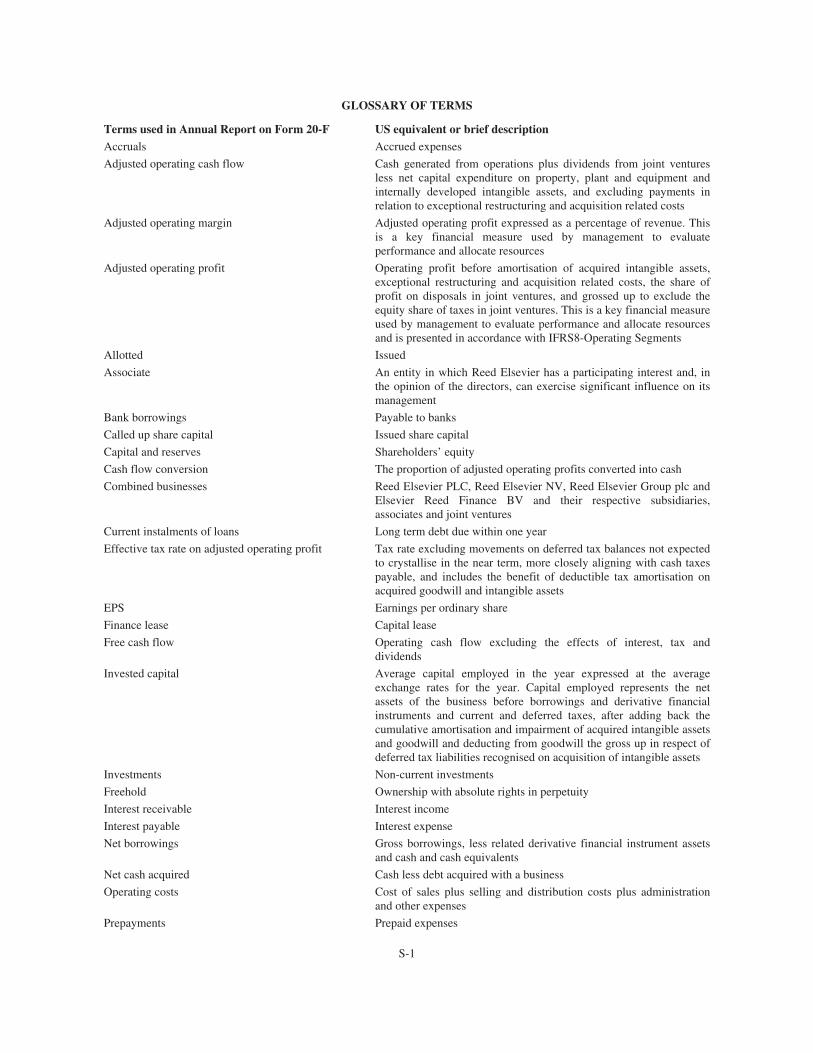
GLOSSARY OF TERMS
Terms used in Annual Report on Form 20-F US equivalent or brief descriptionAccruals Accrued expenses
Adjusted operating cash flow Cash generated from operations plus dividends from joint venturesless net capital expenditure on property, plant and equipment andinternally developed intangible assets, and excluding payments inrelation to exceptional restructuring and acquisition related costs
Adjusted operating margin Adjusted operating profit expressed as a percentage of revenue. Thisis a key financial measure used by management to evaluateperformance and allocate resources
Adjusted operating profit Operating profit before amortisation of acquired intangible assets,exceptional restructuring and acquisition related costs, the share ofprofit on disposals in joint ventures, and grossed up to exclude theequity share of taxes in joint ventures. This is a key financial measureused by management to evaluate performance and allocate resourcesand is presented in accordance with IFRS8-Operating Segments
Allotted Issued
Associate An entity in which Reed Elsevier has a participating interest and, inthe opinion of the directors, can exercise significant influence on itsmanagement
Bank borrowings Payable to banks
Called up share capital Issued share capital
Capital and reserves Shareholders’ equity
Cash flow conversion The proportion of adjusted operating profits converted into cash
Combined businesses Reed Elsevier PLC, Reed Elsevier NV, Reed Elsevier Group plc andElsevier Reed Finance BV and their respective subsidiaries,associates and joint ventures
Current instalments of loans Long term debt due within one year
Effective tax rate on adjusted operating profit Tax rate excluding movements on deferred tax balances not expectedto crystallise in the near term, more closely aligning with cash taxespayable, and includes the benefit of deductible tax amortisation onacquired goodwill and intangible assets
EPS Earnings per ordinary share
Finance lease Capital lease
Free cash flow Operating cash flow excluding the effects of interest, tax anddividends
Invested capital Average capital employed in the year expressed at the averageexchange rates for the year. Capital employed represents the netassets of the business before borrowings and derivative financialinstruments and current and deferred taxes, after adding back thecumulative amortisation and impairment of acquired intangible assetsand goodwill and deducting from goodwill the gross up in respect ofdeferred tax liabilities recognised on acquisition of intangible assets
Investments Non-current investments
Freehold Ownership with absolute rights in perpetuity
Interest receivable Interest income
Interest payable Interest expense
Net borrowings Gross borrowings, less related derivative financial instrument assetsand cash and cash equivalents
Net cash acquired Cash less debt acquired with a business
Operating costs Cost of sales plus selling and distribution costs plus administrationand other expenses
Prepayments Prepaid expenses
S-1
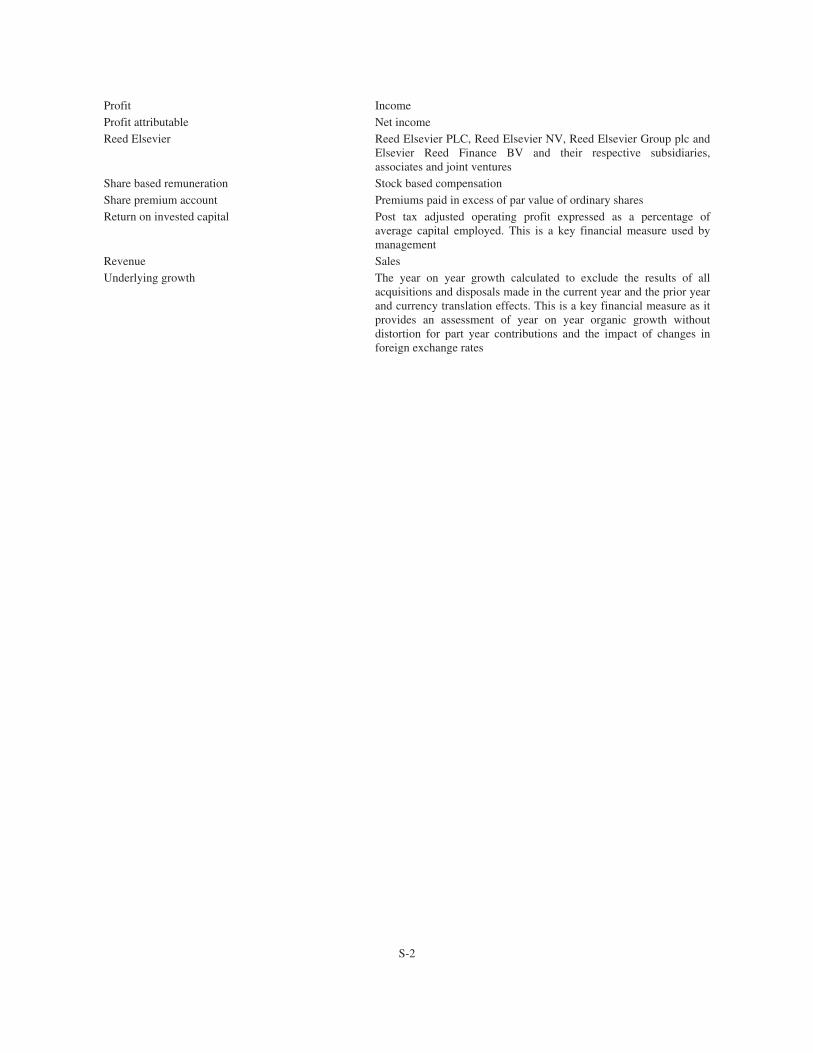
Profit IncomeProfit attributable Net incomeReed Elsevier Reed Elsevier PLC, Reed Elsevier NV, Reed Elsevier Group plc and
Elsevier Reed Finance BV and their respective subsidiaries,associates and joint ventures
Share based remuneration Stock based compensationShare premium account Premiums paid in excess of par value of ordinary sharesReturn on invested capital Post tax adjusted operating profit expressed as a percentage of
average capital employed. This is a key financial measure used bymanagement
Revenue SalesUnderlying growth The year on year growth calculated to exclude the results of all
acquisitions and disposals made in the current year and the prior yearand currency translation effects. This is a key financial measure as itprovides an assessment of year on year organic growth withoutdistortion for part year contributions and the impact of changes inforeign exchange rates
S-2
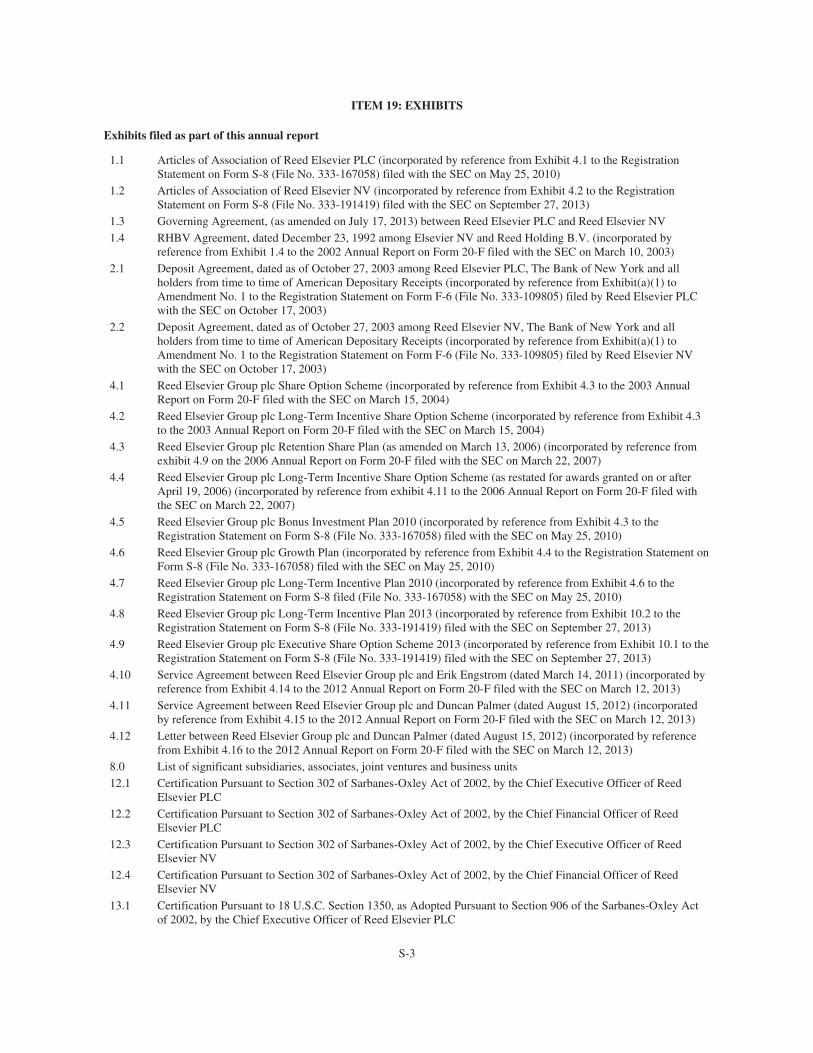
ITEM 19: EXHIBITS
Exhibits filed as part of this annual report
1.1 Articles of Association of Reed Elsevier PLC (incorporated by reference from Exhibit 4.1 to the RegistrationStatement on Form S-8 (File No. 333-167058) filed with the SEC on May 25, 2010)
1.2 Articles of Association of Reed Elsevier NV (incorporated by reference from Exhibit 4.2 to the RegistrationStatement on Form S-8 (File No. 333-191419) filed with the SEC on September 27, 2013)
1.3 Governing Agreement, (as amended on July 17, 2013) between Reed Elsevier PLC and Reed Elsevier NV1.4 RHBV Agreement, dated December 23, 1992 among Elsevier NV and Reed Holding B.V. (incorporated by
reference from Exhibit 1.4 to the 2002 Annual Report on Form 20-F filed with the SEC on March 10, 2003)2.1 Deposit Agreement, dated as of October 27, 2003 among Reed Elsevier PLC, The Bank of New York and all
holders from time to time of American Depositary Receipts (incorporated by reference from Exhibit(a)(1) toAmendment No. 1 to the Registration Statement on Form F-6 (File No. 333-109805) filed by Reed Elsevier PLCwith the SEC on October 17, 2003)
2.2 Deposit Agreement, dated as of October 27, 2003 among Reed Elsevier NV, The Bank of New York and allholders from time to time of American Depositary Receipts (incorporated by reference from Exhibit(a)(1) toAmendment No. 1 to the Registration Statement on Form F-6 (File No. 333-109805) filed by Reed Elsevier NVwith the SEC on October 17, 2003)
4.1 Reed Elsevier Group plc Share Option Scheme (incorporated by reference from Exhibit 4.3 to the 2003 AnnualReport on Form 20-F filed with the SEC on March 15, 2004)
4.2 Reed Elsevier Group plc Long-Term Incentive Share Option Scheme (incorporated by reference from Exhibit 4.3to the 2003 Annual Report on Form 20-F filed with the SEC on March 15, 2004)
4.3 Reed Elsevier Group plc Retention Share Plan (as amended on March 13, 2006) (incorporated by reference fromexhibit 4.9 on the 2006 Annual Report on Form 20-F filed with the SEC on March 22, 2007)
4.4 Reed Elsevier Group plc Long-Term Incentive Share Option Scheme (as restated for awards granted on or afterApril 19, 2006) (incorporated by reference from exhibit 4.11 to the 2006 Annual Report on Form 20-F filed withthe SEC on March 22, 2007)
4.5 Reed Elsevier Group plc Bonus Investment Plan 2010 (incorporated by reference from Exhibit 4.3 to theRegistration Statement on Form S-8 (File No. 333-167058) filed with the SEC on May 25, 2010)
4.6 Reed Elsevier Group plc Growth Plan (incorporated by reference from Exhibit 4.4 to the Registration Statement onForm S-8 (File No. 333-167058) filed with the SEC on May 25, 2010)
4.7 Reed Elsevier Group plc Long-Term Incentive Plan 2010 (incorporated by reference from Exhibit 4.6 to theRegistration Statement on Form S-8 filed (File No. 333-167058) with the SEC on May 25, 2010)
4.8 Reed Elsevier Group plc Long-Term Incentive Plan 2013 (incorporated by reference from Exhibit 10.2 to theRegistration Statement on Form S-8 (File No. 333-191419) filed with the SEC on September 27, 2013)
4.9 Reed Elsevier Group plc Executive Share Option Scheme 2013 (incorporated by reference from Exhibit 10.1 to theRegistration Statement on Form S-8 (File No. 333-191419) filed with the SEC on September 27, 2013)
4.10 Service Agreement between Reed Elsevier Group plc and Erik Engstrom (dated March 14, 2011) (incorporated byreference from Exhibit 4.14 to the 2012 Annual Report on Form 20-F filed with the SEC on March 12, 2013)
4.11 Service Agreement between Reed Elsevier Group plc and Duncan Palmer (dated August 15, 2012) (incorporatedby reference from Exhibit 4.15 to the 2012 Annual Report on Form 20-F filed with the SEC on March 12, 2013)
4.12 Letter between Reed Elsevier Group plc and Duncan Palmer (dated August 15, 2012) (incorporated by referencefrom Exhibit 4.16 to the 2012 Annual Report on Form 20-F filed with the SEC on March 12, 2013)
8.0 List of significant subsidiaries, associates, joint ventures and business units12.1 Certification Pursuant to Section 302 of Sarbanes-Oxley Act of 2002, by the Chief Executive Officer of Reed
Elsevier PLC12.2 Certification Pursuant to Section 302 of Sarbanes-Oxley Act of 2002, by the Chief Financial Officer of Reed
Elsevier PLC12.3 Certification Pursuant to Section 302 of Sarbanes-Oxley Act of 2002, by the Chief Executive Officer of Reed
Elsevier NV12.4 Certification Pursuant to Section 302 of Sarbanes-Oxley Act of 2002, by the Chief Financial Officer of Reed
Elsevier NV13.1 Certification Pursuant to 18 U.S.C. Section 1350, as Adopted Pursuant to Section 906 of the Sarbanes-Oxley Act
of 2002, by the Chief Executive Officer of Reed Elsevier PLC
S-3
13.2 Certification Pursuant to 18 U.S.C. Section 1350, as Adopted Pursuant to Section 906 of the Sarbanes-Oxley Actof 2002, by the Chief Financial Officer of Reed Elsevier PLC
13.3 Certification Pursuant to 18 U.S.C. Section 1350, as Adopted Pursuant to Section 906 of the Sarbanes-Oxley Actof 2002, by the Chief Executive Officer of Reed Elsevier NV
13.4 Certification Pursuant to 18 U.S.C. Section 1350, as Adopted Pursuant to Section 906 of the Sarbanes-Oxley Actof 2002, by the Chief Financial Officer of Reed Elsevier NV
15.1 Independent Registered Public Accounting Firm’s Consent — Reed Elsevier Combined Financial Statements15.2 Independent Registered Public Accounting Firm’s Consent — Reed Elsevier PLC Consolidated Financial
Statements15.3 Independent Registered Public Accounting Firm’s Consent — Reed Elsevier NV Consolidated Financial
Statements
The total amount of long term debt securities of Reed Elsevier authorised under any single instrument does not exceed10% of the combined total assets of Reed Elsevier. The Registrants hereby agree to furnish to the Commission, upon itsrequest, a copy of any instrument defining the rights of holders of long term debt of Reed Elsevier or any of the combinedbusinesses for which consolidated or unconsolidated financial statements are required to be filed.
The agreements and other documents filed as exhibits to this report are not intended to provide factual information orother disclosure other than the terms of the agreements or other documents themselves, and you should not rely on them forthat purpose. In particular, any representation and warranties made by any of the registrants in there agreements or otherdocuments were made solely within the specific context of the relevant agreement or document and may not describe theactual state of affairs at the date they were made or at any other time.
S-4

SIGNATURES
Each of the Registrants hereby certifies that it meets all of the requirements for filing on Form 20-F and that it has dulycaused and authorised the undersigned to sign this annual report on its behalf.
REED ELSEVIER PLCRegistrant
REED ELSEVIER NVRegistrant
By: /s/ E ENGSTROM
E EngstromChief Executive Officer
By: /s/ E ENGSTROM
E EngstromChief Executive Officer
By: /s/ D J PALMER
D J PalmerChief Financial Officer
By: /s/ D J PALMER
D J PalmerChief Financial Officer
Dated: March 11, 2014 Dated: March 11, 2014
S-5

Printed by RR Donnelley, 659533

www.reedelsevier.com