annual report - mitchell services
TRANSCRIPT
ANNUAL REPORT 2021
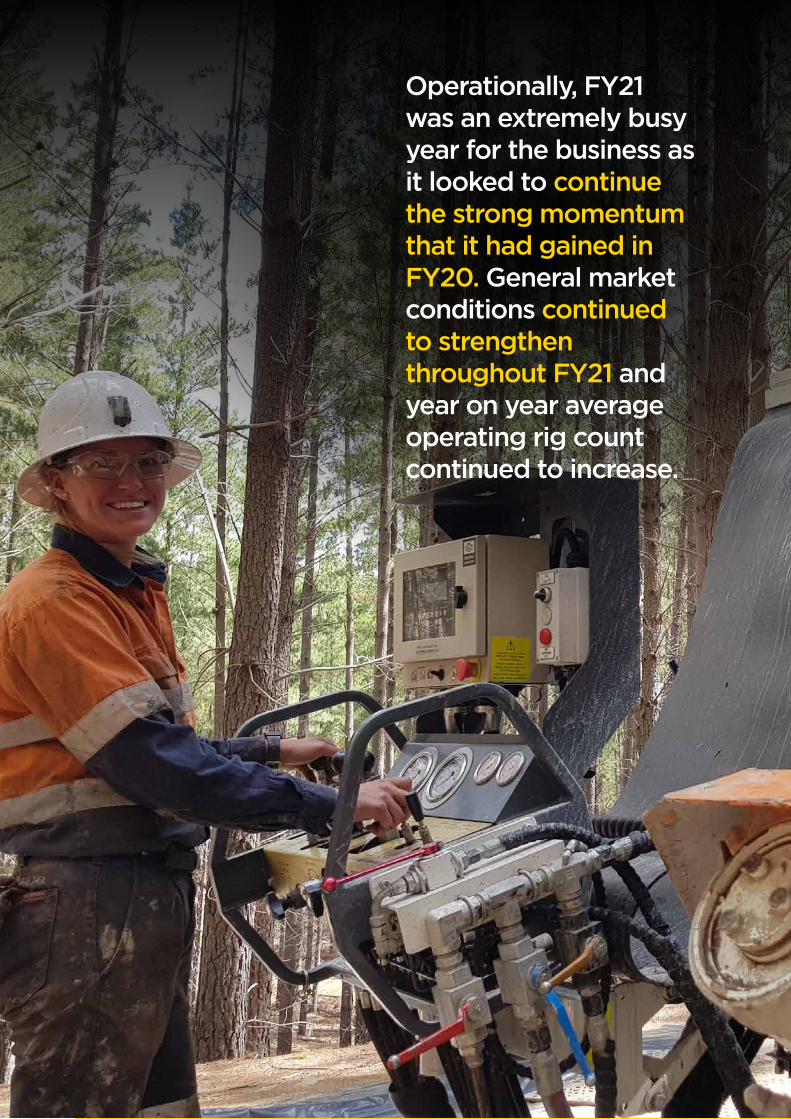
Operationally, FY21 was an extremely busy year for the business as it looked to continue the strong momentum that it had gained in FY20. General market conditions continued to strengthen throughout FY21 and year on year average operating rig count continued to increase.
1Mitchell Services LtdAnnual Report 2021
Chairman’s Report 2
Chief Executive Officer’s Report 4
Directors’ Report 8
Corporate Governance Statement 24
Auditor’s Independence Declaration 30
Consolidated Statement of Profit or Loss and Other Comprehensive Income 31
Consolidated Statement of Financial Position 32
Consolidated Statement of Changes in Equity 33
Consolidated Statement of Cash Flows 34
Notes to the Consolidated Financial Statements 35
Directors’ Declaration 77
Independent Auditor’s Report 78
Additional Australian Stock Exchange Information 83
Corporate Directory IBC
MITCHELL SERVICES LTD ACN 149 206 333 ANNUAL REPORT 30 JUNE 2021
2 Mitchell Services Ltd Annual Report 2021
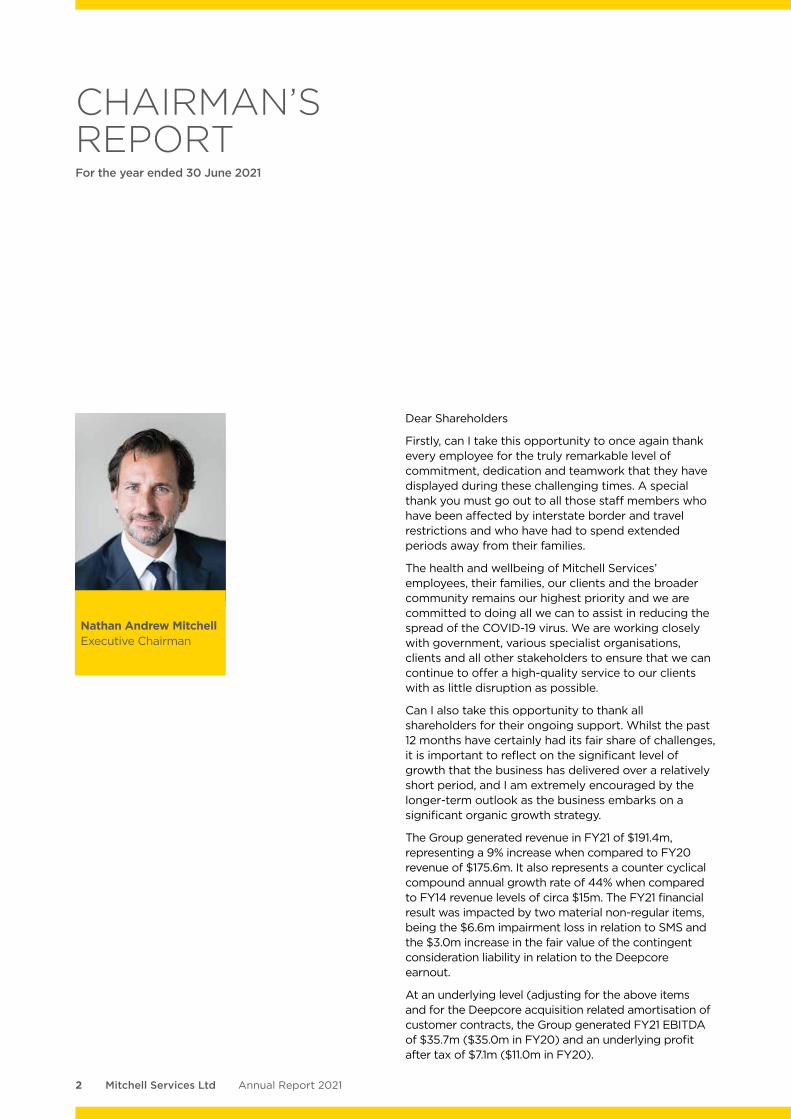
Dear Shareholders
Firstly, can I take this opportunity to once again thank every employee for the truly remarkable level of commitment, dedication and teamwork that they have displayed during these challenging times. A special thank you must go out to all those staff members who have been affected by interstate border and travel restrictions and who have had to spend extended periods away from their families.
The health and wellbeing of Mitchell Services’ employees, their families, our clients and the broader community remains our highest priority and we are committed to doing all we can to assist in reducing the spread of the COVID-19 virus. We are working closely with government, various specialist organisations, clients and all other stakeholders to ensure that we can continue to offer a high-quality service to our clients with as little disruption as possible.
Can I also take this opportunity to thank all shareholders for their ongoing support. Whilst the past 12 months have certainly had its fair share of challenges, it is important to reflect on the significant level of growth that the business has delivered over a relatively short period, and I am extremely encouraged by the longer-term outlook as the business embarks on a significant organic growth strategy.
The Group generated revenue in FY21 of $191.4m, representing a 9% increase when compared to FY20 revenue of $175.6m. It also represents a counter cyclical compound annual growth rate of 44% when compared to FY14 revenue levels of circa $15m. The FY21 financial result was impacted by two material non-regular items, being the $6.6m impairment loss in relation to SMS and the $3.0m increase in the fair value of the contingent consideration liability in relation to the Deepcore earnout.
At an underlying level (adjusting for the above items and for the Deepcore acquisition related amortisation of customer contracts, the Group generated FY21 EBITDA of $35.7m ($35.0m in FY20) and an underlying profit after tax of $7.1m ($11.0m in FY20).
CHAIRMAN’S REPORT For the year ended 30 June 2021
Nathan Andrew Mitchell Executive Chairman
3Mitchell Services LtdAnnual Report 2021
In arriving at these underlying figures, we have not made any adjustment in relation to COVID-19 but estimate that the financial impact of COVID-19 (at an EBITDA level) was approximately $1.0m to $2.0m.
Despite the impact of the impairment loss on earnings, the Group generated strong operating cash flows of $30.1m ($31.2m in FY20) which were primarily used to fund capital expenditure and reduce debt. This continued strong operating cash flow generation has seen a substantial reduction in gross debt (down 25% from $39.5m at 30 June 2020 to $29.6m at 30 June 2021).
As we look past FY21 and ahead towards FY22, the business is extremely well placed to take advantage of buoyant market conditions and execute on its organic growth strategy.
On the demand side, the outlook for drilling services demand is the strongest we have seen since 2008. Global government stimulus and subsequent investment into infrastructure projects is expected to continue to drive demand for resources and (in a world where reserves and grades of certain commodities are decreasing) Australia is seen as a high quality, low risk jurisdiction in which to operate. We are also seeing increased numbers of new projects and exploration programs off the back of increased activity levels within capital markets.
On the supply side, the barriers to entry remain high. There has been a significant level of industry consolidation and access to funding for new mining services providers is challenging given the limited lender appetite within the sector. A tightening labour market and increased lead times in relation to the supply of rigs and related equipment means that access to key drilling services resources is limited.
Recognising these supply side limitations, the business placed a significant forward order for up to 12, latest generation, drill rigs towards the end of 2020 and I strongly believe that decision will yield dividends in the longer term. It was previously our intention to sell nominated rigs to partially fund this capital investment
program but given the strength of the current market we have opted to retain these rigs as the value to business through continued use will far outweigh the potential sale proceeds.
The proposed timing also allows the business to take advantage of the (albeit temporary) cash flow benefit associated with the ATO’s instant asset write off program which is in place until June 2022.
The revenue opportunity pipeline is at record levels and the number of rigs required to service the total revenue opportunity pipeline far exceeds the available rigs in the fleet even after the acquisition of 12 new rigs.
As a result of the organic growth strategy and associated capital investment program the Group expects to generate FY22 revenue and EBITDA of $200m-$220m and $40m-$44m respectively. Based on the anticipated size of the fleet post implementation of the growth strategy, the business would have the capacity to potentially generate $50m-$60m EBITDA and to deliver material EPS growth.
In closing, I would once again like to thank all staff, customers, suppliers and shareholders for your continued support. Thank you, in particular, to all shareholders who have recently participated or intend to participate in the capital raising that is currently underway. The fact that the capital raising could be structured on the basis of an offer to existing shareholders only talks to the strength of shareholder support and I thank you for that support.
On behalf of the Board, thank you.
Nathan Andrew Mitchell Executive Chairman
The outlook for drilling services demand is the strongest we have seen since 2008. Based on the anticipated size of the fleet post implementation of the growth strategy, the business would have the capacity to potentially generate $50m-$60m EBITDA and to deliver material EPS growth.
4 Mitchell Services Ltd Annual Report 2021
Dear Shareholders
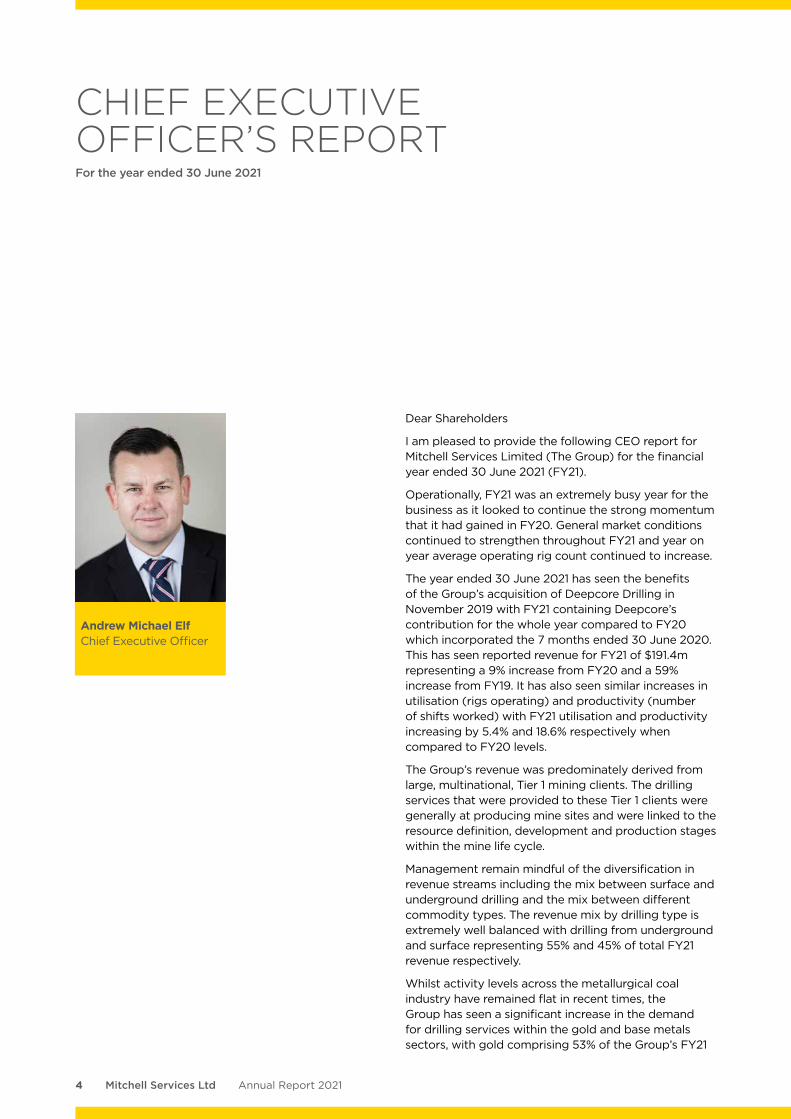
I am pleased to provide the following CEO report for Mitchell Services Limited (The Group) for the financial year ended 30 June 2021 (FY21).
Operationally, FY21 was an extremely busy year for the business as it looked to continue the strong momentum that it had gained in FY20. General market conditions continued to strengthen throughout FY21 and year on year average operating rig count continued to increase.
The year ended 30 June 2021 has seen the benefits of the Group’s acquisition of Deepcore Drilling in November 2019 with FY21 containing Deepcore’s contribution for the whole year compared to FY20 which incorporated the 7 months ended 30 June 2020. This has seen reported revenue for FY21 of $191.4m representing a 9% increase from FY20 and a 59% increase from FY19. It has also seen similar increases in utilisation (rigs operating) and productivity (number of shifts worked) with FY21 utilisation and productivity increasing by 5.4% and 18.6% respectively when compared to FY20 levels.
The Group’s revenue was predominately derived from large, multinational, Tier 1 mining clients. The drilling services that were provided to these Tier 1 clients were generally at producing mine sites and were linked to the resource definition, development and production stages within the mine life cycle.
Management remain mindful of the diversification in revenue streams including the mix between surface and underground drilling and the mix between different commodity types. The revenue mix by drilling type is extremely well balanced with drilling from underground and surface representing 55% and 45% of total FY21 revenue respectively.
Whilst activity levels across the metallurgical coal industry have remained flat in recent times, the Group has seen a significant increase in the demand for drilling services within the gold and base metals sectors, with gold comprising 53% of the Group’s FY21
Andrew Michael Elf Chief Executive Officer
CHIEF EXECUTIVE OFFICER’S REPORT For the year ended 30 June 2021
5Mitchell Services LtdAnnual Report 2021
compared to 34% in FY20. Conversely, FY21 revenue from metallurgical coal comprised approximately 31% compared to 45% in FY20.
At an adjusted level (excluding significant non-regular items) the Group recorded FY21 earnings before interest, tax, depreciation and amortisation (EBITDA) of $35.7m (up $0.7m vs FY20 EBITDA of $35.0m). In arriving at these underlying figures, we have not made any adjustment in relation to COVID-19 but estimate that the financial impact of COVID-19 (at an EBITDA level) was approximately $1.0m to $2.0m.
As announced recently, a settlement was reached with SMS Innovative Mining Pty Ltd (SMS) in relation to the $9.6 million owing by SMS to the Group pursuant to the drill and blast contract that was terminated earlier in the year following SMS’s failure to pay invoices when falling due. To avoid the inherent uncertainties surrounding potential protracted, costly, management time consuming litigation, all claims were resolved on the basis that SMS pay $5 million over three tranches by 30 December 2021. The first tranche of $3 million was paid on 19 July 2021. Whilst this matter has been disappointing, the settlement will allow the Group to focus on the operations of the business as we embark on a significant FY22 organic growth strategy.
Our short-term operational focus is on the deployment and preparation of rigs in anticipation of strong levels of both contracted and potential FY22 work. This, against a backdrop of extremely strong industry fundamentals which include strong, and in many cases, increasing commodity prices.
Finishing each day without harm is a core Mitchell Services value and we are committed to the safety of our most important asset – our people.
We are particularly focused on training to attract, retain and further develop our drillers and support crews to ensure that service levels and the quality of the Mitchell brand remain high.
As part of this commitment, the Group has developed and implemented a program to verify the existence and effectiveness of controls that are designed to mitigate critical health and safety risks within the organisation. To date, this critical control verification program has led to a material improvement in all key safety statistics across the organisation.
I could not be prouder of the performance of our employees who have continued to deliver a safe and productive service to our clients since the start of the COVID-19 pandemic. I would like to thank all our employees, especially those who have had to spend time in quarantine or a longer time away from home than would ordinarily be the case.
We are thankful that our services have been deemed essential throughout COVID-19 so far but managing COVID-19 has come at a cost to the company. The overall estimated financial impact of COVID-19 in FY21 is estimated to be in the range of $1 million to $2 million.
As we reflect on what an extremely busy and challenging year FY21 has been, I note that the outlook for the drilling services market is the strongest it has been since our re-entry into the Australian market in late 2013 and the Company is well positioned to capitalise on these positive fundamentals based on the size of our current tender pipeline and planned organic growth strategy which we expect will translate into strong future earnings.
In closing, I would like to again thank all employees for their hard work and dedication and all shareholders for their ongoing support.
Thank you
Andrew Michael Elf Chief Executive Officer
I could not be prouder of the performance of our employees who have continued to deliver a safe and productive service to our clients.
Anticipate strong levels of demand in FY22 against a backdrop of extremely strong industry fundamentals.
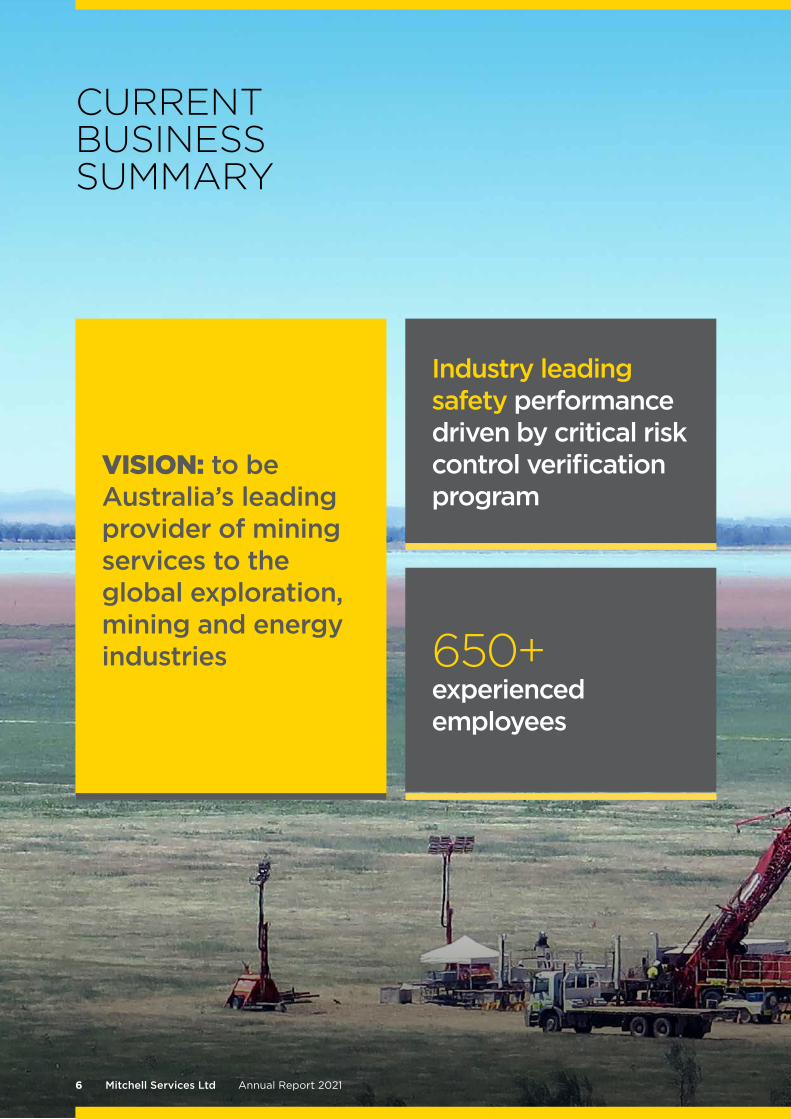
650+ experienced employees
6
CURRENT BUSINESS SUMMARY
Mitchell Services Ltd Annual Report 2021
Industry leading safety performance driven by critical risk control verification program
VISION: to be Australia’s leading provider of mining services to the global exploration, mining and energy industries
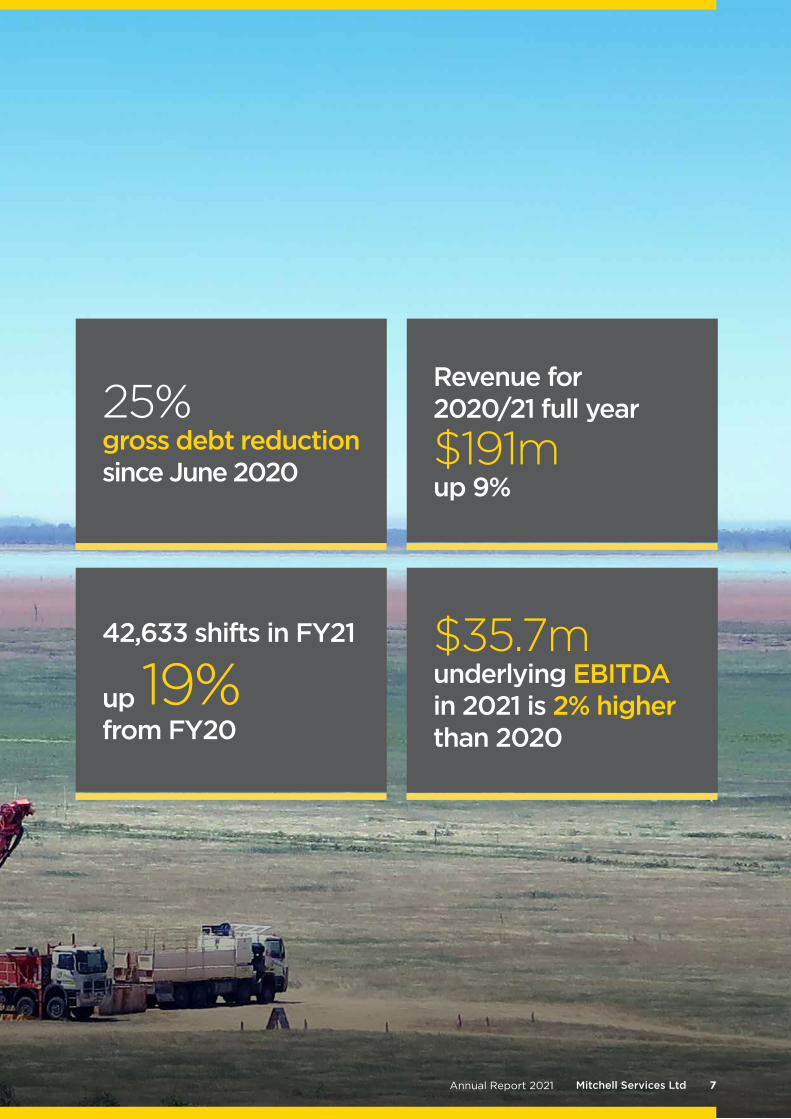
42,633 shifts in FY21
up 19% from FY20
25% gross debt reduction since June 2020
$35.7m underlying EBITDA in 2021 is 2% higher than 2020
Revenue for 2020/21 full year
$191m up 9%
7Mitchell Services LtdAnnual Report 2021
8 Mitchell Services Ltd Annual Report 2021
DIRECTORS’ REPORTFor the year ended 30 June 2021
The Directors of Mitchell Services Limited submit herewith the financial report of Mitchell Services Limited (Company) and its subsidiaries (Group) for the year ended 30 June 2021 (FY21). In order to comply with the provisions of the Corporations Act 2001, the Directors’ report as follows.
DIRECTORS The names and particulars of the Directors of the Company during or since the end of the financial year are:
Nathan Andrew Mitchell (Executive Chairman)Mr Mitchell was appointed to the Board on 29 November 2013 and appointed as Executive Chairman on 19 March 2014.
Mr Mitchell has been involved in the drilling industry for virtually his entire life. With a career spanning over 30 years, he has a proven track record as an industry leader in technical development and business growth. As CEO of Mitchell Drilling Contractors prior to its sale in 2008, Mr Mitchell led that business through a period of rapid local growth and directed an international expansion into India, China, Indonesia, the United States and southern Africa. Other current directorships include Mitchell Drilling International Pty Ltd. Mr Mitchell also previously served on the board of Tlou Energy Limited (ASX: TOU) from June 2009 to February 2016.
At the date of this report, Mr Mitchell has relevant interests in 41,413,691 shares.
Scott David Tumbridge (Executive Director)Mr Tumbridge was appointed as Executive Director on 29 November 2019 following the acquisition by the Company of Deepcore Drilling.
Mr Tumbridge (the founder of Deepcore Drilling) has over 25 years’ experience in the Australasian mining and drilling industries and a proven track record in business development, innovation and operational excellence. Mr Tumbridge brings a wealth of specialist industry knowledge to the Mitchell Services board.
At the date of this report, Mr Tumbridge has relevant interests in 16,148,327 shares.
Peter Richard Miller (Non-Executive Director)Mr Miller was appointed as Director on 8 February 2011.
Mr Miller has been involved in all aspects of the drilling industry for the past 30 years and founded Drill Torque in 1992. His experience encompasses working with all types of drilling rigs, building rigs and managing drilling companies. Having worked in most exploration areas in Australia he is intimately familiar with drilling conditions, equipment requirements and pricing structures to maximise fleet productivity. Mr Miller is widely known and well regarded in the industry.
At the date of this report, Mr Miller has relevant interests in 2,412,505 shares.
Robert Barry Douglas BCom, LLB (Non-Executive Director)Mr Douglas was appointed as Non-Executive Director on 29 November 2013. Mr Douglas has over 20 years of experience in finance and investment banking and is currently an Executive Director of Morgans Financial.
Mr Douglas has experience in all aspects of corporate advisory and equity capital raising for listed public companies and companies seeking to list, including offer structure, prospectus preparation, due diligence, accounts and forecasting, risk management, sales and marketing, logistics and legal requirements. During his career, Mr Douglas has worked extensively with energy and resource companies. Mr Douglas has served on both the Audit and Risk Committee and the Remuneration and Nomination Committee since 20 March 2014 and was Chairman of both Committees between 21 November 2014 and 20 October 2015.
At the date of this report, Mr Douglas has relevant interests in 248,686 shares.
Neal Macrossan O’Connor LLB, GAICD (Non-Executive Director)Mr O’Connor was appointed as Non-Executive Director on 21 October 2015 and is also Chairman of the Remuneration and Nomination Committee. Mr O’Connor also previously served as Chairman of the Audit and Risk Committee from 21 October 2015 to 18 August 2020.
Mr O’Connor was formerly General Counsel and Company Secretary and an Executive Committee member of the global Xstrata Copper. He has extensive experience in the resource industry and brings an added focus on corporate governance and risk management to the Board.
9Mitchell Services LtdAnnual Report 2021
Mr O’Connor currently serves on the Board of Maas Group Holdings Limited (ASX: MGH) and previously served on the Board of Stanmore Coal Limited (ASX: SMR) from September 2017 until May 2020.
At the date of this report, Mr O’Connor has relevant interests in 116,888 shares.
Peter Geoffrey Hudson BA (Acc), GAICD, CA, (Non-Executive Director)Mr Hudson was appointed as Non-Executive Director on 20 July 2020 and is also a member of the Remuneration and Nomination Committee and the chairman of the Audit and Risk Committee.
Mr Hudson is an experienced corporate transaction specialist with over 20 years’ experience in mergers, acquisitions, capital raisings, financial analysis, and project management in Australia and overseas. Previously a partner at global financial services firm KPMG, he brings a wealth of financial, risk management and corporate governance experience to the Board.
At the date of this report, Mr Hudson does not have any relevant interests in the Company’s shares.
Grant Eric Moyle (Alternate Director)Mr Moyle was appointed as Alternate Director for Mr Nathan Mitchell on 30 May 2014.
Mr Moyle is an Executive Director of the Mitchell Group in Brisbane. He brings to the Group his management and board experience in international mining services, governance and strategic business growth.
At the date of this report, Mr Moyle has relevant interests in 252,028 shares.
CHIEF EXECUTIVE OFFICER Andrew Michael Elf BCom, FCPA, MBA, GAICD Andrew was appointed as Chief Executive Officer on 20 March 2014.
Andrew has over 20 years finance, commercial and operational experience working in various senior roles both in Australia and overseas and was a financial director in Indonesia for a top 100 ASX listed company before transitioning into the drilling industry in early 2004. Andrew held several senior roles with Boart Longyear before joining Mitchell Group in March 2010, where he spearheaded the growth of the African business.
Andrew has extensive experience in managing drilling companies in various regions around the world which have worked for global Tier 1 mining and energy houses.
CHIEF FINANCIAL OFFICER & COMPANY SECRETARYGregory Michael Switala BCom (Hons), CAGreg joined Mitchell Services in 2014 and has over 15 years’ experience in audit and commercial finance roles.
Over the past seven years, Greg has led the finance team through a period of substantial growth that has included significant corporate activity including substantial acquisitions and capital (both debt and equity) raisings.
PRINCIPAL ACTIVITIESThe Group provides exploration and mine site drilling services to the exploration, mining, and energy industries, primarily in Australia and is currently headquartered in Seventeen Mile Rocks, Queensland.
The Group provides drilling solutions at all stages of the mining lifecycle, in both the energy and minerals sectors. The diversity in operations allows for better management of the cyclical nature of commodity prices, as well as giving employees exposure to various forms of drilling as part of their career development.
The various stages of the mining lifecycle for which the Group provides drilling services includes:
• Greenfield exploration• Project feasibility• Mine site exploration and resource definition• Development• Production
There were no significant changes in the Group’s nature of activities during the year.
CHANGES IN STATE OF AFFAIRSThere was no significant change in the state of affairs of the Group during the financial year.
SUBSEQUENT EVENTSOther than the two matters detailed on page 14 of this Directors Report, there has not been any matter or circumstance occurring subsequent to the end of the financial year that has significantly affected, or may significantly affect, the operations of the Group, the results of those operations, or the state of affairs of the Group in future financial years.
LIKELY DEVELOPMENTSThe Group will continue to pursue its principal activities during the next financial year.
10 Mitchell Services Ltd Annual Report 2021
DIRECTORS’ REPORTFor the year ended 30 June 2021
ENVIRONMENTAL REGULATIONSThe Group’s operations are not subject to any particular and significant environmental regulation under a law of the Commonwealth or a State or Territory. However, the Group does provide services to entities that are licensed or otherwise subject to conditions for the purposes of environmental legislation or regulation. In these instances, the Group undertakes its compliance duties in accordance with the contractor regime implemented by the licensed or regulated entity.
REVIEW OF OPERATIONSSafetyFinishing each day without harm is a core Mitchell Services value and the Group is committed to the safety of its most important asset — its people. The Group is particularly focused on training to attract, retain and further develop its drillers and support crews to ensure that service levels and the quality of the Mitchell brand remain high.
As part of this commitment to finishing each day without harm, the Group has developed and implemented a program to verify the existence and effectiveness of controls that are designed to mitigate critical health and safety risks within the organisation. To date, this critical control verification program has led to a material improvement in all key safety statistics across the organisation.
The Group has continued to work closely with government, various specialist organisations, clients and all stakeholders to limit the spread of the COVID-19 virus through active preventative measures.
Given the reliance in certain instances on the Group’s fly-in-fly-out workforce, inter-state border restrictions and reductions in domestic airline capacity have represented the largest operational challenges in relation to the virus. To date, these challenges have been appropriately managed in conjunction with our clients through a combination of a well-executed rapid response plans and significant dedication and commitment from field-based employees.
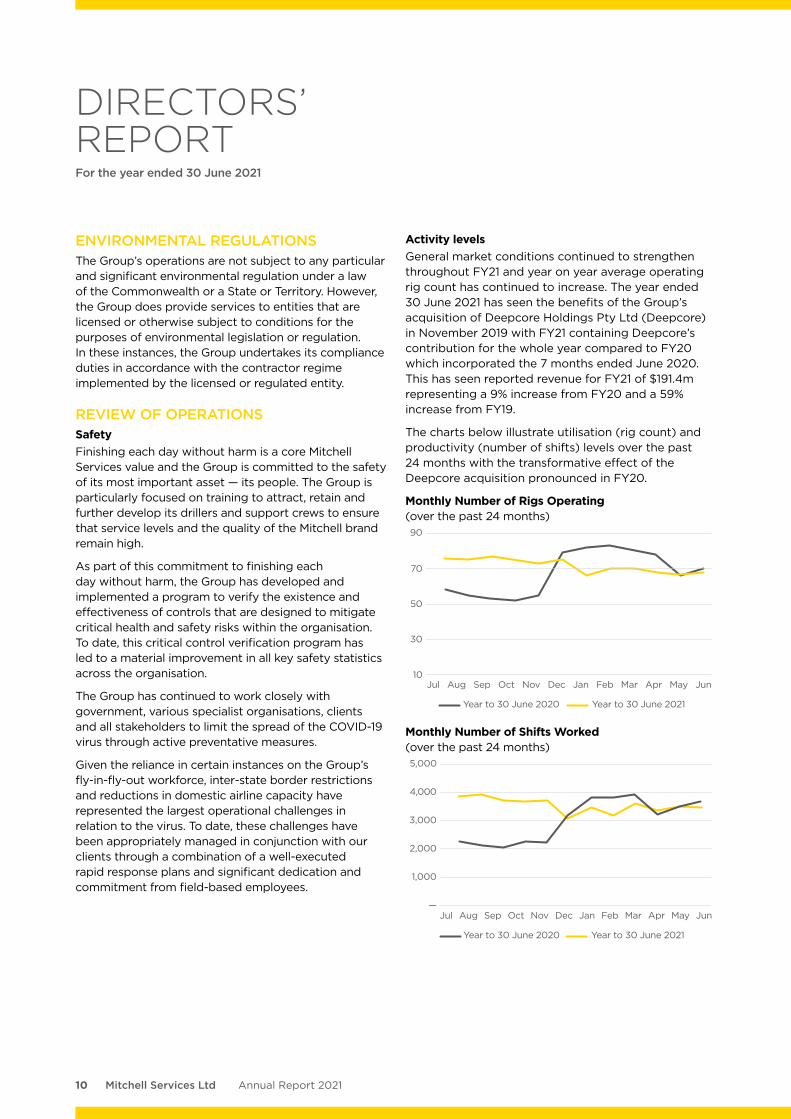
Activity levelsGeneral market conditions continued to strengthen throughout FY21 and year on year average operating rig count has continued to increase. The year ended 30 June 2021 has seen the benefits of the Group’s acquisition of Deepcore Holdings Pty Ltd (Deepcore) in November 2019 with FY21 containing Deepcore’s contribution for the whole year compared to FY20 which incorporated the 7 months ended June 2020. This has seen reported revenue for FY21 of $191.4m representing a 9% increase from FY20 and a 59% increase from FY19.
The charts below illustrate utilisation (rig count) and productivity (number of shifts) levels over the past 24 months with the transformative effect of the Deepcore acquisition pronounced in FY20.
Monthly Number of Rigs Operating (over the past 24 months)90
70
50
30
10
Year to 30 June 2020 Year to 30 June 2021
Jul Aug Sep Oct Nov Dec Jan Feb Mar Apr May Jun
Monthly Number of Shifts Worked (over the past 24 months)5,000
4,000
3,000
2,000
—
1,000
Year to 30 June 2020 Year to 30 June 2021
Jul Aug Sep Oct Nov Dec Jan Feb Mar Apr May Jun
11Mitchell Services LtdAnnual Report 2021
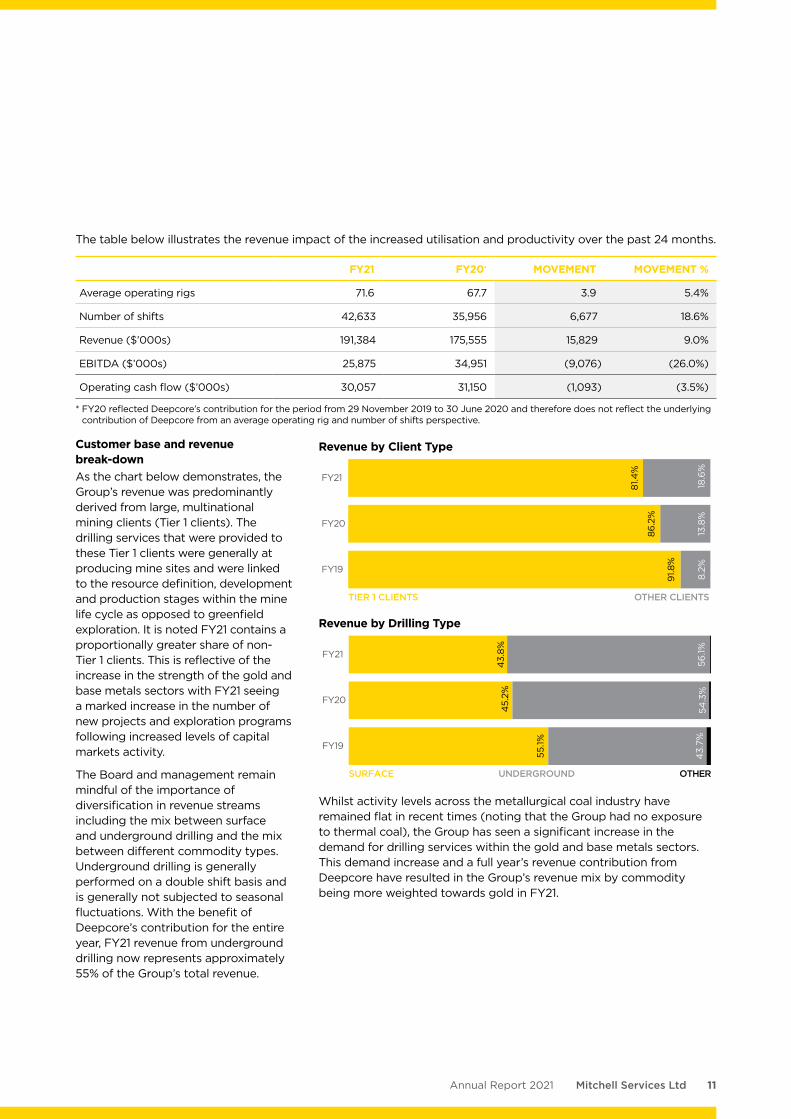
The table below illustrates the revenue impact of the increased utilisation and productivity over the past 24 months.
FY21 FY20• MOVEMENT MOVEMENT %
Average operating rigs 71.6 67.7 3.9 5.4%
Number of shifts 42,633 35,956 6,677 18.6%
Revenue ($’000s) 191,384 175,555 15,829 9.0%
EBITDA ($’000s) 25,875 34,951 (9,076) (26.0%)
Operating cash flow ($’000s) 30,057 31,150 (1,093) (3.5%)
* FY20 reflected Deepcore’s contribution for the period from 29 November 2019 to 30 June 2020 and therefore does not reflect the underlying contribution of Deepcore from an average operating rig and number of shifts perspective.
Customer base and revenue break-downAs the chart below demonstrates, the Group’s revenue was predominantly derived from large, multinational mining clients (Tier 1 clients). The drilling services that were provided to these Tier 1 clients were generally at producing mine sites and were linked to the resource definition, development and production stages within the mine life cycle as opposed to greenfield exploration. It is noted FY21 contains a proportionally greater share of non-Tier 1 clients. This is reflective of the increase in the strength of the gold and base metals sectors with FY21 seeing a marked increase in the number of new projects and exploration programs following increased levels of capital markets activity.
The Board and management remain mindful of the importance of diversification in revenue streams including the mix between surface and underground drilling and the mix between different commodity types. Underground drilling is generally performed on a double shift basis and is generally not subjected to seasonal fluctuations. With the benefit of Deepcore’s contribution for the entire year, FY21 revenue from underground drilling now represents approximately 55% of the Group’s total revenue.
Revenue by Client Type
OTHER CLIENTSTIER 1 CLIENTS
FY19
81.4
%
18.6
%
FY20
86.2
%
13.8
%
FY21
91.8
%
8.2%
Revenue by Drilling Type
55.1%
43.
7%
45.
2%
54.3
%
43.
8%
56.1%
FY19
FY20
FY21
OTHERUNDERGROUNDSURFACE
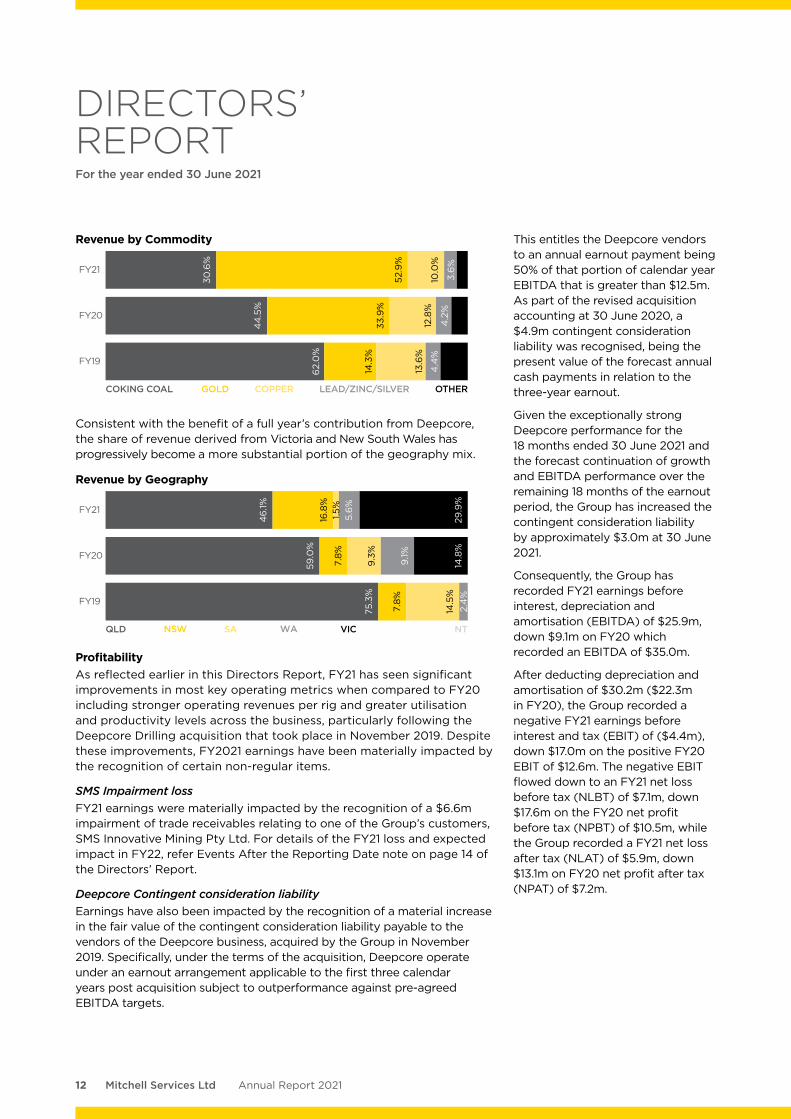
Whilst activity levels across the metallurgical coal industry have remained flat in recent times (noting that the Group had no exposure to thermal coal), the Group has seen a significant increase in the demand for drilling services within the gold and base metals sectors. This demand increase and a full year’s revenue contribution from Deepcore have resulted in the Group’s revenue mix by commodity being more weighted towards gold in FY21.
12 Mitchell Services Ltd Annual Report 2021
DIRECTORS’ REPORTFor the year ended 30 June 2021
Revenue by Commodity
OTHER
FY19
62.
0%
14.3
%
13.6
%
4.4
%
FY20
12.8
%
4.2
%
44
.5%
33.9
%
FY21
52.9
%
3.6
%
30.6
%
10.0
%
COKING COAL GOLD COPPER LEAD/ZINC/SILVER
Consistent with the benefit of a full year’s contribution from Deepcore, the share of revenue derived from Victoria and New South Wales has progressively become a more substantial portion of the geography mix.
Revenue by Geography
75.3
%
7.8%
2.4
%14
.5%
FY19
54.3
%
59.0
%
7.8%
9.1%
14.8
%
9.3
%FY20
46
.1%
16.8
%
5.6
%
29.9
%
1.5%FY21
QLD NSW SA WA VIC NT
ProfitabilityAs reflected earlier in this Directors Report, FY21 has seen significant improvements in most key operating metrics when compared to FY20 including stronger operating revenues per rig and greater utilisation and productivity levels across the business, particularly following the Deepcore Drilling acquisition that took place in November 2019. Despite these improvements, FY2021 earnings have been materially impacted by the recognition of certain non-regular items.
SMS Impairment lossFY21 earnings were materially impacted by the recognition of a $6.6m impairment of trade receivables relating to one of the Group’s customers, SMS Innovative Mining Pty Ltd. For details of the FY21 loss and expected impact in FY22, refer Events After the Reporting Date note on page 14 of the Directors’ Report.
Deepcore Contingent consideration liabilityEarnings have also been impacted by the recognition of a material increase in the fair value of the contingent consideration liability payable to the vendors of the Deepcore business, acquired by the Group in November 2019. Specifically, under the terms of the acquisition, Deepcore operate under an earnout arrangement applicable to the first three calendar years post acquisition subject to outperformance against pre-agreed EBITDA targets.
This entitles the Deepcore vendors to an annual earnout payment being 50% of that portion of calendar year EBITDA that is greater than $12.5m. As part of the revised acquisition accounting at 30 June 2020, a $4.9m contingent consideration liability was recognised, being the present value of the forecast annual cash payments in relation to the three-year earnout.
Given the exceptionally strong Deepcore performance for the 18 months ended 30 June 2021 and the forecast continuation of growth and EBITDA performance over the remaining 18 months of the earnout period, the Group has increased the contingent consideration liability by approximately $3.0m at 30 June 2021.
Consequently, the Group has recorded FY21 earnings before interest, depreciation and amortisation (EBITDA) of $25.9m, down $9.1m on FY20 which recorded an EBITDA of $35.0m.
After deducting depreciation and amortisation of $30.2m ($22.3m in FY20), the Group recorded a negative FY21 earnings before interest and tax (EBIT) of ($4.4m), down $17.0m on the positive FY20 EBIT of $12.6m. The negative EBIT flowed down to an FY21 net loss before tax (NLBT) of $7.1m, down $17.6m on the FY20 net profit before tax (NPBT) of $10.5m, while the Group recorded a FY21 net loss after tax (NLAT) of $5.9m, down $13.1m on FY20 net profit after tax (NPAT) of $7.2m.
13Mitchell Services LtdAnnual Report 2021
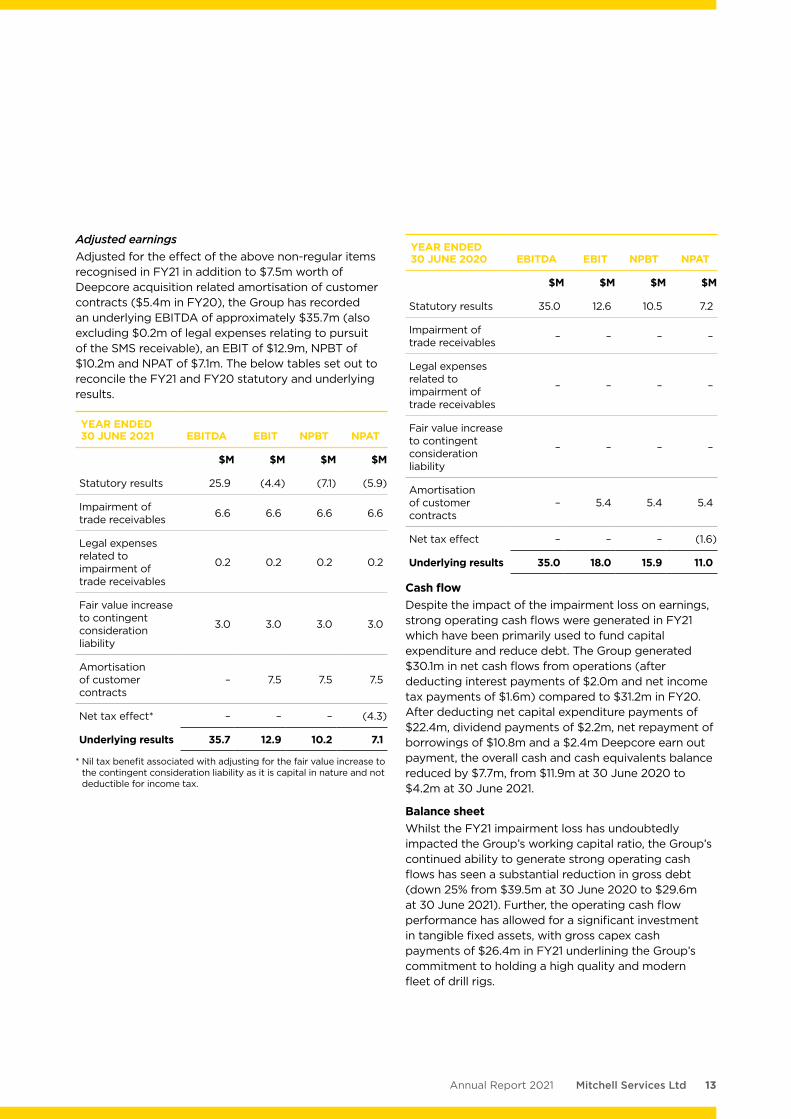
Adjusted earningsAdjusted for the effect of the above non-regular items recognised in FY21 in addition to $7.5m worth of Deepcore acquisition related amortisation of customer contracts ($5.4m in FY20), the Group has recorded an underlying EBITDA of approximately $35.7m (also excluding $0.2m of legal expenses relating to pursuit of the SMS receivable), an EBIT of $12.9m, NPBT of $10.2m and NPAT of $7.1m. The below tables set out to reconcile the FY21 and FY20 statutory and underlying results.
YEAR ENDED 30 JUNE 2021 EBITDA EBIT NPBT NPAT
$M $M $M $M
Statutory results 25.9 (4.4) (7.1) (5.9)
Impairment of trade receivables 6.6 6.6 6.6 6.6
Legal expenses related to impairment of trade receivables
0.2 0.2 0.2 0.2
Fair value increase to contingent consideration liability
3.0 3.0 3.0 3.0
Amortisation of customer contracts
– 7.5 7.5 7.5
Net tax effect* – – – (4.3)
Underlying results 35.7 12.9 10.2 7.1
* Nil tax benefit associated with adjusting for the fair value increase to the contingent consideration liability as it is capital in nature and not deductible for income tax.
YEAR ENDED 30 JUNE 2020 EBITDA EBIT NPBT NPAT
$M $M $M $M
Statutory results 35.0 12.6 10.5 7.2
Impairment of trade receivables – – – –
Legal expenses related to impairment of trade receivables
– – – –
Fair value increase to contingent consideration liability
– – – –
Amortisation of customer contracts
– 5.4 5.4 5.4
Net tax effect – – – (1.6)
Underlying results 35.0 18.0 15.9 11.0
Cash flowDespite the impact of the impairment loss on earnings, strong operating cash flows were generated in FY21 which have been primarily used to fund capital expenditure and reduce debt. The Group generated $30.1m in net cash flows from operations (after deducting interest payments of $2.0m and net income tax payments of $1.6m) compared to $31.2m in FY20. After deducting net capital expenditure payments of $22.4m, dividend payments of $2.2m, net repayment of borrowings of $10.8m and a $2.4m Deepcore earn out payment, the overall cash and cash equivalents balance reduced by $7.7m, from $11.9m at 30 June 2020 to $4.2m at 30 June 2021.
Balance sheetWhilst the FY21 impairment loss has undoubtedly impacted the Group’s working capital ratio, the Group’s continued ability to generate strong operating cash flows has seen a substantial reduction in gross debt (down 25% from $39.5m at 30 June 2020 to $29.6m at 30 June 2021). Further, the operating cash flow performance has allowed for a significant investment in tangible fixed assets, with gross capex cash payments of $26.4m in FY21 underlining the Group’s commitment to holding a high quality and modern fleet of drill rigs.
14 Mitchell Services Ltd Annual Report 2021
DIRECTORS’ REPORTFor the year ended 30 June 2021
Consolidated net debt at 30 June 2021 of $25.4 is down $2.2m (8%) on 30 June 2020 and represents a reduction of $13.1m (34%) from peak levels at 31 December 2019 following the Deepcore acquisition. While the 30 June 2021 net debt balance of $25.4m represents approximately 1.0 times EBITDA on an historic rolling 12-month basis, on a normalised basis it represents approximately 0.7 times.
The Group’s current ratio (current assets: current liabilities) has decreased by 19% from 1.18 at 30 June 2020 to 0.95 at 30 June 2021. This is largely due to the recognition of the impairment loss on trade receivables discussed above.
EVENTS AFTER THE REPORTING DATESMS Impairment lossOn 12 February 2021 the Group terminated a material drilling contract (Contract) with SMS Innovative Mining Pty Ltd (SMS) under which the Company’s wholly owned subsidiary Mitchell Operations Pty Ltd (MO) provided drill and blast services for SMS at the Kirkalocka gold project in Western Australia. The Contract was terminated on grounds of breach of contract for failure by SMS to pay invoices due and owing under the contract. As a result of this failure to pay the invoices that were due and owing, MO had served a statutory demand on SMS for which SMS subsequently made an application to set aside (Proceeding).
The cumulative value of all unpaid invoices issued to SMS under the Contract up to and including the date of contract termination was approximately $9.6m and given the uncertainty in relation to the collectability of this amount and the outcome of the Proceeding, the Group initially recognised an impairment loss for the full amount of $9.6m.
On 13 July 2021 MO and SMS agreed to resolve all claims relating to, in connection with or arising out of, the Proceeding and the Contract on the basis that SMS pay to MO the sum of $5.0m. Pursuant to the terms of the agreed settlement, the $5.0m settlement sum was to be paid in three tranches as follows:
• Tranche 1 — $3.0m payable within 7 days from the date of settlement
• Tranche 2 — $1.0m payable by 30 September 2021
• Tranche 3 — $1.0m payable by 30 December 2021
On 19 July 2021 MO received the tranche 1 payment of $3.0m. On the basis of the first tranche having been collected, the Group has recognised the benefit of the $3.0m in FY21, reducing the impairment loss to
$6.6m and, in FY22, expects to further reduce the impairment loss by $2.0m on collection of the second and third tranches.
On receipt of the final tranche, the Group also anticipates the impairment loss will be reduced by a further amount approximating $0.4m, being the GST component of uncollected invoices which, on being written off as a bad debt, will cease to qualify as taxable supplies and will become refundable from the Australian Tax Office at that point in time.
Equity raisingOn 16 August 2021 the Company announced a material organic growth strategy and capital investment program which included the purchase of 9 LF160 drill rigs which were expected to be delivered (on a staggered basis) by 31 December 2021 and which also included an option for an additional 3 rigs.
To support the funding of this organic growth strategy, the Company also announced that it was undertaking a fully underwritten accelerated non-renounceable entitlement offer to raise approximately $10.5m (Entitlement Offer). Under the Entitlement Offer, eligible shareholders could subscribe for 1 fully paid ordinary share (New Shares) for every 8 Mitchell Services Ltd shares that they held on 18 August 2021 (Record Date) at the issue price of $0.42 per New Share (Offer Price).
Under the Entitlement Offer approximately 24,994,286 New Shares are expected be issued in total, equivalent to approximately 11.1% of the Company’s total shares outstanding at 30 June 2021. New Shares will rank equally in all respects with existing shares of the Company.
The Entitlement Offer was made to both institutional shareholders (Institutional Entitlement Offer) and eligible retail shareholders (Retail Entitlement Offer).
As at the date of this report the Institutional Entitlement Offer is complete with the Company having issued 11,010,656 fully paid New Shares at $0.42 per share on 24 August 2021. The Company anticipates that the settlement of New Shares under the Retail Entitlement Offer (comprising approx. 13,983,630 New Shares at $0.42 per share) will be completed by 10 September 2021.
There has not been any other matter or circumstance occurring subsequent to the end of the reporting period that has significantly affected, or may significantly affect, the operations of the Group, the results of those operations, or the state of affairs of the Group in the future.
15Mitchell Services LtdAnnual Report 2021
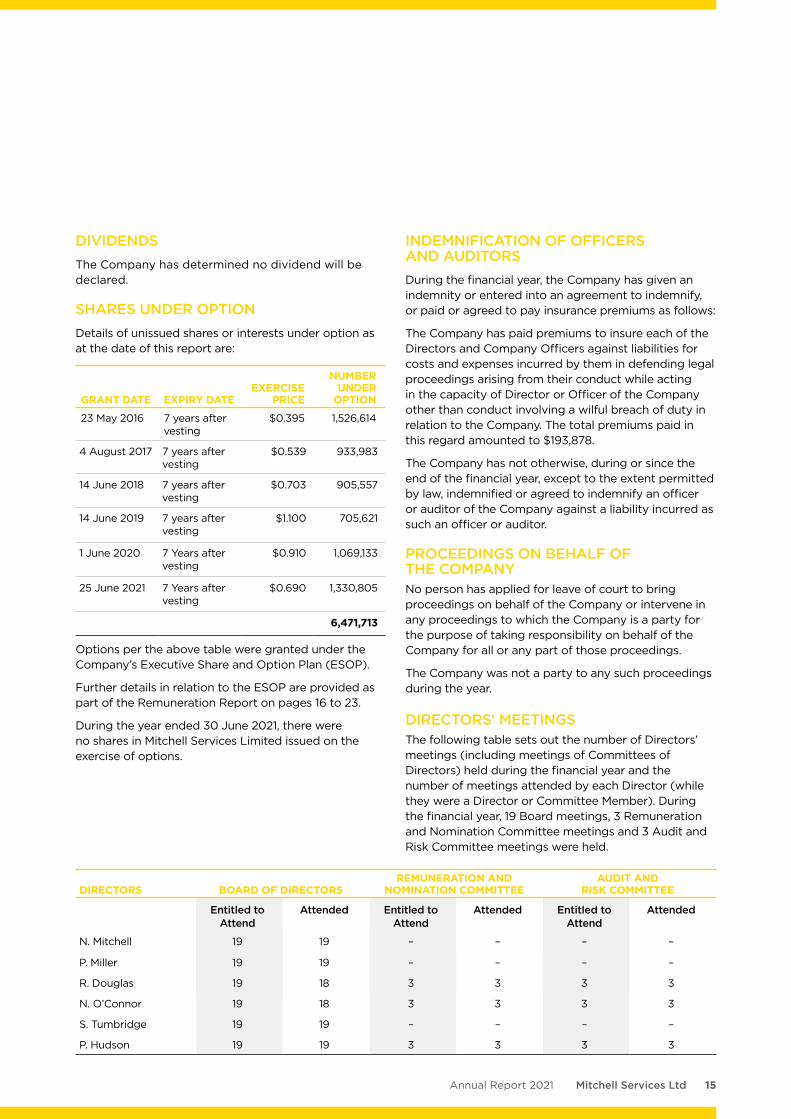
DIVIDENDSThe Company has determined no dividend will be declared.
SHARES UNDER OPTIONDetails of unissued shares or interests under option as at the date of this report are:
GRANT DATE EXPIRY DATEEXERCISE
PRICE
NUMBER UNDER
OPTION
23 May 2016 7 years after vesting
$0.395 1,526,614
4 August 2017 7 years after vesting
$0.539 933,983
14 June 2018 7 years after vesting
$0.703 905,557
14 June 2019 7 years after vesting
$1.100 705,621
1 June 2020 7 Years after vesting
$0.910 1,069,133
25 June 2021 7 Years after vesting
$0.690 1,330,805
6,471,713
Options per the above table were granted under the Company’s Executive Share and Option Plan (ESOP).
Further details in relation to the ESOP are provided as part of the Remuneration Report on pages 16 to 23.
During the year ended 30 June 2021, there were no shares in Mitchell Services Limited issued on the exercise of options.
INDEMNIFICATION OF OFFICERS AND AUDITORSDuring the financial year, the Company has given an indemnity or entered into an agreement to indemnify, or paid or agreed to pay insurance premiums as follows:
The Company has paid premiums to insure each of the Directors and Company Officers against liabilities for costs and expenses incurred by them in defending legal proceedings arising from their conduct while acting in the capacity of Director or Officer of the Company other than conduct involving a wilful breach of duty in relation to the Company. The total premiums paid in this regard amounted to $193,878.
The Company has not otherwise, during or since the end of the financial year, except to the extent permitted by law, indemnified or agreed to indemnify an officer or auditor of the Company against a liability incurred as such an officer or auditor.
PROCEEDINGS ON BEHALF OF THE COMPANYNo person has applied for leave of court to bring proceedings on behalf of the Company or intervene in any proceedings to which the Company is a party for the purpose of taking responsibility on behalf of the Company for all or any part of those proceedings.
The Company was not a party to any such proceedings during the year.
DIRECTORS’ MEETINGSThe following table sets out the number of Directors’ meetings (including meetings of Committees of Directors) held during the financial year and the number of meetings attended by each Director (while they were a Director or Committee Member). During the financial year, 19 Board meetings, 3 Remuneration and Nomination Committee meetings and 3 Audit and Risk Committee meetings were held.
DIRECTORS BOARD OF DIRECTORSREMUNERATION AND
NOMINATION COMMITTEEAUDIT AND
RISK COMMITTEE
Entitled to Attend
Attended Entitled to Attend
Attended Entitled to Attend
Attended
N. Mitchell 19 19 – – – –
P. Miller 19 19 – – – –
R. Douglas 19 18 3 3 3 3
N. O’Connor 19 18 3 3 3 3
S. Tumbridge 19 19 – – – –
P. Hudson 19 19 3 3 3 3
16 Mitchell Services Ltd Annual Report 2021
DIRECTORS’ REPORTFor the year ended 30 June 2021
NON-AUDIT SERVICESThere were no amounts paid or payable to the auditor for non-audit services provided during the year by the auditor. Refer to Note 24 to the Financial Statements.
AUDITOR’S INDEPENDENCE DECLARATIONThe Auditor’s Independence Declaration is included on page 30 of the Annual Report.
REMUNERATION REPORTThis Remuneration Report, which forms part of the Directors’ Report, sets out information about the remuneration of the Group’s Key Management Personnel (KMP) for the financial year ended 30 June 2021. The term Key Management Personnel refers to those persons having authority and responsibility for planning, directing and controlling the activities of the Group, directly or indirectly, including any Director (whether executive or otherwise) of the Group.
Key Management Personnel The Directors and other KMP of the Group during or since the end of the financial year were:
Nathan Andrew Mitchell (Executive Chairman)
Scott David Tumbridge (Executive Director)
Peter Richard Miller (Non-Executive Director)
Robert Barry Douglas (Non-Executive Director)
Neal Macrossan O’Connor (Non-Executive Director)
Peter Geoffrey Hudson (Non-Executive Director)
Andrew Michael Elf (Chief Executive Officer)
Gregory Michael Switala (Chief Financial Officer and Company Secretary)
Remuneration PolicyThe Remuneration Policy of the Group has been designed to align KMP objectives with shareholder and business objectives by providing a fixed remuneration component and offering specific short-term and long-term incentives to key employees based on key performance areas affecting the Group’s financial, operational and safety results. The Board believes the Remuneration Policy to be appropriate and effective in its ability to attract and retain high quality KMP to run and manage the Group.
The Board’s policy for determining the nature and amount of remuneration for KMP of the Group is as follows:
• The Remuneration Policy is developed by the Remuneration and Nomination Committee and approved by the Board;
• All KMP receive a base salary (which is based on factors such as length of service and experience), superannuation, and may receive fringe benefits and performance incentives (both short term and long term);
• The extent to which KMP receive performance incentives will depend on the performance of the Group with reference to specific key performance indicators;
• The performance indicators relating to incentives are aligned with the interests of the Group and therefore shareholders;
• The Remuneration and Nomination Committee reviews KMP packages annually by reference to the Group’s performance, executive performance and comparable information from industry sectors.
Executive remuneration componentsUnder the Group’s remuneration framework for the year ending 30 June 2021, the following remuneration components were available to executive KMP:
• Fixed remuneration that comprises salary and other benefits including superannuation.
• Short term incentives that comprise a cash-based performance bonus, the extent of which will depend on the Group’s financial and safety performance and is designed to attract the highest calibre of executives and senior managers and reward them for performance results leading to growth in shareholder value.
• Long term incentives that comprise an equity only component whereby equity instruments are issued (subject to financial, operational and safety performance-based vesting conditions) to executives and senior managers under the Group’s Executive Share and Option Plan (ESOP) designed to reward those executives and managers for long term growth in shareholder value.
The above structure is designed to provide an appropriate mix of variable and fixed remuneration and to provide an appropriate mix of short-term and long-term incentives to attract and retain high quality KMP and to align incentives with the short-term and long-term objectives of the Group.
17Mitchell Services LtdAnnual Report 2021
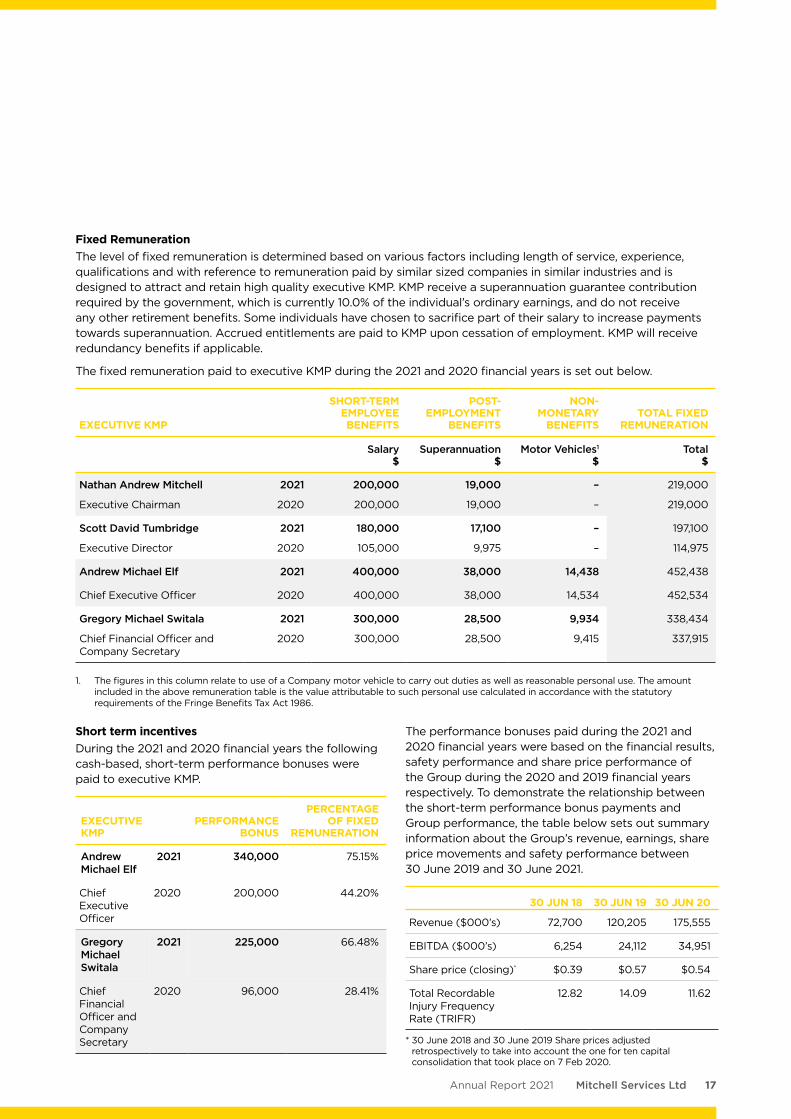
Fixed Remuneration The level of fixed remuneration is determined based on various factors including length of service, experience, qualifications and with reference to remuneration paid by similar sized companies in similar industries and is designed to attract and retain high quality executive KMP. KMP receive a superannuation guarantee contribution required by the government, which is currently 10.0% of the individual’s ordinary earnings, and do not receive any other retirement benefits. Some individuals have chosen to sacrifice part of their salary to increase payments towards superannuation. Accrued entitlements are paid to KMP upon cessation of employment. KMP will receive redundancy benefits if applicable.
The fixed remuneration paid to executive KMP during the 2021 and 2020 financial years is set out below.
EXECUTIVE KMP
SHORT-TERM EMPLOYEE BENEFITS
POST-EMPLOYMENT
BENEFITS
NON-MONETARY
BENEFITSTOTAL FIXED
REMUNERATION
Salary $
Superannuation $
Motor Vehicles1
$Total
$
Nathan Andrew Mitchell 2021 200,000 19,000 – 219,000
Executive Chairman 2020 200,000 19,000 – 219,000
Scott David Tumbridge 2021 180,000 17,100 – 197,100
Executive Director 2020 105,000 9,975 – 114,975
Andrew Michael Elf 2021 400,000 38,000 14,438 452,438
Chief Executive Officer 2020 400,000 38,000 14,534 452,534
Gregory Michael Switala 2021 300,000 28,500 9,934 338,434
Chief Financial Officer and Company Secretary
2020 300,000 28,500 9,415 337,915
1. The figures in this column relate to use of a Company motor vehicle to carry out duties as well as reasonable personal use. The amount included in the above remuneration table is the value attributable to such personal use calculated in accordance with the statutory requirements of the Fringe Benefits Tax Act 1986.
Short term incentives During the 2021 and 2020 financial years the following cash-based, short-term performance bonuses were paid to executive KMP.
EXECUTIVE KMP
PERFORMANCE BONUS
PERCENTAGE OF FIXED
REMUNERATION
Andrew Michael Elf
2021 340,000 75.15%
Chief Executive Officer
2020 200,000 44.20%
Gregory Michael Switala
2021 225,000 66.48%
Chief Financial Officer and Company Secretary
2020 96,000 28.41%
The performance bonuses paid during the 2021 and 2020 financial years were based on the financial results, safety performance and share price performance of the Group during the 2020 and 2019 financial years respectively. To demonstrate the relationship between the short-term performance bonus payments and Group performance, the table below sets out summary information about the Group’s revenue, earnings, share price movements and safety performance between 30 June 2019 and 30 June 2021.
30 JUN 18 30 JUN 19 30 JUN 20
Revenue ($000’s) 72,700 120,205 175,555
EBITDA ($000’s) 6,254 24,112 34,951
Share price (closing)* $0.39 $0.57 $0.54
Total Recordable Injury Frequency Rate (TRIFR)
12.82 14.09 11.62
* 30 June 2018 and 30 June 2019 Share prices adjusted retrospectively to take into account the one for ten capital consolidation that took place on 7 Feb 2020.
18 Mitchell Services Ltd Annual Report 2021
DIRECTORS’ REPORTFor the year ended 30 June 2021
Long-term employee benefits Mitchell Services Limited operates an Executive Share and Option Plan (ESOP) for executives and senior employees of the Group. In accordance with the provisions of the plan, as approved by shareholders at a previous annual general meeting, the Board may designate a Director or employee of the Company as an eligible participant of the ESOP (Eligible Participant). The Board may offer rights, options or shares to an Eligible Participant under the ESOP. A participant is not required to pay for the grant of any rights or options or for the issue of shares.
The objectives of the ESOP are to:
• Attract and retain a high standard of managerial and technical personnel for the benefit of the Group
• Establish a method by which Eligible Participants can participate in future growth and profitability of the Group
• Provide an incentive and reward for Eligible Participants for their contributions to the Group.
Equity instruments issued under the ESOP are subject to satisfaction of certain vesting conditions (tested two years after the offer date), being:
a) EBITDA performance of the Group having regard to respective prior years’ EBITDA performance, performance against budgets and general market conditions between the date of the offer and the vesting date
b) share price performance between the date of the offer and the vesting date
c) safety performance across all operations as determined on a financial year annual TRIFR basis, having regard to respective prior years’ TRIFR performance
d) operational performance, having particular regard to key operational metrics.
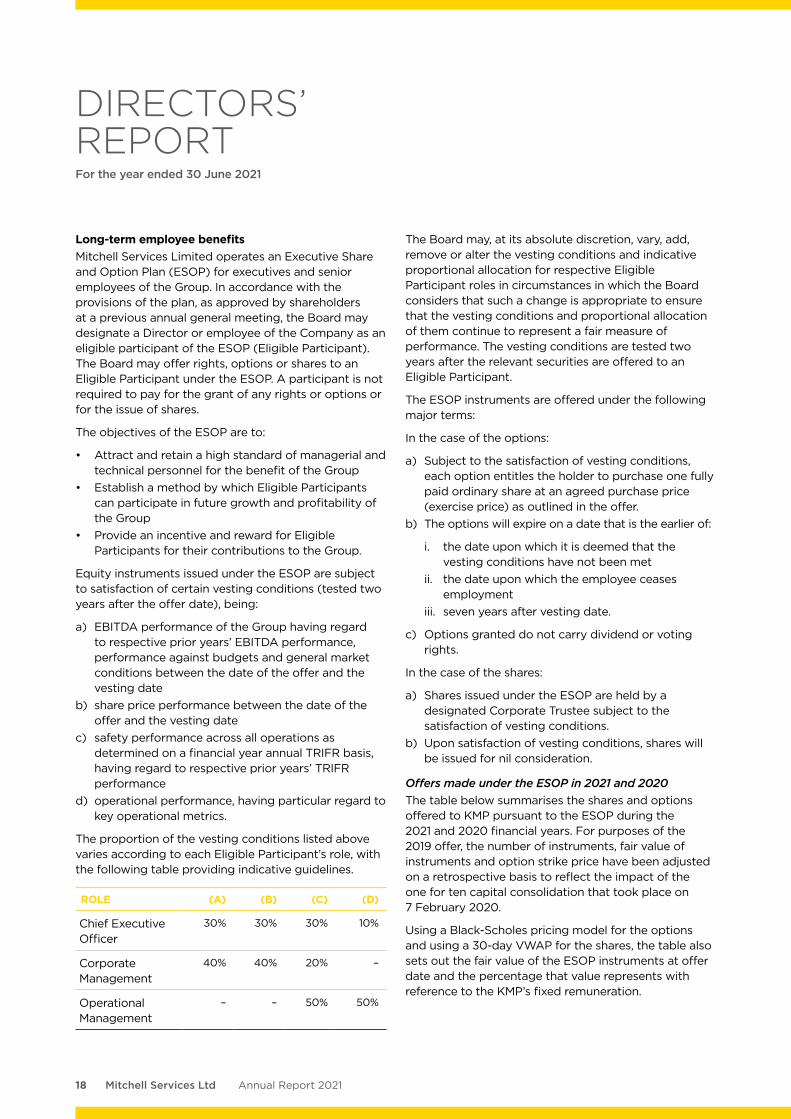
The proportion of the vesting conditions listed above varies according to each Eligible Participant’s role, with the following table providing indicative guidelines.
ROLE (A) (B) (C) (D)
Chief Executive Officer
30% 30% 30% 10%
Corporate Management
40% 40% 20% –
Operational Management
– – 50% 50%
The Board may, at its absolute discretion, vary, add, remove or alter the vesting conditions and indicative proportional allocation for respective Eligible Participant roles in circumstances in which the Board considers that such a change is appropriate to ensure that the vesting conditions and proportional allocation of them continue to represent a fair measure of performance. The vesting conditions are tested two years after the relevant securities are offered to an Eligible Participant.
The ESOP instruments are offered under the following major terms:
In the case of the options:
a) Subject to the satisfaction of vesting conditions, each option entitles the holder to purchase one fully paid ordinary share at an agreed purchase price (exercise price) as outlined in the offer.
b) The options will expire on a date that is the earlier of:
i. the date upon which it is deemed that the vesting conditions have not been met
ii. the date upon which the employee ceases employment
iii. seven years after vesting date.
c) Options granted do not carry dividend or voting rights.
In the case of the shares:
a) Shares issued under the ESOP are held by a designated Corporate Trustee subject to the satisfaction of vesting conditions.
b) Upon satisfaction of vesting conditions, shares will be issued for nil consideration.
Offers made under the ESOP in 2021 and 2020The table below summarises the shares and options offered to KMP pursuant to the ESOP during the 2021 and 2020 financial years. For purposes of the 2019 offer, the number of instruments, fair value of instruments and option strike price have been adjusted on a retrospective basis to reflect the impact of the one for ten capital consolidation that took place on 7 February 2020.
Using a Black-Scholes pricing model for the options and using a 30-day VWAP for the shares, the table also sets out the fair value of the ESOP instruments at offer date and the percentage that value represents with reference to the KMP’s fixed remuneration.
19Mitchell Services LtdAnnual Report 2021
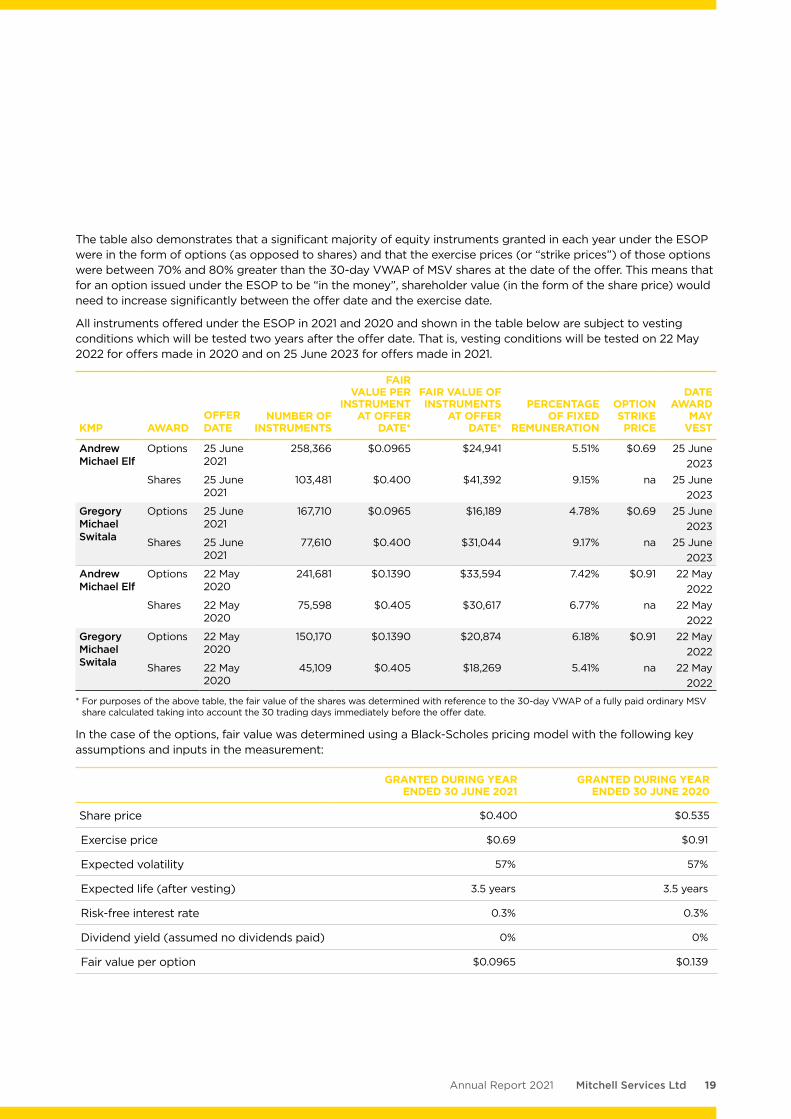
The table also demonstrates that a significant majority of equity instruments granted in each year under the ESOP were in the form of options (as opposed to shares) and that the exercise prices (or “strike prices”) of those options were between 70% and 80% greater than the 30-day VWAP of MSV shares at the date of the offer. This means that for an option issued under the ESOP to be “in the money”, shareholder value (in the form of the share price) would need to increase significantly between the offer date and the exercise date.
All instruments offered under the ESOP in 2021 and 2020 and shown in the table below are subject to vesting conditions which will be tested two years after the offer date. That is, vesting conditions will be tested on 22 May 2022 for offers made in 2020 and on 25 June 2023 for offers made in 2021.
KMP AWARDOFFER DATE
NUMBER OF INSTRUMENTS
FAIR VALUE PER
INSTRUMENT AT OFFER
DATE*
FAIR VALUE OF INSTRUMENTS
AT OFFER DATE*
PERCENTAGE OF FIXED
REMUNERATION
OPTION STRIKE PRICE
DATE AWARD
MAY VEST
Andrew Michael Elf
Options 25 June 2021
258,366 $0.0965 $24,941 5.51% $0.69 25 June 2023
Shares 25 June 2021
103,481 $0.400 $41,392 9.15% na 25 June 2023
Gregory Michael Switala
Options 25 June 2021
167,710 $0.0965 $16,189 4.78% $0.69 25 June 2023
Shares 25 June 2021
77,610 $0.400 $31,044 9.17% na 25 June 2023
Andrew Michael Elf
Options 22 May 2020
241,681 $0.1390 $33,594 7.42% $0.91 22 May 2022
Shares 22 May 2020
75,598 $0.405 $30,617 6.77% na 22 May 2022
Gregory Michael Switala
Options 22 May 2020
150,170 $0.1390 $20,874 6.18% $0.91 22 May 2022
Shares 22 May 2020
45,109 $0.405 $18,269 5.41% na 22 May 2022
* For purposes of the above table, the fair value of the shares was determined with reference to the 30-day VWAP of a fully paid ordinary MSV share calculated taking into account the 30 trading days immediately before the offer date.
In the case of the options, fair value was determined using a Black-Scholes pricing model with the following key assumptions and inputs in the measurement:
GRANTED DURING YEAR ENDED 30 JUNE 2021
GRANTED DURING YEAR ENDED 30 JUNE 2020
Share price $0.400 $0.535
Exercise price $0.69 $0.91
Expected volatility 57% 57%
Expected life (after vesting) 3.5 years 3.5 years
Risk-free interest rate 0.3% 0.3%
Dividend yield (assumed no dividends paid) 0% 0%
Fair value per option $0.0965 $0.139
20 Mitchell Services Ltd Annual Report 2021
DIRECTORS’ REPORTFor the year ended 30 June 2021
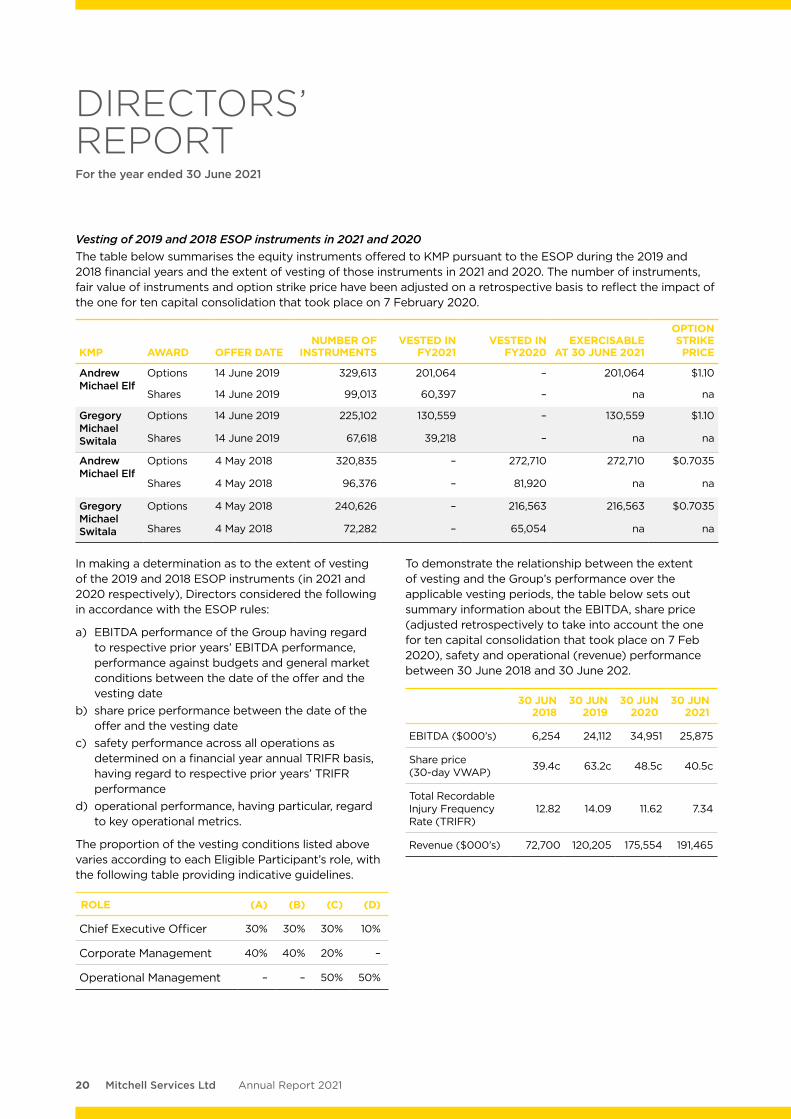
Vesting of 2019 and 2018 ESOP instruments in 2021 and 2020The table below summarises the equity instruments offered to KMP pursuant to the ESOP during the 2019 and 2018 financial years and the extent of vesting of those instruments in 2021 and 2020. The number of instruments, fair value of instruments and option strike price have been adjusted on a retrospective basis to reflect the impact of the one for ten capital consolidation that took place on 7 February 2020.
KMP AWARD OFFER DATENUMBER OF
INSTRUMENTSVESTED IN
FY2021 VESTED IN
FY2020EXERCISABLE
AT 30 JUNE 2021
OPTION STRIKE PRICE
Andrew Michael Elf
Options 14 June 2019 329,613 201,064 – 201,064 $1.10
Shares 14 June 2019 99,013 60,397 – na na
Gregory Michael Switala
Options 14 June 2019 225,102 130,559 – 130,559 $1.10
Shares 14 June 2019 67,618 39,218 – na na
Andrew Michael Elf
Options 4 May 2018 320,835 – 272,710 272,710 $0.7035
Shares 4 May 2018 96,376 – 81,920 na na
Gregory Michael Switala
Options 4 May 2018 240,626 – 216,563 216,563 $0.7035
Shares 4 May 2018 72,282 – 65,054 na na
In making a determination as to the extent of vesting of the 2019 and 2018 ESOP instruments (in 2021 and 2020 respectively), Directors considered the following in accordance with the ESOP rules:
a) EBITDA performance of the Group having regard to respective prior years’ EBITDA performance, performance against budgets and general market conditions between the date of the offer and the vesting date
b) share price performance between the date of the offer and the vesting date
c) safety performance across all operations as determined on a financial year annual TRIFR basis, having regard to respective prior years’ TRIFR performance
d) operational performance, having particular, regard to key operational metrics.
The proportion of the vesting conditions listed above varies according to each Eligible Participant’s role, with the following table providing indicative guidelines.
ROLE (A) (B) (C) (D)
Chief Executive Officer 30% 30% 30% 10%
Corporate Management 40% 40% 20% –
Operational Management – – 50% 50%
To demonstrate the relationship between the extent of vesting and the Group’s performance over the applicable vesting periods, the table below sets out summary information about the EBITDA, share price (adjusted retrospectively to take into account the one for ten capital consolidation that took place on 7 Feb 2020), safety and operational (revenue) performance between 30 June 2018 and 30 June 202.
30 JUN 2018
30 JUN 2019
30 JUN 2020
30 JUN 2021
EBITDA ($000’s) 6,254 24,112 34,951 25,875
Share price (30-day VWAP) 39.4c 63.2c 48.5c 40.5c
Total Recordable Injury Frequency Rate (TRIFR)
12.82 14.09 11.62 7.34
Revenue ($000’s) 72,700 120,205 175,554 191,465
21Mitchell Services LtdAnnual Report 2021
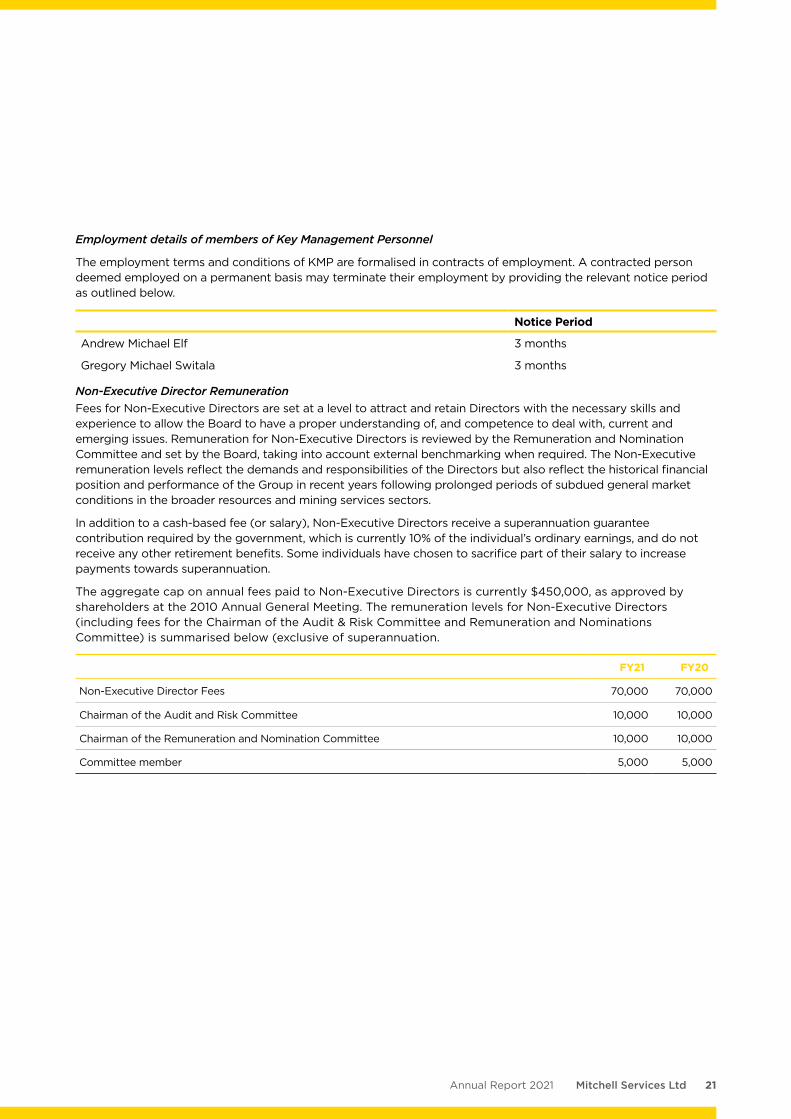
Employment details of members of Key Management Personnel
The employment terms and conditions of KMP are formalised in contracts of employment. A contracted person deemed employed on a permanent basis may terminate their employment by providing the relevant notice period as outlined below.
Notice Period
Andrew Michael Elf 3 months
Gregory Michael Switala 3 months
Non-Executive Director RemunerationFees for Non-Executive Directors are set at a level to attract and retain Directors with the necessary skills and experience to allow the Board to have a proper understanding of, and competence to deal with, current and emerging issues. Remuneration for Non-Executive Directors is reviewed by the Remuneration and Nomination Committee and set by the Board, taking into account external benchmarking when required. The Non-Executive remuneration levels reflect the demands and responsibilities of the Directors but also reflect the historical financial position and performance of the Group in recent years following prolonged periods of subdued general market conditions in the broader resources and mining services sectors.
In addition to a cash-based fee (or salary), Non-Executive Directors receive a superannuation guarantee contribution required by the government, which is currently 10% of the individual’s ordinary earnings, and do not receive any other retirement benefits. Some individuals have chosen to sacrifice part of their salary to increase payments towards superannuation.
The aggregate cap on annual fees paid to Non-Executive Directors is currently $450,000, as approved by shareholders at the 2010 Annual General Meeting. The remuneration levels for Non-Executive Directors (including fees for the Chairman of the Audit & Risk Committee and Remuneration and Nominations Committee) is summarised below (exclusive of superannuation.
FY21 FY20
Non-Executive Director Fees 70,000 70,000
Chairman of the Audit and Risk Committee 10,000 10,000
Chairman of the Remuneration and Nomination Committee 10,000 10,000
Committee member 5,000 5,000
22 Mitchell Services Ltd Annual Report 2021
DIRECTORS’ REPORTFor the year ended 30 June 2021
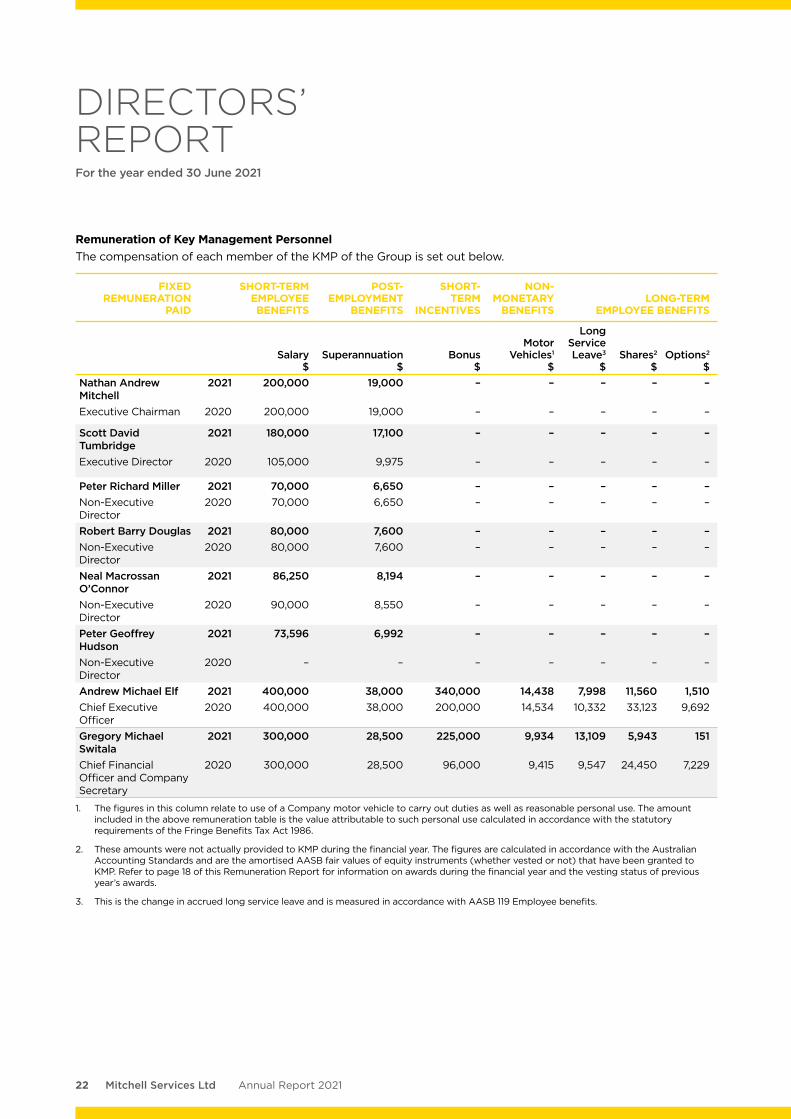
Remuneration of Key Management PersonnelThe compensation of each member of the KMP of the Group is set out below.
FIXED REMUNERATION
PAID
SHORT-TERM EMPLOYEE BENEFITS
POST-EMPLOYMENT
BENEFITS
SHORT-TERM
INCENTIVES
NON-MONETARY
BENEFITSLONG-TERM
EMPLOYEE BENEFITS
Salary $
Superannuation $
Bonus $
Motor Vehicles1
$
Long Service Leave3
$Shares2
$Options2
$Nathan Andrew Mitchell
2021 200,000 19,000 – – – – –
Executive Chairman 2020 200,000 19,000 – – – – –
Scott David Tumbridge
2021 180,000 17,100 – – – – –
Executive Director 2020 105,000 9,975 – – – – –
Peter Richard Miller 2021 70,000 6,650 – – – – –Non-Executive Director
2020 70,000 6,650 – – – – –
Robert Barry Douglas 2021 80,000 7,600 – – – – –Non-Executive Director
2020 80,000 7,600 – – – – –
Neal Macrossan O’Connor
2021 86,250 8,194 – – – – –
Non-Executive Director
2020 90,000 8,550 – – – – –
Peter Geoffrey Hudson
2021 73,596 6,992 – – – – –
Non-Executive Director
2020 – – – – – – –
Andrew Michael Elf 2021 400,000 38,000 340,000 14,438 7,998 11,560 1,510Chief Executive Officer
2020 400,000 38,000 200,000 14,534 10,332 33,123 9,692
Gregory Michael Switala
2021 300,000 28,500 225,000 9,934 13,109 5,943 151
Chief Financial Officer and Company Secretary
2020 300,000 28,500 96,000 9,415 9,547 24,450 7,229
1. The figures in this column relate to use of a Company motor vehicle to carry out duties as well as reasonable personal use. The amount included in the above remuneration table is the value attributable to such personal use calculated in accordance with the statutory requirements of the Fringe Benefits Tax Act 1986.
2. These amounts were not actually provided to KMP during the financial year. The figures are calculated in accordance with the Australian Accounting Standards and are the amortised AASB fair values of equity instruments (whether vested or not) that have been granted to KMP. Refer to page 18 of this Remuneration Report for information on awards during the financial year and the vesting status of previous year’s awards.
3. This is the change in accrued long service leave and is measured in accordance with AASB 119 Employee benefits.
23Mitchell Services LtdAnnual Report 2021
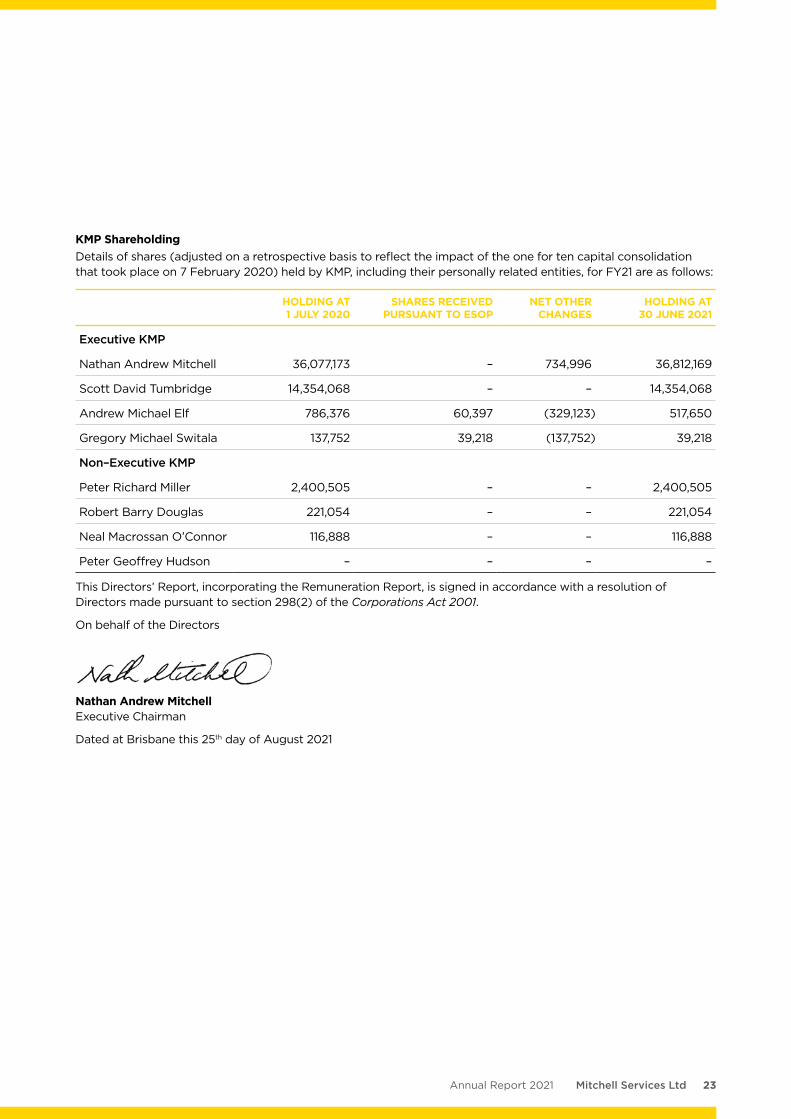
KMP ShareholdingDetails of shares (adjusted on a retrospective basis to reflect the impact of the one for ten capital consolidation that took place on 7 February 2020) held by KMP, including their personally related entities, for FY21 are as follows:
HOLDING AT 1 JULY 2020
SHARES RECEIVED PURSUANT TO ESOP
NET OTHER CHANGES
HOLDING AT 30 JUNE 2021
Executive KMP
Nathan Andrew Mitchell 36,077,173 – 734,996 36,812,169
Scott David Tumbridge 14,354,068 – – 14,354,068
Andrew Michael Elf 786,376 60,397 (329,123) 517,650
Gregory Michael Switala 137,752 39,218 (137,752) 39,218
Non–Executive KMP
Peter Richard Miller 2,400,505 – – 2,400,505
Robert Barry Douglas 221,054 – – 221,054
Neal Macrossan O’Connor 116,888 – – 116,888
Peter Geoffrey Hudson – – – –
This Directors’ Report, incorporating the Remuneration Report, is signed in accordance with a resolution of Directors made pursuant to section 298(2) of the Corporations Act 2001.
On behalf of the Directors
Nathan Andrew Mitchell Executive Chairman
Dated at Brisbane this 25th day of August 2021
24 Mitchell Services Ltd Annual Report 2021
The Board considers there to be a clear and positive relationship between the creation and delivery of long-term shareholder value and high-quality corporate governance. Accordingly, in pursuing its objective, the Board has committed to corporate governance arrangements that strive to foster the values of integrity, respect, trust and openness amongst and between the Board members, management, employees, customers and suppliers.
Unless stated otherwise in this document, the Board’s corporate governance arrangements comply with the recommendations of the ASX Corporate Governance Council as outlined in the 4th edition of the Corporate Governance Principles and Recommendations (‘Recommendations’) for the financial year ended 30 June 2021.
1. BOARD OF DIRECTORS1.1. Role of the BoardThe Board’s primary role is the protection and enhancement of long-term shareholder value. This, together with the Board’s other roles and responsibilities, is set out in the Board Charter, a copy of which can be found on the Group’s website.
To fulfil this role, the Board is responsible for the overall corporate governance of the Group including formulating its strategic direction, approving and monitoring capital expenditure, setting remuneration, appointing, removing and creating succession policies for Directors and senior executives, establishing and monitoring the achievement of management’s goals and ensuring the integrity of risk management, internal control, legal compliance and management information systems. It is also responsible for approving and monitoring financial and other reporting.
The Board has delegated responsibility for operation and administration of the Group to the Chief Executive Officer and Executive Management. Responsibilities are delineated by formal authority delegations.
1.2. Board processesTo assist in the execution of its responsibilities, the Board has established two board committees being the Remuneration and Nominations Committee and the Audit and Risk Committee. Both committees have written charters which are reviewed on a regular basis. The Board has also established a framework for the management of the Group including a system of internal control, a business risk management process and the establishment of appropriate ethical standards.
The full Board currently holds not less than 10 scheduled meetings each year, plus strategy meetings and any extraordinary meetings at such other times as may be necessary to address any specific significant matters that may arise.
The agenda for meetings is prepared by the Company Secretary in conjunction with the Chairman. Standing items include the Chief Executive Officer report, People and Risk report, Human Resources Report, General Manager’s reports, Financial reports, Asset reports and Commercial and Business Development reports. The Board package is provided to Directors and relevant management in advance of meetings. Executives are regularly involved in Board discussions and Directors have other opportunities, including visits to business operations, for contact with a wider group of employees.
The Company Secretary is accountable directly to the Board, through the Chairman, on all matters associated with the proper functioning of the Board.
1.3. Director and executive educationThe Group has an informal induction process to educate new Directors about the nature of the business, current issues, the corporate strategy, the culture and values of the Group, and the expectations of the Group concerning performance of Directors. In addition, Directors are also educated regarding meeting arrangements and Director interaction with each other, senior executives and other stakeholders. Directors also have the opportunity to visit Group facilities and meet with management to gain a better understanding of business operations and operating environment. Directors are given access to continuing education opportunities to update and enhance their skills and knowledge.
The Group also has an informal process to induct new senior executives upon taking such positions. This involves taking the executives through the Group’s structure, strategy, operations, financial position and risk management policies.
1.4. Independent professional advice and access to Group information
Each Director has the right of access to all relevant Group information and to the Group’s Executives and, subject to prior consultation with the Chairman, may seek independent professional advice from a suitably qualified adviser at the Group’s expense. The Directors must consult with an adviser suitably qualified in the relevant field and obtain the Chairman’s approval of the fee payable for the advice before proceeding with the consultation. A copy of the advice received by the Directors is made available to all other members of the Board.
1.5. Composition of the BoardThe names of the Directors of the Company in office at the date of this report together with their respective mix of skills, experience and length of service are set out in the Directors’ Report on pages 8 and 9 of this report.
CORPORATE GOVERNANCE STATEMENTFor the year ended 30 June 2021
25Mitchell Services LtdAnnual Report 2021
The Group believes, for efficiency of operations, it is in its best interests to maintain a small but efficient Board. During the 12 months ended 30 June 2021, the Board consisted of 4 Non-executive Directors (being Peter Miller, Robert Douglas, Neal O’Connor and Peter Hudson), executive Director Scott Tumbridge and Executive Chairman, Nathan Mitchell. Throughout the 12 months ended 30 June 2021, three of the six board members are considered independent, being Robert Douglas, Neal O’Connor and Peter Hudson.
The Executive Chairman is Mr Nathan Mitchell. Under the guidelines, Mr Mitchell does not meet the criteria for independence as he is a director of a substantial shareholder. Peter Richard Miller was previously employed by the Company in an executive capacity and as such does not meet the criteria for independence. Mr Scott Tumbridge does not meet the criteria for independence as he was previously employed by the Group in an executive capacity. He is also a director of a substantial shareholder. Under the guidelines, the majority of the Board should be independent as should the Chair. All Directors are committed to bringing their independent views and judgment to the Board and, in accordance with the Corporations Act 2001, must inform the Board if they have any interest that could conflict with those of the Group. Where the Board considers that a conflict exists, the Director concerned will not be present at the meeting while the item is considered. For these reasons, the Board believes that each of these Directors may be considered to be acting independently in the execution of their duties.
Additionally, notwithstanding Mr Mitchell’s executive capacity and non-independent status, it is the view of the Board that Mr Mitchell brings a particular and unparalleled skills set to the Group, having established the Company, been involved in the drilling industry for his entire working life and being a pioneer of this industry in Australia, is uniquely placed to act as Chairman of the Group.
The Board considers the mix of skills and the diversity of Board members when assessing the composition of the Board. The Board assesses existing and potential Directors’ skills to ensure they have appropriate industry expertise in the Group’s business operations. The Board undertakes appropriate checks before appointing a person as a Director and provides security holders with all material information relevant to a decision on whether or not to elect a Director. The Board’s policy is to seek a diverse range of Directors who have a range of skills, ages, genders and ethnicity that complements the environment in which the Group operates and having due regard to the current size of the Group (refer section 8 below on skills and diversity). Directors each have a written agreement with the Group setting out the terms of their appointment.
2. REMUNERATION AND NOMINATION COMMITTEE
The Remuneration and Nomination Committee has a documented charter, approved by the Board. The Remuneration and Nomination Committee comprises three members – Neal O’Connor (Chair), Robert Douglas and Peter Hudson — each of whom are Non-Executive Directors. The Chairman of the Committee, Neal O’Connor, is an independent Director. The Committee has 2 distinct roles as follows:
• Remuneration related matters; and
• Nomination related matters.
All Directors are invited to Remuneration and Nomination Committee meetings at the discretion of the Committee. The Committee met three times during the year and Committee members’ attendance record is disclosed in the table of Directors’ meetings on page 15 of this report.
Remuneration related mattersThe Committee assists the Board in the general application of the remuneration policy. In doing so, the Committee is responsible for:
• Developing remuneration policies for Directors and Key Management Personnel;
• Reviewing Key Management Personnel packages annually and, based on these reviews, making recommendations to the Board on remuneration levels for Key Management Personnel; and
• Assisting the Board in reviewing Key Management Personnel performance annually.
Executive Directors and Senior Executives are remunerated by way of salary, non-monetary benefits, statutory superannuation, short-term incentive payments and participation in the Mitchell Services Limited Executive Share and Option Plan (ESOP) in accordance with written agreements that set out the terms of their appointments. Non-Executive Directors are remunerated by way of salary and statutory superannuation. There are no schemes for retirement benefits for Directors other than statutory superannuation arrangements. Further disclosure on the policies and practices regarding remuneration is contained in the Remuneration Report of this Annual Report.
Nomination related mattersThe Committee assists the Board in ensuring that the Board comprises Directors with a range and mix of attributes appropriate for achieving its objective. The Committee does this by:
• Overseeing the appointment and induction process for Directors;
• Reviewing the skills and expertise of Directors and identifying potential deficiencies;
26 Mitchell Services Ltd Annual Report 2021
• Identifying suitable candidates for the Board;• Overseeing Board and Directors reviews on an
annual basis; and• Establishing succession planning arrangements
for the Executive team.
3. AUDIT AND RISK COMMITTEEThe Audit and Risk Committee has a documented charter, approved by the Board. The Committee comprises three members – Peter Hudson (Chair), Neal O’Connor and Robert Douglas - each of whom are Non-Executive Directors
The Chairman of the Committee, Peter Hudson, is an independent Director and is not the Chairman of the Board. The purpose of the Committee is to assist the Board in the effective discharge of its responsibilities in relation to the external audit function, accounting policies, financial reporting, funding, financial risk management, business risk monitoring and insurance.
The external auditors and the Chief Executive Officer are invited to Audit and Risk Committee meetings at the discretion of the Committee. The Committee met three times during the year and Committee members’ attendance record is disclosed in the table of Directors’ meetings on page 15 of this report.
The Chief Executive Officer and the Chief Financial Officer declared in writing to the Board that the financial records of the Group for the financial year have been properly maintained, the Group’s financial reports for the financial year ended 30 June 2021 comply with accounting standards and present a true and fair view of the Group’s financial condition and operational results and that the opinion has been formed on the basis of a sound system of risk management and internal control which is operating effectively. This statement is required annually.
The Group’s external auditor audits, or in the case of the half-year, reviews the Group’s financial reports in accordance with the accounting standards.
Management verifies other periodic corporate reports. The verification processes involve a management and operational review and include cross checking statements, information and data to original source reports.
All documents released to the market are subject to final sign off and approval by relevant senior executives and, as required, the Board.
4. PERFORMANCE EVALUATIONThe Remuneration and Nomination Committee is required to annually review the effectiveness of the functioning of the Board, its committees, individual Directors and Senior Executives through internal peer review.
5. RISK MANAGEMENTThe Board considers identification and management of key risks associated with the business as vital to creating and delivering long-term shareholder value.
The main risks that could negatively impact on the performance of the Group’s business activities include:
• Safety of employees and contractors;• Seasonal conditions and business interruptions;• Dependence on key personnel and labour shortages;• Obsolescence to certain machinery due to
technological advancements or client requirements; • Customer demand and outlook for the resources
industry.
An assessment of the business’ risk profile and its risk management framework is undertaken and reviewed by the Board at least annually, covering all aspects of the business from the operational level through to strategic level risks to ensure that the Group is operating within the risk appetite set by the Board. Executive management has been delegated the task of implementing internal controls to identify and manage risks for which the Board provides oversight. The effectiveness of these controls is monitored and reviewed regularly by management. Executive management has reported on an ongoing basis (via monthly Board meetings) to the Board as to whether the Group’s business risks have been effectively managed.
In addition to their regular reporting on business risks, risk management and internal control systems, the Chief Executive Officer and Chief Financial Officer have provided assurance, in writing to the Board:
• That the financial reporting risk management and associated compliance and controls have been assessed and found to be operating effectively; and
• The Group’s financial reports are founded on a sound system of risk management and internal compliance and control.
The Group’s operations are not subject to any particular and significant environmental regulation under the law of the Commonwealth or a State or Territory. However, the Group does provide services to entities that are licensed or otherwise subject to conditions for the purposes of environmental legislation or regulation. In such cases, the Group manages its risks and undertakes its compliance duties in accordance with contractor
CORPORATE GOVERNANCE STATEMENTFor the year ended 30 June 2021
27Mitchell Services LtdAnnual Report 2021
regime implemented by the licensed or regulated entity. Additionally, the Group is not aware of any material exposure to any particular social risks.
The Board is responsible for the overall internal control framework, but recognises that no cost-effective internal control system will preclude all errors and irregularities. Given the size of the Group, there is no dedicated internal audit function. In the absence of an internal audit function, comprehensive practices have been established to ensure:
• Capital expenditure and revenue commitments above a certain size obtain prior Board approval;
• Financial exposures are controlled;• Health and safety standards and management
systems are monitored and reviewed to achieve high standards of performance and compliance with regulations;
• Business transactions are properly authorised and executed;
• The quality and integrity of personnel;• Financial reporting accuracy and compliance
with the financial reporting regulatory framework. Monthly actual results are reported against budgets approved by the Directors and revised forecasts for the year are prepared regularly; and
• Regulation compliance. The Group’s health, safety, environment and sustainability obligations are monitored by all members of the Board.
6. ETHICAL STANDARDS AND GROUP VALUES
All Directors, managers and employees are expected to act with the utmost integrity and objectivity, striving at all times to enhance the reputation and performance of the Group and to live the Group’s values. Every employee has a nominated supervisor to whom they may refer any issues arising from their employment. The Board reviews its Code of Conduct and Ethics regularly and processes are in place to promote and communicate these policies.
Conflict of interest
Directors must keep the Board advised, on an ongoing basis, of any interest that could potentially conflict with those of the Group. The Board has developed procedures to assist Directors to disclose potential conflicts of interest.
Where the Board believes that a conflict exists the Director concerned will not be present at the meeting while the item is considered. Details of Director related entity transactions with the Group are set out in Note 23 to the financial statements.
Code of Conduct
The Group has advised each Director, manager and employee that they must comply with the Group’s Code of Conduct and Ethics. The code requires all Directors, management and employees to, at all times and with all relevant stakeholders:
• Act honestly and in good faith;• Exercise due care and diligence in fulfilling the
functions of office;• Avoid conflicts and make full disclosure of any
possible conflict of interest;• Comply with both the letter and spirit of the law;• Encourage the reporting and investigation of
unlawful and unethical behaviour; and• Comply with the security trading policy.
Whistleblower PolicyThe Group is committed to encouraging and supporting ethical and responsible behaviour. It is also committed to creating and maintaining an open working environment in which concerns regarding unethical, unlawful or undesirable conduct are able to be raised and reported. The policy sets out:
• The process by which concerns can be reported without fear of reprisal
• The investigation process to follow on receipt of a whistleblower report
• The Group’s commitment to rectify any discovered wrongdoing
• The measures in place to protect the whistleblower.
Security Trading PolicyThe Security Trading Policy restricts Directors and employees from acting on price sensitive information (which is not available to the public) until it has been released to the market and adequate time has been given for this to be reflected in the Company’s share price.
Directors and other Key Management Personnel are also prohibited from trading during closed periods. Closed periods are the following periods:
• The period from 1 July until the first trading day after the release of the Company’s annual result to the ASX;
• The period from 1 January until the first trading day after the release of the Company’s half yearly result to the ASX;
• The period from 1 October until the first trading day after the release of the Company’s 30 September quarterly investor report; and
• The period from 1 April until the first trading day after the release of the Company’s 30 March quarterly investor report.
28 Mitchell Services Ltd Annual Report 2021
Anti Bribery and Corruption PolicyThe Group is committed to protecting its assets and reputation by reinforcing the Board and management’s commitment to identify if there are any fraudulent and corrupt activities, for establishing policies, controls and procedures for the prevention and detection of any such activities that may exist and to reinforce to all employees to report any corrupt and fraudulent conduct that they may be aware of. The policy sets out:
• Definitions of Bribery and Corruption;• Examples of conduct which amounts to bribery
and/or corruption• Rules around the prohibition of bribes and
facilitation payments• Rules around gifts and hospitality and gift and
entertainment expenditure• Rules around charitable contributions.
Group ValuesThe Group has adopted and is committed to upholding the following values:
• Finish each day without harm• Foster a culture of respect, support, trust and
recognition• Never openly criticise any team member. Blame is
not productive• Understand your role. Embrace your role. Execute
your role• Provide quality services through effective strategy,
structure and systems• Continuously improve and find a better way.
The Group Values are published on the Group’s website.
7. COMMUNICATION WITH SHAREHOLDERS
The Board provides shareholders with information using a comprehensive Continuous Disclosure Policy and investor relations program which includes identifying matters that may have a material effect on the price of the Company’s shares and notifying them to the ASX.
In summary, the Continuous Disclosure Policy operates as follows:
• The Company Secretary (also the Chief Financial Officer) and the Chief Executive Officer are responsible for interpreting the Group’s policy and where necessary informing the Board. The Company Secretary is responsible for all communications with the ASX. Such matters are advised to the ASX after they are discovered but are referred to the Board in the first instance.
• The full Annual Report is provided via the Company’s website to all shareholders. It provides relevant information about the operations of the Group during the year, changes in the state of affairs and details of future developments.
• The half-yearly report contains summarised financial information and a review of the operations of the Group during the period. The half-year reviewed financial report is lodged with the ASX and sent to any shareholder who requests it.
• Proposed major changes in the Group which may impact on share ownership rights are submitted to a vote of shareholders.
• All announcements made to the market can be accessed via the Company’s website after they have been released to the ASX.
• The external auditor attends the Annual General Meetings to answer questions concerning the conduct of the audit, the preparation and content of the auditor’s report, accounting policies adopted by the Group and the independence of the auditor in relation to the conduct of the audit.
Copies of all material market announcements are provided to the Directors promptly after such announcements have been made to the market. Any new and substantive investor or analyst presentations are released by the Group to the market ahead of any presentation to investors and/or analysts.
Governance-related materials are available for review by shareholders under the ‘Investors’ section of the Group’s website and includes all key corporate policies. In the event that shareholders have any queries as to their holding or as regards the Group’s operations, an investor email address ([email protected]) is available, and all enquiries are promptly addressed. Shareholders are welcome to attend investor briefings and to ask questions at those briefings. Details of these briefings are released to the market periodically via the ASX platform.
The Group strongly encourages shareholders to elect to receive all communications via its registrar (Link Market Services) electronically.
The Board encourages full participation of shareholders at the Annual General Meeting (AGM), to ensure a high level of accountability and identification with the Group’s strategy and goals. Important issues are presented to the shareholders as single resolutions. Shareholders are encouraged to submit questions ahead of the AGM so that these may be addressed at the AGM.
CORPORATE GOVERNANCE STATEMENTFor the year ended 30 June 2021
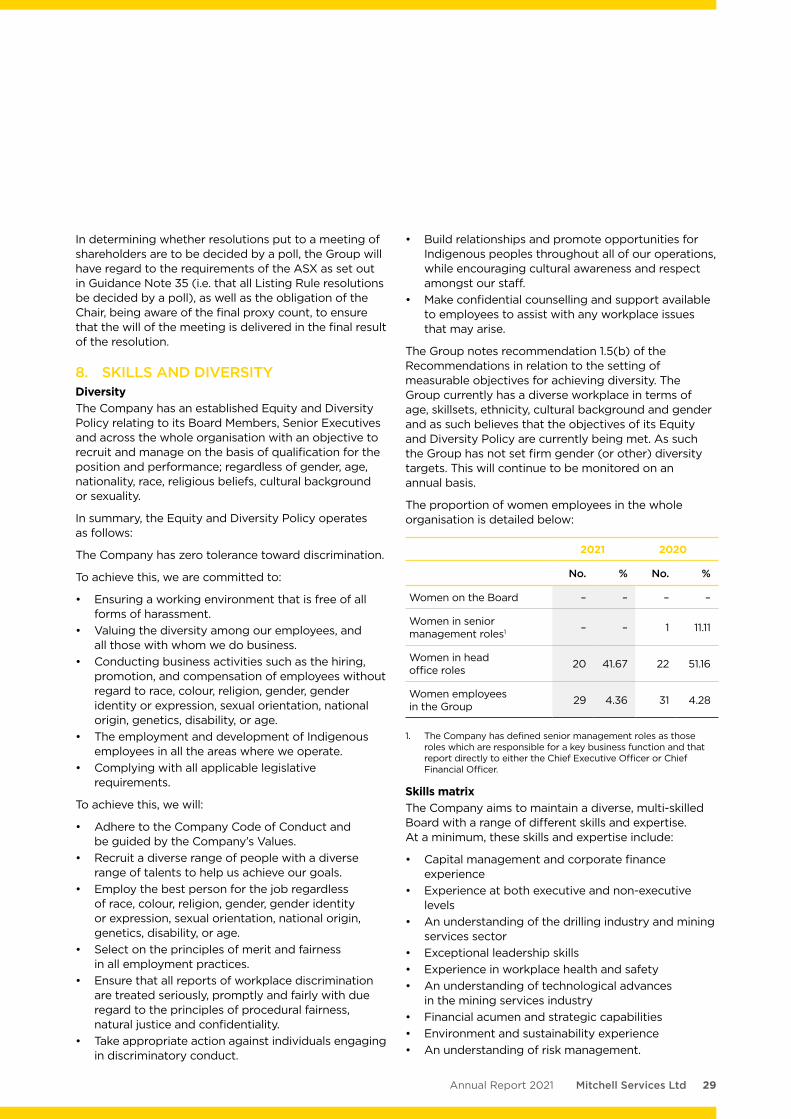
29Mitchell Services LtdAnnual Report 2021
In determining whether resolutions put to a meeting of shareholders are to be decided by a poll, the Group will have regard to the requirements of the ASX as set out in Guidance Note 35 (i.e. that all Listing Rule resolutions be decided by a poll), as well as the obligation of the Chair, being aware of the final proxy count, to ensure that the will of the meeting is delivered in the final result of the resolution.
8. SKILLS AND DIVERSITYDiversityThe Company has an established Equity and Diversity Policy relating to its Board Members, Senior Executives and across the whole organisation with an objective to recruit and manage on the basis of qualification for the position and performance; regardless of gender, age, nationality, race, religious beliefs, cultural background or sexuality.
In summary, the Equity and Diversity Policy operates as follows:
The Company has zero tolerance toward discrimination.
To achieve this, we are committed to:
• Ensuring a working environment that is free of all forms of harassment.
• Valuing the diversity among our employees, and all those with whom we do business.
• Conducting business activities such as the hiring, promotion, and compensation of employees without regard to race, colour, religion, gender, gender identity or expression, sexual orientation, national origin, genetics, disability, or age.
• The employment and development of Indigenous employees in all the areas where we operate.
• Complying with all applicable legislative requirements.
To achieve this, we will:
• Adhere to the Company Code of Conduct and be guided by the Company’s Values.
• Recruit a diverse range of people with a diverse range of talents to help us achieve our goals.
• Employ the best person for the job regardless of race, colour, religion, gender, gender identity or expression, sexual orientation, national origin, genetics, disability, or age.
• Select on the principles of merit and fairness in all employment practices.
• Ensure that all reports of workplace discrimination are treated seriously, promptly and fairly with due regard to the principles of procedural fairness, natural justice and confidentiality.
• Take appropriate action against individuals engaging in discriminatory conduct.
• Build relationships and promote opportunities for Indigenous peoples throughout all of our operations, while encouraging cultural awareness and respect amongst our staff.
• Make confidential counselling and support available to employees to assist with any workplace issues that may arise.
The Group notes recommendation 1.5(b) of the Recommendations in relation to the setting of measurable objectives for achieving diversity. The Group currently has a diverse workplace in terms of age, skillsets, ethnicity, cultural background and gender and as such believes that the objectives of its Equity and Diversity Policy are currently being met. As such the Group has not set firm gender (or other) diversity targets. This will continue to be monitored on an annual basis.
The proportion of women employees in the whole organisation is detailed below:
2021 2020
No. % No. %
Women on the Board – – – –
Women in senior management roles1 – – 1 11.11
Women in head office roles 20 41.67 22 51.16
Women employees in the Group 29 4.36 31 4.28
1. The Company has defined senior management roles as those roles which are responsible for a key business function and that report directly to either the Chief Executive Officer or Chief Financial Officer.
Skills matrixThe Company aims to maintain a diverse, multi-skilled Board with a range of different skills and expertise. At a minimum, these skills and expertise include:
• Capital management and corporate finance experience
• Experience at both executive and non-executive levels
• An understanding of the drilling industry and mining services sector
• Exceptional leadership skills• Experience in workplace health and safety• An understanding of technological advances
in the mining services industry• Financial acumen and strategic capabilities• Environment and sustainability experience• An understanding of risk management.
30 Mitchell Services Ltd Annual Report 2021
Limited liability by a scheme approved under professional standards legislation. Trademark of Chartered Accountants Australia and New Zealand and used with permission A.B.N.: 99 194 967 950
IINNDDEEPPEENNDDEENNCCEE DDEECCLLAARRAATTIIOONN TTOO TTHHEE DDIIRREECCTTOORRSS OOFF MMIITTCCHHEELLLL SSEERRVVIICCEESS LLIIMMIITTEEDD FFOORR TTHHEE YYEEAARR EENNDDEEDD 3300 JJUUNNEE 22002211 In accordance with section 307C of the Corporations Act 2001, I declare that, to the best of my knowledge and belief, in relation to the audit of Mitchell Services Limited for the year ended 30 June 2021, there have been no contraventions of:
the auditor independence requirements of the Corporations Act 2001 in relation to the audit; and any applicable code of professional conduct in relation to the audit.
Jessups
Paul Sapelli Partner Level 1, 211 Sturt Street, Townsville, QLD 4810 Dated: 25 August 2021
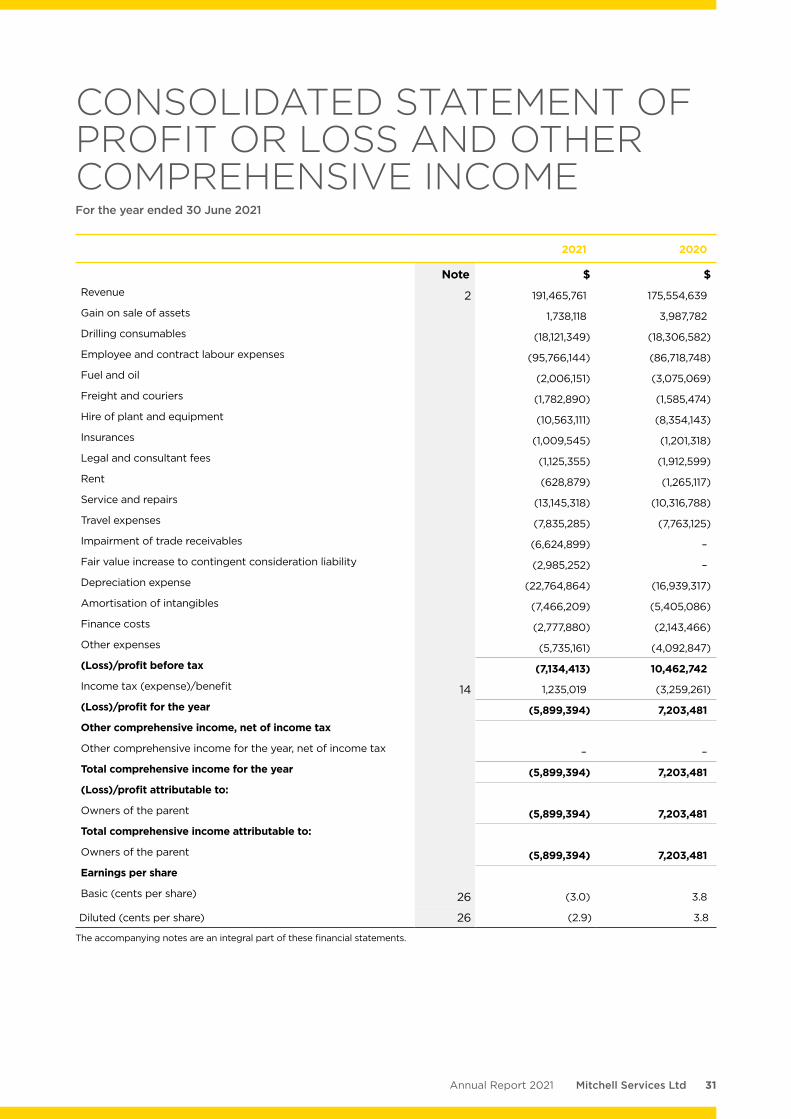
31Mitchell Services LtdAnnual Report 2021
2021 2020
Note $ $Revenue 2 191,465,761 175,554,639
Gain on sale of assets 1,738,118 3,987,782
Drilling consumables (18,121,349) (18,306,582)
Employee and contract labour expenses (95,766,144) (86,718,748)
Fuel and oil (2,006,151) (3,075,069)
Freight and couriers (1,782,890) (1,585,474)
Hire of plant and equipment (10,563,111) (8,354,143)
Insurances (1,009,545) (1,201,318)
Legal and consultant fees (1,125,355) (1,912,599)
Rent (628,879) (1,265,117)
Service and repairs (13,145,318) (10,316,788)
Travel expenses (7,835,285) (7,763,125)
Impairment of trade receivables (6,624,899) –
Fair value increase to contingent consideration liability (2,985,252) –
Depreciation expense (22,764,864) (16,939,317)
Amortisation of intangibles (7,466,209) (5,405,086)
Finance costs (2,777,880) (2,143,466)
Other expenses (5,735,161) (4,092,847)
(Loss)/profit before tax (7,134,413) 10,462,742Income tax (expense)/benefit 14 1,235,019 (3,259,261)
(Loss)/profit for the year (5,899,394) 7,203,481Other comprehensive income, net of income tax Other comprehensive income for the year, net of income tax – –
Total comprehensive income for the year (5,899,394) 7,203,481(Loss)/profit attributable to: Owners of the parent (5,899,394) 7,203,481Total comprehensive income attributable to: Owners of the parent (5,899,394) 7,203,481Earnings per share Basic (cents per share) 26 (3.0) 3.8
Diluted (cents per share) 26 (2.9) 3.8
The accompanying notes are an integral part of these financial statements.
CONSOLIDATED STATEMENT OF PROFIT OR LOSS AND OTHER COMPREHENSIVE INCOME For the year ended 30 June 2021
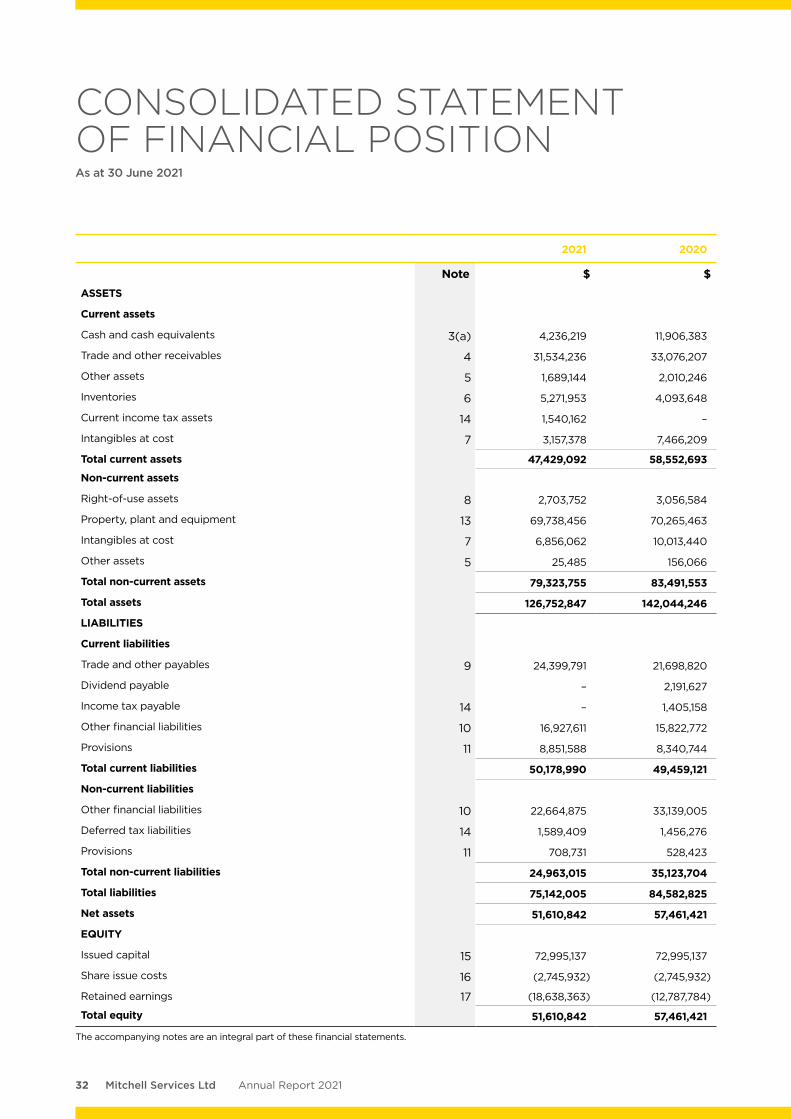
32 Mitchell Services Ltd Annual Report 2021
2021 2020
Note $ $ASSETS Current assets
Cash and cash equivalents 3(a) 4,236,219 11,906,383
Trade and other receivables 4 31,534,236 33,076,207
Other assets 5 1,689,144 2,010,246
Inventories 6 5,271,953 4,093,648
Current income tax assets 14 1,540,162 –
Intangibles at cost 7 3,157,378 7,466,209
Total current assets 47,429,092 58,552,693
Non-current assets
Right-of-use assets 8 2,703,752 3,056,584
Property, plant and equipment 13 69,738,456 70,265,463
Intangibles at cost 7 6,856,062 10,013,440
Other assets 5 25,485 156,066
Total non-current assets 79,323,755 83,491,553
Total assets 126,752,847 142,044,246
LIABILITIES
Current liabilities
Trade and other payables 9 24,399,791 21,698,820
Dividend payable – 2,191,627
Income tax payable 14 – 1,405,158
Other financial liabilities 10 16,927,611 15,822,772
Provisions 11 8,851,588 8,340,744
Total current liabilities 50,178,990 49,459,121
Non-current liabilities
Other financial liabilities 10 22,664,875 33,139,005
Deferred tax liabilities 14 1,589,409 1,456,276
Provisions 11 708,731 528,423
Total non-current liabilities 24,963,015 35,123,704
Total liabilities 75,142,005 84,582,825
Net assets 51,610,842 57,461,421
EQUITY
Issued capital 15 72,995,137 72,995,137
Share issue costs 16 (2,745,932) (2,745,932)
Retained earnings 17 (18,638,363) (12,787,784)
Total equity 51,610,842 57,461,421
The accompanying notes are an integral part of these financial statements.
CONSOLIDATED STATEMENT OF FINANCIAL POSITION As at 30 June 2021
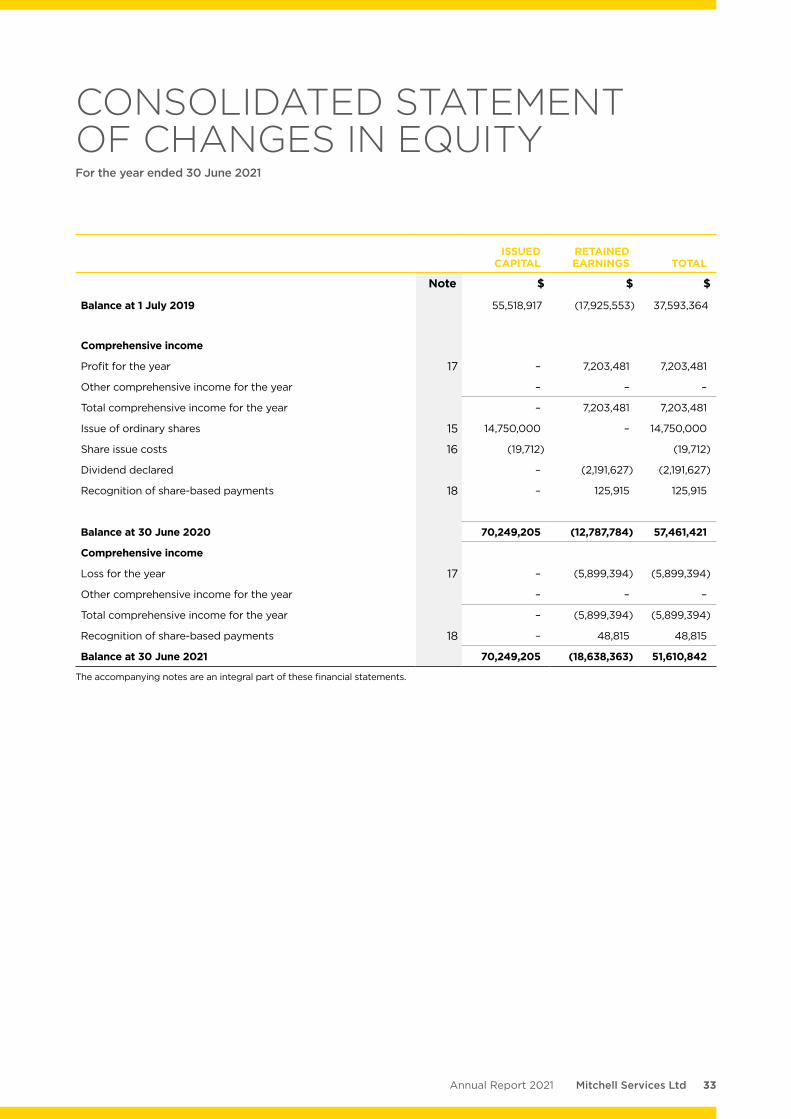
33Mitchell Services LtdAnnual Report 2021
ISSUED CAPITAL
RETAINED EARNINGS TOTAL
Note $ $ $
Balance at 1 July 2019 55,518,917 (17,925,553) 37,593,364
Comprehensive income
Profit for the year 17 – 7,203,481 7,203,481
Other comprehensive income for the year – – –
Total comprehensive income for the year – 7,203,481 7,203,481
Issue of ordinary shares 15 14,750,000 – 14,750,000
Share issue costs 16 (19,712) (19,712)
Dividend declared – (2,191,627) (2,191,627)
Recognition of share-based payments 18 – 125,915 125,915
Balance at 30 June 2020 70,249,205 (12,787,784) 57,461,421
Comprehensive income
Loss for the year 17 – (5,899,394) (5,899,394)
Other comprehensive income for the year – – –
Total comprehensive income for the year – (5,899,394) (5,899,394)
Recognition of share-based payments 18 – 48,815 48,815
Balance at 30 June 2021 70,249,205 (18,638,363) 51,610,842
The accompanying notes are an integral part of these financial statements.
CONSOLIDATED STATEMENT OF CHANGES IN EQUITY For the year ended 30 June 2021
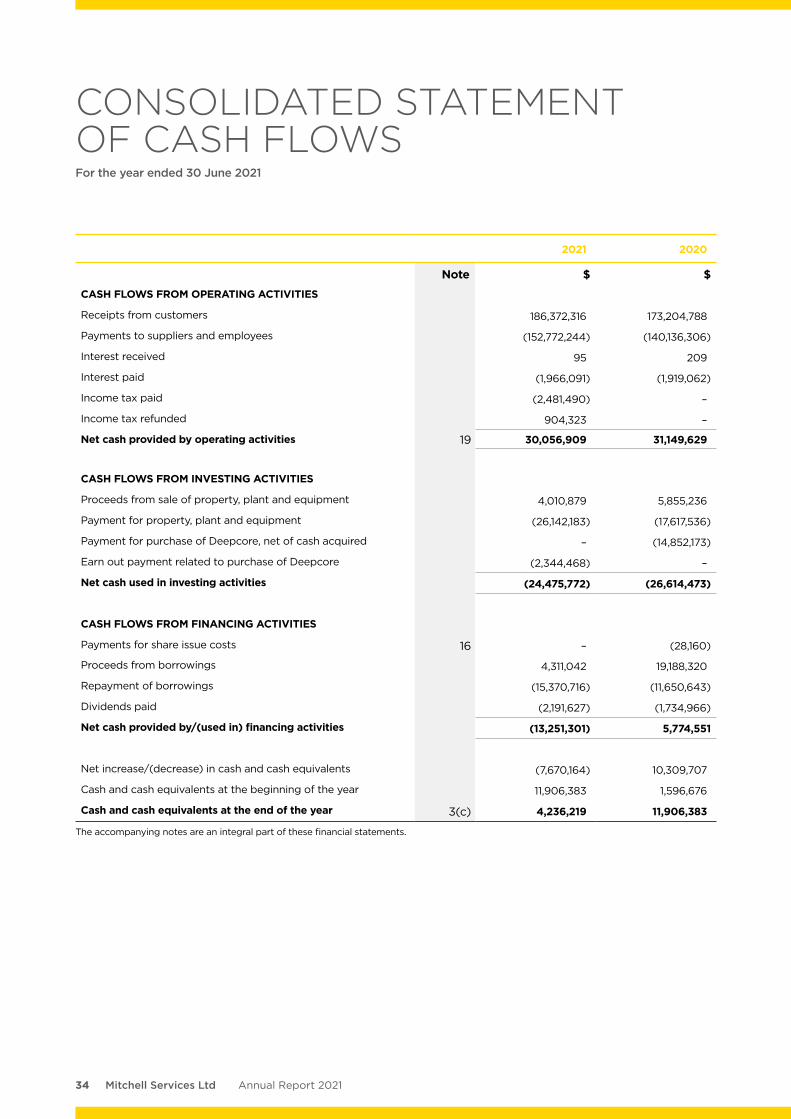
34 Mitchell Services Ltd Annual Report 2021
2021 2020
Note $ $
CASH FLOWS FROM OPERATING ACTIVITIES Receipts from customers 186,372,316 173,204,788
Payments to suppliers and employees (152,772,244) (140,136,306)
Interest received 95 209
Interest paid (1,966,091) (1,919,062)
Income tax paid (2,481,490) –
Income tax refunded 904,323 –
Net cash provided by operating activities 19 30,056,909 31,149,629
CASH FLOWS FROM INVESTING ACTIVITIES
Proceeds from sale of property, plant and equipment 4,010,879 5,855,236
Payment for property, plant and equipment (26,142,183) (17,617,536)
Payment for purchase of Deepcore, net of cash acquired – (14,852,173)
Earn out payment related to purchase of Deepcore (2,344,468) –
Net cash used in investing activities (24,475,772) (26,614,473)
CASH FLOWS FROM FINANCING ACTIVITIES
Payments for share issue costs 16 – (28,160)
Proceeds from borrowings 4,311,042 19,188,320
Repayment of borrowings (15,370,716) (11,650,643)
Dividends paid (2,191,627) (1,734,966)
Net cash provided by/(used in) financing activities (13,251,301) 5,774,551
Net increase/(decrease) in cash and cash equivalents (7,670,164) 10,309,707
Cash and cash equivalents at the beginning of the year 11,906,383 1,596,676
Cash and cash equivalents at the end of the year 3(c) 4,236,219 11,906,383
The accompanying notes are an integral part of these financial statements.
CONSOLIDATED STATEMENT OF CASH FLOWS For the year ended 30 June 2021
35Mitchell Services LtdAnnual Report 2021
1. SIGNIFICANT ACCOUNTING POLICIES (a) General informationMitchell Services Ltd (Company) is a limited company incorporated in Australia. The addresses of its registered office and principal place of business are disclosed in the Corporate Directory of this Annual Report. The principal activities of the Company and its subsidiaries (Group) are exploration and mine site drilling services to the exploration, mining, and energy industries, primarily in Australia.
(b) Basis of preparationThese general purpose consolidated financial statements have been prepared in accordance with the Corporations Act 2001, Australian Accounting Standards and Interpretations of the Australian Accounting Standards Board and in compliance with International Financial Reporting Standards as issued by the International Accounting Standards Board. The Group is a for-profit entity for financial reporting purposes under Australian Accounting Standards. Material accounting policies adopted in the preparation of these financial statements are presented below and have been consistently applied unless stated otherwise.
Except for cash flow information, the financial statements have been prepared on an accrual basis and are based on historical costs, modified, where applicable, by the measurement at fair value of selected non-current assets, financial assets and financial liabilities.
The financial statements were authorised for issue by the Directors on the date shown in the Directors’ Declaration.
(c) Principles of consolidationThe consolidated financial statements incorporate all of the assets, liabilities and results of the Company and all of the subsidiaries. Subsidiaries are entities that the Parent controls. The Parent controls an entity when it is exposed to, or has rights to, variable returns from its involvement with the entity and has the ability to affect those returns through its power over the entity. A list of the subsidiaries is provided in Note 20.
The assets, liabilities and results of all subsidiaries are fully consolidated into the financial statements of the Group from the date on which control is obtained by the Group. The consolidation of a subsidiary is discontinued from the date that control ceases. Intercompany transactions, balances and unrealised gains or losses on transactions between Group entities are fully eliminated on consolidation.
Accounting policies of subsidiaries have been changed and adjustments made where necessary to ensure uniformity of the accounting policies adopted by the Group.
Equity interests in a subsidiary not attributable, directly or indirectly, to the Group are presented as “non-controlling interests”. The Group initially recognises non-controlling interests that are present ownership interests in subsidiaries and are entitled to a proportionate share of the subsidiary’s net assets on liquidation at either fair value or at the non-controlling interests’ proportionate share of the subsidiary’s net assets. Subsequent to initial recognition, non-controlling interests are attributed their share of profit or loss and each component of other comprehensive income. Non-controlling interests are shown separately within the equity section of the statement of financial position and statement of comprehensive income.
(d) Business combinationsBusiness combinations occur where an acquirer obtains control over one or more businesses.
A business combination is accounted for by applying the acquisition method, unless it is a combination involving entities or businesses under common control. The business combination will be accounted for from the date that control is obtained, whereby the fair value of the identifiable assets acquired and liabilities (including contingent liabilities) assumed is recognised (subject to certain limited exemptions).
When measuring the consideration transferred in the business combination, any asset or liability resulting from a contingent consideration arrangement is also included. Subsequent to initial recognition, contingent consideration classified as equity is not remeasured and its subsequent settlement is accounted for within equity. Contingent consideration classified as an asset or liability is remeasured in each reporting period to fair value, recognising any change to fair value in profit or loss, unless the change in value can be identified as existing at acquisition date.
All transaction costs incurred in relation to business combinations, other than those associated with the issue of a financial instrument, are recognised as expenses in profit or loss when incurred.
The acquisition of a business may result in the recognition of goodwill or a gain from a bargain purchase.
NOTES TO THE CONSOLIDATED FINANCIAL STATEMENTSFor the year ended 30 June 2021
36 Mitchell Services Ltd Annual Report 2021
(e) IntangiblesGoodwill and ImpairmentGoodwill is carried at cost less any accumulated impairment losses. Goodwill is calculated as the excess of the sum of:
(i) the consideration transferred at fair value;
(ii) any non-controlling interest (determined under either the fair value or proportionate interest method); and
(iii) the acquisition date fair value of any previously held equity interest;
over the acquisition date fair value of any identifiable assets acquired and liabilities assumed.
The acquisition date fair value of the consideration transferred for a business combination plus the acquisition date fair value of any previously held equity interest shall form the cost of the investment in the separate financial statements.
Changes in the Group’s ownership interests in subsidiaries that do not result in the Group losing control over the subsidiaries are accounted for as equity transactions. The carrying amounts of the Group’s interests and the non-controlling interests are adjusted to reflect the changes in their relative interests in the subsidiaries. Any difference between the amount by which the noncontrolling interests are adjusted and the fair value of the consideration paid or received is recognised directly in equity and attributed to owners of the Company.
When the Group loses control of a subsidiary, a gain or loss is recognised in profit or loss and is calculated as the difference between (i) the aggregate of the fair value of the consideration received and the fair value of any retained interest and (ii) the previous carrying amount of the assets (including goodwill), and liabilities of the subsidiary and any non-controlling interests. All amounts previously recognised in other comprehensive income in relation to that subsidiary are accounted for as if the Group had directly disposed of the related assets or liabilities of the subsidiary (i.e. reclassified to profit or loss or transferred to another category of equity as specified/permitted by applicable Accounting Standards). The fair value of any investment retained in the former subsidiary at the date when control is lost is regarded as the fair value on initial recognition for subsequent accounting under AASB 139: Financial Instruments: Recognition and Measurement, when applicable, the cost on initial recognition of an investment in an associate or a joint venture.
The amount of goodwill recognised on acquisition of each subsidiary in which the Group holds less than 100% interest will depend on the method adopted in measuring the non-controlling interest. The Group can elect in most circumstances to measure the non-controlling interest in the acquiree either at fair value (full goodwill method) or at the non-controlling interest’s proportionate share of the subsidiary’s identifiable net assets (proportionate interest method). In such circumstances, the Group determines which method to adopt for each acquisition and this is stated in the respective note to the financial statements disclosing the business combination.
Under the full goodwill method, the fair value of the non-controlling interest is determined using valuation techniques which make the maximum use of market information where available.
Goodwill on acquisition of subsidiaries is included in intangible assets. Goodwill on acquisition of associates is included in investments in associates.
Goodwill is tested for impairment annually and is allocated to the Group’s cash-generating units or groups of cash-generating units, representing the lowest level at which goodwill is monitored and not larger than an operating segment. Gains and losses on the disposal of an entity include the carrying amount of goodwill related to the entity disposed of.
Changes in the ownership interests in a subsidiary that do not result in a loss of control are accounted for as equity transactions and do not affect the carrying amounts of goodwill.
Customer contracts Customer contracts acquired are initially recognised at fair value and are subsequently carried at fair value less accumulated amortisation and accumulated impairment losses. These costs are amortised to profit or loss using the straight-line method over the contract period or estimated useful life, whichever is shorter.
(f) Revenue recognitionRevenue is recognised for the major business activities as follows:
Revenue from contracts with customersThe Group provides drilling services to the exploration, mining and energy industries pursuant to service contracts with a variety of clients in those sectors. The revenue associated with these drilling contracts is recognised in accordance with AASB15, that is in a manner that depicts the transfer of promised goods or services to customers in an amount that reflects
NOTES TO THE CONSOLIDATED FINANCIAL STATEMENTSFor the year ended 30 June 2021
37Mitchell Services LtdAnnual Report 2021
the consideration to which the Group expects to be entitled in exchange for those goods or services. Revenue from customer contracts is recognised upon satisfaction of a performance obligation under those contracts either over time in accordance with specified units of production (for example meters drilled or hours worked) or at a point in time when risks and rewards pass to the customer under those contracts (for example the sale or hire of certain items including consumables).
Interest incomeInterest income from a financial asset is recognised when it is probable that the economic benefits will flow to the Group and the amount of revenue can be measured reliably. Interest income is accrued on a time basis, by reference to the principal outstanding and at the effective interest rate applicable, which is the rate that exactly discounts estimated future cash receipts through the expected life of the financial asset to that asset’s net carrying amount on initial recognition.
Other revenue is recognised when the right to receive the revenue has been established.
All revenue is stated net of the amount of goods and services tax (GST).
(g) LeasesThe Group as lessee At inception of a contract, the Group assesses if the contract contains or is a lease. If there is a lease present, a right-of-use asset and a corresponding lease liability are recognised by the Group where the Group is a lessee. However, all contracts that are classified as short-term leases (i.e. a lease with a remaining lease term of 12 months or less) and leases of low-value assets are recognised as an operating expense on a straight-line basis over the term of the lease.
Initially the lease liability is measured at the present value of the lease payments still to be paid at the commencement date. The lease payments are discounted at the interest rate implicit in the lease. If this rate cannot be readily determined, the Group uses the incremental borrowing rate.
Lease payments included in the measurement of the lease liability are as follows:
• fixed lease payments less any lease incentives;• variable lease payments that depend on an index or
rate, initially measured using the index or rate at the commencement date;
• the amount expected to be payable by the lessee under residual value guarantees;
• the exercise price of purchase options, if the lessee is reasonably certain to exercise the options;
• lease payments under extension options, if the lessee is reasonably certain to exercise the options; and
• payments of penalties for terminating the lease, if the lease term reflects the exercise of an option to terminate the lease.
The right-of-use assets comprise the initial measurement of the corresponding lease liability, any lease payments made at or before the commencement date and any initial direct costs. The subsequent measurement of the right-of-use assets is at cost less accumulated depreciation and impairment losses.
Right-of-use assets are depreciated over the lease term or useful life of the underlying asset, whichever is the shortest.
Where a lease transfers ownership of the underlying asset or the cost of the right-of-use asset reflects that the Group anticipates to exercise a purchase option, the specific asset is depreciated over the useful life of the underlying asset
(h) Employee benefitsShort-term employee benefitsProvision is made for the Group’s obligation for short-term employee benefits. Short-term employee benefits are benefits (other than termination benefits) that are expected to be settled wholly before 12 months after the end of the annual reporting period in which the employees render the related service, including wages, salaries and sick leave. Short-term employee benefits are measured at the (undiscounted) amounts expected to be paid when the obligation is settled.
The Group’s obligations for short-term employee benefits such as wages, salaries and sick leave are recognised as part of current trade and other payables in the statement of financial position. The Group’s obligations for employees’ annual leave and long service leave entitlements are recognised as provisions in the statement of financial position.
Other long-term employee benefits Provision is made for employees’ long service leave and annual leave entitlements not expected to be settled wholly within 12 months after the end of the annual reporting period in which the employees render the
38 Mitchell Services Ltd Annual Report 2021
related service. Other long-term employee benefits are measured at the present value of the expected future payments to be made to employees. Expected future payments incorporate anticipated future wage and salary levels, durations of service and employee departures and are discounted at rates determined by reference to market yields at the end of the reporting period on government bonds that have maturity dates that approximate the terms of the obligations. Any remeasurements for changes in assumptions of obligations for other long-term employee benefits are recognised in profit or loss in the periods in which the changes occur.
The Group’s obligations for long-term employee benefits are presented as non-current provisions in its statement of financial position, except where the Group does not have an unconditional right to defer settlement for at least 12 months after the end of the reporting period, in which case the obligations are presented as current provisions.
Defined contribution superannuation benefitsAll employees of the Group receive defined contribution superannuation entitlements, for which the Group pays the fixed superannuation guarantee contribution (currently 10.0% of the employee’s average ordinary salary) to the employee’s superannuation fund of choice. All contributions in respect of employees’ defined contribution entitlements are recognised as an expense when they become payable. The Group’s obligation with respect to employees’ defined contribution entitlements is limited to its obligation for any unpaid superannuation guarantee contributions at the end of the reporting period. All obligations for unpaid superannuation guarantee contributions are measured at the (undiscounted) amounts expected to be paid when the obligation is settled and are presented as current liabilities in the Group’s statement of financial position.
Termination benefitsWhen applicable, the Group recognises a liability and expense for termination benefits at the earlier of:
• the date when the Group can no longer withdraw the offer for termination benefits; and
• when the Group recognises costs for restructuring pursuant to AASB 137: Provisions, Contingent Liabilities and Contingent Assets and the costs include termination benefits.
In either case, unless the number of employees affected is known, the obligation for termination benefits is measured on the basis of the number of employees expected to be affected. Termination benefits that are expected to be settled wholly before 12 months after the annual reporting period in which the benefits are recognised are measured at the (undiscounted) amounts expected to be paid. All other termination benefits are accounted for on the same basis as other long-term employee benefits.
Equity-settled compensationThe Group operates an employee share and option plan. Share-based payments to employees are measured at the fair value of the instruments at grant date and amortised over the vesting periods. Share-based payments to non-employees are measured at the fair value of goods or services received or the fair value of the equity instruments issued, if it is determined the fair value of the goods or services cannot be reliably measured, and are recorded at the date the goods or services are received. The corresponding amounts are recognised in the option reserve and statement of profit and loss respectively. The fair value of options is determined using the Black-Scholes pricing model. The number of shares and options expected to vest is reviewed and adjusted at the end of each reporting period such that the amount recognised for services received as consideration for the equity instruments granted is based on the number of equity instruments that eventually vest.
(i) Income taxesThe income tax expense (benefit) for the year comprises current income tax expense (income) and deferred tax expense (income).
Current income tax expense charged to profit or loss is the tax payable on taxable income for the current period. Current tax liabilities (assets) are measured at the amounts expected to be paid to (recovered from) the relevant taxation authority using tax rates (and tax laws) that have been enacted or substantively enacted by the end of the reporting period.
Deferred tax expense reflects movements in deferred tax asset and deferred tax liability balances during the year as well as unused tax losses.
Current and deferred income tax expense is charged or credited outside profit or loss when the tax relates to items that are recognised outside profit or loss or arising from a business combination.
NOTES TO THE CONSOLIDATED FINANCIAL STATEMENTSFor the year ended 30 June 2021
39Mitchell Services LtdAnnual Report 2021
A deferred tax liability shall be recognised for all taxable temporary differences, except to the extent that the deferred tax liability arises from: (a) the initial recognition of goodwill; or (b) the initial recognition of an asset or liability in a transaction which: (i) is not a business combination; and (ii) at the time of the transaction, affects neither accounting profit nor taxable profit (tax loss).
Deferred tax assets and liabilities are calculated at the tax rates that are expected to apply to the period when the asset is realised or the liability is settled and their measurement also reflects the manner in which management expects to recover or settle the carrying amount of the related asset or liability. With respect to non-depreciable items of property, plant and equipment measured at fair value and items of investment property measured at fair value, the related deferred tax liability or deferred tax asset is measured on the basis that the carrying amount of the asset will be recovered entirely through sale. When an investment property that is depreciable is held by the entity in a business model whose objective is to consume substantially all of the economic benefits embodied in the property through use over time (rather than through sale), the related deferred tax liability or deferred tax asset is measured on the basis that the carrying amount of such property will be recovered entirely through use.
Deferred tax assets relating to temporary differences and unused tax losses are recognised only to the extent that it is probable that future taxable profit will be available against which the benefits of the deferred tax asset can be utilised, unless the deferred tax asset relating to temporary differences arises from the initial recognition of an asset or liability in a transaction that:
• is not a business combination; and• at the time of the transaction, affects neither
accounting profit nor taxable profit (tax loss).
Where temporary differences exist in relation to investments in subsidiaries, branches, associates, and joint ventures, deferred tax assets and liabilities are not recognised where the timing of the reversal of the temporary difference can be controlled and it is not probable that the reversal will occur in the foreseeable future.
Current tax assets and liabilities are offset where a legally enforceable right of set-off exists and it is intended that net settlement or simultaneous realisation and settlement of the respective asset and liability will occur. Deferred tax assets and liabilities are offset where: (i) a legally enforceable right of set-off exists; and (ii) the deferred tax assets and liabilities relate to income taxes levied by the same taxation authority on either the same taxable entity or different taxable entities where it is intended that net settlement or simultaneous realisation and settlement of the respective asset and liability will occur in future periods in which significant amounts of deferred tax assets or liabilities are expected to be recovered or settled.
Tax consolidationThe Company and its wholly-owned Australian resident entities have formed a tax-consolidated group and are therefore taxed as a single entity from that date. The head entity within the tax-consolidated group is Mitchell Services Ltd. The members of the tax-consolidated Group are identified in Note 20. Tax expense/income, deferred tax liabilities and deferred tax assets arising from temporary differences of the members of the tax-consolidated group are recognised in the separate financial statements of the members of the tax-consolidated group using the “separate taxpayer within group” approach by reference to the carrying amounts in the separate financial statements of each entity and the tax values applying under tax consolidation. Current tax liabilities and assets and deferred tax assets arising from unused tax losses and relevant tax credits of the members of the tax-consolidated group are recognised by the Company (as head entity in the tax-consolidated group). Due to the existence of a tax funding arrangement between the entities in the tax-consolidated group, amounts are recognised as payable to or receivable by the Company and each member of the Group in relation to the tax contribution amounts paid or payable between the Parent Entity and the other members of the tax-consolidated group in accordance with the arrangement.
40 Mitchell Services Ltd Annual Report 2021
(j) Property, plant and equipmentRecognition and measurementItems of property, plant and equipment are measured at cost less accumulated depreciation and accumulated impairment losses.
Cost includes expenditure that is directly attributable to the acquisition of the asset. The cost of self-constructed assets includes the cost of materials and direct labour and any other costs directly attributable to bringing the assets to a working condition for their intended use.
Where parts of an item of property, plant and equipment have different useful lives, they are accounted for as separate items (major components) of property, plant and equipment.
Any gain or loss on disposal of an item of property, plant and equipment (calculated as the difference between the net proceeds from disposal and the carrying amount of the item) is recognised in profit or loss.
Subsequent expenditure is capitalised only when it is probable that future economic benefits associated with the expenditure will flow to the Group. On-going repairs and maintenance are expensed as incurred.
DepreciationItems of property, plant and equipment are depreciated from the date that they are installed and are ready for use, or in respect of internally constructed assets, from the date that the asset is completed and ready for use.
Depreciation is calculated to write off the cost of property, plant and equipment using both the diminishing value basis or straight-line basis over their estimated useful lives. Depreciation is generally recognised in profit or loss. Leased assets are depreciated over the shorter of the lease term and their useful lives unless it is reasonably certain that the Group will obtain ownership by the end of the lease term. Land is not depreciated.
The depreciation rates used for the current and comparative years of significant items of property, plant and equipment are as follows:
CLASSES OF FIXED ASSET
Leasehold improvements 20.00%
Plant & Equipment 6.67% – 40.00%
Motor Vehicles 12.50% – 50.00%
Office Equipment, Furniture & Fittings 10.00% – 67.67%
Depreciation methods and useful lives are reviewed at each reporting date and adjusted if appropriate.
Impairment of property, plant and equipmentAt the end of each reporting period, the Group reviews the carrying amounts of its tangible assets to determine whether there is any indication that those assets have suffered an impairment loss. If any such indication exists, the recoverable amount of the asset is estimated in order to determine the extent of the impairment loss (if any). When it is not possible to estimate the recoverable amount of an individual asset, the Group estimates the recoverable amount of the cash-generating unit to which the asset belongs. When a reasonable and consistent basis of allocation can be identified, corporate assets are also allocated to individual cash-generating units, or otherwise they are allocated to the smallest group of cash-generating units for which a reasonable and consistent allocation basis can be identified.
Recoverable amount is the higher of fair value less costs to sell and value in use. In assessing value in use, the estimated future cash flows are discounted to their present value using a pre-tax discount rate that reflects current market assessments of the time value of money and the risks specific to the asset for which the estimates of future cash flows have not been adjusted.
When an impairment loss subsequently reverses, the carrying amount of the asset (or cash-generating unit) is increased to the revised estimate of its recoverable amount, but so that the increased amount does not exceed the carrying amount that would have been determined had no impairment loss been recognised for the asset (or cash-generating unit) in prior years. A reversal of an impairment loss is recognised immediately in profit or loss, unless the relevant asset is carried at a re-valued amount, in which case the reversal of the impairment loss is treated as a revaluation increase.
(k) InventoriesInventories are stated at the lower of cost and net realisable value. Costs of inventories are determined on first-in-first-out basis. Net realisable value represents the estimated selling price for inventories less all estimated costs of completion and costs necessary to make the sale. The cost of manufactured products includes direct materials, direct labour and an appropriate portion of variable and fixed overheads. Overheads are applied on the basis of normal operating capacity. Costs are assigned on the basis of weighted average costs.
NOTES TO THE CONSOLIDATED FINANCIAL STATEMENTSFor the year ended 30 June 2021
41Mitchell Services LtdAnnual Report 2021
(l) ProvisionsProvisions are recognised when the Group has a present obligation (legal or constructive) as a result of a past event, it is probable that the Group will be required to settle the obligation, and a reliable estimate can be made of the amount of the obligation.
The amount recognised as a provision is the best estimate of the consideration required to settle the present obligation at the end of the reporting period, taking into account the risks and uncertainties surrounding the obligation. When a provision is measured using the cash flows estimated to settle the present obligation, its carrying amount is the present value of those cash flows (where the effect of the time value of money is material).
When some or all of the economic benefits required to settle a provision are expected to be recovered from a third party, a receivable is recognised as an asset if it is virtually certain that reimbursement will be received and the amount of the receivable can be measured reliably.
(m) Financial instrumentsInitial recognition and measurement Financial assets and financial liabilities are recognised when the Group becomes a party to the contractual provisions to the instrument. For financial assets, this is the date that the Group commits itself to either the purchase or sale of the asset (i.e. trade date accounting is adopted).
Financial instruments (except for trade receivables) are initially measured at fair value plus transaction costs, except where the instrument is classified “at fair value through profit or loss”, in which case transaction costs are expensed to profit or loss immediately. Where available, quoted prices in an active market are used to determine fair value. In other circumstances, valuation techniques are adopted.
Trade receivables are initially measured at the transaction price if the trade receivables do not contain a significant financing component or if the practical expedient was applied as specified in AASB 15.63.
Financial assetsFinancial assets are subsequently measured at:
• amortised cost;• fair value through other comprehensive income; or• fair value through profit or loss.
Measurement is on the basis of the two primary criteria:
• the contractual cash flow characteristics of the financial asset; and
• the business model for managing the financial assets.
A financial asset is subsequently measured at amortised cost if it meets the following conditions:
• the financial asset is managed solely to collect contractual cash flows; and
• the contractual terms within the financial asset give rise to cash flows that are solely payments of principal and interest on the principal amount outstanding on specified dates.
A financial asset is subsequently measured at fair value through other comprehensive income if it meets the following conditions:
• the contractual terms within the financial asset give rise to cash flows that are solely payments of principal and interest on the principal amount outstanding on specified dates; and
• the business model for managing the financial asset comprises both contractual cash flows collection and the selling of the financial asset.
By default, all other financial assets that do not meet the measurement conditions of amortised cost and fair value through other comprehensive income are subsequently measured at fair value through profit or loss.
The Group initially designates a financial instrument as measured at fair value through profit or loss if:
• it eliminates or significantly reduces a measurement or recognition inconsistency (often referred to as “accounting mismatch”) that would otherwise arise from measuring assets or liabilities or recognising the gains and losses on them on different bases;
• it is in accordance with the documented risk management or investment strategy and information about the groupings was documented appropriately, so that the performance of the financial liability that was part of a group of financial liabilities or financial assets can be managed and evaluated consistently on a fair value basis;
• it is a hybrid contract that contains an embedded derivative that significantly modifies the cash flows otherwise required by the contract.
42 Mitchell Services Ltd Annual Report 2021
The initial designation of the financial instruments to measure at fair value through profit or loss is a one-time option on initial classification and is irrevocable until the financial asset is derecognised.
Equity instrumentsAt initial recognition, as long as the equity instrument is not held for trading or not a contingent consideration recognised by an acquirer in a business combination to which AASB 3: Business Combinations applies, the Group may make an irrevocable election to measure any subsequent changes in fair value of the equity instrument in other comprehensive income, while the dividend revenue received on underlying equity instruments investment will still be recognised in profit or loss.
Regular way purchases and sales of financial assets are recognised and derecognised at settlement date in accordance with the Group’s accounting policy.
DerecognitionDerecognition refers to the removal of a previously recognised financial asset or financial liability from the statement of financial position.
Derecognition of financial liabilitiesA liability is derecognised when it is extinguished (i.e. when the obligation in the contract is discharged, cancelled or expires). An exchange of an existing financial liability for a new one with substantially modified terms, or a substantial modification to the terms of a financial liability is treated as an extinguishment of the existing liability and recognition of a new financial liability.
The difference between the carrying amount of the financial liability derecognised and the consideration paid and payable, including any non-cash assets transferred or liabilities assumed, is recognised in profit or loss.
Derecognition of financial assetsA financial asset is derecognised when the holder’s contractual rights to its cash flows expires, or the asset is transferred in such a way that all the risks and rewards of ownership are substantially transferred.
All of the following criteria need to be satisfied for derecognition of financial assets:
• the right to receive cash flows from the asset has expired or been transferred;
• all risk and rewards of ownership of the asset have been substantially transferred; and
• the Group no longer controls the asset (i.e. the Group has no practical ability to make a unilateral decision to sell the asset to a third party).
On derecognition of a financial asset measured at amortised cost, the difference between the asset’s carrying amount and the sum of the consideration received and receivable is recognised in profit or loss.
On derecognition of a debt instrument classified at fair value through other comprehensive income, the cumulative gain or loss previously accumulated in the investment revaluation reserve is reclassified to profit or loss.
On derecognition of an investment in equity which was elected to be classified as at fair value through other comprehensive income, the cumulative gain or loss previously accumulated in the investment’s revaluation reserve is not reclassified to profit or loss, but is transferred to retained earnings.
ImpairmentThe Group recognises a loss allowance for expected credit losses on:
• financial assets that are measured at amortised cost or fair value through other comprehensive income;
• lease receivables;• contract assets;• loan commitments that are not measured at fair
value through profit or loss; and• financial guarantee contracts that are not measured
at fair value through profit or loss.
Loss allowance is not recognised for:
• financial assets measured at fair value through profit or loss; or
• equity instruments measured at fair value through other comprehensive income.
Expected credit losses are the probability-weighted estimate of credit losses over the expected life of a financial instrument. A credit loss is the difference between all contractual cash flows that are due and all cash flows expected to be received, all discounted at the original effective interest rate of the financial instrument.
The Group uses the following approaches to impairment, as applicable under AASB 9: Financial Instruments:
• the general approach; and• the simplified approach.
NOTES TO THE CONSOLIDATED FINANCIAL STATEMENTSFor the year ended 30 June 2021
43Mitchell Services LtdAnnual Report 2021
General approachUnder the general approach, at each reporting period, the Group assesses whether the financial instruments are credit-impaired, and if:
• the credit risk of the financial instrument has increased significantly since initial recognition, the Group measures the loss allowance of the financial instruments at an amount equal to the lifetime expected credit losses; or
• there is no significant increase in credit risk since initial recognition, the Group measures the loss allowance for that financial instrument at an amount equal to 12-month expected credit losses.
Simplified approachThe simplified approach does not require tracking of changes in credit risk at every reporting period, but instead requires the recognition of lifetime expected credit loss at all times.
This approach is applicable to:
• trade receivables or contract assets that result from transactions within the scope of AASB 15: Revenue from Contracts with Customers and that contain a significant financing component; and
• lease receivables.
In measuring the expected credit loss, a provision matrix for trade receivables was used, taking into consideration various data to get to an expected credit loss (i.e. diversity of its customer base, appropriate groupings of its historical loss experience etc).
Recognition of expected credit losses in financial statementsAt each reporting date, the Group recognises the movement in the loss allowance as an impairment gain or loss in the statement of profit or loss and other comprehensive income.
The carrying amount of financial assets measured at amortised cost includes the loss allowance relating to that asset.
Assets measured at fair value through other comprehensive income are recognised at fair value, with changes in fair value recognised in other comprehensive income. Amounts in relation to change in credit risk are transferred from other comprehensive income to profit or loss at every reporting period.
Financial liabilitiesFinancial liabilities are subsequently measured at:
• amortised cost; or• fair value through profit or loss.
A financial liability is measured at fair value through profit or loss if the financial liability is:
• a contingent consideration of an acquirer in a business combination to which AASB 3: Business Combinations applies;
• held for trading; or• initially designated as at fair value through profit
or loss.
All other financial liabilities are subsequently measured at amortised cost using the effective interest method.
The effective interest method is a method of calculating the amortised cost of a debt instrument and of allocating interest expense in profit or loss over the relevant period.
The effective interest rate is the internal rate of return of the financial asset or liability; that is, it is the rate that exactly discounts the estimated future cash flows through the expected life of the instrument to the net carrying amount at initial recognition.
A financial liability is held for trading if:
• it is incurred for the purpose of repurchasing or repaying in the near term;
• part of a portfolio where there is an actual pattern of short-term profit taking; or
• a derivative financial instrument (except for a derivative that is in a financial guarantee contract or a derivative that is in an effective hedging relationship).
Any gains or losses arising on changes in fair value are recognised in profit or loss to the extent that they are not part of a designated hedging relationship.
The change in fair value of the financial liability attributable to changes in the issuer’s credit risk is taken to other comprehensive income and are not subsequently reclassified to profit or loss. Instead, they are transferred to retained earnings upon derecognition of the financial liability.
If taking the change in credit risk in other comprehensive income enlarges or creates an accounting mismatch, then these gains or losses should be taken to profit or loss rather than other comprehensive income.
A financial liability cannot be reclassified.
44 Mitchell Services Ltd Annual Report 2021
(n) Goods and services taxRevenues, expenses and assets are recognised net of the amount of goods and services tax (GST), except:
• where the amount of GST incurred is not recoverable from the Australian Taxation Office (ATO), it is recognised as part of the cost of acquisition of an asset or as part of an item of expense; or
• for receivables and payables which are recognised inclusive of GST.
The net amount of GST recoverable from, or payable to, the ATO is included as part of receivables or payables.
Cash flows are included in the cash flow statement on a gross basis. The GST component of cash flows arising from investing and financing activities which is recoverable from, or payable to, the ATO is classified within operating cash flows.
(o) Cash and cash equivalentsCash and cash equivalents include cash on hand, deposits available on demand with banks, other short term highly liquid investments with ongoing maturities of 3 months or less, and bank overdrafts.
(p) Fair value of Assets and LiabilitiesThe Group measures some of its assets and liabilities at fair value on either a recurring or non-recurring basis, depending on the requirements of the applicable Accounting Standard.
Fair value is the price the Group would receive to sell an asset or would have to pay to transfer a liability in an orderly (i.e. unforced) transaction between independent, knowledgeable, and willing market participants at the measurement date.
As fair value is a market-based measure, the closest equivalent observable market pricing information is used to determine fair value. Adjustments to market values may be made having regard to the characteristics of the specific asset or liability. The fair values of assets and liabilities that are not traded in an active market are determined using one or more valuation techniques. These valuation techniques maximise, to the extent possible, the use of observable market data.
To the extent possible, market information is extracted from either the principal market for the asset or liability (ie the market with the greatest volume and level of activity for the asset or liability) or, in the absence of such a market, the most advantageous market available
to the entity at the end of the reporting period (i.e. the market that maximises the receipts from the sale of the asset or minimises the payments made to transfer the liability, after taking into account transaction costs and transport costs).
For non-financial assets, the fair value measurement also takes into account a market participant’s ability to use the asset in its highest and best use or to sell it to another market participant that would use the asset in its highest and best use.
The fair value of liabilities and the entity’s own equity instruments (excluding those related to share-based payment arrangements) may be valued, where there is no observable market price in relation to the transfer of such financial instruments, by reference to observable market information where such instruments are held as assets. Where this information is not available, other valuation techniques are adopted and, where significant, are detailed in the respective note to the financial statements.
(q) Capital managementManagement controls the capital of the Group in order to maintain an appropriate debt to equity ratio, generate long-term shareholder value and ensure that the Group can fund its operations and continue as a going concern.
The Group’s debt and capital include ordinary share capital, and financial liabilities, supported by financial assets.
Management effectively manages the Group’s capital by assessing the Group’s financial risks and adjusting its capital structure in response to changes in these risks and in the market. These responses include the management of debt levels, distributions to shareholders and share issues.
There have been no changes in the strategy adopted by management to control the capital of the Group since the prior year.
(r) Assets held for sale The Group recognises assets as held for sale when the sale of the asset is approved by the Board and is actively marketed at a reasonable price for immediate sale that is probable within 12 months.
After these conditions are met, the Group measures the assets held for sale at the lower of carrying amount and fair value less costs to sell and are not depreciated.
NOTES TO THE CONSOLIDATED FINANCIAL STATEMENTSFor the year ended 30 June 2021
45Mitchell Services LtdAnnual Report 2021
Any reduction in value on initial recognition or any reduction in fair value less costs to sell after initial recognition shall be recognised as impairment in the profit and loss. A gain for any subsequent increase in fair value less costs to sell shall be recognised in the profit or loss to the extent that it is not in excess of the cumulative impairment loss.
(s) Critical accounting judgements and key sources of estimation uncertainty
In the application of the Group’s accounting policies, the Directors are required to make judgements, estimates and assumptions about the carrying amounts of assets and liabilities that are not readily apparent from other sources. The estimates and associated assumptions are based on historical experience and other factors that are relevant. Actual results may differ from these estimates.
The estimates and underlying assumptions are reviewed on an on-going basis. Revisions to accounting estimates are recognised in the period in which the estimate is revised if the revision affects only that period, or in the period of the revision and future periods if the revision affects both current and future periods.
Key estimates — Business combination relatedIn accordance with accounting policies Note 1(d), assets and liabilities acquired in a business combination are recognised at their fair value at the date of acquisition. The Group acquired Deepcore Holdings Pty Ltd (Deepcore) during the year ended 30 June 2020 with accounting for the business combination finalised per the reported financial statements for the year ended 30 June 2020. There continues to be key accounting considerations related to the business combination, primarily the following items:
• Fair valuation of contingent consideration liability • Assessing carrying value of customer contracts to
ensure not valued in excess of recoverable amount; and
• Goodwill.
(i) Fair valuation of contingent consideration liabilityUnder the terms of the acquisition, Deepcore operate under an earnout arrangement applicable to the first three calendar years post acquisition subject to outperformance against pre-agreed EBITDA targets. This entitles the Deepcore vendors to an annual earnout payment being 50% of that portion of calendar year EBITDA greater than $12,500,000. As part of the finalised acquisition accounting at 30 June 2020, a $4,851,492 contingent consideration liability was recognised, being the present value of the forecast annual cash payments in relation to the three-year earnout.
Given the combination of (i) a significant EBITDA contribution to the Group during the 18 months ended 30 June 2021 (the first half of the earnout period), including the requirement to pay an amount of $2,344,468 to the vendors for EBITDA performance over the calendar year ended 31 December 2020; and (ii) forecast continuation of Deepcore growth and EBITDA performance over the remaining 18 months of the earnout period, the Group assessed the completeness and accuracy of the existing contingent consideration liability and considered it appropriate to increase its fair valuation by $2,985,252 at 30 June 2021. This has resulted in the valuation being increased to $6,297,660 at 30 June 2021, being the present value of estimated future cash outflows payable to the vendors.
(ii) Valuation of customer contractsThe finalised business combination accounting fair valued customer contracts acquired at approximately $17.1m. These contracts are being amortised on a straight-line basis over their estimated life at acquisition date. The carrying value of those contracts at 30 June 2021 totals $4,257,868 with a remaining useful life of those contracts ranging from 3 to 20 months at that date. The Group has assessed whether there are any impairment indicators related to these separable assets and are satisfied there are nil indicators and that they are not carried in excess of their recoverable amount.
46 Mitchell Services Ltd Annual Report 2021
(iii) GoodwillPursuant to the acquisition of Deepcore, the Group recognised goodwill of $5,755,572 with goodwill requiring to be tested for impairment on an annual basis.
Goodwill is monitored by management at the level of the lowest cash-generating-unit (CGU) being the wider Deepcore Drilling business while individual customer contracts, being separable are considered on an individual basis as discussed per (ii) above. Calculations require the use of certain assumptions. Management have modelled cash flow projections based on most recent forecasts incorporating an annual growth rate of 2.0 per cent for a five-year period and taking into account all currently available information. Terminal value growth rate of 2.0 per cent represents an extrapolation of estimated annual growth rates while the pre-tax discount rate used is 18.0 per cent being weighted average cost of capital (WACC) for the Group.
The Group considers key sensitivities to be the following:
• A change in the pre-tax discount rate; and• Operating rig count with its consequential impact
on cash flows.
Management have flexed scenarios based on the above sensitivities and considers goodwill to be carried at lower than their recoverable amount. And, from a wider COVID-19 perspective, the services provided by the Group have continued to be considered essential to the wider economy with utilisation levels in the midst of a global pandemic being testament to its robust business model.
Key Estimates — Impairment loss — Trade receivablesOn 12 February 2021 the Group terminated a material drilling contract (Contract) with SMS Innovative Mining Pty Ltd (SMS) under which the Company’s wholly owned subsidiary Mitchell Operations Pty Ltd (MO) provided drill and blast services for SMS at the Kirkalocka gold project in Western Australia. The Contract was terminated on grounds of breach of contract for failure by SMS to pay invoices due and owing under the contract. As a result of this failure to pay the invoices that were due and owing, MO had served a statutory demand on SMS for which SMS subsequently made an application to set aside (Proceeding).
The cumulative value of all unpaid invoices issued to SMS under the Contract up to and including the date of contract termination was $9,624,899 and given the uncertainty in relation to the collectability of this amount and the outcome of the Proceeding, the Group initially recognised an impairment loss for this amount in full.
On 13 July 2021 MO and SMS agreed to resolve all claims relating to, in connection with or arising out of, the Proceeding and the Contract on the basis that SMS pay to MO the sum of $5,000,000. Pursuant to the terms of the agreed settlement, the $5,000,000 settlement sum was to be paid in three tranches as follows:
• Tranche 1 — $3,000,000 payable within 7 days from the date of settlement
• Tranche 2 — $1,000,000 payable by 30 September 2021
• Tranche 3 — $1,000,000 payable by 30 December 2021
On 19 July 2021 MO received the tranche 1 payment of $3,000,000. The Group considers this first tranche constitutes an adjusting event under AASB 110 Events After the Reporting Period and accordingly has reduced the initially recognised impairment loss by $3,000,000.
(t) Comparative figuresWhen required by accounting standards, comparative figures have been adjusted to conform to changes in presentation for the current financial year.
NOTES TO THE CONSOLIDATED FINANCIAL STATEMENTSFor the year ended 30 June 2021
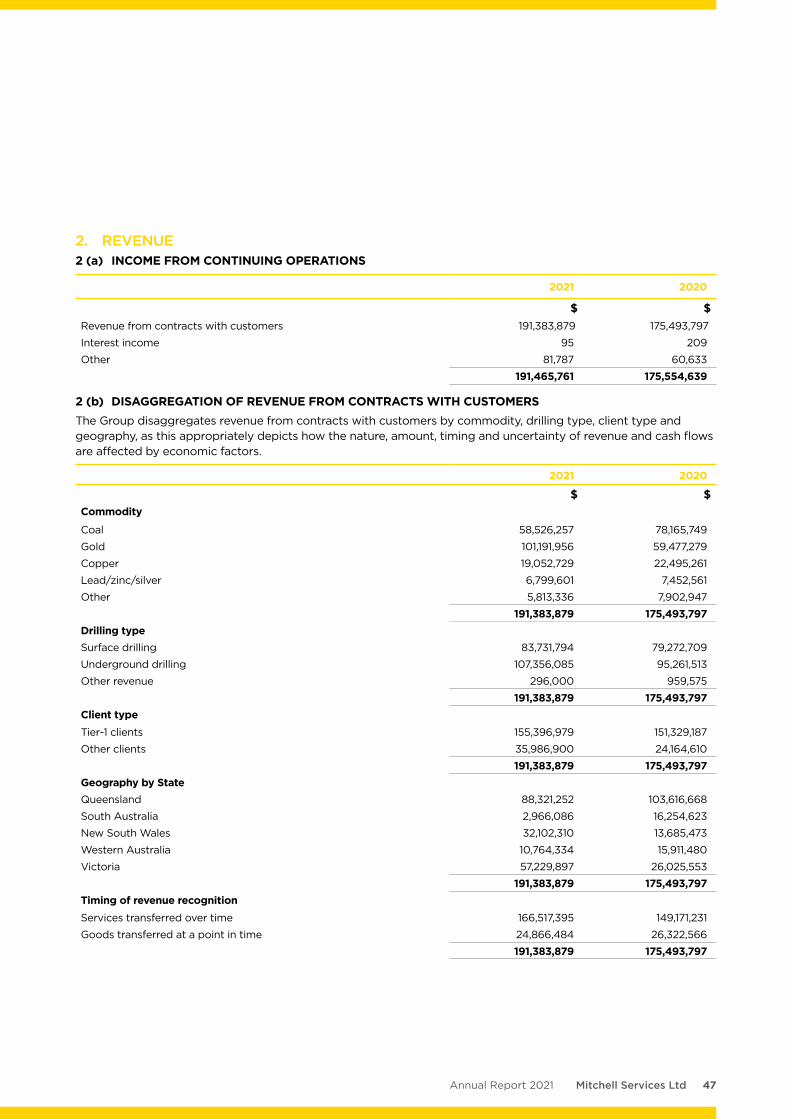
47Mitchell Services LtdAnnual Report 2021
2. REVENUE2 (a) INCOME FROM CONTINUING OPERATIONS
2021 2020
$ $Revenue from contracts with customers 191,383,879 175,493,797
Interest income 95 209
Other 81,787 60,633
191,465,761 175,554,639
2 (b) DISAGGREGATION OF REVENUE FROM CONTRACTS WITH CUSTOMERSThe Group disaggregates revenue from contracts with customers by commodity, drilling type, client type and geography, as this appropriately depicts how the nature, amount, timing and uncertainty of revenue and cash flows are affected by economic factors.
2021 2020
$ $Commodity
Coal 58,526,257 78,165,749
Gold 101,191,956 59,477,279
Copper 19,052,729 22,495,261
Lead/zinc/silver 6,799,601 7,452,561
Other 5,813,336 7,902,947
191,383,879 175,493,797Drilling typeSurface drilling 83,731,794 79,272,709
Underground drilling 107,356,085 95,261,513
Other revenue 296,000 959,575
191,383,879 175,493,797Client typeTier-1 clients 155,396,979 151,329,187
Other clients 35,986,900 24,164,610
191,383,879 175,493,797Geography by StateQueensland 88,321,252 103,616,668
South Australia 2,966,086 16,254,623
New South Wales 32,102,310 13,685,473
Western Australia 10,764,334 15,911,480
Victoria 57,229,897 26,025,553
191,383,879 175,493,797Timing of revenue recognition Services transferred over time 166,517,395 149,171,231
Goods transferred at a point in time 24,866,484 26,322,566
191,383,879 175,493,797
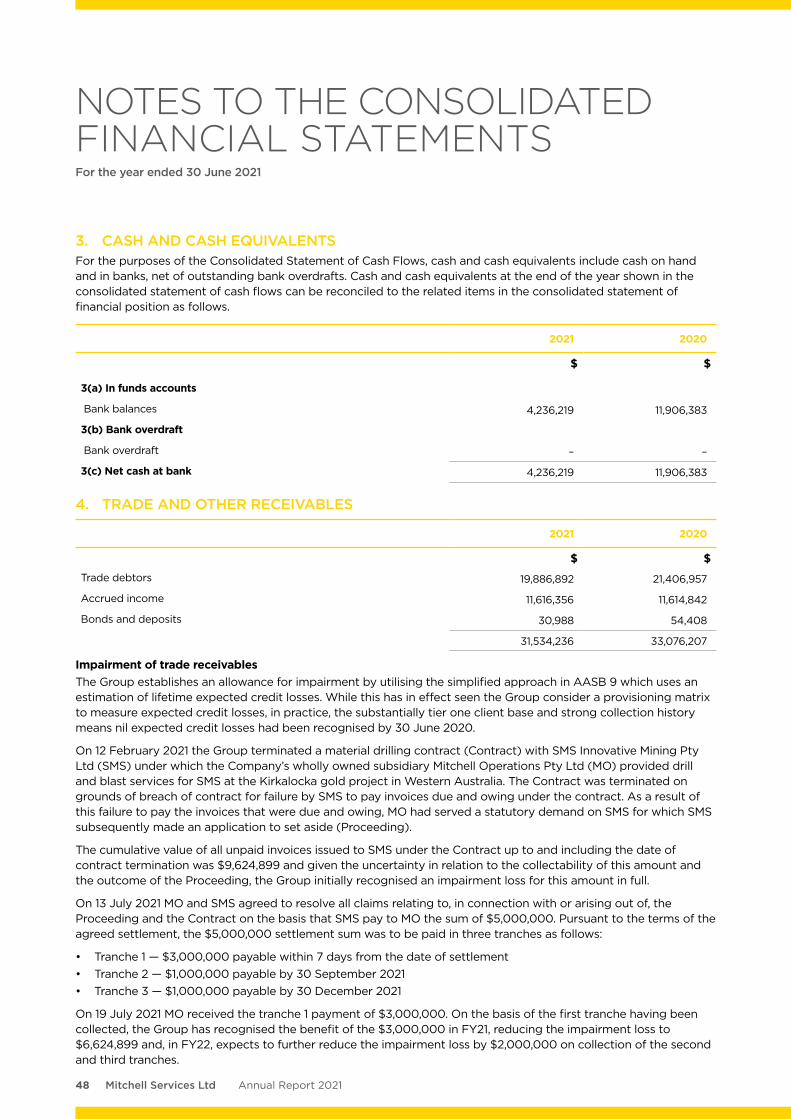
48 Mitchell Services Ltd Annual Report 2021
3. CASH AND CASH EQUIVALENTSFor the purposes of the Consolidated Statement of Cash Flows, cash and cash equivalents include cash on hand and in banks, net of outstanding bank overdrafts. Cash and cash equivalents at the end of the year shown in the consolidated statement of cash flows can be reconciled to the related items in the consolidated statement of financial position as follows.
2021 2020
$ $
3(a) In funds accounts
Bank balances 4,236,219 11,906,383
3(b) Bank overdraft
Bank overdraft – –
3(c) Net cash at bank 4,236,219 11,906,383
4. TRADE AND OTHER RECEIVABLES
2021 2020
$ $Trade debtors 19,886,892 21,406,957
Accrued income 11,616,356 11,614,842
Bonds and deposits 30,988 54,408
31,534,236 33,076,207
Impairment of trade receivablesThe Group establishes an allowance for impairment by utilising the simplified approach in AASB 9 which uses an estimation of lifetime expected credit losses. While this has in effect seen the Group consider a provisioning matrix to measure expected credit losses, in practice, the substantially tier one client base and strong collection history means nil expected credit losses had been recognised by 30 June 2020.
On 12 February 2021 the Group terminated a material drilling contract (Contract) with SMS Innovative Mining Pty Ltd (SMS) under which the Company’s wholly owned subsidiary Mitchell Operations Pty Ltd (MO) provided drill and blast services for SMS at the Kirkalocka gold project in Western Australia. The Contract was terminated on grounds of breach of contract for failure by SMS to pay invoices due and owing under the contract. As a result of this failure to pay the invoices that were due and owing, MO had served a statutory demand on SMS for which SMS subsequently made an application to set aside (Proceeding).
The cumulative value of all unpaid invoices issued to SMS under the Contract up to and including the date of contract termination was $9,624,899 and given the uncertainty in relation to the collectability of this amount and the outcome of the Proceeding, the Group initially recognised an impairment loss for this amount in full.
On 13 July 2021 MO and SMS agreed to resolve all claims relating to, in connection with or arising out of, the Proceeding and the Contract on the basis that SMS pay to MO the sum of $5,000,000. Pursuant to the terms of the agreed settlement, the $5,000,000 settlement sum was to be paid in three tranches as follows:
• Tranche 1 — $3,000,000 payable within 7 days from the date of settlement• Tranche 2 — $1,000,000 payable by 30 September 2021• Tranche 3 — $1,000,000 payable by 30 December 2021
On 19 July 2021 MO received the tranche 1 payment of $3,000,000. On the basis of the first tranche having been collected, the Group has recognised the benefit of the $3,000,000 in FY21, reducing the impairment loss to $6,624,899 and, in FY22, expects to further reduce the impairment loss by $2,000,000 on collection of the second and third tranches.
NOTES TO THE CONSOLIDATED FINANCIAL STATEMENTSFor the year ended 30 June 2021
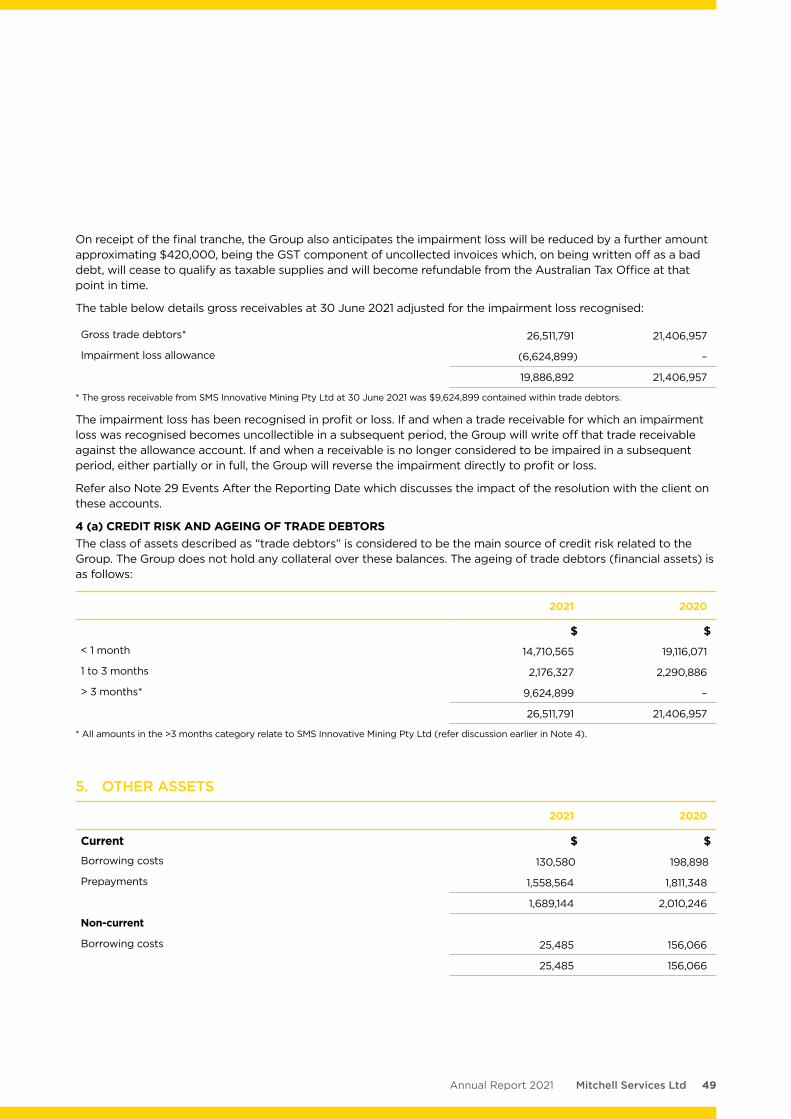
49Mitchell Services LtdAnnual Report 2021
5. OTHER ASSETS
2021 2020
Current $ $
Borrowing costs 130,580 198,898
Prepayments 1,558,564 1,811,348
1,689,144 2,010,246
Non-current
Borrowing costs 25,485 156,066
25,485 156,066
On receipt of the final tranche, the Group also anticipates the impairment loss will be reduced by a further amount approximating $420,000, being the GST component of uncollected invoices which, on being written off as a bad debt, will cease to qualify as taxable supplies and will become refundable from the Australian Tax Office at that point in time.
The table below details gross receivables at 30 June 2021 adjusted for the impairment loss recognised:
Gross trade debtors* 26,511,791 21,406,957
Impairment loss allowance (6,624,899) –
19,886,892 21,406,957
* The gross receivable from SMS Innovative Mining Pty Ltd at 30 June 2021 was $9,624,899 contained within trade debtors.
The impairment loss has been recognised in profit or loss. If and when a trade receivable for which an impairment loss was recognised becomes uncollectible in a subsequent period, the Group will write off that trade receivable against the allowance account. If and when a receivable is no longer considered to be impaired in a subsequent period, either partially or in full, the Group will reverse the impairment directly to profit or loss.
Refer also Note 29 Events After the Reporting Date which discusses the impact of the resolution with the client on these accounts.
4 (a) CREDIT RISK AND AGEING OF TRADE DEBTORSThe class of assets described as “trade debtors” is considered to be the main source of credit risk related to the Group. The Group does not hold any collateral over these balances. The ageing of trade debtors (financial assets) is as follows:
2021 2020
$ $< 1 month 14,710,565 19,116,071
1 to 3 months 2,176,327 2,290,886
> 3 months* 9,624,899 –
26,511,791 21,406,957
* All amounts in the >3 months category relate to SMS Innovative Mining Pty Ltd (refer discussion earlier in Note 4).
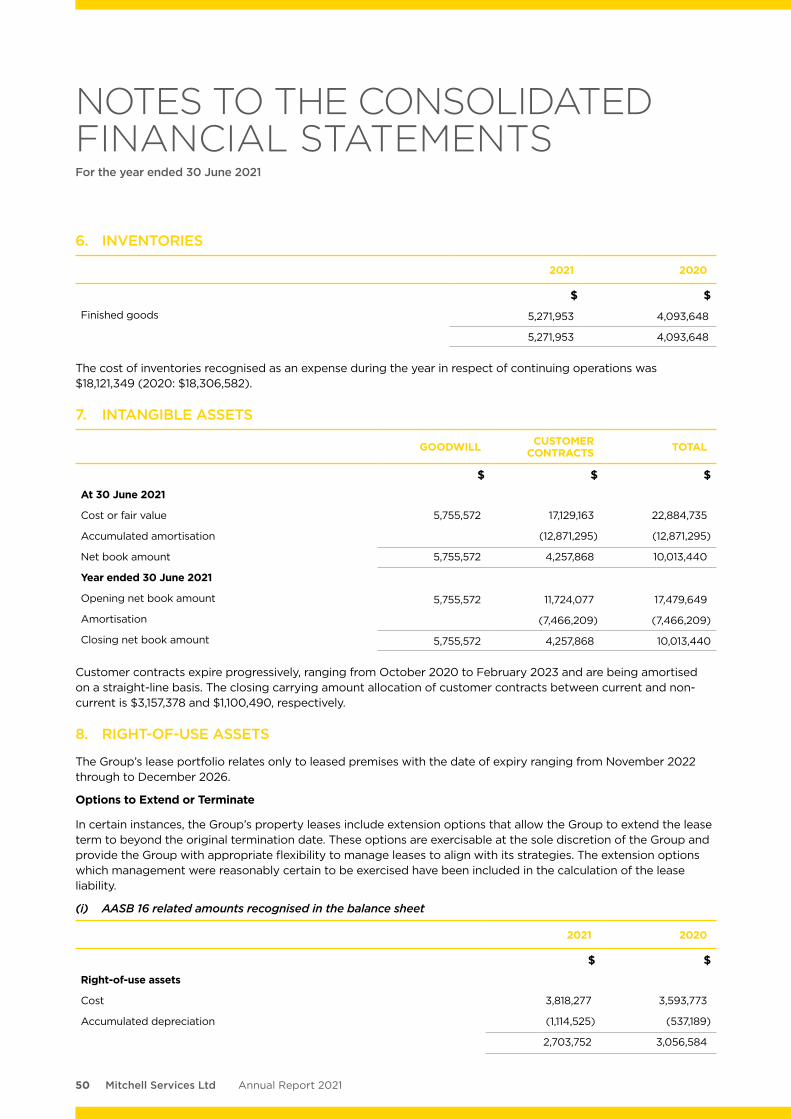
50 Mitchell Services Ltd Annual Report 2021
6. INVENTORIES
2021 2020
$ $
Finished goods 5,271,953 4,093,648
5,271,953 4,093,648
The cost of inventories recognised as an expense during the year in respect of continuing operations was $18,121,349 (2020: $18,306,582).
7. INTANGIBLE ASSETS
GOODWILL CUSTOMER CONTRACTS TOTAL
$ $ $
At 30 June 2021
Cost or fair value 5,755,572 17,129,163 22,884,735
Accumulated amortisation (12,871,295) (12,871,295)
Net book amount 5,755,572 4,257,868 10,013,440
Year ended 30 June 2021
Opening net book amount 5,755,572 11,724,077 17,479,649
Amortisation (7,466,209) (7,466,209)
Closing net book amount 5,755,572 4,257,868 10,013,440
Customer contracts expire progressively, ranging from October 2020 to February 2023 and are being amortised on a straight-line basis. The closing carrying amount allocation of customer contracts between current and non-current is $3,157,378 and $1,100,490, respectively.
8. RIGHT-OF-USE ASSETS
The Group’s lease portfolio relates only to leased premises with the date of expiry ranging from November 2022 through to December 2026.
Options to Extend or Terminate
In certain instances, the Group’s property leases include extension options that allow the Group to extend the lease term to beyond the original termination date. These options are exercisable at the sole discretion of the Group and provide the Group with appropriate flexibility to manage leases to align with its strategies. The extension options which management were reasonably certain to be exercised have been included in the calculation of the lease liability.
(i) AASB 16 related amounts recognised in the balance sheet
2021 2020
$ $
Right-of-use assets
Cost 3,818,277 3,593,773
Accumulated depreciation (1,114,525) (537,189)
2,703,752 3,056,584
NOTES TO THE CONSOLIDATED FINANCIAL STATEMENTSFor the year ended 30 June 2021
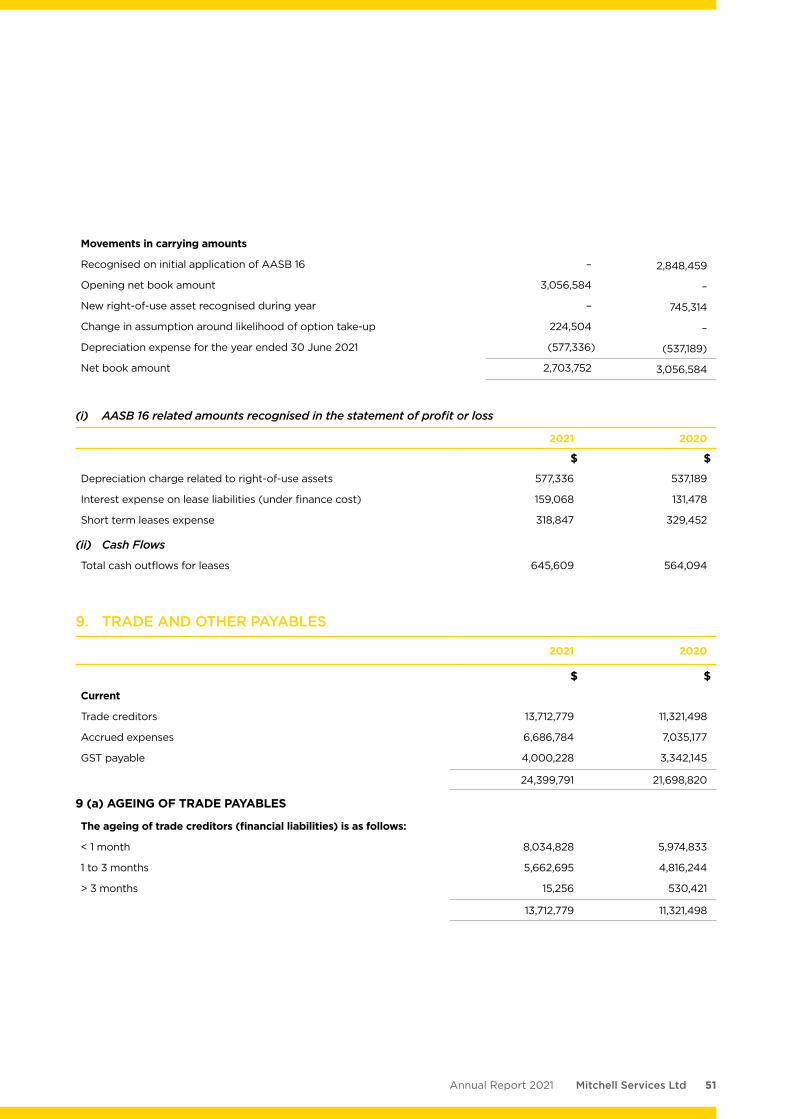
51Mitchell Services LtdAnnual Report 2021
Movements in carrying amounts
Recognised on initial application of AASB 16 – 2,848,459
Opening net book amount 3,056,584 –
New right-of-use asset recognised during year – 745,314
Change in assumption around likelihood of option take-up 224,504 –
Depreciation expense for the year ended 30 June 2021 (577,336) (537,189)
Net book amount 2,703,752 3,056,584
(i) AASB 16 related amounts recognised in the statement of profit or loss
2021 2020
$ $
Depreciation charge related to right-of-use assets 577,336 537,189
Interest expense on lease liabilities (under finance cost) 159,068 131,478
Short term leases expense 318,847 329,452
(ii) Cash Flows
Total cash outflows for leases 645,609 564,094
9. TRADE AND OTHER PAYABLES
2021 2020
$ $
Current
Trade creditors 13,712,779 11,321,498
Accrued expenses 6,686,784 7,035,177
GST payable 4,000,228 3,342,145
24,399,791 21,698,820
9 (a) AGEING OF TRADE PAYABLES
The ageing of trade creditors (financial liabilities) is as follows:
< 1 month 8,034,828 5,974,833
1 to 3 months 5,662,695 4,816,244
> 3 months 15,256 530,421
13,712,779 11,321,498
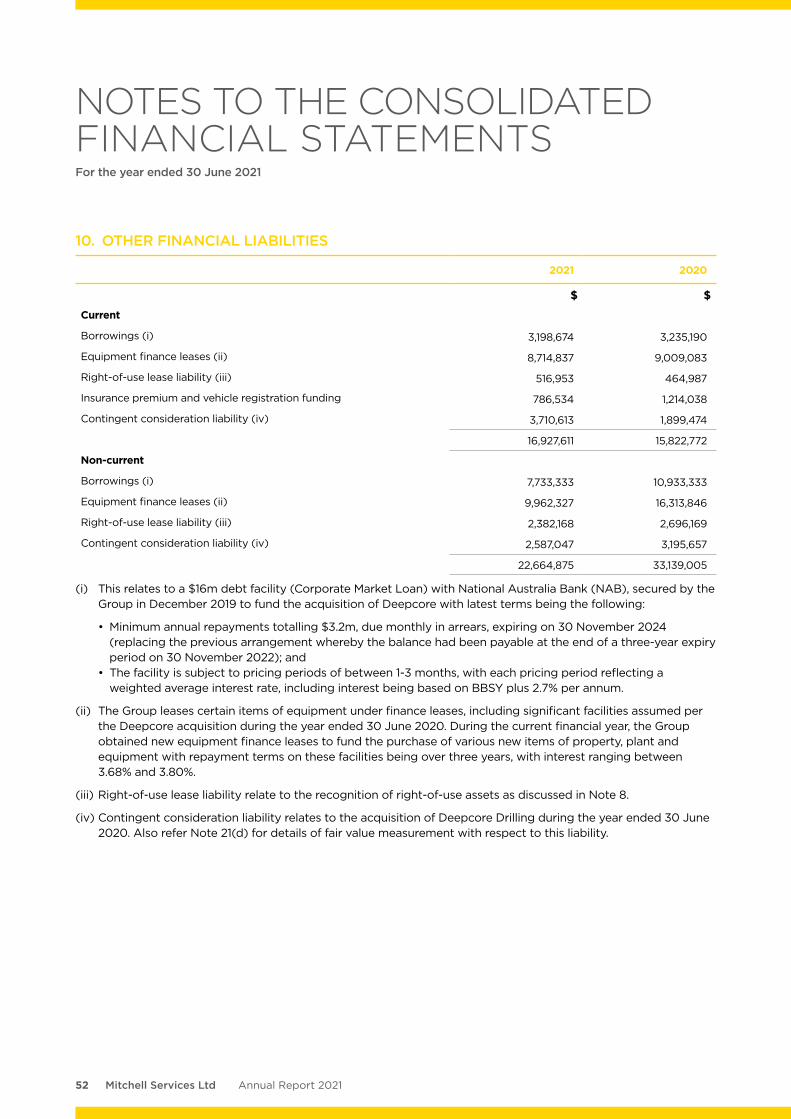
52 Mitchell Services Ltd Annual Report 2021
10. OTHER FINANCIAL LIABILITIES
2021 2020
$ $
Current
Borrowings (i) 3,198,674 3,235,190
Equipment finance leases (ii) 8,714,837 9,009,083
Right-of-use lease liability (iii) 516,953 464,987
Insurance premium and vehicle registration funding 786,534 1,214,038
Contingent consideration liability (iv) 3,710,613 1,899,474
16,927,611 15,822,772
Non-current
Borrowings (i) 7,733,333 10,933,333
Equipment finance leases (ii) 9,962,327 16,313,846
Right-of-use lease liability (iii) 2,382,168 2,696,169
Contingent consideration liability (iv) 2,587,047 3,195,657
22,664,875 33,139,005
(i) This relates to a $16m debt facility (Corporate Market Loan) with National Australia Bank (NAB), secured by the Group in December 2019 to fund the acquisition of Deepcore with latest terms being the following:
• Minimum annual repayments totalling $3.2m, due monthly in arrears, expiring on 30 November 2024 (replacing the previous arrangement whereby the balance had been payable at the end of a three-year expiry period on 30 November 2022); and
• The facility is subject to pricing periods of between 1-3 months, with each pricing period reflecting a weighted average interest rate, including interest being based on BBSY plus 2.7% per annum.
(ii) The Group leases certain items of equipment under finance leases, including significant facilities assumed per the Deepcore acquisition during the year ended 30 June 2020. During the current financial year, the Group obtained new equipment finance leases to fund the purchase of various new items of property, plant and equipment with repayment terms on these facilities being over three years, with interest ranging between 3.68% and 3.80%.
(iii) Right-of-use lease liability relate to the recognition of right-of-use assets as discussed in Note 8.
(iv) Contingent consideration liability relates to the acquisition of Deepcore Drilling during the year ended 30 June 2020. Also refer Note 21(d) for details of fair value measurement with respect to this liability.
NOTES TO THE CONSOLIDATED FINANCIAL STATEMENTSFor the year ended 30 June 2021
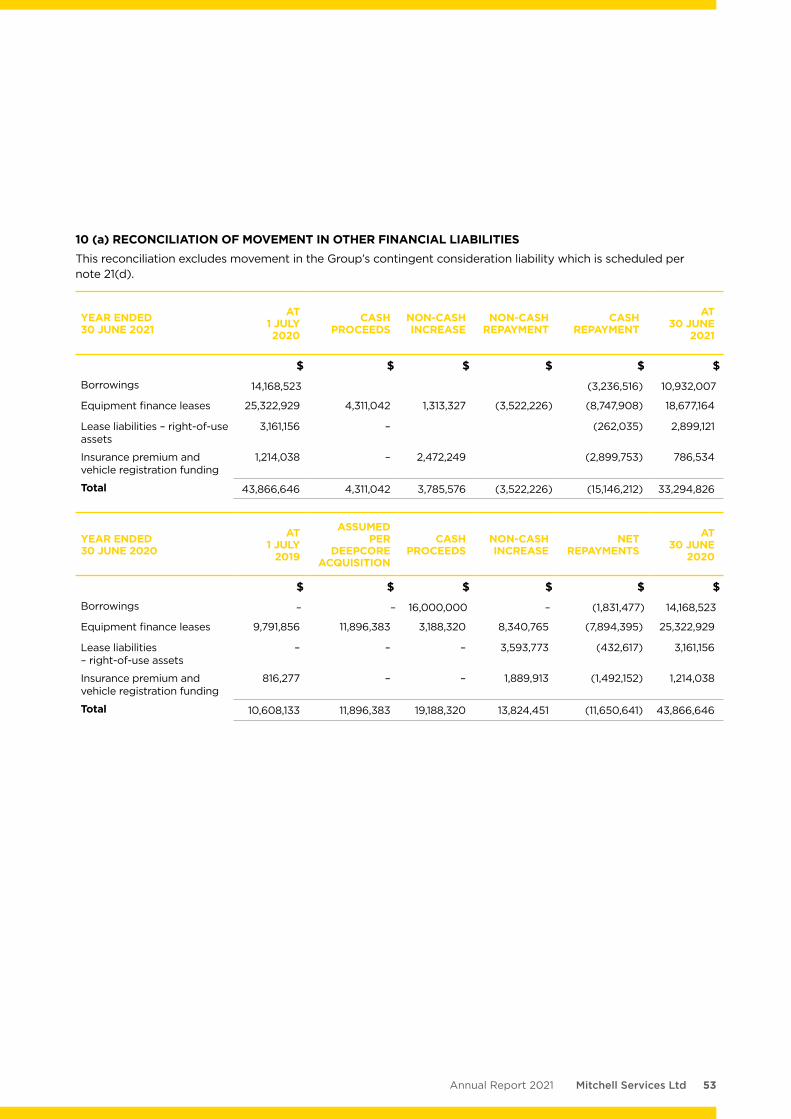
53Mitchell Services LtdAnnual Report 2021
10 (a) RECONCILIATION OF MOVEMENT IN OTHER FINANCIAL LIABILITIESThis reconciliation excludes movement in the Group’s contingent consideration liability which is scheduled per note 21(d).
YEAR ENDED 30 JUNE 2021
AT 1 JULY 2020
CASH PROCEEDS
NON-CASH INCREASE
NON-CASH REPAYMENT
CASH REPAYMENT
AT 30 JUNE
2021
$ $ $ $ $ $Borrowings 14,168,523 (3,236,516) 10,932,007
Equipment finance leases 25,322,929 4,311,042 1,313,327 (3,522,226) (8,747,908) 18,677,164
Lease liabilities – right-of-use assets
3,161,156 – (262,035) 2,899,121
Insurance premium and vehicle registration funding
1,214,038 – 2,472,249 (2,899,753) 786,534
Total 43,866,646 4,311,042 3,785,576 (3,522,226) (15,146,212) 33,294,826
YEAR ENDED 30 JUNE 2020
AT 1 JULY
2019
ASSUMED PER
DEEPCORE ACQUISITION
CASH PROCEEDS
NON-CASH INCREASE
NET REPAYMENTS
AT 30 JUNE
2020
$ $ $ $ $ $Borrowings – – 16,000,000 – (1,831,477) 14,168,523
Equipment finance leases 9,791,856 11,896,383 3,188,320 8,340,765 (7,894,395) 25,322,929
Lease liabilities – right-of-use assets
– – – 3,593,773 (432,617) 3,161,156
Insurance premium and vehicle registration funding
816,277 – – 1,889,913 (1,492,152) 1,214,038
Total 10,608,133 11,896,383 19,188,320 13,824,451 (11,650,641) 43,866,646
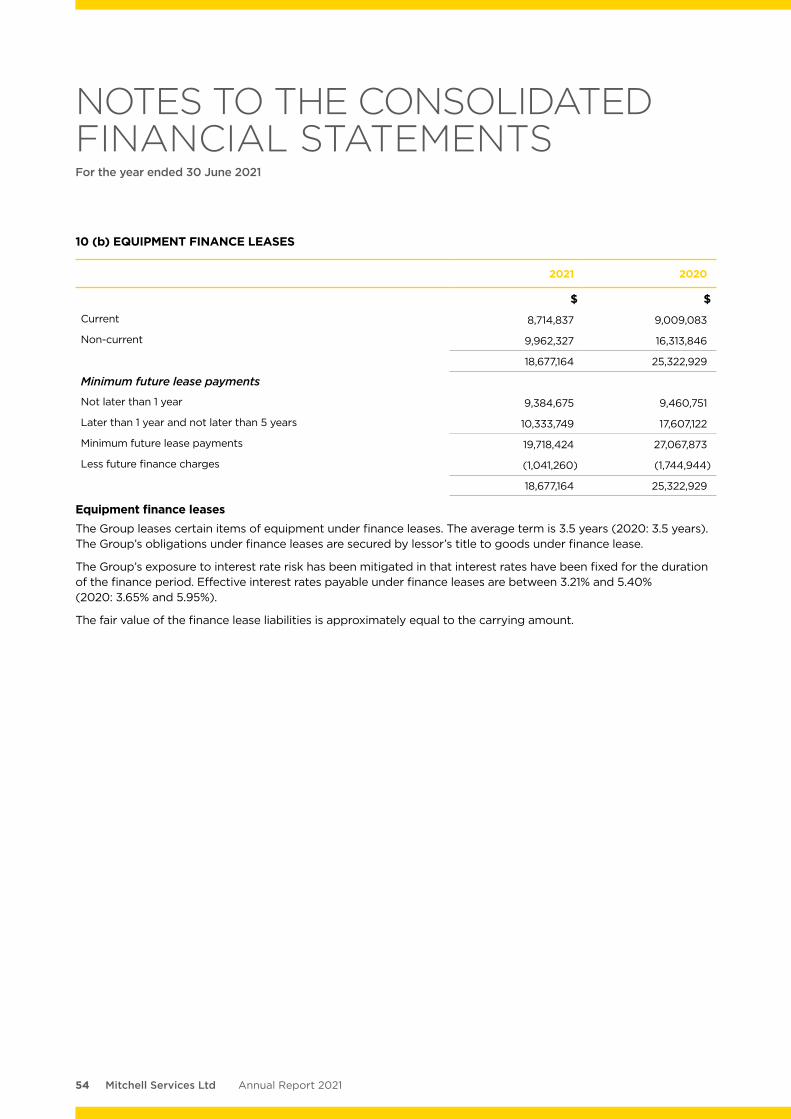
54 Mitchell Services Ltd Annual Report 2021
10 (b) EQUIPMENT FINANCE LEASES
2021 2020
$ $
Current 8,714,837 9,009,083
Non-current 9,962,327 16,313,846
18,677,164 25,322,929
Minimum future lease payments
Not later than 1 year 9,384,675 9,460,751
Later than 1 year and not later than 5 years 10,333,749 17,607,122
Minimum future lease payments 19,718,424 27,067,873
Less future finance charges (1,041,260) (1,744,944)
18,677,164 25,322,929
Equipment finance leases The Group leases certain items of equipment under finance leases. The average term is 3.5 years (2020: 3.5 years). The Group’s obligations under finance leases are secured by lessor’s title to goods under finance lease.
The Group’s exposure to interest rate risk has been mitigated in that interest rates have been fixed for the duration of the finance period. Effective interest rates payable under finance leases are between 3.21% and 5.40% (2020: 3.65% and 5.95%).
The fair value of the finance lease liabilities is approximately equal to the carrying amount.
NOTES TO THE CONSOLIDATED FINANCIAL STATEMENTSFor the year ended 30 June 2021
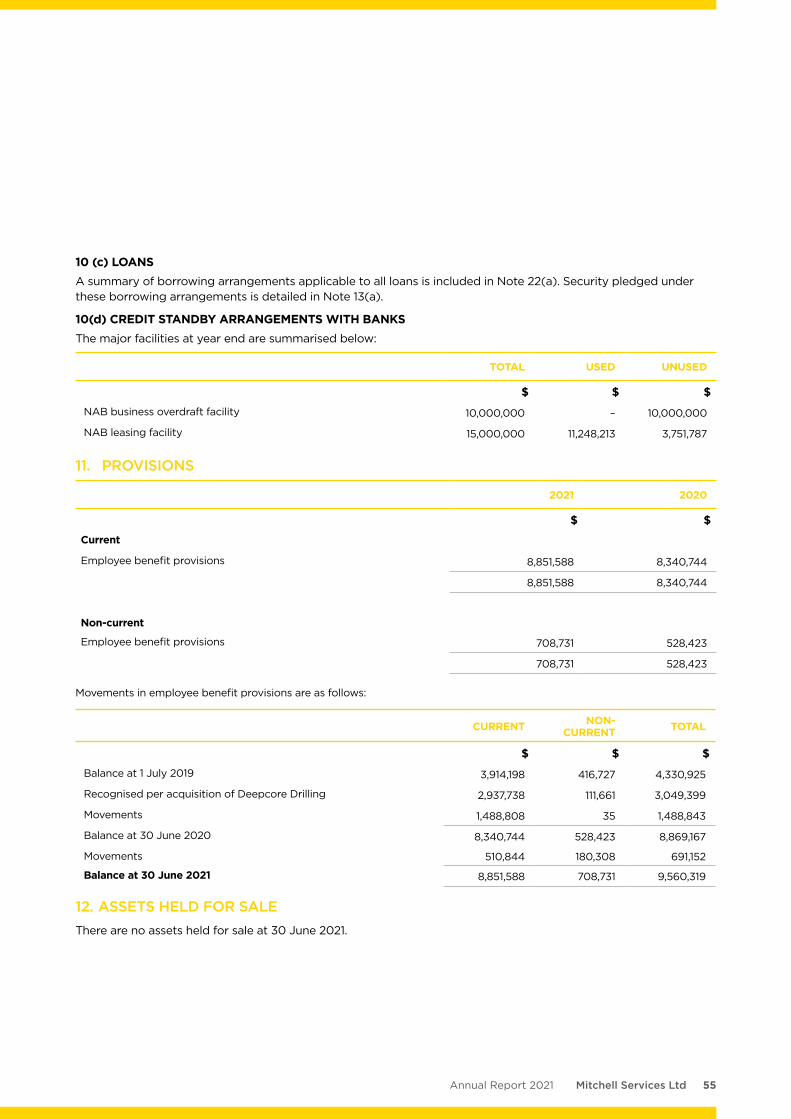
55Mitchell Services LtdAnnual Report 2021
10 (c) LOANS A summary of borrowing arrangements applicable to all loans is included in Note 22(a). Security pledged under these borrowing arrangements is detailed in Note 13(a).
10(d) CREDIT STANDBY ARRANGEMENTS WITH BANKSThe major facilities at year end are summarised below:
TOTAL USED UNUSED
$ $ $
NAB business overdraft facility 10,000,000 – 10,000,000
NAB leasing facility 15,000,000 11,248,213 3,751,787
11. PROVISIONS
2021 2020
$ $
Current
Employee benefit provisions 8,851,588 8,340,744
8,851,588 8,340,744
Non-current
Employee benefit provisions 708,731 528,423
708,731 528,423
Movements in employee benefit provisions are as follows:
CURRENT NON- CURRENT TOTAL
$ $ $
Balance at 1 July 2019 3,914,198 416,727 4,330,925
Recognised per acquisition of Deepcore Drilling 2,937,738 111,661 3,049,399
Movements 1,488,808 35 1,488,843
Balance at 30 June 2020 8,340,744 528,423 8,869,167
Movements 510,844 180,308 691,152
Balance at 30 June 2021 8,851,588 708,731 9,560,319
12. ASSETS HELD FOR SALEThere are no assets held for sale at 30 June 2021.
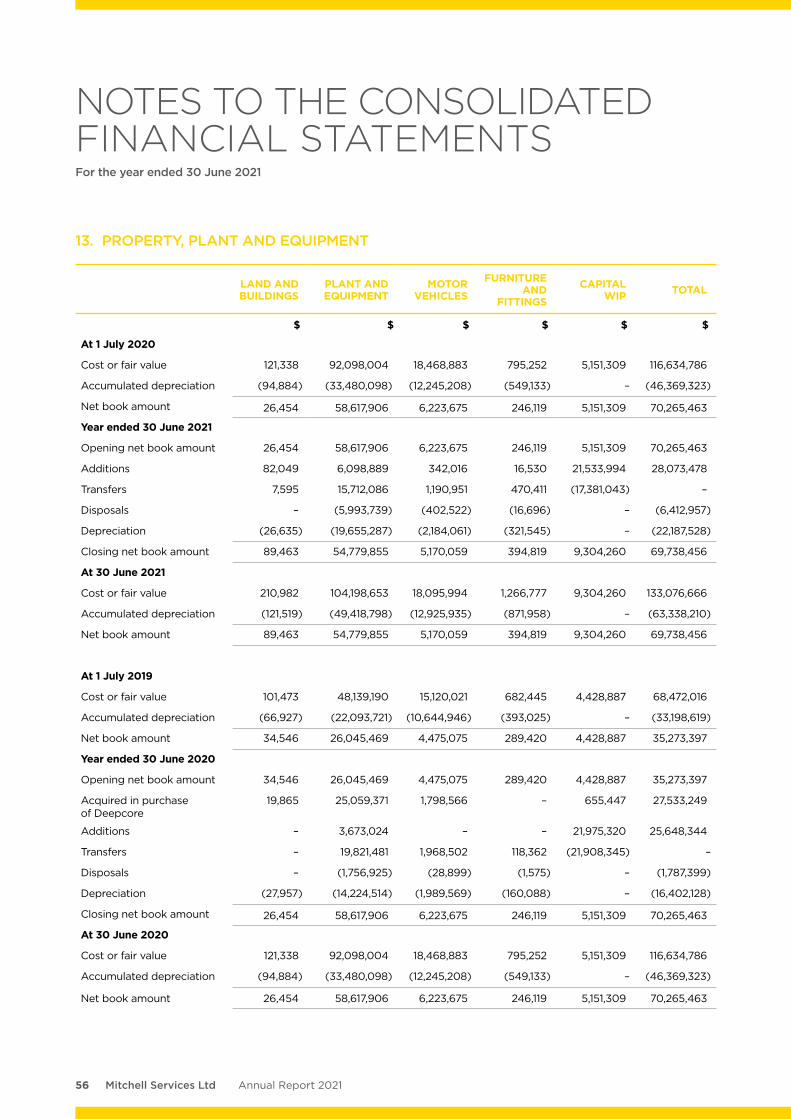
56 Mitchell Services Ltd Annual Report 2021
13. PROPERTY, PLANT AND EQUIPMENT
LAND AND BUILDINGS
PLANT AND EQUIPMENT
MOTOR VEHICLES
FURNITURE AND
FITTINGS
CAPITAL WIP TOTAL
$ $ $ $ $ $
At 1 July 2020
Cost or fair value 121,338 92,098,004 18,468,883 795,252 5,151,309 116,634,786
Accumulated depreciation (94,884) (33,480,098) (12,245,208) (549,133) – (46,369,323)
Net book amount 26,454 58,617,906 6,223,675 246,119 5,151,309 70,265,463
Year ended 30 June 2021
Opening net book amount 26,454 58,617,906 6,223,675 246,119 5,151,309 70,265,463
Additions 82,049 6,098,889 342,016 16,530 21,533,994 28,073,478
Transfers 7,595 15,712,086 1,190,951 470,411 (17,381,043) –
Disposals – (5,993,739) (402,522) (16,696) – (6,412,957)
Depreciation (26,635) (19,655,287) (2,184,061) (321,545) – (22,187,528)
Closing net book amount 89,463 54,779,855 5,170,059 394,819 9,304,260 69,738,456
At 30 June 2021
Cost or fair value 210,982 104,198,653 18,095,994 1,266,777 9,304,260 133,076,666
Accumulated depreciation (121,519) (49,418,798) (12,925,935) (871,958) – (63,338,210)
Net book amount 89,463 54,779,855 5,170,059 394,819 9,304,260 69,738,456
At 1 July 2019
Cost or fair value 101,473 48,139,190 15,120,021 682,445 4,428,887 68,472,016
Accumulated depreciation (66,927) (22,093,721) (10,644,946) (393,025) – (33,198,619)
Net book amount 34,546 26,045,469 4,475,075 289,420 4,428,887 35,273,397
Year ended 30 June 2020
Opening net book amount 34,546 26,045,469 4,475,075 289,420 4,428,887 35,273,397
Acquired in purchase of Deepcore
19,865 25,059,371 1,798,566 – 655,447 27,533,249
Additions – 3,673,024 – – 21,975,320 25,648,344
Transfers – 19,821,481 1,968,502 118,362 (21,908,345) –
Disposals – (1,756,925) (28,899) (1,575) – (1,787,399)
Depreciation (27,957) (14,224,514) (1,989,569) (160,088) – (16,402,128)
Closing net book amount 26,454 58,617,906 6,223,675 246,119 5,151,309 70,265,463
At 30 June 2020
Cost or fair value 121,338 92,098,004 18,468,883 795,252 5,151,309 116,634,786
Accumulated depreciation (94,884) (33,480,098) (12,245,208) (549,133) – (46,369,323)
Net book amount 26,454 58,617,906 6,223,675 246,119 5,151,309 70,265,463
NOTES TO THE CONSOLIDATED FINANCIAL STATEMENTSFor the year ended 30 June 2021
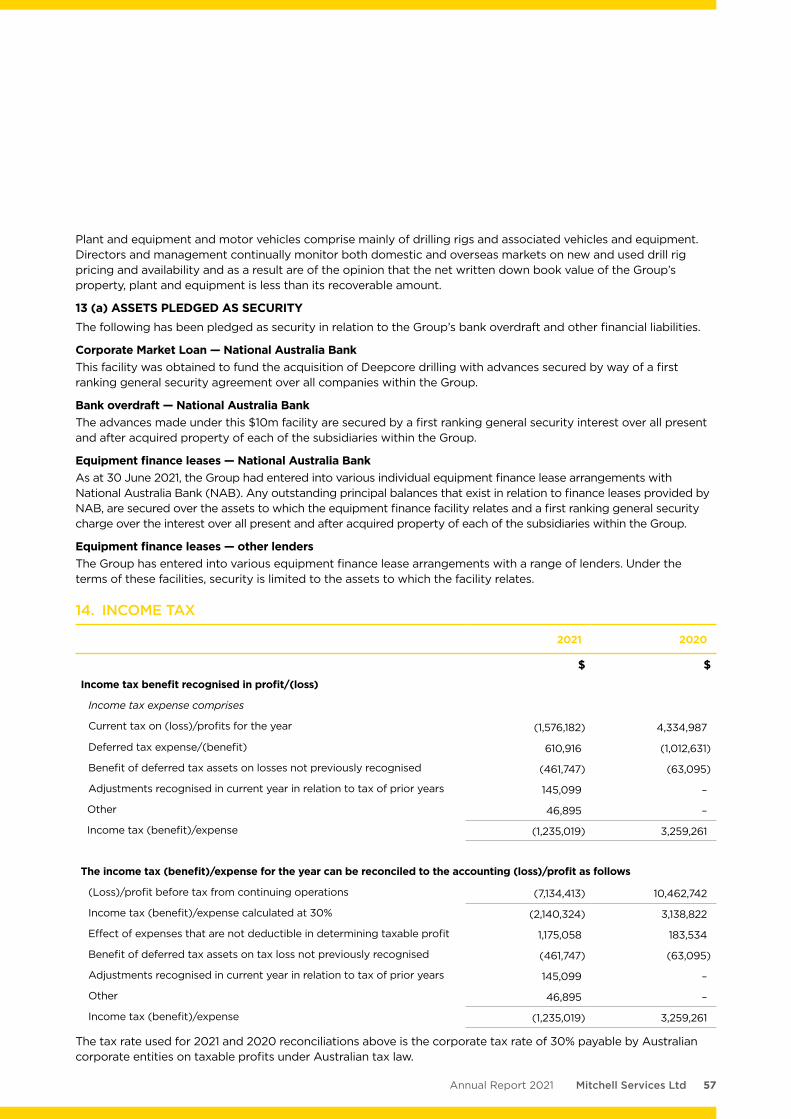
57Mitchell Services LtdAnnual Report 2021
Plant and equipment and motor vehicles comprise mainly of drilling rigs and associated vehicles and equipment. Directors and management continually monitor both domestic and overseas markets on new and used drill rig pricing and availability and as a result are of the opinion that the net written down book value of the Group’s property, plant and equipment is less than its recoverable amount.
13 (a) ASSETS PLEDGED AS SECURITYThe following has been pledged as security in relation to the Group’s bank overdraft and other financial liabilities.
Corporate Market Loan — National Australia Bank This facility was obtained to fund the acquisition of Deepcore drilling with advances secured by way of a first ranking general security agreement over all companies within the Group.
Bank overdraft — National Australia Bank The advances made under this $10m facility are secured by a first ranking general security interest over all present and after acquired property of each of the subsidiaries within the Group.
Equipment finance leases — National Australia Bank As at 30 June 2021, the Group had entered into various individual equipment finance lease arrangements with National Australia Bank (NAB). Any outstanding principal balances that exist in relation to finance leases provided by NAB, are secured over the assets to which the equipment finance facility relates and a first ranking general security charge over the interest over all present and after acquired property of each of the subsidiaries within the Group.
Equipment finance leases — other lenders The Group has entered into various equipment finance lease arrangements with a range of lenders. Under the terms of these facilities, security is limited to the assets to which the facility relates.
14. INCOME TAX
2021 2020
$ $
Income tax benefit recognised in profit/(loss)
Income tax expense comprises
Current tax on (loss)/profits for the year (1,576,182) 4,334,987
Deferred tax expense/(benefit) 610,916 (1,012,631)
Benefit of deferred tax assets on losses not previously recognised (461,747) (63,095)
Adjustments recognised in current year in relation to tax of prior years 145,099 –
Other 46,895 –
Income tax (benefit)/expense (1,235,019) 3,259,261
The income tax (benefit)/expense for the year can be reconciled to the accounting (loss)/profit as follows
(Loss)/profit before tax from continuing operations (7,134,413) 10,462,742
Income tax (benefit)/expense calculated at 30% (2,140,324) 3,138,822
Effect of expenses that are not deductible in determining taxable profit 1,175,058 183,534
Benefit of deferred tax assets on tax loss not previously recognised (461,747) (63,095)
Adjustments recognised in current year in relation to tax of prior years 145,099 –
Other 46,895 –
Income tax (benefit)/expense (1,235,019) 3,259,261
The tax rate used for 2021 and 2020 reconciliations above is the corporate tax rate of 30% payable by Australian corporate entities on taxable profits under Australian tax law.
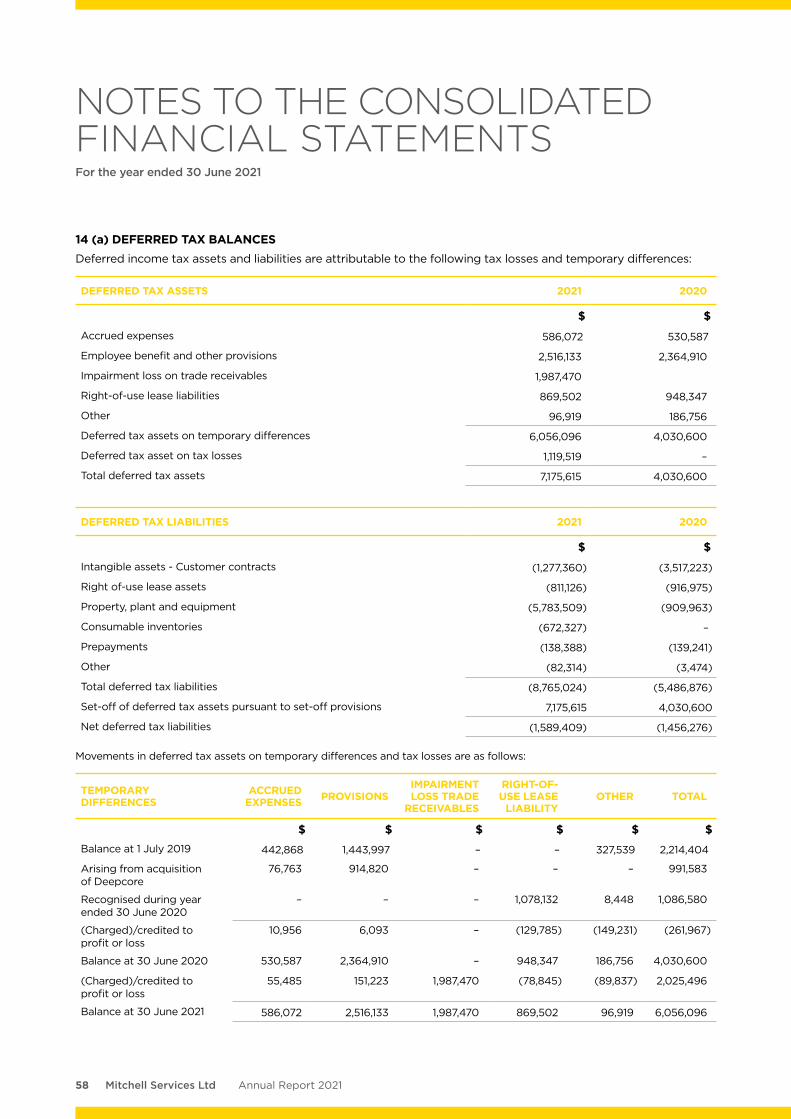
58 Mitchell Services Ltd Annual Report 2021
14 (a) DEFERRED TAX BALANCESDeferred income tax assets and liabilities are attributable to the following tax losses and temporary differences:
DEFERRED TAX ASSETS 2021 2020
$ $
Accrued expenses 586,072 530,587
Employee benefit and other provisions 2,516,133 2,364,910
Impairment loss on trade receivables 1,987,470
Right-of-use lease liabilities 869,502 948,347
Other 96,919 186,756
Deferred tax assets on temporary differences 6,056,096 4,030,600
Deferred tax asset on tax losses 1,119,519 –
Total deferred tax assets 7,175,615 4,030,600
DEFERRED TAX LIABILITIES 2021 2020
$ $
Intangible assets - Customer contracts (1,277,360) (3,517,223)
Right of-use lease assets (811,126) (916,975)
Property, plant and equipment (5,783,509) (909,963)
Consumable inventories (672,327) –
Prepayments (138,388) (139,241)
Other (82,314) (3,474)
Total deferred tax liabilities (8,765,024) (5,486,876)
Set-off of deferred tax assets pursuant to set-off provisions 7,175,615 4,030,600
Net deferred tax liabilities (1,589,409) (1,456,276)
Movements in deferred tax assets on temporary differences and tax losses are as follows:
TEMPORARY DIFFERENCES
ACCRUED EXPENSES PROVISIONS
IMPAIRMENT LOSS TRADE
RECEIVABLES
RIGHT-OF-USE LEASE
LIABILITYOTHER TOTAL
$ $ $ $ $ $Balance at 1 July 2019 442,868 1,443,997 – – 327,539 2,214,404
Arising from acquisition of Deepcore
76,763 914,820 – – – 991,583
Recognised during year ended 30 June 2020
– – – 1,078,132 8,448 1,086,580
(Charged)/credited to profit or loss
10,956 6,093 – (129,785) (149,231) (261,967)
Balance at 30 June 2020 530,587 2,364,910 – 948,347 186,756 4,030,600
(Charged)/credited to profit or loss
55,485 151,223 1,987,470 (78,845) (89,837) 2,025,496
Balance at 30 June 2021 586,072 2,516,133 1,987,470 869,502 96,919 6,056,096
NOTES TO THE CONSOLIDATED FINANCIAL STATEMENTSFor the year ended 30 June 2021
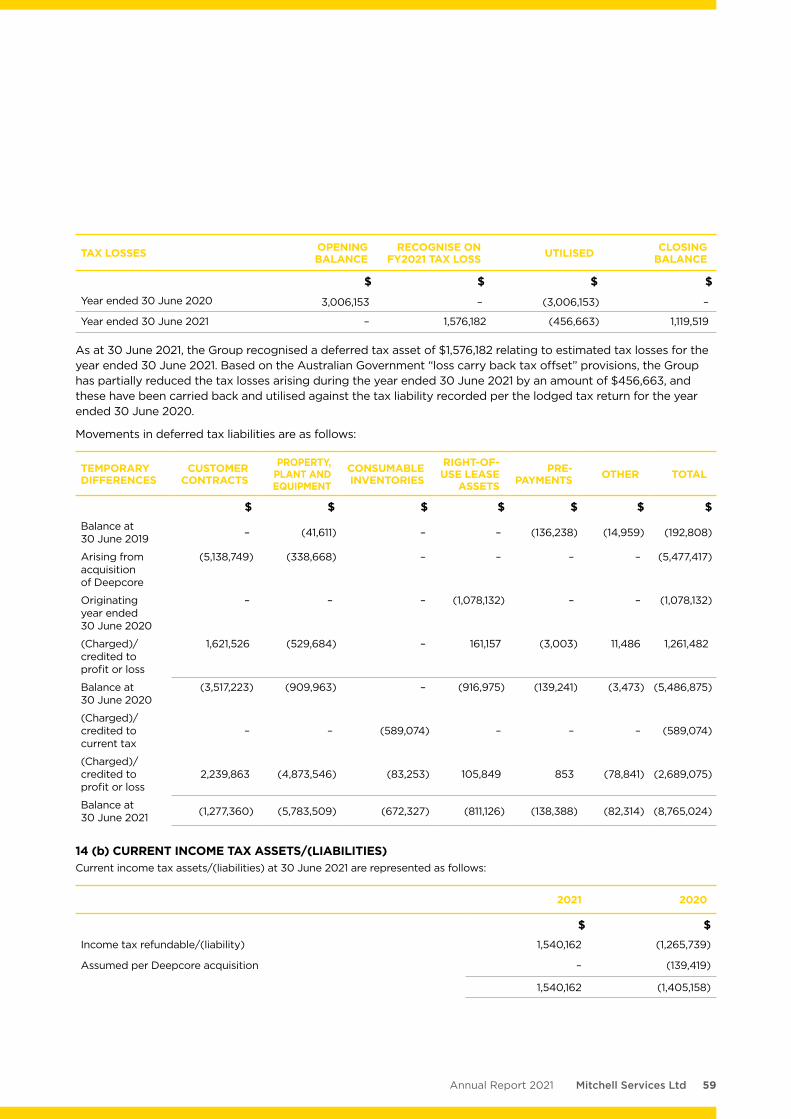
59Mitchell Services LtdAnnual Report 2021
TAX LOSSES OPENING BALANCE
RECOGNISE ON FY2021 TAX LOSS UTILISED CLOSING
BALANCE
$ $ $ $Year ended 30 June 2020 3,006,153 – (3,006,153) –
Year ended 30 June 2021 – 1,576,182 (456,663) 1,119,519
As at 30 June 2021, the Group recognised a deferred tax asset of $1,576,182 relating to estimated tax losses for the year ended 30 June 2021. Based on the Australian Government “loss carry back tax offset” provisions, the Group has partially reduced the tax losses arising during the year ended 30 June 2021 by an amount of $456,663, and these have been carried back and utilised against the tax liability recorded per the lodged tax return for the year ended 30 June 2020.
Movements in deferred tax liabilities are as follows:
TEMPORARY DIFFERENCES
CUSTOMER CONTRACTS
PROPERTY, PLANT AND EQUIPMENT
CONSUMABLE INVENTORIES
RIGHT-OF-USE LEASE
ASSETS
PRE- PAYMENTS OTHER TOTAL
$ $ $ $ $ $ $Balance at 30 June 2019 – (41,611) – – (136,238) (14,959) (192,808)
Arising from acquisition of Deepcore
(5,138,749) (338,668) – – – – (5,477,417)
Originating year ended 30 June 2020
– – – (1,078,132) – – (1,078,132)
(Charged)/credited to profit or loss
1,621,526 (529,684) – 161,157 (3,003) 11,486 1,261,482
Balance at 30 June 2020
(3,517,223) (909,963) – (916,975) (139,241) (3,473) (5,486,875)
(Charged)/credited to current tax
– – (589,074) – – – (589,074)
(Charged)/credited to profit or loss
2,239,863 (4,873,546) (83,253) 105,849 853 (78,841) (2,689,075)
Balance at 30 June 2021 (1,277,360) (5,783,509) (672,327) (811,126) (138,388) (82,314) (8,765,024)
14 (b) CURRENT INCOME TAX ASSETS/(LIABILITIES)Current income tax assets/(liabilities) at 30 June 2021 are represented as follows:
2021 2020
$ $
Income tax refundable/(liability) 1,540,162 (1,265,739)
Assumed per Deepcore acquisition – (139,419)
1,540,162 (1,405,158)
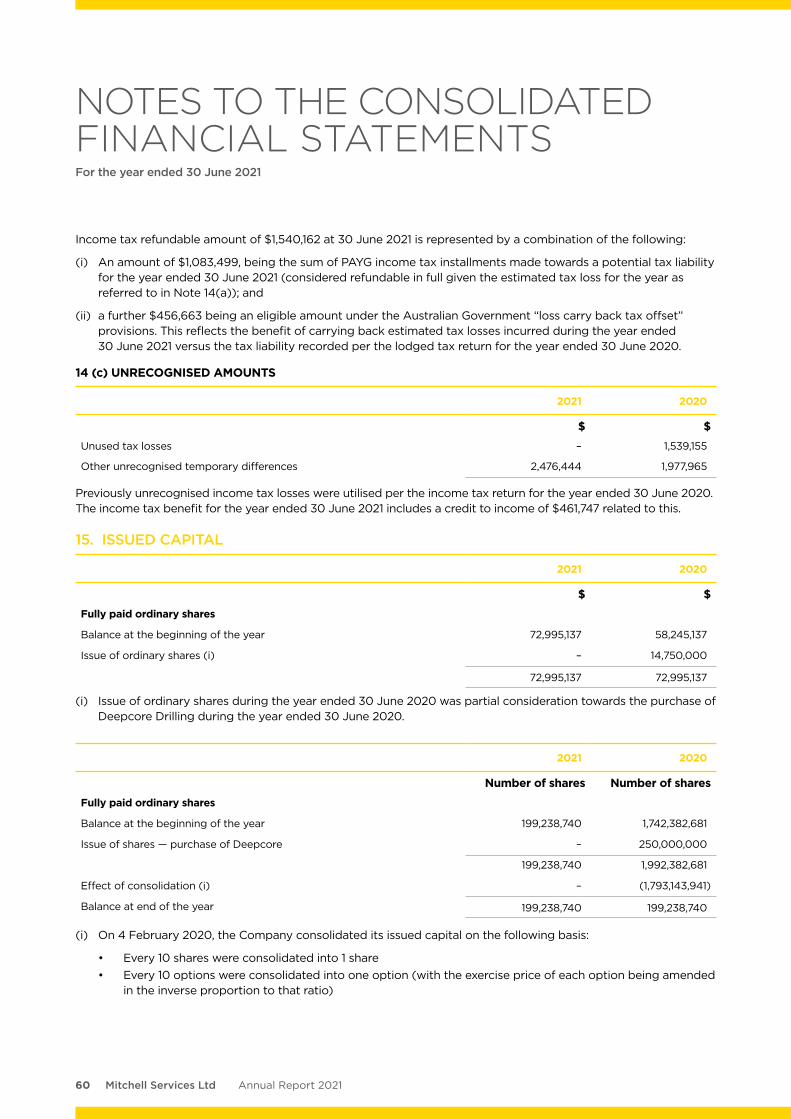
60 Mitchell Services Ltd Annual Report 2021
Income tax refundable amount of $1,540,162 at 30 June 2021 is represented by a combination of the following:
(i) An amount of $1,083,499, being the sum of PAYG income tax installments made towards a potential tax liability for the year ended 30 June 2021 (considered refundable in full given the estimated tax loss for the year as referred to in Note 14(a)); and
(ii) a further $456,663 being an eligible amount under the Australian Government “loss carry back tax offset” provisions. This reflects the benefit of carrying back estimated tax losses incurred during the year ended 30 June 2021 versus the tax liability recorded per the lodged tax return for the year ended 30 June 2020.
14 (c) UNRECOGNISED AMOUNTS
2021 2020
$ $
Unused tax losses – 1,539,155
Other unrecognised temporary differences 2,476,444 1,977,965
Previously unrecognised income tax losses were utilised per the income tax return for the year ended 30 June 2020. The income tax benefit for the year ended 30 June 2021 includes a credit to income of $461,747 related to this.
15. ISSUED CAPITAL
2021 2020
$ $
Fully paid ordinary shares
Balance at the beginning of the year 72,995,137 58,245,137
Issue of ordinary shares (i) – 14,750,000
72,995,137 72,995,137
(i) Issue of ordinary shares during the year ended 30 June 2020 was partial consideration towards the purchase of Deepcore Drilling during the year ended 30 June 2020.
2021 2020
Number of shares Number of shares
Fully paid ordinary shares
Balance at the beginning of the year 199,238,740 1,742,382,681
Issue of shares — purchase of Deepcore – 250,000,000
199,238,740 1,992,382,681
Effect of consolidation (i) – (1,793,143,941)
Balance at end of the year 199,238,740 199,238,740
(i) On 4 February 2020, the Company consolidated its issued capital on the following basis:
• Every 10 shares were consolidated into 1 share• Every 10 options were consolidated into one option (with the exercise price of each option being amended
in the inverse proportion to that ratio)
NOTES TO THE CONSOLIDATED FINANCIAL STATEMENTSFor the year ended 30 June 2021
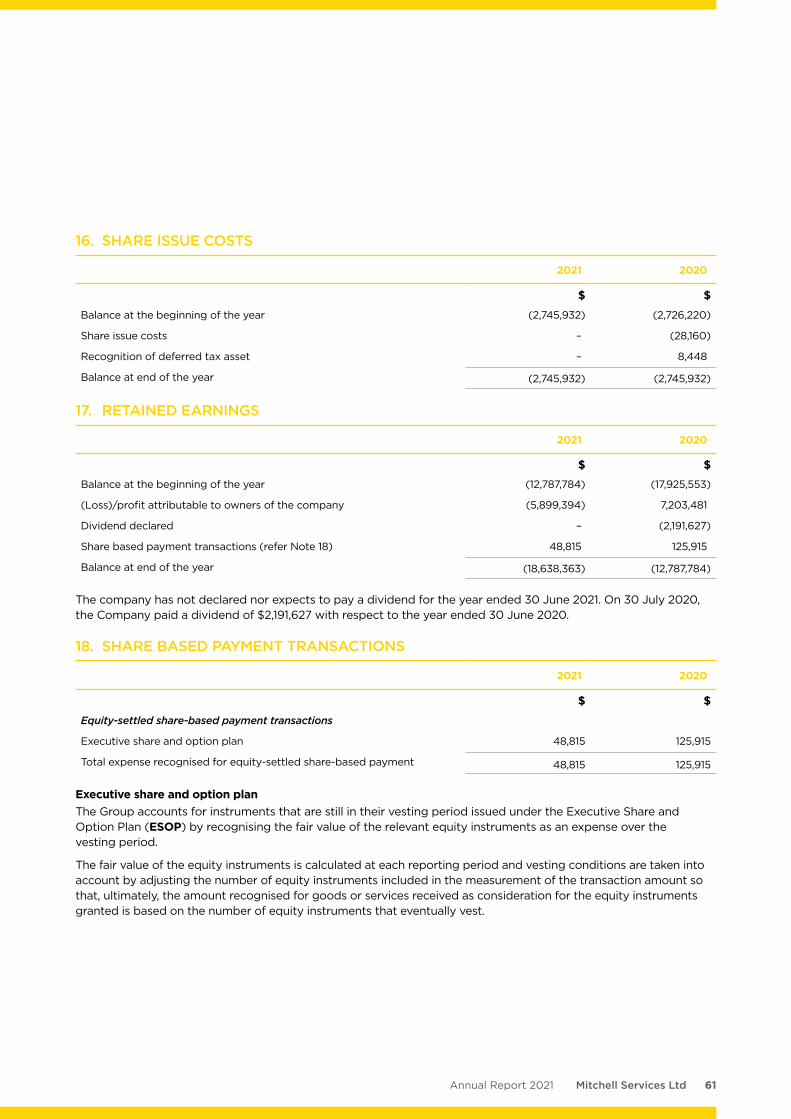
61Mitchell Services LtdAnnual Report 2021
16. SHARE ISSUE COSTS
2021 2020
$ $
Balance at the beginning of the year (2,745,932) (2,726,220)
Share issue costs – (28,160)
Recognition of deferred tax asset – 8,448
Balance at end of the year (2,745,932) (2,745,932)
17. RETAINED EARNINGS
2021 2020
$ $
Balance at the beginning of the year (12,787,784) (17,925,553)
(Loss)/profit attributable to owners of the company (5,899,394) 7,203,481
Dividend declared – (2,191,627)
Share based payment transactions (refer Note 18) 48,815 125,915
Balance at end of the year (18,638,363) (12,787,784)
The company has not declared nor expects to pay a dividend for the year ended 30 June 2021. On 30 July 2020, the Company paid a dividend of $2,191,627 with respect to the year ended 30 June 2020.
18. SHARE BASED PAYMENT TRANSACTIONS
2021 2020
$ $
Equity-settled share-based payment transactions
Executive share and option plan 48,815 125,915
Total expense recognised for equity-settled share-based payment 48,815 125,915
Executive share and option plan The Group accounts for instruments that are still in their vesting period issued under the Executive Share and Option Plan (ESOP) by recognising the fair value of the relevant equity instruments as an expense over the vesting period.
The fair value of the equity instruments is calculated at each reporting period and vesting conditions are taken into account by adjusting the number of equity instruments included in the measurement of the transaction amount so that, ultimately, the amount recognised for goods or services received as consideration for the equity instruments granted is based on the number of equity instruments that eventually vest.
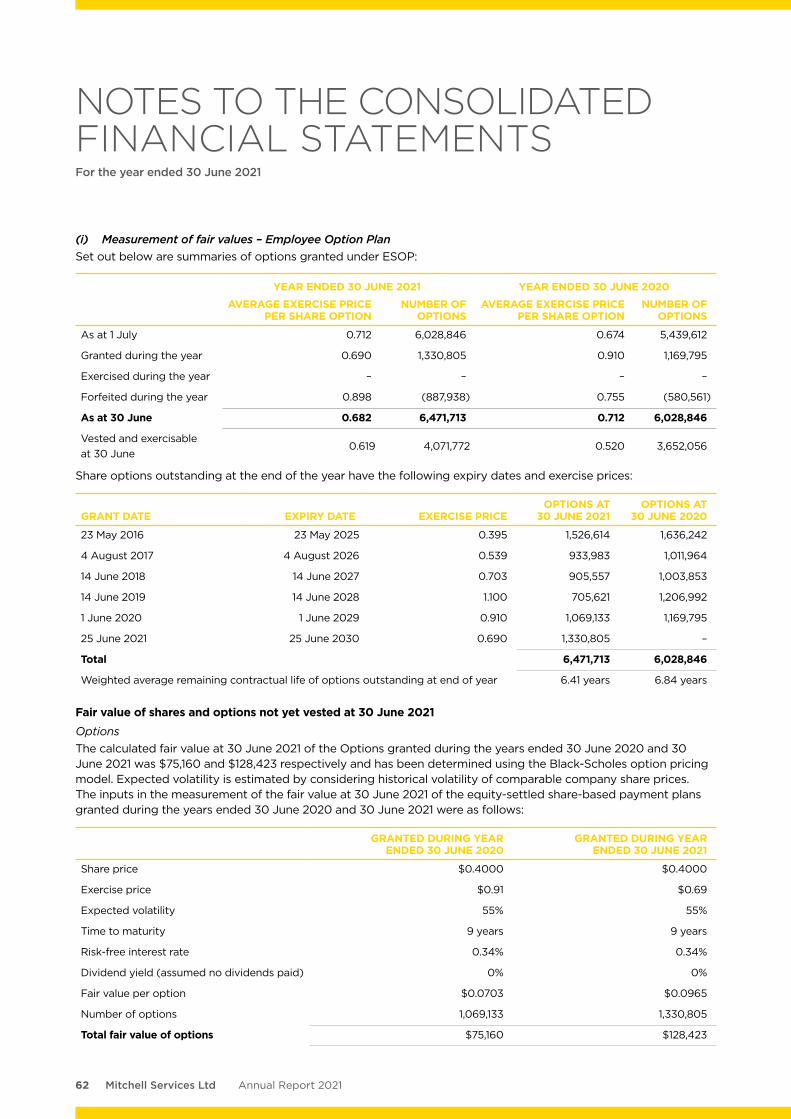
62 Mitchell Services Ltd Annual Report 2021
(i) Measurement of fair values – Employee Option PlanSet out below are summaries of options granted under ESOP:
YEAR ENDED 30 JUNE 2021 YEAR ENDED 30 JUNE 2020AVERAGE EXERCISE PRICE
PER SHARE OPTIONNUMBER OF
OPTIONSAVERAGE EXERCISE PRICE
PER SHARE OPTIONNUMBER OF
OPTIONS
As at 1 July 0.712 6,028,846 0.674 5,439,612
Granted during the year 0.690 1,330,805 0.910 1,169,795
Exercised during the year – – – –
Forfeited during the year 0.898 (887,938) 0.755 (580,561)
As at 30 June 0.682 6,471,713 0.712 6,028,846
Vested and exercisable at 30 June
0.619 4,071,772 0.520 3,652,056
Share options outstanding at the end of the year have the following expiry dates and exercise prices:
GRANT DATE EXPIRY DATE EXERCISE PRICEOPTIONS AT
30 JUNE 2021OPTIONS AT
30 JUNE 2020
23 May 2016 23 May 2025 0.395 1,526,614 1,636,242
4 August 2017 4 August 2026 0.539 933,983 1,011,964
14 June 2018 14 June 2027 0.703 905,557 1,003,853
14 June 2019 14 June 2028 1.100 705,621 1,206,992
1 June 2020 1 June 2029 0.910 1,069,133 1,169,795
25 June 2021 25 June 2030 0.690 1,330,805 –
Total 6,471,713 6,028,846
Weighted average remaining contractual life of options outstanding at end of year 6.41 years 6.84 years
Fair value of shares and options not yet vested at 30 June 2021OptionsThe calculated fair value at 30 June 2021 of the Options granted during the years ended 30 June 2020 and 30 June 2021 was $75,160 and $128,423 respectively and has been determined using the Black-Scholes option pricing model. Expected volatility is estimated by considering historical volatility of comparable company share prices. The inputs in the measurement of the fair value at 30 June 2021 of the equity-settled share-based payment plans granted during the years ended 30 June 2020 and 30 June 2021 were as follows:
GRANTED DURING YEAR ENDED 30 JUNE 2020
GRANTED DURING YEAR ENDED 30 JUNE 2021
Share price $0.4000 $0.4000
Exercise price $0.91 $0.69
Expected volatility 55% 55%
Time to maturity 9 years 9 years
Risk-free interest rate 0.34% 0.34%
Dividend yield (assumed no dividends paid) 0% 0%
Fair value per option $0.0703 $0.0965
Number of options 1,069,133 1,330,805
Total fair value of options $75,160 $128,423
NOTES TO THE CONSOLIDATED FINANCIAL STATEMENTSFor the year ended 30 June 2021
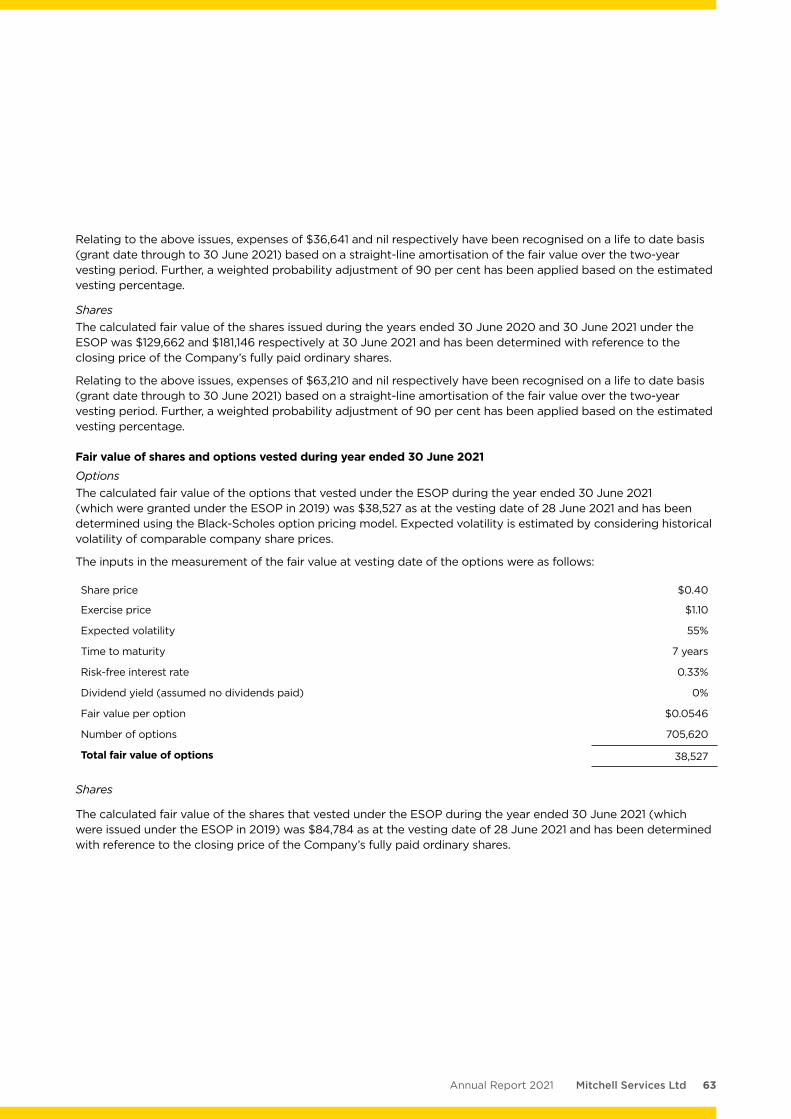
63Mitchell Services LtdAnnual Report 2021
Relating to the above issues, expenses of $36,641 and nil respectively have been recognised on a life to date basis (grant date through to 30 June 2021) based on a straight-line amortisation of the fair value over the two-year vesting period. Further, a weighted probability adjustment of 90 per cent has been applied based on the estimated vesting percentage.
SharesThe calculated fair value of the shares issued during the years ended 30 June 2020 and 30 June 2021 under the ESOP was $129,662 and $181,146 respectively at 30 June 2021 and has been determined with reference to the closing price of the Company’s fully paid ordinary shares.
Relating to the above issues, expenses of $63,210 and nil respectively have been recognised on a life to date basis (grant date through to 30 June 2021) based on a straight-line amortisation of the fair value over the two-year vesting period. Further, a weighted probability adjustment of 90 per cent has been applied based on the estimated vesting percentage.
Fair value of shares and options vested during year ended 30 June 2021 Options The calculated fair value of the options that vested under the ESOP during the year ended 30 June 2021 (which were granted under the ESOP in 2019) was $38,527 as at the vesting date of 28 June 2021 and has been determined using the Black-Scholes option pricing model. Expected volatility is estimated by considering historical volatility of comparable company share prices.
The inputs in the measurement of the fair value at vesting date of the options were as follows:
Share price $0.40
Exercise price $1.10
Expected volatility 55%
Time to maturity 7 years
Risk-free interest rate 0.33%
Dividend yield (assumed no dividends paid) 0%
Fair value per option $0.0546
Number of options 705,620
Total fair value of options 38,527
Shares
The calculated fair value of the shares that vested under the ESOP during the year ended 30 June 2021 (which were issued under the ESOP in 2019) was $84,784 as at the vesting date of 28 June 2021 and has been determined with reference to the closing price of the Company’s fully paid ordinary shares.
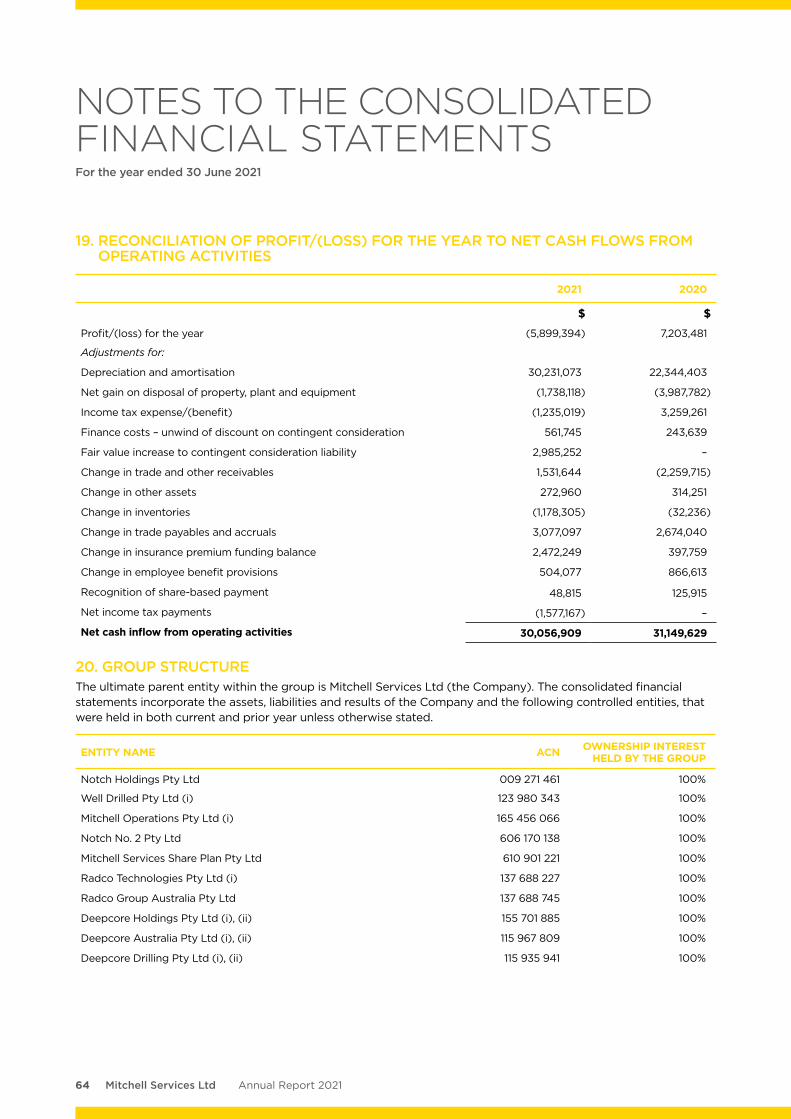
64 Mitchell Services Ltd Annual Report 2021
19. RECONCILIATION OF PROFIT/(LOSS) FOR THE YEAR TO NET CASH FLOWS FROM OPERATING ACTIVITIES
2021 2020
$ $
Profit/(loss) for the year (5,899,394) 7,203,481
Adjustments for:
Depreciation and amortisation 30,231,073 22,344,403
Net gain on disposal of property, plant and equipment (1,738,118) (3,987,782)
Income tax expense/(benefit) (1,235,019) 3,259,261
Finance costs – unwind of discount on contingent consideration 561,745 243,639
Fair value increase to contingent consideration liability 2,985,252 –
Change in trade and other receivables 1,531,644 (2,259,715)
Change in other assets 272,960 314,251
Change in inventories (1,178,305) (32,236)
Change in trade payables and accruals 3,077,097 2,674,040
Change in insurance premium funding balance 2,472,249 397,759
Change in employee benefit provisions 504,077 866,613
Recognition of share-based payment 48,815 125,915
Net income tax payments (1,577,167) –
Net cash inflow from operating activities 30,056,909 31,149,629
20. GROUP STRUCTUREThe ultimate parent entity within the group is Mitchell Services Ltd (the Company). The consolidated financial statements incorporate the assets, liabilities and results of the Company and the following controlled entities, that were held in both current and prior year unless otherwise stated.
ENTITY NAME ACN OWNERSHIP INTEREST HELD BY THE GROUP
Notch Holdings Pty Ltd 009 271 461 100%
Well Drilled Pty Ltd (i) 123 980 343 100%
Mitchell Operations Pty Ltd (i) 165 456 066 100%
Notch No. 2 Pty Ltd 606 170 138 100%
Mitchell Services Share Plan Pty Ltd 610 901 221 100%
Radco Technologies Pty Ltd (i) 137 688 227 100%
Radco Group Australia Pty Ltd 137 688 745 100%
Deepcore Holdings Pty Ltd (i), (ii) 155 701 885 100%
Deepcore Australia Pty Ltd (i), (ii) 115 967 809 100%
Deepcore Drilling Pty Ltd (i), (ii) 115 935 941 100%
NOTES TO THE CONSOLIDATED FINANCIAL STATEMENTSFor the year ended 30 June 2021
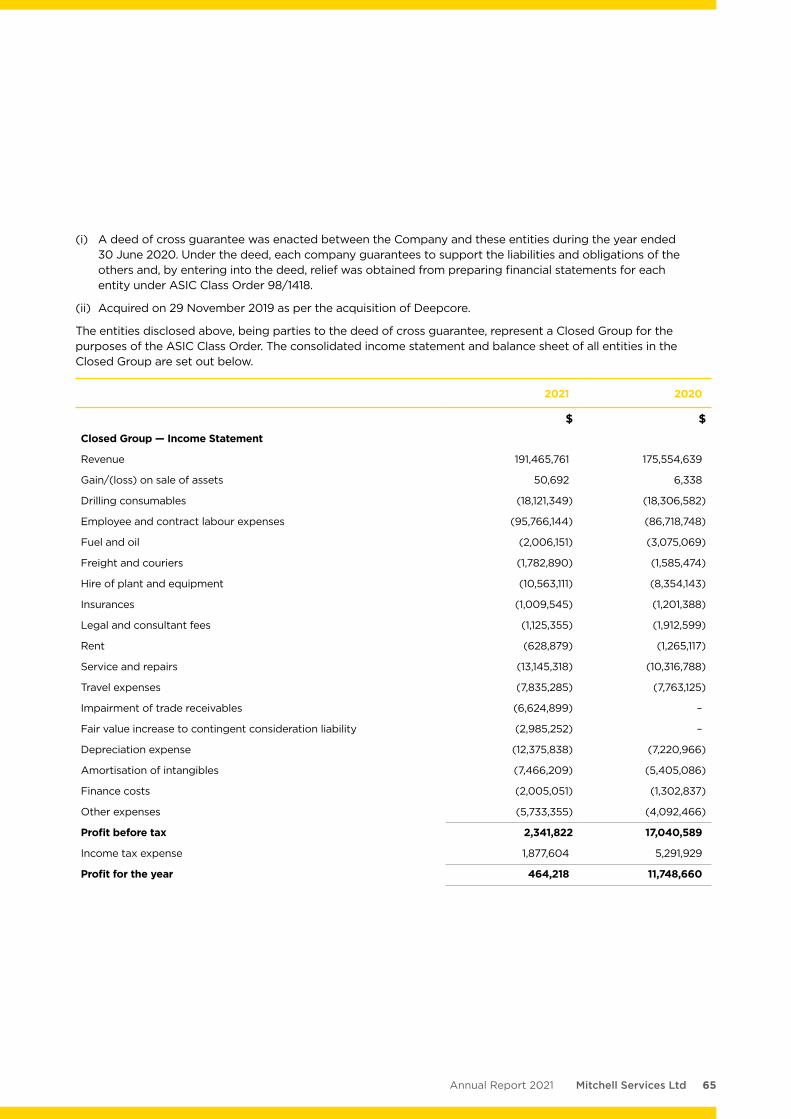
65Mitchell Services LtdAnnual Report 2021
(i) A deed of cross guarantee was enacted between the Company and these entities during the year ended 30 June 2020. Under the deed, each company guarantees to support the liabilities and obligations of the others and, by entering into the deed, relief was obtained from preparing financial statements for each entity under ASIC Class Order 98/1418.
(ii) Acquired on 29 November 2019 as per the acquisition of Deepcore.
The entities disclosed above, being parties to the deed of cross guarantee, represent a Closed Group for the purposes of the ASIC Class Order. The consolidated income statement and balance sheet of all entities in the Closed Group are set out below.
2021 2020
$ $
Closed Group — Income Statement
Revenue 191,465,761 175,554,639
Gain/(loss) on sale of assets 50,692 6,338
Drilling consumables (18,121,349) (18,306,582)
Employee and contract labour expenses (95,766,144) (86,718,748)
Fuel and oil (2,006,151) (3,075,069)
Freight and couriers (1,782,890) (1,585,474)
Hire of plant and equipment (10,563,111) (8,354,143)
Insurances (1,009,545) (1,201,388)
Legal and consultant fees (1,125,355) (1,912,599)
Rent (628,879) (1,265,117)
Service and repairs (13,145,318) (10,316,788)
Travel expenses (7,835,285) (7,763,125)
Impairment of trade receivables (6,624,899) –
Fair value increase to contingent consideration liability (2,985,252) –
Depreciation expense (12,375,838) (7,220,966)
Amortisation of intangibles (7,466,209) (5,405,086)
Finance costs (2,005,051) (1,302,837)
Other expenses (5,733,355) (4,092,466)
Profit before tax 2,341,822 17,040,589
Income tax expense 1,877,604 5,291,929
Profit for the year 464,218 11,748,660
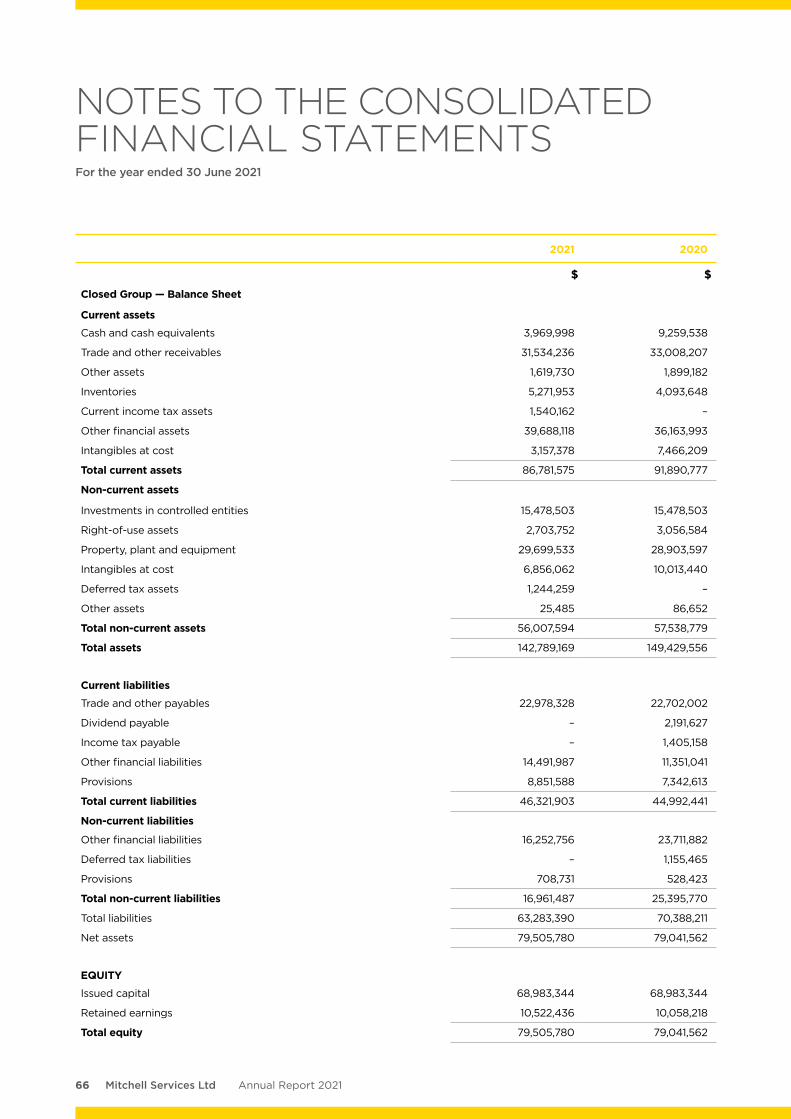
66 Mitchell Services Ltd Annual Report 2021
2021 2020
$ $
Closed Group — Balance Sheet
Current assets
Cash and cash equivalents 3,969,998 9,259,538
Trade and other receivables 31,534,236 33,008,207
Other assets 1,619,730 1,899,182
Inventories 5,271,953 4,093,648
Current income tax assets 1,540,162 –
Other financial assets 39,688,118 36,163,993
Intangibles at cost 3,157,378 7,466,209
Total current assets 86,781,575 91,890,777
Non-current assets
Investments in controlled entities 15,478,503 15,478,503
Right-of-use assets 2,703,752 3,056,584
Property, plant and equipment 29,699,533 28,903,597
Intangibles at cost 6,856,062 10,013,440
Deferred tax assets 1,244,259 –
Other assets 25,485 86,652
Total non-current assets 56,007,594 57,538,779
Total assets 142,789,169 149,429,556
Current liabilities
Trade and other payables 22,978,328 22,702,002
Dividend payable – 2,191,627
Income tax payable – 1,405,158
Other financial liabilities 14,491,987 11,351,041
Provisions 8,851,588 7,342,613
Total current liabilities 46,321,903 44,992,441
Non-current liabilities
Other financial liabilities 16,252,756 23,711,882
Deferred tax liabilities – 1,155,465
Provisions 708,731 528,423
Total non-current liabilities 16,961,487 25,395,770
Total liabilities 63,283,390 70,388,211
Net assets 79,505,780 79,041,562
EQUITY
Issued capital 68,983,344 68,983,344
Retained earnings 10,522,436 10,058,218
Total equity 79,505,780 79,041,562
NOTES TO THE CONSOLIDATED FINANCIAL STATEMENTSFor the year ended 30 June 2021
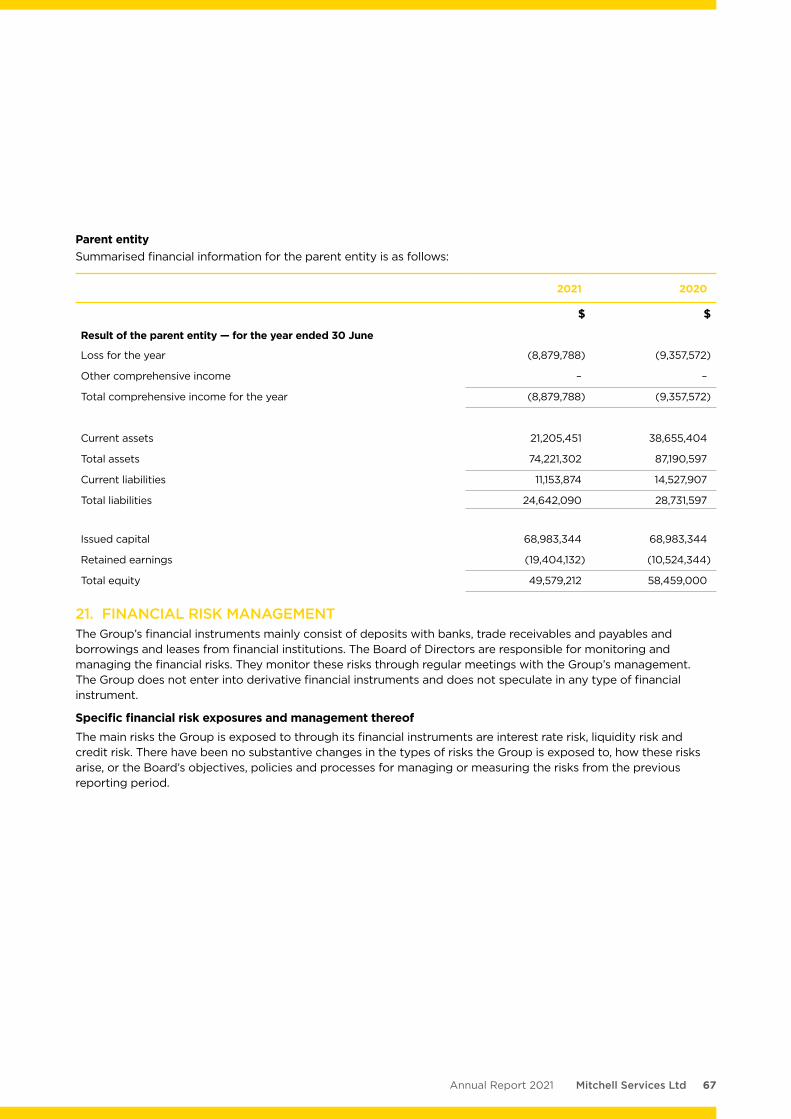
67Mitchell Services LtdAnnual Report 2021
Parent entitySummarised financial information for the parent entity is as follows:
2021 2020
$ $
Result of the parent entity — for the year ended 30 June
Loss for the year (8,879,788) (9,357,572)
Other comprehensive income – –
Total comprehensive income for the year (8,879,788) (9,357,572)
Current assets 21,205,451 38,655,404
Total assets 74,221,302 87,190,597
Current liabilities 11,153,874 14,527,907
Total liabilities 24,642,090 28,731,597
Issued capital 68,983,344 68,983,344
Retained earnings (19,404,132) (10,524,344)
Total equity 49,579,212 58,459,000
21. FINANCIAL RISK MANAGEMENTThe Group’s financial instruments mainly consist of deposits with banks, trade receivables and payables and borrowings and leases from financial institutions. The Board of Directors are responsible for monitoring and managing the financial risks. They monitor these risks through regular meetings with the Group’s management. The Group does not enter into derivative financial instruments and does not speculate in any type of financial instrument.
Specific financial risk exposures and management thereofThe main risks the Group is exposed to through its financial instruments are interest rate risk, liquidity risk and credit risk. There have been no substantive changes in the types of risks the Group is exposed to, how these risks arise, or the Board’s objectives, policies and processes for managing or measuring the risks from the previous reporting period.
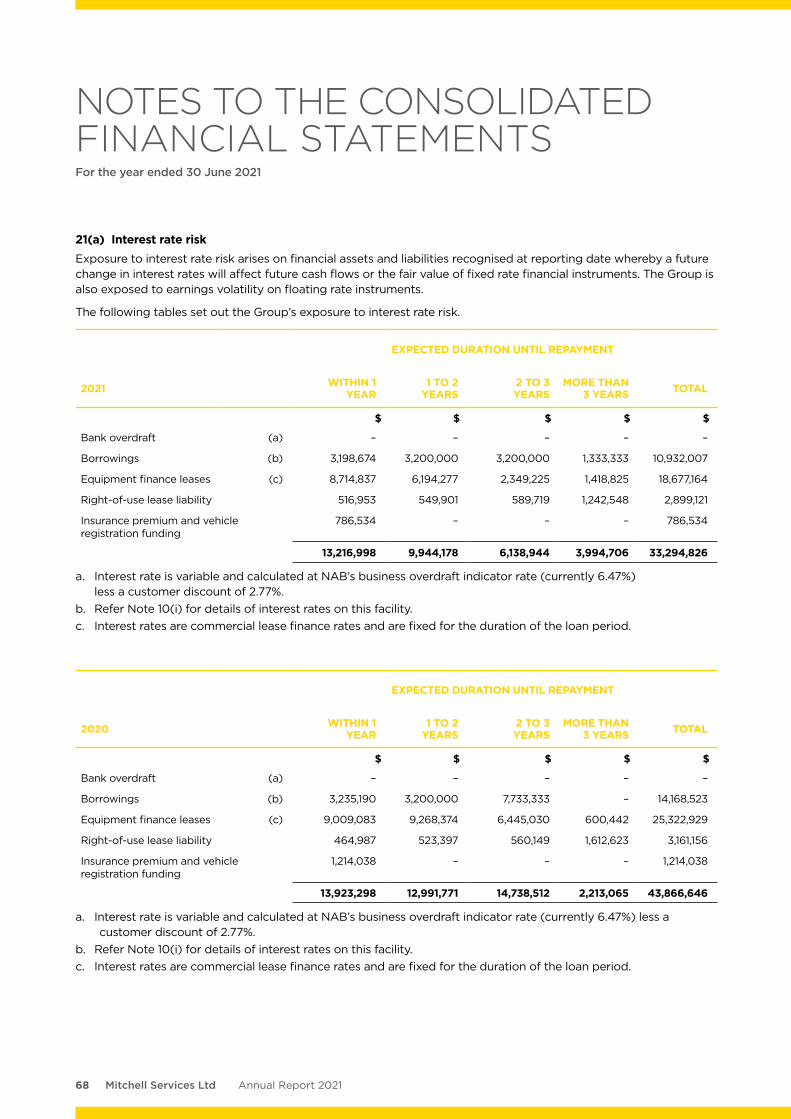
68 Mitchell Services Ltd Annual Report 2021
21(a) Interest rate riskExposure to interest rate risk arises on financial assets and liabilities recognised at reporting date whereby a future change in interest rates will affect future cash flows or the fair value of fixed rate financial instruments. The Group is also exposed to earnings volatility on floating rate instruments.
The following tables set out the Group’s exposure to interest rate risk.
EXPECTED DURATION UNTIL REPAYMENT
2021 WITHIN 1 YEAR
1 TO 2 YEARS
2 TO 3 YEARS
MORE THAN 3 YEARS TOTAL
$ $ $ $ $
Bank overdraft (a) – – – – –
Borrowings (b) 3,198,674 3,200,000 3,200,000 1,333,333 10,932,007
Equipment finance leases (c) 8,714,837 6,194,277 2,349,225 1,418,825 18,677,164
Right-of-use lease liability 516,953 549,901 589,719 1,242,548 2,899,121
Insurance premium and vehicle registration funding
786,534 – – – 786,534
13,216,998 9,944,178 6,138,944 3,994,706 33,294,826
a. Interest rate is variable and calculated at NAB’s business overdraft indicator rate (currently 6.47%) less a customer discount of 2.77%.
b. Refer Note 10(i) for details of interest rates on this facility.c. Interest rates are commercial lease finance rates and are fixed for the duration of the loan period.
EXPECTED DURATION UNTIL REPAYMENT
2020 WITHIN 1 YEAR
1 TO 2 YEARS
2 TO 3 YEARS
MORE THAN 3 YEARS TOTAL
$ $ $ $ $
Bank overdraft (a) – – – – –
Borrowings (b) 3,235,190 3,200,000 7,733,333 – 14,168,523
Equipment finance leases (c) 9,009,083 9,268,374 6,445,030 600,442 25,322,929
Right-of-use lease liability 464,987 523,397 560,149 1,612,623 3,161,156
Insurance premium and vehicle registration funding
1,214,038 – – – 1,214,038
13,923,298 12,991,771 14,738,512 2,213,065 43,866,646
a. Interest rate is variable and calculated at NAB’s business overdraft indicator rate (currently 6.47%) less a customer discount of 2.77%.
b. Refer Note 10(i) for details of interest rates on this facility.c. Interest rates are commercial lease finance rates and are fixed for the duration of the loan period.
NOTES TO THE CONSOLIDATED FINANCIAL STATEMENTSFor the year ended 30 June 2021
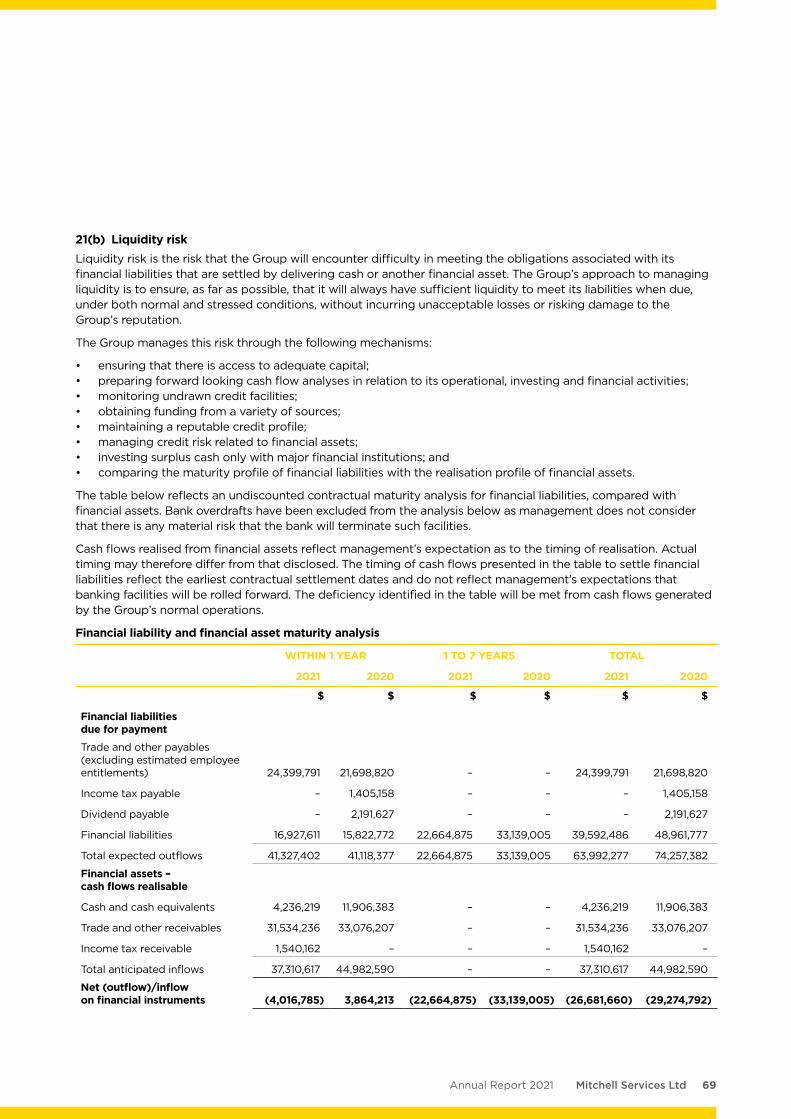
69Mitchell Services LtdAnnual Report 2021
21(b) Liquidity riskLiquidity risk is the risk that the Group will encounter difficulty in meeting the obligations associated with its financial liabilities that are settled by delivering cash or another financial asset. The Group’s approach to managing liquidity is to ensure, as far as possible, that it will always have sufficient liquidity to meet its liabilities when due, under both normal and stressed conditions, without incurring unacceptable losses or risking damage to the Group’s reputation.
The Group manages this risk through the following mechanisms:
• ensuring that there is access to adequate capital;• preparing forward looking cash flow analyses in relation to its operational, investing and financial activities;• monitoring undrawn credit facilities;• obtaining funding from a variety of sources;• maintaining a reputable credit profile;• managing credit risk related to financial assets;• investing surplus cash only with major financial institutions; and• comparing the maturity profile of financial liabilities with the realisation profile of financial assets.
The table below reflects an undiscounted contractual maturity analysis for financial liabilities, compared with financial assets. Bank overdrafts have been excluded from the analysis below as management does not consider that there is any material risk that the bank will terminate such facilities.
Cash flows realised from financial assets reflect management’s expectation as to the timing of realisation. Actual timing may therefore differ from that disclosed. The timing of cash flows presented in the table to settle financial liabilities reflect the earliest contractual settlement dates and do not reflect management’s expectations that banking facilities will be rolled forward. The deficiency identified in the table will be met from cash flows generated by the Group’s normal operations.
Financial liability and financial asset maturity analysis
WITHIN 1 YEAR 1 TO 7 YEARS TOTAL
2021 2020 2021 2020 2021 2020
$ $ $ $ $ $
Financial liabilities due for payment
Trade and other payables (excluding estimated employee entitlements) 24,399,791 21,698,820 – – 24,399,791 21,698,820
Income tax payable – 1,405,158 – – – 1,405,158
Dividend payable – 2,191,627 – – – 2,191,627
Financial liabilities 16,927,611 15,822,772 22,664,875 33,139,005 39,592,486 48,961,777
Total expected outflows 41,327,402 41,118,377 22,664,875 33,139,005 63,992,277 74,257,382
Financial assets – cash flows realisable
Cash and cash equivalents 4,236,219 11,906,383 – – 4,236,219 11,906,383
Trade and other receivables 31,534,236 33,076,207 – – 31,534,236 33,076,207
Income tax receivable 1,540,162 – – – 1,540,162 –
Total anticipated inflows 37,310,617 44,982,590 – – 37,310,617 44,982,590
Net (outflow)/inflow on financial instruments (4,016,785) 3,864,213 (22,664,875) (33,139,005) (26,681,660) (29,274,792)
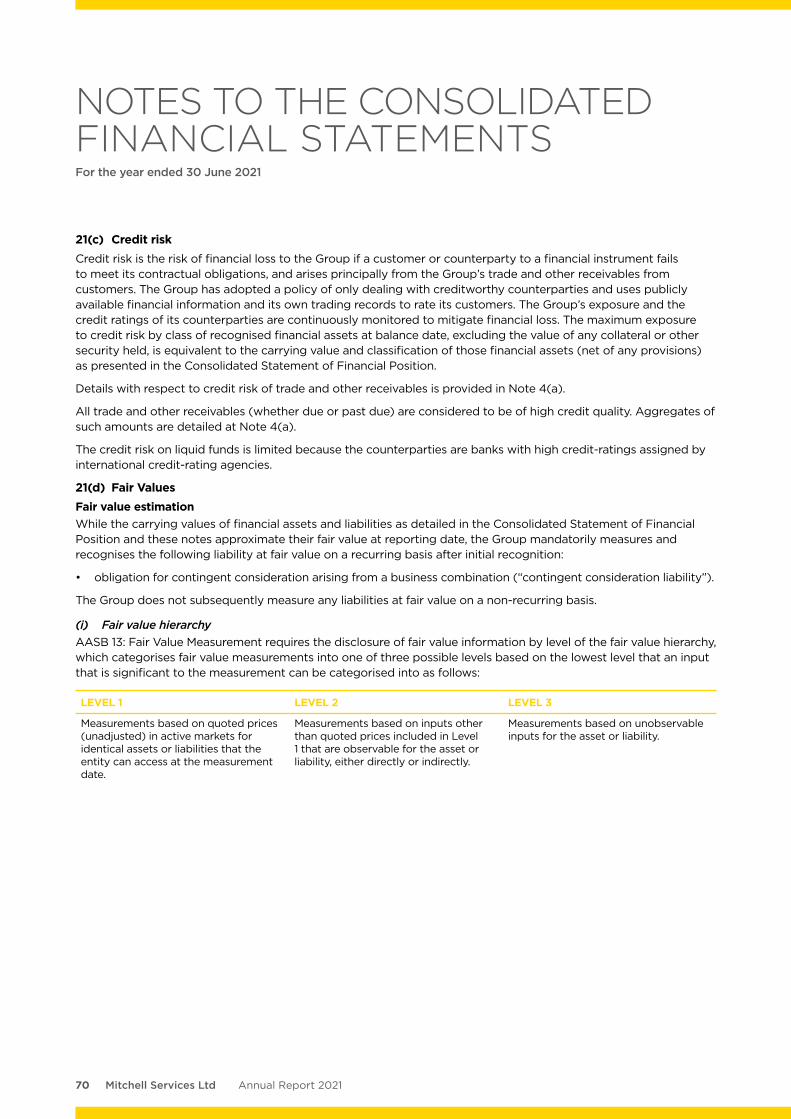
70 Mitchell Services Ltd Annual Report 2021
21(c) Credit riskCredit risk is the risk of financial loss to the Group if a customer or counterparty to a financial instrument fails to meet its contractual obligations, and arises principally from the Group’s trade and other receivables from customers. The Group has adopted a policy of only dealing with creditworthy counterparties and uses publicly available financial information and its own trading records to rate its customers. The Group’s exposure and the credit ratings of its counterparties are continuously monitored to mitigate financial loss. The maximum exposure to credit risk by class of recognised financial assets at balance date, excluding the value of any collateral or other security held, is equivalent to the carrying value and classification of those financial assets (net of any provisions) as presented in the Consolidated Statement of Financial Position.
Details with respect to credit risk of trade and other receivables is provided in Note 4(a).
All trade and other receivables (whether due or past due) are considered to be of high credit quality. Aggregates of such amounts are detailed at Note 4(a).
The credit risk on liquid funds is limited because the counterparties are banks with high credit-ratings assigned by international credit-rating agencies.
21(d) Fair ValuesFair value estimationWhile the carrying values of financial assets and liabilities as detailed in the Consolidated Statement of Financial Position and these notes approximate their fair value at reporting date, the Group mandatorily measures and recognises the following liability at fair value on a recurring basis after initial recognition:
• obligation for contingent consideration arising from a business combination (“contingent consideration liability”).
The Group does not subsequently measure any liabilities at fair value on a non-recurring basis.
(i) Fair value hierarchyAASB 13: Fair Value Measurement requires the disclosure of fair value information by level of the fair value hierarchy, which categorises fair value measurements into one of three possible levels based on the lowest level that an input that is significant to the measurement can be categorised into as follows:
LEVEL 1 LEVEL 2 LEVEL 3
Measurements based on quoted prices (unadjusted) in active markets for identical assets or liabilities that the entity can access at the measurement date.
Measurements based on inputs other than quoted prices included in Level 1 that are observable for the asset or liability, either directly or indirectly.
Measurements based on unobservable inputs for the asset or liability.
NOTES TO THE CONSOLIDATED FINANCIAL STATEMENTSFor the year ended 30 June 2021
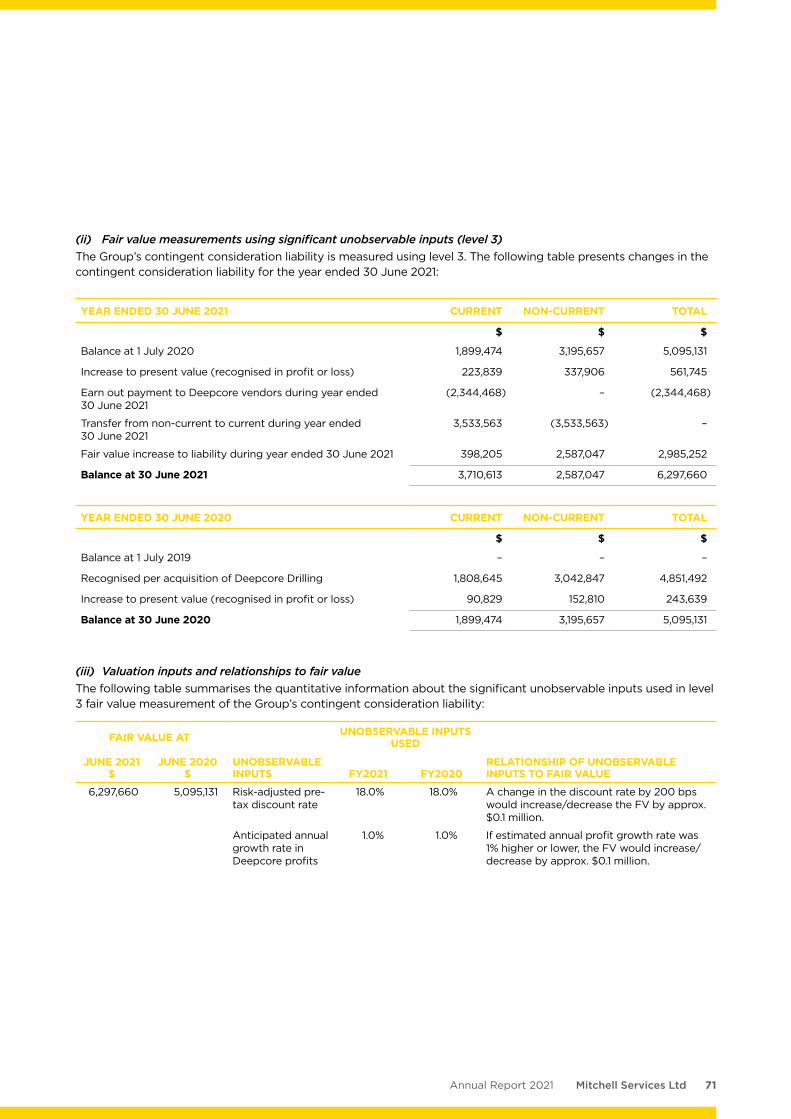
71Mitchell Services LtdAnnual Report 2021
(ii) Fair value measurements using significant unobservable inputs (level 3)The Group’s contingent consideration liability is measured using level 3. The following table presents changes in the contingent consideration liability for the year ended 30 June 2021:
YEAR ENDED 30 JUNE 2021 CURRENT NON-CURRENT TOTAL
$ $ $
Balance at 1 July 2020 1,899,474 3,195,657 5,095,131
Increase to present value (recognised in profit or loss) 223,839 337,906 561,745
Earn out payment to Deepcore vendors during year ended 30 June 2021
(2,344,468) – (2,344,468)
Transfer from non-current to current during year ended 30 June 2021
3,533,563 (3,533,563) –
Fair value increase to liability during year ended 30 June 2021 398,205 2,587,047 2,985,252
Balance at 30 June 2021 3,710,613 2,587,047 6,297,660
YEAR ENDED 30 JUNE 2020 CURRENT NON-CURRENT TOTAL
$ $ $
Balance at 1 July 2019 – – –
Recognised per acquisition of Deepcore Drilling 1,808,645 3,042,847 4,851,492
Increase to present value (recognised in profit or loss) 90,829 152,810 243,639
Balance at 30 June 2020 1,899,474 3,195,657 5,095,131
(iii) Valuation inputs and relationships to fair valueThe following table summarises the quantitative information about the significant unobservable inputs used in level 3 fair value measurement of the Group’s contingent consideration liability:
FAIR VALUE AT UNOBSERVABLE INPUTS USED
JUNE 2021$
JUNE 2020$
UNOBSERVABLE INPUTS FY2021 FY2020
RELATIONSHIP OF UNOBSERVABLE INPUTS TO FAIR VALUE
6,297,660 5,095,131 Risk-adjusted pre-tax discount rate
18.0% 18.0% A change in the discount rate by 200 bps would increase/decrease the FV by approx. $0.1 million.
Anticipated annual growth rate in Deepcore profits
1.0% 1.0% If estimated annual profit growth rate was 1% higher or lower, the FV would increase/ decrease by approx. $0.1 million.
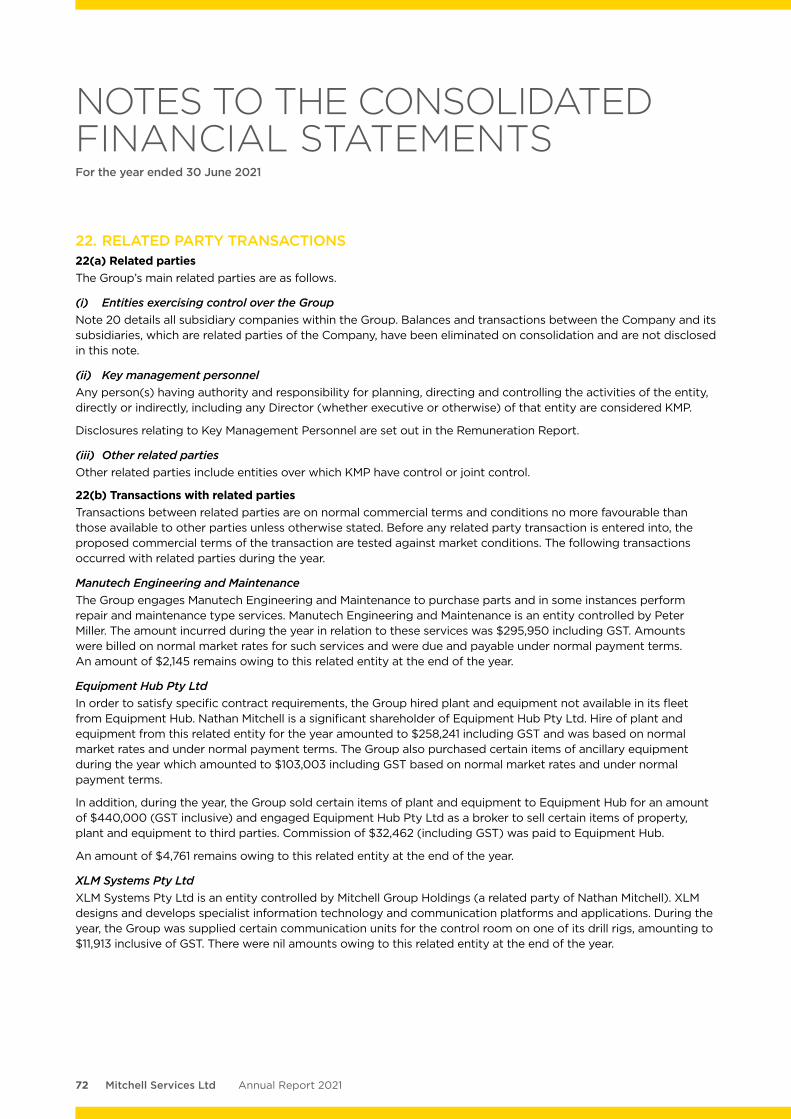
72 Mitchell Services Ltd Annual Report 2021
22. RELATED PARTY TRANSACTIONS 22(a) Related partiesThe Group’s main related parties are as follows.
(i) Entities exercising control over the GroupNote 20 details all subsidiary companies within the Group. Balances and transactions between the Company and its subsidiaries, which are related parties of the Company, have been eliminated on consolidation and are not disclosed in this note.
(ii) Key management personnelAny person(s) having authority and responsibility for planning, directing and controlling the activities of the entity, directly or indirectly, including any Director (whether executive or otherwise) of that entity are considered KMP.
Disclosures relating to Key Management Personnel are set out in the Remuneration Report.
(iii) Other related partiesOther related parties include entities over which KMP have control or joint control.
22(b) Transactions with related partiesTransactions between related parties are on normal commercial terms and conditions no more favourable than those available to other parties unless otherwise stated. Before any related party transaction is entered into, the proposed commercial terms of the transaction are tested against market conditions. The following transactions occurred with related parties during the year.
Manutech Engineering and MaintenanceThe Group engages Manutech Engineering and Maintenance to purchase parts and in some instances perform repair and maintenance type services. Manutech Engineering and Maintenance is an entity controlled by Peter Miller. The amount incurred during the year in relation to these services was $295,950 including GST. Amounts were billed on normal market rates for such services and were due and payable under normal payment terms. An amount of $2,145 remains owing to this related entity at the end of the year.
Equipment Hub Pty LtdIn order to satisfy specific contract requirements, the Group hired plant and equipment not available in its fleet from Equipment Hub. Nathan Mitchell is a significant shareholder of Equipment Hub Pty Ltd. Hire of plant and equipment from this related entity for the year amounted to $258,241 including GST and was based on normal market rates and under normal payment terms. The Group also purchased certain items of ancillary equipment during the year which amounted to $103,003 including GST based on normal market rates and under normal payment terms.
In addition, during the year, the Group sold certain items of plant and equipment to Equipment Hub for an amount of $440,000 (GST inclusive) and engaged Equipment Hub Pty Ltd as a broker to sell certain items of property, plant and equipment to third parties. Commission of $32,462 (including GST) was paid to Equipment Hub.
An amount of $4,761 remains owing to this related entity at the end of the year.
XLM Systems Pty LtdXLM Systems Pty Ltd is an entity controlled by Mitchell Group Holdings (a related party of Nathan Mitchell). XLM designs and develops specialist information technology and communication platforms and applications. During the year, the Group was supplied certain communication units for the control room on one of its drill rigs, amounting to $11,913 inclusive of GST. There were nil amounts owing to this related entity at the end of the year.
NOTES TO THE CONSOLIDATED FINANCIAL STATEMENTSFor the year ended 30 June 2021
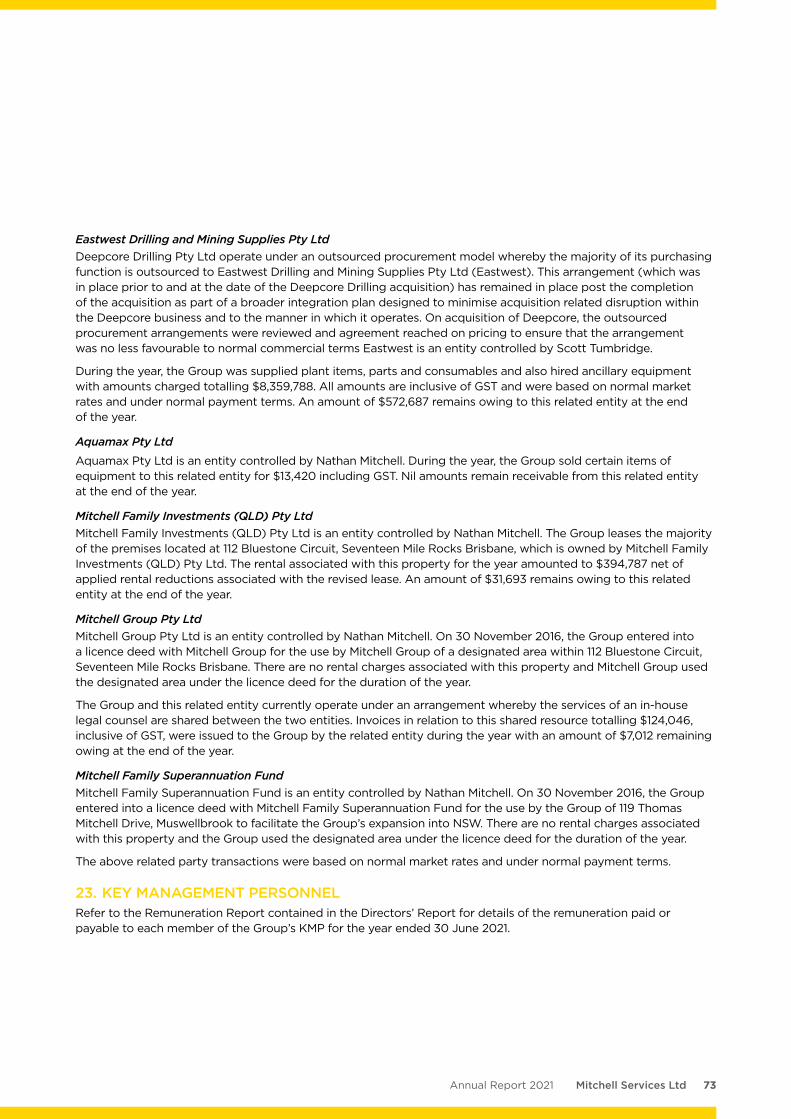
73Mitchell Services LtdAnnual Report 2021
Eastwest Drilling and Mining Supplies Pty LtdDeepcore Drilling Pty Ltd operate under an outsourced procurement model whereby the majority of its purchasing function is outsourced to Eastwest Drilling and Mining Supplies Pty Ltd (Eastwest). This arrangement (which was in place prior to and at the date of the Deepcore Drilling acquisition) has remained in place post the completion of the acquisition as part of a broader integration plan designed to minimise acquisition related disruption within the Deepcore business and to the manner in which it operates. On acquisition of Deepcore, the outsourced procurement arrangements were reviewed and agreement reached on pricing to ensure that the arrangement was no less favourable to normal commercial terms Eastwest is an entity controlled by Scott Tumbridge.
During the year, the Group was supplied plant items, parts and consumables and also hired ancillary equipment with amounts charged totalling $8,359,788. All amounts are inclusive of GST and were based on normal market rates and under normal payment terms. An amount of $572,687 remains owing to this related entity at the end of the year.
Aquamax Pty Ltd
Aquamax Pty Ltd is an entity controlled by Nathan Mitchell. During the year, the Group sold certain items of equipment to this related entity for $13,420 including GST. Nil amounts remain receivable from this related entity at the end of the year.
Mitchell Family Investments (QLD) Pty LtdMitchell Family Investments (QLD) Pty Ltd is an entity controlled by Nathan Mitchell. The Group leases the majority of the premises located at 112 Bluestone Circuit, Seventeen Mile Rocks Brisbane, which is owned by Mitchell Family Investments (QLD) Pty Ltd. The rental associated with this property for the year amounted to $394,787 net of applied rental reductions associated with the revised lease. An amount of $31,693 remains owing to this related entity at the end of the year.
Mitchell Group Pty Ltd Mitchell Group Pty Ltd is an entity controlled by Nathan Mitchell. On 30 November 2016, the Group entered into a licence deed with Mitchell Group for the use by Mitchell Group of a designated area within 112 Bluestone Circuit, Seventeen Mile Rocks Brisbane. There are no rental charges associated with this property and Mitchell Group used the designated area under the licence deed for the duration of the year.
The Group and this related entity currently operate under an arrangement whereby the services of an in-house legal counsel are shared between the two entities. Invoices in relation to this shared resource totalling $124,046, inclusive of GST, were issued to the Group by the related entity during the year with an amount of $7,012 remaining owing at the end of the year.
Mitchell Family Superannuation Fund Mitchell Family Superannuation Fund is an entity controlled by Nathan Mitchell. On 30 November 2016, the Group entered into a licence deed with Mitchell Family Superannuation Fund for the use by the Group of 119 Thomas Mitchell Drive, Muswellbrook to facilitate the Group’s expansion into NSW. There are no rental charges associated with this property and the Group used the designated area under the licence deed for the duration of the year.
The above related party transactions were based on normal market rates and under normal payment terms.
23. KEY MANAGEMENT PERSONNELRefer to the Remuneration Report contained in the Directors’ Report for details of the remuneration paid or payable to each member of the Group’s KMP for the year ended 30 June 2021.
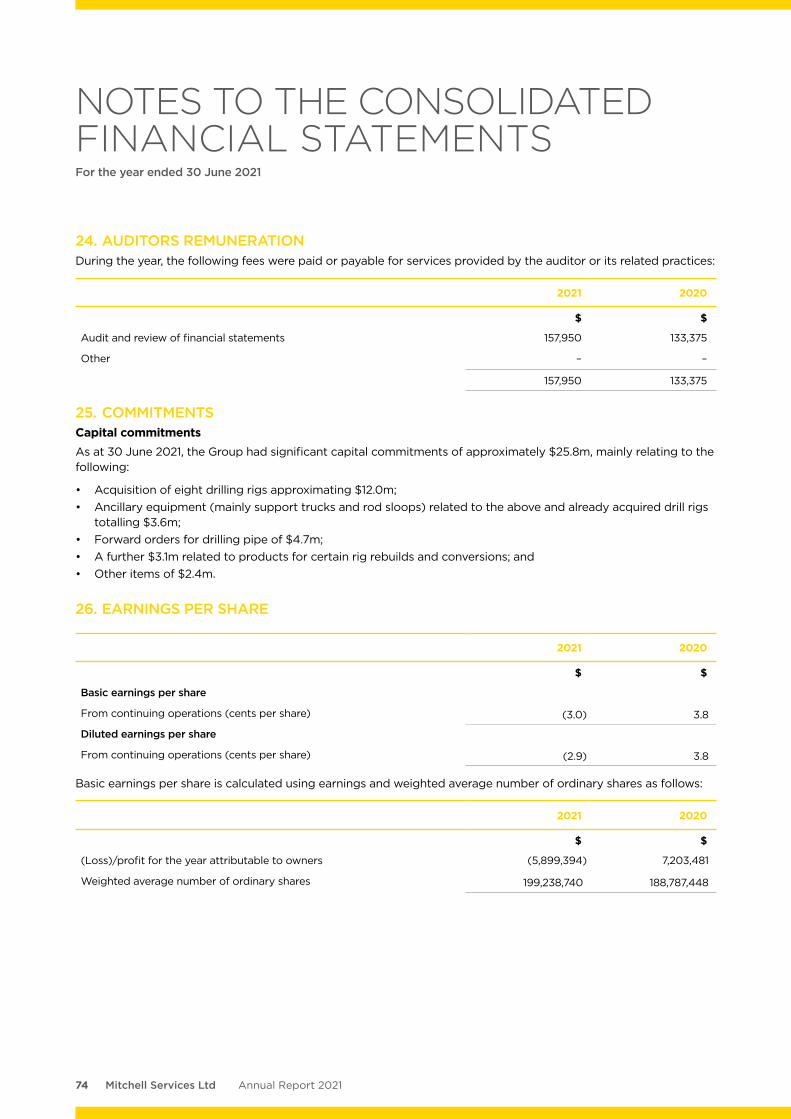
74 Mitchell Services Ltd Annual Report 2021
24. AUDITORS REMUNERATIONDuring the year, the following fees were paid or payable for services provided by the auditor or its related practices:
2021 2020
$ $
Audit and review of financial statements 157,950 133,375
Other – –
157,950 133,375
25. COMMITMENTS Capital commitmentsAs at 30 June 2021, the Group had significant capital commitments of approximately $25.8m, mainly relating to the following:
• Acquisition of eight drilling rigs approximating $12.0m;• Ancillary equipment (mainly support trucks and rod sloops) related to the above and already acquired drill rigs
totalling $3.6m;• Forward orders for drilling pipe of $4.7m;• A further $3.1m related to products for certain rig rebuilds and conversions; and• Other items of $2.4m.
26. EARNINGS PER SHARE
2021 2020
$ $
Basic earnings per share
From continuing operations (cents per share) (3.0) 3.8
Diluted earnings per share
From continuing operations (cents per share) (2.9) 3.8
Basic earnings per share is calculated using earnings and weighted average number of ordinary shares as follows:
2021 2020
$ $
(Loss)/profit for the year attributable to owners (5,899,394) 7,203,481
Weighted average number of ordinary shares 199,238,740 188,787,448
NOTES TO THE CONSOLIDATED FINANCIAL STATEMENTSFor the year ended 30 June 2021
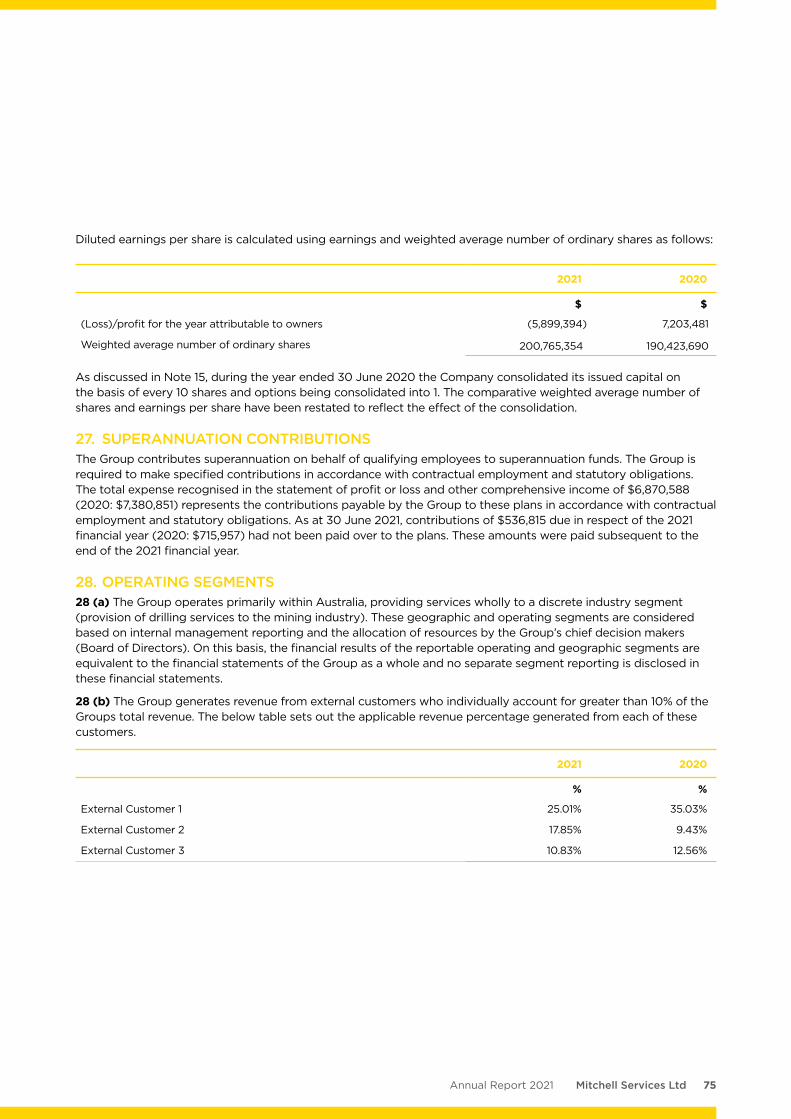
75Mitchell Services LtdAnnual Report 2021
Diluted earnings per share is calculated using earnings and weighted average number of ordinary shares as follows:
2021 2020
$ $
(Loss)/profit for the year attributable to owners (5,899,394) 7,203,481
Weighted average number of ordinary shares 200,765,354 190,423,690
As discussed in Note 15, during the year ended 30 June 2020 the Company consolidated its issued capital on the basis of every 10 shares and options being consolidated into 1. The comparative weighted average number of shares and earnings per share have been restated to reflect the effect of the consolidation.
27. SUPERANNUATION CONTRIBUTIONSThe Group contributes superannuation on behalf of qualifying employees to superannuation funds. The Group is required to make specified contributions in accordance with contractual employment and statutory obligations. The total expense recognised in the statement of profit or loss and other comprehensive income of $6,870,588 (2020: $7,380,851) represents the contributions payable by the Group to these plans in accordance with contractual employment and statutory obligations. As at 30 June 2021, contributions of $536,815 due in respect of the 2021 financial year (2020: $715,957) had not been paid over to the plans. These amounts were paid subsequent to the end of the 2021 financial year.
28. OPERATING SEGMENTS 28 (a) The Group operates primarily within Australia, providing services wholly to a discrete industry segment (provision of drilling services to the mining industry). These geographic and operating segments are considered based on internal management reporting and the allocation of resources by the Group’s chief decision makers (Board of Directors). On this basis, the financial results of the reportable operating and geographic segments are equivalent to the financial statements of the Group as a whole and no separate segment reporting is disclosed in these financial statements.
28 (b) The Group generates revenue from external customers who individually account for greater than 10% of the Groups total revenue. The below table sets out the applicable revenue percentage generated from each of these customers.
2021 2020
% %
External Customer 1 25.01% 35.03%
External Customer 2 17.85% 9.43%
External Customer 3 10.83% 12.56%
76 Mitchell Services Ltd Annual Report 2021
29. EVENTS AFTER THE REPORTING DATE SMS Impairment lossOn 12 February 2021 the Group terminated a material drilling contract (Contract) with SMS Innovative Mining Pty Ltd (SMS) under which the Company’s wholly owned subsidiary Mitchell Operations Pty Ltd (MO) provided drill and blast services for SMS at the Kirkalocka gold project in Western Australia. The Contract was terminated on grounds of breach of contract for failure by SMS to pay invoices due and owing under the contract. As a result of this failure to pay the invoices that were due and owing, MO had served a statutory demand on SMS for which SMS subsequently made an application to set aside (Proceeding).
The cumulative value of all unpaid invoices issued to SMS under the Contract up to and including the date of contract termination was $9,624,899 and given the uncertainty in relation to the collectability of this amount and the outcome of the Proceeding, the Group initially recognised an impairment loss for this amount in full.
On 13 July 2021 MO and SMS agreed to resolve all claims relating to, in connection with or arising out of, the Proceeding and the Contract on the basis that SMS pay to MO the sum of $5,000,000. Pursuant to the terms of the agreed settlement, the $5,000,000 settlement sum was to be paid in three tranches as follows:
• Tranche 1 — $3,000,000 payable within 7 days from the date of settlement
• Tranche 2 — $1,000,000 payable by 30 September 2021
• Tranche 3 — $1,000,000 payable by 30 December 2021
On 19 July 2021 MO received the tranche 1 payment of $3,000,000. On the basis of the first tranche having been collected, the Group has recognised this benefit in FY21, reducing the impairment loss to $6,624,899 and, in FY22, expects to further reduce the impairment loss by $2,000,000 on collection of the second and third tranches.
On receipt of the final tranche, the Group also anticipates the impairment loss will be reduced by a further amount approximating $420,000, being the GST component of uncollected invoices which, on being written off as a bad debt, will cease to qualify as taxable supplies and will become refundable from the Australian Tax Office at that point in time.
Equity raisingOn 16 August 2021 the Company announced a material organic growth strategy and capital investment program which included the purchase of 9 LF160 drill rigs which were expected to be delivered (on a staggered basis) by 31 December 2021 and which also included an option for an additional 3 rigs.
To support the funding of this organic growth strategy, the Company also announced that it was undertaking a fully underwritten accelerated non-renounceable entitlement offer to raise approximately $10.5m (Entitlement Offer). Under the Entitlement Offer, eligible shareholders could subscribe for 1 fully paid ordinary share (New Shares) for every 8 Mitchell Services Ltd shares that they held on 18 August 2021 (Record Date) at the issue price of $0.42 per New Share (Offer Price).
Under the Entitlement Offer approximately 24,994,286 New Shares are expected to be issued in total, equivalent to approximately 11.1% of the Company’s total shares outstanding at 30 June 2021. New Shares will rank equally in all respects with existing shares of the Company.
The Entitlement Offer was made to both institutional shareholders (Institutional Entitlement Offer) and eligible retail shareholders (Retail Entitlement Offer).
As at the date of this report the Institutional Entitlement Offer is complete with the Company having issued 11,010,656 fully paid New Shares at $0.42 per share on 24 August 2021. The Company anticipates that the settlement of New Shares under the Retail Entitlement Offer (comprising approx. 13,983,630 New Shares at $0.42 per share) will be completed by 10 September 2021.
There have not been any other matters or circumstance occurring subsequent to the end of the financial year that has significantly affected, or may significantly affect, the operations of the Group, the results of those operations, or the state of affairs of the Group in future financial years.
NOTES TO THE CONSOLIDATED FINANCIAL STATEMENTSFor the year ended 30 June 2021
77Mitchell Services LtdAnnual Report 2021
DIRECTORS’ DECLARATION
In accordance with a resolution of the Directors of Mitchell Services Limited, the Directors of the company declare that:
1. the financial statements and notes, as set out on pages 31 to 76, are in accordance with the Corporations Act 2001 and:
a. comply with Australian Accounting Standards applicable to the Group, which, as stated in accounting policy Note 1 to the financial statements, constitutes compliance with International Financial Reporting Standards; and
b. give a true and fair view of the financial position as at 30 June 2021 and of the performance for the year ended on that date of the consolidated group;
2. in the Directors’ opinion there are reasonable grounds to believe that the Company will be able to pay its debts as and when they become due and payable; and
3. the Directors have been given the declarations required by s 295A of the Corporations Act 2001 from the Chief Executive Officer and Chief Financial Officer.
As per Note 20, the Company and a number of wholly owned subsidiaries entered into a deed of cross guarantee under which the Company and those subsidiaries guarantee the debts of each other.
At the date of this declaration, there are reasonable grounds to believe that the companies which are party to this deed of cross guarantee will be able to meet any obligations or liabilities to which they are, or may become, subject to by virtue of the deed.
Nathan Mitchell Executive Chairman
Dated at Brisbane this 25th day of August 2021
78 Mitchell Services Ltd Annual Report 2021
CAIRNS 320 Sheridan Street Cairns QLD 4870 PO Box 7817 Cairns QLD 4870 T: +61 7 40377 050
TOWNSVILLE 1/211 Sturt Street Townsville QLD 4810 PO Box 1269 Townsville QLD 4810 T: +61 7 4755 3330
Limited liability by a scheme approved under professional standards legislation. Trademark of Chartered Accountants Australia and New Zealand and used with permission A.B.N.: 99 194 967 950
www.jessupsnq.com.au [email protected]
IINNDDEEPPEENNDDEENNTT AAUUDDIITTOORR’’SS RREEPPOORRTT TTOO TTHHEE MMEEMMBBEERRSS OOFF MMIITTCCHHEELLLL SSEERRVVIICCEESS LLIIMMIITTEEDD FFOORR TTHHEE YYEEAARR EENNDDEEDD 3300 JJUUNNEE 22002211 RREEPPOORRTT OONN TTHHEE AAUUDDIITT OOFF TTHHEE FFIINNAANNCCIIAALL RREEPPOORRTT OOPPIINNIIOONN
We have audited the financial report of Mitchell Services Limited (the Company and its controlled entities (the Group)), which comprises the consolidated statement of financial position as at 30 June 2021, the consolidated statement of profit or loss and other comprehensive income, the consolidated statement of changes in equity and the consolidated statement of cash flows for the year then ended, and notes to the consolidated financial statements, including a summary of significant accounting policies and the directors’ declaration.
In our opinion, the accompanying financial report of the Group is in accordance with the Corporations Act 2001, including:
giving a true and fair view of the Group’s financial position as at 30 June 2021 and of its financial performance for the year then ended; and
complying with Australian Accounting Standards and the Corporations Regulations 2001.
BBAASSIISS FFOORR OOPPIINNIIOONN
We conducted our audit in accordance with Australian Auditing Standards. Our responsibilities under those Standards are further described in the Auditor’s Responsibilities for the Audit of the Financial Report section of our report. We are independent of the Group in accordance with the auditor independence requirements of the Corporations Act 2001 and the ethical requirements of the Accounting Professional and Ethical Standards Board’s APES 110: Code of Ethics for Professional Accountants (the Code) that are relevant to our audit of the financial report in Australia. We have also fulfilled our other ethical responsibilities in accordance with the Code.
We confirm that the independence declaration required by the Corporations Act 2001, which has been given to the directors of the Company, would be in the same terms if given to the directors as at the time of this auditor’s report.
We believe that the audit evidence we have obtained is sufficient and appropriate to provide a basis for our opinion.
79Mitchell Services LtdAnnual Report 2021
KKEEYY AAUUDDIITT MMAATTTTEERRSS
Key audit matters are those matters that, in our professional judgement, were of most significance in our audit of the financial report for the year ended 30 June 2021. These matters were addressed in the context of our audit of the financial report as a whole, and in forming our opinion thereon, and we do not provide a separate opinion on these matters.
RReevveennuuee RReeccooggnniittiioonn
This is a key audit matter given that it is material to the Group’s results and the rates at which revenue is charged to customers is complex and varies depending on the type of drilling service performed and whether the drilling service is coal or minerals based. Group revenue for the year ended 30 June 2021 was $191,465,761 and is detailed in Note 2 to the financial report.
Our audit procedures to address the risk of material misstatement relating to the determination and recognition of drilling service revenue included:
We reviewed the Group’s accounting policies in light of AASB 15: Revenue from Contracts with Customers to ensure that these policies were consistent with that Standard.
We obtained a detailed understanding of the revenue streams and the processes for calculating and recording revenue ensuring that these were consistent with AASB 15: Revenue from Contracts with Customers. We also gained an understanding of the key internal controls in place to ensure that recorded revenue had occurred and was accurate and that revenue had been completely recorded. We tested these controls on a sample basis to ensure that they were operating effectively throughout the year.
We tested a sample of revenue transactions to the daily drilling reports (which are signed by the customer), to signed contracts (ensuring rates charged were accurate) and to receipt of funds in the Group’s bank account.
We tested a sample of revenue earning activities from the daily drilling reports to customer invoices ensuring that revenue earned had been recorded as revenue.
We reviewed credit notes raised after year end to ensure that relevant adjustments were made to 2021 financial year revenues where required.
We tested a sample of revenue earning activities from the daily drilling reports (pre and post 30 June 2021) to revenue recorded to ensure that a proper cut-off had been achieved.
We performed analytical review procedures to determine key movements in revenue and corroborated those movements against supporting documentation.
SSMMSS IInnnnoovvaattiivvee MMiinniinngg PPttyy LLttdd TTrraaddee DDeebbttoorr IImmppaaiirrmmeenntt
The Group was owed $9,624,899 by SMS Innovative Mining Pty Ltd (“SMS”) at 30 June 2021 which is included in trade and other receivables in Note 4 to the financial report. The Group and SMS entered into a Settlement Deed during July 2021 whereby the Group settled on $5,000,000 in relation to the $9,624,899 debt owing. The $5,000,000 is payable $3,000,000 within 7 days after the date of the Settlement Deed, $1,000,000 by 30 September 2021 and $1,000,000 by 30 December 2021. The Group will release SMS from any claim arising from or connected with the dispute after the final $1,000,000 instalment has been received. The $3,000,000 instalment has been received by the Group during July 2021 and accordingly, an impairment expense of $6,624,899 has been recognised in the statement of profit or loss and other comprehensive income during the year ended 30 June 2021. This was a key audit matter given the significance of the impairment amount and the nature of the dispute in relation to payment.
80 Mitchell Services Ltd Annual Report 2021
Our audit procedures to address the risk of material misstatement relating to the trade debtor impairment included:
We reviewed the Settlement Deed to obtain a detailed understanding of its terms and conditions. We traced the receipt of the $3,000,000 instalment to the Group’s bank statement to ensure that it had been
received. We have recalculated the impairment expense of $6,624,899 (being the difference between the $9,624,899
trade debtor and the $3,000,000 instalment received) to ensure its accuracy and completeness. Based on the nature of the Group’s dispute with SMS, we determined that the $2,000,000 component of the
settlement amount (represented by the two instalments of $1,000,000 due by 30 September 2021 and 30 December 2021) remains impaired until funds are received in the Group’s bank account.
FFaaiirr VVaalluuee ooff CCoonnttiinnggeenntt CCoonnssiiddeerraattiioonn LLiiaabbiilliittyy
During the 2020 year, the Group completed the acquisition of 100% of the Deepcore group of companies. The relevant accounting during the 2020 year resulted in the recognition of a contingent consideration liability. The contingent consideration liability is calculated as 50% of the excess of Deepcore EBITDA earned by the Group in each of calendar years 2020, 2021 and 2022. The contingent consideration liability is required to be measured at fair value at each reporting date and requires the forecasting of Deepcore EBITDA for the relevant years. The forecasting of the Deepcore EBITDA is inherently judgemental and we therefore considered this to be a key audit matter. The contingent consideration liability at 30 June 2021 was $6,297,660 which is included in other financial liabilities in Note 10 to the financial report. The fair value increase relating to this liability during the year ended 30 June 2021 was $2,985,252 which has been included in the statement of profit or loss and other comprehensive income.
Our audit procedures to address the risk of material misstatement relating to the contingent consideration liability included:
We understood, evaluated and validated management’s key controls over the contingent consideration payable assessment process.
We checked the contingent consideration payable calculation prepared by management against the formula stated in the Share Purchase Agreement.
The fair value of the contingent consideration was reviewed in light of Deepcore EBITDA forecasts whereby we performed the following: - We held discussions with management to obtain an understanding of the Deepcore business and its
plans for calendar years 2021 and 2022 and related that to the forecasts. - We tested the mathematical accuracy of the underlying Deepcore EBITDA forecasts. - Forecast revenues were analysed for reasonableness in light of current executed contracts, recent
actual average revenues per shift and recent actual shift numbers achieved adjusted for future assumptions.
- Forecast gross profit margins were analysed for reasonableness in light of recent actual gross profit margins achieved and future assumptions.
- Forecast overhead costs were reviewed in light of recent actual overhead costs incurred and future assumptions.
- Ensured that the present value calculation of the contingent consideration liability was accurate and used an appropriate discount factor.
- Ensured that the current and non-current portions of the liability were accurate.
81Mitchell Services LtdAnnual Report 2021
IINNFFOORRMMAATTIIOONN OOTTHHEERR TTHHAANN TTHHEE FFIINNAANNCCIIAALL RREEPPOORRTT AANNDD AAUUDDIITTOORR’’SS RREEPPOORRTT TTHHEERREEOONN
The directors are responsible for the other information. The other information comprises the information included in the Group’s annual report for the year ended 30 June 2021, but does not include the financial report and our auditor’s report thereon. Our opinion on the financial report does not cover the other information and accordingly we do not express any form of assurance conclusion thereon. In connection with our audit of the financial report, our responsibility is to read the other information and, in doing so, consider whether the other information is materially inconsistent with the financial report or our knowledge obtained in the audit or otherwise appears to be materially misstated. If, based on the work we have performed, we conclude that there is a material misstatement of this other information, we are required to report that fact. We have nothing to report in this regard.
RREESSPPOONNSSIIBBIILLIITTIIEESS OOFF TTHHEE DDIIRREECCTTOORRSS FFOORR TTHHEE FFIINNAANNCCIIAALL RREEPPOORRTT
The directors of the Company are responsible for the preparation of the financial report that gives a true and fair view in accordance with Australian Accounting Standards and the Corporations Act 2001 and for such internal control as the directors determine is necessary to enable the preparation of the financial report that gives a true and fair view and is free from material misstatement, whether due to fraud or error.
In preparing the financial report, the directors are responsible for assessing the ability of the Group to continue as a going concern, disclosing, as applicable, matters related to going concern and using the going concern basis of accounting unless the directors either intend to liquidate the Group or to cease operations, or have no realistic alternative but to do so.
AAUUDDIITTOORR’’SS RREESSPPOONNSSIIBBIILLIITTIIEESS FFOORR TTHHEE AAUUDDIITT OOFF TTHHEE FFIINNAANNCCIIAALL RREEPPOORRTT
Our objectives are to obtain reasonable assurance about whether the financial report as a whole is free from material misstatement, whether due to fraud or error, and to issue an auditor’s report that includes our opinion. Reasonable assurance is a high level of assurance, but is not a guarantee that an audit conducted in accordance with the Australian Auditing Standards will always detect a material misstatement when it exists. Misstatements can arise from fraud or error and are considered material if, individually or in the aggregate, they could reasonably be expected to influence the economic decisions of users taken on the basis of this financial report.
A further description of our responsibilities for the audit of the financial report is located at the Auditing and Assurance Standards website at: https://www.auasb.gov.au/admin/file/content102/c3/ar2_2020.pdf. This description forms part of our auditor’s report.
82 Mitchell Services Ltd Annual Report 2021
RREEPPOORRTT OONN TTHHEE RREEMMUUNNEERRAATTIIOONN RREEPPOORRTT
We have audited the Remuneration Report included in pages 16 to 23 of the directors’ report for the year ended 30 June 2021.
In our opinion, the Remuneration Report of Mitchell Services Limited, for the year ended 30 June 2021, complies with section 300A of the Corporations Act 2001.
RReessppoonnssiibbiilliittiieess
The directors of the Company are responsible for the preparation and presentation of the Remuneration Report in accordance with section 300A of the Corporations Act 2001. Our responsibility is to express an opinion on the Remuneration Report, based on our audit conducted in accordance with Australian Auditing Standards.
Jessups
Paul Sapelli Partner Level 1, 211 Sturt Street, Townsville, QLD 4810 Dated: 25 August 2021
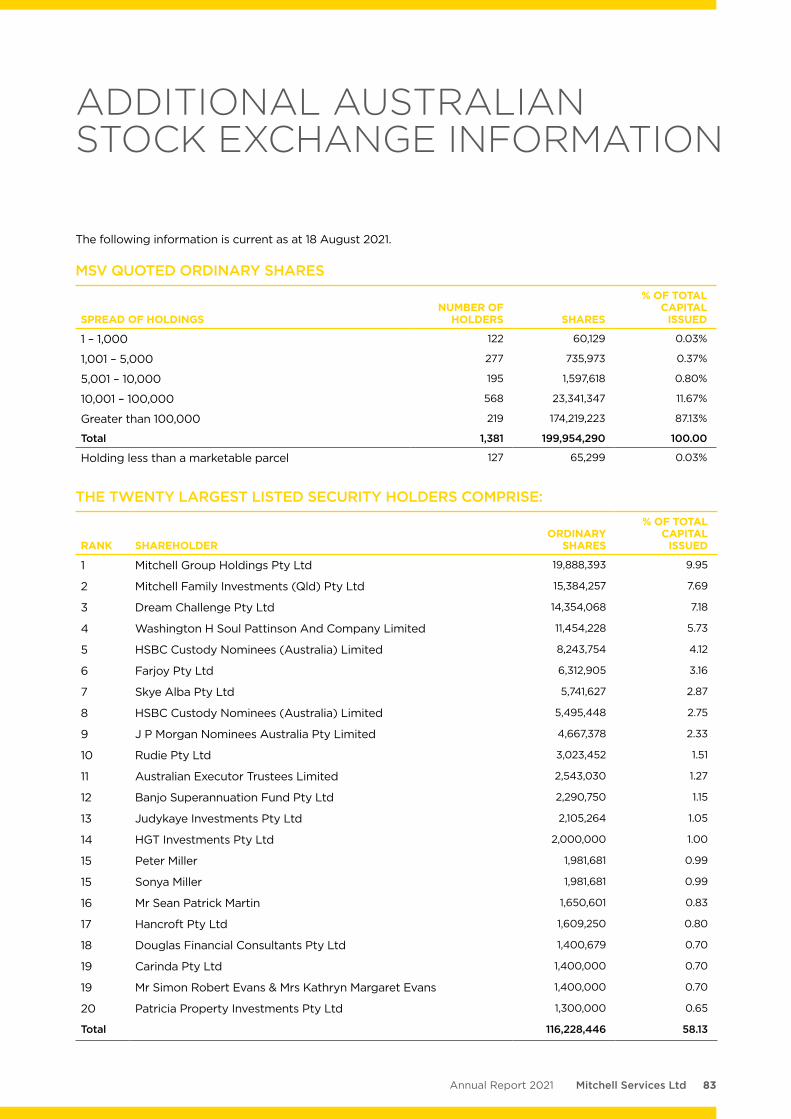
83Mitchell Services LtdAnnual Report 2021
The following information is current as at 18 August 2021.
MSV QUOTED ORDINARY SHARES
SPREAD OF HOLDINGSNUMBER OF
HOLDERS SHARES
% OF TOTAL CAPITAL
ISSUED
1 – 1,000 122 60,129 0.03%
1,001 – 5,000 277 735,973 0.37%
5,001 – 10,000 195 1,597,618 0.80%
10,001 – 100,000 568 23,341,347 11.67%
Greater than 100,000 219 174,219,223 87.13%
Total 1,381 199,954,290 100.00
Holding less than a marketable parcel 127 65,299 0.03%
THE TWENTY LARGEST LISTED SECURITY HOLDERS COMPRISE:
RANK SHAREHOLDERORDINARY
SHARES
% OF TOTAL CAPITAL
ISSUED
1 Mitchell Group Holdings Pty Ltd 19,888,393 9.95
2 Mitchell Family Investments (Qld) Pty Ltd 15,384,257 7.69
3 Dream Challenge Pty Ltd 14,354,068 7.18
4 Washington H Soul Pattinson And Company Limited 11,454,228 5.73
5 HSBC Custody Nominees (Australia) Limited 8,243,754 4.12
6 Farjoy Pty Ltd 6,312,905 3.16
7 Skye Alba Pty Ltd 5,741,627 2.87
8 HSBC Custody Nominees (Australia) Limited 5,495,448 2.75
9 J P Morgan Nominees Australia Pty Limited 4,667,378 2.33
10 Rudie Pty Ltd 3,023,452 1.51
11 Australian Executor Trustees Limited 2,543,030 1.27
12 Banjo Superannuation Fund Pty Ltd 2,290,750 1.15
13 Judykaye Investments Pty Ltd 2,105,264 1.05
14 HGT Investments Pty Ltd 2,000,000 1.00
15 Peter Miller 1,981,681 0.99
15 Sonya Miller 1,981,681 0.99
16 Mr Sean Patrick Martin 1,650,601 0.83
17 Hancroft Pty Ltd 1,609,250 0.80
18 Douglas Financial Consultants Pty Ltd 1,400,679 0.70
19 Carinda Pty Ltd 1,400,000 0.70
19 Mr Simon Robert Evans & Mrs Kathryn Margaret Evans 1,400,000 0.70
20 Patricia Property Investments Pty Ltd 1,300,000 0.65
Total 116,228,446 58.13
ADDITIONAL AUSTRALIAN STOCK EXCHANGE INFORMATION
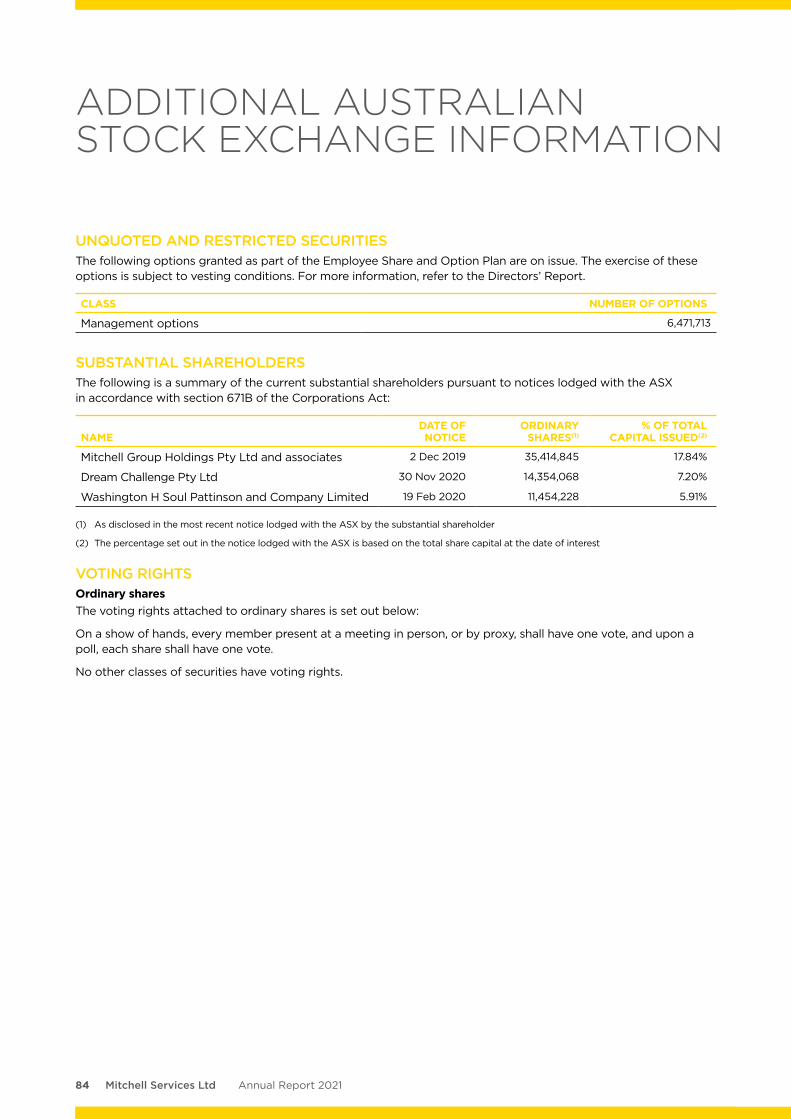
84 Mitchell Services Ltd Annual Report 2021
UNQUOTED AND RESTRICTED SECURITIESThe following options granted as part of the Employee Share and Option Plan are on issue. The exercise of these options is subject to vesting conditions. For more information, refer to the Directors’ Report.
CLASS NUMBER OF OPTIONS
Management options 6,471,713
SUBSTANTIAL SHAREHOLDERSThe following is a summary of the current substantial shareholders pursuant to notices lodged with the ASX in accordance with section 671B of the Corporations Act:
NAMEDATE OF NOTICE
ORDINARY SHARES(1)
% OF TOTAL CAPITAL ISSUED(2)
Mitchell Group Holdings Pty Ltd and associates 2 Dec 2019 35,414,845 17.84%
Dream Challenge Pty Ltd 30 Nov 2020 14,354,068 7.20%
Washington H Soul Pattinson and Company Limited 19 Feb 2020 11,454,228 5.91%
(1) As disclosed in the most recent notice lodged with the ASX by the substantial shareholder
(2) The percentage set out in the notice lodged with the ASX is based on the total share capital at the date of interest
VOTING RIGHTSOrdinary sharesThe voting rights attached to ordinary shares is set out below:
On a show of hands, every member present at a meeting in person, or by proxy, shall have one vote, and upon a poll, each share shall have one vote.
No other classes of securities have voting rights.
ADDITIONAL AUSTRALIAN STOCK EXCHANGE INFORMATION
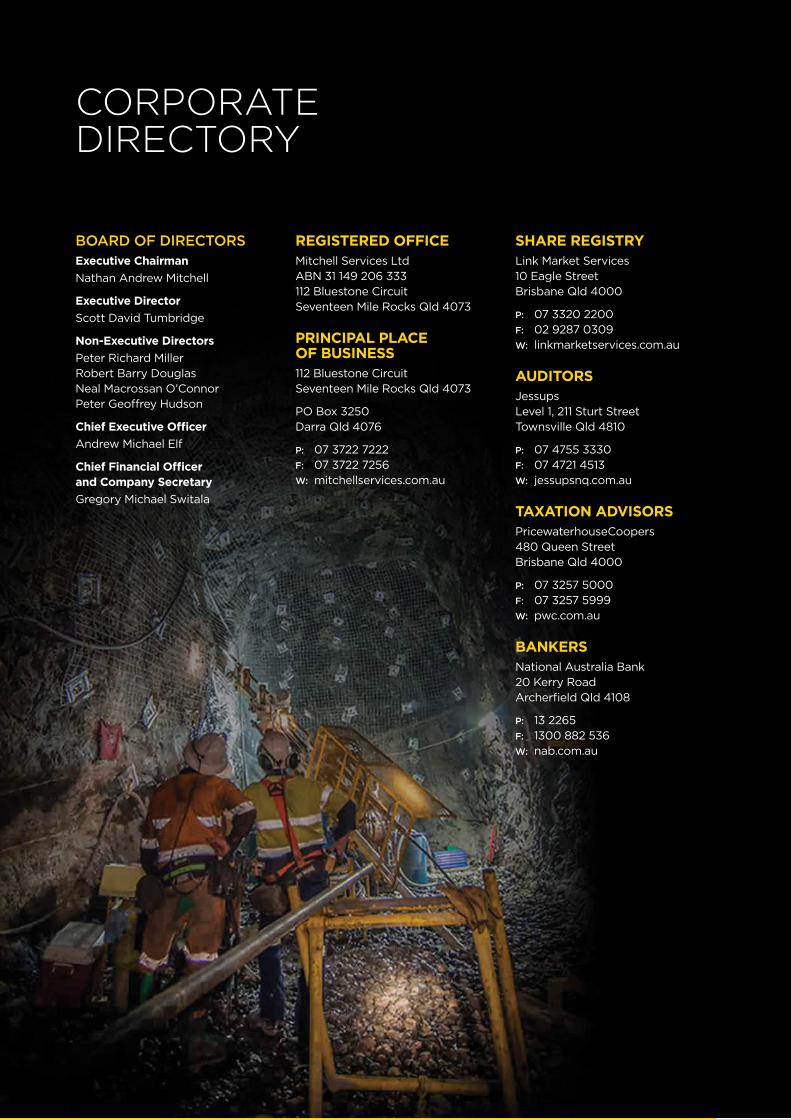
85Mitchell Services LtdAnnual Report 2021
CORPORATE DIRECTORY
BOARD OF DIRECTORSExecutive ChairmanNathan Andrew Mitchell
Executive Director Scott David Tumbridge
Non-Executive DirectorsPeter Richard Miller Robert Barry Douglas Neal Macrossan O’ConnorPeter Geoffrey Hudson
Chief Executive OfficerAndrew Michael Elf
Chief Financial Officer and Company SecretaryGregory Michael Switala
REGISTERED OFFICEMitchell Services Ltd ABN 31 149 206 333 112 Bluestone Circuit Seventeen Mile Rocks Qld 4073
PRINCIPAL PLACE OF BUSINESS112 Bluestone Circuit Seventeen Mile Rocks Qld 4073
PO Box 3250 Darra Qld 4076
P: 07 3722 7222 F: 07 3722 7256 W: mitchellservices.com.au
SHARE REGISTRYLink Market Services 10 Eagle Street Brisbane Qld 4000
P: 07 3320 2200 F: 02 9287 0309 W: linkmarketservices.com.au
AUDITORSJessups Level 1, 211 Sturt Street Townsville Qld 4810
P: 07 4755 3330 F: 07 4721 4513 W: jessupsnq.com.au
TAXATION ADVISORSPricewaterhouseCoopers 480 Queen Street Brisbane Qld 4000
P: 07 3257 5000 F: 07 3257 5999 W: pwc.com.au
BANKERSNational Australia Bank 20 Kerry Road Archerfield Qld 4108
P: 13 2265 F: 1300 882 536 W: nab.com.au