annual report - ministry of earth sciences
TRANSCRIPT
Annual Report2012-2013
Earth System Science Organization Ministry of Earth Sciences
Government of India

Contents
1 OvERvIEw 1
2 AtMOSphERIc ObSERvAtIOnS And SERvIcES 9
3 AtMOSphERIc And clIMAtE pROcESSES And MOdElInG 20
4 cOStAl And OcEAn ObSERvAtIOn SyStEMS, ScIEncE And SERvIcES 29
5 OcEAn tEchnOlOGy 48
6 pOlAR ScIEncE And cRyOSphERE 53
7 GEOScIEncES 60
8 EARth ScIEncE – dAtA cEntRES 68
9 cApAcIty bUIldInG And hUMAn RESOURcE dEvElOpMEnt 71
10 InfRAStRUctURE dEvElOpMEnt 78
11 AwAREnESS And OUtREAch pROGRAMMES 81
12 IntERnAtIOnAl cOOpERAtIOn 84
13 AwARdS And hOnOURS 89
14 pAtEntS & pUblIcAtIOnS 90
15 AdMInIStRAtIvE SUppORt 110
16 pERfORMAncE EvAlUAtIOn REpORt 116
17 AcknOwlEdGEMEntS 123

CHAPTER
1
OvERviEw
(INCOIS), Centre for Marine Living Resources (CMLRE) and Integrated Coastal and Marine Area Management (ICMAM).
Under the framework of ESSO, a well estab-lished mechanism has been put in place to review and monitor the various programs on half-yearly basis, which are generally held in the month of April and October. The primary objective of the review mechanism is to formulate proposals for Annual Plan and apply a mid course corrections, if required.
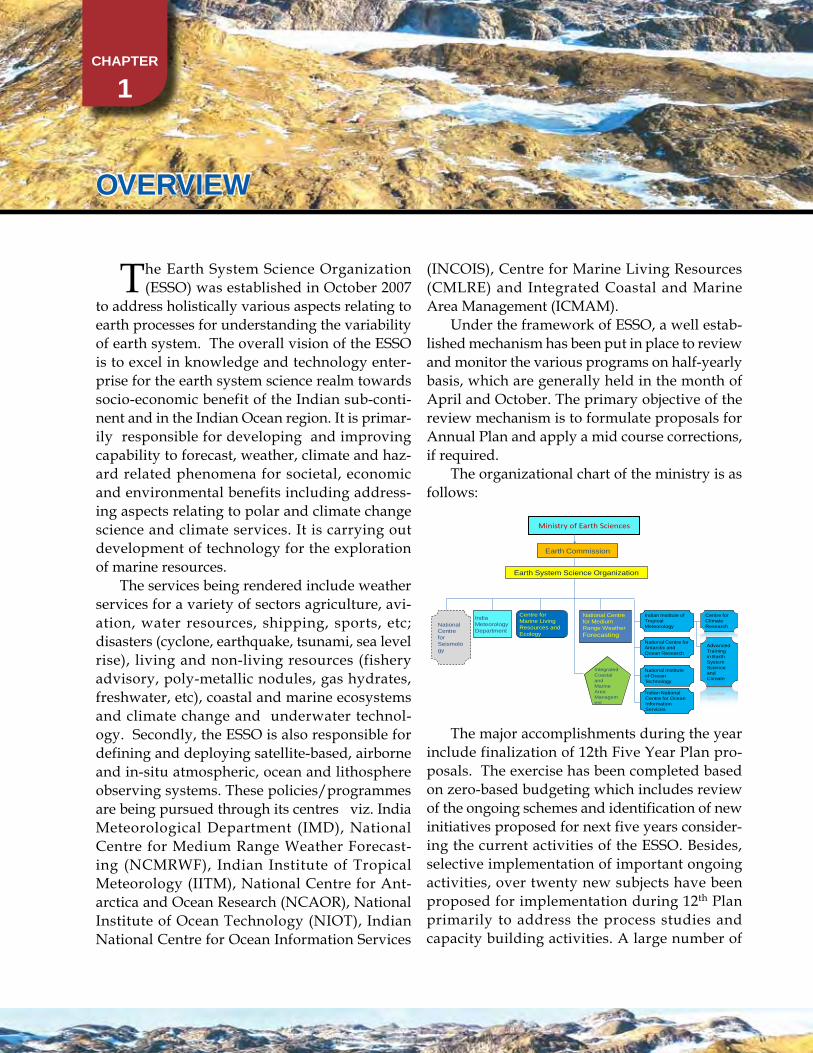
The organizational chart of the ministry is as follows:
Ministry of Earth Sciences
Earth Commission
Earth System Science Organization
India Meteorology Department
Centre for Marine Living Resources and Ecology
Integrated Coastal and Marine Area Management
Indian Institute of Tropical Meteorology
National Centre for Antarctic and Ocean Research
National Institute of Ocean Technology
Indian National Centre for Ocean Information Services
Centre for Climate Research
Advanced Training in Earth System Science and Climate
National Centre for Seismology
National Centre for Medium Range Weather Forecasting
The major accomplishments during the year include finalization of 12th Five Year Plan pro-posals. The exercise has been completed based on zero-based budgeting which includes review of the ongoing schemes and identification of new initiatives proposed for next five years consider-ing the current activities of the ESSO. Besides, selective implementation of important ongoing activities, over twenty new subjects have been proposed for implementation during 12th Plan primarily to address the process studies and capacity building activities. A large number of
The Earth System Science Organization (ESSO) was established in October 2007
to address holistically various aspects relating to earth processes for understanding the variability of earth system. The overall vision of the ESSO is to excel in knowledge and technology enter-prise for the earth system science realm towards socio-economic benefit of the Indian sub-conti-nent and in the Indian Ocean region. It is primar-ily responsible for developing and improving capability to forecast, weather, climate and haz-ard related phenomena for societal, economic and environmental benefits including address-ing aspects relating to polar and climate change science and climate services. It is carrying out development of technology for the exploration of marine resources.
The services being rendered include weather services for a variety of sectors agriculture, avi-ation, water resources, shipping, sports, etc; disasters (cyclone, earthquake, tsunami, sea level rise), living and non-living resources (fishery advisory, poly-metallic nodules, gas hydrates, freshwater, etc), coastal and marine ecosystems and climate change and underwater technol-ogy. Secondly, the ESSO is also responsible for defining and deploying satellite-based, airborne and in-situ atmospheric, ocean and lithosphere observing systems. These policies/programmes are being pursued through its centres viz. India Meteorological Department (IMD), National Centre for Medium Range Weather Forecast-ing (NCMRWF), Indian Institute of Tropical Meteorology (IITM), National Centre for Ant-arctica and Ocean Research (NCAOR), National Institute of Ocean Technology (NIOT), Indian National Centre for Ocean Information Services
2 CHAPTER 1 Overview A
nn
ual
Rep
ort
201
2–20
13
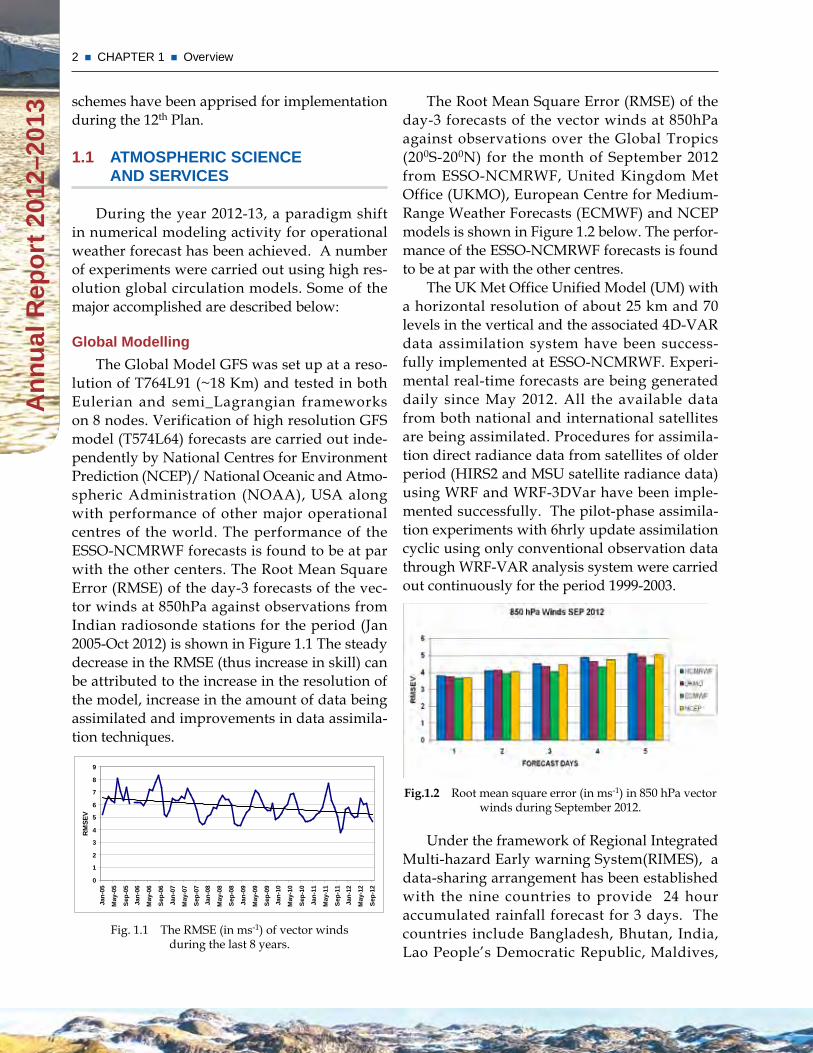
The Root Mean Square Error (RMSE) of the day-3 forecasts of the vector winds at 850hPa against observations over the Global Tropics (200S-200N) for the month of September 2012 from ESSO-NCMRWF, United Kingdom Met Office (UKMO), European Centre for Medium-Range Weather Forecasts (ECMWF) and NCEP models is shown in Figure 1.2 below. The perfor-mance of the ESSO-NCMRWF forecasts is found to be at par with the other centres.
The UK Met Office Unified Model (UM) with a horizontal resolution of about 25 km and 70 levels in the vertical and the associated 4D-VAR data assimilation system have been success-fully implemented at ESSO-NCMRWF. Experi-mental real-time forecasts are being generated daily since May 2012. All the available data from both national and international satellites are being assimilated. Procedures for assimila-tion direct radiance data from satellites of older period (HIRS2 and MSU satellite radiance data) using WRF and WRF-3DVar have been imple-mented successfully. The pilot-phase assimila-tion experiments with 6hrly update assimilation cyclic using only conventional observation data through WRF-VAR analysis system were carried out continuously for the period 1999-2003.
Fig.1.2 Root mean square error (in ms-1) in 850 hPa vector winds during September 2012.
Under the framework of Regional Integrated Multi-hazard Early warning System(RIMES), a data-sharing arrangement has been established with the nine countries to provide 24 hour accumulated rainfall forecast for 3 days. The countries include Bangladesh, Bhutan, India, Lao People’s Democratic Republic, Maldives,
schemes have been apprised for implementation during the 12th Plan.
1.1 ATmOsPHERiC sCiEnCE And sERviCEs
During the year 2012-13, a paradigm shift in numerical modeling activity for operational weather forecast has been achieved. A number of experiments were carried out using high res-olution global circulation models. Some of the major accomplished are described below:
Global modelling
The Global Model GFS was set up at a reso-lution of T764L91 (~18 Km) and tested in both Eulerian and semi_Lagrangian frameworks on 8 nodes. Verification of high resolution GFS model (T574L64) forecasts are carried out inde-pendently by National Centres for Environment Prediction (NCEP)/ National Oceanic and Atmo-spheric Administration (NOAA), USA along with performance of other major operational centres of the world. The performance of the ESSO-NCMRWF forecasts is found to be at par with the other centers. The Root Mean Square Error (RMSE) of the day-3 forecasts of the vec-tor winds at 850hPa against observations from Indian radiosonde stations for the period (Jan 2005-Oct 2012) is shown in Figure 1.1 The steady decrease in the RMSE (thus increase in skill) can be attributed to the increase in the resolution of the model, increase in the amount of data being assimilated and improvements in data assimila-tion techniques.
0
1
2
3
4
5
6
7
8
9
Jan-
05
May
-05
Sep-
05
Jan-
06
May
-06
Sep-
06
Jan-
07
May
-07
Sep-
07
Jan-
08
May
-08
Sep-
08
Jan-
09
May
-09
Sep-
09
Jan-
10
May
-10
Sep-
10
Jan-
11
May
-11
Sep-
11
Jan-
12
May
-12
Sep-
12
RM
SEV
Fig. 1.1 The RMSE (in ms-1) of vector winds during the last 8 years.
3 CHAPTER 1 Overview
An
nu
al R
epo
rt 2
012–
2013
Mongolia, Myanmar, Nepal, and Sri Lanka. The departments of irrigation, agriculture, and other primary users of weather information also have become major beneficiaries.
One month experiment utilizing Indian Satel-lite Vegetation Data in model GFS T574 indicated that the Indian vegetation data positively influ-ences land surface parameters as well as the flow pattern at 850 hPa (1.5 km). Further, Oceansat-2 Scatterometer (OSCAT) winds along with polar winds from NOAA and METOP series of satel-lites were assimilated in the operational model.
Monsoon Mission: The monsoon mission is a multi-institutional and inter-agency research mission with the ultimate aim to improve the monsoon prediction over the country on all time scales. The monsoon mission has been support-ing national and international participation of academic and research institutions. The mission is being implemented (2012-2017).
Agro-meteorological advisory service: The agro advisory service bulletins were issued to 585 Agro Advisory Services units. Weather related information and crop advisory through SMS in Maharashtra has been initiated through Farm-ers Club which is catering to 50,000 farmers. The
total number of SMS subscribers to the Agro-meteorological advisory service is increased to 34.5 lakh.
Modernization meteorological Services: The Atmospheric observation network has been aug-mented including installation of over 10 Dop-pler Weather Radars in various cities, viz., Delhi airport, New Delhi, Nagpur, Jaipur, Hyderabad, Lucknow, Patna, Patiala, Agartala, Mohanbari, Bhuj and Mumbai during the period. The instal-lation of DWRs has improved nowcasting in these cities. Besides, installation of over 552 AWS and 955 ARGS in various locations of the coun-try was completed as a part of national network.
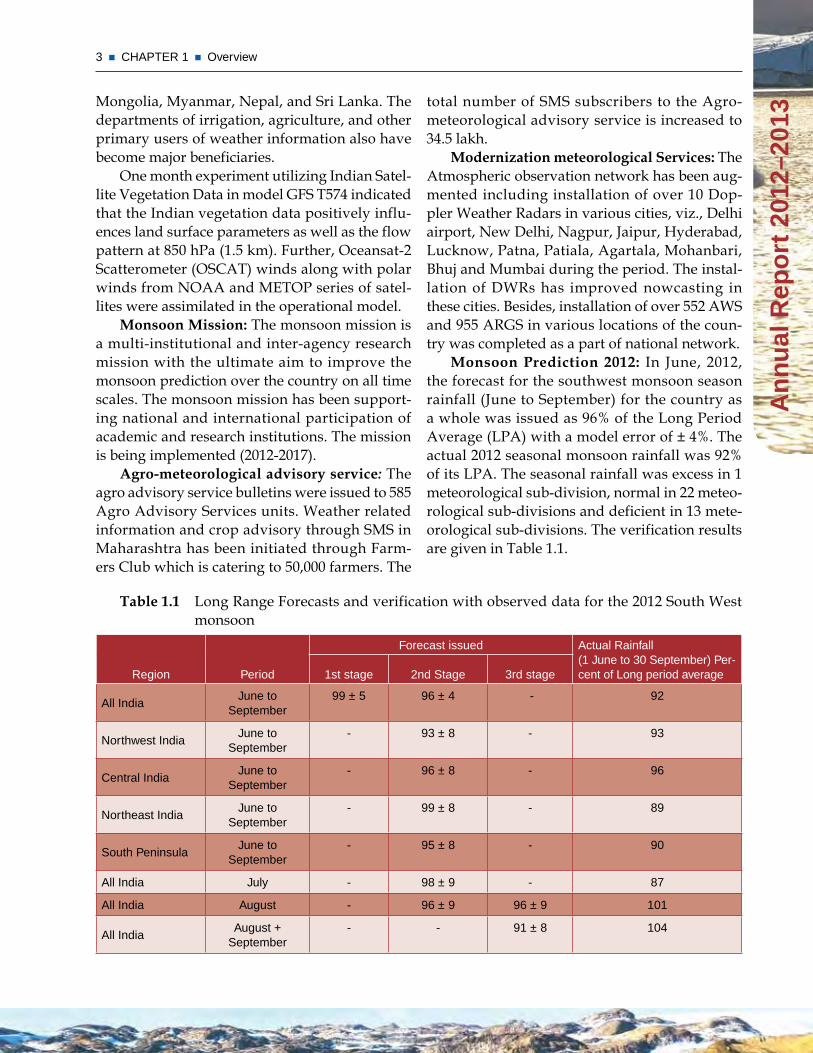
Monsoon Prediction 2012: In June, 2012, the forecast for the southwest monsoon season rainfall (June to September) for the country as a whole was issued as 96% of the Long Period Average (LPA) with a model error of ± 4%. The actual 2012 seasonal monsoon rainfall was 92% of its LPA. The seasonal rainfall was excess in 1 meteorological sub-division, normal in 22 meteo-rological sub-divisions and deficient in 13 mete-orological sub-divisions. The verification results are given in Table 1.1.
Table 1.1 Long Range Forecasts and verification with observed data for the 2012 South West monsoon
Region Period
Forecast issued Actual Rainfall (1 June to 30 September) Per-cent of Long period average1st stage 2nd Stage 3rd stage
All India June to
September 99 ± 5 96 ± 4 - 92
Northwest IndiaJune to
September- 93 ± 8 - 93
Central IndiaJune to
September- 96 ± 8 - 96
Northeast IndiaJune to
September- 99 ± 8 - 89
South PeninsulaJune to
September- 95 ± 8 - 90
All India July - 98 ± 9 - 87
All India August - 96 ± 9 96 ± 9 101
All India August +
September- - 91 ± 8 104
4 CHAPTER 1 Overview A
nn
ual
Rep
ort
201
2–20
13
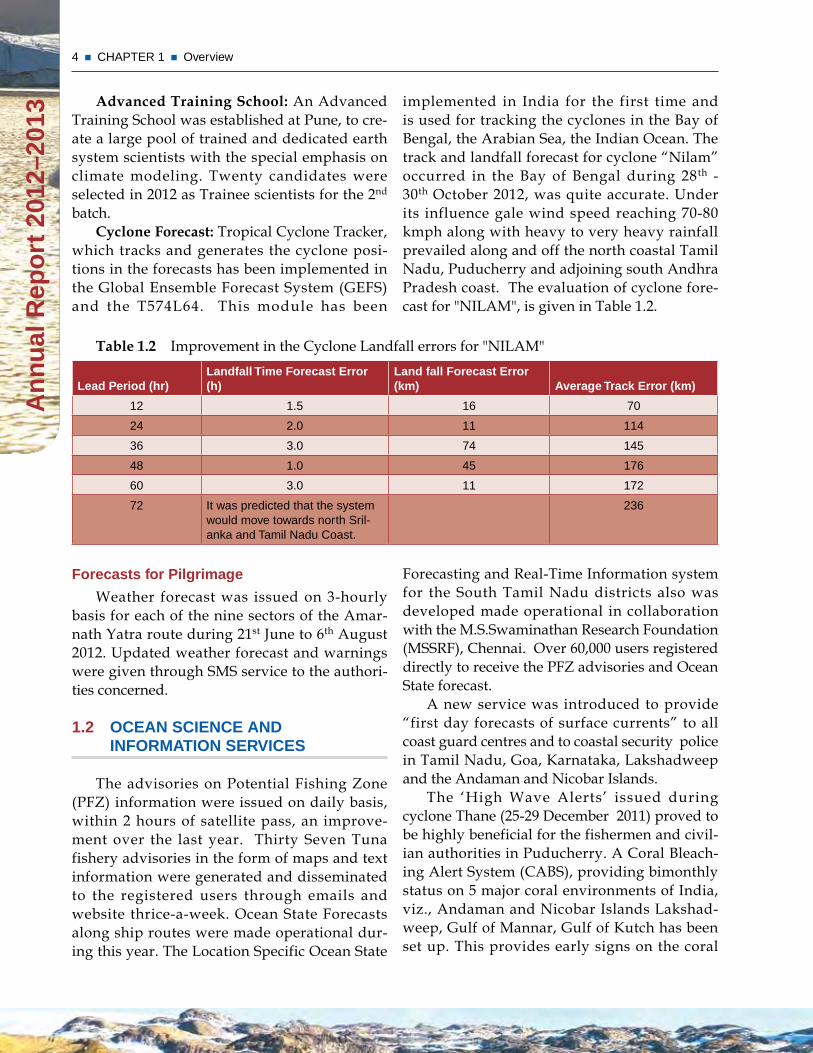
implemented in India for the first time and is used for tracking the cyclones in the Bay of Bengal, the Arabian Sea, the Indian Ocean. The track and landfall forecast for cyclone “Nilam” occurred in the Bay of Bengal during 28th - 30th October 2012, was quite accurate. Under its influence gale wind speed reaching 70-80 kmph along with heavy to very heavy rainfall prevailed along and off the north coastal Tamil Nadu, Puducherry and adjoining south Andhra Pradesh coast. The evaluation of cyclone fore-cast for "NILAM", is given in Table 1.2.
Table 1.2 Improvement in the Cyclone Landfall errors for "NILAM"
Lead Period (hr)Landfall Time Forecast Error (h)
Land fall Forecast Error (km) Average Track Error (km)
12 1.5 16 70
24 2.0 11 114
36 3.0 74 145
48 1.0 45 176
60 3.0 11 172
72 It was predicted that the system would move towards north Sril-anka and Tamil Nadu Coast.
236
Advanced Training School: An Advanced Training School was established at Pune, to cre-ate a large pool of trained and dedicated earth system scientists with the special emphasis on climate modeling. Twenty candidates were selected in 2012 as Trainee scientists for the 2nd batch.
Cyclone Forecast: Tropical Cyclone Tracker, which tracks and generates the cyclone posi-tions in the forecasts has been implemented in the Global Ensemble Forecast System (GEFS) and the T574L64. This module has been
Forecasts for Pilgrimage
Weather forecast was issued on 3-hourly basis for each of the nine sectors of the Amar-nath Yatra route during 21st June to 6th August 2012. Updated weather forecast and warnings were given through SMS service to the authori-ties concerned.
1.2 OCEAn sCiEnCE And inFORmATiOn sERviCEs
The advisories on Potential Fishing Zone (PFZ) information were issued on daily basis, within 2 hours of satellite pass, an improve-ment over the last year. Thirty Seven Tuna fishery advisories in the form of maps and text information were generated and disseminated to the registered users through emails and website thrice-a-week. Ocean State Forecasts along ship routes were made operational dur-ing this year. The Location Specific Ocean State
Forecasting and Real-Time Information system for the South Tamil Nadu districts also was developed made operational in collaboration with the M.S.Swaminathan Research Foundation (MSSRF), Chennai. Over 60,000 users registered directly to receive the PFZ advisories and Ocean State forecast.
A new service was introduced to provide “first day forecasts of surface currents” to all coast guard centres and to coastal security police in Tamil Nadu, Goa, Karnataka, Lakshadweep and the Andaman and Nicobar Islands.
The ‘High Wave Alerts’ issued during cyclone Thane (25-29 December 2011) proved to be highly beneficial for the fishermen and civil-ian authorities in Puducherry. A Coral Bleach-ing Alert System (CABS), providing bimonthly status on 5 major coral environments of India, viz., Andaman and Nicobar Islands Lakshad-weep, Gulf of Mannar, Gulf of Kutch has been set up. This provides early signs on the coral
5 CHAPTER 1 Overview
An
nu
al R
epo
rt 2
012–
2013
officials from Afghanistan, Armenia, Bangla-desh, Bhutan, Cambodia, Comoros, Kenya, Lao PDR, Maldives, Mauritius, Mongolia, Mozam-bique, Myanmar, Nepal, Papua New Guinea, Philippines, Seychelles, Sri Lanka, Tanzania and Uzbekistan met in New Delhi to deliberate on and resolve the issue of organizing resources for implementing RIMES core operations and Mas-ter Plan.
The maps of Coastal Vulnerability Index (CVI) for the entire country was prepared using seven basic parameters - Shoreline Change, Geomorphology, Coastal Regional Elevations, Coastal Slope, Sea-level Change Rate, Mean Sig-nificant Wave Height and Tidal Range. A CVI atlas comprising 157 maps on 1:100000 scales was prepared for nine coastal states and Islands. The tsunami hazard maps on 1:25000 Scale for Tamil Nadu, Andhra Pradesh, Odisha, West Bengal, Kerala, Karnataka and Goa have been completed.
As a part of setting up of a Deep Borehole (~7 Km) Observatory in the Koyna-Warna region for direct and continuous monitoring of intra-plate seismic zone at depth, leading to a better under-standing of the mechanics of faulting, physics of reservoir triggered earthquakes as well as earth-quake hazard assessment, Govt. of Maharashtra has provided 125 acres of land in Hazarmachi area in Karad. The preparatory studies have been initiated to carry out scientific investigations and select the suitable site for deep borehole drilling in the Koyna-Warna region. The investigations include seismological, gseophysical (seismic, gravity, magnetic), LIDAR, geomorphology and structural geological studies, apart from a few shallow (~ 1 km) exploratory boreholes.
1.4 POLAR sCiEnCE & CRyOsPHERE
In March 2012, India successfully com-menced operations at Bharati, the third per-manent station in the Antarctica. The summer complement of the 31st Indian Scientific Expedi-tion to Antarctica returned from Antarctica after completion of targeted activities.
degradation that undergo thermal stress and possible bleaching.
A climatic atlas of Mixed Layer and Sonic Layer for the Tropical Indian Ocean was pre-pared comprising approximately 1,11,000 pro-files from Argo floats and other sources. A software application also was developed for viewing the Mixed Layer and Sonic Layer Depth Climatology which facilitates visualization and spatio-temporal sub-setting.
As a part of Ocean Observation Network, a set of 16 moored buoy network was established for acquisition of realtime data from the seas around India. This has been useful for opera-tional weather forecasting including providing cyclone warning besides validation of satellite data.
1.3 disAsTER suPPORT
The Indian Tsunami Early Warning Centre (ITEWC) has reported 74 earthquakes of mag-nitude > 6.5 during the period. A major earth-quake of initially estimated magnitude 8.7 (later revised to 8.5) on the Richter scale occurred off the West Coast of Northern Sumatra, Indone-sia on 11 April 2012 14:08 IST with epicenter at 2.40 N and 93.070 E. The first bulletin was issued in 8 minutes at 1416 h. This was followed by another earthquake of estimated magnitude 8.5 (later revised to 8.2) occurred off the West Coast of Northern Sumatra, Indonesia on 11 April 2012 16:13 IST with epicenter at 0.77 Deg. N and 92.45 Deg. E. Five tsunami bulletins were issued for the event simultaneously with the first event. Regional Tsunami advisories were disseminated to a total of 21 countries in the Indian Ocean region.
The Firs t Minister ia l Conference of the Regional Integrated Multi-Hazard Early Warning Systems (RIMES) for Afro-Asian Region was organized on 21st June 2012 in Delhi. Both Hon. Minister of Earth Sciences and Hon. Minister of State for Earth Sciences par-ticipated along with Ministers, Ambassadors/High Commissioners and Senior Government
6 CHAPTER 1 Overview A
nn
ual
Rep
ort
201
2–20
13
operational. These plants have been contributing significantly to the drinking water needs of the local population of these islands.The capacity of these plants is 1 lakh liter per day.
In order to harness deep sea resources, development of various equipments such as Remotely Operable Submersible (ROSUB) to assess environmental conditions and Remotely Operable Subsea In-situ Soil Tester (ROSIS) to test mechanical properties of sea-bed has been undertaken. A Remotely Operable Subsea In-situ Soil Tester (ROSIS) has been developed and was tested at a water depth of 5462 m in the Cen-tral Indian Ocean Basin (CIOB).
1.6 COAsTAL mARinE ECOLOGy
R&D efforts over the past 10 years have suc-ceeded in producing black-pearls from the pearl oyster (Pincta damargratifera). Two number of high quality black-pearls were obtained from 12 of the black pearl oysters maintained at the Andaman and Nicobar Hatchery Unit. These pearls fetch more than US$ 50 per pearl in the international market.
Ten Fish Aggregating Devices were deployed successfully off the Andaman & Nicobar Islands.
Deep sea filamentous fungi producing extra-cellular pigment were isolated from a depth of 400m and axenic cultures were developed.
1.7 CLimATE CHAnGE sCiEnCE
The past variability of Indian Ocean Dipole (IOD) and its relationship with the Indian Sum-mer Monsoon (ISM) over 140 Kyr using a sedi-ment core from the southern Indian Ocean has been computed. Short-term climatological stud-ies based on recorded meteorological data have shown that positive IOD mode events tend to increase the ISM rainfall by strengthening the monsoonal-Hadley circulation on annual to decadal timescales. However, long-term vari-ability (millennial timescale) of IOD mode and its relationship with ISM vis-à-vis changing cli-mate of the earth is largely unknown.
During the 6th expedition to the Southern Ocean 2011-12, continuous observations were carried out for ocean currents, atmospheric parameters and biogeochemistry by operating various instruments such as Acoustic Doppler Current Profiler, Automatic Weather Station, surface water sample collection and XBT deploy-ments from 7.7°N-78.1°E onwards during the voyage from Goa to Southern Ocean. CTD, XCTD, Micro-profiler Multiple Plankton net and Bongo net were operated between 40°S-57°30’E and 53°S-57°30’E. Time series observations were made over a period of 48 hours (3 hourly inter-vals) at 40°S-58°30’E.
The summer phase I of the Indian Arctic Programme was completed between June - July 2012. The studies on (i) Long term monitoring of the Kongsfjorden system of the Arctic region for climate change studies and (ii) Quantifying variability in freshwater influx to the Kongsfjor-den system using oxygen isotopes of seawater and the implications to the ice melting have been undertaken. India hosted and chaired the meet-ing Asian Forum for Polar Sciences in New Delhi on 6-7 August 2012. China, Japan, Korea, Malay-sia and host India participated in the meeting and exchanged information on the activities carried out in the Antarctic, Arctic and Southern Ocean.
India won the bid for hosting the Scientific Committee on Antarctic Research (SCAR) – XII International Symposium on Antarctic Earth Sci-ences, in 2015 at Goa.
1.5 OCEAn TECHnOLOGy & REsOuRCEs
The geophysical survey for the revised dam corridor for the Kalpasar project in Gujarat was completed with submission of the draft report. The geotechnical analysis was also completed and the reports of Cone Penetration Testing (CPT) and Vibrocore samples collected along the dam corridor at the Gulf of Khambhat was prepared.
The Two LTTD plants commissioned one each at Minicoy and Agatti of the Lakshad-weep Islands during 2011 were made fully
7 CHAPTER 1 Overview
An
nu
al R
epo
rt 2
012–
2013
Scientists of Earth System Science Organiza-tion (ESSO) received the “National Geoscience Awards for 2010” on 16 February, 2012 at New Delhi, in the field of Oil and Natural Gas Explo-ration, Disaster Management and Oceanography & Marine Geology.
India was re-elected on the 21 member UN Commission on the Limits of the Continental Shelf (CLCS) for a five year period beginning June 2012.
India was re-elected on the Council of Inter-national Seabed Authority in Investors Category (Group B) for the period of 4 years commenc-ing from 1st January, 2013. International Seabed Authority is the UN institution governing the resources of high seas outside the national mari-time zones, set up under the UN Convention on Law of the Sea.
1.11 sCiEnTiFiC PuBLiCATiOns
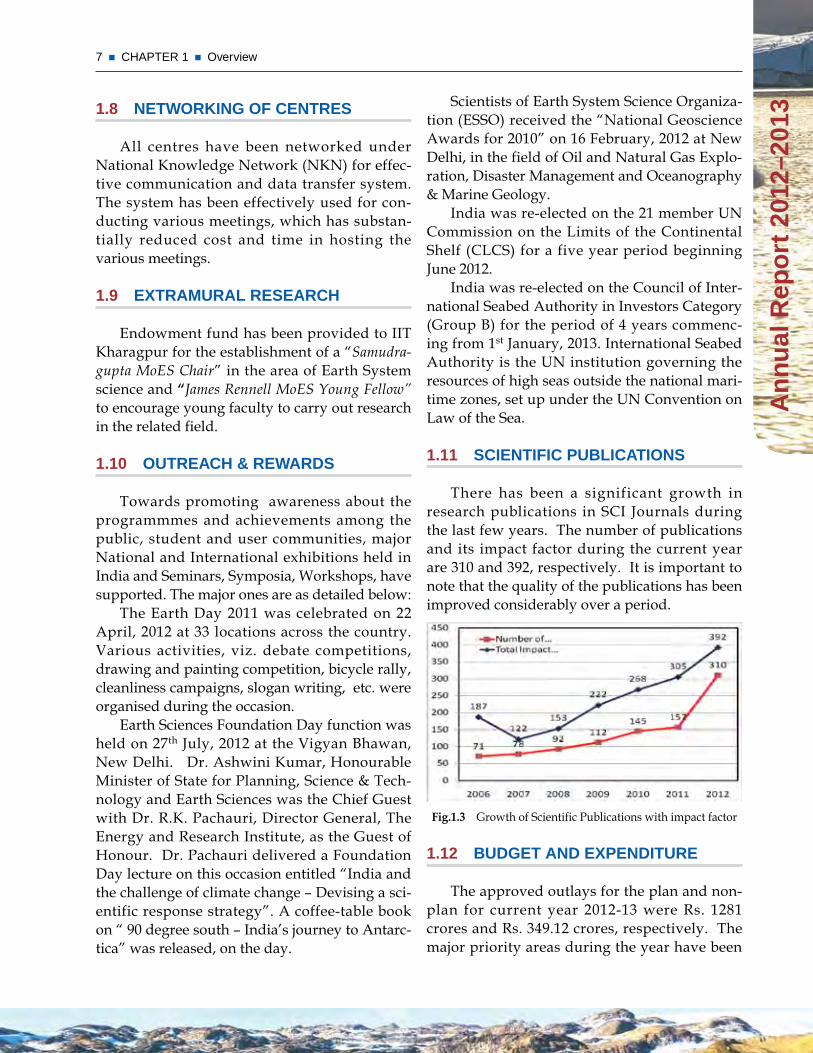
There has been a significant growth in research publications in SCI Journals during the last few years. The number of publications and its impact factor during the current year are 310 and 392, respectively. It is important to note that the quality of the publications has been improved considerably over a period.
Fig.1.3 Growth of Scientific Publications with impact factor
1.12 BudGET And ExPEndiTuRE
The approved outlays for the plan and non-plan for current year 2012-13 were Rs. 1281 crores and Rs. 349.12 crores, respectively. The major priority areas during the year have been
1.8 nETwORkinG OF CEnTREs
All centres have been networked under National Knowledge Network (NKN) for effec-tive communication and data transfer system. The system has been effectively used for con-ducting various meetings, which has substan-tially reduced cost and time in hosting the various meetings.
1.9 ExTRAmuRAL REsEARCH
Endowment fund has been provided to IIT Kharagpur for the establishment of a “Samudra-gupta MoES Chair” in the area of Earth System science and “James Rennell MoES Young Fellow” to encourage young faculty to carry out research in the related field.
1.10 OuTREACH & REwARds
Towards promoting awareness about the programmmes and achievements among the public, student and user communities, major National and International exhibitions held in India and Seminars, Symposia, Workshops, have supported. The major ones are as detailed below:
The Earth Day 2011 was celebrated on 22 April, 2012 at 33 locations across the country. Various activities, viz. debate competitions, drawing and painting competition, bicycle rally, cleanliness campaigns, slogan writing, etc. were organised during the occasion.
Earth Sciences Foundation Day function was held on 27th July, 2012 at the Vigyan Bhawan, New Delhi. Dr. Ashwini Kumar, Honourable Minister of State for Planning, Science & Tech-nology and Earth Sciences was the Chief Guest with Dr. R.K. Pachauri, Director General, The Energy and Research Institute, as the Guest of Honour. Dr. Pachauri delivered a Foundation Day lecture on this occasion entitled “India and the challenge of climate change – Devising a sci-entific response strategy”. A coffee-table book on “ 90 degree south – India’s journey to Antarc-tica” was released, on the day.
8 CHAPTER 1 Overview A
nn
ual
Rep
ort
201
2–20
13
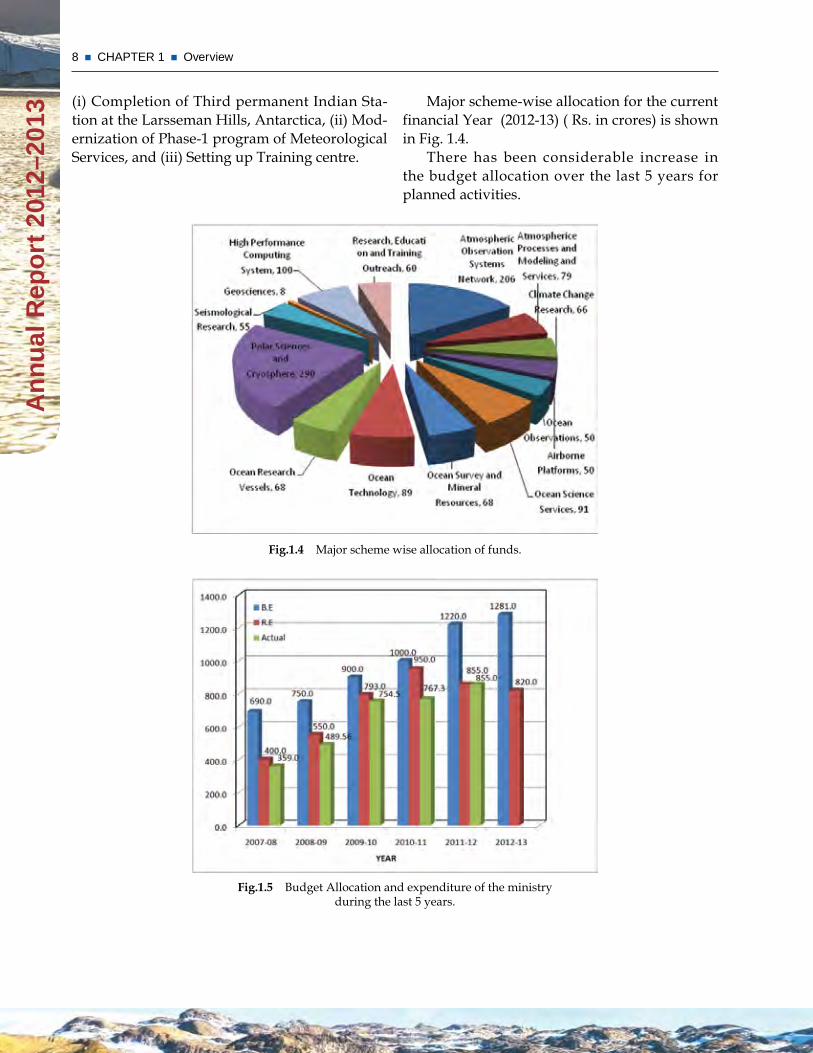
Major scheme-wise allocation for the current financial Year (2012-13) ( Rs. in crores) is shown in Fig. 1.4.
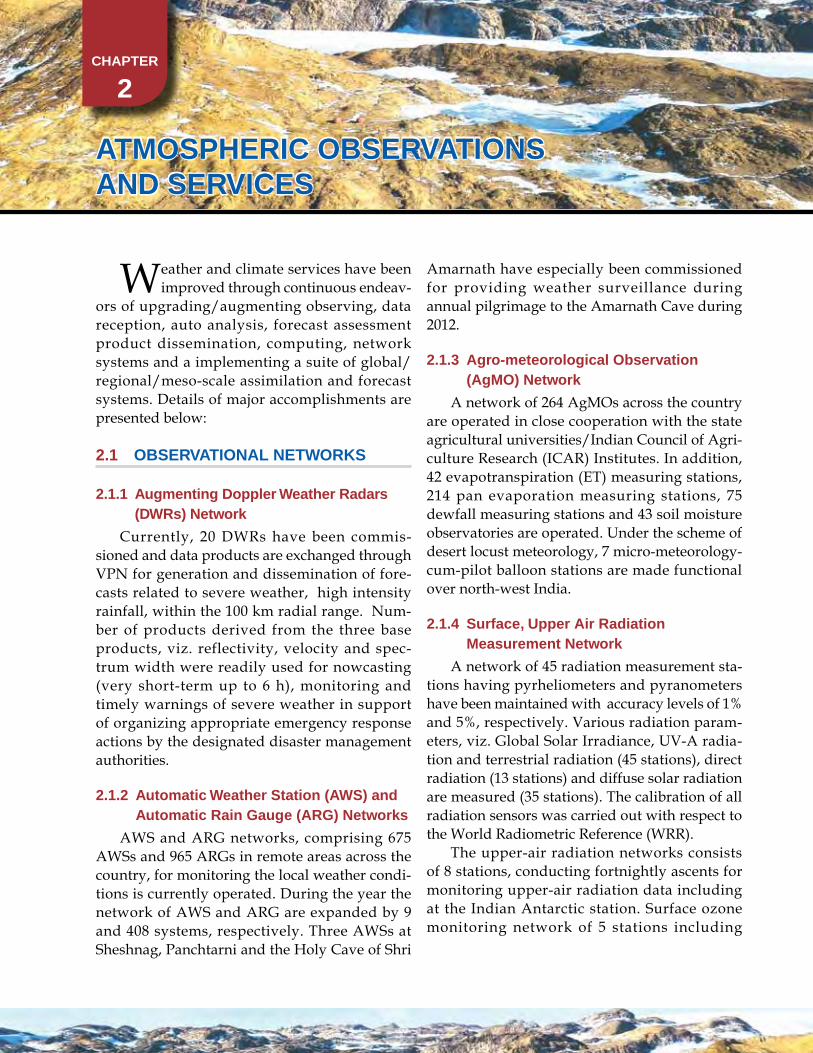
There has been considerable increase in the budget allocation over the last 5 years for planned activities.
Fig.1.4 Major scheme wise allocation of funds.
Fig.1.5 Budget Allocation and expenditure of the ministry during the last 5 years.
(i) Completion of Third permanent Indian Sta-tion at the Larsseman Hills, Antarctica, (ii) Mod-ernization of Phase-1 program of Meteorological Services, and (iii) Setting up Training centre.
CHAPTER
2
ATmOsPHERiC OBsERvATiOns And sERviCEs
Amarnath have especially been commissioned for providing weather surveillance during annual pilgrimage to the Amarnath Cave during 2012.
2.1.3 Agro-meteorological Observation (AgmO) network
A network of 264 AgMOs across the country are operated in close cooperation with the state agricultural universities/Indian Council of Agri-culture Research (ICAR) Institutes. In addition, 42 evapotranspiration (ET) measuring stations, 214 pan evaporation measuring stations, 75 dewfall measuring stations and 43 soil moisture observatories are operated. Under the scheme of desert locust meteorology, 7 micro-meteorology-cum-pilot balloon stations are made functional over north-west India.
2.1.4 surface, upper Air Radiation measurement network
A network of 45 radiation measurement sta-tions having pyrheliometers and pyranometers have been maintained with accuracy levels of 1% and 5%, respectively. Various radiation param-eters, viz. Global Solar Irradiance, UV-A radia-tion and terrestrial radiation (45 stations), direct radiation (13 stations) and diffuse solar radiation are measured (35 stations). The calibration of all radiation sensors was carried out with respect to the World Radiometric Reference (WRR).
The upper-air radiation networks consists of 8 stations, conducting fortnightly ascents for monitoring upper-air radiation data including at the Indian Antarctic station. Surface ozone monitoring network of 5 stations including
Weather and climate services have been improved through continuous endeav-
ors of upgrading/augmenting observing, data reception, auto analysis, forecast assessment product dissemination, computing, network systems and a implementing a suite of global/regional/meso-scale assimilation and forecast systems. Details of major accomplishments are presented below:
2.1 OBsERvATiOnAL nETwORks
2.1.1 Augmenting doppler weather Radars (dwRs) network
Currently, 20 DWRs have been commis-sioned and data products are exchanged through VPN for generation and dissemination of fore-casts related to severe weather, high intensity rainfall, within the 100 km radial range. Num-ber of products derived from the three base products, viz. reflectivity, velocity and spec-trum width were readily used for nowcasting (very short-term up to 6 h), monitoring and timely warnings of severe weather in support of organizing appropriate emergency response actions by the designated disaster management authorities.
2.1.2 Automatic weather station (Aws) and Automatic Rain Gauge (ARG) networks
AWS and ARG networks, comprising 675 AWSs and 965 ARGs in remote areas across the country, for monitoring the local weather condi-tions is currently operated. During the year the network of AWS and ARG are expanded by 9 and 408 systems, respectively. Three AWSs at Sheshnag, Panchtarni and the Holy Cave of Shri
10 CHAPTER 2 Atmospheric Observations and Services A
nn
ual
Rep
ort
201
2–20
13
Humidity, Cloud Top Temperatures, Sea Surface Temperatures and Normalized Difference Vege-tation Index (NDVI) are displayed on ESSO-IMD website. The daily/weekly/monthly/seasonal averages of various products are also displayed, and archived.
Three Ground receiving and processing sys-tems for NOAA/METOP and MODIS Polar orbiting satellites were installed at New Delhi, Chennai and Guwahati. These satellite data receiving & processing systems have enhanced the capability of weather forecast by direct inter-pretation of images and products which include vertical profiles of temperature and humidity, cloud properties, fog, sea surface temperature, surface pressure, NDVI, etc. Night time Fog and MODIS RGB composite images are the two most used products for aviation purposes. Microwave channel images and high-resolution images are used in cyclone monitoring.
Five no’s GPS stations for measuring inte-grated precipitable water vapour were installed at New Delhi, Mumbai, Chennai, Kolkata, and Guwahati to collect data every half hour. IPWV is found to be useful in nowcast of thunder-storms over the station.
The DMDD System transmits satellite cloud imagery, GTS Data and analyzed weather charts round the clock in digital mode, from New Delhi using INSAT–3C satellite. DMDD receiv-ing stations are installed at ESSO-IMD forecast-ing offices all over India. Besides these, there are 3 nos. of DMDD receiving stations, in the neighbouring countries (Nepal, Sri Lanka and Maldives). A cyclone warning dissemination network of 353 stations is in operation for issu-ing cyclone warning to the coastal stations.
2.1.8 Environment monitoring
Surface Ozone Monitoring Network has been commissioned with surface UV Absorption Ozone Photometers to determine O3. Monitor-ing of Columnar Ozone and vertical distribu-tion is also continued at New Delhi, Ranichauri, Varanasi, Nagpur, Pune, Kodaikanal, Thiru-vananthapuram, Port Blair, Guwahati and
fabrication and supply of ozonesondes have been maintained.
2.1.5 network of High wind speed Recording systems
A network of 20 High Wind Speed Recording Systems at various coastal stations is operated.
2.1.6 Aviation meteorological Observation (AmO) network
AMO network at various airports involving, Transmissometers, Current Weather Instrument Systems (CWIS) and Laser Ceilometer, Distant Indicating Wind Equipment (DIWE) at national and international airports has been operated. Indigenously developed Drishti Transmissom-eter was commissioned during the winter of 2012-13 at the Delhi International Airport with full stand-by systems, along with digital Current Weather Information System (CWIS) and Ceil-ometers on all the 3-runways.
2.1.7 satellite meteorological Products and dissemination network
Kalpana-1 and INSAT-3A provide data from the meteorological payloads, viz. Very High Resolution Radiometer (VHRR) for imaging the Earth in Visible (0.55-0.75µm), Infra-Red (IR: 10.5-12.5µm) and water vapour (WV: 5.7-7.1µm) channels having resolution of 2X2 km in visible and 8X8 km in WV and IR channels. In addition the INSAT-3A has a three channel Charge Cou-pled Device (CCD) payload having spatial reso-lution of 1 X 1 Km for imaging the earth in Visible (0.62-0.69µm), Near Infra Red (0.77-0.86µm) and Short Wave Infra Red (1.55-1.77µm) bands of Spectrum. Currently, 48 images from Kalpana-1 VHRR and 24 images are taken from INSAT-3A VHRR are taken daily. Imaging from CCD is done 5 times during daytime only. The quali-tative products (satellite images) are transmit-ted to users for use in Weather forecasting. All products namely, satellite images in all channels and various sectors, outgoing longwave radia-tion, Atmospheric Motion Vectors, Quantitative Precipitation Estimates, Upper Tropospheric
11 CHAPTER 2 Atmospheric Observations and Services
An
nu
al R
epo
rt 2
012–
2013
community radiative transfer model, improved tropical cyclone relocation algorithm, changes in the land, snow and ice skill temperature and use of some new observations in the assimila-tion cycle. The data presently being pre-pro-cessed for Global Forecast System are Upper air sounding – TEMP, GPS & PILOT, Land surface – SYNOP, SYNOP MOBIL & AWS, Marine sur-face – SHIP, Drifting buoy – BUOY, Sub-surface buoy – BATHY, Aircraft observations - AIREP & AMDAR, Automated Aircraft Observation - BUFR (ACARS), Airport Weather Observa-tions – METAR, Satellite winds – SATOB, High density satellite winds - BUFR (EUMETSAT & Japan), Wind profiler observations - BUFR (US/Europe), Surface pressure Analysis - PAOB (Aus-tralia), Radiance (AMSU-A, AMSU-B, HIRS-3 and HIRS-4, MSU, IASI, SSMI, AIRS, AMSRE, GOES, MHS, GPS Radio occultation, Rain Rate (SSMI and TRMM)
2.2.2 short Range Forecasting system (1–3 days)
Meso-Scale Assimilation-Forecast Sys-tem – Weather Research and Forecast (WRF) Framework
The regional mesoscale assimilation-forecast system - WRF (ARW) is implemented with its all components namely, pre-processing programs (WPS and REAL), data assimilation program (WRF-VAR), boundary condition updating and forecasting model (WRF) and NCL for display. The pre-processed observational data from GTS and other sources prepared for the Global Fore-cast System is used for WRF assimilation.
In the WRF-VAR assimilation system, all con-ventional observations over a domain (20oS to 45oN; 40oE to 115oE), which covers the designated Regional Specialized Meteorological Centre (RSMC) Delhi region, are considered to update the first guess obtained from the GFS analy-sis. Assimilation is done with 27 km horizontal resolution and 38 vertical levels. The boundary conditions from GFS forecasts run are updated to get a consistency with improved mesoscale analysis. WRF model is then integrated for 75h
Maitri (Antarctica) stations. Each station is also equipped with the standard Ozone calibrator for onsite calibration.
Aerosol Monitoring Network has been set up by installing skyradiometers at twelve loca-tions, viz. New Delhi, Delhi (Reference Stan-dard), Ranichauri, Varanasi, Nagpur, Pune, Port Blair, Visakhapatnam, Guwahati, Kolkatta, Jodhpur, Rohtak, and Thiruvananthapuram Sky Radiometer is used to measure optical properties of aerosols such as Aerosol Optical Depth, Single Scattering Albedo, Size Distribution, Phase Func-tion, etc. Sky radiometers make measurements in eleven narrow wavebands in the ultraviolet, vis-ible and infrared parts of the solar spectrum. The observing scheme takes measurements in the almucantar geometry every ten minutes, while taking direct solar measurements every minute.
2.2 OPERATiOnAL numERiCAL wEATHER PREdiCTiOn (nwP)
2.2.1 medium Range Forecast system (4-10 days)
Implementation of Global Forecast System (GFS) The Global Forecast System (GFS) at T574L64
resolution has been implemented at ESSO-IMD. In horizontal, it resolves 574 waves (» 25 Km in the tropics) in spectral triangular truncation representation (T574). The model has 64 verti-cal levels (hybrid; sigma and pressure). The hori-zontal representations of model variables are in spectral form (spherical harmonic basis func-tions) with transformation to a Gaussian grid for calculation of nonlinear quantities and physics.
In the operational mode, the Global Data Assimilation (GDAS) cycle runs 4 times a day (00 UTC, 06 UTC, 12 UTC and 18 UTC). The assimilation system for GFS T574 is a global 3-dimensional variation technique, based on NCEP Grid Point Statistical Interpolation (GSI) scheme. The major changes incorporated in T574 GDAS include use of variational quality control, flow dependent re-weighting of back ground statistics, use of new version and coefficient for
12 CHAPTER 2 Atmospheric Observations and Services A
nn
ual
Rep
ort
201
2–20
13
offices undertake value addition to these prod-ucts and communicate to 130 Agromet Field Units (AMFUs) located at State Agricultural Uni-versities (SAUs), institutes of Indian Council of Agricultural Research (ICAR), IIT, etc.
Crop yield forecasting models based on mul-tiple correlation and regression technique are employed under Forecasting Agricultural out-put using Space, Agrometeorology and Land based observations (FASAL). Mid-season yield forecast (F2) and pre-harvest yield forecast (F3) using agromet model with crop area estimation are communicated to the Department of Agri-culture & Cooperation (DAC) for final forecast of crop yields before harvest. Kharif crop yield forecast assessment for 2012 covering 248 dis-tricts in 20 states for seven major crops in the country is also taken up.
2.2.4 Operational models for Cyclone Forecasting
2.2.4.1 Three regional models WRF (ARW), WRF (NMM) and Quasi-Lagrangian Model (QLM) for short-range prediction and one Global model (T574L64) for medium range prediction (7 days) are used for this purpose. The WRF-VAR model is run at the horizontal resolution of 27 km and 9 km with 38 levels in the vertical and the integration is carried up to 72h over three domains covering the area between lat. 25oS to 45oN; long 40oE to 120oE. Initial and boundary conditions are obtained from the ESSO-IMD Global Forecast System at the resolution of 25 km. The boundary conditions are updated at every six hours interval. The QLM model (res-olution 40 km) is used exclusively for cyclone track prediction in case of cyclone situation in the north Indian Ocean. NWP products prepared by other global operational NWP centres like, ECMWF (European Centre for Medium Range Weather Forecasting), GFS (NCEP), JMA (Japan Meteorological Agency), UKMO, etc. are also assessed. A multimodal ensemble (MME) for predicting the track of tropical cyclones for the Indian Seas is developed by applying multiple linear regression technique using the member
with a nested configuration (27 km outer and 9 km inner domain) with physics including cloud microphysics, cumulus, planetary boundary layer and surface layer parameterization. The post-processing programs ARW post and WPP are also installed to generate graphical plots and sent out for SYNERGIE system at various forecasting offices across India. WRF at 3 km resolution was implemented for the National Capital Region of Delhi Region. High resolution WRF model has been made operational to gener-ate 9 Km grid scale regional forecasts from ten regional offices of ESSO-IMD.
Advanced Regional Prediction System (ARPS) Meso-scale Model FrameworkThe ARPS is implemented for the Delhi and
Kolkata region at the horizontal resolution of 9 km with the objective of assimilating the Dop-pler Weather Radar observations.
Nowcast and very short range forecasting systems (0-6 hours)For nowcasting purposes, the application
software called “Warning Decision Support Sys-tem Integrated Information (WDSS-II)”, devel-oped by the National Severe Storm Lab, USA has been used in experimental mode. For meso-scale forecasting, radar data has been assimi-lated into the ARPS mesoscale model. With the ingesting of the Indian DWR observations, the application software is capable of detecting and removing anomalous propagation echoes.
2.2.3 Operational Agrometeorology
Multi Model Ensemble (MME) technique using forecast products available from number of models of India and other countries, viz. T-799 model of European Centre for Medium Range Weather Forecasting (ECMWF), National Centre for Environmental Prediction (NCEP), USA and Japan Meteorological Agency (JMA), Japan and ESSO-IMD and ESSO-NCMRWF models. The products are disseminated to Regional Meteo-rological Centres and Meteorological Centres of ESSO-IMD located in different states. These
13 CHAPTER 2 Atmospheric Observations and Services
An
nu
al R
epo
rt 2
012–
2013
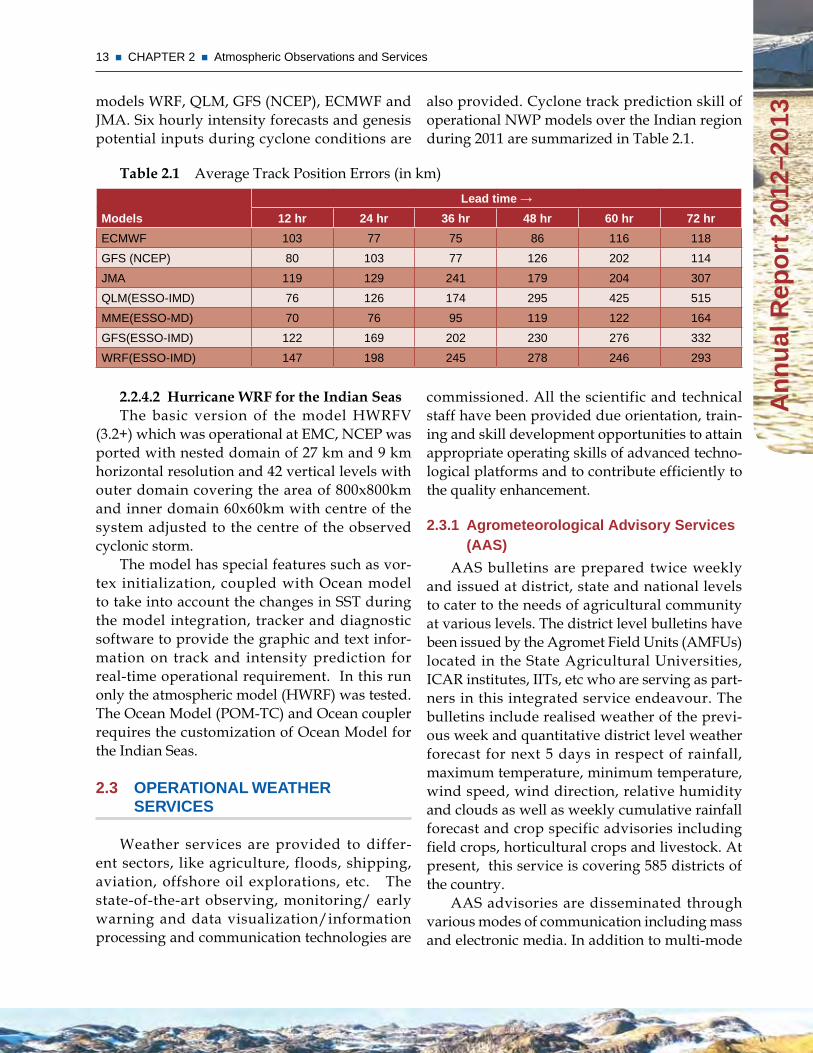
also provided. Cyclone track prediction skill of operational NWP models over the Indian region during 2011 are summarized in Table 2.1.
Table 2.1 Average Track Position Errors (in km)
models
Lead time →12 hr 24 hr 36 hr 48 hr 60 hr 72 hr
ECMWF 103 77 75 86 116 118
GFS (NCEP) 80 103 77 126 202 114
JMA 119 129 241 179 204 307
QLM(ESSO-IMD) 76 126 174 295 425 515
MME(ESSO-MD) 70 76 95 119 122 164
GFS(ESSO-IMD) 122 169 202 230 276 332
WRF(ESSO-IMD) 147 198 245 278 246 293
models WRF, QLM, GFS (NCEP), ECMWF and JMA. Six hourly intensity forecasts and genesis potential inputs during cyclone conditions are
2.2.4.2 Hurricane WRF for the Indian Seas The basic version of the model HWRFV
(3.2+) which was operational at EMC, NCEP was ported with nested domain of 27 km and 9 km horizontal resolution and 42 vertical levels with outer domain covering the area of 800x800km and inner domain 60x60km with centre of the system adjusted to the centre of the observed cyclonic storm.
The model has special features such as vor-tex initialization, coupled with Ocean model to take into account the changes in SST during the model integration, tracker and diagnostic software to provide the graphic and text infor-mation on track and intensity prediction for real-time operational requirement. In this run only the atmospheric model (HWRF) was tested. The Ocean Model (POM-TC) and Ocean coupler requires the customization of Ocean Model for the Indian Seas.
2.3 OPERATiOnAL wEATHER sERviCEs
Weather services are provided to differ-ent sectors, like agriculture, floods, shipping, aviation, offshore oil explorations, etc. The state-of-the-art observing, monitoring/ early warning and data visualization/information processing and communication technologies are
commissioned. All the scientific and technical staff have been provided due orientation, train-ing and skill development opportunities to attain appropriate operating skills of advanced techno-logical platforms and to contribute efficiently to the quality enhancement.
2.3.1 Agrometeorological Advisory services (AAs)
AAS bulletins are prepared twice weekly and issued at district, state and national levels to cater to the needs of agricultural community at various levels. The district level bulletins have been issued by the Agromet Field Units (AMFUs) located in the State Agricultural Universities, ICAR institutes, IITs, etc who are serving as part-ners in this integrated service endeavour. The bulletins include realised weather of the previ-ous week and quantitative district level weather forecast for next 5 days in respect of rainfall, maximum temperature, minimum temperature, wind speed, wind direction, relative humidity and clouds as well as weekly cumulative rainfall forecast and crop specific advisories including field crops, horticultural crops and livestock. At present, this service is covering 585 districts of the country.
AAS advisories are disseminated through various modes of communication including mass and electronic media. In addition to multi-mode
14 CHAPTER 2 Atmospheric Observations and Services A
nn
ual
Rep
ort
201
2–20
13
2.3.3 Flood meteorological service
Flood Meteorological Service provides inputs on catchment scale rainfall to the Central Water Commission (CWC) through 10 Flood Meteoro-logical Offices (FMOs) established in different part of India. Quantitative Precipitation Fore-cast (QPF) up to 72h in advance are regularly issued by FMOs and supplied to CWC for flood forecasting over 42 rivers and their 75 sub-basins. During this monsoon year, total number 15495 of QPF were issued by all the FMOs and overall performance of QPF was 70.1%. Sub basin wise Quantitative Precipitation Forecast(QPF) for day-1, day-2, day-3 using NWP model, opera-tional WRF ARW (9 km x 9 km) and Multi-model Ensemble(0.25° X 0.25°), are operationalized dur-ing the flood season 2012 .
2.3.4 Aviation meteorological services
Aviation meteorological support towards the safety, economy, efficiency and regularity of the aviation services through a net work of 4 Meteo-rological Watch Offices, 18 Aerodrome Meteo-rological Offices (collocated with the 4 MWOs) and 54 Aviation Meteorological Stations (AMSs). An ICAO designated Tropical Cyclone Advisory Center (TCAC) is also functioning. On an aver-age 260000 scheduled and non-scheduled flights were briefed through On-Line Briefing System and through manual briefing.
Efforts are on to implement Quality Man-agement System (QMS) by obtaining ISO certi-fication. Competency assessment of the Aviation Meteorological Personnel (AMP) and Safety Oversight of aviation meteorological service are two major components of the QMS. Safety audit of all the four MWOs and majority of the meteorological offices at busy airports have been completed.
2.3.5 Cyclone warning and advisory services
The Cyclone advisories comprise monitor-ing and prediction of cyclonic disturbances over the north Indian Ocean during 2012 and issued 3 hourly warning/advisory bulletins to national disaster management agencies including
dissemination system, advisories are dissemi-nated to the farming community through SMS and IVR (Interactive Voice Response Technol-ogy) through regional and state level Public Pri-vate Partnership with various service providers. At present, 3.5 million farmers have been ben-efited directly by SMS service delivery of crop specific advisories.
ESSO-IMD and Watershed organization Trust (WOTR) started collaborative project for the generation of short range weather forecast using the inputs from Automated Weather Sta-tions (AWS) and block level advisories. Initially block level forecast and agromet advisories are issued for 2 specified clusters of 25 villages in the Sangamner and Akole Talukas of the Ahmed-nagar District, Maharashtra. A pilot project is also initiated jointly by ESSO-IMD and the Con-sultative Group on International Agricultural Research (CGIAR) to develop block level adviso-ries for the selected districts in Punjab and Bihar.
2.3.2 Hydrometeorological services
The Hydrometeorological support is pro-vided to various Central / State Govt. Organ-isations and other agencies in the field of design flood forecasting, water management and agri-cultural irrigation planning purposes. This includes compilation of rainfall statistics, hydro-meteorological analysis of different river catch-ments and meteorological forecast for flood warning and flood control operations to field units of the Central Water Commission.
Rainfall magnitude and time distribution are provided for various river catchments/ projects in the country. Design storm studies of 42 proj-ects were completed; 41 in India and 1 in Nepal. Based on 3748 number of rain gauges operated all over the country in collaboration with other stakeholders (state governments, Central Water Commission etc.), the daily assessment of mon-soon season rainfall for the country is carried out and rainfall statistics at district-wise/statewise/meteorological-subdivision-wise/region-wise and for the Country as a whole was prepared.
15 CHAPTER 2 Atmospheric Observations and Services
An
nu
al R
epo
rt 2
012–
2013
westwards and intensified into a deep depression in the evening of 23rd October. It then moved west-southwest wards and intensified into a cyclonic storm, ‘MURJAN’ in the evening of 24th October. It then con-tinued to move west-southwestwards and crossed the Somalia coast near lat. 9.50 N between 2230 and 2330h IST on 25th October, 2012. Due to land interaction, it weakened into a deep depression over coastal Somalia at 2330 h IST of 25th October. It further weak-ened into a depression over Somalia in the morning of 26th October while moving west-southwest wards. It further weakened into a well marked low pressure area over Somalia and neighbourhood in the evening of 26th October, 2012.
iii) Cyclonic Storm, ‘NILAM’ over the Bay of Bengal (28 Oct. -1 Nov., 2012) A depression formed over southeast and adjoining southwest Bay of Bengal at 1130h IST of 28th October 2012 near latitude 9.50N and longitude 86.00E. It moved westwards and intensified into a deep depression in the morning of 29th October over the southwest Bay of Bengal near latitude 9.00N and longi-tude 83.00E, about 550 km South-Southeast of Chennai. It continued to move west-wards and intensified into a Cyclonic Storm, NILAM in the morning of 30th October over the southwest Bay of Bengal off the Sri Lanka coast. It then moved north-northwestwards, crossed the north Tamilnadu coast near Mahabalipuram, south of Chennai between 1600 and 1700h IST of 31st October 2012. After the landfall it moved west-northwest-wards and weakened gradually into a deep depression and then into a depression over the south Interior Karnataka in the morning of 01st November 2012. Over the land surface, the cloud mass was significantly sheared to the northeast of system centre during its dis-sipation stage leading to rainfall activity over entire Andhra Pradesh and adjoining Odisha. Maximum rainfall occurred over southwest
National Disaster Management (NDM), Min-istry of Home Affairs (MHA), concerned state Governments and other users at designated intervals. It also issues advisories to the World Meteorological Organization (WMO)/Economic and Social Cooperation for Asia and the Pacific (ESCAP) Panel member countries including Ban-gladesh, Myanmar, Thailand, Pakistan, Oman, Srilanka and Maldives during cyclone period.
Global Maritime Distress and Safety Sys-tem (GMDSS) bulletin contains weather fore-cast of the elements wind direction, wind speed, weather, visibility and wave height for high seas for the area 100 S to 050 N and 600 E to 1000 E for the Indian Navy. Two sea weather bulletins daily for the area covering 500S to 450N and 200E to 1550E are also provided which are valid for 24 and 48h. In disturbed weather (cyclone etc.) extra bulletins are issued every three hours. These bul-letins are issued on Global Channels through Land Earth Station (LES) Arvi via INMARSAT/NAVTEX.
The north Indian Ocean witnessed formation of three cyclonic disturbances during January-October 2012 that are described below:i) Deep Depression over the Bay of Bengal
(10-11 October, 2012) A deep depression formed over the northeast Bay of Bengal in the evening of 10th October, 2012. It moved northward and crossed Ban-gladesh coast near Hatia during 11th morning and then moved northeastwards across Ban-gladesh. It weakened into a well marked low pressure area at 0600 UTC of 11th October, 2012 over Tripura and adjoining Bangladesh and Mizoram. It was short-lived with the life period of about 15h.
ii) Cyclonic Storm, ‘MURJAN’ over the Ara-bian Sea (23-26 October, 2012) A depression formed over southeast and adjoining the southwest and the central Ara-bian Sea near lat. 11.00N and long. 65.00E, about 800 km west of Amini Divi in the morning of 23rd October, 2012. It moved initially west-northwest wards and then
16 CHAPTER 2 Atmospheric Observations and Services A
nn
ual
Rep
ort
201
2–20
13
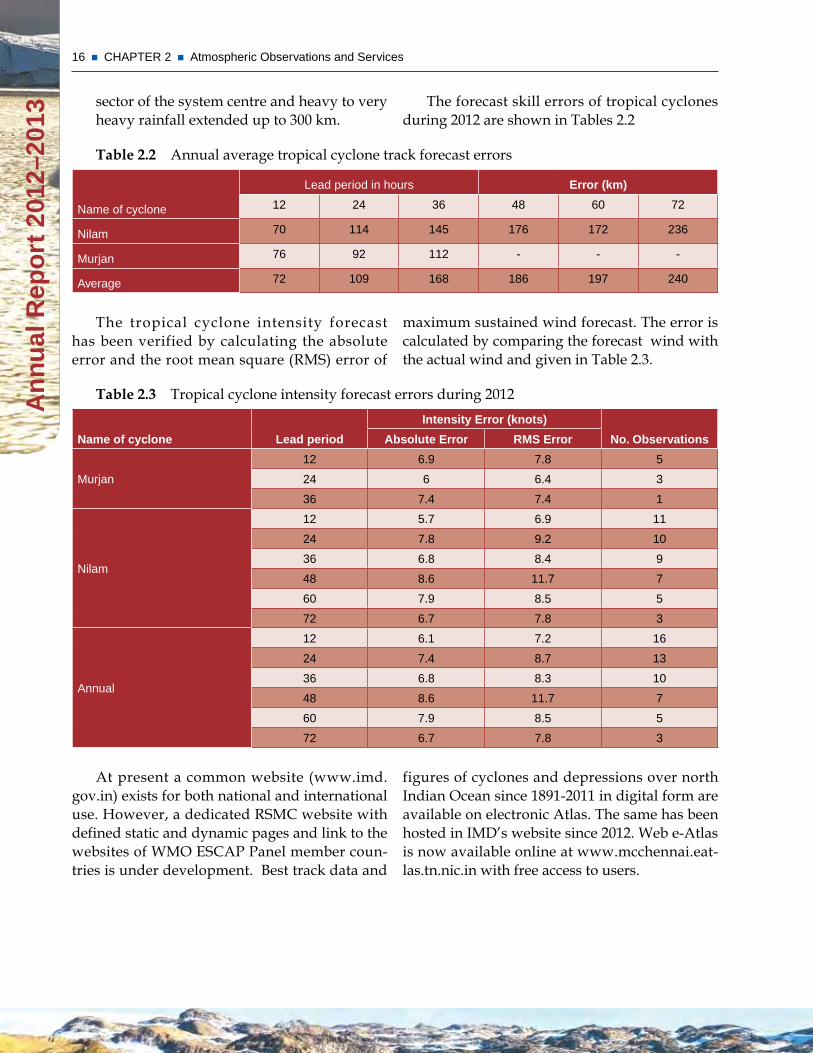
The forecast skill errors of tropical cyclones during 2012 are shown in Tables 2.2
Table 2.2 Annual average tropical cyclone track forecast errors
Name of cyclone
Lead period in hours Error (km)
12 24 36 48 60 72
Nilam 70 114 145 176 172 236
Murjan 76 92 112 - - -
Average 72 109 168 186 197 240
sector of the system centre and heavy to very heavy rainfall extended up to 300 km.
The tropical cyclone intensity forecast has been verified by calculating the absolute error and the root mean square (RMS) error of
maximum sustained wind forecast. The error is calculated by comparing the forecast wind with the actual wind and given in Table 2.3.
Table 2.3 Tropical cyclone intensity forecast errors during 2012
name of cyclone Lead period
intensity Error (knots)
no. ObservationsAbsolute Error Rms Error
Murjan
12 6.9 7.8 5
24 6 6.4 3
36 7.4 7.4 1
Nilam
12 5.7 6.9 11
24 7.8 9.2 10
36 6.8 8.4 9
48 8.6 11.7 7
60 7.9 8.5 5
72 6.7 7.8 3
Annual
12 6.1 7.2 16
24 7.4 8.7 13
36 6.8 8.3 10
48 8.6 11.7 7
60 7.9 8.5 5
72 6.7 7.8 3
At present a common website (www.imd.gov.in) exists for both national and international use. However, a dedicated RSMC website with defined static and dynamic pages and link to the websites of WMO ESCAP Panel member coun-tries is under development. Best track data and
figures of cyclones and depressions over north Indian Ocean since 1891-2011 in digital form are available on electronic Atlas. The same has been hosted in IMD’s website since 2012. Web e-Atlas is now available online at www.mcchennai.eat-las.tn.nic.in with free access to users.
17 CHAPTER 2 Atmospheric Observations and Services
An
nu
al R
epo
rt 2
012–
2013
synoptic charts provided by the Weather Service of South Atfrica. (http://www.imd.gov.in/sec-tion/nhac/dynamic/ polarwrf.htm). Systems/storms in the South Indian Ocean are studied as the southern limits extended up to Antarctica and to develop the connectivity of the southern Indian Ocean and the Antarctica region and understanding of continuum.
2.3.9 metropolitan Air Quality and weather services
A high resolution emission inventory for Pune Metropolitan Region has been prepared based on activity data from various sectors such as transport (vehicles, paved & unpaved roads), residential, commercial, industrial and agricul-ture. Data on surface ozone concentration com-piled for a ten-year period from 1990 to 1999 for Pune and Delhi were analyzed in terms of its frequency distribution, annual trend, diurnal variation and its relation with various meteoro-logical and chemical parameters. It is found that the surface ozone concentration range showing highest frequency of occurrence at Pune is 0-5 ppb during winter and post-monsoon seasons and 15-20 ppb and 5-10 ppb during summer and monsoon seasons, respectively. It is 0-5 ppb at Delhi during all the seasons. The surface ozone concentration has shown a decreasing trend at Pune during the observational period with an average rate of decrease of 1.54 ppb/year.
2.4 mOnsOOn mOniTORinG And PREdiCTiOn
India is predominantly an agricultural country. Success or failure of crops in any year is always crucial and depend on monsoon rain which in turn controls the economy of the coun-try. The salient features of southwest monsoon for the year 2012 are follows:
2.4.1 Onset and withdrawal of s-w monsoon
The arrival of southwest monsoon current over the south Bay of Bengal and south Anda-man Sea was delayed by 3 days and it was set in
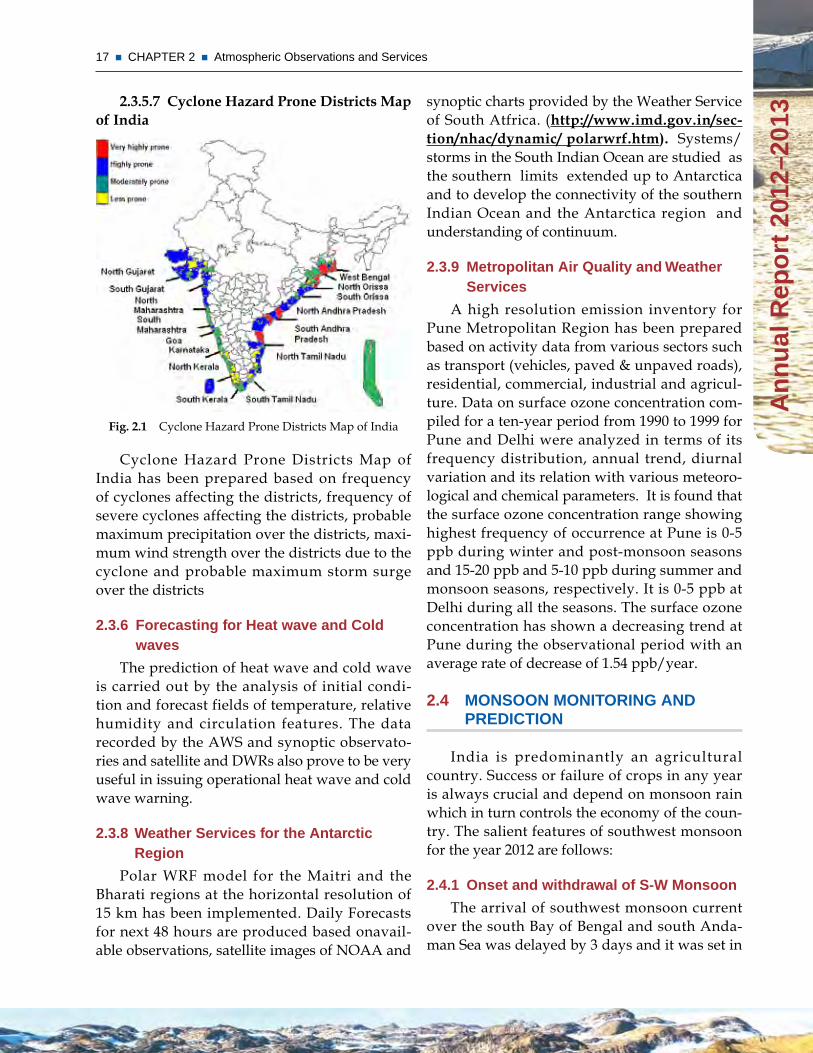
2.3.5.7 Cyclone Hazard Prone Districts Map of India
Fig. 2.1 Cyclone Hazard Prone Districts Map of India
Cyclone Hazard Prone Districts Map of India has been prepared based on frequency of cyclones affecting the districts, frequency of severe cyclones affecting the districts, probable maximum precipitation over the districts, maxi-mum wind strength over the districts due to the cyclone and probable maximum storm surge over the districts
2.3.6 Forecasting for Heat wave and Cold waves
The prediction of heat wave and cold wave is carried out by the analysis of initial condi-tion and forecast fields of temperature, relative humidity and circulation features. The data recorded by the AWS and synoptic observato-ries and satellite and DWRs also prove to be very useful in issuing operational heat wave and cold wave warning.
2.3.8 weather services for the Antarctic Region
Polar WRF model for the Maitri and the Bharati regions at the horizontal resolution of 15 km has been implemented. Daily Forecasts for next 48 hours are produced based onavail-able observations, satellite images of NOAA and
18 CHAPTER 2 Atmospheric Observations and Services A
nn
ual
Rep
ort
201
2–20
13
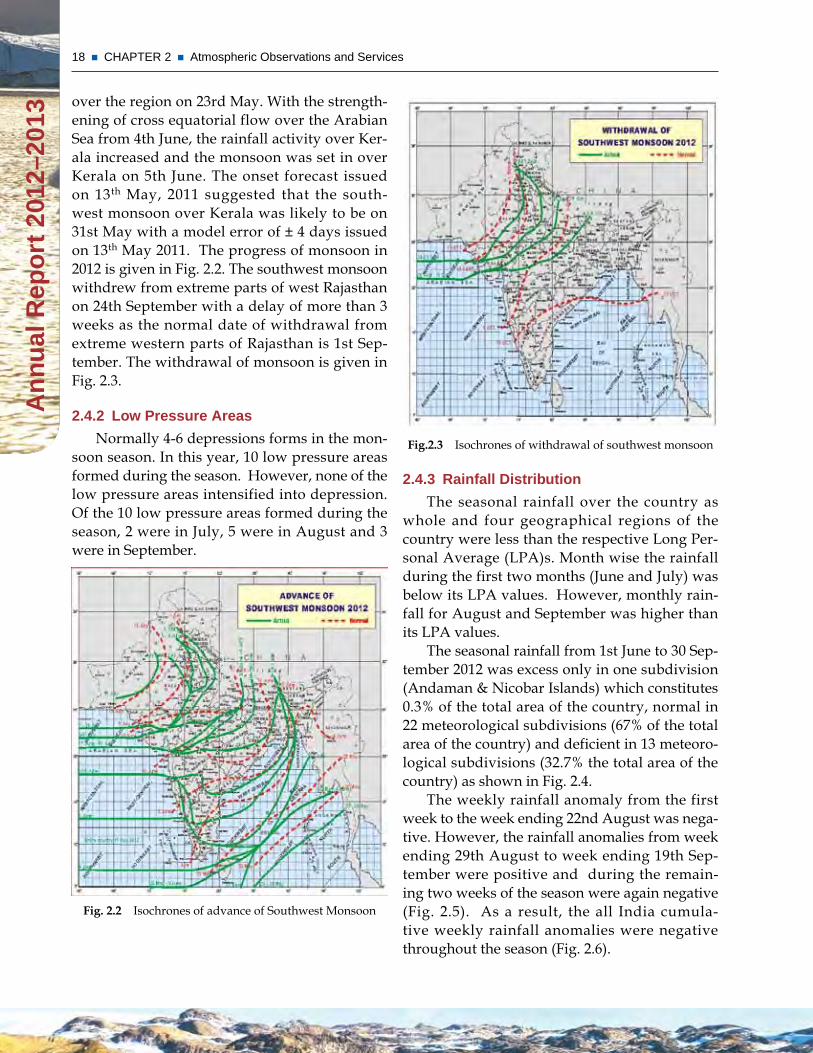
Fig.2.3 Isochrones of withdrawal of southwest monsoon
2.4.3 Rainfall distribution
The seasonal rainfall over the country as whole and four geographical regions of the country were less than the respective Long Per-sonal Average (LPA)s. Month wise the rainfall during the first two months (June and July) was below its LPA values. However, monthly rain-fall for August and September was higher than its LPA values.
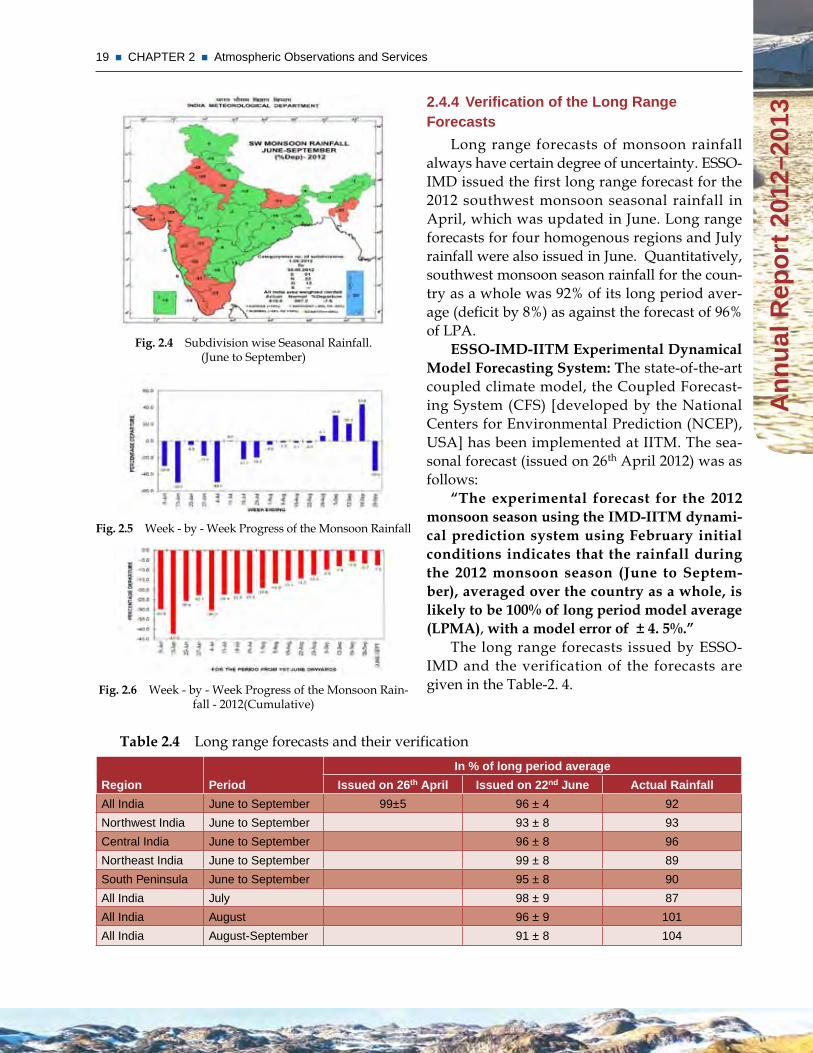
The seasonal rainfall from 1st June to 30 Sep-tember 2012 was excess only in one subdivision (Andaman & Nicobar Islands) which constitutes 0.3% of the total area of the country, normal in 22 meteorological subdivisions (67% of the total area of the country) and deficient in 13 meteoro-logical subdivisions (32.7% the total area of the country) as shown in Fig. 2.4.
The weekly rainfall anomaly from the first week to the week ending 22nd August was nega-tive. However, the rainfall anomalies from week ending 29th August to week ending 19th Sep-tember were positive and during the remain-ing two weeks of the season were again negative (Fig. 2.5). As a result, the all India cumula-tive weekly rainfall anomalies were negative throughout the season (Fig. 2.6).
over the region on 23rd May. With the strength-ening of cross equatorial flow over the Arabian Sea from 4th June, the rainfall activity over Ker-ala increased and the monsoon was set in over Kerala on 5th June. The onset forecast issued on 13th May, 2011 suggested that the south-west monsoon over Kerala was likely to be on 31st May with a model error of ± 4 days issued on 13th May 2011. The progress of monsoon in 2012 is given in Fig. 2.2. The southwest monsoon withdrew from extreme parts of west Rajasthan on 24th September with a delay of more than 3 weeks as the normal date of withdrawal from extreme western parts of Rajasthan is 1st Sep-tember. The withdrawal of monsoon is given in Fig. 2.3.
2.4.2 Low Pressure Areas
Normally 4-6 depressions forms in the mon-soon season. In this year, 10 low pressure areas formed during the season. However, none of the low pressure areas intensified into depression. Of the 10 low pressure areas formed during the season, 2 were in July, 5 were in August and 3 were in September.
Fig. 2.2 Isochrones of advance of Southwest Monsoon
19 CHAPTER 2 Atmospheric Observations and Services
An
nu
al R
epo
rt 2
012–
2013
2.4.4 verification of the Long Range Forecasts
Long range forecasts of monsoon rainfall always have certain degree of uncertainty. ESSO-IMD issued the first long range forecast for the 2012 southwest monsoon seasonal rainfall in April, which was updated in June. Long range forecasts for four homogenous regions and July rainfall were also issued in June. Quantitatively, southwest monsoon season rainfall for the coun-try as a whole was 92% of its long period aver-age (deficit by 8%) as against the forecast of 96% of LPA.
ESSO-IMD-IITM Experimental Dynamical Model Forecasting System: The state-of-the-art coupled climate model, the Coupled Forecast-ing System (CFS) [developed by the National Centers for Environmental Prediction (NCEP), USA] has been implemented at IITM. The sea-sonal forecast (issued on 26th April 2012) was as follows:
“The experimental forecast for the 2012 monsoon season using the IMD-IITM dynami-cal prediction system using February initial conditions indicates that the rainfall during the 2012 monsoon season (June to Septem-ber), averaged over the country as a whole, is likely to be 100% of long period model average (LPMA), with a model error of ± 4. 5%.”
The long range forecasts issued by ESSO-IMD and the verification of the forecasts are given in the Table-2. 4.
Table 2.4 Long range forecasts and their verification
Region Period
in % of long period average
issued on 26th April issued on 22nd June Actual Rainfall
All India June to September 99±5 96 ± 4 92
Northwest India June to September 93 ± 8 93
Central India June to September 96 ± 8 96
Northeast India June to September 99 ± 8 89
South Peninsula June to September 95 ± 8 90
All India July 98 ± 9 87
All India August 96 ± 9 101
All India August-September 91 ± 8 104
Fig. 2.4 Subdivision wise Seasonal Rainfall. (June to September)
Fig. 2.5 Week - by - Week Progress of the Monsoon Rainfall
Fig. 2.6 Week - by - Week Progress of the Monsoon Rain-fall - 2012(Cumulative)
CHAPTER
3
ATmOsPHERiC And CLimATE PROCEssEs And mOdELinG
The meteorological services have signifi-cant impact on society in general. Pub-
lic/private/government sectors demand for accurate prediction of weather and climate at various temporal and spatial scales is increas-ing due to possible impacts of global climate variability and change. Improved and reli-able forecast of weather and climate requires high-resolution dynamical models (e.g. coupled ocean atmosphere-biosphere-cryosphere mod-els). Thus, a combined approach involving land, ocean and atmospheric processes hold the key to improve the forecasts of various temporal and spatial ranges. On the other hand, intensive monitoring of various weather systems through different platform based observing systems including satellites provide not only the neces-sary information about current weather systems, their effective assimilation in numerical models provide important guidance for accurate fore-casts. ESSO has taken positive steps to imple-ment comprehensive developmental programs in these lines involving all its constituent units.
3.1 PHysiCs And dynAmiCs OF TROPiCAL CLOuds
3.1.1 Overview and preliminary results of CAiPEEx
CAIPEEX phase-I aimed at documenting the prevailing microphysical characteristics of aero-sols and clouds and associated environmental conditions over different regions of the country and under different monsoon conditions with the help of an instrumented research aircraft. First time simultaneous observations of aero-sol, cloud condensation nuclei (CCN) and cloud
droplet number concentration (CDNC) over the Gangetic Valley during monsoon season show very high concentrations (> 1000 cm–3) of CCN at elevated layers. Observations of elevated layers with high aerosol concentration over the Gan-getic Valley extending up to 6 km and relatively less aerosol concentration in the boundary layer are also documented. Evidence of strong cloud-aerosol interaction in the moist environments with an increase in the cloud droplet effective radius is seen. Observations also show that pol-lution increases CDNC and the warm rain depth, and delays its initiation. The critical effective radius for warm rain initiation is found to be between 10 and 12 μm in the polluted clouds and it is between 12 and 14 μm in cleaner monsoon clouds.
Observations for warm clouds are found use-ful for verifying and tuning the schemes used in large scale models to parameterize the cloud effective radius (a representative parameter of cloud droplet spectra) using the cloud liquid water content and the cloud droplet number concentration. This analysis used 50-m altitude bin averaged vertical profiles of the microphysi-cal parameters measured in clouds during pre-monsoon, transition to-monsoon, and active monsoon situations sampled at various locations during June to August 2009. These monsoon cumulus clouds are found to be significantly diluted due to entrainment mixing. A linear rela-tionship between the cloud droplet number con-centration and adiabatic fraction (a measure of mixing between the cloud and its environment) is found for the each flight averaged data. The least squares best fit of this linear relationship is suggested as a simple formulation that will
21 CHAPTER 3 Atmospheric and Climate Processes and Modeling
An
nu
al R
epo
rt 2
012–
2013
Spatial distribution of clouds (1.5 deg. elevation) atMandhardev on June 04, 2012
9 UTC 11 UTC
13 UTC
Spatial distribution of clouds (1.5 deg. elevation) atMandhardev on June 04, 2012
9 UTC 11 UTC
13 UTC
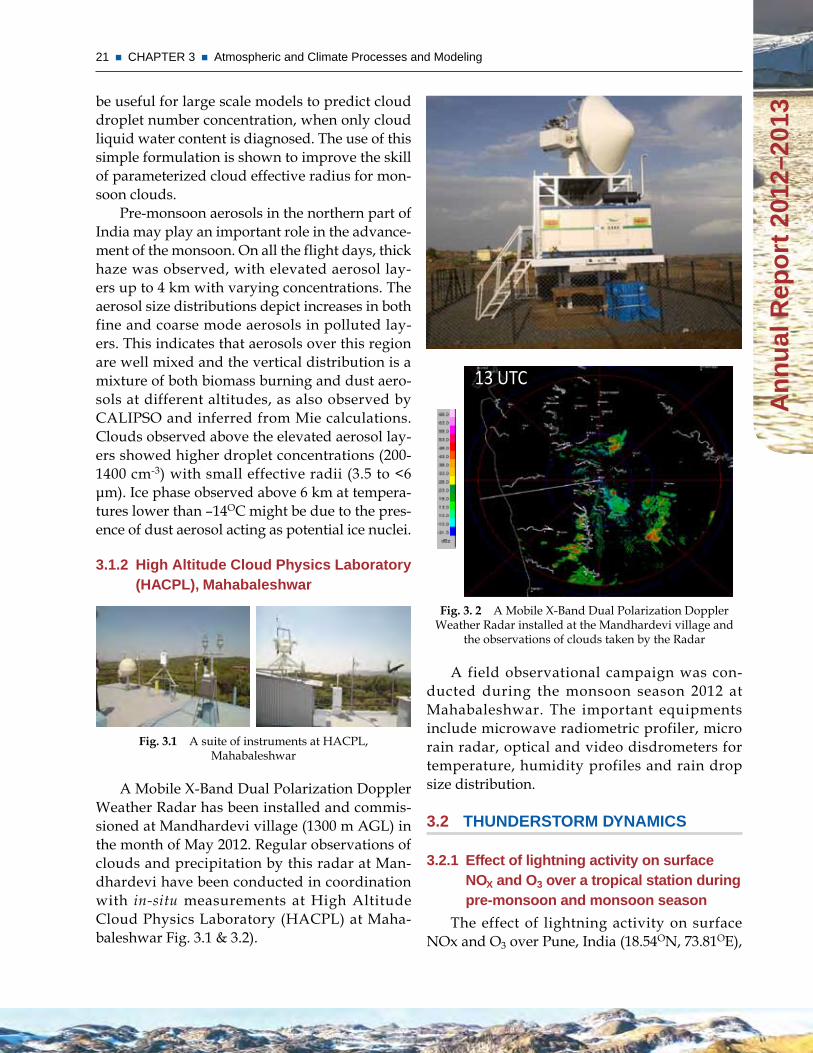
Fig. 3. 2 A Mobile X-Band Dual Polarization Doppler Weather Radar installed at the Mandhardevi village and
the observations of clouds taken by the Radar
A field observational campaign was con-ducted during the monsoon season 2012 at Mahabaleshwar. The important equipments include microwave radiometric profiler, micro rain radar, optical and video disdrometers for temperature, humidity profiles and rain drop size distribution.
3.2 THundERsTORm dynAmiCs
3.2.1 Effect of lightning activity on surface nOx and O3 over a tropical station during pre-monsoon and monsoon season
The effect of lightning activity on surface NOx and O3 over Pune, India (18.54ON, 73.81OE),
be useful for large scale models to predict cloud droplet number concentration, when only cloud liquid water content is diagnosed. The use of this simple formulation is shown to improve the skill of parameterized cloud effective radius for mon-soon clouds.
Pre-monsoon aerosols in the northern part of India may play an important role in the advance-ment of the monsoon. On all the flight days, thick haze was observed, with elevated aerosol lay-ers up to 4 km with varying concentrations. The aerosol size distributions depict increases in both fine and coarse mode aerosols in polluted lay-ers. This indicates that aerosols over this region are well mixed and the vertical distribution is a mixture of both biomass burning and dust aero-sols at different altitudes, as also observed by CALIPSO and inferred from Mie calculations. Clouds observed above the elevated aerosol lay-ers showed higher droplet concentrations (200-1400 cm-3) with small effective radii (3.5 to <6 μm). Ice phase observed above 6 km at tempera-tures lower than –14OC might be due to the pres-ence of dust aerosol acting as potential ice nuclei.
3.1.2 High Altitude Cloud Physics Laboratory (HACPL), mahabaleshwar
Fig. 3.1 A suite of instruments at HACPL, Mahabaleshwar
A Mobile X-Band Dual Polarization Doppler Weather Radar has been installed and commis-sioned at Mandhardevi village (1300 m AGL) in the month of May 2012. Regular observations of clouds and precipitation by this radar at Man-dhardevi have been conducted in coordination with in-situ measurements at High Altitude Cloud Physics Laboratory (HACPL) at Maha-baleshwar Fig. 3.1 & 3.2).
22 CHAPTER 3 Atmospheric and Climate Processes and Modeling A
nn
ual
Rep
ort
201
2–20
13
the lightning activity during monsoon over the Central India. The CAPE shows no significant change during transition of monsoon from break to active or from active to break phase. Time evolution of lightning over the Central India, in the last 12 years shows a systematic increase in lightning activity over the Central India and this increase in lightning over this region is attrib-uted to the increase in CAPE. The lightning data show a typical diurnal pattern with a strong peak at 1700 h local time (LT). Such a typical diurnal variation of lightning and its good positive cor-relation with CAPE suggest that the monsoon convections over the Central India are not purely of oceanic based type but they are combination of oceanic and continental type convections.
3.3 CLimATE PROCEss sTudiEs
3.3.1 Global warming signal emerging in the tropical Pacific
It is found that a global warming signature, which has been manifesting in the Tropical Pacific (TP) SST with increasing trend in the last three decades, has emerged prominent. The result is a hitherto unforeseen anomalous basin-wide warming in the TP during 2009 from boreal sum-mer through the ensuing fall. The corresponding southern oscillation collapsed, with the magni-tude of its index falling below 16% of its standard deviation. Further, model experiments reported in this work show that the unique and serious climate impacts during the summer of 2009 such as the 22% deficit in the Indian summer mon-soon, exceptional drought in 17 southern states, heat wave conditions in India in June and July, etc. were associated with the basin-wide warm-ing in the TP. Interestingly, it is also observed that the 2009 boreal summer conditions in the TP were atmosphere-driven, with little presence of the coupled processes that are the signature of its interannual variability. It is demonstrated through an Empirical Orthogonal Function based reconstruction analysis that, without the global warming trend, the TP will have seen a typical El Niño with maximum warming (cooling) in the
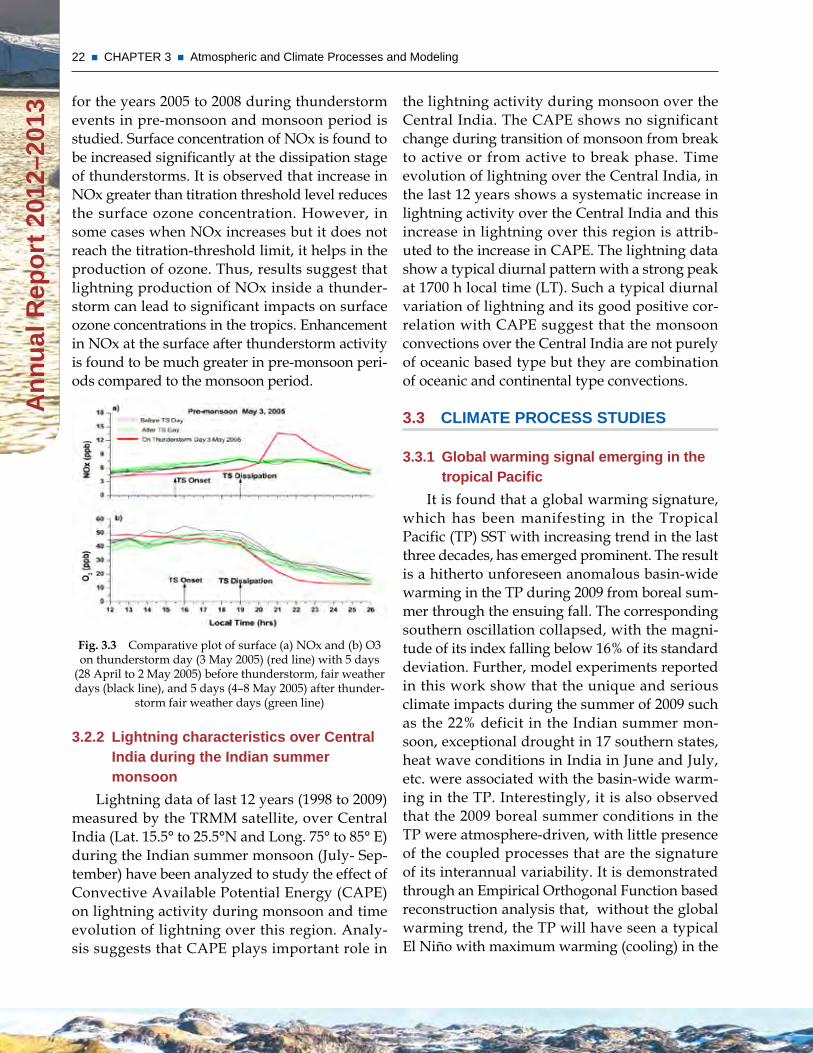
for the years 2005 to 2008 during thunderstorm events in pre-monsoon and monsoon period is studied. Surface concentration of NOx is found to be increased significantly at the dissipation stage of thunderstorms. It is observed that increase in NOx greater than titration threshold level reduces the surface ozone concentration. However, in some cases when NOx increases but it does not reach the titration-threshold limit, it helps in the production of ozone. Thus, results suggest that lightning production of NOx inside a thunder-storm can lead to significant impacts on surface ozone concentrations in the tropics. Enhancement in NOx at the surface after thunderstorm activity is found to be much greater in pre-monsoon peri-ods compared to the monsoon period.
Fig. 3.3 Comparative plot of surface (a) NOx and (b) O3 on thunderstorm day (3 May 2005) (red line) with 5 days
(28 April to 2 May 2005) before thunderstorm, fair weather days (black line), and 5 days (4–8 May 2005) after thunder-
storm fair weather days (green line)
3.2.2 Lightning characteristics over Central india during the indian summer monsoon
Lightning data of last 12 years (1998 to 2009) measured by the TRMM satellite, over Central India (Lat. 15.5° to 25.5°N and Long. 75° to 85° E) during the Indian summer monsoon (July- Sep-tember) have been analyzed to study the effect of Convective Available Potential Energy (CAPE) on lightning activity during monsoon and time evolution of lightning over this region. Analy-sis suggests that CAPE plays important role in
23 CHAPTER 3 Atmospheric and Climate Processes and Modeling
An
nu
al R
epo
rt 2
012–
2013
Trends in extreme temperature indices at stations in South Asia higher than 2000 m above sea level are mostly in disagreement with those reported over the Tibetan Plateau. Observed trends at low altitude locations in South Asia suggest that these sites can generally expect future changes in tem-perature extremes that are consistent with broad-scale warming. High-elevation sites appear to be more influenced by local factors and, hence, future changes in temperature extremes may be less predictable for these locations.
3.3.4 Tropospheric ozone and aerosol long-term trends over the indo-Gangetic Plain (iGP), india
For the first time, long-term trends in tropo-sphere ozone and its association with the indus-trial growth in large part of India are investigated. A multifunction regression model has been used to estimate the trends in troposphere ozone between 1979 and 1992 over the Indian region. Increasing trends in tropospheric ozone are observed over most of the regions of India. Recent year’s (2005-2010) data also show the similar features. It is quite consistent with the observed trends in coal (9.2%/y) and petroleum (8.3%/y) consumption, and NOx and CO emissions in India during the study period. The regressed Tro-pospheric Ozone Residual (TOR) pattern during the monsoon season shows large trend over the entire Indo-Gangetic region and is largest, 6-7.2 % per decade, over the northeastern Gangetic Plain of India. Annually, trend of about 0.4 ±0.25 (1σ) % per year has been seen over the northeastern Gangetic region. Similar positive trend in Aero-sol Index (AI) (1.7 ±1.2 (1σ) % per year) is also detected over this region. The quality of correla-tion between TOR and AI suggested that tropo-spheric ozone appeared to be influenced by the increased anthropogenic activities in this region.
3.4 mOdELinG
3.4.1 numerical weather Prediction modeling
Weather/climate forecasts, including those of extreme weather, are becoming increasingly
east (west), such as in 1997, instead. This indi-cates that the natural climate evolution in the TP has been disrupted. The implication is that any further increase in global warming may result in more basin wide warm events in place of canoni-cal El Niños, along with the occurrence of more intense La Niñas and El Niño Modokis.
3.3.2 Changes in temperature extremes over india
Observational analysis from daily maximum and minimum temperature data at 121 Indian stations for the period 1970-2003 suggests a widespread warming through increase in annual intensity and frequency of hot events, along with decrease in frequency of cold events. More than 75% stations show decreasing trend in number of cold events, and about 70% stations show increasing trend in hot events. Analysis of high-est maximum temperature (lowest minimum temperature) indicates that 78% (71%) of the sta-tions show a warming.
3.3.3 impact of altitude and latitude on changes in temperature extremes over south Asia during 1971-2000
South Asia covers more than 30° of latitude with weather observation stations situated from 6°N at Galle, Sri Lanka, to 36°N at Chitral in Paki-stan. Moreover, the South Asian station network ranges in altitude from sea level to nearly 4000 m above sea level. Time series of 11 objectively defined indices of daily temperature extremes at 197 stations in Bangladesh, India, Nepal, Pakistan and Sri Lanka are used to examine the possible impacts of elevation and latitude on changes in temperature extremes over the period of 1971-2000. Trends in extreme indices are found to be consistent with general warming only at low altitudes and latitudes. Stations at high altitudes and latitudes show both positive and negative trends in extreme temperature indices. As a notable example, the Diurnal Temperature Range (DTR), which has been known to decrease in most parts of the globe, has increasing trends over many high altitude stations in South Asia.
24 CHAPTER 3 Atmospheric and Climate Processes and Modeling A
nn
ual
Rep
ort
201
2–20
13
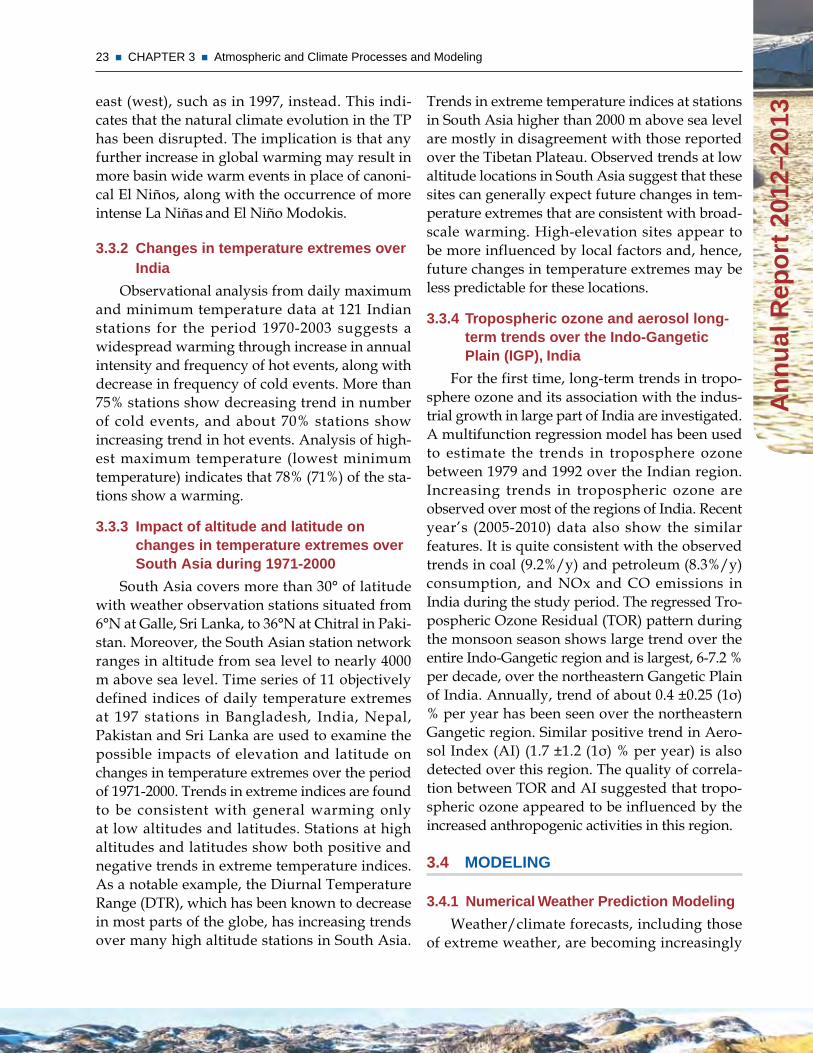
Centers except for some additional satel-lite data for which steps are undertaken to acquire through possible bilateral agree-ments. Full efforts are undertaken to utilize the Indian satellite data. Ocean scatterometer data are now being assimilated (Fig. 3.4). Intial experiments are being performed for utilization of Indian Land use/Land cover data that results in more realistic regional specific variations in rainfall forecast. The quality of the Kalpana winds are continu-ously monitored for its possible utilization on operational mode.
Fig. 3.4 Improved Track prediction of cyclone Thane with the use of OSCAT data
ii) Model Evaluation In order to assess the performance of the present NWP model for weather forecast, continuous evaluation is undertaken vis a vis other global centres over the Indian region. Independent evaluation by NCEP(National Centers for Environmental Prediction) USA on daily basis shows that the performance by India is comparable to any other global
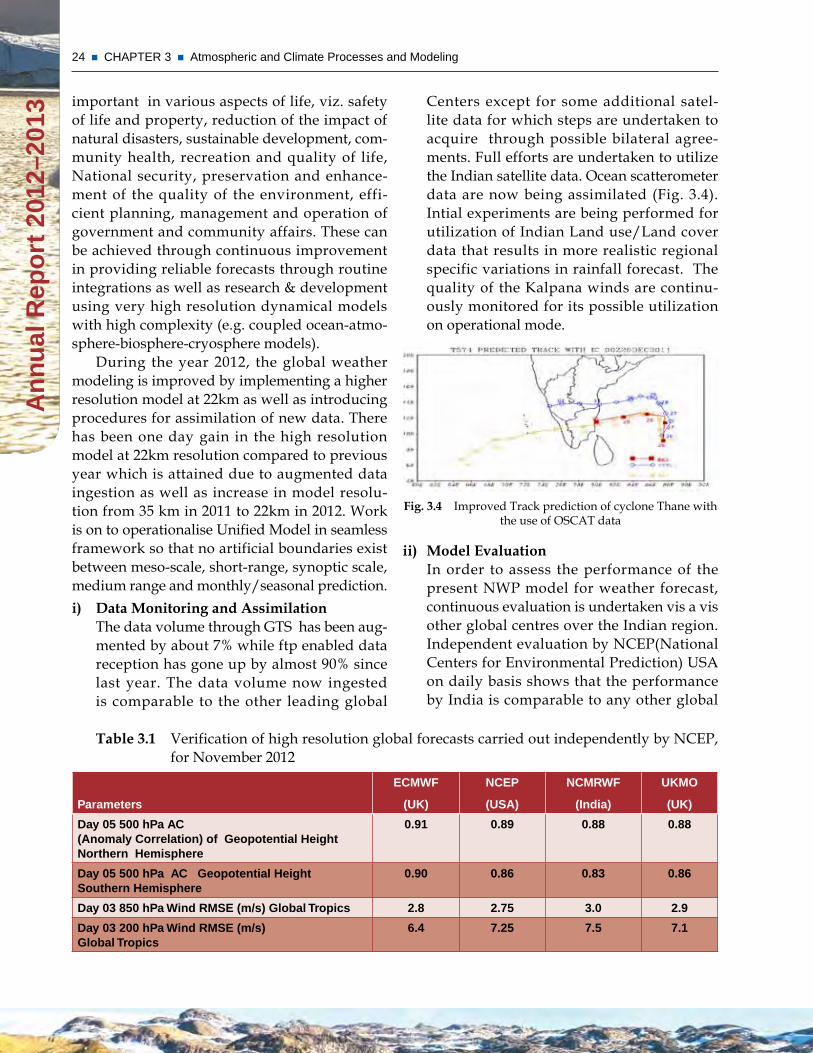
Table 3.1 Verification of high resolution global forecasts carried out independently by NCEP, for November 2012
Parameters
ECmwF
(uk)
nCEP
(usA)
nCmRwF
(india)
ukmO
(uk)
day 05 500 hPa AC (Anomaly Correlation) of Geopotential Height northern Hemisphere
0.91 0.89 0.88 0.88
day 05 500 hPa AC Geopotential Height southern Hemisphere
0.90 0.86 0.83 0.86
day 03 850 hPa wind RmsE (m/s) Global Tropics 2.8 2.75 3.0 2.9
day 03 200 hPa wind RmsE (m/s) Global Tropics
6.4 7.25 7.5 7.1
important in various aspects of life, viz. safety of life and property, reduction of the impact of natural disasters, sustainable development, com-munity health, recreation and quality of life, National security, preservation and enhance-ment of the quality of the environment, effi-cient planning, management and operation of government and community affairs. These can be achieved through continuous improvement in providing reliable forecasts through routine integrations as well as research & development using very high resolution dynamical models with high complexity (e.g. coupled ocean-atmo-sphere-biosphere-cryosphere models).
During the year 2012, the global weather modeling is improved by implementing a higher resolution model at 22km as well as introducing procedures for assimilation of new data. There has been one day gain in the high resolution model at 22km resolution compared to previous year which is attained due to augmented data ingestion as well as increase in model resolu-tion from 35 km in 2011 to 22km in 2012. Work is on to operationalise Unified Model in seamless framework so that no artificial boundaries exist between meso-scale, short-range, synoptic scale, medium range and monthly/seasonal prediction. i) Data Monitoring and Assimilation
The data volume through GTS has been aug-mented by about 7% while ftp enabled data reception has gone up by almost 90% since last year. The data volume now ingested is comparable to the other leading global
25 CHAPTER 3 Atmospheric and Climate Processes and Modeling
An
nu
al R
epo
rt 2
012–
2013
simultaneously. For extending the tempo-ral range of weather forecasts beyond seven days, it is pertinent to utilize a fully cou-pled model. A coupled ocean atmosphere model along with ocean data assimilation has been implemented and trial runs are underway. Hind-cast data from the coupled model have been analysed for 14 seasons from 1996 to 2009. These runs were made with May initial condition each year and the resultant rainfall bias in millimeter for June, July, August period is studied. This shows good simulation of monsoon rain over India; however the simulation over east equatorial Indian Ocean has to be improved by increas-ing the model resolution and proper ocean initialization (Fig. 3.6).
Fig. 3.6 Rainfall bias (in mm) from the UM coupled model runs (left) and the CFS model (right).
v) The Global Ensemble Forecast System (GEFS)Towards Week 2 forecasts Week two forecasts is one of the important requirements for various sectors especially the farming community and water sector. Classical predictability theory suggests that skilful daily forecasts may be realized up to two weeks ahead. However, model integra-tions from slightly different initial condi-tions produce different forecasts. To address this problem it is pertinent to move towards probabilistic forecasts quantifying the dis-tribution of likely outcomes as opposed to a deterministic forecast. In view of this,a global Ensemble Forecasting System at 70 km resolution with 20 members has been
leaders. The marginal under performance by India is attributed to comparatively low data volume and the technique of data assimila-tion which are at present compromised due to lack of required computational facilities. The current trend is on the usage of ensem-ble-based data assimilation techniques for further improving the initial conditions. This utilizes an ensemble of parallel data assimi-lation and forecast cycles and caters to the flow dependent nature of background error covariances, thus representing more realis-tically the uncertainties associated with the initial conditions. These are highly compu-tationally extensive and studies have shown their definite improvements over the existing 4D VAR assimilation technique.
iii) Merged Satellite Gauge Gridded Daily Rainfall Data Preparation In order to validate model and study the var-ious monsoon processes in terms of intersea-sonal and intra-seasonal variability, it is very important to have a good analysed data set of rainfall. A merged satellite gauge gridded daily rainfall data set at 0.50 x 0.50 latitude-longitude grid resolution has been imple-mented. This is generated daily for a period of 7 days. Following is a sample plot during 21-27 August 2012.
Fig. 3.5 Daily Merged Observed and Satellite Data
iv) The Unified Coupled Model The Indian monsoon is a fully coupled sys-tem, where ocean, atmosphere and land-surface interact and play dominant roles
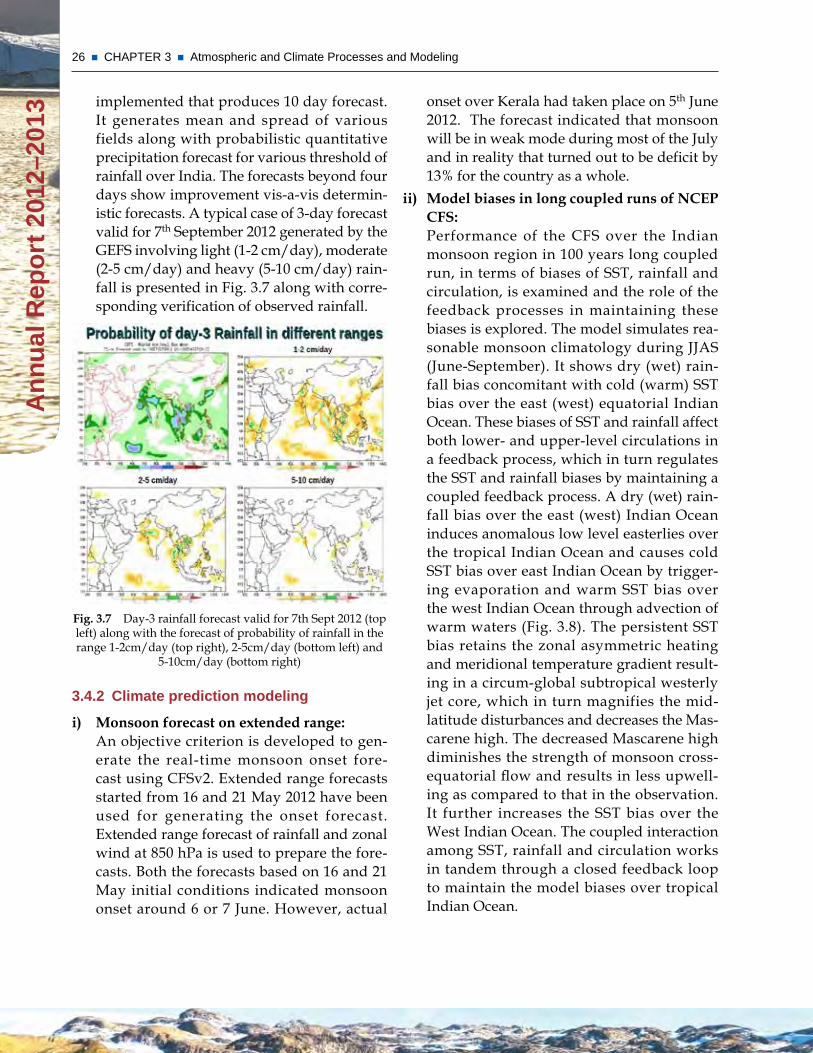
26 CHAPTER 3 Atmospheric and Climate Processes and Modeling A
nn
ual
Rep
ort
201
2–20
13
onset over Kerala had taken place on 5th June 2012. The forecast indicated that monsoon will be in weak mode during most of the July and in reality that turned out to be deficit by 13% for the country as a whole.
ii) Model biases in long coupled runs of NCEP CFS: Performance of the CFS over the Indian monsoon region in 100 years long coupled run, in terms of biases of SST, rainfall and circulation, is examined and the role of the feedback processes in maintaining these biases is explored. The model simulates rea-sonable monsoon climatology during JJAS (June-September). It shows dry (wet) rain-fall bias concomitant with cold (warm) SST bias over the east (west) equatorial Indian Ocean. These biases of SST and rainfall affect both lower- and upper-level circulations in a feedback process, which in turn regulates the SST and rainfall biases by maintaining a coupled feedback process. A dry (wet) rain-fall bias over the east (west) Indian Ocean induces anomalous low level easterlies over the tropical Indian Ocean and causes cold SST bias over east Indian Ocean by trigger-ing evaporation and warm SST bias over the west Indian Ocean through advection of warm waters (Fig. 3.8). The persistent SST bias retains the zonal asymmetric heating and meridional temperature gradient result-ing in a circum-global subtropical westerly jet core, which in turn magnifies the mid-latitude disturbances and decreases the Mas-carene high. The decreased Mascarene high diminishes the strength of monsoon cross-equatorial flow and results in less upwell-ing as compared to that in the observation. It further increases the SST bias over the West Indian Ocean. The coupled interaction among SST, rainfall and circulation works in tandem through a closed feedback loop to maintain the model biases over tropical Indian Ocean.
implemented that produces 10 day forecast. It generates mean and spread of various fields along with probabilistic quantitative precipitation forecast for various threshold of rainfall over India. The forecasts beyond four days show improvement vis-a-vis determin-istic forecasts. A typical case of 3-day forecast valid for 7th September 2012 generated by the GEFS involving light (1-2 cm/day), moderate (2-5 cm/day) and heavy (5-10 cm/day) rain-fall is presented in Fig. 3.7 along with corre-sponding verification of observed rainfall.
Fig. 3.7 Day-3 rainfall forecast valid for 7th Sept 2012 (top left) along with the forecast of probability of rainfall in the range 1-2cm/day (top right), 2-5cm/day (bottom left) and
5-10cm/day (bottom right)
3.4.2 Climate prediction modeling
i) Monsoon forecast on extended range: An objective criterion is developed to gen-erate the real-time monsoon onset fore-cast using CFSv2. Extended range forecasts started from 16 and 21 May 2012 have been used for generating the onset forecast. Extended range forecast of rainfall and zonal wind at 850 hPa is used to prepare the fore-casts. Both the forecasts based on 16 and 21 May initial conditions indicated monsoon onset around 6 or 7 June. However, actual
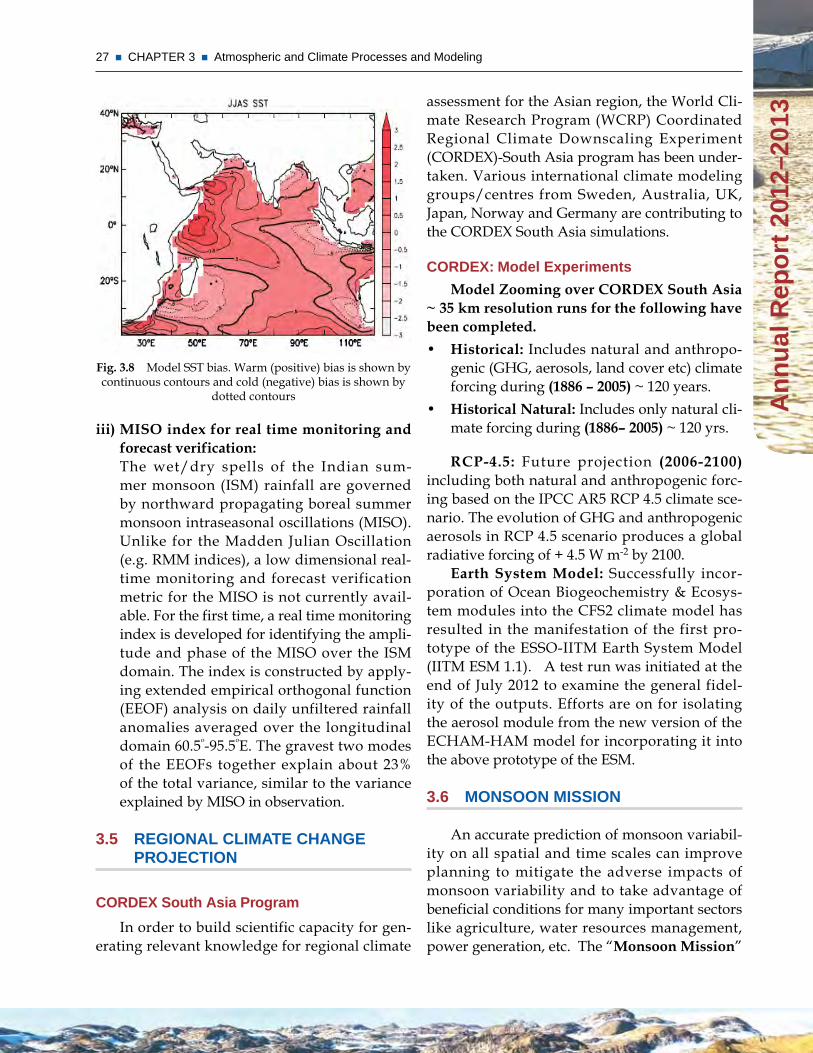
27 CHAPTER 3 Atmospheric and Climate Processes and Modeling
An
nu
al R
epo
rt 2
012–
2013
assessment for the Asian region, the World Cli-mate Research Program (WCRP) Coordinated Regional Climate Downscaling Experiment (CORDEX)-South Asia program has been under-taken. Various international climate modeling groups/centres from Sweden, Australia, UK, Japan, Norway and Germany are contributing to the CORDEX South Asia simulations.
CORdEx: model Experiments
Model Zooming over CORDEX South Asia ~ 35 km resolution runs for the following have been completed.• Historical: Includes natural and anthropo-
genic (GHG, aerosols, land cover etc) climate forcing during (1886 – 2005) ~ 120 years.
• Historical Natural: Includes only natural cli-mate forcing during (1886– 2005) ~ 120 yrs.
RCP-4.5: Future projection (2006-2100) including both natural and anthropogenic forc-ing based on the IPCC AR5 RCP 4.5 climate sce-nario. The evolution of GHG and anthropogenic aerosols in RCP 4.5 scenario produces a global radiative forcing of + 4.5 W m-2 by 2100.
Earth System Model: Successfully incor-poration of Ocean Biogeochemistry & Ecosys-tem modules into the CFS2 climate model has resulted in the manifestation of the first pro-totype of the ESSO-IITM Earth System Model (IITM ESM 1.1). A test run was initiated at the end of July 2012 to examine the general fidel-ity of the outputs. Efforts are on for isolating the aerosol module from the new version of the ECHAM-HAM model for incorporating it into the above prototype of the ESM.
3.6 mOnsOOn missiOn
An accurate prediction of monsoon variabil-ity on all spatial and time scales can improve planning to mitigate the adverse impacts of monsoon variability and to take advantage of beneficial conditions for many important sectors like agriculture, water resources management, power generation, etc. The “Monsoon Mission”
Fig. 3.8 Model SST bias. Warm (positive) bias is shown by continuous contours and cold (negative) bias is shown by
dotted contours
iii) MISO index for real time monitoring and forecast verification: The wet/dry spells of the Indian sum-mer monsoon (ISM) rainfall are governed by northward propagating boreal summer monsoon intraseasonal oscillations (MISO). Unlike for the Madden Julian Oscillation (e.g. RMM indices), a low dimensional real-time monitoring and forecast verification metric for the MISO is not currently avail-able. For the first time, a real time monitoring index is developed for identifying the ampli-tude and phase of the MISO over the ISM domain. The index is constructed by apply-ing extended empirical orthogonal function (EEOF) analysis on daily unfiltered rainfall anomalies averaged over the longitudinal domain 60.5º-95.5ºE. The gravest two modes of the EEOFs together explain about 23% of the total variance, similar to the variance explained by MISO in observation.
3.5 REGiOnAL CLimATE CHAnGE PROJECTiOn
CORdEx south Asia Program
In order to build scientific capacity for gen-erating relevant knowledge for regional climate
28 CHAPTER 3 Atmospheric and Climate Processes and Modeling A
nn
ual
Rep
ort
201
2–20
13
For short to medium range forecasts, a global unified model (UM) of the UK Meteorologi-cal Office with a horizontal resolution of about 25 km and 70 vertical levels and the associated data assimilation system has been implemented. Since May 2012, daily experimental forecasts are being generated. A coupled ocean-atmosphere model based on the UM also has been imple-mented for extended range to seasonal range forecasts.
The major thrust of the mission is to have an active collaboration with academic and research institutes both in India and abroad to fulfil the objectives of the mission. The mission is support-ing focused research by national and interna-tional research groups with definitive objectives and deliverables. So far, 16 research proposals (8 national and 8 international) were approved for funding under the monsoon mission.
The successful monsoon mission will achieve the implementation of the state-of-the art dynamical prediction system for more accu-rate monsoon prediction on all spatial and time scales over the country with significant economic benefits.
has been launched with a vision to develop the state-of-the-art dynamical prediction system for predicting monsoon rainfall on different spa-tial and time scales. The main objective of the monsoon mission is to set up a state-of-the-art dynamical modelling frame work for improv-ing the prediction skill of short to medium range forecasts of rainfall, temperature, winds and extreme weather events and extended range to seasonal forecasts of monsoon rainfall over the country.
The mission has two sub-missions on two different time scales, i) extended range to sea-sonal time scale and b) short to medium range scale. For extended and seasonal forecasts, the state-of-the-art coupled climate model, the Cou-pled Forecasting System (CFS) [developed by the National Centers for Environmental Predic-tion (NCEP), USA] implemented. Retrospective forecast (hindcast) experiments are carried out using the CFS V 2.0 high resolution model (T382, 38 km) and 28 years of retrospective forecasts (hindcasts) using February Initial conditions, for the period, 1981-2008 have been completed. Research work on identification and reduction of systematic biases of the couple model also has been initiated.
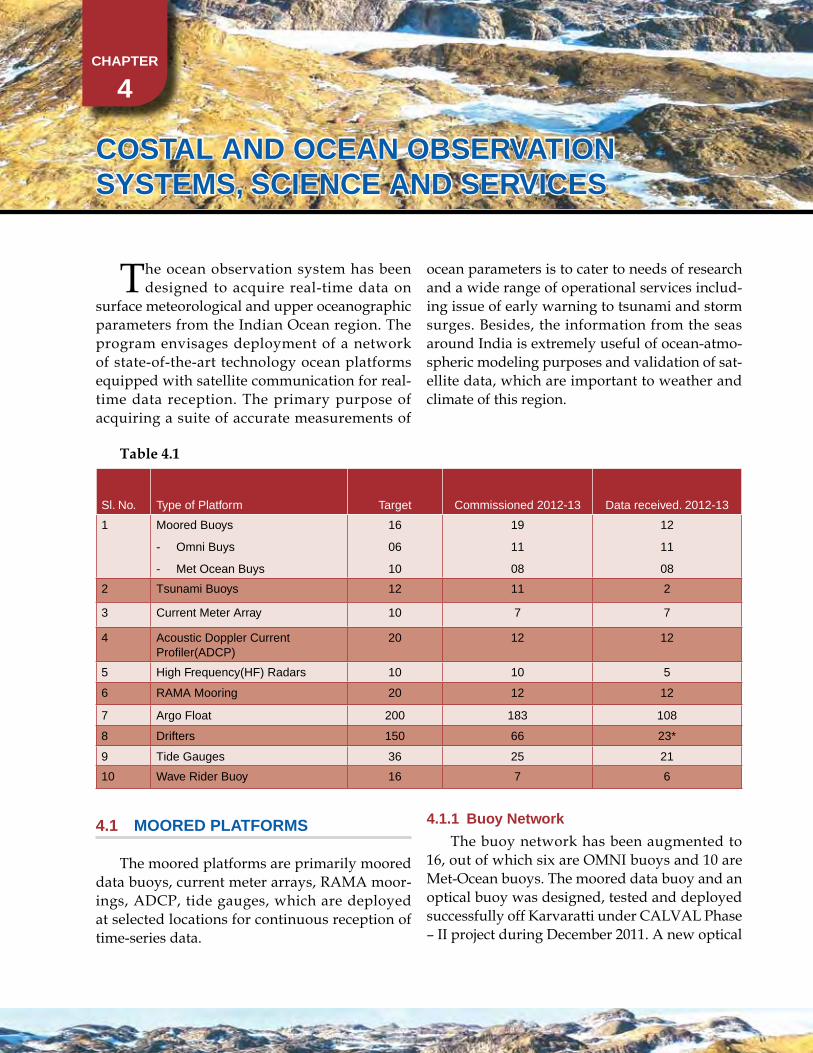
CHAPTER
4
COsTAL And OCEAn OBsERvATiOn sysTEms, sCiEnCE And sERviCEs
The ocean observation system has been designed to acquire real-time data on
surface meteorological and upper oceanographic parameters from the Indian Ocean region. The program envisages deployment of a network of state-of-the-art technology ocean platforms equipped with satellite communication for real-time data reception. The primary purpose of acquiring a suite of accurate measurements of
ocean parameters is to cater to needs of research and a wide range of operational services includ-ing issue of early warning to tsunami and storm surges. Besides, the information from the seas around India is extremely useful of ocean-atmo-spheric modeling purposes and validation of sat-ellite data, which are important to weather and climate of this region.
Table 4.1
Sl. No. Type of Platform Target Commissioned 2012-13 Data received. 2012-13
1 Moored Buoys
- Omni Buys
- Met Ocean Buys
16
06
10
19
11
08
12
11
08
2 Tsunami Buoys 12 11 2
3 Current Meter Array 10 7 7
4 Acoustic Doppler Current Profiler(ADCP)
20 12 12
5 High Frequency(HF) Radars 10 10 5
6 RAMA Mooring 20 12 12
7 Argo Float 200 183 108
8 Drifters 150 66 23*
9 Tide Gauges 36 25 21
10 Wave Rider Buoy 16 7 6
4.1 mOOREd PLATFORms
The moored platforms are primarily moored data buoys, current meter arrays, RAMA moor-ings, ADCP, tide gauges, which are deployed at selected locations for continuous reception of time-series data.
4.1.1 Buoy network
The buoy network has been augmented to 16, out of which six are OMNI buoys and 10 are Met-Ocean buoys. The moored data buoy and an optical buoy was designed, tested and deployed successfully off Karvaratti under CALVAL Phase – II project during December 2011. A new optical
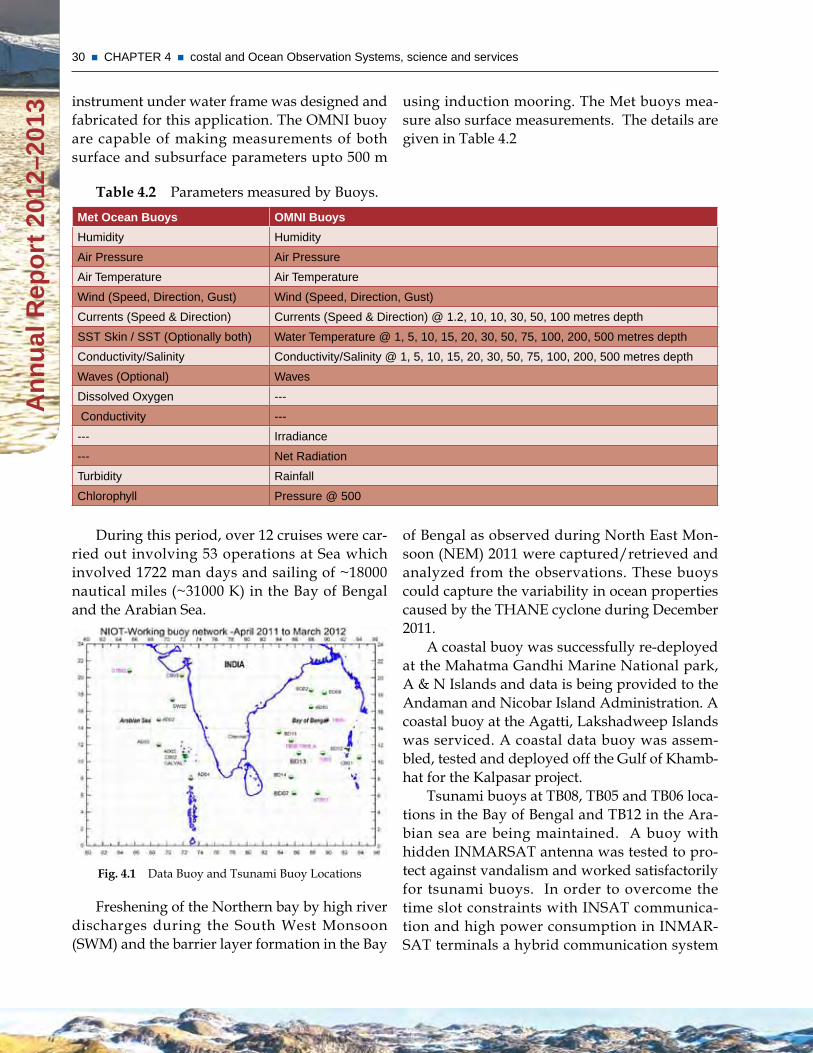
30 CHAPTER 4 costal and Ocean Observation Systems, science and services A
nn
ual
Rep
ort
201
2–20
13
using induction mooring. The Met buoys mea-sure also surface measurements. The details are given in Table 4.2
Table 4.2 Parameters measured by Buoys.met Ocean Buoys Omni Buoys
Humidity Humidity
Air Pressure Air Pressure
Air Temperature Air Temperature
Wind (Speed, Direction, Gust) Wind (Speed, Direction, Gust)
Currents (Speed & Direction) Currents (Speed & Direction) @ 1.2, 10, 10, 30, 50, 100 metres depth
SST Skin / SST (Optionally both) Water Temperature @ 1, 5, 10, 15, 20, 30, 50, 75, 100, 200, 500 metres depth
Conductivity/Salinity Conductivity/Salinity @ 1, 5, 10, 15, 20, 30, 50, 75, 100, 200, 500 metres depth
Waves (Optional) Waves
Dissolved Oxygen ---
Conductivity ---
--- Irradiance
--- Net Radiation
Turbidity Rainfall
Chlorophyll Pressure @ 500
instrument under water frame was designed and fabricated for this application. The OMNI buoy are capable of making measurements of both surface and subsurface parameters upto 500 m
During this period, over 12 cruises were car-ried out involving 53 operations at Sea which involved 1722 man days and sailing of ~18000 nautical miles (~31000 K) in the Bay of Bengal and the Arabian Sea.
Fig. 4.1 Data Buoy and Tsunami Buoy Locations
Freshening of the Northern bay by high river discharges during the South West Monsoon (SWM) and the barrier layer formation in the Bay
of Bengal as observed during North East Mon-soon (NEM) 2011 were captured/retrieved and analyzed from the observations. These buoys could capture the variability in ocean properties caused by the THANE cyclone during December 2011.
A coastal buoy was successfully re-deployed at the Mahatma Gandhi Marine National park, A & N Islands and data is being provided to the Andaman and Nicobar Island Administration. A coastal buoy at the Agatti, Lakshadweep Islands was serviced. A coastal data buoy was assem-bled, tested and deployed off the Gulf of Khamb-hat for the Kalpasar project.
Tsunami buoys at TB08, TB05 and TB06 loca-tions in the Bay of Bengal and TB12 in the Ara-bian sea are being maintained. A buoy with hidden INMARSAT antenna was tested to pro-tect against vandalism and worked satisfactorily for tsunami buoys. In order to overcome the time slot constraints with INSAT communica-tion and high power consumption in INMAR-SAT terminals a hybrid communication system
31 CHAPTER 4 costal and Ocean Observation Systems, science and services
An
nu
al R
epo
rt 2
012–
2013
4.1.2 Reference weather station
A Reference Weather Station was installed at ESSO-NIOT to provide meteorological data such as air temperature, relative humidity, wind speed, wind direction, atmospheric pressure and precipitation. On request through SMS the data transmission module transmit data to user by means of a global system for mobile commu-nication (GSM) or a General Packet Radio Ser-vice (GPRS) network. The OOS Data Reception Centre can display the real-time data through a graphical user interface (GUI).
4.1.3 Current meter Arrays
Towards long term measurements of cur-rents in the Equatorial Indian Ocean, a set of current meter array were deployed between 100 to 3000 m depth. Presently the array consists of 7 deep-sea moorings along the equator (77oE, 83oE and 93oE) and across the equator (1oN, 10S at 770E and 10N, 10S at 930E).
The across-equator currents was observed for the first time. The zonal velocity provides the important information on the simultaneous exis-tence of Equatorial Undercurrent (EUC) during the first week of April 2010 across the equator from 10N to 10S covering the width of about 220 km. The zonal velocity structures also suggest the presence of intra-seasonal monsoonal jets occurring July-September 2010.
Large eastward transport occurs in Novem-ber and during Feb-April and prevails at 10N and 10S during mid-March 2010. Westward transport occurs in January and May from January to mid-February, the transport at 10N is towards west and at 10N it is eastward. This opposite trans-port across the equator may be associated with the biweekly oscillation. From February to early May, eastward transport at 10N is larger than that at 10S. All the above results are being com-piled into research publications.
in tsunami buoy system with both INMARSAT and INSAT is being worked out. The field trials are expected to commence by the end of 2012.
A moored data buoy and an optical buoy was designed, tested and deployed successfully off Kavaratti under CALVAL Phase II project during December 2011. A new optical instru-ment under water frame was designed and fabri-cated for this application.
An Indigenous Buoy Data Acquisition Sys-tem ( IDAS) for Met-Ocean Buoy, Wave Buoy and Tsunami Buoy had been developed. The technology was transferred to an industry to supply and mass production of units. Presently, all the buoys deployed are equipped with IDAS.
For the first time, armed guards were engaged to carry out deployment operations in piracy prone area and successfully carried out 6 deployments and 7 retrievals in the Arabian Sea. Further to the efforts on awareness on vandalism, preservation and protection of buoys in India among fishers continued by organizing aware-ness programmes through a Deep sea going Artisanal Fishermen meet on ‘Call from the Deep sea 2012’ held in two places, viz. from 16th to 20th July at Thuthoor Village, Kanyakumari and subsequently at Chennai from 6th to 8th August 2012. These meetings were attended by artisanal deep sea fishers with Fisheries Experts, Fisheries Scientists, Marine and Coastal Environmental-ists, Academic Scientists, Researchers, Scholars, Professionals in Information and Communica-tion Technology, from neighbouring countries viz., Srilanka, Bangladesh, Indonesia, Malaysia, Maldives, Myanmar, Thailand and Australia.
A Regional workshop on The Best of Prac-tices for Instruments and Methods of Ocean Observation was held from 19 to 21 November 2012 at NIOT Chennai. This workshop concen-trated on present and future trends in ocean observation systems, methods, standards that are followed worldwide and the calibration techniques.
32 CHAPTER 4 costal and Ocean Observation Systems, science and services A
nn
ual
Rep
ort
201
2–20
13
parameters covering over a large area, which are also capable of transmitting realtime data.
4.2.1 ARGO Floats
Argo profiling floats provide real-time data of temperature and salinity profiles in the Indian Ocean upto a depth of 2000m. During the period, India has deployed 24 floats in the Indian Ocean for collection and real-time dis-semination of temperature and salinity data upto 2000 m depth in the Indian Ocean at periodical intervals. In total, 108 floats are active at present, out of which 9 floats are having biogeochemical Sensors. All the active floats (108) data are sub-jected to real time quality control and the data are being sent to GDAC and GTS. The Web-GIS based site for the Indian Argo Program is main-tained. These are about 22,000 users of this site according to ARGO data centre. All the Argo data are being assimilated in the Ocean Model for providing Global ocean analysis. At the Indian Ocean Agro Region Centre (ARC), where all floats data from the Indian Ocean region are archived and distributed. Apart from a number of data products are also generated for research and operational utility.
4.2.2 drifters
66 SVP-B drifters were deployed during 2011-2012 in the Indian Ocean and data has been made available in real-time for operational weather forecast. The data collected was mainly surface ocean currents velocity, atmospheric pressure and temperature. The development of data transmitter compatible with INSAT has been initiated.
4.2.3 xBT Observations
The XBT measurements on vertical tem-perature/salinity profiles, surface meteorology parameters and biological measurements are primarily made along the shipping route using the passengers and cargo vessel’s plying in these areas. The routes include (a) Cochin – Kavaratti - Minicoy – Cochin, (b) Chennai - Port Blair and (c) Kolkata – Port Blair. Scientists participated in
4.1.4 Acoustic doppler Current meter Profiles (AdCP)
The project aimed at enabling a forecast-ing system for the Indian Seas. During the year, retrieval and re-deployment of moorings off the west & east coast was carried out by organizing a number of long cruises. There were 7 recover-ies and 9 deployments on the west coast and 10 recoveries and 11 deployments on the east coast. The analysis of the ADCP data from the slope off both east and west coasts shows the existence of beams, with the energy bending down consider-ably for intra-seasonal periods.
4.1.5 Coastal High Frequency Radar
5 pairs of HF Radar Remote Stations and two Central Stations have been working satisfacto-rily. The general maintenance of all the sites is done at regular intervals and the problems aris-ing at the sites are solved at the earliest possible time so as to make the entire system running continuously and data being received continu-ously at the central sites.
4.1.6 Research moored Array for African– Asian–Australian monsoon Analysis and Prediction (RAmA) Buoys
The Research Moored Array for African– Asian–Australian Monsoon Analysis and Pre-diction (RAMA) moorings is an international research effort by various countries primarily US, and India for collection of meteorological and oceanographic data from the equatorial Indian Ocean. The RAMA moorings provide measure-ments from the Indian Ocean to advance mon-soon research and forecasting. The two cruises are undertaken to deploy various moorings in the Indian Ocean. The Bay of Bengal Mooring Buoy was successfully deployed at 18°N, 89.5°E onboard ORV-Sagar Kanya voyage # SK-288.
4.2 PROFiLinG FLOATs
The profiling floats are primarily drifters, argo floats, gliders, etc., for collection of limited
33 CHAPTER 4 costal and Ocean Observation Systems, science and services
An
nu
al R
epo
rt 2
012–
2013
Chlorophyll Maximum (SCM) were generally found associated with the nutricline. Phyto-plankton community (> 5 µm) was represented by ca. 45 genera and was dominated by diatoms (~60%). Species of Coscinodiscus, Navicula, Pluro-sigma and Thallasiosira were common among the diatom community while Ceratium and Gymno-dium dominated dinoflagellates. Heterotrophic nanoflagellates (HNF, predators of marine bacte-ria) showed increasing trend with maxima dur-ing October-December similar to bacterial counts suggesting a close coupling between these two microbial components. As usual bacterial density was ~3-4 orders of magnitude higher than that of the HNF, especially during the post- monsoon season. The organic matter derived from high phytoplankton productivity during the monsoon possibly serves as the main nutrient source to the microbial fauna during this period and also the operation of multi-step microbial food web. This is also obvious by the dominance of carnivorous copepods of order Poecilostomatoida and Cyclop-oida during post monsoon. Other carnivores/filter feeders abundantly present were chaeto-gnaths, appendicularians, cladocerans (Penilia).
4.3.2 GEOTRACEs (india)
A network of research projects being exe-cuted by a number of research and academic institutions. The objective is to map the distribu-tion of trace elements and isotopes in the Indian Ocean and to identify the factors influencing these distributions. The activities are various stages of implementation and currently involved in acquisition and analysis of samples. One Oceangraphic cruise onboard Sagar Sampada was conducted in the Arabian Sea. Samples from several water profiles were collected along 680 E transect for analysis of trace elements and their isotopes in sediments and corals of the north-ern Indian Ocean. Trace elements and isotopes (TEIs) play important role in the ocean as nutri-ents and as tracers of the contemporary and the past processes. Trace elements regulate ocean processes, such as marine ecosystem dynamics and carbon cycling. Several other trace elements
over 42 XBT / XCTD voyages and collected 649 vertical temperature/salinity profiles, 1078 sea surface salinity samples and 213 phytoplank-ton samples. The major scientific outcome from these data are (i) documentation of intra-sea-sonal to inter-annual variability of upper ocean thermal fields in the South Eastern Arabian Sea (ii) understand the processes of summer intra-seasonal sea surface temperature variability along the coasts of India.
4.3 BiOGEOCHEmiCAL PROCEssEs OF THE indiAn OCEAn
Towards addressing issues relating to under-standing the carbon and nitrogen biogeochemi-cal process and associated trace elements in the seas around India, with a view to increase understanding climate change and marine bio-geochemistry, two programs viz., SIBER and GEOTRACES have been launched.
4.3.1 sustained indian Ocean Biogeochemistry (siBER)
The SIBER is a multi-disciplinary and multi-institutions program dealing open ocean biogeo-chemical studies and estuarine/coastal waters. One of the main objectives of the SIBER pro-gramme was to establish the open ocean time series stations in the Arabian Sea and the Bay of Bengal. The sampling station in the Arabian Sea is located at 17°N 68°E termed as the Arabian Sea Time Series (ASTS) station whereas in the Bay of Bengal it is located at 18°N 89°E and is termed as the Bay of Bengal Time Series (BoBTS) sta-tion (Figure 4.1). In addition to the open ocean, sampling was also done along the coastal tran-sect, off Goa named as the Candolim Time Series (CaTS) station on a monthly basis.
Chl based measurements of phytoplankton biomass since January 2010, show variations spanning over two order of magnitude (0.06 to 5.64 mg m-3; average 1.05). Higher concentra-tions were generally found during post-mon-soon season and vertically at ~9m. Secondary
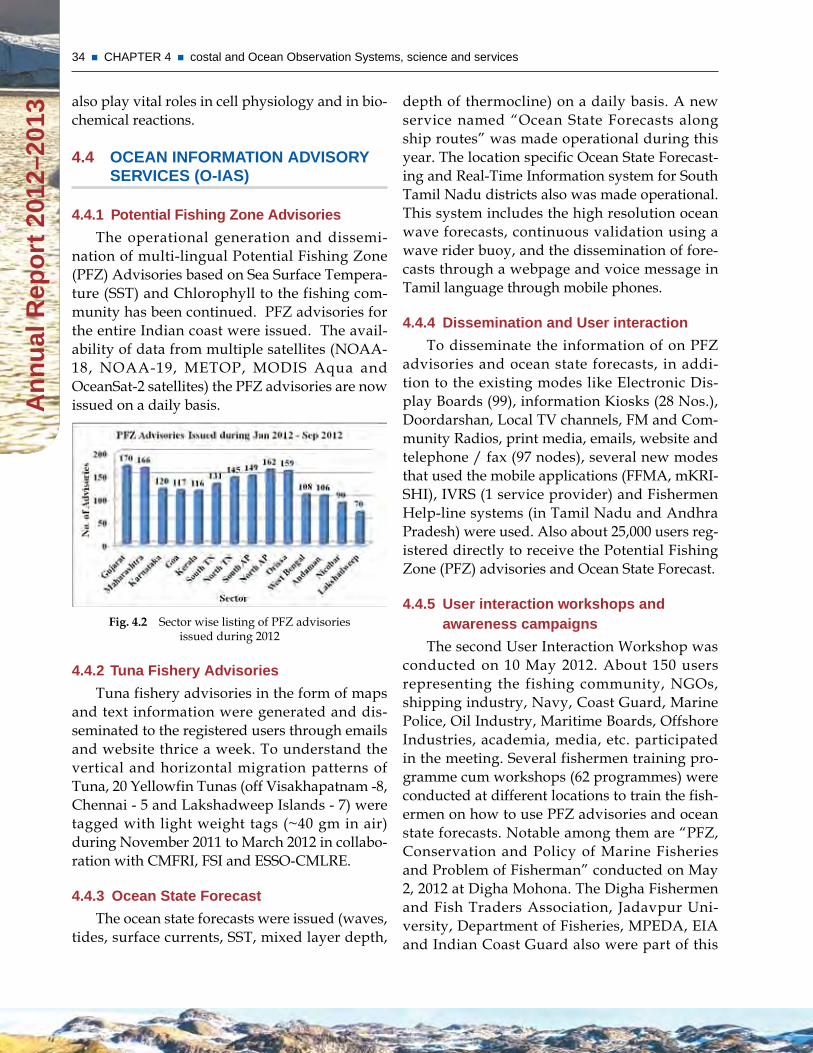
34 CHAPTER 4 costal and Ocean Observation Systems, science and services A
nn
ual
Rep
ort
201
2–20
13
depth of thermocline) on a daily basis. A new service named “Ocean State Forecasts along ship routes” was made operational during this year. The location specific Ocean State Forecast-ing and Real-Time Information system for South Tamil Nadu districts also was made operational. This system includes the high resolution ocean wave forecasts, continuous validation using a wave rider buoy, and the dissemination of fore-casts through a webpage and voice message in Tamil language through mobile phones.
4.4.4 dissemination and user interaction
To disseminate the information of on PFZ advisories and ocean state forecasts, in addi-tion to the existing modes like Electronic Dis-play Boards (99), information Kiosks (28 Nos.), Doordarshan, Local TV channels, FM and Com-munity Radios, print media, emails, website and telephone / fax (97 nodes), several new modes that used the mobile applications (FFMA, mKRI-SHI), IVRS (1 service provider) and Fishermen Help-line systems (in Tamil Nadu and Andhra Pradesh) were used. Also about 25,000 users reg-istered directly to receive the Potential Fishing Zone (PFZ) advisories and Ocean State Forecast.
4.4.5 user interaction workshops and awareness campaigns
The second User Interaction Workshop was conducted on 10 May 2012. About 150 users representing the fishing community, NGOs, shipping industry, Navy, Coast Guard, Marine Police, Oil Industry, Maritime Boards, Offshore Industries, academia, media, etc. participated in the meeting. Several fishermen training pro-gramme cum workshops (62 programmes) were conducted at different locations to train the fish-ermen on how to use PFZ advisories and ocean state forecasts. Notable among them are “PFZ, Conservation and Policy of Marine Fisheries and Problem of Fisherman” conducted on May 2, 2012 at Digha Mohona. The Digha Fishermen and Fish Traders Association, Jadavpur Uni-versity, Department of Fisheries, MPEDA, EIA and Indian Coast Guard also were part of this
also play vital roles in cell physiology and in bio-chemical reactions.
4.4 OCEAn inFORmATiOn AdvisORy sERviCEs (O-iAs)
4.4.1 Potential Fishing Zone Advisories
The operational generation and dissemi-nation of multi-lingual Potential Fishing Zone (PFZ) Advisories based on Sea Surface Tempera-ture (SST) and Chlorophyll to the fishing com-munity has been continued. PFZ advisories for the entire Indian coast were issued. The avail-ability of data from multiple satellites (NOAA-18, NOAA-19, METOP, MODIS Aqua and OceanSat-2 satellites) the PFZ advisories are now issued on a daily basis.
Fig. 4.2 Sector wise listing of PFZ advisories issued during 2012
4.4.2 Tuna Fishery Advisories
Tuna fishery advisories in the form of maps and text information were generated and dis-seminated to the registered users through emails and website thrice a week. To understand the vertical and horizontal migration patterns of Tuna, 20 Yellowfin Tunas (off Visakhapatnam -8, Chennai - 5 and Lakshadweep Islands - 7) were tagged with light weight tags (~40 gm in air) during November 2011 to March 2012 in collabo-ration with CMFRI, FSI and ESSO-CMLRE.
4.4.3 Ocean state Forecast
The ocean state forecasts were issued (waves, tides, surface currents, SST, mixed layer depth,
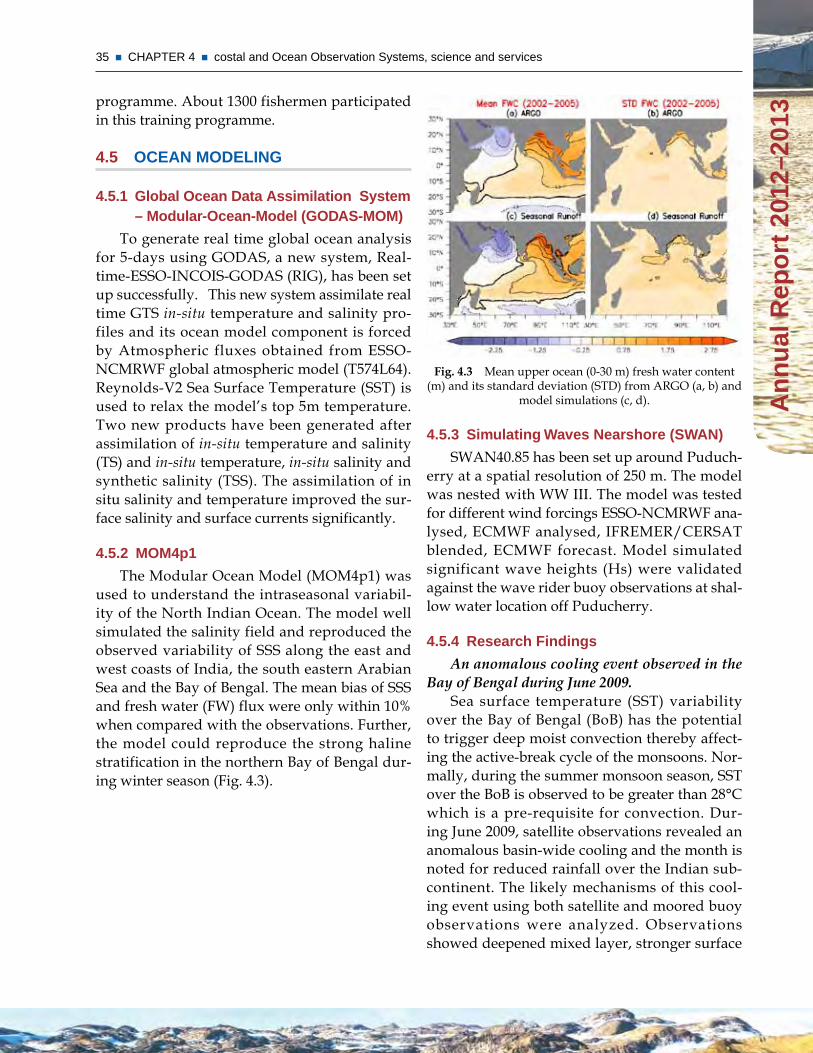
35 CHAPTER 4 costal and Ocean Observation Systems, science and services
An
nu
al R
epo
rt 2
012–
2013
Fig. 4.3 Mean upper ocean (0-30 m) fresh water content (m) and its standard deviation (STD) from ARGO (a, b) and
model simulations (c, d).
4.5.3 simulating waves nearshore (swAn)
SWAN40.85 has been set up around Puduch-erry at a spatial resolution of 250 m. The model was nested with WW III. The model was tested for different wind forcings ESSO-NCMRWF ana-lysed, ECMWF analysed, IFREMER/CERSAT blended, ECMWF forecast. Model simulated significant wave heights (Hs) were validated against the wave rider buoy observations at shal-low water location off Puducherry.
4.5.4 Research Findings
An anomalous cooling event observed in the Bay of Bengal during June 2009.
Sea surface temperature (SST) variability over the Bay of Bengal (BoB) has the potential to trigger deep moist convection thereby affect-ing the active-break cycle of the monsoons. Nor-mally, during the summer monsoon season, SST over the BoB is observed to be greater than 28°C which is a pre-requisite for convection. Dur-ing June 2009, satellite observations revealed an anomalous basin-wide cooling and the month is noted for reduced rainfall over the Indian sub-continent. The likely mechanisms of this cool-ing event using both satellite and moored buoy observations were analyzed. Observations showed deepened mixed layer, stronger surface
programme. About 1300 fishermen participated in this training programme.
4.5 OCEAn mOdELinG
4.5.1 Global Ocean data Assimilation system – modular-Ocean-model (GOdAs-mOm)
To generate real time global ocean analysis for 5-days using GODAS, a new system, Real-time-ESSO-INCOIS-GODAS (RIG), has been set up successfully. This new system assimilate real time GTS in-situ temperature and salinity pro-files and its ocean model component is forced by Atmospheric fluxes obtained from ESSO-NCMRWF global atmospheric model (T574L64). Reynolds-V2 Sea Surface Temperature (SST) is used to relax the model’s top 5m temperature. Two new products have been generated after assimilation of in-situ temperature and salinity (TS) and in-situ temperature, in-situ salinity and synthetic salinity (TSS). The assimilation of in situ salinity and temperature improved the sur-face salinity and surface currents significantly.
4.5.2 mOm4p1
The Modular Ocean Model (MOM4p1) was used to understand the intraseasonal variabil-ity of the North Indian Ocean. The model well simulated the salinity field and reproduced the observed variability of SSS along the east and west coasts of India, the south eastern Arabian Sea and the Bay of Bengal. The mean bias of SSS and fresh water (FW) flux were only within 10% when compared with the observations. Further, the model could reproduce the strong haline stratification in the northern Bay of Bengal dur-ing winter season (Fig. 4.3).
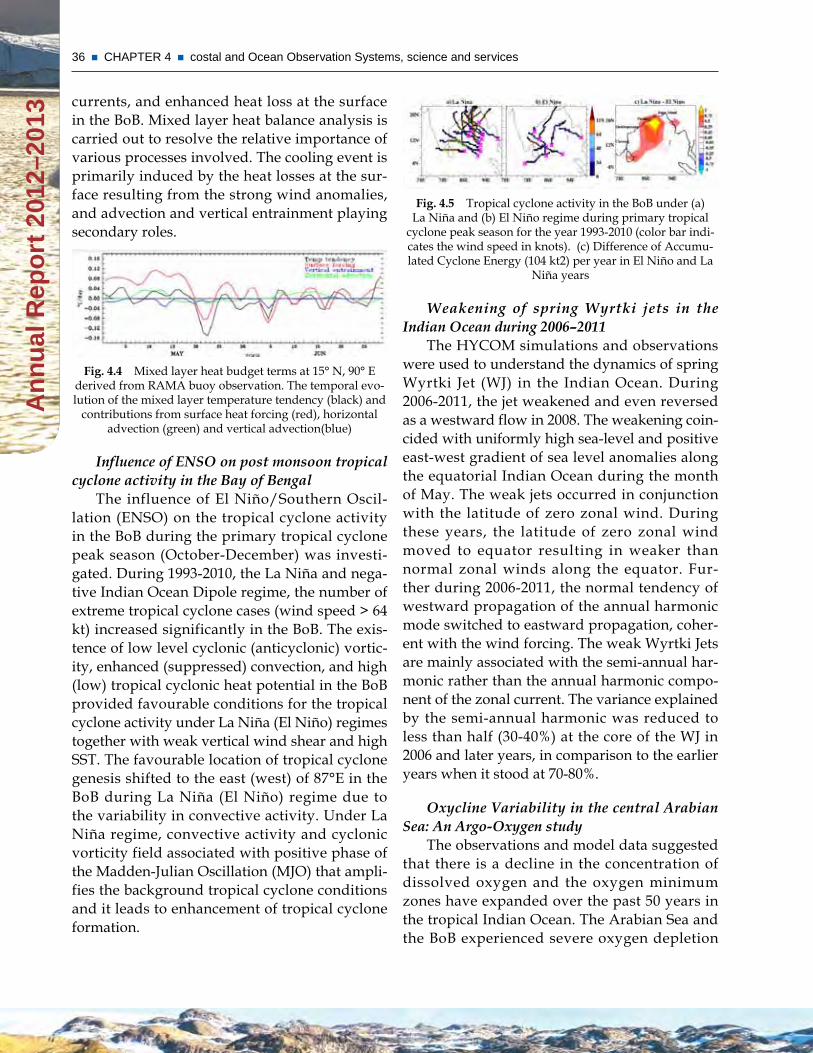
36 CHAPTER 4 costal and Ocean Observation Systems, science and services A
nn
ual
Rep
ort
201
2–20
13
Fig. 4.5 Tropical cyclone activity in the BoB under (a) La Niña and (b) El Niño regime during primary tropical
cyclone peak season for the year 1993-2010 (color bar indi-cates the wind speed in knots). (c) Difference of Accumu-lated Cyclone Energy (104 kt2) per year in El Niño and La
Niña years
Weakening of spring Wyrtki jets in the Indian Ocean during 2006–2011
The HYCOM simulations and observations were used to understand the dynamics of spring Wyrtki Jet (WJ) in the Indian Ocean. During 2006-2011, the jet weakened and even reversed as a westward flow in 2008. The weakening coin-cided with uniformly high sea-level and positive east-west gradient of sea level anomalies along the equatorial Indian Ocean during the month of May. The weak jets occurred in conjunction with the latitude of zero zonal wind. During these years, the latitude of zero zonal wind moved to equator resulting in weaker than normal zonal winds along the equator. Fur-ther during 2006-2011, the normal tendency of westward propagation of the annual harmonic mode switched to eastward propagation, coher-ent with the wind forcing. The weak Wyrtki Jets are mainly associated with the semi-annual har-monic rather than the annual harmonic compo-nent of the zonal current. The variance explained by the semi-annual harmonic was reduced to less than half (30-40%) at the core of the WJ in 2006 and later years, in comparison to the earlier years when it stood at 70-80%.
Oxycline Variability in the central Arabian Sea: An Argo-Oxygen study
The observations and model data suggested that there is a decline in the concentration of dissolved oxygen and the oxygen minimum zones have expanded over the past 50 years in the tropical Indian Ocean. The Arabian Sea and the BoB experienced severe oxygen depletion
currents, and enhanced heat loss at the surface in the BoB. Mixed layer heat balance analysis is carried out to resolve the relative importance of various processes involved. The cooling event is primarily induced by the heat losses at the sur-face resulting from the strong wind anomalies, and advection and vertical entrainment playing secondary roles.
Fig. 4.4 Mixed layer heat budget terms at 15° N, 90° E derived from RAMA buoy observation. The temporal evo-lution of the mixed layer temperature tendency (black) and
contributions from surface heat forcing (red), horizontal advection (green) and vertical advection(blue)
Influence of ENSO on post monsoon tropical cyclone activity in the Bay of Bengal
The influence of El Niño/Southern Oscil-lation (ENSO) on the tropical cyclone activity in the BoB during the primary tropical cyclone peak season (October-December) was investi-gated. During 1993-2010, the La Niña and nega-tive Indian Ocean Dipole regime, the number of extreme tropical cyclone cases (wind speed > 64 kt) increased significantly in the BoB. The exis-tence of low level cyclonic (anticyclonic) vortic-ity, enhanced (suppressed) convection, and high (low) tropical cyclonic heat potential in the BoB provided favourable conditions for the tropical cyclone activity under La Niña (El Niño) regimes together with weak vertical wind shear and high SST. The favourable location of tropical cyclone genesis shifted to the east (west) of 87°E in the BoB during La Niña (El Niño) regime due to the variability in convective activity. Under La Niña regime, convective activity and cyclonic vorticity field associated with positive phase of the Madden-Julian Oscillation (MJO) that ampli-fies the background tropical cyclone conditions and it leads to enhancement of tropical cyclone formation.
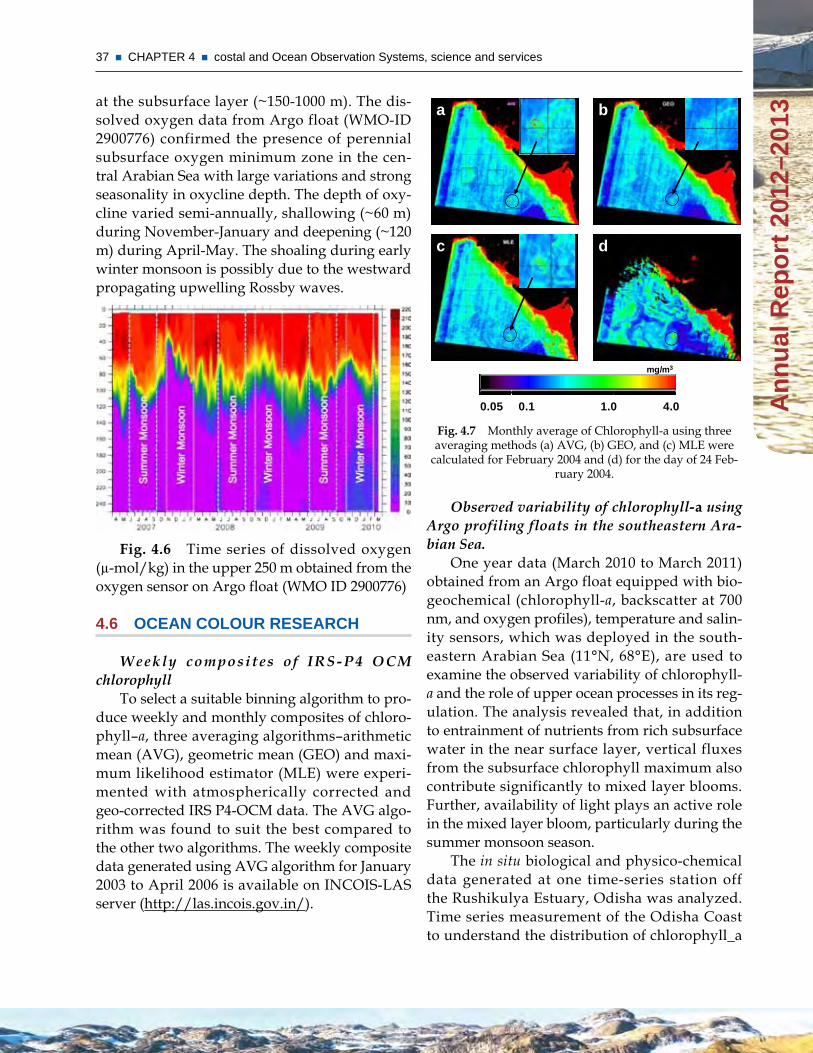
37 CHAPTER 4 costal and Ocean Observation Systems, science and services
An
nu
al R
epo
rt 2
012–
2013
0.05 0.1 1.0 4.0
mg/m3
a b
c d
Fig. 4.7 Monthly average of Chlorophyll-a using three averaging methods (a) AVG, (b) GEO, and (c) MLE were
calculated for February 2004 and (d) for the day of 24 Feb-ruary 2004.
Observed variability of chlorophyll-a using Argo profiling floats in the southeastern Ara-bian Sea.
One year data (March 2010 to March 2011) obtained from an Argo float equipped with bio-geochemical (chlorophyll-a, backscatter at 700 nm, and oxygen profiles), temperature and salin-ity sensors, which was deployed in the south-eastern Arabian Sea (11°N, 68°E), are used to examine the observed variability of chlorophyll-a and the role of upper ocean processes in its reg-ulation. The analysis revealed that, in addition to entrainment of nutrients from rich subsurface water in the near surface layer, vertical fluxes from the subsurface chlorophyll maximum also contribute significantly to mixed layer blooms. Further, availability of light plays an active role in the mixed layer bloom, particularly during the summer monsoon season.
The in situ biological and physico-chemical data generated at one time-series station off the Rushikulya Estuary, Odisha was analyzed. Time series measurement of the Odisha Coast to understand the distribution of chlorophyll_a
at the subsurface layer (~150-1000 m). The dis-solved oxygen data from Argo float (WMO-ID 2900776) confirmed the presence of perennial subsurface oxygen minimum zone in the cen-tral Arabian Sea with large variations and strong seasonality in oxycline depth. The depth of oxy-cline varied semi-annually, shallowing (~60 m) during November-January and deepening (~120 m) during April-May. The shoaling during early winter monsoon is possibly due to the westward propagating upwelling Rossby waves.
Fig. 4.6 Time series of dissolved oxygen (µ-mol/kg) in the upper 250 m obtained from the oxygen sensor on Argo float (WMO ID 2900776)
4.6 OCEAn COLOuR REsEARCH
Weekly composites of IRS-P4 OCM chlorophyll
To select a suitable binning algorithm to pro-duce weekly and monthly composites of chloro-phyll–a, three averaging algorithms–arithmetic mean (AVG), geometric mean (GEO) and maxi-mum likelihood estimator (MLE) were experi-mented with atmospherically corrected and geo-corrected IRS P4-OCM data. The AVG algo-rithm was found to suit the best compared to the other two algorithms. The weekly composite data generated using AVG algorithm for January 2003 to April 2006 is available on INCOIS-LAS server (http://las.incois.gov.in/).
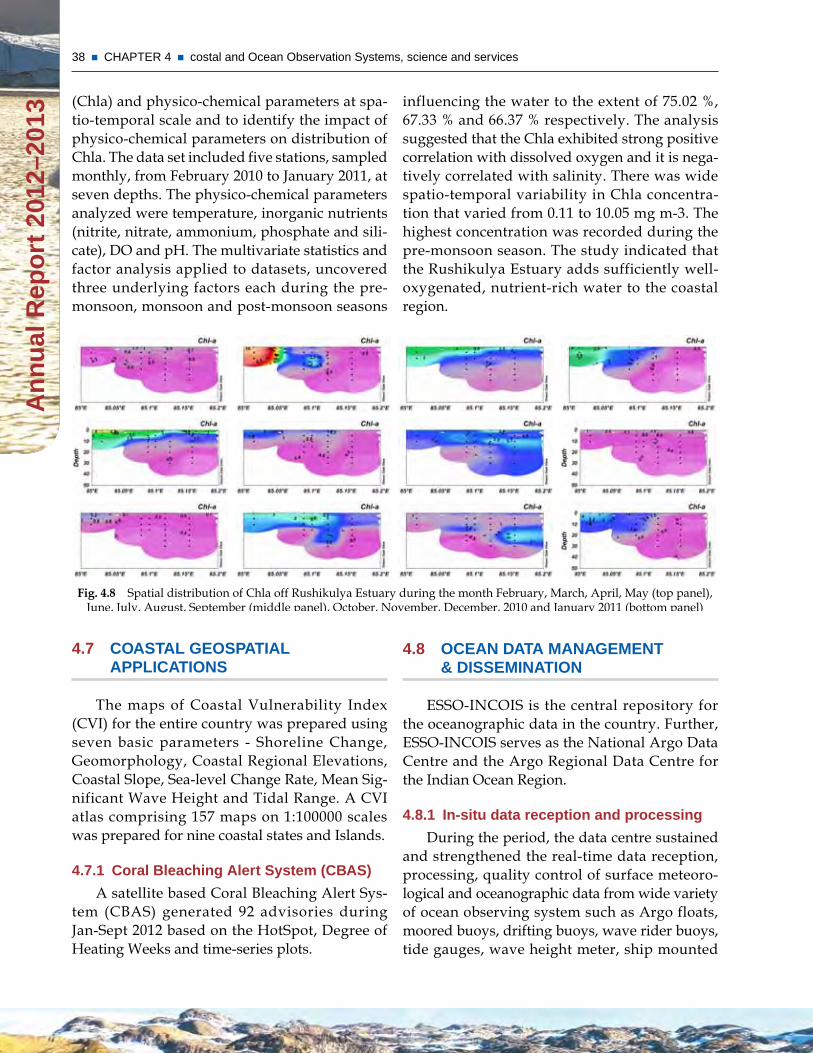
38 CHAPTER 4 costal and Ocean Observation Systems, science and services A
nn
ual
Rep
ort
201
2–20
13
influencing the water to the extent of 75.02 %, 67.33 % and 66.37 % respectively. The analysis suggested that the Chla exhibited strong positive correlation with dissolved oxygen and it is nega-tively correlated with salinity. There was wide spatio-temporal variability in Chla concentra-tion that varied from 0.11 to 10.05 mg m-3. The highest concentration was recorded during the pre-monsoon season. The study indicated that the Rushikulya Estuary adds sufficiently well-oxygenated, nutrient-rich water to the coastal region.
Fig. 4.8 Spatial distribution of Chla off Rushikulya Estuary during the month February, March, April, May (top panel), June, July, August, September (middle panel), October, November, December, 2010 and January 2011 (bottom panel)
(Chla) and physico-chemical parameters at spa-tio-temporal scale and to identify the impact of physico-chemical parameters on distribution of Chla. The data set included five stations, sampled monthly, from February 2010 to January 2011, at seven depths. The physico-chemical parameters analyzed were temperature, inorganic nutrients (nitrite, nitrate, ammonium, phosphate and sili-cate), DO and pH. The multivariate statistics and factor analysis applied to datasets, uncovered three underlying factors each during the pre-monsoon, monsoon and post-monsoon seasons
4.7 COAsTAL GEOsPATiAL APPLiCATiOns
The maps of Coastal Vulnerability Index (CVI) for the entire country was prepared using seven basic parameters - Shoreline Change, Geomorphology, Coastal Regional Elevations, Coastal Slope, Sea-level Change Rate, Mean Sig-nificant Wave Height and Tidal Range. A CVI atlas comprising 157 maps on 1:100000 scales was prepared for nine coastal states and Islands.
4.7.1 Coral Bleaching Alert system (CBAs)
A satellite based Coral Bleaching Alert Sys-tem (CBAS) generated 92 advisories during Jan-Sept 2012 based on the HotSpot, Degree of Heating Weeks and time-series plots.
4.8 OCEAn dATA mAnAGEmEnT & dissEminATiOn
ESSO-INCOIS is the central repository for the oceanographic data in the country. Further, ESSO-INCOIS serves as the National Argo Data Centre and the Argo Regional Data Centre for the Indian Ocean Region.
4.8.1 in-situ data reception and processing
During the period, the data centre sustained and strengthened the real-time data reception, processing, quality control of surface meteoro-logical and oceanographic data from wide variety of ocean observing system such as Argo floats, moored buoys, drifting buoys, wave rider buoys, tide gauges, wave height meter, ship mounted
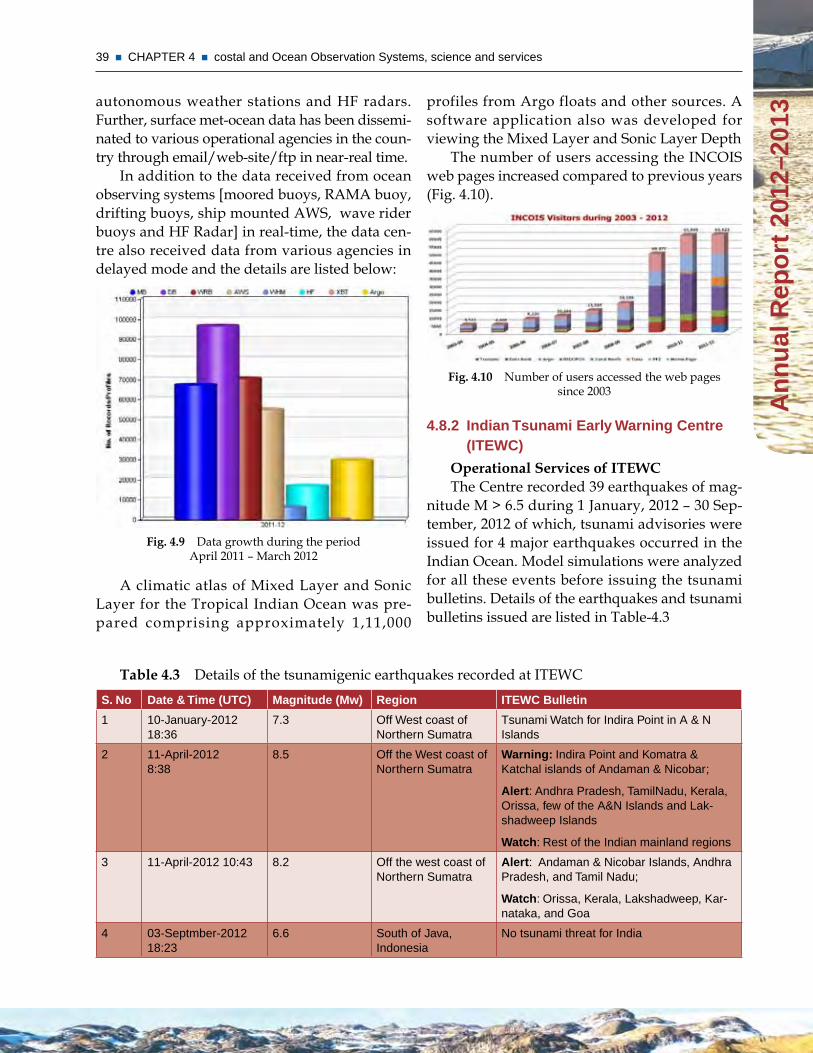
39 CHAPTER 4 costal and Ocean Observation Systems, science and services
An
nu
al R
epo
rt 2
012–
2013
profiles from Argo floats and other sources. A software application also was developed for viewing the Mixed Layer and Sonic Layer Depth
The number of users accessing the INCOIS web pages increased compared to previous years (Fig. 4.10).
Fig. 4.10 Number of users accessed the web pages since 2003
4.8.2 indian Tsunami Early warning Centre (iTEwC)
Operational Services of ITEWCThe Centre recorded 39 earthquakes of mag-
nitude M > 6.5 during 1 January, 2012 – 30 Sep-tember, 2012 of which, tsunami advisories were issued for 4 major earthquakes occurred in the Indian Ocean. Model simulations were analyzed for all these events before issuing the tsunami bulletins. Details of the earthquakes and tsunami bulletins issued are listed in Table-4.3
Table 4.3 Details of the tsunamigenic earthquakes recorded at ITEWCs. no date & Time (uTC) magnitude (mw) Region iTEwC Bulletin
1 10-January-2012 18:36
7.3 Off West coast of Northern Sumatra
Tsunami Watch for Indira Point in A & N Islands
2 11-April-2012 8:38
8.5 Off the West coast of Northern Sumatra
warning: Indira Point and Komatra & Katchal islands of Andaman & Nicobar;
Alert: Andhra Pradesh, TamilNadu, Kerala, Orissa, few of the A&N Islands and Lak-shadweep Islands
watch: Rest of the Indian mainland regions
3 11-April-2012 10:43 8.2 Off the west coast of Northern Sumatra
Alert: Andaman & Nicobar Islands, Andhra Pradesh, and Tamil Nadu;
watch: Orissa, Kerala, Lakshadweep, Kar-nataka, and Goa
4 03-Septmber-2012 18:23
6.6 South of Java, Indonesia
No tsunami threat for India
autonomous weather stations and HF radars. Further, surface met-ocean data has been dissemi-nated to various operational agencies in the coun-try through email/web-site/ftp in near-real time.
In addition to the data received from ocean observing systems [moored buoys, RAMA buoy, drifting buoys, ship mounted AWS, wave rider buoys and HF Radar] in real-time, the data cen-tre also received data from various agencies in delayed mode and the details are listed below:
Fig. 4.9 Data growth during the period April 2011 – March 2012
A climatic atlas of Mixed Layer and Sonic Layer for the Tropical Indian Ocean was pre-pared comprising approximately 1,11,000
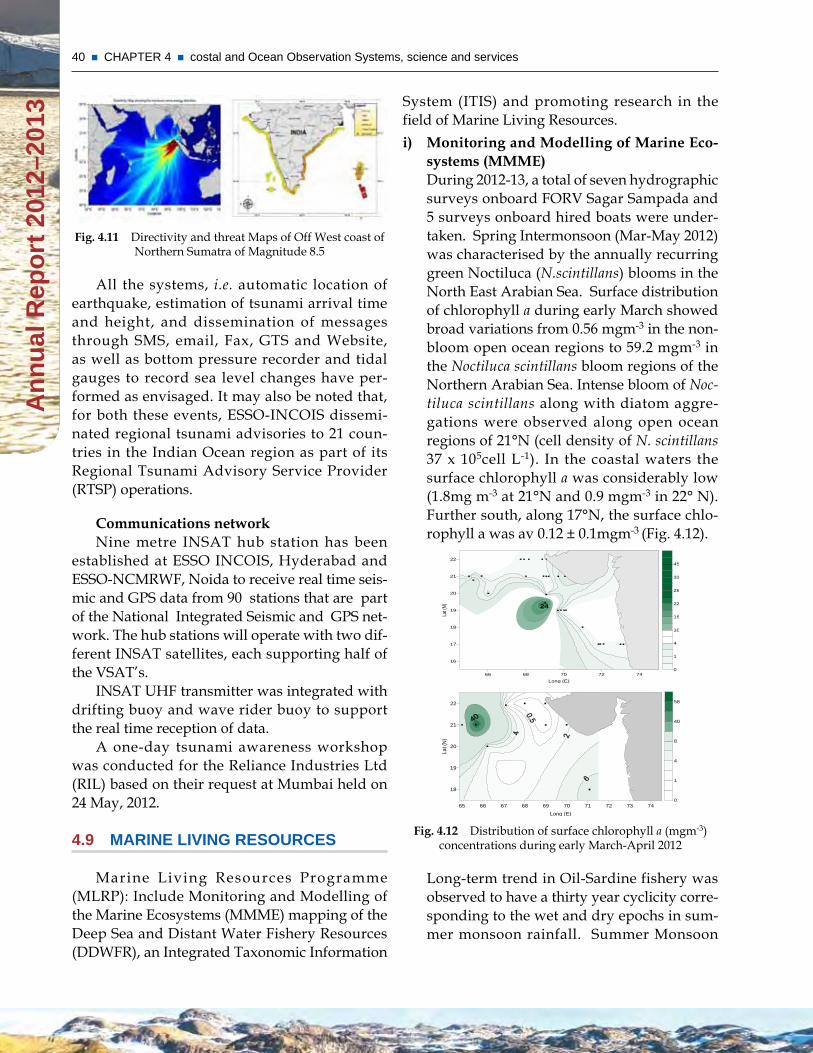
40 CHAPTER 4 costal and Ocean Observation Systems, science and services A
nn
ual
Rep
ort
201
2–20
13
System (ITIS) and promoting research in the field of Marine Living Resources.i) Monitoring and Modelling of Marine Eco-
systems (MMME) During 2012-13, a total of seven hydrographic surveys onboard FORV Sagar Sampada and 5 surveys onboard hired boats were under-taken. Spring Intermonsoon (Mar-May 2012) was characterised by the annually recurring green Noctiluca (N.scintillans) blooms in the North East Arabian Sea. Surface distribution of chlorophyll a during early March showed broad variations from 0.56 mgm-3 in the non-bloom open ocean regions to 59.2 mgm-3 in the Noctiluca scintillans bloom regions of the Northern Arabian Sea. Intense bloom of Noc-tiluca scintillans along with diatom aggre-gations were observed along open ocean regions of 21°N (cell density of N. scintillans 37 x 105cell L-1). In the coastal waters the surface chlorophyll a was considerably low (1.8mg m-3 at 21°N and 0.9 mgm-3 in 22° N). Further south, along 17°N, the surface chlo-rophyll a was av 0.12 ± 0.1mgm-3 (Fig. 4.12).
66 68 70 72 74Long (E)
16
17
18
19
20
21
22
Lat (N
)
0
1
4
10
15
22
26
33
45
24
65 66 67 68 69 70 71 72 73 74Long (E)
18
19
20
21
22
Lat (
N)
0
1
4
8
40
58
Fig. 4.12 Distribution of surface chlorophyll a (mgm-3) concentrations during early March-April 2012
Long-term trend in Oil-Sardine fishery was observed to have a thirty year cyclicity corre-sponding to the wet and dry epochs in sum-mer monsoon rainfall. Summer Monsoon
Fig. 4.11 Directivity and threat Maps of Off West coast of Northern Sumatra of Magnitude 8.5
All the systems, i.e. automatic location of earthquake, estimation of tsunami arrival time and height, and dissemination of messages through SMS, email, Fax, GTS and Website, as well as bottom pressure recorder and tidal gauges to record sea level changes have per-formed as envisaged. It may also be noted that, for both these events, ESSO-INCOIS dissemi-nated regional tsunami advisories to 21 coun-tries in the Indian Ocean region as part of its Regional Tsunami Advisory Service Provider (RTSP) operations.
Communications network Nine metre INSAT hub station has been
established at ESSO INCOIS, Hyderabad and ESSO-NCMRWF, Noida to receive real time seis-mic and GPS data from 90 stations that are part of the National Integrated Seismic and GPS net-work. The hub stations will operate with two dif-ferent INSAT satellites, each supporting half of the VSAT’s.
INSAT UHF transmitter was integrated with drifting buoy and wave rider buoy to support the real time reception of data.
A one-day tsunami awareness workshop was conducted for the Reliance Industries Ltd (RIL) based on their request at Mumbai held on 24 May, 2012.
4.9 mARinE LivinG REsOuRCEs
Marine Living Resources Programme (MLRP): Include Monitoring and Modelling of the Marine Ecosystems (MMME) mapping of the Deep Sea and Distant Water Fishery Resources (DDWFR), an Integrated Taxonomic Information
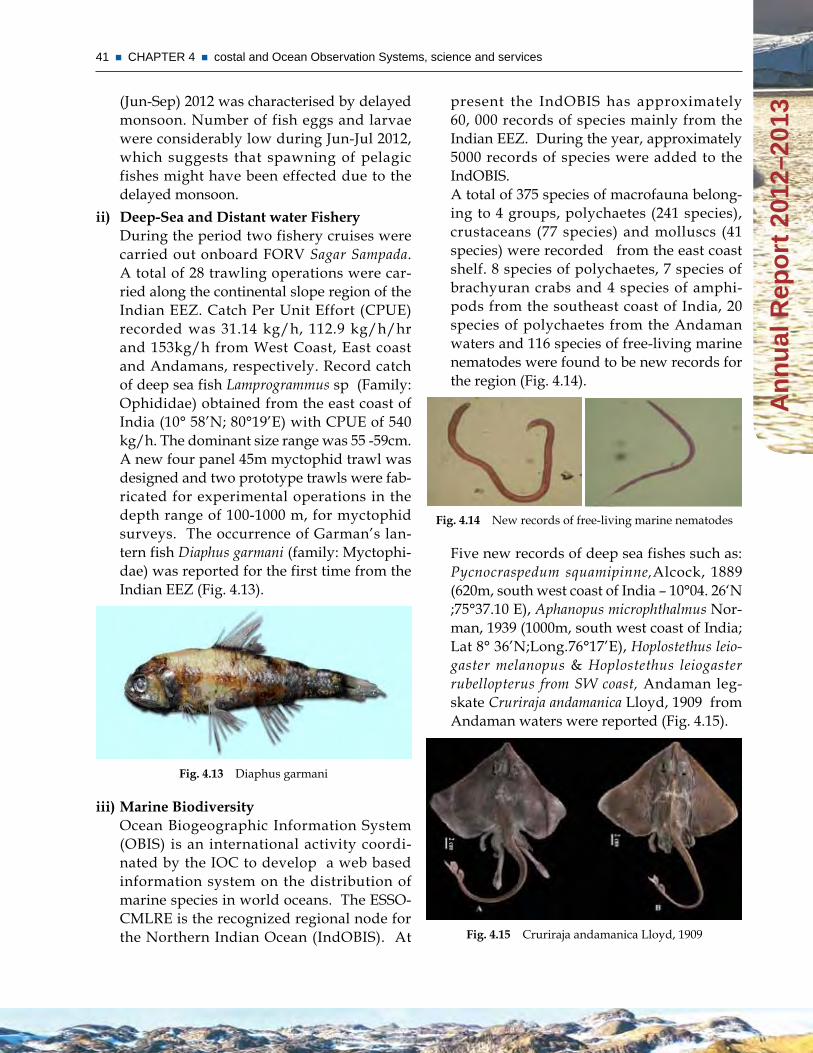
41 CHAPTER 4 costal and Ocean Observation Systems, science and services
An
nu
al R
epo
rt 2
012–
2013
present the IndOBIS has approximately 60, 000 records of species mainly from the Indian EEZ. During the year, approximately 5000 records of species were added to the IndOBIS. A total of 375 species of macrofauna belong-ing to 4 groups, polychaetes (241 species), crustaceans (77 species) and molluscs (41 species) were recorded from the east coast shelf. 8 species of polychaetes, 7 species of brachyuran crabs and 4 species of amphi-pods from the southeast coast of India, 20 species of polychaetes from the Andaman waters and 116 species of free-living marine nematodes were found to be new records for the region (Fig. 4.14).
Fig. 4.14 New records of free-living marine nematodes
Five new records of deep sea fishes such as: Pycnocraspedum squamipinne,Alcock, 1889 (620m, south west coast of India – 10°04. 26‘N ;75°37.10 E), Aphanopus microphthalmus Nor-man, 1939 (1000m, south west coast of India; Lat 8° 36’N;Long.76°17’E), Hoplostethus leio-gaster melanopus & Hoplostethus leiogaster rubellopterus from SW coast, Andaman leg-skate Cruriraja andamanica Lloyd, 1909 from Andaman waters were reported (Fig. 4.15).
Fig. 4.15 Cruriraja andamanica Lloyd, 1909
(Jun-Sep) 2012 was characterised by delayed monsoon. Number of fish eggs and larvae were considerably low during Jun-Jul 2012, which suggests that spawning of pelagic fishes might have been effected due to the delayed monsoon.
ii) Deep-Sea and Distant water Fishery During the period two fishery cruises were carried out onboard FORV Sagar Sampada. A total of 28 trawling operations were car-ried along the continental slope region of the Indian EEZ. Catch Per Unit Effort (CPUE) recorded was 31.14 kg/h, 112.9 kg/h/hr and 153kg/h from West Coast, East coast and Andamans, respectively. Record catch of deep sea fish Lamprogrammus sp (Family: Ophididae) obtained from the east coast of India (10° 58’N; 80°19’E) with CPUE of 540 kg/h. The dominant size range was 55 -59cm. A new four panel 45m myctophid trawl was designed and two prototype trawls were fab-ricated for experimental operations in the depth range of 100-1000 m, for myctophid surveys. The occurrence of Garman’s lan-tern fish Diaphus garmani (family: Myctophi-dae) was reported for the first time from the Indian EEZ (Fig. 4.13).
Fig. 4.13 Diaphus garmani
iii) Marine Biodiversity Ocean Biogeographic Information System (OBIS) is an international activity coordi-nated by the IOC to develop a web based information system on the distribution of marine species in world oceans. The ESSO-CMLRE is the recognized regional node for the Northern Indian Ocean (IndOBIS). At
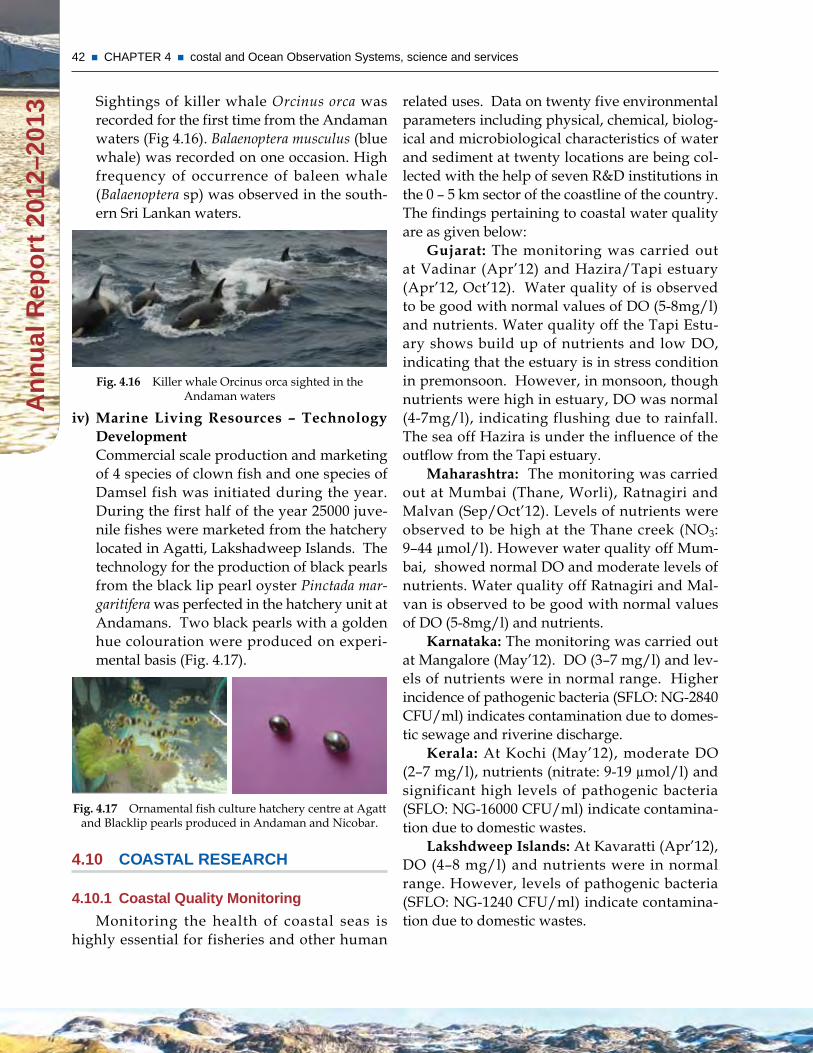
42 CHAPTER 4 costal and Ocean Observation Systems, science and services A
nn
ual
Rep
ort
201
2–20
13
related uses. Data on twenty five environmental parameters including physical, chemical, biolog-ical and microbiological characteristics of water and sediment at twenty locations are being col-lected with the help of seven R&D institutions in the 0 – 5 km sector of the coastline of the country. The findings pertaining to coastal water quality are as given below:
Gujarat: The monitoring was carried out at Vadinar (Apr’12) and Hazira/Tapi estuary (Apr’12, Oct’12). Water quality of is observed to be good with normal values of DO (5-8mg/l) and nutrients. Water quality off the Tapi Estu-ary shows build up of nutrients and low DO, indicating that the estuary is in stress condition in premonsoon. However, in monsoon, though nutrients were high in estuary, DO was normal (4-7mg/l), indicating flushing due to rainfall. The sea off Hazira is under the influence of the outflow from the Tapi estuary.
Maharashtra: The monitoring was carried out at Mumbai (Thane, Worli), Ratnagiri and Malvan (Sep/Oct’12). Levels of nutrients were observed to be high at the Thane creek (NO3: 9–44 µmol/l). However water quality off Mum-bai, showed normal DO and moderate levels of nutrients. Water quality off Ratnagiri and Mal-van is observed to be good with normal values of DO (5-8mg/l) and nutrients.
Karnataka: The monitoring was carried out at Mangalore (May’12). DO (3–7 mg/l) and lev-els of nutrients were in normal range. Higher incidence of pathogenic bacteria (SFLO: NG-2840 CFU/ml) indicates contamination due to domes-tic sewage and riverine discharge.
Kerala: At Kochi (May’12), moderate DO (2–7 mg/l), nutrients (nitrate: 9-19 µmol/l) and significant high levels of pathogenic bacteria (SFLO: NG-16000 CFU/ml) indicate contamina-tion due to domestic wastes.
Lakshdweep Islands: At Kavaratti (Apr’12), DO (4–8 mg/l) and nutrients were in normal range. However, levels of pathogenic bacteria (SFLO: NG-1240 CFU/ml) indicate contamina-tion due to domestic wastes.
Sightings of killer whale Orcinus orca was recorded for the first time from the Andaman waters (Fig 4.16). Balaenoptera musculus (blue whale) was recorded on one occasion. High frequency of occurrence of baleen whale (Balaenoptera sp) was observed in the south-ern Sri Lankan waters.
Fig. 4.16 Killer whale Orcinus orca sighted in the Andaman waters
iv) Marine Living Resources – Technology Development Commercial scale production and marketing of 4 species of clown fish and one species of Damsel fish was initiated during the year. During the first half of the year 25000 juve-nile fishes were marketed from the hatchery located in Agatti, Lakshadweep Islands. The technology for the production of black pearls from the black lip pearl oyster Pinctada mar-garitifera was perfected in the hatchery unit at Andamans. Two black pearls with a golden hue colouration were produced on experi-mental basis (Fig. 4.17).
Fig. 4.17 Ornamental fish culture hatchery centre at Agatt and Blacklip pearls produced in Andaman and Nicobar.
4.10 COAsTAL REsEARCH
4.10.1 Coastal Quality monitoring
Monitoring the health of coastal seas is highly essential for fisheries and other human
43 CHAPTER 4 costal and Ocean Observation Systems, science and services
An
nu
al R
epo
rt 2
012–
2013
pollution was completed for Kochi, Vishakhapat-nam, Koodankulam and Veraval.
Marine Microbial Reference Facility (MMRF): 138 isolates were lyophilized and identification of 158 bacterial isolates is under progress.
4.10.2 Oil spill modelling
The Oil spill trajectory modelling and sensi-tivity mapping is aimed to understand the local habitat specific issues related to oil spill risks and to identify potential resources /areas are at risk and priory identification of most sensitive coastal resources. The local hydrodynamic models were set up for Chennai, Kakinada, Visakhapat-nam, Kanyakumari, Kochin, Kavaratti, Goa, Mumbai, Dahanu, Hazira, etc to generarate oil spill trajectry scenerios. Performance of local hydrodynamic models were compared with field measured data. The model outputs showed very good comparison of measured and simulated results. After successful validation of hydrody-namic models, the same was coupled with the MIKE 21/3 oil spill model to compute oil spill trajectories for different environmental condi-tions including oil characteristics, bathymetry, oceanographic and meteorological parameters, etc. The model was run for predicting fate and trajectory of oil spilled with the actual wind data and simulation was carried out for 48 h of the oil spill about 100 m3 of Crude oil off Chennai.
GIS-based information system with two sce-narios for three seasons set in GNOME were used for risk assessment of coastal resources. The scenarios were set in GNOME with differ-ent seasons and spill types, for the risk assess-ment of oil impact on the coast. Model output from GNOME was imported into GIS and over-laid on the resource information and the risk was calculated based on the proximity of oil from the coast. The oil transport, weathering and oil thickness computation provide a way to ana-lyze the environmental risks to the marine as well as coastal ecosystem due to spill. The oil slick movement and areal coverage (km2) of the
West Bengal: Coastal waters off Sandheads and the Hooghly estuary were monitored during Jul’12. High levels of DO (6-8 mg/l) and moder-ate levels of nutrients indicate good water qual-ity. Moderate levels of pathogenic bacteria at Sandheads (SFLO: 15–650 CFU/ml) indicate con-tamination due to domestic sewage. However at the Hooghly estuary levels of bacteria were rela-tively less (SFLO: 5-215 CFU/ml).
Orissa: The coastal waters of Paradip are characterized by continued high DO values (6–7 mg/l) in Jul’12. Levels of nutrients were within normal range. However, moderate levels of pathogenic bacteria (SFLO: 5-155 CFU/ml) indi-cate contamination due to domestic sewage.
Andhra Pradesh: The monitoring was car-ried out at Visakhapatnam and Kakinada dur-ing Jun’12. Levels of nutrients were higher at the Visakhapatnam harbour than the Kakinada Bay, indicating terrestrial organic load. However, water quality off Visakhapatnam and Kakinada were observed to be within normal range indi-cating fairly good water quality.
Tamil Nadu and Puducherry: The coastal waters of Ennore, Puducherry and Tuticorin were monitored (May/Jun’12 and Sep’12). Lev-els of DO, BOD and nutrients were within nor-mal range. However, significantly high levels of pathogenic bacteria were observed at many shore locations, indicating contamination due to domestic sewage. Heavy metals in water at the Ennore were within normal range.
Andaman & Nicobar Islands: Coastal water quality at Port Blair and Wandoor during May’12, is observed to be good with normal lev-els of DO (5–7mg/L) and nutrients. However high levels of pathogenic bacteria was observed at the Junglighat bay.
Database : Data collected under COMAPS programme over the years have been compiled and organized into a database. Databases for Sandheads, Hooghly estuary, Saptamukhi, Sub-arnarekha, Digha, Haldia Port, Diamond har-bor, Port Blair, Andaman & Nicobar islands were completed. GIS based database on marine
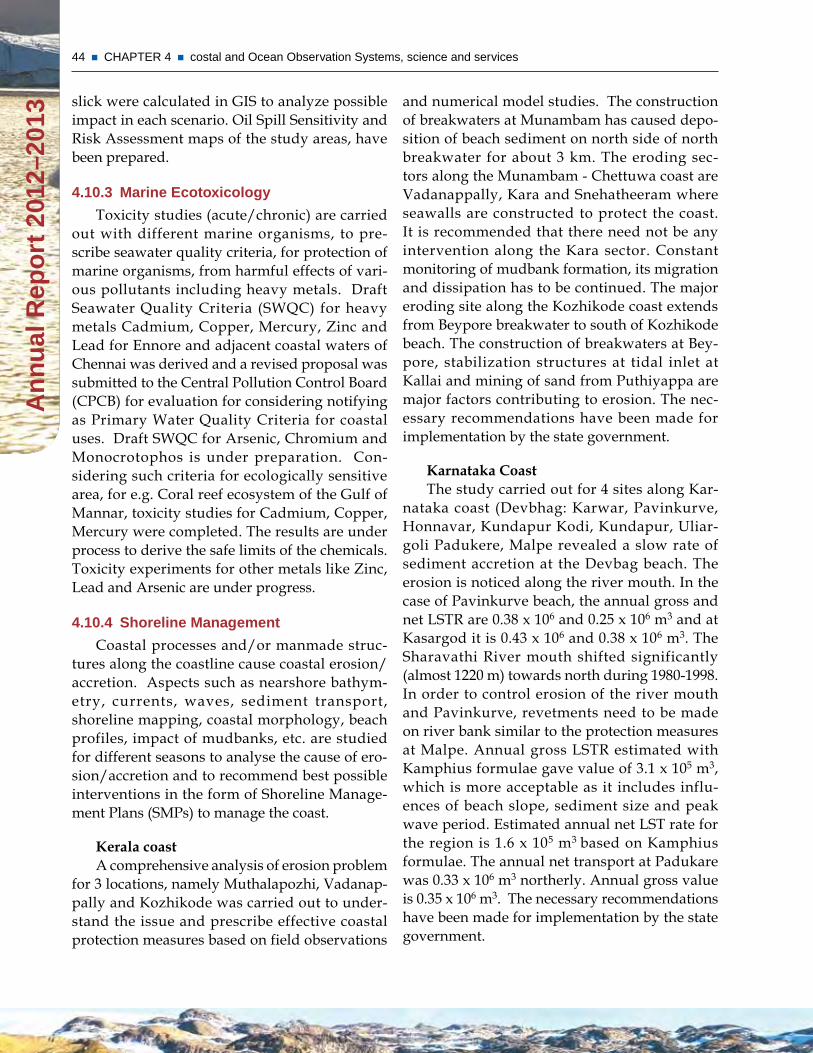
44 CHAPTER 4 costal and Ocean Observation Systems, science and services A
nn
ual
Rep
ort
201
2–20
13
and numerical model studies. The construction of breakwaters at Munambam has caused depo-sition of beach sediment on north side of north breakwater for about 3 km. The eroding sec-tors along the Munambam - Chettuwa coast are Vadanappally, Kara and Snehatheeram where seawalls are constructed to protect the coast. It is recommended that there need not be any intervention along the Kara sector. Constant monitoring of mudbank formation, its migration and dissipation has to be continued. The major eroding site along the Kozhikode coast extends from Beypore breakwater to south of Kozhikode beach. The construction of breakwaters at Bey-pore, stabilization structures at tidal inlet at Kallai and mining of sand from Puthiyappa are major factors contributing to erosion. The nec-essary recommendations have been made for implementation by the state government.
Karnataka CoastThe study carried out for 4 sites along Kar-
nataka coast (Devbhag: Karwar, Pavinkurve, Honnavar, Kundapur Kodi, Kundapur, Uliar-goli Padukere, Malpe revealed a slow rate of sediment accretion at the Devbag beach. The erosion is noticed along the river mouth. In the case of Pavinkurve beach, the annual gross and net LSTR are 0.38 x 10⁶ and 0.25 x 10⁶ m3 and at Kasargod it is 0.43 x 10⁶ and 0.38 x 10⁶ m3. The Sharavathi River mouth shifted significantly (almost 1220 m) towards north during 1980-1998. In order to control erosion of the river mouth and Pavinkurve, revetments need to be made on river bank similar to the protection measures at Malpe. Annual gross LSTR estimated with Kamphius formulae gave value of 3.1 x 10⁵ m3, which is more acceptable as it includes influ-ences of beach slope, sediment size and peak wave period. Estimated annual net LST rate for the region is 1.6 x 10⁵ m3 based on Kamphius formulae. The annual net transport at Padukare was 0.33 x 10⁶ m3 northerly. Annual gross value is 0.35 x 10⁶ m3. The necessary recommendations have been made for implementation by the state government.
slick were calculated in GIS to analyze possible impact in each scenario. Oil Spill Sensitivity and Risk Assessment maps of the study areas, have been prepared.
4.10.3 marine Ecotoxicology
Toxicity studies (acute/chronic) are carried out with different marine organisms, to pre-scribe seawater quality criteria, for protection of marine organisms, from harmful effects of vari-ous pollutants including heavy metals. Draft Seawater Quality Criteria (SWQC) for heavy metals Cadmium, Copper, Mercury, Zinc and Lead for Ennore and adjacent coastal waters of Chennai was derived and a revised proposal was submitted to the Central Pollution Control Board (CPCB) for evaluation for considering notifying as Primary Water Quality Criteria for coastal uses. Draft SWQC for Arsenic, Chromium and Monocrotophos is under preparation. Con-sidering such criteria for ecologically sensitive area, for e.g. Coral reef ecosystem of the Gulf of Mannar, toxicity studies for Cadmium, Copper, Mercury were completed. The results are under process to derive the safe limits of the chemicals. Toxicity experiments for other metals like Zinc, Lead and Arsenic are under progress.
4.10.4 shoreline management
Coastal processes and/or manmade struc-tures along the coastline cause coastal erosion/accretion. Aspects such as nearshore bathym-etry, currents, waves, sediment transport, shoreline mapping, coastal morphology, beach profiles, impact of mudbanks, etc. are studied for different seasons to analyse the cause of ero-sion/accretion and to recommend best possible interventions in the form of Shoreline Manage-ment Plans (SMPs) to manage the coast.
Kerala coastA comprehensive analysis of erosion problem
for 3 locations, namely Muthalapozhi, Vadanap-pally and Kozhikode was carried out to under-stand the issue and prescribe effective coastal protection measures based on field observations
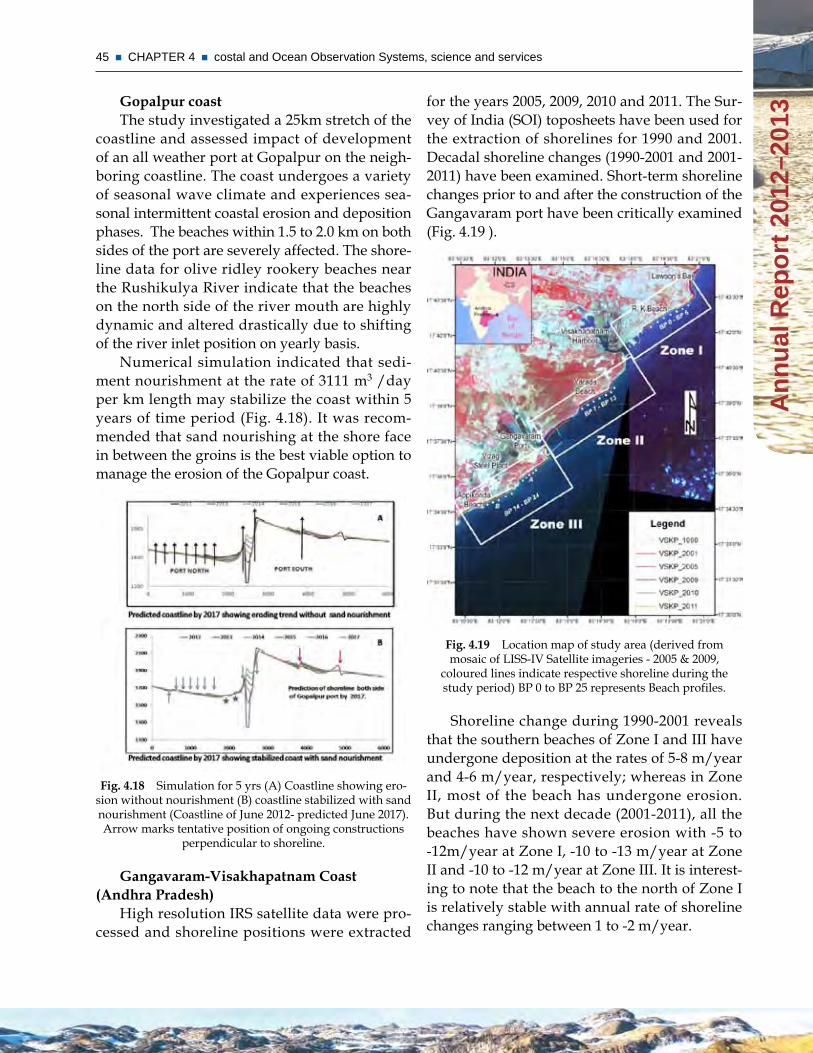
45 CHAPTER 4 costal and Ocean Observation Systems, science and services
An
nu
al R
epo
rt 2
012–
2013
for the years 2005, 2009, 2010 and 2011. The Sur-vey of India (SOI) toposheets have been used for the extraction of shorelines for 1990 and 2001. Decadal shoreline changes (1990-2001 and 2001-2011) have been examined. Short-term shoreline changes prior to and after the construction of the Gangavaram port have been critically examined (Fig. 4.19 ).
Fig. 4.19 Location map of study area (derived from mosaic of LISS-IV Satellite imageries - 2005 & 2009,
coloured lines indicate respective shoreline during the study period) BP 0 to BP 25 represents Beach profiles.
Shoreline change during 1990-2001 reveals that the southern beaches of Zone I and III have undergone deposition at the rates of 5-8 m/year and 4-6 m/year, respectively; whereas in Zone II, most of the beach has undergone erosion. But during the next decade (2001-2011), all the beaches have shown severe erosion with -5 to -12m/year at Zone I, -10 to -13 m/year at Zone II and -10 to -12 m/year at Zone III. It is interest-ing to note that the beach to the north of Zone I is relatively stable with annual rate of shoreline changes ranging between 1 to -2 m/year.
Gopalpur coastThe study investigated a 25km stretch of the
coastline and assessed impact of development of an all weather port at Gopalpur on the neigh-boring coastline. The coast undergoes a variety of seasonal wave climate and experiences sea-sonal intermittent coastal erosion and deposition phases. The beaches within 1.5 to 2.0 km on both sides of the port are severely affected. The shore-line data for olive ridley rookery beaches near the Rushikulya River indicate that the beaches on the north side of the river mouth are highly dynamic and altered drastically due to shifting of the river inlet position on yearly basis.
Numerical simulation indicated that sedi-ment nourishment at the rate of 3111 m3 /day per km length may stabilize the coast within 5 years of time period (Fig. 4.18). It was recom-mended that sand nourishing at the shore face in between the groins is the best viable option to manage the erosion of the Gopalpur coast.
Fig. 4.18 Simulation for 5 yrs (A) Coastline showing ero-sion without nourishment (B) coastline stabilized with sand nourishment (Coastline of June 2012- predicted June 2017). Arrow marks tentative position of ongoing constructions
perpendicular to shoreline.
Gangavaram-Visakhapatnam Coast (Andhra Pradesh)
High resolution IRS satellite data were pro-cessed and shoreline positions were extracted
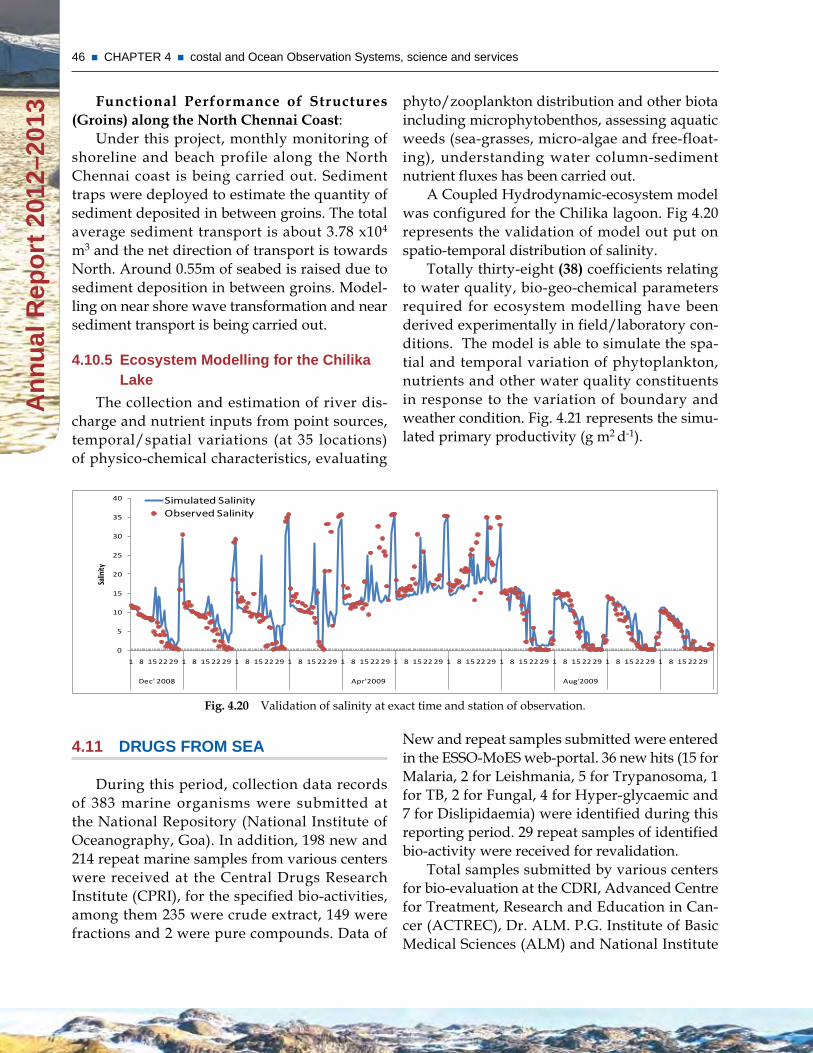
46 CHAPTER 4 costal and Ocean Observation Systems, science and services A
nn
ual
Rep
ort
201
2–20
13
phyto/zooplankton distribution and other biota including microphytobenthos, assessing aquatic weeds (sea-grasses, micro-algae and free-float-ing), understanding water column-sediment nutrient fluxes has been carried out.
A Coupled Hydrodynamic-ecosystem model was configured for the Chilika lagoon. Fig 4.20 represents the validation of model out put on spatio-temporal distribution of salinity.
Totally thirty-eight (38) coefficients relating to water quality, bio-geo-chemical parameters required for ecosystem modelling have been derived experimentally in field/laboratory con-ditions. The model is able to simulate the spa-tial and temporal variation of phytoplankton, nutrients and other water quality constituents in response to the variation of boundary and weather condition. Fig. 4.21 represents the simu-lated primary productivity (g m2 d-1).
Fig. 4.20 Validation of salinity at exact time and station of observation.
0
5
10
15
20
25
30
35
40
1 8 15 22 29 1 8 15 22 29 1 8 15 22 29 1 8 15 22 29 1 8 15 22 29 1 8 15 22 29 1 8 15 22 29 1 8 15 22 29 1 8 15 22 29 1 8 15 22 29 1 8 15 22 29
Dec' 2008 Apr'2009 Aug'2009
Salin
ity
Simulated SalinityObserved Salinity
Functional Performance of Structures (Groins) along the North Chennai Coast:
Under this project, monthly monitoring of shoreline and beach profile along the North Chennai coast is being carried out. Sediment traps were deployed to estimate the quantity of sediment deposited in between groins. The total average sediment transport is about 3.78 x10⁴ m3 and the net direction of transport is towards North. Around 0.55m of seabed is raised due to sediment deposition in between groins. Model-ling on near shore wave transformation and near sediment transport is being carried out.
4.10.5 Ecosystem modelling for the Chilika Lake
The collection and estimation of river dis-charge and nutrient inputs from point sources, temporal/spatial variations (at 35 locations) of physico-chemical characteristics, evaluating
4.11 dRuGs FROm sEA
During this period, collection data records of 383 marine organisms were submitted at the National Repository (National Institute of Oceanography, Goa). In addition, 198 new and 214 repeat marine samples from various centers were received at the Central Drugs Research Institute (CPRI), for the specified bio-activities, among them 235 were crude extract, 149 were fractions and 2 were pure compounds. Data of
New and repeat samples submitted were entered in the ESSO-MoES web-portal. 36 new hits (15 for Malaria, 2 for Leishmania, 5 for Trypanosoma, 1 for TB, 2 for Fungal, 4 for Hyper-glycaemic and 7 for Dislipidaemia) were identified during this reporting period. 29 repeat samples of identified bio-activity were received for revalidation.
Total samples submitted by various centers for bio-evaluation at the CDRI, Advanced Centre for Treatment, Research and Education in Can-cer (ACTREC), Dr. ALM. P.G. Institute of Basic Medical Sciences (ALM) and National Institute
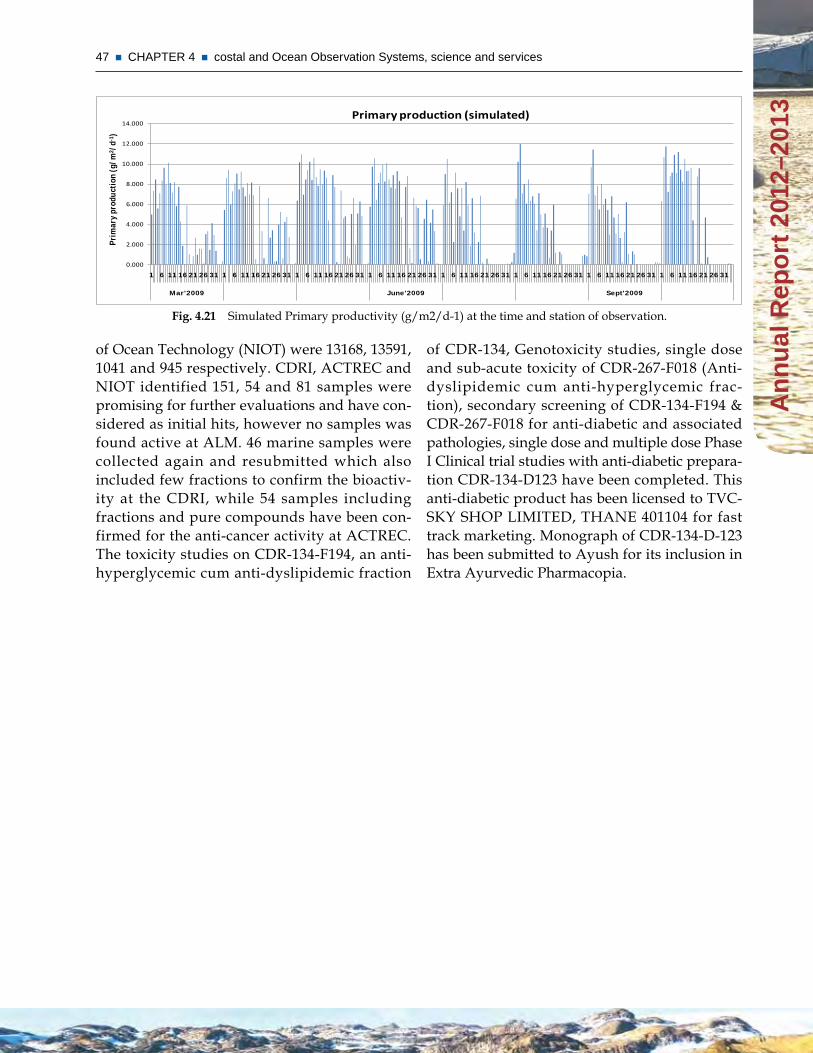
47 CHAPTER 4 costal and Ocean Observation Systems, science and services
An
nu
al R
epo
rt 2
012–
2013
of CDR-134, Genotoxicity studies, single dose and sub-acute toxicity of CDR-267-F018 (Anti-dyslipidemic cum anti-hyperglycemic frac-tion), secondary screening of CDR-134-F194 & CDR-267-F018 for anti-diabetic and associated pathologies, single dose and multiple dose Phase I Clinical trial studies with anti-diabetic prepara-tion CDR-134-D123 have been completed. This anti-diabetic product has been licensed to TVC-SKY SHOP LIMITED, THANE 401104 for fast track marketing. Monograph of CDR-134-D-123 has been submitted to Ayush for its inclusion in Extra Ayurvedic Pharmacopia.
of Ocean Technology (NIOT) were 13168, 13591, 1041 and 945 respectively. CDRI, ACTREC and NIOT identified 151, 54 and 81 samples were promising for further evaluations and have con-sidered as initial hits, however no samples was found active at ALM. 46 marine samples were collected again and resubmitted which also included few fractions to confirm the bioactiv-ity at the CDRI, while 54 samples including fractions and pure compounds have been con-firmed for the anti-cancer activity at ACTREC. The toxicity studies on CDR-134-F194, an anti-hyperglycemic cum anti-dyslipidemic fraction
0.000
2.000
4.000
6.000
8.000
10.000
12.000
14.000
1 6 11 16 21 26 31 1 6 11 16 21 26 31 1 6 11 16 21 26 31 1 6 11 16 21 26 31 1 6 11 16 21 26 31 1 6 11 16 21 26 31 1 6 11 16 21 26 31 1 6 11 16 21 26 31
Mar'2009 June'2009 Sept'2009
Prim
ary
prod
ucti
on (
g/m
2 /d-
1 )
Primary production (simulated)
Fig. 4.21 Simulated Primary productivity (g/m2/d-1) at the time and station of observation.
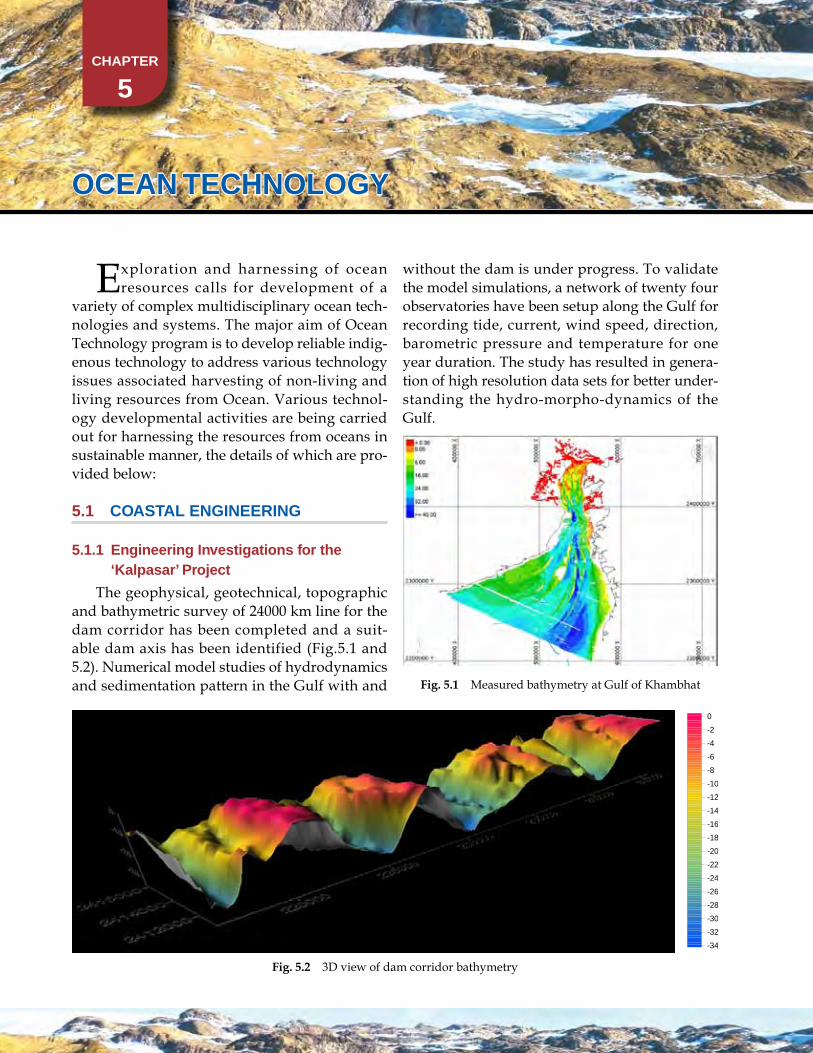
CHAPTER
5
OCEAn TECHnOLOGy
Exploration and harnessing of ocean resources calls for development of a
variety of complex multidisciplinary ocean tech-nologies and systems. The major aim of Ocean Technology program is to develop reliable indig-enous technology to address various technology issues associated harvesting of non-living and living resources from Ocean. Various technol-ogy developmental activities are being carried out for harnessing the resources from oceans in sustainable manner, the details of which are pro-vided below:
5.1 COAsTAL EnGinEERinG
5.1.1 Engineering investigations for the ‘kalpasar’ Project
The geophysical, geotechnical, topographic and bathymetric survey of 24000 km line for the dam corridor has been completed and a suit-able dam axis has been identified (Fig.5.1 and 5.2). Numerical model studies of hydrodynamics and sedimentation pattern in the Gulf with and
without the dam is under progress. To validate the model simulations, a network of twenty four observatories have been setup along the Gulf for recording tide, current, wind speed, direction, barometric pressure and temperature for one year duration. The study has resulted in genera-tion of high resolution data sets for better under-standing the hydro-morpho-dynamics of the Gulf.
Fig. 5.1 Measured bathymetry at Gulf of Khambhat
-34-32-30-28-26-24-22-20-18-16-14-12-10-8-6-4-20
Fig. 5.2 3D view of dam corridor bathymetry
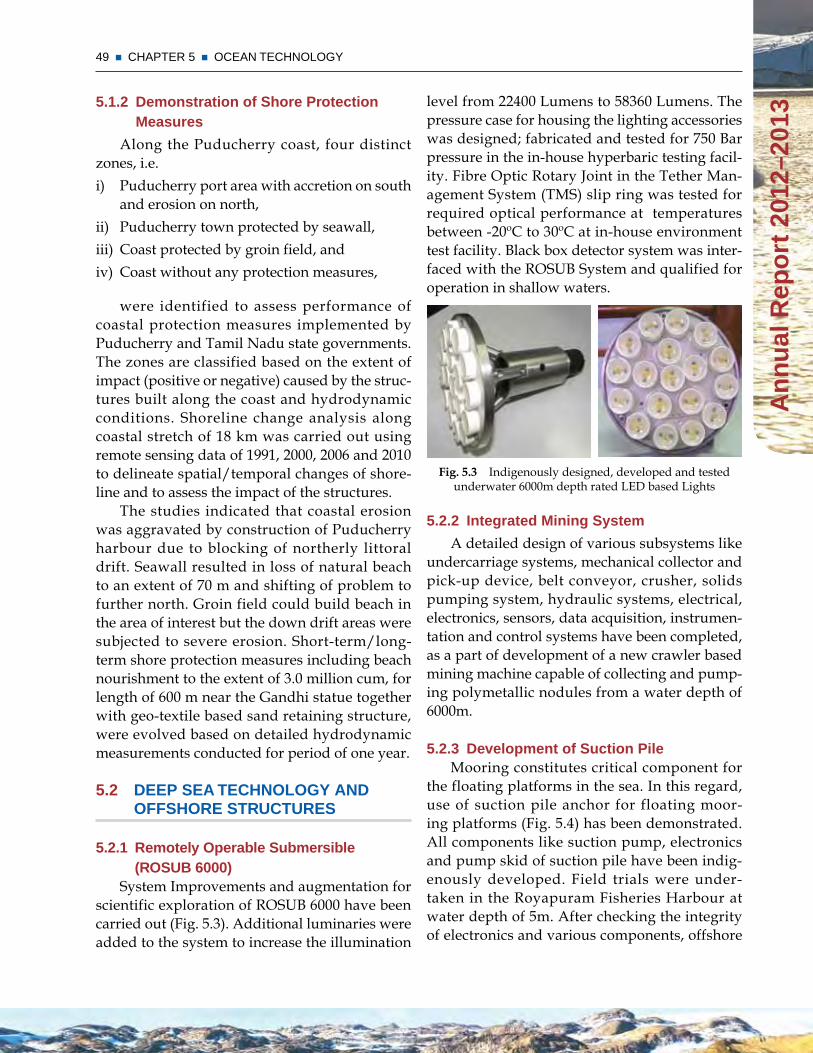
49 CHAPTER 5 OCEAN TECHNOLOGY
An
nu
al R
epo
rt 2
012–
2013
level from 22400 Lumens to 58360 Lumens. The pressure case for housing the lighting accessories was designed; fabricated and tested for 750 Bar pressure in the in-house hyperbaric testing facil-ity. Fibre Optic Rotary Joint in the Tether Man-agement System (TMS) slip ring was tested for required optical performance at temperatures between -20ºC to 30ºC at in-house environment test facility. Black box detector system was inter-faced with the ROSUB System and qualified for operation in shallow waters.
Fig. 5.3 Indigenously designed, developed and tested underwater 6000m depth rated LED based Lights
5.2.2 integrated mining system
A detailed design of various subsystems like undercarriage systems, mechanical collector and pick-up device, belt conveyor, crusher, solids pumping system, hydraulic systems, electrical, electronics, sensors, data acquisition, instrumen-tation and control systems have been completed, as a part of development of a new crawler based mining machine capable of collecting and pump-ing polymetallic nodules from a water depth of 6000m.
5.2.3 development of suction PileMooring constitutes critical component for
the floating platforms in the sea. In this regard, use of suction pile anchor for floating moor-ing platforms (Fig. 5.4) has been demonstrated. All components like suction pump, electronics and pump skid of suction pile have been indig-enously developed. Field trials were under-taken in the Royapuram Fisheries Harbour at water depth of 5m. After checking the integrity of electronics and various components, offshore
5.1.2 demonstration of shore Protection measures
Along the Puducherry coast, four distinct zones, i.e. i) Puducherry port area with accretion on south
and erosion on north, ii) Puducherry town protected by seawall, iii) Coast protected by groin field, and iv) Coast without any protection measures,
were identified to assess performance of coastal protection measures implemented by Puducherry and Tamil Nadu state governments. The zones are classified based on the extent of impact (positive or negative) caused by the struc-tures built along the coast and hydrodynamic conditions. Shoreline change analysis along coastal stretch of 18 km was carried out using remote sensing data of 1991, 2000, 2006 and 2010 to delineate spatial/temporal changes of shore-line and to assess the impact of the structures.
The studies indicated that coastal erosion was aggravated by construction of Puducherry harbour due to blocking of northerly littoral drift. Seawall resulted in loss of natural beach to an extent of 70 m and shifting of problem to further north. Groin field could build beach in the area of interest but the down drift areas were subjected to severe erosion. Short-term/long-term shore protection measures including beach nourishment to the extent of 3.0 million cum, for length of 600 m near the Gandhi statue together with geo-textile based sand retaining structure, were evolved based on detailed hydrodynamic measurements conducted for period of one year.
5.2 dEEP sEA TECHnOLOGy And OFFsHORE sTRuCTuREs
5.2.1 Remotely Operable submersible (ROsuB 6000)
System Improvements and augmentation for scientific exploration of ROSUB 6000 have been carried out (Fig. 5.3). Additional luminaries were added to the system to increase the illumination
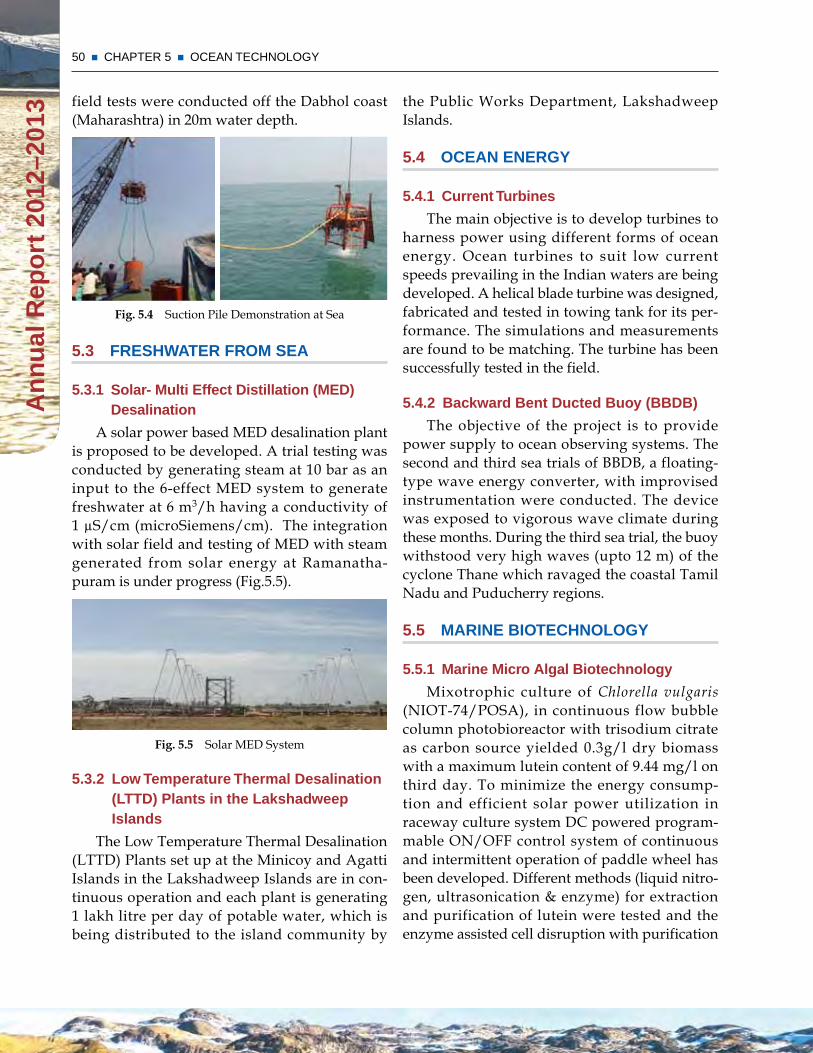
50 CHAPTER 5 OCEAN TECHNOLOGY A
nn
ual
Rep
ort
201
2–20
13
the Public Works Department, Lakshadweep Islands.
5.4 OCEAn EnERGy
5.4.1 Current Turbines
The main objective is to develop turbines to harness power using different forms of ocean energy. Ocean turbines to suit low current speeds prevailing in the Indian waters are being developed. A helical blade turbine was designed, fabricated and tested in towing tank for its per-formance. The simulations and measurements are found to be matching. The turbine has been successfully tested in the field.
5.4.2 Backward Bent ducted Buoy (BBdB)
The objective of the project is to provide power supply to ocean observing systems. The second and third sea trials of BBDB, a floating-type wave energy converter, with improvised instrumentation were conducted. The device was exposed to vigorous wave climate during these months. During the third sea trial, the buoy withstood very high waves (upto 12 m) of the cyclone Thane which ravaged the coastal Tamil Nadu and Puducherry regions.
5.5 mARinE BiOTECHnOLOGy
5.5.1 marine micro Algal Biotechnology
Mixotrophic culture of Chlorella vulgaris (NIOT-74/POSA), in continuous flow bubble column photobioreactor with trisodium citrate as carbon source yielded 0.3g/l dry biomass with a maximum lutein content of 9.44 mg/l on third day. To minimize the energy consump-tion and efficient solar power utilization in raceway culture system DC powered program-mable ON/OFF control system of continuous and intermittent operation of paddle wheel has been developed. Different methods (liquid nitro-gen, ultrasonication & enzyme) for extraction and purification of lutein were tested and the enzyme assisted cell disruption with purification
field tests were conducted off the Dabhol coast (Maharashtra) in 20m water depth.
Fig. 5.4 Suction Pile Demonstration at Sea
5.3 FREsHwATER FROm sEA
5.3.1 solar- multi Effect distillation (mEd) desalination
A solar power based MED desalination plant is proposed to be developed. A trial testing was conducted by generating steam at 10 bar as an input to the 6-effect MED system to generate freshwater at 6 m3/h having a conductivity of 1 µS/cm (microSiemens/cm). The integration with solar field and testing of MED with steam generated from solar energy at Ramanatha-puram is under progress (Fig.5.5).
Fig. 5.5 Solar MED System
5.3.2 Low Temperature Thermal desalination (LTTd) Plants in the Lakshadweep islands
The Low Temperature Thermal Desalination (LTTD) Plants set up at the Minicoy and Agatti Islands in the Lakshadweep Islands are in con-tinuous operation and each plant is generating 1 lakh litre per day of potable water, which is being distributed to the island community by
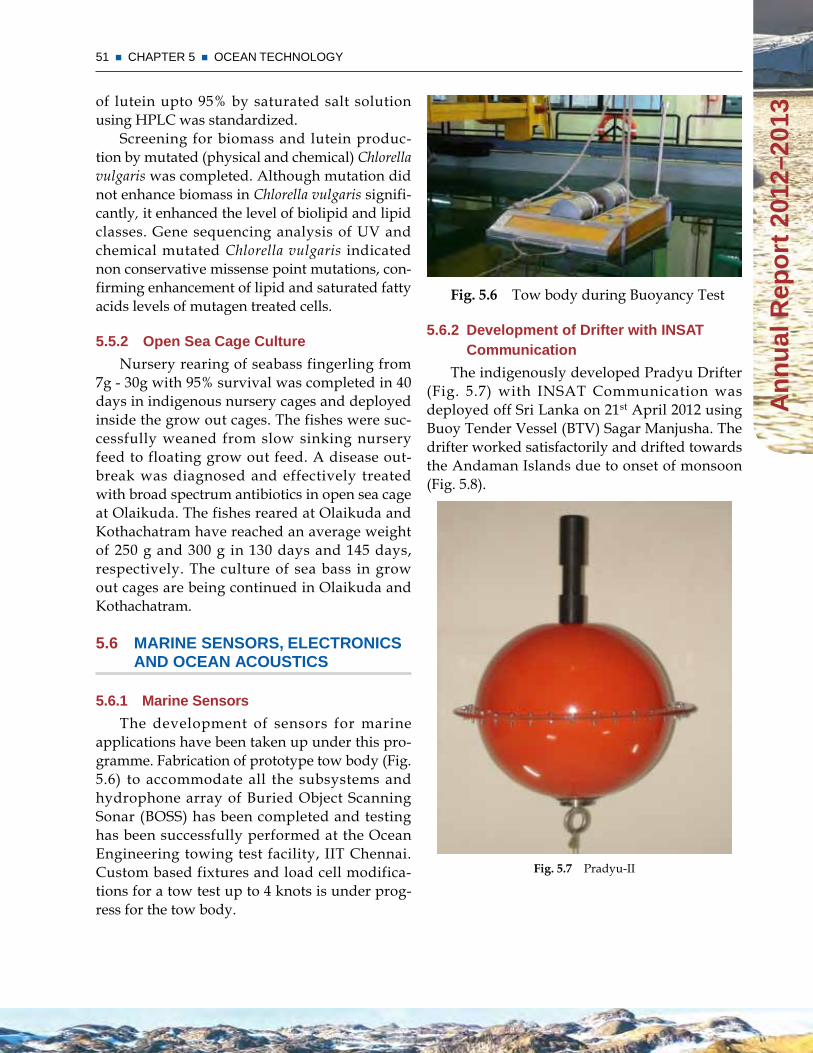
51 CHAPTER 5 OCEAN TECHNOLOGY
An
nu
al R
epo
rt 2
012–
2013
Fig. 5.6 Tow body during Buoyancy Test
5.6.2 development of drifter with insAT Communication
The indigenously developed Pradyu Drifter (Fig. 5.7) with INSAT Communication was deployed off Sri Lanka on 21st April 2012 using Buoy Tender Vessel (BTV) Sagar Manjusha. The drifter worked satisfactorily and drifted towards the Andaman Islands due to onset of monsoon (Fig. 5.8).
Fig. 5.7 Pradyu-II
of lutein upto 95% by saturated salt solution using HPLC was standardized.
Screening for biomass and lutein produc-tion by mutated (physical and chemical) Chlorella vulgaris was completed. Although mutation did not enhance biomass in Chlorella vulgaris signifi-cantly, it enhanced the level of biolipid and lipid classes. Gene sequencing analysis of UV and chemical mutated Chlorella vulgaris indicated non conservative missense point mutations, con-firming enhancement of lipid and saturated fatty acids levels of mutagen treated cells.
5.5.2 Open sea Cage Culture
Nursery rearing of seabass fingerling from 7g - 30g with 95% survival was completed in 40 days in indigenous nursery cages and deployed inside the grow out cages. The fishes were suc-cessfully weaned from slow sinking nursery feed to floating grow out feed. A disease out-break was diagnosed and effectively treated with broad spectrum antibiotics in open sea cage at Olaikuda. The fishes reared at Olaikuda and Kothachatram have reached an average weight of 250 g and 300 g in 130 days and 145 days, respectively. The culture of sea bass in grow out cages are being continued in Olaikuda and Kothachatram.
5.6 mARinE sEnsORs, ELECTROniCs And OCEAn ACOusTiCs
5.6.1 marine sensors
The development of sensors for marine applications have been taken up under this pro-gramme. Fabrication of prototype tow body (Fig. 5.6) to accommodate all the subsystems and hydrophone array of Buried Object Scanning Sonar (BOSS) has been completed and testing has been successfully performed at the Ocean Engineering towing test facility, IIT Chennai. Custom based fixtures and load cell modifica-tions for a tow test up to 4 knots is under prog-ress for the tow body.
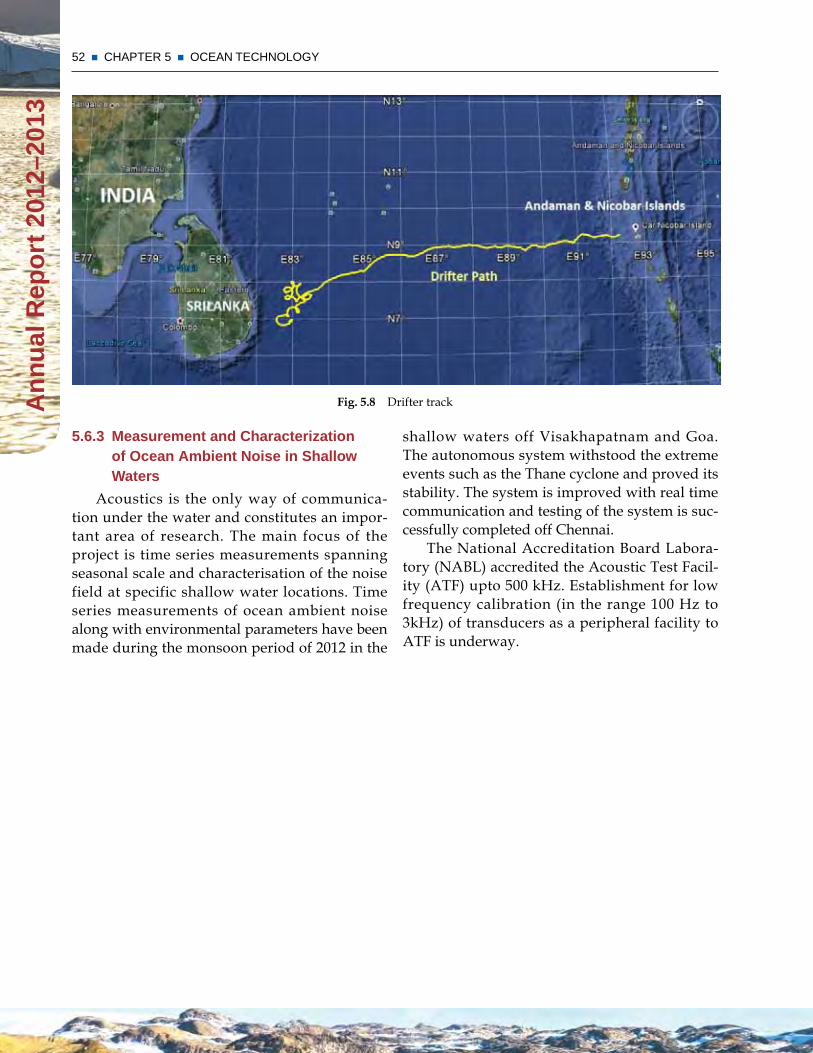
52 CHAPTER 5 OCEAN TECHNOLOGY A
nn
ual
Rep
ort
201
2–20
13
5.6.3 measurement and Characterization of Ocean Ambient noise in shallow waters
Acoustics is the only way of communica-tion under the water and constitutes an impor-tant area of research. The main focus of the project is time series measurements spanning seasonal scale and characterisation of the noise field at specific shallow water locations. Time series measurements of ocean ambient noise along with environmental parameters have been made during the monsoon period of 2012 in the
Fig. 5.8 Drifter track
shallow waters off Visakhapatnam and Goa. The autonomous system withstood the extreme events such as the Thane cyclone and proved its stability. The system is improved with real time communication and testing of the system is suc-cessfully completed off Chennai.
The National Accreditation Board Labora-tory (NABL) accredited the Acoustic Test Facil-ity (ATF) upto 500 kHz. Establishment for low frequency calibration (in the range 100 Hz to 3kHz) of transducers as a peripheral facility to ATF is underway.
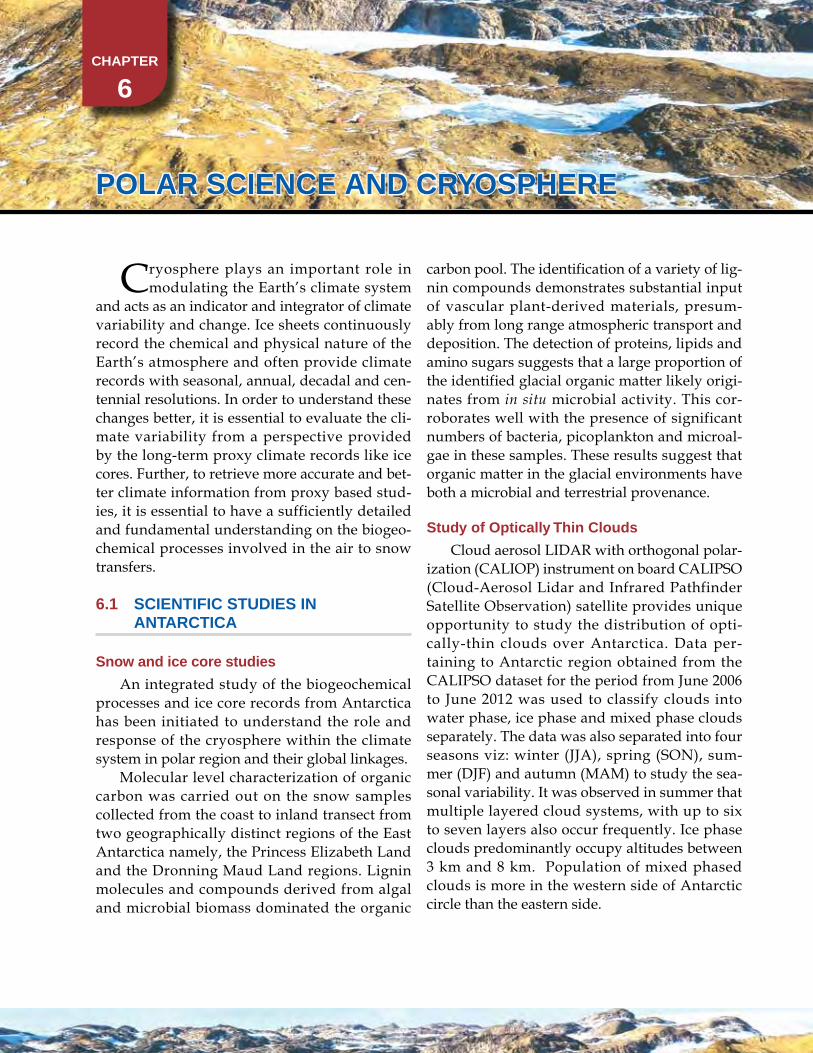
CHAPTER
6
POLAR sCiEnCE And CRyOsPHERE
Cryosphere plays an important role in modulating the Earth’s climate system
and acts as an indicator and integrator of climate variability and change. Ice sheets continuously record the chemical and physical nature of the Earth’s atmosphere and often provide climate records with seasonal, annual, decadal and cen-tennial resolutions. In order to understand these changes better, it is essential to evaluate the cli-mate variability from a perspective provided by the long-term proxy climate records like ice cores. Further, to retrieve more accurate and bet-ter climate information from proxy based stud-ies, it is essential to have a sufficiently detailed and fundamental understanding on the biogeo-chemical processes involved in the air to snow transfers.
6.1 sCiEnTiFiC sTudiEs in AnTARCTiCA
snow and ice core studies
An integrated study of the biogeochemical processes and ice core records from Antarctica has been initiated to understand the role and response of the cryosphere within the climate system in polar region and their global linkages.
Molecular level characterization of organic carbon was carried out on the snow samples collected from the coast to inland transect from two geographically distinct regions of the East Antarctica namely, the Princess Elizabeth Land and the Dronning Maud Land regions. Lignin molecules and compounds derived from algal and microbial biomass dominated the organic
carbon pool. The identification of a variety of lig-nin compounds demonstrates substantial input of vascular plant-derived materials, presum-ably from long range atmospheric transport and deposition. The detection of proteins, lipids and amino sugars suggests that a large proportion of the identified glacial organic matter likely origi-nates from in situ microbial activity. This cor-roborates well with the presence of significant numbers of bacteria, picoplankton and microal-gae in these samples. These results suggest that organic matter in the glacial environments have both a microbial and terrestrial provenance.
study of Optically Thin Clouds
Cloud aerosol LIDAR with orthogonal polar-ization (CALIOP) instrument on board CALIPSO (Cloud-Aerosol Lidar and Infrared Pathfinder Satellite Observation) satellite provides unique opportunity to study the distribution of opti-cally-thin clouds over Antarctica. Data per-taining to Antarctic region obtained from the CALIPSO dataset for the period from June 2006 to June 2012 was used to classify clouds into water phase, ice phase and mixed phase clouds separately. The data was also separated into four seasons viz: winter (JJA), spring (SON), sum-mer (DJF) and autumn (MAM) to study the sea-sonal variability. It was observed in summer that multiple layered cloud systems, with up to six to seven layers also occur frequently. Ice phase clouds predominantly occupy altitudes between 3 km and 8 km. Population of mixed phased clouds is more in the western side of Antarctic circle than the eastern side.
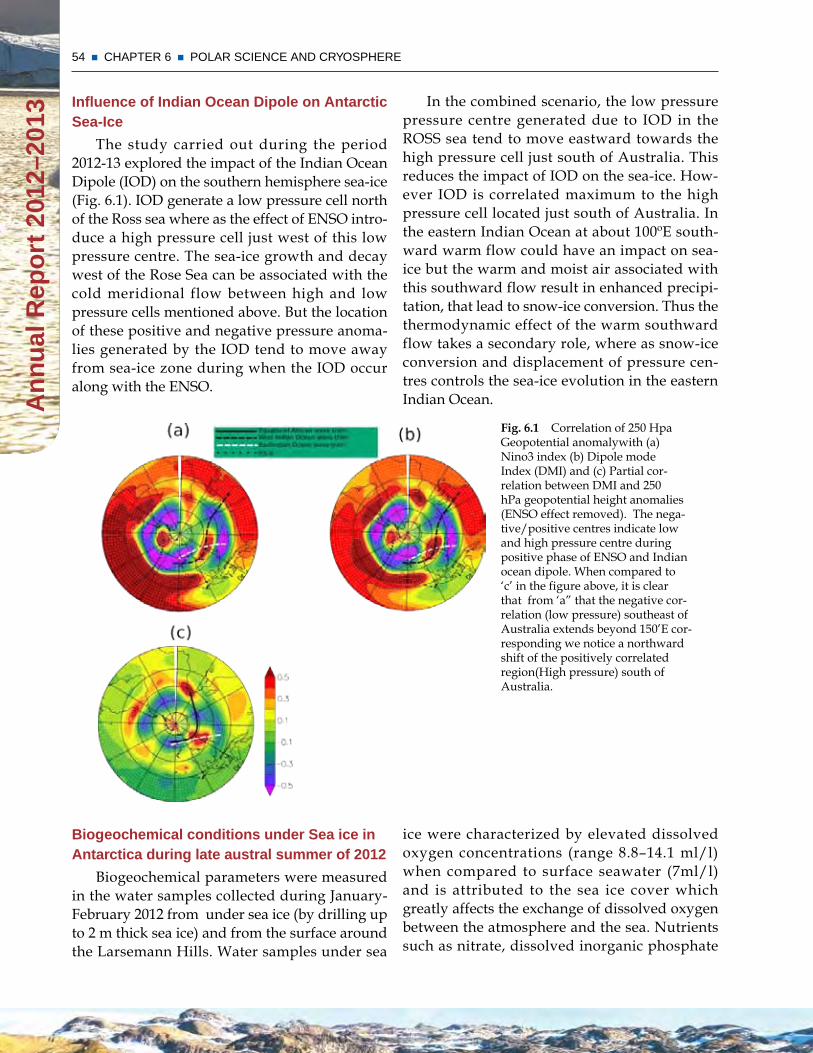
54 CHAPTER 6 POLAR SCIENCE AND CRYOSPHERE A
nn
ual
Rep
ort
201
2–20
13
In the combined scenario, the low pressure pressure centre generated due to IOD in the ROSS sea tend to move eastward towards the high pressure cell just south of Australia. This reduces the impact of IOD on the sea-ice. How-ever IOD is correlated maximum to the high pressure cell located just south of Australia. In the eastern Indian Ocean at about 100ºE south-ward warm flow could have an impact on sea-ice but the warm and moist air associated with this southward flow result in enhanced precipi-tation, that lead to snow-ice conversion. Thus the thermodynamic effect of the warm southward flow takes a secondary role, where as snow-ice conversion and displacement of pressure cen-tres controls the sea-ice evolution in the eastern Indian Ocean.
Fig. 6.1 Correlation of 250 Hpa Geopotential anomalywith (a) Nino3 index (b) Dipole mode Index (DMI) and (c) Partial cor-relation between DMI and 250 hPa geopotential height anomalies (ENSO effect removed). The nega-tive/positive centres indicate low and high pressure centre during positive phase of ENSO and Indian ocean dipole. When compared to ‘c’ in the figure above, it is clear that from ‘a” that the negative cor-relation (low pressure) southeast of Australia extends beyond 150’E cor-responding we notice a northward shift of the positively correlated region(High pressure) south of Australia.
influence of indian Ocean dipole on Antarctic sea-ice
The study carried out during the period 2012-13 explored the impact of the Indian Ocean Dipole (IOD) on the southern hemisphere sea-ice (Fig. 6.1). IOD generate a low pressure cell north of the Ross sea where as the effect of ENSO intro-duce a high pressure cell just west of this low pressure centre. The sea-ice growth and decay west of the Rose Sea can be associated with the cold meridional flow between high and low pressure cells mentioned above. But the location of these positive and negative pressure anoma-lies generated by the IOD tend to move away from sea-ice zone during when the IOD occur along with the ENSO.
Biogeochemical conditions under sea ice in Antarctica during late austral summer of 2012
Biogeochemical parameters were measured in the water samples collected during January-February 2012 from under sea ice (by drilling up to 2 m thick sea ice) and from the surface around the Larsemann Hills. Water samples under sea
ice were characterized by elevated dissolved oxygen concentrations (range 8.8–14.1 ml/l) when compared to surface seawater (7ml/l) and is attributed to the sea ice cover which greatly affects the exchange of dissolved oxygen between the atmosphere and the sea. Nutrients such as nitrate, dissolved inorganic phosphate
55 CHAPTER 6 POLAR SCIENCE AND CRYOSPHERE
An
nu
al R
epo
rt 2
012–
2013
31st indian scientific Expedition to Antarctica
The 31st Indian Scientific Expedition to Ant-arctica was launched in October 2011 and culmi-nated in March 2012 with the commissioning of India’s Third Antarctic Station “Bharati” on 18th March 2012. A team of 47 construction workers with support from two helicopters and two ships was involved in the activities and nearly 92% of the construction was completed during the 126 days of available austral summer period. Most of the services have been made operational and the first winter-over team of 13 members led by Dr. Rupesh M. Das, scientist from the National Physical Laboratory moved in immediately thereafter.
A 23-member team led by Shri Uttam Chand, Scientist from the Snow and Avalanche Study Establishment (DRDO) and Leader of the 31st Indian Scientific Expedition to Antarctica stayed back at the Maitri Station for conducting sci-entific experiments and logistic services during the austral winter of 2012-13. Some of the major projects implemented by the Indian Scientists at Maitri and Bharati during the summer and win-ter months of 2011-12 comprise: ionospheric studies by the National Physical laboratory, Temporal and Spatial Variations of meteorologi-cal parameters, by Snow and Avalanche Study Establishment (SASE), Meteorological parameter observations by ESSO IMD, Geophysical Stud-ies by the Indian Institute of Geomagnetism and National Geophysical Research Institute, Hydro-graphic Surveys by the National Hydrographic Office, Glaciological Studies by the Geological Survey of India and Geochemical and petrologi-cal studies of lamprophyres of Central Dronning Maud Land (CDML), by Nagpur University.
32nd indian scientific Expedition to Antarctica
For the 32nd Indian Scientific Expedition to Antarctica (2012-13), scientific and logistics teams from different national organizations/institutes/ laboratories is led by Shri. P. S. Negi (SASE), Shri. Ajay Dhar (IIG) and Dr. Raghava
and silicate concentrations under sea ice were depleted when compared to surface seawater. The reason being, nutrient demand of ice algae under the ice cover exceeded resupply which might have lead to the depletion of the major nutrients. Ice samples exhibited higher algal biomass, chlorophyll, and low pCO2 concentra-tions. The study infers that the photosynthetic activity drives pCO2 concentration, accumula-tion of dissolved oxygen, and an increase in pH under the ice covered region. This study high-lights the pristine environment available under the ice cover.
Accurate dEm of the Larsemann Hills region
An enhanced Digital Elevation Model (DEM) of the Larsemann Hills region, east Ant-arctica was constructed synergistically by using highly accurate ground-based GPS measure-ments, satellite-derived laser altimetry (GLAS/ICESat) and Radarsat Antarctic Mapping Proj-ect (RAMPv2) DEM-based point elevation dataset. With the use of accurate GPS data as ground control points reference elevations, the newly constructed DEM achieved accuracy with the least average elevation difference of 0.27 m.
Paleoenvironmental reconstruction from the lake sediments of Antarctica
The pristine lakes of Antarctica are excellent archives of environmental changes, both present and the past. A few lakes from the Schirmacher Oasis and Larsemann Hills have been studied. The Holocene paleoenvironmental conditions were reconstructed by studying the biogenic sil-ica, sand and organic carbon contents of a sedi-ment core from the L2 Lake, Larsemann Hills. It was inferred that the high sand (%) during the ~ 8.3 - ~ 5 cal ka B.P period was due to increased glacio-fluvial deposition. The high values of TOC in the upper part of the core indicate the presence of algal mat which is due to the ice-free conditions due to warming.
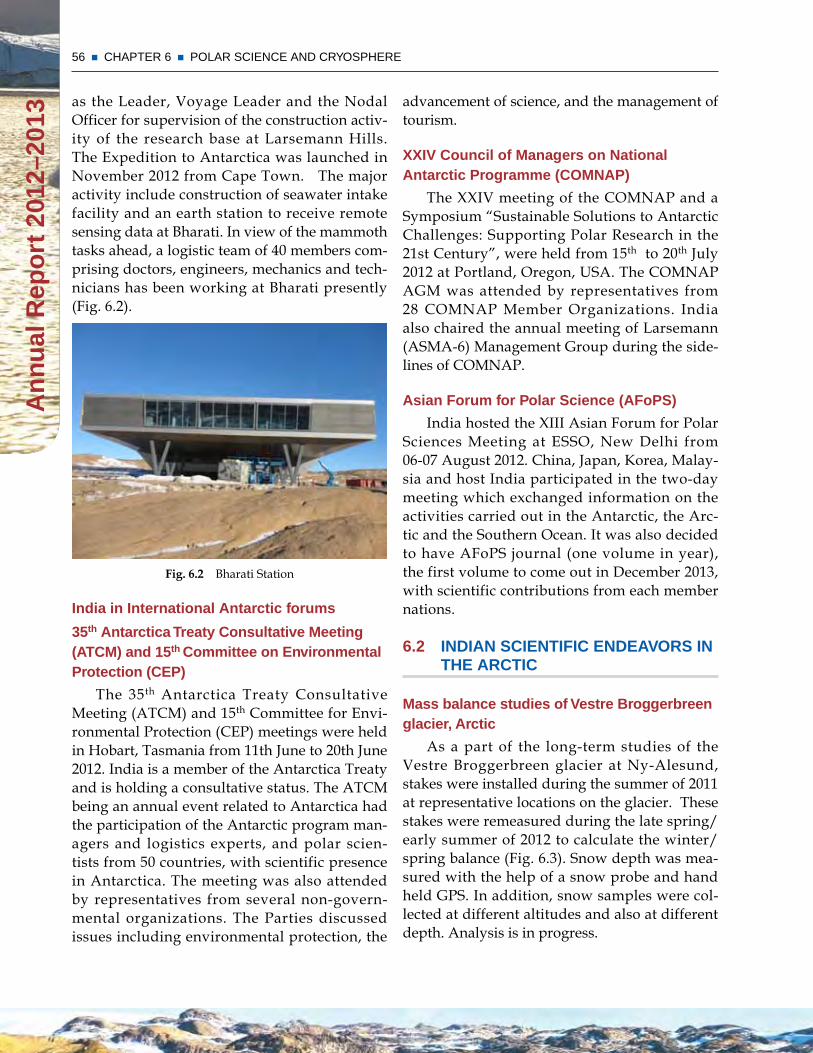
56 CHAPTER 6 POLAR SCIENCE AND CRYOSPHERE A
nn
ual
Rep
ort
201
2–20
13
advancement of science, and the management of tourism.
xxiv Council of managers on national Antarctic Programme (COmnAP)
The XXIV meeting of the COMNAP and a Symposium “Sustainable Solutions to Antarctic Challenges: Supporting Polar Research in the 21st Century”, were held from 15th to 20th July 2012 at Portland, Oregon, USA. The COMNAP AGM was attended by representatives from 28 COMNAP Member Organizations. India also chaired the annual meeting of Larsemann (ASMA-6) Management Group during the side-lines of COMNAP.
Asian Forum for Polar science (AFoPs)
India hosted the XIII Asian Forum for Polar Sciences Meeting at ESSO, New Delhi from 06-07 August 2012. China, Japan, Korea, Malay-sia and host India participated in the two-day meeting which exchanged information on the activities carried out in the Antarctic, the Arc-tic and the Southern Ocean. It was also decided to have AFoPS journal (one volume in year), the first volume to come out in December 2013, with scientific contributions from each member nations.
6.2 indiAn sCiEnTiFiC EndEAvORs in THE ARCTiC
mass balance studies of vestre Broggerbreen glacier, Arctic
As a part of the long-term studies of the Vestre Broggerbreen glacier at Ny-Alesund, stakes were installed during the summer of 2011 at representative locations on the glacier. These stakes were remeasured during the late spring/early summer of 2012 to calculate the winter/spring balance (Fig. 6.3). Snow depth was mea-sured with the help of a snow probe and hand held GPS. In addition, snow samples were col-lected at different altitudes and also at different depth. Analysis is in progress.
as the Leader, Voyage Leader and the Nodal Officer for supervision of the construction activ-ity of the research base at Larsemann Hills. The Expedition to Antarctica was launched in November 2012 from Cape Town. The major activity include construction of seawater intake facility and an earth station to receive remote sensing data at Bharati. In view of the mammoth tasks ahead, a logistic team of 40 members com-prising doctors, engineers, mechanics and tech-nicians has been working at Bharati presently (Fig. 6.2).
Fig. 6.2 Bharati Station
india in international Antarctic forums
35th Antarctica Treaty Consultative meeting (ATCm) and 15th Committee on Environmental Protection (CEP)
The 35th Antarctica Treaty Consultative Meeting (ATCM) and 15th Committee for Envi-ronmental Protection (CEP) meetings were held in Hobart, Tasmania from 11th June to 20th June 2012. India is a member of the Antarctica Treaty and is holding a consultative status. The ATCM being an annual event related to Antarctica had the participation of the Antarctic program man-agers and logistics experts, and polar scien-tists from 50 countries, with scientific presence in Antarctica. The meeting was also attended by representatives from several non-govern-mental organizations. The Parties discussed issues including environmental protection, the
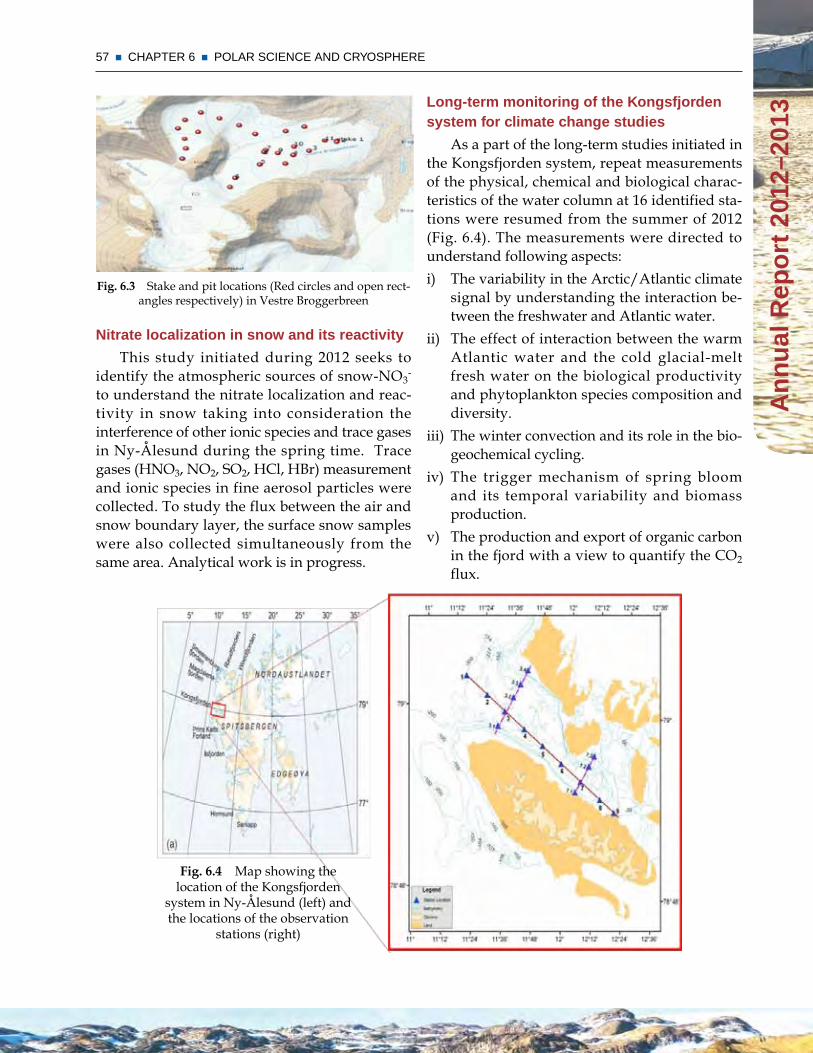
57 CHAPTER 6 POLAR SCIENCE AND CRYOSPHERE
An
nu
al R
epo
rt 2
012–
2013
Long-term monitoring of the kongsfjorden system for climate change studies
As a part of the long-term studies initiated in the Kongsfjorden system, repeat measurements of the physical, chemical and biological charac-teristics of the water column at 16 identified sta-tions were resumed from the summer of 2012 (Fig. 6.4). The measurements were directed to understand following aspects:i) The variability in the Arctic/Atlantic climate
signal by understanding the interaction be-tween the freshwater and Atlantic water.
ii) The effect of interaction between the warm Atlantic water and the cold glacial-melt fresh water on the biological productivity and phytoplankton species composition and diversity.
iii) The winter convection and its role in the bio-geochemical cycling.
iv) The trigger mechanism of spring bloom and its temporal variability and biomass production.
v) The production and export of organic carbon in the fjord with a view to quantify the CO2 flux.
Fig. 6.4 Map showing the location of the Kongsfjorden
system in Ny-Ålesund (left) and the locations of the observation
stations (right)
Fig. 6.3 Stake and pit locations (Red circles and open rect-angles respectively) in Vestre Broggerbreen
nitrate localization in snow and its reactivity
This study initiated during 2012 seeks to identify the atmospheric sources of snow-NO3
- to understand the nitrate localization and reac-tivity in snow taking into consideration the interference of other ionic species and trace gases in Ny-Ålesund during the spring time. Trace gases (HNO3, NO2, SO2, HCl, HBr) measurement and ionic species in fine aerosol particles were collected. To study the flux between the air and snow boundary layer, the surface snow samples were also collected simultaneously from the same area. Analytical work is in progress.
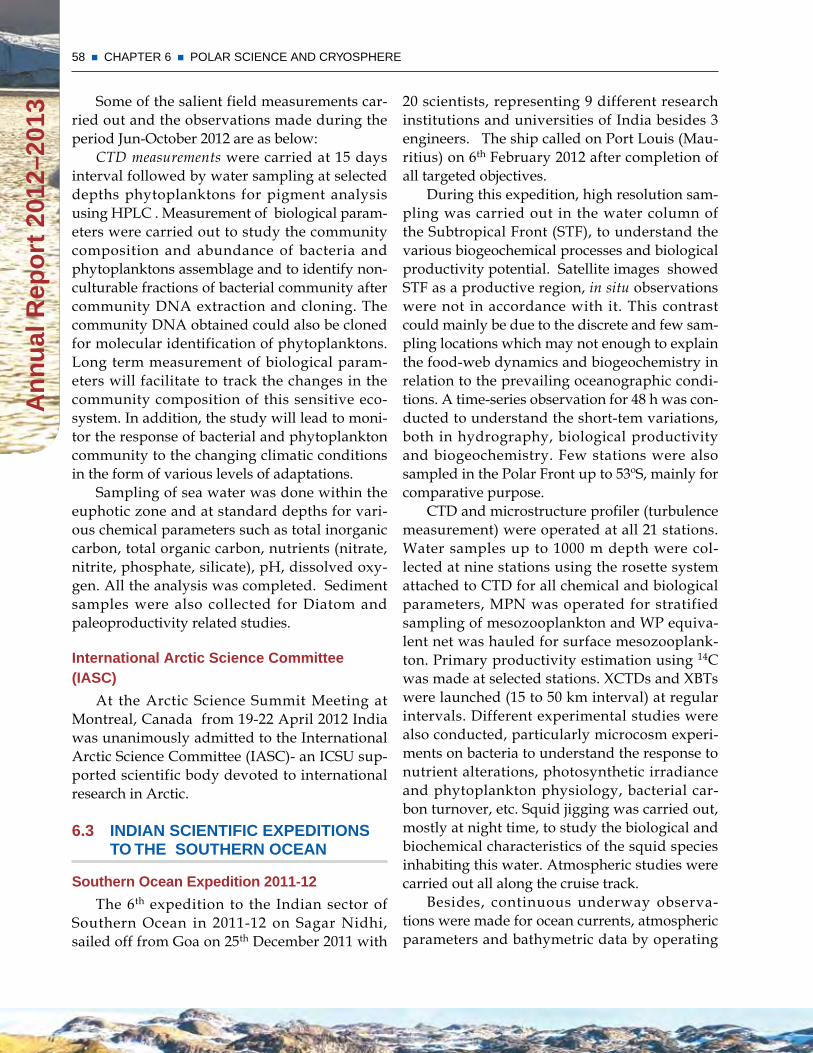
58 CHAPTER 6 POLAR SCIENCE AND CRYOSPHERE A
nn
ual
Rep
ort
201
2–20
13
20 scientists, representing 9 different research institutions and universities of India besides 3 engineers. The ship called on Port Louis (Mau-ritius) on 6th February 2012 after completion of all targeted objectives.
During this expedition, high resolution sam-pling was carried out in the water column of the Subtropical Front (STF), to understand the various biogeochemical processes and biological productivity potential. Satellite images showed STF as a productive region, in situ observations were not in accordance with it. This contrast could mainly be due to the discrete and few sam-pling locations which may not enough to explain the food-web dynamics and biogeochemistry in relation to the prevailing oceanographic condi-tions. A time-series observation for 48 h was con-ducted to understand the short-tem variations, both in hydrography, biological productivity and biogeochemistry. Few stations were also sampled in the Polar Front up to 53ºS, mainly for comparative purpose.
CTD and microstructure profiler (turbulence measurement) were operated at all 21 stations. Water samples up to 1000 m depth were col-lected at nine stations using the rosette system attached to CTD for all chemical and biological parameters, MPN was operated for stratified sampling of mesozooplankton and WP equiva-lent net was hauled for surface mesozooplank-ton. Primary productivity estimation using 14C was made at selected stations. XCTDs and XBTs were launched (15 to 50 km interval) at regular intervals. Different experimental studies were also conducted, particularly microcosm experi-ments on bacteria to understand the response to nutrient alterations, photosynthetic irradiance and phytoplankton physiology, bacterial car-bon turnover, etc. Squid jigging was carried out, mostly at night time, to study the biological and biochemical characteristics of the squid species inhabiting this water. Atmospheric studies were carried out all along the cruise track.
Besides, continuous underway observa-tions were made for ocean currents, atmospheric parameters and bathymetric data by operating
Some of the salient field measurements car-ried out and the observations made during the period Jun-October 2012 are as below:
CTD measurements were carried at 15 days interval followed by water sampling at selected depths phytoplanktons for pigment analysis using HPLC . Measurement of biological param-eters were carried out to study the community composition and abundance of bacteria and phytoplanktons assemblage and to identify non-culturable fractions of bacterial community after community DNA extraction and cloning. The community DNA obtained could also be cloned for molecular identification of phytoplanktons. Long term measurement of biological param-eters will facilitate to track the changes in the community composition of this sensitive eco-system. In addition, the study will lead to moni-tor the response of bacterial and phytoplankton community to the changing climatic conditions in the form of various levels of adaptations.
Sampling of sea water was done within the euphotic zone and at standard depths for vari-ous chemical parameters such as total inorganic carbon, total organic carbon, nutrients (nitrate, nitrite, phosphate, silicate), pH, dissolved oxy-gen. All the analysis was completed. Sediment samples were also collected for Diatom and paleoproductivity related studies.
international Arctic science Committee (iAsC)
At the Arctic Science Summit Meeting at Montreal, Canada from 19-22 April 2012 India was unanimously admitted to the International Arctic Science Committee (IASC)- an ICSU sup-ported scientific body devoted to international research in Arctic.
6.3 indiAn sCiEnTiFiC ExPEdiTiOns TO THE sOuTHERn OCEAn
southern Ocean Expedition 2011-12
The 6th expedition to the Indian sector of Southern Ocean in 2011-12 on Sagar Nidhi, sailed off from Goa on 25th December 2011 with
59 CHAPTER 6 POLAR SCIENCE AND CRYOSPHERE
An
nu
al R
epo
rt 2
012–
20136.4 HimALAyAn CRyOsPHERE sTudiEs
This is new multi-institutional, long-term ini-tiative have following objectives:• To study the dynamics and the rate of change
of select glaciers of the Himalaya to under-stand its impact on hydrology, ecology and climate
• To assess the climate change using ice as an archive of information on past climate and its future implications
• To study the biogeochemical aspects of the Himalayan ice and compare it with the polar environment.
The study area include the Chhota Shigri and the Hamata glacier in the Chandra Basin, the Patsio glacier in the Bhaga Basin and the Mamtusa and the Miyad glaciers in the Miyar basin. Subsequently in September, sampling from two high altitude glaciers of Ladakh (at 5600 m altitude) was carried out and study the recent accumulation layers by deep pitting (1-1.5 m). The analysis of these samples will help us to understand the preservation of environmen-tal/ climatic signals and will help us to identify possible glaciers for an ice core based climate reconstruction study.
Acoustic Doppler Current Profiler (ADCP), Automatic Weather Station (AWS), Multi-beam, Echo-sounder and Sub-bottom profiler.
southern Ocean Expedition 2012-13
In continuation of the studies carried out during the earlier years and based on the results obtained, the seventh multi-institutional scien-tific expedition to the Southern Ocean realm from Mauritius has been launched during late January 2013. This Expedition, on board RV Sagar Nidhi would comprise scientists/researchers from 11 national institutes/universities and would have as its objectives, the following focus themes:• Observations at high resolution in the PF for
detailed understanding about the complex food web dynamics [conventional and mi-crobial] observed from previous expeditions.
• Influence of high nutrients, light limitation and sea ice on productivity.
• Carbon dioxide fluxes within PF- comparing pCO2 and primary production.
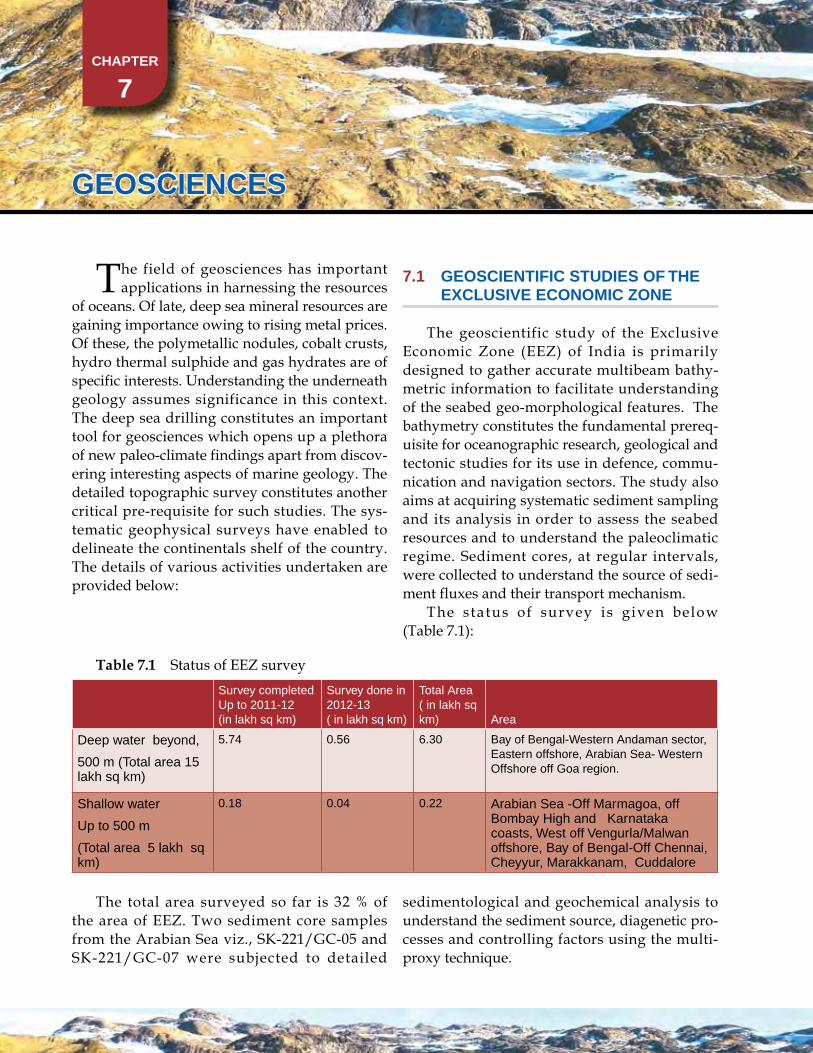
CHAPTER
7
GEOsCiEnCEs
The field of geosciences has important applications in harnessing the resources
of oceans. Of late, deep sea mineral resources are gaining importance owing to rising metal prices. Of these, the polymetallic nodules, cobalt crusts, hydro thermal sulphide and gas hydrates are of specific interests. Understanding the underneath geology assumes significance in this context. The deep sea drilling constitutes an important tool for geosciences which opens up a plethora of new paleo-climate findings apart from discov-ering interesting aspects of marine geology. The detailed topographic survey constitutes another critical pre-requisite for such studies. The sys-tematic geophysical surveys have enabled to delineate the continentals shelf of the country. The details of various activities undertaken are provided below:
7.1 GEOsCiEnTiFiC sTudiEs OF THE ExCLusivE ECOnOmiC ZOnE
The geoscientific study of the Exclusive Economic Zone (EEZ) of India is primarily designed to gather accurate multibeam bathy-metric information to facilitate understanding of the seabed geo-morphological features. The bathymetry constitutes the fundamental prereq-uisite for oceanographic research, geological and tectonic studies for its use in defence, commu-nication and navigation sectors. The study also aims at acquiring systematic sediment sampling and its analysis in order to assess the seabed resources and to understand the paleoclimatic regime. Sediment cores, at regular intervals, were collected to understand the source of sedi-ment fluxes and their transport mechanism.
The status of survey is given below (Table 7.1):
Table 7.1 Status of EEZ surveySurvey completed Up to 2011-12 (in lakh sq km)
Survey done in 2012-13 ( in lakh sq km)
Total Area ( in lakh sq km) Area
Deep water beyond,
500 m (Total area 15 lakh sq km)
5.74 0.56 6.30 Bay of Bengal-Western Andaman sector, Eastern offshore, Arabian Sea- Western Offshore off Goa region.
Shallow water
Up to 500 m
(Total area 5 lakh sq km)
0.18 0.04 0.22 Arabian Sea -Off Marmagoa, off Bombay High and Karnataka coasts, West off Vengurla/Malwan offshore, Bay of Bengal-Off Chennai, Cheyyur, Marakkanam, Cuddalore
The total area surveyed so far is 32 % of the area of EEZ. Two sediment core samples from the Arabian Sea viz., SK-221/GC-05 and SK-221/GC-07 were subjected to detailed
sedimentological and geochemical analysis to understand the sediment source, diagenetic pro-cesses and controlling factors using the multi-proxy technique.
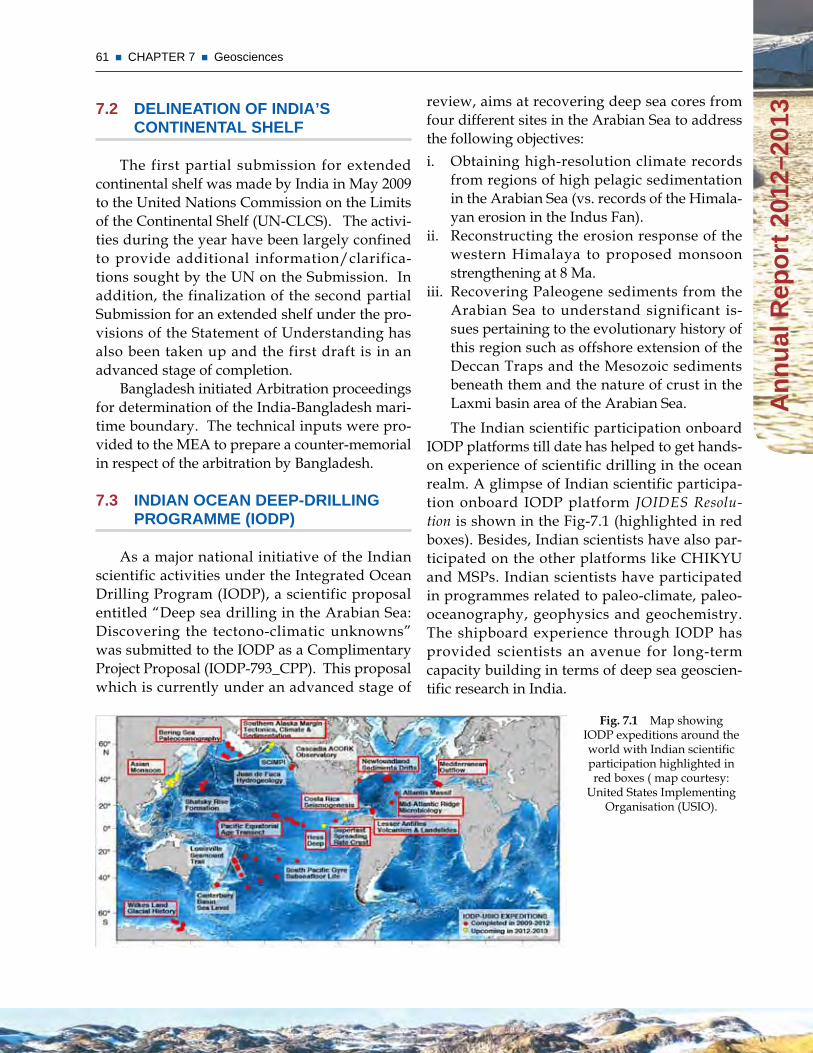
61 CHAPTER 7 Geosciences
An
nu
al R
epo
rt 2
012–
2013
review, aims at recovering deep sea cores from four different sites in the Arabian Sea to address the following objectives:i. Obtaining high-resolution climate records
from regions of high pelagic sedimentation in the Arabian Sea (vs. records of the Himala-yan erosion in the Indus Fan).
ii. Reconstructing the erosion response of the western Himalaya to proposed monsoon strengthening at 8 Ma.
iii. Recovering Paleogene sediments from the Arabian Sea to understand significant is-sues pertaining to the evolutionary history of this region such as offshore extension of the Deccan Traps and the Mesozoic sediments beneath them and the nature of crust in the Laxmi basin area of the Arabian Sea.The Indian scientific participation onboard
IODP platforms till date has helped to get hands-on experience of scientific drilling in the ocean realm. A glimpse of Indian scientific participa-tion onboard IODP platform JOIDES Resolu-tion is shown in the Fig-7.1 (highlighted in red boxes). Besides, Indian scientists have also par-ticipated on the other platforms like CHIKYU and MSPs. Indian scientists have participated in programmes related to paleo-climate, paleo-oceanography, geophysics and geochemistry. The shipboard experience through IODP has provided scientists an avenue for long-term capacity building in terms of deep sea geoscien-tific research in India.
Fig. 7.1 Map showing IODP expeditions around the world with Indian scientific participation highlighted in red boxes ( map courtesy:
United States Implementing Organisation (USIO).
7.2 dELinEATiOn OF indiA’s COnTinEnTAL sHELF
The first partial submission for extended continental shelf was made by India in May 2009 to the United Nations Commission on the Limits of the Continental Shelf (UN-CLCS). The activi-ties during the year have been largely confined to provide additional information/clarifica-tions sought by the UN on the Submission. In addition, the finalization of the second partial Submission for an extended shelf under the pro-visions of the Statement of Understanding has also been taken up and the first draft is in an advanced stage of completion.
Bangladesh initiated Arbitration proceedings for determination of the India-Bangladesh mari-time boundary. The technical inputs were pro-vided to the MEA to prepare a counter-memorial in respect of the arbitration by Bangladesh.
7.3 indiAn OCEAn dEEP-dRiLLinG PROGRAmmE (iOdP)
As a major national initiative of the Indian scientific activities under the Integrated Ocean Drilling Program (IODP), a scientific proposal entitled “Deep sea drilling in the Arabian Sea: Discovering the tectono-climatic unknowns” was submitted to the IODP as a Complimentary Project Proposal (IODP-793_CPP). This proposal which is currently under an advanced stage of
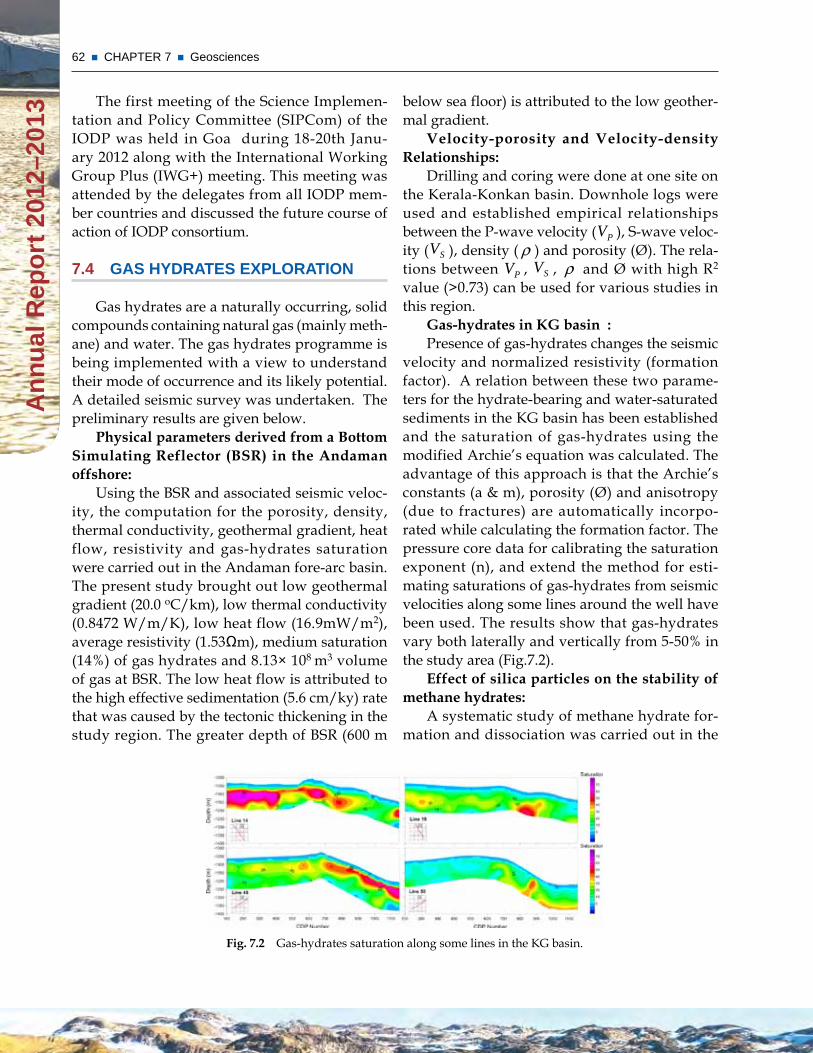
62 CHAPTER 7 Geosciences A
nn
ual
Rep
ort
201
2–20
13
below sea floor) is attributed to the low geother-mal gradient.
Velocity-porosity and Velocity-density Relationships:
Drilling and coring were done at one site on the Kerala-Konkan basin. Downhole logs were used and established empirical relationships between the P-wave velocity ( PV ), S-wave veloc-ity ( SV ), density ( ρ ) and porosity (Ø). The rela-tions between PV , SV , ρ and Ø with high R2 value (>0.73) can be used for various studies in this region.
Gas-hydrates in KG basin :Presence of gas-hydrates changes the seismic
velocity and normalized resistivity (formation factor). A relation between these two parame-ters for the hydrate-bearing and water-saturated sediments in the KG basin has been established and the saturation of gas-hydrates using the modified Archie’s equation was calculated. The advantage of this approach is that the Archie’s constants (a & m), porosity (Ø) and anisotropy (due to fractures) are automatically incorpo-rated while calculating the formation factor. The pressure core data for calibrating the saturation exponent (n), and extend the method for esti-mating saturations of gas-hydrates from seismic velocities along some lines around the well have been used. The results show that gas-hydrates vary both laterally and vertically from 5-50% in the study area (Fig.7.2).
Effect of silica particles on the stability of methane hydrates:
A systematic study of methane hydrate for-mation and dissociation was carried out in the
Fig. 7.2 Gas-hydrates saturation along some lines in the KG basin.
The first meeting of the Science Implemen-tation and Policy Committee (SIPCom) of the IODP was held in Goa during 18-20th Janu-ary 2012 along with the International Working Group Plus (IWG+) meeting. This meeting was attended by the delegates from all IODP mem-ber countries and discussed the future course of action of IODP consortium.
7.4 GAs HydRATEs ExPLORATiOn
Gas hydrates are a naturally occurring, solid compounds containing natural gas (mainly meth-ane) and water. The gas hydrates programme is being implemented with a view to understand their mode of occurrence and its likely potential. A detailed seismic survey was undertaken. The preliminary results are given below.
Physical parameters derived from a Bottom Simulating Reflector (BSR) in the Andaman offshore:
Using the BSR and associated seismic veloc-ity, the computation for the porosity, density, thermal conductivity, geothermal gradient, heat flow, resistivity and gas-hydrates saturation were carried out in the Andaman fore-arc basin. The present study brought out low geothermal gradient (20.0 oC/km), low thermal conductivity (0.8472 W/m/K), low heat flow (16.9mW/m2), average resistivity (1.53Ωm), medium saturation (14%) of gas hydrates and 8.13× 10⁸ m3 volume of gas at BSR. The low heat flow is attributed to the high effective sedimentation (5.6 cm/ky) rate that was caused by the tectonic thickening in the study region. The greater depth of BSR (600 m
63 CHAPTER 7 Geosciences
An
nu
al R
epo
rt 2
012–
2013
such as Remotely Operable Vehicle (ROV) sur-veys, videography surveys, etc., would be con-centrated in this FGM area.
The details of major activities undertaken are provided below: • A bathymetry map and Digital Terrain
Model (DTM) of the FGM area were gen-erated. The maximum area of the FGM site have a slope angle of 0° to 6°. Slope angle map of the FGM area is crucial for the opera-tion of mining system .
• Values of abundance and grade were calcu-lated for all the 42 blocks of the FGM area .
• Preliminary observation of the soil tester and ROSUB data that was collected showed carpet of nodules in the FGM area in the southwest part which is in agreement with the generated maps and figures arrived after processing the exploration data.
7.5.2 Environmental impact Assessment studies (EiA)
EIA studies for nodule mining in CIOB’ were initiated for evaluation of environmental data for providing inputs for mining of polymetallic nodules.
Effect of sample storage on biochemical and microbial parameters
Nodules occur along with deep-sea sedi-ments under extreme conditions such as ~2oC , 500 bar pressure and no natural sunlight, with a total microbial count of ~108 cells g-1 . Between lifting of ores at sea, transportation to land and actual processing there is a time lag during which the sediments are stored under tropical conditions of 1 bar, 28 + 2˚C temperature. For this purpose, sediment samples from 4 different sediment types in the CIOB were analysed. It has been found that, although stored deep-sea sediments altered in their bacterial and biochem-ical properties, the integrity of the net metallur-gical content and properties was nearly stable for the test period and conditions.
suspensions of silica and natural clay. All the experiments were carried out in a stirred reac-tor using 10 wt % of silica and natural sediment samples. The silica grains have also shown con-siderable effect on release of methane during dissociation. It is used suspensions of silica (10 wt%) with 50, 150 and 250 µm diameter and naturally occurring clay sediment (characterized as bentonite) in the KG basin and compared the hydrate kinetics and conversion efficiency. The results indicate that the hydrate induction and growth is significantly faster (typically 1/3 of pure hydrates) in suspensions of silica with 150 and 250 µm. Measured induction time is slightly longer (~ ½ of pure hydrates) for suspensions with 50 µm silica and natural clay sediment. In comparison with pure methane hydrates the conversion decreased by about 20 - 30 % in sil-ica suspensions, while it is comparable in clay sample.
7.5 POLymETALLiC nOduLEs (Pmn)
Polymetallic nodules are potato shaped, porous and black earthy deposits, with size ranging from 2 to 10 cm in diameter. These nod-ules occur at nearly 4 to 5 km depth in the deep oceans lying on the seabed. They comprise, besides manganese and iron, nickel, copper, cobalt, lead, molybdenum, cadmium, vanadium, titanium. India presently has 75000 sq km area in the Central Indian Ocean Basin (CIOB) for developmental activities targeted at harnessing of metals, viz. Copper, Nickel, and Cobalt. This Programme has four components, viz. Survey and Exploration, Environmental Impact Assess-ment (EIA) Study, Technology Development for Mining and Extractive Metallurgy.
7.5.1 survey & Exploration
The identification of a First Generation Minesite (FGM) area in the CIOB is an impor-tant milestone achieved during 11th plan period. The minesite containing an area of 7858 km2 is divided into 42 blocks of equal grid size (0.125° x 0.125°) and all the future exploration activities
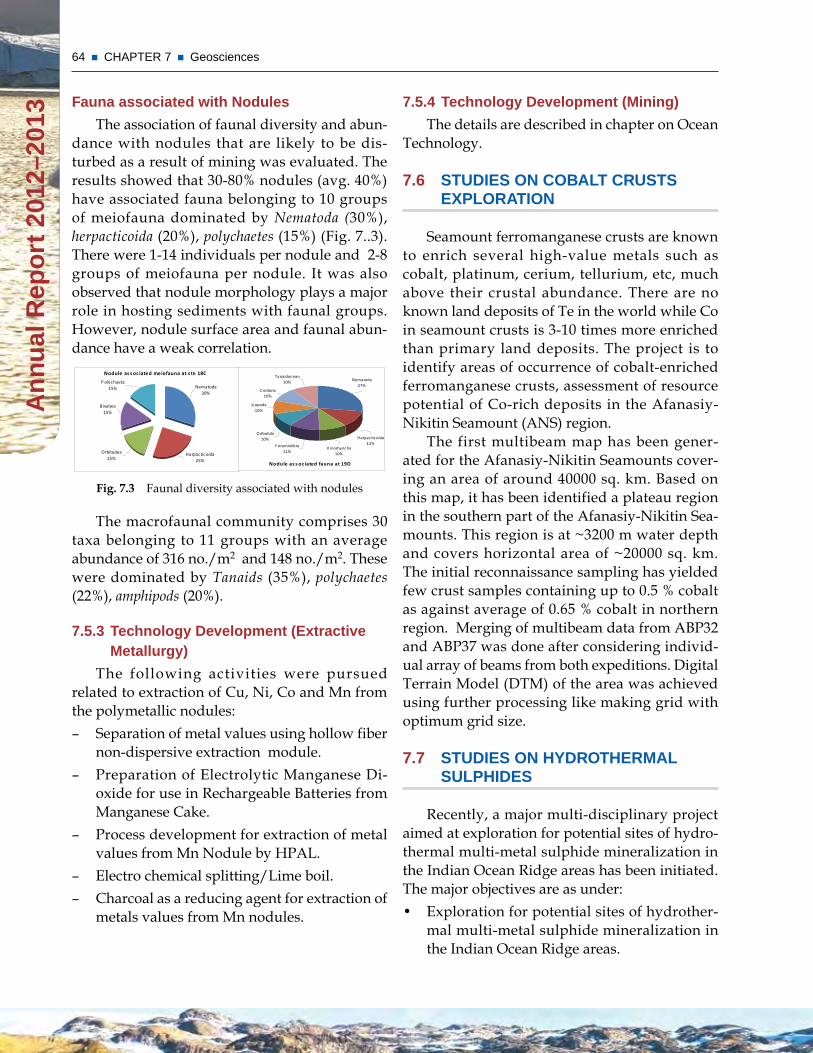
64 CHAPTER 7 Geosciences A
nn
ual
Rep
ort
201
2–20
13
7.5.4 Technology development (mining)
The details are described in chapter on Ocean Technology.
7.6 sTudiEs On COBALT CRusTs ExPLORATiOn
Seamount ferromanganese crusts are known to enrich several high-value metals such as cobalt, platinum, cerium, tellurium, etc, much above their crustal abundance. There are no known land deposits of Te in the world while Co in seamount crusts is 3-10 times more enriched than primary land deposits. The project is to identify areas of occurrence of cobalt-enriched ferromanganese crusts, assessment of resource potential of Co-rich deposits in the Afanasiy-Nikitin Seamount (ANS) region.
The first multibeam map has been gener-ated for the Afanasiy-Nikitin Seamounts cover-ing an area of around 40000 sq. km. Based on this map, it has been identified a plateau region in the southern part of the Afanasiy-Nikitin Sea-mounts. This region is at ~3200 m water depth and covers horizontal area of ~20000 sq. km. The initial reconnaissance sampling has yielded few crust samples containing up to 0.5 % cobalt as against average of 0.65 % cobalt in northern region. Merging of multibeam data from ABP32 and ABP37 was done after considering individ-ual array of beams from both expeditions. Digital Terrain Model (DTM) of the area was achieved using further processing like making grid with optimum grid size.
7.7 sTudiEs On HydROTHERmAL suLPHidEs
Recently, a major multi-disciplinary project aimed at exploration for potential sites of hydro-thermal multi-metal sulphide mineralization in the Indian Ocean Ridge areas has been initiated.The major objectives are as under:• Exploration for potential sites of hydrother-
mal multi-metal sulphide mineralization in the Indian Ocean Ridge areas.
Fauna associated with nodules
The association of faunal diversity and abun-dance with nodules that are likely to be dis-turbed as a result of mining was evaluated. The results showed that 30-80% nodules (avg. 40%) have associated fauna belonging to 10 groups of meiofauna dominated by Nematoda (30%), herpacticoida (20%), polychaetes (15%) (Fig. 7..3). There were 1-14 individuals per nodule and 2-8 groups of meiofauna per nodule. It was also observed that nodule morphology plays a major role in hosting sediments with faunal groups. However, nodule surface area and faunal abun-dance have a weak correlation.
Nodule as s oc iated meiofauna at s tn 18C
Nematoda30%
B ivalves15%
Orbitadea15%
Harpac tic oida25%
P olyc haeta15%
Nodule as s oc iated fauna at 19D
C nidaria10%
Tanaidac ean10%
F oraminifera11%
Is opoda10%
Oribatida10%
K inorhync ha10%
Harpac tic oida12%
Nematoda27%
Fig. 7.3 Faunal diversity associated with nodules
The macrofaunal community comprises 30 taxa belonging to 11 groups with an average abundance of 316 no./m2 and 148 no./m2. These were dominated by Tanaids (35%), polychaetes (22%), amphipods (20%).
7.5.3 Technology development (Extractive metallurgy)
The following activities were pursued related to extraction of Cu, Ni, Co and Mn from the polymetallic nodules: – Separation of metal values using hollow fiber
non-dispersive extraction module.– Preparation of Electrolytic Manganese Di-
oxide for use in Rechargeable Batteries from Manganese Cake.
– Process development for extraction of metal values from Mn Nodule by HPAL.
– Electro chemical splitting/Lime boil.– Charcoal as a reducing agent for extraction of
metals values from Mn nodules.
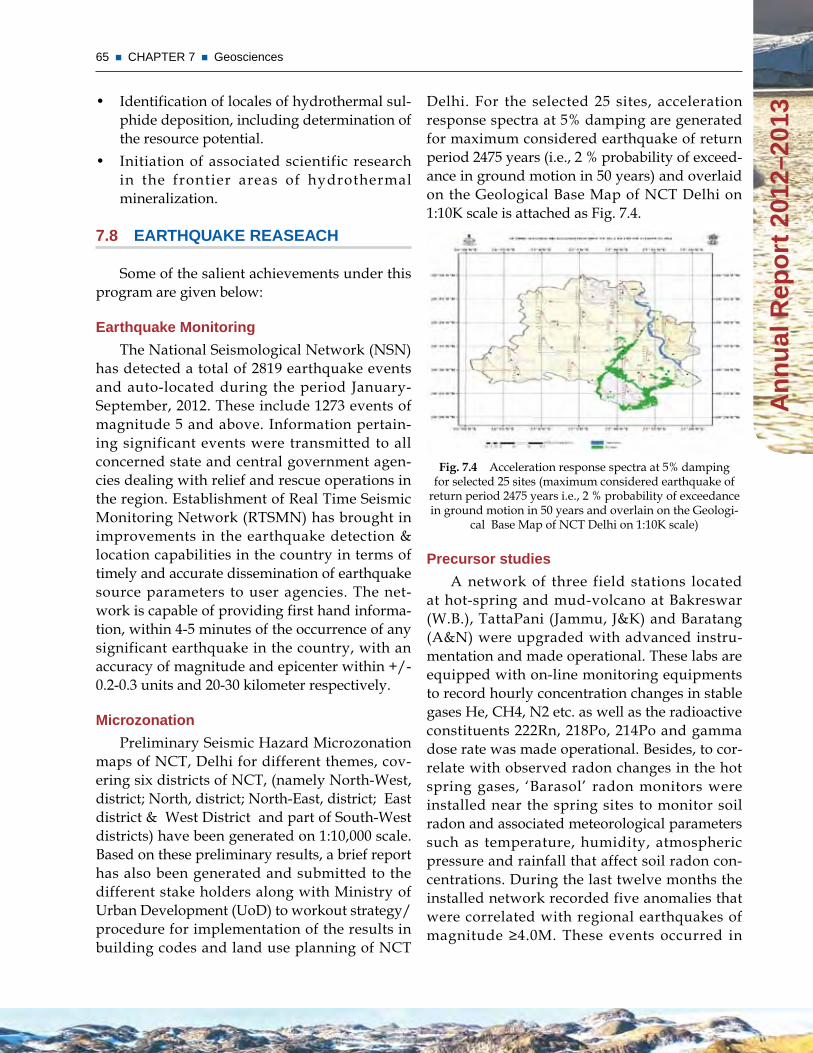
65 CHAPTER 7 Geosciences
An
nu
al R
epo
rt 2
012–
2013
Delhi. For the selected 25 sites, acceleration response spectra at 5% damping are generated for maximum considered earthquake of return period 2475 years (i.e., 2 % probability of exceed-ance in ground motion in 50 years) and overlaid on the Geological Base Map of NCT Delhi on 1:10K scale is attached as Fig. 7.4.
Fig. 7.4 Acceleration response spectra at 5% damping for selected 25 sites (maximum considered earthquake of
return period 2475 years i.e., 2 % probability of exceedance in ground motion in 50 years and overlain on the Geologi-
cal Base Map of NCT Delhi on 1:10K scale)
Precursor studies
A network of three field stations located at hot-spring and mud-volcano at Bakreswar (W.B.), TattaPani (Jammu, J&K) and Baratang (A&N) were upgraded with advanced instru-mentation and made operational. These labs are equipped with on-line monitoring equipments to record hourly concentration changes in stable gases He, CH4, N2 etc. as well as the radioactive constituents 222Rn, 218Po, 214Po and gamma dose rate was made operational. Besides, to cor-relate with observed radon changes in the hot spring gases, ‘Barasol’ radon monitors were installed near the spring sites to monitor soil radon and associated meteorological parameters such as temperature, humidity, atmospheric pressure and rainfall that affect soil radon con-centrations. During the last twelve months the installed network recorded five anomalies that were correlated with regional earthquakes of magnitude ≥4.0M. These events occurred in
• Identification of locales of hydrothermal sul-phide deposition, including determination of the resource potential.
• Initiation of associated scientific research in the frontier areas of hydrothermal mineralization.
7.8 EARTHQuAkE REAsEACH
Some of the salient achievements under this program are given below:
Earthquake monitoring
The National Seismological Network (NSN) has detected a total of 2819 earthquake events and auto-located during the period January-September, 2012. These include 1273 events of magnitude 5 and above. Information pertain-ing significant events were transmitted to all concerned state and central government agen-cies dealing with relief and rescue operations in the region. Establishment of Real Time Seismic Monitoring Network (RTSMN) has brought in improvements in the earthquake detection & location capabilities in the country in terms of timely and accurate dissemination of earthquake source parameters to user agencies. The net-work is capable of providing first hand informa-tion, within 4-5 minutes of the occurrence of any significant earthquake in the country, with an accuracy of magnitude and epicenter within +/- 0.2-0.3 units and 20-30 kilometer respectively.
microzonation
Preliminary Seismic Hazard Microzonation maps of NCT, Delhi for different themes, cov-ering six districts of NCT, (namely North-West, district; North, district; North-East, district; East district & West District and part of South-West districts) have been generated on 1:10,000 scale. Based on these preliminary results, a brief report has also been generated and submitted to the different stake holders along with Ministry of Urban Development (UoD) to workout strategy/procedure for implementation of the results in building codes and land use planning of NCT
66 CHAPTER 7 Geosciences A
nn
ual
Rep
ort
201
2–20
13
mapping was initiated. From the investiga-tions of the earthquake occurrence processes and GPS data analysis, it is inferred that the earthquakes in the Indo-Burmese arc and Sagaing fault region occur due to slip parti-tioning of the predominantly northward rel-ative motion of the India plate with respect to the Sunda plate. Also, the earthquake focal mechanisms in the Indo-Burmese arc region suggest predominantly northward relative motion through dextral strike slip on the NNE-SSW oriented planes and thrust mo-tion on the WNW-ESE oriented planes. The derived stress state suggests that there is no significant variation in the stress state with depth.
• A network of broadband stations was estab-lished in the period 2011-2012 in Rajasthan, northwestern India to image the subsurface structure beneath the region encompass-ing the Malani igneous suites. A teleseismic waveform modeling technique (Receiver Function) was adopted to model the crustal thickness and the shallow sedimentary struc-ture. Preliminary results indicate strong lat-eral variations in the crustal thickness and the thickness of the sedimentary layer. The variation in the arrival of the P-to-S (Pms) conversion from the Moho reflects variation in the crustal thickness/velocities as the sta-tions encompass diverse geological regimes ranging from the Barmer basin to the Ara-valli craton.
• Broadband and long period magnetotelluric data along the east-west profile of length 220 km in Cambay region were acquired at 24 stations with station spacing of 8-10 km, in the frequency range 300-2000 s and 12 long period stations, with station spacing of 15-20 km in the period range 1-10000 s + respec-tively. Preliminary two-dimensional (2D) model was obtained using the galvanic cor-rected data. The preliminary shallow model indicates, high conductive sediments within Cambay graben with resistivity 2-10 ohm,
hypocentral distances ranging from ~250 km to ~1500 km.
Geological studies
• To delineate the offshore extension of Deccan Flood Basalt on the western continental mar-gin of India, multi-channel seismic reflection profiles across the Southwest Continental Margin of India (SWCMI) was analyzed and interpreted. The results suggest presence of westerly dipping seismic reflectors beneath sedimentary strata along the western flank of the Laccadive Ridge. Velocity structure, seismic character, 2D gravity model and geographic locations of the dipping reflec-tors suggest that these reflectors are volcanic in origin, which are interpreted as Seaward Dipping Reflectors (SDRs). The SDRs; 15 to 27 km wide overlain by ~1 km thick sedi-ment; are observed at three locations and characterized by stack of laterally continu-ous, divergent and off-lapping reflectors. Oc-currence of SDRs along western flank of the Laccadive Ridge adjacent to oceanic crust of the Arabian Basin and 2D crustal model de-duced from Free-air gravity anomaly suggest that they are genetically related to incipient volcanism during separation of Madagascar from India.
• Specific studies were carried out using differ-ent geophysical techniques, viz: GPR profiles across the fault section at the Baratang Is-land; Kamraj Nagar, South Andaman; Chidi-yatapu; Collinpur, etc., orientation of fault structures in mud volcano using Electro-magnetic Transient method; fault sections at Brookshabad and Rose Valley, South Anda-man using 2D Electrical Resistivity Imaging. The overall analysis of fault pattern through various geophysical techniques illustrate the major fault system oriented along NW-SE; NE-SW and also along N-S direction in South Andaman.
• To delineate the faults in Indo-Burmese arc region, structural and geomorphological
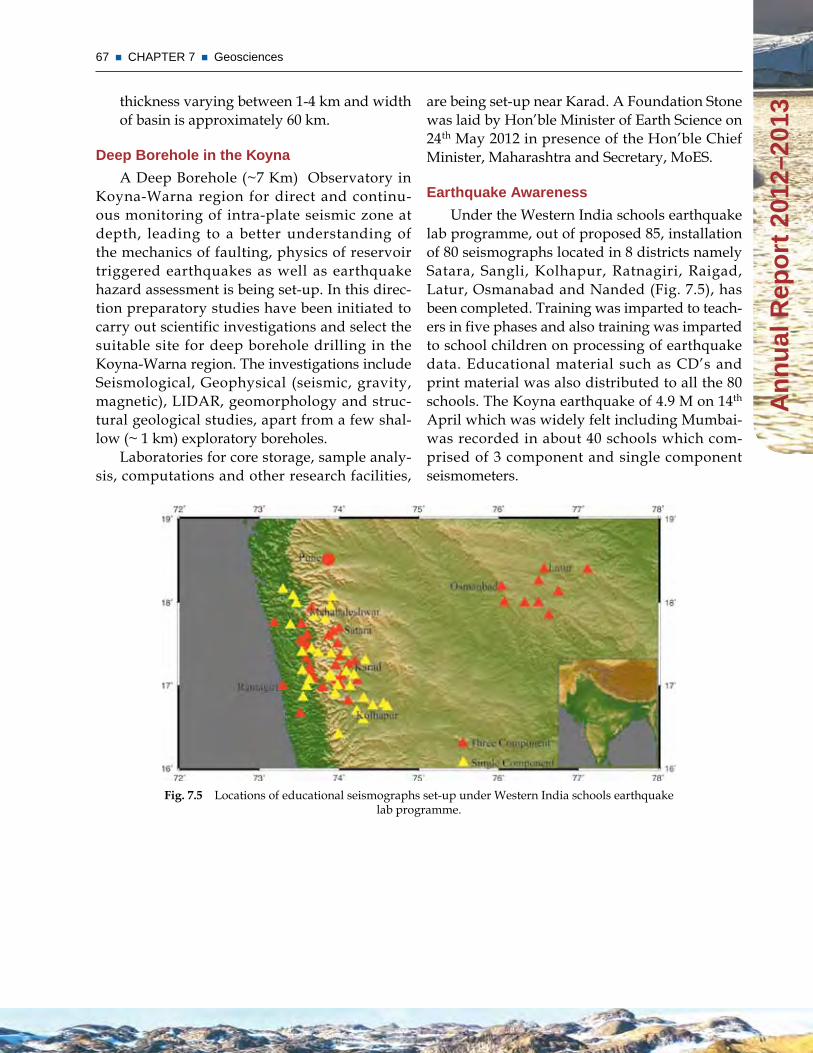
67 CHAPTER 7 Geosciences
An
nu
al R
epo
rt 2
012–
2013
are being set-up near Karad. A Foundation Stone was laid by Hon’ble Minister of Earth Science on 24th May 2012 in presence of the Hon’ble Chief Minister, Maharashtra and Secretary, MoES.
Earthquake Awareness
Under the Western India schools earthquake lab programme, out of proposed 85, installation of 80 seismographs located in 8 districts namely Satara, Sangli, Kolhapur, Ratnagiri, Raigad, Latur, Osmanabad and Nanded (Fig. 7.5), has been completed. Training was imparted to teach-ers in five phases and also training was imparted to school children on processing of earthquake data. Educational material such as CD’s and print material was also distributed to all the 80 schools. The Koyna earthquake of 4.9 M on 14th April which was widely felt including Mumbai-was recorded in about 40 schools which com-prised of 3 component and single component seismometers.
thickness varying between 1-4 km and width of basin is approximately 60 km.
deep Borehole in the koyna
A Deep Borehole (~7 Km) Observatory in Koyna-Warna region for direct and continu-ous monitoring of intra-plate seismic zone at depth, leading to a better understanding of the mechanics of faulting, physics of reservoir triggered earthquakes as well as earthquake hazard assessment is being set-up. In this direc-tion preparatory studies have been initiated to carry out scientific investigations and select the suitable site for deep borehole drilling in the Koyna-Warna region. The investigations include Seismological, Geophysical (seismic, gravity, magnetic), LIDAR, geomorphology and struc-tural geological studies, apart from a few shal-low (~ 1 km) exploratory boreholes.
Laboratories for core storage, sample analy-sis, computations and other research facilities,
Fig. 7.5 Locations of educational seismographs set-up under Western India schools earthquake lab programme.
CHAPTER
8
EARTH sCiEnCE – dATA CEnTREs
Expansion and spreading of artificial (man-made) information structures and
the steady migration of various human activities into cyber space are integral features of develop-ment and progress in the present day world. We need to be concerned with the triad of data, infor-mation and knowledge as well as the delivery of services. In this context, the data centres play a cardinal role in realising the aims and objectives of ESSO. These conditions also shape and deter-mine the current priorities in the purposes and functions of the data centres. The present priori-ties in this area are:(a) substantially strengthening existing data
centres and expanding their activities and es-tablishing new ones;
(b) bringing about integration of all the data cen-tres for smooth access and effective use of their data holdings;
(c) enabling the data centres to seamlessly de-liver data and information services for the national and international comunity.
In addition to working towards the above targets, ESSO is also an active partner in the national efforts in the field of data and its usage. It is worth mentioning that ESSO played a lead role in preparing the vision and also in formulat-ing the implementation plans for the establish-ment of a National Geographical Information System (N-GIS) which is to become a reality in the near future. ESSO is also actively engaged in implementing the National Data Sharing and Accessibility Policy (NDSAP-2012) of the Gov-ernment of India. As part of the latter activ-ity, ESSO-MoES was the second organization to make available data through the Data Portal
India (data.gov.in) established by the Ministry of Communication and Information Technology.
Brief descriptions of the various data cen-tres under ESSO and their ongoing development activities are given below.
8.1 CLimATE dATA CEnTRE
At present, the National Data Centre (NDC) of the India Meteorological Department at Pune is the sole custodian of all meteorological data being collected from various parts of India. The data are available for more than 125 years. The mandate is to archieve quality controlled data and supply for weather prediction, aviation, agri-culture, environmental studies, etc., to research-ers of various institutions and universities.
Long term climate observations are very important for monitoring and predicting climate variability and climate change. To support useful climate services, records of climate data should be assembled in standardized formats, archived in accessible electronic formats, subjected to quality management procedures including qual-ity control. These climate records are accompa-nied by metadata describing the history of the observing site. The present data centre is being improved to provide climate services in the country. The Climate Data Centre will have the following major components:1. Updating of meteorological data base in digi-
tized and GIS format. This will involve data rescue efforts to digitize plenty of meteoro-logical data available in manuscripts and also to develop a metadata base describing the history of the observing site.
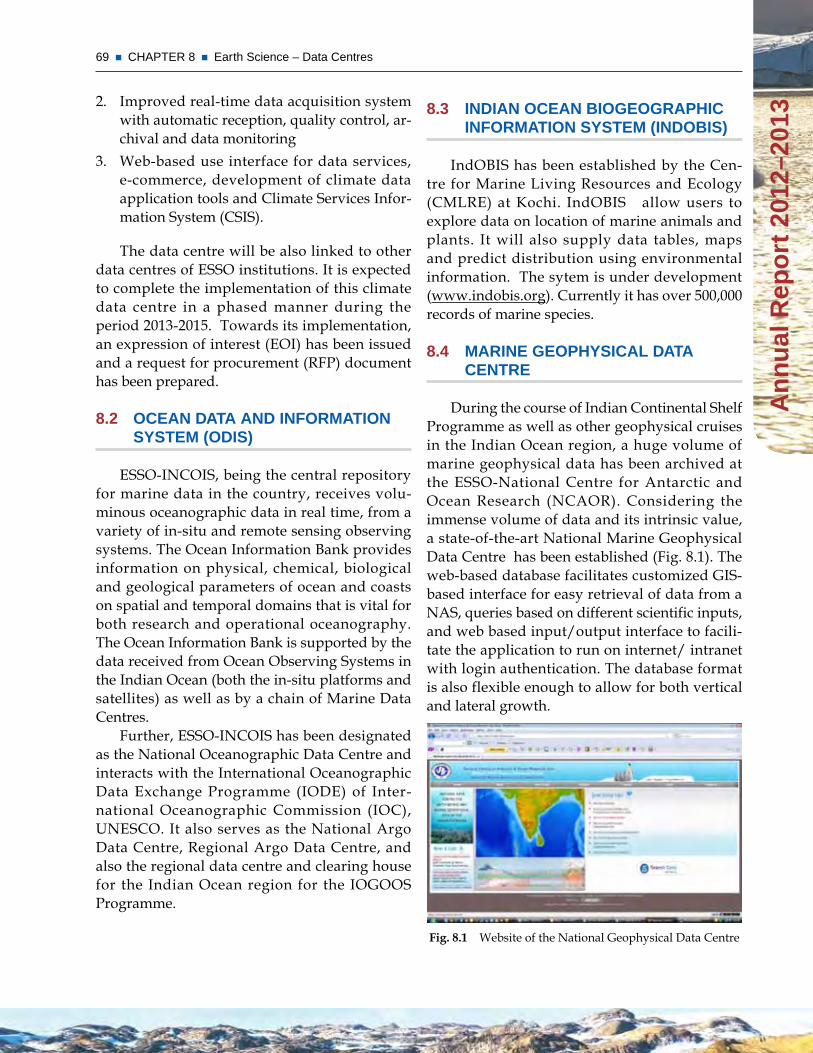
69 CHAPTER 8 Earth Science – Data Centres
An
nu
al R
epo
rt 2
012–
20138.3 indiAn OCEAn BiOGEOGRAPHiC
inFORmATiOn sysTEm (indOBis)
IndOBIS has been established by the Cen-tre for Marine Living Resources and Ecology (CMLRE) at Kochi. IndOBIS allow users to explore data on location of marine animals and plants. It will also supply data tables, maps and predict distribution using environmental information. The sytem is under development (www.indobis.org). Currently it has over 500,000 records of marine species.
8.4 mARinE GEOPHysiCAL dATA CEnTRE
During the course of Indian Continental Shelf Programme as well as other geophysical cruises in the Indian Ocean region, a huge volume of marine geophysical data has been archived at the ESSO-National Centre for Antarctic and Ocean Research (NCAOR). Considering the immense volume of data and its intrinsic value, a state-of-the-art National Marine Geophysical Data Centre has been established (Fig. 8.1). The web-based database facilitates customized GIS-based interface for easy retrieval of data from a NAS, queries based on different scientific inputs, and web based input/output interface to facili-tate the application to run on internet/ intranet with login authentication. The database format is also flexible enough to allow for both vertical and lateral growth.
Fig. 8.1 Website of the National Geophysical Data Centre
2. Improved real-time data acquisition system with automatic reception, quality control, ar-chival and data monitoring
3. Web-based use interface for data services, e-commerce, development of climate data application tools and Climate Services Infor-mation System (CSIS).
The data centre will be also linked to other data centres of ESSO institutions. It is expected to complete the implementation of this climate data centre in a phased manner during the period 2013-2015. Towards its implementation, an expression of interest (EOI) has been issued and a request for procurement (RFP) document has been prepared.
8.2 OCEAn dATA And inFORmATiOn sysTEm (Odis)
ESSO-INCOIS, being the central repository for marine data in the country, receives volu-minous oceanographic data in real time, from a variety of in-situ and remote sensing observing systems. The Ocean Information Bank provides information on physical, chemical, biological and geological parameters of ocean and coasts on spatial and temporal domains that is vital for both research and operational oceanography. The Ocean Information Bank is supported by the data received from Ocean Observing Systems in the Indian Ocean (both the in-situ platforms and satellites) as well as by a chain of Marine Data Centres.
Further, ESSO-INCOIS has been designated as the National Oceanographic Data Centre and interacts with the International Oceanographic Data Exchange Programme (IODE) of Inter-national Oceanographic Commission (IOC), UNESCO. It also serves as the National Argo Data Centre, Regional Argo Data Centre, and also the regional data centre and clearing house for the Indian Ocean region for the IOGOOS Programme.
70 CHAPTER 8 Earth Science – Data Centres A
nn
ual
Rep
ort
201
2–20
13 8.6 nATiOnAL AnTARCTiC dATA CEnTRE (nAdC)
National Antarctic Data Centre, is a reposi-tory of the Antarctic science database for India. The vast amount of data generated from all the Indian Antarctic expeditions to date are being collected, collated, formatted and synthesized for easy accessibility and utilization.
Easy online search tool and online data entry via internet facilitate easy and free exchange of the data to the scientific community. The interna-tional data format called Directory Interchange Format (DIF) has been implemented for easy and reliable exchange of data over the internet keep-ing the concurrency with Australian Antarctic Data Centre and Global Change Master Direc-tory (NASA).
8.5 nATiOnAL sEismOLOGiCAL dATA BAsE CEnTRE (nsdC)
The seismological data from all the network stations is compiled, processed, analyzed and archived systematically at the National Seismo-logical Database Centre (NSDC), on a regular basis. Seismology Division supplies earthquake data / seismicity reports of specific regions to insurance companies, industrial units, power houses, river valley projects, etc.. Consultancy services are also provided to various state and central government agencies on earthquake related matters. Seismological data and earth-quake related information is also supplied to various user agencies dealing with relief and rehabilitation measures, earthquake disaster mit-igation and management related matters, seismic zoning, etc. Earthquake data is also supplied, on request, to various scientific, academic and R&D institutions for research purposes.
CHAPTER
9
CAPACiTy BuiLdinG And HumAn REsOuRCE dEvELOPmEnT
To gain scientific understanding of the individual components of the earth sys-
tem (the atmosphere, ocean, solid earth, bio-sphere) as well as to study the interactions between them and their response to the natu-ral and human induced changes, several pro-grammes have been launched in the XI and XII plan. However there is a dearth of Earth Sci-entists knowledgeable in atmospheric, oceanic and geosciences in the country to work on these programmes. In order to cater to the enormous requirement of skilled manpower in the field of Earth System Sciences and to develop adequate training modules with focus on operational and service-delivery oriented responsibilities of the various units, three training schools were pro-posed during the XI plan. While the Advanced training school in Earth Science and Climate Change was opened during the mid-term stage of the XI plan, the remaining two training cen-ters on oceanography and meteorology will be established during the XII plan.
In addition to the in house training schools, there is a need to continuously upgrade knowl-edge through assimilation of new ideas and application of new knowledge in the field of earth Sciences for improvement of weather and climate forecast. This can be effectively done through adoption of multi-institutional and multi-disciplinary approach involving amal-gamation of expertise existing in various R & D institutes of the country. Therefore ESSO continuously supports focused R & D through networked projects involving various insti-tutes within India and abroad, initiation of aca-demic programmes, and establishment of Chair
Professors, establishment of National Lab facili-ties for benefit of researchers, opening of Centers of Excellence at various Universities with state-of the art research facilities.
9.1 CEnTRE FOR AdvAnCEd TRAininG in EARTH sysTEm sCiEnCEs And CLimATE (CAT EssC)
The Centre for Advanced Training in Earth System Sciences and Climate (CAT-ESSC) was established to create a large pool of trained and dedicated earth system and climate sys-tem scientists with in-depth hands-on expertise on physical processes of the land, ocean, atmo-sphere and cryosphere with special emphasis on modeling. Seventeen meritorious students with Masters in Science/ Graduate Engineers were recruited and provided this induction training extending to eighteen months. The faculty con-sists of scientists from the various units of ESSO and national and international experts. On sat-isfactory completion of the training they will be placed as Scientist-B/C in any institute of the ESSO. In addition the trainees are also given the option to pursue M.Tech. or/and Ph.D before or after induction.
Ten trainee Scientists of the First Batch were deputed to the Abdus Salam International Cen-tre for Theoretical Physics (ICTP), Italy to partici-pate in ENSO-Monsoon Oscillation Workshop held during 31 July – 10 August 2012. Second batch of twenty candidates have been selected in August 2012 as trainee scientists in the academic year 2012-13.
72 CHAPTER 9 CAPACITY BUILDING AND HUMAN RESOURCE DEVELOPMENT A
nn
ual
Rep
ort
201
2–20
13
As part of its training activities, several train-ing programmes during 2012-13 were organ-ised. “The Application of Ocean Colour Remote Sensing in Primary Productivity and Ecosystem Modelling” was organized from 5- 26 February, 2012, jointly by ESSO-INCOIS and Partnership for Observation of the Global Ocean (POGO) and Nippon Foundation (NF). The training programme with 23 participants from various Universities and Research Institutions had par-ticipants from China, Kenya, Indonesia and Tan-zania apart from India. The training programme on “Marine GIS” was organized in collabora-tion with the International Oceanographic Data and Information Exchange (IODE) during 19-23 March 2012 for the benefit of trainees from India. A training course on the use of Tsunami Bul-letins was organized for 25 officers working in the offshore and coastal installations of Reliance Industries Ltd, Mumbai in May, 2012.
9.4 EsTABLisHmEnT OF indiA AFRiCA CEnTRE FOR mEdium RAnGE wEATHER PREdiCTiOn
An India-Africa Centre for Medium Range Weather Forecasting has been planned to fulfill India’s commitments made at the second Africa-India Forum Summit in the area of capacity building in Africa. The establishment of such a centre will enhance African countries’ capabil-ity to implement an end-to-end medium range weather forecasting system for generating and disseminating weather forecasts 3 to 10 days in advance over African continent.
9.5 nATiOnAL GEOCHROnOLOGy FACiLiTy
In order to undertake contemporary cutting-edge research in isotope geochemistry and geo-chronology pertaining to earth, atmospheric, oceanic and planetary sciences, a National Facil-ity for High-resolution Secondary Ionization Mass Spectrometry (HR-SIMS) & Accelerator Mass Spectrometry (AMS) is being set up. The
9.2 TRAininG in OPERATiOnAL mETEOROLOGy
Operational Meteorology training pro-gramme consists of three major training disci-plines namely General Meteorology, Agricultural Meteorology and Meteorological telecommuni-cation & observational systems. Training facili-ties have been recognised as Regional Training Centre (RTC) for Afro-Asian region (RA-II) in the field of General Meteorology & Meteorologi-cal telecommunication & observational systems, respectively by the World Meteorological Orga-nization (WMO) in 1986.
Regular long duration training courses (3-12 months) are conducted for capacity building of the Operational Meteorologists in India and abroad (in RA-II region). During 2012-13, an advanced refresher course on “Application of DWR data in NWP” has been conducted during 19-23 Nov 2012. An international training course on General Meteorology with special emphasize on Aviation Meteorology was given to 6 Bhutan Met personnel for a period of 3 months during October-December 2012 followed by another during February 2013. The prestigious 25th Ses-sion of WMO EC panel of experts on Education and Training was organized during 26-30 March 2012.
9.3 TRAininG CEnTRE FOR OPERATiOnAL OCEAnOGRAPHy
A need for establishing a state-of the art Training School in operational oceanography of International repute was felt when several requests for training were received from Indian Ocean Rim countries, the Bay of Bengal Initia-tive for Multi-Sectoral Technical and Economic Cooperation (BIMSTEC), South Asian Asso-ciation for Regional Cooperation (SAARC), and Regional Integrated Multi-Hazard Early Warning System (RIMES) member countries. The establishment of the International Training School for Operational Oceanography at INCOIS has been approved.
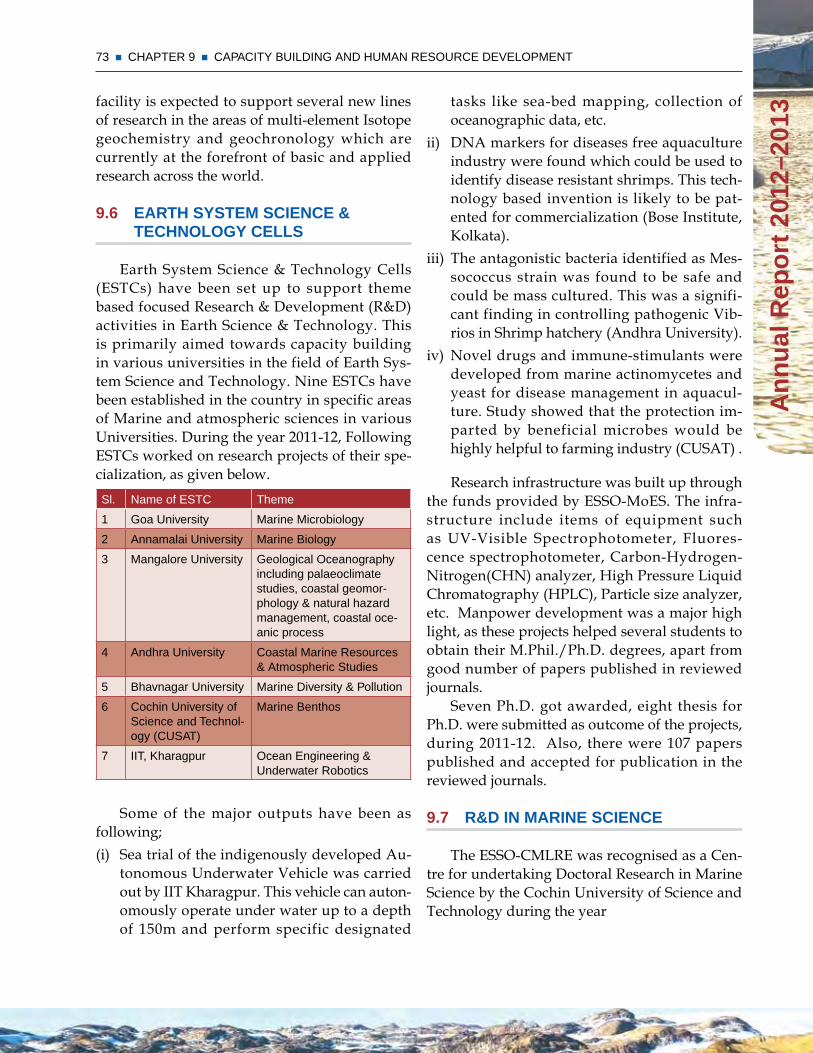
73 CHAPTER 9 CAPACITY BUILDING AND HUMAN RESOURCE DEVELOPMENT
An
nu
al R
epo
rt 2
012–
2013
tasks like sea-bed mapping, collection of oceanographic data, etc.
ii) DNA markers for diseases free aquaculture industry were found which could be used to identify disease resistant shrimps. This tech-nology based invention is likely to be pat-ented for commercialization (Bose Institute, Kolkata).
iii) The antagonistic bacteria identified as Mes-sococcus strain was found to be safe and could be mass cultured. This was a signifi-cant finding in controlling pathogenic Vib-rios in Shrimp hatchery (Andhra University).
iv) Novel drugs and immune-stimulants were developed from marine actinomycetes and yeast for disease management in aquacul-ture. Study showed that the protection im-parted by beneficial microbes would be highly helpful to farming industry (CUSAT) .
Research infrastructure was built up through the funds provided by ESSO-MoES. The infra-structure include items of equipment such as UV-Visible Spectrophotometer, Fluores-cence spectrophotometer, Carbon-Hydrogen-Nitrogen(CHN) analyzer, High Pressure Liquid Chromatography (HPLC), Particle size analyzer, etc. Manpower development was a major high light, as these projects helped several students to obtain their M.Phil./Ph.D. degrees, apart from good number of papers published in reviewed journals.
Seven Ph.D. got awarded, eight thesis for Ph.D. were submitted as outcome of the projects, during 2011-12. Also, there were 107 papers published and accepted for publication in the reviewed journals.
9.7 R&d in mARinE sCiEnCE
The ESSO-CMLRE was recognised as a Cen-tre for undertaking Doctoral Research in Marine Science by the Cochin University of Science and Technology during the year
facility is expected to support several new lines of research in the areas of multi-element Isotope geochemistry and geochronology which are currently at the forefront of basic and applied research across the world.
9.6 EARTH sysTEm sCiEnCE & TECHnOLOGy CELLs
Earth System Science & Technology Cells (ESTCs) have been set up to support theme based focused Research & Development (R&D) activities in Earth Science & Technology. This is primarily aimed towards capacity building in various universities in the field of Earth Sys-tem Science and Technology. Nine ESTCs have been established in the country in specific areas of Marine and atmospheric sciences in various Universities. During the year 2011-12, Following ESTCs worked on research projects of their spe-cialization, as given below.Sl. Name of ESTC Theme
1 Goa University Marine Microbiology
2 Annamalai University Marine Biology
3 Mangalore University Geological Oceanography including palaeoclimate studies, coastal geomor-phology & natural hazard management, coastal oce-anic process
4 Andhra University Coastal Marine Resources & Atmospheric Studies
5 Bhavnagar University Marine Diversity & Pollution
6 Cochin University of Science and Technol-ogy (CUSAT)
Marine Benthos
7 IIT, Kharagpur Ocean Engineering & Underwater Robotics
Some of the major outputs have been as following;(i) Sea trial of the indigenously developed Au-
tonomous Underwater Vehicle was carried out by IIT Kharagpur. This vehicle can auton-omously operate under water up to a depth of 150m and perform specific designated
74 CHAPTER 9 CAPACITY BUILDING AND HUMAN RESOURCE DEVELOPMENT A
nn
ual
Rep
ort
201
2–20
13
also been constituted to consider specific propos-als recommended by the PAMCs and Research Board.
9.8.1 Focussed Research Projects
The following research projects in focussed research areas were funded in 2012-13: i) Geoscience • Exhumation and denudation history of
the western and central Arunachal Hi-malaya: Low Temperature Thermochro-nology investigation to be implemednted - IIT, Bombay.
• “Petrogenesis of mafic and ultramafic magmatism at Madawara Igneous Com-plex, Bundelkhand Craton: Implications for Platinum Group Elements (PGE) Metallogeny” - National Geophysical Re-search Institute, Hyderabad.
• Evaluating structural control on gold min-eralization in Gadag region (Karnataka) – a study based on fabric quantification and kinematic analysis - IIT, Kharagpur.
ii) Atmospheric Research: • Establishment of Pulsed Laser Photolysis
– Laser Induced Fluorescence (PLP-LIF) Spectrometer and measurement of atmo-spheric lifetimes of volatile organic com-pounds in the Earth’s atmosphere IIT, Madras.
• Size-resolved measurements and model-ing of cloud condensation nuclei (CCN) in Indian continental and marine air to be implemented - IIT Madras
• Chemistry of snowfall and Atmospheric aerosols at selected sites in north-western Himalayan ranges - Jawaharlal Nehru University, Delhi
• Understanding of fate and transport of black carbon in the aquatic environment - Tezpur University, Assam.
• Development of a mid-IR Cavity ring-down Spectrometer for high Precision Real-time continuous Monitoring of
A training programme on “The Application of Ocean Colour Remote Sensing in Primary Pro-ductivity and Ecosystem Modelling” was con-ducted in collaboration with Nippon Foundation (NF) – Partnership for Observation of the Global Oceans (POGO) Centre of Excellence in Obser-vational Oceanography at Bermuda Institute of Ocean Sciences (BIOS).
9.8 R & d FundinG in EARTH & ATmOsPHERiC sCiEnCEs
Several projects were launched to improve the understanding of the earth system (the atmo-sphere, ocean, solid earth, biosphere) and their response to the natural and human induced changes. To exploit the research capabilities existing in the country, the areas of funding identified are 1. Atmospheric Science including Climate
Science2. Geoscience3. Ocean Science & Resources4. Hydrology & Cryosphere5. Earth System Technology
The R & D activities include supporting1. Focused research in areas of national
importance; 2. Building indigenous development through
joint collaborative programs3. Human resource development through
opening of Centers of excellence, initiation of academic programmes, establishment of ESSO/MoES Chairs;
4. Setting up of specialized labs as national facilities;
5. National and international collaboration in the field of Earth sciences.
6. National coordinated projects
The programme is monitored by four Project Appraisal and Monitoring Committees (PAMCs) and a Research Board. An Apex committee has
75 CHAPTER 9 CAPACITY BUILDING AND HUMAN RESOURCE DEVELOPMENT
An
nu
al R
epo
rt 2
012–
2013
m to 15 km with a minimum height resolu-tion of 50 m can be measured.
• Advancing Integrated Wireless Sensor Networks for Real-time Monitoring and Detection of Disasters” by Amrita Vishwa Vidyapeetham, Kerala aims to develop and deploy an integrated landslide and flood monitoring and detection system using wire-less sensor network technology. The system will help to predict rainfall induced land-slides in landslide prone area.
9.8.4 Human Resource development & Capacity Building
Indian Center for Space Physics (ICSP), Kolkata: An annual grant for a duration of 5 years has been given to support salary/fellow-ships of scientific manpower for carrying out research in areas of earth system science.
Norwegian Polar Institute: PhD Fellowship for 2 Indian students in Polar Science.
IIT, Gandhinagar: “Varāhamihira ESSO-MoES Chair” and Varāhamihira ESSO-MoES Research Fellow have been established to pro-mote excellence and leadership in research and development in Earth System Science and Engi-neering. Dr Gregory A MacRae , University of Caterbury, New Zealand has joined IIT Gandhi-nagar as Varahamihira ESSO-MoES Chair.
IIT, Delhi: Continuation of Sir Gilbert Walker ESSO-MoES Chair and Sudhansu Kumar Banerji ESSO-MoES Outstanding Faculty Fellow and sponsored M.Tech and PhD programmes in the field of Earth & Atmospheric Sciences programme.
IIT, Kharagpur: Establishment of a “Samu-dragupta ESSO-MoES Chair” in the area of Earth System science and “James Rennell ESSO-MoES Young Fellow” Prof Avijit Gangopadhyay, Umass, Dartmouth has joined IIT Kharagpur as Samudragupta ESSO-MoES Chair
IIT Kanpur : D.N. Wadia MoES Chair at IIT Kanpur. The Chair was established at IIT Kan-pur in 2011 in the area of Earth System Science
Multiple Trace Gases and Stable Isotopic species in the atmosphere- S.N. Bose Na-tional Centre for Basic Sciences, Kolkata
iii) Ocean Science & Services: The projects likely to be funded in the areas of ocean sci-ence include mussel farming, assessment of heavy metal pollution, numerical model validation for prediction of surf zone and rip currents, oil spills and hydrocarbon removal in the marine environment.
9.8.2 Economic Benefits of weather and Hazard services
Impact Assessment and Economic Benefits of Weather and Marine Services – Phase II” has been carried out by the National Council for Applied Economic Research (NCAER), Delhi. The services included (a) Aviation Service (b) Desalination (c) Lobster and Crab fattening (d) Ornamental fish. The study has shown that the Airport Authority of India should earmark Rs 85 crore at current Route Navigation Facility Charges (RNFC) rates or 6 per cent of RNFC to ESSO-IMD for provision of Met services. The overall cost works out to 75 paise per litre of desalinated water for Kavaratti and 10 paise per litre of desalinated water from the project in Thoothukodi using Low temperature Thermal Desalination Technology (LTTD). An important conclusion of the survey was that the with the adoption of LTTD technology in desalination and setting up of hatcheries in coral Islands, ESSO-MoES programmes can increase the domestic product and employment by over 10-20%.
9.8.3 Building indigenous capability
The following two proposals were approved for building indigenous capability: • Development of Ka Band Polarimetric Dop-
pler Radar for cloud profiling by Society for Applied Microwave Electronics Engineering and Research (SAMEER), Mumbai, a Society under DIT. SAMEER will design, develop and fabricate Ka Band (~ 35 GHz) Polari-metric cloud radar with scanning capability wherein cloud parameters from height of 300
76 CHAPTER 9 CAPACITY BUILDING AND HUMAN RESOURCE DEVELOPMENT A
nn
ual
Rep
ort
201
2–20
13
• Cosmic Rays-Cloud-Climate Conun-drum: Can Ion-Aerosol Near-Cloud Mechanism Explain the Observed Cor-relations? – IIT, Kanpur. It aims to study the cosmic ray- cloud connection and its impact on climate. The MOdel of Global Electrical Circuit (MOGEC) has been de-veloped to quantify the electrification of the aerosols in the altitude range from 5 - 24 km. A polydisperse distribution of aerosols is used in the model, which are obtained from the measurements of the to-tal aerosol concentration. The uncharged aerosol concentration is compared with the measurements. In the upper tropo-sphere and in the middle stratosphere, there is very good qualitative agreement between measurements and the model-ing, for uncharged aerosols, where most of the aerosols are charged.
ii) Geoscience • River dynamics and Flood Risk evalu-
ation of the Kosi River, North Bihar plains: an integrated approach” - IIT Kanpur. The proposal is aimed at under-standing river dynamics and flood risk evaluation of the Kosi River in north Bi-har and development of flood manage-ment strategies. The electrical resistivity data suggest the occurrence of 30-40 me-ters thick sand bodies buried below thin silty cover. A detailed field survey using kinematic GPS was carried out in April-May 2012 to generate cross sections of the Kosi River at the reaches downstream of barrage, which are characterized by high potential of channel avulsion.
• Monsoon driven changes as preserved in marine sediments off the Gujarat and Konkan coasts during the past 20Kys - IIT Kharagpur and NCAOR, Goa. The project is based on foraminiferal and geo-chemical proxies from deep-sea samples from the study area. 890 samples col-lected from 6 locations (holes/cores) have been analysed for benthic foraminiferal.
and Climate Change. Prof S.K.Tandon has joined as the Chair.
Koteshwaram ESSO-MoES Chair Professor-ship in the area of Aviation Services, Airborne Observations, Atmospheric Technology has been given to AVM Dr. Ajit Tyagi and ESSO-MoES Panikkar Professorship in the area of Cryo-sphere and Geo-science Research has been given to Shri Rasik Ravindra.
9.8.5 Progress of ongoing projects
A. Focussed Researchi) Atmospheric Research • Research for Seasonal Prediction of
the Indian Monsoon (RESPIM) – IISc, Bangalore The project with an aim to improve the accuracy in simulating the inter-annual variation of the Indian sum-mer monsoon rainfall by different At-mospheric General Circulation Models (AGCM) and Coupled Global Climate Models (CGCM) has been completed. A detailed analysis of the simulation of the Indian monsoon by CGCMs and AGCMs showed that there are large biases in simulating even the mean summer mon-soon rainfall. On the inter-annual scale it was found that simulation of the ENSO- monsoon linkage was realistic though the linkage of the Indian monsoon with Indian Ocean was not realistic.
• Design and Development of a Uni-fied Modelling System for Seam-less Weather and Climate Predictions of Monsoons – IIT, Delhi. The reference model LMDZ is being re-engineered for implementation on the GPU Cluster. The initial spin up in speed of computation for some of the modules implemented on a single GPU Compute node is by an order of magnitude in comparison to CPUs. Work is in progress to imple-ment the complete reference model on the GPU cluster which is now ready for exploitation.
77 CHAPTER 9 CAPACITY BUILDING AND HUMAN RESOURCE DEVELOPMENT
An
nu
al R
epo
rt 2
012–
2013
August 2012 to the CTCZ team. The CTCZ team could successfully collect the ocean component data and are analyzing it further to study the peculiarity of mon-soon 2012.
D. Human Resource Development • NIAS, Bangalore: National Institute of
Advanced Studies (NIAS) has been given an annual grant for 5 years to support the various research and development activi-ties including Ph.D programme in partic-ular in the area of environment, climate change and energy sector. NIAS has car-ried out a study for estimating the year-round energy savings through advancing the Indian Standard Time (IST) and also through introduction of daylight sav-ing time (DST). The study concluded that advancing IST by half an hour saves more energy than the corresponding DST option.
E. National facility • Laser Raman Spectrometer: Center for
Earth Science Studies (CESS), Trivan-drum: The facility will be used to study the application of fluid inclusion tech-nique for oil exploration by using the drill core/cutting samples from ONGC. Preparation of fluid inclusion plates in the Lapidary Facility in CESS has been initiated. The observance of Hydrocar-bon Fluid Inclusions (HCFIs) for the first time in India from quartz grains in the sedimentary rock cuttings collected at a depth of 3055m-3060m from the RV-1 Well (ONGC) in the Ratnagiri offshore basin has been reported.
All samples from 4 holes/cores have been dated using AMC 14C dating tech-niques at NOSAMS facility, Woods Hole, USA.
iii) Climate Change Assessing the Impacts of Climate and Land
Cover Changes on Hydrology - University of Kashmir. Historical hydrological and climatic data has been procured for 24 watersheds of the Jhelum basin. PRECIS Regional Climate Model has been set up and the simulations for various emission scenarios are in progress.
B. Building indigenous capability • Under the New Millennium India Tech-
nology Leadership Initiative (NMITLI) project initiated in April 2010 jointly with the Council of Scientific and Industrial Research (CSIR) for producing biofuel from marine microalgae, a 200 km test-run of a regular vehicle on neat (B100) biodiesel from marine microalgal source was carried out on March 30, 2012.
• Computational Aspects of Numerical Weather Prediction at C-DAC, Pune and NCMRWF, NOIDA. Global Unified Model was successfully installed on the Linux Cluster (Param-Vayu) and tested at a coarse horizontal resolution (3.75 x 2.5 degree) with 70 vertical levels.
C. National Coordinated program • Continental Tropical Convergence Zone
(CTCZ) involving multi-institutes is a National coordinated program and aims to understand the variability of convec-tion/rainfall over the Indian monsoon through various field observations and modeling studies during monsoon. In order to understand the north-south gradients in the thermal field over the Bay and to test hypotheses on the north-ward propagation of monsoon systems, ESSO-MoES provided ship time along with facility for launching GPS sondes on its two Research Vessels, Sagar Kanya and Sagar Nidhi from 9 July-8
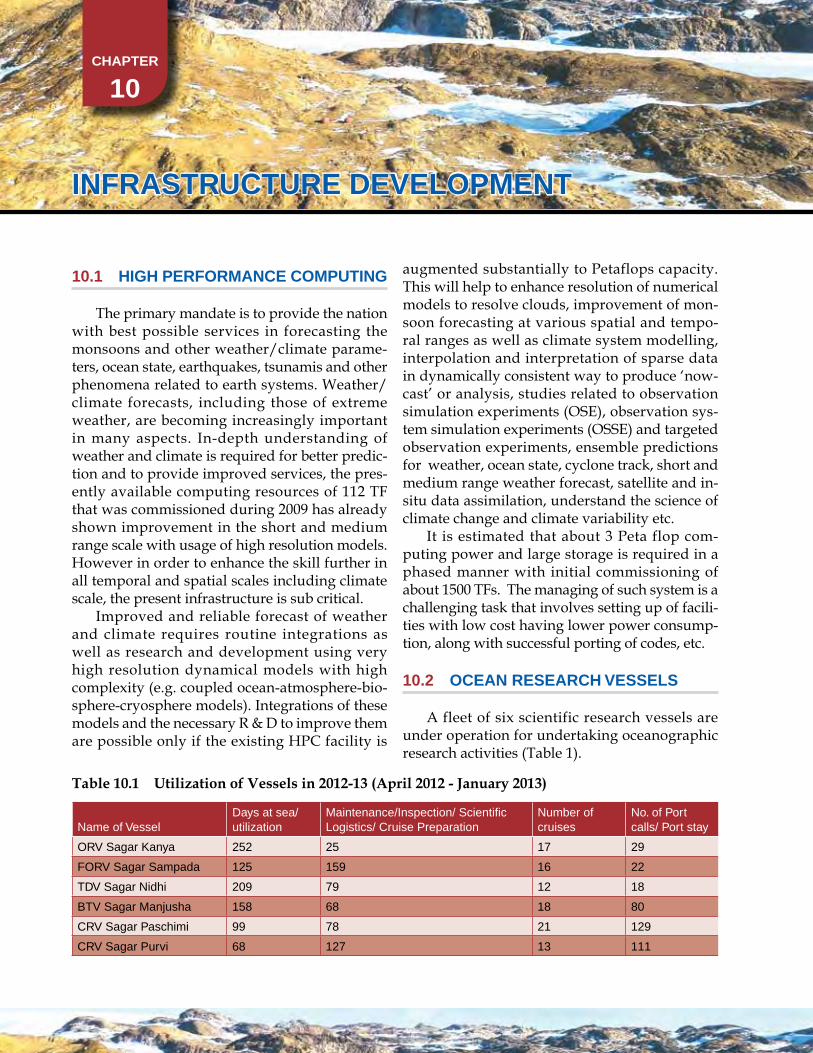
CHAPTER
10
inFRAsTRuCTuRE dEvELOPmEnT
10.1 HiGH PERFORmAnCE COmPuTinG
The primary mandate is to provide the nation with best possible services in forecasting the monsoons and other weather/climate parame-ters, ocean state, earthquakes, tsunamis and other phenomena related to earth systems. Weather/climate forecasts, including those of extreme weather, are becoming increasingly important in many aspects. In-depth understanding of weather and climate is required for better predic-tion and to provide improved services, the pres-ently available computing resources of 112 TF that was commissioned during 2009 has already shown improvement in the short and medium range scale with usage of high resolution models. However in order to enhance the skill further in all temporal and spatial scales including climate scale, the present infrastructure is sub critical.
Improved and reliable forecast of weather and climate requires routine integrations as well as research and development using very high resolution dynamical models with high complexity (e.g. coupled ocean-atmosphere-bio-sphere-cryosphere models). Integrations of these models and the necessary R & D to improve them are possible only if the existing HPC facility is
augmented substantially to Petaflops capacity. This will help to enhance resolution of numerical models to resolve clouds, improvement of mon-soon forecasting at various spatial and tempo-ral ranges as well as climate system modelling, interpolation and interpretation of sparse data in dynamically consistent way to produce ‘now-cast’ or analysis, studies related to observation simulation experiments (OSE), observation sys-tem simulation experiments (OSSE) and targeted observation experiments, ensemble predictions for weather, ocean state, cyclone track, short and medium range weather forecast, satellite and in-situ data assimilation, understand the science of climate change and climate variability etc.
It is estimated that about 3 Peta flop com-puting power and large storage is required in a phased manner with initial commissioning of about 1500 TFs. The managing of such system is a challenging task that involves setting up of facili-ties with low cost having lower power consump-tion, along with successful porting of codes, etc.
10.2 OCEAn REsEARCH vEssELs
A fleet of six scientific research vessels are under operation for undertaking oceanographic research activities (Table 1).
Table 10.1 Utilization of Vessels in 2012-13 (April 2012 - January 2013)
Name of VesselDays at sea/ utilization
Maintenance/Inspection/ Scientific Logistics/ Cruise Preparation
Number of cruises
No. of Port calls/ Port stay
ORV Sagar Kanya 252 25 17 29
FORV Sagar Sampada 125 159 16 22
TDV Sagar Nidhi 209 79 12 18
BTV Sagar Manjusha 158 68 18 80
CRV Sagar Paschimi 99 78 21 129
CRV Sagar Purvi 68 127 13 111
79 CHAPTER 10 infrastructure development
An
nu
al R
epo
rt 2
012–
2013
different water depths upto 6000 meter along with Chlorophyll, Rhodamine, pH, etc. profiler. Separate sampling room is built adjacent to the wet lab and geological core cutter lab. Scientific winches like hydrographic winch, CTD winch, Active heave compensation winch, etc. are avail-able onboard for deployment and retrieval of scientific equipments. All winches are facilitated with 6000 meter length cable. Vessel was dry-docked at Dry-Docks World, Singapore to com-plete dry-dock and afloat repairs.
Buoy Tender vessel (BTv) sagar manjusha
BTV Sagar Manjusha was actively involved in providing platform for deployment and retrieval of data buoys, suction pile operation, radiometer testing, water sampling and bathym-etry survey.
Coastal Research vessels (CRvs) sagar Purvi and sagar Paschimi
CRVs Sagar Purvi and Sagar Paschimi were mainly used for the implementation of Coastal Ocean Monitoring and Prediction System (COMAPS) and Integrated Coastal and Marine Area Management (ICMAM) programmes. In addition, Sagar Paschimi was used for Kal-pasar project and Marine Bio-technology-NIOT for water sampling. Sagar Purvi had under-gone major overhauling of main and auxiliary engines at Cochin to cater the statutory / Class requirement.
The process of acquisition of two coastal research vessels as a replacement of CRVs Sagar Purvi and Sagar Paschimi, has been initiated.
10.3 AiRBORnE PLATFORms
Targeted atmospheric observations are required for better understanding of the complex atmospheric process involving aerosols, clouds and their interaction, for their accurate represen-tation in weather and climate models. Ground based and satellite observations have some limi-tations in making targeted atmospheric observa-tions and thus highlight the need for airborne
Oceanographic Research vessel (ORv) sagar kanya
ORV Sagar Kanya continued to provide ser-vices to scientists from several national insti-tutions and universities. The vessel was also deployed for the National Institute of Ocean Technology-Ocean Observation Systems (NIOT-OOS); Sustained Indian Biogeochemistry and Ecosystem Research (SIBER), Science Applica-tions International Corporation (SAIC) Buoy, The Continental Tropical Convergence Zone (CTCZ); the Research Moored Array for Afri-can-Asian-Australian Monsoon Analysis and Prediction (RAMA) moorings; Hydrothermal Mineralisation in the Indian Ocean; Current measurements and Geotracers, project.
Fishery Oceanographic Research vessel (FORv) sagar sampada
FORV Sagar Sampada undertook scientific cruises within the Indian EEZ towards undertak-ing environment and productivity surveys, Geo-tracers programme, SIBER, Studies on fish eggs and larvae, Deep-sea fishery survey and studies on marine benthos. Other scheduled activities are IndOBIS survey, and the Southern Ocean expedition.
Technology demonstration vessel (Tdv) sagar nidhi
TDV Sagar Nidhi, the sophisticated ice class multi-disciplinary vessel having fully automatic diesel-electric propulsion with azimuth and bow thrusters, Dynamic Positioning class II (DP II) system, is being used essentially for demon-stration of ocean technologies, viz. Remotely Operable Submersible (ROSUB), Automatic Coring System (ACS), In-situ Soil Tester, and shallow water mining system, etc. The ves-sel was also utilized for deployment of RAMA mooring, ADCP Moorings, and deployment & retrieval of tsunami and OMNI buoys. The ves-sel is expected to undertake the Southern Ocean Expedition during the year. The Conductivity, Temperature, Depth recorder (CTD) Rosette is also commissioned to collect water samples at
80 CHAPTER 10 infrastructure development A
nn
ual
Rep
ort
201
2–20
13
proposed to procure a twin Turbo-Prop Engine aircraft along with a host of observational sen-sors for measurements of atmospheric processes including weather parameters, aerosol, trace gases, radiation, atmospheric electricity and microphysics of clouds. The proposed aircraft also will be equipped with a weather radar and atmospheric LIDAR
measurements. The recent successful experiment CAIPEEX (Cloud Aerosol Interaction and Pre-cipitation Enhancement Experiment) by ESSO-IITM Pune using airborne platforms highlighted the need and use for airborne platforms for tar-geted atmospheric observations. With this moti-vation, a programme for the National Facility for Airborne Research (NAFR) under the 12th Five Year plan (2012-2017) has been initiated. It is
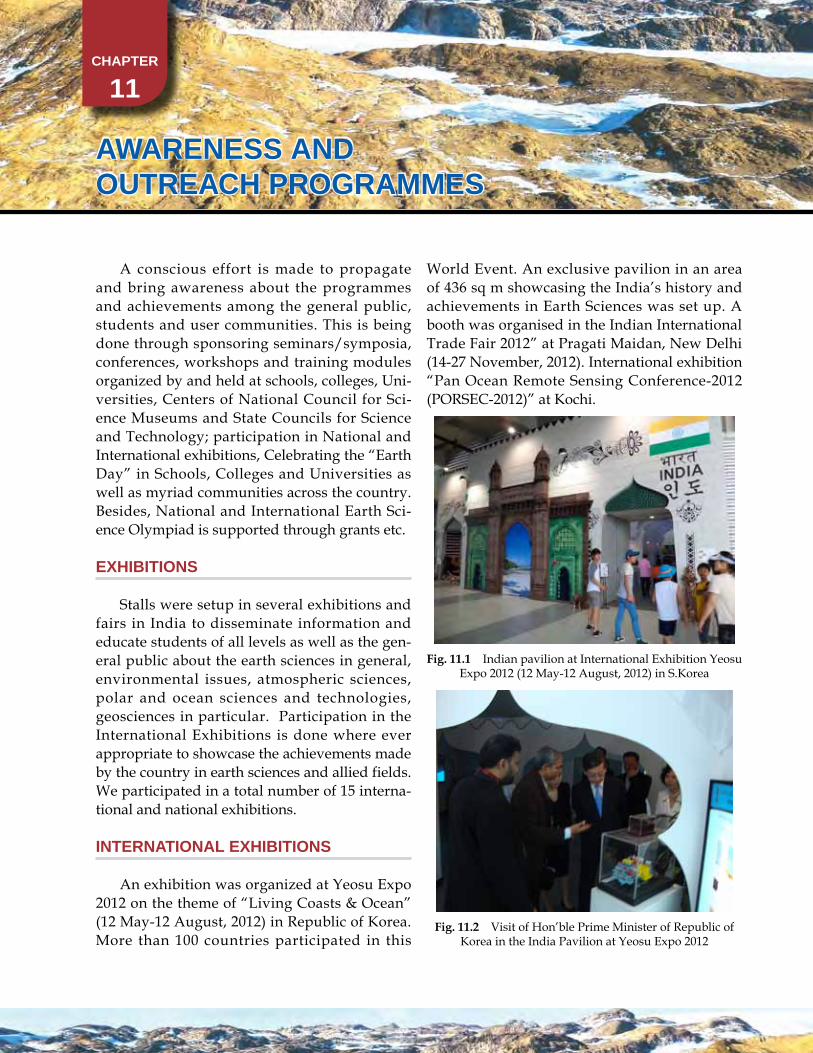
CHAPTER
11
AwAREnEss And OuTREACH PROGRAmmEs
A conscious effort is made to propagate and bring awareness about the programmes and achievements among the general public, students and user communities. This is being done through sponsoring seminars/symposia, conferences, workshops and training modules organized by and held at schools, colleges, Uni-versities, Centers of National Council for Sci-ence Museums and State Councils for Science and Technology; participation in National and International exhibitions, Celebrating the “Earth Day” in Schools, Colleges and Universities as well as myriad communities across the country. Besides, National and International Earth Sci-ence Olympiad is supported through grants etc.
ExHiBiTiOns
Stalls were setup in several exhibitions and fairs in India to disseminate information and educate students of all levels as well as the gen-eral public about the earth sciences in general, environmental issues, atmospheric sciences, polar and ocean sciences and technologies, geosciences in particular. Participation in the International Exhibitions is done where ever appropriate to showcase the achievements made by the country in earth sciences and allied fields. We participated in a total number of 15 interna-tional and national exhibitions.
inTERnATiOnAL ExHiBiTiOns
An exhibition was organized at Yeosu Expo 2012 on the theme of “Living Coasts & Ocean” (12 May-12 August, 2012) in Republic of Korea. More than 100 countries participated in this
World Event. An exclusive pavilion in an area of 436 sq m showcasing the India’s history and achievements in Earth Sciences was set up. A booth was organised in the Indian International Trade Fair 2012” at Pragati Maidan, New Delhi (14-27 November, 2012). International exhibition “Pan Ocean Remote Sensing Conference-2012 (PORSEC-2012)” at Kochi.
Fig. 11.1 Indian pavilion at International Exhibition Yeosu Expo 2012 (12 May-12 August, 2012) in S.Korea
Fig. 11.2 Visit of Hon’ble Prime Minister of Republic of Korea in the India Pavilion at Yeosu Expo 2012
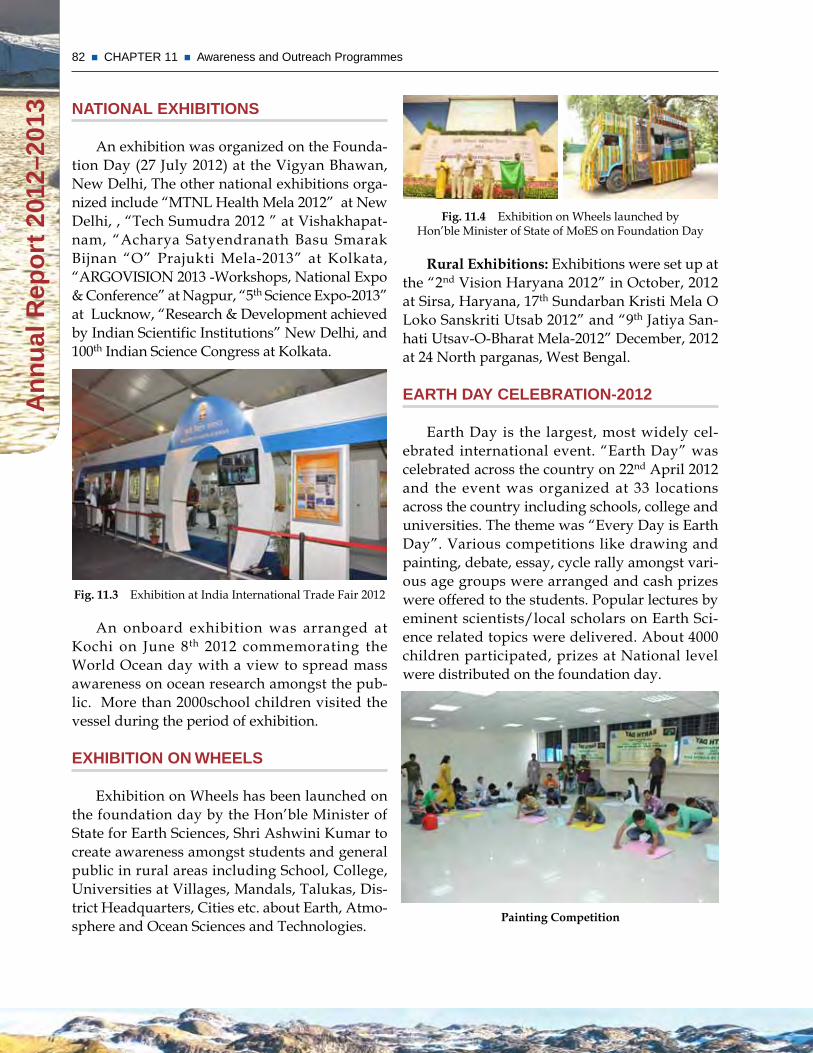
82 CHAPTER 11 Awareness and Outreach Programmes A
nn
ual
Rep
ort
201
2–20
13
Fig. 11.4 Exhibition on Wheels launched by Hon’ble Minister of State of MoES on Foundation Day
Rural Exhibitions: Exhibitions were set up at the “2nd Vision Haryana 2012” in October, 2012 at Sirsa, Haryana, 17th Sundarban Kristi Mela O Loko Sanskriti Utsab 2012” and “9th Jatiya San-hati Utsav-O-Bharat Mela-2012” December, 2012 at 24 North parganas, West Bengal.
EARTH dAy CELEBRATiOn-2012
Earth Day is the largest, most widely cel-ebrated international event. “Earth Day” was celebrated across the country on 22nd April 2012 and the event was organized at 33 locations across the country including schools, college and universities. The theme was “Every Day is Earth Day”. Various competitions like drawing and painting, debate, essay, cycle rally amongst vari-ous age groups were arranged and cash prizes were offered to the students. Popular lectures by eminent scientists/local scholars on Earth Sci-ence related topics were delivered. About 4000 children participated, prizes at National level were distributed on the foundation day.
Painting Competition
nATiOnAL ExHiBiTiOns
An exhibition was organized on the Founda-tion Day (27 July 2012) at the Vigyan Bhawan, New Delhi, The other national exhibitions orga-nized include “MTNL Health Mela 2012” at New Delhi, , “Tech Sumudra 2012 ” at Vishakhapat-nam, “Acharya Satyendranath Basu Smarak Bijnan “O” Prajukti Mela-2013” at Kolkata, “ARGOVISION 2013 -Workshops, National Expo & Conference” at Nagpur, “5th Science Expo-2013” at Lucknow, “Research & Development achieved by Indian Scientific Institutions” New Delhi, and 100th Indian Science Congress at Kolkata.
Fig. 11.3 Exhibition at India International Trade Fair 2012
An onboard exhibition was arranged at Kochi on June 8th 2012 commemorating the World Ocean day with a view to spread mass awareness on ocean research amongst the pub-lic. More than 2000school children visited the vessel during the period of exhibition.
ExHiBiTiOn On wHEELs
Exhibition on Wheels has been launched on the foundation day by the Hon’ble Minister of State for Earth Sciences, Shri Ashwini Kumar to create awareness amongst students and general public in rural areas including School, College, Universities at Villages, Mandals, Talukas, Dis-trict Headquarters, Cities etc. about Earth, Atmo-sphere and Ocean Sciences and Technologies.
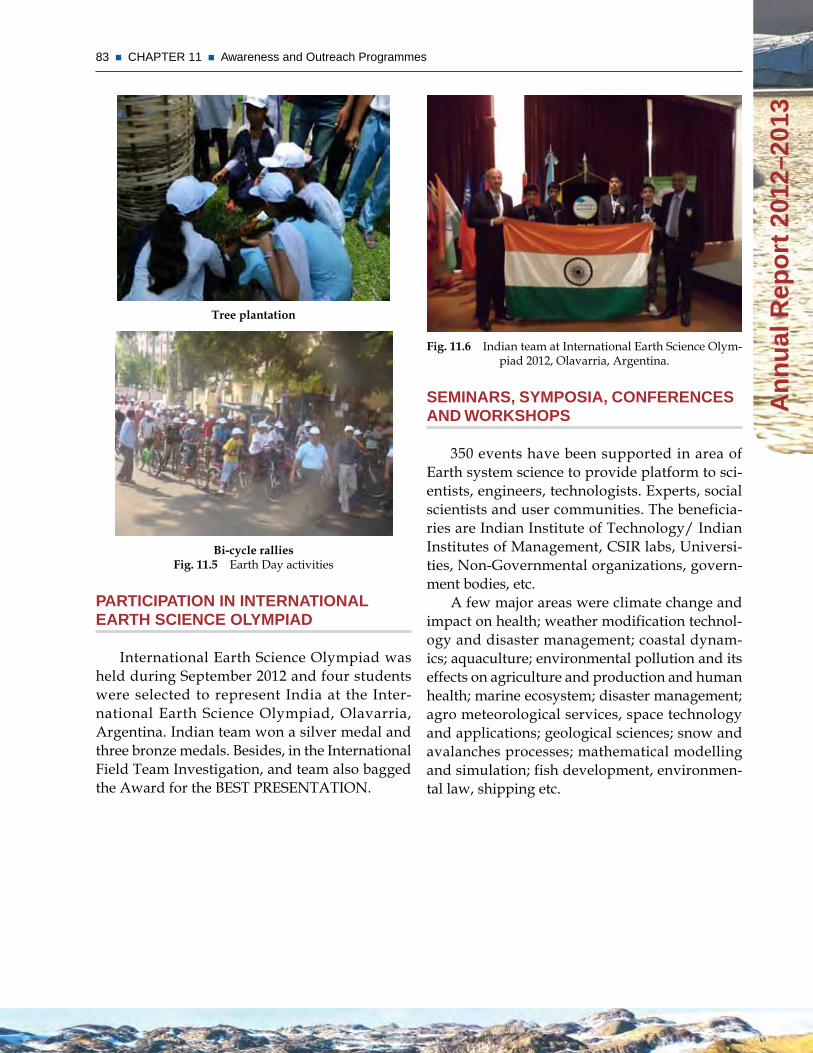
83 CHAPTER 11 Awareness and Outreach Programmes
An
nu
al R
epo
rt 2
012–
2013
Fig. 11.6 Indian team at International Earth Science Olym-piad 2012, Olavarria, Argentina.
sEminARs, symPOsiA, COnFEREnCEs And wORksHOPs
350 events have been supported in area of Earth system science to provide platform to sci-entists, engineers, technologists. Experts, social scientists and user communities. The beneficia-ries are Indian Institute of Technology/ Indian Institutes of Management, CSIR labs, Universi-ties, Non-Governmental organizations, govern-ment bodies, etc.
A few major areas were climate change and impact on health; weather modification technol-ogy and disaster management; coastal dynam-ics; aquaculture; environmental pollution and its effects on agriculture and production and human health; marine ecosystem; disaster management; agro meteorological services, space technology and applications; geological sciences; snow and avalanches processes; mathematical modelling and simulation; fish development, environmen-tal law, shipping etc.
Tree plantation
Bi-cycle rallies Fig. 11.5 Earth Day activities
PARTiCiPATiOn in inTERnATiOnAL EARTH sCiEnCE OLymPiAd
International Earth Science Olympiad was held during September 2012 and four students were selected to represent India at the Inter-national Earth Science Olympiad, Olavarria, Argentina. Indian team won a silver medal and three bronze medals. Besides, in the International Field Team Investigation, and team also bagged the Award for the BEST PRESENTATION.
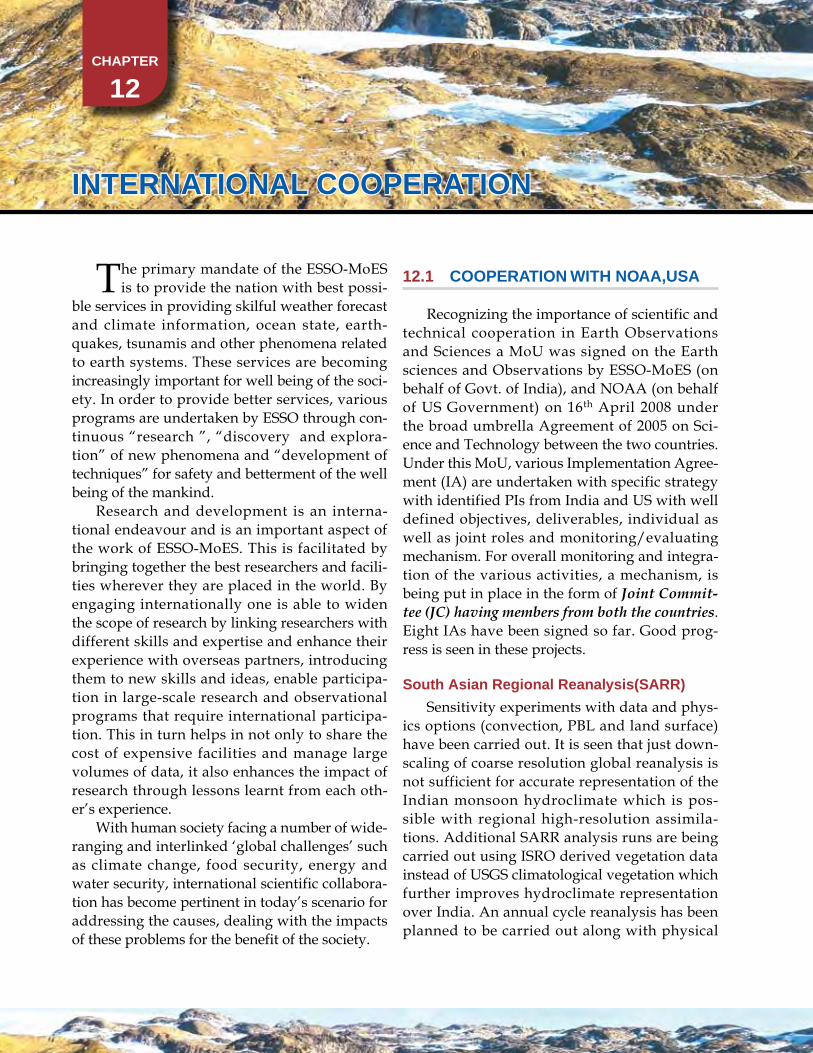
CHAPTER
12
inTERnATiOnAL COOPERATiOn
The primary mandate of the ESSO-MoES is to provide the nation with best possi-
ble services in providing skilful weather forecast and climate information, ocean state, earth-quakes, tsunamis and other phenomena related to earth systems. These services are becoming increasingly important for well being of the soci-ety. In order to provide better services, various programs are undertaken by ESSO through con-tinuous “research ”, “discovery and explora-tion” of new phenomena and “development of techniques” for safety and betterment of the well being of the mankind.
Research and development is an interna-tional endeavour and is an important aspect of the work of ESSO-MoES. This is facilitated by bringing together the best researchers and facili-ties wherever they are placed in the world. By engaging internationally one is able to widen the scope of research by linking researchers with different skills and expertise and enhance their experience with overseas partners, introducing them to new skills and ideas, enable participa-tion in large-scale research and observational programs that require international participa-tion. This in turn helps in not only to share the cost of expensive facilities and manage large volumes of data, it also enhances the impact of research through lessons learnt from each oth-er’s experience.
With human society facing a number of wide-ranging and interlinked ‘global challenges’ such as climate change, food security, energy and water security, international scientific collabora-tion has become pertinent in today’s scenario for addressing the causes, dealing with the impacts of these problems for the benefit of the society.
12.1 COOPERATiOn wiTH nOAA,usA
Recognizing the importance of scientific and technical cooperation in Earth Observations and Sciences a MoU was signed on the Earth sciences and Observations by ESSO-MoES (on behalf of Govt. of India), and NOAA (on behalf of US Government) on 16th April 2008 under the broad umbrella Agreement of 2005 on Sci-ence and Technology between the two countries. Under this MoU, various Implementation Agree-ment (IA) are undertaken with specific strategy with identified PIs from India and US with well defined objectives, deliverables, individual as well as joint roles and monitoring/evaluating mechanism. For overall monitoring and integra-tion of the various activities, a mechanism, is being put in place in the form of Joint Commit-tee (JC) having members from both the countries. Eight IAs have been signed so far. Good prog-ress is seen in these projects.
south Asian Regional Reanalysis(sARR)
Sensitivity experiments with data and phys-ics options (convection, PBL and land surface) have been carried out. It is seen that just down-scaling of coarse resolution global reanalysis is not sufficient for accurate representation of the Indian monsoon hydroclimate which is pos-sible with regional high-resolution assimila-tions. Additional SARR analysis runs are being carried out using ISRO derived vegetation data instead of USGS climatological vegetation which further improves hydroclimate representation over India. An annual cycle reanalysis has been planned to be carried out along with physical
85 CHAPTER 12 International Cooperation
An
nu
al R
epo
rt 2
012–
2013
nonlinear technique like neural network in order to improve the performance of the forecast.
Climate monitoring and Prediction system for the south Asian Region
Based on various observational datasets a set of tools are being developed to monitor on real time the current state of climate over the South Asian Region using observational datas-ets based on the global data assimilation system and renalysis; outgoing longwave radiation; sea surface temperatures, estimate of soil moisture, surface temperature and rainfall etc.
Tropical Cyclone Research
This involves development and implementa-tion of a state-of-the-art NWP modelling system for accurate tropical cyclone track and intensity prediction for the Bay of Bengal and the Arabian Sea
insAT 3d data Processing
This involves development and evaluation of algorithms and techniques for satellite-based precipitation estimates, sea surface temperature, humidity and temperature profiles, ozone etc. using INSAT-3D satellite data over India
Tsunami science, detection, Analysis, modeling & Forecasting
This involves joint working towards improved capability to develop and sustain tsunami detection and analysis systems, and other early warning capabilities in meteorologi-cal, hydrological, oceanographic aspects that will assist in effective warnings and disaster mitigation.
dynamical seasonal Prediction of indian summer monsoon Rainfall (Establishment of monsoon desk)
Indian and US scientists are working jointly on ‘Dynamical Seasonal Prediction of Indian Summer Monsoon Rainfall’. A “Monsoon Desk” has been established in this regard. A dedicated
initialization and rainfall assimilation experi-ments using NCEP data.
The Research moored Array for African–Asian–Australian monsoon Analysis and Prediction (RAmA)
A new moored buoy array in the Indian Ocean provided measurements to advance mon-soon research and forecasting. It is designed specifically for studying large-scale ocean–atmo-sphere interactions, mixed-layer dynamics, and ocean circulation related to the monsoons on intraseasonal to decadal time scales. The planned array consists mainly of 38 surface moorings and 8 subsurface moorings. Presently, 21 surface moorings 8 sub subsurface moorings have been deployed in the Indian Ocean by collaborative effort by many countries. India has deployed 3 sub-surface moorings and 17 out of 38 surface moorings are deployed and maintained by India-US joint initiative. These data are being used for operational and research purposes which are rel-evant to Monsoon. NOAA and MoES will work to reach 100% implementation of the RAMA by 2014. During the last one year, India has pro-vided 60 days of ship time for maintaining 17 moored buoys in the Indian Ocean. PMEL/NOAA has trained 3 engineers one week in US and 1 month onboard research vessel. During the next three months, India/US will jointly ser-vice the existing moorings.
Climate modelling and Ocean data Assimilation Analysis
This involves work on statistical down-scaling using GFDL coupled model analysis in predicting seasonal precipitation over India towards development of prediction of monthly rainfall for the Indian region using different GFDL model outputs. It is seen simple regres-sion model as rainfall is not linearly related to a single predictor, a multiple regression model to forecast monthly rainfall is more useful. Impact of other parameters like 200 hPa height, sea level pressure or 850 hPa relative humidity are being carried out. Future work will include
86 CHAPTER 12 International Cooperation A
nn
ual
Rep
ort
201
2–20
13
during monsoon season and validation studies are being carried out. The unified model with 4D-VAR data assimilation scheme is being run along with assimilation of Indian surface obser-vations. The coupled ocean atmosphere model along with ocean data assimilation has been implemented and trial runs are underway.
12.4 COOPERATiOn wiTH nERC (nATuRAL EnviROnmEnTAL REGiOnAL COunCiL)
Ministry of Earth Sciences and the Natu-ral Environment Research Council (NERC), UK entered into an MoU to work together to support research in the area of Changing Water Cycle in South Asia. Five projects have been undertaken. A NERC-MoES joint meeting to review the prog-ress of the on-going projects on Changing Water Cycle was conducted on 7-8 February, 2013 at MoES, Prithvi Bhavan, in which 10 UK Scientists and 15 Indian Scientists have participated.
It is proposed to sign a memorandum of understanding (MoU) with NERC on collabo-ration in Earth Sciences. The cabinet approval for signing the MoU with NERC, UK has been received. A scoping workshop was conducted jointly by NERC and MoES at New Delhi during 4-6 February, 2013 to discuss potential areas for collaboration under monsoon research.
Cooperation with Badan meteorologi klimatologi dan Geofisika (BmkG)
The identified areas of technical cooperation are (i) Agromet advisory Service; (ii) Fishery Ser-vice (iii) Observing Systems (iv) Climate Change and (v) Tsunami Operations (v) Geophysics (vi) Instrumentation. A team of scientists from BMKG visited IITM Pune for training on the couple ocean model system.
Cooperation with Regional integrated multi-Hazard Early warning system (RimEs)
The constituent units of ESSO-MoES have been taking leadership role in enhancing tech-nical capabilities of the RIMES Member and
scientist at the monsoon desk has been identified (Kate Howard). The model codes have been suc-cessfully implemented at the ESSO/MoES iden-tified Centers . The performance of the model was assessed during monsoon 2011 vis a vis the existing operational model. Detailed evaluation of the performance by NCMRWF showed posi-tive results (with practically 1 day gain in the performance of the flow pattern), has transferred the model to IMD. for its subsequent operational usage. Scientists from IMD and NCMRWF par-ticipated in a review meeting held in NCEP, USA to present the performance of the high resolution model over India during monsoon 2011.
12.2 indiA-us COOPERATiOn On wEATHER And CLimATE FORECAsTinG And AGRiCuLTuRE
Agro-Climatological and water Resource Availability modeling for Agricultural management
Under the framework for India-US Coopera-tion on Weather and Climate Forecasting and Agriculture, three demonstration projects were identified (a) Agricultural cropland monitor-ing and determination of crop water productiv-ity in India; (b) Applying satellite observations for current season agro-climatological monitor-ing: Predicting the impact of weather on food production; and (c) Modeling groundwater and surface water availability in an agricultural area, were finalized to be taken up under this coop-eration. During the recent Joint Committee meet-ing during June in USA, USGS and MoES agreed to work in the ground water as well as drilling program.
12.3 COOPERATiOn wiTH ukmO, uk
The Global Unified Model (UM) N512L70 with a resolution of 25 kms has been success-fully implemented at NCMRWF which includes aerosol climatology. The regional version of the Unified model with upgraded physics was run
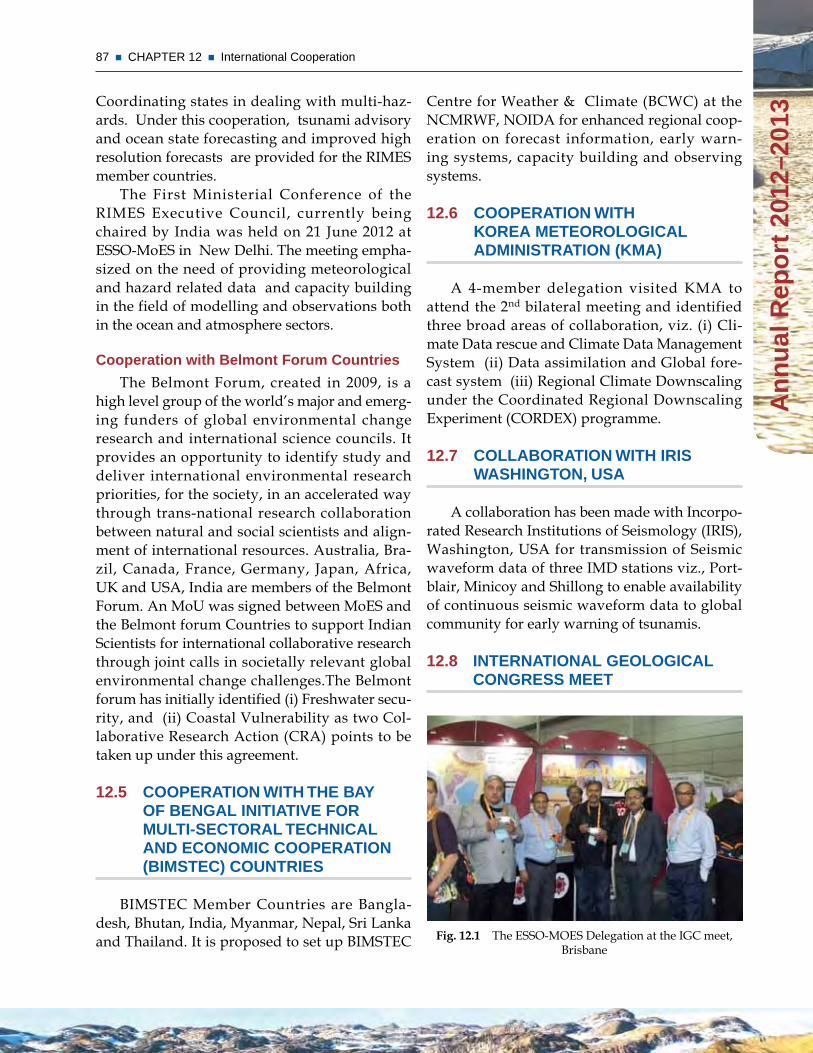
87 CHAPTER 12 International Cooperation
An
nu
al R
epo
rt 2
012–
2013
Centre for Weather & Climate (BCWC) at the NCMRWF, NOIDA for enhanced regional coop-eration on forecast information, early warn-ing systems, capacity building and observing systems.
12.6 COOPERATiOn wiTH kOREA mETEOROLOGiCAL AdminisTRATiOn (kmA)
A 4-member delegation visited KMA to attend the 2nd bilateral meeting and identified three broad areas of collaboration, viz. (i) Cli-mate Data rescue and Climate Data Management System (ii) Data assimilation and Global fore-cast system (iii) Regional Climate Downscaling under the Coordinated Regional Downscaling Experiment (CORDEX) programme.
12.7 COLLABORATiOn wiTH iRis wAsHinGTOn, usA
A collaboration has been made with Incorpo-rated Research Institutions of Seismology (IRIS), Washington, USA for transmission of Seismic waveform data of three IMD stations viz., Port-blair, Minicoy and Shillong to enable availability of continuous seismic waveform data to global community for early warning of tsunamis.
12.8 inTERnATiOnAL GEOLOGiCAL COnGREss mEET
Fig. 12.1 The ESSO-MOES Delegation at the IGC meet, Brisbane
Coordinating states in dealing with multi-haz-ards. Under this cooperation, tsunami advisory and ocean state forecasting and improved high resolution forecasts are provided for the RIMES member countries.
The First Ministerial Conference of the RIMES Executive Council, currently being chaired by India was held on 21 June 2012 at ESSO-MoES in New Delhi. The meeting empha-sized on the need of providing meteorological and hazard related data and capacity building in the field of modelling and observations both in the ocean and atmosphere sectors.
Cooperation with Belmont Forum Countries
The Belmont Forum, created in 2009, is a high level group of the world’s major and emerg-ing funders of global environmental change research and international science councils. It provides an opportunity to identify study and deliver international environmental research priorities, for the society, in an accelerated way through trans-national research collaboration between natural and social scientists and align-ment of international resources. Australia, Bra-zil, Canada, France, Germany, Japan, Africa, UK and USA, India are members of the Belmont Forum. An MoU was signed between MoES and the Belmont forum Countries to support Indian Scientists for international collaborative research through joint calls in societally relevant global environmental change challenges.The Belmont forum has initially identified (i) Freshwater secu-rity, and (ii) Coastal Vulnerability as two Col-laborative Research Action (CRA) points to be taken up under this agreement.
12.5 COOPERATiOn wiTH THE BAy OF BEnGAL iniTiATivE FOR muLTi-sECTORAL TECHniCAL And ECOnOmiC COOPERATiOn (BimsTEC) COunTRiEs
BIMSTEC Member Countries are Bangla-desh, Bhutan, India, Myanmar, Nepal, Sri Lanka and Thailand. It is proposed to set up BIMSTEC
88 CHAPTER 12 International Cooperation A
nn
ual
Rep
ort
201
2–20
13
CMLRE represented the Ministry in the meeting of the Commission for Conservation of Antarctic Marine Living Resources (CCAMLR) held at Hobart, Australia from 22nd October to 1st November 2012.
12.11 THE FOLLOwinG EssO/mOEs sCiEnTisTs wERE sELECTEd TO JOin in diFFEREnT inTERnATiOnAL PAnELs
• UN Commission on the Limits of the Con-tinental Shelf (CLCS): Dr. S. Rajan, 2012-17: Member
• PALCOMM (Palaeoclimate Commission), and International Quaternary Association (INQUA): Dr Thamban Meloth; Member
• Policy Board of SIOS; Dr. Rahul Mohan, 2012; Member
• WMO expert panel on Climate Services In-formation System (CSIS); ; Dr M. Rajeevan; 2012; Member
• Review and Monitoring Committee of the German Ministry for Education and Science research program on the role of the middle atmosphere in climate (ROMIC), German Aerospace Agency, Germany: Dr Gufran Beig, IITM Pune, 2011-2012, Member
• WMO/CAS Expert Team on Weather Modi-fication Research, Dr J.R. Kulkarni, IITM Pune, 2012, Member.
• Tree-Ring Laboratory, Lamont Doherty Earth Observatory, Columbia University, USA: Dr H.P. Borgaonkar, IITM Pune, Ad-junct Scientist
• International Commission on Clouds and Precipitation (ICCP): Dr Thara Prabhakaran, IITM Pune, 2012, Member.
The 4-member MOES delegation led by Dr Shailesh Nayak, Secretary, MoES attended the 34th meeting of the International Geological Con-gress (IGC), at Brisbane, Australia during 5-10 August, 2012. As a part of this meeting, India, represented jointly by the Ministry of Mines/Geological Survey of India, the Ministry of Earth Sciences and the Indian National Science Acad-emy (INSA), presented a south Asian bid, on behalf of five countries viz., India, Bangladesh, Nepal, Pakistan and Sri Lanka, for holding the 36th meeting of IGC in India in 2020. India won the bid, with overwhelming response of 128 votes in its favor as against 51 votes for Canada, the only other contender.
12.9 indiAn OCEAn GOOs (iOGOOs)
The IOGOOS secretariat has been function-ing at ESSO-INCOIS since its inception in 2002. The IOGOOS membership has grown from 19 to 26 institutions representing 14 countries. The functioning of IOGOOS secretariat at INCOIS has been extended upto 2013.
12.10 mARinE sCiEnCE
ESSO-CMLRE attended the meeting of the Intergovernmental panel on HAB (IP-HAB) held in Paris in April 2012.
ESSO-CMLRE attended the 16th session of the Subsidiary Body of Scientific Technical and Technological Advise (SBSTTA) to the Conven-tion of Biological Diversity (CBO) held at Mon-treal, Canada from 30th April to 5th May 2012.
ESSO-CMLRE attended the meeting of the Convention of Biological Diversity (CBD) - Con-ference of Parties CoP-11as a member of Indian delegate, held at Hyderabad from 8th to 19th Oct 2012.
CHAPTER
13
AwARds And HOnOuRs
13.1 AwARds
• Certificate of Excellence by WMO’s GURME program: Dr Gufran Beig, IITM Pune for the Development of System of Air quality Fore-casting & Research (SAFAR) for the Com-monwealth Games 2010, New Delhi.
• WCRP Award for outstanding presentation at the WCRP's Open Science Conference, held at the Denver, USA, 24-28 October 2011: Dr. Ayantika Dey Choudhury, IITM Pune for the paper entitled, ‘Dynamical response of the South Asian monsoon trough to la-tent heating from stratiform and convective precipitation’.
• BOYSCAST Fellowship, 2010-2100 by the De-partment of Science and Technology (DST) to conduct advance research at the National Centre for Atmospheric Research (NCAR), Atmospheric Chemistry Division, USA: Dr Sachin D. Ghude, IITM, Pune
13.2 FELLOwsHiPs
1. International Society of Photogrammetry and Remote Sensing: Dr Shailesh Nayak, Sec-retary (MoES), Elected Fellow, 2012
2. Indian Academy of Sciences, Bangalore: Dr M. Rajeevan, Adviser & Scientist-G (MoES), Elected Fellow, 2012
3. Andhra Pradesh Akademi of Sciences (APAS): Dr. Srinivasa Kumar T, Head (ASG), INCOIS, elected distinguished Fellow, 2012
4. Scientific Committee on Antarctic Research (SCAR) Fellowship: Ms. Runa Antony, NCAOR, 2011-12
5. SCAR-COMNAP fellowship; Mr Jenson V George, NCAOR, 2012-13
CHAPTER
14
PATEnTs & PuBLiCATiOns
PATEnTs FiLEd
1. An Apparatus for the Functioning of Inte-grated Marine Surveillance System. Patent application no: 873/CHE/2012.
REsEARCH PuBLiCATiOns
ATmOsPHERE
• Abhik S., Halder M., Mukhopadhyay P., Jiang X., Goswami B.N., (2012), Possible new mechanism for northward propagation of boreal summer intraseasonal oscillations based on TRMM and MERRA reanalysis, Cli-mate Dynamics, DOI:10.1007/s00382-012-1425-x, 1-14
• Abhilash S., Sahai A.K., Mohankumar K., George J.P., Das S., (2012), Assimilation of doppler weather radar radial velocity and reflectivity observations in WRF-3DVAR sys-tem for short-range forecasting of convective storms, Pure and Applied Geophysics, DOI 10.1007/s00024-012-0462-z, 1-24
• Agnihotri, G., and Mohapatra,M., (2012), Prediction of occurrence of daily summer monsoon precipitation over Karnataka, Meteorological Applications, 19, 130-139.
• Agrawal, K.K., and Singh, P.K., (2012), Char-acteristics of rainfall pattern for crop plan-ning at Jabalpur region (Madhya Pradesh) of India, Mausam, 63, 639-644.
• Akre, R.S., and Nagrale, G.S., (2012), A study of drought situation in El-Nino years over
central India homogeneous region, Mausam, 63, 162-164.
• Ali K., Budhavant K.B., Safai P.D., Rao P.S.P., (2012), Seasonal factors influencing in chemi-cal composition of total suspended particles at Pune, India, Science of the Total Environ-ment, 414, 257-267
• Ali K., Inamdar S.R., Beig G., Ghude S., Peshin S., (2012), Ozone scenario at Pune and Delhi during the decade of 1990s, Journal of Earth System Science, 121, 373-383
• Ali, M., Kaur, S., Tyagi, S.B., Singh, U.P., 2012, Modeling of short duration extreme rainfall events over Lower Yamuna Catch-ment, Mausam, 63, 391-400.
• Ashok K., Sabin.T.P., Swapna P., Mur-tugudde R.G., (2012), Is a global warm-ing signature emerging in the tropical Pacific?, Geophysical Research Letters, 39, DOI:10.1029/2011GL050232, L02701, 1-5
• Balachandran, S., and Geetha, B., (2012), Sta-tistical prediction of seasonal cyclonic activ-ity over North Indian Ocean, Mausam, 63, 17-28.
• Bansod S.D., Singh H.N., Patil S.D., Singh N., (2012), Recent changes in the circulation parameters and their association with Indian summe rmonsoon rainfall, Journal of Atmo-spheric and Solar Terrestrial Physics, 77, 248–253
• Bawiskar S.M., Chipade M.D., (2012), Predic-tion of sub-seasonality of Indian monsoon through kinetic energy of wave zero, Inter-national Journal of Geology, Earth and Envi-ronmental Sciences, 2, 104-115

91 CHAPTER 14 Patents & publications
An
nu
al R
epo
rt 2
012–
2013
over Indian coasts through satellite imagery, Mausam, 63, 193-202.
• Chatterjee A., Ghosh S.K., Adak A., Singh A.K., Devara P.C.S., Raha S., (2012), Effect of dust and anthropogenic aerosols on colum-nar aerosol optical properties over Darjeeling (2200 m asl), Eastern Himalayas, India, PLoS ONE, 7, e40286, 1-10
• Chaudhari H.S., Pokhrel S., Saha S.K., Dhakate A., Yadav R.K., Salunke K., Mahapa-tra S., Sabeerali C.T., Suryachandra A. Rao, (2012), Model biases in long coupled runs of NCEP CFS in the context of Indian summer monsoon, International Journal of Climatol-ogy, DOI: 10.1002/joc.3489, 1-13
• Chinthalu G.R., Dharmaraj T., Dhakate A.R., Devara P.C.S., (2012), features of Andhra Pradesh cyclonic storm in the Bay of Bengal during September 1997, Natural Hazards, 62, DOI 10.1007/s11069-012-0097-5, 613-633
• Chowdary J.S., Xie S-P, Tokinaga H., Oku-mura Y.M., Kubota H., Johnson N., Zheng X-T, (2012), Interdecadal variations in ENSO teleconnection to the Indo–Western Pacific for 1870–2007, Journal of Climate, 25, DOI: 10.1175/JCLI-D-11-00070.1, 1722–1744
• Dani K.K., Raj P.E., Devara P.C.S., Pandith-urai G., Sonbawne S.M., Maheskumar R.S., Saha S.K., Jaya Rao Y., (2012), Long-term trends and variability in measured multi-spectral aerosol optical depth over a tropical urban station in India, International Journal of Climatology, 32, DOI: 10.1002/joc.2250, 153-160
• Das S.K., Das S.S., Chiang C.W., Kumar K.K., Nee J.B., (2012), Variability in tropopause height and its temperature on different time scales: An observational study over Banqiao, Taiwan, Journal of Atmospheric and Solar Terrestrial Physics, 81-82, DOI:10.1016/j.jastp.2012.03.013, 1-8
• Das S.S., Kishore Kumar K., Das Subrata Kumar, Vineeth C., Pant T.K., Ramkumar G., (2012), Variability of mesopause tempera-ture derived from two independent methods
• Beig G., Fadnavis S., Schmidt H., Brasseur G.P., (2012), Inter-comparison of 11-year solar cycle response in mesospheric ozone and temperature obtained by HALOE satellite data and HAMMONIA model, Journal of Geophysical Research, 117, OI:10.1029/2011JD015697, D00P10, 1-12
• Biju, P.S., Anjit Anjan, Vashistha, R.D., and Santhosh, K., (2012), An indigenous state-of-the-art Digital Automatic Recording System (DARS) for surface meteorological observa-tories, Mausam , 63, 607-614.
• Biswas, B K., and Dukare, P.B., (2012), A cli-matological study of thunderstorm activity over Aurangabad (Chikalthana) Airport with special relevance to aviation in flight plan-ning, Mausam, 63, 319-325.
• Budhavant K.B., Rao P.S.P., Safai P.D., Gawhane R.D., Raju M.P., Mahajan C.M., Satsangi P.G., (2012), Atmospheric wet and dry depositions of ions over an urban location in South-West India, Aerosol and Air Quality Research, 12, DOI:10.4209/aaqr.2011.12.0233, 561-570
• Chakraborty S., Goswami B.N., Dutta K., (2012), Pacific coral oxygen isotope and the tropospheric temperature gradient over the Asian monsoon region: a tool to reconstruct past Indian summer monsoon rainfall, Jour-nal of Quaternary Science, 27, DOI:10.1002/jqs.1541, 269-278
• Chakraborty, P.K., and Sen, A.K., (2012), A synoptic analogue model for quantitative precipitation forecast over Damodar valley area, Mausam, 63, 330-334.
• Charlotte B.V., George G., Yesodharan S., (2012), Outstanding rainfall events of boreal fall monsoon season of southern peninsular India associated with the Intensification of Negative Indian Ocean Dipole, International Journal of Scientific & Engineering Research, 3, 1-10.
• Charan Singh, Das, S., Verma, R.B., Verma, B.L., Bandyopadhyay, B.K., (2012), Rainfall estimation of landfalling tropical cyclones
92 CHAPTER 14 Patents & publications A
nn
ual
Rep
ort
201
2–20
13
land and sea regions during INDOEX field phases, Marine Science, 2, DOI:10.5923/j.ms.20120205.06, 77-84
• Devara P.C.S., Simha C.P., Saha S.K., Babu K.N., Shukla A.K., (2012), Optical remote sensing of pristine and coastal aerosol fea-tures over the Arabian sea, International Journal of Optics and Applications, 2, DOI: 10.5923/j.optics.20120204.04, 48-55
• Dharmaraj T., Patil M.M., Waghmare R.T., Raj P.E., (2012), Carbon dioxide and water vapour characteristics on the west coast of Arabian Sea during Indian summer mon-soon, Journal of Earth System Science, 121, 903-910
• Dugam S.S., (2012), Effect of change in aero-sol concentration and temperature over Indian region on rainfall variability in SW monsoon season, Elixir Meteorology, 44, 7168-7170
• Dugam S.S., (2012), Long-term change in pre-monsoon thermal index over central Indian region and south west monsoon variability, International Journal of Applied Engineering and Technology, 2, 6-11
• Dutta S., Narkhedkar S.G., Devi S., Sikka D.R., (2012), Composite energetics study for contrasting south west monsoon years in the recent decade, Atmosfera, 25, 109-126
• Fadnavis S., Beig G., Chakraborti T., (2012), Decadal solar signal in ozone and tempera-ture through the mesosphere of Northern tropics, Journal of Atmospheric and Solar Terrestrial Physics, 78-79, doi:10.1016/j.jastp.2010.09.035, 2-7
• Ganshin A., Oda T., Saito M., Maksyutov S., Valsala V., Andres R.J., Fisher R.E., Lowry D., Luckyanov A., Matsueda H., Nisbet M., Rigby M., Sawa Y., Toumi R., Tsuboi K., Varlagin A., Zhuravlev R., (2012), A global coupled Eulerian-Lagrangian model and 1×1 km CO2 surface flux dataset for high-reso-lution atmospheric CO2 transport simula-tions, Geoscientific Model Development, 5, DOI:10.5194/gmd-5-231-2012, 231-243
using meteor radar and its comparison with SABER and EOS MLS and a collocated multi-wavelength dayglow photometer over an equatorial station, Thumba (8.5ON, 76.5OE), International Journal of Remote Sensing, 33, 4634–4647
• Das S.S., Uma K.N., Das S.K., (2012), MST radar observations of short-period gravity wave during overhead tropi-cal cyclone, Radio Science, 47, RS2019, DOI:10.1029/2011RS004840, 1-10
• Das, G.K., Midya, S.K., Debnath, G.C., Roy, S.N., 2012, The relationship between geopo-tential height and movement & landfall of tropical cyclone in the Bay of Bengal region, Mausam, 63, 469-474.
• Das, A.K, and Siddique, L.A., (2012), A case study of heavy downpour over NE India, Mausam, 503-507.
• Das Gupta, M and Indira Rani, S. (2013), Validation of Kalpana-1 atmospheric motion vectors against upper air observations and numerical model derived winds. Inter-national Journal of Remote Sensing, 34, 2350-2367.
• Deepa R., Gnanaseelan C., Deshpande M., Salvekar P.S., (2012), Model study on under-standing the influence of Arabian Sea mini warm pool on monsoon onset vortex forma-tion, Pure and Applied Geophysics, 169, DOI 10.1007/s00024-011-0406-z, 1693-1706
• Deshpande M.S., Pattnaik S., Salvekar P.S., (2012), Impact of cloud parameterization on the numerical simulation of a super cyclone, Annales Geophysicae, 30, DOI:10.5194/angeo-30-775-2012, 775-795
• Deshpande N.R., Kulkarni A., Krishna Kumar K., (2012), Characteristic features of hourly rainfall in India, International Journal of Climatology, 32, DOI:10.1002/joc.2375, 1730-1744
• Devara P.C.S., Jaya Rao Y., Dani K.K., Maheskumar R.S., Saha S.K., Raj P.E., Son-bawne S.M., (2012), Aerosol, Ozone and water Vapour distributions observed over
93 CHAPTER 14 Patents & publications
An
nu
al R
epo
rt 2
012–
2013
1961-1990 monthly surface climatology of India and patterns of differences of some meteorological parameters with respect to the 1951-1980 climatology, Mausam, 377-390.
• Jenamani, R.K., 2012, Development of inten-sity based fog climatological information sys-tem (daily and hourly) at IGI airport, New Delhi for use in fog forecasting and aviation, Mausam, 63,89-112.
• Jenamani, R.K., (2012), Micro-climatic study and trend analysis of fog characteristics at IGI airport New Delhi using hourly data (1981-2005), Mausam, 63, 203-218.
• Jenamani, R.K., (2012), Analysis of Ocean-Atmospheric features associated with extreme temperature variation over east coast of India – A special emphasis to Orissa heat waves of 1998 and 2005, Mausam, 63, 401-422
• Jeong H-I, Lee D-Y, Ashok K., Ahn J-B, Lee J-Y, Luo J-J, Schemm J-K E., Hendon H.H., Braganza L., Ham Y-G, (2012), Assessment of the APCC coupled MME suite in pre-dicting the distinctive climate impacts of two flavors of ENSO during boreal winter, Climate Dynamics, 39, DOI:10.1007/s00382-012-1359-3, 475-493
• Joseph S., Sahai A.K., Goswami B.N., Terray P., Masson S., Luo J.-J., (2012), Possible role of warm SST bias in the simulation of boreal summer monsoon in SINTEX-F2 coupled model, Climate Dynamics, 38, DOI 10.1007/s00382-011-1264-1, 1561-1576
• Joshi I.S., Christiana T.M., (2012), Link-age between Cyclonic storms, Geomag-netic storms, Sunspot numbers and Climate Change, Research Journal of Recent Sciences, 1, 100-103
• Joshi I.S., Christiana T.M., (2012), Linkage between cyclonic storms, QBO, total Ozone and climate change, Research Journal of Recent Sciences, 67-69
• Joshi I.S., Devara P.C.S., (2012), Middle atmo-sphere Aerosols, Dynamics and Monsoon Variability: a Review, International Journal
• Giri, R.K., Satish, P., Ravindra Kumar and Panda J., (2012), Significance Of Scatterom-eter Winds Data In Weak Vortices Diagnosis In Indian Seas, International Journal of Phys-ics and Mathematical Sciences 2 (1), 1-12, 19-26.
• Giri, R.K, Pooja,R., Satish, P., and Singh, J, (2012), Satellite viewed dust storms – An Overview, International Journal of Physics and Mathematical Sciences, 2 (1), 38-45.
• Gudadhe S. S., Sangode S. J., Patil S. K., Chate. D. M., Meshram D. C., Badekar A.G., (2012), Pre-and post-monsoon variations in the magnetic susceptibilities of soils of Mum-bai metropolitan region: implications to sur-face redistribution of urban soils loaded with anthropogenic particulates, Environmental Earth Sciences, DOI:10.1007/s12665-012-1528-z, 1-18
• Gupta, S., Mohanty, W. K., Prakash R., and Shukla, A. K, 2012, Crustal Heterogeneity and Seismo-tectonics of the National Capi-tal Region, Delhi, India, Journal of Pure and Applied Geophysics,
• Gupta, J.P., Ram, M., Lal, M., 2012, Semi – quantitative precipitation forecast for middle Ganga sub-catchment by synoptic analogue method, Mausam, 63, 648-652.
• Gupta, J.P., Ram, Mannu and Lal, Moti, 2012, Semi – quantitative precipitation forecast for river Sai catchment by synoptic analogue method, Mausam, 63, 499-503.
• Halder M., Mukhopadhyay P., Halder S., (2012), Study of the microphysical properties associated with the monsoon intraseasonal oscillation as seen from the TRMM observa-tions, Annales Geophysicae, 30, 897-910
• Hosalikar, K.S., Mohan, K.N., Vashistha, R.D., and Ajit Tyagi, (2012), An integrated automatic aviation meteorological instru-ment system at C.S.I. airport, Mumbai, Mausam, 63, 247-260.
• Jaswal, A.K., Bhambak, S.R., Gujar, M.K., Mohite, M.K., Anantharaman, S., and Bha-gyalakshmy, S., (2012), Development of
94 CHAPTER 14 Patents & publications A
nn
ual
Rep
ort
201
2–20
13
• Konwar M., Parekh A., Goswami B.N., (2012), Dynamics of east-west asymmetry of Indian summer monsoon rainfall trends in recent decades, Geophysical Research Let-ters, 39, DOI:10.1029/2012GL052018, L10708, 1-6
• Kothawale D.R., Krishna Kumar K., Sriniva-san G., (2012), Spatial asymmetry of temper-ature trends over India and possible role of aerosols, Theoretical and Applied Climatol-ogy, online, DOI:10.1007/s00704-012-0628-8, 1-18
• Krishnan R., Sabin T.P., Ayantika D.C., Kitoh A., Sugi M., Murakami H., Turner A.G., Slingo J.M., Rajendran K., (2012), Will the South Asian monsoon overturning circula-tion stabilize any further?, Climate Dynam-ics, online, DOI 10.1007/s00382-012-1317-0, 1-25
• Kulkarni Ashwini, (2012), Weakening of Indian summer monsoon rainfall in warming environment, Theoretical and Applied Cli-matology, online, DOI 10.1007/s00704-012-0591-4, 1-13
• Kulkarni B.D., Bansod S.D., (2012), Predict-ing hydrlogic response to climate change in the Bhima river basin using the SWAT model, Indian Journal of Power and River Valley Development, 62, 36-41
• Kulkarni J.R., Maheshkumar R.S., Morwal S.B., Padma kumari B., Konwar M., Desh-pande C.G., Joshi R.R., Bhalwankar R.V., Pandithurai G., Safai P.D., Narkhedkar S.G., Dani K.K., Nath A., Nair Sathy, Sapre V.V., Puranik P.V., Kandalgaonkar S.S., Mujumdar V.R., Khaladkar R.M., Vijaykumar R., Prabha T.V., Goswami B.N., (2012), Cloud Aero-sol Interaction and Precipitation Enhance-ment Experiment (CAIPEEX): overview and preliminary results, Current Science, 102, 413-425
• Kulkarni M.N., Kamra A.K., (2012), Model for calculating the vertical distribution of the atmospheric electric potential in the exchange layer in a maritime clean
of Research in Chemistry and Environment, 2, 1-10
• Joshi I.S., (2012), Volcanic eruption Eyjafjal-lajokull of April 2010 and its effects on pres-sure, temperature and rainfall, Journal of Applied Geochemistry, 103-105
• Jyoti, L.M., and Sen, S., (2012), On the tran-sit of Venus 2012: Method of computation for prediction of contact timings , Mausam, 63,113-122.
• Kakade S.B., Kulkarni A., (2012), Relationship between ESI tendency and Indian monsoon rainfall: a possible mechanism, Atmospheric Science Letters, 13, DOI: 10.1002/asl.357, 22-28
• Kakade S.B., Kulkarni Ashwini, (2012), Changing relationship between surface tem-peratures and Indian monsoon rainfall with the phase of ESI tendency, Advances in Mete-orology, 2012, DOI:10.1155/2012/934624, Article ID 934624, 1-8
• Kambezidis H.D., Kaskaoutis D.G., Kharol S. K., Krishna Moorthy K., Satheesh S.K., Kalapureddy M.C.R., Badarinath K.V.S., Sharma A. R., Wild M., (2012), Multi-decadal variation of the net downward shortwave radiation over south Asia: The solar dim-ming effect, Atmospheric Environment, 50, DOI:10.1016/j.atmosenv. 2011.11.008, 360-372
• Kashyapi, A. and Bahot, A.S., (2012), Pheno-phase wise study of parameters controlling water requirement of soyabean crop [Gly-cine max (L.) Merr.] at various agroclimatic zones, Mausam, 63, 239-246.
• Konwar M., Maheskumar R.S., Das S.K., Morwal S.B., (2012), Nature of light rain dur-ing presence and absence of bright band, Journal of Earth System Science, 121, 947-961
• Konwar M., Maheskumar R.S., Kulkarni J. R., Freud E., Goswami B.N., Rosen-feld D., (2012), Aerosol control on depth of warm rain in convective clouds, Jour-nal of Geophysical Research, 117, D13204, DOI:10.1029/2012JD017585, 1-10
95 CHAPTER 14 Patents & publications
An
nu
al R
epo
rt 2
012–
2013
period at the coastal station, Goa, Meteo-rology and Atmospheric Physics, 115, DOI 10.1007/s00703-011-0164-6, 73-80
• Latha R., Murthy B.S., (2012), Response of Cassava canopy to mid-day pseudo sunrise induced by solar eclipse, International Jour-nal of Biometeorology, DOI:10.1007/s00484-012-0576-0, 1-4
• Litta, A.J., Mohanty, U.C., Prasad, S.K., Mohapatra, M., Ajit Tyagi and Sahu, S.C., (2012), Simulation of Tornado over Orissa (India) on 31 March 2009 using WRF-NMM model, Natural Hazards 61, 1219-1242
• Mahajan P. N., Khaladkar R. M., Narkhedkar S. G., Nair S., Prabhu A., Mahakur M., (2012), Investigation of features of May, 2001 tropi-cal cyclone over the Arabian Sea through IRS-P4 and other satellite data, Mausam, 63, 137-148
• Mandal, H.S., Khan, P.K., Shukla, A.K., (2012), Soil responses near Delhi Ridge and adjacent region in Greater Delhi during inci-dence of a local earthquake, Journal of Natu-ral Hazards, DOI 10.1007/s11069-012-0098-4.
• Manoj M.G., Devara P.C.S., Joseph S., Sahai A.K., (2012), Aerosol indirect effect during the aberrant Indian summer monsoon breaks of 2009, Atmospheric Environment, 60, DOI:10.1016/j.atmosenv.2012.06.007, 153-16
• Manjusha Chourasia, Ashrit, R.G., George, J.P., (2013), Impact of Cyclone Bogus-ing and regional Assimilation on tropi-cal cyclone track and intensity predictions Mausam, 64, 135-148.
• Maurya A.K., Singh R., Veenadhari B., Kumar Sushil, Cohen M.B., Selvakumaran R., Pant P., Singh A.K., Siingh D., Inan U.S., (2012), Morphological features of tweeks and night-time D region ionosphere at tweek reflection height from the observations in the low-lat-itude Indian sector, Journal of Geophysical Research, 117, DOI:10.1029/2011JA016976, A05301, 1-12
• McCarthy M.P., Sanjay J., Booth B.B.B., Krishna Kumar K., Betts R.A., (2012),
atmosphere, Advances in Space Research, 50, DOI:10.1016/j.asr.2012.06.028, 1231-1240
• Kulkarni, M.A., and Mohapatra, M., (2012), The simulation of tropical cyclones over North Indian Ocean”, Natural Hazards , 63, 1337-1359.
• Kulandeivelu, E. and Guhan, M.V., (2012), Record rainfall over Ketty valley, Nilgiri, Tamil Nadu , Mausam, 63, 165-167.
• Kumar A., Mitra A.K., Bohra A.K., Iyengar G.R. and Durai V.R., (2012), Multi-Model Ensemble (MME) prediction of rainfall using neural networks during monsoon season in India, Meteorological Applications, 19, 161-169.
• Kumar A.,Pai D.S., Singh J.V.,Singh Ran-jeet and Sikka D.R. (2012), Statistical mod-els for long-range forecasting of southwest monsoon rainfall over India using stepwise regression and neural network, Atmospheric and Climate Sciences, 2,322-336.
• Kumar Sumit, Devara P.C.S. , (2012), Aerosol characterization: comparison between measured and modeled surface radiative forcing over Bay of Bengal, Remote Sensing Letters, 3, DOI: 10.1080/01431161.2011.600466, 373–381
• Kumar, A, Roy Bhowmik, S.K., and Das, A.K., (2012), Implementation of Polar WRF for short range prediction of weather over Maitri region in Antarctica, Journal of Earth system science,
• Kumar Sumit, Devara P.C.S., Manoj M.G., (2012), Multi-site characterization of tropical aerosols: Implications for regional radiative forcing, Atmospheric Research, 106, 71-85
• Lal D.M., Ghude S.D., Patil S.D., Kulkarni S.H., Jena C., Tiwari S., Srivastava M.K., (2012), Tropospheric ozone and aerosol long-term trends over the Indo-Gangetic Plain ( IGP), India, Atmospheric Research, DOI:10.1016/ j.atmosres.2012.02.014, 1-11
• Latha R., Murthy B.S., (2012), Natural reduc-tion of CO2 observed in the pre-monsoon
96 CHAPTER 14 Patents & publications A
nn
ual
Rep
ort
201
2–20
13
• Murugavel P., Pawar S.D., Gopalakrishnan V., (2012), Trends of Convective Available Potential Energy over the Indian region and its effect on rainfall, International Journal of Climatology, 32, DOI: 10.1002/joc.2359, 1362-1372
• Nair S., Sanjay J., Pandithurai G., Mahesku-mar R.S., Kulkarni J.R., (2012), On the param-eterization of cloud droplet effective radius using CAIPEEX aircraft observations for warm clouds in India, Atmospheric Research, 108, DOI:10.1016/j.atmosres.2012.02.002, 104-114
• Nandargi S., Dhar O.N., (2012), Extreme rain-storm events over the Northwest Himalayas during 1875–2010, Journal of Hydrometeo-rology, 13, DOI: 10.1175/JHM-D-12-08.1, 1383-1388
• Nandargi S., Mulye S.S., (2012), Relationships between rainy days, mean daily intensity and seasonal rainfall over the Koyna Catch-ment during 1961–2005, The Scientific World Journal, 2012, DOI:10.1100/2012/894313, A.ID 894313, 1-10
• Olatinwo R.O., Prabha T.V., Paz J.O., Hoogenboom G., (2012), Predicting favorable conditions for early leaf spot of peanut using output from the Weather Research and Fore-casting (WRF) model, International Journal of Biometeorology, 56, DOI: 10.1007/s00484-011-0425-6, 259-268
• Osuri, K.K., Mohanty, U.C., Routray, A., and Mohapatra, M., (2012), The impact of satel-lite-derived wind data assimilation on track, intensity and structure of tropical cyclones over the North Indian Ocean, International Journal of Remote Sensing, 33, 1627-1652.
• Padmakumari B., Maheskumar R.S., Morwal S.B., Harikishan G., Konwar M., Kulkarni J.R., Goswami B.N., (2012), Aircraft observations of elevated pollution layers near the foothills of the Himalayas during CAIPEEX-2009, Quarterly Journal of Royal Meteorological Society, online, DOI:10.1002/qj.1989, 1-14
Influence of vegetation on the ITCZ and South Asian Monsoon in HadCM3, Earth System Dynamics, 3, DOI:10.5194/esd-3-87-2012, 87-96
• Meena G.S., Patil S.D., Manoj M.G., Devara P.C.S., (2012), Tropospheric NO2 variability over the metropolitan cities and hill stations of India, Natural Hazards, DOI:10.1007/s11069-012-0392-1, 1-15
• Metri, S.M., (2012), Study of GPS Radiosonde observation system in Goa, Mausam, 63, 291-298.
• Mini, V.K., Prabhakaran Nair, V.K., 2012, An analysis of monthly and synoptic scale variation of radio refractive index during pre-monsoon and monsoon onset phase Mausam, 63, 508-510.
• Mohapatra, M., Mandal, G.S., Bandyopad-hyay, B.K., Ajit Tyagi and Mohanty, U.C., (2012), Classification of cyclone hazard prone districts of India, Natural Hazards ,63, 1601-1620.
• Mohapatra, M., Bandyopadhyay, B.K.,and Ajit Tyagi, (2012), Best Track parameters of tropical cyclones over the North Indian Ocean: a review, 2012,Natural Hazards, 63, 1285-1317
• Morwal S.B., Maheshkumar R.S., Padma Kumari B., Kulkarni J.R., Goswami B.N., Cloud microphysical properties over Indian monsoon regions during CAIPEEX-2009, (2012), Journal of Atmospheric and Solar Terrestrial Physics, 81-82, DOI:10.1016/j.jastp.2012.04.01076-85
• Mujumdar M., Preethi B., Sabin T.P., Ashok K., Saeed S., Pai D.S., Krishnan R., (2012), Asian summer monsoon response to the La Ni˜na event of 2010, Meteorological Applica-tions, 19, 216-225
• Murthy B.S., Latha R., Sreeja P., Dharma-raj T., (2012), Transient land breeze: Eclipse induced wind flow modifications—Obser-vations over plant canopy, Journal of Atmo-spheric and Solar Terrestrial Physics, 89, DOI:10.1016/j.jastp.2012.07.010, 33-39
97 CHAPTER 14 Patents & publications
An
nu
al R
epo
rt 2
012–
2013
Environment, The Scientific World Journal, DOI:10.1100/2012/ 425838, ID 425838, 1-8
• Pawar S.D., Lal D.M., Murugavel P., (2012), Lightning characteristics over central India during Indian summer monsoon, Atmo-spheric Research, 106, 44-49
• Pawar S.D., Meena G.S., Jadhav D.B., (2012), Air Ion Variation at Poultry-farm, Coastal, Mountain, Rural and Urban Sites in India, Aerosol and Air Quality Research, 12, 440–451
• Pawar V., Pawar S.D., Beig G., Sahu S.K., (2012), Effect of lightning activity on sur-face NOx and O3 over a tropical sta-tion during pre-monsoon and monsoon seasons, Journal of Geophysical Research, 117, DOI:10.1029/2011JD016930, 1-11
• Pokhrel S., Chaudhari H.S., Saha S.K., Dhakate A., Yadav R.K., Salunke K., Mahapa-tra S., Suryachandra A. Rao, (2012), ENSO, IOD and Indian summer monsoon in NCEP climate forecast system, Climate Dynamics, DOI: 10.1007/s00382-012-1349-5, 1-23
• Pokhrel S., Dhakate A., Chaudhari H.S., Saha S.K., (2012), Status of NCEP CFS vis-a-vis IPCC AR4 models for the simulation of Indian summer monsoon, Theoretical and Applied Climatology, DOI 10.1007/s00704-012-0652-8, 1-14
• Pokhrel S., Sikka D.R., (2012), Variability of the TRMM-PR total and convective and stratiform rain fractions over the Indian region during the summer monsoon, Climate Dynamics, DOI:10.1007/s00382-012-1502-1, 1-24
• Prabha T.V., Karipot A., Axisa D., Padma Kumari B., Maheskumar R.S., Konwar M., Kulkarni J.R., Goswami B.N., (2012), Scale interactions near the foothills of Himalayas during CAIPEEX, Journal of Geophysical Research, 117, DOI:10.1029/2011JD016754, D10203, 1-19
• Pradhan, D., De, U.K. and Singh, U.V., (2012), Development of nowcasting technique and evaluation of convective indices for
• Padmakumari B., Maheskumar R.S., Harikis-han G., Kulkarni J.R., Goswami B.N., (2012), Comparative study of aircraft- and satel-lite-derived aerosol and cloud microphysi-cal parameters during CAIPEEX-2009 over the Indian region, International Journal of Remote Sensing, online, DOI:10.1080/01431161.2012.705442, 1-16
• Pal S., Devara P.C.S., (2012), Wavelet-based spectral analysis of long-term time series of optical properties of aerosols obtained by lidar and radiometer measurements over an urban station in Western India, Journal of Atmospheric and Solar Terrestrial Physics, 84-85, DOI:10.1016/j.jastp.2012.05.014, 75-87
• Panda, J., and Giri, R.K., (2012), A compre-hensive study of surface and upper air char-acterstics over two stations on the west coast of India during the occurrence of a cyclonic storm, Natural hazards, DOI10.1007/s11069-012-0282-6
• Pandithurai G., Dipu S., Prabha T.V., Mahes-kumar R.S., Kulkarni J.R., Goswami B.N., (2012), Aerosol effect on droplet spectral dis-persion in warm continental cumuli, Jour-nal of Geophysical Research, 117, D16202, DOI:10.1029/2011JD016532, 1-15
• Pattanaik, D.R., Ajit Tyagi, and Arun Kumar, (2012), Dynamical-Empirical forecast for the Indian monsoon rainfall using the NCEP Coupled Modeling System – Application for real time monsoon forecast, Mausam, 63, 433-448.
• Pattanaik, D. R. , Mukhopadhyay, B. , and Arun Kumar, (2012), Monthly Forecast of Indian Southwest Monsoon Rainfall Based on NCEP’s Coupled Forecast System. Atmo-spheric and Climate Science, 2, 479-491.
• Patwardhan S., Kulkarni Ashwini, Krishna Kumar K., (2012), Impact of global warming on cyclonic disturbances over south Asian region, Journal of Earth System Science, 121, 203–210
• Pawar S.D., Gopalkrishnan V., (2012), Possi-ble Source of Intermediate Ions over Marine
98 CHAPTER 14 Patents & publications A
nn
ual
Rep
ort
201
2–20
13
Rao, (2012), Development of a perfect prog-nosis probabilistic model for prediction of lightning over southeast India, J.Earth Syst Sci., 121, 355-371.
• Rajeevan, M., Unnikrishnan, C.K., Jyoti Bhate and Niranjan Kumar, K., and Sreekala, P.P., (2012), Northeast monsoon over India: vari-ability and prediction, Meteorological Appli-cations, 19: 226–236.
• Rajeevan, M., Unnikrishnan, C.K., and Pre-ethi, B., (2012), Evaluation of the ENSEM-BLES multi-model seasonal forecasts of Indian summer monsoon variability, Climate Dynamics, DOI 10.1007/s00382-011-1061-1
• Rajendran K., Kitoh A., Srinivasan J., Mizuta R., Krishnan R., (2012), Monsoon circula-tion interaction with western ghats orog-raphy under changing climate: Projection by a 20-km mesh AGCM, Theoretical and Applied Climatology, DOI:10.1007/s00704-012-0690-2, 1-17
• Ram, R.D., Verma, R.B., Singh, U.P., and Raha, G.N., (2012), Threshold values of vari-ous indices of thunder storms during pre monsoon over Mohanbari, Mausam, 63, 326-330.
• Ram, S., and Mohapatra, M., (2012), Some aspect of squall over Indira Gandhi Inter-national airport, New Delhi, Mausam, 63, 623-638.
• Ramesh Kumar P., Kamra A.K., (2012), Land–sea contrast in lightning activity over the sea and peninsular regions of South/Southeast Asia, Atmospheric Research, 118, DOI:10.1016/j.atmosres.2012.05.027, 52–67
• Ramesh Kumar P., Kamra A.K., (2012), Vari-ability of lightning activity in South/South-east Asia during 1997–98 and 2002–03 El Nino/La Nina events, Atmospheric Research, 118, DOI:10.1016/j.atmosres.2012.06.004, 84–10
• Ranalkar, M. R., Mishra, R.P., Anjit Anjan and Krishnaiah, (2012), Network of Auto-matic Weather Stations : Pseudo random burst sequence type, Mausam, 63, 587-606.
thunderstorm prediction in Gangetic West Bengal (India) using Doppler Weather Radar and upper air data, Mausam, 63, 299-318.
• Pradhan, D., and De, U.K., (2012), Dop-pler Weather Radar analysis of short term cyclonic storm, Mausam, 63, 459-468.
• Prakash, S., Giri, R.K., and Adesh,(2012), An Episode Of Convective Heavy Rainfall Over Tamil Nadu and Kerala: Observational Study, International Journal of Physics and Mathematical Sciences, 2 (1), 1-12, 86-96.
• Preethi B., Revadekar J.V., (2012), Kharif foodgrain yield and daily summer monsoon precipitation over India, International Jour-nal of Climatology, DOI: 10.1002/joc.3565, 1-9
• Puttanna, B., and Agnihotri, G., (2012), Floods in Karnataka during 2009 : A synoptic study, Mausam, 63, 223-230.
• Rahman, M. M. , D . S . Arya , N. K . Goel and A. K. Mitra, (2012), Rainfall Statistics Evaluation of ECMWF Model and TRMM Data over Bangladesh for Flood Related Studies ", Met. Applications, DOI: 10.1002/met.293
• Rahul P.R.C., Salvekar P.S., Devara P.C.S., (2012), Super cyclones induce variability in the aerosol optical depth prior to their for-mation over the oceans, IEEE Geoscience a n d R e m o t e S e n s i n g L e t t e r s , 9 , D O I : 1 0 . 1 1 0 9 / L G R S . 2 0 1 1 . 2 1 7 0 5 5 1 , 985-988
• Rajavel, M., Samui, R.P., Kanade, K.G., (2012), Assessment of water requirement of tobacco at Rajamundry (Andhra Pradesh), Mausam, 63, 231-238
• Rajeevan, M., Rohini, P., Niranjan Kumar, K., Srinivasan, J., and Unnikrishnan, C.K., (2012), A study of vertical cloud structure of the Indian summer monsoon using Cloud-Sat data, Climate Dynamics, DOI 10.1007/s00382-012-1374-4.
• Rajeevan, M., Madhulatha, A., Rajasekhar, M., Jyoti Bhate, Amit Kesarkar and B.V.Appa
99 CHAPTER 14 Patents & publications
An
nu
al R
epo
rt 2
012–
2013
Sensing, 33, DOI:10.1080/01431161.2012.697642, 7132-7150
• Ross R.S., Krishnamurti T.N., Pattnaik S., (2012), Interactions of diabatic heating in convective superbursts with energy con-version processes in the genesis of Cape Verde Hurricanes from African easterly waves, Monthly Weather Review, 140,DOI: 10.1175/2011MWR3621.1, 748-773
• Roy Bhowmik, S.K., and Durai, V.R., (2012), Development of multi-model ensemble based district level medium range rainfall forecast system for Indian region, Journal of Earth system Science, 121(2), 273-285.
• Sabeerali C.T., Suryachandra A. Rao, Ajay-amohan R.S., Murtugudde R., (2012), On the relationship between Indian summer mon-soon withdrawal and Indo-Pacific SST anom-alies before and after 1976/1977 climate shift, Climate Dynamics, 39, DOI: 10.1007/s00382-011-1269-9, 841-859
• Sabin T.P., Babu C.A., Joseph P.V., (2012), SST–convection relation over tropical oceans, International Journal of Climatology, online, DOI: 10.1002/joc.3522, 1-12
• Safai P.D., Raju M.P., Maheshkumar, Kulkarni J.R., Rap P.S.P., Devara P.C.S., (2012), Vertical profiles of black carbon aerosols over the urban locations in South India, Science of the Total Environment, 431, DOI:10.1016/ j.scitotenv.2012.05.058, 323-331
• Saha Subodh K., Halder S., Suryachan-dra A. Rao, Goswami B.N., (2012), Mod-ulat ion of ISOs by land-atmosphere feedback and contribution to the interan-nual variability of Indian summer mon-soon, Journal of Geophysical Research, 117, DOI:10.1029/2011JD017291, D13101, 1-14
• Sahu, S.C., (2012), Impact of AWS obser-vations in WRF-3DVAR data assimilation system: a case study on abnormal warming condition in Odisha, Natural Hazards DOI 10.1007/s 11069-012-0393
• Samala, B.K., Krishnan R., Roxy M., (2012), Assessment of one month forecasts of weak
• Rao Koteswara K., Lakshmi Kumar T.V., Rao Lakshmana, V., (2012), Variability of agro climatic regime over homogeneous mon-soon regions of India - El Niño and La Niña events, Global and Planetary Change, 92-93, DOI:10.1016/j.gloplacha.2012.03.007, 48-57
• Rao P.B., Beig G., Dabas R.S., Ramkumar R., Gurubaran S., Rao K.G., Manoharan P.K., Patra A.K., Ravindran S., Pant T.K., Venkat Ratnam M., Chakravarty S.C., Sridhran R., (2012), Overview of CAWSES-India program with emphasis to equatorial atmospheric coupling processes , Journal of Atmo-spheric and Solar Terrestrial Physics, 75-76, DOI:10.1016/j.jastp.2011.08.005, 98-114
• Ray, K., Joshi. B.N., Vasoya, I.M., Darji, N.S. and Gandhi, L.A., (2012), QPF model for Sabarmati basin based on Synoptic analogue method, Mausam, 63, 565-572
• Revadekar J.V., Hameed S., Collins D., Man-ton M., Sheikh M., Borgaonkar H. P., Kotha-wale D. R., Adnan M., Ahmed A. U., Ashraf J., Baidya S., Islam N., Jayasinghearachchi D., Manzoor N., Premalal K. H., (2012), Impact of altitude and latitude on changes in tem-perature extremes over South Asia during 1971-2000, International Journal of Climatol-ogy, DOI: 10.1002/joc.3418, 1-11
• Revadekar J.V., Kothawale D.R., Patward-han S.K., Pant G.B., Rupa Kumar K., (2012), About the observed and future changes in temperature extremes over India, Natural Hazards, 60, DOI 10.1007/s11069-011-9895-4, 1133-1155
• Revadekar J.V., Preethi B., (2012), Statistical analysis of the relationship between sum-mer monsoon precipitation extremes and foodgrain yield over India, International Journal of Climatology, 32, DOI: 10.1002/joc.2282, 419-429
• Revadekar J.V., Tiwari Y.K., Ravi Kumar K.,(2012), Impact of climate variability on NDVI over the Indian region during 1981–2010, International Journal of Remote
100 CHAPTER 14 Patents & publications A
nn
ual
Rep
ort
201
2–20
13
• Siingh D., Singh R.P., Singh A.K., Sanjay Kumar, Kulkarni M.N., Singh Abhay K., (2012), Discharges in the stratosphere and mesosphere, Space Science Reviews, 169, DOI:10.1007/s11214-012-9906-0, 73-121
• Singh, O.P., (2012), Satellite derived sea sur-face temperature variability in the Bay of Bengal, Mausam, 63, 71-76.
• Singh, M., and Bhardwaj, S.S., (2012), Veri-fication and usability of location specific medium range weather forecast for Kullu valley, Mausam, 63, 543-552.
• Singh Arvind, Gandhi N., Ramesh R., (2012), Contribution of atmospheric nitrogen depo-sition to new production in the nitrogen limited photic zone of the northern Indian Ocean, Journal of Geophysical Research, 117, June 2012, DOI:10.1029/2011JC007737, C06004, 1-11
• Singh Narendra, Joshi R.R., Damle S.H., Pant G.B., (2012), The 404 MHz wind profiler to observe precipitation, Current Science, 103, 46-54
• Singh Prem, Parekh A., Attada R., (2012), Comparison of a simple logarithmic and equivalent neutral wind approaches for converting buoy-measured wind speed to the standard height: special emphasis to North Indian Ocean, Theoretical and Applied Climatology, online, DOI:10.1007/s00704-012-0674-2itm
• Sohn S-J, Tam C-Y, Ashok K., Ahn J-B, (2012), Quantifying the reliability of precipitation datasets for monitoring large-scale East Asian precipitation variations, International Journal of Climatology, 32, DOI: 10.1002/joc.2380, 1520-1526
• Somaru Ram, (2012), On the recent strength-ening of the relationship between Palmer Drought Severity Index and teak (Tectona grandis L. F.) tree-ring width chronology from Maharashtra, India: A case study, Qua-ternary International, 248, January 2012, DOI:10.1016/j.quaint.2011.06.035, 92-97
Indian monsoons based on the NCEP climate forecast system, Meteorological Applica-tions, 19, DOI: 10.1002/met.1331, 189-199
• Satish, P., Giri, R.K., and Adesh, (2012), Disastrous squalls at Delhi, International Journal of Physics and Mathematical Sci-ences, 2 (1), 1-12, 131-147.
• Satish, P., Giri, R.K., and Agarwal, S.C., (2012), ARPS Model Simulation of Synoptic Scale Weather, International Journal of Phys-ics and Mathematical Sciences 2 (1), 1-12.
• Sawant V.S., Meena G.S., Jadhav D.B., (2012), Effect of negative air Ions on fog and smoke, Aerosol and Air Quality Research, 12, DOI:10.4209/aaqr.2011.11.0214, 1007-1015
• Sawaisarje, G.K, and Ranalkar, M.R., (2012), Cumulonimbus cloud with anvil over India : Synoptic cloud type observations 1970-2000, Mausam, 63 , 529-542.
• Sengupta, S., Mandal, B.K., and Pradhan, D., 2012, Exceptional heavy rainfall over Ajoy, Mayurakshi and Kansabati catchments and QPF verification during flood season of Sep-tember 2009, Mausam, 63, 479-488.
• Sheesley R.J., Kirillova E., Andersson A., Kruså M., Praveen P.S., Budhavant K., Safai P.D., Rao P.S.P., Gustafsson O., (2012), Year-round radiocarbon-based source apportionment of carbonaceous aerosols at two background sites in South Asia, Geophysical Research Letters, 117, DOI :10 .1029/2011JD017161 , D10202 , 1-16
• Siingh D., Chate D.M., Ali K., (2012), Time-elapsed evolution of aerosol size distribu-tions by snow particles after the passage of blizzards over the Maitri (Antarctica), International Journal of Remote Sensing, 33, 962–978
• Siingh D., Ramesh Kumar P., Kulkarni M.N., Singh R.P., Singh A.K., (2012), Lightning, convective rain and solar act ivity - Over the South/Southeast Asia, Atmospheric Research, online, DOI:10.1016/j.atmosres.2012.07.026, 1-13
101 CHAPTER 14 Patents & publications
An
nu
al R
epo
rt 2
012–
2013
DOI:10.1088/1748-9326/7/1/014002, 014002, 1-8
• Srivastava A.K., Singh S., Pant P., Dumka U.C., (2012), Characteristics of black carbon over Delhi and Manora Peak - a compara-tive study, Atmospheric Science Letters, 13, DOI:10.1002/asl.386, 223-230
• Srivastava A.K., Singh Sachchidanand, Tiwari S., Bisht D.S., (2012), Contribution of anthropogenic aerosols in direct radiative forcing and atmospheric heating rate over Delhi in the Indo-Gangetic Basin, Environ-mental Science and Pollution Research, 19, DOI:10.1007/s11356-011-0633-y, 1144-1158
• Srivastava A.K., Singh Sachchidanand, Tiwari S., Kanawade V.P., Bisht D.S., (2012), Variation between near-surface and colum-nar aerosol characteristics during the winter and summer at Delhi in the Indo-Gangetic Basin, Journal of Atmospheric and Solar Terrestrial Physics, 77, DOI:10.1016/j.jastp.2011.11.009, 57-66
• Srivastava A.K., Tripathi S.N., Dey Sagnik, Kanawade V.P., Tiwari S., (2012), Inferring aerosol types over the Indo-Gangetic basin from ground based sunphotometer mea-surements, Atmospheric Research, 109-110, DOI:10.1016/j.atmosres. 2012.02.010, 64-75
• Srivastava, K., Sharan S., Lau,Y., Yeung, H.Y., Cheng, T.L., Bhardwaj, R., Kannan, A.M., Roy Bhowmik, S.K., and Singh, H., (2012), Use of SWIRLS nowcasting system for quantitative precipitation forecast using Indian DWR data, Mausam, 63, 1-16.
• Suhas E., Neena J.M., Goswami B.N., (2012), Indian monsoon intraseasonal oscillations (MISO) index for real time monitoring and forecast verification, Climate Dynamics, DOI: 10.1007/s00382-012-1462-5, 1-12
• Suryachandra A. Rao, Dhakate A.R., Saha S.K., Mahapatra S., Chaudhari H.S., Pokhrel S., Sahu S.K., (2012), Why is Indian Ocean warming consistently?, Climatic Change, 110, March 2012, DOI 10.1007/s10584-011-0121-x, 709-719
• Somaru Ram, (2012), Tree growth climate relationships of conifer trees and recon-struction of summer season Palmer Drought Severity Index (PDSI) at Pahalgam in Sri-nagar, India, Quaternary International, 254, DOI:10.1016/j.quaint.2011.09.026, 152-158
• Soni V.K., Pandithurai G., Pai D.S., (2012), Evaluation of long-term changes of solar radiation in India, International Journal of Climatology, 32, DOI: 10.1002/joc.2294, 540-551
• Sowjanya,K., Sarat Kar, A. Routray and P. Mali (2012) Impact of SSM/I retrieval data on the systematic bias of analyses and fore-casts of the Indian summer monsoon using WRF Assimilation system. Int. J. Remote Sensing. DOI:10.1080/01431161.2012.712230.
• Sreenivas P., Gnanaseelan C., Prasad K.V.S.R., (2012), Influence of El Niño and Indian Ocean Dipole on sea level vari-ability in the Bay of Bengal, Global and Plan-etary Chang,, 80-81, DOI:10.1016/j.gloplacha.2011.11.001, 215–225
• Srivastava A.K., Pant P., Dumka U.C., Hegde P., (2012), Black Carbon Aerosol Characteris-tics and Its Radiative Impact over Nainital: A High-Altitude Station in the Central Himala-yas, Journal of the Institute of Engineering, 8, 1-10
• Srivastava A.K., Rajeevan M., Zubair L., Revadekar J., (2012), State of the Climate in 2011 : South Asian Regional Summary, Bul-letin of the American Meteorological Society, 93, s208-s211
• Srivastava, K., Gao, J., Brewster, K., Roy Bhowmik, S.K., Xue Ming and Gadi Ranu, (2012), Assimilation of Indian radar data with ADAS and 3DVAR techniques for sim-ulation of a small scale tropical cyclone using ARPS mode, Natural Hazards, 58, 15-29.
• Srivastava A.K., Ram K., Pant P., Hegde P., Joshi H., (2012), Black carbon aerosols over Manora Peak in the Indian Himala-yan foothills: implications for climate forc-ing, Environmental Research Letters, 7,
102 CHAPTER 14 Patents & publications A
nn
ual
Rep
ort
201
2–20
13
mesoscale convective complexes, Mausam, 63, 29-54.
• Urankar G., Prabha T.V., Pandithurai G., Pallavi P., Achuthavarier D., Goswami B.N., (2012), Aerosol and cloud feed-backs on surface energy balance over selected regions of the Indian subconti-nent, Journal of Geophysical Research, 117, DOI:10.1029/2011JD016363, D04210
• Varikoden H., Preethi B., (2012), Wet and dry years of Indian summer monsoon and its relation with Indo-Pacific sea surface tem-peratures, International Journal of Climatol-ogy, online, DOI: 10.1002/joc.3547, 1-11
• Verma, I.J., Koppar, A.L., Balasubrama-nian, R., Jadhav, V.N., Erande, R.S., (2012), Monthly climatic water balance at selected locations in India, Mausam, 63, 129-136.
• Verma, I.J., Das, H.P., Balasubramanian, R., Jadhav, V.N., (2012), Comparative study on water and heat unit requirement of finger millet (Eleusine coracana G.) in different agroclimatic zones, Mausam, 63, 167-172.
• Verma, I.J., Soni, V.K., Sabale, N.D., and Koppar, A.L., (2012), Spatial variability of annual and monthly Potential Evapotranspi-ration (PET) over India, Mausam, 581-586.
• Vijayakumar K., Devara P.C.S., (2012), Study of aerosol optical depth, ozone, and precipi-table water vapour content, International Journal of Remote Sensing, DOI:10.1080/01431161.2012.705444
• Vijaykumar K., Devara P.C.S., (2012), Varia-tions in aerosol optical and microphysical properties during an Indian festival observed with space-borne and ground-based obser-vations, Atmosfera, 25, 381-395
• Vishnu R., Varikoden H., Anil Kumar V., Das S.M., Mohan Kumar G., Symon V.N.S., (2012), Abnormal modulation of atmospheric parameters during the tsunami of 2004, Current Science, 102, 1575-1580
• Waliser D.E., Moncrieff M.W., Burridge D., Fink A.H., Gochis D. Goswami B.N., Guan
• Terray P., Kamala K., Masson S., Madec G., Sahai A.K., Luo J-J, (2012), Role of the intra-daily SST variability in the Indian monsoon variability and monsoon-ENSO-IOD rela-tionships in a global coupled model, Climate Dynamics, 39, DOI:10.1007/s00382-011-1240-9, 729-754
• Tinmaker M.I.R., Ali K., (2012), Space time variation of lightning activity over northeast India, Meteorologische Zeitschrift, 21, DOI 10.1127/0941-2948/2012/0227, 135-143
• Tiwari S., Chate D.M., Bisht D.S., Srivastava M.K., Padmanabhamurty B., (2012), Rainwa-ter chemistry in the North Western Himala-yan Region, India, Atmospheric Research, 104, 128–138
• Tiwari S., Chate D.M., Pragya P., Ali K., Bisht D.S., (2012), Variations in Mass of the PM10, PM2.5 and PM1 during the monsoon and the winter at New Delhi, Aerosol and Air Quality Research, 12, DOI:10.4209/aaqr.2011.06.0075, 20-29
• Tiwari S., Chate D.M., Srivastava M.K., Safai P.D., Srivastava A.K., Bisht D.S., Pada-manabhamurty B., (2012), Statistical evalua-tion of PM10 and distribution of PM1, PM2.5, and PM10 in ambient air due to extreme fireworks episodes (Deepawali festivals) in megacity Delhi, Natural Hazards, 61, DOI 10.1007/s11069-011-9931-4, 521–531
• Tomar, M.S., (2012), An insight into the severe floods in India during 2005, 2006 & 2007, Mausam, 63, 65-70.
• Tomar, M.S., (2012), Measurement and analysis of Radio refractive index over Pati-ala during monsoon season with respect to its diurnal and monthly characteristics, Mausam, 63, 334-338.
• Tomar, M.S., (2012), Rainfall pattern over Patiala during monsoon season, 63, Mausam, 645-647.
• Tyagi, A., Sikka, D.R., Goyal, S., Bhowmik, M., (2012), A satellite based study of pre-monsoon thunderstorms (Nor’westers) over eastern India and their organization into
103 CHAPTER 14 Patents & publications
An
nu
al R
epo
rt 2
012–
2013
• Jena, B., Debadatta, S., and Avinash Kumar (2012), Investigation of the biophysical pro-cesses over the oligotrophic waters of South Indian Ocean subtropical gyre, triggered by cyclone Edzani, International Journal of Applied Earth Observation & Geoinforma-tion, 18, 49-56.
• Huang, J.P., Mojib, N., Goli, R.R., Watkins,S., Waites, K.B., Ravindra, R., Andersen, D.T., and Bej, A.K., (2012), Antimicrobial activity of PVP from an Antarctic bacterium, Janthi-nobacterium sp. Ant5-2, on multi-drug and methicillin resistant Staphylococcus aureus. Natural Product Bioprospectives, 2, 104-110.
• Mahalinganathan, K., Thamban, M., Lal-uraj, C. M. and Redkar, B. L. (2012), Relation between surface topography and sea-salt snow chemistry from Princess Elizabeth Land, East Antarctica, The Cryosphere, 6, 505-515
• Manoj, M. C., Thamban, M., Sahana, A., Rahul Mohan and Mahender, K.,(2012), Prov-enance and temporal variability of ice rafted debris in the Indian sector of the Southern Ocean during the last 22000 years, Journal of Earth System Science, 121, p.
• Thamban, M., Naik, S.S., Laluraj, C.M., Chaturvedi, A., and Ravindra, R., (2012), Antarctic Climate Variability During the Past Few Centuries Based on Ice Core Records from Coastal Dronning Maud Land and Its Implications on the Recent Warming [In] R. Sinha and R. Ravindra (Eds.), Earth Sys-tem Processes and Disaster Management, Society of Earth Scientists Series 1, DOI 10.1007/978-3-642-28845-6_5.
• Pavithran, S., Anilkumar, N., Krishnan, K.P., Sharon, B.N., Jenson V.G., Nanajkar,M., Racheal Chacko., Dessai, D.G.G., and Achuthankutty, C.T. (2012), Contrasting pat-tern in chlorophyll a distribution within the polar front of the Indian sector of Southern Ocean during austral summer 2010, Current Science, v. 102, p. 899-903.
B., Harr P., Heming J., Hsu H-H, Jakob C., Janiga M., Johnson R., Jones S., Knippertz P., Marengo J., Nguyen H., Pope M., Serra Y., Thorncroft C., Wheeler M., Wood R., Yuter S., (2012), The Year of tropical convec-tion (May 2008-April 2010) Climate Vari-ability and Weather highlights, Bulletin of the American Meteorological Society, 93, DOI:10.1175/2011BAMS3095.1, 1-31
• Yadav R.K., Rupa Kumar K., Rajeevan M., (2012), Characteristic features of winter pre-cipitation and its variability over northwest India, Journal of Earth System Science, 121, 611-623
CRyOsPHERE
• Antony, R., Krishnan,K.P., Laluraj, C.M., Thamban, M., P.K. Dhakephalkar,P.K., Anupama S. E., and Shivaji, S. (2012), Diver-sity and physiology of culturable bacteria associated with a coastal Antarctic ice core, Microbiological Research, doi:10.1016/j.micres.2012.03.003.
• Gandhi, Navin., R. Ramesh, A. H. Laskar, M. S. Sheshshayee, Suhas Shetye,N. Anilkumar, Shramik M. Patil and Rahul Mohan (2012), Zonal variability in primary production and nitrogen uptake rates in the southwestern Indian Ocean and the Southern Ocean, Deep-Sea Research Part I, 67, 32-43.
• Gawas-Sakhalkar Puja, Singh S.M., Naik S.,and Ravindra, R. (2012), High tempera-ture optima phosphatases from cold-tol-erant Arctic fungus, Penicillium citrinum, Polar Research, 31, 11105, http://dx.doi.org/10.3402/polar.v31i0.11105.
• Govil, Pawan., Rajesh Asthana ., Abhijit Mazumder and Ravindra, R. (2012), Grain Size Distribution and its Influence on Biolog-ical Productivity During Holocene in a Fresh Water Lake in Larsemann Hills, Antarctica, National Academy Science Letters, DOI 10.1007/s40009-012-0013-2.
104 CHAPTER 14 Patents & publications A
nn
ual
Rep
ort
201
2–20
13
• Singh S.M., Sharma J., Gawas P., Upadhyay A.K., Pedneker S.M, Ravindra R., (2012), Atmospheric deposition studies of heavy metals in Arctic by comparative analysis of lichens and cryoconite, Environmental Monitoring and Assessment, doi:10.1007/s10661-012-2638-5.
• Singh S.M., Singh S.K., Yadav L., Singh P.N. & Ravindra R., (2012), Filamentous Soil Fungi from Ny-Ålesund, Spitsbergen, and Screening for Extracellular Enzymes, ARC-TIC, 65, 35-55.
• Singh P., Singh A., D`Souza L.M., Roy U., Singh S.M., (2012), Chemical Constituents and Antioxidant activity of Arctic Mush-room Lycoperdon molle Pers. Polar Research, 31, 17329DOI: 10.3402/polar.v31i0.17329.
• Sinha, R. K. and Krishnan, K.P., (2012), Novel opportunity for understanding origin and evolution of life: perspectives on the explo-ration of subglacial environment of Lake Vostok, Antarctica, Annals of Microbiology, DOI:10.1007/s13213-012-0525-5.
• Sruthi, K.V., Thamban, M., Manoj, M.C. and Laluraj,C.M., (2012). Association of trace ele-ments with various geochemical phases in the Indian Sector of Southern Ocean during past 22,000 years and its palaeoceanographic implications. Current Science, v. 103, p. 803-809.
• Thamban, M. and Thakur, R. C., (2012), Trace metal concentrations of surface snow from Ingrid Christensen Coast, East Ant-arctica - Spatial variability and possible anthropogenic contributions. Environmental Monitoring and Assessment, DOI: 10.1007/s10661-012-2764-0.
GEOsCiEnCE
• Bansal, B.K., and Verma, M., (2012), The M 4.9 Delhi earthquake of 5 March 2012, Curr.Sci., 102, 1704-1708.
• Chopra, S., Kumar, D., Choudhury, P., and Yadav, R.B.S., (2012), Stochastic Finite Fault
• Ravindra, Rasik., and Laluraj, C.M., (2012), Cryosphere Research: Indian Perspective, Proceedings of Indian national Science Acad-emy, 78, 249-257.
• Satheesan, K. (2012), Tracer–tracer relation in the Arctic stratosphere using Fuzzy Logic, Tellus B Journal. 4, 17164, http://dx.doi.org/10.3402/tellusb.v64i0.17164
• Shetye, S., Sudhakar, M., Ramesh, R., Mohan, R., Patil, S., and Laskar, A., (2012), Sea sur-face pCO2 in the Indian sector of the south-ern ocean during austral summer of 2009, Advances in Geosciences. 28: Atmospheric Science and Ocean Sciences, Eds. Chun-Chieh Wu and Jianping Gan,World Scientific Publishing Company.
• Singh P., Singh S.M., D`Souza L.M., Wahid-hullah S. (2012), Phytochemical profile and antioxidant potential of four Arctic vas-cular plants. Polar Biology, DOI 10.1007/s00300-012-1225-0.
• Singh, S.M., Ochyra, R., Pednekar, S., Ast-hana, R. and R. Ravindra (2012), A Holocene moss species preserved in lake sediment core and the present moss diversity at Schirm-acher Oasis, Antarctica, Antarctic Science, doi: 10.1017/S0954102012000211.
• Singh, P. and S. M. Singh (2012), Charac-terization of yeast and filamentous fungi isolated from cryoconite holes of Svalbard, Arctic, Polar Biology, 35, 575–583.
• Singh S.M. & Ravindra R (2012), Impact of climate change on Lichen & Moss communi-ties in Ny-Ålesund, Arctic: some preliminary observations: (In) R. Sinha and R. Ravindra (Eds.), “Earth System Processes and Disaster management”, Springer DOI 10.1007/978-3-642-28845-6_7, 93-100.
• Singh S.M., Sharma J., Gawas-Sakhalkar P., Upadhyay A.K., Naik S., Bande D., Ravindra R (2012), Chemical and bacteriological anal-ysis of soil from the middle and late Weich-selian from Western Spitsbergen, Arctic, Quaternary International, Doi:10.1016. 03.008
105 CHAPTER 14 Patents & publications
An
nu
al R
epo
rt 2
012–
2013
• Kayal J.R., Arefiev S.S., BaruahSaurabh, Hazarika D., Gogoi N., Gautam J.L., Baruah Santanu, Dorbath C., Tatevossian R., (2012), Large and great earthquakes in the Shillong plateau–Assam valley area of Northeast India Region:Pop-up and transverse tecton-ics. Tectonophysics, 86–192.
• Kumar, S., Chopra, S., Choudhury, P., Singh, A.P., and Yadav, R.B.S., (2012). Ambient noise levels in Gujarat State (India) Seismic Network, Geomatics, Natural Hazards and Risks, http://dx.doi.org/10.1080/19475705.2011.611952.
• Manoj, M.C., Singhvi, A. and Sridhar, A., (2012), Indian Participation in XVIII Inter-national Union for Quaternary Research (INQUA) Congress, 2011, Journal Geological Society of India, 79, 223-224.
• Manoj, M.C., Thamban, M., Basavaiah,N., Mohan, R., (2012), Evidence for climatic and oceanographic controls on terrigenous sedi-ment supply to the Indian Ocean sector of the Southern Ocean over the past 63,000 years. Geo-Marine Letters, 32, 251-265
• Mandal, H.S., Khan, P.K., Shukla, A.K., (2012). Soil responses near Delhi Ridge and adjacent region in Greater Delhi during inci-dence of a local earthquake. Journal of Natu-ral Hazards, DOI 10.1007/s11069-012-0098-4.
• Pandit, D., and Panigrahi, M.K., (2012), Com-parative petrogenesis and tectonics of Paleo-proterozoic Malanjkhand and Dongargarh granitoids, Central India, Journal of Asian Earth Sciences, 50, 1-170.
• Ray, D, Rajan, S. and Ravindra,R., (2012), Role of subducting component and sub-arc mantle in arc petrogenesis: Andaman volca-nic arc, Current Science, 102, 605-609.
• Reddy, C.D., Prajapati, S.K., Sunil1, P. S., and Arora, S. K., (2012), Transient Postseismic Mantle Relaxation Following 2004 Sumatra Earthquake: Implications of Seismic Vul-nerability in the Andaman-Nicobar Region. Nat. Hazards Earth Syst. Sci., 12, 431–441,
Modeling of Mw 4.8 Earthquake in Kachchh, Gujarat, India, Journal of Seismology, DOI 10.1007/s10950-012-9280-0.
• Chopra,S., Kumar,V., Suthar, A., and Pankaj Kumar, (2012), Modeling of strong ground motions for 1991 Uttarkashi, 1999 Chamoli earthquakes and a hypothetical great earth-quake in Garhwal-Kumaun Himalaya, Natu-ral Hazards, doi : 10.1007/s11069-012-0289-z.
• Chopra, S., Kumar, D., Rastogi, B.K., Choud-hury, P., and Yadav, R.B.S., (2012), Esti-mation of site amplification functions in Gujarat region, India, Natural Hazards, DOI: 10.1007/s11069-012-0116-6.
• Chopra, S., Kumar, D., Rastogi, B.K., Choud-hury, P., and Yadav, R.B.S.,(2012), Estima-tion of seismic hazard in Gujarat region, India, Natural Hazards, DOI:10.1007/s11069-012-0117-5.
• Chopra, S., Kumar, D., Rastogi, B.K., Choud-hury, P., Yadav, R.B.S., (2012), Deterministic seismic scenario for Gujarat region, India, Natural Hazards, 60 (2), 517-540
• C h o u d h u r y , P . , C a t h e r i n e , J . K . , Gahalaut,V.K., Chopra, S., Dumka, R. and Singha Roy, K., (2012), Post-seismic defor-mation associated with the 2001 Bhuj Earth-quake, Natural Hazards, doi 10.1007/s11069-012-0191-8.
• Exon, N., Pandey, D. K. and Gallagher, S. (2012), Scientific drilling in the Indian Ocean, Eos Trans. American Geophysical Union, 93, 70, DOI:10.1029/2012EO070011.
• Gallagher, S., Exon, N., Pandey, D. K., Rajan S., Coffin, M. and Takai, K. (2012), New Frontiers in Scientific Drilling of the Indian Ocean., Scientific Drilling (14), 60-63, DOI:10.2204/iodp.sd.14.09.2012.
• Gupta, A.K., Sutar, A.K., Chopra, S. , Kumarand,S., and Rastogi, B.K., (2012), Attenuation Characteristics of Coda Waves in Mainland Gujarat (India), Tectonophysics, DOI: 10.1016/j.tecto.2012.01.002.
106 CHAPTER 14 Patents & publications A
nn
ual
Rep
ort
201
2–20
13
geopotential models and GPS-Levelling Data. J. Earth Syst. Sci. 121, 1025–1032.
• Tiwari, M., (2012), High Resolution Southwest Monsoon Reconstruction for the Past ~2800 Years: Wind vs. Precipitation. In “Earth Sys-tem Processes and Disaster Management”, [In] R. Sinha & R. Ravindra (Eds.), Society of Earth Scientists Series 1, Springer, Berlin, 101-112 doi: 10.1007/978-3-642-28845-6.
• Verma, M., and Bansal, B.K., (2012). Indian National GNSS Programme: Crustal defor-mation measurements in the Indian Sub-con-tinent, J Asian Earth Sciences, 50, 1–6.
• Verma, M., and Bansal, B.K., (2012). Earth-quake precursory studies in India: Scenario and future perspectives, J. Asian Earth Sci-ences, 54–55, 1–8.
• Yadav, R.B.S., Bayrak, Y., Tripathi, J.N., Chopra, S., and Bayrak, E., (2012), Regional Variation of the ω-Upper Bound Magnitude of GIII Distribution in Hindukush-Pamir Himalaya and the Adjoining Regions: A Perspective on Earthquake Hazard, Tecto-nophysics, doi:10.1016/j.tecto.2012.03.015.
• Yadav, R.B.S., Bayrak, Y., Tripathi, J.N., Chopra, S., Singh, A.P., Bayrak, E., (2012), A Probabilistic Assessment of Earthquake Hazard Parameters in NW Himalaya and the Adjoining Regions, Pure and Applied Geo-physics, 169, 1619-1639.
• Yadav, R.B.S., Bayrak, Y., Tripathi, J.N., Cho-pra, S., Bayrak, E., (2012), Regional variation of the ω-upper bound magnitude of GIII dis-tribution in Hindukush-Pamir Himalaya and the adjacent regions: A perspective on earth-quake hazard, Tectonophysics, 544-545, 1-12.
• Yadav, R.B.S., Gahalaut, V.K., Chopra, S., Shan, B., (2012), Tectonic implications and seismicity triggering during the 2008 Baluch-istan, Pakistan earthquake sequence, Journal of Asian Earth Sciences, 45, 167-178
• Yadav, J.K.S., Giri, R.K., Meena, L.R., (2012), IPWV estimation and data quality analysis
Nat-Hazards-Earth-Syst-Sci., Doi:10.5194/Nhess-12-431-2012.
• Reddy, C. D., Sunil, P.S., Prajapati, S.K., Pon-raj, M., and Amrithraj, S., (2012), Geodynam-ics Of The Ne Indian Lithosphere: Geodetic And Seismotectonic Perspective. Memoir of the Geological Society of India, 241-250, ISBN: 978-81-907636-2-2.
• Shrivastava, M.N., Reddy, C.D., and Praj-apati, S.K., (2012), Topographic Constraints On Deviatoric Stress Field in the Indo-Eur-asian Collision Region: Seismo-Tectonic Implications, Pure and applied Geophysics, DOI 10.1007/S00024-012-0570-9.
• Shukla H.P., Dattatrayam, R.S., and Bhat-nagar, A.K., (2012), Seismicity of region around dams in North West India, Mausam, 63, 261-274.
• Singh.S.K., Pacheco, J.F., Ordaz,M., Datta-trayam, R.S., Suresh, G., and Baidya, P.R., (2012), Estimating tsunami potential of earth-quakes in the Sumatra – Andaman Region based on broadband seismograms in India, Natural Hazards, 64, 1491-1510
• Singh, A.P., Mishra, O.P., Yadav, R.B.S., Kumar, D., (2012), A new insight into crustal heterogeneity beneath the 2001 Bhuj earth-quake region of Northwest India and its implications for rupture initiations, Journal of Asian Earth Sciences, 48, 31-42.
• Singh, A.P., Mishra, O.P., Kumar, D., Kumar, S., Yadav, R.B.S., (2012), Spatial variation of the aftershock activity across the Kachchh Rift Basin and its seismotectonic implica-tions, Journal of Earth System Science, 121, 439-451.
• Singh, A.P., Murty, T.S., Rastogi, B.K., Yadav, R.B.S., (2012), Earthquake Generated Tsunami in the Indian Ocean and Probable Vulnerability Assessment for the East Coast of India, Marine Geodesy, 35, 49-65.
• Srinivas, N. Tiwari, V. M., Tarial, J. Prajapati, S. K., Meshram, A. E., Singh, B., and Nagara-jan, B., (2012) Gravimetric Geoid of a part of South India and its comparison with global
107 CHAPTER 14 Patents & publications
An
nu
al R
epo
rt 2
012–
2013
prey-predator system with reserve, Nonlin-ear Dynamics, 78, 1805-1829.
• Chakraborty, K., Kar, T.K., (2012), Economic perspective of marine reserves in fisheries: A bioeconomic model (2012) Mathematical Bio-sciences, 240, 212-222.
• Chakravorty Soumi, Chowdary J.S., Gnanas-eelan C., (2012), Spring asymmetric mode in the tropical Indian Ocean: role of El Nin˜o and IOD, Climate Dynamics, online, DOI 10.1007/s00382-012-1340-1, 1-15
• Chatterjee, A., Shankar, D., Shenoi, S.S.C., Reddy, G.V., Michael, G.S., Ravichandran, M., Gopalkrishna, V.V., Rama Rao, E.P., Udaya Bhaskar, T.V.S., Sanjeevan, V.N., (2012), A new atlas of temperature and salin-ity for the North Indian Ocean, Journal of Earth System Science, 121, 559-593.
• Gandhi N., Ramesh R., Laskar A.H., Shesh-shayee M.S., Shetye S., Anilkumar N., Patil S.M., Mohan R., (2012), Zonal variability in primary production and nitrogen uptake rates in the southwestern Indian Ocean and the Southern Ocean, Deep-Sea Research I, 67, DOI:10.1016/j.dsr.2012.05.003,32-43
• George, G., Meenakumari, B., Raman, M., Kumar, S., Vethamony, P., Babu, M.T., Ver-lecar, X., (2012), Remotely sensed chloro-phyll: A putative trophic link for explaining variability in Indian oil sardine stocks, Jour-nal of Coastal Research, 28 (1 A), pp. 105-113.
• Girish kumar, M.S., Ravichandran, M., (2012), The influences of ENSO on tropical cyclone activity in the Bay of Bengal dur-ing October-December, Journal of Geo-physical Research C: Oceans, 117, C2, DOI: 10.1029/2011JC007417
• Girishkumar, M.S., Ravichandran, M., Pant, V., (2012), Observed chlorophyll-a bloom in the southern Bay of Bengal during winter 2006-2007, International Journal of Remote Sensing, 33, 1264-1275.
• Gnanaseelan C., Deshpande Aditi, McPh-aden M.J . , (2012) , Impact of Indian Ocean Dipole and El Niño/Southern
from different GNSS antenna, Mausam, 63,77-88.
OCEAn sCiEnCE And TECHnOLOGy
• Agarwal N., Sharma R., Parekh A., Basu S., Sarkar A., Agarwal V.K., (2012), Argo obser-vations of barrier layer in the tropical Indian Ocean, Advances in Space Research, 50, DOI: 10.1016/j.asr.2012.05.021, 642–654
• Amol, P., Shankar, D., Aparna, S.G., Shenoi, S.S.C., Fernando, V., Shetye, S.R., Mukher-jee, A., Agarvadekar, Y., Khalap, S., Satelkar, N.P., (2012), Observational evidence from direct current measurements for propaga-tion of remotely forced waves on the shelf off the west coast of India, Journal of Geo-physical Research C: Oceans, 117, C5, DOI: 10.1029/2011JC007606.
• Avinash Kumar, Jayappa, K. S. and Vetham-ony, P., (2012), Evolution of Swarna Estuary and Its Impact on Braided Islands and Estua-rine Banks, Southwest Coast of India. Envi-ronmental Earth Sciences, 65, 835-848.
• Avinash Kumar, Jena, B., Vinaya, M.S., Jay-appa, K.S. Narayana A.C. and Ganagadhra Bhat, H. (2012), Regionally tuned algorithm to study the seasonal variation of suspended sediment concentration using IRS-P4 Ocean Color Monitor data, The Egyptian Journal of Remote Sensing and Space Science, 15, 67-81.
• Chacko, N., Ravichandran, M., Rao, R.R., Chandra Shenoi, S.S., (2012), An anomalous cooling event observed in the Bay of Ben-gal during June 2009, Ocean Dynamics, 62, 671-681.
• Chakraborty, K., Jana, S., Kar, T.K., (2012), Global dynamics and bifurcation in a stage structured prey-predator fishery model with harvesting, Applied Mathematics and Com-putation, 218, 9271-9290.
• Chakraborty, K., Jana, S., Kar, T.K., (2012), Ef fort dynamics of a delay- induced
108 CHAPTER 14 Patents & publications A
nn
ual
Rep
ort
201
2–20
13
• Latha, G., Sanjana, M.C., (2012), Mid-frequency ambient noise notch using time series measurements in Bay of Ben-gal , IEEE J . of Oceanic Engineering, 37, 255-260.
• Maneesha, K., Murty, V.S.N., Ravichandran, M., Lee, T., Yu, W., McPhaden, M.J., (2012), Upper ocean variability in the Bay of Bengal during the tropical cyclones Nargis and Laila Progress in Oceanography, 106, 49-61.
• Nagamani, P.V., Ali, M.M., Goni, G.J., Pedro, D.N., Pezzullo, J.C., Bhaskar, T.V.S.U., Gopalakrishna, V.V., (2012), Kurian, N. Vali-dation of satellite-derived tropical cyclone heat potential with in situ observations in the North Indian Ocean, Remote Sensing Let-ters, 3, 615-620.
• Nagaraja Kumar, M., Srinivasa Kumar, T., Naga Swetha, N., Maity, S., Jemima, U., (2012), A comparative study on feasibility of utilization of GHRSST product for opera-tional generation of Potential Fishing Zone (PFZ) advisories in India (2012) International Journal of Earth Sciences and Engineering, 5, 240-246.
• Nisha, P.G., Muraleedharan, P.M., Keerthi, M.G., Sathe, P.V., Ravichandran, M., (2012), Does sea level pressure modulate the dynamic and thermodynamic forcing in the tropical Indian Ocean? International Journal of Remote Sensing, 33, 1991-2002.
• Pokhrel, S., Rahaman, H., Parekh, A., Saha, S.K., Dhakate, A., Hemantkumar S Chaud-hari, Gairola, R.M., (2012), Evaporation-precipitation variability over Indian Ocean and its assessment in NCEP Climate Fore-cast System (CFSv2), Climate Dynamics, 39, 2585-2608.
• Prakash, P., Kumar, T.S., Rahman, S.H., Nayak, S., (2012), Binning algorithm for high-resolution IRS-P4 OCM chlorophyll image (2012) International Journal of Remote Sensing, 33, 5789-5798.
• Prakash, S., Nair, T.M.B., Bhaskar, T.V.S.U., Prakash, P., Gilbert, D., (2012), Oxycline
Oscillation wind-forcing on the Wyrtki jets, Journal of Geophysical Research, 117, DOI:10.1029/2012JC007918, C08005,1-11
• Harikumar, R., Sampath, S., Sasi Kumar, V. , (2012), Altitudinal and temporal evolution of raindrop size distribution observed over a tropical station using a K-band radar,
• International Journal of Remote Sensing, 33, pp. 3286-3300.
• Jayakumar A., Gnanaseelan C., (2012), Anomalous intraseasonal events in the ther-mocline ridge region of Southern Tropical Indian Ocean and their regional impacts, Journal of Geophysical Research, 117, DOI:10.1029/2011JC007357, C03021, 1-16
• Jayakumar A., Gnanaseelan C., Sabin T.P., (2012), Mechanism of intraseasonal oceanic signature in the region off southern tip of India during boreal summer, International Journal of Climatology, online, DOI:10.1002/joc.3585, 1-9
• Jayakumar A., Gnanaseelan C., (2012), Study the mechanism of surface chlorophyll vari-ability in the southern tropical Indian Ocean using an OGCM, Marine Geodesy, 35, DOI:10.1080/01490419.2011.637874, 246-256
• Joseph, S., Wallcraft, A.J., Jensen, T.G., Ravi-chandran, M., Shenoi, S.S.C., Nayak, S. , (2012), Weakening of spring Wyrtki jets in the Indian Ocean during 2006-2011, Jour-nal of Geophysical Research C: Oceans, 117, DOI: 10.1029/2011JC007581
• Kumar, T.S., Nayak, S., Kumar, C.P., Yadav, R.B.S., Kumar, B.A., Sunanda, M.V., Devi, E.U., Kumar, N.K., Kishore, S.A., Shenoi, S.S.C., (2012), Successful monitoring of the 11 April 2012 tsunami off the coast of Suma-tra by Indian Tsunami Early Warning Cen-tre, Current Science, 102 (11), p. 1519.
• Laluraj C. M., Balachandran, K.K. and Sabu, P. (2012), Enhanced biological production in the southeastern Arabian Sea during spring intermonsoon, Advances in Oceanography and Limnology, DOI:10.1080/19475721.2012.718720
109 CHAPTER 14 Patents & publications
An
nu
al R
epo
rt 2
012–
2013
Landsat TM and Resourcesat-1 LISS IV: An example of coastal resource conservation along Tamil Nadu Coast, India, Journal of Coastal Conservation, 16, 1-12.
• Srinivasa Kumar, T., Nayak, S., Kumar, P., Yadav, R.B.S., Kumar, A., Sunanda, M.V., Uma Devi, E., Shenoi, S.S.C., (2012), Perfor-mance of the tsunami forecast system for the Indian Ocean, Current Science, 102, 110-114.
• Talaulikar, M., Thayapurath, S., Desa, E., Matondkar, S.G.P., Srinivasa Kumar, T., Lotliker, A., Inamdar, A., (2012), Empiri-cal algorithm to estimate the average cosine of underwater light field at 490 nm, Remote Sensing Letters, 3, 585-593.
• Udaya Bhaskar, T.V.S., Swain, D., Ravichan-dran, M., (2012), Determination of sonic layer depth from XBT profiles and climatological salinities in the Arabian sea, International Journal of Earth Sciences and Engineering, 5, 35-43.
• Valsala V., Maksyutov S., Murtugudde R., (2012), Window for carbon uptake in the southern subtropica l Indian Ocean, Geophysical Research Letters, 39, DOI:10.1029/2012GL052857, 1-7
• Valsala V., Maksyutov S., Telszewski M., Nakaoka S., Nojii Y., Ikeda M., Murtugudde R., (2012), Climate impacts on the structures of the North Pacific air-sea CO2 flux variabil-ity, Biogeosciences, 9, 477-492
• Vialard J., Jayakumar A., Gnanaseelan C., Lengaigne M., Sengupta D., Goswami B.N., (2012), Processes of 30-90 days sea surface temperature variability in the northern Indian Ocean during boreal summer, Cli-mate Dynamics, 38, DOI: 10.1007/s00382-011-1015-3, 1901-1916.
• Zacharia, J., Rajan, C.K., Jayaram, C., (2012), A cold pool formation in the Lakshadweep Sea during Indian summer monsoon, Ocean Dynamics, 62, 881-892.
variability in the central Arabian Sea: An Argo-oxygen study, Journal of Sea Research, 71, 1-8.
• Rahaman, W., Singh, S.K., and Shukla, A.D., (2012), Rhenium in Indian rivers: Sources, fluxes, and contribution to oceanic budget. Geochemistry Geophysics Geosystem, 13. doi: 10.1029/2012GC004083.
• Ravichandran, M., Girishkumar, M.S., Riser, S., (2012), Observed variability of chlorophyll-a using Argo profiling floats in the southeastern Arabian Sea, Deep-Sea Research Part I: Oceanographic Research Papers, 65, 15-25.
• Revichandran, C., Srinivas, K., Muraleed-haran, K.R., Rafeeq, M., Amaravayal, S., Vijayakumar, K., Jayalakshmy, K.V., (2012), Environmental set-up and tidal propagation in a tropical estuary with dual connection to the sea (SW Coast of India), Environmental Earth Sciences, 66, 1031-1042.
• Roxy M., Tanimoto Y., (2012), Influence of sea surface temperature on the intra-seasonal variability of the South China Sea summer monsoon, Climate Dynamics, 39, DOI:10.1007/s00382-011-1118-x, 1209-1218
• Singh, S.K., and Rahul Mohan, (2012), The Contribution of Diatoms to World wide Crude Oil Deposits, [In] R. Gor-don and J. Seckbach (Eds.), The Science of Algal Fuels, Cellular Origin, Life in Extreme Habitats and Astrobiology, DOI 10.1007/978-94-007-5110- 1_20.
• Sabique, L., Annapurnaiah, K., Balakrishnan Nair, T.M., Srinivas, K., (2012), Contribu-tion of Southern Indian Ocean swells on the wave heights in the Northern Indian Ocean - A modeling study, Ocean Engineering, 43, 113-120.
• Srinivasa Kumar, T., Mahendra, R.S., Nayak, S., Radhakrishnan, K., Sahu, K.C. , (2012), Identification of hot spots and well man-aged areas of Pichavaram mangrove using
CHAPTER
15
AdminisTRATivE suPPORT
15.1 CiTiZEn’s CHARTER
The Charter is given below. The potential areas of services are:-i. To improve dissemination of weather fore-
cast to various sectors like agriculture, avia-tion, sports, urban areas, defence, etc.
ii. To provide wide-range ocean information services for sectors like fisheries, shipping, navy, coast guard, etc.
iii. To develop technology for exploring and harnessing marine resources in a sustain-able way.
iv. To undertake and support cryospheric research in the Antartica, Arctic and Himalayas.
v. To monitor earthquakes, conduct seismo-logical and geosciences research.
vi. To provide early warning on natural disas-ters like cyclone, storm surge and tsunami etc..
vii. To assess the coastal and ocean marine liv-ing resources.
viii. To encourage formulation of research and development schemes in the earth system science, create capacity building and pro-mote human resource development.
ix. To extend support to seminars, symposia, conferences, exhibitions, etc. and process ap-plications for grants to organize seminars/symposia/conferences.
x. To create awareness about earth system sci-ence sector by participation in educational programmes, exhibitions and trade fairs and through partnership with NGOs.
xi. This Charter is a declaration of vision, mis-sion, values and standards and commit-ment to act in manner to achieve excellence for improving forecast for weather, climate and hazards as well as the exploration and exploitation of cast marine resource for the socio-economic benefit of the society. All the centers of ESSO have been directed to adopt the Citizen Charter in toto.
15.2 imPLEmEnTATiOn OF THE 15-POinT PROGRAmmE On minORiTy wELFARE
The proper implementation of the 15-point programme on minority welfare including inter alia, ensuring adequate representation of minor-ity communities while making recruitment or forming Selection Committee set up for filling up of vacancies in Group A, B, C including MTS has been ensured.
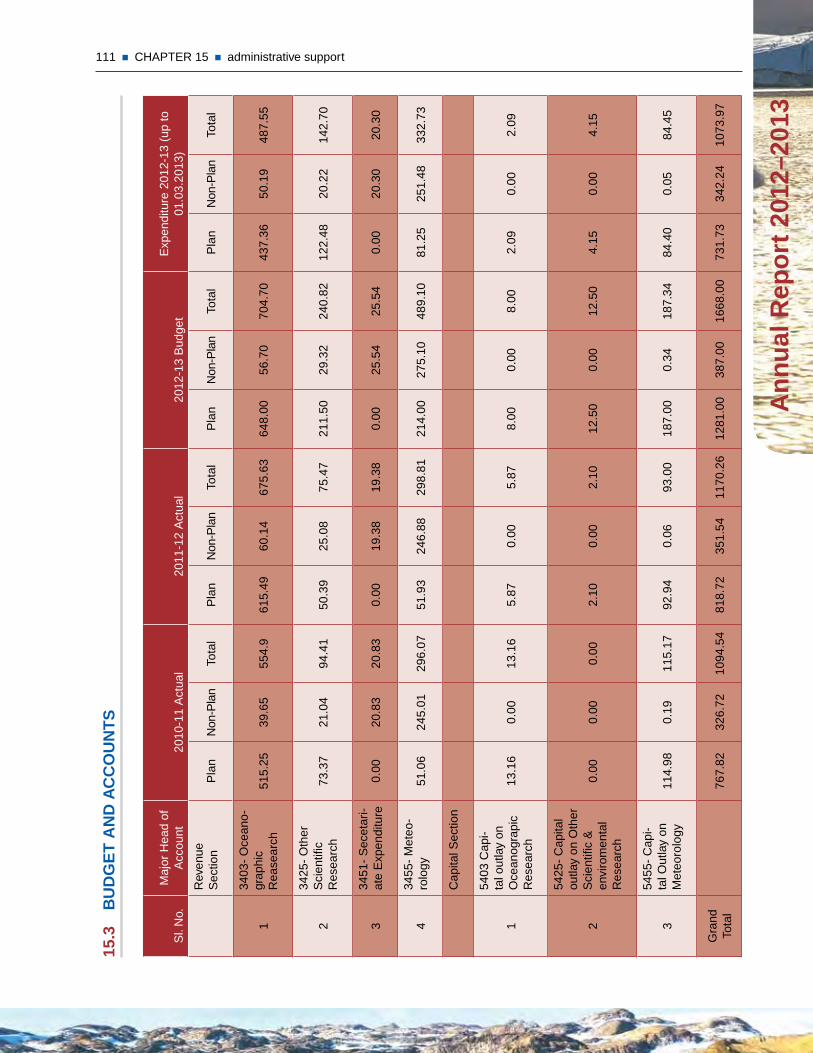
111 CHAPTER 15 administrative support
An
nu
al R
epo
rt 2
012–
2013
15.3
B
ud
GE
T A
nd
AC
CO
un
Ts
Sl.
No.
Maj
or H
ead
of
Acc
ount
2010
-11
Act
ual
2011
-12
Act
ual
2012
-13
Bud
get
Exp
endi
ture
201
2-13
(up
to
01.0
3.20
13)
Rev
enue
S
ectio
nP
lan
Non
-Pla
n To
tal
Pla
nN
on-P
lan
Tota
lP
lan
Non
-Pla
n To
tal
Pla
nN
on-P
lan
Tota
l
1
3403
- O
cean
o-gr
aphi
c R
ease
arch
515.
2539
.65
554.
961
5.49
60.1
467
5.63
648.
0056
.70
704.
7043
7.36
50.1
948
7.55
2
3425
- O
ther
S
cien
tific
R
esea
rch
73.3
721
.04
94.4
150
.39
25.0
875
.47
211.
5029
.32
240.
8212
2.48
20.2
214
2.70
334
51-
Sec
etar
i-at
e E
xpen
ditu
re0.
0020
.83
20.8
30.
0019
.38
19.3
80.
0025
.54
25.5
40.
0020
.30
20.3
0
434
55-
Met
eo-
rolo
gy51
.06
245.
0129
6.07
51.9
324
6.88
298.
8121
4.00
275.
1048
9.10
81.2
525
1.48
332.
73
Cap
ital S
ectio
n
1
5403
Cap
i-ta
l out
lay
on
Oce
anog
rapi
c R
esea
rch
13.1
60.
0013
.16
5.87
0.00
5.87
8.00
0.00
8.00
2.09
0.00
2.09
2
5425
- C
apita
l ou
tlay
on O
ther
S
cien
tific
&
envi
rom
enta
l R
esea
rch
0.00
0.00
0.00
2.10
0.00
2.10
12.5
00.
0012
.50
4.15
0.00
4.15
3
5455
- C
api-
tal O
utla
y on
M
eteo
rolo
gy11
4.98
0.19
115.
1792
.94
0.06
93.0
018
7.00
0.34
187.
3484
.40
0.05
84.4
5
Gra
nd
Tota
l76
7.82
326.
7210
94.5
481
8.72
351.
5411
70.2
612
81.0
038
7.00
1668
.00
731.
7334
2.24
1073
.97
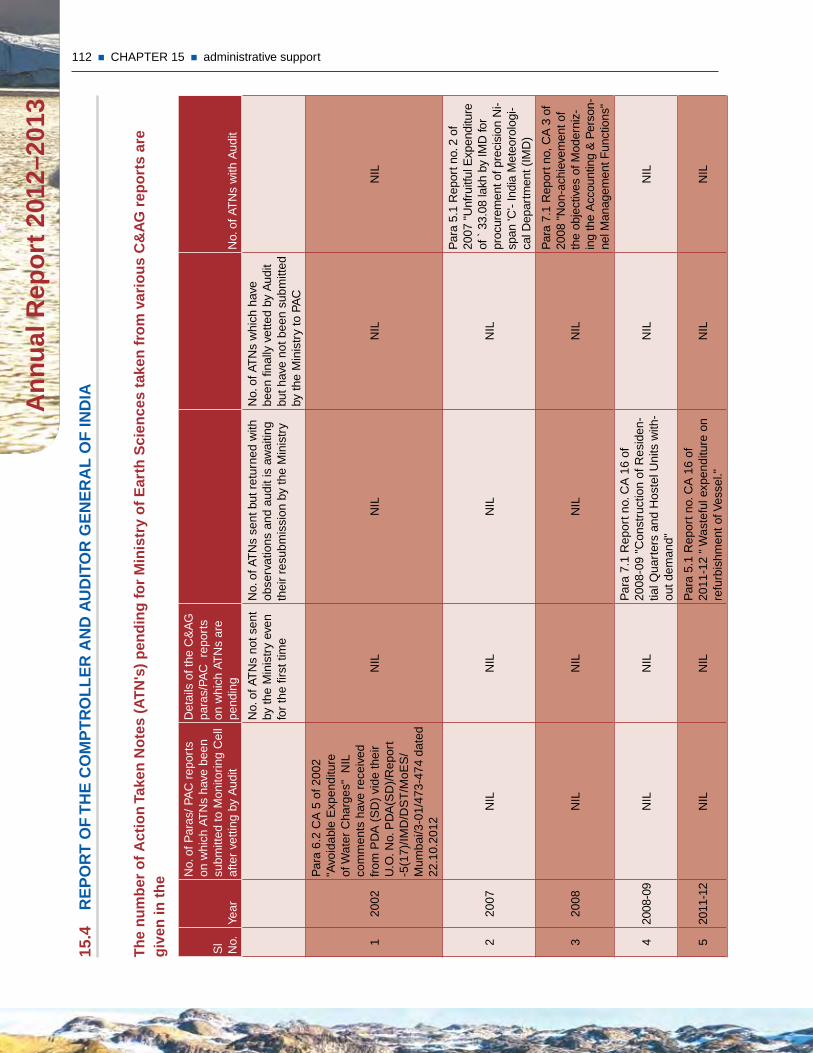
112 CHAPTER 15 administrative support A
nn
ual
Rep
ort
201
2–20
13
15.4
R
EP
OR
T O
F T
HE
CO
mP
TR
OL
LE
R A
nd
Au
diT
OR
GE
nE
RA
L O
F in
diA
Th
e n
um
ber
of
Act
ion
Tak
en n
ote
s (A
Tn
's)
pen
din
g fo
r m
inis
try
of
Ear
th s
cien
ces
take
n f
rom
var
iou
s C
&A
G r
epo
rts
are
giv
en in
th
e
Sl
No.
Year
No.
of P
aras
/ PA
C r
epor
ts
on w
hich
AT
Ns
have
bee
n su
bmitt
ed to
Mon
itorin
g C
ell
afte
r ve
tting
by
Aud
it
Det
ails
of t
he C
&A
G
para
s/PA
C r
epor
ts
on w
hich
AT
Ns
are
pend
ing
No.
of A
TN
s w
ith A
udit
No.
of A
TN
s no
t sen
t by
the
Min
istr
y ev
en
for
the
first
tim
e
No.
of A
TN
s se
nt b
ut r
etur
ned
with
ob
serv
atio
ns a
nd a
udit
is a
wai
ting
thei
r re
subm
issi
on b
y th
e M
inis
try
No.
of A
TN
s w
hich
hav
e be
en fi
nally
vet
ted
by A
udit
but h
ave
not b
een
subm
itted
by
the
Min
istr
y to
PA
C
120
02
Par
a 6.
2 C
A 5
of 2
002
"Avo
idab
le E
xpen
ditu
re
of W
ater
Cha
rges
" N
IL
com
men
ts h
ave
rece
ived
fr
om P
DA
(S
D)
vide
thei
r U
.O. N
o. P
DA
(SD
)/R
epor
t -5
(17)
/IMD
/DS
T/M
oES
/M
umba
i/3-0
1/47
3-47
4 da
ted
22.1
0.20
12
NIL
NIL
NIL
NIL
220
07N
ILN
ILN
ILN
IL
Par
a 5.
1 R
epor
t no.
2 o
f 20
07 "
Unf
ruitf
ul E
xpen
ditu
re
of `
33.
08 la
kh b
y IM
D fo
r pr
ocur
emen
t of p
reci
sion
Ni-
span
'C'-
Indi
a M
eteo
rolo
gi-
cal D
epar
tmen
t (IM
D)
320
08N
ILN
ILN
ILN
IL
Par
a 7.
1 R
epor
t no,
CA
3 o
f 20
08 "
Non
-ach
ieve
men
t of
the
obje
ctiv
es o
f Mod
erni
z-in
g th
e A
ccou
ntin
g &
Per
son-
nel M
anag
emen
t Fun
ctio
ns"
420
08-0
9N
ILN
IL
Par
a 7.
1 R
epor
t no.
CA
16
of
20
08-0
9 "C
onst
ruct
ion
of R
esid
en-
tial Q
uart
ers
and
Hos
tel U
nits
with
-ou
t dem
and"
NIL
NIL
520
11-1
2N
ILN
ILP
ara
5.1
Rep
ort n
o. C
A 1
6 of
2011
-12
" W
aste
ful e
xpen
ditu
re o
n re
furb
ishm
ent o
f Ves
sel."
NIL
NIL
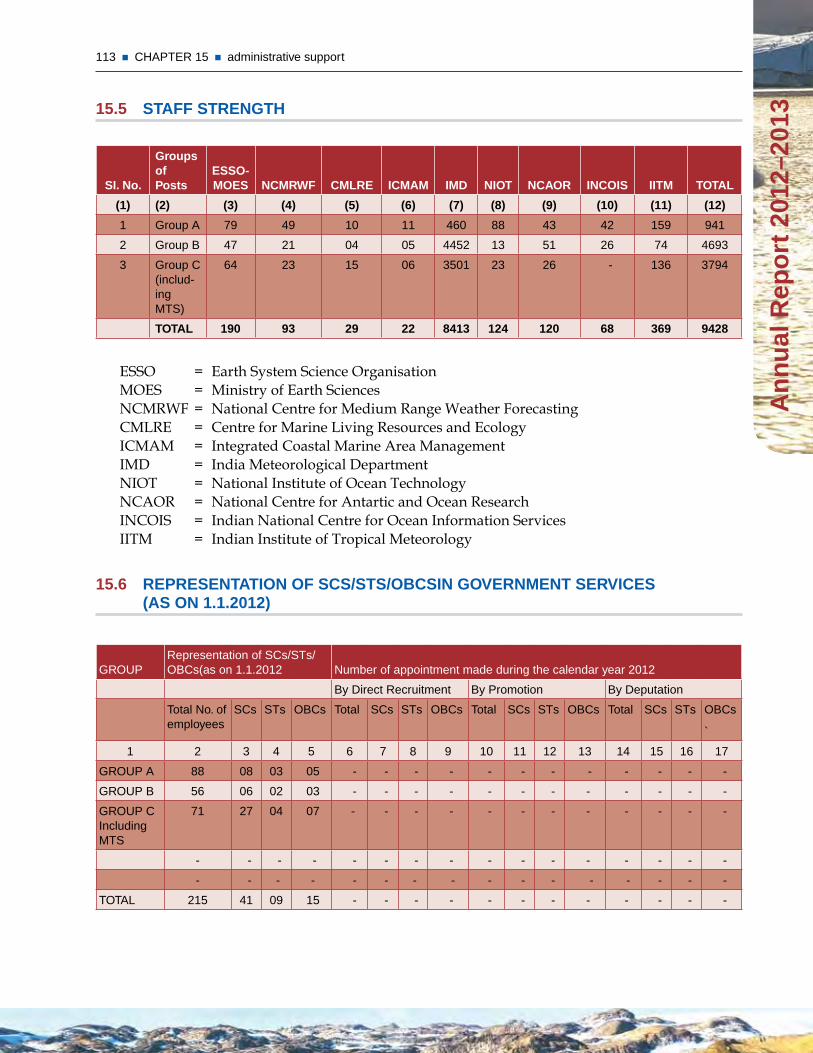
113 CHAPTER 15 administrative support
An
nu
al R
epo
rt 2
012–
201315.5 sTAFF sTREnGTH
si. no.
Groups of Posts
EssO-mOEs nCmRwF CmLRE iCmAm imd niOT nCAOR inCOis iiTm TOTAL
(1) (2) (3) (4) (5) (6) (7) (8) (9) (10) (11) (12)
1 Group A 79 49 10 11 460 88 43 42 159 941
2 Group B 47 21 04 05 4452 13 51 26 74 4693
3 Group C (includ-ing MTS)
64 23 15 06 3501 23 26 - 136 3794
TOTAL 190 93 29 22 8413 124 120 68 369 9428
ESSO = Earth System Science OrganisationMOES = Ministry of Earth SciencesNCMRWF = National Centre for Medium Range Weather ForecastingCMLRE = Centre for Marine Living Resources and EcologyICMAM = Integrated Coastal Marine Area ManagementIMD = India Meteorological DepartmentNIOT = National Institute of Ocean TechnologyNCAOR = National Centre for Antartic and Ocean ResearchINCOIS = Indian National Centre for Ocean Information ServicesIITM = Indian Institute of Tropical Meteorology
15.6 REPREsEnTATiOn OF sCs/sTs/OBCsin GOvERnmEnT sERviCEs (As On 1.1.2012)
GROUPRepresentation of SCs/STs/OBCs(as on 1.1.2012 Number of appointment made during the calendar year 2012
By Direct Recruitment By Promotion By Deputation
Total No. of employees
SCs STs OBCs Total SCs STs OBCs Total SCs STs OBCs Total SCs STs OBCs
`
1 2 3 4 5 6 7 8 9 10 11 12 13 14 15 16 17
GROUP A 88 08 03 05 - - - - - - - - - - - -
GROUP B 56 06 02 03 - - - - - - - - - - - -
GROUP C Including MTS
71 27 04 07 - - - - - - - - - - - -
- - - - - - - - - - - - - - - -
- - - - - - - - - - - - - - - -
TOTAL 215 41 09 15 - - - - - - - - - - - -
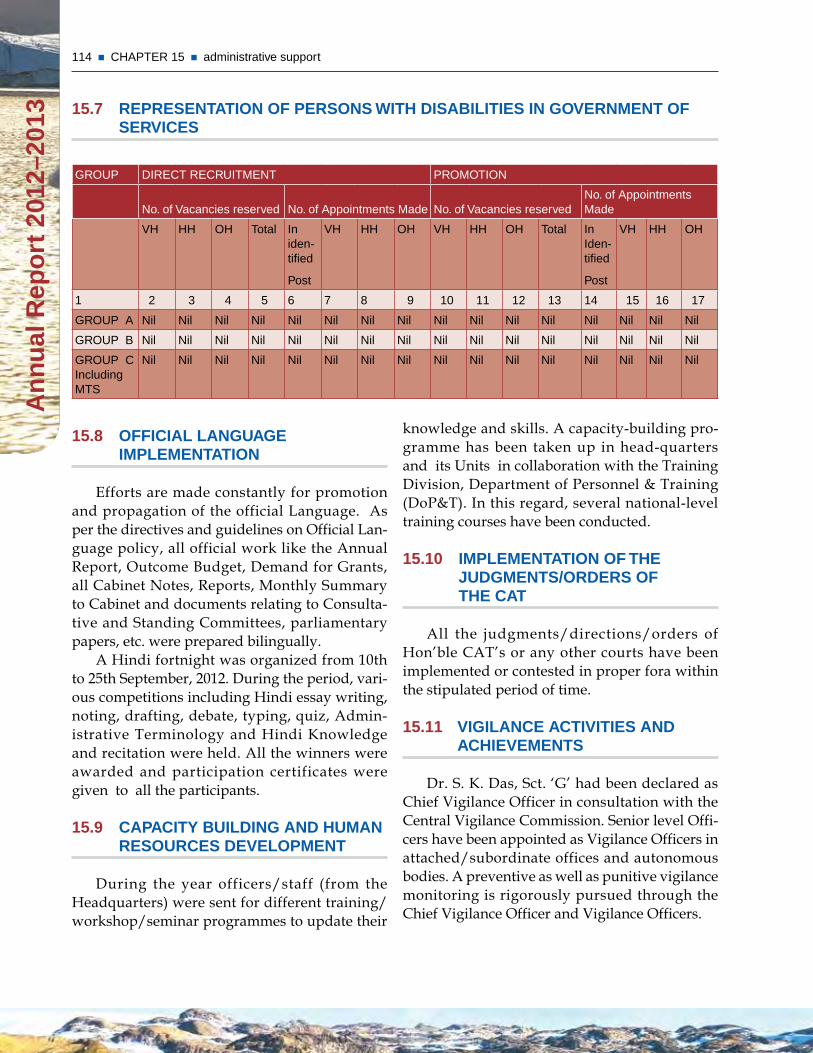
114 CHAPTER 15 administrative support A
nn
ual
Rep
ort
201
2–20
13 15.7 REPREsEnTATiOn OF PERsOns wiTH disABiLiTiEs in GOvERnmEnT OF sERviCEs
GROUP DIRECT RECRUITMENT PROMOTION
No. of Vacancies reserved No. of Appointments Made No. of Vacancies reservedNo. of Appointments Made
VH HH OH Total In iden-tified
Post
VH HH OH VH HH OH Total In Iden-tified
Post
VH HH OH
1 2 3 4 5 6 7 8 9 10 11 12 13 14 15 16 17
GROUP A Nil Nil Nil Nil Nil Nil Nil Nil Nil Nil Nil Nil Nil Nil Nil Nil
GROUP B Nil Nil Nil Nil Nil Nil Nil Nil Nil Nil Nil Nil Nil Nil Nil Nil
GROUP C Including MTS
Nil Nil Nil Nil Nil Nil Nil Nil Nil Nil Nil Nil Nil Nil Nil Nil
15.8 OFFiCiAL LAnGuAGE imPLEmEnTATiOn
Efforts are made constantly for promotion and propagation of the official Language. As per the directives and guidelines on Official Lan-guage policy, all official work like the Annual Report, Outcome Budget, Demand for Grants, all Cabinet Notes, Reports, Monthly Summary to Cabinet and documents relating to Consulta-tive and Standing Committees, parliamentary papers, etc. were prepared bilingually.
A Hindi fortnight was organized from 10th to 25th September, 2012. During the period, vari-ous competitions including Hindi essay writing, noting, drafting, debate, typing, quiz, Admin-istrative Terminology and Hindi Knowledge and recitation were held. All the winners were awarded and participation certificates were given to all the participants.
15.9 CAPACiTy BuiLdinG And HumAn REsOuRCEs dEvELOPmEnT
During the year officers/staff (from the Headquarters) were sent for different training/workshop/seminar programmes to update their
knowledge and skills. A capacity-building pro-gramme has been taken up in head-quarters and its Units in collaboration with the Training Division, Department of Personnel & Training (DoP&T). In this regard, several national-level training courses have been conducted.
15.10 imPLEmEnTATiOn OF THE JudGmEnTs/ORdERs OF THE CAT
All the judgments/directions/orders of Hon’ble CAT’s or any other courts have been implemented or contested in proper fora within the stipulated period of time.
15.11 viGiLAnCE ACTiviTiEs And ACHiEvEmEnTs
Dr. S. K. Das, Sct. ‘G’ had been declared as Chief Vigilance Officer in consultation with the Central Vigilance Commission. Senior level Offi-cers have been appointed as Vigilance Officers in attached/subordinate offices and autonomous bodies. A preventive as well as punitive vigilance monitoring is rigorously pursued through the Chief Vigilance Officer and Vigilance Officers.
115 CHAPTER 15 administrative support
An
nu
al R
epo
rt 2
012–
2013
Officers and First Appellate Authorities, respec-tively. CPIO and Ist Appeallate authorities have also been nominated for attached/subordinate offices and autonomous institutes. Applica-tions received under RTI are being promptly addressed to by the CPIOs and information arranged/provided accordingly. The Ministry has uploaded the RTI Quarterly/Half Yearly/Annual report on CIC web-site.
15.14 PARLiAmEnT mATTERs
The Ministry has Parliament Section which caters to the correspondence with the Parlia-ment Secretariats. Between April 2012 to Decem-ber 2012, the Ministry has replied a Parliament Question in Lok Sabha (44 Questions) & Rajya Sabha (49 Questions).
15.12 GRiEvAnCE REdREssAL OF PuBLiC And sTAFF
The Ministry of Earth Sciences is a Scien-tific Ministry and has no direct public dealings. However, the Ministry has taken steps to ensure that due attention is paid to the public/staff grievances. Sh Taranjit Singh, Director has been nominated as Staff Grievances Redressal Officer and Public Grievances Redressal Officer (upto January, 2013). The Ministry of Public Griev-ances and Administrative Reforms has launched an online public Grievances website www.pgportal.gov.in where grievances can be lodged online. Up to 27/02/2013, MoES has received 299 grievances out of which 279 were disposed of. The rate of disposal was 93%.
15.13 imPLEmEnTATiOn OF RiGHT TO inFORmATiOn ACT, 2005
Sh B.K.Thakur and Sh Taranjit Singh has been nominated as Central Public Information
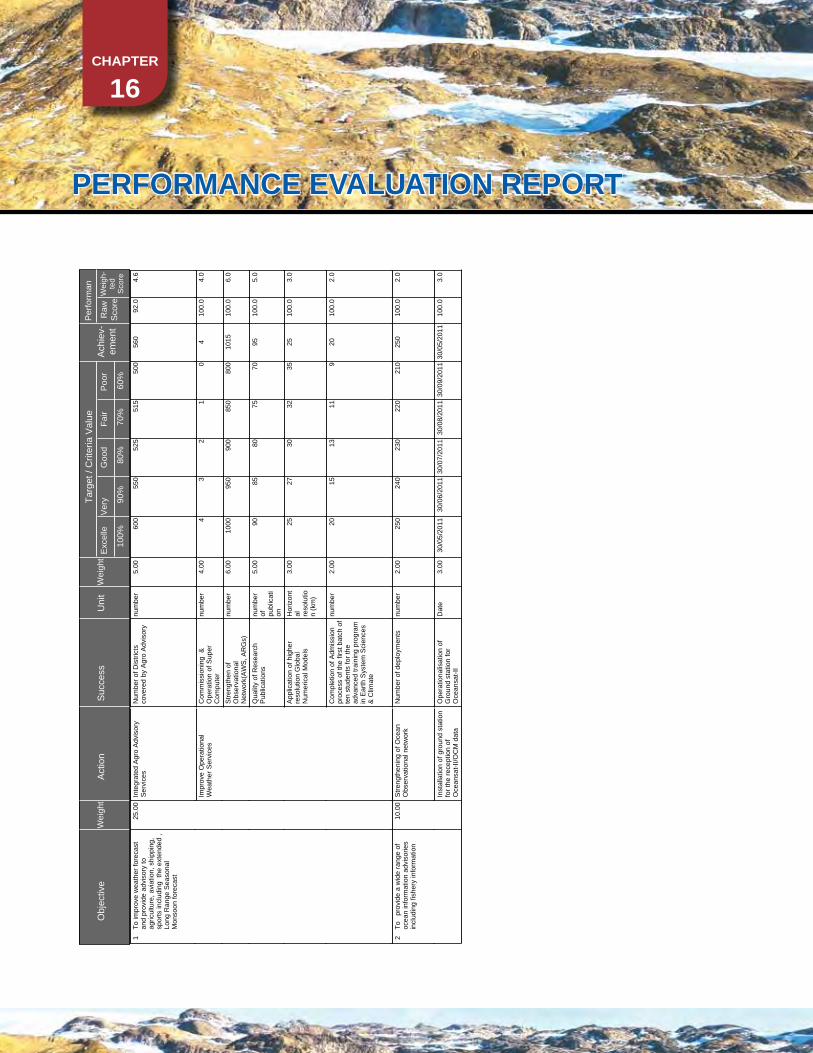
CHAPTER
16
PERFORmAnCE EvALuATiOn REPORT
Per
form
ance
Eva
luat
ion
Rep
ort
Per
form
ance
Eva
luat
ion
Rep
ort f
or M
inis
try o
f Ear
th S
cien
ces
[A
chie
vem
ent S
ubm
itted
]
(201
1-20
12)
Obj
ectiv
eW
eigh
tA
ctio
nU
nit
Tar
get /
Crit
eria
Val
ueW
eigh
t
80%
100%
70%
60%
90%
Ver
y F
air
Poo
rE
xcel
le G
ood
Suc
cess
Ach
iev-
emen
t
Per
form
an
Raw
Sco
reW
eigh
-te
dS
core
To im
prov
e w
eath
er fo
reca
stan
d pr
ovid
e ad
viso
ry to
agric
ultu
re, a
viat
ion,
shi
ppin
g,sp
orts
incl
udin
g th
e ex
tend
ed ,
Long
Ran
ge S
easo
nal
Mon
soon
fore
cast
25.0
0In
tegr
ated
Agr
o A
dvis
ory
Ser
vice
sN
umbe
r of D
istri
cts
cove
red
by A
gro
Adv
isor
ynu
mbe
r55
051
550
052
560
05.
001
4.6
560
92.0
Impr
ove
Ope
ratio
nal
Wea
ther
Ser
vice
sC
omm
issi
onin
g &
Ope
ratio
n of
Sup
erC
ompu
ter
num
ber
31
02
44.
004.
04
100.
0
Stre
ngth
en o
fO
bser
vatio
nal
Net
wor
k(A
WS
, AR
Gs)
num
ber
950
850
800
900
1000
6.00
6.0
1015
100.
0
Qua
lity
of R
esea
rch
Pub
licat
ions
num
ber
of publ
icat
ion
8575
7080
905.
005.
095
100.
0
App
licat
ion
of h
ighe
rre
solu
tion
Glo
bal
Num
eric
al M
odel
s
Hor
izon
tal re
solu
tion
(km
)
2732
3530
253.
003.
025
100.
0
Com
plet
ion
of A
dmis
sion
proc
ess
of th
e fir
st b
atch
of
ten
stud
ents
for t
head
vanc
ed tr
aini
ng p
rogr
amin
Ear
th S
yste
m S
cien
ces
& C
limat
e
num
ber
1511
913
202.
002.
020
100.
0
To
prov
ide
a w
ide
rang
e of
ocea
n in
form
atio
n ad
viso
ries
incl
udin
g fis
hery
info
rmat
ion
10.0
0S
treng
then
ing
of O
cean
Obs
erva
tiona
l net
wor
kN
umbe
r of d
eplo
ymen
tsnu
mbe
r24
022
021
023
025
02.
002
2.0
250
100.
0
Inst
alla
tion
of g
roun
d st
atio
nfo
r the
rece
ptio
n of
Oce
ansa
t-II/O
CM
dat
a
Ope
ratio
nalis
atio
n of
Gro
und
stat
ion
for
Oce
ansa
t-II
Dat
e30
/06/
2011
30/0
8/20
1130
/09/
2011
30/0
7/20
1130
/05/
2011
3.00
3.0
30/0
5/20
1110
0.0
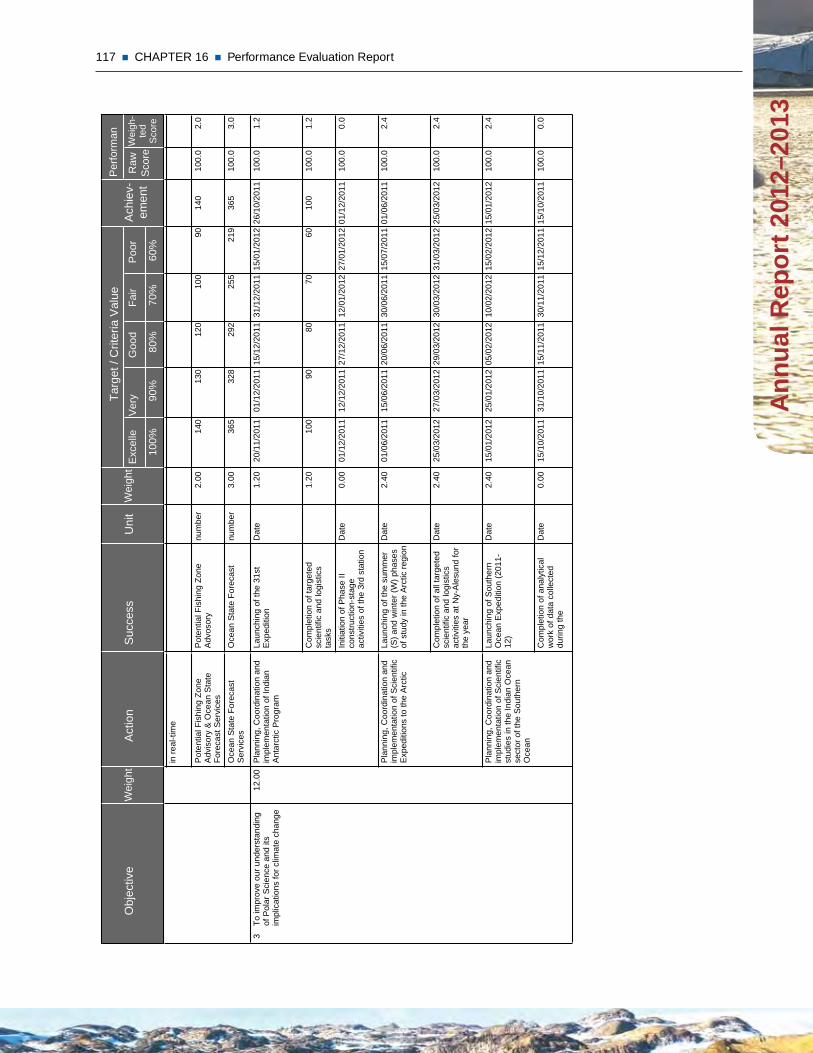
117 CHAPTER 16 Performance Evaluation Report
An
nu
al R
epo
rt 2
012–
2013
Per
form
ance
Eva
luat
ion
Rep
ort
Per
form
ance
Eva
luat
ion
Rep
ort f
or M
inis
try o
f Ear
th S
cien
ces
[A
chie
vem
ent S
ubm
itted
]
(201
1-20
12)
Obj
ectiv
eW
eigh
tA
ctio
nU
nit
Tar
get /
Crit
eria
Val
ueW
eigh
t
80%
100%
70%
60%
90%
Ver
y F
air
Poo
rE
xcel
le G
ood
Suc
cess
Ach
iev-
emen
t
Per
form
an
Raw
Sco
reW
eigh
-te
dS
core
in re
al-ti
me
Pot
entia
l Fis
hing
Zon
eA
dvis
ory
& O
cean
Sta
teFo
reca
st S
ervi
ces
Pot
entia
l Fis
hing
Zon
eA
dvos
ory
num
ber
130
100
9012
014
02.
002.
014
010
0.0
Oce
an S
tate
For
ecas
tS
ervi
ces
Oce
an S
tate
For
ecas
tnu
mbe
r32
825
521
929
236
53.
003.
036
510
0.0
To im
prov
e ou
r und
erst
andi
ngof
Pol
ar S
cien
ce a
nd it
sim
plic
atio
ns fo
r clim
ate
chan
ge
12.0
0P
lann
ing,
Coo
rdin
atio
n an
dim
plem
enta
tion
of In
dian
Ant
arct
ic P
rogr
am
Laun
chin
g of
the
31st
Exp
editi
onD
ate
01/1
2/20
1131
/12/
2011
15/0
1/20
1215
/12/
2011
20/1
1/20
111.
203
1.2
26/1
0/20
1110
0.0
Com
plet
ion
of ta
rget
edsc
ient
ific
and
logi
stic
sta
sks
9070
6080
100
1.20
1.2
100
100.
0
Initi
atio
n of
Pha
se II
cons
truct
ion-
stag
eac
tiviti
es o
f the
3rd
sta
tion
Dat
e12
/12/
2011
12/0
1/20
1227
/01/
2012
27/1
2/20
1101
/12/
2011
0.00
0.0
01/1
2/20
1110
0.0
Pla
nnin
g, C
oord
inat
ion
and
impl
emen
tatio
n of
Sci
entif
icE
xped
ition
s to
the
Arc
tic
Laun
chin
g of
the
sum
mer
(S) a
nd w
inte
r (W
) pha
ses
of s
tudy
in th
e A
rctic
regi
on
Dat
e15
/06/
2011
30/0
6/20
1115
/07/
2011
20/0
6/20
1101
/06/
2011
2.40
2.4
01/0
6/20
1110
0.0
Com
plet
ion
of a
ll ta
rget
edsc
ient
ific
and
logi
stic
sac
tiviti
es a
t Ny-
Ale
sund
for
the
year
Dat
e27
/03/
2012
30/0
3/20
1231
/03/
2012
29/0
3/20
1225
/03/
2012
2.40
2.4
25/0
3/20
1210
0.0
Pla
nnin
g, C
oord
inat
ion
and
impl
emen
tatio
n of
Sci
entif
icst
udie
s in
the
Indi
an O
cean
sect
or o
f the
Sou
ther
nO
cean
Laun
chin
g of
Sou
ther
nO
cean
Exp
editi
on (2
011-
12)
Dat
e25
/01/
2012
10/0
2/20
1215
/02/
2012
05/0
2/20
1215
/01/
2012
2.40
2.4
15/0
1/20
1210
0.0
Com
plet
ion
of a
naly
tical
wor
k of
dat
a co
llect
eddu
ring
the
Dat
e31
/10/
2011
30/1
1/20
1115
/12/
2011
15/1
1/20
1115
/10/
2011
0.00
0.0
15/1
0/20
1110
0.0
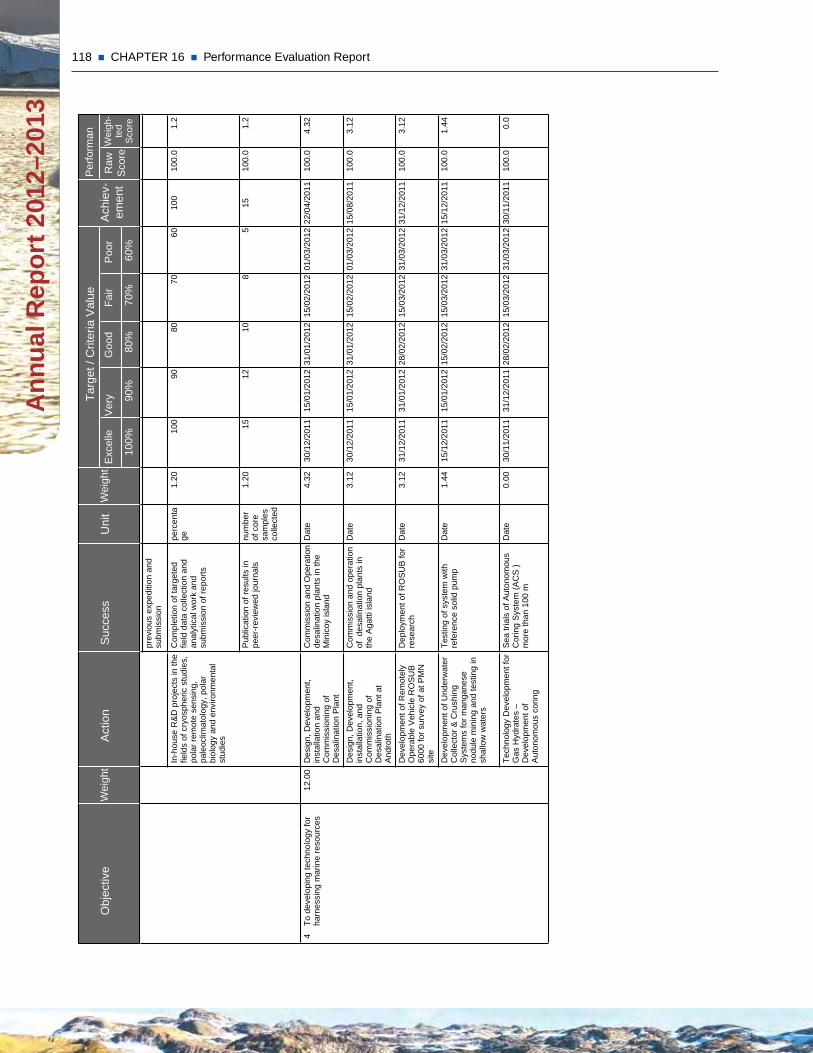
118 CHAPTER 16 Performance Evaluation Report A
nn
ual
Rep
ort
201
2–20
13P
erfo
rman
ce E
valu
atio
n R
epor
t
Per
form
ance
Eva
luat
ion
Rep
ort f
or M
inis
try o
f Ear
th S
cien
ces
[A
chie
vem
ent S
ubm
itted
]
(201
1-20
12)
Obj
ectiv
eW
eigh
tA
ctio
nU
nit
Tar
get /
Crit
eria
Val
ueW
eigh
t
80%
100%
70%
60%
90%
Ver
y F
air
Poo
rE
xcel
le G
ood
Suc
cess
Ach
iev-
emen
t
Per
form
an
Raw
Sco
reW
eigh
-te
dS
core
prev
ious
exp
editi
on a
ndsu
bmis
sion
In-h
ouse
R&
D p
roje
cts
in th
efie
lds
of c
ryos
pher
ic s
tudi
es,
pola
r rem
ote
sens
ing,
pale
oclim
atol
ogy,
pol
arbi
olog
y an
d en
viro
nmen
tal
stud
ies
Com
plet
ion
of ta
rget
edfie
ld d
ata
colle
ctio
n an
dan
alyt
ical
wor
k an
dsu
bmis
sion
of r
epor
ts
perc
enta
ge90
7060
8010
01.
201.
210
010
0.0
Pub
licat
ion
of re
sults
inpe
er-r
evie
wed
jour
nals
num
ber
of c
ore
sam
ples
colle
cted
128
510
151.
201.
215
100.
0
To d
evel
opin
g te
chno
logy
for
harn
essi
ng m
arin
e re
sour
ces
12.0
0D
esig
n, D
evel
opm
ent,
inst
alla
tion
and
Com
mis
sion
ing
ofD
esal
inat
ion
Pla
nt
Com
mis
sion
and
Ope
ratio
nde
salin
atio
n pl
ants
in th
eM
inic
oy is
land
Dat
e15
/01/
2012
15/0
2/20
1201
/03/
2012
31/0
1/20
1230
/12/
2011
4.32
44.
3222
/04/
2011
100.
0
Des
ign,
Dev
elop
men
t,in
stal
latio
n, a
ndC
omm
issi
onin
g of
Des
alin
atio
n P
lant
at
And
roth
Com
mis
sion
and
ope
ratio
nof
des
alin
atio
n pl
ants
inth
e A
gatti
isla
nd
Dat
e15
/01/
2012
15/0
2/20
1201
/03/
2012
31/0
1/20
1230
/12/
2011
3.12
3.12
15/0
8/20
1110
0.0
Dev
elop
men
t of R
emot
ely
Ope
rabl
e V
ehic
le R
OS
UB
6000
for s
urve
y of
at P
MN
site
Dep
loym
ent o
f RO
SU
B fo
rre
sear
chD
ate
31/0
1/20
1215
/03/
2012
31/0
3/20
1228
/02/
2012
31/1
2/20
113.
123.
1231
/12/
2011
100.
0
Dev
elop
men
t of U
nder
wat
erC
olle
ctor
& C
rush
ing
Sys
tem
s fo
r man
gane
seno
dule
min
ing
and
test
ing
insh
allo
w w
ater
s
Test
ing
of s
yste
m w
ithre
fere
nce
solid
pum
pD
ate
15/0
1/20
1215
/03/
2012
31/0
3/20
1215
/02/
2012
15/1
2/20
111.
441.
4415
/12/
2011
100.
0
Tech
nolo
gy D
evel
opm
ent f
orG
as H
ydra
tes
–D
evel
opm
ent o
fA
uton
omou
s co
ring
Sea
tria
ls o
f Aut
onom
ous
Cor
ing
Sys
tem
(AC
S )
mor
e th
an 1
00 m
Dat
e31
/12/
2011
15/0
3/20
1231
/03/
2012
28/0
2/20
1230
/11/
2011
0.00
0.0
30/1
1/20
1110
0.0
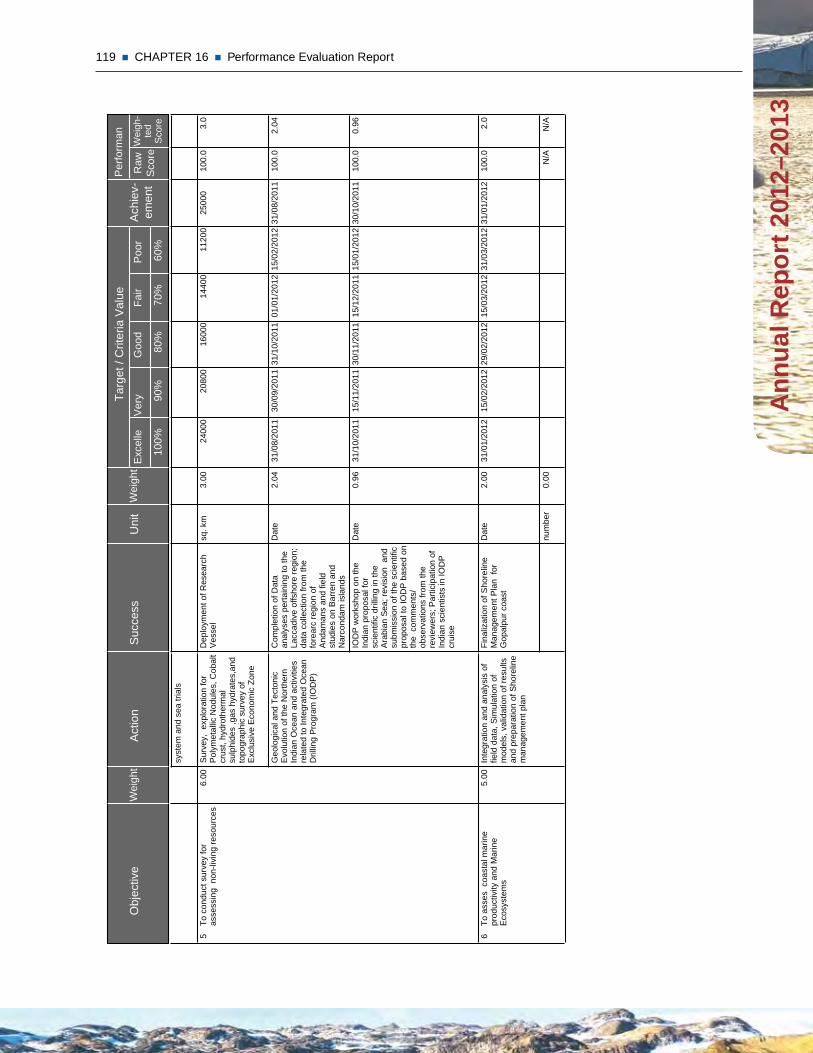
119 CHAPTER 16 Performance Evaluation Report
An
nu
al R
epo
rt 2
012–
2013
Per
form
ance
Eva
luat
ion
Rep
ort
Per
form
ance
Eva
luat
ion
Rep
ort f
or M
inis
try o
f Ear
th S
cien
ces
[A
chie
vem
ent S
ubm
itted
]
(201
1-20
12)
Obj
ectiv
eW
eigh
tA
ctio
nU
nit
Tar
get /
Crit
eria
Val
ueW
eigh
t
80%
100%
70%
60%
90%
Ver
y F
air
Poo
rE
xcel
le G
ood
Suc
cess
Ach
iev-
emen
t
Per
form
an
Raw
Sco
reW
eigh
-te
dS
core
syst
em a
nd s
ea tr
ials
To c
ondu
ct s
urve
y fo
ras
sess
ing
non
-livi
ng re
sour
ces
6.00
Sur
vey,
exp
lora
tion
for
Pol
ymet
allic
Nod
ules
, Cob
alt
crus
t, hy
drot
herm
alsu
lphi
des
,gas
hyd
rate
s,an
dto
pogr
aphi
c su
rvey
of
Exc
lusi
ve E
cono
mic
Zon
e
Dep
loym
ent o
f Res
earc
hV
esse
lsq
. km
2080
014
400
1120
016
000
2400
03.
005
3.0
2500
010
0.0
Geo
logi
cal a
nd T
ecto
nic
Evo
lutio
n of
the
Nor
ther
nIn
dian
Oce
an a
nd a
ctiv
ities
rela
ted
to In
tegr
ated
Oce
anD
rillin
g P
rogr
am (I
OD
P)
Com
plet
ion
of D
ata
anal
yses
per
tain
ing
to th
eLa
ccad
ive
offs
hore
regi
on;
data
col
lect
ion
from
the
fore
arc
regi
on o
fA
ndam
ans
and
field
stud
ies
on B
arre
n an
dN
arco
ndam
isla
nds
Dat
e30
/09/
2011
01/0
1/20
1215
/02/
2012
31/1
0/20
1131
/08/
2011
2.04
2.04
31/0
8/20
1110
0.0
IOD
P w
orks
hop
on th
eIn
dian
pro
posa
l for
scie
ntifi
c dr
illin
g in
the
Ara
bian
Sea
; rev
isio
n a
ndsu
bmis
sion
of t
he s
cien
tific
prop
osal
to IO
DP
bas
ed o
nth
e c
omm
ents
/ob
serv
atio
ns fr
om th
ere
view
ers;
Par
ticip
atio
n of
Indi
an s
cien
tists
in IO
DP
crui
se
Dat
e15
/11/
2011
15/1
2/20
1115
/01/
2012
30/1
1/20
1131
/10/
2011
0.96
0.96
30/1
0/20
1110
0.0
To a
sses
coa
stal
mar
ine
prod
uctiv
ity a
nd M
arin
eE
cosy
stem
s
5.00
Inte
grat
ion
and
anal
ysis
of
field
dat
a, S
imul
atio
n of
mod
els,
val
idat
ion
of re
sults
and
prep
arat
ion
of S
hore
line
man
agem
ent p
lan
Fina
lizat
ion
of S
hore
line
Man
agem
ent P
lan
for
Gop
alpu
r coa
st
Dat
e15
/02/
2012
15/0
3/20
1231
/03/
2012
29/0
2/20
1231
/01/
2012
2.00
62.
031
/01/
2012
100.
0
num
ber
0.00
N/A
N/A
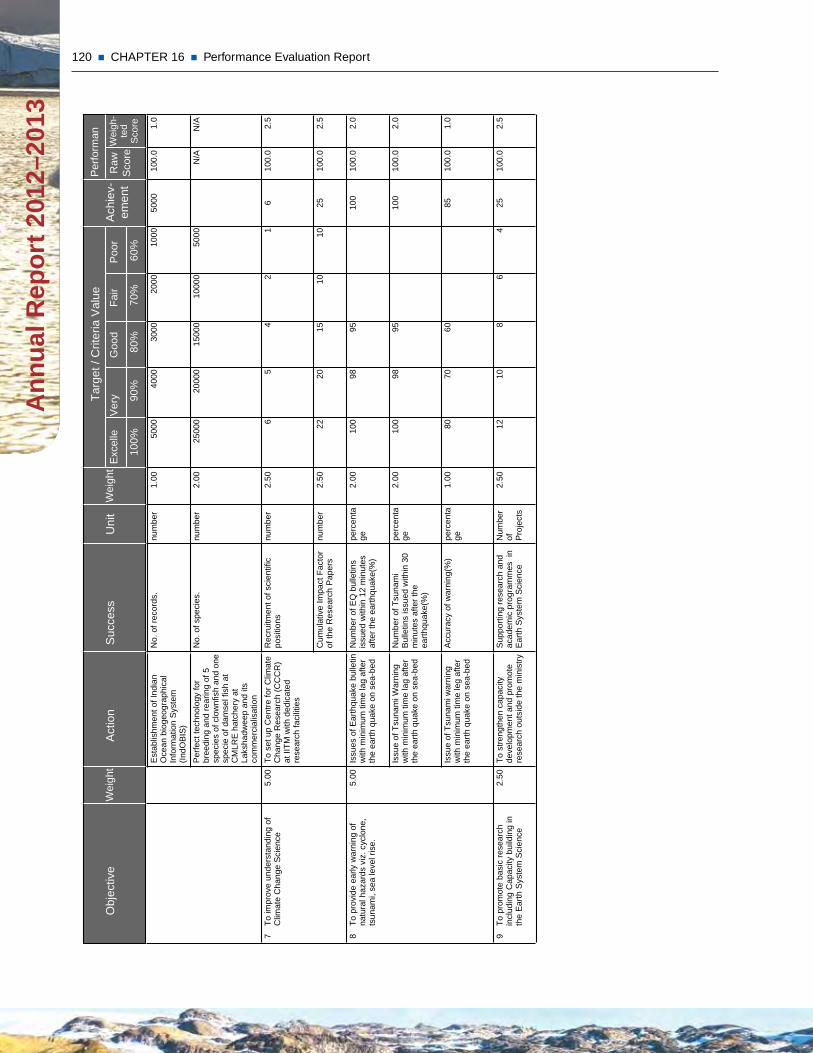
120 CHAPTER 16 Performance Evaluation Report A
nn
ual
Rep
ort
201
2–20
13P
erfo
rman
ce E
valu
atio
n R
epor
t
Per
form
ance
Eva
luat
ion
Rep
ort f
or M
inis
try o
f Ear
th S
cien
ces
[A
chie
vem
ent S
ubm
itted
]
(201
1-20
12)
Obj
ectiv
eW
eigh
tA
ctio
nU
nit
Tar
get /
Crit
eria
Val
ueW
eigh
t
80%
100%
70%
60%
90%
Ver
y F
air
Poo
rE
xcel
le G
ood
Suc
cess
Ach
iev-
emen
t
Per
form
an
Raw
Sco
reW
eigh
-te
dS
core
Est
ablis
hmen
t of I
ndia
nO
cean
bio
geog
raph
ical
Info
rmat
ion
Sys
tem
(IndO
BIS
)
No.
of r
ecor
ds.
num
ber
4000
2000
1000
3000
5000
1.00
1.0
5000
100.
0
Per
fect
tech
nolo
gy fo
rbr
eedi
ng a
nd re
arin
g of
5sp
ecie
s of
clo
wnf
ish
and
one
spec
ie o
f dam
sel f
ish
atC
MLR
E h
atch
ery
atLa
ksha
dwee
p an
d its
com
mer
cial
isat
ion
No.
of s
peci
es.
num
ber
2000
010
000
5000
1500
025
000
2.00
N/A
N/A
To im
prov
e un
ders
tand
ing
ofC
limat
e C
hang
e S
cien
ce5.
00To
set
up
Cen
tre fo
r Clim
ate
Cha
nge
Res
earc
h (C
CC
R)
at II
TM w
ith d
edic
ated
rese
arch
faci
litie
s
Rec
ruitm
ent o
f sci
entif
icpo
sitio
nsnu
mbe
r5
21
46
2.50
72.
56
100.
0
Cum
ulat
ive
Impa
ct F
acto
rof
the
Res
earc
h P
aper
snu
mbe
r20
1010
1522
2.50
2.5
2510
0.0
To p
rovi
de e
arly
war
ning
of
natu
ral h
azar
ds v
iz. c
yclo
ne,
tsun
ami,
sea
leve
l ris
e.
5.00
Issu
es o
f Ear
thqu
ake
bulle
tinw
ith m
inim
um ti
me
lag
afte
rth
e ea
rth q
uake
on
sea-
bed
Num
ber o
f EQ
bul
letin
sis
sued
with
in 1
2 m
inut
esaf
ter t
he e
arth
quak
e(%
)
perc
enta
ge98
9510
02.
008
2.0
100
100.
0
Issu
e of
Tsu
nam
i War
ning
with
min
imum
tim
e la
g af
ter
the
earth
qua
ke o
n se
a-be
d
Num
ber o
f Tsu
nam
iB
ulle
tins
issu
ed w
ithin
30
min
utes
afte
r the
earth
quak
e(%
)
perc
enta
ge98
9510
02.
002.
010
010
0.0
Issu
e of
Tsu
nam
i war
ning
with
min
imum
tim
e le
g af
ter
the
earth
qua
ke o
n se
a-be
d
Acc
urac
y of
war
ning
(%)
perc
enta
ge70
6080
1.00
1.0
8510
0.0
To p
rom
ote
basi
c re
sear
chin
clud
ing
Cap
acity
bui
ldin
g in
the
Ear
th S
yste
m S
cien
ce
2.50
To s
treng
then
cap
acity
deve
lopm
ent a
nd p
rom
ote
rese
arch
out
side
the
min
istry
Sup
porti
ng re
sear
ch a
ndac
adem
ic p
rogr
amm
es i
nE
arth
Sys
tem
Sci
ence
Num
ber
of Pro
ject
s
106
48
122.
509
2.5
2510
0.0
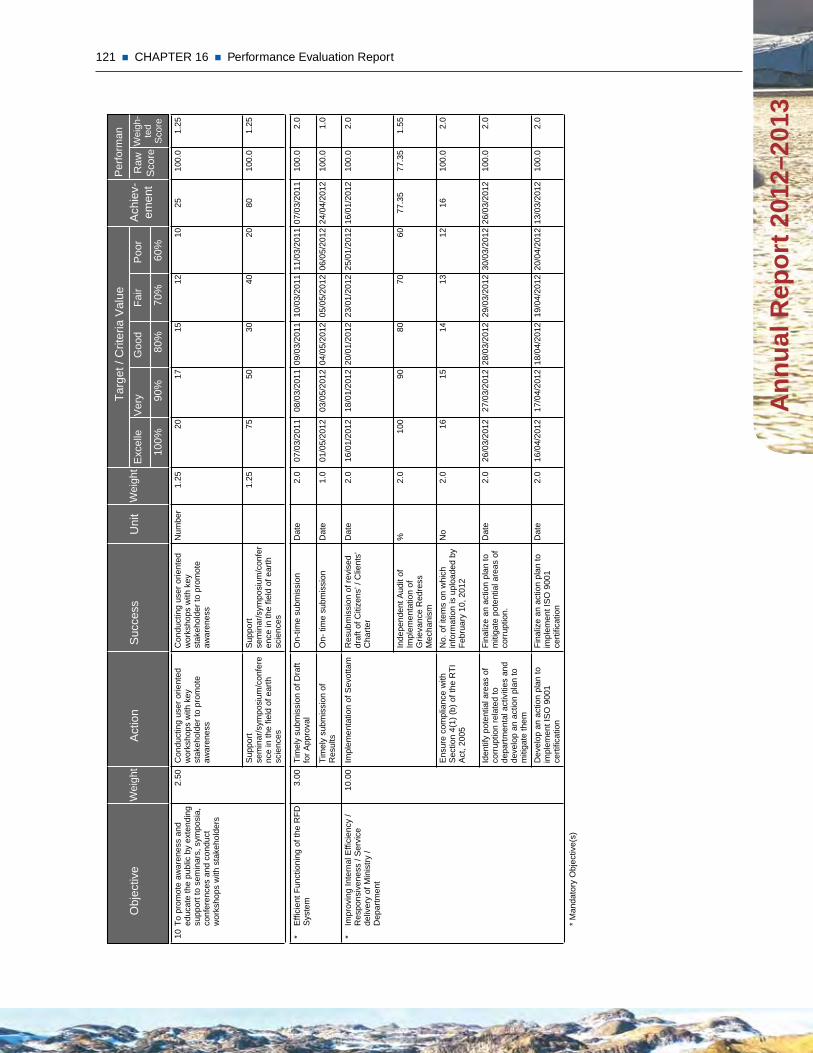
121 CHAPTER 16 Performance Evaluation Report
An
nu
al R
epo
rt 2
012–
2013
Per
form
ance
Eva
luat
ion
Rep
ort
Per
form
ance
Eva
luat
ion
Rep
ort f
or M
inis
try o
f Ear
th S
cien
ces
[A
chie
vem
ent S
ubm
itted
]
(201
1-20
12)
Obj
ectiv
eW
eigh
tA
ctio
nU
nit
Tar
get /
Crit
eria
Val
ueW
eigh
t
80%
100%
70%
60%
90%
Ver
y F
air
Poo
rE
xcel
le G
ood
Suc
cess
Ach
iev-
emen
t
Per
form
an
Raw
Sco
reW
eigh
-te
dS
core
Effi
cien
t Fun
ctio
ning
of t
he R
FDS
yste
m3.
00Ti
mel
y su
bmis
sion
of D
raft
for A
ppro
val
On-
time
subm
issi
onD
ate
08/0
3/20
1110
/03/
2011
11/0
3/20
1109
/03/
2011
07/0
3/20
112.
0*
2.0
07/0
3/20
1110
0.0
Tim
ely
subm
issi
on o
fR
esul
tsO
n- ti
me
subm
issi
onD
ate
03/0
5/20
1205
/05/
2012
06/0
5/20
1204
/05/
2012
01/0
5/20
121.
01.
024
/04/
2012
100.
0
Impr
ovin
g In
tern
al E
ffici
ency
/R
espo
nsiv
enes
s / S
ervi
cede
liver
y of
Min
istry
/D
epar
tmen
t
10.0
0Im
plem
enta
tion
of S
evot
tam
Res
ubm
issi
on o
f rev
ised
draf
t of C
itize
ns’ /
Clie
nts’
Cha
rter
Dat
e18
/01/
2012
23/0
1/20
1225
/01/
2012
20/0
1/20
1216
/01/
2012
2.0
*2.
016
/01/
2012
100.
0
Inde
pend
ent A
udit
ofIm
plem
enta
tion
ofG
rieva
nce
Red
ress
Mec
hani
sm
%90
7060
8010
02.
01.
5577
.35
77.3
5
Ens
ure
com
plia
nce
with
Sec
tion
4(1)
(b) o
f the
RTI
Act
, 200
5
No.
of i
tem
s on
whi
chin
form
atio
n is
upl
oade
d by
Febr
uary
10,
201
2
No
1513
1214
162.
02.
016
100.
0
Iden
tify
pote
ntia
l are
as o
fco
rrup
tion
rela
ted
tode
partm
enta
l act
iviti
es a
ndde
velo
p an
act
ion
plan
tom
itiga
te th
em
Fina
lize
an a
ctio
n pl
an to
miti
gate
pot
entia
l are
as o
fco
rrup
tion.
Dat
e27
/03/
2012
29/0
3/20
1230
/03/
2012
28/0
3/20
1226
/03/
2012
2.0
2.0
26/0
3/20
1210
0.0
Dev
elop
an
actio
n pl
an to
impl
emen
t IS
O 9
001
certi
ficat
ion
Fina
lize
an a
ctio
n pl
an to
impl
emen
t IS
O 9
001
certi
ficat
ion
Dat
e17
/04/
2012
19/0
4/20
1220
/04/
2012
18/0
4/20
1216
/04/
2012
2.0
2.0
13/0
3/20
1210
0.0
* M
anda
tory
Obj
ectiv
e(s)
To p
rom
ote
awar
enes
s an
ded
ucat
e th
e pu
blic
by
exte
ndin
gsu
ppor
t to
sem
inar
s, s
ympo
sia,
conf
eren
ces
and
cond
uct
wor
ksho
ps w
ith s
take
hold
ers
2.50
Con
duct
ing
user
orie
nted
wor
ksho
ps w
ith k
eyst
akeh
olde
r to
prom
ote
awar
enes
s
Con
duct
ing
user
orie
nted
wor
ksho
ps w
ith k
eyst
akeh
olde
r to
prom
ote
awar
enes
s
Num
ber
1712
1015
201.
2510
1.25
2510
0.0
Sup
port
sem
inar
/sym
posi
um/c
onfe
renc
e in
the
field
of e
arth
scie
nces
Sup
port
sem
inar
/sym
posi
um/c
onfe
ren
ce in
the
field
of e
arth
scie
nces
5040
2030
751.
251.
2580
100.
0
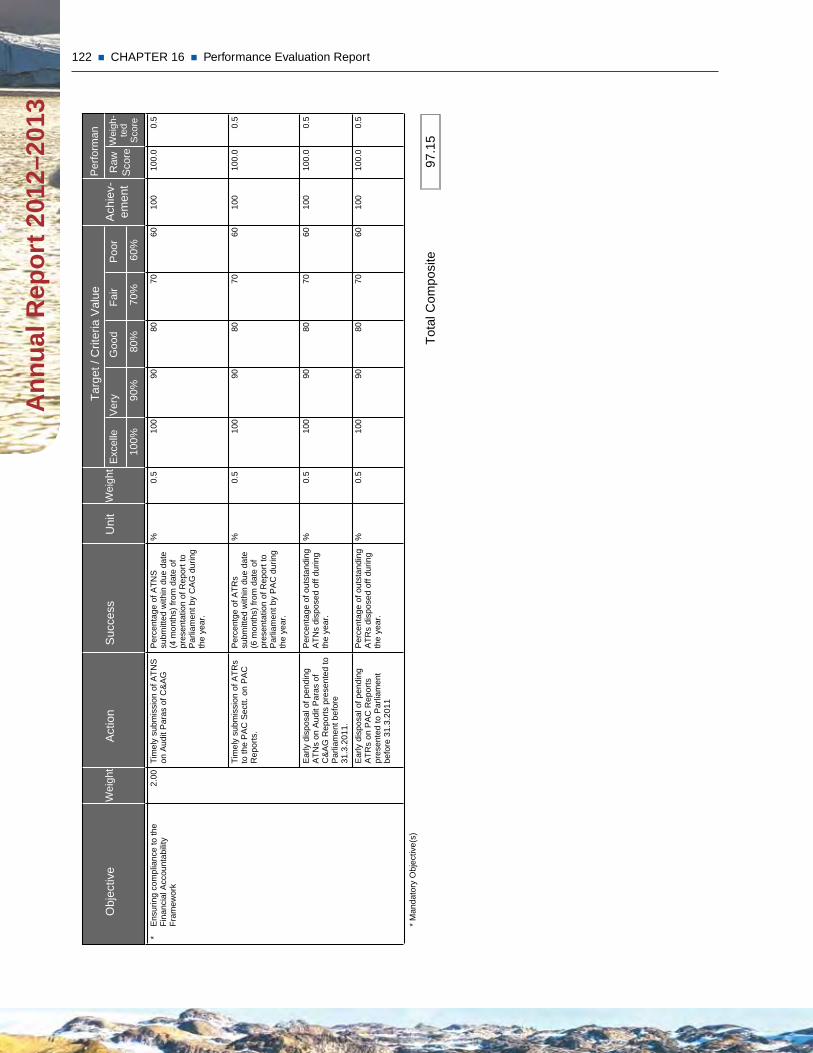
122 CHAPTER 16 Performance Evaluation Report A
nn
ual
Rep
ort
201
2–20
13P
erfo
rman
ce E
valu
atio
n R
epor
t
Per
form
ance
Eva
luat
ion
Rep
ort f
or M
inis
try o
f Ear
th S
cien
ces
[A
chie
vem
ent S
ubm
itted
]
(201
1-20
12)
Obj
ectiv
eW
eigh
tA
ctio
nU
nit
Tar
get /
Crit
eria
Val
ueW
eigh
t
80%
100%
70%
60%
90%
Ver
y F
air
Poo
rE
xcel
le G
ood
Suc
cess
Ach
iev-
emen
t
Per
form
an
Raw
Sco
reW
eigh
-te
dS
core
Ens
urin
g co
mpl
ianc
e to
the
Fina
ncia
l Acc
ount
abili
tyFr
amew
ork
2.00
Tim
ely
subm
issi
on o
f ATN
Son
Aud
it P
aras
of C
&A
GP
erce
ntag
e of
ATN
Ssu
bmitt
ed w
ithin
due
dat
e(4
mon
ths)
from
dat
e of
pres
enta
tion
of R
epor
t to
Par
liam
ent b
y C
AG
dur
ing
the
year
.
%90
7060
8010
00.
5*
0.5
100
100.
0
Tim
ely
subm
issi
on o
f ATR
sto
the
PA
C S
ectt.
on
PA
CR
epor
ts.
Per
cent
ge o
f ATR
ssu
bmitt
ed w
ithin
due
dat
e(6
mon
ths)
from
dat
e of
pres
enta
tion
of R
epor
t to
Par
liam
ent b
y P
AC
dur
ing
the
year
.
%90
7060
8010
00.
50.
510
010
0.0
Ear
ly d
ispo
sal o
f pen
ding
ATN
s on
Aud
it P
aras
of
C&
AG
Rep
orts
pre
sent
ed to
Par
liam
ent b
efor
e31
.3.2
011.
Per
cent
age
of o
utst
andi
ngA
TNs
disp
osed
off
durin
gth
e ye
ar.
%90
7060
8010
00.
50.
510
010
0.0
Ear
ly d
ispo
sal o
f pen
ding
ATR
s on
PA
C R
epor
tspr
esen
ted
to P
arlia
men
tbe
fore
31.
3.20
11
Per
cent
age
of o
utst
andi
ngA
TRs
disp
osed
off
durin
gth
e ye
ar.
%90
7060
8010
00.
50.
510
010
0.0
* M
anda
tory
Obj
ectiv
e(s)
Tota
l Com
posi
te97
.15
scheme on Research and Development, Chaired by Prof. Sulochana Gadgil, IISc Bangalore.
8. PAMC on Hydrology and Cryosphere and the Indian Panel of Changing Water Cycle Programme, Chaired by Prof V.K.Gaur, CM-MACS, Bangalore.
9. Programme Advisory Committee of seismic-ity and early prediction for Koyna deep bore hole investigations and the programme man-agement board on national programme on Earthquake precursors, chaired by Dr Harsh K Gupta, Member, NDMA, New Delhi.
10. Technology Research Board for Earth System Science Technology and the Expert Com-mittee to take over the Centre for Earth Sys-tem Science Studies, chaired by Dr P.S.Goel, DRDO, Hyderabad.
11. Group monitoring committee (GMC) on seis-micity programme, chaired by Dr V.P.Dimri, NGRI, Hydrabad.
12. Expert group on Active Fault Mapping, chaired by Dr P.Pande, GSI, Lucknow.
13. PAMC on Geosciences, chaired by Prof. Ashok Singhvi , PRL, Ahmedabad.
14. Committee on vision document on Oceanic Sciences, chaired by Prof Satish Shetye, Vice Chancellor, Goa University, Goa.
15. PAMC on Ocean Science and Resources, chaired by Prof. S.Krishnaswami, PRL, Ahmedabad
16. Steering Committee on Potential Drugs from Sea, chaired by Prof. Goverdhan Mehta, Hy drabad University.
During the year, many scientists and academicians from India and abroad
actively participated as external experts in the various committees and helped us in the on-going activities and programmes of the ESSO-MoES. We would like to thank all of them, who worked in the scientific and administrative com-mittees, selection and recruitment boards, and expert panels for reviewing research proposals.
The following committees constituted by the ESSO-MoES participated in the on-going activi-ties and programmes. 1. International Advisory Panel, Chaired by Dr
J.Shukla, George Mason University, USA.2. High Level Committee, High Performance
Computer (HPC), chaired by Prof N. Bal-akrishnan, IISc, Bangalore.
3. Technical Evaluation Committee, High Performance Computer , Chaired by Prof. O.P.Sharma, IIT Delhi.
4. Program Advisory & Monitoring Committee (PAMC) on Atmospheric Sciences, Scientific Steering Committee, Monsoon mission and the Committee on vision document on At-mospheric and climate sciences, chaired by Prof. J. Srinivasan, IISc Bangalore.
5. Scientific Review and Monitoring Commit-tee, Monsoon mission, and the Scientific Steering Committee, CTCZ programme, chaired by Prof. D.R. Sikka, Delhi.
6. Expert Committee on Airborne Research Fa-cility, chaired by Dr A.R. Upadhyaya, Hon Scientist, NAL Bangalore.
7. Scientific Steering Committee, CTCZ Pro-gramme, and the committee on continued
ACknOwLEdGEmEnTs
