annual-report-2018-19.pdf - palmerston north city council
TRANSCRIPT
AR 2018
/19
P A P A I O E APALMERSTON NORTH CITY
PŪRONGO Ā-TAU ANNUAL REPORT
pncc.govt.nz
Te Kaunihera o Papaioea Palmerston North City Council
SMALL CITY BENEFITSBIG CITY AMBITION
2
Small city benefits - Big city ambition
Cover: He Ara Kotahi bridge at night
Palmerston NorthSMALL CITY BENEFITS BIG CITY AMBITION
Five Strategic Goals
AN INNOVATIVE AND GROWING CITY
A CREATIVE AND EXCITING CITY2.A CONNECTED AND SAFE COMMUNITY
A DRIVEN AND ENABLING COUNCIL.
AN ECO CITY4.
3
PNCC Annual Report 2018/19
HE MIHIKei te mihi atu ki a Tararua te pae maunga me
tōna taumata Te Ahu ā Tūranga.
Ko te awa e rere mai nei ko Manawatū. Ko Tānenuiarangi te tangata, ko Rangitāne te iwi,
no reira ka tuku whakamihi ki te iwi o Rangitāne e pupuri nei i te mauri o tēnei whenua.
Tini whetu ki te rangi, Rangitāne ki te whenua.
Tihei Mauriora!
The Palmerston North City Council respectfully recognises the local iwi Rangitāne and their customary
relationship to this area and appreciates the ongoing support of the iwi in the development of this City and all of those people who have made it their home.
The Council remains committed to fostering and strengthening our relationship with Rangitāne.
6
Small city benefits - Big city ambition
Rale
igh
Rese
rve
7
PNCC Annual Report 2018/19
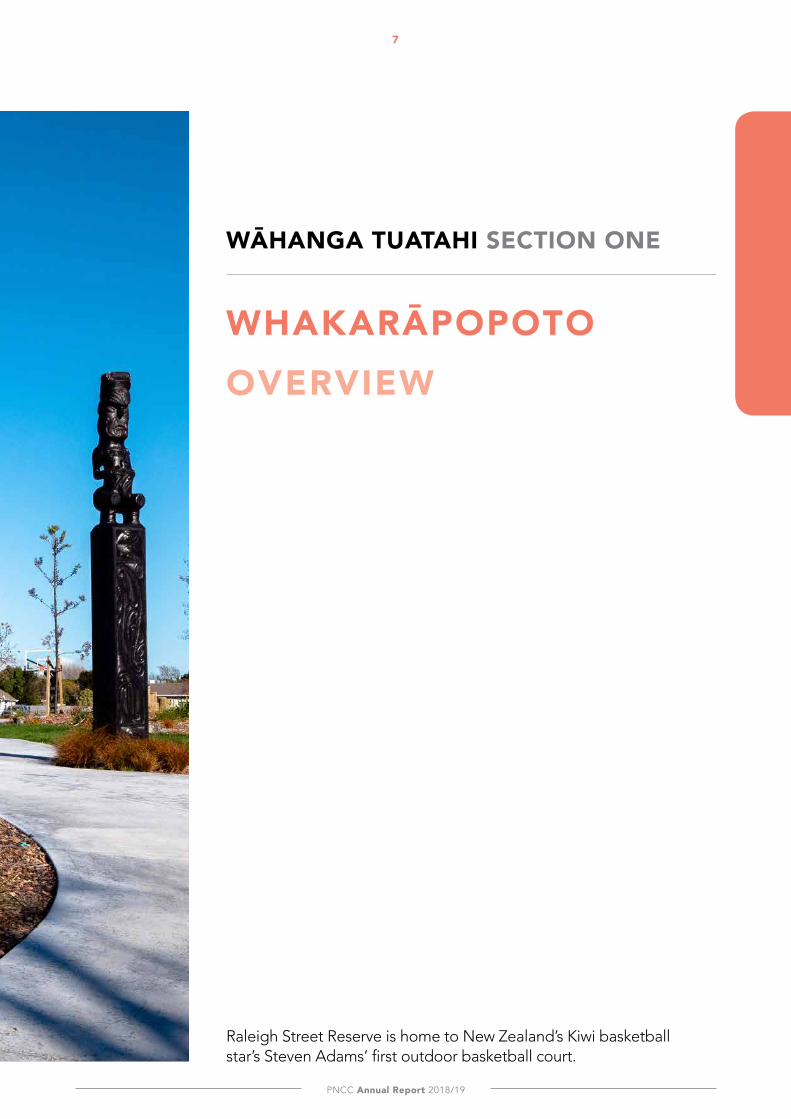
WĀHANGA TUATAHI SECTION ONE
WHAKARĀPOPOTOOVERVIEW
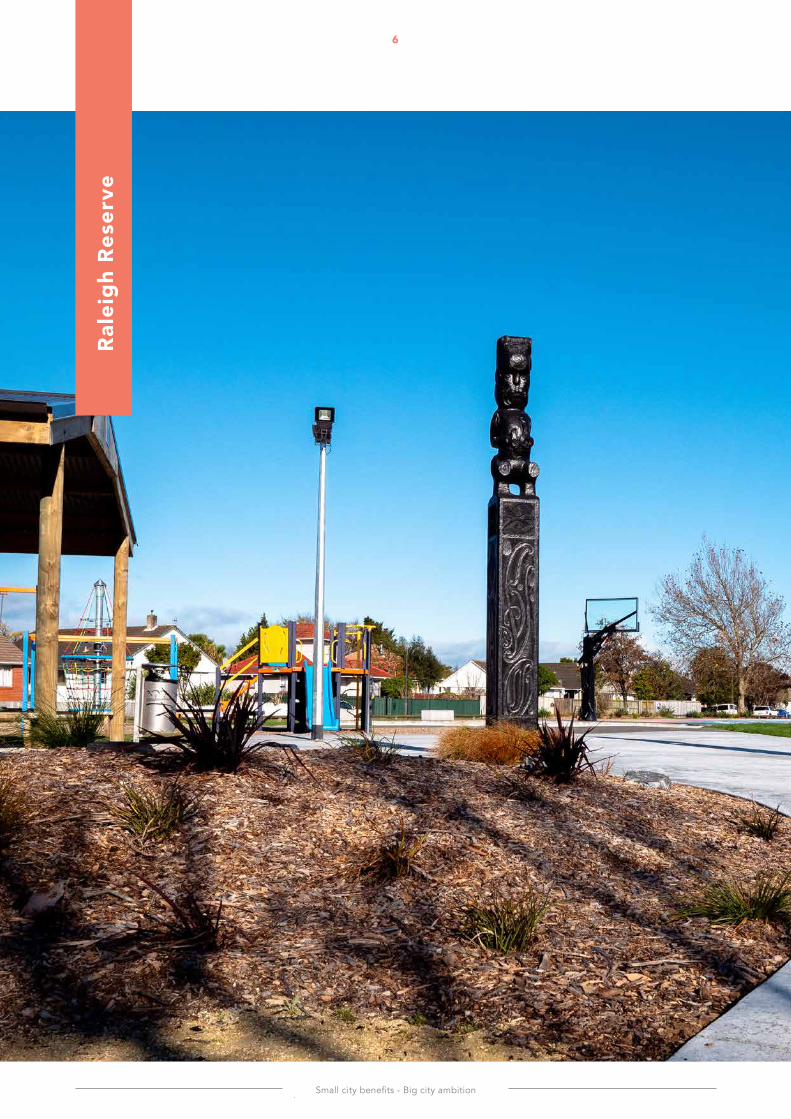
Raleigh Street Reserve is home to New Zealand’s Kiwi basketball star’s Steven Adams’ first outdoor basketball court.
Small city benefits - Big city ambition
YE
AR
IN
RE
VIE
W
8
YEAR IN REVIEW Kia ora,
Palmerston North is on a growth trajectory. Strong investment, rising wages, population growth and exciting new
projects have marked the 2018/19 financial year for the city. Palmerston North has continued to prosper in the past
financial year, strengthening fundamentals and progressing bold ambitions to be a city of the future.
Strong economic growth continued across the region and
Palmerston North. More than three billion dollars of public
and private sector investment has been committed to further
developing our region and city over the next decade. With
strong growth indicators, dynamic cultural and sporting
milestones, and a unifying community spirit, it has been a
year of success.
GROWTH PLATFORM
Our 10 Year Plan (2018-28) vision of ‘small city benefits, big
city ambition’ laid the foundation for investment and growth
in the city and region. It is built on strategic investment in
essential infrastructure together with catalyst projects for
shaping our city of the future.
The city’s goals are designed to combine the best of
metropolitan and provincial New Zealand, making us more
attractive to capital, talent and visitors than other regional
centres. Being competitive and bold is integral to securing the
future wellbeing of our communities.
Our Sustainable Growth catalyst projects provide the core
infrastructure. From roads to pipes to water, this is the critical
framework for managing the pressures of expansion. In
large-scale project highlights, the Government confirmed
investment in an integrated rail freight transport hub in the
Manawatū region. A $48 million Provincial Growth Fund (PGF)
package in November 2018 for the Manawatū-Whanganui
region includes investments in FoodHQ, the National Driver
Training Centre and KiwiRail ($40 million) for the new
Manawatū freight hub.
An Memorandum of Understanding signed with KiwiRail
and NZTA in June sees us working towards establishing
the Central New Zealand freight hub. Co-locating the new
rail facility to integrate with air and road freight functions
will deliver a world-class regional multi-modal transport
opportunity.
Also, in Provincial Growth Fund, February saw a $400,000
grant to the Rural Innovation Lab at Massey University to help
establish the facility.
Our largest infrastructure project is the Wastewater Treatment
Plant Upgrade (Nature Calls), a prerequisite for city expansion
that is fundamental to environmentally-sustainable growth.
Over the last year, six options to treat and distribute
wastewater have been confirmed for consultation with the
public. In advance of upgrade work, the focus over the next
three years is evaluating options and deciding on a preferred
option to seek a renewed consent for wastewater discharge.
In urban growth infrastructure, we’ve programmed works for
water, wastewater and stormwater reticulation in the main
growth areas of Whakarongo, Kakatangiata and the North
East Industrial Zone at Railway Road.
Wellbeing infrastructure is fundamental, and Papaioea Place
is a significant investment in social housing delivered on
time and within budget by Council. The redevelopment of
Papaioea Place saw the first construction phase of a
$7.3 million project completed this year with 30 new social
housing units opening. Phase two is being brought forward
so more people in need can be accommodated. The design
includes houses that are warm and eco rated.
These homes have changed the way tenants live and
interact with each other.
FINANCIAL POSITION
We are pleased to report that the end of financial year
result is a favourable operating controllable surplus against
budget of $2.93m. Of this amount, $2.3m is due to budgeted
operating expenditure relating to the Council’s Whakarongo
development, which is now being treated as inventory and
will be recognised when sales are made. An additional $0.4m
of the favourable variance relates to the carry forward of two
operating programmes.
The capital new programme continued to progress well with
a total of $35m completed. This is a significant achievement
for a team undergoing transformation, when compared
to $27.3m completed in 2017/18 and $15.2m completed
in 2016/17. Overall, 73% of capital new expenditure was
completed against budget.
PNCC Annual Report 2018/19
YE
AR
IN R
EV
IEW
9
Significant delivery of the renewal programme $23.3m (89%)
has occurred yet some projects are underspent. Projects
contributing to the underspend include the Central Energy
Trust (CET) Arena speedway relocation and City Centre
Streetscape Plan Square East (Streets for People), which were
both deferred. Also contributing are the library upgrade
programmes, which require further investigation into options
before proceeding due to the building being designated
earthquake prone.
Net debt increased on the previous year though less than
budget. The increase reflects progress during the year on key
capital projects. Increasing debt is expected in future years to
pay for investment in essential infrastructure and key capital
assets, distributing costs between generations.
LIVEABILITY HIGHLIGHTS
Our catalyst projects for the city centre and Manawatū River
Network are at the heart of developing a vibrant, desirable
and connected regional city. It has been a year of milestones.
The new He Ara Kotahi bridge & shared pathway is seen by
many residents as a gem. The iconic bridge opened in June,
with 110,000 bikes and people visiting in its first two months.
The bridge, plaza and 7.2 km of shared pathway to Massey,
Food HQ and Linton are bringing a new vibrancy and sense of
connectedness to Palmerston North.
In February at the Esplanade, the Central Energy Trust
Wildbase Recovery Centre was opened. It is a world class
rehabilitation facility for New Zealand’s endangered birds.
Already, the centre has attracted over 42,000 visitors with over
2,100 students experiencing its education programmes.
Artificial turf was installed under the Masterplan modernising
The CET Arena, significantly with $520,000 external funding
raised. Designs for both the entrance plaza and speedway
pits relocation are well-advanced with cost estimates being
finalised. Design work is also progressing for the Southern
and Western Embankments.
The city centre is being redesigned as a more attractive place
to gather, shop, work and dine. Physical construction of Stage
1 (Square side of Square East - Plaza to Broadway) of ‘Streets
for People’ (City Centre Streetscape Plan and Redesign) has
been completed, as has the detailed design of Stage 1b
(Business side of Square East – Plaza to Broadway).
Managing earthquake-prone buildings (EPB) is a challenge
shared with regions throughout New Zealand. Council-owned
EPB are being progressively upgraded. With the Central
Library classified earthquake-prone, Council is reviewing how
library services are delivered in future.
We continue to transform the Manawatū river network as
the city’s waterfront location. Key projects delivered include
Ahimate Dog Park, Ahimate natural reserve natural play
features, installation of Pou at key Whāroa and the first
illuminated path in the southern hemisphere. Along with
He Ara Kotahi, the network links the city to its
Manawatū River foreshore.
The designation for the new state highway ‘Te Ahu a Turanga’
connecting Manawatū with Tararua was approved. Although
under appeal, it will ultimately unlock opportunities for
biodiversity and recreation at Te Āpiti, and provide regional/
national transport connections for rural productivity,
transport logistics and distribution. A PGF feasibility study is
also underway to investigate tourism opportunities that will
be unlocked through the new highway route.
Small city benefits - Big city ambition
LGN
Z E
xC
ELL
EN
CE
AW
AR
dS
10
PARTNERING FOR PERFORMANCE
Council recognises that great cities are built on partnerships
of strengths, and that Palmerston North’s diversity is a
competitive advantage. Stronger collaboration has been at
the centre of planning and has garnered some awards in the
financial year.
The Council Transformation Programme embarked on in
2018 to deliver change is focused on building a driven and
enabling Council to support the city vision. Organisational
priorities of a high-performance culture, customer-centric
services, actively-engaged communities and operational
excellence are being pursued through greater internal and
external collaboration.
Council conducts an annual resident satisfaction survey
to gauge public perception of Council’s services, facilities,
leadership and governance. In 2018/19, 59 per cent of
residents surveyed were satisfied or very satisfied with
Council’s overall performance. In working with our
community to be a catalyst and enabler of change in the city,
our goal is to do things in a simpler, faster and better way for
the overall benefit of our community.
Key partnerships continue to be recognised and strengthened
with significant partnership agreements with iwi and
recognition by Massey University. Council was recognised by
Massey University as a strong partner for our city – winning
the Domestic Partnership Award at the Massey University
Defining Excellence Awards. This award recognised the close
connection with Massey as a true partner. Along with Food
HQ, both provide huge importance to the city and region.
Events and attractions are drawing in regional and national
crowds and attracting visitors to our city, boosting economic
activity and reputation. Partnering well is instrumental to
delivering a great event. Year highlights ranged from hosting
the Hurricanes, Harlem Globetrotters, New Zealand Grand
Prix and Speedway Teams Champs through to UB40, The New
Zealand Sister Cities conference and The Festival of Cultures.
The Festival of Cultures won the 2019 Local Government New
Zealand (LGNZ) Excellence Award for Social Wellbeing. This is
particularly significant in its celebration with over 130 cultures
recognised in Palmerston North as we grow and become
more diverse.
It’s been an exciting, eventful and successful year for the city.
We are on track with our vision and ambitious yet achievable
goals. Council is advancing Palmerston North, and we look
forward to working with our communities to create the great
future our city deserves.
Ngā mihi,
Grant Smith jp Heather Shotter Mayor Chief Executive
23 September 2019 23 September 2019
11
PNCC Annual Report 2018/19
FINA
NC
IAL O
VE
RV
IEW
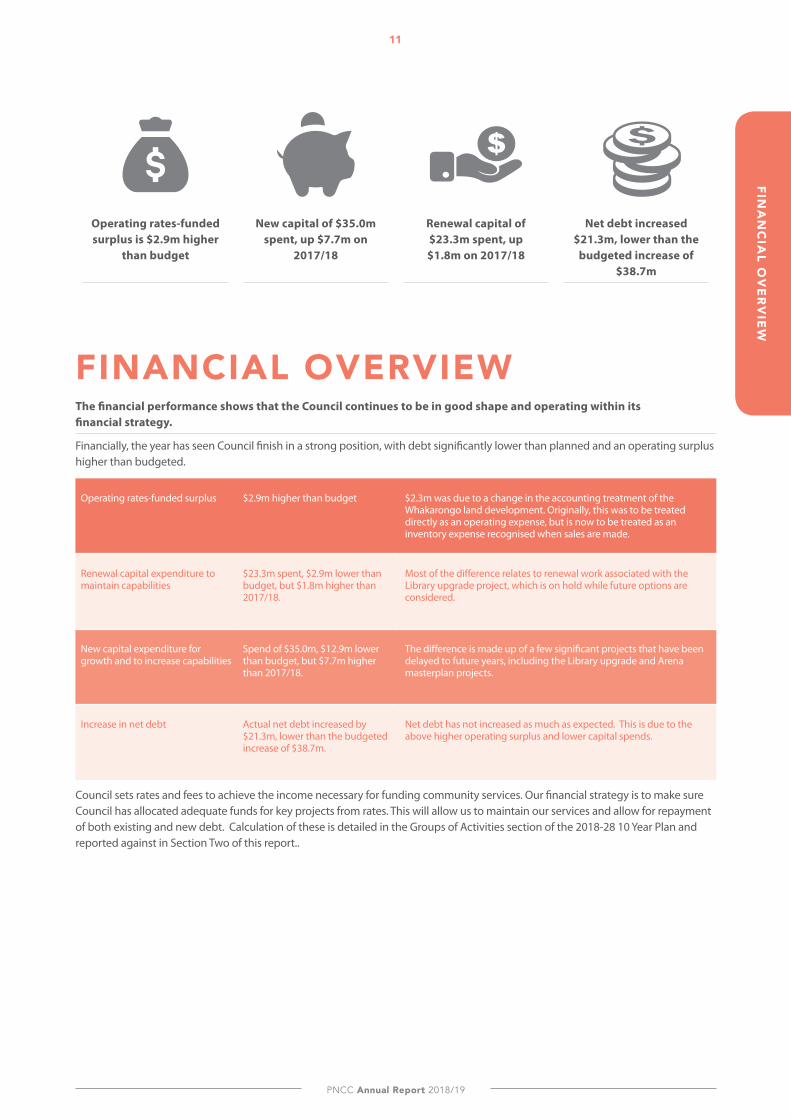
FINANCIAL OVERVIEWThe financial performance shows that the Council continues to be in good shape and operating within its financial strategy.
Financially, the year has seen Council finish in a strong position, with debt significantly lower than planned and an operating surplus higher than budgeted.
Operating rates-funded surplus $2.9m higher than budget $2.3m was due to a change in the accounting treatment of the Whakarongo land development. Originally, this was to be treated directly as an operating expense, but is now to be treated as an inventory expense recognised when sales are made.
Renewal capital expenditure to maintain capabilities
$23.3m spent, $2.9m lower than budget, but $1.8m higher than 2017/18.
Most of the difference relates to renewal work associated with the Library upgrade project, which is on hold while future options are considered.
New capital expenditure for growth and to increase capabilities
Spend of $35.0m, $12.9m lower than budget, but $7.7m higher than 2017/18.
The difference is made up of a few significant projects that have been delayed to future years, including the Library upgrade and Arena masterplan projects.
Increase in net debt Actual net debt increased by $21.3m, lower than the budgeted increase of $38.7m.
Net debt has not increased as much as expected. This is due to the above higher operating surplus and lower capital spends.
Council sets rates and fees to achieve the income necessary for funding community services. Our financial strategy is to make sure Council has allocated adequate funds for key projects from rates. This will allow us to maintain our services and allow for repayment of both existing and new debt. Calculation of these is detailed in the Groups of Activities section of the 2018-28 10 Year Plan and reported against in Section Two of this report..
Operating rates-funded surplus is $2.9m higher
than budget
New capital of $35.0m spent, up $7.7m on
2017/18
Net debt increased $21.3m, lower than the
budgeted increase of $38.7m
Renewal capital of $23.3m spent, up $1.8m on 2017/18
12
Small city benefits - Big city ambition
FIN
AN
CIA
L O
VE
RV
IEW
OPERATING REVENUE ANd ExPENdITURE
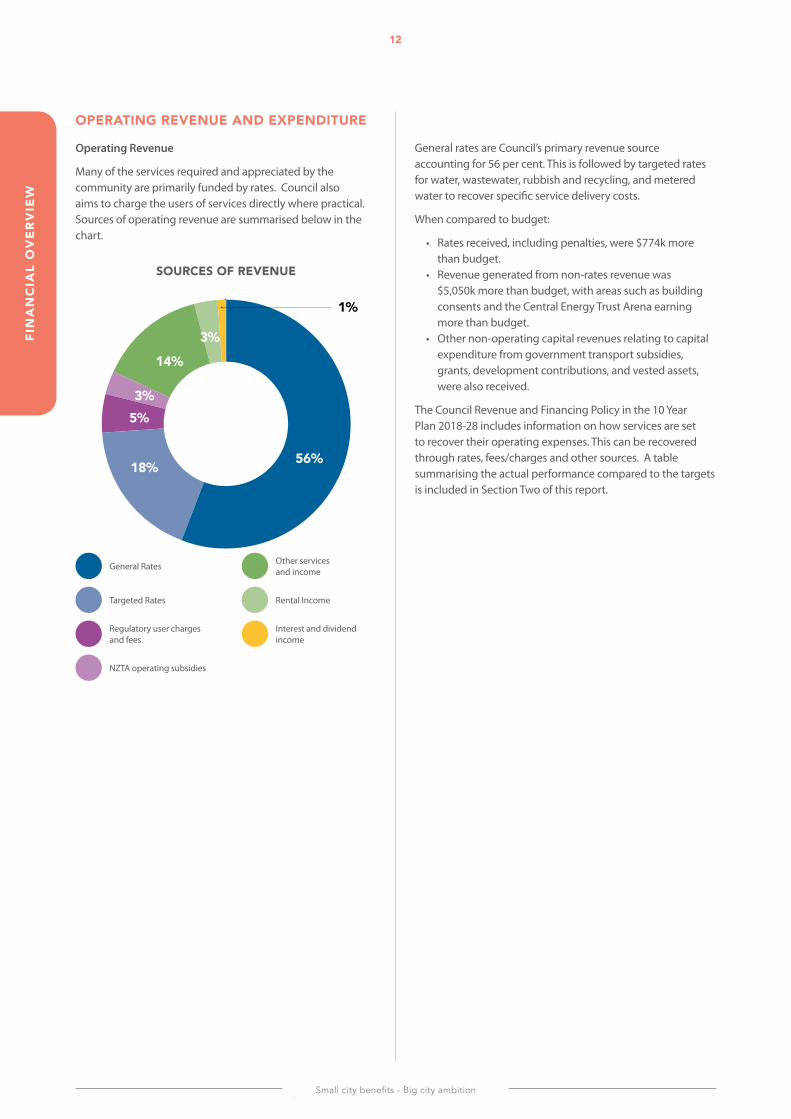
Operating Revenue
Many of the services required and appreciated by the community are primarily funded by rates. Council also aims to charge the users of services directly where practical. Sources of operating revenue are summarised below in the chart.
56%18%
5%3%
14%
3%
1%
General Rates
Targeted Rates
Regulatory user charges and fees
NZTA operating subsidies
Other services and income
Rental Income
SOURCES OF REVENUE
Interest and dividend income
General rates are Council’s primary revenue source accounting for 56 per cent. This is followed by targeted rates for water, wastewater, rubbish and recycling, and metered water to recover specific service delivery costs.
When compared to budget:
• Rates received, including penalties, were $774k more than budget.
• Revenue generated from non-rates revenue was $5,050k more than budget, with areas such as building consents and the Central Energy Trust Arena earning more than budget.
• Other non-operating capital revenues relating to capital expenditure from government transport subsidies, grants, development contributions, and vested assets, were also received.
The Council Revenue and Financing Policy in the 10 Year Plan 2018-28 includes information on how services are set to recover their operating expenses. This can be recovered through rates, fees/charges and other sources. A table summarising the actual performance compared to the targets is included in Section Two of this report.
13
PNCC Annual Report 2018/19
FINA
NC
IAL O
VE
RV
IEW
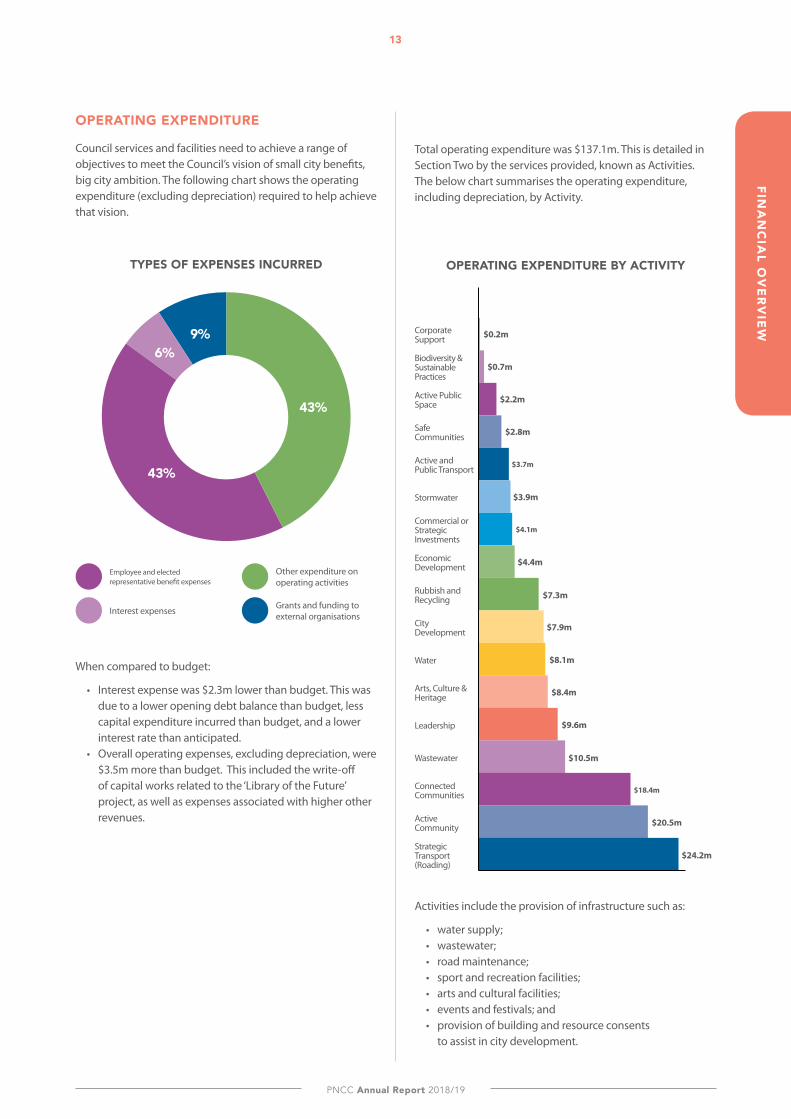
Total operating expenditure was $137.1m. This is detailed in Section Two by the services provided, known as Activities. The below chart summarises the operating expenditure, including depreciation, by Activity.
Activities include the provision of infrastructure such as:
• water supply; • wastewater; • road maintenance; • sport and recreation facilities; • arts and cultural facilities; • events and festivals; and • provision of building and resource consents
to assist in city development.
OPERATING ExPENdITURE
Council services and facilities need to achieve a range of objectives to meet the Council’s vision of small city benefits, big city ambition. The following chart shows the operating expenditure (excluding depreciation) required to help achieve that vision.
When compared to budget:
• Interest expense was $2.3m lower than budget. This was due to a lower opening debt balance than budget, less capital expenditure incurred than budget, and a lower interest rate than anticipated.
• Overall operating expenses, excluding depreciation, were $3.5m more than budget. This included the write-off of capital works related to the ‘Library of the Future’ project, as well as expenses associated with higher other revenues.
Employee and elected representative benefit expenses
Interest expenses
Other expenditure on operating activities
Grants and funding to external organisations
43%
9%
43%
6%
TYPES OF ExPENSES INCURREd OPERATING ExPENdITURE BY ACTIVITY
Corporate Support
Biodiversity & SustainablePractices
Active Public Space
Safe Communities
Active and Public Transport
Stormwater
Commercial or StrategicInvestments
Economic Development
Rubbish and Recycling
City Development
Water
Arts, Culture & Heritage
Leadership
Wastewater
Connected Communities
Active Community
Strategic Transport (Roading)
$0.2m
$0.7m
$2.2m
$2.8m
$3.7m
$3.9m
$4.1m
$4.4m
$7.3m
$7.9m
$8.1m
$8.4m
$9.6m
$10.5m
$18.4m
$20.5m
$24.2m
14
Small city benefits - Big city ambition
FIN
AN
CIA
L O
VE
RV
IEW
RENEWAL CAPITAL ExPENdITURE SPENT
2013
/14
2014
/15
2015
/16
2016
/17
2017
/18
2018
/19
25
20
10
$0
$ million
15
5
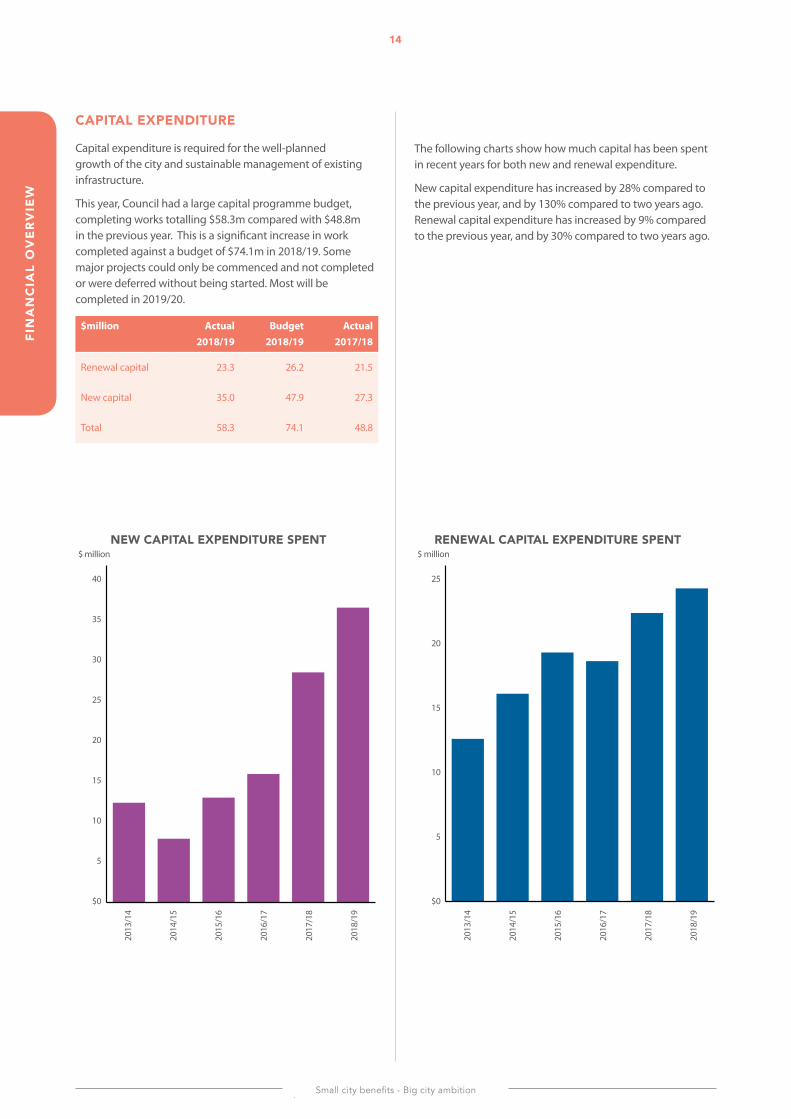
CAPITAL ExPENdITURE
Capital expenditure is required for the well-planned growth of the city and sustainable management of existing infrastructure.
This year, Council had a large capital programme budget, completing works totalling $58.3m compared with $48.8m in the previous year. This is a significant increase in work completed against a budget of $74.1m in 2018/19. Some major projects could only be commenced and not completed or were deferred without being started. Most will be completed in 2019/20.
$million Actual 2018/19
Budget 2018/19
Actual 2017/18
Renewal capital 23.3 26.2 21.5
New capital 35.0 47.9 27.3
Total 58.3 74.1 48.8
NEW CAPITAL ExPENdITURE SPENT
2013
/14
2014
/15
2015
/16
2016
/17
2017
/18
2018
/19
40
30
20
10
$0
$ million
35
25
15
5
The following charts show how much capital has been spent in recent years for both new and renewal expenditure.
New capital expenditure has increased by 28% compared to the previous year, and by 130% compared to two years ago. Renewal capital expenditure has increased by 9% compared to the previous year, and by 30% compared to two years ago.
15
PNCC Annual Report 2018/19
FINA
NC
IAL O
VE
RV
IEW
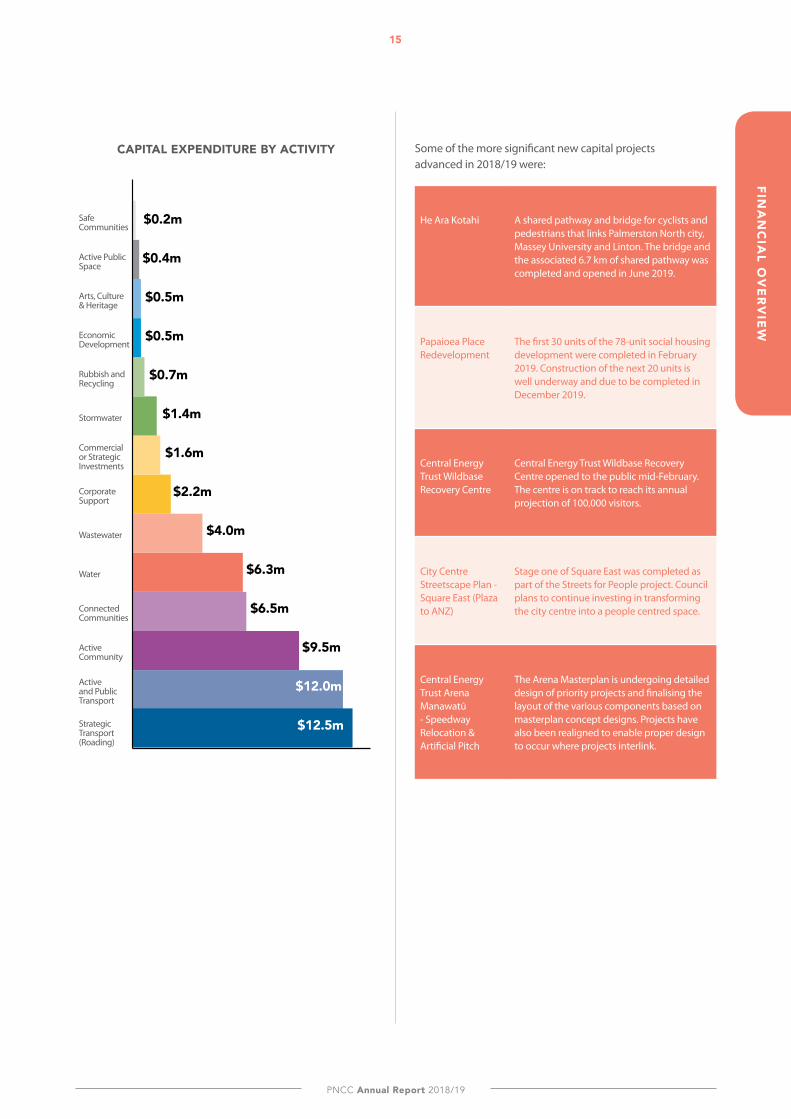
CAPITAL ExPENdITURE BY ACTIVITY Some of the more significant new capital projects advanced in 2018/19 were:
He Ara Kotahi A shared pathway and bridge for cyclists and pedestrians that links Palmerston North city, Massey University and Linton. The bridge and the associated 6.7 km of shared pathway was completed and opened in June 2019.
Papaioea Place Redevelopment
The first 30 units of the 78-unit social housing development were completed in February 2019. Construction of the next 20 units is well underway and due to be completed in December 2019.
Central Energy Trust Wildbase Recovery Centre
Central Energy Trust Wildbase Recovery Centre opened to the public mid-February. The centre is on track to reach its annual projection of 100,000 visitors.
City Centre Streetscape Plan - Square East (Plaza to ANZ)
Stage one of Square East was completed as part of the Streets for People project. Council plans to continue investing in transforming the city centre into a people centred space.
Central Energy Trust Arena Manawatū - Speedway Relocation & Artificial Pitch
The Arena Masterplan is undergoing detailed design of priority projects and finalising the layout of the various components based on masterplan concept designs. Projects have also been realigned to enable proper design to occur where projects interlink.
$0.2m
$0.4m
$0.5m
$0.5m
$0.7m
$1.4m
$1.6m
$2.2m
$4.0m
$6.3m
$6.5m
$9.5m
Safe Communities
Active Public Space
Economic Development
Arts, Culture & Heritage
Rubbish and Recycling
Stormwater
Commercial or Strategic Investments
Corporate Support
Wastewater
Water
Connected Communities
Active Community
Active and Public Transport
$12.0m
Strategic Transport (Roading)
$12.5m
16
Small city benefits - Big city ambition
FIN
AN
CIA
L O
VE
RV
IEW
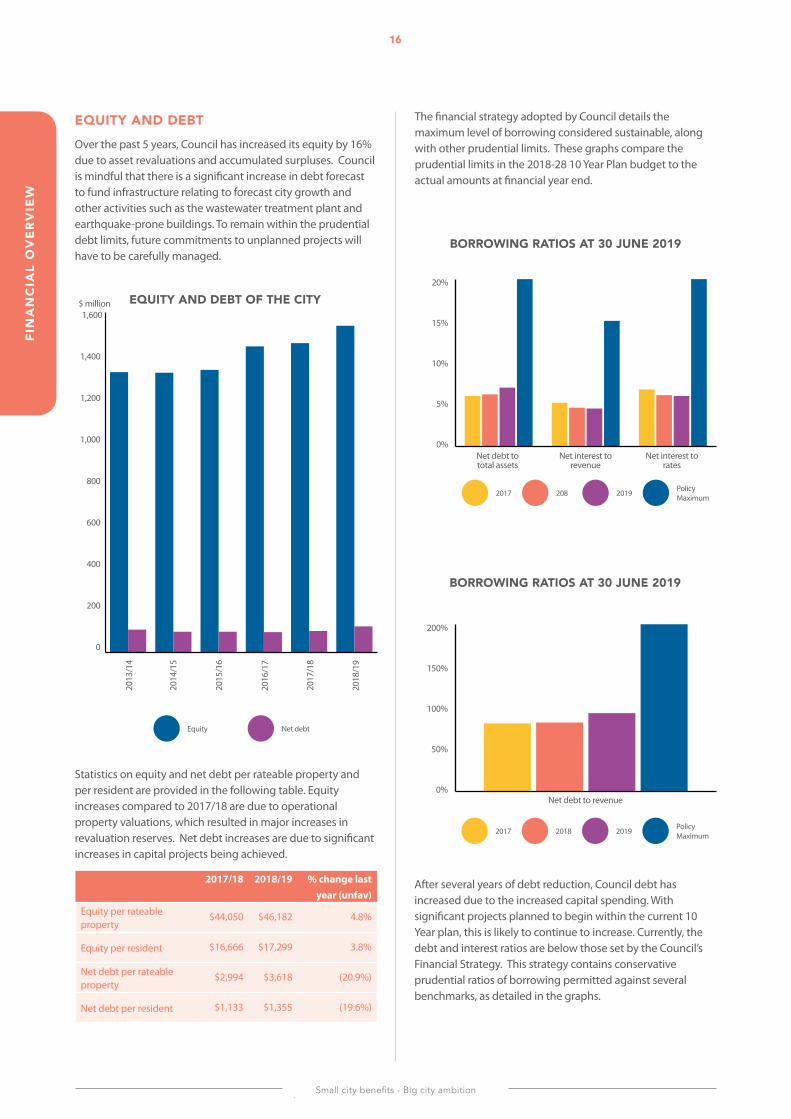
The financial strategy adopted by Council details the maximum level of borrowing considered sustainable, along with other prudential limits. These graphs compare the prudential limits in the 2018-28 10 Year Plan budget to the actual amounts at financial year end.
After several years of debt reduction, Council debt has increased due to the increased capital spending. With significant projects planned to begin within the current 10 Year plan, this is likely to continue to increase. Currently, the debt and interest ratios are below those set by the Council’s Financial Strategy. This strategy contains conservative prudential ratios of borrowing permitted against several benchmarks, as detailed in the graphs.
EQUITY ANd dEBTOver the past 5 years, Council has increased its equity by 16% due to asset revaluations and accumulated surpluses. Council is mindful that there is a significant increase in debt forecast to fund infrastructure relating to forecast city growth and other activities such as the wastewater treatment plant and earthquake-prone buildings. To remain within the prudential debt limits, future commitments to unplanned projects will have to be carefully managed.
Statistics on equity and net debt per rateable property and per resident are provided in the following table. Equity increases compared to 2017/18 are due to operational property valuations, which resulted in major increases in revaluation reserves. Net debt increases are due to significant increases in capital projects being achieved.
2017/18 2018/19 % change last year (unfav)
Equity per rateable property
$44,050 $46,182 4.8%
Equity per resident $16,666 $17,299 3.8%
Net debt per rateable property
$2,994 $3,618 (20.9%)
Net debt per resident $1,133 $1,355 (19.6%)
EQUITY ANd dEBT OF THE CITY
Equity Net debt
2013
/14
1,600
0
400
800
1,000
1,400
$ million20
17/1
8
2016
/17
2015
/16
2014
/15
2018
/19
600
200
1,200
BORROWING RATIOS AT 30 JUNE 2019
2017 208 2019 Policy Maximum
20%
15%
10%
5%
0%Net debt to total assets
Net interest to revenue
Net interest to rates
BORROWING RATIOS AT 30 JUNE 2019
2017 2018 2019 Policy Maximum
200%
150%
100%
50%
0%Net debt to revenue
17
PNCC Annual Report 2018/19
THE
RO
LE O
F CO
UN
CIL
THE ROLE OF COUNCIL The purpose of Palmerston North City Council is defined in the Local Government Act 2002. The Act governs local democratic decision-making to meet the current and future needs of communities. This includes cost-effective and good quality local infrastructure, local public services, and regulatory functions.
Put simply, Council delivers infrastructure, services and performance that are efficient, effective and appropriate. Both for present and anticipated future circumstances.
The community needs the Council to provide these essential services to support city function and growth. It’s the role of elected councillors to determine how to achieve this and to plan for future needs.
A 10 Year Plan is completed every three years to help outline how Council will achieve its goals. This is a major exercise for determining what the community wants and what the city needs. It involves consulting with the community on proposed future services, the planned renewal of infrastructure, and new projects. Council considered submissions from the community before finalising the 10 Year Plan from 2018 to 2028. The Plan was then adopted in June 2018.
The planning considered how city growth will be accommodated and what resources could be made available. Resources were considered in relation to Council’s 30 Year Infrastructure Strategy, which covers its key infrastructure assets. The Strategy sets out an assessment of requirements, issues and the estimated costs of maintaining and renewing existing infrastructure over that period. It also examines how the city’s infrastructure will meet growth requirements and new legislative requirements. The first ten years of this 30-year strategy are incorporated into the 10 Year Plan.
Protecting past investments in core infrastructure is important. It ensures that people and businesses can rely on the city’s roads, water, stormwater and wastewater services. Even in tough economic times, allowing these amenities to become rundown would be short sighted. Council is committed to maintaining and renewing them in a responsible way.
Planning for city growth is a constant challenge. Council requires a development framework that not only encourages city development and renewal but makes sure the costs are allocated evenly. These costs are reasonably split between developers funding new growth and the community funding capability maintenance.
Council will continue to provide other services such as supporting community groups, and providing recreation facilities, like:
• Parks; • Sports fields;• Pathways;• Libraries;• Cemeteries;• Social housing;• Building services; and • Animal control.
These and the many other services provided, allow Palmerston North to be a city where residents enjoy the benefits of small city living. While also having the opportunities found in a big city. A city where people want to live. More events are being held for the community to enjoy and to attract visitors, many adding to the vibrancy of the city.
Council will also keep working with businesses to ensure Palmerston North is a city that attracts, fosters and retains businesses. This will help keep and create jobs for residents.
All other services and planning for these services are outlined in the 10 Year Plan.
The 10 Year Plan also includes Council’s Financial Strategy. This provides an overview of Council’s attitude towards things like the use of debt to fund growth and the types of activities funded by rates. The plan outlines the nature of the services provided by Council and how performance is measured.
The Council updates its budget through the Annual Budget (Plan) process. Each year a detailed audited Annual Report is produced showing Council’s actual performance against plans, budgets and measures.
In planning for city growth and services, Council needs to identify the vision, guiding principles and strategic goals. These elements help us take advantage of opportunities and compete with other regional centres. This focus has been incorporated into the 10 Year Plan and is reflected in Council’s vision:
PALMERSTON NORTH Small city benefits, big city ambition
Further details are included in the 10 Year Plan 2018-2028, available on Council’s website. .
18
Small city benefits - Big city ambition
THE
RO
LE O
F C
OU
NC
IL
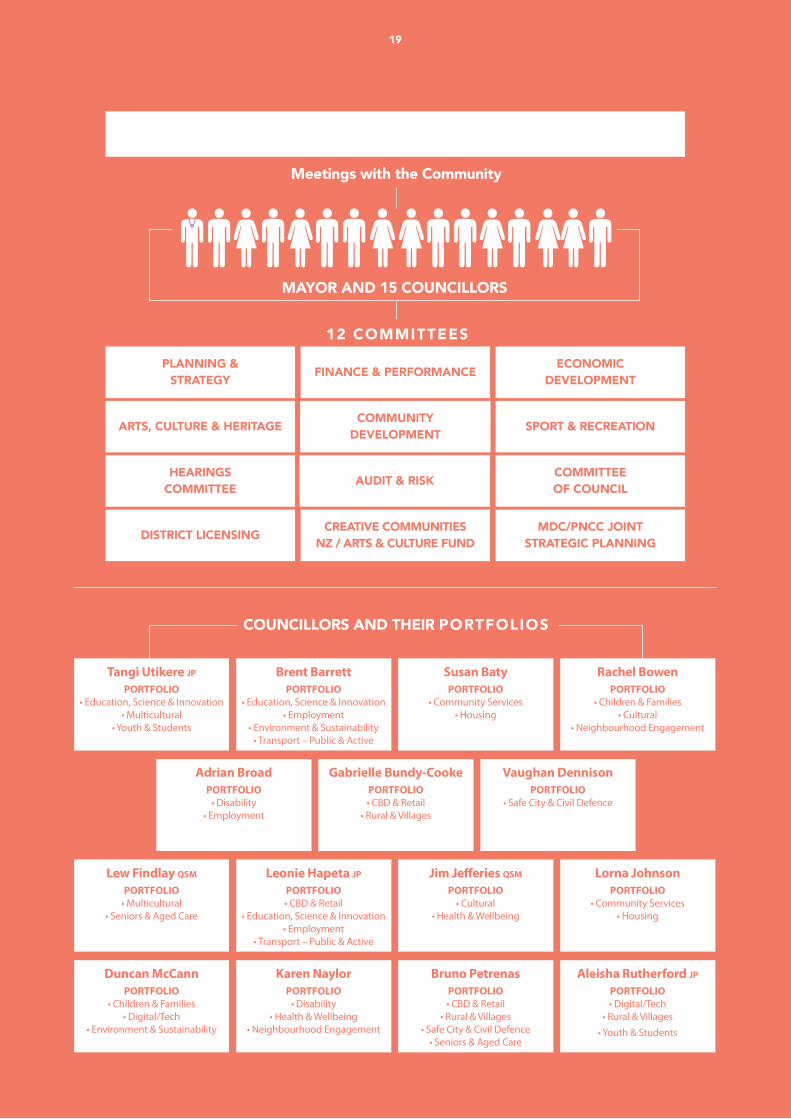
COUNCIL STRUCTUREThe Council is composed of 16 elected members – a Mayor and 15 Councillors. Council elections take place every three years, with the most recent being in October 2016 and the next election being in October 2019. There are no wards or community boards, with the Mayor and Councillors elected on a city-wide basis.
The Council reviews its committee structure after each election. The committee structure comprises three primary standing committees: Economic Development, Finance and Performance, and Planning and Strategy.
These committees meet monthly, with a full Council meeting on the last Monday of each month. The Arts, Culture and Heritage, Audit and Risk, Community Development, and Sport and Recreation Committees have four scheduled meetings, with other committees meeting on an as-required basis.
The purpose of these meetings is to ensure that Council affairs are being conducted in accordance with its vision, goals and legislative requirements. The Council also has a monitoring role in relation to the performance of Council Controlled Organisations.
The Council has adopted a Local Governance Statement setting its governance role, as required by the Local Government Act 2002. The statement ensures that information is available about the processes Council follows when making and implementing decisions, and how the community can influence these processes. This includes requirements for Conflicts of Interest.
Other governance documents include the Code of Conduct, Policy on the Appointment of Directors to Council Organisations, and the Council’s Standing Orders.
In the interests of good management and effective administration, Council believes it is essential to encourage the delegation of decision-making. The full list of delegations can be viewed in the Council’s Delegations Manual, which is available on the Council’s website, www.pncc.govt.nz.
However, the overall responsibility for maintaining effective systems of internal control ultimately rests with the Council. Internal controls include the policies, systems and procedures established to provide measurable assurance that specific objectives will be achieved.
As a regulatory body, the Council administers various regulations and laws. It is imperative that Council also complies with all relevant legislation. External law firms with local government expertise are contracted to assist Council to comply with applicable legislation.
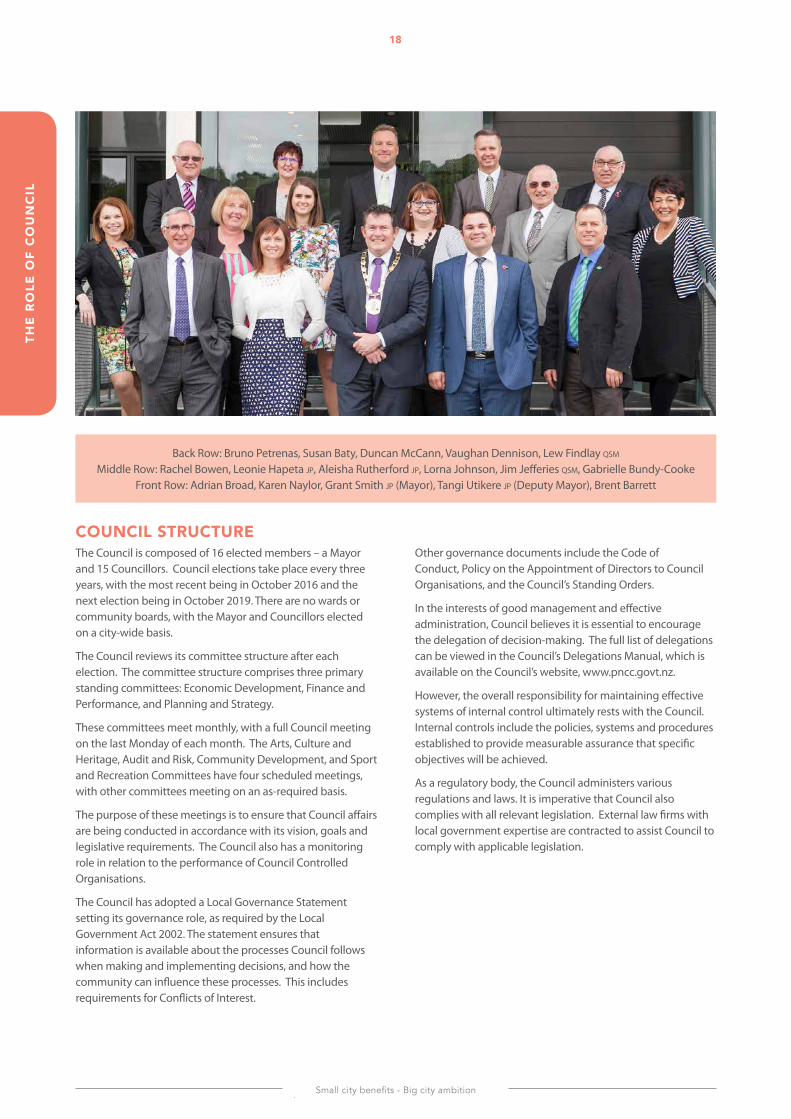
Back Row: Bruno Petrenas, Susan Baty, Duncan McCann, Vaughan Dennison, Lew Findlay qsm
Middle Row: Rachel Bowen, Leonie Hapeta jp, Aleisha Rutherford jp, Lorna Johnson, Jim Jefferies qsm, Gabrielle Bundy-CookeFront Row: Adrian Broad, Karen Naylor, Grant Smith jp (Mayor), Tangi Utikere jp (Deputy Mayor), Brent Barrett
PNCC Annual Report 2018/19
THE
RO
LE O
F CO
UN
CIL
MAYOR ANd 15 COUNCILLORS
PUBLIC
Meetings with the Community
12 COMMITTEES
PLANNING & STRATEGY FINANCE & PERFORMANCE ECONOMIC
dEVELOPMENT
ARTS, CULTURE & HERITAGE SPORT & RECREATIONCOMMUNITY dEVELOPMENT
AUdIT & RISKHEARINGS COMMITTEE
COMMITTEE OF COUNCIL
MdC/PNCC JOINTSTRATEGIC PLANNING
CREATIVE COMMUNITIES NZ / ARTS & CULTURE FUNddISTRICT LICENSING
Tangi Utikere jpPORTFOLIO
• Education, Science & Innovation • Multicultural
• Youth & Students
Brent BarrettPORTFOLIO
• Education, Science & Innovation• Employment
• Environment & Sustainability• Transport – Public & Active
Susan BatyPORTFOLIO
• Community Services • Housing
Rachel BowenPORTFOLIO
• Children & Families • Cultural
• Neighbourhood Engagement
Adrian BroadPORTFOLIO
• Disability • Employment
Gabrielle Bundy-CookePORTFOLIO• CBD & Retail
• Rural & Villages
Vaughan DennisonPORTFOLIO
• Safe City & Civil Defence
Lew Findlay qsmPORTFOLIO
• Multicultural • Seniors & Aged Care
Leonie Hapeta jpPORTFOLIO• CBD & Retail
• Education, Science & Innovation• Employment
• Transport – Public & Active
Jim Jefferies qsmPORTFOLIO
• Cultural• Health & Wellbeing
Lorna JohnsonPORTFOLIO
• Community Services • Housing
Duncan McCann PORTFOLIO
• Children & Families• Digital/Tech
• Environment & Sustainability
Karen NaylorPORTFOLIO
• Disability• Health & Wellbeing
• Neighbourhood Engagement
Bruno PetrenasPORTFOLIO• CBD & Retail
• Rural & Villages• Safe City & Civil Defence
• Seniors & Aged Care
Aleisha Rutherford jpPORTFOLIO• Digital/Tech
• Rural & Villages• Youth & Students
COUNCILLORS ANd THEIR PORTFOLIOS
19
20
Small city benefits - Big city ambition
THE
RO
LE O
F C
OU
NC
IL
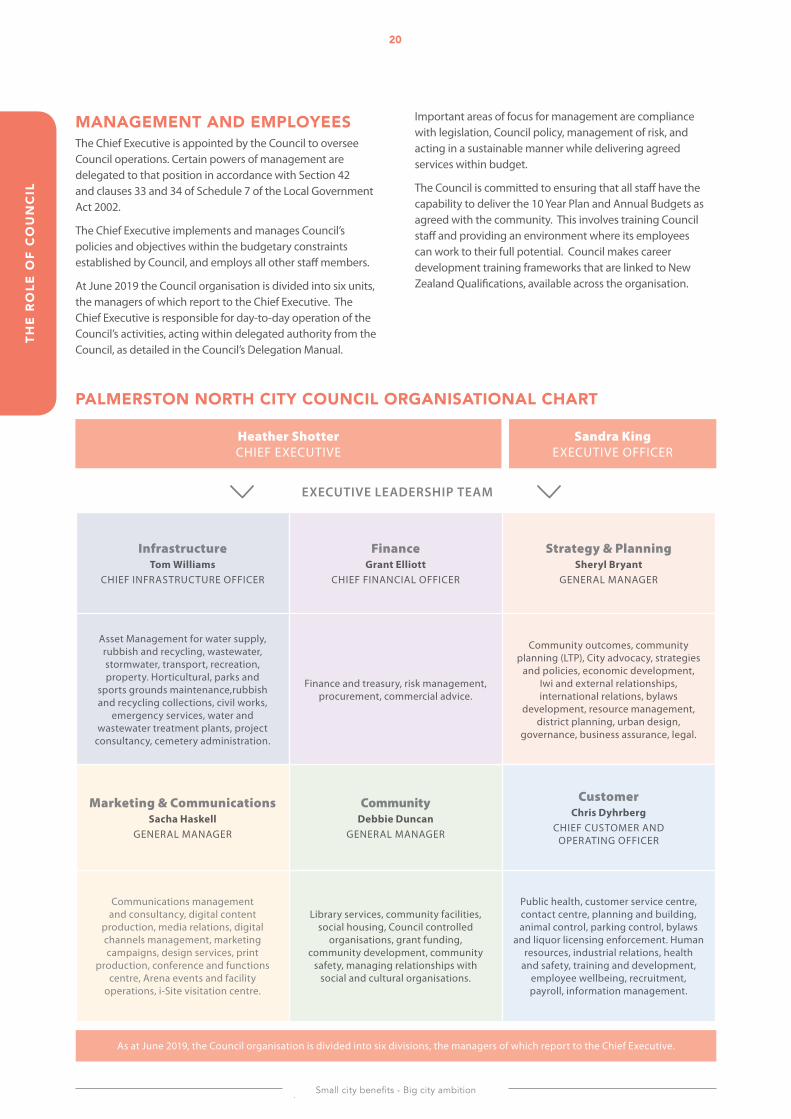
PALMERSTON NORTH CITY COUNCIL ORGANISATIONAL CHART
InfrastructureTom Williams
CHIEF INFRASTRUCTURE OFFICER
FinanceGrant Elliott
CHIEF FINANCIAL OFFICER
Strategy & PlanningSheryl Bryant
GENERAL MANAGER
Asset Management for water supply, rubbish and recycling, wastewater, stormwater, transport, recreation, property. Horticultural, parks and
sports grounds maintenance,rubbish and recycling collections, civil works,
emergency services, water and wastewater treatment plants, project
consultancy, cemetery administration.
Finance and treasury, risk management, procurement, commercial advice.
Community outcomes, community planning (LTP), City advocacy, strategies
and policies, economic development, Iwi and external relationships, international relations, bylaws
development, resource management, district planning, urban design,
governance, business assurance, legal.
Marketing & CommunicationsSacha Haskell
GENERAL MANAGER
CommunityDebbie Duncan
GENERAL MANAGER
CustomerChris Dyhrberg
CHIEF CUSTOMER AND OPERATING OFFICER
Communications management and consultancy, digital content
production, media relations, digital channels management, marketing campaigns, design services, print
production, conference and functions centre, Arena events and facility
operations, i-Site visitation centre.
Library services, community facilities, social housing, Council controlled
organisations, grant funding, community development, community
safety, managing relationships with social and cultural organisations.
Public health, customer service centre, contact centre, planning and building, animal control, parking control, bylaws
and liquor licensing enforcement. Human resources, industrial relations, health
and safety, training and development, employee wellbeing, recruitment, payroll, information management.
Heather Shotter CHIEF EXECUTIVE
EXECUTIVE LEADERSHIP TEAM
As at June 2019, the Council organisation is divided into six divisions, the managers of which report to the Chief Executive.
MANAGEMENT ANd EMPLOYEESThe Chief Executive is appointed by the Council to oversee Council operations. Certain powers of management are delegated to that position in accordance with Section 42 and clauses 33 and 34 of Schedule 7 of the Local Government Act 2002.
The Chief Executive implements and manages Council’s policies and objectives within the budgetary constraints established by Council, and employs all other staff members.
At June 2019 the Council organisation is divided into six units, the managers of which report to the Chief Executive. The Chief Executive is responsible for day-to-day operation of the Council’s activities, acting within delegated authority from the Council, as detailed in the Council’s Delegation Manual.
Important areas of focus for management are compliance with legislation, Council policy, management of risk, and acting in a sustainable manner while delivering agreed services within budget.
The Council is committed to ensuring that all staff have the capability to deliver the 10 Year Plan and Annual Budgets as agreed with the community. This involves training Council staff and providing an environment where its employees can work to their full potential. Council makes career development training frameworks that are linked to New Zealand Qualifications, available across the organisation.
Sandra King EXECUTIVE OFFICER
21
PNCC Annual Report 2018/19
WH
AT’S H
AP
PE
NIN
G IN
THE
CITY
?
WHAT’S HAPPENING IN THE CITY? CITY dEMOGRAPHICSPalmerston North is growing strongly. Based on 2013 census figures, NZ Statistics estimated the city’s population to be 88,700 in June 2018.
This was a 1.7 per cent increase over the previous 12 months (the national increase was 1.9 per cent). The estimate suggests Palmerston North has a 1.8 per cent share of the national population. Population projections prepared for the Council in June 2019 by Sense Partners suggest the City’s population will be 107,860 people by 2043. It is a youthful population. The median age of Palmerston North’s population in 2018 was 33.6 years compared with 36.9 years as the national median age, making it New Zealand’s second youngest city after Hamilton (31.8). This is influenced by the large number of tertiary students attracted primarily for tertiary education and New Zealand’s largest army base located within the city boundary at Linton Military Camp. About 17.1 per cent of Palmerston North residents are Māori, compared with 15.6 per cent nationally (2013 estimates). Palmerston North is one of New Zealand’s recognised refugee centres, and prides itself on being a welcoming, diverse, inclusive and safe place for all its residents, with over 130 different ethnic communities calling the city home.
SOCIAL, CULTURAL ANd LEISURE ENVIRONMENTAccess to lifestyle is a feature of living in Palmerston North, and the city has a high level of community spirit.
The people of Palmerston North enjoy a comfortable worklife balance while there are plenty of organised community events, recreational amenities, with numerous interest and hobby groups and clubs providing plenty to do. Housing is still relatively affordable in Palmerston North. The city’s average price has risen 14.0 per cent since June 2018 and is now $445,586. That sits well below the national average of $689,000, where average prices increased by just 2.0 per cent in the year to June 2019 (CoreLogic QV June 2019). Due to the lower median age of the city’s population, in 2013 only 62 per cent of Palmerston North people lived in a house that they owned (with or without a mortgage). This is slightly lower than the proportion of people nationwide who own their own houses (65 per cent). The average median weekly rent in Palmerston North was $315 compared with the national median of $422 (MBIE private sector rental bond data, May 2019).
22
Small city benefits - Big city ambition
WH
AT’
S H
AP
PE
NIN
G
IN T
HE
CIT
Y?
Data from MidCentral Health shows that age-adjusted mortality rates from all causes in Palmerston North matches the rate for New Zealand. Palmerston North is well provided with playgrounds, sportsfields, parks and reserves. There are over 10 hectares of recreation parks and open space per 1,000 people. The national benchmark is 4ha per 1,000 people. With a thriving arts and culture scene, Palmerston North is well endowed with arts and cultural facilities, many superior to that of larger centres. This is reflected in a recent series of focus groups on life in Palmerston North where participants commented on the city’s increasingly vibrant arts scene.
ENVIRONMENTAL SUSTAINABILITY Council’s strategic direction is for Palmerston North to be regarded as an environmentally concerned and caring eco city.
There’s a commitment by the city to develop its shared pathway and cycleway network. This continues to encourage alternative means of transport and commuting, while providing for safer leisure activities. The Green Corridors programme continues to create open green spaces from the Tararua Ranges to the Manawatū River. Since 2001 more than 140,000 trees have been planted in the Turitea Valley and Summerhill areas.
These plantings have restored wonderful habitats for native birds, improved the water quality for native fish, and resulted in a scenic network of public tracks through the bush. Sustainable practices are being continually developed and implemented by the Council for the benefit of the city and the surrounding environment. The most prominent issue is wastewater disposal. Council is addressing the impact of the city’s treated wastewater discharge on the Manawatū River. As a result, Council has agreed with Horizons Regional Council to apply for new consents for the treatment and discharge of wastewater from the Wastewater Treatment Plant in Awapuni by June 2022, six years before current consents come to an end. A Best Practicable Options Assessment (BPO) review for treating and disposing of the city’s wastewater is underway. Following extensive community consultation, the final decision on this is to be made by June 2021, with an application to Horizons for resource consents by June 2022. Council will ensure the resulting wastewater scheme is operational no later than five years after the necessary resource consents come into play. Palmerston North has plentiful supplies of clean fresh air, and as the risk of exceeding New Zealand Air Quality Standards is low, Horizons does not insist on the city having an air quality monitoring programme.
ECONOMY, VISITOR NUMBERS, BUSINESS dEVELOPMENT ANd EMPLOYMENTPalmerston North has experienced strong economic growth since 2000.
Median annual salaries and wages in the city have been increasing faster than the rate of growth for New Zealand, with an increase of 79.3 per cent between March 2000 and March 2018. The national increase over this period was 75.3 per cent. Total incomes (salaries and wages and income from self-employment) in 2017 was $2,543 million in the year to March 2018, 116 per cent higher than in 2000, while national income growth was 137 per cent over this period.
Total visitor spending in the city has been increasing. Domestic visitor spending was $365 million in the year to June 2019 – an increase of 1.3 per cent from the previous year, and international visitor spending was $68 million - up 7.1 per cent. Three carriers operate from Palmerston North Airport – Air New Zealand, Jetstar and Originair. Following the introduction of Jetstar flights between Palmerston North and Auckland in February 2016, and the reintroduction of Originair flights between Nelson and Palmerston North in September 2016, passenger numbers through the airport have increased significantly. In the year to June 2019, there were 687,142 passengers – an increase of 4.5 per cent from the previous year. Electronic card retail spending in Palmerston North reached $1,182 million in the year ended June 2019, an increase of 4.6 per cent from the previous year, while national retail spending growth slowed to 3.4 per cent.
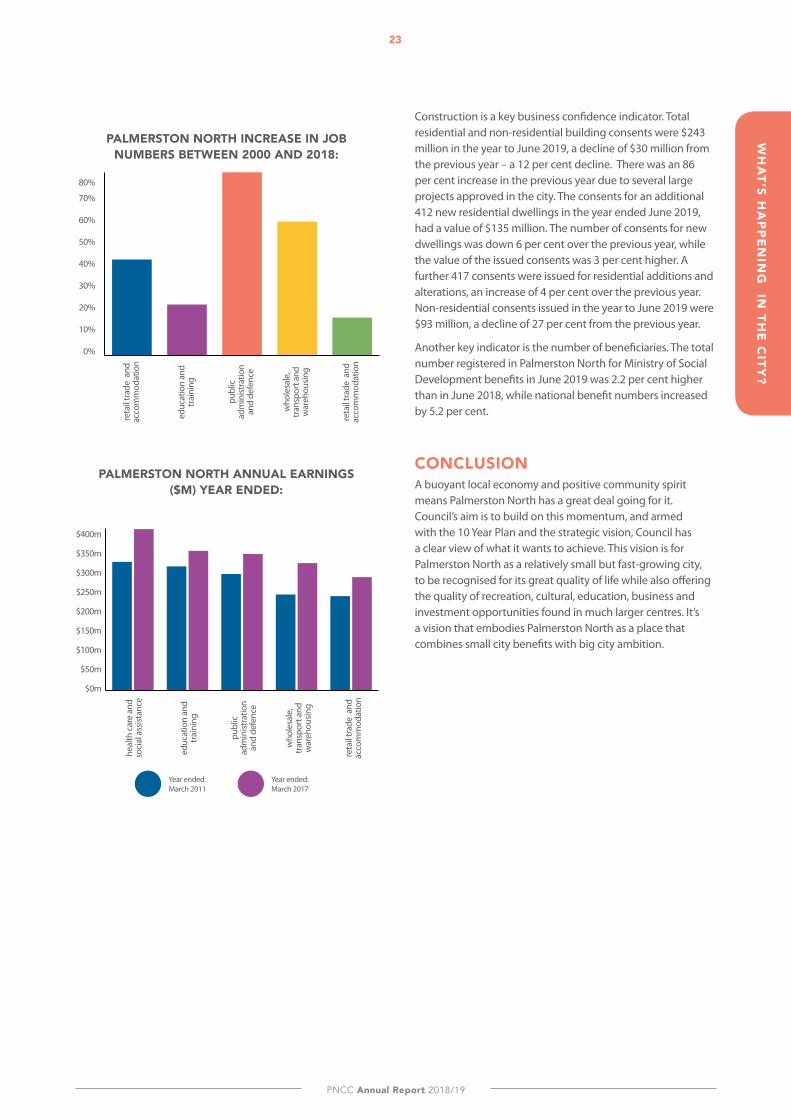
Employment trends in Palmerston North have shown encouraging growth across several business sectors. While tertiary education remains extremely important to the city, it is no longer the largest sector for total earnings (salaries and wages and self-employment income). Between 2000 and 2018, job numbers have increased by 57 per cent in wholesale, transport and warehousing. Numbers in health-care and social assistance have increased by 41 per cent. The public administration and defence sector has increased by 78 per cent. The range of sectors now contributing to growth reduces economic exposure should any downturn affect one or two sectors, and provides for a more robust economy.
23
PNCC Annual Report 2018/19
WH
AT’S H
AP
PE
NIN
G IN
THE
CITY
?
Construction is a key business confidence indicator. Total residential and non-residential building consents were $243 million in the year to June 2019, a decline of $30 million from the previous year – a 12 per cent decline. There was an 86 per cent increase in the previous year due to several large projects approved in the city. The consents for an additional 412 new residential dwellings in the year ended June 2019, had a value of $135 million. The number of consents for new dwellings was down 6 per cent over the previous year, while the value of the issued consents was 3 per cent higher. A further 417 consents were issued for residential additions and alterations, an increase of 4 per cent over the previous year. Non-residential consents issued in the year to June 2019 were $93 million, a decline of 27 per cent from the previous year.
Another key indicator is the number of beneficiaries. The total number registered in Palmerston North for Ministry of Social Development benefits in June 2019 was 2.2 per cent higher than in June 2018, while national benefit numbers increased by 5.2 per cent.
CONCLUSIONA buoyant local economy and positive community spirit means Palmerston North has a great deal going for it. Council’s aim is to build on this momentum, and armed with the 10 Year Plan and the strategic vision, Council has a clear view of what it wants to achieve. This vision is for Palmerston North as a relatively small but fast-growing city, to be recognised for its great quality of life while also offering the quality of recreation, cultural, education, business and investment opportunities found in much larger centres. It’s a vision that embodies Palmerston North as a place that combines small city benefits with big city ambition.
PALMERSTON NORTH ANNUAL EARNINGS ($M) YEAR ENdEd:
Year ended: March 2017
Year ended: March 2011
heal
th c
are
and
soci
al a
ssist
ance
educ
atio
n an
d tr
aini
ng
publ
ic
adm
inist
ratio
n an
d de
fenc
e
who
lesa
le,
tran
spor
t and
w
areh
ousin
g
reta
il tr
ade
and
ac
com
mod
atio
n
$400m
$350m
$300m
$250m
$200m
$150m
$100m
$50m
$0m
PALMERSTON NORTH INCREASE IN JOB NUMBERS BETWEEN 2000 ANd 2018:
70%
60%
50%
40%
30%
20%
10%
0%
reta
il tr
ade
and
ac
com
mod
atio
n
educ
atio
n an
d tr
aini
ng
publ
ic
adm
inist
ratio
n an
d de
fenc
e
who
lesa
le,
tran
spor
t and
w
areh
ousin
g
reta
il tr
ade
and
ac
com
mod
atio
n
80%
4C
ON
TEN
TS
Small city benefits - Big city ambition
CONTENTS
WĀHANGA TUATAHI
SECTION ONE
6
WHAKARĀPOPOTOOVERVIEW
Year in Review 8
Financial Overview 11
The Role of Council 17
What’s happening in the City? 21
WĀHANGA TUARUA
SECTION TWO
24
NGĀ MAHI A TE KAUNIHERAWHAT THE COUNCIL DOES
GOAL 1 - Innovative & Growing City
City Development Activity 36(includes Housing and Future Development, Urban Design Heritage Management)
Strategic Transport (Roading) Activity 41
Economic Development Activity 47
Goal 2 - Creative & Exciting City
Active Public Space Activity 52(includes Placemaking, Events & Festivals, Palmy Unleashed)
Arts, Culture & Heritage Activity 57(includes arts & cultural organisations/groups)
Active Community Activity 62(includes Sport and Recreation, Parks, Sportsfields and Reserves)
Active and Public Transport Activity 70(includes cycle/pedestrian paths, buses & bike stands)
GOAL 3 - Connected & Safe Community
Connected Communities Activity 76(includes libraries, community centres, community groups and Social Housing)
Safe Communities Activity 84(includes animal control, civil defence, public health & safer community initiatives)
GOAL 4 - Eco-City
Rubbish & Recycling Activity 92
Biodiversity & Sustainable Practices Activity 96
Stormwater Activity 102
Wastewater Activity 106
Water Supply Activity 112
GOAL 5 - Driven & Enabling Council
Leadership Activity 120
Corporate Support Activity 124
Commercial or Strategic Investments Activity 128
5C
ON
TEN
TS
PNCC Annual Report 2018/19
WĀHANGA TUAWHĀ
SECTION FOUR
212
NGĀ TŌPŪTANGA A TE KAUNIHERACOUNCIL CONTROLLED ORGANISATIONS
WĀHANGA TUARIMA
SECTION FIVE
230
KŌRERO ĀPITIHANGAADDITIONAL INFORMATION
WĀHANGA TUATORU
SECTION THREE
132
PUAKANGA AHUMONIFINANCIAL STATEMENTS
Independent Auditor’s Report 134
Statement of Compliance and Responsibility 137
Statement of Comprehensive Revenue and Expense 138
Statement of Financial Position 139
Statement of Changes in Equity 140
Statement of Cash Flows 141
Notes to the Financial Statements 142
Annual Report Disclosure Statement 196
Insurance of Assets 200
Funding Impact Statements 201
Overview 214
Caccia Birch Trust Board 215
Central Economic Development Agency Limited 217
Globe Theatre Trust Board 220
The Regent Theatre Trust 222
Te Manawa Museums Trust 225
Palmerston North Airport Ltd 228
How to find us 232
Glossary 234

24
Small city benefits - Big city ambition
Ahi
mat
e Pa
rk
25
PNCC Annual Report 2018/19
Wh
At th
e C
ou
nC
il Do
es
WĀHANGA TUARUA seCtion tWo
NGĀ MAHI A TE KAUNIHERAWhAt the CounCil Does
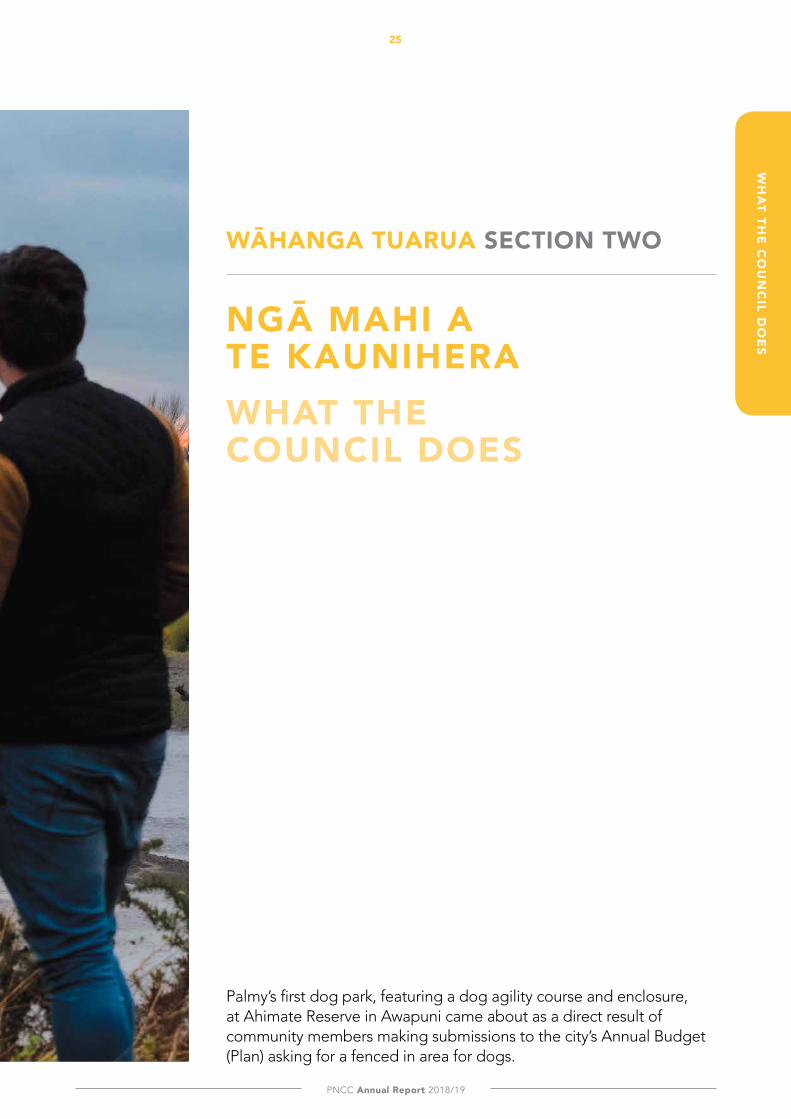
Palmy’s first dog park, featuring a dog agility course and enclosure, at Ahimate Reserve in Awapuni came about as a direct result of community members making submissions to the city’s Annual Budget (Plan) asking for a fenced in area for dogs.
Small city benefits - Big city ambition
Wh
At
the
Co
un
Cil
Do
es
WhAt the CounCil Does(Statement of service provision)
OVERVIEWOur vision for Palmerston North is to embrace the benefits of small city living. While still offering our residents and region the lifestyle, education and business opportunities of much larger metropolitan cities. Council’s vision is ‘Small city benefits, big city ambition’. To achieve this Palmerston North people and its businesses require Council to provide appropriate levels of services and facilities.
The 10 Year Plan and Annual Budgets (Plans) provide more detail on these services and how our performance can be measured. Council develops a vision and goals in consultation with the community. These are called community outcomes. Many of the community outcomes require collaboration and involvement from other organisations in the community to achieve them.
Council’s goals as set in the 10 Year Plan for 2018/19 were:
1. An Innovative & Growing City A city that is clever about the way it uses its natural advantages to encourage and support innovation, entrepreneurship and new industries. It positions itself to take advantage of change to fuel sustainable growth, prosperity and wellbeing.
2. A Creative & Exciting City A city that draws inspiration from the diversity within its culture and creates a vibrant urban environment. It attracts creative and clever people, and nurtures creative talent.
3. A Connected & Safe Community A city that includes, supports, connects and uses the talents and advantages of the whole community in the pursuit of prosperity and wellbeing. A city that has an international reputation as a safe city to live, study, work and play. A city that embraces its iwi heritage and partnership, where people connect with the city’s past and celebrate its history and heritage.
4. An Eco City A future-focused city that plans for and cares about the future, enhancing its natural and built environment. Our city will realise the benefits of creating clean energy, lowering carbon emissions, and reducing our ecological footprint.
5. A Driven & Enabling Council A Council and organisation that works as one team with its communities, a catalyst and enabler for change in the city.
Each of these goals has activities or services which have been summarised here alongside the goals they contribute to. There is information to show how the Council has performed over the year. Detailing whether performance targets were met, what it cost and whether services were provided within budget.
There are explanations of significant capital projects for new acquisitions, to meet future growth requirements or increase levels of service. As well as renewals, to replace and maintain the standard of existing assets.
The summaries also detail issues Council is facing, how we expect these to impact our city and residents, and how Council services are improving.
ACTIVITIES SUMMARY INFORMATION
The following tables summarise the following activity and service information:
• Operational requirement and funding• Funding sources • Capital expenditure• Non-financial performance measures
Activity pages containing more detail can be found immediately after the tables within the relevant activities.
Since the budget was prepared, circumstances have changed in some areas. Explanation of significant variances are included in the activities sections that follow.
26
27
PNCC Annual Report 2018/19
FINA
NC
IAl R
ESU
lTS
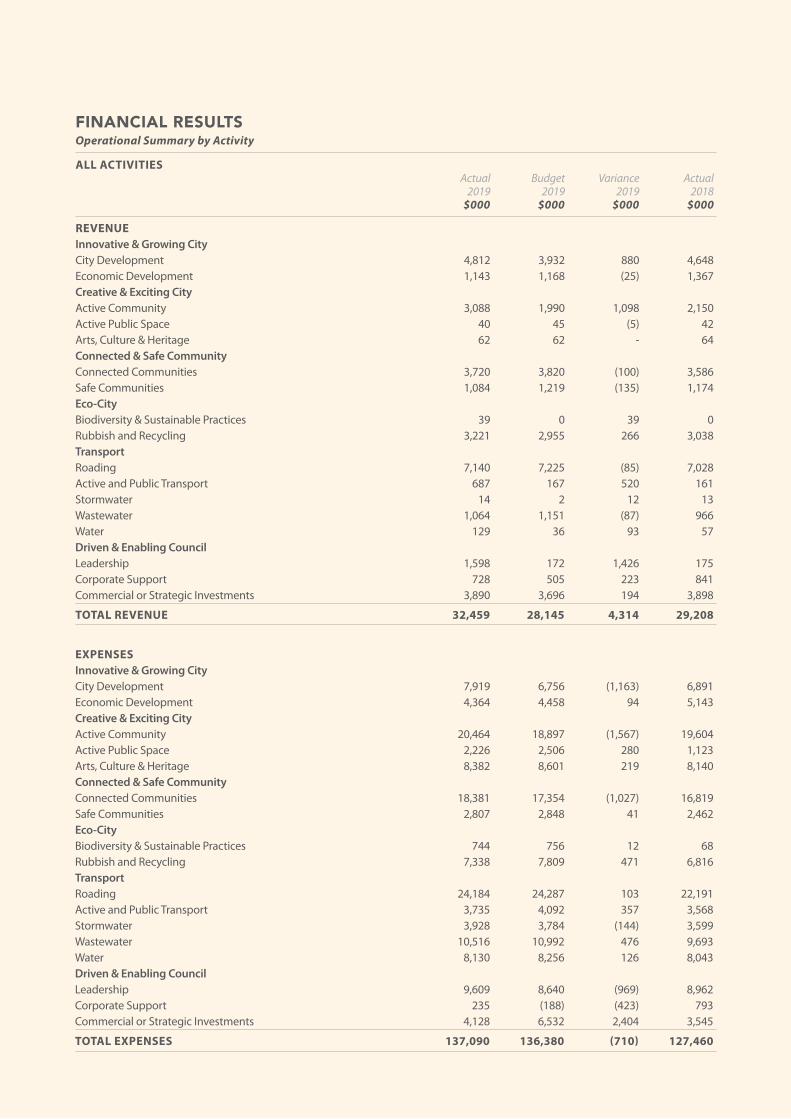
FINANCIAl RESUlTSOperational Summary by Activity
ALL ACTIVITIES Actual Budget Variance Actual 2019 2019 2019 2018 $000 $000 $000 $000
REVENUE Innovative & Growing City City Development 4,812 3,932 880 4,648Economic Development 1,143 1,168 (25) 1,367Creative & Exciting City Active Community 3,088 1,990 1,098 2,150Active Public Space 40 45 (5) 42Arts, Culture & Heritage 62 62 - 64Connected & Safe Community Connected Communities 3,720 3,820 (100) 3,586Safe Communities 1,084 1,219 (135) 1,174Eco-City Biodiversity & Sustainable Practices 39 0 39 0Rubbish and Recycling 3,221 2,955 266 3,038Transport Roading 7,140 7,225 (85) 7,028Active and Public Transport 687 167 520 161Stormwater 14 2 12 13Wastewater 1,064 1,151 (87) 966Water 129 36 93 57Driven & Enabling Council Leadership 1,598 172 1,426 175Corporate Support 728 505 223 841Commercial or Strategic Investments 3,890 3,696 194 3,898
TOTAL REVENUE 32,459 28,145 4,314 29,208
EXPENSES Innovative & Growing City City Development 7,919 6,756 (1,163) 6,891Economic Development 4,364 4,458 94 5,143Creative & Exciting City Active Community 20,464 18,897 (1,567) 19,604Active Public Space 2,226 2,506 280 1,123Arts, Culture & Heritage 8,382 8,601 219 8,140Connected & Safe Community Connected Communities 18,381 17,354 (1,027) 16,819Safe Communities 2,807 2,848 41 2,462Eco-City Biodiversity & Sustainable Practices 744 756 12 68Rubbish and Recycling 7,338 7,809 471 6,816Transport Roading 24,184 24,287 103 22,191Active and Public Transport 3,735 4,092 357 3,568Stormwater 3,928 3,784 (144) 3,599Wastewater 10,516 10,992 476 9,693Water 8,130 8,256 126 8,043Driven & Enabling Council Leadership 9,609 8,640 (969) 8,962Corporate Support 235 (188) (423) 793Commercial or Strategic Investments 4,128 6,532 2,404 3,545
TOTAL EXPENSES 137,090 136,380 (710) 127,460
28
Small city benefits - Big city ambition
FIN
AN
CIA
l R
ESU
lTS
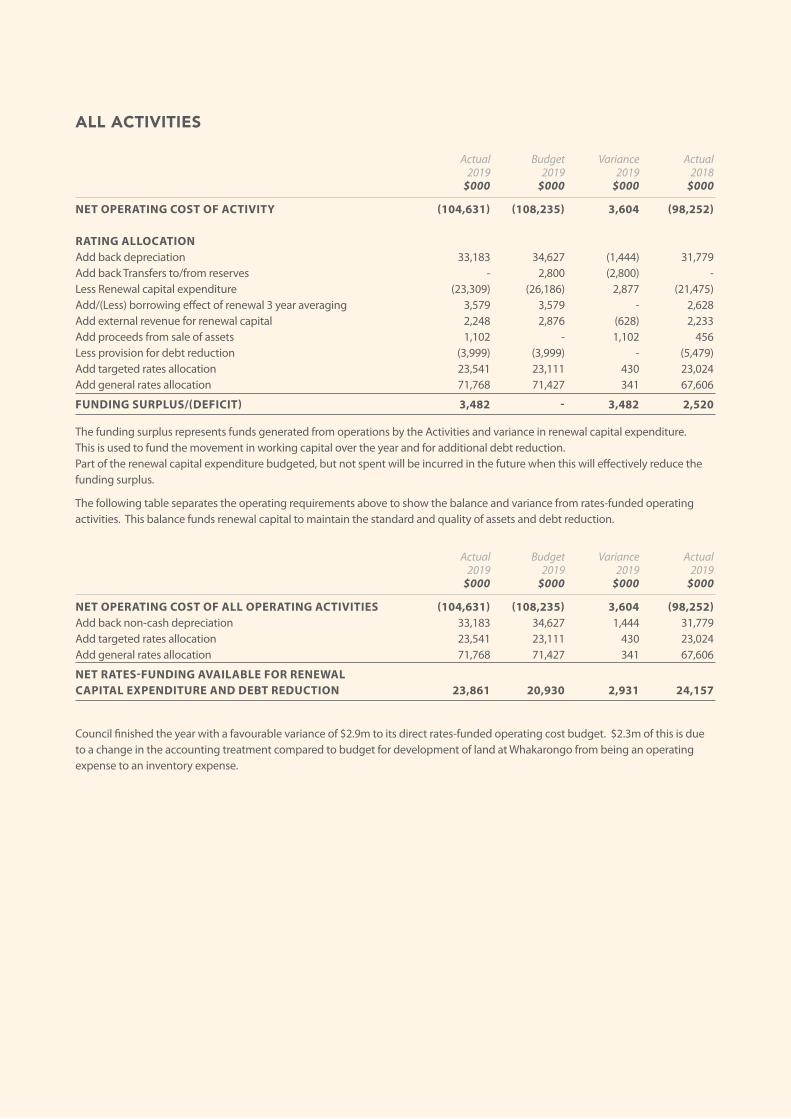
All ACtiVities Actual Budget Variance Actual 2019 2019 2019 2018 $000 $000 $000 $000
NET OPERATING COST OF ACTIVITY (104,631) (108,235) 3,604 (98,252) RATING ALLOCATION Add back depreciation 33,183 34,627 (1,444) 31,779Add back Transfers to/from reserves - 2,800 (2,800) -Less Renewal capital expenditure (23,309) (26,186) 2,877 (21,475)Add/(Less) borrowing effect of renewal 3 year averaging 3,579 3,579 - 2,628Add external revenue for renewal capital 2,248 2,876 (628) 2,233Add proceeds from sale of assets 1,102 - 1,102 456Less provision for debt reduction (3,999) (3,999) - (5,479)Add targeted rates allocation 23,541 23,111 430 23,024Add general rates allocation 71,768 71,427 341 67,606
FUNDING SURPLUS/(DEFICIT) 3,482 - 3,482 2,520
The funding surplus represents funds generated from operations by the Activities and variance in renewal capital expenditure. This is used to fund the movement in working capital over the year and for additional debt reduction. Part of the renewal capital expenditure budgeted, but not spent will be incurred in the future when this will effectively reduce the funding surplus.
The following table separates the operating requirements above to show the balance and variance from rates-funded operating activities. This balance funds renewal capital to maintain the standard and quality of assets and debt reduction.
Actual Budget Variance Actual 2019 2019 2019 2019 $000 $000 $000 $000
NET OPERATING COST OF ALL OPERATING ACTIVITIES (104,631) (108,235) 3,604 (98,252)Add back non-cash depreciation 33,183 34,627 1,444 31,779Add targeted rates allocation 23,541 23,111 430 23,024Add general rates allocation 71,768 71,427 341 67,606
NET RATES-FUNDING AVAILABLE FOR RENEWAL CAPITAL EXPENDITURE AND DEBT REDUCTION 23,861 20,930 2,931 24,157
Council finished the year with a favourable variance of $2.9m to its direct rates-funded operating cost budget. $2.3m of this is due to a change in the accounting treatment compared to budget for development of land at Whakarongo from being an operating expense to an inventory expense.
29
PNCC Annual Report 2018/19
FINA
NC
IAl R
ESU
lTS
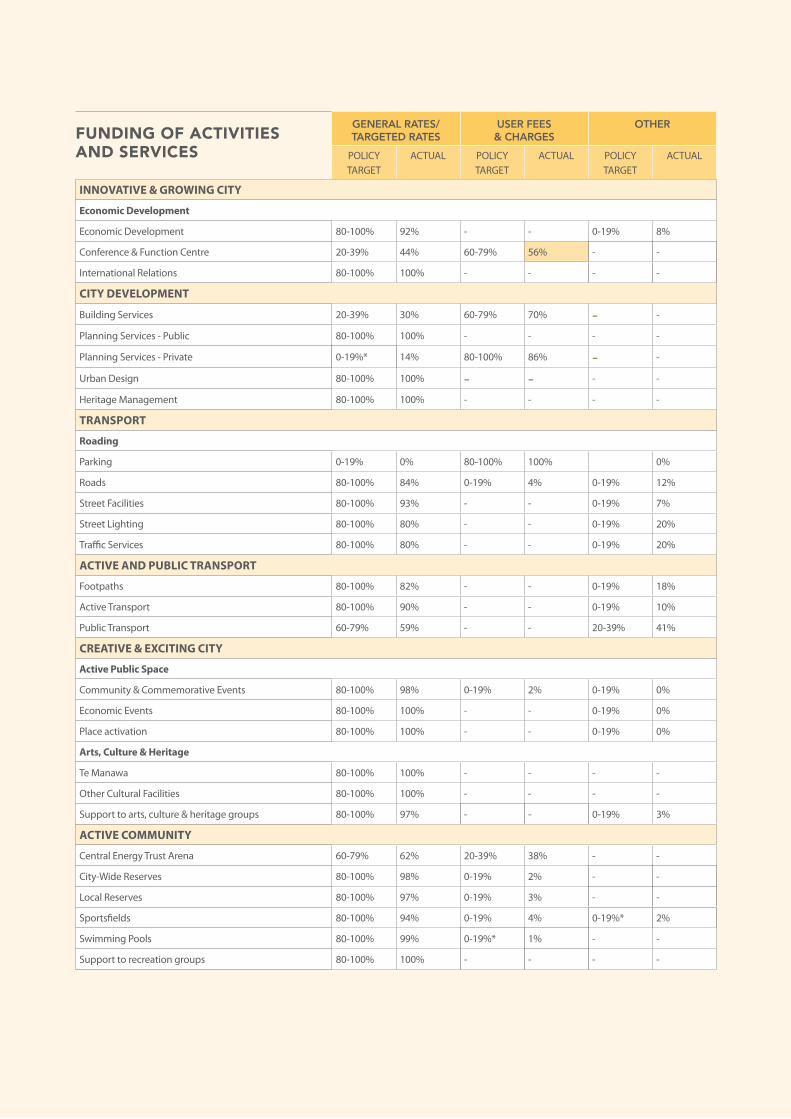
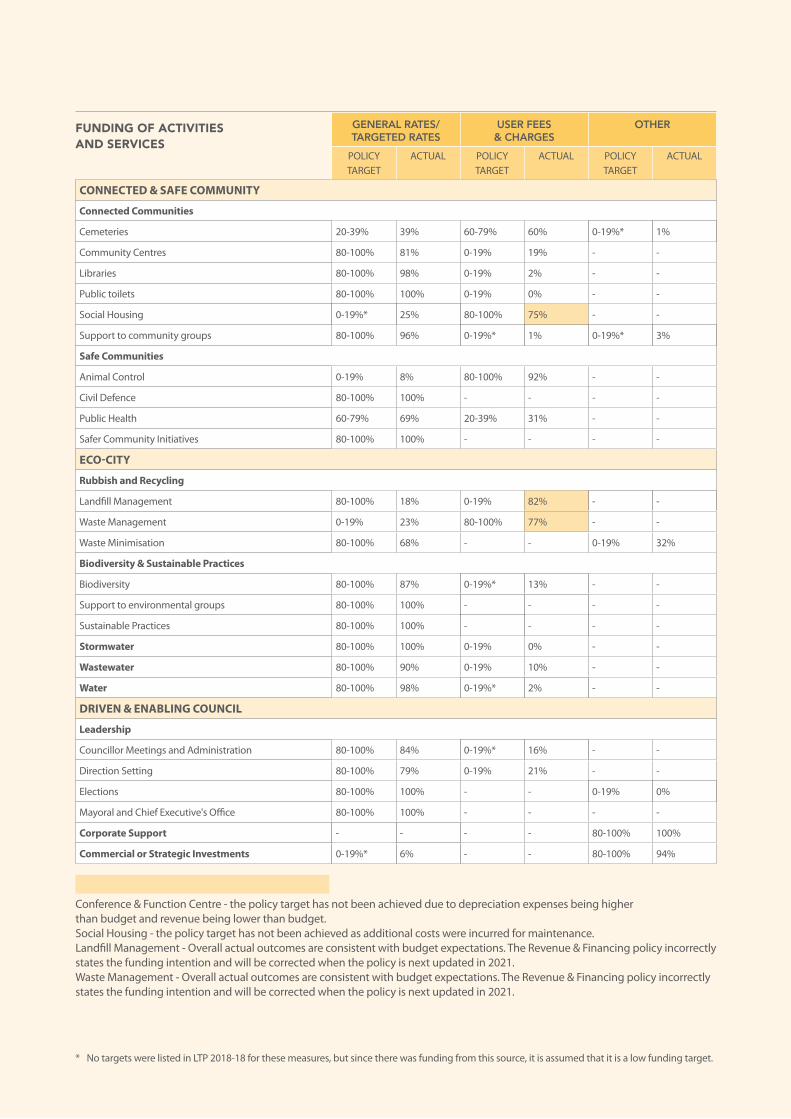
GENERAL RATES/TARGETED RATES
USER FEES & CHARGES
OTHER
POLICY TARGET
ACTUAL POLICY TARGET
ACTUAL POLICY TARGET
ACTUAL
INNOVATIVE & GROWING CITY
Economic Development
Economic Development 80-100% 92% - - 0-19% 8%
Conference & Function Centre 20-39% 44% 60-79% 56% - -
International Relations 80-100% 100% - - - -
CITY DEVELOPMENT
Building Services 20-39% 30% 60-79% 70% - -
Planning Services - Public 80-100% 100% - - - -
Planning Services - Private 0-19%* 14% 80-100% 86% - -
Urban Design 80-100% 100% - - - -
Heritage Management 80-100% 100% - - - -
TRANSPORT
Roading
Parking 0-19% 0% 80-100% 100% 0%
Roads 80-100% 84% 0-19% 4% 0-19% 12%
Street Facilities 80-100% 93% - - 0-19% 7%
Street Lighting 80-100% 80% - - 0-19% 20%
Traffic Services 80-100% 80% - - 0-19% 20%
ACTIVE AND PUBLIC TRANSPORT
Footpaths 80-100% 82% - - 0-19% 18%
Active Transport 80-100% 90% - - 0-19% 10%
Public Transport 60-79% 59% - - 20-39% 41%
CREATIVE & EXCITING CITY
Active Public Space
Community & Commemorative Events 80-100% 98% 0-19% 2% 0-19% 0%
Economic Events 80-100% 100% - - 0-19% 0%
Place activation 80-100% 100% - - 0-19% 0%
Arts, Culture & Heritage
Te Manawa 80-100% 100% - - - -
Other Cultural Facilities 80-100% 100% - - - -
Support to arts, culture & heritage groups 80-100% 97% - - 0-19% 3%
ACTIVE COMMUNITY
Central Energy Trust Arena 60-79% 62% 20-39% 38% - -
City-Wide Reserves 80-100% 98% 0-19% 2% - -
Local Reserves 80-100% 97% 0-19% 3% - -
Sportsfields 80-100% 94% 0-19% 4% 0-19%* 2%
Swimming Pools 80-100% 99% 0-19%* 1% - -
Support to recreation groups 80-100% 100% - - - -
FUNDING OF ACTIVITIES AND SERVICES
30
Small city benefits - Big city ambition
FIN
AN
CIA
l R
ESU
lTS
GENERAL RATES/TARGETED RATES
USER FEES & CHARGES
OTHER
POLICY TARGET
ACTUAL POLICY TARGET
ACTUAL POLICY TARGET
ACTUAL
CONNECTED & SAFE COMMUNITY
Connected Communities
Cemeteries 20-39% 39% 60-79% 60% 0-19%* 1%
Community Centres 80-100% 81% 0-19% 19% - -
Libraries 80-100% 98% 0-19% 2% - -
Public toilets 80-100% 100% 0-19% 0% - -
Social Housing 0-19%* 25% 80-100% 75% - -
Support to community groups 80-100% 96% 0-19%* 1% 0-19%* 3%
Safe Communities
Animal Control 0-19% 8% 80-100% 92% - -
Civil Defence 80-100% 100% - - - -
Public Health 60-79% 69% 20-39% 31% - -
Safer Community Initiatives 80-100% 100% - - - -
ECO-CITY
Rubbish and Recycling
Landfill Management 80-100% 18% 0-19% 82% - -
Waste Management 0-19% 23% 80-100% 77% - -
Waste Minimisation 80-100% 68% - - 0-19% 32%
Biodiversity & Sustainable Practices
Biodiversity 80-100% 87% 0-19%* 13% - -
Support to environmental groups 80-100% 100% - - - -
Sustainable Practices 80-100% 100% - - - -
Stormwater 80-100% 100% 0-19% 0% - -
Wastewater 80-100% 90% 0-19% 10% - -
Water 80-100% 98% 0-19%* 2% - -
DRIVEN & ENABLING COUNCIL
Leadership
Councillor Meetings and Administration 80-100% 84% 0-19%* 16% - -
Direction Setting 80-100% 79% 0-19% 21% - -
Elections 80-100% 100% - - 0-19% 0%
Mayoral and Chief Executive's Office 80-100% 100% - - - -
Corporate Support - - - - 80-100% 100%
Commercial or Strategic Investments 0-19%* 6% - - 80-100% 94%
Variance explanation for user fees and charges:
Conference & Function Centre - the policy target has not been achieved due to depreciation expenses being higher than budget and revenue being lower than budget. Social Housing - the policy target has not been achieved as additional costs were incurred for maintenance. Landfill Management - Overall actual outcomes are consistent with budget expectations. The Revenue & Financing policy incorrectly states the funding intention and will be corrected when the policy is next updated in 2021. Waste Management - Overall actual outcomes are consistent with budget expectations. The Revenue & Financing policy incorrectly states the funding intention and will be corrected when the policy is next updated in 2021.
FUNDING OF ACTIVITIES AND SERVICES
* No targets were listed in LTP 2018-18 for these measures, but since there was funding from this source, it is assumed that it is a low funding target.

31
PNCC Annual Report 2018/19
FINA
NC
IAl R
ESU
lTS
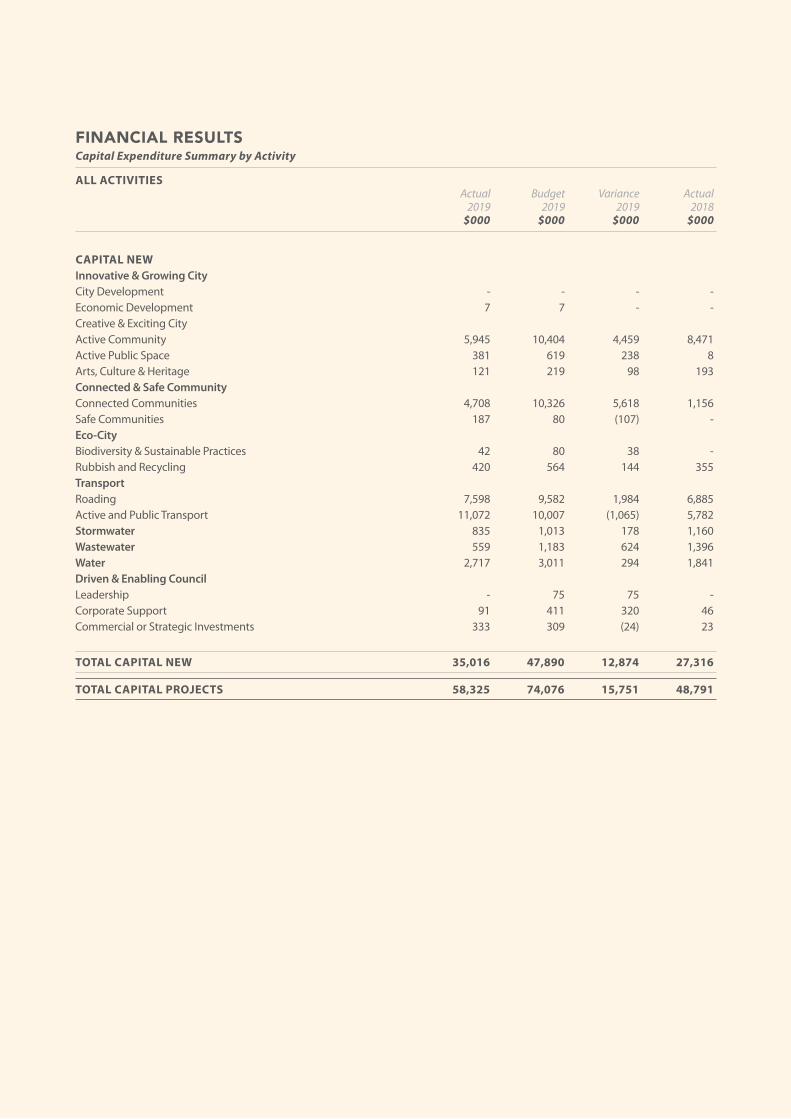
FINANCIAl RESUlTSCapital Expenditure Summary by Activity
ALL ACTIVITIES Actual Budget Variance Actual 2019 2019 2019 2018 $000 $000 $000 $000
CAPITAL RENEWAL Innovative & Growing City City Development - - - -Economic Development 461 330 (131) 164Creative & Exciting City Active Community 3,547 4,187 640 3,216Active Public Space - 23 23 -Arts, Culture & Heritage 374 320 (54) 105Connected & Safe Community Connected Communities 1,824 3,766 1,942 1,522Safe Communities 13 36 23 6Eco-City Biodiversity & Sustainable Practices - - - -Rubbish and Recycling 275 362 87 298Transport Roading 4,917 5,473 556 4,359Active and Public Transport 943 868 (75) 931Stormwater 578 635 57 255Wastewater 3,456 4,112 656 3,451Water 3,608 3,415 (193) 3,271Driven & Enabling Council Leadership - - - -Corporate Support 2,092 1,328 (764) 2,265Commercial or Strategic Investments 1,221 1,331 110 1,632
TOTAL CAPITAL RENEWAL 23,309 26,186 2,877 21,475
32
Small city benefits - Big city ambition
FIN
AN
CIA
l R
ESU
lTS
FINANCIAl RESUlTSCapital Expenditure Summary by Activity
ALL ACTIVITIES Actual Budget Variance Actual 2019 2019 2019 2018 $000 $000 $000 $000
CAPITAL NEW Innovative & Growing City City Development - - - -Economic Development 7 7 - -Creative & Exciting City Active Community 5,945 10,404 4,459 8,471Active Public Space 381 619 238 8Arts, Culture & Heritage 121 219 98 193Connected & Safe Community Connected Communities 4,708 10,326 5,618 1,156Safe Communities 187 80 (107) -Eco-City Biodiversity & Sustainable Practices 42 80 38 -Rubbish and Recycling 420 564 144 355Transport Roading 7,598 9,582 1,984 6,885Active and Public Transport 11,072 10,007 (1,065) 5,782Stormwater 835 1,013 178 1,160Wastewater 559 1,183 624 1,396Water 2,717 3,011 294 1,841Driven & Enabling Council Leadership - 75 75 -Corporate Support 91 411 320 46Commercial or Strategic Investments 333 309 (24) 23
TOTAL CAPITAL NEW 35,016 47,890 12,874 27,316
TOTAL CAPITAL PROJECTS 58,325 74,076 15,751 48,791
33
PNCC Annual Report 2018/19
FINA
NC
IAl R
ESU
lTS
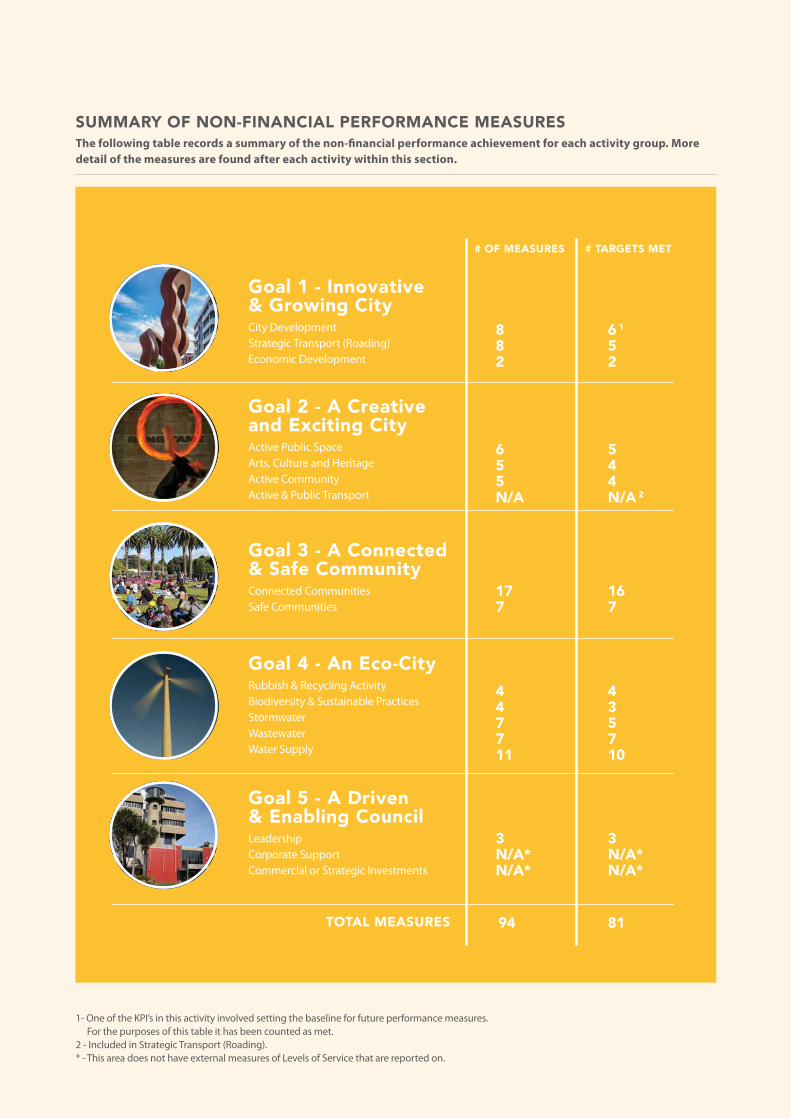
SUMMARY OF NON-FINANCIAl PERFORMANCE MEASURESThe following table records a summary of the non-financial performance achievement for each activity group. More detail of the measures are found after each activity within this section.
1- One of the KPI’s in this activity involved setting the baseline for future performance measures. For the purposes of this table it has been counted as met.
2 - Included in Strategic Transport (Roading).* - This area does not have external measures of Levels of Service that are reported on.
# OF MEASURES # TARGETS MET
Goal 1 - Innovative & Growing CityCity DevelopmentStrategic Transport (Roading)Economic Development
Goal 4 - An Eco-CityRubbish & Recycling ActivityBiodiversity & Sustainable PracticesStormwaterWastewaterWater Supply
Goal 3 - A Connected & Safe CommunityConnected CommunitiesSafe Communities
Goal 2 - A Creative and Exciting CityActive Public SpaceArts, Culture and HeritageActive CommunityActive & Public Transport
Goal 5 - A Driven & Enabling CouncilLeadershipCorporate SupportCommercial or Strategic Investments
TOTAl MEASURES
882
655n/A
177
447711
3n/A*n/A*
6 1
52
544n/A 2
167
4357 10
3n/A*n/A*
94 81
Small city benefits - Big city ambition
34
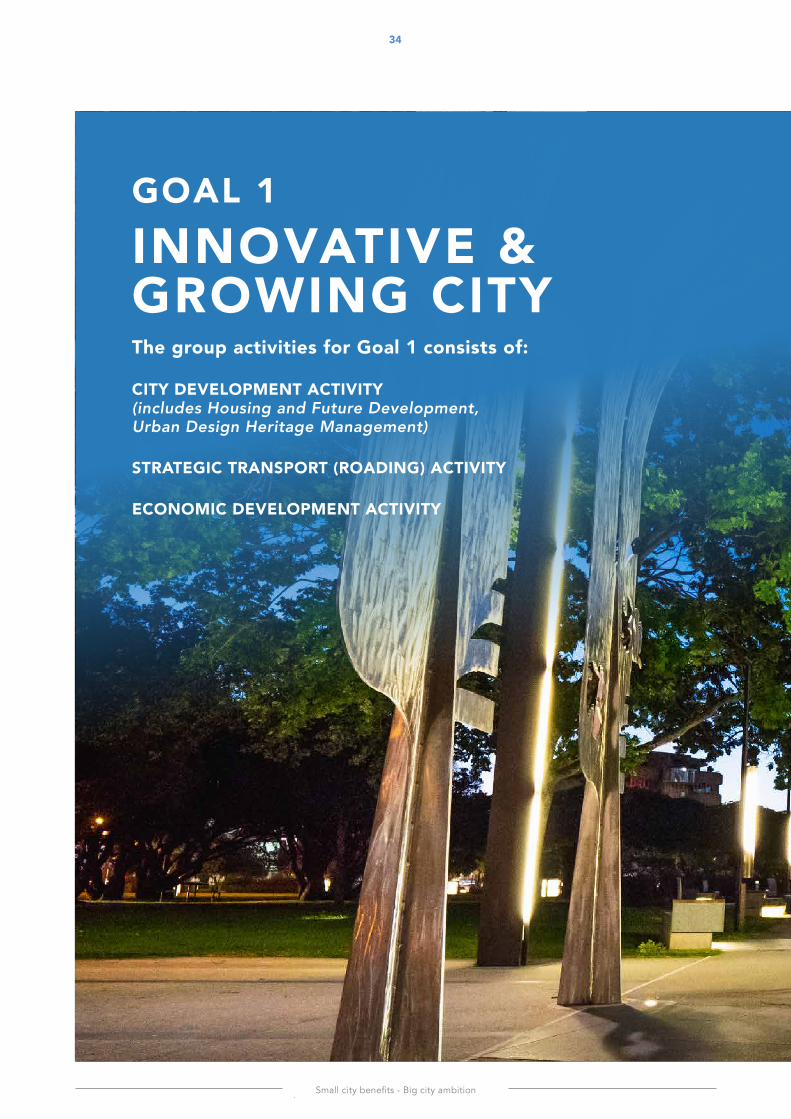
GOAl 1innoVAtiVe & GROWING CITY The group activities for Goal 1 consists of:
CITY DEVElOPMENT ACTIVITY (includes Housing and Future Development, Urban Design Heritage Management)
STRATEGIC TRANSPORT (ROADING) ACTIVITY
ECONOMIC DEVElOPMENT ACTIVITY
PNCC Annual Report 2018/19
INN
OV
ATIV
E &
GR
OW
ING
CITY
35
Small city benefits - Big city ambition
36
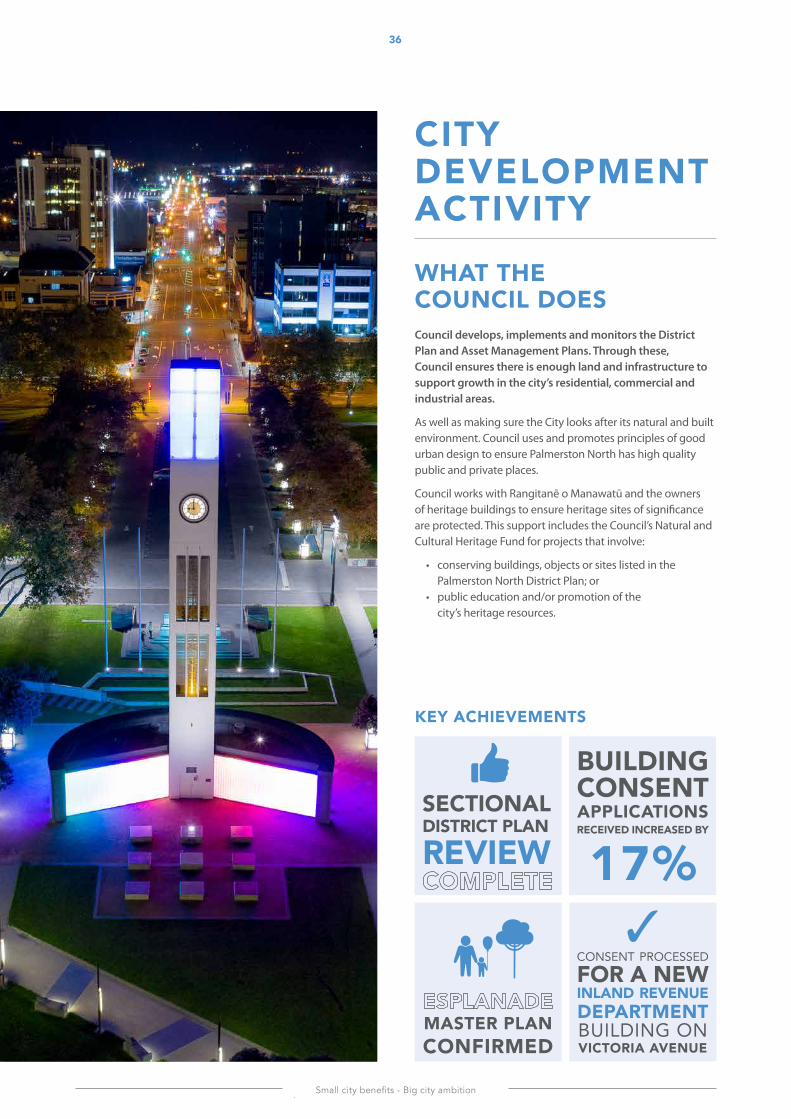
CITY DEVElOPMENT ACTIVITYWhAt the CounCil DoesCouncil develops, implements and monitors the District Plan and Asset Management Plans. Through these, Council ensures there is enough land and infrastructure to support growth in the city’s residential, commercial and industrial areas.
As well as making sure the City looks after its natural and built environment. Council uses and promotes principles of good urban design to ensure Palmerston North has high quality public and private places.
Council works with Rangitanē o Manawatū and the owners of heritage buildings to ensure heritage sites of significance are protected. This support includes the Council’s Natural and Cultural Heritage Fund for projects that involve:
• conserving buildings, objects or sites listed in the Palmerston North District Plan; or
• public education and/or promotion of the city’s heritage resources.
KEY ACHIEVEMENTS
seCtionAl DISTRICT PlAN
REVIEW
BUIlDING Consent APPliCAtionsRECEIVED INCREASED BY
17%
MASTER PlAN CONFIRMED
CONSENT PROCESSED
FOR A NEW INlAND REVENUE DEPARTMENT BUILDING ON VICTORIA AVENUE
PNCC Annual Report 2018/19
G1 - C
ITY D
EV
ElO
PM
EN
T AC
TIVITY
37
WHAT HAPPENED IN THE YEAR
HOUSING AND FUTURE DEVElOPMENTCouncil completed the Sectional District Plan review in 2018/19, which provides the framework for housing and future development. The project received a New Zealand Planning Institute Award in the District Planning category. While the Sectional District Plan review is now complete, a series of District Plan changes are still underway. These changes will deliver on the City Development Strategy, the recommendations of the Housing and Business Needs Assessment, and new national planning standards.
Significant new District Plan work was initiated throughout the year:
• Proposal to rezone land at Napier Road and Kikiwhenua (Te-Wanaka Road) for residential development
• Investigations for rezoning land at Kakatangiata• Preparation of a structure plan to guide new
development at Aokautere• Proposal to rezone land at Roxburgh Crescent from
industrial to residential• Requirements for pressure sewer systems in some parts
of the City
Development was also initiated in the recently rezoned Hokowhitu residential area and Council intends to begin development at Whakarongo. The notice of requirement for Te Ahu a Turanga was successfully processed. This project was led by Palmerston North City Council on behalf of Palmerston North, Manawatū and Tararua. Separate to its reporting role, Council also submitted evidence on the Te Ahu a Turanga project. Council sought the provision of a shared path, which NZTA subsequently agreed to.
BUIlDING CONTROlFinancially, 2018/19 proved particularly busy for the building services team. The number of building consent applications received for processing increased by 17 per cent over the previous year (1248 received in 2018/19, up from 1,115 in 2017/18). Even with this increase, Council exceeded its target with 96 per cent of these processed within the statutory timeframes.
This year the building services team continued to build strong relationships with customers, builders, developers and industry professionals:
• The Building Services team received the Training Commitment award at this year’s Building Official’s Annual Conference. The award recognises the organisation that has shown the most commitment to significantly improving the position of training in their field.
• The building officer cadet programme between UCOL and Palmerston North City Council continued to prove successful. The programme has now entered its third year with all signs indicating that it will continue.
• The Independent Qualified Persons registration process was improved, ensuring an acceptable level of competency from those in the industry. Building users will now also have greater confidence that fire-life safety systems are adequate.
• The Eco Design Advisor service continued to prove very popular, particularly during the cooler months. More in-home consultations were delivered, providing free and independent advice on maintaining a warm and healthy home environment.
The Building (Earthquake-prone Buildings) Amendment Act 2016 came into effect in July 2017. Consultation on priority routes and buildings (typically un-reinforced masonry buildings) was completed in August 2018. Several public workshops were held to inform potentially affected building owners of the changes, with a good level of engagement. One building has been issued with an earthquake-prone building notice to date.
The city continued to grow in 2018/19 with the construction sector at the forefront of this growth. As a result, building consents will continue to increase in number and complexity for some time to come.
PlANNINGRecord numbers of land-use and subdivision consents were lodged in 2018/19, while staff shortages meant heavier reliance on external planning consultants. Despite this, revenue budgets were still met. Unfortunately, due to increased workloads, and complexity of the district plan, statutory timeframes have suffered. Council’s key performance indicator of processing 95 per cent of consents within timeframes wasn’t achieved. To address the workload issue and increase capacity, approval has been granted for two additional planners to join the team.
Several high-profile consents were processed this year and development is now underway:
• Consent was processed for a new Inland Revenue Department building on Victoria Avenue. The Inland Revenue Department was forced to evacuate its former building as it was determined to be the highest rating of earthquake-prone building.
• Multiple Housing New Zealand developments were
Small city benefits - Big city ambition
38G
1 -
CIT
Y D
EV
ElO
PM
EN
T A
CTI
VIT
Y
processed, including a new subdivision on Centennial Drive (at the former Massey Teachers College site).
Each of these projects involved early pre-application meetings with staff and design experts, which helped create smoother consent processes. A formal pre-application process is currently being developed to help customers through the consenting process. This is to help ensure that design discussions and advice are undertaken early in the consenting process. Council has recognised that to achieve our vision and goals for the city we need to enhance our relationships with the development community. Several initiatives are also now underway to improve our relationships with key development stakeholders.
URBAN DESIGNUrban design manages the relationships between buildings, places, spaces, activities and networks. It recognises that towns and cities are part of constantly evolving relationships between people, land, culture and the wider environment. Council applies urban design principles to Council projects and private development. This helps Council to improve the quality of the built environment and the reputation of the city. Improvements in this area have been a focus for Council, after recommendations from Charles Landry, following the 2013 assessment of the city.
This year, Council continued to prepare master planning documents to inform catalyst projects. The Draft Civic and Cultural Precinct Plan was prepared and will be subject to further consultation. An assessment of options for addressing the earthquake prone status of the central library has also been a key focus. The Arena Masterplan was revised to better align the new speedway pits, grandstand and public entrance plaza while allowing for greater public recreation multi-utility to the public along Cuba Street. The Esplanade Master Plan and Draft Te Apiti Masterplan were also confirmed this year.
Design review and pre-application processes for important commercial and residential developments continued as part of the administration of the District Plan, including:
• the Centennial Park Subdivision; • the Quest Hotel Development; and• the new IRD Building.
Council held a series of workshops with developers looking to undertake multi-unit housing, which is enabled under the new District Plan. A reassessment of the 2013 creative cities index was also completed during the year, with the results to be confirmed early next year.
HERITAGE MANAGEMENTThe key focus for heritage management in 2018/19 was working with owners of earthquake prone heritage buildings. Council concentrated heavily on helping owners better understand the process, options and costs of addressing the earthquake prone status of their buildings. Allocation of the Heritage Fund was completed, with the focus again
on supporting the owners of earthquake prone heritage buildings. Council also connected with All Saints Church regarding the allocation of the first of three $100,000 grants over the next three years.
ONGOING CONSIDERATIONSA key focus for Council will be improving residential land supply and assessing the distribution of retail and office activities in the city. These priorities have been determined by the Housing and Business Needs Assessment. Council also needs to begin aligning its District Plan with new National Planning Standards, including preparing a fully electronic District Plan.
Planning services will focus on managing workloads to keep up with the sheer number of consents that need processing. To address this, recruitment of additional planners and consultants is underway. A review of services is also being carried out to identify and implement efficiencies in processing to improve customer relationships.
Further enhancements to the online building consenting system and client relationship management services will assist in this process. While customers will find the service will further improve the quality of their applications and reduce their processing times and costs.
Council will continue to communicate the benefits of urban design in the coming year. As part of this Council will be looking to aid the development community through the Delivering Change Fund. The fund is a unique method of developing capacity in urban design within the development community.
Continuing to build Council’s relationships with owners of earthquake prone heritage buildings will be central in Council’s priorities for the future. Earthquake prone buildings remain the most critical heritage management issue facing the city.
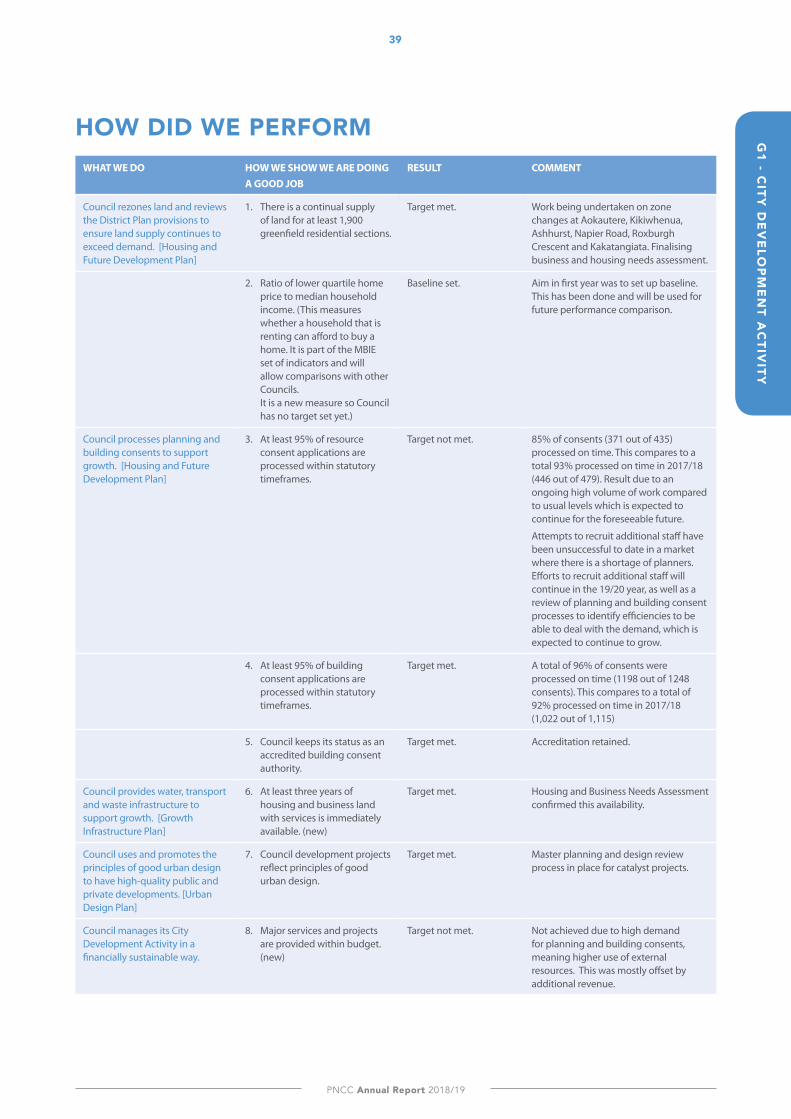
PNCC Annual Report 2018/19
39G
1 - CITY
DE
VE
lOP
ME
NT A
CTIV
ITY
HOW DID WE PERFORMWHAT WE DO HOW WE SHOW WE ARE DOING
A GOOD JOBRESULT COMMENT
Council rezones land and reviews the District Plan provisions to ensure land supply continues to exceed demand. [Housing and Future Development Plan]
1. There is a continual supply of land for at least 1,900 greenfield residential sections.
Target met. Work being undertaken on zone changes at Aokautere, Kikiwhenua, Ashhurst, Napier Road, Roxburgh Crescent and Kakatangiata. Finalising business and housing needs assessment.
2. Ratio of lower quartile home price to median household income. (This measures whether a household that is renting can afford to buy a home. It is part of the MBIE set of indicators and will allow comparisons with other Councils. It is a new measure so Council has no target set yet.)
Baseline set. Aim in first year was to set up baseline. This has been done and will be used for future performance comparison.
Council processes planning and building consents to support growth. [Housing and Future Development Plan]
3. At least 95% of resource consent applications are processed within statutory timeframes.
Target not met. 85% of consents (371 out of 435) processed on time. This compares to a total 93% processed on time in 2017/18 (446 out of 479). Result due to an ongoing high volume of work compared to usual levels which is expected to continue for the foreseeable future.
Attempts to recruit additional staff have been unsuccessful to date in a market where there is a shortage of planners. Efforts to recruit additional staff will continue in the 19/20 year, as well as a review of planning and building consent processes to identify efficiencies to be able to deal with the demand, which is expected to continue to grow.
4. At least 95% of building consent applications are processed within statutory timeframes.
Target met. A total of 96% of consents were processed on time (1198 out of 1248 consents). This compares to a total of 92% processed on time in 2017/18 (1,022 out of 1,115)
5. Council keeps its status as an accredited building consent authority.
Target met. Accreditation retained.
Council provides water, transport and waste infrastructure to support growth. [Growth Infrastructure Plan]
6. At least three years of housing and business land with services is immediately available. (new)
Target met. Housing and Business Needs Assessment confirmed this availability.
Council uses and promotes the principles of good urban design to have high-quality public and private developments. [Urban Design Plan]
7. Council development projects reflect principles of good urban design.
Target met. Master planning and design review process in place for catalyst projects.
Council manages its City Development Activity in a financially sustainable way.
8. Major services and projects are provided within budget. (new)
Target not met. Not achieved due to high demand for planning and building consents, meaning higher use of external resources. This was mostly offset by additional revenue.
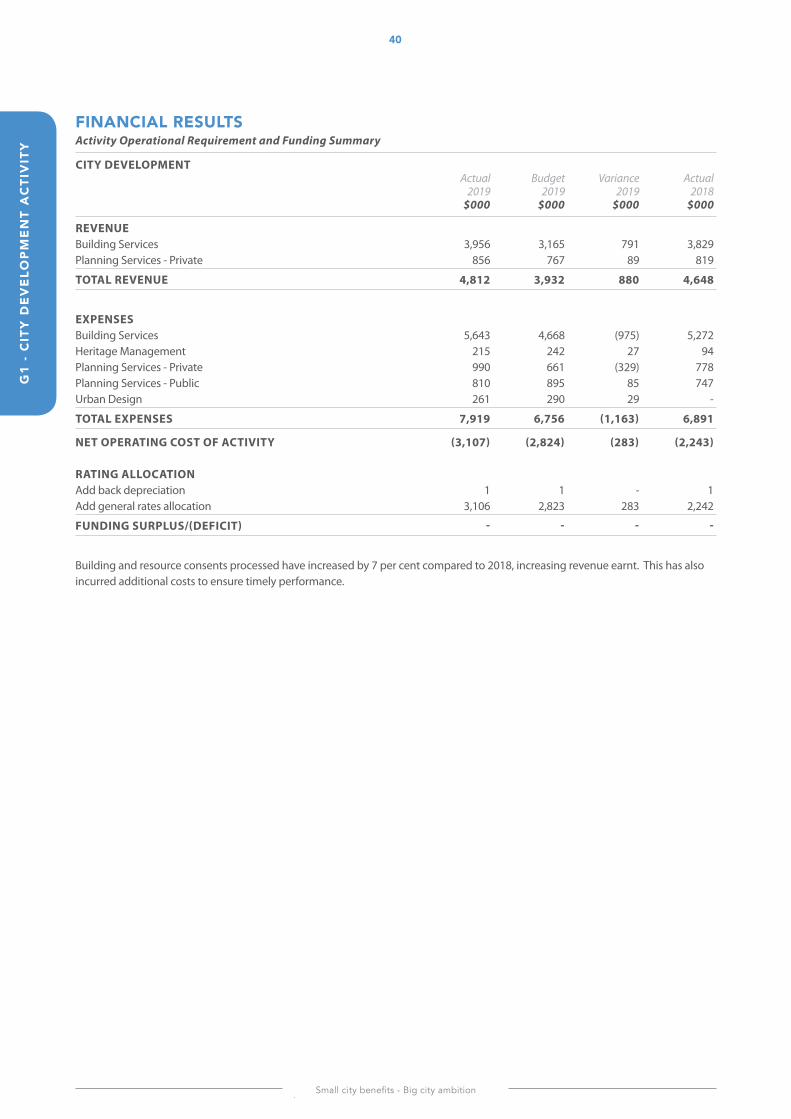
Small city benefits - Big city ambition
40G
1 -
CIT
Y D
EV
ElO
PM
EN
T A
CTI
VIT
Y
FINANCIAl RESUlTSActivity Operational Requirement and Funding Summary
CITY DEVELOPMENT Actual Budget Variance Actual 2019 2019 2019 2018 $000 $000 $000 $000
REVENUE Building Services 3,956 3,165 791 3,829Planning Services - Private 856 767 89 819
TOTAL REVENUE 4,812 3,932 880 4,648
EXPENSES Building Services 5,643 4,668 (975) 5,272Heritage Management 215 242 27 94Planning Services - Private 990 661 (329) 778Planning Services - Public 810 895 85 747Urban Design 261 290 29 -
TOTAL EXPENSES 7,919 6,756 (1,163) 6,891
NET OPERATING COST OF ACTIVITY (3,107) (2,824) (283) (2,243) RATING ALLOCATION Add back depreciation 1 1 - 1Add general rates allocation 3,106 2,823 283 2,242
FUNDING SURPLUS/(DEFICIT) - - - -
Building and resource consents processed have increased by 7 per cent compared to 2018, increasing revenue earnt. This has also incurred additional costs to ensure timely performance.
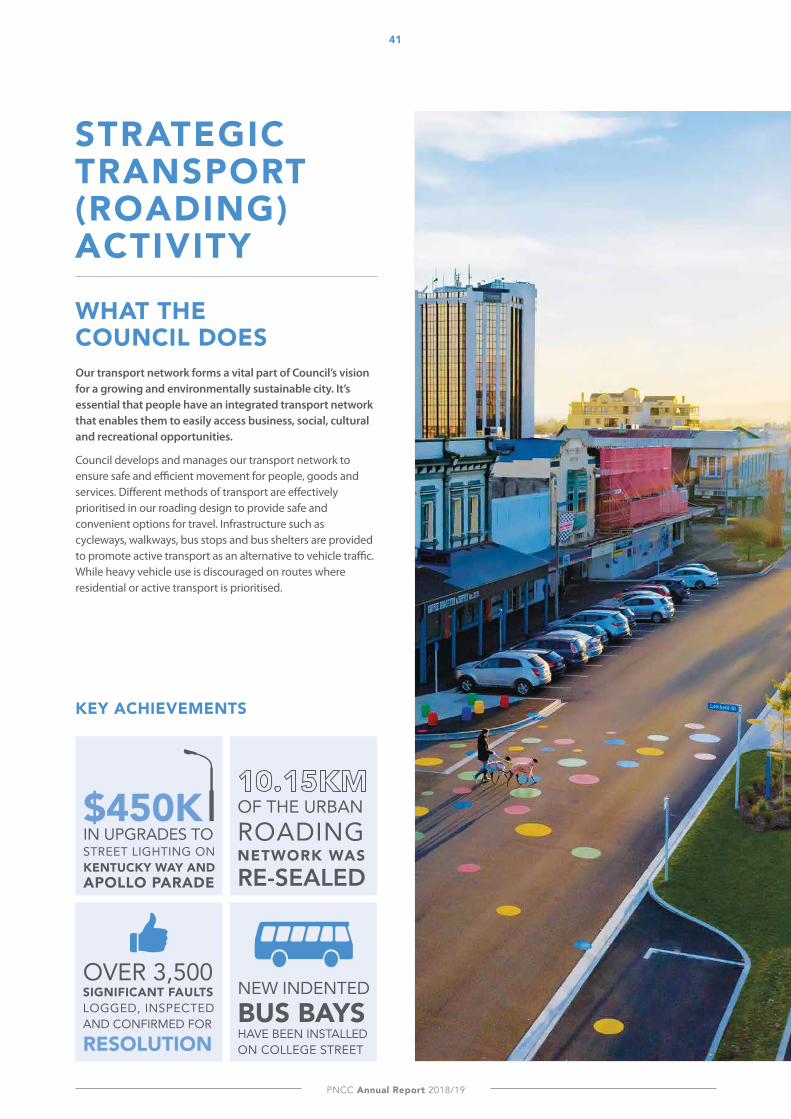
PNCC Annual Report 2018/19
41G
1- STRA
TEG
IC TR
AN
SPO
RT A
CTIV
ITY
STRATEGIC TRANSPORT (ROADING) ACTIVITY
WhAt the CounCil DoesOur transport network forms a vital part of Council’s vision for a growing and environmentally sustainable city. It’s essential that people have an integrated transport network that enables them to easily access business, social, cultural and recreational opportunities.
Council develops and manages our transport network to ensure safe and efficient movement for people, goods and services. Different methods of transport are effectively prioritised in our roading design to provide safe and convenient options for travel. Infrastructure such as cycleways, walkways, bus stops and bus shelters are provided to promote active transport as an alternative to vehicle traffic. While heavy vehicle use is discouraged on routes where residential or active transport is prioritised.
KEY ACHIEVEMENTS
OF THE URBAN ROADING NETWORK WAS RE-SEALED
$450K IN UPGRADES TO STREET LIGHTING ON KENTUCKY WAY AND APOllO PARADE
NEW INDENTED BUS BAYS HAVE BEEN INSTALLEDON COLLEGE STREET
OVER 3,500 SIGNIFICANT FAUlTS LOGGED, INSPECTED AND CONFIRMED FOR
RESOlUTION

Small city benefits - Big city ambition
42G
1- S
TRA
TEG
IC T
RA
NSP
OR
T A
CTI
VIT
Y WHAT HAPPENED IN THE YEAR
MAINTENANCE AND RENEWAlThroughout the year, programmed maintenance and operations have addressed most of the road condition and fault issues. With high public expectation Council ensured these projects were completed in a timely manner. Enhanced investment was prioritised for kerb drains and grate cleaning, such as leaf clearance during the autumn months.
Transport and stormwater activities collaborated to upgrade grates and network drainage capacity in some areas to alleviate persistent stormwater flooding issues.
The investment in upgrading the key heavy traffic arterial road Tremaine Avenue continued. Work on the section from Wood to Downing Street was completed in 2018/19. Major upgrade work has also been completed:
• Work was finished between Armstrong Ave and Rewa Street, where major pavement, kerb and channel faults required a full road treatment.
• A total of 10.15 km of the urban roading network was re-sealed. The focus was on the major arterial and collector roads, due to their poorer condition.
An enhanced programme of footpath renewal work was initiated with over 3,500 significant faults logged, inspected and confirmed for resolution. Approximately 300 faults have been repaired with the balance scheduled to be remedied in the next two financial years.
NETWORK IMPROVEMENTSKey investments completed this year focused on upgrading the network to improve safety, traffic circulation and environmental outcomes. The completion of the James Line upgrade from a rural to an urban standard improved connectivity in the area. This upgrade will also help to unlock the development potential of residential land around Whakarongo. The project was synchronized with significant investment in new stormwater, water and wastewater network infrastructure to service residential development in the area.
The first section of the Cuba Street revitalisation, from the ring road to George Street was completed, providing an enhanced route for pedestrians and cyclists. Road safety was a focus of the project with the expected rise in pedestrian and cycle use, especially around vehicle speeds. The surveyed mean speed was measured at 28 km/h after the revitalisation, down from 37 km/h prior to the project.
The final section of Forest Hill Road was also sealed in 2018/19, including completion of significant retaining wall work. The completion of the project will see an improvement in safety and environmental outcomes for users.
Additional road safety improvements were completed around the network:
• Council invested $450k in upgrades to street lighting on Kentucky Way and Apollo Parade. The project included the installation of extra street lights to improve night-time lighting in the area.
• Low cost safety improvements have been made to one of the Turitea Road one-lane bridges following a fatal vehicle crash. These improvements included the installation of bollards and clearer signs and markings.
• New indented bus bays have been installed on College Street to improve cycle safety as part of wider transport improvements.
• Several safety reviews were completed throughout the city, highlighting options for further consideration by Council. Areas to improve include rural school bus safety, pedestrian safety needs across the network, and safety for pedestrians and cyclists in Broadway Avenue. The need for improvements to Broadway Avenue come following a pedestrian fatality and a serious injury crash involving a cyclist.
Year one of the additional lighting programme was completed on budget this year. The replacement of high-pressure sodium lamp streetlights with energy efficient LED lights is 95 per cent complete, with the final lights due to be changed by the end of July 2019.
REGIONAl FREIGHTCouncil continued to work collaboratively with NZTA, and other road controlling authorities to progress the Regional Freight Ring Road proposal. The Regional Growth Fund support for a KiwiRail regional freight hub has slowed progress. This was due to KiwiRail’s continued work on confirming their preferred location for their new rail hub. A location on the outskirts of Palmerston North will support the detailed business case work for the ring road.
The ring road is central to improving access for freight movement in central New Zealand. Once the project is confirmed, Council will be looking to get NZTA agreement on advancing certain projects. These projects will enable heavy transport to be diverted away from Palmerston North’s urban roads.
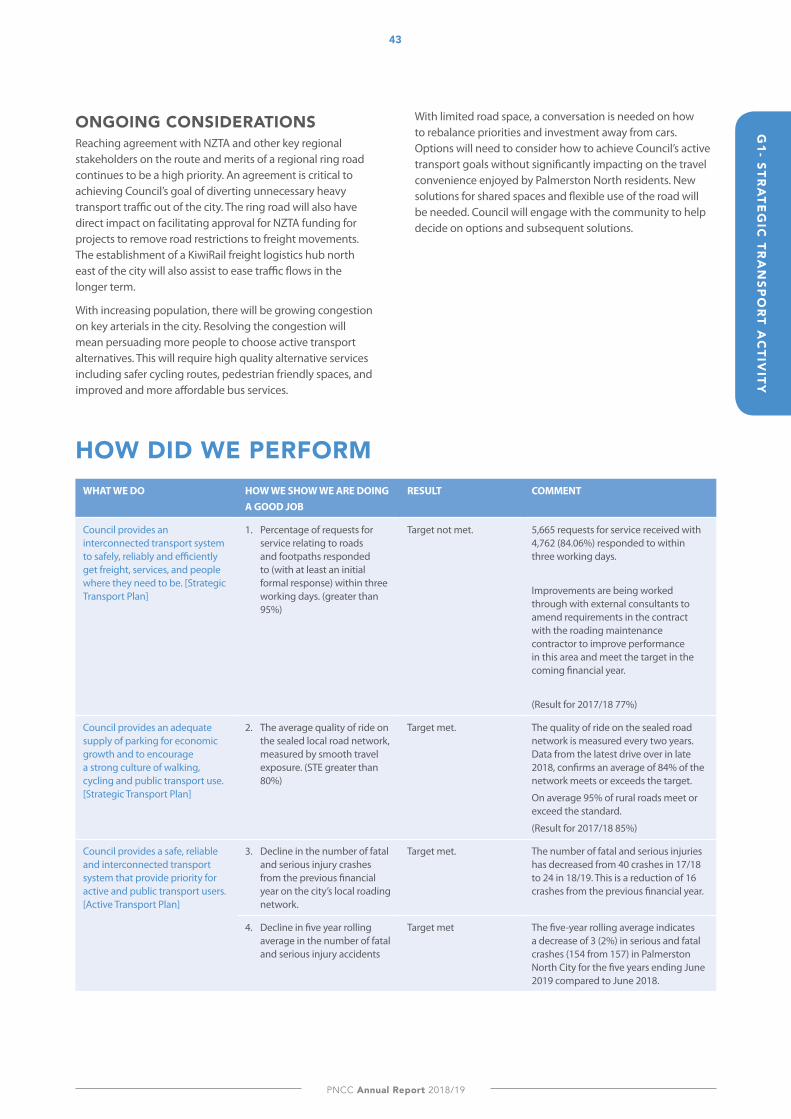
PNCC Annual Report 2018/19
43G
1- STRA
TEG
IC TR
AN
SPO
RT A
CTIV
ITY
ONGOING CONSIDERATIONS Reaching agreement with NZTA and other key regional stakeholders on the route and merits of a regional ring road continues to be a high priority. An agreement is critical to achieving Council’s goal of diverting unnecessary heavy transport traffic out of the city. The ring road will also have direct impact on facilitating approval for NZTA funding for projects to remove road restrictions to freight movements. The establishment of a KiwiRail freight logistics hub north east of the city will also assist to ease traffic flows in the longer term.
With increasing population, there will be growing congestion on key arterials in the city. Resolving the congestion will mean persuading more people to choose active transport alternatives. This will require high quality alternative services including safer cycling routes, pedestrian friendly spaces, and improved and more affordable bus services.
With limited road space, a conversation is needed on how to rebalance priorities and investment away from cars. Options will need to consider how to achieve Council’s active transport goals without significantly impacting on the travel convenience enjoyed by Palmerston North residents. New solutions for shared spaces and flexible use of the road will be needed. Council will engage with the community to help decide on options and subsequent solutions.
HOW DID WE PERFORMWHAT WE DO HOW WE SHOW WE ARE DOING
A GOOD JOBRESULT COMMENT
Council provides an interconnected transport system to safely, reliably and efficiently get freight, services, and people where they need to be. [Strategic Transport Plan]
1. Percentage of requests for service relating to roads and footpaths responded to (with at least an initial formal response) within three working days. (greater than 95%)
Target not met. 5,665 requests for service received with 4,762 (84.06%) responded to within three working days.
Improvements are being worked through with external consultants to amend requirements in the contract with the roading maintenance contractor to improve performance in this area and meet the target in the coming financial year.
(Result for 2017/18 77%)
Council provides an adequate supply of parking for economic growth and to encourage a strong culture of walking, cycling and public transport use. [Strategic Transport Plan]
2. The average quality of ride on the sealed local road network, measured by smooth travel exposure. (STE greater than 80%)
Target met. The quality of ride on the sealed road network is measured every two years. Data from the latest drive over in late 2018, confirms an average of 84% of the network meets or exceeds the target.
On average 95% of rural roads meet or exceed the standard.
(Result for 2017/18 85%)
Council provides a safe, reliable and interconnected transport system that provide priority for active and public transport users. [Active Transport Plan]
3. Decline in the number of fatal and serious injury crashes from the previous financial year on the city’s local roading network.
Target met. The number of fatal and serious injuries has decreased from 40 crashes in 17/18 to 24 in 18/19. This is a reduction of 16 crashes from the previous financial year.
4. Decline in five year rolling average in the number of fatal and serious injury accidents
Target met The five-year rolling average indicates a decrease of 3 (2%) in serious and fatal crashes (154 from 157) in Palmerston North City for the five years ending June 2019 compared to June 2018.
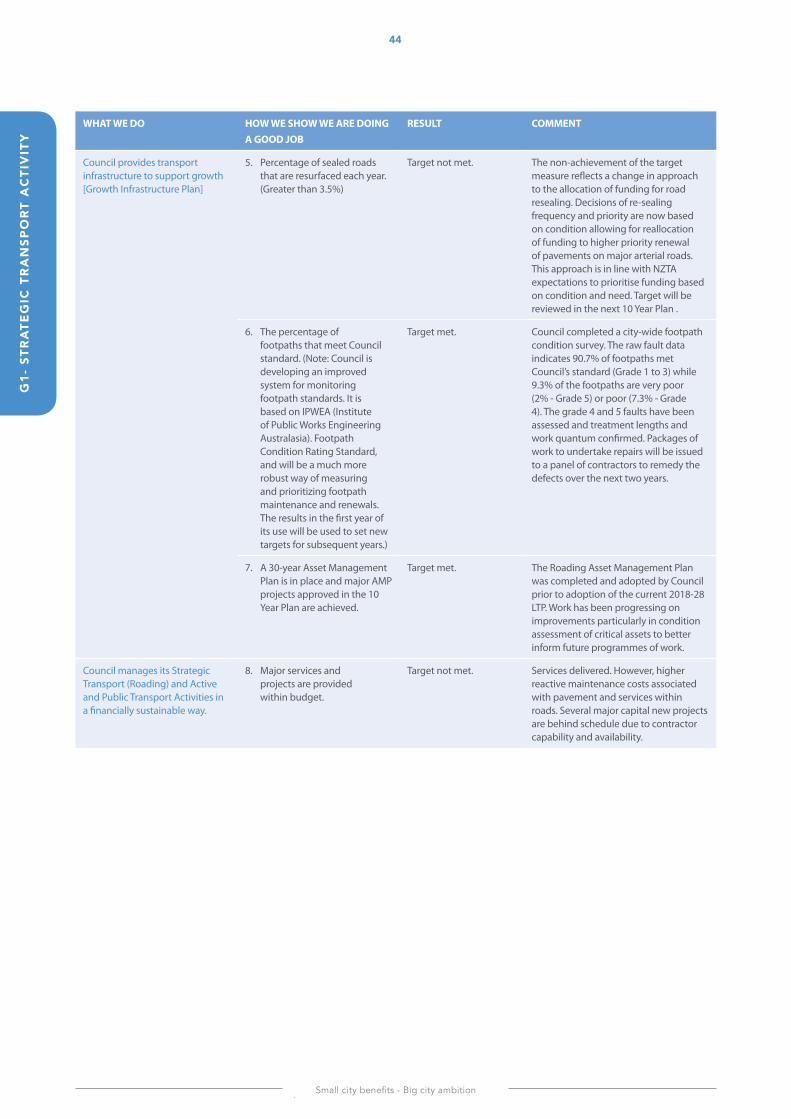
Small city benefits - Big city ambition
G1-
STR
ATE
GIC
TR
AN
SPO
RT
AC
TIV
ITY
44
WHAT WE DO HOW WE SHOW WE ARE DOING A GOOD JOB
RESULT COMMENT
Council provides transport infrastructure to support growth [Growth Infrastructure Plan]
5. Percentage of sealed roads that are resurfaced each year. (Greater than 3.5%)
Target not met. The non-achievement of the target measure reflects a change in approach to the allocation of funding for road resealing. Decisions of re-sealing frequency and priority are now based on condition allowing for reallocation of funding to higher priority renewal of pavements on major arterial roads. This approach is in line with NZTA expectations to prioritise funding based on condition and need. Target will be reviewed in the next 10 Year Plan .
6. The percentage of footpaths that meet Council standard. (Note: Council is developing an improved system for monitoring footpath standards. It is based on IPWEA (Institute of Public Works Engineering Australasia). Footpath Condition Rating Standard, and will be a much more robust way of measuring and prioritizing footpath maintenance and renewals. The results in the first year of its use will be used to set new targets for subsequent years.)
Target met. Council completed a city-wide footpath condition survey. The raw fault data indicates 90.7% of footpaths met Council’s standard (Grade 1 to 3) while 9.3% of the footpaths are very poor (2% - Grade 5) or poor (7.3% - Grade 4). The grade 4 and 5 faults have been assessed and treatment lengths and work quantum confirmed. Packages of work to undertake repairs will be issued to a panel of contractors to remedy the defects over the next two years.
7. A 30-year Asset Management Plan is in place and major AMP projects approved in the 10 Year Plan are achieved.
Target met. The Roading Asset Management Plan was completed and adopted by Council prior to adoption of the current 2018-28 LTP. Work has been progressing on improvements particularly in condition assessment of critical assets to better inform future programmes of work.
Council manages its Strategic Transport (Roading) and Active and Public Transport Activities in a financially sustainable way.
8. Major services and projects are provided within budget.
Target not met. Services delivered. However, higher reactive maintenance costs associated with pavement and services within roads. Several major capital new projects are behind schedule due to contractor capability and availability.
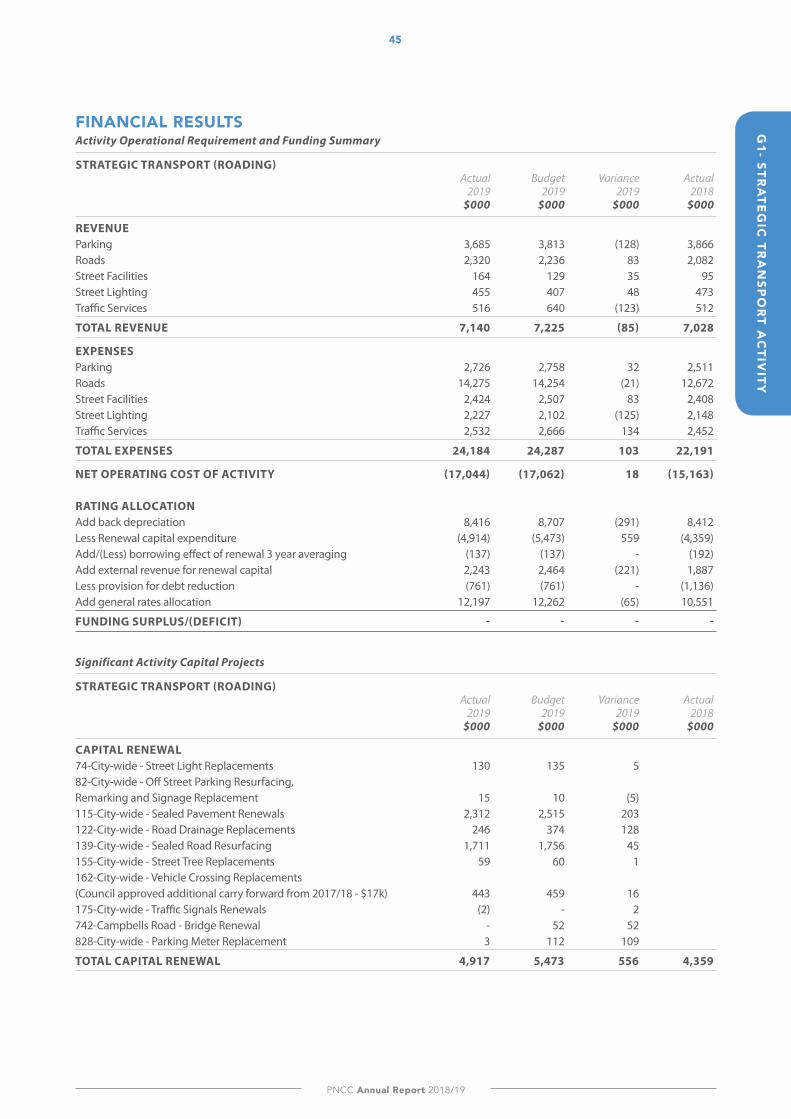
PNCC Annual Report 2018/19
G1- STR
ATE
GIC
TRA
NSP
OR
T AC
TIVITY
45
FINANCIAl RESUlTSActivity Operational Requirement and Funding Summary
STRATEGIC TRANSPORT (ROADING) Actual Budget Variance Actual 2019 2019 2019 2018 $000 $000 $000 $000
REVENUE Parking 3,685 3,813 (128) 3,866Roads 2,320 2,236 83 2,082Street Facilities 164 129 35 95Street Lighting 455 407 48 473Traffic Services 516 640 (123) 512
TOTAL REVENUE 7,140 7,225 (85) 7,028
EXPENSES Parking 2,726 2,758 32 2,511Roads 14,275 14,254 (21) 12,672Street Facilities 2,424 2,507 83 2,408Street Lighting 2,227 2,102 (125) 2,148Traffic Services 2,532 2,666 134 2,452
TOTAL EXPENSES 24,184 24,287 103 22,191
NET OPERATING COST OF ACTIVITY (17,044) (17,062) 18 (15,163) RATING ALLOCATION Add back depreciation 8,416 8,707 (291) 8,412Less Renewal capital expenditure (4,914) (5,473) 559 (4,359)Add/(Less) borrowing effect of renewal 3 year averaging (137) (137) - (192)Add external revenue for renewal capital 2,243 2,464 (221) 1,887Less provision for debt reduction (761) (761) - (1,136)Add general rates allocation 12,197 12,262 (65) 10,551
FUNDING SURPLUS/(DEFICIT) - - - -
Significant Activity Capital Projects
STRATEGIC TRANSPORT (ROADING) Actual Budget Variance Actual 2019 2019 2019 2018 $000 $000 $000 $000
CAPITAL RENEWAL 74-City-wide - Street Light Replacements 130 135 5 82-City-wide - Off Street Parking Resurfacing, Remarking and Signage Replacement 15 10 (5) 115-City-wide - Sealed Pavement Renewals 2,312 2,515 203 122-City-wide - Road Drainage Replacements 246 374 128 139-City-wide - Sealed Road Resurfacing 1,711 1,756 45 155-City-wide - Street Tree Replacements 59 60 1 162-City-wide - Vehicle Crossing Replacements (Council approved additional carry forward from 2017/18 - $17k) 443 459 16 175-City-wide - Traffic Signals Renewals (2) - 2 742-Campbells Road - Bridge Renewal - 52 52 828-City-wide - Parking Meter Replacement 3 112 109
TOTAL CAPITAL RENEWAL 4,917 5,473 556 4,359
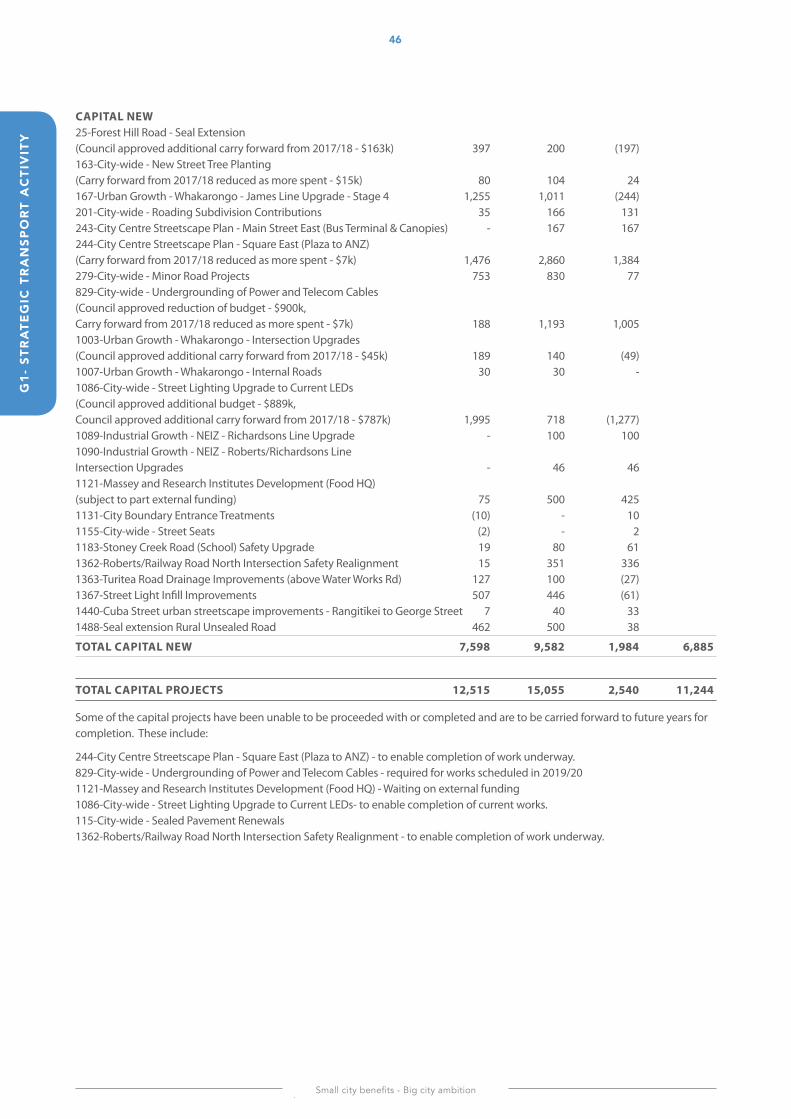
Small city benefits - Big city ambition
46G
1- S
TRA
TEG
IC T
RA
NSP
OR
T A
CTI
VIT
Y
CAPITAL NEW 25-Forest Hill Road - Seal Extension (Council approved additional carry forward from 2017/18 - $163k) 397 200 (197) 163-City-wide - New Street Tree Planting (Carry forward from 2017/18 reduced as more spent - $15k) 80 104 24 167-Urban Growth - Whakarongo - James Line Upgrade - Stage 4 1,255 1,011 (244) 201-City-wide - Roading Subdivision Contributions 35 166 131 243-City Centre Streetscape Plan - Main Street East (Bus Terminal & Canopies) - 167 167 244-City Centre Streetscape Plan - Square East (Plaza to ANZ) (Carry forward from 2017/18 reduced as more spent - $7k) 1,476 2,860 1,384 279-City-wide - Minor Road Projects 753 830 77 829-City-wide - Undergrounding of Power and Telecom Cables (Council approved reduction of budget - $900k, Carry forward from 2017/18 reduced as more spent - $7k) 188 1,193 1,005 1003-Urban Growth - Whakarongo - Intersection Upgrades (Council approved additional carry forward from 2017/18 - $45k) 189 140 (49) 1007-Urban Growth - Whakarongo - Internal Roads 30 30 - 1086-City-wide - Street Lighting Upgrade to Current LEDs (Council approved additional budget - $889k, Council approved additional carry forward from 2017/18 - $787k) 1,995 718 (1,277) 1089-Industrial Growth - NEIZ - Richardsons Line Upgrade - 100 100 1090-Industrial Growth - NEIZ - Roberts/Richardsons Line Intersection Upgrades - 46 46 1121-Massey and Research Institutes Development (Food HQ) (subject to part external funding) 75 500 425 1131-City Boundary Entrance Treatments (10) - 10 1155-City-wide - Street Seats (2) - 2 1183-Stoney Creek Road (School) Safety Upgrade 19 80 61 1362-Roberts/Railway Road North Intersection Safety Realignment 15 351 336 1363-Turitea Road Drainage Improvements (above Water Works Rd) 127 100 (27) 1367-Street Light Infill Improvements 507 446 (61) 1440-Cuba Street urban streetscape improvements - Rangitīkei to George Street 7 40 33 1488-Seal extension Rural Unsealed Road 462 500 38
TOTAL CAPITAL NEW 7,598 9,582 1,984 6,885
TOTAL CAPITAL PROJECTS 12,515 15,055 2,540 11,244
Some of the capital projects have been unable to be proceeded with or completed and are to be carried forward to future years for completion. These include:
244-City Centre Streetscape Plan - Square East (Plaza to ANZ) - to enable completion of work underway. 829-City-wide - Undergrounding of Power and Telecom Cables - required for works scheduled in 2019/20 1121-Massey and Research Institutes Development (Food HQ) - Waiting on external funding 1086-City-wide - Street Lighting Upgrade to Current LEDs- to enable completion of current works. 115-City-wide - Sealed Pavement Renewals 1362-Roberts/Railway Road North Intersection Safety Realignment - to enable completion of work underway.

47
PNCC Annual Report 2018/19
G1- STR
ATE
GIC
TRA
NSP
OR
T AC
TIVITY
47
ECONOMIC DEVElOPMENT ACTIVITY
• Central Economic Development Agency
• Conference and Function Centre and;
• International Relations
WhAt the CounCil DoesCouncil works directly alongside other organisations to create a robust economic environment for the city. Council provides business support services as well as funding for generating visitation and other activities that support economic development.
Council works to increase the city’s profile as a welcoming and productive city that offers attractive opportunities for business and employment. This includes funding to cement Palmerston North as a city of choice for events, which will ultimately attract visitors.
KEY ACHIEVEMENTS
THE CONFERENCE & FUNCTION
hosteD
312EVENTS
INTERNATIONAlRElATIONSHosted the 2019SISTER CITIESNZ NATIONALConference and visits
DuKe KunshAnUNIVERSITY (CHINA)OFFERED TERTIARY SCHOlARSHIP TO APALMERSTON NORTH STUDENT
WHICH HELPED CONTRIBUTE TO THE
$3.93M IN DIRECT ECONOMIC BENEFIT TO THE CITY
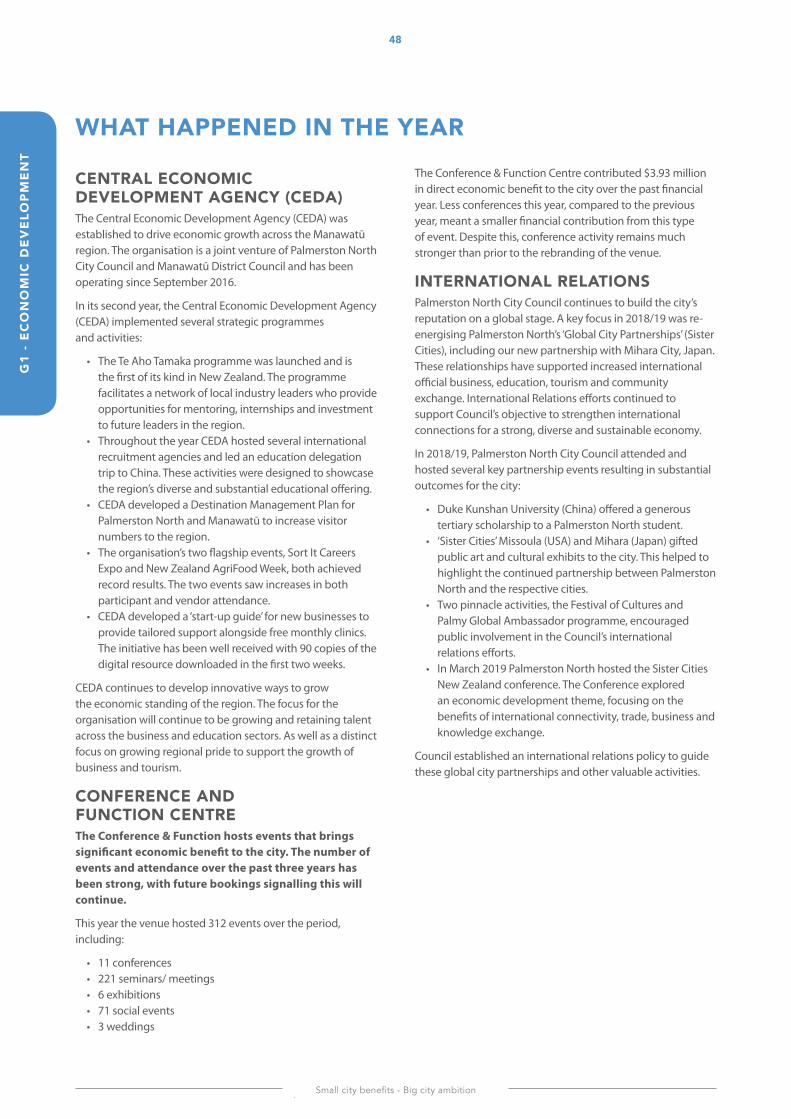
Small city benefits - Big city ambition
48G
1 -
EC
ON
OM
IC D
EV
ElO
PM
EN
T
WHAT HAPPENED IN THE YEAR
CENTRAl ECONOMIC DEVElOPMENT AGENCY (CEDA)The Central Economic Development Agency (CEDA) was established to drive economic growth across the Manawatū region. The organisation is a joint venture of Palmerston North City Council and Manawatū District Council and has been operating since September 2016.
In its second year, the Central Economic Development Agency (CEDA) implemented several strategic programmes and activities:
• The Te Aho Tamaka programme was launched and is the first of its kind in New Zealand. The programme facilitates a network of local industry leaders who provide opportunities for mentoring, internships and investment to future leaders in the region.
• Throughout the year CEDA hosted several international recruitment agencies and led an education delegation trip to China. These activities were designed to showcase the region’s diverse and substantial educational offering.
• CEDA developed a Destination Management Plan for Palmerston North and Manawatū to increase visitor numbers to the region.
• The organisation’s two flagship events, Sort It Careers Expo and New Zealand AgriFood Week, both achieved record results. The two events saw increases in both participant and vendor attendance.
• CEDA developed a ‘start-up guide’ for new businesses to provide tailored support alongside free monthly clinics. The initiative has been well received with 90 copies of the digital resource downloaded in the first two weeks.
CEDA continues to develop innovative ways to grow the economic standing of the region. The focus for the organisation will continue to be growing and retaining talent across the business and education sectors. As well as a distinct focus on growing regional pride to support the growth of business and tourism.
CONFERENCE AND FUNCTION CENTREThe Conference & Function hosts events that brings significant economic benefit to the city. The number of events and attendance over the past three years has been strong, with future bookings signalling this will continue.
This year the venue hosted 312 events over the period, including:
• 11 conferences • 221 seminars/ meetings • 6 exhibitions• 71 social events • 3 weddings
The Conference & Function Centre contributed $3.93 million in direct economic benefit to the city over the past financial year. Less conferences this year, compared to the previous year, meant a smaller financial contribution from this type of event. Despite this, conference activity remains much stronger than prior to the rebranding of the venue.
INTERNATIONAl RElATIONSPalmerston North City Council continues to build the city’s reputation on a global stage. A key focus in 2018/19 was re-energising Palmerston North’s ‘Global City Partnerships’ (Sister Cities), including our new partnership with Mihara City, Japan. These relationships have supported increased international official business, education, tourism and community exchange. International Relations efforts continued to support Council’s objective to strengthen international connections for a strong, diverse and sustainable economy.
In 2018/19, Palmerston North City Council attended and hosted several key partnership events resulting in substantial outcomes for the city:
• Duke Kunshan University (China) offered a generous tertiary scholarship to a Palmerston North student.
• ‘Sister Cities’ Missoula (USA) and Mihara (Japan) gifted public art and cultural exhibits to the city. This helped to highlight the continued partnership between Palmerston North and the respective cities.
• Two pinnacle activities, the Festival of Cultures and Palmy Global Ambassador programme, encouraged public involvement in the Council’s international relations efforts.
• In March 2019 Palmerston North hosted the Sister Cities New Zealand conference. The Conference explored an economic development theme, focusing on the benefits of international connectivity, trade, business and knowledge exchange.
Council established an international relations policy to guide these global city partnerships and other valuable activities.
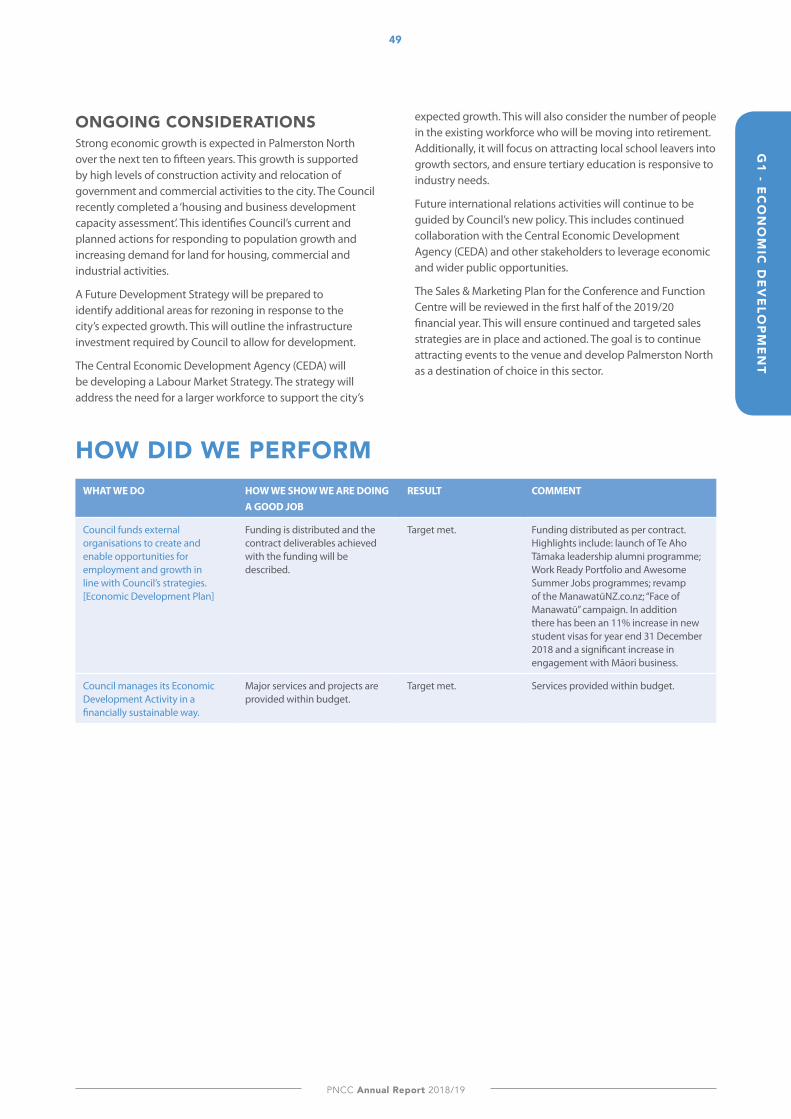
PNCC Annual Report 2018/19
49G
1 - EC
ON
OM
IC D
EV
ElO
PM
EN
T
ONGOING CONSIDERATIONSStrong economic growth is expected in Palmerston North over the next ten to fifteen years. This growth is supported by high levels of construction activity and relocation of government and commercial activities to the city. The Council recently completed a ‘housing and business development capacity assessment’. This identifies Council’s current and planned actions for responding to population growth and increasing demand for land for housing, commercial and industrial activities.
A Future Development Strategy will be prepared to identify additional areas for rezoning in response to the city’s expected growth. This will outline the infrastructure investment required by Council to allow for development.
The Central Economic Development Agency (CEDA) will be developing a Labour Market Strategy. The strategy will address the need for a larger workforce to support the city’s
expected growth. This will also consider the number of people in the existing workforce who will be moving into retirement. Additionally, it will focus on attracting local school leavers into growth sectors, and ensure tertiary education is responsive to industry needs.
Future international relations activities will continue to be guided by Council’s new policy. This includes continued collaboration with the Central Economic Development Agency (CEDA) and other stakeholders to leverage economic and wider public opportunities.
The Sales & Marketing Plan for the Conference and Function Centre will be reviewed in the first half of the 2019/20 financial year. This will ensure continued and targeted sales strategies are in place and actioned. The goal is to continue attracting events to the venue and develop Palmerston North as a destination of choice in this sector.
HOW DID WE PERFORMWHAT WE DO HOW WE SHOW WE ARE DOING
A GOOD JOBRESULT COMMENT
Council funds external organisations to create and enable opportunities for employment and growth in line with Council’s strategies. [Economic Development Plan]
Funding is distributed and the contract deliverables achieved with the funding will be described.
Target met. Funding distributed as per contract. Highlights include: launch of Te Aho Tāmaka leadership alumni programme; Work Ready Portfolio and Awesome Summer Jobs programmes; revamp of the ManawatūNZ.co.nz; “Face of Manawatū” campaign. In addition there has been an 11% increase in new student visas for year end 31 December 2018 and a significant increase in engagement with Māori business.
Council manages its Economic Development Activity in a financially sustainable way.
Major services and projects are provided within budget.
Target met. Services provided within budget.
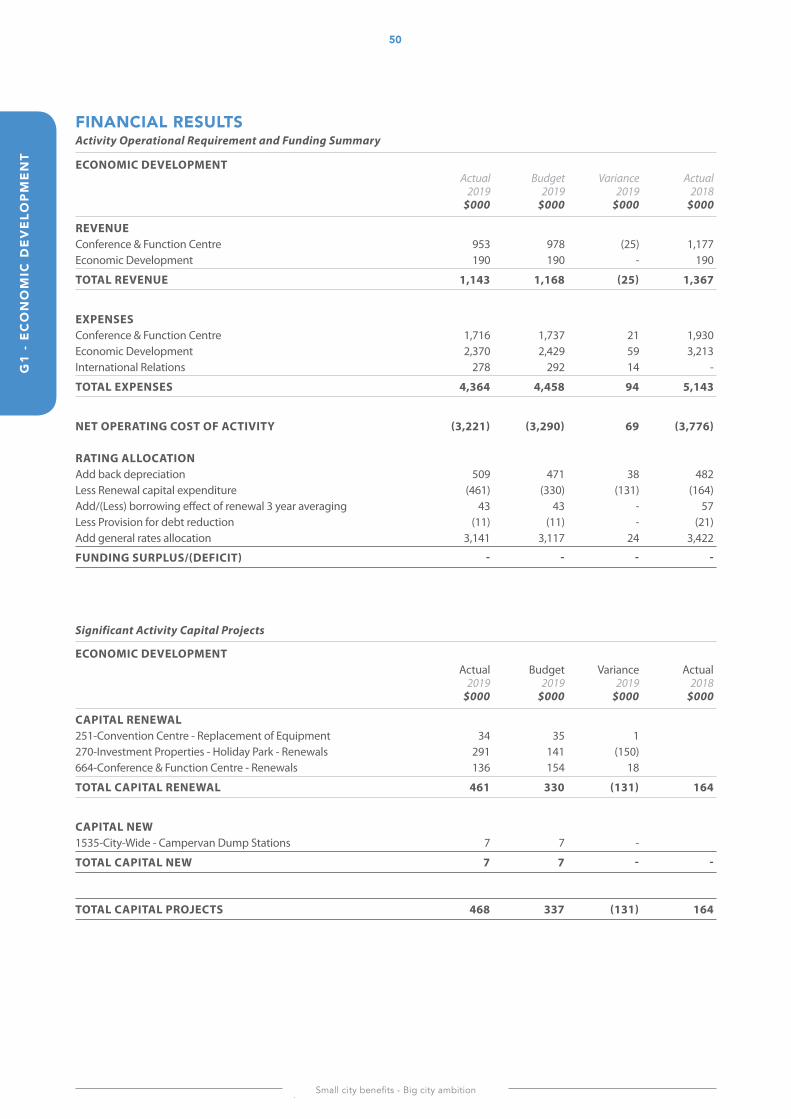
Small city benefits - Big city ambition
50G
1 -
EC
ON
OM
IC D
EV
ElO
PM
EN
T
FINANCIAl RESUlTSActivity Operational Requirement and Funding Summary
ECONOMIC DEVELOPMENT Actual Budget Variance Actual 2019 2019 2019 2018 $000 $000 $000 $000
REVENUE Conference & Function Centre 953 978 (25) 1,177Economic Development 190 190 - 190
TOTAL REVENUE 1,143 1,168 (25) 1,367
EXPENSES Conference & Function Centre 1,716 1,737 21 1,930Economic Development 2,370 2,429 59 3,213International Relations 278 292 14 -
TOTAL EXPENSES 4,364 4,458 94 5,143
NET OPERATING COST OF ACTIVITY (3,221) (3,290) 69 (3,776) RATING ALLOCATION Add back depreciation 509 471 38 482Less Renewal capital expenditure (461) (330) (131) (164)Add/(Less) borrowing effect of renewal 3 year averaging 43 43 - 57Less Provision for debt reduction (11) (11) - (21)Add general rates allocation 3,141 3,117 24 3,422
FUNDING SURPLUS/(DEFICIT) - - - -
Significant Activity Capital Projects
ECONOMIC DEVELOPMENT Actual Budget Variance Actual 2019 2019 2019 2018 $000 $000 $000 $000
CAPITAL RENEWAL 251-Convention Centre - Replacement of Equipment 34 35 1 270-Investment Properties - Holiday Park - Renewals 291 141 (150) 664-Conference & Function Centre - Renewals 136 154 18
TOTAL CAPITAL RENEWAL 461 330 (131) 164
CAPITAL NEW 1535-City-Wide - Campervan Dump Stations 7 7 -
TOTAL CAPITAL NEW 7 7 - -
TOTAL CAPITAL PROJECTS 468 337 (131) 164
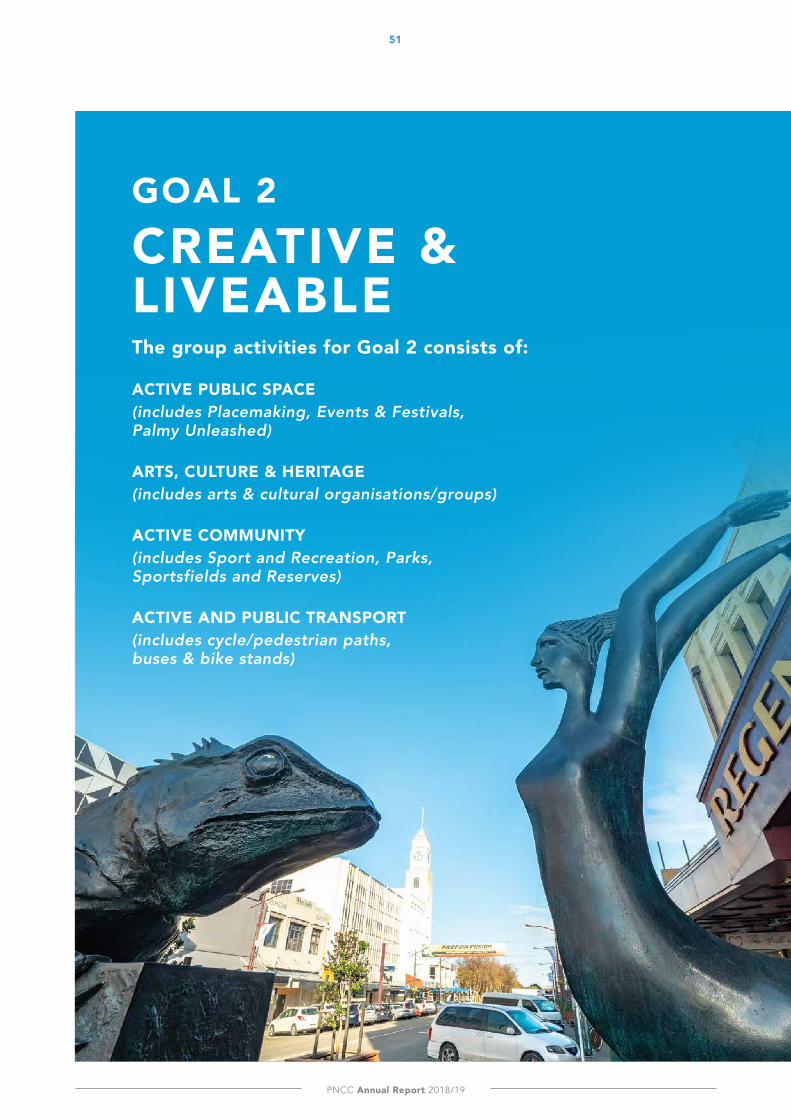
PNCC Annual Report 2018/19
G1 - E
CO
NO
MIC
DE
VE
lOP
ME
NT
51
GOAl 2CREATIVE & liVeABleThe group activities for Goal 2 consists of:
ACtiVe PuBliC sPACe(includes Placemaking, Events & Festivals, Palmy Unleashed)
ARTS, CUlTURE & HERITAGE(includes arts & cultural organisations/groups)
ACTIVE COMMUNITY(includes Sport and Recreation, Parks, Sportsfields and Reserves)
ACTIVE AND PUBlIC TRANSPORT(includes cycle/pedestrian paths, buses & bike stands)
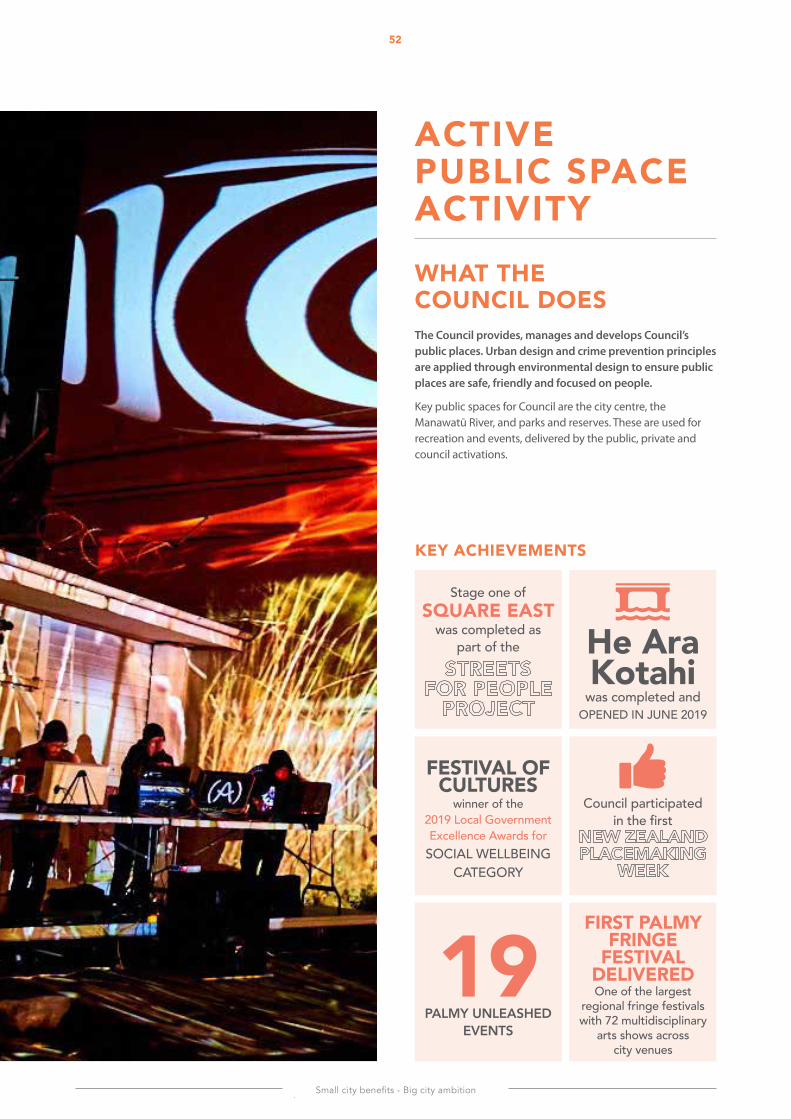
Small city benefits - Big city ambition
G2
- A
CTI
VE
PU
BlI
C S
PAC
E52
ACtiVe PuBliC sPACe ACTIVITYWhAt the CounCil DoesThe Council provides, manages and develops Council’s public places. Urban design and crime prevention principles are applied through environmental design to ensure public places are safe, friendly and focused on people.
Key public spaces for Council are the city centre, the Manawatū River, and parks and reserves. These are used for recreation and events, delivered by the public, private and council activations.
KEY ACHIEVEMENTS
he Ara Kotahi
was completed and OPENED IN JUNE 2019
FESTIVAl OF CUlTURES
winner of the 2019 Local Government Excellence Awards for
SOCIAL WELLBEING CATEGORY
FIRST PAlMY FRINGE
FESTIVAl DElIVERED One of the largest
regional fringe festivals with 72 multidisciplinary
arts shows across city venues
Stage one of SQUARE EAST
was completed as part of the
Council participated in the first
19PALMY UNLEASHED
EVENTS
PNCC Annual Report 2018/19
G2 - A
CTIV
E P
UB
lIC SPA
CE
53
WHAT HAPPENED IN THE YEAR
STREETSCAPE / CITY CENTRE PlANConsultation is ongoing with various stakeholders to identify a range of low-cost solutions to improve connectivity in the city. Council is focused on creating access for pedestrians, cyclists and other active transport users in the city centre area.
Council’s vision for a pedestrian and cycle focused city centre significantly advanced in 2018/19:
• Stage one of Square East was completed as part of the Streets for People project.
• The upgrade of Cuba Street from the ring road to George Street was completed.
Council’s Urban Cycling Masterplan also received New Zealand Transport Agency funding support and consultation with the community is ongoing.
MANAWATŪ RIVER FRAMEWORKThe Manawatū River framework consists of a programme of interrelated projects. The largest project was He Ara Kotahi, a pedestrian cycling bridge. The bridge and the associated 7.2 km of shared pathway leading to Linton was completed and opened in June 2019. The project opened access to additional sections of the Manawatū River and connects the city to the Turitea and Kahuterawa Streams. The pathway will allow for further engagement with the community through the Urban Eels and Rangitanē Pā site projects.
Other Manawatū river focused projects were also completed during the year:
• Natural play areas were planned and developed.• Carparking and a dog agility park were built at Ahimate
Reserve, with the city’s dog owners embracing the new space with great feedback received.
• Council installed 200 metres of glow pathing, the first of its kind in Australasia.
• A bike jump park was installed at the end of Albert Street. • Council also constructed a mobile gym for use
along the riverside.
PlACEMAKINGCouncil successfully participated in the first New Zealand Placemaking Week in 2018/19, alongside Tāmaki Makaurau and Ōtautahi. The city’s global position as a ‘place’ leader was reinforced as Council representatives joined the PlacemakingX network on behalf of Australasia.
The ‘Placemaking’ initiative partnered with community members on 29 projects throughout the year. Council focused on the reinforcement of laneways through the ‘Laneway in a Day’ project in Snails Lane and the tactical urbanism trials in Maple Lane.
EVENTS AND FESTIVAlSIn recent years, Palmerston North has continued to make progress towards delivering a successful economic and business events programme. The newly formed Council Events and Partnerships Team implemented a new framework to best deliver events through three areas of focus Nationally Significant, Annual and Community Events (including Palmy Unleashed). This year the Community event ‘Festival of Cultures’ won the Local Government New Zealand Award for Social Wellbeing and there has been a significant increase in event activations in the city as well as attraction of nationally significant events not seen in the city for several years such as the return of Investec Super Rugby. We also successfully delivered a programme of community and commemorative events.
Council continued facilitating opportunities for new and existing community focused events:
• Winner of the 2018 Local Government Excellence Awards for Social Wellbeing Palmerston North celebrated its 27th International Festival of Cultures, one of the city’s longest-running community events. The festival is aimed at helping to meet the on-going social-well-being needs of the community. Attendance this year grew to 17,000, a 13 per cent increase on 2018.
• The Anzac Day Dawn service continued to grow in attendance, with a record attendance in 2018/19. For the first time in several years, the ceremony was honoured with a fly over from Royal New Zealand Air Force, based at Ohakea.
• Activations in the Square grew by 22 per cent this year with 89 bookings.
On 16 March 2019, the whole community came together in solidarity at the tenth Community Lantern Parade. The parade signifies the official opening of the International Festival of Cultures. The event was held as planned, the day after the tragic events in Christchurch. A vigil was held prior to the event opening embracing and supporting the local Muslim community. Attendees from all walks of life joining in prayer and showing unified support. While the event’s intention was to celebrate diversity, the vigil gathering also showed the empathy and caring of the Palmerston North community.
Sadly, the Christchurch terrorist attacks prompted the postponement of the eagerly anticipated New Zealand Tattoo which, although hugely disappointing, has meant next year we will be putting on the spectacle on 4 April 2020.
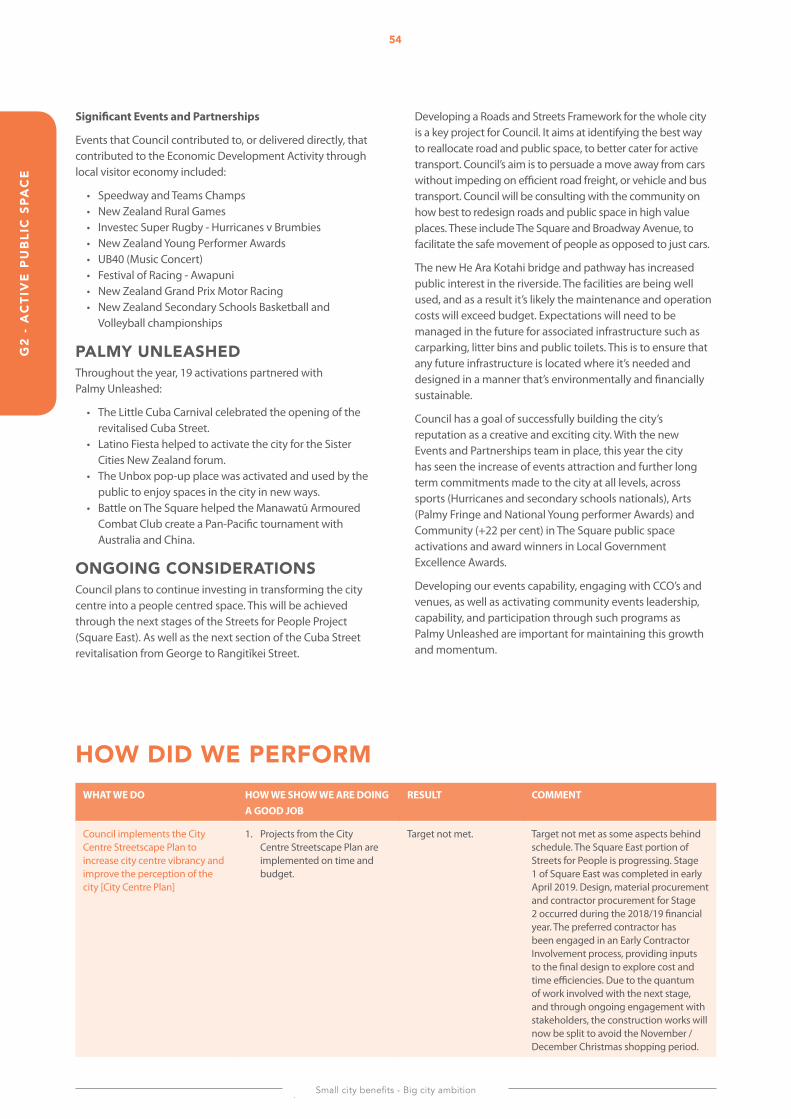
Small city benefits - Big city ambition
54G
2 -
AC
TIV
E P
UB
lIC
SPA
CE
Significant Events and Partnerships
Events that Council contributed to, or delivered directly, that contributed to the Economic Development Activity through local visitor economy included:
• Speedway and Teams Champs• New Zealand Rural Games • Investec Super Rugby - Hurricanes v Brumbies• New Zealand Young Performer Awards• UB40 (Music Concert) • Festival of Racing - Awapuni• New Zealand Grand Prix Motor Racing• New Zealand Secondary Schools Basketball and
Volleyball championships
PAlMY UNlEASHEDThroughout the year, 19 activations partnered with Palmy Unleashed:
• The Little Cuba Carnival celebrated the opening of the revitalised Cuba Street.
• Latino Fiesta helped to activate the city for the Sister Cities New Zealand forum.
• The Unbox pop-up place was activated and used by the public to enjoy spaces in the city in new ways.
• Battle on The Square helped the Manawatū Armoured Combat Club create a Pan-Pacific tournament with Australia and China.
ONGOING CONSIDERATIONSCouncil plans to continue investing in transforming the city centre into a people centred space. This will be achieved through the next stages of the Streets for People Project (Square East). As well as the next section of the Cuba Street revitalisation from George to Rangitīkei Street.
Developing a Roads and Streets Framework for the whole city is a key project for Council. It aims at identifying the best way to reallocate road and public space, to better cater for active transport. Council’s aim is to persuade a move away from cars without impeding on efficient road freight, or vehicle and bus transport. Council will be consulting with the community on how best to redesign roads and public space in high value places. These include The Square and Broadway Avenue, to facilitate the safe movement of people as opposed to just cars.
The new He Ara Kotahi bridge and pathway has increased public interest in the riverside. The facilities are being well used, and as a result it’s likely the maintenance and operation costs will exceed budget. Expectations will need to be managed in the future for associated infrastructure such as carparking, litter bins and public toilets. This is to ensure that any future infrastructure is located where it’s needed and designed in a manner that’s environmentally and financially sustainable.
Council has a goal of successfully building the city’s reputation as a creative and exciting city. With the new Events and Partnerships team in place, this year the city has seen the increase of events attraction and further long term commitments made to the city at all levels, across sports (Hurricanes and secondary schools nationals), Arts (Palmy Fringe and National Young performer Awards) and Community (+22 per cent) in The Square public space activations and award winners in Local Government Excellence Awards.
Developing our events capability, engaging with CCO’s and venues, as well as activating community events leadership, capability, and participation through such programs as Palmy Unleashed are important for maintaining this growth and momentum.
HOW DID WE PERFORMWHAT WE DO HOW WE SHOW WE ARE DOING
A GOOD JOBRESULT COMMENT
Council implements the City Centre Streetscape Plan to increase city centre vibrancy and improve the perception of the city [City Centre Plan]
1. Projects from the City Centre Streetscape Plan are implemented on time and budget.
Target not met. Target not met as some aspects behind schedule. The Square East portion of Streets for People is progressing. Stage 1 of Square East was completed in early April 2019. Design, material procurement and contractor procurement for Stage 2 occurred during the 2018/19 financial year. The preferred contractor has been engaged in an Early Contractor Involvement process, providing inputs to the final design to explore cost and time efficiencies. Due to the quantum of work involved with the next stage, and through ongoing engagement with stakeholders, the construction works will now be split to avoid the November / December Christmas shopping period.
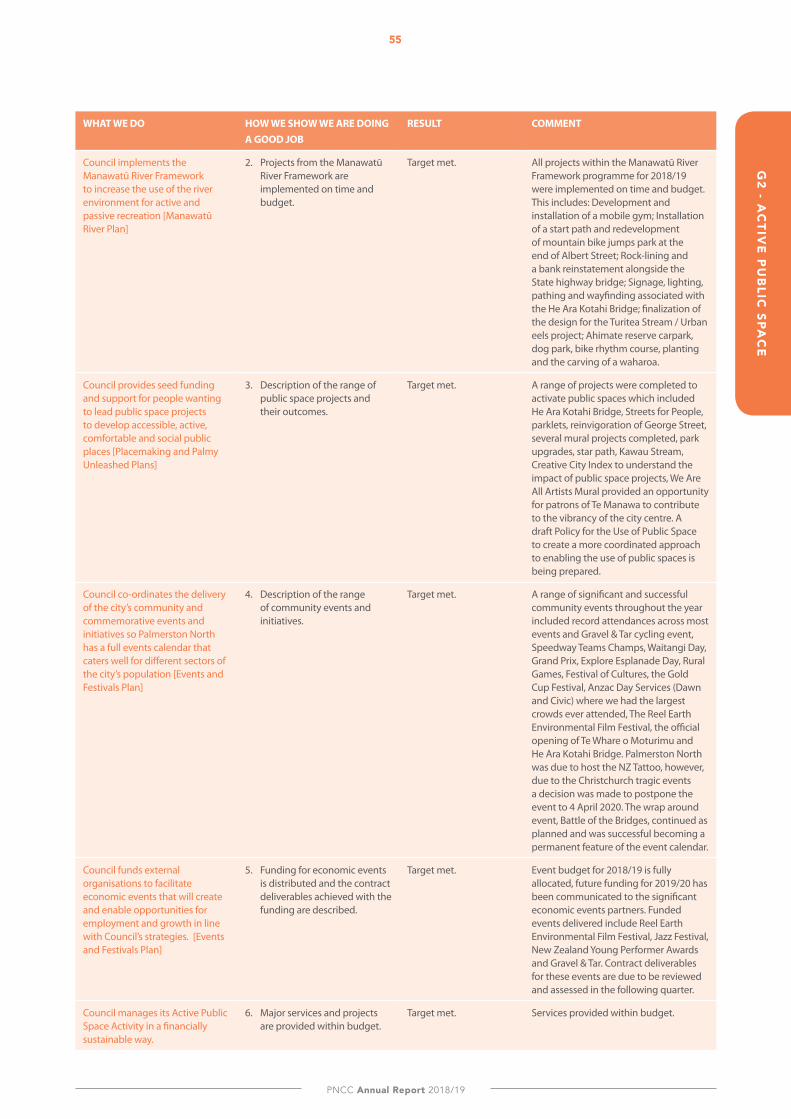
PNCC Annual Report 2018/19
G2 - A
CTIV
E P
UB
lIC SPA
CE
55
WHAT WE DO HOW WE SHOW WE ARE DOING A GOOD JOB
RESULT COMMENT
Council implements the Manawatū River Framework to increase the use of the river environment for active and passive recreation [Manawatū River Plan]
2. Projects from the Manawatū River Framework are implemented on time and budget.
Target met. All projects within the Manawatū River Framework programme for 2018/19 were implemented on time and budget. This includes: Development and installation of a mobile gym; Installation of a start path and redevelopment of mountain bike jumps park at the end of Albert Street; Rock-lining and a bank reinstatement alongside the State highway bridge; Signage, lighting, pathing and wayfinding associated with the He Ara Kotahi Bridge; finalization of the design for the Turitea Stream / Urban eels project; Ahimate reserve carpark, dog park, bike rhythm course, planting and the carving of a waharoa.
Council provides seed funding and support for people wanting to lead public space projects to develop accessible, active, comfortable and social public places [Placemaking and Palmy Unleashed Plans]
3. Description of the range of public space projects and their outcomes.
Target met. A range of projects were completed to activate public spaces which included He Ara Kotahi Bridge, Streets for People, parklets, reinvigoration of George Street, several mural projects completed, park upgrades, star path, Kawau Stream, Creative City Index to understand the impact of public space projects, We Are All Artists Mural provided an opportunity for patrons of Te Manawa to contribute to the vibrancy of the city centre. A draft Policy for the Use of Public Space to create a more coordinated approach to enabling the use of public spaces is being prepared.
Council co-ordinates the delivery of the city’s community and commemorative events and initiatives so Palmerston North has a full events calendar that caters well for different sectors of the city’s population [Events and Festivals Plan]
4. Description of the range of community events and initiatives.
Target met. A range of significant and successful community events throughout the year included record attendances across most events and Gravel & Tar cycling event, Speedway Teams Champs, Waitangi Day, Grand Prix, Explore Esplanade Day, Rural Games, Festival of Cultures, the Gold Cup Festival, Anzac Day Services (Dawn and Civic) where we had the largest crowds ever attended, The Reel Earth Environmental Film Festival, the official opening of Te Whare o Moturimu and He Ara Kotahi Bridge. Palmerston North was due to host the NZ Tattoo, however, due to the Christchurch tragic events a decision was made to postpone the event to 4 April 2020. The wrap around event, Battle of the Bridges, continued as planned and was successful becoming a permanent feature of the event calendar.
Council funds external organisations to facilitate economic events that will create and enable opportunities for employment and growth in line with Council’s strategies. [Events and Festivals Plan]
5. Funding for economic events is distributed and the contract deliverables achieved with the funding are described.
Target met. Event budget for 2018/19 is fully allocated, future funding for 2019/20 has been communicated to the significant economic events partners. Funded events delivered include Reel Earth Environmental Film Festival, Jazz Festival, New Zealand Young Performer Awards and Gravel & Tar. Contract deliverables for these events are due to be reviewed and assessed in the following quarter.
Council manages its Active Public Space Activity in a financially sustainable way.
6. Major services and projects are provided within budget.
Target met. Services provided within budget.
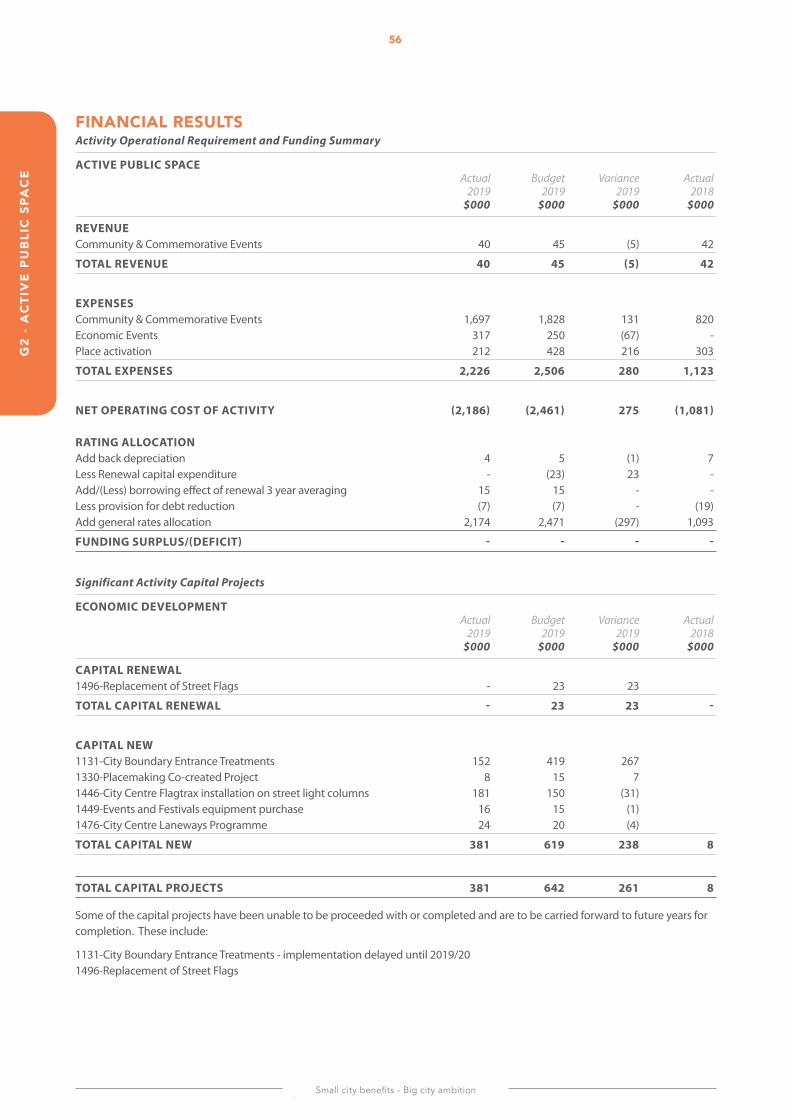
Small city benefits - Big city ambition
56G
2 -
AC
TIV
E P
UB
lIC
SPA
CE
FINANCIAl RESUlTSActivity Operational Requirement and Funding Summary
ACTIVE PUBLIC SPACE Actual Budget Variance Actual 2019 2019 2019 2018 $000 $000 $000 $000
REVENUE Community & Commemorative Events 40 45 (5) 42
TOTAL REVENUE 40 45 (5) 42
EXPENSES Community & Commemorative Events 1,697 1,828 131 820Economic Events 317 250 (67) -Place activation 212 428 216 303
TOTAL EXPENSES 2,226 2,506 280 1,123
NET OPERATING COST OF ACTIVITY (2,186) (2,461) 275 (1,081) RATING ALLOCATION Add back depreciation 4 5 (1) 7Less Renewal capital expenditure - (23) 23 -Add/(Less) borrowing effect of renewal 3 year averaging 15 15 - -Less provision for debt reduction (7) (7) - (19)Add general rates allocation 2,174 2,471 (297) 1,093
FUNDING SURPLUS/(DEFICIT) - - - -
Significant Activity Capital Projects
ECONOMIC DEVELOPMENT Actual Budget Variance Actual 2019 2019 2019 2018 $000 $000 $000 $000
CAPITAL RENEWAL 1496-Replacement of Street Flags - 23 23
TOTAL CAPITAL RENEWAL - 23 23 -
CAPITAL NEW 1131-City Boundary Entrance Treatments 152 419 267 1330-Placemaking Co-created Project 8 15 7 1446-City Centre Flagtrax installation on street light columns 181 150 (31) 1449-Events and Festivals equipment purchase 16 15 (1) 1476-City Centre Laneways Programme 24 20 (4)
TOTAL CAPITAL NEW 381 619 238 8
TOTAL CAPITAL PROJECTS 381 642 261 8
Some of the capital projects have been unable to be proceeded with or completed and are to be carried forward to future years for completion. These include:
1131-City Boundary Entrance Treatments - implementation delayed until 2019/20 1496-Replacement of Street Flags
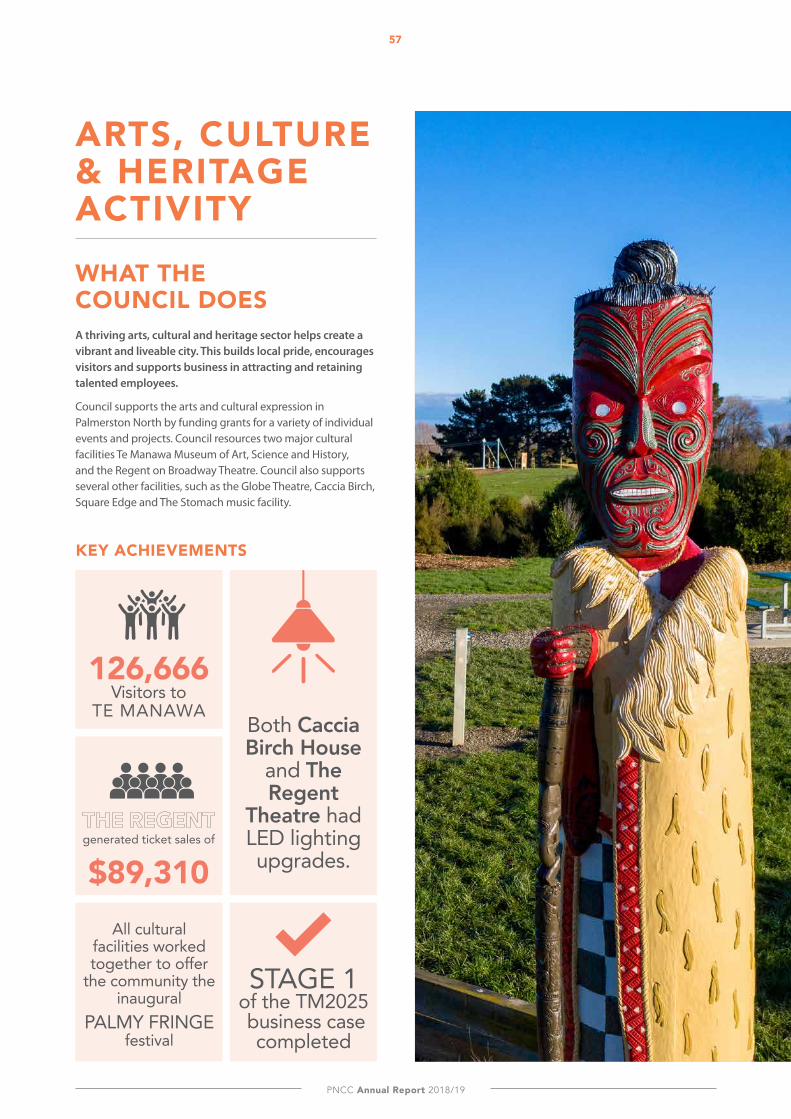
PNCC Annual Report 2018/19
57G
2 - AC
TIVE
PU
BlIC
SPAC
E
ARTS, CUlTURE & HERITAGE ACTIVITYWhAt the CounCil DoesA thriving arts, cultural and heritage sector helps create a vibrant and liveable city. This builds local pride, encourages visitors and supports business in attracting and retaining talented employees.
Council supports the arts and cultural expression in Palmerston North by funding grants for a variety of individual events and projects. Council resources two major cultural facilities Te Manawa Museum of Art, Science and History, and the Regent on Broadway Theatre. Council also supports several other facilities, such as the Globe Theatre, Caccia Birch, Square Edge and The Stomach music facility.
KEY ACHIEVEMENTS
Both Caccia Birch House
and The Regent
Theatre had LED lighting upgrades.
All cultural facilities worked together to offer
the community the inaugural
PALMY FRINGE festival
126,666 Visitors to
TE MANAWA
generated ticket sales of
$89,310
STAGE 1 of the TM2025 business case
completed
Small city benefits - Big city ambition
58G
2 -
AR
TS,
CU
lTU
RE
& H
ER
ITA
GE
WHAT HAPPENED IN THE YEAR
CUlTURAl FACIlITIESCouncil Controlled Organisations (CCOs) were established by Council to govern and operate facilities and services under contract to Council. Annual Statements of Intent (SOI), similar to annual plans, are negotiated annually and include core activities, budgets and performance measures.
In 2018/2019 Council paid over $3.5 million to Council Controlled Organisations (CCOs) in operating funds, distributed accordingly:
• Te Manawa - $3,131,026• The Regent - $231,038• The Globe - $113,366• Caccia Birch - $114,318
COUNCIl OWNED BUIlDINGSCouncil has a robust renewals and facilities management programme to help enhance the city’s existing arts and culture buildings. These facilities are important in achieving the Council’s aspirations and meeting the community’s needs.
The buildings that sit in the Cultural Facilities portfolio include:
• The Globe Theatre• The Regent Theatre• Square Edge Building• Te Manawa and the Art Gallery• Creative Sounds • Caccia Birch House
In 2018/19 Improvements and maintenance to Council’s cultural facilities portfolio were a high priority:
• Council finished replacing the heating and cooling systems in The Globe Theatre.
• Toilet and bathroom facilities were refurbished on the first floor of the Square Edge Building.
• Both Caccia Birch House and The Regent Theatre had LED lighting upgrades.
• Council replaced the deck at the Awaho School House within Te Manawa Museum.
TE MANAWAIn 2018/19, Te Manawa continued developing visually appealing experiences for visitors with exhibitions developed and built by Te Manawa touring other cities. This helped increase Te Manawa Museum’s national profile.
Te Manawa Museum’s successful results in 2018/19 can be attributed to several key activities:
• Stage 1 of the TM2025 business case for a re-imagining of Te Manawa as a museum of the future was completed.
• Te Manawa was accepted as part of the international community engagement mentoring programme OF|BY|FOR ALL. As part of this, two staff members were invited to attend an all-expenses paid programme workshop in Santa Cruz, USA.
• The NOA ‘We Are All Artists!’ Pasteup Initiative tested co-creation and partnership concepts, with institutions sharing and contributing resources. NOA participants created works of art to scale up and these were pasted onto a large inner-city wall on Church Street.
Onsite visitors this year were 126,666 compared to 141,436 in 2017/2018. The diversion of funds towards the refurbishment of the Art Gallery meant that fewer exhibitions were developed and visitors decreased because the gallery was closed for 3 months. Additionally, Council opted to run the Waitangi Day events in The Square instead of at Te Manawa, and Te Ahi Kaea cultural centre was postponed. Attendance at travelling exhibitions decreased from 251,141 in 17/18 to 103,589 this year. Online reach increased from 524,746 in 17/18 to 634,221 in 18/19.
THE GlOBEThe Globe achieved great results in 2018/19 with a 32 per cent increase in usage nights (18/19: 680) over the previous year (17/18: 514). There were 253 Performances in 18/19 compared to 175 in 17/18. The Globe also welcomed 27 new hirers. 57 per cent of usage, 95 per cent of which is performance based, is driven through Memoranda of Understanding (MOU) agreements with 6 organisations. Community use accounts for 80 per cent of total usage.
The Globe’s success can be attributed to a few key productions:
• The inaugural Palmy Fringe Festival was held this year. • Two seasons of local amateur drama were hosted by The
Globe - Seussical Jr by Manawatū Youth Theatre and The Wedding Singer from Manawatū Theatre Society.
• The Summer Sounds Festival featured nine touring national and international music acts, including the Jazz Festival.
• The Reel Earth Film Festival also proved popular with residents and visitors.
PNCC Annual Report 2018/19
G2 - A
RTS, C
UlTU
RE
& H
ER
ITAG
E59
Several “sold out” events this year also showed that the Globe is attracting an engaged audience with its choices in programming, including:
• Don McGlashan; • Rodger Fox’s shows Steve Gadd and “Charlie Parker
with Strings”; • Graeme James;• Stretch;• One Night in Africa; and • two shows for the D-Day Dedication.
REGENTRegent Theatre marked 20 years since its refurbishment in 2018 with a programme of ten celebratory events. The events were attended by 3,828 patrons generating ticket sales of $89,310. A ‘one off’ performance of Rock of Ages was also recreated especially for the anniversary.
Other standout shows were Pasifika Fusion, the Pacific Island Cultural Festival and 12 performances of ‘Wicked’ by Abbey Musical Theatre. As a result, Abbey Musical Theatre have now scheduled two major productions a year going forward.
This year’s bookings included:
• Attendances for 18/19 were 98,781, an increase of 8.5 per cent over 17/18: 91,065. 66.8 per cent of those were attending community events including 5 culturally diverse performances: Pasifika Fusion, Chinese Moon Festival and three kapa haka events. There were 153 live nights slightly less than the target of 160.
• Commercial use accounted for 56 per cent of hireage income and the Regent was well used by the education sector with 20 school productions and awards events.
• Maintenance renewals of this gorgeous old lady continued as per plan with the Regency Room repainted, the stage lighting console replaced and partial funding obtained for a new sound system.
Attendances for the year are 98,781 compared to 91,065 last year. In 2018/19 bookings made by local organisations accounted for 89 per cent. While ten per cent of all attendees to the theatre were generated by local dance schools.
CACCIA BIRCH The Board has continued its work carefully caring for this heritage listed building while promoting and encouraging community access. The venue was use 247 days this year, slightly down on last year (17/18: 267). There were 14 free and 15 fee community events with good attendances including 525 to a Bridal Fair, 6 tour groups, 2 music recitals and a 3 day international quilt exhibition.
The exterior and interior have been maintained through an annual works programme. A renewed landscape plan is being developed for the grounds and embankment. Stage one of the Coach House Archive has been completed with stage two now underway.
ONGOING CONSIDERATIONS The Arts Powerhouse stakeholders board was formed in the third quarter of the year. As part of its duties, the board has developed a shared understanding of how the sector can work more collaboratively. The Palmy arts sector is thriving, and the challenge is to maximise collaboration and grow audiences both locally and nationally through a range of activities including artist selection for future Palmy Fringe festivals.
Council has been carrying out a review into the governance of the Council Controlled Organisations (CCOs). This helps ensure that services and facilities are being delivered in the most cost-effective manner, and drives the organisations to support the delivery of Council’s strategic objectives.
The major focus for the cultural CCOs and other organisations working in the arts, culture and heritage sector is the development of a coordinated strategy. This strategy will act as a guide for implementing Council’s Arts Plan. Council’s goal regarding the CCOs is to develop the city into an arts powerhouse with a national reputation for creativity and the arts.
Council’s cultural facilities require continued maintenance which is being addressed currently and will continue to be addressed in the coming years. This includes continued work around fire safety upgrades and asbestos management. Council has also completed detailed seismic assessments for its buildings initially identified as earthquake prone and is working through its seismic programme to address this.
Council continues to work with the Te Manawa Museum Board regarding the proposed refurbished museum complex with a business case still to be developed.
The sound system at the Regent is now 20 years old. The Board has sourced two thirds of the cost of a replacement system and the balance is to be paid for by Council as a capital grant in 2019/20.
The Board of Caccia Birch have been considering succession planning. This is to ensure that the management and operational knowledge of the facility is passed over in a timely and sustainable way. Funding needs to be sourced to enable the hiring of a second staff member to learn the role. The new role will also be responsible for staffing weekend bookings and supporting community access to the site.
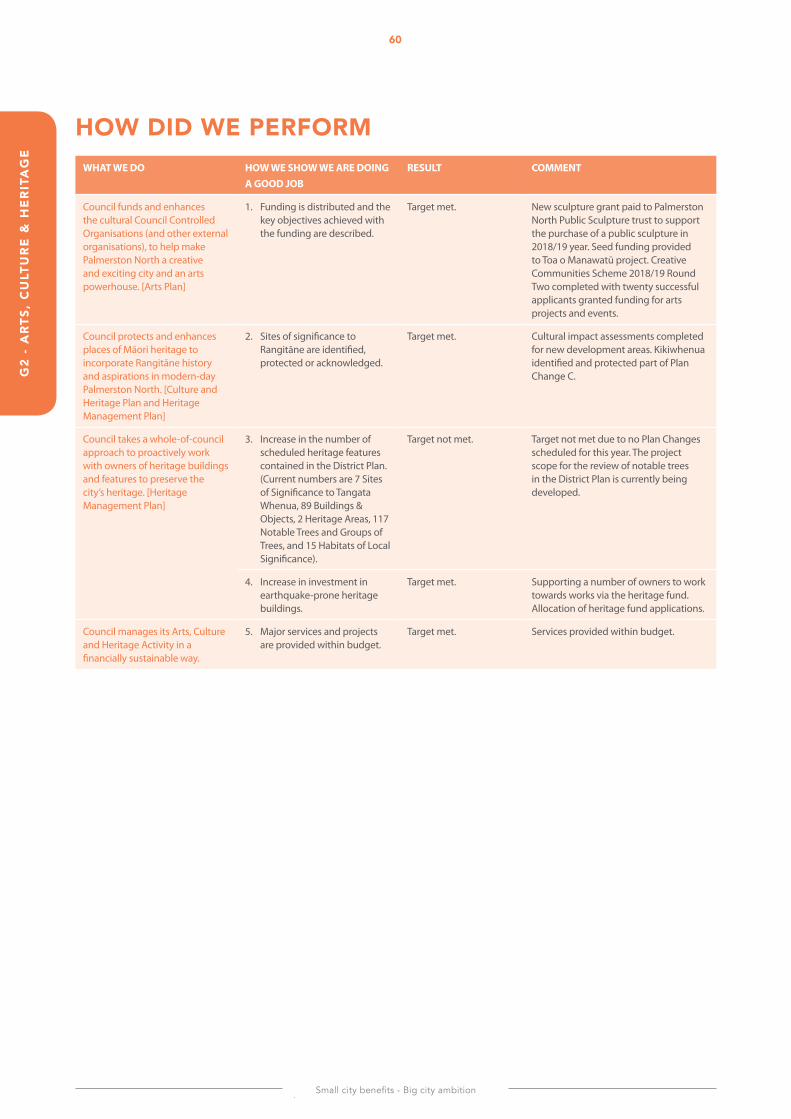
Small city benefits - Big city ambition
G2
- A
RTS
, C
UlT
UR
E &
HE
RIT
AG
E60
HOW DID WE PERFORMWHAT WE DO HOW WE SHOW WE ARE DOING
A GOOD JOBRESULT COMMENT
Council funds and enhances the cultural Council Controlled Organisations (and other external organisations), to help make Palmerston North a creative and exciting city and an arts powerhouse. [Arts Plan]
1. Funding is distributed and the key objectives achieved with the funding are described.
Target met. New sculpture grant paid to Palmerston North Public Sculpture trust to support the purchase of a public sculpture in 2018/19 year. Seed funding provided to Toa o Manawatū project. Creative Communities Scheme 2018/19 Round Two completed with twenty successful applicants granted funding for arts projects and events.
Council protects and enhances places of Māori heritage to incorporate Rangitāne history and aspirations in modern-day Palmerston North. [Culture and Heritage Plan and Heritage Management Plan]
2. Sites of significance to Rangitāne are identified, protected or acknowledged.
Target met. Cultural impact assessments completed for new development areas. Kikiwhenua identified and protected part of Plan Change C.
Council takes a whole-of-council approach to proactively work with owners of heritage buildings and features to preserve the city’s heritage. [Heritage Management Plan]
3. Increase in the number of scheduled heritage features contained in the District Plan. (Current numbers are 7 Sites of Significance to Tangata Whenua, 89 Buildings & Objects, 2 Heritage Areas, 117 Notable Trees and Groups of Trees, and 15 Habitats of Local Significance).
Target not met. Target not met due to no Plan Changes scheduled for this year. The project scope for the review of notable trees in the District Plan is currently being developed.
4. Increase in investment in earthquake-prone heritage buildings.
Target met. Supporting a number of owners to work towards works via the heritage fund. Allocation of heritage fund applications.
Council manages its Arts, Culture and Heritage Activity in a financially sustainable way.
5. Major services and projects are provided within budget.
Target met. Services provided within budget.
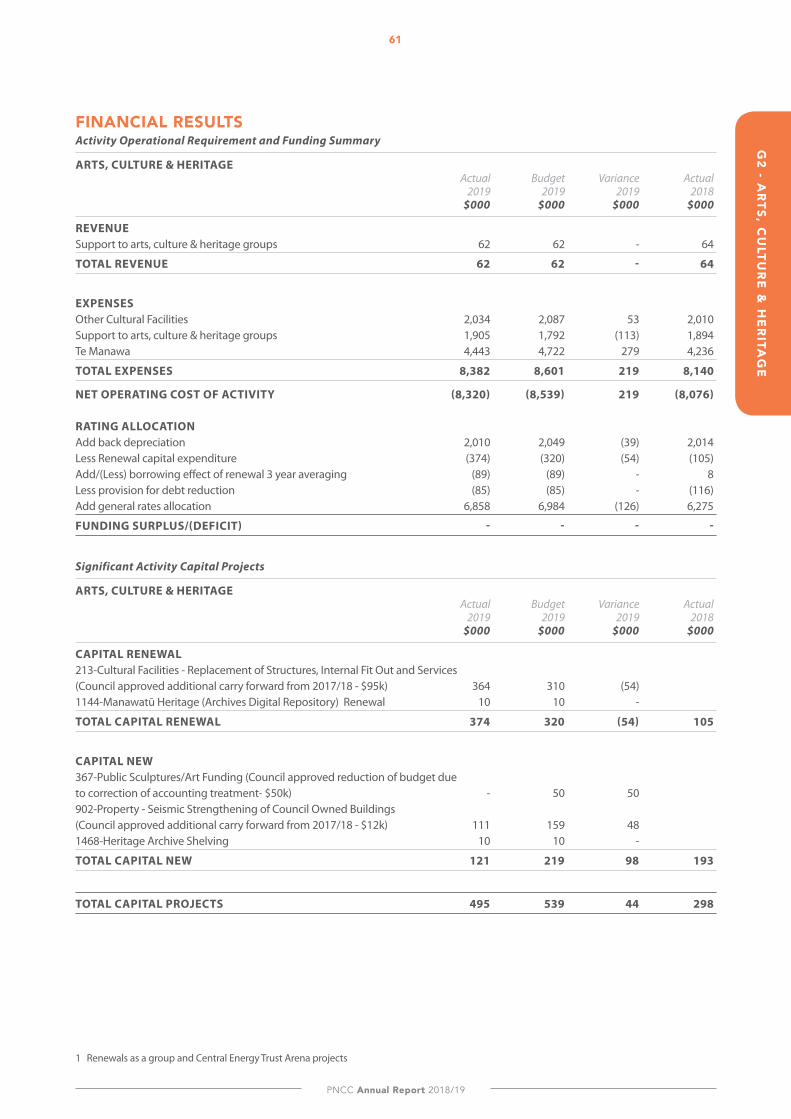
PNCC Annual Report 2018/19
61G
2 - AR
TS, CU
lTUR
E &
HE
RITA
GE
1 Renewals as a group and Central Energy Trust Arena projects
FINANCIAl RESUlTSActivity Operational Requirement and Funding Summary
ARTS, CULTURE & HERITAGE Actual Budget Variance Actual 2019 2019 2019 2018 $000 $000 $000 $000
REVENUE Support to arts, culture & heritage groups 62 62 - 64
TOTAL REVENUE 62 62 - 64
EXPENSES Other Cultural Facilities 2,034 2,087 53 2,010Support to arts, culture & heritage groups 1,905 1,792 (113) 1,894Te Manawa 4,443 4,722 279 4,236
TOTAL EXPENSES 8,382 8,601 219 8,140
NET OPERATING COST OF ACTIVITY (8,320) (8,539) 219 (8,076) RATING ALLOCATION Add back depreciation 2,010 2,049 (39) 2,014Less Renewal capital expenditure (374) (320) (54) (105)Add/(Less) borrowing effect of renewal 3 year averaging (89) (89) - 8Less provision for debt reduction (85) (85) - (116)Add general rates allocation 6,858 6,984 (126) 6,275
FUNDING SURPLUS/(DEFICIT) - - - -
Significant Activity Capital Projects
ARTS, CULTURE & HERITAGE Actual Budget Variance Actual 2019 2019 2019 2018 $000 $000 $000 $000
CAPITAL RENEWAL 213-Cultural Facilities - Replacement of Structures, Internal Fit Out and Services (Council approved additional carry forward from 2017/18 - $95k) 364 310 (54) 1144-Manawatū Heritage (Archives Digital Repository) Renewal 10 10 -
TOTAL CAPITAL RENEWAL 374 320 (54) 105
CAPITAL NEW 367-Public Sculptures/Art Funding (Council approved reduction of budget due to correction of accounting treatment- $50k) - 50 50 902-Property - Seismic Strengthening of Council Owned Buildings (Council approved additional carry forward from 2017/18 - $12k) 111 159 48 1468-Heritage Archive Shelving 10 10 -
TOTAL CAPITAL NEW 121 219 98 193
TOTAL CAPITAL PROJECTS 495 539 44 298
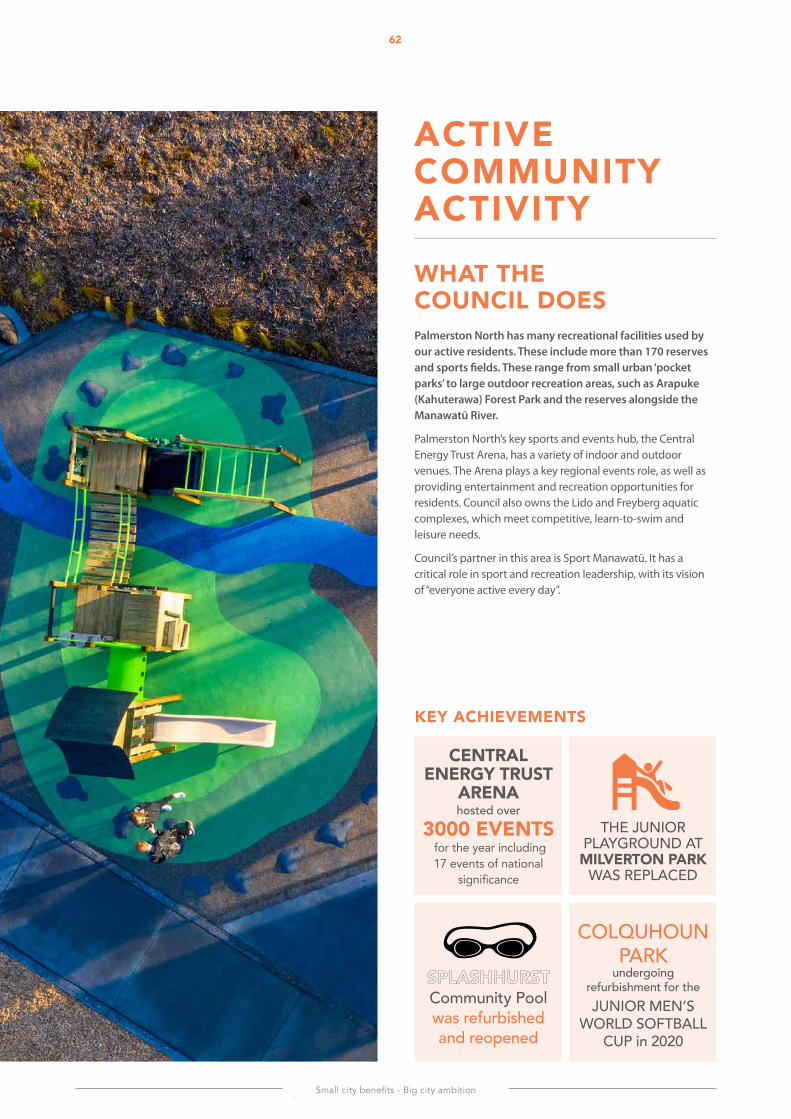
Small city benefits - Big city ambition
62G
2 -
AR
TS,
CU
lTU
RE
& H
ER
ITA
GE
ACtiVe COMMUNITY ACTIVITY
WhAt the CounCil DoesPalmerston North has many recreational facilities used by our active residents. These include more than 170 reserves and sports fields. These range from small urban ‘pocket parks’ to large outdoor recreation areas, such as Arapuke (Kahuterawa) Forest Park and the reserves alongside the Manawatū River.
Palmerston North’s key sports and events hub, the Central Energy Trust Arena, has a variety of indoor and outdoor venues. The Arena plays a key regional events role, as well as providing entertainment and recreation opportunities for residents. Council also owns the Lido and Freyberg aquatic complexes, which meet competitive, learn-to-swim and leisure needs.
Council’s partner in this area is Sport Manawatū. It has a critical role in sport and recreation leadership, with its vision of “everyone active every day”.
KEY ACHIEVEMENTS
THE JUNIOR PLAYGROUND AT MIlVERTON PARK
WAS REPLACED
COLQUHOUN PARK
undergoing refurbishment for theJUNIOR MEN’S
WORLD SOFTBALL CUP in 2020
CENTRAl ENERGY TRUST
ARENA hosted over
3000 eVents for the year including 17 events of national
significance
Community Pool was refurbished and reopened
PNCC Annual Report 2018/19
63G
2 - AC
TIVE
CO
MM
UN
ITY G
2 - AC
TIVE
CO
MM
UN
ITY
WHAT HAPPENED IN THE YEAR
CENTRAl ENERGY TRUST ARENACentral Energy Trust Arena had a successful year however did have to manage an interrupted period due to flood damage experienced at Fly Palmy Arena.
This flagship stadium underwent a complete floor replacement taking out venue for the second half of the financial year. As a result, over 100 individual bookings were impacted which caused interruptions to community sporting leagues. While unavoidable this has cost the facility revenue for this financial year, however the community now has one of the best indoor sports floors nationally available for future years.
Fly Palmy Arena experienced significant floor damage over the Christmas period. This effectively meant the facility was without its flagship stadium for the entire second half of the financial year. As a result, over 100 individual bookings were impacted. The staff juggled the needs of community groups with the commercial reality of still conducting events of significance to the city. This has caused major interruptions to community sporting leagues, which while unavoidable have cost the facility significant revenue.
Central Energy Trust Arena still had a strong year with many major events attracted to the city bringing significant economic benefit:
• Le Cirque Vole; • NZDIA Forum; • NZ Secondary School Basketball Nationals; • NZ Secondary Schools Volleyball Nationals; • NZ Junior Badminton Nationals; • Futsal Nationals; • International Schoolgirls Netball Exchange; • Harlem Globetrotters;• Eclipse Pink Floyd Tribute; • Pulse Netball;• Hurricanes Super Rugby; and • a UB40 Concert.
These headline events were joined by annual events such as the “sold-out” Speedway Teams Champs, Manawatū Home and Lifestyle Show, Women’s Lifestyle Expo, Christmas in the Park and Manawatū Turbo’s home games.
Palmerston North City Council would like to acknowledge the contribution of the following organisations towards the multi-sport artificial turf at Central Energy Trust Arena:
• New Zealand Community Trust;• The Lion Foundation;• Mainland Foundation; and • Eastern and Central Community Trust.
CITY-WIDE RESERVES / lOCAl RESERVES There have been many projects undertaken on Council reserves during the year. Many of these are smaller ongoing
projects such as replacing furniture and playground components. As well as renewing signs, hard surfaces and gardens to ensure that parks assets continue to meet the expectations of residents.
Larger projects were also undertaken to provide unique and enjoyable parks and reserves for Palmerston North residents:
• Council installed a flying fox, log scramble, walking tracks, a disk golf course and a dog agility park at the Linklater reserve.
• The old Ashhurst school pool was refurbished and reopened on June 22nd as Splashhurst Community Pool. The pool is owned by Council and managed by CLM.
• A new pumping facility was installed at the Hokowhitu Lagoon to help manage water levels.
• The Esplanade master planning framework was completed, and the Esplanade User Group Forum was established to guide future development.
• The junior playground at Milverton Park was replaced, after serving the community well over the last 26 years.
• A mobile gymnasium was installed at the Ashhurst Domain.
• The Manawatū Mountain Bike Club continued to develop Mountain bike trails at Arapuke Park.
• Council Installed new irrigation in the Victoria Esplanade Rose Gardens.
CENTRAl ENERGY TRUST WIlDBASE RECOVERY CENTRECentral Energy Trust Wildbase Recovery Centre opened to the public mid-February through a graduated opening approach. This approach ensured the successful management of initial public interest and ensured that the visitor experience was maximised. This also allowed flexibility to change the approach based on how the different groups interacted with the centre.
The centre has seen over 35,000 visitors in the first three months of operation. Given that the centre was operating in a limited capacity during this period, the centre is on track to reach its annual projection of 100,000 visitors. The graduated approach also assisted in the development of the education programme. The approach meant the Centre was able to identify parts of the community where additional content and programmes needed to be created. During this time, over 1,500 students have also accessed the free education programme Their feedback helped to develop and improve the offering for the remainder of the school year.
Through this process the centre connected with a large range of groups in the community using our primary engagement channels (free public access, education programmes, and guided tours). Using social media and digital tools the centre reached a wider audience and these systems will continue to be developed and improved. This continued development indicates a progression for the centre to operate over seven
Small city benefits - Big city ambition
G2
- A
CTI
VE
CO
MM
UN
ITY
64
days with a national and potentially international reach.
Central Energy Trust Wildbase Recovery opened at the beginning of 2019 following a commissioning period. The project was possible thanks to substantial community assistance and support. Palmerston North City Council acknowledges the major grants received from:
• Wildbase Recovery Community Trust; • Central Energy Trust; • NZ Lotteries Commission; • Powerco; • NZ Community Trust; • Eastern & Central Community Trust; • The Lion Foundation;• The Sargood Bequest; and • Pub Charity Ltd.
There have also been many others who have supported the project, such as community groups and several trade-related parties who have contributed in-kind.
SPORTS FIElDSThe Council is supporting the Junior Men’s World Softball Cup, at Colquhoun Park in 2020, through the refurbishment of the existing pavilion and development of the grounds. Extensive project planning has been undertaken during the year to enable this large capital works programme to commence in August 2019.
Massey University confirmed its commitment to the installation of an artificial hockey turf, and after securing external funding, awarded a construction contract in June 2019.
Manawatū Cricket secured funds for their share of an upgrade to the Bruce Turner pavilion and the grandstand, which have now been completed. The installation of new practice nets at Fitzherbert Park will commence in spring.
Council also engaged in a few other projects to upgrade aspects of our sporting fields:
• New field drainage was installed at Ongley Park. • Council completed installing shade and shelter at the
Manawatū Community Athletics Track. • The tennis court surfaces at Awapuni and Vautier Parks
were also renewed.
SUPPORT TO RECREATION GROUPSThe Council’s support to recreation groups is predominately through its contract with Sport Manawatū. They continue to run a variety of programmes linked to improving health and active lifestyle outcomes. As well as building the sport sector’s capacity and capability through a wide range of up-skilling activities for sports organisations, coaches, sport and recreation providers and volunteers.
A key event organised by Sport Manawatū was the Regional Sports Conference held in August 2018. The event was attended by 120 partners and organisations from the sport
and recreation sector. The topics covered included technology and diversity in sport, social media, engagement and managing player behaviour. Sport Manawatū also administer two funds on behalf of the Council. These funds aim to support sports events and remove barriers for people on low incomes to participate in sport and recreation.
There are a variety of projects that Council and Sport Manawatū staff have worked on collaboratively. These projects contribute towards meeting Council’s strategic aspirations:
• Council and Sport Manawatū engaged on the future of bowls discussions.
• Sport Manawatū is actively in the Manawatū River framework.
• Council engaged Sport Manawatū in its artificial turf projects.
• The two organisations consulted thoroughly on aspirations for the Arena Master Plan development.
• Council involved Sport Manawatū on fitness trail and exercise equipment projects.
• The Raleigh Park development involved direct input from Sport Manawatū.
Sport Manawatū’s Active Transport Advisor also plays a key role in delivering cycle skills training programmes to school-aged children.
In addition, Council supports recreation groups in a variety of ways such as granting leases on Council reserve land. As well as supporting clubs and organisations through operating grants (e.g. Manawatū Mountain Bike Club, Massey University).
ONGOING CONSIDERATIONS The Arena Masterplan is undergoing detailed design of priority projects and finalising the layout of the various components based on masterplan concept designs. Projects have also been realigned to enable proper design to occur where projects interlink. This will also allow for more accurate construction timelines within existing budgets.
Arena Masterplan projects and timelines going forward are:
• Speedway Pits: this project will be conducted in two stages to ensure operations for speedway are not hindered. Stage one will occur in the 2019/20 financial year and stage two in the 2020/21 financial year.
• Entrance Plaza: this project directly links with stage two of the speedway project and will occur in the 2020/21 financial year.
• Embankment: this project will occur across three financial years between 2019-2022. This will create a link from the redeveloped south side of the Arena One venue around to and linking with the existing Grandstand.
• South Grandstand: the design of the embankment will consider and allow for the development of a new Grandstand which is planned for the 2022/23 financial year.
Construction of the new Artificial Turf is expected to open in July 2019. Demolition of buildings on the corner of
PNCC Annual Report 2018/19
G2 - A
CTIV
E C
OM
MU
NITY
65
Waldegrave and Cuba Streets will take place to make way for the new Entrance Plaza to be constructed.
Considerable asset renewal works will also be undertaken during the 2019/20 financial year. This includes the resurfacing of all courts in the B&M Centre over the Christmas period. As well as new LED lighting, ceiling acoustic tile replacement and enhancements to the sprinkler system in Fly Palmy Arena and improvement to stormwater systems in the facility.
The splash pad at Memorial Park, which is a key component of the park masterplan, didn’t commence in 2018/2019 as expected. This was because Council had not secured the external funding needed. Whilst this project had merit, Council knew the that external funding environment is limited. They chose not to apply for this funding until funding for other Council projects had been secured. In future, Council will need to carefully consider the impacts of the limited pool of external funding on the timing. As well as Council’s contribution to reserve projects in the 10-Year Plan.
The primary issue for the Central Energy Trust Wildbase Recovery Centre will be ensuring that the level of service to the community is maximised while balancing with the needs of the patients. This provides a unique challenge where the centre attempts to provide as many services as possible while not negatively impacting animal welfare. This is managed through clear messaging about the importance of the primary function of the facility, the animal welfare. This will enable the Centre to celebrate the goals of being a community focused council while balancing the eco city approach.
Another key issue for the Centre will be ensuring that community access will be made available wherever possible. This includes the education programme but also focuses on the wider community groups who may have accessibility
restrictions which need to be considered. By working with the wider Council and Community Unit, strategies will be put in place to ensure existing frameworks are used and built on where possible. The interpretation material will need to be continuously developed to ensure that it stays relevant to the current climate.
Council is applying the Sports Facility Investment Process, a component of the Regional Sports Facilities Plan, to the artificial turf project. The project is now entering the feasibility phase to determine the long-term feasibility of the project. Even if the project is feasible, there are many more stages it must progress through. This including Central Football securing external funding before construction can commence.
Council’s Active Community Plan set priorities to achieve the goal of having the most active community in the country. The delivery of actions within this Plan requires greater collaboration with Sport Manawatū, sport and recreation groups and the wider community. This will allow Council to reduce barriers to participation, maximise recreation opportunities the City offers and respond to emerging demographic and societal trends. A new partnership arrangement with Sport Manawatū is being entered, which includes a new set of outcomes aligned with the Council’s strategic direction.
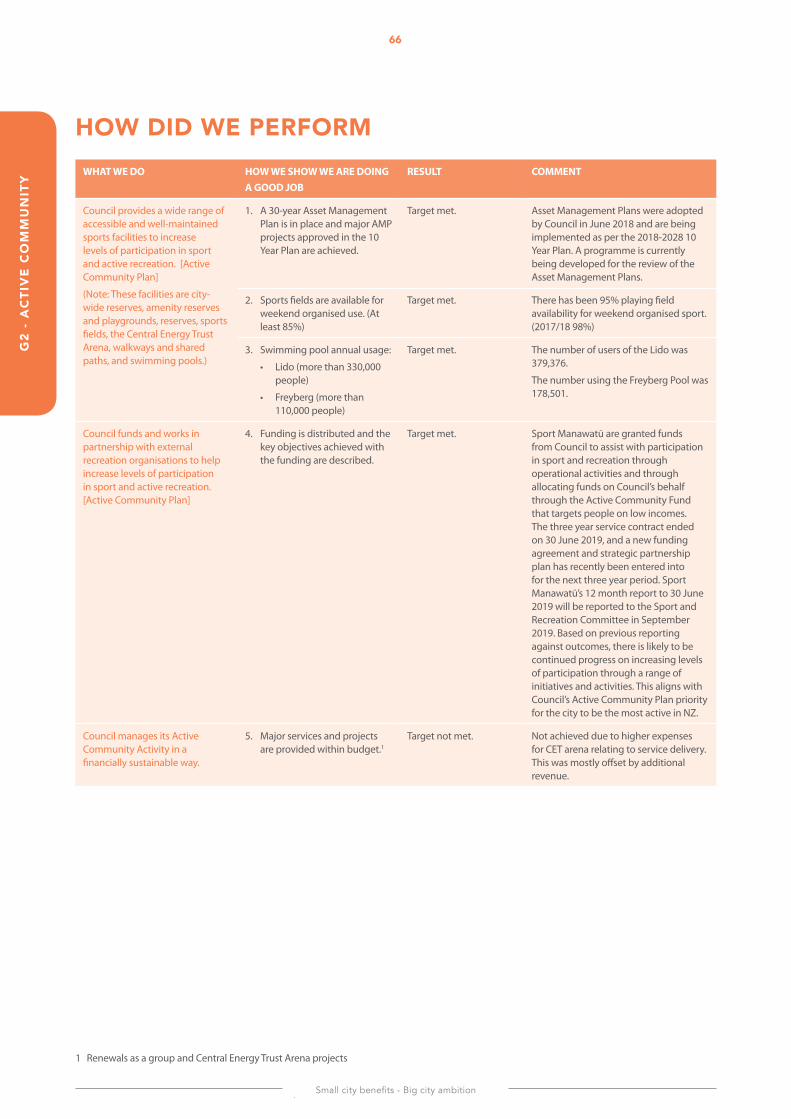
Small city benefits - Big city ambition
66G
2 -
AC
TIV
E C
OM
MU
NIT
Y
HOW DID WE PERFORMWHAT WE DO HOW WE SHOW WE ARE DOING
A GOOD JOBRESULT COMMENT
Council provides a wide range of accessible and well-maintained sports facilities to increase levels of participation in sport and active recreation. [Active Community Plan]
(Note: These facilities are city-wide reserves, amenity reserves and playgrounds, reserves, sports fields, the Central Energy Trust Arena, walkways and shared paths, and swimming pools.)
1. A 30-year Asset Management Plan is in place and major AMP projects approved in the 10 Year Plan are achieved.
Target met. Asset Management Plans were adopted by Council in June 2018 and are being implemented as per the 2018-2028 10 Year Plan. A programme is currently being developed for the review of the Asset Management Plans.
2. Sports fields are available for weekend organised use. (At least 85%)
Target met. There has been 95% playing field availability for weekend organised sport. (2017/18 98%)
3. Swimming pool annual usage:
• Lido (more than 330,000 people)
• Freyberg (more than 110,000 people)
Target met. The number of users of the Lido was 379,376.
The number using the Freyberg Pool was 178,501.
Council funds and works in partnership with external recreation organisations to help increase levels of participation in sport and active recreation. [Active Community Plan]
4. Funding is distributed and the key objectives achieved with the funding are described.
Target met. Sport Manawatū are granted funds from Council to assist with participation in sport and recreation through operational activities and through allocating funds on Council’s behalf through the Active Community Fund that targets people on low incomes. The three year service contract ended on 30 June 2019, and a new funding agreement and strategic partnership plan has recently been entered into for the next three year period. Sport Manawatū’s 12 month report to 30 June 2019 will be reported to the Sport and Recreation Committee in September 2019. Based on previous reporting against outcomes, there is likely to be continued progress on increasing levels of participation through a range of initiatives and activities. This aligns with Council’s Active Community Plan priority for the city to be the most active in NZ.
Council manages its Active Community Activity in a financially sustainable way.
5. Major services and projects are provided within budget.1
Target not met. Not achieved due to higher expenses for CET arena relating to service delivery. This was mostly offset by additional revenue.
1 Renewals as a group and Central Energy Trust Arena projects
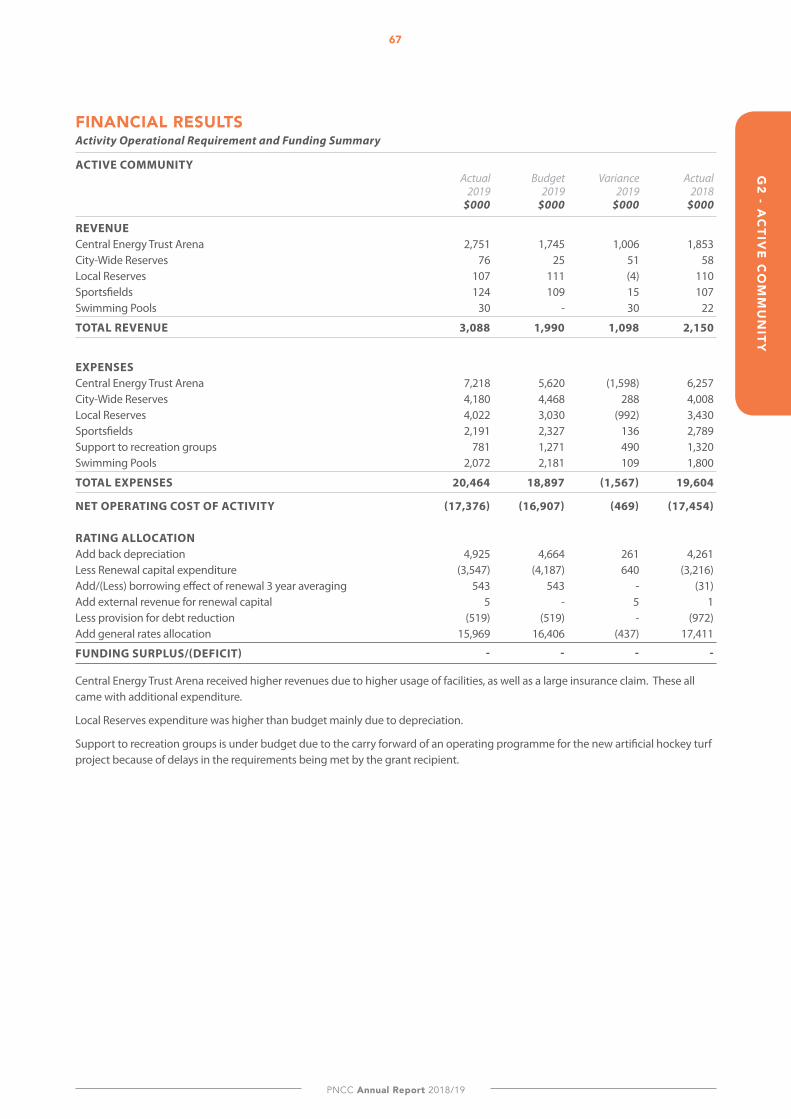
PNCC Annual Report 2018/19
G2 - A
CTIV
E C
OM
MU
NITY
67
FINANCIAl RESUlTSActivity Operational Requirement and Funding Summary
ACTIVE COMMUNITY Actual Budget Variance Actual 2019 2019 2019 2018 $000 $000 $000 $000
REVENUE Central Energy Trust Arena 2,751 1,745 1,006 1,853City-Wide Reserves 76 25 51 58Local Reserves 107 111 (4) 110Sportsfields 124 109 15 107Swimming Pools 30 - 30 22
TOTAL REVENUE 3,088 1,990 1,098 2,150
EXPENSES Central Energy Trust Arena 7,218 5,620 (1,598) 6,257City-Wide Reserves 4,180 4,468 288 4,008Local Reserves 4,022 3,030 (992) 3,430Sportsfields 2,191 2,327 136 2,789Support to recreation groups 781 1,271 490 1,320Swimming Pools 2,072 2,181 109 1,800
TOTAL EXPENSES 20,464 18,897 (1,567) 19,604
NET OPERATING COST OF ACTIVITY (17,376) (16,907) (469) (17,454) RATING ALLOCATION Add back depreciation 4,925 4,664 261 4,261Less Renewal capital expenditure (3,547) (4,187) 640 (3,216)Add/(Less) borrowing effect of renewal 3 year averaging 543 543 - (31)Add external revenue for renewal capital 5 - 5 1Less provision for debt reduction (519) (519) - (972)Add general rates allocation 15,969 16,406 (437) 17,411
FUNDING SURPLUS/(DEFICIT) - - - -
Central Energy Trust Arena received higher revenues due to higher usage of facilities, as well as a large insurance claim. These all came with additional expenditure.
Local Reserves expenditure was higher than budget mainly due to depreciation.
Support to recreation groups is under budget due to the carry forward of an operating programme for the new artificial hockey turf project because of delays in the requirements being met by the grant recipient.
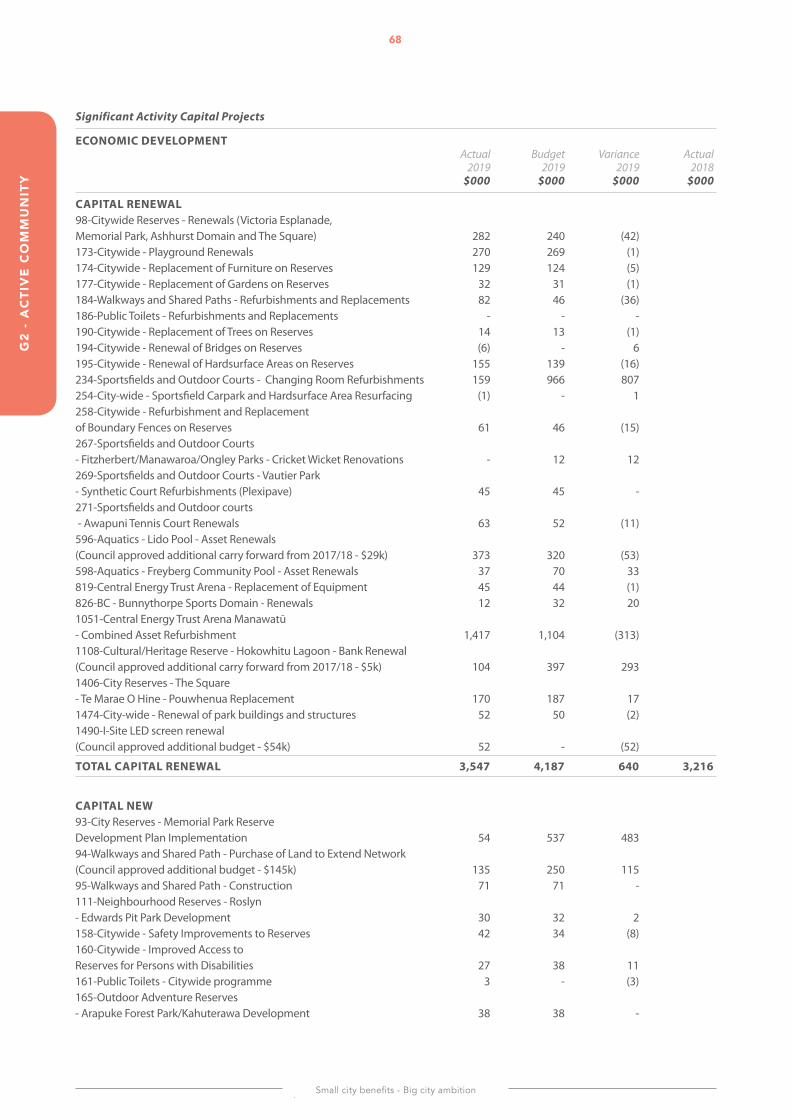
Small city benefits - Big city ambition
68G
2 -
AC
TIV
E C
OM
MU
NIT
Y
Significant Activity Capital Projects
ECONOMIC DEVELOPMENT Actual Budget Variance Actual 2019 2019 2019 2018 $000 $000 $000 $000
CAPITAL RENEWAL 98-Citywide Reserves - Renewals (Victoria Esplanade, Memorial Park, Ashhurst Domain and The Square) 282 240 (42) 173-Citywide - Playground Renewals 270 269 (1) 174-Citywide - Replacement of Furniture on Reserves 129 124 (5) 177-Citywide - Replacement of Gardens on Reserves 32 31 (1) 184-Walkways and Shared Paths - Refurbishments and Replacements 82 46 (36) 186-Public Toilets - Refurbishments and Replacements - - - 190-Citywide - Replacement of Trees on Reserves 14 13 (1) 194-Citywide - Renewal of Bridges on Reserves (6) - 6 195-Citywide - Renewal of Hardsurface Areas on Reserves 155 139 (16) 234-Sportsfields and Outdoor Courts - Changing Room Refurbishments 159 966 807 254-City-wide - Sportsfield Carpark and Hardsurface Area Resurfacing (1) - 1 258-Citywide - Refurbishment and Replacement of Boundary Fences on Reserves 61 46 (15) 267-Sportsfields and Outdoor Courts - Fitzherbert/Manawaroa/Ongley Parks - Cricket Wicket Renovations - 12 12 269-Sportsfields and Outdoor Courts - Vautier Park - Synthetic Court Refurbishments (Plexipave) 45 45 - 271-Sportsfields and Outdoor courts - Awapuni Tennis Court Renewals 63 52 (11) 596-Aquatics - Lido Pool - Asset Renewals (Council approved additional carry forward from 2017/18 - $29k) 373 320 (53) 598-Aquatics - Freyberg Community Pool - Asset Renewals 37 70 33 819-Central Energy Trust Arena - Replacement of Equipment 45 44 (1) 826-BC - Bunnythorpe Sports Domain - Renewals 12 32 20 1051-Central Energy Trust Arena Manawatū - Combined Asset Refurbishment 1,417 1,104 (313) 1108-Cultural/Heritage Reserve - Hokowhitu Lagoon - Bank Renewal (Council approved additional carry forward from 2017/18 - $5k) 104 397 293 1406-City Reserves - The Square - Te Marae O Hine - Pouwhenua Replacement 170 187 17 1474-City-wide - Renewal of park buildings and structures 52 50 (2) 1490-I-Site LED screen renewal (Council approved additional budget - $54k) 52 - (52)
TOTAL CAPITAL RENEWAL 3,547 4,187 640 3,216
CAPITAL NEW 93-City Reserves - Memorial Park Reserve Development Plan Implementation 54 537 483 94-Walkways and Shared Path - Purchase of Land to Extend Network (Council approved additional budget - $145k) 135 250 115 95-Walkways and Shared Path - Construction 71 71 - 111-Neighbourhood Reserves - Roslyn - Edwards Pit Park Development 30 32 2 158-Citywide - Safety Improvements to Reserves 42 34 (8) 160-Citywide - Improved Access to Reserves for Persons with Disabilities 27 38 11 161-Public Toilets - Citywide programme 3 - (3) 165-Outdoor Adventure Reserves - Arapuke Forest Park/Kahuterawa Development 38 38 -
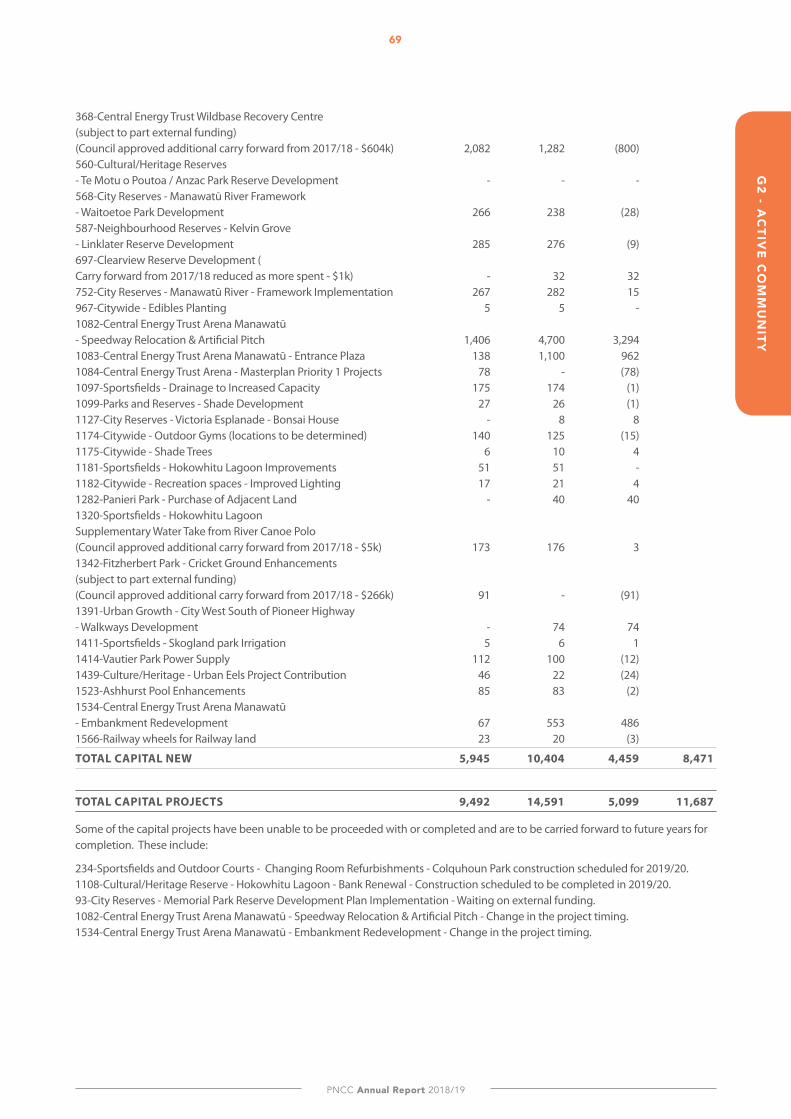
PNCC Annual Report 2018/19
69G
2 - AC
TIVE
CO
MM
UN
ITY
368-Central Energy Trust Wildbase Recovery Centre (subject to part external funding) (Council approved additional carry forward from 2017/18 - $604k) 2,082 1,282 (800) 560-Cultural/Heritage Reserves - Te Motu o Poutoa / Anzac Park Reserve Development - - - 568-City Reserves - Manawatū River Framework - Waitoetoe Park Development 266 238 (28) 587-Neighbourhood Reserves - Kelvin Grove - Linklater Reserve Development 285 276 (9) 697-Clearview Reserve Development ( Carry forward from 2017/18 reduced as more spent - $1k) - 32 32 752-City Reserves - Manawatū River - Framework Implementation 267 282 15 967-Citywide - Edibles Planting 5 5 - 1082-Central Energy Trust Arena Manawatū - Speedway Relocation & Artificial Pitch 1,406 4,700 3,294 1083-Central Energy Trust Arena Manawatū - Entrance Plaza 138 1,100 962 1084-Central Energy Trust Arena - Masterplan Priority 1 Projects 78 - (78) 1097-Sportsfields - Drainage to Increased Capacity 175 174 (1) 1099-Parks and Reserves - Shade Development 27 26 (1) 1127-City Reserves - Victoria Esplanade - Bonsai House - 8 8 1174-Citywide - Outdoor Gyms (locations to be determined) 140 125 (15) 1175-Citywide - Shade Trees 6 10 4 1181-Sportsfields - Hokowhitu Lagoon Improvements 51 51 - 1182-Citywide - Recreation spaces - Improved Lighting 17 21 4 1282-Panieri Park - Purchase of Adjacent Land - 40 40 1320-Sportsfields - Hokowhitu Lagoon Supplementary Water Take from River Canoe Polo (Council approved additional carry forward from 2017/18 - $5k) 173 176 3 1342-Fitzherbert Park - Cricket Ground Enhancements (subject to part external funding) (Council approved additional carry forward from 2017/18 - $266k) 91 - (91) 1391-Urban Growth - City West South of Pioneer Highway - Walkways Development - 74 74 1411-Sportsfields - Skogland park Irrigation 5 6 1 1414-Vautier Park Power Supply 112 100 (12) 1439-Culture/Heritage - Urban Eels Project Contribution 46 22 (24) 1523-Ashhurst Pool Enhancements 85 83 (2) 1534-Central Energy Trust Arena Manawatū - Embankment Redevelopment 67 553 486 1566-Railway wheels for Railway land 23 20 (3)
TOTAL CAPITAL NEW 5,945 10,404 4,459 8,471
TOTAL CAPITAL PROJECTS 9,492 14,591 5,099 11,687
Some of the capital projects have been unable to be proceeded with or completed and are to be carried forward to future years for completion. These include:
234-Sportsfields and Outdoor Courts - Changing Room Refurbishments - Colquhoun Park construction scheduled for 2019/20. 1108-Cultural/Heritage Reserve - Hokowhitu Lagoon - Bank Renewal - Construction scheduled to be completed in 2019/20. 93-City Reserves - Memorial Park Reserve Development Plan Implementation - Waiting on external funding. 1082-Central Energy Trust Arena Manawatū - Speedway Relocation & Artificial Pitch - Change in the project timing. 1534-Central Energy Trust Arena Manawatū - Embankment Redevelopment - Change in the project timing.
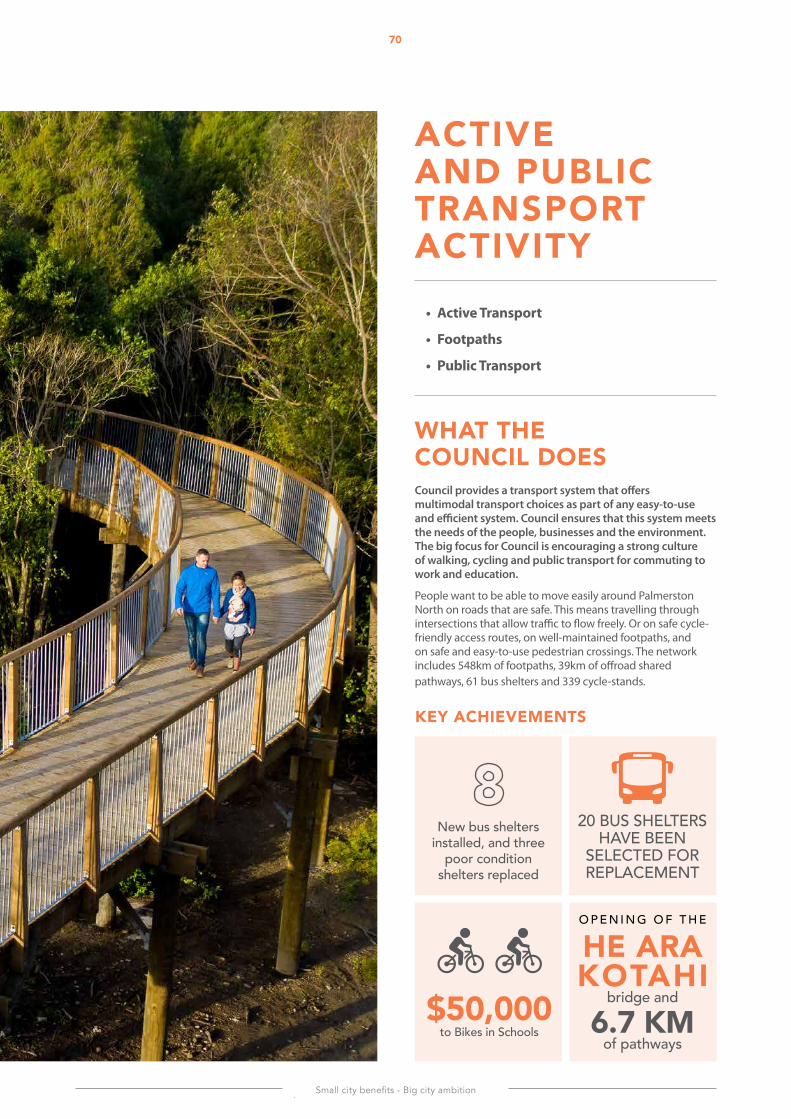
Small city benefits - Big city ambition
G2
- A
CTI
VE
AN
D P
UB
lIC
TR
AN
SPO
RT
70
KEY ACHIEVEMENTS
ACtiVe AnD PuBliC TRANSPORT ACTIVITY
• Active Transport
• Footpaths
• Public Transport
WhAt the CounCil DoesCouncil provides a transport system that offers multimodal transport choices as part of any easy-to-use and efficient system. Council ensures that this system meets the needs of the people, businesses and the environment. The big focus for Council is encouraging a strong culture of walking, cycling and public transport for commuting to work and education.
People want to be able to move easily around Palmerston North on roads that are safe. This means travelling through intersections that allow traffic to flow freely. Or on safe cycle-friendly access routes, on well-maintained footpaths, and on safe and easy-to-use pedestrian crossings. The network includes 548km of footpaths, 39km of offroad shared pathways, 61 bus shelters and 339 cycle-stands.
20 BUS SHELTERS HAVE BEEN
SELECTED FOR REPLACEMENT
O P E N I N G O F T H E
HE ARA KotAhi
bridge and
6.7 KM of pathways
New bus shelters installed, and three
poor condition shelters replaced
$50,000 to Bikes in Schools
PNCC Annual Report 2018/19
G2 - A
CTIV
E A
ND
PU
BlIC
TRA
NSP
OR
T71
WHAT HAPPENED IN THE YEAR
ACTIVE TRANSPORTIn 2018/19, Council strived towards creating an easily accessible and maneuverable city with key improvements to the active transport network:
• He Ara Kotahi, or ‘pathway that brings people together’, was completed and opened in June 2019. He Ara Kotahi is comprised of a new pedestrian cycle bridge across the Manawatū River and 6.7 km of off-road pathway. The pathway connects Massey University and Linton to the city. It also provides a new direct off-road sealed cycle route to Massey University and the research campus.
• Council has continued its support of Bikes in Schools and provided $40,000 to Ashhurst School and $10,000 to Hokowhitu School. The Ashhurst School bike facilities were opened on 22 June.
• The Walker’s Road pathway linking the Adventist College to the Pioneer Highway shared pathway was completed and formally opened in May 2019.
Palmerston North City Council would like to acknowledge the contribution from Central Energy Trust towards the lighting for He Ara Kotahi bridge.
FOOTPATHSCouncil is investing strongly in maintaining and upgrading the footpath network around the city. In 2018/19 several footpaths were extended to meet the needs of the residents and growth of the city.
Footpath extensions were completed on:
• McGregor Street;• Racecourse Road;• James Line; and • Centennial Drive.
PUBlIC TRANSPORTHorizons Regional Council provides the public transport services while Palmerston North City Council provides bus stops and shelters. Both councils work together to ensure services meet residents’ needs.
In 2018/19, Palmerston North City Council investigated several opportunities to install and upgrade bus shelters around the city:
• The investment to develop a safer buffered cycleway route along College Street was started with investment
in indented bus bays completed. Work is now on-hold pending discussions with affected business owners in the Awapuni shopping centre. This is to mitigate the impact of car parking loss on College Street.
• Eight new bus shelters have been installed and three poor condition shelters replaced.
• A further 20 bus shelters have been selected for replacement. Work is underway to tender for the supply of the shelters to ensure value for money.
ONGOING CONSIDERATIONS With key progress made to key elements of the cycling and walking infrastructure, the focus will shift to joining up existing elements of the network. This will provide enhanced and safer options for cyclists and pedestrians. Council is currently consulting on the Urban Cycling Masterplan, which sets out a vision for a priority network.
To enable construction of a cost-effective active transport network will require trade-offs, particularly in respect to the road. The impacts particularly on parking will require on-going engagement with the community. Council will need to ensure the benefits of an active city are achieved with acceptable impacts on existing road users. To assist with developing a futuristic and integrated transport network, Council is undertaking work to clarify how the road space might be allocated. This work is integral to better meet the needs of different users and transport modes.
Specific investment in creating streets and places for people will continue within and around The Square and Central Business District. The ‘Streets for People’ and Cuba Street stage two projects will continue to invest in cycle and pedestrian prioritised spaces.
Council continues to work collaboratively with Horizons Regional Council to deliver improved public services. This will include investment in infrastructure for improved bus stops, more bus shelters and an upgraded central city bus terminal. These investments will be scheduled and designed to support and integrate with Horizons Regional Council’s new ticketing initiatives. A review of the services will also take place to inform a re-tendering of the public transport services.
HOW DID WE PERFORMThe levels of service and performance measures for this Activity are included with the Strategic Transport (Roading) levels of service pages 43-44.
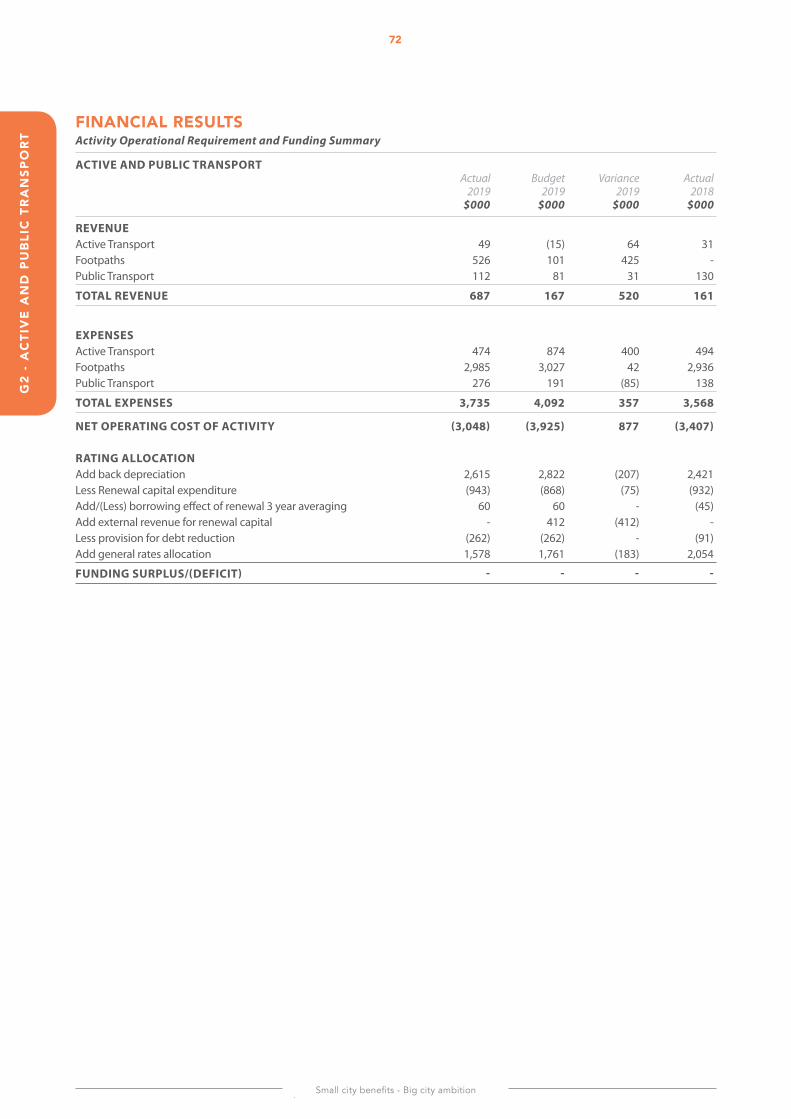
Small city benefits - Big city ambition
72G
2 -
AC
TIV
E A
ND
PU
BlI
C T
RA
NSP
OR
T
FINANCIAl RESUlTSActivity Operational Requirement and Funding Summary
ACTIVE AND PUBLIC TRANSPORT Actual Budget Variance Actual 2019 2019 2019 2018 $000 $000 $000 $000
REVENUE Active Transport 49 (15) 64 31Footpaths 526 101 425 -Public Transport 112 81 31 130
TOTAL REVENUE 687 167 520 161
EXPENSES Active Transport 474 874 400 494Footpaths 2,985 3,027 42 2,936Public Transport 276 191 (85) 138
TOTAL EXPENSES 3,735 4,092 357 3,568
NET OPERATING COST OF ACTIVITY (3,048) (3,925) 877 (3,407) RATING ALLOCATION Add back depreciation 2,615 2,822 (207) 2,421Less Renewal capital expenditure (943) (868) (75) (932)Add/(Less) borrowing effect of renewal 3 year averaging 60 60 - (45)Add external revenue for renewal capital - 412 (412) -Less provision for debt reduction (262) (262) - (91)Add general rates allocation 1,578 1,761 (183) 2,054
FUNDING SURPLUS/(DEFICIT) - - - -
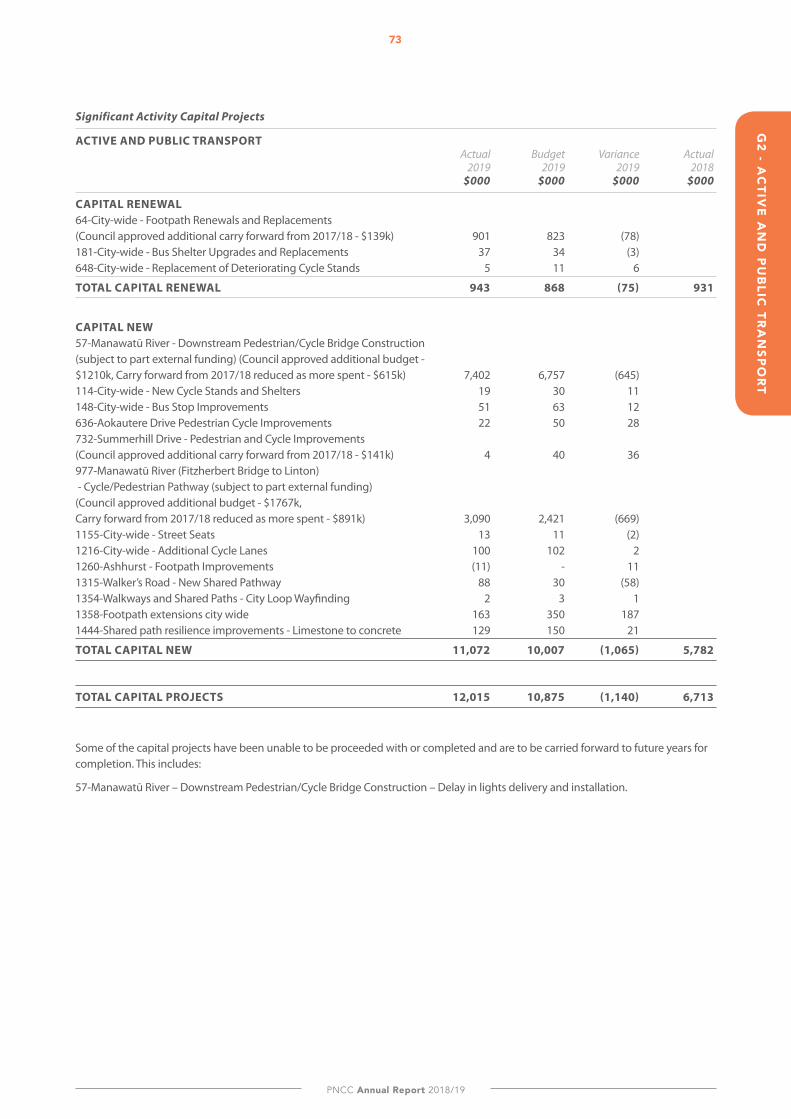
PNCC Annual Report 2018/19
G2 - A
CTIV
E A
ND
PU
BlIC
TRA
NSP
OR
T73
Significant Activity Capital Projects
ACTIVE AND PUBLIC TRANSPORT Actual Budget Variance Actual 2019 2019 2019 2018 $000 $000 $000 $000
CAPITAL RENEWAL 64-City-wide - Footpath Renewals and Replacements (Council approved additional carry forward from 2017/18 - $139k) 901 823 (78) 181-City-wide - Bus Shelter Upgrades and Replacements 37 34 (3) 648-City-wide - Replacement of Deteriorating Cycle Stands 5 11 6
TOTAL CAPITAL RENEWAL 943 868 (75) 931
CAPITAL NEW 57-Manawatū River - Downstream Pedestrian/Cycle Bridge Construction (subject to part external funding) (Council approved additional budget - $1210k, Carry forward from 2017/18 reduced as more spent - $615k) 7,402 6,757 (645) 114-City-wide - New Cycle Stands and Shelters 19 30 11 148-City-wide - Bus Stop Improvements 51 63 12 636-Aokautere Drive Pedestrian Cycle Improvements 22 50 28 732-Summerhill Drive - Pedestrian and Cycle Improvements (Council approved additional carry forward from 2017/18 - $141k) 4 40 36 977-Manawatū River (Fitzherbert Bridge to Linton) - Cycle/Pedestrian Pathway (subject to part external funding) (Council approved additional budget - $1767k, Carry forward from 2017/18 reduced as more spent - $891k) 3,090 2,421 (669) 1155-City-wide - Street Seats 13 11 (2) 1216-City-wide - Additional Cycle Lanes 100 102 2 1260-Ashhurst - Footpath Improvements (11) - 11 1315-Walker’s Road - New Shared Pathway 88 30 (58) 1354-Walkways and Shared Paths - City Loop Wayfinding 2 3 1 1358-Footpath extensions city wide 163 350 187 1444-Shared path resilience improvements - Limestone to concrete 129 150 21
TOTAL CAPITAL NEW 11,072 10,007 (1,065) 5,782
TOTAL CAPITAL PROJECTS 12,015 10,875 (1,140) 6,713
Some of the capital projects have been unable to be proceeded with or completed and are to be carried forward to future years for completion. This includes:
57-Manawatū River – Downstream Pedestrian/Cycle Bridge Construction – Delay in lights delivery and installation.
Small city benefits - Big city ambition
74
GOAl 3ConneCteD & SAFE COMMUNITY The group activities for Goal 3 consists of:
CONNECTED COMMUNITIES(includes libraries, community centres, community groups and Social Housing)
SAFE COMMUNITIES(includes animal control, civil defence, public health & safer community initiatives)
PNCC Annual Report 2018/19
G3 - C
ON
NE
CTE
D &
SAFE
CO
MM
UN
ITY75
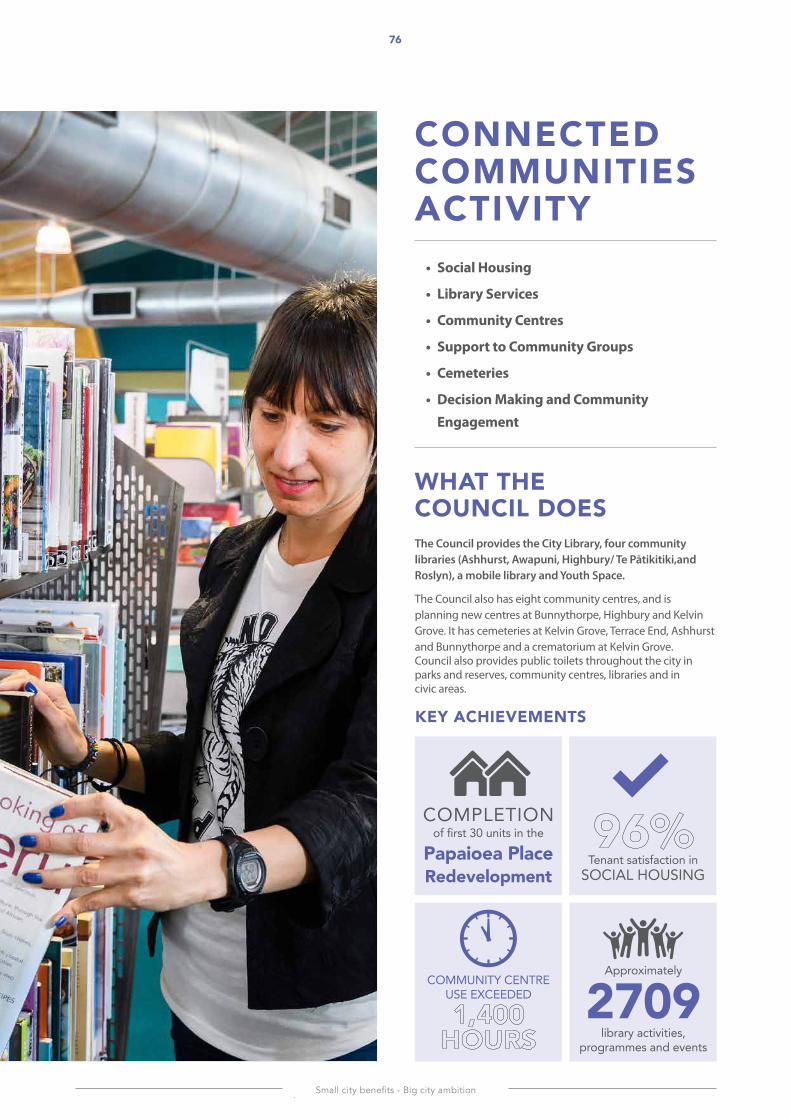
Small city benefits - Big city ambition
76G
3 -
CO
NN
EC
TED
CO
MM
UN
ITIE
S
KEY ACHIEVEMENTS
ConneCteD COMMUNITIES ACTIVITY
• Social Housing
• Library Services
• Community Centres
• Support to Community Groups
• Cemeteries
• Decision Making and Community Engagement
WhAt the CounCil DoesThe Council provides the City Library, four community libraries (Ashhurst, Awapuni, Highbury/ Te Pātikitiki,and Roslyn), a mobile library and Youth Space.
The Council also has eight community centres, and is planning new centres at Bunnythorpe, Highbury and Kelvin Grove. It has cemeteries at Kelvin Grove, Terrace End, Ashhurst and Bunnythorpe and a crematorium at Kelvin Grove. Council also provides public toilets throughout the city in parks and reserves, community centres, libraries and in civic areas.
Tenant satisfaction inSOCIAL HOUSING
Approximately
2709 library activities,
programmes and events
COMPLETION of first 30 units in the
Papaioea Place Redevelopment
COMMUNITY CENTRE USE EXCEEDED
PNCC Annual Report 2018/19
77G
3 - CO
NN
EC
TED
CO
MM
UN
ITIES
WHAT HAPPENED IN THE YEAR
SOCIAl HOUSINGThe major capital project undertaken by Council this year was the redevelopment of the Papaioea Place housing complex. The first 30 units of this 78-unit development were completed in February 2019 Construction of the next 20 units is well underway and due to be completed in December 2019.
Occupancy levels across Council’s social housing portfolio remained high with demand continuing to exceed availability. Since the first stage of Papaioea Place housing redevelopment project was completed, 30 grateful tenants have relocated into these units. Many reported feeling more connected to their local community in their modern, eco-friendly units. They’re engaging with their neighbours regularly and feel warm and safe in their new units.
The tenant satisfaction survey was completed with 96 per cent of respondents expressing their appreciation and satisfaction with their units, complex and service received from Council.
lIBRARY SERVICESPalmerston North’s libraries are some of the most heavily used Council facilities, with over 900,000 visits across seven locations including the Mobile Library. The libraries continue to be innovative in the way they respond to community needs.
The libraries provide a range of physical and digital content, services, programmes, connections and experiences:
• The Pasifika youth mentoring programme, Va Pasifika - Cultural Engagement from the Old Plantation, is a programme where young people attended a full three-day immersion weekend. The programme promotes connecting with traditional knowledge and expertise. Palmerston North City Council delivered the programme in partnership with UCOL, Massey University, Sport Manawatū, Oranga Tamariki and Te Wananga o Aotearoa.
• The City Library launched a new portal to its services and content last year. This new design with enhanced usability (particularly for mobile devices) has been well received by the community. The number of website sessions increased to 482,949 and the number of users increased by 23,081 to 304,337 over the year.
• The city libraries also joined a new Inter Loan group that enables reciprocal content material sharing with over 130 other New Zealand libraries.
• The city libraries also added Haynes Manuals, an on-line library of car and motorcycle repair manuals, to the digital collection.
• This year the Eastern and Central Community Trust sponsored Summer Reading Programme was highly successful. Over 764 children participated across the city library’s seven facilities.
• The Te Reo and Pasifika summer reading streams continued to go from strength to strength. This year an additional two languages were added to the multi-lingual options taking the total languages offered to 14.
E-book and e-audiobook collections have grown by 30 per cent and items and usage continues to grow. The breadth of digital content allows users to undertake server activities. These include learning a new language, taking a course to learn a new skill, or having an author read their book to their child. Together with other community partners, the City Library continues to support the creation and projection of original digital content on physical spaces.
Now with 22,000 digital items on line, Manawatū Heritage continues to raise the bar nationally for showcasing local heritage. It was recognised in 2019 with a citation for contributions to local history from the Palmerston North Heritage Trust. This year saw the introduction of bilingual navigation and the launch of the Manawatū Heritage Tours App. The Manawatū Heritage Kiosk brought the digital repository to people in the community across the city and had over 20,000 uses. Together with the National Library, The Manawatū Standard was digitised on Papers Past up to 1945.
Approximately 2,709 activities, programmes and events were delivered this year. All with the intention of fostering and supporting the goals of literacy, lifelong learning, creative expression, celebrating heritage and enhancing social connection and wellbeing:
• The libraries hosted several book launches, film festivals and poetry readings.
• The libraries engaged activities supporting Local Heritage Week and New Zealand Music Month.
The breadth of these programmes and events was able to be achieved because of collaboration with many of the city’s organisations, cultural institutions and the wider community. These collaborations add vibrancy and a sense of creativity to the city.
There has been a continued focus on youth development through daily activities and regular events and programmes at Youth Space. The focus this year continues to be on employment and preparing for work. Development opportunities have been offered on CV writing, personal branding, being work ready and youth leadership. These courses have run in conjunction with local organisations including Careers New Zealand, Youth Chamber of Commerce and tertiary education providers.
Potential opportunities in the tertiary sector and students continue drive library programmes as student involvement in the city and community continues to increase. The Youth Co-lab has continued to develop to facilitate community (youth) led development of programmes and services. This has enabled the Youth Space to be far more innovative in its service delivery.
Small city benefits - Big city ambition
G3
- C
ON
NE
CTE
D C
OM
MU
NIT
IES
78
COMMUNITY CENTRES (AND SUPPORT TO COMMUNITY GROUPS)Council’s community centres were well used this year, with usage exceeding the annual target of 1,400 hours of use each per annum:
• Ashhurst 1504; • Awapuni 3150; • Highbury Whanau Centre 2253; • Kelvin Grove 1865; • Palmerston North Community Leisure 1859.5;• Milson 1552; • Pasifika / Westbrook 1301; and • Rangiora 2429.
Officers work with various management committees throughout the year to ensure that high community use of the Centres is supported:
• Milson Community Centre had their first successful Open Day in celebration of Neighbours Day. The festivities focused on the centre’s recent upgrades, reconnecting with the local community and the shopping centre.
• The Bunnythorpe community was busy with an Easter Celebration at the Owen Street playground. The community also opened a new Pump bike track, which was named “Mugby Junction BMX” by public vote.
The Committees gather together quarterly. The last meeting for 2018/19 was themed “welcoming communities”. As part of the meeting Council officers from across the community, infrastructure and planning divisions met with attendees. Together they brainstormed how this approach might be applied to the community centre buildings, processes and activities. All centres completed an Adopting Communities Practices template to take to their boards.
CEMETERIESProjects at the cemetery this year were delayed by the demands of other projects in the city, particularly concreting. As a result, several projects have carried over into the new year. This included a planned new soil shed and road extension. Planning is well underway to enhance the entrance to the Kelvin Grove Cemetery through the installation of replacement fencing.
DECISION MAKING AND COMMUNITY ENGAGEMENTCouncil seeks feedback from a wide range of residents on decisions and projects that Council is working on. This ensures the community have an opportunity to be actively engaged and involved. The Council does this through a variety of ways including face to face, on site, drop in sessions, online, social media. Council also receives feedback on its services through the Annual Resident Satisfaction survey.
This year the Council decided to consult on it’s Annual Budget (Plan) even though it is no longer legislatively required. Council undertook this consultation to help inform the development of the budget. We also sought feedback on a proposal to change the way we calculate rates.
The Council received 179 submissions with 35 people appearing to speak to their submission as part of the hearings process.
This year Council also sought feedback through other consultations such as:
• College Street upgrades; • ‘Nature Calls’ project; • Dog Control; • the Manawatū Gorge, and• Speed limits bylaw review.
Decision Making and Community Engagement is also undertaken in conjunction with the Council’s Leadership Activity (Goal 5: A Driven and Enabling Council). More information can be found here: (page 120).
ONGOING CONSIDERATIONS Council will continue stage one of the redevelopment of the Papaioea Place housing complex, which will see a total of 50 new units completed by December 2019. Stage two of the Papaioea Place redevelopment will begin in January 2020 with construction on an additional 28 units.
A high level of demand for social housing is evident, with shortages in suitable housing for Palmerston North’s most vulnerable residents. This is especially true for those with complex needs and continues to be a concern for the city. Council works closely with other social housing providers to ensure there is a coordinated understanding of housing demand and availability. Funding for the final stage of the Papaioea Place project has been brought forward. This will mean the project can be completed within three years. The additional units will help alleviate some demand by providing more housing on the same area of land.
The Central Library building was designated Earthquake prone in December 2018. The City Library continues to occupy the building with full services while future options are considered. Preliminary work has commenced on finding options for the Central Library and any options will also be considered in relation to the Civic and Cultural masterplan.
It’s evident that an online booking system would be a valuable resource for the community centres. A solution has been developed in conjunction with representatives from several community centres and it will be trailed in July.
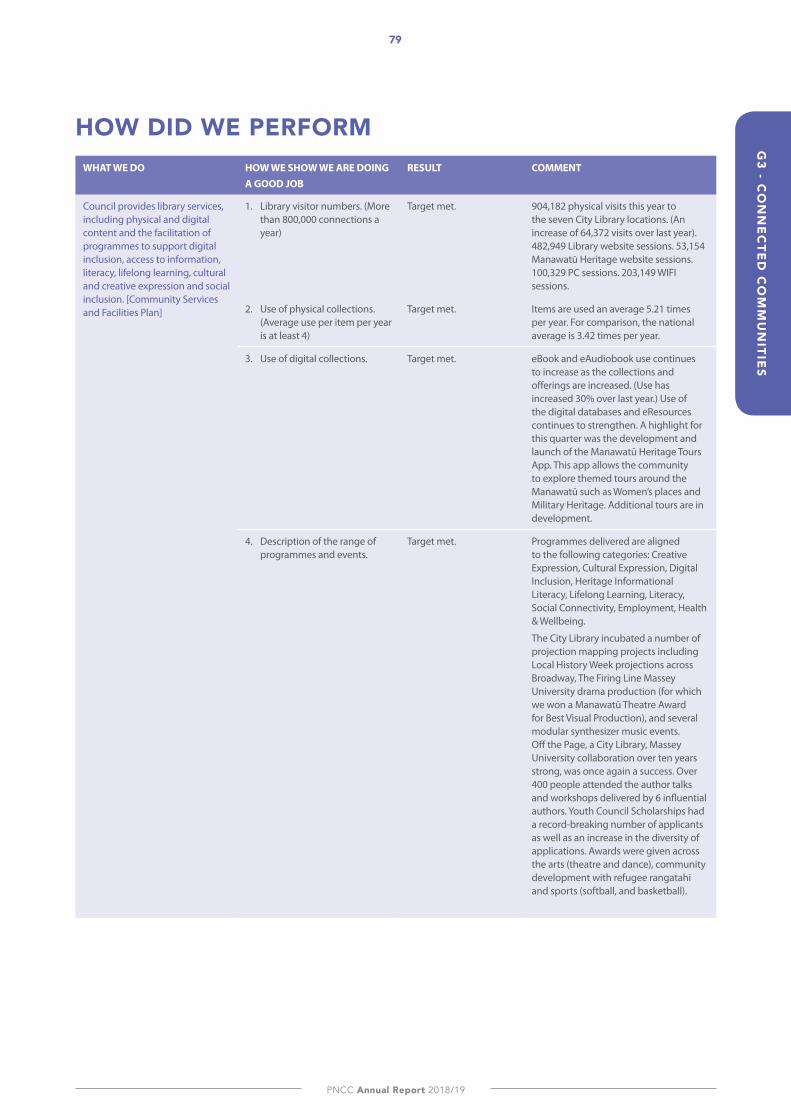
PNCC Annual Report 2018/19
G3 - C
ON
NE
CTE
D C
OM
MU
NITIE
S79
HOW DID WE PERFORMWHAT WE DO HOW WE SHOW WE ARE DOING
A GOOD JOBRESULT COMMENT
Council provides library services, including physical and digital content and the facilitation of programmes to support digital inclusion, access to information, literacy, lifelong learning, cultural and creative expression and social inclusion. [Community Services and Facilities Plan]
1. Library visitor numbers. (More than 800,000 connections a year)
Target met. 904,182 physical visits this year to the seven City Library locations. (An increase of 64,372 visits over last year). 482,949 Library website sessions. 53,154 Manawatū Heritage website sessions. 100,329 PC sessions. 203,149 WIFI sessions.
2. Use of physical collections. (Average use per item per year is at least 4)
Target met. Items are used an average 5.21 times per year. For comparison, the national average is 3.42 times per year.
3. Use of digital collections. Target met. eBook and eAudiobook use continues to increase as the collections and offerings are increased. (Use has increased 30% over last year.) Use of the digital databases and eResources continues to strengthen. A highlight for this quarter was the development and launch of the Manawatū Heritage Tours App. This app allows the community to explore themed tours around the Manawatū such as Women’s places and Military Heritage. Additional tours are in development.
4. Description of the range of programmes and events.
Target met. Programmes delivered are aligned to the following categories: Creative Expression, Cultural Expression, Digital Inclusion, Heritage Informational Literacy, Lifelong Learning, Literacy, Social Connectivity, Employment, Health & Wellbeing.
The City Library incubated a number of projection mapping projects including Local History Week projections across Broadway, The Firing Line Massey University drama production (for which we won a Manawatū Theatre Award for Best Visual Production), and several modular synthesizer music events. Off the Page, a City Library, Massey University collaboration over ten years strong, was once again a success. Over 400 people attended the author talks and workshops delivered by 6 influential authors. Youth Council Scholarships had a record-breaking number of applicants as well as an increase in the diversity of applications. Awards were given across the arts (theatre and dance), community development with refugee rangatahi and sports (softball, and basketball).
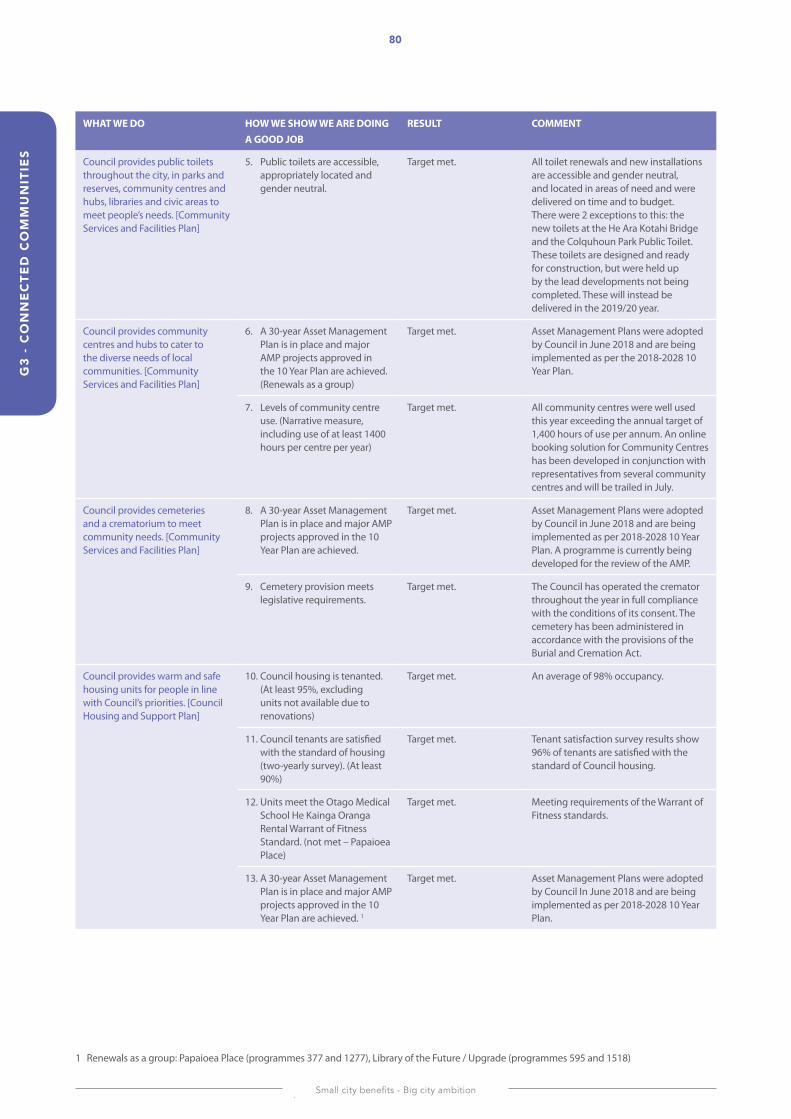
Small city benefits - Big city ambition
80G
3 -
CO
NN
EC
TED
CO
MM
UN
ITIE
S
WHAT WE DO HOW WE SHOW WE ARE DOING A GOOD JOB
RESULT COMMENT
Council provides public toilets throughout the city, in parks and reserves, community centres and hubs, libraries and civic areas to meet people’s needs. [Community Services and Facilities Plan]
5. Public toilets are accessible, appropriately located and gender neutral.
Target met. All toilet renewals and new installations are accessible and gender neutral, and located in areas of need and were delivered on time and to budget. There were 2 exceptions to this: the new toilets at the He Ara Kotahi Bridge and the Colquhoun Park Public Toilet. These toilets are designed and ready for construction, but were held up by the lead developments not being completed. These will instead be delivered in the 2019/20 year.
Council provides community centres and hubs to cater to the diverse needs of local communities. [Community Services and Facilities Plan]
6. A 30-year Asset Management Plan is in place and major AMP projects approved in the 10 Year Plan are achieved. (Renewals as a group)
Target met. Asset Management Plans were adopted by Council in June 2018 and are being implemented as per the 2018-2028 10 Year Plan.
7. Levels of community centre use. (Narrative measure, including use of at least 1400 hours per centre per year)
Target met. All community centres were well used this year exceeding the annual target of 1,400 hours of use per annum. An online booking solution for Community Centres has been developed in conjunction with representatives from several community centres and will be trailed in July.
Council provides cemeteries and a crematorium to meet community needs. [Community Services and Facilities Plan]
8. A 30-year Asset Management Plan is in place and major AMP projects approved in the 10 Year Plan are achieved.
Target met. Asset Management Plans were adopted by Council in June 2018 and are being implemented as per 2018-2028 10 Year Plan. A programme is currently being developed for the review of the AMP.
9. Cemetery provision meets legislative requirements.
Target met. The Council has operated the cremator throughout the year in full compliance with the conditions of its consent. The cemetery has been administered in accordance with the provisions of the Burial and Cremation Act.
Council provides warm and safe housing units for people in line with Council’s priorities. [Council Housing and Support Plan]
10. Council housing is tenanted. (At least 95%, excluding units not available due to renovations)
Target met. An average of 98% occupancy.
11. Council tenants are satisfied with the standard of housing (two-yearly survey). (At least 90%)
Target met. Tenant satisfaction survey results show 96% of tenants are satisfied with the standard of Council housing.
12. Units meet the Otago Medical School He Kainga Oranga Rental Warrant of Fitness Standard. (not met – Papaioea Place)
Target met. Meeting requirements of the Warrant of Fitness standards.
13. A 30-year Asset Management Plan is in place and major AMP projects approved in the 10 Year Plan are achieved. 1
Target met. Asset Management Plans were adopted by Council In June 2018 and are being implemented as per 2018-2028 10 Year Plan.
1 Renewals as a group: Papaioea Place (programmes 377 and 1277), Library of the Future / Upgrade (programmes 595 and 1518)
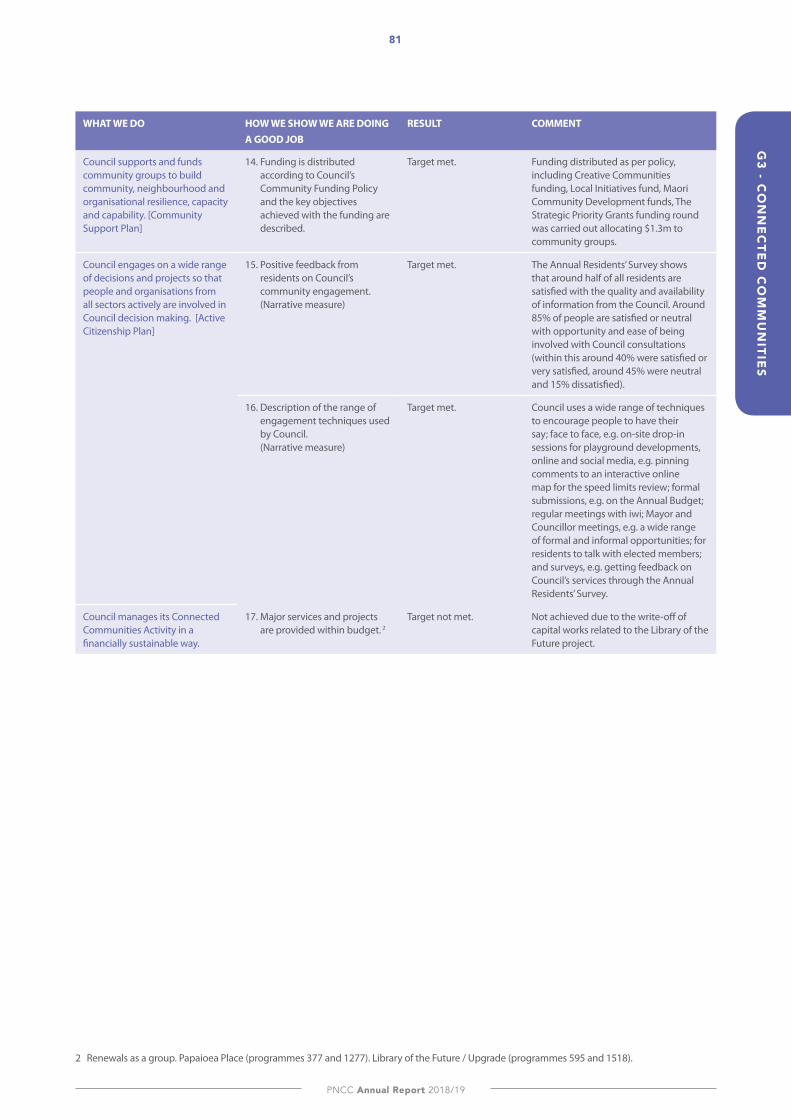
PNCC Annual Report 2018/19
G3 - C
ON
NE
CTE
D C
OM
MU
NITIE
S81
WHAT WE DO HOW WE SHOW WE ARE DOING A GOOD JOB
RESULT COMMENT
Council supports and funds community groups to build community, neighbourhood and organisational resilience, capacity and capability. [Community Support Plan]
14. Funding is distributed according to Council’s Community Funding Policy and the key objectives achieved with the funding are described.
Target met. Funding distributed as per policy, including Creative Communities funding, Local Initiatives fund, Maori Community Development funds, The Strategic Priority Grants funding round was carried out allocating $1.3m to community groups.
Council engages on a wide range of decisions and projects so that people and organisations from all sectors actively are involved in Council decision making. [Active Citizenship Plan]
15. Positive feedback from residents on Council’s community engagement. (Narrative measure)
Target met. The Annual Residents’ Survey shows that around half of all residents are satisfied with the quality and availability of information from the Council. Around 85% of people are satisfied or neutral with opportunity and ease of being involved with Council consultations (within this around 40% were satisfied or very satisfied, around 45% were neutral and 15% dissatisfied).
16. Description of the range of engagement techniques used by Council. (Narrative measure)
Target met. Council uses a wide range of techniques to encourage people to have their say; face to face, e.g. on-site drop-in sessions for playground developments, online and social media, e.g. pinning comments to an interactive online map for the speed limits review; formal submissions, e.g. on the Annual Budget; regular meetings with iwi; Mayor and Councillor meetings, e.g. a wide range of formal and informal opportunities; for residents to talk with elected members; and surveys, e.g. getting feedback on Council’s services through the Annual Residents’ Survey.
Council manages its Connected Communities Activity in a financially sustainable way.
17. Major services and projects are provided within budget. 2
Target not met. Not achieved due to the write-off of capital works related to the Library of the Future project.
2 Renewals as a group. Papaioea Place (programmes 377 and 1277). Library of the Future / Upgrade (programmes 595 and 1518).
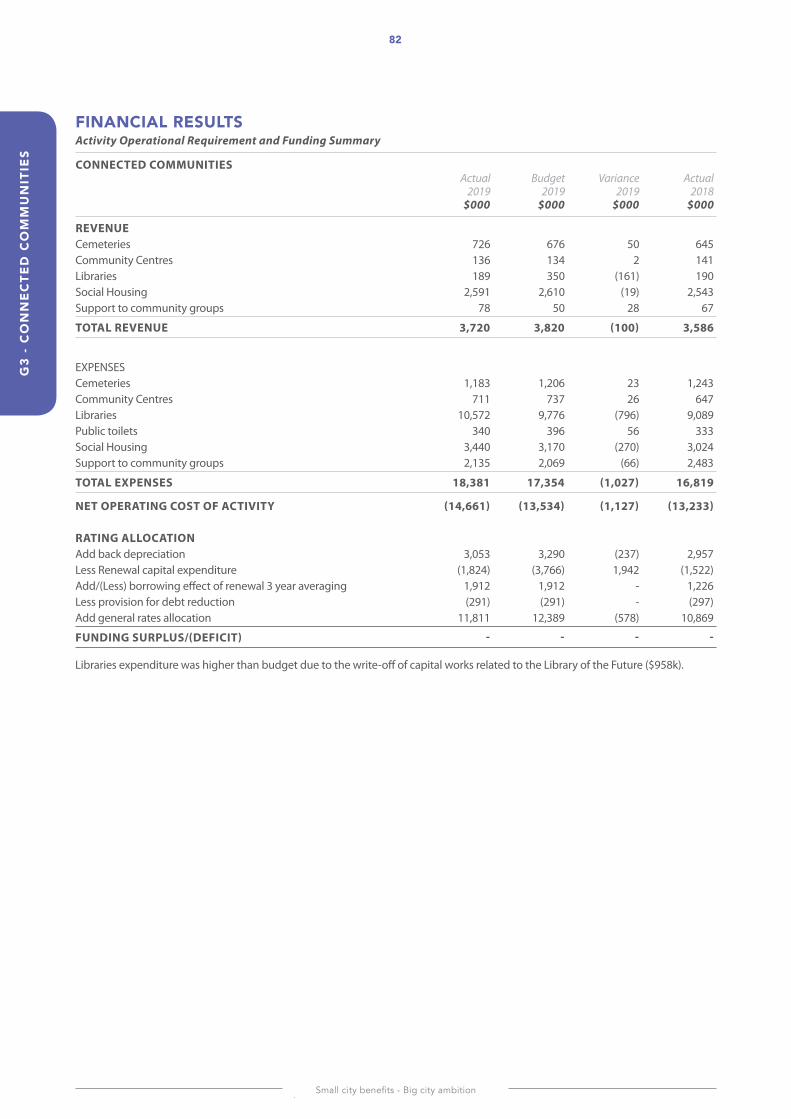
Small city benefits - Big city ambition
82G
3 -
CO
NN
EC
TED
CO
MM
UN
ITIE
S
FINANCIAl RESUlTSActivity Operational Requirement and Funding Summary
CONNECTED COMMUNITIES Actual Budget Variance Actual 2019 2019 2019 2018 $000 $000 $000 $000
REVENUE Cemeteries 726 676 50 645Community Centres 136 134 2 141Libraries 189 350 (161) 190Social Housing 2,591 2,610 (19) 2,543Support to community groups 78 50 28 67
TOTAL REVENUE 3,720 3,820 (100) 3,586
EXPENSES Cemeteries 1,183 1,206 23 1,243Community Centres 711 737 26 647Libraries 10,572 9,776 (796) 9,089Public toilets 340 396 56 333Social Housing 3,440 3,170 (270) 3,024Support to community groups 2,135 2,069 (66) 2,483
TOTAL EXPENSES 18,381 17,354 (1,027) 16,819
NET OPERATING COST OF ACTIVITY (14,661) (13,534) (1,127) (13,233) RATING ALLOCATION Add back depreciation 3,053 3,290 (237) 2,957Less Renewal capital expenditure (1,824) (3,766) 1,942 (1,522)Add/(Less) borrowing effect of renewal 3 year averaging 1,912 1,912 - 1,226Less provision for debt reduction (291) (291) - (297)Add general rates allocation 11,811 12,389 (578) 10,869
FUNDING SURPLUS/(DEFICIT) - - - -
Libraries expenditure was higher than budget due to the write-off of capital works related to the Library of the Future ($958k).
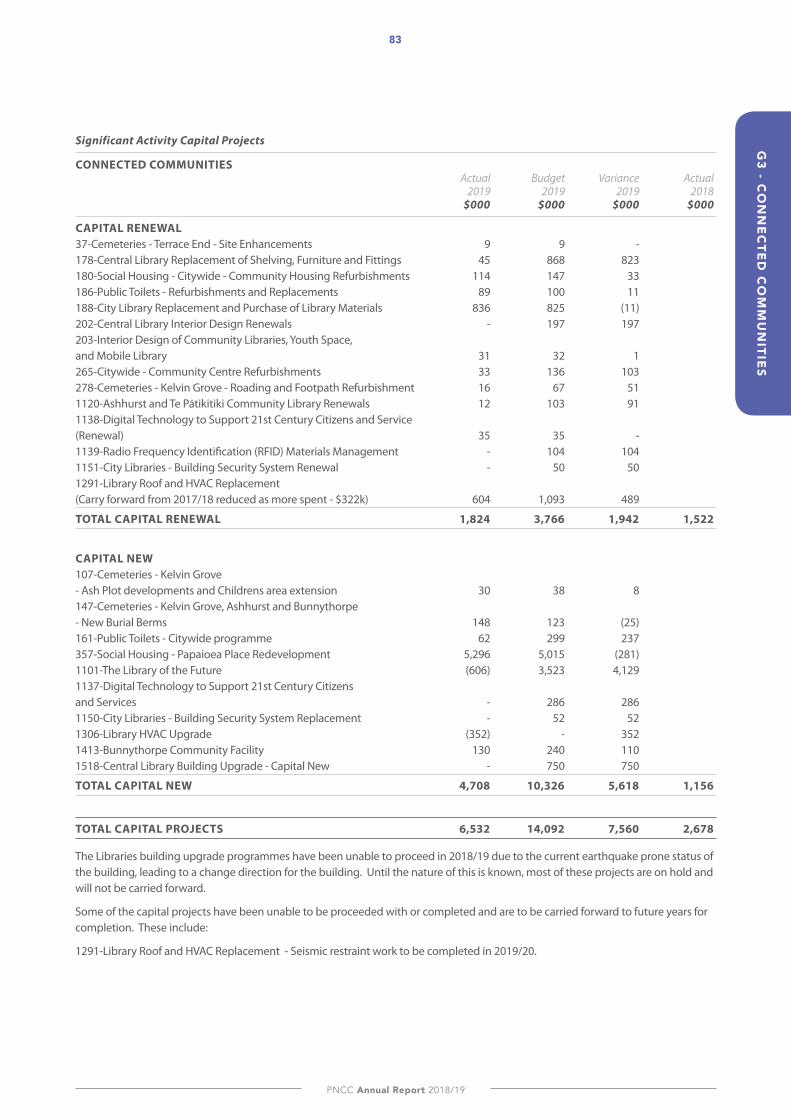
PNCC Annual Report 2018/19
83G
3 - CO
NN
EC
TED
CO
MM
UN
ITIES
Significant Activity Capital Projects
CONNECTED COMMUNITIES Actual Budget Variance Actual 2019 2019 2019 2018 $000 $000 $000 $000
CAPITAL RENEWAL 37-Cemeteries - Terrace End - Site Enhancements 9 9 - 178-Central Library Replacement of Shelving, Furniture and Fittings 45 868 823 180-Social Housing - Citywide - Community Housing Refurbishments 114 147 33 186-Public Toilets - Refurbishments and Replacements 89 100 11 188-City Library Replacement and Purchase of Library Materials 836 825 (11) 202-Central Library Interior Design Renewals - 197 197 203-Interior Design of Community Libraries, Youth Space, and Mobile Library 31 32 1 265-Citywide - Community Centre Refurbishments 33 136 103 278-Cemeteries - Kelvin Grove - Roading and Footpath Refurbishment 16 67 51 1120-Ashhurst and Te Pātikitiki Community Library Renewals 12 103 91 1138-Digital Technology to Support 21st Century Citizens and Service (Renewal) 35 35 - 1139-Radio Frequency Identification (RFID) Materials Management - 104 104 1151-City Libraries - Building Security System Renewal - 50 50 1291-Library Roof and HVAC Replacement (Carry forward from 2017/18 reduced as more spent - $322k) 604 1,093 489
TOTAL CAPITAL RENEWAL 1,824 3,766 1,942 1,522
CAPITAL NEW 107-Cemeteries - Kelvin Grove - Ash Plot developments and Childrens area extension 30 38 8 147-Cemeteries - Kelvin Grove, Ashhurst and Bunnythorpe - New Burial Berms 148 123 (25) 161-Public Toilets - Citywide programme 62 299 237 357-Social Housing - Papaioea Place Redevelopment 5,296 5,015 (281) 1101-The Library of the Future (606) 3,523 4,129 1137-Digital Technology to Support 21st Century Citizens and Services - 286 286 1150-City Libraries - Building Security System Replacement - 52 52 1306-Library HVAC Upgrade (352) - 352 1413-Bunnythorpe Community Facility 130 240 110 1518-Central Library Building Upgrade - Capital New - 750 750
TOTAL CAPITAL NEW 4,708 10,326 5,618 1,156
TOTAL CAPITAL PROJECTS 6,532 14,092 7,560 2,678
The Libraries building upgrade programmes have been unable to proceed in 2018/19 due to the current earthquake prone status of the building, leading to a change direction for the building. Until the nature of this is known, most of these projects are on hold and will not be carried forward.
Some of the capital projects have been unable to be proceeded with or completed and are to be carried forward to future years for completion. These include:
1291-Library Roof and HVAC Replacement - Seismic restraint work to be completed in 2019/20.
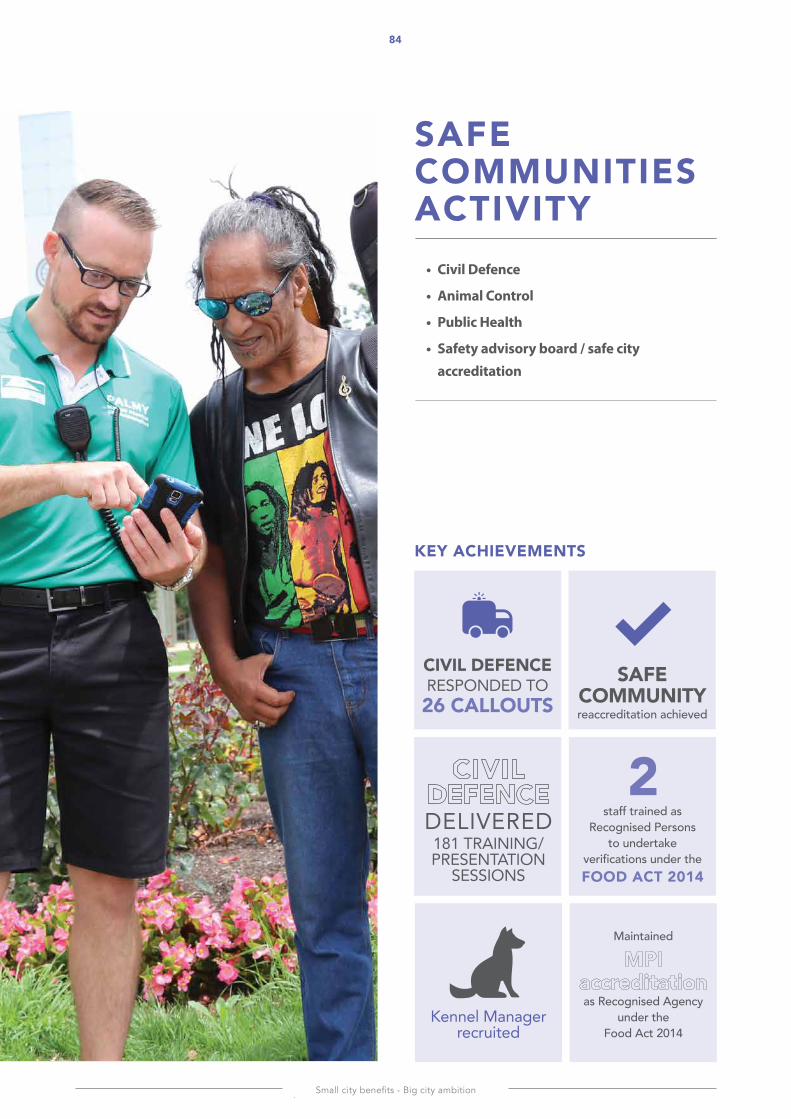
Small city benefits - Big city ambition
84G
3 -
CO
NN
EC
TED
CO
MM
UN
ITIE
S
SAFE COMMUNITIES ACTIVITY
• Civil Defence
• Animal Control
• Public Health
• Safety advisory board / safe city accreditation
KEY ACHIEVEMENTS
SAFE COMMUNITY reaccreditation achieved
staff trained as Recognised Persons
to undertake verifications under the FOOD ACT 2014
Maintained
as Recognised Agency under the
Food Act 2014Kennel Manager
recruited
CIVIl DEFENCE RESPONDED TO 26 CAllouts
DELIVERED 181 TRAINING/ PRESENTATION
SESSIONS
2
PNCC Annual Report 2018/19
G3 - SA
FE C
OM
MU
NITIE
S85
WhAt the CounCil DoesCouncil provides a local disaster recovery coordination plan, an emergency operations centre, and a Civil Defence response team of trained Council staff and volunteers. Council is also responsible for public education programmes around Civil Defence. We work closely with other emergency service providers to meet our statutory responsibilities.
Animal Control Services protect the community’s health and enhance safety through the administration of the Dog Control Act 1996 and Impounding Act 1955. The service aims to achieve compliance through the provision of information, education and enforcement in the following activities:
• Investigation of dog attacks on people and other animals and complaints relating to dog fouling and behaviour, excessive barking and roaming dogs.
• Attending to secured dog notifications.• Enforcement of dog registration.• Classifying dogs as menacing or dangerous.• Carrying out “preferred owner” property inspections.• Operating the Council’s Pound.• Ensuring the securing of unattended stock on roads.
Public Health Services provide regulatory services that protect the community’s health and enhance safety. The service aims to achieve compliance with legislation, bylaws, and policies through the provision of information, education and enforcement in the following areas:
• Registration of food premises, hairdressers, camping grounds, funeral directors and offensive trades.
• Audit and verification of Food Control Plans and investigation of food complaints.
• Investigation and resolution of public nuisances, housing issues and overgrown vegetation complaints.
• Response to hazardous substance issues not covered by other agencies.
• Investigation of complaints of excessive noise and monitoring compliance with the district plan noise levels.
• Investigation of complaints relating to signs in public places and animals and bees.
• Inspection of and reporting on licensed premises and manager certificates.
WhAt hAPPeneD in THE YEARCIVIl DEFENCEIn 2018/19 Council’s focus remained on emergency preparedness and extending our response capabilities:
• Community Response Plans are being drawn up for the outlying city areas of Ashhurst, Linton and Longburn. The plans include ongoing public education to promote awareness and preparedness and will be extended to Bunnythorpe and Aokautere.
• Emergency management continues to maintain a 24/7 on-call service for Palmerston North. Our Rescue Emergency Support Team (REST) has been activated on several occasions to assist in our communities. This included a deployment to Nelson to assist with the fire emergency.
• Regular training and exercises were held within Council and with outside agencies to ensure that planning for emergency response is well-managed.
• Three PNCC staff are also taking part in the inaugural Response and Recovery Leadership Capability Development Programme being conducted throughout 2019.
ANIMAl CONTROlThe Code of Welfare: Temporary Housing of Companion Animals came into force on 1 October 2018. To meet the increased obligations for care and animal wellbeing a Kennel Manager was recruited. Improvements to the Pound have provided temperature control, suitable bedding, improved exercise areas and bird proofing. Plants have also been introduced to the Pound to improve the environment for the dogs.
The number of registered dogs in Palmerston North increased to 8,449, from 8,271 in 2017/18. There are 6,829 owners, of whom 3,094 are approved preferred owners.
There were 84 reported dog attacks. Of these there were 28 ‘dog on person’ attacks, with 22 classified minor, five moderate and one serious. There were 32 ‘dog on dog’ attacks, with 20 classified as minor, 11 moderate and one serious. There were 24 ‘dog on other animal’ attacks, with 11 classified minor, 13 moderate and none serious.
Animal Control Officers issued 105 infringement notice during the year:
• 71 were issued for non-registration; • 27 for failing to have a dog under control or confined; • four for failing to comply with a menacing classification; • two for barking issues; and • one for failing to comply with a dangerous classification.
Small city benefits - Big city ambition
G3
- SA
FE C
OM
MU
NIT
IES
86
WHAT HAPPENED IN THE YEARTwenty-six of the infringements were waived or cancelled for compliance or due to extenuating circumstances.
Animal Control Officers impounded 500 dogs, with 362 of these returned to their owners, 51 rehomed and 76 euthanised.
Two successful prosecutions relating to dog attacks were concluded. Two menacing dog classifications were appealed, and the classifications upheld.
To establish a more robust assessment of whether barking dogs meet the loud and persistent threshold a community survey tool was introduced. This provides a better picture of the extent of nuisance caused to the neighbourhood to better inform compliance action.
PuBliC heAlthPalmerston North City Council maintained MPI accreditation as a Recognised Agency under the Food Act 2014. Two recognised persons were determined to have maintained competency, and two new staff were assessed as competent to apply for recognised person status.
An Environmental Health Technical Officer position was established to provide the required capacity identified as necessary in the resourcing schedule. The position was established to carry out the required verification audits.
Food safety training was provided for Festival of Cultures and the IPU. An agreement with NZDF Force Health Protection was reached. This will provide reciprocal training and work experience opportunities.
During 2018/19, a high volume of applications and requests were processed and addressed by Council:
• Environmental Health Officers processed 101 new food premise applications, 369 food control plans were verified, 180 food enquiries were responded to and nine food premises complaints were investigated.
• In 2018/19, 3,493 noise complaints were responded to compared to 3,319 in 2017/18. Of which 97 per cent were responded to within 60 minutes.
• There were 165 complaints regarding overgrown vegetation compared with 281 in 2017/18.
• Council received 13 complaints about cats compared to six in 2017/18. Council also provided 135 cat traps compared to 125 in 2017/18.
• An additional 28 complaints relating to poultry were received compared to 32 in 2017/18.
• There were six complaints relating to bees compared to seven in 2017/18.
• Council received and actioned 12 complaints relating to signage during this year, compared to 11 in 2017/18.
• Vehicle complaints about abandoned vehicles declined, 322 were responded to compared to 439 in 2017/18.
The Palmerston North Animals and Bees Bylaw 2018 came into force on 1 July 2018. This created a requirement for all
cats born after 1 July 2018, and over six months of age, to be microchipped. As well as registered with the New Zealand Companion Animals Register, or another Council approved microchip registry. Cats over six months are also required to be de-sexed (unless kept for breeding purposes and are registered with a nationally recognised cat breeders’ body including New Zealand Cat Fancy Ltd. and Catz Inc.). No complaints were received regarding non-compliance. The information on the Councils website on cats was reviewed and significantly improved.
Palmerston North has 88 registered hairdressers, four funeral directors, one camping ground and one offensive trade.
During the 2018/19 year the following alcohol licenses and manager certificates were processed:
• New on-licenses 15• New Off licenses 4• On- license renewals 44• Off license renewals 13• Club license renewals 13• Special licenses 99• New Managers Certificates 104• Manager Certificate renewals 176• Temporary authorities 17
SAFETY ADVISORY BOARD / SAFE CITY ACCREDITATIONThe Safety Advisory Board is comprised of representatives from major government agencies and organisations working within the city. The six priorities for the Board are collaboration, road safety, injury prevention, crime prevention, alcohol and other drug harm reduction and resilience.
The reaccreditation process marked the end of five years work and was an opportunity for the Board to reflect on what it had achieved. This included reviewing priorities and developing a new workplan for the next reaccreditation period. A collaborative priority setting exercise, based on a range of agency data, was held to review priorities for the Board. This ensured the focus was correct going forward.
The City Ambassadors programme continued over the summer months with ambassadors roaming the CBD daily acting as guardians of the public space and addressing antisocial behaviour. Most interactions were vibrancy related public assistance (directional, events, parking) with the remainder safety related (alcohol, disorder, police referrals).
PNCC Annual Report 2018/19
G3 - SA
FE C
OM
MU
NITIE
S87
ONGOING CONSIDERATIONS The 10 Year Plan (2018-28) includes provision to relocate our Emergency Operating Centre. The Centre will move from the Civic Administration Building on The Square to a new purpose-built headquarters on Victoria Avenue in 2019. This will help future-proof civil emergency planning, provision and management. This Centre is expected to be occupied from October 2019.
The Code of Welfare: Temporary Housing of Companion Animals requires structural provision for the quarantine and isolation of dogs. Unfortunately, that cannot be achieved within the current Pound’s footprint. Designing a Pound facility compliant with the Code will be carried out over the next year.
The charging structure for animal control fees will be reviewed. This is to ensure the most appropriate balance for costs is achieved between registered dog owners and non-compliant dog owners.
Animal control education will be developed and delivered, focusing on owner responsibilities and dog behaviour. The aim is to create improved dog ownership and behaviour. Education will also be developed and delivered to improve public understanding of how to behave around dogs.
A review under section 137 of the Food Act is being carried out by MPI. The results may have implications on the ongoing provision of the food verification service. There is potential for greater opportunities to provide regional food verification services.
The Ministry of Health are reviewing the Environmental Health Officer Qualification Regulations 1993. This may create greater flexibility for Council’s future environmental health resourcing skill and competency requirements.
The Safety Advisory Board is at the beginning of a new five-year reaccreditation cycle. A workplan is in the process of being developed that builds on the activities to date. This work will be done in conjunction with a review of the Board’s composition. As well as the findings of a priority setting workshop carried out late last year.
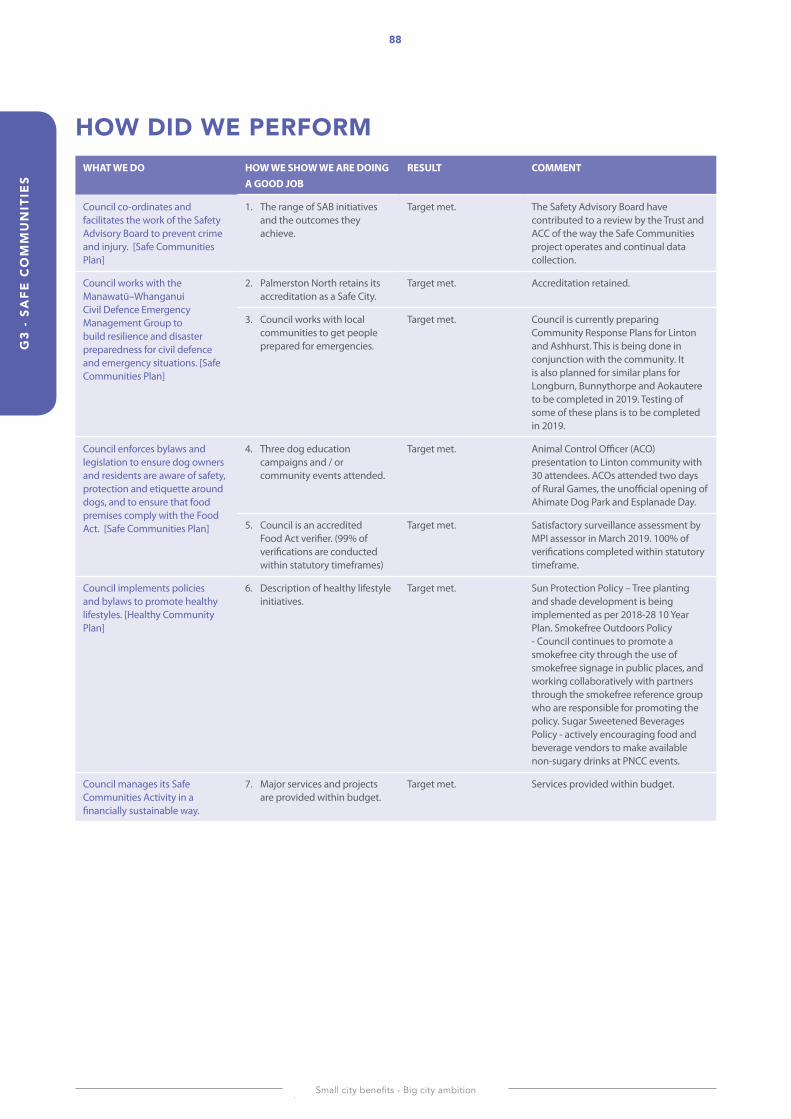
Small city benefits - Big city ambition
88G
3 -
SAFE
CO
MM
UN
ITIE
S
HOW DID WE PERFORMWHAT WE DO HOW WE SHOW WE ARE DOING
A GOOD JOBRESULT COMMENT
Council co-ordinates and facilitates the work of the Safety Advisory Board to prevent crime and injury. [Safe Communities Plan]
1. The range of SAB initiatives and the outcomes they achieve.
Target met. The Safety Advisory Board have contributed to a review by the Trust and ACC of the way the Safe Communities project operates and continual data collection.
Council works with the Manawatū–Whanganui Civil Defence Emergency Management Group to build resilience and disaster preparedness for civil defence and emergency situations. [Safe Communities Plan]
2. Palmerston North retains its accreditation as a Safe City.
Target met. Accreditation retained.
3. Council works with local communities to get people prepared for emergencies.
Target met. Council is currently preparing Community Response Plans for Linton and Ashhurst. This is being done in conjunction with the community. It is also planned for similar plans for Longburn, Bunnythorpe and Aokautere to be completed in 2019. Testing of some of these plans is to be completed in 2019.
Council enforces bylaws and legislation to ensure dog owners and residents are aware of safety, protection and etiquette around dogs, and to ensure that food premises comply with the Food Act. [Safe Communities Plan]
4. Three dog education campaigns and / or community events attended.
Target met. Animal Control Officer (ACO)presentation to Linton community with 30 attendees. ACOs attended two days of Rural Games, the unofficial opening of Ahimate Dog Park and Esplanade Day.
5. Council is an accredited Food Act verifier. (99% of verifications are conducted within statutory timeframes)
Target met. Satisfactory surveillance assessment by MPI assessor in March 2019. 100% of verifications completed within statutory timeframe.
Council implements policies and bylaws to promote healthy lifestyles. [Healthy Community Plan]
6. Description of healthy lifestyle initiatives.
Target met. Sun Protection Policy – Tree planting and shade development is being implemented as per 2018-28 10 Year Plan. Smokefree Outdoors Policy - Council continues to promote a smokefree city through the use of smokefree signage in public places, and working collaboratively with partners through the smokefree reference group who are responsible for promoting the policy. Sugar Sweetened Beverages Policy - actively encouraging food and beverage vendors to make available non-sugary drinks at PNCC events.
Council manages its Safe Communities Activity in a financially sustainable way.
7. Major services and projects are provided within budget.
Target met. Services provided within budget.
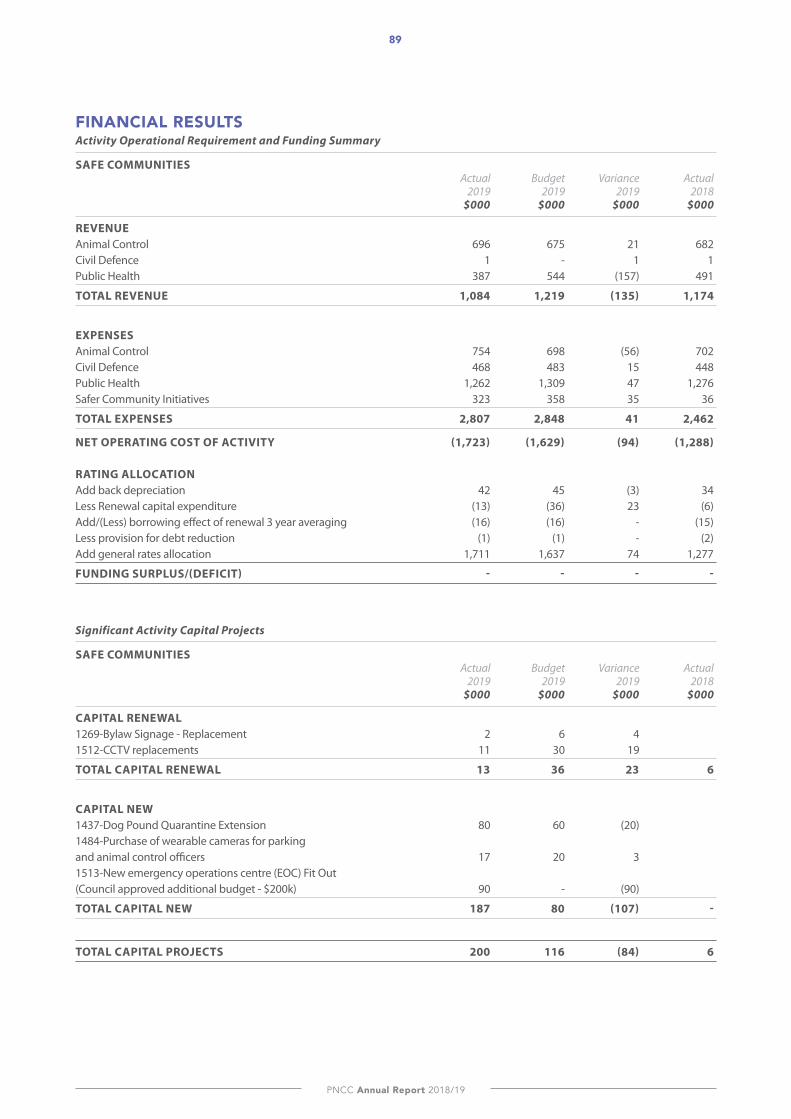
PNCC Annual Report 2018/19
89
FINANCIAl RESUlTSActivity Operational Requirement and Funding Summary
SAFE COMMUNITIES Actual Budget Variance Actual 2019 2019 2019 2018 $000 $000 $000 $000
REVENUE Animal Control 696 675 21 682Civil Defence 1 - 1 1Public Health 387 544 (157) 491
TOTAL REVENUE 1,084 1,219 (135) 1,174
EXPENSES Animal Control 754 698 (56) 702Civil Defence 468 483 15 448Public Health 1,262 1,309 47 1,276Safer Community Initiatives 323 358 35 36
TOTAL EXPENSES 2,807 2,848 41 2,462
NET OPERATING COST OF ACTIVITY (1,723) (1,629) (94) (1,288) RATING ALLOCATION Add back depreciation 42 45 (3) 34Less Renewal capital expenditure (13) (36) 23 (6)Add/(Less) borrowing effect of renewal 3 year averaging (16) (16) - (15)Less provision for debt reduction (1) (1) - (2)Add general rates allocation 1,711 1,637 74 1,277
FUNDING SURPLUS/(DEFICIT) - - - -
Significant Activity Capital Projects
SAFE COMMUNITIES Actual Budget Variance Actual 2019 2019 2019 2018 $000 $000 $000 $000
CAPITAL RENEWAL 1269-Bylaw Signage - Replacement 2 6 4 1512-CCTV replacements 11 30 19
TOTAL CAPITAL RENEWAL 13 36 23 6
CAPITAL NEW 1437-Dog Pound Quarantine Extension 80 60 (20) 1484-Purchase of wearable cameras for parking and animal control officers 17 20 3 1513-New emergency operations centre (EOC) Fit Out (Council approved additional budget - $200k) 90 - (90)
TOTAL CAPITAL NEW 187 80 (107) -
TOTAL CAPITAL PROJECTS 200 116 (84) 6
Small city benefits - Big city ambition
90
GOAl 4ECO-CITY The group activities for Goal 4 consists of:
RUBBISH & RECYClING
BIODIVERSITY & SUSTAINABlE PRACTICES
STORMWATER
WASTEWATER
WATER SUPPlY

PNCC Annual Report 2018/19
G4 - E
CO
-CITY
91
GOAl 4ECO-CITY The group activities for Goal 4 consists of:
RUBBISH & RECYClING
BIODIVERSITY & SUSTAINABlE PRACTICES
STORMWATER
WASTEWATER
WATER SUPPlY
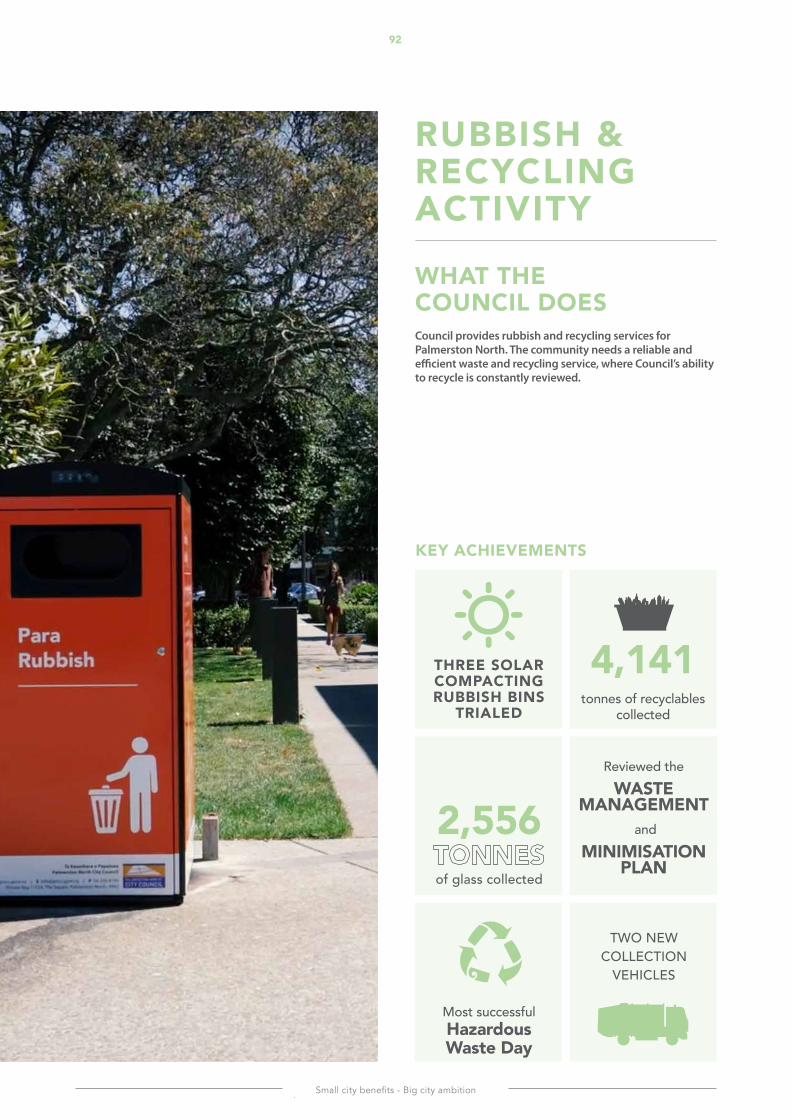
Small city benefits - Big city ambition
G4
- E
CO
-CIT
Y92
KEY ACHIEVEMENTS
RUBBISH & RECYClING ACTIVITY
WhAt the CounCil DoesCouncil provides rubbish and recycling services for Palmerston North. The community needs a reliable and efficient waste and recycling service, where Council’s ability to recycle is constantly reviewed.
Reviewed the WAste
MANAGEMENT and
MINIMISATION PlAn
TWO NEW COLLECTION
VEHICLES
2,556
of glass collected
Most successful Hazardous Waste Day
THREE SOlAR COMPACTING RUBBISH BINS
TRIAlEDtonnes of recyclables
collected
4,141
PNCC Annual Report 2018/19
G4 - E
CO
-CITY
93
WHAT HAPPENED IN THE YEARThe Waste Management and Minimisation Plan was reviewed and adopted by Council after consultation with the community. This plan helps to inform the development of future programmes to support existing and new services.
Several new initiatives were undertaken this year to improve the quality and output of Council’s rubbish and recycling services:
• Council invested in two new collection vehicles to replace the current leased vehicles collecting recycling.
• Following a Health and Safety review of some of the city’s narrower roads a small number of properties were allocated a new collection point.
• Council introduced a trial of solar compacting rubbish bins in three key locations within the city.
• A review of the existing public space rubbish and recycling bins has led to a redesign that follows the national standards. This will make it easier to determine the right container for your waste.
• Motor Oil and oil filter collections were established at the Ferguson Street Recycling Centre.
• Following the successful Hazardous Waste Day in June 2018, it was held again in June 2019. It was expanded to include batteries and oil to make the event a one stop shop to safely dispose of Hazardous Waste.
• Council supported World Clean-up Day in September 2018 by collecting and disposing of the waste collected during this event.
• Compostable dog waste bags were made available for purchase at the Council to promote the reduction of plastics in the environment
• Rubbish bag prices held steady at $2.50 during the year.• Council continued to work closely with commodity
buyers to provide good quality and targeted products to meet the demands of the industry.
High levels of contamination in recycling collections remained a significant issue. Ongoing efforts to inform users of the correct items that can be placed in the recycling collection service will continue. Rubbish bag sales and weekly recycling volumes have remained steady. The quantity of materials dropped off at the recycling drop off points has also remained steady.
ONGOING CONSIDERATIONS Councils needs to address several issues, so services can meet the challenging needs of the community. The estimated total diversion of waste from landfill has plateaued. The impact of extensions to existing services has been marginal and outweighed by additional waste volumes being generated, particularly in the construction sector. Council’s educational efforts have included a targeted approach to changing behavior and attitudes towards waste minimization. This has included the use of social media campaigns and collaboration with external agencies.
The cost of providing the recycling service has been affected by significant changes in the price of recycled product. China’s decision last year to block the importation of low value recycled plastic has resulted in an ongoing low price or difficulties in selling these products. This highlights the continued exposure of New Zealand based recycling service providers to offshore markets. Council is continuing to investigate new and emerging opportunities to recycle low value and soft plastics.
Illegal dumping continues to be a cost burden for Council and the community. Council has continued to stabilise illegal dumping incidents using a multi-pronged approach that included issuing 22 infringement notices in 2018/19.
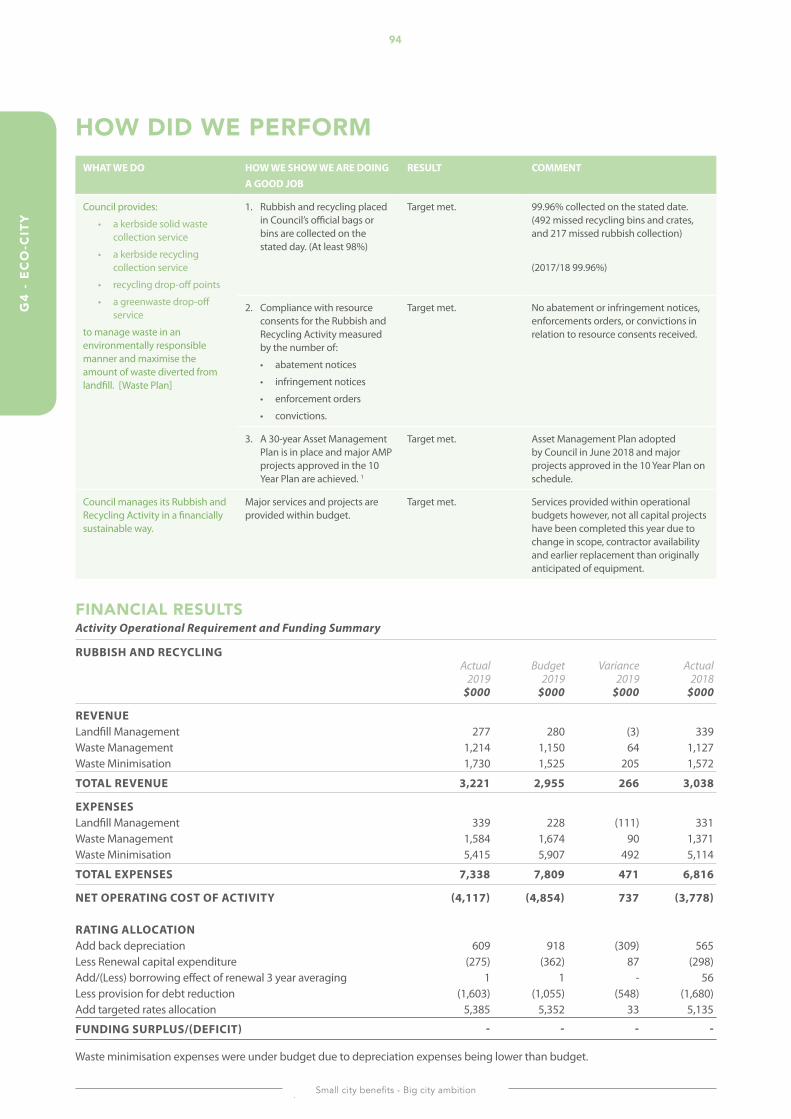
Small city benefits - Big city ambition
G4
- E
CO
-CIT
Y94
HOW DID WE PERFORMWHAT WE DO HOW WE SHOW WE ARE DOING
A GOOD JOBRESULT COMMENT
Council provides:
• a kerbside solid waste collection service
• a kerbside recycling collection service
• recycling drop-off points
• a greenwaste drop-off service
to manage waste in an environmentally responsible manner and maximise the amount of waste diverted from landfill. [Waste Plan]
1. Rubbish and recycling placed in Council’s official bags or bins are collected on the stated day. (At least 98%)
Target met. 99.96% collected on the stated date. (492 missed recycling bins and crates, and 217 missed rubbish collection)
(2017/18 99.96%)
2. Compliance with resource consents for the Rubbish and Recycling Activity measured by the number of:
• abatement notices
• infringement notices
• enforcement orders
• convictions.
Target met. No abatement or infringement notices, enforcements orders, or convictions in relation to resource consents received.
3. A 30-year Asset Management Plan is in place and major AMP projects approved in the 10 Year Plan are achieved. 1
Target met. Asset Management Plan adopted by Council in June 2018 and major projects approved in the 10 Year Plan on schedule.
Council manages its Rubbish and Recycling Activity in a financially sustainable way.
Major services and projects are provided within budget.
Target met. Services provided within operational budgets however, not all capital projects have been completed this year due to change in scope, contractor availability and earlier replacement than originally anticipated of equipment.
FINANCIAl RESUlTSActivity Operational Requirement and Funding Summary
RUBBISH AND RECYCLING Actual Budget Variance Actual 2019 2019 2019 2018 $000 $000 $000 $000
REVENUE Landfill Management 277 280 (3) 339Waste Management 1,214 1,150 64 1,127Waste Minimisation 1,730 1,525 205 1,572
TOTAL REVENUE 3,221 2,955 266 3,038
EXPENSES Landfill Management 339 228 (111) 331Waste Management 1,584 1,674 90 1,371Waste Minimisation 5,415 5,907 492 5,114
TOTAL EXPENSES 7,338 7,809 471 6,816
NET OPERATING COST OF ACTIVITY (4,117) (4,854) 737 (3,778) RATING ALLOCATION Add back depreciation 609 918 (309) 565Less Renewal capital expenditure (275) (362) 87 (298)Add/(Less) borrowing effect of renewal 3 year averaging 1 1 - 56Less provision for debt reduction (1,603) (1,055) (548) (1,680)Add targeted rates allocation 5,385 5,352 33 5,135
FUNDING SURPLUS/(DEFICIT) - - - -
Waste minimisation expenses were under budget due to depreciation expenses being lower than budget.
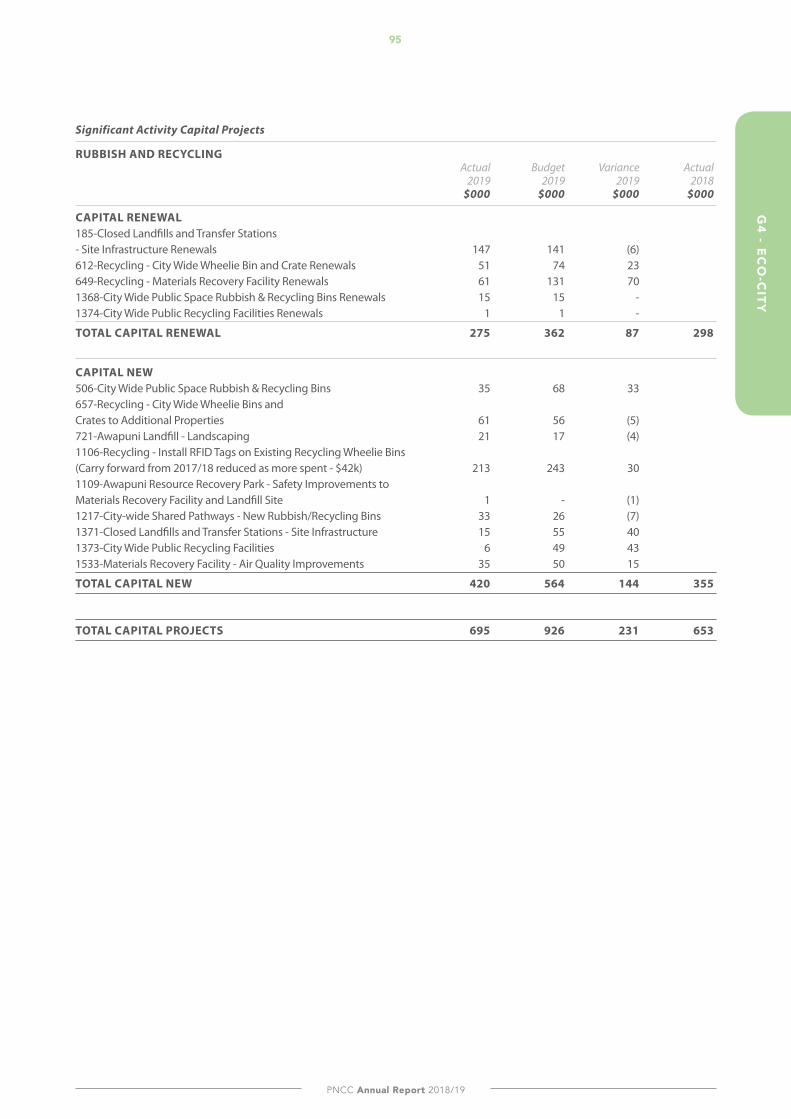
PNCC Annual Report 2018/19
G4 - E
CO
-CITY
95
Significant Activity Capital Projects
RUBBISH AND RECYCLING Actual Budget Variance Actual 2019 2019 2019 2018 $000 $000 $000 $000
CAPITAL RENEWAL 185-Closed Landfills and Transfer Stations - Site Infrastructure Renewals 147 141 (6) 612-Recycling - City Wide Wheelie Bin and Crate Renewals 51 74 23 649-Recycling - Materials Recovery Facility Renewals 61 131 70 1368-City Wide Public Space Rubbish & Recycling Bins Renewals 15 15 - 1374-City Wide Public Recycling Facilities Renewals 1 1 -
TOTAL CAPITAL RENEWAL 275 362 87 298
CAPITAL NEW 506-City Wide Public Space Rubbish & Recycling Bins 35 68 33 657-Recycling - City Wide Wheelie Bins and Crates to Additional Properties 61 56 (5) 721-Awapuni Landfill - Landscaping 21 17 (4) 1106-Recycling - Install RFID Tags on Existing Recycling Wheelie Bins (Carry forward from 2017/18 reduced as more spent - $42k) 213 243 30 1109-Awapuni Resource Recovery Park - Safety Improvements to Materials Recovery Facility and Landfill Site 1 - (1) 1217-City-wide Shared Pathways - New Rubbish/Recycling Bins 33 26 (7) 1371-Closed Landfills and Transfer Stations - Site Infrastructure 15 55 40 1373-City Wide Public Recycling Facilities 6 49 43 1533-Materials Recovery Facility - Air Quality Improvements 35 50 15
TOTAL CAPITAL NEW 420 564 144 355
TOTAL CAPITAL PROJECTS 695 926 231 653
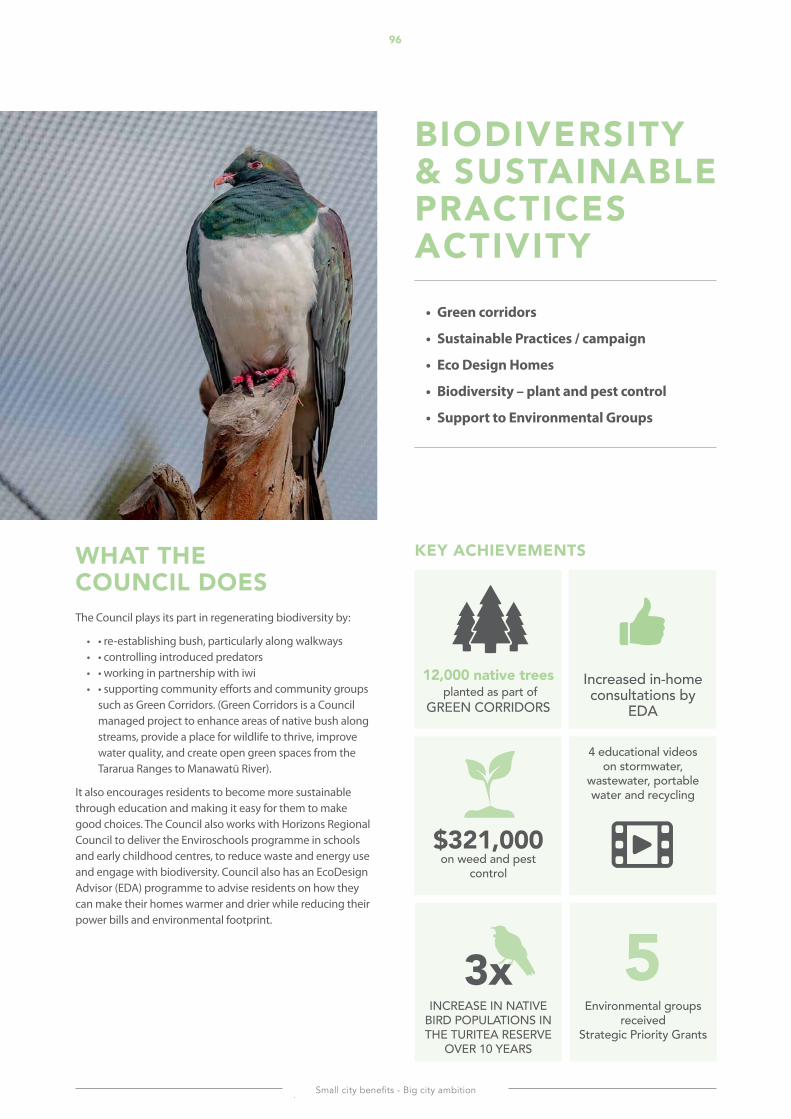
Small city benefits - Big city ambition
96G
4 - B
IOD
IVER
SITY
& SU
STA
INA
BlE
PRA
CTI
CES
KEY ACHIEVEMENTS
BIODIVERSITY & sustAinABle PRACTICES ACTIVITY
• Green corridors
• Sustainable Practices / campaign
• Eco Design Homes
• Biodiversity – plant and pest control
• Support to Environmental Groups
WhAt the CounCil DoesThe Council plays its part in regenerating biodiversity by:
• • re-establishing bush, particularly along walkways• • controlling introduced predators• • working in partnership with iwi• • supporting community efforts and community groups
such as Green Corridors. (Green Corridors is a Council managed project to enhance areas of native bush along streams, provide a place for wildlife to thrive, improve water quality, and create open green spaces from the Tararua Ranges to Manawatū River).
It also encourages residents to become more sustainable through education and making it easy for them to make good choices. The Council also works with Horizons Regional Council to deliver the Enviroschools programme in schools and early childhood centres, to reduce waste and energy use and engage with biodiversity. Council also has an EcoDesign Advisor (EDA) programme to advise residents on how they can make their homes warmer and drier while reducing their power bills and environmental footprint.
4 educational videos on stormwater,
wastewater, portable water and recycling
Environmental groups received
Strategic Priority Grants
$321,000 on weed and pest
control
INCREASE IN NATIVE BIRD POPULATIONS IN THE TURITEA RESERVE
OVER 10 YEARS
Increased in-home consultations by
EDA
12,000 native trees planted as part of
GREEN CORRIDORS
3x 5
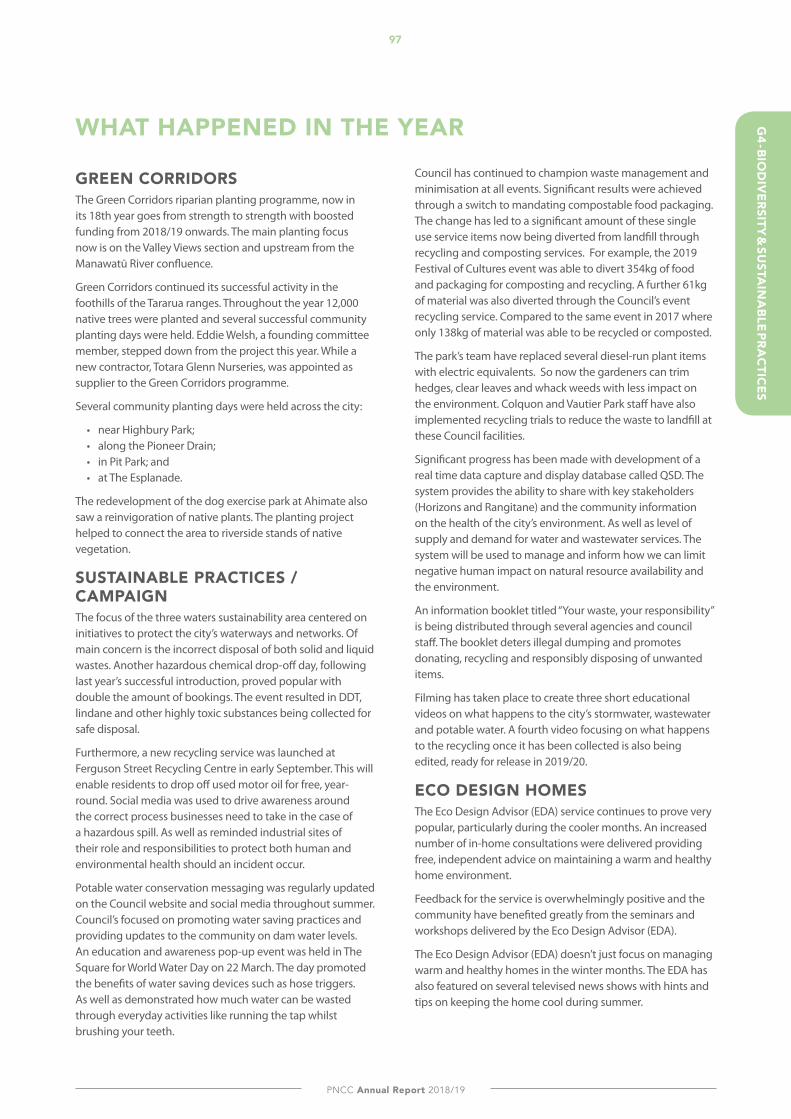
PNCC Annual Report 2018/19
97G
4 - BIOD
IVERSITY &
SUSTA
INA
BlE PRAC
TICES
WHAT HAPPENED IN THE YEAR
GREEN CORRIDORS The Green Corridors riparian planting programme, now in its 18th year goes from strength to strength with boosted funding from 2018/19 onwards. The main planting focus now is on the Valley Views section and upstream from the Manawatū River confluence.
Green Corridors continued its successful activity in the foothills of the Tararua ranges. Throughout the year 12,000 native trees were planted and several successful community planting days were held. Eddie Welsh, a founding committee member, stepped down from the project this year. While a new contractor, Totara Glenn Nurseries, was appointed as supplier to the Green Corridors programme.
Several community planting days were held across the city:
• near Highbury Park; • along the Pioneer Drain; • in Pit Park; and • at The Esplanade.
The redevelopment of the dog exercise park at Ahimate also saw a reinvigoration of native plants. The planting project helped to connect the area to riverside stands of native vegetation.
SUSTAINABlE PRACTICES / CAMPAIGNThe focus of the three waters sustainability area centered on initiatives to protect the city’s waterways and networks. Of main concern is the incorrect disposal of both solid and liquid wastes. Another hazardous chemical drop-off day, following last year’s successful introduction, proved popular with double the amount of bookings. The event resulted in DDT, lindane and other highly toxic substances being collected for safe disposal.
Furthermore, a new recycling service was launched at Ferguson Street Recycling Centre in early September. This will enable residents to drop off used motor oil for free, year-round. Social media was used to drive awareness around the correct process businesses need to take in the case of a hazardous spill. As well as reminded industrial sites of their role and responsibilities to protect both human and environmental health should an incident occur.
Potable water conservation messaging was regularly updated on the Council website and social media throughout summer. Council’s focused on promoting water saving practices and providing updates to the community on dam water levels. An education and awareness pop-up event was held in The Square for World Water Day on 22 March. The day promoted the benefits of water saving devices such as hose triggers. As well as demonstrated how much water can be wasted through everyday activities like running the tap whilst brushing your teeth.
Council has continued to champion waste management and minimisation at all events. Significant results were achieved through a switch to mandating compostable food packaging. The change has led to a significant amount of these single use service items now being diverted from landfill through recycling and composting services. For example, the 2019 Festival of Cultures event was able to divert 354kg of food and packaging for composting and recycling. A further 61kg of material was also diverted through the Council’s event recycling service. Compared to the same event in 2017 where only 138kg of material was able to be recycled or composted.
The park’s team have replaced several diesel-run plant items with electric equivalents. So now the gardeners can trim hedges, clear leaves and whack weeds with less impact on the environment. Colquon and Vautier Park staff have also implemented recycling trials to reduce the waste to landfill at these Council facilities.
Significant progress has been made with development of a real time data capture and display database called QSD. The system provides the ability to share with key stakeholders (Horizons and Rangitane) and the community information on the health of the city’s environment. As well as level of supply and demand for water and wastewater services. The system will be used to manage and inform how we can limit negative human impact on natural resource availability and the environment.
An information booklet titled “Your waste, your responsibility” is being distributed through several agencies and council staff. The booklet deters illegal dumping and promotes donating, recycling and responsibly disposing of unwanted items.
Filming has taken place to create three short educational videos on what happens to the city’s stormwater, wastewater and potable water. A fourth video focusing on what happens to the recycling once it has been collected is also being edited, ready for release in 2019/20.
ECO DESIGN HOMES The Eco Design Advisor (EDA) service continues to prove very popular, particularly during the cooler months. An increased number of in-home consultations were delivered providing free, independent advice on maintaining a warm and healthy home environment.
Feedback for the service is overwhelmingly positive and the community have benefited greatly from the seminars and workshops delivered by the Eco Design Advisor (EDA).
The Eco Design Advisor (EDA) doesn’t just focus on managing warm and healthy homes in the winter months. The EDA has also featured on several televised news shows with hints and tips on keeping the home cool during summer.
Small city benefits - Big city ambition
G4 -
BIO
DIV
ERSI
TY &
SUST
AIN
ABl
E PR
AC
TIC
ES98
BIODIVERSITY – PlANT AND PEST CONTROlIn 2018/19, Council continued its investment in pest and weed management in parks and reserves, Arapuke Forest Park and the Kahuterawa. This included regular predator trapping and noxious weed removal and monitoring and reporting of species trapped.
Council spent $321,000 on weed and pest control and monitoring in Turitea Water Catchment Reserve. Council’s on-going investment in pest management in the Turitea Reserve has been vindicated through native bird species monitoring. Results confirmed a population increase of triple in species such as bellbird, tui and kereru over the last ten years. Approval has been obtained for toutouwai (NZ Robin) to be re-introduced into the reserve, with this now scheduled for 2020.
The work in this reserve is now recognised as an example of best practice pest management in unfenced reserves. A scientific report due next year will repoty on the outcomes of 15 years of intensive pest management in Turitea Reserve.
Council continues to work beyond the Turitea Reserve to manage pests and weeds in adjacent locations:
• Hardings Park; • Arapuke Forest Park; • the Turitea Green Corridors; • as well as more isolated pockets as widespread as Victoria
Esplanade, Bledisloe Bush, and Ashhurst Domain.
The recently completed He Ara Kotahi Pathway to Linton has highlighted the work needed to control various plant and animal pests in areas largely unvisited by people until now. More than 3,900 native plants have been planted along the pathway. Focus has been planting the stream crossings and embankment sections, as well as associated weed and invasive species control along the pathway.
Council supports residents to manage pests on their own properties with advice and training. As well as providing traps to groups willing to work collectively to make predator free pockets.
Council continues to contribute to Horizons-led biodiversity enhancements in the Te Apiti/Manawatū Gorge and the Weedbusters programme.
SUPPORT TO ENVIRONMENTAl GROUPSAt the beginning of 2018/19, the Community Development team was invited to Environmental Sector Strategic Planning Day. The event focused on discussing with the community Council’s plans and how they fit with Council’s Eco City Strategy.
One of the major issues highlighted by the community was plastic pollution, especially in waterways. In response to this, our team coordinated a clean-up along the river dedicated to the World Clean Up day 2018. While Palmerston North City Council facilitated clean up in the city, environmental groups cleaned the river from Dannevirke to Foxton. September saw
a spike in requests for assistance from community groups and businesses wanting to implement clean-up events to clear litter in the city. Council has made ‘clean up’ kits, consisting of gloves, bags and pick up sticks, available to groups throughout the year.
After this clean up, the community decided to take a step further and survey the plastic pollution in 40 sample sites in Palmerston North This provided a benchmark for the city and initiated the Palmy Plastic Pollution Challenge. Council staff have been supporting the Palmy Plastic Pollution Challenge group as they gathered samples of plastic pollution in the city’s streams. Four Council officers and some Councilors participated in sampling on the identified sites.
Council facilitated collaboration between the Environmental sector and Council Planning and Infrastructure Units. This work will aid the development of an action plan to tackle the issue. A workshop held on the 22 June saw council staff from multiple departments contributing as guest speakers, topic leaders and idea contributors. The workshop was held alongside members of the community working together to develop possible solutions.
Council supported and hosted several initiatives throughout the year to support various environmental groups:
• During the year Palmerston North City Environmental Trust approached Council asking for support in recruiting a board member. A suitable person was appointed to the position and is now actively involved.
• Council supported the annual Reel Earth Environmental Film Festival, by providing guidance and connecting with partners and funders. Palmerston North City Council is also represented on the Reel Earth advisory group.
• Council provided an engagement platform for the Waste minimisation plan consultation.
• Support was provided for community initiatives such as Green Corridors and Pit Park, through the Movies in Parks series.
• Council hosted minor events in The Square as part of the summer Placemaking initiative: Tiakitanga a Papatuanuku - Care for Mother Earth and Weta hotel making workshops. As well as facilitated the establishment of Orchard at Queen Elizabeth College.
• A public engagement process was held for identifying a location for the Pascal Street Trust’s community garden. The garden is successfully operating in the Awapuni park.
PNCC Annual Report 2018/19
G4 - BIO
DIV
ERSITY & SU
STAIN
ABlE PRA
CTIC
ES99
ONGOING CONSIDERATIONS The sustainable practices focus will shift from recycling and disposal of items to campaigns promoting reduction and reuse.
In the water space, focus will be on Council’s vision of ‘one water’ as we look to develop these activities. This will mean using an integrated approach to water management. As part of the Wastewater Best Practical Options Project, Council will be engaging with key stakeholders and the community. Council will be using a new interactive tool on effective strategies to reduce wastewater flows and contaminant levels.
The challenge is to identify specific actions which Council could promote, mandate or incentivise that has the potential to reduce the amount of wastewater generated. This will ultimately inform the size and cost of the preferred option for managing the city’s wastewater into the middle of the 21st century.
Green Corridors new partnership with Totara Glenn Nurseries will help the programme continue many years of successful planting. As well as enhance the relationship with landowners near green corridors.
For the coming year, the focus of the Eco Design Advisor service will be on continuing to work with landlords, tenants, property managers and community groups (including those from the refugee community). Council’s goal is to achieve higher performance and create healthier rental properties.
New and existing reserve areas have been developed along the Manawatū riverside, as part of the River Framework programme. This provides Council with the opportunity to increase biodiversity within the urban environment. This includes the management of areas to encourage insects such as bees and butterflies, planting for nectar collecting birds and supporting natural fish habitats. This will have to be carefully balanced with increased numbers of people walking and cycling along the river.
Palmerston North City Council will be supporting the environmental sector by producing the first Palmerston North Strategy to combat plastic pollution. The Manawatū River Source to Sea (S2S) project will be coordinating community groups efforts around River Catchment with planting and restoring the habitat. This may be affected in future by the Manawatū River Framework and upgrades to the Waste water treatment plan.
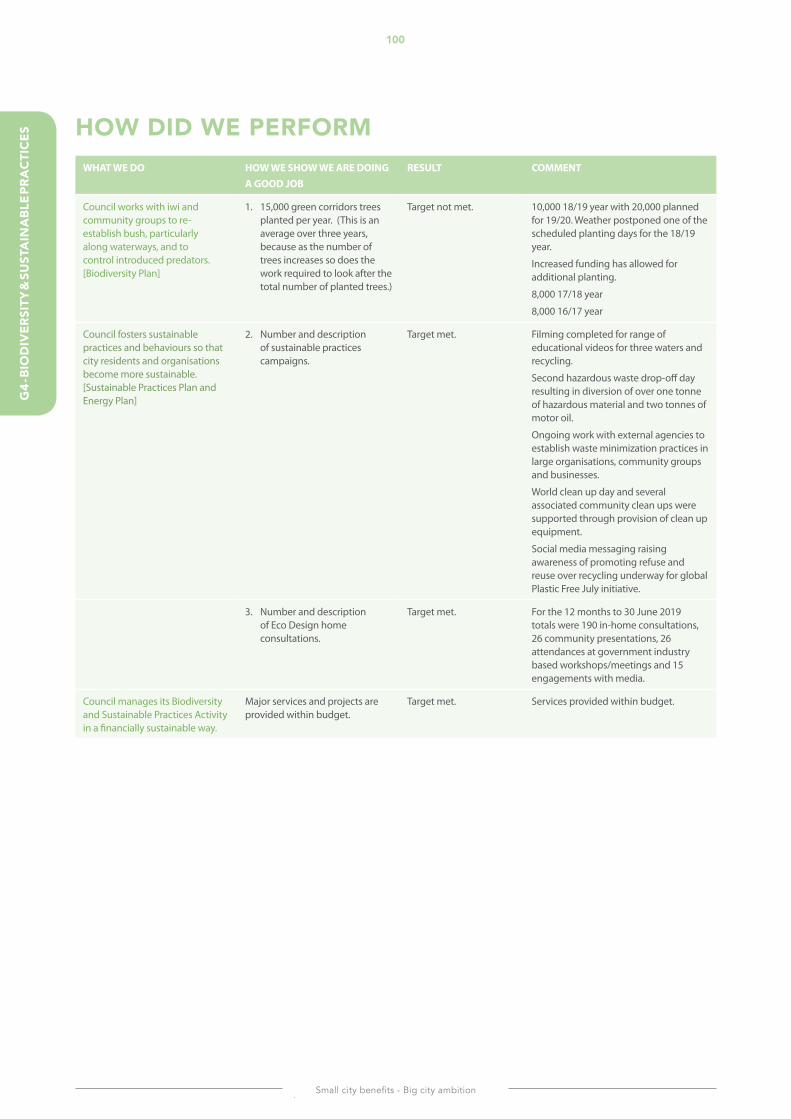
Small city benefits - Big city ambition
100G
4 - B
IOD
IVER
SITY
& SU
STA
INA
BlE
PRA
CTI
CES HOW DID WE PERFORM
WHAT WE DO HOW WE SHOW WE ARE DOING A GOOD JOB
RESULT COMMENT
Council works with iwi and community groups to re-establish bush, particularly along waterways, and to control introduced predators. [Biodiversity Plan]
1. 15,000 green corridors trees planted per year. (This is an average over three years, because as the number of trees increases so does the work required to look after the total number of planted trees.)
Target not met. 10,000 18/19 year with 20,000 planned for 19/20. Weather postponed one of the scheduled planting days for the 18/19 year.
Increased funding has allowed for additional planting.
8,000 17/18 year
8,000 16/17 year
Council fosters sustainable practices and behaviours so that city residents and organisations become more sustainable. [Sustainable Practices Plan and Energy Plan]
2. Number and description of sustainable practices campaigns.
Target met. Filming completed for range of educational videos for three waters and recycling.
Second hazardous waste drop-off day resulting in diversion of over one tonne of hazardous material and two tonnes of motor oil.
Ongoing work with external agencies to establish waste minimization practices in large organisations, community groups and businesses.
World clean up day and several associated community clean ups were supported through provision of clean up equipment.
Social media messaging raising awareness of promoting refuse and reuse over recycling underway for global Plastic Free July initiative.
3. Number and description of Eco Design home consultations.
Target met. For the 12 months to 30 June 2019 totals were 190 in-home consultations, 26 community presentations, 26 attendances at government industry based workshops/meetings and 15 engagements with media.
Council manages its Biodiversity and Sustainable Practices Activity in a financially sustainable way.
Major services and projects are provided within budget.
Target met. Services provided within budget.
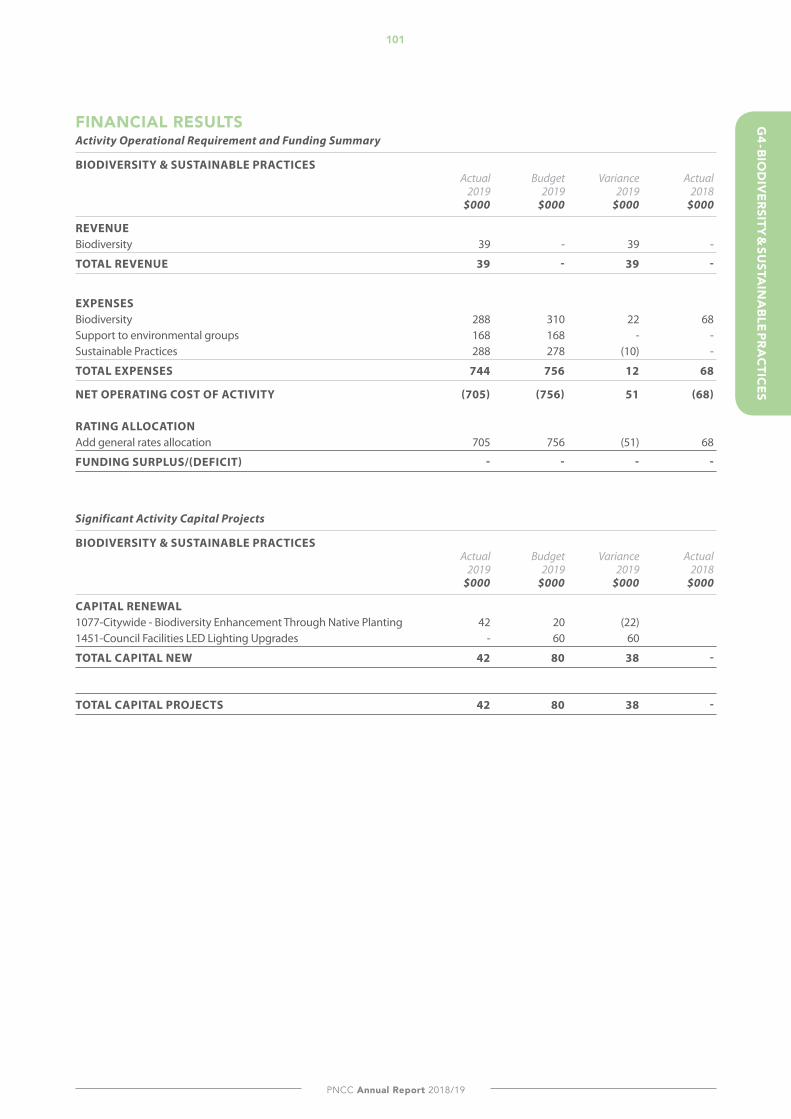
PNCC Annual Report 2018/19
101G
4 - BIOD
IVERSITY &
SUSTA
INA
BlE PRAC
TICES
FINANCIAl RESUlTSActivity Operational Requirement and Funding Summary
BIODIVERSITY & SUSTAINABLE PRACTICES Actual Budget Variance Actual 2019 2019 2019 2018 $000 $000 $000 $000
REVENUE Biodiversity 39 - 39 -
TOTAL REVENUE 39 - 39 -
EXPENSES Biodiversity 288 310 22 68Support to environmental groups 168 168 - -Sustainable Practices 288 278 (10) -
TOTAL EXPENSES 744 756 12 68
NET OPERATING COST OF ACTIVITY (705) (756) 51 (68) RATING ALLOCATION Add general rates allocation 705 756 (51) 68
FUNDING SURPLUS/(DEFICIT) - - - -
Significant Activity Capital Projects
BIODIVERSITY & SUSTAINABLE PRACTICES Actual Budget Variance Actual 2019 2019 2019 2018 $000 $000 $000 $000
CAPITAL RENEWAL 1077-Citywide - Biodiversity Enhancement Through Native Planting 42 20 (22) 1451-Council Facilities LED Lighting Upgrades - 60 60
TOTAL CAPITAL NEW 42 80 38 -
TOTAL CAPITAL PROJECTS 42 80 38 -
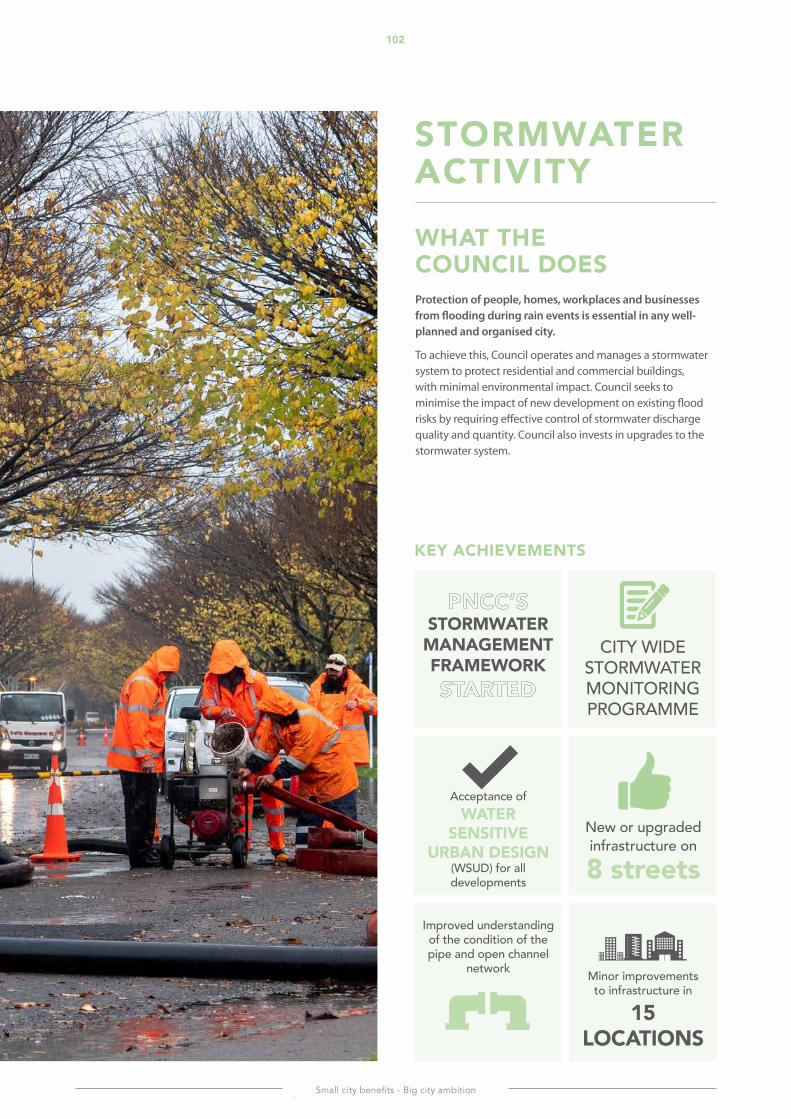
Small city benefits - Big city ambition
G4
- ST
OR
MW
ATE
R 102
KEY ACHIEVEMENTS
STORMWATER ACTIVITY
WhAt the CounCil DoesProtection of people, homes, workplaces and businesses from flooding during rain events is essential in any well-planned and organised city.
To achieve this, Council operates and manages a stormwater system to protect residential and commercial buildings, with minimal environmental impact. Council seeks to minimise the impact of new development on existing flood risks by requiring effective control of stormwater discharge quality and quantity. Council also invests in upgrades to the stormwater system.
Minor improvements to infrastructure in
15 loCAtions
Acceptance of WATER
sensitiVe URBAN DESIGN
(WSUD) for all developments
Improved understanding of the condition of the pipe and open channel
network
CITY WIDE STORMWATER MONITORING PROGRAMME
STORMWATER MANAGEMENT FRAMEWORK
New or upgraded infrastructure on8 streets
PNCC Annual Report 2018/19
G4 - STO
RM
WA
TER
103
WHAT HAPPENED IN THE YEAR
STORMWATER MANAGEMENTCouncil has continued to work pro-actively with property owners and developers in 2018/19. This was to ensure agreement and implement measures to more effectively manage stormwater discharge quality and quantity from new development. This has become urgent with the increasing impact of climate change. As well as the intensification of the city as gardens and backyards are replaced with houses and driveways. Stormwater Management Plans for any sub-division and major building consent application is now accepted as a necessary part of sustainable development.
To support greater clarity around the measures to be employed, Council has started work on our very own Stormwater Management Framework. When completed, the framework will provide an overview of the challenges for each stormwater catchment in the city. This will include the priorities for action and improved guidance on engineering and non-engineering solutions. As well as guidance on potential future investment in flood mitigation for larger areas.
Council has continued its focus on identifying and addressing local stormwater efficiency and nuisance flooding issues. Investments in new and upgraded infrastructure have been completed in:
• Vernon Street; • Footes Lane off Broadway Ave; • Patea Place;• Manuka Street; • Rewa Street; • Meremere Ave;• Parata Street; and • Ferguson Street.
Along with minor improvements in another 15 locations across the network. New and replacement pumps have been purchased to enable renewal works in the coming year at four key stormwater pump stations.
Council continued to invest in modelling of the stormwater network to improve understanding of flooding risks and identify cost effective improvements. During the year the model was revised and improved to provide more robust data for the city. The model was extended to include the Whakarongo growth area and the area south of the city to Longburn.
NETWORK PERFORMANCEDespite this work there were several significant high intensity stormwater rainfall events particularly in December. These resulted in flood damage to approximately ten properties within the city. Some immediate mitigation work was undertaken to clear the local network of blockage and investigation work is underway to identify cost effective improvements to reduce the risk of future flooding events.
Council has on-going investment in CCTV inspection of critical and aged parts of the pipe network. This along with condition assessments of pump stations has identified areas that in urgent need of renewal. Council needs to ensure there is a robust understanding of the investment required to ensure effective stormwater management in the city. A city-wide inspection of the open drain and streams network has identified a significant backlog in deferred maintenance. Additional funding has been approved to address this issue over the next ten years.
ONGOING CONSIDERATIONSThe flood events are a reminder of our changing climate and the changes to rainfall intensity. Work needs to continue using modelling and improved information on the network and property risks to identify at risk areas in the city. This will help us to identify effective and affordable flood litigation impacts.
Central government has signalled its desire to achieve significant improvements in fresh water quality. This will be reflected in higher quality standards for discharges to fresh water. The urban streams and waterways of Palmerston North are heavily degraded due to overgrowth of exotic vegetation. As well as the burden of litter and significant levels of contaminants entering via the stormwater system. Council will need to work pro-actively with the community to achieve improved stormwater quality. This can be achieved through a combination of investment in treatment systems at the source where possible and remediation of the existing urban waterways. Council will also consider regulatory action to address illegal discharges.
To support this Council has started work on a comprehensive city-wide fresh water monitoring programmes in close collaboration with Rangitanē. This will help benchmark the problem, identify problem areas for priority attention and demonstrate improvements made to the regulator. Council’s goal is to transform our urban waterways into breathing and living green corridors.
The city’s stormwater infrastructure continues to age. Use of CCTV, physical inspection and condition assessment will enable Council to develop a robust and complete assessment of renewal requirements. It is likely that increasing investment in the stormwater network will be required to maintain levels of service.
Small city benefits - Big city ambition
104G
4 -
STO
RM
WA
TER
HOW DID WE PERFORMWHAT WE DO HOW WE SHOW WE ARE DOING
A GOOD JOBRESULT COMMENT
Council provides stormwater services to protect buildings from inundation from flooding in major events. [Three Waters Plan]
1. The number of flood events per year resulting in stormwater from Council’s stormwater system entering a habitable floor in an urban area. (no more than 5)
Target met. 3 flood events on 13th, 20th, and 25th December 2018.
(2017/18 one flood event)
Council provides stormwater infrastructure to support growth. [Growth Infrastructure Plan]
2. The number of habitable floors per 1,000 properties within urban stormwater service areas affected by a flood event. (0.1 habitable floors per 1000 properties)
Target met. 9 Habitable Floors flooded in the year to date. This is equal to 0.1 habitable floors flooded per 1000 properties
(2017/18 three)
3. Median time to attend a flooding event (Less than 2 hours). (Note: A flooding event is one resulting in stormwater entering a habitable building.)
Target not met. (not practicable to reliably measure this)
In all cases of stormwater flooding of habitable floors in buildings, notification to Council occurred after the response period for the event had elapsed.
4. The number of complaints received about the performance of Council’s stormwater system per 1,000 properties connected. (No more than 15)
Target not met. 18.24 complaints per 1000 connections (total of 607). The majority of the complaints related to stormwater ponding on the road, for which no action is required nor justified as this road ponding is part of the stormwater system design.
(2017/18 19.9 complains per 1000 connections)
5. Compliance with resource consents1 for discharge from Council’s stormwater system measured by the number of:
• abatement notices
• infringement notices
• enforcement orders
• convictions
in relation to stormwater resource consents.
Target met. 100% compliance with resource consent.
6. A 30-year Asset Management Plan is in place and major AMP projects approved in the 10 Year Plan are achieved. 2
Target met. A 30 year Asset Management Plan for Stormwater was adopted by Council in June 2018 prior to adopting the 2018-28 10 Year Plan.
Work is on-going with the new development of 5 year detailed renewal and capital new programmes. Work is continuing with collecting improved information on the condition and performance of the piped stormwater network. A condition and performance assessment of around 50% of the open drains and streams network has been completed. Information collected to date is being used to inform planning and budgeting for maintenance and renewals for years 2 and 3 of the 10 Year Plan.
Council manages its Stormwater Activity in a financially sustainable way.
Major services and projects are provided within budget.
Target met. Services provided within budget.
1 Council holds only consents associated with construction and maintenance of stormwater facilities. There are no specific Stormwater discharge consents.
2 Renewals as a group: City-wide Stormwater Improvement Works (programme 1060)
PNCC Annual Report 2018/19
105G
4 - STOR
MW
ATE
R
FINANCIAl RESUlTSActivity Operational Requirement and Funding Summary
STORMWATER Actual Budget Variance Actual 2019 2019 2019 2018 $000 $000 $000 $000
REVENUE Stormwater Collection and Disposal 14 2 12 13
TOTAL REVENUE 14 2 12 13
EXPENSES Stormwater Collection and Disposal 3,928 3,784 (144) 3,599
TOTAL EXPENSES 3,928 3,784 (144) 3,599
NET OPERATING COST OF ACTIVITY (3,914) (3,782) (132) (3,586) RATING ALLOCATION Add back depreciation 1,744 1,787 (43) 1,713Less Renewal capital expenditure (578) (635) 57 (255)Add/(Less) borrowing effect of renewal 3 year averaging (6) (6) - (147)Add proceeds from sale of assets 157 - 157 -Less provision for debt reduction (123) (123) - (224)Add general rates allocation 2,720 2,759 (39) 2,499
FUNDING SURPLUS/(DEFICIT) - - - -
Significant Activity Capital Projects
STORMWATER Actual Budget Variance Actual 2019 2019 2019 2018 $000 $000 $000 $000
CAPITAL RENEWAL 20-City-wide - Stormwater Pump Station Renewals 8 70 62 1062-City-wide - Stormwater Renewal Works 570 565 (5)
TOTAL CAPITAL RENEWAL 578 635 57 255
CAPITAL NEW 51-City-wide - Stormwater Subdivision Contributions - 50 50 197-Urban Growth - North East Industrial Park Stormwater - 20 20 1001-Urban Growth - Whakarongo - Installation of Stormwater Systems 219 380 161 1060-City-wide - Stormwater Improvement Works 616 563 (53)
TOTAL CAPITAL NEW 835 1,013 178 1,160
TOTAL CAPITAL PROJECTS 1,413 1,648 235 1,415
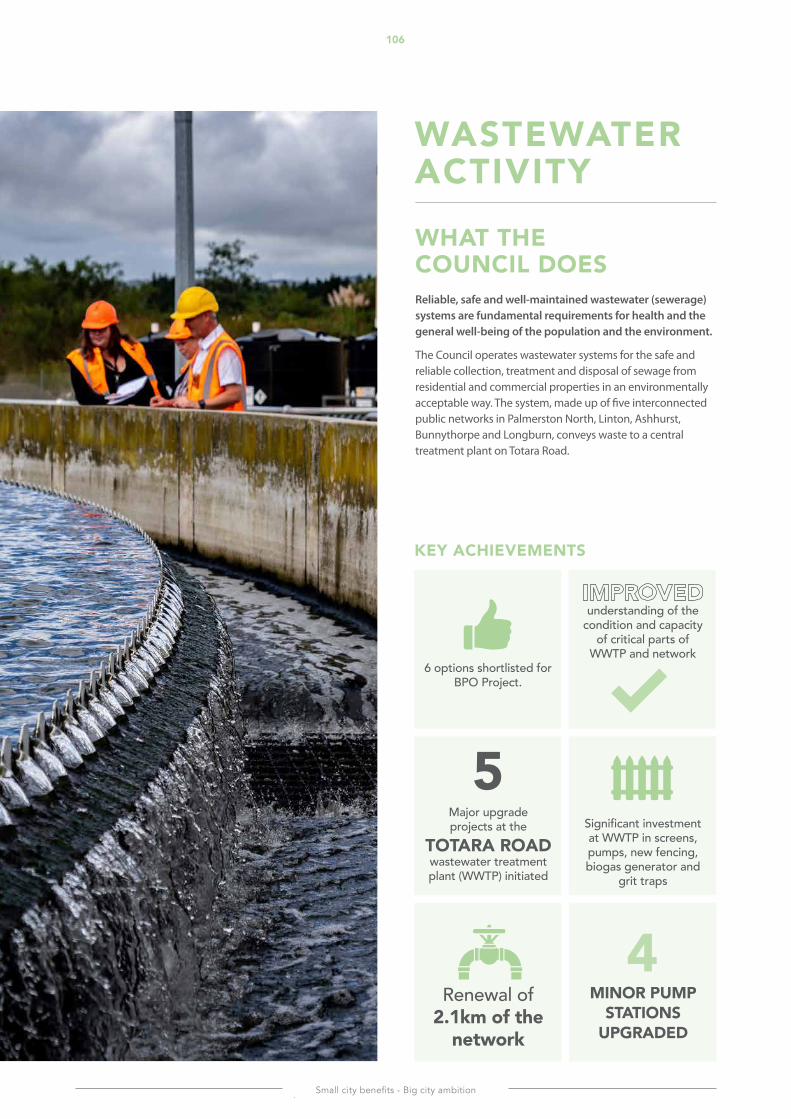
Small city benefits - Big city ambition
106G
4 -
STO
RM
WA
TER
KEY ACHIEVEMENTS
WASTEWATER ACTIVITY
WhAt the CounCil DoesReliable, safe and well-maintained wastewater (sewerage) systems are fundamental requirements for health and the general well-being of the population and the environment.
The Council operates wastewater systems for the safe and reliable collection, treatment and disposal of sewage from residential and commercial properties in an environmentally acceptable way. The system, made up of five interconnected public networks in Palmerston North, Linton, Ashhurst, Bunnythorpe and Longburn, conveys waste to a central treatment plant on Totara Road.
Significant investment at WWTP in screens, pumps, new fencing, biogas generator and
grit traps
MINOR PUMP stAtions
UPGRADED
Major upgrade projects at the
TOTARA ROAD wastewater treatment plant (WWTP) initiated
Renewal of 2.1km of the
network
understanding of the
condition and capacity of critical parts of
WWTP and network6 options shortlisted for
BPO Project.
4
5
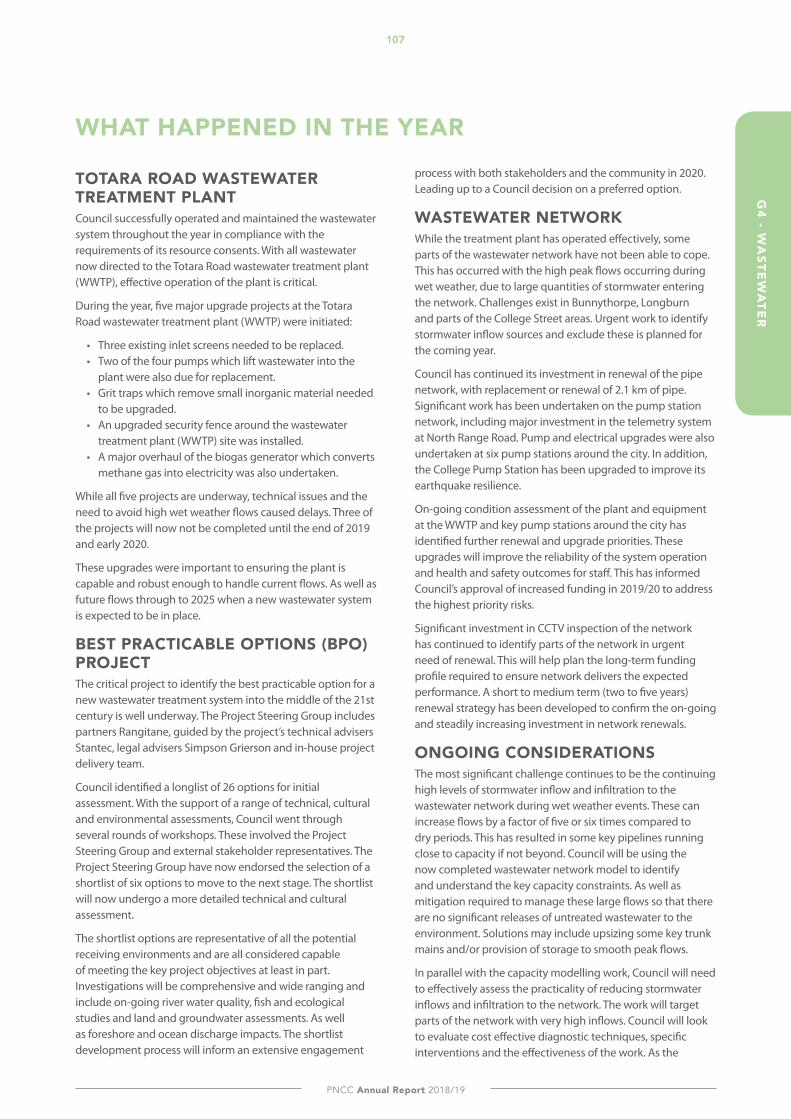
PNCC Annual Report 2018/19
G4 - W
ASTE
WA
TER
107
WHAT HAPPENED IN THE YEAR
TOTARA ROAD WASTEWATER TREATMENT PlANTCouncil successfully operated and maintained the wastewater system throughout the year in compliance with the requirements of its resource consents. With all wastewater now directed to the Totara Road wastewater treatment plant (WWTP), effective operation of the plant is critical.
During the year, five major upgrade projects at the Totara Road wastewater treatment plant (WWTP) were initiated:
• Three existing inlet screens needed to be replaced. • Two of the four pumps which lift wastewater into the
plant were also due for replacement. • Grit traps which remove small inorganic material needed
to be upgraded. • An upgraded security fence around the wastewater
treatment plant (WWTP) site was installed. • A major overhaul of the biogas generator which converts
methane gas into electricity was also undertaken.
While all five projects are underway, technical issues and the need to avoid high wet weather flows caused delays. Three of the projects will now not be completed until the end of 2019 and early 2020.
These upgrades were important to ensuring the plant is capable and robust enough to handle current flows. As well as future flows through to 2025 when a new wastewater system is expected to be in place.
BEST PRACTICABlE OPTIONS (BPO) PROJECTThe critical project to identify the best practicable option for a new wastewater treatment system into the middle of the 21st century is well underway. The Project Steering Group includes partners Rangitane, guided by the project’s technical advisers Stantec, legal advisers Simpson Grierson and in-house project delivery team.
Council identified a longlist of 26 options for initial assessment. With the support of a range of technical, cultural and environmental assessments, Council went through several rounds of workshops. These involved the Project Steering Group and external stakeholder representatives. The Project Steering Group have now endorsed the selection of a shortlist of six options to move to the next stage. The shortlist will now undergo a more detailed technical and cultural assessment.
The shortlist options are representative of all the potential receiving environments and are all considered capable of meeting the key project objectives at least in part. Investigations will be comprehensive and wide ranging and include on-going river water quality, fish and ecological studies and land and groundwater assessments. As well as foreshore and ocean discharge impacts. The shortlist development process will inform an extensive engagement
process with both stakeholders and the community in 2020. Leading up to a Council decision on a preferred option.
WASTEWATER NETWORKWhile the treatment plant has operated effectively, some parts of the wastewater network have not been able to cope. This has occurred with the high peak flows occurring during wet weather, due to large quantities of stormwater entering the network. Challenges exist in Bunnythorpe, Longburn and parts of the College Street areas. Urgent work to identify stormwater inflow sources and exclude these is planned for the coming year.
Council has continued its investment in renewal of the pipe network, with replacement or renewal of 2.1 km of pipe. Significant work has been undertaken on the pump station network, including major investment in the telemetry system at North Range Road. Pump and electrical upgrades were also undertaken at six pump stations around the city. In addition, the College Pump Station has been upgraded to improve its earthquake resilience.
On-going condition assessment of the plant and equipment at the WWTP and key pump stations around the city has identified further renewal and upgrade priorities. These upgrades will improve the reliability of the system operation and health and safety outcomes for staff. This has informed Council’s approval of increased funding in 2019/20 to address the highest priority risks.
Significant investment in CCTV inspection of the network has continued to identify parts of the network in urgent need of renewal. This will help plan the long-term funding profile required to ensure network delivers the expected performance. A short to medium term (two to five years) renewal strategy has been developed to confirm the on-going and steadily increasing investment in network renewals.
ONGOING CONSIDERATIONS The most significant challenge continues to be the continuing high levels of stormwater inflow and infiltration to the wastewater network during wet weather events. These can increase flows by a factor of five or six times compared to dry periods. This has resulted in some key pipelines running close to capacity if not beyond. Council will be using the now completed wastewater network model to identify and understand the key capacity constraints. As well as mitigation required to manage these large flows so that there are no significant releases of untreated wastewater to the environment. Solutions may include upsizing some key trunk mains and/or provision of storage to smooth peak flows.
In parallel with the capacity modelling work, Council will need to effectively assess the practicality of reducing stormwater inflows and infiltration to the network. The work will target parts of the network with very high inflows. Council will look to evaluate cost effective diagnostic techniques, specific interventions and the effectiveness of the work. As the
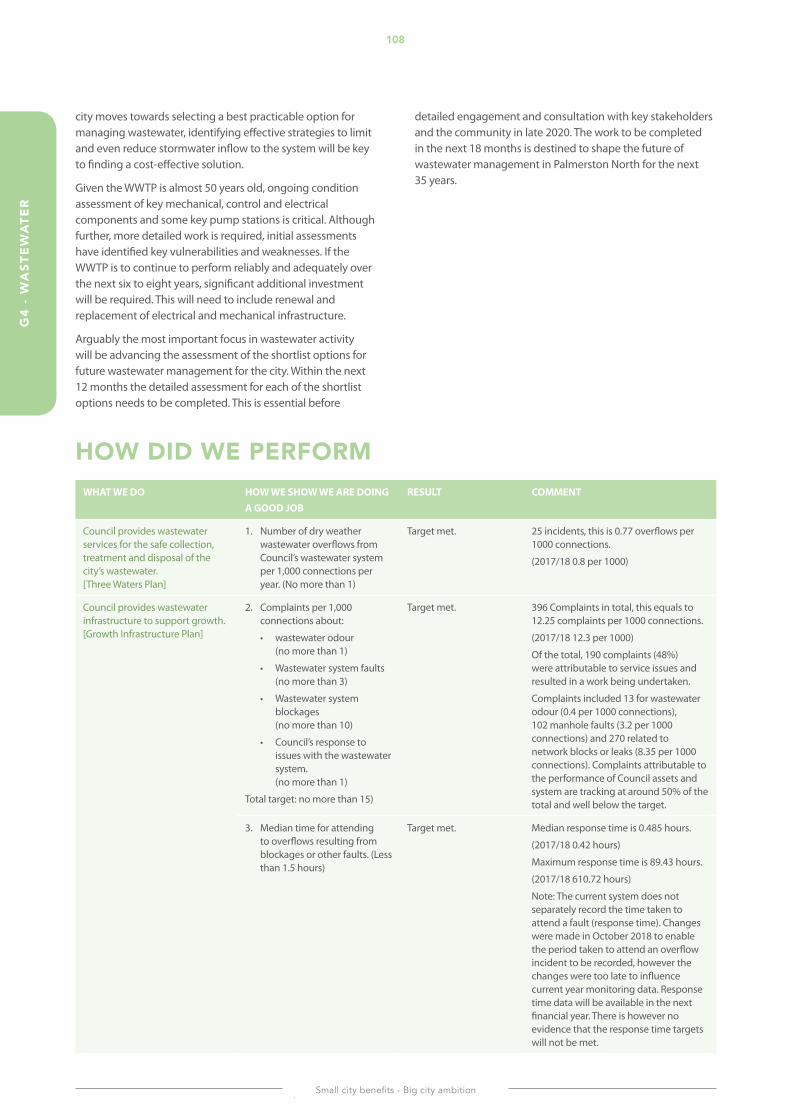
Small city benefits - Big city ambition
108G
4 -
WA
STE
WA
TER
city moves towards selecting a best practicable option for managing wastewater, identifying effective strategies to limit and even reduce stormwater inflow to the system will be key to finding a cost-effective solution.
Given the WWTP is almost 50 years old, ongoing condition assessment of key mechanical, control and electrical components and some key pump stations is critical. Although further, more detailed work is required, initial assessments have identified key vulnerabilities and weaknesses. If the WWTP is to continue to perform reliably and adequately over the next six to eight years, significant additional investment will be required. This will need to include renewal and replacement of electrical and mechanical infrastructure.
Arguably the most important focus in wastewater activity will be advancing the assessment of the shortlist options for future wastewater management for the city. Within the next 12 months the detailed assessment for each of the shortlist options needs to be completed. This is essential before
detailed engagement and consultation with key stakeholders and the community in late 2020. The work to be completed in the next 18 months is destined to shape the future of wastewater management in Palmerston North for the next 35 years.
HOW DID WE PERFORMWHAT WE DO HOW WE SHOW WE ARE DOING
A GOOD JOBRESULT COMMENT
Council provides wastewater services for the safe collection, treatment and disposal of the city’s wastewater. [Three Waters Plan]
1. Number of dry weather wastewater overflows from Council’s wastewater system per 1,000 connections per year. (No more than 1)
Target met. 25 incidents, this is 0.77 overflows per 1000 connections.
(2017/18 0.8 per 1000)
Council provides wastewater infrastructure to support growth. [Growth Infrastructure Plan]
2. Complaints per 1,000 connections about:
• wastewater odour (no more than 1)
• Wastewater system faults (no more than 3)
• Wastewater system blockages (no more than 10)
• Council’s response to issues with the wastewater system. (no more than 1)
Total target: no more than 15)
Target met. 396 Complaints in total, this equals to 12.25 complaints per 1000 connections.
(2017/18 12.3 per 1000)
Of the total, 190 complaints (48%) were attributable to service issues and resulted in a work being undertaken.
Complaints included 13 for wastewater odour (0.4 per 1000 connections), 102 manhole faults (3.2 per 1000 connections) and 270 related to network blocks or leaks (8.35 per 1000 connections). Complaints attributable to the performance of Council assets and system are tracking at around 50% of the total and well below the target.
3. Median time for attending to overflows resulting from blockages or other faults. (Less than 1.5 hours)
Target met. Median response time is 0.485 hours.
(2017/18 0.42 hours)
Maximum response time is 89.43 hours.
(2017/18 610.72 hours)
Note: The current system does not separately record the time taken to attend a fault (response time). Changes were made in October 2018 to enable the period taken to attend an overflow incident to be recorded, however the changes were too late to influence current year monitoring data. Response time data will be available in the next financial year. There is however no evidence that the response time targets will not be met.
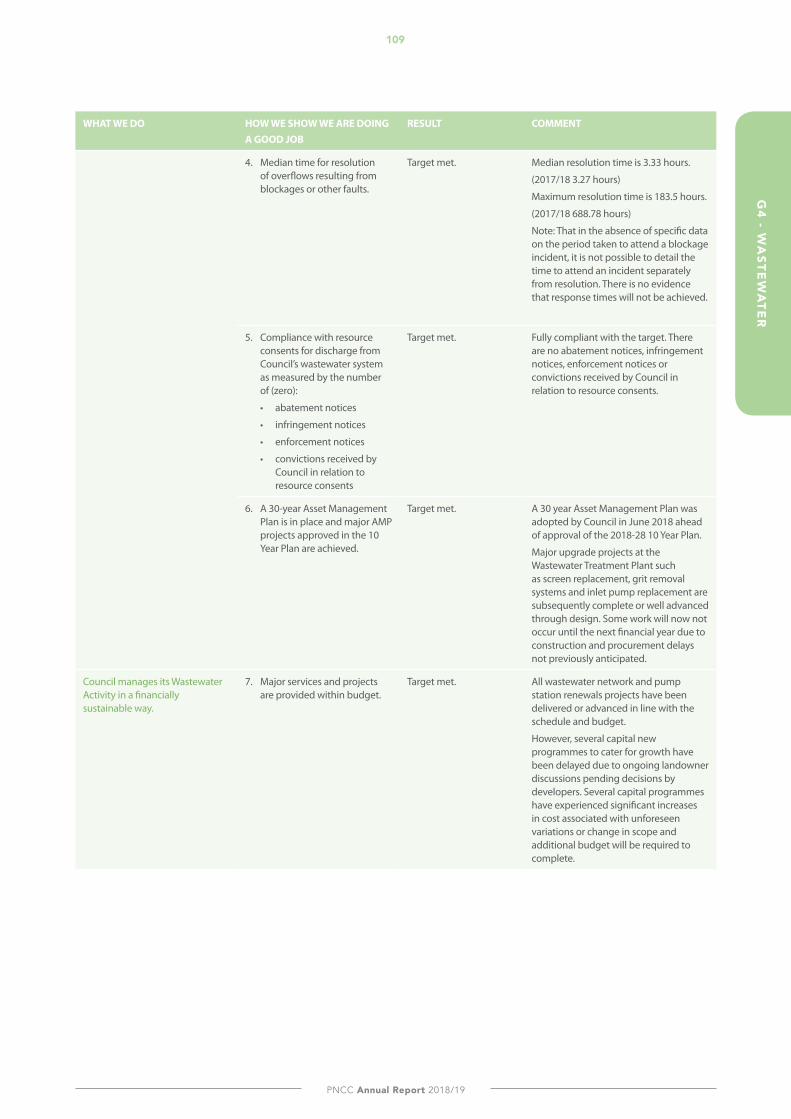
PNCC Annual Report 2018/19
109G
4 - WA
STEW
ATE
R
WHAT WE DO HOW WE SHOW WE ARE DOING A GOOD JOB
RESULT COMMENT
4. Median time for resolution of overflows resulting from blockages or other faults.
Target met. Median resolution time is 3.33 hours.
(2017/18 3.27 hours)
Maximum resolution time is 183.5 hours.
(2017/18 688.78 hours)
Note: That in the absence of specific data on the period taken to attend a blockage incident, it is not possible to detail the time to attend an incident separately from resolution. There is no evidence that response times will not be achieved.
5. Compliance with resource consents for discharge from Council’s wastewater system as measured by the number of (zero):
• abatement notices
• infringement notices
• enforcement notices
• convictions received by Council in relation to resource consents
Target met. Fully compliant with the target. There are no abatement notices, infringement notices, enforcement notices or convictions received by Council in relation to resource consents.
6. A 30-year Asset Management Plan is in place and major AMP projects approved in the 10 Year Plan are achieved.
Target met. A 30 year Asset Management Plan was adopted by Council in June 2018 ahead of approval of the 2018-28 10 Year Plan.
Major upgrade projects at the Wastewater Treatment Plant such as screen replacement, grit removal systems and inlet pump replacement are subsequently complete or well advanced through design. Some work will now not occur until the next financial year due to construction and procurement delays not previously anticipated.
Council manages its Wastewater Activity in a financially sustainable way.
7. Major services and projects are provided within budget.
Target met. All wastewater network and pump station renewals projects have been delivered or advanced in line with the schedule and budget.
However, several capital new programmes to cater for growth have been delayed due to ongoing landowner discussions pending decisions by developers. Several capital programmes have experienced significant increases in cost associated with unforeseen variations or change in scope and additional budget will be required to complete.
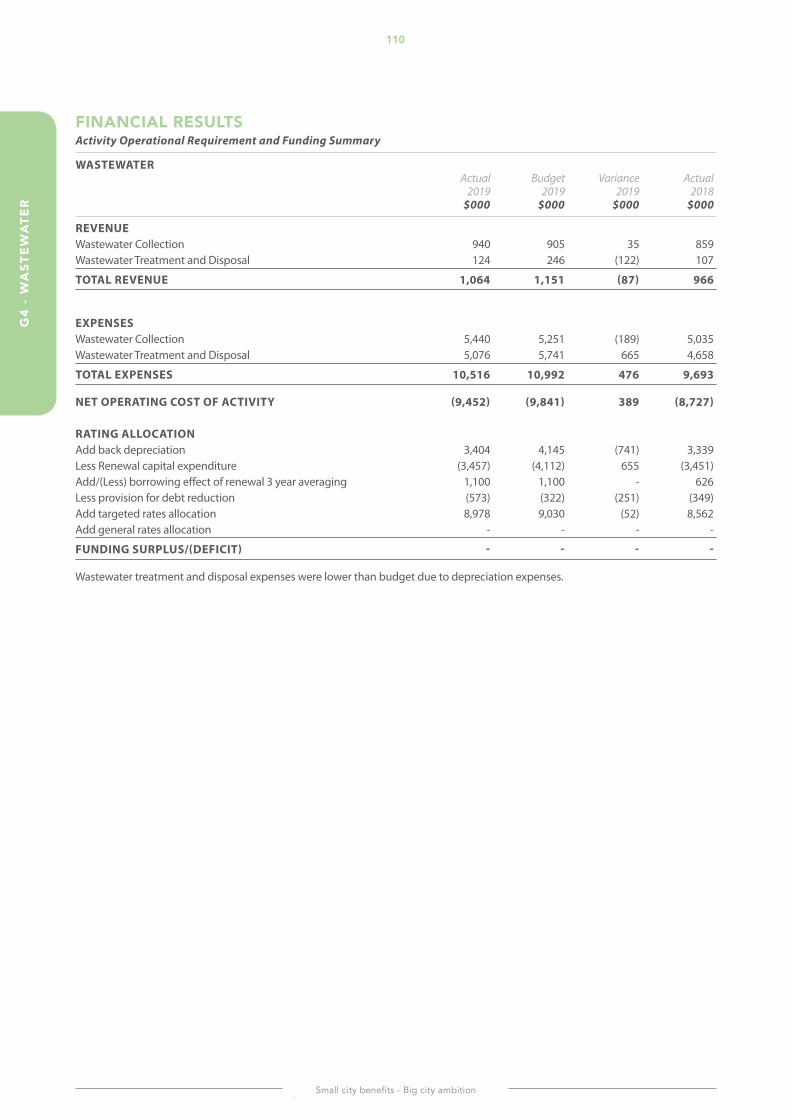
Small city benefits - Big city ambition
110G
4 -
WA
STE
WA
TER
FINANCIAl RESUlTSActivity Operational Requirement and Funding Summary
WASTEWATER Actual Budget Variance Actual 2019 2019 2019 2018 $000 $000 $000 $000
REVENUE Wastewater Collection 940 905 35 859Wastewater Treatment and Disposal 124 246 (122) 107
TOTAL REVENUE 1,064 1,151 (87) 966
EXPENSES Wastewater Collection 5,440 5,251 (189) 5,035Wastewater Treatment and Disposal 5,076 5,741 665 4,658
TOTAL EXPENSES 10,516 10,992 476 9,693
NET OPERATING COST OF ACTIVITY (9,452) (9,841) 389 (8,727) RATING ALLOCATION Add back depreciation 3,404 4,145 (741) 3,339Less Renewal capital expenditure (3,457) (4,112) 655 (3,451)Add/(Less) borrowing effect of renewal 3 year averaging 1,100 1,100 - 626Less provision for debt reduction (573) (322) (251) (349)Add targeted rates allocation 8,978 9,030 (52) 8,562Add general rates allocation - - - -
FUNDING SURPLUS/(DEFICIT) - - - -
Wastewater treatment and disposal expenses were lower than budget due to depreciation expenses.
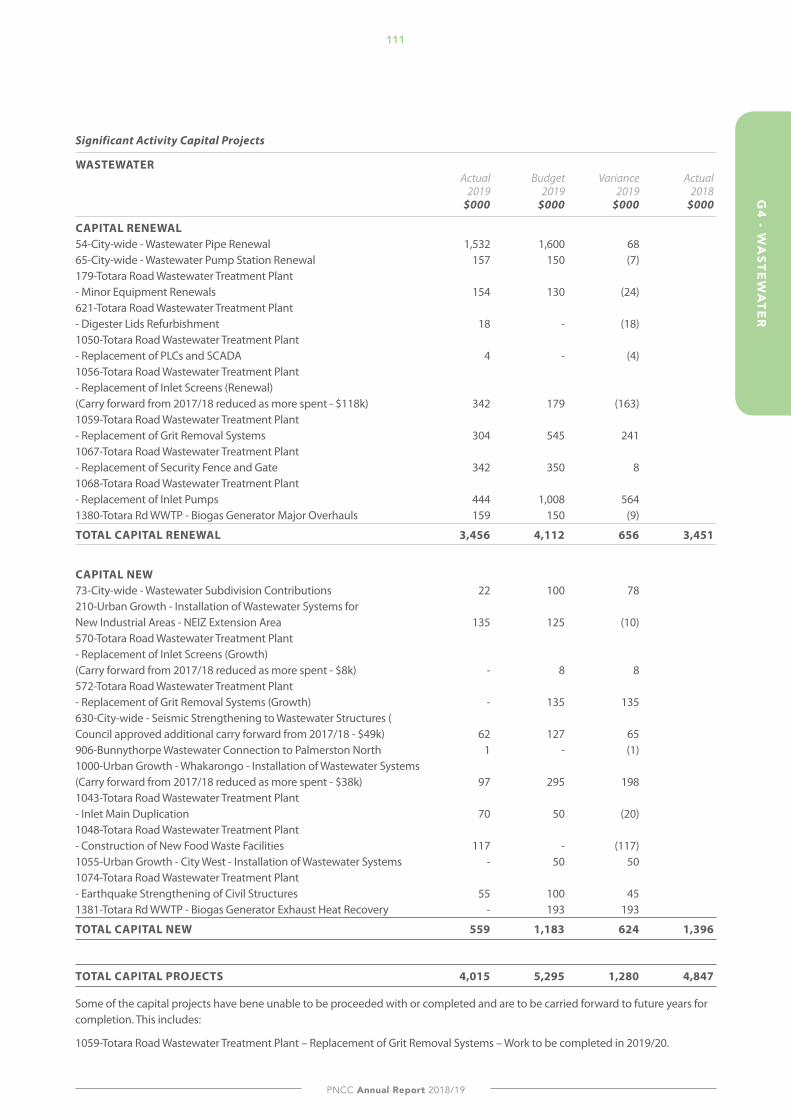
PNCC Annual Report 2018/19
G4 - W
ASTE
WA
TER
111
Significant Activity Capital Projects
WASTEWATER Actual Budget Variance Actual 2019 2019 2019 2018 $000 $000 $000 $000
CAPITAL RENEWAL 54-City-wide - Wastewater Pipe Renewal 1,532 1,600 68 65-City-wide - Wastewater Pump Station Renewal 157 150 (7) 179-Totara Road Wastewater Treatment Plant - Minor Equipment Renewals 154 130 (24) 621-Totara Road Wastewater Treatment Plant - Digester Lids Refurbishment 18 - (18) 1050-Totara Road Wastewater Treatment Plant - Replacement of PLCs and SCADA 4 - (4) 1056-Totara Road Wastewater Treatment Plant - Replacement of Inlet Screens (Renewal) (Carry forward from 2017/18 reduced as more spent - $118k) 342 179 (163) 1059-Totara Road Wastewater Treatment Plant - Replacement of Grit Removal Systems 304 545 241 1067-Totara Road Wastewater Treatment Plant - Replacement of Security Fence and Gate 342 350 8 1068-Totara Road Wastewater Treatment Plant - Replacement of Inlet Pumps 444 1,008 564 1380-Totara Rd WWTP - Biogas Generator Major Overhauls 159 150 (9)
TOTAL CAPITAL RENEWAL 3,456 4,112 656 3,451
CAPITAL NEW 73-City-wide - Wastewater Subdivision Contributions 22 100 78 210-Urban Growth - Installation of Wastewater Systems for New Industrial Areas - NEIZ Extension Area 135 125 (10) 570-Totara Road Wastewater Treatment Plant - Replacement of Inlet Screens (Growth) (Carry forward from 2017/18 reduced as more spent - $8k) - 8 8 572-Totara Road Wastewater Treatment Plant - Replacement of Grit Removal Systems (Growth) - 135 135 630-City-wide - Seismic Strengthening to Wastewater Structures ( Council approved additional carry forward from 2017/18 - $49k) 62 127 65 906-Bunnythorpe Wastewater Connection to Palmerston North 1 - (1) 1000-Urban Growth - Whakarongo - Installation of Wastewater Systems (Carry forward from 2017/18 reduced as more spent - $38k) 97 295 198 1043-Totara Road Wastewater Treatment Plant - Inlet Main Duplication 70 50 (20) 1048-Totara Road Wastewater Treatment Plant - Construction of New Food Waste Facilities 117 - (117) 1055-Urban Growth - City West - Installation of Wastewater Systems - 50 50 1074-Totara Road Wastewater Treatment Plant - Earthquake Strengthening of Civil Structures 55 100 45 1381-Totara Rd WWTP - Biogas Generator Exhaust Heat Recovery - 193 193
TOTAL CAPITAL NEW 559 1,183 624 1,396
TOTAL CAPITAL PROJECTS 4,015 5,295 1,280 4,847
Some of the capital projects have bene unable to be proceeded with or completed and are to be carried forward to future years for completion. This includes:
1059-Totara Road Wastewater Treatment Plant – Replacement of Grit Removal Systems – Work to be completed in 2019/20.
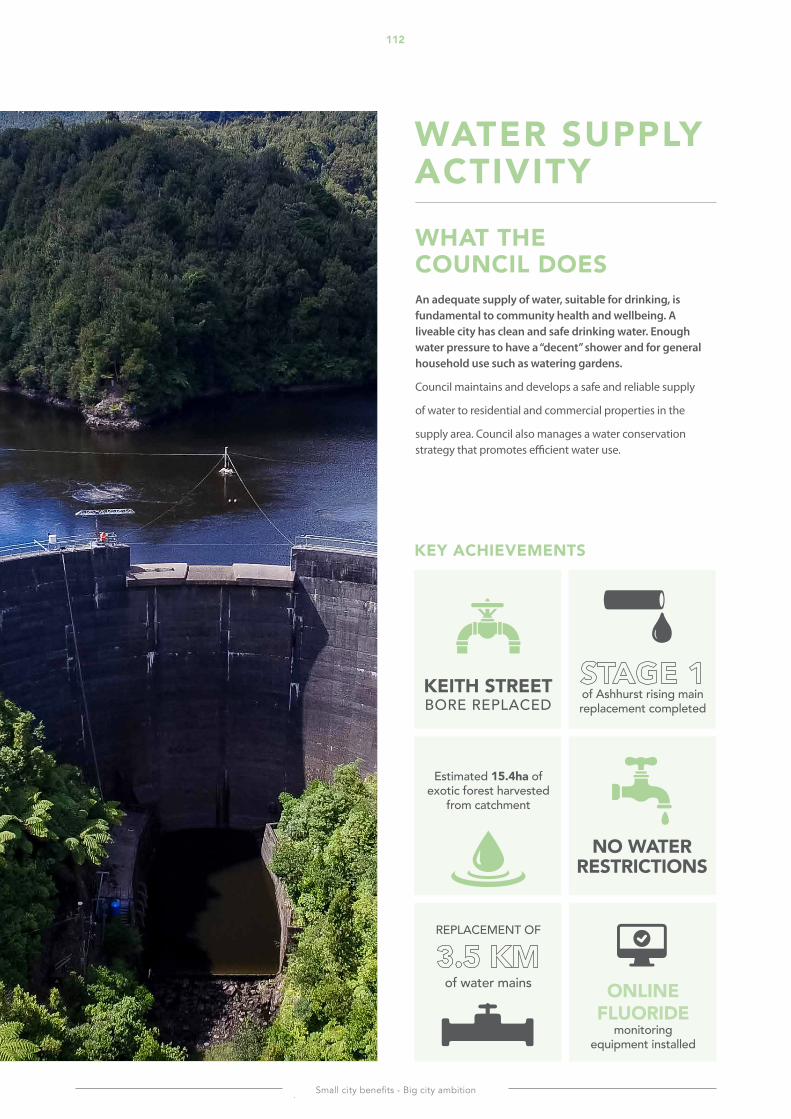
Small city benefits - Big city ambition
112G
4 -
WA
TER
SU
PP
lY
KEY ACHIEVEMENTS
WATER SUPPlY ACTIVITY
WhAt the CounCil DoesAn adequate supply of water, suitable for drinking, is fundamental to community health and wellbeing. A liveable city has clean and safe drinking water. Enough water pressure to have a “decent” shower and for general household use such as watering gardens.
Council maintains and develops a safe and reliable supply
of water to residential and commercial properties in the
supply area. Council also manages a water conservation strategy that promotes efficient water use.
online FlUORIDE
monitoring equipment installed
Estimated 15.4ha of exotic forest harvested
from catchment
REPLACEMENT OF
of water mains
of Ashhurst rising main replacement completed
KEITH STREET BORE REPLACED
NO WATER RESTRICTIONS
PNCC Annual Report 2018/19
113G
4 - WA
TER
SUP
PlY
WHAT HAPPENED IN THE YEAR
QUANTITY AND QUAlITY OF SUPPlYTotal water demand for this year was similar to the previous year. Rain fell sufficiently regularly to ensure demand from all users was met with no restrictions.
Council continued its work to formulate a comprehensive water conservation approach including engineering and customer focussed initiatives. Council implemented real-time monitoring of the top 30 water customers by volume. This enabled collaboration between Council and customers on more effective water leakage measures and demand management to the benefit of the wider network.
Water supplied from all the sources in the city has continued to comply with New Zealand Drinking Water Standards. While water quality exceeded the standard for most of the network, there were network failures in the Ashhurst supply. These failures resulted in unacceptable loss of supply and water quality. Work has begun on renewing the critical main in the Ashhurst section of the network.
Council continued to invest in increasing supply capacity to meet growth and provide resilience. This meant increasing the number of bore sources within the city. The replacement Keith Street bore has now been connected to the supply. Work is also well advanced on both the new Railway Road bore and the replacement No 2 bore at Papaioea Park.
Council successfully harvested an estimated 15.4ha of mature pine forest in the Turitea Water Supply Catchment with no measurable impact on water quality. This project also provided significant financial benefit to Council.
RISK AND RESIlIENCECouncil continued to focus on identifying and addressing key water quality and resilience risks:
• Council installed online fluoride monitoring equipment on all its water sources.
• Upgrades were made at the Takaro Park bore head to eliminate potential contamination risks. These risks were associated with poor quality piping, valves and the below ground bore head installation.
• There is ongoing work to identify seismic strengthening requirements at the Turitea Waste Water Treatment Plant.
• Seismic valves were designed and installed on the outlet pipes from the main reservoirs to ensure they retain water following an earthquake.
• A more detailed assessment of the condition of critical plant and equipment at each water supply source was conducted. The results mean enhanced renewal and capital programmes in 2019/20 to improve reliability and health and safety for operations staff.
Monitoring of the aeration system in the Turitea Dams has been effective at reducing iron and manganese levels in raw water. This has reduced risks of discoloured water events in the network.
NETWORK INVESTMENTCouncil continued its significant investment in network renewal, including:
• replacement of a further 3.5 km of water mains; • 49 water meters; and • 364 tobys.
The first section of the Ashhurst rising main renewal was completed. Planning and design was also completed for the remainder of the project which continues into 2019/20.
ONGOING CONSIDERATIONS During the year, the provision of water supply has been the focus of numerous reviews by national government agencies. Council is still waiting for details of new government proposals for regulating the water industry and confirmation of changes to the New Zealand Drinking Water Standards. Council has been looking to get ahead of the changes and work is already underway. This will ensure that we’re ready to implement multi-barrier treatment for both ground water and surface water sources. As well as implement treatment that achieves higher residual chlorine levels in the network.
The key capital programme in 2019/20 will be construction on the second trunk watermain from the Turitea Waste Water Treatment Plant to the Ngahere Park reservoir. This will be challenging due to the terrain. Council will also need to maintain access on the narrow road for residents and treatment plant staff.
Council have endorsed the urgency of addressing the condition of the Ashhurst rising main. Council has allocated $1.4 million to replace the rising main from the bore at Hacketts Road through to Cambridge Ave. In addition, construction will begin on the second falling main from the Ashhurst reservoir to the town. This will ensure pressure and fire flow standards for the residential area of Ashhurst.
Seismic modelling and safety assessments on the two Turitea Dams has been completed. Council will now be working to confirm the programme of actions to ensure the dams can be operated safely into the future. This means ensuring an effective response plan is in place, which is understood by potentially affected parties in the event of an earthquake.
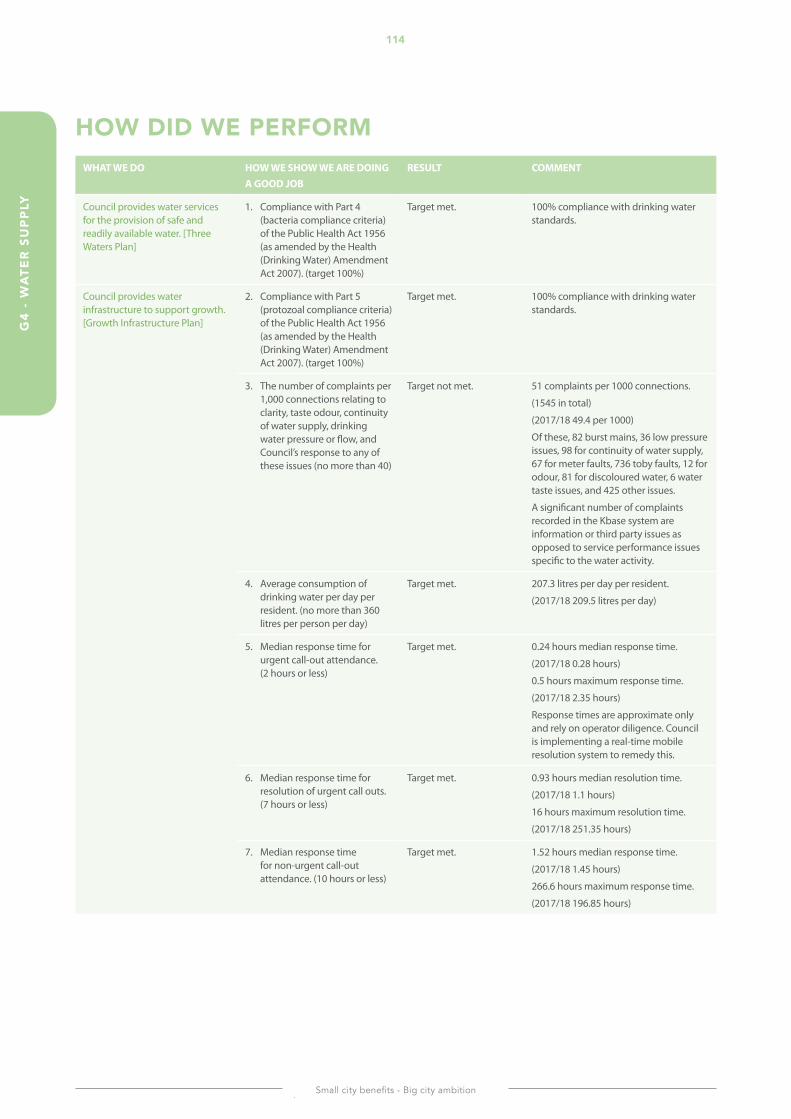
Small city benefits - Big city ambition
114G
4 -
WA
TER
SU
PP
lY
HOW DID WE PERFORMWHAT WE DO HOW WE SHOW WE ARE DOING
A GOOD JOBRESULT COMMENT
Council provides water services for the provision of safe and readily available water. [Three Waters Plan]
1. Compliance with Part 4 (bacteria compliance criteria) of the Public Health Act 1956 (as amended by the Health (Drinking Water) Amendment Act 2007). (target 100%)
Target met. 100% compliance with drinking water standards.
Council provides water infrastructure to support growth. [Growth Infrastructure Plan]
2. Compliance with Part 5 (protozoal compliance criteria) of the Public Health Act 1956 (as amended by the Health (Drinking Water) Amendment Act 2007). (target 100%)
Target met. 100% compliance with drinking water standards.
3. The number of complaints per 1,000 connections relating to clarity, taste odour, continuity of water supply, drinking water pressure or flow, and Council’s response to any of these issues (no more than 40)
Target not met. 51 complaints per 1000 connections.
(1545 in total)
(2017/18 49.4 per 1000)
Of these, 82 burst mains, 36 low pressure issues, 98 for continuity of water supply, 67 for meter faults, 736 toby faults, 12 for odour, 81 for discoloured water, 6 water taste issues, and 425 other issues.
A significant number of complaints recorded in the Kbase system are information or third party issues as opposed to service performance issues specific to the water activity.
4. Average consumption of drinking water per day per resident. (no more than 360 litres per person per day)
Target met. 207.3 litres per day per resident.
(2017/18 209.5 litres per day)
5. Median response time for urgent call-out attendance. (2 hours or less)
Target met. 0.24 hours median response time.
(2017/18 0.28 hours)
0.5 hours maximum response time.
(2017/18 2.35 hours)
Response times are approximate only and rely on operator diligence. Council is implementing a real-time mobile resolution system to remedy this.
6. Median response time for resolution of urgent call outs. (7 hours or less)
Target met. 0.93 hours median resolution time.
(2017/18 1.1 hours)
16 hours maximum resolution time.
(2017/18 251.35 hours)
7. Median response time for non-urgent call-out attendance. (10 hours or less)
Target met. 1.52 hours median response time.
(2017/18 1.45 hours)
266.6 hours maximum response time.
(2017/18 196.85 hours)
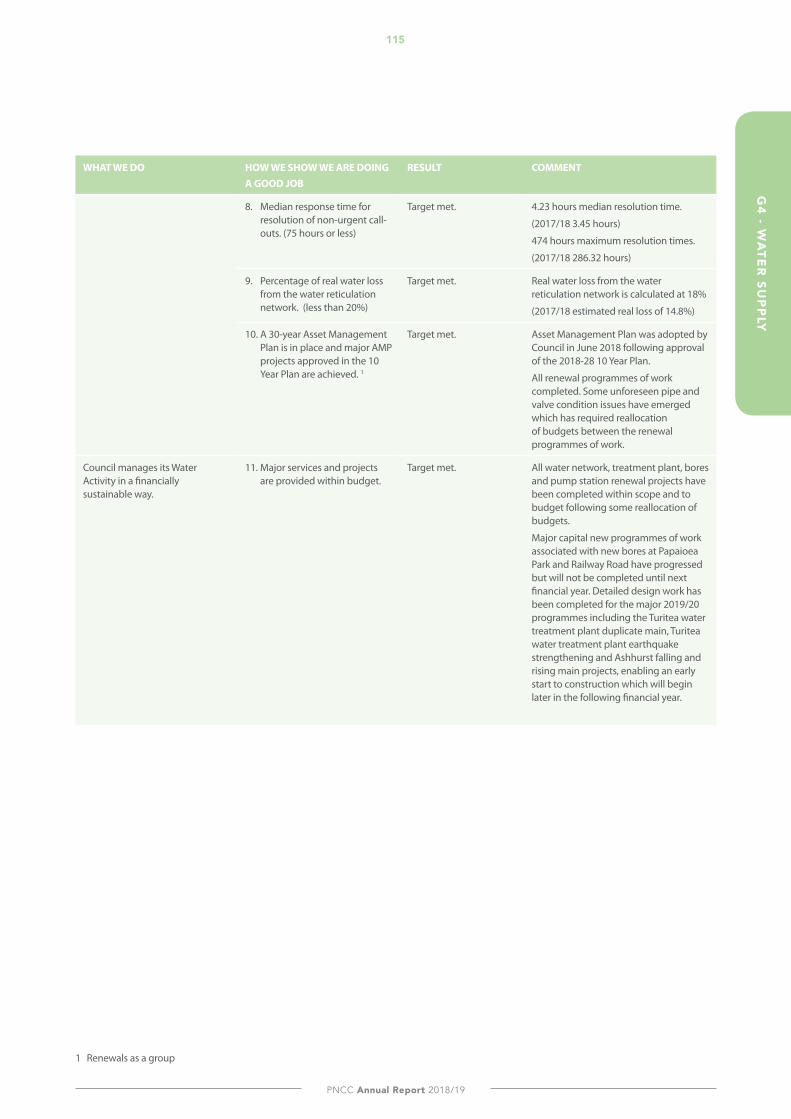
PNCC Annual Report 2018/19
115G
4 - WA
TER
SUP
PlY
WHAT WE DO HOW WE SHOW WE ARE DOING A GOOD JOB
RESULT COMMENT
8. Median response time for resolution of non-urgent call-outs. (75 hours or less)
Target met. 4.23 hours median resolution time.
(2017/18 3.45 hours)
474 hours maximum resolution times.
(2017/18 286.32 hours)
9. Percentage of real water loss from the water reticulation network. (less than 20%)
Target met. Real water loss from the water reticulation network is calculated at 18%
(2017/18 estimated real loss of 14.8%)
10. A 30-year Asset Management Plan is in place and major AMP projects approved in the 10 Year Plan are achieved. 1
Target met. Asset Management Plan was adopted by Council in June 2018 following approval of the 2018-28 10 Year Plan.
All renewal programmes of work completed. Some unforeseen pipe and valve condition issues have emerged which has required reallocation of budgets between the renewal programmes of work.
Council manages its Water Activity in a financially sustainable way.
11. Major services and projects are provided within budget.
Target met. All water network, treatment plant, bores and pump station renewal projects have been completed within scope and to budget following some reallocation of budgets.
Major capital new programmes of work associated with new bores at Papaioea Park and Railway Road have progressed but will not be completed until next financial year. Detailed design work has been completed for the major 2019/20 programmes including the Turitea water treatment plant duplicate main, Turitea water treatment plant earthquake strengthening and Ashhurst falling and rising main projects, enabling an early start to construction which will begin later in the following financial year.
1 Renewals as a group

Small city benefits - Big city ambition
G4
- W
ATE
R S
UP
PlY
116
FINANCIAl RESUlTSActivity Operational Requirement and Funding Summary
WATER SUPPLY Actual Budget Variance Actual 2019 2019 2019 2018 $000 $000 $000 $000
REVENUE Water Collection 120 28 92 18Water Distribution 11 8 3 39Water Treatment (2) - (2) -
TOTAL REVENUE 129 36 93 57
EXPENSES Water Collection 2,636 2,845 209 2,073Water Distribution 3,986 3,643 (343) 4,525Water Treatment 1,508 1,768 260 1,445
TOTAL EXPENSES 8,130 8,256 126 8,043
NET OPERATING COST OF ACTIVITY (8,001) (8,220) 219 (7,986) RATING ALLOCATION Add back depreciation 2,891 3,094 (203) 2,817Less Renewal capital expenditure (3,608) (3,415) (193) (3,270)Add/(Less) borrowing effect of renewal 3 year averaging 168 168 - (281)Add proceeds from sale of assets 793 - 793 290Less provision for debt reduction (1,378) (356) (1,022) (848)Add targeted rates allocation 9,135 8,729 406 9,278
FUNDING SURPLUS/(DEFICIT) - - - -
Significant Activity Capital Projects
WATER SUPPLY Actual Budget Variance Actual 2019 2019 2019 2018 $000 $000 $000 $000
CAPITAL RENEWAL 54-City-wide - Wastewater Pipe Renewal 2 - (2) 199-City-wide - Water Bore Headworks and stations Renewal 362 283 (79) 207-Turitea Water Treatment Plant - Equipment and Facility Renewals 191 197 6 214-City-wide - Water Toby and Meter Replacements 286 171 (115) 218-City-wide - Water Pipe Replacements 1,952 2,014 62 663-Ashhurst - Bore to Reservoir Pipe Replacement 661 600 (61) 1058-City-wide - Groundwater Bores Renewal 154 150 (4)
TOTAL CAPITAL RENEWAL 3,608 3,415 (193) 3,271
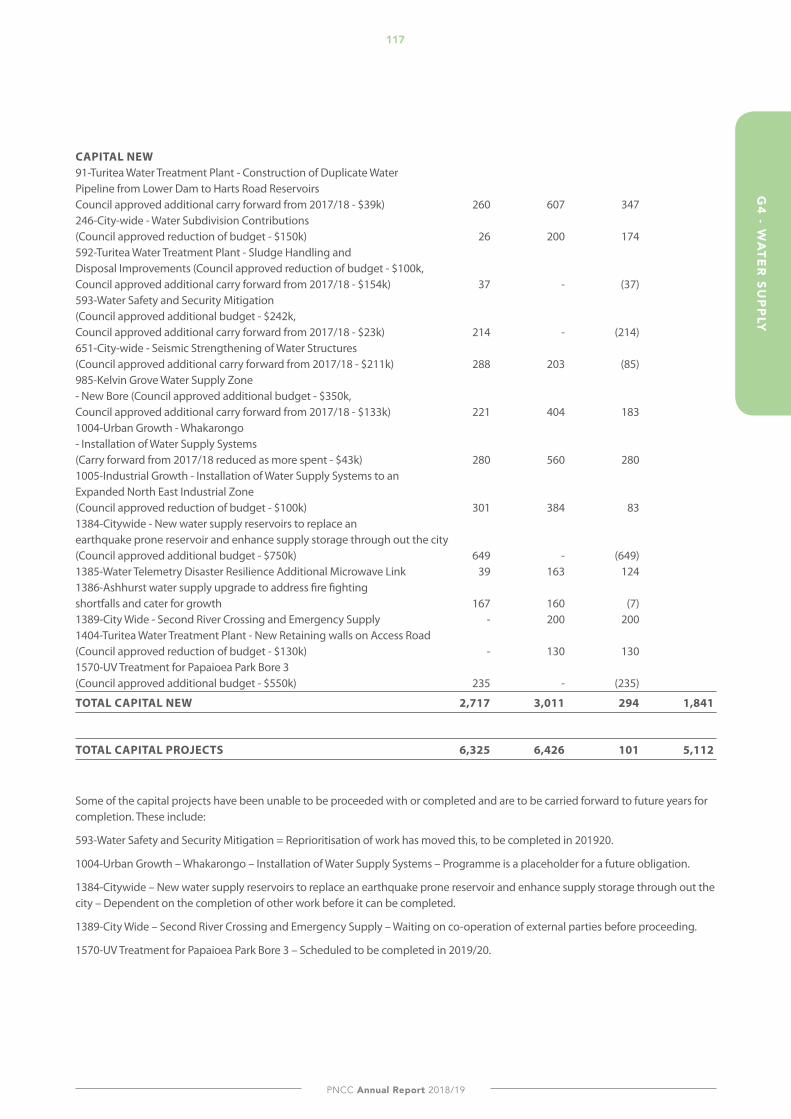
PNCC Annual Report 2018/19
G4 - W
ATE
R SU
PP
lY117
CAPITAL NEW 91-Turitea Water Treatment Plant - Construction of Duplicate Water Pipeline from Lower Dam to Harts Road Reservoirs Council approved additional carry forward from 2017/18 - $39k) 260 607 347 246-City-wide - Water Subdivision Contributions (Council approved reduction of budget - $150k) 26 200 174 592-Turitea Water Treatment Plant - Sludge Handling and Disposal Improvements (Council approved reduction of budget - $100k, Council approved additional carry forward from 2017/18 - $154k) 37 - (37) 593-Water Safety and Security Mitigation (Council approved additional budget - $242k, Council approved additional carry forward from 2017/18 - $23k) 214 - (214) 651-City-wide - Seismic Strengthening of Water Structures (Council approved additional carry forward from 2017/18 - $211k) 288 203 (85) 985-Kelvin Grove Water Supply Zone - New Bore (Council approved additional budget - $350k, Council approved additional carry forward from 2017/18 - $133k) 221 404 183 1004-Urban Growth - Whakarongo - Installation of Water Supply Systems (Carry forward from 2017/18 reduced as more spent - $43k) 280 560 280 1005-Industrial Growth - Installation of Water Supply Systems to an Expanded North East Industrial Zone (Council approved reduction of budget - $100k) 301 384 83 1384-Citywide - New water supply reservoirs to replace an earthquake prone reservoir and enhance supply storage through out the city (Council approved additional budget - $750k) 649 - (649) 1385-Water Telemetry Disaster Resilience Additional Microwave Link 39 163 124 1386-Ashhurst water supply upgrade to address fire fighting shortfalls and cater for growth 167 160 (7) 1389-City Wide - Second River Crossing and Emergency Supply - 200 200 1404-Turitea Water Treatment Plant - New Retaining walls on Access Road (Council approved reduction of budget - $130k) - 130 130 1570-UV Treatment for Papaioea Park Bore 3 (Council approved additional budget - $550k) 235 - (235)
TOTAL CAPITAL NEW 2,717 3,011 294 1,841
TOTAL CAPITAL PROJECTS 6,325 6,426 101 5,112
Some of the capital projects have been unable to be proceeded with or completed and are to be carried forward to future years for completion. These include:
593-Water Safety and Security Mitigation = Reprioritisation of work has moved this, to be completed in 201920.
1004-Urban Growth – Whakarongo – Installation of Water Supply Systems – Programme is a placeholder for a future obligation.
1384-Citywide – New water supply reservoirs to replace an earthquake prone reservoir and enhance supply storage through out the city – Dependent on the completion of other work before it can be completed.
1389-City Wide – Second River Crossing and Emergency Supply – Waiting on co-operation of external parties before proceeding.
1570-UV Treatment for Papaioea Park Bore 3 – Scheduled to be completed in 2019/20.
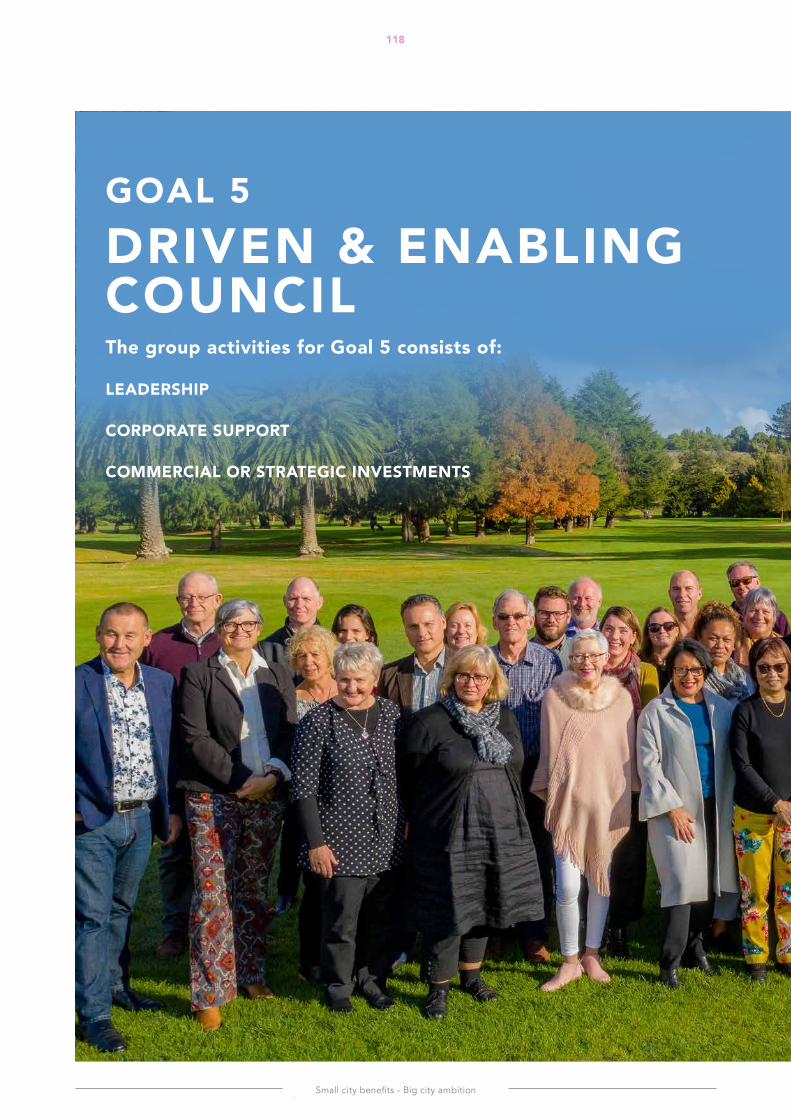
Small city benefits - Big city ambition
118
GOAl 5DRIVEN & ENABlING CounCil The group activities for Goal 5 consists of:
lEADERSHIP
CORPORATE SUPPORT
COMMERCIAl OR STRATEGIC INVESTMENTS
PNCC Annual Report 2018/19
G5 - D
RIV
EN
& E
NA
BlIN
G C
OU
NC
Il119
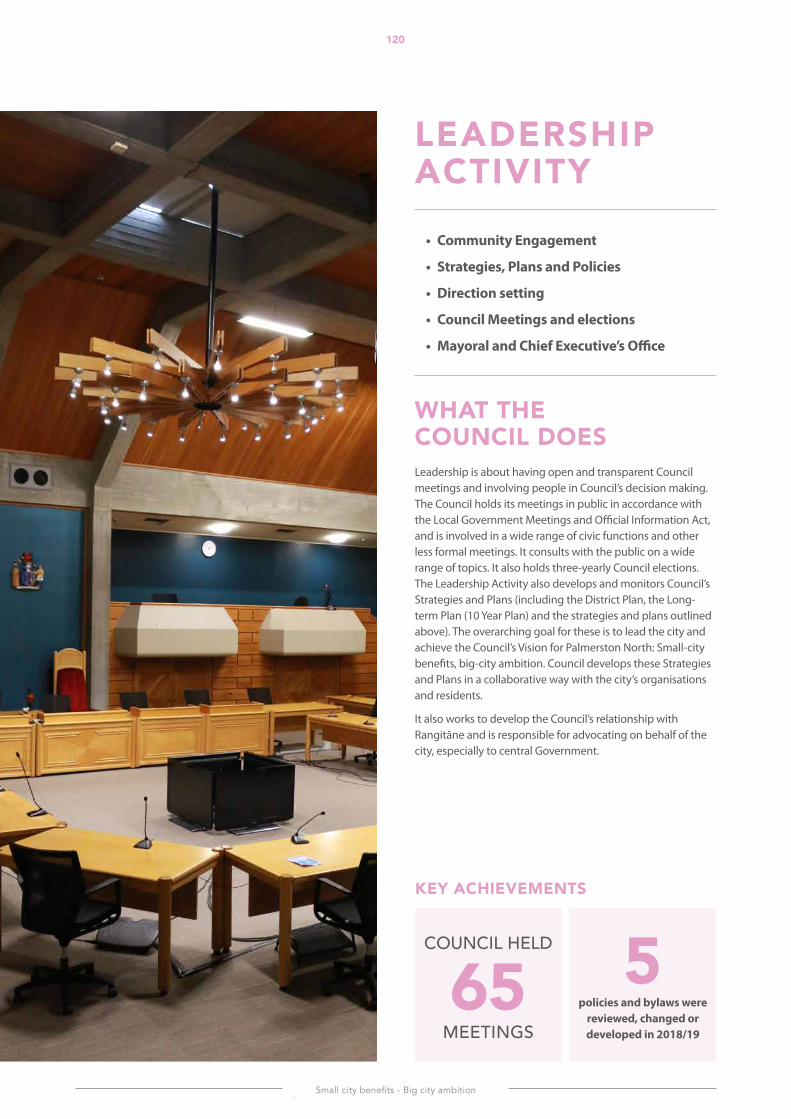
Small city benefits - Big city ambition
120G
5 -
lEA
DE
RSH
IP
KEY ACHIEVEMENTS
lEADERSHIP ACTIVITY
• Community Engagement
• Strategies, Plans and Policies
• Direction setting
• Council Meetings and elections
• Mayoral and Chief Executive’s Office
WhAt the CounCil DoesLeadership is about having open and transparent Council meetings and involving people in Council’s decision making. The Council holds its meetings in public in accordance with the Local Government Meetings and Official Information Act, and is involved in a wide range of civic functions and other less formal meetings. It consults with the public on a wide range of topics. It also holds three-yearly Council elections. The Leadership Activity also develops and monitors Council’s Strategies and Plans (including the District Plan, the Long-term Plan (10 Year Plan) and the strategies and plans outlined above). The overarching goal for these is to lead the city and achieve the Council’s Vision for Palmerston North: Small-city benefits, big-city ambition. Council develops these Strategies and Plans in a collaborative way with the city’s organisations and residents.
It also works to develop the Council’s relationship with Rangitāne and is responsible for advocating on behalf of the city, especially to central Government.
COUNCIL HELD
65
MEETINGSpolicies and bylaws were
reviewed, changed or developed in 2018/19
5
PNCC Annual Report 2018/19
121G
5 - lEA
DE
RSH
IP
WHAT HAPPENED IN THE YEAR
COMMUNITY ENGAGEMENT Council’s aim is to have a wide range of people contributing their voice to Council’s decisions. We do this by offering people different ways to have their say and by making it easy and relevant.
Council conducts phases of engagement and consultation to learn about community views and values:
• Face to face: Council held “community drop-ins” for local park and playground developments. Residents were able to see and comment on rough plans. The drop-ins were promoted through letter-box drops, local schools and on social media. Through this method residents and staff find that they often recognise each other. This makes it easier to engage in further discussions as the park is developed.
• Mayor and Councillor contact: The Mayor and Councillors are in daily contact with residents. Some of these are organised meetings about topics and some are set times when people can raise any issue they want. Other times conversations take place on the street or in supermarkets as people go about their daily lives.
• Surveys: Council surveyed 800 randomly selected residents to get their feedback on their satisfaction with Council and its services. This continues to help us provide improved services.
• On-line and social media engagement: Council’s digital presence was a big focus as it gives residents a very simple way to have their say. In 2018/19 Council undertook a council-first type of online engagement. We sought feedback on changes to speed limits on roads in the City whereby residents “pinned” their comments to an online interactive map. People could also support or comment on suggestions that other people had already pinned. The site had 10,000 visits and people pinned over 700 comments.
• Formal submissions: Council produced a draft Annual Budget and Consultation Document and then sought public submissions. We received 179 submissions, and 34 of these submitters came to hearings to discuss their ideas with Councillors.
STRENGTHENING RElATIONSHIPS WITH RANGITĀneCouncil and Rangitāne worked together to develop a new partnership agreement, including integrating iwi priorities across the new suit of strategies and plans. Iwi leaders are included as members of the Best Practicable Options (BPO) Wastewater Steering Group to ensure Rangitāne are fully involved from the early stages of this major project.
Major physical works now underway, well advanced in planning, or completed in 2018/19 acknowledged Rangitāne culture and values. Most are associated with the Manawatū River Park and include:
• Central Energy Trust Wildbase Recovery,• He Ara Kotahi Bridge,• Development of Ahimate Park,• Manawatū River ‘gateways’ at Albert Street
and Raukawa Road,• Te Motu o Poutoa – ANZAC Park Reserve Management
Plan, and• Hei Manga Oranga monitoring framework.
STRATEGIES, PlANS AND POlICIES The review of Council’s strategic direction has provided an overarching framework for all aspects of policy review. The contribution of a policy or bylaw to achieving Council’s strategic direction was emphasised throughout all review processes.
Several policies and bylaws were reviewed, changed or developed in 2018/19:
• review of the Cemeteries and Crematorium Bylaw;• the Dog Control Bylaw; • the Community Funding Policy; • the Wastewater Bylaw; and • the Urban Fire Control Bylaw (revocation).
Council moved from a ‘rolling review’ of Council’s strategic direction to one which directly informs the 10 year plan. This means that there is an even greater importance placed on robust research and information to inform the strategy process. A significant achievement in the past year, has been the development of an outcomes monitoring system. A dashboard will display each of the measures of success identified by Council during the 10 Year Plan process. The community will be able to see a series of measures displayed under each of Council’s strategic goals.
DIRECTION SETTINGThe broad Council direction was set as part of a suite of new strategies prepared to inform the 2018 Long Term Plan. The focus for this year was communicating the strategic direction confirmed in 2018. As well as assisting Council with specific direction setting matters including policies on the use public spaces and Council venues.
COUNCIl MEETINGS AND ElECTIONSYear two of the Annual Budget resulted in 179 people making submissions with 35 speaking to elected members through the hearings process.
During the year,19 formal consultations were undertaken where people could express their views to inform Council’s decision making.
Council held 65 meetings over the course of the year which provided for public comment and participation opportunities.
The establishment of The Palmerston North City Council Co-Management Committee was agreed. The Committee is a partnership between the Council and Rangitāne to co-manage wahi tupuna (ancestral sites). It’s anticipated that
Small city benefits - Big city ambition
122G
5 -
lEA
DE
RSH
IP
the kawenata agreement will be signed at the beginning of August with the establishment of the Committee occurring post-election.
ONGOING CONSIDERATIONS Council will continue to develop the range of ways in which people can have their say. Online, social media, and face to face will remain key methods. Council will continue to embed a stronger understanding of the strategic direction with Council and the community. This will aid in preparations for reviewing the strategic direction with Council post the 2019 election.
Moving into 2019/20, consultation on the draft Use of Public Space Policy, draft Venues Policy and draft Play Policy will be undertaken. A review of city signs will inform changes to organisational practice. Each of these projects will contribute to Council’s Goal 2: A creative and exciting city.
Focus will also be on extending the range and quality of outcome monitoring and ensuring that this information
contributes to the development of the 10 year plan. The Council’s response to the National Policy Statement on Urban Development Capacity will contribute to this picture. Particularly in ensuring that a long-term view is taken of city housing issues, in keeping with Goal 1: An innovative and growing city.
The Governance Team is focused on organising the 2019 Local Body Elections. After the Elections the make-up of Council could have changed with new Elected Members, new Committees and new meeting schedules. The Governance team is working on ensuring everything is in place to support a seamless transition into the new triennium.
A review of the Governance Support function has been undertaken. This will ensure that the elected Council receives the necessary support and advice to be more effective in its decision-making role. This will also enhance participation in the democratic process. It’s intended that the review will be implemented post -election.
HOW DID WE PERFORMWHAT WE DO HOW WE SHOW WE ARE DOING
A GOOD JOBRESULT COMMENT
Council engages on a wide range of decisions and projects so that people and organisations from all sectors are actively involved in Council decision making. This level of service is also part of the Connected Communities Activity.
1. Positive feedback from residents on Council’s community engagement.
Target met. The Annual Residents’ Survey shows that around half of all residents are satisfied with the quality and availability of information from the Council. Around 40% are satisfied with their opportunities and ease of having a say in Council decisions. Most of the remaining people are neutral, with only around 15% dissatisfied with information or involvement in decision making.
2. Description of the range of engagement techniques used by Council.
Target met. Council uses a wide range of techniques to encourage people to have their say: face to face, e.g. on-site drop-in sessions for playground developments; online and social media, e.g. pinning comments to an interactive online map for the speed limits review; formal submissions, e.g. on the Annual Budget; regular meetings with iwi; Mayoral and Councillor meetings, e.g. a wide range of formal and informal opportunities for residents to talk with elected members; and surveys, e.g. getting feedback on Council’s services through the Annual Residents’ Survey.
Council has Plans, Strategies and Policies in place to deliver on the Vision.
Council works on the Plans, Strategies and Policies with city stakeholders to lead the city and deliver on the Vision in a collaborative way.
3. Strategies, Plans and Policies are in place, monitored and reviewed.
Target met. The new strategic framework was adopted for the three years beginning 2018/19. Data to report the measures of success identified in the five Council strategies is being gathered and will be reported to the Council in September. This material will be also be made available to the public through Envisio. Strategic forums are being organized (one per goal) for staff to discuss progress achieving each of the plans. Each Council policy is being reviewed according to the schedule established in the plans.
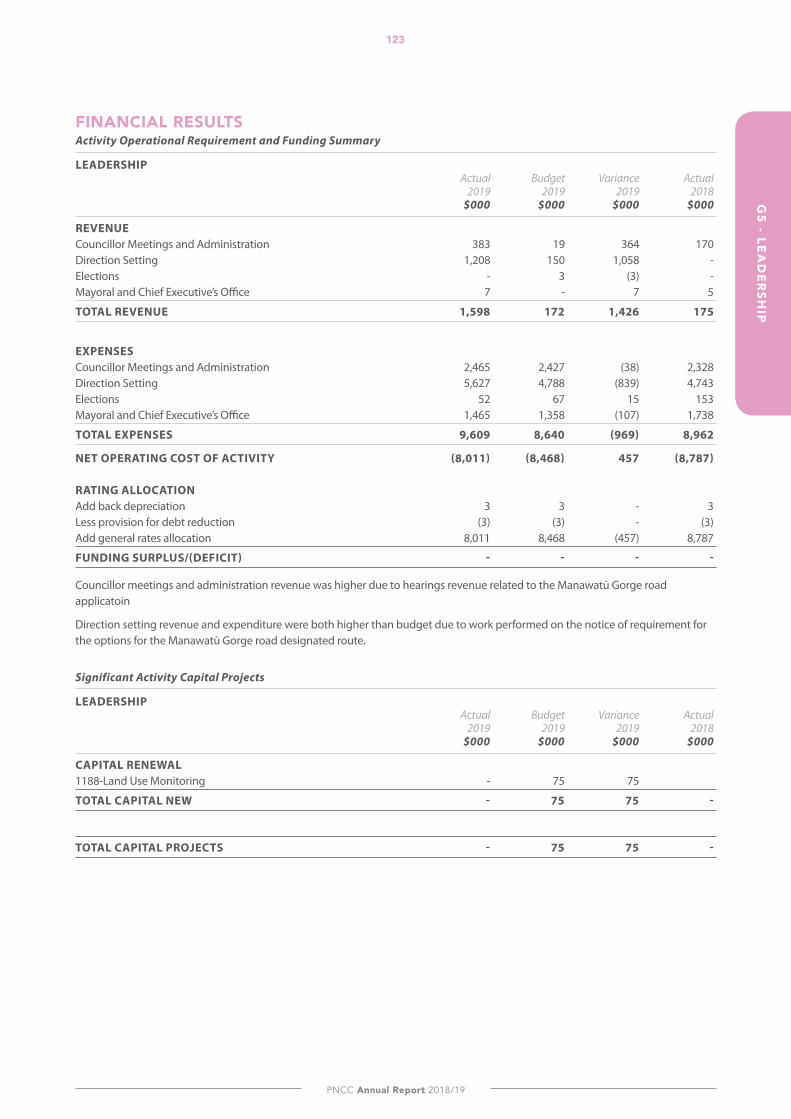
PNCC Annual Report 2018/19
G5 - lE
AD
ER
SHIP
123
FINANCIAl RESUlTSActivity Operational Requirement and Funding Summary
LEADERSHIP Actual Budget Variance Actual 2019 2019 2019 2018 $000 $000 $000 $000
REVENUE Councillor Meetings and Administration 383 19 364 170Direction Setting 1,208 150 1,058 -Elections - 3 (3) -Mayoral and Chief Executive’s Office 7 - 7 5
TOTAL REVENUE 1,598 172 1,426 175
EXPENSES Councillor Meetings and Administration 2,465 2,427 (38) 2,328Direction Setting 5,627 4,788 (839) 4,743Elections 52 67 15 153Mayoral and Chief Executive’s Office 1,465 1,358 (107) 1,738
TOTAL EXPENSES 9,609 8,640 (969) 8,962
NET OPERATING COST OF ACTIVITY (8,011) (8,468) 457 (8,787) RATING ALLOCATION Add back depreciation 3 3 - 3Less provision for debt reduction (3) (3) - (3)Add general rates allocation 8,011 8,468 (457) 8,787
FUNDING SURPLUS/(DEFICIT) - - - -
Councillor meetings and administration revenue was higher due to hearings revenue related to the Manawatū Gorge road applicatoin
Direction setting revenue and expenditure were both higher than budget due to work performed on the notice of requirement for the options for the Manawatū Gorge road designated route.
Significant Activity Capital Projects
LEADERSHIP Actual Budget Variance Actual 2019 2019 2019 2018 $000 $000 $000 $000
CAPITAL RENEWAL 1188-Land Use Monitoring - 75 75
TOTAL CAPITAL NEW - 75 75 -
TOTAL CAPITAL PROJECTS - 75 75 -
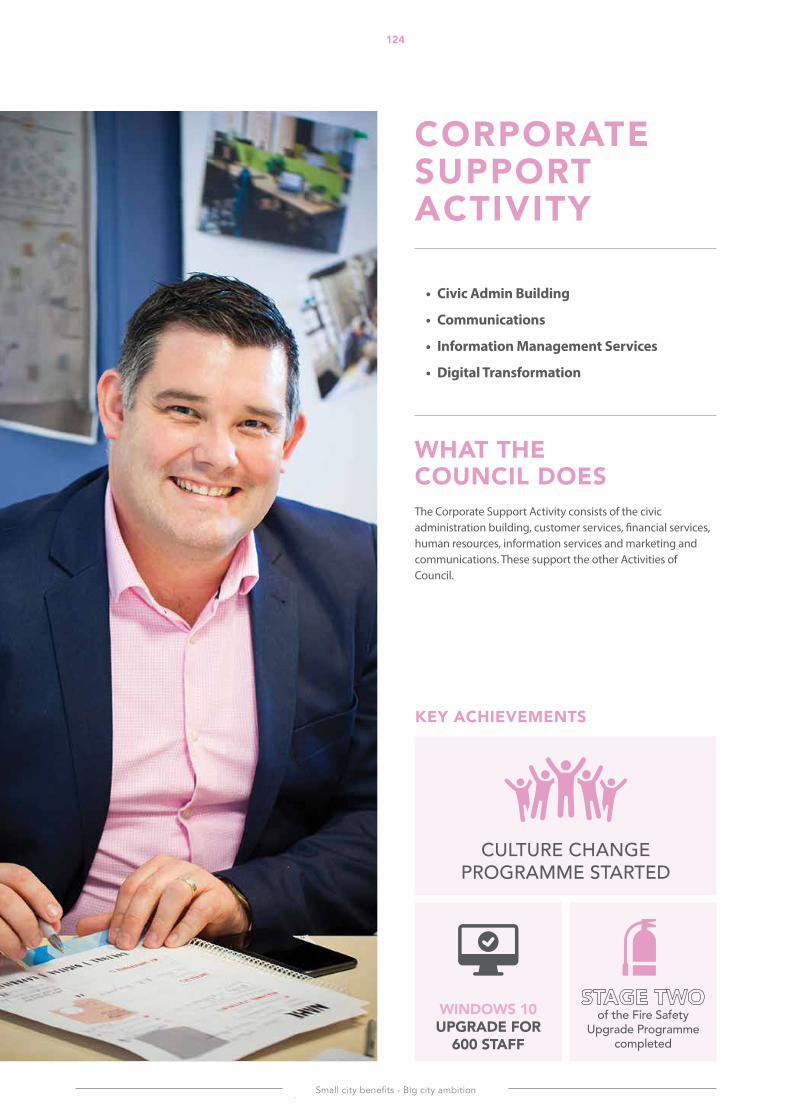
Small city benefits - Big city ambition
124G
5 -
CO
RP
OR
ATE
SU
PP
OR
T
KEY ACHIEVEMENTS
CORPORATE SUPPORT ACTIVITY
• Civic Admin Building
• Communications
• Information Management Services
• Digital Transformation
WhAt the CounCil DoesThe Corporate Support Activity consists of the civic administration building, customer services, financial services, human resources, information services and marketing and communications. These support the other Activities of Council.
CULTURE CHANGE PROGRAMME STARTED
of the Fire Safety Upgrade Programme
completed
WinDoWs 10 UPGRADE FOR
600 STAFF
PNCC Annual Report 2018/19
125G
5 - CO
RP
OR
ATE
SUP
PO
RT
WHAT HAPPENED IN THE YEAR
CIVIC ADMIN BUIlDING Council staff occupies about 90% of the Civic Admin Building (CAB) with external tenants making up the balance.
There was continued focus on compliance works in the building during the year. Stage two of the four-stage fire safety upgrade programme was completed. Stage two focused on the stairwells, lobbies and bathrooms in the central core of the building.
Stage three of the fire compliance work has been designed and priced and is ready to be undertaken next year.
Other works completed in the CAB this year included:
• Installation of a kitchenette on the fifth-floor office wing.• Replacement of the carpet in the office space on the
ground floor.
MARKETING AND COMMUNICATIONSThis year has seen marketing and communications improve services to the city through enhancing digital and social media capability, videography and photography content creation, and strategic and tactical communications advice for our Council staff and city. Our emphasis this year has been on growing our digital engagement and this has seen significant increases in online engagement with the community and deep levels of online community conversations interested in Council activities for the city. Facebook followers of Council increased by 135 per cent on the previous year, PNCC website users increased by 14 per cent, and the number of website sessions increased by 20 per cent, which means a greater level of engagement with the community. This year we also activated our PalmyProud campaign to generate pride in the city and spread the good word about our great city and community. This was delivered through a number of national and international events that generated record attendances such as Super Rugby , Matariki, ANZAC Day and Waitangi Day.
INFORMATION MANAGEMENT SERVICES It’s been a challenging year in terms of executing organisational change, and the ongoing effects of delivering increasing volumes of unbudgeted projects. The team has enabled the Palmerston North City Council (PNCC) reorganisation to happen smoothly from a technology perspective. This meant many changes to security, data structures and people’s roles. Council has re-architected the way we deliver technology. We’ve focus on using proven practices such as a common end user solution, and cloud services to improve resiliency and the human experience.
While it has been a busy 12 months, it’s also been a year of quiet achievement:
• Office 365 rolled out throughout the organisation including more than 20 cloud applications and email and archive migration.
• A Security programme has been implemented with features such as Two Factor Authentication, Firewall Role Establishment and Single Sign On (SSO) Standards.
• Disaster relief and business continuity plan design has been underway for the new Civil Defence Emergency Operations Centre (EOC) building. This meant creating fibre links and DR failover and Unit testing. As well as establishing an Emergency Operations Centre (EOC) datacentre.
• People technology projects have been completed including a Windows 10 upgrade for 600 staff. Meeting rooms and public technology as well as field service tools have also been upgraded.
The year focused around delivering services and solutions that make a difference to people, both internal to Palmerston North City Council and external. Whether that be the public or other organisations that the Information Management team provide support to.
Our vision and goals are simple and intended to guide us as we strive to continually improve the way we work:
OUR VISIONCustomer Centric Service
• Provide responsive, positive customer experiences• Transform how and where people work and
engage with us• Technology and spaces that help people work the way
they want to• Enabling people and tools• Enabling people to serve themselves, to own their
responsibilities
Our Goals
• Fit for Purpose Solutions• Relevant information• Transparent processes• Responsive & approachable people• Valued by stakeholders
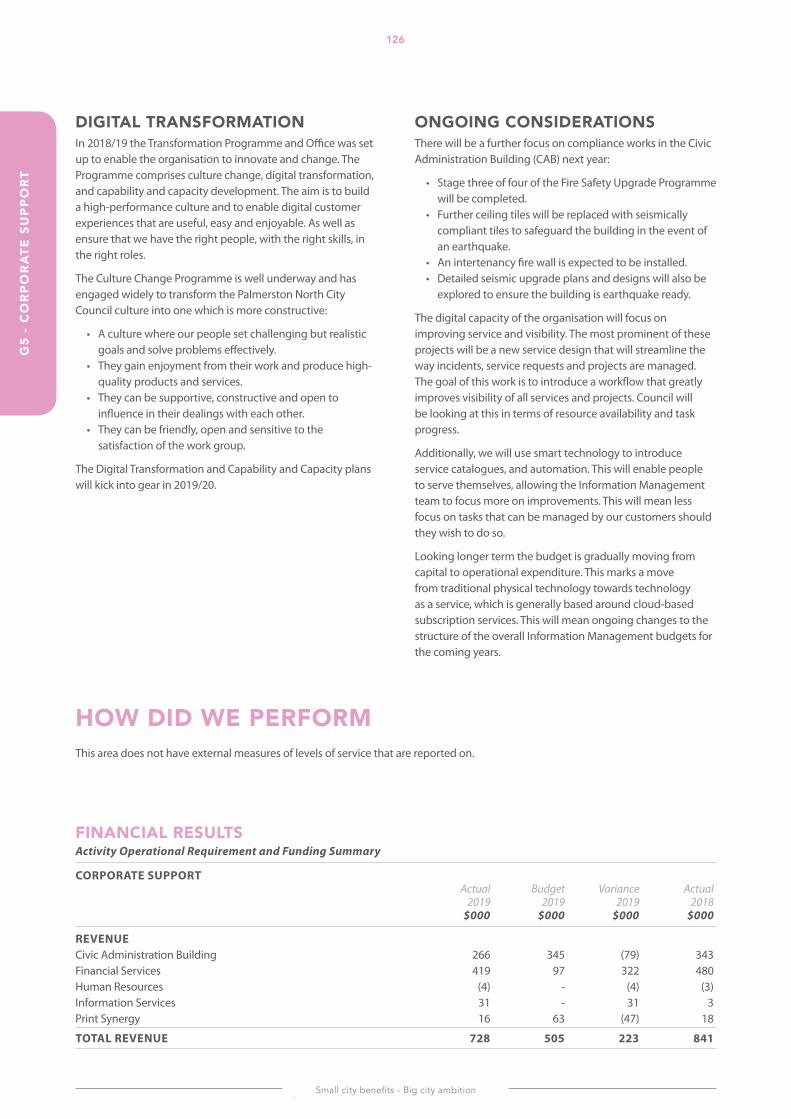
Small city benefits - Big city ambition
G5
- C
OR
PO
RA
TE S
UP
PO
RT
126
DIGITAl TRANSFORMATIONIn 2018/19 the Transformation Programme and Office was set up to enable the organisation to innovate and change. The Programme comprises culture change, digital transformation, and capability and capacity development. The aim is to build a high-performance culture and to enable digital customer experiences that are useful, easy and enjoyable. As well as ensure that we have the right people, with the right skills, in the right roles.
The Culture Change Programme is well underway and has engaged widely to transform the Palmerston North City Council culture into one which is more constructive:
• A culture where our people set challenging but realistic goals and solve problems effectively.
• They gain enjoyment from their work and produce high-quality products and services.
• They can be supportive, constructive and open to influence in their dealings with each other.
• They can be friendly, open and sensitive to the satisfaction of the work group.
The Digital Transformation and Capability and Capacity plans will kick into gear in 2019/20.
ONGOING CONSIDERATIONS There will be a further focus on compliance works in the Civic Administration Building (CAB) next year:
• Stage three of four of the Fire Safety Upgrade Programme will be completed.
• Further ceiling tiles will be replaced with seismically compliant tiles to safeguard the building in the event of an earthquake.
• An intertenancy fire wall is expected to be installed.• Detailed seismic upgrade plans and designs will also be
explored to ensure the building is earthquake ready.
The digital capacity of the organisation will focus on improving service and visibility. The most prominent of these projects will be a new service design that will streamline the way incidents, service requests and projects are managed. The goal of this work is to introduce a workflow that greatly improves visibility of all services and projects. Council will be looking at this in terms of resource availability and task progress.
Additionally, we will use smart technology to introduce service catalogues, and automation. This will enable people to serve themselves, allowing the Information Management team to focus more on improvements. This will mean less focus on tasks that can be managed by our customers should they wish to do so.
Looking longer term the budget is gradually moving from capital to operational expenditure. This marks a move from traditional physical technology towards technology as a service, which is generally based around cloud-based subscription services. This will mean ongoing changes to the structure of the overall Information Management budgets for the coming years.
HOW DID WE PERFORMThis area does not have external measures of levels of service that are reported on.
FINANCIAl RESUlTSActivity Operational Requirement and Funding Summary
CORPORATE SUPPORT Actual Budget Variance Actual 2019 2019 2019 2018 $000 $000 $000 $000
REVENUE Civic Administration Building 266 345 (79) 343Financial Services 419 97 322 480Human Resources (4) - (4) (3)Information Services 31 - 31 3Print Synergy 16 63 (47) 18
TOTAL REVENUE 728 505 223 841
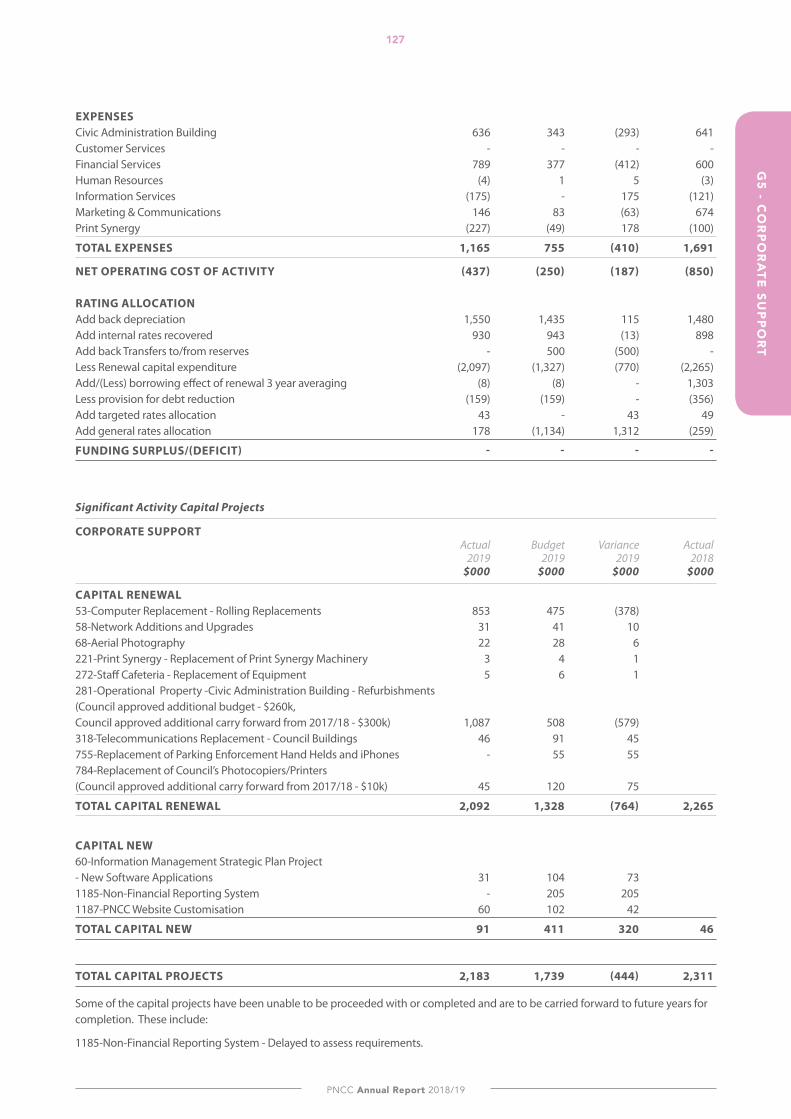
PNCC Annual Report 2018/19
G5 - C
OR
PO
RA
TE SU
PP
OR
T127
EXPENSES Civic Administration Building 636 343 (293) 641Customer Services - - - -Financial Services 789 377 (412) 600Human Resources (4) 1 5 (3)Information Services (175) - 175 (121)Marketing & Communications 146 83 (63) 674Print Synergy (227) (49) 178 (100)
TOTAL EXPENSES 1,165 755 (410) 1,691
NET OPERATING COST OF ACTIVITY (437) (250) (187) (850) RATING ALLOCATION Add back depreciation 1,550 1,435 115 1,480Add internal rates recovered 930 943 (13) 898Add back Transfers to/from reserves - 500 (500) -Less Renewal capital expenditure (2,097) (1,327) (770) (2,265)Add/(Less) borrowing effect of renewal 3 year averaging (8) (8) - 1,303Less provision for debt reduction (159) (159) - (356)Add targeted rates allocation 43 - 43 49Add general rates allocation 178 (1,134) 1,312 (259)
FUNDING SURPLUS/(DEFICIT) - - - -
Significant Activity Capital Projects
CORPORATE SUPPORT Actual Budget Variance Actual 2019 2019 2019 2018 $000 $000 $000 $000
CAPITAL RENEWAL 53-Computer Replacement - Rolling Replacements 853 475 (378) 58-Network Additions and Upgrades 31 41 10 68-Aerial Photography 22 28 6 221-Print Synergy - Replacement of Print Synergy Machinery 3 4 1 272-Staff Cafeteria - Replacement of Equipment 5 6 1 281-Operational Property -Civic Administration Building - Refurbishments (Council approved additional budget - $260k, Council approved additional carry forward from 2017/18 - $300k) 1,087 508 (579) 318-Telecommunications Replacement - Council Buildings 46 91 45 755-Replacement of Parking Enforcement Hand Helds and iPhones - 55 55 784-Replacement of Council’s Photocopiers/Printers (Council approved additional carry forward from 2017/18 - $10k) 45 120 75
TOTAL CAPITAL RENEWAL 2,092 1,328 (764) 2,265
CAPITAL NEW 60-Information Management Strategic Plan Project - New Software Applications 31 104 73 1185-Non-Financial Reporting System - 205 205 1187-PNCC Website Customisation 60 102 42
TOTAL CAPITAL NEW 91 411 320 46
TOTAL CAPITAL PROJECTS 2,183 1,739 (444) 2,311
Some of the capital projects have been unable to be proceeded with or completed and are to be carried forward to future years for completion. These include:
1185-Non-Financial Reporting System - Delayed to assess requirements.
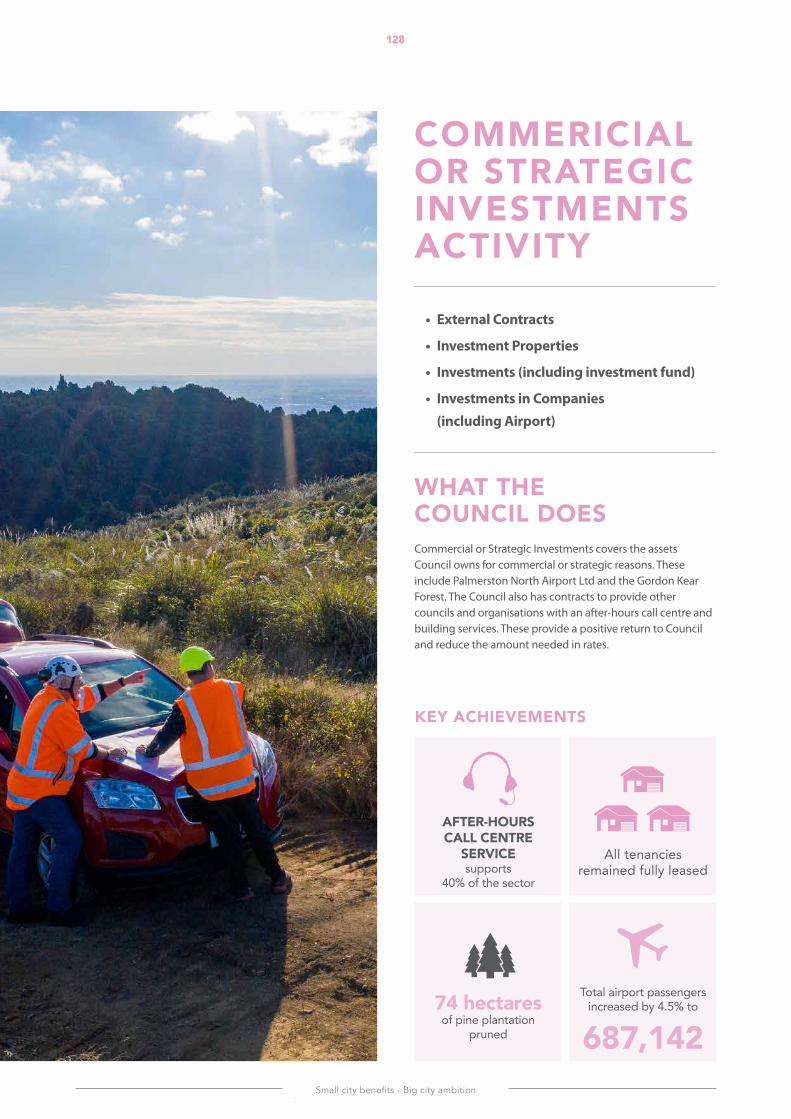
128
Small city benefits - Big city ambition
G5
- C
OR
PO
RA
TE S
UP
PO
RT
128
KEY ACHIEVEMENTS
COMMERICIAl OR STRATEGIC INVESTMENTS ACTIVITY
• External Contracts
• Investment Properties
• Investments (including investment fund)
• Investments in Companies (including Airport)
WhAt the CounCil DoesCommercial or Strategic Investments covers the assets Council owns for commercial or strategic reasons. These include Palmerston North Airport Ltd and the Gordon Kear Forest. The Council also has contracts to provide other councils and organisations with an after-hours call centre and building services. These provide a positive return to Council and reduce the amount needed in rates.
All tenancies remained fully leased
Total airport passengers increased by 4.5% to
687,142
AFTER-HOURS CAll CENTRE
SERVICE supports
40% of the sector
74 hectares of pine plantation
pruned
PNCC Annual Report 2018/19
129G
5 - CO
RP
OR
ATE
SUP
PO
RT
WHAT HAPPENED IN THE YEAR
EXTERNAl CONTRACTSCouncil provides after-hours call centre services for Palmerston North and the wider New Zealand local government sector for other cities and districts. The service is expanding to offer more channels to client councils, including social media monitoring. Two new clients were acquired in 2018/19 meaning the service now supports 40 per cent of the sector. The service has achieved double digit revenue growth in three of the past four years.
Customer loyalty is measured via Net Promoter Score. For the second time in three years our clients have given us the maximum possible score of +100. That level of endorsement has ensured we move into 2019/20 with more prospective clients joining the service.
Building Services continued to be delivered on behalf of the Manawatū District Council with the level of activity increasing throughout the year. This was due largely to the region’s economic growth. As a result, an increase in resourcing for the service has been sourced to address the increased workload.
Council provides parking enforcement administration for parking infringements issued by the airport. There were 1116 infringements issued in 2018/19 compared to 364 in 2017/18, an increase of over 200 per cent. This was principally due to increased enforcement activity and increased customer activity at the airport.
INVESTMENT PROPERTY Several Council properties are leased to generate revenue.
Typically, this occurs when part of a purchased property is not required by Council, or until the property is used for its intended purpose.
Council’s investment property portfolio remained relatively static throughout the year. All tenancies remained fully leased at market rentals for most of the year. In the few instances where there was tenant turnover, tenancies were re-leased within a month or so from being vacant.
The portfolio also maintained low levels of arrears.
INVESTMENTS Council owns the commercial pine plantation known as Gordon Kear Forest as part of its investment portfolio. The primary reason for the investment is to generate revenue as an alternative funding source for future city development.
The Council’s commercial pine plantation is in its second rotation. The trees are planted in the winter of each year following harvest of the first tree crop. They are currently aged from three to nine years.
Areas identified as suitable for Clearwood (free of knots or blemishes caused by original branches) have undergone further pruning. Expenditure is lower than budget as the area ready for pruning was less than originally scheduled. Timing
of silvicultural operations depends on tree growth and work is expected to continue for at least eight more years. This will include pruning and thinning, which means removing trees not selected for the final crop.
Further roadworks were carried out to improve access for all forest operations and provide better emergency access. As part of those works, Council took the opportunity to partner with Horizons Regional Council to upgrade three culverts within the forest. This removed barriers to fish passage and Council received funding for 60 per cent of the costs.
An opportunity also arose during the year to coordinate with a neighbouring forest owner to harvest a small area of Council-owned trees from the first rotation. These had previously been written off as inaccessible.
INVESTMENTS IN COMPANIES (INClUDING AIRPORT)Council owns the Palmerston North Airport Ltd (PNAL) to ensure the city has an appropriate air gateway for passengers and freight. Total passenger throughput for the year increased by 4.5 per cent to 687,142. Palmerston North Airport Ltd (PNAL) produced a net profit after tax to shareholders funds of 4.5 per cent compared to 2.9 per cent in 2018. A dividend of $643,650 was paid to the Council during the year, an increase from $520,000 in 2018.
ONGOING CONSIDERATIONS A mindset of maximising value and minimising pain in every customer experience is a key driver for the coming decade. A team of more than 50 staff now work round the clock. The contact centre is increasingly focused on the skills required to support the multiple channels our customers choose. Non-voice channels such as email, instant messaging and social media are now commonplace. Along with the use of artificial intelligence (AI) customers are more enabled than ever to use self-service facilities.
The continued growth of the contact centre means its near capacity in its current location. Looking for creative resourcing solutions, such as remote agents, may help address future growth needs while also planning for business continuity. In the coming year more than half of our after-hours contracts will be due for renewal. This will prompt councils to review their current arrangements and increase desire to future proof the customer experience offered to their residents. The after-hours service needs to be positioned to ensure it is the front-runner to retain and attract clients. This means offering a range of channels, care and expertise using modern technologies and creative thinking. The service will undergo a strategic review in the next 12 months.
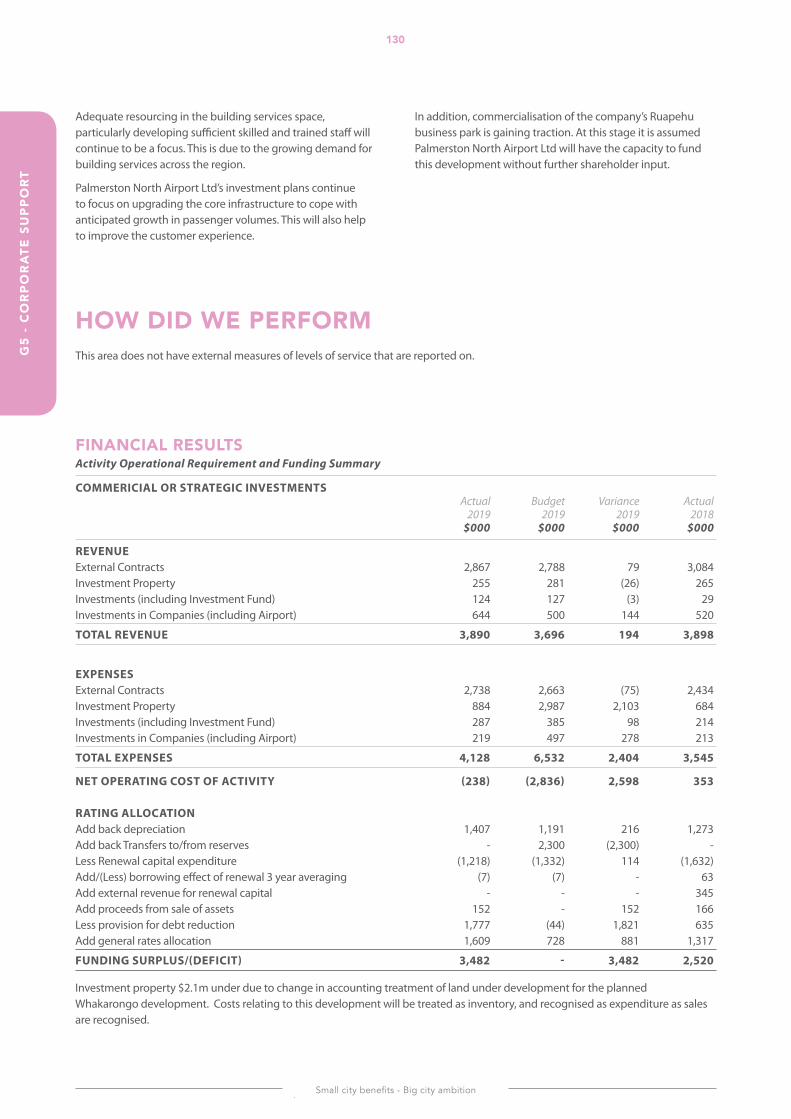
Small city benefits - Big city ambition
G5
- C
OR
PO
RA
TE S
UP
PO
RT
130
Adequate resourcing in the building services space, particularly developing sufficient skilled and trained staff will continue to be a focus. This is due to the growing demand for building services across the region.
Palmerston North Airport Ltd’s investment plans continue to focus on upgrading the core infrastructure to cope with anticipated growth in passenger volumes. This will also help to improve the customer experience.
In addition, commercialisation of the company’s Ruapehu business park is gaining traction. At this stage it is assumed Palmerston North Airport Ltd will have the capacity to fund this development without further shareholder input.
HOW DID WE PERFORMThis area does not have external measures of levels of service that are reported on.
FINANCIAl RESUlTSActivity Operational Requirement and Funding Summary
COMMERICIAL OR STRATEGIC INVESTMENTS Actual Budget Variance Actual 2019 2019 2019 2018 $000 $000 $000 $000
REVENUE External Contracts 2,867 2,788 79 3,084Investment Property 255 281 (26) 265Investments (including Investment Fund) 124 127 (3) 29Investments in Companies (including Airport) 644 500 144 520
TOTAL REVENUE 3,890 3,696 194 3,898
EXPENSES External Contracts 2,738 2,663 (75) 2,434Investment Property 884 2,987 2,103 684Investments (including Investment Fund) 287 385 98 214Investments in Companies (including Airport) 219 497 278 213
TOTAL EXPENSES 4,128 6,532 2,404 3,545
NET OPERATING COST OF ACTIVITY (238) (2,836) 2,598 353 RATING ALLOCATION Add back depreciation 1,407 1,191 216 1,273Add back Transfers to/from reserves - 2,300 (2,300) -Less Renewal capital expenditure (1,218) (1,332) 114 (1,632)Add/(Less) borrowing effect of renewal 3 year averaging (7) (7) - 63Add external revenue for renewal capital - - - 345Add proceeds from sale of assets 152 - 152 166Less provision for debt reduction 1,777 (44) 1,821 635Add general rates allocation 1,609 728 881 1,317
FUNDING SURPLUS/(DEFICIT) 3,482 - 3,482 2,520
Investment property $2.1m under due to change in accounting treatment of land under development for the planned Whakarongo development. Costs relating to this development will be treated as inventory, and recognised as expenditure as sales are recognised.
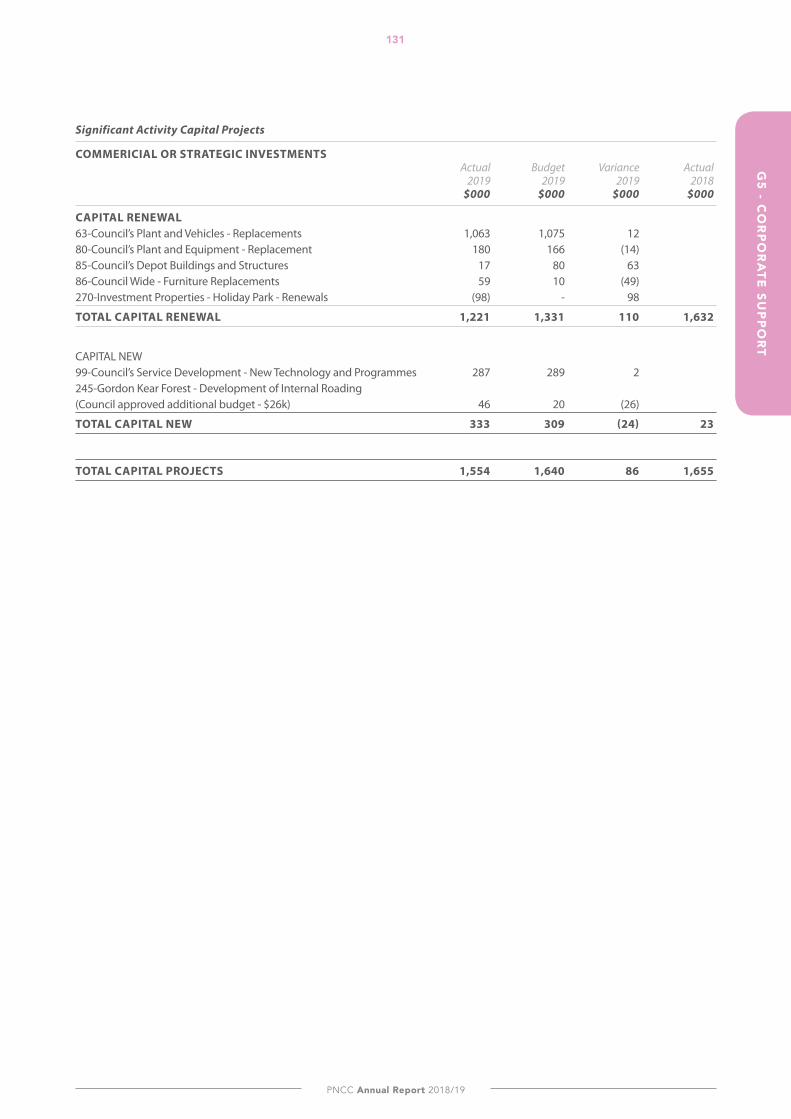
PNCC Annual Report 2018/19
G5 - C
OR
PO
RA
TE SU
PP
OR
T131
Significant Activity Capital Projects
COMMERICIAL OR STRATEGIC INVESTMENTS Actual Budget Variance Actual 2019 2019 2019 2018 $000 $000 $000 $000
CAPITAL RENEWAL 63-Council’s Plant and Vehicles - Replacements 1,063 1,075 12 80-Council’s Plant and Equipment - Replacement 180 166 (14) 85-Council’s Depot Buildings and Structures 17 80 63 86-Council Wide - Furniture Replacements 59 10 (49) 270-Investment Properties - Holiday Park - Renewals (98) - 98
TOTAL CAPITAL RENEWAL 1,221 1,331 110 1,632
CAPITAL NEW 99-Council’s Service Development - New Technology and Programmes 287 289 2 245-Gordon Kear Forest - Development of Internal Roading (Council approved additional budget - $26k) 46 20 (26)
TOTAL CAPITAL NEW 333 309 (24) 23
TOTAL CAPITAL PROJECTS 1,554 1,640 86 1,655
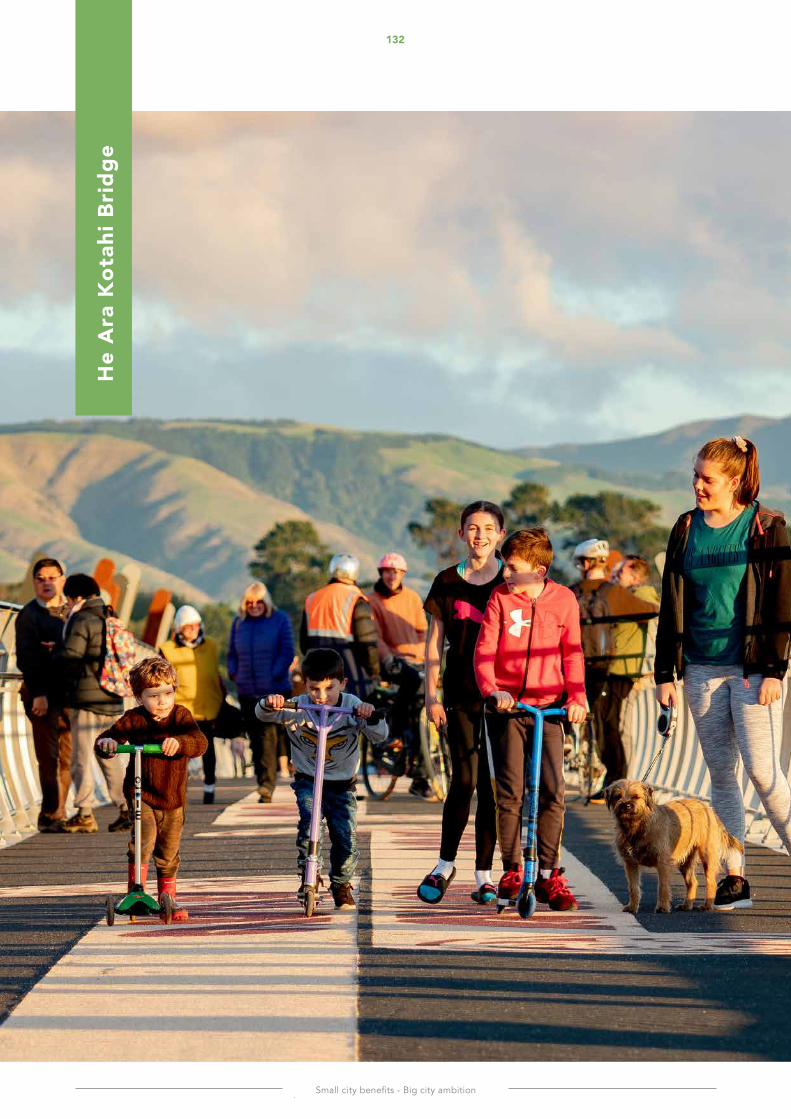
132
Small city benefits - Big city ambition
FIN
AN
CIA
L ST
ATE
ME
NTS
He
Ara
Kot
ahi B
ridg
e

133
PNCC Annual Report 2018/19
FINA
NC
IAL STA
TEM
EN
TS
WĀHANGA TUATORU SECTION THREE
PUAKANGA AHUMONIFINANCIAL STATEMENTS
Experience the ever-changing views of the Manawatū River and its
surrounds on this path which follows the river from He Ara Kotahi
Bridge to Linton Military Camp.
134
Small city benefits - Big city ambition
INd
EP
EN
dE
NT
AU
dIT
OR
'S R
EP
OR
T
INDEPENDENT AUdITOR’S REPORT To the readers of Palmerston North City Council’s annual report for the year ended 30 June 2019
The Auditor General is the auditor of Palmerston North City Council (the City Council) and its subsidiaries and controlled entities (the Group). The Auditor General has appointed me, Karen Young, using the staff and resources of Audit New Zealand, to report on the information in the City Council’s annual report that we are required to audit under the Local Government Act 2002 (the Act). We refer to this information as “the audited information” in our report.
We are also required to report on:
• whether the City Council has complied with the requirements of Schedule 10 of the Act that apply to the annual report; and
• the completeness and accuracy of the City Council’s disclosures about its performance against benchmarks that are required by the Local Government (Financial Reporting and Prudence) Regulations 2014.
We refer to this information as “the disclosure requirements” in our report.
We completed our work on 23 September 2019. This is the date on which we give our report.
OPINION ON THE AUdITEd INFORMATIONIn our opinion:
• the financial statements on pages 138 to 195:
• present fairly, in all material respects:
• the City Council and Group’s financial position as at 30 June 2019; and
• the results of the operations and cash flows for the year ended on that date; and
• comply with generally accepted accounting practice in New Zealand in accordance with Public Benefit Entity Reporting Standards;
• the funding impact statement on page 202, presents fairly, in all material respects, the amount of funds produced from each source of funding and how the funds were applied as compared to the information included in the City Council’s annual plan; and
• the “what the council does” (statement of service performance) on pages 26 to 131:
• presents fairly, in all material respects, the levels of service for each group of activities for the year ended 30 June 2019, including:
• the levels of service achieved compared with the intended levels of service and whether any intended changes to levels of service were achieved; and
• the reasons for any significant variation between the levels of service achieved and the intended levels of service; and
• complies with generally accepted accounting practice in New Zealand; and
• the statement about capital expenditure for each group of activities on pages 31 to 131, presents fairly, in all material respects, actual capital expenditure as compared to the budgeted capital expenditure included in the City Council’s annual plan; and
• the funding impact statement for each group of activities on pages 201 to 211, presents fairly, in all material respects, the amount of funds produced from each source of funding and how the funds were applied as compared to the information included in the City Council’s long-term plan.
REPORT ON THE dISCLOSURE REQUIREMENTS We report that the City Council has:
• complied with the requirements of Schedule 10 of the Act that apply to the annual report; and
• made the disclosures about performance against benchmarks as required by the Local Government (Financial Reporting and Prudence Regulations 2014) on pages 196 to 199, which represent a complete list of required disclosures and accurately reflects the information drawn from the City Council and Group’s audited information and, where applicable, the City Council’s long term plan and annual plans.
135
PNCC Annual Report 2018/19
INd
EP
EN
dE
NT A
Ud
ITOR
'S RE
PO
RT
BASIS FOR OUR OPINION ON THE AUdITEd INFORMATIONWe carried out our audit in accordance with the Auditor General’s Auditing Standards, which incorporate the Professional and Ethical Standards and the International Standards on Auditing (New Zealand) issued by the New Zealand Auditing and Assurance Standards Board. We describe our responsibilities under those standards further in the “Responsibilities of the auditor for the audited information” section of this report.
We have fulfilled our responsibilities in accordance with the Auditor General’s Auditing Standards.
We believe that the audit evidence we have obtained is sufficient and appropriate to provide a basis for our opinion on the audited information.
RESPONSIBILITIES OF THE COUNCIL FOR THE AUdITEd INFORMATIONThe Council is responsible for meeting all legal requirements that apply to its annual report.
The Council’s responsibilities arise under the Local Government Act 2002 and the Local Government (Financial Reporting and Prudence) Regulations 2014.
The Council is responsible for such internal control as it determines is necessary to enable it to prepare the information we audit that is free from material misstatement, whether due to fraud or error.
In preparing the information we audit the Council is responsible for assessing its ability to continue as a going concern. The Council is also responsible for disclosing, as applicable, matters related to going concern and using the going concern basis of accounting, unless there is an intention to amalgamate or cease all of the functions of the City Council and the Group or there is no realistic alternative but to do so.
RESPONSIBILITIES OF THE AUdITOR FOR THE AUdITEd INFORMATIONOur objectives are to obtain reasonable assurance about whether the audited information, as a whole, is free from material misstatement, whether due to fraud or error, and to issue an audit report that includes our opinion.
Reasonable assurance is a high level of assurance, but is not a guarantee that an audit carried out in accordance with the Auditor General’s Auditing Standards will always detect a material misstatement when it exists. Misstatements are differences or omissions of amounts or disclosures, and can arise from fraud or error. Misstatements are considered material if, individually or in the aggregate, they could reasonably be expected to influence the decisions of readers taken on the basis of this audited information.
For the budget information reported in the audited information, our procedures were limited to checking that the budget information agreed to the City Council’s annual plan.
We did not evaluate the security and controls over the electronic publication of the audited information.
As part of an audit in accordance with the Auditor General’s Auditing Standards, we exercise professional judgement and maintain professional scepticism throughout the audit. Also:
• We identify and assess the risks of material misstatement of the audited information, whether due to fraud or error, design and perform audit procedures responsive to those risks, and obtain audit evidence that is sufficient and appropriate to provide a basis for our opinion. The risk of not detecting a material misstatement resulting from fraud is higher than for one resulting from error, as fraud may involve collusion, forgery, intentional omissions, misrepresentations, or the override of internal control.
• We obtain an understanding of internal control relevant to the audit in order to design audit procedures that are appropriate in the circumstances, but not for the purpose of expressing an opinion on the effectiveness of the City Council and Group’s internal control.
• We evaluate the appropriateness of accounting policies used and the reasonableness of accounting estimates and related disclosures made by the Council.
• We determine the appropriateness of the reported intended levels of service in the statement of service performance, as a reasonable basis for assessing the levels of service achieved and reported by the City Council.
• We conclude on the appropriateness of the use of the going concern basis of accounting by the Council and, based on the audit evidence obtained, whether a material uncertainty exists related to events or conditions that may cast a significant doubt on the City Council and Group’s ability to continue as a going concern. If we conclude that a material uncertainty exists, we are required to draw attention in our audit report to the related disclosures in the audited information or, if such disclosures are inadequate, to modify our opinion. Our conclusions are based on the audit evidence obtained up to the date of our audit report. However, future events or conditions may cause the City Council and the Group to cease to continue as a going concern.
136
Small city benefits - Big city ambition
INd
EP
EN
dE
NT
AU
dIT
OR
'S R
EP
OR
T
• We evaluate the overall presentation, structure and content of the audited information, including the disclosures, and whether the audited information represents, where applicable, the underlying transactions and events in a manner that achieves fair presentation.
• We obtain sufficient appropriate audit evidence regarding the entities or business activities within the Group to express an opinion on the consolidated audited information.
We communicate with the Council regarding, among other matters, the planned scope and timing of the audit and significant audit findings, including any significant deficiencies in internal control that we identify during our audit.
OTHER INFORMATIONThe Council is responsible for the other information included in the annual report. The other information comprises the information included on pages 4 to 234, but does not include the audited information and the disclosure requirements.
Our opinion on the audited information and our report on the disclosure requirements do not cover the other information.
Our responsibility is to read the other information. In doing so, we consider whether the other information is materially inconsistent with the audited information and the disclosure requirements, or our knowledge obtained during our work, or otherwise appears to be materially misstated. If, based on our work, we conclude that there is a material misstatement of this other information, we are required to report that fact. We have nothing to report in this regard.
INDEPENDENCEWe are independent of the City Council and Group in accordance with the independence requirements of the Auditor General’s Auditing Standards, which incorporate the independence requirements of Professional and Ethical Standard 1 (Revised): Code of Ethics for Assurance Practitioners issued by the New Zealand Auditing and Assurance Standards Board.
In addition to this audit of the audited information and our report on the disclosure requirements, we have performed a limited assurance engagement related to the City Council’s debenture trust deed. Other than this audit and the engagement, we have no relationship with, or interests in the City Council or its subsidiaries.
Karen Young
Audit New Zealand On behalf of the Auditor General Wellington, New Zealand
23 September 2019
137
PNCC Annual Report 2018/19
STATEMENT OF COMPLIANCE ANd RESPONSIBILITY
COMPLIANCE1. The Council of Palmerston North City Council hereby confirms that all statutory requirements relating to the Annual Report
adopted on 23 September 2019 have been complied with.
RESPONSIBILITY2. The Council and management of Palmerston North City Council accept responsibility for the preparation of the annual
Financial Statements and the judgements used in them.3. The Council and management of Palmerston North City Council accept responsibility for establishing and maintaining a system
of internal control designed to provide reasonable assurance as to the integrity and reliability of financial reporting.4. In the opinion of the Council and management of Palmerston North City Council, the annual Financial Statements for the year
ended 30 June 2019 fairly reflect the financial position and operations of Palmerston North City Council.
Grant Smith Heather Shotter Mayor Chief Executive
23 September 2019 23 September 2019
STATE
ME
NT O
F CO
MP
LIAN
CE
AN
d R
ESP
ON
SIBILITY
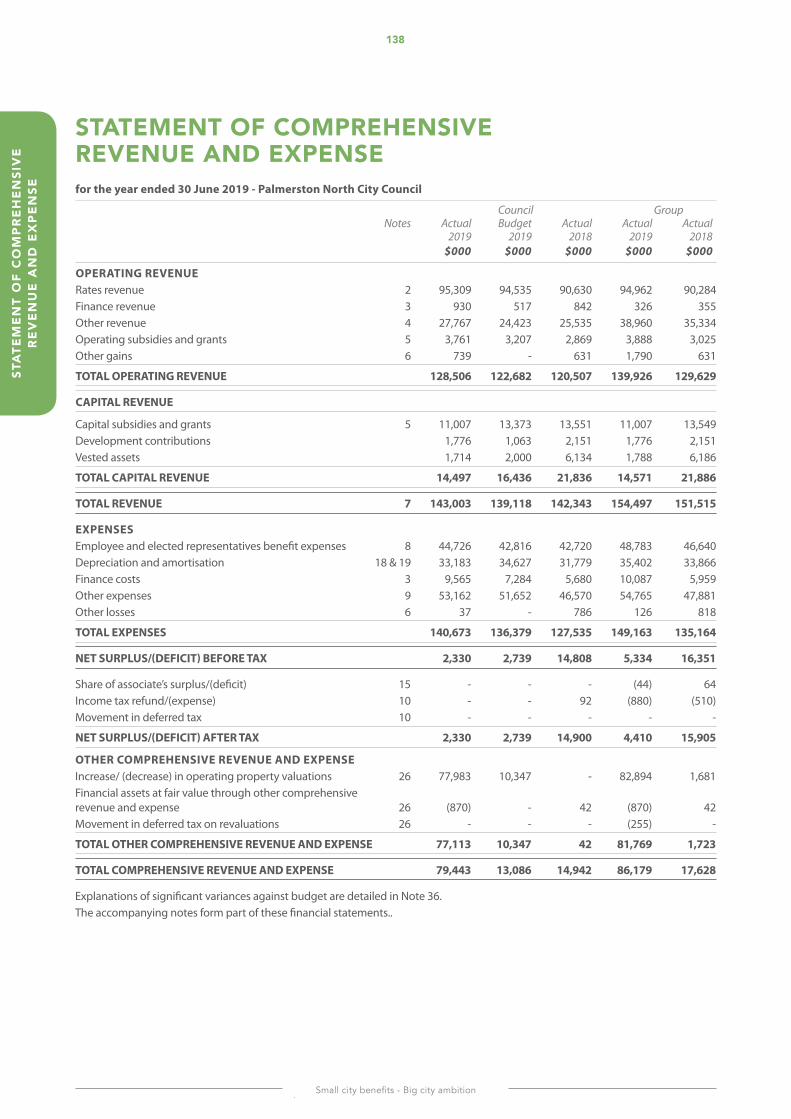
138
Small city benefits - Big city ambition
STATEMENT OF COMPREHENSIVE REVENUE ANd EXPENSEfor the year ended 30 June 2019 - Palmerston North City Council
Council Group Notes Actual Budget Actual Actual Actual 2019 2019 2018 2019 2018 $000 $000 $000 $000 $000
OPERATING REVENUE Rates revenue 2 95,309 94,535 90,630 94,962 90,284 Finance revenue 3 930 517 842 326 355 Other revenue 4 27,767 24,423 25,535 38,960 35,334 Operating subsidies and grants 5 3,761 3,207 2,869 3,888 3,025 Other gains 6 739 - 631 1,790 631
TOTAL OPERATING REVENUE 128,506 122,682 120,507 139,926 129,629
CAPITAL REVENUE
Capital subsidies and grants 5 11,007 13,373 13,551 11,007 13,549 Development contributions 1,776 1,063 2,151 1,776 2,151 Vested assets 1,714 2,000 6,134 1,788 6,186
TOTAL CAPITAL REVENUE 14,497 16,436 21,836 14,571 21,886
TOTAL REVENUE 7 143,003 139,118 142,343 154,497 151,515
EXPENSES Employee and elected representatives benefit expenses 8 44,726 42,816 42,720 48,783 46,640 Depreciation and amortisation 18 & 19 33,183 34,627 31,779 35,402 33,866 Finance costs 3 9,565 7,284 5,680 10,087 5,959 Other expenses 9 53,162 51,652 46,570 54,765 47,881 Other losses 6 37 - 786 126 818
TOTAL EXPENSES 140,673 136,379 127,535 149,163 135,164
NET SURPLUS/(DEFICIT) BEFORE TAX 2,330 2,739 14,808 5,334 16,351
Share of associate’s surplus/(deficit) 15 - - - (44) 64 Income tax refund/(expense) 10 - - 92 (880) (510)Movement in deferred tax 10 - - - - -
NET SURPLUS/(DEFICIT) AFTER TAX 2,330 2,739 14,900 4,410 15,905
OTHER COMPREHENSIVE REVENUE AND EXPENSE Increase/ (decrease) in operating property valuations 26 77,983 10,347 - 82,894 1,681Financial assets at fair value through other comprehensive revenue and expense 26 (870) - 42 (870) 42 Movement in deferred tax on revaluations 26 - - - (255) -
TOTAL OTHER COMPREHENSIVE REVENUE AND EXPENSE 77,113 10,347 42 81,769 1,723
TOTAL COMPREHENSIVE REVENUE AND EXPENSE 79,443 13,086 14,942 86,179 17,628
Explanations of significant variances against budget are detailed in Note 36.The accompanying notes form part of these financial statements..
STA
TEM
EN
T O
F C
OM
PR
EH
EN
SIV
E R
EV
EN
UE
AN
d E
XP
EN
SE
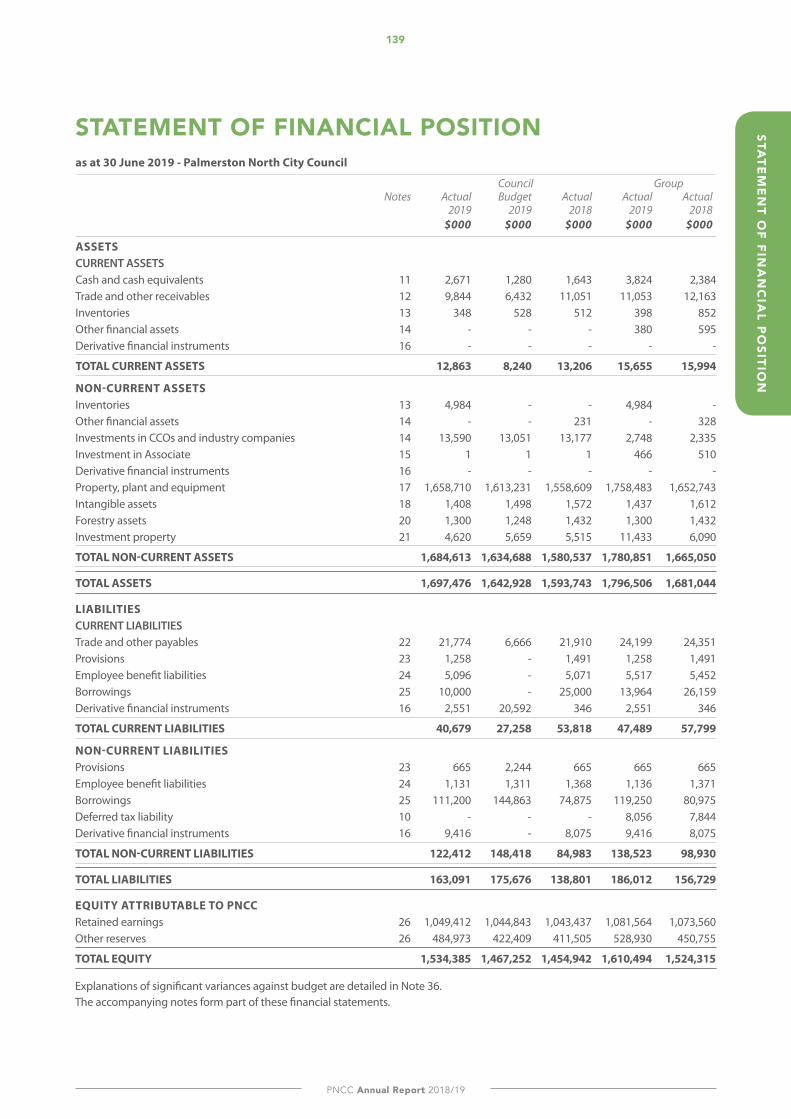
139
PNCC Annual Report 2018/19
STATE
ME
NT O
F FINA
NC
IAL P
OSITIO
N
STATEMENT OF FINANCIAL POSITIONas at 30 June 2019 - Palmerston North City Council
Council Group Notes Actual Budget Actual Actual Actual 2019 2019 2018 2019 2018 $000 $000 $000 $000 $000
ASSETS CURRENT ASSETS Cash and cash equivalents 11 2,671 1,280 1,643 3,824 2,384 Trade and other receivables 12 9,844 6,432 11,051 11,053 12,163 Inventories 13 348 528 512 398 852 Other financial assets 14 - - - 380 595 Derivative financial instruments 16 - - - - -
TOTAL CURRENT ASSETS 12,863 8,240 13,206 15,655 15,994
NON-CURRENT ASSETS Inventories 13 4,984 - - 4,984 - Other financial assets 14 - - 231 - 328 Investments in CCOs and industry companies 14 13,590 13,051 13,177 2,748 2,335 Investment in Associate 15 1 1 1 466 510 Derivative financial instruments 16 - - - - - Property, plant and equipment 17 1,658,710 1,613,231 1,558,609 1,758,483 1,652,743 Intangible assets 18 1,408 1,498 1,572 1,437 1,612 Forestry assets 20 1,300 1,248 1,432 1,300 1,432 Investment property 21 4,620 5,659 5,515 11,433 6,090
TOTAL NON-CURRENT ASSETS 1,684,613 1,634,688 1,580,537 1,780,851 1,665,050
TOTAL ASSETS 1,697,476 1,642,928 1,593,743 1,796,506 1,681,044
LIABILITIES CURRENT LIABILITIES Trade and other payables 22 21,774 6,666 21,910 24,199 24,351 Provisions 23 1,258 - 1,491 1,258 1,491 Employee benefit liabilities 24 5,096 - 5,071 5,517 5,452 Borrowings 25 10,000 - 25,000 13,964 26,159 Derivative financial instruments 16 2,551 20,592 346 2,551 346
TOTAL CURRENT LIABILITIES 40,679 27,258 53,818 47,489 57,799
NON-CURRENT LIABILITIES Provisions 23 665 2,244 665 665 665 Employee benefit liabilities 24 1,131 1,311 1,368 1,136 1,371 Borrowings 25 111,200 144,863 74,875 119,250 80,975 Deferred tax liability 10 - - - 8,056 7,844 Derivative financial instruments 16 9,416 - 8,075 9,416 8,075
TOTAL NON-CURRENT LIABILITIES 122,412 148,418 84,983 138,523 98,930
TOTAL LIABILITIES 163,091 175,676 138,801 186,012 156,729
EQUITY ATTRIBUTABLE TO PNCC Retained earnings 26 1,049,412 1,044,843 1,043,437 1,081,564 1,073,560 Other reserves 26 484,973 422,409 411,505 528,930 450,755
TOTAL EQUITY 1,534,385 1,467,252 1,454,942 1,610,494 1,524,315
Explanations of significant variances against budget are detailed in Note 36. The accompanying notes form part of these financial statements.
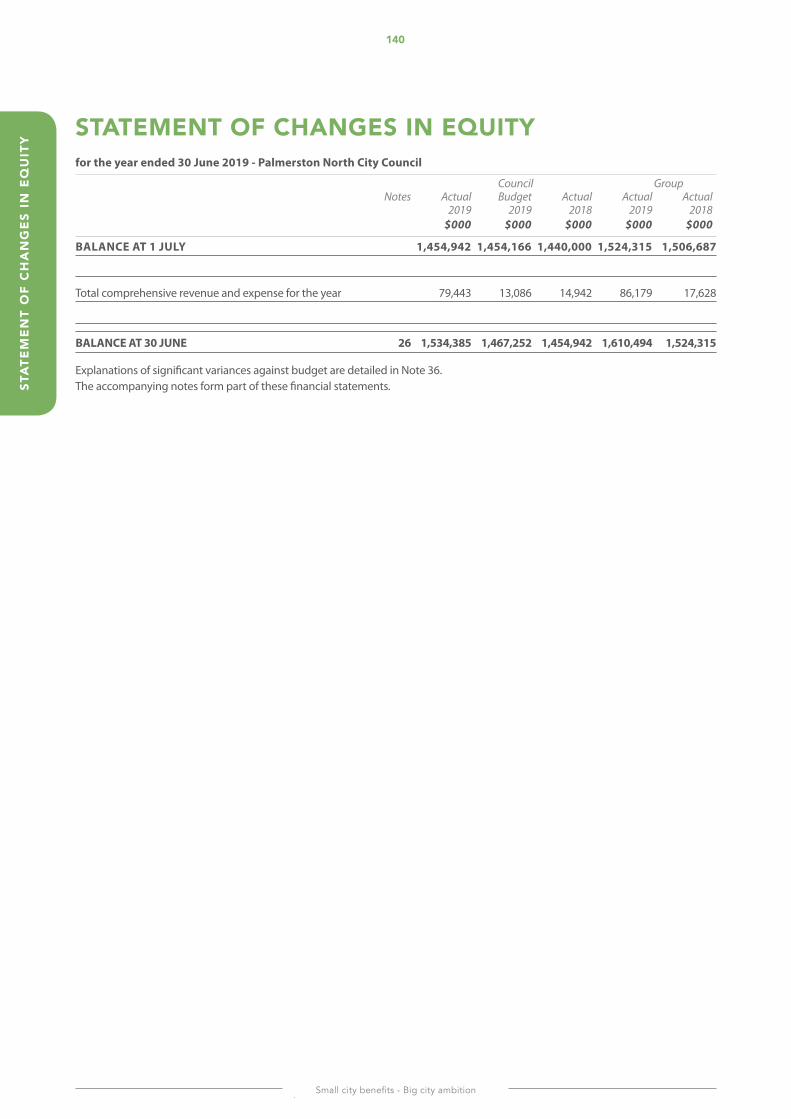
140
Small city benefits - Big city ambition
STA
TEM
EN
T O
F C
HA
NG
ES
IN E
QU
ITY
STATEMENT OF CHANGES IN EQUITYfor the year ended 30 June 2019 - Palmerston North City Council
Council Group Notes Actual Budget Actual Actual Actual 2019 2019 2018 2019 2018 $000 $000 $000 $000 $000
BALANCE AT 1 JULY 1,454,942 1,454,166 1,440,000 1,524,315 1,506,687
Total comprehensive revenue and expense for the year 79,443 13,086 14,942 86,179 17,628
BALANCE AT 30 JUNE 26 1,534,385 1,467,252 1,454,942 1,610,494 1,524,315
Explanations of significant variances against budget are detailed in Note 36. The accompanying notes form part of these financial statements.
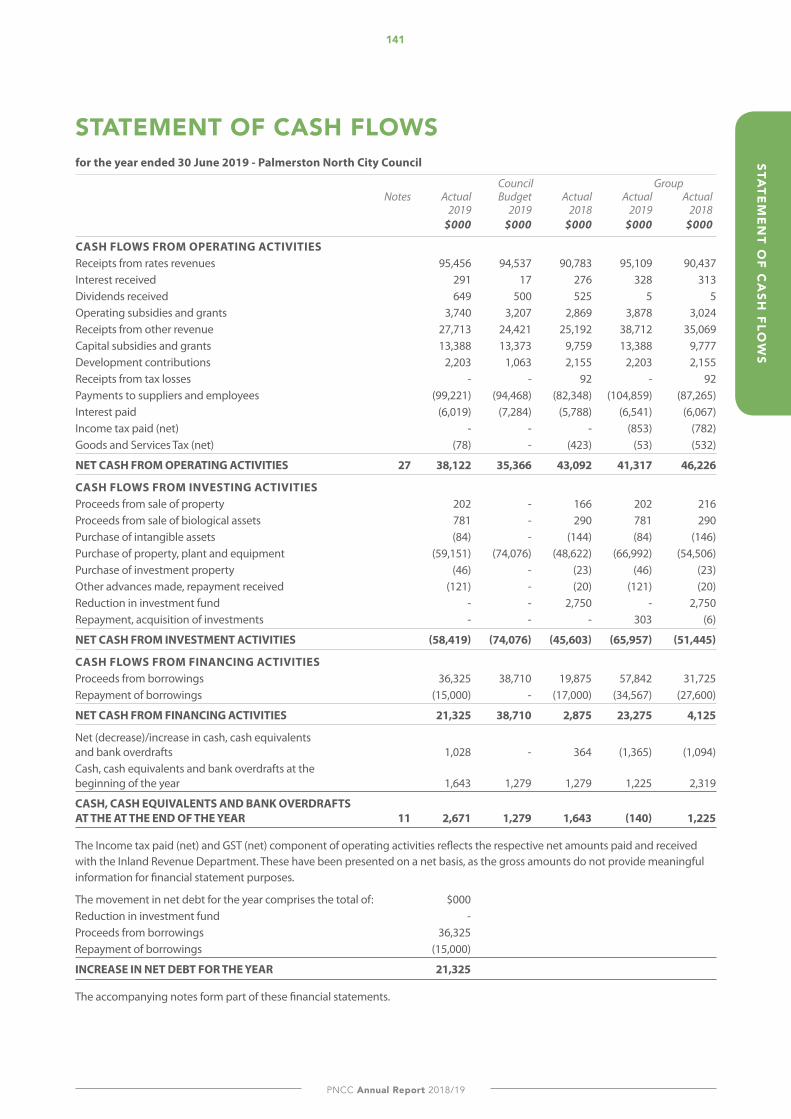
141
PNCC Annual Report 2018/19
STATE
ME
NT O
F CA
SH FLO
WS
STATEMENT OF CASH FLOWSfor the year ended 30 June 2019 - Palmerston North City Council
Council Group Notes Actual Budget Actual Actual Actual 2019 2019 2018 2019 2018 $000 $000 $000 $000 $000
CASH FLOWS FROM OPERATING ACTIVITIES Receipts from rates revenues 95,456 94,537 90,783 95,109 90,437Interest received 291 17 276 328 313Dividends received 649 500 525 5 5Operating subsidies and grants 3,740 3,207 2,869 3,878 3,024Receipts from other revenue 27,713 24,421 25,192 38,712 35,069Capital subsidies and grants 13,388 13,373 9,759 13,388 9,777Development contributions 2,203 1,063 2,155 2,203 2,155Receipts from tax losses - - 92 - 92Payments to suppliers and employees (99,221) (94,468) (82,348) (104,859) (87,265)Interest paid (6,019) (7,284) (5,788) (6,541) (6,067)Income tax paid (net) - - - (853) (782)Goods and Services Tax (net) (78) - (423) (53) (532)
NET CASH FROM OPERATING ACTIVITIES 27 38,122 35,366 43,092 41,317 46,226
CASH FLOWS FROM INVESTING ACTIVITIES Proceeds from sale of property 202 - 166 202 216Proceeds from sale of biological assets 781 - 290 781 290Purchase of intangible assets (84) - (144) (84) (146)Purchase of property, plant and equipment (59,151) (74,076) (48,622) (66,992) (54,506)Purchase of investment property (46) - (23) (46) (23)Other advances made, repayment received (121) - (20) (121) (20)Reduction in investment fund - - 2,750 - 2,750Repayment, acquisition of investments - - - 303 (6)
NET CASH FROM INVESTMENT ACTIVITIES (58,419) (74,076) (45,603) (65,957) (51,445)
CASH FLOWS FROM FINANCING ACTIVITIES Proceeds from borrowings 36,325 38,710 19,875 57,842 31,725Repayment of borrowings (15,000) - (17,000) (34,567) (27,600)
NET CASH FROM FINANCING ACTIVITIES 21,325 38,710 2,875 23,275 4,125
Net (decrease)/increase in cash, cash equivalents and bank overdrafts 1,028 - 364 (1,365) (1,094)Cash, cash equivalents and bank overdrafts at the beginning of the year 1,643 1,279 1,279 1,225 2,319
CASH, CASH EQUIVALENTS AND BANK OVERDRAFTS AT THE AT THE END OF THE YEAR 11 2,671 1,279 1,643 (140) 1,225
The Income tax paid (net) and GST (net) component of operating activities reflects the respective net amounts paid and received with the Inland Revenue Department. These have been presented on a net basis, as the gross amounts do not provide meaningful information for financial statement purposes.
The movement in net debt for the year comprises the total of: $000Reduction in investment fund - Proceeds from borrowings 36,325Repayment of borrowings (15,000)
INCREASE IN NET DEBT FOR THE YEAR 21,325
The accompanying notes form part of these financial statements.
142
Small city benefits - Big city ambition
NO
TES
TO T
HE
FIN
AN
CIA
L ST
ATE
ME
NTS NOTES TO THE FINANCIAL STATEMENTS
NOTE 1STATEMENT OF ACCOUNTING POLICIES FOR THE YEAR ENdEd 30 JUNE 2019
REPORTING ENTITY
Palmerston North City Council (PNCC) is a territorial local authority governed by the Local Government Act 2002 (LGA) and is domiciled and operates in New Zealand. The relevant legislation governing the Council’s operations includes the LGA and the Local Government (Rating) Act 2002.
The parent ‘council’ financial statements are for PNCC as a separate legal entity. The Palmerston North City Council ‘group’ financial statements incorporate the Palmerston North City Council, its 100% share of its subsidiary Palmerston North Airport Limited (PNAL) and the following Council Controlled Organisations (CCO’s) (100% share) with all incorporated in New Zealand:
• Caccia Birch Trust Board,• Globe Theatre Trust Board,• Palmerston North Performing Arts Trust Board,• The Regent Theatre Trust, and• Te Manawa Museums Trust.
PNCC’s 50% equity share of its associate Central Economic Development Agency Limited (CEDA) is equity accounted into the group financial statements.
PNCC and group provide local infrastructure, regulatory services and local public services to the community. The Council does not operate to make a financial return. Accordingly, PNCC has designated itself and the group as public benefit entities (“PBE”) for financial reporting purposes.
The financial statements of PNCC and entities included in the group are for the year ended 30 June 2019. The financial statements were authorised for issue by Council on 23 September 2019.
BASIS OF PREPARATION
The financial statements have been prepared on the going concern basis, and the accounting policies have been applied consistently throughout the period.
Statement of compliance
The financial statements of PNCC have been prepared in accordance with the requirements of the Local Government Act 2002, which includes the requirement to comply with New Zealand generally accepted accounting practice (NZ GAAP).
These financial statements have been prepared in accordance with NZ GAAP. They comply with NZ Public Benefit Entity International Public Sector Accounting Standards, and are prepared in accordance with Tier 1 PBE Standards.
Measurement base
The financial statements have been prepared on an historical cost basis, modified by the revaluation of land and buildings, infrastructural assets, investment property, biological assets and certain financial instruments (including derivative instruments).
Presentation currency and rounding
The financial statements are presented in New Zealand dollars and all values are rounded to the nearest thousand dollars ($’000), unless shown otherwise.
Changes in accounting policies
There have been no changes in accounting policies during the financial year as a consequence of changes in accounting standards.
Standards issued and not yet effective that have not been early adopted
PNCC expects there will be minimal or no change to these accounting policies in applying any currently updated or proposed accounting standards.
SIGNIFICANT ACCOUNTING POLICIES
Basis of consolidation
The consolidated financial statements are prepared by adding together like items of assets, liabilities, equity, revenue and expenses of entities in the group on a line-by-line basis. All significant intra-group balances, transactions, revenue and expenses are eliminated on consolidation.
Subsidiaries
PNCC consolidates as subsidiaries in the group financial statements all entities where PNCC has the capacity to control their financing and operating policies so as to obtain benefits from the activities of the entity. This power exists where PNCC controls the majority voting power on the governing body or where such policies have been irreversibly predetermined by PNCC or where the determination of such policies is unable to materially impact the level of potential ownership benefits that arise from the activities of the subsidiary.
143
PNCC Annual Report 2018/19
NO
TE 1
PNCC measures the cost of a business combination as the aggregate of the fair values, at the date of exchange, of assets given, liabilities incurred or assumed, in exchange for control of the subsidiary.
Any excess of the cost of the business combination over PNCC’s interest in the net fair value of the identifiable assets, liabilities and contingent liabilities is recognised as goodwill. If PNCC’s interest in the net fair value of the identifiable assets, liabilities and contingent liabilities recognised exceeds the cost of the business combination, the difference will be recognised immediately in the surplus or deficit.
Investment in subsidiaries is carried at cost in PNCC’s own “parent entity” financial statements.
Associate
An associate is an entity over which the Council has significant influence and that is neither a subsidiary nor an interest in a joint venture. PNCC’s associate investment is accounted for in the group financial statements using the equity method. The investment in an associate is initially recognised at cost and the carrying amount in the group financial statements is increased or decreased to recognise the group’s share of the surplus or deficit of the associate after the date of acquisition. Distributions received from an associate reduce the carrying amount of the investment in the group financial statements.
If the share of deficits of an associate equals or exceeds its interest in the associate, the group discontinues recognising its share of further deficits. After the group’s interest is reduced to zero, additional deficits are provided for, and a liability is recognised, only to the extent that PNCC has incurred legal or constructive obligations or made payments on behalf of the associate. If the associate subsequently reports surpluses, the group will resume recognising its share of those surpluses only after its share of the surpluses equals the share of deficits not recognised.
Where the group transacts with an associate, surpluses or deficits are eliminated to the extent of the group’s interest in the associate.
Dilution gains or losses arising from investments in associates are recognised in the surplus or deficit.
The investment in the associate is carried at cost in the PNCC’s parent entity financial statements.
Joint ventures
A joint venture is a contractual arrangement whereby two or more parties undertake an economic activity that is subject to joint control.
For jointly controlled assets, PNCC recognises in its financial statements its share of jointly controlled assets, the liabilities and expenses it incurs, its share of liabilities and expenses incurred jointly, and revenue from the sale or use of its share of the output of the joint venture.
Revenue
Revenue is measured at the fair value of consideration received or receivable when it is probable that the economic benefit will flow to PNCC.
Rates revenue
The following policies for rates have been applied:
• General rates, targeted rates (excluding metered water), and uniform annual general charges are recognised at the start of the financial year to which the rates resolution relates. They are recognised at the amounts due. The Council considers the effect of payment of rates by instalments is not sufficient to require discounting of rates receivables and subsequent recognition of interest revenue.
• Rates arising from late payment penalties are recognised as revenue when rates become overdue.
• Revenue from metered water rates is recognised on an accrual basis based on usage. Unbilled usage, as a result of unread meters at year end, is accrued on an average usage basis.
• Rate remissions are recognised as a reduction of rates revenue when the Council has received an application that satisfies its rates remission policy.
Agency revenue
Where revenue is derived by acting as an agent for another party, the revenue that is recognised is the commission or fee on that transaction.
Provision of services
Revenue from the rendering of services is recognised on a percentage completion basis with reference to the recoverable costs incurred at balance date.
Sale of goods
Sales of goods are recognised when a product is sold to the customer. Sales are usually in cash or by credit card. The recorded revenue is the gross amount of the sale, including credit card fees payable for the transaction. Such fees are included in other expenses.
Government subsidies and other grants
PNCC receives government subsidies from the New Zealand Transport Agency, which subsidises part of PNCC’s costs of maintenance and capital expenditure of the local roading infrastructure. The subsidies are recognised as revenue upon entitlement as conditions pertaining to eligible expenditure have been fulfilled.
Other grants are recognised as revenue when they become receivable unless there is an obligation in substance to return the funds if conditions of the grant are not met. If there is such an obligation, the grants are initially recorded as grants received in advance and recognised as revenue when conditions of the grant are satisfied.
144
Small city benefits - Big city ambition
NO
TE 1
Traffic and parking infringements
Traffic and parking infringements are recognised when the infringement notices are issued, less assessed impairment losses determined by considering the collection history over the last year.
Vested assets
Where a physical asset is acquired for nil or nominal consideration the fair value of the asset received is recognised as capital revenue when control over the asset is obtained. Fair value is determined by reference to the cost of constructing the asset or construction cost of the property developer.
Development contributions
Development and financial contributions are recognised as revenue when PNCC provides, or is able to provide, the service for which the contribution was charged. Otherwise development and financial contributions are recognised as liabilities until such time that PNCC provides, or is able to provide, the service.
Development contributions are classified as part of “Capital Revenue” in the Statement of Comprehensive Revenue and Expense.
Interest and dividends
Interest revenue is recognised using the effective interest method.
Dividends are recognised when the right to receive payment has been established.
Borrowing costs
Borrowing costs are recognised as an expense in the period in which they are incurred.
Grant expenditure
The Council’s grants awarded have no substantive conditions attached.
Non-discretionary grants are those grants that are awarded if the grant application meets the specified criteria and are recognised as expenditure when an application that meets the specified criteria for the grant has been received.
Discretionary grants are those grants where PNCC has no obligation to award on receipt of the grant application and are recognised as expenditure when a successful applicant has been notified of PNCC’s decision..
Income Tax
Income tax expense comprises both current tax and deferred tax, and is calculated using tax rates that have been enacted or substantively enacted by balance date.
Current tax is the amount of income tax payable based on the taxable surplus for the current year, plus any adjustments to income tax payable in respect of prior years.
Deferred tax is the amount of income tax payable or recoverable in future periods in respect of temporary
differences and unused tax losses. Temporary differences are differences between the carrying amount of assets and liabilities in the financial statements and the corresponding tax bases used in the computation of taxable surplus.
Deferred tax liabilities are generally recognised for all taxable temporary differences. Deferred tax assets are recognised to the extent that it is probable that taxable surpluses will be available against which the deductible temporary differences or tax losses can be utilised.
Deferred tax is not recognised if the temporary difference arises from the initial recognition of goodwill or from the initial recognition of an asset and liability in a transaction that is not a business combination, and at the time of the transaction, affects neither accounting surplus nor taxable surplus.
Current tax and deferred tax are recognised against the surplus or deficit for the period, except to the extent that it relates to a business combination, or to transactions recognised in other comprehensive revenue and expense or directly in equity.
Operating leases
An operating lease is a lease that does not transfer substantially all the risks and rewards incidental to ownership of an asset. Lease payments under an operating lease are recognised as an expense on a straight-line basis over the lease term.
Cash and cash equivalents
Cash and cash equivalents includes cash on hand, deposits held at call with banks, other short-term highly liquid investments with original maturities of three months or less, and bank overdrafts.
Bank overdrafts are shown within borrowings in current liabilities in the statement of financial position.
Trade and other receivables
Trade and other receivables are initially measured at fair value and subsequently measured at amortised cost using the effective interest method, less any provision for impairment.
Financial assets
Financial assets and liabilities are initially recognised at fair value plus transaction costs unless they are carried at fair value through surplus or deficit in which case the transaction costs are recognised in the surplus or deficit.
Purchases and sales of financial assets are recognised on trade-date, the date on which PNCC commits to purchase or sell the asset. Financial assets are derecognised when the rights to receive cash flows from the financial assets have expired or have been transferred and PNCC has transferred substantially all the risks and rewards of ownership.
PNCC classifies its financial assets into the following categories:
• fair value through surplus or deficit, • loans and receivables,
145
PNCC Annual Report 2018/19
NO
TE 1
• held-to-maturity investments, and • fair value through other comprehensive revenue and
expense.
The classification depends on the purpose for which the financial asset was acquired. Management determines the classification of its investments at initial recognition.
Financial assets at fair value through surplus or deficit
Financial assets at fair value through surplus or deficit include financial assets held for trading. A financial asset is classified as held for trading if acquired principally for the purpose of selling in the short term or it is part of a portfolio of identified financial instruments that are managed together and for which there is evidence of short-term profit taking. Derivatives are also categorised as held for trading unless they are designated as hedges (PNCC does not apply hedge accounting).
Assets in this category are classified as current assets unless settlement is beyond twelve months and in management’s assessment they are likely to be held to maturity or are not expected to be realised within 12 months of the balance sheet date.
After initial recognition they are measured at their fair values with gains or losses on remeasurement recognised in the surplus or deficit.
Loans and receivables
Loans and receivables are non-derivative financial assets with fixed or determinable payments that are not quoted in an active market. They are included in current assets, except for maturities greater than 12 months after the balance date, which are included in non-current assets. PNCC’s loans and receivables comprise cash and cash equivalents, trade and other receivables, term deposits, community and related party loans.
After initial recognition they are measured at amortised cost, using the effective interest method, less impairment. Gains and losses when the asset is impaired or derecognised are recognised in the surplus or deficit.
Loans to community organisations made by PNCC at nil, or below market interest rates are initially recognised at the present value of their expected future cash flows, discounted at the current market rate of return for a similar financial instrument. The loans are subsequently measured at amortised cost using the effective interest method. The difference between the face value and present value of the expected future cash flows of the loan is recognised in the surplus or deficit as a grant.
Held to maturity investments
Held to maturity investments are non-derivative financial assets with fixed or determinable payments and fixed maturities that PNCC has the positive intention and ability to hold to maturity.
After initial recognition they are measured at amortised cost, using the effective interest method to each repricing date, less impairment. Gains and losses when the asset is impaired
or derecognised are recognised in the surplus or deficit.
Assets in this category include NZLGFA borrower notes.
Financial assets at fair value through other comprehensive revenue and expense
Financial assets at fair value through other comprehensive revenue and expense are those that are designated at initial recognition or are not classified in any of the other categories above. They are included in non-current assets unless management intends to dispose of the investment within 12 months of the balance date. PNCC’s financial assets at fair value through other comprehensive revenue and expense include:
• investments that PNCC intends to hold long-term but which may be realised before maturity (i.e. unlisted shares held in Civic Financial Services Ltd), and
• shareholdings that PNCC holds for strategic purposes.
PNCC’s investments in its subsidiary companies are not included in this category as they are held at cost (as allowed by PBE IPSAS 6 Consolidated and Separate Financial Statements and PBE IPSAS 7 Investments in Associates) whereas this category is to be measured at fair value.
After initial recognition these investments are measured at their fair value, with gains and losses recognised in other comprehensive revenue and expense, except for impairment losses, which are recognised in the surplus or deficit.
On derecognition the cumulative gain or loss previously recognised in other comprehensive revenue and expense is reclassified from equity to the surplus or deficit.
Fair value
The fair value of financial instruments traded in active markets is based on quoted market prices at the balance sheet date. The quoted market price used is the current bid price.
The fair value of financial instruments (including financial assets at fair value through surplus or deficit) that are not traded in an active market is determined using appropriate valuation techniques. PNCC uses a variety of methods and makes assumptions that are based on market conditions existing at each balance date. Quoted market prices or dealer quotes for similar instruments are used for long-term debt instruments held. Other techniques, such as discounted expected cash flows, are used to determine fair value for the remaining financial instruments.
Impairment of financial assets
At each balance sheet date PNCC assesses whether there is any objective evidence that a financial asset or group of financial assets is impaired. Any impairment losses are recognised in the surplus or deficit.
Impairment of a loan or receivable is established when there is objective evidence that PNCC will not be able to collect all amounts due according to the original terms. The amount of the impairment is the difference between the asset’s carrying amount and the present value of estimated future cash flows, discounted using the original effective interest rate.
146
Small city benefits - Big city ambition
NO
TE 1
Impairment for all other financial assets is established when there is objective evidence that PNCC will not be able to collect amounts due on original terms or there is a significant or prolonged decline in fair value of an investment. Any impairment losses are recognised in the surplus or deficit..
Inventories
Inventories (such as spare parts and other items) held for distribution or consumption in the provision of services are measured at cost adjusted for any loss of service potential.
The amount of any write down from cost for any loss of service potential is recognised in the surplus or deficit.
When land held for development and future resale is transferred from property, plant and equipment to inventory, the fair value of the land at the date of transfer is its deemed cost.
Costs directly attributable to the developed land are capitalised to inventory, with the exception of infrastructural assets which are capitalised to property, plant and equipment.
Non-current assets held for sale
Non-current assets held for sale are classified as held for sale if their carrying amount will be recovered principally through a sale transaction, rather than through continuing use. Non-current assets held for sale are measured at the lower of their carrying amount and fair value less costs to sell.
Any impairment losses for write-downs of non-current assets held for sale are recognised in the surplus or deficit.
Any increases in fair value (less costs to sell) are recognised up to the level of any impairment losses that have been previously recognised.
Non-current assets (including those that are part of a disposal group) are not depreciated or amortised while they are classified as held for sale.
Property, plant and equipment
Property, plant and equipment consists of:
Operational assets - include land, buildings, recreation and community facilities, landfill post-closure, library books, heritage and art collections, plant and equipment, and motor vehicles.
Restricted assets - are parks and reserves owned by PNCC which provide a benefit or service to the community and cannot be disposed of because of legal or other restrictions.
Infrastructure assets - are the fixed utility systems owned by PNCC and the group. The infrastructure networks owned by PNCC include transport, water, wastewater and stormwater networks, waste management and airport utility assets (PNAL). Each asset class includes all items that are required for the network to function, for example, wastewater reticulation includes reticulation piping and sewer pump stations.
Property, plant and equipment is shown at cost or valuation, less accumulated depreciation and impairment losses.
Revaluation
The following property, plant and equipment asset groups are revalued at least every three years to ensure their carrying amount does not differ materially from fair value:
• roading (except land under roads) and parking network,• water, wastewater and stormwater networks, and • parks, building property, recreation, sportsfields and
community facilities.
All other asset classes are carried at depreciated historical cost.
PNCC assesses the carrying values of its revalued assets annually to ensure that they do not differ materially from the assets’ fair values. If there is a material difference, then the off-cycle asset classes are revalued.
PNCC accounts for revaluations of property, plant and equipment on a class of asset basis.
Land under roads is generally considered ‘non tradable’ due to the perpetual nature of community use. As there is no generally accepted methodology for the valuation of land under roads, PNCC is not revaluing this land and will carry this at deemed cost. Under the previous NZ IFRS PNCC has elected to use the fair value of land under roads as at 1 July 2005 as deemed cost.
Accounting for revaluation
The results of revaluing are included in other comprehensive revenue and expense and credited or debited to an asset revaluation reserve for that class of asset. Where this results in a debit balance in the asset revaluation reserve, this balance is expensed in the surplus or deficit. Any subsequent increase on revaluation that reverses a previous decrease in value recognised in the surplus or deficit will be recognised first in the surplus or deficit up to the amount previously expensed.
Additions
The cost of an item of property, plant and equipment is recognised as an asset if, and only if, it is probable that future economic benefits or service potential associated with the item will flow to PNCC and group and the cost of the item can be measured reliably.
In most instances, an item of property, plant and equipment is recognised at its cost. Where an asset is acquired through a non-exchange transaction, or for a nominal cost, it is recognised at fair value as at the date of acquisition.
Subsequent costs
Costs incurred subsequent to initial acquisition are capitalised only when it is probable that future economic benefits or service potential associated with the item will flow to PNCC and the cost of the item can be measured reliably.
The costs of day-to-day servicing of property, plant and equipment are recognised in the surplus or deficit as they are incurred.
147
PNCC Annual Report 2018/19
NO
TE 1
Disposals
Gains and losses on disposals are determined by comparing the proceeds with the carrying amount of the asset. Gains and losses on disposals are reported net in the surplus or deficit. When revalued assets are sold, the amounts included in asset revaluation reserves in respect of those assets are transferred to retained earnings.
Depreciation
Depreciation is provided on a straight-line basis on all property, plant and equipment (except as referred to in the following paragraph), at rates that will write off the cost (or valuation) of the assets to their estimated residual values over their useful lives.
Land, land under roads, restricted assets, assets under construction, investment properties, biological assets, and the museum, art gallery and heritage assets are not depreciated.
The heritage and art collection assets of Te Manawa Museums Trust have not been depreciated, as it is the Trust’s policy to maintain the collections in its current state, in accordance with the Trust’s Conservation Policy. Donated objects are recorded at fair value, or depreciated replacement cost, or nil value if considered unrealisable or irreplaceable. There is a portion of the heritage and art collection that is not formally owned by the Te Manawa Museums Trust. These assets are held and maintained by the Trust by agreement with the owners.
The useful lives used to determine associated depreciation rates of major classes of assets have been estimated as follows:
OPERATING ASSETS YearsBuildings 50-100 Building fit-out 10-50Plant and equipment 3-25Furniture and fittings 4-25Motor vehicles 3-18Computer equipment 2-7Library books 3-10Exhibitions 1-5Leasehold improvements 1-30
INFRASTRUCTURAL ASSETSRoadingBridges and culverts 25-125Sub-base and base course 100Surfaces 1-20Footpaths 15-99Kerb and channel 80Signage 20Signals, streetlights 10-80Trees 100Vehicle crossing 80
CarparksCarpark buildings 50Sub-base and base course 100Surfaces 20-40
Waste ManagementBuildings 50-100Safety fence, portable screens 40Pumps 30Sumps, drainage 100Machinery 15-35Wheelie bins 15
StormwaterPipework 100-250Sumps 150Laterals, manholes 120-150Pumping station/pumps 10-100
WastewaterPipeworks, laterals, manholes 75-120Pumps 15-30Pumping stations 30-100Buildings 50-100Treatment plants 15-120
WaterPipeworks, laterals 50-120Hydrants 75Tobies 50-70Valves 80Water meters 15-25Pumping stations 10-100Dams 15-1000Reservoirs 100
AirportRunway, taxiways, and aprons 2-99
The residual value and useful life of an asset is reviewed, and adjusted if applicable, at each financial year end.
Intangible assets
Goodwill
Goodwill on acquisition of subsidiaries is included in “Intangible Assets”.
Separately recognised goodwill is tested for impairment annually and carried at cost less accumulated impairment losses. An impairment loss recognised for goodwill is not reversed in any subsequent period.
Goodwill is allocated to cash generating units for the purposes of impairment testing. The allocation is made to those cash generating units or groups of cash generating units that are expected to benefit from the business combination in which the goodwill arose.
Software acquisition and development
Acquired computer software licenses are capitalised on the basis of the costs incurred to acquire and bring to use the specific software.
Costs that are directly associated with the development of software for internal use by PNCC are recognised as an intangible asset. Direct costs include the software
148
Small city benefits - Big city ambition
NO
TE 1
development employee costs and an appropriate portion of relevant overheads.
Costs associated with maintaining computer software and staff training costs are recognised as an expense when incurred.
Other intangible assets
Costs incurred are capitalised on assets constructed on third party land, such as an athletic track, which have long term access available to residents.
Carpark leases
Acquired carpark leases are capitalised on the basis of the costs incurred to acquire and bring to use the specific carparks.
Amortisation
The carrying value of an intangible asset with a finite life is amortised on a straight-line basis over its useful life. Amortisation begins when the asset is available for use and ceases at the date that the asset is derecognised. The amortisation charge for each period is recognised in the surplus or deficit.
The useful lives used to determine amortisation rates of major classes of intangible assets have been estimated as follows:
Computer software and licences 3-7 years
Athletic track 9 years
Carpark leases 50 years
Impairment of property, plant and equipment and intangible assets
Intangible assets subsequently measured at cost that have an indefinite useful life, or are not yet available for use, and goodwill, are not subject to amortisation and are tested annually for impairment.
Property, plant, and equipment and intangible assets subsequently measured at cost that have a finite useful life are reviewed for impairment at each balance date and whenever events or changes in circumstances indicate that the carrying amount may not be recoverable.
An impairment loss is recognised for the amount by which the asset’s carrying amount exceeds its recoverable amount. The recoverable amount is the higher of an asset’s fair value less costs to sell and its value in use.
If an asset’s carrying amount exceeds its recoverable amount, the asset is regarded as impaired and the carrying amount is written-down to the recoverable amount. For revalued assets, the impairment loss is recognised against the revaluation reserve for that class of asset. Where that results in a debit balance in the revaluation reserve, the balance is recognised in the surplus or deficit.
For assets not carried at a revalued amount, the total impairment loss is recognised in the surplus or deficit.
The reversal of an impairment loss on a revalued asset is
credited to other comprehensive revenue and expense and increases the asset revaluation reserve for that class of asset. However, to the extent that an impairment loss for that class of asset was previously recognised in the surplus or deficit, a reversal of the impairment loss is also recognised in the surplus or deficit.
For assets not carried at a revalued amount, the reversal of an impairment loss is recognised in the surplus or deficit.
Value in use for non-cash-generating assets
Non-cash-generating assets are those assets that are not held with the primary objective of generating a commercial return.
For non-cash generating assets, value in use is determined using an approach based on either a depreciated replacement cost approach, restoration cost approach, or a service units approach. The most appropriate approach used to measure value in use depends on the nature of the impairment and availability of information.
Value in use for cash-generating assets
Cash-generating assets are those assets that are held with the primary objective of generating a commercial return.
The value in use for cash-generating assets and cash-generating units is the present value of expected future cash flows.
Forestry assets
Standing investment forestry assets are independently revalued annually at fair value less estimated costs to sell for one growth cycle. Fair value is determined based on the present value of expected net cash flows discounted at a current market determined rate. This calculation is based on existing sustainable felling plans and assessments regarding growth, timber prices, felling costs and silvicultural costs and takes into consideration environmental, operational and market restrictions.
Gains or losses arising on initial recognition of biological assets at fair value less estimated costs to sell and from a change in fair value less estimated costs to sell are recognised in the surplus or deficit.
The costs to maintain the forestry assets are included in the surplus or deficit when incurred.
Compensating emission units relating to pre-1990 forest land are recorded at a nil cost. Possible deforestation penalties relating to pre-1990 forest land are not recognised. Refer Note 29 for details.
Investment property
Properties leased to third parties under operating leases are classified as investment property unless the property is held to meet service delivery objectives, rather than to earn rentals or for capital appreciation.
Investment property is measured initially at its cost, including transaction costs.
After initial recognition, PNCC measures all investment property at fair value as determined annually by an

149
PNCC Annual Report 2018/19
NO
TE 1
independent valuer.
Gains or losses arising from a change in the fair value of investment property are recognised in the surplus or deficit.
Trade and other payables
Trade and other payables are recorded at their face value.
Employee benefits
Short-term employee benefits
Employee benefits that PNCC expects to be settled within 12 months of balance date are measured at nominal values based on accrued entitlements at current rates of pay.
These include salaries and wages accrued up to balance date, annual leave earned, but not yet taken at balance date, retirement gratuities and long service leave entitlements expected to be settled within 12 months, time in lieu and sick leave.
PNCC recognises a liability for sick leave to the extent that compensated absences in the coming year are expected to be greater than the sick leave entitlements earned in the coming year. The amount is calculated based on the unused sick leave entitlement that can be carried forward at balance date, to the extent that PNCC anticipates it will be used by staff to cover those future absences.
Long-term employee benefits
Entitlements that are payable beyond 12 months, such as long service leave and retirement gratuities, have been calculated on an actuarial basis. The calculations are based on:
• likely future entitlements accruing to staff, based on years of service, years to entitlement, the likelihood that staff will reach the point of entitlement and contractual entitlements information, and
• the present value of the estimated future cash flows discounted at a current market determined rate.
Superannuation schemes
Defined contribution schemes - obligations for contributions to defined contribution superannuation schemes are recognised as an expense in the surplus or deficit as incurred.
Defined benefit schemes - PNCC belongs to the Defined Benefit Plan Contributors Scheme (the scheme), which is managed by the Board of Trustees of the National Provident Fund. The scheme is a multi-employer defined benefit scheme.
Insufficient information is available to use defined benefit accounting, as it is not possible to determine from the terms of the scheme the extent to which the scheme’s surplus/deficit will affect future contributions by individual employers, as there is no prescribed basis for allocation. The scheme is therefore accounted for as a defined contribution scheme. Further information on this scheme is disclosed in note 29.
Provisions
PNCC recognises a provision for future expenditure of uncertain amount or timing when there is a present
obligation (either legal or constructive) as a result of a past event, it is probable that expenditures will be required to settle the obligation, and a reliable estimate can be made of the amount of the obligation.
Provisions are measured at the present value of the expenditures expected to be required to settle the obligation using a pre-tax discount rate that reflects current market assessments of the time value of money and the risks specific to the obligation. The increase in the provision due to the passage of time is recognised as an interest expense and is included in “finance costs”.
Financial guarantee contracts
A financial guarantee contract is a contract that requires PNCC to make specified payments to reimburse the holder for a loss it incurs because a specified debtor fails to make payment when due.
Financial guarantee contracts are initially recognised at fair value. If a financial guarantee contract was issued in a stand-alone arm’s length transaction to an unrelated party, its fair value at inception is equal to the consideration received. When no consideration is received a provision is recognised based on the probability PNCC will be required to reimburse a holder for a loss incurred discounted to present value. The portion of the guarantee that remains unrecognised, prior to discounting to fair value, is disclosed as a contingent liability.
Financial guarantees are subsequently measured at the initial recognition amount less any amortisation, however if PNCC assesses that it is probable that expenditure will be required to settle a guarantee, then the provision for the guarantee is measured at the present value of the future expenditure.
Borrowings
Borrowings are initially recognised at the amount borrowed plus transaction costs incurred. After initial recognition, all borrowings are measured at amortised cost using the effective interest method.
Borrowings are classified as current liabilities unless PNCC and group has an unconditional right to defer settlement of the liability for at least 12 months after the balance date.
Equity
Equity is the community’s interest in PNCC and is measured as the difference between total assets and total liabilities. Equity is disaggregated and classified into the following components:
• retained earnings,• special reserves and funds,• asset revaluation reserves, and • fair value through other comprehensive revenue
and expense.
Special reserves and funds
Special reserves and funds are a component of equity generally representing a particular use to which various parts of equity have been assigned. Special reserves and funds may be legally restricted or created by PNCC.
150
Small city benefits - Big city ambition
NO
TE 1
Special reserves and funds are those subject to specific conditions accepted as binding by PNCC and which may not be revised by PNCC without reference to the Courts or a third party. Transfers from these reserves may be made only for certain specified purposes or when certain specified conditions are met.
Also included in special reserves and funds are reserves restricted by Council decision. The Council may alter them without reference to any third party or the Courts. Transfers to and from these reserves are at the discretion of the Council.
PNCC’s objectives, policies and processes for managing capital are described in note 35.
Asset revaluation reserves
Asset revaluation reserves relates to the revaluation of property, plant and equipment to fair value.
Fair value through other comprehensive revenue and expense
Fair value through other comprehensive revenue and expense reserve relates to the cumulative net change of fair value of financial assets through other comprehensive revenue and expense.
Goods and Services Tax (GST)
All items in the financial statements are stated exclusive of GST, except for trade and other receivables and trade and other payables, which are stated on a GST inclusive basis. Where GST is not recoverable as input tax it is recognised as part of the related asset or expense.
The net amount of GST recoverable from, or payable to, the Inland Revenue Department (IRD) is included as part of receivables or payables in the statement of financial position.
The net GST paid to, or received from the IRD, including the GST relating to investing and financing activities, is classified as an operating cash flow in the statement of cash flows.
Commitments and contingencies are disclosed exclusive of GST.
Budget figures
The budget figures are those approved by the Council prior to the beginning of the year in the relevant 10 Year Plan or Annual Budget. The budget figures have been prepared in accordance with NZ GAAP, using accounting policies that are consistent with those adopted by PNCC for the preparation of these financial statements.
Cost allocation
PNCC has derived the cost of service for each significant activity of PNCC using the cost allocation system outlined below.
Direct costs are those costs directly attributable to a significant activity. Indirect costs are those costs that cannot be identified in an economically feasible manner with a specific significant activity.
Direct costs are charged directly to significant activities.
Indirect costs are charged to significant activities using appropriate cost drivers such as actual usage, staff numbers and floor area.
Critical accounting estimates and assumptions
In preparing these financial statements PNCC has made estimates and assumptions concerning the future. These estimates and assumptions may differ from the subsequent actual results. Estimates and assumptions are continually evaluated and are based on historical experience and other factors, including expectations of future events that are believed to be reasonable under the circumstances. The estimates and assumptions that have a significant risk of causing a material adjustment to the carrying amounts of assets and liabilities within the next financial year are discussed below.
Landfill aftercare provision
Estimating the landfill aftercare provision – see note 23.
Property, Plant and Equipment Revaluation
Estimating the fair value of groups of property, plant and equipment – see note 17.
Infrastructural assets
Estimating depreciated replacement cost (DRC) valuations over infrastructural assets. These include:
• the physical deterioration and condition of an asset, for example PNCC could be carrying an asset at an amount that does not reflect its actual condition. This is particularly so for those assets which are not visible, for example stormwater, wastewater and water supply pipes that are underground. This risk is minimised by PNCC performing a combination of physical inspections and condition modelling assessments of underground assets.
• estimating any obsolescence or surplus capacity of an asset.
• estimates are made when determining the remaining useful lives over which the asset will be depreciated. These estimates can be impacted by the local conditions, for example weather patterns and traffic growth. If useful lives do not reflect the actual consumption of the benefits of the asset, then PNCC could be over or under estimating the annual deprecation charge recognised as an expense in the surplus or deficit. To minimise this risk PNCC’s infrastructural asset useful lives have been determined with reference to the NZ Infrastructural Asset Valuation and Depreciation Guidelines published by the New Zealand Asset Management Support Group, and have been adjusted for local conditions based on past experience. Asset inspections, deterioration and condition modelling are also carried out regularly as part of the PNCC’s asset management planning activities, which gives PNCC further assurance over its useful life estimates.
Experienced staff engineers perform PNCC’s infrastructural asset revaluations which are certified by independent valuers or reviewed and confirmed as appropriate by independent engineers.
151
PNCC Annual Report 2018/19
NO
TE 1
Critical judgements in applying accounting policies
Management has exercised the following critical judgements in applying accounting policies for the period ended 30 June 2019.
Classification of property
PNCC owns a number of residential rental properties (community housing), which are maintained primarily to provide housing to older people and people with special needs. The receipt of market-based rental from these properties is not the prime reason for holding these properties. The properties are held for service delivery objectives as part of PNCC’s social housing policy. The properties are therefore accounted for as property, plant and equipment and not investment property.
For the purpose of assessing impairment indicators and impairment testing, PNCC classifies non-financial assets as either cash-generating or non-cash-generating assets. PNCC classifies a non-financial asset as a cash-generating asset if the primary objective of the asset is to generate commercial return. All other assets are classified as non-cash-generating assets.
All property, plant and equipment and intangible assets held by PNCC and the group are classified as non-cash-generating assets. This includes assets that generate fee revenue or other cash flows, as the cash flows generated are generally not sufficient to represent commercial return on the assets. Forestry Assets and Investment Property are classified as cash-generating assets as these assets generate cash returns.
Reporting format
These financial statements incorporate applicable amendments to legislation governing financial reporting requirements. In addition, the 2018/28 10 Year Plan may incorporate changes from the 2015/25 10 Year Plan or 2017/18 Annual Budget. The effect of these is that any required additional or amended disclosure has also required restatement of 2018 comparative information from that previously reported.
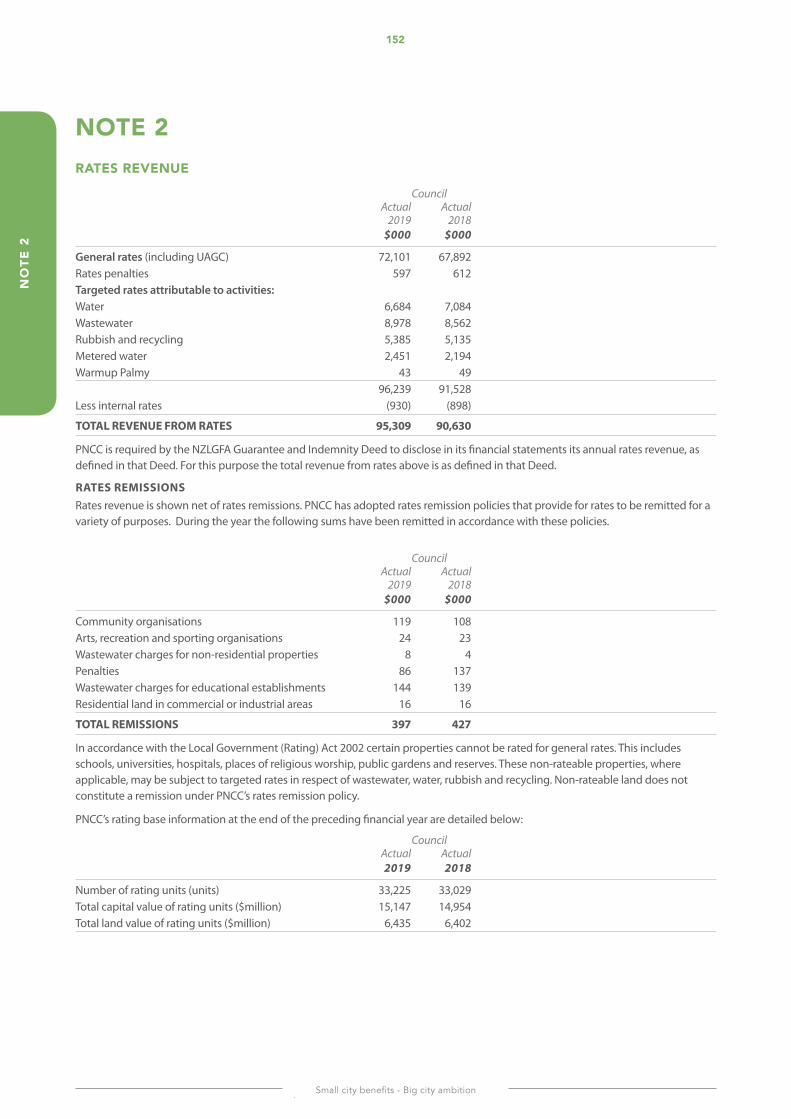
152
Small city benefits - Big city ambition
NO
TE 2
NOTE 2RATES REVENUE
Council Actual Actual 2019 2018 $000 $000
General rates (including UAGC) 72,101 67,892 Rates penalties 597 612 Targeted rates attributable to activities: Water 6,684 7,084 Wastewater 8,978 8,562 Rubbish and recycling 5,385 5,135 Metered water 2,451 2,194 Warmup Palmy 43 49 96,239 91,528 Less internal rates (930) (898)
TOTAL REVENUE FROM RATES 95,309 90,630
PNCC is required by the NZLGFA Guarantee and Indemnity Deed to disclose in its financial statements its annual rates revenue, as defined in that Deed. For this purpose the total revenue from rates above is as defined in that Deed.
RATES REMISSIONS Rates revenue is shown net of rates remissions. PNCC has adopted rates remission policies that provide for rates to be remitted for a variety of purposes. During the year the following sums have been remitted in accordance with these policies.
Council Actual Actual 2019 2018 $000 $000
Community organisations 119 108 Arts, recreation and sporting organisations 24 23 Wastewater charges for non-residential properties 8 4 Penalties 86 137 Wastewater charges for educational establishments 144 139 Residential land in commercial or industrial areas 16 16
TOTAL REMISSIONS 397 427
In accordance with the Local Government (Rating) Act 2002 certain properties cannot be rated for general rates. This includes schools, universities, hospitals, places of religious worship, public gardens and reserves. These non-rateable properties, where applicable, may be subject to targeted rates in respect of wastewater, water, rubbish and recycling. Non-rateable land does not constitute a remission under PNCC’s rates remission policy.
PNCC’s rating base information at the end of the preceding financial year are detailed below:
Council Actual Actual 2019 2018
Number of rating units (units) 33,225 33,029 Total capital value of rating units ($million) 15,147 14,954 Total land value of rating units ($million) 6,435 6,402
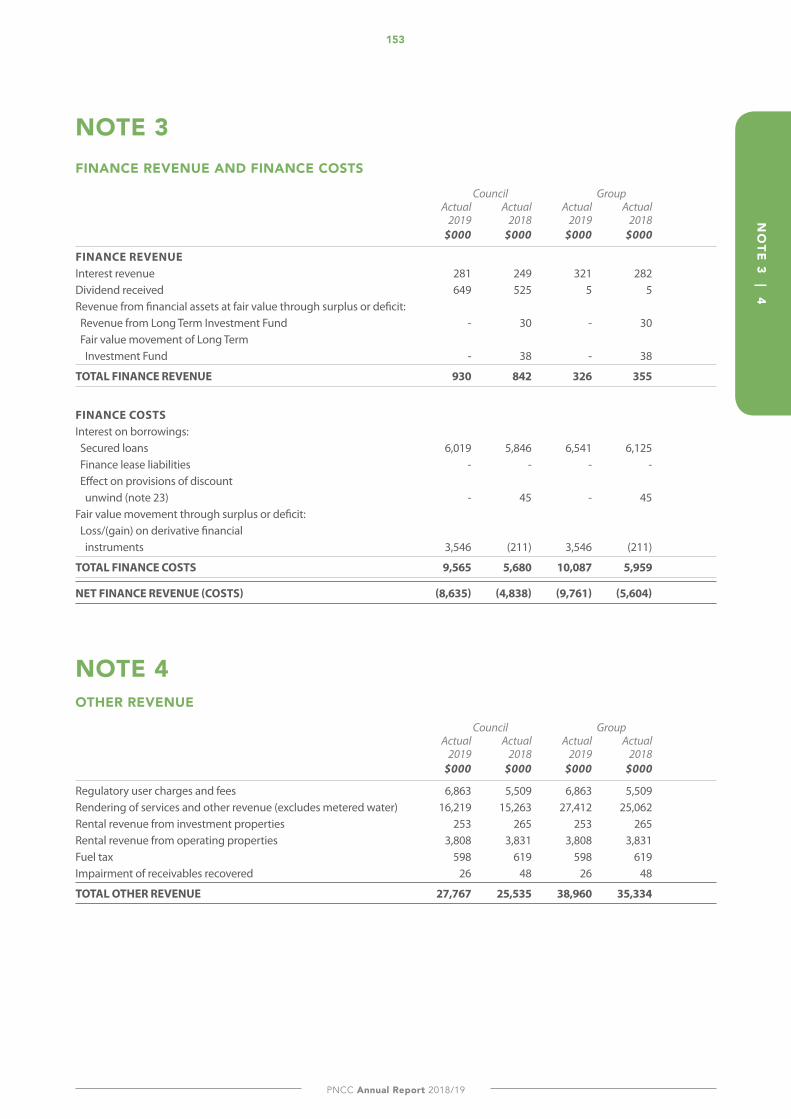
153
PNCC Annual Report 2018/19
NO
TE 3 | 4
NOTE 3FINANCE REVENUE ANd FINANCE COSTS
Council Group Actual Actual Actual Actual 2019 2018 2019 2018 $000 $000 $000 $000
FINANCE REVENUE Interest revenue 281 249 321 282 Dividend received 649 525 5 5 Revenue from financial assets at fair value through surplus or deficit: Revenue from Long Term Investment Fund - 30 - 30 Fair value movement of Long Term Investment Fund - 38 - 38
TOTAL FINANCE REVENUE 930 842 326 355
FINANCE COSTS Interest on borrowings: Secured loans 6,019 5,846 6,541 6,125 Finance lease liabilities - - - - Effect on provisions of discount unwind (note 23) - 45 - 45 Fair value movement through surplus or deficit: Loss/(gain) on derivative financial instruments 3,546 (211) 3,546 (211)
TOTAL FINANCE COSTS 9,565 5,680 10,087 5,959
NET FINANCE REVENUE (COSTS) (8,635) (4,838) (9,761) (5,604)
NOTE 4OTHER REVENUE
Council Group Actual Actual Actual Actual 2019 2018 2019 2018 $000 $000 $000 $000
Regulatory user charges and fees 6,863 5,509 6,863 5,509 Rendering of services and other revenue (excludes metered water) 16,219 15,263 27,412 25,062 Rental revenue from investment properties 253 265 253 265 Rental revenue from operating properties 3,808 3,831 3,808 3,831 Fuel tax 598 619 598 619 Impairment of receivables recovered 26 48 26 48
TOTAL OTHER REVENUE 27,767 25,535 38,960 35,334
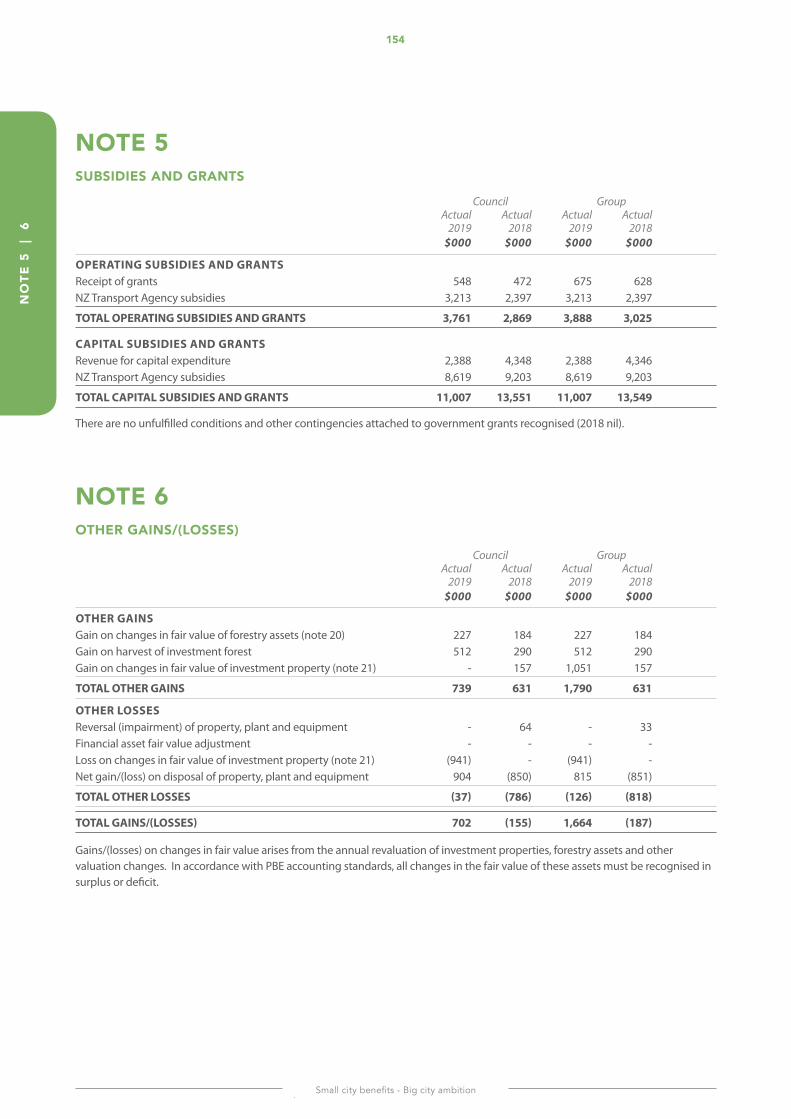
154
Small city benefits - Big city ambition
NO
TE 5
|
6
NOTE 5SUBSIdIES ANd GRANTS
Council Group Actual Actual Actual Actual 2019 2018 2019 2018 $000 $000 $000 $000
OPERATING SUBSIDIES AND GRANTS Receipt of grants 548 472 675 628 NZ Transport Agency subsidies 3,213 2,397 3,213 2,397
TOTAL OPERATING SUBSIDIES AND GRANTS 3,761 2,869 3,888 3,025
CAPITAL SUBSIDIES AND GRANTS Revenue for capital expenditure 2,388 4,348 2,388 4,346 NZ Transport Agency subsidies 8,619 9,203 8,619 9,203
TOTAL CAPITAL SUBSIDIES AND GRANTS 11,007 13,551 11,007 13,549
There are no unfulfilled conditions and other contingencies attached to government grants recognised (2018 nil).
NOTE 6OTHER GAINS/(LOSSES)
Council Group Actual Actual Actual Actual 2019 2018 2019 2018 $000 $000 $000 $000
OTHER GAINS Gain on changes in fair value of forestry assets (note 20) 227 184 227 184 Gain on harvest of investment forest 512 290 512 290 Gain on changes in fair value of investment property (note 21) - 157 1,051 157
TOTAL OTHER GAINS 739 631 1,790 631
OTHER LOSSES Reversal (impairment) of property, plant and equipment - 64 - 33 Financial asset fair value adjustment - - - - Loss on changes in fair value of investment property (note 21) (941) - (941) - Net gain/(loss) on disposal of property, plant and equipment 904 (850) 815 (851)
TOTAL OTHER LOSSES (37) (786) (126) (818)
TOTAL GAINS/(LOSSES) 702 (155) 1,664 (187)
Gains/(losses) on changes in fair value arises from the annual revaluation of investment properties, forestry assets and other valuation changes. In accordance with PBE accounting standards, all changes in the fair value of these assets must be recognised in surplus or deficit.
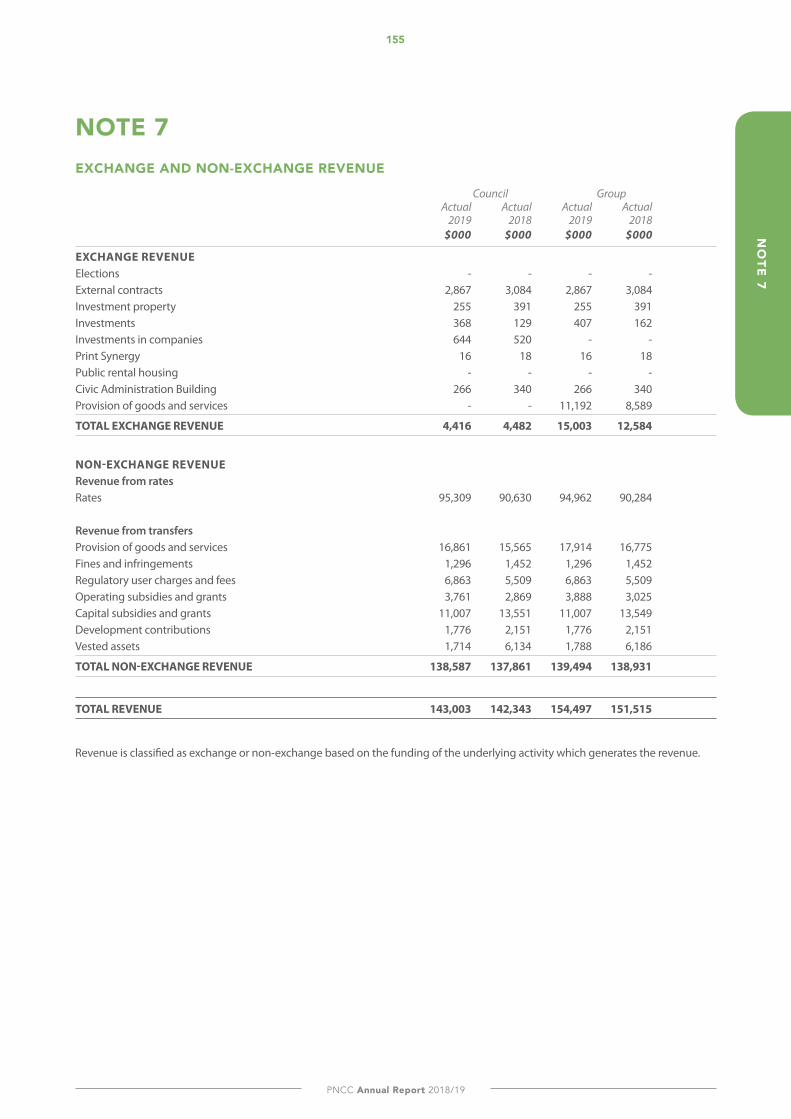
155
PNCC Annual Report 2018/19
NO
TE 7
NOTE 7EXCHANGE ANd NON-EXCHANGE REVENUE
Council Group Actual Actual Actual Actual 2019 2018 2019 2018 $000 $000 $000 $000
EXCHANGE REVENUE Elections - - - - External contracts 2,867 3,084 2,867 3,084 Investment property 255 391 255 391 Investments 368 129 407 162 Investments in companies 644 520 - - Print Synergy 16 18 16 18 Public rental housing - - - - Civic Administration Building 266 340 266 340 Provision of goods and services - - 11,192 8,589
TOTAL EXCHANGE REVENUE 4,416 4,482 15,003 12,584
NON-EXCHANGE REVENUE Revenue from rates Rates 95,309 90,630 94,962 90,284 Revenue from transfers Provision of goods and services 16,861 15,565 17,914 16,775 Fines and infringements 1,296 1,452 1,296 1,452 Regulatory user charges and fees 6,863 5,509 6,863 5,509 Operating subsidies and grants 3,761 2,869 3,888 3,025 Capital subsidies and grants 11,007 13,551 11,007 13,549 Development contributions 1,776 2,151 1,776 2,151 Vested assets 1,714 6,134 1,788 6,186
TOTAL NON-EXCHANGE REVENUE 138,587 137,861 139,494 138,931
TOTAL REVENUE 143,003 142,343 154,497 151,515
Revenue is classified as exchange or non-exchange based on the funding of the underlying activity which generates the revenue.
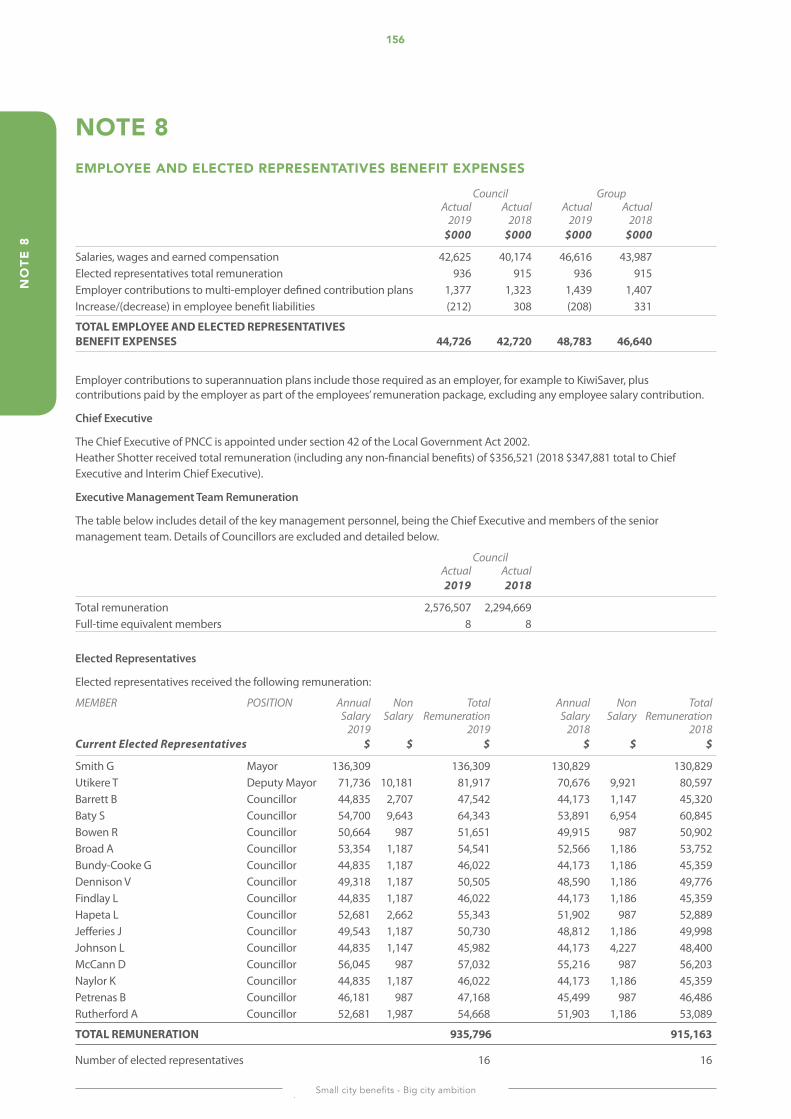
156
Small city benefits - Big city ambition
NO
TE 8
NOTE 8EMPLOYEE ANd ELECTEd REPRESENTATIVES BENEFIT EXPENSES
Council Group Actual Actual Actual Actual 2019 2018 2019 2018 $000 $000 $000 $000
Salaries, wages and earned compensation 42,625 40,174 46,616 43,987 Elected representatives total remuneration 936 915 936 915 Employer contributions to multi-employer defined contribution plans 1,377 1,323 1,439 1,407 Increase/(decrease) in employee benefit liabilities (212) 308 (208) 331
TOTAL EMPLOYEE AND ELECTED REPRESENTATIVES BENEFIT EXPENSES 44,726 42,720 48,783 46,640
Employer contributions to superannuation plans include those required as an employer, for example to KiwiSaver, plus contributions paid by the employer as part of the employees’ remuneration package, excluding any employee salary contribution.
Chief Executive
The Chief Executive of PNCC is appointed under section 42 of the Local Government Act 2002. Heather Shotter received total remuneration (including any non-financial benefits) of $356,521 (2018 $347,881 total to Chief Executive and Interim Chief Executive).
Executive Management Team Remuneration
The table below includes detail of the key management personnel, being the Chief Executive and members of the senior management team. Details of Councillors are excluded and detailed below.
Council Actual Actual 2019 2018
Total remuneration 2,576,507 2,294,669Full-time equivalent members 8 8
Elected Representatives
Elected representatives received the following remuneration:
MEMBER POSITION Annual Non Total Annual Non Total Salary Salary Remuneration Salary Salary Remuneration 2019 2019 2018 2018Current Elected Representatives $ $ $ $ $ $
Smith G Mayor 136,309 136,309 130,829 130,829Utikere T Deputy Mayor 71,736 10,181 81,917 70,676 9,921 80,597Barrett B Councillor 44,835 2,707 47,542 44,173 1,147 45,320Baty S Councillor 54,700 9,643 64,343 53,891 6,954 60,845Bowen R Councillor 50,664 987 51,651 49,915 987 50,902Broad A Councillor 53,354 1,187 54,541 52,566 1,186 53,752Bundy-Cooke G Councillor 44,835 1,187 46,022 44,173 1,186 45,359Dennison V Councillor 49,318 1,187 50,505 48,590 1,186 49,776Findlay L Councillor 44,835 1,187 46,022 44,173 1,186 45,359Hapeta L Councillor 52,681 2,662 55,343 51,902 987 52,889Jefferies J Councillor 49,543 1,187 50,730 48,812 1,186 49,998Johnson L Councillor 44,835 1,147 45,982 44,173 4,227 48,400McCann D Councillor 56,045 987 57,032 55,216 987 56,203Naylor K Councillor 44,835 1,187 46,022 44,173 1,186 45,359Petrenas B Councillor 46,181 987 47,168 45,499 987 46,486Rutherford A Councillor 52,681 1,987 54,668 51,903 1,186 53,089
TOTAL REMUNERATION 935,796 915,163
Number of elected representatives 16 16
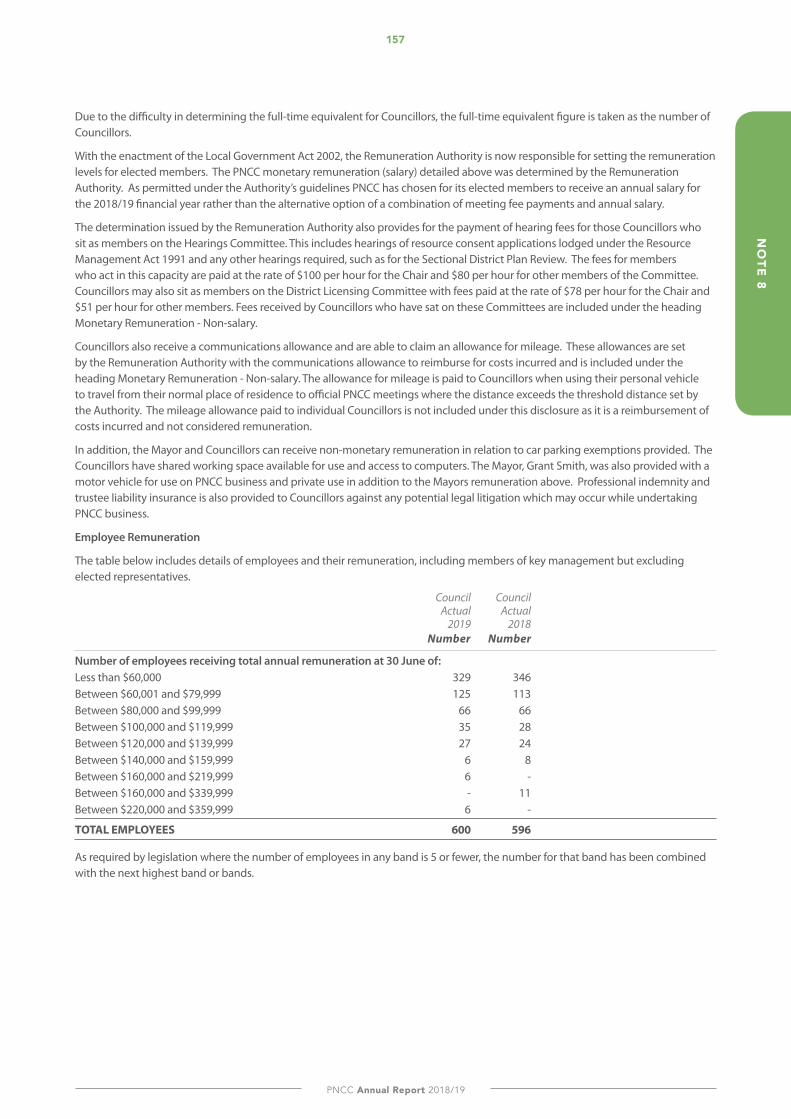
157
PNCC Annual Report 2018/19
NO
TE 8
Due to the difficulty in determining the full-time equivalent for Councillors, the full-time equivalent figure is taken as the number of Councillors.
With the enactment of the Local Government Act 2002, the Remuneration Authority is now responsible for setting the remuneration levels for elected members. The PNCC monetary remuneration (salary) detailed above was determined by the Remuneration Authority. As permitted under the Authority’s guidelines PNCC has chosen for its elected members to receive an annual salary for the 2018/19 financial year rather than the alternative option of a combination of meeting fee payments and annual salary.
The determination issued by the Remuneration Authority also provides for the payment of hearing fees for those Councillors who sit as members on the Hearings Committee. This includes hearings of resource consent applications lodged under the Resource Management Act 1991 and any other hearings required, such as for the Sectional District Plan Review. The fees for members who act in this capacity are paid at the rate of $100 per hour for the Chair and $80 per hour for other members of the Committee. Councillors may also sit as members on the District Licensing Committee with fees paid at the rate of $78 per hour for the Chair and $51 per hour for other members. Fees received by Councillors who have sat on these Committees are included under the heading Monetary Remuneration - Non-salary.
Councillors also receive a communications allowance and are able to claim an allowance for mileage. These allowances are set by the Remuneration Authority with the communications allowance to reimburse for costs incurred and is included under the heading Monetary Remuneration - Non-salary. The allowance for mileage is paid to Councillors when using their personal vehicle to travel from their normal place of residence to official PNCC meetings where the distance exceeds the threshold distance set by the Authority. The mileage allowance paid to individual Councillors is not included under this disclosure as it is a reimbursement of costs incurred and not considered remuneration.
In addition, the Mayor and Councillors can receive non-monetary remuneration in relation to car parking exemptions provided. The Councillors have shared working space available for use and access to computers. The Mayor, Grant Smith, was also provided with a motor vehicle for use on PNCC business and private use in addition to the Mayors remuneration above. Professional indemnity and trustee liability insurance is also provided to Councillors against any potential legal litigation which may occur while undertaking PNCC business.
Employee Remuneration
The table below includes details of employees and their remuneration, including members of key management but excluding elected representatives.
Council Council Actual Actual 2019 2018 Number Number
Number of employees receiving total annual remuneration at 30 June of: Less than $60,000 329 346 Between $60,001 and $79,999 125 113 Between $80,000 and $99,999 66 66 Between $100,000 and $119,999 35 28 Between $120,000 and $139,999 27 24 Between $140,000 and $159,999 6 8 Between $160,000 and $219,999 6 - Between $160,000 and $339,999 - 11 Between $220,000 and $359,999 6 -
TOTAL EMPLOYEES 600 596
As required by legislation where the number of employees in any band is 5 or fewer, the number for that band has been combined with the next highest band or bands.
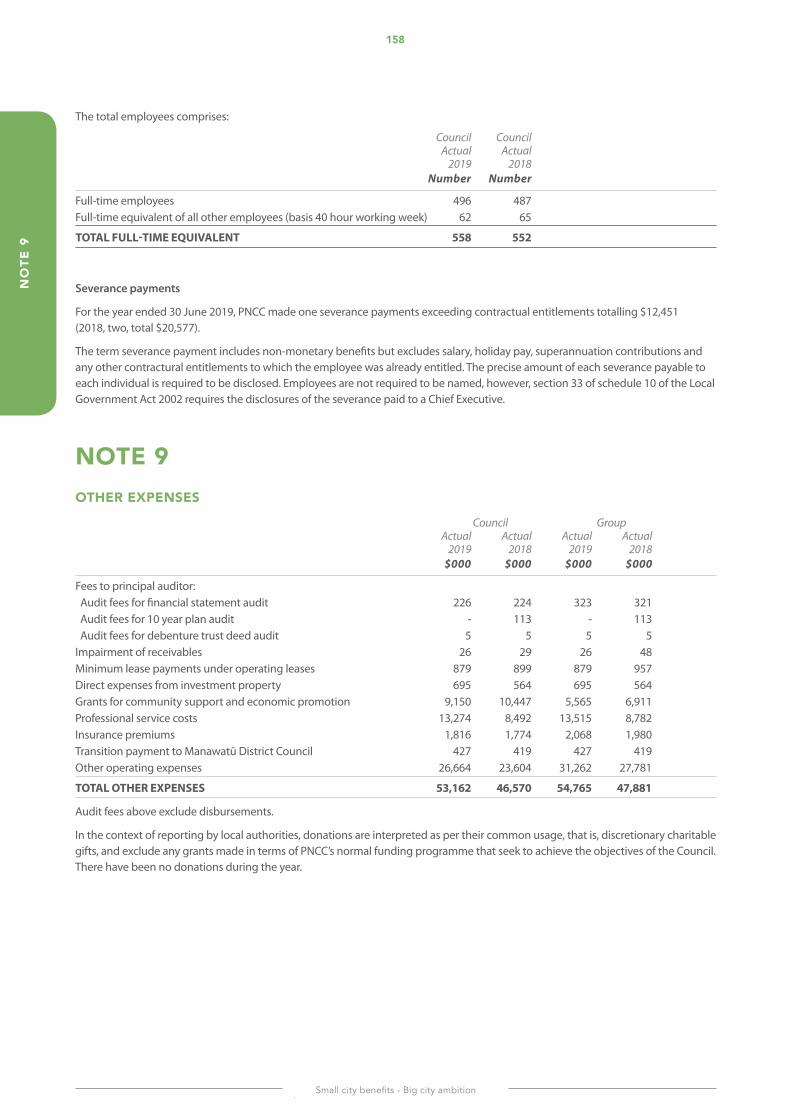
158
Small city benefits - Big city ambition
NO
TE 9
The total employees comprises:
Council Council Actual Actual 2019 2018 Number Number
Full-time employees 496 487Full-time equivalent of all other employees (basis 40 hour working week) 62 65
TOTAL FULL-TIME EQUIVALENT 558 552
Severance payments
For the year ended 30 June 2019, PNCC made one severance payments exceeding contractual entitlements totalling $12,451 (2018, two, total $20,577).
The term severance payment includes non-monetary benefits but excludes salary, holiday pay, superannuation contributions and any other contractural entitlements to which the employee was already entitled. The precise amount of each severance payable to each individual is required to be disclosed. Employees are not required to be named, however, section 33 of schedule 10 of the Local Government Act 2002 requires the disclosures of the severance paid to a Chief Executive.
NOTE 9OTHER EXPENSES
Council Group Actual Actual Actual Actual 2019 2018 2019 2018 $000 $000 $000 $000
Fees to principal auditor: Audit fees for financial statement audit 226 224 323 321 Audit fees for 10 year plan audit - 113 - 113 Audit fees for debenture trust deed audit 5 5 5 5 Impairment of receivables 26 29 26 48 Minimum lease payments under operating leases 879 899 879 957 Direct expenses from investment property 695 564 695 564 Grants for community support and economic promotion 9,150 10,447 5,565 6,911 Professional service costs 13,274 8,492 13,515 8,782 Insurance premiums 1,816 1,774 2,068 1,980 Transition payment to Manawatū District Council 427 419 427 419 Other operating expenses 26,664 23,604 31,262 27,781
TOTAL OTHER EXPENSES 53,162 46,570 54,765 47,881
Audit fees above exclude disbursements.
In the context of reporting by local authorities, donations are interpreted as per their common usage, that is, discretionary charitable gifts, and exclude any grants made in terms of PNCC’s normal funding programme that seek to achieve the objectives of the Council. There have been no donations during the year.
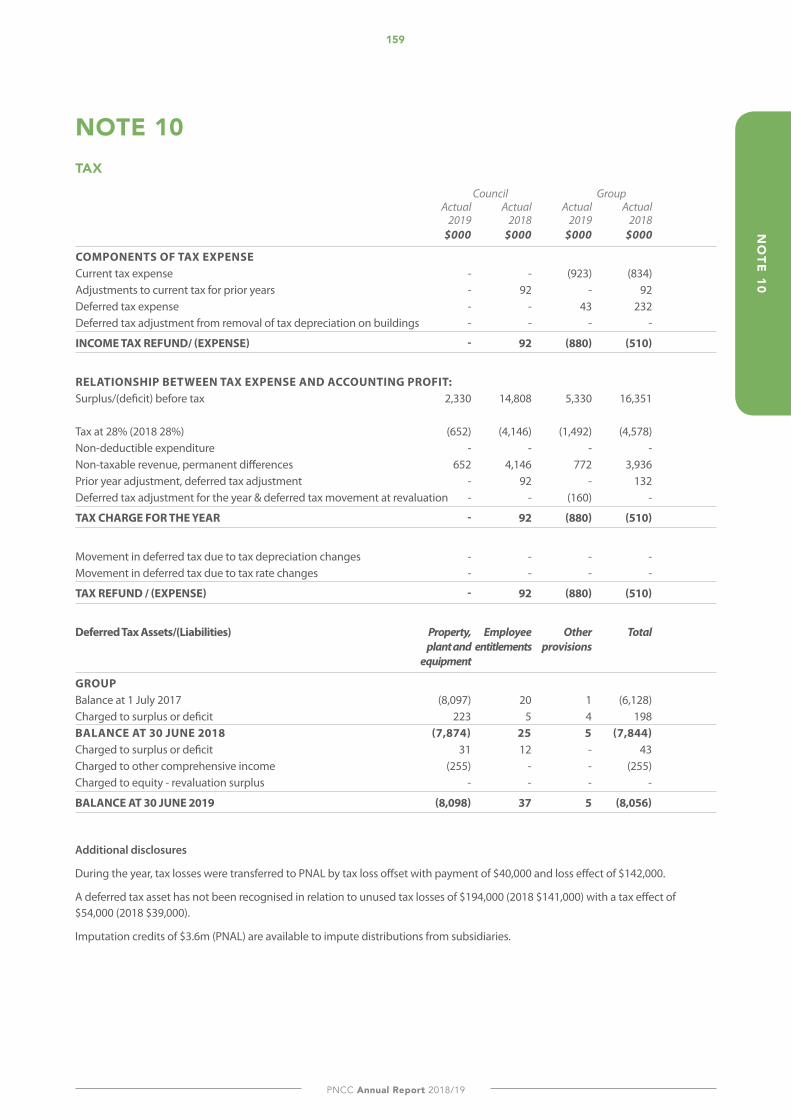
159
PNCC Annual Report 2018/19
NO
TE 10
NOTE 10TAX
Council Group Actual Actual Actual Actual 2019 2018 2019 2018 $000 $000 $000 $000
COMPONENTS OF TAX EXPENSE Current tax expense - - (923) (834)Adjustments to current tax for prior years - 92 - 92 Deferred tax expense - - 43 232 Deferred tax adjustment from removal of tax depreciation on buildings - - - -
INCOME TAX REFUND/ (EXPENSE) - 92 (880) (510)
RELATIONSHIP BETWEEN TAX EXPENSE AND ACCOUNTING PROFIT: Surplus/(deficit) before tax 2,330 14,808 5,330 16,351 Tax at 28% (2018 28%) (652) (4,146) (1,492) (4,578)Non-deductible expenditure - - - - Non-taxable revenue, permanent differences 652 4,146 772 3,936 Prior year adjustment, deferred tax adjustment - 92 - 132 Deferred tax adjustment for the year & deferred tax movement at revaluation - - (160) -
TAX CHARGE FOR THE YEAR - 92 (880) (510)
Movement in deferred tax due to tax depreciation changes - - - - Movement in deferred tax due to tax rate changes - - - -
TAX REFUND / (EXPENSE) - 92 (880) (510)
Deferred Tax Assets/(Liabilities) Property, Employee Other Total plant and entitlements provisions equipment
GROUP Balance at 1 July 2017 (8,097) 20 1 (6,128)Charged to surplus or deficit 223 5 4 198 BALANCE AT 30 JUNE 2018 (7,874) 25 5 (7,844)Charged to surplus or deficit 31 12 - 43 Charged to other comprehensive income (255) - - (255)Charged to equity - revaluation surplus - - - -
BALANCE AT 30 JUNE 2019 (8,098) 37 5 (8,056)
Additional disclosures
During the year, tax losses were transferred to PNAL by tax loss offset with payment of $40,000 and loss effect of $142,000.
A deferred tax asset has not been recognised in relation to unused tax losses of $194,000 (2018 $141,000) with a tax effect of $54,000 (2018 $39,000).
Imputation credits of $3.6m (PNAL) are available to impute distributions from subsidiaries.
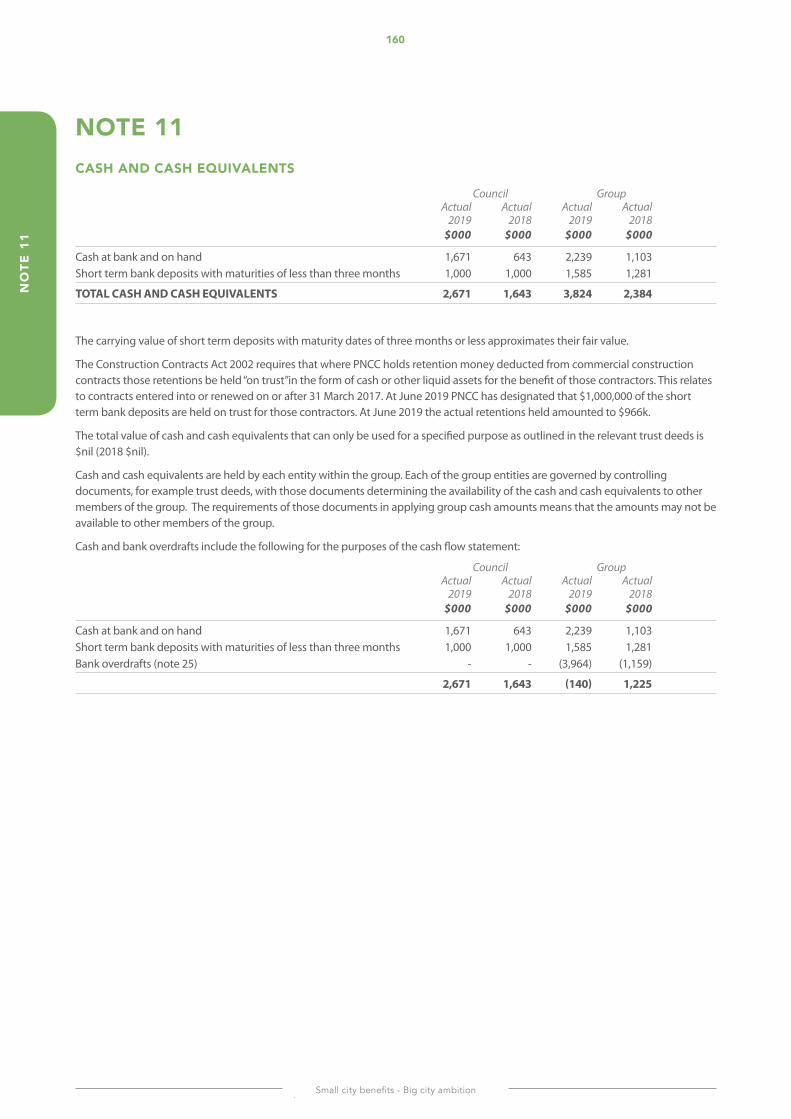
160
Small city benefits - Big city ambition
NO
TE 1
1
NOTE 11CASH ANd CASH EQUIVALENTS
Council Group Actual Actual Actual Actual 2019 2018 2019 2018 $000 $000 $000 $000
Cash at bank and on hand 1,671 643 2,239 1,103 Short term bank deposits with maturities of less than three months 1,000 1,000 1,585 1,281
TOTAL CASH AND CASH EQUIVALENTS 2,671 1,643 3,824 2,384
The carrying value of short term deposits with maturity dates of three months or less approximates their fair value.
The Construction Contracts Act 2002 requires that where PNCC holds retention money deducted from commercial construction contracts those retentions be held “on trust”in the form of cash or other liquid assets for the benefit of those contractors. This relates to contracts entered into or renewed on or after 31 March 2017. At June 2019 PNCC has designated that $1,000,000 of the short term bank deposits are held on trust for those contractors. At June 2019 the actual retentions held amounted to $966k.
The total value of cash and cash equivalents that can only be used for a specified purpose as outlined in the relevant trust deeds is $nil (2018 $nil).
Cash and cash equivalents are held by each entity within the group. Each of the group entities are governed by controlling documents, for example trust deeds, with those documents determining the availability of the cash and cash equivalents to other members of the group. The requirements of those documents in applying group cash amounts means that the amounts may not be available to other members of the group.
Cash and bank overdrafts include the following for the purposes of the cash flow statement:
Council Group Actual Actual Actual Actual 2019 2018 2019 2018 $000 $000 $000 $000
Cash at bank and on hand 1,671 643 2,239 1,103 Short term bank deposits with maturities of less than three months 1,000 1,000 1,585 1,281 Bank overdrafts (note 25) - - (3,964) (1,159)
2,671 1,643 (140) 1,225
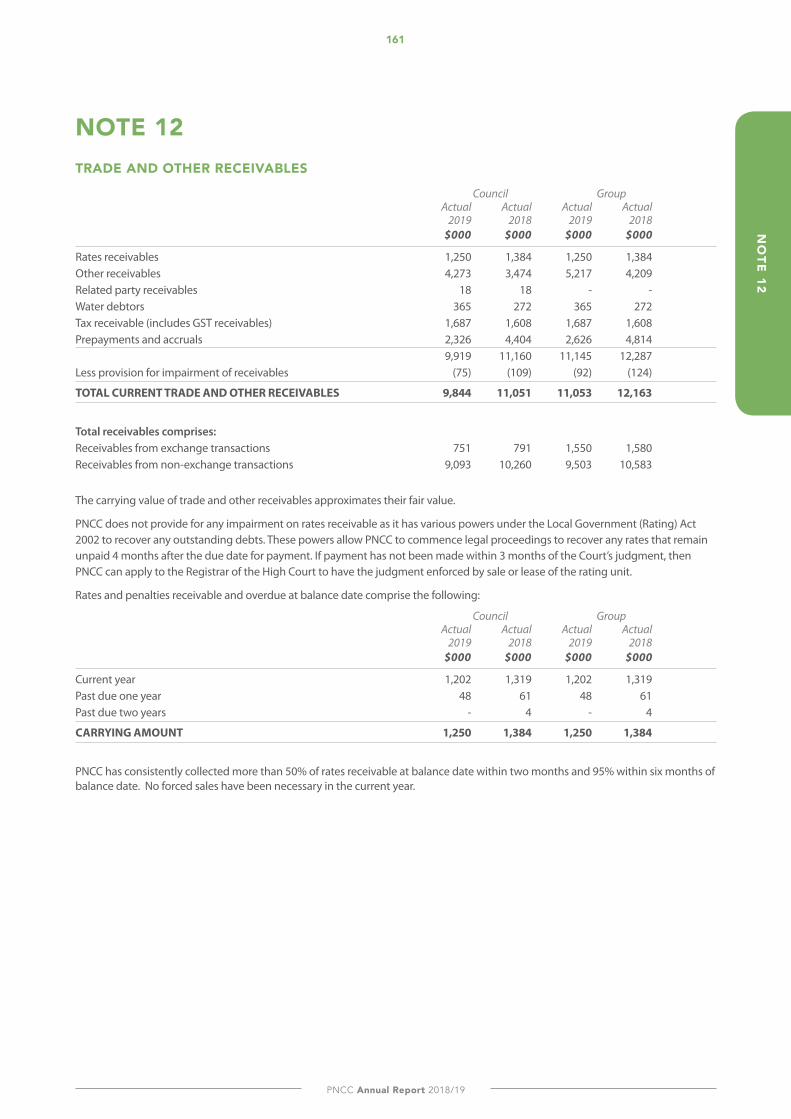
161
PNCC Annual Report 2018/19
NO
TE 12
NOTE 12TRAdE ANd OTHER RECEIVABLES
Council Group Actual Actual Actual Actual 2019 2018 2019 2018 $000 $000 $000 $000
Rates receivables 1,250 1,384 1,250 1,384 Other receivables 4,273 3,474 5,217 4,209 Related party receivables 18 18 - - Water debtors 365 272 365 272 Tax receivable (includes GST receivables) 1,687 1,608 1,687 1,608 Prepayments and accruals 2,326 4,404 2,626 4,814 9,919 11,160 11,145 12,287 Less provision for impairment of receivables (75) (109) (92) (124)
TOTAL CURRENT TRADE AND OTHER RECEIVABLES 9,844 11,051 11,053 12,163
Total receivables comprises: Receivables from exchange transactions 751 791 1,550 1,580 Receivables from non-exchange transactions 9,093 10,260 9,503 10,583
The carrying value of trade and other receivables approximates their fair value.
PNCC does not provide for any impairment on rates receivable as it has various powers under the Local Government (Rating) Act 2002 to recover any outstanding debts. These powers allow PNCC to commence legal proceedings to recover any rates that remain unpaid 4 months after the due date for payment. If payment has not been made within 3 months of the Court’s judgment, then PNCC can apply to the Registrar of the High Court to have the judgment enforced by sale or lease of the rating unit.
Rates and penalties receivable and overdue at balance date comprise the following:
Council Group Actual Actual Actual Actual 2019 2018 2019 2018 $000 $000 $000 $000
Current year 1,202 1,319 1,202 1,319 Past due one year 48 61 48 61 Past due two years - 4 - 4
CARRYING AMOUNT 1,250 1,384 1,250 1,384
PNCC has consistently collected more than 50% of rates receivable at balance date within two months and 95% within six months of balance date. No forced sales have been necessary in the current year.
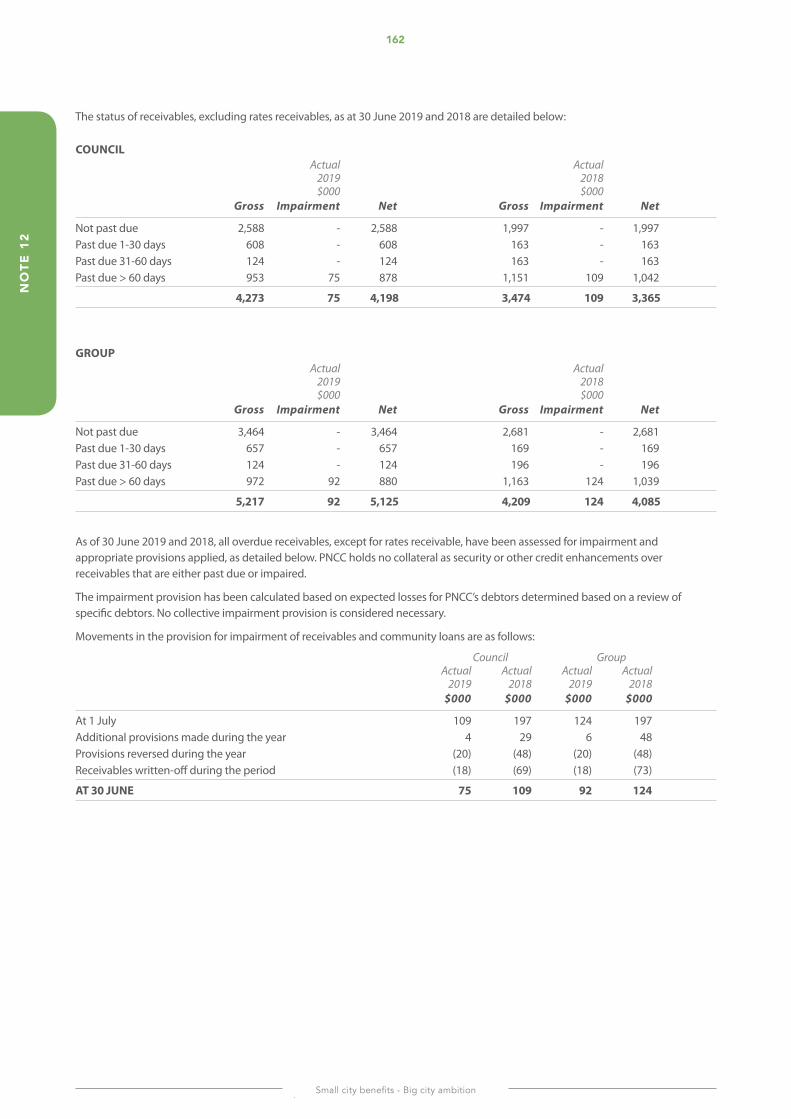
162
Small city benefits - Big city ambition
NO
TE 1
2
The status of receivables, excluding rates receivables, as at 30 June 2019 and 2018 are detailed below:
COUNCIL Actual Actual 2019 2018 $000 $000 Gross Impairment Net Gross Impairment Net
Not past due 2,588 - 2,588 1,997 - 1,997 Past due 1-30 days 608 - 608 163 - 163 Past due 31-60 days 124 - 124 163 - 163 Past due > 60 days 953 75 878 1,151 109 1,042
4,273 75 4,198 3,474 109 3,365
GROUP Actual Actual 2019 2018 $000 $000 Gross Impairment Net Gross Impairment Net
Not past due 3,464 - 3,464 2,681 - 2,681 Past due 1-30 days 657 - 657 169 - 169 Past due 31-60 days 124 - 124 196 - 196 Past due > 60 days 972 92 880 1,163 124 1,039
5,217 92 5,125 4,209 124 4,085
As of 30 June 2019 and 2018, all overdue receivables, except for rates receivable, have been assessed for impairment and appropriate provisions applied, as detailed below. PNCC holds no collateral as security or other credit enhancements over receivables that are either past due or impaired.
The impairment provision has been calculated based on expected losses for PNCC’s debtors determined based on a review of specific debtors. No collective impairment provision is considered necessary.
Movements in the provision for impairment of receivables and community loans are as follows:
Council Group Actual Actual Actual Actual 2019 2018 2019 2018 $000 $000 $000 $000
At 1 July 109 197 124 197Additional provisions made during the year 4 29 6 48Provisions reversed during the year (20) (48) (20) (48)Receivables written-off during the period (18) (69) (18) (73)
AT 30 JUNE 75 109 92 124
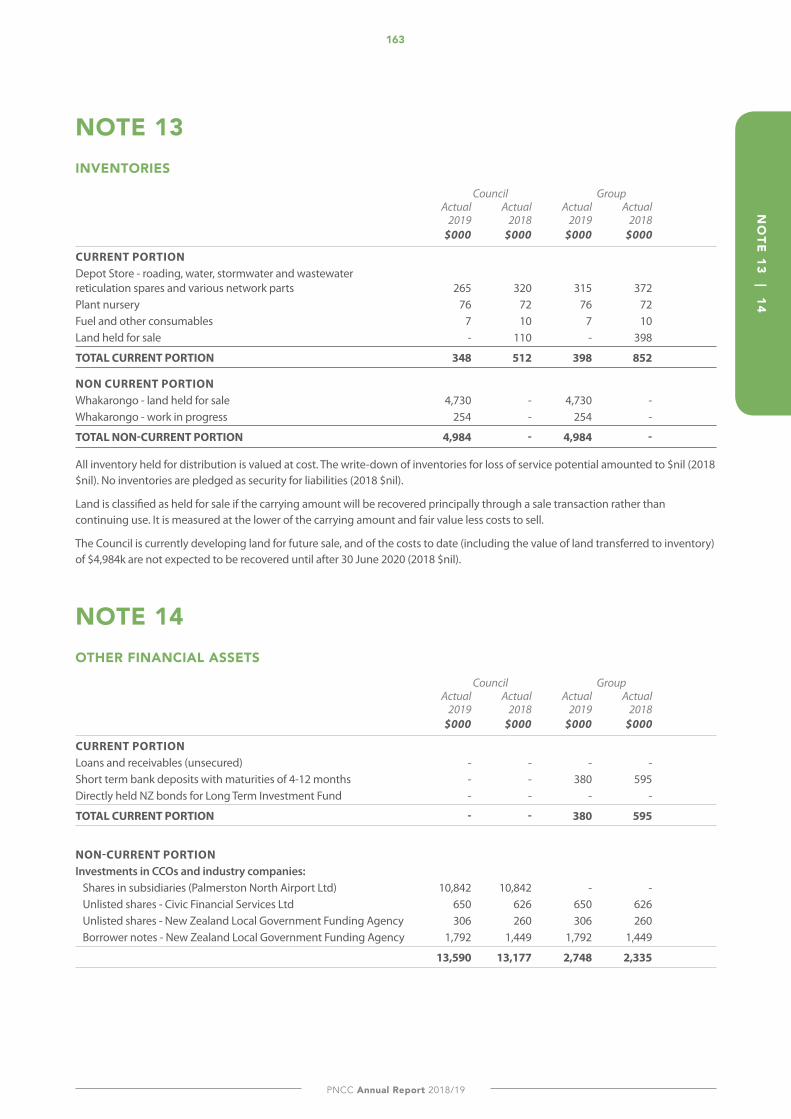
163
PNCC Annual Report 2018/19
NO
TE 13 | 14
NOTE 13INVENTORIES
Council Group Actual Actual Actual Actual 2019 2018 2019 2018 $000 $000 $000 $000
CURRENT PORTION Depot Store - roading, water, stormwater and wastewater reticulation spares and various network parts 265 320 315 372 Plant nursery 76 72 76 72 Fuel and other consumables 7 10 7 10 Land held for sale - 110 - 398
TOTAL CURRENT PORTION 348 512 398 852
NON CURRENT PORTION Whakarongo - land held for sale 4,730 - 4,730 - Whakarongo - work in progress 254 - 254 -
TOTAL NON-CURRENT PORTION 4,984 - 4,984 -
All inventory held for distribution is valued at cost. The write-down of inventories for loss of service potential amounted to $nil (2018 $nil). No inventories are pledged as security for liabilities (2018 $nil).
Land is classified as held for sale if the carrying amount will be recovered principally through a sale transaction rather than continuing use. It is measured at the lower of the carrying amount and fair value less costs to sell.
The Council is currently developing land for future sale, and of the costs to date (including the value of land transferred to inventory) of $4,984k are not expected to be recovered until after 30 June 2020 (2018 $nil).
NOTE 14OTHER FINANCIAL ASSETS
Council Group Actual Actual Actual Actual 2019 2018 2019 2018 $000 $000 $000 $000
CURRENT PORTION Loans and receivables (unsecured) - - - - Short term bank deposits with maturities of 4-12 months - - 380 595 Directly held NZ bonds for Long Term Investment Fund - - - -
TOTAL CURRENT PORTION - - 380 595
NON-CURRENT PORTION Investments in CCOs and industry companies: Shares in subsidiaries (Palmerston North Airport Ltd) 10,842 10,842 - - Unlisted shares - Civic Financial Services Ltd 650 626 650 626 Unlisted shares - New Zealand Local Government Funding Agency 306 260 306 260 Borrower notes - New Zealand Local Government Funding Agency 1,792 1,449 1,792 1,449
13,590 13,177 2,748 2,335
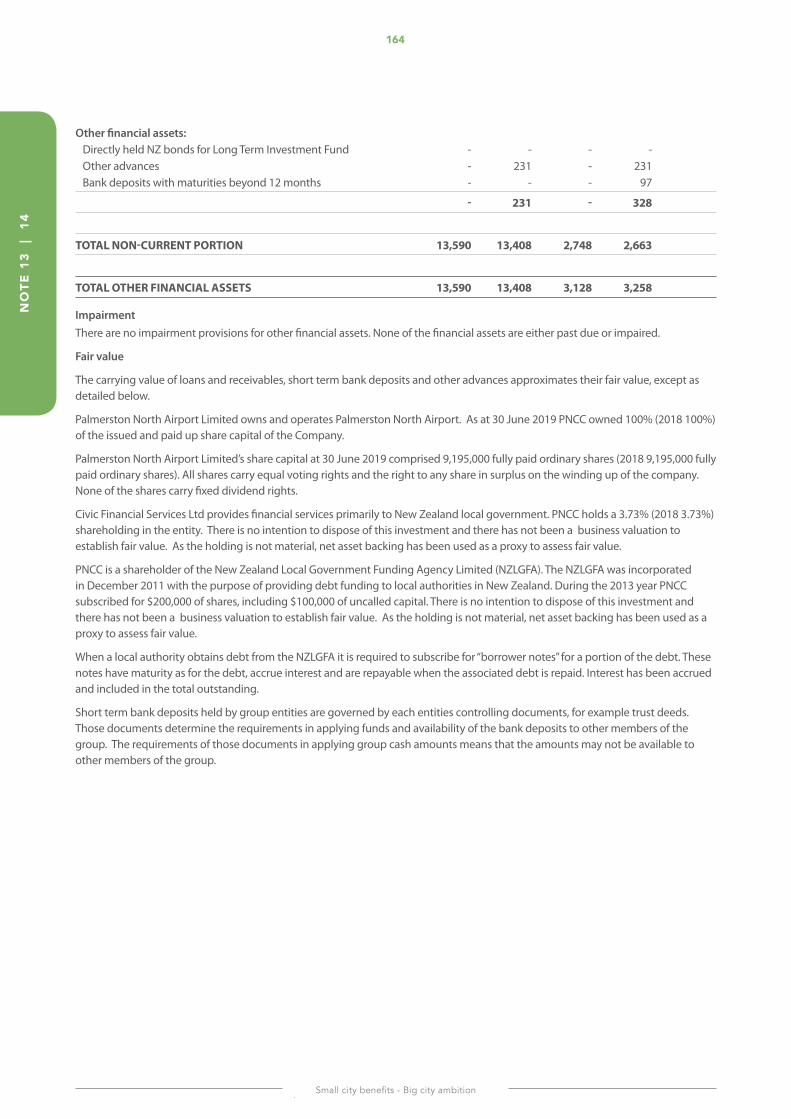
164
Small city benefits - Big city ambition
NO
TE 1
3 |
14
Other financial assets: Directly held NZ bonds for Long Term Investment Fund - - - - Other advances - 231 - 231 Bank deposits with maturities beyond 12 months - - - 97
- 231 - 328
TOTAL NON-CURRENT PORTION 13,590 13,408 2,748 2,663
TOTAL OTHER FINANCIAL ASSETS 13,590 13,408 3,128 3,258
ImpairmentThere are no impairment provisions for other financial assets. None of the financial assets are either past due or impaired.
Fair value
The carrying value of loans and receivables, short term bank deposits and other advances approximates their fair value, except as detailed below.
Palmerston North Airport Limited owns and operates Palmerston North Airport. As at 30 June 2019 PNCC owned 100% (2018 100%) of the issued and paid up share capital of the Company.
Palmerston North Airport Limited’s share capital at 30 June 2019 comprised 9,195,000 fully paid ordinary shares (2018 9,195,000 fully paid ordinary shares). All shares carry equal voting rights and the right to any share in surplus on the winding up of the company. None of the shares carry fixed dividend rights.
Civic Financial Services Ltd provides financial services primarily to New Zealand local government. PNCC holds a 3.73% (2018 3.73%) shareholding in the entity. There is no intention to dispose of this investment and there has not been a business valuation to establish fair value. As the holding is not material, net asset backing has been used as a proxy to assess fair value.
PNCC is a shareholder of the New Zealand Local Government Funding Agency Limited (NZLGFA). The NZLGFA was incorporated in December 2011 with the purpose of providing debt funding to local authorities in New Zealand. During the 2013 year PNCC subscribed for $200,000 of shares, including $100,000 of uncalled capital. There is no intention to dispose of this investment and there has not been a business valuation to establish fair value. As the holding is not material, net asset backing has been used as a proxy to assess fair value.
When a local authority obtains debt from the NZLGFA it is required to subscribe for “borrower notes” for a portion of the debt. These notes have maturity as for the debt, accrue interest and are repayable when the associated debt is repaid. Interest has been accrued and included in the total outstanding.
Short term bank deposits held by group entities are governed by each entities controlling documents, for example trust deeds. Those documents determine the requirements in applying funds and availability of the bank deposits to other members of the group. The requirements of those documents in applying group cash amounts means that the amounts may not be available to other members of the group.
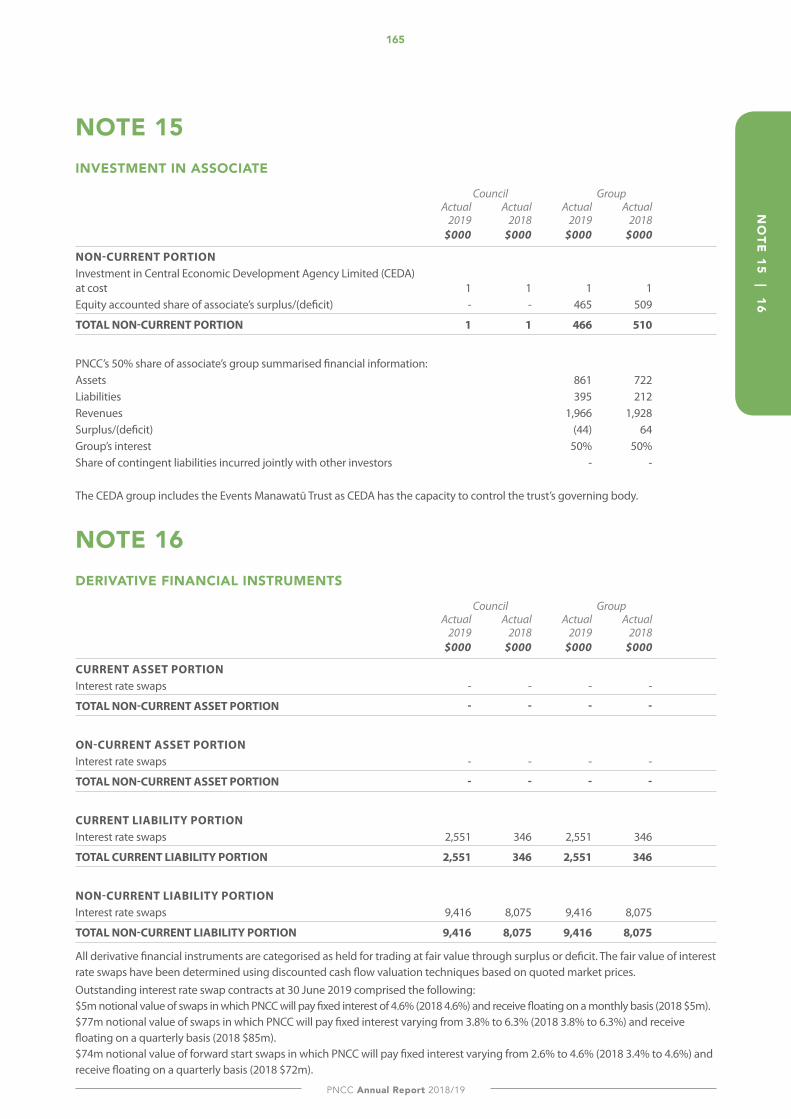
165
PNCC Annual Report 2018/19
NO
TE 15 | 16
NOTE 15INVESTMENT IN ASSOCIATE
Council Group Actual Actual Actual Actual 2019 2018 2019 2018 $000 $000 $000 $000
NON-CURRENT PORTION Investment in Central Economic Development Agency Limited (CEDA) at cost 1 1 1 1 Equity accounted share of associate’s surplus/(deficit) - - 465 509
TOTAL NON-CURRENT PORTION 1 1 466 510
PNCC’s 50% share of associate’s group summarised financial information: Assets 861 722 Liabilities 395 212 Revenues 1,966 1,928 Surplus/(deficit) (44) 64 Group’s interest 50% 50%Share of contingent liabilities incurred jointly with other investors - - The CEDA group includes the Events Manawatū Trust as CEDA has the capacity to control the trust’s governing body.
NOTE 16dERIVATIVE FINANCIAL INSTRUMENTS
Council Group Actual Actual Actual Actual 2019 2018 2019 2018 $000 $000 $000 $000
CURRENT ASSET PORTION Interest rate swaps - - - -
TOTAL NON-CURRENT ASSET PORTION - - - -
ON-CURRENT ASSET PORTION Interest rate swaps - - - -
TOTAL NON-CURRENT ASSET PORTION - - - -
CURRENT LIABILITY PORTION Interest rate swaps 2,551 346 2,551 346
TOTAL CURRENT LIABILITY PORTION 2,551 346 2,551 346
NON-CURRENT LIABILITY PORTION Interest rate swaps 9,416 8,075 9,416 8,075
TOTAL NON-CURRENT LIABILITY PORTION 9,416 8,075 9,416 8,075
All derivative financial instruments are categorised as held for trading at fair value through surplus or deficit. The fair value of interest rate swaps have been determined using discounted cash flow valuation techniques based on quoted market prices. Outstanding interest rate swap contracts at 30 June 2019 comprised the following: $5m notional value of swaps in which PNCC will pay fixed interest of 4.6% (2018 4.6%) and receive floating on a monthly basis (2018 $5m). $77m notional value of swaps in which PNCC will pay fixed interest varying from 3.8% to 6.3% (2018 3.8% to 6.3%) and receive floating on a quarterly basis (2018 $85m). $74m notional value of forward start swaps in which PNCC will pay fixed interest varying from 2.6% to 4.6% (2018 3.4% to 4.6%) and receive floating on a quarterly basis (2018 $72m).
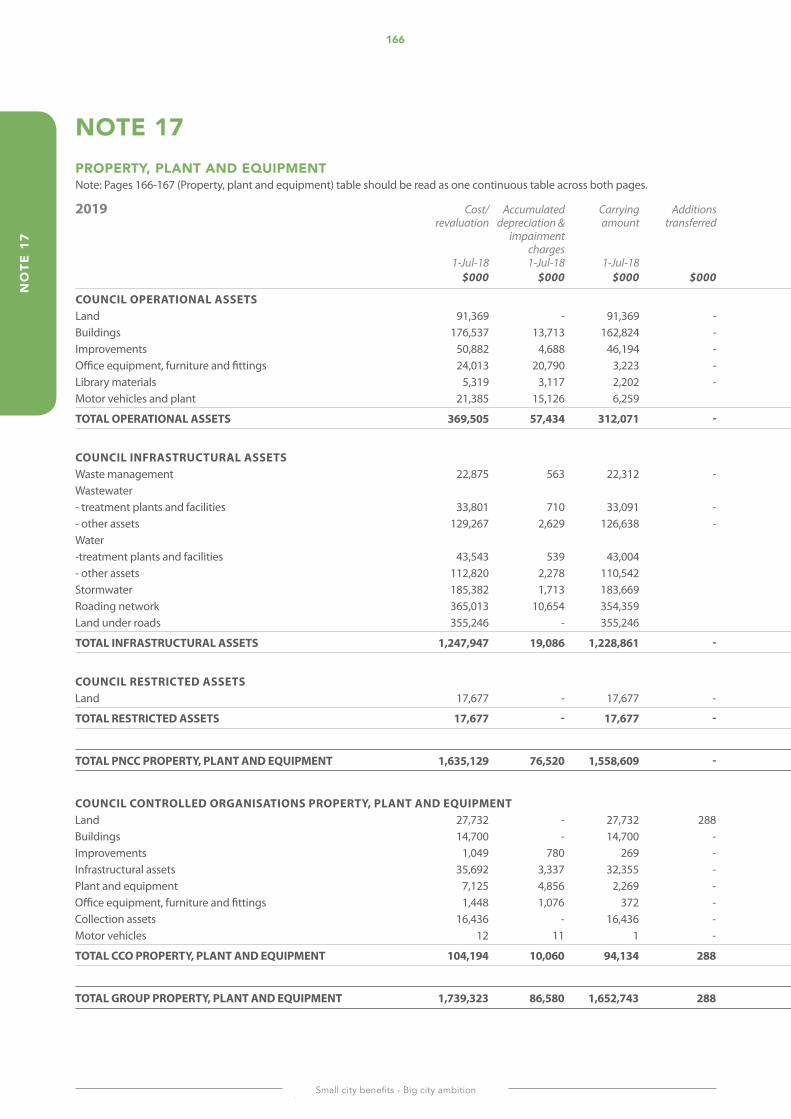
166
Small city benefits - Big city ambition
NO
TE 1
7
NOTE 17PROPERTY, PLANT ANd EQUIPMENT Note: Pages 166-167 (Property, plant and equipment) table should be read as one continuous table across both pages.
2019 Cost/ Accumulated Carrying Additions Current Current Reversal of Current year Current year Revaluation Cost/ Accumulated Carrying revaluation depreciation & amount transferred year year accumulated impairment depreciation surplus revaluation depreciation amount impairment additions disposals depreciation charges & impairment charges on disposal charges 1-Jul-18 1-Jul-18 1-Jul-18 30-Jun-19 30-Jun-19 30-Jun-19 $000 $000 $000 $000 $000 $000 $000 $000 $000 $000 $000 $000 $000
COUNCIL OPERATIONAL ASSETS Land 91,369 - 91,369 - (286) 3,930 - - - 44,634 131,787 - 131,787 Buildings 176,537 13,713 162,824 - 245 103 24 - 6,965 8,036 184,715 62 184,653 Improvements 50,882 4,688 46,194 - 16,738 5 2 - 3,410 (11,138) 56,477 1,442 55,035 Office equipment, furniture and fittings 24,013 20,790 3,223 - 1,507 2 1 - 736 - 25,518 21,723 3,795 Library materials 5,319 3,117 2,202 - 845 487 487 - 777 - 5,677 3,414 2,263 Motor vehicles and plant 21,385 15,126 6,259 1,537 306 261 - 1,471 22,616 16,336 6,280
TOTAL OPERATIONAL ASSETS 369,505 57,434 312,071 - 20,586 4,833 775 - 13,359 41,532 426,790 42,977 383,813
COUNCIL INFRASTRUCTURAL ASSETS Waste management 22,875 563 22,312 - 552 - - - 577 - 23,427 1,140 22,287 Wastewater - treatment plants and facilities 33,801 710 33,091 - 3,143 - - - 747 - 36,944 1,457 35,487 - other assets 129,267 2,629 126,638 - 1,153 - - - 2,657 - 130,420 5,286 125,134 Water -treatment plants and facilities 43,543 539 43,004 1,269 - - - 549 - 44,812 1,088 43,724 - other assets 112,820 2,278 110,542 5,075 - - - 2,342 - 117,895 4,620 113,275 Stormwater 185,382 1,713 183,669 3,111 - - - 1,744 - 188,493 3,457 185,036 Roading network 365,013 10,654 354,359 24,597 800 - - 10,960 - 388,810 21,614 367,196 Land under roads 355,246 - 355,246 429 - - - - - 355,675 - 355,675
TOTAL INFRASTRUCTURAL ASSETS 1,247,947 19,086 1,228,861 - 39,329 800 - - 19,576 - 1,286,476 38,662 1,247,814
COUNCIL RESTRICTED ASSETS Land 17,677 - 17,677 - - - - - - 9,406 27,083 - 27,083
TOTAL RESTRICTED ASSETS 17,677 - 17,677 - - - - - - 9,406 27,083 - 27,083
TOTAL PNCC PROPERTY, PLANT AND EQUIPMENT 1,635,129 76,520 1,558,609 - 59,915 5,633 775 - 32,935 50,938 1,740,349 81,639 1,658,710
COUNCIL CONTROLLED ORGANISATIONS PROPERTY, PLANT AND EQUIPMENT Land 27,732 - 27,732 288 (16) - - - - 4,000 32,004 - 32,004 Buildings 14,700 - 14,700 - (1,714) - - - 363 918 13,541 - 13,541 Improvements 1,049 780 269 - 6 - - - 45 - 1,055 825 230 Infrastructural assets 35,692 3,337 32,355 - 3,402 360 304 - 1,159 - 38,734 4,192 34,542 Plant and equipment 7,125 4,856 2,269 - 867 516 483 - 508 - 7,476 4,881 2,595 Office equipment, furniture and fittings 1,448 1,076 372 - 82 254 251 - 132 - 1,276 957 319 Collection assets 16,436 - 16,436 - 106 - - - - - 16,542 - 16,542 Motor vehicles 12 11 1 - - - - - 1 - 12 12 -
TOTAL CCO PROPERTY, PLANT AND EQUIPMENT 104,194 10,060 94,134 288 2,733 1,130 1,038 - 2,208 4,918 110,640 10,867 99,773
TOTAL GROUP PROPERTY, PLANT AND EQUIPMENT 1,739,323 86,580 1,652,743 288 62,648 6,763 1,813 - 35,143 55,856 1,850,989 92,506 1,758,483 *
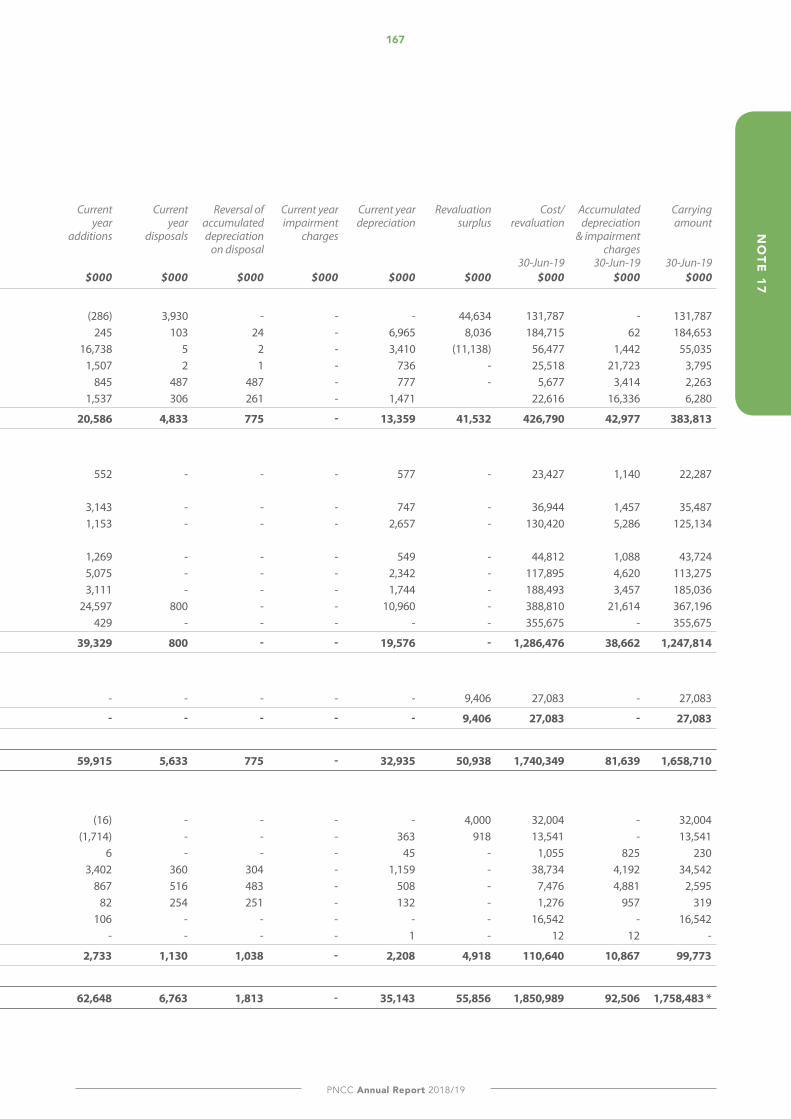
167
PNCC Annual Report 2018/19
NO
TE 17
NOTE 17PROPERTY, PLANT ANd EQUIPMENT Note: Pages 166-167 (Property, plant and equipment) table should be read as one continuous table across both pages.
2019 Cost/ Accumulated Carrying Additions Current Current Reversal of Current year Current year Revaluation Cost/ Accumulated Carrying revaluation depreciation & amount transferred year year accumulated impairment depreciation surplus revaluation depreciation amount impairment additions disposals depreciation charges & impairment charges on disposal charges 1-Jul-18 1-Jul-18 1-Jul-18 30-Jun-19 30-Jun-19 30-Jun-19 $000 $000 $000 $000 $000 $000 $000 $000 $000 $000 $000 $000 $000
COUNCIL OPERATIONAL ASSETS Land 91,369 - 91,369 - (286) 3,930 - - - 44,634 131,787 - 131,787 Buildings 176,537 13,713 162,824 - 245 103 24 - 6,965 8,036 184,715 62 184,653 Improvements 50,882 4,688 46,194 - 16,738 5 2 - 3,410 (11,138) 56,477 1,442 55,035 Office equipment, furniture and fittings 24,013 20,790 3,223 - 1,507 2 1 - 736 - 25,518 21,723 3,795 Library materials 5,319 3,117 2,202 - 845 487 487 - 777 - 5,677 3,414 2,263 Motor vehicles and plant 21,385 15,126 6,259 1,537 306 261 - 1,471 22,616 16,336 6,280
TOTAL OPERATIONAL ASSETS 369,505 57,434 312,071 - 20,586 4,833 775 - 13,359 41,532 426,790 42,977 383,813
COUNCIL INFRASTRUCTURAL ASSETS Waste management 22,875 563 22,312 - 552 - - - 577 - 23,427 1,140 22,287 Wastewater - treatment plants and facilities 33,801 710 33,091 - 3,143 - - - 747 - 36,944 1,457 35,487 - other assets 129,267 2,629 126,638 - 1,153 - - - 2,657 - 130,420 5,286 125,134 Water -treatment plants and facilities 43,543 539 43,004 1,269 - - - 549 - 44,812 1,088 43,724 - other assets 112,820 2,278 110,542 5,075 - - - 2,342 - 117,895 4,620 113,275 Stormwater 185,382 1,713 183,669 3,111 - - - 1,744 - 188,493 3,457 185,036 Roading network 365,013 10,654 354,359 24,597 800 - - 10,960 - 388,810 21,614 367,196 Land under roads 355,246 - 355,246 429 - - - - - 355,675 - 355,675
TOTAL INFRASTRUCTURAL ASSETS 1,247,947 19,086 1,228,861 - 39,329 800 - - 19,576 - 1,286,476 38,662 1,247,814
COUNCIL RESTRICTED ASSETS Land 17,677 - 17,677 - - - - - - 9,406 27,083 - 27,083
TOTAL RESTRICTED ASSETS 17,677 - 17,677 - - - - - - 9,406 27,083 - 27,083
TOTAL PNCC PROPERTY, PLANT AND EQUIPMENT 1,635,129 76,520 1,558,609 - 59,915 5,633 775 - 32,935 50,938 1,740,349 81,639 1,658,710
COUNCIL CONTROLLED ORGANISATIONS PROPERTY, PLANT AND EQUIPMENT Land 27,732 - 27,732 288 (16) - - - - 4,000 32,004 - 32,004 Buildings 14,700 - 14,700 - (1,714) - - - 363 918 13,541 - 13,541 Improvements 1,049 780 269 - 6 - - - 45 - 1,055 825 230 Infrastructural assets 35,692 3,337 32,355 - 3,402 360 304 - 1,159 - 38,734 4,192 34,542 Plant and equipment 7,125 4,856 2,269 - 867 516 483 - 508 - 7,476 4,881 2,595 Office equipment, furniture and fittings 1,448 1,076 372 - 82 254 251 - 132 - 1,276 957 319 Collection assets 16,436 - 16,436 - 106 - - - - - 16,542 - 16,542 Motor vehicles 12 11 1 - - - - - 1 - 12 12 -
TOTAL CCO PROPERTY, PLANT AND EQUIPMENT 104,194 10,060 94,134 288 2,733 1,130 1,038 - 2,208 4,918 110,640 10,867 99,773
TOTAL GROUP PROPERTY, PLANT AND EQUIPMENT 1,739,323 86,580 1,652,743 288 62,648 6,763 1,813 - 35,143 55,856 1,850,989 92,506 1,758,483 *
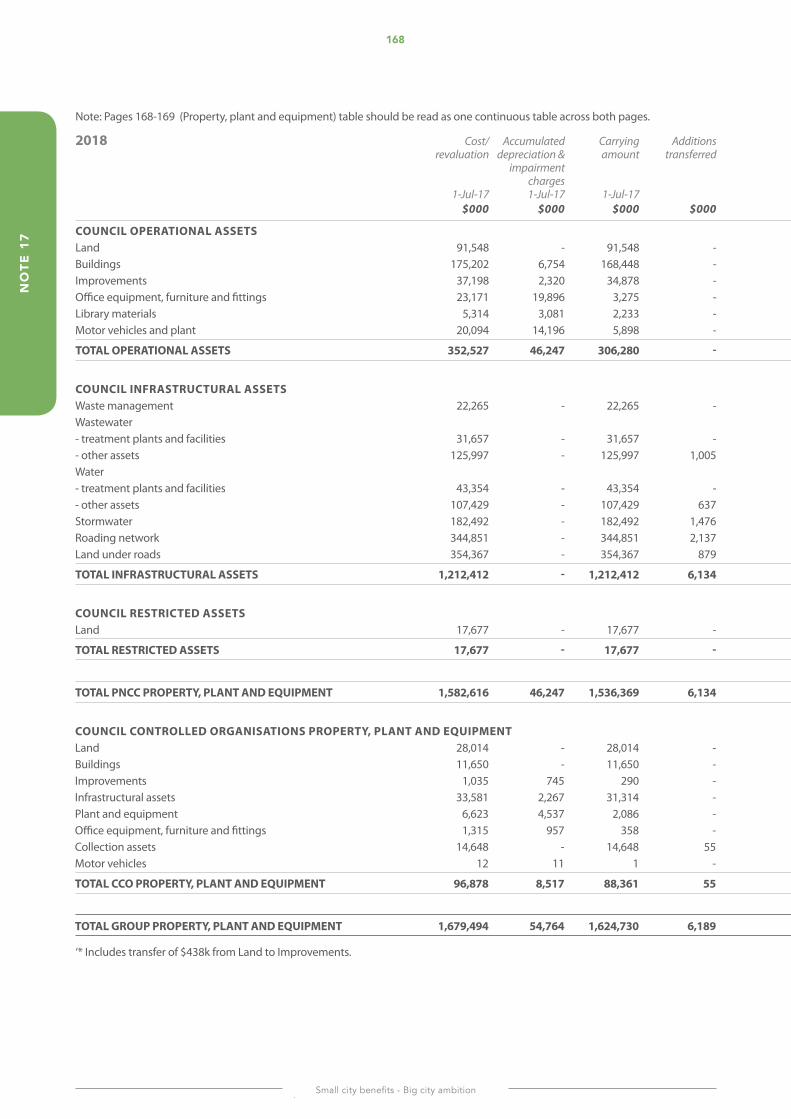
168
Small city benefits - Big city ambition
NO
TE 1
7
Note: Pages 168-169 (Property, plant and equipment) table should be read as one continuous table across both pages.
2018 Cost/ Accumulated Carrying Additions Current Current Reversal of Current year Current year Revaluation Cost/ Accumulated Carrying revaluation depreciation & amount transferred year year accumulated impairment depreciation surplus revaluation depreciation amount impairment additions disposals depreciation charges & impairment charges on disposal charges 1-Jul-17 1-Jul-17 1-Jul-17 30-Jun-18 30-Jun-18 30-Jun-18 $000 $000 $000 $000 $000 $000 $000 $000 $000 $000 $000 $000 $000
COUNCIL OPERATIONAL ASSETS Land 91,548 - 91,548 - (179) - - - - - 91,369 - 91,369 Buildings 175,202 6,754 168,448 - 1,714 379 44 - 7,003 - 176,537 13,713 162,824 Improvements 37,198 2,320 34,878 - 13,684 - - - 2,368 - 50,882 4,688 46,194 Office equipment, furniture and fittings 23,171 19,896 3,275 - 842 - - - 894 - 24,013 20,790 3,223 Library materials 5,314 3,081 2,233 - 764 759 759 - 795 - 5,319 3,117 2,202 Motor vehicles and plant 20,094 14,196 5,898 - 1,787 496 423 64 1,417 - 21,385 15,126 6,259
TOTAL OPERATIONAL ASSETS 352,527 46,247 306,280 - 18,612 1,634 1,226 64 12,477 - 369,505 57,434 312,071
COUNCIL INFRASTRUCTURAL ASSETS Waste management 22,265 - 22,265 - 610 - - - 563 - 22,875 563 22,312 Wastewater - treatment plants and facilities 31,657 - 31,657 - 2,144 - - - 710 - 33,801 710 33,091 - other assets 125,997 - 125,997 1,005 2,703 438 - - 2,629 - 129,267 2,629 126,638 Water - treatment plants and facilities 43,354 - 43,354 - 189 - - - 539 - 43,543 539 43,004 - other assets 107,429 - 107,429 637 4,923 169 - - 2,278 - 112,820 2,278 110,542 Stormwater 182,492 - 182,492 1,476 1,416 2 - - 1,713 - 185,382 1,713 183,669 Roading network 344,851 - 344,851 2,137 18,025 - - - 10,654 - 365,013 10,654 354,359 Land under roads 354,367 - 354,367 879 - - - - - - 355,246 - 355,246
TOTAL INFRASTRUCTURAL ASSETS 1,212,412 - 1,212,412 6,134 30,010 609 - - 19,086 - 1,247,947 19,086 1,228,861
COUNCIL RESTRICTED ASSETS Land 17,677 - 17,677 - - - - - - - 17,677 - 17,677
TOTAL RESTRICTED ASSETS 17,677 - 17,677 - - - - - - - 17,677 - 17,677
TOTAL PNCC PROPERTY, PLANT AND EQUIPMENT 1,582,616 46,247 1,536,369 6,134 48,622 2,243 1,226 64 31,563 - 1,635,129 76,520 1,558,609
COUNCIL CONTROLLED ORGANISATIONS PROPERTY, PLANT AND EQUIPMENT Land 28,014 - 28,014 - 6 288 - - - - 27,732 - 27,732 Buildings 11,650 - 11,650 - 3,356 2 - - 304 - 14,700 - 14,700 Improvements 1,035 745 290 - 14 - - - 35 - 1,049 780 269 Infrastructural assets 33,581 2,267 31,314 - 2,111 - - - 1,070 - 35,692 3,337 32,355 Plant and equipment 6,623 4,537 2,086 - 757 224 226 (31) 545 - 7,125 4,856 2,269 Office equipment, furniture and fittings 1,315 957 358 - 135 2 2 - 121 - 1,448 1,076 372 Collection assets 14,648 - 14,648 55 55 3 - - - 1,681 16,436 - 16,436 Motor vehicles 12 11 1 - - - - - - - 12 11 1
TOTAL CCO PROPERTY, PLANT AND EQUIPMENT 96,878 8,517 88,361 55 6,434 519 228 (31) 2,075 1,681 104,194 10,060 94,134
TOTAL GROUP PROPERTY, PLANT AND EQUIPMENT 1,679,494 54,764 1,624,730 6,189 55,056 2,762 1,454 33 33,638 1,681 1,739,323 86,580 1,652,743
‘* Includes transfer of $438k from Land to Improvements.
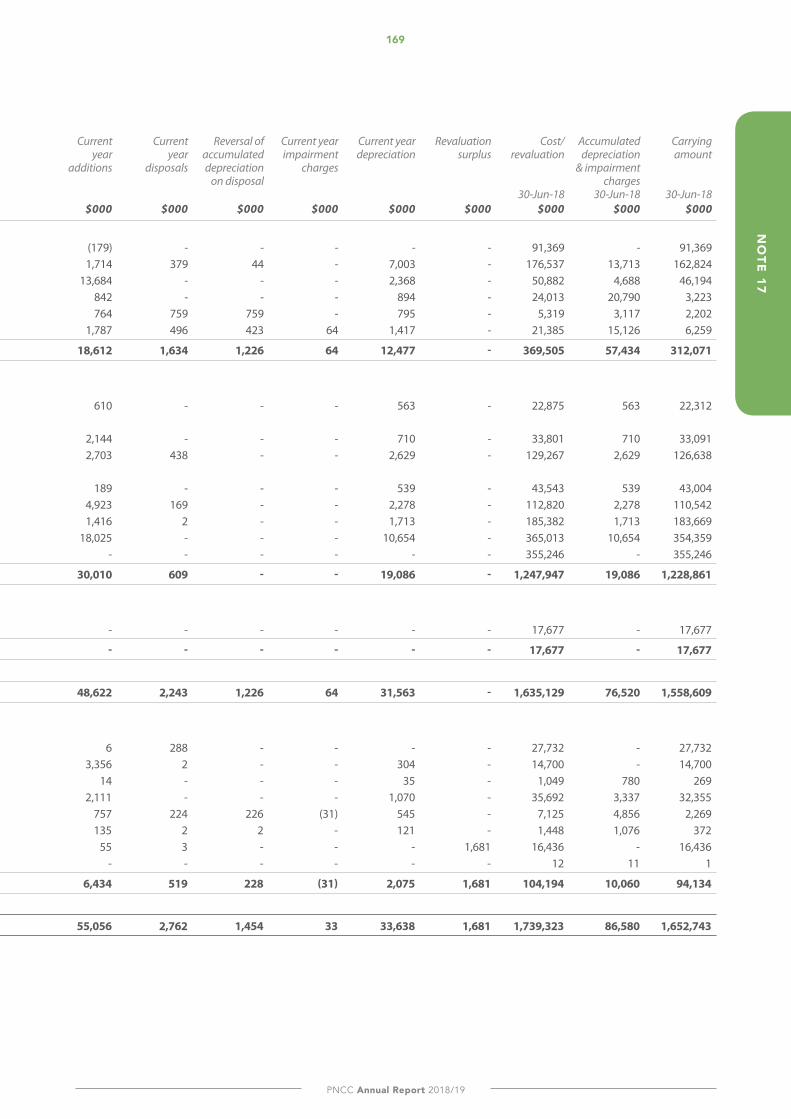
169
PNCC Annual Report 2018/19
NO
TE 17
Note: Pages 168-169 (Property, plant and equipment) table should be read as one continuous table across both pages.
2018 Cost/ Accumulated Carrying Additions Current Current Reversal of Current year Current year Revaluation Cost/ Accumulated Carrying revaluation depreciation & amount transferred year year accumulated impairment depreciation surplus revaluation depreciation amount impairment additions disposals depreciation charges & impairment charges on disposal charges 1-Jul-17 1-Jul-17 1-Jul-17 30-Jun-18 30-Jun-18 30-Jun-18 $000 $000 $000 $000 $000 $000 $000 $000 $000 $000 $000 $000 $000
COUNCIL OPERATIONAL ASSETS Land 91,548 - 91,548 - (179) - - - - - 91,369 - 91,369 Buildings 175,202 6,754 168,448 - 1,714 379 44 - 7,003 - 176,537 13,713 162,824 Improvements 37,198 2,320 34,878 - 13,684 - - - 2,368 - 50,882 4,688 46,194 Office equipment, furniture and fittings 23,171 19,896 3,275 - 842 - - - 894 - 24,013 20,790 3,223 Library materials 5,314 3,081 2,233 - 764 759 759 - 795 - 5,319 3,117 2,202 Motor vehicles and plant 20,094 14,196 5,898 - 1,787 496 423 64 1,417 - 21,385 15,126 6,259
TOTAL OPERATIONAL ASSETS 352,527 46,247 306,280 - 18,612 1,634 1,226 64 12,477 - 369,505 57,434 312,071
COUNCIL INFRASTRUCTURAL ASSETS Waste management 22,265 - 22,265 - 610 - - - 563 - 22,875 563 22,312 Wastewater - treatment plants and facilities 31,657 - 31,657 - 2,144 - - - 710 - 33,801 710 33,091 - other assets 125,997 - 125,997 1,005 2,703 438 - - 2,629 - 129,267 2,629 126,638 Water - treatment plants and facilities 43,354 - 43,354 - 189 - - - 539 - 43,543 539 43,004 - other assets 107,429 - 107,429 637 4,923 169 - - 2,278 - 112,820 2,278 110,542 Stormwater 182,492 - 182,492 1,476 1,416 2 - - 1,713 - 185,382 1,713 183,669 Roading network 344,851 - 344,851 2,137 18,025 - - - 10,654 - 365,013 10,654 354,359 Land under roads 354,367 - 354,367 879 - - - - - - 355,246 - 355,246
TOTAL INFRASTRUCTURAL ASSETS 1,212,412 - 1,212,412 6,134 30,010 609 - - 19,086 - 1,247,947 19,086 1,228,861
COUNCIL RESTRICTED ASSETS Land 17,677 - 17,677 - - - - - - - 17,677 - 17,677
TOTAL RESTRICTED ASSETS 17,677 - 17,677 - - - - - - - 17,677 - 17,677
TOTAL PNCC PROPERTY, PLANT AND EQUIPMENT 1,582,616 46,247 1,536,369 6,134 48,622 2,243 1,226 64 31,563 - 1,635,129 76,520 1,558,609
COUNCIL CONTROLLED ORGANISATIONS PROPERTY, PLANT AND EQUIPMENT Land 28,014 - 28,014 - 6 288 - - - - 27,732 - 27,732 Buildings 11,650 - 11,650 - 3,356 2 - - 304 - 14,700 - 14,700 Improvements 1,035 745 290 - 14 - - - 35 - 1,049 780 269 Infrastructural assets 33,581 2,267 31,314 - 2,111 - - - 1,070 - 35,692 3,337 32,355 Plant and equipment 6,623 4,537 2,086 - 757 224 226 (31) 545 - 7,125 4,856 2,269 Office equipment, furniture and fittings 1,315 957 358 - 135 2 2 - 121 - 1,448 1,076 372 Collection assets 14,648 - 14,648 55 55 3 - - - 1,681 16,436 - 16,436 Motor vehicles 12 11 1 - - - - - - - 12 11 1
TOTAL CCO PROPERTY, PLANT AND EQUIPMENT 96,878 8,517 88,361 55 6,434 519 228 (31) 2,075 1,681 104,194 10,060 94,134
TOTAL GROUP PROPERTY, PLANT AND EQUIPMENT 1,679,494 54,764 1,624,730 6,189 55,056 2,762 1,454 33 33,638 1,681 1,739,323 86,580 1,652,743
‘* Includes transfer of $438k from Land to Improvements.
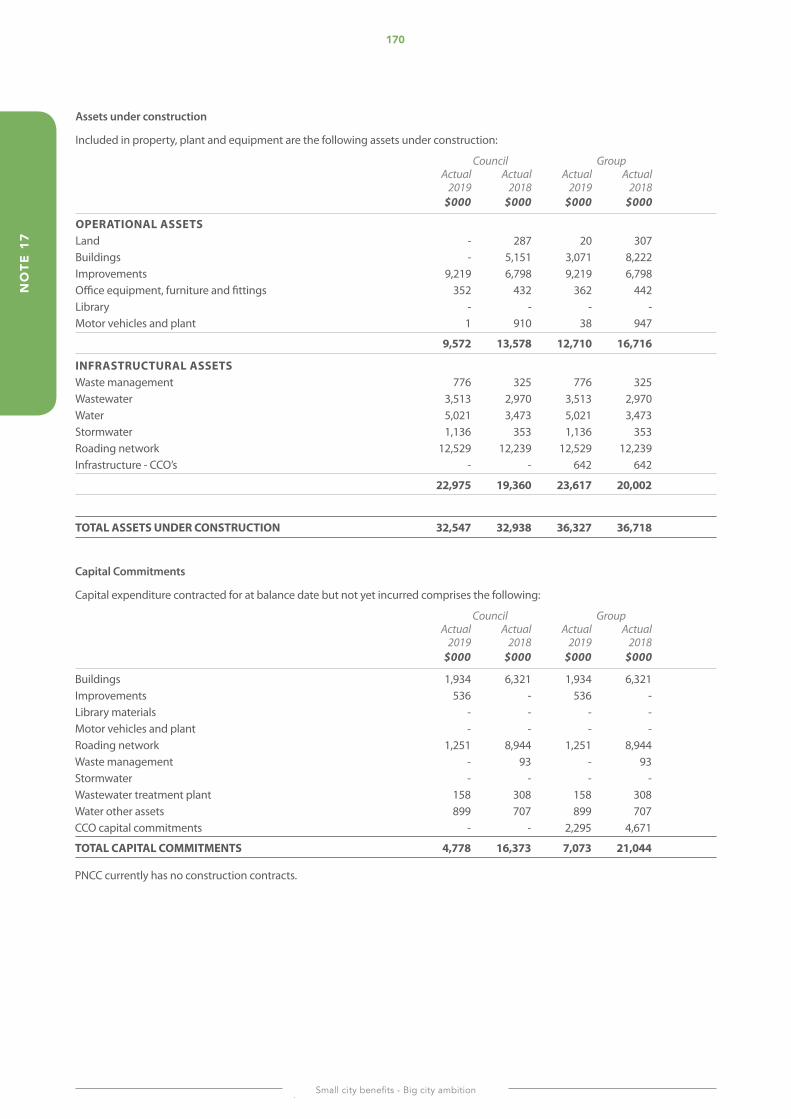
170
Small city benefits - Big city ambition
NO
TE 1
7
Assets under construction
Included in property, plant and equipment are the following assets under construction:
Council Group Actual Actual Actual Actual 2019 2018 2019 2018 $000 $000 $000 $000
OPERATIONAL ASSETS Land - 287 20 307 Buildings - 5,151 3,071 8,222 Improvements 9,219 6,798 9,219 6,798 Office equipment, furniture and fittings 352 432 362 442 Library - - - - Motor vehicles and plant 1 910 38 947
9,572 13,578 12,710 16,716
INFRASTRUCTURAL ASSETS Waste management 776 325 776 325 Wastewater 3,513 2,970 3,513 2,970 Water 5,021 3,473 5,021 3,473 Stormwater 1,136 353 1,136 353 Roading network 12,529 12,239 12,529 12,239 Infrastructure - CCO’s - - 642 642
22,975 19,360 23,617 20,002
TOTAL ASSETS UNDER CONSTRUCTION 32,547 32,938 36,327 36,718
Capital Commitments
Capital expenditure contracted for at balance date but not yet incurred comprises the following:
Council Group Actual Actual Actual Actual 2019 2018 2019 2018 $000 $000 $000 $000
Buildings 1,934 6,321 1,934 6,321 Improvements 536 - 536 - Library materials - - - - Motor vehicles and plant - - - - Roading network 1,251 8,944 1,251 8,944 Waste management - 93 - 93 Stormwater - - - - Wastewater treatment plant 158 308 158 308 Water other assets 899 707 899 707 CCO capital commitments - - 2,295 4,671
TOTAL CAPITAL COMMITMENTS 4,778 16,373 7,073 21,044
PNCC currently has no construction contracts.
171
PNCC Annual Report 2018/19
NO
TE 17
Revaluation of assets
Property, plant and equipment have been valued in accordance with the accounting policy set out in the Statement of Accounting Policy, under the ‘asset revaluation’ section (note 1).
Assets are valued to ‘fair value’ under the highest and best use scenario. Fair value is the amount for which an item could be exchanged or settled between knowledgeable willing parties in an arm’s length transaction.
Where the fair value of the asset can be determined by reference to the price in an active market for the same asset or similiar asset, the fair value of the asset is determined using this information. Where direct evidence of value is not available from an active market, fair value is determined from market-based evidence by appraisal, undertaken by a professionally qualified valuer. If there is no market-based evidence of fair value because of the specialised nature of the asset and the asset is rarely sold, fair value will be determined using the optimised depreciated replacement cost approach.
Operational land, buildings, sportsfields and recreational and community facilities
Fair value of land and buildings was determined from market-based evidence by an independent valuer. Where buildings and site improvements have been identified as being earthquake prone, then the valuation has been reduced by the estimated earthquake strengthening costs. The most recent valuation was performed by Andrew Walshaw (ANZIV, SPINZ) of Morgans Property Advisors, last valued effective 30 June 2019
For site improvements valuation at fair value is determined by optimised depreciated replacement cost basis.The most recent valuation was performed by Andrew Walshaw (ANZIV, SPINZ) of Morgans Property Advisors, last valued effective 30 June 2019.
Restricted land and buildings
Fair value was determined from market-based evidence by an independent valuer. The most recent valuation was performed by Andrew Walshaw (ANZIV, SPINZ) of Morgans Property Advisors, effective 30 June 2019.
Infrastructural Asset Classes: roads, water reticulation, wastewater reticulation, stormwater networks and waste management
Infrastructure assets were last valued effective 30 June 2017.
The fair value of infrastructure assets, excluding land, was determined on an optimised depreciated replacement cost basis, assuming continuation of current asset capability and processing requirements. The valuation was prepared by staff engineers employed by PNCC (led by Eng Lim - BE, ME, MIPENZ, PGDipBusAdmin) and was carried out using the New Zealand Infrastructure Asset Valuation and Depreciation Guidelines produced by New Zealand Asset Management Support (NAMS) Group. The valuation was reviewed by Colin Gerrard (BSc, MSc, GIPENZ), an Associate Director from AECOM New Zealand Limited, who confirmed that the
valuation basis is appropriate for external reporting purposes.
Infrastructure land (excluding land under roads) was valued in 2017 on the basis of ‘open market value’ derived from sales evidenced for 17 urban localities in Palmerston North, Ashhurst and Aokautere and one rate for rural area. The open market value was in turn discounted to provide the specific rates for undeveloped land. While some infrastructure land (particularly off-street parking land) has independent certificates of title and therefore can be disposed of, the reality is that infrastructure land is required to be retained by PNCC for community use. The fair value was determined by Andrew Walshaw (ANZIV, SPINZ) of Morgans Property Advisors.
Additions and acquisitions to infrastructure assets since valuation date are valued at cost.
Land under roads (road reserves), infrastructure land and off-street parking land
Valuation of infrastructure land is generally considered ‘non tradable’ due to the perpetual nature of community use. It was valued at 30 June 2017 based on the undeveloped land value of the adjoining land with a discount applied to recognise the non-tradable nature of the asset. This asset class is re-valued as part of the infrastructural assets revaluation. The fair value was determined by Andrew Walshaw (ANZIV, SPINZ) of Morgans Property Advisors.
Land for off-street carparks, that have independent ‘certficates of title’ and can be disposed of, have been individually valued by registered valuer on an open market value basis, which is the price for which the property might reasonably be expected to be sold at the operative date between a willing buyer and willing seller in an arms length transaction. The fair value was determined by Andrew Walshaw (ANZIV, SPINZ) of Morgans Property Advisors at 30 June 2017.
Land under roads was valued based on the fair value of adjoining undeveloped land determined by Chris Leahy (Registered Valuer FNZIV, FNZPI) of CL Property Solutions Ltd, effective 30 June 2005. On transition to NZ IFRS PNCC has elected to use the fair value of land under roads as at 30 June 2005 as deemed cost. Land under roads is no longer revalued.
Replacement cost
The most recent estimate of the replacement cost of infrastructural assets detailed above and as existed as at the latest valuation 30 June 2017 is:
Council $000
Wastewater - treatment plants and facilities 46,186 - other assets 244,462 Water - treatment plants and facilities 58,917 - other assets 174,051 Stormwater 246,500 Roading network 637,000
172
Small city benefits - Big city ambition
NO
TE 1
7
Palmerston North Airport
Land and buildings owned by Palmerston North Airport Ltd are recorded at fair value. Land fair value has been determined using the market value in alternative use highest and best use methodology with buildings using an optimised depreciated replacement cost basis An independent registered valuer, Morgans Property Advisors, last re-valued the assets as at 30 June 2019.
Airside infrastructure assets owned by Palmerston North Airport Ltd have been valued at fair value. Fair value was last determined by independent valuers AECOM New Zealand Ltd on an optimised depreciated replacement cost basis as at 30 June 2017.
Library collections
Library books were valued as at 30 June 1993, at their deemed cost. The NZ Pacific collection is valued at cost. All other books are valued at cost less accumulated depreciation. Additions since valuation date are stated at cost.
Heritage and art collection
The art collection assets are re-valued every three years and the heritage collection assets every four years.
The entire art collection (owned and custodial) was valued as at 30 January 2018 by Art + Object Auckland, on the basis of a fair, minimum value realisable.
The entire heritage collection (owned and custodial) was valued as at 30 June 2015 by Webb’s, Auckland, on the basis of a fair, minimum value realisable.
Assets pledged as security
The net carrying amount of plant and equipment held under finance leases is $nil (2018 $nil). Except for assets subject to the housing improvement suspensory loan of $480k (2018 $480k) secured by mortgage against the relevant housing units, PNCC does not have any assets pledged as security for liabilties.
A registered first debenture and mortgage is secured over assets and property owned by Palmerston North Airport Ltd. The borrowings are from the Bank of New Zealand and at 30 June 2019 land, buildings and other property assets with a carrying value of $82m has been pledged as security.
Significant acquisitions and replacement of assets
In accordance with the provisions of clause 24 of Schedule 10 of the Local Government Act 2002, the What the Council Does section contains more information on the significant acquisitions and renewals of assets on an activity basis.
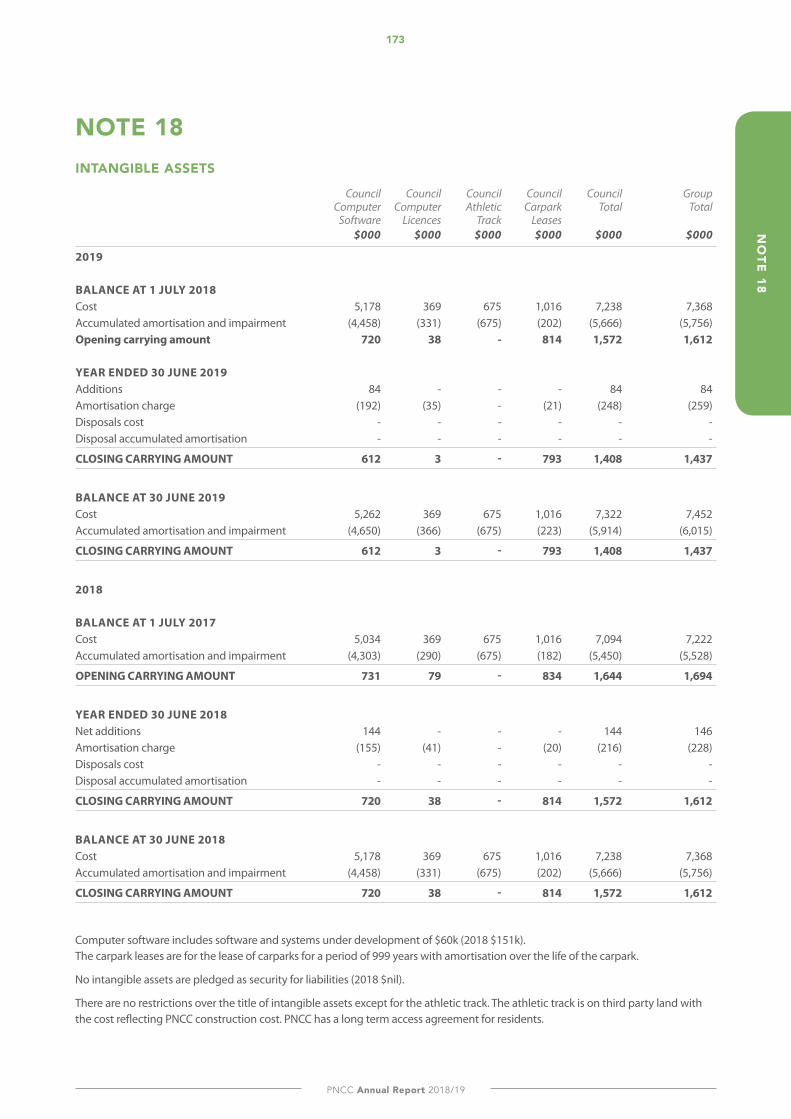
173
PNCC Annual Report 2018/19
NO
TE 18
NOTE 18INTANGIBLE ASSETS
Council Council Council Council Council Group Computer Computer Athletic Carpark Total Total Software Licences Track Leases $000 $000 $000 $000 $000 $000
2019 BALANCE AT 1 JULY 2018 Cost 5,178 369 675 1,016 7,238 7,368 Accumulated amortisation and impairment (4,458) (331) (675) (202) (5,666) (5,756)Opening carrying amount 720 38 - 814 1,572 1,612 YEAR ENDED 30 JUNE 2019 Additions 84 - - - 84 84 Amortisation charge (192) (35) - (21) (248) (259)Disposals cost - - - - - - Disposal accumulated amortisation - - - - - -
CLOSING CARRYING AMOUNT 612 3 - 793 1,408 1,437
BALANCE AT 30 JUNE 2019 Cost 5,262 369 675 1,016 7,322 7,452 Accumulated amortisation and impairment (4,650) (366) (675) (223) (5,914) (6,015)
CLOSING CARRYING AMOUNT 612 3 - 793 1,408 1,437
2018 BALANCE AT 1 JULY 2017 Cost 5,034 369 675 1,016 7,094 7,222 Accumulated amortisation and impairment (4,303) (290) (675) (182) (5,450) (5,528)
OPENING CARRYING AMOUNT 731 79 - 834 1,644 1,694
YEAR ENDED 30 JUNE 2018 Net additions 144 - - - 144 146 Amortisation charge (155) (41) - (20) (216) (228)Disposals cost - - - - - - Disposal accumulated amortisation - - - - - -
CLOSING CARRYING AMOUNT 720 38 - 814 1,572 1,612
BALANCE AT 30 JUNE 2018 Cost 5,178 369 675 1,016 7,238 7,368 Accumulated amortisation and impairment (4,458) (331) (675) (202) (5,666) (5,756)
CLOSING CARRYING AMOUNT 720 38 - 814 1,572 1,612
Computer software includes software and systems under development of $60k (2018 $151k). The carpark leases are for the lease of carparks for a period of 999 years with amortisation over the life of the carpark.
No intangible assets are pledged as security for liabilities (2018 $nil).
There are no restrictions over the title of intangible assets except for the athletic track. The athletic track is on third party land with the cost reflecting PNCC construction cost. PNCC has a long term access agreement for residents.
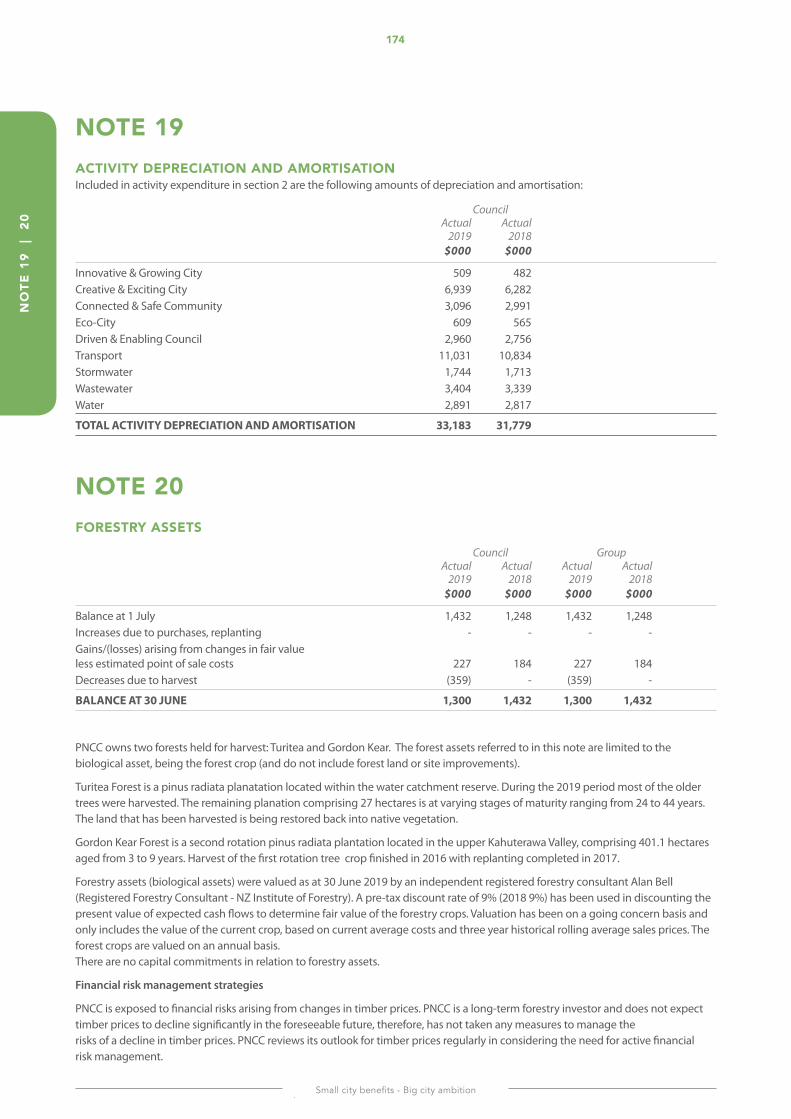
174
Small city benefits - Big city ambition
NO
TE 1
9 |
20
NOTE 19ACTIVITY dEPRECIATION ANd AMORTISATION Included in activity expenditure in section 2 are the following amounts of depreciation and amortisation:
Council Actual Actual 2019 2018 $000 $000
Innovative & Growing City 509 482Creative & Exciting City 6,939 6,282Connected & Safe Community 3,096 2,991Eco-City 609 565Driven & Enabling Council 2,960 2,756Transport 11,031 10,834Stormwater 1,744 1,713Wastewater 3,404 3,339Water 2,891 2,817
TOTAL ACTIVITY DEPRECIATION AND AMORTISATION 33,183 31,779
NOTE 20FORESTRY ASSETS
Council Group Actual Actual Actual Actual 2019 2018 2019 2018 $000 $000 $000 $000
Balance at 1 July 1,432 1,248 1,432 1,248 Increases due to purchases, replanting - - - - Gains/(losses) arising from changes in fair value less estimated point of sale costs 227 184 227 184 Decreases due to harvest (359) - (359) -
BALANCE AT 30 JUNE 1,300 1,432 1,300 1,432
PNCC owns two forests held for harvest: Turitea and Gordon Kear. The forest assets referred to in this note are limited to the biological asset, being the forest crop (and do not include forest land or site improvements).
Turitea Forest is a pinus radiata planatation located within the water catchment reserve. During the 2019 period most of the older trees were harvested. The remaining planation comprising 27 hectares is at varying stages of maturity ranging from 24 to 44 years. The land that has been harvested is being restored back into native vegetation.
Gordon Kear Forest is a second rotation pinus radiata plantation located in the upper Kahuterawa Valley, comprising 401.1 hectares aged from 3 to 9 years. Harvest of the first rotation tree crop finished in 2016 with replanting completed in 2017.
Forestry assets (biological assets) were valued as at 30 June 2019 by an independent registered forestry consultant Alan Bell (Registered Forestry Consultant - NZ Institute of Forestry). A pre-tax discount rate of 9% (2018 9%) has been used in discounting the present value of expected cash flows to determine fair value of the forestry crops. Valuation has been on a going concern basis and only includes the value of the current crop, based on current average costs and three year historical rolling average sales prices. The forest crops are valued on an annual basis. There are no capital commitments in relation to forestry assets.
Financial risk management strategies
PNCC is exposed to financial risks arising from changes in timber prices. PNCC is a long-term forestry investor and does not expect timber prices to decline significantly in the foreseeable future, therefore, has not taken any measures to manage the risks of a decline in timber prices. PNCC reviews its outlook for timber prices regularly in considering the need for active financial risk management.
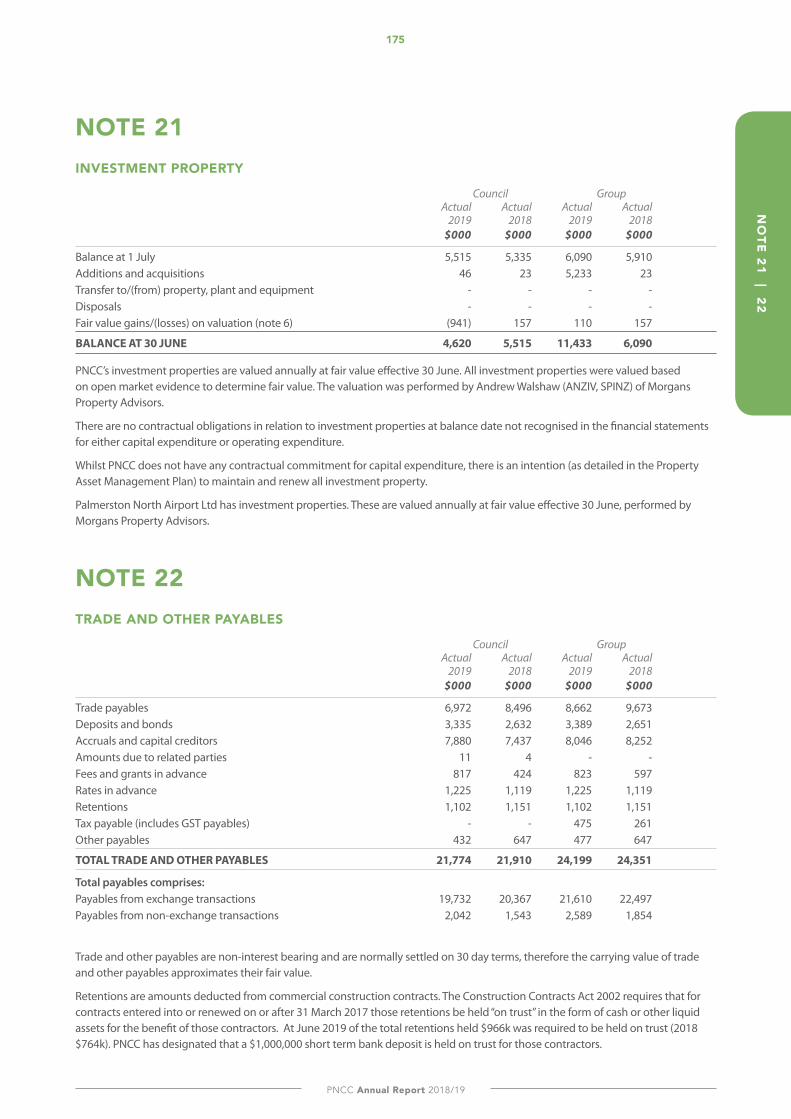
175
PNCC Annual Report 2018/19
NO
TE 21 | 22
NOTE 21INVESTMENT PROPERTY
Council Group Actual Actual Actual Actual 2019 2018 2019 2018 $000 $000 $000 $000
Balance at 1 July 5,515 5,335 6,090 5,910 Additions and acquisitions 46 23 5,233 23 Transfer to/(from) property, plant and equipment - - - - Disposals - - - - Fair value gains/(losses) on valuation (note 6) (941) 157 110 157
BALANCE AT 30 JUNE 4,620 5,515 11,433 6,090
PNCC’s investment properties are valued annually at fair value effective 30 June. All investment properties were valued based on open market evidence to determine fair value. The valuation was performed by Andrew Walshaw (ANZIV, SPINZ) of Morgans Property Advisors.
There are no contractual obligations in relation to investment properties at balance date not recognised in the financial statements for either capital expenditure or operating expenditure.
Whilst PNCC does not have any contractual commitment for capital expenditure, there is an intention (as detailed in the Property Asset Management Plan) to maintain and renew all investment property.
Palmerston North Airport Ltd has investment properties. These are valued annually at fair value effective 30 June, performed by Morgans Property Advisors.
NOTE 22TRAdE ANd OTHER PAYABLES
Council Group Actual Actual Actual Actual 2019 2018 2019 2018 $000 $000 $000 $000
Trade payables 6,972 8,496 8,662 9,673 Deposits and bonds 3,335 2,632 3,389 2,651 Accruals and capital creditors 7,880 7,437 8,046 8,252 Amounts due to related parties 11 4 - - Fees and grants in advance 817 424 823 597 Rates in advance 1,225 1,119 1,225 1,119 Retentions 1,102 1,151 1,102 1,151 Tax payable (includes GST payables) - - 475 261 Other payables 432 647 477 647
TOTAL TRADE AND OTHER PAYABLES 21,774 21,910 24,199 24,351
Total payables comprises: Payables from exchange transactions 19,732 20,367 21,610 22,497 Payables from non-exchange transactions 2,042 1,543 2,589 1,854
Trade and other payables are non-interest bearing and are normally settled on 30 day terms, therefore the carrying value of trade and other payables approximates their fair value.
Retentions are amounts deducted from commercial construction contracts. The Construction Contracts Act 2002 requires that for contracts entered into or renewed on or after 31 March 2017 those retentions be held “on trust” in the form of cash or other liquid assets for the benefit of those contractors. At June 2019 of the total retentions held $966k was required to be held on trust (2018 $764k). PNCC has designated that a $1,000,000 short term bank deposit is held on trust for those contractors.
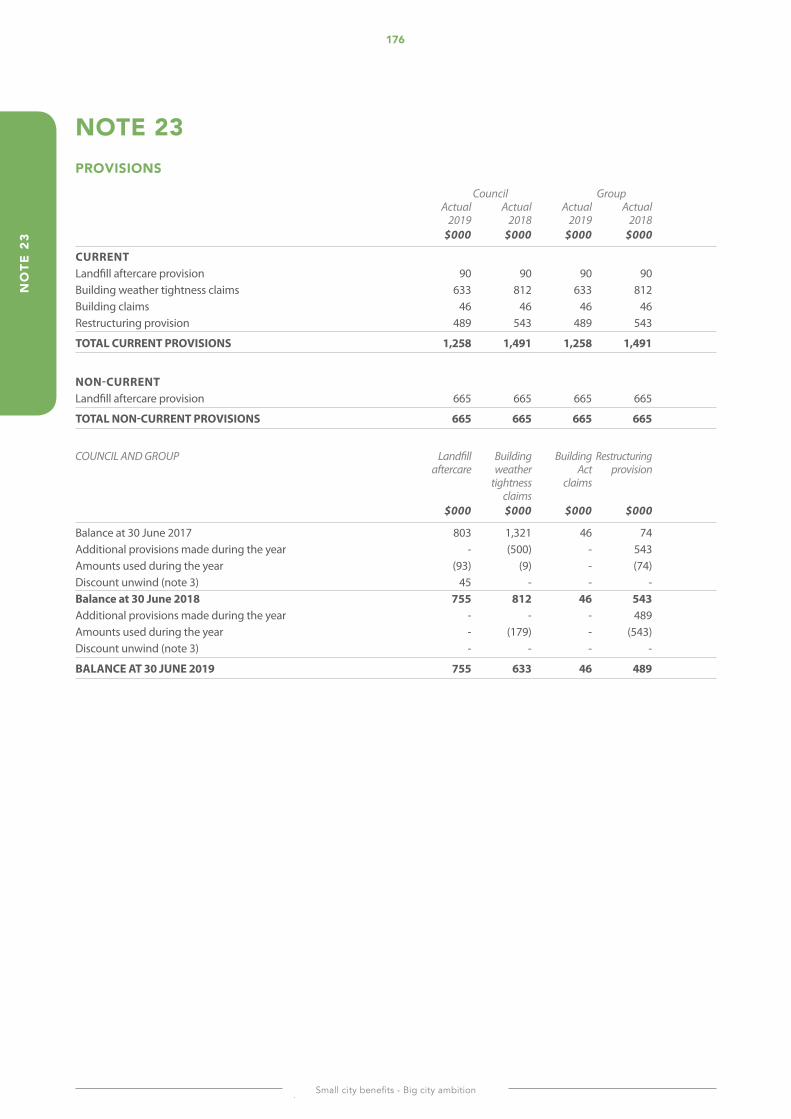
176
Small city benefits - Big city ambition
NO
TE 2
3
NOTE 23PROVISIONS
Council Group Actual Actual Actual Actual 2019 2018 2019 2018 $000 $000 $000 $000
CURRENT Landfill aftercare provision 90 90 90 90 Building weather tightness claims 633 812 633 812 Building claims 46 46 46 46 Restructuring provision 489 543 489 543
TOTAL CURRENT PROVISIONS 1,258 1,491 1,258 1,491
NON-CURRENT Landfill aftercare provision 665 665 665 665
TOTAL NON-CURRENT PROVISIONS 665 665 665 665
COUNCIL AND GROUP Landfill Building Building Restructuring aftercare weather Act provision tightness claims claims $000 $000 $000 $000
Balance at 30 June 2017 803 1,321 46 74 Additional provisions made during the year - (500) - 543 Amounts used during the year (93) (9) - (74)Discount unwind (note 3) 45 - - - Balance at 30 June 2018 755 812 46 543 Additional provisions made during the year - - - 489 Amounts used during the year - (179) - (543)Discount unwind (note 3) - - - -
BALANCE AT 30 JUNE 2019 755 633 46 489
177
PNCC Annual Report 2018/19
NO
TE 23
Landfill aftercare provision
PNCC, as owner and operator of the Awapuni landfill since 1952, has a legal obligation under resource consent to provide ongoing maintenance and monitoring of its landfill post-closure. The landfill closed at the end of January 2007. Post-closure activities include leachate, water, gas monitoring and remedial measures such as ongoing site maintenance, drainage systems and wastewater treatment, final clay capping, soil covering and vegetation.
Estimates of future monitoring costs and remedial works have been made by council engineers. These engineering estimates are the basis upon which PNCC has established this financial provision. The provision includes all expected future costs and obligations associated with landfill post-closure.
The provision has been estimated taking into account and based upon known technology, existing knowledge and current legal requirements for the remaining closure and ongoing maintenance and monitoring costs. The amount of the provision is the present value of future cash flows expected to be incurred, using a discount rate of 6.0%. PNCC engineers and accountants review the amount of the landfill provision at least once a year. The long term nature of the landfill liability means that there are inherent uncertainties in estimating costs that will be incurred.
Cash outflows for post-closure remedial works were completed in 2015, with consent monitoring costs expected to continue for up to 11 years (until 2029).
Landfill post-closure remedial works are capitalised to the landfill asset where they give rise to future economic benefits. Components of the capitalised landfill asset are then depreciated over their useful lives.
The landfill provision of $755k (2018 $755k) is for consent monitoring costs.
No reimbursement from other sources outside of PNCC is expected.
Building weather tightness claims
PNCC has unresolved weather tightness claims. Refer to note 29 for further details. PNCC is unable to assess it’s exposure to these claims with the cost of any successful claims against PNCC expected to be substantially covered by provisions made.
PNCC also has exposure to possible calls relating to professional indemnity insurance cover, mainly relating to weather tightness claims. Refer to note 29 for further details. A call of $167k (payable on 1 July 2019) has been recognised in 2019. Current expectations are that one further and final call of an amount less than $167k will be made in either 2023 or 2024.
PNCC has made a provision of $633k (2018 $812k) to cover unresolved and future weather tightness claims and future insurance pool calls.
Building Act claims
PNCC has further unresolved Building Act claims. Refer to note 29 for further details. PNCC is unable to assess it’s exposure to these claims with the cost of any successful claims against PNCC expected to be substantially covered under PNCC’s insurance policies.
PNCC has made a provision of $46,000 (2018 $46,000) to cover unresolved and future building claims, although the potential liability and timing of any payment is uncertain.
Restructuring provision
There are some areas undergoing a change process to better meet the future needs of the community. The restructuring provision is to meet the estimated remaining possible cost of this process.
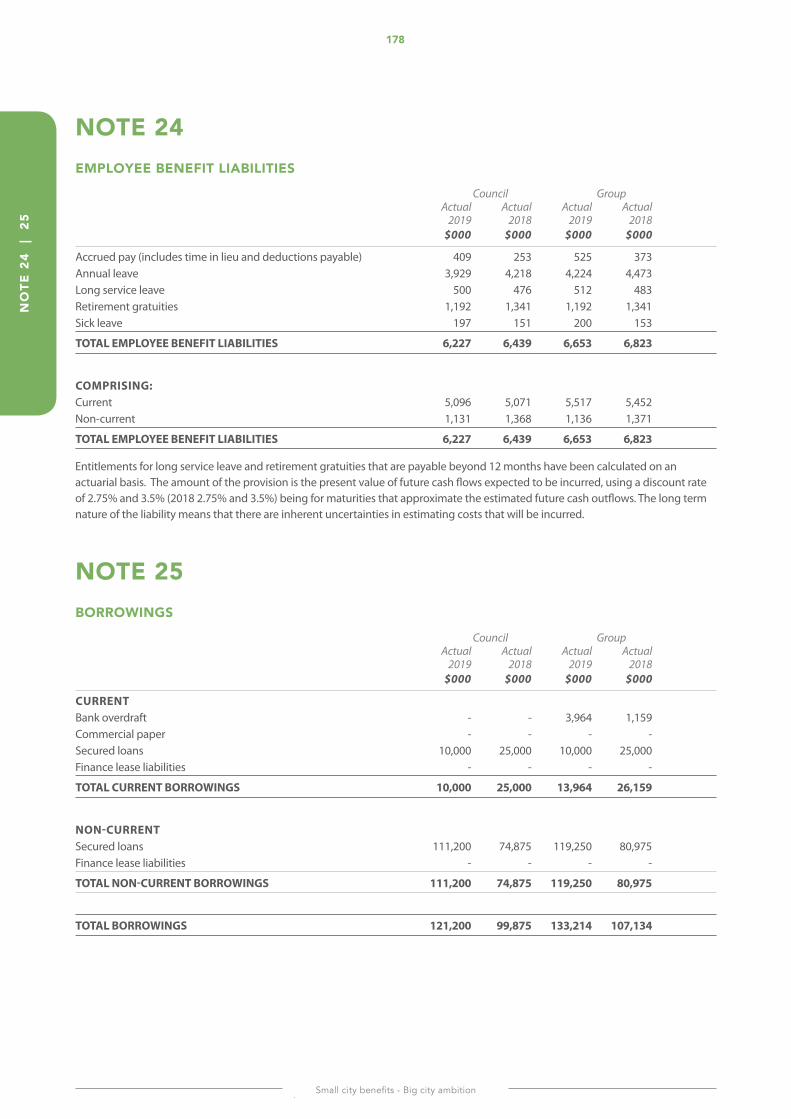
178
Small city benefits - Big city ambition
NO
TE 2
4 |
25
NOTE 24EMPLOYEE BENEFIT LIABILITIES
Council Group Actual Actual Actual Actual 2019 2018 2019 2018 $000 $000 $000 $000
Accrued pay (includes time in lieu and deductions payable) 409 253 525 373 Annual leave 3,929 4,218 4,224 4,473 Long service leave 500 476 512 483 Retirement gratuities 1,192 1,341 1,192 1,341 Sick leave 197 151 200 153
TOTAL EMPLOYEE BENEFIT LIABILITIES 6,227 6,439 6,653 6,823
COMPRISING: Current 5,096 5,071 5,517 5,452 Non-current 1,131 1,368 1,136 1,371
TOTAL EMPLOYEE BENEFIT LIABILITIES 6,227 6,439 6,653 6,823
Entitlements for long service leave and retirement gratuities that are payable beyond 12 months have been calculated on an actuarial basis. The amount of the provision is the present value of future cash flows expected to be incurred, using a discount rate of 2.75% and 3.5% (2018 2.75% and 3.5%) being for maturities that approximate the estimated future cash outflows. The long term nature of the liability means that there are inherent uncertainties in estimating costs that will be incurred.
NOTE 25BORROWINGS
Council Group Actual Actual Actual Actual 2019 2018 2019 2018 $000 $000 $000 $000
CURRENT Bank overdraft - - 3,964 1,159 Commercial paper - - - - Secured loans 10,000 25,000 10,000 25,000 Finance lease liabilities - - - -
TOTAL CURRENT BORROWINGS 10,000 25,000 13,964 26,159
NON-CURRENT Secured loans 111,200 74,875 119,250 80,975 Finance lease liabilities - - - -
TOTAL NON-CURRENT BORROWINGS 111,200 74,875 119,250 80,975
TOTAL BORROWINGS 121,200 99,875 133,214 107,134
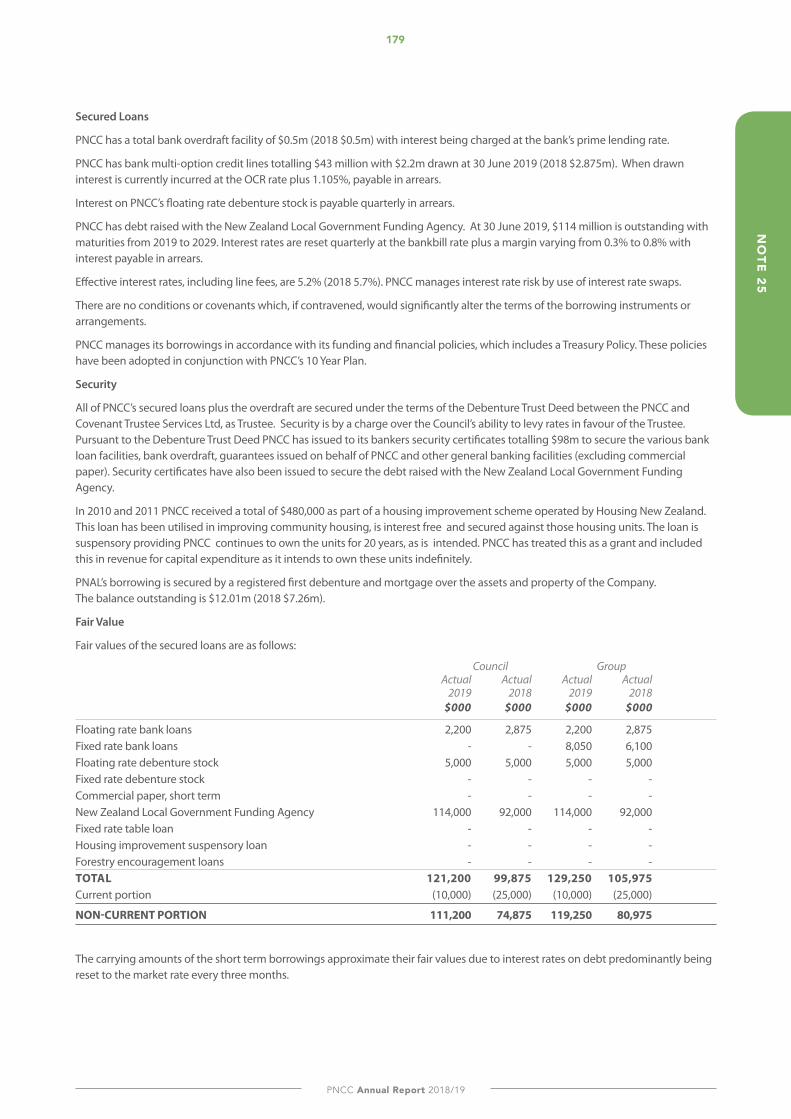
179
PNCC Annual Report 2018/19
NO
TE 25
Secured Loans
PNCC has a total bank overdraft facility of $0.5m (2018 $0.5m) with interest being charged at the bank’s prime lending rate.
PNCC has bank multi-option credit lines totalling $43 million with $2.2m drawn at 30 June 2019 (2018 $2.875m). When drawn interest is currently incurred at the OCR rate plus 1.105%, payable in arrears.
Interest on PNCC’s floating rate debenture stock is payable quarterly in arrears.
PNCC has debt raised with the New Zealand Local Government Funding Agency. At 30 June 2019, $114 million is outstanding with maturities from 2019 to 2029. Interest rates are reset quarterly at the bankbill rate plus a margin varying from 0.3% to 0.8% with interest payable in arrears.
Effective interest rates, including line fees, are 5.2% (2018 5.7%). PNCC manages interest rate risk by use of interest rate swaps.
There are no conditions or covenants which, if contravened, would significantly alter the terms of the borrowing instruments or arrangements.
PNCC manages its borrowings in accordance with its funding and financial policies, which includes a Treasury Policy. These policies have been adopted in conjunction with PNCC’s 10 Year Plan.
Security
All of PNCC’s secured loans plus the overdraft are secured under the terms of the Debenture Trust Deed between the PNCC and Covenant Trustee Services Ltd, as Trustee. Security is by a charge over the Council’s ability to levy rates in favour of the Trustee. Pursuant to the Debenture Trust Deed PNCC has issued to its bankers security certificates totalling $98m to secure the various bank loan facilities, bank overdraft, guarantees issued on behalf of PNCC and other general banking facilities (excluding commercial paper). Security certificates have also been issued to secure the debt raised with the New Zealand Local Government Funding Agency.
In 2010 and 2011 PNCC received a total of $480,000 as part of a housing improvement scheme operated by Housing New Zealand. This loan has been utilised in improving community housing, is interest free and secured against those housing units. The loan is suspensory providing PNCC continues to own the units for 20 years, as is intended. PNCC has treated this as a grant and included this in revenue for capital expenditure as it intends to own these units indefinitely.
PNAL’s borrowing is secured by a registered first debenture and mortgage over the assets and property of the Company. The balance outstanding is $12.01m (2018 $7.26m).
Fair Value
Fair values of the secured loans are as follows:
Council Group Actual Actual Actual Actual 2019 2018 2019 2018 $000 $000 $000 $000
Floating rate bank loans 2,200 2,875 2,200 2,875Fixed rate bank loans - - 8,050 6,100Floating rate debenture stock 5,000 5,000 5,000 5,000Fixed rate debenture stock - - - -Commercial paper, short term - - - -New Zealand Local Government Funding Agency 114,000 92,000 114,000 92,000Fixed rate table loan - - - -Housing improvement suspensory loan - - - -Forestry encouragement loans - - - -TOTAL 121,200 99,875 129,250 105,975Current portion (10,000) (25,000) (10,000) (25,000)
NON-CURRENT PORTION 111,200 74,875 119,250 80,975
The carrying amounts of the short term borrowings approximate their fair values due to interest rates on debt predominantly being reset to the market rate every three months.
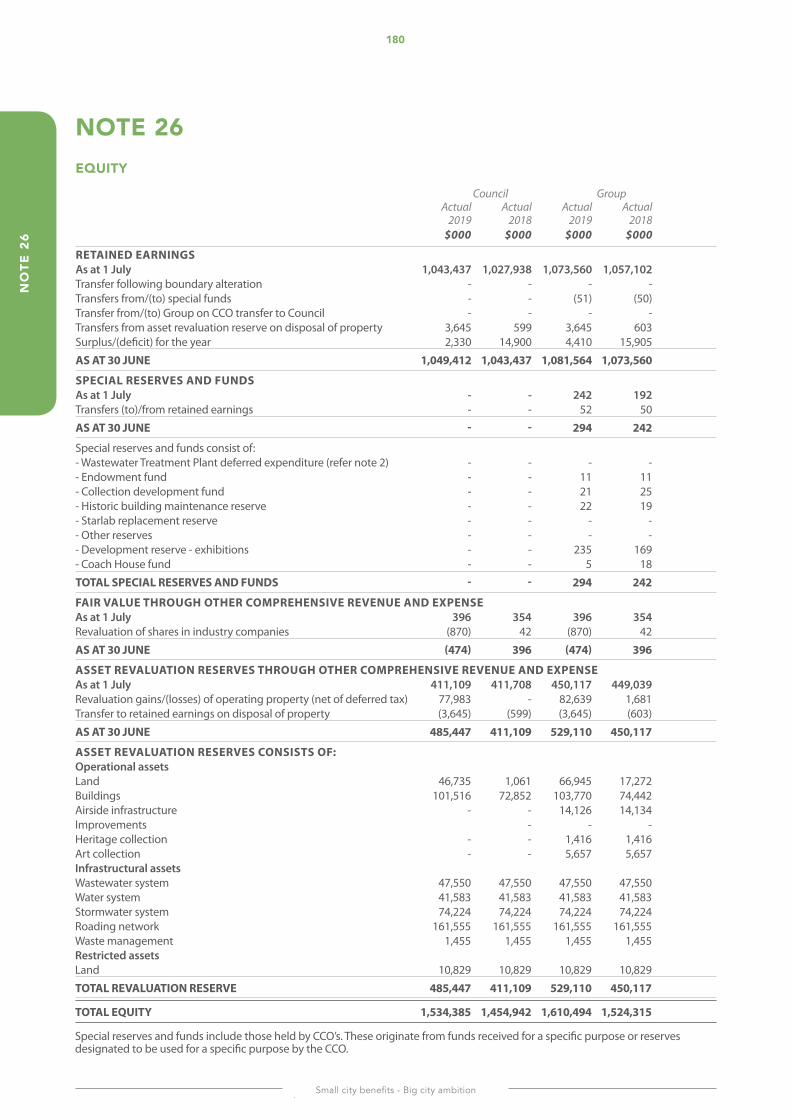
180
Small city benefits - Big city ambition
NO
TE 2
6
NOTE 26EQUITY
Council Group Actual Actual Actual Actual 2019 2018 2019 2018 $000 $000 $000 $000
RETAINED EARNINGS As at 1 July 1,043,437 1,027,938 1,073,560 1,057,102 Transfer following boundary alteration - - - - Transfers from/(to) special funds - - (51) (50)Transfer from/(to) Group on CCO transfer to Council - - - - Transfers from asset revaluation reserve on disposal of property 3,645 599 3,645 603 Surplus/(deficit) for the year 2,330 14,900 4,410 15,905
AS AT 30 JUNE 1,049,412 1,043,437 1,081,564 1,073,560
SPECIAL RESERVES AND FUNDS As at 1 July - - 242 192 Transfers (to)/from retained earnings - - 52 50
AS AT 30 JUNE - - 294 242
Special reserves and funds consist of: - Wastewater Treatment Plant deferred expenditure (refer note 2) - - - - - Endowment fund - - 11 11 - Collection development fund - - 21 25 - Historic building maintenance reserve - - 22 19 - Starlab replacement reserve - - - - - Other reserves - - - - - Development reserve - exhibitions - - 235 169 - Coach House fund - - 5 18
TOTAL SPECIAL RESERVES AND FUNDS - - 294 242
FAIR VALUE THROUGH OTHER COMPREHENSIVE REVENUE AND EXPENSE As at 1 July 396 354 396 354 Revaluation of shares in industry companies (870) 42 (870) 42
AS AT 30 JUNE (474) 396 (474) 396
ASSET REVALUATION RESERVES THROUGH OTHER COMPREHENSIVE REVENUE AND EXPENSE As at 1 July 411,109 411,708 450,117 449,039 Revaluation gains/(losses) of operating property (net of deferred tax) 77,983 - 82,639 1,681 Transfer to retained earnings on disposal of property (3,645) (599) (3,645) (603)
AS AT 30 JUNE 485,447 411,109 529,110 450,117
ASSET REVALUATION RESERVES CONSISTS OF: Operational assets Land 46,735 1,061 66,945 17,272 Buildings 101,516 72,852 103,770 74,442 Airside infrastructure - - 14,126 14,134 Improvements - - - Heritage collection - - 1,416 1,416 Art collection - - 5,657 5,657 Infrastructural assets Wastewater system 47,550 47,550 47,550 47,550 Water system 41,583 41,583 41,583 41,583 Stormwater system 74,224 74,224 74,224 74,224 Roading network 161,555 161,555 161,555 161,555 Waste management 1,455 1,455 1,455 1,455 Restricted assets Land 10,829 10,829 10,829 10,829
TOTAL REVALUATION RESERVE 485,447 411,109 529,110 450,117
TOTAL EQUITY 1,534,385 1,454,942 1,610,494 1,524,315
Special reserves and funds include those held by CCO’s. These originate from funds received for a specific purpose or reserves designated to be used for a specific purpose by the CCO.
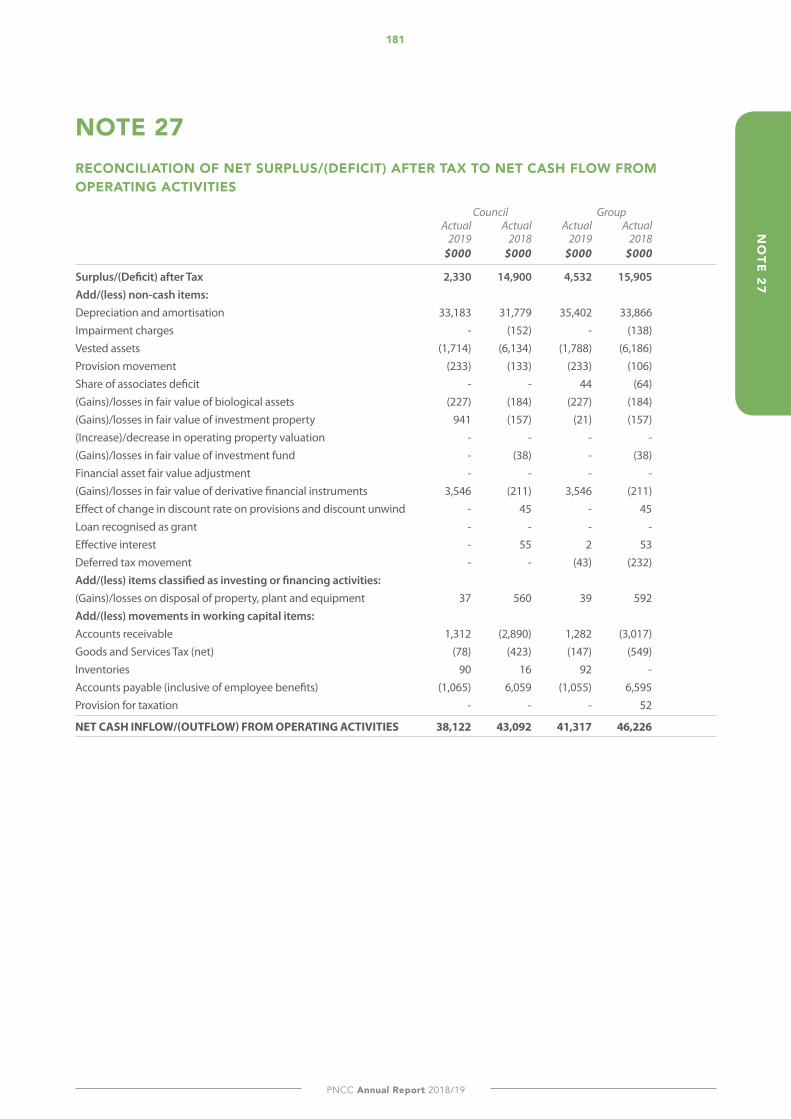
181
PNCC Annual Report 2018/19
NO
TE 27
NOTE 27RECONCILIATION OF NET SURPLUS/(dEFICIT) AFTER TAX TO NET CASH FLOW FROM OPERATING ACTIVITIES
Council Group Actual Actual Actual Actual 2019 2018 2019 2018 $000 $000 $000 $000
Surplus/(Deficit) after Tax 2,330 14,900 4,532 15,905 Add/(less) non-cash items: Depreciation and amortisation 33,183 31,779 35,402 33,866 Impairment charges - (152) - (138)Vested assets (1,714) (6,134) (1,788) (6,186)Provision movement (233) (133) (233) (106)Share of associates deficit - - 44 (64)(Gains)/losses in fair value of biological assets (227) (184) (227) (184)(Gains)/losses in fair value of investment property 941 (157) (21) (157)(Increase)/decrease in operating property valuation - - - - (Gains)/losses in fair value of investment fund - (38) - (38)Financial asset fair value adjustment - - - - (Gains)/losses in fair value of derivative financial instruments 3,546 (211) 3,546 (211)Effect of change in discount rate on provisions and discount unwind - 45 - 45 Loan recognised as grant - - - - Effective interest - 55 2 53 Deferred tax movement - - (43) (232)Add/(less) items classified as investing or financing activities: (Gains)/losses on disposal of property, plant and equipment 37 560 39 592 Add/(less) movements in working capital items: Accounts receivable 1,312 (2,890) 1,282 (3,017)Goods and Services Tax (net) (78) (423) (147) (549)Inventories 90 16 92 - Accounts payable (inclusive of employee benefits) (1,065) 6,059 (1,055) 6,595 Provision for taxation - - - 52
NET CASH INFLOW/(OUTFLOW) FROM OPERATING ACTIVITIES 38,122 43,092 41,317 46,226
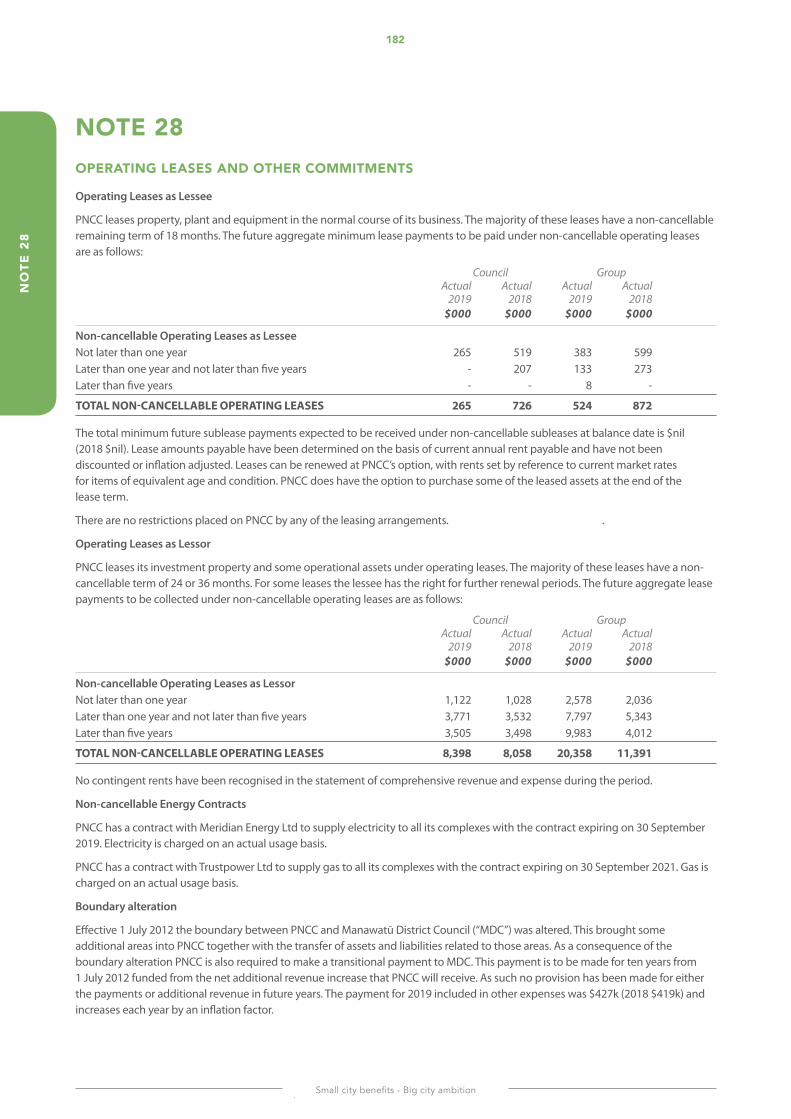
182
Small city benefits - Big city ambition
NO
TE 2
8
NOTE 28OPERATING LEASES ANd OTHER COMMITMENTS
Operating Leases as Lessee
PNCC leases property, plant and equipment in the normal course of its business. The majority of these leases have a non-cancellable remaining term of 18 months. The future aggregate minimum lease payments to be paid under non-cancellable operating leases are as follows:
Council Group Actual Actual Actual Actual 2019 2018 2019 2018 $000 $000 $000 $000
Non-cancellable Operating Leases as Lessee Not later than one year 265 519 383 599 Later than one year and not later than five years - 207 133 273 Later than five years - - 8 -
TOTAL NON-CANCELLABLE OPERATING LEASES 265 726 524 872
The total minimum future sublease payments expected to be received under non-cancellable subleases at balance date is $nil (2018 $nil). Lease amounts payable have been determined on the basis of current annual rent payable and have not been discounted or inflation adjusted. Leases can be renewed at PNCC’s option, with rents set by reference to current market rates for items of equivalent age and condition. PNCC does have the option to purchase some of the leased assets at the end of the lease term.
There are no restrictions placed on PNCC by any of the leasing arrangements. .
Operating Leases as Lessor
PNCC leases its investment property and some operational assets under operating leases. The majority of these leases have a non-cancellable term of 24 or 36 months. For some leases the lessee has the right for further renewal periods. The future aggregate lease payments to be collected under non-cancellable operating leases are as follows:
Council Group Actual Actual Actual Actual 2019 2018 2019 2018 $000 $000 $000 $000
Non-cancellable Operating Leases as Lessor Not later than one year 1,122 1,028 2,578 2,036 Later than one year and not later than five years 3,771 3,532 7,797 5,343 Later than five years 3,505 3,498 9,983 4,012
TOTAL NON-CANCELLABLE OPERATING LEASES 8,398 8,058 20,358 11,391
No contingent rents have been recognised in the statement of comprehensive revenue and expense during the period.
Non-cancellable Energy Contracts
PNCC has a contract with Meridian Energy Ltd to supply electricity to all its complexes with the contract expiring on 30 September 2019. Electricity is charged on an actual usage basis.
PNCC has a contract with Trustpower Ltd to supply gas to all its complexes with the contract expiring on 30 September 2021. Gas is charged on an actual usage basis.
Boundary alteration
Effective 1 July 2012 the boundary between PNCC and Manawatū District Council (“MDC”) was altered. This brought some additional areas into PNCC together with the transfer of assets and liabilities related to those areas. As a consequence of the boundary alteration PNCC is also required to make a transitional payment to MDC. This payment is to be made for ten years from 1 July 2012 funded from the net additional revenue increase that PNCC will receive. As such no provision has been made for either the payments or additional revenue in future years. The payment for 2019 included in other expenses was $427k (2018 $419k) and increases each year by an inflation factor.
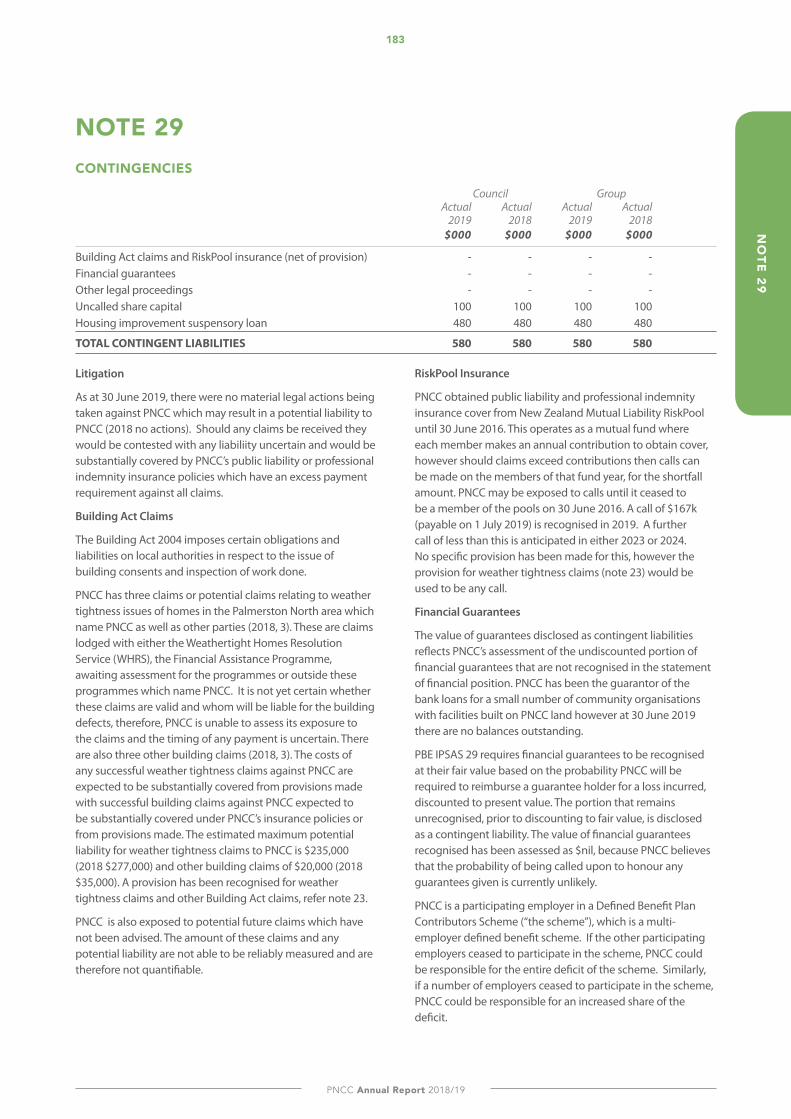
183
PNCC Annual Report 2018/19
NO
TE 29
NOTE 29CONTINGENCIES
Council Group Actual Actual Actual Actual 2019 2018 2019 2018 $000 $000 $000 $000
Building Act claims and RiskPool insurance (net of provision) - - - - Financial guarantees - - - - Other legal proceedings - - - - Uncalled share capital 100 100 100 100 Housing improvement suspensory loan 480 480 480 480
TOTAL CONTINGENT LIABILITIES 580 580 580 580
Litigation
As at 30 June 2019, there were no material legal actions being taken against PNCC which may result in a potential liability to PNCC (2018 no actions). Should any claims be received they would be contested with any liabiliity uncertain and would be substantially covered by PNCC’s public liability or professional indemnity insurance policies which have an excess payment requirement against all claims.
Building Act Claims
The Building Act 2004 imposes certain obligations and liabilities on local authorities in respect to the issue of building consents and inspection of work done.
PNCC has three claims or potential claims relating to weather tightness issues of homes in the Palmerston North area which name PNCC as well as other parties (2018, 3). These are claims lodged with either the Weathertight Homes Resolution Service (WHRS), the Financial Assistance Programme, awaiting assessment for the programmes or outside these programmes which name PNCC. It is not yet certain whether these claims are valid and whom will be liable for the building defects, therefore, PNCC is unable to assess its exposure to the claims and the timing of any payment is uncertain. There are also three other building claims (2018, 3). The costs of any successful weather tightness claims against PNCC are expected to be substantially covered from provisions made with successful building claims against PNCC expected to be substantially covered under PNCC’s insurance policies or from provisions made. The estimated maximum potential liability for weather tightness claims to PNCC is $235,000 (2018 $277,000) and other building claims of $20,000 (2018 $35,000). A provision has been recognised for weather tightness claims and other Building Act claims, refer note 23.
PNCC is also exposed to potential future claims which have not been advised. The amount of these claims and any potential liability are not able to be reliably measured and are therefore not quantifiable.
RiskPool Insurance
PNCC obtained public liability and professional indemnity insurance cover from New Zealand Mutual Liability RiskPool until 30 June 2016. This operates as a mutual fund where each member makes an annual contribution to obtain cover, however should claims exceed contributions then calls can be made on the members of that fund year, for the shortfall amount. PNCC may be exposed to calls until it ceased to be a member of the pools on 30 June 2016. A call of $167k (payable on 1 July 2019) is recognised in 2019. A further call of less than this is anticipated in either 2023 or 2024. No specific provision has been made for this, however the provision for weather tightness claims (note 23) would be used to be any call.
Financial Guarantees
The value of guarantees disclosed as contingent liabilities reflects PNCC’s assessment of the undiscounted portion of financial guarantees that are not recognised in the statement of financial position. PNCC has been the guarantor of the bank loans for a small number of community organisations with facilities built on PNCC land however at 30 June 2019 there are no balances outstanding.
PBE IPSAS 29 requires financial guarantees to be recognised at their fair value based on the probability PNCC will be required to reimburse a guarantee holder for a loss incurred, discounted to present value. The portion that remains unrecognised, prior to discounting to fair value, is disclosed as a contingent liability. The value of financial guarantees recognised has been assessed as $nil, because PNCC believes that the probability of being called upon to honour any guarantees given is currently unlikely.
PNCC is a participating employer in a Defined Benefit Plan Contributors Scheme (“the scheme”), which is a multi-employer defined benefit scheme. If the other participating employers ceased to participate in the scheme, PNCC could be responsible for the entire deficit of the scheme. Similarly, if a number of employers ceased to participate in the scheme, PNCC could be responsible for an increased share of the deficit.
184
Small city benefits - Big city ambition
NO
TE 2
9
New Zealand Local Government Funding Agency Limited
PNCC is a shareholder of the New Zealand Local Government Funding Agency Limited (NZLGFA). The NZLGFA was incorporated in December 2011 with the purpose of providing debt funding to local authorities in New Zealand and it has a current credit rating from S&P Global’s of AA+. PNCC is one of several shareholders of the NZLGFA. In that regard it has uncalled capital of $0.1m. When aggregated with the uncalled capital of other shareholders, this is available in the event that an imminent default is identified. Also, together with the other shareholders, PNCC is a guarantor of all of NZLGFA’s borrowings. At 30 June 2019 NZLGFA had borrowings totalling $9,840m (2018 $8,594m). Financial reporting standards require PNCC to recognise the guarantee liability at fair value. However, PNCC has been unable to determine a sufficiently reliable fair value for the guarantee, and therefore has not recognised a liability. PNCC considers the risk of NZLGFA defaulting on repayment of interest or capital to be very low on the basis that we are not aware of any local authority debt default events in New Zealand and local government legislation would enable local authorities to levy a rate to recover sufficient funds to meet any debt obligations if further funds were required.
Housing improvement suspensory loan
In 2010 and 2011 PNCC received a total of $480,000 as part of a housing improvement scheme operated by Housing New Zealand. This loan has been utilised in improving community housing, is interest free and secured against those housing units. The loan is suspensory providing PNCC continues to own the units for 20 years, as is intended. PNCC has treated this as a grant and not a loan and included this in revenue for capital expenditure as it intends to own these units indefinitely. Should any of these units be sold within the 20 year period the related loan would be repayable.
Emission Units
PNCC owns land and forests subject to the New Zealand emissions trading scheme. This has implications should the land be deforested with the Government providing compensation emission units for this restriction. PNCC has received 34,470 compensating emission units relating to qualifying pre-1990 forests which are recorded at a nil value.
Should forest land be deforested, PNCC may be liable for deforestation penalties relating to pre-1990 forest land of approximately 620 hectares. As it is intended to re-plant this land, or allow it to regenerate, in forest species with no current intention of deforestation, no liability is provided.
Unquantified contingent liabilities
There are various claims that PNCC are currently contesting which have not been quantified due to the nature of the issues, the uncertainty of the outcome and/or the extent to which PNCC have a responsibility to the claimant. The possibility of any outflow in settlement in these cases is assessed as remote.
Palmerston North Airport Ltd had been using PFOS foam for firefighting training exercises at the airport until the late 1980s. Preliminary investigations have commenced to detemine the level and extent of any residue contamination that may be present on site. The extent of any costs from the investigation remain unknown until the preliminary tests are completed. The airport has now selected a compliant foam for future use.
Contingent assets
PNCC enables sports clubs to construct facilities (eg club rooms) on reserve land. These clubs control the use of these facilities and PNCC will only gain control of the asset if the club vacates the facility. Until this event occurs these assets are not recognised as assets in the Statement of Financial Position.
PNCC had provided a loan to the Manfeild Park Trust to assist with the construction of a multi-purpose indoor/outdoor stadium at Manfeild Park. Repayment of the loan has been suspended and will be required only if certain conditions are incurred, primarily relating to winding up of the Trust or sale by the Trust of it’s assets. As this is not expected to occur in normal ongoing operations of the Trust the loan asset is not recognised in the Statement of Financial Position.
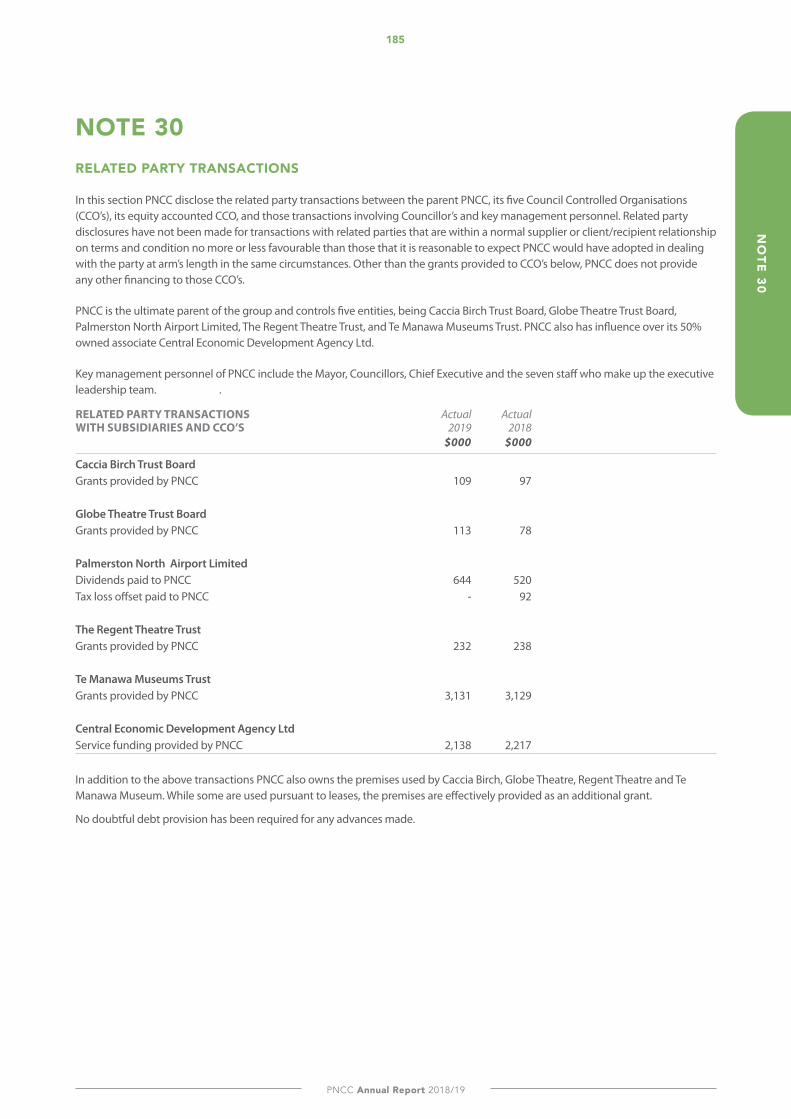
185
PNCC Annual Report 2018/19
NO
TE 30
NOTE 30RELATEd PARTY TRANSACTIONS
In this section PNCC disclose the related party transactions between the parent PNCC, its five Council Controlled Organisations (CCO’s), its equity accounted CCO, and those transactions involving Councillor’s and key management personnel. Related party disclosures have not been made for transactions with related parties that are within a normal supplier or client/recipient relationship on terms and condition no more or less favourable than those that it is reasonable to expect PNCC would have adopted in dealing with the party at arm’s length in the same circumstances. Other than the grants provided to CCO’s below, PNCC does not provide any other financing to those CCO’s.
PNCC is the ultimate parent of the group and controls five entities, being Caccia Birch Trust Board, Globe Theatre Trust Board, Palmerston North Airport Limited, The Regent Theatre Trust, and Te Manawa Museums Trust. PNCC also has influence over its 50% owned associate Central Economic Development Agency Ltd.
Key management personnel of PNCC include the Mayor, Councillors, Chief Executive and the seven staff who make up the executive leadership team. .
RELATED PARTY TRANSACTIONS Actual ActualWITH SUBSIDIARIES AND CCO’S 2019 2018 $000 $000
Caccia Birch Trust Board Grants provided by PNCC 109 97 Globe Theatre Trust Board Grants provided by PNCC 113 78 Palmerston North Airport Limited Dividends paid to PNCC 644 520Tax loss offset paid to PNCC - 92 The Regent Theatre Trust Grants provided by PNCC 232 238 Te Manawa Museums Trust Grants provided by PNCC 3,131 3,129 Central Economic Development Agency Ltd Service funding provided by PNCC 2,138 2,217
In addition to the above transactions PNCC also owns the premises used by Caccia Birch, Globe Theatre, Regent Theatre and Te Manawa Museum. While some are used pursuant to leases, the premises are effectively provided as an additional grant.
No doubtful debt provision has been required for any advances made.
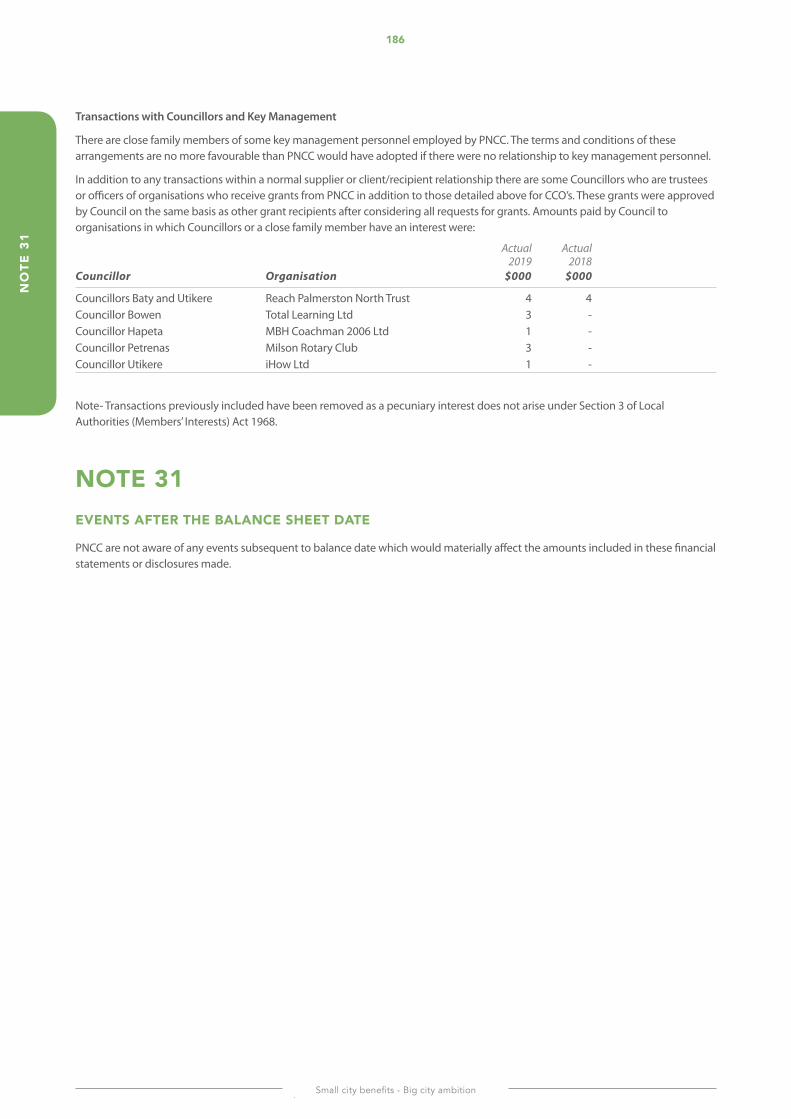
186
Small city benefits - Big city ambition
NO
TE 3
1
Transactions with Councillors and Key Management
There are close family members of some key management personnel employed by PNCC. The terms and conditions of these arrangements are no more favourable than PNCC would have adopted if there were no relationship to key management personnel.
In addition to any transactions within a normal supplier or client/recipient relationship there are some Councillors who are trustees or officers of organisations who receive grants from PNCC in addition to those detailed above for CCO’s. These grants were approved by Council on the same basis as other grant recipients after considering all requests for grants. Amounts paid by Council to organisations in which Councillors or a close family member have an interest were:
Actual Actual 2019 2018Councillor Organisation $000 $000
Councillors Baty and Utikere Reach Palmerston North Trust 4 4Councillor Bowen Total Learning Ltd 3 -Councillor Hapeta MBH Coachman 2006 Ltd 1 -Councillor Petrenas Milson Rotary Club 3 -Councillor Utikere iHow Ltd 1 -
Note- Transactions previously included have been removed as a pecuniary interest does not arise under Section 3 of Local Authorities (Members’ Interests) Act 1968.
NOTE 31EVENTS AFTER THE BALANCE SHEET dATE
PNCC are not aware of any events subsequent to balance date which would materially affect the amounts included in these financial statements or disclosures made.
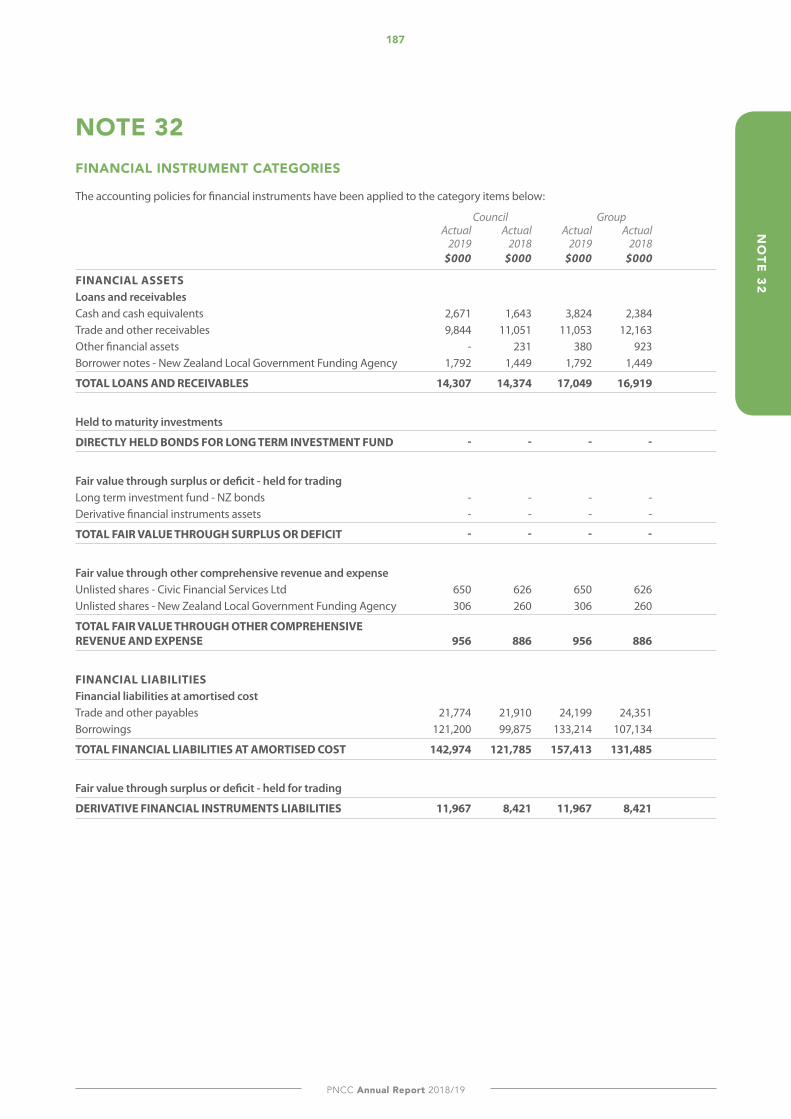
187
PNCC Annual Report 2018/19
NO
TE 32
NOTE 32FINANCIAL INSTRUMENT CATEGORIES
The accounting policies for financial instruments have been applied to the category items below:
Council Group Actual Actual Actual Actual 2019 2018 2019 2018 $000 $000 $000 $000
FINANCIAL ASSETS Loans and receivables Cash and cash equivalents 2,671 1,643 3,824 2,384 Trade and other receivables 9,844 11,051 11,053 12,163 Other financial assets - 231 380 923 Borrower notes - New Zealand Local Government Funding Agency 1,792 1,449 1,792 1,449
TOTAL LOANS AND RECEIVABLES 14,307 14,374 17,049 16,919
Held to maturity investments
DIRECTLY HELD BONDS FOR LONG TERM INVESTMENT FUND - - - -
Fair value through surplus or deficit - held for trading Long term investment fund - NZ bonds - - - - Derivative financial instruments assets - - - -
TOTAL FAIR VALUE THROUGH SURPLUS OR DEFICIT - - - -
Fair value through other comprehensive revenue and expense Unlisted shares - Civic Financial Services Ltd 650 626 650 626 Unlisted shares - New Zealand Local Government Funding Agency 306 260 306 260
TOTAL FAIR VALUE THROUGH OTHER COMPREHENSIVE REVENUE AND EXPENSE 956 886 956 886
FINANCIAL LIABILITIES Financial liabilities at amortised cost Trade and other payables 21,774 21,910 24,199 24,351 Borrowings 121,200 99,875 133,214 107,134
TOTAL FINANCIAL LIABILITIES AT AMORTISED COST 142,974 121,785 157,413 131,485
Fair value through surplus or deficit - held for trading
DERIVATIVE FINANCIAL INSTRUMENTS LIABILITIES 11,967 8,421 11,967 8,421
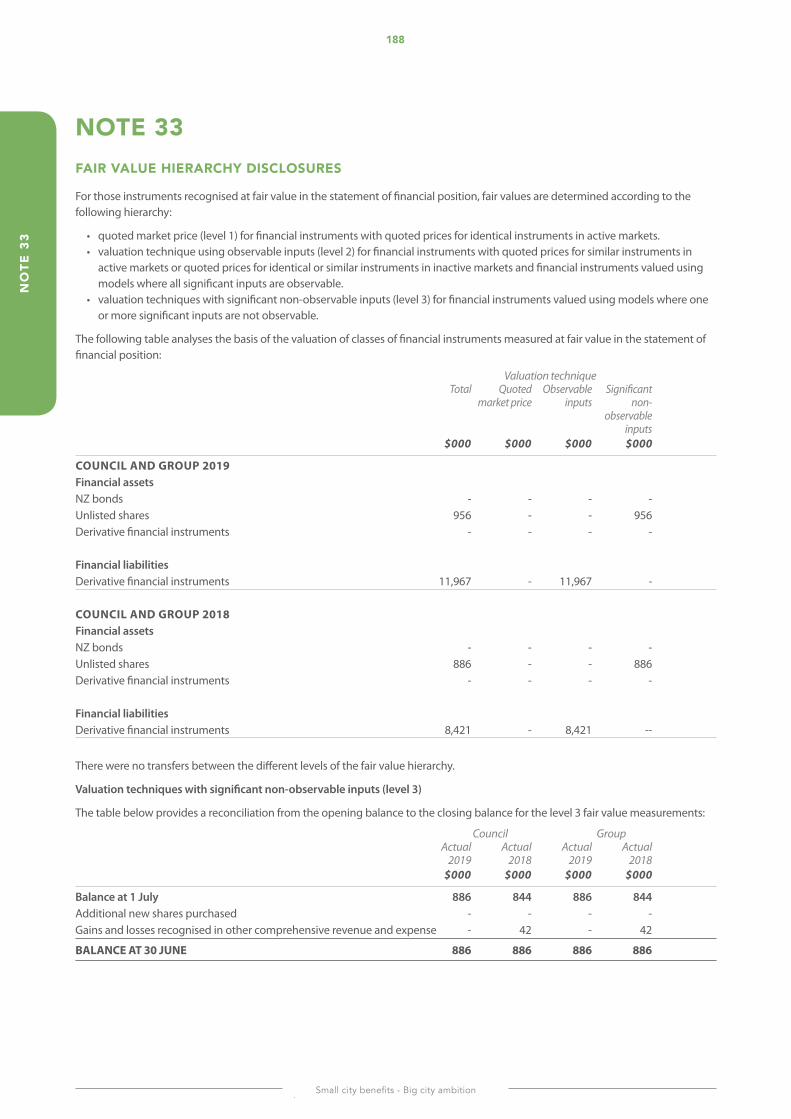
188
Small city benefits - Big city ambition
NO
TE 3
3
NOTE 33FAIR VALUE HIERARCHY dISCLOSURES
For those instruments recognised at fair value in the statement of financial position, fair values are determined according to the following hierarchy:
• quoted market price (level 1) for financial instruments with quoted prices for identical instruments in active markets. • valuation technique using observable inputs (level 2) for financial instruments with quoted prices for similar instruments in
active markets or quoted prices for identical or similar instruments in inactive markets and financial instruments valued using models where all significant inputs are observable.
• valuation techniques with significant non-observable inputs (level 3) for financial instruments valued using models where one or more significant inputs are not observable.
The following table analyses the basis of the valuation of classes of financial instruments measured at fair value in the statement of financial position:
Valuation technique Total Quoted Observable Significant market price inputs non- observable inputs $000 $000 $000 $000
COUNCIL AND GROUP 2019 Financial assets NZ bonds - - - -Unlisted shares 956 - - 956Derivative financial instruments - - - -
Financial liabilities Derivative financial instruments 11,967 - 11,967 -
COUNCIL AND GROUP 2018 Financial assets NZ bonds - - - -Unlisted shares 886 - - 886Derivative financial instruments - - - - Financial liabilities Derivative financial instruments 8,421 - 8,421 --
There were no transfers between the different levels of the fair value hierarchy.
Valuation techniques with significant non-observable inputs (level 3)
The table below provides a reconciliation from the opening balance to the closing balance for the level 3 fair value measurements:
Council Group Actual Actual Actual Actual 2019 2018 2019 2018 $000 $000 $000 $000
Balance at 1 July 886 844 886 844 Additional new shares purchased - - - - Gains and losses recognised in other comprehensive revenue and expense - 42 - 42
BALANCE AT 30 JUNE 886 886 886 886
189
PNCC Annual Report 2018/19
NO
TE 34
NOTE 34FINANCIAL INSTRUMENT RISKS
PNCC has adopted a Treasury Policy which prescribes the framework within which the financial assets and liabilities will be managed. The policy has a particular focus on risks associated with financial instruments. It does not allow any transactions which are speculative in nature to be entered into.
PwC New Zealand is engaged as advisors in relation to PNCC’s term borrowings.
PNCC has financial assets and liabilities as outlined in note 11 (cash and cash equivalents), note 12 (trade and other receivables), note 14 (other financial assets), note 16 (derivative financial instruments), note 22 (trade and other payables) and note 25 (borrowings).
The level of borrowing is determined by the Council through the 10 Year Plan as modified each year by the Annual Budget. All external debt must be authorised by resolution of the Council. The Treasury Policy contains not only guidelines aimed at minimising the impact of various types of risk but also sets what are assessed as being prudent maximum borrowing limits.
Market risks
Price risk
Price risk is the risk that the fair value of a financial instrument will fluctuate as a result of changes in market prices. PNCC is exposed to equity securities price risk on its share investments intended to be held long term. This price risk arises due to market movements in listed securities or unlisted shares.
Currency risk
Currency risk is the risk that the fair value of a financial instrument will fluctuate due to changes in foreign exchange rates. PNCC has no exposure to currency risk.
Fair value interest rate risks
Fair value interest rate risk is the risk that the value of a financial instrument will fluctuate due to changes in market interest rates. Borrowing issued at fixed rates expose PNCC to fair value interest rate risk. PNCC’s Treasury Policy prescribes that no more than 45% of the total borrowings will have a floating rate profile. Fixed to floating interest rate swaps are entered into to hedge the fair value interest rate risk arising where PNCC has borrowed at fixed rates in excess of prescribed levels. In addition investments at fixed interest rates expose PNCC to fair value interest rate risk.
Cash flow interest rate risks
Cash flow interest rate risk is the risk that cash flows from a financial instrument will fluctuate because of changes in market interest rates. Borrowings and investments issued at variable interest rates expose PNCC to cash flow interest rate risk. PNCC manages its cash flow interest rate risk on borrowings by using interest rate swaps. Such interest rate swaps have the economic effect of converting borrowings at floating rates into fixed rates that are generally lower than those available if PNCC borrowed at fixed rates directly. Under interest rate swaps, PNCC agrees with other parties to exchange, at specified intervals, the difference between fixed contract rates and floating rate interest amounts calculated by reference to the agreed notional principal amounts.
Credit risk
Credit risk is the risk that a third party will default on its obligation to PNCC, causing PNCC to incur a loss. Financial instruments will potentially subject PNCC to credit risk.
Credit risk is minimised as a result of several key controls including maintaining maximum limits for each broad class of counterparty and individual counterparties, limiting investments to organisations with a S&P Global’s investment grade rating or equivalent, and controlling the level and spread of trade and other receivables outstanding. As a result there are no significant concentrations of credit risk. The maximum exposure to credit risk is represented by the carrying amount of each financial asset in the Statement of Financial Position and the face value of off-balance sheet guarantees to community groups (refer Note 29).
PNCC has no collateral or other credit enhancements for financial instruments that give rise to credit risk.
PNCC is exposed to credit risk as a guarantor of all of the NZLGFA’s borrowings. Refer note 29 for details. .
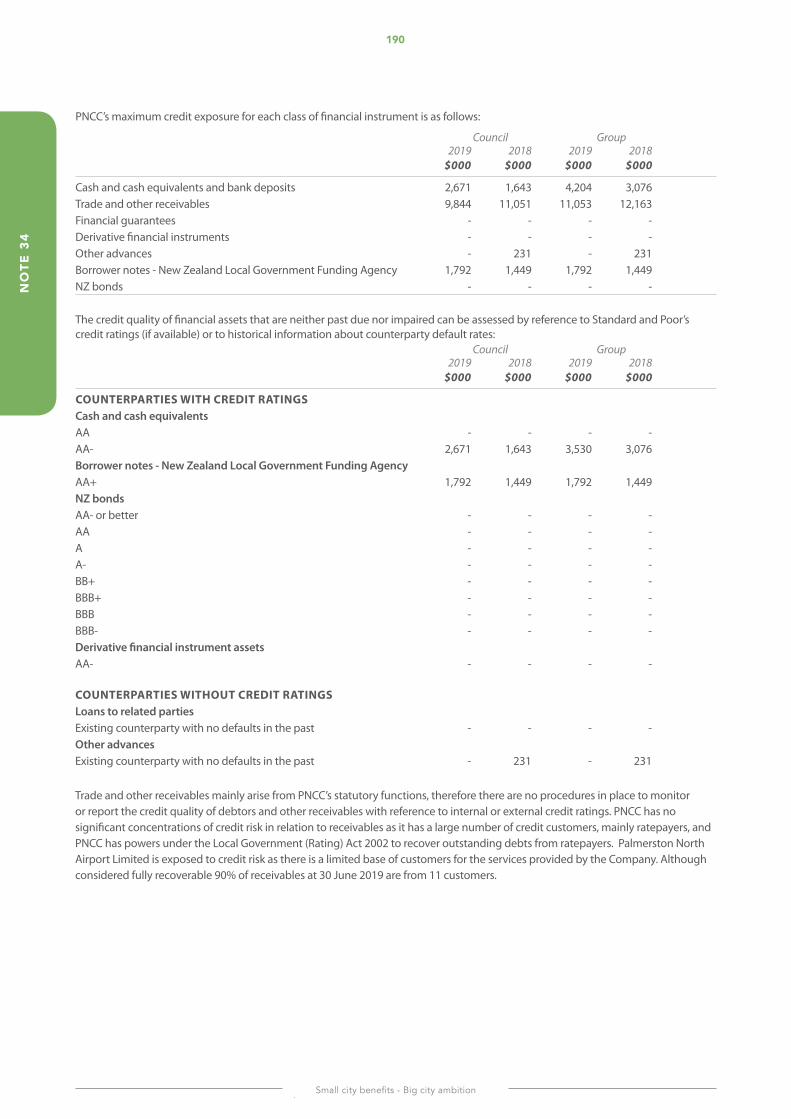
190
Small city benefits - Big city ambition
NO
TE 3
4
PNCC’s maximum credit exposure for each class of financial instrument is as follows:
Council Group 2019 2018 2019 2018 $000 $000 $000 $000
Cash and cash equivalents and bank deposits 2,671 1,643 4,204 3,076Trade and other receivables 9,844 11,051 11,053 12,163Financial guarantees - - - -Derivative financial instruments - - - -Other advances - 231 - 231Borrower notes - New Zealand Local Government Funding Agency 1,792 1,449 1,792 1,449NZ bonds - - - -
The credit quality of financial assets that are neither past due nor impaired can be assessed by reference to Standard and Poor’s credit ratings (if available) or to historical information about counterparty default rates: Council Group 2019 2018 2019 2018 $000 $000 $000 $000
COUNTERPARTIES WITH CREDIT RATINGS Cash and cash equivalents AA - - - -AA- 2,671 1,643 3,530 3,076Borrower notes - New Zealand Local Government Funding Agency AA+ 1,792 1,449 1,792 1,449NZ bonds AA- or better - - - -AA - - - -A - - - -A- - - - -BB+ - - - -BBB+ - - - -BBB - - - -BBB- - - - -Derivative financial instrument assets AA- - - - - COUNTERPARTIES WITHOUT CREDIT RATINGS Loans to related parties Existing counterparty with no defaults in the past - - - - Other advances Existing counterparty with no defaults in the past - 231 - 231
Trade and other receivables mainly arise from PNCC’s statutory functions, therefore there are no procedures in place to monitor or report the credit quality of debtors and other receivables with reference to internal or external credit ratings. PNCC has no significant concentrations of credit risk in relation to receivables as it has a large number of credit customers, mainly ratepayers, and PNCC has powers under the Local Government (Rating) Act 2002 to recover outstanding debts from ratepayers. Palmerston North Airport Limited is exposed to credit risk as there is a limited base of customers for the services provided by the Company. Although considered fully recoverable 90% of receivables at 30 June 2019 are from 11 customers.

191
PNCC Annual Report 2018/19
NO
TE 34
Liquidity risk
Liquidity risk is the risk that PNCC will encounter difficulty raising liquid funds to meet commitments as they fall due. Prudent liquidity risk management implies maintaining sufficient cash, the availability of funding through an adequate amount of committed credit facilities and the ability to close out market positions. PNCC aims to maintain flexibility in funding by keeping committed credit lines available.
PNCC manages its borrowings in accordance with its funding and financial policies, which includes a Liability Management Policy. These policies have been adopted as part of PNCC’s Treasury Policy.
The table below analyses PNCC’s financial liabilities into relevant maturity groupings based on the remaining period at the balance date to the contractual maturity date. Future interest payments on floating rate debt are based on the floating rate on the instrument at the balance date. The amounts disclosed are the contractual undiscounted cash flows and include interest payments.
Carrying Contractual Less than 1-2 years 3-5 years More than amount cash flows 1 year 5 years $000 $000 $000 $000 $000 $000
COUNCIL 2019 Trade and other payables 21,774 21,774 21,774 - - - Bank overdraft - - - - - - Secured loans 2,200 2,262 57 2,205 - - Debentures 5,000 5,393 121 121 5,151 - Commercial paper, short term - - - - - - New Zealand Local Government Funding Agency 114,000 117,305 2,489 22,489 40,208 52,119Finance leases - - - - - -
TOTAL 142,974 146,734 24,441 24,815 45,359 52,119
GROUP 2019 Trade and other payables 24,199 24,199 24,199 - - - Bank overdraft 3,964 4,894 186 186 4,522 - Secured loans 10,250 13,098 435 2,583 10,080 - Debentures 5,000 5,393 121 121 5,151 - Commercial paper, short term - - - - - - New Zealand Local Government Funding Agency 114,000 117,305 2,489 22,489 40,208 52,119Finance leases - - - - - -
TOTAL 157,413 164,889 27,430 25,379 59,961 52,119
COUNCIL 2018 Trade and other payables 21,910 21,910 21,910 - - - Bank overdraft - - - - - - Secured loans 2,875 3,043 81 81 2,881 - Debentures 5,000 5,566 133 133 5,300 - Commercial paper, short term - - - - - - New Zealand Local Government Funding Agency 92,000 101,625 27,096 1,718 43,886 28,925Finance leases - - - - - -
TOTAL 121,785 132,144 49,220 1,932 52,067 28,925
GROUP 2018 Trade and other payables 24,351 24,351 24,351 - - - Bank overdraft 1,159 1,370 46 46 1,278 - Secured loans 8,975 10,594 398 398 9,798 - Debentures 5,000 5,566 133 133 5,300 - Commercial paper, short term - - - - - - New Zealand Local Government Funding Agency 92,000 101,625 27,096 1,718 43,886 28,925Finance leases - - - - - -
TOTAL 131,485 143,506 52,024 2,295 60,262 28,925
PNCC is exposed to liquidity risk as a guarantor of all of the NZLGFA’s borrowings. This guarantee becomes callable in the event of the NZLGFA failing to pay its borrowings when they fall due. Refer note 29 for details.
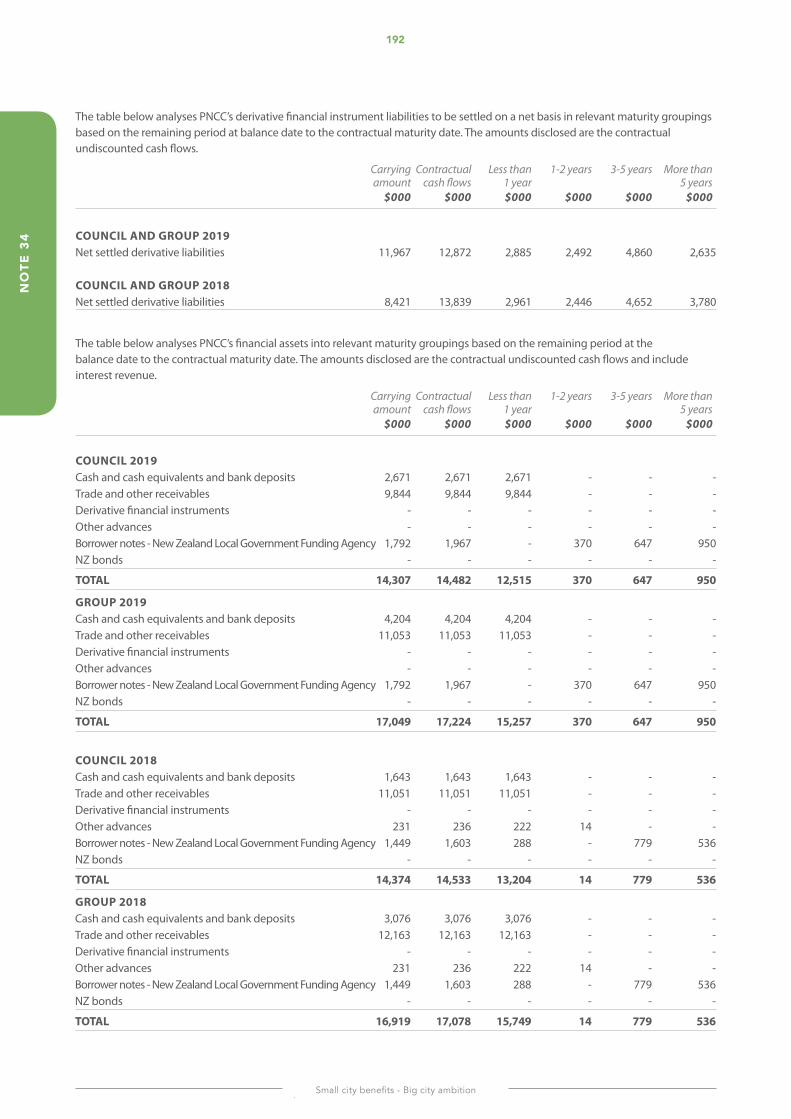
192
Small city benefits - Big city ambition
NO
TE 3
4
The table below analyses PNCC’s derivative financial instrument liabilities to be settled on a net basis in relevant maturity groupings based on the remaining period at balance date to the contractual maturity date. The amounts disclosed are the contractual undiscounted cash flows.
Carrying Contractual Less than 1-2 years 3-5 years More than amount cash flows 1 year 5 years $000 $000 $000 $000 $000 $000
COUNCIL AND GROUP 2019 Net settled derivative liabilities 11,967 12,872 2,885 2,492 4,860 2,635 COUNCIL AND GROUP 2018 Net settled derivative liabilities 8,421 13,839 2,961 2,446 4,652 3,780
The table below analyses PNCC’s financial assets into relevant maturity groupings based on the remaining period at the balance date to the contractual maturity date. The amounts disclosed are the contractual undiscounted cash flows and include interest revenue.
Carrying Contractual Less than 1-2 years 3-5 years More than amount cash flows 1 year 5 years $000 $000 $000 $000 $000 $000
COUNCIL 2019 Cash and cash equivalents and bank deposits 2,671 2,671 2,671 - - - Trade and other receivables 9,844 9,844 9,844 - - - Derivative financial instruments - - - - - - Other advances - - - - - - Borrower notes - New Zealand Local Government Funding Agency 1,792 1,967 - 370 647 950NZ bonds - - - - - -
TOTAL 14,307 14,482 12,515 370 647 950
GROUP 2019 Cash and cash equivalents and bank deposits 4,204 4,204 4,204 - - - Trade and other receivables 11,053 11,053 11,053 - - - Derivative financial instruments - - - - - - Other advances - - - - - - Borrower notes - New Zealand Local Government Funding Agency 1,792 1,967 - 370 647 950 NZ bonds - - - - - -
TOTAL 17,049 17,224 15,257 370 647 950
COUNCIL 2018 Cash and cash equivalents and bank deposits 1,643 1,643 1,643 - - - Trade and other receivables 11,051 11,051 11,051 - - - Derivative financial instruments - - - - - - Other advances 231 236 222 14 - - Borrower notes - New Zealand Local Government Funding Agency 1,449 1,603 288 - 779 536NZ bonds - - - - - -
TOTAL 14,374 14,533 13,204 14 779 536
GROUP 2018 Cash and cash equivalents and bank deposits 3,076 3,076 3,076 - - - Trade and other receivables 12,163 12,163 12,163 - - - Derivative financial instruments - - - - - - Other advances 231 236 222 14 - - Borrower notes - New Zealand Local Government Funding Agency 1,449 1,603 288 - 779 536 NZ bonds - - - - - -
TOTAL 16,919 17,078 15,749 14 779 536
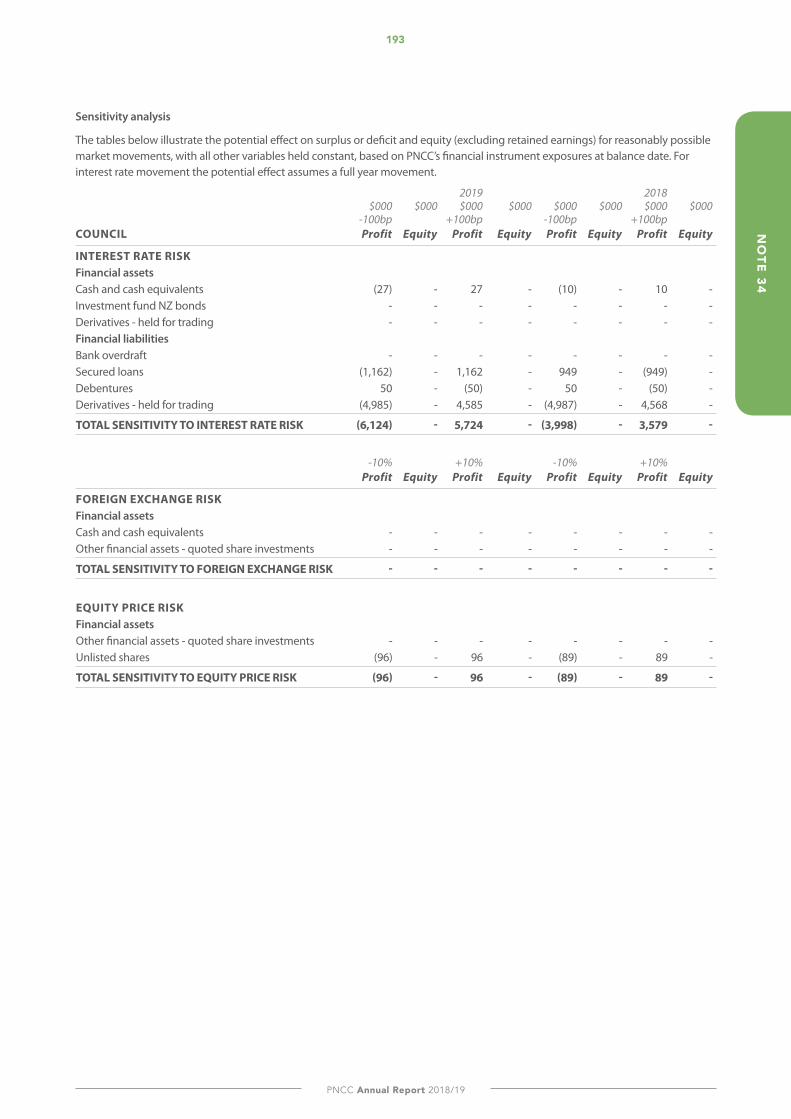
193
PNCC Annual Report 2018/19
NO
TE 34
Sensitivity analysis
The tables below illustrate the potential effect on surplus or deficit and equity (excluding retained earnings) for reasonably possible market movements, with all other variables held constant, based on PNCC’s financial instrument exposures at balance date. For interest rate movement the potential effect assumes a full year movement.
2019 2018 $000 $000 $000 $000 $000 $000 $000 $000 -100bp +100bp -100bp +100bp COUNCIL Profit Equity Profit Equity Profit Equity Profit Equity
INTEREST RATE RISK Financial assets Cash and cash equivalents (27) - 27 - (10) - 10 - Investment fund NZ bonds - - - - - - - - Derivatives - held for trading - - - - - - - - Financial liabilities Bank overdraft - - - - - - - - Secured loans (1,162) - 1,162 - 949 - (949) - Debentures 50 - (50) - 50 - (50) - Derivatives - held for trading (4,985) - 4,585 - (4,987) - 4,568 -
TOTAL SENSITIVITY TO INTEREST RATE RISK (6,124) - 5,724 - (3,998) - 3,579 -
-10% +10% -10% +10% Profit Equity Profit Equity Profit Equity Profit Equity
FOREIGN EXCHANGE RISK Financial assets Cash and cash equivalents - - - - - - - - Other financial assets - quoted share investments - - - - - - - -
TOTAL SENSITIVITY TO FOREIGN EXCHANGE RISK - - - - - - - -
EQUITY PRICE RISK Financial assets Other financial assets - quoted share investments - - - - - - - - Unlisted shares (96) - 96 - (89) - 89 -
TOTAL SENSITIVITY TO EQUITY PRICE RISK (96) - 96 - (89) - 89 -
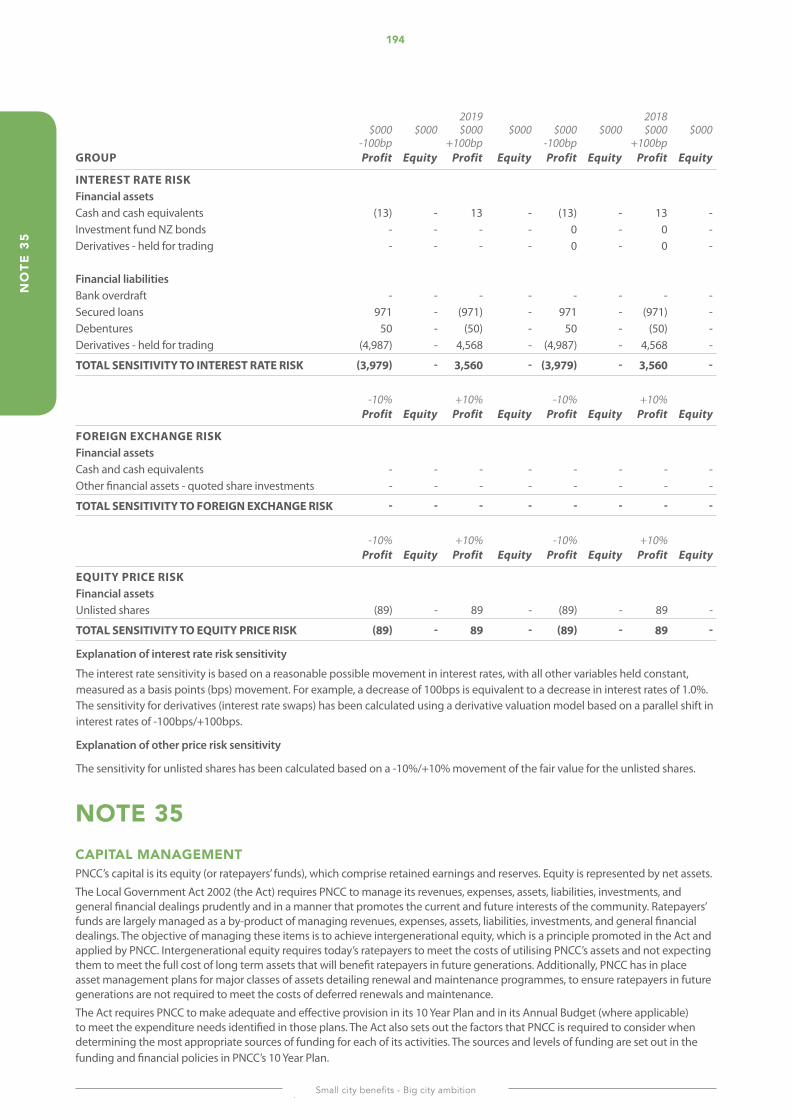
194
Small city benefits - Big city ambition
NO
TE 3
5
NOTE 35CAPITAL MANAGEMENTPNCC’s capital is its equity (or ratepayers’ funds), which comprise retained earnings and reserves. Equity is represented by net assets.
The Local Government Act 2002 (the Act) requires PNCC to manage its revenues, expenses, assets, liabilities, investments, and general financial dealings prudently and in a manner that promotes the current and future interests of the community. Ratepayers’ funds are largely managed as a by-product of managing revenues, expenses, assets, liabilities, investments, and general financial dealings. The objective of managing these items is to achieve intergenerational equity, which is a principle promoted in the Act and applied by PNCC. Intergenerational equity requires today’s ratepayers to meet the costs of utilising PNCC’s assets and not expecting them to meet the full cost of long term assets that will benefit ratepayers in future generations. Additionally, PNCC has in place asset management plans for major classes of assets detailing renewal and maintenance programmes, to ensure ratepayers in future generations are not required to meet the costs of deferred renewals and maintenance.
The Act requires PNCC to make adequate and effective provision in its 10 Year Plan and in its Annual Budget (where applicable) to meet the expenditure needs identified in those plans. The Act also sets out the factors that PNCC is required to consider when determining the most appropriate sources of funding for each of its activities. The sources and levels of funding are set out in the funding and financial policies in PNCC’s 10 Year Plan.
2019 2018 $000 $000 $000 $000 $000 $000 $000 $000 -100bp +100bp -100bp +100bp GROUP Profit Equity Profit Equity Profit Equity Profit Equity
INTEREST RATE RISK Financial assets Cash and cash equivalents (13) - 13 - (13) - 13 - Investment fund NZ bonds - - - - 0 - 0 - Derivatives - held for trading - - - - 0 - 0 - Financial liabilities Bank overdraft - - - - - - - - Secured loans 971 - (971) - 971 - (971) - Debentures 50 - (50) - 50 - (50) - Derivatives - held for trading (4,987) - 4,568 - (4,987) - 4,568 -
TOTAL SENSITIVITY TO INTEREST RATE RISK (3,979) - 3,560 - (3,979) - 3,560 -
-10% +10% -10% +10% Profit Equity Profit Equity Profit Equity Profit Equity
FOREIGN EXCHANGE RISK Financial assets Cash and cash equivalents - - - - - - - - Other financial assets - quoted share investments - - - - - - - -
TOTAL SENSITIVITY TO FOREIGN EXCHANGE RISK - - - - - - - -
-10% +10% -10% +10% Profit Equity Profit Equity Profit Equity Profit Equity
EQUITY PRICE RISK Financial assets Unlisted shares (89) - 89 - (89) - 89 -
TOTAL SENSITIVITY TO EQUITY PRICE RISK (89) - 89 - (89) - 89 -
Explanation of interest rate risk sensitivity
The interest rate sensitivity is based on a reasonable possible movement in interest rates, with all other variables held constant, measured as a basis points (bps) movement. For example, a decrease of 100bps is equivalent to a decrease in interest rates of 1.0%. The sensitivity for derivatives (interest rate swaps) has been calculated using a derivative valuation model based on a parallel shift in interest rates of -100bps/+100bps.
Explanation of other price risk sensitivity
The sensitivity for unlisted shares has been calculated based on a -10%/+10% movement of the fair value for the unlisted shares.
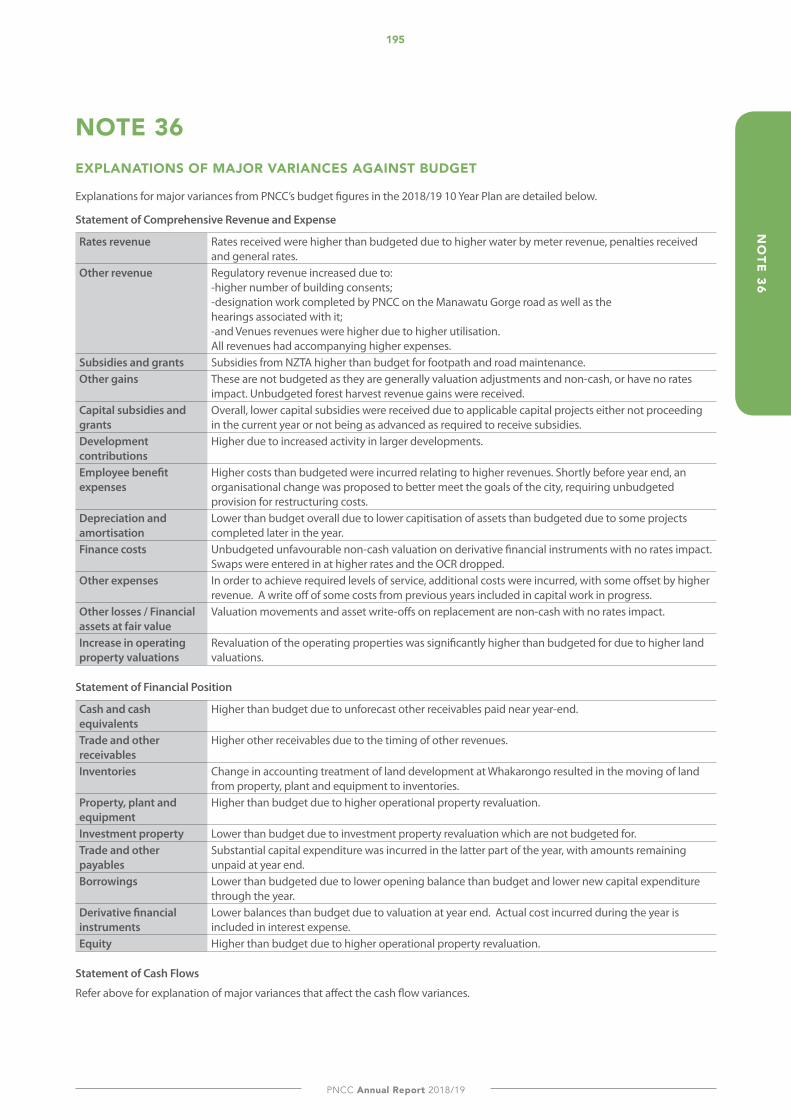
195
PNCC Annual Report 2018/19
NO
TE 36
NOTE 36EXPLANATIONS OF MAJOR VARIANCES AGAINST BUdGET
Explanations for major variances from PNCC’s budget figures in the 2018/19 10 Year Plan are detailed below.
Statement of Comprehensive Revenue and Expense
Rates revenue Rates received were higher than budgeted due to higher water by meter revenue, penalties received and general rates.
Other revenue Regulatory revenue increased due to:-higher number of building consents; -designation work completed by PNCC on the Manawatu Gorge road as well as the hearings associated with it; -and Venues revenues were higher due to higher utilisation. All revenues had accompanying higher expenses.
Subsidies and grants Subsidies from NZTA higher than budget for footpath and road maintenance.Other gains These are not budgeted as they are generally valuation adjustments and non-cash, or have no rates
impact. Unbudgeted forest harvest revenue gains were received.Capital subsidies and grants
Overall, lower capital subsidies were received due to applicable capital projects either not proceeding in the current year or not being as advanced as required to receive subsidies.
Development contributions
Higher due to increased activity in larger developments.
Employee benefit expenses
Higher costs than budgeted were incurred relating to higher revenues. Shortly before year end, an organisational change was proposed to better meet the goals of the city, requiring unbudgeted provision for restructuring costs.
Depreciation and amortisation
Lower than budget overall due to lower capitisation of assets than budgeted due to some projects completed later in the year.
Finance costs Unbudgeted unfavourable non-cash valuation on derivative financial instruments with no rates impact. Swaps were entered in at higher rates and the OCR dropped.
Other expenses In order to achieve required levels of service, additional costs were incurred, with some offset by higher revenue. A write off of some costs from previous years included in capital work in progress.
Other losses / Financial assets at fair value
Valuation movements and asset write-offs on replacement are non-cash with no rates impact.
Increase in operating property valuations
Revaluation of the operating properties was significantly higher than budgeted for due to higher land valuations.
Statement of Financial Position
Cash and cash equivalents
Higher than budget due to unforecast other receivables paid near year-end.
Trade and other receivables
Higher other receivables due to the timing of other revenues.
Inventories Change in accounting treatment of land development at Whakarongo resulted in the moving of land from property, plant and equipment to inventories.
Property, plant and equipment
Higher than budget due to higher operational property revaluation.
Investment property Lower than budget due to investment property revaluation which are not budgeted for.Trade and other payables
Substantial capital expenditure was incurred in the latter part of the year, with amounts remaining unpaid at year end.
Borrowings Lower than budgeted due to lower opening balance than budget and lower new capital expenditure through the year.
Derivative financial instruments
Lower balances than budget due to valuation at year end. Actual cost incurred during the year is included in interest expense.
Equity Higher than budget due to higher operational property revaluation.
Statement of Cash Flows
Refer above for explanation of major variances that affect the cash flow variances.
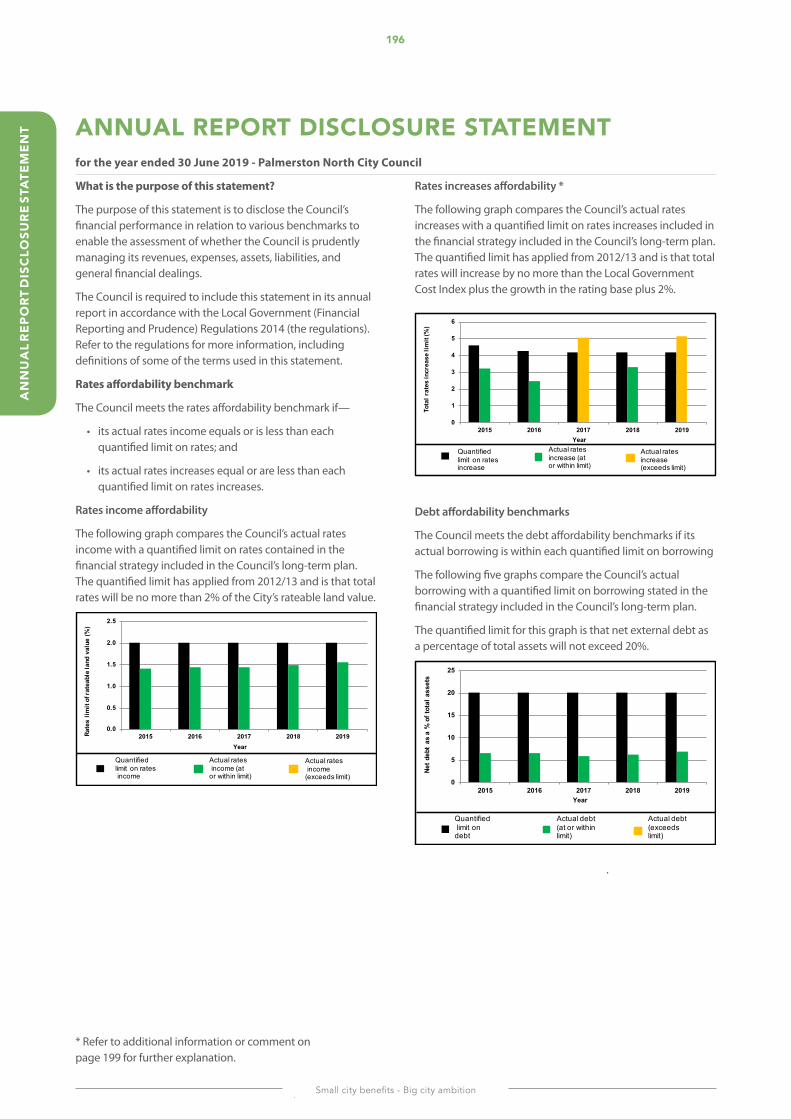
196
Small city benefits - Big city ambition
AN
NU
AL
REP
ORT
dIS
CLO
SUR
E ST
ATE
MEN
T ANNUAL REPORT dISCLOSURE STATEMENTfor the year ended 30 June 2019 - Palmerston North City Council
What is the purpose of this statement?
The purpose of this statement is to disclose the Council’s financial performance in relation to various benchmarks to enable the assessment of whether the Council is prudently managing its revenues, expenses, assets, liabilities, and general financial dealings.
The Council is required to include this statement in its annual report in accordance with the Local Government (Financial Reporting and Prudence) Regulations 2014 (the regulations). Refer to the regulations for more information, including definitions of some of the terms used in this statement.
Rates affordability benchmark
The Council meets the rates affordability benchmark if—
• its actual rates income equals or is less than each quantified limit on rates; and
• its actual rates increases equal or are less than each quantified limit on rates increases.
Rates income affordability
The following graph compares the Council’s actual rates income with a quantified limit on rates contained in the financial strategy included in the Council’s long-term plan. The quantified limit has applied from 2012/13 and is that total rates will be no more than 2% of the City’s rateable land value.
Rates increases affordability *
The following graph compares the Council’s actual rates increases with a quantified limit on rates increases included in the financial strategy included in the Council’s long-term plan. The quantified limit has applied from 2012/13 and is that total rates will increase by no more than the Local Government Cost Index plus the growth in the rating base plus 2%.
Debt affordability benchmarks
The Council meets the debt affordability benchmarks if its actual borrowing is within each quantified limit on borrowing
The following five graphs compare the Council’s actual borrowing with a quantified limit on borrowing stated in the financial strategy included in the Council’s long-term plan.
The quantified limit for this graph is that net external debt as a percentage of total assets will not exceed 20%.
.
0
1
2
3
4
5
6
2015 2016 2017 2018 2019To
tal r
ates
incr
ease
lim
it (%
)
Year
Quantifiedlimit on ratesincrease
Actual rates increase (at or within limit)
Actual rates increase (exceeds limit)
0.0
0.5
1.0
1.5
2.0
2.5
2015 2016 2017 2018 2019Rate
s lim
it of
rate
able
land
val
ue (%
)
Year
Quantified limit on ratesincome
Actual ratesincome (at
or within limit)
Actual ratesincome
(exceeds limit)0
5
10
15
20
25
2015 2016 2017 2018 2019
Net d
ebt
as a
% o
f tot
al a
sset
s
Year
Quantifiedlimit on
debt
Actual debt(at or withinlimit)
Actual debt (exceeds limit)
* Refer to additional information or comment on page 199 for further explanation.
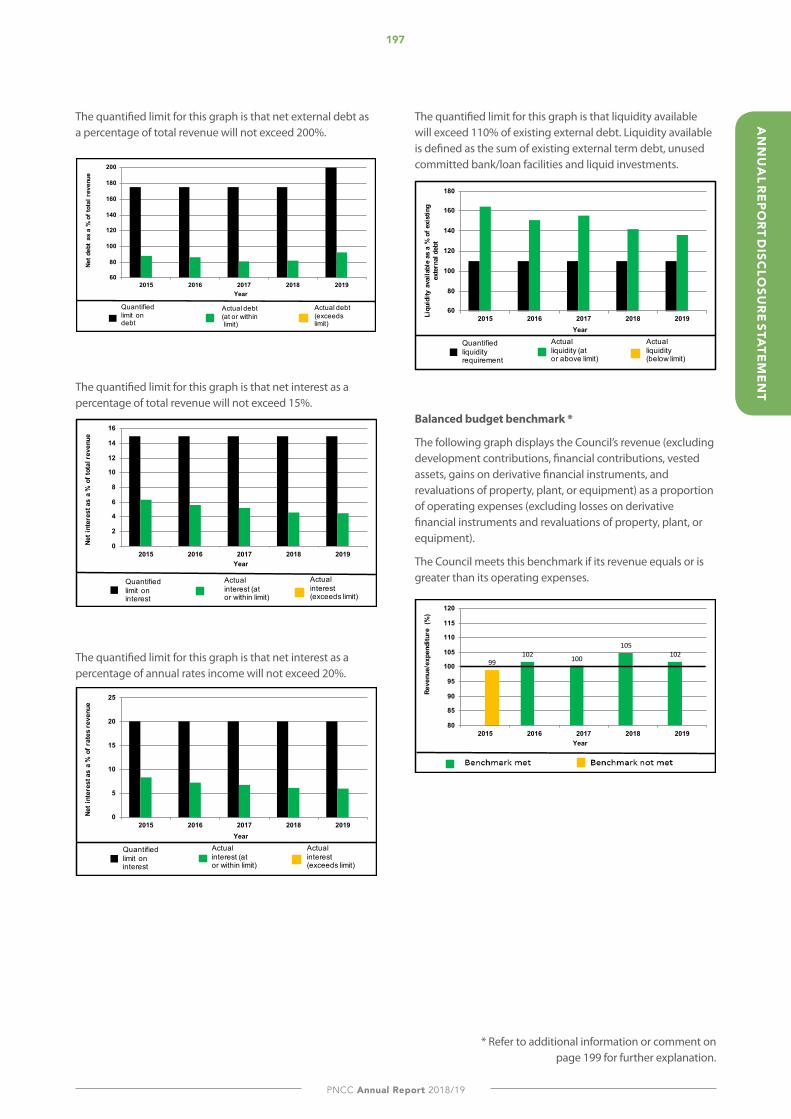
197
PNCC Annual Report 2018/19
AN
NU
AL R
EPORT d
ISCLO
SUR
E STATEM
ENT
The quantified limit for this graph is that net external debt as a percentage of total revenue will not exceed 200%.
The quantified limit for this graph is that net interest as a percentage of total revenue will not exceed 15%.
The quantified limit for this graph is that net interest as a percentage of annual rates income will not exceed 20%.
The quantified limit for this graph is that liquidity available will exceed 110% of existing external debt. Liquidity available is defined as the sum of existing external term debt, unused committed bank/loan facilities and liquid investments.
Balanced budget benchmark *
The following graph displays the Council’s revenue (excluding development contributions, financial contributions, vested assets, gains on derivative financial instruments, and revaluations of property, plant, or equipment) as a proportion of operating expenses (excluding losses on derivative financial instruments and revaluations of property, plant, or equipment).
The Council meets this benchmark if its revenue equals or is greater than its operating expenses.
60
80
100
120
140
160
180
200
2015 2016 2017 2018 2019
Net d
ebt
as a
% o
f tot
al r
even
ue
Year
Quantifiedlimit on debt
Actual debt (at or withinlimit)
Actual debt (exceeds limit)
0
2
4
6
8
10
12
14
16
2015 2016 2017 2018 2019
Net i
nter
est a
s a
% o
f tot
al re
venu
e
Year
Quantified limit on interest
Actual interest (at or within limit)
Actual interest (exceeds limit)
0
5
10
15
20
25
2015 2016 2017 2018 2019
Net i
nter
est a
s a
% o
f rat
es re
venu
e
Year
Quantifiedlimit on interest
Actual interest (ator within limit)
Actual interest (exceeds limit)
60
80
100
120
140
160
180
2015 2016 2017 2018 2019Liqu
idity
ava
ilabl
e as
a %
of e
xist
ing
exte
rnal
deb
t
Year
Quantifiedliquidity requirement
Actual liquidity (ator above limit)
Actual liquidity (below limit)
102 100
105102
99
80
85
90
95
100
105
110
115
120
2015 2016 2017 2018 2019
Reve
nue/
expe
nditu
re (
%)
Year
* Refer to additional information or comment on page 199 for further explanation.
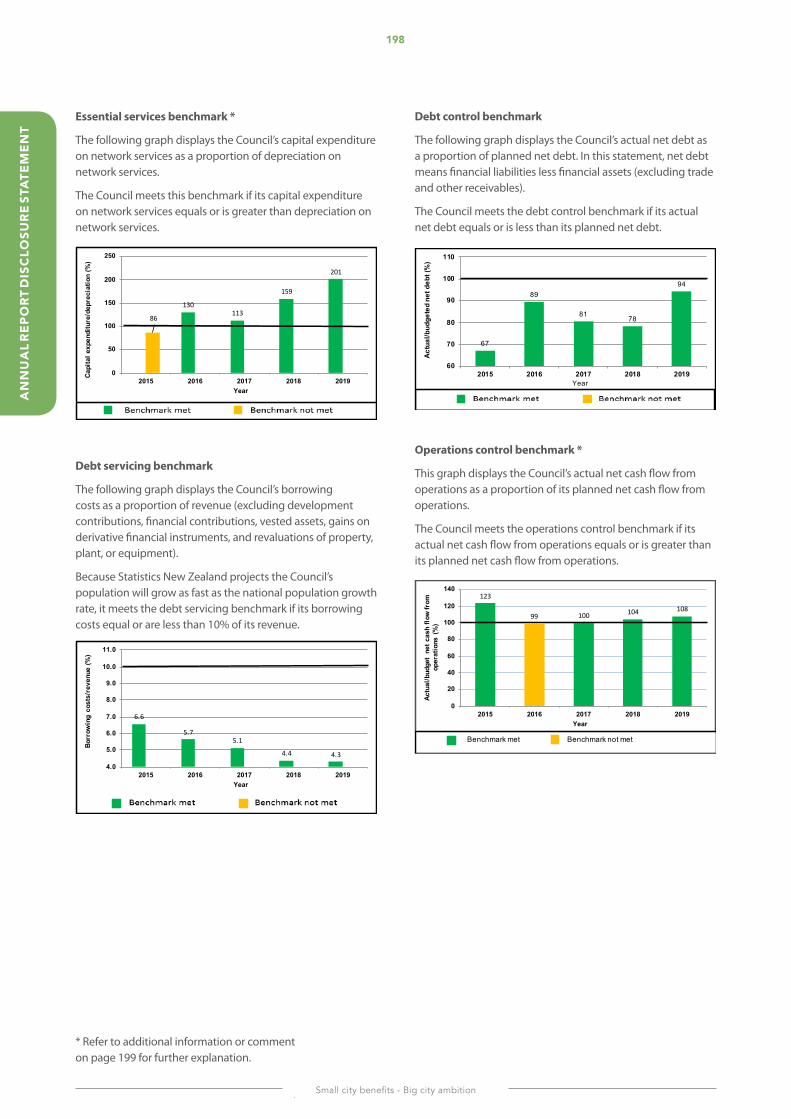
198
Small city benefits - Big city ambition
AN
NU
AL
REP
ORT
dIS
CLO
SUR
E ST
ATE
MEN
T
Essential services benchmark *
The following graph displays the Council’s capital expenditure on network services as a proportion of depreciation on network services.
The Council meets this benchmark if its capital expenditure on network services equals or is greater than depreciation on network services.
Debt servicing benchmark
The following graph displays the Council’s borrowing costs as a proportion of revenue (excluding development contributions, financial contributions, vested assets, gains on derivative financial instruments, and revaluations of property, plant, or equipment).
Because Statistics New Zealand projects the Council’s population will grow as fast as the national population growth rate, it meets the debt servicing benchmark if its borrowing costs equal or are less than 10% of its revenue.
Debt control benchmark
The following graph displays the Council’s actual net debt as a proportion of planned net debt. In this statement, net debt means financial liabilities less financial assets (excluding trade and other receivables).
The Council meets the debt control benchmark if its actual net debt equals or is less than its planned net debt.
Operations control benchmark *
This graph displays the Council’s actual net cash flow from operations as a proportion of its planned net cash flow from operations.
The Council meets the operations control benchmark if its actual net cash flow from operations equals or is greater than its planned net cash flow from operations.
130 113
159
201
86
0
50
100
150
200
250
2015 2016 2017 2018 2019
Capi
tal e
xpen
ditu
re/d
epre
ciat
ion
(%)
Year
6.6
5.75.1
4.4 4.3
4.0
5.0
6.0
7.0
8.0
9.0
10.0
11.0
2015 2016 2017 2018 2019
Borr
owin
g co
sts/
reve
nue
(%)
Year
67
89
8178
94
60
70
80
90
100
110
2015 2016 2017 2018 2019
Actu
al/b
udge
ted
net d
ebt (
%)
Year
123
99 100 104 108
0
20
40
60
80
100
120
140
2015 2016 2017 2018 2019
Actu
al/b
udge
t ne
t cas
h flo
w fr
om
oper
atio
ns (
%)
Year
Benchmark met Benchmark not met
* Refer to additional information or comment on page 199 for further explanation.
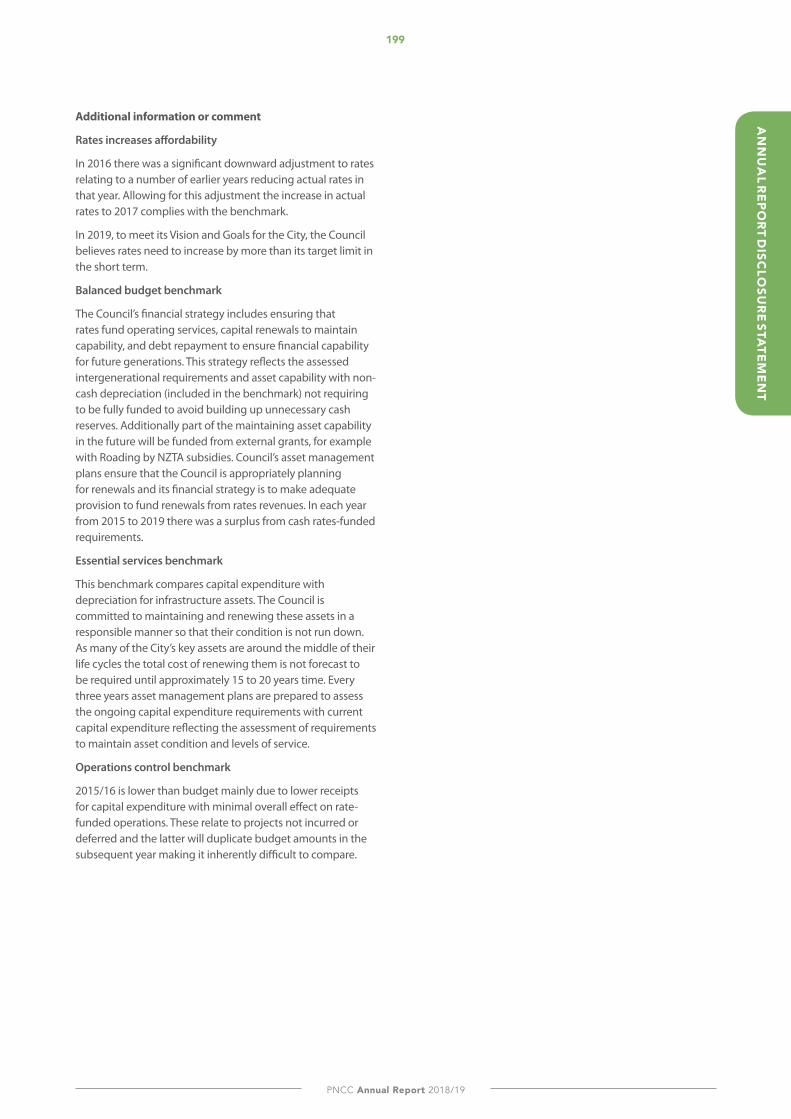
199
PNCC Annual Report 2018/19
AN
NU
AL R
EPORT d
ISCLO
SUR
E STATEM
ENT
Additional information or comment
Rates increases affordability
In 2016 there was a significant downward adjustment to rates relating to a number of earlier years reducing actual rates in that year. Allowing for this adjustment the increase in actual rates to 2017 complies with the benchmark.
In 2019, to meet its Vision and Goals for the City, the Council believes rates need to increase by more than its target limit in the short term.
Balanced budget benchmark
The Council’s financial strategy includes ensuring that rates fund operating services, capital renewals to maintain capability, and debt repayment to ensure financial capability for future generations. This strategy reflects the assessed intergenerational requirements and asset capability with non-cash depreciation (included in the benchmark) not requiring to be fully funded to avoid building up unnecessary cash reserves. Additionally part of the maintaining asset capability in the future will be funded from external grants, for example with Roading by NZTA subsidies. Council’s asset management plans ensure that the Council is appropriately planning for renewals and its financial strategy is to make adequate provision to fund renewals from rates revenues. In each year from 2015 to 2019 there was a surplus from cash rates-funded requirements.
Essential services benchmark
This benchmark compares capital expenditure with depreciation for infrastructure assets. The Council is committed to maintaining and renewing these assets in a responsible manner so that their condition is not run down. As many of the City’s key assets are around the middle of their life cycles the total cost of renewing them is not forecast to be required until approximately 15 to 20 years time. Every three years asset management plans are prepared to assess the ongoing capital expenditure requirements with current capital expenditure reflecting the assessment of requirements to maintain asset condition and levels of service.
Operations control benchmark
2015/16 is lower than budget mainly due to lower receipts for capital expenditure with minimal overall effect on rate-funded operations. These relate to projects not incurred or deferred and the latter will duplicate budget amounts in the subsequent year making it inherently difficult to compare.
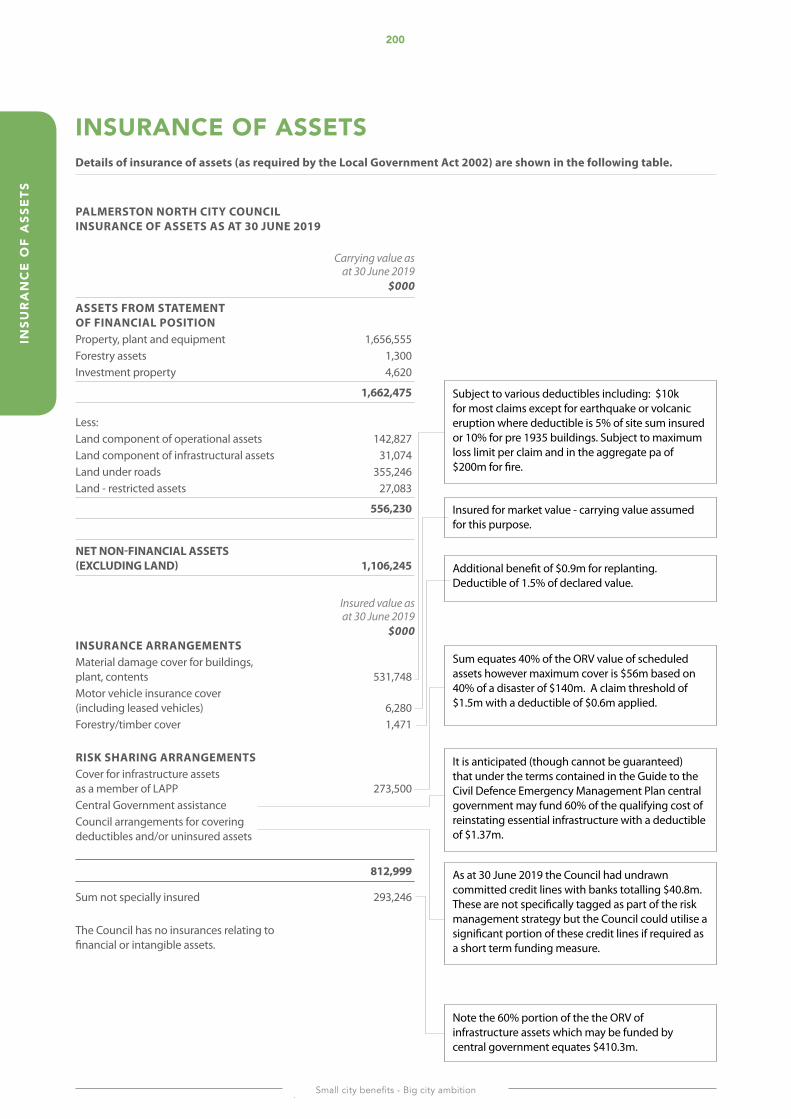
200
Small city benefits - Big city ambition
INSU
RA
NC
E O
F A
SSE
TS
INSURANCE OF ASSETSDetails of insurance of assets (as required by the Local Government Act 2002) are shown in the following table.
PALMERSTON NORTH CITY COUNCIL INSURANCE OF ASSETS AS AT 30 JUNE 2019 Carrying value as
at 30 June 2019$000
ASSETS FROM STATEMENT OF FINANCIAL POSITIONProperty, plant and equipment 1,656,555 Forestry assets 1,300 Investment property 4,620
1,662,475
Less: Land component of operational assets 142,827 Land component of infrastructural assets 31,074 Land under roads 355,246 Land - restricted assets 27,083
556,230
NET NON-FINANCIAL ASSETS (EXCLUDING LAND) 1,106,245
Insured value as
at 30 June 2019$000
INSURANCE ARRANGEMENTSMaterial damage cover for buildings, plant, contents 531,748 Motor vehicle insurance cover (including leased vehicles) 6,280 Forestry/timber cover 1,471 RISK SHARING ARRANGEMENTS Cover for infrastructure assets as a member of LAPP 273,500 Central Government assistance Council arrangements for covering deductibles and/or uninsured assets
812,999
Sum not specially insured 293,246 The Council has no insurances relating to financial or intangible assets.
Sum equates 40% of the ORV value of scheduled assets however maximum cover is $56m based on 40% of a disaster of $140m. A claim threshold of $1.5m with a deductible of $0.6m applied.
It is anticipated (though cannot be guaranteed) that under the terms contained in the Guide to the Civil Defence Emergency Management Plan central government may fund 60% of the qualifying cost of reinstating essential infrastructure with a deductible of $1.37m.
As at 30 June 2019 the Council had undrawn committed credit lines with banks totalling $40.8m. These are not specifically tagged as part of the risk management strategy but the Council could utilise a significant portion of these credit lines if required as a short term funding measure.
Note the 60% portion of the the ORV of infrastructure assets which may be funded by central government equates $410.3m.
Insured for market value - carrying value assumed for this purpose.
Additional benefit of $0.9m for replanting. Deductible of 1.5% of declared value.
Subject to various deductibles including: $10k for most claims except for earthquake or volcanic eruption where deductible is 5% of site sum insured or 10% for pre 1935 buildings. Subject to maximum loss limit per claim and in the aggregate pa of $200m for fire.
201
PNCC Annual Report 2018/19
FUN
dIN
G IM
PAC
T STATE
ME
NTS
FUNdING IMPACT STATEMENTSfor the year ended 30 June 2019 - Palmerston North City Council
The Local Government (Financial Reporting and Prudence) Regulations 2014 prescribe the format for funding impact statements to show the sources and application of funds for the whole of Council and for each group of activities of the Council.
These statements are designed to show where operational and capital funding come from, and how they are used.
In the following pages actual results are detailed along with the budgets from the 2018/19 10 Year Plan. This information is presented in two ways: Firstly, at the “Whole of Council” level, and in a slightly different form at the “Group of Activities” level. At the Group of Activities level, internal revenue and expenditure are shown as separate items, while at the Whole of Council level they are not displayed as the amounts balance each other out.
Capital expenditure is grouped into three broad categories based on which one the programme most relates to.
The three categories are:
• to meet additional demand, • to improve the level of service, or• to replace existing assets.
The three categories do not clearly represent the fact that some programmes will contribute to more than one purpose.
In addition to the statements mentioned the Council also provides Activity Operational Requirement and Funding Summary statements for each Group of Activities and for all Activities which show the revenue and expenses for the services provided, as well as how the rates are allocated (refer section 2).
Please Note: The totals appear different between the two statements due to the different way the figures have been categorised. The Funding Impact Statements include rates revenue, whereas the Activity Operational Requirement and Funding Summary separate rates out to clearly show how they have been calculated and the actual amount required to deliver that service. In addition, the Activity Operational Requirement and Funding Summary include depreciation in the expenses to show the full cost of the activity, while this is not included in the Funding Impact Statements.
The Local Government (Financial Reporting and Prudence) Regulations 2014 prescribe that each of the group of activities funding impact statements include budget information from the 10 Year Plan.
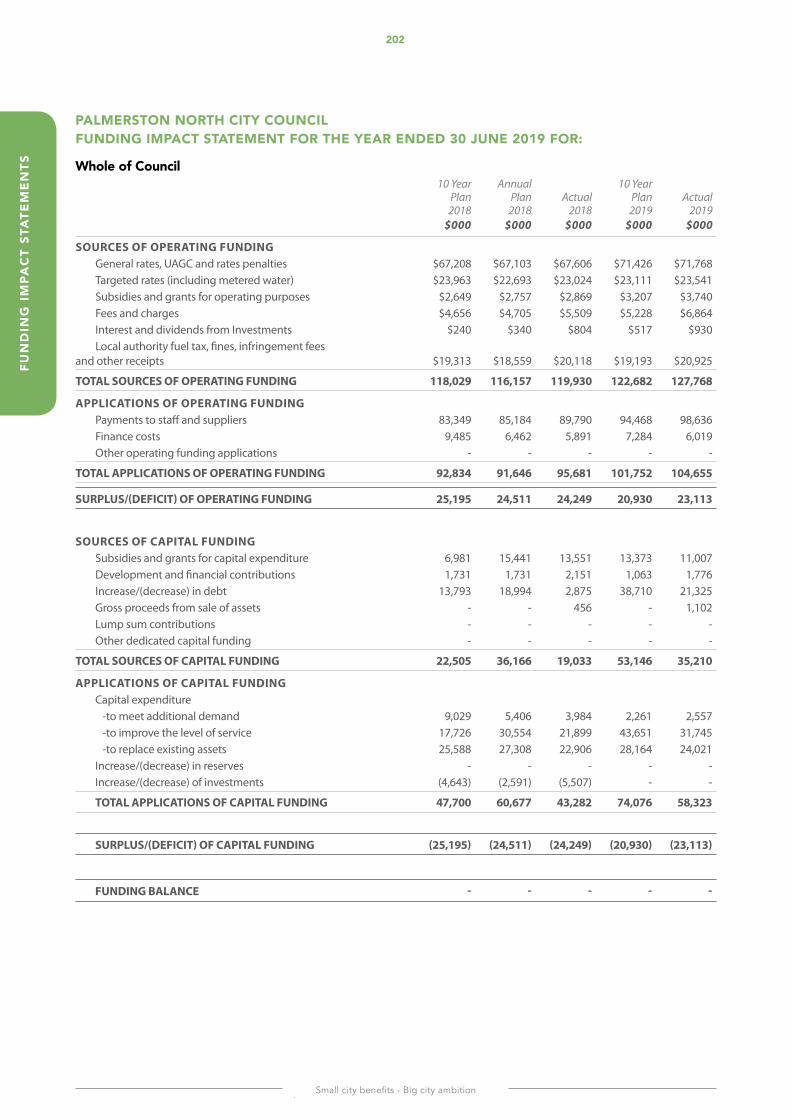
202
Small city benefits - Big city ambition
FUN
dIN
G I
MPA
CT
STA
TEM
EN
TS
PALMERSTON NORTH CITY COUNCIL FUNdING IMPACT STATEMENT FOR THE YEAR ENdEd 30 JUNE 2019 FOR:
Whole of Council 10 Year Annual 10 Year Plan Plan Actual Plan Actual 2018 2018 2018 2019 2019 $000 $000 $000 $000 $000
SOURCES OF OPERATING FUNDING General rates, UAGC and rates penalties $67,208 $67,103 $67,606 $71,426 $71,768 Targeted rates (including metered water) $23,963 $22,693 $23,024 $23,111 $23,541 Subsidies and grants for operating purposes $2,649 $2,757 $2,869 $3,207 $3,740 Fees and charges $4,656 $4,705 $5,509 $5,228 $6,864 Interest and dividends from Investments $240 $340 $804 $517 $930 Local authority fuel tax, fines, infringement fees and other receipts $19,313 $18,559 $20,118 $19,193 $20,925
TOTAL SOURCES OF OPERATING FUNDING 118,029 116,157 119,930 122,682 127,768
APPLICATIONS OF OPERATING FUNDING Payments to staff and suppliers 83,349 85,184 89,790 94,468 98,636 Finance costs 9,485 6,462 5,891 7,284 6,019 Other operating funding applications - - - - -
TOTAL APPLICATIONS OF OPERATING FUNDING 92,834 91,646 95,681 101,752 104,655
SURPLUS/(DEFICIT) OF OPERATING FUNDING 25,195 24,511 24,249 20,930 23,113
SOURCES OF CAPITAL FUNDING Subsidies and grants for capital expenditure 6,981 15,441 13,551 13,373 11,007 Development and financial contributions 1,731 1,731 2,151 1,063 1,776 Increase/(decrease) in debt 13,793 18,994 2,875 38,710 21,325 Gross proceeds from sale of assets - - 456 - 1,102 Lump sum contributions - - - - - Other dedicated capital funding - - - - -
TOTAL SOURCES OF CAPITAL FUNDING 22,505 36,166 19,033 53,146 35,210
APPLICATIONS OF CAPITAL FUNDING Capital expenditure -to meet additional demand 9,029 5,406 3,984 2,261 2,557 -to improve the level of service 17,726 30,554 21,899 43,651 31,745 -to replace existing assets 25,588 27,308 22,906 28,164 24,021 Increase/(decrease) in reserves - - - - - Increase/(decrease) of investments (4,643) (2,591) (5,507) - -
TOTAL APPLICATIONS OF CAPITAL FUNDING 47,700 60,677 43,282 74,076 58,323
SURPLUS/(DEFICIT) OF CAPITAL FUNDING (25,195) (24,511) (24,249) (20,930) (23,113)
FUNDING BALANCE - - - - -
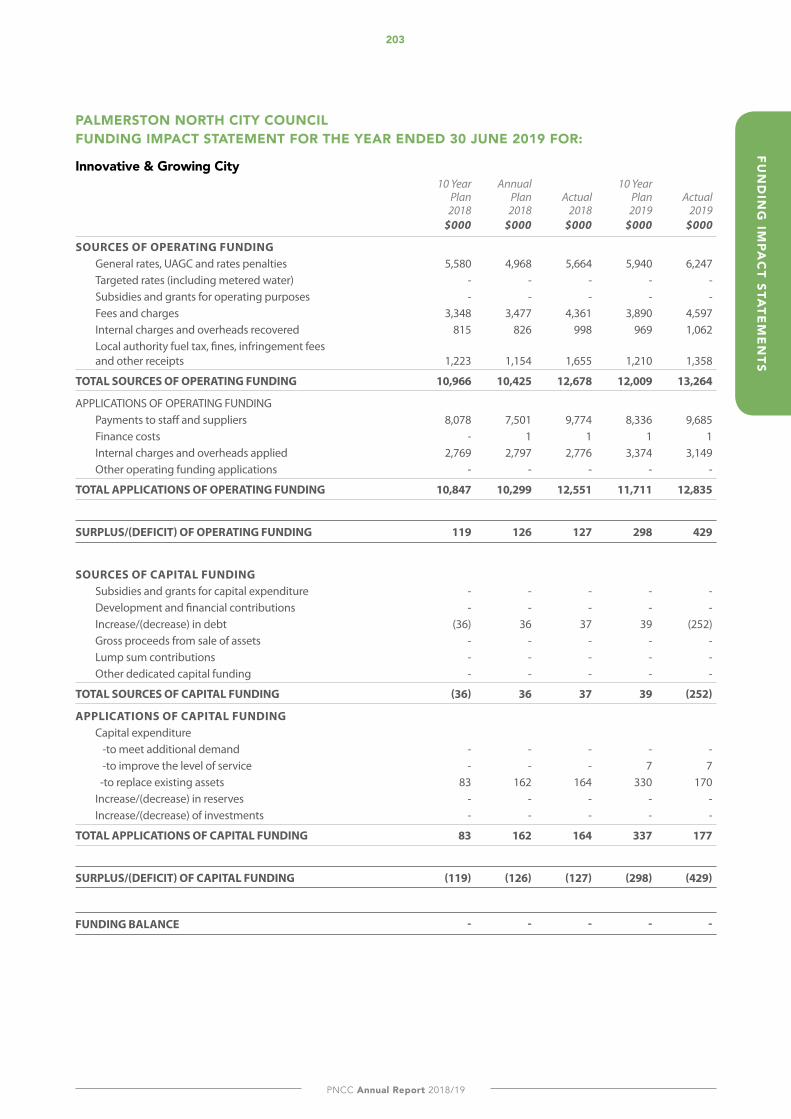
203
PNCC Annual Report 2018/19
FUN
dIN
G IM
PAC
T STATE
ME
NTS
PALMERSTON NORTH CITY COUNCIL FUNdING IMPACT STATEMENT FOR THE YEAR ENdEd 30 JUNE 2019 FOR:
Innovative & Growing City 10 Year Annual 10 Year Plan Plan Actual Plan Actual 2018 2018 2018 2019 2019 $000 $000 $000 $000 $000
SOURCES OF OPERATING FUNDING General rates, UAGC and rates penalties 5,580 4,968 5,664 5,940 6,247 Targeted rates (including metered water) - - - - - Subsidies and grants for operating purposes - - - - - Fees and charges 3,348 3,477 4,361 3,890 4,597 Internal charges and overheads recovered 815 826 998 969 1,062 Local authority fuel tax, fines, infringement fees and other receipts 1,223 1,154 1,655 1,210 1,358
TOTAL SOURCES OF OPERATING FUNDING 10,966 10,425 12,678 12,009 13,264
APPLICATIONS OF OPERATING FUNDING Payments to staff and suppliers 8,078 7,501 9,774 8,336 9,685 Finance costs - 1 1 1 1 Internal charges and overheads applied 2,769 2,797 2,776 3,374 3,149 Other operating funding applications - - - - -
TOTAL APPLICATIONS OF OPERATING FUNDING 10,847 10,299 12,551 11,711 12,835
SURPLUS/(DEFICIT) OF OPERATING FUNDING 119 126 127 298 429
SOURCES OF CAPITAL FUNDING Subsidies and grants for capital expenditure - - - - - Development and financial contributions - - - - - Increase/(decrease) in debt (36) 36 37 39 (252) Gross proceeds from sale of assets - - - - - Lump sum contributions - - - - - Other dedicated capital funding - - - - -
TOTAL SOURCES OF CAPITAL FUNDING (36) 36 37 39 (252)
APPLICATIONS OF CAPITAL FUNDING Capital expenditure -to meet additional demand - - - - - -to improve the level of service - - - 7 7 -to replace existing assets 83 162 164 330 170 Increase/(decrease) in reserves - - - - - Increase/(decrease) of investments - - - - -
TOTAL APPLICATIONS OF CAPITAL FUNDING 83 162 164 337 177
SURPLUS/(DEFICIT) OF CAPITAL FUNDING (119) (126) (127) (298) (429)
FUNDING BALANCE - - - - -

204
Small city benefits - Big city ambition
FUN
dIN
G I
MPA
CT
STA
TEM
EN
TS
PALMERSTON NORTH CITY COUNCIL FUNdING IMPACT STATEMENT FOR THE YEAR ENdEd 30 JUNE 2019 FOR:
Creative & Exciting City 10 Year Annual 10 Year Plan Plan Actual Plan Actual 2018 2018 2018 2019 2019 $000 $000 $000 $000 $000
SOURCES OF OPERATING FUNDING General rates, UAGC and rates penalties 21,453 23,881 24,779 25,861 25,001 Targeted rates (including metered water) - - - - - Subsidies and grants for operating purposes - 58 76 62 102 Fees and charges - - - - 1 Internal charges and overheads recovered - - 13 - 69 Local authority fuel tax, fines, infringement fees and other receipts 2,048 1,950 2,179 2,035 3,088
TOTAL SOURCES OF OPERATING FUNDING 23,501 25,889 27,047 27,958 28,261
APPLICATIONS OF OPERATING FUNDING Payments to staff and suppliers 9,791 12,793 13,683 13,659 18,329 Finance costs 1,486 1,078 985 1,538 1,260 Internal charges and overheads applied 7,611 7,540 7,930 8,089 4,696 Other operating funding applications - - - - -
TOTAL APPLICATIONS OF OPERATING FUNDING 18,888 21,411 22,598 23,286 24,285
SURPLUS/(DEFICIT) OF OPERATING FUNDING 4,613 4,478 4,449 4,672 3,976
SOURCES OF CAPITAL FUNDING Subsidies and grants for capital expenditure 1,482 4,404 3,852 1,066 1,451 Development and financial contributions 165 165 164 165 173 Increase/(decrease) in debt 4,803 3,660 3,135 9,869 4,687 Gross proceeds from sale of assets - - - - - Lump sum contributions - - - - - Other dedicated capital funding - - - - -
TOTAL SOURCES OF CAPITAL FUNDING 6,450 8,229 7,151 11,100 6,311
APPLICATIONS OF CAPITAL FUNDING Capital expenditure -to meet additional demand 1,885 - - - - -to improve the level of service 5,080 8,934 8,125 11,028 6,239 -to replace existing assets 4,098 3,773 3,475 4,744 4,048 Increase/(decrease) in reserves - - - - - Increase/(decrease) of investments - - - - -
TOTAL APPLICATIONS OF CAPITAL FUNDING 11,063 12,707 11,600 15,772 10,287
SURPLUS/(DEFICIT) OF CAPITAL FUNDING (4,613) (4,478) (4,449) (4,672) (3,976)
FUNDING BALANCE - - - - -
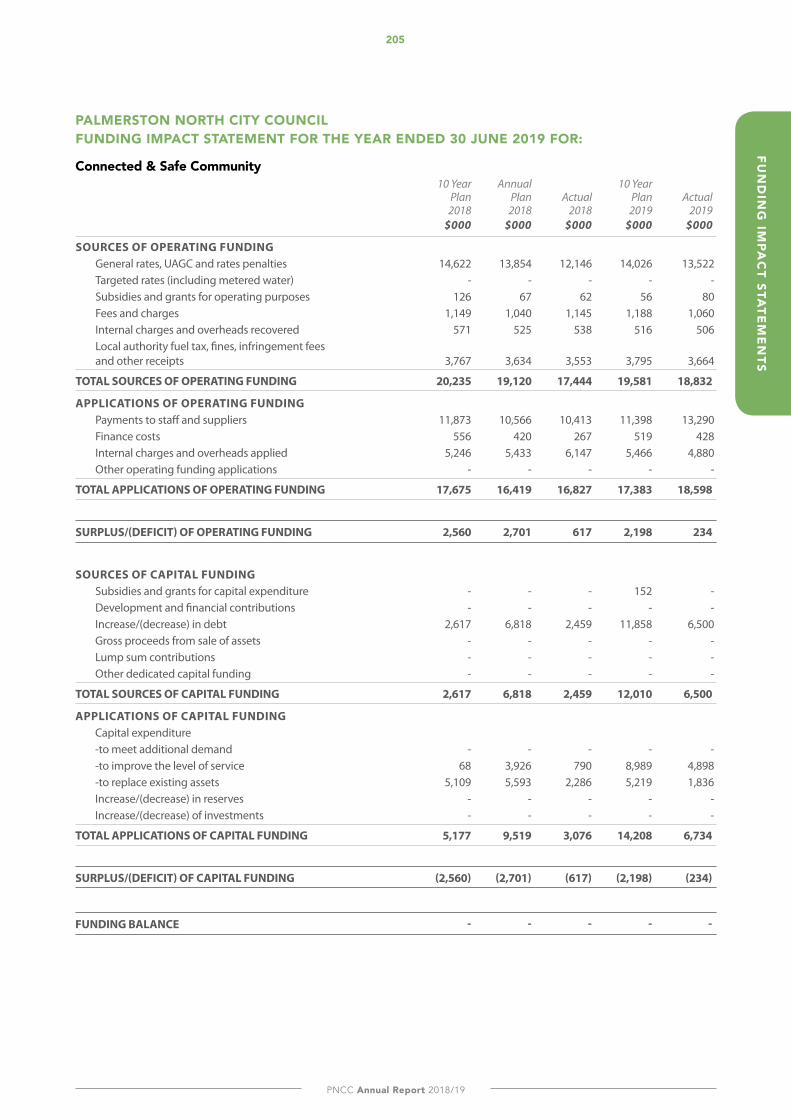
205
PNCC Annual Report 2018/19
FUN
dIN
G IM
PAC
T STATE
ME
NTS
PALMERSTON NORTH CITY COUNCIL FUNdING IMPACT STATEMENT FOR THE YEAR ENdEd 30 JUNE 2019 FOR:
Connected & Safe Community 10 Year Annual 10 Year Plan Plan Actual Plan Actual 2018 2018 2018 2019 2019 $000 $000 $000 $000 $000
SOURCES OF OPERATING FUNDING General rates, UAGC and rates penalties 14,622 13,854 12,146 14,026 13,522 Targeted rates (including metered water) - - - - - Subsidies and grants for operating purposes 126 67 62 56 80 Fees and charges 1,149 1,040 1,145 1,188 1,060 Internal charges and overheads recovered 571 525 538 516 506 Local authority fuel tax, fines, infringement fees and other receipts 3,767 3,634 3,553 3,795 3,664
TOTAL SOURCES OF OPERATING FUNDING 20,235 19,120 17,444 19,581 18,832
APPLICATIONS OF OPERATING FUNDING Payments to staff and suppliers 11,873 10,566 10,413 11,398 13,290 Finance costs 556 420 267 519 428 Internal charges and overheads applied 5,246 5,433 6,147 5,466 4,880 Other operating funding applications - - - - -
TOTAL APPLICATIONS OF OPERATING FUNDING 17,675 16,419 16,827 17,383 18,598
SURPLUS/(DEFICIT) OF OPERATING FUNDING 2,560 2,701 617 2,198 234
SOURCES OF CAPITAL FUNDING Subsidies and grants for capital expenditure - - - 152 - Development and financial contributions - - - - - Increase/(decrease) in debt 2,617 6,818 2,459 11,858 6,500 Gross proceeds from sale of assets - - - - - Lump sum contributions - - - - - Other dedicated capital funding - - - - -
TOTAL SOURCES OF CAPITAL FUNDING 2,617 6,818 2,459 12,010 6,500
APPLICATIONS OF CAPITAL FUNDING Capital expenditure -to meet additional demand - - - - - -to improve the level of service 68 3,926 790 8,989 4,898 -to replace existing assets 5,109 5,593 2,286 5,219 1,836 Increase/(decrease) in reserves - - - - - Increase/(decrease) of investments - - - - -
TOTAL APPLICATIONS OF CAPITAL FUNDING 5,177 9,519 3,076 14,208 6,734
SURPLUS/(DEFICIT) OF CAPITAL FUNDING (2,560) (2,701) (617) (2,198) (234)
FUNDING BALANCE - - - - -
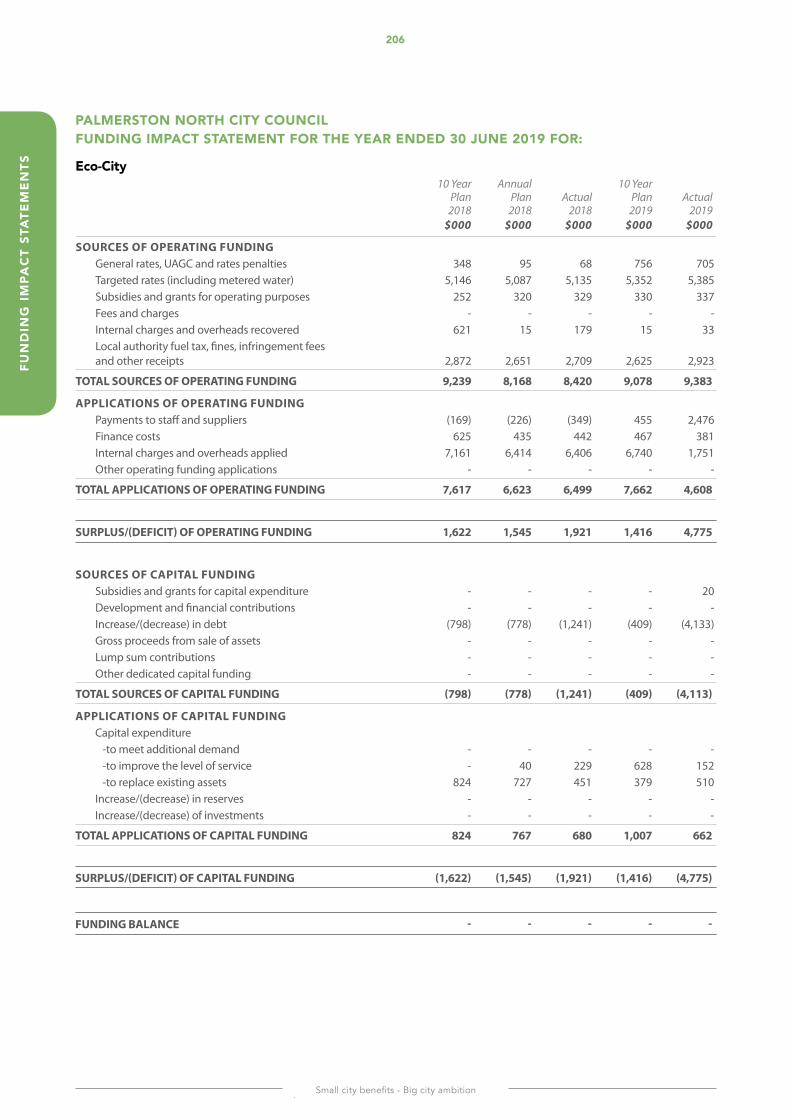
206
Small city benefits - Big city ambition
FUN
dIN
G I
MPA
CT
STA
TEM
EN
TS
PALMERSTON NORTH CITY COUNCIL FUNdING IMPACT STATEMENT FOR THE YEAR ENdEd 30 JUNE 2019 FOR:
Eco-City 10 Year Annual 10 Year Plan Plan Actual Plan Actual 2018 2018 2018 2019 2019 $000 $000 $000 $000 $000
SOURCES OF OPERATING FUNDING General rates, UAGC and rates penalties 348 95 68 756 705 Targeted rates (including metered water) 5,146 5,087 5,135 5,352 5,385 Subsidies and grants for operating purposes 252 320 329 330 337 Fees and charges - - - - - Internal charges and overheads recovered 621 15 179 15 33 Local authority fuel tax, fines, infringement fees and other receipts 2,872 2,651 2,709 2,625 2,923
TOTAL SOURCES OF OPERATING FUNDING 9,239 8,168 8,420 9,078 9,383
APPLICATIONS OF OPERATING FUNDING Payments to staff and suppliers (169) (226) (349) 455 2,476 Finance costs 625 435 442 467 381 Internal charges and overheads applied 7,161 6,414 6,406 6,740 1,751 Other operating funding applications - - - - -
TOTAL APPLICATIONS OF OPERATING FUNDING 7,617 6,623 6,499 7,662 4,608
SURPLUS/(DEFICIT) OF OPERATING FUNDING 1,622 1,545 1,921 1,416 4,775
SOURCES OF CAPITAL FUNDING Subsidies and grants for capital expenditure - - - - 20 Development and financial contributions - - - - - Increase/(decrease) in debt (798) (778) (1,241) (409) (4,133) Gross proceeds from sale of assets - - - - - Lump sum contributions - - - - - Other dedicated capital funding - - - - -
TOTAL SOURCES OF CAPITAL FUNDING (798) (778) (1,241) (409) (4,113)
APPLICATIONS OF CAPITAL FUNDING Capital expenditure -to meet additional demand - - - - - -to improve the level of service - 40 229 628 152 -to replace existing assets 824 727 451 379 510 Increase/(decrease) in reserves - - - - - Increase/(decrease) of investments - - - - -
TOTAL APPLICATIONS OF CAPITAL FUNDING 824 767 680 1,007 662
SURPLUS/(DEFICIT) OF CAPITAL FUNDING (1,622) (1,545) (1,921) (1,416) (4,775)
FUNDING BALANCE - - - - -

207
PNCC Annual Report 2018/19
FUN
dIN
G IM
PAC
T STATE
ME
NTS
PALMERSTON NORTH CITY COUNCIL FUNdING IMPACT STATEMENT FOR THE YEAR ENdEd 30 JUNE 2019 FOR:
Driven & Enabling Council 10 Year Annual 10 Year Plan Plan Actual Plan Actual 2018 2018 2018 2019 2019 $000 $000 $000 $000 $000
SOURCES OF OPERATING FUNDING General rates, UAGC and rates penalties 9,202 9,204 9,845 8,062 9,798 Targeted rates (including metered water) - - 49 - 43 Subsidies and grants for operating purposes - - 5 - 7 Fees and charges 160 187 - 150 1,204 Internal charges and overheads recovered 45,186 42,805 51,996 34,868 26,159 Local authority fuel tax, fines, infringement fees and other receipts 3,870 4,029 5,001 4,223 5,005
TOTAL SOURCES OF OPERATING FUNDING 58,418 56,225 66,896 47,303 42,216
APPLICATIONS OF OPERATING FUNDING Payments to staff and suppliers 40,882 40,543 49,463 33,401 31,058 Finance costs 1,018 776 735 811 704 Internal charges and overheads applied 13,327 11,827 12,105 13,010 8,972 Other operating funding applications - - - - -
TOTAL APPLICATIONS OF OPERATING FUNDING 55,227 53,146 62,303 47,222 40,734
SURPLUS/(DEFICIT) OF OPERATING FUNDING 3,191 3,079 4,593 81 1,482
SOURCES OF CAPITAL FUNDING Subsidies and grants for capital expenditure - - 345 - 26 Development and financial contributions - - - - - Increase/(decrease) in debt (5,134) (1,379) (6,645) 3,373 2,369 Gross proceeds from sale of assets 0 - 166 - 152 Lump sum contributions - - - - - Other dedicated capital funding - - - - -
TOTAL SOURCES OF CAPITAL FUNDING (5,134) (1,379) (6,134) 3,373 2,547
APPLICATIONS OF CAPITAL FUNDING Capital expenditure -to meet additional demand - - - - - -to improve the level of service 234 332 69 795 424 -to replace existing assets 2,467 3,959 3,897 2,659 3,605 Increase/(decrease) in reserves - - - - - Increase/(decrease) of investments (4,644) (2,591) (5,507) - -
TOTAL APPLICATIONS OF CAPITAL FUNDING (1,943) 1,700 (1,541) 3,454 4,029
SURPLUS/(DEFICIT) OF CAPITAL FUNDING (3,191) (3,079) (4,593) (81) (1,482)
FUNDING BALANCE 0 - - - -

208
Small city benefits - Big city ambition
FUN
dIN
G I
MPA
CT
STA
TEM
EN
TS
PALMERSTON NORTH CITY COUNCIL FUNdING IMPACT STATEMENT FOR THE YEAR ENdEd 30 JUNE 2019 FOR:
Transport 10 Year Annual 10 Year Plan Plan Actual Plan Actual 2018 2018 2018 2019 2019 $000 $000 $000 $000 $000
SOURCES OF OPERATING FUNDING General rates, UAGC and rates penalties 13,222 12,666 12,605 14,022 13,775 Targeted rates (including metered water) - - - - - Subsidies and grants for operating purposes 2,271 2,313 2,397 2,759 3,214 Fees and charges - - 3 - 2 Internal charges and overheads recovered - - 4 - 55 Local authority fuel tax, fines, infringement fees and other receipts 4,705 4,529 4,789 4,633 4,610
TOTAL SOURCES OF OPERATING FUNDING 20,198 19,508 19,798 21,414 21,656
APPLICATIONS OF OPERATING FUNDING Payments to staff and suppliers 8,925 9,070 9,331 10,567 12,321 Finance costs 2,578 1,845 1,700 2,210 1,812 Internal charges and overheads applied 3,901 3,839 3,898 4,073 2,809 Other operating funding applications - - - - -
TOTAL APPLICATIONS OF OPERATING FUNDING 15,404 14,754 14,929 16,850 16,942
SURPLUS/(DEFICIT) OF OPERATING FUNDING 4,794 4,754 4,869 4,564 4,714
SOURCES OF CAPITAL FUNDING Subsidies and grants for capital expenditure 5,500 11,037 9,274 12,156 9,509 Development and financial contributions 692 692 905 369 787 Increase/(decrease) in debt 7,886 6,993 2,880 8,840 9,670 Gross proceeds from sale of assets - - - - - Lump sum contributions - - - - - Other dedicated capital funding - - - - -
TOTAL SOURCES OF CAPITAL FUNDING 14,078 18,722 13,059 21,365 19,966
APPLICATIONS OF CAPITAL FUNDING Capital expenditure -to meet additional demand 2,255 2,964 2,009 652 1,479 -to improve the level of service 11,280 15,033 10,628 18,936 17,342 -to replace existing assets 5,337 5,479 5,291 6,341 5,859 Increase/(decrease) in reserves - - - - - Increase/(decrease) of investments - - - - -
TOTAL APPLICATIONS OF CAPITAL FUNDING 18,872 23,476 17,928 25,929 24,680
SURPLUS/(DEFICIT) OF CAPITAL FUNDING (4,794) (4,754) (4,869) (4,564) (4,714)
FUNDING BALANCE - - - - -
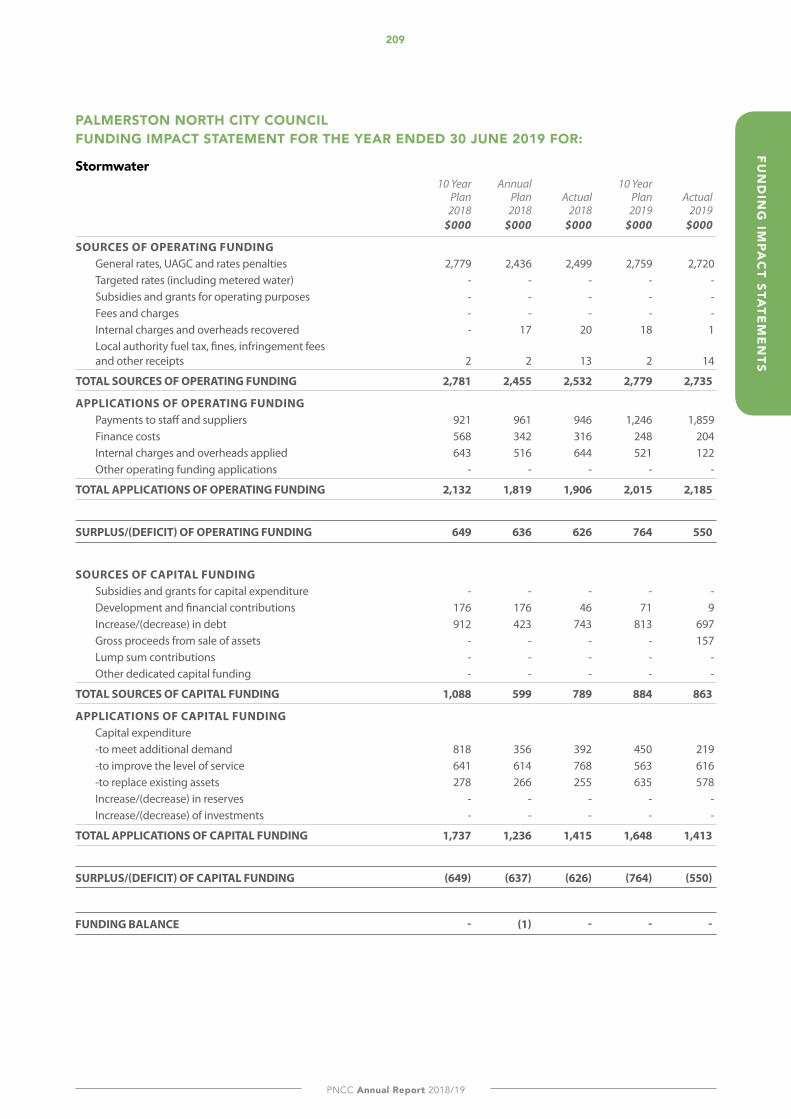
209
PNCC Annual Report 2018/19
FUN
dIN
G IM
PAC
T STATE
ME
NTS
PALMERSTON NORTH CITY COUNCIL FUNdING IMPACT STATEMENT FOR THE YEAR ENdEd 30 JUNE 2019 FOR:
Stormwater 10 Year Annual 10 Year Plan Plan Actual Plan Actual 2018 2018 2018 2019 2019 $000 $000 $000 $000 $000
SOURCES OF OPERATING FUNDING General rates, UAGC and rates penalties 2,779 2,436 2,499 2,759 2,720 Targeted rates (including metered water) - - - - - Subsidies and grants for operating purposes - - - - - Fees and charges - - - - - Internal charges and overheads recovered - 17 20 18 1 Local authority fuel tax, fines, infringement fees and other receipts 2 2 13 2 14
TOTAL SOURCES OF OPERATING FUNDING 2,781 2,455 2,532 2,779 2,735
APPLICATIONS OF OPERATING FUNDING Payments to staff and suppliers 921 961 946 1,246 1,859 Finance costs 568 342 316 248 204 Internal charges and overheads applied 643 516 644 521 122 Other operating funding applications - - - - -
TOTAL APPLICATIONS OF OPERATING FUNDING 2,132 1,819 1,906 2,015 2,185
SURPLUS/(DEFICIT) OF OPERATING FUNDING 649 636 626 764 550
SOURCES OF CAPITAL FUNDING Subsidies and grants for capital expenditure - - - - - Development and financial contributions 176 176 46 71 9 Increase/(decrease) in debt 912 423 743 813 697 Gross proceeds from sale of assets - - - - 157 Lump sum contributions - - - - - Other dedicated capital funding - - - - -
TOTAL SOURCES OF CAPITAL FUNDING 1,088 599 789 884 863
APPLICATIONS OF CAPITAL FUNDING Capital expenditure -to meet additional demand 818 356 392 450 219 -to improve the level of service 641 614 768 563 616 -to replace existing assets 278 266 255 635 578 Increase/(decrease) in reserves - - - - - Increase/(decrease) of investments - - - - -
TOTAL APPLICATIONS OF CAPITAL FUNDING 1,737 1,236 1,415 1,648 1,413
SURPLUS/(DEFICIT) OF CAPITAL FUNDING (649) (637) (626) (764) (550)
FUNDING BALANCE - (1) - - -
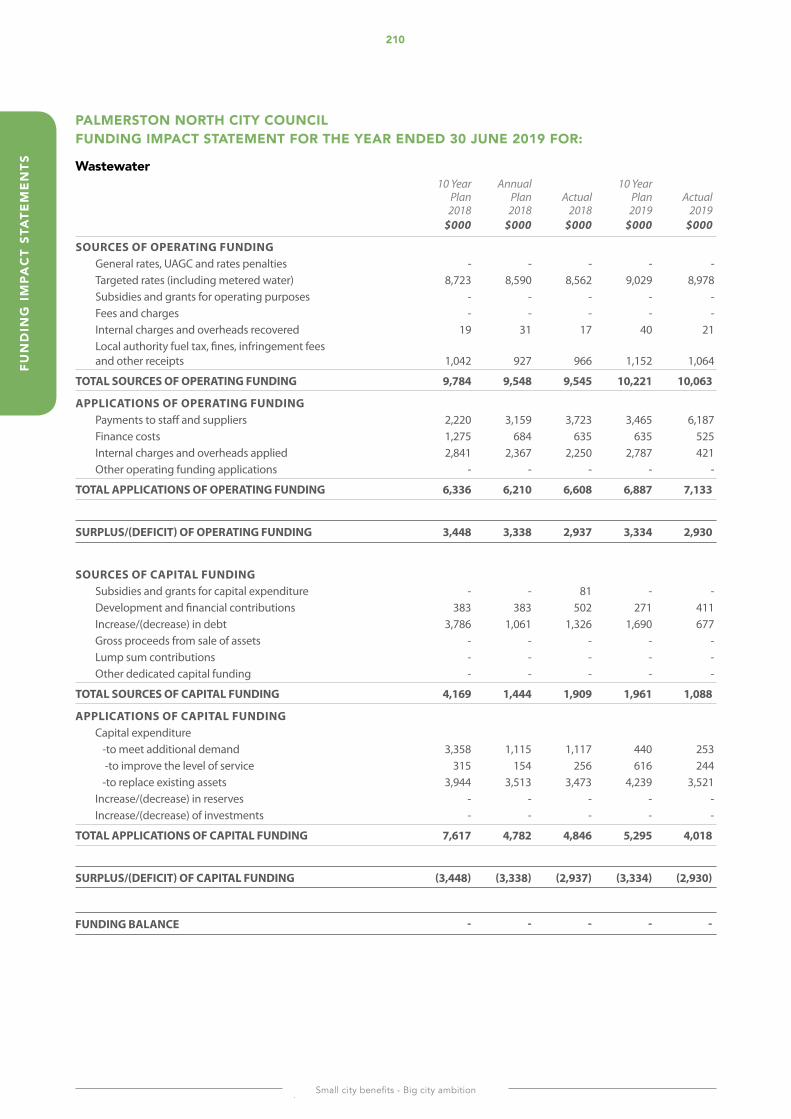
210
Small city benefits - Big city ambition
FUN
dIN
G I
MPA
CT
STA
TEM
EN
TS
PALMERSTON NORTH CITY COUNCIL FUNdING IMPACT STATEMENT FOR THE YEAR ENdEd 30 JUNE 2019 FOR:
Wastewater 10 Year Annual 10 Year Plan Plan Actual Plan Actual 2018 2018 2018 2019 2019 $000 $000 $000 $000 $000
SOURCES OF OPERATING FUNDING General rates, UAGC and rates penalties - - - - - Targeted rates (including metered water) 8,723 8,590 8,562 9,029 8,978 Subsidies and grants for operating purposes - - - - - Fees and charges - - - - - Internal charges and overheads recovered 19 31 17 40 21 Local authority fuel tax, fines, infringement fees and other receipts 1,042 927 966 1,152 1,064
TOTAL SOURCES OF OPERATING FUNDING 9,784 9,548 9,545 10,221 10,063
APPLICATIONS OF OPERATING FUNDING Payments to staff and suppliers 2,220 3,159 3,723 3,465 6,187 Finance costs 1,275 684 635 635 525 Internal charges and overheads applied 2,841 2,367 2,250 2,787 421 Other operating funding applications - - - - -
TOTAL APPLICATIONS OF OPERATING FUNDING 6,336 6,210 6,608 6,887 7,133
SURPLUS/(DEFICIT) OF OPERATING FUNDING 3,448 3,338 2,937 3,334 2,930
SOURCES OF CAPITAL FUNDING Subsidies and grants for capital expenditure - - 81 - - Development and financial contributions 383 383 502 271 411 Increase/(decrease) in debt 3,786 1,061 1,326 1,690 677 Gross proceeds from sale of assets - - - - - Lump sum contributions - - - - - Other dedicated capital funding - - - - -
TOTAL SOURCES OF CAPITAL FUNDING 4,169 1,444 1,909 1,961 1,088
APPLICATIONS OF CAPITAL FUNDING Capital expenditure -to meet additional demand 3,358 1,115 1,117 440 253 -to improve the level of service 315 154 256 616 244 -to replace existing assets 3,944 3,513 3,473 4,239 3,521 Increase/(decrease) in reserves - - - - - Increase/(decrease) of investments - - - - -
TOTAL APPLICATIONS OF CAPITAL FUNDING 7,617 4,782 4,846 5,295 4,018
SURPLUS/(DEFICIT) OF CAPITAL FUNDING (3,448) (3,338) (2,937) (3,334) (2,930)
FUNDING BALANCE - - - - -
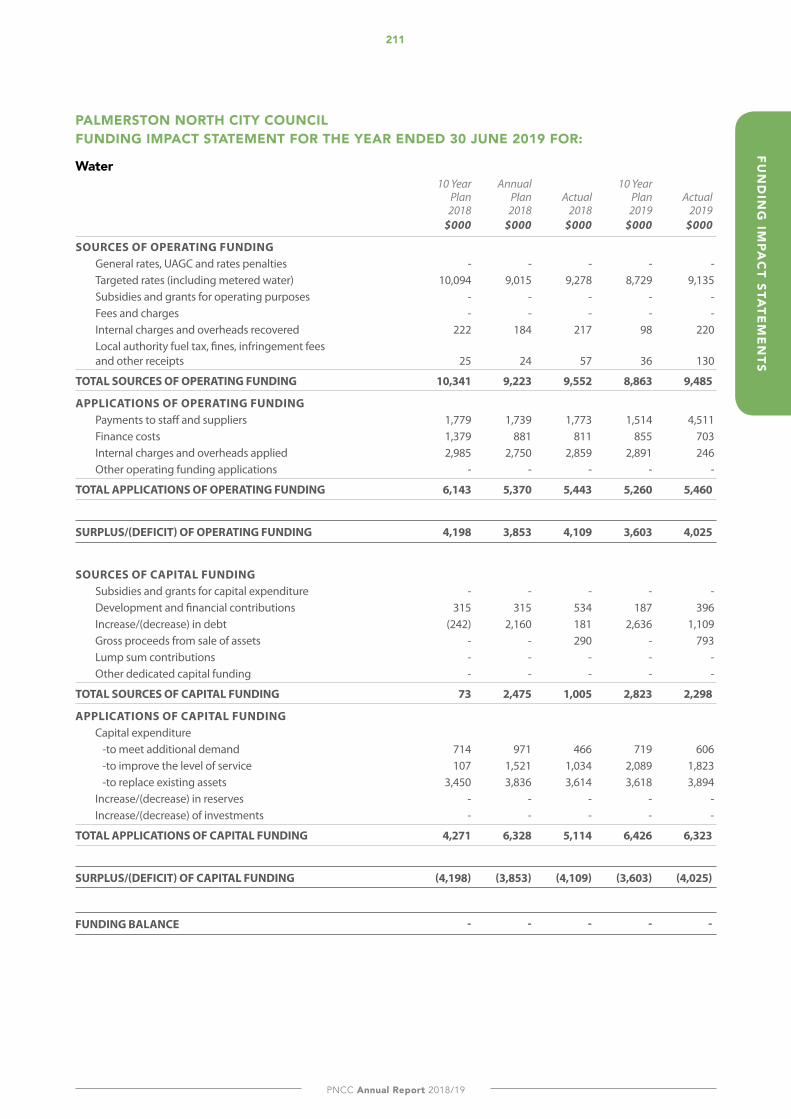
211
PNCC Annual Report 2018/19
FUN
dIN
G IM
PAC
T STATE
ME
NTS
PALMERSTON NORTH CITY COUNCIL FUNdING IMPACT STATEMENT FOR THE YEAR ENdEd 30 JUNE 2019 FOR:
Water 10 Year Annual 10 Year Plan Plan Actual Plan Actual 2018 2018 2018 2019 2019 $000 $000 $000 $000 $000
SOURCES OF OPERATING FUNDING General rates, UAGC and rates penalties - - - - - Targeted rates (including metered water) 10,094 9,015 9,278 8,729 9,135 Subsidies and grants for operating purposes - - - - - Fees and charges - - - - - Internal charges and overheads recovered 222 184 217 98 220 Local authority fuel tax, fines, infringement fees and other receipts 25 24 57 36 130
TOTAL SOURCES OF OPERATING FUNDING 10,341 9,223 9,552 8,863 9,485
APPLICATIONS OF OPERATING FUNDING Payments to staff and suppliers 1,779 1,739 1,773 1,514 4,511 Finance costs 1,379 881 811 855 703 Internal charges and overheads applied 2,985 2,750 2,859 2,891 246 Other operating funding applications - - - - -
TOTAL APPLICATIONS OF OPERATING FUNDING 6,143 5,370 5,443 5,260 5,460
SURPLUS/(DEFICIT) OF OPERATING FUNDING 4,198 3,853 4,109 3,603 4,025
SOURCES OF CAPITAL FUNDING Subsidies and grants for capital expenditure - - - - - Development and financial contributions 315 315 534 187 396 Increase/(decrease) in debt (242) 2,160 181 2,636 1,109 Gross proceeds from sale of assets - - 290 - 793 Lump sum contributions - - - - - Other dedicated capital funding - - - - -
TOTAL SOURCES OF CAPITAL FUNDING 73 2,475 1,005 2,823 2,298
APPLICATIONS OF CAPITAL FUNDING Capital expenditure -to meet additional demand 714 971 466 719 606 -to improve the level of service 107 1,521 1,034 2,089 1,823 -to replace existing assets 3,450 3,836 3,614 3,618 3,894 Increase/(decrease) in reserves - - - - - Increase/(decrease) of investments - - - - -
TOTAL APPLICATIONS OF CAPITAL FUNDING 4,271 6,328 5,114 6,426 6,323
SURPLUS/(DEFICIT) OF CAPITAL FUNDING (4,198) (3,853) (4,109) (3,603) (4,025)
FUNDING BALANCE - - - - -

212
Small city benefits - Big city ambition
CO
UN
CIL
CO
NTR
OLL
ED
OR
GA
NIS
ATI
ON
S
Cac
cia
Birc
h
213
PNCC Annual Report 2018/19
CO
UN
CIL C
ON
TRO
LLED
OR
GA
NISA
TION
S
WĀHANGA TUAWHĀ SECTION FOUR
NGĀ TŌPŪTANGA A TE KAUNIHERA COUNCIL CONTROLLED ORGANISATIONS
Caccia Birch is a Historical Places Trust Category I listed property. The
property is for the enjoyment of the whole community and also to
promote its use for educational and cultural purposes.
214
Small city benefits - Big city ambition
Ov
ER
vIE
w
OvERvIEwThe Council provides some of its services and facilities through Council Controlled Organisations (CCOs). These are primarily set up to independently manage Council facilities, or deliver specific services and developments on behalf of residents.
A CCO is any organisation where Council (or Councils) owns or controls at least 50 percent of the voting rights, or has the right to appoint at least 50 percent of the directors or trustees.
These organisations can bring business and community expertise that Council may not be able to access easily. They can also attract funding from sources other than ratepayers.
The Council has five reporting CCOs:
• Caccia Birch Trust Board • Central Economic Development Agency Ltd (CEDA)• Globe Theatre Trust Board • Te Manawa Museums Trust• The Regent Theatre Trust.
A Council Controlled Trading Organisation (CCTO) is a CCO that is set up to make a profit for the Council and its ratepayers.
The Council has one CCTO:
• Palmerston North Airport Limited (PNAL).
Run by independent boards, CCOs and CCTOs operate at arm’s length from the Council. Each year there is an agreement on the services that a Board will provide. This agreement is called the Statement of Intent. Council then provides funding (if required) so that the Board can implement the Statement of Intent.
Apart from CEDA and PNAL, the CCOs meet their obligations by:
• Providing a range of entertainment and recreational opportunities for a wide variety of performers and audiences.
• Preserving and promoting the city’s heritage. • Adding to its science, education and research base.
By cultivating a vibrant and creative city that enhances its attractiveness to residents and visitors, these CCOs add to the city’s wider economic development and cultural capital.
CEDA contributes to the city’s economic sustainability by attracting, nurturing and retaining businesses and jobs.
PNAL advances the region by maximising connectivity, stimulating investment and by providing support for its range of economic sectors.
Council can exempt small CCOs from the planning and reporting requirements of the Local Government Act. These are called exempted organisations, and the Council has two: the Palmerston North Performing Arts Trust and the Manawatū-Wanganui Regional Disaster Relief Fund Trust.
CACCIA BIRCH TRUST BOARD
CENTRAL ECONOMIC DEVELOPMENT AGENCY
GLOBE THEATRE TRUST BOARD
THE REGENT THEATRE TRUST
TE MANAwA MUSEUMS TRUST
PALMERSTON NORTH AIRPORT LTD
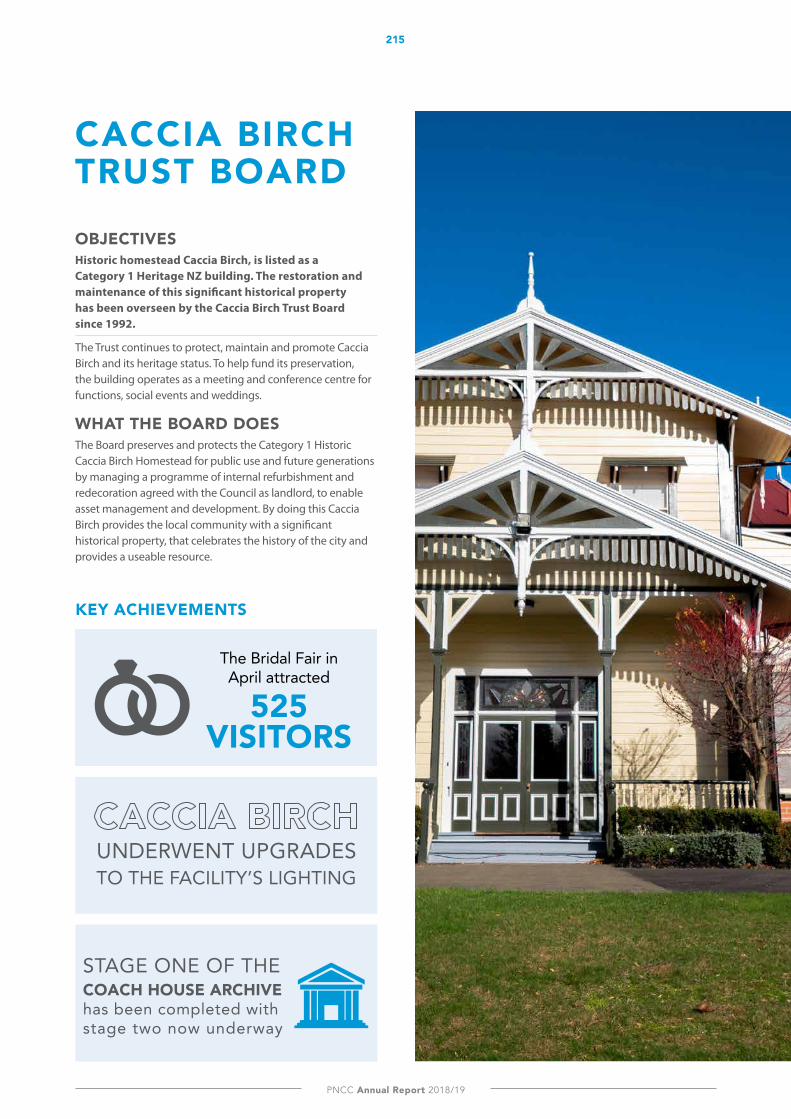
215
PNCC Annual Report 2018/19
CA
CC
IA B
IRC
H TR
UST B
OA
RD
OBJECTIvESHistoric homestead Caccia Birch, is listed as a Category 1 Heritage NZ building. The restoration and maintenance of this significant historical property has been overseen by the Caccia Birch Trust Board since 1992.
The Trust continues to protect, maintain and promote Caccia Birch and its heritage status. To help fund its preservation, the building operates as a meeting and conference centre for functions, social events and weddings.
WHAT THE BOARD DOESThe Board preserves and protects the Category 1 Historic Caccia Birch Homestead for public use and future generations by managing a programme of internal refurbishment and redecoration agreed with the Council as landlord, to enable asset management and development. By doing this Caccia Birch provides the local community with a significant historical property, that celebrates the history of the city and provides a useable resource.
CACCIA BIRCH TRUST BOARD
KEY ACHIEVEMENTS
STAGE ONE OF THE COACH HOUSE ARCHIVE has been completed with stage two now underway
UNDERWENT UPGRADES TO THE FACILITY’S LIGHTING
The Bridal Fair in April attracted
525 vISITORS

216
Small city benefits - Big city ambition
CA
CC
IA B
IRC
H T
RU
ST B
OA
RD
HOW DID WE PERFORM
MEASURE 2018/19TARGET
RESULT COMMENT
Open afternoons 10 Target met. 14 advertised free Open afternoons were held bringing an average of 30 visitors each afternoon. A further fifteen publicly accessible event opportunities took place including the free PNCC sponsored community Christmas event that successfully encouraged 300 visitors.
There were two music recitals held, Heritage Weekend and two high tea events.
A major highlight was hosting the 3-day International Quilt Exhibition attracting around 300 visitors.
Tour groups 5 Target met. Six tour groups were hosted including the Kapiti Garden Group, Raumati and Parkwood Retirement Villages, Ranfurly House twice and PN based U3A group. Smaller visitor groups from Wairarapa and Horowhenua also took advantage of our open days in early January with approximately 130 people visiting over the holiday break.
Usage days 250 Target not met.
247 days of use and a 66.81% occupancy – 2 % lower than anticipated, however we were more productive from a fiscal perspective. The increased number of publicly accessible events introduced a large visitor numbers to the tally and will hopefully pay dividend in the future.
Satisfaction (users) 90% Target met. Feedback from tours verbally provided a high level of satisfaction. Google reviews an average score of 4 out of 5 from approx. 30+ responses which are unable to be linked to visitors. We make feedback forms available to clients and visitors and report a 100% satisfaction rate due to no negative returns. We continue to look for other methods to encourage more feedback and regularly receive complimentary emails or phone calls after events are held.
New community group users
1 Target met. Three regular community organisations use the venue through the year for their meetings on an ad hoc basis and recently a new group, the Life House Trust arranged a fund-raising event and we are aiming to assist more such events in the future.
WHAT HAPPENED IN THE YEARCaccia Birch House is a Council Controlled Organisation (CCO). Palmerston North City Council funds operation of the heritage listed building. As well as maintains and facilitates Caccia Birch alongside a Board. In 2018/19, Palmerston North City Council paid $109,000 in operating funds to Caccia Birch.
During the year, Caccia Birch underwent upgrades to the facility’s lighting. The existing lighting was replaced with durable LED lighting.
Community involvement and access was a key focus this year. Caccia Birch can be hired as a venue for private functions and is often opened to the public Caccia Birch was hired 688 times this year compared to 631 in 2017/18. While 29 days were made available for free community access compare to 20 the previous year.
The Board and Council have implemented an exterior and interior annual works programme for Caccia Birch. This is to ensure that the whole of the facility maintains its unique heritage aspects. A renewed landscape plan is being developed for the grounds and embankment.
Stage one of the Coach House Archive has been completed with stage two now underway.
ONGOING CONSIDERATIONS Caccia Birch requires continued maintenance, which is being addressed currently and will continue to be addressed in the coming years.
The Board of Caccia Birch have been considering succession planning. This is to ensure that the management and operational knowledge of the facility is passed over in a timely and sustainable way. Funding needs to be sourced to enable the hiring of a second staff member to learn the role. The new role will also be responsible for staffing weekend bookings and supporting community access to the site.
Council is currently carrying out a review into the governance of the Council Controlled Organisations (CCOs). This will help to ensure that services and facilities are being delivered in the most cost-effective manner. While also driving the organisations to support the delivery of Council’s strategic objectives.
The major focus for the cultural CCOs and other organisations working in the arts, culture and heritage sector is the development of a coordinated strategy. This strategy will act as a guide for implementing Council’s Arts Plan. Council’s goal regarding the CCOs is to develop the city into an arts powerhouse with a national reputation for creativity and the arts.

217
PNCC Annual Report 2018/19
CE
DA
OBJECTIvESCEDA is a limited liability company incorporated and registered under the Companies Act 1993 that is 50 per cent owned by the Council and 50 per cent by Manawatū District Council.
It has operated since September 2016. The primary objective of CEDA is to drive and facilitate the creation and growth of economic wealth for Manawatū and beyond.
WHAT THE BOARD DOESThe Board guides and monitors the business and affairs of CEDA.
CEDA’s key strategic objectives in driving and facilitating the creation and growth of economic wealth for Manawatū and beyond are to:
• Support the growth of business in the region to grow bigger and better.
• Grow and retain education and talent in the region so businesses have the skills to grow.
• Enhance the brand and experience of the region.
CEDA has been providing tailored business start-up support through free monthly clinics for over a year. As part of this initiative the CEDA Start-up Guide was recently developed. The Guide features critical information for those starting on their business journey. It quickly proved popular with the digital resource downloaded 90 times in the first two weeks since publishing.
CENTRAL ECONOMIC DEVELOPMENT AGENCY (CEDA)
KEY ACHIEVEMENTS
SORT IT CAREERS EXPO achieved a record attendance of 5000 PEOPLE, including 3000 STUDENTS from 21 SECONDARY SCHOOLS
218
Small city benefits - Big city ambition
CE
DA
WHAT HAPPENED IN THE YEARThe Central Economic Development Agency (CEDA) launched Te Aho Tamaka in December 2018, the first programme of its kind in New Zealand. As part of the programme, eight distinguished leaders from across multiple industries have been identified. These leaders have been identified thanks to their roles in building a network of global leaders and ambassadors for the region. The programme facilitates opportunities for future leaders in the Manawatū to access mentoring, internships and investment from individuals who’re established in their field. Te Aho Tamaka aims to enable projects that will successfully contribute to the region’s economic development and growth.
Throughout the year, the Central Economic Development Agency hosted international recruitment agents in addition to leading education delegation to China. These activities successfully showcased the region’s educational offering and promoted Palmerston North as a great place to study. The number of international students grew by 11 percent compared to a national decline of 4 percent (end December 2018).
CEDA led the development of a Destination Management Plan for Palmerston North and Manawatū. The overarching objective of the plan is growing visitor activity and value for the benefit of our communities. CEDA also worked closely with key stakeholders developing a regional identity to support the attraction and retention of business and talent.
It was another successful year for CEDA’s flagship events, Sort It Careers Expo and New Zealand AgriFood Week. The Sort It Careers Expo achieved a record attendance of 5000 people, including 3,000 students from 21 secondary schools across the Manawatū-Whanganui region. A strong attendance and more than 80 exhibitors made 2019 the Expo’s most successful year yet. While New Zealand AgriFood Week had many of its 15 events sell out.
CEDA has been providing tailored business start-up support through free monthly clinics for over a year. As part of this initiative the CEDA Start-up Guide was recently developed. The Guide features critical information for those starting on their business journey. It quickly proved popular with the digital resource downloaded 90 times in the first two weeks since publishing.
ONGOING CONSIDERATIONS CEDA is developing seven conference proposals to support business events coming to Palmerston North and Manawatū in the next 18 months. The team met with more than 30 event organisers throughout the year to showcase the city and region as a conference destination.
Palmerston North City Council and Manawatū District Council provided a reviewed Letter of Expectations for CEDA’s Statement of Intent 2019/20. The Letter outlines a sharpened focus on inward investment, business retention and growth, and developing a talent pipeline.
HOW DID WE PERFORM
MEASURE 2018/19TARGET
RESULT COMMENT
Increase the value of international students in the region
Increase on 2016 baseline
Target met. Increase on 2016 baseline ($72.5m* 2016)
Result: 2017/18 year to June is $115m**
Programmes and initiatives developed and delivered to meet needs identified through regional skills gap analysis
2 programmes developed
Target met. 4 programmes delivered/implemented
Year on year growth of unique visits to the regional website www.ManawatuNZ.co.nz
10% growth Target met. 11.2% increase, to 175,688
Consumer social media and e-Newsletter growth
10% growth Target met. Social media average 12% increase, eNewsletter 23.9% increase
Successful media results for the visitor sector 5 direct media publications
Target met. 50 media publications
Destination management Plans and Strategy developed
Plan and Strategy developed
Target met. Plan and strategy developed.
*Based on Value Added plus Tax – Infometrics Report, March 2017
**Based on Value Added plus Tax
219
PNCC Annual Report 2018/19
CE
DA
MEASURE 2018/19TARGET
RESULT COMMENT
Grow Manawatū’s share of regional delegate days through targeted bids
10% growth Target not met.
Year to March 2019 (latest figures) results from all business events (meetings, incentives, conferences and exhibitions) was 237,903 delegate days, a 3.3% increase from March 2019 of 230,400.
Grow Manawatū’s share of regional delegate days through targeted bids
33% win/loss ratio
Target met. 100% win ratio
Percentage of customers satisfied with visitor information services in the region
80% satisfaction
Target met. 96% satisfaction
Number of businesses actively engaged in Regional Business Partner Programme
400 Target not met.
320 Businesses engaged through the Regional Business Partner Network
Number of unique businesses that have accessed CEDA’s additional support services
100 Target met. 223 businesses
Engage with business that identify as Maori through the Regional Business Partner Programme
12 Target met. 18 Māori businesses Engaged through the Regional Business Partner Programme
Ongoing engagement with Maori business support agencies / Iwi representatives
8 engagements
Target met. 52 engagements.
CEDA has engaged with Maori Sector organisations and stakeholders to understand how we can assist and collaborate on key projects. These engagements included: Te Puni Kokiri (10), Te Tihi (3), Poutama Trust (6), Te Au Pakihi (1), Ngati Raukawa (2), Te Manu Atatu (6), Massey Te Au Rangahau (7), Ngati Kauwhata (5), Rangitane (4), Rangitane Ki Tamakinui a Rua (4), and Kahunnungu (4).
We have also engaged with Iwi across Palmerston North City, Manawatū District and Tararua District as part of our Regional Identity,
Development of Ag Cluster strategy Strategy developed
Target met. Strategy developed.
The AgTech strategy framework for Manawatū has been developed in collaboration with Sprout (Agtech Accelerator) and regional stakeholdrs. “New Zealand’s Central Innovation Belt: A Global Agritech Hub in the Manawatū.” The strategy has been developed to support the positioning of Manawatū as one of the top 3 agri ecosystems in the world, with a three year action plan.
Distribution and Logistics business attraction plan developed and initiated
Plan initiated Target met. Plan completed (Project Unlock)
Partnership agreements and workplans in place with tertiary sector, and defence committee
Partnership and workplans agreed and actioned
Target met. Agreements in place.
Partnership agreements are in place with Education New Zealand, Massey University, UCOL, IPU New Zealand, and English Teaching College along with Palmerston North Girls’ and Boys’ High Schools, Awatapu College, St Peter’s College, Freyberg High School and Feilding High School.
Number of businesses assisted by CEDA to relocate to the region
3 Target not met.
Result: 0.
Continued assistance with the retention of one significant business in the region. Engaged or continued to engage with eight businesses around potential relocation to the region.
Contributed to the development and negotiation to advance major government and commercial investment into the Central NZ Distribution Hub.
% satisfaction with BCC support / services provided
80% or higher satisfaction
Target met. 83.3% agreed/ strongly agreed programme exceeded expectations
Note: two of the measures previously recorded in the 10 Year Plan are no longer in CEDA’s contract.
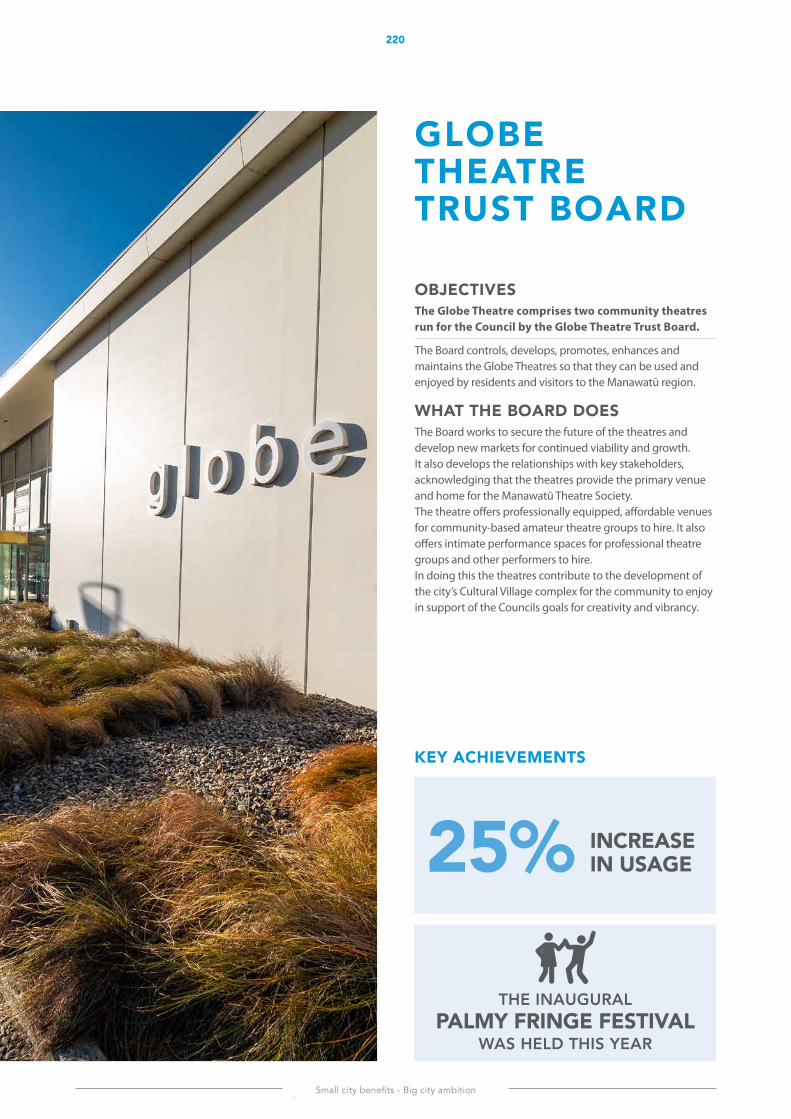
220
Small city benefits - Big city ambition
GLO
BE
TH
EA
TRE
TR
UST
BO
AR
D
OBJECTIvESThe Globe Theatre comprises two community theatres run for the Council by the Globe Theatre Trust Board.
The Board controls, develops, promotes, enhances and maintains the Globe Theatres so that they can be used and enjoyed by residents and visitors to the Manawatū region.
WHAT THE BOARD DOESThe Board works to secure the future of the theatres and develop new markets for continued viability and growth. It also develops the relationships with key stakeholders, acknowledging that the theatres provide the primary venue and home for the Manawatū Theatre Society. The theatre offers professionally equipped, affordable venues for community-based amateur theatre groups to hire. It also offers intimate performance spaces for professional theatre groups and other performers to hire. In doing this the theatres contribute to the development of the city’s Cultural Village complex for the community to enjoy in support of the Councils goals for creativity and vibrancy.
GLOBE THEATRE TRUST BOARD
KEY ACHIEVEMENTS
THE INAUGURAL PALMY FRINGE FESTIVAL
WAS HELD THIS YEAR
INCREASE IN USAGE 25%
221
PNCC Annual Report 2018/19
GLO
BE
THE
ATR
E TR
UST B
OA
RD
WHAT HAPPENED IN THE YEARThe Globe Theatre is a Council Controlled Organisation (CCO), which operates alongside a Board. In 2018/19, Palmerston North City Council paid $113,000 in operating funds to the Globe Theatre. The Globe Theatre also forms part of Council’s cultural facilities portfolio. In 2018/19, the heating and cooling systems in the Globe Theatre were replaced. This formed part of Council’s robust renewals and facilities management programme. To help enhance the city’s existing arts and culture buildings. The Globe Theatre is important in achieving the Council’s aspirations and meeting the community’s needs.
The Globe achieved great results in 2018/19 with a 25 per cent increase in usage and performance events over the previous year. The Globe also welcomed several new and diverse hirers, X local organisations now hire the Globe under Memorandum of Understanding (MOU) agreements.
The Globe’s success can be attributed to a few key productions:
• Two seasons of local amateur drama were hosted by The Globe - Seussical Jr by Manawatū Youth Theatre and The Wedding Singer from Manawatū Theatre Society.
• The Summer Sounds Festival featured nine touring national and international music acts, including the Jazz Festival.
• The Reel Earth Film Festival also proved popular with residents and visitors.
Several “sold out” events this year also showed that the Globe is attracting an engaged audience with its choices in programming, including:
• Don McGlashan; • Rodger Fox’s shows Steve Gadd and “Charlie Parker with
Strings”; • Graeme James;• Stretch;• One Night in Africa; and • two shows for the D-Day Dedication.
ONGOING CONSIDERATIONS Council is currently carrying out a review into the governance of the Council Controlled Organisations (CCOs). This will help to ensure that services and facilities are being delivered in the most cost-effective manner. While it will also drive the organisations to support the delivery of Council’s strategic objectives.
The major focus for the cultural CCOs and other organisations working in the arts, culture and heritage sector is the development of a coordinated strategy. This strategy will act as a guide for implementing Council’s Arts Plan. Council’s goal regarding the CCOs is to develop the city into an arts powerhouse with a national reputation for creativity and the arts.
HOW DID WE PERFORM
MEASURE 2018/19TARGET
RESULT COMMENT
Usage nights ≥350 Target met. 680 usage nights.
Performances ≥165 Target met. 253 performance nights.
Satisfaction (hirers) ≥97% Target not met.
93%
Satisfaction (audiences)
≥78% Target met. 84%
Audience surveys take place monthly and target ticket buyers through the Globe ticketing system. Comments and feedback are considered at Board meetings. The factors most likely to affect satisfaction ratings of visitors is front-of-house/reception and online booking of tickets.
Events co-promoted by the Globe
5 Target met. 28 events were co-promoted (i.e. some form of box office split rather than a straightforward hire-fee)
Proportion of MOU-driven usage
60%
of which 90% is performance based
Target not met.
57% of usage of which 95% was performance-based.
Depreciation costs funded
33% Target met. 45% depreciation funded in 2018/19
However, depreciation of the new rig will start in 2019/20 and the proposed new digital lights in 2020/21 and this will increase depreciation costs from 2020 onwards. In addition, the scheduled renewal programme has been implemented, with the replacement of office computers, promotional materials and café furniture.
Donation and fundraising revenue2
$10,000 Target not met.
$2,494 raised.
2 Excluding PNCC, non-capital
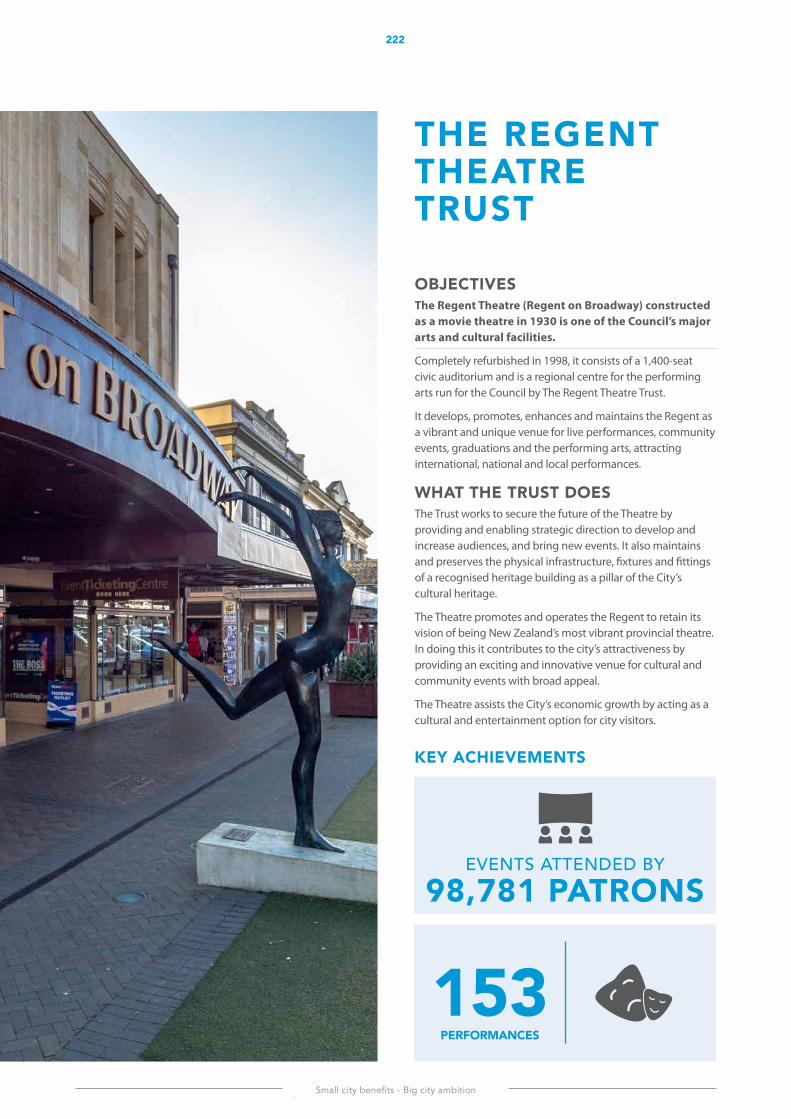
222
Small city benefits - Big city ambition
THE
RE
GE
NT
THE
ATR
E T
RU
ST
OBJECTIvESThe Regent Theatre (Regent on Broadway) constructed as a movie theatre in 1930 is one of the Council’s major arts and cultural facilities.
Completely refurbished in 1998, it consists of a 1,400-seat civic auditorium and is a regional centre for the performing arts run for the Council by The Regent Theatre Trust.
It develops, promotes, enhances and maintains the Regent as a vibrant and unique venue for live performances, community events, graduations and the performing arts, attracting international, national and local performances.
WHAT THE TRUST DOESThe Trust works to secure the future of the Theatre by providing and enabling strategic direction to develop and increase audiences, and bring new events. It also maintains and preserves the physical infrastructure, fixtures and fittings of a recognised heritage building as a pillar of the City’s cultural heritage.
The Theatre promotes and operates the Regent to retain its vision of being New Zealand’s most vibrant provincial theatre. In doing this it contributes to the city’s attractiveness by providing an exciting and innovative venue for cultural and community events with broad appeal.
The Theatre assists the City’s economic growth by acting as a cultural and entertainment option for city visitors.
THE REGENT THEATRE TRUST
KEY ACHIEVEMENTS
153PERFORMANCES
EVENTS ATTENDED BY 98,781 PATRONS
223
PNCC Annual Report 2018/19
THE
RE
GE
NT TH
EA
TRE
TRU
ST
WHAT HAPPENED IN THE YEARThe Regent Theatre is another Council Controlled Organisation (CCO), which operates under the governance of a Board. In 2018/19, Palmerston North City Council paid $232,000 in operating funds to The Regent Theatre.
The Regent Theatre marked 20 years since its refurbishment in 2018 with a programme of ten celebratory events. The events were attended by 3,828 patrons generating ticket sales of $89,310. A ‘one off’ performance of Rock of Ages was also recreated especially for the anniversary.
The Regent Theatre also forms part of Council’s cultural facilities portfolio. In 2018/19, LED lighting upgrades were completed in the theatre. This formed part of Council’s renewals and facilities management programme. To help enhance the city’s existing arts and culture buildings. Facilities like the Regent Theatre are important in achieving the Council’s aspirations and meeting the community’s needs.
In 2018/19 bookings made by local organisations accounted for 89 per cent. Throughout the year, 153 performances were held throughout the year. Community events were attended by 65,986 patrons.
ONGOING CONSIDERATIONS The sound system at the Regent is now 20 years old. The Board has sourced two thirds of the cost of a replacement system to date and hope to secure the balance of the funding in 2019/20.
Council is currently carrying out a review into the governance of the Council Controlled Organisations (CCOs). This will help to ensure that services and facilities are being delivered in the most cost-effective manner. While it will also drive the organisations to support the delivery of Council’s strategic objectives.
The major focus for the cultural CCOs and other organisations working in the arts, culture and heritage sector is the development of a coordinated strategy. This strategy will act as a guide for implementing Council’s Arts Plan. Council’s goal regarding the CCOs is to develop the city into an arts powerhouse with a national reputation for creativity and the arts.
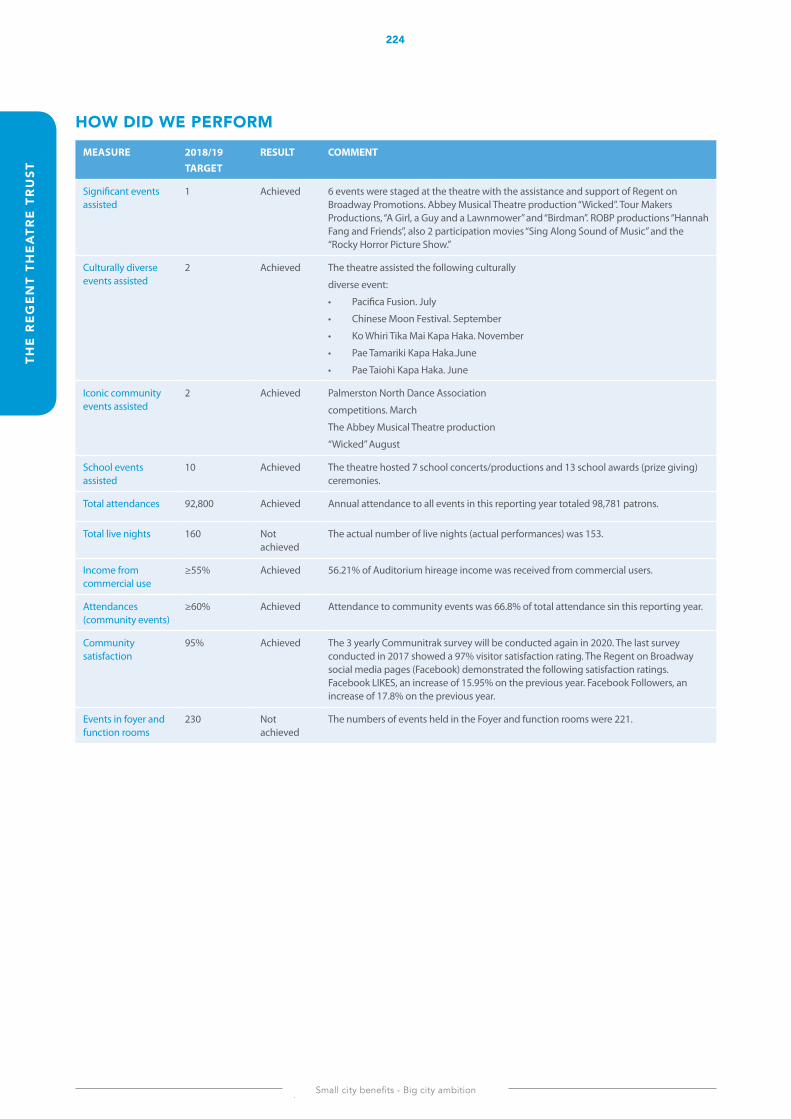
224
Small city benefits - Big city ambition
THE
RE
GE
NT
THE
ATR
E T
RU
ST
HOW DID WE PERFORM
MEASURE 2018/19TARGET
RESULT COMMENT
Significant events assisted
1 Achieved 6 events were staged at the theatre with the assistance and support of Regent on Broadway Promotions. Abbey Musical Theatre production “Wicked”. Tour Makers Productions, “A Girl, a Guy and a Lawnmower” and “Birdman”. ROBP productions “Hannah Fang and Friends”, also 2 participation movies “Sing Along Sound of Music” and the “Rocky Horror Picture Show.”
Culturally diverse events assisted
2 Achieved The theatre assisted the following culturally
diverse event:
• Pacifica Fusion. July
• Chinese Moon Festival. September
• Ko Whiri Tika Mai Kapa Haka. November
• Pae Tamariki Kapa Haka.June
• Pae Taiohi Kapa Haka. June
Iconic community events assisted
2 Achieved Palmerston North Dance Association
competitions. March
The Abbey Musical Theatre production
“Wicked” August
School events assisted
10 Achieved The theatre hosted 7 school concerts/productions and 13 school awards (prize giving) ceremonies.
Total attendances 92,800 Achieved Annual attendance to all events in this reporting year totaled 98,781 patrons.
Total live nights 160 Not achieved
The actual number of live nights (actual performances) was 153.
Income from commercial use
≥55% Achieved 56.21% of Auditorium hireage income was received from commercial users.
Attendances (community events)
≥60% Achieved Attendance to community events was 66.8% of total attendance sin this reporting year.
Community satisfaction
95% Achieved The 3 yearly Communitrak survey will be conducted again in 2020. The last survey conducted in 2017 showed a 97% visitor satisfaction rating. The Regent on Broadway social media pages (Facebook) demonstrated the following satisfaction ratings. Facebook LIKES, an increase of 15.95% on the previous year. Facebook Followers, an increase of 17.8% on the previous year.
Events in foyer and function rooms
230 Not achieved
The numbers of events held in the Foyer and function rooms were 221.
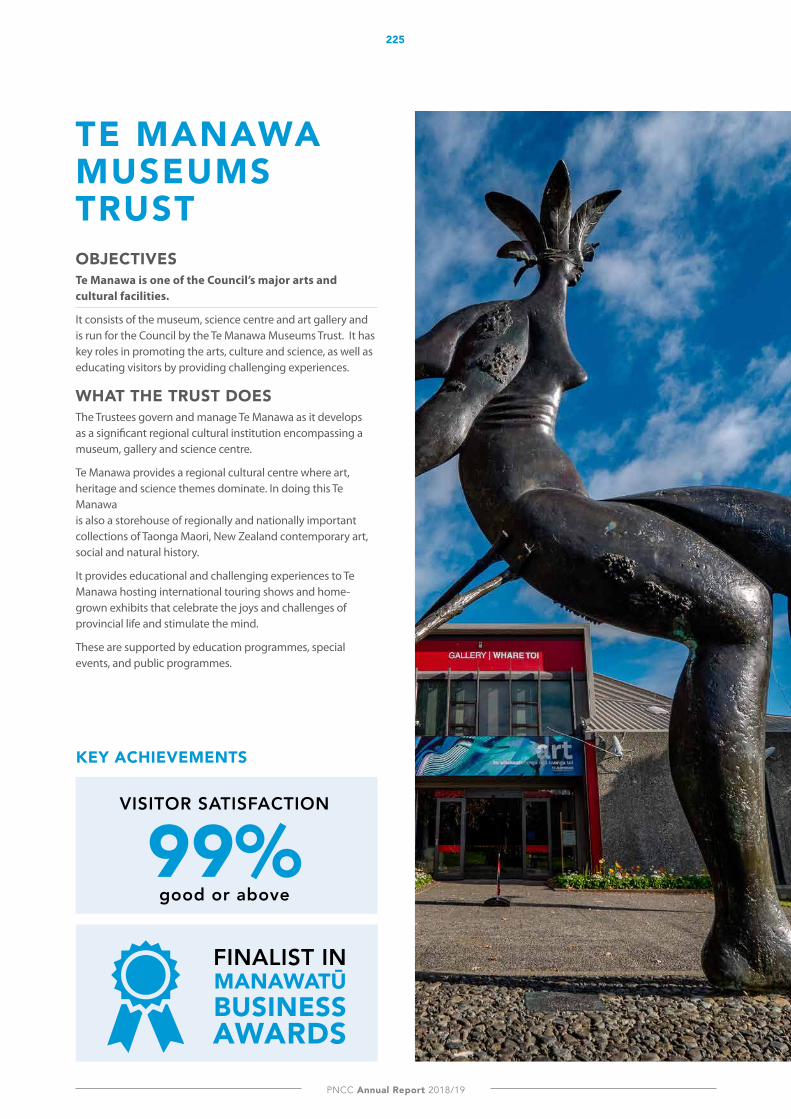
225
PNCC Annual Report 2018/19
TE M
AN
Aw
A M
USE
UM
S TRU
ST
OBJECTIvESTe Manawa is one of the Council’s major arts and cultural facilities.
It consists of the museum, science centre and art gallery and is run for the Council by the Te Manawa Museums Trust. It has key roles in promoting the arts, culture and science, as well as educating visitors by providing challenging experiences.
WHAT THE TRUST DOESThe Trustees govern and manage Te Manawa as it develops as a significant regional cultural institution encompassing a museum, gallery and science centre.
Te Manawa provides a regional cultural centre where art, heritage and science themes dominate. In doing this Te Manawa is also a storehouse of regionally and nationally important collections of Taonga Maori, New Zealand contemporary art, social and natural history.
It provides educational and challenging experiences to Te Manawa hosting international touring shows and home-grown exhibits that celebrate the joys and challenges of provincial life and stimulate the mind.
These are supported by education programmes, special events, and public programmes.
TE MANAwA MUSEUMS TRUST
KEY ACHIEVEMENTS
FINALIST INMANAWATŪ BUSINESSAwARDS
VISITOR SATISFACTION
99% good or above

226
Small city benefits - Big city ambition
TE M
AN
Aw
A M
USE
UM
S TR
UST
WHAT HAPPENED IN THE YEARIn 2018/19 Te Manawa focused on developing vision related attractions to increase its visitor numbers. Throughout the year 126,666 people visited the museum for more than eight exhibitions:
• Secrets of Mona Lisa; • Taku Pe’u Tupuna; • Boots, Bullets and Balls exhibitions; • Jerome Kavanagh Sound Journey; • NOA PasteUP! Initiative; • Art Gallery Refresh and new exhibitions; • Santa’s Cave Centenary Events Programme; and• The Reflection Room WW100 community
engagement initiative.
These exhibitions also aligned to several travelling exhibitions, including Sunlight/ Ihi Komaru, which opened at Canterbury Museum and was visited by 45,515 people. These developed exhibitions were aimed at increasing Te Manawa’s profile across New Zealand and the world.
Te Manawa also focused heavily on creating a digital presence. This included the use of social media, with the museum extending its reach by creating an Instagram account.
Partnerships also held significance in 2018/19, with Te Manawa looking to enhance its iwi partnership. Rangitāne were involved in the development and implementation of Te Ahikaea. Te Ahikaea now called ‘Rangimarie’– The Peoples Place is being undertaken by Te Rangimārie Marae Trustees. It will be a dual venue cultural tourism project utilising the Te Rangi Whenua Gallery at Te Manawa and the Te Rangimārie marae complex at Rangiotu.
The business case was completed and accepted by Te Rangimārie Marae. The design brief for Te Rangi Whenua was also completed. A performance programme is now being developed for public performances at Te Manawa.
Throughout the year, Te Manawa received $447,178 from grants, fundraising and sponsorship. Visitor satisfaction was rated 99% good, very good or excellent.
ONGOING CONSIDERATIONS Council is currently carrying out a review into the governance of the Council Controlled Organisations (CCOs). This will help to ensure that services and facilities are being delivered in the most cost-effective manner. While it will also drive the organisations to support the delivery of Council’s strategic objectives.
The major focus for the cultural CCOs and other organisations working in the arts, culture and heritage sector is the development of a coordinated strategy. This strategy will act as a guide for implementing Council’s Arts Plan. Council’s goal regarding the CCOs is to develop the city into an arts powerhouse with a national reputation for creativity and the arts.
Council continues to work with the Te Manawa Museum Board regarding the proposed refurbished museum complex with a business case still to be developed.
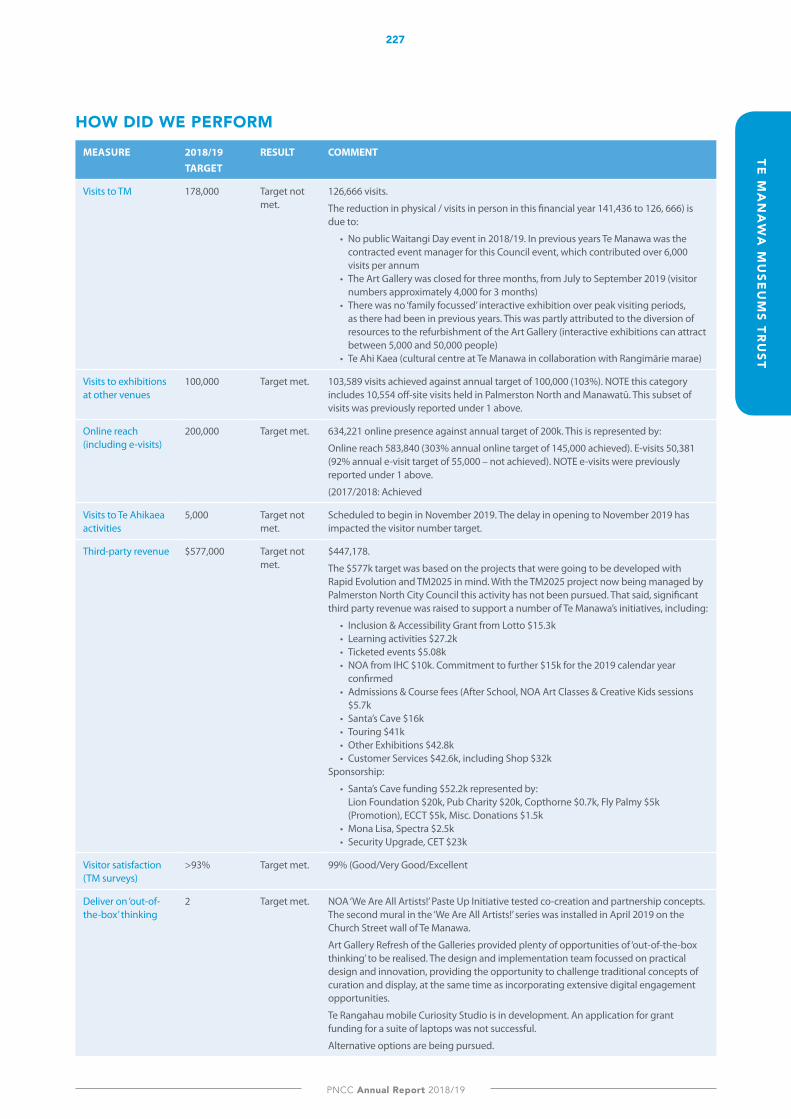
227
PNCC Annual Report 2018/19
TE M
AN
Aw
A M
USE
UM
S TRU
ST
HOW DID WE PERFORM
MEASURE 2018/19TARGET
RESULT COMMENT
Visits to TM 178,000 Target not met.
126,666 visits.
The reduction in physical / visits in person in this financial year 141,436 to 126, 666) is due to:
• No public Waitangi Day event in 2018/19. In previous years Te Manawa was the contracted event manager for this Council event, which contributed over 6,000 visits per annum
• The Art Gallery was closed for three months, from July to September 2019 (visitor numbers approximately 4,000 for 3 months)
• There was no ‘family focussed’ interactive exhibition over peak visiting periods, as there had been in previous years. This was partly attributed to the diversion of resources to the refurbishment of the Art Gallery (interactive exhibitions can attract between 5,000 and 50,000 people)
• Te Ahi Kaea (cultural centre at Te Manawa in collaboration with Rangimārie marae)
Visits to exhibitions at other venues
100,000 Target met. 103,589 visits achieved against annual target of 100,000 (103%). NOTE this category includes 10,554 off-site visits held in Palmerston North and Manawatū. This subset of visits was previously reported under 1 above.
Online reach (including e-visits)
200,000 Target met. 634,221 online presence against annual target of 200k. This is represented by:
Online reach 583,840 (303% annual online target of 145,000 achieved). E-visits 50,381 (92% annual e-visit target of 55,000 – not achieved). NOTE e-visits were previously reported under 1 above.
(2017/2018: Achieved
Visits to Te Ahikaea activities
5,000 Target not met.
Scheduled to begin in November 2019. The delay in opening to November 2019 has impacted the visitor number target.
Third-party revenue $577,000 Target not met.
$447,178.
The $577k target was based on the projects that were going to be developed with Rapid Evolution and TM2025 in mind. With the TM2025 project now being managed by Palmerston North City Council this activity has not been pursued. That said, significant third party revenue was raised to support a number of Te Manawa’s initiatives, including:
• Inclusion & Accessibility Grant from Lotto $15.3k • Learning activities $27.2k • Ticketed events $5.08k • NOA from IHC $10k. Commitment to further $15k for the 2019 calendar year
confirmed • Admissions & Course fees (After School, NOA Art Classes & Creative Kids sessions
$5.7k • Santa’s Cave $16k • Touring $41k • Other Exhibitions $42.8k • Customer Services $42.6k, including Shop $32k
Sponsorship:
• Santa’s Cave funding $52.2k represented by: Lion Foundation $20k, Pub Charity $20k, Copthorne $0.7k, Fly Palmy $5k (Promotion), ECCT $5k, Misc. Donations $1.5k
• Mona Lisa, Spectra $2.5k • Security Upgrade, CET $23k
Visitor satisfaction (TM surveys)
>93% Target met. 99% (Good/Very Good/Excellent
Deliver on ‘out-of-the-box’ thinking
2 Target met. NOA ‘We Are All Artists!’ Paste Up Initiative tested co-creation and partnership concepts. The second mural in the ‘We Are All Artists!’ series was installed in April 2019 on the Church Street wall of Te Manawa.
Art Gallery Refresh of the Galleries provided plenty of opportunities of ‘out-of-the-box thinking’ to be realised. The design and implementation team focussed on practical design and innovation, providing the opportunity to challenge traditional concepts of curation and display, at the same time as incorporating extensive digital engagement opportunities.
Te Rangahau mobile Curiosity Studio is in development. An application for grant funding for a suite of laptops was not successful.
Alternative options are being pursued.
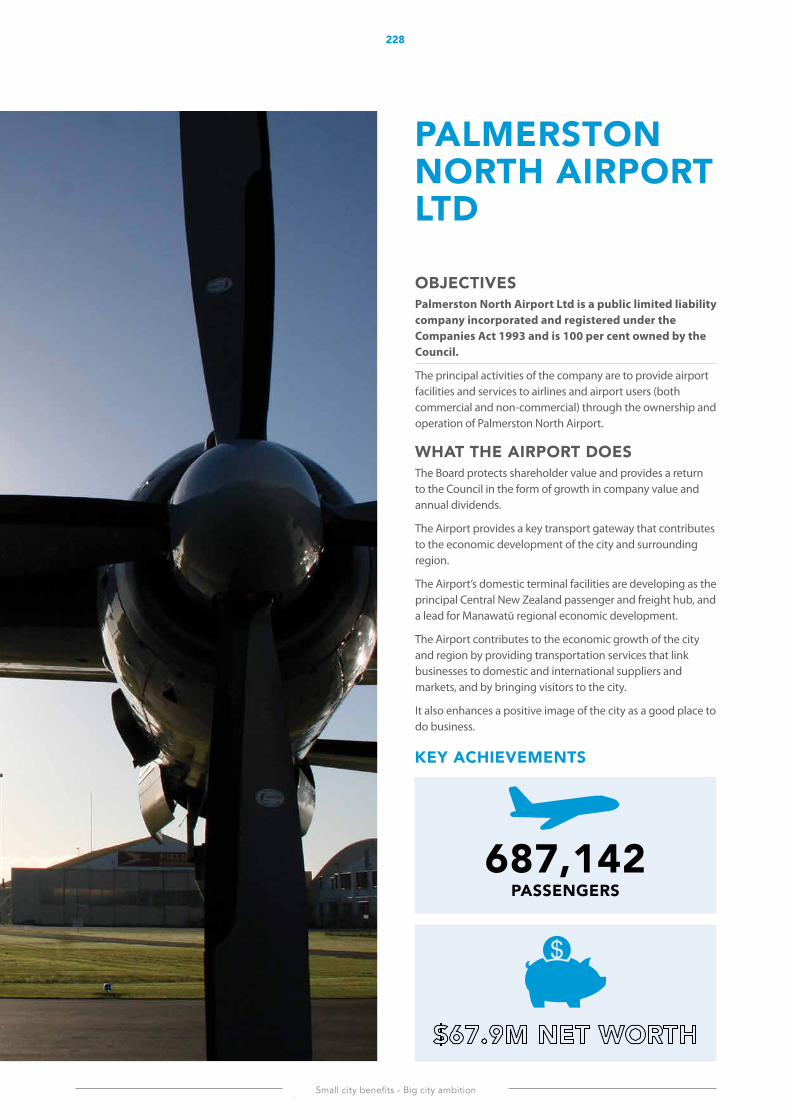
228
Small city benefits - Big city ambition
PALM
ER
STO
N N
OR
TH A
IRP
OR
T LT
D
OBJECTIvESPalmerston North Airport Ltd is a public limited liability company incorporated and registered under the Companies Act 1993 and is 100 per cent owned by the Council.
The principal activities of the company are to provide airport facilities and services to airlines and airport users (both commercial and non-commercial) through the ownership and operation of Palmerston North Airport.
WHAT THE AIRPORT DOESThe Board protects shareholder value and provides a return to the Council in the form of growth in company value and annual dividends.
The Airport provides a key transport gateway that contributes to the economic development of the city and surrounding region.
The Airport’s domestic terminal facilities are developing as the principal Central New Zealand passenger and freight hub, and a lead for Manawatū regional economic development.
The Airport contributes to the economic growth of the city and region by providing transportation services that link businesses to domestic and international suppliers and markets, and by bringing visitors to the city.
It also enhances a positive image of the city as a good place to do business.
PALMERSTON NORTH AIRPORT LTD
KEY ACHIEVEMENTS
687,142 PASSENGERS
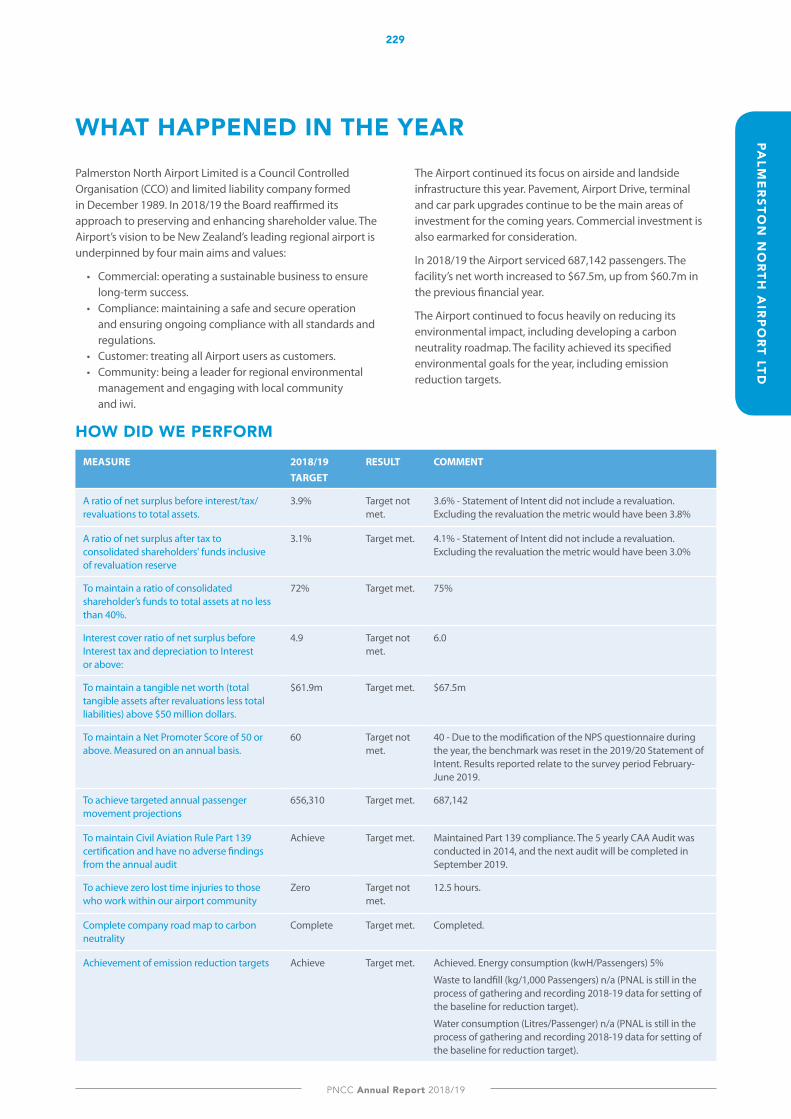
229
PNCC Annual Report 2018/19
PALM
ER
STON
NO
RTH
AIR
PO
RT LTD
WHAT HAPPENED IN THE YEARPalmerston North Airport Limited is a Council Controlled Organisation (CCO) and limited liability company formed in December 1989. In 2018/19 the Board reaffirmed its approach to preserving and enhancing shareholder value. The Airport’s vision to be New Zealand’s leading regional airport is underpinned by four main aims and values:
• Commercial: operating a sustainable business to ensure long-term success.
• Compliance: maintaining a safe and secure operation and ensuring ongoing compliance with all standards and regulations.
• Customer: treating all Airport users as customers. • Community: being a leader for regional environmental
management and engaging with local community and iwi.
The Airport continued its focus on airside and landside infrastructure this year. Pavement, Airport Drive, terminal and car park upgrades continue to be the main areas of investment for the coming years. Commercial investment is also earmarked for consideration.
In 2018/19 the Airport serviced 687,142 passengers. The facility’s net worth increased to $67.5m, up from $60.7m in the previous financial year.
The Airport continued to focus heavily on reducing its environmental impact, including developing a carbon neutrality roadmap. The facility achieved its specified environmental goals for the year, including emission reduction targets.
HOW DID WE PERFORM
MEASURE 2018/19TARGET
RESULT COMMENT
A ratio of net surplus before interest/tax/revaluations to total assets.
3.9% Target not met.
3.6% - Statement of Intent did not include a revaluation. Excluding the revaluation the metric would have been 3.8%
A ratio of net surplus after tax to consolidated shareholders' funds inclusive of revaluation reserve
3.1% Target met. 4.1% - Statement of Intent did not include a revaluation. Excluding the revaluation the metric would have been 3.0%
To maintain a ratio of consolidated shareholder’s funds to total assets at no less than 40%.
72% Target met. 75%
Interest cover ratio of net surplus before Interest tax and depreciation to Interest or above:
4.9 Target not met.
6.0
To maintain a tangible net worth (total tangible assets after revaluations less total liabilities) above $50 million dollars.
$61.9m Target met. $67.5m
To maintain a Net Promoter Score of 50 or above. Measured on an annual basis.
60 Target not met.
40 - Due to the modification of the NPS questionnaire during the year, the benchmark was reset in the 2019/20 Statement of Intent. Results reported relate to the survey period February-June 2019.
To achieve targeted annual passenger movement projections
656,310 Target met. 687,142
To maintain Civil Aviation Rule Part 139 certification and have no adverse findings from the annual audit
Achieve Target met. Maintained Part 139 compliance. The 5 yearly CAA Audit was conducted in 2014, and the next audit will be completed in September 2019.
To achieve zero lost time injuries to those who work within our airport community
Zero Target not met.
12.5 hours.
Complete company road map to carbon neutrality
Complete Target met. Completed.
Achievement of emission reduction targets Achieve Target met. Achieved. Energy consumption (kwH/Passengers) 5%
Waste to landfill (kg/1,000 Passengers) n/a (PNAL is still in the process of gathering and recording 2018-19 data for setting of the baseline for reduction target).
Water consumption (Litres/Passenger) n/a (PNAL is still in the process of gathering and recording 2018-19 data for setting of the baseline for reduction target).

230
Small city benefits - Big city ambition
Ad
dit
ion
Al
info
rm
Ati
on
Palm
erst
on n
orth
Cen
tral
lib
rary
231
PNCC Annual Report 2018/19
Ad
ditio
nA
l info
rm
Atio
n
WĀHANGA TUARIMA SECtion fiVE
KŌRERO ĀPITIHANGA AdditionAl informAtion
Palmerston North Central Library provides a warm and welcoming
environment in a stunning architectural masterpiece. It collaborates
with community groups and individuals to make our community more
engaging, connected and inspiring. Te Ara Whānui o Te Ao: Inspiring
people to explore the pathways to the world.
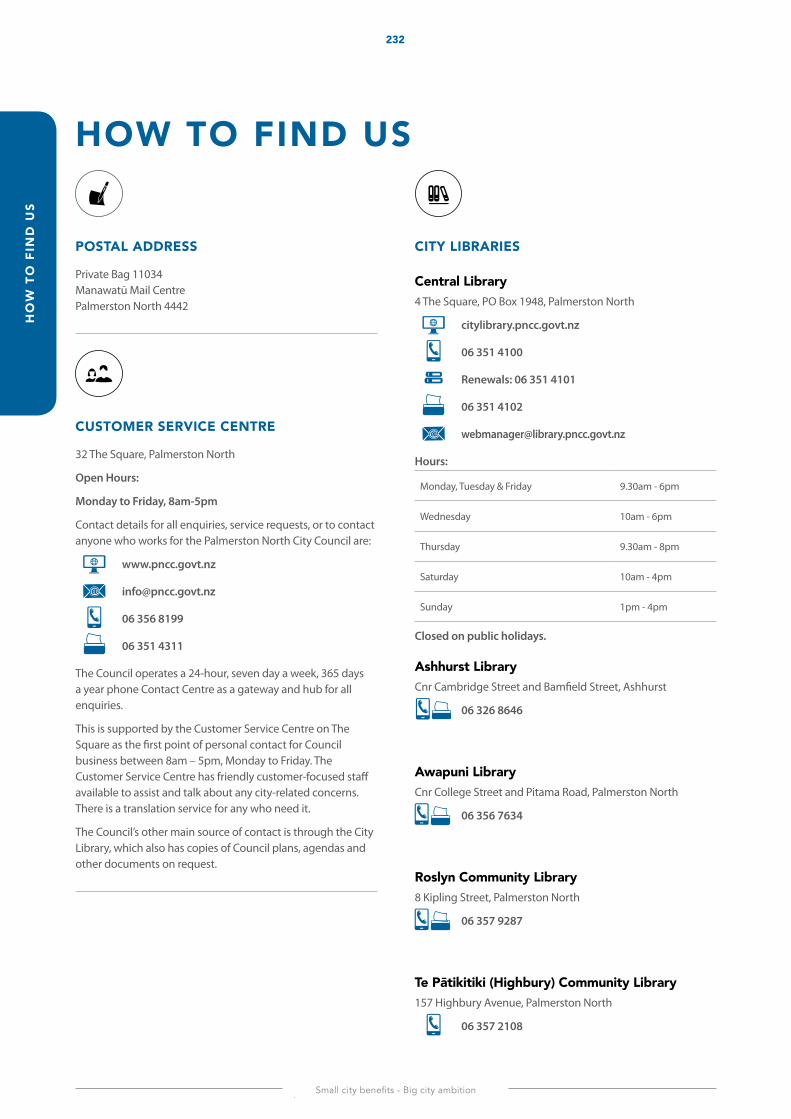
232
Small city benefits - Big city ambition
HO
W T
O f
INd
Us
HOW TO fINd Us
PoStAl AddrESS
Private Bag 11034 Manawatū Mail Centre Palmerston North 4442
CUsTOMER sERVICE CENTRE
32 The Square, Palmerston North
Open Hours:
Monday to Friday, 8am-5pm
Contact details for all enquiries, service requests, or to contact anyone who works for the Palmerston North City Council are:
www.pncc.govt.nz
06 356 8199
06 351 4311
The Council operates a 24-hour, seven day a week, 365 days a year phone Contact Centre as a gateway and hub for all enquiries.
This is supported by the Customer Service Centre on The Square as the first point of personal contact for Council business between 8am – 5pm, Monday to Friday. The Customer Service Centre has friendly customer-focused staff available to assist and talk about any city-related concerns. There is a translation service for any who need it.
The Council’s other main source of contact is through the City Library, which also has copies of Council plans, agendas and other documents on request.
CitY liBrAriES
Central library4 The Square, PO Box 1948, Palmerston North
citylibrary.pncc.govt.nz
06 351 4100
Renewals: 06 351 4101
06 351 4102
Hours:
Monday, Tuesday & Friday 9.30am - 6pm
Wednesday 10am - 6pm
Thursday 9.30am - 8pm
Saturday 10am - 4pm
Sunday 1pm - 4pm
Closed on public holidays.
Ashhurst library Cnr Cambridge Street and Bamfield Street, Ashhurst
06 326 8646
Awapuni libraryCnr College Street and Pitama Road, Palmerston North
06 356 7634
roslyn Community library 8 Kipling Street, Palmerston North
06 357 9287
Te Pātikitiki (Highbury) Community Library157 Highbury Avenue, Palmerston North
06 357 2108
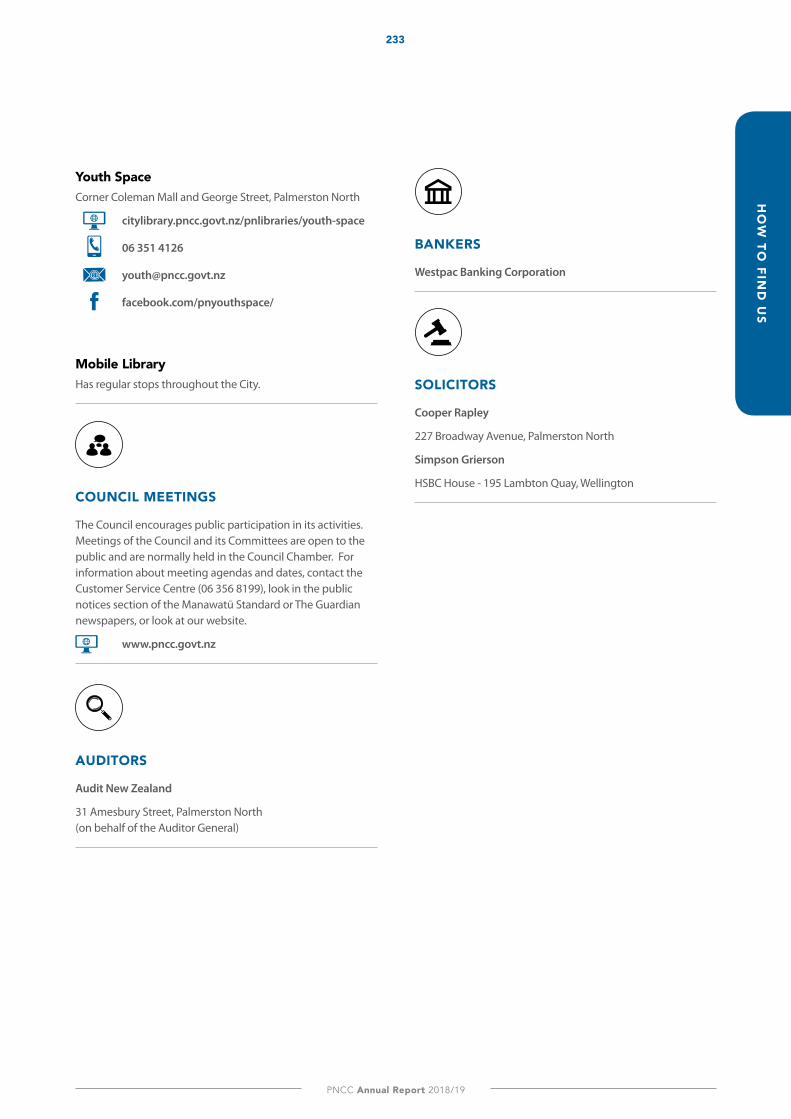
233
PNCC Annual Report 2018/19
HO
W TO
fINd
Us
Youth SpaceCorner Coleman Mall and George Street, Palmerston North
citylibrary.pncc.govt.nz/pnlibraries/youth-space
06 351 4126
facebook.com/pnyouthspace/
mobile library Has regular stops throughout the City.
COUNCIL MEETINGs
The Council encourages public participation in its activities. Meetings of the Council and its Committees are open to the public and are normally held in the Council Chamber. For information about meeting agendas and dates, contact the Customer Service Centre (06 356 8199), look in the public notices section of the Manawatū Standard or The Guardian newspapers, or look at our website.
www.pncc.govt.nz
AUdITORs
Audit New Zealand
31 Amesbury Street, Palmerston North (on behalf of the Auditor General)
BAnKErS
Westpac Banking Corporation
SoliCitorS
Cooper Rapley
227 Broadway Avenue, Palmerston North
Simpson Grierson
HSBC House - 195 Lambton Quay, Wellington
234
Small city benefits - Big city ambition
GLO
ssA
Ry
GLOssARy10 Year Plan (LTP or Long Term Plan)
A 10 Year Plan prepared by Council every three years. It describes Council’s planned contributions to its vision and goals, shows why they are necessary, how much they are expected to cost, and how success will be judged.
Activity
The goods or services that the Council provides to the community. The Council has 18 Activities, e.g. Cemeteries, Water, or Parks, Sport and Recreation.
Annual Budget (previously Annual Plan)
This is a budget document that shows how the Council will fund any year of the 10 Year Plan. Produced in years two and three of the 10 Year Plan, it provides consistency and direction to Council activities.
Asset Management Plans (AMPs)
These ensure that the Council’s major infrastructural assets are maintained to ensure high environmental standards and meet the future needs of the city at the lowest possible cost over the long term. Council has AMPs for roading and parking, stormwater, rubbish and recycling, wastewater, water, property, and recreation and community facilities.
Capital New
Expenditure which will increase the value of or create new Council assets (land, infrastructure, plant and equipment). A household analogy would be expenditure to build a new bedroom.
Capital Renewal
Maintaining and keeping existing infrastructure and facilities up to standard.
Capital Revenue
Some capital new and capital renewal expenditure is partly funded by amounts received from government or other parties for transport subsidies, grants and development contributions.
Community Outcomes
Short or long-term outcomes that a local authority aims at to promote the social, economic, environmental, and cultural well-being of its district or region. They are the Council’s Vision, Goals and Strategies.
Council Controlled Organisation (CCO)
An organisation in which Council (or Councils) owns or controls at least 50 per cent of the voting rights, or has the right to appoint at least 50 per cent of the directors or trustees. CCOs are mostly set up to independently manage Council facilities or deliver specific services on behalf of residents.
Council Controlled Trading Organisation (CCTO)
As for CCO but trading with the main purpose or intention to make a profit.
Depreciation
Spreading the costs of assets over their useful life.
Development Contributions
Development Contributions provide Council with a way of obtaining contributions to fund infrastructure requirements due to growth. A Development Contributions Policy is required as a component of the Funding and Financial Policies in the 10 Year Plan under section 102(2)(d) of the Local Government Act 2002.
Financial Year
The Council’s financial year runs from 1 July to 30 June. The 2019 financial year therefore covers the period 1 July 2018 to 30 June 2019.
Group of Activities
Groups of Activities show how the Council will work towards community outcomes. The Council has 11 Groups of Activities. Activities that provide similar services have been grouped together. Changes to the Local Government Act mean that infrastructural Activities are also Groups of Activities.
Level of Service
A measurable description of what the Council does (or is planning to do) for residents.
Maintenance Costs
Expenditure in relation to repairs and maintenance of Council’s assets.
Operating Expenditure
Expenditure that is necessary for the normal activities of Council. Using a household analogy, this would be paying for electricity or food.
Performance Measures
Performance measures show how people can judge the success of the Council. The measures in the current 10 Year Plan are part of the Council’s performance framework. The Council has other more technical performance measures in documents such as Asset Management Plans.
Programmes
Programmes are the detailed financial actions that include capital and non-capital works within any financial year to achieve Council’s outcomes.
Treasury Policy
This sets out when and how Council will invest, and for what purposes, and when and how Council will borrow, and for what purposes.
Uniform Annual General Charge (UAGC)
A component of the general rate that is levied as a uniform amount on every property.
Cover: He Ara Kotahi bridge at night

235
PNCC Annual Report 2018/19
GLO
ssAR
y
Manawatū river overlooking Ahimate Park

Te Kaunihera o Papaioea | Palmerston North City Council
pncc.govt.nz | [email protected] | 06 356 8199
Private Bag 11034, The Square, Palmerston North, 4442
#PalmyProud