annual report 2017 - soneri bank limited
TRANSCRIPT

Annual Report 2017
Registered Office: Rupali House 241-242,Upper Mall Scheme, Anand Road, Lahore - 54000, PakistanTel: (042) 35713101-04
Central Office: 10th Floor, PNSC Building,M.T. Khan Road, Karachi - 74000, PakistanTel: (021) 111-567-890
24/7 Phone Banking: 021-111-SONERI (766374)Over 285 branches & 300+ ATMswww.soneribank.com SoneriBankPK @SoneriBank_Pk
Soneri Bank Limited

The path that leads up to real treasure is paved with shining discoveries and glittering revelations. Just as the real value of gold never escapes the trained eye of a true Gold miner, Soneri Bank identi�ies the real value of its customers through years of �inest banking experience, and continues to evolve asa progressive and trusted �inancial entity in the region.

Soneri Bank strives to be theVESSEL OF LIGHTthat shines its beacon of transformation on everyone - the light of equality and diversity, our core ethos.
Inspired by one of the most valuable in the world,Soneri Bank continuously reinvents itself to cater to a diverse customer portfolio and aspires towardsthe golden standard of service quality.

CONTENTSDirectors’ Report to Shareholders
Statement of Internal Controls
Code of Conduct
Mechanism adopted for Board's own
Performance Evaluation
Statement of Compliance with the Best Practices
of Code of Corporate Governance
Auditors’ Review Report to the Members on
Statement of Compliance With the Best
Practices of Code of Corporate Governance
Auditors’ Report to the Members
Statement of Financial Position
Profit & Loss Account
Statement of Comprehensive Income
56
68
69
72
73
75
76
77
78
79
Cash Flow Statement
Statement of Changes in Equity
Notes to the Financial Statements
Report of Shari’ah Board
Notice of the Annual General Meeting
Jama Punji
Pattern of Shareholding
List of Branches
List of Foreign Correspondents
Glossary
80
81
82
158
160
163
164
167
171
187
Vision
Mission
Core Values
Board of Directors
Senior Management
Products and Services
CSR Activities
Fair Treatment of Customer
Organizational Structure
Corporate Information
List of Committees’ of the Board of Directors
Board and Committees’ Meetings
Management Committees
Key Performance Indicators
7
9
11
12
14
16
26
30
32
34
35
37
38
40
Six Years’ Financial Summary
Branch Performance
Concentration of Advances, NPL, Deposits and
Off-Balance Sheet Items
Maturities of Assets and Liabilities
Key Interest Bearing Assets and Liabilities
Statement of Value Addition
Quarterly Performance
Six Years’ Vertical Analysis
Six Years’ Horizontal Analysis
Cash Flow Analysis
Market Statistics of SNBL Shares
Financial Calendar
Chairman’s Review Report
41
44
45
46
47
48
49
50
51
52
53
54
55

VISIONTo better serve customers to helpthem and the society grow.
Our brand promise,Roshan Har Qadam exudes the
PURITY OF GOLD.Whatever we create and offer to our
customers is an embodimentof our philosophy.
Soneri Bank Limited | Annual Report 2017 | 07

MISSIONWe provide innovative and efficientfinancial solutions to our customers.
Soneri Bank Limited | Annual Report 2017 | 09
Like meticulousCRAFTSMEN,our employees shape everypart of our business, leadingto achievement and success.

CORE VALUESWe are customer centricWe have high moral standardsWe take ownershipWe are proactiveWe collaborate
Soneri Bank Limited | Annual Report 2017 | 11
Our business is conducted with aGOLDEN TOUCHof excellence and highestechelons of integrityand transparency.

BOARD OF DIRECTORSAlauddin Feerasta
ChairmanMohammad Aftab Manzoor
President & Chief Executive OfficerNooruddin Feerasta
DirectorAmin A. FeerastaExecutive Director
Muhammad Rashid ZahirDirector
Manzoor AhmedDirector
Inam ElahiDirector
Jamil Hassan HamdaniDirector
Soneri Bank Limited | Annual Report 2017 | 13

SENIOR MANAGEMENTAmin A. FeerastaExecutive Director
Mohammad Aftab ManzoorPresident & Chief Executive
Officer
Muhammad QaisarHead of Commercial &
Retail Banking
Syed Asim AliHead of Audit
Mirza Zafar BaigChief Financial Officer
Anita LalaniHead of Human
Resources
Ahmed Saqib AsadChief Information Officer
Iqbal ZaidiHead of Compliance
& Control
Masood TyabjiHead of Corporate &Investment Banking
Shahid AbdullahHead of Treasury,
Capital Markets, FI & PRI
Mubarik AliCountry Credit Head
Ali Hassan ShahHead of Operations
Soneri Bank Limited | Annual Report 2017 | 15
SilverSilver GoldGold PlatinumPlatinum
Real-timesalary transfer
Real-timesalary transfer
PersonalLoan
PersonalLoan
Speed FinanceSpeed Finance
BancassuranceBancassuranceCar FinanceCar Finance Payroll Solution
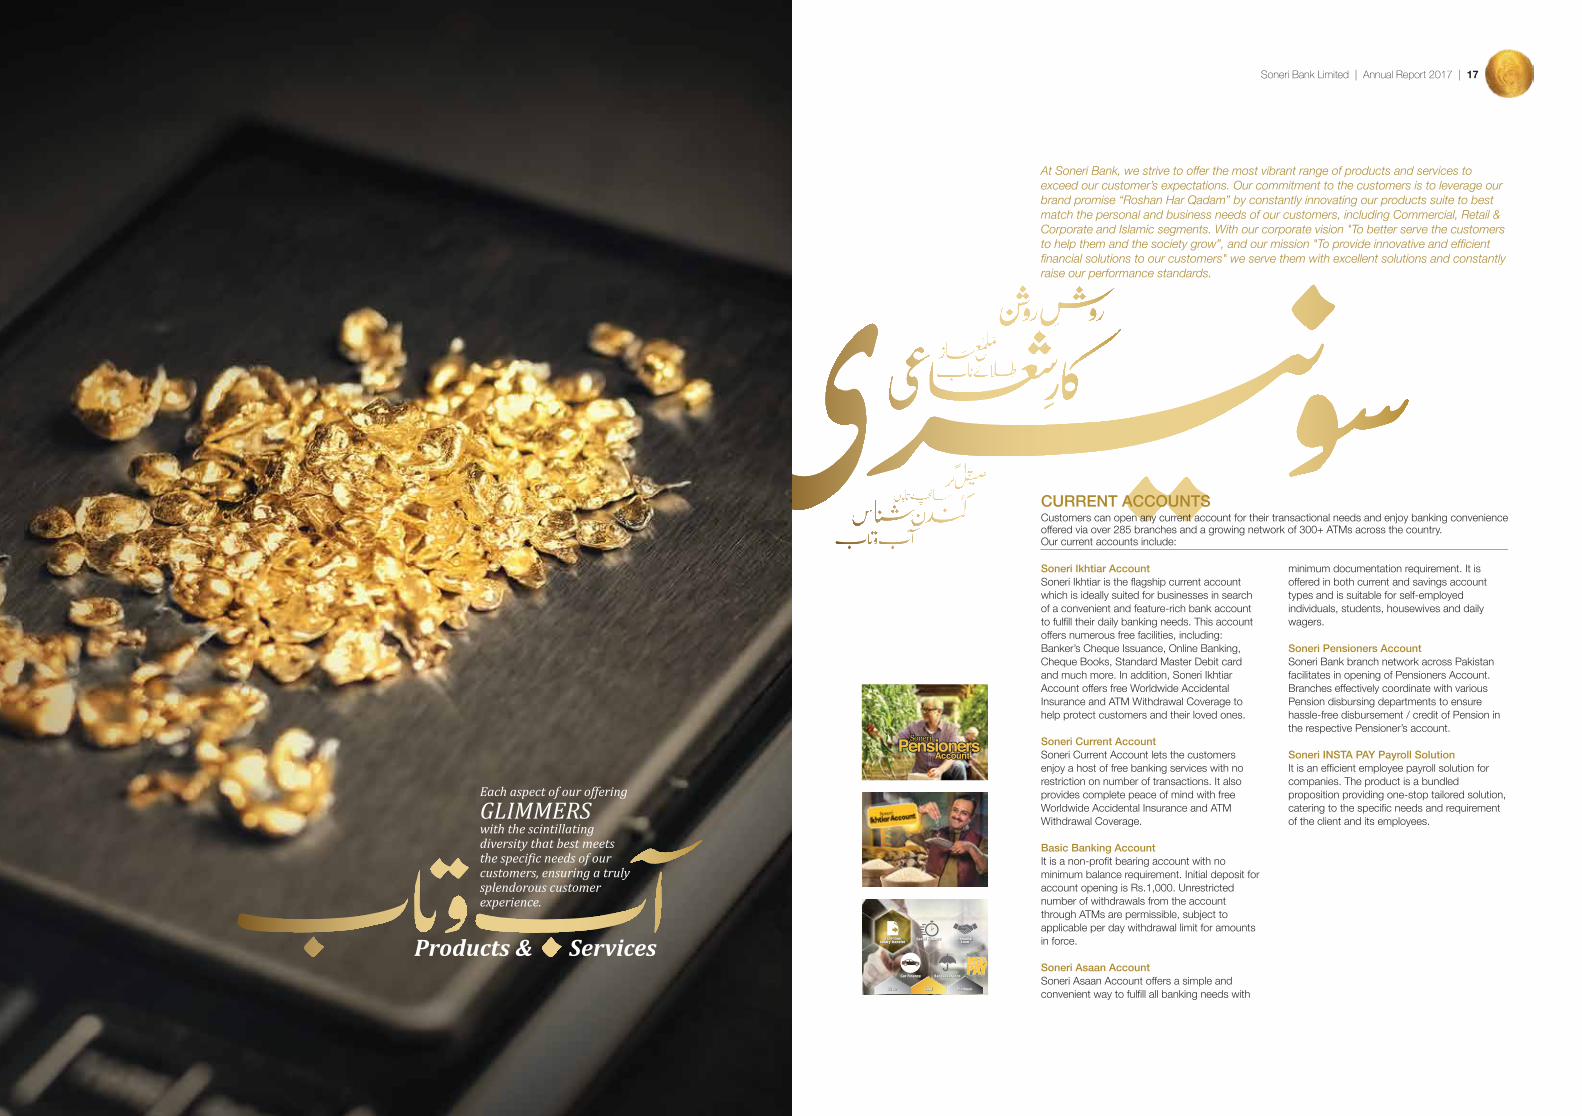
Customers can open any current account for their transactional needs and enjoy banking convenience offered via over 285 branches and a growing network of 300+ ATMs across the country.Our current accounts include:
CURRENT ACCOUNTS
Soneri Ikhtiar AccountSoneri Ikhtiar is the flagship current account which is ideally suited for businesses in search of a convenient and feature-rich bank account to fulfill their daily banking needs. This account offers numerous free facilities, including: Banker’s Cheque Issuance, Online Banking, Cheque Books, Standard Master Debit card and much more. In addition, Soneri Ikhtiar Account offers free Worldwide Accidental Insurance and ATM Withdrawal Coverage to help protect customers and their loved ones.
Soneri Current AccountSoneri Current Account lets the customers enjoy a host of free banking services with no restriction on number of transactions. It also provides complete peace of mind with free Worldwide Accidental Insurance and ATM Withdrawal Coverage.
Basic Banking AccountIt is a non-profit bearing account with no minimum balance requirement. Initial deposit for account opening is Rs.1,000. Unrestricted number of withdrawals from the account through ATMs are permissible, subject to applicable per day withdrawal limit for amounts in force.
Soneri Asaan AccountSoneri Asaan Account offers a simple and convenient way to fulfill all banking needs with
minimum documentation requirement. It is offered in both current and savings account types and is suitable for self-employed individuals, students, housewives and daily wagers.
Soneri Pensioners AccountSoneri Bank branch network across Pakistan facilitates in opening of Pensioners Account. Branches effectively coordinate with various Pension disbursing departments to ensure hassle-free disbursement / credit of Pension in the respective Pensioner’s account.
Soneri INSTA PAY Payroll SolutionIt is an efficient employee payroll solution for companies. The product is a bundled proposition providing one-stop tailored solution, catering to the specific needs and requirement of the client and its employees.
At Soneri Bank, we strive to offer the most vibrant range of products and services to exceed our customer’s expectations. Our commitment to the customers is to leverage our brand promise “Roshan Har Qadam” by constantly innovating our products suite to best match the personal and business needs of our customers, including Commercial, Retail & Corporate and Islamic segments. With our corporate vision "To better serve the customers to help them and the society grow”, and our mission "To provide innovative and efficient financial solutions to our customers" we serve them with excellent solutions and constantly raise our performance standards.
Soneri Bank Limited | Annual Report 2017 | 17
Products & Services
Each aspect of our offering
GLIMMERSwith the scintillating diversity that best meets the speci�ic needs of our customers, ensuring a truly splendorous customer experience.

Soneri Bank offers a complete range of savings products with attractive returns. These accounts are designed to cater to the specific needs of individuals, senior citizens and corporates.Our savings product suite includes:
SAVINGS ACCOUNTS
PLS Savings AccountBasic deposit account with no minimum balance requirement. It can be opened with an initial deposit of just Rs.100. The complete range of ADC services is offered on this account, including: Standard Master Debit card, Internet/Mobile Banking, Online Banking and SMS Alerts.
Soneri Savings AccountFlexible and fast growing cumulative monthly profit account. The rate of profit on this account increases with the account balance as per the defined tiers. The complete range of ADC services is offered on this account.
Soneri Sahara AccountA savings account for senior citizens to meet their basic banking needs. The account can be opened singly or jointly (husband & wife), provided either of them is of 60 years or above. They can enjoy high returns on their savings every month with the flexibility of withdrawing profits anytime.
Soneri Rupee Term DepositsSoneri Rupee Term Deposits are for customers who intend to retain their savings for a fixed period and earn a higher rate of profit. Term Deposits allow customers to save a fixed
amount in Rupees for a set period ranging from 1 month to 3 years at attractive profit rates. The depositor has the option to reinvest the deposit automatically with or without profit.
Soneri Diamond Deposits(Monthly Income Scheme) Soneri Diamond Deposits provide investment opportunities to customers looking for additional monthly income with an attractive return. Customers will earn monthly profit on their investment for a period ranging from 1 to 3 years.
Soneri Foreign Currency AccountsDealing in foreign currencies is no more a hassle. Soneri Bank offers FCY Current, Savings and Term Deposit accounts to cater to the foreign currency transactional and saving needs of the customers with a host of attractive features.
FCY Term DepositsSoneri Bank’s Foreign Currency Term Deposit offers competitive profit rates for any selected term of up to 1 year. It is an ideal investment to help customers save in a foreign currency and see their deposit grow over time.
RupeeTermDeposits
RupeeTermDeposits
CURRENCYACCOUNT
Soneri Bank ensures meeting all banking needs of its customers by offering variety of financing products to facilitate them to grow their businesses and also contribute their share towards industrial growth of the country.
FINANCING PRODUCTS
The Bank is also committed to play its role towards strengthening the SME sector by encouraging quality players to avail credit facilities through our nationwide branches, empowering them to grow beyond financial limitations. In addition to our conventional financing products including Running Finance, Cash Finance, Term/Demand Finance, Letter of Credits (LCs), Finance against Imported Merchandise (FIM), Finance against Trust Receipts (FATR) and Letter of Guarantees (LGs), the Bank also offers following specific financing products to help its customers operate their businesses without worrying about funding requirements.
Soneri Speed FinanceSoneri Speed Finance is focused towards providing quick and flexible financing solutions to its customers while keeping their savings secure. This product is offered to individuals, Small & Medium Enterprises, and commercial & corporate businesses for meeting their business needs. It has been designed to provide hassle-free and swift financing solutions to meet both the short and long term financing needs of the customer. It is primarily secured against liquid security including Soneri Bank’s deposits (LCY & FCY Term Deposits, Cash Margin, Lien on Account) and Government Securities (DSC/SSC/RIC).
Prime Minister’s Youth Business Loan(PMYBL) SchemeThe Government has introduced Prime Minister’s Youth Business Loan Scheme with a markup subsidy and partial guarantee facility for extension of small business loans. The scheme was launched by the Prime Minister for promoting youth entrepreneurship in the country. The main objective of PMYBL Scheme is to provide loans to the unemployed youth for establishing or extending business enterprises. As an Executing Agency, Soneri Bank is also offering loans under this scheme.
Be Young & Successful!
Soneri Bank Limited | Annual Report 2017 | 19

CONSUMER FINANCE Soneri Car Finance
Now you can become the owner of a brand
new car through Soneri Car Finance Scheme.
Soneri Bank offers Car Finance facility up to
Rs. 3 million, repayable up to 5 years in equal
monthly installments. Option of used and
reconditioned cars is also available. Processing
of application is fast and hassle-free with partial
payment and early settlement options.
Soneri Personal Finance
An easy solution to your cash needs – now you
can turn your dreams into reality via Soneri
Personal Finance Scheme. Soneri Bank offers
Personal Finance up to Rs. 500,000, repayable
up to 5 years in equal monthly installments to
meet personal financial needs. Option of partial
payment and early payment is also available.
AGRICULTURE FINANCINGAgriculture contributes a handsome share in the
GDP of our country, and the livelihood of a large
number of Rural Population is based on this.
Soneri Bank offers various Agriculture Financing
Products (conventional as well as Islamic) for
the farming/rural communities to meet their
working capital/development needs. All these
products help them grow their agriculture
produce and livelihood. Following Agriculture
Financing Products are available for the uplifting
of Agri economy:
• Farm Production Loans – Revolving Credit
• Farm Development Loans
• Tractor & Implements Loans
• Non-Farm Working Capital Loan –
Dairy Farming
• Non-Farm Development Loan –
Dairy Farming
• Non-Farm Working Capital Loan –
Poultry Farming
• Non-Farm Development Loan –
Poultry Farming
• Non-Farm Working Capital Loan –
Fish Farming
• Non-Farm Development Loan –
Fish Farming
• Non-Farm Working Capital Loan –
Cattle Farming
• Non-Farm Development Loan –
Cattle Farming
• Value Chain – Contract Farmers Financing
• Mustaqeem Tractor Loans
• Ijarah
AGRICULTURE FINANCING
HOME REMITTANCESoneri Bank Limited (SBL), under guidance of Pakistan Remittance Initiative (PRI), (a joint venture of State Bank, Ministry of Finance and Ministry of Overseas Pakistanis, Pakistan), started Home Remittance Payments Disbursement Initiative in July, 2012. In a very short span of time and with exceptional customer support and service delivery standards, Soneri Bank managed to make a positive contribution towards Home Remittance Business. Soneri Bank has recognized the potential in Home Remittance Business and branded its business with the product name “Soneri Mehnat Wasool Remittance” as the Home Remittance Service. This service provides the customer an avenue to receive their money with ease, sent from abroad and over 285 Soneri Bank branches in 130 cities across Pakistan. Soneri Bank has already established cordial relationships with many GLOBAL Exchange Companies operating in different region of Gulf Countries, UK, America and Canada to facilitate its customers.
ALTERNATE DELIVERYCHANNELATMsWith a growing network of 300+ ATMs across the country, customer can conveniently withdraw cash and avail ancillary services through our ATMs.
Soneri Mobile Banking
With Soneri Mobile Banking, customers can
access their accounts anytime and anywhere
via their mobile phones. They can view their
account statements, perform fund transfers, get
themselves registered for e-statement, enquire
about different Soneri products by product info
tab, get mobile top-ups and pay their bills
conveniently sitting in the comfort of their
homes and workplaces. Soneri Mobile App is
available for Android/iOS users.
Soneri Direct Internet Banking
Soneri Direct Internet Banking provides our
customers with a simple, convenient and
secure solution to operate their bank account(s)
online 24/7 from anywhere in the world.
Customers can access their account(s) anytime,
print account statements, pay utility bills,
transfer funds, get there Soneri Debit Card
activated for e-commerce transaction and view
the history of their Soneri Internet Banking
activities with a single click from their
computers.
Soneri EMV Master Debit Card
With Soneri EMV Master Debit Card having an
upgrade security layer, customers enjoy a
cashless experience of spending and making
payments anywhere within the country and
across the globe. Customers are able to avail
unmatched opportunities and benefits of the
Mastercard Debit Classic & Gold Cards.
SMS Alerts
Soneri Bank offers SMS Alerts Service to all of
its customers in order to make them feel secure
and in control of their spending. The alerts are
instant and keep customers updated about
their account transactions.
Soneri Bank Limited | Annual Report 2017 | 21

Roshan Aghaz & Roshan Aghaz TakafulThese Bancassurance plans encourage parents to save money for their children’s higher education and provide protection in case of an eventuality. In the unfortunate event of death of the assured parent during the savings term, the built-in “Education Continuation” benefit ensures that the targeted fund at maturity is achieved.
Roshan TakmeelThis is a savings plan especially designed for those individuals who wish to have financial independence post-retirement, wish to retire early or to top-up their existing pension plan. The plan is ideal for self-employed and professionals like doctors, dentists, architects, lawyers, engineers and financial consultants. It is also suitable for employees having benefits of provident funds.
Karobar MuhafizThis Bancassurance plan covers the lives of two individuals (or business partners) simultaneously allowing business continuation/succession in case of eventuality. It includes benefits like hospitalization, critical illness, accidental disability and death benefits. SMEs, large enterprises and partnerships can avail this plan to ensure stability of their businesses. Professional practitioners like doctors, dentists, accountants, lawyers, architects, engineers etc. can also use this plan to their advantage.
Sunehra Cash BuilderThis is a regular premium Bancassurance product where the premium paid will be credited to customer’s individual account to be invested as per the chosen investment strategy. Sunehra Cash Builder is intended for far sighted individuals who want a secure future for themselves and their loved ones at the same time reaping benefits on their hard earned incomes. This plan ensures that our customers achieve their respective goals even when customer is unable to continue regular income.
Sunehra Income BuilderThis plan provides insurance cover in the form of guaranteed sum assured offering parallel returns on premium investment. Be it an objective of saving for your child’s education, marriage of your progeny, building / buying a home for yourself and your family, or starting / expansion of business, Sunehra Income Builder plan is a one stop solution for all your financial needs.
Sunehra Ehad TakafulThis plan offers a unique combination of savings, investment and protection. It provides Takaful coverage that is in line with Shari’ah Principles. Sunehra Ehad enables customers to build income for events like child education, daughter’s marriage, building / renovation of house or planning for carefree life after retirement.
Phone Banking
Customers can not only access their accounts
24/7 with Soneri Phone Banking, but can also
request for different services being offered
including ATM Debit Card Replacement, Stop
Cheque Request, Banker’s Cheque, ATM Debit
Card Account Linking / De-Linking, Cheque
Book request, E-Statement & Account
Statement Request.
Simply dialing + 92-21-111-SONERI (766374)
can give a lot of ease to customers and will help
to fulfill their financial needs with just a call.
FonePay
Straight from digital payment universe, FonePay
is an easy app that allow Soneri customers to
have a cashless lifestyle and allow them to pay
45,000 online and offline merchants, from the
palm of their hands using FonePay on their
smartphones.
PROTECTION ANDCOVERAGE PRODUCTSSoneri Bank offers a variety of exclusively
designed Bancassurance conventional and
Takaful products that cater to the protection,
savings and investment needs of its customers.
Bancassurance is one of the best purchases for
the future of customers’ family. SBL offer advice
from certified professionals with expertise to
help tailor customized coverage plans for
customers’ family's individual needs. Few of
these products are:
Sunehra Saver & Sunehra Saver Takaful
These are SBL’s Bancassurance plans that
encourage customers to save at an early stage
of their career to cater for the midlife family
expenses. It is an affordable plan for young
executives, entrepreneurs, middle aged
professionals, working ladies and housewives.
The plan is designed to meet the future financial
needs like, wedding, education, house
purchase, starting a business or expansion of
an existing enterprise of the assured.
SunehraIncome BuilderMulti-Purpose Savings Plan
KAROBARMUHAFIZPlan ahead for a secure partnership
Soneri Bank Limited | Annual Report 2017 | 23

Working Capital & Trade Finance FacilitiesOur corporate banking team is equipped with the required knowledge to contribute towards the sustainable growth of our clients by offering innovative, diverse and flexible solutions to meet their working capital needs, trade related solutions and expansion support.
Investment BankingThe Investment Banking Wing offers structured financial solutions and aims to establish strategic long term relationships with our clientele. This segment is well equipped to offer advisory services catering to various requirements such as Financial, M&A, Equity / Debt Capital Markets, Project Financing and Debt Syndication. Building upon Soneri Bank’s established relationships within the local market, the Investment Banking Wing identifies and helps unlock greater value for customers.
Supply Chain ManagementBeing a provider of financial services we offer end-to-end supply chain financing solutions to dealers & vendors of our blue chip corporate customers to meet business requirements.
Cash ManagementSBL’s Cash Management services coupled with our next generation, web-based Cash Management System ‘Soneri Trans@ct’, provides our valued customers with comprehensive, one stop solution for cash flow management, i.e. Receivables and Payables Management, in the most effective and efficient manner.Our Cash Management services, comprise of a full array of products & services, designed and tailored to enable our Corporate, Commercial and SME customers to securely exchange
funds and financial information in real-time with their trading partners, for optimal management of working capital.
CHINA DESKThe China–Pakistan Economic Corridor (CPEC) is a collection of projects currently under construction at a cost of around $54 billion as part of China's ambitious One Belt, One Road initiative, and is part of Pakistan's Vision 2025. CPEC brings in a number of opportunities. The large influx of investments will work as a strong economic incentive for Pakistan’s government and social sectors to improve the business environment and enhance the commercial attractiveness for more foreign investments. Industrialization in Pakistan will also help create jobs for the country’s large, under-employed population, turning a social and fiscal burden into an economic and developmental driver. CPEC will create more private-sector opportunities and offer a realistic pathway out of poverty for Pakistan. Economic development will help maintain domestic stability and enhance security in Pakistan for the medium to long term. The core vision of CPEC is to improve infrastructure to facilitate interconnectivity.
In addition to a Chinese Business Unit, Islamabad, the Bank has established another unit in Karachi and is planning to establish one more in Lahore to cater all banking requirements of Chinese customers by providing tailor-made solutions under one roof.
SONERI MUSTAQEEMISLAMIC BANKINGSoneri Mustaqeem Islamic Banking offers a broad range of 100% Shari’ah Compliant financial solutions for the customers. Our Islamic Portfolio includes:
CURRENT ACCOUNTSoneri Jari AccountSoneri Jari (Current Account), on the basis of Qard can be opened by any individuals, partnership, joint account holders, companies, corporates, trusts, etc. without any hassle and with many attractive and unique features.
Rahat Mustaqeem Account Rahat Mustaqeem account is a remunerative current account, which is opened on the basis of Mudarabah. In Rahat Mustaqeem Account the customer gets low return on his investments through deployment of funds in Shari’ah Compliant modes, but on the other hand they benefit from a range of free services catering to various banking needs ideal for Business owners.
SAVING ACCOUNTSoneri Munafa & Soneri Bachat AccountSoneri Munafa & Soneri Bachat (Saving Accounts) are opened on the basis of “Mudarabah”, where Mustaqeem Islamic Banking is the “Mudarib” (manager of the funds) and you, the customers, are the “Rabb-ul-Maal” (owner of funds/depositor). These deposits are deployed in Shari’ah Compliant modes such as Ijarah, Murabaha, Musharakah, Istisna, Musawamah etc. The depositors enjoy the Shari’ah Compliant halal profit in our Soneri Munafa & Soneri Bachat Accounts.
FOREIGN CURRENCYACCOUNTDealing in foreign currencies is no more a hassle. Soneri Bank offers FCY Current, Savings & Term Deposit accounts to cater to the foreign currency transactional and saving needs of the customers with a host of attractive features.
SONERI CAR IJARAH Car Ijarah is Soneri Bank’s car financing product which is interest-free car financing. It is based on the Islamic financing mode of Ijarah (leasing) and is ideal for individuals who want to get interest-free financing to acquire a car.
Car Ijarah works through a car rental agreement, under which the Bank purchases the car and rents it out to the customer for a period of 1 to 5 years, agreed at the time of the contract. Upon completion of the Ijarah period, the vehicle will be sold at a token amount or gifted to the customer.
CORPORATE &INVESTMENT BANKINGSoneri Bank’s Corporate & Investment Banking is well equipped to meet the requirements of Corporate clients having strong presence in Karachi, Lahore and Islamabad with full coverage.
Our team of Relationship Managers and Team Leaders is fully geared to establish meaningful relationships with our blue chip Corporate & Institutional clients, including public sector entities to become partners in their growth by acting as financial advisors effectively catering to their financial needs and offering financial solutions through the following suite of products:
Soneri Bank Limited | Annual Report 2017 | 25

Soneri Bank has aimed to enrich the society in all walks of life by truthfully embracing its brand promise of Roshan Har Qadam. With the spirit of the Sun that universally shines on everyone, in 2017, our CSR activities embodied principle of diversity and making an impact for the betterment of fellow beings. This year the major focus of the Bank was in the field of health care, education and women empowerment along with other areas of community development, sports and rehabilitation.
CONTRIBUTION TOHEALTH CARESoneri Bank believes in providing quality life to individuals of society. In the same spirit, generous contributions were made to various organizations working towards the health sector by the Bank.
The Kidney Centre (TKC)The Kidney Centre (TKC) is a non-profit organization with an up-to-date medical facility which is providing comprehensive and quality renal care to thousands of underprivileged patients. Soneri Bank took the opportunity to support one of its fund raising events of the year.
Fatimid FoundationFatimid Foundation is a non-profit organization that provides free blood to patients suffering from various chronic blood disorders requiring blood therapy as an essential part of their treatment. To support the cause, Soneri Bank co-sponsored the seminar for International Thalassemia Day.
Patients’ Aid Foundation (PAF)Patients’ Aid Foundation (PAF) is a charity based organization committed to provide free quality healthcare to all. In collaboration with JPMC (Jinnah Postgraduate Medical Centre), various patient related activities have been accomplished including reconstructing and renovating buildings, reinstating crucial equipment, and providing free medicine and laboratory tests. PAF is working towards “The Jinnah Institute of Cancer and Research (JIC)” in which technologies like CyberKnife will be used to treat the disease.
The project is expected to be fully functional by 2020. Soneri Bank pledged the cause by sponsoring its annual fund raising event.
Karwan-e-Hayat – Institute ofMental Health CareKarwan-e-Hayat is a non-profit organization, dedicated to the cause of mental health in Pakistan. It has been providing free or largely subsidized mental health care to an underserved section of our society since 1983. The clinics and hospitals provide psychiatric treatment mainly to the poor and underprivileged. Soneri Bank supported the institute by participating in their annual fund raising event.
Pink Ribbon Pakistan – United AgainstBreast CancerPink Ribbon Pakistan – a project of Women’s Empowerment Group is a non-funded, self-sustained campaign, mostly supported by contributions through public philanthropy and driven by a large number of volunteers all over the country. The mission of Pink Ribbon Pakistan is to develop Pakistan’s first dedicated breast cancer hospital with state-of-the-art medical equipment in order to fulfill the dire need of approximately 9.8 million women who are at a risk of breast cancer in Pakistan. The multistory building will provide a holistic breast cancer management solution; diagnostic and treatment facilities to breast cancer patients with latest technology cure. Soneri Bank pledged to this cause by monetary contribution towards building of the hospital and contribution in annual fund raiser event.
Soneri Bank Limited | Annual Report 2017 | 27
Corporate Social Responsibility
Soneri Bank
BRIGHTENSthe lives of countless deserving families in our country by working tirelessly to improve lives and uplift the spirit ofthe community.

Pakistan Parkinson’s SocietyPakistan Parkinson’s Society was created with the mission of easing the life of people afflicted by this it disease. Not only does it helps in curing the disease, but also provides general understanding and management of the same to patient’s care givers and their families. Over the last nine years, the society has taken a patient centric approach to its activities helping to bring significant increase in awareness and options for managing the disease in all segments of the society. Soneri Bank contributed monetarily towards the efforts of the institute so that the quality of life can be improved of those affected by the disease in the country.
Marie Adelaide Leprosy Centre (MALC)MALC is a non-profit organization serving leprosy, TB & eye patients in Pakistan which includes medical and surgical treatment as well as the physical and social needs of deformed patients. Deserving cases are provided with educational, vocational and socio-economic assistance for rehabilitation and integration into their respective communities. Soneri Bank participated in a fund raiser play organized by MALC to help in providing patients with proper access to healthcare facilities.
LRBTLRBT is the largest provider of free eye care for the poor in the country and a safety net for many visually impaired population in Pakistan. In order to further endorse the efforts of the institute, Soneri Bank participated in the Golf Tournament 2017.
Children First SocietyChildren First Society is a non-profit organization working towards the ailment of children by providing free treatment, medical supplies, machines and equipment. Various initiatives of cleanliness and hygiene have also been taken for betterment of their patients. The Children First Society’s child development services help children to achieve healthy life to become healthy adults. Soneri Bank supported the cause by participating in their fund raiser event.
National Institute of Child Health (NICH) – OAKSOAKS is the alumni association of Kinnaird College for Women. Both OAKS and NICH have a relationship over the years in which funds have been raised for lifesaving medical equipment for the hospital which includes ventilators, incubators and special thalassemia testing machinery. Soneri Bank supported this cause by participating in the event fund raiser brochure.
EMPOWERING EDUCATION With the focus in the field of education, Soneri Bank has generously supported and promoted various educational organizations for its development.
The Citizens Foundation (TCF)The Citizens Foundation (TCF) a non-profit organization brings positive social change through education. It is one of Pakistan’s leading organizations in the field of education for the less privileged. To support TCF’s cause of improving the literacy rate of Pakistan, Soneri Bank sponsored a fund raiser play. ‘Heer Ranjha’ to help TCF in its noble cause.
Rotary Pakistan Literacy Mission (RPLM)Rotary Pakistan Literacy Mission (RPLM) is part of Rotary Pakistan, striving to overcome the hurdles of class and privileged education by adopting government schools through various Rotary clubs and remodel schools with extensive work on infrastructure and teaching so as to bring them at par with the private sector. Soneri Bank extended its support by sponsoring its fund raising event to uplift RPLM adopted schools in Karachi.
Habib University FoundationHabib University is a liberal arts and sciences university that offers an interdisciplinary education drawing from the fields of science, engineering, arts, humanities and the social sciences. Committed to providing the highest standards of excellence in tertiary education and envisioned as a node for intellectual activity
in the region, Habib University hopes to foster a new generation of scholars who can positively impact society. Soneri Bank partly sponsored the first Habib University Model United Nations (HUMUN) event conducted in collaboration with United Nations Information Centre (UNIC) to support the socio-economic understandingamongst the youth.
SOS Children’s Villages of PakistanSOS Children's Villages of Pakistan is a social welfare organization affiliated with the world's largest orphan and abandoned children charity. SOS is working for the shelter, education, and job trainings to help them lead a better life in the long-term. Soneri Bank continued to supportthis cause by sponsoring SOS Children’sCarnival 2017.
REHABILITATION EFFORTS
Saving Thar – Old Associates of Kinnaird Society (OAKS)Saving Thar is a life-saving project for building the lives and empowering communities in the drought-prone areas of Tharparkar. Soneri Bank expanded the Village Development Model by adopting a village of Rohaj Halepoto which caters 157 households. Several activities like ber grafting, tree plantation, kitchen gardening training, gift goats and providing solar panels for households are part of the sustainability program. With the continued efforts for this cause, Soneri Bank sponsored Solar lights in households in each village in Rohaj Halepoto and Mithu Paro UC Tagusar.
Special Olympics PakistanSpecial Olympics Pakistan is committed to transforming the lives of people with intellectual disabilities through the power of sports. A year-round sports training to the intellectually disabled is provided through a wide range of sports competitions, health screenings. Seminars are also conducted to raise awareness and create opportunities for families and community members to help the disabled experience joy, courage and pride. Soneri Bank partly sponsored their paly “Sab Golmaal Hai” and pledge its support to the cause.
WOMEN EMPOWERMENT
International Women Leaders SummitSoneri Bank was part of International Women Leaders’ Summit in 2017. The conference was a professional forum to collate successful and diversified professional women leaders across the globe to impart and integrate their experiences at a local forum for an exchange of broader perspectives and learning.
LADIESFUND® Women AwardsLADIESFUND® is an initiative to provide financial security to women and to promote and train women entrepreneurs. It aims to integrate the entrepreneurial needs based on the economic and social aspects of the local communities, with respect to greater women participation in the workforce. Soneri Bank became part of the 9th LADIESFUND® Women’s Awards for Pakistan to support women empowerment initiatives.
Behbud Association Karachi Behbud Association Karachi is a well-known NGO conducting development programs in the areas of health, education, women empowerment and vocational trainings for many years. By contributing in their annual fund raising event, Soneri Bank supported their cause of serving humanity.
Attock Sahara Foundation (ASF)Attock Sahara Foundation (ASF) welfare based non-profit organization serves the community since 1966. Its aim is to play a vital role in uplifting the socio-economic conditions of the surrounding communities through various welfare projects. Soneri Bank supported their mission by sponsoring an annual fund raising exhibition for this noble cause.
PROMOTING SPORTS
Supporting GolferIn the spirit of promoting new talent and ambitious people to achieve their dreams, Soneri Bank has sponsored an inspiring golfer to represent the Bank in various tournaments nationwide.
Soneri Bank Limited | Annual Report 2017 | 29

2017 has been an intensive Customer Experience journey across the board at Soneri Bank. Together with our business and support function stakeholders, we have managed to cover significant ground on some critical customer experiential indicators across the process monitoring and optimization fronts.
It has also been a year which has seen noteworthy behavioral change across the board regarding ownership of the service health of the business and a rejuvenated will to drive improvement.
In line with SBP guidelines; Board approved Financial Consumer Protection (FCP) and Consumer Grievance Handling Mechanism (CGHM) policies were also implemented. These initiatives were taken as State Bank of Pakistan has rebranded consumer protection as a success proposition for the banks rather than being a compliance issue. Hence, the concept of responsible banking was introduced. In line with the 7 guiding principles of the FCP policy, various initiatives were taken in 2017 to enhance the overall Customer Experience i.e.i) Formation of Service Quality Council which meets on periodic basis to discuss key customer impacting issues and remedies.ii) Fair Treatment of Consumers (FTC) / Service Quality trainings conducted for all front end and relevant support functions across the country, the objective was to ensure that staff is conversant with the fundamentals of handling customers fairly and customer retention skills.iii) Fair and transparent pricing mechanism adopted.iv) Financial awareness program for customers through social media and bank’s website.v) Endorsement of control policies to curb fraud/forgeries, criminal activities and violation of code of conduct.vi) Development of a comprehensive in-house Voice of Customer Platform which delivered insights on customer satisfaction, psychographics and anti-attrition analysis.vii) Adopted various mechanisms to ensure that customer complaints are being catered timely and effectively.
Bank also initiated frequent qualitative tests of complaint handling process.
Complaint Handling The Bank has a separate function to deal with customer complaints, named as Complaint Management Unit (CMU). The Bank clearly defines the complaint resolution process, roles and responsibilities of people involved right from the receipt of a complaint to its resolution or disposal. The Bank also has a centralized Complaint Management System that accommodates complaints received through any source of communication channel including regulators. Brief description of complaint handling procedure and details of Key Contact points are available on all customer touch points. In year 2017, various measures were taken to align Soneri Bank with the Consumer Grievance Handling Mechanism (CGHM) guidelines of SBP i.e. revision of complaint resolution turnaround times (TATs), escalations, mystery shopping, Voice of Customer (VoC) and Quality Assurance programs for complaint handling.
Below are the key complaint statistics of Soneri Bank for year 2017: Total complaint received: 14,085Total complaint resolved: 14,053 Average Problem Incident Ratio (PIR): 2.48% Average within TATs Resolution: 99% Average Complaint Resolution Satisfaction Ratio (CRS): 84%
Soneri Bank Limited | Annual Report 2017 | 31
7 Guiding Principles forFair Treatment of Customers
Financial Educationand Awareness
Clear and TimelyDisclosure
Impartial andJust Treatment
Protection Against Fraud& Invasion of Privacy
ComplaintsHandling
Competition
Behaviour andWork Ethics
Soneri Bank’s Fair Treatment of Customer makes sure each customer is valued and their grievances are thoroughly dealt with, thus laying down a
BRIGHT WAYfor others to follow.
Fair Treatment Of CustomerService Quality Initiatives

Head ofOperations
Head ofRisk Management
Head ofInformation Technology
Executive Director
Shari’ah Board
Head of Audit
Board Audit Committee
Board of Directors
Head ofIslamic Banking
Head of RemedialManagement Unit
CountryCredit Head
Head of HumanResources
Head of Compliance& Controls
CompanySecretary
Chief FinancialOfficer
Head of Corporate &Investment Banking
Head of Treasury,FI and PRI.
Head of Retail &Commercial Banking
President & CEO
ORGANIZATIONALSTRUCTURE
Soneri Bank Limited | Annual Report 2017 | 33

CORPORATEINFORMATION
CHAIRMANMR. ALAUDDIN FEERASTA
CHIEF EXECUTIVE OFFICERMR. MOHAMMAD AFTAB MANZOOR
DIRECTORSMR. NOORUDDIN FEERASTAMR. AMIN A. FEERASTA (EXECUTIVE DIRECTOR)MR. MUHAMMAD RASHID ZAHIRMR. MANZOOR AHMED (NIT NOMINEE)MR. INAM ELAHIMR. JAMIL HASSAN HAMDANI
CHIEF FINANCIAL OFFICERMR. MIRZA ZAFAR BAIG*
COMPANY SECRETARYMR. MUHAMMAD ALTAF BUTT
AUDITORSA.F. FERGUSON & CO.CHARTERED ACCOUNTANTS
SHARI’AH BOARDMUFTI EHSAN WAQUAR AHMAD (CHAIRMAN)MUFTI MUHAMMAD ZAHID (RESIDENT MEMBER)MUFTI BILAL AHMED QAZI (MEMBER)
LEGAL ADVISORSMANAN ASSOCIATES, ADVOCATES
REGISTERED OFFICE RUPALI HOUSE 241-242, UPPER MALL SCHEME,ANAND ROAD, LAHORE - 54000
CENTRAL OFFICE 10TH FLOOR, PNSC BUILDING,M.T. KHAN ROAD, KARACHI-74000
REGISTRAR AND SHARE TRANSFER AGENTTHK ASSOCIATES (PRIVATE) LTD.,1ST FLOOR, 40-C,BLOCK-6, P.E.C.H.S.,KARACHI - 75400UAN: (021) 111-000-322FAX: (021) 341 68271
* Assumed charge effective 01 January 2018

Soneri Bank Limited | Annual Report 2017 | 35
LIST OF COMMITTEES’OF THE BOARD OF DIRECTORS
Audit Committee of the Board
1. Mr. Inam Elahi Chairman2. Mr. Nooruddin Feerasta Member3. Mr. Muhammad Rashid Zahir Member4. Mr. Jamil Hassan Hamdani Member Mr. Muhammad Altaf Butt Secretary
Credit Committee of the Board
1. Mr. Nooruddin Feerasta Chairman2. Mr. Alauddin Feerasta Member3. Mr. Mohammad Aftab Manzoor Member4. Mr. Muhammad Rashid Zahir Member5. Mr. Manzoor Ahmed Member Mr. Muhammad Altaf Butt Secretary
Risk Management Committee of the Board
1. Mr. Manzoor Ahmed Chairman2. Mr. Mohammad Aftab Manzoor Member3. Mr. Amin A. Feerasta Member4. Mr. Inam Elahi Member Mr. Javed H. Siddiqi Secretary
Human Resource & Remuneration Committee of the Board
1. Mr. Manzoor Ahmed Chairman2. Mr. Inam Elahi Member3. Mr. Jamil Hassan Hamdani Member Mr. Muhammad Altaf Butt Secretary
Committee of Independent Directors of the Board
1. Mr. Jamil Hassan Hamdani Chairman2. Mr. Inam Elahi Member Mr. Muhammad Altaf Butt Secretary

LIST OF COMMITTEES’OF THE BOARD OF DIRECTORS
Audit Committee
Constitution:Mr. Inam ElahiChairman
Mr. Nooruddin Feerasta Member Mr. Muhammad Rashid Zahir Member
Mr. Jamil Hassan HamdaniMember
Credit Committee
Constitution:Mr. Nooruddin FeerastaChairman Mr. Alauddin FeerastaMember
Mr. Mohammad Aftab ManzoorMember
Mr. Muhammad Rashid ZahirMember
Mr. Manzoor AhmedMember
Risk Management Committee
Constitution:Mr. Manzoor AhmedChairman
Mr. Mohammad Aftab ManzoorMember Mr. Amin A. FeerastaMember
Mr. Inam ElahiMember
Human Resource & Remuneration Committee
Constitution:Mr. Manzoor AhmedChairman
Mr. Inam Elahi Member Mr. Jamil Hassan HamdaniMember
Committee of Independent Directors’
Constitution:Mr. Jamil Hassan HamdaniChairman Mr. Inam Elahi Member
Terms of Reference
Audit Committee is mandated the responsibilities to determine appropriateness of measures taken by the management to safeguard Bank’s assets, ensure consistency of accounting policies, review financial statements and recommend appointment of the external auditors as well as to have close coordination with them so as to comply with statutory and CCG requirements. The Committee is inter-alia also responsible to ascertain the effectiveness of the Internal Control System including financial and operational controls, ensuring adequate and effective accounting and reporting structure and monitoring compliance with the best practices of the corporate governance. The other functions of the Committee include consideration of major findings of internal investigations and management’s response thereto as well as ensuring that an effective internal audit functions is in place.
Terms of Reference
The primary functions of the Credit Committee of the Board are to ensure adherence to the lending policies, review the credit policies, systems and controlling strategies for their further strengthening and monitoring the loan portfolios regularly on an overall basis including a periodical review of problem loans including classified and stuck-up cases. The Committee is also required to ensure that there are adequate systems, procedures and controls in the Bank for all significant areas related to credit and that the laid down procedures / guidelines are effectively communicated down the line and put in place a reasonable setup to implement the same. The Committee is also assigned the responsibility to review the credit related activities of the Executive Credit Committee (ECC) on a quarterly basis for threshold; fund based Rs.200.00 million & above, non-fund based Rs.400.00 million & above and total exposure Rs.400.00 million & above.
Terms of Reference
Primary responsibilities of the Board Risk Management Committee is to provide oversight and advice to the BoD of Soneri Bank Limited in relation to current and potential future risk exposures of the Bank and future risk strategy, including approval of risk appetite and tolerance. The Committee also ensures that an organizational culture that places a high priority required for effective risk management is established by promoting a risk awareness culture within the Bank. It also validates that resources allocated for risk management are adequate, given the size, nature and volume of the business and the managers and staff that take, monitor and control risk posses sufficient knowledge and expertise. The Committee also monitors the development of appropriate financial models and a system used to calculate each category of risk, and ensure that the Bank has a clear, comprehensive and well documented polices and procedural guidelines relating to risk management available at all times and the relevant staff fully understand those policies. The Committee also ensures that the Bank’s overall exposure to credit, market, liquidity, and operational risk is maintained at prudent levels and consistent with the available capital under rigorous stress tests.
Terms of Reference
The Human Resource and Remuneration Committee is responsible for overseeing the Human Resources function of the Bank by ensuring development and implementation of HR strategies that recruit, retain and inspire professional excellence in employees of the Bank. It recommends human resource management policies to the Board that ensures equal opportunity, gender balance, and transparency. It also reviews the significant HR policies of the Bank and ensures that they are well aligned to the market.
Terms of Reference
Committee of Independent Directors is responsible for providing an independent opinion on state of affairs of the Bank and giving recommendations, if any, to the Board.

Soneri Bank Limited | Annual Report 2017 | 37
BOARD ANDCOMMITTEES’ MEETINGS
Details of the meetings of the Board of Directors and its Committees held during 2017 and the attendance by each director/committee member are given as under:-
* Not a member of the Committee** Leave of absence was granted to those directors/members, by the Board/Committee, who could not attend some of the meetings.
S.No.
Atte
nded
**
Atte
nded
**
Atte
nded
**
Atte
nded
**
Atte
nded
**
Atte
nded
** Held during
the tenor in the year
Held during
the tenor in the year
Held during
the tenor in the year
Held during
the tenor in the year
Held during
the tenor in the year
Held during
the tenor in the year
Name of Director
Board ofDirectorsMeetings
1 Mr. Alauddin Feerasta 6 6 * * 4 4 * * * * * *
2 Mr. Mohammad Aftab Manzoor 6 6 * * 4 4 1 1 4 4 * *
3 Mr. Nooruddin Feerasta 6 4 4 3 4 3 * * * * * *
4 Mr. Amin A. Feerasta 5 4 * * * * * * 4 4 * * (Executive Director)
5 Mr. Muhammad Rashid Zahir 6 6 4 4 4 4 1 1 * * * *
6 Mr. Manzoor Ahmed (NIT Nominee) 6 5 * * 3 3 5 5 4 4 * *
7 Mr. Inam Elahi 5 4 3 2 * * 4 4 4 3 1 1
8 Mr. Jamil Hassan Hamdani 4 4 2 2 * * 3 1 * * 1 1
9. Mr. Amar Zafar Khan 1 1 1 1 1 1 1 1 * * * *
10. Syed Ali Zafar 2 1 1 1 * * * * * * * *
11. Mr. Shahid Anwar (NIT Nominee) 1 1 1 1 * * 1 0 * * * *
Board AuditCommitteeMeetings
Board CreditCommitteeMeetings
Board Risk Management CommitteeMeetings
Board Human Resource &
Remuneration CommitteeMeetings
BoardIndependent
Directors’ Committee Meetings
Total Number of meetings held duringthe year 6 4 4 5 4 1

MANAGEMENTCOMMITTEES
1. Management Committee 1. Mr. Mohammad Aftab Manzoor, Chairman 2. Mr. Amin A. Feerasta 3. Mr. Iqbal Zaidi 4. Mr. Shahid Abdullah 5. Mr. Ali Hassan Shah 6. Mr. Mirza Zafar Baig 7. Mr. Muhammad Qaisar 8. Mr. Masood Tyabji 9. Ms. Anita Lalani 10. Mr. Mubarak Ali 11. Mr. Ahmed Saqib Asad 12. Mr. Abbas Hatim, Secretary
2. Executive Credit Committee 1. Mr. Mohammad Aftab Manzoor, Chairman 2. Mr. Amin A. Feerasta 3. Mr. Muhammad Qaisar 4. Mr. Masood Tyabji 5. Mr. Mubarik Ali, Secretary
3. Assets and liability Committee 1. Mr. Mohammad Aftab Manzoor, Chairman 2. Mr. Amin A. Feerasta 3. Mr. Mirza Zafar Baig 4. Mr. Muhammad Qaisar 5. Mr. Masood Tyabji 6. Mr. Mubarik Ali 7. Mr. Javed Hussain Siddiqi 8. Mr. Shahid Abdullah, Secretary
4. Investment Committee 1. Mr. Mohammad Aftab Manzoor, Chairman 2. Mr. Amin A. Feerasta 3. Mr. Shahid Abdullah 4. Mr. Mirza Zafar Baig 5. Mr. Muhammad Qaisar 6. Mr. Masood Tyabji 7. Mr. Muhammad Imran Khan, Secretary
5. I.T. Steering Committee 1. Mr. Mohammad Aftab Manzoor, Chairman 2. Mr. Amin A. Feerasta 3. Mr. Mirza Zafar Baig 4. Mr. Muhammad Qaisar 6. Mr. Ahmed Saqib Asad 7. Mr. Ali Hassan Shah 8. Mr. Mir Tehmeed 9. Mr. Qurban R. Punjwani, Secretary
6. Credit Risk Management Committee 1. Mr. Mohammad Aftab Manzoor, Chairman 2. Mr. Amin A. Feerasta 3. Mr. Masood Tyabji 4. Mr. Mubarik Ali 5. Mr. Mirza Zafar Baig 6. Mr. Muhammad Qaisar 7. Mr. Javed H. Siddiqi, Secretary

Soneri Bank Limited | Annual Report 2017 | 39
MANAGEMENTCOMMITTEES
7. Market & Liquidity Risk Management Committee 1. Mr. Mirza Zafar Baig, Chairman 2. Mr. Shahid Abdullah 3. Mr. Javed H. Siddiqi 4. Mian Nadeem Aslam 5. Mr. Salman Arshad 6. Mr. Abbas Hatim 7. Mr. Muhammad Imran Khan 8. Mian Umar Farooq, Secretary
8. Operational Risk Management Committee 1. Mr. Mohammad Aftab Manzoor, Chairman 2. Mr. Amin A. Feerasta 3. Mr. Iqbal Zaidi 4. Mr. Ali Hassan Shah 5. Mr. Mubarik Ali 6. Mr. Muhammad Qaisar 7. Mr. Ahmed Saqib Asad 8. Mr. Masood Tyabji 9. Mr. Mirza Zafar Baig 10. Mr. Javed H. Siddiqi, Secretary
9. Business Continuity Plan Steering Committee 1. Mr. Mohammad Aftab Manzoor, Chairman 2. Mr. Amin A. Feerasta 3. Mr. Iqbal Zaidi 4. Mr. Ali Hassan Shah 5. Mr. Ahmed Saqib Asad 6. Mr. Muhammad Qaisar 7. Ms. Anita Lalani 8. Mr. Masood Tyabji 9. Mr. Mirza Zafar Baig 10. Mr. Amir Hameed Khan 11. Lt. Col(R) Zahid Raza 12. Mian Asif Iqbal 13. Mr. Muhammad Khawar Ali Shah 14. Mr. Muhammad Tanveer 15. Mr. Muhammad Azizullah Abid 16. Mr. Zain-ul-Abydeen Khandwani 17. Mr. Javed H. Siddiqi, Secretary

KEY PERFORMANCEINDICATORS
2017 2016Variance
Compared to 2016Amount %
Financial
Investments-Gross Rs. In Million 117,546 117,998 (452) 0%
Advances-Gross “ 172,772 133,753 39,019 29%
Deposits “ 227,348 209,925 17,423 8%
Shareholders’ Equity (including surplus) “ 18,505 18,289 216 1%
Net Interest Income “ 6,659 6,844 (185) -3%
Non Interest Income “ 3,269 2,736 533 19%
Gross Income “ 9,928 9,580 348 4%
Profit before provisions “ 2,897 3,101 (204) -7%
Provisions “ 66 24 42 175%
Profit Before Taxation “ 2,831 3,077 (246) -8%
Profit After Taxation “ 1,643 1,879 (236) -13%
Non Financial
No. of customers Absolute 494,205 470,379 23,826 5%
No.of new branches opened “ 10 25 (15) -60%
No. of branches closed “ 8 3 5 167%
No. of new accounts opened “ 91,220 75,602 15,618 21%
No. of VISA cards issued “ 58,691 84,416 (25,725) -30%
No. of permanent employees “ 2,847 2,715 132 5%
No. of virtual banking customers “ 37,830 32,841 4,989 15%
No. of mobile banking customers “ 40,500 35,073 5,427 15%
Key Financial Ratios
Earnings Per Share Rs. 1.4906 1.7042
Book Value Per Share “ 14.91 14.46
Share Price “ 13.40 17.65
Market Capitalization Rs. In Million 14,773 19,458
Price to Earning Ratio Times 8.99 10.38
Return on Equity % 10.15% 12.02%
Return on Assets % 0.55% 0.71%
Capital Adequacy Ratio % 12.77% 14.12%

Soneri Bank Limited | Annual Report 2017 | 41
SIX YEARS’FINANCIAL SUMMARY 2012-2017
(Rs. In Million)2017 2016 2015 2014 2013 2012
Profit & Loss AccountMark-up / return / interest earned 18,505 17,524 18,320 16,906 13,639 13,813
Mark-up / return / interest expensed 11,846 10,680 10,722 10,626 8,751 8,934
Fund based income 6,659 6,844 7,598 6,280 4,888 4,879 Fee, commission, brokerage and exchange income 1,829 1,576 1,809 1,939 1,600 1,191 Dividend income and capital gain 1,399 1,131 1,284 535 623 528 Other income 41 29 57 35 22 12 Non interest income 3,269 2,736 3,150 2,509 2,245 1,731 Total income 9,928 9,580 10,748 8,789 7,133 6,610 Operating expenses 7,031 6,479 6,123 5,798 4,868 4,368
Profit before tax and provisions 2,897 3,101 4,625 2,991 2,265 2,242
Provisions 66 24 1,029 549 735 520 Profit before taxation 2,831 3,077 3,596 2,442 1,530 1,722 Profit after taxation 1,643 1,879 2,213 1,582 1,037 1,104
Bonus shares issued - - - - 1,002 993Cash dividend paid - 1,378 1,378 1,102 - -
0
2,000
4,000
6,000
8,000
201720162015201420132012
FUND BASED INCOME(Rs. in Million)
4,879 4,888
6,280
7,5986,844 6,659
0
500
1,000
1,500
2,000
2,500
3,000
3,500
201720162015201420132012
NON-MARKUP INCOME(Rs. in Million)
1,731
2,2452,509
3,150
2,736
3,269
0
500
1,000
1,500
2,000
2,500
3,000
3,500
4,000
201720162015201420132012
PROFIT BEFORE TAXATION(Rs. in Million)
1,722 1,530
2,442
3,596
3,0772,831
0
500
1,000
1,500
2,000
2,500
201720162015201420132012
PROFIT AFTER TAXATION(Rs. in Million)
1,104 1,037
1,582
2,213
1,8791,643

SIX YEARS’FINANCIAL SUMMARY 2012-2017
(Rs. In Million)2017 2016 2015 2014 2013 2012
Statement of Financial PositionPaid up capital - net of discount 11,025 11,025 10,023 10,023 10,023 9,021 Reserves 1,752 1,424 1,049 934 618 410 Unappropriate profit 3,665 3,496 4,264 3,150 1,810 1,947 Shareholders' equity 16,442 15,945 15,336 14,107 12,451 11,378 Surplus on revaluation of assets 2,063 2,344 2,856 2,932 832 954 Net assets 18,505 18,289 18,192 17,039 13,283 12,332 Total assets 322,134 278,521 253,342 213,175 169,234 158,629 Earning assets 288,266 248,726 223,942 184,288 147,225 137,810 Gross advances 172,772 133,753 120,617 115,614 104,673 83,599 Advances-net of provisions 164,293 125,306 112,002 107,968 97,534 77,170 Non-Performing Loans (NPL) 10,245 10,419 11,584 10,224 10,424 9,927 Investments 117,429 117,884 108,846 75,716 46,703 59,517 Total liabilities 303,629 260,231 235,150 196,136 155,951 146,297 Deposits and other accounts 227,348 209,925 184,847 162,964 140,439 120,451 Current and Savings accounts (CASA) 158,339 142,241 126,798 110,135 98,633 82,363 Borrowings 64,584 38,905 39,876 25,825 10,485 20,398 Interest bearing liabilities 294,930 199,807 184,209 149,236 116,929 114,209 Contingencies and commitments 111,416 83,399 117,301 64,358 74,136 61,327
0
2,000
4,000
6,000
8,000
10,000
12,000
201720162015201420132012
PAID UP CAPITAL(Rs. in Million)
9,02110,023 10,023 10,023
11,025 11,025
0
2,250
4,500
6,750
9,000
11,250
13,500
15,750
18,000
201720162015201420132012
SHAREHOLDERS’ EQUITY(Rs. in Million)
11,378
12,45114,107
15,336 15,945 16,442
0
55,000
110,000
165,000
220,000
275,000
330,000
201720162015201420132012
TOTAL ASSETS(Rs. in Million)
158,629 169,234
213,175
253,342278,521
322,134
0
36,000
72,000
108,000
144,000
180,000
201720162015201420132012
GROSS ADVANCES (Rs. in Million)
83,599
104,673115,614
120,617133,753
172,772
0
40,000
80,000
120,000
160,000
200,000
240,000
201720162015201420132012
DEPOSITS(Rs. in Million)
120,451
140,439162,964
184,847209,925
227,348
0
20,000
40,000
60,000
80,000
100,000
120,000
201720162015201420132012
INVESTMENTS(Rs. in Million)
59,51746,703
75,716
108,846117,884 117,429

Soneri Bank Limited | Annual Report 2017 | 43
SIX YEARS’FINANCIAL SUMMARY 2012-2017
2017 2016 2015 2014 2013 2012
FINANCIAL RATIOS
Profit before taxation ratio ( PBT/total income) % 28.52% 32.12% 33.46% 27.78% 21.45% 26.05%Gross spread (NIM/Interest Income) " 35.98% 39.06% 41.47% 37.15% 35.84% 35.32%Non interest income to total income " 32.93% 28.56% 29.31% 28.55% 31.47% 26.19%Income /expense ratio ( excluding provisions) Times 1.41 1.48 1.76 1.52 1.47 1.51 Return on average equity (ROE) % 10.15% 12.01% 15.03% 11.91% 8.70% 10.24%Return on average assets (ROA) " 0.55% 0.71% 0.95% 0.83% 0.63% 0.77%Return on capital employed ( ROCE) " 15.30% 16.83% 19.77% 14.33% 11.60% 14.32%Earnings per share (EPS before taxation) Rs. 2.57 2.79 3.26 2.44 1.53 1.91 Earnings per share ( EPS after taxation) Rs. 1.49 1.70 2.01 1.44 0.94 1.00 Gross advances to deposits ratio % 75.99% 63.71% 65.25% 70.94% 74.53% 69.40%Net advances to deposits ratio " 72.26% 59.69% 60.59% 66.25% 69.45% 64.07%Break up value per share (excl. surplus on revaluation of assets) Rs. 14.91 14.46 15.30 14.07 12.42 12.61 Break up value per share (excl. surplus on revaluation of fixed assets) " 15.04 15.75 17.04 15.77 12.67 12.96 Break up value per share (incl. surplus on revaluation of assets) " 16.78 16.59 18.15 17.00 13.25 13.67 Earning assets to total assets % 89.49% 89.30% 88.40% 86.45% 86.99% 86.88%Earning assets to interest bearing liabilities Times 0.98 1.24 1.22 1.23 1.26 1.21 Weighted average cost of deposits % 3.78% 3.47% 4.42% 6.18% 5.85% 6.84%CASA to total deposits " 69.65% 67.76% 68.60% 67.58% 70.23% 68.38%NPLs to total advances ratio " 5.93% 7.79% 9.60% 8.84% 9.96% 11.87%Coverage ratio (Specific Provisions/NPLs) " 82.39% 80.58% 73.97% 74.44% 68.20% 64.68%Assets to equity Times 19.59 17.47 16.52 15.11 13.59 13.94 Total assets per share Times 292.19 252.63 252.76 212.69 168.85 175.84 Deposits to shareholders' equity Times 13.83 13.22 12.05 11.55 11.28 10.59
Risk Adequacy
Tier I Capital Rs.in Million 15,963 15,329 15,032 13,916 12,229 11,240 Risk Weighted Assets (RWA) " 161,971 141,609 128,905 124,596 106,768 96,176 Tier I to RWA % 9.86% 10.82% 11.66% 11.17% 11.45% 11.69%Capital Adequacy Ratio " 12.77% 14.12% 15.39% 12.50% 11.93% 12.37%Net Return on Average RWA " 1.01% 1.33% 1.72% 1.27% 0.97% 1.15%
Stock Dividend
Bonus shares issued % - - - - 10.00% 11.00%Cash dividend % 7.50% * 12.50% 12.50% 10.00% - -
Share Information
Market Value per share-31 December Rs. 13.40 17.65 15.13 12.33 10.93 7.09 - High during the year " 19.20 17.90 15.35 16.73 11.38 9.40- Low during the year " 12.25 12.76 10.06 9.50 5.90 3.71Market Capitalization Rs.in Million 14,773 19,458 16,680 13,593 12,050 7,106 Price to book value (excl. surplus on revaluation of assets) Rs. 0.90 1.22 0.99 0.88 0.88 0.56 Price to earning ratio Times 8.99 10.38 7.54 8.56 11.63 7.09
Industry Share
Deposits % 1.84% 1.78% 1.99% 1.96% 1.87% 1.80%Advances " 2.65% 2.40% 2.52% 2.59% 2.57% 2.17%
Non Financial InformationNo of branches Absolute 290 288 266 246 239 233 No of permanent employees " 2,847 2,715 2,715 2,639 2,835 2,644 No. of ATMs " 313 306 274 263 265 251 *Subject to shareholder’s approval in the forthcoming AGM

PER BRANCHPERFORMANCE
GROSS ADVANCES(Rs. in Million)
060
120180240300360420480540600
201720162015201420132012
358.79437.96
469.98 453.45 464.42
595.77
DEPOSITS(Rs. in Million)
0
200
400
600
800
201720162015201420132012
516.96
587.61662.46
694.91728.91 783.96
CASA(Rs. in Million)
353.49
412.69447.70
476.68493.89 546.00
060
120180240300360420480540600
201720162015201420132012
PROFIT BEFORE TAXATION(Rs. in Million)
0
3
6
9
12
15
201720162015201420132012
7.39 6.40
9.93
13.52
10.69 9.76

Soneri Bank Limited | Annual Report 2017 | 45
CONCENTRATION OF ADVANCES, NPL, DEPOSITS AND OFF-BALANCE SHEET ITEMS - 31 DECEMBER 2017
Advances (Gross) Classified Advances Deposits Off-balance sheet items (Rupees (Percent) (Rupees (Percent) (Rupees (Percent) (Rupees (Percent) in ‘000) in ‘000) in ‘000) in ‘000)
Agriculture, Forestry, Hunting and Fishing 3,343,280 1.94% 198,471 1.94% 88,138 0.04% 215,547 0.56%Textile 30,255,594 17.51% 6,358,479 62.07% 1,992,435 0.88% 3,450,851 8.90%Chemical and Pharmaceuticals 4,870,844 2.82% 450,871 4.40% 2,190,816 0.96% 2,322,027 5.99%Cement 2,040,717 1.18% - - 106,558 0.05% 1,009,178 2.60%Sugar 5,006,715 2.90% 85,704 0.84% 111,208 0.05% 34,758 0.09%Footwear and Leather garments 1,223,719 0.71% 24,900 0.24% 708,860 0.31% 259,790 0.67%Automobile and transportation equipment 637,260 0.37% 13,510 0.13% 1,963,820 0.86% 683,517 1.76%Electronics and electrical appliances 2,488,977 1.44% 50,898 0.50% 386,551 0.17% 2,015,374 5.20%Construction 1,098,535 0.64% - - 1,470,364 0.65% 1,876,474 4.84%Power (electricity), Gas, Water, Sanitary 9,035,625 5.22% 166,121 1.62% 7,349,383 3.23% 1,992,412 5.14%Wholesale and Retail Trade 15,651,181 9.06% - - 5,462,968 2.40% 4,028,291 10.39%Exports/Imports 6,671,982 3.86% - - 1,832,268 0.81% 1,408,330 3.63%Financial 1,130,320 0.65% 215,947 2.11% 16,662,241 7.33% 1,619,773 4.18%Food and Allied 56,083,536 32.46% - - 2,792,018 1.23% 5,310,887 13.70%Individuals 7,840,834 4.54% 93,165 0.91% 104,800,775 46.10% 138,719 0.35%Others 25,393,311 14.70% 2,586,603 25.24% 79,430,051 34.93% 12,387,794 32.00%
172,772,430 100.00% 10,244,669 100.00% 227,348,454 100.00% 38,753,722 100.00%
Agriculture, Forestry, Hunting and FishingChemical and PharamaceuticalsSugarAutomobile and transportation equipmentConstructionWholesale and Retail TradeFinancialIndividuals
TextileCementFootwear and Leather garmentsElectronics and electrical appliancesPower (electricity), Gas, Water, SanitaryExports/ImportsFood and AlliedOthers
34.93%
Deposits Off-Balance Sheet items
8.90%5.99%
2.60%
0.56%
13.70%0.09%
3.63%
5.14%
4.84%
10.39%
32.00%
0.67%
1.76%
5.20%
4.18%
0.35%
1.94%
17.51%9.06%
3.86%
32.46%4.54%
14.70%
5.22%1.18%
0.71%
1.04%
0.65%
1%
0% 2.82%2.90%
Advances (Gross) Classified Advances
25.24%
1.94%
62.07%
0.13%
0.00%
0.24%2.11%
0.91%0.50%
4.40%
0.04%
0.88%
0.96%
0.05%
0.05%
0.31%
0.86%
0.17%
0.65%
3.23
%2.
40% 0.8
1%
7.33%
46.10%
1.23%

MATURITIES OFASSETS AND LIABILITIES (CONTRACTUAL)
Total Upto 3M 3M to 1Y 1Y to 3Y 3Y to 5Y 5Y & above---------------------------- (Rupees in Million) -------------------------------
Assets
Cash and balances with treasury banks 19,431 19,431 - - - -
Balances with other banks 1,151 1,151 - - - -
Lendings to financial institutions 6,544 4,435 2,109 - - -
Investments - net 117,429 75,244 5,806 21,460 13,144 1,775
Advances - net 164,293 110,417 17,682 8,930 12,984 14,280
Operating fixed assets 6,581 148 711 1,035 1,087 3,600
Other assets - net 6,705 5,111 1,588 - 6 -
322,134 215,937 27,896 31,425 27,221 19,655
Liabilities
Bills payable 4,895 4,895 - - - -
Borrowings 64,584 50,858 12,770 84 105 767
Deposits and other accounts 227,348 201,450 25,005 893 - -
Sub-ordinated loans 2,998 1 1 2 2 2,992
Deferred tax liabilities - net 936 - 936 - - -
Other liabilities 2,868 2,275 593 - - -
303,629 259,479 39,305 979 107 3,759
ASSETS(Rs. in Million)
0
36,666
73,333
110,000
146,666
183,333
220,000
5Y & above3Y to 5Y1Y to 3Y3M to 1YUpto 3M
215,937
27,896 31,425 27,22119,655
LIABILITIES(Rs. in Million)
026,00052,00078,000
104,000130,000156,000182,000208,000234,000260,000
5Y & above3Y to 5Y1Y to 3Y3M to 1YUpto 3M
259,479
39,305
979 107 3,759

Soneri Bank Limited | Annual Report 2017 | 47
KEY INTEREST BEARINGASSETS AND LIABILITIES
2017 2016
Avg.Vol (Rs. in Million)
Effective Interest Rate %
Interest (Rs. in Million)
Avg.Vol (Rs. in Million)
Effective Interest Rate %
Interest (Rs. in Million)
Interest Bearing Assets Balances with other banks 1,031 0.77 8 816 0.45 4 Lendings to financial institutions 10,494 5.74 602 6,649 5.11 340 Advances (excluding NPLs) 141,761 6.79 9,623 108,467 7.13 7,730 Investments (excluding equity investments) 127,956 6.46 8,272 125,859 7.51 9,451
Interest Bearing LiabilitiesDeposits and other accounts 217,192 3.84 8,330 198,018 4.04 8,006 Sub-ordinated loans 2,998 7.49 224 2,999 7.64 229 Borrowings 66,296 4.96 3,291 46,406 5.27 2,445
EFFECTIVE INTEREST RATE ON ASSETS & LIABILITIES
0.0%
1.5%
3.0%
4.5%
6.0%
7.5%
9.0%
Cost ofSub-ordinated
LoansCost of
BorrowingsCost of
DepositsReturn on
InvestmentsReturn on
LoansReturn on
Lendings to F.IsBalance withother Banks
20162017
0.77 0.45
5.74
5.11
6.79 7.136.46
7.51
3.84 4.04
4.965.27
7.49 7.64
KIBOR-6 MONTHS
6.40%
6.30%
6.20%
6.10%
6.00%
5.90%
5.80%
5.70%Dec Nov Oct Sep Aug Jul Jun May Apr Mar Feb Jan
2017 2016

STATEMENT OFVALUE ADDITION
2017 2016Value added (Rs. in Million) % (Rs. in Million) %Net Interest Income 6,659 6,844 Non interest income 3,269 2,736 Operating expenses excluding staff costs,depreciation, amortization, donations and Workers Welfare Fund (3,471) (3,061)Provision against advances,investments & others (66) (24)Value added available for distribution 6,391 6,495
To Employees -Salaries, allowances and other benefits 2,797 43.76% 2,674 41.16%To Government -Income tax 1,188 18.59% 1,198 18.44% -Worker Welfare fund 59 0.92% 64 0.99%To Providers of Capital -Cash Dividends 827 * 12.94% 1,378 21.22%To Society -Donations 16 0.25% 15 0.23%To Expansion and Growth - Depreciation 567 8.87% 576 8.87% - Amortization 121 1.90% 89 1.37% - Retained in business 816 12.77% 501 7.72%
6,391 100% 6,495 100%*Subject to shareholder’s approval in the forthcoming AGM
2017
Society0% To Providers
of Capital13%
Expansionand
Growth24%
Government19%
Employees44%
2016
Expansionand
Growth18%
Government20%
Employees41%
Soceity0%
To Providersof Capital
21%

Soneri Bank Limited | Annual Report 2017 | 49
QUARTERLY PERFORMANCE2017 & 2016
2017 2016
Profit & Loss Account 4th Quarter 3rd Quarter 2nd Quarter 1st quarter 4th Quarter 3rd Quarter 2nd Quarter 1st quarter
Mark-up / return / interest earned 4,851 4,954 4,443 4,257 4,150 4,045 4,796 4,533
Mark-up / return / interest expensed (3,099) (3,305) (2,795) (2,647) (2,566) (2,581) (2,891) (2,642)
Net mark-up interest income 1,752 1,649 1,648 1,610 1,584 1,464 1,905 1,891
Provisions 34 30 46 (176) (51) 92 (9) (56)
Non-mark-up / interest income 739 737 613 1,180 569 633 965 569
Non-mark-up / interest expenses (1,795) (1,766) (1,773) (1,697) (1,644) (1,618) (1,635) (1,582)
Profit before taxation 730 650 534 917 458 571 1,226 822
Taxation (318) (231) (318) (321) (120) (205) (590) (283)
Profit after taxation 412 419 216 596 338 366 636 539
Statement of Financial Position
Assets
Cash and balances with treasury banks 19,431 18,968 20,977 15,453 18,279 18,212 19,278 13,341
Balances with other banks 1,151 875 2,096 1,002 823 899 1,095 1,090
Lendings to financial institutions 6,544 11,651 15,671 12,821 5,537 10,113 5,486 6,635
Investments-net 117,429 132,960 128,581 121,071 117,884 124,806 151,368 133,334
Advances-net 164,293 155,851 149,749 132,596 125,306 98,606 115,885 112,765
Operating Fixed assets 6,581 5,113 5,143 5,159 5,138 5,232 5,257 5,006
Other assets 6,705 5,788 5,958 4,605 5,554 4,321 6,981 4,333
Total Assets 322,134 331,206 328,175 292,707 278,521 262,189 305,350 276,504
Liabilities
Bills payable 4,895 4,305 4,361 3,858 4,164 2,680 3,400 2,718
Borrowings 64,584 87,578 65,447 47,703 38,905 31,623 74,775 52,817
Deposits and the other accounts 227,348 214,846 234,426 216,285 209,925 201,967 202,222 195,618
Sub-ordinated loans 2,998 2,998 2,998 2,998 2,999 2,999 2,999 2,999
Deferred tax liabilities -net 936 701 839 940 1,138 1,347 1,448 1,546
Other liabilities 2,868 3,657 2,890 3,709 3,101 3,310 2,432 3,210
Total Liabilities 303,629 314,085 310,961 275,493 260,232 243,926 287,276 258,908
Equity
Share Capital 11,025 11,025 11,025 11,025 11,025 11,025 11,025 11,025
Reserves 1,752 1,670 1,586 1,543 1,424 1,356 1,283 1,156
Un-appropriated profit 3,665 3,180 2,824 2,621 3,496 3,192 2,868 2,338
Surplus on revaluation of assets 2,063 1,246 1,779 2,025 2,344 2,690 2,898 3,077
Total Equity 18,505 17,121 17,214 17,214 18,289 18,263 18,074 17,596
(Rs. in Million)

SIX YEARS’ VERTICAL ANALYSISSTATEMENT OF FINANCIAL POSITION/PROFIT & LOSS ACCOUNT
2017 2016 2015 2014 2013 2012Statement of Financial Position Rs.in Mln % Rs.in Mln % Rs.in Mln % Rs.in Mln % Rs.in Mln % Rs.in Mln %
AssetsCash and balances with treasury banks 19,431 6% 18,279 7% 16,718 7% 15,776 7% 12,673 7% 11,491 7%Balances with other banks 1,151 0% 823 0% 1,635 1% 575 0% 707 0% 1,249 1%Lendings to financial institutions 6,544 2% 5,537 2% 3,094 1% 604 0% 2,988 2% 1,123 1%Investments-net 117,429 36% 117,884 42% 108,846 43% 75,716 36% 46,703 28% 59,517 38%Advances-net 164,293 51% 125,306 45% 112,002 44% 107,968 51% 97,534 58% 77,170 49%Operating fixed assets 6,581 2% 5,138 2% 4,957 2% 5,014 2% 3,734 2% 3,821 2%Deferred tax assets-net - 0% - 0% - 0% - 0% 103 0% 304 0%Other assets 6,705 2% 5,554 2% 6,090 2% 7,522 4% 4,792 3% 3,954 2%Total Assets 322,134 100% 278,521 100% 253,342 100% 213,175 100% 169,234 100% 158,629 100%
Liabilities and EquityDeposits and other accounts 227,348 71% 209,925 75% 184,847 73% 162,964 76% 140,439 83% 120,451 76%Borrowings 64,584 20% 38,905 14% 39,876 16% 25,825 12% 10,485 6% 20,398 13%Bills payable 4,895 2% 4,164 1% 3,077 1% 3,063 1% 2,718 2% 2,659 2%Other liabilities 2,868 1% 3,101 1% 2,933 1% 2,864 1% 2,309 1% 2,490 2%Deferred tax liabilities-net 936 0% 1,138 0% 1,417 1% 1,420 1% - 0% - 0%Sub-ordinated loans 2,998 1% 2,999 1% 3,000 1% - 0% - 0% 299 0%Total Liabilities 303,629 94% 260,232 93% 235,150 93% 196,136 92% 155,951 92% 146,297 92%
Net Assets 18,505 6% 18,289 7% 18,192 7% 17,039 8% 13,283 8% 12,332 8%
Represented byShare capital - net of discount 11,025 3% 11,025 4% 10,023 4% 10,023 5% 10,023 6% 9,021 6%Reserves 1,752 1% 1,424 1% 1,049 0% 934 0% 618 0% 410 0%Un-appropriated profit 3,665 1% 3,496 1% 4,264 2% 3,150 1% 1,810 1% 1,947 1%Surplus on revaluation of assets 2,063 1% 2,344 1% 2,856 1% 2,932 1% 832 0% 954 1%
18,505 6% 18,289 7% 18,192 7% 17,039 8% 13,283 8% 12,332 8%
Profit & Loss Account
Mark-up / Interest / Return / Non Interest Income
Mark-up / return / interest earned 18,505 85% 17,524 86% 18,320 85% 16,906 87% 13,639 86% 13,813 89%Fee, commission, brokerage and exchange income 1,829 8% 1,576 8% 1,809 8% 1,939 10% 1,600 10% 1,191 8%Capital gain and dividend income 1,399 6% 1,131 6% 1,284 6% 535 3% 623 4% 528 3%Other income 41 0% 29 0% 57 0% 35 0% 22 0% 12 0%Total income 21,774 100% 20,260 100% 21,470 100% 19,415 100% 15,884 100% 15,544 100%
Mark-up / Interest / Return / Non Interest ExpenseMark-up / return / interest expensed 11,846 54% 10,680 53% 10,722 50% 10,626 55% 8,751 55% 8,934 57%Operating expenses 7,031 32% 6,479 32% 6,123 29% 5,798 30% 4,868 31% 4,368 28%Provisions 66 0% 24 0% 1,029 5% 549 3% 735 5% 520 3%Taxation 1,188 5% 1,198 6% 1,383 6% 860 4% 493 3% 618 4%Total expenses 20,131 92% 18,381 91% 19,257 90% 17,833 92% 14,847 93% 14,440 93%Profit after taxation 1,643 8% 1,879 9% 2,213 10% 1,582 8% 1,037 7% 1,104 7%

Soneri Bank Limited | Annual Report 2017 | 51
SIX YEARS’ HORIZONTAL ANALYSISSTATEMENT OF FINANCIAL POSITION/PROFIT & LOSS ACCOUNT
2017 2017 vs 2016 2016 2016 vs
2015 2015 2015 vs 2014 2014 2014 vs
2013 2013 2013 vs 2012 2012 2012 vs
2011Statement of financial position Rs.in Mln % Rs.in Mln % Rs.in Mln % Rs.in Mln % Rs.in Mln % Rs.in Mln %
Assets
Cash and balances with treasury 19,431 6% 18,279 9% 16,718 6% 15,776 24% 12,673 10% 11,491 28%
Balances with other banks 1,151 40% 823 -50% 1,635 184% 575 -19% 707 -43% 1,249 42%
Lendings to financial institutions 6,544 18% 5,537 79% 3,094 412% 604 -80% 2,988 166% 1,123 38%
Investments-net 117,429 0% 117,884 8% 108,846 44% 75,716 62% 46,703 -22% 59,517 30%
Advances-net 164,293 31% 125,306 12% 112,002 4% 107,968 11% 97,534 26% 77,170 18%
Operating fixed assets 6,581 28% 5,138 4% 4,957 -1% 5,014 34% 3,734 -2% 3,821 5%
Deferred tax assets -net - 0% - 0% - 0% - -100% 103 -66% 304 -21%
Other assets 6,705 21% 5,554 -9% 6,090 -19% 7,522 57% 4,792 21% 3,954 8%
Total Assets 322,134 16% 278,521 10% 253,342 19% 213,175 26% 169,234 7% 158,629 22%
Liabilities and Equity
Deposits and other accounts 227,348 8% 209,925 14% 184,847 13% 162,964 16% 140,439 17% 120,451 21%
Borrowings 64,584 66% 38,905 -2% 39,876 54% 25,825 146% 10,485 -49% 20,398 40%
Bills payable 4,895 18% 4,164 35% 3,077 0% 3,063 13% 2,718 2% 2,659 69%
Other liabilities 2,868 -8% 3,101 6% 2,933 2% 2,864 24% 2,309 -7% 2,490 5%
Deferred tax liabilities - net 936 -18% 1,138 -20% 1,417 0% 1,420 100% - 0% - 0%
Sub-ordinated loans 2,998 0% 2,999 0% 3,000 100% - 0% - -100% 299 -67%
Total Liabilities 303,629 17% 260,232 11% 235,150 20% 196,136 26% 155,951 7% 146,297 23%
Share capital - net of discount 11,025 0% 11,025 10% 10,023 0% 10,023 0% 10,023 11% 9,021 12%
Reserves 1,752 23% 1,424 36% 1,049 12% 934 51% 618 51% 410 -65%
Un-appropriated profit 3,665 5% 3,496 -18% 4,264 35% 3,150 74% 1,810 -7% 1,947 98%
Surplus on revaluation of assets 2,063 -12% 2,344 -18% 2,856 -3% 2,932 252% 832 -13% 954 29%
Total Equity 18,505 1% 18,289 1% 18,192 7% 17,039 28% 13,283 8% 12,332 13%
Profit & Loss AccountMark-up / Interest / Return / Non Interest IncomeMark-up / return / interest earned 18,505 6% 17,524 -4% 18,320 8% 16,906 24% 13,639 -1% 13,813 7%
Fee, commission, brokerage and
exchange income 1,829 16% 1,576 -13% 1,809 -7% 1,939 21% 1,600 34% 1,191 0%
Capital gain and dividend income 1,399 24% 1,131 -12% 1,284 140% 535 -14% 623 18% 528 23%
Other income 41 41% 29 -49% 57 63% 35 59% 22 83% 12 -92%
Total Income 21,774 7% 20,260 -6% 21,470 11% 19,415 22% 15,884 2% 15,544 6%
Mark-up / Interest / Return / Non Interest ExpenseMark-up / return / non interest expensed 11,846 11% 10,680 0% 10,722 1% 10,626 21% 8,751 -2% 8,934 -1%
Operating expenses 7,031 9% 6,479 6% 6,123 6% 5,798 19% 4,868 11% 4,368 30%
Provisions 66 175% 24 -98% 1,029 87% 549 -25% 735 41% 520 -59%
Taxation 1,188 -1% 1,198 -13% 1,383 61% 860 74% 493 -20% 618 109%
Total Expenses 20,131 10% 18,381 -5% 19,257 8% 17,833 20% 14,847 3% 14,440 4%
Profit after taxation 1,643 -13% 1,879 -15% 2,213 40% 1,582 53% 1,037 -6% 1,104 41%

CASH FLOW STATEMENTDIRECT METHOD
2017 2016(Rupees in ‘000)
CASH FLOWS FROM OPERATING ACTIVITIES
Markup / return / interest and commission receipts 21,698,028 21,373,766 Markup / return / interest payments (11,935,492) (10,912,123)Cash payments to employees, suppliers and others (6,347,845) (5,735,970)
3,414,691 4,725,673 (Increase) / decrease in operating assets Lendings to financial institutions (1,007,575) (2,442,639) Held-for-trading securities (10,525,132) 790,865 Advances - net (39,133,407) (13,433,330) Others assets (excluding advance taxation) (741,323) (147,436)
(51,407,437) (15,232,540)Increase / (decrease) in operating liabilities Bills payable 731,938 1,086,443 Borrowings 25,539,709 (1,102,159) Deposits and other accounts 17,423,001 25,078,318 Other liabilities (105,957) 350,859
43,588,691 25,413,461 (4,404,055) 14,906,594
Income tax paid (1,525,730) (1,831,964)Net cash (used in) / generated from operating activities (5,929,785) 13,074,630
CASH FLOWS FROM INVESTING ACTIVITIESNet investments in securities 9,016,120 (10,321,961)Dividend received 228,166 194,129 Investment in operating fixed assets (including intangible assets) (616,943) (1,004,102)Proceeds from disposal of fixed assets 23,014 53,526 Net cash generated from / (used in) investing activities 8,650,357 (11,078,408)
CASH FLOWS FROM FINANCING ACTIVITIESSub-ordinated loans (1,200) (1,200)Dividend paid (1,378,079) (1,378,079)Net cash used in financing activities (1,379,279) (1,379,279)
Increase in cash and cash equivalents 1,341,293 616,943 Cash and cash equivalents at the beginning of the period 18,963,729 18,346,786 Cash and cash equivalents at the end of the period 20,305,022 18,963,729
CASH AND CASH EQUIVALENTS AT THE END OF THE PERIODCash and balances with treasury banks 19,431,256 18,278,840 Balances with other banks 873,766 684,889
20,305,022 18,963,729
INDIRECT METHOD - SUMMARY 2017 2016 2015 2014 2013 2012Cash flows from operating activities (5,930) 13,075 33,745 30,230 (11,213) 17,573 Cash flows from investing activities 8,650 (11,079) (33,398) (27,389) 12,076 (13,881)Cash flows from financing activities (1,379) (1,379) 1,898 - (299) (599)
Cash and cash equivalents at the beginning of the year 18,964 18,347 16,102 13,261 12,697 9,604 Cash and cash equivalents at the end of the year 20,305 18,964 18,347 16,102 13,261 12,697
2017
Investing activities8,650
Operating activities(5,930)
Financingactivities(1,379)
2016
Investing activities(11,079)
Financingactivities(1,379)
Operating activities13,075
(Rs. in Million)

Soneri Bank Limited | Annual Report 2017 | 53
MARKET STATISTICS OFSNBL SHARES
YearMarket Share Price Trend
Quarter end High (Rs.) Low (Rs.) Closing (Rs.)
2017
March 19.20 15.85 16.00June 17.60 12.67 14.68
September 16.54 12.50 13.45December 14.00 12.25 13.40
2016
March 15.90 12.76 14.00June 14.50 13.00 14.22
September 15.49 13.40 14.64December 17.90 14.10 17.65
Jan2017
Feb2017
Mar2017
Apr2017
May2017
Jun2017
Jul2017
Aug2017
Sep2017
Oct2017
Nov2017
Dec2017
25
20
15
10
5
0
Lowest Closing Highest
Monthly Pattern of Market Share Price
0
10000
20000
30000
40000
50000
60000
201720162015201420132012
SONERI BANK PRICE VS KSE INDEX(2012-2017)
16,905
32,812
40,471
Year ended
Share Price (Rs.)
KSE-100TM Index
2012 2013 2014 2015 2016 2017
7.09
16,905
10.93
25,261
12.33
32,131
15.13
32,812
17.65
47,807
13.40
40,471
20.0018.0016.0014.0012.0010.008.006.004.002.000
25,261
23,131
47,807
Soneri Bank Ltd. PriceKSE-100 Index

FINANCIALCALENDAR
2017• 1st Quarter Results issued on 17 April 2017
• 2nd Quarter Results issued on 21 August 2017
• 3rd Quarter Results issued on 18 October 2017
• Annual Results issued on 20 February 2018
• 26th Annual General Meeting scheduled for 30 March 2018
2016
• 1st Quarter Results issued on 20 April 2016
• 2nd Quarter Results issued on 16 August 2016
• 3rd Quarter Results issued on 21 October 2016
• Annual Results issued on 15 February 2017
• 25th Annual General Meeting held on 28 March 2017

Soneri Bank Limited | Annual Report 2017 | 55
by 25 basis points, increasing the Policy Rate to 6 percent. As a growing financial institution, Soneri Bank with its robust position can capitalize on the economy’s positive trends.
Today the banking landscape is undergoing a phenomenal transformation with emerging technologies in the financial sector. Banks are keen on exploring and investing in new technologies to face the dynamics of the market today. This embrace is not just with the digital realm, it’s about change of mindsets, culture, habits, disruptive measures of legacy system, visionary leadership and smart-customer engagement.
As we sail into the future our technological infrastructure continues to expand with the launch of our Core Banking System (T24) in the year 2018, which will enhance our efficiencies, leverage our banking experience, excel our customer service and increase our diverse business portfolio.
On behalf of the Board, I would like to express my sincere appreciation to our valuable customers and shareholders for their continued trust and patronage, the State Bank of Pakistan, the Securities and Exchange Commission of Pakistan and other regulatory bodies for their valuable discernment and supportive measures. I would also like to convey my heartfelt gratitude to all Sonerians for their consistent endeavors to make 2017 a successful year. Our employees are pivotal partners in our journey towards excellence, they uphold the brand values to provide enhanced convenience and quality service to our valuable customers, as we reach for even greater milestones.
Roshan Har Qadam!
Alauddin FeerastaChairmanKarachi: 20 February 2018
Soneri Bank’s 25-year journey encompasses the challenges and victories we voyaged with our commitment to deliver financial solutions, banking convenience and security for today’s banking needs. Despite the challenging landscape and intense market competition, Soneri Bank has managed to deliver on various key performance
indicators.
Under the Board’s direction, the Management has aligned all its resources to fulfill our strategic business goals, taking ownership and ensuring timely implementation.
Pakistan’s macroeconomic outlook is improving continuously and country’s Gross Domestic Product (GDP) growth forecasted to
be around 5.3 percent - 5.5 percent during FY2018-2019. Pak rupee depreciated by 5
percent against US dollar in the interbank market during December 2017 and completion of some key power projects will serve to buoy the country’s export manufacturing base and overall GDP growth. Large Scale Manufacturing (LSM) Index posted strong growth of over 7 percent during the period July-November 2017. Progress on the China Pakistan Economic Corridor Projects (CPEC) coupled with better security situation, will be pivotal and serves as a key differentiating factor compared to previous periods of economic challenges. Outlook on Foreign Direct Investment (FDI) remains positive given continuing CPEC projects.
After remaining stable for almost two and a half years, Pak Rupee has depreciated; currency devaluation was a key event, which will serve to strengthen the country’s external account (July-December 2017 current account deficit at US$7.4 billion vs. US$4.7 billion previous year). The Government has also introduced additional import tariff for non-essential items in October 2017, which will help to dampen the rise in imports. Depreciation of Pak Rupee will give rise to inflation. State Bank of Pakistan raised interest rates for the first time in 4 years in January 2018
Chairman’s Review Report

DIRECTORS’ REPORTTO SHAREHOLDERS
On behalf of the Board of Directors, we are pleased to present the Directors' Report of Soneri Bank Limited (the Bank) along with the audited financial statements and auditors' report thereon for the year ended 31 December 2017.
EconomyIn 2017, the economy gained further momentum by posting a decade high GDP increase of 5.3 percent driven by a recovery in agricultural production along with encouraging performance by the services and the manufacturing sectors. Further, infrastructure and CPEC-related projects continued to boost construction related industries. Although there was a decline in capital markets the otherwise reviving economy was supported by improved business sentiment leading to a surge in private sector credit off-take during 2017.
During the year, the country’s foreign exchange reserves declined by US$ 3 billion to US$ 20.2 billion as total imports could not be financed completely from foreign exchange inflows causing pressure on current account.
Headline CPI inflation remained stable in the first two quarters of FY 2017, but picked up gradually in the third and fourth quarter. The 5 percent PKR depreciation and rising international oil prices are likely to add further to the inflationary pressures.
FY 2018 may prove to be challenging in terms of financing essential imports while raising funds to match loan repayment obligations, but the economy remains on a growth trajectory and will benefit from the visible improvement in security and power supply.
Business OverviewIn 2017, due to the low interest rate regime, the Bank experienced margin compression despite delivering a notable increase in volumes. The 2.70 percent decline in net markup income was more than offset by double digit increase delivered through non-markup income. Non markup expenses grew in line with our expansion and technological advancement while NPL’s were managed effectively at sound levels.
In 2017 the Bank grew in terms of geographical footprint, balance sheet size and delivered requisite shareholder return. Serving our customers from 290 branches and 313 ATMs across 133 cities the Bank continues to build its brand by delivering financial solutions and providing banking convenience and security for today’s banking needs.
The Bank adequately meets the SBP Basel III requirements and is well positioned to meet its growth plans with Capital Adequacy Ratio of 12.77 percent.
Looking at the last six years’ performance, the deposits base of the Bank increased to Rs. 227.35 billion which translates into compounded annual growth rate (CAGR) of 13.55 percent. The CASA component of deposits showed an impressive growth, with six years CAGR of 13.96 percent. This represents the Bank’s policy to mobilize low cost deposits. Similarly, net advances rose to Rs. 164.293 billion with six year CAGR of 16.31 percent.
GROSS ADVANCES(Rs. in Million)
DEPOSITS(Rs. in Million)
0
40,000
80,000
120,000
160,000
200,000
240,000
201720162015201420132012
120,451
140,439162,964
184,847209,925
227,348
0
36,000
72,000
108,000
144,000
180,000
201720162015201420132012
83,599
104,673115,614
120,617133,753
172,772

Soneri Bank Limited | Annual Report 2017 | 57
DIRECTORS’ REPORTTO SHAREHOLDERS
Operating ResultsThe highlights of financial results for FY 2017 are presented as follows:
The Bank posted profit after taxation of Rs. 1.643 billion which translates into earnings per share of Rs. 1.4906 (31 December 2016: Rs. 1.7042). Profit before taxation for the year stood at Rs. 2.831 billion against Rs. 3.077 billion last year. Net Markup Income decreased by 2.70 percent year on year owing to overall reduction in margins due to lower interest rates and intense competition, although there is positive volumetric variance. On the other hand, revenue streams of Dividend Income, Exchange Income and Capital Gains were higher by 24.89, 50.50 and 22.55 percent respectively, compared with FY 2016. Greater emphasis on Non Fund Based Income offset the impact of reduced spreads which increased by 19.48 percent and stood at Rs. 3.269 billion as against Rs. 2.736 billion last year. The results incorporate higher tax charge on account of Super tax which was re-imposed this year.
Shareholders' Equity (excluding surplus)DepositsAdvances - netInvestments - net
Statement of Financial Position 31 December2017
31 December2016
Variance(%)
16,442227,348164,293117,429
15,945209,925125,306117,884
3.128.30
31.11(0.39)
------------ (Rs. in Million) ------------
Net markup incomeNon Markup IncomeNon Markup ExpensesProfit before tax and provisionsProfit before taxationProfit after taxationEarnings Per Share (Rupees)
Profit & Loss Account 31 December2017
31 December2016
Variance(%)
6,6593,2697,0312,8972,8311,643
1.4906
6,8442,7366,4793,1023,0771,879
1.7042
(2.70)19.48
8.52(6.61)(7.99)
(12.56)(12.56)
------------ (Rs. in Million) ------------
Balance withother Banks, 95
Lendings to Fl,515
Loans &Advances,
9,623
Investments8,272
Non-Interest Income 2017(Rs. in Million)
Income fromdealing in FX,
437
Gain onsale of
securities,1,158
Otherincome,41
Fee,commission& brokerage
1,393
Dividendincome,
240
Interest Income 2017(Rs. in Million)
PROFIT AFTER TAXATION(Rs. in Million)
0
500
1,000
1,500
2,000
2,500
201720162015201420132012
1,104 1,037
1,582
2,213
1,8791,643

DIRECTORS’ REPORTTO SHAREHOLDERS
Non markup expenses increased by 8.52 percent due to inflationary pressure and the full year impact of branches opened in 2016. The branch network of the Bank now stands at 290 (2016: 288)
The Bank’s net assets (including surplus) amounted to Rs. 18.505 billion as at 31 December 2017. Overall deposits showed a growth of 8.30 percent while current deposits increased by 22.37 percent year on year. Advances (net of provisions) grew by 31.11 percent. The Bank’s net Advances to Deposits ratio increased to 72.26 percent from 59.69 percent in 2016. The NPL coverage was prudently managed. It increased to 82.77 percent (2016: 81.07 percent). Investments remained flat with major deployment being in government securities.
DividendThe Board has recommended a final cash dividend (D-9) of Re. 0.75/- per share (i.e. 7.50%) for the year ended 31 December 2017 to be approved in the 26th Annual General Meeting of the Shareholders.
Looking AheadIn FY 2018, the Bank is expected to deliver growth in its core income by increasing spreads. Our focus remains on reducing cost of deposits by improving the deposit mix. This along with the likely increase in discount rate regime will support our margins in 2018.
On non markup income the Bank has strategized to capitalize on our existing relations together with continuing the growth momentum in Trade volumes. In the outgoing year we saw a significant decline in the capital market index, in 2018 a turnaround will benefit us in recovering some lost ground.
The Bank has successfully managed to keep its NPL’s at a sound level and will continue its efforts in increasing recoveries in 2018.
Investments have been made on the technological front as we are set to deliver the upgrade of our core banking system which will drive a lot of efficiencies and modernization; overall this will lead the way towards a fundamental shift in the way we do things.
There will be challenges ahead due to mounting political pressure and external sector vulnerabilities. However, the Bank is confident that 2018 will offer opportunities offered by infrastructure development projects and a visible improvement in security and power supply.
Second (2nd) Issuance Of Term Finance Certificates (TFCs)The Bank had issued its second Term Finance Certificates in the year 2015. It has been regular on meeting its commitments under the agreement and the fifth (5th) redemption and profit payments were duly made to the TFC investors on 05 January 2018.
Credit Rating The Pakistan Credit Rating Agency (PACRA) maintained the long term credit rating of AA- (Double A Minus) and short term rating of A1+ (A One Plus) with Stable Outlook through its notification dated: 15 December 2017 [2016: long term AA- (Double A Minus): short term A1+ (A One Plus)]
PACRA has also maintained the credit rating of unsecured, subordinated and listed Term Finance Certificates (TFC – 2) issue of worth PKR 3,000 million at A+ (Single A plus) with Stable Outlook vide its notification dated: 15 December 2017.
Board of DirectorsElection of Directors was held in 25th AGM convened on 28 March 2017. Out of the retiring directors both M/s. Amar Zafar Khan and Shahid Anwar opted not to contest the elections and in their place, M/s. Amin A. Feerasta and Inam Elahi were elected.
Further, during the year Syed Ali Zafar resigned effective 17 May 2017 and in his place, Mr. Jamil Hassan Hamdani was appointed by the Board on 17 May 2017. State Bank of Pakistan clearance to these appointments was duly received under the Fit & Proper Test requirements.
The Board remained fully compliant with the provision with regard to their training program. Two directors have received "Certificate of Director Education" from the Pakistan Institute of Corporate Governance (“PICG”). Four directors are exempt from training as mentioned in Provisio to Regulation No. 5.19.7 of the Rule Book of Pakistan Stock Exchange Limited. Remaining one director was recently appointed against casual vacancy in May 2017.
Our directors have also attended various courses/workshops in recent years. In the year 2015, three directors have attended a week – long course on “The Accelerated Certificate in Company Direction” a program of the Institute of Directors, UK arranged in Pakistan by the PICG. Further during the year 2016, three other directors have also participated in a three full days’ workshop on “Corporate Governance & Director Duties Excellence” held in Malaysia.

Soneri Bank Limited | Annual Report 2017 | 59
DIRECTORS’ REPORTTO SHAREHOLDERS
Board and Committees’ Meetings Details of the meetings of the Board of Directors and its Committees held during 2017 and the attendance by each director/committee member are given as under:-
* Not a member of the Committee ** Leave of absence was granted to those directors/members, by the Board/Committee, who could not attend some of the meetings.
Sr.No.
Name ofDirector
Board ofDirectorsMeetings
Heldduring
thetenorin theyear
Heldduring
thetenorin theyear
Heldduring
thetenorin theyear
Heldduring
thetenorin theyear
Heldduring
thetenorin theyear
Heldduring
thetenorin theyear
Board AuditCommitteeMeetings
Board CreditCommitteeMeetings
Board HumanResource &
RemunerationCommitteeMeetings
Board RiskManagementCommitteeMeetings
Board Independent
Directors’CommitteeMeetings
Atte
nded
**
Atte
nded
**
Atte
nded
**
Atte
nded
**
Atte
nded
**
Atte
nded
**
1 Mr. AlauddinFeerasta 6
6
6
5
6
6
5
4
1
2
1
6
6
4
4
6
5
4
4
1
1
1
*
*
4
*
4
*
3
2
1
1
1
*
*
3
*
4
*
2
2
1
1
1
4
4
4
*
4
3
*
*
1
*
*
4
4
3
*
4
3
*
*
1
*
*
*
1
*
*
1
5
4
3
1
*
1
*
1
*
*
1
5
4
1
1
*
0
*
4
*
4
*
4
4
*
*
*
*
*
4
*
4
*
4
3
*
*
*
*
*
*
*
*
*
*
1
1
*
*
*
*
*
*
*
*
*
1
1
*
*
*
2 Mr. MohammadAftab Manzoor
3 Mr. NooruddinFeerasta
4 Mr. Amin A. Feerasta(Executive Director)
5 Mr. MuhammadRashid Zahir
6 Mr. Manzoor Ahmed(NIT Nominee)
7 Mr. Inam Elahi
8 Mr. Jamil HassanHamdani
9 Mr. Amar ZafarKhan
10 Syed Ali Zafar
11 Mr. Shahid Anwar(NIT Nominee)
Total Number of meetingsheld during the year 6 4 4 5 4 1

DIRECTORS’ REPORTTO SHAREHOLDERS
Statement of Investments of Provident and Gratuity FundsThe Bank operates approved funded provident and gratuity fund schemes covering all its permanent employees. The investment balances (do not include deposit with banks) are as follows:
Compliance With Code of Corporate GovernanceAs required by the Code of Corporate Governance (the Code), a prescribed statement by the Board, along with Auditors' Review Report thereon, forms part of this Annual Report.
The directors are pleased to give the following statement as required by clause (xvi) of the Code:
• The financial statements present fairly the state of affairs of the Bank, the results of its operations, cash flows and changes in equity.• Proper books of account of the Bank have been maintained.• Accounting policies as stated in the notes to the financial statements have been consistently applied in the preparation of financial statements. Accounting estimates are based on reasonable and prudent judgment.• International Financial Reporting Standards, as applicable to banks in Pakistan, and as stated in note 3 to the financial statements, have been followed in the preparation of the financial statements.• The system of internal control is sound in design and has been effectively implemented and monitored.• There are no significant doubts upon the Bank’s ability to continue as a going concern.• There has been no material departure from the best practices of corporate governance, as detailed in the listing regulations contained in the Rule Book of Pakistan Stock Exchange Limited.• The details of outstanding statutory payments, if any, have been adequately disclosed in the financial statements.
Statement on Risk Management FrameworkThe Bank’s risk management framework is based on a clear understanding of various risks, disciplined risk assessment and measurement procedures and continuous monitoring. The Bank risk appetite framework sets out the qualitative and quantitative thresholds for risk capacity and tolerance. The Bank risk strategy seeks to balance the risk profile against sustainable returns to achieve the business goals of the Bank. Our Risk appetite is set in line with the overall strategy and approved by the board while the risk management framework identifies and manages current and emerging risks that could materially affect the delivery of the Bank strategy. The policies and procedures established for this purpose are continuously benchmarked with international best practices. The Board of Directors has oversight on all the risks assumed by the Bank. Specific Committees have been constituted to facilitate focused oversight of various risks.
Through our Risk Management Framework, we manage enterprise wide risks with the objective of maximizing risk-adjusted returns while remaining within our risk appetite. As part of this framework, the Board has approved a set of principles which describe the risk management culture prevails in the Bank. The Bank has formulated a comprehensive Stress Testing Policy to measure impact of adverse stress scenarios on the adequacy of capital. The stress scenarios are idiosyncratic, market wide and a combination of both.
In the interests of all our stakeholders, we only take risks within our risk appetite and risk tolerances, and where consistent with our approved risk strategy. Risk Management policies, models, tools and systems are regularly reviewed to improve the framework and reflect market changes. We take individual responsibility to ensure risk-taking is disciplined and focused, particularly within our area of authority. We make sure risk-taking is transparent, controlled and reported in line with the Risk Management Framework, within risk appetite and risk tolerance boundaries and only where there is appropriate infrastructure and resources.
Management of the Bank is well aware of the significance of establishing a meaningful risk management function in the Bank and established different Senior Management Committees to perform business decisions considering risk and returns thereby assist the BRMC/Board. The Bank has persistently invested in human capital, technology, market resources to strengthen the Risk Management Function in the Bank in executing the Bank’s strategy, the Bank operates within internally approved risk appetite and external requirements relating to capital, liquidity and leverage risk. The Bank is committed to ensuring that effective risk management remains central to all its activities and is a core management competency. The aim is to ensure that risk management is embedded in the Bank's processes and culture, thus contributing to the achievement of its core objectives.
Investments of Provident FundInvestments of Gratuity Fund
31 December 2017(Un-audited)
381,060229,654
31 December 2016(Audited)
525,730144,304
----------------- (Rupees in ’000) -----------------

Soneri Bank Limited | Annual Report 2017 | 61
DIRECTORS’ REPORTTO SHAREHOLDERS
Statement on Internal ControlsThe Board of Directors acknowledges its responsibility for ensuring that an adequate and effective internal control system covering all aspects of our banking operations is in existence and vigorously followed by senior management.
Based on our review of internal control system through various reports from Internal Audit Division, Internal Control Compliance & Control Group and Statutory Auditors as well as various policies, procedures and other matters presented for our review and approval, from time to time, the management believes that the Bank’s existing system of Internal Control is considered reasonable in design and is being effectively implemented and monitored.
Financial StatementsThe financial statements of the Bank have been audited without qualification by the auditors of the Bank, M/s. A.F. Ferguson & Co., Chartered Accountants and approved/authorized by the Board in its meeting held on 20 February 2018 for issuance to the shareholders.
No material changes and commitments affecting the financial position of your Bank have occurred between the end of the financial year to which these financial statements relate and the date of the Directors’ Report.
External AuditorsThe retiring auditors M/s. A.F. Ferguson & Co., Chartered Accountants, being eligible, offer themselves for re-appointment. The audit committee of the Board has recommended their re-appointment.
Corporate Social Responsibility (CSR)Soneri Bank endorses its brand promise of Roshan Har Qadam with its philanthropic efforts in the field of healthcare, education and women empowerment along with other areas of community development, sports and rehabilitation. A summary of the bank’s key CSR activities during the year forms part of the Annual Report.
Six Years’ Operating and Financial Data Six years financial performance of the Bank is presented on page No. 41.
Pattern of ShareholdingThe pattern of shareholding as required under section 227(2)(f) of the Companies Act, 2017 and Clause (xvi) of the Code of Corporate Governance, 2012 forms part of this Annual Report.
AcknowledgmentWe would like to take this opportunity to thank the State Bank of Pakistan, the Securities and Exchange Commission of Pakistan and the Ministry of Finance for their continued support and guidance. We are also thankful to our valued customers for their continued patronage and confidence and want to extend our appreciation to the Bank employees as the driving force in the growth of the Bank over the years.
On behalf of the Board of Directors.
MOHAMMAD AFTAB MANZOORPresident & Chief Executive Officer
ALAUDDIN FEERASTAChairman
Karachi: 20 February 2018

41

Soneri Bank Limited | Annual Report 2017 | 63
525,730144,304
381,060229,654

166**44******
266**441144**
3664343******
454******44**
566444411****
665**335544**
75432**444311
84422**31**11
911111111****
102111********
111111**10****
644541

Soneri Bank Limited | Annual Report 2017 | 65
subordinated, unsecured

2016 2017
2016 2017
16,442227,348164,293117,429
15,945209,925125,306117,884
3.128.30
31.11(0.39)
6,6593,2697,0312,8972,8311,643
1.4906
6,8442,7366,4793,1023,0771,879
1.7042
(2.70)19.48
8.52(6.61)(7.99)
(12.56)(12.56)
Balance withother Banks, 95
Lendings to Fl,515
Loans &Advances,
9,623
Investments8,272
Non-Interest Income 2017(Rs. in Million)
Income fromdealing in FX,
437
Gain onsale of
securities,1,158
Otherincome,41
Fee,commission& brokerage
1,393
Dividendincome,
240
Interest Income 2017(Rs. in Million)
PROFIT AFTER TAXATION(Rs. in Million)
0
500
1,000
1,500
2,000
2,500
201720162015201420132012
1,104 1,037
1,582
2,213
1,8791,643

Soneri Bank Limited | Annual Report 2017 | 67
GROSS ADVANCES(Rs. in Million)
DEPOSITS(Rs. in Million)
0
40,000
80,000
120,000
160,000
200,000
240,000
201720162015201420132012
120,451
140,439162,964
184,847209,925
227,348
0
36,000
72,000
108,000
144,000
180,000
201720162015201420132012
83,599
104,673115,614
120,617133,753
172,772

This Statement of Internal Control is based on an ongoing process designed to:
- Identify the significant risks in achieving the Bank’s policies, aims and objectives.
- Evaluate the nature and extent of those risks.
- Manage these risks efficiently, effectively and economically.
This process was in place for the year ended 31 December 2017.
The Board of Directors has instituted an effective Internal Audit Division which not only monitors compliance with the Bank’s policies, procedures and
controls and reports significant deviations regularly to the Board Audit Committee (BAC) but also regularly reviews the adequacy of the overall Internal
Control System. The observations and weaknesses pointed out by the external auditors are also addressed promptly and necessary steps are taken
by the management to eliminate such weaknesses.
It is the responsibility of the Bank’s management to establish and maintain an adequate and effective system of internal control, to implement sound
control procedures and to maintain a suitable control environment. In order to ensure implementation as well as to minimize various regulatory,
reputational and compliance risks, the management conduct on site monitoring of branches through periodical visits and Off-Site monitoring through
various automated tools such as SAS AML ,World Check, Sonaware dot net as well as various internally developed systems by Compliance & Control
Group.
The Bank has adopted the internationally accepted COSO (Committee of Sponsoring Organizational of Tread way Commission) Internal Control-
Integrated Framework. A reputable advisory firm had been appointed to provide services on implementation of SBP Guidelines on Internal Controls
over Financial Reporting (ICFR) in the prior years. To further strengthen controls, enhanced governance and monitoring the management had
constituted an Internal Control Department which is also an integral part of Compliance & Control Group of the Bank.
In order to ensure consistency in the process of compliance with the relevant guidelines the Bank followed a structured roadmap. Accordingly, the
Bank had completed a detailed documentation of the existing processes and controls, together with a comprehensive gap analysis of the control
design and development of implemented remediation plans for the gaps in 2010.
Furthermore, the bank has developed a comprehensive management testing and reporting framework for ensuring ongoing operating effectiveness
of majority of key controls and has significantly addressed the design improvement opportunities identified to complete the project related initiatives.
While concerted efforts have always been made to comply with the SBP Guidelines issued, the identification, evaluation, and management of risks
within each of the Bank’s key activities, and their continued evaluation and changes to procedure remains an ongoing process.
In accordance with SBP directives, the Bank has completed all the stages of ICFR and upon satisfactory completion of ICFR roadmap, the SBP
granted waiver from the submission of external auditor Long Form Reports effective 2012. An annual assessment report by Board Audit Committee
on ICFR duly signed by chairman BAC is being submitted to SBP since then.
The Bank has also successfully completed the cycle of SBP’s Internal Control over Financial Reporting exercise for the Year 2017 and report will be
submitted by BAC to the State Bank of Pakistan during the year 2018.
_______________________________
MOHAMMAD AFTAB MANZOOR
President & Chief Executive Officer
Karachi: 20 February 2018
STATEMENT OFINTERNAL CONTROLSYEAR ENDED 31 DECEMBER 2017

Soneri Bank Limited | Annual Report 2017 | 69
This Code of Conduct (Code) outlines the principles, policies and laws that govern the activities of Soneri Bank Limited (Bank), and to which the Board members, employees and others who work with the Bank, or represent the Bank directly or indirectly must adhere. All employees are required to read, understand, sign and follow the Code of Conduct.
OBJECTIVESoneri Bank Limited (Bank) expects all of its employees to act in full compliance with the policies & guidelines set forth in this Code of Conduct. It is the employee’s responsibility to make oneself familiar with the following and other policies related to their own business unit:
1. OUTSIDE BUSINESS INTEREST No employees shall engage directly or indirectly, in any other
business but shall faithfully and diligently, perform the duties entrusted to him /her from time to time and devote maximum time and attention to work of the Bank, and ensure his/her best endeavors to promote its interest and welfare. No employee shall take up any activity which will bring him/her any reward or remuneration or benefit, directly or indirectly other than from the job at the Bank.
2. FINANCIAL INTEREST No employee or his/her immediate family shall enter into
speculative and trading activity in stocks, shares, bonds, or any other securities or commodities, either on his/her own account or that of any other person, firm, company, nor shall involve in other speculative activity (ies) including betting/gambling. Further, an employee and his/her immediate family shall not derive any benefit or assist others to derive any benefit from the access to and possession of information about the Bank, which is not in the public domain and thus constitutes inside information. All the employees are required to comply with the applicable company law on prevention of insider trading.
3. ANTI BRIBERY & CORRUPTION No employee shall accept any presents either in cash or kind
from Bank clients, suppliers, vendors and contractors or others, by way of illegal gratification or otherwise. Any such instance where business judgment has been compromised due to such monetary or non-monetary gifts will be considered as a violation of this code. Accepting gifts and benefits that may appear as engaging others in bribery or influencing for a consideration for an official or business favor is prohibited.
No employee shall give or take bribes or engage in any form of corruption.
4. VIOLATION OF LAW No payment or transaction should be made or undertaken, by an
employee or authorized or instructed to be made or undertaken by any other person or the Bank if the consequence of that transaction or payment would be the violation of any law in force.
5. POLITICAL PARTICIPATION No employee shall take part in, subscribe in any aid of, assist
in or take part in any political activity whatsoever. No employee shall canvass or otherwise, interfere or use his/her influence in connection with or take part in any election to a legislative or local body, whether in Pakistan or elsewhere. Provided that a Bank employee who is qualified to vote at such elections may exercise his/her right to vote.
6. PROTECTING BANKS RESOURCES An employee must not peruse such outside business
activity(ies) and relationships using Banks resources (including but not limited to physical space, office supplies, office communication equipment or time) or allow any outside business, civic or charitable activities to interfere with his/her job performance. Employees must never compromise on integrity, either for personal or professional benefit. Each employee is also personally responsible for the integrity of the information, reports and records under his/her control.
7. ACT OF MISCONDUCT Employee shall not commit any act of subversion or misconduct
or misbehavior; and will also not act in any manner, which could be prejudicial or detrimental to the interest of the Bank. The Bank shall be entitled to dispense with the services of any employee, any time per the law of his/her employment and/or repeated negligence, disobedience, dishonesty, breach of trust, acts of any other misconduct or subversion without any notice.
8. DATA SECURITY AND CONFIDENTIALITY All employees shall avoid, during his/her employment or
thereafter to disclose or divulge to any person whomsoever any information relating to the Bank or its customers, suppliers, employees or any confidential information which he/she may have access to while being in the service of the Bank. All employees shall be bound to protect the confidentiality of the non-public information at all times.
9. ABIDANCE OF LAWS OF THE LAND Notwithstanding anything contained hereinabove every
employee will abide by all the laws of the land including Labor Laws where applicable.
10. PUNCTUALITY Employees are expected to be at work on time every business
day. In the event that employee is absent or late due to illness, accident or personal reasons, he/she is required to inform his/her supervisor as soon as possible so that the department may make other arrangements for substitute help while the employee is away.
11. SEPARATION FROM THE BANK In case of resignation every employee will have to attend his/
her duties until the resignation is accepted and employee is
CODE OFCONDUCT(SUMMARIZED VERSION)

properly relieved by the competent authority. In case he/she fails to attend his/her duty after tendering resignation, the resignation will not be considered and he/she may be dealt according to the relevant HR Policy.
Employees at the time of separation from Bank should return Bank assets, facilities (blackberry, laptop, mobile etc), visiting and Identity cards, stamps etc.
12. ETHICS, DISCRIMINATION OR HARASSMENT All employees are expected to comply with ethical standards
as a critical element of their responsibilities. It is encouraged to raise possible ethical issues and Bank prohibits any retaliatory action against any individual for raising legitimate concerns regarding ethics, discrimination or harassment matters or for reporting suspected violations. In case of any issue that has been reported, investigation/inquiry shall be held, and all employees are required to fully co-operate with any appropriately authorized internal or external investigations.
13. DRESS CODE & PERSONAL HYGIENE Employees are expected to dress in a manner consistent with
the nature of work performed. While at work, all employees are expected to dress neatly and appropriately in normal office as per the Dress code policy of the Bank.
All employees are expected to abide with the personal hygiene requirements.
14. PROTECTING BANK RESOURCES All employees are responsible for safeguarding the tangible
and intangible assets of the Bank and its customers, suppliers and distributors that are under their control. Bank assets may be used only for proper company purpose. Misappropriation, carelessness or waste of Bank assets is a breach of one’s duty to the Bank and should be avoided at all cost.
15. FRAUD, THEFT OR ILLEGAL ACTIVITY An employee must not: - steal, embezzle or misappropriate money, funds or anything of
value from the Bank, doing so shall subject him/her to potential disciplinary action according to the Bank policy
- use Bank’s assets for personal gain or advantage - remove Bank’s assets from their premises and facilities unless
properly authorized by the relevant competent authority - use Bank’s stationery or corporate documents, Bank’s brand
name for non official purposes since such implies endorsement from Soneri Bank
16. EMPLOYEE IDENTIFICATION & SECURITY If employees are supplied with an identification card, this must
be worn visibly when on Bank’s premises. Each employee is also responsible for the safekeeping of his/her ID card.
17. PASSWORD SECURITY All employees are responsible to safeguard their password and
ensure that they maintain honesty and integrity at all times. Password is unique to an individual and its sharing is strictly prohibited. In an event where it is reported that employees have shared their login credentials (User ID/Password) with other employees, both the parties would be accountable and liable to strict disciplinary action which may result in termination from employment.
18. USE OF COMMUNICATION TOOLS Bank’s telephone, e-mail, voice-mail, computer, systems etc are
primarily for business purposes. Employees may not use these systems in a manner that could be harmful or embarrassing to the Bank. Personal communications using these systems must be kept to a minimum. In case of his/her separation from the Bank, all rights to property and information generated or obtained as part of an employment relationship remains the exclusive property of the Bank only.
An employee must never use Bank systems to transmit or receive electronic images or text of a sexual nature or containing ethnic slurs, racial epithets or any other material of a harassing, offensive or lewd nature.
19. RECORD MANAGEMENT Records are very important business assets. The Bank is
committed to managing its records in a consistent, systematic and reliable manner; records provide evidence for business activities and decisions and are often required to meet legal and regulatory requirements. Employees are required to retain the records in accordance with their importance and applicable statutory record retention requirements and Bank policies.
20. TAXATION The Bank is also committed to accuracy in tax related records
and tax reporting in compliance with the overall intent and applicable laws. Tax returns must be filed on a timely basis and taxes due paid in time.
21. WORKFORCE DIVERSITY The Bank believes that diversity in the staff is critical to
its success and is fully committed to equal employment opportunity, compliance with fair employment practices and non discrimination laws. The Bank prohibits sexual or any other kind of discrimination, harassment or intimidation, whether committed by or against a supervisor, co-worker, customer, vendor or visitor.
22. RELATED STAFF MEMBERS Where husbands, wives or other relatives are employed in the
same or related areas, no employee should allow personal and/or domestic circumstances to impinge upon or affect either working relationships or the breach of Bank’s employment regulations regarding confidentiality and fidelity.
CODE OFCONDUCT(SUMMARIZED VERSION)

Soneri Bank Limited | Annual Report 2017 | 71
23. DRUG FREE WORKPLACE Selling, manufacturing, distributing, possessing, using or being
under the influence of illegal drugs on the job is prohibited.
24. HEALTH AND SAFETY To protect the well being of the Bank’s valued customers and
employees, smoking and eating betel leaf within the premises of Bank is strictly prohibited.
25. UNFAIR DEALING PRACTICES No employee may take unfair advantage of anyone through
manipulation, concealment, abuse of confidential information, misrepresentation of facts or other unfair dealing practices.
26. MEDIA AND PUBLIC SPEAKING No employee other than the authorized personnel is allowed
to publish, make speech, give interviews or make public appearance that are connected to Bank’s business interests, else an approval is required from Head of HR, Head of Compliance and President.
27. VENDOR RELATIONSHIP Employees responsible for buying assets on Bank’s behalf
should purchase all goods and services on the basis of quality, price, availability, terms and service. Employees responsible for customer relationship must never lead a supplier or customer to believe that they can inappropriately influence any procurement decisions at Bank. Employees shall ensure to abide by all the provisions of the Fixed Asset Management and Expenditure Control Policies of the Bank
28. CONFLICT OF INTEREST Real or perceived conflicts of interest in any process or form
should be disclosed and avoided. An employee or any of his/her relatives/associates should not derive any undue personal benefit or advantage by virtue of his/her position or relationship with the Bank. Any dealings with a related party must be conducted in such a way that no preferential treatment is given and adequate disclosures are made as required by the law and as per the applicable policies of the Bank.
Employees must be sensitive to any activities, interests or relationships that might interfere with or even appear to interfere with his/her ability to act in the best interests of the Bank and its customers.
An employee must notify an authorized person or HR of any business relationship or proposed business transaction Bank may have with any company in which he/she or a related party has a direct or indirect interest or from which he/she or related party may drive a benefit. Even if related party or relative is employed, this may raise conflict of interest. Therefore, it should be avoided.
29. ACCESS TO BUSINESS INFORMATION Employees should also take steps to ensure that business
related paper work and documents are produced, copied properly filed and stored or if not needed, should be properly discarded to minimize the risk that an unauthorized person might obtain access to confidential information. Access to work areas and systems should also be properly controlled.
30. CUSTOMER CONFIDENTIALITY Employees of the Bank are strictly prohibited to disclose the
fact to the customer or any other quarter that a suspicious transaction or related information is being or has been reported to any authority, except if required by law.
31. PERSONAL INVESTMENTS If any personal investment that affects or appears to affect an
employee’s ability to make an unbiased business decision for Bank, should be avoided.
32. PERSONAL FINANCIAL NEEDS Bank employee and their families are encouraged to use the
Bank for their personal financial services needs.
33. MODIFICATIONS AND AMENDMENTS The Code of Conduct is subject to variances, modifications,
and amendments, from time to time through the resolution of the Board of Directors.
34. BREACH OF CODE OF CONDUCT In case of the breach of any of the above “Code of Conduct”,
the employee shall be liable to disciplinary action. This shall be without prejudice, to any other rights and remedies of the Bank.
Failure to observe these policies may result in a disciplinary action, up to and including immediate termination of employment or any other relationship with the Bank. Furthermore, violations of this Code may also be violations of the law and may result in civil or criminal penalties.
If an employee has any questions about these policies or would like to report violation of the Code of Conduct, he/she may approach Head of Compliance Division for further guidance and advice.
CODE OFCONDUCT(SUMMARIZED VERSION)

MECHANISM ADOPTED FOR BOARD’S OWN PERFORMANCE EVALUATION
Soneri Bank Limited has put in place a mechanism whereby Performance of overall Board is evaluated annually. Quantitative technique is used where scaled questionnaire is provided to each director to obtain their feedback. Assessment is carried out for the following categories:-
• Overall Board• Chairman of the Bank• CEO of the Bank• Sponsor Directors• Independent Directors• Individual Directors• Board Committees
Scale from 1 to 5 (1 being “Strongly disagree” and 5 being “Very strongly agree”) is used to rate the assessment criteria given under each section. Feedback so received from each director is then collated and analyzed to denote Performance in percentage terms against each of the above mentioned section.
Final result of the Annual Evaluation of the Board’s Own Performance is then presented to the Board of Directors which it accordingly reviews and identifies any issues, weaknesses or challenges along with how these can be adequately addressed. Accordingly, Board has reviewed its Performance Evaluation for the year 2016 in its 159th meeting convened on 09 December 2017.
This mechanism disclosure on the evaluation process adopted by the Soneri Bank Limited is being published for all the stakeholders in compliance of the BPRD Circular No.11 dated: 22 August 2016.

Soneri Bank Limited | Annual Report 2017 | 73
This statement is being presented to comply with the Code of Corporate Governance (CCG) contained in Regulation No. 5.19 of the Rule Book of Pakistan Stock Exchange Limited for the purpose of establishing a framework of good governance, whereby a listed company is managed in compliance with the best practices of corporate governance.
The Bank has applied the principles contained in the CCG in the following manner:
1. The Bank encourages representation of independent non-executive directors and directors representing minority interests on its Board of Directors. At present, the Board comprises of seven members, of whom six are non-executive directors including two independent directors and one is executive director. Further, the President and CEO is also deemed executive director:
The independent directors meet the criteria of independence under clause 5.19.1.(b) of the CCG.
2. The directors have confirmed that none of them is serving as a director on more than seven listed companies, including this Bank (excluding the listed subsidiaries of listed holding companies where applicable), except one director who has valid SECP exemption.
3. All the resident directors of the Bank are registered as taxpayers and none of them has defaulted in payment of any loan to a banking company, a DFI or an NBFC or, being a Broker of the stock exchange, has been declared as a defaulter by that stock exchange.
4. New Board was elected in Twenty-Fifth Annual General Meeting of the Shareholders held on 28 March 2017. Post elections, one casual vacancy occurred on the Board with resignation of Syed Ali Zafar. The Board filled the casual vacancy with the appointment of Mr. Jamil Hassan Hamdani in accordance with CCG requirements.
5. The Bank has prepared a “Code of Conduct” and has ensured that appropriate steps have been taken to disseminate it throughout the Bank along with its supporting policies and procedures.
6. The Board has developed a vision/ mission statement, overall corporate strategy and significant policies of the Bank. A complete record of particulars of significant policies along with the dates on which they were approved or amended has been maintained.
7. All the powers of the Board have been duly exercised and decisions on material transactions, including appointment and determination of remuneration and terms and conditions of employment of the CEO, other executive and non-executive directors, have been taken by the Board.
8. The meetings of the Board were presided over by the Chairman and the Board met at least once in every quarter. Written notices of the Board meetings, along with agenda and working papers, were circulated at least seven days before the meetings. The minutes of the meetings were appropriately recorded and circulated.
9. The Board remained fully compliant with the provision with regard to their training program. Two directors have received “Certificate of Director Education” from the Pakistan Institute of Corporate Governance (“PICG”). Four directors are exempt from training as mentioned in proviso to Regulation No. 5.19.7 of the Rule Book of Pakistan Stock Exchange Limited. Remaining one director was recently appointed against casual vacancy in May 2017.
STATEMENT OF COMPLIANCE WITH THE BEST PRACTICES OFCODE OF CORPORATE GOVERNANCE
Category
Independent Directors Mr. Inam Elahi Mr. Jamil Hassan Hamdani
Executive Directors Mr. Mohammad Aftab Manzoor (President & Chief Executive Officer) Mr. Amin A. Feerasta (Chief Operating Officer)
Non-Executive Directors Mr. Alauddin Feerasta Mr. Nooruddin Feerasta Mr. Muhammad Rashid Zahir Mr. Manzoor Ahmed (NIT Nominee)
Names

STATEMENT OF COMPLIANCE WITH THE BEST PRACTICES OFCODE OF CORPORATE GOVERNANCE9.1 Our directors have also attended various courses/workshops in recent years. In the year 2015, three directors have attended a week – long
course on “The Accelerated Certificate in Company Direction” a program of the Institute of Directors, UK arranged in Pakistan by the PICG. Further during the year 2016, three other directors have also participated in a three full days’ workshop on “Corporate Governance & Director Duties Excellence” held in Malaysia.
10. The Board has approved appointment of CFO, Company Secretary and Head of Internal Audit, including their remuneration and terms and conditions of employment. During the year, the Board filled up the casual vacancy with the appointment of new CFO on recommendation of Human Resource and Remuneration Committee (HRRC).
11. The directors’ report for this year has been prepared in compliance with the requirements of the CCG and fully describes the salient matters required to be disclosed.
12. The financial statements of the Bank were duly endorsed by the Chief Executive Officer and Chief Financial Officer before approval of the Board.
13. The directors, Chief Executive Officer and executives do not hold any interest in the shares of the Bank other than that disclosed in the pattern of shareholding.
14. The Bank has complied with all the corporate and financial reporting requirements of the CCG.
15. The Board has formed an audit committee. It comprises of four members, all are non-executive directors including two independent directors. The Chairman of the committee is also an independent director.
16. The meetings of the audit committee were held once every quarter prior to approval of interim and final results of the Bank as required by the CCG. The terms of reference of the committee have been formed and advised to the committee for compliance.
17. The Board has formed Human Resource and Remuneration Committee (HRRC). It comprises of three members, of whom two are independent directors and one is non-executive director. The Chairman of the committee is also a non-executive director.
18. The Board has set-up an effective internal audit function. The Head of Internal Audit and Audit team are suitably qualified and experienced for the purpose and are conversant with the policies and procedures of the Bank.
19. The statutory auditors of the Bank have confirmed that they have been given a satisfactory rating under the quality control review program of the Institute of Chartered Accountants of Pakistan, that they or any of the partners of the firm, their spouses and minor children do not hold shares of the Bank and that the firm and all its partners are in compliance with International Federation of Accountants (IFAC) guidelines on Code of Ethics as adopted by the Institute of Chartered Accountants of Pakistan.
20. The statutory auditors or the persons associated with them have not been appointed to provide other services except in accordance with the listing regulations and the auditors have confirmed that they have observed IFAC guidelines in this regard.
21. The ‘closed period’, prior to the announcement of interim/final results, and business decisions, which may materially affect the market price of Bank’s securities, was determined and intimated to directors, employees and the stock exchange.
22. Material/price sensitive information has been disseminated among all market participants at once through the stock exchange.
23. During the year, Board has conducted “Own Performance Evaluation” as per the CCG requirements and the result of which was also reviewed by the Board.
24. We confirm that all other material principles enshrined in the CCG have been fully complied with.
_______________________________ _______________________________MOHAMMAD AFTAB MANZOOR ALAUDDIN FEERASTAPresident & Chief Executive Officer Chairman
Karachi: 20 February 2018

Soneri Bank Limited | Annual Report 2017 | 75
AUDITORS’ REVIEW REPORT TO THE MEMBERS ONSTATEMENT OF COMPLIANCE WITH THE BESTPRACTICES OF CODE OF CORPORATE GOVERNANCE
We have reviewed the enclosed Statement of Compliance with the best practices contained in the Code of Corporate Governance (the Code)
prepared by the Board of Directors of Soneri Bank Limited (‘the Bank’) for the year ended December 31, 2017 to comply with the requirements of
Rule 5.19 of the Pakistan Stock Exchange Regulations issued by the Pakistan Stock Exchange Limited where the Bank is listed.
The responsibility for compliance with the Code is that of the Board of Directors of the Bank. Our responsibility is to review, to the extent where such
compliance can be objectively verified, whether the Statement of Compliance reflects the status of the Bank’s compliance with the provisions of the
Code and report if it does not and to highlight any non-compliance with the requirements of the Code. A review is limited primarily to inquiries of the
Bank’s personnel and review of various documents prepared by the Bank to comply with the Code.
As a part of our audit of the financial statements, we are required to obtain an understanding of the accounting and internal control systems sufficient
to plan the audit and develop an effective audit approach. We are not required to consider whether the Board of Directors’ statement on internal
control covers all risks and controls or to form an opinion on the effectiveness of such internal controls, the Bank’s corporate governance procedures
and risks.
The Code requires the Bank to place before the Audit Committee, and upon recommendation of the Audit Committee, place before the Board of
Directors for their review and approval its related party transactions distinguishing between transactions carried out on terms equivalent to those that
prevail in arm’s length transactions and transactions which are not executed at arm’s length price and recording proper justification for using such
alternate pricing mechanism. We are only required and have ensured compliance of this requirement to the extent of the approval of the related party
transactions by the Board of Directors upon recommendation of the Audit Committee. We have not carried out any procedures to determine whether
the related party transactions were undertaken at arm’s length price or not.
Based on our review, nothing has come to our attention which causes us to believe that the Statement of Compliance does not appropriately reflect
the Bank’s compliance, in all material respects, with the best practices contained in the Code as applicable to the Bank for the year ended December
31, 2017.
Chartered Accountants
Karachi: March 03, 2018
A. F. FERGUSON & CO., Chartered Accountants, a member firm of the PwC networkState Life Building No. 1-C, I.I. Chundrigar Road, P.O. Box 4716, Karachi-74000, PakistanTel: +92 (21) 32426682-6/32426711-5; Fax: +92(21) 32415007/32427938/32424740; <www.pwc.com/pk>
• KARACHI • LAHORE • ISLAMABAD

AUDITORS’ REPORTTO THE MEMBERS
We have audited the annexed statement of financial position of Soneri Bank Limited (the Bank) as at December 31, 2017 and the related profit and loss account, statement of comprehensive income, cash flow statement and statement of changes in equity together with the notes forming part thereof (here-in-after referred to as the ‘financial statements’) for the year then ended, in which are incorporated the unaudited certified returns from the branches except for thirty five branches which have been audited by us and we state that we have obtained all the information and explanations which, to the best of our knowledge and belief were necessary for the purposes of our audit.
It is the responsibility of the Bank’s Management to establish and maintain a system of internal control, and prepare and present the financial statements in conformity with approved accounting standards and the requirements of the Banking Companies Ordinance, 1962 (LVII of 1962), and the Companies Ordinance, 1984 (XLVII of 1984). Our responsibility is to express an opinion on these financial statements based on our audit.
We conducted our audit in accordance with the International Standards on Auditing as applicable in Pakistan. These standards require that we plan and perform the audit to obtain reasonable assurance about whether the financial statements are free of any material misstatement. An audit includes examining, on a test basis, evidence supporting amounts and disclosures in the financial statements. An audit also includes assessing accounting policies and significant estimates made by management, as well as, evaluating the overall presentation of the financial statements. We believe that our audit provides a reasonable basis for our opinion and after due verification, which in case of loans and advances covered more than sixty percent of the total loans and advances of the Bank, we report that:
(a) in our opinion, proper books of accounts have been kept by the Bank as required by the Companies Ordinance, 1984 (XLVII of 1984), and the returns referred to above received from the branches have been found adequate for the purposes of our audit;
(b) in our opinion:
(i) the statement of financial position and profit and loss account together with the notes thereon have been drawn up in conformity with the Banking Companies Ordinance, 1962 (LVII of 1962), and the Companies Ordinance, 1984 (XLVII of 1984), and are in agreement with the books of account and are further in accordance with accounting policies consistently applied;
(ii) the expenditure incurred during the year was for the purpose of the Bank’s business; and
(iii) the business conducted, investments made and the expenditure incurred during the year were in accordance with the objects of the Bank and the transactions of the Bank which have come to our notice have been within the powers of the Bank;
(c) in our opinion and to the best of our information and according to the explanations given to us the statement of financial position, profit and loss account, statement of comprehensive income, cash flow statement and statement of changes in equity together with the notes forming part thereof conform with approved accounting standards as applicable in Pakistan, and give the information required by the Banking Companies Ordinance, 1962 (LVII of 1962), and the Companies Ordinance, 1984 (XLVII of 1984), in the manner so required and give a true and fair view of the state of the Bank’s affairs as at December 31, 2017, and its true balance of the profit, its comprehensive income, its cash flows and changes in equity for the year then ended; and
(d) in our opinion Zakat deductible at source under the Zakat and Ushr Ordinance, 1980 (XVIII of 1980), was deducted by the Bank and deposited in the Central Zakat Fund established under section 7 of that Ordinance.
Chartered AccountantsEngagement Partner: Noman Abbas SheikhKarachi: March 03, 2018
A. F. FERGUSON & CO., Chartered Accountants, a member firm of the PwC networkState Life Building No. 1-C, I.I. Chundrigar Road, P.O. Box 4716, Karachi-74000, PakistanTel: +92 (21) 32426682-6/32426711-5; Fax: +92(21) 32415007/32427938/32424740; <www.pwc.com/pk>
• KARACHI • LAHORE • ISLAMABAD

Soneri Bank Limited | Annual Report 2017 | 77
STATEMENT OFFINANCIAL POSITIONAS AT 31 DECEMBER 2017
Note 2017 2016
------- (Rupees in ‘000) -------
ASSETS
Cash and balances with treasury banks 6 19,431,256 18,278,840
Balances with other banks 7 1,151,015 822,689
Lendings to financial institutions 8 6,544,152 5,536,577
Investments - net 9 117,428,516 117,883,960
Advances - net 10 164,292,915 125,305,765
Operating fixed assets 11 6,581,465 5,138,424
Deferred tax assets - net 18 - -
Other assets - net 12 6,704,657 5,554,451
322,133,976 278,520,706
LIABILITIES
Bills payable 14 4,895,447 4,163,509
Borrowings 15 64,584,236 38,905,078
Deposits and other accounts 16 227,348,454 209,925,453
Sub-ordinated loans 17 2,997,600 2,998,800
Liabilities against assets subject to finance lease - -
Deferred tax liabilities - net 18 935,711 1,137,530
Other liabilities 19 2,867,929 3,101,109
303,629,377 260,231,479
NET ASSETS 18,504,599 18,289,227
REPRESENTED BY
Share capital 20 11,024,636 11,024,636
Reserves 1,752,494 1,423,829
Unappropriated profit 3,664,580 3,496,305
16,441,710 15,944,770
Surplus on revaluation of assets - net of tax 21 2,062,889 2,344,457
18,504,599 18,289,227
CONTINGENCIES AND COMMITMENTS 22
The annexed notes 1 to 46 and Annexures I, II, III and IV form an integral part of these financial statements.
Mohammad Aftab ManzoorPresident & Chief Executive Officer
Alauddin FeerastaChairman
Inam ElahiDirector
Muhammad Rashid ZahirDirector
Mirza Zafar BaigChief Financial Officer

FOR THE YEAR ENDED 31 DECEMBER 2017
Note 2017 2016------- (Rupees in ‘000) -------
Mark-up / return / interest earned 23 18,504,526 17,524,408 Mark-up / return / interest expensed 24 (11,845,628) (10,680,270)Net mark-up / return / interest income 6,658,898 6,844,138
Provision against loans and advances - net 10.4.1 63,247 31,072 Provision / (reversal of provision) against diminution in the value of investments - net 9.3 3,168 (6,941)Bad debts written off directly - net 10.8 32 276
66,447 24,407 Net mark-up / return / interest income after provisions 6,592,451 6,819,731
Non mark-up / interest incomeFee, commission and brokerage income 1,392,650 1,286,185 Dividend income 240,327 192,429 Income from dealing in foreign currencies - net 25 436,991 290,364 Gain on sale of securities - net 26 1,158,244 945,150 Unrealised gain / (loss) on revaluation of investments classified as ‘held for trading’ - net 34 (6,484)Other income 27 41,052 28,593 Total non-mark-up / interest income 3,269,298 2,736,237
9,861,749 9,555,968 Non mark-up / interest expenses Administrative expenses 28 6,942,982 6,388,894 Provision against other assets - net 12.4 - 30 Other charges 29 87,797 89,705 Total non-mark-up / interest expenses 7,030,779 6,478,629
2,830,970 3,077,339 Extraordinary / unusual items - - Profit before taxation 2,830,970 3,077,339
Taxation - Current 30 1,016,967 1,099,377 - Prior years 30 157,743 161,371 - Deferred 30 12,934 (62,253)
1,187,644 1,198,495
Profit after taxation 1,643,326 1,878,844
------- (Rupees) -------Basic and diluted earnings per share 31 1.4906 1.7042
The annexed notes 1 to 46 and Annexures I, II, III and IV form an integral part of these financial statements.
PROFIT & LOSSACCOUNT
Mohammad Aftab ManzoorPresident & Chief Executive Officer
Alauddin FeerastaChairman
Inam ElahiDirector
Muhammad Rashid ZahirDirector
Mirza Zafar BaigChief Financial Officer

Soneri Bank Limited | Annual Report 2017 | 79
STATEMENT OFCOMPREHENSIVE INCOMEFOR THE YEAR ENDED 31 DECEMBER 2017
Note 2017 2016
------- (Rupees in ‘000) -------
Profit after taxation for the year 1,643,326 1,878,844
Other comprehensive income:
Item that will not be reclassified to profit and loss account
Components of comprehensive income reflected in equity
- Remeasurements of defined benefit plan 9,229 (18,537)
- Tax on remeasurements of defined benefit plan (3,230) 6,488
5,999 (12,049)
Comprehensive income transferred to equity 1,649,325 1,866,795
Items that may be reclassified subsequently to profit and loss account
Components of comprehensive income not reflected in equity
- Net change in value of "available-for-sale" securities (1,961,322) (493,705)
- Net deferred tax asset on changes in value of "available-for-sale" securities 686,463 172,797
(i) (1,274,859) (320,908)
Surplus on revaluation of operating fixed assets (ii) - -
Total comprehensive income 374,466 1,545,887
(i) Surplus / (deficit) on revaluation of “available-for-sale securities - net of tax” has been shown in the Statement of Comprehensive Income in order to comply with the revised “Prudential Regulations for Corporate / Commercial Banking” issued by the State Bank of Pakistan.
(ii) Surplus on revaluation of operating fixed assets net of tax is presented under the head “Surplus / (deficit) on revaluation of assets” below equity in accordance with the requirements of section 235 of the Companies Ordinance, 1984.
The annexed notes 1 to 46 and Annexures I, II, III and IV form an integral part of these financial statements.
Mohammad Aftab ManzoorPresident & Chief Executive Officer
Alauddin FeerastaChairman
Inam ElahiDirector
Muhammad Rashid ZahirDirector
Mirza Zafar BaigChief Financial Officer

CASH FLOWSTATEMENTFOR THE YEAR ENDED 31 DECEMBER 2017
Note 2017 2016------- (Rupees in ‘000) -------
CASH FLOWS FROM OPERATING ACTIVITIESProfit before taxation 2,830,970 3,077,339 Less: Dividend income 240,327 192,429
2,590,643 2,884,910 Adjustments:
Depreciation on operating fixed assets 11.2 566,783 575,700 Depreciation on ijarah assets 10.2 82,977 97,969 Amortisation of intangible assets 11.3 120,787 89,382 Operating fixed assets written off directly 29 27,649 24,871 Provision / (reversal of provision) against diminution in the value of investments - net 9.3 3,168 (6,941)Unrealised (gain) / loss on revaluation of investments classified as held-for-trading - net (34) 6,484 Provision against non-performing loans and advances 10.4.1 63,247 31,072 Provision against other assets 12.4 - 30 Gain on sale of operating fixed assets 27 (17,897) (11,565)Gain on sale of non-banking assets - (600)Bad debts written off directly 10.8 32 276
846,712 806,678 3,437,355 3,691,588
(Increase) / decrease in operating assetsLendings to financial institutions (1,007,575) (2,442,639)Held-for-trading securities (10,525,132) 790,865 Advances - net (39,133,407) (13,433,330)Others assets (excluding advance taxation) (645,993) 1,087,957
(51,312,107) (13,997,147)Increase / (decrease) in operating liabilities
Bills payable 731,938 1,086,443 Borrowings 25,539,709 (1,102,159)Deposits and other accounts 17,423,001 25,078,318 Other liabilities (223,951) 149,551
43,470,697 25,212,153 (4,404,055) 14,906,594
Income tax paid (1,525,730) (1,831,964)Net cash (used in) / generated from operating activities (5,929,785) 13,074,630
CASH FLOWS FROM INVESTING ACTIVITIESNet investments in available-for-sale securities 11,197,279 (11,740,670)Net investments in held-to-maturity securities (2,181,159) 1,418,709 Dividends received 228,166 194,129 Purchase of operating fixed assets (616,943) (1,004,102)Sale proceeds on disposal of non-banking assets - 18,000 Sale proceeds on disposal of operating fixed assets 23,014 35,526 Net cash generated from / (used in) investing activities 8,650,357 (11,078,408)
CASH FLOWS FROM FINANCING ACTIVITIESPayments for sub-ordinated loans 32 (1,200) (1,200)Dividends paid (1,378,079) (1,378,079)Net cash used in financing activities (1,379,279) (1,379,279)
Increase in cash and cash equivalents 1,341,293 616,943 Cash and cash equivalents at the beginning of the year 18,963,729 18,346,786 Cash and cash equivalents at the end of the year 33 20,305,022 18,963,729
The annexed notes 1 to 46 and Annexures I, II, III and IV form an integral part of these financial statements.
Mohammad Aftab ManzoorPresident & Chief Executive Officer
Alauddin FeerastaChairman
Inam ElahiDirector
Muhammad Rashid ZahirDirector
Mirza Zafar BaigChief Financial Officer

Soneri Bank Limited | Annual Report 2017 | 81
STATEMENT OFCHANGES IN EQUITYFOR THE YEAR ENDED 31 DECEMBER 2017
Particulars Share capital
Capital reservesGeneral reserve
Unappro-priated
profit (b)TotalDiscount
on issueof shares
Share premium
Statutory reserve (a)
---------------------------------- (Rupees in ‘000) --------------------------------------------
Balance as at 1 January 2016 11,024,636 (1,001,361) 1,405 1,048,060 - 4,263,217 15,335,957
Discount on issue of shares adjusted against share premium / unappropriated profit - 1,001,361 (1,405) - - (999,956) -
Profit after taxation for the year - - - - - 1,878,844 1,878,844
Other comprehensive income for the year - Remeasurements of defined benefit plan - - - - - (18,537) (18,537) - Tax on remeasurements of defined benefit plan - - - - - 6,488 6,488
- - - - - (12,049) (12,049)
Transactions with owners recognised directly in equity
Final cash dividend for the year ended31 December 2015 at Rs.1.25 per share - - - - - (1,378,079) (1,378,079)
Transfer from surplus on revaluation of fixedassets to unappropriated profit - net of tax (note 21) - - - - - 120,097 120,097
Transfer from unappropriated profit to statutory reserve - - - 375,769 - (375,769) -
Balance as at 31 December 2016 11,024,636 - - 1,423,829 - 3,496,305 15,944,770
Profit after taxation for the year - - - - - 1,643,326 1,643,326
Other comprehensive income for the year - Remeasurements of defined benefit plan - - - - - 9,229 9,229 - Tax on remeasurements of defined benefit plan - - - - - (3,230) (3,230)
- - - - - 5,999 5,999
Transactions with owners recognised directly in equity
Final cash dividend for the year ended31 December 2016 at Rs 1.25 per share - - - - - (1,378,079) (1,378,079)
Transfer from surplus on revaluation of fixedassets to unappropriated profit - net of tax (note 21) - - - - - 225,694 225,694
Transfer from unappropriated profit to statutory reserve - - - 328,665 - (328,665) -
Balance as at 31 December 2017 11,024,636 - - 1,752,494 - 3,664,580 16,441,710
(a) This represents reserve created under section 21(i)(a) of the Banking Companies Ordinance, 1962.
(b) As explained in note 10.5 to these financial statements, unappropriated profit includes an amount of Rs. 829.847 million net of tax as at 31 December 2017 (31 December 2016: Rs. 716.711 million) representing additional profit arising from availing forced sales value benefit for determining provisioning requirement which is not available for distribution either as cash or stock dividend to shareholders and bonus to employees.
The annexed notes 1 to 46 and Annexures I, II, III and IV form an integral part of these financial statements.
Mohammad Aftab ManzoorPresident & Chief Executive Officer
Alauddin FeerastaChairman
Inam ElahiDirector
Muhammad Rashid ZahirDirector
Mirza Zafar BaigChief Financial Officer

NOTES TO AND FORMING PARTOF THE FINANCIAL STATEMENTSFOR THE YEAR ENDED 31 DECEMBER 2017
1 STATUS AND NATURE OF BUSINESS
Soneri Bank Limited (“the Bank”) was incorporated in Pakistan on 28 September 1991 as a public limited company under the repealed Companies Ordinance, 1984 (now Companies Act, 2017). Its registered office is situated at Rupali House 241-242, Upper Mall Scheme, Anand Road, Lahore, Punjab and its shares are quoted on Pakistan Stock Exchange Limited. The Bank is engaged in banking services as described in the Banking Companies Ordinance, 1962 and operates with 290 branches including 19 Islamic banking branches (2016: 288 branches including 16 Islamic banking branches) in Pakistan.
Based on the financial statements of the Bank for the year ended 31 December 2016 the Pakistan Credit Rating Agency Limited (PACRA) has maintained the Bank’s long-term rating as AA- (31 December 2015: AA-) and short-term rating as A1+ (31 December 2015: A1+).
2 BASIS OF PRESENTATION
2.1 In accordance with the directives of the Federal Government regarding the shifting of the banking system to Islamic modes, the State Bank of Pakistan has issued various circulars from time to time. Permissible forms of trade-related modes of financing include purchase of goods by banks from their customers and immediate resale to them at appropriate mark-up in price on deferred payment basis. The purchases and sales arising under these arrangements are not reflected in these financial statements as such but are restricted to the amount of facility actually utilised and appropriate portion of mark-up thereon.
2.2 The financial results of the Islamic banking branches of the Bank have been consolidated in these financial statements for reporting purposes, after eliminating material intra branch transactions / balances. The financial results of the Islamic banking branches are disclosed in Annexure II to these financial statements.
3 STATEMENT OF COMPLIANCE
3.1 These financial statements have been prepared in accordance with the approved accounting standards as applicable in Pakistan. The approved accounting standards comprise of such International Financial Reporting Standards (IFRSs) issued by the International Accounting Standards Board and Islamic Financial Accounting Standards (IFASs) issued by the Institute of Chartered Accountants of Pakistan, as are notified under the Companies Ordinance, 1984, provisions of and the directives issued under the Companies Ordinance, 1984, the Banking Companies Ordinance, 1962, and the directives issued by the Securities and Exchange Commission of Pakistan (SECP) and the State Bank of Pakistan (SBP). Wherever the requirements of provisions and directives issued under the Companies Ordinance, 1984, the Banking Companies Ordinance, 1962, the IFASs notified under the Companies Ordinances, 1984 and the directives issued by the SECP and the SBP differ from the requirements of the IFRSs, the provisions and the directives issued under the Companies Ordinance, 1984, the Banking Companies Ordinance, 1962, IFASs notified under the Companies Ordinance, 1984 and the directives issued by SECP and SBP prevail.
3.2 The Companies Ordinance, 1984 has been repealed after the enactment of the Companies Act, 2017. However, as allowed by the SECP vide its circular No. 23 dated 04 October 2017, these financial statements have been prepared in accordance with the provisions of the repealed Companies Ordinance, 1984.
3.3 The SBP has deferred the applicability of International Accounting Standard (IAS) 39, ‘Financial Instruments: Recognition and Measurement’ and International Accounting Standard (IAS) 40, ‘Investment Property’ for Banking Companies through BSD Circular No. 10 dated: 26 August 2002 till further instructions. In addition, the Securities and Exchange Commission of Pakistan has deferred the applicability of International Financial Reporting Standard 7, Financial Instruments: Disclosures (IFRS 7) vide SRO 411(I) / 2008 dated: 28 April 2008 till further orders. Accordingly, the requirements of these standards have not been considered in the preparation of these financial statements. However, investments have been classified and valued in accordance with the requirements prescribed by SBP through various circulars.
3.4 The SBP vide its BSD Circular No. 07 dated: 20 April 2010 has clarified that for the purpose of preparation of financial statements in accordance with International Accounting Standard - 1 (Revised), ‘Presentation of Financial Statements’, two statement approach shall be adopted i.e. separate ‘Profit and Loss Account’ and ‘Statement of Comprehensive Income’ shall be presented, and Balance Sheet shall be renamed as ‘Statement of Financial Position’. Furthermore, the surplus / deficit on revaluation of available for sale (AFS) securities shall be included in the ‘Statement of Comprehensive Income’. However, it should continue to be shown separately in the Statement of Financial Position below equity. Accordingly, the above requirements have been adopted in the preparation of these financial statements.
3.5 The SBP vide its BPRD Circular No. 04 dated: 25 February 2015 has clarified that the reporting requirements of IFAS-3 for Islamic Banking Institutions (IBIs) relating to annual, half yearly and quarterly financial statements would be notified by SBP through issuance of specific instructions and uniform disclosure formats in consultation with IBIs. These reporting requirements have not been ratified to date. Accordingly, the disclosures requirements under IFAS 3 have not been considered in these financial statements.

Soneri Bank Limited | Annual Report 2017 | 83
3.6 Standards, interpretations and amendments to published approved accounting standards that are effective in the current year:
3.6.1 The Bank has applied the following amendments for the first time for their accounting period commencing 01 January 2017:
- Disclosure initiative – amendments to IAS 7. The amendments to IAS 7 require disclosure of changes in liabilities arising from financing activities. This has been disclosed in note 32 to the financial statements.
In addition to the above there are certain other new standards, amendments and interpretations that are mandatory for the Bank’s accounting periods beginning on or after 01 January 2017 but are considered not to be relevant or do not have any significant effect on the Bank’s operations and are, therefore, not disclosed in these financial statements.
3.7 Standards, interpretations and amendments to published approved accounting standards that are not yet effective:
3.7.1 The following revised standards, amendments and interpretations with respect to the approved accounting standards would be effective from the dates mentioned below against the respective standard, amendments or interpretation:
Standard, Interpretations or Amendments Effective date (accounting periods beginning on or after)
- IFRS 9 - Financial Instruments 01 July, 2018- IFRS 15 - Revenue from contracts 01 July, 2018- IFRS 16 - Leases 01 January, 2019
The management is in the process of assessing the impact of these standards on the financial statements of the Bank.
3.7.2 The SBP vide its circular 2 of 2018 dated: 25 January, 2018 has specified the new reporting format for financial statements of banking companies. The new format has revised the disclosure requirements and will become applicable for the annual financial statements of the Bank for the year ending 31 December 2018.
3.7.3 There are certain new and amended standards and interpretations that are mandatory for the Bank’s accounting periods beginning on or after 01 January 2018 but are considered not to be relevant or will not have any significant effect on the Bank’s operations and are therefore not detailed in these financial statements.
4 BASIS OF MEASUREMENT
4.1 Accounting convention
These financial statements have been prepared under the historical cost convention, except that certain operating fixed assets are stated at revalued amounts, certain investments and commitments in respect of forward exchange contracts have been marked to market and are carried at fair values and staff retirement benefits are carried at present value.
4.2 Functional and presentation currency
Items included in the financial statements are measured using the currency of the primary economic environment in which the Bank operates. These financial statements are presented in Pakistani Rupee which is the Bank’s functional and presentation currency.
4.3 Critical accounting estimates and judgements
The preparation of the financial statements in conformity with the approved accounting standards as applicable in Pakistan requires the management to make judgements, estimates and assumptions that affect the reported amounts of assets and liabilities and income and expenses. It also requires management to exercise judgement in application of its accounting policies. The estimates and associated assumptions are based on historical experience and various other factors that are believed to be reasonable under the circumstances. These estimates and assumptions are reviewed on an ongoing basis. Revisions to accounting estimates are recognised in the period in which the estimate is revised if the revision affects only that period, or in the period of revision and future periods if the revision affects both current and future periods.
4.4 Significant accounting estimates
Significant accounting estimate and areas where judgements were made by the management in the application of accounting policies are as follows:
i) classification and provisioning against investments (notes 5.3 and 9);ii) classification and provisioning against loans and advances (notes 5.4 and 10);iii) current and deferred taxation (notes 5.7, 18, 22.8.1, 22.8.3 and 30);iv) accounting for defined benefit plan (notes 5.9 and 35);v) depreciation, amortisation methods, useful lives and revaluation of operating fixed assets notes 5.5 and 11);vi) impairment of assets (note 5.6); andvii) workers' welfare fund (notes 19.1 and 29).
5 SUMMARY OF SIGNIFICANT ACCOUNTING POLICIES
The significant accounting policies applied in the preparation of these financial statements are set out below. These policies have been consistently applied to all the years presented.

5.1 Cash and cash equivalents
Cash and cash equivalents for the purpose of cash flow statement represent cash in hand and balances with treasury banks, balances with other banks in current and deposit accounts, national prize bonds, if any, and overdrawn nostro accounts.
5.2 Lendings to / borrowings from financial and other institutions
The Bank enters into repurchase agreements (repo) and reverse repurchase agreements (reverse repo) at contracted rates for a specified period of time. These are recorded as under:
(a) Sale of securities under repurchase agreements
Securities sold subject to a repurchase agreement (repo) are retained in the financial statements as investments and the counter party liability is included in borrowings. The differential in sale and repurchase value is recognised over the period of the contract and recorded as an expense.
(b) Purchase of securities under resale agreements
Securities purchased under agreement to resell (reverse repo) are included in lendings to financial institutions. The underlying security is not recognised as a separate asset in the financial statements. The difference between the contracted price and resale price is recognised over the period of the contract and recorded as income.
(c) Lending under margin trading system
Securities purchased under margin financing are recorded as “lendings to financial and other institutions” at the fair value of the consideration given. All margin financing transactions are accounted for on the transaction date. Income on margin financing is accrued over the period of the contract.
(d) Borrowings
These are recorded at the proceeds received. Mark-up on such borrowings is charged on a time proportion basis to the profit and loss account over the period of borrowings.
(e) Bai Muajjal
Bai Muajjal transactions with the SBP is classified under “investments” and with other financial institutions is classified under “lendings to financial institutions”. In Bai Muajjal, the Bank sells shariah compliant instruments on credit to customers. The credit price is agreed at the time of sale and such proceeds are received at the end of the credit period. The difference between the sale and the credit price is recognised over the credit period and recorded as income.
5.3 Investments
The Bank classifies its investments as follows:
(a) Held for trading
These represent securities, which are either acquired for the purpose of generating profit from short-term fluctuations in market prices, interest rates or dealer’s margin or are securities included in the portfolio in which a pattern of short-term profit making exists.
(b) Held to maturity
These are securities with fixed or determinable payments and maturity, which the Bank has the positive intent and ability to hold till maturity.
(c) Available for sale
These are investments, other than those in subsidiaries and associates, if any, that do not fall under the held for trading or held to maturity categories.
Investments other than those categorised as held for trading are initially recognised at fair value which includes transaction costs associated with the investment. Investments classified as held for trading are initially recognised at fair value, and transaction costs are expensed in the profit and loss account.
All purchases and sales of investments that require delivery within the time frame established by regulations or market conventions are recognised at the trade date. Trade date is the date on which the Bank commits to purchase or sell the investment.
Premium or discount on acquisition of investments is amortised through the profit and loss account over the remaining period till maturity using effective interest method.

Soneri Bank Limited | Annual Report 2017 | 85
In accordance with the requirements of the State Bank of Pakistan, quoted securities, other than those classified as ‘held to maturity’, are subsequently remeasured at market values. Surplus / (deficit) arising on revaluation of quoted securities classified as ‘available for sale’, is taken to a separate account shown in the Statement of Financial Position below equity. Surplus / (deficit) arising on revaluation of quoted securities which are classified as ‘held for trading’, is taken to the profit and loss account. Cost of investment is determined on a weighted average basis.
In accordance with the BSD circular No. 14 dated: 24 September 2004 issued by SBP, investments classified as ‘held to maturity’ are carried at amortised cost less impairment, if any.
Unquoted equity securities, excluding investments in subsidiaries and associates, if any, are valued at the lower of cost and break-up value. Break-up value of unquoted equity securities is calculated with reference to the net assets of the investee company as per the latest available audited financial statements.
Impairment loss in respect of investments categorised as available for sale (except term finance certificates and sukuk) and held to maturity is recognised based on management’s assessment of objective evidence of impairment as a result of one or more events that may have an impact on the estimated future cash flows of the investments. A significant or prolonged decline in the fair value of a listed equity investment below its cost is also considered an objective evidence of impairment. Provision for diminution in the value of term finance certificates and sukuk is made as per the requirements of the Prudential Regulations issued by SBP. In case of impairment of available for sale securities, the cumulative loss that has been recognised directly in surplus / deficit on revaluation of securities on the statement of financial position below equity is removed therefrom and recognised in the profit and loss account. For investments classified as held to maturity, the impairment loss is recognised in the profit and loss account.
Gain / loss on sale of investments is credited / charged to the profit and loss account.
5.4 Advances
Advances are stated net of specific and general provisions. Specific provision for advances are made in accordance with the requirements of the Prudential Regulations and other directives issued by SBP and charged to the profit and loss account. General provision against consumer and small enterprises financings portfolio is maintained as per the requirements of the Prudential Regulations issued by SBP. Advances are written off when there is no realistic prospect of recovery. In addition to conventional products, the Bank also offers various Islamic financing products which mainly include the following:
MurabahaMurabaha financings are reflected as receivables at the invoiced amount. Actual sales and purchases are not reflected, as the goods are purchased by the customer as an agent of the Bank and all documents relating to purchase are in the customer’s name. However, the profit on that sale revenue not due for payment is deferred and is recognised on a time proportion basis. Funds disbursed under Murabaha financing arrangements for purchase of goods are recorded as “Advance Against Murabaha” in advances.
SalamSalam financings are reflected as receivables at the invoiced amount. Profit not due for payment is deferred and is recognised on a time proportion basis. Funds disbursed under Salam financing arrangements for purchase of goods are recorded as “Advance Against Salam” in advances.
Diminishing MusharakaIn Diminishing Musharaka based financing, the Bank enters into a Musharaka based on Shirkat-ul-milk for financing an agreed share of fixed asset (e.g. house, land, plant or machinery) with its customers and enters into periodic rental payment agreement for the utilisation of the Bank’s Musharaka share by the customer.
Ijarah assetsIjarah assets are stated at cost less accumulated depreciation and impairment losses, if any. Depreciation is charged from the date of recognition of ijarah assets on a straight line basis over the period of Ijarah. Impairment of Ijarah assets is determined on the same basis as that of operating fixed assets.
Ijarah income is recognised in income on an accrual basis as and when the rental becomes due. Impairment of Ijarah rental is determined in accordance with the requirements of the Prudential Regulations and other directives issued by SBP and charged to the profit and loss account.
5.5 Operating fixed assets and depreciation
(a) Tangible assets - owned
Operating fixed assets (other than land and buildings) are stated at cost less accumulated depreciation and impairment losses, if any. Buildings are carried at revalued amount less any accumulated depreciation and subsequent impairment losses, if any. Land is carried at revalued amount less subsequent impairment losses, if any.
Depreciation on all operating fixed assets (excluding land which is not depreciated) is charged using the straight line method in accordance with the rates specified in note 11.2 to the financial statements after taking into account residual values, if any. The residual values and useful lives are reviewed and adjusted, if appropriate, at each reporting date. Depreciation on additions is charged from the month the assets are available for use while in the case of assets disposed of, it is charged upto the month of disposal.
Subsequent costs are included in the asset’s carrying amount or recognised as a separate asset, as appropriate, only when it is probable that future economic benefits associated with the item will flow to the Bank and the cost of the item can be measured reliably. All other repair and maintenance expenditure are charged to the profit and loss account as and when incurred.

Land and buildings are revalued by professionally qualified valuers with sufficient regularity to ensure that the net carrying amount does not differ materially from their fair value.
Surplus arising on revaluation is credited to the surplus on revaluation of fixed assets account. Deficit arising on subsequent revaluation of fixed assets is adjusted against the balance in the above mentioned surplus account as allowed under the provisions of the Companies Ordinance, 1984. The surplus on revaluation of fixed assets to the extent of incremental depreciation charged on the related assets is transferred to unappropriated profit.
An asset’s carrying amount is written down immediately to its recoverable amount if the asset’s carrying amount is greater than its estimated recoverable amount.
Gains and losses on disposal of fixed assets are credited / charged to the profit and loss account currently, except that the related surplus on revaluation of fixed assets (net of deferred taxation) is transferred directly to unappropriated profit.
(b) Tangible assets - leased
Leases are classified as finance lease wherever the terms of the lease transfer substantially all the risks and rewards of ownership to the lessee. All other leases are classified as operating lease. Lease payments, if any, under operating lease are charged to income on a straight line basis over the lease term.
Assets held under finance lease, if any, are stated at lower of fair value or present value of minimum lease payments at inception less accumulated depreciation. The outstanding obligations under the lease agreements are shown as a liability net of finance charges allocable to future periods.
The finance charges are allocated to accounting periods in a manner so as to provide a constant periodic rate of return on the outstanding liability.
Depreciation on assets held under finance lease is charged in a manner consistent with that for depreciable assets which are owned by the Bank.
(c) Intangible assets
Intangible assets having a definite useful lives are stated at cost less accumulated amortisation and impairment losses, if any. Intangible assets are amortised from the month, when these assets are available for use, using the straight line method, whereby the cost of the intangible asset is amortised on the basis of the estimated useful life over which economic benefits are expected to flow to the Bank. The residual values, useful lives and amortisation method is reviewed and adjusted, if appropriate, at each reporting date.
Subsequent costs are included in the asset’s carrying amounts or recognised as a separate asset, as appropriate, only when it is probable that future economic benefits associated with the item will flow to the Bank and the cost of the item can be measured reliably.
Intangible assets having an indefinite useful life are stated at acquisition cost less accumulated impairment losses, if any.
Gains and losses on disposals, if any, are taken to the profit and loss account in the period in which they arise.
(d) Capital work in progress
Capital work-in-progress is stated at cost less accumulated impairment losses, if any. All expenditure connected with specific assets incurred during installation and construction / development period are carried under this head. These are transferred to specific assets as and when assets become available for use.
5.6 Impairment
The carrying amount of assets are reviewed at each reporting date to determine whether there is any indication of impairment of any asset or group of assets. If any such indication exists, the recoverable amount of such assets is estimated and impairment losses are recognised immediately in the financial statements. The resulting impairment loss is taken to the profit and loss account except for impairment loss on revalued assets, which is adjusted against related revaluation surplus to the extent that the impairment loss does not exceed the surplus on revaluation of that asset.
An impairment loss is reversed (except for impairment loss relating to goodwill), if there has been a change in the estimate used to determine the recoverable amount. Such reversals are only made to the extent that the asset’s carrying amount does not exceed the amount that would have been determined if no impairment loss had been recognised.
5.7 Taxation
Income tax expense comprises of current and deferred tax. Income tax expense is recognised in the profit and loss account except to the extent that it relates to items recognised directly in equity or below equity, in which case it is recognised in equity or below equity.
Current
Provision for current taxation is based on the taxable income at the current rates of taxation after taking into account available tax credit and rebates. The charge for current tax also includes adjustments, where considered necessary relating to prior years, which arises from assessments / developments made during the year.

Soneri Bank Limited | Annual Report 2017 | 87
Deferred
Deferred tax is recognised using the balance sheet liability method on all temporary differences between the carrying amounts of assets and liabilities used for financial reporting purposes and amounts used for taxation purposes. Deferred tax is calculated at the rates that are expected to apply to the period when the differences are expected to reverse based on tax rates that have been enacted or substantively enacted by the reporting date.
A deferred tax asset is recognised only to the extent that it is probable that future taxable profits will be available against which the asset can be utilised.
The carrying amount of deferred tax asset is reviewed at each reporting date and reduced to the extent that it is no longer probable that sufficient taxable profits will be available to allow all or part of the deferred tax asset to be utilised.
The Bank also recognises deferred tax asset / liability on deficit / surplus on revaluation of operating fixed assets and securities which is adjusted against the related deficit / surplus in accordance with the requirements of International Accounting Standard (IAS) 12, ‘Income Taxes’.
5.8 Provisions and contingent assets and liabilities
Provisions are recognised when the Bank has a legal or constructive obligation as a result of past events, it is probable that an outflow of resources will be required to settle the obligation and a reliable estimate of the amount can be made. Provisions are reviewed at each reporting date and are adjusted to reflect the current best estimate.
Contingent assets are not recognised and are also not disclosed unless an inflow of economic benefits is probable. Contingent liabilities are not recognised but disclosed unless the probability of an outflow of resources embodying economic benefits are remote.
5.9 Staff retirement benefits
(a) Defined benefit plan
The Bank operates an approved funded gratuity scheme for its permanent employees. The liability recognised in the statement of financial position in respect of defined benefit gratuity scheme, is the present value of the defined benefit obligation at the statement of financial position date less the fair value of plan assets. Contributions to the fund are made on the basis of actuarial recommendations using the Projected Unit Credit Method. Valuations are conducted by an independent actuary with the last valuation conducted on 31 December 2017.
Amounts arising as a result of “remeasurements”, representing the actuarial gains and losses and the difference between the actual investment returns and the return implied by the net interest cost are recognised in the Statement of Financial Position immediately, with a charge or credit to “Other Comprehensive Income” in the periods in which they occur.
Gratuity is payable to staff on completion of the prescribed qualifying period of service under the scheme.
(b) Defined contribution plan
The Bank operates an approved funded provident fund scheme for all its permanent employees. Equal monthly contributions are made, both by the Bank and its employees, to the Fund at the rate of 8.33% of basic salaries of the employees.
5.10 Borrowings / deposits and their cost
Borrowings / deposits are recorded at the proceeds received. Borrowing / deposit costs are recognised as an expense in the period in which these are incurred to the extent that they are not directly attributable to the acquisition of or construction of qualifying assets. Borrowing costs that are directly attributable to the acquisition, construction or production of a qualifying asset (one that takes a substantial period of time to get ready for use or sale) are capitalised as part of the cost of the asset.
5.11 Sub-ordinated loans
Sub-ordinated loans are initially recorded at the amount of proceeds received. Mark-up on sub-ordinated loans is charged to the profit and loss account over the period on an accrual basis and is recognised separately as part of other liabilities.
5.12 Revenue recognition
- Mark-up income / interest on advances and return on investments are recognised on a time proportion basis using the effective yield on the arrangement / instrument except that mark-up / return on non-performing advances and investments is recognised on receipt basis. Interest / return / mark-up on rescheduled / restructured advances and investments is recognised as permitted by SBP except where, in the opinion of the management, it would not be prudent to do so.
- Fee, commission and brokerage income is recognised upon performance of services.
- Dividend income from investments is recognised when the Bank’s right to receive the dividend is established.
- Premium or discount on acquisition of investments is amortised using effective yield method and taken to profit and loss account.

- Gains and losses on disposal of investments and certain operating fixed assets are dealt with through the profit and loss account in the year in which they arise (also refer note 5.5).
- Profits on Bai Muajjal lendings are recognised on a straight line basis.
5.13 Foreign currencies
(a) Foreign currency transactions
Foreign currency transactions are translated into rupees at the exchange rates prevailing on the date of the transaction. Monetary assets and liabilities in the foreign currencies are expressed in rupee terms at the exchange rates ruling on the reporting date. Outstanding forward foreign exchange contracts and foreign bills purchased are valued at the forward rates applicable to the respective maturities. Exchange gains and losses are included in the profit and loss account.
(b) Translation gains and losses
Translation gains and losses are included in the profit and loss account.
5.14 Commitments
Commitments for outstanding forward foreign exchange contracts are disclosed in the financial statements at the contracted rates. Contingent liabilities / commitments for letters of credit and letters of guarantee denominated in foreign currencies are expressed in rupee terms at the rates of exchange ruling on the reporting date.
5.15 Provision for guarantee claims and other off balance sheet obligations
Provision for guarantee claims and other off-balance sheet obligations are recognised when intimated and where reasonable certainty exists for the Bank to settle the obligation. Charge to profit and loss account is stated net of expected recoveries.
5.16 Acceptances
Acceptances comprise undertakings by the Bank to pay bills of exchange drawn on customers. The Bank expects most acceptances to be simultaneously settled with the reimbursement from the customers. Acceptances are accounted for as off-balance sheet transactions and are disclosed under “Contingencies and Commitments”.
5.17 Financial instruments
5.17.1 Financial assets and liabilities
Financial instruments carried on the balance sheet include cash and balances with treasury banks, balances with other banks, lendings to financial and other institutions, investments, advances, certain receivables, bills payable, borrowings from financial institutions, deposits and other accounts, sub-ordinated loans and other payables. The particular recognition methods adopted for significant financial assets and financial liabilities are disclosed in the individual policy statements associated with them.
5.17.2 Derivative financial instruments
Derivative financial instruments, if any, are initially recognised at fair value on the date on which a derivative contract is entered into and are, subsequently, remeasured at fair value using appropriate valuation techniques. All derivative financial instruments are carried as assets when fair value is positive and liability when fair value is negative. Any change in the fair value of derivative financial instruments is taken to the profit and loss account.
5.17.3 Off-setting
Financial assets and financial liabilities are off-set and the net amount is reported in the financial statements when there exists a legally enforceable right to set-off and the Bank intends either to settle on a net basis or to realise the assets and to settle the liabilities simultaneously. Income and expense items of such assets and liabilities are also off-set and the net amount is reported in the financial statements.
5.18 Basic and diluted earnings per share
The Bank presents basic and diluted earnings per share (EPS) for its shareholders. Basic EPS is calculated by dividing the profit or loss attributable to ordinary shareholders of the Bank by the weighted average number of ordinary shares outstanding during the year. Diluted EPS is determined by adjusting the profit or loss attributable to ordinary shareholders and the weighted average number of ordinary shares outstanding for the effects of all dilutive potential ordinary shares, if any.
5.19 Dividend and appropriation to reserves
Dividend and appropriation to reserves after the reporting date, except appropriations which are required by law are recognised as liability in the Bank’s financial statements in the year in which these are approved.

Soneri Bank Limited | Annual Report 2017 | 89
5.20 Segment reporting
A segment is a distinguishable component of the Bank that is engaged either in providing product or services (business segment), or in providing products or services within a particular economic environment (geographical segment), which is subject to risks and rewards that are different from those of other segments. Segments are reported as per the Bank’s functional structure and are as follows:
(a) Business segments
(i) Corporate finance
Corporate banking includes financing and services provided to corporate customers including services in connection with mergers and acquisitions, underwriting, privatisation, securitisation, syndication, Initial Public Offers (IPOs), etc. It also includes deposits mobilized from Corporate branches.
(ii) Trading and sales
It includes fixed income, equity, foreign exchanges, lendings and repos.
(iii) Retail banking
It includes all retail related lendings and banking services (including staff, consumer and SME financing) as well as deposits mobilized from Retail branches.
(iv) Others
It includes the Bank’s head office related activities and other activities not specifically tagged to the segments above.
(b) Geographical segment
The operations of the Bank are currently based only in Pakistan. Therefore, geographical segment is not relevant.
5.21 Non Banking Assets
The non banking assets acquired in satisfaction of claims, if any, are carried at revalued amounts less accumulated depreciation and accumulated impairment losses, if any. These assets are to be revalued by professionally qualified valuers with sufficient regularity to ensure their net carrying value does not differ materially from their fair value. A surplus arising on revaluation of non-banking assets acquired in satisfaction of claims is required to be credited to the ‘surplus on revaluation of assets’ account appearing on the Statement of Financial Position below equity. Any deficit arising on revaluation is first set off against the surplus account for that non-banking asset, if any, or if no surplus exists, is charged to the profit and loss account directly. Legal fees, transfer cost and direct cost of acquiring title to property is charged to the profit and loss account.
Note 2017 2016
------ (Rupees in ‘000) -------
6 CASH AND BALANCES WITH TREASURY BANKS
In hand Local currency 6.1 3,766,397 3,818,859 Foreign currencies 1,458,786 976,734
In transit Local currency 1,420 - Foreign currency 247,298 -
With State Bank of Pakistan in Local currency current accounts 6.2 10,548,538 9,225,205 Foreign currency current accounts 6.3 582,452 697,883 Foreign currency deposit accounts against foreign
currency deposits mobilised 6.4 1,623,784 2,000,422
With National Bank of Pakistan in Local currency current accounts 1,202,581 1,559,737
19,431,256 18,278,840

6.1 This includes National Prize Bonds of Rs. 5.724 million (2016: Rs. 4.047 million).
6.2 The local currency current accounts are maintained with the State Bank of Pakistan (SBP) as per the requirements of Section 36 of the State Bank of Pakistan Act, 1956. This section requires banking companies to maintain a local currency cash reserve in current accounts opened with the SBP at a sum not less than such percentage of its time and demand liabilities as may be prescribed by the SBP.
6.3 This represents cash reserve account maintained with SBP at an amount equivalent to at least 5% of the Bank’s foreign currency deposits mobilised under FE-25 scheme and carry NIL return (2016: NIL return).
6.4 These represent special cash reserve maintained with SBP at an amount equivalent to at least 15% of the Bank’s foreign currency deposits mobilised under FE-25 scheme and 6% special cash reserve requirement on FE-25 deposits maintained by Islamic banking branches.
Note 2017 2016 7 BALANCES WITH OTHER BANKS ------- (Rupees in ‘000) -------
In Pakistan
In current accounts 12,115 32,110
In deposit accounts 206,419 141,130
Outside Pakistan
In current accounts 7.1 932,481 649,449
1,151,015 822,689
7.1 This includes Rs. 473.631 million (2016: Rs. 636.305 million) eligible for Automated Investment Plans. This balance is current in nature with no return on balance. However, if balance is increased over a specified amount, it entitles the Bank to earn interest income from the correspondent banks at agreed rates.
Note 2017 2016
8 LENDINGS TO FINANCIAL INSTITUTIONS ------- (Rupees in ‘000) -------
Call money lendings - 2,500,000
Repurchase agreement lendings 8.2 985,507 -
Letters of placement 8.3 3,950,000 300,000
Foreign currency placements - 1,045,985
Bai Muajjal 8.4 1,608,645 1,690,592
6,544,152 5,536,577
8.1 Particulars of lendings
In local currency 6,544,152 4,490,592
In foreign currencies - 1,045,985
6,544,152 5,536,577
8.2 These represent lending under repurchase agreement which is secured against government securities and carries mark-up at the rate of 6.00% (2016: NIL).
8.3 These represent lending to financial institutions which carry mark-up at the rate ranging from 5.70% to 6.25% per annum (2016: 6.30% per annum) and is due to mature on 04 June 2018 (2016: 10 February 2017).
8.4 These carry profit at rates ranging between 5.73% to 7.18% per annum (2016: 5.90% to 7.04% per annum) and are due to mature latest by 21 June 2018.

Soneri Bank Limited | Annual Report 2017 | 91
2017 2016
Note Held by Given as Total
Held by Given as Total
bank collateral bank collateral
Held-for-trading securities
Market Treasury Bills 10,525,132 - 10,525,132 - - -
10,525,132 - 10,525,132 - - -
Available-for-sale securities
Market Treasury Bills 26,987,270 15,381,391 42,368,661 37,857,303 6,304,140 44,161,443
Pakistan Investment Bonds 30,034,160 22,108,899 52,143,059 41,508,591 20,537,270 62,045,861
Government of Pakistan
Ijarah Sukuks 2,009,104 - 2,009,104 2,118,675 - 2,118,675
Commercial Papers 227,877 - 227,877 - - -
Term Finance Certificates and Sukuks 2,142,857 - 2,142,857 2,503,559 - 2,503,559
Fully paid-up ordinary shares 3,689,607 - 3,689,607 2,988,906 - 2,988,906
Units of mutual funds 240,000 - 240,000 200,000 - 200,000
65,330,875 37,490,290 102,821,165 87,177,034 26,841,410 114,018,444
Held-to-maturity securities
Pakistan Investment Bonds 3,337,333 - 3,337,333 259,643 - 259,643
Term Finance Certificates and Sukuks 642,348 - 642,348 1,538,879 - 1,538,879
3,979,681 - 3,979,681 1,798,522 - 1,798,522
Investments at cost 79,835,688 37,490,290 117,325,978 88,975,556 26,841,410 115,816,966
Less: provision for diminution
in the value of investments 9.3 (117,452) - (117,452) (114,284) - (114,284)
Investments (net of provision) 79,718,236 37,490,290 117,208,526 88,861,272 26,841,410 115,702,682
Net surplus on revaluation
of held-for-trading securities 9.12 34 - 34 - - -
Net surplus on revaluation
of available-for-sale securities 21.2 198,338 21,618 219,956 2,109,200 72,078 2,181,278
Total investments 79,916,608 37,511,908 117,428,516 90,970,472 26,913,488 117,883,960
9 INVESTMENTS - NET
9.1 Investments by types
------------------------------------- (Rupees in ‘000) ---------------------------------------

Note 2017 20169.2 Investments by segments ------- (Rupees in ‘000) -------
Federal Government Securities - Market Treasury Bills 9.5 52,893,793 44,161,443 - Pakistan Investment Bonds 9.5 55,480,392 62,305,504 - Government of Pakistan Ijarah Sukuks 2,009,104 2,118,675
110,383,289 108,585,622 Fully paid-up ordinary shares of Rs. 10 each
Listed companies - Agritech Limited [851,560 (2016: 851,560) shares] 29,805 29,805 - Allied Bank Limited [2,851,000 (2016: 534,500) shares] 272,727 53,190 - Altern Energy Limited [3,311,500 (2016: 2,100,000) shares] 136,258 77,142 - Askari Bank Limited [5,000,000 (2016: NIL) shares] 115,439 - - Bank AL Habib Limited [NIL (2016: 2,000,000) shares] - 85,731 - Bank Alfalah Limited [NIL (2016: 4,000,000) shares] - 113,993 - Cherat Cement Company Limited [2,774,200 (2016: NIL) shares] 330,788 - - Cherat Packaging Limited [200,000 (2016: NIL) shares] 40,513 - - Dawood Lawrancepur Limited [282,000 (2016:257,500) shares] 53,863 48,971 - Dolmen City REIT [3,750,000 (2016: NIL) shares] 41,866 - - Engro Corporation Limited [920,000 (2016: 1,400,000) shares] 271,719 420,426 - Engro Fertilizers Limited [6,040,000 (2016: 3,649,500) shares] 401,360 265,233 - Fatima Fertilizer Company Limited [5,000,000 (2016: 5,000,000) shares] 159,942 160,180 - Fauji Fertilizer Bin Qasim Limited [ 3,500,000 (2016: 2,210,500) shares] 144,821 120,017 - Habib Bank Limited [NIL (2016: 590,100) shares] - 129,117 - Habib Metropolitan Bank Limited [413,500 (2016: NIL) shares] 13,370 - - Hub Power Company Limited [914,500 (2016: NIL) shares] 98,886 - - Kohat Cement Company Limited [352,700 (2016: NIL) shares] 47,990 - - Lucky Cement Limited [412,500 (2016: NIL) shares] 239,544 - - MCB Bank Limited [1,052,500 (2016: 1,080,300) shares] 242,551 250,219 - NIB Bank Limited [NIL (2016: 2,758,000) shares] - 4,615 - Nishat Chunian Limited [3,682,000 (2016: 2,150,000) shares] 206,826 86,278 - Nishat Mills Limited [3,370,000 (2016: 3,300,000) shares] 418,098 361,864 - Oil and Gas Development Company Limited [1,875,000 (2016: 2,300,000) shares] 284,587 324,727 - Packages Limited [99,450 (2016: NIL) shares] 59,282 - - Pakistan International Bulk Terminal Limited [NIL (2016: 1,000,000) shares] - 32,800 - Pakistan State Oil Company Limited [6,000 (2016: 1,100,000) shares] 1,670 407,798 - Sui Southern Gas Company Limited [1,200,000 (2016: NIL) shares] 44,122 - - United Bank Limited [100,000 (2016: NIL) shares] 16,780 -
Un-listed companies - DHA Cogen Limited [5,853,822 (2016: 5,853,822) shares] 9.6 - - (Chief Executive: Mr. Siraj ul Haq)
- ISE Towers REIT Management Company Limited (formerly Islamabad Stock Exchange Limited) [3,034,603 (2016: 3,034,603) 9.7 11,100 11,100 shares] (Chief Executive: Mian Ayyaz Afzal)
- Pakistan Export Finance Guarantee Agency Limited [569,958 (2016: 569,958) shares] 9.8 5,700 5,700 (Liquidator: Mr. Usman Khawaja)
3,689,607 2,988,906
Term Finance Certificates, Debentures, Bonds andParticipation Term Certificates
Listed Term Finance Certificates of Rs. 5,000 each
- Azgard Nine Limited [10,000 (2016: 10,000) certificates] 16,269 16,269 16,269 16,269
Balance carried forward 114,089,165 111,590,797

Soneri Bank Limited | Annual Report 2017 | 93
Note 2017 2016
------- (Rupees in ‘000) -------
Balance brought forward 114,089,165 111,590,797
Un-listed Term Finance Certificates of Rs. 5,000 each,
unless otherwise specified
- Agritech Limited [1,488 (2016: 1,488) certificates] 7,440 7,440
- Azgard Nine Limited [2,150 (2016: 2,150) certificates] 10,750 10,750
- Bank Al Habib Limited - 6th issue [50,000 (2016: NIL) certificates] 250,000 -
- Bank Alfalah Limited - 4th issue [NIL (2016: 10,000) certificates] - 33,247
- Faysal Bank Limited - 2nd issue [NIL (2016: 15,000) certificates] - 37,425
- Habib Bank Limited [NIL (2016: 1,000) certificates] - 99,988
- JS Bank Limited [NIL (2016: 50,000) certificates] - 450,000
- Standard Chartered Bank (Pakistan) Limited - 4th issue
[NIL (2016: 40,000) certificates] - 200,000
Sukuk Certificates and Bonds of Rs. 5,000 each, unless
otherwise specified
- Al Baraka Bank (Pakistan) Limited [175 (2016: 175) certificates of Rs 1,000,000 each] 100,000 124,999
- Eden Housing Limited [10,000 (2016: 10,000) certificates] 6,560 6,560
- Engro Fertilizers Limited [32,300 (2016: 32,300) certificates] 113,050 145,350
- K- Electric Limited (Al-Shirkah) [100,000 (2016: 100,000) certificates] 450,000 500,000
- K- Electric Limited [NIL (2016: 80,000) certificates] - 400,000
- Liberty Power Tech Limited [1,099,430 (2016: 1,099,430) certificates of Rs.100 each] 52,728 65,335
- Pakistan Mobile Communication Limited [100,000 (2016: 100,000) certificates] 333,333 500,000
- Meezan Bank Limited [425 (2016: 425) certificates of Rs. 1,000,000 each] 425,000 425,000
- Neelum Jhelum Hydro Power Company (Private) Limited [9,750 (2016: 9,750)
certificates of Rs. 100,000 each] 975,000 975,000
- Three Star Hosiery Mills (Private) Limited [5,100 (2016: 5,100) certificates] 25,215 25,215
- Water and Power Development Authority (WAPDA)
Sukuk [4,000 (2016: 4,000 certificates)] 9.9 19,860 19,860
2,768,936 4,026,169
Units of Mutual Funds
Open-ended
- NIT Islamic Equity Fund [11,530,775 (2016: 9,756,098) units]
(Managed by National Investment Trust Limited) 140,000 100,000
- NIT Income Fund [9,211,835 (2016: 9,211,835) units]
(Managed by National Investment Trust Limited) 100,000 100,000
240,000 200,000
Commercial Papers
- U Microfinance Bank [2,400 (2016: NIL) units] 227,877 -
Total investments at cost 117,325,978 115,816,966
Less: Provision against diminution in the value of investments 9.3 (117,452) (114,284)
Total investments - net of provision 117,208,526 115,702,682
Surplus on revaluation of held-for-trading securities- net 9.12 34 -
Surplus on revaluation of available-for-sale securities - net 21.2 219,956 2,181,278
Total investments at market value 117,428,516 117,883,960

Note 2017 2016
------- (Rupees in ‘000) -------
9.3 Particulars of provision against diminution in the value of investments
Opening balance 114,284 125,900
Charge for the year 3,168 3,773
Reversals made during the year - (10,714)
3,168 (6,941)
Provision reversed on disposal - (4,675)
Closing balance 117,452 114,284
9.3.1 Particulars of provision against diminution in the value
of investments by type and segment
Available-for-sale securities
Listed companies
- Fully paid up ordinary shares of Rs. 10 each 25,658 22,490
Unlisted companies
- Fully paid up ordinary shares of Rs. 10 each
- Pakistan Export Finance Guarantee Agency Limited 5,700 5,700
Held-to-maturity securities
Term Finance Certificates of Rs 5,000 each
- Agritech Limited 7,440 7,440
- Azgard Nine Limited 27,019 27,019
Sukuk Certificates and Bonds of Rs 5,000 each
- Eden Housing Limited 6,560 6,560
- Three Stars Hosiery Mills (Private) Limited 25,215 25,215
- Water and Power Development Authority (WAPDA) sukuk 9.9 19,860 19,860
117,452 114,284
9.4 Investments include certain approved government securities which are held by the Bank to comply with the Statutory Liquidity Requirement determined on the basis of the Bank’s demand and time liabilities as set out under section 29 of the Banking Companies Ordinance, 1962.
9.5 Pakistan Investment Bonds include securities having book value of Rs. 30.700 million (2016: Rs. 30.700 million) pledged with the State Bank of Pakistan and National Bank of Pakistan to facilitate T. T. discounting facility for the branches of the Bank. Market Treasury Bills and Pakistan Investment Bonds are eligible for discounting with the State Bank of Pakistan.
9.6 DHA Cogen Limited shares were received under the enforcement of a pledge of third party shares by the consortium banks. These shares were recorded at NIL value as the break-up value of these shares as per the available audited financial statements is Rs. (29.10).
9.7 This denotes shares of ISE Towers REIT Management Company Limited, [formerly Islamabad Stock Exchange Limited (ISEL)], acquired in pursuance of corporatisation and demutualisation of ISEL as a public company limited by shares.
9.8 This investment is fully provided. As per the “shares subscription agreement”, it can only be sold to an existing investor.
9.9 The Bank purchased 4,000 certificates (on 29 September 2009) of WAPDA through a market based transaction for a cash consideration of Rs. 19.8 million having a face value of Rs. 20 million. These certificates were available in the seller’s CDC account and on completion of the transaction were transferred to the Bank’s CDC account. A periodic Ijarah rental was due on 22 October 2009 which was not paid to the Bank on the plea that certain discrepancy in the Central Depository Register was the reason for non-payment.
The Bank through a legal notice clarified the position that it had purchased the aforesaid sukuk certificates from the market for a valuable consideration when these sukuk certificates were already entered in the CDC’s Register of seller’s account. However, the Bank has made full provision against these certificates. The Bank has filed a recovery suit which is pending before the Honourable High Court of Sindh, Karachi.

Soneri Bank Limited | Annual Report 2017 | 95
9.10 Significant particulars relating to government securities, term finance certificates and sukuk certificates are as follows:
Type of investment Maturity Principal payments
Yield / Coupon rate (%)
Coupon payments
Market Treasury Bills January 2018 to March 2018 On maturity 5.98 to 6.14 At maturity Pakistan Investment Bonds March 2018 to January 2024 On maturity 7.00 to 12.00 Semi-annually GoP Ijarah Sukuks December 2018 to June 2020 On maturity 5.24 to 5.51 Semi-annually Term Finance Certificates (Refer Annexure IV)Sukuk Certificates (Refer Annexure IV)
9.11 Quality of available-for-sale securities2017 2016
Securities (at market value - net of provision) Amount Latestavailable rating Amount Latest
available rating (Rupees in ‘000) (Rupees in ‘000)
Federal Government Securities - Market Treasury Bills 42,368,137 Sovereign 44,147,931 Sovereign - Pakistan Investment Bonds 52,469,229 Sovereign 63,679,488 Sovereign - GoP Ijarah sukuks 2,011,120 Sovereign 2,139,500 Sovereign
Fully paid up ordinary shares of Rs. 10 each
Listed companies - Agritech Limited 4,147 D 10,798 D - Allied Bank Limited 242,278 AA+(L) A1+(S) 63,718 AA+(L) A1+(S) - Altern Energy Limited 142,461 Unrated 86,625 Unrated - Askari Bank Limited 96,550 AA+(L) A1+(S) - - - Bank AL Habib Limited - - 117,980 AA+(L) A1+(S) - Bank Alfalah Limited - - 151,840 AA(L) A1+(S) - Cherat Cement Company Limited 307,685 A(L) A1(S) - - - Cherat Packaging Limited 39,800 Unrated - - - Dawood Lawrancepur Limited 53,016 Unrated 65,148 Unrated - Dolmen City REIT 41,250 RR1 - - - Engro Corporation Limited 252,770 AA(L) A1+(S) 442,526 AA(L) A1+(S) - Engro Fertilizers Limited 409,029 AA-(L) A1+(S) 248,093 AA-(L) A1+(S) - Fatima Fertilizer Company Limited 154,400 AA-(L) A1+(S) 184,450 AA-(L) A1+(S) - Fauji Fertilizer Bin Qasim Limited 124,390 Unrated 113,200 AA(L) A1+(S) - Habib Bank Limited - - 161,245 AAA(L) A1+(S) - Habib Metropolitan Bank Limited 14,266 AA+(L) A1+(S) - - - Hub Power Company Limited 83,220 AA+(L) A1+(S) - - - Kohat Cement Company Limited 50,069 A(L) A1(S) - - - Lucky Cement Limited 213,432 Unrated - - - MCB Bank Limited 223,467 AAA(L) A1+(S) 256,917 AAA(L) A1+(S) - NIB Bank Limited - - 4,992 AA-(L) A1+(S) - Nishat Chunian Limited 168,525 Unrated 134,224 Unrated - Nishat Mills Limited 503,815 AA(L) A1+(S) 502,490 AA(L) A1+(S) - Oil and Gas Development Company Limited 305,231 AAA(L) A1+(S) 380,305 AAA(L) A1+(S) - Packages Limited 50,703 AA(L) A1+(S) - - - Pakistan International Bulk Terminal Limited - - 32,990 Unrated - Pakistan State Oil Company Limited 1,759 AA(L) A1+(S) 477,631 AA(L) A1+(S) - Sui Southern Gas Company Limited 36,587 A+(L) A1(S) - - - United Bank Limited 18,797 AAA(L) A1+(S) - -
Un-listed companies - at cost - ISE Towers REIT Management Company Limited
(formerly Islamabad Stock Exchange Limited) 11,100 Unrated 11,100 Unrated - Pakistan Export Finance Guarantee Agency Limited 5,700 Unrated 5,700 Unrated
Units of mutual funds
Open-ended - NIT Islamic Equity Fund 115,192 AA-(f) 125,171 Unrated - NIT Income Fund 97,279 A+(f) 96,987 A+(f)
Balance carried forward 100,615,404 113,641,049

2017 2016
Securities (at market value-net of provision) AmountLatest
available ratingAmount
Latestavailable rating
(Rupees in ‘000) (Rupees in ‘000)
Balance brought forward 100,615,404 113,641,049
Commercial Papers - U Microfinance Bank 227,877 Unrated - -
Term Finance Certificates - Bank Al Habib 250,000 AA - - - Habib Bank Limited - - 100,230 AAA - JS Bank Limited - - 450,000 A+
Sukuk certificates - Al Baraka Bank (Pakistan) Limited 42,832 A 52,978 A - K-Electric Limited 460,125 AA+ 515,337 AA+ - Meezan Bank Limited 444,225 AA- 442,638 AA- - Neelum Jhelum Hydropower Company (Private) Limited 975,000 AAA 975,000 AAA
Total 103,015,463 116,177,232
L represents “long-term rating”S represents “short-term rating” D represents “default” f represents “fund’s stability rating” Sovereign represent Government Securities. The international rating of Pakistan is B- (as per Moodys).
Note 2017 2016 ------- (Rupees in ‘000) -------
9.12 Unrealised gain / (loss) on revaluation of investments classified as held for trading
Market Treasury Bills 34 -
10 ADVANCES - NET
Loans, cash credits, running finances, etc.In Pakistan 164,955,815 124,932,351
Bills discounted and purchased (excluding treasury bills)Payable in Pakistan 2,136,425 1,631,223 Payable outside Pakistan 4,569,514 4,912,059
6,705,939 6,543,282
Assets held under Ijarah (IFAS-2) 10.2 301,549 268,841 Advance against Islamic financings 10.3 809,127 2,008,562 Advances - gross 172,772,430 133,753,036
Provision against non-performing advances - specific 10.4.1 (8,440,840) (8,395,931)Provision against consumer and small enterprise loans - general 10.4.1 (38,675) (51,340)
(8,479,515) (8,447,271)
Advances - net of provision 164,292,915 125,305,765
10.1 Particulars of advances (gross)
10.1.1 In local currency 167,117,315 126,123,910 In foreign currencies 5,655,115 7,629,126
172,772,430 133,753,036
10.1.2 Short-term (upto one year) 129,821,396 99,247,530 Long-term (over one year) 42,951,034 34,505,506
172,772,430 133,753,036

Soneri Bank Limited | Annual Report 2017 | 97
10.2 Assets held under Ijarah (IFAS-2)
2017Cost Accumulated Depreciation
At 1 January 2017
Additions / (Deletions) /
(Adjustments)
At 31 December
2017
At 01January
2017
Charge for the year /
(depreciation on deletions) / (Adjustments)
At 31 December
2017
Net investment in Ijarah as at
31 December 2017
Rate of depreciation
%
-----------------------------------------(Rupees in ‘000)-------------------------------------------------------
Motor vehicles 292,221 155,329 381,633 79,489 61,947 103,403 278,230 20 to 33.33 (42,211) (38,033) (23,706) -
Plant and machinery 171,675 - 54,072 115,566 21,030 30,753 23,319 20 to 33.33 (105,843) (105,843)
(11,760) -
463,896 155,329 435,705 195,055 82,977 134,156 301,549 (148,054) (143,876)
(35,466) -
2016Cost Accumulated Depreciation
At 1 January 2016
Additions / (Deletions) /
(Adjustments)
At 31 December
2016
At 01January
2016
Charge for the year /
(depreciation on deletions) / (Adjustments)
At 31 December
2016
Net investment in Ijarah as at
31 December 2016
Rate of depreciation
%
-----------------------------------------(Rupees in ‘000)-------------------------------------------------------
Motor vehicles 231,270 119,229 292,221 82,367 49,995 79,489 212,732 20 to 33.33 (43,150) (25,632) (15,128) (27,241)
Plant and machinery 302,681 24,961 171,675 221,661 47,974 115,566 56,109 20 to 33.33 (113,809) (102,428)
(42,158) (51,641)
533,951 144,190 463,896 304,028 97,969 195,055 268,841 (156,959) (128,060)
(57,286) (78,882)
The Ijarah payments receivable from customers for each of the following periods under the terms of the respective arrangements are given below:
2017 2016 ------- (Rupees in ‘000) -------
Not later than one year* 110,550 88,183 Later than one year but not later than five years* 115,322 111,916
225,872 200,099
*This excludes the amount of security deposit received from customers.
10.3 Advance against Islamic financings
Car Ijarah 67,176 57,543 Diminishing musharaka - 1,008,948 Murabaha 416,473 580,556 Salam 325,478 361,515
809,127 2,008,562

10.4 Advances include Rs. 10,244.669 million (2016: Rs. 10,419.420 million) which have been placed under non-performing status as detailed below:
2017
Category ofClassification
Classified Advances Provision Required Provision Held
Domestic Overseas Total Domestic Overseas Total Domestic Overseas Total
------------------------------------------------- (Rupees in ‘000) -------------------------------------------------------------
Other Assets Especially
Mentioned* 20,595 - 20,595 411 - 411 411 - 411
Substandard 193,956 - 193,956 24,557 - 24,557 24,557 - 24,557
Doubtful 592,392 - 592,392 256,746 - 256,746 256,746 - 256,746
Loss 9,437,726 - 9,437,726 8,159,126 - 8,159,126 8,159,126 - 8,159,126
10,244,669 - 10,244,669 8,440,840 - 8,440,840 8,440,840 - 8,440,840
2016
Category ofClassification
Classified Advances Provision Required Provision Held
Domestic Overseas Total Domestic Overseas Total Domestic Overseas Total
------------------------------------------------- (Rupees in ‘000) -------------------------------------------------------------
Other Assets Especially
Mentioned* 68,938 - 68,938 1,859 - 1,859 1,859 - 1,859
Substandard 698,888 - 698,888 121,947 - 121,947 121,947 - 121,947
Doubtful 564,124 - 564,124 107,106 - 107,106 107,106 - 107,106
Loss 9,087,470 - 9,087,470 8,165,019 - 8,165,019 8,165,019 - 8,165,019
10,419,420 - 10,419,420 8,395,931 - 8,395,931 8,395,931 - 8,395,931
* The ‘Other Assets Especially Mentioned’ category pertains to agricultural finance and small enterprise amounting to Rs. 14.161 million (2016: Rs. 50.356 million) and Rs. 6.434 million (2016: Rs. 18.582 million) respectively.
10.4.1 Particulars of provision against non-performing loans and advances
Note 2017 2016
General General
Specific Consumer Small Total Specific Consumer Small Total
Enterprises Enterprises
Opening balance 8,395,931 29,340 22,000 8,447,271 8,568,984 27,224 19,000 8,615,208
Charge for the year 771,168 9,335 - 780,503 1,352,429 2,116 3,000 1,357,545
Reversals (695,256) - (22,000) (717,256) (1,326,473) - - (1,326,473)
75,912 9,335 (22,000) 63,247 25,956 2,116 3,000 31,072
Transfers 25,972 - - 25,972 5,852 - - 5,852
Amount written off 10.8 (56,975) - - (56,975) (204,861) - - (204,861)
Closing balance 8,440,840 38,675 - 8,479,515 8,395,931 29,340 22,000 8,447,271
10.4.1.1 The general provision against consumer financing is required to be maintained at varying percentages based on the non-performing loan ratio present in the portfolio. These percentages range from 1% to 2.5% for secured and 4% to 7% for unsecured portfolio.
10.4.1.2 The Bank has maintained general provision against housing finance portfolio at the rate of 0.50% of the performing portfolio. The State Bank of Pakistan vide its circular no. 9 of 2017 dated: 22 December 2017 abolished the requirement of maintaining general reserve of 1% against secured Small Enterprise (SE) portfolio, while general reserve to be maintained against unsecured SE portfolio has been reduced from 2% to 1%. Currently, the Bank does not have any unsecured SE portfolio.
---------------------------------------------------- (Rupees in ‘000) ---------------------------------------------------

Soneri Bank Limited | Annual Report 2017 | 99
10.4.1.3 Particulars of provision against non-performing loans and advances
2017 2016
General General
Specific Consumer Small Total Specific Consumer Small Total
Enterprises Enterprises
------------------------------------------- (Rupees in ‘000) -----------------------------------------------------
In local currency 8,440,840 38,675 - 8,479,515 7,946,650 29,340 22,000 7,997,990
In foreign currencies - - - - 449,281 - - 449,281
8,440,840 38,675 - 8,479,515 8,395,931 29,340 22,000 8,447,271
10.5 The Bank has availed the benefit of forced sales value of pledged stocks, mortgaged residential and commercial properties held as collateral against non-performing advances as allowed under the prudential regulations issued by the State Bank of Pakistan. Had the benefit not been taken by the Bank, the specific provision against non-performing advances would have been higher by Rs.1,276.688 million (2016: Rs. 1,102.633 million. The additional profit arising from availing this benefit - net of tax amounts to Rs. 829.847 million (2016: Rs. 716.711 million). This profit is not available for distribution either as cash or stock dividend to shareholders and bonus to employees.
10.6 The SBP has granted relaxation in provisioning requirements in respect of exposures in Dewan Mushtaq Group (DMG). Had this relaxation not been available, provision against loans and advances would have been higher by Rs. 44.930 million (2016: Rs. 44.930 million).
10.7 The Bank has made provision against its non-performing portfolio as per the category of classification of the loans, however, the Bank still holds enforceable collateral realisable through litigation. These securities comprise of charge against various tangible assets of the borrower including land, building and machinery, stock in trade, etc.
Note 2017 2016
------- (Rupees in ‘000) -------
10.8 Particulars of write offs:
10.8.1 Against provisions 10.4.1 56,975 204,861
Directly charged to the profit and loss account - net 32 276
57,007 205,137
10.8.2 Write offs of Rs. 500,000 and above 10.8.2.1 56,955 204,683
Write offs of below Rs. 500,000 52 454
57,007 205,137
10.8.2.1 Details of loan write offs of Rs. 500,000 and above
In terms of sub-section (3) of Section 33A of the Banking Companies Ordinance, 1962 the statement in respect of written-off loans or any other financial relief of five hundred thousand rupees or above allowed to a person(s) during the year ended 31 December 2017 is given in Annexure - I. However, these write offs do not affect the Bank’s right to recover the outstanding debts from these customers.
10.9 Particulars of loans and advances to directors, associated companies, etc.
Debts due by directors, executives or officers of the Bank or any of them either severally or jointly with any other persons*.
2017 2016
------- (Rupees in ‘000) -------
Balance at beginning of the year 3,183,003 2,783,602
Loans granted during the year 1,055,977 1,267,149
Repayments (923,267) (867,748)
Balance at end of the year 3,315,713 3,183,003
* Represents loans given by the Bank to its executives and other employees as per the terms of their employment.

Note 2017 2016
------- (Rupees in ‘000) -------
11 OPERATING FIXED ASSETS
Capital work-in-progress 11.1 421,895 257,269
Property and equipment 11.2 6,042,783 4,678,852
Intangible assets 11.3 116,787 202,303
6,581,465 5,138,424
11.1 Capital work-in-progress
Civil works 15,057 44,885
Advances to suppliers and contractors 17,577 10,017
Advances against purchase of premises 60,000 -
Core banking system 329,261 200,404
Consultant’s fee and other charges - 1,963
421,895 257,269
11.2 Property and equipment
2017
COST / REVALUED AMOUNT ACCUMULATED DEPRECIATION
At 1 January
2017
Additions / (deletions) /
adjustments*
Revaluation surplus
At 31 December
2017
At 1 January
2017
Charge for the year /
(depreciation on deletions) / adjustments*
At 31 December 2017
Book value at 31 December
2017
Rate of depreciation
%
----------------------------------------------------- (Rupees in ‘000) ----------------------------------------------------
Freehold land 936,055 - 319,915 1,255,970 - - - 1,255,970 -
Leasehold land 186,967 - 162,080 349,047 - - - 349,047 -
Buildings on freehold land 138,296 22,772 26,478 187,546 38,179 9,899 48,078 139,468 5 - 9
Buildings on leasehold land 2,742,286 28,570 1,037,961 3,808,770 1,175,867 197,334 1,373,201 2,435,569 5 - 13
- -
(47) * -
Leasehold improvements 1,231,522 96,734 - 1,300,554 242,423 63,186 299,345 1,001,209 5
(27,749) (6,264)
47 * -
Furniture and fixtures 427,233 30,589 - 419,952 213,824 36,690 220,214 199,738 10
(27,851) (23,339)
(10,019) * (6,961) *
Electrical, office and
computer equipment 2,293,532 224,998 - 2,375,457 1,701,351 225,259 1,785,826 589,631 20
(153,545) (147,800)
10,472 * 7,016 *
Vehicles 257,661 12,986 - 251,188 163,056 34,415 179,037 72,151 20
(19,459) (18,434)
8,213,552 416,649 1,546,434 9,948,484 3,534,700 566,783 3,905,701 6,042,783
(228,604) (195,837)
453 * 55 *

Soneri Bank Limited | Annual Report 2017 | 101
2016
COST / REVALUED AMOUNT ACCUMULATED DEPRECIATION
At 1 January
2016
Additions / (deletions) /
adjustments*
Revaluation surplus
At 31 December
2016
At 1 January
2016
Charge for the year /
(depreciation on deletions) / adjustments*
At 31 December 2016
Book value at 31 December
2016
Rate of depreciation
%
----------------------------------------------------- (Rupees in ‘000) ----------------------------------------------------
Freehold land 923,215 12,840 - 936,055 - - - 936,055 -
Leasehold land 186,967 - - 186,967 - - - 186,967
Buildings on freehold land 138,136 160 - 138,296 28,632 9,547 38,179 100,117 5 - 9
Buildings on leasehold land 2,968,500 13,290 - 2,742,286 1,071,811 205,355 1,175,867 1,566,419 5 - 13
(239,504) (101,299)
Leasehold improvements 1,031,999 221,999 - 1,231,522 193,194 56,327 242,423 989,099 5
(22,476) (7,098)
Furniture and fixtures 385,965 47,240 - 427,233 183,051 35,480 213,824 213,409 10
(5,972) (4,707)
Electrical, office and 2,336,813 267,682 - 2,293,532 1,779,687 230,147 1,701,351 592,181 20
computer equipment (311,460) (308,980)
497 * 497 *
Vehicles 230,160 44,970 - 257,661 141,681 38,844 163,056 94,605 20
(17,469) (17,469)
8,201,755 608,181 - 8,213,552 3,398,056 575,700 3,534,700 4,678,852
(596,881) (439,553)
497 * 497 *
* These represent reclassification adjustments.
11.2.1 The cost of fully depreciated property and equipment still in use amounts to Rs. 1,888.837 million (2016: Rs. 1,651.181 million).
11.2.2 During the year 2017, the Bank’s freehold / leasehold land and buildings on freehold / leasehold land have been revalued by M/s Harvester Services (Private) Limited (Valuation and Engineering Consultants) on the basis of their professional assessment of the present market value. As a result of revaluation, the market value of freehold / leasehold land was determined at Rs. 1,605.017 million and buildings on freehold / leasehold land was determined at Rs. 2,575.037 million.
Had there been no revaluation, the carrying amount of freehold / leasehold land and buildings on freehold / leasehold land as at 31 December 2017 would have been Rs.1,010.140 million and Rs. 532.398 million respectively (2016: Rs. 1,012.706 million and Rs. 407.942 million respectively).
11.2.3 Details of disposals / deletion of property and equipment to executives and other persons with original cost or book value in excess of Rs. 1 million or Rs. 250,000 respectively (whichever is less) are given in Annexure - III which is an integral part of these financial statements.

11.3 Intangible assets
2017
Cost Accumulated amortisation
Annual rate of amortisation
(%)At 1 January
2017
Additions / (deletions) /
adjustments*
At 31 December
2017
At 1 January 2017
Charge for the year /
(amortisation on deletion) / adjustments*
At 31 December
2017
Net book value at 31 December
2017
---------------------------------------- (Rupees in ‘000) --------------------------------------
Software 671,250 34,973 706,223 470,419 120,057 590,476 115,747 33.33
- -
Trademark 5,786 298 6,084 4,314 730 5,044 1,040 33.33
- -
677,036 35,271 712,307 474,733 120,787 595,520 116,787
- -
2016
Cost Accumulated amortisation
Annual rate of amortisation
(%)At 1 January
2016
Additions / (deletions) /
adjustments*
At 31 December
2016
At 1 January 2016
Charge for the year /
(amortisation on deletion) / adjustments*
At 31 December
2016
Net book value at 31 December
2016
---------------------------------------- (Rupees in ‘000) --------------------------------------
Software 454,291 217,456 671,250 382,105 88,811 470,419 200,831 33.33
- -
(497) * (497) *
Trademark 4,208 1,578 5,786 3,743 571 4,314 1,472 33.33
458,499 219,034 677,036 385,848 89,382 474,733 202,303
- -
(497) * (497) *
* These represent reclassification adjustments.
11.3.1 The cost of fully amortised intangible assets still in use amounts to Rs. 444.870 million (2016: Rs. 359.741 million).

Soneri Bank Limited | Annual Report 2017 | 103
Note 2017 2016
------- (Rupees in ‘000) -------
12 OTHER ASSETS
Income / mark-up accrued in local currency 12.1 3,603,349 3,499,946
Income / mark-up accrued in foreign currencies 5,504 10,077
Dividend receivable 26,811 14,650
Unrealised gain on forward foreign exchange contracts 275,173 -
Advances, deposits, advance rent and prepayments 349,624 353,124
Advance taxation (provisions less payments) 1,587,778 1,095,725
Cash margin against future trading 3 -
Stationery and stamps in hand 34,007 33,650
Due from the State Bank of Pakistan 282,275 53,250
Advance against subscription of shares 12.2 50,000 -
Advance against subscription of Term Finance Certificates - 253,000
Others 12.3 646,210 397,106
6,860,734 5,710,528
Less: provision held against other assets 12.3 & 12.4 (156,077) (156,077)
Other assets (net of provision) 6,704,657 5,554,451
12.1 State Bank of Pakistan vide its Circular no. 13 of 2016 dated: 7 October 2016 has made certain amendments to regulation R-8 of Prudential Regulations requiring the banks to suspend the mark-up of borrowers which have been rescheduled / restructured for more than once and have been classified as regular by the Bank. As a consequence of the above, the Bank has suspended mark-up amounting to Rs. 14.9 million.
12.2 This amount represents advance paid to 1 Link for the subscription of shares during the year in respect of Bank’s portion of investment.
12.3 This includes an amount of Rs. 143.443 million (2016: Rs.143.443 million) in respect of fraud and forgery claims relating to cash embezzlement made in the Bank. The Bank has initiated legal proceedings against the alleged and has also taken necessary steps to further strengthen its internal control system.
2017 2016
12.4 Provision against other assets ------- (Rupees in ‘000) -------
Opening balance 156,077 157,826
Charge for the year - 30
Transfers - (248)
Write-offs - (1,531)
Closing balance 156,077 156,077
13 CONTINGENT ASSETS
There were no contingent assets as at the balance sheet date.
14 BILLS PAYABLE
In Pakistan 4,895,447 4,163,509
Outside Pakistan - -
4,895,447 4,163,509
15 BORROWINGS
In Pakistan 61,441,013 36,256,914
Outside Pakistan 3,143,223 2,648,164
64,584,236 38,905,078

Note 2017 2016
------- (Rupees in ‘000) -------
15.1 Particulars of borrowings with respect to currencies
In local currency 61,441,013 36,256,914
In foreign currencies 3,143,223 2,648,164
64,584,236 38,905,078
15.2 Details of borrowings secured / unsecured
Secured
Borrowings from the State Bank of Pakistan
Under Export Refinance Scheme 15.2.1 10,348,288 8,139,378
Long term Financing Facility for plant and machinery 15.2.2 998,524 880,459
Modernisation of SME-Rice Husking 15.2.3 11,600 17,200
Financing facility for storage of agriculture produce - 11,250
Repurchase agreement borrowings 15.2.4 35,035,335 20,561,740
Repurchase agreement borrowings - other banks 15.2.5 2,474,983 6,299,081
Borrowings from other financial institutions - Foreign 15.2.6 2,865,974 2,510,364
Borrowings from other financial institutions - Local 15.2.7 9,999,058 -
61,733,762 38,419,472
Unsecured
Call borrowings 15.2.8 2,573,225 347,806
Overdrawn nostro accounts 277,249 137,800
2,850,474 485,606
64,584,236 38,905,078
15.2.1 The Bank has entered into an agreement with the State Bank of Pakistan (SBP) for extending Export Finance to its customers. Borrowings under the Export Refinance Scheme of SBP carry interest at rates ranging from 1.00% to 2.50% per annum (2016: 1.00% to 2.50% per annum). These are secured against demand promissory notes and are due to mature latest by 27 June 2018 (2016: latest by 28 June 2017).
15.2.2 These represent borrowings from the SBP under scheme for Long-term Financing Facility at rates ranging from 4.50% to 9.70% per annum (2016: 4.50% to 9.70% per annum), and have varying long term maturities due by 06 April 2027 (2016: due by 10 September 2025). Under the agreement, SBP has a right to recover the outstanding amount from the Bank at the respective maturity date of each finance by directly debiting the current account of the Bank maintained with SBP.
15.2.3 These represent borrowings from the SBP under the scheme for Modernisation of SME Rice Husking Mills in Sindh at the rate ranging from 4.75% to 6.25% per annum (2016: 4.75% to 6.25% per annum) and are due to mature latest by 16 December 2019 (2016: latest by 16 December 2019).
15.2.4 These represent repurchase agreements executed with the State Bank of Pakistan which carry mark up at the rate of 5.88% per annum (2016: 5.95% per annum) and are due to mature latest by 05 January 2018 (2016: latest by 06 January 2017).
15.2.5 These represent repurchase agreements at rates ranging from of 5.70% to 5.90% per annum (2016: 5.50% to 5.95% per annum) and are due to mature latest by 22 January 2018 (2016: latest by 22 May 2017).
15.2.6 These represent borrowings against foreign bills from various foreign banks at rates ranging from 2.07% to 2.96% per annum (2016: 1.60% to 1.75% per annum) and are due to mature latest by 20 March 2018 (2016: latest by 06 June 2017).
15.2.7 These represent borrowings executed with the local financial institutions secured against government securities which carry mark up at the rate of 5.83% per annum (2016: NIL) and are due to mature latest by 30 November 2018.
15.2.8 These represent borrowings from a commercial bank in the inter bank money market. These carry mark-up at the rate of 5.73% per annum (2016: 5.60% per annum) and are due to mature latest by 06 March 2018 (2016: latest by 08 March 2017).

Soneri Bank Limited | Annual Report 2017 | 105
16 DEPOSITS AND OTHER ACCOUNTS 2017 2016 ------- (Rupees in ‘000) -------
CustomersRemunerative Fixed deposits 62,623,863 59,765,887 Savings deposits 84,278,761 85,444,378 Current accounts 655,198 496,159
Non-remunerative Current accounts 59,358,597 49,164,840 Call deposits 391,435 148,911 Margin deposits 3,378,360 2,316,868
210,686,214 197,337,043 Financial institutionsRemunerative deposits 16,298,322 12,335,522 Non-remunerative deposits 363,918 252,888
16,662,240 12,588,410
227,348,454 209,925,453 16.1 Particulars of deposits
In local currency 216,459,536 196,619,654 In foreign currencies 10,888,918 13,305,799
227,348,454 209,925,453
17 SUB-ORDINATED LOANS
Unsecured - non-participatory Listed Term Finance Certificates 2,997,600 2,998,800
17.1 This denotes rated, listed and unsecured Term Finance Certificates (TFCs) issued as instrument of redeemable capital with a tenor of 8 years. The Pakistan Credit Rating Agency Limited (PACRA) has assigned a credit rating of A+ to the instrument as on 15 December 2017. The instrument is sub-ordinated as to the payment of principal and profit to all other indebtedness of the Bank (including deposits) and is not redeemable before maturity without prior approval of the State Bank of Pakistan. Principal is redeemable semi-annually in such a way that 0.30% of the principal will be redeemed in the first 90 months and the remaining principal of 99.70% at maturity at the end of the 96th month in July 2023.
Mark-up is payable semi-annually in arrears calculated on a 365 days period on the outstanding principal amount and is chargeable at a floating rate of six months KIBOR (prevailing immediately preceding the date before the start of each six month period) plus 1.35% per annum (subject to no floor and cap).
The TFCs contains a lock-in clause which stipulates that neither interest nor principal may be paid (even at maturity) if such payments will result in shortfall in the Bank’s Minimum Capital Requirement (MCR) or Capital Adequacy Requirement (CAR) or increase any existing shortfall in MCR and CAR.
The instrument will be subject to loss absorbency and / or any other requirements under SBP’s Basel III Capital Rules. Upon the occurrence of a Point of Non-Viability event as defined by SBP’s Basel III Capital Rule, SBP may at its option, fully and permanently convert the TFCs into common shares of the Bank and / or have them immediately written off (either partially or in full). Number of shares to be issued to TFC Holders at the time of conversion will be equal to the ‘Outstanding Face Value of the TFC’ divided by market value per share of the Bank’s common equity on the date of trigger of the non-viability event as declared by SBP, subject to the cap of 225,000,000 shares.
Note 2017 2016 18 DEFERRED TAX LIABILITIES - NET ------- (Rupees in ‘000) -------
Deferred credits arising in respect of:Accelerated tax depreciation 356,881 326,408 Surplus on revaluation of operating fixed assets 21.1 717,598 442,284 Surplus on revaluation of available for sale securities 21.2 76,984 763,447
1,151,463 1,532,139 Deferred debits arising in respect of:Actuarial loss on defined benefit plan (23,185) (26,415)Provision against non-performing advances (192,567) (368,194)
(215,752) (394,609)
Deferred tax liabilities - net 935,711 1,137,530

Note 2017 2016 19 OTHER LIABILITIES ------- (Rupees in ‘000) -------
Mark-up / return / interest payable in local currency 965,633 1,046,386 Mark-up / return / interest payable in foreign currencies 28,081 37,192 Unearned commission and income on bills discounted 25,090 24,435 Unrealised loss on forward foreign exchange contracts - 6,911 Accrued expenses 442,935 471,720 Branch adjustment account - net 54,333 336,312 Payable to Workers’ Welfare Fund 19.1 441,856 382,357 Sundry deposits 453,197 370,072 Others 456,804 425,724
2,867,929 3,101,109
19.1 The Bank has made full provision for Workers Welfare Fund (WWF) based on profit for the respective years (2008-2017). The Supreme Court of Pakistan vide its order dated: 10 November, 2016 had held that the amendments made in the law introduced by the Federal Government for the levy of Workers Welfare Fund were not lawful. The Federal Board of Revenue has filed review petitions against this order which are currently pending. Legal advice obtained on the matter indicates that consequent to filing of these review petitions the judgment may not currently be treated as conclusive. Accordingly, the Bank continues to maintain the provision in respect of WWF.
20 SHARE CAPITAL
20.1 Authorised capital
2017 2016 2017 2016 (Number of shares) ------- (Rupees in ‘000) -------
1,500,000,000 1,500,000,000 Ordinary shares of Rs. 10/- each 15,000,000 15,000,000
20.2 Issued, subscribed and paid-up capital
2017 2016 2017 2016
Issued for cash
Issued as bonus
sharesTotal
Issued for cash
Issued as bonus
sharesTotal
Opening balance 387,397,655 715,065,828 1,102,463,483 387,397,655 715,065,828 1,102,463,483 11,024,636 11,024,636 Shares issued during the year - - - - - - - - Closing balance 387,397,655 715,065,828 1,102,463,483 387,397,655 715,065,828 1,102,463,483 11,024,636 11,024,636
20.3 Major shareholders as at 31 December 2017 are as follows:Number of Percentage of
Name of shareholder shares held shareholding
National Investment (Unit) Trust 108,015,049 9.80%Trustees - Alauddin Feerasta Trust 387,386,560 35.14%Trustees - Feerasta Senior Trust 128,006,009 11.61%Trustees - Alnu Trust 64,067,005 5.81%Mr. Amir Feerasta 62,140,630 5.64%
749,615,253 68.00%
Major shareholders as at 31 December 2016 were as follows:Number of Percentage of
Name of shareholder shares held shareholding
National Investment (Unit) Trust 117,680,572 10.67%Trustees - Alauddin Feerasta Trust 387,386,560 35.14%Trustees - Feerasta Senior Trust 128,006,009 11.61%Trustees - Alnu Trust 64,067,005 5.81%Mr. Amir Feerasta 62,140,630 5.64%
759,280,776 68.87%
---- (Rupees in ‘000) ----
----------------------------- Number of shares ----------------------------

Soneri Bank Limited | Annual Report 2017 | 107
Note 2017 2016 21 SURPLUS ON REVALUATION OF ASSETS (NET OF TAX) ------- (Rupees in ‘000) -------
- Operating fixed assets 21.1 1,919,917 926,626 - Available-for-sale securities 21.2 142,972 1,417,831
2,062,889 2,344,457 21.1 Surplus on revaluation of operating fixed assets - net of tax
Surplus on revaluation of operating fixed assets at 01 January 1,368,910 1,662,172 Adjustments arising in respect of revaluation of operating fixed assets 1,546,434 -
Transferred to unappropriated profit in respect of incremental depreciation charged on related assets - net of deferred tax (96,823) (120,097)Related deferred tax liability (52,135) (64,669)
(148,958) (184,766)
Realised on adjustment / disposal / write off during the year - net of deferred tax (83,766) (70,523)Related deferred tax liability on surplus reversed on adjustment / disposal / write off (45,105) (37,973)
(128,871) (108,496) 2,637,515 1,368,910
Related deferred tax liability on surplus at 01 January (442,284) (544,926)Related deferred tax liability in respect of incremental depreciation:
- Charged during the year 52,135 64,669 - In Respect of revaluation of operating fixed assets during the year (372,554) -
Related deferred tax liability on surplus reversed on adjustment / disposal / write off 45,105 37,973 Less: related deferred tax liability (717,598) (442,284)Surplus on revaluation of operating fixed assets at 31 December 1,919,917 926,626
21.2 Surplus / (deficit) on revaluation of available for sale securities - net of tax
Federal government securities 327,662 1,640,940 Sukuk certificates 29,325 32,624 Quoted shares (109,502) 485,556 Others - open ended mutual funds (27,529) 22,158
219,956 2,181,278 Related deferred tax liability (76,984) (763,447)
142,972 1,417,831 22 CONTINGENCIES AND COMMITMENTS
22.1 Direct credit substitutes
Financial guarantees issued favouring:- Government 1,549,322 1,972,010 - Others 1,062,235 1,983,754
2,611,557 3,955,764 22.2 Transaction-related contingent liabilities
Guarantees issued favouring:- Government 6,704,027 6,561,129 - Financial institutions 467,043 112,714 - Others 5,276,430 4,276,255
12,447,500 10,950,098 22.3 Trade-related contingent liabilities
Letters of credit 20,567,881 27,450,143
Acceptances 3,126,784 3,299,085
22.4 Commitments in respect of forward lendings
Commitments to extend credit 10,654,182 5,595,318
The Bank has certain other commitments to extend credit that represent revocable commitments and do not attract any significant penalty or expense in case the facility is withdrawn unilaterally.

2017 2016
22.5 Commitments in respect of forward foreign exchange contracts ------- (Rupees in ‘000) -------
Purchase
- From other banks 30,295,305 13,910,917
- From customers 2,643,340 4,250,556
32,938,645 18,161,473
Sale
- To other banks 28,212,490 13,246,036
- To customers 190,488 547,268
28,402,978 13,793,304
The maturities of the above contracts are spread over a period of one year.
22.6 Commitments in respect of purchase of operating fixed assets 666,359 194,207
22.7 Other contingencies
22.7.1 Taxation
(a) The Income tax returns of the Bank have been filed upto tax year 2017 (accounting year ended 31 December 2016). The Income tax authorities have issued amended assessment orders for tax years 2011, 2014, 2015 and 2016 and created additional tax demands of Rs. 588.931 million which have been fully paid as required under the law. The Bank has filed appeals before the various appellate forums against these amendments. Assessments from Tax Year 2001-2002 upto Tax Year 2010 have been decided at the level of Appellate Tribunal Inland Revenue. The department has filed tax references in respect of certain matters with the Honourable Lahore High Court which are currently pending. In case of any adverse decision an additional tax liability of Rs. 617.120 million (which includes impact of certain timing differences as well) may arise. Further, assessments for tax years 2012 and 2013 have been decided at the level of Commissioner Inland Revenue (Appeals). The department has filed appeals with Appellate Tribunal Inland Revenue which are, currently pending. In case of any adverse decision an additional tax liability of Rs. 866.384 million (which includes impact of certain timing differences as well) may arise. However, the management is confident that these matters will be ultimately decided in favor of the Bank and the Bank will not be exposed to any additional tax liability on these account.
(b) Tax Authorities have passed orders for tax years 2008 to 2012 levying Federal Excise Duty on certain items. The Bank has filed appeals against these assessments which are pending before various appellate forums. The aggregate net amount involved is Rs. 64.571 million. The management of the Bank is confident that the appeals will be decided in the favor of the Bank.
(c) Tax Authorities have passed orders for tax years 2014 and 2015 under section 161/205 of the Income Tax Ordinance 2001, creating a demand of Rs. 106.685 million and Rs. 67.672 million respectively for non-deduction of tax at source. Against the said demands, the Bank has already filed appeals before the Commissioner Inland Revenue (Appeals) which are currently pending.
22.7.2 Claims against the Bank not acknowledged as debts amounted to Rs 8.673 million (2016: Rs 2.400 million).
22.7.3 The Assistant Commissioner, Inland Revenue vide orders under section 182/140 of the Income Tax Ordinance, 2001 and under section 19 (6) of the Federal Excise Act, 2005 has levied penalties, against staff of the Bank amounting to Rs. 30 million and Rs. 246.014 million respectively. The action taken by the Bank in these cases were backed by legal opinion of the customer’s lawyer / stay order of the Islamabad High Court. Currently, the matter is pending before Commissioner Inland Revenue (Appeals) subsequent to appeal filed by the staff. In case of any adverse decision in appeals, the Bank reserves the right of recourse on customers for re-imbursement.
22.7.4 A penalty of Rs 50 million has been imposed by the Competition Commission of Pakistan (“the Commission”) on the Bank on account of uncompetitive behaviour and imposing uniform cost on cash withdrawal from ATM transactions. The Bank along with other banks had filed a constitutional petition before the Competition Appellate Tribunal which has set aside the order of the Commission. Against the said order of the Competition Appellate Tribunal, the Commission has filed an appeal before the Supreme Court of Pakistan, the hearing of which is currently pending.
22.7.5 Through the Finance Act, 2008 an amendment was made in the Employees Old Age Benefits Act, 1976 whereby the exemption available to banks and their employees was withdrawn by omission of clause (e) of Section 47 of the said Act and banks and their employees were made liable for contribution to Employee Old Age Benefit Institution. The Lahore High Court, subsequently, nullified the amendments made through the Finance Act, 2008.
Subsequently, several other banks also filed the Constitutional Petition before the Sindh High Court which decided the matter in favor of the banks. As a result of the decision of the Lahore High Court and Sindh High Court, the Bank stopped EOBI contribution w.e.f. February 2012. An appeal was filed by the EOBI in the Supreme Court of Pakistan which has been disposed off by the Honorable Court vide its order dated: 10 November 2016 in favor of the banks. However, EOBI has filed review Petition on 09 December 2016 before the Supreme Court of Pakistan which is currently pending.

Soneri Bank Limited | Annual Report 2017 | 109
In case of any adverse decision by the Supreme Court of Pakistan, a contribution of Rs.128.627 million (upto 31 December 2016: Rs. 102.489 million) will become payable by the Bank to the EOBI. The said amount of Rs.128.627 million has not been provided in these financial statements as the Bank is fully confident that the case will be decided in the Bank’s favour.
2017 2016
------- (Rupees in ‘000) -------
23 MARK-UP / RETURN / INTEREST EARNED
On loans and advances to customers 9,597,777 7,719,754
Ijarah income - net 25,357 10,206
On investments:
- Held-for-trading securities 1,045,371 141,630
- Available-for-sale securities 6,991,156 9,168,548
- Held-to-maturity securities 235,064 140,768
On deposits with financial institutions 94,513 30,907
On securities purchased under resale agreements 77,267 47,178
On placements and call money lendings 287,589 143,058
Income on bai muajjal placements 150,432 122,359
18,504,526 17,524,408
24 MARK-UP / RETURN / INTEREST EXPENSED
Deposits 8,329,920 8,006,336
Securities sold under repurchase agreements 2,812,472 2,124,075
Borrowings from the State Bank of Pakistan under various re-finance schemes 226,780 242,784
Borrowings from other financial institutions - Foreign 82,785 11,528
Borrowings from other financial institutions - Local 57,204 -
Call borrowings 111,980 66,447
Sub-ordinated loans 224,487 229,100
11,845,628 10,680,270
25 INCOME FROM DEALING IN FOREIGN CURRENCIES - NET
This includes conversion cost of foreign currency transactions into local currency funds (i.e. swap cost on foreign currency transactions) which amounts to Rs. 186.816 million (2016: Rs. 134.558 million).
2017 2016
------- (Rupees in ‘000) -------
26 GAIN ON SALE OF SECURITIES - NET
Gain / (loss) in respect of:
- Ordinary shares - listed equity securities 61,608 379,739
- Units of mutual funds 29,951 77,094
- Pakistan Investment Bonds 1,057,407 438,461
- Market Treasury Bills 5,680 16,456
- Term Finance Certificates 4,622 3,327
- GoP Ijarah Sukuks (1,024) 30,073
1,158,244 945,150
27 OTHER INCOME
Gain on sale of property and equipment 17,897 11,565
Gain on sale of non-banking assets - 600
Staff notice period and other recoveries 23,155 16,428
41,052 28,593
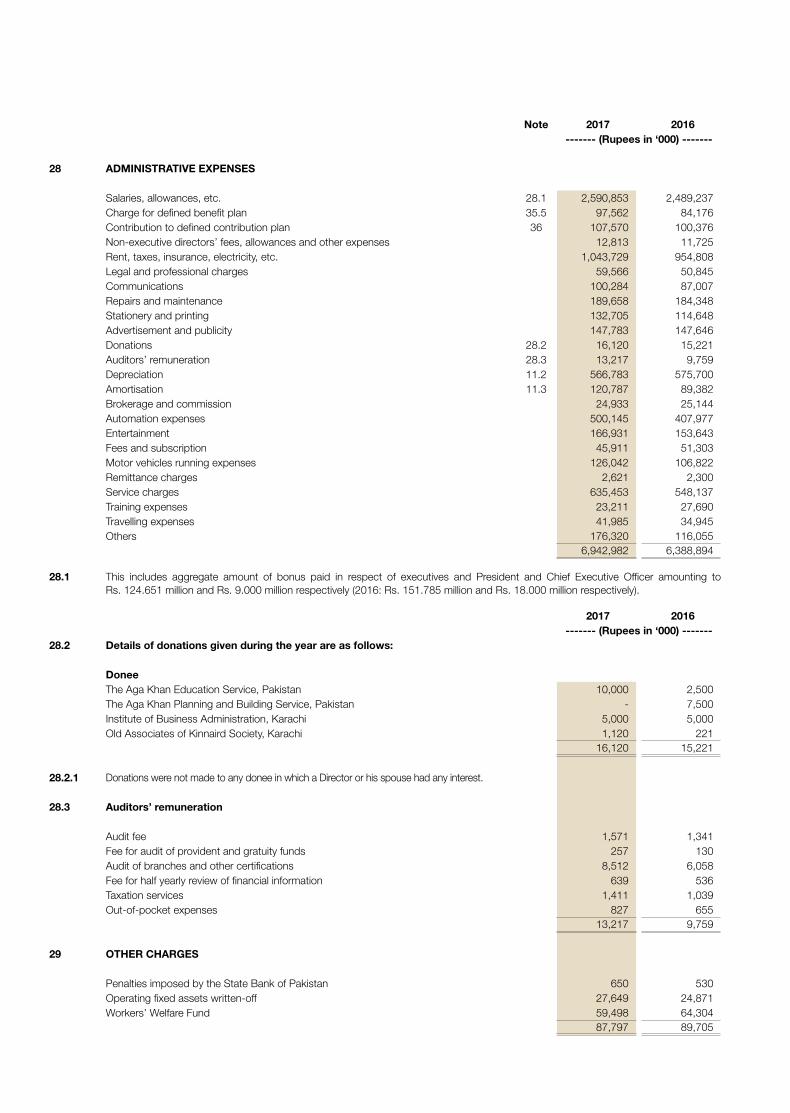
Note 2017 2016 ------- (Rupees in ‘000) -------
28 ADMINISTRATIVE EXPENSES
Salaries, allowances, etc. 28.1 2,590,853 2,489,237 Charge for defined benefit plan 35.5 97,562 84,176 Contribution to defined contribution plan 36 107,570 100,376 Non-executive directors’ fees, allowances and other expenses 12,813 11,725 Rent, taxes, insurance, electricity, etc. 1,043,729 954,808 Legal and professional charges 59,566 50,845 Communications 100,284 87,007 Repairs and maintenance 189,658 184,348 Stationery and printing 132,705 114,648 Advertisement and publicity 147,783 147,646 Donations 28.2 16,120 15,221 Auditors’ remuneration 28.3 13,217 9,759 Depreciation 11.2 566,783 575,700 Amortisation 11.3 120,787 89,382 Brokerage and commission 24,933 25,144 Automation expenses 500,145 407,977 Entertainment 166,931 153,643 Fees and subscription 45,911 51,303 Motor vehicles running expenses 126,042 106,822 Remittance charges 2,621 2,300 Service charges 635,453 548,137 Training expenses 23,211 27,690 Travelling expenses 41,985 34,945 Others 176,320 116,055
6,942,982 6,388,894
28.1 This includes aggregate amount of bonus paid in respect of executives and President and Chief Executive Officer amounting to Rs. 124.651 million and Rs. 9.000 million respectively (2016: Rs. 151.785 million and Rs. 18.000 million respectively).
2017 2016 ------- (Rupees in ‘000) -------
28.2 Details of donations given during the year are as follows:
DoneeThe Aga Khan Education Service, Pakistan 10,000 2,500 The Aga Khan Planning and Building Service, Pakistan - 7,500 Institute of Business Administration, Karachi 5,000 5,000 Old Associates of Kinnaird Society, Karachi 1,120 221
16,120 15,221
28.2.1 Donations were not made to any donee in which a Director or his spouse had any interest.
28.3 Auditors’ remuneration
Audit fee 1,571 1,341 Fee for audit of provident and gratuity funds 257 130 Audit of branches and other certifications 8,512 6,058 Fee for half yearly review of financial information 639 536 Taxation services 1,411 1,039 Out-of-pocket expenses 827 655
13,217 9,759
29 OTHER CHARGES
Penalties imposed by the State Bank of Pakistan 650 530 Operating fixed assets written-off 27,649 24,871 Workers’ Welfare Fund 59,498 64,304
87,797 89,705

Soneri Bank Limited | Annual Report 2017 | 111
Note 2017 2016 ------- (Rupees in ‘000) -------
30 TAXATION
For the yearCurrent 1,016,967 1,099,377 Deferred 12,934 (62,253)
1,029,901 1,037,124 For prior years
Current 30.1 16,711 161,371 Deferred 141,032 -
157,743 161,371
1,187,644 1,198,495
30.1 This includes Rs. 122.470 million (2016: Rs. 161.371 million) on account of super tax for rehabilitation of temporarily displaced person at the rate 4% of the taxable income for the tax year 2017 (accounting year ended 31 December 2016), which was re-imposed by Finance Act, 2017.
Note 2017 2016 ------- (Rupees in ‘000) -------
30.2 Relationship between tax expense and accounting profit
Profit before taxation 2,830,970 3,077,339
Tax at the applicable tax rate of 35% (2016: 35%) 990,840 1,077,069 Tax effect on permanent differences 2,440 2,013 Prior years 157,743 161,371 Others 36,621 (41,958)
1,187,644 1,198,495
31 BASIC AND DILUTED EARNINGS PER SHARE
Profit for the year after taxation 1,643,326 1,878,844
------ (Number of shares) ------
Weighted average number of ordinary shares 1,102,463,483 1,102,463,483
---------- (Rupees) ----------
Basic and diluted earnings per share 31.1 1.4906 1.7042
31.1 There were no convertible dilutive potential ordinary shares outstanding on 31 December 2017 and 2016.
Sub-Ordinated Loans
Other Liabilities - Mark-up Payable*
32 NET DEBT RECONCILIATION ------- (Rupees in ‘000) -------
Net debt as at 01 January 2017 2,998,800 107,463
Other non-cash movementsMark-up accrued - 224,487
Cash flowsPrincipal paid (1,200) - Mark-up paid - (223,073)
(1,200) (223,073)Net debt as at 31 December 2017 2,997,600 108,877
* Mark-up is covered under cash flow from operating activities.

Note 2017 2016 33 CASH AND CASH EQUIVALENTS ------- (Rupees in ‘000) -------
Cash and balances with treasury banks 6 19,431,256 18,278,840 Balances with other banks 7 1,151,015 822,689 Overdrawn nostro accounts 15.2 (277,249) (137,800)
20,305,022 18,963,729
2017 2016 34 STAFF STRENGTH (Numbers of employees)
Permanent 2,847 2,715 Temporary / on contractual basis 23 29 Bank’s own staff strength at the end of the year 2,870 2,744 Outsourced 34.1 1,151 981 Total staff strength at the end of the year 4,021 3,725
34.1 Outsourced represents employees hired by an outside contractor / agency and posted in the Bank to perform various tasks / activities of the Bank.
35 DEFINED BENEFIT PLAN
35.1 General description
As mentioned in note 5.9, the Bank operates a funded gratuity scheme for all its permanent employees. The benefits under the gratuity scheme are payable on retirement at the age of 60 or earlier cessation of service, in lump sum. The benefit (for all employees other than the President) is equal to one month’s last drawn basic salary for each year of eligible service with the Bank subject to a minimum qualifying period of service of five years. For the President, the benefit is determined as per the terms of his employment. The plan assets and defined benefit obligations are based in Pakistan.
35.2 Principal actuarial assumptions 2017 2016
a) Discount factor used (% per annum) 7.75 7.50b) Expected rate of salary increase (% per annum) 6.75 6.50c) Mortality rates (for death in service)* SLIC (2001-05)-1 SLIC (2001-05)-1d) Rate of employee turnover Ultra-Heavy Heavy
* Assumptions regarding future mortality are set based on actuarial advice in accordance with the published statistics and experience in Pakistan. The rates assumed are based on the State Life Insurance Corporation Limited [SLIC (2001 - 2005)] ultimate mortality tables rated down one year.
Note 2017 2016 35.3 Reconciliation of payable to defined benefit plan ------- (Rupees in ‘000) -------
Present value of defined benefit obligation 35.4 694,310 629,630 Fair value of plan assets 35.4 (694,310) (629,630)
- -
35.4 The movement in the defined benefit obligation is as follows:
2017
Present value of obligation
Fair value of plan assets
Total
----------------(Rupees in ‘000)----------------
As at 01 January 629,630 (629,630) - Current service cost 97,562 - 97,562 Interest expense / (income) 48,630 (48,630) -
775,822 (678,260) 97,562 Remeasurements:- Return on plan assets, excluding amounts included in interest expense - 11,694 11,694 - (Gain) / loss from change in financial assumptions 491 - 491 - (Gain) / loss from change in demographic assumptions 7,998 - 7,998 - (Gain) / loss from change in experience adjustments (29,412) - (29,412)
(20,923) 11,694 (9,229)
Contributions during the year - (88,333) (88,333)Benefit payments (60,589) 60,589 - As at 31 December 694,310 (694,310) -

Soneri Bank Limited | Annual Report 2017 | 113
2016
Present value of obligation
Fair value of plan assets
Total
----------------(Rupees in ‘000)----------------
As at 01 January 523,705 (523,705) - Current service cost 84,176 - 84,176 Interest expense / (income) 48,537 (48,537) -
656,418 (572,242) 84,176 Remeasurements:- Return on plan assets, excluding amounts included in interest income - (18,549) (18,549)- (Gain) / loss from change in financial assumptions 43,348 - 43,348 - (Gain) / loss from change in experience adjustments (6,262) - (6,262)
37,086 (18,549) 18,537
Contributions during the year - (102,713) (102,713)Benefit payments (63,874) 63,874 - As at 31 December 629,630 (629,630) -
2017 2016 ------- (Rupees in ‘000) -------
35.5 Charge for defined benefit plan
Current service cost 97,562 84,176 Interest cost 48,630 48,537 Expected return on plan assets (48,630) (48,537)
97,562 84,176
35.6 Composition of plan assets
As at 31 December 2017 As at 31 December 2016 Quoted Non-quoted Total Quoted Non-quoted Total
Cash and bank balances - 545,416 545,416 - 490,544 490,544 Equity instruments:- Mutual funds units and shares 141,474 - 141,474 131,556 - 131,556 Debt instruments:- Government - 7,420 7,420 - 7,530 7,530 - Corporates - - - - - -
141,474 552,836 694,310 131,556 498,074 629,630
35.7 Analysis of present value of defined benefit obligation 2017 2016----- (Rupees in ‘000) -----
Split by vested / non-vested(i) Vested benefits 622,730 543,514 (ii) Non-vested benefits 71,580 86,116
694,310 629,630
35.8 The plan assets and defined benefit obligations are based in Pakistan.
35.9 Historical information 2017 2016 2015 2014 2013 ------------------------------- (Rupees in ‘000) -----------------------------
Present value of defined benefit obligation 694,310 629,630 523,705 446,315 385,636 Fair value of plan assets (694,310) (629,630) (523,705) (446,315) (385,636)Surplus / (deficit) - - - - -
Experience adjustments on plan liabilities (20,923) 37,086 507 (5,922) 33,187 Experience adjustments on plan assets 11,694 (18,549) (6,237) (832) 4,341
(9,229) 18,537 (5,730) (6,754) 37,528
------------------------------------- (Rupees in ‘000) -------------------------------------

35.10 Actual return on plan assets during the year amounted to Rs 29.127 million (2016: Rs 76.163 million).
The Gratuity scheme exposes the Bank to the following risks:
Mortality risksThis is the risk that the actual mortality experience is different. The effect depends on the beneficiaries’ service / age distribution and the benefit.
Investment risksThis is the risk of the investment underperforming and not being sufficient to meet the liabilities.
Final salary risksThis is the risk that the final salary at the time of cessation of service is greater than what was assumed. Since the benefit is calculated on the final salary, the benefit amount increases similarly.
Withdrawal risksThis is the risk of higher or lower withdrawal experience than assumed. The final effect could go either way depending on the beneficiaries’ service / age distribution and the benefit.
35.11 The sensitivities of the defined benefit obligation to changes in the principal actuarial assumptions are as under:
As at 31 December 2017 As at 31 December 2016
ParticularsChange in
assumption
Increase / (decrease) in present value of defined benefit obligation Change in
assumption
Increase / (decrease) in present value of defined benefit obligation
(%) (Rupees in ‘000) (%) (Rupees in ‘000)
Discount rate +1% -4.91% (34,065) +1% -7.06% (44,422)-1% 5.45% 37,812 -1% 16.28% 102,492
Salary increase rate +1% 5.69% 39,520 +1% 8.37% 52,678 -1% -5.22% (36,227) -1% 4.52% 28,453
Mortality rate 1 year set back 0.00% 0.024 1 year set back 0.02% 115.28 1 year set forward -0.00% (24.551) 1 year set forward -0.02% (115.08)
The above sensitivities analyses are based on a change in an assumption while holding all other assumptions constant. When calculating the sensitivity of the defined benefit obligation to significant actuarial assumptions, the same method (present value of the defined benefit obligation calculated with the projected unit credit method at the end of the reporting period) has been applied when calculating the gratuity liability recognised within the statement of financial position.
35.12 The weighted average duration of the defined benefit obligation is 5.16 years (31 December 2016: 7.55 years).
35.13 Expected maturity analysis of undiscounted defined benefit obligation for the gratuity scheme is as follows:
As at 31 December 2017
Particulars Within ayear
Between 2 and 3 years
Between 4 and 5 years
Between 6 and 10 years
----------------------- (Rupees in ‘000) ------------------------
Defined benefit obligation 110,755 263,264 237,967 635,800
35.14 The expected gratuity expense for the next year commencing 01 January 2018 works out to be Rs 94.683 million (2016: Rs 97.562 million).
35.14.1 Gratuity expense for the year ended 31 December 2018 (Rupees in ‘000)
Service cost 94,683
Net Interest on the net defined benefit liability / (asset)
(i) Interest cost on defined benefit obligation 53,198
(ii) Interest income on plan assets (53,198)
(iii) Net Interest cost -
Gratuity cost to be recognised in the profit and loss account 94,683

Soneri Bank Limited | Annual Report 2017 | 115
35.15 The disclosures made in notes 35.1 to 35.14.1 are based on the information included in the independent actuarial valuation report of the Bank as of 31 December 2017.
36 DEFINED CONTRIBUTION PLAN
The Bank operates an approved funded provident fund scheme for all its permanent and confirmed employees. Equal monthly contributions are made, both by the Bank and its employees, to the fund at the rate of 8.33 percent (2016: 8.33 percent) of basic salaries of the employees. The contribution made by the Bank during the year amounted to Rs. 107.584 million (2016: Rs. 100.376 million each). The total number of employees as at 31 December 2017 eligible under the scheme were 2,379 (2016: 2,370 employees).
37 COMPENSATION OF DIRECTORS AND EXECUTIVES
President / Directors/Chief Executive Officer Executive Director * Executives
2017 2016 2017 2016 2017 2016-------------------------------------- (Rupees in ‘000) --------------------------------------
Fees - - 12,813 11,725 - - Managerial remuneration 34,764 39,272 9,744 - 831,618 687,860 Charge for defined benefit plan 4,138 4,968 1,011 - 74,445 66,910 Contribution to defined
contribution plan 2,896 3,271 812 - 62,512 51,939 Rent and house maintenance 15,644 17,672 3,897 - 324,922 269,675 Utilities 1,416 1,144 - - - - Medical 320 752 974 - 81,231 67,429 Leave encashment and others 1,235 1,279 2,758 - 334,222 273,351
60,413 68,358 32,009 11,725 1,708,950 1,417,164
Number of persons 1 1 8 7 965 738
* Executives mean employees, other than the Chief Executive Officer and directors, whose basic salary exceed five hundred thousand rupees in a financial year.
The aggregate amount charged to profit and loss account as remuneration to other key management personnel amounts to Rs. 228.896 million (2016: Rs. 221.340 million) respectively.
In addition to above, all executives and President / Chief Executive Officer of the Bank are also entitled to bonus which is disclosed in note 28.1 to these financial statements.
In addition, the Bank also provides club membership fee to its President / Chief Executive Officer, Executive Director and certain executives. The amount charged on account of club membership fee during the year amounted to Rs 0.927 million (2016: Rs 0.881 million). Furthermore, the President / Chief Executive Officer and Executive Director are also provided with free use of Bank maintained car in accordance with their entitlements.
38 FAIR VALUE MEASUREMENTS
38.1 Fair value is the price that would be received to sell an asset or paid to transfer a liability in an orderly transaction between market participants at the measurement date.
The fair values of traded investments are based on quoted market prices, except for tradable securities classified as ‘held-to-maturity’ which are carried at amortised cost.
The fair values of unquoted equity investments are determined on the basis of break-up values of these investments as per the latest available audited financial statements.
The fair values of fixed-term loans and deposits, other assets and other liabilities cannot be calculated with sufficient reliability due to absence of current and active market for such assets and liabilities and reliable data regarding market rates for similar instruments. The provision for impairment of loans and advances and investments have been calculated in accordance with the Bank’s accounting policy as stated in note 5.3 and 5.4 to these financial statements.
The repricing profile, effective interest rates and maturities are stated in note 43 to these financial statements.
In the opinion of the management, the fair value of the remaining financial assets and liabilities are not significantly different from their carrying values since these assets and liabilities are either short-term in nature or, in the case of financings and deposits, are periodically repriced.
2017 2016Book value Fair value Book value Fair value
38.2 Off-balance sheet financial instruments
Forward purchase of foreign exchange 32,938,645 34,001,944 18,161,473 18,049,972
Forward sale of foreign exchange 28,402,978 29,191,104 13,793,304 13,688,715
----------------------- (Rupees in ‘000) -----------------------

38.3 The table below analyses the financial and non-financial assets carried at fair values, by valuation methods. For financial assets, the Bank essentially carries its investments in debt and equity securities at fair values. Valuation of these investments is carried out as per guidelines specified by the SBP. In case of non-financial assets, such as land and building, the Bank has adopted revaluation model as per IAS 16.
The different levels have been defined as follows:
- Quoted prices (unadjusted) in active markets for identical assets or liabilities (level 1);
- Inputs other than quoted prices included within level 1 that are observable for the asset or liability, either directly (i.e. as prices) or indirectly (i.e. derived from prices) (level 2); and
- Inputs for the assets or liabilities that are not based on observable market data (i.e. unobservable inputs e.g. estimated future cash flows) (level 3).
2017 Level 1 Level 2 Level 3 Total
RECURRING FAIR VALUE MEASUREMENTS ----------------------- (Rupees in ‘000) -----------------------
Financial Assets - on balance sheetINVESTMENTS - NET
Held-for-trading securitiesMarket Treasury Bills - 10,525,166 - 10,525,166
Available-for-sale securitiesMarket Treasury Bills - 42,368,137 - 42,368,137 Pakistan Investment Bonds - 52,469,229 - 52,469,229 Government of Pakistan Ijarah Sukuks - 2,011,120 - 2,011,120 Sukuk certificates - 1,922,182 - 1,922,182 Term Finance Certificates - 250,000 - 250,000 Commercial Papers - 227,877 - 227,877 Fully paid-up ordinary shares - Listed 3,537,647 - - 3,537,647 Units of mutual funds 212,471 - - 212,471
Financial Assets - off balance sheetForward purchase of foreign exchange - 34,001,944 - 34,001,944 Forward sale of foreign exchange - 29,191,104 - 29,191,104
Non - Financial AssetsOperating fixed assets (land and buildings)* - - 4,180,054 4,180,054
3,750,118 172,966,759 4,180,054 180,896,931
2016 Level 1 Level 2 Level 3 Total
RECURRING FAIR VALUE MEASUREMENTS ----------------------- (Rupees in ‘000) -----------------------
Financial Assets - on balance sheetINVESTMENTS - NET
Available-for-sale securitiesMarket Treasury Bills - 44,147,931 - 44,147,931 Pakistan Investment Bonds - 63,679,488 - 63,679,488 Government of Pakistan Ijarah Sukuks - 2,139,500 - 2,139,500 Sukuk certificates - 1,985,953 - 1,985,953 Term Finance Certificates - 550,230 - 550,230 Fully paid-up ordinary shares - Listed 3,435,171 - - 3,435,171 Units of mutual funds 222,158 - - 222,158
Financial Assets - off balance sheetForward purchase of foreign exchange - 18,049,972 - 18,049,972 Forward sale of foreign exchange - 13,688,715 - 13,688,715
Non - Financial AssetsOperating fixed assets(land and buildings)* - - 2,789,558 2,789,558
3,657,329 144,241,789 2,789,558 150,688,676
* The Bank carries out periodic valuation of these assets for reasons disclosed in note 5.5 (a) to these financial statements.

Soneri Bank Limited | Annual Report 2017 | 117
The Bank’s policy is to recognise transfers into and out of the different fair value hierarchy levels at the date the event or change in circumstances that caused the transfer occurred. There were no transfers between levels 1 and 2 during the year.
(a) Financial instruments in level 1
Financial instruments included in level 1 comprise of investments in listed ordinary shares and units of mutual funds.
(b) Financial instruments in level 2
Financial instruments included in level 2 comprise of GoP Ijarah Sukuks, Pakistan Investment Bonds, Market Treasury bills, corporate bonds, term finance and sukuk certificates.
(c) Financial instruments in level 3
Financial instruments included in level 3 comprise of operating fixed assets (land and buildings).
Valuation techniques and inputs used in determination of fair values
Item Valuation techniques and input used
Fully paid-up ordinary sharesFair values of investments in listed equity securities are valued on the basis of closing quoted market prices available at the stock exchange.
Pakistan Investment Bonds / Market Treasury Bills
Fair values of Pakistan Investment Bonds and Treasury Bills are derived using the PKRV rates (Reuters page).
Government of Pakistan - Ijarah Sukuks
Fair values of GoP Ijarah Sukuks are derived using the PKISRV rates announced by the Financial Market Association (FMA) through Reuters. These rates denote an average of quotes received from nine different pre-defined / approved dealers / brokers.
Term Finance, Bonds and Sukuk certificates
Investments in debt securities (comprising term finance certificates, bonds, sukuk certificates and any other security issued by a company or a body corporate for the purpose of raising funds in the form of redeemable capital) are valued on the basis of the rates announced by the Mutual Funds Association of Pakistan (MUFAP) in accordance with the methodology prescribed by the Securities and Exchange Commission of Pakistan. In the determination of the rates, the MUFAP takes into account the holding pattern of these securities and categorises them as traded, thinly traded and non-traded securities.
Units of mutual fundsFair values of investments in units of mutual funds are determined based on redemption prices as at the close of the business day.
Operating fixed assets (land and buildings)
Land and buildings are revalued on a periodic basis using professional valuers. The valuation is based on their assessment of the market value of the assets. The effect of changes in the unobservable inputs used in the valuations cannot be determined with reasonable certainty. Accordingly, a qualitative disclosure of sensitivity has not been presented in these financial statements.
38.4 The following table presents the changes in level 3 items for the years ended 31 December 2016 and 31 December 2017 for recurring fair value measurements:
Freeholdland
Leasehold land
Building on freehold land
Building on leasehold land Total
Opening balance 01 January 2016 923,215 186,967 109,504 1,896,689 3,116,375 Acquisitions 12,840 - 160 13,290 26,290 Disposals - - - (239,504) (239,504)Amounts recognised in profit and loss account
for depreciation and impairment - - (9,547) (104,056) (113,603)Gains recognised in “Surplus on Revaluation
of Operating Fixed Assets” - - - - - Closing balance 31 December 2016 936,055 186,967 100,117 1,566,419 2,789,558
Acquisitions - - 22,772 28,523 51,295 Disposals - - - - - Amounts recognised in profit and loss account
for depreciation and impairment - - (9,899) (197,334) (207,233)Gains recognised in “Surplus on Revaluation
of Operating Fixed Assets” 319,915 162,080 26,478 1,037,961 1,546,434 Closing balance 31 December 2017 1,255,970 349,047 139,468 2,435,569 4,180,054

39 SEGMENT DETAILS WITH RESPECT TO BUSINESS ACTIVITIES
The segment analysis with respect to business activities is as follows:
Corporate Trading and Retail Others TotalSales Banking
------------------- (Rupees in ‘000) --------------------------------31 December 2017Total income 6,339,813 10,274,190 5,140,273 19,548 21,773,824Total expenses (excluding provisions) 5,419,506 7,987,205 4,508,730 960,966 18,876,407Profit / (loss) before provisions and taxation 920,307 2,286,985 631,543 (941,418) 2,897,417Provisions / (reversal of provision) 281,493 - (215,046) - 66,447Profit / (loss) before taxation 638,814 2,286,985 846,589 (941,418) 2,830,970Segment assets (gross) 114,478,717 118,256,543 91,129,090 7,022,670 330,887,020Segment non-performing assets 3,404,204 40,159 7,061,230 12,605 10,518,198Segment provision required * 2,567,759 40,159 6,132,521 12,605 8,753,044Segment liabilities 18,532,477 53,358,903 226,684,034 5,053,963 303,629,377Segment return on net assets (ROA) (%)** 0.57% 1.93% 1.00% (13.43%) 0.88%Segment cost of funds (%)*** 4.08% 5.49% 3.73% 7.49% 4.13%
Corporate Trading and Retail Others TotalSales Banking
------------------------------ (Rupees in ‘000) --------------------------------31 December 2016Total income 4,873,143 10,860,845 4,507,613 19,044 20,260,645Total expenses (excluding provisions) 4,428,198 7,765,688 3,833,912 1,131,101 17,158,899Profit / (loss) before provisions and taxation 444,945 3,095,157 673,701 (1,112,057) 3,101,746Provisions / (reversal of provision) 353,245 - (328,838) - 24,407Profit / (loss) before taxation 91,700 3,095,157 1,002,539 (1,112,057) 3,077,339Segment assets (gross) 83,937,044 119,143,711 79,330,566 4,827,017 287,238,338Segment non-performing assets 3,096,799 40,159 7,540,218 12,605 10,689,781Segment provision required * 2,260,294 40,159 6,404,574 12,605 8,717,632Segment liabilities 19,903,826 29,924,207 205,911,614 4,491,832 260,231,479Segment return on net assets (ROA) (%)** 0.11% 2.60% 1.37% (23.10%) 1.10%Segment cost of funds (%)*** 4.78% 5.98% 3.92% 7.64% 4.33%
* The provision against each segment represents provision held against advances, investments and other assets.** Segment ROA= Net income / (Segment Assets - Segment Provisions) computed on cut-off balances.
*** Segment cost of funds have been computed based on the average balances.
39.1 The above analysis includes allocation of items as per the approved mapping policy of the Bank. Prior year figures have been re-arranged for comparison.
40 TRUST ACTIVITIES
The Bank commonly acts as a trustee and in other fiduciary capacity that results in the holding or placing of assets on behalf of individuals, trusts, retirement benefit plans and other institutions. These are not the assets of the Bank and, therefore, are not included in the Statement of Financial Position. The following is the list of assets held under trust:
Category Type No. of IPS accounts Face Value2017 2016 2017 2016
------ (Rupees in ‘000) ------
Asset Management Companies Ijarah Sukuk 3 years 3 3 19,000 19,000 Employee Funds / NGO’s PIB 3 years 1 5 170,500 217,500 Employee Funds / NGO’s MTB 6 months 2 2 160,000 120,000 Individuals MTB 3 to 6 months 1 - 10,100 - Individuals MTB 12 months - 1 - 330,000 Individuals PIB 3 years - 2 - 62,000 Individuals PIB 5 years 1 1 5,000 5,000 Individuals PIB 10 years 3 3 45,400 45,400 Individuals PIB 20 years 1 1 10,000 10,000 Corporate MTB 3 months 1 - 3,150,000 - Corporate PIB 3 years - 1 - 20,000 Corporate PIB 5 years 1 1 12,000 12,000 Staff retirement funds - related party PIB 15 to 20 years 2 2 18,000 18,000 Bank’s executive - related party MTB 3 to 6 months - 1 - 10,000
16 23 3,600,000 868,900

Soneri Bank Limited | Annual Report 2017 | 119
41 RELATED PARTY TRANSACTIONS
The related parties of the Bank comprise related group companies, major shareholders, directors and their close family members (including their associates), staff retirement funds and key management personnel.
Usual transactions with related parties include deposits, advances, acceptances and provision of other banking services which are carried out in accordance with agreed terms. Transactions with executives are undertaken at terms in accordance with employment agreements and services rules and include provision of advances on terms softer than those offered to the customers of the Bank. Contributions to and accruals in respect of staff retirement benefit plans are made in accordance with the actuarial valuation / terms of the benefit plan as disclosed in notes 35 and 36. Remuneration to the key management personnel is disclosed in note 37 to these financial statements. Assets held under trust are disclosed in note 40 to these financial statements. Loans and advances to directors and associated companies are disclosed in note 10.9 to these financial statements.
The details of transactions with related parties during the year other than those which have been disclosed else where in these financial statements, are as follows:
Key management personnel Other related parties
Bank’s Chief Executive
Officer / Executives
Directors and their
close family members
Related Group
Companies
Major
Shareholders
Staff retirement
funds
2017 2016*** 2017 2016*** 2017 2016*** 2017 2016*** 2017 2016***
--------------------------------------------------- (Rupees in ‘ 000) ---------------------------------------------------
Deposits
Balance at the beginning of the year 111,243 102,166 419,458 389,299 698,357 614,015 943,607 930,734 955,865 307,666
Placement during the year 360,800 461,622 1,363,117 1,064,973 55,578,161 48,430,789 7,958,523 6,662,800 1,433,416 1,682,409
Transfer in * - 71 85,040 - - - - - - -
Withdrawal during the year (334,961) (452,599) (1,547,590) (1,034,814) (55,403,427) (48,346,447) (6,714,214) (6,649,927) (1,104,979) (1,034,210)
Transfer out ** (90,755) (17) (84,681) - (22,134) - - - - -
Balance at the end of the year 46,327 111,243 235,344 419,458 850,957 698,357 2,187,916 943,607 1,284,302 955,865
Advances
Balance at the beginning of the year 167,260 168,716 4,000 12,300 - - - - - -
Disbursements during the year 30,380 22,715 500 4,000 - - - - - -
Transfer in * - 8,841 - - - - - - - -
Repayments during the year (41,370) (24,588) (1,000) (12,300) - - - - - -
Transfer out ** (45,415) (8,424) - - - - - - - -
Balance at the end of the year 110,855 167,260 3,500 4,000 - - - - - -
Profit / interest expense on deposits 1,403 5,817 21,022 25,684 56,000 58,639 74,612 79,777 57,837 38,739
Mark-up / return / interest earned 8,022 9,278 289 295 - - - - - -
Commission / brokerage bank
charges recovered 68 55 34 38 286 321 6 6 - -
Transaction-related contingent liabilities - - - - - 763 - - - -
Other administrative expenses - - - - 13,893 9,009 - - - -
Investments - - - - - - 240,000 200,000 - -
Other receivables - - - - 437,365 - - - - -
Donation - - - - - 345 - - - -
* This represents balances pertaining to parties that became related during the current year.
** This represents balances pertaining to parties that ceased to be related during any part of the current year.
*** During the current year, the scope of related party definition was internally examined by the management in the light of applicable regulations and necessary adjustments have been
made in the prior period balances / transactions.

42 CAPITAL ADEQUACY
42.1 Capital Management
The State Bank of Pakistan (SBP) introduced guidelines with respect to disclosure of capital adequacy related information in the financial statements of banks vide its communication dated: 04 February 2014. These guidelines are based on the requirements of Basel III which were introduced earlier by the SBP in August 2013 for implementation by the banks in Pakistan. The SBP has specified a transitional period till 2018 for implementation of Basel III guidelines. The SBP vide its BPRD Circular No. 11 of 2014 dated: 05 November 2014 revised the disclosure requirements with respect to capital adequacy related information. The disclosures below have been prepared on the basis of the SBP’s circular.
The objective of managing capital is to safeguard the Bank’s ability to continue as a going concern, so that it could continue to provide adequate returns to shareholders by pricing products and services commensurating with the level of risk. It is the policy of the Bank to maintain adequate capital base so as to maintain investor, creditor and market confidence and to support future development of the business. The impact of the level of capital on shareholders’ return is also recognised and the Bank recognises the need to maintain a balance between the higher returns that might be possible with greater gearing and the advantages and security afforded by a sound capital position.
Goals of managing capital
The goals of capital management are as follows:
- To be an appropriately capitalised institution, as defined by regulatory authorities and in accordance with risk profile;
- Maintain strong ratings and protect the Bank against unexpected events;
- Ensure availability of adequate capital (including the quantum) at a reasonable cost so as to enable the Bank to expand; and achieve overall low cost of capital with appropriate mix of capital elements.
Statutory minimum capital requirement and management of capital
The State Bank of Pakistan requires all banks to have minimum paid up capital (net of losses) of Rs. 10 billion. The paid up capital of the Bank for the year ended 31 December 2017 stood at Rs. 11,024.636 million. In addition banks are also required to maintain a minimum Capital Adequacy Ratio (CAR) of 11.275 percent of the risk weighted exposure of the Bank as at 31 December 2017. The Bank’s CAR as at 31 December 2017 was approximately 12.77 percent of its risk weighted exposure.
The capital of the Bank is managed keeping in view the minimum “Capital Adequacy Ratio” required by the SBP through BPRD Circular No. 06 dated: 15 August 2013. The adequacy of the capital is measured with reference to the risk-weighted assets of the Bank.
The required capital adequacy ratio is achieved by the Bank through improvement in the asset quality, ensuring better recovery management and striking balance with low risk assets. Banking operations are categorised as either trading book or banking book and risk-weighted assets are determined according to specified requirements of the State Bank of Pakistan that seek to reflect the varying levels of risk attached to assets and off-balance sheet exposures. The total risk-weighted exposures comprise the credit risk, market risk and operational risk.
For the purpose of calculating capital under the capital adequacy framework, the capital of the bank is classified in two tiers as per the Basel III framework. The total regulatory capital consists of the sum of Tier 1 Capital and Tier 2 Capital. Tier 1 Capital includes Common Equity Tier 1 (CET1) and Additional Tier 1 Capital (AT1). CET1 of the Bank includes the sum of fully paid up capital, balance in share premium, reserves for issuance of bonus share, general / statutory reserves as disclosed in the balance sheet, un-appropriated profit, less regulatory adjustments. The Bank’s common shares are perpetual in nature and have the last subordination in case of liquidation.
AT1 capital includes instruments issued by the banks that meet the qualifying criteria for AT1, share premium resulting from the issuance of AT1 instruments less regulatory adjustments applicable on AT1 capital. The Bank has not allocated any AT1 capital.
Tier 2 capital includes subordinated debt / Instruments, share premium resulting from the issue of instruments included in Tier 2, Revaluation Reserves (net of deficits, if any), General Provisions or General Reserves for loan losses, Foreign Exchange Translation Reserves, Undisclosed Reserves less regulatory adjustments applicable on Tier-2 capital. The Bank Tier-2 capital comprises subordinated Term Finance Certificates (TFCs’) of Rs. 2.998 billion, revaluation reserve (upto a maximum of 89% net of taxes of the balance in the related revaluation reserve) and general provisions for loan losses.
The calculation of capital adequacy enables the Bank to assess its long-term soundness. As the Bank carries on the business on a wide area network basis, it is critical that it is able to continuously monitor the exposure across the entire organisation and aggregate the risks so as to take an integrated approach / view.

Soneri Bank Limited | Annual Report 2017 | 121
42.2 Capital Adequacy Ratio (CAR) disclosure
2017 2016 Particulars Amount
------- (Rupees in ‘000) -------Common Equity Tier 1 capital (CET1): Instruments and reservesFully paid-up capital / capital deposited with the SBP 11,024,636 11,024,636 Balance in share premium account - - Reserve for issue of bonus shares - - Discount on issue of shares - - General / Statutory Reserves 1,752,494 1,423,829 Gain / (Losses) on derivatives held as Cash Flow Hedge - - Unappropriated profits 3,664,580 3,496,305 Minority Interests arising from CET1 capital instruments issued
to third party by consolidated bank subsidiaries (amount allowed in CET1 capital of the consolidation group) - -
CET 1 before Regulatory Adjustments 16,441,710 15,944,770 Total regulatory adjustments applied to CET1 (Note 42.2.1) (479,111) (615,993)Common Equity Tier 1 15,962,599 15,328,777
Additional Tier 1 (AT 1) CapitalQualifying Additional Tier-1 capital instruments plus any related share premium of which: - -
- classified as equity - - - classified as liabilities - -
Additional Tier-1 capital instruments issued by consolidated subsidiaries and held by third parties - - - of which: instrument issued by subsidiaries subject to phase out - -
AT1 before regulatory adjustments - - Total of Regulatory Adjustment applied to AT1 capital (Note 42.2.2) - - Additional Tier 1 capital after regulatory adjustments - - Tier 1 Capital (CET1 + admissible AT1) 15,962,599 15,328,777
Tier 2 CapitalQualifying Tier 2 capital instruments under Basel III plus any related share premium - - Capital instruments subject to phase out arrangement issued 2,997,600 2,998,800 Tier 2 capital instruments issued to third parties by consolidated subsidiaries - -
- of which: instruments issued by subsidiaries subject to phase out - - General Provisions or general reserves for loan losses-up to maximum
of 1.25% of Credit Risk Weighted Assets 38,675 51,340 Revaluation Reserves (net of taxes)of which:
- Revaluation reserves on fixed assets 1,708,726 722,768 - Unrealized gains / losses on AFS 127,245 1,105,908
Foreign Exchange Translation Reserves - - Undisclosed/Other Reserves (if any) - - T2 before regulatory adjustments 4,872,246 4,878,816 Total regulatory adjustment applied to T2 capital (Note 42.2.3) (149,880) (208,871)Tier 2 capital (T2) after regulatory adjustments 4,722,366 4,669,945 Tier 2 capital recognized for capital adequacy 4,722,366 4,669,945 Portion of Additional Tier 1 capital recognized in Tier 2 capital - - Total Tier 2 capital admissible for capital adequacy 4,722,366 4,669,945 TOTAL CAPITAL (T1 + admissible T2) 20,684,965 19,998,722
Total Risk Weighted Assets (RWA) {for details refer Note 42.3.4} 161,970,856 141,609,046
Capital Ratios and buffers (in percentage of risk weighted assets)CET1 to total RWA 9.86% 10.82%Tier-1 capital to total RWA 9.86% 10.82%Total capital to total RWA 12.77% 14.12%Bank specific buffer requirement (minimum CET1 requirement plus capital - -
conservation buffer plus any other buffer requirement) of which:- capital conservation buffer requirement - - - countercyclical buffer requirement - - - D-SIB or G-SIB buffer requirement - -
CET1 available to meet buffers (as a percentage of risk weighted assets) 3.86% 4.82%

2017 2016
Particulars Amount Pre-Basel III treatment*
Amount Pre-Basel III treatment*
------------- (Rupees in ‘000) -------------
42.2.1 Common Equity Tier 1 capital: Regulatory adjustments
Goodwill (net of related deferred tax liability) - - - - All other intangibles (net of any associated deferred tax liability) 446,048 - 403,363 - Shortfall of provisions against classified assets** - - - - Deferred tax assets that rely on future profitability excluding those
arising from temporary differences (net of related tax liability) - - - - Defined-benefit pension fund net assets - - - - Reciprocal cross holdings in CET1 capital instruments 33,063 - 117,980 - Cash flow hedge reserve - - - - Investment in own shares / CET1 instruments - - - - Securitization gain on sale - - - - Capital shortfall of regulated subsidiaries - - - - Deficit on account of revaluation from Bank’s holdings of property / AFS - - - - Investments in the capital instruments of banking, financial and insurance
entities that are outside the scope of regulatory consolidation, where theBank does not own more than 10% of the issued share capital (amount above 10% threshold) - - 94,650 -
Significant investments in the common stocks of banking, financial andinsurance entities that are outside the scope of regulatory consolidation (amount above 10% threshold) - - - -
Deferred Tax Assets arising from temporary differences (amountabove 10% threshold, net of related tax liability) - - - -
Amount exceeding 15% threshold of which:- significant investments in the common stocks of financial entities - - - - - deferred tax assets arising from temporary differences - - - - National specific regulatory adjustments applied to CET1 capital - - - - Investment in TFCs of other banks exceeding the prescribed limit - - - - Any other deduction specified by SBP - - - - Regulatory adjustment applied to CET1 due to insufficient AT1 and
Tier 2 to cover deductions - - - - Total regulatory adjustments applied to CET1 479,111 - 615,993 -
42.2.2 Additional Tier 1 Capital: regulatory adjustments
Investment in mutual funds exceeding the prescribed limit (SBP specific - - - - adjustment)
Investment in own AT1 capital instruments - - - - Reciprocal cross holdings in Additional Tier 1 capital instruments - - - -
Investments in the capital instruments of banking, financial and insuranceentities that are outside the scope of regulatory consolidation, wherethe Bank does not own more than 10% of the issued share capital(amount above 10% threshold) - - - -
Significant investments in the capital instruments issued by banking,financial and insurance entities that are outside the scope ofregulatory consolidation - - - -
Portion of deduction applied 50:50 to core capital and supplementarycapital based on pre-Basel III treatment which, during transitionalperiod, remain subject to deduction from tier-1 capital - - - -
Regulatory adjustments applied to Additional Tier 1 due to insufficientTier 2 to cover deductions - - - -
Total of Regulatory Adjustment applied to AT1 capital - - - -
2017 2016 Particulars Amount
------- (Rupees in ‘000) -------National minimum capital requirements prescribed by SBPCET1 minimum ratio 6.00% 6.00%Tier 1 minimum ratio 7.50% 7.50%Total capital minimum ratio 11.275% 10.65%

Soneri Bank Limited | Annual Report 2017 | 123
* This column highlights items that are still subject to Pre Basel III treatment during the transitional period.** State Bank of Pakistan has granted relaxation in respect of provision held against a customer as disclosed in note 10.6. State Bank of
Pakistan has allowed the Bank to avail this relaxation in calculation of capital adequacy ratio.
2017 2016
Particulars Amount Pre-Basel III treatment*
Amount Pre-Basel III treatment*
------------- (Rupees in ‘000) -------------
42.2.3 Tier 2 Capital: regulatory adjustments
Portion of deduction applied 50:50 to core capital and supplementarycapital based on pre-Basel III treatment which, during transitionalperiod, remain subject to deduction from tier-2 capital - - - -
Reciprocal cross holdings in Tier 2 instruments 149,880 - - - Investment in own Tier 2 capital instrument - - - - Investments in the capital instruments of banking, financial and insurance
entities that are outside the scope of regulatory consolidation, wherethe Bank does not own more than 10% of the issued share capital(amount above 10% threshold) - - 208,871 -
Significant investments in the capital instruments issued by banking,financial and insurance entities that are outside the scope ofregulatory consolidation - - - -
Amount of Regulatory Adjustment applied to T2 capital 149,880 - 208,871 -
* This column highlights items that are still subject to Pre Basel III treatment during the transitional period.
2017 201642.2.4 Risk Weighted Assets subject to pre-Basel III treatment ---- (Rupees in ‘000) ----
Risk weighted assets in respect of deduction items (which during the transitional - - period will be risk weighted subject to Pre-Basel III Treatment)
of which: deferred tax assets - - of which: defined-benefit pension fund net assets - - of which: recognized portion of investment in capital of banking, financial and
insurance entities where holding is less than 10% of the issued commonshare capital of the entity - -
of which: recognized portion of investment in capital of banking, financial andinsurance entities where holding is more than 10% of the issued commonshare capital of the entity - -
Amounts below the thresholds for deduction (before risk weighting)Non-significant investments in the capital of other financial entities - - Significant investments in the common stock of financial entities - - Deferred tax assets arising from temporary differences (net of related tax liability) - -
Applicable caps on the inclusion of provisions in Tier 2Provisions eligible for inclusion in Tier 2 in respect of exposures subject
to standardized approach (prior to application of cap) - - Cap on inclusion of provisions in Tier 2 under standardized approach - - Provisions eligible for inclusion in Tier 2 in respect of exposures subject
to internal ratings-based approach (prior to application of cap) - - Cap for inclusion of provisions in Tier 2 under internal ratings-based approach - -
42.2.5 Leverage ratio
According to Basel III instructions issued by State Bank of Pakistan (BPRD Circular no. 06 dated: 15 August 2013), it is mandatory for all the banks to calculate and report the Leverage Ratio on a quarterly basis with the minimum benchmark of 3%.
The reason for calculating leverage ratio is to avoid excessive on- and off-balance sheet leverage in the banking system. A simple, transparent and non-risk based ratio has been introduced with the following objectives:
- Constrain the build-up of leverage in the banking sector which can damage the broader financial system and the economy; and
- Reinforce the risk based requirements with an easy to understand and a non-risk based measure.

Particulars2017 2016
---- (Rupees in ‘000) ----
On balance sheet exposures
1 On-balance sheet items (excluding derivatives but including collateral) 321,693,540 278,520,706
2 Derivatives (forward contracts and currency swaps) 1,019,454 114,609
3 Total on balance sheet exposures 322,712,994 278,635,315
Off balance sheet exposures
4 Off-balance sheet items (excluding derivatives) 58,309,244 58,948,414
5 Commitment in respect of derivatives (derivatives having negative fair value are also included) 591,110 308,766
6 Total off balance sheet exposures 58,900,354 59,257,180
Capital and total exposures
7 Tier 1 capital (Note 42.2) 15,962,599 15,328,777
8 Total exposures (sum of lines 3 and 6) 381,613,348 337,892,495
Basel III leverage ratio 4.18% 4.54%
The current year’s leverage ratio is 4.18% (2016: 4.54%) whereas total tier 1 capital and total exposures are Rs. 15,962.599 million and Rs 381,613.348 million respectively.
42.3 Capital Structure Reconciliation
42.3.1 Reconciliation of each financial statement line item to item under regulatory scope of reporting - Step 1
Particulars
Balance sheet as in published financial
statements
Under regulatory scope of reporting
---- (Rupees in ‘000) ----
Assets
Cash and balances with treasury banks 19,431,256 19,431,256
Balances with other banks 1,151,015 1,151,015
Lending to financial institutions 6,544,152 6,544,152
Investments 117,428,516 117,428,516
Advances 164,292,915 164,292,915
Operating fixed assets 6,581,465 6,581,465
Deferred tax assets - -
Other assets 6,704,657 6,704,657
Total assets 322,133,976 322,133,976
Liabilities and Equity
Bills payable 4,895,447 4,895,447
Borrowings 64,584,236 64,584,236
Deposits and other accounts 227,348,454 227,348,454
Sub-ordinated loans 2,997,600 2,997,600
Liabilities against assets subject to finance lease - -
Deferred tax liabilities 935,711 935,711
Other liabilities 2,867,929 2,867,929
Total liabilities 303,629,377 303,629,377
Share capital 11,024,636 11,024,636
Reserves 1,752,494 1,752,494
Unappropriated profit 3,664,580 3,664,580
Surplus on revaluation of assets - net of tax 2,062,889 2,062,889
Total liabilities and equity 322,133,976 322,133,976

Soneri Bank Limited | Annual Report 2017 | 125
42.3.2 Reconciliation of balance sheet to eligible regulatory capital - Step 2
Particulars Reference
Balance sheet as in published financial
statements
Under regulatory scope of reporting
---- (Rupees in ‘000) ----AssetsCash and balances with treasury banks 19,431,256 19,431,256 Balances with other banks 1,151,015 1,151,015 Lending to financial institutions 6,544,152 6,544,152
Investments 117,428,516 117,428,516 of which:- non-significant capital investments in capital of other financial
institutions exceeding 10% threshold a - - - significant capital investments in financial sector entities
exceeding regulatory threshold b - - - mutual funds exceeding regulatory threshold c - - - reciprocal crossholding of capital instrument d 182,943 182,943 - others e - - Advances 164,292,915 164,292,915 - shortfall in provisions / excess of total EL amount
over eligible provisions under IRB f - - - general provisions reflected in Tier 2 capital g - - Operating fixed assets 6,581,465 6,581,465 - of which: Intangibles k 446,048 446,048
Deferred tax assets - - of which:- DTAs that rely on future profitability excluding those arising from temporary differences h - - - DTAs arising from temporary differences exceeding regulatory threshold i - - Other assets 6,704,657 6,704,657 of which:- goodwill j - - - defined-benefit pension fund net assets l - - Total assets 322,133,976 322,133,976
Liabilities and EquityBills payable 4,895,447 4,895,447 Due from financial institutions 64,584,236 64,584,236 Deposits and other accounts 227,348,454 227,348,454 Sub-ordinated loans of which: 2,997,600 2,997,600 - eligible for inclusion in AT1 m - - - eligible for inclusion in Tier 2 n 2,997,600 2,997,600 Liabilities against assets subject to finance lease - - Deferred tax liabilities of which: 935,711 935,711 - DTLs related to goodwill o - - - DTLs related to intangible assets p - - - DTLs related to defined pension fund net assets q - - - other deferred tax liabilities r 935,711 935,711 Other liabilities 2,867,929 2,867,929 Total liabilities 303,629,377 303,629,377
Share capital 11,024,636 11,024,636 - of which: amount eligible for CET1 s 11,024,636 11,024,636 - of which: amount eligible for AT1 t - - Reserves of which: 1,752,494 1,752,494 - portion eligible for inclusion in CET1 - Statutory reserve u 1,752,494 1,752,494 - portion eligible for inclusion in CET1 - General reserve - - - portion eligible for inclusion in Tier 2 - General reserve v - -
Discount on issue of shares - -

Particulars Reference
Balance sheet as in published financial
statements
Under regulatory scope of reporting
---- (Rupees in ‘000) ----
Unappropriated profit w 3,664,580 3,664,580 Minority Interest of which: - - - portion eligible for inclusion in CET1 x - - - portion eligible for inclusion in AT1 y - - - portion eligible for inclusion in Tier 2 z - - Surplus on revaluation of assets of which: 2,062,889 2,062,889 - revaluation reserves on fixed assets 1,919,917 1,919,917 - unrealized gains/losses on AFS aa 142,972 142,972 - in case of deficit on revaluation (deduction from CET1) ab - - Total liabilities and equity 322,133,976 322,133,976
42.3.3 Basel III Disclosure (with added column) - Step 3
Particulars
Source based on reference
number from step 2
Component of regulatory
capital reported by
Bank
------ (Rupees in ‘000) ------ Common Equity Tier 1 capital (CET1): Instruments and reserves
1 Fully paid-up capital
(s)
11,024,636 2 Balance in share premium account - 3 Discount on issue of shares - 4 Reserve for issue of bonus shares - 5 General / Statutory Reserves
(u) 1,752,494
6 Gain / (Losses) on derivatives held as cash flow hedge - 7 Unappropriated / unremitted profits (w) 3,664,580 8 Minority Interests arising from CET1 capital instruments issued to third
party by consolidated bank subsidiaries (amount allowed in CET1 capital of the consolidation group) (x) - 9 CET 1 before regulatory adjustments 16,441,710
Common Equity Tier 1 capital: Regulatory adjustments10 Goodwill (net of related deferred tax liability) (j) - (s) - 11 All other intangibles (net of any associated deferred tax liability) (k) - (p) 446,048 12 Shortfall of provisions against classified assets (f) - 13 Deferred tax assets that rely on future profitability excluding those arising -
from temporary differences (net of related tax liability) (h) - (r) * x% - 14 Defined-benefit pension fund net assets (l) - (q) * x% - 15 Reciprocal cross holdings in CET1 capital instruments (d) 33,063 16 Cash flow hedge reserve - 17 Investment in own shares / CET1 instruments - 18 Securitization gain on sale - 19 Capital shortfall of regulated subsidiaries - 20 Deficit on account of revaluation from Bank’s holdings of property / AFS (ab) - 21 Investments in the capital instruments of banking, financial and insurance
entities that are outside the scope of regulatory consolidation, where the Bank does not - own more than 10% of the issued share capital (amount above 10% threshold) (a) - (ac) - (ae)
22 Significant investments in the capital instruments issued by banking, - financial and insurance entities that are outside the scope of regulatory consolidation(amount above 10% threshold) (b) - (ad) - (af) -
23 Deferred Tax Assets arising from temporary differences (amount above - 10% threshold, net of related tax liability) (i) -
24 Amount exceeding 15% threshold of which: - - significant investments in the common stocks of financial entities - - deferred tax assets arising from temporary differences -
25 National specific regulatory adjustments applied to CET1 capital - 26 Investment in TFCs of other banks exceeding the prescribed limit - 27 Any other deduction specified by SBP (mention details) -28 Regulatory adjustment applied to CET1 due to insufficient AT1 and -
Tier 2 to cover deductions -29 Total regulatory adjustments applied to CET1 479,111
Common Equity Tier 1 15,962,599

Soneri Bank Limited | Annual Report 2017 | 127
Particulars
Source based on reference number from
step 2
Component of regulatory
capital reported by
Bank
---- (Rupees in ‘000) ----Additional Tier 1 (AT 1) Capital
30 Qualifying Additional Tier-1 instruments plus any related share premium - of which:
31 - classified as equity (t) - 32 - classified as liabilities (m) - 33 Additional Tier-1 capital instruments issued by consolidated subsidiaries
and held by third parties (y) - 34 - of which: instrument issued by subsidiaries subject to phase out - 35 AT1 before regulatory adjustments -
Additional Tier 1 Capital: Regulatory adjustments36 Investment in mutual funds exceeding the prescribed limit (SBP specific adjustment) - 37 Investment in own AT1 capital instruments - 38 Reciprocal cross holdings in Additional Tier 1 capital instruments - 39 Investments in the capital instruments of banking, financial and insurance
entities that are outside the scope of regulatory consolidation, where the Bank does notown more than 10% of the issued share capital (amount above 10% threshold) (ac) -
40 Significant investments in the capital instruments issued by banking,financial and insurance entities that are outside the scope of regulatory consolidation (ad) -
41 Portion of deduction applied 50:50 to core capital and supplementarycapital based on pre-Basel III treatment which, during transitional period, remain subject todeduction from Tier-1 capital -
42 Regulatory adjustments applied to Additional Tier 1 due to insufficientTier 2 to cover deductions -
43 Total of regulatory adjustment applied to AT1 capital - 44 Additional Tier 1 capital -45 Additional Tier 1 capital recognised for capital adequacy -
Tier 1 capital (CET1 + admissible AT1) 15,962,599
Tier 2 capital46 Qualifying Tier 2 capital instruments under Basel III -47 Capital instruments subject to phase out arrangement from Tier 2 (n) 2,997,600 48 Tier 2 capital instruments issued to third party by consolidated subsidiaries
- of which: instruments issued by subsidiaries subject to phase out (z) - 49 General provisions or general reserves for loan losses-up to maximum
of 1.25% of Credit Risk Weighted Assets (g) 38,62550 Revaluation Reserves eligible for Tier 2 of which:51 - portion pertaining to fixed asset 1,708,726 52 - portion pertaining to AFS securities 56% of (aa) 127,245 53 Foreign Exchange Translation Reserves (v) -54 Undisclosed / Other Reserves (if any) -55 T2 before regulatory adjustments 4,872,246
Tier 2 capital: Regulatory adjustments56 Portion of deduction applied 50:50 to core capital and supplementary
capital based on pre-Basel III treatment which, during transitional period, remain subject todeduction from tier-2 capital
57 Reciprocal cross holdings in Tier 2 instruments -58 Investment in own Tier 2 capital instrument -59 Investments in the capital instruments of banking, financial and insurance
entities that are outside the scope of regulatory consolidation, where the Bank does notown more than 10% of the issued share capital (amount above 10% threshold) (ae) 149,880
60 Significant investments in the capital instruments issued by banking,financial and insurance entities that are outside the scope of regulatory consolidation (af) -
61 Amount of regulatory adjustment applied to T2 capital 149,880 62 Tier 2 capital (T2) 4,722,366 63 Tier 2 capital recognised for capital adequacy 4,722,366 64 Excess Additional Tier 1 capital recognised in Tier 2 capital - 65 Total Tier 2 capital admissible for capital adequacy 4,722,366
TOTAL CAPITAL (T1 + admissible T2) 20,684,965

42.3.4 Risk-weighted exposures Note 2017 2016
Capitalrequirement
Riskadjusted
value
Capitalrequirement
Riskadjusted
value Credit risk
----------------------- (Rupees in ‘000) ----------------------- Portfolios subject to standardised approach (Comprehensive Approach)
On-balance sheet items:Cash and cash equivalent - - - - Sovereign and central banks 4,180 37,071 4,257 39,972 Public sector entities (PSEs) 131,972 1,170,480 112,199 1,053,514 Banks and securities firms 127,031 1,126,663 304,920 2,863,094 Corporate portfolio 42.4 9,954,907 88,291,858 7,921,914 74,384,170 Retail non mortgages 42.4 1,125,027 9,978,066 984,131 9,240,663 Mortgages – Residential 117,719 1,044,075 110,605 1,038,542 Past due loans 249,385 2,211,838 271,062 2,545,187 Operating fixed assets 691,768 6,135,417 504,284 4,735,061 Other assets 170,792 1,514,788 101,808 955,939
12,572,781 111,510,256 10,315,180 96,856,142 Off balance sheet items:
Non-market related:-Direct credit substitutes 42.5 1,718,882 15,245,069 1,351,145 12,686,804 Performance-related contingencies 42.5 563,409 4,996,972 452,785 4,251,507 Trade-related contingencies 42.5 444,993 3,946,720 600,374 5,637,316
2,727,284 24,188,761 2,404,304 22,575,627 Market related:-Outstanding interest rate contracts - - - - Outstanding foreign exchange contracts 57,033 505,833 17,472 164,056
57,033 505,833 17,472 164,056 Portfolios subject to Internal Rating Based (IRB) Approach
e.g. Corporate,Sovereign , Retail ,Securitization etc.
Equity Exposure Risk in the Banking Book
Equity portfolio subject to market-based approaches
Under simple risk weight methodUnder internal models approach
Equity portfolio subject to PD / LGDEquity Exposure Risk in the Banking Book Listed equity investments held in banking book 74,785 663,280 472,628 4,437,820 Unlisted equity investments held in banking book 1,877 16,650 1,773 16,650 Recognised portion of significant investment - - - -
76,662 679,930 474,401 4,454,470 Total credit risk exposures 15,433,760 136,884,780 13,211,357 124,050,295
Market Risk
Capital requirement for portfolios subject to Standardised Approach
Interest rate risk 30,608 382,600 11,940 149,250 Equity position risk 594,728 7,434,100 35,545 444,313 Foreign exchange risk 24,743 309,288 14,926 186,575 Position in options - - - -
Total market risk exposures 650,079 8,125,988 62,411 780,138

Soneri Bank Limited | Annual Report 2017 | 129
2017 2016
Capitalrequirement
Risk adjusted
value
Capitalrequirement
Risk adjusted
value Capital Requirement for portfolios subject to ----------------------- (Rupees in ‘000) ----------------------- Internal Models Approach
Interest rate riskForeign exchange risk etc.
Operational Risk
Capital requirement for operational risks 1,356,807 16,960,088 1,342,289 16,778,613
Total 17,440,646 161,970,856 14,616,057 141,609,046
Capital Adequacy Ratio Required Actual Required ActualDecember 2017 December 2016
CET1 to total RWA 6.00% 9.86% 6.00% 10.82%Tier-1 capital to total RWA 7.50% 9.86% 7.50% 10.82%Total capital to total RWA 11.275% 12.77% 10.65% 14.12%
42.4 Cash margin and eligible securities amounting to Rs.55,599 million (2016: Rs.33,770 million) have been deducted from gross advances using comprehensive approach to credit risk mitigation under Basel III. Advances are not net off with general provision amounting to Rs.38.675 million (2016: Rs. 51.340 million) which is reported separately in Tier II (supplementary) capital as per BSD Circular Letter no. 03 dated: 20 May 2006.
42.5 Cash margin and eligible securities amounting to Rs. 661.910 million (2016: Rs.727.996 million) have been deducted from off-balance sheet items.
42.6 Contracts having original maturities of 14 days or less have been excluded.
42.7 Main Features of Regulatory Capital Instruments
Main Features Common Shares Instrument 1
1 Issuer Soneri Bank Limited Soneri Bank Limited
2 Unique identifier (e.g. PSX Symbol or Bloomberg identifier etc.) SNBL SNBL - TFCs
3 Governing law(s) of the instrument Laws of Islamic Republic of
PakistanLaws of Islamic Republic of Pakistan
4 Regulatory treatment
4.1 Transitional Basel III rules Common Equity Tier 1 Tier 2
4.2 Post-transitional Basel III rules Common Equity Tier 1 Tier 2
4.3 Eligible at solo/ group/ group & solo Solo Solo
4.4 Instrument type Ordinary Shares Subordinated Debt
5 Amount recognized in regulatory capital (Currency in PKR thousands, as of reporting date) Rs. 11,024,636 Rs. 2,997,600
6 Par value of instrument Rs.10 Rs.5,000
7 Accounting classification Shareholders’ Equity Liability
8 Original date of issuance Various From 1992 July 2015
9 Perpetual or dated Perpetual Dated
9.1 Original maturity date N/A July 2023
10 Issuer call subject to prior supervisory approval No Yes, after 5 years from last day of public subscription
10.1 Optional call date, contingent call dates and redemption amount N/A N/A
10.2 Subsequent call dates, if applicable N/A N/A
11 Coupons / dividends
11.1 Fixed or floating dividend/ coupon N/A Floating
11.2 Coupon rate and any related index/ benchmark N/A Floating rate at 6 month KIBOR plus 1.35%
11.3 Existence of a dividend stopper No Yes
11.4 Fully discretionary, partially discretionary or mandatory Fully Discretionary Mandatory
11.5 Existence of step up or other incentive to redeem No No
11.6 Non-cumulative or cumulative Non-cumulative Cumulative
12 Convertible or non-convertible Non-convertible Convertible in case of PONV

Main Features Common Shares Instrument 1
12.1 If convertible, conversion trigger (s) N/A At the option of supervisor it can be converted into common equity upon occurrence of certain trigger events , called point of non viability (PONV).
The PONV is the earlier of;
1. A decision made by SBP that a conversion or temporary/ permanent write off is necessary without which the Bank would become non viable.
2. The decision to make a public sector injection of capital, or
equivalent support, without which the Bank would have become non viable,
as determined by SBP.
12.2 If convertible, fully or partially N/A May convert fully or partiallyin case of PONV
12.3 If convertible, conversion rate N/A To be determined in the caseof trigger event
12.4 If convertible, mandatory or optional conversion N/A Convertible at the discretionof SBP in case of PONV
12.5 If convertible, specify instrument type convertible into N/A Common Equity Tier 1
12.6 If convertible, specify issuer of instrument it converts into N/A SNBL (Ordinary shares)
13 Write-down feature No Yes
14 If write-down, write-down trigger(s) N/A At the option of supervisor it can be either written off upon occurrence of a certain trigger events, called point of non viability(PONV). The PONV is
the earlier of:
1. A decision made by SBP that a conversion or temporary/ permanent write off is necessary without which the Bank would become non viable.
2. The decision to make a public
sector injection of capital, or equivalent support, without which the Bank would have become non
viable, as determined by SBP.
15 If write-down, full or partial N/AMay be written-down fully or
partially;
16 If write-down, permanent or temporary N/A N/A
17 If temporary write-down, description of write-up mechanism N/AAs may be determined by reversal
of trigger events and subject to regulator’s approval
18 Position in subordination hierarchy in liquidation (specify instrument type immediately senior to instrument N/A Senior to ordinary shareholders
19 Non-compliant transitioned features No No
20 If yes, specify non-compliant features N/A N/A
43 RISK MANAGEMENT
The primary goal of risk management is to identify, assess and monitor risks inherent in the activities of the Bank and take adequate measures to manage and control these risks on a timely basis. This will help in achieving sustainable business growth, financial and non-financial targets with better protection and soundness. The Bank’s aim is to achieve an appropriate balance between risk and return and to minimise potential adverse effects on the Bank’s financial performance.

Soneri Bank Limited | Annual Report 2017 | 131
The Bank’s risk management framework encompasses the culture, processes and structure and is directed towards the effective management of potential opportunities and threats to the Bank. The prime objective of the Bank’s risk management strategy is to abandon the traditional approach of ‘managing risk by silos’ and to put in place integrated risk and economic capital management capabilities that will enable the Bank to achieve integrated view of risks across its various business operations and to gain strategic advantage from its risk management capabilities.
The Board of Directors (BOD) keeps an oversight on the Bank-wide risk management framework and approves the risk management strategy and policies of the Bank. The Board Risk Management Committee (BRMC), ensures that the Bank maintains a complete and prudent integrated risk management framework at all times and ensures that the risk exposures are maintained within acceptable levels. Moreover, the Credit Risk Management Committee (CRMC), Market Risk Management Committee (MRMC) and the Operational Risk Management Committee (ORMC) and all other senior management committees are mainly responsible for ensuring the compliance of the BOD approved risk management policy and for monitoring and managing risk levels in relevant areas of the Bank.
The Bank’s risk management policy, formulated on regulatory guidelines, covers all major types of risk that the Bank is exposed to. The policy is laid down on key risk management principles which includes management oversight and control culture, risk recognition and assessment, control activities and segregation of duties, information and communication and monitoring activities and correcting deficiencies.
• Develops risk framework / policies & procedures for management of Credit Market, Liquidity, Operational and other inherent risks;
• Development of system & procedures for identification assessment, monitoring & control of Credit, Market, Liquidity, Operational and other inherent risks;
• Monitoring of risk on a portfolio basis.
Risk Management Division
• Assesses the adequacy of Risk Management processes• Assesses the adequacy of Internal Control Framework
• Ensures compliance with all statutory and regulatory requirements • Ensures compliance with Bank’s policies
• Reviews Operational Risk Management Framework and ensures its compliance;
• Assesses the effectiveness and efficiency of internal controls environment of the Bank;
• Monitors Bank-wide operational risks;
• Ensures adequacy of capital with respect to required operational risk charge;
• To conduct risk and control assessment exercise for processes / products / systems.
• Monitors Liquidity Risk;
• Monitors interest rate risk;
• Develops strategies to manage Liquidity needs in view of current economic political situation;
• Regulates structure / composition of assets & liabilities and decide pricing & advances.
• Establishes business continuity plan and ensures its effective implementation;
• Ensures the protection and availability of critical business processes and supporting technology in case of crises;
• Sponsors the execution and maintenance of risk assessment business impact
analysis, crises recovery plans and training programs;
• Ensures the adequacy of plans;
• Ensures that alternate sites and/or spaces are available for critical process;
• Ensures that proper training sessions are conducted.
To manage Capital Market risk
• Monitors and ensures compliance with regulatory and internal policies covering foreign exchange risk, interest rate risk, equity price risk, and liquidity risk;
• Reviews the profitability objectives and investment strategies;
• Discusses and/or devise strategies to mitigate risks and ensures optimum level of risk-return relationship is maintained.
• Ensures implementation of CRM policy/strategy;
• Ensures compliance with regulatory requirements & internal policies and compliance with limits respect to credit;
• Reviews and assesses the credit portfolio structure;
• Analyzes market, conditions and economic sectors in which the Bank has exposure or is willing to take exposure;
• Reviews and analyzes NPLs portfolio;• Ensures adequacy of credit assessment
and monitoring mechanism;• Assesses adequacy of credit risk rating /
scoring systems of the Bank.
Considers the adequacy & effectiveness of InternalControl framework • Reviews risk profile
• Reviews RM strategies, policies systems and procedures.• Ensures Credit, Market, Liquidity, Operational & other risk
are maintained at an acceptable level
The Shari’ah Board ensures that all the procedure manuals, product programs
/ structures, process flows, related agreements, marketing
advertisements, sales illustrations and brochures are in conformity with the
rules and principles of Shari’ah.
The committee reviews lending
policies, procedures & establishes
strategy to strengthen & monitor the loan
portfolio
C
Assessment & Monitoring
Assurance
Approves risk management strategy and policy
Board of Directors
Board Audit Committee Board Risk Management Committee
Credit Risk Mangement Committee
Market Risk Management Committee
Asset Liability Committee
Internal Audit Compliance
BCP Steering Committee
C
President & CEO
Operation Risk Management Committee
Executive Director & Chief Operating Officer
Investment Committee
Board Credit Committee Shari’ah Board

The Bank has a well-established risk management structure, with an active Board of Directors and Board Risk Management Committee supported by an experienced senior management team and a centralised risk management group which is independent of the business lines.
The Bank has undertaken a number of initiatives in the areas of assessment, measurement and monitoring of credit risk, market risk, funding liquidity risk and operational risk. These measures are providing competitive advantage to the Bank besides preparing the Bank for the full implementation of Basel-III.
43.1 Credit risk
Credit risk is a risk arising from the potential that an obligor is either unwilling to perform on an obligation or its ability to perform is impaired resulting in financial loss to the Bank. Credit risk mainly arises from all placement of deposits, lending and investing activities i.e. transactions that give rise to actual, contingent or potential claims against any counterparty, borrower or obligor.
Credit Risk Management Objectives and Organisation
Lending of money is the core business activity, a major source of revenue and a significant exposure for the Bank. Lendings are mainly funded from depositors’ money. Therefore, in order to protect the stakeholders’ wealth, the Bank has deployed considerable resources and adequate controls to manage, monitor and control credit risk throughout the Bank.
The main objective of the credit risk management process is to identify, assess, measure and monitor credit risk in all the financial exposures of the Bank. The Bank has established a rigorous credit risk management framework to timely and effectively manage credit risk at transaction as well as at portfolio level. In addition to this, the Enterprise Risk Management (ERM) solution of SAS provides information / analysis in making better credit decisions, measured risk-taking, better loan pricing and efficient capital allocation thereagainst thus resulting in efficient and effective use of funds and increase in profitability of the Bank.
The Bank has an organisational structure for managing credit risk, established on internal control environment and equipped with adequate level of expertise and resources.
CREDIT RISK MANAGEMENT STRUCTURE
Corporate, ME, SE,Agriculture Risk Review
Board Risk ManagementCommittee
Head of RiskManagement
Division
Credit Division
Credit Policy andCredit manual
Credit Approval andMonitoring
CreditAdministration
Credit RiskManagementDepartment
Credit RiskReview
Department
Consumer RiskReview
Board of Directors
President &CEO
Board Credit Committee
Executive Director & Chief Operating Officer
Credit RiskManagementCommittee
Executive CreditCommittee
Executive Director & Chief Operating Officer
Head of Risk Management Division
BOD / BRMC
Risk Analytics &Economic Capital
Department
Market & LiquidityRisk Management
Department / TreasuryMiddle Office
Base II / IIIImplementation &
Policy ReviewDepartment
Operational Risk / BCP Management
Department
Credit RiskManagement /
ReviewDepartment
President & CEO
RISK MANAGEMENT FUNCTION

Soneri Bank Limited | Annual Report 2017 | 133
Credit Approval Authorities and Credit Standards
The Board of Directors has delegated lending powers to different tiers of credit approving authorities, constituted at central and regional levels. Extension of credit is executed, in strong internal control environment, in the light of the Bank’s credit policies and procedures and regulatory requirements.
Credit Portfolio Management
Besides managing credit risk at transaction level, the Bank regularly monitors credit risk at portfolio level and ensures that no undue concentration of risk is present in the overall credit exposure at Bank level. The Bank has a well established and rigorous management information set-up which allows efficient and effective assessment, monitoring and management of its credit risk profile in various dimensions.
Credit Risk Rating
The Credit Risk Rating System provides solid grounds for the assessment and measurement of credit risk against each obligor in addition to fulfilling regulatory requirements. The SAS based Internal Obligor Risk Rating System for Agriculture, Corporate, ME/SE and Consumer borrowers has been approved by the BoD of the Bank. This rating system is an empirical risk rating system which will helps to assess the Probability of Default (PD) of these obligors; risk based pricing, risk diversification and portfolio management as per the requirements of SBP / Basel Accords and also has the capability to track historical defaults and loss experiences.
These Credit Risk Rating Systems are now incorporated with Bank’s Credit Approval Processing Systems (CAPs) for its Corporate, ME/SE and Consumer borrowers; resultantly this facility reduces the TAT in Credit Risk Review process and approvals and establishes a single platform for initiation and monitoring the Bank’s portfolio.
The ORR assigns risk grades to customers, in accordance with the regulatory requirements, in twelve grades, out of which top nine grades refer to regular customers whereas remaining three grades pertain to defaulted ones. Whereas, FRR assigns each loan facility in six categories, in accordance with regulatory requirements. Business Units assign credit risk rating to every customer and loan facility as an integral part of the Bank’s credit approval process.
Credit Risk Management Policy
A sound credit risk management framework forms part of the overall business strategy and credit operations of the Bank. The principles for credit risk management have been laid down in the Bank’s credit policy, credit manual, and credit risk procedural manual. The policy has been developed in accordance with the requirements of the State Bank of Pakistan and is reviewed and updated (where required) on a periodic basis.
Credit Risk Assessment
The Bank has a well established and rigorous pre-approval evaluation process of credit risk embedded in credit transaction executed by the Business Units. The entire process broadly encompasses, gathering relevant information on the borrower, credit investigations and visits, detailed credit appraisal and credit risk assessment / measurement.
Credit Risk Limit Structure
In addition to monitoring credit limits specified in the Prudential Regulations of the State Bank of Pakistan, the credit limit structure of the Bank includes internal limits as established by the senior management and the BOD. Internal limits include limits with respect to BOD approved risk appetite, industry / sector, credit approval authority, large exposures limits, linkage ratio limits for corporate borrowers, exposure with banks and NBFIs, exposure with insurance companies and foreign countries. All these limits are monitored on a regular basis and any exceptions are reported to the relevant authorities for their timely action where necessary.
Collateral
Collateral act as mitigants in case of default by the borrower. Therefore, most of the facilities extended by the Bank are backed by appropriate and quality collaterals. Similarly, lendings to financial institutions and DFIs are backed by securities viz., Market Treasury Bills and Pakistan Investment Bonds. Clean facilities are provided, under strict control environment, only to the extent permissible under the Prudential Regulations of the State Bank of Pakistan. The credit manual of the Bank contains list of approved collaterals that the Bank can take and internal control standards for the management of collaterals obtained against credit facilities.
Early Warning System
The Bank has an effective early warning system which enables the Business Units / credit managers / credit administration personnel to identify and report problem loans on a prompt basis. Reports are received from Business Units on a regular basis, which are escalated to the concerned authority for necessary action on a timely basis.

Remedial Management and allowances for impairment
The Bank has standards for identification and classification of credit facilities, restructuring as well as related provisioning requirements and write-off policy, with clear responsibilities pertaining to all processes that are required to be followed.
Non-performing loans beyond certain aging / classification category are required to be referred to Remedial Management Group (RMG) which initiates recovery proceedings against the borrowers in accordance with the applicable laws.
43.1.1 Segmental information
43.1.1.1 Segments by class of business2017
Advances (Gross) Deposits**Contingencies and
commitments(Rupees in ‘000) (Percent) (Rupees in ‘000) (Percent) (Rupees in ‘000) (Percent)
Agriculture, Forestry, Hunting and Fishing 3,343,280 1.94% 88,138 0.04% 215,547 0.56%
Textile 30,255,594 17.51% 1,992,435 0.88% 3,450,851 8.90%
Chemical and Pharmaceuticals 4,870,844 2.82% 2,190,816 0.96% 2,322,027 5.99%
Cement 2,040,717 1.18% 106,558 0.05% 1,009,178 2.60%
Sugar 5,006,715 2.90% 111,208 0.05% 34,758 0.09%
Footwear and Leather Garments 1,223,719 0.71% 708,860 0.31% 259,790 0.67%
Automobile and Transportation Equipment 637,260 0.37% 1,963,820 0.86% 683,517 1.76%
Electronics and Electrical Appliances 2,488,977 1.44% 386,551 0.17% 2,015,374 5.20%
Construction 1,098,535 0.64% 1,470,364 0.65% 1,876,474 4.84%
Power (electricity), Gas, Water, Sanitary 9,035,625 5.22% 7,349,383 3.23% 1,992,412 5.14%
Wholesale and Retail Trade 15,651,181 9.06% 5,462,968 2.40% 4,028,291 10.39%
Exports / Imports 6,671,982 3.86% 1,832,268 0.81% 1,408,330 3.63%
Financial 1,130,320 0.65% 16,662,241 7.33% 1,619,773 4.18%
Food and Allied 56,083,536 32.46% 2,792,018 1.23% 5,310,887 13.70%
Individuals 7,840,834 4.54% 104,800,775 46.10% 138,719 0.35%
Others* 25,393,311 14.70% 79,430,051 34.93% 12,387,794 32.00%
172,772,430 100.00% 227,348,454 100.00% 38,753,722 100.00%
2016
Advances (Gross) Deposits**Contingencies and
commitments(Rupees in ‘000) (Percent) (Rupees in ‘000) (Percent) (Rupees in ‘000) (Percent)
Agriculture, Forestry, Hunting and Fishing 3,222,913 2.41% 83,271 0.04% 434,278 0.95%
Textile 28,707,232 21.46% 2,033,721 0.97% 4,906,597 10.75%
Chemical and Pharmaceuticals 4,844,065 3.62% 2,682,125 1.28% 3,372,462 7.39%
Cement 1,215,055 0.91% 73,336 0.03% 551,519 1.21%
Sugar 2,837,320 2.12% 233,554 0.11% 9,390 0.02%
Footwear and Leather Garments 954,568 0.71% 788,401 0.38% 264,313 0.58%
Automobile and Transportation Equipment 891,890 0.67% 7,843,582 3.74% 714,212 1.56%
Electronics and Electrical Appliances 1,381,090 1.03% 810,801 0.39% 2,840,490 6.22%
Construction 900,940 0.67% 1,694,297 0.81% 2,371,761 5.19%
Power (electricity), Gas, Water, Sanitary 7,358,320 5.50% 6,407,546 3.05% 2,137,140 4.68%
Wholesale and Retail Trade 17,879,883 13.37% 3,396,733 1.62% 6,323,110 13.85%
Exports / Imports 6,842,185 5.12% 1,915,437 0.91% 2,495,322 5.47%
Financial 999,275 0.75% 12,588,410 6.00% 1,578,513 3.46%
Food and Allied 31,175,457 23.31% 4,771,451 2.27% 7,277,675 15.94%
Individuals 6,788,432 5.08% 100,200,089 47.73% 156,732 0.34%
Others* 17,754,411 13.27% 64,402,699 30.67% 10,221,576 22.39%
133,753,036 100.00% 209,925,453 100.00% 45,655,090 100.00%
* All other business classes are less than ten percent of the total exposure.** Contingencies only include direct credit substitutes, transaction related contingent liabilities and trade related contingent liabilities.

Soneri Bank Limited | Annual Report 2017 | 135
43.1.1.2 Segment by sector
2017
Advances (Gross) DepositsContingencies and
commitments
(Rupees in ‘000) (Percent) (Rupees in ‘000) (Percent) (Rupees in ‘000) (Percent)
Public / Government 57,328,349 33.18% 49,022,952 21.56% 1,614,107 4.17%
Private 115,444,081 66.82% 178,325,502 78.44% 37,139,615 95.83%
172,772,430 100.00% 227,348,454 100.00% 38,753,722 100.00%
2016
Advances (Gross) DepositsContingencies and
commitments
(Rupees in ‘000) (Percent) (Rupees in ‘000) (Percent) (Rupees in ‘000) (Percent)
Public / Government 34,526,634 25.81% 39,209,705 18.68% 1,646,373 3.61%
Private 99,226,402 74.19% 170,715,748 81.32% 44,008,717 96.39%
133,753,036 100.00% 209,925,453 100.00% 45,655,090 100.00%
43.1.1.3 Details of non-performing advances 2017 2016
and specific provisions by class ofClassified Advances
Specific Provision
Held
Classified Advances
Specific Provision
Heldbusiness segment
--------------------- (Rupees in ‘000) ---------------------
Agriculture, Forestry, Hunting and Fishing 198,471 161,247 240,810 140,103
Textile 6,358,479 5,601,600 6,304,340 5,582,698
Chemical and Pharmaceuticals 450,871 435,670 450,871 430,264
Production and Transmission of energy 166,121 149,871 166,121 166,121
Sugar 85,704 85,704 86,454 86,454
Footwear and Leather garments 24,900 24,900 24,900 24,900
Automobile and Transportation Equipment 13,510 13,510 49,310 49,310
Electronics and Electrical Appliances 50,898 50,898 50,898 50,898
Construction - - - -
Power (electricity), Gas, Water, Sanitary - - - -
Wholesale and Retail Trade - - - -
Exports / Imports - - - -
Financial 215,947 215,947 233,301 233,301
Insurance - - - -
Services - - - -
Individuals 93,165 63,405 70,498 48,935
Others 2,586,603 1,638,088 2,741,917 1,582,947
10,244,669 8,440,840 10,419,420 8,395,931
43.1.1.4 Details of non-performing advances 2017 2016
and specific provision by sectorClassified Advances
Specific Provision
Held
Classified Advances
Specific Provision
Held
--------------------- (Rupees in ‘000) ---------------------
Public / Government - - - -
Private 10,244,669 8,440,840 10,419,420 8,395,931
10,244,669 8,440,840 10,419,420 8,395,931

43.1.1.5 Geographical segment analysis 2017
Profit before taxation
Total assets employed
Net assets employed
Contingencies and
Commitments
--------------------- (Rupees in ‘000) ---------------------
Pakistan 2,830,970 322,133,976 18,504,599 111,415,886
Asia Pacific (including South Asia) - - - -
Europe - - - -
United States of America and Canada - - - -
Middle East - - - -
Others - - - -
2,830,970 322,133,976 18,504,599 111,415,886
2016
Profit before taxation
Total assets employed
Net assets employed
Contingencies and
Commitments
--------------------- (Rupees in ‘000) ---------------------
Pakistan 3,077,339 278,520,706 18,289,227 83,399,392
Asia Pacific (including South Asia) - - - -
Europe - - - -
United States of America and Canada - - - -
Middle East - - - -
Others - - - -
3,077,339 278,520,706 18,289,227 83,399,392
43.2 Credit Risk – General Disclosures, Basel III Specific
The Bank has adopted the Standardised Approach of the Basel II Accord. According to the regulatory statement submitted under the Standardised Approach, the portfolio has been divided into claims fully secured by residential property, claims on corporate (excluding equity exposure) and claims categorised as retail portfolio. Claims on corporate constitute 84% (2016: 83%) of the total exposure, 3% (2016: 3%) represent claims that are fully secured against residential property and the remaining 13% (2016: 14%) exposure pertains to claims categorised as retail portfolio.
43.3 Credit Risk: Standardised Approach
Currently, the Bank does not have any policy whereby customers have to be rated by a rating agency. Therefore, the Bank uses unsolicited / solicited ratings of JCR-VIS, PACRA and other foreign agencies approved by the SBP, wherever applicable.
Following are the types of exposure for which each agency is used:
Exposure JCR-VIS PACRAFitch, Moody’s
& S&P
Corporate -
Banks
Sovereigns - -
SMEs - - -
Securitizations - - -
Most of the Bank’s asset base is short or medium term. Therefore, the Bank uses the entity’s rating to assess the risk of exposure without any adjustments.
For exposure amounts after risk mitigation subject to the standardised approach, amount of Bank’s / DFI’s outstanding (rated and unrated ) in each risk bucket as well as those that are deducted are as follows:

Soneri Bank Limited | Annual Report 2017 | 137
Exposures Rating
CategoryAmount
OutstandingDeduction
CRMNet Amount
-------------- (Rupees in ‘000) --------------
- Cash and Cash Equivalent 5,473,901 5,473,901 -
- Corporate 1 8,841,542 982,936 1,571,721
2 7,423,071 187,500 3,617,786
3,4 59,127 - 59,127
5,6 - - -
Unrated 46,640,474 319,240 46,321,234
Unrated-2 30,063,972 686,380 36,721,990
- Public Sector Entities 1 - - -
2,3 1,003,121 - 501,561
4, 5 - - -
6 - - -
Unrated 43,165,860 41,828,022 668,919
-
- Banks 1,2,3 7,063,239 2,535,672 905,513
4,5,6 55,615 - 30,350
Unrated 941,087 - 190,800
- Sovereigns etc. 1 - - -
2 - - -
3 - - -
4,5 - - -
6 37,071 - 37,071
Unrated - - -
- Government of Pakistan 165,161,767 130,271,535 -
- State Bank of Pakistan 2,169,165 2,169,165 -
- Retail 13,615,190 311,102 9,978,066
- Residential Mortgage 2,983,071 - 1,044,075
- Past Dues Loans 1,835,958 - 2,200,523
- Past Dues against Residential Mortgage 22,630 - 11,315
- Significant investment in Commercial entities - - -
- Significant investment and DTAs above 15% threshold - - -
- Unlisted Equity Investments 11,100 - 16,650
- Listed Equity Investments 663,280 - 663,280
- Operating Fixed Assets 6,135,417 - 6,135,417
- Other Assets 1,514,788 - 1,514,788
344,880,446 184,765,453 112,190,186
The Bank has adopted the comprehensive approach to credit risk mitigation under Basel III and, therefore, has applied haircuts to the collateral. Moreover, all eligible collaterals that includes cash / liquid securities have been taken into account with respect to credit risk mitigation.
43.4 Market risk
43.4.1 Market risk is the risk that the value of on and off-balance sheet positions of a financial institution will be adversely affected by movements in market rates or prices such as interest rates, foreign exchange rates, equity prices and / or commodity prices resulting in a loss to earnings and capital.

Market Risk Management Objective and Organisation
The Risk Management Framework requires that strong risk management practices are integrated in key strategic, capital and financial planning processes and day-to-day business processes across the Bank.
The Bank has established a rigorous market risk management framework to efficiently and effectively monitor and manage market risk in every transaction as well as at portfolio level. The Bank has made substantial investment to add value to its market risk management framework by purchasing the license of Market Risk Management System (MRMS), part of Enterprise Risk Management (ERM) solution, of SAS. The said solution provides adequate analysis to facilitate better investment decisions, measured risk-taking and efficient capital allocation there against; thus, leading to efficient and effective use of funds.
The Bank has a sound organisation structure for managing market risk, established on strong internal control environment and equipped with adequate level of expertise and resources. The Risk Management Committee (RMC), a BOD level sub-committee, is primarily responsible to monitor and manage market risk in all the financial exposures of the Bank, supported by senior management committees namely Asset and Liability Management Committee (ALCO) and Market Risk Management Committee (MRMC).
Market Risk Monitoring
The Bank’s market risk policies set out risk management parameters, governance and control frameworks as well as reporting arrangements for key risk indicators. The Bank has a well-established structure of internal limits with respect to its treasury and investment operations. The Treasury Middle Office (TMO), within the Market Risk Management Department, monitors each and every transaction executed through treasury, monitors risk limits, reports breaches, off market rates, rate reasonability against benchmark rates, tolerance PV01 limits and assesses market risk in money market transactions, investments in equity securities, monitors impairments in equity securities and its stop loss limit and foreign exchange transactions. In order to mitigate unnecessary risk and ensure minimum business losses, Earmarking Policy has also been implemented to ensure risk migration from high risk to low risk transactions.
Portfolio Analysis and Management
Besides managing market risk at transaction level, the Bank regularly monitors market risk at portfolio level and ensures that no undue concentration of risk and adverse correlation is present in the overall financial exposures at the Bank level. The Bank has a well established management information set-up which allows efficient and effective assessment, monitoring and management of its market risk profile in various dimensions.
Marking-to-Market
The Bank is marking-to-market (MTM) its investment in tradable and available for sale securities, i.e., equity securities, debt securities and foreign exchange ready and forward transactions, on a regular basis. The same is independently reviewed by the Risk Management Division.
MARKET RISK MANAGEMENT STRUCTURE
Board of Directors
Market RiskManagementDepartment
President & CEO
Head of RiskManagement
Division
Board RiskManagementCommittee
Executive Director & Chief Operating Officer
Market RiskManagementCommittee
ALCO

Soneri Bank Limited | Annual Report 2017 | 139
Market Risk Assessment and Measurement
The Bank is assessing and measuring market risk in all of its financial exposures using various types of measurement and analytical tools like Value at Risk (VaR), duration and convexity, interest rate gap and duration gap. The Bank is using Standardized Approach for exposures in its balance sheet, to calculate market risk capital charge and risk weighted asset for Capital Adequacy Ratio (CAR) calculation purposes.
The Bank’s principle market risk measurement methodology are VAR and stress testing. Historical financial market rates, prices and volatility serve as the basis for the statistical VAR model underlying the potential loss estimation. The Bank uses ten days as well as 30 days holding period at 99% confidence level to model risk in different portfolios. The main assumptions and scenarios of our stress analysis includes:
1. Parallel shift in yield curve by 2%, 3% and 4%.
2. Change in the slope of yield curve by changing short-term, medium-term and long-term maturities by different rates.
3. Penalty or reward depending on net long or net short position in foreign currency exposure.
4. Fall in general equity price upto 50%.
43.4.2 Foreign Exchange Risk
Foreign exchange risk is the probability of loss resulting from adverse movements in exchange rates. Exchange position arising from trading activities is monitored through foreign exchange limits on aggregate and individual currency basis. Hedging strategies and mark-to-market valuations are used to mitigate exchange risk resulting from open position. Overall exchange position risk is maintained in accordance with the regulatory requirements prescribed by the State Bank of Pakistan.
2017
Assets LiabilitiesOff-balance sheet items
Net foreign currency exposure
------------------------- (Rupees in ‘000) -------------------------
Pakistan Rupee 311,353,383 289,569,155 (3,587,357) 18,196,871
United States Dollar 9,442,974 11,487,189 2,323,782 279,567
Great Britain Pound 378,339 1,932,156 1,569,218 15,401
Japanese Yen 457 29 (504) (76)
Euro 793,965 640,848 (149,109) 4,008
Other currencies 164,858 - (156,030) 8,828
322,133,976 303,629,377 - 18,504,599
2016
Assets LiabilitiesOff-balance sheet items
Net foreign currency exposure
------------------------- (Rupees in ‘000) -------------------------
Pakistan Rupee 265,511,030 244,232,697 (3,174,354) 18,103,979
United States Dollar 12,338,889 13,739,985 1,575,300 174,204
Great Britain Pound 300,331 1,497,250 1,199,866 2,947
Japanese Yen 4 637 (13) (646)
Euro 352,672 760,898 409,660 1,434
Other currencies 17,780 12 (10,459) 7,309
278,520,706 260,231,479 - 18,289,227
43.4.3 Equity Position Risk
The Bank invests mainly in blue chip securities depending upon market mispricing through arbitrage. Further, the risk arising from investments in equity securities lies in both its banking and trading books which is measured and assessed using the Value at Risk (VaR) approach. The VaR of the portfolio is reported to the BRMC, ALCO/MRMC and other authorities on a periodical basis.

43.4.4 Mismatch of Interest Rate Sensitive Assets and Liabilities
Yield risk is the risk of decline in earnings due to adverse movement of the yield curve. Interest rate risk represents the risk that value of financial instruments will fluctuate due to change in market interest rates. The Bank is exposed to yield / interest rate risk as a result of mismatches or gaps in the amounts of assets and liabilities and off-balance sheet instruments that mature or re-price in a given period. The Bank manages this risk by matching the re-pricing of assets and liabilities and off-balance sheet instruments. The Bank’s yield / interest rate sensitivity position for on-balance sheet instruments is based on the earlier of contractual re-pricing or maturity date and for off-balance sheet instruments is based on settlement date. The Bank quantifies the yield curve risk via duration, PVBP and convexity for rate sensitive assets and liabilities held in banking and trading book. The Bank also measure impact on net worth depending on duration gap of rate sensitive assets and liabilities.
2017Exposed to yield/ interest rate risk Non-interest
bearing financial
instruments
Effective yield/
interest rateTotal
Upto 1 month
Over 1 to 3 months
Over 3 to 6 months
Over 6 months to 1 year
Over 1 to 2 years
Over 2 to 3 years
Over 3 to 5 years
Over 5 to 10 years
Above 10 years
% -----------------------------------------------------------------------(Rupees in ‘000) -----------------------------------------------------------------------On-balance sheet financial instruments
AssetsCash and balances with treasury banks 0.00% 19,431,256 - - - - - - - - - 19,431,256 Balances with other banks 3.10% 1,151,015 206,419 - - - - - - - - 944,596 Lendings to financial institutions 5.90% 6,544,152 3,185,507 1,250,000 2,108,645 - - - - - - - Investments 6.27% 117,428,516 10,785,616 65,344,495 3,452,847 433,663 10,649,794 10,363,631 12,531,162 106,087 - 3,761,221 Advances 6.85% 164,292,915 18,644,624 89,327,636 54,078,233 438,593 - - - - - 1,803,829 Other assets 0.00% 6,465,730 - - - - - - - - - 6,465,730
315,313,584 32,822,166 155,922,131 59,639,725 872,256 10,649,794 10,363,631 12,531,162 106,087 - 32,406,632 LiabilitiesBills payable 0.00% 4,895,447 - - - - - - - - - 4,895,447 Borrowings 5.02% 64,584,236 38,560,895 12,020,383 2,752,596 10,017,014 11,600 72,269 104,841 767,389 - 277,249 Deposits and other accounts 5.17% 227,348,454 59,694,790 78,262,480 12,065,207 12,940,368 486,731 406,568 - - - 63,492,310 Sub-ordinated loans 7.49% 2,997,600 2,997,600 - - - - - - - - - Other liabilities 0.00% 2,771,059 - - - - - - - - - 2,771,059
302,596,796 101,253,285 90,282,863 14,817,803 22,957,382 498,331 478,837 104,841 767,389 - 71,436,065 On-balance sheet gap 12,716,788 (68,431,119) 65,639,268 44,821,922 (22,085,126) 10,151,463 9,884,794 12,426,321 (661,302) - (39,029,433)Non financial net assets 5,787,811 Total net assets 18,504,599
Off-balance sheet financial instrumentsForward purchase of foreign exchange 32,938,645 14,982,653 13,149,222 4,626,438 180,332 - - - - - - Forward sale of foreign exchange (28,402,978) (10,851,025) (9,944,116) (7,604,477) (3,360) - - - - - - Off-balance sheet gap 4,535,667 4,131,628 3,205,106 (2,978,039) 176,972 - - - - - -
Total Yield / Interest Risk Sensitivity Gap (64,299,491) 68,844,374 41,843,883 (21,908,154) 10,151,463 9,884,794 12,426,321 (661,302) - (39,029,433)
Cumulative Yield / Interest Risk (64,299,491) 4,544,883 46,388,766 24,480,612 34,632,075 44,516,869 56,943,190 56,281,888 56,281,888
Sensitivity Gap2016
Exposed to yield/ interest rate risk Non-interest bearing financial
instruments
Effective yield/
interest rateTotal
Upto 1 month
Over 1 to 3 months
Over 3 to 6 months
Over 6 months to 1 year
Over 1 to 2 years
Over 2 to 3 years
Over 3 to 5 years
Over 5 to 10 years
Above 10 years
% -----------------------------------------------------------------------(Rupees in ‘000) -----------------------------------------------------------------------On-balance sheet financial instruments
AssetsCash and balances with treasury banks 0.00% 18,278,840 - - - - - - - - - 18,278,840 Balances with other banks 3.49% 822,689 141,130 - - - - - - - - 681,559 Lendings to financial institutions 5.14% 5,536,577 2,603,228 1,887,364 1,045,985 - - - - - - - Investments 6.51% 117,883,960 11,459,986 5,947,345 24,156,770 12,943,977 23,110,725 9,215,467 19,505,899 7,875,361 - 3,668,430 Advances 6.67% 125,305,765 15,034,097 58,565,049 49,626,843 56,287 - - - - - 2,023,489 Other assets 0.00% 5,317,284 - - - - - - - - - 5,317,284
273,145,115 29,238,441 66,399,758 74,829,598 13,000,264 23,110,725 9,215,467 19,505,899 7,875,361 - 29,969,602 LiabilitiesBills payable 0.00% 4,163,509 - - - - - - - - - 4,163,509 Borrowings 4.96% 38,905,078 27,487,185 5,669,245 4,739,121 - 52,449 17,200 340,919 461,159 - 137,800 Deposits and other accounts 4.59% 209,925,453 60,538,305 68,981,558 13,383,725 13,246,397 1,573,169 316,614 - - 51,885,685 Sub-ordinated loans 7.41% 2,998,800 2,998,800 - - - - - - - - - Other liabilities 0.00% 3,017,562 - - - - - - - - - 3,017,562
259,010,402 91,024,290 74,650,803 18,122,846 13,246,397 1,625,618 333,814 340,919 461,159 - 59,204,556 On-balance sheet gap 14,134,713 (61,785,849) (8,251,045) 56,706,752 (246,133) 21,485,107 8,881,653 19,164,980 7,414,202 - (29,234,954)Non financial net assets 4,154,514 Total net assets 18,289,227
Off-balance sheet financial instrumentsForward purchase of foreign exchange 18,161,473 6,899,877 8,189,838 3,010,609 61,149 - - - - - - Forward sale of foreign exchange (13,793,304) (7,473,778) (4,245,629) (2,073,897) - - - - - - - Off-balance sheet gap 4,368,169 (573,901) 3,944,209 936,712 61,149 - - - - - -
Total Yield / Interest Risk Sensitivity Gap (62,359,750) (4,306,836) 57,643,464 (184,984) 21,485,107 8,881,653 19,164,980 7,414,202 - (29,234,954)
Cumulative Yield / Interest Risk Sensitivity Gap (62,359,750) (66,666,586) (9,023,122) (9,208,106) 12,277,001 21,158,654 40,323,634 47,737,836 47,737,836

Soneri Bank Limited | Annual Report 2017 | 141
(a) The effective interest rate is a historical rate (for December month) for a fixed rate instrument carried at amortised cost and a current market rate for a floating rate instrument.
(b) The effective interest rate has been computed by excluding non-performing advances.
(c) The effective interest rate has been computed by excluding non-remunerative deposits.
43.5 Liquidity risk
Liquidity risk is the potential inability to meet contractual and contingent financial obligations, either on or off balance sheet, as they become due. Primary liquidity objective of the Bank is to provide adequate funding for businesses throughout market cycles, including periods of financial stress.
Liquidity Management
Day to day funding, is managed by Treasury Division through net cash flows from payment systems, fresh deposits mobilised by branches, maturing money market deposits, etc.
The Bank maintains a portfolio of highly marketable assets viz., Market Treasury Bills and Pakistan Investment Bonds, that can either be sold in the open market or funds can be arranged there against under repo arrangements. This is further supported by investments in short term securities viz., Certificate of Investments etc. In line with its liquidity risk management policy, the Bank maintains a cushion over and above the minimum statutory liquidity requirement of the SBP, for maintaining liquidity reserves, to ensure continuity of cash flows.
Liquidity Risk Monitoring
The Bank monitors its liquidity risk through various liquidity ratios and liquidity risk indicators and any deviations or breaches are reported to the relevant authorities for timely action. Moreover, Asset and Liability Management Committee (ALCO), a senior management committee, also reviews the liquidity position of the Bank on at least monthly basis and takes appropriate measures where required.
Liquidity Risk Assessment
The Bank uses liquidity gap ladder to assess the liquidity gaps and liquidity needs in different time buckets, under normal and stressed scenarios. Whereas, the Contingency Funding Plan (CFP) of the Bank is also tested on the basis of the results of liquidity stress testing.
Sources of liquidity are regularly reviewed / monitored by the Asset and Liability Management Committee (ALCO). The ALCO reviews the current economic situation, projected cash flows and asset / liability mix and approves strategy for managing appropriate liquidity. The liquidity risk management policy of the Bank encompasses liquidity contingency plan for actions to be taken in case of liquidity crises.
Mandatory stress tests of SBP are conducted, on a periodic basis, to test the adequacy of liquidity contingency plan and to identify the extent of liquidity stress that the Bank is able to take in current conditions.
Liquidity management framework allows the Bank to run stress analysis on the balance sheet and off-balance positions, which include, but are not limited to, the following:
1. Significant withdrawals from corporate clients deposits.
2. Withdrawal of top ten, top fifteen, and top twenty deposits.
3. Loss in the funding value of unencumbered assets.
4. Availability of secure lending is subject to significant over collateralisation.

43.5.1 MATURITIES OF ASSETS AND LIABILITIES
2017Over 1 Over 3 Over 6 Over 1 Over 2 Over 3 Over 5
Total Upto 1 to 3 to 6 Months to 2 to 3 to 5 to 10 AboveMonth Months Months to 1 Year Years Years Years Years 10 Years
----------------------------------------------------------------- (Rupees in ‘000) ------------------------------------------------------------------Assets
Cash and balances with
treasury banks 19,431,256 9,293,690 4,491,799 2,515,925 3,129,842 - - - - -
Balances with other banks 1,151,015 1,151,015 - - - - - - - -
Lendings to financial institutions 6,544,152 3,185,507 1,250,000 2,108,645 - - - - - -
Investments - net 117,428,516 10,757,354 64,485,809 3,761,221 2,045,023 11,096,177 10,363,631 13,143,989 1,775,312 -
Advances - net 164,292,915 32,386,064 35,980,209 28,165,484 24,810,124 11,854,995 3,831,854 12,984,391 7,908,981 6,370,813
Operating fixed assets 6,581,465 22,028 126,556 89,603 621,671 600,409 434,297 1,086,845 1,934,347 1,665,709
Deferred tax assets - net - - - - - - - - - -
Other assets - net 6,704,657 5,110,402 - - 1,587,778 - - 6,477 - -
322,133,976 61,906,060 106,334,373 36,640,878 32,194,438 23,551,581 14,629,782 27,221,702 11,618,640 8,036,522
Liabilities
Bills payable 4,895,447 4,895,447 - - - - - - - -
Borrowings 64,584,236 38,838,144 12,020,383 2,752,596 10,017,014 11,600 72,269 104,841 767,389 -
Deposits and other accounts 227,348,454 36,773,121 43,242,556 24,220,815 30,130,995 24,797,949 19,061,221 29,582,013 19,539,784 -
Sub-ordinated loans 2,997,600 600 - - 600 1,200 1,200 2,400 2,991,600 -
Deferred tax liabilities - net 935,711 - - - 935,711 - - - - -
Other liabilities 2,867,929 2,274,932 - - 592,997 - - - - -
303,629,377 82,782,244 55,262,939 26,973,411 41,677,317 24,810,749 19,134,690 29,689,254 23,298,773 -
Net assets 18,504,599 (20,876,184) 51,071,434 9,667,467 (9,482,879) (1,259,168) (4,504,908) (2,467,552) (11,680,133) 8,036,522
Share capital 11,024,636
Reserves 1,752,494
Unappropriated profit - net 3,664,580
Surplus on revaluation of assets 2,062,889
18,504,599
2016Over 1 Over 3 Over 6 Over 1 Over 2 Over 3 Over 5
Total Upto 1 to 3 to 6 Months to 1 to 2 to 3 to 5 to 10 AboveMonth Months Months Year Years Years Years Years 10 Years
----------------------------------------------------------------- (Rupees in ‘000) ------------------------------------------------------------------Assets
Cash and balances with
treasury banks 18,278,840 8,748,155 3,784,613 2,634,416 3,111,656 - - - - -
Balances with other banks 822,689 822,689 - - - - - - - -
Lendings to financial institutions 5,536,577 2,603,228 1,887,364 1,045,985 - - - - - -
Investments - net 117,883,960 11,459,986 8,579,767 20,095,305 13,144,599 25,192,173 9,702,467 20,124,610 9,585,053 -
Advances - net 125,305,765 17,208,279 25,024,743 36,986,069 11,581,168 5,274,282 6,781,159 8,696,314 5,667,930 8,085,821
Operating fixed assets 5,138,424 44,648 177,272 199,739 632,504 474,315 764,204 961,649 536,401 1,347,692
Deferred tax assets - net - - - - - - - - - -
Other assets - net 5,554,451 4,452,247 - - 1,095,725 - - 6,479 - -
278,520,706 45,339,232 39,453,759 60,961,514 29,565,652 30,940,770 17,247,830 29,789,052 15,789,384 9,433,513
Liabilities
Bills payable 4,163,509 4,163,509 - - - - - - - -
Borrowings 38,905,078 27,624,985 5,669,245 4,739,121 - 52,449 17,200 340,919 461,159 -
Deposits and other accounts 209,925,453 36,572,905 35,018,878 24,376,150 28,792,034 23,558,021 17,186,184 26,751,279 17,670,002 -
Sub-ordinated loans 2,998,800 600 - - 600 1,200 1,200 2,400 2,992,800 -
Deferred tax liabilities - net 1,137,530 - - - 1,137,530 - - - - -
Other liabilities 3,101,109 2,618,343 - - 482,766 - - - - -
260,231,479 70,980,342 40,688,123 29,115,271 30,412,930 23,611,670 17,204,584 27,094,598 21,123,961 -
Net assets 18,289,227 (25,641,110) (1,234,364) 31,846,243 (847,278) 7,329,100 43,246 2,694,454 (5,334,577) 9,433,513
Share capital 11,024,636
Reserves 1,423,829
Unappropriated profit - net 3,496,305
Surplus on revaluation of assets 2,344,45718,289,227

Soneri Bank Limited | Annual Report 2017 | 143
Cash and balances with treasury banks, savings and current deposits and running finance do not have any contractual maturities. However, these have been allocated into the above time bands based on historical withdrawal pattern of the said cash and balances with treasury banks ,deposits and running finances. Furthermore, it has been assumed that on a going concern basis, these are not expected to fall below the current year’s level.
43.5.2 Maturities of assets and liabilities - based on contractual maturity of the assets and liabilities of the Bank
2017Over 1 Over 3 Over 6 Over 1 Over 2 Over 3 Over 5
Total Upto 1 to 3 to 6 Months to 1 to 2 to 3 to 5 to 10 AboveMonth Months Months Year Years Years Years Years 10 Years
----------------------------------------------------------------- (Rupees in ‘000) ------------------------------------------------------------------AssetsCash and balances with
treasury banks 19,431,256 19,431,256 - - - - - - - - Balances with other banks 1,151,015 1,151,015 - - - - - - - - Lendings to financial institutions 6,544,152 3,185,507 1,250,000 2,108,645 - - - - - - Investments - net 117,428,516 10,757,354 64,485,809 3,761,221 2,045,023 11,096,177 10,363,631 13,143,989 1,775,312 - Advances - net 164,292,915 89,353,510 21,063,194 13,546,215 4,135,356 5,098,600 3,831,855 12,984,391 7,908,981 6,370,813Operating fixed assets 6,581,465 22,028 126,556 89,603 621,671 600,409 434,297 1,086,845 1,934,347 1,665,709Deferred tax assets - net - - - - - - - - - - Other assets - net 6,704,657 5,110,402 - - 1,587,778 - - 6,477 - -
322,133,976 129,011,072 86,925,559 19,505,684 8,389,828 16,795,186 14,629,783 27,221,702 11,618,640 8,036,522
LiabilitiesBills payable 4,895,447 4,895,447 - - - - - - - - Borrowings 64,584,236 38,838,144 12,020,383 2,752,596 10,017,014 11,600 72,269 104,841 767,389 - Deposits and other accounts 227,348,454 170,610,202 30,839,378 12,065,207 12,940,368 486,731 406,568 - - - Sub-ordinated loans 2,997,600 600 - - 600 1,200 1,200 2,400 2,991,600 - Deferred tax liabilities - net 935,711 - - - 935,711 - - - - - Other liabilities 2,867,929 2,274,932 - - 592,997 - - - - -
303,629,377 216,619,325 42,859,761 14,817,803 24,486,690 499,531 480,037 107,241 3,758,989 -
Net assets 18,504,599 (87,608,253) 44,065,798 4,687,881 (16,096,862) 16,295,655 14,149,746 27,114,461 7,859,651 8,036,522
Share capital 11,024,636Reserves 1,752,494Unappropriated profit - net 3,664,580Surplus on revaluation of assets 2,062,889
18,504,599
2016Over 1 Over 3 Over 6 Over 1 Over 2 Over 3 Over 5
Total Upto 1 to 3 to 6 Months to 1 to 2 to 3 to 5 to 10 AboveMonth Months Months Year Years Years Years Years 10 Years
----------------------------------------------------------------- (Rupees in ‘000) ------------------------------------------------------------------AssetsCash and balances with
treasury banks 18,278,840 18,278,840 - - - - - - - - Balances with other banks 822,689 822,689 - - - - - - - - Lendings to financial institutions 5,536,577 2,603,228 1,887,364 1,045,985 - - - - - - Investments - net 117,883,960 11,459,986 8,579,767 20,095,305 13,144,599 25,192,173 9,702,467 20,124,610 9,585,053 - Advances - net 125,305,765 43,738,573 18,077,744 30,177,733 1,952,728 2,127,763 6,781,159 8,696,314 5,667,930 8,085,821Operating fixed assets 5,138,424 44,648 177,272 199,739 632,504 474,315 764,204 961,649 536,401 1,347,692Deferred tax assets - net - - - - - - - - - - Other assets - net 5,554,451 4,452,247 - - 1,095,725 - - 6,479 - -
278,520,706 81,400,211 28,722,147 51,518,762 16,825,556 27,794,251 17,247,830 29,789,052 15,789,384 9,433,513
LiabilitiesBills payable 4,163,509 4,163,509 - - - - - - - - Borrowings 38,905,078 27,624,985 5,669,245 4,739,121 - 52,449 17,200 340,919 461,159 - Deposits and other accounts 209,925,453 157,602,976 23,802,572 13,383,725 13,246,397 1,573,169 316,614 - - - Sub-ordinated loans 2,998,800 600 - - 600 1,200 1,200 2,400 2,992,800 - Deferred tax liabilities - net 1,137,530 - - - 1,137,530 - - - - - Other liabilities 3,101,109 2,618,343 - - 482,766 - - - - -
260,231,479 192,010,413 29,471,817 18,122,846 14,867,293 1,626,818 335,014 343,319 3,453,959 -
Net assets 18,289,227 (110,610,202) (749,670) 33,395,916 1,958,263 26,167,433 16,912,816 29,445,733 12,335,425 9,433,513
Share capital 11,024,636Reserves 1,423,829
Unappropriated profit - net 3,496,305
Surplus on revaluation of assets 2,344,457
18,289,227
The management believes that the above maturity analysis does not reveal the expected maturity of cash and balances with treasury banks, current and saving deposits and running finance, as contractual maturity analysis alone does not provide information about the conditions expected in normal circumstances. The management believes that the maturity profile disclosed in note 43.5.1 that includes maturities of cash and balances with treasury banks, current and saving deposits and running finance determined by the Asset and Liability Management Committee (ALCO) keeping in view historical behaviour of these balances reflects a more meaningful analysis of the liquidity risk of the Bank.

43.5.3 Liquidity Coverage Ratio (LCR)
According to Basel III instructions issued by the State Bank of Pakistan (BPRD Circular No. 08 dated: 23 June 2016), it is mandatory for all the banks to calculate and report the LCR statement on monthly frequency with the minimum benchmark of 90% as of 31 December 2017.
The Liquidity Coverage Ratio (LCR) is a quantitative requirement which aims to ensure that a Bank maintains an adequate level of unencumbered high quality liquid assets which can easily be converted into cash at little or no loss of value in private markets, to withstand an acute liquidity stress scenario over a 30-day horizon at both the entity and consolidated level.
The LCR has two components:
a) Value of the stock of High Quality Liquid Assets (HQLA) in stressed conditions; and
b) Total net cash outflows, calculated according to the stress scenario for which a Bank would need sufficient liquidity on hand to survive for up to 30 days.
Particulars
TOTAL UNWEIGHTEDa
VALUE (average)
TOTAL WEIGHTEDb
VALUE (average)
------(Rupees in ‘000)------
HIGH QUALITY LIQUID ASSETS
1 Total high quality liquid assets (HQLA) 91,189,257
CASH OUTLFLOWS
2 Retail deposits and deposits from small business customers of which:
2.1 stable deposit
2.2 less stable deposit 107,155,255 10,715,523
3 Unsecured wholesale funding of which: - -
3.1 operational deposits (all counterparties) - -
3.2 non-operational deposits (all counterparties) 96,840,527 29,621,924
3.3 unsecured debt 20,758,152 20,758,152
4 Secured wholesale funding
5 Additional requirements of which:
5.1 outflows related to derivative exposures and other collateral requirements 4,928,952 4,928,952
5.2 outflows related to loss of funding on debt products - -
5.3 credit and Liquidity facilities
6 Other contractual funding obligations 121,199,035 9,269,532
7 Other contingent funding obligations 44,581,270 2,229,063
8 TOTAL CASH OUTFLOWS 395,463,191 77,523,146
CASH INFLOWS
9 Secured lending 23,332,473 11,719,602
10 Inflows from fully performing exposures 4,814,029 4,814,029
11 Other cash inflows
12 TOTAL CASH INLFOWS 28,146,502 16,533,631
TOTAL ADJUSTED
VALUE
21 TOTAL HQLA 91,189,257
22 TOTAL NET CASH OUTFLOWS 60,989,515
23 LIQUIDITY COVERAGE RATIO 149.52%
a Unweighted values must be calculated as outstanding balances maturing or callable within 30 days (for inflows and outflows).
b Weighted values must be calculated after the application of respective haircuts (for HQLA) or inflow and outflow rates (for inflows and outflows).
c Adjusted values must be calculated after the application of both (i) haircuts and inflow and outflow rates and (ii) any applicable caps (i.e. cap on level 2B and level 2 assets for HQLA and cap on inflows.

Soneri Bank Limited | Annual Report 2017 | 145
43.5.4 Net Stable Funding Ratio (NSFR)
According to Basel III instructions issued by the State Bank of Pakistan (BPRD Circular No. 08 dated: 23 June 2016), it is mandatory for all the banks to calculate and report the Leverage Ratio on a quarterly basis with the minimum of 100% on an ongoing basis from 31 December 2017.
The purpose of the net stable funding ratio (“NSFR”) is to ensure that banks hold a minimum amount of stable funding based on the liquidity characteristics of their assets and off-balance sheet activities over a one year horizon.
The NSFR limits overreliance on short-term wholesale funding, encourages better assessment of funding risk across all on- and off-balance sheet items and promotes funding stability. The objective is to reduce maturity mismatches between the asset and liability items on the balance sheet and thereby reduce funding and rollover risk.
ParticularsUnweighted value by residual maturity Weighted
valueNo Maturity < 6 months 6 months to < 1 yr ≥ 1 yr------(Rupees in ‘000)------
Available Stable Funding (ASF) Item 1 Capital:2 Regulatory capital 15,962,599 - - - 15,962,599 3 Other capital instruments 4,722,366 - - - 4,722,366
4Retail deposits and deposit from small business customers:
- - - - -
5 Stable deposits - - - - - 6 Less stable deposits - - 142,401,749 - 128,161,574 7 Wholesale funding: - - - - - 8 Operational deposits - - - - - 9 Other wholesale funding - - 69,757,407 - 34,878,704 10 Other liabilities: - - 935,711 - 467,856 11 NSFR derivative liabilities - 29,191,103 -
12All other liabilities and equity not included in other categories
- 85,092,036 579,076 2,683,032 2,972,570
13 Total ASF 187,165,669 Required Stable Funding (RSF) Item 14 Total NSFR high-quality liquid assets (HQLA) 93,218,240 1,469,072
15Deposits held at other financial institutions for
operational purposes - - - - -
16 Performing loans and securities:
17Performing loans to financial institutions secured
by Level 1 HQLA - 37,510,318 - - 1,875,516
18Performing loans to financial institutions secured
by non-Level 1 HQLA and unsecured performing loans to financial institutions
- 633,638 150,000 - 170,046
19
Performing loans to non- financial corporate clients, loans to retail and small business customers, and loans to sovereigns, central banks and PSEs, of which:
- - 28,791,839 - 24,473,063
20With a risk weight of less than or equal to 35%
under the Basel II Standardised Approach for credit risk
- - 7,120,515 - 4,628,335
21Securities that are not in default and do not qualify
as HQLA including exchange-traded equities. - - 2,606,478 3,896,281 6,111,787
22 Other assets: - - 135,729,558 - 67,864,779 23 Physical traded commodities, including gold - - -
24Assets posted as initial margin for derivative
contracts- - -
25 NSFR derivative assets - 3,883,510 3,883,510
26NSFR derivative liabilities before deduction of
variation margin posted- 5,838,221 5,838,221
27All other assets not included in the above
categories - - 12,477,110 - 12,477,110
28 Off-balance sheet items - - 167,212,728 - 8,360,636 29 Total RSF 137,152,075 30 Net Stable Funding Ratio (%) 136.47%

43.6 Operational Risk
Operational risk ‘OpRisk’ is defined as the risk of loss resulting from inadequate or failed internal processes, people and systems or external events. This includes legal risk as well as the reputational consequences of failures in operational risk management. The Bank uses Basic Indicator approach for assessing capital charge for operational risk.
The main objective of the operational risk management is to minimise expected and unexpected losses arising out of operational activities of the Bank.
The Bank has established a rigorous operational risk management framework to efficiently and effectively monitor and manage operational risk in each business and support activity of the Bank as well as those arising from external events like from natural disasters, outsourcing, etc.
The Bank has a sound organisation structure for managing operational risk, established on strong internal control environment and equipped with adequate level of expertise and resources. The Bank has also formed an Operational Risk Management Committee (ORMC), a senior management committee to assist the Board Risk Management Committee (RMC), to ensure the compliance of BoD approved operational risk management framework, supported by the Risk Management Division (RMD).
Operational Risk Assessment
The Bank has been conducting risk and control self assessment (RCSA) exercise for each business and support function of the Bank in order to identify and assess operational risks inherent in existing activities, processes and systems. Through the RCSA exercise, the Bank has been able to develop inventory of risks, controls and key risk indicators (KRI) and has identified gaps in its operating activities which are rectified on a priority basis.
Operational Risk Monitoring
Operational risk monitoring is conducted through KRIs, identified in the RCSA exercise for each process. All branches, offices, divisions / departments furnish KRI reports on a periodical basis to the Operational Risk Management Department (within the Risk Management Division).
Operational Risk Measurement
OPERATIONAL RISK MANAGEMENT OBJECTIVE AND ORGANIZATION
Board of Directors
Board Risk ManagementCommittee
Operational Risk ManagementDepartment
President & CEO
Head of Risk ManagementDivision
Executive Director &Chief Operating Officer
Operational RiskManagementCommittee
BCP StreeringCommittee

Soneri Bank Limited | Annual Report 2017 | 147
The Bank keeps a detailed track of its operational loss events and maintains a database. This helps the Bank to step towards advanced approach of Basel II accord and also allows the Bank to formulate strategy to rectify the gap of reoccurrence of the incident. The Bank has, in compliance of BPRD Circular No. 04 of 2014 “Implementation of Operational Risk Management Framework” created separate Op-Loss general ledgers in the Bank’s system which are being used for reporting of operational losses and are bifurcated into 7 operational loss categories as per the requirement of Basel II accord. The Bank also gathers external loss events occurring in the banking industry and designs strategies to prevent occurrence of similar incidents in the Bank.
Operational Risk Assessment for New Products and Services
Operational risk in all new products, systems and processes are identified and assessed by the RMD so that risk associated can be mitigated to an acceptable level. Assessment comprises of:
- review of new process flows and their control activities;- conduct RCSA exercise; and- identification, adequate assessment and ranking of all risks and controls.
Business Continuity Plan
In order to ensure continuity of the Bank’s operations, the Bank has in place a well developed, BoD approved Business Continuity Plan (BCP) which has been implemented across the Bank. The BCP has been well communicated down the line and regular trainings and testing is conducted across the country. Permanent back up sites have also been established and related testing carried out by critical staff to their designated back up sites. The BCP Steering Committee, a senior management committee, is responsible to ensure the adequacy of the BCP of the Bank as well as to ensure its effective implementation and compliance. The committee reports to the Board Risk Management Committee.
44 DATE OF AUTHORISATION FOR ISSUE
These financial statements were authorised for issue on 20 February 2018 by the Board of Directors of the Bank.
45 GENERAL
45.1 Comparative
Comparative information has been re-classified, re-arranged or additionally incorporated in these financial statements, wherever necessary to facilitate comparison and better presentation. There were no significant reclassification during the current year except for the reclassification as mentioned below:
45.1.2 An amount of Rs. 914.193 million has been reclassified from “Deposits and other accounts” to “Bills payable”. Furthermore, an amount of Rs. 4.927 million has been reclassified from “Bills payable” to “Other liabilities”.
45.2 Figures have been rounded off to the nearest thousand rupees unless otherwise stated.
46 NON-ADJUSTING EVENT AFTER THE BALANCE SHEET DATE
The Board of Directors in its meeting held on 20 February 2018 has proposed a cash dividend in respect of the year ended 31 December 2017 of Re. 0.75 per share (2016: Rs 1.25 per share). This appropriation will be approved in the forthcoming Annual General Meeting. The financial statements for the year ended 31 December 2017 do not include the effect of these appropriations which will be accounted for in the financial statements of the Bank for the year ending 31 December 2018.
Mohammad Aftab ManzoorPresident & Chief Executive Officer
Alauddin FeerastaChairman
Inam ElahiDirector
Muhammad Rashid ZahirDirector
Mirza Zafar BaigChief Financial Officer

S.NO.Name and address
of borrower
Name of Individuals/ partners/directors
(with CNIC No.)
Father/ Husband’s Name
Outstanding liabilities at beginning of the yearPrincipal
Written off
Mark-up Written off/
Waived
Other Financial
Relief Provided
TotalPrincipal Mark-up Others Total
1 2 3 4 5 6 7 8= 5+6+7 9 10 11 12=9+10+11---------------------------------------------- (Rupees in Million) ----------------------------------------------
1 Syed Akhtar Shah Bukhari Syed Akhtar Shah Bukhari Mr. Muhammad Shah Bukhari 2.299 0.942 - 3.241 - 0.757 - 0.757
Mouza Lai Wahin, Lodhran CNIC No. 31202-3630093-3
2 Al Sheraz Enterprises Mr. Sheraz Tallat Mr. Sheikh Tallat Mahmood 9.478 0.940 - 10.418 - 3.818 0.007 3.825
Shop # H-849, Inside Akbari Mandi, Lahore CNIC No. 35201-5211790-3
3 Mudassar Brothers Mr. Muhammad Gulzar Sheikh Muhammad Bashir - 5.207 - 5.207 - 22.226 0.415 22.641
Shop # H-1275, Inside Akbari Mandi, Lahore CNIC No. 35202-2439483-3
4 Parveen Akhtar Hussain Mrs. Parveen Akhtar Hussain W/o. Ashiq Hussain 0.603 0.306 - 0.909 0.152 1.491 0.565 2.208
Mohallah Mason Road, C-II, House No.36, CNIC No. 35202-4148851-2
Lahore
5 Shahid Mehmood Rana & Tanvir Ahmed Mr. Shahid Mehmood Rana Mr. Khair Din 1.747 0.898 - 2.645 - 0.684 - 0.684
Wando P.O. Khas, Tehsil Kamoke, Gujranwala CNIC No. 34102-2282800-7
Mr. Tanvir Ahmed Mr. Khair Din
CNIC No. 34102-6413904-5
6 Iqbal Rice Mills Mr. Muhammad Iqbal Mr. Muhammad Shareef 25.728 5.648 - 31.376 - 9.997 0.637 10.634
Iqbal Rice Mills, G.T.Road Sadhoke, CNIC No. 34101-3176831-7
Distt: Gujranwala
7 SNI Trading Company (Pvt) Limited Mr. Nauman Hafeez Sheikh Abdul Hafeez - 1.347 - 1.347 - 0.972 - 0.972
85 Hafeez Chamber , Mall Lahore CNIC No. 35202-6191931-1
Mr. Imran Hafeez Sheikh Abdul Hafeez
CNIC No. 35202-9231828-9
Mr. Salman Hafeez Sheikh Abdul Hafeez
CNIC No. 35202-6190981-1
8 Saloos Industries Limited Sheikh Abdul Hafeez Sheikh Abdul Ghafoor - 8.109 - 8.109 - 5.422 - 5.422
85 Hafeez Chamber, Mall Lahore CNIC No. 35202-9146423-9
Mr. Imran Hafeez Sheikh Abdul Hafeez
CNIC No. 35202-9231828-9
Mr. Salman Hafeez Sheikh Abdul Hafeez
CNIC No. 35202-6190981-1
Mr. Nauman Hafeez Sheikh Abdul Hafeez
CNIC No. 35202-6191931-1
Ms. Hina Sami D/o. Mr. Sami Ullah
CNIC No. 35202-7190458-2
9 Rajput Poly (Pvt) Limited Mr. Rana Muhammad Shahzad Mr. Muhammad Ashraf 21.493 7.721 - 29.214 - 2.304 - 2.304
93-Sundar Estate, Multan Road, Lahore CNIC No. 35202-8227846-5
Mrs. Sumaira Ashraf W/o. Muhammad Ashraf
CNIC No. 35401-1765569-4
10 Abdullah Protein Farms Mr. Muhamamd Ali Ghuman Mr. Muhammad Iqbal 4.947 1.737 - 6.684 - 1.347 0.017 1.364
Mouza Kot Karam Buksh, Tehsil Daska, CNIC No. 35201-0419575-7
Distt: Sialkot
11 Shan Wears Mrs. Parveen Nazim W/o. Nazim uddin Dar - 2.733 - 2.733 - 2.236 0.105 2.341
Dar House Jinnah Street Muradia Road, Sialkot CNIC No. 34603-2135693-6
Mr. Nazim Ud Din Dar Mr. Muhammad Saeed Dar
CNIC No. 34603-2206639-1
12 Ghazi & Company Mr. Imtiaz Ahmed Mr. Haji Dost Muhammad - 1.302 - 1.302 - 4.331 - 4.331
House No.38, Al-Hamra Society, Karachi CNIC No. 42201-6240233-5
13 Dewan Motors (Pvt) Ltd. Hina Yousuf W/o. Dewan - 1.063 - 1.063 - 17.868 0.961 18.829
7th Floor, Block-A, FTC Building, CNIC No. 42301-7944605-4 M. Yousuf Farooque
Shahrah-e-Faisal, Karachi Dewan M. Yousuf Farooque Dewan M. Umer Farooque
CNIC No. 42301-6948978-9
Dewan Abdullah Ahmed Saleh Dewan M. Umer Farooque
CNIC No. 42301-7511974-1
Dewan Abdul Baqi Farooque Dewan M. Umer Farooque
CNIC No. 42301-7130155-5
Dewan Asim Mushfiq Farooque Dewan M. Umer Farooque
CNIC No. 42301-4927084-9
M. Naeem Uddin Malik M. Saeeduddin Malik
CNIC No. 42201-5195341-7
Syed Monis Abdullah Alvi Syed Riaz uddin Alvi
CNIC No. 42201-6886191-3
14 NHN Petro Industries Mr. Hussain Hashim Ali Mr. Hashim Ali 20.389 1.955 - 22.344 - 6.912 0.222 7.134
Plot No.44, Sector No.24, Korangi Industrial CNIC No. 42000-2051581-5
Area, Karachi Mrs. Amyna Hashim Ali W/o. Hussain Hashim Ali
CNIC No. 42000-8232434-6
15 Quality Autos & Car Decoration Mr. Kamran Hussain Mr. Zahoor Hussain - 1.660 - 1.660 - 1.831 0.036 1.867
Shop # 3, Al Siraj Square, Main Super Highway, CNIC No. 42101-8037228-3
Waterpump, F.B.Area Block # 14, Karachi
16 A.K Textile Mills Mr. Mansoor Sadruddin Mr. Sadruddin - 1.365 - 1.365 - 1.425 0.246 1.671
House No.262, Amynabad Colony, off Martin CNIC No. 42201-8893280-5
Road, Karachi
STATEMENT SHOWING WRITTEN-OFF LOANS OR ANY OTHER FINANCIAL RELIEFOF FIVE HUNDRED THOUSAND RUPEES AND ABOVE PROVIDED
DURING THE YEAR ENDED 31 DECEMBER 2017
Annexure - I

Soneri Bank Limited | Annual Report 2017 | 149
17 Pearl Fabrics Corporation Shaikh Manzar Alam Mr. S. M. Sadiq 32.600 28.037 - 60.637 32.600 73.954 1.217 107.771
Plot # 20, Sector-27 Korangi Industrial Area, CNIC No. 42301-8070436-3
Karachi Mr. Adnan Manzar Shaikh Manzar Alam
CNIC No. 42301-5414509-7
Mrs. Nazia Manzar (Retired Partner) Shaikh Manzar Alam
CNIC No. 42301-0868993-0
18 Tek Chand Grain Traders Mr. Tek Chand Mr. Hemraj - 3.549 - 3.549 - 2.613 - 2.613
Shahpur chakar Taluka Matyari CNIC No. 41303-2454169-9
19 Golden Industries Mr. Dayo Mal Daya Ram Mr. Asha Ram 102.647 48.683 - 151.330 20.147 48.683 0.522 69.352
Plot No. A-29, SITE Area, CNIC No. 41306-3300997-5
Hyderabad Mr. Nand Lal Mr. Asha Ram
CNIC No. 41306-0810738-5
Mr. Chcho Mal Mr. Asha Ram
CNIC No. 41207-2369355-9
20 Amar Trucking Station Mr. Kishor Kumar Mr. Thanwar Dass - 3.115 - 3.115 - 5.103 0.143 5.246
By-pass, Main Hyderabad Road, CNIC No. 41307-5356972-5
Tando Allahyar Mr. Dileep Kumar Mr. Ratan Lal
CNIC No. 41307-7369643-9
21 Amar CNG Filling Station Mr. Kishor Kumar Mr. Thanwar Dass 3.709 4.897 - 8.606 3.709 3.882 0.163 7.754
By-pass, Main Hyderabad Road, CNIC No. 41307-5356972-5
Tando Allahyar Mr. Dileep Kumar Mr. Ratan Lal
CNIC No. 41307-7369643-9
22 Mirza Ali Baig Mirza Ali Baig Mirza Muhammad Nasir Baig 2.500 1.604 - 4.104 - 1.193 0.033 1.226
House # 4-A, Gulgasht Colony, CNIC No. 61101-9006844-7
Bosan Road, Multan
23 Mehmood Hussain Mr. Mehmood Hussain Mr. Hussain Bukhsh 0.996 1.162 - 2.158 - 0.734 - 0.734
Mouza Pannau, CNIC No. 31202-4981488-3
Bahawalpur
24 Super Sportif Mrs. Khizra Nokhaiz Mr. Nokhaiz Afzal Sandal 6.500 - - 6.500 - 1.130 - 1.130
17/A, Fazal ul Qadir Road, CNIC No. 34603-6421827-8
Sialkot Cantt.
25 Sunny Poultry Breeders Mr. Muhammad Hussain Patel Mr. Suleman Patel 0.567 0.220 - 0.787 - 0.800 0.179 0.979
2nd Floor, Gulistan Chamber, Block 7-8, CNIC No. 42301-7093516-3
Shabirabad, Off Shaheed-e-Millat Road, Karachi
26 Deedar & Sons Mr. Deedar Ali Bhai Mr. Ali Bhai 1.847 2.182 - 4.029 0.347 2.239 0.176 2.762
Flat No.6, III-E/4, Gulshan-e-Ali, Nazimabad No.3, CNIC No. 42201-0467876-5
Karachi
27 Pakistan Airconditioning & Refrigeration Sheikh Arshad Farooq Sheikh Muhammad Farooq - 30.037 - 30.037 - 22.093 - 22.093
Corporation (Pvt) Limited CNIC No. 42000-0497406-1
311-314, Muhammadi House , I.I. Chundrigar Mr. Amjad Farooq Sheikh Muhammad Farooq
Road, Karachi CNIC No. 42000-0397564-5
Mr. Abid Farooq Sheikh Muhammad Farooq
CNIC No. 35202-4085641-3
Mrs. Surriya Farooq Sheikh Muhammad Farooq
CNIC No. 42000-0389449-6
Mr. Asad Amjad Farooq Mr. Amjad Farooq
CNIC No. 42000-0397565-5
28 Quality Autos Mr. Farhan Hussain Mr. Zahoor Hussain 2.297 0.519 - 2.816 - 0.744 - 0.744
Shop No.A-1/2, Al-Siraj Square , F.B Area, CNIC No. 42201-2157861-1
Karachi
29 Shahid Ansari & Company Mr. Shahid Ansari Mr. Gulrez Ahmed Ansari 8.414 5.643 - 14.057 - 3.248 0.370 3.618
Bungalow No.14/B, Civil Lines Tarique Road, CNIC No. 41303-9016607-3
Near Gul Medicare, Saddar, Hyderabad
30 Dream Departmental Store Mr. Farrukh Anwer Ali Mr. Anwer Ali 6.899 0.862 - 7.761 - 1.552 0.159 1.711
G-1,1,2,3 Sector-22, Rufi Shopping Paradise, CNIC No. 42501-9458192-1
Scheme No.33, University Road, Karachi Mr. Amir Ali Mr. Anwer Ali
CNIC No. 42501-8095380-9
31 Habib & Habib (Pvt) Ltd Mr. Muhammad Ahmed Siddiqui Mr. Taskhir Ahmed - 9.588 - 9.588 - 0.700 - 0.700
216-217, 2nd Floor, The Forum, Plot No. G-20, CNIC No. 42301-1079656-9
Block-9, Khayaban-e-Jami, Clifton, Karachi Mr. Munir Ahmed Siddiqui Mr. Muhammad Ahmed Siddiqui
CNIC No. 42301-6622548-1
Mr. Mubashir Ahmed Siddiqui Mr. Muhammad Ahmed Siddiqui
CNIC No. 42000-0513848-5
Mrs. Razia Begum Mr. Muhammad Ahmed Siddiqui
CNIC No. 42101-1725279-8
Total 255.660 183.031 - 438.691 56.955 252.289 6.173 315.417
STATEMENT SHOWING WRITTEN-OFF LOANS OR ANY OTHER FINANCIAL RELIEFOF FIVE HUNDRED THOUSAND RUPEES AND ABOVE PROVIDED
DURING THE YEAR ENDED 31 DECEMBER 2017
Annexure - I
S.NO.Name and address
of borrower
Name of Individuals/ partners/directors
(with CNIC No.)
Father/ Husband’s Name
Outstanding liabilities at beginning of the yearPrincipal
Written off
Mark-up Written off/
Waived
Other Financial
Relief Provided
TotalPrincipal Mark-up Others Total
1 2 3 4 5 6 7 8= 5+6+7 9 10 11 12=9+10+11---------------------------------------------- (Rupees in Million) ----------------------------------------------

Islamic Banking Division Annexure - II
The Bank is operating nineteen Islamic banking branches at the end of current year (2016: sixteen branches). The statement of financial position, profit and loss account and cash flow statement of these branches (including Islamic Banking Division) are as follows:
BSD circular letter No. 03 dated: 22 January, 2013 requires all Islamic Banks and Banks with Islamic Banking Branches to present all financing, advances for assets under Islamic modes of financing and any other related items pertaining to Islamic mode of financing under the caption Islamic Financing and Related Assets in the Statement of Financial Position.
31 December 31 December(i) Statement of Financial Position 2017 2016
------------(Rupees in ‘000)----------
ASSETSCash and balances with treasury banks 1,029,113 646,512 Balances with other banks 26 26 Due from financial institutions 4,108,645 1,690,592 Investments 4,445,932 5,265,057 Islamic financing and related assets vi 4,584,085 3,727,219 Operating fixed assets 194,194 157,391 Due from head office 966,419 167,209 Other assets 252,493 225,276 Total Assets 15,580,907 11,879,282
LIABILITIESBills payable 45,598 108,521 Due to financial institutions 97,863 71,538 Deposits and other accounts
- Current accounts 3,348,379 2,326,188 - Saving accounts 6,531,630 4,866,902 - Term deposits 3,941,815 2,896,033 - Others 190,189 160,317
Other liabilities 196,525 250,489 Total Liabilities 14,351,999 10,679,988
NET ASSETS 1,228,908 1,199,294
REPRESENTED BY:Islamic Banking Fund 1,000,000 1,000,000 Accumulated profit 160,665 114,918
1,160,665 1,114,918 Surplus on revaluation of assets 68,243 84,376
1,228,908 1,199,294
(ii) Profit and Loss Account
Profit / return on financing, investments and placements earned 879,681 687,317 Return on deposits and other dues expensed (ii a) (529,440) (415,927)Net income earned before provision 350,241 271,390
Reversal of provision against non-performing financings 29,706 9,798
Net income earned after provision 379,947 281,188
Other incomeFee, commission and brokerage income 34,013 32,841 Gain on sale of securities - net (1,026) 22,194 Other income 5,869 2,674
418,803 338,897 Other expensesAdministrative expenses 257,388 222,290 Other charges 750 1,689
258,138 223,979
Profit before taxation 160,665 114,918

Soneri Bank Limited | Annual Report 2017 | 151
(ii.a) These figures have been adjusted to exclude inter segment profitability charge of Rs. 60.752 million @ 6.08% per annum (2016: Rs. 48.087 million @ 6.35% per annum) in line with financial reporting requirement.
(ii.b) Deposits and other accounts include redeemable capital of Rs.11,398.643 million (31 December 2016: Rs. 8,259.094 million) and deposits on Qard basis of Rs. 2,883.370 million (31 December 2016: Rs. 1,990.346 million). Remunerative deposits which are on Mudaraba basis are considered as redeemable capital and non-remunerative deposits are classified as being on Qard basis.
31 December 31 December(iii) Cash Flow Statement 2017 2016
------------(Rupees in ‘000)---------- CASH FLOWS FROM OPERATING ACTIVITIESProfit before taxation 160,665 114,918
Adjustments:Depreciation / amortisation 107,206 120,823 Reversal of provision against non-performing islamic financing & related assets (29,706) (9,798)Operating fixed assets written off directly 504 1,685 Gain on sale of fixed assets (661) (1,180)
77,343 111,530 238,008 226,448
(Increase) / decrease in operating assetsDue from financial institutions (2,418,053) (1,166,211)Islamic financing and related assets-net (910,138) (170,492)Due from Head Office (638,545) 96,910 Others assets - (excluding advance taxation) (27,217) (31,024)
(3,993,953) (1,270,817)Increase / (decrease) in operating liabilities
Bills payable (62,923) 58,670 Due to financial institutions 26,325 (168,664)Deposits and other accounts 3,762,573 1,295,801 Other liabilities (168,882) (41,282)
3,557,093 1,144,525 Net cash (used in) / generated from operating activities (198,852) 100,156
CASH FLOWS FROM INVESTING ACTIVITIESNet investments in securities 802,992 (357,009)Investment in operating fixed assets (62,214) (37,328)Proceeds from disposal of fixed assets 1,340 1,180 Net cash generated from / (used in) investing activities 742,118 (393,157)
CASH FLOWS FROM FINANCING ACTIVITIESFunds received from Head Office - 400,000 Profit remitted to head office (160,665) (114,918)Net cash (used in) / generated from financing activities (160,665) 285,082
Increase / (Decrease) in cash and cash equivalents 382,601 (7,919)Cash and cash equivalents at the beginning of the year 646,538 654,457 Cash and cash equivalents at the end of the year 1,029,139 646,538
CASH AND CASH EQUIVALENTS AT THE END OF THE YEARCash and balances with treasury banks 1,029,113 646,512 Balances with other banks 26 26
1,029,139 646,538
(iv) Remuneration to shariah advisor 5,715 5,290
(v) Charity Fund
Opening balance - - Addition during the year 116 952 Payment / utilisation during the year (116) (952)Closing balance - -
Annexure - II

31 December 31 December 2017 2016
(vi) Islamic financing and related assets ------------(Rupees in ‘000)----------
Murabaha 573,685 500,261 Musharakah 521,204 - Assets held under Ijarah ( IFAS- 2) (vi) a 301,549 268,841 Diminishing Musharaka 1,892,336 958,966 Salam 47,068 48,578 Advance against islamic financing:- Murabaha 416,473 580,556 - Car Ijarah 67,176 57,543 - Diminishing Musharaka - 1,008,948 - Salam 325,478 361,515 Other Islamic modes of financing 467,398 - Islamic financing and related assets - Gross 4,612,367 3,785,208 Provision against non-performing financing (28,283) (57,989)Islamic financing and related assets - net of provision 4,584,084 3,727,219
(vi) a Assets held under Ijarah - Ijarah accounted for under IFAS-2
Motor vehicles 278,231 212,732 Plant and machinery 23,318 56,109
301,549 268,841 (vii) Deposits
Deposits are generated through the following pools:
(i) Normal poolDeposits generated under this pool are on the basis of Qard and Mudaraba
(ii) Special pool Deposits generated under this pool are on the basis of Mudaraba from high net worth customers.
Deposits taken on a Qard basis are classified as ‘Current Accounts’ and deposits generated on ‘Modaraba basis’ are classified as ‘Savings Deposits’ and ‘Fixed Deposits’. No profit or loss is passed on to current account depositors. While the product features of each product differ, there is usually no restriction on withdrawals or number of transactions in current and saving accounts. In case of fixed deposits, pre-mature withdrawals can be made as per approved terms only.
(viii) Profit / (loss) distribution to depositor’s pool
The Bank maintained the following pools for profit declaration and distribution during the year ended 31 December 2017:
i) Mudaraba Pool;ia) Normal pool;ib) Special pool;ii) Musharaka Pool under SBP’s Islamic Export Refinance Scheme.
Profits realised through normal / special pool are distributed between the Bank and the depositors in proportion to their respective share in the pool. All Modaraba based deposits are fully invested in accordance with their respective Pool to produce returns for them. In case where the Bank is unable to utilise all funds available for investment, priority is given to the deposit account holders. Rab-ul-Maal share is distributed among depositors according to weightages assigned at the inception of profit calculation period. Mudarib can distribute its share of profit to Rab-ul-Maal upto a maximum of 60% of their profit as incentive profits (Hiba).
Profits are distributed from the pool such that the depositors (remunerative) only bear the risk of assets in accordance with their respective pool during the profit calculation period. In case of loss in a pool during the profit calculation period, the loss is distributed among the depositors (remunerative) according to their ratio of investments.
The deposits and funds accepted under the Mudaraba Pool are provided to diversified sectors and avenues of the economy / business mainly to ‘Chemical and Pharmaceutical’, ‘Textile and Allied’, ‘Food and Allied’, ‘Automobile and Transportation’, Shoes and Leather’, ‘Electronics and Electrical Appliances’, ‘Financial’ and ‘Investment in Government of Pakistan Ijarah Sukuks’.
Annexure - II
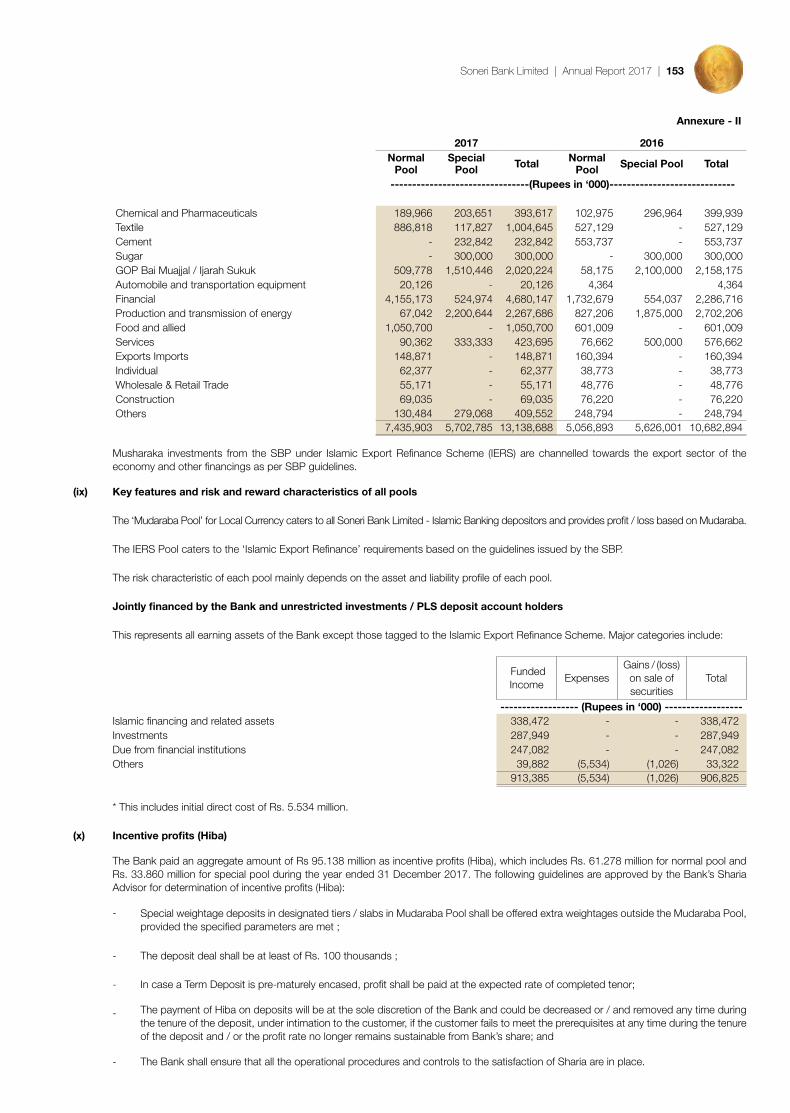
Soneri Bank Limited | Annual Report 2017 | 153
2017 2016Normal
PoolSpecial
Pool Total Normal Pool Special Pool Total
--------------------------------(Rupees in ‘000)-----------------------------
Chemical and Pharmaceuticals 189,966 203,651 393,617 102,975 296,964 399,939 Textile 886,818 117,827 1,004,645 527,129 - 527,129 Cement - 232,842 232,842 553,737 - 553,737 Sugar - 300,000 300,000 - 300,000 300,000 GOP Bai Muajjal / Ijarah Sukuk 509,778 1,510,446 2,020,224 58,175 2,100,000 2,158,175 Automobile and transportation equipment 20,126 - 20,126 4,364 4,364 Financial 4,155,173 524,974 4,680,147 1,732,679 554,037 2,286,716 Production and transmission of energy 67,042 2,200,644 2,267,686 827,206 1,875,000 2,702,206 Food and allied 1,050,700 - 1,050,700 601,009 - 601,009 Services 90,362 333,333 423,695 76,662 500,000 576,662 Exports Imports 148,871 - 148,871 160,394 - 160,394 Individual 62,377 - 62,377 38,773 - 38,773 Wholesale & Retail Trade 55,171 - 55,171 48,776 - 48,776 Construction 69,035 - 69,035 76,220 - 76,220 Others 130,484 279,068 409,552 248,794 - 248,794
7,435,903 5,702,785 13,138,688 5,056,893 5,626,001 10,682,894
Musharaka investments from the SBP under Islamic Export Refinance Scheme (IERS) are channelled towards the export sector of the economy and other financings as per SBP guidelines.
(ix) Key features and risk and reward characteristics of all pools
The ‘Mudaraba Pool’ for Local Currency caters to all Soneri Bank Limited - Islamic Banking depositors and provides profit / loss based on Mudaraba.
The IERS Pool caters to the ‘Islamic Export Refinance’ requirements based on the guidelines issued by the SBP.
The risk characteristic of each pool mainly depends on the asset and liability profile of each pool.
Jointly financed by the Bank and unrestricted investments / PLS deposit account holders
This represents all earning assets of the Bank except those tagged to the Islamic Export Refinance Scheme. Major categories include:
Funded Income
ExpensesGains / (loss)
on sale of securities
Total
------------------ (Rupees in ‘000) ------------------ Islamic financing and related assets 338,472 - - 338,472 Investments 287,949 - - 287,949 Due from financial institutions 247,082 - - 247,082 Others 39,882 (5,534) (1,026) 33,322
913,385 (5,534) (1,026) 906,825
* This includes initial direct cost of Rs. 5.534 million.
(x) Incentive profits (Hiba)
The Bank paid an aggregate amount of Rs 95.138 million as incentive profits (Hiba), which includes Rs. 61.278 million for normal pool and Rs. 33.860 million for special pool during the year ended 31 December 2017. The following guidelines are approved by the Bank’s Sharia Advisor for determination of incentive profits (Hiba):
- Special weightage deposits in designated tiers / slabs in Mudaraba Pool shall be offered extra weightages outside the Mudaraba Pool, provided the specified parameters are met ;
- The deposit deal shall be at least of Rs. 100 thousands ;
- In case a Term Deposit is pre-maturely encased, profit shall be paid at the expected rate of completed tenor;
- The payment of Hiba on deposits will be at the sole discretion of the Bank and could be decreased or / and removed any time during the tenure of the deposit, under intimation to the customer, if the customer fails to meet the prerequisites at any time during the tenure of the deposit and / or the profit rate no longer remains sustainable from Bank’s share; and
- The Bank shall ensure that all the operational procedures and controls to the satisfaction of Sharia are in place.
Annexure - II

(xi) Contractual maturities of mudaraba based deposit accounts
Particulars
2017
Total Upto 1 Month
Over 1 to 3 Months
Over 3 to 6 Months
Over 6 Months to
1 Year
Over 1 to 2 Years
Over 2 to 3 Years
Over 3 to 5 Years
------------------------------------------------(Rupees in ‘000)---------------------------------------------Fixed Deposits 3,941,815 49,000 2,625,160 18,050 - 1,241,992 4,100 3,513 Savings Deposits 7,186,828 7,186,828 - - - - - - Current Deposits - Remunerative 655,198 655,198 - - - - - -
11,783,841 7,891,026 2,625,160 18,050 - 1,241,992 4,100 3,513
Profit / (loss) distribution to depositor’s pool
General Remunerative Depositor’s Pools
Profit Sharing Ratio
(Depositor: Mudarib)
Profit rate return earned
Mudarib Share
transferred to the
Depositors through Hiba (Rupees in ‘000)
Mudarib Share
transferred to the
Depositors through Hiba
(Percent)
Mudarib share Net of
Hiba(Rupees in
‘000)
Mudarib share Net of Hiba (Percent)
Profit rateand weightageannouncement
period
Profit rate return
distributed
Mudaraba PoolNormal Pool 75.00% 7.25% 61,278 5.39% 222,841 19.61% Monthly 4.42%Special Pool 75.00% 6.70% 33,860 10.30% 48,337 14.70% Monthly 5.67%Total 75.00% 7.02% 95,138 6.49% 271,178 18.51% Monthly 5.01%
IERS Musharaka PoolRatio of
weightage of Bank to SBP
Share of profit to SBP
(Rupees in ‘000)
HIBA (Rupees in
‘000)
Profit rate and weightage
announcement period
Profit rate return earned
by SBP
Musharaka Pool SBP’s Islamic Export Refinance Scheme 0.3244 672.564 3.968 Quarterly 2.21%0.3468 1,598.848 5.719 Quarterly 1.80%0.2400 608.912 18.153 Quarterly 1.00%0.1425 143.693 1.616 Quarterly 1.08%
Parameters used for allocation of profit, charging expenses and provisions, etc. along with a brief description of their major components:
Income generated from relevant assets, calculated at the end of each month is first set aside for the Musharaka pool arrangement between the Bank and the State Bank of Pakistan. It is then allocated between the participants of the pool as per the agreed weightages and rates.
The Mudaraba Pool profit is divided between the Bank and depositors in the ratio of Bank’s average equity (pertaining to Islamic banking branches) and average depositors balances commingled in each pool on a pro-rata basis. The depositors’ share of profit is allocated amongst them on the basis of weightages declared before start of each month, after deduction of a mudarib fee. During the year ended 31 December 2017, the Bank charged 25% (2016: 25%) of the profit as Mudarib fee. These weightages are declared by the Bank in compliance with the requirements of the SBP and Shariah.
The allocation (of income and expenses to different pools) is made on a pre-defined basis and accounting principles / standards. Provisions against any non-performing assets of the pool are not passed on to the pool.
(xii) Allocation of Income and Expenses to Depositors’ Pools
a) Following are material items of revenues, expenses, gains and losses2017 2016
-----(Rupees in ‘000)----
Profit / return earned on financings, investments and placements 873,503 673,218 Other income (including other charges) 38,856 57,799 Directly related costs attributable to pool (5,534) (4,674)
906,825 726,343
b) Following weightages have been assigned to different products under the Mudaraba Pool during the year:
Percentage of total
Mudaraba based
deposits
Minimum weightage
Maximum weightage
Savings - Soneri Munafa Account 67% 0.3333 0.9667Savings - Soneri Bachat Account 2% 0.3333 0.3333Current Remunerative - Soneri Rahat Account 4% 0.0083 0.0083Savings - Assan Account 0% 0.3333 0.3333Time Deposits - Soneri Meadi 27% 0.4833 0.9750
The Bank shares all its revenue generated through banking operations with the deposit account (pertaining to Islamic Operation) holders.
Annexure - II

Soneri Bank Limited | Annual Report 2017 | 155
Disposal of fixed assets (refer note 11.2.3)
Disposals / deletions of property and equipment with original cost or book value in excess of rupees one million or two hundred fifty thousand respectively (whichever is less):
Particulars Cost Bookvalue
Sale price / insurance proceeds
Mode of settlement /
disposal
Particulars of buyers / insurance companies
--------- (Rupees in ‘000) ---------
Leasehold Improvement
------------- do ------------- 2,389 1,812 - Written off
------------- do ------------- 2,285 1,707 - Written off
------------- do ------------- 1,934 1,523 - Written off
------------- do ------------- 1,469 1,288 - Written off
------------- do ------------- 1,450 1,100 - Written off
------------- do ------------- 1,434 1,177 - Written off
------------- do ------------- 1,390 984 - Written off
------------- do ------------- 1,354 959 - Written off
------------- do ------------- 1,183 879 - Written off
------------- do ------------- 1,167 875 - Written off
------------- do ------------- 1,023 916 - Written off
------------- do ------------- 881 773 - Written off
------------- do ------------- 799 655 - Written off
------------- do ------------- 735 579 - Written off
------------- do ------------- 648 571 - Written off
------------- do ------------- 637 559 - Written off
------------- do ------------- 648 481 - Written off
------------- do ------------- 678 480 - Written off
------------- do ------------- 739 440 - Written off
------------- do ------------- 536 379 - Written off
------------- do ------------- 428 375 - Written off
------------- do ------------- 368 322 - Written off
------------- do ------------- 401 304 - Written off
------------- do ------------- 331 297 - Written off
------------- do ------------- 385 292 - Written off
------------- do ------------- 431 257 - Written off
Items with WDV of below Rs. 250,000/-
and cost of less than
Rs. 1,000,000 2,026 1,501 397 Various Various
27,749 21,485 397
Furniture and fixtures
------------- do ------------- 1,781 348 - Written off
------------- do ------------- 1,286 - - Written off
------------- do ------------- 1,279 - - Written off
------------- do ------------- 1,125 89 - Written off
------------- do ------------- 1,116 116 - Written off
------------- do ------------- 1,095 - - Written off
------------- do ------------- 1,051 48 - Written off
------------- do ------------- 531 400 - Written off
Items with WDV of below Rs. 250,000/-
and cost of less than
Rs. 1,000,000 18,587 3,511 609 Various Various
27,851 4,512 609
Annexure - III

Disposal of fixed assets (refer note 11.2.3)
Particulars Cost Book value Sale price / insurance proceeds
Mode of settlement /
disposal
Particulars of buyers / insurance companies
--------- (Rupees in ‘000) ---------
Electrical, office and
computer equipment
------------- do ------------- 3,610 - 134 Tender Mujeeb Alam & Co
------------- do ------------- 2,240 - 83 Tender Mujeeb Alam & Co
------------- do ------------- 2,225 1,113 834 Tender Infotel Pak Pvt Ltd
------------- do ------------- 1,448 - - Written off
------------- do ------------- 1,359 - - Written off
------------- do ------------- 1,323 - 9 Tender Touch Point (Pvt) Ltd
------------- do ------------- 1,237 - 9 Tender Touch Point (Pvt) Ltd
------------- do ------------- 1,183 - 7 Tender Touch Point (Pvt) Ltd
------------- do ------------- 1,183 - - Written off
------------- do ------------- 1,119 - 9 Tender Touch Point (Pvt) Ltd
------------- do ------------- 1,111 - 9 Tender Touch Point (Pvt) Ltd
------------- do ------------- 1,107 - 7 Tender Touch Point (Pvt) Ltd
------------- do ------------- 1,107 - 7 Tender Touch Point (Pvt) Ltd
------------- do ------------- 1,082 - 7 Tender Touch Point (Pvt) Ltd
------------- do ------------- 1,082 - 7 Tender Touch Point (Pvt) Ltd
------------- do ------------- 1,082 - 7 Tender Touch Point (Pvt) Ltd
------------- do ------------- 1,082 - 7 Tender Touch Point (Pvt) Ltd
------------- do ------------- 1,077 - - Written off
------------- do ------------- 1,071 - 7 Tender Touch Point (Pvt) Ltd
------------- do ------------- 1,039 - - Written off
------------- do ------------- 1,039 17 - Written off
Items with WDV of below Rs. 250,000/-
each or cost of less than
Rs. 1,000,000 124,739 4,615 6,805 Various Various
153,545 5,745 7,948
Vehicles
------------- do ------------- 1,445 - 1,050 Tender Sohail Ahmed
------------- do ------------- 1,269 - 1,058 Tender Wasim Mirza
------------- do ------------- 1,269 - 1,064 Tender Wasim Mirza
------------- do ------------- 1,124 974 1,020 Tender Jubilee General Insurance Company Limited
Items with WDV of below Rs. 250,000/-
each or cost of less than
Rs. 1,000,000 14,352 51 9,868 Various Various
19,459 1,025 14,060
228,604 32,767 23,014
Annexure - III

Soneri Bank Limited | Annual Report 2017 | 157
Particulars of investment in Term Finance Certificates and Sukuk Certificates - (refer note 9.11)
Name of InvesteeNumber of
certificates held
Paid upvalue per certificate
Total paidup value (before
redemption)Profit Principal redemption
Balance as at 31
December 2017
Balance as at 31
December 2016
Name ofChief Executive
2017 2016 (Rupees) (Rs. in ‘000) (Rupees in ‘000)
(a) Held to maturity securities
(i) Listed Term Finance Certificates
Azgard Nine Limited 10,000 10,000 5,000 50,000 - 6 months Kibor + 1.00% (1-2 years) - 6 months Kibor + 1.25% (3-5 years) - 6 months Kibor + 1.00% (6-7.5 years)
0.88% of principal amount in 42 months, 1.63% from 48 months to 66 months remaining principal in four equal semi annual instalments starting from the 72nd month from the date of issue.
16,269 16,269 Mr. Ahmed Shaikh
(ii) Un-listed Term Finance Certificates
Agritech Limited 1,488 1,488 5,000 7,440 11.00 % Per Annum 0.02% of principal amount in the first 60 months and remaining principal paid in 66th month from the date of issue.
7,440 7,440 Mr. Faisal Muzammil
Azgard Nine Limited 2,150 2,150 5,000 10,750 NIL 10% of principal amount from 24 months to 36 months , 15% from 42 months to 48 months remaining principal in two equal semi annual instalments starting from the 54th month from the date of issue.
10,750 10,750 Mr. Ahmed Shaikh
Bank Al Falah Limited - 4th issue - 10,000 5,000 50,000 6 months Kibor + 2.50% 0.02% of principal amount in the first 78 months and remaining principal in three equal semi annual instalments starting from the 84th month from the date of issue.
- 33,247 Mr. Nauman Ansari
Faysal Bank Limited - 2nd Issue - 15,000 5,000 75,000 6 months Kibor + 2.25% 0.02% of principal amount in the first 60 months and remaining principal in four equal semi annual instalments starting from the 66th month from the date of issue.
- 37,425 Mr. Yousaf Hussain
Standard Chartered Bank (Pakistan) Limited - 40,000 5,000 200,000 6 months Kibor + 0.75% Principal paid in two equal semi annual instalments starting from the 114th month from the date of issue.
- 200,000 Mr. Shahzad Dada
(iii) Listed Sukuk Certificates
Engro Fertilizers Limited 32,300 32,300 5,000 161,500 6 months Kibor + 1.75% 2.50% of principal amount in 24 months, 10.00% from 30 months to 36 months remaining principal in four equal semi annual instalments starting from the 42nd month from the date of issue.
113,050 145,350 Mr. Ruhail Muhammad
K-Electric Limited AZM Sukuk - 80,000 5,000 400,000 3 months Kibor + 2.25% Principal paid in 36 months from the date of issue. - 400,000 Mr. Tayyab Tareen
(iv) Un-listed Sukuk Certificates
Al Baraka Bank (Pakistan) Limited 100 100 1,000,000 100,000 6 months Kibor + 1.25% Principal paid in fourteen equal semi annual instalments. 57,143 71,428 Mr. Shafqaat Ahmed
Eden Housing Limited 10,000 10,000 5,000 50,000 3 months Kibor + 2.5% 12.50% of principal amount from 18 to 24 months, 0.38% in 15 months, 2.27% from 18 to 21 months, 2.60% in 24 months, 4.72% from 27 months to 36 months ,5.62% from 39 months to 48 months and remaining principal in four equal quarterly instalments starting from the 51th month from the date of issue.
6,560 6,560 Mr. Muhammad Amjad
Liberty Power Tech Limited 1,099,430 1,099,430 100 109,943 3 months Kibor + 3.00% Quarterly instalments starting from 01 April 2011. 52,728 65,335 Mr. Ashraf Salim Mukaty
Pakistan Mobile Communication Limited 100,000 100,000 5,000 500,000 3 months Kibor + 0.88% Principal paid in twelve equal quarterly instalments starting from the 27th month from the date of issue.
333,333 500,000 Mr. Aamir Ibrahim
Three Star Hosiery Mills (Private) Limited 5,100 5,100 5,000 25,500 3 months Kibor + 3.25% with floor of 11% and Cap of 25%
Principal paid in seven equal semi annual instalments starting from the 24th month from the date of issue.
25,215 25,215 Mr. Muhammad Rasheed
WAPDA 4,000 4,000 5,000 20,000 6 months Kibor + 0.35% Principal paid in 80 months from the date of issue. 19,860 19,860 Lt. Gen.(R) Muzammil Hussain
(b) Available for sales securities
(i) Un-listed Term Finance Certificates
Bank Al Habib Limited 50,000 - 5,000 250,000 6 months Kibor + 1.50% Perpetual. 250,000 - Mr. Mansoor Ali Khan
Habib Bank Limited - 1,000 100,000 99,980 6 months Kibor + 0.50% 0.02% of principal amount in the first 108 months and remaining principal in two equal semi annual instalments starting from the 114th month from the date of issue.
- 99,988 Mr. Rayomond Kotwal
JS Bank Limited - 90,000 5,000 450,000 6 months Kibor + 1.40% 0.02% of principal amount in the first 72 months and remaining principal in two equal semi annual instalments starting from the 78th month from the date of issue.
- 450,000 Mr. Khalid Imran
(ii) Listed Sukuk Certificate
K-Electric Limited Sukuk-ul-Shirkah 100,000 100,000 5,000 500,000 3 months Kibor + 1.00% Principal paid in twenty equal quarterly instalments starting from the 27th month from the date of issue.
450,000 500,000 Mr. Tayyab Tareen
(iii)Un-listed Sukuk Certificates
AlBaraka Bank (Pakistan) Limited 75 75 1,000,000 75,000 6 months Kibor + 1.25% Principal paid in fourteen equal semi annual instalments. 42,857 53,571 Mr. Shafqaat Ahmed
Meezan Bank Limited 425 425 1,000,000 425,000 6 months kibor + 0.50% Principal paid in 120 months from the date of issue. 425,000 425,000 Mr. Irfan Siddiqui
Neelum Jhelum Hydro Power Company (Private) Limited
9,750 9,750 100,000 975,000 6 months kibor + 1.10% Principal paid in sixteen equal semi annual instalments starting from the 30th month from the date of issue.
975,000 975,000 Brig (Retd.) Muhammad Zareen
Total 2,785,205 4,042,438
Annexure - IV

REPORT OFSHARI’AH BOARD
In the name of Allah, the Beneficent, the Merciful
By the grace of Almighty Allah, the year under review was the 12th year of Islamic commercial banking for Soneri Bank Limited, while the Board of Directors and Executive Management are solely responsible to ensure that the operations of Soneri Bank Limited – Islamic Banking (Mustaqeem) are conducted in a manner that comply with Shari’ah principles at all times, we are required to submit a report on the overall Shari’ah compliance environment of Soneri Bank Limited – Islamic Banking (Mustaqeem).
To form an opinion on the overall Shariah Compliance environment as required by the regulatory framework, the Shari’ah Compliance Department of the Bank needs to carry out reviews, on test check basis, of each class of transactions, the relevant documentation and process flows. Further, the reports of the internal Shari’ah audit and external Shari’ah audit also form the basis of this report.
During the year under review, the Shari’ah Board supervised and analyzed various transactions, processes and their Shari’ah Compliance as an ongoing practice to ensure that the transactions continue to be valid as per Shari’ah. The main modes of financing used for the Bank’s Islamic financing activities consist of Murabaha, Ijarah, Diminishing Musharakah, Salam and Running Musharakah. It is encouraging to report that the Bank has been gradually moving from trade based to Participatory modes which is beneficial for the development of Islamic Banking in long run.
To strengthen and broaden the functions of Shari’ah control, the Shari’ah Compliance Department of the Bank goes the extra mile to facilitate the customers accompanying the business teams on their visits to understand and assess the customers’ business needs and giving their due feedback on the process flows.
Additionally, to maintain the high level of compliance, the Shariah Compliance department performed random physical inspections of Islamic financing transactions. Additionally, Shariah Compliance is also involved in the review process of profit distribution to the depositors on monthly basis with their utmost best efforts and it was generally found in conformity with Shari’ah Rules & Principles and Pool Management guidelines of the State Bank of Pakistan.
Based on above, we are of the view that:i. The Soneri Bank Limited – Islamic Banking (Mustaqeem) has a mechanism in place to ensure Shari’ah compliance in their overall operations.
We hope to improve this mechanism with adequately staffed SCD. Moreover, the Board of Directors has considered expanding Islamic Banking Business in the coming years with very aggressive targets, where adequately staffed SCD is essential in the coming years.
ii. The Bank has complied by and large with Shari’ah rules and principles in the light of fatawa, rulings and guidelines issued by its Shari’ah Board.
iii. The Bank has complied with the directives, regulations, instructions and guidelines related to Shari’ah compliance issued by SBP in accordance with the rulings of SBP’s Shari’ah Board.The Bank has complied with the SBP instructions on profit and loss distribution and pool management. A comprehensive automated solution for profit distribution on multiple pools with proper asset tagging is still under development. The management of Soneri Bank must complete this development to ensure smooth profit distribution.
iv. Bank has a well-defined system in place in form of Shariah compliance review and internal Shariah Audit to ensure that the earning realized from the sources or means prohibited by Shariah shall be identified. In this regards, few discrepancies have been found in some Salam transactions which warrants further research to denounce it as Shariah Compliant. The same shall be finalized in the subsequent Shariah Board meetings.
v. During the year, an amount of Rupees one hundred sixteen thousand one hundred ninety nine only (PKR 116,199/-) was recovered from the customers as charity on account of delay in payments which has been disbursed in charitable purposes.
vi. It is encouraging to note that the Bank’s learning and Development Department on our advice carried out Islamic Banking training for almost all the employees posted in Islamic Banking group. However, we advise that the Bank should now focus on specialized Islamic Banking certification courses including Shariah documentation enabling the Islamic banking employees to have more dedicated approach.
We pray to Almighty Allah, for the success of Islamic Banking and provide us the guidance to adhere to his Shariah in day to day operations and forgive our mistakes.
And Allah knows best
____________________________Mufti Ehsan Waquar Ahmad
Chairman Shari’ah Board
____________________________ ____________________________ Mufti Muhammad Zahid Mufti Bilal Ahmed Qazi Resident Shari’ah Board Shari’ah Board Member
Karachi: 20 February 2018
FOR THE YEAR ENDED 31 DECEMBER 2017

Soneri Bank Limited | Annual Report 2017 | 159

NOTICE OF THEANNUAL GENERAL MEETING
Notice is hereby given that Twenty Sixth (26th) Annual General Meeting of Soneri Bank Limited will be held at Avari Hotel, Lahore on Friday, 30 March 2018 at 9:00 a.m. to transact the following business:
Ordinary Business
1) To confirm the minutes of last Annual General Meeting held on 28 March 2017.
2) To receive, consider and adopt Annual Audited Accounts together with the Directors’and Auditors’ Reports thereon for the year ended 31 December 2017.
3) To approve and declare the final cash dividend of Re.0.75/- per share (i.e.7.5%) for the financial year ended 31 December 2017 as recommended by the Board of Directors in its 160th meeting held on 20 February 2018.
4) To appoint Auditors of the Bank for the year ending 31 December 2018 till the conclusion of next Annual General Meeting and fix their remuneration. Retiring Auditors, M/s. A.F. Ferguson & Co., Chartered Accountants, being eligible, have offered themselves for re-appointment.
5) To transact such other ordinary business as may be placed before the meeting with the permission of the Chair.
BY ORDER OF THE BOARD
Muhammad Altaf ButtCompany SecretaryKarachi: 20 February 2018
NOTES:
1. Share Transfer Books of Soneri Bank Limited (the “Bank”) will remain closed from 23 March 2018 to 30 March 2018 (both days inclusive).
2. A member entitled to attend and vote at this meeting may appoint another member as his or her proxy to attend and vote. Proxies, in order to be effective, must be received at the registered office of the Bank not less than 48 hours before the time of holding the meeting. Proxy form shall be witnessed by two persons whose names, addresses and Computerized National Identity Card (CNIC) numbers shall be mentioned on the form. Proxy form, both in English and Urdu language is being separately sent to the shareholders, along with Notice of AGM.
3. The CDC account/sub account holders shall have to produce their original Computerized National Identity Card (CNIC) or original passport at the time of attending the meeting for identification purpose, alongwith participant’s I.D Number and their Account No. in CDS.
In case of corporate entity, the Board of Directors’ resolution/power of attorney with specimen signature of the nominee together with the original proxy form duly filled in must be received at the registered office of the Bank not less than 48 hours before the time of holding the meeting. The nominees shall produce their original CNIC or original passport at the time of attending the meeting for identification purpose.
4. Shareholders are requested to notify change in their addresses, if any, to our Share Registrar, M/s. THK Associates (Pvt.) Ltd, 1st Floor, 40-C, Block-6, P.E.C.H.S. Karachi.
5. Mandatory submission of CNIC
Those shareholders who have not yet submitted a valid copy of their CNIC, are once again requested to submit the same immediately to our Share Registrar so as to comply with the mandatory requirement of the Securities and Exchange Commission of Pakistan (“SECP”) Notification No.S.R.O.831(I)/2012 dated 05 July 2012 which requires that the dividend warrant should bear CNIC number of the member.
6. Transmission of Audited Financial Statements & Notice Of Annual General Meeting Through E-Mail
SECP through its Notification No.S.R.O.787(1)2014 dated 08 September 2014, has allowed companies to circulate their annual balance sheet and profit & loss account, auditor’s report and directors’ report etc. (“Audited Financial Statements”) along with Notice of Annual General

Soneri Bank Limited | Annual Report 2017 | 161
NOTICE OF THEANNUAL GENERAL MEETING
Meeting (“Notice”) to their shareholders through email. The shareholders who wish to receive Annual Audited Financial Statements and Notice of AGM through email are requested to fill the consent form given in below link and return it to our Share Registrar. http://www.soneribank.com/investor-relations/stock-information/
7. Increase in withholding tax on dividend income for Non-Filers and payment of cash dividend through electronic mode
The Shareholders are hereby informed that pursuant to amendments in Section 150 of the Income Tax Ordinance, 2001 through Finance Act, 2017, Income Tax will be deducted at source @15% for filers and @20.00% for non-filers of income tax return (determined as per “Active Tax Payer List (ATL)” available on Federal Board of Revenue’s website) from the dividend amount, if any.
In case of joint account, each holder is to be treated individually as either a filer or non-filer and tax will be deducted on the basis of shareholding of each joint holder as may be notified by the shareholder, in writing as follows, to our Share Registrar. In case no such notification is received by us, equal deduction of tax will be made where proportionate holding is not available with us.
Company NameFolio/CDS A/c.
No.Total Shares
Principal Shareholder Joint Shareholder
Name &CNIC No.
Shareholding proportion
(No. of Shares)
Name &CNIC No.
Shareholding proportion
(No. of Shares)
The CNIC number/NTN details is now mandatory and is required for checking the tax status as per the Active Taxpayers List (ATL) issued by Federal Board of Revenue (FBR) from time to time.
8. E-Dividend Mandate (Mandatory)
In terms of Section 242 of the Companies Act, 2017 (“Act”) and Companies (Distribution of Dividends) Regulations, 2017, every listed company is required to pay dividend, if any, to their shareholders compulsorily through electronic mode directly crediting the same in their bank account.
In this respect, the Bank has already communicated through its letter dated 25 October 2017 addressed to the shareholders individually along with newspapers publications requesting to provide the International Bank Account Number (“IBAN”), however response from very few shareholders was received.
Shareholders are again requested to update their record. In this connection, CDC shareholders may submit their IBAN details to their investor account services or their brokers where shares are placed electronically. In case of physical holding, the shareholders are requested to submit their bank mandate details to the Bank’s Share Registrar. For providing the Bank Mandate details to CDC/Share Registrar, the requisite form is given at page no.185 or can be downloaded from the Bank’s website, direct link of which is;
http://www.soneribank.com/wp-content/uploads/2017/10/Dividend_Mandate_form.pdf
9. Unclaimed Dividend and Shares
Pursuant to Section 244 of the Act, any shares issued or dividend declared by the Bank, which remain unclaimed or unpaid for a period of three years from the date it became due and payable shall rest with the Federal Government after compliance of procedures prescribed under the Act. In this respect, we had already initiated the process and concerned shareholders were advised vide our letter dated 04.10.2017 to claim their unclaimed dividend/Shares. However, only few shareholders have claimed their pending entitlements so far. Statement of such unclaimed dividend/shares is available on the Bank’s website which may be accessed by surfing the link: http://www.soneribank.com/about-us/investor-relations/shareholders-information/
Shareholders are again advised to approach the Bank’s Share Registrar to claim their pending dividend/shares at the earliest failing which the Bank shall proceed ahead in terms of requirement of Section 244(2) (a) & (b) of the Act.
10. Deposit of Physical shares into CDC Account
The Shareholders having shares in physical form are advised to open CDC sub-account with any of the brokers or Investor Account directly with the CDC to place their shares in scrip-less form, this will facilitate them in many ways including safe custody and sale of shares at any time they want, as the trading of physical shares is not permitted as per existing regulations of Pakistan Stock Exchange Limited.

Further, Section 72 of the Act states that after the commencement of this Act from a date notified by the Commission, a company having share capital, shall have shares in book-entry form only. Every existing company shall be required to replace its physical shares with book-entry form in a manner as may be specified and from the date notified by the Commission, within a period not exceeding four years from the commencement of this Act.
11. Video Conference Facility for attending Annual General Meeting
As per the SECP’s Circular No.10 dated 21.05.2014, members may avail video conference facility subject to fulfillment of certain requirements & procedures.
The members who wish to attend Annual General Meeting via video conference, may send their consent on the below format to the Bank at its registered office address.
If the Bank receives consent from members holding in aggregate 10% or more shareholding residing at a geographical location, to participate in the meeting through video conference at least 10 days prior to date of the meeting, the Bank will arrange video conference facility in that city subject to availability of such facility in that city.
Consent Form for Video Conference Facility
“I/We____________________________of______________, being a member of Soneri Bank Limited, holder of _______________Ordinary shares as per registered Folio/CDC Account No._______________hereby opt for video conference facility at_____________________________ (geographical location).
__________________Signature of Member
12. Availability of Audited Financial Statements on the Bank’s website
The audited financial statements of the Bank for the year ended 31 December 2017 have been made available on the Bank’s website www.soneribank.com, in addition to annual and quarterly financial statements for the prior years. Notice of 26th Annual General Meeting is also placed on the web portal of the Bank.
Inspection of Documents:
The copies of the latest annual audited financial statements, Memorandum & Articles of Association and other documents/information have been kept at the registered office of the Bank which may be inspected on any working day during business hours till the date of 26th Annual General Meeting.
NOTICE OF THEANNUAL GENERAL MEETING


971 1 - 100 33,854 0.003 1284 101 - 500 352,160 0.032 1067 501 - 1000 839,178 0.076 2066 1001 - 5000 4,675,680 0.424 1425 5001 - 10000 11,620,762 1.054 597 10001 - 15000 7,005,558 0.635 143 15001 - 20000 2,475,632 0.225 64 20001 - 25000 1,437,515 0.130 43 25001 - 30000 1,177,700 0.107 25 30001 - 35000 821,814 0.075 13 35001 - 40000 490,232 0.045 10 40001 - 45000 424,673 0.039 12 45001 - 50000 569,150 0.052 20 50001 - 55000 1,055,315 0.096 9 55001 - 60000 511,728 0.046 8 60001 - 65000 494,957 0.045 7 65001 - 70000 468,965 0.043 7 70001 - 75000 513,497 0.047 9 75001 - 80000 696,436 0.063 3 80001 - 85000 247,084 0.022 5 85001 - 90000 432,964 0.039 2 90001 - 95000 183,516 0.017 6 95001 - 100000 590,834 0.054 2 100001 - 105000 205,916 0.019 3 105001 - 110000 324,869 0.030 5 110001 - 115000 560,293 0.051 3 115001 - 120000 348,233 0.032 2 120001 - 125000 244,026 0.022 2 130001 - 135000 266,404 0.024 1 135001 - 140000 137,875 0.013 3 140001 - 145000 425,230 0.039 1 145001 - 150000 147,502 0.013 1 150001 - 155000 154,000 0.014 3 155001 - 160000 476,550 0.043 3 160001 - 165000 492,056 0.045 1 170001 - 175000 170,940 0.016 1 185001 - 190000 189,835 0.017 2 195001 - 200000 400,000 0.036 1 200001 - 205000 203,002 0.018 1 210001 - 215000 214,864 0.020 1 230001 - 235000 232,268 0.021 2 235001 - 240000 472,573 0.043 1 240001 - 245000 243,269 0.022 1 245001 - 250000 250,000 0.023 2 280001 - 285000 565,689 0.051 1 285001 - 290000 287,342 0.026 2 290001 - 295000 584,735 0.053 1 295001 - 300000 295,838 0.027
FORM 34PATTERN OF HOLDING OF THE SHARES HELD BY THE SHAREHOLDERSAS ON 31 DECEMBER 2017
No. ofShareholders From Shareholding To Total
Shares Held Percentage

Soneri Bank Limited | Annual Report 2017 | 165
1 350001 - 355000 353,709 0.032 1 365001 - 370000 366,300 0.033 1 375001 - 380000 375,134 0.034 1 415001 - 420000 420,000 0.038 1 490001 - 495000 493,500 0.045 1 495001 - 500000 500,000 0.045 1 500001 - 505000 501,500 0.046 1 570001 - 575000 571,046 0.052 3 600001 - 605000 1,811,000 0.164 1 635001 - 640000 636,427 0.058 1 720001 - 725000 722,000 0.066 1 995001 - 1000000 1,000,000 0.091 1 1040001 - 1045000 1,040,150 0.094 1 1125001 - 1130000 1,129,647 0.103 1 1210001 - 1215000 1,214,807 0.110 1 2095001 - 2100000 2,100,000 0.191 1 2765001 - 2770000 2,766,216 0.251 1 3440001 - 3445000 3,441,416 0.312 1 3590001 - 3595000 3,591,580 0.326 1 4445001 - 4450000 4,449,000 0.404 1 4450001 - 4455000 4,450,500 0.404 1 4990001 - 4995000 4,990,500 0.453 1 5060001 - 5065000 5,060,452 0.459 1 5490001 - 5495000 5,494,500 0.498 1 8430001 - 8435000 8,430,965 0.765 1 9475001 - 9480000 9,477,018 0.860 1 10905001 - 10910000 10,907,450 0.989 1 13545001 - 13550000 13,546,734 1.229 1 19735001 - 19740000 19,739,759 1.791 1 22290001 - 22295000 22,291,500 2.022 1 24630001 - 24635000 24,631,642 2.234 1 26785001 - 26790000 26,786,763 2.430 1 37280001 - 37285000 37,280,242 3.382 1 37505001 - 37510000 37,508,988 3.402 1 38285001 - 38290000 38,288,654 3.473 1 45140001 - 45145000 45,143,700 4.095 1 45840001 - 45845000 45,840,844 4.158 1 47105001 - 47110000 47,109,707 4.273 1 51385001 - 51390000 51,386,588 4.661 1 76615001 - 76620000 76,619,421 6.950 1 86005001 - 86010000 86,008,806 7.802 1 107595001 - 107600000 107,595,049 9.760 1 301375001 - 301380000 301,377,754 27.337 7887 Total 1,102,463,481 100
FORM 34PATTERN OF HOLDING OF THE SHARES HELD BY THE SHAREHOLDERSAS ON 31 DECEMBER 2017
No. ofShareholders From Shareholding To Total
Shares Held Percentage

FORM 34PATTERN OF HOLDING OF THE SHARES HELD BY THE SHAREHOLDERSAS ON 31 DECEMBER 2017
Directors, Chief Executive Officer and their spouses and minor children DIRECTORS Mr. Alauddin Feerasta 2 10,080,679 0.9144 Mr. Nooruddin Feerasta 1 14,048 0.0013 Mr. Amin A. Feerasta 1 5,401 0.0005 Mr. Muhammad Rashid Zahir 1 10,065 0.0009 Mr. Jamil Hassan Hamdani 1 1,000 0.0001 Mr. Inam Elahi 1 626 0.0001CHIEF EXECUTIVE OFFICER Mr. Mohammad Aftab Manzoor 0.0000DIRECTORS’ SPOUSES AND MINOR CHILDREN Mrs. Aziza A. Feerasta 1 5,401 0.0005 w/o Mr. Alauddin Feerasta Mrs. Amyna N. Feerasta 1 7,021 0.0000 w/o Mr. Nooruddin Feerasta Mrs. Salima A. Feerasta 1 5,401 0.0005 w/o Amin A. Feerasta 10 10,129,642 0.9182
Associated Companies, undertakings and related parties Trustees Alauddin Feerasta Trust 2 387,386,560 35.1383 Trustees Feerasta Senior Trust 2 128,006,009 11.6109 Trustees Alnu Trust 2 64,067,005 5.8113 Executives - - - National Investment Trust Limited 2 108,015,049 9.7976Banks, Development Financial Instituions, Non Banking Financial Instituions. 14 31,660,824 2.8718Insurance Companies 3 13,562,912 1.2302Modarabas 4 4,899 0.0004Mutual Funds AKD Index Tracker Fund 1 72,947 0.0066 Safeway Mutual Fund Limited 1 6,820 0.0006 TRI Star Mutual Fund Limited 1 276 0.0000Joint Stock Companies 50 165,659,646 15.0263Foreign Companies 8 47,229,943 4.2840Others 6 149,028 0.0135General Public: a) Local 6,592 133,312,574 12.0922b) Foreign 1,189 13,199,347 1.1973
Total: 7,887 1,102,463,481 100.00 Shareholders Holding Five Percent or More Voting Interest in the Bank Trustees Alauddin Feerasta Trust 387,386,560 35.1383Trustees Feerasta Senior Trust 128,006,009 11.6109National Investment Trust Limited 108,015,049 9.7976Trustees Alnu Trust 64,067,005 5.8113Mr. Amir Feerasta 62,140,630 5.6365 * Voting rights on shares are restricted upto five percent only. -:-:-:-:-:-:-:-:-:-:-:-:-:-:-:-:-:-:-:-:-:-:-:-:-:-:-:-:-:-:-:-:-:-:-:- Trading in shares during the year 2017: Directors, CEO, CFO, HOA, Company Secretary and Executives - NIL
Categories of Shareholders No. of Shareholders Shares Held Percentage

Soneri Bank Limited | Annual Report 2017 | 167
CENTRAL REGION
01 Main Branch, Lahore Tel: (042) 36368141-8 & 111-567-890 02 Defence Branch, Lahore Tel. No: (042) 35897181-2 & 35691037-8 03 Gulberg Branch, Lahore Tel. No: (042) 35713445-8, 35759273 & (042) 35772294-5 04 Circular Road Branch, Lahore Tel. No: (042) 37670486 & 37670489 05 Model Town Branch, Lahore Tel. No: (042) 35889311-2 & 35915666 06 Peco Road Branch, Lahore Tel. No: (042) 35177800-2, 35222306-7 07 Cavalry Ground Branch, Lahore Tel. No: (042) 36653728-9 & 36619697 08 Islamic Banking Temple Road Branch, Lahore Tel. No: (042) 36376341, 2 & 6 09 Allama Iqbal Town Branch, Lahore Tel. No: (042) 37812394-5 10 Baghbanpura Branch, Lahore Tel. No: (042) 36832811-3 11 Thokar Niaz Baig Branch, Lahore Tel. No: (042) 35313651, 3 & 4 12 Ghazi Chowk Branch, Lahore Tel. No: (042) 35188505-7 Islamic Banking 13 New Garden Town Branch, Lahore Tel. No: (042) 35940611,3 & 8 14 DHA Phase-III Branch, Lahore Tel. No: (042) 35734083-5 15 Chungi Amer Sadhu Branch, Lahore Tel. No: (042) 35922182-4 16 Johar Town Branch, Lahore Tel. No: (042) 35204191-3
17 Wahdat Road Branch, Lahore Tel. No: (042) 37424821-6 & 37420591 18 Gunpat Road Branch, Lahore Tel. No: (042) 37361607-9 19 Airport Road Branch, Lahore Tel. No: (042) 35700115-7 20 Ravi Road Branch, Lahore Tel. No: (042) 37725356-7 21 Shahdara Branch, Lahore Tel. No: (042) 37920085 & 37941741-3 22 Manga Mandi Branch, Lahore Tel. No: (042) 35383517-8
23 Badian Road Branch, Lahore Tel. No: (042) 37165390 & 3 24 Mughalpura Branch, Lahore Tel. No: (042) 36880892-4 25 Upper Mall Branch, Lahore Tel. No: (042) 35789346-9 26 Islampura Branch, Lahore Tel. No: (042) 37214394-6 27 Garhi Shahu Branch, Lahore Tel. No: (042) 36294201-2 28 Zarrar Shaheed Road Br., Lahore Tel. No: (042) 36635167-8 29 Hamdard Chowk Kot Lakhpat Br., Lahore Tel. No: (042) 35140261-5 30 Kana Kacha Branch, Lahore Tel. No: (042) 35472222 & 0316-8226116-18 31 Sabzazar Branch, Lahore Tel. No: (042) 37830881-2 32 DHA Phase-IV Br., Lahore Tel. No: (042) 35694156-7 33 Azam Cloth Market Branch, Lahore Tel. No: (042) 37662203-4
34 Jail Road Branch, Lahore Tel. No: (042) 35408935-7 35 Badami Bagh Branch, Lahore Tel. No: (042) 37731601, 2 & 4 36 Montgomery Road Branch, Lahore Tel. No: (042) 36291013-4 Islamic Banking37 DHA Phase: VI Branch, Lahore Tel. No: (042) 37180535, 6 & 7 38 Bahria Town Branch, Lahore Tel. No: 0316-8226348 & 9 39 Expo Centre Branch, Lahore Tel. No: (042) 35314087-8 & 35314090-1 40 Wapda Town Branch, Lahore Tel. No: (042) 35187611, 2 & 5 41 Shah Alam Market Branch, Lahore Tel. No: (042) 37376212 & 5 42 DHA Phase-V Branch, Lahore Tel. No: (042) 35695678 & 0316-8226322-3 43 Chauburji Branch, Lahore Tel. No: (042) 37112228 & 0316-8226325-7 44 Walton Road Branch, Lahore Tel. No: (042) 36672305 & 0316-8226339, 40 & 41 45 Faisal Town Branch, Lahore Tel. No: (042) 35170540 & 0316-8226335, 7 & 8
46 Karim Block Branch, Lahore Tel. No: (042) 35417757 & 0316-8226412, 3 & 4 47 Defence Road Branch, Lahore Tel. No: 0316-8226415-8 48 Safari Garden Branch, Lahore 49 Muridke Branch Tel. No: (042) 37166511-2
50 Main Branch, Gujranwala Tel. No: (055) 3843560-2, 111-567-890 Islamic Banking51 Gujranwala Cantt. Branch, Gujranwala Tel. No: (055) 3861931, 3 & 5 52 Wapda Town Branch, Gujranwala Tel. No: (055) 4291136-7 53 Kamokee Branch, Distt. Gujranwala Tel. No: (055) 6813501-6 54 Main Branch, Faisalabad Tel. No: (041) 2639873, 7 & 8 & (041) 111-567-890 55 Peoples Colony Branch, Faisalabad Tel. No: (041) 8555715-6 56 Ghulam Muhammadabad Branch, Faisalabad Tel. No: (041) 2680113-4 Islamic Banking 57 East Canal Road Branch, Faisalabad Tel. No: (041) 2421381-2 58 Civil Lines Branch, Faisalabad Tel. No: (041) 2648111 & 2648105 59 Madina Town Branch, Faisalabad Tel. No: (041) 8735551 & 0316-8226453 & 0316-8226451 60 Jaranwala Branch, Distt. Faisalabad Tel: No: (041) 4312201-2 61 Samundri Branch, Distt. Faisalabad Tel. No: (041) 3423983-4 62 Painsera Branch, Distt. Faisalabad Tel. No: (041) 2557100-500 & 2574300 63 Khurrianwala Branch Tel. No: (041) 4360701, 2, 4 & 5 64 Chiniot Branch Tel. No: (047) 6333840-2 65 Jhang Branch Tel. No: (047) 7651601-2 66 Small Industrial Estate Branch, Sialkot Tel. No: (052) 3242607-9
67 Pasrur Road Branch, Sialkot Tel. No: (052) 3521655 & 3521755
REGISTERED OFFICERupali House, 241-242Upper Mall Scheme, Anand RoadLahore-54000, Pakistan.Tel. No: (+92-42) 35713101-4 & 35792180
CENTRAL OFFICE 10th Floor, PNSC Building, M. T. Khan RoadKarachi-74000, Pakistan.Tel. No: (+92-21) 111-567-890Swift: SONEPKKAXXX
LIST OFBRANCHESAS AT 31 DECEMBER 2017

LIST OFBRANCHES
Islamic Banking68 Sialkot Cantt Branch, Sialkot Tel. No: (052) 4560023-4 69 Godhpur Branch, Sialkot Tel. No: (052) 4563932-3 70 Daska Branch, Distt. Sialkot Tel. No: (052) 6617847-8 71 Sheikhupura Branch Tel. No: (056) 3613570 & 3813133 72 Nankana Sahib Branch Tel. No: (056) 2876342-3 73 Wazirabad Branch Tel. No: (055) 6603703-4 & 6608555 74 Ghakkar Mandi Branch Tel. No: (055) 3832611-2 75 Main Branch, Multan Tel. No: (061) 4519927 & 4512884 Islamic Banking76 Shah Rukn-e-Alam Branch, Multan Tel. No: (061) 6784052-3 & 6782081 77 Bosan Road Branch, Multan Tel. No: (061) 6210690-3 & 6520693 78 Mumtazabad Branch, Multan Tel No: (061) 6760212, 3 & 4 79 Gulgasht Colony Branch, Multan Tel. No: (061)-6222701 & 0316-8226393-5 80 Wapda Town Branch, Multan Tel. No: (061) 6213011 & 0316-8226441-2 81 Azmat Road Br., Dera Ghazi Khan Tel. No: (064) 2471630-7 82 Lodhran Branch Tel. No: (0608) 364766-7 83 Rahim Yar Khan Branch Tel. No: (068) 5886042-4 84 Liaqatpur Br., Distt. Rahim Yar Khan Tel. No: (068) 5792041-2
85 Sadiqabad Branch Tel. No: (068) 5702162 & 5800168 86 Bahawalpur Branch Tel. No: (062) 2731703-1 87 Ahmedpur Sharqia Branch District Bahawalpur Tel. No: (062) 2271345 & 0316-8226404, 6 & 8 88 Hasilpur Branch Tel. No: (062) 2441481-3 89 Sargodha Branch Tel. No: (048) 3726021-3 90 Pull-111 Branch, Distt. Sargodha Tel. No: (048) 3791403-4 & 0316-8226449 & 50 91 Bhalwal Branch Tel. No: (048) 6642224 & 0316-8226331-2 92 Khanewal Branch Tel. No: (065) 2551560-2
93 Kabirwala Br., Distt. Khanewal Tel. No: (065) 2400910-3 94 Abdul Hakeem Br., Distt. Khanewal Tel. No: (065) 2441888 95 Mian Channu Branch Tel. No: (065) 2662201-2 96 Depalpur Branch Tel. No: (044) 4541341-2 97 Okara Branch Tel. No: (044) 2553012-4 98 Hujra Shah Muqeem Branch District Okara Tel. No: (044) 4860401-3 & 0316-8226419, 20 & 21 99 Haveli Lakha Branch Tel. No: (044) 4775412 100 Sahiwal Branch Tel. No: (040) 4467742-3 101 Chichawatni Br., Distt. Sahiwal Tel. No: (040) 5484852-3
102 Layyah Branch Tel. No: (060) 6414207-8 103 Chowk Azam Branch, Distt. Layyah Tel. No: (060) 6372103 & 0316-8226401, 2 & 3 104 Kharoor Pacca Branch Tel. No: (0608) 341041-2 105 Muzafargarh Branch Tel. No: (066) 2422901, 3 & 5 106 Fazal Garh Sanawan Branch, Distt. Muzafargarh Tel. No: (066) 2250214-5 107 Sheikho Sugar Mills Branch Distt. Muzafargarh Tel. No: (061) 6006257 108 Shahbaz Khan Road Branch, Kasur Tel. No: (0492) 764891-2 109 Jalalpur Bhattian Br., Distt. Hafizabad Tel. No: (0547) 500847-52 110 Hafizabad Branch Tel. No: (0547) 541641-2 111 Pattoki Branch Tel. No: (049) 4422435-6 112 Ellahabad Branch Tel. No: (049) 4751130 113 Khudian Branch Tel. No: (049) 2791595 114 Sambrial Branch Tel. No: (052) 6523451-2 115 Gagoo Mandi Branch, Distt. Vehari Tel. No: (067) 3500311-2 116 Mailsi Branch, Distt. Vehari Tel. No: (067) 3750140-5 117 Burewala Branch, Distt. Vehari Tel. No: (067) 3773110 & 20
118 Mandi Bahauddin Branch Tel. No: (0546) 507601-2 119 Bahawalnagar Branch Tel. No: (063) 2274795-6
120 Haroonabad Br., Distt. Bahawalnagar Tel. No: (063) 2251664-5 121 Toba Tek Singh Branch Tel. No: (046) 2513203-4 122 Gojra Branch, Distt. Toba Tek Singh Tel. No: (046) 3516388-9 123 Kamalia Branch, Distt. Toba Tek Singh Tel. No: (046) 3411405-6 124 Pir Mahal Branch Tel. No: (046) 3361690 & 5 125 Gujrat Branch Tel. No: (053) 3520591, 2 & 4 126 Kharian Branch Tel. No: (053) 7602904, 5 & 7 127 Pak Pattan Br., Distt. Pak Pattan Tel.: (0457) 371781 & 2 128 Arif wala Br., Distt. Pak Pattan Tel.: (0457) 834015 & 6 129 Chishtian Branch Tel. No: (063) 2501141 & 0316-8226305 130 Khanpur Branch Tel. No: (068) 5577719-20 & 0316-8226307-9 131 Narowal Branch Tel. No: (0542) 411405 & 0316-8226328-30 132 Rajanpur Branch Tel. No: (0604) 688108 & 0316-8226396 SOUTH REGION133 Main Branch, Karachi Tel. No: (021) 32436990-4 & 32444401-5 & UAN:(021) 111 567 890 134 Clifton Branch, Karachi Tel. No: (021) 35877773-4, 35861286 135 Garden Branch, Karachi Tel. No: (021) 32232877-8 136 F. B. Area Branch, Karachi Tel. No: (021) 36373782-3 & 36811646 137 Korangi Industrial Area Br., Karachi Tel. No: (021) 35113898-9, 35113900-1
138 AKU Branch, Karachi Tel. No: (021) 34852252-3 139 Haidery Branch, Karachi Tel. No: (021) 36638617 & 36630409-410 140 Jodia Bazar Branch, Karachi Tel. No: (021) 32413627, 32414920 & 32441786 141 Shahrah-e-Faisal Branch, Karachi Tel. No: (021) 34535553-4 & 34322150 142 DHA Branch, Karachi Tel. No: (021) 35852209 & 35845211 143 Gulshan-e-Iqbal Branch, Karachi Tel. No: (021) 34811831-2
AS AT 31 DECEMBER 2017

Soneri Bank Limited | Annual Report 2017 | 169
LIST OFBRANCHESAS AT 31 DECEMBER 2017
144 SITE Branch, Karachi Tel. No: (021) 32568213 & 0316-8226193-9 145 Zamzama Branch, Karachi Tel. No: (021) 35375836-7 146 Gole Market Branch, Karachi Tel. No: (021) 36618932 & 36681324 147 Gulistan-e-Jauhar Branch, Karachi Tel. No: (021) 34020944-5 148 M. A. Jinnah Road Branch, Karachi Tel. No: (021) 32213972 & 32213498 149 Gulbahar Branch, Karachi Tel. No: (021) 36607744 & 36682701 150 North Karachi Branch, Karachi Tel. No: (021) 36920140-1 151 Block-7 Gulshan-e-Iqbal Branch, Karachi Tel. No: (021) 34815811-2 & 34833728 Islamic Banking 152 Cloth Market Branch, Karachi Tel. No: (021) 32442961 & 32442977 153 Paria Street Kharadar Branch, Karachi Tel. No: (021) 32201059-60 154 Suparco Branch, Karachi Tel. No: (021) 34970560 & 34158325-6 155 Chandni Chowk Branch, Karachi Tel. No: (021) 34937933 & 34141296
156 Allama Iqbal Road Branch, Karachi Tel. No: (021) 34387673-4 157 Nishtar Road Branch, Karachi Tel. No: (021) 32239713 & 32239678 Islamic Banking 158 Waterpump Branch, Karachi Tel. No: (021) 36312113 & 36312108 159 Apwa Complex Branch, Karachi Tel. No: (021) 32253143 & 32253216 160 Clifton Block-2 Branch, Karachi Tel. No: (021) 35361115-6 161 Malir Branch, Karachi Tel. No: (021) 34517982-3 162 Bahadurabad Branch, Karachi Tel. No: (021) 34135842-3 163 New Challi Branch, Karachi Tel. No: (021) 32625246 & 32625279 164 Shah Faisal Colony Branch, Karachi Tel. No: (021) 34602446-7 165 Zaibunissa Street Saddar Branch, Karachi Tel. No: (021) 35220026-7 166 Liaquatabad Branch, Karachi Tel No: (021) 34860723-6 & 34860725 167 Lea Market Branch, Karachi Tel. No: (021) 32526193-4 168 Korangi Township No: 2 Branch, Karachi Tel. No: (021) 35071176, 80 & 81 (021) 35058041
169 North Karachi Ind. Area Branch, Karachi Tel. No: (021) 36962851-3 170 F. B. Industrial Area Branch, Karachi Tel. No: (021) 36829961-3 171 Napier Road Branch, Karachi Tel. No: (021) 32713538-9 172 Gulshan-e-Hadeed Branch, Karachi Tel. No: (021) 34710252 & 34710256 173 Metroville Branch, Karachi Tel. No: (021) 36752206-7
174 Defence Phase-II Extension Br., Karachi Tel. No: (021) 35386910 & 1 175 North Karachi Township Branch, Karachi Tel. No: (021) 36968605-6 176 Stock Exchange Branch, Karachi Tel. No: (021) 32414003-4 & 32415927-8 177 Gulshan-e-Jamal Branch, Karachi Tel. No: (021) 34682682-3 178 Alyabad Branch, Karachi Tel. No: (021) 36826727 & 36332517 179 Saudabad Branch, Malir, Karachi Tel. No: (021) 34111901-2 180 Shireen Jinnah Colony Branch, Karachi Tel. No: (021) 34166262-4 Islamic Banking 181 Al-Tijarah Centre Branch, Karachi Tel. No: (021) 34169252-3 182 Barkat-e-Haidery Branch, Karachi Tel. No: (021) 36645688-9 183 Shadman Town Branch, Karachi Tel. No: (021) 36903038-9 184 Enquiry Office Nazimabad No: 2 Branch, Karachi Tel. No: (021) 36601504-5 185 Blk 13-D Gulshan-e-Iqbal Br., Karachi Tel. No: (021) 34983878 186 Timber Market Branch, Karachi Tel. No: (021) 32742491-2 187 Khayaban-e-Ittehad Branch, Karachi Tel: (021) 35347414-5 188 Bahria Complex-III Branch, Karachi Tel. No: (021) 35640730-1 & 35640490-4 189 New M. A. Jinnah Road Branch, Karachi Tel. No: (021) 34894941-2 190 DHA Phase-IV Branch, Karachi Tel. No: (021) 35311491 191 Gulberg Branch, Karachi Tel. No: (021) 36340553 & 0316-8226291-2
192 New Sabzi Mandi Branch, Karachi Tel. No: (021) 36870506 & 0316-8226409, 10 & 11 193 Clifton Block-08 Branch, Karachi Tel. No: (021) 35867435 194 Block-02 Gulshan-e-Iqbal Br., Karachi Tel. No: (021) 34988781-2
195 Garden Market Branch, Karachi Tel. No: (021) 32244195-6 & 0316-8226431-3 196 Block-N North Nazimabad Branch, Karachi Tel. No: (021) 36641623-4 & 0316-8226436 & 38 197 Marriot Road Branch, Karachi Tel. No: (021) 32461840 & 42 198 Gulshan-e-Maymar Branch, Karachi Tel. No: (021) 36881235-6 & 0316-8226445, 6 & 7 199 Shersha Branch, Karachi 200 Main Branch, Hyderabad Tel. No: (022) 2781528-9 & UAN: (022) 111-567-890 201 F. J. Road Branch, Hyderabad Tel. No: (022) 2728131 & 2785997 (022) 2780205 202 Latifabad Branch, Hyderabad Tel. No: (022) 3816309 & 3816625 203 Qasimabad Branch, Hyderabad Tel. No: (022) 2651968-69 Islamic Banking 204 Isra University Br., Distt. Hyderabad Tel. No: (022) 2032322 & 2030161-4 205 Prince Ali Road Branch, Hyderabad Tel. No: (022) 2638515-6 206 S.I.T.E. Branch, Hyderabad Tel. No: (022) 3886861-2 207 Faqir Jo Pir Branch, Hyderabad Tel. No: (022) 2612685-6 208 Auto Bhan Road Branch, Hyderabad Tel. No: (022) 2100062-3 & 0316-8226313-4
209 Matyari Branch, Distt. Matyari Tel. No: (022) 2760125-6 210 Tando Allah Yar Branch Tel. No: (022) 3890262-3 211 Sultanabad Branch, Distt. Tando Allah Yar Tel. No: (022) 3404101-2 212 Tando Muhammad Khan Branch Tel. No: (022) 3340371 & 2 213 Sukkur Branch Tel. No: (071) 5622382 & 5622925 214 Sanghar Branch, Distt. Sanghar Tel. No: (0235) 543376-8 215 Tando Adam Branch, Distt. Sanghar Tel. No: (0235) 571640-44 216 Shahdadpur Br., Distt. Sanghar Tel. No: (0235) 841982 & 4 217 Golarchi Branch, Distt. Badin Tel. No: (0297) 853193-4 218 Talhar Branch, Distt. Badin Tel. No: (0297) 830389 219 Deh. Sonhar Branch, Distt. Badin Tel. No: (0297) 870729 & 870783

LIST OFBRANCHESAS AT 31 DECEMBER 2017
220 Matli Branch Tel. No: (0297) 840171-2 221 Tando Bago Branch, Distt. Badin Tel. No: (0297) 854554-5 222 Buhara Branch, Distt. Thatta Tel. No: (0298) 613169 & 0316-8226439-40 223 Dhabeji Branch, Distt. Thatta 224 Hub Branch, Distt. Lasbela Tel. No: (0853) 310225-7 225 Umerkot Branch Tel. No: (0238) 571350 & 571356 226 Nawabshah Branch Tel. No: (0244) 363919
227 Mirpurkhas Branch Tel. No: (0233) 876418-9 228 Larkana Branch Tel. No: (074) 4058601-4 229 Panjhatti Branch Tel. No: (0243) 552183-4 230 Ghotki Branch Tel. No: (0723) 680305-6 231 Deharki Branch Tel. No: (0723) 644157-8 232 Thull Branch Tel. No: (0722) 610150, 1 & 3 233 Kandkhot Branch Tel. No: (0722) 572883, 4 & 5 234 Jacobabad Branch Tel. No: (0722) 654041 & 5 235 Shahdadkot Br., Distt. Qamber Shahdadkot Tel. No: (074) 4012402 & 3 236 Dadu Branch Tel. No: (025) 4711417 & 0316-8226294-6 237 Shikarpur Branch Tel. No: (0726) 540381-3 & 0316-8226319-21 238 Main Branch, Quetta Tel. No: (081) 2821610 & 2821641 Islamic Banking 239 Shahrah-e-Iqbal Branch, Quetta Tel. No: (081) 2820227-30 & 2820237 240 Chamman Branch Tel. No: (0826) 613685 & 0316-8226342-3 241 Khuzdar Branch Tel. No: (0848) 412861, 2 & 3 & 0316-8226466-68 242 Gawadar Branch Tel. No: (0864) 211103-5 & 0316-8226454-6
NORTH REGION 243 Main Branch, Peshawar Tel. No: (091) 5277914-6 & 5277394
244 Chowk Yadgar Branch, Peshawar Tel. No: (091) 2573335-6
Islamic Banking 245 Khyber Bazar Branch, Peshawar Tel. No: (091) 2566812-3 246 Main Branch, Rawalpindi Tel. No: (051) 5123123, 5 & 8 & (051) 5123132, 4 & 6 247 Chandni Chowk Branch, Rawalpindi Tel. No: (051) 4571186-7 & (051) 4571160, 3, 5, & 8 248 22 Number Chungi Branch, Rawalpindi Tel. No: (051) 5563576, 7 & 8 249 Muslim Town Branch, Rawalpindi Tel. No: (051) 5405514 & 4931112 250 Pindora Branch, Rawalpindi Tel. No: (051) 4419019-22 251 Gulraiz Branch, Rawalpindi Tel. No: (051) 5509690-2 Islamic Banking252 Peshawar Road Br., Rawalpindi Tel. No: (051) 5460115-6 253 Bahria Town Branch, Rawalpindi Tel. No: (051) 5733772-3 254 Bewal Br., Distt. Rawalpindi Tel. No: (051) 3360274-5 255 Main Branch, Islamabad Tel. No: (051) 2348174 & 2348178 & UAN: (051) 111-567-890 256 G-9 Markaz Branch, Islamabad Tel. No: (051) 2850171-3 Islamic Banking 257 I-10 Markaz Branch, Islamabad Tel. No: (051) 4101733-5 258 I-9 Markaz Branch, Islamabad Tel. No: (051) 4858101-3 259 E-11 Branch, Islamabad Tel. No: (051) 2228756-9
260 DHA Phase-II Br., Islamabad Tel. No: (051) 5161969 & 5161970 Islamic Banking 261 F-8 Markaz Branch, Islamabad Tel. No: (051) 2818019-21 262 G-11 Markaz Branch, Islamabad Tel. No: (051) 2363366-67 263 F-11 Markaz Branch, Islamabad Tel No: (051) 2101076 & 7 264 F-6 Branch, Islamabad Tel. No: (051) 2826573-4 & 0316-8226303 265 PWD Branch, Islamabad Tel. No: (051) 5708789, 90 & 91 266 Lathrar Road Branch, Tarlai, Distt. Islamabad Tel. No: (051) 2241664-6 267 Soan Garden Br., Distt. Islamabad Tel. No: (051) 5738942-4
268 Gujar Khan Branch Tel. No: (051) 3516327, 29 & 30 269 Waisa Branch, Distt. Attock Tel. No: (057) 2651066-8 Islamic Banking270 Swabi Branch, Distt. Swabi Tel. No: (0938) 221741, 3 & 4 271 Mirpur Branch, (AJK) Tel. No: (05827) 444488 & 448044 272 Islamgarh Branch, (AJK) Tel. No: (05827) 423981-2 273 Jattlan Branch, Distt. Mirpur (AJK) Tel. No: (05827) 403591-4 274 Gilgit Branch Tel. No: (05811) 453749 275 Denyore Branch, Distt. Gilgit Tel. No: (05811) 459986-7 276 Jutial Branch, Distt. Gilgit Tel. No: (05811) 457233-5
277 Aliabad Branch, Hunza Tel. No: (05813) 455000 & 455001 278 Gahkuch Branch Tel. No: (05814) 450408-10 279 Skardu Branch Tel. No: (05815) 450327 & 450189 280 Abbottabad Branch Tel. No: (0992) 385231-3 & 383073-75 281 Jhelum Branch Tel. No: (0544) 625794-5 282 Chitral Branch, Distt. Chitral Tel. No: (0943) 412078-9 283 Chakwal Branch Tel. No: (0543) 543128-30 284 Mardan Branch Tel. No: (0937) 864755-7 285 Muzaffarabad Branch Tel. No: (0582) 2920025-6 Islamic Banking 286 Chillas Branch, Distt. Diamer Tel. No: (05812) 450631-2 287 Islamic Banking Mingora Branch, Swat Tel. No: (0946) 714355 288 Battagram Branch Tel. No: (0997) 311045-7 289 Mansehra Branch Tel. No: (0997) 301931, 2, 5 & 6 290 Kohat Branch, Distt. Kohat

Soneri Bank Limited | Annual Report 2017 | 171
FOREIGNCORRESPONDENTS
Country Name of Bank
01 Afghanistan Bank Alfalah Limited Afghanistan Bank E Millie Afghanistan Habib Bank Limited Afghanistan National Bank Of Pakistan 02 Algeria Citibank NA Algeria 03 Argentina Banco Credicoop Cooperativo Limitado Banco de Galicia Y Buenos Aires 04 Australia Australia And Newzealand Banking Group Ltd. Australia BNP Paribas Australia Citibank NA Australia Commonwealth Bank of Australia HSBC Bank Australia Limited J. P. Morgan Chase Bank NV Mizuho Bank Limited Australia National Australia Bank Ltd. 05 Austria Erste Group Bank AG Austria Oberbank AG Raiffeisen Bank International AG Raiffeisenlandes Bank Vorarlberg Raiffeisenlandesbank Niederösterreich-Wien AG Austria Raiffeisenlandesbank Oberösterreich Aktiengesellschaft Austria UniCredit Bank Austria AG 06 Bahrain Al-Baraka Islamic Bank Allied Bank Limited Bahrain Bank Alfalah Limited Bahrain Bank Al Habib Limited Citibank N.A. Habib Bank Limited JS bank Limited Bahrain Standard Chartered Bank The Arab Investment Co. United Bank Limited 07 Bulgaria UniCredit BulBank AD Citibank Europe Plc Bulgaria 08 Bangladesh Bank Asia Limited Bangladesh Brac Bank Bangladesh Dhaka Bank Ltd. Bangladesh Eastern Bank Limited Bangladesh Habib Bank Limited Jamuna Bank Limited Bangladesh National Bank Limited Bangladesh Standard Chartered Bank Woori Bank Southeast Bank Ltd. Bangladesh The City Bank Ltd. Bangladesh United Commercial Bank Ltd. Bangladesh 09 Belgium Bank Of America NA Belgium Belfius Bank SA/NV BNP Paribas Fortis Citibank Europe Plc Belgium Commerzbank AG
AS AT 31 DECEMBER 2017

FOREIGNCORRESPONDENTS
Country Name of Bank
Credit Europe Bank NV Deutsche Bank AG Habib Bank Limited KBC Bank NV 10 Brazil Banco Do Brasil SA Brazil Banco Fibra SA Brazil Banco Santander (Brasil) SA Brazil Banco Itaú BBA SA Brazil Deutsche Bank SA 11 Canada Bank Of Montreal Canada Canadian Imperial Bank of Commerce Federation Des Caisses Desjardins Du Quebec Canada Habib Canadian Bank HSBC Bank Canada Royal Bank of Canada 12 Chile Banco de Credito E Inversiones 13 China Agricultural Bank of China Agricultural Development Bank of China Bank of America N.A Bank of Beijing Bank of China Bank of Communications Bank of Guiyang Co Ltd Bank Of Hebei Co. Limited China Bank of Jiangsu Co Bank Of Ningbo co. Ltd. China Bank Of Ningxia China Bank Of Ruifeng China Bank of Shanghai China Citic Bank China Construction Bank Corporation China Everbright Bank China Guangfa Bank co. Ltd. China China Merchants Bank China Minsheng Banking Corporation Ltd. China Citibank (China) Co. Ltd. Commerzbank AG Export Import Bank of China Guangdong Huaxing Bank Co Ltd Guangdong Nanhai Rural Commercial Bank Co. Ltd. China HSBC Bank (China) Company Ltd. Hua Xia Bank Industrial Bank Co. Ltd. China Industrial and Commercial Bank of China Industrial Bank Of Korea (China) Limited Jinan Rural Commercial Bank Co. Ltd. China J. P. Morgan Chase Bank (China) Company Ltd. Jiangsu Jiangyin Rural Commercial Bank Co Ltd KBC Bank NV Mizuho Bank (China) Co. Ltd. Ping An Bank Co Qilu Bank Co., Ltd. Shandong Zhangdian Rural Commercial Bank Co Ltd Shanghai Pudong Development Bank Shengjing Bank China
AS AT 31 DECEMBER 2017

Soneri Bank Limited | Annual Report 2017 | 173
FOREIGNCORRESPONDENTS
Country Name of Bank
Skandinaviska Enskilda Banken AB Standard Chartered Bank (China) Limited Sumitomo Mitsui Banking Corporation (China) Limited Unicredit Spa China Weifang Rural Commercial Bank Co Ltd Woori Bank China Zhejiang Mintai Commercial Bank Zhejiang Tailong Commercial Bank 14 Cyprus Bank of Cyprus Public Company Ltd. Hellenic Bank Public Company Ltd. 15 Czech Republic Ceska Sporitelna AS Ceskoslovenska Obchodni Banka Citi Bank Europe PLC Commerz Bank AG Komercni Banka AS Unicredit Bank Czech Republic 16 Denmark Danske Bank 17 Egypt Banque Misr SAE Citibank Cairo HSBC Bank Egypt SAE Egypt Mashreq Bank psc Societe Arabe Internationale De Banque Egypt Suez Canal Bank Sae Egypt 18 Ethiopia Bank Of Abyssinia SC Ethiopia Dashen Bank SC Cooperative Bank of Oromia SC Ethiopia 19 Finland Danske Bank OP Corporate Bank Plc Finland 20 France Banque Federative Du Credit Mutuel France Banque Palatine France BNP-Paribas S.A. Citibank Europe Plc France Habib Bank Limited HSBC France (Formerly HSBC CCF) KEB Hana Bank France National Bank of Pakistan Credit Du Nord Societe Generale 21 Germany Bank Of America NA Germany Commerzbank AG Danske Bank Deutsche Bank AG DZ Bank AG Deutsche Zentral Genossenschaftsbank Germany Hamburger Sparkasse HSH Nordbank AG JP Morgan Chase Bank Kreissparkasse Steinfurt Landesbank Baden-Wurttemerg M. M. Warburg U. Co National Bank of Pakistan SEB AG
AS AT 31 DECEMBER 2017

FOREIGNCORRESPONDENTS
Country Name of Bank
Sparkasse Dortmund Sparkasse Krefeld Sparkasse Westmuensterland Standard Chartered Bank UniCredit Bank AG (Hypovereinsbank) 22 Greece Alpha Bank AE Citibank Europe PLC 23 Hong Kong ABN Amro Bank NV Hongkong Bank of America NA BNP Paribas Citibank N.A. Commerzbank AG Deutsche Bank AG Hongkong Habib Bank Zurich Hongkong Limited Hongkong The Hong Kong and Shanghai Banking Corporation HBZ Finance Hongkong Limited Hongkong J. P. Morgan Chase Bank N.A. KBC Bank NV,Hongkong Branch Mashreqbank psc National Bank of Pakistan Punjab National Bank Hongkong Shinhan Bank, Hong Kong Standard Chartered Bank (Hong Kong) Limited Sumitomo Mitsui Banking Corporation The Bank of New York Mellon Hongkong UniCredit Bank AG Hongkong Wells Fargo Bank NA 24 Hungary CIB Bank Ltd. Citibank Europe PLC Raiffeisen Bank ZRT UniCredit Bank Hungary ZRT 25 India Citibank N.A. Bank of America DCB Bank Limited Deutsche Bank AG HongKong and Shanghai Banking Corporation Limited ICICI Bank Limited Indusind Bank Ltd.India J. P. Morgan Chase Bank NA Kalupur Commercial Co-op Mashreqbank psc Punjab and Sind Bank Punjab National Bank Standard Chartered Bank 26 Indonesia Bank Indonesia Bank Mandiri Jakarta The Bank of Tokyo-Mitsubishi UFJ Ltd. Citibank N.A. HongKong and Shanghai Banking Corporation Limited J. P. Morgan Chase Bank NA PT BPD Jawa Barat Dan Banten Indonesia Standard Chartered Bank 27 Ireland Citibank Europe plc
AS AT 31 DECEMBER 2017

Soneri Bank Limited | Annual Report 2017 | 175
FOREIGNCORRESPONDENTS
Country Name of Bank
Danske Bank A/S 28 Italy Banca Carige SPA Banca di Credito Popolare Banca di Napoli SpA Banca Monte Dei Paschi Di Siena Banca Nuova SPA Banca Popolare di Vicenza Banca UBAE Spa Banco Popolare di Sondrio Bper Banca Spa Italy Cassa di Risparmio Di Fermo SPA Cassa di Risparmio del Friuli Venezia Giulia SpA Italy Cassa Di Risparmio in Bologna Spa Italy Commerzbank AG Citibank NA Italy Credito Valtellinese Deutsche Bank SPA Intesa Sanpaolo S.P.A. Unicredit S.P.A Union Di Banche Italiane SPA Italy 29 Japan The Bank of Tokyo-Mitsubishi UFJ Ltd. Citibank Japan Limited Deutsche Bank AG Hong Kong & Shanghai Banking Corporation., (The) JP Morgan Chase Bank Mizuho Corporate Bank National Bank of Pakistan Resona Bank Ltd. Saitama Resona Bank Ltd. Standard Chartered Bank Sumitomo Mitsui Banking Corporation The Tokushima Bank Limited 30 Kenya Citibank N.A. Habib Bank Limited Kenya Commercial Bank Limited Standard Chartered Bank Kenya Limited 31 Korea (South) The Bank of Tokyo-Mitsubishi UFJ Ltd. Busan Bank Citibank Korea Inc. Daegu Bank Korea KEB Hana Bank HongKong & Shanghai Banking Corporation Limited Industrial Bank of Korea JPMorgan Chase Bank Kookmin Bank Korea Development Bank Korea National Bank of Pakistan National Federation of Fisheries Corp. Korea NongHyup Shinhan Bank Standard Chartered Bank Korea Ltd The Export Import Bank Of Korea The Bank Of Newyork Mellon Korea Woori Bank Wells Fargo Bank N.A Korea
AS AT 31 DECEMBER 2017

FOREIGNCORRESPONDENTS
Country Name of Bank
32 Kuwait Citibank NA Commercial Bank of Kuwait SAK National Bank of Kuwait 33 Lebanon Banque Libano-Francaise SAL CitiBank Beirut First National Bank SAL 34 Macau Standard Chartered Bank Macau 35 Malaysia Ambank (M) Berhad Malaysia Bank of Tokyo-Mitsubishi UFJ Ltd. Bank Pertanian Malaysia/ Agro Bank Citibank Berhad Hong Leong Bank Bhd HSBC Bank Malaysia Berhad J. P. Morgan Chase Bank Berhad Standard Chartered Bank Malaysia Berhad 36 Mauritius Habib Bank Limited The Mauritius Commercial Bank Limited 37 Mexico Banco Nacional de Mexico SA 38 Morocco Citibank Maghreb Attijariwafa Bank 39 Nepal Himalayan Bank 40 Netherlands ABN-AMRO Bank N.V. Citibank Europe PLC CommerzBank AG Kantoor Credit Europe Bank N.V. Deutsche Bank AG HSBC Netherlands Habib Bank Limited 41 New Zealand Australia And Newzealand Banking Group Ltd. Bank of New Zealand 42 Norway DNB Bank ASA Danske Bank AS Skandinaviska Enskilda Banken 43 Oman Bank Sohar SAOG Bank of Dhofar Piraeus Bank Oman International SAOG Oman Standard Chartered Bank 44 Philippines Asian Development Bank Standard Chartered Bank Phillipines Limited The Bank of Tokyo-Mitsubishi UFJ Ltd. 45 Poland Bank Handlowy W Wearszawie SA Mbank S.A Danske Bank A/S Poland Bank Zachodni WBK SA Poland
AS AT 31 DECEMBER 2017

Soneri Bank Limited | Annual Report 2017 | 177
FOREIGNCORRESPONDENTS
Country Name of Bank
46 Portugal Banco BPI SA Novo Banco SA Caixa Central De Credito Agricola Mutuo Crl Portugal Banco Popular Portugal SA Portugal BNP Paribas Fortis SA/NV Portugal Banco Santander Totta SA Portugal 47 Qatar HSBC Bank Middle East Limited Mashreq Bank Standard Chartered Bank United Bank Limited 48 Romania Banca Commerciala Romana SA Citibank Europe PLC, Dublin-Sucursala Romania Unicredit Bank SA Romania 59 Russia Credit Bank Of Moscow Joint Stock Company Commercial Bank Citibank Russia 50 Saudi Arabia Alawwal Bank Al Inma Bank Bank Al Jazira Saudi Arabia J. P. Morgan Chase Bank National Bank of Pakistan National Commercial Bank (The) Samba Financial Group 51 Singapore ABN Amro Bank NV Bank Mandiri (Persero) PT Bank of America NA Bank of Tokyo Mitsubishi UFJ Ltd. Citibank N.A. Commerzbank AG Cooperatieve Rabobank UA Singapore Deutsche Bank AG Habib Bank Limited HongKong & Shanghai Banking Corporation Limited HSH Nordbank AG Intesa Sanpaolo SPA JPMorgan Chase Bank National Association Singapore KBC Bank Singapore Branch Mizuho Corporate Bank Ltd National Bank of Kuwait SAK RaboBank Shinhan Bank Standard Chartered Bank Sumitomo Mitsui Banking Corporation Woori Bank Singapore Wells Fargo Bank N.A Singapore 52 Slovakia Ceskoslovenska Obchodna Banka AS Ceska Sporitelna as Slovakia Tatra Bank AS 53 Slovenia UniCredit Banka Slovenija DD Nova Kreditna Banka Maribor DD Slovenia 54 South Africa Citibank South Africa FirstRand Bank Ltd.
AS AT 31 DECEMBER 2017

FOREIGNCORRESPONDENTS
Country Name of Bank
HBZ Bank Limited Mercantile Bank Limited South Africa Standard Bank of South Africa Limited Standard Chartered Bank South Africa 55 Spain Banco Papular Espanol SA Banco de Sabadell Banco Santander SA Spain Bankia SA Spain Banque Marocaine du Commerce Exterieur International SA Spain Bank of Tokyo Mitsubishi UFJ Ltd. Caixa Bank SA Spain Citibank Europe Plc Spain Commerzbank AG Deutsche Bank SAE Spain HSBC Bank plc Kutxabank SA 56 Sri-Lanka Bank of Ceylon Commercial Bank of Ceylon Limited Habib Bank Limited Hatton National Bank Limited MCB Bank Limited People’s Bank Standard Chartered Bank The HongKong & Shanghai Banking Corporation Limited 57 Sweden Citibank Europe Plc Sweden Danske Bank Skandinaviska Enskilda Banken AB Svenska Handelsbanken AB 58 Switzerland Arab Bank (Switzerland) Ltd. Banque Cantonale Vaudoise Banque de Commerce et de Placements S.A. Barclays Bank (Suisse) S.A CA Indosuez Switzerland SA Switzerland Citibank NA Switzerland Credit Agricole (Suisse) S.A. Deutsche Bank AG Habib Bank AG Zurich Hinduja Bank (Switzerland) Ltd. HSBC Bank Plc Switzerland Royal bank of Scotland UBS AG United Bank Switzerland AG Zurcher Kantonalbank 59 Taiwan Citibank Taiwan Limited Deutsche Bank AG J. P. Morgan Chase Bank NA Mega International Commercial Bank Mizuho Corporate Bank Ltd. Standard Chartered Bank (Taiwan) Limited Sunny Bank Limited Wells Fargo Bank N.A Taiwan 60 Tanzania UBL Bank Tanzania Ltd.
AS AT 31 DECEMBER 2017

Soneri Bank Limited | Annual Report 2017 | 179
FOREIGNCORRESPONDENTS
Country Name of Bank
61 Thailand Citibank N.A. J. P. Morgan Chase Bank NA Kasikornbank Public Company Ltd Krung Thai Bank Public Co Ltd Thailand Mizuho Corporate Bank Ltd. Standard Chartered Bank (Thai) PLC Sumitomo Mitsui Banking Cororation Thanachart Bank Public Company Limited The Siam Commercial Bank Public Company Limited 62 Tunisia Citi Bank NA Tunis International Bank 63 Turkey Akbank T.A.S. Albaraka Turk Participation Bank Alternatifbank A.S. Citibank A.S. Denizbank AS QNB Finansbank Habib Bank Limited Kuveyt Turk Katilim Bankasi AS Turkiye Cumhuriyeti Ziraat Bankasi AS Turkey Turkey Garanti Bankasi AS Turkiye Finans Katilim Bankasi AS Turkiye Vakiflar Bankasi TAO Vakif Katilim Bankasi AS Turkey Yapi Ve Kredi Bankasi AS 64 U.A.E. Abu Dhabi Commercial Bank Citibank N.A. Credit Europe Bank (Dubai) Ltd. Deutsche Bank AG Dubai Islamic Bank Emirates Islamic Bank Emirates NBD Bank PJSC First Abu Dhabi Bank Habib Bank AG Zurich Habib Bank Limited HSBC Bank Middle East Limited KEB Hana Bank UAE MCB Bank Limited Dubai UAE Mashreq Bank psc National Bank of Fujairah Standard Chartered Bank United Bank Limited 65 U.K. Bank Of America NA UK Bank Mandiri (Europe) Limited Bank of Cyprus UK Bank of Ireland (UK) PLC Citibank N.A. Clydesdale Bank plc Commerzbank AG Habib - UK PLC Habib Bank AG Zurich Hongkong & Shanghai Banking Corp. LTD. UK HSBC Bank plc Intesa Sanpaolo SPA UK J. P. Morgan Chase Bank NA
AS AT 31 DECEMBER 2017

FOREIGNCORRESPONDENTS
Country Name of Bank
MashreqBank Psc Mizuho Bank China Limited UK Northern Bank Ltd.UK Santander UK Plc UK Standard Chartered Bank Sumitomo Mitsui Banking Corporation Europe Ltd. United Bank UK 66 U.S.A. ABN-AMRO Capital USA LLC Bank of America NA Bank of New York Mellon Bank Of Tokyo Mitsubishi UFJ Limited BOKF,NA Branch Banking & Trust Co. Citibank N.A. Citizen Bank N.A USA Comerica Bank Commerzbank AG USA Deutsche Bank Trust Company Americas East-West Bank First Tennessee Bank National Association USA Habib American Bank International Finance Corporation Intesa Sanpaolo SPA J. P. Morgan Chase Bank MashreqBank psc Metro City Bank USA MUFG Union Bank National Association USA National Bank of Pakistan New York Commercial Bank USA Nonghyup Bank USA PNC Bank National Association USA Peoples United Bank National Association USA Citizens Bank NA Regions Bank Shinhan Bank America Standard Chartered Bank Sumitomo Mitsui Banking Corporation The Bank of Tokyo-Mitsubishi UFJ Ltd., UMB Bank NA United Bank Limited US Century Bank Wells Fargo Bank NA Woori Bank 67 Vietnam An Binh Commercial Joint Stock Citibank NA J. P. Morgan Chase Bank NA Kookmin Bank Military Commercial Joint Stock Bank Vietnam Shinhan Bank Vietnam Standard Chartered Bank Vietnam Export Import Commercial Joint Stock Bank Vietnam
AS AT 31 DECEMBER 2017

PROXY FORM26th Annual General Meeting
I / We of being member(s) of SONERI BANK LIMITEDand holder of ordinary shares.
Register Folio No.
CDC participant I.D. No.: Sub-Account No.:
CNIC No.: or Passport No.:
hereby appoint of or failing him / her of who is / are also member(s) of SONERI BANK LIMITED as my / our proxy to attend and vote for me / our behalf at the 26th Annual General Meeting of the Bank to be held on 30 March 2018 or at any adjournment thereof.
Affix Rs. 5RevenueStamp
(Signatures should agree with thespecimen signature registeredwith the Bank)
1. WITNESS 2. WITNESS
Signature : Signature :
Name: Name:
Address: Address:
CNIC No.: CNIC No.:
or Passport No: or Passport No:
IMPORTANT:
1. This Proxy Form, duly completed and signed, must be received at the Registered Office of the Bank at SONERI BANK LIMITED, Rupali House, 241-242 Upper Mall Scheme, Anand Road, Lahore-54000, not less than 48 hours before the time of holding the meeting.
2. No person shall act as Proxy unless he / she himself / herself is a member of the Company, except that a corporation may appoint a person who is not a member.
3. If a member appoints more than one proxy and more than one instruments of proxy are deposited by a member with the Company, all such instruments of proxy shall be rendered invalid.
4. CDC Shareholders and their Proxies should attach an attested photocopy of their Computerized National Identity Card (CNIC) or Passport with the proxy form before submission to the Company. (Original CNIC / Passport is required to be produced at the time of the meeting).
5. In case of corporate entity, the Board of Directors' resolution / power of attorney with specimen signature of the nominee shall be submitted along with proxy form to the Company.
Dated this day of 2018 Signature of Shareholder
Signature of Proxy

The Company SecretarySoneri Bank LimitedRupali House 241-242Upper Mall SchemeAnand RoadLahore-54000
Soneri Bank Limited
AFFIXCORRECTPOSTAGE

The Company SecretarySoneri Bank LimitedRupali House 241-242Upper Mall SchemeAnand RoadLahore-54000
Soneri Bank Limited
AFFIXCORRECTPOSTAGE


________________________________ ________________________________ ________________________________ ________________________________
Bank Mandate Form I Mr./ Ms./ Mrs. ____________________________s/o, d/o, w/o, _________________________ hereby authorized Soneri Bank Limited to send/ directly credit cash dividends declared by it, in my bank account as detailed below:
(i) Shareholder’s Information
Name of Shareholder
Folio No./ Participant & Account No./ CDC Investor No. CNIC No. - - NTN - Passport No. (in case of foreign shareholder)
Address
Cell Number
Landline Number
Email ID
(ii) Dividend Mandate Information
Title of Bank Account
International Bank Account Number (IBAN) - Mandatory P K Bank’s Name
Bank’s Address
It is stated that the above particulars given by me are correct to the best of my knowledge and I shall keep the Company/ Share Registrar informed in case of any changes in the said particulars in future. _____________________ Shareholder’s signature
Note: Bank Mandate details must be verified by the concerned Bank Branch to avoid any error. Shareholders holding shares in physical form should send this form to Share Registrar, THK Associates (Pvt.) Ltd. Whereas CDC Shareholders should send it to Investor Account Services or Broker where shares are placed in electronic form, along with legible photocopy of valid CNIC.

Soneri Bank Limited | Annual Report 2017 | 187
Mould of light
Master of handling gold
Glossary:
Extraordinary gold
A person who polishes gold
A person who coats gold
Brilliance, splendor
A bright action or duty
A bright way or behavior

Annual Report 2017
Registered Office: Rupali House 241-242,Upper Mall Scheme, Anand Road, Lahore - 54000, PakistanTel: (042) 35713101-04
Central Office: 10th Floor, PNSC Building,M.T. Khan Road, Karachi - 74000, PakistanTel: (021) 111-567-890
24/7 Phone Banking: 021-111-SONERI (766374)Over 285 branches & 300+ ATMswww.soneribank.com SoneriBankPK @SoneriBank_Pk
Soneri Bank Limited