annual report 2014 - annualreports.com
TRANSCRIPT

Annual Report 2014

KEY FIGURES 4
REPORT OF THE BOARD OF DIRECTORSTO THE GENERAL ASSEMBLY 5
MESSAGE FROM THE CHAIRMAN 11
CORPORATE GOVERNANCE 15Governing bodies 16Controlling bodies 18Organizational chart 20Members of governing and controlling bodies as at January 1, 2015 21
ACTIVITY REPORT 232014 activities 242014 results and outlook for 2015 27
FINANCIAL STATEMENTS 29Income statement 30Statement of comprehensive income 31Balance sheet 32Statement of changes in equity 33Statement of cash flows 34Notes to the financial statements 35Auditor’s Report 66
MILESTONES IN DEVELOPMENT 69
Contents
European Company for the Financing of Railroad Rolling Stock
Annual Report 2014
3

EUROFIMA is a supranational organization. Its sharehold-ers, which are also its customers, are the railways of its member States. EUROFIMA fulfills a task of public interest. It is located in Basel, Switzerland.
CONSTITUTION AND MISSION
EUROFIMA was established on November 20, 1956, based on an international treaty (the “Convention”) between sov-ereign States. It is governed by the Convention signed by its member States, its articles of association (“Statutes”) and in a subsidiary manner by the law of the country in which it is located. It was originally founded for a period of 50 years. The decision taken by the extraordinary Gen-eral Assembly of February 1, 1984, to extend this period for an additional 50 years, until 2056, was approved by all member States. EUROFIMA’s shareholders are railways of the European member States which are parties to the Con-vention.
EUROFIMA’s mission is to support the development of rail transportation in Europe and to support the railways which are its shareholders, as well as other railway bodies, in re-newing and modernizing their equipment.
ACTIVITY
EUROFIMA finances railway equipment through borrow-ings or equity capital. EUROFIMA secures title to or obtains security interests deemed equivalent (in particular pledg-es) on or in respect of equipment. The general principles of EUROFIMA’s activity are defined in an agreement (the “Basic Agreement”) between the railways and EUROFIMA. The Basic Agreement remains valid for the entire duration of EUROFIMA’s existence and can only be altered with the consent of all the railways and EUROFIMA. EUROFIMA’s equity is primarily used for investments in liquid assets and, to a limited extent, for equipment financing contracts.
EQUIPMENT
EUROFIMA either holds title to the equipment until the financing has been completely reimbursed or it holds a direct or indirect security interest deemed equivalent, par-ticularly pledges. The equipment is recorded in the com-pany’s register with its number and type. Each railway is responsible for maintaining the equipment. In case of dam-age or loss, the equipment must be replaced without delay and at the railway’s expense. If a railway does not fulfill its obligations, EUROFIMA has the right to repossess the equipment to cover its exposure. The railway continues to assume responsibility for all contracts into which it has en-tered with the company. EUROFIMA has never experienced a loss due to the failure of a railway to assume its contrac-tual obligations.
GUARANTEE RESERVE AND SUBSIDIARY SHAREHOLDER GUARANTEE
In the event of a default by a railway, the guarantee re-serve, as outlined in Article 29 of the Statutes, may be called upon. According to this article, the yearly allocation to the guarantee reserve corresponds to the balance of the annual profit, after allocation to the ordinary reserve of 5% of the net profit and the eventual payment of a dividend, statutorily limited to a maximum of 4% of the paid-in share capital. After appropriation of the 2014 surplus, the guar-antee reserve reached CHF 673.5 million. In addition, pursuant to Article 26 of the Statutes, each shareholder guarantees the fulfillment of all equipment financing contracts in proportion to its participation in EUROFIMA’s share capital and up to a maximum amount equal to its participation in EUROFIMA’s subscribed share capital. This subsidiary shareholder guarantee can only be called when (i) a railway and its guaranteeing member State have not discharged obligations under equipment financing contracts and (ii) the guarantee reserve, as out-lined by Article 29 of the Statutes, is not sufficient to cover the loss resulting from such non-payment.
Report of the Board of Directorsto the General Assembly
Key figures
2014 2013 2012
Balance sheet
Total 26 089 27 577 31 300
Assets
Liquid assets (1) 4 305 4 093 4 198
Equipment financing contracts 18 275 20 932 22 532
Derivative financial instruments 3 493 2 533 4 552
Liabilities
Outstanding borrowings (2) 23 300 24 634 28 305
Derivative financial instruments 1 186 1 380 1 437
Equity
Equity + Callable share capital 3 664 3 625 3 613
Net profit and appropriation to reserves
Net profit for the financial year 33 34 34
Appropriation to statutory reserves 30 30 37
Ratios in %
Total operating expense/ Total operating income 20.4 23.6 22.5
Net profit / Average equity 2.1 2.3 2.3
(Equity + Callable share capital) / Outstanding borrowings 15.7 14.7 12.8
(Sound share capital (3) + Shareholder guarantee AAA/AA) / Outstanding borrowings 21.4 20.1 17.5
(Sound share capital (4) + Shareholder guarantee Aaa/Aa) / Outstanding borrowings 21.2 19.9 17.3
Borrowings and repayments during the financial year
Borrowings 3 700 3 438 3 263
Repayments 6 240 4 682 5 403
Repayment rate in % 168.7 136.2 165.2
Railway equipment financed during the financial year
Locomotives 15 46 0
Multiple-unit trains
- Motor units 199 12 62
- Trailer cars 268 12 108
Passenger cars 16 149 23
Freight cars 0 3 0
(1) Cash and cash equivalents and financial investments.(2) Amounts due to credit institutions and customers and debts evidenced by certificates.(3) Equity and callable share capital AAA/AA.(4) Equity and callable share capital Aaa/Aa.
Due to rounding, numbers presented throughout this document may not add up precisely to the totals provided and percentages may not precisely reflect the absolute figures.
Financial data: amounts in million CHFRailway equipment financed: in units
4
Annual Report 2014 Annual Report 2014
5
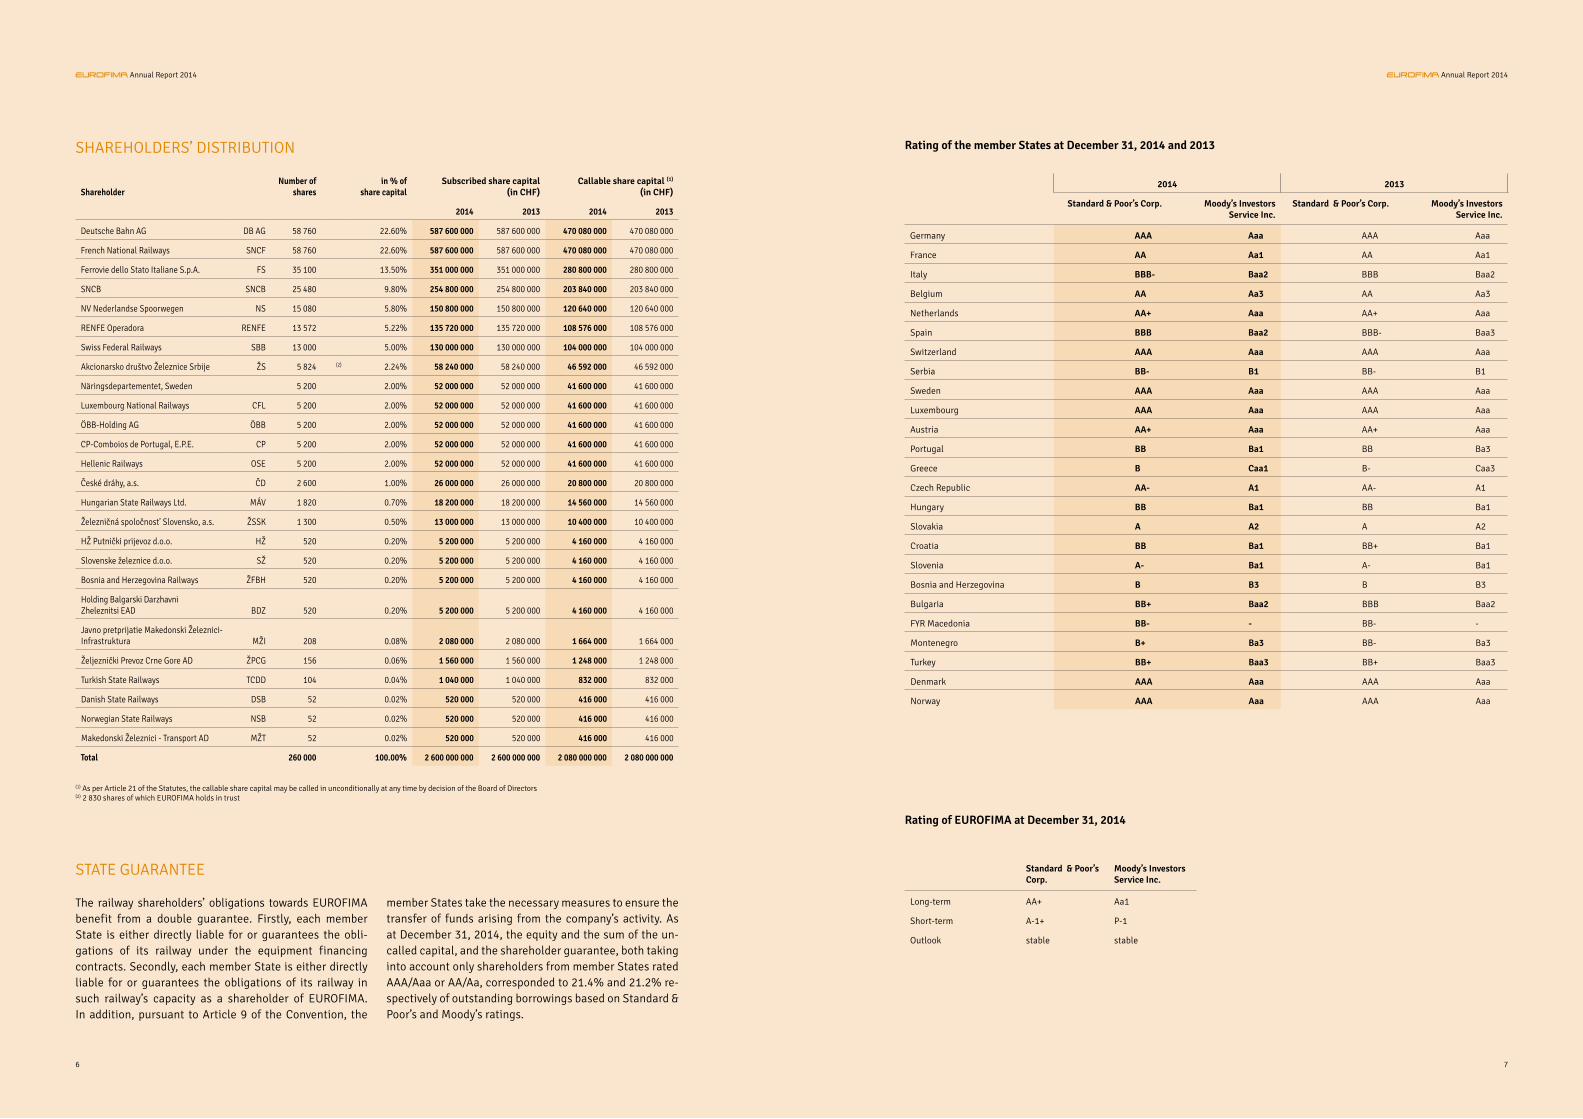
2014 2013
Standard & Poor’s Corp. Moody’s Investors Service Inc.
Standard & Poor’s Corp. Moody’s Investors Service Inc.
Germany AAA Aaa AAA Aaa
France AA Aa1 AA Aa1
Italy BBB- Baa2 BBB Baa2
Belgium AA Aa3 AA Aa3
Netherlands AA+ Aaa AA+ Aaa
Spain BBB Baa2 BBB- Baa3
Switzerland AAA Aaa AAA Aaa
Serbia BB- B1 BB- B1
Sweden AAA Aaa AAA Aaa
Luxembourg AAA Aaa AAA Aaa
Austria AA+ Aaa AA+ Aaa
Portugal BB Ba1 BB Ba3
Greece B Caa1 B- Caa3
Czech Republic AA- A1 AA- A1
Hungary BB Ba1 BB Ba1
Slovakia A A2 A A2
Croatia BB Ba1 BB+ Ba1
Slovenia A- Ba1 A- Ba1
Bosnia and Herzegovina B B3 B B3
Bulgaria BB+ Baa2 BBB Baa2
FYR Macedonia BB- - BB- -
Montenegro B+ Ba3 BB- Ba3
Turkey BB+ Baa3 BB+ Baa3
Denmark AAA Aaa AAA Aaa
Norway AAA Aaa AAA Aaa
Standard & Poor’s Corp.
Moody’s Investors Service Inc.
Long-term AA+ Aa1
Short-term A-1+ P-1
Outlook stable stable
Rating of the member States at December 31, 2014 and 2013
Rating of EUROFIMA at December 31, 2014
SHAREHOLDERS’ DISTRIBUTION
ShareholderNumber of
sharesin % of
share capitalSubscribed share capital
(in CHF)Callable share capital (1)
(in CHF)
2014 2013 2014 2013
Deutsche Bahn AG DB AG 58 760 22.60% 587 600 000 587 600 000 470 080 000 470 080 000
French National Railways SNCF 58 760 22.60% 587 600 000 587 600 000 470 080 000 470 080 000
Ferrovie dello Stato Italiane S.p.A. FS 35 100 13.50% 351 000 000 351 000 000 280 800 000 280 800 000
SNCB SNCB 25 480 9.80% 254 800 000 254 800 000 203 840 000 203 840 000
NV Nederlandse Spoorwegen NS 15 080 5.80% 150 800 000 150 800 000 120 640 000 120 640 000
RENFE Operadora RENFE 13 572 5.22% 135 720 000 135 720 000 108 576 000 108 576 000
Swiss Federal Railways SBB 13 000 5.00% 130 000 000 130 000 000 104 000 000 104 000 000
Akcionarsko društvo Železnice Srbije ŽS 5 824 (2) 2.24% 58 240 000 58 240 000 46 592 000 46 592 000
Näringsdepartementet, Sweden 5 200 2.00% 52 000 000 52 000 000 41 600 000 41 600 000
Luxembourg National Railways CFL 5 200 2.00% 52 000 000 52 000 000 41 600 000 41 600 000
ÖBB-Holding AG ÖBB 5 200 2.00% 52 000 000 52 000 000 41 600 000 41 600 000
CP-Comboios de Portugal, E.P.E. CP 5 200 2.00% 52 000 000 52 000 000 41 600 000 41 600 000
Hellenic Railways OSE 5 200 2.00% 52 000 000 52 000 000 41 600 000 41 600 000
České dráhy, a.s. ČD 2 600 1.00% 26 000 000 26 000 000 20 800 000 20 800 000
Hungarian State Railways Ltd. MÁV 1 820 0.70% 18 200 000 18 200 000 14 560 000 14 560 000
Železničná spoločnost' Slovensko, a.s. ŽSSK 1 300 0.50% 13 000 000 13 000 000 10 400 000 10 400 000
HŽ Putnički prijevoz d.o.o. HŽ 520 0.20% 5 200 000 5 200 000 4 160 000 4 160 000
Slovenske železnice d.o.o. SŽ 520 0.20% 5 200 000 5 200 000 4 160 000 4 160 000
Bosnia and Herzegovina Railways ŽFBH 520 0.20% 5 200 000 5 200 000 4 160 000 4 160 000
Holding Balgarski DarzhavniZheleznitsi EAD BDZ 520 0.20% 5 200 000 5 200 000 4 160 000 4 160 000
Javno pretprijatie Makedonski Železnici-Infrastruktura MŽI 208 0.08% 2 080 000 2 080 000 1 664 000 1 664 000
Željeznički Prevoz Crne Gore AD ŽPCG 156 0.06% 1 560 000 1 560 000 1 248 000 1 248 000
Turkish State Railways TCDD 104 0.04% 1 040 000 1 040 000 832 000 832 000
Danish State Railways DSB 52 0.02% 520 000 520 000 416 000 416 000
Norwegian State Railways NSB 52 0.02% 520 000 520 000 416 000 416 000
Makedonski Železnici - Transport AD MŽT 52 0.02% 520 000 520 000 416 000 416 000
Total 260 000 100.00% 2 600 000 000 2 600 000 000 2 080 000 000 2 080 000 000
STATE GUARANTEE
The railway shareholders’ obligations towards EUROFIMA benefit from a double guarantee. Firstly, each member State is either directly liable for or guarantees the obli-gations of its railway under the equipment financing contracts. Secondly, each member State is either directly liable for or guarantees the obligations of its railway in such railway’s capacity as a shareholder of EUROFIMA. In addition, pursuant to Article 9 of the Convention, the
member States take the necessary measures to ensure the transfer of funds arising from the company’s activity. As at December 31, 2014, the equity and the sum of the un-called capital, and the shareholder guarantee, both taking into account only shareholders from member States rated AAA/Aaa or AA/Aa, corresponded to 21.4% and 21.2% re-spectively of outstanding borrowings based on Standard & Poor’s and Moody’s ratings.
(1) As per Article 21 of the Statutes, the callable share capital may be called in unconditionally at any time by decision of the Board of Directors(2) 2 830 shares of which EUROFIMA holds in trust
6
Annual Report 2014 Annual Report 2014
7
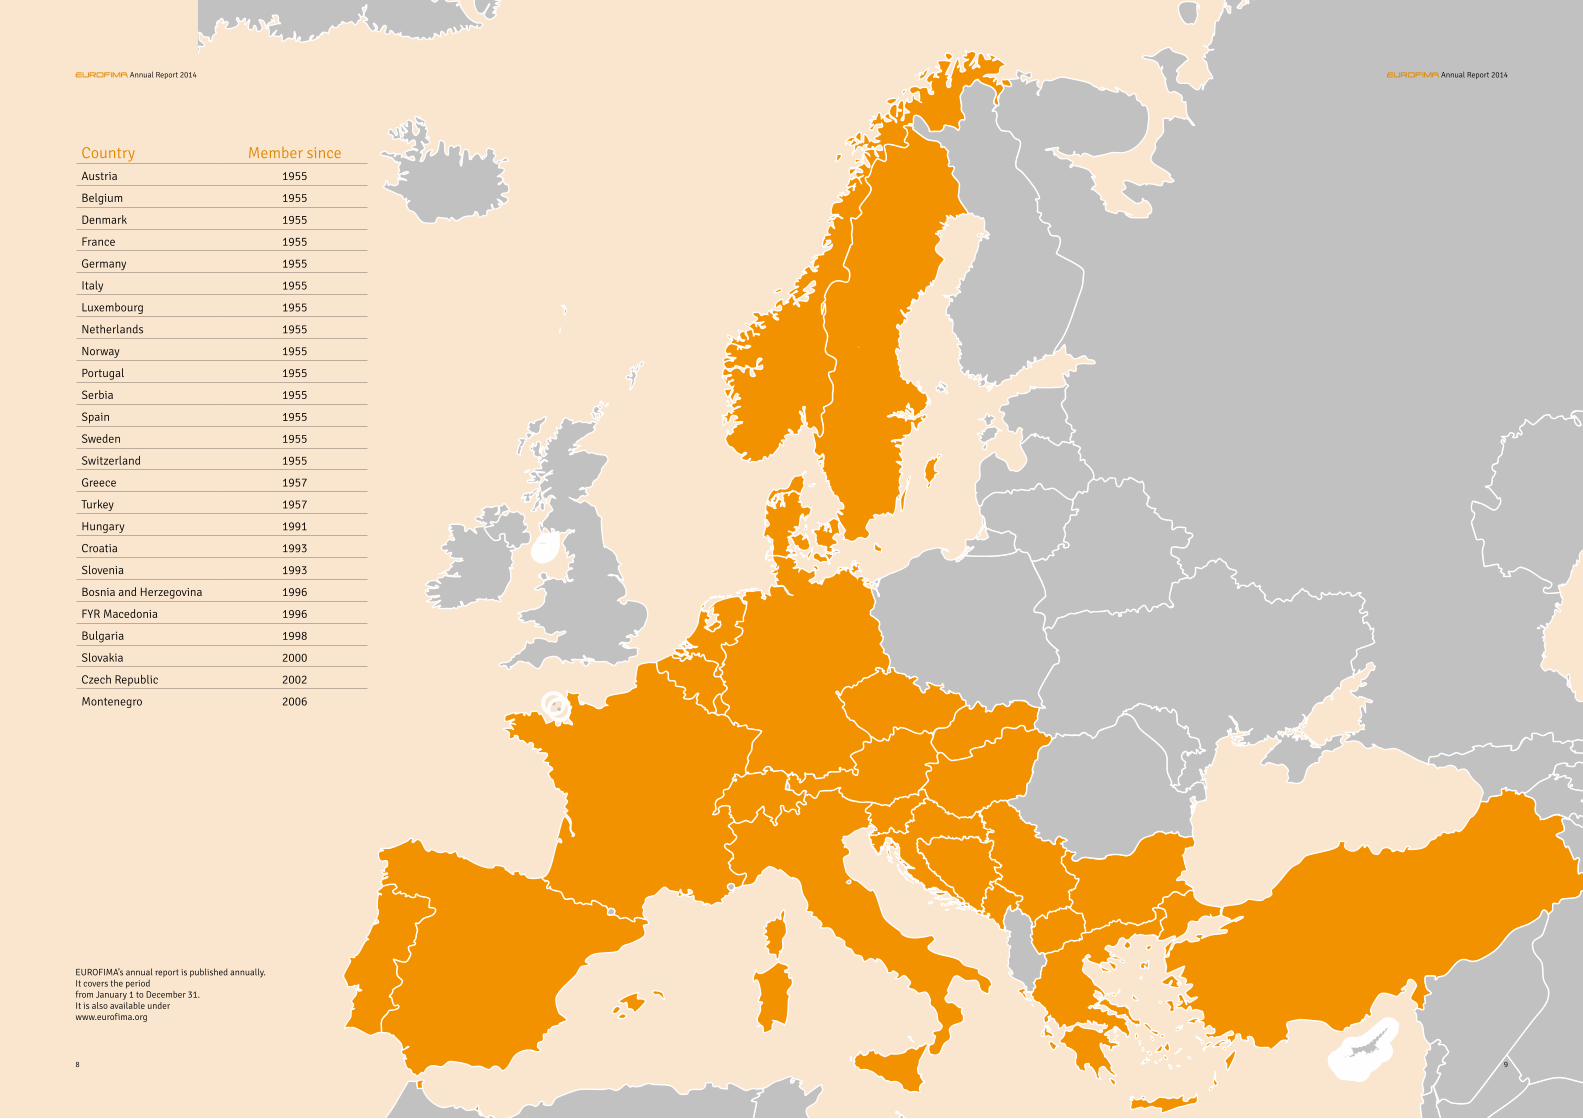
EUROFIMA’s annual report is published annually.It covers the periodfrom January 1 to December 31.It is also available underwww.eurofima.org
Country Member sinceAustria 1955
Belgium 1955
Denmark 1955
France 1955
Germany 1955
Italy 1955
Luxembourg 1955
Netherlands 1955
Norway 1955
Portugal 1955
Serbia 1955
Spain 1955
Sweden 1955
Switzerland 1955
Greece 1957
Turkey 1957
Hungary 1991
Croatia 1993
Slovenia 1993
Bosnia and Herzegovina 1996
FYR Macedonia 1996
Bulgaria 1998
Slovakia 2000
Czech Republic 2002
Montenegro 2006
8
Annual Report 2014 Annual Report 2014
9

Message fromthe Chairman
Annual Report 2014
18.3outstanding
development-related loansto the railway sector in Europe
CHF
BIL
LIO
N
0loan lossesin EUROFIMA’s history
CHF
BIL
LIO
N3.7borrowingsin 2014
18.5%liquidity ratio Liquid assets/outstanding borrowings
26.3%estimated Basel II ratio
10
Annual Report 2014
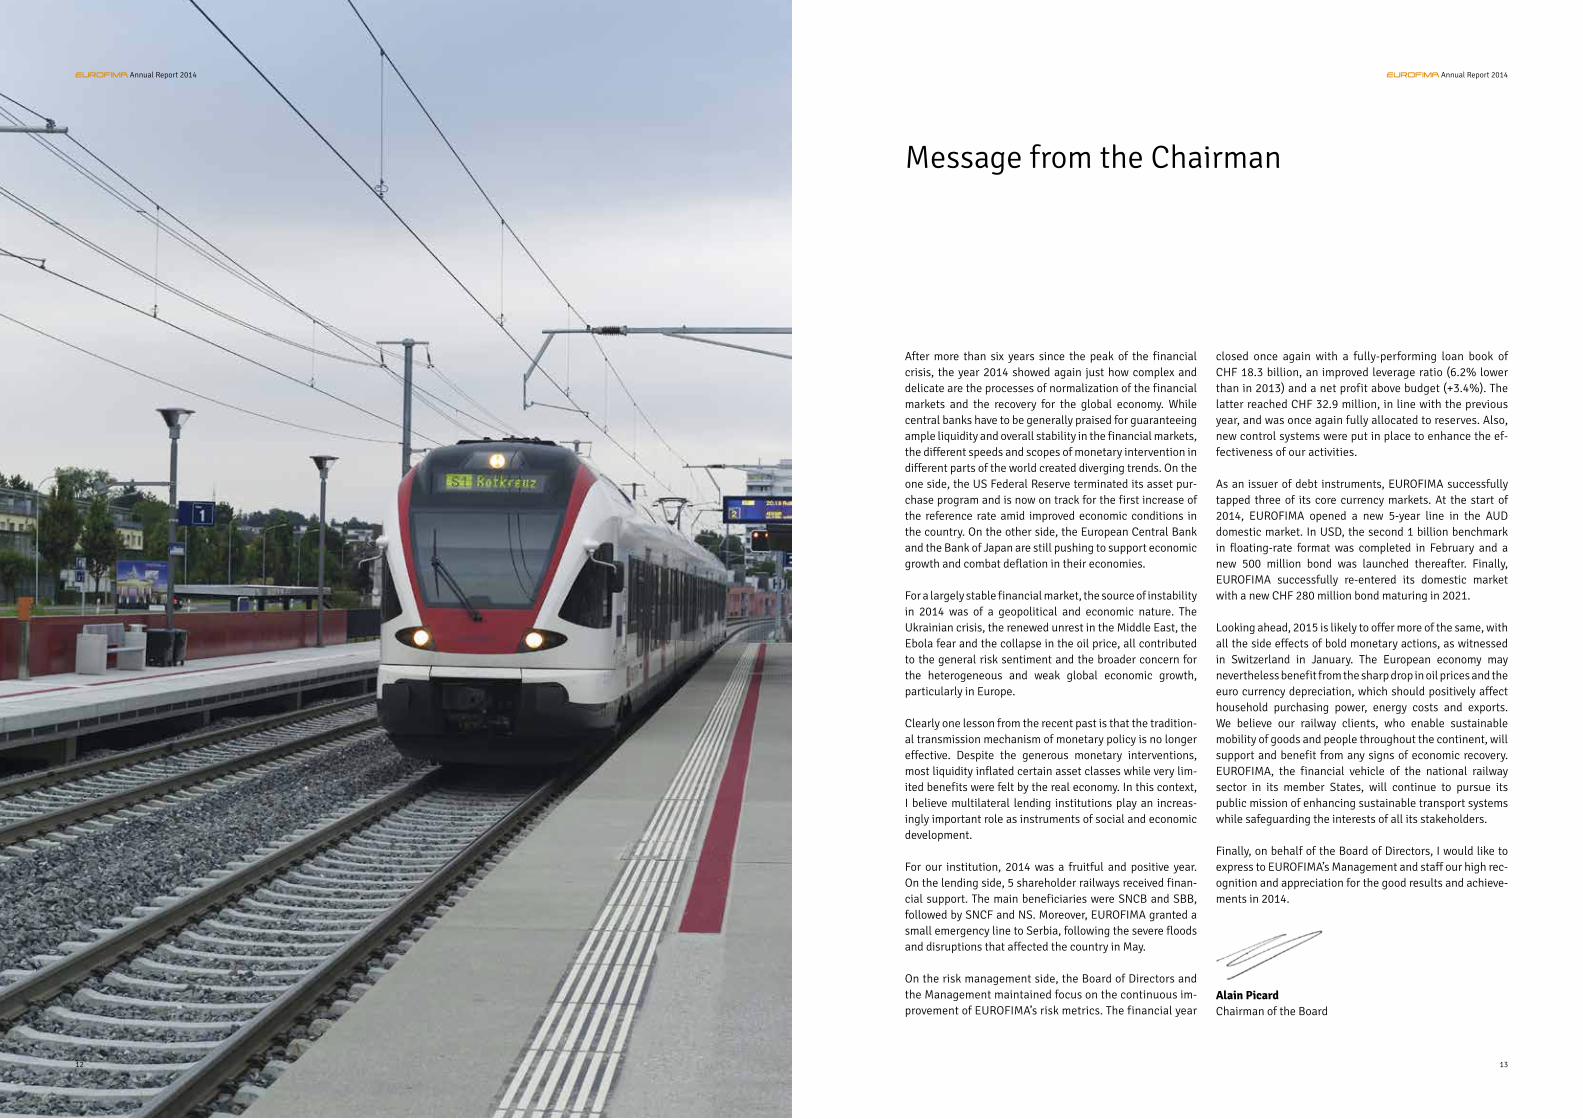
Message from the Chairman
After more than six years since the peak of the financial crisis, the year 2014 showed again just how complex and delicate are the processes of normalization of the financial markets and the recovery for the global economy. While central banks have to be generally praised for guaranteeing ample liquidity and overall stability in the financial markets, the different speeds and scopes of monetary intervention in different parts of the world created diverging trends. On the one side, the US Federal Reserve terminated its asset pur-chase program and is now on track for the first increase of the reference rate amid improved economic conditions in the country. On the other side, the European Central Bank and the Bank of Japan are still pushing to support economic growth and combat deflation in their economies.
For a largely stable financial market, the source of instability in 2014 was of a geopolitical and economic nature. The Ukrainian crisis, the renewed unrest in the Middle East, the Ebola fear and the collapse in the oil price, all contributed to the general risk sentiment and the broader concern for the heterogeneous and weak global economic growth, particularly in Europe.
Clearly one lesson from the recent past is that the tradition-al transmission mechanism of monetary policy is no longer effective. Despite the generous monetary interventions, most liquidity inflated certain asset classes while very lim-ited benefits were felt by the real economy. In this context, I believe multilateral lending institutions play an increas-ingly important role as instruments of social and economic development.
For our institution, 2014 was a fruitful and positive year. On the lending side, 5 shareholder railways received finan-cial support. The main beneficiaries were SNCB and SBB, followed by SNCF and NS. Moreover, EUROFIMA granted a small emergency line to Serbia, following the severe floods and disruptions that affected the country in May.
On the risk management side, the Board of Directors and the Management maintained focus on the continuous im-provement of EUROFIMA’s risk metrics. The financial year
Alain PicardChairman of the Board
closed once again with a fully-performing loan book of CHF 18.3 billion, an improved leverage ratio (6.2% lower than in 2013) and a net profit above budget (+3.4%). The latter reached CHF 32.9 million, in line with the previous year, and was once again fully allocated to reserves. Also, new control systems were put in place to enhance the ef-fectiveness of our activities.
As an issuer of debt instruments, EUROFIMA successfully tapped three of its core currency markets. At the start of 2014, EUROFIMA opened a new 5-year line in the AUD domestic market. In USD, the second 1 billion benchmark in floating-rate format was completed in February and a new 500 million bond was launched thereafter. Finally, EUROFIMA successfully re-entered its domestic market with a new CHF 280 million bond maturing in 2021.
Looking ahead, 2015 is likely to offer more of the same, with all the side effects of bold monetary actions, as witnessed in Switzerland in January. The European economy may nevertheless benefit from the sharp drop in oil prices and the euro currency depreciation, which should positively affect household purchasing power, energy costs and exports. We believe our railway clients, who enable sustainable mobility of goods and people throughout the continent, will support and benefit from any signs of economic recovery. EUROFIMA, the financial vehicle of the national railway sector in its member States, will continue to pursue its public mission of enhancing sustainable transport systems while safeguarding the interests of all its stakeholders.
Finally, on behalf of the Board of Directors, I would like to express to EUROFIMA’s Management and staff our high rec-ognition and appreciation for the good results and achieve-ments in 2014.
12
Annual Report 2014 Annual Report 2014
13

Corporate Governance
Governing bodies
Controlling bodies
Organizational chart
Members of governing and controlling bodies as at January 1, 2015
Annual Report 2014

Governing bodies
As a public international body, EUROFIMA is governed first by its constitutive documents and only subsidiarily by Swiss law. Its constitutive documents are the Convention, the Statutes and the Basic Agreement. The organization’s legal framework sets out the structure for EUROFIMA’s governance. In addition to the constitutive documents, EUROFIMA’s activities are governed by a set of policies, guidelines and rules of procedures adopted by the General Assembly, the Board of Directors or the Management. As a supranational organization, EUROFIMA is not subject to any national or international regulatory authority.
The member States have reserved extensive corporate gov-ernance rights over EUROFIMA. The following changes to EUROFIMA’s organization require the consent of the mem-ber States: head office, objective, duration, conditions for admission of shareholders, quorums applicable to impor-tant shareholders’ resolutions, equal voting rights of direc-tors, all terms dealing with the shareholders’ liability and the establishment of branches.
EUROFIMA has to report annually on its development and its financial position to its member States. Such reporting is done through the International Transport Forum, an inter-governmental organization within the OECD family.
EUROFIMA is managed and administered by the General Assembly, the Board of Directors and the Management.
GENERAL ASSEMBLY
The General Assembly convenes at least once annually. It approves the annual report of the Board of Directors, the audited financial statements, the appropriation of the an-nual surplus, the discharge of the acts of the Management and the Board of Directors, and it appoints the External Au-ditor. It also approves the maximum amount of borrowings and the organization regulations. Decisions are taken by the majority of votes of the shares represented. However, in order to amend the Statutes, to reduce or to increase the subscribed share capital, to transfer shares and subscrip-
tion rights, to dissolve the organization, to appoint liquida-tors, and to extend the organization’s duration, a superma-jority representing at least seven-tenths of the subscribed share capital is required. The General Assembly decides upon any other questions which are submitted to it by the Board of Directors.
In 2014, the General Assembly convened on three occa-sions. The main subjects examined by the General Assem-bly on which it took decisions were: the annual report and the appropriation of 2013 surplus, the discharge of mem-bers of the Board of Directors and the Management for the financial year 2013, the maximum amounts of borrowings which may be concluded, the updated organization regula-tions, the establishment of External Auditors as a statutory body of EUROFIMA, and the partial renewal of the Board of Directors.
BOARD OF DIRECTORS
The Board of Directors is responsible for EUROFIMA’s strat-egy and its financial success. It sets the overall direction and assumes supervision and control of the organization and its Management.
It meets at least once quarterly. Each director has one vote. A majority of directors present or represented constitute a quorum. Decisions are taken on the basis of the majority of the directors present or represented except for the con-clusion of borrowings where a three-fourths majority is re-quired. In urgent cases, decisions may be reached accord-ing to a written procedure.
With the exception of certain reserved powers, the Board of Directors is authorized to entrust all or part of the man-agement of the institution to one or several of its members (“representatives”) or third persons who need not necessar-ily be directors (“members of the Management”). As a re-sult, the executive management is delegated to members of the Management. In this regard, the General Assembly has established organization regulations determining the
rights and responsibilities of the Board of Directors and the Management.
The Board of Directors authorizes all equipment financing contracts and all borrowings within the limits laid down by the General Assembly. It is responsible for the financial statements as well as the existence and maintenance of the internal control system on financial reporting. The Board of Directors is the competent body to call-in the not paid-in share capital.
The Board members, including the Chairman and Vice-Chairmen, are appointed by the General Assembly, with one member for each shareholder holding at least 2% of the share capital. They are appointed for a period of three years and are eligible for re-election. As at January 1, 2015, the Board of Directors consisted of 13 members.
The Chairman calls the Board meetings with sufficient no-tice and draws up the agenda. Any other Board member has the right to call an additional meeting, if deemed neces-sary. Minutes are kept of the proceedings and decisions of the Board of Directors.
In order to ensure an efficient interaction with the Board of Directors, the meetings are also attended by the Man-agement. The Chairman works with the Management in be-tween the meetings.
The Board of Directors established two advisory bodies: the Chairman’s Committee and the Audit and Risk Committee.
The Chairman’s Committee deals with a broad variety of top-ics in preparation for meetings of the Board of Directors. It further determines objectives, reviews appraisals and de-cides terms of engagement of the Management within the principles set by the Board of Directors. It consists of the Chairman, the Vice-Chairmen and two other Board members.
The Audit and Risk Committee supports the Board of Direc-tors in its comprehensive supervisory role with respect to financial control, risk control, audit and compliance man-agement. In this respect, it oversees the activities of both Internal and External Audit. It consists of three Board mem-bers.
The Board of Directors met on 4 occasions in 2014. On av-erage, Director attendance was 92%. The main subjects ex-amined by the Board of Directors on which it took decisions were: the annual budget, the quarterly and annual financial statements, the general authorization to carry out borrow-ing transactions and associated treasury and derivative transactions, the annual report to the General Assembly, the main internal policies, the report to the Governments parties to EUROFIMA’s Convention, the credit rating of the organization, the assessments of the financial position, risk and capital adequacy, and the conclusions of borrowings and equipment financing contracts.
The members of the Board of Directors and its advisory bod-ies are listed on page 21.
MANAGEMENT
Under the authority of the Chief Executive Officer and the supervision of the Board of Directors, the Management is responsible for managing the business, overseeing the day-to-day operations of the organization, and preparing decisions for the Board of Directors. The Management con-sists of the Chief Executive Officer and the Chief Financial Officer. The Management meets as and when required by the operations of the organization. In 2014, 18 meetings were held. The Chief Executive Officer chairs the meetings of the Management. The members of the Management are appointed by the Board of Directors.The members of the Management are listed on page 21.
16
Annual Report 2014 Annual Report 2014
17

Controlling bodies
KEY CHANGES IN 2014
In order to align EUROFIMA’s control set-up with best prac-tice, several key changes were implemented in 2014.
The General Assembly established External Audit as a body of EUROFIMA, replacing the Auditors Committee which was previously the statutory body in charge of auditing the fi-nancial statements. Subsequently, it elected the previous Independent Auditor PwC, which up to that point in time audited the financial statements on the basis of a Board mandate, as the External Auditor.
The Board of Directors newly outsourced the Internal Audit function to a professional services firm. The Board of Di-rectors further established the Audit and Risk Committee to assist the Board in its overarching responsibilities with regard to financial control, risk control, audit and compli-ance management.
EXTERNAL AUDIT
The External Auditor is appointed annually by the Gener-al Assembly in accordance with Article 10 of the Statutes. The responsibility of the External Auditor is to audit the fi-nancial statements, to report the results of the audit to the General Assembly and to the Board of Directors, and to ex-press an opinion concerning the financial statements. The External Auditor also verifies the existence of an internal control system designed for the preparation of the finan-cial statements. The audit is carried out in accordance with Swiss Auditing Standards and International Standards on Auditing.
The amounts paid to the External Auditor are disclosed in note 7 to the financial statements. The External Auditor also receives the minutes of the meetings of the Board of Directors and the General Assembly.
INTERNAL AUDIT
The Internal Auditor reports to the Audit and Risk Com-mittee of the Board of Directors. Based on its independent risk assessment, Internal Audit develops an internal audit plan which is reviewed and approved by the Audit and Risk Committee. Its audit scope includes, but is not limited to, EUROFIMA’s risk management system, the internal control system, and the policies and procedures adopted by its gov-erning bodies.
Further information on risk management is included in note 3 to the financial statements.
INTERNAL CONTROL
The objective of internal control is to ensure a proper func-tioning of business operations. EUROFIMA’s internal con-trol is focused on the financial reporting process and the management of risks. It covers the entire range of policies, procedures, systems and controls for managing and moni-toring the organization’s operations, risk exposure and fi-nancial reporting process.
EUROFIMA strives for a balanced mix of both preventive and detective controls taking place at the process levels and at the entity level. The main principle for organizing EUROFIMA’s work flows and reducing the risk of error or inappropriate actions is segregation of duties.
The ultimate responsibility for the existence and mainte-nance of the internal control system is with the Board of Directors. The Management is responsible for its implemen-tation and execution. On behalf of the Board of Directors, the Audit and Risk Committee assesses the quality of the internal control system’s performance over time.
The External Auditor is responsible for verifying the exist-ence and the implementation of the internal control system on financial reporting. The Internal Auditor verifies the in-ternal control system with periodic internal reviews of the organization’s activities and ensures that they comply with the policies and procedures adopted by the governing bod-ies. Further information on risk management is included in note 3 to the financial statements.
No advance or credit is granted to members of EUROFIMA’s administrative, managerial, and supervisory bodies and no commitment is entered into on their behalf by way of guar-antees of any kind by EUROFIMA.
AUDITORS COMMITTEE
Until its dissolution on December 12, 2014 the Auditors Committee was composed of five members appointed by the General Assembly.
The activities of the Auditors Committee covered the audit of the financial statements as well as the monitoring of the financial reporting process and the effectiveness of the in-ternal controls. In addition, it reviewed the independence of the Independent Auditor and, in particular, the provision of additional services by the Independent Auditor. The Audi-tors Committee met twice in 2014.
18
Annual Report 2014 Annual Report 2014
19
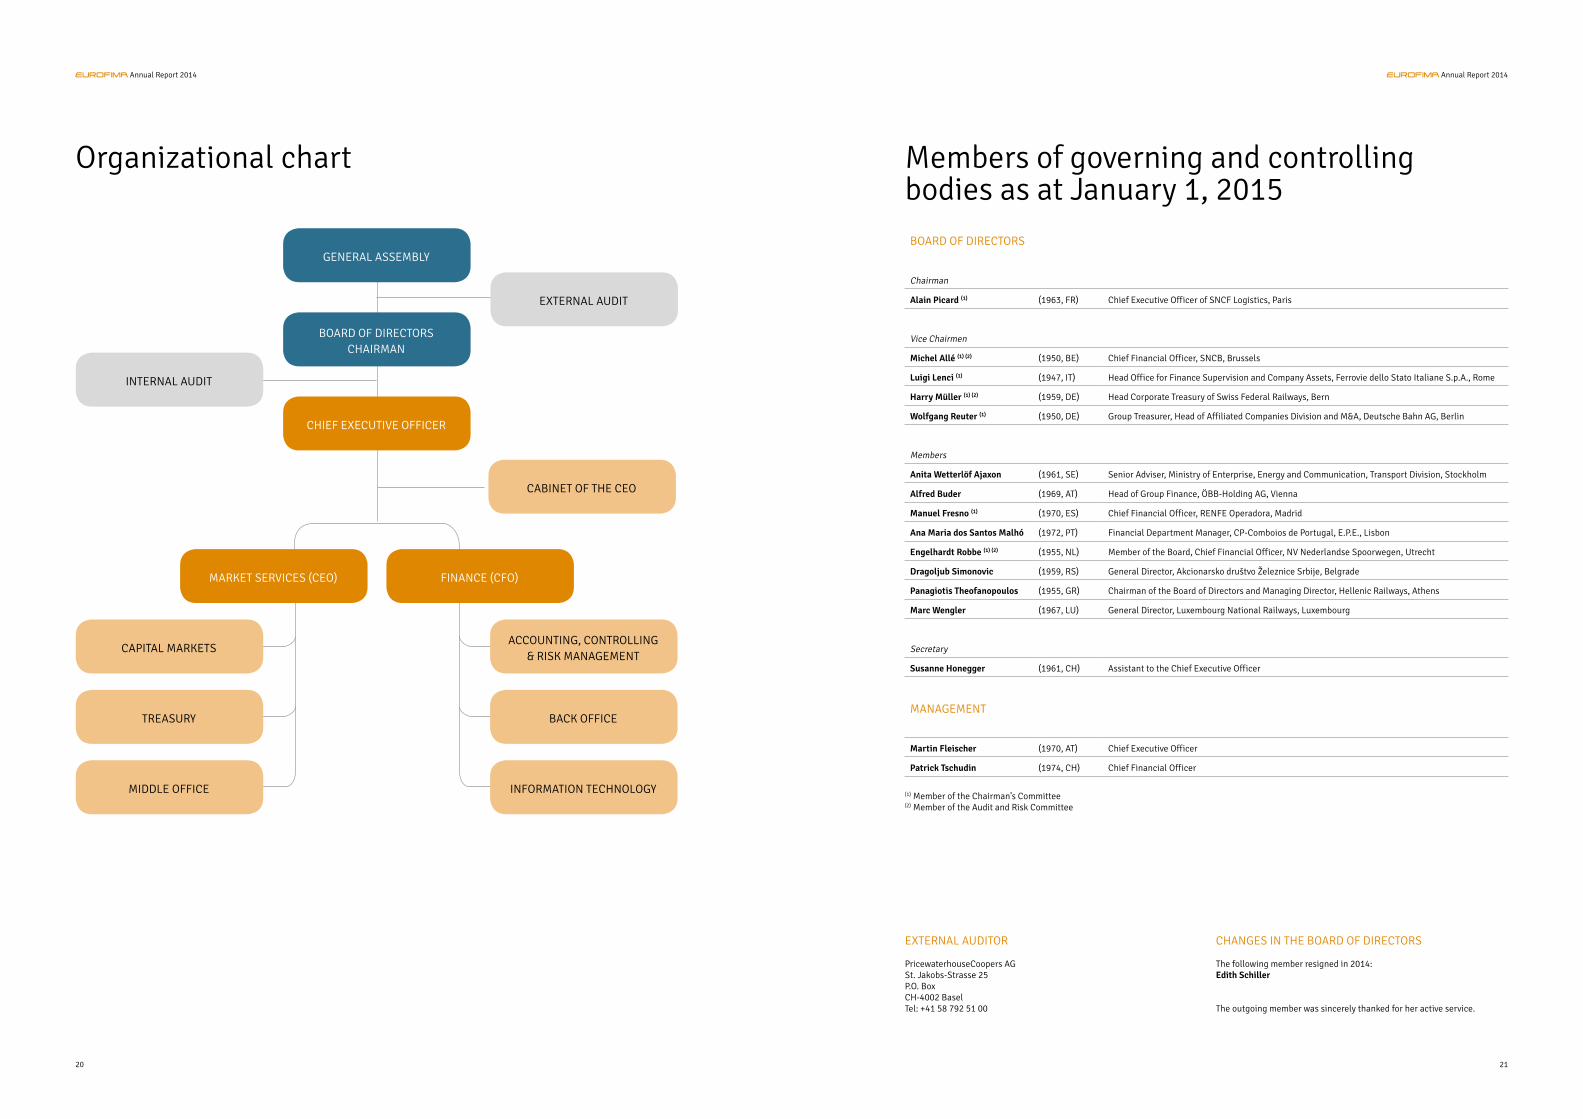
Organizational chart
GENERAL ASSEMBLY
BOARD OF DIRECTORSCHAIRMAN
CHIEF EXECUTIVE OFFICER
CABINET OF THE CEO
MARKET SERVICES (CEO)
CAPITAL MARKETS
TREASURY
MIDDLE OFFICE
FINANCE (CFO)
ACCOUNTING, CONTROLLING& RISK MANAGEMENT
BACK OFFICE
INFORMATION TECHNOLOGY
EXTERNAL AUDIT
INTERNAL AUDIT
Members of governing and controlling bodies as at January 1, 2015BOARD OF DIRECTORS
Chairman
Alain Picard (1) (1963, FR) Chief Executive Officer of SNCF Logistics, Paris
Vice Chairmen
Michel Allé (1) (2) (1950, BE) Chief Financial Officer, SNCB, Brussels
Luigi Lenci (1) (1947, IT) Head Office for Finance Supervision and Company Assets, Ferrovie dello Stato Italiane S.p.A., Rome
Harry Müller (1) (2) (1959, DE) Head Corporate Treasury of Swiss Federal Railways, Bern
Wolfgang Reuter (1) (1950, DE) Group Treasurer, Head of Affiliated Companies Division and M&A, Deutsche Bahn AG, Berlin
Members
Anita Wetterlöf Ajaxon (1961, SE) Senior Adviser, Ministry of Enterprise, Energy and Communication, Transport Division, Stockholm
Alfred Buder (1969, AT) Head of Group Finance, ÖBB-Holding AG, Vienna
Manuel Fresno (1) (1970, ES) Chief Financial Officer, RENFE Operadora, Madrid
Ana Maria dos Santos Malhó (1972, PT) Financial Department Manager, CP-Comboios de Portugal, E.P.E., Lisbon
Engelhardt Robbe (1) (2) (1955, NL) Member of the Board, Chief Financial Officer, NV Nederlandse Spoorwegen, Utrecht
Dragoljub Simonovic (1959, RS) General Director, Akcionarsko društvo Železnice Srbije, Belgrade
Panagiotis Theofanopoulos (1955, GR) Chairman of the Board of Directors and Managing Director, Hellenic Railways, Athens
Marc Wengler (1967, LU) General Director, Luxembourg National Railways, Luxembourg
Secretary
Susanne Honegger (1961, CH) Assistant to the Chief Executive Officer
MANAGEMENT
Martin Fleischer (1970, AT) Chief Executive Officer
Patrick Tschudin (1974, CH) Chief Financial Officer
EXTERNAL AUDITOR PricewaterhouseCoopers AGSt. Jakobs-Strasse 25P.O. BoxCH-4002 BaselTel: +41 58 792 51 00
CHANGES IN THE BOARD OF DIRECTORS
The following member resigned in 2014:Edith Schiller
The outgoing member was sincerely thanked for her active service.
(1) Member of the Chairman’s Committee(2) Member of the Audit and Risk Committee
20
Annual Report 2014 Annual Report 2014
21

Annual Report 2014
2014 activities
2014 results and outlook for 2015
Activity Report
2014 activities
The enduring difficult economic conditions along with the central bank’s expansive monetary policies led to persistently low and partially negative interest rates. The financial market’s capital allocation and risk compensation mechanisms were significantly distorted and brought about a challenging opera-tional environment for EUROFIMA.
High attention was paid to credit and liquidity risk manage-ment. Treasury risk management was subject to a full review, resulting in a partial recalibration of the risk metrics and limits. The conservative risk/return profile of financial instru-ments was maintained and the sound coverage of derivative exposure could be preserved. The newly implemented core IT solution proved to be a crucial pillar for the continuous and timely monitoring and managing of financial risk.
Important organizational improvements regarding corporate governance were implemented: the Auditors Committee was replaced by an External Auditor, the Internal Audit role was en-hanced and the Audit and Risk Committee was established as an advisory body of the Board of Directors.
LENDING POLICY
EUROFIMA’s core activity and public mission consist of sup-porting the development of rail transportation in Europe by providing its shareholders, 26 national railway operators, and other railway bodies with cost-effective financing to renew and modernize their railway equipment. The eligibility criteria and general procedures for granting this support are outlined in EUROFIMA’s constitutive documents (Basic Agreement, Convention, Statutes) as well as in its Internal Policy Guide.
The conservative lending policy paired with the various layers of support granted in the constitutive documents, result in a high-quality and resilient loan portfolio which never suffered a loss in the entire history of EUROFIMA.
Requests for financing from railway operators are evaluated through a thorough approval process consisting of three phases:
» Internal due diligence: EUROFIMA’s internal teams appraise the economic, financial, legal and technical aspects of each railway project and evaluate any potential risk related to it. Particular emphasis is put on the technical and economic evaluation of the rolling stock which collateralizes the re-quested financing. If necessary, external consultants are involved to support the internal due diligence.
» Approval from governing bodies: The General Assembly sets the amounts which can be borrowed and subsequently used for lending purposes. The Board of Directors approves the financing requests.
» Monitoring: Upon conclusion of the financing, EUROFIMA monitors the implementation of the railway project, the sta-tus of rolling stock collateral and any systemic risk that may deteriorate its position as lender.
LENDING ACTIVITY IN 2014
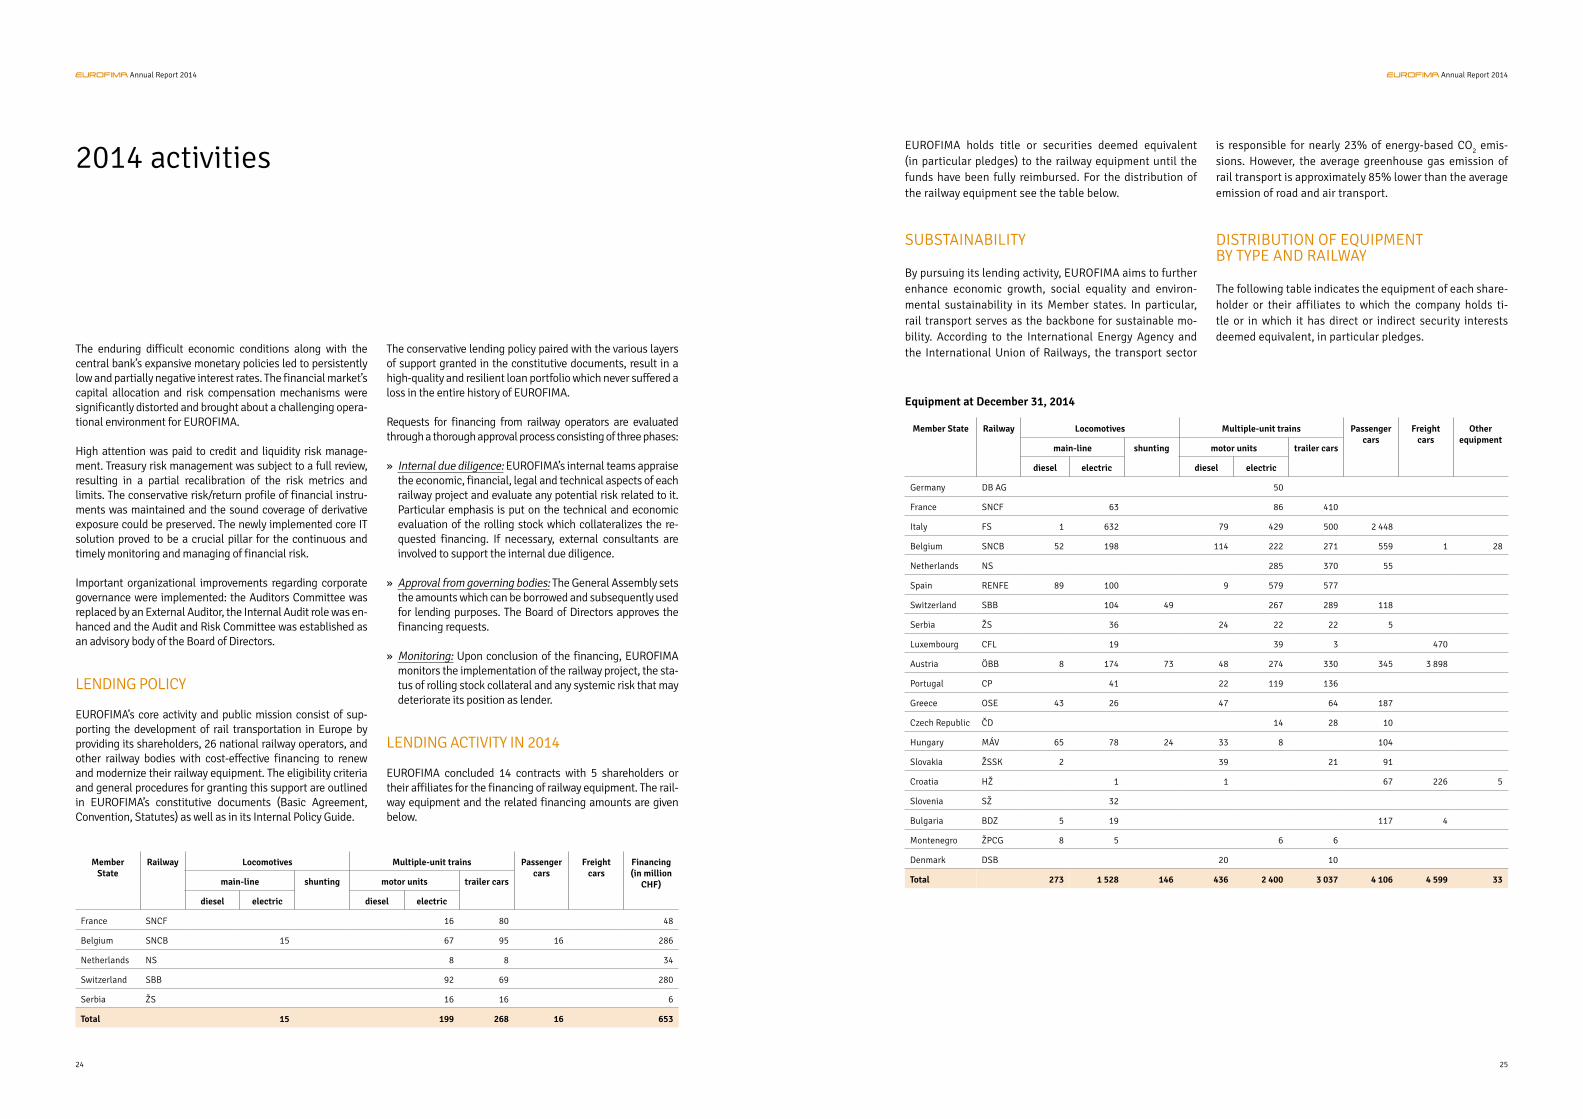
EUROFIMA concluded 14 contracts with 5 shareholders or their affiliates for the financing of railway equipment. The rail-way equipment and the related financing amounts are given below.
EUROFIMA holds title or securities deemed equivalent (in particular pledges) to the railway equipment until the funds have been fully reimbursed. For the distribution of the railway equipment see the table below.
SUBSTAINABILITY
By pursuing its lending activity, EUROFIMA aims to further enhance economic growth, social equality and environ-mental sustainability in its Member states. In particular, rail transport serves as the backbone for sustainable mo-bility. According to the International Energy Agency and the International Union of Railways, the transport sector
is responsible for nearly 23% of energy-based CO2 emis-
sions. However, the average greenhouse gas emission of rail transport is approximately 85% lower than the average emission of road and air transport.
DISTRIBUTION OF EQUIPMENTBY TYPE AND RAILWAY The following table indicates the equipment of each share-holder or their affiliates to which the company holds ti-tle or in which it has direct or indirect security interests deemed equivalent, in particular pledges.
Member State
Railway Locomotives Multiple-unit trains Passenger cars
Freight cars
Financing(in million
CHF)main-line shunting motor units trailer cars
diesel electric diesel electric
France SNCF 16 80 48
Belgium SNCB 15 67 95 16 286
Netherlands NS 8 8 34
Switzerland SBB 92 69 280
Serbia ŽS 16 16 6
Total 15 199 268 16 653
Member State Railway Locomotives Multiple-unit trains Passenger cars
Freight cars
Other equipment
main-line shunting motor units trailer cars
diesel electric diesel electric
Germany DB AG 50
France SNCF 63 86 410
Italy FS 1 632 79 429 500 2 448
Belgium SNCB 52 198 114 222 271 559 1 28
Netherlands NS 285 370 55
Spain RENFE 89 100 9 579 577
Switzerland SBB 104 49 267 289 118
Serbia ŽS 36 24 22 22 5
Luxembourg CFL 19 39 3 470
Austria ÖBB 8 174 73 48 274 330 345 3 898
Portugal CP 41 22 119 136
Greece OSE 43 26 47 64 187
Czech Republic ČD 14 28 10
Hungary MÁV 65 78 24 33 8 104
Slovakia ŽSSK 2 39 21 91
Croatia HŽ 1 1 67 226 5
Slovenia SŽ 32
Bulgaria BDZ 5 19 117 4
Montenegro ŽPCG 8 5 6 6
Denmark DSB 20 10
Total 273 1 528 146 436 2 400 3 037 4 106 4 599 33
Equipment at December 31, 2014
24
Annual Report 2014 Annual Report 2014
25
2014 results and outlook for 2015
2014 RESULTS
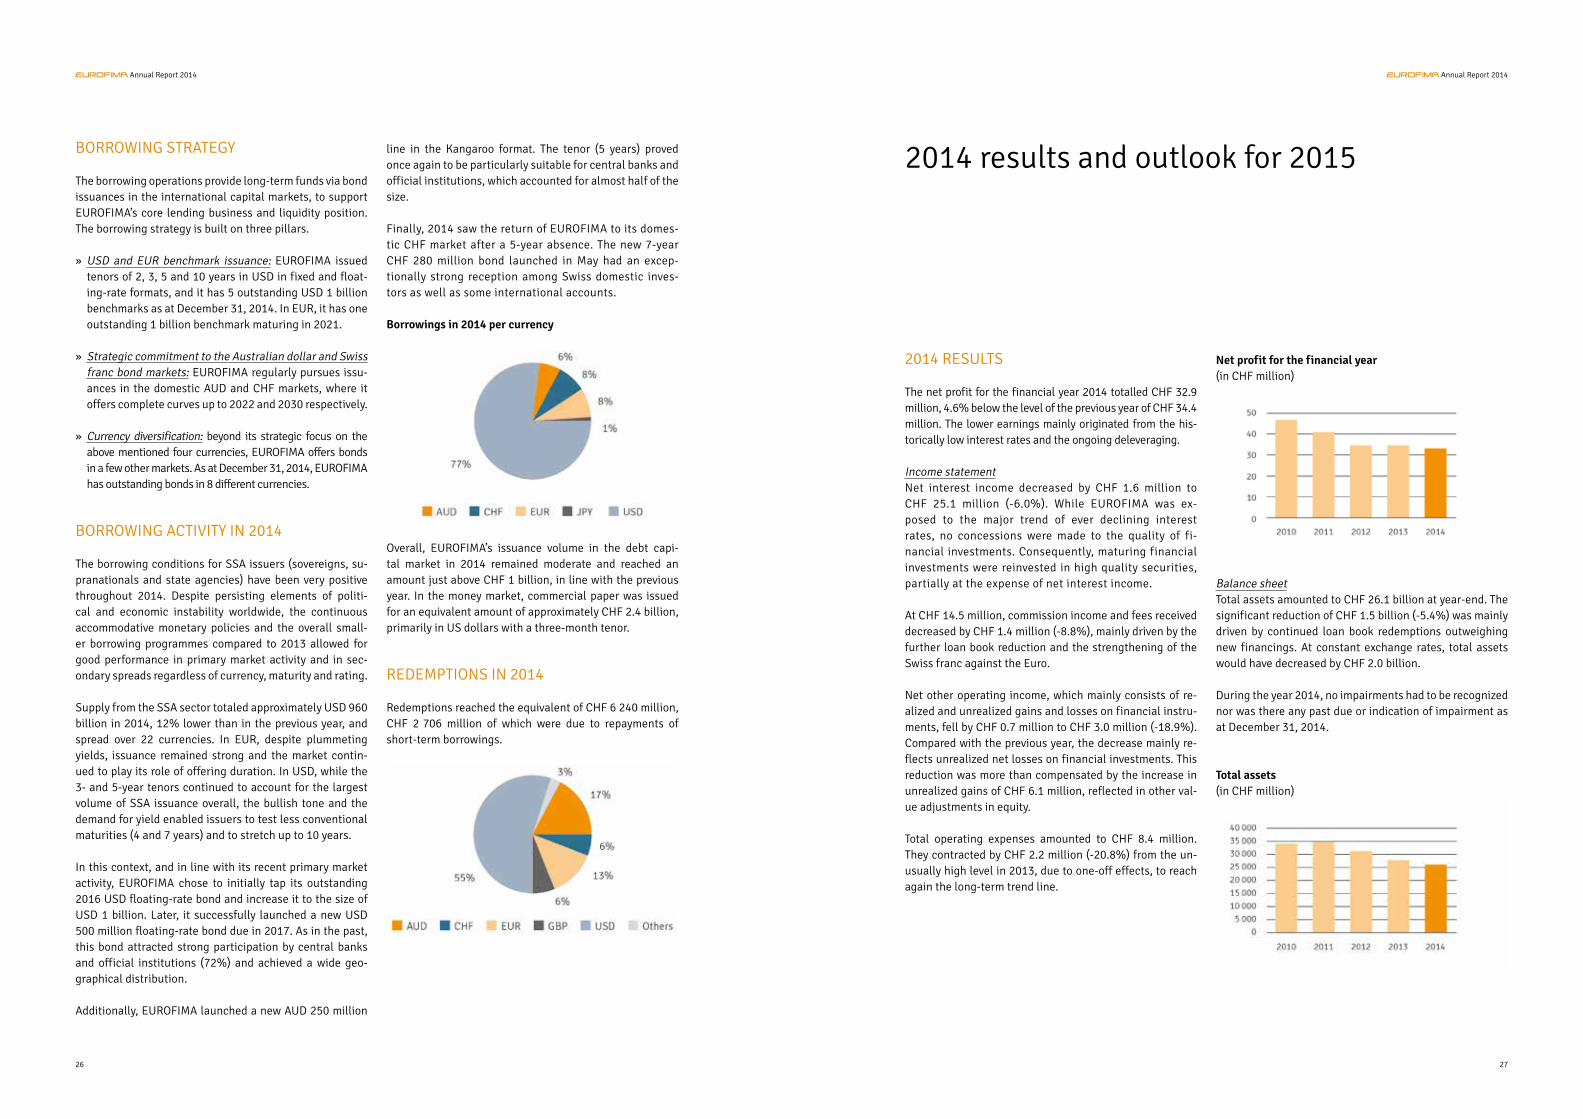
The net profit for the financial year 2014 totalled CHF 32.9 million, 4.6% below the level of the previous year of CHF 34.4 million. The lower earnings mainly originated from the his-torically low interest rates and the ongoing deleveraging.
Income statementNet interest income decreased by CHF 1.6 million to CHF 25.1 million (-6.0%). While EUROFIMA was ex-posed to the major trend of ever declining interest rates, no concessions were made to the quality of fi-nancial investments. Consequently, maturing financial investments were reinvested in high quality securities, partially at the expense of net interest income.
At CHF 14.5 million, commission income and fees received decreased by CHF 1.4 million (-8.8%), mainly driven by the further loan book reduction and the strengthening of the Swiss franc against the Euro.
Net other operating income, which mainly consists of re-alized and unrealized gains and losses on financial instru-ments, fell by CHF 0.7 million to CHF 3.0 million (-18.9%). Compared with the previous year, the decrease mainly re-flects unrealized net losses on financial investments. This reduction was more than compensated by the increase in unrealized gains of CHF 6.1 million, reflected in other val-ue adjustments in equity.
Total operating expenses amounted to CHF 8.4 million. They contracted by CHF 2.2 million (-20.8%) from the un-usually high level in 2013, due to one-off effects, to reach again the long-term trend line.
Net profit for the financial year(in CHF million)
Balance sheetTotal assets amounted to CHF 26.1 billion at year-end. The significant reduction of CHF 1.5 billion (-5.4%) was mainly driven by continued loan book redemptions outweighing new financings. At constant exchange rates, total assets would have decreased by CHF 2.0 billion.
During the year 2014, no impairments had to be recognized nor was there any past due or indication of impairment as at December 31, 2014.
Total assets(in CHF million)
BORROWING STRATEGY
The borrowing operations provide long-term funds via bond issuances in the international capital markets, to support EUROFIMA’s core lending business and liquidity position. The borrowing strategy is built on three pillars.
» USD and EUR benchmark issuance: EUROFIMA issued tenors of 2, 3, 5 and 10 years in USD in fixed and float-ing-rate formats, and it has 5 outstanding USD 1 billion benchmarks as at December 31, 2014. In EUR, it has one outstanding 1 billion benchmark maturing in 2021.
» Strategic commitment to the Australian dollar and Swiss franc bond markets: EUROFIMA regularly pursues issu-ances in the domestic AUD and CHF markets, where it offers complete curves up to 2022 and 2030 respectively.
» Currency diversification: beyond its strategic focus on the above mentioned four currencies, EUROFIMA offers bonds in a few other markets. As at December 31, 2014, EUROFIMA has outstanding bonds in 8 different currencies.
BORROWING ACTIVITY IN 2014 The borrowing conditions for SSA issuers (sovereigns, su-pranationals and state agencies) have been very positive throughout 2014. Despite persisting elements of politi-cal and economic instability worldwide, the continuous accommodative monetary policies and the overall small-er borrowing programmes compared to 2013 allowed for good performance in primary market activity and in sec-ondary spreads regardless of currency, maturity and rating.
Supply from the SSA sector totaled approximately USD 960 billion in 2014, 12% lower than in the previous year, and spread over 22 currencies. In EUR, despite plummeting yields, issuance remained strong and the market contin-ued to play its role of offering duration. In USD, while the 3- and 5-year tenors continued to account for the largest volume of SSA issuance overall, the bullish tone and the demand for yield enabled issuers to test less conventional maturities (4 and 7 years) and to stretch up to 10 years.
In this context, and in line with its recent primary market activity, EUROFIMA chose to initially tap its outstanding 2016 USD floating-rate bond and increase it to the size of USD 1 billion. Later, it successfully launched a new USD 500 million floating-rate bond due in 2017. As in the past, this bond attracted strong participation by central banks and official institutions (72%) and achieved a wide geo-graphical distribution.
Additionally, EUROFIMA launched a new AUD 250 million
line in the Kangaroo format. The tenor (5 years) proved once again to be particularly suitable for central banks and official institutions, which accounted for almost half of the size.
Finally, 2014 saw the return of EUROFIMA to its domes-tic CHF market after a 5-year absence. The new 7-year CHF 280 million bond launched in May had an excep-tionally strong reception among Swiss domestic inves-tors as well as some international accounts.
Borrowings in 2014 per currency
Overall, EUROFIMA’s issuance volume in the debt capi-tal market in 2014 remained moderate and reached an amount just above CHF 1 billion, in line with the previous year. In the money market, commercial paper was issued for an equivalent amount of approximately CHF 2.4 billion, primarily in US dollars with a three-month tenor.
REDEMPTIONS IN 2014
Redemptions reached the equivalent of CHF 6 240 million, CHF 2 706 million of which were due to repayments of short-term borrowings.
26
Annual Report 2014 Annual Report 2014
27
Financial Statements Annual Report 2014
Income statement
Statement of comprehensive income
Balance sheet
Statement of changes in equity
Statement of cash flows
Notes to the financial statements
Auditor’s Report
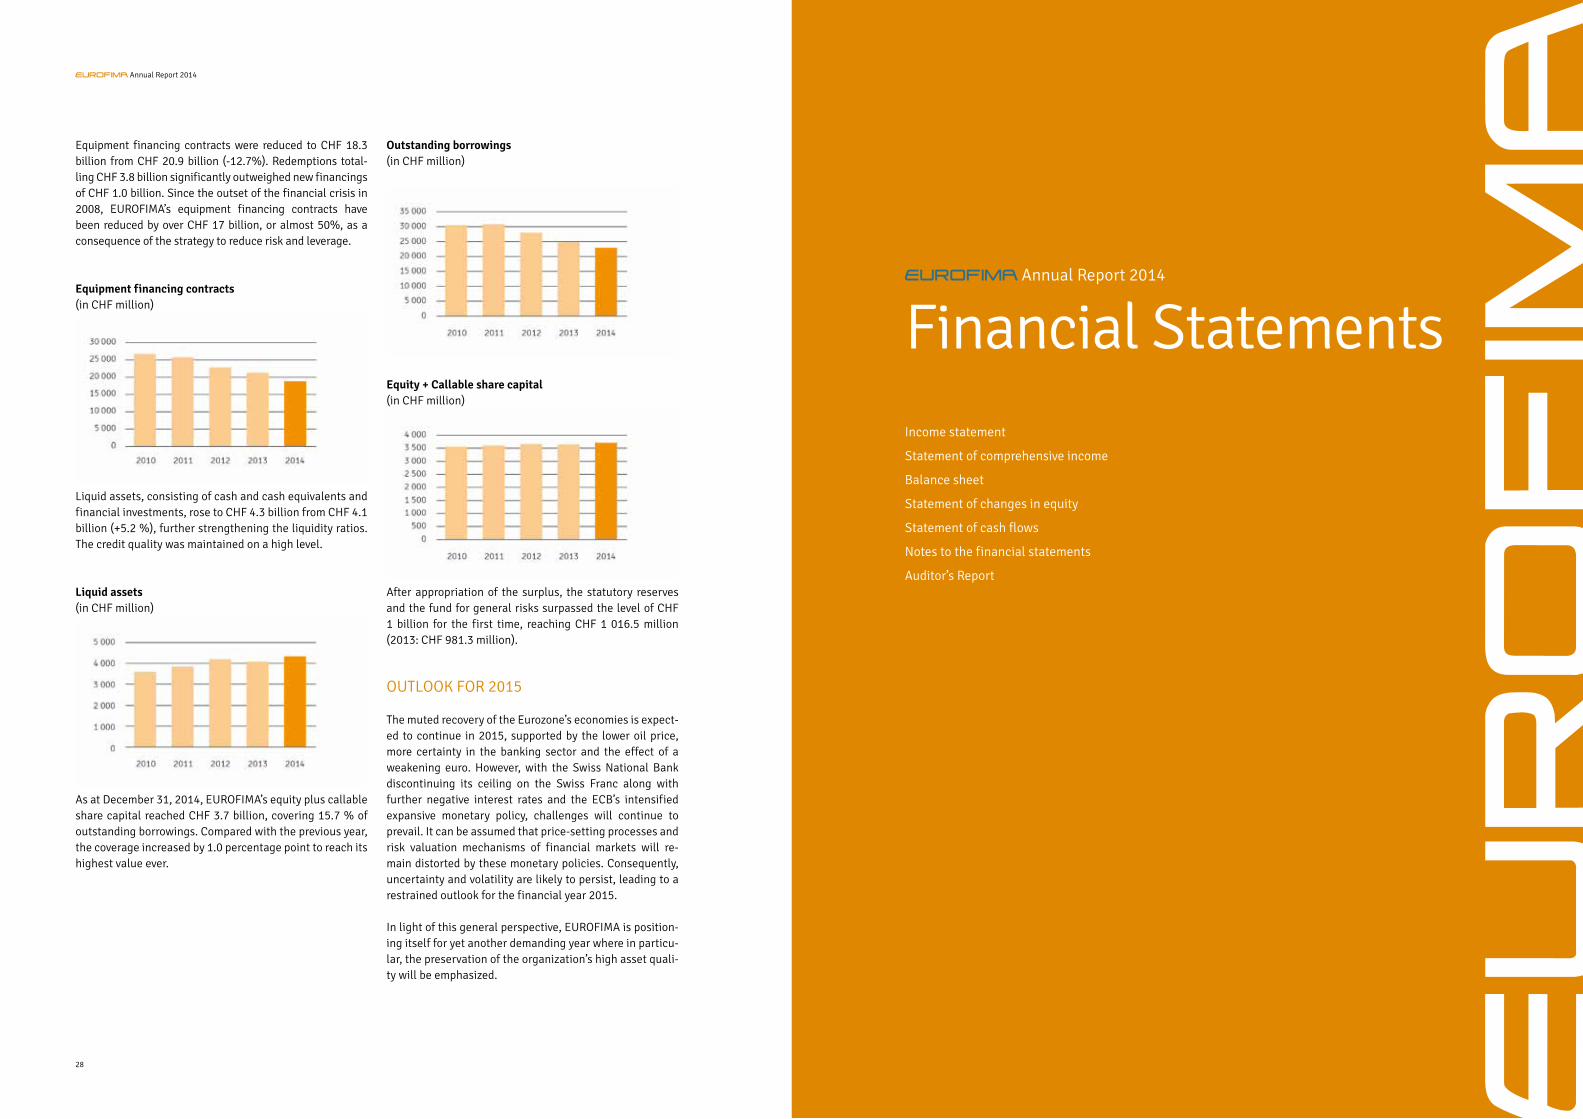
Equipment financing contracts were reduced to CHF 18.3 billion from CHF 20.9 billion (-12.7%). Redemptions total-ling CHF 3.8 billion significantly outweighed new financings of CHF 1.0 billion. Since the outset of the financial crisis in 2008, EUROFIMA’s equipment financing contracts have been reduced by over CHF 17 billion, or almost 50%, as a consequence of the strategy to reduce risk and leverage.
Equipment financing contracts(in CHF million)
Liquid assets, consisting of cash and cash equivalents and financial investments, rose to CHF 4.3 billion from CHF 4.1 billion (+5.2 %), further strengthening the liquidity ratios. The credit quality was maintained on a high level.
Liquid assets(in CHF million)
As at December 31, 2014, EUROFIMA’s equity plus callable share capital reached CHF 3.7 billion, covering 15.7 % of outstanding borrowings. Compared with the previous year, the coverage increased by 1.0 percentage point to reach its highest value ever.
Outstanding borrowings(in CHF million)
Equity + Callable share capital(in CHF million)
After appropriation of the surplus, the statutory reserves and the fund for general risks surpassed the level of CHF 1 billion for the first time, reaching CHF 1 016.5 million (2013: CHF 981.3 million).
OUTLOOK FOR 2015
The muted recovery of the Eurozone’s economies is expect-ed to continue in 2015, supported by the lower oil price, more certainty in the banking sector and the effect of a weakening euro. However, with the Swiss National Bank discontinuing its ceiling on the Swiss Franc along with further negative interest rates and the ECB’s intensified expansive monetary policy, challenges will continue to prevail. It can be assumed that price-setting processes and risk valuation mechanisms of financial markets will re-main distorted by these monetary policies. Consequently, uncertainty and volatility are likely to persist, leading to a restrained outlook for the financial year 2015.
In light of this general perspective, EUROFIMA is position-ing itself for yet another demanding year where in particu-lar, the preservation of the organization’s high asset quali-ty will be emphasized.
28
Annual Report 2014

(amounts in CHF ‘000) Notes 2014 2013
Interest and similar income 4 959 143 1 151 943
Interest and similar expenses 4 -934 056 -1 125 239
Net interest income 25 087 26 703
Commission income and fees received 5 14 514 15 884
Commission expenses and fees paid 5 -1 300 -1 212
Net commission income 13 214 14 673
Net gains/(losses) on financial instruments 6 2 922 3 637
Foreign exchange gains/(losses) -32 -88
Other operating income/(expense) 99 158
Net other operating income/(expense) 2 989 3 707
Total operating income 41 289 45 083
General administrative expenses 7 -7 563 -9 774
Depreciation/amortization on fixed assets 13 -853 -869
Total operating expense -8 416 -10 642
Net profit for the financial year 32 873 34 440
(amounts in CHF ’000) Notes 2014 2013
Net profit for the financial year 32 873 34 440
Other comprehensive income:
Items that may be reclassified subsequently to profit or loss:
Fair value adjustments on available-for-sale financial assets 16 7 149 -24 382
Items that will not be reclassified to profit or loss:
Remeasurements on post-employment benefit liability 15, 16 -1 084 1 869
Other comprehensive income for the financial year 6 066 -22 513
Total comprehensive income for the financial year 38 939 11 927
Income statement Statement of comprehensive income
30
Annual Report 2014 Annual Report 2014
31
Statement of changes in equity
(amounts in CHF ’000)Subscribed
share capitalCallable
share capitalStatutory
reservesFund for
general risksOther
reservesRetained earnings Total
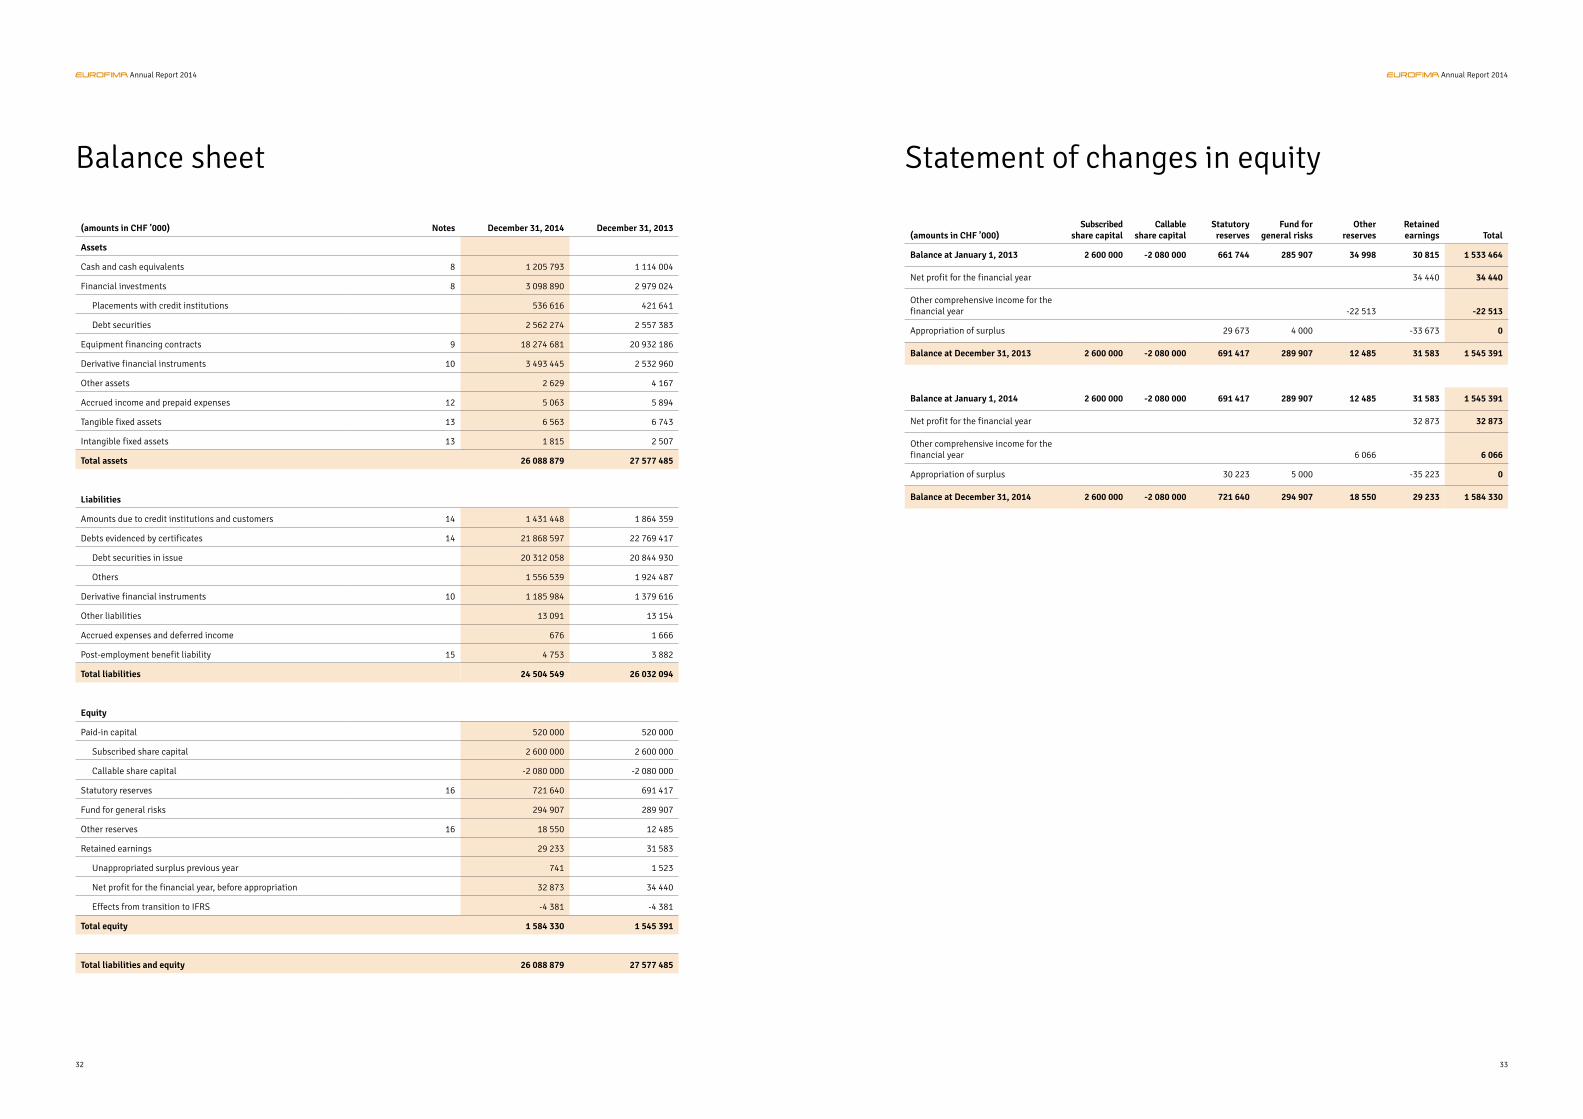
Balance at January 1, 2013 2 600 000 -2 080 000 661 744 285 907 34 998 30 815 1 533 464
Net profit for the financial year 34 440 34 440
Other comprehensive income for the financial year -22 513 -22 513
Appropriation of surplus 29 673 4 000 -33 673 0
Balance at December 31, 2013 2 600 000 -2 080 000 691 417 289 907 12 485 31 583 1 545 391
Balance at January 1, 2014 2 600 000 -2 080 000 691 417 289 907 12 485 31 583 1 545 391
Net profit for the financial year 32 873 32 873
Other comprehensive income for the financial year 6 066 6 066
Appropriation of surplus 30 223 5 000 -35 223 0
Balance at December 31, 2014 2 600 000 -2 080 000 721 640 294 907 18 550 29 233 1 584 330
(amounts in CHF ’000) Notes December 31, 2014 December 31, 2013
Assets
Cash and cash equivalents 8 1 205 793 1 114 004
Financial investments 8 3 098 890 2 979 024
Placements with credit institutions 536 616 421 641
Debt securities 2 562 274 2 557 383
Equipment financing contracts 9 18 274 681 20 932 186
Derivative financial instruments 10 3 493 445 2 532 960
Other assets 2 629 4 167
Accrued income and prepaid expenses 12 5 063 5 894
Tangible fixed assets 13 6 563 6 743
Intangible fixed assets 13 1 815 2 507
Total assets 26 088 879 27 577 485
Liabilities
Amounts due to credit institutions and customers 14 1 431 448 1 864 359
Debts evidenced by certificates 14 21 868 597 22 769 417
Debt securities in issue 20 312 058 20 844 930
Others 1 556 539 1 924 487
Derivative financial instruments 10 1 185 984 1 379 616
Other liabilities 13 091 13 154
Accrued expenses and deferred income 676 1 666
Post-employment benefit liability 15 4 753 3 882
Total liabilities 24 504 549 26 032 094
Equity
Paid-in capital 520 000 520 000
Subscribed share capital 2 600 000 2 600 000
Callable share capital -2 080 000 -2 080 000
Statutory reserves 16 721 640 691 417
Fund for general risks 294 907 289 907
Other reserves 16 18 550 12 485
Retained earnings 29 233 31 583
Unappropriated surplus previous year 741 1 523
Net profit for the financial year, before appropriation 32 873 34 440
Effects from transition to IFRS -4 381 -4 381
Total equity 1 584 330 1 545 391
Total liabilities and equity 26 088 879 27 577 485
Balance sheet
32
Annual Report 2014 Annual Report 2014
33

(amounts in CHF ’000) 2014 2013
Cash flows from operating activities
Disbursements of equipment financings -962 667 -211 438
Repayments of equipment financings 3 394 953 1 367 558
Interest paid -1 033 019 -1 189 559
Interest received 1 065 729 1 215 050
Commission and fees paid -881 -1 212
Commission and fees received 15 300 16 340
Other operating cash flows paid -9 964 -9 185
Other operating cash flows received 822 754
Net cash from operating activities 2 470 274 1 188 308
Cash flows from investing activities
Financial investments
Purchases of debt securities -1 407 412 -1 389 542
Redemptions of debt securities 911 300 1 008 901
Sales of debt securities 545 505 217 404
Placements with credit institutions -1 008 508 -694 859
Repayments of placements with credit institutions 896 675 396 481
Other items
Purchase and disposal of fixed assets 22 -1 927
Net cash from investing activities -62 419 -463 542
Cash flows from financing activities
Issue of debt evidenced by certificates 3 440 814 3 312 216
Redemption of debt evidenced by certificates -5 512 480 -4 568 522
Placements with credit institutions and customers 258 758 125 340
Redemptions of placements with credit institutions and customers -727 513 -113 180
Net cash flow from derivative financial instruments 244 097 133 596
Net cash from financing activities -2 296 324 -1 110 550
Net foreign exchange rate difference -19 742 -118 207
Increase/(decrease) in cash and cash equivalents 91 790 -503 991
Cash and cash equivalents at the beginning of the year 1 114 004 1 617 994
Cash and cash equivalents at the end of the year 1 205 793 1 114 004
Statement of cash flows Notes to the financial statements
1. GENERAL INFORMATION
EUROFIMA (‘the entity’) was established on November 20, 1956, as a joint stock company, based on an international treaty (the “Convention”) between sovereign States. EUROFIMA is a single entity domiciled in Basel, Switzerland. The general principles of EUROFIMA’s activity are defined in an agreement (the “Basic Agreement”) between the railways and EUROFIMA. The Basic Agreement remains valid for the entire duration of EUROFIMA’s existence and can only be altered with the consent of all the railways and EUROFIMA.
EUROFIMA finances railway equipment through borrow-ings in the international capital markets and through the use of a part of its equity. EUROFIMA either holds title to the equipment it finances until the financing has been completely reimbursed or it holds a direct or indirect secu-rity interest deemed equivalent, particularly pledges.
EUROFIMA’s equity is primarily used for liquidity manage-ment purposes, i.e. investments in money market paper or bonds and, to a limited extent, for financing railway equip-ment.
2. SUMMARY OF SIGNIFICANT ACCOUNT-ING POLICIES
2.1. Basis of preparation
The financial statements of EUROFIMA have been pre-pared in accordance with International Financial Reporting Standards (IFRS) as issued by the International Account-ing Standards Board (IASB). The financial statements have been prepared on a historical cost basis, except for availa-ble-for-sale investments, derivative financial instruments and financial assets and liabilities designated at fair value through profit or loss, all of which have been measured at fair value.
The financial statements are presented in CHF.
2.2. Presentation of financial statements
The entity presents its balance sheet generally in order of liquidity.
Financial assets and financial liabilities are offset and the net amount reported in the balance sheet only when there is a current legally enforceable right to offset the recognized amounts and there is an intention to settle on a net basis, or to realize the assets and settle the liability simultaneously. Income and expenses are not offset in the income statement unless required or permitted by any ac-counting standard or interpretation.
2.3. Significant accounting judgments and estimates
In preparing the financial statements, EUROFIMA is re-quired to make certain critical accounting estimates and assumptions that affect the reported profits, financial position and other information disclosed in the financial statements. These estimates are based on available infor-mation and judgments made by EUROFIMA. Actual results in the future could deviate from such estimates and the dif-ference may be material to the financial statements. The most significant judgments and estimates are:
Fair values of financial instrumentsWhere the fair values of financial assets and financial li-abilities recorded on the balance sheet cannot be derived from active markets, they are determined using a variety of valuation techniques that include the use of mathematical models. The inputs to these models are derived from ob-servable market data. Only in the very infrequent situation that observable market data is not available, judgment is required to establish fair values. Further information can be found in note 2.5.8.
34
Annual Report 2014 Annual Report 2014
35
Impairment losses on financial assetsEUROFIMA reviews its individually significant financial as-sets at least at each balance sheet date to assess whether there is objective evidence of impairment as a result of one or more events. When determining a potential impairment loss, EUROFIMA’s judgment is required in the estimation of the amount and timing of future cash flows. These esti-mates are based on assumptions about a number of factors and actual results may differ, resulting in future changes to an allowance for impairments.
Pension obligationThe cost of the defined benefit pension plan is determined using an actuarial valuation. The actuarial valuation in-volves making assumptions about discount rates, future sal-ary increases, mortality rates and future pension increases. Due to the long–term nature of these plans, such estimates are subject to significant uncertainty. See note 15 for the assumptions used.
2.4. Foreign currency translation
Items included in the financial statements are measured using the currency of the primary economic environment in which the entity operates (“the functional currency”), which is the Swiss Franc. The financial statements are pre-sented in Swiss Francs (“the presentation currency”).
Foreign currency transactions are translated into the func-tional currency using the exchange rates prevailing at the date of the transactions. Gains and losses resulting from the translation of all assets and liabilities denominated in foreign currencies are recognized in the income statement under the heading ‘Foreign exchange gains/losses’.
Monetary assets and liabilities denominated in currencies other than Swiss Franc are translated into Swiss Francs at the exchange rate prevailing at the balance sheet date. The gain or loss arising from such translation is recorded in the income statement. Non-monetary items that are measured in terms of historical cost in a foreign currency are trans-lated using the exchange rates at the dates of the initial transactions.
2.5. Financial instruments
2.5.1. Initial recognition, subsequent measurement and derecognition
Regular way purchases are recognized and derecognized in the balance sheet on the trade date, i.e. the date that the entity becomes a party to the contractual provisions of the instrument. Financial assets are derecognized when the
rights to receive cash flows from the financial assets have expired or have been transferred and the entity has trans-ferred substantially all risks and rewards of ownership. Fi-nancial liabilities are derecognized when the obligations specified in the contract are discharged or have expired.
Financial instruments are initially recognized at fair value plus, in the case of financial instruments not carried at fair value through profit or loss, transaction costs. Avail-able-for-sale financial assets and financial instruments at fair value through profit or loss are subsequently carried at fair value. Loans and receivables, held-to-maturity as-sets and financial liabilities at amortized cost are carried at amortized cost using the effective interest rate method.
Realized and unrealized gains and losses arising from changes in the fair value of the financial assets at fair value through profit or loss category are included in the income statement in the period in which they arise under the heading ‘Net gains/(losses) on financial instruments’.
When the transaction price differs from the fair value of other observable current market transactions in the same instrument, or differs based on a valuation technique whose variables include only data from observable mar-kets, the entity immediately recognizes the difference be-tween the transaction price and fair value (a “Day 1” profit or loss) in “Net gains/(losses) on financial instruments”. In cases where fair value is determined using data which is not observable, the difference between the transaction price and model value is only recognized in the income statement when the inputs become observable, or when the instrument is derecognized.
Unrealized gains and losses arising from changes in the fair value of available-for-sale debt instruments, excluding foreign currency translation gains and losses, are recog-nized in other comprehensive income and are accumu-lated in the other reserves until such instrument is sold, collected or otherwise disposed of. Currency translation effects on available-for-sale debt instruments are recog-nized in the income statement. Interest earned on availa-ble-for-sale financial investments is recognized as interest income and calculated in accordance with the effective interest rate method.
When securities classified as available-for-sale are sold, collected, disposed of, or impaired, the unrealized gains or losses are included in the income statement.
2.5.2. Financial instrument categories
Financial assets or financial liabilities at fair value through profit or lossThis category has two sub-categories: financial assets or
financial liabilities held for trading, and those designated as at fair value through profit or loss at initial recognition.
A financial asset or financial liability is classified as held for trading if acquired or incurred principally for the purpose of selling or repurchasing it in the near term or if so classified by EUROFIMA. Derivatives are used by EUROFIMA for risk reduction purposes only. In accordance with IAS 39, derivatives are classified as held for trading.
For financial assets or financial liabilities designated as at fair value through profit or loss, the criteria for so desig-nating such financial assets or financial liabilities at initial recognition is that the currency and/or interest rate risk in all of these positions are economically hedged using deriv-atives. The cash flows on a set of financial instruments are matched together offsetting the changes in fair values in the income statement. In such instances, the application of the Fair Value Option results in more relevant information, as accounting mismatches are significantly reduced in the sense that the same accounting valuation can be applied for all involved financial instruments. Without the use of the Fair Value Option an accounting mismatch would arise as only some of the instruments would be measured at fair value through profit or loss (i.e. derivatives).
Loans and receivablesLoans and receivables are non-derivative financial assets with fixed or determinable payments that are not quoted in an active market. They arise when EUROFIMA provides money or services directly to a debtor with no intention of trading the receivable.
Held-to-maturity investmentsHeld-to-maturity investments are non-derivative financial assets with fixed or determinable payments and fixed ma-turity that EUROFIMA has the positive intention and ability to hold to maturity.
Available-for-sale financial assetsAvailable-for-sale financial assets are those non-derivative financial assets (debt instruments) that are either desig-nated in this category or not classified in any of the other categories.
Available-for-sale financial assets may be sold in anticipa-tion of or in response to changes in interest level, credit-worthiness or liquidity needs.
Financial liabilities at amortized costFinancial instruments issued by the entity that are not des-ignated at fair value through profit or loss, are measured at amortized cost. After initial measurement at fair value, debt issued and other borrowings are subsequently meas-ured at amortized cost. Amortized cost is calculated by tak-
ing into account any discount or premium on the issue and costs that are an integral part of the effective interest rate.
2.5.3. Cash and cash equivalents
Cash and cash equivalents (“CCE”) comprise cash deposits held at call with banks and other short-term investments with an original contractual maturity of three months or less, calculated from the date the placement or the acqui-sition was made. In the balance sheet, bank overdrafts are included in amounts due to credit institutions and custom-ers. Cash deposits held at call are classified as loans and receivables. Other short term investments that comprise cash and cash equivalents are classified as either finan-cial assets at fair value through profit or loss or loans and receivables. The classification depends on the purpose for which the instruments were acquired.
2.5.4. Financial investments
EUROFIMA classifies its investments in the following cate-gories: financial assets at fair value through profit or loss, loans and receivables, held-to-maturity investments, and available-for-sale financial assets. The classification de-pends on the purpose for which the investments were ac-quired. It determines the classification of its investments at initial recognition and re-evaluates this designation at every reporting date.
2.5.5. Equipment financing contracts
Equipment financing contracts are measured at amortized cost if the Fair Value Option is not applied. In most cases the equipment financing contract meets the criteria for applying Fair Value Option and EUROFIMA designates the equipment financing contract irrevocably on initial recog-nition as financial asset at fair value through profit or loss. The matching of the equipment financing contracts, swaps and borrowings is one key criterion for the application of the Fair Value Option and for the designation at fair value of all involved financial instruments.
2.5.6. Derivative financial instruments
Derivative financial instruments are initially recognized in the balance sheet at fair value and are subsequently meas-ured at fair value. They are recorded in the balance sheet as an asset in cases of positive fair value and as a liability in cases of negative fair value.
Even though EUROFIMA only uses derivatives to effectively mitigate currency and exchange risks in accordance with its risk management policies, it does not apply hedge ac-counting. However, it applies the Fair Value Option, with which a natural hedge (offset) can be achieved. Due to the
36
Annual Report 2014 Annual Report 2014
37
principle of cash flow matching, opposite changes in fair values of financial assets and liabilities and related deriv-ative instruments tend to offset each other. As a result, an accounting mismatch is reduced.
2.5.7. Amounts due to credit institutions and customers and debts evidenced by certificates
Outstanding borrowings are carried at amortized cost us-ing the effective interest method if the Fair Value Option is not applied. In most cases borrowings involved in the fi-nancing of railway equipment are designated as at fair val-ue through profit or loss (see section above). The matching of the equipment financing contracts, swaps and borrow-ings is the reason for the designation at fair value through profit or loss of all involved financial instruments. Borrow-ings carried at amortized cost are recognized initially at fair value, net of transaction costs incurred. Borrowings are subsequently stated at amortized cost; any difference between the proceeds (net of transaction costs) and the redemption value is recognized in the income statement over the period of the borrowing using the effective inter-est method.
2.5.8. Determination of fair value
The fair values of liquid assets quoted in an active market are determined based on the instruments’ quoted market prices or dealer price quotations, without any deduction for transaction costs. According to the fair value measure-ment hierarchy stated in note 17, these instruments are classified as “Level 1”.
For all other financial instruments, EUROFIMA establishes the fair values by using valuation techniques. These may include the use of recent arm’s length transactions, refer-ence to other instruments that are substantially the same and a discounted cash flow model that maximizes the use of independently sourced market parameters, for example yield curves and currency rates. Most market parameters are either directly observable or are implied from instru-ment prices. The model may perform numerical procedures in the pricing, such as interpolation, when input values do not directly correspond to the most actively traded market trade parameters. With the exception of one investment, no valuations include significant unobservable inputs.
The valuation process involves the determination of future expected cash flows based on the contractual agreements and the computation of their present value using currently observable money market yield curves, swap yield curves and foreign exchange rates.
Valuation models and techniques are reviewed regularly for model performance and calibration. Current year val-
uation methodologies were consistent with the prior year unless otherwise noted.
As valuation techniques are used, the estimated fair value of financial instruments may not be realizable in the mar-ket and deviate significantly under different assumptions and parameters. If the measurement is mainly based on observable market data, the instruments are classified as “Level 2”. In cases where fair value determination is not based on observable market data, the instruments are classified as “Level 3”.
2.5.9. Impairment of financial assets
At each balance sheet date, EUROFIMA assesses whether there is objective evidence that a financial asset or a group of financial assets might be impaired.
Objective evidence may include: indications that the bor-rower or a group of borrowers is experiencing significant financial difficulty; the probability that they will enter bankruptcy or other financial reorganization; default or delinquency in interest or principal payments; and where observable data indicates that there is a measurable de-crease in the estimated future cash flows, such as changes in arrears or economic conditions that correlate with de-faults.
Assets that are subject to amortization are reviewed for im-pairment whenever events or changes in circumstances in-dicate that the carrying amount may not be recoverable. An impairment loss is recognized in the income statement for the amount by which the asset’s carrying amount exceeds its recoverable amount or net present value of expected future cash flows calculated using the original effective interest rate.
If any such evidence exists for available-for-sale debt in-struments, the cumulative loss (measured as the differ-ence between the acquisition cost and the current fair value, less any impairment loss on that financial asset pre-viously recognized in profit or loss) is removed from equity and recognized in the income statement.
If, in a subsequent period, the fair value of a financial in-strument increases and the increase can be objectively re-lated to a credit event occurring after the impairment loss was recognized in the income statement, the impairment loss is reversed through the income statement.
2.6. Fixed assets
Fixed assets include the entity’s premises “Ritterhof”, of-fice equipment and other tangible and intangible fixed as-
sets owned by the entity.
Tangible and intangible fixed assets are stated at historical cost less accumulated depreciation and amortization less any accumulated impairment in value. Gains and losses on disposals are determined by comparing proceeds with carry-ing amount and are included in the income statement. Assets purchased at a price below CHF 20 000 are not recognized on balance, but expensed directly based on materiality.
Depreciation is calculated using the straight-line method to write down the cost of the fixed assets to their residu-al values over their estimated useful lives. The estimated useful lives are:
» Buildings 40 years» Land Indefinite useful life» Furniture, equipment and vehicles 2 to 10 years» Computer hardware & licenses 3 to 5 years
Fixed assets are derecognized on disposal or when no fu-ture economic benefits are expected from their use.
2.7. Impairment of fixed assets
The entity assesses at each reporting date whether there is an indication that an asset may be impaired. If any in-dication exists, the entity estimates the asset’s recovera-ble amount. An asset’s recoverable amount is the higher of an asset’s fair value less costs to sell and its value in use. Where the carrying amount of an asset exceeds its re-coverable amount, the asset is considered impaired and is written down to its recoverable amount.
A previously recognized impairment loss is reversed only if there has been a change in the assumptions used to determine the asset’s recoverable amount since the last impairment loss was recognized. The reversal is limited so that the carrying amount of the asset does not exceed its recoverable amount, nor exceeds the carrying amount that would have been determined, net of depreciation, had no impairment loss been recognized for the asset in prior years. Such a reversal is recognized in the income state-ment.
2.8. Post-employment benefit liability
Under IFRS, EUROFIMA’s pension plan qualifies as a de-fined benefit plan. It is governed by Swiss law. The plan is a group administration plan managed and administered by a third party under contractual agreements with the entity. Plan assets held in trust are governed by Swiss regulations and practice, as is the nature of the relationship between
the entity and the trustee. Contributions to the pension plan are paid by the employer and the employees.
The liability recognized in the balance sheet in respect of this defined benefit pension plan is the present value of the defined benefit obligation at the end of the reporting period less the fair value of plan assets. The defined bene-fit obligation is calculated annually by independent actu-aries using the projected unit credit method. The present value of the defined benefit obligation is determined by discounting the estimated future cash outflows using in-terest rates of high-quality corporate bonds denominated in Swiss Francs (the currency in which the benefits will be paid) and that have terms to maturity approximating to the terms of the related pension obligation.
Remeasurements arising from experience adjustments and changes in actuarial assumptions are charged or cred-ited to equity in other comprehensive income in the period in which they arise. Past-service costs are recognized im-mediately in income.
Interest expense (income) on the net defined benefit ob-ligation are presented in the income statement as part of the “interest and similar expenses” (“interest and similar income”).
2.9. Provisions
Provisions are recognized when (i) the entity has a present legal or constructive obligation as a result of past events; (ii) it is probable that an outflow of resources will be re-quired to settle the obligation; and (iii) the amount can be reliably estimated.
Provisions are measured at the present value of the ex-penditures expected to be required to settle the obligation using a rate that reflects current market assessments of the time value of money and the risks specific to the obli-gation. The increase in the provision due to passage of time is recognized as interest expense.
2.10. Equity
The subscribed share capital is made up of 260 000 regis-tered shares with a nominal amount of CHF 10 000 each, 20% of which is paid in. The unpaid subscribed share capi-tal may be called in unconditionally at any time by decision of the Board of Directors, as described in Article 21 of the Statutes.
The statutory reserves are made up of the ordinary reserve and the guarantee reserve. In the event of a default under
38
Annual Report 2014 Annual Report 2014
39
an equipment financing contract the guarantee reserve, as described in Article 29 of the Statutes, may be called upon.
The fund for general risks includes amounts which the entity decides to put aside to cover risks associated with equipment financing contracts and other financial opera-tions such as swaps having regard to the particular risks attached to such operations.
The other reserves include the reserve for other value adjustments due to changes in the fair value of availa-ble-for-sale financial assets. Furthermore, the other re-serves include that part of other comprehensive income that is attributable to the entity’s defined benefit pension plan.
2.11. Dividends
Dividend distribution to the entity’s shareholders is recog-nized as a liability after the dividends are approved by the General Assembly.
2.12. Accrued income and prepaid expenses and accrued expenses and deferred income
Accrued income and prepaid expenses comprise of in-come related to the current financial year, to be received in a subsequent financial year and expenditures incurred during the financial year but relating to a subsequent fi-nancial year.
Accrued expenses and deferred income comprise of ex-penses related to the current financial year, to be paid in a subsequent financial year and income received at or be-fore the balance sheet date but relating to a subsequent financial year.
2.13. Recognition of income and expenses
Revenue is recognized to the extent that it is probable that the economic benefits will flow to the entity and the reve-nue can be reliably measured. The below specific recogni-tion criteria must also be met before revenue is recognized.
2.13.1. Interest and similar income and expense
For all financial instruments measured at amortized cost, interest bearing financial assets classified as availa-ble-for-sale and financial instruments designated at fair value through profit or loss, interest income or expense is recorded using the effective interest rate method. The effective interest rate is the rate that exactly discounts es-
timated future cash payments or receipts through the ex-pected life of the financial instrument or a shorter period, where appropriate, to the net carrying amount of the finan-cial asset or financial liability. The calculation takes into account all contractual terms of the financial instrument (for example, prepayment options) and includes any fees or incremental costs that are directly attributable to the in-strument and are an integral part of the effective interest rate, but not future credit losses.
Once the recorded value of a financial asset or a group of similar financial assets has been reduced due to an im-pairment loss, interest income continues to be recognized using the rate of interest used to discount the future cash flows for the purpose of measuring the impairment loss.
The entity may act as an agent in a limited number of fi-nancing transactions. Where this is the case, only any net amounts earned will be presented in interest and similar income.
2.13.2. Fees and commission income
Issuance fees and redemption premiums or discounts are accrued over the period to maturity of the related borrow-ings. Any early redemption fees are recognized when a contract is early terminated.
Commission income on equipment financing contracts is recorded on an accrual basis.
2.13.3. Net gains/losses on financial instruments
The entity recognizes both realized and unrealized gains and losses on debt securities and other financial in-struments including the results from the sale of availa-ble-for-sale financial assets in Net gains/losses on finan-cial instruments.
2.14. Taxation
As a public international body set up by a large number of States, the entity benefits from comprehensive tax exemptions pursuant to the Additional Protocol to the Convention. In Switzerland, besides being exempt from any income and capital taxes otherwise levied on corpo-rations, such privileges include the following privileges relevant to the capital market: exemption from stamp duties on any issuance of debt instruments by the entity, exemption of the entity’s debt instruments issued outside Switzerland from turnover taxes, and finally exemption of debt instruments issued outside Switzerland from Swiss withholding taxes.
2.15. Segment reporting
EUROFIMA is a single entity without subsidiaries and oper-ates as a one segment entity, which is in accordance with the internal reporting structure to the Management and the Board of Directors.
2.16. Related parties
Germany and France hold 22.6% of EUROFIMA’s share cap-ital, each through their fully owned state railways DB AG and SNCF. Consequently, these countries qualify as related parties together with their railways.
EUROFIMA has identified members of the Board of Direc-tors, the Management Committee and the Unit Heads as key management personnel.
2.17. New standards, amendments and interpretations adopted by the entity
EUROFIMA adopted the amendment to IAS 32, ‘Financial instruments: Presentation’, on offsetting financial assets and financial liabilities. This amendment clarifies that for the presentation in the balance sheet, the right of set-off must not be contingent on a future event. It must also be legally enforceable for all counterparties in the normal course of business, as well as in the event of default, insol-vency or bankruptcy. The amendment did not have a signif-icant effect on the financial statements.
Other standards, amendments and interpretations which are effective for the financial year beginning on January 1,2014, are not material to the entity.
2.18. Standards issued but not yet effective
The standards and interpretations that are issued but not yet effective up to the date of issuance of the entity’s fi-nancial statements are disclosed below. The entity intends to adopt these standards, if applicable, when they become effective.
IFRS 9 Financial InstrumentsIFRS 9, as issued, reflects the IASB’s work on the replace-ment of IAS 39. The complete version of IFRS 9 was issued in July 2014 and addresses the classification, measure-ment and recognition of financial assets and financial lia-bilities and hedge accounting.
IFRS 9 requires financial assets to be classified into two measurement categories: those measured at fair value
and those measured at amortized cost. The determination is made at initial recognition. The classification depends on the entity’s business model for managing its financial instruments and the contractual cash flow characteristics of the instrument. For financial liabilities, the standard re-tains most of the IAS 39 requirements.
There is now a new expected credit losses model that re-places the incurred loss impairment model used in IAS 39.
The hedge accounting model under IFRS 9 replaces the rule-based hedge accounting requirements in IAS 39 to more closely align the accounting with risk management activities.
The standard is effective for accounting periods beginning on or after January 1, 2018. Early adoption is permitted. EUROFIMA is in the process of assessing IFRS 9’s full impact.
IFRS 15 Revenue from contracts with customersIFRS 15 deals with revenue recognition and establishes principles for reporting useful information to users of fi-nancial statements about the nature, amount, timing and uncertainty of revenue and cash flows arising from an enti-ty’s contracts with customers.
The standard is effective for annual periods beginning on or after January 1, 2017, and earlier application is permit-ted. EUROFIMA does not anticipate that IFRS 15 will have a material impact on future financial statements.
40
Annual Report 2014 Annual Report 2014
41

3. RISK AND CAPITAL MANAGEMENT
The identification, measurement, monitoring and control of risk are key management responsibilities. The principles and policies for risk management are established by the Board of Directors. The compliance with these guidelines and the implementation of controls are the Management’s responsibility.
Within the normal course of its activities, EUROFIMA is ex-posed to a variety of financial risks, mainly credit risk, mar-ket risk and liquidity risk. EUROFIMA’s risk management focuses on the unpredictability of financial markets and aims at minimizing potential adverse effects on its finan-cial position and performance. EUROFIMA’s risk manage-ment seeks to appropriately identify, measure, monitor and report all types of risks inherent in the entity’s operations. The risk management and control processes are reviewed and refined on a regular basis.
3.1. Managing financial risk
The Board of Directors approves the policies regulating the entity’s capital market, lending and treasury activ-ities. These policies cover the management of credit risk, market risk and liquidity risk. In this regard, sys-tems and procedures are in place to control and report on the main financial risks. Exposure to credit risk, market risk and liquidity risk is controlled by a system of pre-approved risk limits. Such limits are reviewed and adjusted periodically in light of external developments and experience. Compliance with established limits and policies is monitored by controlling and internal audit which are independent from the units carrying out the transactions. The results of such compliance checks are periodically reviewed by the Management and the Audit and Risk Committee.
On a quarterly basis, the Board of Directors receives from the Management both a risk report and a status report on the financial results of the entity. The risk report provides the Board of Directors with the status of various quantita-tive risk parameters.
Quantitative key risk figures that are regularly monitored and reported upon are, among other things, the following:
» Credit risk:- Credit exposure per consolidated one obligor- Breakdown of assets per external credit rating- Composition of the derivatives book and the collateral
coverage- Risk weight of assets
» Interest rate and foreign exchange risk:- Sensitivity analysis, with a special focus on long term
financial assets and available-for-sale financial assets- Interest rate reset risk analysis- Net foreign currency position
» Liquidity risk:- Current liquidity position expressed as a ratio to out-
standing borrowings- Liquidity forecasts
» Equity risk:- Estimated Basel II ratio- Large exposures- Capitalization ratios
The Management also provides the Board of Directors with regular updates on key financial risk issues and other sig-nificant events deemed appropriate or requested.
A review of the major risks which could affect the entity’s balance sheet and income statement is included in the agenda of every quarterly Board meeting. For each category of risk, the assessment takes into account the probability of occurrence and the potential impact on the balance sheet and income statement. The latest assessment of risks by the Board of Directors was performed on December 12, 2014.
EUROFIMA is an end-user of derivative financial instru-ments. It does not perform any proprietary trading activ-ities and uses derivative financial instruments solely for hedging of market risk exposures. It predominantly uses interest rate and cross currency swaps. It does not use any credit derivatives.
3.2. Credit risk
Credit risk is the risk of financial loss resulting from a counterparty failing to honor its payment obligation. Credit risk is the main financial risk in EUROFIMA’s operations. It primarily originates from EUROFIMA’s core lending activities. EUROFIMA is also exposed to credit risk in its treasury operations through the financial instruments held to manage its liquidity and market risks.
EUROFIMA follows a prudent approach towards credit risk. Policies approved by the Board of Directors set out mini-mum credit quality levels for counterparties on the basis of the ratings attributed to counterparties and/or instruments by the rating agencies Standard & Poor’s and Moody’s. Fur-thermore, other observable information is used to assess the credit risk.
Individual counterparty limits are set and reviewed on a
monthly basis by the Management. Credit exposure is re-ported to the Board of Directors quarterly on a one obligor basis, i.e. the exposure to connected individual counter-parties is consolidated. The entity’s maximum exposure to credit risk, before taking into account any collateral or other credit enhancements, is represented by the carrying amounts of its financial assets.
As at December 31, 2014, all financial assets were ful-ly performing (December 31, 2013: fully performing). No impairment was recognized in 2014 (2013: none). No amounts were overdue as at December 31, 2014 (Decem-ber 31, 2013: no amounts overdue).
Equipment financing contractsFor each financial year, the General Assembly determines the maximum amount of borrowings which may be con-cluded for the purpose of equipment financing contracts. The Board of Directors decides a financing budget within such maximum amount. Financing limits can be adjusted within a financial year in response to credit relevant de-velopments.
The equipment financing contracts are secured by railroad rolling stock. The entity either holds title to equipment or has a direct or indirect security interest deemed equivalent, in particular pledges, until all contractual obligations are fulfilled. Where rolling stock provided as collateral does no longer meet the requirements laid down in the financing contract, it is substituted. The collateral is administered by the entity. The regular verification of technical and ac-counting information assures that the entity keeps track of the rolling stock collateral and initiates any collateral substitutions in a timely manner.
Moreover, EUROFIMA engages independent experts to support its recurring technical and economic evaluation of the rolling stock collateral and to perform onsite examina-tions of some of its rolling stock collateral.
During the year, EUROFIMA did not take possession of any rolling stock collateral (2013: none).
Pursuant to Article 26 of the Statutes, each shareholder guarantees the fulfillment of all equipment financing contracts on a pro rata basis of its participation in EUROFIMA’s subscribed share capital and up to a maximum amount equal to its participation in EUROFIMA’s share capital. Such shareholder guarantee can only be called where (i) a railway and its member State have not discharged obligations under equipment financing contracts and (ii) the guarantee reserve, as stipulated by Article 29 of EUROFIMA’s Statutes, is not sufficient to cover the loss resulting from such non-payment. As at December 31, 2014, taking into account only shareholders from
member States rated AAA/Aaa or AA/Aa, the shareholder guarantee amounted to CHF 1.89 billion and CHF 1.87 billion based on the ratings of Standard & Poor’s and Moody’s respectively.
The credit risk inherent in the portfolio of equipment financ-ing contracts is reviewed and monitored on an ongoing ba-sis. A breakdown of the equipment financing contracts per counterparty and per credit rating is provided in note 9.
DerivativesThe net positive replacement value of derivatives conclud-ed with financial counterparties amounted to CHF 3 007 million as at December 31, 2014 (2013: CHF 1 662 million). The change in the net positive replacement value was main-ly caused by a strengthening of the USD against the CHF and lower interest rates in several major currencies. The International Swaps and Derivatives Association (“ISDA”) Master Agreement is the entity’s preferred agreement for documenting derivatives activity. It provides the contractual framework within which the over-the-counter products are concluded, and contractually binds both parties to apply close-out netting across all outstanding transactions cov-ered by an agreement if either party defaults or other pre-agreed termination events occur.
In order to reduce the credit exposures of derivatives, EUROFIMA has entered into ISDA Master Agreements with one-way credit support annex (CSA) collateral agreements with most major derivative counterparties. Such CSA agreements require that collateral be posted by the derivative counterparty once the exposure exceeds a pre-agreed threshold. Securities received as collateral are held on an account to which the entity holds legal title. In 2014, the entity did neither rehypothecate any of the collateral it received (2013: none), nor did it take possession of any of the collateral it received (2013: none).
The fair value of the collateral received by EUROFIMA under its CSA’s as at December 31, 2014 amounted to CHF 2 250 million (2013: CHF 1 140 million). As at year-end 2014, 73% of the net positive replacement value of all derivatives con-cluded with financial counterparties was covered by col-lateral (2013: 70%). This collateral consisted exclusively of bonds issued by governments, state agencies and suprana-tional organizations with a high credit rating. All derivatives are valued at their net present value and the positions per counterparty are monitored on a daily basis.
Liquid assetsLiquid assets comprise of cash and cash equivalents and financial investments. For investments in securities with maturities greater than one year, the minimum rating at the time of purchase is AA-/Aa3 (based on Standard & Poor’s and/or Moody’s ratings). For instruments maturing in less
42
Annual Report 2014 Annual Report 2014
43
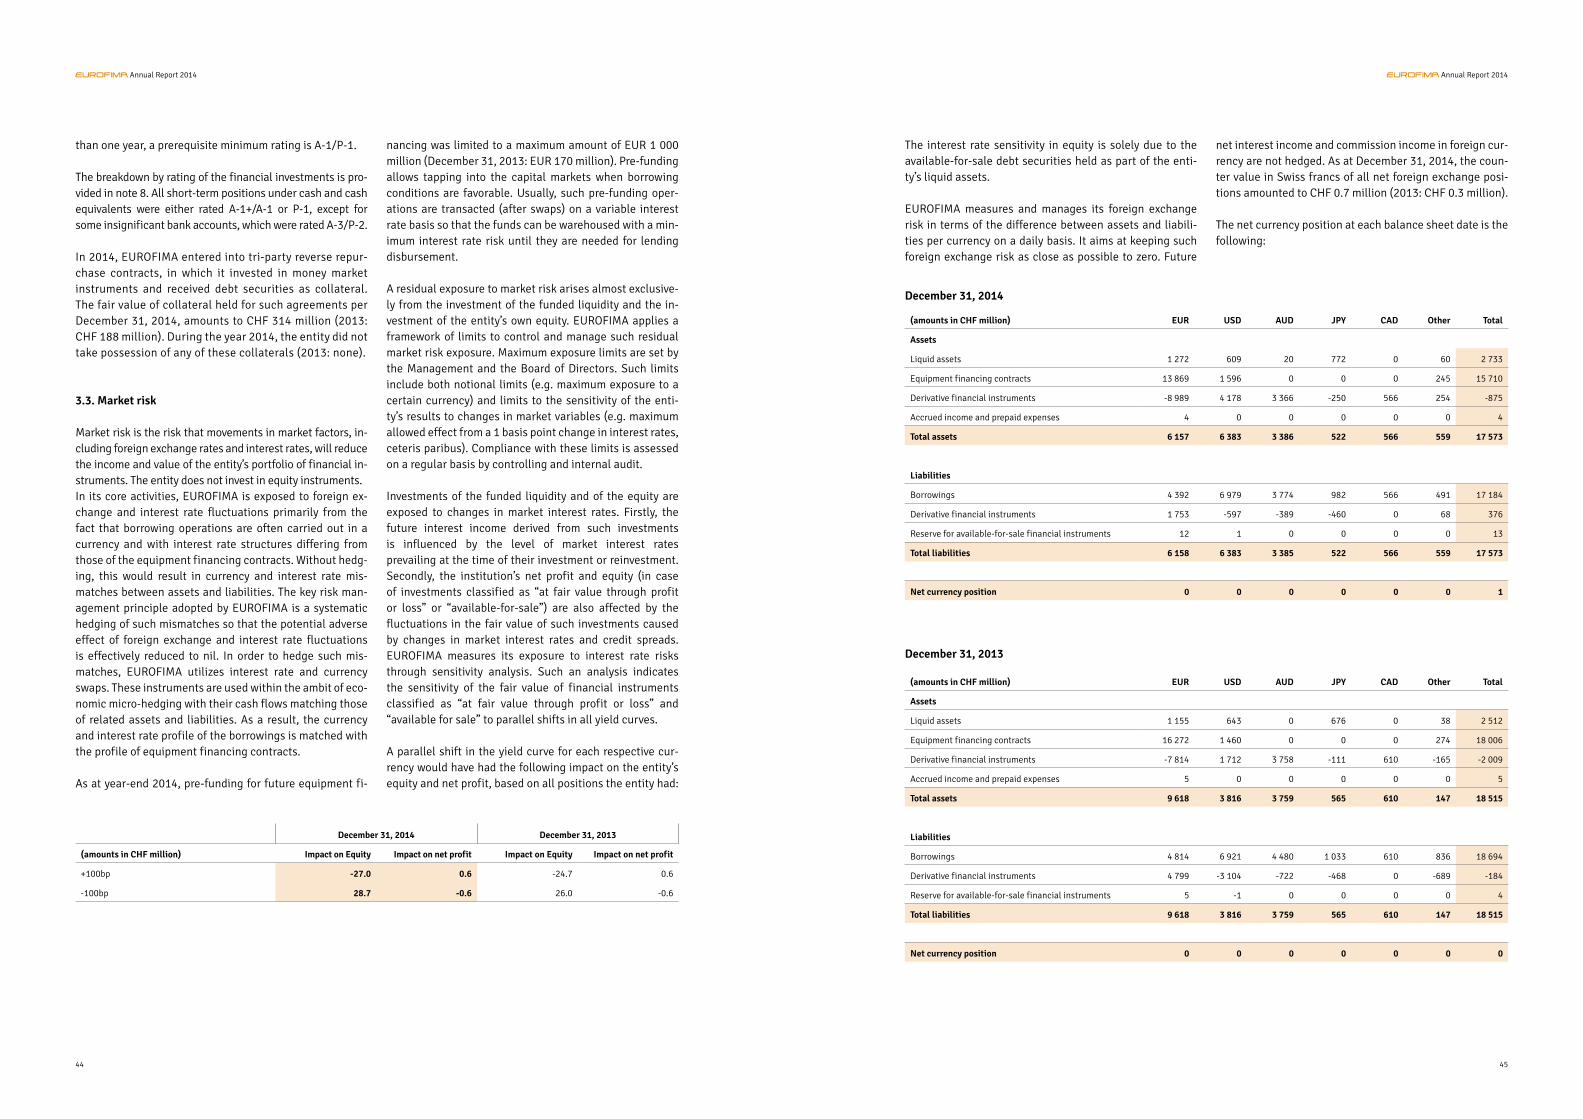
December 31, 2014 December 31, 2013
(amounts in CHF million) Impact on Equity Impact on net profit Impact on Equity Impact on net profit
+100bp -27.0 0.6 -24.7 0.6
-100bp 28.7 -0.6 26.0 -0.6
than one year, a prerequisite minimum rating is A-1/P-1.
The breakdown by rating of the financial investments is pro-vided in note 8. All short-term positions under cash and cash equivalents were either rated A-1+/A-1 or P-1, except for some insignificant bank accounts, which were rated A-3/P-2.
In 2014, EUROFIMA entered into tri-party reverse repur-chase contracts, in which it invested in money market instruments and received debt securities as collateral. The fair value of collateral held for such agreements per December 31, 2014, amounts to CHF 314 million (2013: CHF 188 million). During the year 2014, the entity did not take possession of any of these collaterals (2013: none).
3.3. Market risk
Market risk is the risk that movements in market factors, in-cluding foreign exchange rates and interest rates, will reduce the income and value of the entity’s portfolio of financial in-struments. The entity does not invest in equity instruments.In its core activities, EUROFIMA is exposed to foreign ex-change and interest rate fluctuations primarily from the fact that borrowing operations are often carried out in a currency and with interest rate structures differing from those of the equipment financing contracts. Without hedg-ing, this would result in currency and interest rate mis-matches between assets and liabilities. The key risk man-agement principle adopted by EUROFIMA is a systematic hedging of such mismatches so that the potential adverse effect of foreign exchange and interest rate fluctuations is effectively reduced to nil. In order to hedge such mis-matches, EUROFIMA utilizes interest rate and currency swaps. These instruments are used within the ambit of eco-nomic micro-hedging with their cash flows matching those of related assets and liabilities. As a result, the currency and interest rate profile of the borrowings is matched with the profile of equipment financing contracts.
As at year-end 2014, pre-funding for future equipment fi-
nancing was limited to a maximum amount of EUR 1 000 million (December 31, 2013: EUR 170 million). Pre-funding allows tapping into the capital markets when borrowing conditions are favorable. Usually, such pre-funding oper-ations are transacted (after swaps) on a variable interest rate basis so that the funds can be warehoused with a min-imum interest rate risk until they are needed for lending disbursement.
A residual exposure to market risk arises almost exclusive-ly from the investment of the funded liquidity and the in-vestment of the entity’s own equity. EUROFIMA applies a framework of limits to control and manage such residual market risk exposure. Maximum exposure limits are set by the Management and the Board of Directors. Such limits include both notional limits (e.g. maximum exposure to a certain currency) and limits to the sensitivity of the enti-ty’s results to changes in market variables (e.g. maximum allowed effect from a 1 basis point change in interest rates, ceteris paribus). Compliance with these limits is assessed on a regular basis by controlling and internal audit.
Investments of the funded liquidity and of the equity are exposed to changes in market interest rates. Firstly, the future interest income derived from such investments is influenced by the level of market interest rates prevailing at the time of their investment or reinvestment. Secondly, the institution’s net profit and equity (in case of investments classified as “at fair value through profit or loss” or “available-for-sale”) are also affected by the fluctuations in the fair value of such investments caused by changes in market interest rates and credit spreads. EUROFIMA measures its exposure to interest rate risks through sensitivity analysis. Such an analysis indicates the sensitivity of the fair value of financial instruments classified as “at fair value through profit or loss” and “available for sale” to parallel shifts in all yield curves.
A parallel shift in the yield curve for each respective cur-rency would have had the following impact on the entity’s equity and net profit, based on all positions the entity had:
The interest rate sensitivity in equity is solely due to the available-for-sale debt securities held as part of the enti-ty’s liquid assets.
EUROFIMA measures and manages its foreign exchange risk in terms of the difference between assets and liabili-ties per currency on a daily basis. It aims at keeping such foreign exchange risk as close as possible to zero. Future
net interest income and commission income in foreign cur-rency are not hedged. As at December 31, 2014, the coun-ter value in Swiss francs of all net foreign exchange posi-tions amounted to CHF 0.7 million (2013: CHF 0.3 million).
The net currency position at each balance sheet date is the following:
December 31, 2014
(amounts in CHF million) EUR USD AUD JPY CAD Other Total
Assets
Liquid assets 1 272 609 20 772 0 60 2 733
Equipment financing contracts 13 869 1 596 0 0 0 245 15 710
Derivative financial instruments -8 989 4 178 3 366 -250 566 254 -875
Accrued income and prepaid expenses 4 0 0 0 0 0 4
Total assets 6 157 6 383 3 386 522 566 559 17 573
Liabilities
Borrowings 4 392 6 979 3 774 982 566 491 17 184
Derivative financial instruments 1 753 -597 -389 -460 0 68 376
Reserve for available-for-sale financial instruments 12 1 0 0 0 0 13
Total liabilities 6 158 6 383 3 385 522 566 559 17 573
Net currency position 0 0 0 0 0 0 1
(amounts in CHF million) EUR USD AUD JPY CAD Other Total
Assets
Liquid assets 1 155 643 0 676 0 38 2 512
Equipment financing contracts 16 272 1 460 0 0 0 274 18 006
Derivative financial instruments -7 814 1 712 3 758 -111 610 -165 -2 009
Accrued income and prepaid expenses 5 0 0 0 0 0 5
Total assets 9 618 3 816 3 759 565 610 147 18 515
Liabilities
Borrowings 4 814 6 921 4 480 1 033 610 836 18 694
Derivative financial instruments 4 799 -3 104 -722 -468 0 -689 -184
Reserve for available-for-sale financial instruments 5 -1 0 0 0 0 4
Total liabilities 9 618 3 816 3 759 565 610 147 18 515
Net currency position 0 0 0 0 0 0 0
December 31, 2013
44
Annual Report 2014 Annual Report 2014
45
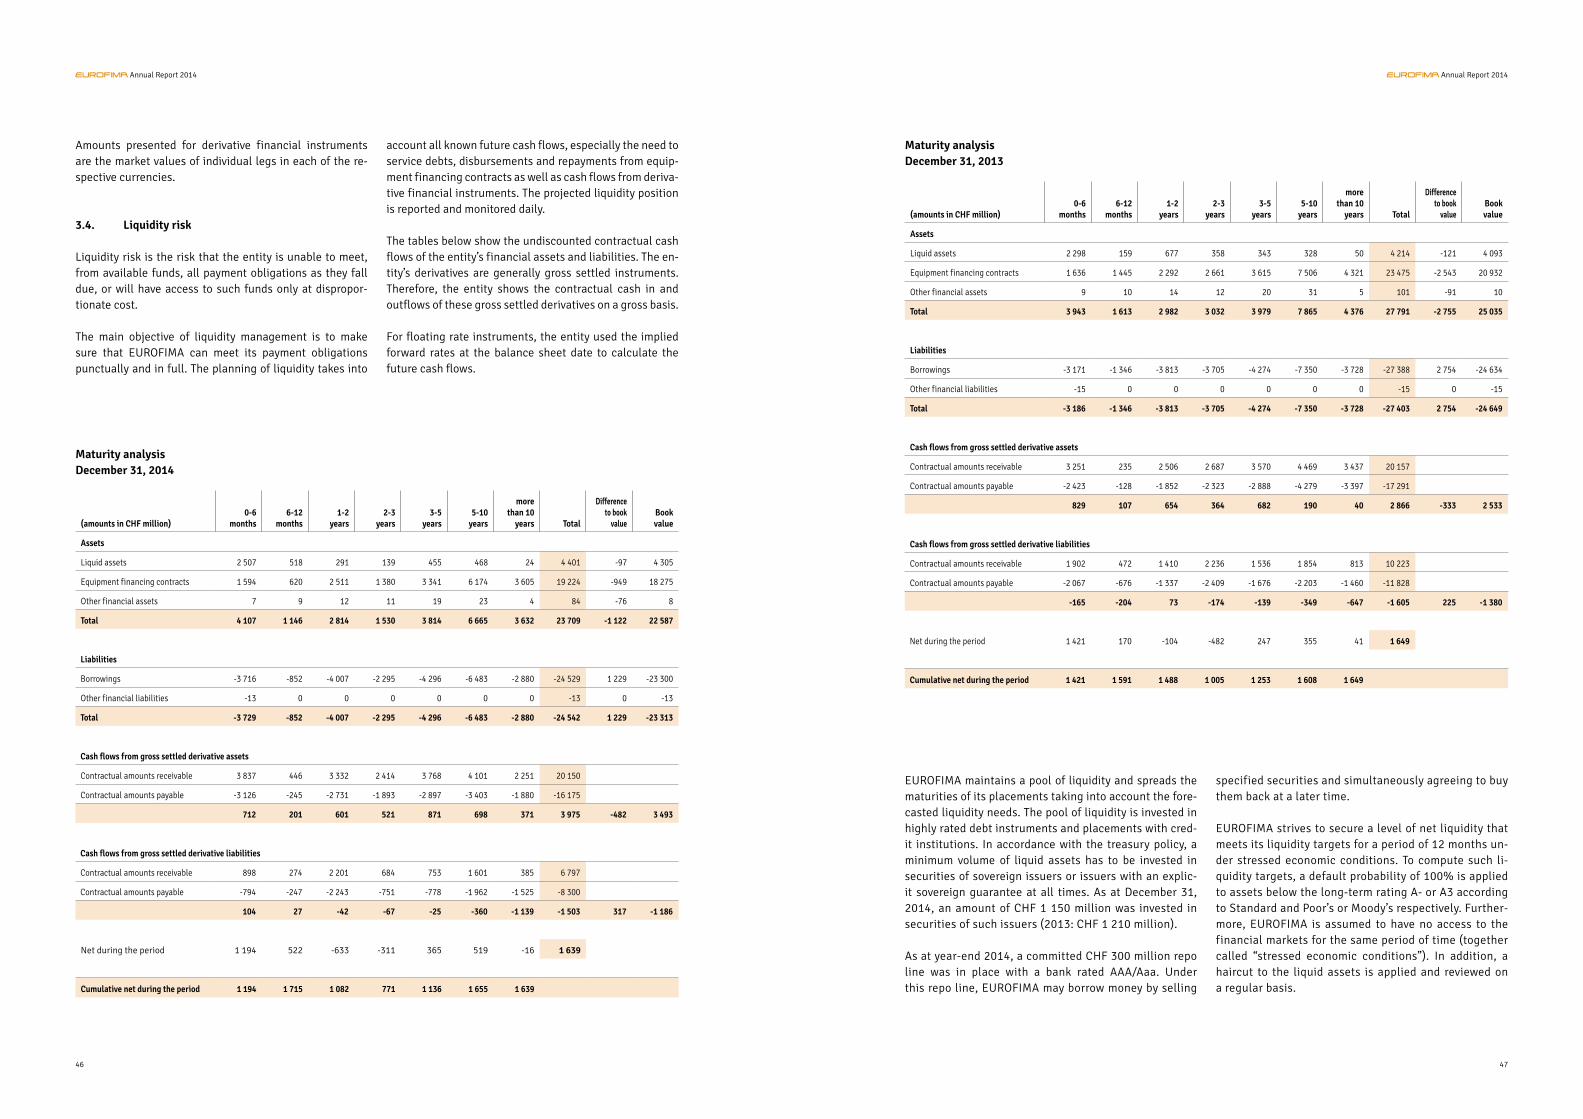
Amounts presented for derivative financial instruments are the market values of individual legs in each of the re-spective currencies.
3.4. Liquidity risk
Liquidity risk is the risk that the entity is unable to meet, from available funds, all payment obligations as they fall due, or will have access to such funds only at dispropor-tionate cost.
The main objective of liquidity management is to make sure that EUROFIMA can meet its payment obligations punctually and in full. The planning of liquidity takes into
account all known future cash flows, especially the need to service debts, disbursements and repayments from equip-ment financing contracts as well as cash flows from deriva-tive financial instruments. The projected liquidity position is reported and monitored daily.
The tables below show the undiscounted contractual cash flows of the entity’s financial assets and liabilities. The en-tity’s derivatives are generally gross settled instruments. Therefore, the entity shows the contractual cash in and outflows of these gross settled derivatives on a gross basis.
For floating rate instruments, the entity used the implied forward rates at the balance sheet date to calculate the future cash flows.
Maturity analysisDecember 31, 2014
(amounts in CHF million)0-6
months6-12
months1-2
years2-3
years3-5
years5-10
years
more than 10
years Total
Differenceto book
valueBook value
Assets
Liquid assets 2 507 518 291 139 455 468 24 4 401 -97 4 305
Equipment financing contracts 1 594 620 2 511 1 380 3 341 6 174 3 605 19 224 -949 18 275
Other financial assets 7 9 12 11 19 23 4 84 -76 8
Total 4 107 1 146 2 814 1 530 3 814 6 665 3 632 23 709 -1 122 22 587
Liabilities
Borrowings -3 716 -852 -4 007 -2 295 -4 296 -6 483 -2 880 -24 529 1 229 -23 300
Other financial liabilities -13 0 0 0 0 0 0 -13 0 -13
Total -3 729 -852 -4 007 -2 295 -4 296 -6 483 -2 880 -24 542 1 229 -23 313
Cash flows from gross settled derivative assets
Contractual amounts receivable 3 837 446 3 332 2 414 3 768 4 101 2 251 20 150
Contractual amounts payable -3 126 -245 -2 731 -1 893 -2 897 -3 403 -1 880 -16 175
712 201 601 521 871 698 371 3 975 -482 3 493
Cash flows from gross settled derivative liabilities
Contractual amounts receivable 898 274 2 201 684 753 1 601 385 6 797
Contractual amounts payable -794 -247 -2 243 -751 -778 -1 962 -1 525 -8 300
104 27 -42 -67 -25 -360 -1 139 -1 503 317 -1 186
Net during the period 1 194 522 -633 -311 365 519 -16 1 639
Cumulative net during the period 1 194 1 715 1 082 771 1 136 1 655 1 639
Maturity analysisDecember 31, 2013
(amounts in CHF million)0-6
months6-12
months1-2
years2-3
years3-5
years5-10
years
more than 10
years Total
Differenceto book
valueBook value
Assets
Liquid assets 2 298 159 677 358 343 328 50 4 214 -121 4 093
Equipment financing contracts 1 636 1 445 2 292 2 661 3 615 7 506 4 321 23 475 -2 543 20 932
Other financial assets 9 10 14 12 20 31 5 101 -91 10
Total 3 943 1 613 2 982 3 032 3 979 7 865 4 376 27 791 -2 755 25 035
Liabilities
Borrowings -3 171 -1 346 -3 813 -3 705 -4 274 -7 350 -3 728 -27 388 2 754 -24 634
Other financial liabilities -15 0 0 0 0 0 0 -15 0 -15
Total -3 186 -1 346 -3 813 -3 705 -4 274 -7 350 -3 728 -27 403 2 754 -24 649
Cash flows from gross settled derivative assets
Contractual amounts receivable 3 251 235 2 506 2 687 3 570 4 469 3 437 20 157
Contractual amounts payable -2 423 -128 -1 852 -2 323 -2 888 -4 279 -3 397 -17 291
829 107 654 364 682 190 40 2 866 -333 2 533
Cash flows from gross settled derivative liabilities
Contractual amounts receivable 1 902 472 1 410 2 236 1 536 1 854 813 10 223
Contractual amounts payable -2 067 -676 -1 337 -2 409 -1 676 -2 203 -1 460 -11 828
-165 -204 73 -174 -139 -349 -647 -1 605 225 -1 380
Net during the period 1 421 170 -104 -482 247 355 41 1 649
Cumulative net during the period 1 421 1 591 1 488 1 005 1 253 1 608 1 649
EUROFIMA maintains a pool of liquidity and spreads the maturities of its placements taking into account the fore-casted liquidity needs. The pool of liquidity is invested in highly rated debt instruments and placements with cred-it institutions. In accordance with the treasury policy, a minimum volume of liquid assets has to be invested in securities of sovereign issuers or issuers with an explic-it sovereign guarantee at all times. As at December 31, 2014, an amount of CHF 1 150 million was invested in securities of such issuers (2013: CHF 1 210 million).
As at year-end 2014, a committed CHF 300 million repo line was in place with a bank rated AAA/Aaa. Under this repo line, EUROFIMA may borrow money by selling
specified securities and simultaneously agreeing to buy them back at a later time.
EUROFIMA strives to secure a level of net liquidity that meets its liquidity targets for a period of 12 months un-der stressed economic conditions. To compute such li-quidity targets, a default probability of 100% is applied to assets below the long-term rating A- or A3 according to Standard and Poor’s or Moody’s respectively. Further-more, EUROFIMA is assumed to have no access to the financial markets for the same period of time (together called “stressed economic conditions”). In addition, a haircut to the liquid assets is applied and reviewed on a regular basis.
46
Annual Report 2014 Annual Report 2014
47
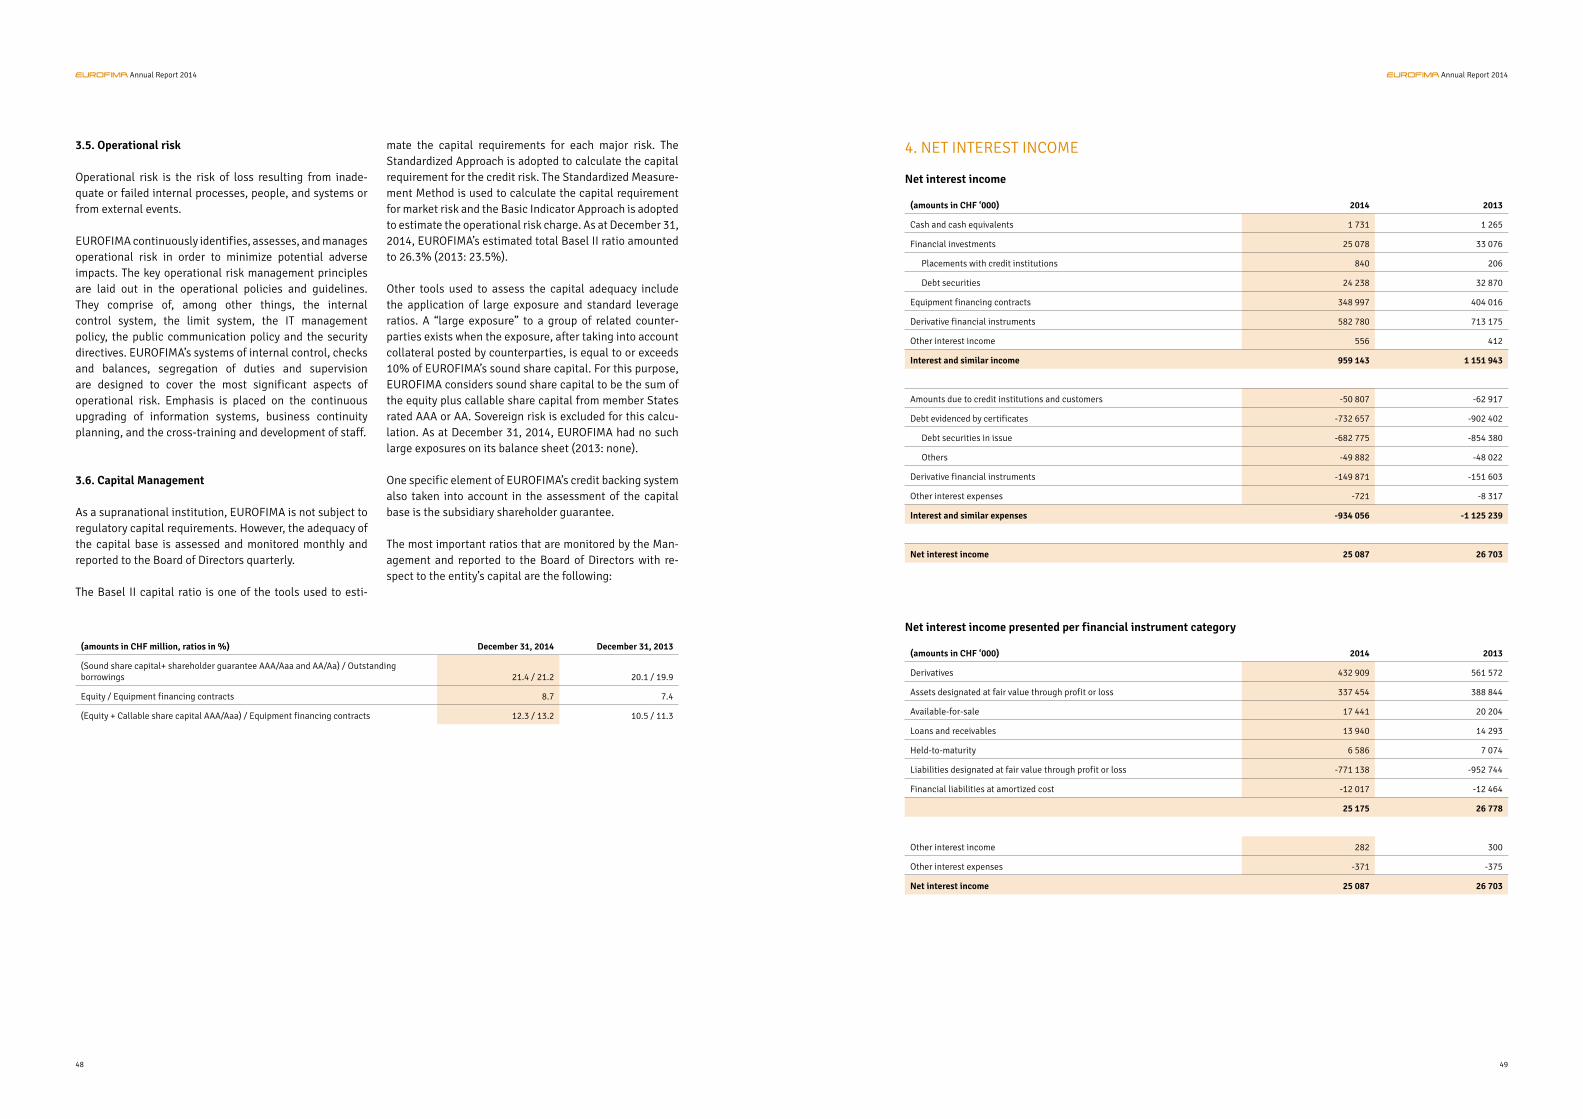
3.5. Operational risk
Operational risk is the risk of loss resulting from inade-quate or failed internal processes, people, and systems or from external events.
EUROFIMA continuously identifies, assesses, and manages operational risk in order to minimize potential adverse impacts. The key operational risk management principles are laid out in the operational policies and guidelines. They comprise of, among other things, the internal control system, the limit system, the IT management policy, the public communication policy and the security directives. EUROFIMA’s systems of internal control, checks and balances, segregation of duties and supervision are designed to cover the most significant aspects of operational risk. Emphasis is placed on the continuous upgrading of information systems, business continuity planning, and the cross-training and development of staff.
3.6. Capital Management
As a supranational institution, EUROFIMA is not subject to regulatory capital requirements. However, the adequacy of the capital base is assessed and monitored monthly and reported to the Board of Directors quarterly.
The Basel II capital ratio is one of the tools used to esti-
mate the capital requirements for each major risk. The Standardized Approach is adopted to calculate the capital requirement for the credit risk. The Standardized Measure-ment Method is used to calculate the capital requirement for market risk and the Basic Indicator Approach is adopted to estimate the operational risk charge. As at December 31, 2014, EUROFIMA’s estimated total Basel II ratio amounted to 26.3% (2013: 23.5%).
Other tools used to assess the capital adequacy include the application of large exposure and standard leverage ratios. A “large exposure” to a group of related counter-parties exists when the exposure, after taking into account collateral posted by counterparties, is equal to or exceeds 10% of EUROFIMA’s sound share capital. For this purpose, EUROFIMA considers sound share capital to be the sum of the equity plus callable share capital from member States rated AAA or AA. Sovereign risk is excluded for this calcu-lation. As at December 31, 2014, EUROFIMA had no such large exposures on its balance sheet (2013: none).
One specific element of EUROFIMA’s credit backing system also taken into account in the assessment of the capital base is the subsidiary shareholder guarantee.
The most important ratios that are monitored by the Man-agement and reported to the Board of Directors with re-spect to the entity’s capital are the following:
(amounts in CHF million, ratios in %) December 31, 2014 December 31, 2013
(Sound share capital+ shareholder guarantee AAA/Aaa and AA/Aa) / Outstanding borrowings 21.4 / 21.2 20.1 / 19.9
Equity / Equipment financing contracts 8.7 7.4
(Equity + Callable share capital AAA/Aaa) / Equipment financing contracts 12.3 / 13.2 10.5 / 11.3
4. NET INTEREST INCOME
(amounts in CHF ‘000) 2014 2013
Derivatives 432 909 561 572
Assets designated at fair value through profit or loss 337 454 388 844
Available-for-sale 17 441 20 204
Loans and receivables 13 940 14 293
Held-to-maturity 6 586 7 074
Liabilities designated at fair value through profit or loss -771 138 -952 744
Financial liabilities at amortized cost -12 017 -12 464
25 175 26 778
Other interest income 282 300
Other interest expenses -371 -375
Net interest income 25 087 26 703
Net interest income presented per financial instrument category
(amounts in CHF ‘000) 2014 2013
Cash and cash equivalents 1 731 1 265
Financial investments 25 078 33 076
Placements with credit institutions 840 206
Debt securities 24 238 32 870
Equipment financing contracts 348 997 404 016
Derivative financial instruments 582 780 713 175
Other interest income 556 412
Interest and similar income 959 143 1 151 943
Amounts due to credit institutions and customers -50 807 -62 917
Debt evidenced by certificates -732 657 -902 402
Debt securities in issue -682 775 -854 380
Others -49 882 -48 022
Derivative financial instruments -149 871 -151 603
Other interest expenses -721 -8 317
Interest and similar expenses -934 056 -1 125 239
Net interest income 25 087 26 703
Net interest income
48
Annual Report 2014 Annual Report 2014
49

5. NET COMMISSION INCOME
(amounts in CHF ‘000) 2014 2013
Commission on equipment financing contracts - designated at fair value through profit or loss
13 326 14 460
Commission on equipment financing contracts - loans and receivables 1 188 1 274
Upfront fees 0 150
Commission expenses and fees paid -1 300 -1 212
Net commission income 13 214 14 673
6. NET GAINS/LOSSES ON FINANCIAL INSTRUMENTS
(amounts in CHF ‘000) 2014 2013
Gains/(losses) on the sale of available-for-sale financial assets 4 041 3 664
Gains/(losses) on derivative financial instruments 219 833 -510 466
Gains/(losses) on financial assets designated as at fair value through profit or loss 333 029 -594 903
Gains/(losses) on financial liabilities designated as at fair value through profit or loss -553 981 1 105 342
Net gains/(losses) on financial instruments 2 922 3 637
7. GENERAL ADMINISTRATIVE EXPENSES
(amounts in CHF ‘000) 2014 2013
Personnel costs -4 340 -6 195
Social security expenses -406 -593
Defined benefit pension plan costs -610 -796
Office premises costs -112 -135
Other general administrative expenses -2 106 -2 070
Cost coverage, rental and other administrative income 11 15
Total general administrative expenses -7 563 -9 774
The item “Other general administrative expenses” includes in its majority IT related expenses, legal counsel fees, rep-resentation expenses and independent auditors fees.
Auditing and additional fees
PwC charged the following fees for professional services rendered for the financial year ending:
(amounts in CHF ‘000) 2014 2013
Audit services -193 -238
Audit-related services -38 -111
Total -231 -348
Audit services are defined as the standard audit work performed each year in order to issue an opinion on the entity’s financial statements. Audit-Related Services include those other assurance services provided by the independent auditor but not restricted to those that can only be provided by the auditor signing the audit report. They comprise amounts for services such as audits of IT infrastructure and consultation regarding new accounting pronouncements.
8. LIQUID ASSETS
The portfolio of liquid assets is composed of and measured as follows:
Credit rating structure of liquid assets
Below the liquid assets are shown with their long-term rating (amounts in CHF ‘000). If a specific rating is not available, the issuer, guarantor or obligor rating is applied, whichever is stronger. EUROFIMA groups the Standard & Poor’s ratings as follows: AAA, AA for ratings from AA+ to AA-, A for ratings from A+ to A-, BBB for ratings from BBB+ to BBB-, and <BBB for ratings below BBB-. EUROFIMA groups the Moody’s ratings as follows: Aaa, Aa for ratings from Aa1 to Aa3, A for ratings from A1 to A3, Baa for ratings from Baa1 to Baa3, and <Baa for ratings below Baa3.
(amounts in CHF ‘000) December 31, 2014 December 31, 2013
Cash at banks 46 541 144 755
Placement with credit institutions 536 616 421 641
Debt securities - bonds 2 562 274 2 557 383
Other liquid assets 1 159 252 969 249
Total liquid assets 4 304 683 4 093 028
of which
Cash and cash equivalents at fair value 1 049 248 919 248
Cash and cash equivalents at amortized cost 156 545 194 756
Total cash and cash equivalents 1 205 793 1 114 004
Financial investments at fair value 2 588 673 2 527 611
Financial investments at amortized cost 510 217 451 413
Total financial investments 3 098 890 2 979 024
Cash at banks
Standard & Poor's December 31,2014
December 31,2013
AAA 0 19 737
AA 1 090 19 351
A 45 433 105 660
BBB 18 7
<BBB 0 0
N.R. 0 0
Total 46 541 144 755
Moody's December 31,2014
December 31,2013
Aaa 6 19 749
Aa 0 0
A 45 433 105 660
Baa 18 7
<Baa 0 0
N.R. 1 084 19 339
Total 46 541 144 755
50
Annual Report 2014 Annual Report 2014
51
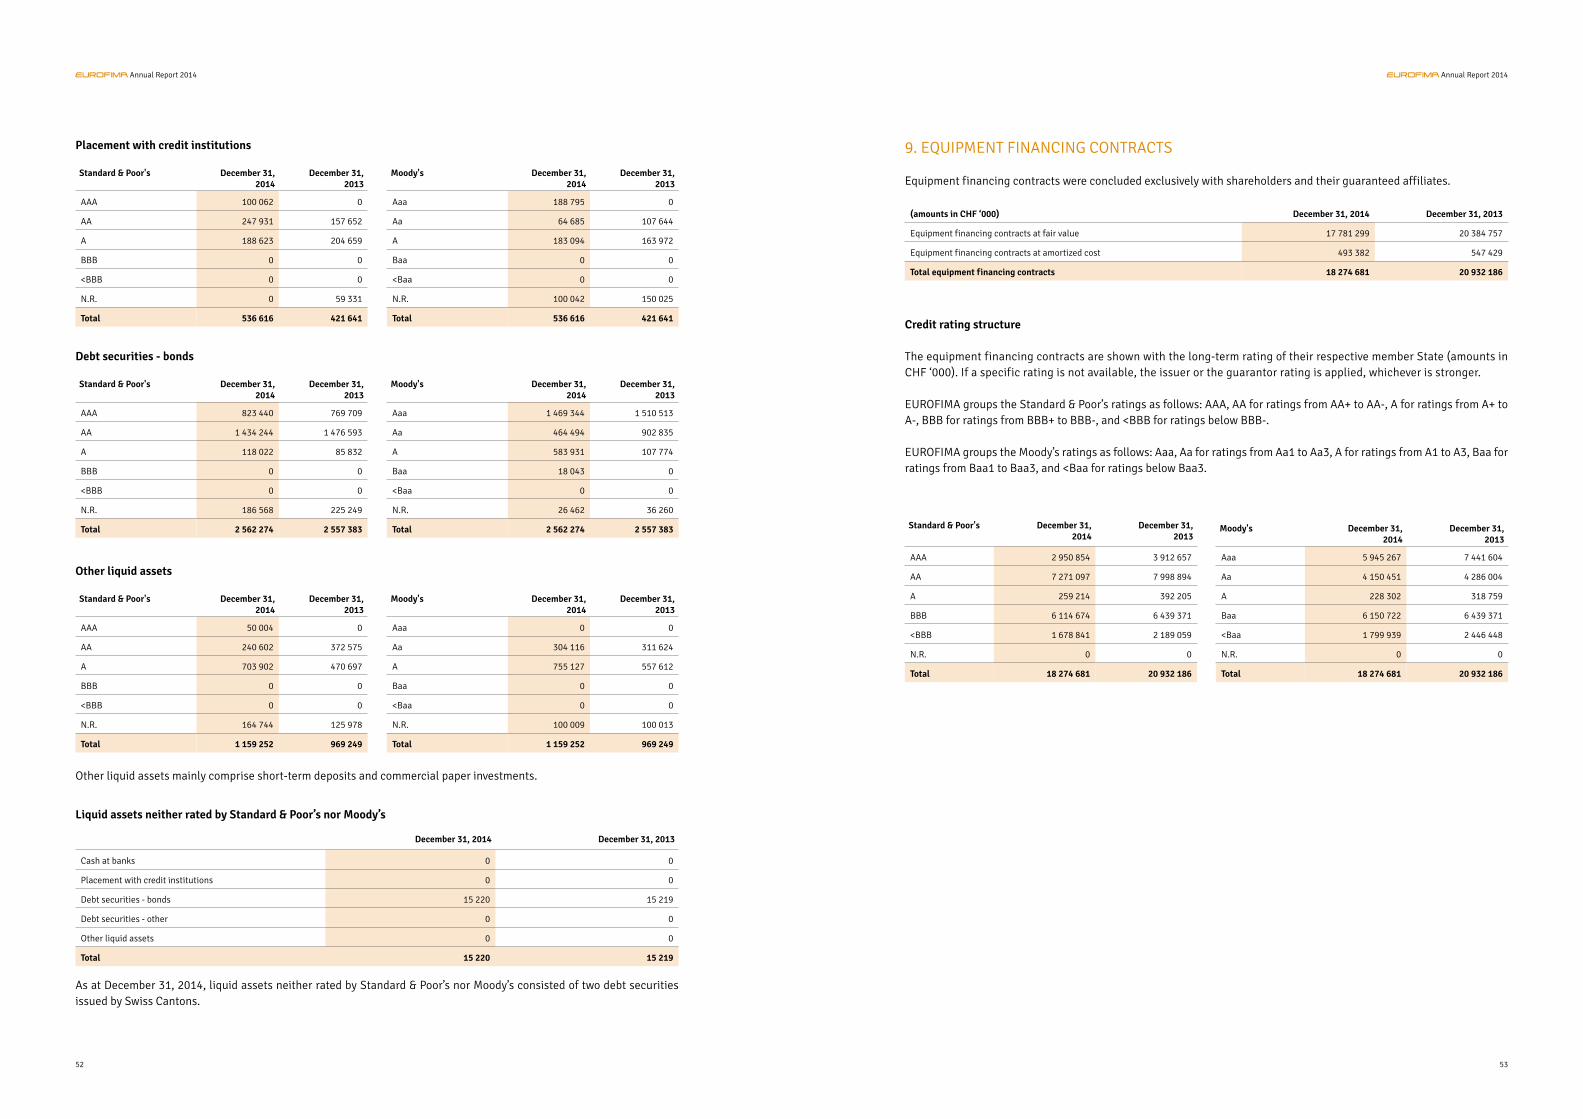
As at December 31, 2014, liquid assets neither rated by Standard & Poor’s nor Moody’s consisted of two debt securities issued by Swiss Cantons.
Liquid assets neither rated by Standard & Poor’s nor Moody’s
December 31, 2014 December 31, 2013
Cash at banks 0 0
Placement with credit institutions 0 0
Debt securities - bonds 15 220 15 219
Debt securities - other 0 0
Other liquid assets 0 0
Total 15 220 15 219
Debt securities - bonds
Standard & Poor's December 31,2014
December 31,2013
AAA 823 440 769 709
AA 1 434 244 1 476 593
A 118 022 85 832
BBB 0 0
<BBB 0 0
N.R. 186 568 225 249
Total 2 562 274 2 557 383
Moody's December 31,2014
December 31,2013
Aaa 1 469 344 1 510 513
Aa 464 494 902 835
A 583 931 107 774
Baa 18 043 0
<Baa 0 0
N.R. 26 462 36 260
Total 2 562 274 2 557 383
Other liquid assets
Standard & Poor's December 31,2014
December 31,2013
AAA 50 004 0
AA 240 602 372 575
A 703 902 470 697
BBB 0 0
<BBB 0 0
N.R. 164 744 125 978
Total 1 159 252 969 249
Moody's December 31,2014
December 31,2013
Aaa 0 0
Aa 304 116 311 624
A 755 127 557 612
Baa 0 0
<Baa 0 0
N.R. 100 009 100 013
Total 1 159 252 969 249
Placement with credit institutions
Standard & Poor's December 31,2014
December 31,2013
AAA 100 062 0
AA 247 931 157 652
A 188 623 204 659
BBB 0 0
<BBB 0 0
N.R. 0 59 331
Total 536 616 421 641
Moody's December 31,2014
December 31,2013
Aaa 188 795 0
Aa 64 685 107 644
A 183 094 163 972
Baa 0 0
<Baa 0 0
N.R. 100 042 150 025
Total 536 616 421 641
Other liquid assets mainly comprise short-term deposits and commercial paper investments.
9. EQUIPMENT FINANCING CONTRACTS
Equipment financing contracts were concluded exclusively with shareholders and their guaranteed affiliates.
(amounts in CHF ‘000) December 31, 2014 December 31, 2013
Equipment financing contracts at fair value 17 781 299 20 384 757
Equipment financing contracts at amortized cost 493 382 547 429
Total equipment financing contracts 18 274 681 20 932 186
Credit rating structure
The equipment financing contracts are shown with the long-term rating of their respective member State (amounts in CHF ‘000). If a specific rating is not available, the issuer or the guarantor rating is applied, whichever is stronger.
EUROFIMA groups the Standard & Poor’s ratings as follows: AAA, AA for ratings from AA+ to AA-, A for ratings from A+ to A-, BBB for ratings from BBB+ to BBB-, and <BBB for ratings below BBB-.
EUROFIMA groups the Moody’s ratings as follows: Aaa, Aa for ratings from Aa1 to Aa3, A for ratings from A1 to A3, Baa for ratings from Baa1 to Baa3, and <Baa for ratings below Baa3.
Standard & Poor's December 31,2014
December 31,2013
AAA 2 950 854 3 912 657
AA 7 271 097 7 998 894
A 259 214 392 205
BBB 6 114 674 6 439 371
<BBB 1 678 841 2 189 059
N.R. 0 0
Total 18 274 681 20 932 186
Moody's December 31,2014
December 31,2013
Aaa 5 945 267 7 441 604
Aa 4 150 451 4 286 004
A 228 302 318 759
Baa 6 150 722 6 439 371
<Baa 1 799 939 2 446 448
N.R. 0 0
Total 18 274 681 20 932 186
52
Annual Report 2014 Annual Report 2014
53
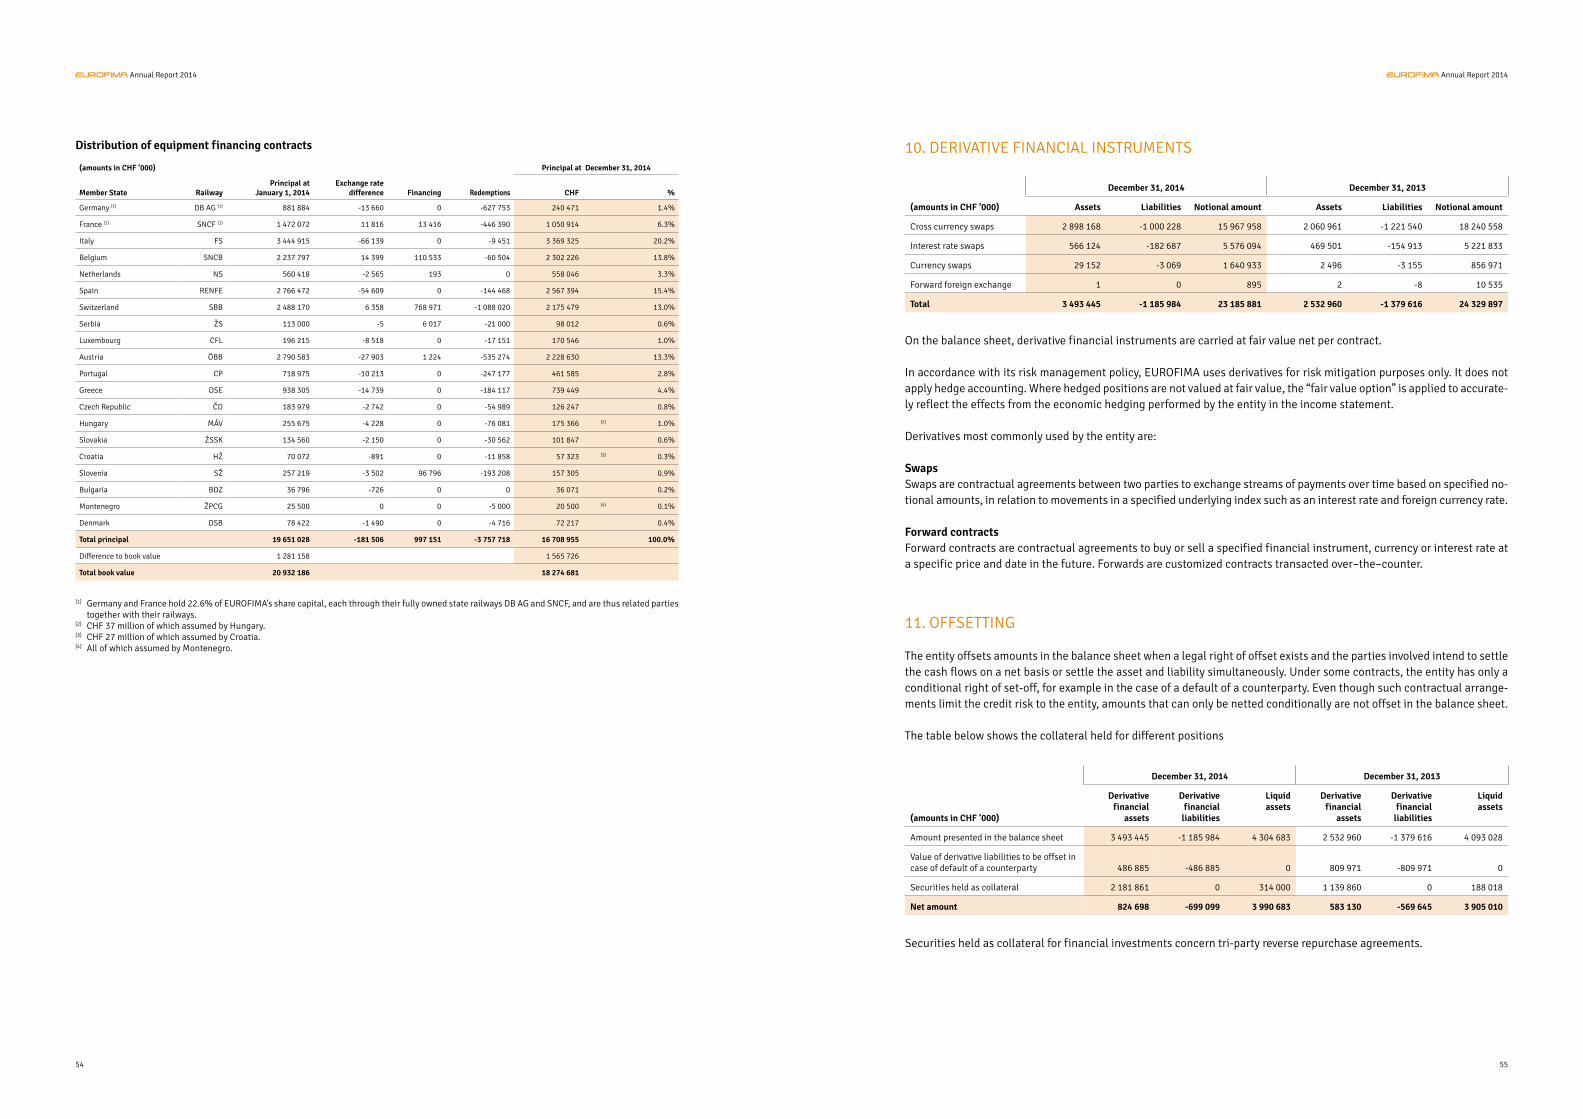
(amounts in CHF ‘000) Principal at December 31, 2014
Member State RailwayPrincipal at
January 1, 2014Exchange rate
difference Financing Redemptions CHF %
Germany (1) DB AG (1) 881 884 -13 660 0 -627 753 240 471 1.4%
France (1) SNCF (1) 1 472 072 11 816 13 416 -446 390 1 050 914 6.3%
Italy FS 3 444 915 -66 139 0 -9 451 3 369 325 20.2%
Belgium SNCB 2 237 797 14 399 110 533 -60 504 2 302 226 13.8%
Netherlands NS 560 418 -2 565 193 0 558 046 3.3%
Spain RENFE 2 766 472 -54 609 0 -144 468 2 567 394 15.4%
Switzerland SBB 2 488 170 6 358 768 971 -1 088 020 2 175 479 13.0%
Serbia ŽS 113 000 -5 6 017 -21 000 98 012 0.6%
Luxembourg CFL 196 215 -8 518 0 -17 151 170 546 1.0%
Austria ÖBB 2 790 583 -27 903 1 224 -535 274 2 228 630 13.3%
Portugal CP 718 975 -10 213 0 -247 177 461 585 2.8%
Greece OSE 938 305 -14 739 0 -184 117 739 449 4.4%
Czech Republic ČD 183 979 -2 742 0 -54 989 126 247 0.8%
Hungary MÁV 255 675 -4 228 0 -76 081 175 366 (2) 1.0%
Slovakia ŽSSK 134 560 -2 150 0 -30 562 101 847 0.6%
Croatia HŽ 70 072 -891 0 -11 858 57 323 (3) 0.3%
Slovenia SŽ 257 219 -3 502 96 796 -193 208 157 305 0.9%
Bulgaria BDZ 36 796 -726 0 0 36 071 0.2%
Montenegro ŽPCG 25 500 0 0 -5 000 20 500 (4) 0.1%
Denmark DSB 78 422 -1 490 0 -4 716 72 217 0.4%
Total principal 19 651 028 -181 506 997 151 -3 757 718 16 708 955 100.0%
Difference to book value 1 281 158 1 565 726
Total book value 20 932 186 18 274 681
Distribution of equipment financing contracts
(1) Germany and France hold 22.6% of EUROFIMA’s share capital, each through their fully owned state railways DB AG and SNCF, and are thus related parties together with their railways.
(2) CHF 37 million of which assumed by Hungary.(3) CHF 27 million of which assumed by Croatia.(4) All of which assumed by Montenegro.
11. OFFSETTING
The entity offsets amounts in the balance sheet when a legal right of offset exists and the parties involved intend to settle the cash flows on a net basis or settle the asset and liability simultaneously. Under some contracts, the entity has only a conditional right of set-off, for example in the case of a default of a counterparty. Even though such contractual arrange-ments limit the credit risk to the entity, amounts that can only be netted conditionally are not offset in the balance sheet.
The table below shows the collateral held for different positions
December 31, 2014 December 31, 2013
(amounts in CHF ‘000)
Derivative financial
assets
Derivative financial
liabilities
Liquidassets
Derivative financial
assets
Derivative financial
liabilities
Liquidassets
Amount presented in the balance sheet 3 493 445 -1 185 984 4 304 683 2 532 960 -1 379 616 4 093 028
Value of derivative liabilities to be offset in case of default of a counterparty 486 885 -486 885 0 809 971 -809 971 0
Securities held as collateral 2 181 861 0 314 000 1 139 860 0 188 018
Net amount 824 698 -699 099 3 990 683 583 130 -569 645 3 905 010
Securities held as collateral for financial investments concern tri-party reverse repurchase agreements.
10. DERIVATIVE FINANCIAL INSTRUMENTS
December 31, 2014 December 31, 2013
(amounts in CHF ‘000) Assets Liabilities Notional amount Assets Liabilities Notional amount
Cross currency swaps 2 898 168 -1 000 228 15 967 958 2 060 961 -1 221 540 18 240 558
Interest rate swaps 566 124 -182 687 5 576 094 469 501 -154 913 5 221 833
Currency swaps 29 152 -3 069 1 640 933 2 496 -3 155 856 971
Forward foreign exchange 1 0 895 2 -8 10 535
Total 3 493 445 -1 185 984 23 185 881 2 532 960 -1 379 616 24 329 897
On the balance sheet, derivative financial instruments are carried at fair value net per contract.
In accordance with its risk management policy, EUROFIMA uses derivatives for risk mitigation purposes only. It does not apply hedge accounting. Where hedged positions are not valued at fair value, the “fair value option” is applied to accurate-ly reflect the effects from the economic hedging performed by the entity in the income statement.
Derivatives most commonly used by the entity are:
SwapsSwaps are contractual agreements between two parties to exchange streams of payments over time based on specified no-tional amounts, in relation to movements in a specified underlying index such as an interest rate and foreign currency rate.
Forward contractsForward contracts are contractual agreements to buy or sell a specified financial instrument, currency or interest rate at a specific price and date in the future. Forwards are customized contracts transacted over–the–counter.
54
Annual Report 2014 Annual Report 2014
55
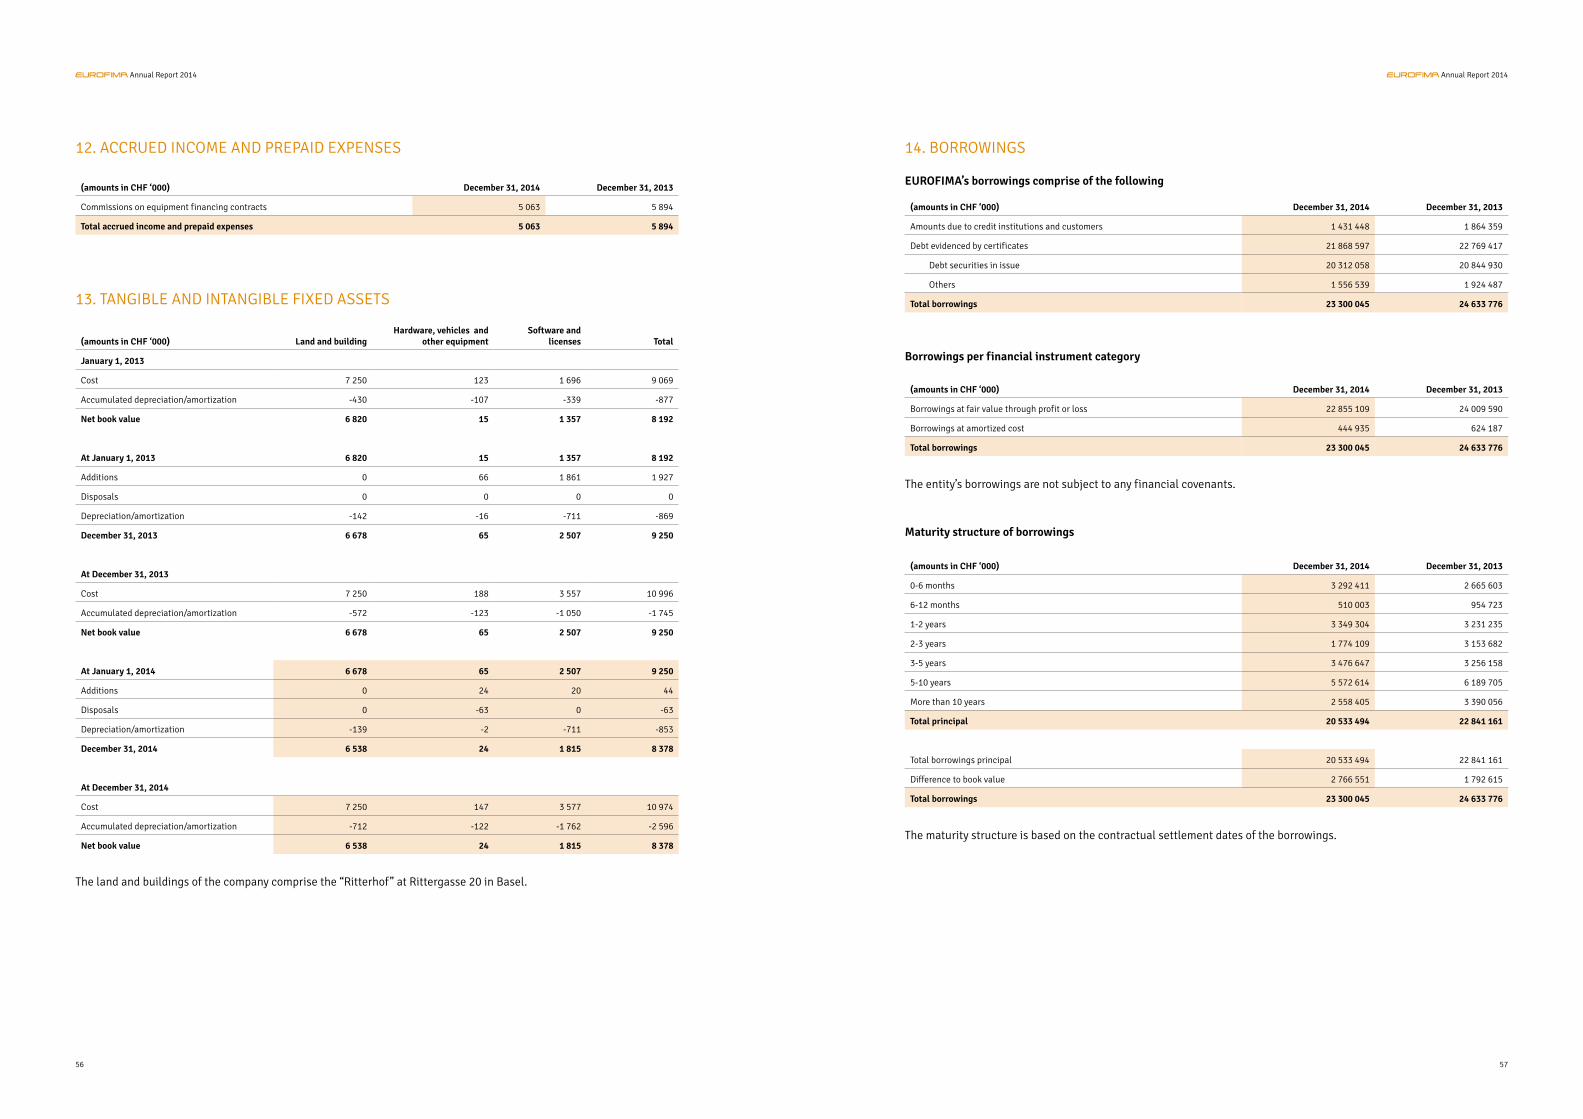
12. ACCRUED INCOME AND PREPAID EXPENSES
13. TANGIBLE AND INTANGIBLE FIXED ASSETS
(amounts in CHF ‘000) Land and buildingHardware, vehicles and
other equipmentSoftware and
licenses Total
January 1, 2013
Cost 7 250 123 1 696 9 069
Accumulated depreciation/amortization -430 -107 -339 -877
Net book value 6 820 15 1 357 8 192
At January 1, 2013 6 820 15 1 357 8 192
Additions 0 66 1 861 1 927
Disposals 0 0 0 0
Depreciation/amortization -142 -16 -711 -869
December 31, 2013 6 678 65 2 507 9 250
At December 31, 2013
Cost 7 250 188 3 557 10 996
Accumulated depreciation/amortization -572 -123 -1 050 -1 745
Net book value 6 678 65 2 507 9 250
At January 1, 2014 6 678 65 2 507 9 250
Additions 0 24 20 44
Disposals 0 -63 0 -63
Depreciation/amortization -139 -2 -711 -853
December 31, 2014 6 538 24 1 815 8 378
At December 31, 2014
Cost 7 250 147 3 577 10 974
Accumulated depreciation/amortization -712 -122 -1 762 -2 596
Net book value 6 538 24 1 815 8 378
The land and buildings of the company comprise the “Ritterhof” at Rittergasse 20 in Basel.
(amounts in CHF ‘000) December 31, 2014 December 31, 2013
Commissions on equipment financing contracts 5 063 5 894
Total accrued income and prepaid expenses 5 063 5 894
14. BORROWINGS
EUROFIMA’s borrowings comprise of the following
(amounts in CHF ‘000) December 31, 2014 December 31, 2013
Amounts due to credit institutions and customers 1 431 448 1 864 359
Debt evidenced by certificates 21 868 597 22 769 417
Debt securities in issue 20 312 058 20 844 930
Others 1 556 539 1 924 487
Total borrowings 23 300 045 24 633 776
Borrowings per financial instrument category
(amounts in CHF ‘000) December 31, 2014 December 31, 2013
Borrowings at fair value through profit or loss 22 855 109 24 009 590
Borrowings at amortized cost 444 935 624 187
Total borrowings 23 300 045 24 633 776
The entity’s borrowings are not subject to any financial covenants.
Maturity structure of borrowings
(amounts in CHF ‘000) December 31, 2014 December 31, 2013
0-6 months 3 292 411 2 665 603
6-12 months 510 003 954 723
1-2 years 3 349 304 3 231 235
2-3 years 1 774 109 3 153 682
3-5 years 3 476 647 3 256 158
5-10 years 5 572 614 6 189 705
More than 10 years 2 558 405 3 390 056
Total principal 20 533 494 22 841 161
Total borrowings principal 20 533 494 22 841 161
Difference to book value 2 766 551 1 792 615
Total borrowings 23 300 045 24 633 776
The maturity structure is based on the contractual settlement dates of the borrowings.
56
Annual Report 2014 Annual Report 2014
57
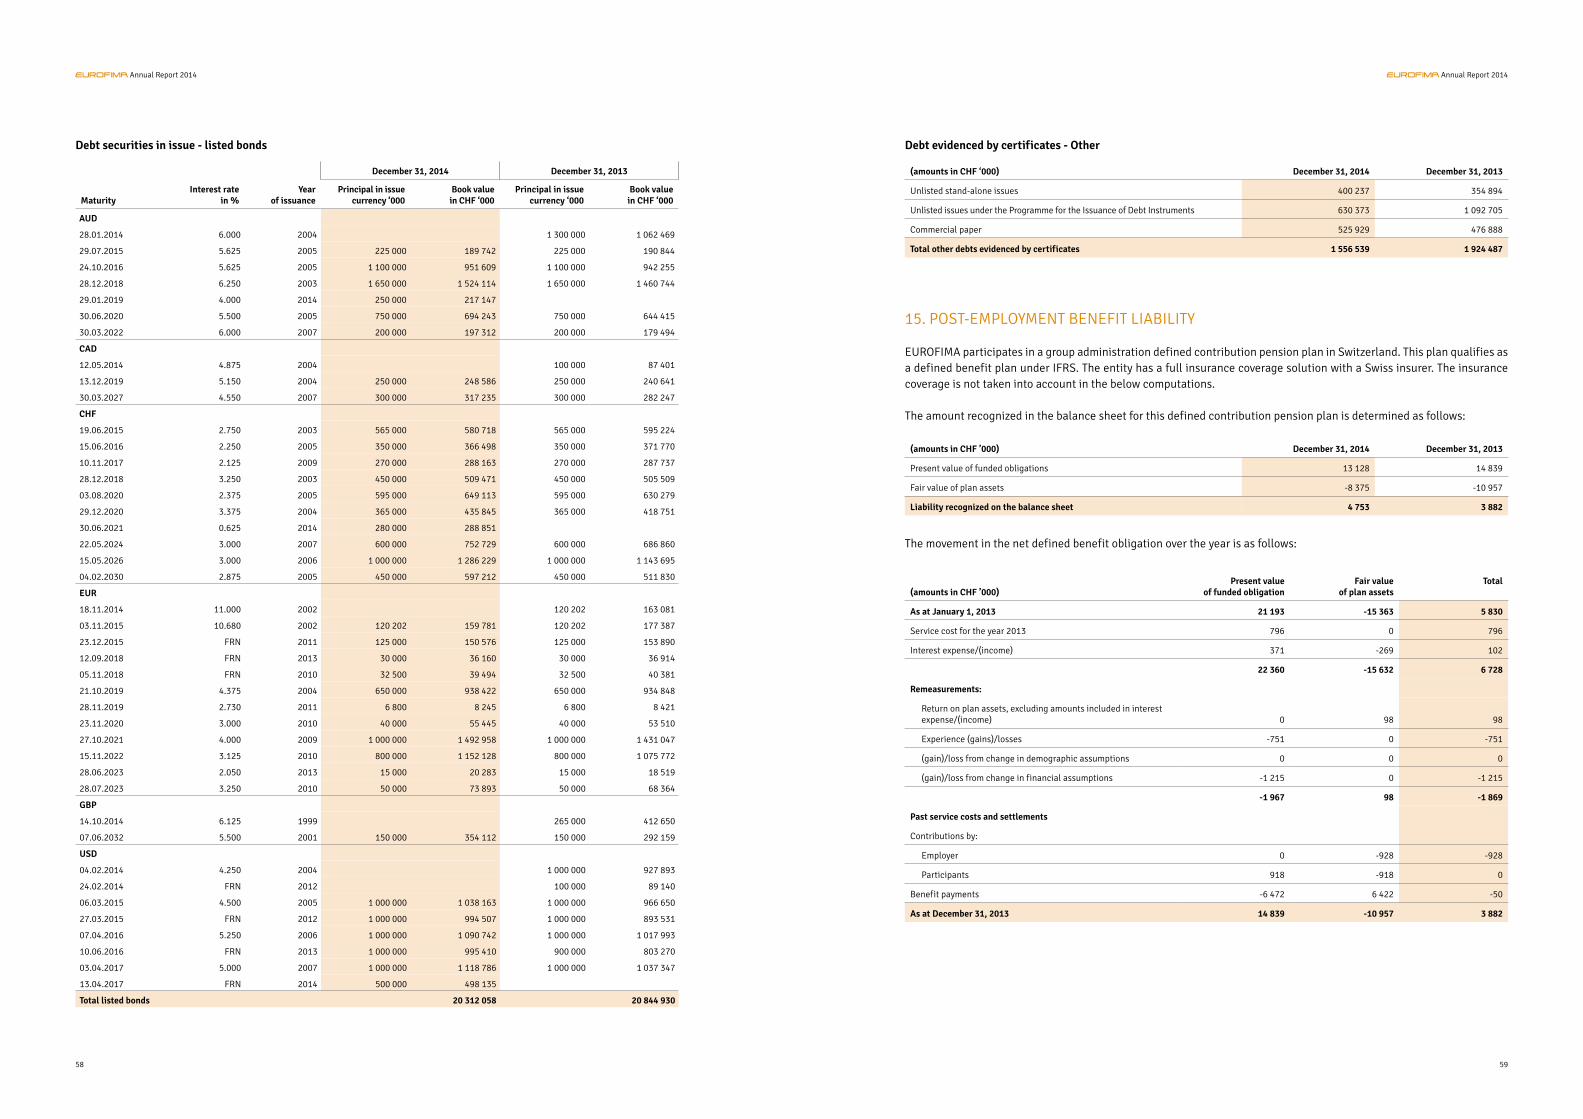
December 31, 2014 December 31, 2013
MaturityInterest rate
in %Year
of issuancePrincipal in issue
currency ‘000Book value
in CHF ‘000Principal in issue
currency ‘000Book value
in CHF ‘000
AUD
28.01.2014 6.000 2004 1 300 000 1 062 469
29.07.2015 5.625 2005 225 000 189 742 225 000 190 844
24.10.2016 5.625 2005 1 100 000 951 609 1 100 000 942 255
28.12.2018 6.250 2003 1 650 000 1 524 114 1 650 000 1 460 744
29.01.2019 4.000 2014 250 000 217 147
30.06.2020 5.500 2005 750 000 694 243 750 000 644 415
30.03.2022 6.000 2007 200 000 197 312 200 000 179 494
CAD
12.05.2014 4.875 2004 100 000 87 401
13.12.2019 5.150 2004 250 000 248 586 250 000 240 641
30.03.2027 4.550 2007 300 000 317 235 300 000 282 247
CHF
19.06.2015 2.750 2003 565 000 580 718 565 000 595 224
15.06.2016 2.250 2005 350 000 366 498 350 000 371 770
10.11.2017 2.125 2009 270 000 288 163 270 000 287 737
28.12.2018 3.250 2003 450 000 509 471 450 000 505 509
03.08.2020 2.375 2005 595 000 649 113 595 000 630 279
29.12.2020 3.375 2004 365 000 435 845 365 000 418 751
30.06.2021 0.625 2014 280 000 288 851
22.05.2024 3.000 2007 600 000 752 729 600 000 686 860
15.05.2026 3.000 2006 1 000 000 1 286 229 1 000 000 1 143 695
04.02.2030 2.875 2005 450 000 597 212 450 000 511 830
EUR
18.11.2014 11.000 2002 120 202 163 081
03.11.2015 10.680 2002 120 202 159 781 120 202 177 387
23.12.2015 FRN 2011 125 000 150 576 125 000 153 890
12.09.2018 FRN 2013 30 000 36 160 30 000 36 914
05.11.2018 FRN 2010 32 500 39 494 32 500 40 381
21.10.2019 4.375 2004 650 000 938 422 650 000 934 848
28.11.2019 2.730 2011 6 800 8 245 6 800 8 421
23.11.2020 3.000 2010 40 000 55 445 40 000 53 510
27.10.2021 4.000 2009 1 000 000 1 492 958 1 000 000 1 431 047
15.11.2022 3.125 2010 800 000 1 152 128 800 000 1 075 772
28.06.2023 2.050 2013 15 000 20 283 15 000 18 519
28.07.2023 3.250 2010 50 000 73 893 50 000 68 364
GBP
14.10.2014 6.125 1999 265 000 412 650
07.06.2032 5.500 2001 150 000 354 112 150 000 292 159
USD
04.02.2014 4.250 2004 1 000 000 927 893
24.02.2014 FRN 2012 100 000 89 140
06.03.2015 4.500 2005 1 000 000 1 038 163 1 000 000 966 650
27.03.2015 FRN 2012 1 000 000 994 507 1 000 000 893 531
07.04.2016 5.250 2006 1 000 000 1 090 742 1 000 000 1 017 993
10.06.2016 FRN 2013 1 000 000 995 410 900 000 803 270
03.04.2017 5.000 2007 1 000 000 1 118 786 1 000 000 1 037 347
13.04.2017 FRN 2014 500 000 498 135
Total listed bonds 20 312 058 20 844 930
Debt securities in issue - listed bonds
15. POST-EMPLOYMENT BENEFIT LIABILITY
EUROFIMA participates in a group administration defined contribution pension plan in Switzerland. This plan qualifies as a defined benefit plan under IFRS. The entity has a full insurance coverage solution with a Swiss insurer. The insurance coverage is not taken into account in the below computations.
The amount recognized in the balance sheet for this defined contribution pension plan is determined as follows:
(amounts in CHF ’000) December 31, 2014 December 31, 2013
Present value of funded obligations 13 128 14 839
Fair value of plan assets -8 375 -10 957
Liability recognized on the balance sheet 4 753 3 882
The movement in the net defined benefit obligation over the year is as follows:
(amounts in CHF ’000)Present value
of funded obligationFair value
of plan assetsTotal
As at January 1, 2013 21 193 -15 363 5 830
Service cost for the year 2013 796 0 796
Interest expense/(income) 371 -269 102
22 360 -15 632 6 728
Remeasurements:
Return on plan assets, excluding amounts included in interest expense/(income) 0 98 98
Experience (gains)/losses -751 0 -751
(gain)/loss from change in demographic assumptions 0 0 0
(gain)/loss from change in financial assumptions -1 215 0 -1 215
-1 967 98 -1 869
Past service costs and settlements
Contributions by:
Employer 0 -928 -928
Participants 918 -918 0
Benefit payments -6 472 6 422 -50
As at December 31, 2013 14 839 -10 957 3 882
Debt evidenced by certificates - Other
(amounts in CHF ‘000) December 31, 2014 December 31, 2013
Unlisted stand-alone issues 400 237 354 894
Unlisted issues under the Programme for the Issuance of Debt Instruments 630 373 1 092 705
Commercial paper 525 929 476 888
Total other debts evidenced by certificates 1 556 539 1 924 487
58
Annual Report 2014 Annual Report 2014
59
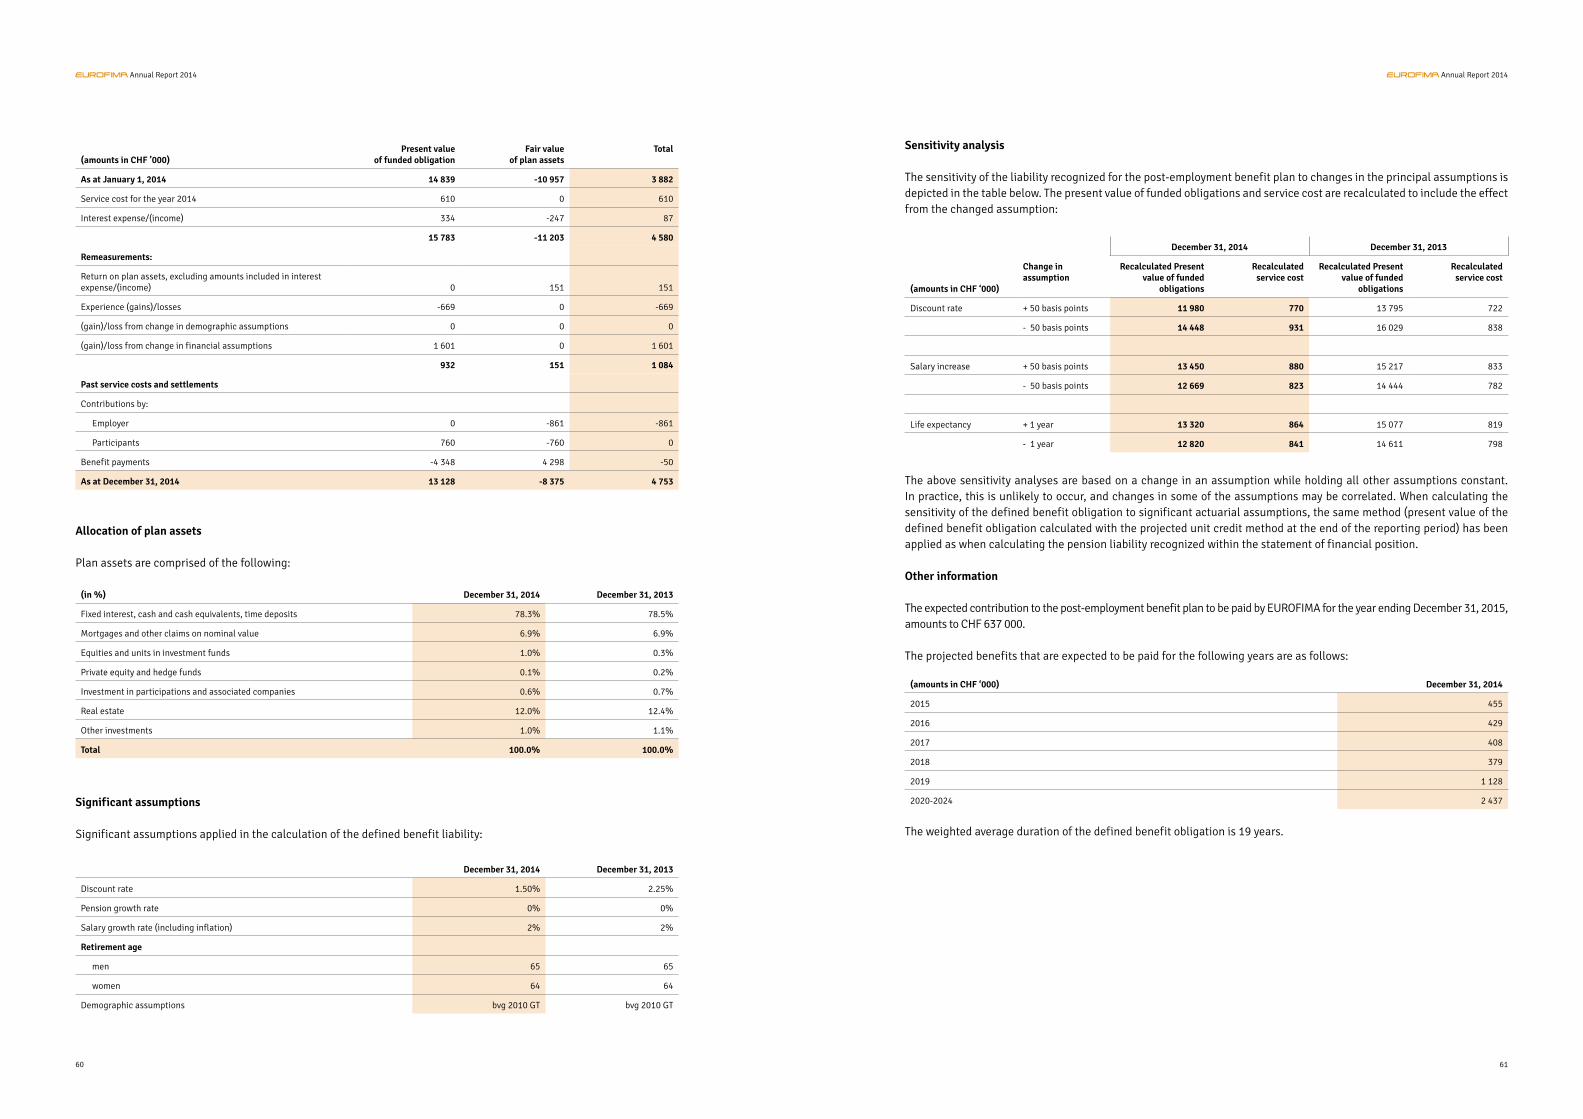
Allocation of plan assets
Plan assets are comprised of the following:
(in %) December 31, 2014 December 31, 2013
Fixed interest, cash and cash equivalents, time deposits 78.3% 78.5%
Mortgages and other claims on nominal value 6.9% 6.9%
Equities and units in investment funds 1.0% 0.3%
Private equity and hedge funds 0.1% 0.2%
Investment in participations and associated companies 0.6% 0.7%
Real estate 12.0% 12.4%
Other investments 1.0% 1.1%
Total 100.0% 100.0%
Significant assumptions
Significant assumptions applied in the calculation of the defined benefit liability:
December 31, 2014 December 31, 2013
Discount rate 1.50% 2.25%
Pension growth rate 0% 0%
Salary growth rate (including inflation) 2% 2%
Retirement age
men 65 65
women 64 64
Demographic assumptions bvg 2010 GT bvg 2010 GT
(amounts in CHF ’000)Present value
of funded obligationFair value
of plan assetsTotal
As at January 1, 2014 14 839 -10 957 3 882
Service cost for the year 2014 610 0 610
Interest expense/(income) 334 -247 87
15 783 -11 203 4 580
Remeasurements:
Return on plan assets, excluding amounts included in interest expense/(income) 0 151 151
Experience (gains)/losses -669 0 -669
(gain)/loss from change in demographic assumptions 0 0 0
(gain)/loss from change in financial assumptions 1 601 0 1 601
932 151 1 084
Past service costs and settlements
Contributions by:
Employer 0 -861 -861
Participants 760 -760 0
Benefit payments -4 348 4 298 -50
As at December 31, 2014 13 128 -8 375 4 753
Sensitivity analysis
The sensitivity of the liability recognized for the post-employment benefit plan to changes in the principal assumptions is depicted in the table below. The present value of funded obligations and service cost are recalculated to include the effect from the changed assumption:
December 31, 2014 December 31, 2013
(amounts in CHF ‘000)
Change in assumption
Recalculated Present value of funded
obligations
Recalculatedservice cost
Recalculated Present value of funded
obligations
Recalculatedservice cost
Discount rate + 50 basis points 11 980 770 13 795 722
- 50 basis points 14 448 931 16 029 838
Salary increase + 50 basis points 13 450 880 15 217 833
- 50 basis points 12 669 823 14 444 782
Life expectancy + 1 year 13 320 864 15 077 819
- 1 year 12 820 841 14 611 798
The above sensitivity analyses are based on a change in an assumption while holding all other assumptions constant. In practice, this is unlikely to occur, and changes in some of the assumptions may be correlated. When calculating the sensitivity of the defined benefit obligation to significant actuarial assumptions, the same method (present value of the defined benefit obligation calculated with the projected unit credit method at the end of the reporting period) has been applied as when calculating the pension liability recognized within the statement of financial position. Other information
The expected contribution to the post-employment benefit plan to be paid by EUROFIMA for the year ending December 31, 2015, amounts to CHF 637 000.
The projected benefits that are expected to be paid for the following years are as follows:
(amounts in CHF ‘000) December 31, 2014
2015 455
2016 429
2017 408
2018 379
2019 1 128
2020-2024 2 437
The weighted average duration of the defined benefit obligation is 19 years.
60
Annual Report 2014 Annual Report 2014
61
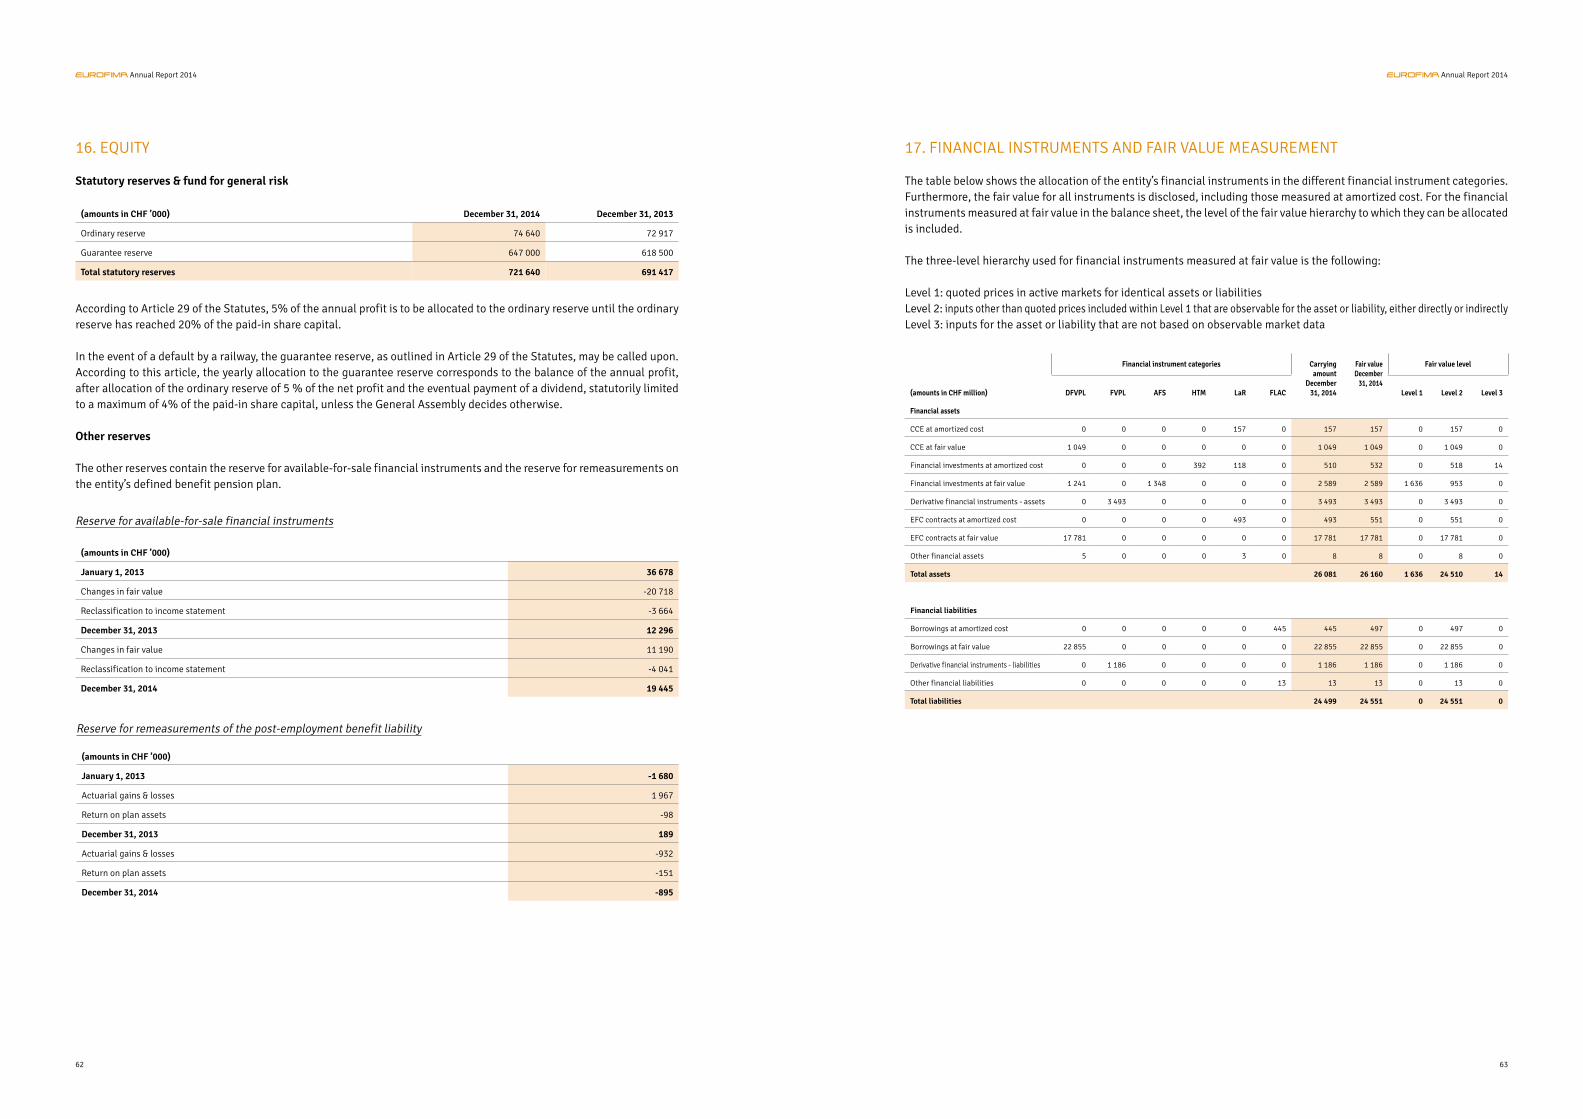
16. EQUITY
Statutory reserves & fund for general risk
(amounts in CHF ’000) December 31, 2014 December 31, 2013
Ordinary reserve 74 640 72 917
Guarantee reserve 647 000 618 500
Total statutory reserves 721 640 691 417
According to Article 29 of the Statutes, 5% of the annual profit is to be allocated to the ordinary reserve until the ordinary reserve has reached 20% of the paid-in share capital.
In the event of a default by a railway, the guarantee reserve, as outlined in Article 29 of the Statutes, may be called upon. According to this article, the yearly allocation to the guarantee reserve corresponds to the balance of the annual profit, after allocation of the ordinary reserve of 5 % of the net profit and the eventual payment of a dividend, statutorily limited to a maximum of 4% of the paid-in share capital, unless the General Assembly decides otherwise.
Other reserves
The other reserves contain the reserve for available-for-sale financial instruments and the reserve for remeasurements on the entity’s defined benefit pension plan.
Reserve for remeasurements of the post-employment benefit liability
Reserve for available-for-sale financial instruments
(amounts in CHF ’000)
January 1, 2013 36 678
Changes in fair value -20 718
Reclassification to income statement -3 664
December 31, 2013 12 296
Changes in fair value 11 190
Reclassification to income statement -4 041
December 31, 2014 19 445
(amounts in CHF ’000)
January 1, 2013 -1 680
Actuarial gains & losses 1 967
Return on plan assets -98
December 31, 2013 189
Actuarial gains & losses -932
Return on plan assets -151
December 31, 2014 -895
Financial instrument categories Carrying amount
December 31, 2014
Fair value December
31, 2014
Fair value level
(amounts in CHF million) DFVPL FVPL AFS HTM LaR FLAC Level 1 Level 2 Level 3
Financial assets
CCE at amortized cost 0 0 0 0 157 0 157 157 0 157 0
CCE at fair value 1 049 0 0 0 0 0 1 049 1 049 0 1 049 0
Financial investments at amortized cost 0 0 0 392 118 0 510 532 0 518 14
Financial investments at fair value 1 241 0 1 348 0 0 0 2 589 2 589 1 636 953 0
Derivative financial instruments - assets 0 3 493 0 0 0 0 3 493 3 493 0 3 493 0
EFC contracts at amortized cost 0 0 0 0 493 0 493 551 0 551 0
EFC contracts at fair value 17 781 0 0 0 0 0 17 781 17 781 0 17 781 0
Other financial assets 5 0 0 0 3 0 8 8 0 8 0
Total assets 26 081 26 160 1 636 24 510 14
Financial liabilities
Borrowings at amortized cost 0 0 0 0 0 445 445 497 0 497 0
Borrowings at fair value 22 855 0 0 0 0 0 22 855 22 855 0 22 855 0
Derivative financial instruments - liabilities 0 1 186 0 0 0 0 1 186 1 186 0 1 186 0
Other financial liabilities 0 0 0 0 0 13 13 13 0 13 0
Total liabilities 24 499 24 551 0 24 551 0
17. FINANCIAL INSTRUMENTS AND FAIR VALUE MEASUREMENT
The table below shows the allocation of the entity’s financial instruments in the different financial instrument categories. Furthermore, the fair value for all instruments is disclosed, including those measured at amortized cost. For the financial instruments measured at fair value in the balance sheet, the level of the fair value hierarchy to which they can be allocated is included.
The three-level hierarchy used for financial instruments measured at fair value is the following:
Level 1: quoted prices in active markets for identical assets or liabilitiesLevel 2: inputs other than quoted prices included within Level 1 that are observable for the asset or liability, either directly or indirectlyLevel 3: inputs for the asset or liability that are not based on observable market data
62
Annual Report 2014 Annual Report 2014
63
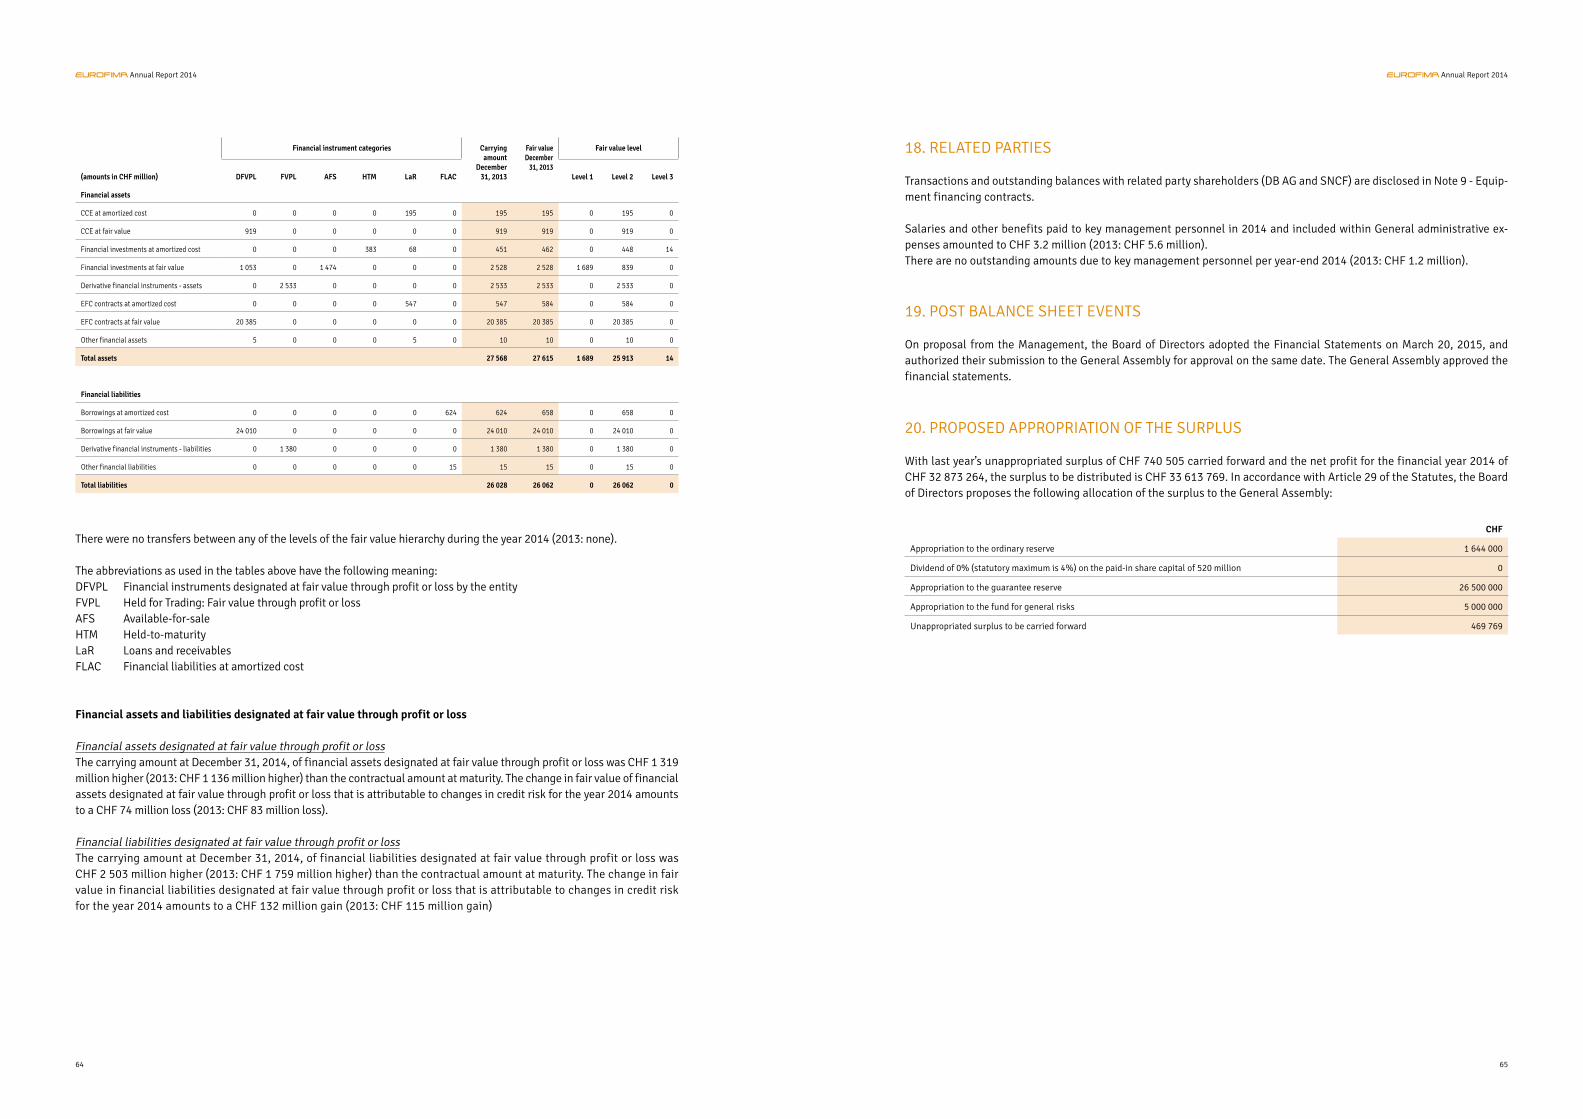
Financial instrument categories Carrying amount
December 31, 2013
Fair value December
31, 2013
Fair value level
(amounts in CHF million) DFVPL FVPL AFS HTM LaR FLAC Level 1 Level 2 Level 3
Financial assets
CCE at amortized cost 0 0 0 0 195 0 195 195 0 195 0
CCE at fair value 919 0 0 0 0 0 919 919 0 919 0
Financial investments at amortized cost 0 0 0 383 68 0 451 462 0 448 14
Financial investments at fair value 1 053 0 1 474 0 0 0 2 528 2 528 1 689 839 0
Derivative financial instruments - assets 0 2 533 0 0 0 0 2 533 2 533 0 2 533 0
EFC contracts at amortized cost 0 0 0 0 547 0 547 584 0 584 0
EFC contracts at fair value 20 385 0 0 0 0 0 20 385 20 385 0 20 385 0
Other financial assets 5 0 0 0 5 0 10 10 0 10 0
Total assets 27 568 27 615 1 689 25 913 14
Financial liabilities
Borrowings at amortized cost 0 0 0 0 0 624 624 658 0 658 0
Borrowings at fair value 24 010 0 0 0 0 0 24 010 24 010 0 24 010 0
Derivative financial instruments - liabilities 0 1 380 0 0 0 0 1 380 1 380 0 1 380 0
Other financial liabilities 0 0 0 0 0 15 15 15 0 15 0
Total liabilities 26 028 26 062 0 26 062 0
There were no transfers between any of the levels of the fair value hierarchy during the year 2014 (2013: none).
The abbreviations as used in the tables above have the following meaning:DFVPL Financial instruments designated at fair value through profit or loss by the entityFVPL Held for Trading: Fair value through profit or lossAFS Available-for-saleHTM Held-to-maturityLaR Loans and receivablesFLAC Financial liabilities at amortized cost
Financial assets and liabilities designated at fair value through profit or loss
Financial assets designated at fair value through profit or lossThe carrying amount at December 31, 2014, of financial assets designated at fair value through profit or loss was CHF 1 319 million higher (2013: CHF 1 136 million higher) than the contractual amount at maturity. The change in fair value of financial assets designated at fair value through profit or loss that is attributable to changes in credit risk for the year 2014 amounts to a CHF 74 million loss (2013: CHF 83 million loss).
Financial liabilities designated at fair value through profit or lossThe carrying amount at December 31, 2014, of financial liabilities designated at fair value through profit or loss was CHF 2 503 million higher (2013: CHF 1 759 million higher) than the contractual amount at maturity. The change in fair value in financial liabilities designated at fair value through profit or loss that is attributable to changes in credit risk for the year 2014 amounts to a CHF 132 million gain (2013: CHF 115 million gain)
18. RELATED PARTIES
Transactions and outstanding balances with related party shareholders (DB AG and SNCF) are disclosed in Note 9 - Equip-ment financing contracts.
Salaries and other benefits paid to key management personnel in 2014 and included within General administrative ex-penses amounted to CHF 3.2 million (2013: CHF 5.6 million).There are no outstanding amounts due to key management personnel per year-end 2014 (2013: CHF 1.2 million).
19. POST BALANCE SHEET EVENTS
On proposal from the Management, the Board of Directors adopted the Financial Statements on March 20, 2015, and authorized their submission to the General Assembly for approval on the same date. The General Assembly approved the financial statements.
20. PROPOSED APPROPRIATION OF THE SURPLUS
With last year’s unappropriated surplus of CHF 740 505 carried forward and the net profit for the financial year 2014 of CHF 32 873 264, the surplus to be distributed is CHF 33 613 769. In accordance with Article 29 of the Statutes, the Board of Directors proposes the following allocation of the surplus to the General Assembly:
CHF
Appropriation to the ordinary reserve 1 644 000
Dividend of 0% (statutory maximum is 4%) on the paid-in share capital of 520 million 0
Appropriation to the guarantee reserve 26 500 000
Appropriation to the fund for general risks 5 000 000
Unappropriated surplus to be carried forward 469 769
64
Annual Report 2014 Annual Report 2014
65
Auditor’s Report
66
Annual Report 2014 Annual Report 2014
67

Milestonesin development
Annual Report 2014

1957 First issue in Swiss francs1961 First issue in Dutch guilders1962 First share capital increase from 50 to 100 million
Swiss francs1964 First issue in Deutsche Mark1967 First issue in US dollars 1970 Second share capital increase from 100 to 300
million Swiss francs1971 First issue in French francs First issue in Luxembourg francs1972 First issue in Belgian francs1976 Third share capital increase from 300 to 500 million
Swiss francs1978 First issue in Yen in the “Samurai” market1979 First issue in Austrian shillings1982 First issue in Sterling1984 Extension of the duration of the company for
another 50 years, until 2056 Fourth share capital increase from 500 to 750
million Swiss francs1986 First issue in Italian lira1987 EUROFIMA opens the Spanish “Matador” market First issue in Australian, Canadian and New
Zealand dollars1989 First issue in Swedish krona First issue in Portuguese escudos1990 Fifth share capital increase from 750 to 1 050
million Swiss francs1992 Admission of the Hungarian State Railways (MÁV)1993 Sixth share capital increase from 1 050 to 2 100
million Swiss francs 1994 Admission of the Croatian (HŽ) and the Slovenian
(SŽ) Railways 1995 First issue in Hong Kong dollars1996 Admission of the Railways of Bosnia and
Herzegovina (ŽBH) and the Railways of the Former Yugoslav Republic
of Macedonia (CFARYM)1997 First issue in South African rand Seventh share capital increase from 2 100 to 2 600
million Swiss francs
1998 First issue in Czech koruna First issue in Polish zlotys First issue in Greek drachmas1999 First issue in euro Admission of the Bulgarian State Railways (BDZ)2001 Admission of the Railways of the Slovak Republic
(ŽSSK) First domestic “Kangaroo” issue in Australian
dollars 2002 First issue in Norwegian krona Admission of the Railways of the Czech Republic
(ČD)2004 First US dollar 1 billion benchmark issue2005 First issue in Mexican pesos First issue in Turkish lira First domestic “Maple” issue in Canadian dollars2006 First issue in Icelandic krona2007 First Swiss franc 1 billion benchmark issue2008 First domestic “Kauri” issue in New Zealand dollars First issue in the Japanese “Uridashi” market2010 First euro 1 billion benchmark issue2013 First US dollar FRN 1 billion benchmark issue
Milestones in development
Designed by SinergicaGENOVA, ITALY
Photos kindly provided by SBB and SNCF
70
Annual Report 2014

Rittergasse 20P.O. Box 1764CH-4001 Basel, Switzerland
Tel.: +41 61 287 33 40Fax: +41 61 287 32 40
www.eurofima.org