annual report 2012 - annualreports.com
TRANSCRIPT

ANNUAL REPORT 2012
tor
m A
/S ANN
UAL R
EPOR
T 2012


3
TORM 2012
CoNtENtS
HigHligHtS
Introduction 4
Five-year key figures 6
2012 highlights 7
Outlook 2013 8
Strategic direction 11
DiviSioNS
Tanker Division 12
Tanker Division – supply and demand 14
Bulk Division 16
Bulk Division – supply and demand 18
About torm
People 20
Corporate Social Responsibility 22
Risk management 25
Corporate governance 28
Board of Directors and Executive Management 31
Investor information 33
FiNANCiAl StAtEmENtS 2012
Financial review 2012 38
Consolidated income statement 46
Consolidated statement of comprehensive income 47
Consolidated balance sheet 48
Consolidated statement of changes in equity 50
Consolidated cash flow statement 51
Notes 52
Management’s and auditor’s report 86
Parent Company 2012 89
Fleet overview 102
Glossary 104
TORM A/S · Tuborg Havnevej 18 · DK-2900 Hellerup · Denmark · Tel.: +45 3917 9200 · www.torm.com · Founded: 1889 · CVR: 22460218

4
TORM 2012
Highlights
iNtroDuCtioN2012 was marked by the uncertainty surrounding the Company’s financial situation and the continued adverse market conditions in the product tanker and dry bulk markets. TORM succeeded in its endeavors of reaching a Restructuring Agreement with its lenders and time charter partners while simultaneously driving considerable operational improvements. This has created a stronger foundation for TORM as a major player in the cyclical shipping markets going forward.
RestRuctuRingIn November 2012, TORM completed a restructuring with the cooperation of the Company’s lenders and time charter partners, which provides the Company with a stable platform for the coming years. The solution secured TORM deferral of bank debt, new liquidity and substantial savings from the restructured time charter fleet.
BANK DEBTAs part of the restructuring, TORM secured a new working capital facility of USD 100 million until 30 September 2014.
The group of banks aligned key terms and conditions as well as financial covenants across all existing debt facilities, and all maturities on existing credit facilities were adjusted until 31 December 2016. The bank debt remains unimpaired.
Interest on the existing debt will only be paid if the Company has sufficient liquidity and otherwise rolled over until at least 30 June 2014 with potential extension until 30 September 2014. The Company will pay interest on the new working capital facility.
The new financing agreements provide a deferral of installments on the existing bank debt until 30 September 2014. In this period, rescheduled principal amortization only falls due if the Company has sufficient liquidity. Provided that TORM generates sufficient cash, specific cash sweep mechanisms will apply.
Certain specific option rights were agreed with three bank groups that may trigger a sales process for up to 22 vessels and repayment of the related debt. Only one bank group has exercised the option on five vessels, and TORM has subsequently accounted for the assets as held for sale in the financial statements.
CHARTERED-IN TONNAGEAs part of the restructuring, the time charter-in partners accepted that the time charter-in contracts were either permanently changed and rates aligned to market terms or allowed for termination with redelivery of the vessels. These amendments resulted in a significant reduction of the Company’s future time charter commitments with an
estimated total positive nominal mark-to-market impact on TORM of approximately USD 270 million. As part of the restructuring, TORM redelivers 22 vessels ahead of the original contract schedule.
NEW SHAREHOLDER STRUCTUREThe outstanding amount that the time charter partners had as a consequence of the amended contractual conditions as well as a fee to the banks were estimated to an agreed debt of USD 200 million that was converted into new shares in the Company. The banks received 73% ownership and the time charter partners 17%, while the existing shareholders retained 10% ownership, compared to the 7.5% communicated at the Annual General Meeting in April 2012. The Danish Financial Supervisory Authority subsequently issued an exemption from the Danish mandatory takeover rules. In December 2012, TORM published a listing prospectus to admit the new shares for trading on NASDAQ OMX Copenhagen.
ACCOUNTING EFFECTSThe restructuring resulted in a net accounting loss of USD 145 million, mainly related to cancelled time charter agreements, which is recognized in profit/loss. In addition, the restructuring resulted in special financial expenses of USD 65 million. The restructuring also included the above-mentioned USD 200 million capital increase.
2012 peRfoRmanceTORM incurred a clearly unsatisfactory loss before tax of USD 579 million in 2012. The performance is in line with the revised forecast of 27 February 2013. The results include special items of USD 210 million from the restructuring and recognized impairment charges of USD 116 million related to FR8 and assets held for sale. The operational loss of USD 253 million before special items of USD -326 million was driven by the adverse market conditions during 2012 in both the product tanker and dry bulk segments. In addition, the Bulk and Tanker Divisions’ results were to a significant degree adversely affected by TORM’s challenging financial position up until the completion of the restructuring by the end of the year.
The product tanker freight rates remained under pressure in 2012 as the markets continued to suffer from tonnage oversupply. Global growth indicators were sluggish, which negatively impacted the oil product transportation. Nevertheless, by leveraging strong customer relationships and scale benefits and despite the critical financial situation, TORM achieved high fleet utilization as well as earnings above spot market benchmarks.
The dry bulk market also suffered from a record-high tonnage influx combined with slower demand growth,

5
TORM 2012
Highlights
especially in China. Freight rates were generally at a lower level than experienced in 2011. During 2012, TORM strengthened its customer relations and signed the largest number of contract cargoes in the history of the Company.
During the year, TORM took delivery of two MR newbuild-ings (TORM Arawa and TORM Anabel) and reduced its owned fleet by two product tankers (TORM Lana and TORM Ugland) in addition to cancelling one newbuilding contract with scheduled delivery in 2014. The sales and cancellations were completed as part of TORM’s efforts to generate liquidity and reduce debt while negotiating the restructuring. As part of the restructuring, TORM has redelivered one finance lease vessel.
Despite difficult circumstances, TORM’s organization continued to improve its performance in important areas such as customers, quality, costs, safety and environment. These improvements are described in more detail on the following pages.
A special word of appreciation to TORM’s entire organiza-tion for a remarkable performance during a particularly challenging period in the Company’s 124-year history. This
performance level bodes well for the future. TORM would also like to thank all external stakeholders for their continued support.
2013 going foRwaRdTORM has now created a financial and operational platform for the coming years, which will give the Com-pany time to achieve a more permanent long-term capital structure. The Board and Management are confident that the Company will demonstrate the ability to create a long-term foundation for the Company in close coopera-tion with its lenders and shareholders.
TORM will in 2013 focus on driving further performance improvements, i.e. forging even stronger customer relations, continue quality improvements, maintaining the highest safety, environment and CSR standards as well as delivering cost-efficient operations.
The shipping environment is expected to remain volatile in the coming years, but TORM seeks to take advantage of the gradual market improvement.
Chairman of the Board, Flemming Ipsen (left), and CEO of TORM, Jacob Meldgaard (right).
Flemming Ipsen, Chairman of the Board Jacob Meldgaard, CEO

6
TORM 2012
Highlights
FivE-YEAr KEY FigurES2012 2011 2010 2009 2008
iNComE StAtEmENt (uSD millioN)
Revenue 1,121 1,305 856 862 1,184Time charter equivalent earnings (TCE) 466 644 561 633 906Gross profit -93 81 180 243 538EBITDA -195 -44 97 203 572Operating profit/(loss) (EBIT) -449 -389 -80 50 446Financial items -131 -63 -57 -69 -86Profit/(loss) before tax -579 -451 -136 -19 360Net profit/(loss) for the year -581 -453 -135 -17 361Net profit/(loss) for the year excl. impairment charges and restructuring costs -255 -253 -100 3 361
bAlANCE SHEEt (uSD millioN)
Non-current assets 1,971 2,410 2,984 2,944 2,913Total assets 2,355 2,779 3,286 3,227 3,317Equity 267 644 1,115 1,247 1,279Total liabilities 2,088 2,135 2,171 1,981 2,038Invested capital 2,123 2,425 2,987 2,926 2,822Net interest-bearing debt 1,868 1,787 1,875 1,683 1,550Cash and cash equivalents 28 86 120 122 168
CASH FloW (uSD millioN)
From operating activities -100 -75 -1 116 385From investing activities, 0 168 -187 -199 -262 thereof investment in tangible fixed assets -59 -118 -254 -289 -378From financing activities 42 -128 186 37 -59Total net cash flow -57 -34 -2 -46 63
KEY FiNANCiAl FigurES*)
Gross margins: TCE 41.5% 49.4% 65.5% 73.4% 76.5% Gross profit -8.3% 6.2% 21.0% 28.2% 45.4% EBITDA -17.3% -3.4% 11.3% 23.5% 48.3% Operating profit -40.0% -29.8% -9.3% 5.8% 37.7%Return on Equity (RoE) -127.4% -51.5% -11.4% -1.3% 30.6%Return on Invested Capital (RoIC)**) -19.7% -14.4% -2.7% 1.7% 16.4%Equity ratio 11.4% 23.2% 33.9% 38.6% 38.6%Exchange rate DKK/USD, end of period 5.66 5.75 5.61 5.19 5.28Exchange rate DKK/USD, average 5.79 5.36 5.62 5.36 5.09
SHArE-rElAtED KEY FigurES*)
Earnings/(loss) per share, EPS (USD) -3.3 -6.5 -2.0 -0.3 5.2Diluted earnings/(loss) per share, EPS (USD) -3.3 -6.5 -2.0 -0.3 5.2Cash flow per share, CFPS (USD) -0.6 -1.1 0.0 1.7 5.6Proposed dividend per share (USD)***) 0.00 0.00 0.00 0.00 0.76Proposed dividend per share (DKK) 0.00 0.00 0.00 0.00 4.00Extraordinary dividend per share (DKK) 0.00 0.00 0.00 0.00 4.50Share price in DKK, end of period (per share of DKK 0.01 each) ****) 1.7 3.7 39.7 50.7 55.5Number of shares, end of period (million) 728.0 72.8 72.8 72.8 72.8Number of shares (excl. treasury shares), average (million) 178.2 69.5 69.3 69.2 69.2
*) Key figures are calculated in accordance with the recommendations from the Danish Society of Financial Analysts. **) Return on Invested Capital is defined as: Operating profit divided by average Invested capital, defined as average of beginning and ending balances of
(equity plus Net interest bearing debt less Non-operating assets).***) Proposed dividend per share has been translated into USD using the USD/DKK exchange rate at year-end for the year in question.****) 2008-2011: DKK 5.00 each.

7
TORM 2012
Highlights
• In 2012, the Company incurred a loss before tax of USD 579 million. This is clearly unsatisfactory and impacted by special items of USD -326 million including restructuring costs of USD 210 million, impairment loss from assets held for sale of USD 74 million, an impairment loss of USD 42 million related to FR8 (see “Financial Review” page 38 for more details). The performance is in line with the revised forecast of 27 February 2013.
• Throughout 2012, the Tanker Division’s earnings were negatively impacted by low freight rates and continued tonnage oversupply in the global product tanker market. The continued European financial crisis and a slowdown in GDP growth in China and the USA negatively affected global indicators. Combined, these factors led to a slowdown in global oil consumption, consequently adversely impacting oil product transportation. The Tanker Division’s result was to a significant degree adversely affected by TORM’s financial situation in 2012.
•During 2012, dry bulk freight rates continued to be volatile and under pressure. The dry bulk spot market stayed volatile due to seasonality and events such as the drought during the US grain season, the Indonesian raw material export ban and the tropical storms Isaac and Sandy. In 2012, the bulk market saw the highest level of newbuilding deliveries ever recorded. However, demand from China continued to be strong. The Bulk Division experienced a high number of waiting days in 2012 due to the Company’s challenging financial situation.
• The Company’s 2012 performance was negatively impacted by a USD 16 million net loss from the sale of TORM Lana and the cancellation of one product tanker newbuilding contract. In addition, there was a loss of USD 10 million from the termination of finance lease vessels in connection with the restructuring. Five MR vessels are accounted for as assets held for sale with an impairment charge of USD 74 million.
• As stated in company announcements no. 31 dated 2 October 2012 and no. 32 and no. 33 dated 5 November 2012, TORM entered into a Restructuring Agreement with its banks and time charter partners that secured the Company deferral of bank debt, new liquidity and substantial savings from the restructured time charter book. The receivable that the time charter partners were given for the amended contractual conditions as well as
a fee to the banks, estimated at a total net present value of USD 200 million, has been converted into shares in TORM, corresponding to 90% of the shares in the Company. Consequently, the existing shareholders retained an ownership interest of 10%.
• As of 31 December 2012, cash totaled USD 28 million and undrawn credit facilities amounted to USD 42 million. TORM has no newbuilding order book and therefore no CAPEX commitments related hereto.
• The book value of the fleet excluding finance lease vessels as of 31 December 2012 was USD 1,934 million. Based on broker valuations, TORM’s fleet excluding finance lease vessels had a market value of USD 1,145 million as of 31 December 2012. In accordance with IFRS, TORM estimates the fleet’s total long-term earning potential each quarter based on discounted future cash flows. The estimated value of the fleet as of 31 December 2012 supports the carrying amount.
• As of 31 December 2012, net interest-bearing debt amounted to USD 1,868 million.
• As of 31 December 2012, equity amounted to USD 267 million (DKK 1,513 million), corresponding to USD 0.4 per share (DKK 2.1) excluding treasury shares, resulting in an equity ratio of 11%.
• As of 31 December 2012, 8% of the total earning days in the Tanker Division for 2013 were covered at a rate of USD/day 15,126 and 66% of the total earning days in the Bulk Division at USD/day 13,155.
• For the full year 2013, TORM forecasts a loss before tax of USD 100-150 million before potential vessel sales and impairment charges. TORM expects to remain in compliance with the financial covenants for 2013. In addition, TORM expects to be operational cash flow positive after interest payment. The uncertainties and sensitivities about freight rates and asset prices may have an effect on the Company’s compliance with the financial covenants. As 24,676 earning days are uncovered at year-end 2012, a change in freight rates of USD/day 1,000 would impact profit before tax by USD 25 million.
• The Board of Directors proposes that no dividend be distributed for 2012.
2012 HigHligHtS 2012 proved challenging for shipping in general and in particular TORM faced uncertainty
for a prolonged period. On a positive note, TORM succeeded in achieving a financial restructuring, which brings stability to the Company for the coming period. The Board of Directors is confident that TORM together with its most important stakeholders will re-establish the foundation for a stronger company going forward,
says Chairman of the Board Flemming Ipsen.

8
TORM 2012
Highlights
eaRnings and coveRage foR 2013For the full year 2013, TORM forecasts a loss before tax of USD 100-150 million before potential vessel sales and impairment charges. TORM expects to remain in compliance with the financial covenants for 2013. In addition, TORM expects to be operational cash flow positive after interest payment. The uncertainties and sensitivities about freight rates and asset prices may have an effect on the Company’s compliance with the financial covenants. As 24,676 earning days are uncovered at year-end 2012, a change in freight rates of USD/day 1,000 would impact profit before tax by USD 25 million.
As of 31 December 2012, the Tanker Division had covered 8% of the total earning days in 2013 at an average rate of USD/day 15,126 against 14% at an average rate of USD/day 15,002 at the same time in 2011.
As of 31 December 2012, the Bulk Division had covered 66% of the total earning days in 2013 at an average rate of USD/day 13,155 against 87% at an average rate of USD/day 13,906 at the same time in 2011.
The table on this page shows the effect of variations in the expected freight rates for product tankers and bulk carriers on the result before tax for 2013.
As of 31 December 2012, the interest-bearing bank debt totaled USD 1.904 million. 97% of the interest is fixed for three months and 3% for one month. This corresponds to 24% of TORM’s 2013 interest expenses being fixed (at an average fixed interest rate of 2.83% including the margin). A change in interest rates of 25 basispoints would impact the result before tax by USD 4 million.
The most important factors affecting TORM’s earnings in 2013 are:• Global economic growth• Consumption of refined oil products• Oil trading activity and developments in ton-miles• Commodities transport, in particular iron ore and coal• Fleet growth from addition of vessels, scrapping of
vessels and delays to deliveries from the order book• One-off market shaping events such as strikes,
embargoes, political instability, weather conditions, etc.• Potential difficulties of major business partners• TORM’s profile as a counterpart
outlook foR the tankeR divisionThe product tanker market is expected to gradually improve during 2013. Going forward, TORM expects increasing oil consumption and increased ton-miles effects from relocation of refinery capacity to increase demand. The supply side is still affected by the tonnage influx in 2008-2012, which resulted in ample tonnage supply. However, a manageable order book, scrapping of existing tonnage and possible postponement of newbuild-ings will reduce supply growth and impact rates positively. Freight rates are expected to be volatile and uncertainty exists related to the level of newbuilding ordering going forward.
TORM does not publish its freight rate forecast, but instead provides market expectations as of 1 March 2013 on page 10.
outlook foR the Bulk divisionTORM remains cautious about the prospects for the dry bulk market in 2013 due to the expected high level of newbuilding deliveries across all segments. Freight rates are expected to remain under pressure due to the oversupply of tonnage and the market’s significant dependence on China coupled with seasonal demand fluctuations.
TORM does not publish its freight rate forecast, but instead provides market expectations as of 1 March 2013 on page 10.
outlooK 2013•For 2013, TORM forecasts a loss before tax of USD 100-150 million before potential vessel
sales and impairment charges
•Given the number of open earning days, profit/loss before tax will be impacted by USD 25 million in case of a freight rate change of USD/day 1,000
2013 NEt ProFit SENSitivitY to CHANgES iN FrEigHt rAtES
Change in freight rates (USD/day) USD million -2,000 -1,000 1,000 2,000
LR2 -6.0 -3.0 3.0 6.0 LR1 -4.5 -2.2 2.2 4.5 MR -27.8 -13.9 13.9 27.8 Handysize -7.9 -3.9 3.9 7.9 tanker division -46.2 -23.1 23.1 46.2
Panamax -5.1 -2.6 2.6 5.1 Handymax 2.0 1.0 -1.0 -2.0 Bulk division -3.2 -1.6 1.6 3.2
total -49.4 -24.7 24.7 49.4

9
TORM 2012
Highlights
CovErED AND CHArtErED-iN EArNiNg DAYS iN torm AS oF 31 DECEmbEr 2012
2013 2014 2015 2013 2014 2015Owned days
LR2 2,760 2,904 2,880 LR1 2,492 2,497 2,495 MR 12,459 12,223 12,168 Handysize 3,933 3,920 3,883 Tanker Division 21,645 21,544 21,425 Panamax 726 682 726 Handymax - - - Bulk Division 726 682 726
total 22,371 22,226 22,151
T/C-in days at fixed rate T/C-in costs, USD/dayLR2 - - - - - - LR1 - - - 12,296 - - MR 203 726 726 13,959 15,145 15,895 Handysize - - - - - - Tanker Division 1,251 726 726 13,690 15,145 15,895 Panamax 2,705 1,816 1,676 9,515 12,393 12,225 Handymax 233 - - 10,991 - -Bulk Division 2,938 1,816 1,676 9,632 12,393 12,225
total 4,189 2,542 2,402 10,844 13,179 13,335
T/C-in days at floating rateLR2 726 721 726 LR1 - - - MR 1,360 1,810 1,727 Handysize - - - Tanker Division 2,086 2,531 2,453 Panamax 636 411 363 Handymax 363 363 363Bulk Division 999 774 726
total 3,085 3,305 3,179
Total physical days Total covered daysLR2 3,486 3,625 3,606 475 353 6 LR1 2,695 2,497 2,495 456 174 - MR 14,868 14,759 14,621 963 - - Handysize 3,933 3,920 3,883 1 - - Tanker Division 24,982 24,801 24,604 1,895 527 6 Panamax 4,067 2,909 2,765 1,499 25 - Handymax 596 363 363 1,575 869 908 Bulk Division 4,663 3,272 3,128 3,074 895 908
total 29,645 28,072 27,732 4,969 1,422 914
Covered, % Coverage rates, USD/dayLR2 14% 10% 0% 15,891 15,316 13,993 LR1 17% 7% 0% 16,461 15,666 - MR 6% 0% 0% 14,109 - - Handysize 0% 0% 0% 23,536 - - Tanker Division 8% 2% 0% 15,126 15,432 13,993 Panamax 37% 1% 0% 15,299 20,372 - Handymax 264% 240% 250% 11,113 16,612 16,853 Bulk Division 66% 27% 29% 13,155 16,718 16,853
total 17% 5% 3% 13,907 16,241 16,835
Fair value of freight rate derivatives that are mark-to-market in the income statement (USD million): Contracts not included above 0.0, Contracts included above 1.3.notes: Actual no. of days can vary from projected no. of days primarily due to vessel sales and delays of vessel deliveries. T/C-in days at fixed rate do not inclu-de effects from profit split arrangements. For T/C-in days at floating rate, rates are determined at the entry of every half year, and then TORM will receive approximately 10% profit/loss compared to this rate.

10
TORM 2012
Highlights
Matters discussed in this release may constitute forward looking statements. Forward-looking statements reflect our current views with respect to future events and financial performance and may include statements concerning plans, objectives, goals, strategies, future events or performance, and underlying assumptions and other statements, which are other than statements of historical facts.
The forward-looking statements in this release are based upon various assumptions, many of which are based, in turn, upon further assumptions, including without limitation, Management’s examination of historical operating trends, data contained in our records and other data available from third parties.
Although TORM believes that these assumptions were reasonable when made, because these assumptions are inherently subject to significant uncertainties and contin-gencies which are difficult or impossible to predict and are beyond our control, TORM cannot assure you that it will achieve or accomplish these expectations, beliefs or projections.
Important factors that, in our view, could cause actual results to differ materially from those discussed in the forward-looking statements include the conclusion of definitive waiver documents with our lenders, the strength of world economies and currencies, changes in charter hire rates and vessel values, changes in demand for “ton miles” of crude oil carried by oil tankers, the effect of changes in OPEC’s petroleum production levels and worldwide oil consumption and storage, changes in demand that may affect attitudes of time charterers to scheduled and unscheduled dry-docking, changes in TORM’s operating expenses, including bunker prices, dry-docking and insurance costs, changes in governmental rules and regulations including requirements for double hull tankers or actions taken by regulatory authorities, potential liability from pending or future litigation, domestic and international political conditions, potential disruption of shipping routes due to accidents and political events or acts by terrorists.
Risks and uncertainties are further described in reports filed by TORM with the US Securities and Exchange Commission, including the TORM Annual Report on Form 20-F and its reports on Form 6-K. See page 30 in the Annual Report.
safe haRBoR statement
tCE rAtES iN tHE ForWArD CoNtrACt mArKEt For tHE ProDuCt tANKEr AND tHE bulK SEgmENtS AS oF 1 mArCH 2013
2012 2013
USD/day realized Q2 Q3 Q4
Product tankerLR2 10,735 - - -LR1 12,294 13,000 14,000 15,000MR 12,042 14,750 13,000 15,750Handysize 12,196 - - -Dry bulkPanamax 10,248 9,450 7,400 7,950Handymax 10,481 7,575 6,825 7,100
There is no active forward derivatives market for LR2 and Handysize vessels. Source: IMAREX, Fuel Forward swaps, TORM. Earnings represent a roundtrip voyage, i.e. including a ballast back to the load port. Actual income will increase significantly when optimizing trading of vessels. Typically TORM has outperformed the forward contract market for product tankers.

11
TORM 2012
Highlights
QUALITY
SAFETY, ENVIRONMENT
AND CSR
COSTS
CUSTOMERS
StrAtEgiC DirECtioN
The Company will in the short to medium term operate under constraints which are a consequence of the current capital structure.
TORM’s strategic framework focuses on four common goals: • Putting customers first: for example achieve full
customer reach and thereby outperform available earnings benchmarks
• Ensuring quality in everything: for example improve technical and commercial tradability and deliver optimized processes
• Acting responsibly: for example maintaining the highest safety, environment and CSR standards
• Operating in a cost-efficient manner: for example delivering on TORM’s cost program with USD 100 million in accumulated savings between 2012 and 2014
pRoduct tankeR segmentTORM’s business model in this segment centers on its continued presence in the spot market. This will allow the Company to take advantage of the anticipated volatility and a market recovery. In the short term, TORM will not seek higher coverage than the current levels, as the Company is of the opinion that there is an upside potential in the market. However, TORM will seek to take coverage if market conditions provide sufficiently attractive rate levels.
TORM will continue to strengthen the service offering to customers in terms of quality, flexibility and proximity. For instance, TORM strives to be a quality carrier approved at all times by a pre-defined, representative group of oil majors, thus securing optimal trading flexibility and profitability. During 2012, TORM again improved its performance on this objective by 2 percentage points. On proximity, TORM has reorganized the structure of its Tanker Division into supporting all vessel segments depending on the geographical location of the customers. By doing so, the Company mirrors the organization and needs of individual customers, thereby enhancing customer relationships.
As of 31 December 2012, TORM owned 65 product tankers and had chartered in 11 vessels.
Bulk segmentTORM will continue its transformation from a tonnage provider to a freight service provider to primarily industrial customers. During 2012, TORM expanded its cargo book with several new contracts of affreightment (COAs) with new and existing customers.
TORM holds a cautious view on the dry bulk markets for the coming period. Therefore, the Company will minimize market risk by maintaining a high coverage for 2013 and TORM intends to gradually increase coverage for 2014. The coverage will be achieved by a mix of reletting the time chartered-in fleet and concluding COAs.
As of 31 December 2012, TORM owned two dry bulk vessels and operated a long-term time chartered-in fleet of eight vessels, which will be complemented by a number of vessels for spot voyages to optimize the COA program.
•Maintaining upside potential with a spot-oriented product tanker fleet
•Serve as a freight service provider in bulk

12
TORM 2012
Divisions
TANKER FREIGHT RATES 2012Source: Clarksons
USD/day
Ras Tanura Chiba Clean 75K Average Earnings - LR2
Ras Tanura Chiba Clean 55K Average Earnings - LR1
Rotterdam New York Clean 37K Average Earnings - MR
Oct Nov DecJul Aug SepApr May JunFeb MarJan0
5,000
10,000
15,000
20,000
25,000
30,000
USD million
ASSET PRICES ON FIVE-YEAR-OLD SECOND-HAND PRODUCT TANKERS IN 2012Source: Clarksons
Oct Nov DecJul Aug SepApr May JunFeb MarJan0.00
5.00
10.00
15.00
20.00
25.00
30.00
35.00
40.00
45.00
LR2 LR1 MR Handsize
tANKEr DiviSioN
Product tanker freight rates continued to be under pressure in 2012 as the markets continued to suffer from tonnage oversupply. Global economic growth indicators were sluggish, which hampered the global oil consumption and subsequently the refined oil product transportation. Asset prices for product tankers declined during 2012.
In the first quarter of 2012, the freight markets for especially the larger segments (LRs) continued at the low levels from end-2011. This was mainly due to reduced demand for naphtha in the East and a weak Arabian Gulf market impacted by temporary refinery closures and limited arbitrage opportunities. The freight rates for medium-sized vessels (MRs) were positively influenced by Brazilian imports leading to increasing ton-miles. However, lower imports and domestic demand of gasoline in the USA put the market under pressure.
In the second quarter of 2012, the jet oil arbitrage to Europe opened, increasing the freight rates for LRs in the East. The MR freight rates were negatively affected in the West by a lack of diesel arbitrage between the USA and Europe as well as closed arbitrage for gasoline from Europe to the USA due to weaker US East Coast demand.
In the third quarter of 2012, freight rates continued at low levels, mainly due to mixed global growth signals and a
supply overhang of tonnage. The eastern market was stronger, and LRs were supported by the increased long haul fixtures from the Arabian Gulf to Brazil and the naphtha trade in general, together with the distillate arbitrage from the Middle East to the West. The western market remained weak, and MRs were impacted by planned refinery maintenance in Europe and continued limited diesel trade from the US Gulf to Europe. Rates firmed up following a refinery explosion in Venezuela, leading to increased long haul trades from the US Gulf. MRs were positively impacted by new trades created by the permanent closures of refineries in Australia.
The fourth quarter of 2012 showed a positive development in MR freight rates in the West triggered by the hurricane Sandy’s landfall on the US East Coast at the end of October, which had a short-term impact, leading to product supply disruptions through refinery shutdowns and reduced productivity. At the same time, refinery outages on the US West Coast positively impacted the ton-miles factor through an increased product flow from the US Gulf and the Far East. The eastern market was positively impacted by continued distillates arbitrage to Europe, increased naphtha demand, arbitrage opportunities driven by an improved economic outlook in the Far East economies and an increasing demand for ethylene in China.
•Despite TORM’s challenging financial position, commercial benchmarks were still outperformed
•Continued global economic weakness adversely affected freight rates
•Reorganization to enhance customer relations

13
TORM 2012
Divisions
Despite TORM’s challenging financial position, TORM once again outperformed the commercial spot benchmarks by 9%, 13% and 37% for LR2, LR1 and MR, respectively (source: Clarksons benchmarks on TC1, TC2, TC5). This is due to TORM’s strong customer relations and the Com-pany’s scale effects. Nevertheless, TORM’s result exclud-ing restructuring effects was a loss for the year of USD 156 million before impairment losses of USD 74 million (2011: USD 107 million before impairment losses of USD 187 million).
In October 2012, TORM reorganized the Tanker Division to focus on the geograph ical location of the customers and covering all vessel segments. By doing so, the Company
mirrors the organization and needs of individual custom-ers better and enhances customer relations.
During the first quarter of 2012, one MR product tanker was sold and one MR product tanker newbuilding was cancelled. In addition, TORM took delivery of two MR product tanker newbuildings. In the second quarter of 2012, TORM sold its share in a joint venture in which the main asset was the 2007-built LR1 vessel TORM Ugland.
At year-end 2012, TORM owned 65 product tankers and had chartered in 11 vessels. Furthermore, TORM operated 20 vessels primarily in the LR2 Pool. There were no newbuildings on order.
tANKEr DiviSioN
2011 2012 2012
USD million Total Q1 Q2 Q3 Q4 Total
iNComE StAtEmENt ExCL. RESTRUCTURiNg EFFECTS*)Revenue 958.7 251.4 232.6 214.0 219.1 917.1 Port expenses, bunkers and commissions -510.7 -138.7 -137.0 -128.9 -133.5 -538.1 Freight and bunker derivatives 4.9 -0.4 -0.1 0.4 -0.5 -0.6 time charter equivalent earnings 452.9 112.3 95.5 85.5 85.1 378.4
Charter hire -199.3 -51.2 -43.7 -39.4 -19.5 -153.8 Operating expenses -161.8 -39.6 -40.4 -41.6 -43.9 -165.5 gross profit/(loss) (net earnings from shipping activities) 91.8 21.5 11.4 4.5 21.7 59.1
Net profit from sale of vessels -11.6 -15.9 0.0 0.0 -0.1 -16.0 Administrative expenses -58.0 -14.9 -14.8 -13.0 -16.2 -58.9 Other operating income 2.7 0.5 0.3 0.4 -0.6 0.6 Share of results of jointly controlled entities 9.7 0.1 -5.5 0.3 0.1 -5.0 eBitda 34.6 -8.7 -8.6 -7.8 4.9 -20.2
Depreciation incl. impairment losses -328.6 -33.3 -33.5 -34.4 -108.4 -209.6
operating profit/(loss) (eBit) -294.0 -42.0 -42.1 -42.2 -103.5 -229.8
*) Please refer to ’Financial Review’ on page 38 for further details.
LR1 product tanker TORM Estrid discharging vacuum gasoil at Proevestenen in Denmark.

14
TORM 2012
Divisions
LR2 LR1 MR Handysize
% of existing fleet
YEARLY NET FLEET GROWTH (BASED ON NO. OF VESSELS)Source: SSY
-10
-5
0
5
10
15
20
25
2013e2012201120102009
tANKEr DiviSioN – SuPPlY AND DEmAND
supplYThe existing global product tanker fleet at the end of 2011 consisted of a total of 2,492 vessels: 225 LR2 vessels, 330 LR1 vessels, 1,253 MR vessels and 684 Handysize vessels. At the end of 2012, the global product tanker fleet totaled 2,535 vessels, comprising 228 LR2 vessels, 339 LR1 vessels, 1,287 MR vessels and 681 Handysize vessels. This corresponds to an overall fleet growth of 1.8% (2.2% in terms of capacity), ranging from -0.4% for Handysize vessels to 2.7% for LR1 and MR vessels (source: broker estimates).
The development in the supply situation is a function of the existing product tanker order book, newbuilding orders, cancellations, postponed deliveries of orders (slippage) and phasing out of older product tankers.
NEWBUILDING ORDER BOOKAt the end of 2012, the existing order book of product tankers for delivery in 2013-2015 came to 257 vessels: 15 LR2 vessels, 18 LR1 vessels, 198 MR vessels and 26 Handysize vessels. This corresponds to a gross increase in the period of between 4% and 15% depending on the segment, which relatively is one of the lowest order books in the shipping industry.
New contracting in 2012 gained momentum (+125% year-on-year) as a result of newbuilding prices slipping to a nine-year low and new fuel-efficient designs becoming available. During 2012, more than 80% of the orders placed were in the MR segment.
CANCELLATIONS AND POSTPONEMENTSSince the global financial downturn began in 2008, shipyards and shipping companies have cancelled newbuilding orders and generally renegotiated newbuild-ing contracts. TORM estimates that the cancellation of newbuilding orders has already reduced the original global product tanker order book for 2013-2015 by 10%.
In both 2011 and 2012, approximately 30% of the scheduled deliveries did not materialize due to cancellations and delivery slippage. Whereas some slippage is also expected in 2013 and beyond, the extent of this is not likely to reach the same level as in recent years.
PHASING OUT OF OLDER AND SINGLE-HULLED VESSELSInternational Maritime Organization (IMO) regulations on single-hulled tankers have resulted in the majority of these older vessels having already been phased out. In 2012, approximately three quarters of vessels scrapped were double hulls. Older vessels will continuously be phased out, as it is increasingly difficult to trade older tonnage. It is expected that approximately 6% of the existing vessels in the global fleet will be phased out or scrapped in the period from 2013-2015. The Handysize segment is estimated to phase out roughly 11% of the fleet during 2013-2015.
NEWBUILDINGSTORM anticipates that there will be limited ordering of new product tankers, which can be delivered before the end of 2014. The Company expects that the new ordering activity for 2013 and 2014 will be – in capacity terms – at the same annual level as was the case in 2012.
The product tanker supply is estimated to have a com-pound annual growth rate of approximately 2% during 2013-2015.
•Gradual improvement in the supply and demand balance
•Currently manageable order book for product tankers
•Demand driven by increased oil consumption and relocation of refineries (higher ton-miles factor)

15
TORM 2012
Divisions
*) Converted into standard MR units
Num
ber
of v
esse
ls*)
SUPPLY AND DEMAND 2013-2015 Source: TORM
Swin
g fa
ctor
s
0
200
400
Phas
e ou
t and
scra
ppin
g
Can
cella
tions
Tota
l sup
ply
incr
ease
Ord
er b
ook
gros
s
New
ord
ers
with
deliv
ery
befo
re 2
014
Tota
l dem
and
incr
ease
Incr
ease
dto
n-m
iles
Gro
wth
inoi
l dem
and
Supply Swing factors Demand
demandThere is a correlation between freight rates (total vessel utilization) and GDP growth and global oil demand. TORM’s forecasted demand for transportation of refined oil products is based on various additional factors such as an expansion of the refinery capacity dislocated from the consumption areas, changes to transport patterns and port days.
REFINERY CAPACITY AND TRANSPORTATION (TON-MILES)The net global refinery capacity is estimated to grow by approximately 3.8 million barrels/day during 2013- 2015 (source: IEA). The majority of the refinery additions are located in Asia, in particular in China and India, and in the Middle East. With refinery capacity additions outpacing growth in local demand, a significant part of this new production is expected to be transported long haul by product tankers, mainly to Europe, South America and the USA, where demand outpaces local refinery capacity or refineries are being closed. This figure only includes the confirmed closure of refineries. Several US- and Euro-pean-based refineries may also be closed as they are currently held for sale due to unattractive refining margins.
TORM anticipates the following major changes to refined oil product transportation patterns:• A decline in gasoline imports to the US East Coast,
though imports from the Middle East and India will increase
• An increase in imports of middle distillates to Europe from the US Gulf, the Middle East and India
• An increase in imports of all products to South America and specifically Brazil from all continents (but especially from the US Gulf)
• A decline in trade from China to the Arabian Gulf (e.g. gasoline)
•AnincreaseintradetoWestAfricafromEurope,theArabian Gulf and South East Asia
INCREASE IN OIL DEMANDOil demand is expected to increase by approximately 1.0% or 0.9 million barrels/day to 90.8 million barrels/day in 2013 (source: IEA December 2012). In the following years, 2014 to 2015, cumulated oil demand is expected to grow by 1.4% per year. The non-OECD areas, especially China, the Middle East, Russia and Brazil, are expected to be the areas with the strongest growth in oil demand.
The product tanker ton-miles demand is estimated to have a compound annual growth rate of approximately 3% p.a. during 2013-2015.
swing factoRsA central element in understanding the product tanker market is the swing factors. Swing factors are by definition unpredictable and can create sudden spikes in the product tanker market.
Swing factors are typically major events such as hurri-canes, embargoes, wars, political intervention, strikes, blockage of waterways and ports, geographical product shortages and unforeseen disruptions to refinery produc-tion. Other known factors include slow steaming and potential substitution of product tanker tonnage between crude and product transport. The use of product tanker vessels for floating storage purposes as seen in 2009 and 2010 is also an example of a swing factor, which requires that the oil price is in contango.
Other significant uncertainties are related to newbuilding order activity and potential changes to China’s import and/ or export requirements.
modelThe supply and demand model below is a marginal model taking the main factors into consideration. The model calculates all tonnage in terms of MR equivalents.

16
TORM 2012
Divisions
0.00
5.00
10.00
15.00
20.00
25.00
30.00
35.00
40.00
45.00
ASSET PRICES ON FIVE-YEAR-OLD SECOND-HAND DRY BULK CARRIERS IN 2012Source: Clarksons
Oct Nov DecJul Aug SepApr May JunFeb MarJan
USD million
Panamax Handymax Panamax Handymax
TCE in USD/day
BULK FREIGHT RATES 2012Source: Clarksons
0
2,000
4,000
6,000
8,000
10,000
12,000
14,000
16,000
18,000
Oct Nov DecJul Aug SepApr May JunFeb MarJan
The global bulk fleet grew by approximately 10% in 2012 despite considerable scrapping. The net supply growth is estimated to have been positively impacted by slow steam-ing, lay-up and congestion. Growth in trade volumes in 2012 reached approximately 5% with increased Chinese iron ore imports as the primary driver. The dry bulk demand measured in ton-miles is estimated to have increased less, as Brazil has been losing market share in the Asian iron ore market (source: Clarksons and RS Platou).
Bulk asset prices gradually declined during 2012 due to a high number of newbuilding deliveries exceeding demand growth. For example, the estimated price for a five-year-old second-hand Panamax bulk carrier decreased by 30% during 2012 (Clarksons).
The dry bulk spot market was volatile during 2012 driven by seasonality and events like the drought in the US grain season, the Indonesian raw material export ban and the tropical storms Isaac and Sandy.
The freight rates in the Panamax segment moved between USD/day 3,500 and 13,000 with an average market level of USD/day 7,679, or approximately 45% below 2011 levels (Clarksons, Baltic Dry Index). In addition, the bulk freight market was suffering from general economic unrest, especially concerning the Eurozone area, and a high influx of new tonnage. As a consequence, the bulk freight market
reached the lowest level experienced in the Baltic Dry Index in more than a decade.
In the first quarter of 2012, freight rates were under pressure due to a large number of seasonal newbuilding deliveries. Furthermore, the market was negatively influenced by a slower growth in Chinese commodity demand and a delay in the South American grain season.
The second quarter of 2012 started with a positive sentiment as a result of South American grain coming into season. However, general macroeconomic uncertainty and events like the Indonesian export ban led to an overall negative movement. Especially the larger segments suffered from high tonnage inflow and a decline in volumes from high iron ore prices and high stock levels in Chinese ports.
In the third quarter of 2012, the bulk market continued to be under pressure. The Pacific market was impacted by the monsoon season and in the Atlantic, freight rates were adversely affected by drought, leading to the lowest North American grain yield in six years, as well as a logistical disruption caused by the tropical storm Isaac.
The fourth quarter of 2012 was negatively affected by the seasonal decline in freight rates for both the Atlantic and the Pacific markets. This occurred despite the fact that the demand for iron ore continued to be firm.
bulK DiviSioN•Lowest average spot market in a decade
•The Bulk Division achieved earnings above spot benchmarks

17
TORM 2012
Divisions
bulK DiviSioN
2011 2012 2012
USD million Total Q1 Q2 Q3 Q4 Total
iNComE StAtEmENt ExCL. RESTRUCTURiNg EFFECTS*)Revenue 346.5 59.2 39.7 42.0 63.2 204.1 Port expenses, bunkers and commissions -164.3 -33.5 -24.6 -25.3 -43.9 -127.3 Freight and bunker derivatives 9.2 14.0 -8.0 7.6 -3.1 10.5 time charter equivalent earnings 191.4 39.7 7.1 24.3 16.2 87.3
Charter hire -199.0 -33.2 -16.9 -25.0 -25.4 -100.5 Operating expenses -3.2 -0.7 -1.0 -0.7 -1.0 -3.4 gross profit/(loss) (net earnings from shipping activities) -10.8 5.8 -10.8 -1.4 -10.2 -16.6
Net profit from sale of vessels -40.9 0.0 0.0 0.0 0.0 0.0 Administrative expenses -13.2 -1.7 -1.7 -1.9 -3.0 -8.3 Other operating income 0.4 0.0 0.1 0.0 0.2 0.3 Share of results of jointly controlled entities 0.0 0.0 0.0 0.0 0.0 0.0 eBitda -64.5 4.1 -12.4 -3.3 -13.0 -24.6
Depreciation incl. impairment losses -3.2 -0.7 -0.6 -0.8 -0.7 -2.8 operating profit/(loss) (eBit) -67.7 3.4 -13.0 -4.1 -13.7 -27.4 *) Please refer to 'Financial Review' on page 38 for further details.
TORM experienced an increasing number of waiting days and ballasting days due to adverse effects of the Company’s financial situation. The Bulk Division delivered an operating result (EBIT) of USD -27 million excl. restructuring effects (USD -68 million in 2011). This was driven by the fact that the bulk markets had the lowest average spot market level (BDI) in a decade. TORM achieved average earnings of USD/day 10,248 in the Panamax segment, which was 33% higher than the average market of USD/day 7,679 (Baltic Panamax Index average four benchmark routes). In the Handymax segment, TORM’s average daily earnings were USD/day 10,481, which is 11% higher than the average market level of USD/day
9,454 (Baltic Supramax Index average six benchmark routes).
During 2012, TORM focused on strengthening its customer relations and signed the largest number of contract cargoes (COAs) in the history of the Company. The coverage for 2013 is thus entirely based on COAs with key customers.
At year-end 2012, TORM owned two Panamax bulk car riers. On average, TORM operated 23 vessels during 2012. There are no bulk vessels in the Company’s order book.
Discharge operation in Asia.

18
TORM 2012
Divisions
0
100
200
300
400
500
600
700
800
900
1,000
1,100
1,200
2012201120102009200820072006200520042003
Million tons per month
SEABORNE EXPORTS OF MAJOR COMMODITIES Source: Clarksons
Steel products Grain/soybeans
Coal Iron ore
BULK ORDER BOOK AS PERCENT OF EXISTING FLEETSource: TORM
2013 orderbook
2012201120102009 2014 orderbook
Cape P-PMX PMX
SMX Handy
-10%
0%
10%
20%
30%
40%
50%
70%
60%
TORM expects the dry bulk market to remain under pressure during 2013 due to the fleet oversupply built up over the past three to four years. However, the fleet boom is gradually slowing down, which may be a first sign of a cyclical low in the bulk market.
supplYThe volume of expected newbuilding deliveries in 2013 is estimated to be in the region of 55-65 million dwt, which is 5-10 million dwt less than the actual deliveries in 2012 (source: RS Platou). The Panamax segment is predicted to incur the largest net year-on-year fleet growth of 7-8%.
As in 2011-12, TORM anticipates that the scheduled newbuilding deliveries for 2013 will be partially offset by cancellations and delivery slippage. This is a result of the availability of financing still being tight and freight rates remaining under pressure.
More importantly, the weak asset prices combined with strong steel prices will continue to increase the incentive for scrapping older vessels. In 2012, a total of 32 million dwt was scrapped corresponding to 5% of the existing fleet. It is projected that a similar number will be scrapped during 2013 (source: RS Platou).
Adjusted for an expected scrapping of 30-35 million dwt, the net fleet growth in 2013 will be around 4-6% calculated on a year-on-year basis
bulK DiviSioN – SuPPlY AND DEmAND •Continued supply increase during 2013, though at a lower level than in recent years, due to
scrapping and less newbuilding deliveries
•2013 demand growth estimated at a slightly lower level than in 2012
•Supply will continue to outpace demand, but at a lower speed

19
TORM 2012
Divisions
TORM bulk carrier loading grain in New Orleans, USA.
demandThe major commodities, iron ore and coal, represent about 60% of the total seaborne dry bulk transportation. TORM does not expect major changes in the trading patterns for the major bulk commodities, but expects the dependency on China and other growing Asian economies as the major importers of dry bulk commodities to continue (source: IEA and RS Platou).
The global seaborne iron ore trade is projected to increase by 6% in 2013, compared to 5% in 2012. China is the world’s largest steel producer and its iron ore consumption is expected to grow by 5% during 2013 (source: RS Platou). In 2012, China sourced about 50% of its iron ore from the import markets. TORM expects this ratio to increase if iron ore prices should decline again.
The global seaborne coal trade is projected to grow by approximately 7% in 2013. The largest market for coal is Asia, which accounts for about 65% of the global consump-tion of both steam coal for electricity generation and coking coal for steel production. China alone accounts for roughly half of the global coal consumption and sourced 95% from domestic production in 2012.
Seaborne transportation demand is estimated to increase by approximately 4% year-on-year in 2013.
TORM expects the demand growth of approximately 4% p.a. to be exceeded by a net fleet growth of 4-6% p.a., even after adjusting for cancellations, slippage and scrapping.

20
TORM 2012
About TORM
40% Philippines
48% India
8% Denmark4% Croatia
GEOGRAPHICAL DISTRIBUTION OF SEAFARES IN %100% = 2,692 seafarers ultimo 2012 incl. contracted crew
53% Denmark
28% India
11% Philippines
6% Singapore
2% USA 0% Brazil
GEOGRAPHICAL DISTRIBUTION OF LAND-BASED EMPLOYEES IN %100% = 298 employees ultimo 2012
PEoPlE
peRfoRmance cultuRe in challenging times2012 proved to be a challenging year for TORM and its employees due to the Company’s financial situation as well as uncertainty about the future ownership structure. For the onshore organization, this resulted in a higher than normal attrition rate. Despite this, TORM experienced increased performance levels in 2012 both in the shore organization and among seafarers.
Training and communication were key priorities in 2012 to ensure an aligned workforce across the sea and shore organizations. A total of six global seafarer conferences were held in Denmark, India and the Philippines.
SEAFARERS TORM’s seafarers continued to deliver high performance levels across KPIs throughout 2012. This resulted in an increase in the tradability of the Company’s fleet, zero observations by customers regarding TORM’s compliance with the officer matrix (crew qualifications) and the highest retention rate among senior officers in five years.
In 2012, the Company continued its focus on integrating TORM’s Leadership Philosophy. This included the estab-lishment of a Senior Officer Incentive Program aimed at rewarding high performance by creating a structured performance ranking of all vessels and senior officers.
Creating focus on the core vessel success factors allows vessel management to see the connection between their own performance and the overall performance of TORM.
SHORE ORGANIZATION Ashore, the employees showed remarkable effort and performance throughout the challenging times of the restructuring and, consequently, the Company was able to uphold a strong TORM brand among customers, suppliers and partners.
A focus point for 2012 was to further develop KPIs and feedback structures to enable TORM to deliver on its objectives.
new opeRational maRine hR platfoRm NEW CREWING SYSTEM In 2012, TORM implemented a new global crewing system platform, enabling the Company to manage all seafarers in the same global system. This allows for standardized global procedures and processes and ensures consistent customer service. TORM’s strategic aim is to drive a global, uniform and cost-efficient manning of the Company’s fleet with the necessary qualifications and, during 2012, performance improved and the organization continued to deliver on customer requirements.
• Integration of TORM’s Leadership Philosophy on board the vessels
•New and significantly improved operational Marine HR platform

21
TORM 2012
About TORM
TORM continued its focus on integrating the Company’s Leadership Philosophy in the organization as well as on board the vessels.
SQE officer reviews safety procedures with crew members on board one of TORM’s product tankers.
BLENDING In 2012, the Company started to blend different nationa-lities and competencies on board the individual vessels. In 2012, TORM had 15 vessels in total operating with a minimum of three different nationalities on board. This is a significant shift in the manning operation and allows employees at sea to feel part of a large company with global career opportunities on board as well as ashore. It has been positively received by TORM’s seafarers and, among other things, resulted in a positive shift in retention among senior officers.
NEW OFFICE SET-UP IN MANILA In April 2012, TORM moved into its new offices in Manila. Today, TORM is the second largest crew operator in the Philippines based on the number of Filipino senior officers, and the new set-up under its own brand signals the Company’s commitment in the Philippines and is part of the new Marine HR platform.

22
TORM 2012
About TORM
CO2 EMISSION PER VESSEL PER G/TON-KM Source: TORM
201220112010
0
2
4
6
Target for 2020:6.4 g/ton-km
8
10
8.27.8 7.6
201220112010
0
0.5
1.0
2.0
1.5
Target for 2020: 2.2 ton-employee
2.5
3.0
CO2 EMISSION PER OFFICE EMPLOYEE IN TON Source: TORM
2.42.6 2.6
CorPorAtE SoCiAl rESPoNSibilitY
RepoRting and tRanspaRencYResponsible behavior is central to the way TORM does business. TORM’s CSR policies cover the following areas:• Legal compliance• Risk management• Sustainable business operations• Anti-corruption• Transparency
In 2009, TORM became the first Danish shipping company to sign the UN Global Compact. Since then, the Company has reported on its social and environmental performance every year to ensure progress and accountability to stakeholders. The Company believes that accountability in all aspects is necessary in order to be the preferred carrier in the industry.
The Company has reported to the Carbon Disclosure Project since 2007 and will continue this reporting as it promotes TORM’s ambition of minimizing emissions and costs.
In March 2012, TORM introduced online CSR reporting via the Company’s CSR site, which has catered to approxi-mately 5,000 unique readers in 2012. TORM will continue to strengthen its online presence and will release its full 2012 reporting at the end of March 2013.
BUSINESS PRINCIPLESThe shipping industry is strongly regulated with regard to safety and environmental protection and the customers have ever stricter compliance criteria. TORM is committed to exceeding compliance and continue making CSR a strong value proposition for customers.
During 2012, TORM introduced a revised set of business principles that serves as a guideline for the Company’s responsible business conduct. These principles are rooted in TORM’s Leadership Philosophy and the commitment to the UN Global Compact.
INSPECTIONS AND AUDITSThe shipping industry, and the product tanker segment in particular, is subject to a wide range of inspections and
•Online CSR reporting launched, increasing reach to approximately 5,000 unique readers in 2012
•Reductions in CO2 emissions and costs with increased focus on fuel efficiency
•Continued positive trend in safety performance

23
TORM 2012
About TORM
TORM maintains armed guards on all vessels passing through High Risk Areas.
audits carried out by terminals, port states, classification societies, internal auditors and oil companies. In order to exceed the standards set by stakeholders, the Company has enhanced the vetting preparations and increased the number of internal vettings on the vessels carried out by SQE officers.
enviRonment and climateMarine pollution constitutes TORM’s largest environmental risk. Consequently, the Company seeks to minimize its environmental impact by taking constant care and measuring progress on identified key performance indicators.
FUEL EFFICIENCYTORM takes a proactive approach to fuel efficiency as this has a significant environmental and economic impact. During 2012, the Company focused on enhancing the measurability of engine performance, on increasing energy efficiency management training and addressing the mindset and behavior of the relevant stakeholders. The Company has also implemented a system to optmize hull and propeller cleaning intervals to reduce fuel consump-tion. In addition, TORM has conducted successful pilot projects on e.g. trim of vessels, engine optimization tools and certain retrofits to the vessels. TORM will continue the efforts in 2013 with several new initiatives.
CLIMATE PERFORMANCETORM has reduced the year-on-year CO2 emissions from 7.8 to 7.6 g/ton-km, primarily driven by speed reductions across the fleet and fuel efficiency initiatives. In 2013, TORM will continue the investments in fuel efficiency
projects covering retrofitting, performance management and changes in mindset and behavior.
The development in CO2 emissions from offices was flat from 2011 to 2012 at 2.6 g/ton-employee. Since 2008, TORM has improved performance on this measure by approximately 10%.
OIL SPILLSIn 2012, TORM experienced one oil spill equivalent to one barrel of oil. This spill was due to a damaged air vent pipe. Additionally, TORM experienced six smaller oil spills amounting to two barrels in total. All incidents were investigated and procedures were revised accordingly.
health, safetY and secuRitY 90% of TORM’s employees work at sea, and providing healthy, safe and secure working conditions for them is an essential part of the business. The Company’s safety policy is rooted in the rules and regulations issued by the Danish Maritime Occupational Health Service.
SAFETY CULTUREA strong safety culture is central to TORM, and the Company has never experienced work-related fatalities.
Lost Time Accident Frequency (LTAF) is an indicator of serious work-related personal injuries that result in more than one day off work. During 2012, TORM had an LTAF below 1. This is due to continued focus on improving occupational safety on board vessels, e.g. through training and near-miss reporting. The definition of LTAF follows standard practice among shipping companies.

24
TORM 2012
About TORM
LOST TIME ACCIDENT FREQUENCY (LTAF)Source: TORM
201220112010
0
0.5
1
2
1.5
1.01
0.67
0.99
Target for 2012:1.0
LTAF = work-related personal injuries that result in more than one day off work per million hours of work
Near-miss reports provide TORM with an opportunity to analyze conditions that might lead to accidents and ultimately prevent accidents. A high number of near-miss reports indicate that the organization is aware of the risks and responding to them. In 2012, TORM exceeded the target of 6.0 near-miss reports per month per vessel on average by reaching 6.2 due to continued focus on this area.
PIRACYTORM’s response to piracy is founded in the Best Manage-ment Practice (BMP) developed by the International Chamber of Shipping, the International Shipping Federa-tion and national navy forces. During 2012, TORM experi-enced two failed attempts of hijacking and two robberies. The Company will continue to monitor the risk situation and preempt hijacking by following Company security procedures, which currently means engaging armed guards on all vessels passing through High Risk Areas. During 2012, TORM did 271 voyages with armed guards.
ResponsiBle BusinessTORM cooperates with peers and stakeholders in a number of areas to increase responsibility in the shipping industry and the supply chain. Especially as a co-founder of the Maritime Anti-Corruption Network (MACN) in 2010, TORM strives to minimize corruption.
In 2012, TORM initiated a pilot project on fighting corrup-tion in Nigeria together with the UN Development Programme (UNDP). West Africa is an increasingly important region in the international shipping industry, and avoiding institutionalization of facilitation payments is
crucial. The Company has also established process targets for monitoring facilitation payments.
EMPLOYEES AND COMMUNITIESThe Company has among others been a long-standing supporter of maritime education in India and the Philip-pines. This commitment also has a strategic purpose and reflects the Company’s ties to local communities.
outlook 2013• Implement successful fuel pilot projects in the entire
fleet to optimize vessel performance further • Continue monitoring of facilitation payments• Complete roll-out of newly introduced business
principles• Continue focus on work-rest hours on board vessels• Certification of fleet according to the Maritime Labour
Convention
This section constitutes TORM’s reporting according to the requirements of The Danish Financial Statements Act on CSR.
TORM’s CSR Report is due online on 31 March 2013. To see the report and further information on TORM’s CSR work, please visit www.torm.com/csr.
TORM reports to the UN Global Compact. To see the reports, please visit www.unglobalcompact.org.
TORM reports to the Carbon Disclosure Project.To see the reports, please visit www.carbondisclosureproject.net.

25
TORM 2012
About TORM
riSK mANAgEmENt
TORM believes that a strong risk management framework is vital to protecting the Company and to ensuring that the Company is well-positioned in key markets. The objective remains a balance of risk and reward that generates the most value for shareholders.
Risks are defined as all events or developments that could significantly reduce TORM’s ability to sustain the long-term value of the Company.
The risk management approach emphasizes management accountability and broad organizational anchoring of risk management and mitigation activities. The approach is based on a combination of overall risk management tools such as scenario and sensitivity analyses, a bi-annual update of the risk profile and specific policies governing the risk management in all key areas. Finally there is a verification process for the adequacy of TORM’s risk management infrastructure.
The key risks associated with TORM’s activities can broadly be divided into the four main categories described in the figure below.
Adequate management of operational and compliance risks within TORM’s risk tolerance limits is a prerequisite for active management of industry and market-related risks.
Management and the Board of Directors discuss and decide on the Company’s tolerance of the most significant risks, while Management is responsible for the ongoing monitoring of risks and implementation of mitigating actions. TORM’s overall risk tolerance for each of the four main categories is detailed below.
LONG-TERM STRATEGIC RISKS (“RISK-SEEKING”) Risks and opportunities beyond the immediate strategy window are monitored by Management and incorporated in updates of corporate strategy. Industry-changing risks, such as the substitution of oil for other energy sources and radical changes in transportation patterns, are considered to have a relatively high potential impact, but are consid-ered as long-term risks.
INDUSTRY AND MARKET-RELATED RISKS (“RISK-SEEKING”)TORM’s business is very sensitive to changes in market-related risks such as changes in the global economic situation and changes in freight rates, particularly in the product tanker market.
It remains a cornerstone of the Company’s strategy to actively pursue this type of risk by taking positions to benefit from fluctuations in freight rates and vessel prices. However, the prolonged period of depressed freight rates has highlighted the need for maintaining the resilience to absorb these fluctuations.
riSKS ASSoCiAtED WitH torm’S ACtivitiES iN 2012
long-teRm stRategic Risks
industRY and maRket- Related Risks
opeRational and compliance Risks
financial Risks
•Political risks
•Substitution of oil
• Macroeconomic development
•Freight rate volatility
•Bunker price fluctuations
• Sales and purchase price
fluc tuations
• Compliance with relevant maritime regimes
•Vessel utilization
•Counterparty risk
•Safe operation of vessels
•Terrorism and piracy
• Availability of experienced sea farers and
staff
• Compliance with environmental regulations
•Stability of IT systems
•Fraud
• Insurance coverage
•Funding and liquidity risk
• Interest rate risk
•Currency risk
•Capital structure and liquidity continue to be managed actively
•Market risks remain high, but TORM is positioned for market recovery
•Operational risks remain well-managed

26
TORM 2012
About TORM
d2012
2011 (values based on the 2011 Annual Report)
c
d
g
b
aa
b
ii/h h a
a
Con
sequ
ence
s
High
High
Low
Low
Likehood
TORM TOP RISK MAP (RISK EVALUATION INCLUDES EFFECT OF CURRENTLY DEPLOYED MITIGATION)
a Bulk trading exposure
b Tanker freight rates
c Bunker price
d Timing of sale and purchase of vessels
e Oil major approval
f Environmental regulations
g Severe vessel accidents
h Capital structure
i Liquidity
f
f
ee
g
OPERATIONAL AND COMPLIANCE RISKS (“RISK-AVERSE”)TORM aims at maintaining its position as a quality operator with high focus on operating safe and reliable vessels. Consequently, commercial operations are an important part of TORM’s business model. This area involves potentially severe risks with respect to environ-ment, health, safety and compliance. TORM constantly focuses on reducing these risks through rigorous pro-cedures and standardized controls carried out by well-trained employees. Quality-enhancing measures were implemented during 2012 and will continue to be imple-mented in 2013.
FINANCIAL RISKS (“RISK-NEUTRAL”)Management believes that a prudent approach to financial risks, including funding, benefits the Company the most.
During 2012, significant progress has been made in improving the capital structure, funding and liquidity, but, as described on page 27, these two areas require contin-ued actions to further reduce the risk.
TORM’S CURRENT RISK PROFILEThe key aspects of TORM’s current risk profile is summar-ized below:•Market risks are high due to the continued pressure on
freight rates and vessel values, but TORM remains well-positioned for an upswing
•While having secured the Restructuring Agreement during 2012, the Company’s risks related to the current capital structure and liquidity remain high
• Risks within the Company’s immediate sphere of control, including compliance with quality and environ-mental requirements, have remained stable due to the implemented mitigating controls
TORM’s top risks and changes compared to 2012 are described below. For a more in-depth description of the various risks and TORM’s risk management as well as sensitivity analyses, please see note 23 on page 78.

27
TORM 2012
About TORM
# riSK DESCriPtioN SEvEritY (HigH, mEDium, loW)
CommENt to DEvEloPmENt 2011 - 2012 / StAtuS 2012
iND
uSt
rY/
mA
rK
Et-r
ElA
tED
riS
KS
a Bulk trading exposure
The risk of a bulk counterparty expo-sure materializing and of TORM not being able to predict and act on the devel-opment in the bulk freight rates.
Low A high coverage has been maintained, but due to low bulk freight rates, iron ore prices and political unrest the counterparty exposure has increased. The overall bulk trading exposure has increased marginally.
b Tanker freight rates
The risk of sustained low tanker freight rates or of TORM not being able to predict and act on the devel-opment in these.
High While the T/C-in fleet has been significantly reduced, the continued low spot tanker freight rates result in unattractive hedging opportunities for the remaining tanker fleet. Accordingly, TORM has retained a high exposure towards the tanker market.
c Bunker price The risk of unex-pected bunker price increases not covered by cor responding freight rate in-creases.
Medium Adequate bunker purchase procedures continue to be in place, but as bunker prices are volatile and not necessarily reflected in the freight rates, TORM con-tinues to be exposed to bunker price changes.
d Timing of sale and purchase of vessels
The risk of TORM not purchasing and selling vessels timely relative to market developments and business require-ments.
High Vessel values have deteriorated further, and the operational covenants in the new financing agree-ments restrict traditional asset management activi-ties resulting in a continued high risk.
oP
ErA
tio
NA
l A
ND
Co
mP
liA
NC
E r
iSK
S
e Oil major approval
The risk of a partial ban of the TORM tanker fleet by oil majors.
Medium The overall tradability of the fleet with oil majors has improved somewhat, but the risk is largely un-changed.
f Environmental regulations
The risk of violations of environmental regulations.
Medium TORM’s comprehensive environmental compliance and monitoring infrastructure has been main-tained, but potential new environmental regulations increased the risk somewhat.
g Severe vessel accidents
The risk of a severe vessel accident.
Medium TORM’s comprehensive quality and safety procedures have been maintained, thereby leaving the risk largely unchanged.
FiN
AN
CiA
l r
iSK
S
h Capital structure The risk that the cur-rent capital structure restricts doing other-wise sound business.
High While the Restructuring Agreement has been com-pleted, the negative margin between the market value of TORM’s vessels and the long-term debt has in-creased, leaving the consequence and the likelihood of the risk occurring high.
i Liquidity The risk that the liquidity is too tight to effectively maintain the operation of the Company.
High Relative to business requirements, the liquidity is currently low and highly sensitive to changes in busi-ness conditions, leaving the consequence and the likelihood of the risk occurring relatively high.

28
TORM 2012
About TORM
CorPorAtE govErNANCE
TORM’s Board of Directors and Executive Management are committed to maintaining high standards of corporate governance. To TORM, good corporate governance represents the framework and guideline for business management. This includes the overall principles and structures which regulate the interaction between the Company’s management levels. The aim is to ensure that the Company is managed in a proper and orderly manner, consistent with applicable legislation and codes.
coRpoRate goveRnance RecommendationsIn line with the ‘comply or explain’ principle, the Board of Directors has considered the current Corporate Govern-ance Recommendations which form part of the disclosure obligations for companies listed on NASDAQ OMX Copenhagen. With the amendment of the Articles of Association, approved at the Annual General Meeting in April 2012, the Company was in full compliance with the recommendations. However, by September 2012, the tenure of two Board members had exceeded 12 years, meaning that at least half of the members elected by the general meeting were no longer considered independent persons. This has bearing on two of the recommendations and consequently TORM was in compliance with 77 out of 79 Danish Corporate Governance Recommendations as of 31 December 2012. TORM regained compliance on these two recommendations after the election of a new Board of Directors on 9 January 2013.
TORM complies with the most recent recommendation regarding diversity at management levels. Along with other major Danish shipowners, TORM has signed the Charter on More Women on Boards. In 2012, the Company continued to focus its diversity efforts on encouraging and developing female talent. In terms of gender diversity, as of December 2012 females represented 34% of the land-based employees globally (defined as non-managerial individual performers), 29% of middle management and 9% of top management (vice presidents and above). With the implementation of TORM’s Leadership Philosophy and the current focus on diversity-enhancing measures, TORM expects that, all things being equal, diversity will grow within the Company in the coming years.
This corporate governance section and an overview of TORM’s position on the individual recommendations are available on TORM’s website, and they constitute TORM’s
mandatory Corporate Governance Report in accordance with Section 107b of the Danish Financial Statements Act.
As of 31 of December 2012, TORM complied with the US Sarbanes-Oxley Act as it applies to foreign private issuers.
BoaRd of diRectoRsIn accordance with Danish company legislation, TORM exercises a two-tier management structure. The Board of Directors lays out policies and directives, which in turn the Executive Management implements in its day-to-day operations. The Board of Directors acts as a partner as well as a supervisory body to the Executive Management. No member of the Executive Management is a member of the Board of Directors, but the Executive Management ordinarily attends Board meetings.
The primary responsibilities of the Board of Directors are to safeguard the interests of the shareholders and to ensure that the Company is properly managed in accord-ance with the Articles of Association and applicable laws and regulations, and to pursue the commercial goals as well as the strategic development of the Company.
At the end of 2012, the Board of Directors consisted of five members, of whom three were elected at the Annual General Meeting. The remaining two members are elected by the employees. Board members elected by the employ-ees have the same rights, duties and responsibilities as Board members elected at the Annual General Meeting.
The Board of Directors has laid down management guidelines and a Code of Ethics and Conduct in order to ensure that the Company is managed and its business activities are carried out in accordance with principles of integrity and ethics.
TORM’s Board of Directors and Executive Management continually work to improve the management of the Company. The Board of Directors meets at least five times a year in accordance with the Rules of Procedure. In 2012, 61 Board meetings were held due to the extraordinary circumstances during the restructuring.
The Board of Directors on a regular basis evaluates the work, the results and the composition of the Board of Directors and Executive Management.
•As of 31 December 2012, TORM complied with 77 out of 79 Danish Corporate Governance Recommendations
•A comprehensive system for internal control and risk management is in place as a result of the Sarbanes-Oxley compliance program

29
TORM 2012
About TORM
On 9 January 2013, four new Board members were elected (Mr. Flemming Ipsen, Mr. Olivier Dubois, Mr. Alexander Green and Mr. Jon Syvertsen) at the Extraordin ary General Meeting. They replaced Mr. N.E. Nielsen, Mr. Christian Frigast and Mr. Jesper Jarlbæk, who had relinquished their mandates as members of the Board of Directors.
the audit committeeThe Audit Committee meets at least four times a year, and both the Executive Management and the independent auditors attend these meetings. In 2012, seven meetings were held. As of 31 December 2012, the Audit Committee had two members, elected by the Board of Directors from its members.
The members of the Audit Committee possess the relevant qualifications to perform the Committee’s tasks.
The Audit Committee performs its duties under a charter approved by the Board of Directors on an annual basis, and the Committee assists the Board of Directors in supervis-ing and enhancing financial reporting, risk management processes, internal controls and auditing processes.
The Audit Committee presents a report on the Commit-tee’s activities to the Board of Directors no later than at the first Board meeting following an Audit Committee meeting.
RemuneRation committee and RemuneRation policiesThe Remuneration Committee meets at least twice a year, and three meetings were held in 2012. As of 31 December 2012, the Remuneration Committee had two members, elected by the Board of Directors from its members. The Remuneration Committee assists the Board of Directors in reviewing Management’s performance and remuneration as well as the Company’s general remuneration policies.
In order to attract, retain and motivate qualified managers, remuneration is based on the nature and the quality of work, the value creation to the Company and remuneration levels in comparable businesses. The amounts and components of the remuneration to the individual mem-
bers of the Board of Directors and Executive Management are disclosed in note 4 to the financial statements.
eXecutive managementThe Executive Management is responsible for the day-to-day operation of TORM and for the ongoing optimization and follow-up. As of 31 December 2012, the Executive Management consisted of two members: CEO Jacob Meldgaard and CFO Roland M. Andersen.
inteRnal contRol and Risk managementThe Board of Directors has the overall responsibility for the Company’s internal control and the assessment and management of risk. Management is responsible for the identification of key risks, the operation of an effective internal control system and the implementation of adequate risk management processes.
Management is also responsible for periodical reporting to the Audit Committee and the Board of Directors on key risks such as business-critical geopolitical, environmental, macroeconomic, financial and operational risks. The Board of Directors reviews the key risks and discusses the development in relation to these risks with the Executive Management as appropriate, however at least once a year.
As a consequence of its listing on NASDAQ in the USA, TORM is obliged to comply with a number of standards, rules and regulations aimed at good corporate governance under the Sarbanes-Oxley Act as applicable to foreign private issuers. The most important parts of the require-ments are listed in Section 404, which requires Manage-ment and the independent auditors to report on the adequacy of the Company’s internal control of financial reporting.
TORM’s Sarbanes-Oxley compliance program and system for internal control and risk management in connection with the financial reporting are executed and monitored in the Internal Control and Administration System (INCA). INCA is consistent with the recognized framework established by the Committee of Sponsoring Organizations (COSO) and provides a clear audit trail of changes in risk assessments, a design of controls as well as of the results
mEEtiNgS AttENDED/HElD
membersBoard of
directorsaudit
committeeRemuneration
committeeNiels Erik Nielsen 2) 61/61 3/3Christian Frigast 1) 2) 55/61 7/7 3/3Peter Abildgaard 3) 27/61Kari Millum Gardarnar 47/61Rasmus J. Hoffmann 49/61Jesper Jarlbæk 1) 58/61 6/7Gabriel Panayotides 2) 3) 20/61 0/3Angelos Papoulias 1) 3) 21/61 1/7Stefanos-Niko Zouvelos 2) 3) 25/61 0/3
1) Member of the Audit Committee 2) Member of the Remuneration Committee
3) Member until April 2012

30
TORM 2012
About TORM
of tests of internal controls. TORM’s process for financial reporting and the INCA system consist of the following elements, performed throughout the financial year:
• Overall scoping: Based on earlier years’ experience, budgets and actual figures for the financial year and the knowledge of significant changes affecting TORM, it is assessed whether changes should be made to the scoping.
• Risk assessment: TORM performs a risk assessment with the purpose of identifying the Company’s financial reporting risks, i.e. risks of misstatement that could (individually or in combination with others) result in a material misstatement of the financial statements. For this assessment, TORM uses a top-down risk-based approach. The process starts with the identification and assessment of the risks related to financial reporting, including possible changes to those risks compared to last year. In the process of identifying and assessing risks, knowledge and understanding of the business, the organization, operations and process are taken into consideration as well as the size, complexity and organizational structure and financial reporting environ-ment. Further, as part of the assessment of risk, the entity-wide controls and the general IT controls are considered. The potential likelihood of the risk occurring as well as the financial impact or consequences are also taken into consideration.
•Mapping: The material risks identified in the risk assessment are mapped to the financial statements and to the existing internal controls to ensure that gaps between material risks and internal controls have not materialized.
•Monitoring: Based on information from TORM’s subsid-iaries and the Parent Company’s financial data, an internal financial report to Management is prepared every month. The financial reporting and supporting documentation are verified on an ongoing basis. At the end of each quarter, external financial statements are prepared, and additional controls and analyses are performed compared to the monthly financial report. At the end of the year, additional controls and analyses are performed compared to the quarterly financial reports, primarily to ensure a correct and complete presentation in the annual report of the Company.
• Testing: TORM ensures at least annually, by testing, that there are no material weaknesses in the internal controls which could potentially lead to a material misstatement of the financial reporting.
• Conclusion: At the end of each financial year, TORM concludes whether any material weaknesses have been found in the internal controls covering the financial reporting. In the FORM 20-F for 2011, filed with the US Securities and Exchange Commission (SEC) on 30 April 2012, Management as well as the auditors concluded that there were no material weaknesses or areas of concern as of 31 December 2011. Management’s conclusion and the auditors’ evaluation of the internal controls and the testing performed by Management regarding 2012 are expected to be filed with the SEC in April 2013.
In view of TORM’s Sarbanes-Oxley compliance program and comprehensive system for internal control and risk management in connection with the financial reporting as well as the size of the Company, the Board of Directors has not yet found it relevant to establish an internal audit function. The Board of Directors also acknowledges the already intensified internal controlling across all offices and geographies. The Board of Directors continues to evaluate the need for an internal audit function annually.
In addition to ensuring compliance with the relevant legislation, TORM believes that the increased focus on internal controls and risk management contributes positively to improving the effectiveness of the Company’s business procedures and processes, and hence earnings, both in the short and the long term.
whistleBloweR facilitYAs part of the internal control system, the Board of Directors has, since 2006, had a whistleblower facility, handling the filing of complaints to an independent lawyer’s office concerning violations of laws, regulations and good business conduct by TORM representatives. In 2012, there were nil enquiries to the whistleblower facility.
The whistleblower facility is registered and approved by the Danish Data Protection Agency. For further information on the whistleblower facility, please visit TORM’s website www.torm.com/whistleblower.
For TORM’s overall guidelines for incentive schemes for members of the Board of Directors and the Management, please visit www.torm.com/investor-relations/incentive-programme.
For further information on TORM’s position on the individual corporate governance recommendations, please visit TORM’s website www.torm.com/investor-relations/corporategovernance/report2012.

31
TORM 2012
About TORM
Flemming Ipsen became a Board mem-ber and Chairman of TORM in Janu-ary 2013. Mr. Ipsen holds a PMD from Harvard Business School and an LLM from the University of Copenhagen. Mr. Ipsen is chairman of the Remueration Committee and a member of the Audit Committee and has management duties in the following companies:• A/S Mærsk Aviation Holding• Star Air A/S• Ejendomselskabet Lindø
• Royal Danish Yacht Club• Mærsk Broker A/S• Port of Hanstholm• Maritime & Commercial Court• J Poulsen Shipping A/S• Julius Koch International A/S• The Danish Institute of Arbitration• TORM Foundation
special competencies:• General management• Active management from boards• Shipping and maritime law
FlEmmiNg iPSEN / Born: 16-04-1948 / TORM shares: 500
Olivier Dubois became a Board member and Deputy Chairman of TORM in Janu-ary 2013. Mr. Dubois is CFO of the Elior Group. Mr. Dubois holds an MBA degree from ESSEC, a Political Science degree from Institut d’Etudes Politiques in Paris and a Bachelor’s degree in Economics from the University of Paris. Mr. Dubois is Chairman of TORM’s Audit Committee and has management duties in:
• Elior Group• Meilleurtaux
special competencies:• General and financial management • Active management from boards• Audit committees• Shipping
oliviEr DuboiS / Born: 20-03-1954 / TORM shares: 10
Alexander Green became a Board mem-ber in January 2013. Mr. Green holds a Bachelor’s degree in Civil Engineering from the University of Salford and has been trained at the Royal Military Acad-emy at Sandhurst and the Royal School of Military Engineering. Mr. Green is a member of TORM’s Remuneration Committee.
special competencies:• Oil, energy and commodity trading• Management of physical and
derivative trading• Risk management
AlExANDEr grEEN / Born: 26-07-1963 / TORM shares: 100
boArD oF DirECtorS
A member of the Board since April 2011, representing the employees of TORM on the Board. Mr. Gardarnar is employed by TORM as Captain and has been with the Company since 1975.
special competencies:• Worldwide sea services since 1975
with experience from general, refrigerated, container and project cargos as well as dry bulk and tanker cargo
KAri millum gArDArNAr / Born: 05-05-1951 / TORM shares: 2,880

32
TORM 2012
About TORM
ExECutivE mANAgEmENt
Jacob Meldgaard has been Chief Executive Officer since 1 April 2010. Before this, Mr. Meldgaard served as Executive Vice President of Dampskibsselskabet NORDEN A/S. Mr. Meldgaard holds a Bachelor’s degree in International Trade from Copenhagen Business School, Denmark and has attended the Advanced Management Program at Wharton Business School and Harvard Business School in the USA.
Chief Financial Officer since May 2008. From 2005 to 2008, Roland M. Andersen was CFO of the Danish mobile and broadband operator Sonofon/Cybercity. From 2000 to 2005, he was CFO of the private equity-owned Cybercity. Prior to this, Roland M. An-dersen held positions with A.P. Moller-Maersk, most recently as CFO of A.P. Moller- Maersk Singapore. Complementing his professional experience, Roland M. Andersen holds an M.Sc. and has attended the Executive Program at London Business School.
JACob mElDgAArD / Born: 24-06-68 / TORM shares: 100,000
rolAND m. ANDErSEN / Born: 22-03-68 / TORM shares: 10,449
A member of the Board since April 2011, representing the employees of TORM on the Board. Mr. Hoffmann is employed by TORM as Chief Engineer and has been with the Company since 2003.
special competencies:• 19 years of sailing experience on
various vessel types
rASmuS J. SKAuN HoFFmANN / Born: 10-04-1977 / TORM shares: 1,675
Jon Syvertsen became a Board member in January 2013. Mr. Syvertsen holds an MBA from IESE Business School and a Master’s degree in Naval Architecture from the Norwegian Institute of Tech-nology. Mr. Syvertsen is a member of TORM’s Remuneration Committee and has management duties in the following companies:
• Gram Car Carriers Ltd• KM Holdings AS• Arne Blystad AS• Offshore Heavy Transport AS
special competencies:• General management from boards• Shipping
JoN SYvErtSEN / Born: 22-08-1961 / TORM shares: 0

33
TORM 2012
About TORM
0.0
0.5
1.0
1.5
2.0
2.5
3.0
3.5
4.0
4.5
5.0
5.5
6.0
0
200,000
400,000
600,000
800,000
1,000,000
1,200,000
1,400,000
1,600,000
OctJul Aug Sep Nov DecApr May JunJan Feb Mar
TORM SHARE PRICE PERFORMANCE AND TURNOVER, COPENHAGEN
Price in DKK# of shares
Share price (RH)Share volume (LH)
iNvEStor iNFormAtioN
communication to the investoRsTo ensure consistent communication to all investors, quarterly and annual financial statements and other stock exchange announcements are the main vehicles of communication. In 2012, TORM issued 43 announcements to the stock exchange, which are accessible in both Danish and English versions on www.torm.com/investor-relations. Interested stakeholders can sign up for TORM’s investor relations mailing list here.
TORM maintains regular capital market contact through analyst and industry presentations, investor meetings and teleconferences. Road shows are primarily held in Copenhagen and in the major European and US financial centers.
For a three-week period prior to the publication of quarterly and annual financial statements, communication is limited to issues of a general nature and no individual investor meetings are held.
changes to the shaRe capitalAt TORM’s Annual General Meeting held on 23 April 2012, the Board of Directors was authorized to reduce the share capital of TORM by a nominal value of DKK 363,272,000 from DKK 364,000,000 nominal value to DKK 728,000 nominal value by transfer of the reduction amount to a special reserve fund and by changing the nominal value per share from DKK 5.00 to DKK 0.01. The main reason was that new shares cannot be issued at a price below the
nominal value, and TORM was thereby unable to issue new shares prior to the capital reduction as the share price was below DKK 5.
At TORM’s Annual General Meeting held on 23 April 2012, the Board of Directors was also authorized to increase TORM’s share capital by up to a total nominal amount of DKK 2,400,000,000 by cash payment, conversion of debt or contribution of assets other than cash without pre-emptive subscription rights for the existing shareholders at a rate discounted to the market price, as per article 2.14 of the Articles of Association. This article was later repealed at the Extraordinary General Meeting held on 9 January 2013.
In connection with the completion of the restructuring, the Board of Directors decided to exercise the authorizations to first reduce the share capital as described above and subsequently to increase the share capital of TORM by a nominal amount of DKK 6,552,000 by issuance of 655,200,000 shares of a nominal value of DKK 0.01 each. The capital increase comprised a private placement of new shares by conversion of debt of DKK 1,174,100,581 in total
StoCK ExCHANgE NASDAQ OMXCopenhagen A/S
NASDAQNew York
Ratio (odR:adR) – 10:1isin code DK0060082915 US8910721005ticker symbol TORM TRMD
•Capital decrease and subsequent capital increase as a result of the Restructuring Agreement
•Five new shareholders exceeding 5% ownership
•ADR-ratio changed to comply with the US-listing rules

34
TORM 2012
About TORM
(approximately USD 200 million) pursuant to the terms of the Restructuring Agreement and supplementary agree-ments to TORM’s banks and time charter partners or their assignees. The capital increase was fully subscribed for the aggregate of 655,200,000 new shares of a nominal value of DKK 0.01 each, at a subscription price of DKK 1.79 per share of DKK nominal value 0.01 each (approximately USD 0.31 per share). The new shares issued corresponded to 90% of TORM’s registered share capital and votes, following the registration of the capital increase with the Danish Business Authority. TORM’s issued share capital hereafter amounts to DKK 7,280,000 nominal value, equal to 728,000,000 shares of DKK 0.01 nominal value each.
tRadingFollowing the capital increase, TORM published a listing prospectus to admit the new shares for trading on NASDAQ OMX Copenhagen, which took effect on 10 December 2012.
The average daily trading volumes in 2012 were approxi-mately 113,000 on NASDAQ OMX and 31,000 American Depository Receipts (ADRs). The share price deteriorated from DKK 3.9 per share at the beginning of 2012 to DKK 1.7 per share at the end of 2012.
TORM ensured continued compliance with the NASDAQ rules by changing the ratio of its ADRs to its common shares from 1:1 to 1:10.
shaReholdeRsAs of 31 December 2012, TORM had approximately 14,300 registered shareholders representing 88% of the share capital. In compliance with section 29 of the Danish Securities Trading Act, the following shareholders have reported to TORM that they owned more than 5% of the shares as of 5 November 2012:
•HSH Nordbank AG: 13.6%•Danske Bank: 11.5%•Nordea Bank Danmark A/S: 11.3%•Deutsche Bank AG: 6.2%•DBS Bank Ltd.: 5.5%• Alpha Trust and its trustee First Link Management:
5.2%*)
At the end of 2012, the members of the Board of Directors held a total of 5,156 shares, equivalent to a total market capitalization of DKK 0.0 million (USD 0.0 million). The members of the Executive Management held a total of 110,449 shares, equivalent to a market capitalization of DKK 0.2 million (USD 0.0 million). The Board of Directors and all employees are limited to trading shares during a four-week period after the publication of financial reports.
TORM’s company’s registrar is VP Securities, Weide-kampsgade 14, P.O. Box 4040, DK-2300 Copenhagen S, Denmark.
dividend TORM’s dividend policy states that up to 50% of the net profit for the year may be distributed as dividend. Further-more, dividend distribution should always be considered in light of TORM’s capital structure, strategic developments, future obligations, market trends and shareholder interest. Following the restructuring, the terms of the credit facilities include a covenant that there will be no issuance of new shares or dividend distribution without consent from the lenders.
The Board of Directors recommends that no dividend be paid for 2012.
*) Based on Alpha Trust’s notice to the Company dated 23 September 2011 and their proxy to the Chairman of the Board of Directors of TORM A/S in relation to the Annual General Meeting on 23 April 2012, adjusted for dilution following the restructuring.
For further information about investor relations, please visit www.torm.com/investor-relations.
For access to the Listing Prospectus, please visit www.torm.com.

35
TORM 2012
About TORM
FiNANCiAl CAlENDAr 2013
28 February 2013 Deadline for shareholder submis-sions to the Annual General Meeting
13 March 2013 Annual Report 201211 April 2013 Annual General Meeting08 May 2013 First quarter 2013 results15 August 2013 First half 2013 results05 November 2013 Nine months 2013 results
iNvEStor rElAtioNS CoNtACt
Christian Søgaard-ChristensenVP, Investor Relations & Corporate Support
Phone: +45 3917 9285E-mail: [email protected]
ANAlYStS CovEriNg torm
aBg sundal collierAnalyst: Lars HeindorffPhone: +45 3318 6115
carnegieAnalyst: Stig FrederiksenPhone: +45 3288 0258
danske equitiesAnalyst: Brian Børsting (in transition)Phone: +45 4512 8036
dnB marketsAnalyst: Nicolay DyvikPhone: +47 2294 8542
fearnley fonds asaAnalyst: Rikard VaboPhone: +47 2293 6000
handelsbanken capital marketsAnalyst: Dan Togo JensenPhone: +45 3341 8246
nordea marketsAnalyst: Finn Bjarke PedersenPhone: +45 3333 5723

TORM 2012

TORM 2012TORM Estrid prior to discharge operation in Copenhagen before proceeding to Malmö, Sweden.
FINANCIAL stAtemeNts 2012Financial review 2012 38
Consolidated income statement 46
Consolidated statement of comprehensive income 47
Consolidated balance sheet 48
Consolidated statement of changes in equity 50
Consolidated cash flow statement 51
Notes 52
Management’s and auditor’s report 86
Parent company 2012 89
Fleet overview 102
Glossary 104
37
TORM 2012
RESTRUCTURINGIn November 2012, TORM completed a restructuring with the cooperation of the Company’s banks and time charter partners, which provides the Company with a robust platform for the coming years. The agreement secured TORM deferral of bank debt, new liquidity and substantial savings from the restructured time charter book.
The accounting effects from the restructuring are presented in detail in the table on page 39.
For the purpose of the analysis of the segment results in the tables on page 40 and 41, the effects of the restructuring have been excluded to enable a like-for-like comparison between 2011 and 2012.
For further details on the restructuring, please refer to the introduction on pages 4 and 5, the liquidity and cash sec-tion of this financial review and note 2 as well as company announcement no. 40 of 7 December 2012 including the attached listing prospectus.
FINANCIAL RevIew 2012
Key FACts oN the RestRuCtuRINg
TORM completed its restructuring on 5 November 2012. The key elements of the restructuring are outlined below.
NEw lIqUIdITy dEfERRal of baNk dEbT RESTRUCTURING of THE CHaRTER book
NEw SHaREHoldER STRUCTURE
A new working capital facili ty of USD 100 million was established with the following key terms:• Maturity on 30 September 2014
without fixed amort ization• A cash sweep mechanism applies if
TORM’s cash position exceeds USD 50 million
• Cash interest with a margin of 650 basis points (bp) and LIBOR floor of 150 bp
• First lien on the majority of TORM’s vessels
The existing bank facilities prior to the restructuring with a total outstanding debt of USD 1,800 million were rolled over together with accrued swap liabilities of USD 46 million under a new financing agreement. The key terms of the facilities were aligned through the new agreement:• Maturities aligned to 31 December
2016• No fixed installments until 30 June
2014 and with potential extension to 30 September 2014, in which period a cash sweep mechanism applies
• Annualized minimum installments of USD 100 million until 31 Decem-ber 2016
• Retranching of each loan facility to a senior tranche, a junior tranche and a subordinated tranche based on loan-to-value
• Average interest margin of approxi-mately 240 bp across loan facilities (the margin for each tranche differs)
• Uniform financial covenants (mini-mum liquidity, loan-to-value, net leverage ratio and interest coverage)
• Certain specific option rights for three bank facilities that may trigger a sales process for up to 22 vessels and repayment of the related debt
o One bank facility has exercised the option on five vessels
• Charter-in commitments were reduced with an estimated positive mark-to-market impact of approxi-mately USD 270 million measured as the nominal difference between the originally contracted rates and the reference market rate as of March 2012
• TORM will redeliver 22 vessels ahead of the original contract schedule
• Cancellation of five agreements concerning vessels not yet delivered to TORM
• Charter rates aligned to market level for the remaining contracts
• In consideration for the new liquidity, amended bank facilities and reduc-tion of charter-in commitments, TORM’s banks and time charter partners received a total restruc-turing fee and agreed debt amount of approximately USD 200 million which was converted into 655.2 million new shares
• Subscription price of DKK 1.79 per share corresponding to a total restructuring fee and agreed debt amount of USD 200 million
• New shareholder structure at com-pletion:
o Existing shareholders: 10% o Certain banks: 73% o Time charter partners: 17%
38 Financial review 2012

TORM 2012
ACCouNtINg ImPACt oF the RestRuCtuRINg AgReemeNt AND CeRtAIN ReLAteD tRANsACtIoNs
USD million
Fee to banks
1)
Fee to charter-
ins (operating
lease) 2)
Fee to charter-
ins (finance leases)
3)
New finance
lease 4)
Capital decrease
5)
Conver-sion of
debt 6)
Transfer to non-current
liabilities 7)
Drawdown and pay-ment of interest
and fees 8)
Fee to advisors
9)
Net ac-counting
impact
Charter hire - -135 - - - - - - - -135 Net profit/(loss) from sale of vessels - - -10 - - - - - - -10 Financial expenses - - - - - - - - -65 -65Net profit/(loss) 0 -135 -10 0 0 0 0 0 -65 -210
Vessels and capitalized dry-docking - - -67 15 - - - - - -52 Cash and cash equivalents - - - - - - - 5 -74 -69 ToTal aSSETS 0 0 -67 15 0 0 0 5 -74 -121
Common shares - - - - -61 1 - - - -60 Special reserve - - - - 61 - - - - 61 Retained profit - -135 -10 - - 199 - - -68 -14 Total equity 0 -135 -10 0 0 200 0 0 -68 -13
Mortgage debt and bank loans - - - - - - 1,830 58 -6 1,882 Finance lease liabilities - - -28 15 - - - - - -13 Total non-current liabilities 0 0 -28 15 0 0 1,830 58 -6 1,869
Mortgage debt and bank loans -10 - - - - - -1,784 - - -1,794 Finance lease liabilities - - -50 - - - - - - -50 Other liabilities 10 135 21 - - -200 -46 -53 - -133 Total current liabilities 0 135 -29 0 0 -200 -1,830 -53 0 -1,977
ToTal EqUITy aNd lIabIlITIES 0 0 -67 15 0 0 0 5 -74 -121
1) A USD 10 million fee to the banks was recognized as transaction costs against mortgage debt and bank loans and as an increase of agreed debt in other liabilities.
2) Of USD 190 million in consideration to time charter-in partners, USD 169 million was for accounting purposes considered to relate to termination and modification of charter-in debt in respect of operating leases. Of the USD 169 million, charter hire of USD 34 million was previously rolled up in accrued charter hire in other liabilities. The net amount of USD 135 million was expensed as termination costs of USD 88 million (terminated contracts) and an expected loss on continuing time charter-ins of USD 47 million (onerous contracts), both in the line item charter hire.
3) TORM’s two finance leases (USD 67 million in vessels) have been terminated as part of the restructuring, whereof one subsequently has been accounted for as a new finance lease, cf. note 4 below. USD 21 million of the consideration of USD 190 million to time charter-in partners was considered to relate to settlement of terminated charter-in contracts in respect of finance leases. The USD 21 million was added to other liabilities, and the finance lease liabilities and book value of the vessels were removed from the balance sheet resulting in a net loss of USD 10 million in net profit/(loss) from sale of vessels.
4) One of TORM’s two finance leases has re-entered the fleet under new terms and has been accounted for as a new finance lease, cf. note 3 above. The new finance lease results in an addition of USD 15 million to the line item vessels and a corresponding increase in finance lease liabilities.
5) The capital decrease approved at the Annual General Meeting on 23 April 2012 was completed as part of the completion of the restructuring by decreasing the nominal amount per share from DKK 5.00 to DKK 0.01. The share capital was reduced by USD 61 million which has been transferred from the line item common shares to the line item special reserve.
6) The total restructuring fee and agreed debt of USD 200 million was converted into new shares upon completion of the restructuring. TORM issued 665.2 million new shares of a nominal value of DKK 0.01 each, at a subscription price of DKK 1.79 per new share, corresponding to an increase of the nominal share capital of USD 1 million and an increase in retained profit of USD 199 million.
7) As of completion of the restructuring, TORM was no longer in breach of any covenants, and as a result hereof TORM’s bank debt was not considered to fall due within a period of 12 months from completion of the restructuring. Consequently, USD 1,784 million in mortgage debt and bank loans have been transferred from current to non-current liabilities. In addition, USD 46 million of swap liabilities have been transferred to non-current liabilities.
8) At completion of the restructuring, TORM made a drawdown of USD 60 million on the new working capital facility of which USD 2 million was used to pay upfront and agency fees and recognized as transaction costs against mortgage debt and bank loans. In addition, the drawdown was used to finance the payment of rolled-up interest of USD 22 million and other accrued fees and expenses of approximately USD 31 million. As of 28 December 2012, the Company repaid USD 2 million, so that the total drawdown at year end 2012 was USD 58 million.
9) Fees to advisors of the Company and the Company’s creditors related to the work on the Restructuring Agreement.
39Financial review 2012

TORM 2012
CoNsoLIDAteD segmeNt INFoRmAtIoN 2012 - ADjusteD FoR the RestRuCtuRINg eFFeCts
This table displays the segment results for 2012 excluding restructuring effects to enable a like-for-like comparison with 2011. In addition, it outlines the total effect on EBIT as well as the split on segments. The full accounting effects from the restructuring are presented in detail in the table on page 39.
2012
USD million
TankerDivisionwithout
restruc-turing
Restruc-turing
effects
TankerDivision
Total
BulkDivisionwithout
restruc-turing
Restruc-turing
effects
BulkDivision
Total
Divisionswithout
restruc-turing
Restruc-turing
effectsNot
allocated Total
INCoME STaTEMENT
Revenue 917.1 - 917.1 204.1 - 204.1 1,121.2 0.0 - 1,121.2Port expenses, bunkers and commissions -538.1 - -538.1 -127.3 - -127.3 -665.4 0.0 - -665.4Freight and bunker derivatives -0.6 - -0.6 10.5 - 10.5 9.9 0.0 - 9.9Time charter equivalent earnings 378.4 0.0 378.4 87.3 0.0 87.3 465.7 0.0 0.0 465.7
Charter hire -153.8 -74.6 -228.4 -100.5 -60.7 -161.2 -254.3 -135.3 - -389.6Operating expenses -165.5 - -165.5 -3.4 - -3.4 -168.9 0.0 - -168.9Gross profit/(loss) (Net earn-ings from shipping activities) 59.1 -74.6 -15.5 -16.6 -60.7 -77.3 42.5 -135.3 0.0 -92.8
Net profit/(loss) from sale of vessels -16.0 -10.0 -26.0 0.0 - 0.0 -16.0 -10.0 - -26.0Administrative expenses -58.9 - -58.9 -8.3 - -8.3 -67.2 0.0 - -67.2Other operating income 0.6 - 0.6 0.3 - 0.3 0.9 0.0 - 0.9Share of results of jointly controlled entities -5.0 - -5.0 0.0 - 0.0 -5.0 0.0 -4.4 -9.4EbITda -20.2 -84.6 -104.8 -24.6 -60.7 -85.3 -44.8 -145.3 -4.4 -194.5
Depreciation incl. impairment losses -209.6 - -209.6 -2.8 - -2.8 -212.4 0.0 -41.6 -254.0
operating profit/(loss) (EbIT) (Segment result) -229.8 -84.6 -314.4 -27.4 -60.7 -88.1 -257.2 -145.3 -46.0 -448.5
fINaNCIal PERfoRMaNCE oVERVIEwTORM achieved a clearly unsatisfactory net loss of USD 581 million in 2012 compared to a net loss of USD 453 million in 2011, resulting in earnings per share (EPS) of USD -3.3 in 2012. The performance in 2012 was weaker due to lower freight rates and accounting effects of the execution of the re-structuring, vessel sales and impairment charges. As outlined in the table on page 39, the effects related to the restructuring amounted to USD 210 million. TORM furthermore recorded impairment losses of USD 74 million relating to five vessels treated as assets held for sale and USD 42 million relating to the Company’s 50% investment in FR8. Please refer to note 9 for a review of the impairment testing performed by Manage-ment.
The loss before tax for the year was USD 579 million, which is in line with the latest guidance of a loss before tax of approxi-mately USD 579 million.
Total revenue in 2012 was USD 1,121 million compared to USD 1,305 million in 2011. TCE earnings in 2012 amounted to USD 466 million compared to USD 644 million in 2011. The de-crease in TCE earnings was due to a decrease in the number of available earning days of 16%, corresponding to a reduction in earnings of USD 102 million, and lower freight rates in both the Tanker Division and the Bulk Division, corresponding to a reduction in earnings of USD 68 million.
The operating loss increased by USD 60 million to a loss of USD 449 million in 2012 from a loss of USD 389 million in 2011. The increased loss compared to 2011 was primarily due to the accounting effects of the restructuring of USD 145 mil-lion, which was partly offset by a reduction in loss from sale of vessels of USD 36 million and net decrease of USD 84 million in impairment losses on jointly controlled entities and tangible and intangible assets. For 2011, the impairment losses amounted to USD 200 million.
TORM’s total assets decreased by USD 424 million in 2012 to USD 2,355 million from USD 2,779 million in 2011, of which the carrying amount of vessels including vessels held for sale, capitalized dry-docking and prepayments on vessels amounted to USD 2,082 million, compared to USD 2,349 mil-lion in 2011. The decrease was primarily due to impairment losses of USD 116 million and depreciation of USD 138 million.
Current assets excluding cash increased by USD 73 million. The increase in current assets is primarily due to an increase in assets held for sale of USD 113 million compared to 2011, partly offset by a decrease in freight receivables. The decrease in freight receivables was primarily driven by a significant decrease in revenue.
Total equity decreased by USD 377 million in 2012 to USD 267 million from USD 644 million in 2011. The decrease in equity was mainly due to the loss for the year of USD 581 million, hereof USD 210 million relating to the restructuring. The
40 Financial review 2012

TORM 2012
impact of the loss for the year was partly offset by an increase in capital of USD 200 million by conversion of debt.
TORM’s total liabilities decreased by USD 47 million in 2012 to USD 2,088 million from USD 2,135 million in 2011, primarily due to redelivery of one finance lease contract in connection with the restructuring of USD 46 million and a decrease in trade payables and other payables of USD 69 million, which is partly offset by drawdowns of USD 58 million on the new working capital facility.
SEGMENT RESULTS TORM’s revenue derives from two segments: The Tanker Division and the Bulk Division. The table Segment gross profit/loss on page 41 presents the results of shipping activities by operating segment for the years 2011 and 2012 excluding the restructuring effects. The gross profit for 2012 in the Tanker Division decreased by USD 33 million and in the Bulk Division by USD 6 million compared to 2011.
The change in time charter equivalent earnings in the Tanker Division and the Bulk Division is summarized as illustrated in the table on page 41.
Furthermore the table on page 42 summarizes earnings data per quarter.
Tanker divisionRevenue in the Tanker Division decreased by 4% to USD 917 million from USD 959 million in 2011, and time charter equivalent earnings decreased by USD 75 million or 16% to USD 378 million in 2012 from USD 453 million in 2011. The decrease in TCE earnings was primarily due to a decrease in both the number of available earning days of 9% and the weighted average TCE earnings per available earning day of 8% compared to 2011.
In the LR2 fleet, one finance lease was redelivered in 2012 as part of the restructuring. Combined with the sale of two ves-sels late in 2011, the number of available earning days in the LR2 fleet decreased by 19% compared to 2011, resulting in a reduction in earnings of USD 12 million. The average freight rates dropped by 21% from 2011 to 2012, resulting in a reduc-tion in earnings of USD 10 million.
In the LR1 fleet, one vessel was sold in 2012 (50% ownership), and the time charter fleet was significantly reduced as part of the restructuring, leaving the number of available earning days in the LR1 fleet 18% lower compared to 2011. The ave-rage freight rates increased by 2% in 2012. In total, earnings were reduced by USD 17 million.
In the MR fleet, two newbuildings were delivered to the fleet of owned vessels and one vessel was sold. The time charter fleet was reduced as part of the restructuring, resulting in a decrease in the number of available earning days of 573 days or 3%. In combination with a decrease in freight rates of 12%, this resulted in reduced earnings of USD 36 million.
In the Handysize fleet, the average freight rates were 8% higher than in 2011, resulting in an increase in earnings of USD 4 million.
bulk divisionIn the Bulk Division, revenue decreased by 41% to USD 204 million from USD 347 million in 2011, and time charter equiva-lent earnings decreased by 54% or USD 104 million to USD 87 million from USD 191 million in 2011. Earnings were nega-tively affected by an overall decrease of 35% in the number of available earning days combined with a reduction in the weighted average TCE earnings per available earning day of 28% compared to 2011.
segmeNt gRoss PRoFIt/(Loss)
USD millionTanker
DivisionBulk
DivisionTotal 2011
Tanker Division
Bulk Division
Total 2012
Revenue 958.7 346.5 1,305.2 917.1 204.1 1,121.2Port expenses, bunkers and commissions -510.7 -164.3 -675.0 -538.1 -127.3 -665.4Freight and bunker derivatives 4.9 9.2 14.1 -0.6 10.5 9.9Time charter equivalent earnings 452.9 191.4 644.3 378.4 87.3 465.7
Charter hire*) -199.3 -199.0 -398.3 -153.8 -100.5 -254.3Operating expenses -161.8 -3.2 -165.0 -165.5 -3.4 -168.9
Gross profit/(loss) (Net earnings from shipping activities) 91.8 -10.8 81.0 59.1 -16.6 42.5
*) 2012 figures exclude the impact from the restructuring as explained on page 38 and 39 to enable a like-for-like comparison between 2011 and 2012.
ChANge IN tIme ChARteR equIvALeNt eARNINgs
USD millionHandy-
size MR LR1 LR2
Un- allo-
cated
Tanker division
TotalHandy-
maxPana-
max
Un- allo-
cated
bulkdivision
Total Total
Time charter equivalent earnings 2011 44.4 242.3 102.2 61.5 2.5 452.9 53.5 129.6 8.3 191.4 644.3Change in number of earning days 0.6 -7.8 -18.9 -11.6 - -37.7 -23.4 -41.0 - -64.4 -102.1Change in freight rates 3.6 -28.6 1.9 -10.3 - -33.4 -6.3 -28.2 - -34.5 -67.9Other - - - - -3.4 -3.4 - - -5.2 -5,2 -8.6
Time charter equivalent earnings 2012 48.6 205.9 85.2 39.6 -0.9 378.4 23.8 60.4 3.1 87.3 465.7
Unallocated earnings comprise fair value adjustment of freight and bunker derivatives, which are not designated as hedges, and gains and losses on freight and bunker derivatives, which are not entered into for hedging purposes.
41Financial review 2012

TORM 2012
eARNINgs DAtA2012 %
Changefull yearUSD million
2011Full year Q1 Q2 Q3 Q4 full year
tANKeR DIvIsIoN
lR2/aframax vessels
Available earning days 4,560 899 854 989 961 3,703 -19% Owned 4,234 808 711 806 781 3,106 T/C 326 91 143 184 180 598Spot rates 1) 11,821 10,814 10,206 13,581 14,383 12,573 6%TCE per earning day 2) 13,505 7,865 14,157 11,082 10,025 10,735 -21%
lR1/Panamax vessels
Available earning days 8,537 2,076 1,879 1,716 1,296 6,967 -18% Owned 2,537 636 606 644 644 2,530 T/C 6,000 1,440 1,273 1,072 652 4,437Spot rates 1) 11,855 12,515 11,237 13,512 11,856 11,953 1%TCE per earning day 2) 12,017 12,977 11,747 12,723 11,424 12,294 2%
MR vessels
Available earning days 17,625 4,681 4,362 4,176 3,833 17,052 -3% Owned 13,627 3,549 3,436 3,491 3,486 13,962 T/C 3,998 1,132 926 685 347 3,090Spot rates 1) 13,448 14,363 11,510 10,612 14,165 12,178 -9%TCE per earning day 2) 13,718 14,082 11,418 9,843 12,655 12,042 -12%
Handysize vessels
Available earning days 3,935 989 981 1,007 1,009 3,986 1% Owned 3,935 989 981 1,007 1,009 3,986 T/C - - - - - -Spot rates 1) 10,074 12,823 10,939 11,263 13,211 11,801 17%TCE per earning day 2) 11,288 13,122 12,189 10,873 12,617 12,196 8%
BuLK DIvIsIoN
Panamax vessels
Available earning days 8,998 1,848 1,447 1,205 1,726 6,226 -31% Owned 730 182 174 184 184 724 T/C 8,268 1,666 1,272 1,021 1,543 5,502TCE per earning day 2) 14,783 11,727 11,084 10,857 7,541 10,248 -31%
Handymax vessels
Available earning days 4,212 642 260 757 762 2,421 -43% Owned - - - - - - T/C 4,212 642 260 757 762 2,421TCE per earning day 2) 13,065 12,683 4,954 9,916 11,076 10,481 -20%
1) Spot rate = Time Charter Equivalent Earnings for all charters with less than six months’ duration = Gross freight income less bunker, commissions and port expenses.
2) TCE = Time Charter Equivalent Earnings = Gross freight income less bunker, commissions and port expenses.
In the Panamax fleet, the number of available earning days decreased by 2,772 days compared to 2011 or 31% due to a reduction in the time charter fleet, causing a decrease in earnings of USD 41 million. Freight rates were on average 31% lower than in 2011 and reduced earnings by USD 28 million compared to 2011.
In the Handymax fleet, the number of available earning days decreased by 1,791 days to 2,421 days compared to 2011 or 43% due to a decrease in the time charter fleet. The decrease in available earning days decreased earnings by USD 23 million, whereas a decrease in average freight rates of 20% resulted in a decrease in earnings of USD 6 million.
OPERATION OF VESSELSAs compared to 2011, the charter hire cost in the Tanker Divi-sion decreased by USD 46 million (23%) to USD 154 million in 2012, whereas the charter hire cost in the Bulk Division decreased by USD 99 million (49%) to USD 101 million. The decreases were primarily caused by a reduction of chartering days due to a large number of redeliveries in connection with the restructuring and reduced activity in the Bulk Division.
The development in operating expenses can be summarized as illustrated in the table on page 43. The table also sum ma -rizes the operating data for the Company’s fleet of owned and bareboat chartered vessels.
42 Financial review 2012

TORM 2012
Operating expenses for the owned vessels increased by USD 4 million to USD 169 million in 2012. During 2012, the cost savings and efficiency programs continued, keeping the cost development under control.
The total fleet of owned vessels had 585 off-hire days, cor-responding to 2.3% of the number of operating days in 2012 compared to 373 off-hire days in 2011, corresponding to 1.4% of operating days.
ADMINISTRATIVE EXPENSES AND OTHER OPERATING INCOMETotal administrative expenses amounted to USD 67 million, which was a decrease of USD 4 million or 6% compared to the USD 71 million in 2011 and mainly due to a reduction in the number of employees.
Other operating income primarily comprises chartering com-missions and service fees. Other operating income amounted to USD 1 million in 2012, against USD 3 million in 2011.
FINANCIAL INCOME AND EXPENSESNet financial expenses in 2012 were USD 131 million against USD 63 million in 2011, corresponding to an increase of USD 68 million, whereof USD 65 million relates to fees to advisors of the Company and the Company’s creditors related to the work on the Restructuring Agreement.
TAXTax for the year amounted to an expense of USD 2 million, which was the same level as in 2011.
VESSELS AND DRY-DOCKINGThe decrease in tangible fixed assets of USD 382 million to USD 1,956 million in 2012 is attributable to the disposal of ves-sels, impairment losses for the year, reclassification to assets held for sale and depreciation for the year.
One LR2 tanker was redelivered and one MR tanker repre-senting a total carrying amount of USD 74 million was sold. In addition, two MR newbuildings were delivered amounting to USD 103 million.
Transfer to assets held for sale amounted to USD 134 million in 2012 against USD 62 million in 2011. Depreciation regar ding tangible fixed assets amounted to USD 138 million in 2012, against USD 145 million in 2011, and an impairment loss of USD 74 million relating to the five MR vessels classified as held for sale was recorded in 2012, whereas the impairment loss relating to the tanker fleet in 2011 was USD 98 million.
INVESTMENTS IN ENTITIES, INCLUDING JOINTLY CONTROLLED ENTITIES (FR8)The carrying amount of the investment in and loans to jointly controlled entities was USD 1 million at 31 December 2012, compared to USD 58 million at 31 December 2011. The car-rying amount was primarily reduced by an impairment loss of USD 42 million relating to TORM’s 50% investment in FR8 compared to an impairment loss of USD 13 million in 2011, also relating to FR8. The 50% ownership of one vessel was sold, reducing the carrying value in investments in jointly controlled entities and loans by USD 15 million. The share of results of jointly controlled entities in 2012 was a loss of USD 9 million, of which a loss of USD 4 million derived from FR8,
ChANge IN oPeRAtINg exPeNses
USD million Tanker DivisionBulk
DivisionHandysize MR LR1 LR2 Panamax Unallocated Total
Operating expenses 2011 24 91 16 31 3 0 165Change in operating days - 2 - -4 - - -2 Change in operating expenses per day - 6 - - - - 6
operating expenses 2012 24 99 16 27 3 0 169
oPeRAtINg DAtA
USD/day Tanker Division Bulk Division 2012
Handysize MR LR1 LR2 Tanker Handymax Panamax bulk TotalOperating expenses per operating day in 2011 6,013 6,479 6,403 6,586 6,417 - 4,440 4,440 6,363 Operating expenses per operating day in 2012 6,004 6,921 6,293 6,554 6,649 - 4,637 4,637 6,591 Change in the operating expenses per operating day in % 0% 7% -2% 0% 4% N/A 4% 4% 4%
Operating days in 2012*) 4,026 14,290 2,562 4,015 24,893 - 732 732 25,625 - Off-hire 40 152 2 86 280 - 8 8 288 - Dry-docking - 175 30 92 297 - - - 297 +/- Bareboat charters out/in - - - -732 -732 - - - -732 + Vessels chartered in - 3,090 4,437 598 8,125 2,421 5,502 7,923 16,048
available earning days 3,986 17,053 6,967 3,703 31,709 2,421 6,226 8,647 40,356
*) Including bareboat charters.
43Financial review 2012
TORM 2012
against a loss of USD 4 million in 2011, of which a loss of USD 12 million derived from FR8.
ASSESSMENT OF IMPAIRMENT OF ASSETSDuring 2012, TORM continued to observe indications of potential impairment of the Company’s assets in the form of a downward trend in freight rates and vessel prices. As a conse-quence, Management followed its usual practice of performing an impairment review every quarter and presenting the out-come to the Audit Committee. The Audit Committee evaluates the impairment review and prepares a recommendation to the Board of Directors. The recoverable amount of the assets is reviewed by assessing the net selling price and the value in use for the significant assets within the two cash generating units: The Tanker Division and the Bulk Division.
In the assessment of the net selling price, Management included a review of market values derived as the average of two internationally recognized shipbrokers’ valuations. The shipbrokers’ primary input is deadweight tonnage, yard and age of the vessel. The assessment of the value in use was based on the net present value of the expected future cash flows. The key assumptions are considered to be related to future developments in freight rates and operating expenses and to the weighted average cost of capital (WACC) applied as discounting factor in the calculations.
The impairment assessment, which is made under the assumption that TORM will continue to operate its fleet in the current set-up, is highly sensitive in particular to changes in the freight rates.
The underlying assumptions and sensitivities for the dis-counted cash flow calculations are presented in note 9.
The lenders under one of the Company’s bank facilities have exercised their option to initiate a sales process of the five MR vessels financed by that facility. At 31 December 2012, Management expects that these five vessels will be sold within 12 months, and the vessels have been reclassified from non-current assets to assets held for sale. An impairment loss of USD 74 million equal to the difference between the expected sales price and the book value was recognized as a result hereof. In addition, impairment losses from the 50% invest-ment in FR8 accounted for USD 42 million in 2012 compared to USD 13 million in 2011.
The Tanker Division and the Bulk Division were not impaired further in 2012, whereas impairment losses of USD 187 million in 2011 related to the Tanker Division.
The Company will continue to monitor developments on a quarterly basis for indications of impairment.
LIQUIDITY AND CASH FLOWIn 2012, the invested capital decreased by USD 297 million to USD 2,128 million at 31 December 2012, from USD 2,425 million at 31 December 2011. The decrease can primarily be explained by the disposal of vessels, impairment loss for the year, reclassification to assets held for sale and depreciation for the year.
Total cash and cash equivalents amounted to USD 28 million at the end of 2012 against USD 86 million at the end of 2011, resulting in a net decrease in cash and cash equivalents for the year of USD 58 million, compared to a net decrease of USD
34 million in 2011. The undrawn credit facility at 31 December 2012 amounted to USD 42 million (2011: USD 52 million).
The Company’s operations generated a cash outflow of USD 100 million in 2012, of which fees to advisors of the Com-pany and the Company’s creditors related to the work on the Restructuring Agreement amounted to USD 65 million. In 2011, the cash outflow from operations was USD 75 million. In addition, the Company invested USD 59 million in tangible fixed assets during 2012, primarily comprising the deliveries under the newbuilding program, against USD 118 million in 2011. In 2012, the Company generated USD 50 million in cash flow from the sale of non-current assets, primarily vessels, compared to USD 284 million in 2011.
The total cash inflow from financing activities amounted to USD 42 million, compared to a cash outflow of USD 128 million in 2011. Additional borrowings generated an inflow of USD 82 million, hereof USD 58 million relating to the new working capital facility. Repayment on mortgage debt and bank loans amounted to USD 35 million. TORM did not pay any dividends to its shareholders during 2012.
PRIMARY FACTORS AFFECTING RESULTS OF OPERATIONSTORM generates revenue by charging customers for the transportation of refined oil products, crude oil and, to a lesser extent, dry bulk cargoes, using the Company’s tankers and dry bulk vessels. The Company’s focus is on maintaining a young, high quality fleet and optimizing the mix between long-term chartered-in and owned vessels to the extent allowed in TORM’s financing agreement. In the Bulk Division, this is sup-plemented by short-term time charter contracts lasting from a single trip to several months. The Company actively manages the deployment of the fleet between spot market voyage char-ters, which generally last from several days to several weeks, and time charters to the extent allowed in TORM’s finan cing agreement. Some of the Company’s product tankers are employed in a pool, where revenue is derived from both spot market voyage charters and time charters.
TORM believes that the important measures for analyzing trends in the results of its operations for both tankers and dry bulk vessels consist of the following:
• Timecharterequivalent(TCE)earningsperavailable earning day. TCE earnings per available earning day are defined as revenue less voyage expenses divided by the number of available earning days. Voyage expenses primarily consist of port and bunker expenses that are unique to a particular voyage, which would otherwise be paid by a charterer under a time charter, as well as com-missions, freight and bunker derivatives. TORM believes that presenting revenue net of voyage expenses neutra-lizes the variability created by unique costs associated with particular voyages or the deployment of vessels on the spot market and facilitates comparisons between periods on a consistent basis. Under time charter contracts, the char-terer pays the voyage expenses, while under voyage charter contracts the shipowner pays these expenses. A charterer has the choice of entering into a time charter (which may be a one-trip time charter) or a voyage charter. TORM is neu-tral as to the charterer’s choice because the Company will primarily base its financial decisions on expected TCE rates rather than on expected revenue. The analysis of revenue is therefore primarily based on developments in TCE earnings.
44 Financial review 2012

TORM 2012
• Spotcharterrates.Aspotmarketvoyagecharterisgener-ally a contract to carry a specific cargo from a load port to a discharge port for an agreed freight per ton of cargo or a specified total amount. Under spot market voyage charters, TORM pays voyage expenses such as port, canal and bunker costs. Spot charter rates are volatile and fluctuate on a seasonal and year-to-year basis. Fluctuations derive from imbalances in the availability of cargoes for shipment and the number of vessels available at any given time to trans-port these cargoes. Vessels operating in the spot market generate revenue that is less predictable, but may enable the Company to capture increased profit margins during periods of improvements in tanker rates.
• Timecharterrates.Atimecharterisgenerallyacontractto charter a vessel for a fixed period of time at a set daily or monthly rate. Under time charters, the charterer pays voyage expenses such as port, canal and bunker costs. Ves-sels operating on time charters provide more predictable cash flows, but can yield lower profit margins than vessels operating in the spot market during periods characterized by favorable market conditions.
• Availableearningdays.Availableearningdaysarethetotalnumber of days in a period when a vessel is ready and avail-able to perform a voyage, meaning the vessel is not off-hire or in dry-dock. For the owned vessels, this is calculated by taking operating days and subtracting off-hire days and days in dry-dock. For the chartered-in vessels, no such calcula-tion is required because charter hire is only paid on earning days and not for off-hire days or days in dry-dock.
• Operatingdays.Operatingdaysarethetotalnumberofavailable days in a period with respect to the owned vessels, before deducting unavailable days due to off-hire days and days in dry-dock. Operating days is a measurement that is only applicable to the owned vessels, not to the chartered-in vessels.
• Operatingexpensesperoperatingday.Operatingexpensesper operating day are defined as crew wages and related costs, the costs of spares and consumable stores, expenses relating to repairs and maintenance (excluding capitalized dry-docking), the cost of insurance and other expenses on a per operating day basis. Operating expenses are only paid for owned vessels. The Company does not pay such costs for the chartered-in vessels, as they are paid by the vessel owner and instead factored into the charter hire cost for such chartered-in vessels.
45Financial review 2012

TORM 2012
USD '000 Note 2012 2011
Revenue 1,121,215 1,305,208Port expenses, bunkers and commissions -665,395 -675,004Freight and bunker derivatives 9,914 14,105
Time charter equivalent earnings 465,734 644,309
Charter hire -389,603 -398,326Operating expenses 4 -168,903 -164,949
Gross profit (Net earnings from shipping activities) 3 -92,772 81,034
Net profit/(loss) from sale of vessels 26 -26,048 -52,538Administrative expenses 4, 5 -67,224 -71,222Other operating income 951 3,170Share of results of jointly controlled entities 28 -9,408 -4,217
EbITda -194,501 -43,773
Impairment losses on jointly controlled entities 9 -41,542 -13,000Impairment losses on tangible and intangible assets 7, 8, 9, 26 -74,232 -187,000Amortizations and depreciation 7, 8 -138,229 -144,826
operating profit/(loss) (EbIT) -448,504 -388,599
Financial income 10 11,846 9,930Financial expenses 10 -142,427 -72,716
Profit/(loss) before tax -579,085 -451,385
Tax 13 -1,558 -1,621
Net profit/(loss) for the year -580,643 -453,006
EaRNINGS/(loSS) PER SHaRE
2012 2011Earnings/(loss) per share (USD) 29 -3.3 -6.5Earnings/(loss) per share (DKK)*) -18,9 -34.9Diluted earnings/(loss) per share (USD) 29 -3.3 -6.5Diluted earnings/(loss) per share (DKK)*) -18,9 -34.9
*) Calculated from USD to DKK at the average USD/DKK exchange rate for the relevant period.
The accompanying notes are an integrated part of these financial statements.
CONSOLIDATED INCOME STATEMENT1 JANUARY – 31 DECEMBER
46 Consolidated financial statements 2012

TORM 2012
CONSOLIDATED STATEMENT OF COMPREHENSIVE INCOME1 JANUARY – 31 DECEMBER
USD '000 2012 2011
Net profit/(loss) for the year -580,643 -453,006
other comprehensive income:
Exchange rate adjustment arising on translation of entities using a measurement currency different from USD 343 -399Fair value adjustment on hedging instruments -11,112 -29,668Value adjustment on hedging instruments transferred to income statement 18,186 1,700Fair value adjustment on other investments available for sale 170 8,651other comprehensive income after tax 7,587 -19,716
Total comprehensive income for the year -573,056 -472,722
The accompanying notes are an integrated part of these financial statements.
47Consolidated financial statements 2012

TORM 2012
USD '000 Note 2012 2011
AssetsNoN-CuRReNt Assets
Intangible assets
Goodwill 0 0Other intangible assets 1,720 1,903
Total intangible assets 7, 9 1,720 1,903
Tangible fixed assets
Land and buildings 812 1,976Vessels and capitalized dry-docking 18 1,948,348 2,258,550Prepayments on vessels 0 69,250Other plant and operating equipment 6,504 8,176
Total tangible fixed assets 8, 9 1,955,664 2,337,952
financial assets
Investments in jointly controlled entities 9, 28 1,040 50,259Loans to jointly controlled entities 0 8,198Other investments 6 12,333 11,614
Total financial assets 13,373 70,071
Total non-current assets 1,970,757 2,409,926
CuRReNt Assets
Bunkers 72,544 84,552Freight receivables 11 117,331 140,177Other receivables 12 16,831 26,037Prepayments 15,566 11,731Cash and cash equivalents 28,328 85,548Total current assets excluding assets held for sale 250,600 348,045
Non-current assets held for sale 26 133,980 21,236
Total current assets 384,580 369,281
ToTal aSSETS 2,355,337 2,779,207
The accompanying notes are an integrated part of these financial statements.
CONSOLIDATED BALANCE SHEETAT 31 DECEMBER
48 Consolidated financial statements 2012

TORM 2012
USD '000 Note 2012 2011
equIty AND LIABILItIesequIty
Common shares 14 1,247 61,098Special reserve 60,974 0Treasury shares 14 -19,104 -17,309Revaluation reserves 6,350 6,180Retained profit 236,607 620,032Hedging reserves -22,739 -29,813Currency translation reserves 4,004 3,661Total equity 267,339 643,849
LIABILItIesNoN-CuRReNt LIABILItIes
Deferred tax liability 13 53,220 53,711Mortgage debt and bank loans 2, 17, 18, 20 1,881,014 0Finance lease liabilities 21 14,371 29,361Deferred income 15 5,224 6,407Total non-current liabilities 1,953,829 89,479
CuRReNt LIABILItIes
Mortgage debt and bank loans 2, 17, 18, 20 812 1,794,644Finance lease liabilities 21 0 48,296Trade payables 83,766 115,552Current tax liabilities 325 1,216Other liabilities 16 48,083 84,904Acquired liabilities related to options on vessels 24 0 84Deferred income 15 1,183 1,183Total current liabilities 134,169 2,045,879
Total liabilities 2,087,998 2,135,358
ToTal EqUITy aNd lIabIlITIES 2,355,337 2,779,207
The accompanying notes are an integrated part of these financial statements.
Accounting policies, critical estimates and judgements 1Liquidity, capital resources, going concern and subsequent events 2Guarantee commitments and contingent liabilities 19Derivative financial instruments 22Risks associated with TORM's activities 23Related party transactions 25
CONSOLIDATED BALANCE SHEETAT 31 DECEMBER
49Consolidated financial statements 2012

TORM 2012
USD ‘000Common
sharesSpecial
reserve*)Treasury
sharesRetained
profitProposeddividends
Revalua-tion
reservesHedgingreserves
Transla-tion
reserves Total
EqUITy
Equity at 1 January 2011 61,098 0 -17,883 1,072,330 0 -2,471 -1,845 4,060 1,115,289
Comprehensive income for the year:
Net profit/(loss) for the year - - - -453,006 - - - - -453,006Other comprehensive income for the year - - - - - 8,651 -27,968 -399 -19,716Total comprehensive income for the year 0 0 0 -453,006 0 8,651 -27,968 -399 -472,722
Share capital decrease - - - - - - - - 0Conversion of debt - - - - - - - - 0Acquisition of treasury shares, cost - - - - - - - - 0Transaction costs share issue - - - - - - - - 0Disposal treasury shares, cost - - 574 - - - - - 574Loss from disposal of treasury shares - - - -574 - - - - -574Share-based compensation - - - 1,282 - - - - 1,282Total changes in equity 2011 0 0 574 -452,298 0 8,651 -27,968 -399 -471,440
Equity at 31 december 2011 61,098 0 -17,309 620,032 0 6,180 -29,813 3,661 643,849
Comprehensive income for the year:
Net profit/(loss) for the year - - - -580,643 - - - - -580,643Other comprehensive income for the year - - - - - 170 7,074 343 7,587Total comprehensive income for the year 0 0 0 -580,643 0 170 7,074 343 -573,056
Share capital decrease -60,974 60,974 - - - - - - 0Conversion of debt 1,123 - - 198,877 - - - - 200,000Acquisition of treasury shares, cost - - -1,795 - - - - - -1,795Transaction costs share issue - - - -2,944 - - - - -2,944Disposal treasury shares, cost - - - - - - - - 0Loss from disposal of treasury shares - - - - - - - - 0Share-based compensation - - - 1,285 - - - - 1,285Total changes in equity 2012 -59,851 60,974 -1,795 -383,425 0 170 7,074 343 -376,510
Equity at 31 december 2012 1,247 60,974 -19,104 236,607 0 6,350 -22,739 4,004 267,339
*) Special reserve in accordance with the Danish Companies Act.
The accompanying notes are an integrated part of these financial statements.
CONSOLIDATED STATEMENT OF CHANGES IN EQUITY
50 Consolidated financial statements 2012

TORM 2012
USD '000 Note 2012 2011CaSH flow fRoM oPERaTING aCTIVITIES
Operating profit/(loss) -448,504 -388,599
Adjustments:Reversal of net loss from sale of vessels 26,048 52,538Reversal of amortization and depreciation 138,229 144,826Reversal of impairment of jointly controlled entities 41,542 13,000Reversal of impairment of tangible and intangible assets 74,232 187,000Reversal of share of result from jointly controlled entities 9,408 4,217Reversal of restructuring charter-in fee 168,870 0Reversal of other non-cash movements 27 2,777 -6,796
Dividends received 428 1Dividends received from jointly controlled entities 0 1,360Interest received and exchange gains 676 4,983Interest paid and exchange losses -51,598 -66,951Advisor fees related to financing and restructuring plan -64,972 0Income taxes paid/repaid -2,935 -2,671Change in bunkers, receivables and payables 27 6,285 -17,687
Net cash flow from operating activities -99,514 -74,779
CaSH flow fRoM INVESTING aCTIVITIES
Investment in tangible fixed assets -59,446 -118,455Loans to jointly controlled entities 8,198 2,100Sale of equity interests and securities 1,948 0Sale of non-current assets 49,626 284,475
Net cash flow from investing activities 326 168,120
CaSH flow fRoM fINaNCING aCTIVITIES
Borrowing, mortgage debt 82,451 87,043Borrowing, finance lease liabilities 0 46,765Repayment/redemption, mortgage debt -34,597 -254,104Repayment/redemption, finance lease liabilities -2,219 -7,468Transaction costs share issue -1,872 0Purchase/disposals of treasury shares -1,795 0Cash flow from financing activities 41,968 -127,764
Net cash flow from operating, investing and financing activities -57,220 -34,423
Cash and cash equivalents at 1 January 85,548 119,971
Cash and cash equivalents at 31 december 28,328 85,548
Of which restricted cash and cash equivalents 0 0
Non-restricted cash and cash equivalents at 31 december 28,328 85,548
The accompanying notes are an integrated part of these financial statements.
CONSOLIDATED CASH FLOW STATEMENT1 JANUARY - 31 DECEMBER
51Consolidated financial statements 2012

TORM 2012
aCCoUNTING PolICIES, CRITICal aCCoUNTING ESTIMaTES aNd JUdGEMENTSThe annual report has been prepared in accordance with the International Financial Reporting Standards as adopted by the EU and the disclosure requirements for Danish listed companies’ financial reporting issued by NASDAQ OMX Copenhagen.
The annual report also complies with the International Financial Reporting Standards (IFRS) issued by the International Accounting Standards Board (IASB).
The financial statements are prepared in accordance with the historical cost convention except where fair value accounting is specifically required by IFRS.
The functional currency in all major entities is USD, and the Com-pany applies USD as presentation currency in the preparation of the annual report.
ADOPTION OF NEW OR AMENDED IFRSsBased on an assessment of new or amended and revised accounting standards and interpretations (‘IFRSs’) issued by IASB and IFRSs endorsed by the European Union effective on 1 January 2012, it has been assessed that the application of the new IFRSs has not had a material impact on the consolidated financial state-ments in 2012 and TORM does not anticipate any significant im-pact on future periods from the adoption of these new IFRSs.
ACCOUNTING STANDARDS AND INTERPRETATIONS NOT YET ADOPTEDIASB has issued a number of new or amended and revised ac-counting standards and interpretations that have not yet come into effect. The following is the most significant:
• IASBhasissuedIFRS9‘FinancialInstruments’,whichisappli-cable for reporting periods starting on or after 1 January 2015. The new standard and subsequent amendments will substan-tially change the classification and measurement of financial instruments and hedging requirements. The new standard and amendments have not yet been endorsed by the European Union. The impact on the consolidated financial statements has not yet been determined on a sufficiently reliable basis.
KEY ACCOUNTING POLICIESThe Management considers the following to be the most impor t ant accounting policies for the TORM Group.
Participation in pools TORM generates its revenue from shipping activities, which to some extent are conducted through pools. Total pool revenue is generated from each vessel participating in the pools in which the Group participates and is based on either voyage or time charter parties. The pool measures net revenues based on the contractual rates and the duration of each voyage, and net revenue is recog-nized upon delivery of services in accordance with the terms and conditions of the charter parties.
The pools are regarded as jointly controlled operations, and the Company’s share of the income statement and balance sheet in the respective pools is accounted for by recognizing a proportional share, based on participation in the pool, combining items of a uniform nature.
The Company’s share of the income in the pools is primarily dependent on the number of days the Company’s vessels have been available for the pools in relation to the total available pool earning days during the period.
In 2012, TORM acted as pool manager of one pool in which the Company is participating with a significant number of vessels. As pool manager TORM receives a chartering commission income to cover the expenses associated with this role. The chartering commission income is calculated as a fixed percentage of the freight income from each charter agreement. If the pool does not earn any freight income, TORM will not receive any commission income. The commission income is recognized in the income statement under ‘Other operating income’ simultaneously with the recognition of the underlying freight income in the pool.
Cross-over voyages Revenue is recognized upon delivery of services in accordance with the terms and conditions of the charter parties. For cross-over voyages (voyages in progress at the end of a reporting period), the uncertainty and the dependence on estimates are greater than for finalized voyages. The Company recognizes a percentage of the estimated revenue for the voyage equal to the percentage of the estimated duration of the voyage completed at the balance sheet date. The estimate of revenue is based on the expected duration and destination of the voyage. Voyage expenses are recognized as incurred.
When recognizing revenue, there is a risk that the actual number of days it takes to complete the voyage will differ from the esti-mate, and for time charter parties a lower day rate may have been agreed for additional days. The contract for a single voyage may state several alternative destination ports. The destination port may change during the voyage, and the rate may vary depending on the destination port. Changes to the estimated duration of the voyage as well as changing destinations and weather conditions will affect the voyage expenses.
demurrage revenue Freight contracts contain conditions regarding the amount of time available for loading and discharging of the vessel. If these condi-tions are breached, TORM is compensated for the additional time incurred in the form of demurrage revenue. Demurrage revenue is recognized upon delivery of services in accordance with the terms and conditions of the charter parties. Upon completion of the voyage, the Company assesses the time spent in port, and a demurrage claim based on the relevant contractual conditions is submitted to the charterers. The claim will often be met by coun-terclaims due to differences in the interpretation of the agreement compared to the actual circumstances of the additional time used. Based on previous experience, 95% of the demurrage claim submitted is recognized as demurrage revenue. The Company receives the demurrage payment upon reaching final agreement of the amount, which on average is approximately 100 days after the original demurrage claim was submitted. If the Group accepts a reduction of more or less than 5% of the original claim, or if the charterer is not able to pay, demurrage revenue will be affected.
Vessels Vessels are measured at cost less accumulated depreciation and accumulated impairment losses. Cost comprises acquisition cost and costs directly related to the acquisition up until the time when the asset is ready for use, including interest expenses incurred during the period of construction, based on the loans obtained for the vessels. All major components of vessels except for dry- docking costs are depreciated on a straight-line basis to the estimated residual value over their estimated useful lives, which TORM estimates to be 25 years. The Company considers that a 25-year depreciable life is consistent with that used by other ship-owners with comparable tonnage. Depreciation is based on cost less the estimated residual value. Residual value is estimated as the lightweight tonnage of each vessel multiplied by scrap value per ton. The useful life and the residual value of the vessels are reviewed at least at each financial year-end based on market conditions, regulatory requirements and the Company’s business plans.
Note 1
52 Notes

TORM 2012
The Company also evaluates the carrying amounts to determine if events have occurred that indicate impairment and would require a modification of their carrying amounts. Prepayment on vessels is measured at costs incurred.
dry-docking Approximately every 30 and 60 months depending on the nature of work and external requirements, the vessels are required to undergo planned dry-dockings for replacement of certain com-ponents, major repairs and maintenance of other components, which cannot be carried out while the vessels are operating. These dry-docking costs are capitalized and depreciated on a straight-line basis over the estimated period until the next dry-docking. The residual value of such components is estimated at nil. The useful life of the dry-docking costs are reviewed at least at each financial year-end based on market conditions, regulatory requirements and TORM’s business plans.
A portion of the cost of acquiring a new vessel is allocated to the components expected to be replaced or refurbished at the next dry-docking. Depreciation hereof is carried over the period until the next dry-docking. For newbuildings, the initial dry-docking asset is estimated based on the expected costs related to the first-coming dry-docking, which again is based on experience and past history of similar vessels. For second-hand vessels, a dry-docking asset is also segregated and capitalized separately, taking into account the normal docking intervals of the Company.
At subsequent dry-dockings the costs comprise the actual costs incurred at the dry-docking yard. Dry-docking costs may include the cost of hiring crews to effect replacements and repairs and the cost of parts and materials used, cost of travel, lodging and supervision of Company personnel and the cost of hiring third-party personnel to oversee a dry-docking. Dry-docking activities include, but are not limited to, the inspection, service on turbo-charger, replacement of shaft seals, service on boiler, replacement of hull anodes, applying of antifouling and hull paint, steel repairs and refurbishment and replacement of other parts of the vessel.
deferred tax All significant Danish entities within the Group entered into the Danish tonnage tax scheme for a binding 10-year period with effect from 1 January 2001. As a consequence of the acquisition of 50% of OMI in 2007, however, a new 10-year binding period commenced with effect from 1 January 2008. Under the Danish tonnage tax scheme, taxable income is not calculated on the basis of income and expenses as under the normal corporate taxation. Instead, taxable income is calculated with reference to the ton-nage used during the year. The taxable income of a company for a given period is calculated as the sum of the taxable income under the tonnage tax scheme and the taxable income from the activi-ties that are not covered by the tonnage tax scheme computed in accordance with the ordinary Danish corporate tax rules.
If the entities‘ participation in the Danish tonnage tax scheme is abandoned, or if the entities’ level of investment and activity is significantly reduced, a deferred tax liability will become payable. A deferred tax liability is recognized in the balance sheet at each period end calculated using the balance sheet liability method. The deferred tax liability relating to the vessels is measured on the basis of the difference between the tax base of the vessels at the date of entry into the tonnage tax scheme and the lower of cost and the realized or realizable sales value of the vessels.
OTHER ACCOUNTING POLICIES
Consolidation principlesThe consolidated financial statements comprise the financial statements of the Parent Company, TORM A/S, and its subsi-diaries, i.e. the entities in which the Parent Company, directly or indirectly, holds the majority of the voting rights or otherwise exer-cises control. Entities in which the Group exercises significant, but not controlling influence are regarded as associated companies and are recognized using the equity method.
Companies which are by agreement managed jointly with one or more companies and therefore are subject to joint control (jointly controlled entities) are accounted for using the equity method.
The consolidated financial statements are prepared on the basis of the financial statements of the Parent Company, its subsi diaries and proportionately consolidated activities by combining items of a uniform nature and eliminating intercompany transactions, balances and shareholdings as well as realized and unrealized gains and losses on transactions between the consolidated companies. The financial statements used for consolidation pur-poses are prepared in accordance with the Company’s accounting policies.
business combinationsNewly acquired or formed entities are recognized in the consoli-dated financial statements from the date of acquisition or for-mation. The date of acquisition is the date on which control is effectively obtained. Entities sold or wound up are recognized in the consolidated financial statements until the date of the sale or the winding up. The date of sale or winding up is the date when control is effectively obtained by a third party. The comparative figures are not restated for entities acquired, disposed of or wound up.
Business combinations are accounted for by applying the pur-chase method, whereby the acquired entities’ identifiable assets, liabilities and contingent liabilities are measured at fair value at the acquisition date. The tax effect of the revaluation activities is also taken into account. The cost of a business combination is measured as the fair value of the consideration agreed upon. When a business combination agreement provides for an adjust-ment to the cost of the combination contingent on future events, the amount of that adjustment is included in the cost of the com-bination if the event is probable and the adjustment can be mea-s ured reliably. Costs of issuing debt or equity instruments in con-nection with a business combination are accounted for together with the debt or equity issuance. All other costs associated with the acquisition are expensed in the income statement.
The excess of the cost of the business combination over the fair value of the acquired assets, liabilities and contingent liabilities is recognized as goodwill under intangible assets and is tested for impairment at least once every year. Upon acquisition, goodwill is allocated to the relevant cash generating units, which subse-quently form the basis for impairment testing.
If the fair value of the acquired assets, liabilities and contingent liabilities exceeds the cost of the business combination, the iden-tification of assets and liabilities and the processes of measuring the fair value of the assets and liabilities and the cost of the busi-ness combination are reassessed. If the fair value of the business combination continues to exceed the cost, the resulting gain is recognized in the income statement.
Note 1 – CoNtINueD
53Notes

TORM 2012
foreign currenciesThe functional currency of all significant entities, including sub-sidiaries and associated companies, is USD, because the Com-pany’s vessels operate in international shipping markets, in which income and expenses are settled in USD, and the Company’s most significant assets and liabilities in the form of vessels and related liabilities are denominated in USD. Transactions in cur-rencies other than the functional currency are translated into the functional currency at the transaction date. Cash, receivables and payables and other monetary items denominated in currencies other than the functional currency are translated into the func-tional currency at the exchange rate at the balance sheet date. Gains or losses due to differences between the exchange rate at the transaction date and the exchange rate at the settlement date or the balance sheet date are recognized in the income statement under ‘Financial income and expenses’.
An exchange rate gain or loss relating to a non-monetary item carried at fair value is recognized in the same line as the fair value adjustment.
The reporting currency of the Company is USD. Upon recognition of entities with functional currencies other than USD, the financial statements are translated into USD. Income statement items are translated into USD at the average exchange rates for the period, whereas balance sheet items are translated at the exchange rates as at the balance sheet date. Exchange differences arising from the translation of financial statements into USD are recognized as a separate component of equity. On the disposal of an entity, the cumulative amount of the exchange differences recognized in the separate component of equity relating to that entity is transferred to the income statement as part of the gain or loss on disposal.
derivative financial instrumentsDerivative financial instruments, primarily interest rate swaps, forward currency exchange contracts, forward freight agreements and forward contracts regarding bunker purchases, are entered into to hedge future committed or anticipated transactions. TORM applies hedge accounting under the specific rules on cash flow hedges when allowed and appropriate. As part of the restruc-turing, TORM will not be able to enter into new derivatives.
In addition, TORM takes limited positions in forward freight agree-ments as a supplement to the Company’s physical positions in vessels, which are not entered into for hedging purposes.
Derivative financial instruments are initially recognized in the ba lance sheet at fair value at the date when the derivative contract is entered into and are subsequently measured at their fair value as other receivables or other liabilities, respectively.
Changes in the fair value of derivative financial instruments, which are designated as cash flow hedges and deemed to be effective, are recognized directly in ‘Other comprehensive income’. When the hedged transaction is recognized in the income statement, the cumulative value adjustment recognized in ‘Other comprehensive income’ is transferred to the income statement and included in the same line as the hedged transaction. However, when the hedged transaction results in the recognition of a fixed asset, the gains and losses previously accumulated in ‘Other comprehensive income’ are transferred from ‘Other comprehensive income’ and included in the initial measurement of the cost of the fixed asset. Changes in the fair value of a portion of a hedge deemed to be ineffective are recognized in the income statement.
Changes in the fair value of derivative financial instruments that are not designated as hedges are recognized in the income state-ment. While effectively reducing cash flow risk in accordance with the risk management policy of the Company, interest rate swaps with cap features and certain forward freight agreements and
forward contracts regarding bunker purchases do not qualify for hedge accounting. Changes in fair value of these derivate financial instruments are therefore recognized in the income statement under ‘Financial income’ or expenses for interest rate swaps with cap features and under ‘Freight and bunkers derivatives’ for for-ward freight agreements and forward bunker contracts. Changes in fair value of forward freight agreements, which are not entered into for hedge purposes, are also recognized under ‘Freight and bunker derivatives’.
Segment informationTORM consists of two business segments: The Tanker Division and the Bulk Division. This segmentation is based on the Group’s internal management and reporting structure. In the tanker seg-ment, the services provided primarily comprise transport of crude oil and refined oil products such as gasoline, jet fuel and naphtha, and in the bulk segment the services provided comprise transport of dry cargo – typically commodities such as coal, grain, iron ore, etc. Transactions between segments are based on market-related prices and are eliminated at Group level. The Group only has one geographical segment, because the Company considers the global market as a whole, and as the individual vessels are not limited to specific parts of the world. Customer address geography is not related to the geography of the service rendered. Consequently, it is not possible to provide geographical segment information on revenue from external customers or non-current segment assets.
The accounting policies applied for the segments regarding recog-nition and measurement are consistent with the policies for TORM as described in this note.
The segment income statement comprises income directly attributable to the segment and expenses which are directly or indirectly attributable to the segment. Indirect allocation of expenses is based on distribution keys reflecting the segment’s use of shared resources.
The segment’s non-current assets consist of the non-current assets used directly for segment operations.
Current assets are allocated to segments to the extent that they are directly attributable to segment operations, including in ven t ories, outstanding freight or other receivables and prepay-ments.
Segment liabilities comprise segment operating liabilities including trade payables and other liabilities.
Not allocated items primarily comprise assets and liabilities as well as revenues and expenses relating to the Company’s admi-nistrative functions and investment activities, including cash and bank balances, interest-bearing debt, income tax, deferred tax, etc.
Employee benefitsWages, salaries, social security contributions, paid holiday and sick leave, bonuses and other monetary and non-monetary benefits are recognized in the year in which the employees render the associated services.
Pension plansThe Group has entered into defined contribution plans only. Pen-sion costs related to defined contribution plans are recorded in the income statement in the year to which they relate.
Share-based paymentFor the period 2007-2009, the Management and all land-based employees and officers employed on permanent contracts (apart from trainees, apprentices and cadets) that were directly em-ployed by TORM A/S participated in an incentive scheme, which
Note 1 – CoNtINueD
54 Notes

TORM 2012
included grants of shares and share options. In 2010 and 2011, a new incentive scheme comprising share options was established for Management and certain key employees. The schemes do not provide the choice of cash settlement instead of shares. The value of the services received as consideration for the shares and share options granted under the schemes is measured at the fair value of the granted shares and share options. The fair value is measured at the grant date and is recognized in the income state-ment as staff costs under administrative expenses and operating expenses over the vesting period. The counter item is recognized in equity. The fair value is measured based on the Black-Scholes and Monte Carlo models.
leasesAgreements to charter in vessels and to lease other plant and operating equipment, where TORM has substantially all the risks and rewards of ownership, are recognized in the balance sheet as finance leases. Lease assets are measured at the lower of fair value and the present value of minimum lease payments deter-mined in the leases.
For the purpose of calculating the present value, the interest rate implicit in the lease or an incremental borrowing rate is used as discount factor. The lease assets are depreciated and written down under the same accounting policy as the vessels owned by the Company or over the lease period depending on the lease terms.
The corresponding lease obligation is recognized as a liability in the balance sheet, and the interest element of the lease payment is charged to the income statement as incurred.
Other charter agreements concerning vessels and other leases are classified as operating leases, and lease payments are charged to the income statement on a straight-line basis over the lease term. The obligation for the remaining lease term is dis-closed in the notes to the financial statements.
Agreements to charter out vessels, where substantially all the risks and rewards of ownership are transferred to the lessee, are classified as finance leases, and an amount equal to the net investment in the lease is recognized and presented in the ba lance sheet as a receivable. The carrying amount of the vessel is de-recognized and any gain or loss on disposal is recognized in the income statement.
Other agreements to charter out vessels are classified as opera-ting leases, and lease income is recognized in the income state-ment on a straight-line basis over the lease term.
Sale and leaseback transactionsA gain or loss related to a sale and leaseback transaction resul-ting in a finance lease is deferred and amortized in proportion to the gross rental on the time charter over the lease term.
A gain related to a sale and leaseback transaction resulting in an operating lease is recognized in the income statement im-mediately, provided the transaction is established at fair value or the sales price is lower than the fair value. If the sales price exceeds the fair value, the difference between the sales price and the fair value is deferred and amortized in proportion to the lease payments over the term of the lease. A loss related to a sale and leaseback transaction resulting in an operating lease is recognized in the income statement at the date of the transaction, unless the loss is compensated by future lease payments below fair value, the loss is deferred and amortized in proportion to the lease payments over the term of the lease.
INCOME STATEMENT
RevenueIncome, including revenue, is recognized in the income statement when:• Theincomegeneratingactivitieshavebeencarriedoutonthe
basis of a binding agreement• Theincomecanbemeasuredreliably• Itisprobablethattheeconomicbenefitsassociatedwiththe
transaction will flow to the Company• Costsrelatingtothetransactioncanbemeasuredreliably
Revenue comprises freight, charter hire and demurrage revenues from the vessels and gains and losses on forward freight agree-ments designated as hedges. Revenue is recognized when it meets the general criteria mentioned above and when the stage of completion can be measured reliably. Accordingly, freight, charter hire and demurrage revenue are recognized at selling price upon delivery of the service according to the charter parties concluded.
Port expenses, bunkers and commissionsPort expenses, bunker fuel consumption and commissions are recognized as incurred. Gains and losses on forward bunker con-tracts designated as hedges and write-down and provisions for losses on freight receivables are included in this line.
freight and bunker derivativesFreight and bunker derivatives comprise fair value adjustments and gains and losses on forward freight agreements, forward bun-ker contracts and other derivative financial instruments directly relating to shipping activities which are not designated as hedges.
Charter hireCharter hire comprises expenses related to the chartering in of vessels incurred in order to achieve the net revenue for the period.
operating expensesOperating expenses, which comprise crew expenses, repair and maintenance expenses and tonnage duty, are expensed as incurred.
Net profit/(loss) from sale of vesselsNet profit/(loss) from sale of vessels is recognized when the sig-nificant risks and rewards of ownership have been transferred to the buyer, and it is measured as the difference between the sales price less sales costs and the carrying amount of the asset. Net profit/(loss) from sale of vessels also includes onerous contracts related to sale of vessels and losses from cancellation of new-building contracts.
administrative expensesAdministrative expenses, which comprise administrative staff costs, management costs, office expenses and other expenses relating to administration, are expensed as incurred.
other operating incomeOther operating income primarily comprises chartering commis-sions, management fees and profits and losses deriving from the disposal of other plant and operating equipment.
Impairment losses on jointly controlled entitiesImpairment losses on jointly controlled entities comprise the re-duction in the value of the equity investment in jointly controlled entities by the amount by which the carrying amount of the invest-ment exceeds its recoverable amount. In the event of indication of impairment, the carrying amount is assessed, and the value of the asset is written down to its recoverable amount equal to the higher of the value in use based on net present value of future earnings from the assets and its net selling price.
Note 1 – CoNtINueD
55Notes

TORM 2012
amortizations, depreciation and impairment lossesAmortizations, depreciation and impairment losses comprise amortization of other intangible assets and depreciation of tan-gible fixed assets for the period as well as the write-down of the value of assets by the amount by which the carrying amount of the asset exceeds its recoverable amount. In the event of indica-tion of impairment, the carrying amount is assessed and the value of the asset is written down to its recoverable amount equal to the higher of value in use based on net present value of future ear nings from the assets and its net selling price.
financial incomeFinancial income comprises interest income, realized and un-realized exchange rate gains relating to transactions in curren-cies other than the functional currency, realized gains from other equity investments and securities, unrealized gains from securi-ties, dividends received and other financial income including value adjustments of certain financial instruments not accounted for as hedges of future transactions.
Interest is recognized in accordance with the accrual basis of accounting taking into account the effective interest rate. Dividends from other investments are recognized when the right to receive payment has been decided, which is typically when the divi dend has been declared and can be received without conditions.
financial expensesFinancial expenses comprise interest expenses, financing costs of finance leases, realized and unrealized exchange rate losses relating to transactions in currencies other than the functional currency, realized losses from other equity investments and securities, unrealized losses from securities and other financial expenses including value adjustments of certain financial instru-ments not accounted for as hedges of future transactions. Interest is recognized in accordance with the accrual basis of accounting taking into account the effective interest rate.
TaxIn Denmark, TORM A/S is jointly taxed with its Danish subsidia-ries. The Parent Company provides for and pays the aggregate Danish tax on the taxable income of these companies, but re co-vers the relevant portion of the taxes paid from the subsidiaries based on each entity’s portion of the aggregate taxable income. Tax expenses comprise the expected tax including tonnage tax on the taxable income for the year for the Group, adjustments rela-ting to previous years and the change in deferred tax for the year. However, tax relating to equity items is posted directly in equity.
BALANCE SHEET
GoodwillGoodwill is measured as the excess of the cost of the business combination over the fair value of the acquired assets, liabilities and contingent liabilities and is recognized as an asset under intangible assets.
Goodwill is not amortized, but the recoverable amount of goodwill is assessed every quarter. For impairment testing purposes, good-will is on initial recognition allocated to those cash generating units to which it relates.
other intangible assetsOther intangible assets were acquired in connection with the acquisition of OMI and are amortized over their useful lives, which vary from one to 15 years.
other plant and operating equipmentLand is measured at cost.
Buildings are measured at cost less accumulated depreciation and accumulated impairment losses. Buildings are depreciated on a straight-line basis over 50 years.
Operating equipment is measured at cost less accumulated depreciation. Computer equipment is depreciated on a straight-line basis over three years, and other operating equipment is depreciated on a straight-line basis over five years.
Leasehold improvements are measured at cost less accumulated amortization and impairment losses, and leasehold improvements are amortized on a straight-line basis over the shorter of the term of the lease and the estimated useful life. Cost comprises acquisi-tion cost and costs directly related to the acquisition up until the time when the asset is ready for use.
Investments in jointly controlled entitiesInvestments in jointly controlled entities comprise investments in companies which are by agreement managed jointly with one or more companies and therefore subject to joint control and are measured at equity value.
financial assetsFinancial assets are initially recognized at the settlement date at fair value plus transaction costs, except for financial assets at fair value through profit or loss, which are recognized at fair value. Financial assets are derecognized when the rights to receive cash flows from the assets have expired or have been transferred.
Financial assets are classified as:• Financial assets at fair value through profit or loss• Held-to-maturity investments• Loans and receivables• Available for sale financial assets
other investmentsOther investments comprise shares in other companies and are classified as available for sale. Listed shares are measured at the market value at the balance sheet date, and unlisted shares are measured at estimated fair value. Unrealized gains and losses resulting from changes in fair value of shares are recognized in ‘Other comprehensive income’. Realized gains and losses resul-ting from sales of shares are recognized as financial items in the income statement. The cumulative value adjustment recognized in ‘Other comprehensive income’ is transferred to the income statement when the shares are sold. Dividends on shares in other companies are recognized as financial income in the period in which they are declared.
Other investments are presented as non-current, unless Manage-ment intends to dispose of the investments within 12 months from the balance sheet date.
other financial assetsOther financial assets comprise TORM’s rights to a share of the gain on purchase options on vessels, which were acquired as part of the acquisition of OMI, and are classified as derivative finan-cial instruments. The rights are measured and recognized at fair value, and the change for the period is recognized in the income statement under financial income or expenses.
ReceivablesOutstanding freight receivables and other receivables that are expected to be realized within 12 months from the balance sheet date are classified as loans and receivables and presented as cur-rent assets. Receivables are measured at the lower of amortized cost and net realizable values, which corresponds to nominal
Note 1 – CoNtINueD
56 Notes

TORM 2012
value less provision for bad debts. Derivative financial instruments included in other receivables are measured at fair value.
Impairment of assetsNon-current assets are reviewed quarterly to determine any indication of impairment due to a significant decline in either the assets’ market value or in the cash flows generated by the assets. In case of such indication, the recoverable amount of the asset is estimated as the higher of the asset’s net selling price and its value in use. The value in use is the present value of the future cash flows expected to derive from an asset. If the recoverable amount is less than the carrying amount of the asset, the carrying amount is reduced to the recoverable amount. The impairment loss is recognized immediately in the income statement.
For the purpose of assessing impairment, assets including good-will and time charter and bareboat contracts are grouped at the lowest levels at which goodwill is monitored for internal manage-ment purposes. The two cash generating units of the Company are the Tanker Division and the Bulk Division.
bunkersBunkers and luboil are stated at the lower of cost and net rea lizable value. Cost is determined using the FIFO method and includes expenditures incurred in acquiring the bunkers and luboil and delivery cost less discounts.
Treasury sharesTreasury shares are recognized as a separate component of equity at cost. Upon subsequent disposal of treasury shares, any con-sideration is also recognized directly in equity.
dividendDividend is recognized as a liability at the time of declaration at the Annual General Meeting. Dividend proposed for the year is moved from ‘Retained profit’ and presented as a separate compo-nent of equity.
ProvisionsProvisions are recognized when the Company has a legal or con-structive obligation as a result of past events and it is probable that it will lead to an outflow of resources that can be reliably estimated. Provisions are measured at the estimated liability that is expected to arise, taking into account the time value of money.
acquired liabilities related to options on vesselAs part of the acquisition of OMI, the Company acquired certain option obligations relating to vessels chartered out on time char-ter contracts. The option obligations are classified as derivative financial instruments and are recognized at fair value. The change for the period is recognized in the income statement under finan-cial income or expenses.
Mortgage debt and bank loansAt the time of borrowing, mortgage debt and bank loans are mea-sured at fair value less transaction costs. Mortgage debt and bank loans are subsequently measured at amortized cost. This means that the difference between the proceeds at the time of borrowing and the nominal amount of the loan is recognized in the income statement as a financial expense over the term of the loan apply-ing the effective interest method.
When terms of existing financial liabilities are renegotiated, or other changes regarding the effective interest rate occurs, TORM performs a test to evaluate whether the new terms are sub-stantially different from the original terms. If the new terms are substantially different from the original terms, TORM accounts for the change as an extinguishment of the original financial liability and the recognition of a new financial liability. TORM considers the new terms to be substantially different from the original terms if
the present value of the cash flows under the new terms, includ-ing any fees paid net of any fees received and discounted using the original effective interest rate, is at least 10% different from the discounted present value of the remaining cash flows of the origi-nal financial liability.
other liabilitiesLiabilities are initially measured at cost and subsequently mea-sured at amortized cost. Derivative financial instruments included in other liabilities are measured at fair value.
CASH FLOW STATEMENTThe cash flow statement shows the Company’s cash flows and cash and cash equivalents at the beginning and the end of the period.
Cash flow from operating activities is presented using the indirect method and is based on net profit for the year adjusted for tax, financial income and expenses, net profit from sale of vessels, non-cash operating items, changes in working capital, income tax paid, dividends received and interest paid/received.
Cash flow from investing activities comprises the purchase and sale of tangible fixed assets and financial assets.
Cash flow from financing activities comprises changes in long-term debt, bank loans, finance lease liabilities, purchases or sales of treasury shares and dividend paid to shareholders.
Cash and cash equivalents comprise cash at bank and in hand including restricted cash and cash equivalents. Other investments are classified as investment activities.
EARNINGS PER SHAREBasic earnings per share are calculated by dividing the consoli-dated net profit or loss for the year available to common share-holders by the weighted average number of common shares outstanding during the period. Treasury shares are not included in the calculation. Purchases and sales of treasury shares during the period are weighted based on the remaining period.
Diluted earnings per share are calculated by adjusting the con-solidated profit or loss available to common shareholders and the weighted average number of common shares outstanding for the effects of all potentially dilutive shares. Such potentially dilutive common shares are excluded when the effect of including them would be to increase earnings per share or reduce a loss per share.
CRITICAL ACCOUNTING ESTIMATES AND JUDGEMENTSThe preparation of financial statements in accordance with IFRS requires Management to make estimates and assumptions that affect the reported amounts of assets and liabilities, the disclo-sure of contingent assets and liabilities at the date of the financial statements and the reported amounts of revenues and expenses during the reporting period. These estimates and assumptions are affected by the way TORM applies its accounting policies. An accounting estimate is considered critical if the estimate requires Management to make assumptions about matters subject to significant uncertainty, if different estimates could reasonably have been used, or if changes in the estimate that would have a material impact on the Company’s financial position or results of operations are reasonably likely to occur from period to period. Management believes that the accounting estimates applied are appropriate and the resulting balances are reasonable. However, actual results could differ from the original estimates requiring adjustments to these balances in future periods.
Note 1 – CoNtINueD
57Notes

TORM 2012
Management believes that the following are the significant accounting estimates and judgements used in the preparation of the consolidated financial statement:
Carrying amounts of vesselsThe Company evaluates the carrying amounts of the vessels to determine if events have occurred that would require a modi-fication of their carrying amounts. The valuation of vessels is reviewed based on events and changes in circumstances that would indicate that the carrying amount of the assets might not be recovered. In assessing the recoverability of the vessels, the Company reviews certain indicators of potential impairment such as reported sale and purchase prices, market demand and general market conditions. Furthermore, market valuations from leading, independent and internationally recognized shipbroking companies are obtained on a quarterly basis as part of the review for potential impairment indicators. If an indication of impair-ment is identified, the need for recognizing an impairment loss is assessed by comparing the carrying amount of the vessels to the higher of the fair value less cost to sell and the value in use.
The review for potential impairment indicators and projection of future undiscounted and discounted cash flows related to the vessels is complex and requires the Company to make various estimates including future freight rates, earnings from the ves-sels and discount rates. All of these factors have historically been volatile.
The carrying amounts of TORM’s vessels may not represent their fair market value at any point in time as market prices of second-hand vessels to a certain degree tend to fluctuate with changes in charter rates and the cost of newbuildings. However, if the estimated future cash flow or related assumptions in the future experience change, an impairment write-down of vessels may be required.
lIqUIdITy, CaPITal RESoURCES aNd SUbSEqUENT EVENTS
LIQUIDITY AND CAPITAL RESOURCES In 2012, TORM succeeded in achieving a restructuring agreement, which stabilizes the Company in the coming period.
As of 31 December 2012, TORM’s cash position totaled USD 28 million and undrawn credit facilities amounted to USD 42 million (2011: USD 52 million). TORM has no newbuilding order book and therefore no CAPEX commitments related hereto.
TORM’s bank debt (excluding the working capital facility of USD 100 million) has aligned key terms and conditions across all facilities with maturity on 31 December 2016. The financing agree-ments provide for a deferral of installment on the bank debt until 30 September 2014, in which period rescheduled principal amor-t izations will only fall due if the Company has sufficient liquidity. Provided that the Company generates sufficient cash, certain cash sweep mechanisms will apply. Annualized minimum repayments of USD 100 million will commence with effect from 30 September 2014 until 31 December 2016. If vessels are sold, the related debt will fall due.
Interest on the existing debt will only be paid if the Company has sufficient liquidity and otherwise the remainder will be rolled up until at least 30 June 2014 with potential extension until 30 Sep-tember 2014. The Company will pay interest on the new working capital facility until 30 September 2014.
The financial covenants appear uniformly across the bank debt facilities and include:• Minimum liquidity: Cash plus available part of the USD 100 mil-
lion working capital facility must exceed USD 50 million to be tested from 31 December 2012. This will later adjust to a cash requirement of USD 30 million by 30 September 2014 and USD 40 million by 31 March 2015.
• Loantovalueratio:Asof31December2012,thetotalbankdebt (excluding working capital facility) of USD 1,846 million
is split into a senior debt facility of USD 1,020 million, a junior debt facility of USD 466 million and a subordinated debt facility of USD 360 million. All debt facilities have collateral in the ves-sels. The senior debt facility must have an initial agreed ratio of loan to TORM’s fleet value (excl. finance lease vessels) below 85% to be confirmed from 30 June 2013. This will gradually step down to 65% by 30 June 2016. The remaining bank debt of USD 826 million is divided into two additional debt facilities both with collateral in the vessels.
• ConsolidatednetdebttocashadjustedEBITDA:Initialagreedratio of maximum 30:1 to be tested from 30 June 2013 and gradual step down to a 6:1 ratio by 30 June 2016.
• Interestcoverratio:AgreedcashadjustedEBITDAtointerestratio of initially minimum 1.4x by 30 June 2014 and gradual step up to 2.5 by 31 December 2015.
The terms of the credit facilities include additional covenants, including among other things:• Achange-of-controlprovisionwithathresholdof25%ofshares
or voting rights• Noissuanceofnewsharesordividenddistributionwithoutcon-
sent from the lenders
As of 31 December 2012, TORM is in compliance with all cove -nants.
SUBSEQUENT EVENTSFor the full year 2013, TORM forecasts a loss before tax of USD 100-150 million before potential vessel sales and impairment charges. TORM expects to remain in compliance with the financial covenants for 2013. In addition, TORM expects to be operational cash flow positive after interest payment. The uncertainties and sensitivities about freight rates and asset prices may have an effect on the Company’s compliance with the financial covenants. As 24,676 earning days are uncovered at year-end 2012, a change in freight rates of USD/day 1,000 would impact profit before tax by USD 25 million. For further details on the forecast, please refer to ‘Outlook 2013’ on page 8 and ‘Safe Harbor Statement’ on page 10.
Note 1 – CoNtINueD
Note 2
58 Notes
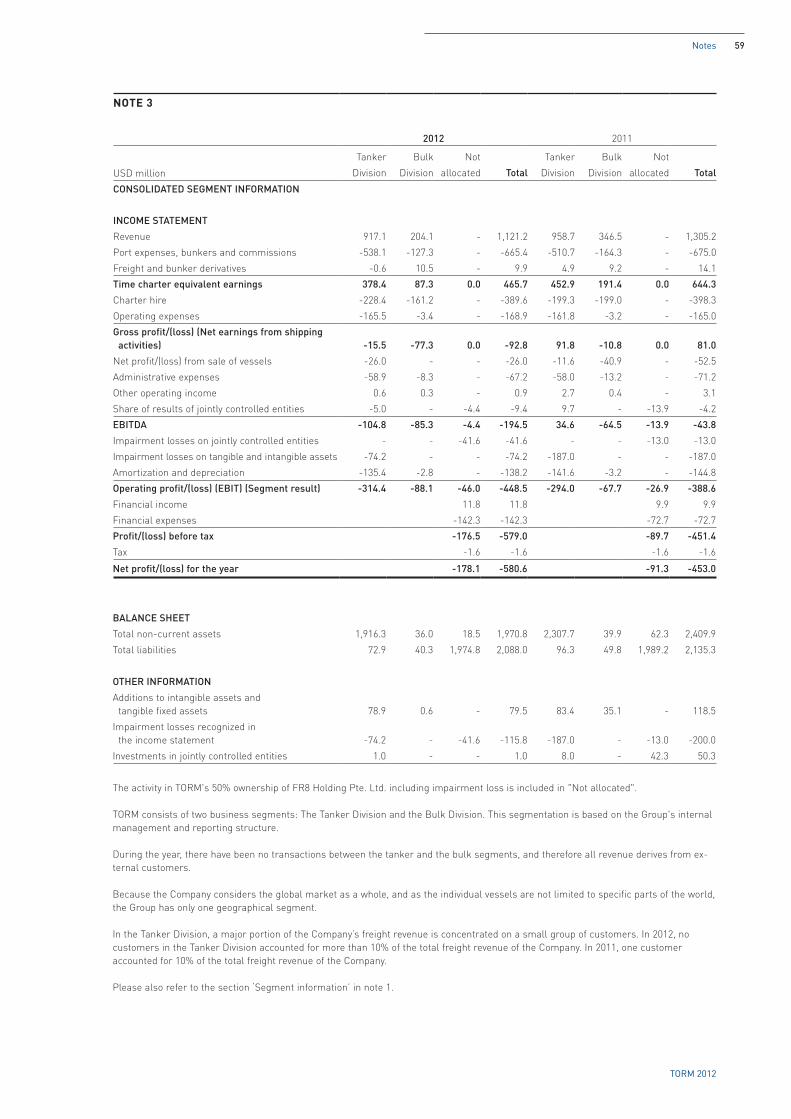
TORM 2012
Note 3
2012 2011
Tanker Bulk Not Tanker Bulk Not
USD million Division Division allocated Total Division Division allocated Total
CoNSolIdaTEd SEGMENT INfoRMaTIoN
INCoME STaTEMENT
Revenue 917.1 204.1 - 1,121.2 958.7 346.5 - 1,305.2Port expenses, bunkers and commissions -538.1 -127.3 - -665.4 -510.7 -164.3 - -675.0Freight and bunker derivatives -0.6 10.5 - 9.9 4.9 9.2 - 14.1Time charter equivalent earnings 378.4 87.3 0.0 465.7 452.9 191.4 0.0 644.3
Charter hire -228.4 -161.2 - -389.6 -199.3 -199.0 - -398.3Operating expenses -165.5 -3.4 - -168.9 -161.8 -3.2 - -165.0Gross profit/(loss) (Net earnings from shipping activities) -15.5 -77.3 0.0 -92.8 91.8 -10.8 0.0 81.0
Net profit/(loss) from sale of vessels -26.0 - - -26.0 -11.6 -40.9 - -52.5Administrative expenses -58.9 -8.3 - -67.2 -58.0 -13.2 - -71.2Other operating income 0.6 0.3 - 0.9 2.7 0.4 - 3.1Share of results of jointly controlled entities -5.0 - -4.4 -9.4 9.7 - -13.9 -4.2EbITda -104.8 -85.3 -4.4 -194.5 34.6 -64.5 -13.9 -43.8
Impairment losses on jointly controlled entities - - -41.6 -41.6 - - -13.0 -13.0Impairment losses on tangible and intangible assets -74.2 - - -74.2 -187.0 - - -187.0Amortization and depreciation -135.4 -2.8 - -138.2 -141.6 -3.2 - -144.8operating profit/(loss) (EbIT) (Segment result) -314.4 -88.1 -46.0 -448.5 -294.0 -67.7 -26.9 -388.6
Financial income 11.8 11.8 9.9 9.9Financial expenses -142.3 -142.3 -72.7 -72.7Profit/(loss) before tax -176.5 -579.0 -89.7 -451.4
Tax -1.6 -1.6 -1.6 -1.6
Net profit/(loss) for the year -178.1 -580.6 -91.3 -453.0
balaNCE SHEET
Total non-current assets 1,916.3 36.0 18.5 1,970.8 2,307.7 39.9 62.3 2,409.9Total liabilities 72.9 40.3 1,974.8 2,088.0 96.3 49.8 1,989.2 2,135.3
oTHER INfoRMaTIoN
Additions to intangible assets and tangible fixed assets 78.9 0.6 - 79.5 83.4 35.1 - 118.5Impairment losses recognized in the income statement -74.2 - -41.6 -115.8 -187.0 - -13.0 -200.0Investments in jointly controlled entities 1.0 - - 1.0 8.0 - 42.3 50.3
The activity in TORM's 50% ownership of FR8 Holding Pte. Ltd. including impairment loss is included in "Not allocated".
TORM consists of two business segments: The Tanker Division and the Bulk Division. This segmentation is based on the Group's internal management and reporting structure.
During the year, there have been no transactions between the tanker and the bulk segments, and therefore all revenue derives from ex-ternal customers.
Because the Company considers the global market as a whole, and as the individual vessels are not limited to specific parts of the world, the Group has only one geographical segment.
In the Tanker Division, a major portion of the Company’s freight revenue is concentrated on a small group of customers. In 2012, no customers in the Tanker Division accounted for more than 10% of the total freight revenue of the Company. In 2011, one customer accounted for 10% of the total freight revenue of the Company.
Please also refer to the section ‘Segment information’ in note 1.
59Notes

TORM 2012
Note 4USD million 2012 2011STaff CoSTS
Total staff costs
Staff costs included in operating expenses 17.4 18.0Staff costs included in administrative expenses 40.8 46.7
Total 58.2 64.7
Staff costs comprise the following
Wages and salaries 52.7 58.1Share-based compensation 1.3 1.2Pension costs 3.7 5.0Other social security costs 0.5 0.4
Total 58.2 64.7
of which remuneration to the board of directors and salaries to the Executive Management:
USD ‘000 2012**) 2011Board
remune-ration
Committee remune-
ration
Total short-term
benefits
Board remune-
ration
Committee remune-
ration
Total short-term
benefitsboard of directors
Niels Erik Nielsen 347 9 356 187 9 196Christian Frigast 225 17 242 121 19 140Peter Abildgaard (resigned on 27 April 2012) 22 - 22 75 - 75Lennart Arrias (resigned on 14 April 2011) - - 0 21 - 21Margrethe Bligaard (resigned on 14 April 2011) - - 0 21 - 21Kari Millum Gardarnar (appointed on 14 April 2011) 139 - 139 53 - 53Rasmus Johannes Hoffmann (appointed on 14 April 2011) 139 - 139 53 - 53Bo Jagd (resigned on 14 April 2011) - - 0 21 3 24Jesper Jarlbæk 139 9 148 75 9 84Gabriel Panayotides*) 22 3 25 75 9 84Angelos Papoulias*) 22 3 25 75 15 90Stefanos-Niko Zouvelos*) 22 3 25 75 9 84
Total for the year 1,077 44 1,121 852 73 925
*) Did not stand for re-election at the Annual General Meeting on 23 April 2012.
**) For 2012, the Board of Directors has received additional compensation for the extraordinary work carried out during the restructuring process.
Short-term benefits Share-based
Executive Management 2012 Salaries Bonus Pensioncompen-sation*) Total
Jacob Meldgaard 929 - - 252 1,181Roland M. Andersen 675 - 15 173 863
Total for 2012 1,604 0 15 425 2,044
*) Share-based compensation to Executive Management relates to the theoretical value of share options granted before 2012, but allocated to and recognized in the income statement for 2012. The current share price is well below the exercise prices for these options which are considerably out-of-the-money.
Short-term benefits Share-based
Executive Management 2011 Salaries Bonus Pensioncompen-
sation TotalJacob Meldgaard 1,003 - - 227 1,230Roland M. Andersen 722 - 22 231 975
Total for 2011 1,725 0 22 458 2,205
Employee information
The average number of permanently employed staff in the Group in 2012 was 305 (2011: 332) land-based employees and 161 (2011: 212) seafarers.
The majority of the staff on vessels are not employed by TORM.
The average number of employees is calculated as full-time equivalents (FTE).
The members of Management are, in the event of termination by the Company, entitled to a severance payment of up to 24 months' salary.
60 Notes

TORM 2012
Note 4 - CoNtINueD
INCENTIVE SCHEME FOR MANAGEMENT AND CERTAIN EMPLOYEES FOR 2010-2012TORM’s share option programs are subject to Danish law and include certain adjustment provisions and exercise conditions and other terms customary for share option programs of this nature. Among other things, the programs provide that a share capital increase made at a subscription price below market value (except where a capital increase is made pursuant to a general employee share scheme), should result in a proportional adjustment of the number of shares in the Company which can be acquired when exercising a share option. As a result of the capital reduction and the issuance of the new shares at a subscription price below market value in connection with the restructuring, TORM’s share option programs were adjusted in accordance with their terms. As a consequence of the discounted issuance of the new shares, the exercise price of TORM’s issued share options was adjusted with a factor of 0.6823 and the number of share options held by the holders was adjusted with a factor of 1.4655.
Incentive schemeIn 2010, a share option-based incentive scheme was established for certain employees including the Executive Management, mem-bers of the management group and certain key employees. 35 persons were comprised by the 2010 grant and 40 persons by the 2011 grant. The Company has granted 0 share options in 2012.
The Board of Directors is not included in the share option pro-gram 2010-2012.
The share option program 2010-2012 comprises share options only and aims at incentivizing the participants to seek to improve the results of the Company and thereby the value of the Company, i.e. the share price, to the mutual benefit of themselves and the shareholders of the Company.
The share options can be granted in 2010, 2011 and 2012 at the discretion of the Board of Directors in accordance with criteria determined by the Board of Directors.
In 2012, 40,000 (2011: 30,000) of the share options granted in 2011 and 40,000 (2011: 35,000) of the share options granted in 2010 were forfeited.
As at 31 December 2012, a total number of 2,720,636 unexercised share options were outstanding under the share option program for 2010 and 2011, including 891,406 options to members of the current Executive Management.
The share options vest in connection with the publication of the annual report in the third calendar year following the grant.
Vested share options may be exercised from the vesting date until the publication of the annual report in the sixth year from the grant. Additionally, the share options may only be exercised in an exercise window during a period of four weeks from the date of the Company’s publication of an interim report or an annual report.
Each share option gives the employee the right to acquire one share with a nominal value of DKK 5 which was adjusted to a nominal value of DKK 0.01 in connection with the adjustment for the discounted issuance of the new shares. As set out above, in connection with the new shares, the number of shares in the Company that can be acquired on the basis of each individual share option is adjusted on a pro rata basis. Exercised options are settled by the Company’s holding of treasury shares or, in certain situations, by settlement in cash.
For grants made in 2010, the exercise price is DKK 33.59, which was calculated as the average closing price on NASDAQ OMX Copenhagen on the day of the publication of the interim financial report for the third quarter of 2010 and the following four busi-ness days plus a hurdle rate of 12% per annum calculated from the date of the grant until the vesting date and after adjustment for the discounted issuance of the new shares. For grants made in 2011, the exercise price is DKK 27.20, which was calculated as the average closing price on NASDAQ OMX Copenhagen on the day of the publication of the annual report for 2010 and the following four business days plus a hurdle rate of 12% per annum calculated from the date of the grant until the vesting date.
Participants resigning from their positions with the Company as good leavers prior to vesting are allowed to keep their share options and to exercise them in accordance with the terms and conditions of the share option program 2010-2012. Bad leaver participants will lose all share options that have not vested at the time of final resignation. This is in accordance with the mandatory provisions of the Danish Stock Option Act.
In 2012, an expense of USD 0.6 million has been recognized in the income statement regarding share options granted in 2010 and USD 0.7 million regarding share options granted in 2011.
The fair value of the share options granted in 2010 and 2011 is based on the Black-Scholes model and as at the grant date calculated at USD 1.6 million for the 2010 grant and USD 2.0 million for the 2011 grant.
The key assumptions for the calculation of the fair value based on the Black-Scholes model are:• ThesharepriceatthetimeofgrantwasestimatedatDKK
34.70 per share for the 2010 grant and DKK 29.40 per share for the 2011 grant based on the closing price on NASDAQ OMX Copenhagen A/S as at 24 November 2010 for the 2010 grant and as at 16 March 2011 for the 2011 grant
• TheexercisepriceisadjustedforTORMdividends• Theexpecteddividendrateatthegrantdateis0%• ThevolatilityoftheTORMshareisestimatedbasedonthe
Company’s historical volatility and was estimated at 47.76% for the 2010 grant and 49.95% for the 2011 grant
• Therisk-freeinterestratebaseduponexpiryoftheoptionsis1.81% for the 2010 grant and 2.37% for the 2011 grant
• Theoptionsareonaverageheldforaperiodof3.8yearsforthe 2010 grant and 4.5 years for the 2011 grant
61Notes

TORM 2012
Note 4 - CoNtINueD
Changes in outstanding share options are as follows: Total options Options allocation per year
Number of share options 2012 2012 2011 2010Share option program - 2010 to 2012
Executive Management
Granted 608,262 - 304,131 304,131Adjustment for the discounted issuance of new shares 283,144 - 141,572 141,572Transferred to resigned employees 0 - - -Exercised 0 - - -Forfeited/expired in 2010-2011 0 - - -Forfeited/expired in 2012 0 - - -Not exercised at 31 december 2012 891,406 0 445,703 445,703
other employees
Granted 1,393,210 - 761,605 631,605Adjustment for the discounted issuance of new shares 546,108 - 310,292 235,816Transferred to resigned employees -140,947 - -61,637 -79,310Exercised 0 - - -Forfeited/expired in 2010-2011 -65,000 - -30,000 -35,000Forfeited/expired in 2012 -80,000 - -40,000 -40,000Not exercised at 31 december 2012 1,653,371 0 940,260 713,111
Resigned employees
Adjustment for the discounted issuance of new shares 34,912 - 11,637 23,275Transferred from management and other employees 140,947 - 61,637 79,310Exercised 0 - - -Forfeited/expired in 2010-2011 0 - - -Forfeited/expired in 2012 0 - - -Not exercised at 31 december 2012 175,859 0 73,274 102,585
Total number of share options not exercised at 31 december 2012 2,720,636 0 1,459,237 1,261,399
Total number of share options not exercised at 31 december 2011 1,936,472 0 1,035,736 900,736
Total number of share options that could be exercised at 31 december 2012 0 0 0 0
Total number of share options that could be exercised at 31 december 2011 0 0 0 0
62 Notes

TORM 2012
Note 4 - CoNtINueD
INCENTIVE SCHEME FOR MANAGEMENT AND EMPLOYEES FOR 2007-2009In 2007, an incentive scheme was established for all land-based employees and officers employed on permanent contracts (apart from trainees, apprentices and cadets) that were directly employed in TORM A/S. The Board of Directors was not included in the scheme. The scheme covers the financial years of 2007, 2008 and 2009. The scheme consists of both bonuses and share options.
bonusThe bonus was awarded based on TORM achieving a calculated RoIC (Return on Invested Capital) in each financial year compared to each year's budgeted RoIC. If the RoIC was higher or lower, the amount available for bonuses was adjusted accordingly. 75% of the achieved bonus was paid in cash and 25% in shares, which the employees would own provided that they were still employed by the Company after a period of two years. The number of shares granted to the employee depended on the market price of the TORM share when TORM's annual report for the grant year was published. In addition to the RoIC-based bonus, a discretionary bonus could be awarded. In 2009, the RoIC target was not achieved and, conse-quently, only the discretionary bonus was awarded. The individual employee's share of the bonus was based partly on the individual's salary and partly on the evaluation of the individual's performance. The employee received the bonus after the publication of TORM's annual report. For the financial year 2010, 2011 and 2012 no bonus has been awarded under this program as it only covers the financial years 2007-2009.
An income of USD 0.0 million (2011: an income of USD 0.3 million) relating to the amortization of shares for 2007-2008 has been recognized in the income statement for 2012.
Please refer to the annual reports for 2007-2009 for further infor-mation on bonuses under this scheme in 2007-2009.
Share optionsIn 2007, the Company established a share option scheme for the period 2007-2009 for all land-based employees and officers em-ployed on permanent contracts with the Company, including the members of the Executive Management.
The share option program 2007-2009 is subject to Danish law and includes certain adjustment provisions and exercise conditions and other terms customary for share option programs of this nature. Among other things, the program provides that a share capital increase made at a subscription price below market value (except where a capital increase is made pursuant to a general employee share scheme), should result in a proportional adjustment of the number of shares in the Company which can be acquired when exercising a share option. Any issue of bonus shares in the Com-pany or a change in the denomination of the shares in the Company or share capital reductions made at a price above market value also lead to adjustments of the number of shares. Furthermore, the exercise price of the stock options is adjusted if excess dividends are distributed to the shareholders. Excess dividends are defined as any dividend payments which materially deviate from the dividend payments of the Company taken into consideration when granting the share options. For example the Board of Directors’ decision to pay an extraordinary dividend based on its authorization granted by the general meeting will constitute an excess dividend. As set out above and in order to ensure that the value of the share options re-mains unaffected by the issuance of the new shares, and in accor-dance with the adjustment provisions of the share option program, the exercise price and the number of options was adjusted with an adjustment factor of 0.6823 and 1.4655 respectively.
As at 31 December 2012, a total number of 3,933,666 unexercised share options were outstanding under the share option program
for 2007-2009, including 327,920 options to members of the current Executive Management.
Approximately 50% of the share options were granted with a fixed exercise price (standard options). For the share options granted in 2007, the exercise price is DKK 101.19 per share, in 2008 DKK 108.97 per share and in 2009 DKK 116.67 per share after adjust-ment for the extraordinary dividend paid out in September 2007 and December 2008 and after adjustment for the discounted issuance of the new shares.
The other approximately 50% of the share options were granted with an exercise price that is ultimately determined at the publi-cation of the Company’s annual report after a three-year period, e.g. for the grant in 2009, determination took place in March 2012. The exercise price is based on the market price of the shares on 5 March 2007 and is adjusted for the relative development in the share price in relation to a defined peer group (peer group options). Furthermore, the exercise price is reduced if the Company’s total shareholder return (calculated on the basis of the share price of the respective shares’ primary place of listing with dividends reinvested in the Company) exceeds the average total shareholder return of a defined peer group (peer group options). Finally, adjustments are made to reflect the dividends paid by the Company to its share-holders during the vesting periods. If the shares develop relatively better than the peer group, the share options will be in the money. After adjustment for the discounted issuance of new shares for peer group options granted in 2007, the exercise price is DKK 72.32, for peer group options granted in 2008, the exercise price is DKK 54.58 and for peer group options granted in 2009, the exercise price is DKK 24.56. As at 31 December 2012, a total number of 1,744,333 unexercised standard options were outstanding and a total number of 2,189,333 unexercised peer group options were outstanding.
The share options may be exercised in an exercise window starting at expiry of a seven-day period after publication of the annual report in the third calendar year after the date of grant (from 2010-2012) and ending at the end of the sixth calendar year after the date of grant (2013-2015). During the exercise window, the share options may only be exercised within windows of 28 days after the Compa-ny’s publication of annual reports and interim financial reports. For the 2007 grant, share options can be exercised after the publication of the annual report for 2009 in March 2010, and shall be exercised by March 2013 at the latest, for the 2008 grant, share options can be exercised after the publication of the annual report for 2010 in March 2011, and shall be exercised by March 2014 at the latest, and finally, for the 2009 grant, share options can be exercised after the publication of the annual report for 2011 in March 2012, and shall be exercised by March 2015 at the latest. As at 31 December 2012, all 3,933,666 share options were vested.
Each share option gives the employee the right to acquire one share with a nominal value of DKK 5 which was adjusted to a nominal value of DKK 0.01 in connection with the adjustment for the dis-counted issuance of the new shares. As set out above, in connection with the capital reduction and the listing, the number of shares in the Company that can be acquired on the basis of each individual share option is adjusted on a pro rata basis. Exercised options are settled by the Company’s holding of treasury shares or, in certain situations, by settlement in cash.
Participants resigning from their positions with the Company as good leavers prior to vesting are allowed to keep their share options and to exercise them in accordance with the terms and conditions of the share option program 2007-2009. Bad leaver participants will lose all share options that have not vested at the time of final resignation. This is in accordance with the mandatory provisions of the Danish Stock Option Act.
63Notes

TORM 2012
Note 4 - CoNtINueD
Changes in outstanding share options are as follows:
Total options Options allocation per yearNumber of share options 2012 2009 2008 2007Share option program - 2007 to 2009
Executive Management
Granted 752,119 223,761 200,009 328,349Adjustment for the discounted issuance of new shares 104,159 104,159 - -Transferred to resigned employees -528,358 - -200,009 -328,349Exercised 0 - - -Forfeited/expired in 2007-2011 0 - - -Forfeited/expired in 2012 0 - - -Not exercised at 31 december 2012 327,920 327,920 0 0
other employees
Granted 2,668,369 1,022,003 887,353 759,013Adjustment for the discounted issuance of new shares 389,107 158,898 129,482 100,727Transferred to resigned employees -1,120,344 -296,089 -344,783 -479,472Exercised 0 - - -Forfeited/expired in 2007-2011 -690,084 -350,326 -269,936 -69,822Forfeited/expired in 2012 -40,070 -40,070 - -Not exercised at 31 december 2012 1,206,978 494,416 402,116 310,446
Resigned employees
Adjustment for the discounted issuance of new shares 755,624 134,309 249,662 371,653Transferred from management and other employees 1,648,702 296,089 544,792 807,821Exercised 0 - - -Forfeited/expired in 2007-2011 -5,558 -1,080 -2,359 -2,119Forfeited/expired in 2012 0 - - -Not exercised at 31 december 2012 2,398,768 429,318 792,095 1,177,355
Total number of share options not exercised at 31 december 2012 3,933,666 1,251,654 1,194,211 1,487,801
of which:
Share options with a fixed exercise price 1,744,333 555,043 529,566 659,724Share options with an exercise price based on peer group 2,189,333 696,611 664,645 828,077
Total number of share options not exercised at 31 december 2011 2,724,846 894,358 815,067 1,015,421
Total number of share options that could be exercised at 31 december 2012:
Share options with a fixed exercise price 1,744,333 555,043 529,566 659,724Share options with an exercise price based on peer group 2,189,333 696,611 664,645 828,077
3,933,666 1,251,654 1,194,211 1,487,801
Total number of share options that could be exercised at 31 december 2011 1,830,488 0 815,067 1,015,421
In 2012, a total expense of USD 0.0 million has been recognized in the income statement regarding share options.
The fair value of the share options granted in 2007, 2008 and 2009 was based on the Black-Scholes and Monte Carlo models and calculated at USD 10.9 million for the 2007 grant, USD 6.3 million for the 2008 grant and USD 1.4 million for the 2009 grant as per the grant date.
The key assumptions for the calculation of the fair value based on the Black-Scholes and Monte Carlo models are: • ThesharepriceatthemeasurementdatewasestimatedatDKK
48.6 per share for the 2009 grant, DKK 140.0 for the 2008 grant and DKK 202.25 for the 2007 grant based on the share price on NASDAQ OMX Copenhagen A/S as at 10 July 2009 for the 2009 grant, 31 March 2008 for the 2008 grant and 9 August 2007 for the 2007 grant
64 Notes

TORM 2012
Note 5USD million 2012 2011REMUNERaTIoN To aUdIToRS aPPoINTEd aT THE PaRENT CoMPaNy'S aNNUal GENERal MEETING
deloitte
Audit fees 0.5 0.5Audit-related fees 1.3 0.6Tax fees 0.8 0.1Fees other services 0.3 0.2
2.9 1.4
Note 6USD million 2012 2011oTHER INVESTMENTS
Other investments include shares in other companies.Cost:
Balance at 1 January 5.4 5.4Additions - -Disposals - -Balance at 31 December 5.4 5.4
Value adjustment:
Balance at 1 January 6.2 -2.4Exchange rate adjustment 0.7 -0.5Value adjustment for the year - 9.1Disposals - -balance at 31 december 6.9 6.2
Carrying amount at 31 december 12.3 11.6
Of which listed 0.0 0.0 Of which unlisted 12.3 11.6
Note 4 - CoNtINueD
• Theexerciseprice(beforeadjustingforinterimdividends)isDKK201 per share for the 2009 grant, DKK 190 for the 2008 grant and DKK 179 for the 2007 grant
• TheexercisepricewillbeadjustedforinterimTORMdividends,amounting to an adjustment of DKK 30.0 per share for the 2009 grant, DKK 30.3 per share for the 2008 grant and DKK 30.7 per share for the 2007 grant
• Theexpecteddividendrateatthegrantdateisestimatedat3%for the 2009 grant, 3% for the 2008 grant and 3% for the 2007 grant of the equity per annum
• ThevolatilityoftheTORMshareisestimatedbasedontheCom-pany’s historical volatility at 39.2% for the 2009 grant, 34.9% for the 2008 grant, 36% for the 2007 grant, and for the peer group at
30.8% for the 2009 grant, 26% for the 2008 grant and 22% for the 2007 grant
• Therisk-freeinterestratebaseduponexpiryoftheoptionsis2.68% for the 2009 grant, 3.80% for the 2008 grant and 4.46% for the 2007 grant
• Theoptionsareonaverageheldforaperiodof4.2yearsforthe2009 grant, 4.5 years for the 2008 grant and 4.1 years for the 2007 grant
• ThecorrelationratebetweenpeergroupandTORMis92.5%forthe 2009 grant, 92.5% for the 2008 grant and 92.5% for the 2007 grant, based on the correlation on the 12-month return for the historical share prices during the last ten years
65Notes

TORM 2012
Note 7Other
intangible assetsUSD million Goodwill Total
INTaNGIblE aSSETS
Cost:
Balance at 1 January 2011 89.2 2.7 91.9Additions - - 0.0Disposals - - 0.0balance at 31 december 2011 89.2 2.7 91.9
amortization and impairment losses:
Balance at 1 January 2011 - 0.7 0.7Disposals - - 0.0Amortization and impairment losses for the year 89.2 0.1 89.3balance at 31 december 2011 89.2 0.8 90.0
Carrying amount at 31 december 2011 0.0 1.9 1.9
Cost:
Balance at 1 January 2012 89.2 2.7 91.9Additions - - 0.0Disposals - - 0.0balance at 31 december 2012 89.2 2.7 91.9
amortization and impairment losses:
Balance at 1 January 2012 89.2 0.8 90.0Disposals - - 0.0Amortization and impairment losses for the year - 0.2 0.2balance at 31 december 2012 89.2 1.0 90.2
Carrying amount at 31 december 2012 0.0 1.7 1.7
66 Notes

TORM 2012
Note 8
Land andbuildings
Vessels and capitalized
dry-docking
Pre- payments
on vessels
Other plant and operating
equipment TotalUSD million
TaNGIblE fIXEd aSSETS
Cost:
Balance at 1 January 2011 4.1 3,113.9 243.3 24.8 3,386.1Exchange rate adjustment - - - -0.2 -0.2Additions - 20.7 94.8 3.0 118.5Disposals -1.9 -334.6 -7.8 -0.4 -344.7Transferred to/from other items - 199.3 -199.3 - 0.0Transferred to non-current assets held for sale - - -61.8 - -61.8balance at 31 december 2011 2.2 2,999.3 69.2 27.2 3,097.9
depreciation and impairment losses:
Balance at 1 January 2011 0.5 553.8 16.3 15.2 585.8Exchange rate adjustment - - - -0.1 -0.1Disposals -0.4 -67.8 - -0.3 -68.5Depreciation for the year 0.1 140.6 - 4.2 144.9Impairment loss - 97.8 - - 97.8Transferred to/from other items - 16.3 -16.3 - 0.0balance at 31 december 2011 0.2 740.7 0.0 19.0 759.9
Carrying amount at 31 december 2011 2.0 2,258.6 69.2 8.2 2,338.0
Of which finance leases 0.0 71.5 0.0 0.0 71.5
Of which financial expenses included in cost 0.0 2.8 0.8 0.0 3.6
Cost:
Balance at 1 January 2012 2.2 2,999.3 69.2 27.2 3,097.9Exchange rate adjustment - - - - 0.0Additions - 35.8 41.7 2.0 79.5Disposals -0.5 -146.7 -8.0 -0.2 -155.4Transferred to/from other items - 102.9 -102.9 - 0.0Transferred to non-current assets held for sale - -239.3 - - -239.3balance at 31 december 2012 1.7 2,752.0 0.0 29.0 2,782.7
depreciation and impairment losses:
Balance at 1 January 2012 0.2 740.7 - 19.0 759.9Exchange rate adjustment - - - - 0.0Disposals -0.1 -39.4 - -0.2 -39.7Depreciation for the year 0.8 133.7 - 3.7 138.2Impairment loss - 74.2 - - 74.2Transferred to non-current assets held for sale - -105.5 - - -105.5balance at 31 december 2012 0.9 803.7 0.0 22.5 827.1
Carrying amount at 31 december 2012 0.8 1,948.3 0.0 6.5 1,955.6
Of which finance leases 0.0 14.7 0.0 0.0 14.7
Of which financial expenses included in cost 0.0 2.3 0.0 0.0 2.3
Included in the carrying amount for vessels and capitalized dry-docking are capitalized dry-docking costs in the amount of USD 30.6 mil-lion (2011: USD 33.2 million).
For information on assets used as collateral security, please refer to note 18.
In all material aspects, the depreciation under ‘Other plant and operating equipment’ of USD 3.7 million relates to administration (2011: USD 4.2 million).
Please refer to note 9 for information on impairment testing.
67Notes

TORM 2012
Note 9
IMPaIRMENT TESTINGAs of 31 December 2012, Management performed a review of the recoverable amount of the assets by assessing the recoverable amount for the significant assets within the cash generating units: The Tanker Division, the Bulk Division and the investment in 50% of FR8.
As of 31 December 2012, the recoverable amount of the Tanker Division was the value in use, whereas the recoverable amount of the Bulk Division was the net selling price.
Based on this review, Management concluded that:• Assets within the Bulk Division were not impaired as the net
selling price exceeded the carrying amount by USD 3 million• Assets within the Tanker Division were not further impaired
as the value in use was equal to the carrying amount• The carrying amount of the investment in 50% of FR8 was
during 2012 impaired by USD 42 million to nil in addition to the impairment losses previously recognized
In the assessment of the net selling price of the Bulk Division, Management included a review of market values calculated as the average of valuations from two internationally acknowledged shipbrokers.
The assessment of the value in use of the Tanker Division and the investment in 50% of FR8 was based on the present value of the expected future cash flows.
The major assumptions used in the calculation of the value in use are:• The cash flows are based on known tonnage including ves-
sels contracted for delivery in future periods. Assets held for sale are not included. Additions or sales of tonnage are not factored in as the timing and effect of such transactions are highly uncertain. However, additions will only be made if Management expects to achieve a return in excess of the discount rate applied in the impairment test.
• The product tankers are expected to generate normal income for 25 years. Given the current age profile of the tanker fleet, the average remaining life would be approxi-mately 17 years.
• Freight rate estimates in the period 2013 to 2015 are based on the Company’s business plans, which in 2014 and 2015 assume a gradual increase towards the 10-year historic average.
• Beyond 2015, freight rates for the Tanker Division are based on the following 10-year historic average freight rates from Clarkson adjusted by the inflation rate:
o LR2 USD/day 26,578 o LR1 USD/day 22,446 o MR USD/day 19,814 • Operating expenses and administrative expenses are
estimated based on TORM’s current run rate adjusted for cost adjustments outlined in the operating budgets and the business plans for the period 2013 to 2014. Beyond 2014, operating expenses per operating day and administrative expenses are expected to increase with the inflation rate.
• WACC is set to 8.0% (2011: 8.0%) for the Tanker Division. WACC is calculated using a standard WACC model in which cost of equity, cost of debt and capital structure are the key parameters.
• The inflation rate is based on the US Federal Reserve and ECB inflation target over the medium term, currently set to 2%.
Management believes that these major assumptions are rea-sonable.
The calculation of value in use is sensitive to changes in the key assumptions, which are considered to be related to the future development in freight rates, WACC applied as discount-ing factor in the calculations and the development in operating expenses. The sensitivities have been assessed as follows, all other things being equal:• A decrease in the tanker freight rates of USD/day 1,000
would result in a further impairment of USD 204 million for the Tanker Division
• An increase of the WACC of 1% would result in a further impairment of USD 139 million for the Tanker Division
• An increase of the operating expenses of 10% would result in a further impairment of USD 155 million for the Tanker Division
As outlined above, the impairment tests have been prepared on the basis that the Company will continue to operate its ves-sels as a fleet in the current set-up. In comparison, the market value of TORM’s vessels was USD 1,159 million (excluding product tankers held for sale), which is USD 790 million less than the carrying impaired amount.
Reference is made to note 26, in which an impairment loss of USD 74 million relating to non-current assets held for sale is disclosed.
68 Notes

TORM 2012
Note 10
USD million 2012 2011fINaNCIal ITEMS
financial income
Interest income from cash and cash equivalents, etc. 0.5 1.3Dividends 0.4 0.0Fair value adjustments on derivative financial instruments 8.2 4.2Exchange rate adjustments, including net gain from forward exchange rate contracts 2.7 4.4
11.8 9.9
financial expenses
Interest expenses on mortgage and bank debt, including realized net loss on interest-related derivatives 74.7 58.7Exchange rate adjustments, including net realized loss from forward exchange rate contracts 0.1 4.0Financial expenses related to the restructuring 65.0 0.0Other financial expenses 2.6 10.6Of which included in the cost of tangible fixed assets 0.0 -0.6
142.4 72.7
Total financial items -130.6 -62.8
Note 11USD million 2012 2011fREIGHT RECEIVablES
Analysis of freight receivables at 31 December: Neither past due nor impaired 77.5 78.7Due < 30 days 8.0 43.7Due between 30 and 180 days 22.7 13.4Due > 180 days 9.1 4.4
117.3 140.2
At 31 December 2012, freight receivables included receivables at a value of USD 0.2 million (2011: USD 0.2 million), which are individu-ally determined to be impaired to a value of USD 0.0 million (2011: USD 0.0 million).
Movements in provisions for impairment of freight receivables during the year are as follows:
USD million 2012 2011PRoVISIoN foR IMPaIRMENT of fREIGHT RECEIVablES
Balance at 1 January 0.2 0.2Provisions for the year - -Provisions reversed during the year - -Provisions utilized during the year - -
balance at 31 december 0.2 0.2
Provision for impairment of freight receivables has been recognized in the income statement under ‘Port expenses, bunkers and commissions’.The provision is based on an individual assessment of each receivable.
Note 12USD million 2012 2011oTHER RECEIVablES
Partners and commercial managements 2.8 5.0Derivative financial instruments 2.9 5.6Receivables at joint ventures 2.7 4.5Tax receivables 0.8 0.6Miscellaneous, including items related to shipping activities 7.6 10.3
16.8 26.0
69Notes

TORM 2012
Note 13
USD million 2012 2011TaX
Current tax for the year -1.9 -2.6Adjustments related to previous years -0.2 0.5Adjustment of deferred tax 0.5 0.5
-1.6 -1.6
2012 2011RECoNCIlIaTIoN of THE EffECTIVE CoRPoRaTIoN TaX RaTE foR THE yEaR
Corporation tax rate in Denmark 25.0% 25.0%Differences in tax rates, foreign subsidiaries -12.0% -2.4%Differences in tax rates, foreign jointly controlled entities -0.2% -0.8%Adjustment of tax related to previous years 0.0% 0.1%Effect from the tonnage tax scheme -13.1% -22.3%
Effective corporate tax rate -0.3% -0.4%
The Company participates in the tonnage tax scheme in Denmark. The participation in the tonnage tax scheme is binding until 31 De-cember 2017.
Under the Danish tonnage tax scheme, income and expenses from shipping activities are not subject to direct taxation. Instead the tax-able income is calculated from:• Thenettonnageofthevesselsusedtogeneratetheincomefromshippingactivities• Arateapplicabletothespecificnettonnageofthevessel,basedonaslidingscale• Thenumberofdaysthevesselsareusedduringtheyear
The Company expects to participate in the tonnage tax scheme after the binding period and at a minimum to maintain an investing and activity level equivalent to the time of entering into the tonnage tax scheme.
USD million 2012 2011dEfERREd TaX
Balance at 1 January 53.7 54.2Deferred tax for the year -0.5 -0.5
balance at 31 december 53.2 53.7
Essentially all deferred tax relates to vessels included in the transition account under the Danish tonnage tax scheme.
Note 142012 2011 2012 2011
Number of sharesmillion
Number of sharesmillion
Nominal value
DKK million
Nominal value
DKK millionCoMMoN SHaRES
Balance at 1 January 72.8 72.8 364.0 364.0Share capital decrease - - -363.3 -Share capital increase 655.2 - 6.6 -
balance at 31 december 728.0 72.8 7.3 364.0
The common shares consist of 728 million shares of a nominal value of DKK 0.01 each (2011: DKK 5.00 each). No shares carry special rights. All issued shares are fully paid.
In connnection with the restructuring in November 2012, the nominal value of the Company’s common shares was reduced from DKK 5.00 to DKK 0.01 per share with a value of DKK 363.3 million. The nominal value of the Company’s share amounted hereafter to DKK 0.7 million. The Company’s share capital was hereafter increased by a nominal amount of DKK 6.6 million to DKK 7.3 million by issuance of 655.2 million shares with a nominal value of DKK 0.01 per share.
70 Notes

TORM 2012
Note 14 - CoNtINueD
2012 2011 2012 2011 2012 2011Number of
shares(1,000)
Number of shares(1,000)
Nominal value
DKK million
Nominal value
DKK million
% of share
capital
% of share
capital
TREaSURy SHaRES
Balance at 1 January 3,230.4 3,461.6 16.2 17.3 4.4 4.8
Change in share capital - - -16.1 - -4.0 -
Change in ADS ratio -258.4 - - - - -
Purchase 3,739.8 - - - 0.5 -
Sale - - - - - -
Used for share-based compensation - -231.2 - -1.1 - -0.4
balance at 31 december 6,711.8 3,230.4 0.1 16.2 0.9 4.4
The total consideration for the treasury shares was USD 19.1 million (2011: USD 17.3 million).
At 31 December 2012, the Company’s holding of treasury shares represented 6,711,792 shares (2011: 3,230,432 shares) of DKK 0.01 each at a total nominal value of USD 0.0 million (2011: USD 2.8 million) and a market value of USD 2.1 million (2011: USD 2.1 million). The retained shares equates to 0.9% (2011: 4.4%) of the Company’s common shares.
The treasury shares are held as a hedge of the Company's program for share-based compensation.
Note 15USD million 2012 2011
dEfERREd INCoME
Deferred gain related to sale and leaseback transactions 6.4 7.6
6.4 7.6
Note 16USD million 2012 2011
oTHER lIabIlITIES
Partners and commercial managements 11.9 6.1
Accrued operating expenses 14.4 6.6
Accrued interest 0.9 3.6
Wages and social expenses 12.7 17.8
Derivative financial instruments 1.0 41.2
Payables to joint ventures 0.4 0.8
Miscellaneous, including items related to shipping activities 6.8 8.8
48.1 84.9
71Notes

TORM 2012
Note 17
EffECTIVE INTEREST RaTE aNd faIR ValUE of MoRTaGE dEbT aNd baNk loaNS
In November 2012, TORM completed a restructuring. As part of the restructuring, TORM secured a new working capital facility of USD 100 million until 30 September 2014. The group of banks aligned key terms and conditions as well as financial covenants across all existing debt facilities, and the maturity on all existing credit facilities was adjusted to 31 December 2016.
Please refer to note 2 for further information on the Company’s liquidity and capital resources and note 22 and 23 for further information on interest rate risks.
At 31 December 2011, the Company’s mortgage debt and bank loans were subject to an unremediated breach of financial covenants and therefore formally due in 2012.
The table below shows the effective interest and fair value of the mortgage debt and bank loans.
2012 2011
USD millionFixed/
floating MaturityEffectiveinterest
Fairvalue Maturity
Effectiveinterest
Fairvalue
loaN
USD Floating - - - 2012 3.2% 1,803.7USD Floating 2014 15.6%*) 58.0 - - -USD Floating 2016 3.4%**) 1,846.1 - - -
weighted average effective interest rate 3.5% 3.2%
fair value 1,904.1 1,803.7
As of 31 December 2011, part of the loans with floating interest rate were swapped to fixed interest rate.
*) Effective interest rate includes deferred and amortized bank fees and commitment fee
**) Effective interest rate includes deferred and amortized bank fees related to original facilities and fees related to the restructured bank loans
72 Notes

TORM 2012
Note 18
USD million 2012 2011CollaTERal SECURITy foR MoRTGaGE dEbT aNd baNk loaNS
Value of loans collateralized by vessels 1,903.7 1,768.5
1,903.7 1,768.5
The total carrying amount for vessels that have been provided as security was USD 2,082 million at 31 December 2012 (2011: USD 2,280 million).
Note 19USD million 2012 2011GUaRaNTEE CoMMITMENTS aNd CoNTINGENT lIabIlITIES
Guarantee commitments 0.0 0.0
The guarantee commitments of the Group are less than USD 0.1 million and relate to guarantee commitments to the Danish Shipowners’ Association.
Note 20CoNTRaCTUal oblIGaTIoNS, MoRTGaGE dEbT aNd baNk loaNS
TORM has various contractual obligations and commercial commitments to make future payments including lease obligations, purchase commitments, interest payments and repayment of mortgage debt and bank loans.
At 31 December 2011, the Company’s mortgage debt and bank loans were formally due in 2012 due to an unremediated breach of financial covenants. With the Restructuring Agreement per 5 November 2012, the Company has extended its debt to 31 December 2016 and is no longer in breach. In addition, the Company secured a USD 100 million working capital facility available with expiring date on 30 September 2014.
The following table summarizes the Company’s contractual obligations.
As of 31 December 2012:
2013 2014 2015 2016 2017There-
after TotalUSD millionMortgage debt and bank loans 1) 0.8 96.8 94.2 1,690.0 - - 1,881.8Interest payments related to scheduled interest fixing 12.3 - - - - - 12.3Estimated variable interest payments 3) 42.9 56.0 54.2 58.3 - - 211.4
Total 56.0 152.8 148.4 1,748.3 0.0 0.0 2,105.5
2013 2014 2015 2016 2017There-
after TotalUSD millionFinance lease liabilities 4) -1.9 -1.4 -0.9 -0.1 18.7 - 14.4Interest element finance lease 4.0 4.4 4.7 4.8 3.2 - 21.1Chartered-in vessels (incl. vessels not delivered) (Operating lease) 5) 71.9 45.0 43.5 15.7 13.5 5.8 195.4Newbuilding installments and exercised purchase options (Purchase obligations) 6) - - - - - - 0.0Other operating leases 7) 7.8 5.8 2.1 2.0 0.4 - 18.1
Total 81.8 53.8 49.4 22.4 35.8 5.8 249.0
Contractual obligations - as lessor:
Charter hire income for vessels on time charter and bareboat charter (incl. vessels not delivered) (Operating lease) 8) 23.7 7.3 0.1 - - - 31.1
Total 23.7 7.3 0.1 0.0 0.0 0.0 31.1
73Notes

TORM 2012
Note 20 – CoNtINueD
As of 31 December 2011:
There-afterUSD million 2012 2013 2014 2015 2016 Total
Mortgage debt and bank loans 1) 1,794.7 - - - - - 1,794.7Interest payments related to interest rate swaps 2) 30.9 15.6 8.5 5.0 3.5 - 63.5Estimated variable interest payments 3) 9.4 - - - - - 9.4
Total 1,835.0 15.6 8.5 5.0 3.5 0.0 1,867.6
There-afterUSD million 2012 2013 2014 2015 2016 Total
Finance lease liabilities 4) 48.3 2.4 2.6 2.9 3.2 18.3 77.7Interest element regarding finance lease 2.7 2.5 2.3 2.0 1.7 1.1 12.3Chartered-in vessels (incl. vessels not delivered) (Operating lease) 5) 268.3 214.0 190.2 145.9 75.0 143.1 1,036.5Newbuilding installments and exercised purchase options (Purchase obligations) 6) 52.0 9.7 20.0 - - - 81.7Other operating leases 7) 6.9 6.9 5.0 1.8 1.0 0.1 21.7
Total 378.2 235.5 220.1 152.6 80.9 162.6 1,229.9
Contractual obligations - as lessor:Charter hire income for vessels on time charter and bareboat charter (incl. vessels not delivered) (Operating lease) 8) 68.6 16.5 4.6 - - - 89.7
Total 68.6 16.5 4.6 0.0 0.0 0.0 89.7
1) The presented amounts to be repaid are adjusted by directly related costs arising from the issuing of the loans by USD 25.1 million (2011: USD 12.3 million), which are amortized over the term of the loans.
2) Actual fixed rate according to interest rate swaps is used for the hedged interest payments.
3) Variable interest payments are estimated based on the average forward rates for each year. This corresponds to an average net interest including margin of 2.9% (2011: 2.5%).
4) One leasing agreement includes a purchase liability upon default of certain financial covenants similar to those disclosed in note 17.
5) Leases have been entered into with a mutually non-cancelable lease period of up to eight years. The obligation is based on minimum lease payments. Certain leases include a profit sharing element implying that the actual charter hire may be higher. The average period until redelivery of the vessels is 0.9 years (2011: 2.3 years).
6) At 31 December 2012, TORM had no contracted newbuildings (2011: three newbuildings to be delivered during 2012-2014 for which the total outstanding contractual commitment at 31 December 2011 amounted to USD 82 million).
7) Other operating leases primarily consist of contracts regarding office spaces, cars and apartments as well as IT-related contracts.
8) Charter hire income for vessels on time charter and bareboat charter is recognized under revenue. The average period until redelivery of the vessels is 1.0 years (2011: 0.6 years).
74 Notes

TORM 2012
Note 21Minimum
lease payments
Interest element
Carrying amountUSD million
fINaNCE lEaSE lIabIlITIES - aS lESSEE
lease liabilities regarding finance lease assets:
2012
Falling due within one year 2.1 -3.9 -1.8Total current 2.1 -3.9 -1.8
Falling due between one and five years 33.4 -17.2 16.2Falling due after five years - - 0.0Total non-current 33.4 -17.2 16.2
Total 35.5 -21.1 14.4
fair value 14.4
2011
Falling due within one year 55.6 -7.3 48.3Total current 55.6 -7.3 48.3
Falling due between one and five years 19.6 -8.4 11.2Falling due after five years 19.3 -1.1 18.2Total non-current 38.9 -9.5 29.4
Total 94.5 -16.8 77.7
fair value 77.7
Finance lease in 2012 relates to one MR product tanker (2011: Two) chartered on bareboat expiring no later than in 2017. At the expiry of the charter period, the Company has an obligation to purchase the vessel.
75Notes

TORM 2012
Note 22
dERIVaTIVE fINaNCIal INSTRUMENTS
The table below shows the fair value of the derivative financial instruments:
USD million
fair value as of 31
december 2012
Fair value as of 31
December 2011
Hedge accounting cash flows:
Derivative financial instruments regarding interest rate and currency exchange rate: Forward exchange contracts - -3.8Interest rate swaps - -26.0
Non-hedge accounting:
Derivative financial instruments regarding interest rates: Interest rate swaps - -11.1
Derivative financial instruments regarding freight and bunkers: Bunker swaps 1.3 2.3FFAs - 1.5
Derivative financial instruments regarding options on vessels: Acquired liabilities related to options on vessels - -0.1
1.3 -37.2
of which included in:
Current assets
Other receivables 1.4 3.9
Current liabilities
Other liabilities -0.1 -41.0Acquired liabilities related to options on vessels - -0.1
1.3 -37.2
76 Notes

TORM 2012
Note 22 – CoNtINueD
The table below shows realized amounts as well as fair value adjustments regarding derivative financial instruments recognized in income statements and equity in 2012 and 2011:
USD million
Freight and bunker
derivativesOperatingexpenses
Administrativeexpenses
Financialitems
Equityhedging
reservesBunker swaps 3.0 - - - -FFAs 6.9 - - - -Forward exchange contracts - -1.7 -1.6 - 3.3Interest rate swaps - - - -15.5 3.8Currency contracts - - - 0.0 -Right to share of gain on purchase options on vessels - - - - -
Total 2012 9.9 -1.7 -1.6 -15.5 7.1
Bunker swaps 7.0 - - - -FFAs 7.1 - - - -Forward exchange contracts - 1.2 1.6 - -3.3Interest rate swaps - - - -8.4 -24.6Currency contracts - - - -3.7 -Right to share of gain on purchase options on vessels - - - -6.0 -
Total 2011 14.1 1.2 1.6 -18.1 -27.9
Please refer to the section ‘Risk Management’ and note 23 for further information on commercial and financial risks.
The forward exchange rate contracts with a fair value of USD 0.0 million (2011: USD -3.8 million) are designated as hedge accounting to hedge a part of TORM’s payments in 2013 regarding administrative and operating expenses denominated in DKK.
The interest rate swaps with a fair value of USD 0.0 million (2011: USD -26.0 million) are designated as hedge accounting to hedge a part of TORM’s interest payments during the period 2013 to 2016.
The gains or losses on these contracts will be recognized in the income statement when realized together with the hedged items.
77Notes
TORM 2012
Note 23
RISkS aSSoCIaTEd wITH ToRM’S aCTIVITIESThe risks can generally be divided into four main categories: 1) Long-term strategic risks, 2) Industry and market-related risks, 3) Operational and compliance risks and 4) Financial risks.
The risks described under each of the four categories are consid-ered to be among the most significant risks for TORM within each category.
Under the new financing agreements, TORM is required to limit its derivative trading to spot exchange contracts in the ordinary course of business. Therefore TORM cannot use derivatives to the same extent as before to hedge the exposure towards fluctuations in freight rates, bunker prices and currency and interest rates. Going forward, TORM may obtain consent to increase its use of derivatives and then the policies and guidelines mentioned under the various risks will still apply.
1) loNG-TERM STRaTEGIC RISkSIndustry-changing risks, such as the substitution of oil for other energy sources and radical changes in transportation patterns, are considered to have a relatively high potential impact, but are long-term risks. Management continues to monitor long-term strategic risks at least bi-annually to ensure the earliest possible mitigation of potential risks as well as to develop necessary capabilities to exploit opportunities created by the same risks.
2) INdUSTRy aNd MaRkET-RElaTEd RISkSIndustry and market-related risk factors relate to changes in the markets and in the political, economic and physical environment that Management cannot control and can only influence to a very limited degree, such as freight rates and vessel and bunker prices.
FREIGHT RATE VOLATILITYThe Company’s income is principally generated from voyages car-ried out by its fleet of vessels. As such, TORM is exposed to the considerable volatility that characterizes freight rates on such voyages.
In the tanker segment, it is the Company’s strategy to seek a cer-tain exposure to this risk, as volatility also represents an opportunity as earnings historically have been higher in the day-to-day market compared to time charters. On the other hand, TORM is aiming at reducing the sensitivity to the volatility of freight rates by achieving economies of scale, by actively seeking the optimal geographical positioning of the fleet and by optimizing the service offered to customers.
Within the tanker segment, freight income is to a certain extent covered against general fluctuations through the use of physical contracts, such as cargo contracts and time charter agreements with durations of 6-24 months. In addition, TORM has historically used financial instruments such as forward freight agreements (FFAs) and synthetical time charter contracts, with coverage of typically 3-12 months forward, based on market expectations and in accordance with the Company’s risk management policies. In 2012, 12% of freight earnings deriving from the Company’s tankers was secured in this way compared to 33% in 2011. Physi-cal time charter contracts accounted for 92% (2011: 57%) of overall hedging, as this hedging instrument resulted in higher rates than those offered by the forward market. In 2012, the Company entered into FFAs with a total notional contract value of USD 14 million (2011: USD 331 million). At the end of 2012, the coverage for 2013 was at a relatively low level of 17% (by the end of 2011: 26%).
FFA trade and other freight-related derivatives are currently re-stricted by the new financing agreements, but are otherwise sub-ject to specific policies and guidelines approved by the Board of
Directors including trading limits, stop-loss policies, segregation of duties and other internal control procedures.
For the bulk segment, TORM has sought to have high coverage in the declining market. The targeted coverage for the next 12 months rolling is more than 75% for owned and time charter vessels. TORM will actively seek cover using the spot market, reletting time charters and/or using derivative instruments to the extent possible under the new financing agreements.
All things being equal and to the extent the Company’s vessels have not already been chartered out at fixed rates, a freight rate change of USD/day 1,000 would lead to the following change in profit before tax based on the expected number of earning days for the coming financial year:
USD million 2013 2012SENSITIVITy To CHaNGES IN fREIGHT RaTES
Change in freight rates of USD/day 1,000:Change in profit before tax 24.7 30.3
Change in equity 24.7 30.3
SALES AND PURCHASE PRICE FLUCTUATIONSAs an owner of 67 vessels, TORM is exposed to risk associated with changes in the value of the vessels, which can vary consider-ably during their useful lives. As of 31 December 2012, the car-rying value of the fleet excluding finance lease vessels was USD 1,949 million. Based on broker valuations, TORM’s fleet excluding finance lease vessels had a market value of USD 1,159 million as of 31 December 2012.
During the year, TORM took delivery of two MR newbuildings and reduced its fleet by three product tankers. One MR product tanker and the 50% ownership of one LR1 product tanker were sold and furthermore one LR2 vessel on finance lease was redelivered. The Company also cancelled one MR newbuilding with scheduled delivery in 2014 and has no vessels on order.
Under the new financing agreements, TORM must obtain consent from the banks to sell and purchase vessels and thus the Com-pany’s mitigation options are limited.
BUNKER PRICE FLUCTUATIONSThe cost of fuel oil consumed by the vessels – known in the in-dustry as bunkers - accounted for 69% of the total voyage costs in 2012 (2011: 69%) and is by far the biggest single cost related to a voyage.
Thus TORM is exposed to fluctuations in bunker prices that are not reflected in the freight rates achieved by the Company. To reduce this exposure TORM has historically hedged part of it’s bunker requirements with oil derivatives, but the use of oil deriva-tives is currently restricted by the new financing agreements.
To the extent applicable bunker trade is subject to specific risk policies and guidelines approved by the Board of Directors inclu-ding trading limits, stop-loss, stop-gain and stop-at-zero policies, segregation of duties and other internal control procedures.
In 2012, TORM covered 17.4% (2011: 7.6%) of its bunker require-ments using hedging instruments. As at 31 December 2012, the total market value of bunker hedge contracts was USD 1.3 million (2011: USD 2.1 million).
All things being equal, a price change of 10% per ton of bunker oil (without subsequent changes in freight rates) would lead to the following change in expenditure based on the expected bunker consumption in the spot market:
78 Notes

TORM 2012
Note 23 – CoNtINueD
USD million 2013 2012seNsItIvIty to ChANges IN the BuNKeR PRICes Change in the bunker prices of 10% per ton:Change in bunker expenses 33.5 46.7
Change in equity 33.5 46.7
3) oPERaTIoNal aNd CoMPlIaNCE RISkSOperational risks are risks associated with the ongoing opera-tions of the business and include risks such as safe operation of vessels, availability of experienced seafarers and staff, terrorism, piracy and insurance and counterparty risk.
INSURANCE COVERAGEIn the course of the fleet’s operation, various casualties, accidents and other incidents may occur that may result in financial losses for TORM. For example, national and international rules, regula-tions and conventions mean that the Company may incur substan-tial liabilities in the event that a vessel is involved in an oil spill or emission of other environmentally hazardous agents.
In order to reduce the exposure to these risks, the fleet is insured against such risks to the extent possible. The total insurance program comprises a broad cover of risks in relation to the opera-tion of vessels and transportation of cargoes, including personal injury, environmental damage and pollution, cargo damage, third-party casualty and liability, hull and machinery damage, total loss and war. All of TORM’s owned vessels are insured for an amount corresponding to their market value plus a margin to cover any fluctuations. Liability risks are covered in line with international standards. Furthermore, all vessels are insured for loss of hire for a period of up to 90 days in the event of a casualty. It is TORM’s policy to cooperate with financially sound inter national insuran ce companies with a credit rating of BBB or better - presently some 14-16 companies along with two P&I Clubs to diversify risk. The P&I Clubs are member of the inter nationally recognized collabo-ration, International Group of P&I Clubs, and the Company’s vessels are each insured for the maximum amounts available in the P&I system. At the end of 2012, the aggregate insured value of hull and machinery and interest for TORM’s owned vessels amounted to USD 2.6 billion (2011: USD 2.7 billion).
COUNTERPARTY RISKThe negative development in the shipping industry since 2009 caused counterparty risk to be an ever-present challenge demanding close monitoring to manage and decide on actions to minimize possible losses. The maximum counterparty risk associated is equal to the values recognized in the balance sheet. A consequential effect of the counterparty risk is loss of income in future periods, e.g. counterparts not being able to fulfill their responsibilities under a time charter, a contract of affreightment or an option. The main risk is the difference between the fixed rates under a time charter or a contract of affreightment and the market rates prevailing upon default.
The Company has focused closely on its risk policies and proce-d ures during the year to assure that risks managed in the day-to-day business are kept at agreed levels and that changes in the risk situations are brought to Management’s attention.
The Company’s counterparty risks are primarily associated with:• Receivables,cashandcashequivalents• Contractsofaffreightmentwithapositivefairvalue• Derivativefinancialinstrumentsandcommodityinstruments with positive fair value
Receivables, cash and cash equivalentsThe majority of TORM’s customers are companies that operate in the oil industry. It is assessed that these companies are to a great extent subject to the same risk factors as those identified for TORM’s Tanker Division.
In the Tanker Division, a major part of the Company’s freight revenues stems from a small group of customers. One customer accounted for 8% (2011: 10%) of the freight revenues in 2012. The concentration of earnings on a few customers requires extra attention to credit risk. TORM has a credit policy under which continued credit evaluations of new and existing customers take place. For long-standing customers, payment of freight normally takes place after a vessel has discharged her cargo. For new and smaller customers, the Company’s credit risk is limited as freight most often is paid prior to the cargo’s discharge or, alternatively, that a suitable bank guarantee is placed in lieu thereof.
The Bulk Division enforces appropriate vetting of counterparties using all available information and insists on additional mitigation such as bank guarantees, upfront payment of freight or parent company guarantee, if required, to reduce the risk profile of a contract to a reasonable level without jeopardizing the commercial opportunity.
As a consequence of the payment patterns mentioned above, the Company’s receivables within the Tanker and the Bulk Divisions primarily consist of receivables from voyages in progress at year-end and, to a lesser extent, of outstanding demurrage. For the past five years, the Company has not experienced any significant losses in respect of charter payments or any other freight agree-ments. With regard to the collection of demurrage, the Company’s average stands at 97%, which is considered to be satisfactory given the differences in interpretation of events. In 2012, demur-rage represented 9.0% (2011: 9.7%) of the total freight revenues.
The Company only places cash deposits with major banks covered by a government guarantee or with strong and acceptable credit ratings.
derivative financial instruments and commodity instrumentsIn 2012, 100% of TORM’s forward freight agreements (FFAs) and approximately 70% of fuel swaps have been cleared either through Norsk Oppgjørs Sentral (NOS), London Clearinghouse (LCH) or NYMEX Clearport, hereby effectively reducing counterparty credit risk by daily clearing of balances. Over the counter fuel swaps have restrictively been entered into with major oil companies, banks or highly reputed partners with a satisfactory credit rating. Financial derivative instruments, mainly interest rate swaps and forward exchange contracts, have been exclusively traded with major banks in possession of a high credit rating.
4) fINaNCIal RISkSFinancial risks relate to the Company’s financial position, finan-cing and cash flows generated by the business including foreign exchange risk and interest rate risk. The Company’s liquidity and capital resources are described in note 2.
All TORM’s interest rate and currency swap transactions were closed-out as part of the restructuring and TORM will not be able to enter into new derivative transactions.
As a result, TORM’s entire debt is now uncovered in relation to interest risk, and the foreign exchange risk primarily related to non-USD denominated administrative and operating expenses is thereby left unhedged. Any changes in interest rates and currency rates could therefore have a material adverse effect on TORM’s future performance, results of operations, cash flows and finan-cial position.
79Notes

TORM 2012
FOREIGN EXCHANGE RISKTORM uses USD as functional currency because the majority of the Company’s transactions are denominated in USD. The foreign exchange risk is thereby limited to cash flows not denominated in USD. The primary risk relates to transactions denominated in DKK, EUR and SGD and relates to administrative and operating expenses.
The part of the Company’s expenses that are denominated in cur-rencies other than USD account for approximately 95% for admini-strative expenses and approximately 10% for operating expenses.
Other significant cash flows in non-USD-related currencies occur occasionally. No other significant cash flows in non-USD-related currencies occurred in 2012.
At 31 December 2012, the overall hedge of the foreign exchange risk for 2013 is 0% (at 31 December 2011: 52% for 2012).
Forward foreign exchange contracts and other foreign exchange contracts have during 2012 been traded subject to specific risk policies and guidelines approved by the Board of Directors inclu-ding trading limits, segregation of duties and other internal con-trol procedures.
All things being equal, a change in the USD exchange rate of 10% in relation to DKK would result in a change in profit before tax and equity as follows:
USD million 2013 2012SENSITIVITy To CHaNGES IN THE USd/dkk EXCHaNGE RaTE
Effect of a change in the USD exchange rate of 10% in relation to DKK: Change in profit before tax 6.4 4.6
Change in equity 6.4 1.2
INTEREST RATE RISK TORM’s interest rate risk generally relates to interest-bearing mortgage debt and bank loans. All the Company’s loans for fi-nancing vessels are denominated in USD, and all are floating rate loans. Fixing interest exposure is therefore reduced to the schedu-led interest fixing of the debt.
At the end of 2012, TORM has fixed 23% of the interest exposure. The fixing was a result of the scheduled interest fixing of the debt (through 27 March 2013).
All things being equal, a change in the interest rate level of 1% point on the unhedged variable interest debt will result in a change in the interest rate expenses as follows:
USD million 2013 2012SENSITIVITy To CHaNGES IN INTEREST RaTES
Effect of a change in the interest rate level of 1% point:Change in interest rate expenses 14.1 5.0
Change in equity 14.1 5.0
TORM’s interest-bearing debt increased from year-end 2011 to year-end 2012 by USD 81 million (2011: increased by USD 169 mil-lion) to USD 1,868 million (2011: USD 1,787 million).
Note 23 – CoNtINueD
80 Notes

TORM 2012
Note 24
fINaNCIal INSTRUMENTS
USD million 2012 2011CaTEGoRIES of fINaNCIal aSSETS aNd lIabIlITIES aS dEfINEd IN IaS 39:
loans and receivables
Loans to jointly controlled entities 0.0 8.2 Freight receivables 117.3 140.2 Other receivables 13.7 21.5 Cash and cash equivalents 28.3 85.6
159.3 255.5
available for sale assets
Other investments 12.3 11.6
12.3 11.6
derivative financial instruments (assets)
Other receivables (held for trading) 2.3 3.9
2.3 3.9
financial liabilities measured at amortized cost
Mortage debt and bank loans 1,881.8 1,794.6 Finance lease liabilities 14.4 77.7 Trade payables 83.8 115.6 Other liabilities 34.5 26.0
2,014.5 2,013.9
derivative financial instruments (liabilities)
Acquired liabilities related to options on vessels (held for trading) 0.0 0.1 Other liabilities (held for trading) 1.0 11.2 Other liabilities (hedge accounting) 0.0 29.8
1.0 41.1
The fair value of the financial assets and liabilities above equals the carrying amount except for mortage debt and bank loans for which the fair value can be found in note 17.
faIR ValUE HIERaRCHy foR fINaNCIal INSTRUMENTS MEaSUREd aT faIR ValUE IN THE balaNCE SHEETThe table below shows the fair value hierarchy for financial instruments measured at fair value in the balance sheet. The financial instruments in question are grouped into Levels 1 to 3 based on the degree to which the fair value is observable.
•Level1fairvaluemeasurementsarethosederivedfromquotedprices(unadjusted)inactivemarketsforidenticalassetsorliabilities•Level2fairvaluemeasurementsarethosederivedfrominputotherthanquotedpricesincludedwithinLevel1thatareobservablefor
the asset or liability, either directly (as prices) or indirectly (derived from prices)•Level3fairvaluemeasurementsarethosederivedfromvaluationtechniquesthatincludeinputfortheassetorliabilitythatarenot
based on observable market data (unobservable inputs)
81Notes

TORM 2012
Note 24 – CoNtINueD2012
USD million
Quoted prices
(Level 1)
Observable input
(Level 2)
Un observ-able
input(Level 3) Total
available for sale financial assets:
Other investments 0.0 - 12.3 12.3
derivative financial instruments (assets):
Other receivables (held for trading) - 2.3 - 2.3Other receivables (hedge accounting) - 0.0 - 0.0
Total financial assets 0.0 2.3 12.3 14.6
derivative financial instruments (liabilities):
Other liabilities (held for trading) - 1.0 - 1.0Other liabilities (hedge accounting) - 0.0 - 0.0
Total financial liabilities 0.0 1.0 0.0 1.0
2011
USD million
Quoted prices
(Level 1)
Observable input
(Level 2)
Unobserv-able
input(Level 3) Total
available for sale financial assets:
Other investments 0.0 - 11.6 11.6
derivative financial instruments (assets):
Other receivables (held for trading) - 3.9 - 3.9Other receivables (hedge accounting) - 0.0 - 0.0
Total financial assets 0.0 3.9 11.6 15.5
derivative financial instruments (liabilities):
Acquired liabilities related to options on vessels (held for trading) - 0.1 - 0.1Other liabilities (held for trading) - 11.2 - 11.2Other liabilities (hedge accounting) - 29.8 - 29.8
Total financial liabilities 0.0 41.1 0.0 41.1
There were no transfers between Level 1 and 2 in 2012 and 2011.
RECoNCIlIaTIoN of fINaNCIal INSTRUMENTS MEaSUREd aT faIR ValUE IN THE balaNCE SHEET baSEd oN lEVEl 3
USD million 2012 2011other investments, available for sale:
balance at 1 January 11.6 2.8Gain/loss in other comprehensive income 0.2 8.8Transfers to/from Level 3 0.5 -
balance at 31 december 12.3 11.6
Gain/loss in the income statement for assets held at the end of the reporting period 0.0 0.0
82 Notes

TORM 2012
Note 25
RElaTEd PaRTy TRaNSaCTIoNS
Niels Erik Nielsen, former Chairman of the Board of Directors, was during the year a practicing partner in the law firm Lett. Lett has rendered legal assistance during the financial year as one of a number of law firms. The firm’s fee of USD 2.0 million (2011: USD 0.2 million) is based upon the amount of time spent by the firm.
Jesper Jarlbæk, former member of the Board of Directors, is Chairman of the Board of Directors and shareholder in Basico Consult-ing A/S and member of the Board of Directors and shareholder in IT2 Treasury Solutions Ltd. TORM has used Basico Consulting A/S for interim employment during the financial year amounting to USD 0.8 million (2011: USD 0.8 million), and IT2 Treasury Solutions Ltd. has licensed treasure management software and related implementation during the financial year amounting to USD 0.2 million (2011: USD 0.0 million). Interim employment fees and implementation fees are based upon the amount of time spent by the firms.
Angelos Papoulias, former member of the Board of Directors until April 2012, is director of Investments & Finance Ltd. TORM has paid Investments & Finance Ltd. for consulting services during the financial year amounting to USD 0.8 million (2011: USD 1.3 million) based upon the amount of time spent by the firm.
Until the completion of the restructuring, Alpha Trust and its trustee, First Link Management Services Limited, was considered to have control over TORM via the ownership of 52.23% of the share capital of the Company.
During the financial year, TORM carried on trading with its jointly controlled entities for a total amount of USD 1.5 million (2011: USD 8.4 million). In July 2012, TORM acquired a claim against affiliates of a time charter-in partner for a consideration of USD 3.0 million from a subsidiary of TORM’s jointly controlled entity FR8 Holdings Pte. Ltd.
To the best of TORM’s knowledge, there have been no other transactions with such parties during the financial year.
Management remuneration is disclosed in note 4.
Note 26NoN-CURRENT aSSETS HEld foR SalE
At year end 2012, the Company has entered into negotiations concerning the sale of five MR tankers. The tankers have been classified as held for sale and are presented separately in the balance sheet and included under ‘Tanker’ in the segment information.
An impairment loss of USD 74 million from adjusting the book value of the tankers to the market value at year-end 2012 has been recognized in the income statement for 2012 under ‘Impairment losses on tangible and intangible assets’.
At year-end 2011, the Company had entered into contracts regarding sale of two newbuilding contracts, which qualified for a classifica-tion as assets held for sale. The loss from the sale of the contracts amounting to USD 41 million was recognized in the income statement for 2011 under ‘Net profit/(loss) from sale of vessels’.
Note 27CaSH flowS
USD million 2012 2011Reversal of other non-cash movements:
Amortization of acquired assets and liabilities -1.3 -2.7Share-based payment 1.3 1.3Adjustments on derivative financial instruments 2.5 -4.0Exchange rate adjustments 0.7 0.3Gain from sale of other fixed assets than vessels -0.4 -1.7
2.8 -6.8
USD million 2012 2011Change in bunkers, receivables and payables:
Change in bunkers 11.7 -48.0Change in receivables 27.8 -45.3Change in prepayments -3.8 8.7Change in trade payables and other liabilities -67.8 82.3Fair value changes of derivative financial instruments 38.4 -13.7Other non-cash movements included in current assets and liabilities 0.0 -1.7
6.3 -17.7
83Notes

TORM 2012
Note 28
ENTITIES IN THE GRoUP
Parent Company:
TORM A/S Denmark
Investments in subsidiaries*):
DK Vessel HoldCo GP ApS 100% DenmarkDK Vessel HoldCo K/S 100% DenmarkLong Range 1 A/S 100% DenmarkLR1 Management K/S 100% DenmarkMedium Range A/S 100% DenmarkMR Management K/S 100% DenmarkOMI Holding Ltd. 100% MauritiusOMI Marine Service Ltd. 100% DelawareTiber Shipping LLC 100% Marshall IslandsTorghatten & TORM Shipowning ApS 100% DenmarkTORM Brasil Consultoria em Transporte Maritimo LTDA. 100% BrazilTORM Crewing Service Ltd. 100% BermudaTORM Singapore Pte. Ltd. 100% SingaporeTORM Shipping India Private Limited 100% IndiaTORM USA LLC 100% DelawareTT Shipowning K/S 100% DenmarkVesselCo 1 K/S 100% DenmarkVesselCo 2 K/S 100% DenmarkVesselCo 3 K/S 100% DenmarkVesselCo 4 K/S 100% DenmarkVesselCo A ApS 100% DenmarkVesselCo B ApS 100% DenmarkVesselCo C ApS 100% DenmarkVesselCo D ApS 100% DenmarkVesselCo 2 Pte. Ltd. 100% SingaporeVesselCo 4 Pte. Ltd. 100% SingaporeVesselCo 6 Pte. Ltd. 100% SingaporeVesselCo 7 Pte. Ltd. 100% Singapore
Investments in legal entities included as jointly controlled entities*):
FR8 Holdings Pte. Ltd. 50% SingaporeLong Range 2 A/S 50% DenmarkLR2 Management K/S 50% DenmarkTORM Shipping (Phils.), Inc. 25% PhilippinesUgland & TORM Shipowning ApS**) 50% DenmarkUT Shipowning K/S**) 50% Denmark
*) Entities with activities in the financial year.
**) Entities divested in the financial year.
As part of the restructuring, TORM has made substantial changes to the internal legal group structure of the Company to align it with the individual loan facilities. This involves transfer of vessels to separate legal entities in Denmark and Singapore. All legal entities are ultimately owned by TORM A/S.
Furthermore, TORM participates in a number of joint ventures, primarily The LR2 Pool, which are not legal entities. The investments in these joint ventures are included as investments in jointly controlled operations.
84 Notes

TORM 2012
Note 28 – CoNtINueD
INCoME aNd EXPENSES aNd SUMMaRIzEd balaNCE SHEET daTa foR JoINTly CoNTRollEd ENTITIES
USD million 2012 2011Total income 22.6 60.4Total expenses -31.2 -68.8
Net profit for the year -8.6 -8.4
Non-current assets 0.4 237.0Current assets 1.8 62.6
Non-current liabilities 0.0 163.8Current liabilities 0.0 35.2
In 2012, TORM entered into an agreement to sell its 50% stake in the joint venture entity Ugland & TORM Shipowning ApS. The trans-action led to a P&L loss of USD 5 million, which has been recognized in the financial statement for 2012 under ‘Share of results of jointly controlled entities’.
NEwbUIldING CoNTRaCTS aNd PURCHaSE oPTIoNS oN VESSElS IN JoINTly CoNTRollEd ENTITIESAt 31 December 2012, no purchase options on vessels were exercised (2011: no purchase options exercised) in jointly controlled entities. TORM’s share of the total outstanding contractual commitment for the exercised purchase options on vessels amounts to USD 0 million (2011: USD 0 million) as at 31 December 2012.
Note 292012 2011
EaRNINGS/loSS PER SHaRE
Net profit/(loss) for the year (USd million) -580.6 -453.0
Million shares
Average number of shares 182.0 72.8Average number of treasury shares -3.8 -3.3Average number of shares outstanding 178.2 69.5Dilutive effect of outstanding share options 0.0 0.0
average number of shares outstanding incl. dilutive effect of share options 178.2 69.5
Earnings/(loss) per share (USd) -3.3 -6.5
diluted earnings/(loss) per share (USd) -3.3 -6.5
When calculating diluted earnings per share for 2012, 6,654,302 share options (2011: 4,661,318 share options) have been omitted as they are out-of-the-money, but potential-ly the share options might dilute earnings per share in the future.
85Notes

TORM 2012
stAtemeNt By mANAgemeNtWe have today presented the annual report of TORM A/S for the financial year 1 January - 31 December 2012.
The annual report is prepared in accordance with International Financial Reporting Standards as adopted by the EU and additional Danish disclosure requirements for annual reports of listed companies.
In our opinion, the consolidated financial statements and the parent financial statements give a true and fair view of the Group’s and the Parent’s financial position as of 31 December 2012 as well as of their financial performance and cash flows for the financial year 1 January - 31 December 2012.
We also believe that the management report contains a fair review of the development and performance of the Group’s and the Parent’s business and of their financial position as a whole, together with a description of the principal risks and uncertainties that they face.
We recommend the annual report for adoption at the Annual General Meeting.
Copenhagen, 13 March 2013
boaRd of dIRECToRS:Flemming IpsenChairman
Olivier DuboisDeputy Chairman
Kari Millum Gardarnar
Alexander Green
Rasmus Johannes Hoffmann
Jon Syvertsen
EXECUTIVE MaNaGEMENT:Jacob MeldgaardCEO
Roland M. AndersenCFO
86 Statement by management

TORM 2012
To THE SHaREHoldERS of ToRM a/S
REPoRT oN THE CoNSolIdaTEd fINaNCIal STaTEMENTS aNd PaRENT fINaNCIal STaTEMENTSWe have audited the consolidated financial statements and parent financial statements of TORM A/S on pages 46 – 100 for the financial year 1 January to 31 December 2012, which comprise the income statement, the statement of comprehen-sive income, balance sheet, statement of changes in equity, cash flow statement and notes, including accounting policies, for the Group as well as for the Parent. The consolidated financial statements and the parent financial statements are prepared in accordance with International Financial Repor-ting Standards as adopted by the EU and Danish disclosure requirements for listed companies.
MaNaGEMENT’S RESPoNSIbIlITy foR THE CoNSolIdaTEd fINaNCIal STaTEMENTS aNd THE PaRENT fINaNCIal STaTEMENTSManagement is responsible for the preparation of consolidated financial statements and parent financial statements that give a true and fair view in accordance with International Financial Reporting Standards as adopted by the EU and Danish disclo-sure requirements for listed companies and for such internal control as the Management determines is necessary to enable the preparation and fair presentation of consolidated financial statements and parent financial statements that are free from material misstatement, whether due to fraud or error.
aUdIToR’S RESPoNSIbIlITyOur responsibility is to express an opinion on the consolidated financial statements and the parent financial statements based on our audit. We conducted our audit in accordance with International Standards on Auditing and additional require-ments under Danish audit regulation. This requires that we comply with ethical requirements and plan and perform the audit to obtain reasonable assurance about whether the consolidated financial statements and the parent financial statements are free from material misstatement.
An audit involves performing procedures to obtain audit evi-dence about the amounts and disclosures in the consolidated financial statements and the parent financial statements. The procedures selected depend on the auditor’s judgment, including the assessment of the risks of material misstate-ments of the consolidated financial statements and the parent financial statements, whether due to fraud or error. In making those risk assessments, the auditor considers internal control relevant to the entity’s preparation of consolidated financial
statements and parent financial statements that give a true and fair view in order to design audit procedures that are appropriate in the circumstances, but not for the purpose of expressing an opinion on the effectiveness of the entity’s internal control. An audit also includes evaluating the appro-priateness of accounting policies used and the reasonableness of accounting estimates made by Management, as well as the overall presentation of the consolidated financial statements and the parent financial statements.
We believe that the audit evidence we have obtained is suf-ficient and appropriate to provide a basis for our audit opinion.
Our audit has not resulted in any qualification.
oPINIoNIn our opinion, the consolidated financial statements and the parent financial statements give a true and fair view of the Group’s and the Parent’s financial position at 31 December 2012 and of the results of their operations and cash flows for the financial year 1 January to 31 December 2012 in accord-ance with International Financial Reporting Standards as adopted by the EU and Danish disclosure requirements for listed companies.
STaTEMENT oN THE MaNaGEMENT CoMMENTaRy (PaGES 4-45)Pursuant to the Danish Financial Statements Act, we have read the management commentary. We have not performed any further procedures in addition to the audit of the consoli-dated financial statements and the parent financial state-ments.
On this basis, it is our opinion that the information provided in the Management Commentary is consistent with the consoli-dated financial statements and the parent financial state-ments.
Copenhagen, 13 March 2013
DELOITTEStatsautoriseret Revisionspartnerselskab
Anders Dons Henrik KjelgaardState Authorised State AuthorisedPublic Accountant Public Accountant
INDePeNDeNt AuDItoR’s RePoRt
87Auditor’s report

TORM 2012
88

TORM 2012
PAReNt ComPANy 2012
89Financial review 2012

TORM 2012
INC
OM
E ST
ATEM
ENT
1 ja
nu
ary
- 31
dec
emb
er
uSd
‘000
not
e20
1220
11r
even
ue1,
118,
509
1,29
4,58
2Po
rt e
xpen
ses,
bun
kers
and
com
mis
sion
s-6
66,3
08-6
73,0
63Fr
eigh
t and
bun
ker
deri
vativ
es9,
914
14,1
05
Tim
e ch
arte
r eq
uiva
lent
ear
ning
s46
2,11
563
5,62
4
cha
rter
hir
e-4
17,7
03-4
46,9
19O
pera
ting
expe
nses
2-1
42,5
19-1
36,8
85
Gro
ss p
rofit
(Net
ear
ning
s fr
om s
hipp
ing
activ
ities
)-9
8,10
751
,820
net
pro
fit/(l
oss)
from
sal
e of
ves
sels
-8,0
47-5
9,71
5ad
min
istr
ativ
e ex
pens
es2,
3-5
4,87
7-5
3,05
1O
ther
ope
ratin
g ex
pens
es-1
,782
-1,1
55
EBIT
DA
-162
,813
-62,
101
Impa
irm
ent l
osse
s on
tang
ible
and
inta
ngib
le a
sset
s 5,
6-2
8,60
0-1
73,2
94am
ortiz
atio
n an
d de
prec
iatio
n6
-96,
097
-121
,513
Ope
ratin
g pr
ofit/
(los
s) (E
BIT
)-2
87,5
10-3
56,9
08
Fina
ncia
l inc
ome
713
,343
11,0
79Fi
nanc
ial e
xpen
ses
7-2
05,4
55-9
7,86
5
Pro
fit/(
loss
) bef
ore
tax
-479
,622
-443
,694
Tax
expe
nses
10-1
,282
-1,0
93
Net
pro
fit/(
loss
) for
the
year
-480
,904
-444
,787
All
oc
Ati
on
of
pr
of
it/(
los
s) f
or
th
e y
eA
r
The
boa
rd o
f dir
ecto
rs r
ecom
men
ds th
at th
e ne
t pro
fit/(l
oss)
for
the
year
of u
Sd -
481
mill
ion
is a
lloca
ted
as fo
llow
s:
Prop
osed
div
iden
d u
Sd 0
.0 p
er s
hare
of d
KK
0,0
1 (2
011:
uSd
0.0
per
sha
re o
f dK
K 5
.00)
0r
etai
ned
prof
it -4
80,9
04
-480
,904
The
acco
mpa
nyin
g no
tes
are
an in
tegr
ated
par
t of t
hese
fina
ncia
l sta
tem
ents
.
STAT
EMEN
T O
F C
OM
PR
EHEN
SIVE
INC
OM
E1
jan
uar
y -
31 d
ecem
ber
uSd
‘000
2012
2011
Net
pro
fit/(
loss
) for
the
year
-480
,904
-444
,787
Oth
er c
ompr
ehen
sive
inco
me:
Fair
val
ue a
djus
tmen
t on
hedg
e in
stru
men
ts-1
0,76
2-2
9,12
8Va
lue
adju
stm
ent o
n he
dge
inst
rum
ents
tran
sfer
red
to in
com
e st
atem
ent
17,4
2385
2Fa
ir v
alue
adj
ustm
ent o
n ot
her
inve
stm
ents
ava
ilabl
e fo
r sa
le16
98,
651
Oth
er c
ompr
ehen
sive
inco
me
afte
r ta
x6,
830
-19,
625
Tota
l com
preh
ensi
ve in
com
e fo
r th
e ye
ar-4
74,0
74-4
64,4
12
The
acco
mpa
nyin
g no
tes
are
an in
tegr
ated
par
t of t
hese
fina
ncia
l sta
tem
ents
.
90 Parent company 2012

TORM 2012
BAL
ANC
E SH
EET
aT 3
1 d
ecem
ber
BAL
ANC
E SH
EET
aT 3
1 d
ecem
ber
uSd
‘000
not
e20
1220
11A
SSET
S
NO
N-C
UR
REN
T A
SSET
S
Inta
ngib
le a
sset
s
Goo
dwill
00
Tota
l Int
angi
ble
asse
ts5
00
Tang
ible
fixe
d as
sets
Land
and
bui
ldin
gs81
21,
976
Vess
els
and
capi
taliz
ed d
ry-d
ocki
ng13
22,6
871,
840,
549
Prep
aym
ents
on
vess
els
036
,120
Oth
er p
lant
and
ope
ratin
g eq
uipm
ent
5,07
26,
464
Tota
l Tan
gibl
e fix
ed a
sset
s6
28,5
711,
885,
109
Fina
ncia
l ass
ets
Inve
stm
ent i
n su
bsid
iari
es4,
13
1,75
5,79
719
,825
Loan
s to
sub
sidi
arie
s39
,725
53,8
75In
vest
men
ts in
join
tly c
ontr
olle
d en
titie
s4
9242
,411
Loan
s to
join
tly c
ontr
olle
d en
titie
s0
8,19
8O
ther
inve
stm
ents
4
11,7
8111
,612
Tota
l Fin
anci
al a
sset
s1,
807,
395
135,
921
Tota
l non
-cur
rent
ass
ets
1,83
5,96
62,
021,
030
CU
RR
ENT
ASS
ETS
bun
kers
72,5
4483
,321
Frei
ght r
ecei
vabl
es8
114,
689
137,
882
Oth
er r
ecei
vabl
es9
12,3
9320
,920
Prep
aym
ents
14,9
7011
,664
cas
h an
d ca
sh e
quiv
alen
ts24
,687
70,9
2723
9,28
332
4,71
4
non
-cur
rent
ass
ets
held
for
sale
2053
,592
21,2
36
Tota
l cur
rent
ass
ets
292,
875
345,
950
TOTA
L A
SSET
S2,
128,
841
2,36
6,98
0
The
acco
mpa
nyin
g no
tes
are
an in
tegr
ated
par
t of t
hese
fina
ncia
l sta
tem
ents
.
uSd
‘000
not
e20
1220
11EQ
UIT
Y A
ND
LIA
BIL
ITIE
S
EQU
ITY
com
mon
sha
res
1,24
761
,098
Spec
ial r
eser
ve60
,974
0Tr
easu
ry s
hare
s-1
9,10
4-1
7,30
9r
eval
uatio
n re
serv
es6,
349
6,18
0r
etai
ned
prof
it90
,093
373,
777
Prop
osed
div
iden
d0
0H
edgi
ng r
eser
ves
-21,
957
-28,
618
Tran
slat
ion
rese
rves
5,89
65,
896
Tota
l equ
ity12
3,49
840
1,02
4
LIA
BIL
ITIE
S
Non
-cur
rent
liab
ilitie
s
def
erre
d ta
x lia
bilit
y10
53,3
5053
,858
mor
tgag
e de
bt a
nd b
ank
loan
s12
, 13,
15
1,80
6,23
30
Fina
nce
leas
e lia
bilit
ies
1614
,370
26,8
06To
tal n
on-c
urre
nt li
abili
ties
1,87
3,95
380
,664
Cur
rent
liab
ilitie
s
mor
tgag
e de
bt a
nd b
ank
loan
s12
, 13,
15
813
1,51
5,57
4Fi
nanc
e le
ase
liabl
ilitie
s 16
01,
620
Loan
s fr
om s
ubsi
diar
ies
017
4,81
4Tr
ade
paya
bles
82,4
5811
4,27
0c
urre
nt ta
x lia
bilit
ies
342
1,09
4O
ther
liab
ilitie
s11
47,7
7777
,836
acqu
ired
liab
ilitie
s re
late
d to
opt
ions
on
vess
els
084
Tota
l cur
rent
liab
ilitie
s13
1,39
01,
885,
292
Tota
l lia
bilit
ies
2,00
5,34
31,
965,
956
TOTA
L EQ
UIT
Y A
ND
LIA
BIL
ITIE
S2,
128,
841
2,36
6,98
0
acco
untin
g po
licie
s1
Gua
rant
ee a
nd c
ontin
gent
liab
ilitie
s14
der
ivat
ive
finan
cial
inst
rum
ents
17Fi
nanc
ial i
nstr
umen
ts18
rel
ated
par
ty tr
ansa
ctio
ns19
The
acco
mpa
nyin
g no
tes
are
an in
tegr
ated
par
t of t
hese
fina
ncia
l sta
tem
ents
.
91Parent company 2012

TORM 2012
STAT
EMEN
T O
F C
HAN
GES
IN E
QU
ITY
CASH
FLO
W S
TATE
MEN
T1
jan
uar
y -
31 d
ecem
ber
uSd
mill
ion
com
mon
shar
esSp
ecia
l re
serv
e*)
Trea
sury
shar
es**
)r
etai
ned
prof
itPr
opos
eddi
vide
nds
reva
luat
ion
rese
rves
Hed
ging
rese
rves
Tran
slat
ion
rese
rves
Tota
l
EQU
ITY
Equi
ty a
t 1 J
anua
ry 2
011
61.1
0.0
-17.
981
7.9
0.0
-2.4
-0.4
5.9
864.
2
Cha
nges
in e
quity
201
1:
net
pro
fit/(l
oss)
for
the
year
--
--4
44.8
--
--
-444
.8O
ther
com
preh
ensi
ve in
com
e fo
r t
he y
ear
--
--
-8.
7-2
8.3
--1
9.6
Tota
l com
preh
ensi
ve in
com
e fo
r t
he y
ear
0.0
0.0
0.0
-444
.80.
08.
7-2
8.3
0.0
-464
.4
Shar
e ca
pita
l dec
reas
e-
--
--
--
-0.
0c
onve
rsio
n of
deb
t-
--
--
--
-0.
0ac
quis
ition
of t
reas
ury
shar
es,
cos
t-
--
--
--
-0.
0Tr
ansa
ctio
n co
sts,
sha
re is
sue
--
--
--
--
0.0
dis
posa
l tre
asur
y sh
ares
, cos
t-
-0.
6-
--
--
0.6
Loss
from
dis
posa
l of t
reas
ury
sha
res
--
--0
.6-
--
--0
.6Sh
are-
base
d co
mpe
nsat
ion
--
-1.
3-
--
-1.
3To
tal c
hang
es in
equ
ity 2
011
0.0
0.0
0.6
-444
.10.
08.
7-2
8.3
0.0
-463
.1
Equi
ty a
t 31
Dec
embe
r 20
1161
.10.
0-1
7.3
373.
80.
06.
3-2
8.7
5.9
401.
1
Com
preh
ensi
ve in
com
e fo
r th
e ye
ar:
net
pro
fit/(l
oss)
for
the
year
--
--4
80.9
--
--
-480
.9O
ther
com
preh
ensi
ve in
com
e fo
r t
he y
ear
--
--
-0.
26.
6-
6.8
Tota
l com
preh
ensi
ve in
com
e fo
r t
he y
ear
0.0
0.0
0.0
-480
.90.
00.
26.
60.
0-4
74.1
Shar
e ca
pita
l dec
reas
e-6
1.0
61.0
--
--
--
0.0
con
vers
ion
of d
ebt
1.1
--
198.
9-
--
-20
0.0
acqu
isiti
on o
f tre
asur
y sh
ares
, c
ost
--
-1.8
--
--
--1
.8Tr
ansa
ctio
n co
sts,
sha
re is
sue
--
--2
.9-
--
--2
.9d
ispo
sal t
reas
ury
shar
es, c
ost
--
--
--
--
0.0
Loss
from
dis
posa
l of t
reas
ury
sha
res
--
--
--
--
0.0
Shar
e-ba
sed
com
pens
atio
n-
--
1.2
--
--
1.2
Tota
l cha
nges
in e
quity
201
2-5
9.9
61.0
-1.8
-283
.70.
00.
26.
60.
0-2
77.6
Equi
ty a
t 31
Dec
embe
r 20
121.
261
.0-1
9.1
90.1
0.0
6.4
-22.
05.
912
3.5
*)
Spec
ial r
eser
ve in
acc
orda
nce
with
the
dan
ish
com
pani
es a
ct.
**)
Plea
se re
fer
to n
ote
14 in
the
cons
olid
ated
fina
ncia
l sta
tem
ents
for
furt
her
info
rmat
ion
on tr
easu
ry s
hare
s.
uSd
‘000
not
e20
1220
11C
ASH
FLO
W F
RO
M O
PER
ATI
NG
AC
TIVI
TIES
Ope
ratin
g pr
ofit/
(loss
)-2
87,5
10-3
56,9
08
adju
stm
ents
:r
ever
sal o
f pro
fit fr
om s
ale
of v
esse
ls8,
047
59,7
15r
ever
sal o
f dep
reci
atio
n an
d im
pair
men
t los
ses
124,
697
294,
807
rev
ersa
l of o
ther
non
-cas
h m
ovem
ents
213,
714
-4,6
27r
ever
sal o
f res
truc
turi
ng c
hart
er-i
n fe
e14
1,67
60
div
iden
ds r
ecei
ved
427
1,41
7In
tere
st r
ecei
ved
and
exch
ange
rat
e ga
ins
3,03
45,
920
Inte
rest
pai
d an
d ex
chan
ge r
ate
loss
es-4
5,09
1-6
1,92
5ad
viso
r fe
es r
elat
ed to
fina
ncin
g an
d re
stru
ctur
ing
plan
-64,
015
0In
com
e ta
xes
paid
/rep
aid
-2,5
43-2
,240
cha
nge
in b
unke
rs, a
ccou
nts
rece
ivab
les
and
paya
bles
2112
,548
-19,
182
Net
cas
h fl
ow fr
om o
pera
ting
activ
ities
-105
,016
-83,
023
CA
SH F
LOW
FR
OM
INVE
STIN
G A
CTI
VITI
ES
Inve
stm
ent i
n ta
ngib
le fi
xed
asse
ts-6
3,09
4-7
6,88
4In
vest
men
t in
equi
ty in
tere
sts
and
secu
ritie
s-7
70
Sale
of e
quity
inte
rest
s an
d se
curi
ties
1,94
80
Loan
s an
d re
paym
ent o
f loa
ns to
sub
sidi
arie
s an
d jo
intly
con
trol
led
entit
ies
-14,
069
111,
278
Sale
of n
on-c
urre
nt a
sset
s89
,917
292,
709
Net
cas
h fl
ow fr
om in
vest
ing
activ
ities
14,6
2532
7,10
3
CA
SH F
LOW
FR
OM
FIN
AN
CIN
G A
CTI
VITI
ES
bor
row
ing,
mor
tgag
e de
bt82
,451
33,7
80r
epay
men
t/re
dem
ptio
n, m
ortg
age
debt
-34,
597
-230
,142
rep
aym
ent/
rede
mpt
ion,
fina
nce
leas
e lia
bilit
ies
-36
-4,4
76Tr
ansa
ctio
n co
sts
shar
e is
sue
-1,8
720
Purc
hase
/dis
posa
ls o
f tre
asur
y sh
ares
-1,7
950
div
iden
ds p
aid
00
Cas
h fl
ow fr
om fi
nanc
ing
activ
ities
44,1
51-2
00,8
38
Net
cas
h fl
ow fr
om o
pera
ting,
inve
stin
g an
d fin
anci
ng a
ctiv
ities
-46,
240
43,2
42
Cas
h an
d ca
sh e
quiv
alen
ts a
t 1 J
anua
ry70
,927
27,6
85
Cas
h an
d ca
sh e
quiv
alen
ts a
t 31
Dec
embe
r24
,687
70,9
27
Of w
hich
res
tric
ted
cash
and
cas
h eq
uiva
lent
s0
0
Non
-res
tric
ted
cash
and
cas
h eq
uiva
lent
s at
31
Dec
embe
r24
,687
70,9
27
The
acco
mpa
nyin
g no
tes
are
an in
tegr
ated
par
t of t
hese
fina
ncia
l sta
tem
ents
.
92 Parent company 2012

TORM 2012
no
te 2
uSd
mill
ion
2012
2011
STA
FF C
OST
S
Tota
l sta
ff c
osts
Staf
f cos
ts in
clud
ed in
ope
ratin
g ex
pens
es17
.418
.0St
aff c
osts
incl
uded
in a
dmin
istr
ativ
e ex
pens
es33
.137
.7
50.5
55.7
Staf
f cos
ts c
ompr
ise
the
foll
owin
g:
Wag
es a
nd s
alar
ies
45.2
49.3
Shar
e-ba
sed
com
pens
atio
n1.
31.
3Pe
nsio
n co
sts
3.5
4.8
Oth
er s
ocia
l sec
urity
cos
ts0.
50.
3
50.5
55.7
Empl
oyee
info
rmat
ion
The
aver
age
num
ber
of p
erm
anen
tly e
mpl
oyed
sta
ff in
the
Pare
nt c
ompa
ny in
the
finan
cial
yea
r w
as 1
61 (2
011:
186
) lan
d-ba
sed
empl
oyee
s an
d 16
1 (2
011:
212
) sea
fare
rs.
The
aver
age
num
ber
of e
mpl
oyee
s is
cal
cula
ted
as a
full-
time
equi
vale
nt (F
Te).
man
agem
ent r
emun
erat
ion
is d
iscl
osed
in n
ote
4 in
the
cons
olid
ated
fina
ncia
l sta
tem
ents
.
no
te 3
uSd
mill
ion
2012
2011
REM
UN
ERA
TIO
N T
O A
UD
ITO
RS
AP
PO
INTE
D A
T TH
E P
AR
ENT
CO
MP
AN
Y'S
AN
NU
AL
GEN
ERA
L M
EETI
NG
Del
oitt
e
audi
t fee
s 0.
30.
4au
dit-
rela
ted
fees
1.
30.
4Ta
x fe
es
0.8
0.1
Fees
for
othe
r se
rvic
es
0.3
0.4
2.7
1.3
no
te 1
AC
CO
UN
TIN
G P
OLI
CIE
S SU
PP
LEM
ENTA
RY
AC
CO
UN
TIN
G P
OLI
CIE
S FO
R T
HE
PA
REN
T C
OM
PA
NY
In a
dditi
on to
the
acco
untin
g po
licie
s fo
r th
e G
roup
as
pres
ente
d in
not
e 1
in th
e co
nsol
idat
ed fi
nanc
ial s
tate
men
ts, t
he P
aren
t com
pany
, TO
rm
a/
S, a
pplie
s th
e fo
llow
ing
supp
lem
enta
ry a
ccou
ntin
g po
licie
s.
Fore
ign
curr
enci
es
exch
ange
rat
e ga
ins
or lo
sses
on
inte
rcom
pany
bal
ance
s w
ith fo
reig
n su
bsid
iari
es, w
hich
are
con
side
red
part
of t
he in
vest
men
t in
the
entit
y,
are
reco
gniz
ed d
irec
tly in
equ
ity.
Inve
stm
ent i
n su
bsid
iari
es a
nd jo
intl
y co
ntro
lled
ent
ities
In
vest
men
t in
subs
idia
ries
, ass
ocia
ted
com
pani
es a
nd jo
intly
con
trol
led
entit
ies
are
reco
gniz
ed a
nd m
easu
red
in th
e fin
anci
al s
tate
men
ts o
f the
Pa
rent
com
pany
at c
ost a
nd c
lass
ified
as
'non
-cur
rent
ass
ets'
. div
i-de
nds
are
reco
gniz
ed u
nder
'Fin
anci
al in
com
e'.
93Parent company 2012

TORM 2012
no
te 5
uSd
mill
ion
Goo
dwill
Tota
lIN
TAN
GIB
LE A
SSET
S
Cos
t:
bal
ance
at 1
jan
uary
201
189
.289
.2ad
ditio
ns-
0,0
dis
posa
ls-
0,0
Bal
ance
at 3
1 D
ecem
ber
2011
89.2
89.2
Impa
irm
ent l
osse
s:
bal
ance
at 1
jan
uary
201
10.
00.
0d
ispo
sals
-0,
0Im
pair
men
t los
ses
for
the
year
89.2
89.2
Bal
ance
at 3
1 D
ecem
ber
2011
89.2
89.2
Car
ryin
g am
ount
at 3
1 D
ecem
ber
2011
0.0
0.0
Cos
t:
bal
ance
at 1
jan
uary
201
289
.289
.2ad
ditio
ns-
0,0
dis
posa
ls-
0,0
Bal
ance
at 3
1 D
ecem
ber
2012
89.2
89.2
Impa
irm
ent l
osse
s:
bal
ance
at 1
jan
uary
201
289
.289
.2d
ispo
sals
-0,
0Im
pair
men
t los
ses
for
the
year
-0,
0B
alan
ce a
t 31
Dec
embe
r 20
1289
.289
.2
car
ryin
g am
ount
at 3
1 d
ecem
ber
2012
0.0
0.0
In c
onne
ctio
n w
ith th
e di
ssol
vem
ent o
f cer
tain
sub
sidi
arie
s ac
quir
ed a
s pa
rt o
f the
acq
uisi
tion
of O
mI,
the
rela
ted
good
will
was
tr
ansf
erre
d to
the
Pare
nt c
ompa
ny in
201
0.
no
te 4
Inve
stm
ent
in jo
intly
Inve
stm
ent i
n co
ntro
lled
Tota
lO
ther
uSd
mill
ion
subs
idia
ries
activ
ities
inve
stm
ents
inve
stm
ents
FIN
AN
CIA
L A
SSET
S
Cos
t:
bal
ance
at 1
jan
uary
201
126
.011
2.7
138.
75.
4ad
ditio
ns-
-0,
0-
dis
posa
ls-6
.2-
-6.2
-Tr
ansf
erre
d fr
om v
esse
ls a
nd c
apita
lized
dry
-doc
king
--
0,0
-B
alan
ce a
t 31
Dec
embe
r 20
1119
.811
2.7
132.
55.
4
Dep
reci
atio
n an
d im
pair
men
t los
ses:
bal
ance
at 1
jan
uary
201
10.
0-4
5.1
-45.
1-2
.4ex
chan
ge r
ate
adju
stm
ent
--
0,0
-0.5
Valu
e ad
just
men
t for
the
year
--
0,0
9.1
dis
posa
ls-
-0,
0-
Impa
irm
ent l
osse
s-
-25.
2-2
5.2
-B
alan
ce a
t 31
Dec
embe
r 20
110.
0-7
0.3
-70.
36.
2
Car
ryin
g am
ount
at 3
1 D
ecem
ber
2011
19.8
42.4
62.2
11.6
Cos
t:
bal
ance
at 1
jan
uary
201
219
.811
2.7
132.
55.
4ad
ditio
ns10
0.6
-10
0.6
-d
ispo
sals
0.0
-0.
0-
Tran
sfer
red
from
ves
sels
and
cap
italiz
ed d
ry-d
ocki
ng1,
655.
2-
1,65
5.2
-B
alan
ce a
t 31
Dec
embe
r 20
121,
775.
611
2.7
1,88
8.3
5.4
Dep
reci
atio
n an
d im
pair
men
t los
ses:
bal
ance
at 1
jan
uary
201
20.
0-7
0.3
-70.
36.
2ex
chan
ge r
ate
adju
stm
ent
--
0,0
0.2
Valu
e ad
just
men
t for
the
year
--
0,0
-d
ispo
sals
--
0,0
-Im
pair
men
t los
ses
-19.
8-4
2.3
-62.
1-
Bal
ance
at 3
1 D
ecem
ber
2012
-19.
8-1
12.6
-132
.46.
4
Car
ryin
g am
ount
at 3
1 D
ecem
ber
2012
1,75
5.8
0.1
1,75
5.9
11.8
Her
eof l
iste
d0.
0H
ereo
f unl
iste
d11
.8
Plea
se r
efer
to n
ote
9 in
the
cons
olid
ated
fina
ncia
l sta
tem
ents
for
info
rmat
ion
on im
pair
men
t tes
ting.
a lis
t of c
ompa
nies
in th
e G
roup
is fo
und
in n
ote
28 in
the
cons
olid
ated
fina
ncia
l sta
tem
ents
.
94 Parent company 2012

TORM 2012
no
te 6
Vess
els
and
Oth
er p
lant
Land
and
capi
taliz
edPr
epay
men
tsan
d op
erat
ing
uSd
mill
ion
build
ings
dry-
dock
ing
on v
esse
lseq
uipm
ent
Tota
lTA
NG
IBLE
FIX
ED A
SSET
S
Cos
t:
bal
ance
at 1
jan
uary
201
12.
32,
619.
018
6.6
21.6
2,82
9.5
addi
tions
-17
.457
.02.
476
.8d
ispo
sals
--3
16.8
-7.8
-0.2
-324
.8Tr
ansf
erre
d to
/fro
m o
ther
item
s-
104.
8-1
04.8
-0.
0Tr
ansf
erre
d to
non
-cur
rent
ass
ets
held
for
sale
--
-61.
8-
-61.
8B
alan
ce a
t 31
Dec
embe
r 20
112.
32,
424.
469
.223
.82,
519.
7
Dep
reci
atio
n an
d im
pair
men
t los
ses:
bal
ance
at 1
jan
uary
201
10.
342
0.4
16.3
13.9
450.
9d
ispo
sals
--5
4.9
--0
.2-5
5.1
dep
reci
atio
n fo
r th
e ye
ar-
118.
0-
3.6
121.
6Lo
ss o
n sa
le o
f new
build
ings
--
33.1
-33
.1Im
pair
men
t los
s-
84.1
--
84.1
Tran
sfer
red
to/f
rom
oth
er it
ems
-16
.3-1
6.3
-0.
0B
alan
ce a
t 31
Dec
embe
r 20
110.
358
3.9
33.1
17.3
634.
6
Car
ryin
g am
ount
at 3
1 D
ecem
ber
2011
2.0
1,84
0.5
36.1
6.5
1,88
5.1
Of w
hich
fina
nce
leas
es0.
026
.90.
00.
026
.9
Of w
hich
fina
ncia
l exp
ense
s in
clud
ed in
cos
t0.
02.
00.
80.
02.
8
Cos
t:
bal
ance
at 1
jan
uary
201
22.
32,
424.
469
.223
.82,
519.
7ad
ditio
ns-
34.9
41.7
1.8
78.4
dis
posa
ls-0
.5-1
36.4
-8.0
--1
44.9
Tran
sfer
red
to/f
rom
oth
er it
ems
-10
2.9
-102
.9-
0.0
Tran
sfer
red
to n
on-c
urre
nt a
sset
s he
ld fo
r sa
le-
-95.
6-
--9
5.6
Tran
sfer
red
to in
vest
men
t in
subs
idia
ries
*)-
-2,3
07.4
--
-2,3
07.4
Bal
ance
at 3
1 D
ecem
ber
2012
1.8
22.8
0.0
25.6
50.2
Dep
reci
atio
n an
d im
pair
men
t los
ses:
bal
ance
at 1
jan
uary
201
20.
358
3.9
33.1
17.3
634.
6d
ispo
sals
-0.1
-43.
4-
--4
3.5
dep
reci
atio
n fo
r th
e ye
ar0.
892
.1-
3.2
96.1
Loss
on
sale
of n
ewbu
ildin
gs-
--
-0.
0Im
pair
men
t los
s-
28.6
--
28.6
Tran
sfer
red
to/f
rom
oth
er it
ems
-33
.1-3
3.1
-0.
0Tr
ansf
erre
d to
non
-cur
rent
ass
ets
held
for
sale
--4
2.0
--
-42.
0Tr
ansf
erre
d to
inve
stm
ent i
n su
bsid
iari
es*)
--6
52.2
--
-652
.2B
alan
ce a
t 31
Dec
embe
r 20
121.
00.
10.
020
.521
.6
Car
ryin
g am
ount
at 3
1 D
ecem
ber
2012
0.8
22.7
0.0
5.1
28.6
Of w
hich
fina
nce
leas
es0.
014
.70.
00.
014
.7
Of w
hich
fina
ncia
l exp
ense
s in
clud
ed in
cos
t0.
02.
70.
00.
02.
7
Incl
uded
in th
e ca
rryi
ng a
mou
nt fo
r ve
ssel
s an
d ca
pita
lized
dry
-doc
king
are
cap
italiz
ed d
ry-d
ocki
ng c
osts
in th
e am
ount
of u
Sd 4
.7 m
il-lio
n (2
011:
uSd
25.
7 m
illio
n).
Plea
se r
efer
to n
ote
9 in
the
cons
olid
ated
fina
ncia
l sta
tem
ents
for
info
rmat
ion
on im
pair
men
t tes
ting.
Plea
se r
efer
to n
ote
13 fo
r in
form
atio
n in
rel
atio
n to
ass
ets
used
for
colla
tera
l sec
urity
.
*) V
esse
ls a
nd c
apita
lized
dry
-doc
king
hav
e be
en c
ontr
ibut
ed in
kin
d in
who
lly o
wne
d su
bsid
iari
es a
s a
part
of t
he r
estr
uctu
ring
.
no
te 7
uSd
mill
ion
2012
2011
FIN
AN
CIA
L IT
EMS
Fina
ncia
l inc
ome
Inte
rest
inco
me
from
cas
h an
d ca
sh e
quiv
alen
ts, e
tc.
2.7
1.9
Gai
n on
sal
e fr
om in
vest
men
ts in
join
tly c
ontr
olle
d en
titie
s 1.
90.
0d
ivid
ends
0.4
0.0
div
iden
ds fr
om s
ubsi
diar
ies
0.1
1.4
Fair
val
ue a
djus
tmen
ts o
n de
riva
tive
finan
cial
inst
rum
ents
5.7
3.7
exch
ange
rat
e a
djus
tmen
ts, i
nclu
ding
net
gai
n
fro
m fo
rwar
d ex
chan
ge r
ate
cont
ract
s2.
54.
113
.311
.1
Fina
ncia
l exp
ense
s
Inte
rest
exp
ense
on
mor
tgag
e an
d ba
nk d
ebt,
incl
udin
g ne
t gai
n/lo
ss o
n in
tere
st-r
elat
ed d
eriv
ativ
es
70.8
50.3
exch
ange
rat
e ad
just
men
ts, i
nclu
ding
net
rea
lized
loss
from
forw
ard
exch
ange
rat
e co
ntra
cts
0.1
4.0
advi
sor
fees
rel
ated
to fi
nanc
ing
and
rest
ruct
urin
g pl
an64
.00.
0Im
pair
men
t los
ses
on s
ubsi
diar
ies
19.8
0.0
Impa
irm
ent l
osse
s on
join
tly c
ontr
olle
d en
titie
s46
.025
.2W
rite
-dow
n on
fina
ncia
l fix
ed a
sset
s re
gard
ing
liqui
datio
n of
inac
tive
subs
idia
ries
and
join
tly c
ontr
olle
d en
titie
s1.
99.
1O
ther
fina
ncia
l exp
ense
s2.
89.
9O
f whi
ch in
clud
ed in
the
cost
of t
angi
ble
fixed
ass
ets
0.0
-0.6
205.
497
.9
Tota
l fin
anci
al it
ems
-192
.1-8
6.8
no
te 8
uSd
mill
ion
2012
2011
FREI
GH
T R
ECEI
VAB
LES
anal
ysis
of f
reig
ht r
ecei
vabl
es a
t 31
dec
embe
r:
nei
ther
pas
t due
nor
impa
ired
76.
4 78
.2d
ue <
30
days
8
.0
43.2
due
bet
wee
n 30
and
180
day
s 2
2.7
13.3
due
> 1
80 d
ays
7.6
3.
2
114
.7
137.
9
at 3
1 d
ecem
ber
2012
, fre
ight
rec
eiva
bles
incl
ude
rece
ivab
les
at a
val
ue o
f uSd
0.2
mill
ion
(201
1: u
Sd 0
.2 m
illio
n),
whi
ch a
re in
divi
dual
ly d
eter
min
ed to
be
impa
ired
to a
val
ue o
f uSd
0.0
mill
ion
(201
1: u
Sd 0
.0 m
illio
n).
mov
emen
ts in
the
prov
isio
n fo
r im
pair
men
t of f
reig
ht r
ecei
vabl
es d
urin
g th
e ye
ar a
re a
s fo
llow
s:
uSd
mill
ion
2012
2011
PR
OVI
SIO
N F
OR
IMP
AIR
MEN
T O
F FR
EIG
HT
REC
EIVA
BLE
S
bal
ance
at 1
jan
uary
0.2
0.1
Prov
isio
ns fo
r th
e ye
ar-
0.1
Prov
isio
ns r
ever
sed
duri
ng th
e ye
ar-
-Pr
ovis
ions
util
ized
dur
ing
the
year
--
Bal
ance
at 3
1 D
ecem
ber
0.2
0.2
Prov
isio
n fo
r im
pair
men
t of f
reig
ht r
ecei
vabl
es h
as b
een
reco
gniz
ed in
the
inco
me
stat
emen
t und
er 'P
ort e
xpen
ses,
bu
nker
s an
d co
mm
issi
ons'
. The
pro
visi
on is
bas
ed o
n an
indi
vidu
al a
sses
smen
t of e
ach
rece
ivab
le.
95Parent company 2012

TORM 2012
no
te 9
uSd
mill
ion
2012
2011
OTH
ER R
ECEI
VAB
LES
Part
ners
and
com
mer
cial
man
agem
ents
2.8
5.0
der
ivat
ive
finan
cial
inst
rum
ents
2.9
5.6
rec
eiva
bles
at j
oint
ven
ture
s0.
03.
7Ta
x re
ceiv
able
s0.
80.
6m
isce
llane
ous,
incl
udin
g ite
ms
rela
ted
to s
hipp
ing
activ
ities
5.9
6.0
12.4
20.9
no
te 1
0u
Sd m
illio
n20
1220
11TA
X
cur
rent
tax
for
the
year
1.6
-2.0
adju
stm
ents
rel
ated
to p
revi
ous
year
s0.
20.
5ad
just
men
t of d
efer
red
tax
-0.5
0.5
1.3
-1.0
Effe
ctiv
e co
rpor
ate
tax
rate
-0.3
%-0
.2%
The
com
pany
par
ticip
ates
in th
e to
nnag
e ta
x sc
hem
e in
den
mar
k. T
he p
artic
ipat
ion
in th
e to
nnag
e ta
x sc
hem
e is
bin
ding
un
til 3
1 d
ecem
ber
2017
.
und
er th
e d
anis
h to
nnag
e ta
x sc
hem
e, th
e in
com
e an
d ex
pens
es fr
om s
hipp
ing
activ
ities
are
not
sub
ject
to d
irec
t tax
atio
n.
Inst
ead
the
taxa
ble
inco
me
is c
alcu
late
d fr
om:
• Th
e ne
t ton
nage
of t
he v
esse
ls u
sed
to g
ener
ate
the
inco
me
from
shi
ppin
g ac
tiviti
es•
A ra
te a
pplic
able
to th
e sp
ecifi
c ne
t ton
nage
of t
he v
esse
l, ba
sed
on a
slid
ing
scal
e•
The
num
ber
of d
ays
the
vess
els
are
used
dur
ing
the
year
.
The
com
pany
exp
ects
to p
artic
ipat
e in
the
tonn
age
tax
sche
me
afte
r th
e bi
ndin
g pe
riod
and
at a
min
imum
to m
aint
ain
its c
urre
nt in
vest
-in
g an
d ac
tivity
leve
l.
The
diffe
renc
e be
twee
n th
e ef
fect
ive
corp
orat
e ta
x ra
te o
f -0.
3% (2
011:
-0.
2%) a
nd th
e co
rpor
atio
n ta
x ra
te in
den
mar
k of
25%
(201
1:
25%
) pri
mar
ily r
elat
es to
the
tonn
age
tax
sche
me.
Paym
ent o
f div
iden
ds to
the
shar
ehol
ders
of T
Or
m a
/S h
as n
o ta
xabl
e co
nseq
uenc
es fo
r TO
rm
a/S
.
uSd
mill
ion
2012
2011
DEF
ERR
ED T
AX
def
erre
d ta
x at
1 j
anua
ry
53.9
54.4
def
erre
d ta
x fo
r th
e ye
ar-0
.6-0
.5
Def
erre
d ta
x at
31
Dec
embe
r53
.353
.9
esse
ntia
lly a
ll de
ferr
ed ta
x re
late
s to
ves
sels
incl
uded
in th
e tr
ansi
tion
acco
unt u
nder
the
dan
ish
tonn
age
tax
sche
me.
no
te 1
1u
Sd m
illio
n20
1220
11O
THER
LIA
BIL
ITIE
S
Part
ners
and
com
mer
cial
man
agem
ents
12.0
6.0
accr
ued
oper
atin
g ex
pens
es14
.45.
4ac
crue
d in
tere
sts
0.8
3.2
Wag
es a
nd s
ocia
l exp
ense
s11
.615
.8d
eriv
ativ
e fin
anci
al in
stru
men
ts1.
037
.5m
isce
llane
ous,
incl
udin
g ite
ms
rela
ted
to s
hipp
ing
activ
ities
8.0
9.9
47.8
77.8
no
te 1
2EF
FEC
TIVE
INTE
RES
T R
ATE
AN
D F
AIR
VA
LUE
OF
MO
RTG
AG
E D
EBT
AN
D B
AN
K L
OA
NS
In n
ovem
ber
2012
, TO
rm
com
plet
ed a
res
truc
turi
ng. a
s pa
rt o
f the
res
truc
turi
ng, T
Or
m s
ecur
ed a
new
wor
king
faci
lity
of u
Sd 1
00 m
il-lio
n un
til 3
0 Se
ptem
ber
2014
. The
gro
up o
f ban
ks a
ligne
d ke
y te
rms
and
cond
ition
s as
wel
l as
finan
cial
cov
enan
ts a
cros
s al
l exi
stin
g de
bt
faci
litie
s, a
nd a
ll m
atur
ity o
n ex
istin
g cr
edit
faci
litie
s w
as a
djus
ted
to 3
1 d
ecem
ber
2016
.
Plea
se r
efer
to n
ote
2 in
the
grou
p fin
anci
al s
tate
men
ts fo
r fu
rthe
r in
form
atio
n on
the
com
pany
’s li
quid
ity a
nd c
apita
l res
ourc
es a
nd
note
22
and
23 in
the
grou
p fin
anci
al s
tate
men
ts fo
r fu
rthe
r in
form
atio
n on
inte
rest
rat
e ri
sks.
as 3
1 d
ecem
ber
2011
, the
com
pany
's m
ortg
age
debt
and
ban
k lo
ans
wer
e su
bjec
t to
an u
nrem
edia
ted
brea
ch o
f fin
anci
al c
oven
ants
and
th
eref
ore
form
ally
due
in 2
012.
The
tabl
e be
low
sho
ws
the
effe
ctiv
e in
tere
st a
nd fa
ir v
alue
of t
he m
ortg
age
debt
and
ban
k lo
ans.
2012
2011
uSd
mill
ion
Fixe
d/flo
atin
gm
atur
ityef
fect
ive
inte
rest
Fair
valu
em
atur
ityef
fect
ive
inte
rest
Fair
valu
eLO
AN
uSd
Floa
ting
--
-
2012
3.3%
1,5
21.8
u
SdFl
oatin
g20
1415
,6%
*)58
.0-
--
uSd
Floa
ting
2016
3,4%
**)
1,77
1.3
--
-
Wei
ghte
d av
erag
e ef
fect
ive
inte
rest
rat
e3.
6%3.
3%
Fair
val
ue1,
829.
31,
521.
8
as o
f 31
dec
embe
r 20
11, p
art o
f the
loan
s w
ith fl
oatin
g in
tere
st r
ate
wer
e sw
appe
d to
fixe
d in
tere
st r
ate.
*)
effe
ctiv
e in
tere
st r
ate
incl
udes
def
erre
d an
d am
ortiz
ed b
ank
fees
and
com
mitm
ent f
ee.
**)
effe
ctiv
e in
tere
st r
ate
incl
udes
def
erre
d an
d am
ortiz
ed b
ank
fees
rela
ted
to o
rigi
nal f
acili
ties
and
fees
rela
ted
to th
e re
stru
ctur
ed b
ank
loan
s.
96 Parent company 2012

TORM 2012
no
te 1
3u
Sd m
illio
n20
1220
11C
OLL
ATE
RA
L SE
CU
RIT
Y
col
late
ral s
ecur
ity fo
r m
ortg
age
debt
and
ban
k lo
ans:
Vess
els
-1,
486.
6In
vest
men
t in
subs
idia
ries
1,82
8.9
-
1,82
8.9
1,48
6.6
The
tota
l car
ryin
g am
ount
for
vess
els
that
hav
e be
en p
rovi
ded
as s
ecur
ity a
mou
nts
to u
Sd 0
mill
ion
(201
1: u
Sd 1
,897
mill
ion)
.Th
e to
tal c
arry
ing
amou
nt fo
r in
vest
men
t in
subs
idia
ries
that
hav
e be
en p
rovi
ded
as s
ecur
ity a
mou
nts
to u
Sd 1
,734
mill
ion
(201
1: u
Sd 0
m
illio
n).
no
te 1
4u
Sd m
illio
n20
1220
11G
UA
RA
NTE
E A
ND
CO
NTI
NG
ENT
LIA
BIL
ITIE
S
Gua
rant
ees
for
bank
loan
s in
sub
sidi
arie
s11
5.9
237.
1G
uara
ntee
s fo
r le
asin
g lia
bilit
ies
in s
ubsi
diar
ies
40.3
92.0
Oth
er g
uara
ntee
liab
ilitie
s0.
00.
0To
tal G
uara
ntee
and
con
tinge
nt li
abili
ties
156.
232
9.1
Oth
er g
uara
ntee
s re
late
to g
uara
ntee
liab
ilitie
s to
the
dan
ish
Ship
owne
rs' a
ssoc
iatio
n an
d am
ount
to le
ss th
an u
Sd 0
.1 m
illio
n.
NO
TE 1
5C
ON
TRA
CTU
AL
OB
LIG
ATI
ON
S, M
OR
TGA
GE
DEB
T A
ND
BA
NK
LOA
NS
TOr
m h
as v
ario
us c
ontr
actu
al o
blig
atio
ns a
nd c
omm
erci
al c
omm
itmen
ts to
mak
e fu
ture
pay
men
ts in
clud
ing
leas
e ob
ligat
ions
, pur
chas
e co
mm
itmen
ts, i
nter
est p
aym
ents
and
rep
aym
ent o
f mor
tgag
e de
bt a
nd b
ank
loan
s.
at 3
1 d
ecem
ber
2011
, the
com
pany
's m
ortg
age
debt
and
ban
k lo
ans
wer
e fo
rmal
ly d
ue in
201
2 du
e to
an
unre
med
iate
d br
each
of f
inan
-ci
al c
oven
ants
. With
the
res
truc
turi
ng a
gree
men
t per
5 n
ovem
ber
2012
, the
com
pany
has
ext
ende
d its
deb
t to
31 d
ecem
ber
2016
and
is
no lo
nger
in b
reac
h. In
add
ition
, the
com
pany
sec
ured
a u
Sd 1
00 m
illio
n w
orki
ng c
apita
l fac
ility
ava
ilabl
e w
ith e
xpir
ing
date
30
Sept
em-
ber
2014
.
The
follo
win
g ta
ble
sum
mar
izes
the
com
pany
's c
ontr
actu
al o
blig
atio
ns:
no
te 1
5 –
co
nti
nu
ed
as o
f 31
dec
embe
r 20
12:
uSd
mill
ion
2013
2014
2015
2016
2017
Ther
eafte
rTo
tal
mor
tgag
e de
bt a
nd b
ank
loan
s 1)
0.
893
.787
.81,
624.
8-
-1,
807.
1In
tere
st p
aym
ents
rel
ated
to s
ched
uled
inte
rest
fix
ing
11.8
--
--
-11
.8es
timat
ed v
aria
ble
inte
rest
pay
men
ts 3
)41
.153
.751
.955
.8-
-20
2.5
Tota
l53
.714
7.4
139.
71,
680.
60.
00.
02,
021.
4
2013
2014
2015
2016
2017
Ther
eafte
rTo
tal
uSd
mill
ion
Fina
nce
leas
e lia
bilit
ies
4)-1
.9-1
.4-0
.9-0
.118
.7-
14.4
Inte
rest
ele
men
t fin
ance
leas
e4.
04.
44.
74.
83.
2-
21.1
cha
rter
ed-i
n ve
ssel
s (in
cl. v
esse
ls n
ot d
eliv
ered
) (O
pera
ting
leas
e) 5
)71
.945
.043
.515
.713
.55.
819
5.4
new
build
ing
inst
allm
ents
and
exe
rcis
ed p
urch
ase
opt
ions
(Pur
chas
e ob
ligat
ions
) 6)
--
--
--
0.0
Oth
er o
pera
ting
leas
es 7
)4.
73.
20.
10.
1-
-8.
1
Tota
l78
.751
.247
.420
.535
.45.
823
9.0
con
trac
tual
obl
igat
ions
- a
s le
ssor
:c
hart
er h
ire
inco
me
for
vess
els
on ti
me
char
ter
and
b
areb
oat c
hart
er (i
ncl.
vess
els
not
del
iver
ed) (
Ope
ratin
g le
ase)
8)
23.7
7.3
0.1
--
-31
.1
Tota
l23
.77.
30.
10.
00.
00.
031
.1
as o
f 31
dec
embe
r 20
11:
Ther
eafte
ru
Sd m
illio
n20
1220
1320
1420
1520
16To
tal
mor
tgag
e de
bt a
nd b
ank
loan
s 1)
1,
515.
6-
--
--
1,51
5.6
Inte
rest
pay
men
ts r
elat
ed to
inte
rest
rat
e sw
aps
2)
28.6
13.5
8.2
4.6
2.9
-57
.8es
timat
ed v
aria
ble
inte
rest
pay
men
ts 3
)4.
8-
--
--
4.8
Tota
l1,
549.
013
.58.
24.
62.
90.
01,
578.
2
Ther
eafte
ru
Sd m
illio
n20
1220
1320
1420
1520
16To
tal
Fina
nce
leas
e lia
bilit
ies
4)1.
61.
82.
12.
32.
717
.928
.4In
tere
st e
lem
ent f
inan
ce le
ase
3.3
3.1
2.8
2.6
2.2
1.4
15.4
cha
rter
ed-i
n ve
ssel
s (in
cl. v
esse
ls n
ot d
eliv
ered
) (O
pera
ting
leas
e) 5
)32
7.1
273.
124
8.2
184.
185
.512
6.1
1,24
4.1
new
build
ing
inst
allm
ents
and
exe
rcis
ed p
urch
ase
opt
ions
(Pur
chas
e ob
ligat
ions
) 6)
52.0
9.8
19.9
--
-81
.7O
ther
ope
ratin
g le
ases
7)
4.7
4.8
3.3
0.1
0.1
-13
.0
Tota
l38
8.7
292.
627
6.3
189.
190
.514
5.4
1,38
2.6
con
trac
tual
obl
igat
ions
- a
s le
ssor
:c
hart
er h
ire
inco
me
for
vess
els
on ti
me
char
ter
and
b
areb
oat c
hart
er (i
ncl.
vess
els
not
del
iver
ed) (
Ope
ratin
g le
ase)
8)
68.6
16.5
4.6
--
-89
.7
Tota
l68
.616
.54.
60.
00.
00.
089
.7
1) T
he p
rese
nted
am
ount
s to
be
repa
id a
re a
djus
ted
by d
irect
ly re
late
d co
sts
aris
ing
from
the
issu
ing
of th
e lo
ans
by u
Sd 2
5.1
mill
ion
(201
1: u
Sd 6
.2 m
illio
n) w
hich
are
am
ortiz
ed o
ver
the
term
of t
he lo
ans.
2) a
ctua
l fixe
d ra
te a
ccor
ding
to in
tere
st r
ate
swap
s is
use
d fo
r th
e co
vere
d in
tere
st p
aym
ents
.
3) V
aria
ble
inte
rest
pay
men
ts a
re e
stim
ated
bas
ed o
n th
e av
erag
e fo
rwar
d ra
tes
for
each
yea
r. Th
is c
orre
spon
ds to
an
aver
age
net i
nter
est i
nclu
ding
mar
gin
of 2
.9%
(2
011:
2.5
%).
4) O
ne le
asin
g ag
reem
ent i
nclu
des
a pu
rcha
se li
abili
ty u
pon
defa
ult o
f cer
tain
fina
ncia
l cov
enan
ts s
imila
r to
thos
e di
sclo
sed
in n
ote
16.
5) L
ease
s ha
ve b
een
ente
red
into
with
a m
utua
lly n
on-c
ance
labl
e le
ase
peri
od o
f up
to e
ight
yea
rs. T
he o
blig
atio
n is
bas
ed o
n m
inim
um le
ase
paym
ents
. cer
tain
leas
es
incl
ude
a pr
ofit s
hari
ng e
lem
ent i
mpl
ying
that
the
actu
al c
hart
er h
ire m
ay b
e hi
gher
. The
ave
rage
per
iod
until
rede
liver
y of
the
vess
els
is 0
.9 y
ears
(201
1: 2
.3 y
ears
).
6) a
t 31
dec
embe
r 20
12, T
Or
m h
ad n
o co
ntra
cted
new
build
ings
(201
1: th
ree
new
build
ings
to b
e de
liver
ed d
urin
g 20
12-2
014
for
whi
ch th
e to
tal o
utst
andi
ng c
ontr
actu
al
com
mitm
ent a
t 31
dec
embe
r 20
11 a
mou
nted
to u
Sd 8
2 m
illio
n).
7) O
ther
ope
ratin
g le
ases
pri
mar
ily c
onsi
st o
f con
trac
ts re
gard
ing
offic
e sp
aces
, car
s an
d ap
artm
ents
as
wel
l as
IT-r
elat
ed c
ontr
acts
.
8) c
hart
er h
ire in
com
e fo
r ve
ssel
s on
tim
e ch
arte
r an
d ba
rebo
at c
hart
er is
reco
gniz
ed u
nder
reve
nue.
The
ave
rage
per
iod
until
rede
liver
y of
the
vess
els
is 1
.0 y
ears
(2
011:
0.6
yea
rs).
97Parent company 2012

TORM 2012
no
te 1
6
min
imum
leas
epa
ymen
tsIn
tere
stel
emen
tc
arry
ing
amou
ntu
Sd m
illio
nFI
NA
NC
E LE
ASE
LIA
BIL
ITIE
S -
AS
LESS
EE
Leas
e lia
bilit
ies
rega
rdin
g fin
ance
leas
e as
sets
:
2012
Falli
ng d
ue w
ithin
one
yea
r2.
1-3
.9-1
.8To
tal c
urre
nt2.
1-3
.9-1
.8
Falli
ng d
ue b
etw
een
one
and
five
year
s33
.4-1
7.2
16.2
Falli
ng d
ue a
fter
five
year
s-
-0.
0To
tal n
on-c
urre
nt33
.4-1
7.2
16.2
Tota
l 35
.5-2
1.1
14.4
Fair
val
ue14
,4
2011
Falli
ng d
ue w
ithin
one
yea
r4.
9-3
.31.
6To
tal c
urre
nt4.
9-3
.31.
6
Falli
ng d
ue b
etw
een
one
and
five
year
s19
.6-1
0.7
8.9
Falli
ng d
ue a
fter
five
year
s19
.3-1
.417
.9To
tal n
on-c
urre
nt38
.9-1
2.1
26.8
Tota
l 43
.8-1
5.4
28.4
Fair
val
ue28
.4
Fina
nce
leas
e re
late
s to
an
mr
pro
duct
tank
er c
hart
ered
on
bare
boat
exp
irin
g no
late
r th
an in
201
7.
at th
e ex
pire
of t
he c
hart
er p
erio
d, th
e c
ompa
ny h
as a
n ob
ligat
ion
to p
urch
ase
the
vess
el.
no
te 1
7D
ERIV
ATI
VE F
INA
NC
IAL
INST
RU
MEN
TS
The
tabl
e be
low
sho
ws
the
fair
val
ue o
f the
der
ivat
ive
finan
cial
inst
rum
ents
:
uSd
mill
ion
Fair
val
ue
as o
f 31
Dec
embe
r 20
12
Fair
val
ue
as o
f 31
dec
embe
r 20
11H
edge
acc
ount
ing,
cas
h fl
ows:
der
ivat
ive
finan
cial
inst
rum
ents
reg
ardi
ng in
tere
st r
ate
and
curr
ency
exc
hang
e ra
te:
Forw
ard
exch
ange
rat
e co
ntra
cts
--3
.8In
tere
st r
ate
swap
s
--2
4.8
Non
hed
ge a
ccou
ntin
g:
der
ivat
ive
finan
cial
inst
rum
ents
reg
ardi
ng in
tere
st r
ate
and
curr
ency
exc
hang
e ra
te:
Inte
rest
rat
e sw
aps
--8
.5
der
ivat
ive
finan
cial
inst
rum
ents
reg
ardi
ng fr
eigh
t and
bun
kers
: b
unke
r sw
ap1.
32.
3Fo
rwar
d Fr
eigh
t agr
eem
ents
-1.
5
der
ivat
ive
finan
cial
inst
rum
ents
reg
ardi
ng o
ptio
ns o
n ve
ssel
s:
acqu
ired
liab
ilitie
s re
late
d to
opt
ions
on
vess
els
--0
.1
1.3
-33.
4
Her
eof i
nclu
ded
in:
Cur
rent
ass
ets
Oth
er r
ecei
vabl
es1.
43.
9
Cur
rent
liab
ilitie
s
Oth
er li
abili
ties
-0.1
-37.
2ac
quir
ed li
abili
ties
rela
ted
to o
ptio
ns o
n ve
ssel
s0.
0-0
.1
1.3
-33.
4
98 Parent company 2012

TORM 2012
no
te 1
7 –
co
nti
nu
ed
The
tabl
e be
low
sho
ws
real
ized
am
ount
s as
wel
l as
fair
val
ue a
djus
tmen
ts r
egar
ding
der
ivat
ive
finan
cial
inst
rum
ents
rec
ogni
zed
in th
e in
com
e st
atem
ent a
nd e
quity
in 2
012
and
2011
:In
com
e st
atem
ent
uSd
mill
ion
Frei
ght a
nd
bunk
erde
riva
tives
Ope
ratin
gex
pens
esad
min
istr
ativ
eex
pens
esFi
nanc
ial
item
s
equi
tyhe
dgin
gre
serv
esb
unke
r sw
aps
3.0
--
--
Forw
ard
Frei
ght a
gree
men
ts6.
9-
--
-Fo
rwar
d ra
te c
ontr
acts
-
-1.7
-1.6
-3.
3In
tere
st r
ate
swap
s -
--
-14.
73.
4c
urre
ncy
cont
ract
s-
--
0.0
-r
ight
to s
hare
of g
ain
on p
urch
ase
optio
ns o
n ve
ssel
s-
--
--
Tota
l 201
29.
9-1
.7-1
.6-1
4.7
6.7
bun
ker
swap
s7.
0-
--
-Fo
rwar
d Fr
eigh
t agr
eem
ents
7.1
--
--
Forw
ard
rate
con
trac
ts
-1.
21.
6-
-3.3
Inte
rest
rat
e sw
aps
--
--5
.6-2
4.9
cur
renc
y co
ntra
cts
--
--3
.7-
rig
ht to
sha
re o
f gai
n on
pur
chas
e op
tions
on
vess
els
--
--6
.0-
Tota
l 201
114
.11.
21.
6-1
5.3
-28.
2
Plea
se r
efer
to th
e se
ctio
n m
anag
ing
risk
and
exp
osur
e an
d no
te 2
3 in
the
cons
olid
ated
fina
ncia
l sta
tem
ents
for
furt
her
info
rmat
ion
on
finan
cial
ris
ks.
The
forw
ard
exch
ange
rat
e co
ntra
cts
with
a fa
ir v
alue
of u
Sd 0
.0 m
illio
n (2
011:
uSd
-3.
8 m
illio
n) a
re d
esig
nate
d as
hed
ge a
ccou
ntin
g to
he
dge
a pa
rt o
f TO
rm
's p
aym
ents
in 2
013
rega
rdin
g ad
min
istr
ativ
e an
d op
erat
ing
expe
nses
den
omin
ated
in d
KK
.
The
inte
rest
rat
e sw
aps
with
a fa
ir v
alue
of u
Sd 0
.0 m
illio
n (2
011:
uSd
-24
.8 m
illio
n) a
re d
esig
nate
d as
hed
ge a
ccou
ntin
g to
hed
ge a
par
t of
TO
rm
's in
tere
st p
aym
ents
dur
ing
the
peri
od 2
013
to 2
016.
The
gain
s or
loss
es o
n th
ese
cont
ract
s w
ill b
e re
cogn
ized
in th
e in
com
e st
atem
ent w
hen
real
ized
toge
ther
with
the
hedg
ed it
ems.
no
te 1
8FI
NA
NC
IAL
INST
RU
MEN
TS
uSd
mill
ion
2012
2011
CA
TEG
OR
IES
OF
FIN
AN
CIA
L A
SSET
S A
ND
LIA
BIL
ITIE
S A
S D
EFIN
ED IN
IAS
39:
Loan
s an
d re
ceiv
able
s
Loan
s to
sub
sidi
arie
s39
.753
.8Lo
ans
to jo
intly
con
trol
led
entit
ies
0.0
8.2
Frei
ght r
ecei
vabl
es, e
tc.
114.
713
7.9
Oth
er r
ecei
vabl
es
9.3
16.7
cas
h an
d ca
sh e
quiv
alen
ts24
.770
.9
188.
428
7.5
Ava
ilabl
e fo
r sa
le fi
nanc
ial a
sset
s
Oth
er in
vest
men
ts
11.8
11.6
11.8
11.6
Der
ivat
ive
finan
cial
inst
rum
ents
(ass
ets)
Oth
er r
ecei
vabl
es (h
eld
for
trad
ing)
2.3
3.9
2.3
3.9
Fina
ncia
l lia
bilit
ies
mea
sure
d at
am
ortiz
ed c
ost
mor
tgag
e de
bt a
nd b
ank
loan
s1,
807.
01,
516.
0Fi
nanc
e le
ase
liabi
litie
s 14
.428
.4Lo
an fr
om s
ubsi
diar
ies
0.0
174.
8Tr
ade
paya
bles
82.5
114.
3O
ther
liab
ilitie
s 35
.123
.1
1,93
9.0
1,85
6.6
Der
ivat
ive
finan
cial
inst
rum
ents
(lia
bilit
ies)
acqu
ired
liab
ilitie
s re
late
d to
opt
ions
on
vess
els
(hel
d fo
r tr
adin
g)0.
00.
1O
ther
liab
ilitie
s (h
eld
for
trad
ing)
1.0
8.7
Oth
er li
abili
ties
(hed
ge a
ccou
ntin
g)0.
028
.6
1.0
37.4
The
fair
val
ue o
f the
fina
ncia
l ass
ets
and
liabi
litie
s ab
ove
equa
ls th
e ca
rryi
ng a
mou
nt e
xcep
t for
mor
tgag
e de
bt a
nd b
ank
loan
s fo
r
whi
ch th
e fa
ir v
alue
can
be
foun
d in
not
e 12
.
FAIR
VA
LUE
HIE
RA
RC
HY
FOR
FIN
AN
CIA
L IN
STR
UM
ENTS
MEA
SUR
ED A
T FA
IR V
ALU
E IN
TH
E B
ALA
NC
E SH
EET
The
tabl
e be
low
sho
ws
the
fair
val
ue h
iera
rchy
for
finan
cial
inst
rum
ents
mea
sure
d at
fair
val
ue in
the
bala
nce
shee
t. Th
e fin
anci
al
inst
rum
ents
in q
uest
ion
are
grou
ped
into
Lev
els
1 to
3 b
ased
on
the
degr
ee to
whi
ch th
e fa
ir v
alue
is o
bser
vabl
e.
- Le
vel 1
fair
val
ue m
easu
rem
ents
are
thos
e de
rive
d fr
om q
uote
d pr
ices
(una
djus
ted)
in a
ctiv
e m
arke
ts fo
r id
entic
al a
sset
s or
liab
ilitie
s.-
Leve
l 2 fa
ir v
alue
mea
sure
men
ts a
re th
ose
deri
ved
from
inpu
t oth
er th
an q
uote
d pr
ices
incl
uded
with
in L
evel
1 th
at a
re o
bser
vabl
e fo
r th
e as
set o
r lia
bilit
y, e
ither
dir
ectly
(as
pric
es) o
r in
dire
ctly
(der
ived
from
pri
ces)
.-
Leve
l 3 fa
ir v
alue
mea
sure
men
ts a
re th
ose
deri
ved
from
val
uatio
n te
chni
ques
that
incl
ude
inpu
t for
the
asse
t or
liabi
lity
that
are
not
ba
sed
on o
bser
vabl
e m
arke
t dat
a (u
nobs
erva
ble
inpu
t).
99Parent company 2012

TORM 2012
no
te 1
8 -
co
nti
nu
ed
2012
uSd
mill
ion
Quo
ted
pric
es(L
evel
1)
Obs
erva
ble
inpu
t(L
evel
2)
uno
bser
v-ab
le
inpu
t(L
evel
3)
Tota
l
Ava
ilabl
e fo
r sa
le fi
nanc
ial a
sset
s:
Oth
er in
vest
men
ts
--
11.8
11.8
Der
ivat
ive
finan
cial
inst
rum
ents
(ass
ets)
:
Oth
er r
ecei
vabl
es (h
eld
for
trad
ing)
-1.
4-
1.4
Tota
l fin
anci
al a
sset
s 0.
01.
411
.813
.2
Der
ivat
ive
finan
cial
inst
rum
ents
(lia
bilit
ies)
:
acqu
ired
liab
ilitie
s re
late
d to
opt
ions
on
vess
els
(hel
d fo
r tr
adin
g)-
--
0.0
Oth
er li
abili
ties
(hel
d fo
r tr
adin
g)-
0.1
-0.
1O
ther
liab
ilitie
s (h
edge
acc
ount
ing)
-0.
0-
0.0
Tota
l fin
anci
al li
abili
ties
0.0
0.1
0.0
0.1
2011
uSd
mill
ion
Quo
ted
pric
es(L
evel
1)
Obs
erva
ble
inpu
t(L
evel
2)
uno
bser
v-ab
le
inpu
t(L
evel
3)
Tota
l
Ava
ilabl
e fo
r sa
le fi
nanc
ial a
sset
s:
Oth
er in
vest
men
ts
--
11.6
11.6
Der
ivat
ive
finan
cial
inst
rum
ents
(ass
ets)
:
Oth
er r
ecei
vabl
es (h
eld
for
trad
ing)
-3.
9-
3.9
Tota
l fin
anci
al a
sset
s 0.
03.
911
.615
.5
Der
ivat
ive
finan
cial
inst
rum
ents
(lia
bilit
ies)
:
acqu
ired
liab
ilitie
s re
late
d to
opt
ions
on
vess
els
(hel
d fo
r tr
adin
g)-
0.1
-0.
1O
ther
liab
ilitie
s (h
eld
for
trad
ing)
-8.
7-
8.7
Oth
er li
abili
ties
(hed
ge a
ccou
ntin
g)-
28.6
-28
.6
Tota
l fin
anci
al li
abili
ties
0.0
37.4
0.0
37.4
Ther
e w
ere
no tr
ansf
ers
betw
een
Leve
l 1 a
nd 2
in 2
012
and
2011
.
REC
ON
CIL
IATI
ON
OF
FIN
AN
CIA
L IN
STR
UM
ENTS
MEA
SUR
ED A
T FA
IR V
ALU
E IN
TH
E B
ALA
NC
E SH
EET
BA
SED
ON
LEV
EL 3
uSd
mill
ion
2012
2011
Oth
er in
vest
men
ts, a
vaila
ble
for
sale
:
Bal
ance
at 1
Jan
uary
11.6
2.8
Gai
n/lo
ss in
the
inco
me
stat
emen
t -
-G
ain/
loss
in o
ther
com
preh
ensi
ve in
com
e 0.
28.
8Tr
ansf
ers
to/f
rom
Lev
el 3
--
Bal
ance
at 3
1 D
ecem
ber
11.8
11.6
Gai
n/lo
ss in
the
inco
me
stat
emen
t for
ass
ets
held
at t
he e
nd o
f the
rep
ortin
g pe
riod
0.
00.
0
no
te 1
9R
ELA
TED
PA
RTY
TR
AN
SAC
TIO
NS
Subs
idia
ries
and
join
tly c
ontr
olle
d en
titie
s ar
e co
nsid
ered
as
rela
ted
part
ies
in r
elat
ion
to th
e Pa
rent
com
pany
, TO
rm
a/S
, in
addi
tion
to
the
rela
ted
part
ies
disc
lose
d in
not
e 25
to th
e co
nsol
idat
ed fi
nanc
ial s
tate
men
ts. T
he fo
llow
ing
tran
sact
ions
took
pla
ce b
etw
een
TOr
m
a/S
and
subs
idia
irie
s an
d jo
intly
con
trol
led
entit
ies
duri
ng th
e ye
ar:
uSd
mill
ion
2012
2011
Serv
ices
pro
vide
d by
TO
rm
a/S
3.8
21.3
asse
ts s
old
by T
Or
m a
/S68
.182
.8Se
rvic
es p
rovi
ded
by s
ubsi
diar
ies
and
join
tly c
ontr
olle
d en
titie
s80
.872
.1
152.
717
6.2
The
serv
ice
prov
ided
bet
wee
n th
e pa
rtie
s ar
e al
l dir
ectly
rel
ated
to th
e G
roup
's s
hipp
ing
activ
ities
.
no
te 2
0N
ON
-CU
RR
ENT
ASS
ETS
HEL
D F
OR
SA
LE
at y
ear
end
2012
, the
com
pany
has
ent
ered
into
neg
otia
tions
con
cern
ing
the
sale
of t
wo
mr
tank
ers.
The
tank
ers
have
bee
n cl
assi
fied
as
held
for
sale
and
are
pre
sent
ed s
epar
atel
y in
the
bala
nce
shee
t and
are
incl
uded
und
er T
anke
r d
ivis
ion
in th
e se
gmen
t inf
orm
atio
n.
an im
pair
men
t los
s of
uSd
29
mill
ion
from
adj
ustin
g th
e bo
ok v
alue
of t
he ta
nker
s to
the
mar
ket v
alue
at y
ear-
end
2012
has
bee
n re
cogn
ized
in th
e in
com
e st
atem
ent f
or 2
012
unde
r im
pair
men
t los
ses
on ta
ngib
le a
nd in
tang
ible
ass
ets.
at y
ear-
end
2011
, the
com
pany
had
ent
ered
into
con
trac
ts r
egar
ding
sal
e of
new
build
ing
cont
ract
s, w
hich
qua
lifie
d fo
r a
clas
sific
atio
n as
ass
ets
held
for
sale
. The
loss
from
the
sale
of t
he c
ontr
acts
am
ount
ing
to u
Sd 4
1 m
illio
n w
as r
ecog
nize
d in
the
inco
me
stat
emen
t for
20
11 u
nder
net
pro
fit/(l
oss)
from
sal
e of
ves
sels
.
no
te 2
1C
ASH
FLO
WS
uSd
mill
ion
2012
2011
Rev
ersa
l of o
ther
non
-cas
h m
ovem
ents
:
amor
tizat
ion
of a
cqui
red
asse
ts a
nd li
abili
ties
-0.1
-2.0
Fair
val
ue a
djus
tmen
s on
der
ivat
ive
finan
cial
inst
rum
ents
2.5
-4.0
cur
renc
y tr
ansl
atio
n ad
just
men
ts0.
40.
1Sh
are-
base
d pa
ymen
t1.
31.
3G
ain
from
sal
e of
oth
er fi
xed
asse
ts th
an v
esse
ls-0
.40.
0
3.7
-4.6
uSd
mill
ion
2012
2011
Cha
nge
in b
unke
rs, a
ccou
nts
rece
ivab
les
and
paya
bles
:
cha
nge
in b
unke
rs11
.6-4
7.3
cha
nge
in r
ecei
vabl
es28
.0-4
4.6
cha
nge
in p
repa
ymen
ts-3
.38.
6c
hang
e in
trad
e pa
yabl
es a
nd o
ther
liab
ilitie
s-5
8.5
84.3
Fair
val
ue c
hang
es o
f der
ivat
ive
finan
cial
inst
rum
ents
34.7
-14.
5O
ther
non
cas
h m
ovem
ents
incl
uded
in c
urre
nt a
sset
s an
d lia
bilit
ies
0.0
-5.7
12.5
-19.
2
100 Parent company 2012

TORM 2012
101

TORM 2012
Fleet overview102
toRm FLeet oveRvIew As oF 31 DeCemBeR 2012
tANKeRs/BuLK segmeNt vesseL Dwt BuILt owNeRshIP
CARRyINg vALue
(usD m)
Tanker LR2 TORM HELENE 99,999 1997 100% 20*)Tanker LR2 TORM KRISTINA 105,001 1999 100% 27*)Tanker LR2 TORM GUDRUN 101,122 2000 100% 28*)Tanker LR2 TORM INGEBORG 99,999 2003 100% 29*)Tanker LR2 TORM VALBORG 99,999 2003 100% 29*)Tanker LR2 TORM MARINA 109,672 2007 100% 47*)Tanker LR2 TORM MAREN 110,000 2008 100% 49*)Tanker LR2 TORM MATHILDE 110,000 2008 100% 50*)
Tanker LR1 TORM SARA 72,718 2003 100% 33*)Tanker LR1 TORM ESTRID 74,999 2004 100% 23*)Tanker LR1 TORM EMILIE 74,999 2004 100% 33*)Tanker LR1 TORM ISMINI 74,999 2004 100% 23*)Tanker LR1 TORM SIGNE 72,718 2005 100% 35*)Tanker LR1 TORM SOFIA 72,718 2005 100% 36*)Tanker LR1 TORM VENTURE 74,999 2007 100% 31*)
Tanker MR TORM GUNHILD 44,999 1999 100% 14*)Tanker MR TORM ANNE 44,990 1999 100% 16*)Tanker MR TORM NECHES 47,052 2000 100% 30*)Tanker MR TORM CLARA 45,999 2000 100% 28*)Tanker MR TORM CECILIE 44,946 2001 100% 27*)Tanker MR TORM AMAZON 47,275 2002 100% 15*)Tanker MR TORM SAN JACINTO 47,038 2002 100% 34*)Tanker MR TORM MARY 45,990 2002 100% 18*)Tanker MR TORM VITA 45,940 2002 100% 18*)Tanker MR TORM CAROLINE 44,946 2002 100% 30*)Tanker MR TORM GERTRUD 45,940 2002 100% 20*)Tanker MR TORM GERD 45,940 2002 100% 19*)Tanker MR TORM THYRA 45,990 2003 100% 19*)Tanker MR TORM FREYA 45,990 2003 100% 18*)Tanker MR TORM MOSELLE 47,024 2003 100% 35*)Tanker MR TORM ROSETTA 47,015 2003 100% 35*)Tanker MR TORM CAMILLA 44,990 2003 100% 26*)Tanker MR TORM CARINA 44,990 2003 100% 26*)Tanker MR TORM HORIZON 46,955 2004 100% 38*)Tanker MR TORM HELVIG 44,990 2005 100% 31*)Tanker MR TORM RAGNHILD 44,990 2005 100% 32*)Tanker MR TORM THAMES 47,035 2005 100% 40*)Tanker MR TORM KANSAS 46,922 2006 100% 40*)Tanker MR TORM REPUBLICAN 46,893 2006 100% 40*)Tanker MR TORM PLATTE 46,920 2006 100% 41*)Tanker MR TORM LAURA 52,000 2008 100% 38*)Tanker MR TORM LENE 52,000 2008 100% 38*)Tanker MR TORM LOTTE 52,000 2009 100% 38*)

TORM 2012
Fleet overview 103
tANKeRs/BuLK segmeNt vesseL Dwt BuILt owNeRshIP
CARRyINg vALue
(usD m)
Tanker MR TORM LOUISE 52,000 2009 100% 39*)Tanker MR TORM LILLY 52,000 2009 100% 39*)Tanker MR TORM ALICE 50,500 2010 100% **)Tanker MR TORM ALEXANDRA 50,500 2010 100% 41*)Tanker MR TORM ASLAUG 50,500 2010 100% **)Tanker MR TORM AGNETE 50,500 2010 100% 41*)Tanker MR TORM ALMENA 50,500 2010 100% **)Tanker MR TORM AGNES 50,500 2011 100% **)Tanker MR TORM AMALIE 50,500 2011 100% **)Tanker MR TORM ARAWA 49,999 2012 100% 50*)Tanker MR TORM ANABEL 49,999 2012 100% 50*)
Tanker Handysize TORM MADISON 35,828 2000 100% 27*)Tanker Handysize TORM TRINITY 35,834 2000 100% 27*)Tanker Handysize TORM RHONE 35,751 2000 100% 27*)Tanker Handysize TORM CHARENTE 35,751 2001 100% 28*)Tanker Handysize TORM OHIO 37,274 2001 100% 29*)Tanker Handysize TORM LOIRE 37,106 2004 100% 35*)Tanker Handysize TORM GARONNE 37,178 2004 100% 34*)Tanker Handysize TORM SAONE 37,106 2004 100% 35*)Tanker Handysize TORM FOX 37,006 2005 100% 36*)Tanker Handysize TORM TEVERE 36,990 2005 100% 36*)Tanker Handysize TORM GYDA 37,000 2009 100% 41*)
Bulk Panamax TORM ANHOLT 74,195 2004 100% 17*)Bulk Panamax TORM BORNHOLM 75,912 2004 100% 19*)
*) Indicates vessels for which TORM believes that, as of 31 December 2012, the basic charter-free market value is lower than the vessel’s carrying amount.
**) Indicates that the vessels are assets held for sale.

TORM 2012
Glossary104
gLossARy20-f: Annual report filed with the US Securities and Exchange Commission (SEC).
adR: American Depository Receipt. Proof of ownership (the equivalent) of one share. ADRs are used by foreign com-panies wishing to be admitted to listing on American stock exchanges.
adS: American Depositary Shares. Shares registered with the SEC and kept in custody with a bank as security for the ADRs issued. bareboat: See B/B.
b/b: Bareboat. A form of charter arrangement where the charterer is responsible for all costs and risks in connection with the operation of the vessel.
bulk: Dry cargo – typically commodities such as coal, grain, iron ore, etc.
bunkers: Fuel with which to run a vessel’s engines.
Capesize: Bulk carriers with a cargo carrying capacity of120,000-200,000 dwt.
Classification society: Independent organization, which ensures through verification of design, construction, building process and operation of vessels that the vessels at all times meet a long list of requirements to seaworthiness, etc. If the vessels do not meet these requirements, insuring and mortgaging the vessel will typically not be possible.
Coa: Contract of Affreightment. A contract that involves a number of consecutive cargoes at previously agreed freight rates.
Coating: The internal coatings applied to the tanks of a product tanker enabling the vessel to load refined oil products.
demurrage: A charge against the charterer of a vessel for delaying the vessel beyond the allowed free time. The demurrage rate will ty pically be at a level equal to the earnings in USD/day for the voyage.
dkk: Danish kroner.
dry cargo: See Bulk.
dwt: Deadweight ton. The cargo carrying capacity of a vessel.
ffa: Forward Freight Agreement. A financial derivative instrument enabling freight to be hedged forward at a fixed price.
GaaP: Generally Accepted Accounting Principles.
Handymax: Dry bulk carriers with a cargo carrying capacity of 40,000-60,000 dwt.
Handysize: A specific class of product tankers with a cargo carrying capacity of 20,000 – 40,000 dwt.
IaS: International Accounting Standards.
IfRS: International Financial Reporting Standards.
IMo: International Maritime Organization.
kamsarmax: Dry bulk carriers with a cargo carrying capacity of 80,000–85,000 dwt.
kPI: Key Performance Indicator. A measure of performance used to define and evaluate how the company is making progress towards its long-term organizational goals.
lR1: Long Range 1. A specific class of product tankers with a cargo carrying capacity of 60,000 – 80,000 dwt.
lR2: Long Range 2. A specific class of product tankers with a cargo carrying capacity of 80,000 – 110,000 dwt.
lTaf: Lost Time Accident Frequency. Work-related personal injuries that result in more than one day off work per million hours of work.
MR: Medium Range. A specific class of product tankers with a cargo carrying capacity of 40,000 – 60,000 dwt.
oil major: One of the world’s largest publicly owned oil and gas companies. Examples of oil majors are BP, Chevron, ExxonMobil, Shell and Total.
oPEC: Organization of the Petroleum Exporting Countries.
Panamax: Dry bulk carriers with a cargo carrying capacity of 60,000–80,000 dwt. The biggest vessel allowed to pass through the Panama Canal.
P&I club: Protection & Indemnity Club.
Pool: A grouping of vessels of similar size and characteristics, owned by different owners, but commercially operated jointly. The pool manager is mandated to charter the vessels out for the maximum be nefit of the pool as a whole. Earnings are equalized taking account of differences in vessel specifications, the number of days the vessels have been ready for charter, etc.
Product tanker: A vessel suitable for carrying clean petroleum products such as gasoline, jet fuel and naphtha.
Sarbanes-oxley act: An act passed by the US Congress in 2002 to protect investors from the possibility of fraudulent accounting activities by corporations. It mandated strict reforms to improve financial disclosures from corporations and prevent accounting fraud.
SEC: US Securities and Exchange Commission.
Supramax: Dry bulk carriers with a cargo carrying capacity of 40-60,000 dwt.
T/C: Time charter. An agreement covering the chartering out of a vessel to an end user for a defined period of time, where the owner is responsible for crewing the vessel, but the charterer must pay port costs and bunkers.
TCE: See T/C equivalent.
Time charter: See T/C.
Ton-miles: A unit of freight transportation equivalent to a ton of freight moved one mile.
T/C equivalent: The freight receivable after deducting port expenses, consumption of bunkers and commissions.
UN: The United Nations.


ANNUAL REPORT 2011
TORM A/S TUBORG HAVNEVEJ 18
DK-2900 HELLERUP DENMARK
TEL.: +45 3917 9200 WWW.TORM.COM
toR
m A
/s ANN
UAL R
EPOR
T 2011
DESIG
N: B
YSTED A/S