annual report 2006
TRANSCRIPT
Annual Report 2006
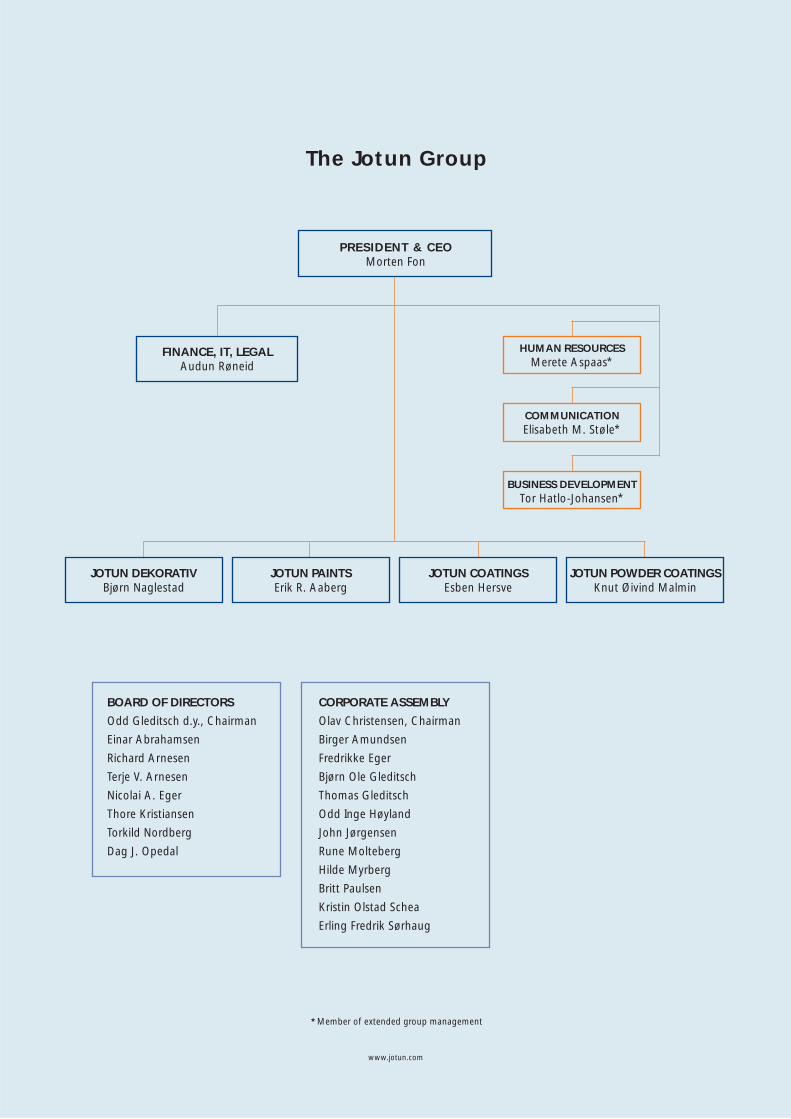
The Jotun Group
*Member of extended group management
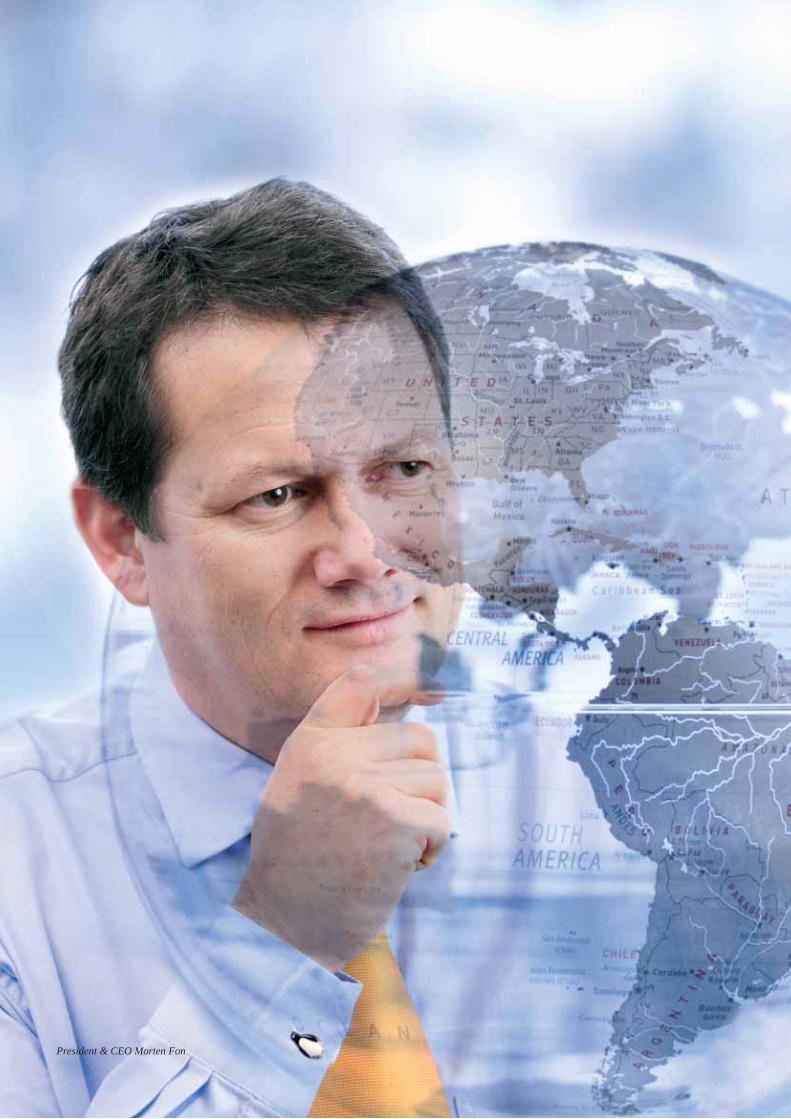
PRESIDENT & CEOMorten Fon
FINANCE, IT, LEGALAudun Røneid
HUMAN RESOURCESMerete Aspaas*
COMMUNICATIONElisabeth M. Støle*
BUSINESS DEVELOPMENTTor Hatlo-Johansen*
BOARD OF DIRECTORS
Odd Gleditsch d.y., Chairman
Einar Abrahamsen
Richard Arnesen
Terje V. Arnesen
Nicolai A. Eger
Thore Kristiansen
Torkild Nordberg
Dag J. Opedal
JOTUN DEKORATIVBjørn Naglestad
JOTUN PAINTSErik R. Aaberg
JOTUN COATINGSEsben Hersve
JOTUN POWDER COATINGSKnut Øivind Malmin
CORPORATE ASSEMBLY
Olav Christensen, Chairman
Birger Amundsen
Fredrikke Eger
Bjørn Ole Gleditsch
Thomas Gleditsch
Odd Inge Høyland
John Jørgensen
Rune Molteberg
Hilde Myrberg
Britt Paulsen
Kristin Olstad Schea
Erling Fredrik Sørhaug
www.jotun.com
DEFINITIONS OF KEY FIGURES
3) Operating margin % =Operating profit
Sales and other operating income x 100
Profit on ordinary activitiesAverage equity
4) x 100Return on equity % =
x 100Return of assets % =1)Profit on ordinary activities before taxation + financial costs
Average total assets
Profit on ordinary activities before taxation + financial costsAverage total assets - non-interest-bearing liabilities
x 1002) Return on capital employed % =
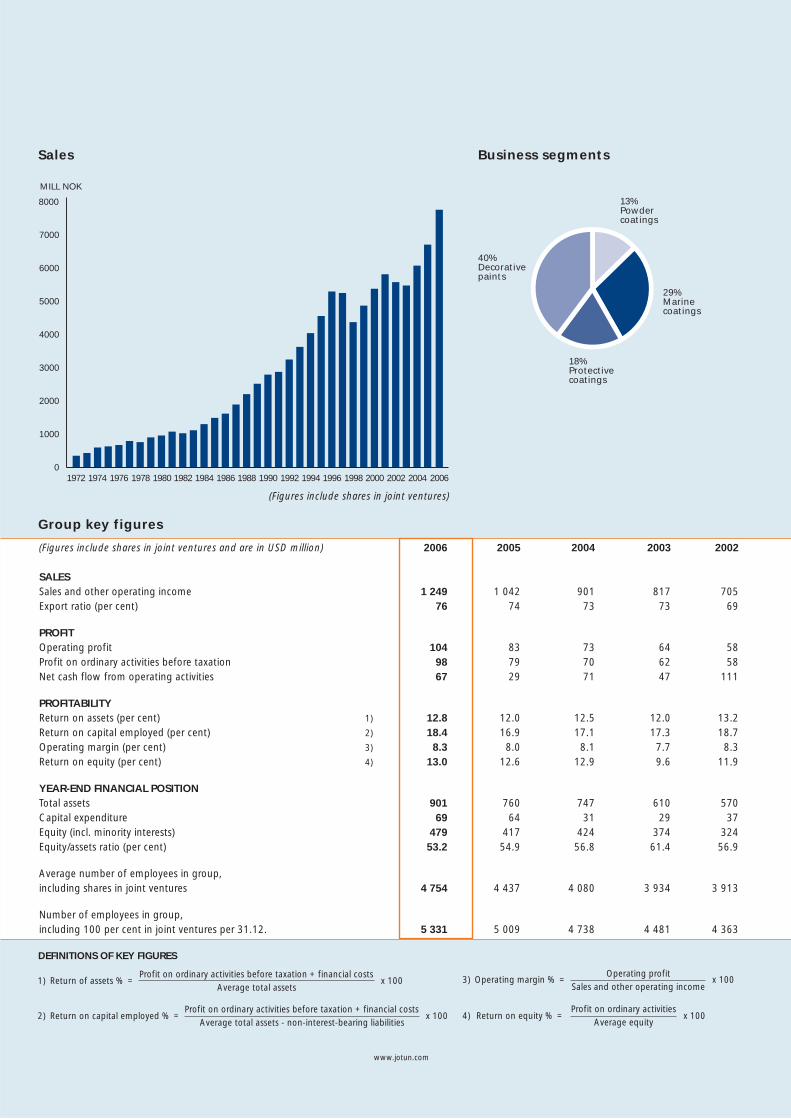
Group key figures
(Figures include shares in joint ventures and are in USD million) 2006 2005 2004 2003 2002
SALES Sales and other operating income 1 249 1 042 901 817 705Export ratio (per cent) 76 74 73 73 69
PROFIT Operating profit 104 83 73 64 58Profit on ordinary activities before taxation 98 79 70 62 58Net cash flow from operating activities 67 29 71 47 111 PROFITABILITY Return on assets (per cent) 1) 12.8 12.0 12.5 12.0 13.2Return on capital employed (per cent) 2) 18.4 16.9 17.1 17.3 18.7Operating margin (per cent) 3) 8.3 8.0 8.1 7.7 8.3Return on equity (per cent) 4) 13.0 12.6 12.9 9.6 11.9 YEAR-END FINANCIAL POSITION Total assets 901 760 747 610 570Capital expenditure 69 64 31 29 37Equity (incl. minority interests) 479 417 424 374 324Equity/assets ratio (per cent) 53.2 54.9 56.8 61.4 56.9 Average number of employees in group, including shares in joint ventures 4 754 4 437 4 080 3 934 3 913 Number of employees in group, including 100 per cent in joint ventures per 31.12. 5 331 5 009 4 738 4 481 4 363
0
1000
2000
3000
4000
5000
6000
7000
8000
MILL NOK
1972 1974 1976 1978 1980 1982 1984 1986 1988 1990 1992 1994 1996 1998 2000 2002 2004 2006
Sales
(Figures include shares in joint ventures)
Business segments
29% Marine coatings
18% Protective coatings
40% Decorative paints
13% Powder coatings
www.jotun.com
www.jotun.com 1
For more than 80 years, Jotun has built
a strong reputation for innovative products
and superior customer service. Yet what makes
Jotun unique has been its ability to embrace
diversity and adapt quickly to new markets,
new technologies and new ways of thinking.
As a group with 67 companies, 40 production facilities, and agents, branch offices and distributors in more than 70 different countries, Jotun is truly a multinational giant in the global coatings market. However, Jotun’s success has less to do with its size or global reach than the group’s ability to adapt to change.
Jotun’s remarkable ability to adapt is built on three unique qualities. Firstly, the group’s owners have always supported bold growth initia-tives and allowed regional managers the freedom to manage the busi-ness without excessive interference. Secondly, the group recognises that to be successful in any region, the group must not only establish a local presence; it must also respect the local culture and work to integrate Jotun into the local environment. Thirdly, Jotun recognises that the cultural, ethnic and national diversity of its employees has been an essential factor in building a truly global network.
Jotun demonstrates the same willingness to embrace change in every part of its business. This year, Jotun has moved quickly to adapt to regional and global trends and continues to invest in emerging markets and increase capacity where necessary in markets where the group is established. At the same time, the group’s Research & Development department continues to develop new and exciting products to meet the ever-changing demands of customers.
We recognise that Jotun faces many challenges in the future. However, for a group characterised by such diversity, we are joined by a common Jotun culture which unites us all. For this reason, we remain confident that Jotun will continue to find success by working together to adapt to new circumstances, wherever they may occur.
Adaptability
Jotun worldwide 3
The management team 4
Employees 12
Single Source Solution and global Key Account Management 14
Global competence 16
Supply chain management 18
A history of adaptability 20
Decorative paints 22
Protective coatings 24
Marine coatings 26
Powder coatings 28
Chairman of the Board 30
Directors’ report 32
Profi t and loss account 37
Balance sheet 38
Cash fl ow statement 40
Accounting policies 41
Notes 43
Auditor’s report 60
Jotun companies 61
contents
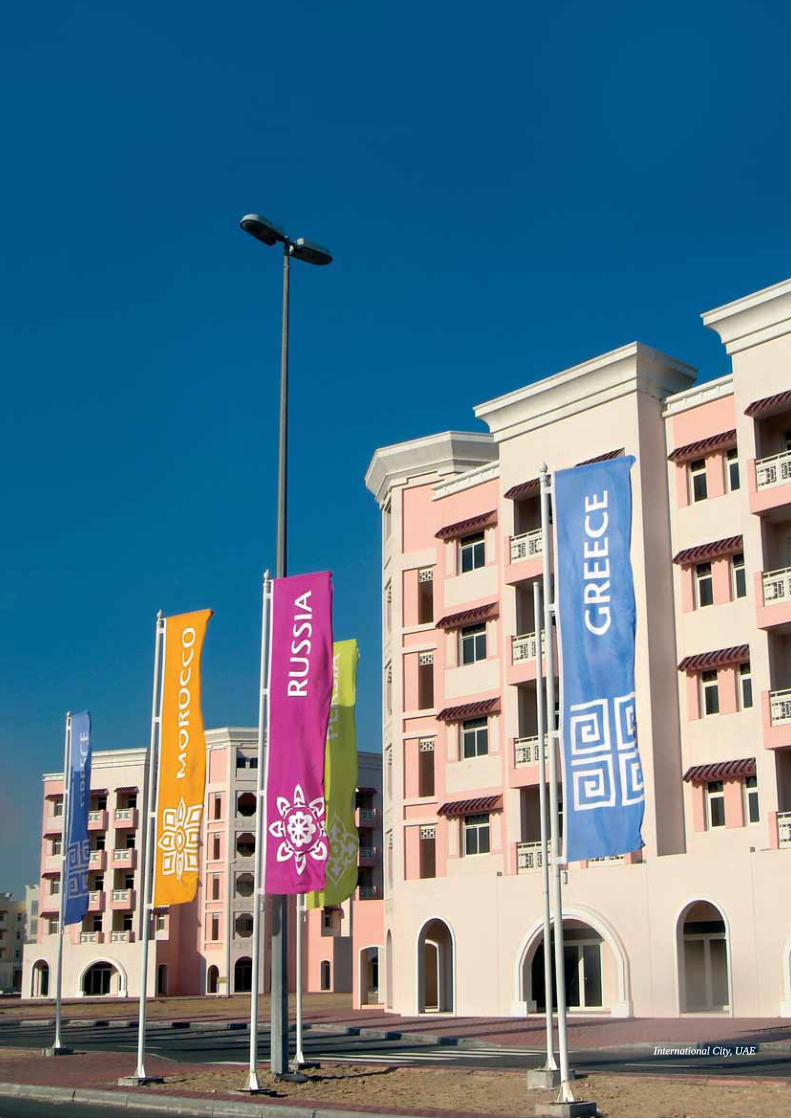
2 www.jotun.comInternational City, UAEInternational City, UAE
www.jotun.com 3
worldwide
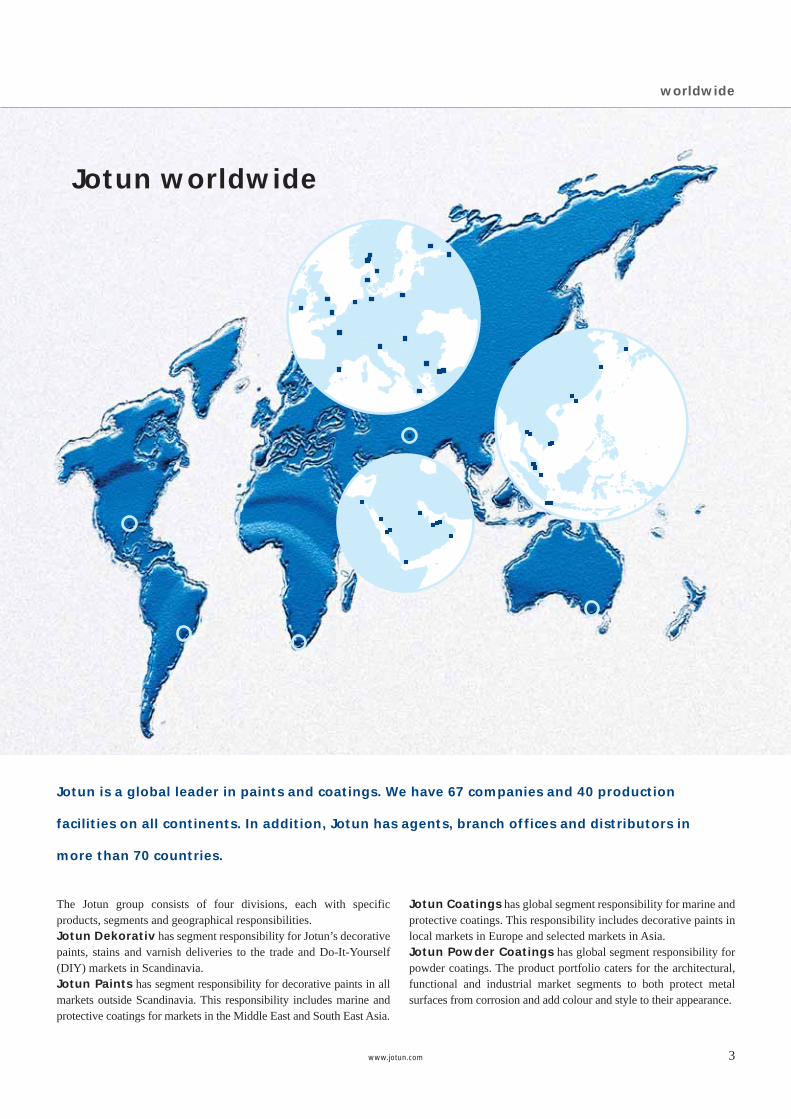
The Jotun group consists of four divisions, each with specific products, segments and geographical responsibilities. Jotun Dekorativ has segment responsibility for Jotun’s decorative paints, stains and varnish deliveries to the trade and Do-It-Yourself (DIY) markets in Scandinavia.Jotun Paints has segment responsibility for decorative paints in all markets outside Scandinavia. This responsibility includes marine and protective coatings for markets in the Middle East and South East Asia.
Jotun is a global leader in paints and coatings. We have 67 companies and 40 production
facilities on all continents. In addition, Jotun has agents, branch offices and distributors in
more than 70 countries.
Jotun worldwide
Jotun Coatings has global segment responsibility for marine and protective coatings. This responsibility includes decorative paints in local markets in Europe and selected markets in Asia.Jotun Powder Coatings has global segment responsibility for powder coatings. The product portfolio caters for the architectural, functional and industrial market segments to both protect metal surfaces from corrosion and add colour and style to their appearance.
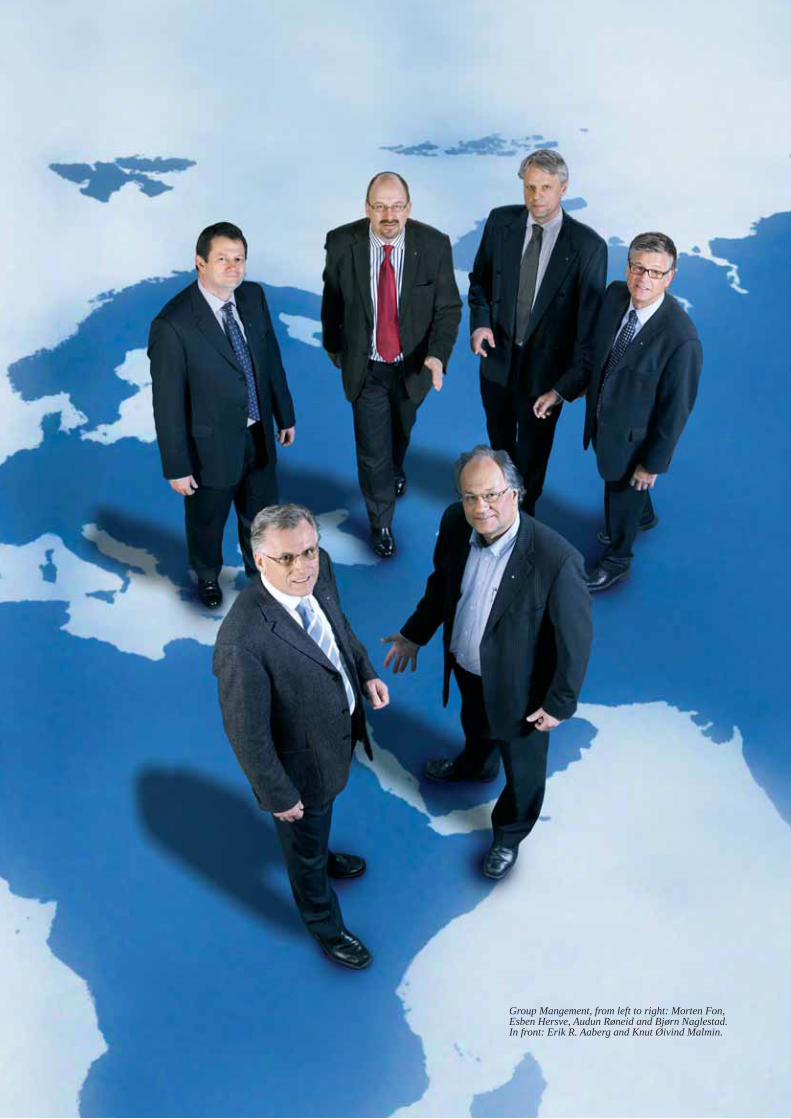
Group Mangement, from left to right: Morten Fon, Esben Hersve, Audun Røneid and Bjørn Naglestad. In front: Erik R. Aaberg and Knut Øivind Malmin.
www.jotun.com 5
the management team
Securing our future through organic growth
With so much good news to report from 2006, it is tempting to look back and celebrate
our achievements. However, in an industry characterised by rapid change, we cannot afford
to rest on our successes.
The Jotun Group can look back on 2006 secure in the knowledge that the group continues to move in the right direction. Positive develop-ments in all business areas have helped the group not only to post strong financial results, but also to strengthen its market position. In addition, we continue to make significant capital investment in new products, new facilities and in the development of both existing and potential markets throughout the world.
Jotun must continue to build on our strengths. As a global player, we face many challenges – from the relative scarcity of raw materials and a competitive recruitment market, to increasingly strict environmental regulations and relatively unpredictable currency fluctuations. In addition, the global trend toward consolidation is likely to create increased compe-tition and change how Jotun interacts with customers. While we recognise the significance of this trend, Jotun will continue to pursue a strategy of organic growth.
Jotun’s ability to adapt to changing market forces, new business seg-ments and new regions has been a core feature of the group’s growth for most of its history. As a leading provider of marine coatings to the Norwegian shipping industry, Jotun has always had an international
perspective, and ever since the opening of the first production facility in Libya in 1962, Jotun has continued to seek opportunities in international markets.
As a result, Jotun has developed a strong global network, extensive local knowledge and an entrepreneurial spirit to successfully pursue an organic growth strategy. We under-stand that developing our business in both mature and emerging markets takes courage,
patience, a long-term perspective and the ability to adapt – qualities which are expressed in Jotun’s values – Loyalty, Respect, Care and Boldness – and strengthened by the cultural diversity of our employees. These values create opportunities for the group, especially in international markets.
“Jotun has developed into
a bigger, stronger and more
unified entity, creating value
for shareholders, employees,
customers and stakeholders.”
Morten Fon, President & CEO, Jotun Group
President & CEO Morten Fon
www.jotun.com 7
the management team
However, to capture these opportunities, we must exploit the cultural diversity and expertise throughout our organisation. This year, we have launched a number of exciting new initiatives to capitalise on our global strength. These include the Jotun Academy, which will provide more structured skills-training and management development programmes, the Business Development Department, tasked with sourcing expertise throughout the organisation to support new busi-ness initiatives, and a more ambitious recruitment programme to bring more talented people into our organisation. We are also sourc-ing our global expertise into Key Account Management teams to help manage some of our larger customers in the marine and protective segments and provide single source solutions for our customers.
We are confident that these initiatives will strengthen our organisa-tion, but they do not represent any significant change in our business model. Our traditions, values and the quality of our people have allowed Jotun the luxury of being able to remain true to the vision of our founders, and allow us to do what we do best – adapt to change.
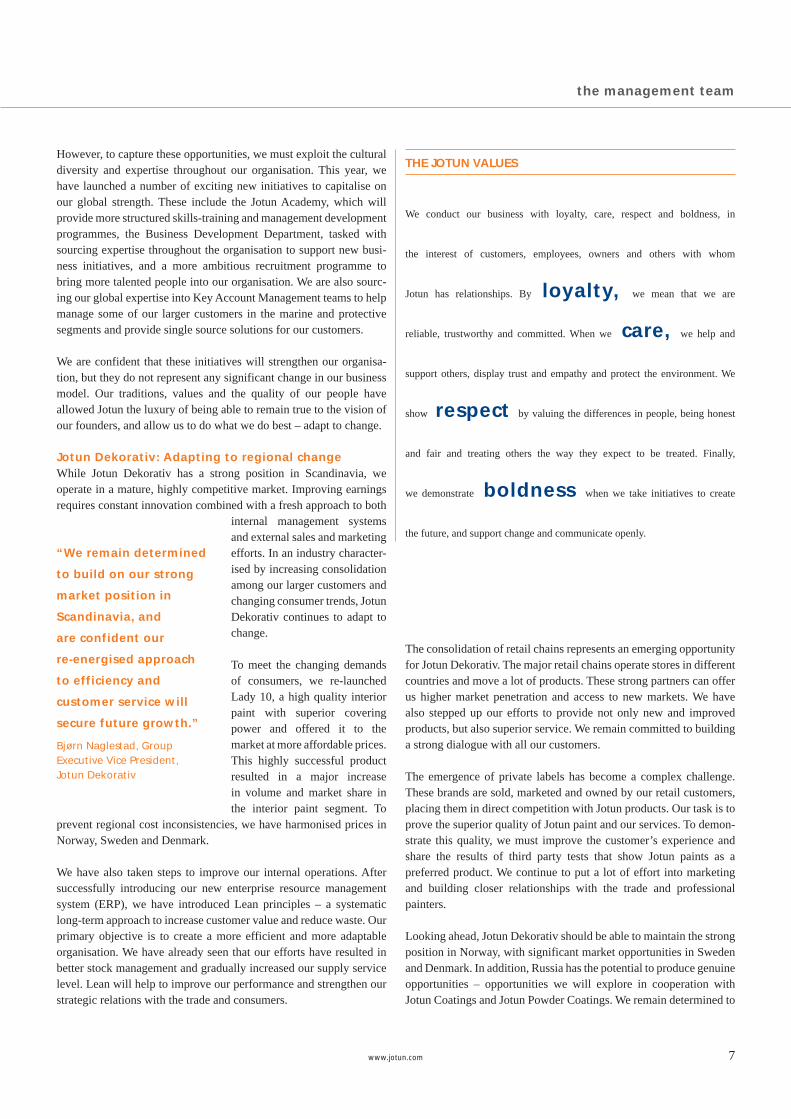
Jotun Dekorativ: Adapting to regional change While Jotun Dekorativ has a strong position in Scandinavia, we operate in a mature, highly competitive market. Improving earnings requires constant innovation combined with a fresh approach to both
internal management systems and external sales and marketing efforts. In an industry character-ised by increasing consolidation among our larger customers and changing consumer trends, Jotun Dekorativ continues to adapt to change.
To meet the changing demands of consumers, we re-launched Lady 10, a high quality interior paint with superior covering power and offered it to the market at more affordable prices. This highly successful product resulted in a major increase in volume and market share in the interior paint segment. To
prevent regional cost inconsistencies, we have harmonised prices in Norway, Sweden and Denmark.
We have also taken steps to improve our internal operations. After successfully introducing our new enterprise resource management system (ERP), we have introduced Lean principles – a systematic long-term approach to increase customer value and reduce waste. Our primary objective is to create a more efficient and more adaptable organisation. We have already seen that our efforts have resulted in better stock management and gradually increased our supply service level. Lean will help to improve our performance and strengthen our strategic relations with the trade and consumers.
THE JOTUN VALUES
We conduct our business with loyalty, care, respect and boldness, in
the interest of customers, employees, owners and others with whom
Jotun has relationships. By loyalty, we mean that we are
reliable, trustworthy and committed. When we care, we help and
support others, display trust and empathy and protect the environment. We
show respect by valuing the differences in people, being honest
and fair and treating others the way they expect to be treated. Finally,
we demonstrate boldness when we take initiatives to create
the future, and support change and communicate openly.
“We remain determined
to build on our strong
market position in
Scandinavia, and
are confident our
re-energised approach
to efficiency and
customer service will
secure future growth.”
Bjørn Naglestad, Group Executive Vice President, Jotun Dekorativ
The consolidation of retail chains represents an emerging opportunity for Jotun Dekorativ. The major retail chains operate stores in different countries and move a lot of products. These strong partners can offer us higher market penetration and access to new markets. We have also stepped up our efforts to provide not only new and improved products, but also superior service. We remain committed to building a strong dialogue with all our customers.
The emergence of private labels has become a complex challenge. These brands are sold, marketed and owned by our retail customers, placing them in direct competition with Jotun products. Our task is to prove the superior quality of Jotun paint and our services. To demon-strate this quality, we must improve the customer’s experience and share the results of third party tests that show Jotun paints as a preferred product. We continue to put a lot of effort into marketing and building closer relationships with the trade and professional painters.
Looking ahead, Jotun Dekorativ should be able to maintain the strong position in Norway, with significant market opportunities in Sweden and Denmark. In addition, Russia has the potential to produce genuine opportunities – opportunities we will explore in cooperation with Jotun Coatings and Jotun Powder Coatings. We remain determined to
8 www.jotun.com
the management team
build on our strong market position in Scandinavia, and are confident our re-energised approach to efficient customer service will secure future growth.
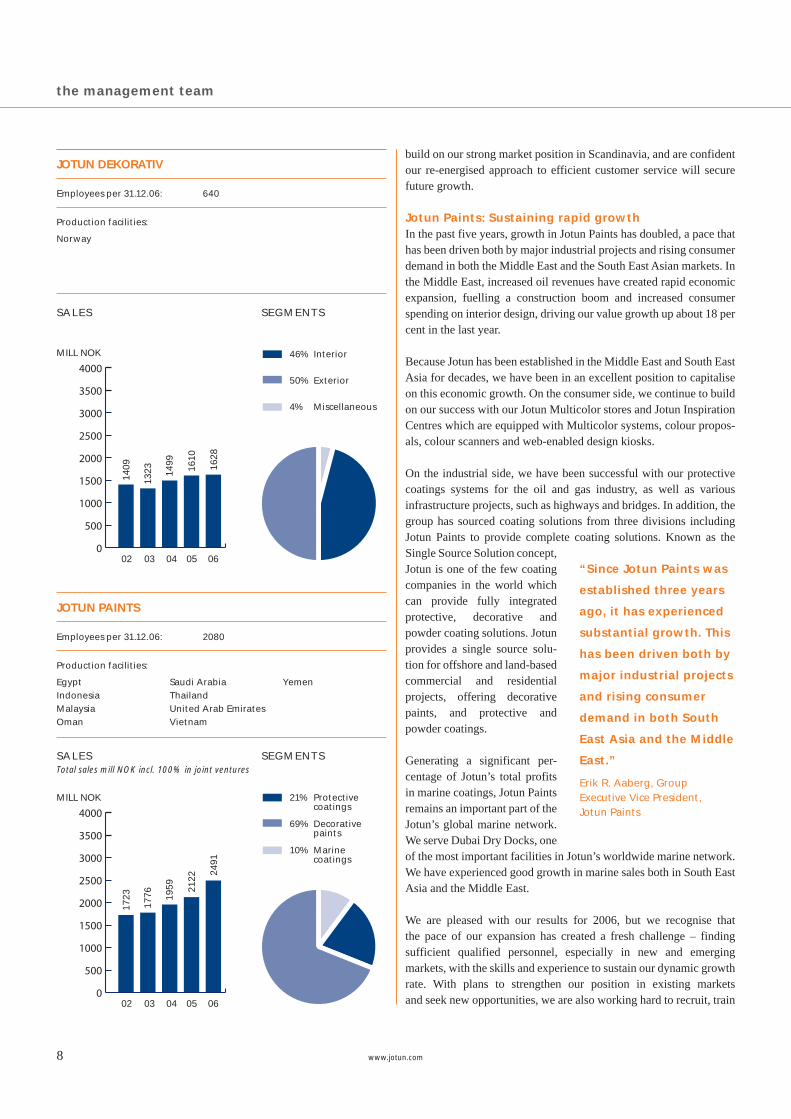
Jotun Paints: Sustaining rapid growthIn the past five years, growth in Jotun Paints has doubled, a pace that has been driven both by major industrial projects and rising consumer demand in both the Middle East and the South East Asian markets. In the Middle East, increased oil revenues have created rapid economic expansion, fuelling a construction boom and increased consumer spending on interior design, driving our value growth up about 18 per cent in the last year.
Because Jotun has been established in the Middle East and South East Asia for decades, we have been in an excellent position to capitalise on this economic growth. On the consumer side, we continue to build on our success with our Jotun Multicolor stores and Jotun Inspiration Centres which are equipped with Multicolor systems, colour propos-als, colour scanners and web-enabled design kiosks.
On the industrial side, we have been successful with our protective coatings systems for the oil and gas industry, as well as various infrastructure projects, such as highways and bridges. In addition, the group has sourced coating solutions from three divisions including Jotun Paints to provide complete coating solutions. Known as the Single Source Solution concept, Jotun is one of the few coating companies in the world which can provide fully integrated protective, decorative and powder coating solutions. Jotun provides a single source solu-tion for offshore and land-based commercial and residential projects, offering decorative paints, and protective and powder coatings.
Generating a significant per-centage of Jotun’s total profits in marine coatings, Jotun Paints remains an important part of the Jotun’s global marine network. We serve Dubai Dry Docks, one of the most important facilities in Jotun’s worldwide marine network. We have experienced good growth in marine sales both in South East Asia and the Middle East. We are pleased with our results for 2006, but we recognise that the pace of our expansion has created a fresh challenge – finding sufficient qualified personnel, especially in new and emerging markets, with the skills and experience to sustain our dynamic growth rate. With plans to strengthen our position in existing markets and seek new opportunities, we are also working hard to recruit, train
“Since Jotun Paints was
established three years
ago, it has experienced
substantial growth. This
has been driven both by
major industrial projects
and rising consumer
demand in both South
East Asia and the Middle
East.”
Erik R. Aaberg, Group Executive Vice President, Jotun Paints
0
500
1000
1500
2000
2500
3000
3500
4000
MILL NOK
02
1409
1323 14
99
1610
1628
04 05 0603
Norway
Production facilities:
SALES SEGMENTS
46% Interior
50% Exterior
4% Miscellaneous
0
500
1000
1500
2000
2500
3000
3500
4000
MILL NOK
02
1723
1776 19
59 2122
2491
04 05 0603
EgyptIndonesiaMalaysiaOman
Saudi ArabiaThailandUnited Arab EmiratesVietnam
Yemen
Production facilities:
SALESTotal sales mill NOK incl. 100% in joint ventures
SEGMENTS
21% Protective coatings
69% Decorative paints
10% Marine coatings
JOTUN DEKORATIV
Employees per 31.12.06: 640
JOTUN PAINTS
Employees per 31.12.06: 2080
www.jotun.com 9
and retain the skilled personnel necessary to sustain our long-term success and benefit long-term from the market opportunities we see around us.
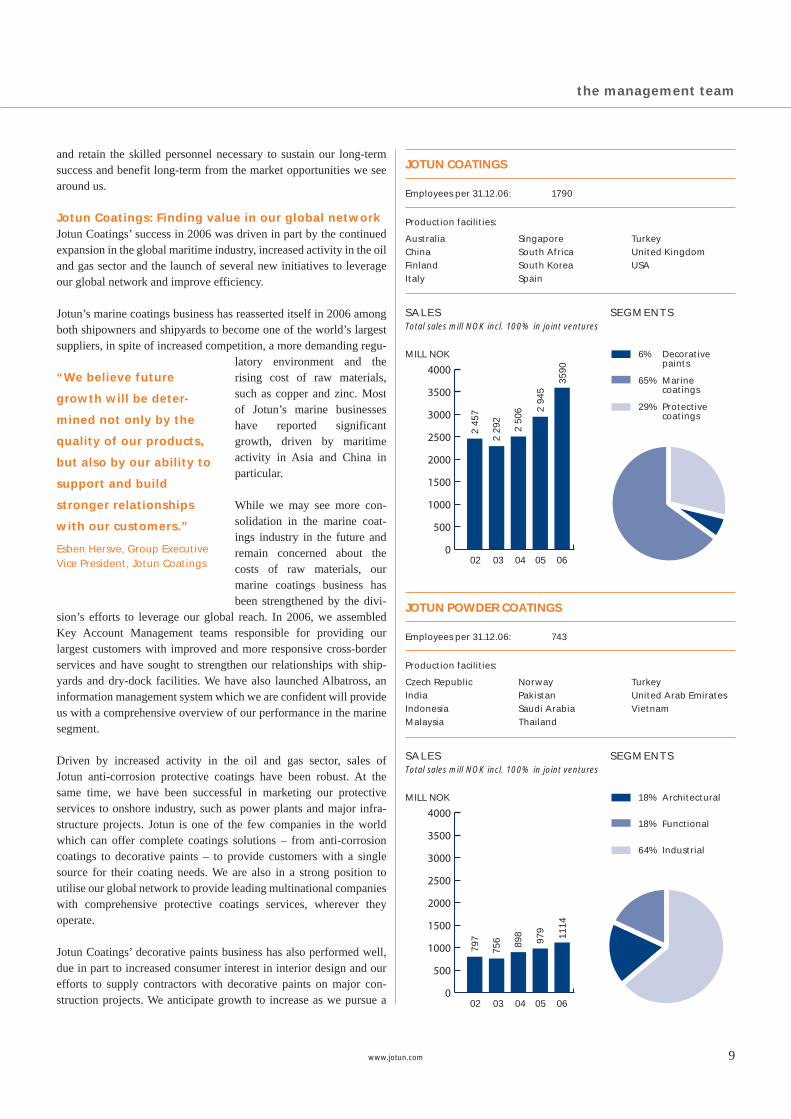
Jotun Coatings: Finding value in our global networkJotun Coatings’ success in 2006 was driven in part by the continued expansion in the global maritime industry, increased activity in the oil and gas sector and the launch of several new initiatives to leverage our global network and improve efficiency.
Jotun’s marine coatings business has reasserted itself in 2006 among both shipowners and shipyards to become one of the world’s largest suppliers, in spite of increased competition, a more demanding regu-
latory environment and the rising cost of raw materials, such as copper and zinc. Most of Jotun’s marine businesses have reported significant growth, driven by maritime activity in Asia and China in particular.
While we may see more con-solidation in the marine coat-ings industry in the future and remain concerned about the costs of raw materials, our marine coatings business has been strengthened by the divi-
sion’s efforts to leverage our global reach. In 2006, we assembled Key Account Management teams responsible for providing our largest customers with improved and more responsive cross-border services and have sought to strengthen our relationships with ship-yards and dry-dock facilities. We have also launched Albatross, an information management system which we are confident will provide us with a comprehensive overview of our performance in the marine segment.
Driven by increased activity in the oil and gas sector, sales of Jotun anti-corrosion protective coatings have been robust. At the same time, we have been successful in marketing our protective services to onshore industry, such as power plants and major infra-structure projects. Jotun is one of the few companies in the world which can offer complete coatings solutions – from anti-corrosion coatings to decorative paints – to provide customers with a single source for their coating needs. We are also in a strong position to utilise our global network to provide leading multinational companies with comprehensive protective coatings services, wherever they operate.
Jotun Coatings’ decorative paints business has also performed well, due in part to increased consumer interest in interior design and our efforts to supply contractors with decorative paints on major con-struction projects. We anticipate growth to increase as we pursue a
the management team
“We believe future
growth will be deter-
mined not only by the
quality of our products,
but also by our ability to
support and build
stronger relationships
with our customers.”
Esben Hersve, Group Executive Vice President, Jotun Coatings
0
500
1000
1500
2000
2500
3000
3500
4000
MILL NOK
02
2 45
7
2 29
2
2 50
6 2 94
5
3590
04 05 0603
AustraliaChinaFinlandItaly
SingaporeSouth AfricaSouth KoreaSpain
TurkeyUnited KingdomUSA
Production facilities:
SALESTotal sales mill NOK incl. 100% in joint ventures
SEGMENTS
6% Decorative paints
65% Marine coatings
29% Protective coatings
0
500
1000
1500
2000
2500
3000
3500
4000
MILL NOK
02
797
756 89
8
979
1114
04 05 0603
Czech RepublicIndiaIndonesiaMalaysia
NorwayPakistanSaudi ArabiaThailand
TurkeyUnited Arab EmiratesVietnam
Production facilities:
SALESTotal sales mill NOK incl. 100% in joint ventures
SEGMENTS
18% Architectural
18% Functional
64% Industrial
JOTUN COATINGS
Employees per 31.12.06: 1790
JOTUN POWDER COATINGS
Employees per 31.12.06: 743
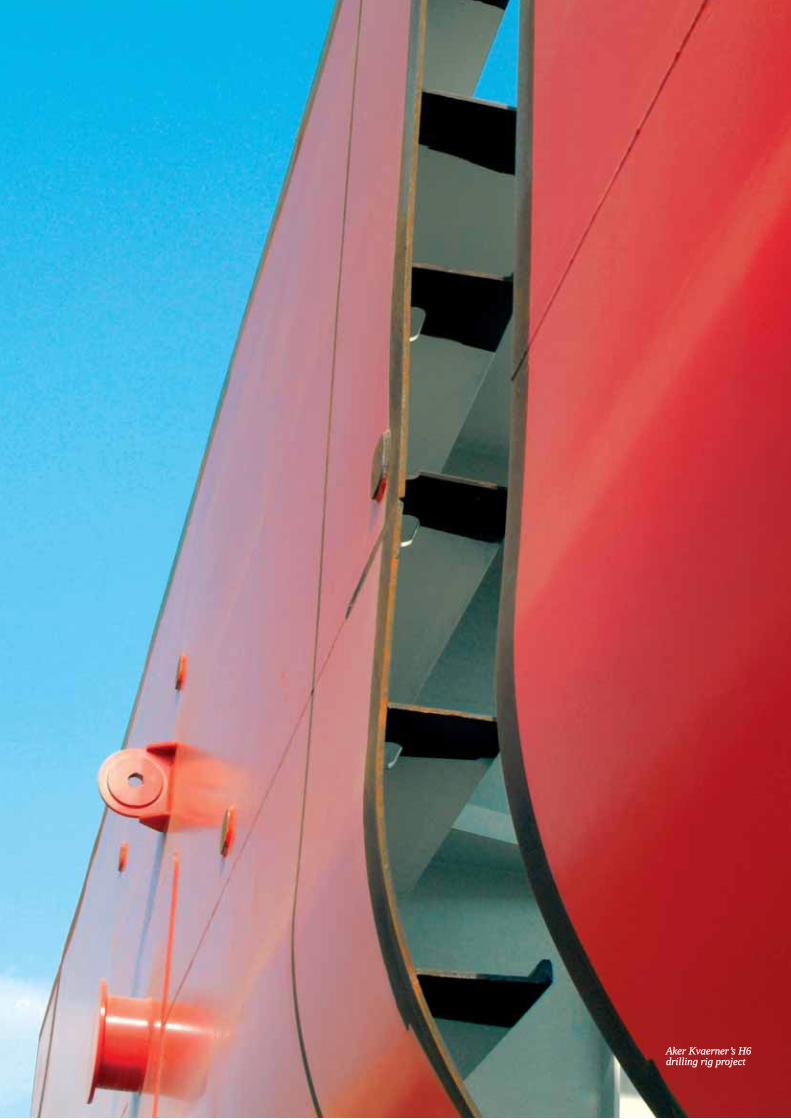
Aker Kvaerner’s H6 Aker Kvaerner’s H6 drilling rig projectdrilling rig project
www.jotun.com 11
Jotun Group• Continued overall growth for the Jotun Group – sales and EBIT
all-time high
• Successful turnaround of the Jotun Powder Coatings division
• Strengthened focus on Jotun’s values and business principles
• New factories in China and Yemen
• Established Business Development Department to enhance organic
growth
Jotun Coatings • High level of activity in all segments and strong growth in most
companies
• Several successful product launches supporting the divisions’
underlying growth
• Global Key Account Management programme for our largest
customers
Jotun Paints• Strong growth in all markets and regions, securing a profi table
business
• Advanced project groups securing mega-projects in the Middle East
• Record number of Multicolor centres
Jotun Dekorativ • All-time high sales for the division, securing a continued strong
market position in Scandinavia
• Successful re-launch of Lady 10 – a high quality interior paint
• Implementation of Lean Management philosophy; increasing
effi ciency and improving quality
Jotun Powder Coatings• Relying on stronger local focus, with more segment-based
divisional support
• Continued growth in volume and operating sales
• Launch of Corro-Coat Durasol – a new level of quality for
the architectural range
the management team
strategic focus on the distribution of Multicolor centres and increased activity in countries such as China and India.
Jotun Powder Coatings: A vital part of JotunIn 2006 Jotun Powder Coatings strengthened its position as the number four global powder coatings supplier. Our 14 companies, working in close cooperation with agents and distributors around the world, generated sales growth of more than 11 per cent this year, sup-ported by especially strong results in Turkey, the United Arab Emirates, Saudi Arabia and the Czech Republic. While part of our success is due to a general increase in the global demand for powder coatings, our growth rate far exceeds the industry average of about five to six per cent.
Perhaps more importantly, 2006 saw Jotun Powder Coatings become a more pivotal part of the Penguin family. Today, Jotun Powder
Coatings is a vital part of Jotun’s Single Source Solution concept, coordinating with Jotun Coatings and Jotun Paints to provide large customers with a full range of coating solutions for offshore and land-based industrial and architectural projects.
We believe that providing powder coatings solutions to architects and contractors on major commercial or residential
development projects represents a significant business opportunity. To ensure Jotun Powder Coatings are specified by these large custom-ers, we continue to invest heavily in research and development to bring new products to both functional and architectural markets. Our market share for industrial powder coatings, which makes up a sig-nificant part of our business, will also have high priority in the inno-vation process, and we have also approved and implemented an initiative to upgrade and replace old production equipment. We also took steps to give our local companies far more freedom to generate new business opportunities in the markets they know best. This has enabled our country managers to be more responsive to market changes and improve local customer service, which has helped to stimulate growth and improve our earnings. We have also priori-tised both internal and external training programmes to further develop our technical and commercial competence.
While Jotun Powder Coatings’ market share has been increasingly threatened by local competitors in some markets and we have seen margins impacted by the rising costs of raw materials, we are confi-dent that the changes we have put in place in 2006 will continue to release our untapped potential. In addition, our expanded and more visible role within the Jotun Group has re-energised our division and allowed us the freedom, support and flexibility to grow.
“Our expanded role
within the Jotun Group
has re-energised our
division and allowed us
the freedom, support
and flexibility to grow.”
Knut Øivind Malmin, Group Executive Vice President, Jotun Powder Coatings
HIGHLIGHTS 2006
12 www.jotun.com
employees
”What makes Jotun special is its ability
to adapt to new environments.”
Ashraf Maged, Business Development Manager
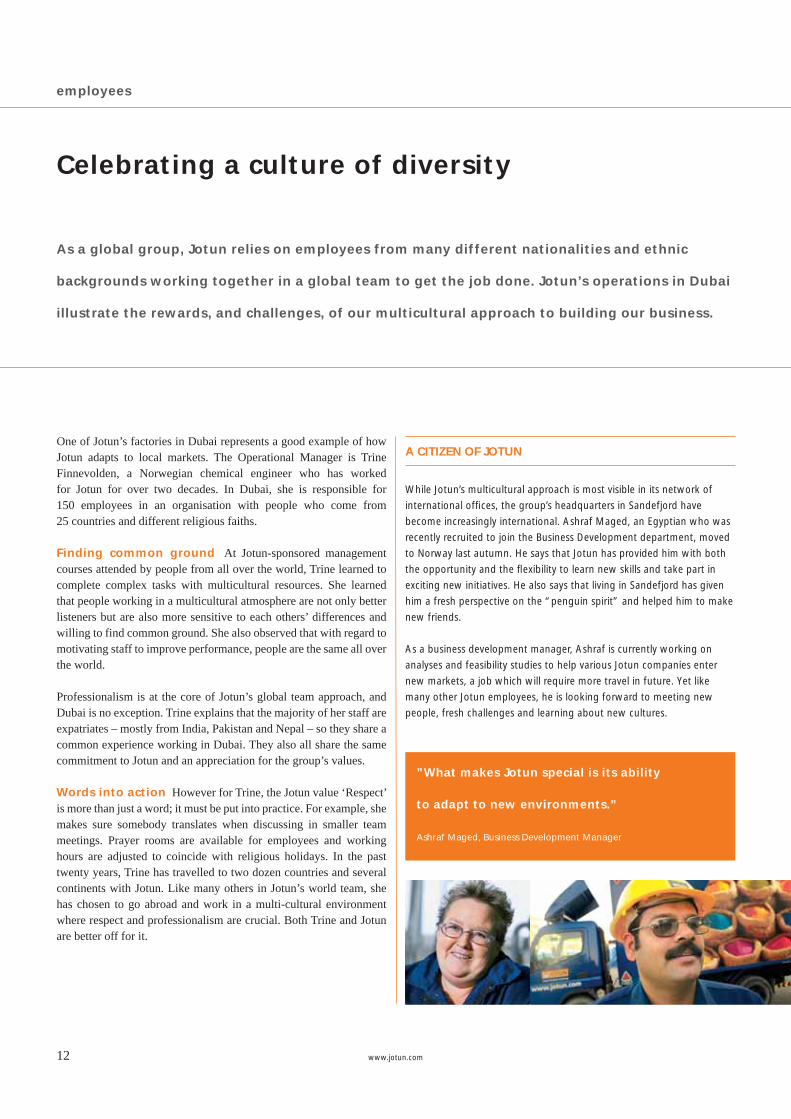
Celebrating a culture of diversity
As a global group, Jotun relies on employees from many different nationalities and ethnic
backgrounds working together in a global team to get the job done. Jotun’s operations in Dubai
illustrate the rewards, and challenges, of our multicultural approach to building our business.
One of Jotun’s factories in Dubai represents a good example of how Jotun adapts to local markets. The Operational Manager is Trine Finnevolden, a Norwegian chemical engineer who has worked for Jotun for over two decades. In Dubai, she is responsible for 150 employees in an organisation with people who come from 25 countries and different religious faiths.
Finding common ground At Jotun-sponsored management courses attended by people from all over the world, Trine learned to complete complex tasks with multicultural resources. She learned that people working in a multicultural atmosphere are not only better listeners but are also more sensitive to each others’ differences and willing to find common ground. She also observed that with regard to motivating staff to improve performance, people are the same all over the world.
Professionalism is at the core of Jotun’s global team approach, and Dubai is no exception. Trine explains that the majority of her staff are expatriates – mostly from India, Pakistan and Nepal – so they share a common experience working in Dubai. They also all share the same commitment to Jotun and an appreciation for the group’s values.
Words into action However for Trine, the Jotun value ‘Respect’ is more than just a word; it must be put into practice. For example, she makes sure somebody translates when discussing in smaller team meetings. Prayer rooms are available for employees and working hours are adjusted to coincide with religious holidays. In the past twenty years, Trine has travelled to two dozen countries and several continents with Jotun. Like many others in Jotun’s world team, she has chosen to go abroad and work in a multi-cultural environment where respect and professionalism are crucial. Both Trine and Jotun are better off for it.
While Jotun’s multicultural approach is most visible in its network of
international offi ces, the group’s headquarters in Sandefjord have
become increasingly international. Ashraf Maged, an Egyptian who was
recently recruited to join the Business Development department, moved
to Norway last autumn. He says that Jotun has provided him with both
the opportunity and the fl exibility to learn new skills and take part in
exciting new initiatives. He also says that living in Sandefjord has given
him a fresh perspective on the “penguin spirit” and helped him to make
new friends.
As a business development manager, Ashraf is currently working on
analyses and feasibility studies to help various Jotun companies enter
new markets, a job which will require more travel in future. Yet like
many other Jotun employees, he is looking forward to meeting new
people, fresh challenges and learning about new cultures.
A CITIZEN OF JOTUN

With more than 5300 employees worldwide, Jotun is one global company made up of many different cultures.
14
single source solution and global key account management
An integrated, global approach to customer service
To improve customer service for Jotun’s larger customers in the marine and protective
segments, Jotun has leveraged its global reach and ability to deliver a broad range of
coatings solutions.
Although Jotun’s long history of serving the maritime industry has played a significant role in the group’s international expansion, Jotun’s relationship with many large shipowners has until recently been locally or regionally focused. However, in an increasingly global industry dominated by fewer but larger players, serving major ship-owners requires a more global perspective.
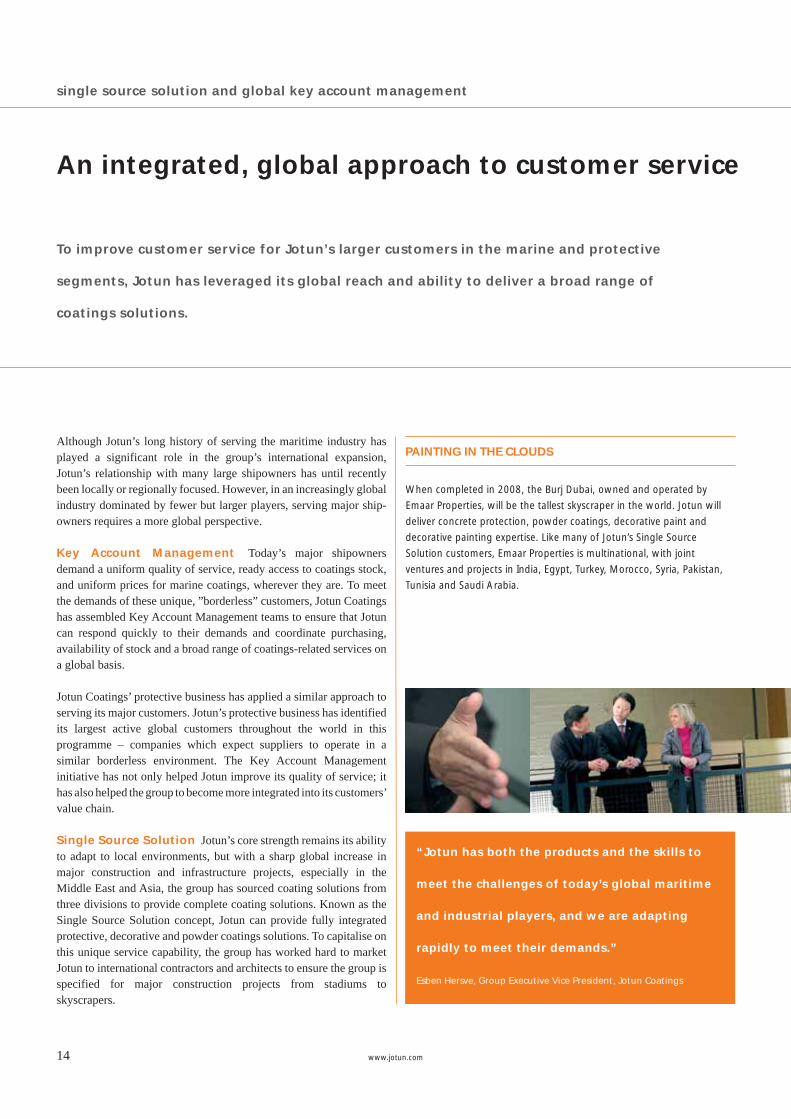
Key Account Management Today’s major shipowners demand a uniform quality of service, ready access to coatings stock, and uniform prices for marine coatings, wherever they are. To meet the demands of these unique, ”borderless” customers, Jotun Coatings has assembled Key Account Management teams to ensure that Jotun can respond quickly to their demands and coordinate purchasing, availability of stock and a broad range of coatings-related services on a global basis.
Jotun Coatings’ protective business has applied a similar approach to serving its major customers. Jotun’s protective business has identified its largest active global customers throughout the world in this programme – companies which expect suppliers to operate in a similar borderless environment. The Key Account Management initiative has not only helped Jotun improve its quality of service; it has also helped the group to become more integrated into its customers’ value chain.
Single Source Solution Jotun’s core strength remains its ability to adapt to local environments, but with a sharp global increase in major construction and infrastructure projects, especially in the Middle East and Asia, the group has sourced coating solutions from three divisions to provide complete coating solutions. Known as the Single Source Solution concept, Jotun can provide fully integrated protective, decorative and powder coatings solutions. To capitalise on this unique service capability, the group has worked hard to market Jotun to international contractors and architects to ensure the group is specified for major construction projects from stadiums to skyscrapers.
When completed in 2008, the Burj Dubai, owned and operated by
Emaar Properties, will be the tallest skyscraper in the world. Jotun will
deliver concrete protection, powder coatings, decorative paint and
decorative painting expertise. Like many of Jotun’s Single Source
Solution customers, Emaar Properties is multinational, with joint
ventures and projects in India, Egypt, Turkey, Morocco, Syria, Pakistan,
Tunisia and Saudi Arabia.
“Jotun has both the products and the skills to
meet the challenges of today’s global maritime
and industrial players, and we are adapting
rapidly to meet their demands.”
Esben Hersve, Group Executive Vice President, Jotun Coatings
PAINTING IN THE CLOUDS
www.jotun.com
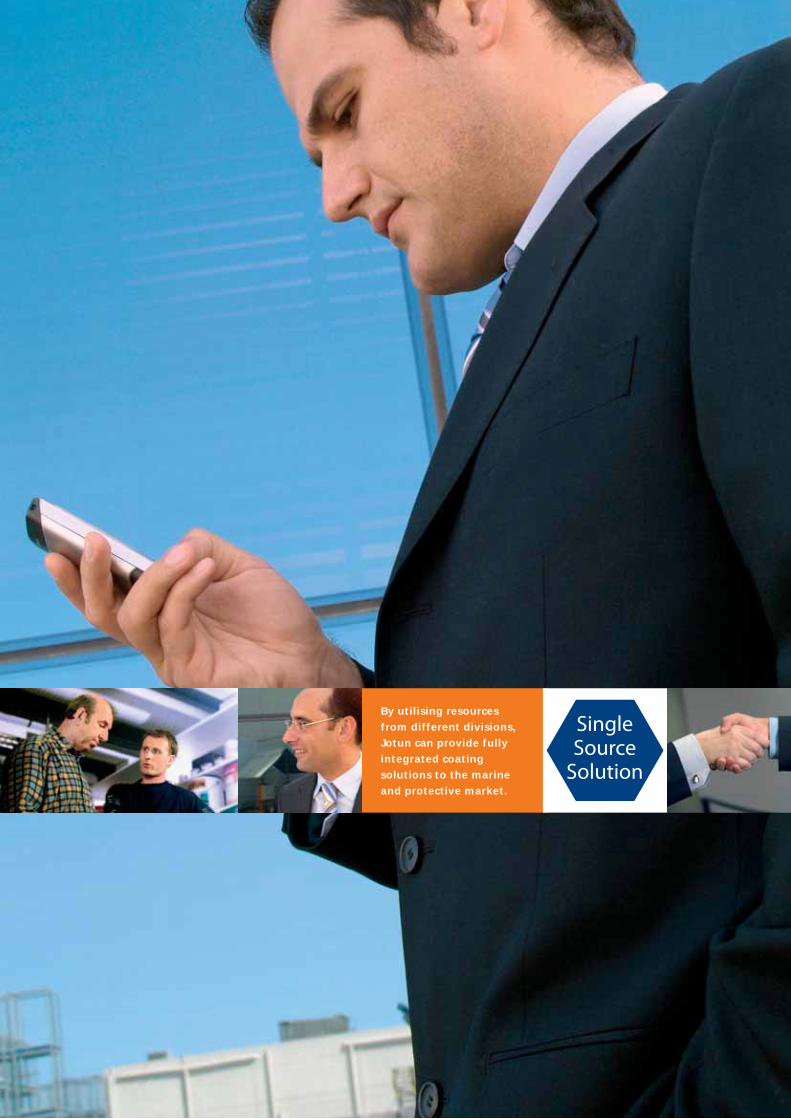
By utilising resources from different divisions, Jotun can provide fully integrated coating solutions to the marine and protective market.
16 www.jotun.com
global competence
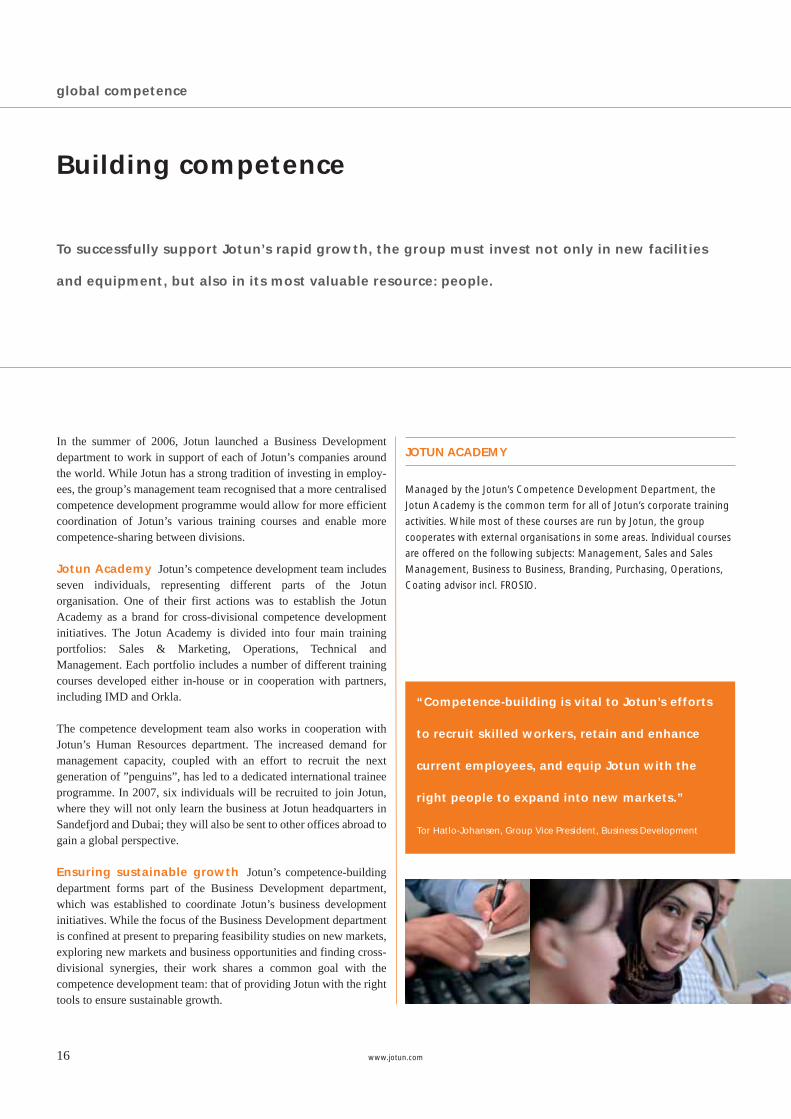
“Competence-building is vital to Jotun’s efforts
to recruit skilled workers, retain and enhance
current employees, and equip Jotun with the
right people to expand into new markets.”
Tor Hatlo-Johansen, Group Vice President, Business Development
Building competence
To successfully support Jotun’s rapid growth, the group must invest not only in new facilities
and equipment, but also in its most valuable resource: people.
In the summer of 2006, Jotun launched a Business Development department to work in support of each of Jotun’s companies around the world. While Jotun has a strong tradition of investing in employ-ees, the group’s management team recognised that a more centralised competence development programme would allow for more efficient coordination of Jotun’s various training courses and enable more competence-sharing between divisions.
Jotun Academy Jotun’s competence development team includes seven individuals, representing different parts of the Jotun organisation. One of their first actions was to establish the Jotun Academy as a brand for cross-divisional competence development initiatives. The Jotun Academy is divided into four main training portfolios: Sales & Marketing, Operations, Technical and Management. Each portfolio includes a number of different training courses developed either in-house or in cooperation with partners, including IMD and Orkla.
The competence development team also works in cooperation with Jotun’s Human Resources department. The increased demand for management capacity, coupled with an effort to recruit the next generation of ”penguins”, has led to a dedicated international trainee programme. In 2007, six individuals will be recruited to join Jotun, where they will not only learn the business at Jotun headquarters in Sandefjord and Dubai; they will also be sent to other offices abroad to gain a global perspective.
Ensuring sustainable growth Jotun’s competence-building department forms part of the Business Development department, which was established to coordinate Jotun’s business development initiatives. While the focus of the Business Development department is confined at present to preparing feasibility studies on new markets, exploring new markets and business opportunities and finding cross-divisional synergies, their work shares a common goal with the competence development team: that of providing Jotun with the right tools to ensure sustainable growth.
Managed by the Jotun’s Competence Development Department, the
Jotun Academy is the common term for all of Jotun’s corporate training
activities. While most of these courses are run by Jotun, the group
cooperates with external organisations in some areas. Individual courses
are offered on the following subjects: Management, Sales and Sales
Management, Business to Business, Branding, Purchasing, Operations,
Coating advisor incl. FROSIO.
JOTUN ACADEMY

Investing in competence- building initiatives is more than an advantage – it is a necessity.
18 www.jotun.com
supply chain management
Embracing Lean Management
Jotun has been using Lean principles in factories around the world for years. It is now becoming
part of the business culture. The lean methodology will now be used more systematically
in all companies – improving our supply chain throughout the organisation.
Eight months ago, Jotun Dekorativ launched a new efficiency initia-tive to optimise its purchasing, production, logistics and distribution processes at some of its facilities in Norway. Due to the cold winters, peak demand for paint in Scandinavia occurs during the warm summer months. To manage these seasonal variations, Jotun Dekorativ has been producing paints months in advance of the warmer seasons, building up stock. Today, an initiative to utilise lean principles to optimise its purchasing logistics and distribution processes is under way at our facilities in Norway.
Go with the flow The new system is designed to facilitate a more consistent flow of products throughout Jotun’s entire value chain. Rather than pushing stock, Jotun will only produce what is necessary, when it is necessary. This approach will help the group not only to reduce costs, but also improve customer service and allow Jotun to respond more rapidly to market changes. The focus is on the performance of the entire supply chain rather than just the production and logistics functions.
The system has already proven to be highly effective. In the last eight months, Jotun Dekorativ has reduced its stock from 9.1 million litres to 5.5 million litres, allowing the group to reduce the number of external warehouses it uses from six to one. We have also managed to cut lead times in production from three weeks to four days and increase production capacity by 20–30 per cent. This production improvement has materialised without any major increase in manpower or new investments.
Continuous improvement Whilst encouraging, the division still has a long way to go to fully implement the system. Indeed, Jotun must not only encourage our suppliers of raw materials, packaging and logistics services to harmonise their operations with ours; we must also work more closely with our customers to ensure they get the best out of the new system. As Lean Management is based on the principle of continuous improvement, the work to fine-tune these new processes will remain a high priority for years to come.
Lean Management is a manufacturing methodology that was originally
developed by Toyota to streamline the manufacture of its cars. The
primary objective of the lean production model is to get the right things
to the right place at the right time, fi rst time, while minimising waste
and ensuring fl ow, all with a common focus on continuous improve-
ment. Below are ten rules summarising the principles of lean production:
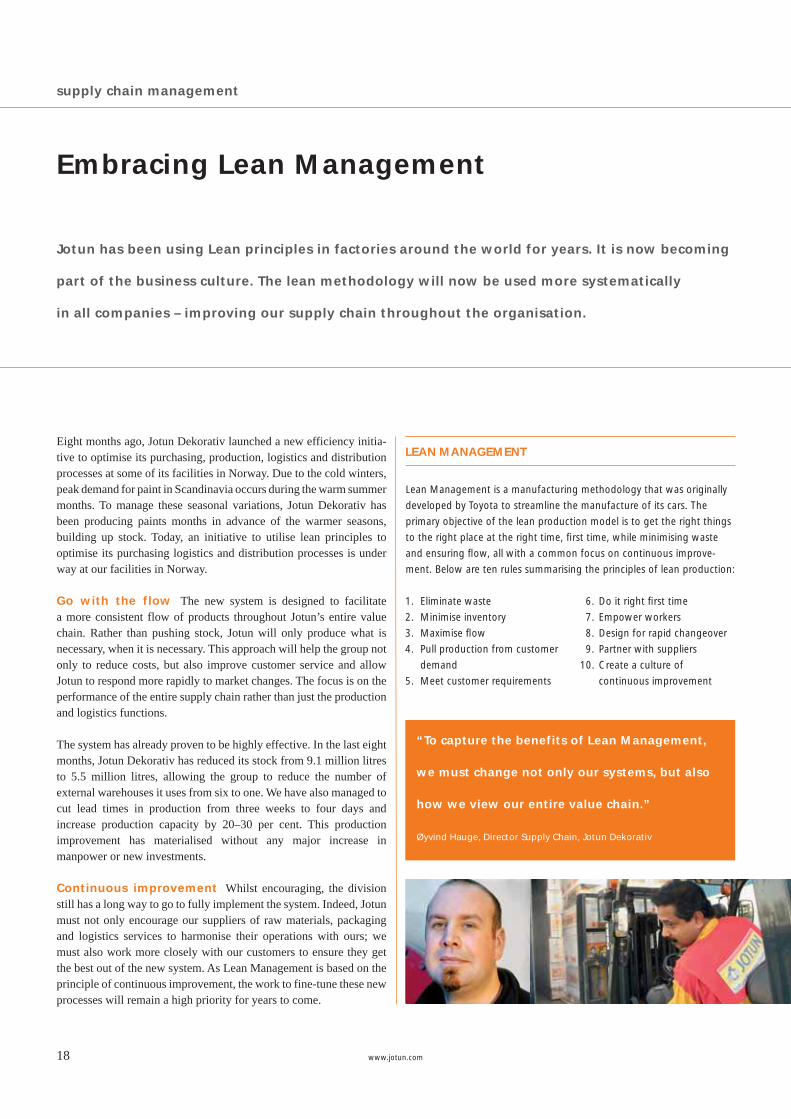
“To capture the benefits of Lean Management,
we must change not only our systems, but also
how we view our entire value chain.”
Øyvind Hauge, Director Supply Chain, Jotun Dekorativ
1. Eliminate waste
2. Minimise inventory
3. Maximise fl ow
4. Pull production from customer
demand
5. Meet customer requirements
6. Do it right fi rst time
7. Empower workers
8. Design for rapid changeover
9. Partner with suppliers
10. Create a culture of
continuous improvement
LEAN MANAGEMENT
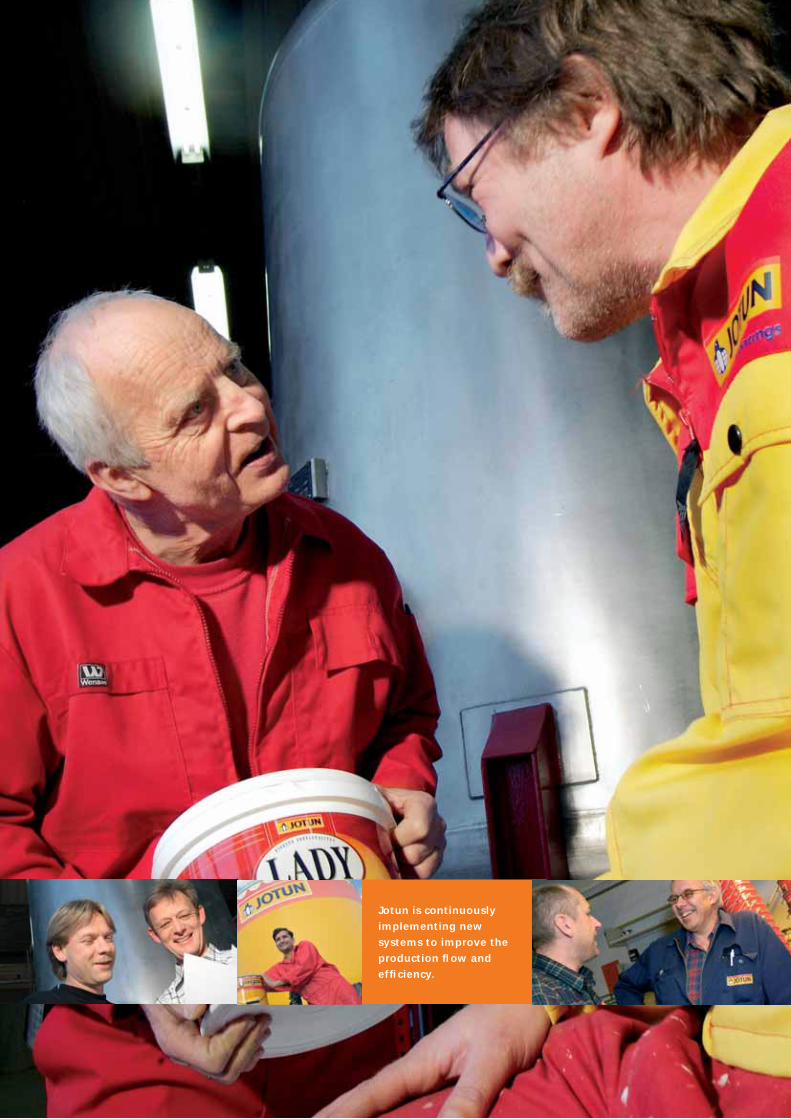
Jotun is continuously implementing new systems to improve the production fl ow and effi ciency.
20 www.jotun.com
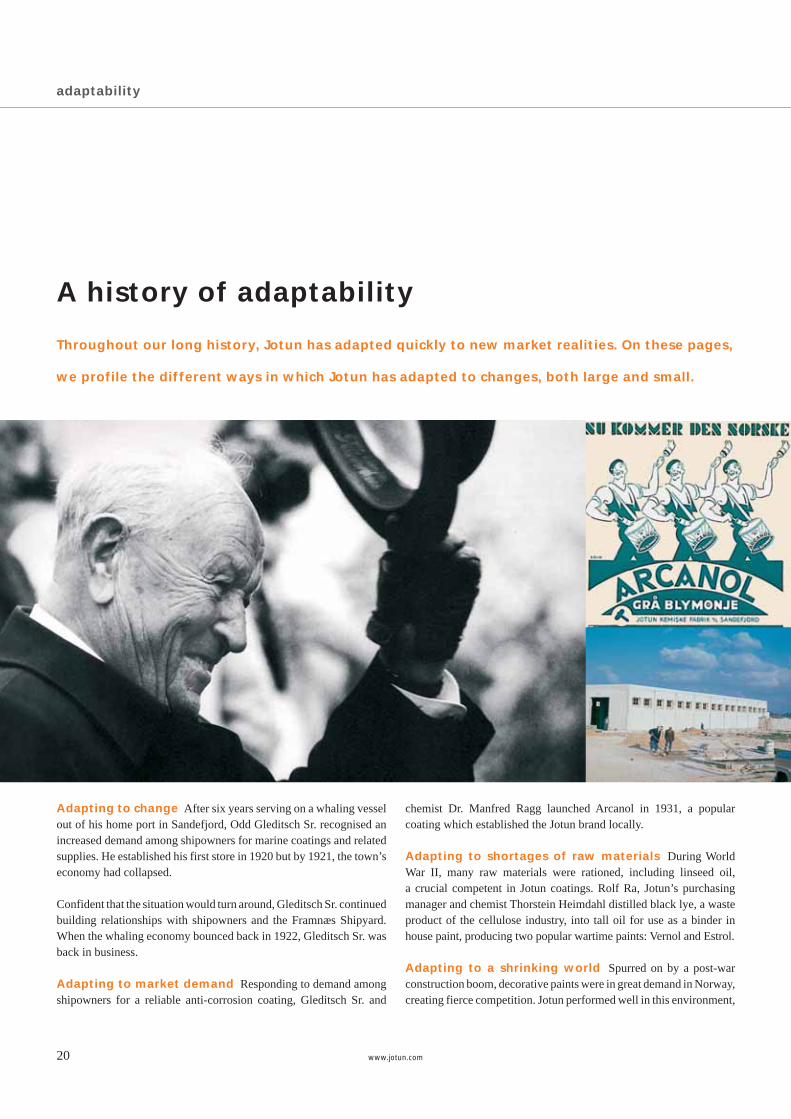
Throughout our long history, Jotun has adapted quickly to new market realities. On these pages,
we profile the different ways in which Jotun has adapted to changes, both large and small.
A history of adaptability
Adapting to change After six years serving on a whaling vessel out of his home port in Sandefjord, Odd Gleditsch Sr. recognised an increased demand among shipowners for marine coatings and related supplies. He established his first store in 1920 but by 1921, the town’s economy had collapsed.
Confident that the situation would turn around, Gleditsch Sr. continued building relationships with shipowners and the Framnæs Shipyard. When the whaling economy bounced back in 1922, Gleditsch Sr. was back in business.
Adapting to market demand Responding to demand among shipowners for a reliable anti-corrosion coating, Gleditsch Sr. and
chemist Dr. Manfred Ragg launched Arcanol in 1931, a popular coating which established the Jotun brand locally.
Adapting to shortages of raw materials During World War II, many raw materials were rationed, including linseed oil, a crucial competent in Jotun coatings. Rolf Ra, Jotun’s purchasing manager and chemist Thorstein Heimdahl distilled black lye, a waste product of the cellulose industry, into tall oil for use as a binder in house paint, producing two popular wartime paints: Vernol and Estrol.
Adapting to a shrinking world Spurred on by a post-war construction boom, decorative paints were in great demand in Norway, creating fierce competition. Jotun performed well in this environment,
adaptability
www.jotun.com 21
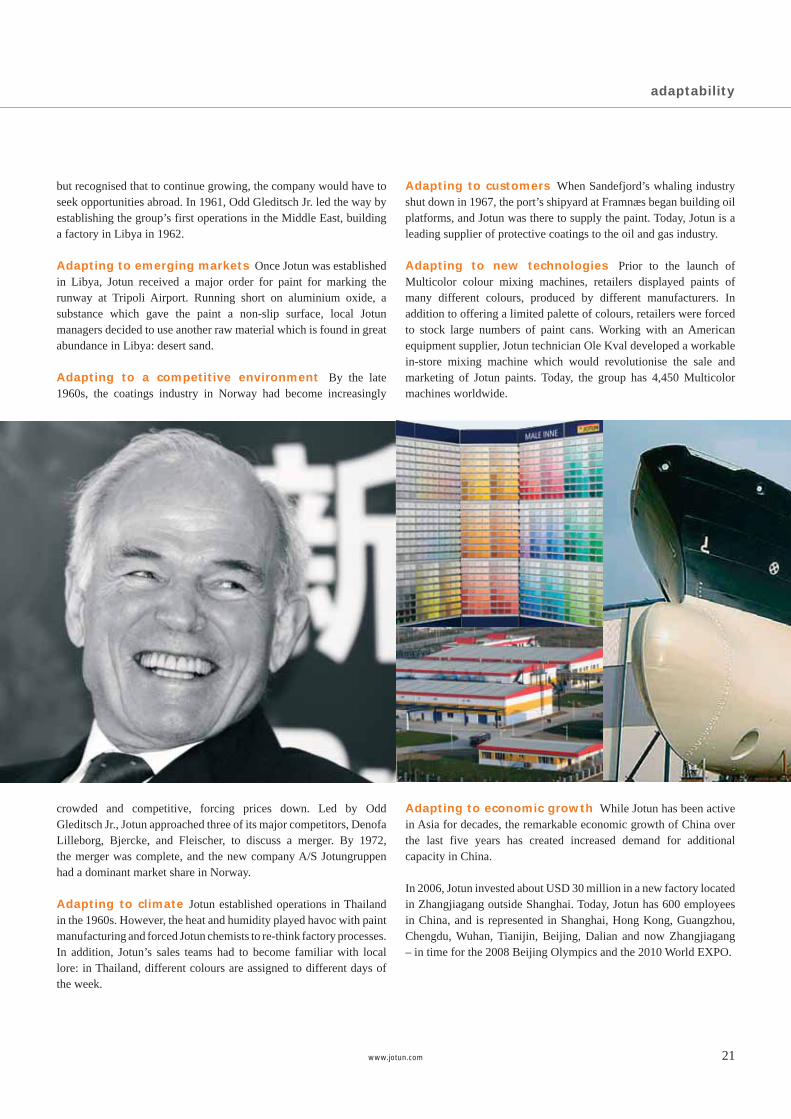
but recognised that to continue growing, the company would have to seek opportunities abroad. In 1961, Odd Gleditsch Jr. led the way by establishing the group’s first operations in the Middle East, building a factory in Libya in 1962.
Adapting to emerging markets Once Jotun was established in Libya, Jotun received a major order for paint for marking the runway at Tripoli Airport. Running short on aluminium oxide, a substance which gave the paint a non-slip surface, local Jotun managers decided to use another raw material which is found in great abundance in Libya: desert sand.
Adapting to a competitive environment By the late 1960s, the coatings industry in Norway had become increasingly
crowded and competitive, forcing prices down. Led by Odd Gleditsch Jr., Jotun approached three of its major competitors, Denofa Lilleborg, Bjercke, and Fleischer, to discuss a merger. By 1972, the merger was complete, and the new company A/S Jotungruppen had a dominant market share in Norway.
Adapting to climate Jotun established operations in Thailand in the 1960s. However, the heat and humidity played havoc with paint manufacturing and forced Jotun chemists to re-think factory processes. In addition, Jotun’s sales teams had to become familiar with local lore: in Thailand, different colours are assigned to different days of the week.
Adapting to customers When Sandefjord’s whaling industry shut down in 1967, the port’s shipyard at Framnæs began building oil platforms, and Jotun was there to supply the paint. Today, Jotun is a leading supplier of protective coatings to the oil and gas industry.
Adapting to new technologies Prior to the launch of Multicolor colour mixing machines, retailers displayed paints of many different colours, produced by different manufacturers. In addition to offering a limited palette of colours, retailers were forced to stock large numbers of paint cans. Working with an American equipment supplier, Jotun technician Ole Kval developed a workable in-store mixing machine which would revolutionise the sale and marketing of Jotun paints. Today, the group has 4,450 Multicolor machines worldwide.
Adapting to economic growth While Jotun has been active in Asia for decades, the remarkable economic growth of China over the last five years has created increased demand for additional capacity in China.
In 2006, Jotun invested about USD 30 million in a new factory located in Zhangjiagang outside Shanghai. Today, Jotun has 600 employees in China, and is represented in Shanghai, Hong Kong, Guangzhou, Chengdu, Wuhan, Tianijin, Beijing, Dalian and now Zhangjiagang – in time for the 2008 Beijing Olympics and the 2010 World EXPO.
adaptability
22 www.jotun.com
decorative paints
All the colours of the world
As one of the world’s leading suppliers of
decorative paints, Jotun’s success is built
on quality products and services and the
industry’s most extensive global network of
in-shop tinting systems.
Jotun manufactures and sells decorative paints throughout the world. Responsibility for the group’s decorative paint activities is divided between Jotun Dekorativ and Jotun Paints, but is also carried out in some of Jotun Coatings’ markets. Marketing strategies are built around in-shop tinting and colours, brand-building under the Jotun umbrella, close alliances with dealers and distributors as well as painters, contractors, specifiers and developers at all levels.
The USD 40 billion global market for decorative paints is expected to increase, fuelled by new construction in emerging markets and increased consumer appetite for Do-It-Yourself projects in mature markets. A general trend toward consolidation has created multina-tional home decorating outlet stores in some regions and global con-struction companies in others. This trend has not only helped drive volume sales; it has also changed how paint suppliers interact with major retailers and contractors.
Tougher environmental standards are also having an impact on the global decorative paint market, as more countries begin to follow
Europe’s lead in restricting the use of solvents in paints. Jotun paints are produced in compliance with these new regulations and in some cases exceed environmental laws and regulations. On the consumer side, interest in interior decoration is increasing worldwide, although tastes vary considerably in different markets.
Customer relations with the trade and Do-It-Yourself sectors, together with our focus on understanding the customer are important factors. These factors, together with effective marketing and sales service, are under constant development to ensure that we stay ahead of our com-petitors. Jotun’s success in this segment, which has also been driven by quality products, excellent service and its extensive network of Multicolor centres, suggests that consumers the world over respond to the same thing – quality, good service and choice.
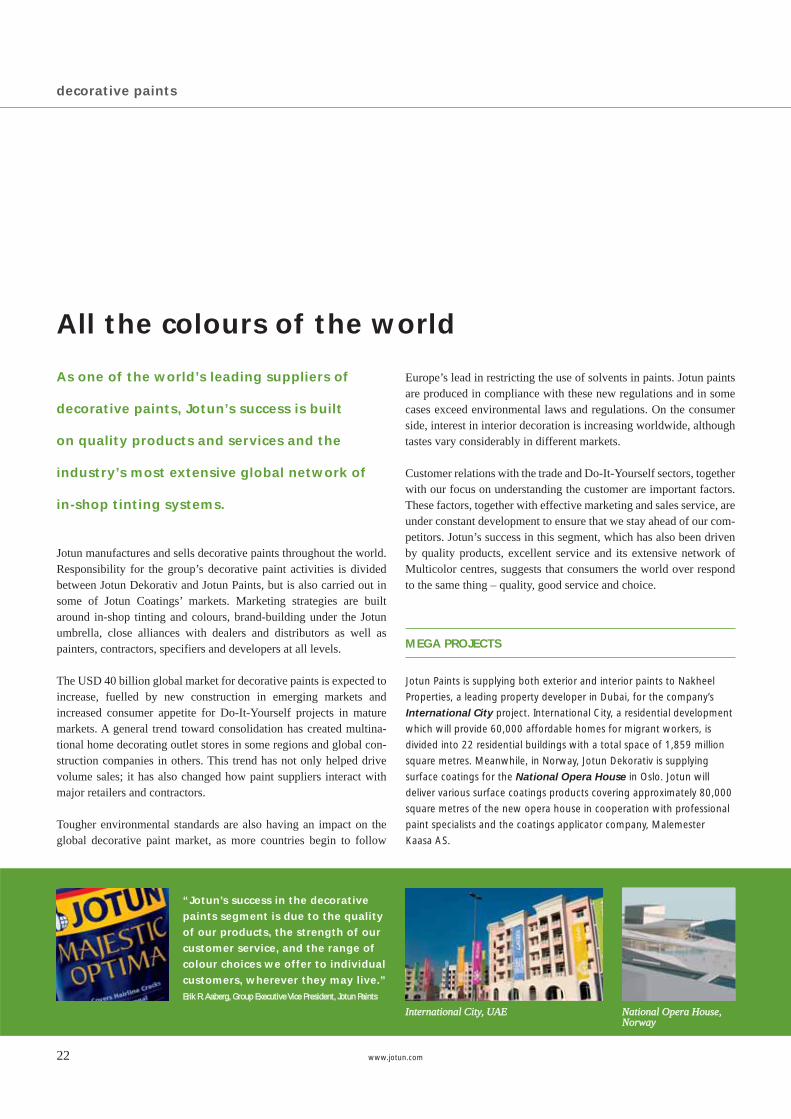
Jotun Paints is supplying both exterior and interior paints to Nakheel
Properties, a leading property developer in Dubai, for the company’s
International City project. International City, a residential development
which will provide 60,000 affordable homes for migrant workers, is
divided into 22 residential buildings with a total space of 1,859 million
square metres. Meanwhile, in Norway, Jotun Dekorativ is supplying
surface coatings for the National Opera House in Oslo. Jotun will
deliver various surface coatings products covering approximately 80,000
square metres of the new opera house in cooperation with professional
paint specialists and the coatings applicator company, Malemester
Kaasa AS.
“Jotun’s success in the decorative paints segment is due to the quality of our products, the strength of our customer service, and the range of colour choices we offer to individual customers, wherever they may live.”Erik R. Aaberg, Group Executive Vice President, Jotun Paints Erik R. Aaberg, Group Executive Vice President, Jotun Paints
National Opera House, National Opera House, NorwayNorway
International City, UAEInternational City, UAE
MEGA PROJECTS
www.jotun.com 23
decorative paints
deco
rati
ve
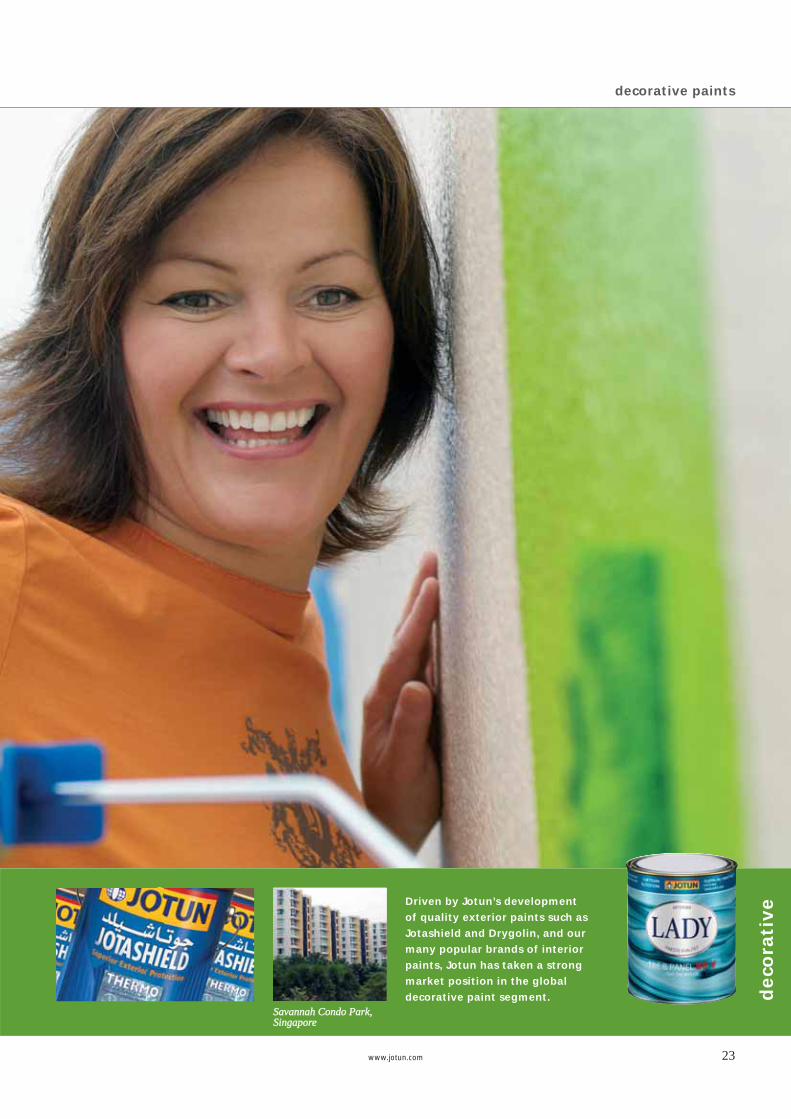
Savannah Condo Park, Savannah Condo Park, SingaporeSingapore
Driven by Jotun’s development of quality exterior paints such as Jotashield and Drygolin, and our many popular brands of interior paints, Jotun has taken a strong market position in the global decorative paint segment.
24 www.jotun.com
protective coatings
Building stronger customer relationships
Thanks to increased global activity in both
the energy and construction industries, there
is demand for quality protective coatings sup-
pliers with strong global networks.
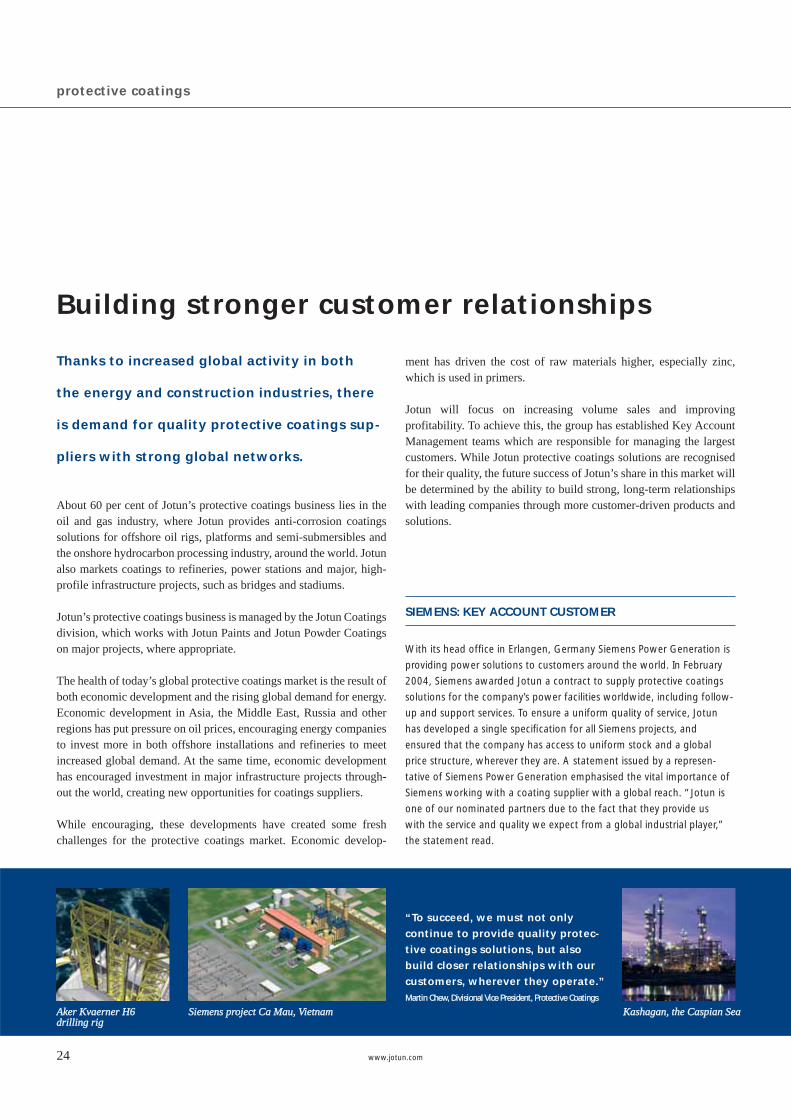
About 60 per cent of Jotun’s protective coatings business lies in the oil and gas industry, where Jotun provides anti-corrosion coatings solutions for offshore oil rigs, platforms and semi-submersibles and the onshore hydrocarbon processing industry, around the world. Jotun also markets coatings to refineries, power stations and major, high-profile infrastructure projects, such as bridges and stadiums.
Jotun’s protective coatings business is managed by the Jotun Coatings division, which works with Jotun Paints and Jotun Powder Coatings on major projects, where appropriate.
The health of today’s global protective coatings market is the result of both economic development and the rising global demand for energy. Economic development in Asia, the Middle East, Russia and other regions has put pressure on oil prices, encouraging energy companies to invest more in both offshore installations and refineries to meet increased global demand. At the same time, economic development has encouraged investment in major infrastructure projects through-out the world, creating new opportunities for coatings suppliers.
While encouraging, these developments have created some fresh challenges for the protective coatings market. Economic develop-
ment has driven the cost of raw materials higher, especially zinc, which is used in primers.
Jotun will focus on increasing volume sales and improving profita bility. To achieve this, the group has established Key Account Management teams which are responsible for managing the largest customers. While Jotun protective coatings solutions are recognised for their quality, the future success of Jotun’s share in this market will be determined by the ability to build strong, long-term relationships with leading companies through more customer-driven products and solutions.
With its head offi ce in Erlangen, Germany Siemens Power Generation is
providing power solutions to customers around the world. In February
2004, Siemens awarded Jotun a contract to supply protective coatings
solutions for the company’s power facilities worldwide, including follow-
up and support services. To ensure a uniform quality of service, Jotun
has developed a single specifi cation for all Siemens projects, and
ensured that the company has access to uniform stock and a global
price structure, wherever they are. A statement issued by a represen-
tative of Siemens Power Generation emphasised the vital importance of
Siemens working with a coating supplier with a global reach. “Jotun is
one of our nominated partners due to the fact that they provide us
with the service and quality we expect from a global industrial player,”
the statement read.
Siemens project Ca Mau, VietnamSiemens project Ca Mau, VietnamAker Kvaerner H6 Aker Kvaerner H6 drilling rigdrilling rig
Kashagan, the Caspian SeaKashagan, the Caspian Sea
“To succeed, we must not only continue to provide quality protec-tive coatings solutions, but also build closer relationships with our customers, wherever they operate.” Martin Chew, Divisional Vice President, Protective CoatingsMartin Chew, Divisional Vice President, Protective Coatings
SIEMENS: KEY ACCOUNT CUSTOMER
www.jotun.com 25
pro
tect
ive
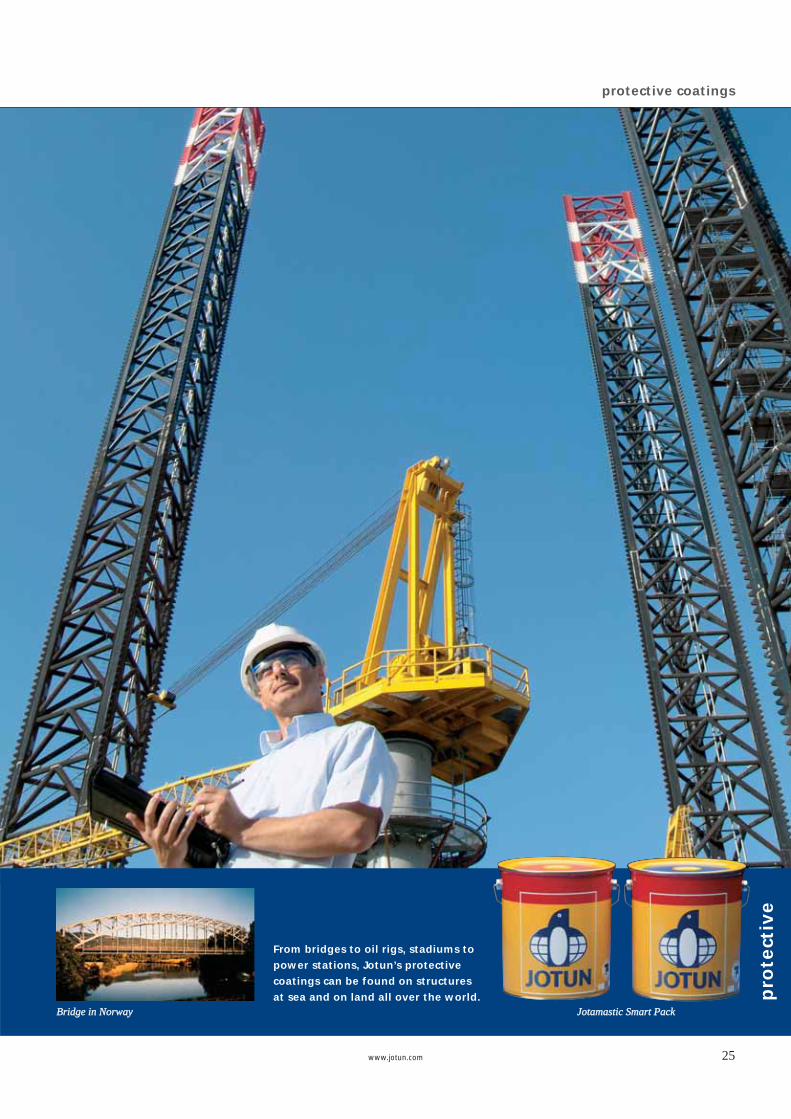
Bridge in NorwayBridge in Norway
protective coatings
From bridges to oil rigs, stadiums to power stations, Jotun’s protective coatings can be found on structures at sea and on land all over the world.
Jotamastic Smart PackJotamastic Smart Pack
26 www.jotun.com
marine coatings
Serving the borderless maritime industry
For more than 80 years, Jotun has been an
innovative supplier of marine coatings.
Yet in an increasingly global industry domi-
nated by fewer but larger players, Jotun is
working to optimise its global network.
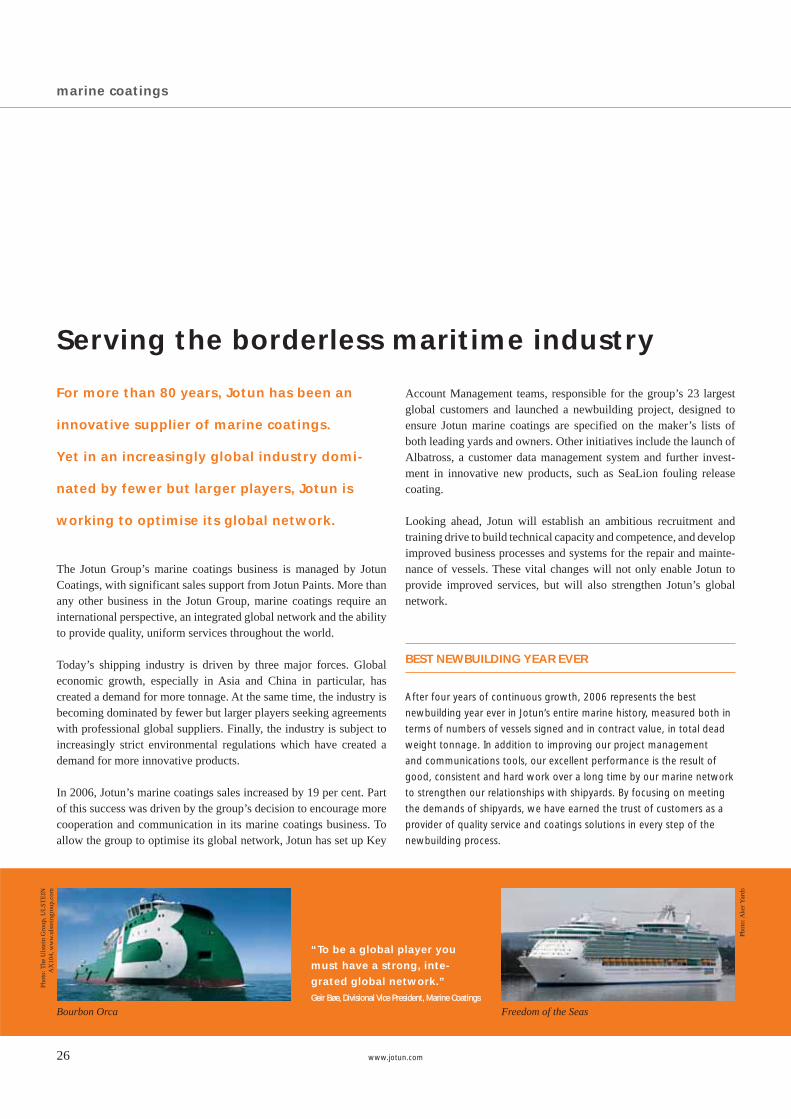
The Jotun Group’s marine coatings business is managed by Jotun Coatings, with significant sales support from Jotun Paints. More than any other business in the Jotun Group, marine coatings require an international perspective, an integrated global network and the ability to provide quality, uniform services throughout the world.
Today’s shipping industry is driven by three major forces. Global economic growth, especially in Asia and China in particular, has created a demand for more tonnage. At the same time, the industry is becoming dominated by fewer but larger players seeking agreements with professional global suppliers. Finally, the industry is subject to increasingly strict environmental regulations which have created a demand for more innovative products.
In 2006, Jotun’s marine coatings sales increased by 19 per cent. Part of this success was driven by the group’s decision to encourage more cooperation and communication in its marine coatings business. To allow the group to optimise its global network, Jotun has set up Key
Account Management teams, responsible for the group’s 23 largest global customers and launched a newbuilding project, designed to ensure Jotun marine coatings are specified on the maker’s lists of both leading yards and owners. Other initiatives include the launch of Albatross, a customer data management system and further invest-ment in innovative new products, such as SeaLion fouling release coating.
Looking ahead, Jotun will establish an ambitious recruitment and training drive to build technical capacity and competence, and develop improved business processes and systems for the repair and mainte-nance of vessels. These vital changes will not only enable Jotun to provide improved services, but will also strengthen Jotun’s global network.
“To be a global player you must have a strong, inte-grated global network.”
Geir Bøe, Divisional Vice President, Marine CoatingsGeir Bøe, Divisional Vice President, Marine Coatings
After four years of continuous growth, 2006 represents the best
newbuilding year ever in Jotun’s entire marine history, measured both in
terms of numbers of vessels signed and in contract value, in total dead
weight tonnage. In addition to improving our project management
and communications tools, our excellent performance is the result of
good, consistent and hard work over a long time by our marine network
to strengthen our relationships with shipyards. By focusing on meeting
the demands of shipyards, we have earned the trust of customers as a
provider of quality service and coatings solutions in every step of the
newbuilding process.
Freedom of the SeasBourbon Orca
Phot
o: A
ker Y
ards
Phot
o: T
he U
lste
in G
roup
, UL
STE
IN
AX
104,
ww
w.u
lste
ingr
oup.
com
BEST NEWBUILDING YEAR EVER
www.jotun.com 27
mari
ne
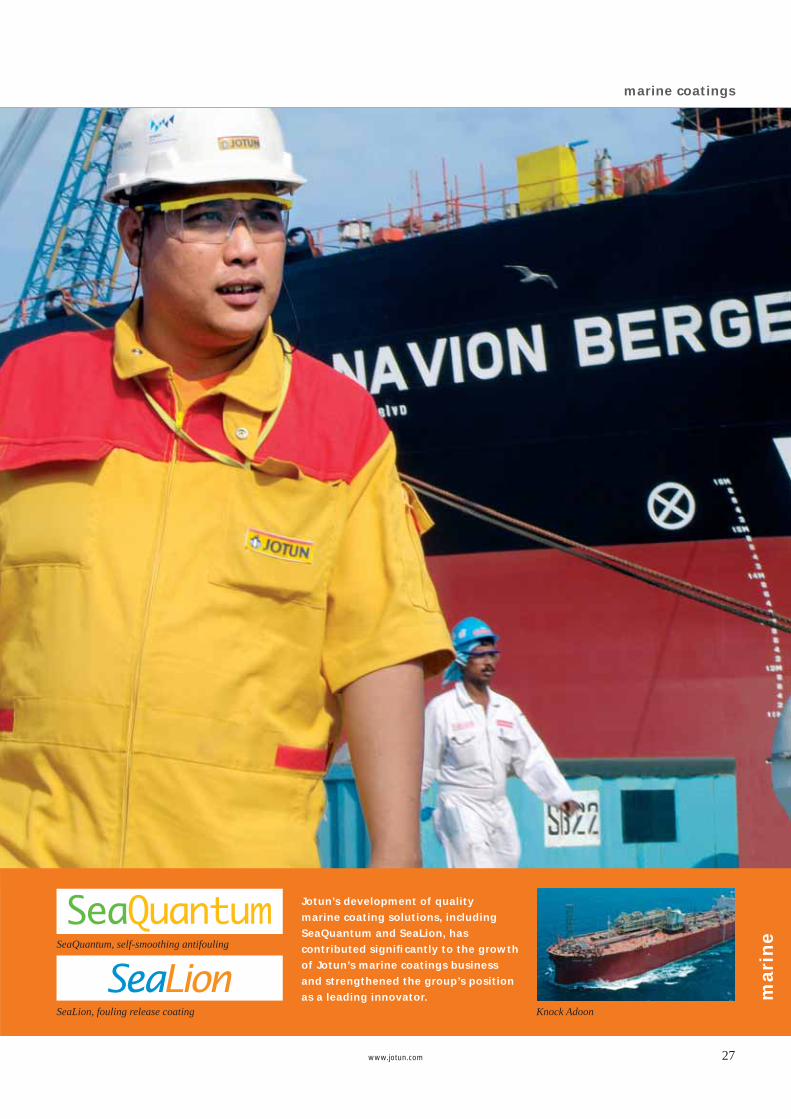
Knock Adoon
marine coatings
SeaLion, fouling release coating
SeaQuantum, self-smoothing antifouling
Jotun’s development of quality marine coating solutions, including SeaQuantum and SeaLion, hascon tributed signifi cantly to the growth of Jotun’s marine coatings business and strengthened the group’s position as a leading innovator.
28 www.jotun.com
powder coatings
Anticipating change in a complex market
As the world’s fourth largest supplier of
powder coatings, Jotun has staked out
a strong position in an expanding market.
Jotun’s powder coatings business focuses on three core segments: architectural, industrial and functional coatings. While performing well in all of these markets in 2006, Jotun Powder Coatings is recog-nised for its expertise in serving the oil and gas industry with specialised heat- and corrosion-resistant pipe coatings, valves and related oil and gas equipment.
The total global powder coatings industry is estimated to be worth around USD 4.5 billion. Today’s powder coatings market is relatively healthy, although the emergence of small local producers has created overcapacity in the industrial segment in certain markets, putting pressure on margins. To compete in these complex and crowded markets, Jotun Powder Coatings has recently reorganised to allow managers the flexibility to adjust to changing markets at a local level. By generating more volume and focussing increasingly on premium products, Jotun Powder Coatings will continue to expand.
Conditions are somewhat different in the architectural and functional markets, where the industry has seen more consolidation amongst customers. Many major new construction projects in Europe, the
Middle East and Asia are managed by internationally based archi-tects and contractors. To compete in this market, Jotun Powder Coatings works closely with Jotun Coatings and Jotun Paints to offer complete solutions to these multinationals to ensure Jotun is specified as a coatings supplier. Jotun applies a similar approach to marketing its functional powder coatings solutions to the oil and gas industry.
By strengthening its presence in local markets and working with other business units within Jotun, the group’s powder coatings division has become an increasingly important part of the group’s overall growth strategy.
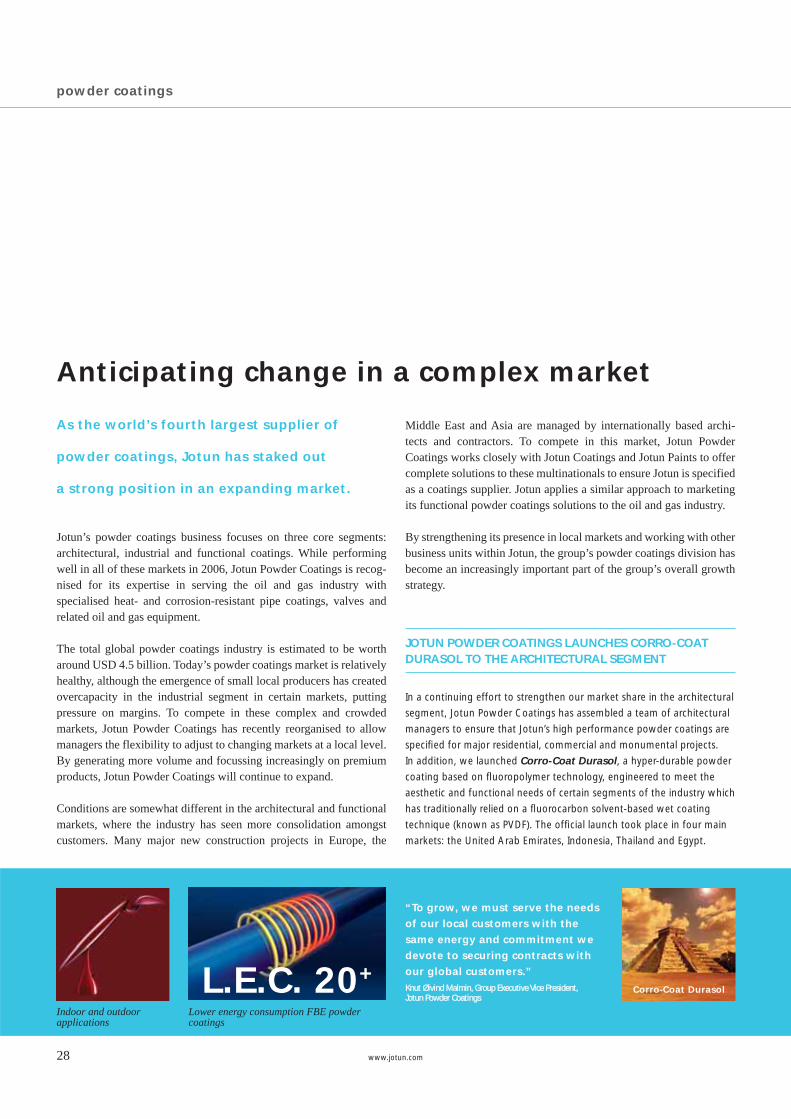
“To grow, we must serve the needs of our local customers with the same energy and commitment we devote to securing contracts with our global customers.” Knut Øivind Malmin, Group Executive Vice President, Knut Øivind Malmin, Group Executive Vice President, Jotun Powder CoatingsJotun Powder Coatings
In a continuing effort to strengthen our market share in the architectural
segment, Jotun Powder Coatings has assembled a team of architectural
managers to ensure that Jotun’s high performance powder coatings are
specifi ed for major residential, commercial and monumental projects.
In addition, we launched Corro-Coat Durasol, a hyper-durable powder
coating based on fl uoropolymer technology, engineered to meet the
aesthetic and functional needs of certain segments of the industry which
has traditionally relied on a fl uorocarbon solvent-based wet coating
technique (known as PVDF). The offi cial launch took place in four main
markets: the United Arab Emirates, Indonesia, Thailand and Egypt.
Indoor and outdoor applications
Lower energy consumption FBE powder coatings
L.E.C. 20+Corro-Coat Durasol
JOTUN POWDER COATINGS LAUNCHES CORRO-COAT DURASOL TO THE ARCHITECTURAL SEGMENT
www.jotun.com 29
po
wd
er
coati
ng
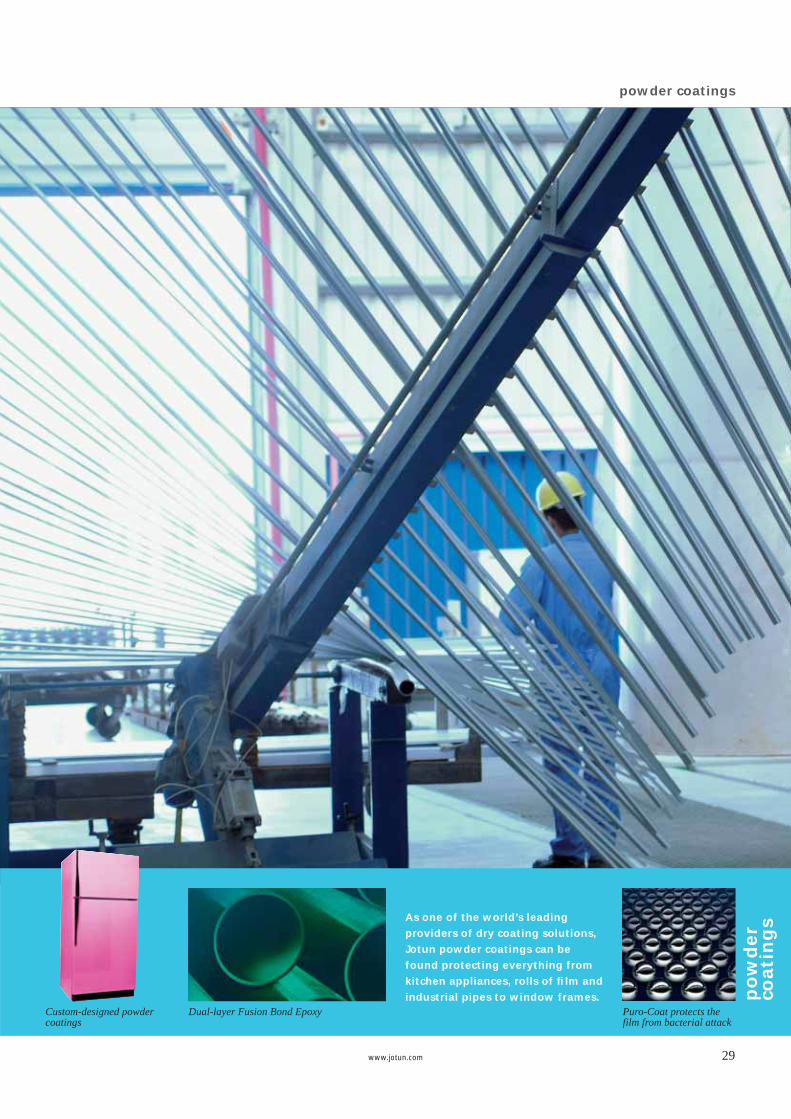
sAs one of the world’s leading providers of dry coating solutions, Jotun powder coatings can be found protecting everything from kitchen appliances, rolls of fi lm and industrial pipes to window frames.
Custom-designed powder coatings
Dual-layer Fusion Bond Epoxy Puro-Coat protects the film from bacterial attack
powder coatings
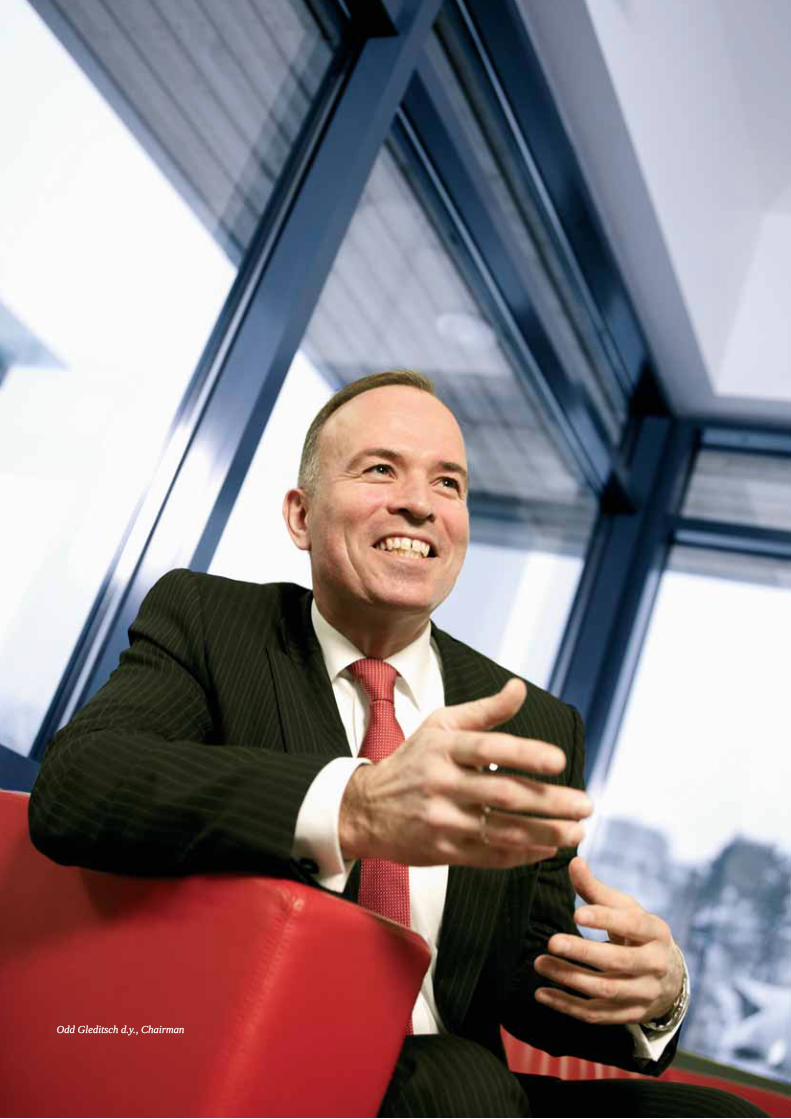
Odd Gleditsch d.y., ChairmanOdd Gleditsch d.y., Chairman
chairman of the board
The risks and rewards of long-term investment
Jotun’s strong performance in 2006 has its origins in the group’s long-term organic
growth strategy.
Jotun’s continued growth in 2006 was supported by several new developments. We increased capacity by opening new factories, gained market share in some areas and segments by improving our sales performance, and launched several new management initiatives to improve efficiency and build our competence. While the group’s four divisions continue to serve their own markets, the management team is finding new ways of working together to leverage our global reach and capacity to strengthen our business.
Global challenges As a global player, Jotun remains sensitive to macro-economic trends. For example, the rising cost of many raw materials over the past few years continues to put pressure on our margins. However, it should be noted that the costs of raw materials is not incon-sistent with historical averages. Jotun’s profits are also affected by the weakness of the dollar, an issue which remains a concern. To meet these challenges, Jotun must continue to improve all aspects of our operations.
Looking forward, Jotun will continue to pursue a strategy of organic growth, without excluding acquisitions. While we recognise that the consolidation amongst other coatings suppliers may result in increased competition in certain markets, we remain convinced
that our successful record and experience in establishing Jotun in emerging markets represents the way forward.
A long-term perspectiveJotun’s organic growth strategy is also consistent with our corporate structure. Because Jotun is not a listed company, we are under less pressure to deliver quarterly gains to satisfy short-term investors.
Rather, we have the freedom to take some risks and make incremental investments in new markets. Once established in an emerg-ing market, we can then develop our business step-by-step. After all, the seeds of our current success in the Middle East and Asia were planted and nurtured over time, and have helped support a growth rate of about ten per cent annually over the last ten years.
While generally considered safer than an acquisition-driven growth strategy, the organic growth model is not without risk. Today, Jotun faces many challenges, from managing working capital to maintaining our high level of competence. To ensure we can support our rapid growth and maintain our reputation for quality, we need to continue building our technical, sales and management capacity. In the meantime, we will continue to explore new markets, and seek to gain market share in all regions in which we operate.
31www.jotun.com
“To ensure we can support our
rapid growth and maintain our
reputation for quality, we need to
continue to build our technical,
sales and management capacity.”
Odd Gleditsch d.y., Chairman of the Board

1. PRINCIPAL ACTIVITIESAt the end of 2006, the Jotun Group was engaged in the development, manufacture, marketing and sale of paint and coating systems and surface treatment products through four divisions: Jotun Dekorativ: Decorative paints, stains and varnishes for the trade and DIY markets in Norway, Sweden, Denmark and Iceland, and the manufacture of binders. Jotun Coatings: Marine and protective coatings for industrial and offshore use in Europe, the USA, South Africa, Australia and North East Asia, and decorative products for local customers in the same regions. Jotun Paints: Decorative paints in the Middle East and South East Asia, and marine and protective coatings for local customers in the same regions. Jotun Powder Coatings: Powder coatings for architectural, func-tional and industrial market segments to protect metal surfaces from corrosion and add colour and style to their appearance.
Jotun has a global network and is represented on every continent through its various subsidiaries and joint ventures. The group com-prises 67 companies across 35 countries, including 40 production facilities. In addition, Jotun has agents, branch offices and distri butors in more than 70 countries. The parent company Jotun A/S has its head office in Sandefjord, Norway.
2. THE ACCOUNTSThe 2006 accounts were prepared on a going concern basis. The consolidated accounts comprise the results posted by subsi-diaries and all joint ventures in which Jotun A/S directly or indirectly owns a stake of 20 per cent or more, with consolidation based on the gross method.
ResultsGroup operating income totalled NOK 7,733 million, against NOK 6,710 million in 2005. The group recorded pre-tax profits of NOK 585 million, against NOK 490 million in 2005. The overall tax charge for the year was NOK 209 million, against NOK 151 million in 2005. The group profit after tax but before minority interests was NOK 376 million, against NOK 339 million in 2005. The parent company Jotun A/S posted pre-tax profits of NOK 461 million, against NOK 451 million in 2005. After tax totalling NOK 134 million, the parent company accounts show a profit of NOK 327 million, compared with NOK 349 million in 2005.
Financial position and capital structureThe group is exposed to credit, interest rate and exchange rate risks in its ordinary business operations, and active steps are taken to keep these risks at acceptable levels. In addition to credit insurance, procedures have been established to assess customer creditworthiness in order to reduce the credit risk.
directors’ report
Directors’ report
33www.jotun.com
Net interest-bearing debt by the end of 2006 was NOK 229 million, compared with NOK 251 million at the end of 2005. The group’s interest rate exposure therefore remains limited. The primary exchange rate exposure relates to the USD and USD-related currencies. Exchange rate exposure in the group’s balance sheet and net cash flows is hedged through currency loans, forward contracts, foreign exchange swaps and options. Group investments totalled NOK 278 million in 2006. On behalf of the group, Jotun A/S had overdraft facilities and other committed short-term and long-term lines of credit amounting to NOK 1,275 million at year-end, none of which had been utilised. At the same time, Jotun A/S had liquid reserves (committed lines of credit, cash, bank deposits, etc.) totalling NOK 1,462 million. The group’s net cash flow in 2006 was NOK 108 million, against NOK -183 million in 2005. The cash flow from operations was NOK 415 million. The group’s equity ratio stood at 53.2 per cent at year-end, against 54.9 per cent a year earlier. Liquid reserves and the capital base are considered to be satisfac-tory for both the Jotun Group and the parent company Jotun A/S.
Allocation of profitJotun A/S recorded a net profit of NOK 327,200,000 for 2006, with the proposed allocation for approval by the AGM as follows:
Provision for dividends (NOK 500 per share) NOK 171,000,000Allocation to other equity NOK 156,200,000Total allocation NOK 327,200,000
On this basis, unrestricted equity at year-end 2006 totalled NOK 2,217 million, against NOK 2,075 million a year earlier.
3. THE MARKETJotun DekorativThe division’s sales were at a record level in 2006. Higher volumes of both interior and exterior paints were achieved. However, financial results were adversely affected by the harmonisation of prices in Scandinavia. After a few years with delivery challenges during the high season, deliveries to customers improved as a result of the implementation of a new ERP system. A programme to increase supply chain efficiency and reduce working capital based on Lean principles was launched in 2006. Jotun’s strong brands in Norway are increasingly being challenged by private labels and further consolidation in the trade. Our growth is still coming from increased volumes of our major brands and premium qualities. The Lady interior and Drygolin exterior brands have further strengthened their positions as Norway’s undisputed No.1 paint brands. In Sweden, Jotun entered both the professional paint market and the COOP chain with the Scanox range (e.g. Butinox). Additional
distribution has been achieved through the Colorama chain in Sweden and Denmark. Strong customer relations and innovation are keys to Jotun’s further growth. In 2007, new premium products with features based on consumer insight will be launched. This will increase the total value of the paint category for the benefit of both customers and Jotun. Marketing initiatives, mainly via TV, the internet and in-store, will also be used to support our launches, face the challenge from private labels and encourage the consumer to paint.
Jotun CoatingsThe division is expanding rapidly and sales have increased since 2005. Profits have improved despite a challenging raw material market, but are still not in line with the group’s long-term expecta-tions for profitability. The marine segment strengthened its position in 2006. This busi-ness is still benefiting from an upturn in global trade and the resulting increase in demand for transport. The industry is becoming domi-nated by fewer, larger players seeking agreements with professional suppliers. Closer cooperation and improved communication in the marine network has contributed to the strengthened position with these customers. The protective segment has benefited from increased global activ-ity in both the energy and construction industries and improved its position considerably in 2006. Economic development has encour-aged investment in major infrastructure projects, creating new oppor-tunities for us as a coating supplier. We have improved our ability to handle such projects by establishing a Key Account Management programme. Effective innovations have been developed to meet customer needs and increasingly strict environmental regulations. This has con-tributed to the improved performance of the division. While encouraging, the rapid development has created some fresh challenges for the industry and Jotun Coatings as a supplier. In response to this, an ambitious recruitment and training initiative has been launched to strengthen technical competence. High growth is expected over the next few years as a result of both new and further development in rapidly expanding markets such as Russia, Brazil, India, Turkey, the Black Sea region and China. Jotun Coatings opened its new production facility in China in January 2006. The volumes manufactured by this factory are strongly supporting the rapidly increasing level of our activity in China. Jotun has also decided to build a factory in Pune in India. This factory will be an important part of Jotun’s extensive network of production facil-ities – serving a market with a very high domestic potential.
Jotun PaintsJotun Paints has three business segments; decorative, marine and protective, of which decorative is the most important in terms of sales and earnings. All three segments have good profitability and are growing. Decorative in the Middle East is growing particularly rapidly, but our position in several markets in South East Asia has also improved significantly during the period. The division has been less affected by the general increases in raw material costs and has a good operating margin.
directors’ report
www.jotun.com34
The division is expanding and continues to be the market leader in the Middle East. The Multicolor concept (Jotun’s in-store colour-mixing system) gives Jotun one of its competitive advantages. Further development of the concept and its applications has helped to boost distribution and maintain a strong market position. Steps are also being taken to strengthen sales and marketing expertise within the local companies as well as on a regional basis. The division is active in the construction project market through-out the Middle East and South East Asia and has established a good position amongst architects and contractors. Paint deliveries to many large and prestigious projects have been secured. Jotun has achieved success by establishing an early presence in markets with growth potential. A strategic focus on marketing and organisational development has led to the establishment and reinforcement of strong positions in markets such as Saudi Arabia, the United Arab Emirates and Malaysia. Jotun Paints is continually assessing potential new markets in the light of this strategy and has significant exports to a number of markets in Middle East and South East Asia. Strong growth has led to the need for increased production capacity. A new factory was opened in Yemen in early 2006. Invest-ments are also being made to expand the group’s production facilities in Saudi Arabia and Egypt.
Jotun Powder Coatings After a difficult year with weak performance due to sliding margins and increased costs, Jotun Powder Coatings has managed to turn the division into a profitable operation. It is now showing stronger and healthier results. The division has continued to grow in terms of sales volume and operating result in Europe, the Middle East and South East Asia. Margins have improved with stronger sales of premium products. The key for the future success of the division will revolve around three elements; innovation, competence and collaboration across borders and divisions. In addition to a continuous focus on brand-building and value-added products, a well structured innovation process has been estab-lished. Innovation is an important factor in order to respond to the increased competition in the market. People and competence represent an important part of any busi-ness today and in order to have a competitive edge it is important to develop our people further. The Jotun Powder School was introduced last year with the aim of increasing professional skills in the areas of sales and technical support. To develop competence in production and improve process efficiency, the Jotun Operations Academy was established in collaboration with other Jotun divisions. Collaboration between Jotun’s divisions has become much more focused. There are clear benefits and synergies to be gained both from working closer in specific business areas where there are similarities and from transferring best practice. The restructuring of the division from a geographical, region-based structure towards a more segment-based structure with a stronger local focus has proven to be a success. As a result of this change, the operations are closer to the markets and more responsive
to customer and product requirements across national boundaries. Divisional support will continue to play an important role in the further development of local operations.
4. HEALTH, SAFETY AND THE ENVIRONMENT (HSE) Objectives and activitiesThe world around us demands continuous work relating to technical and operational initiatives to safeguard health, safety and the environ-ment (HSE). In its approach to HSE, Jotun strives to ensure that its activities satisfy both internal and external interests. Jotun aims to become more competitive through an active and responsible approach to HSE. Priority is given to ensuring that initia-tives aimed at improving group profitability do not compromise HSE. The six audits conducted by HSE personnel in 2006 revealed that most of the group’s factories, laboratories and warehouses meet acceptable HSE standards. However, some facilities require upgrading and action plans have been prepared for improvements. The Board of Directors emphasises the importance of continuous improvement in HSE-related work and actions.
CostsThe overall cost of HSE measures and initiatives shows a slight downward trend over the past five years. Most of the decrease is due to lower operating costs relating to waste disposal and waste treat-ment. In 2006 HSE-related operating costs were slightly up at NOK 25 million. This increase was partly due to two new factories, the cost of purchasing personal protective equipment, and higher waste manage-ment costs arising from increased production. HSE-related investments totalled NOK 19.5 million (same as in 2005).
Working environmentSafety has always been a priority at Jotun, and the group’s aim is to work continuously to safeguard our employees. Jotun considers preventive work to be the most important tool as regards working environment and health.
GroupThe overall incidence of sick leave within the Jotun Group stood at 1.9 per cent. This represents an increase from 1.8 per cent in 2005. A total of 1,311 working days were lost as a result of injuries, equivalent to 0.1 per cent of total working hours. The total number of lost-time injuries due to accidents was 77, compared to 53 injuries in 2005. The frequency of injuries resulting in absence of at least one day was 7.86 per million working hours. The accidents were mainly related to crushing injuries, cuts and burns. This is higher than desir-able, and initiatives aimed at reducing injuries are under continuous assessment. There were 22 accidents involving damage to property in 2006, compared to 11 accidents in 2005. A total of NOK 11.2 million was invested in improvements to the working environment in 2006. This included installation of dust filters, ventilation systems, first-aid stations and air-conditioning.
directors’ report
35www.jotun.com
Jotun A/SThe incidence of sick leave within Jotun A/S stood at 5.2 per cent in 2006, against 4.0 per cent in 2005. The trend in Norway shows an increase in sick leave in 2006. The increase in Jotun is a result of long-term sick leave cases. Although some of Jotun’s factories need improvement, the Board of Directors and the Group Management consider the working envi-ronment in general to be satisfactory.
Environment*Emissions to air consist of dust from the production of powder coatings and solvents from paint production. A total of 59,700 tonnes of solvents was used in 2006, against 55,800 in 2005. The increase was mainly due to a higher production volume. The group generated 14,700 tonnes of waste in 2006, of which 5,000 tonnes were classified as hazardous waste. This represents an increase compared to 2005 when 12,400 tonnes of waste were gener-ated, with hazardous waste accounting for 4,200 tonnes. A total of 69,900 tonnes of water-based waste was discharged from production (against 64,300 tonnes in 2005). Of this, 46,400 tonnes were treated (against 47,300 tonnes in 2005). The authorities regard discharges into public sewage systems to be a local problem at eight of the group’s factories. A total of NOK 1.9 million was invested in measures to prevent or reduce adverse environmental effects (down from NOK 2.9 million in 2005). These measures included equipment to reduce waste volumes and treat process water.
* In 2005, figures from Jotun Paints Inc., USA, were missing. They are now included in the historical data and deviation from figures published in 2006 occurs.
Future challengesThe recruitment, training and expertise of employees are vital for the realisation of the group’s goals and visions. Particular attention will be given to the preventive maintenance of manufacturing equipment and buildings over the next few years. The European Regulation on Registration Evaluation and Autho-ri sation of Chemicals (REACH) was adopted by the European Council on 18 December 2006 and will enter into force on 1 June 2007. REACH will represent a major challenge for the chemical industry over a period of more than 11 years. Jotun is preparing for this challenge by screening all substances, raw materials and products, and by initiating and participating in the project ”Innochem 2006–2010” with the purpose of developing effective systems to turn the new regulation into a promoter of innovation instead of being a threat to R&D, innovation and the production of chemicals in Norway and Europe. In this context a case study is being carried out in 2006–2007 together with a supplier and some customers to give input to the guidelines that are under development by the European Commission. Directive 2004/42/EC on the limitation of emissions of volatile organic compounds due to the use of organic solvents in certain paints and varnishes (the so-called VOC Paints Directive) lays down maximum VOC concentrations. The limits came into force on 1 January 2007. The concentration of solvents in Jotun’s products is
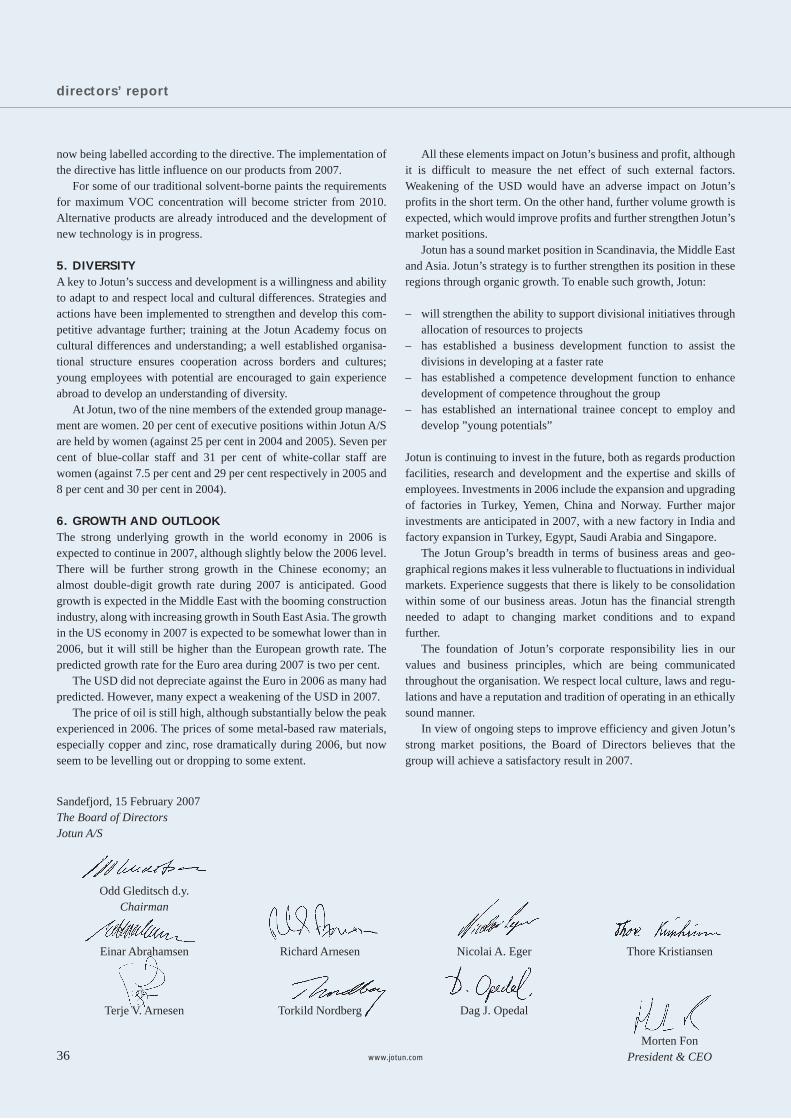
Sandefjord, 15 February 2007The Board of Directors Jotun A/S
Odd Gleditsch d.y. Chairman
Einar Abrahamsen Richard Arnesen Nicolai A. Eger Thore Kristiansen
Terje V. Arnesen Torkild Nordberg Dag J. Opedal
Morten Fon President & CEO
directors’ report
www.jotun.com36
now being labelled according to the directive. The implementation of the directive has little influence on our products from 2007. For some of our traditional solvent-borne paints the requirements for maximum VOC concentration will become stricter from 2010. Alternative products are already introduced and the development of new technology is in progress.
5. DIVERSITYA key to Jotun’s success and development is a willingness and ability to adapt to and respect local and cultural differences. Strategies and actions have been implemented to strengthen and develop this com-petitive advantage further; training at the Jotun Academy focus on cultural differences and understanding; a well established organisa-tional structure ensures cooperation across borders and cultures; young employees with potential are encouraged to gain experience abroad to develop an understanding of diversity. At Jotun, two of the nine members of the extended group manage-ment are women. 20 per cent of executive positions within Jotun A/S are held by women (against 25 per cent in 2004 and 2005). Seven per cent of blue-collar staff and 31 per cent of white-collar staff are women (against 7.5 per cent and 29 per cent respectively in 2005 and 8 per cent and 30 per cent in 2004).
6. GROWTH AND OUTLOOK The strong underlying growth in the world economy in 2006 is expected to continue in 2007, although slightly below the 2006 level. There will be further strong growth in the Chinese economy; an almost double-digit growth rate during 2007 is anticipated. Good growth is expected in the Middle East with the booming construction industry, along with increasing growth in South East Asia. The growth in the US economy in 2007 is expected to be somewhat lower than in 2006, but it will still be higher than the European growth rate. The predicted growth rate for the Euro area during 2007 is two per cent. The USD did not depreciate against the Euro in 2006 as many had predicted. However, many expect a weakening of the USD in 2007. The price of oil is still high, although substantially below the peak experienced in 2006. The prices of some metal-based raw materials, especially copper and zinc, rose dramatically during 2006, but now seem to be levelling out or dropping to some extent.
All these elements impact on Jotun’s business and profit, although it is difficult to measure the net effect of such external factors. Weakening of the USD would have an adverse impact on Jotun’s profits in the short term. On the other hand, further volume growth is expected, which would improve profits and further strengthen Jotun’s market positions. Jotun has a sound market position in Scandinavia, the Middle East and Asia. Jotun’s strategy is to further strengthen its position in these regions through organic growth. To enable such growth, Jotun:
– will strengthen the ability to support divisional initiatives through allocation of resources to projects
– has established a business development function to assist the divisions in developing at a faster rate
– has established a competence development function to enhance development of competence throughout the group
– has established an international trainee concept to employ and develop ”young potentials”
Jotun is continuing to invest in the future, both as regards production facilities, research and development and the expertise and skills of employees. Investments in 2006 include the expansion and upgrading of factories in Turkey, Yemen, China and Norway. Further major investments are anticipated in 2007, with a new factory in India and factory expansion in Turkey, Egypt, Saudi Arabia and Singapore. The Jotun Group’s breadth in terms of business areas and geo-graphical regions makes it less vulnerable to fluctuations in individual markets. Experience suggests that there is likely to be consolidation within some of our business areas. Jotun has the financial strength needed to adapt to changing market conditions and to expand further. The foundation of Jotun’s corporate responsibility lies in our values and business principles, which are being communicated throughout the organisation. We respect local culture, laws and regu-lations and have a reputation and tradition of operating in an ethically sound manner. In view of ongoing steps to improve efficiency and given Jotun’s strong market positions, the Board of Directors believes that the group will achieve a satisfactory result in 2007.
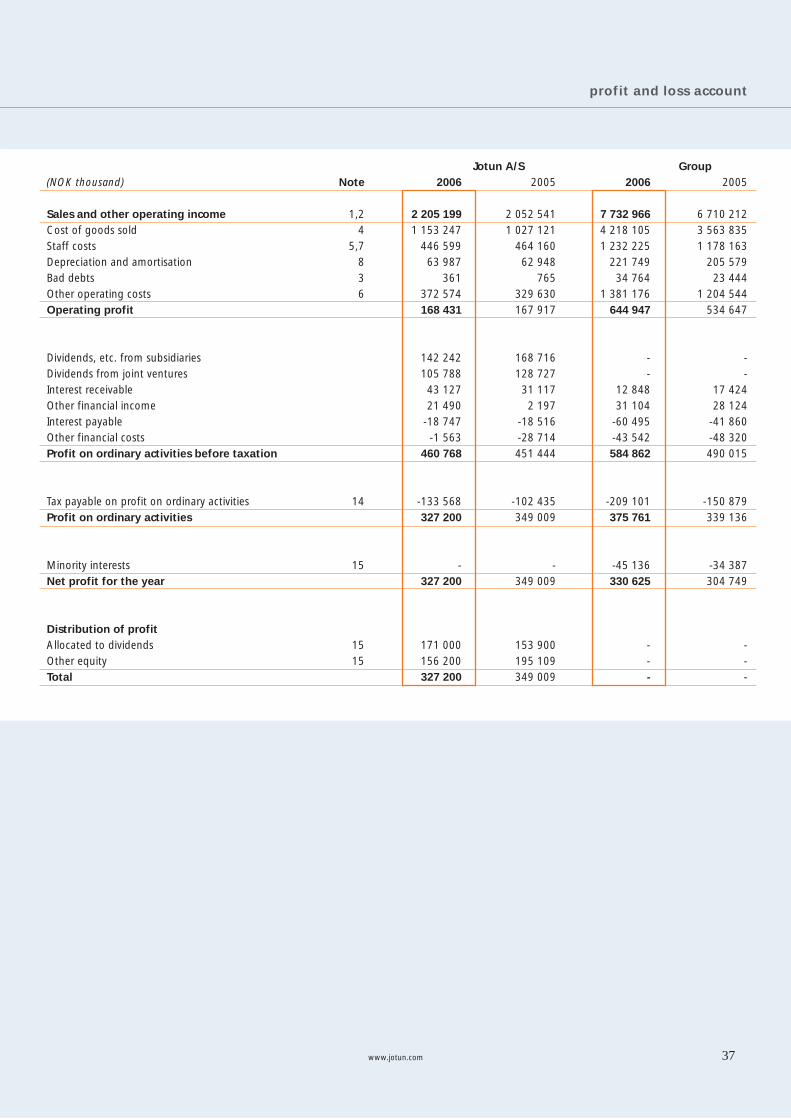
profit and loss account
www.jotun.com 37
Jotun A/S Group(NOK thousand) Note 2006 2005 2006 2005
Sales and other operating income 1,2 2 205 199 2 052 541 7 732 966 6 710 212Cost of goods sold 4 1 153 247 1 027 121 4 218 105 3 563 835Staff costs 5,7 446 599 464 160 1 232 225 1 178 163Depreciation and amortisation 8 63 987 62 948 221 749 205 579Bad debts 3 361 765 34 764 23 444Other operating costs 6 372 574 329 630 1 381 176 1 204 544Operating profit 168 431 167 917 644 947 534 647
Dividends, etc. from subsidiaries 142 242 168 716 - -Dividends from joint ventures 105 788 128 727 - -Interest receivable 43 127 31 117 12 848 17 424Other financial income 21 490 2 197 31 104 28 124Interest payable -18 747 -18 516 -60 495 -41 860Other financial costs -1 563 -28 714 -43 542 -48 320Profit on ordinary activities before taxation 460 768 451 444 584 862 490 015
Tax payable on profit on ordinary activities 14 -133 568 -102 435 -209 101 -150 879Profit on ordinary activities 327 200 349 009 375 761 339 136
Minority interests 15 - - -45 136 -34 387Net profit for the year 327 200 349 009 330 625 304 749
Distribution of profit Allocated to dividends 15 171 000 153 900 - -Other equity 15 156 200 195 109 - -Total 327 200 349 009 - -
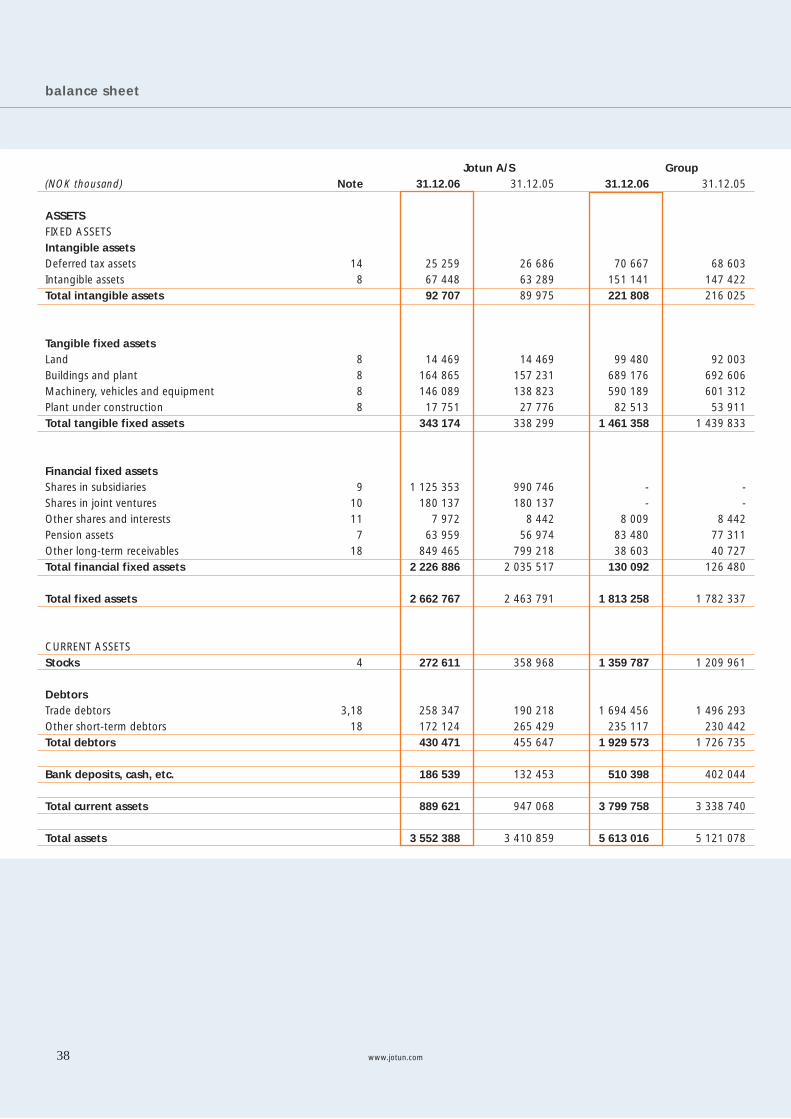
balance sheet
www.jotun.com38
Jotun A/S Group(NOK thousand) Note 31.12.06 31.12.05 31.12.06 31.12.05 ASSETS FIXED ASSETS Intangible assets Deferred tax assets 14 25 259 26 686 70 667 68 603 Intangible assets 8 67 448 63 289 151 141 147 422 Total intangible assets 92 707 89 975 221 808 216 025
Tangible fixed assets Land 8 14 469 14 469 99 480 92 003 Buildings and plant 8 164 865 157 231 689 176 692 606 Machinery, vehicles and equipment 8 146 089 138 823 590 189 601 312 Plant under construction 8 17 751 27 776 82 513 53 911Total tangible fixed assets 343 174 338 299 1 461 358 1 439 833 Financial fixed assets Shares in subsidiaries 9 1 125 353 990 746 - -Shares in joint ventures 10 180 137 180 137 - -Other shares and interests 11 7 972 8 442 8 009 8 442Pension assets 7 63 959 56 974 83 480 77 311Other long-term receivables 18 849 465 799 218 38 603 40 727 Total financial fixed assets 2 226 886 2 035 517 130 092 126 480
Total fixed assets 2 662 767 2 463 791 1 813 258 1 782 337
CURRENT ASSETS Stocks 4 272 611 358 968 1 359 787 1 209 961
Debtors Trade debtors 3,18 258 347 190 218 1 694 456 1 496 293 Other short-term debtors 18 172 124 265 429 235 117 230 442Total debtors 430 471 455 647 1 929 573 1 726 735 Bank deposits, cash, etc. 186 539 132 453 510 398 402 044 Total current assets 889 621 947 068 3 799 758 3 338 740 Total assets 3 552 388 3 410 859 5 613 016 5 121 078
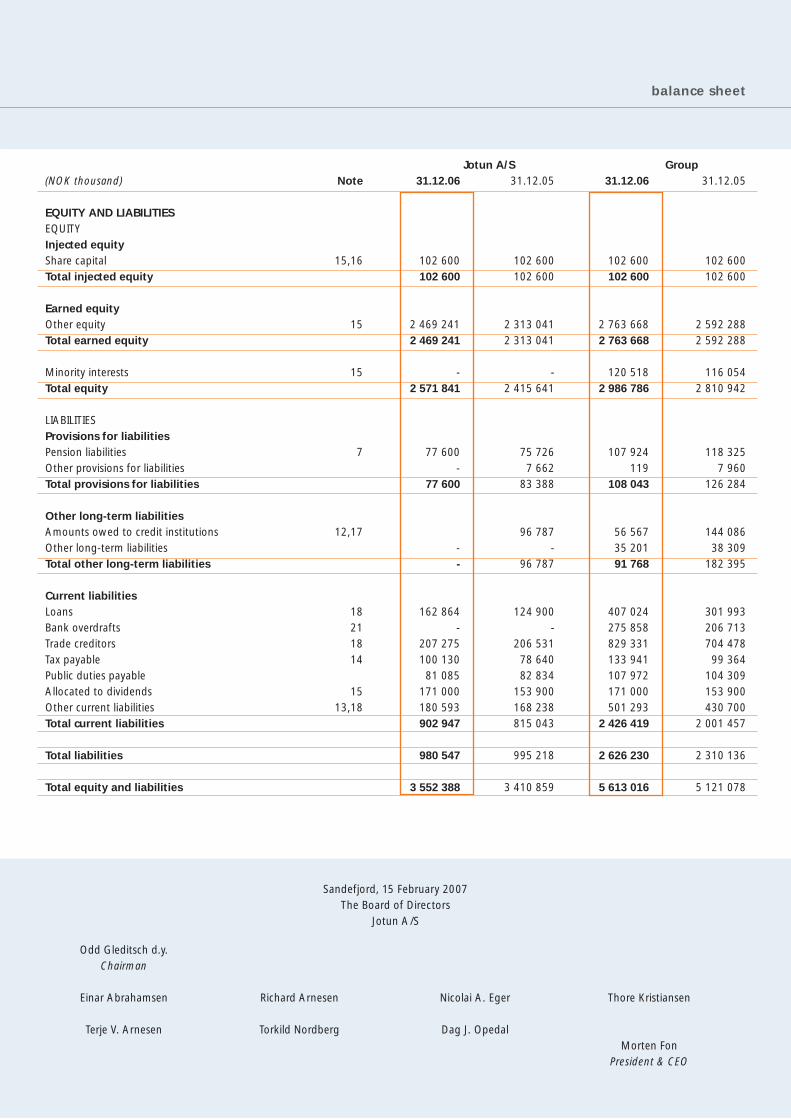
balance sheet
Jotun A/S Group(NOK thousand) Note 31.12.06 31.12.05 31.12.06 31.12.05
EQUITY AND LIABILITIES EQUITY Injected equity Share capital 15,16 102 600 102 600 102 600 102 600Total injected equity 102 600 102 600 102 600 102 600 Earned equity Other equity 15 2 469 241 2 313 041 2 763 668 2 592 288Total earned equity 2 469 241 2 313 041 2 763 668 2 592 288 Minority interests 15 - - 120 518 116 054Total equity 2 571 841 2 415 641 2 986 786 2 810 942 LIABILITIES Provisions for liabilities Pension liabilities 7 77 600 75 726 107 924 118 325Other provisions for liabilities - 7 662 119 7 960Total provisions for liabilities 77 600 83 388 108 043 126 284 Other long-term liabilities Amounts owed to credit institutions 12,17 96 787 56 567 144 086Other long-term liabilities - - 35 201 38 309Total other long-term liabilities - 96 787 91 768 182 395 Current liabilities Loans 18 162 864 124 900 407 024 301 993Bank overdrafts 21 - - 275 858 206 713Trade creditors 18 207 275 206 531 829 331 704 478Tax payable 14 100 130 78 640 133 941 99 364Public duties payable 81 085 82 834 107 972 104 309Allocated to dividends 15 171 000 153 900 171 000 153 900Other current liabilities 13,18 180 593 168 238 501 293 430 700Total current liabilities 902 947 815 043 2 426 419 2 001 457 Total liabilities 980 547 995 218 2 626 230 2 310 136
Total equity and liabilities 3 552 388 3 410 859 5 613 016 5 121 078
Odd Gleditsch d.y. Chairman
Einar Abrahamsen Richard Arnesen Nicolai A. Eger Thore Kristiansen
Terje V. Arnesen Torkild Nordberg Dag J. Opedal Morten Fon President & CEO
Sandefjord, 15 February 2007The Board of Directors
Jotun A/S
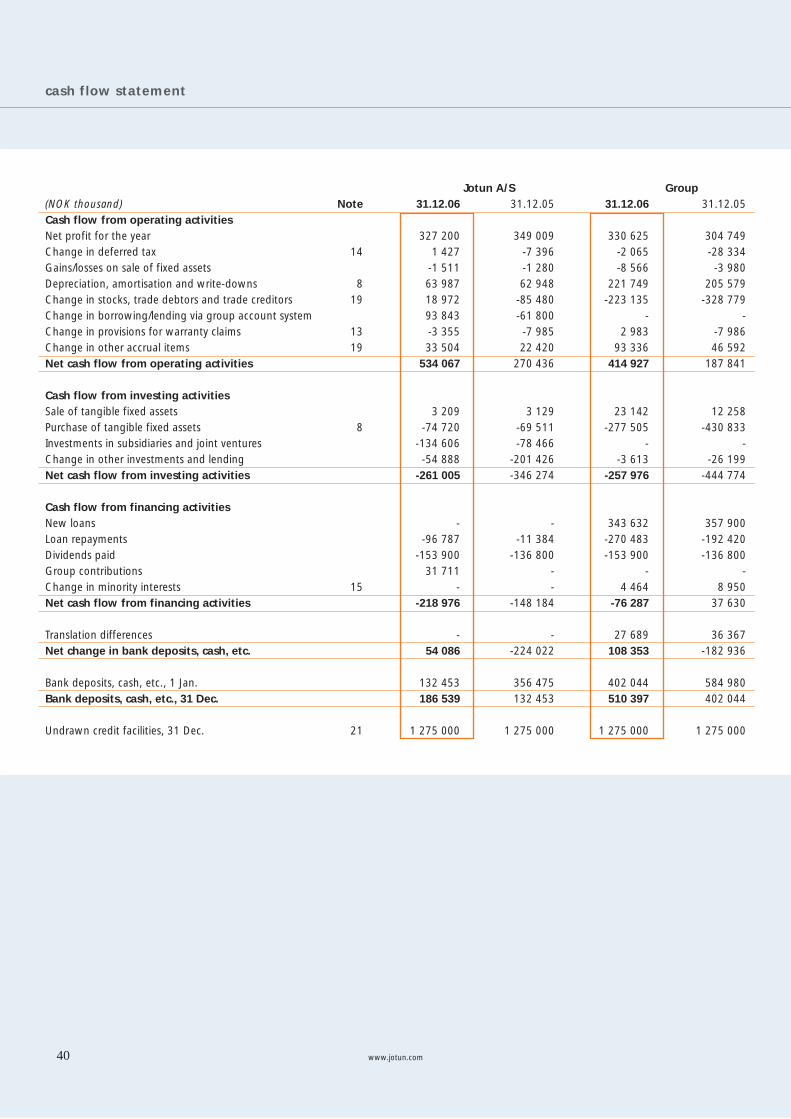
cash flow statement
www.jotun.com40
Jotun A/S Group(NOK thousand) Note 31.12.06 31.12.05 31.12.06 31.12.05Cash flow from operating activities Net profit for the year 327 200 349 009 330 625 304 749Change in deferred tax 14 1 427 -7 396 -2 065 -28 334Gains/losses on sale of fixed assets -1 511 -1 280 -8 566 -3 980Depreciation, amortisation and write-downs 8 63 987 62 948 221 749 205 579Change in stocks, trade debtors and trade creditors 19 18 972 -85 480 -223 135 -328 779Change in borrowing/lending via group account system 93 843 -61 800 - -Change in provisions for warranty claims 13 -3 355 -7 985 2 983 -7 986Change in other accrual items 19 33 504 22 420 93 336 46 592Net cash flow from operating activities 534 067 270 436 414 927 187 841 Cash flow from investing activitiesSale of tangible fixed assets 3 209 3 129 23 142 12 258Purchase of tangible fixed assets 8 -74 720 -69 511 -277 505 -430 833Investments in subsidiaries and joint ventures -134 606 -78 466 - -Change in other investments and lending -54 888 -201 426 -3 613 -26 199Net cash flow from investing activities -261 005 -346 274 -257 976 -444 774 Cash flow from financing activities New loans - - 343 632 357 900Loan repayments -96 787 -11 384 -270 483 -192 420Dividends paid -153 900 -136 800 -153 900 -136 800Group contributions 31 711 - - -Change in minority interests 15 - - 4 464 8 950Net cash flow from financing activities -218 976 -148 184 -76 287 37 630 Translation differences - - 27 689 36 367Net change in bank deposits, cash, etc. 54 086 -224 022 108 353 -182 936 Bank deposits, cash, etc., 1 Jan. 132 453 356 475 402 044 584 980Bank deposits, cash, etc., 31 Dec. 186 539 132 453 510 397 402 044 Undrawn credit facilities, 31 Dec. 21 1 275 000 1 275 000 1 275 000 1 275 000
accounting policies
www.jotun.com 41
Basis for valuation and classificationThe annual accounts for Jotun A/S and the group comprise the profit and loss account, balance sheet, cash flow statement and notes to the accounts, which have been prepared in accordance with the Companies Act (Norway), the Financial Reporting Act (Norway) and generally accepted accounting principles as at 31 December 2006. In a move to make the accounts more accessible, that the financial statements are presented as summaries, with the relevant figures broken down in the notes. As such, the notes form an integral part of the annual accounts. The parent company and group accounts are based on the funda-mental concepts of historic cost, comparability, going concern, con-gruence and prudence. Transactions are included in the accounts at the value of the payment at the time of the transaction. Income is included in the profit and loss account as it is earned, and costs are recognised in line with the income to which they relate. In the case of sales of goods and services, items are therefore normally taken to income when the goods are delivered or the service is provided. Where projects are identified as generating a loss, a provision is made to cover the entire loss. Hedging and portfolio management are taken into account. Costs that cannot be related to specific items of income are included in the accounts as they are incurred. In the case of the restructuring or termination of operations, all estimated associated costs are charged to the accounts at the time the relevant decision is taken. Where actual figures are not available at the time the accounts are prepared, generally accepted accounting principles dictate that the management should use the best possible estimates in the profit and loss account and balance sheet. Discrepancies may arise between esti-mated and actual figures. Assets/liabilities related to the working capital cycle and items falling due within one year of the year-end are classified as current assets/liabilities. Current assets/liabilities are valued at the lower/higher of cost and net realisable value. Net realisable value is defined as the expected future selling price, net of selling costs. Other assets are classified as fixed assets. Fixed assets are valued at cost. Fixed assets that reduce in value are depreciated. Any drop in the value of a fixed asset that is not considered temporary results in the write-down of that fixed asset. Equivalent policies are normally applied for liabil-ities. In line with generally accepted accounting principles, there are a few departures from the general valuation policies above, with any such departures being commented on in the relevant notes. Importance is attached to financial realities, and not solely to legal form, when applying accounting policies and presenting transactions and other matters. Conditional losses that are both likely and quantifiable are charged to the profit and loss account. The division of the segmental information is based on the company’s internal management and reporting objectives, and on risk and earnings. Sales figures are pre-sented for both the divisions and geographical areas, since the geo-graphical distribution of operations is important in any assessment of the company.
Consolidation of subsidiaries and joint venturesThe group accounts cover the parent company and its subsidiaries
(companies in which it directly or indirectly controls more than 50 per cent of the shares or otherwise has a significant influence) and joint ventures (companies over which it shares control with other shareholders under the terms of a specific agreement to this effect). Full line-by-line consolidation is used for subsidiaries and propor-tional line-by-line consolidation for joint ventures. The group accounts present the financial performance and posi-tion of the group as a single entity. The accounting policies are used consistently for all group companies to all intents and purposes. New subsidiaries are included in the accounts from the time a controlling influence is acquired, and companies that have been sold are included until the date of disposal. All inter-company transactions and bal-ances have therefore been eliminated. Unrealised gains on stocks of goods, etc. arising from inter-company transactions are eliminated in the group’s stocks and operating profit figures.
Elimination of shares in subsidiaries and joint venturesThe acquisition method has been used to consolidate holdings in sub-sidiaries and joint ventures. This means that the cost to the parent company of shares in subsidiaries and joint ventures is offset against their equity at the time of acquisition. Any excess paid over the book value of the separable net assets acquired is assigned to the assets to which it relates and depreciated in line with these assets, with the balance included as goodwill under intangible assets in the group balance sheet. Goodwill is amortised on a straight-line basis over its estimated useful life, normally ten years in the paint industry.
Translation of the accounts of subsidiaries and joint venturesThe profit and loss accounts of foreign subsidiaries and joint ventures are translated into NOK at the average exchange rates for each month, while their assets and liabilities are translated at the exchange rates ruling at the year-end. Translation differences arising on consolidation are taken directly to equity. Income and costs from hedging the equity of foreign com-panies are offset against translation differences. Translation differences attributable to minority interests are included under minority interests.
Subsidiaries in high-inflation countriesThe accounts of subsidiaries in countries with high rates of inflation, i.e. Jotun Toz Boya San. ve. Ticaret AS and Jotun Boya San. ve. Ticaret AS in Turkey are prepared in EUR and USD respectively as their notional currency. This means that their assets and liabilities are valued on the basis of their historical cost in these currencies.
Minority interestsMinority interests’ share of after-tax profit on ordinary activities and share of equity are shown on separate lines.
Financial instrumentsFinancial instruments are used extensively to reduce exchange rate and interest rate risk at Jotun. Exchange rate instruments are carried at market value and interest rate instruments are carried at the lower of cost and market value.
accounting policies
www.jotun.com42
Jotun manages the hedging of cash flows from operating activities exposed to exchange rate risk as a portfolio on the basis of anticipated future cash flows. Contracts used for this purpose do not qualify for hedge accounting. Gains/losses are recognised under other financial income/costs, and open contracts are carried at market value. The hedging of group balance sheet items can be divided into portfolios. This exposure relates primarily to the parent company’s net invest-ments in foreign operations. Normally instruments used to hedge such balance sheet items qualify for hedge accounting, so realised exchange rate gains/losses are taken directly to equity and offset against transla-tion differences. Open contracts hedging balance sheet items are carried at market value, and unrealised gains/losses are taken to equity. Where such instruments do not qualify for hedge accounting, changes in value are recognised under other financial income/costs. The interest component of a hedge is also taken to the profit and loss account under other financial income/costs. Various types of derivative are used to hedge interest rate risk on the basis of a portfolio view of the underlying items. The underlying items are primarily off balance sheet items. Since many hedges cannot be linked to specific loans, open contracts are valued at the lower of cost and market value. Gains/losses are recognised when realised under other financial income/costs.
Shares, bonds and other securitiesMarket-based shares, bonds and other financial instruments classified as current assets are valued at market value in line with § 5–8 of the Financial Reporting Act (Norway). Other securities classified as current assets are valued on a portfolio basis. The portfolio is managed as a single unit and, as such, its value is adjusted only if the total value of the portfolio falls below the total cost of the various securities it comprises. Securities classified as fixed assets are included at the lower of cost and market value.
Intangible assetsAll costs relating to market investments and research and develop-ment are charged to the profit and loss account on an ongoing basis. Acquired goodwill and technology are capitalised and amortised over their estimated useful life, normally five to ten years in the paint industry.
Tangible fixed assets and depreciationTangible fixed assets are reported at cost less accumulated deprecia-tion. Depreciation is charged against operating profit on a straight-line basis over the estimated useful life of an asset. Depreciation for the year is included in the annual operating profit. Where the net realisable value of a fixed asset is lower than its book value, and this is attributable to causes that are not considered temporary, the fixed asset is written down to its net realisable value.
Costs relating to normal maintenance and repairs are charged to the profit and loss account on an ongoing basis. Costs relating to major replacements and renewals that substantially increase the estimated useful life of a fixed asset are capitalised. Interest which relates to facilities under construction is capitalised as part of the cost.
StocksStocks are valued at the lowest of cost, materials cost and net realis-able value on a FIFO basis. The materials cost of semi-finished and finished goods produced internally is defined as direct materials and labour costs plus a proportion of indirect production costs. Allowances are made for obsolescence.
Debtors and liabilitiesDebtors and liabilities denominated in foreign currencies are trans-lated at the exchange rates ruling at the year-end. Debtors are included in the accounts at their full value, with deduc-tions for anticipated bad debts.
PensionsPensions are accounted for in line with NRS 6 of the Norwegian Accounting Standard. Pension liabilities relating to defined benefit plans are shown at the present value of projected pension benefits at the year-end. Pension scheme assets are shown at their market value. Any scheme surpluses are included in the balance sheet only where it is likely that they can be put to use. Actuarial gains and losses of up to 10 per cent of gross liabilities/assets are not taken to the profit and loss account, while any gain or loss in excess of 10 per cent is amortised over a period of three years. The year’s net pension costs are included in the profit and loss account under staff costs.
Tax and deferred taxThe tax charge relates to the accounting profit/loss for the year and comprises the sum of tax payable and the change in deferred tax lia-bilities and tax assets. Deferred tax is computed using the liability method on the basis of the temporary timing differences between values for tax and accounting purposes at the end of the year. The nominal tax rate is used in these calculations. Temporary positive and negative timing differences which reverse or may reverse in the same period are offset.
Cash flow statementThe cash flow statement is prepared using the indirect method. Cash and cash equivalents comprise cash, bank deposits and other short-term liquid investments which can be converted to known cash amounts immediately with no material price risk.
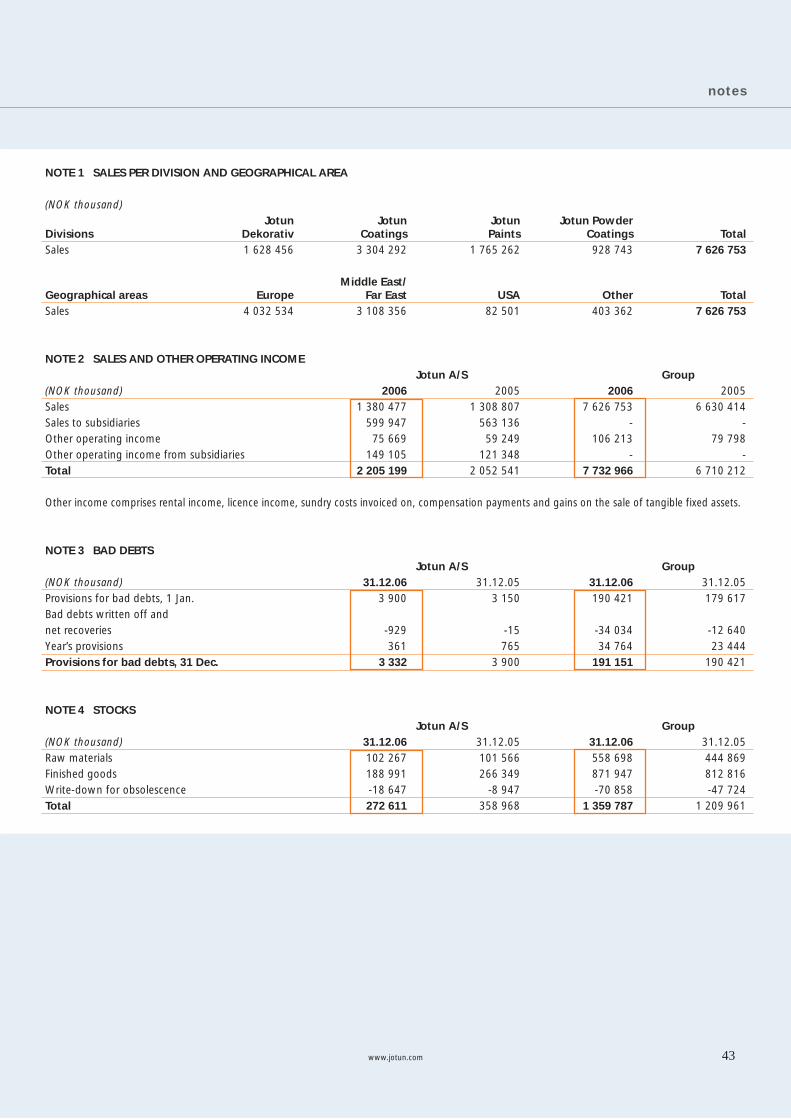
notes
www.jotun.com 43
NOTE 1 SALES PER DIVISION AND GEOGRAPHICAL AREA
(NOK thousand) Jotun Jotun Jotun Jotun PowderDivisions Dekorativ Coatings Paints Coatings TotalSales 1 628 456 3 304 292 1 765 262 928 743 7 626 753
Middle East/ Geographical areas Europe Far East USA Other TotalSales 4 032 534 3 108 356 82 501 403 362 7 626 753
NOTE 2 SALES AND OTHER OPERATING INCOME Jotun A/S Group(NOK thousand) 2006 2005 2006 2005Sales 1 380 477 1 308 807 7 626 753 6 630 414Sales to subsidiaries 599 947 563 136 - - Other operating income 75 669 59 249 106 213 79 798Other operating income from subsidiaries 149 105 121 348 - - Total 2 205 199 2 052 541 7 732 966 6 710 212 Other income comprises rental income, licence income, sundry costs invoiced on, compensation payments and gains on the sale of tangible fixed assets.
NOTE 3 BAD DEBTS Jotun A/S Group(NOK thousand) 31.12.06 31.12.05 31.12.06 31.12.05Provisions for bad debts, 1 Jan. 3 900 3 150 190 421 179 617Bad debts written off and net recoveries -929 -15 -34 034 -12 640Year’s provisions 361 765 34 764 23 444Provisions for bad debts, 31 Dec. 3 332 3 900 191 151 190 421
NOTE 4 STOCKS Jotun A/S Group(NOK thousand) 31.12.06 31.12.05 31.12.06 31.12.05Raw materials 102 267 101 566 558 698 444 869Finished goods 188 991 266 349 871 947 812 816Write-down for obsolescence -18 647 -8 947 -70 858 -47 724Total 272 611 358 968 1 359 787 1 209 961
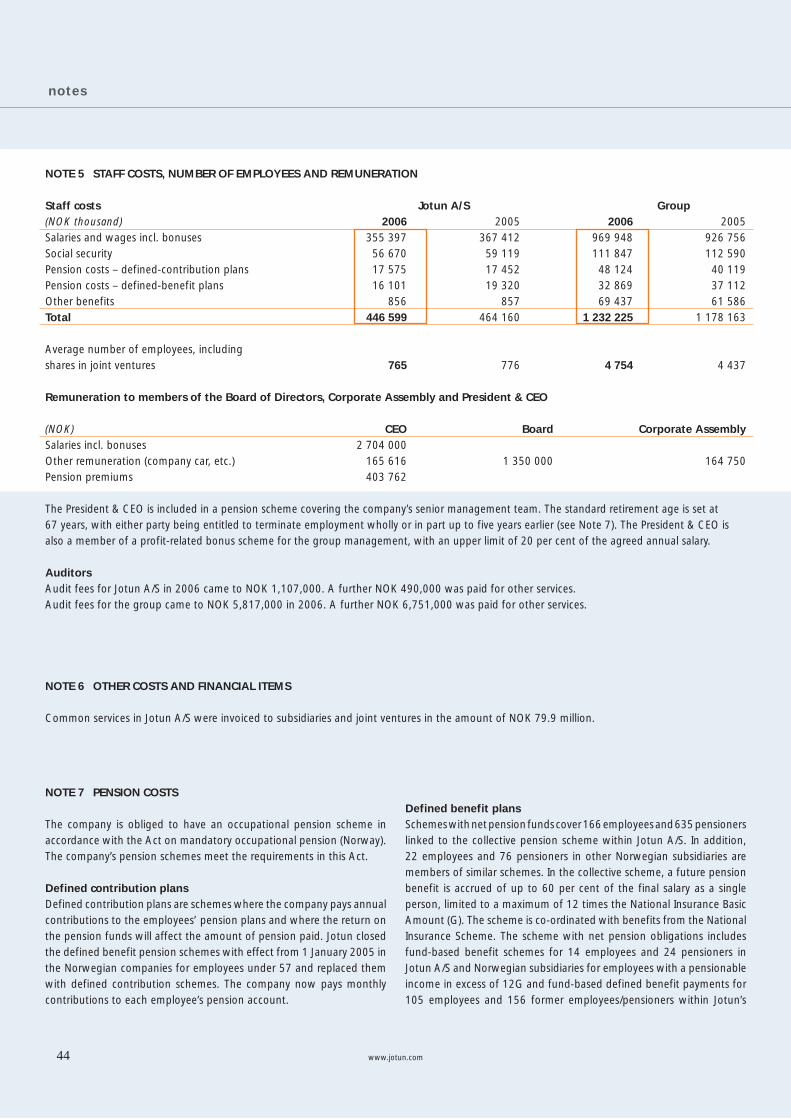
notes
www.jotun.com44
NOTE 5 STAFF COSTS, NUMBER OF EMPLOYEES AND REMUNERATION
Staff costs Jotun A/S Group(NOK thousand) 2006 2005 2006 2005Salaries and wages incl. bonuses 355 397 367 412 969 948 926 756Social security 56 670 59 119 111 847 112 590Pension costs – defined-contribution plans 17 575 17 452 48 124 40 119Pension costs – defined-benefit plans 16 101 19 320 32 869 37 112Other benefits 856 857 69 437 61 586Total 446 599 464 160 1 232 225 1 178 163 Average number of employees, including shares in joint ventures 765 776 4 754 4 437 Remuneration to members of the Board of Directors, Corporate Assembly and President & CEO
(NOK) CEO Board Corporate AssemblySalaries incl. bonuses 2 704 000Other remuneration (company car, etc.) 165 616 1 350 000 164 750Pension premiums 403 762
The President & CEO is included in a pension scheme covering the company’s senior management team. The standard retirement age is set at 67 years, with either party being entitled to terminate employment wholly or in part up to five years earlier (see Note 7). The President & CEO is also a member of a profit-related bonus scheme for the group management, with an upper limit of 20 per cent of the agreed annual salary.
AuditorsAudit fees for Jotun A/S in 2006 came to NOK 1,107,000. A further NOK 490,000 was paid for other services. Audit fees for the group came to NOK 5,817,000 in 2006. A further NOK 6,751,000 was paid for other services.
NOTE 7 PENSION COSTS
The company is obliged to have an occupational pension scheme in accordance with the Act on mandatory occupational pension (Norway).The company’s pension schemes meet the requirements in this Act.
Defined contribution plansDefined contribution plans are schemes where the company pays annual contributions to the employees’ pension plans and where the return on the pension funds will affect the amount of pension paid. Jotun closed the defined benefit pension schemes with effect from 1 January 2005 in the Norwegian companies for employees under 57 and replaced them with defined contribution schemes. The company now pays monthly contributions to each employee’s pension account.
Defined benefit plansSchemes with net pension funds cover 166 employees and 635 pensioners linked to the collective pension scheme within Jotun A/S. In addition, 22 employees and 76 pensioners in other Norwegian subsidiaries are members of similar schemes. In the collective scheme, a future pension benefit is accrued of up to 60 per cent of the final salary as a single person, limited to a maximum of 12 times the National Insurance Basic Amount (G). The scheme is co-ordinated with benefits from the National Insurance Scheme. The scheme with net pension obligations includes fund-based benefit schemes for 14 employees and 24 pensioners in Jotun A/S and Norwegian subsidiaries for employees with a pensionable income in excess of 12G and fund-based defined benefit payments for 105 employees and 156 former employees/ pensioners within Jotun’s
NOTE 6 OTHER COSTS AND FINANCIAL ITEMS
Common services in Jotun A/S were invoiced to subsidiaries and joint ventures in the amount of NOK 79.9 million.
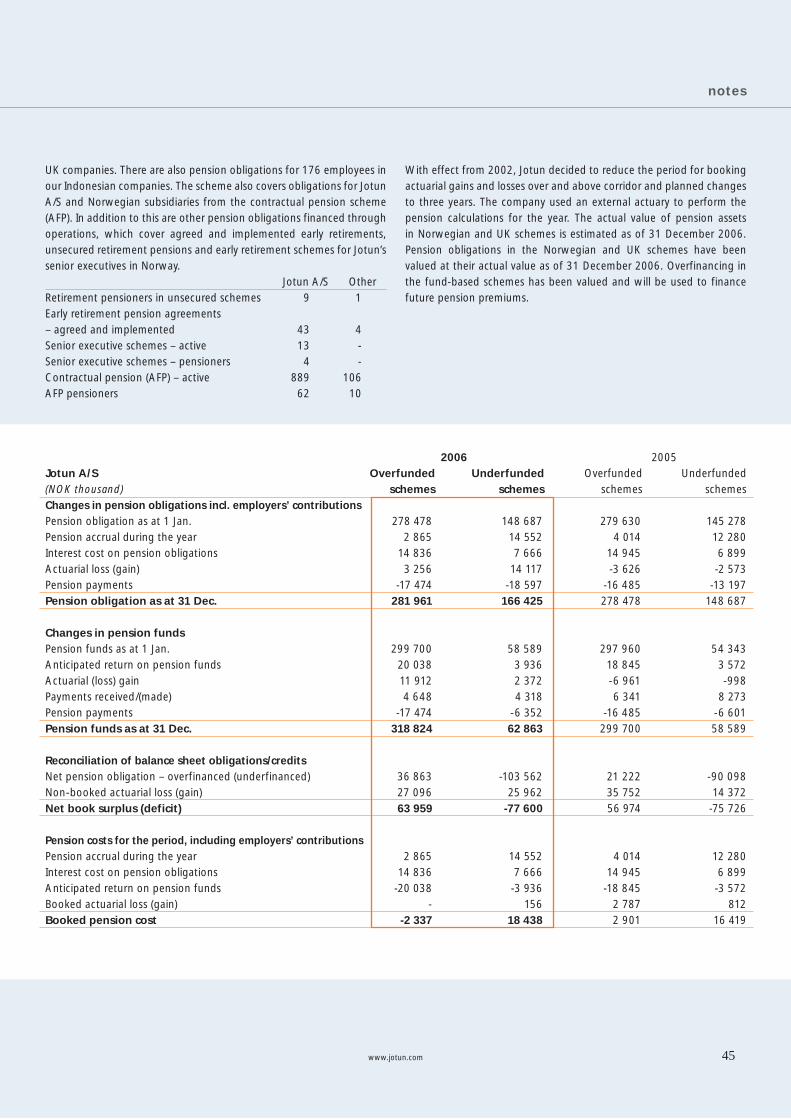
notes
www.jotun.com 45
UK companies. There are also pension obligations for 176 employees in our Indonesian companies. The scheme also covers obligations for Jotun A/S and Norwegian subsidiaries from the contractual pension scheme (AFP). In addition to this are other pension obligations financed through operations, which cover agreed and implemented early retirements, unsecured retirement pensions and early retirement schemes for Jotun’s senior executives in Norway. Jotun A/S Other Retirement pensioners in unsecured schemes 9 1Early retirement pension agreements – agreed and implemented 43 4Senior executive schemes – active 13 -Senior executive schemes – pensioners 4 -Contractual pension (AFP) – active 889 106AFP pensioners 62 10
2006 2005Jotun A/S Overfunded Underfunded Overfunded Underfunded (NOK thousand) schemes schemes schemes schemesChanges in pension obligations incl. employers’ contributionsPension obligation as at 1 Jan. 278 478 148 687 279 630 145 278 Pension accrual during the year 2 865 14 552 4 014 12 280 Interest cost on pension obligations 14 836 7 666 14 945 6 899 Actuarial loss (gain) 3 256 14 117 -3 626 -2 573 Pension payments -17 474 -18 597 -16 485 -13 197 Pension obligation as at 31 Dec. 281 961 166 425 278 478 148 687 Changes in pension funds Pension funds as at 1 Jan. 299 700 58 589 297 960 54 343 Anticipated return on pension funds 20 038 3 936 18 845 3 572 Actuarial (loss) gain 11 912 2 372 -6 961 -998 Payments received/(made) 4 648 4 318 6 341 8 273 Pension payments -17 474 -6 352 -16 485 -6 601 Pension funds as at 31 Dec. 318 824 62 863 299 700 58 589 Reconciliation of balance sheet obligations/credits Net pension obligation – overfinanced (underfinanced) 36 863 -103 562 21 222 -90 098 Non-booked actuarial loss (gain) 27 096 25 962 35 752 14 372 Net book surplus (deficit) 63 959 -77 600 56 974 -75 726 Pension costs for the period, including employers’ contributions Pension accrual during the year 2 865 14 552 4 014 12 280 Interest cost on pension obligations 14 836 7 666 14 945 6 899 Anticipated return on pension funds -20 038 -3 936 -18 845 -3 572 Booked actuarial loss (gain) - 156 2 787 812 Booked pension cost -2 337 18 438 2 901 16 419
With effect from 2002, Jotun decided to reduce the period for booking actuarial gains and losses over and above corridor and planned changes to three years. The company used an external actuary to perform the pension calculations for the year. The actual value of pension assets in Norwegian and UK schemes is estimated as of 31 December 2006. Pension obligations in the Norwegian and UK schemes have been valued at their actual value as of 31 December 2006. Overfinancing in the fund-based schemes has been valued and will be used to finance future pension premiums.
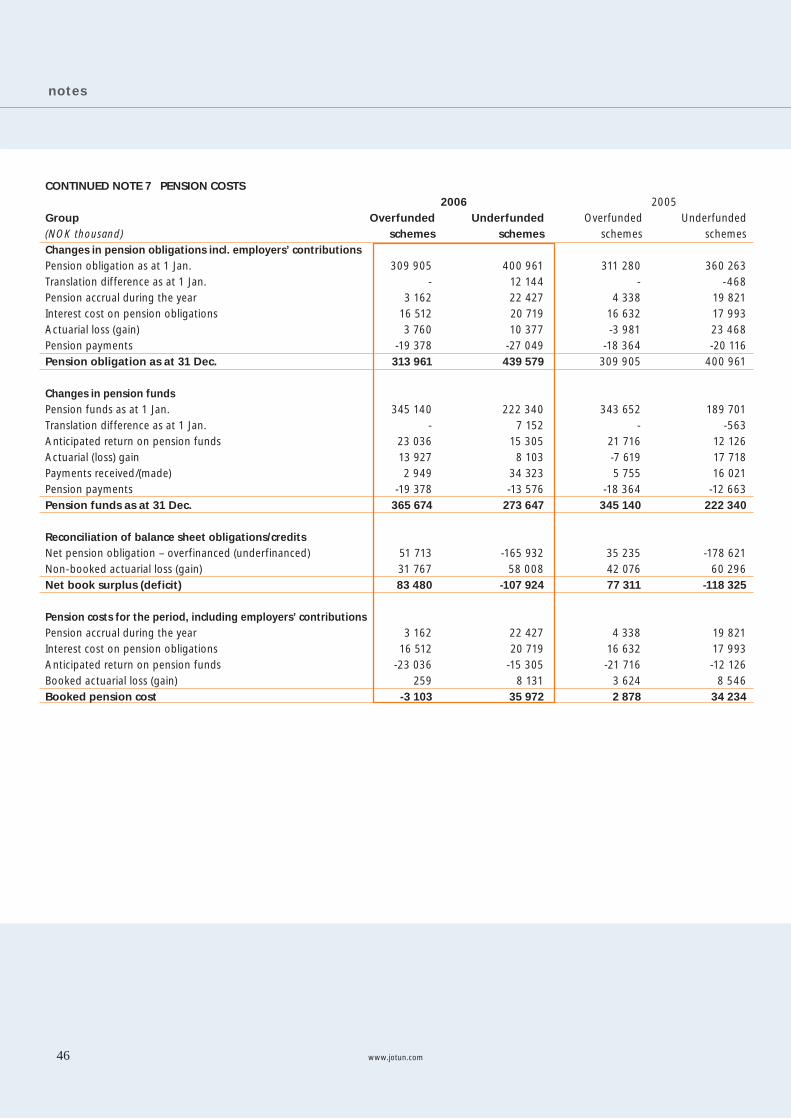
notes
www.jotun.com46
CONTINUED NOTE 7 PENSION COSTS 2006 2005Group Overfunded Underfunded Overfunded Underfunded (NOK thousand) schemes schemes schemes schemesChanges in pension obligations incl. employers’ contributionsPension obligation as at 1 Jan. 309 905 400 961 311 280 360 263 Translation difference as at 1 Jan. - 12 144 - -468 Pension accrual during the year 3 162 22 427 4 338 19 821 Interest cost on pension obligations 16 512 20 719 16 632 17 993 Actuarial loss (gain) 3 760 10 377 -3 981 23 468 Pension payments -19 378 -27 049 -18 364 -20 116 Pension obligation as at 31 Dec. 313 961 439 579 309 905 400 961
Changes in pension funds Pension funds as at 1 Jan. 345 140 222 340 343 652 189 701 Translation difference as at 1 Jan. - 7 152 - -563 Anticipated return on pension funds 23 036 15 305 21 716 12 126 Actuarial (loss) gain 13 927 8 103 -7 619 17 718 Payments received/(made) 2 949 34 323 5 755 16 021 Pension payments -19 378 -13 576 -18 364 -12 663 Pension funds as at 31 Dec. 365 674 273 647 345 140 222 340
Reconciliation of balance sheet obligations/credits Net pension obligation – overfinanced (underfinanced) 51 713 -165 932 35 235 -178 621 Non-booked actuarial loss (gain) 31 767 58 008 42 076 60 296 Net book surplus (deficit) 83 480 -107 924 77 311 -118 325
Pension costs for the period, including employers’ contributions Pension accrual during the year 3 162 22 427 4 338 19 821 Interest cost on pension obligations 16 512 20 719 16 632 17 993 Anticipated return on pension funds -23 036 -15 305 -21 716 -12 126 Booked actuarial loss (gain) 259 8 131 3 624 8 546Booked pension cost -3 103 35 972 2 878 34 234
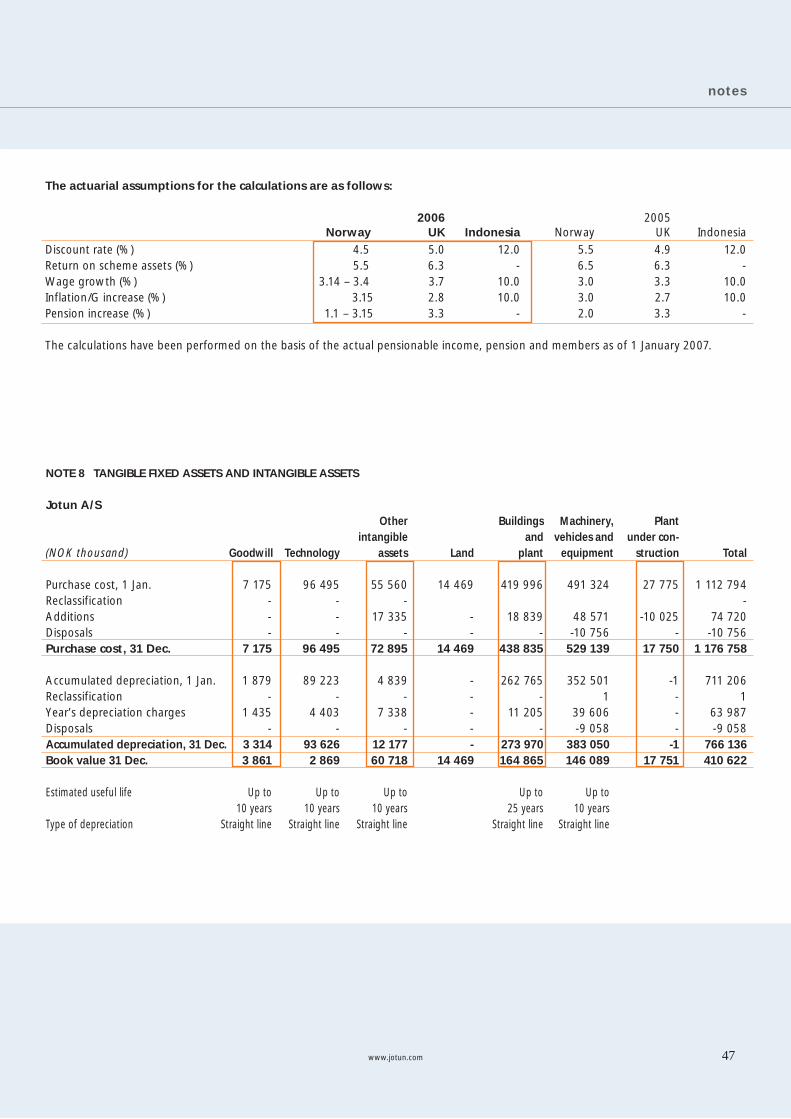
notes
www.jotun.com 47
NOTE 8 TANGIBLE FIXED ASSETS AND INTANGIBLE ASSETS
Jotun A/S Other Buildings Machinery, Plant intangible and vehicles and under con-(NOK thousand) Goodwill Technology assets Land plant equipment struction Total Purchase cost, 1 Jan. 7 175 96 495 55 560 14 469 419 996 491 324 27 775 1 112 794Reclassification - - - -Additions - - 17 335 - 18 839 48 571 -10 025 74 720Disposals - - - - - -10 756 - -10 756Purchase cost, 31 Dec. 7 175 96 495 72 895 14 469 438 835 529 139 17 750 1 176 758 Accumulated depreciation, 1 Jan. 1 879 89 223 4 839 - 262 765 352 501 -1 711 206Reclassification - - - - - 1 - 1Year’s depreciation charges 1 435 4 403 7 338 - 11 205 39 606 - 63 987Disposals - - - - - -9 058 - -9 058Accumulated depreciation, 31 Dec. 3 314 93 626 12 177 - 273 970 383 050 -1 766 136Book value 31 Dec. 3 861 2 869 60 718 14 469 164 865 146 089 17 751 410 622 Estimated useful life Up to Up to Up to Up to Up to 10 years 10 years 10 years 25 years 10 yearsType of depreciation Straight line Straight line Straight line Straight line Straight line
The actuarial assumptions for the calculations are as follows:
2006 2005 Norway UK Indonesia Norway UK IndonesiaDiscount rate (%) 4.5 5.0 12.0 5.5 4.9 12.0Return on scheme assets (%) 5.5 6.3 - 6.5 6.3 -Wage growth (%) 3.14 – 3.4 3.7 10.0 3.0 3.3 10.0Inflation/G increase (%) 3.15 2.8 10.0 3.0 2.7 10.0Pension increase (%) 1.1 – 3.15 3.3 - 2.0 3.3 -
The calculations have been performed on the basis of the actual pensionable income, pension and members as of 1 January 2007.
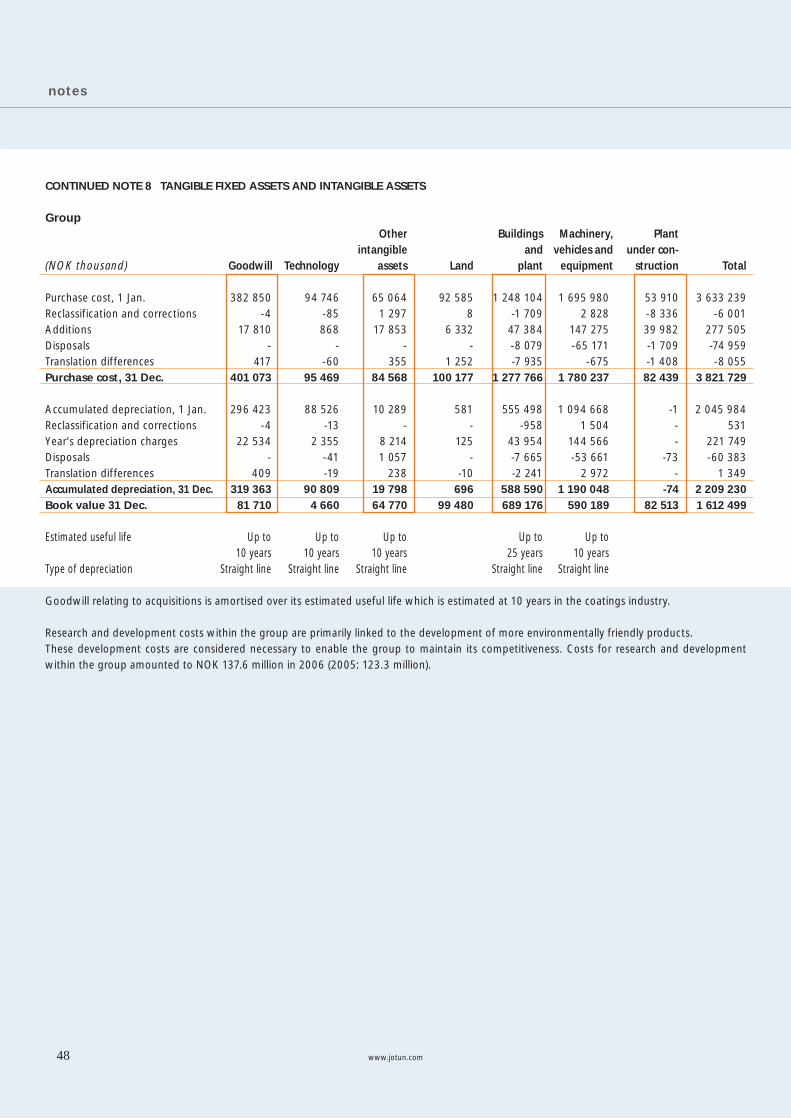
notes
48 www.jotun.com
CONTINUED NOTE 8 TANGIBLE FIXED ASSETS AND INTANGIBLE ASSETS
Group Other Buildings Machinery, Plant intangible and vehicles and under con-(NOK thousand) Goodwill Technology assets Land plant equipment struction Total
Purchase cost, 1 Jan. 382 850 94 746 65 064 92 585 1 248 104 1 695 980 53 910 3 633 239Reclassification and corrections -4 -85 1 297 8 -1 709 2 828 -8 336 -6 001Additions 17 810 868 17 853 6 332 47 384 147 275 39 982 277 505Disposals - - - - -8 079 -65 171 -1 709 -74 959Translation differences 417 -60 355 1 252 -7 935 -675 -1 408 -8 055Purchase cost, 31 Dec. 401 073 95 469 84 568 100 177 1 277 766 1 780 237 82 439 3 821 729 Accumulated depreciation, 1 Jan. 296 423 88 526 10 289 581 555 498 1 094 668 -1 2 045 984Reclassification and corrections -4 -13 - - -958 1 504 - 531Year’s depreciation charges 22 534 2 355 8 214 125 43 954 144 566 - 221 749Disposals - -41 1 057 - -7 665 -53 661 -73 -60 383Translation differences 409 -19 238 -10 -2 241 2 972 - 1 349Accumulated depreciation, 31 Dec. 319 363 90 809 19 798 696 588 590 1 190 048 -74 2 209 230Book value 31 Dec. 81 710 4 660 64 770 99 480 689 176 590 189 82 513 1 612 499
Estimated useful life Up to Up to Up to Up to Up to 10 years 10 years 10 years 25 years 10 yearsType of depreciation Straight line Straight line Straight line Straight line Straight line
Goodwill relating to acquisitions is amortised over its estimated useful life which is estimated at 10 years in the coatings industry.
Research and development costs within the group are primarily linked to the development of more environmentally friendly products.These development costs are considered necessary to enable the group to maintain its competitiveness. Costs for research and development within the group amounted to NOK 137.6 million in 2006 (2005: 123.3 million).
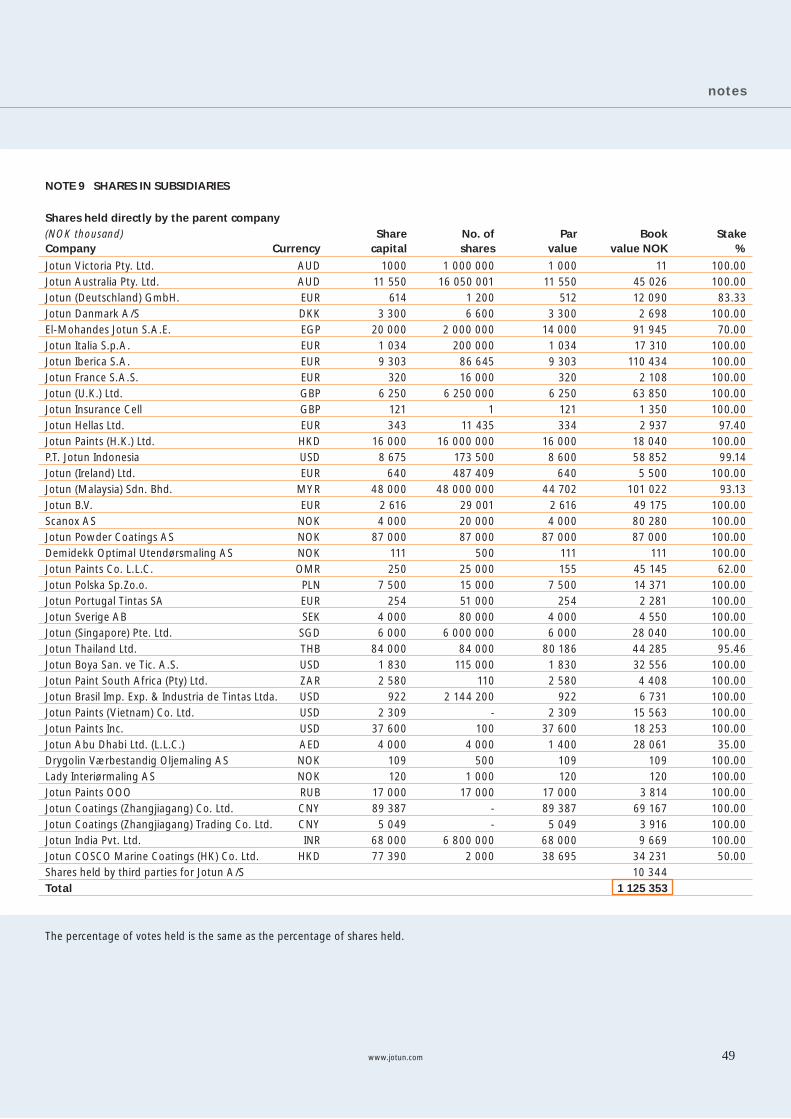
notes
www.jotun.com 49
NOTE 9 SHARES IN SUBSIDIARIES
Shares held directly by the parent company (NOK thousand) Share No. of Par Book StakeCompany Currency capital shares value value NOK %
Jotun Victoria Pty. Ltd. AUD 1000 1 000 000 1 000 11 100.00 Jotun Australia Pty. Ltd. AUD 11 550 16 050 001 11 550 45 026 100.00 Jotun (Deutschland) GmbH. EUR 614 1 200 512 12 090 83.33 Jotun Danmark A/S DKK 3 300 6 600 3 300 2 698 100.00 El-Mohandes Jotun S.A.E. EGP 20 000 2 000 000 14 000 91 945 70.00 Jotun Italia S.p.A. EUR 1 034 200 000 1 034 17 310 100.00 Jotun Iberica S.A. EUR 9 303 86 645 9 303 110 434 100.00 Jotun France S.A.S. EUR 320 16 000 320 2 108 100.00 Jotun (U.K.) Ltd. GBP 6 250 6 250 000 6 250 63 850 100.00 Jotun Insurance Cell GBP 121 1 121 1 350 100.00 Jotun Hellas Ltd. EUR 343 11 435 334 2 937 97.40 Jotun Paints (H.K.) Ltd. HKD 16 000 16 000 000 16 000 18 040 100.00 P.T. Jotun Indonesia USD 8 675 173 500 8 600 58 852 99.14 Jotun (Ireland) Ltd. EUR 640 487 409 640 5 500 100.00 Jotun (Malaysia) Sdn. Bhd. MYR 48 000 48 000 000 44 702 101 022 93.13 Jotun B.V. EUR 2 616 29 001 2 616 49 175 100.00 Scanox AS NOK 4 000 20 000 4 000 80 280 100.00 Jotun Powder Coatings AS NOK 87 000 87 000 87 000 87 000 100.00 Demidekk Optimal Utendørsmaling AS NOK 111 500 111 111 100.00 Jotun Paints Co. L.L.C. OMR 250 25 000 155 45 145 62.00 Jotun Polska Sp.Zo.o. PLN 7 500 15 000 7 500 14 371 100.00 Jotun Portugal Tintas SA EUR 254 51 000 254 2 281 100.00 Jotun Sverige AB SEK 4 000 80 000 4 000 4 550 100.00 Jotun (Singapore) Pte. Ltd. SGD 6 000 6 000 000 6 000 28 040 100.00 Jotun Thailand Ltd. THB 84 000 84 000 80 186 44 285 95.46 Jotun Boya San. ve Tic. A.S. USD 1 830 115 000 1 830 32 556 100.00 Jotun Paint South Africa (Pty) Ltd. ZAR 2 580 110 2 580 4 408 100.00 Jotun Brasil Imp. Exp. & Industria de Tintas Ltda. USD 922 2 144 200 922 6 731 100.00 Jotun Paints (Vietnam) Co. Ltd. USD 2 309 - 2 309 15 563 100.00 Jotun Paints Inc. USD 37 600 100 37 600 18 253 100.00 Jotun Abu Dhabi Ltd. (L.L.C.) AED 4 000 4 000 1 400 28 061 35.00 Drygolin Værbestandig Oljemaling AS NOK 109 500 109 109 100.00 Lady Interiørmaling AS NOK 120 1 000 120 120 100.00 Jotun Paints OOO RUB 17 000 17 000 17 000 3 814 100.00 Jotun Coatings (Zhangjiagang) Co. Ltd. CNY 89 387 - 89 387 69 167 100.00 Jotun Coatings (Zhangjiagang) Trading Co. Ltd. CNY 5 049 - 5 049 3 916 100.00 Jotun India Pvt. Ltd. INR 68 000 6 800 000 68 000 9 669 100.00 Jotun COSCO Marine Coatings (HK) Co. Ltd. HKD 77 390 2 000 38 695 34 231 50.00 Shares held by third parties for Jotun A/S 10 344 Total 1 125 353
The percentage of votes held is the same as the percentage of shares held.
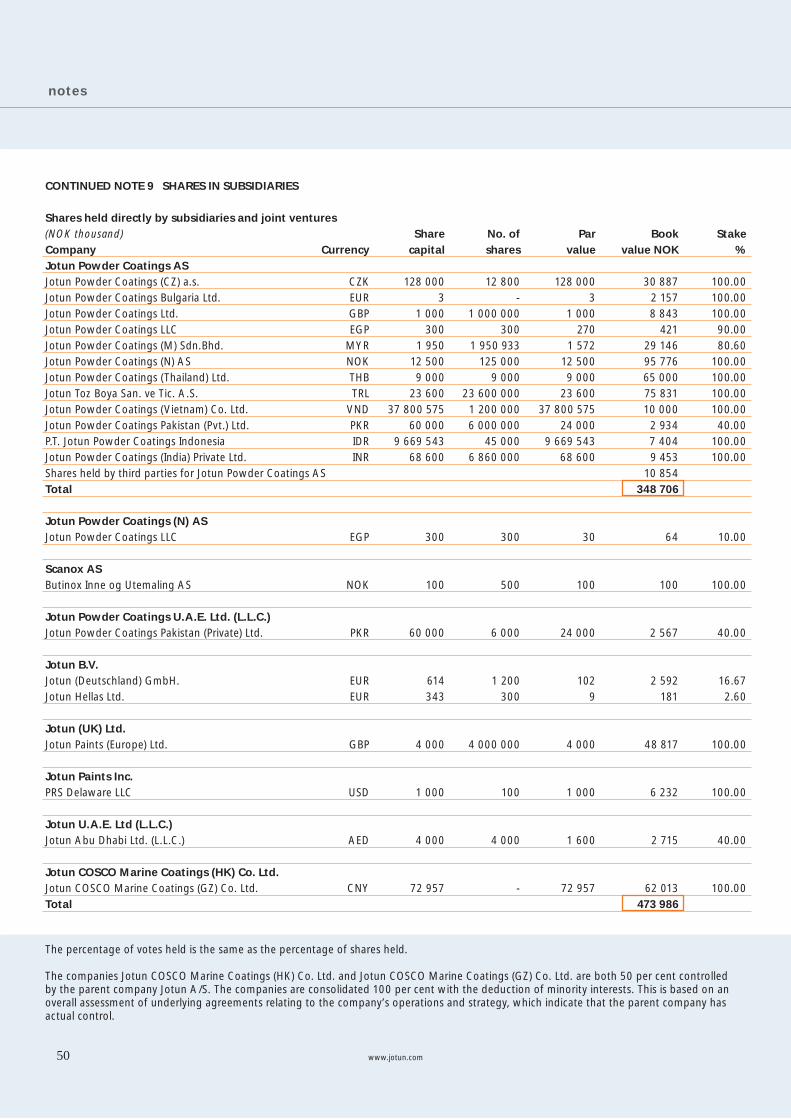
notes
www.jotun.com50
CONTINUED NOTE 9 SHARES IN SUBSIDIARIES
Shares held directly by subsidiaries and joint ventures(NOK thousand) Share No. of Par Book Stake Company Currency capital shares value value NOK % Jotun Powder Coatings ASJotun Powder Coatings (CZ) a.s. CZK 128 000 12 800 128 000 30 887 100.00 Jotun Powder Coatings Bulgaria Ltd. EUR 3 - 3 2 157 100.00 Jotun Powder Coatings Ltd. GBP 1 000 1 000 000 1 000 8 843 100.00 Jotun Powder Coatings LLC EGP 300 300 270 421 90.00 Jotun Powder Coatings (M) Sdn.Bhd. MYR 1 950 1 950 933 1 572 29 146 80.60 Jotun Powder Coatings (N) AS NOK 12 500 125 000 12 500 95 776 100.00 Jotun Powder Coatings (Thailand) Ltd. THB 9 000 9 000 9 000 65 000 100.00 Jotun Toz Boya San. ve Tic. A.S. TRL 23 600 23 600 000 23 600 75 831 100.00 Jotun Powder Coatings (Vietnam) Co. Ltd. VND 37 800 575 1 200 000 37 800 575 10 000 100.00 Jotun Powder Coatings Pakistan (Pvt.) Ltd. PKR 60 000 6 000 000 24 000 2 934 40.00 P.T. Jotun Powder Coatings Indonesia IDR 9 669 543 45 000 9 669 543 7 404 100.00 Jotun Powder Coatings (India) Private Ltd. INR 68 600 6 860 000 68 600 9 453 100.00 Shares held by third parties for Jotun Powder Coatings AS 10 854 Total 348 706 Jotun Powder Coatings (N) AS Jotun Powder Coatings LLC EGP 300 300 30 64 10.00
Scanox AS Butinox Inne og Utemaling AS NOK 100 500 100 100 100.00
Jotun Powder Coatings U.A.E. Ltd. (L.L.C.)Jotun Powder Coatings Pakistan (Private) Ltd. PKR 60 000 6 000 24 000 2 567 40.00
Jotun B.V.Jotun (Deutschland) GmbH. EUR 614 1 200 102 2 592 16.67Jotun Hellas Ltd. EUR 343 300 9 181 2.60
Jotun (UK) Ltd.Jotun Paints (Europe) Ltd. GBP 4 000 4 000 000 4 000 48 817 100.00
Jotun Paints Inc.PRS Delaware LLC USD 1 000 100 1 000 6 232 100.00
Jotun U.A.E. Ltd (L.L.C.)Jotun Abu Dhabi Ltd. (L.L.C.) AED 4 000 4 000 1 600 2 715 40.00
Jotun COSCO Marine Coatings (HK) Co. Ltd.Jotun COSCO Marine Coatings (GZ) Co. Ltd. CNY 72 957 - 72 957 62 013 100.00Total 473 986
The percentage of votes held is the same as the percentage of shares held.
The companies Jotun COSCO Marine Coatings (HK) Co. Ltd. and Jotun COSCO Marine Coatings (GZ) Co. Ltd. are both 50 per cent controlled by the parent company Jotun A/S. The companies are consolidated 100 per cent with the deduction of minority interests. This is based on an overall assessment of underlying agreements relating to the company’s operations and strategy, which indicate that the parent company has actual control.
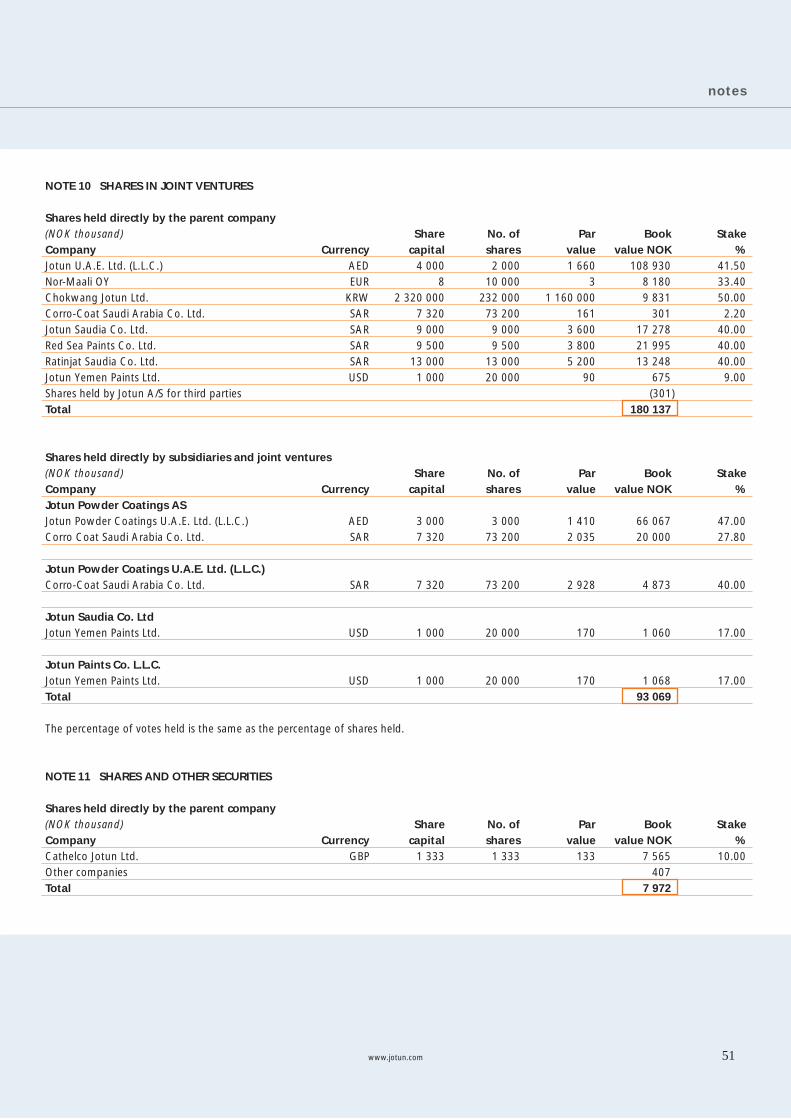
notes
www.jotun.com 51
NOTE 10 SHARES IN JOINT VENTURES
Shares held directly by the parent company(NOK thousand) Share No. of Par Book Stake Company Currency capital shares value value NOK % Jotun U.A.E. Ltd. (L.L.C.) AED 4 000 2 000 1 660 108 930 41.50Nor-Maali OY EUR 8 10 000 3 8 180 33.40Chokwang Jotun Ltd. KRW 2 320 000 232 000 1 160 000 9 831 50.00Corro-Coat Saudi Arabia Co. Ltd. SAR 7 320 73 200 161 301 2.20Jotun Saudia Co. Ltd. SAR 9 000 9 000 3 600 17 278 40.00Red Sea Paints Co. Ltd. SAR 9 500 9 500 3 800 21 995 40.00Ratinjat Saudia Co. Ltd. SAR 13 000 13 000 5 200 13 248 40.00Jotun Yemen Paints Ltd. USD 1 000 20 000 90 675 9.00Shares held by Jotun A/S for third parties (301) Total 180 137
Shares held directly by subsidiaries and joint ventures(NOK thousand) Share No. of Par Book Stake Company Currency capital shares value value NOK % Jotun Powder Coatings AS Jotun Powder Coatings U.A.E. Ltd. (L.L.C.) AED 3 000 3 000 1 410 66 067 47.00Corro Coat Saudi Arabia Co. Ltd. SAR 7 320 73 200 2 035 20 000 27.80
Jotun Powder Coatings U.A.E. Ltd. (L.L.C.) Corro-Coat Saudi Arabia Co. Ltd. SAR 7 320 73 200 2 928 4 873 40.00
Jotun Saudia Co. Ltd Jotun Yemen Paints Ltd. USD 1 000 20 000 170 1 060 17.00
Jotun Paints Co. L.L.C. Jotun Yemen Paints Ltd. USD 1 000 20 000 170 1 068 17.00Total 93 069
The percentage of votes held is the same as the percentage of shares held.
NOTE 11 SHARES AND OTHER SECURITIES
Shares held directly by the parent company(NOK thousand) Share No. of Par Book Stake Company Currency capital shares value value NOK % Cathelco Jotun Ltd. GBP 1 333 1 333 133 7 565 10.00 Other companies 407 Total 7 972
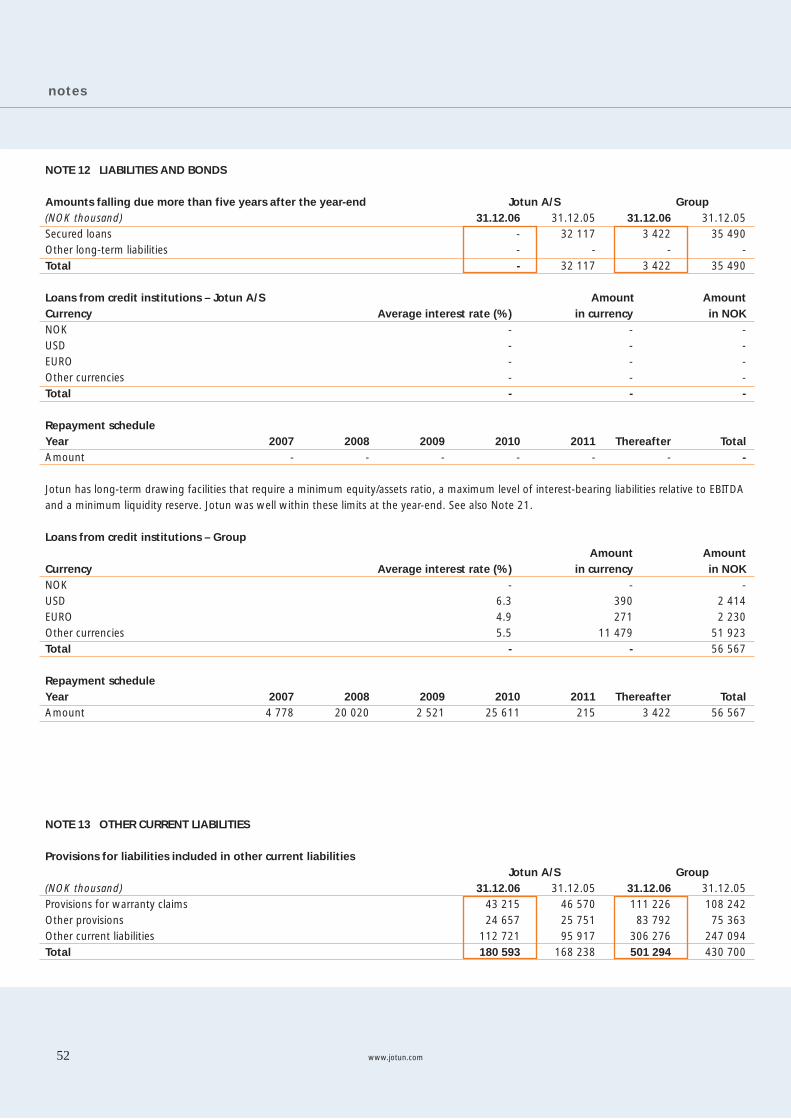
notes
www.jotun.com52
NOTE 13 OTHER CURRENT LIABILITIES
Provisions for liabilities included in other current liabilities Jotun A/S Group(NOK thousand) 31.12.06 31.12.05 31.12.06 31.12.05Provisions for warranty claims 43 215 46 570 111 226 108 242Other provisions 24 657 25 751 83 792 75 363Other current liabilities 112 721 95 917 306 276 247 094Total 180 593 168 238 501 294 430 700
NOTE 12 LIABILITIES AND BONDS
Amounts falling due more than five years after the year-end Jotun A/S Group(NOK thousand) 31.12.06 31.12.05 31.12.06 31.12.05Secured loans - 32 117 3 422 35 490Other long-term liabilities - - - -Total - 32 117 3 422 35 490
Loans from credit institutions – Jotun A/S Amount AmountCurrency Average interest rate (%) in currency in NOKNOK - - -USD - - -EURO - - -Other currencies - - -Total - - -
Repayment scheduleYear 2007 2008 2009 2010 2011 Thereafter TotalAmount - - - - - - -
Jotun has long-term drawing facilities that require a minimum equity/assets ratio, a maximum level of interest-bearing liabilities relative to EBITDA and a minimum liquidity reserve. Jotun was well within these limits at the year-end. See also Note 21.
Loans from credit institutions – Group Amount AmountCurrency Average interest rate (%) in currency in NOKNOK - - -USD 6.3 390 2 414EURO 4.9 271 2 230Other currencies 5.5 11 479 51 923Total - - 56 567
Repayment scheduleYear 2007 2008 2009 2010 2011 Thereafter TotalAmount 4 778 20 020 2 521 25 611 215 3 422 56 567
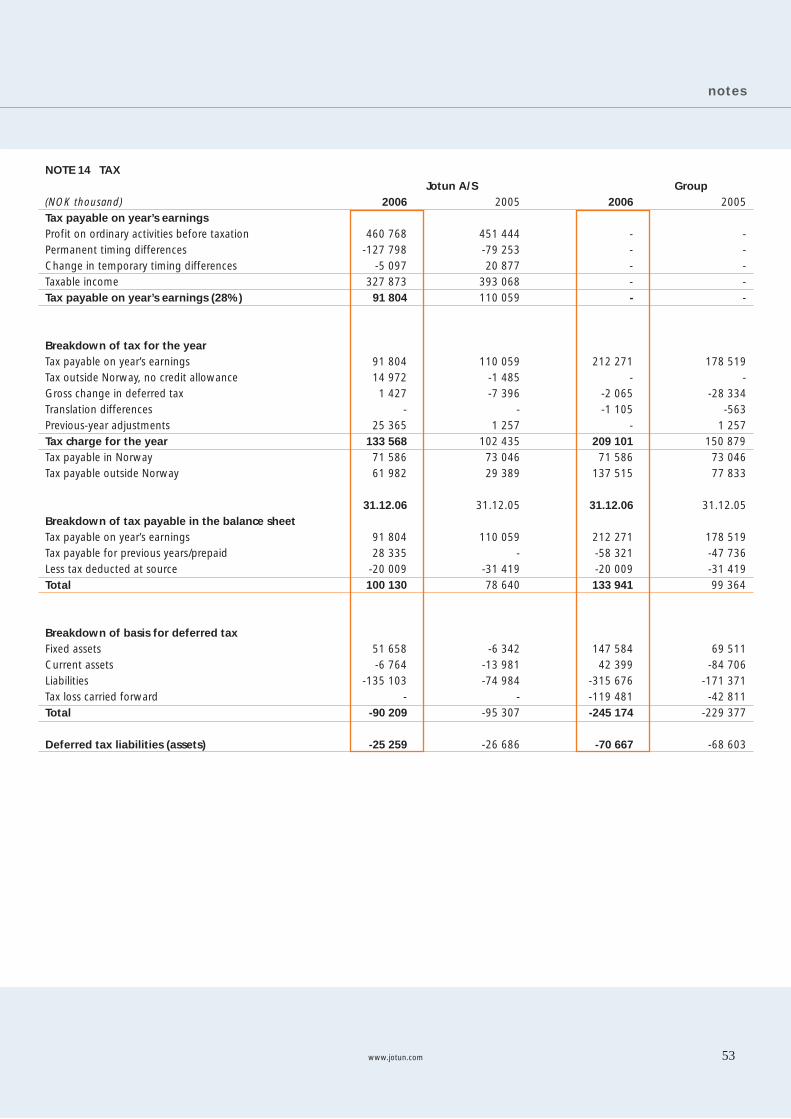
notes
www.jotun.com 53
NOTE 14 TAX Jotun A/S Group(NOK thousand) 2006 2005 2006 2005Tax payable on year’s earningsProfit on ordinary activities before taxation 460 768 451 444 - -Permanent timing differences -127 798 -79 253 - -Change in temporary timing differences -5 097 20 877 - -Taxable income 327 873 393 068 - -Tax payable on year’s earnings (28%) 91 804 110 059 - - Breakdown of tax for the yearTax payable on year’s earnings 91 804 110 059 212 271 178 519Tax outside Norway, no credit allowance 14 972 -1 485 - -Gross change in deferred tax 1 427 -7 396 -2 065 -28 334Translation differences - - -1 105 -563Previous-year adjustments 25 365 1 257 - 1 257Tax charge for the year 133 568 102 435 209 101 150 879Tax payable in Norway 71 586 73 046 71 586 73 046Tax payable outside Norway 61 982 29 389 137 515 77 833 31.12.06 31.12.05 31.12.06 31.12.05Breakdown of tax payable in the balance sheetTax payable on year’s earnings 91 804 110 059 212 271 178 519Tax payable for previous years/prepaid 28 335 - -58 321 -47 736 Less tax deducted at source -20 009 -31 419 -20 009 -31 419Total 100 130 78 640 133 941 99 364 Breakdown of basis for deferred tax Fixed assets 51 658 -6 342 147 584 69 511Current assets -6 764 -13 981 42 399 -84 706Liabilities -135 103 -74 984 -315 676 -171 371Tax loss carried forward - - -119 481 -42 811Total -90 209 -95 307 -245 174 -229 377 Deferred tax liabilities (assets) -25 259 -26 686 -70 667 -68 603
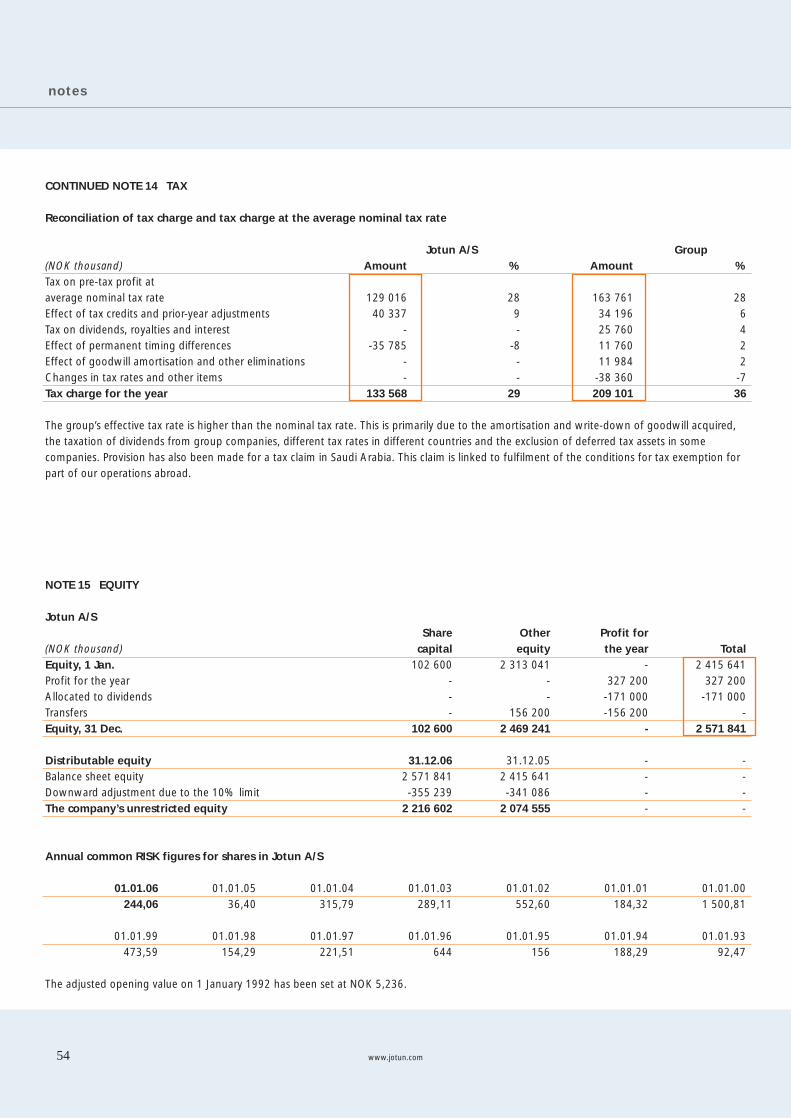
notes
www.jotun.com54
CONTINUED NOTE 14 TAX
Reconciliation of tax charge and tax charge at the average nominal tax rate Jotun A/S Group(NOK thousand) Amount % Amount %Tax on pre-tax profit at average nominal tax rate 129 016 28 163 761 28Effect of tax credits and prior-year adjustments 40 337 9 34 196 6Tax on dividends, royalties and interest - - 25 760 4Effect of permanent timing differences -35 785 -8 11 760 2Effect of goodwill amortisation and other eliminations - - 11 984 2Changes in tax rates and other items - - -38 360 -7Tax charge for the year 133 568 29 209 101 36
The group’s effective tax rate is higher than the nominal tax rate. This is primarily due to the amortisation and write-down of goodwill acquired, the taxation of dividends from group companies, different tax rates in different countries and the exclusion of deferred tax assets in some companies. Provision has also been made for a tax claim in Saudi Arabia. This claim is linked to fulfilment of the conditions for tax exemption for part of our operations abroad.
NOTE 15 EQUITY
Jotun A/S Share Other Profit for (NOK thousand) capital equity the year TotalEquity, 1 Jan. 102 600 2 313 041 - 2 415 641Profit for the year - - 327 200 327 200Allocated to dividends - - -171 000 -171 000Transfers - 156 200 -156 200 -Equity, 31 Dec. 102 600 2 469 241 - 2 571 841 Distributable equity 31.12.06 31.12.05 - -Balance sheet equity 2 571 841 2 415 641 - -Downward adjustment due to the 10% limit -355 239 -341 086 - -The company’s unrestricted equity 2 216 602 2 074 555 - -
Annual common RISK figures for shares in Jotun A/S
01.01.06 01.01.05 01.01.04 01.01.03 01.01.02 01.01.01 01.01.00 244,06 36,40 315,79 289,11 552,60 184,32 1 500,81
01.01.99 01.01.98 01.01.97 01.01.96 01.01.95 01.01.94 01.01.93 473,59 154,29 221,51 644 156 188,29 92,47
The adjusted opening value on 1 January 1992 has been set at NOK 5,236.
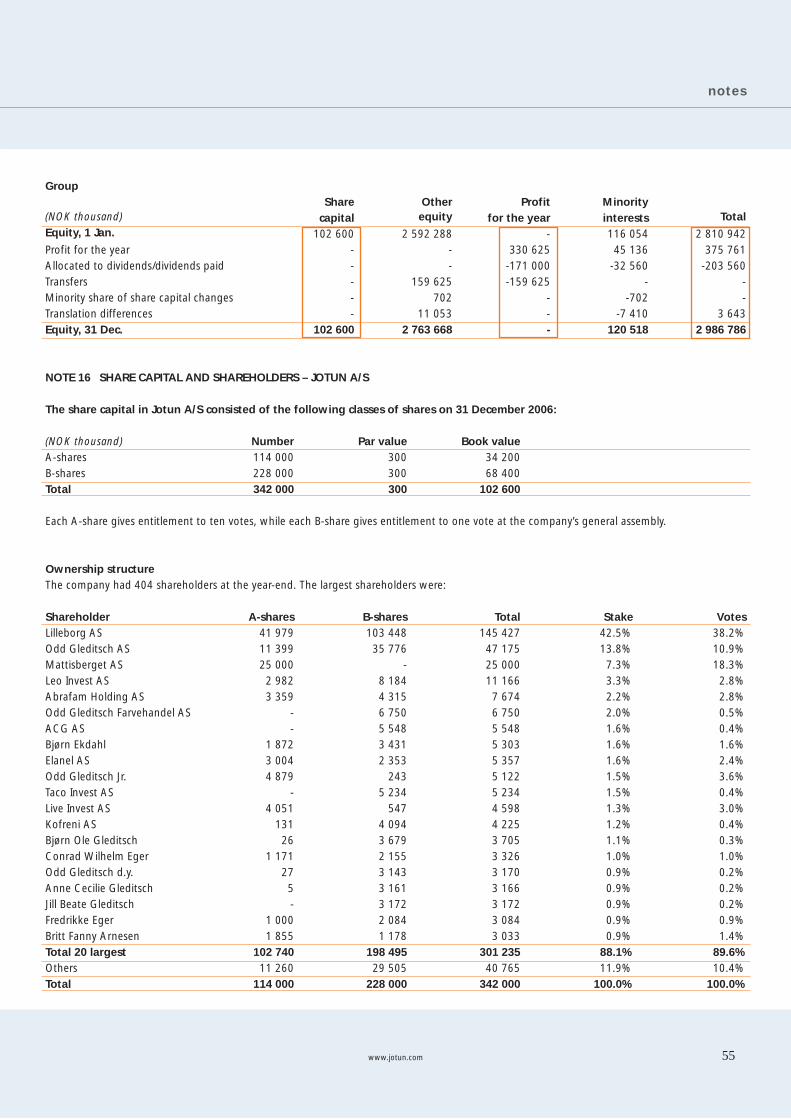
notes
www.jotun.com 55
Group Share Other Profit Minority(NOK thousand) capital equity for the year interests Total Equity, 1 Jan. 102 600 2 592 288 - 116 054 2 810 942 Profit for the year - - 330 625 45 136 375 761Allocated to dividends/dividends paid - - -171 000 -32 560 -203 560Transfers - 159 625 -159 625 - -Minority share of share capital changes - 702 - -702 -Translation differences - 11 053 - -7 410 3 643 Equity, 31 Dec. 102 600 2 763 668 - 120 518 2 986 786
NOTE 16 SHARE CAPITAL AND SHAREHOLDERS – JOTUN A/S
The share capital in Jotun A/S consisted of the following classes of shares on 31 December 2006:
(NOK thousand) Number Par value Book valueA-shares 114 000 300 34 200B-shares 228 000 300 68 400Total 342 000 300 102 600
Each A-share gives entitlement to ten votes, while each B-share gives entitlement to one vote at the company’s general assembly.
Ownership structureThe company had 404 shareholders at the year-end. The largest shareholders were:
Shareholder A-shares B-shares Total Stake VotesLilleborg AS 41 979 103 448 145 427 42.5% 38.2%Odd Gleditsch AS 11 399 35 776 47 175 13.8% 10.9%Mattisberget AS 25 000 - 25 000 7.3% 18.3%Leo Invest AS 2 982 8 184 11 166 3.3% 2.8%Abrafam Holding AS 3 359 4 315 7 674 2.2% 2.8%Odd Gleditsch Farvehandel AS - 6 750 6 750 2.0% 0.5%ACG AS - 5 548 5 548 1.6% 0.4%Bjørn Ekdahl 1 872 3 431 5 303 1.6% 1.6%Elanel AS 3 004 2 353 5 357 1.6% 2.4%Odd Gleditsch Jr. 4 879 243 5 122 1.5% 3.6%Taco Invest AS - 5 234 5 234 1.5% 0.4%Live Invest AS 4 051 547 4 598 1.3% 3.0%Kofreni AS 131 4 094 4 225 1.2% 0.4%Bjørn Ole Gleditsch 26 3 679 3 705 1.1% 0.3%Conrad Wilhelm Eger 1 171 2 155 3 326 1.0% 1.0%Odd Gleditsch d.y. 27 3 143 3 170 0.9% 0.2%Anne Cecilie Gleditsch 5 3 161 3 166 0.9% 0.2%Jill Beate Gleditsch - 3 172 3 172 0.9% 0.2%Fredrikke Eger 1 000 2 084 3 084 0.9% 0.9%Britt Fanny Arnesen 1 855 1 178 3 033 0.9% 1.4%Total 20 largest 102 740 198 495 301 235 88.1% 89.6%Others 11 260 29 505 40 765 11.9% 10.4%Total 114 000 228 000 342 000 100.0% 100.0%
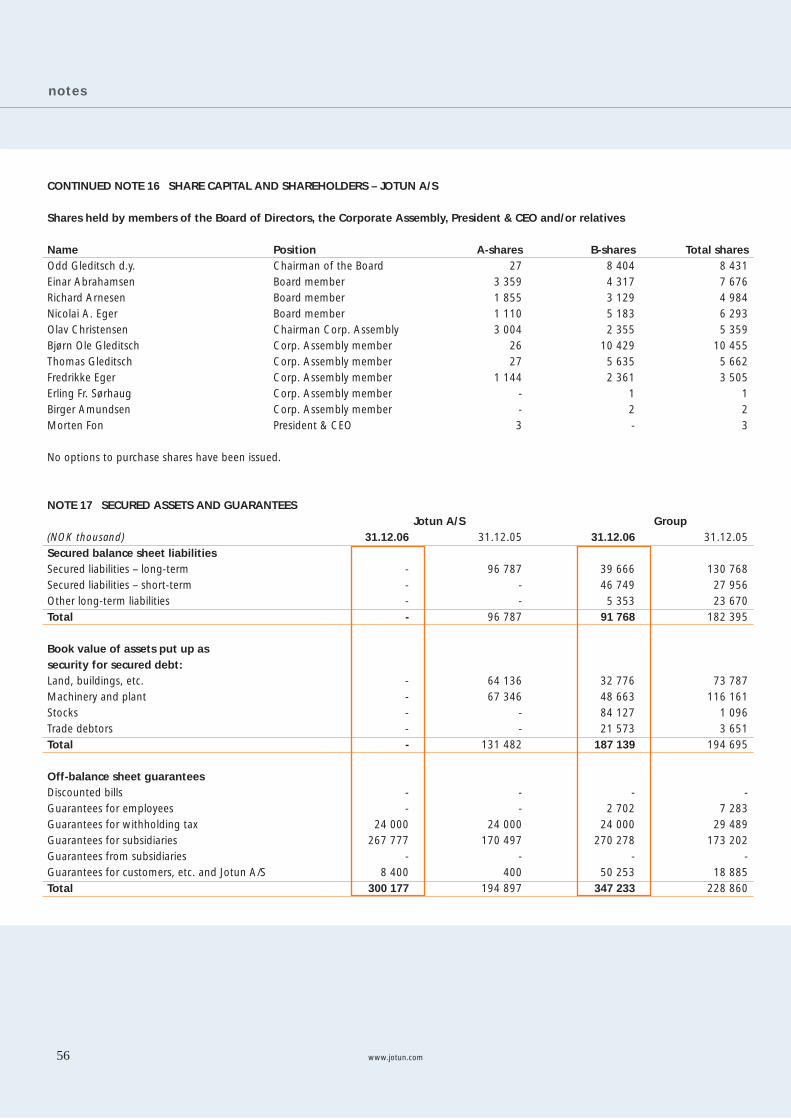
notes
www.jotun.com56
CONTINUED NOTE 16 SHARE CAPITAL AND SHAREHOLDERS – JOTUN A/S
Shares held by members of the Board of Directors, the Corporate Assembly, President & CEO and/or relatives
Name Position A-shares B-shares Total sharesOdd Gleditsch d.y. Chairman of the Board 27 8 404 8 431Einar Abrahamsen Board member 3 359 4 317 7 676Richard Arnesen Board member 1 855 3 129 4 984Nicolai A. Eger Board member 1 110 5 183 6 293Olav Christensen Chairman Corp. Assembly 3 004 2 355 5 359Bjørn Ole Gleditsch Corp. Assembly member 26 10 429 10 455Thomas Gleditsch Corp. Assembly member 27 5 635 5 662Fredrikke Eger Corp. Assembly member 1 144 2 361 3 505Erling Fr. Sørhaug Corp. Assembly member - 1 1Birger Amundsen Corp. Assembly member - 2 2Morten Fon President & CEO 3 - 3
No options to purchase shares have been issued.
NOTE 17 SECURED ASSETS AND GUARANTEES Jotun A/S Group(NOK thousand) 31.12.06 31.12.05 31.12.06 31.12.05Secured balance sheet liabilitiesSecured liabilities – long-term - 96 787 39 666 130 768Secured liabilities – short-term - - 46 749 27 956Other long-term liabilities - - 5 353 23 670Total - 96 787 91 768 182 395
Book value of assets put up as security for secured debt: Land, buildings, etc. - 64 136 32 776 73 787Machinery and plant - 67 346 48 663 116 161Stocks - - 84 127 1 096Trade debtors - - 21 573 3 651Total - 131 482 187 139 194 695 Off-balance sheet guaranteesDiscounted bills - - - -Guarantees for employees - - 2 702 7 283Guarantees for withholding tax 24 000 24 000 24 000 29 489Guarantees for subsidiaries 267 777 170 497 270 278 173 202Guarantees from subsidiaries - - - -Guarantees for customers, etc. and Jotun A/S 8 400 400 50 253 18 885Total 300 177 194 897 347 233 228 860
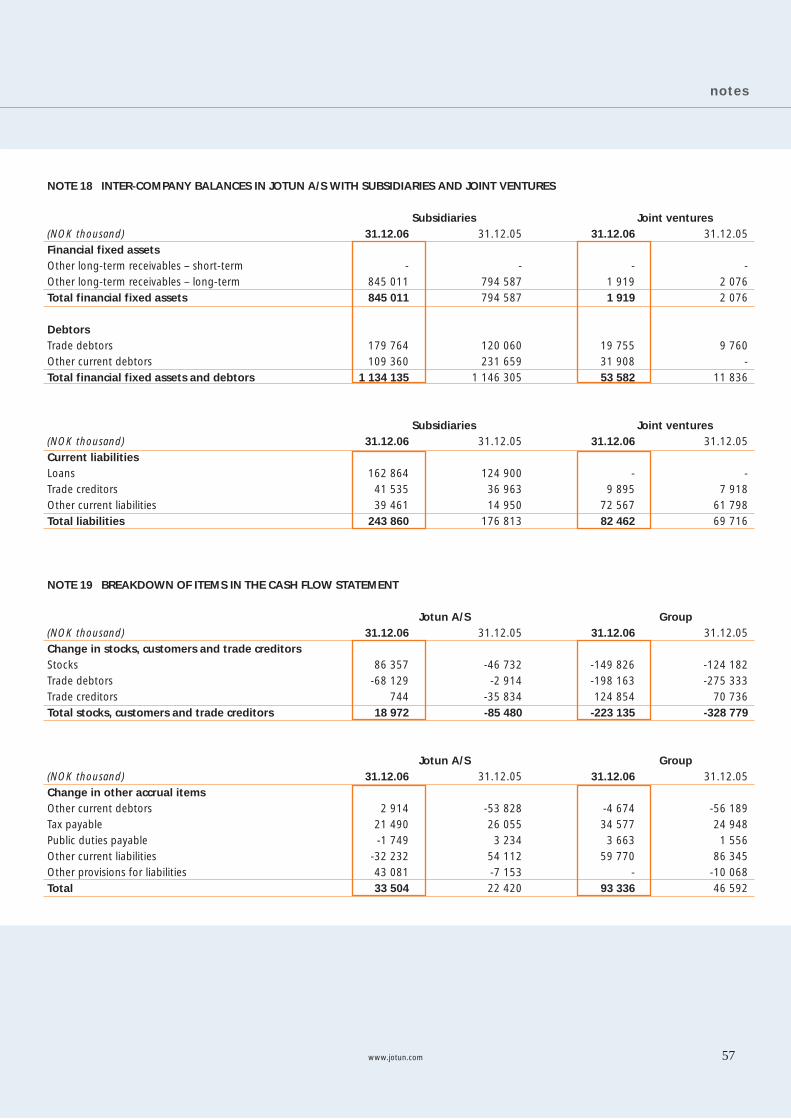
notes
www.jotun.com 57
NOTE 18 INTER-COMPANY BALANCES IN JOTUN A/S WITH SUBSIDIARIES AND JOINT VENTURES
Subsidiaries Joint ventures(NOK thousand) 31.12.06 31.12.05 31.12.06 31.12.05 Financial fixed assets Other long-term receivables – short-term - - - - Other long-term receivables – long-term 845 011 794 587 1 919 2 076Total financial fixed assets 845 011 794 587 1 919 2 076
DebtorsTrade debtors 179 764 120 060 19 755 9 760 Other current debtors 109 360 231 659 31 908 - Total financial fixed assets and debtors 1 134 135 1 146 305 53 582 11 836
Subsidiaries Joint ventures(NOK thousand) 31.12.06 31.12.05 31.12.06 31.12.05Current liabilities Loans 162 864 124 900 - - Trade creditors 41 535 36 963 9 895 7 918 Other current liabilities 39 461 14 950 72 567 61 798 Total liabilities 243 860 176 813 82 462 69 716
NOTE 19 BREAKDOWN OF ITEMS IN THE CASH FLOW STATEMENT
Jotun A/S Group(NOK thousand) 31.12.06 31.12.05 31.12.06 31.12.05Change in stocks, customers and trade creditors Stocks 86 357 -46 732 -149 826 -124 182 Trade debtors -68 129 -2 914 -198 163 -275 333 Trade creditors 744 -35 834 124 854 70 736 Total stocks, customers and trade creditors 18 972 -85 480 -223 135 -328 779
Jotun A/S Group(NOK thousand) 31.12.06 31.12.05 31.12.06 31.12.05 Change in other accrual items Other current debtors 2 914 -53 828 -4 674 -56 189 Tax payable 21 490 26 055 34 577 24 948 Public duties payable -1 749 3 234 3 663 1 556 Other current liabilities -32 232 54 112 59 770 86 345 Other provisions for liabilities 43 081 -7 153 - -10 068Total 33 504 22 420 93 336 46 592
notes
www.jotun.com58
NOTE 20 CONTINGENT LIABILITIES AND OTHER OFF-BALANCE SHEET LIABILITIES
Jotun is involved in a number of disputes and complaints in connection with its operations, including those referred to below. Provisions have been made for the anticipated outcome of disputes where a negative outcome is more likely and reliable estimates can be made. Anticipated insurance cover has been taken into account in the assessment of the size of these provisions. Jotun acknowledges that the outcome of these disputes is subject to some uncertainty, but is of the opinion that these
Jotun A/S 31.12.06 31.12.05Unused part of short- and long-termcommitted credit facilities 1 275 000 1 275 000
The requirement for liquidity reserves for the group rests with the parent company, which can wholly or partly finance subsidiaries and associated companies through internal loans. At the year-end, Jotun A/S had credit facilities totalling NOK 1.2 billion. NOK 600 million of these facilities fall
NOTE 21 OVERDRAFTS AND OTHER CREDIT FACILITIES
disputes will be resolved without impacting significantly on the group’s financial position. A number of legal and arbitration cases are under way in connection with operations in the USA.
Customers are claiming compensation from Jotun Paints Inc. for alleged product defects and defective technology acquired from the Valspar Corporation. The cases are expected to be resolved in 2008 and 2009.
due in 2012, while NOK 600 million will fall due in 2010. The latter NOK 600 million can be extended to 2012 if this is acceptable to the credit providers (extension option). No credit had been used in these facilities as at 31 Dec.The credit facilities above include an unused, committed line to Jotun A/S of NOK 75 million in the company’s group account system. Jotun A/S is the principal company in the Jotun Group’s group account system and is responsible for exposure with respect to the bank. The remainder of the credit facilities in the group are mainly short-term uncommitted credit that is not included in the liquidity reserve.
Policy for hedging of currency and interest rate exposure Currency exposure in the group balance sheet must be 30–100 per cent hedged where exposure is greater than NOK 25 million per currency (or currency group). Currency exposure concerning the parent company’s net cash flows from operations, in a future 12-month perspective, must be 30–100 per cent hedged where exposure is greater than NOK 15 million per currency (or currency group). If the aforementioned two currency exposures (balance sheet exposure and cash flow exposure) go against each other in relation to a currency, only the net exposure exceeding NOK 15 million must be hedged. Interest exposure in the group’s balance sheet shall be 30–80 per cent hedged if the total exposure exceeds NOK 25 million per currency. All transactions are undertaken in accordance with the abovemen-tioned guidelines and with the aim of reducing the total currency and interest rate exposure. Financial instruments are used extensively to re-duce such risk. This is explained in more detail below.
Managing and controlling currency riskCurrency exposure in the group balance sheet is hedged via currency loans and currency swaps. This exposure primarily consists of the parent company’s net investments in international operations. The market value change in the hedging instruments is recorded directly against equity as a contra entry to translation differences. No part of this hedging accounting is reflected in the company accounts of Jotun A/S. Jotun’s net cash flows from operations are mainly generated within
NOTE 22 FINANCIAL INSTRUMENTS AND RISK MANAGEMENT
the individual group companies and responsibility for hedging any currency exposures rests at a local level. Included in cash flows from the parent company’s operations (and those of the subsidiaries that are in-cluded in the parent company’s group account system) are the dividends and licence revenues from other external companies. In order to protect the parent company from fluctuations in currency exchange rates, for-ward contracts and options are used as hedging instruments. Market value change in hedgings are entered in the profit and loss account under financial income and costs. Hedging instruments are valued at their actual value, and non-realised value changes are entered in the profit and loss account as Jotun A/S does not use hedging accounting for cash flow hedging. As of 31 December 2006, Jotun A/S had balance sheet hedgings in the form of currency swaps (currency swap agreements) totalling NOK 456.6 million (purchase of NOK, disposal of USD, SGD, AUD, THB, KRW, AED, SAR and IDR). The hedging transactions had a reduced value of NOK 0.8 million (the difference between the spot rate at the time of contract establishment and the spot rate on 31 December 2006). As of 31 December 2006, Jotun A/S had agreed hedging trans actions internally and externally to hedge cash flows. Jotun A/S had internal forward contracts with Jotun Danmark concerning the purchase of DKK 28.5 million in return for the sale of Norwegian kroner. The contracts had a reduced value for Jotun A/S of NOK 0.5 million (the difference between the spot rate at the time of contract establishment and the spot rate on 31 December 2006).
notes
59www.jotun.com
Jotun A/S had external option contracts and forward contracts to hedge cash flows totalling NOK 333.3 million and NOK 27.3 million in the future sale of USD and SEK respectively. The contracts had an added value for Jotun A/S of NOK 4.0 million, of which an added value of NOK 4.3 million relates to the USD contracts and a reduced value of NOK 0.3 relates to the SEK sales. The added value for the forward contracts corresponds to the difference between the spot rate at the time of contract establishment and the spot rate on 31 December 2006. For options, market prices were obtained from the banks which issued the options. The option contracts were purchased as cost-free option structures (put/call/knock in), and the market value therefore represents the change in value since the time of purchase.
Managing and controlling interest rate riskThe Jotun Group has a low interest-bearing debt and low interest rate exposure. Behind this are large loans for long-term investments in factories, which are partly offset by more short-term bank investments. The group’s interest rate hedging is managed centrally based on measurements of interest rate exposure per currency. Interest rate derivatives and fixed-rate loans are used to hedge interest rate risk. As of 31 December 2006 Jotun A/S had agreed external interest rate swap agreements from a variable interest rate (LIBOR 3 mth) to a fixed interest rate through to maturity for a total of NOK 206.7 million in the currencies EUR, GBP, USD and IDR. The difference between the variable interest rate and fixed interest rate is amortised on an ongoing basis with one third per month between each new interest rate determi-nation. The interest difference is entered in the profit and loss account under financial income and costs.
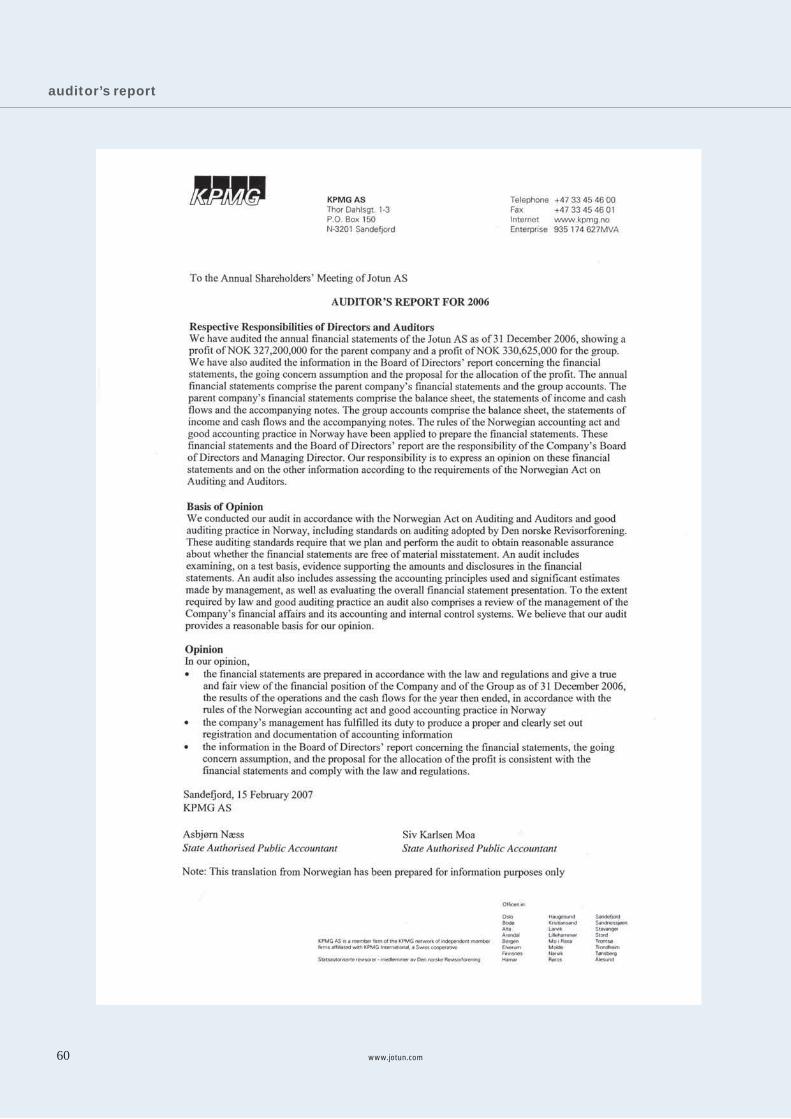
auditor’s report
www.jotun.com60
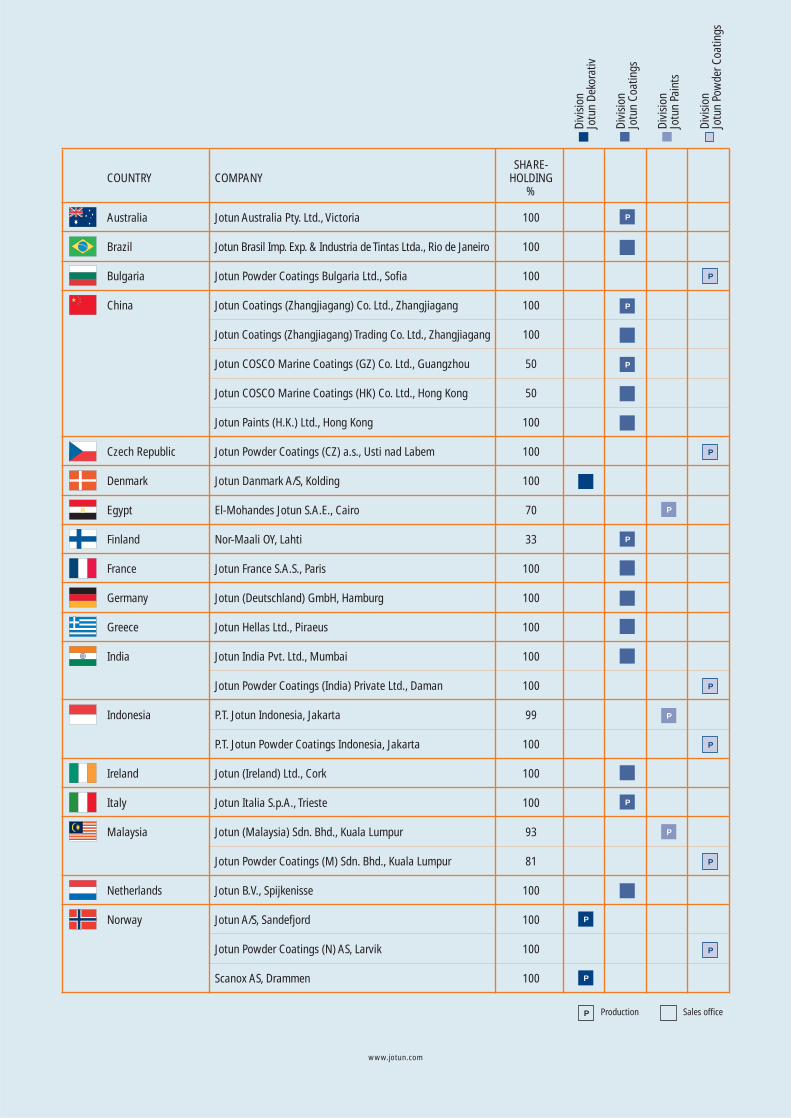
Australia Jotun Australia Pty. Ltd., Victoria 100 P
Brazil Jotun Brasil Imp. Exp. & Industria de Tintas Ltda., Rio de Janeiro 100
Bulgaria Jotun Powder Coatings Bulgaria Ltd., Sofia 100 P
China Jotun Coatings (Zhangjiagang) Co. Ltd., Zhangjiagang 100 P
Jotun Coatings (Zhangjiagang) Trading Co. Ltd., Zhangjiagang 100
Jotun COSCO Marine Coatings (GZ) Co. Ltd., Guangzhou 50 P
Jotun COSCO Marine Coatings (HK) Co. Ltd., Hong Kong 50
Jotun Paints (H.K.) Ltd., Hong Kong 100
Czech Republic Jotun Powder Coatings (CZ) a.s., Usti nad Labem 100 P
Denmark Jotun Danmark A/S, Kolding 100
Egypt El-Mohandes Jotun S.A.E., Cairo 70 P
Finland Nor-Maali OY, Lahti 33 P
France Jotun France S.A.S., Paris 100
Germany Jotun (Deutschland) GmbH, Hamburg 100
Greece Jotun Hellas Ltd., Piraeus 100
India Jotun India Pvt. Ltd., Mumbai 100
Jotun Powder Coatings (India) Private Ltd., Daman 100 P
Indonesia P.T. Jotun Indonesia, Jakarta 99 P
P.T. Jotun Powder Coatings Indonesia, Jakarta 100 P
Ireland Jotun (Ireland) Ltd., Cork 100
Italy Jotun Italia S.p.A., Trieste 100 P
Malaysia Jotun (Malaysia) Sdn. Bhd., Kuala Lumpur 93 P
Jotun Powder Coatings (M) Sdn. Bhd., Kuala Lumpur 81 P
Netherlands Jotun B.V., Spijkenisse 100
Norway Jotun A/S, Sandefjord 100 P
Jotun Powder Coatings (N) AS, Larvik 100 P
Scanox AS, Drammen 100 P
SHARE-COUNTRY COMPANY HOLDING %
Div
isio
nJo
tun
Deko
rativ
Div
isio
nJo
tun
Coat
ings
Div
isio
nJo
tun
Pain
ts
Div
isio
n Jo
tun
Pow
der C
oatin
gs
P Production Sales offi ce
www.jotun.com
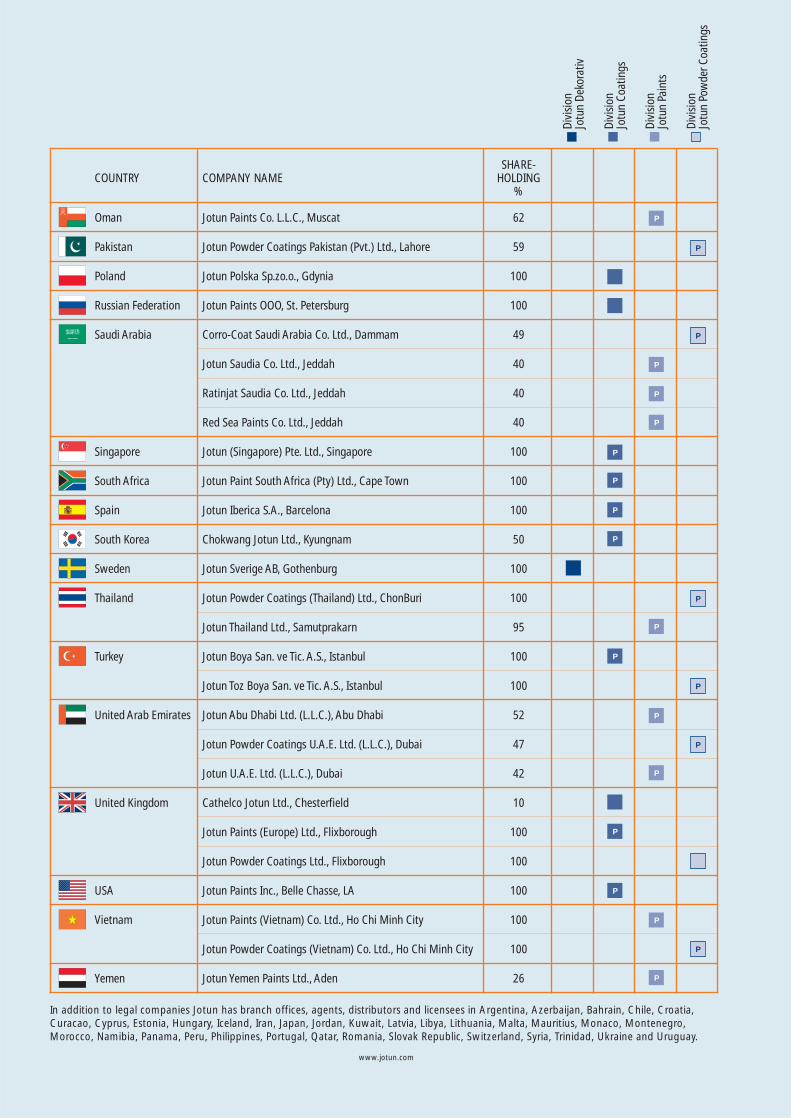
Oman Jotun Paints Co. L.L.C., Muscat 62 P
Pakistan Jotun Powder Coatings Pakistan (Pvt.) Ltd., Lahore 59 P
Poland Jotun Polska Sp.zo.o., Gdynia 100
Russian Federation Jotun Paints OOO, St. Petersburg 100
Saudi Arabia Corro-Coat Saudi Arabia Co. Ltd., Dammam 49 P
Jotun Saudia Co. Ltd., Jeddah 40 P
Ratinjat Saudia Co. Ltd., Jeddah 40 P
Red Sea Paints Co. Ltd., Jeddah 40 P
Singapore Jotun (Singapore) Pte. Ltd., Singapore 100 P
South Africa Jotun Paint South Africa (Pty) Ltd., Cape Town 100 P
Spain Jotun Iberica S.A., Barcelona 100 P
South Korea Chokwang Jotun Ltd., Kyungnam 50 P
Sweden Jotun Sverige AB, Gothenburg 100
Thailand Jotun Powder Coatings (Thailand) Ltd., ChonBuri 100 P
Jotun Thailand Ltd., Samutprakarn 95 P
Turkey Jotun Boya San. ve Tic. A.S., Istanbul 100 P
Jotun Toz Boya San. ve Tic. A.S., Istanbul 100 P
United Arab Emirates Jotun Abu Dhabi Ltd. (L.L.C.), Abu Dhabi 52 P
Jotun Powder Coatings U.A.E. Ltd. (L.L.C.), Dubai 47 P
Jotun U.A.E. Ltd. (L.L.C.), Dubai 42 P
United Kingdom Cathelco Jotun Ltd., Chesterfield 10
Jotun Paints (Europe) Ltd., Flixborough 100 P
Jotun Powder Coatings Ltd., Flixborough 100
USA Jotun Paints Inc., Belle Chasse, LA 100 P
Vietnam Jotun Paints (Vietnam) Co. Ltd., Ho Chi Minh City 100 P
Jotun Powder Coatings (Vietnam) Co. Ltd., Ho Chi Minh City 100 P
Yemen Jotun Yemen Paints Ltd., Aden 26 P
SHARE-COUNTRY COMPANY NAME HOLDING %
Div
isio
nJo
tun
Deko
rativ
Div
isio
nJo
tun
Coat
ings
Div
isio
nJo
tun
Pain
ts
Div
isio
n Jo
tun
Pow
der C
oatin
gs
In addition to legal companies Jotun has branch offices, agents, distributors and licensees in Argentina, Azerbaijan, Bahrain, Chile, Croatia, Curacao, Cyprus, Estonia, Hungary, Iceland, Iran, Japan, Jordan, Kuwait, Latvia, Libya, Lithuania, Malta, Mauritius, Monaco, Montenegro, Morocco, Namibia, Panama, Peru, Philippines, Portugal, Qatar, Romania, Slovak Republic, Switzerland, Syria, Trinidad, Ukraine and Uruguay.
www.jotun.com
ww
w.jo
tun
.com
TEXT: B
LUE IN
TERN
ATIO
NA
L CO
MM
UN
ICA
TION
AS
TRA
NSLA
TION
: LION
BR
IDG
E PH
OTO
: LIND
A C
AR
TRID
GE, M
OR
TEN R
AK
KE
GR
APH
IC D
ESIGN
: METR
O B
RA
ND
ING
AS
PRIN
T: BK
GR
AFISK