annual financial - wisconsin department of employee
TRANSCRIPT
For
Yea
r En
ded December 31, 2013
R E P O R T
ANNUALFINANCIAL
COMPREHENSIVE 2013
R E P O R T
ANNUALFINANCIAL
COMPREHENSIVE 2013
State of WisconsinDepartment of
Employee Trust Funds

State of WisconsinDepartment of
Employee Trust Funds
For
Yea
r En
ded December 31, 2013
R E P O R T
ANNUALFINANCIAL
COMPREHENSIVE 2013
R E P O R T
ANNUALFINANCIAL
COMPREHENSIVE 2013

801 W. Badger RoadPO Box 7931Madison, WI 53707-79311-877-533-5020http://etf.wi.gov
ET-8501
The Department of Employee Trust Funds does not discriminate on the basis of disability in the provision of programs, services, or employment. If you are speech, hearing, or visually impaired and need assistance, call toll free 1-877-533-5020; (608) 266-3285 (local Madison) or 1-800-947-3529 (Wisconsin Relay Service). We will try to find another way to provide you with usable information.
Robert Willett, Chief Trust Financial Officer and Controller
Nancy Ketterhagen, Editor
For
Yea
r En
ded December 31, 2013
R E P O R T
ANNUALFINANCIAL
COMPREHENSIVE 2013
R E P O R T
ANNUALFINANCIAL
COMPREHENSIVE 2013

December 9, 2013
November 25, 2014 GOVERNOR SCOTT WALKER MEMBERS OF THE STATE LEGISLATURE PUBLIC EMPLOYEES, EMPLOYERS AND OTHER INTERESTED PARTIES: I am pleased to present the Comprehensive Annual Financial Report (CAFR) of the Wisconsin Department of Employee Trust Funds (ETF) for the year ended December 31, 2013.This report is intended to provide comprehensive and reliable information about ETF, the Wisconsin Retirement System (WRS), and other benefit plans and trust funds administered by ETF. Management is responsible for both the accuracy of the data and the completeness and fairness of the presentation. I hope you will find this report useful and informative. The WRS continues to be one of the best-funded public employee retirement systems in the country. A well-funded system ensures that a lifetime of benefits can be paid to today’s workers without burdening the next generation of taxpayers with higher contributions. The financial strength of the WRS is attributable to its unique plan design, funding discipline at the state and local level, strong governance, and the effective investment strategies of the State of Wisconsin Investment Board (SWIB). Historical Overview The WRS was created effective January 1, 1982. The system covers state and local public employees, including the University of Wisconsin System, local police and firefighters, and all publicly-employed teachers in the state. Those not included are employees of the City of Milwaukee and Milwaukee County, who are covered under separate retirement systems. While the WRS has existed since 1982, pension coverage for local government employees has been in place since 1891, when the legislature required Milwaukee to create a pension fund for retired and disabled police and firefighters. Since that date, the legislature has extended pension coverage to other public employees, along with creating group life and health insurance programs. The Group Insurance Board was created in 1959 to monitor the administration of the life and health insurance programs. In 1967, the Department of Employee Trust Funds was created to administer the various retirement and related benefit programs. Currently, the WRS is composed of 28% state employees and 72% local employees. As of December 31, 2013, the WRS had 256,788 active employees, 180,056 annuitants (retirees, disabilitants, and beneficiaries), and 157,761 inactive employees with deferred benefits payable. ETF Mission and Responsibilities ETF’s mission is “to develop and deliver quality benefits and services to our customers while safeguarding the integrity of the Trust.” ETF administers retirement, health, life, income continuation, long-term disability, and long-term care insurance programs, along with an employee reimbursement accounts program, commuter benefits program, and a deferred compensation plan. ETF also administers retirement disability coverage and serves as the state’s designated coverage agent for Social Security for Wisconsin public employers. There
STATE OF WISCONSIN Department of Employee Trust Funds
Robert J. Conlin SECRETARY
801 W Badger Road PO Box 7931 Madison WI 53707-7931 1-877-533-5020 (toll free) Fax 608-267-4549 etf.wi.gov
December 15, 2014
are five different statutory boards with responsibilities for programs operated by the Department. The ETF Board is both the overall governing body for the Department and the general policy-setting and trustee board for the entire WRS. All insurance programs are administered through contractual arrangements with private sector insurance firms and service corporations. Participation by eligible employees is mandatory for retirement and Social Security but optional for the other programs. ETF collects but does not invest the trust fund monies created for these programs. That responsibility rests with SWIB. ETF is responsible for:
• Collecting all monies due the trust funds. • Calculating and ensuring appropriate disbursement of all benefit payments from the trust
funds. • Providing information to, and answering inquiries from, participating employees and
employers. • Establishing the controls, systems, and procedures necessary to ensure the appropriate
administration and security of the trust. Administration ETF’s administration of the WRS continues to make it one of the most cost-efficient systems, in terms of administrative expenses per member. In a recent public pension fund administration benchmarking study conducted by industry leader CEM Benchmarking, Inc., the annual per-member administrative expenses associated with the retirement and disability programs was $59 for the WRS, compared to the median per-member cost of $87. ETF employs one full-time equivalent staff person per 1,789 members, compared to the peer system median of one per 1,548 members. Internal Controls ETF has a formal internal control plan that is reviewed annually and updated as necessary. This plan provides reasonable assurance that ETF assets are safeguarded, that applicable statutes and rules are followed, and ETF goals and objectives are achieved. The Legislative Audit Bureau considers ETF’s controls in order to determine auditing procedures for the purpose of expressing an opinion on ETF’s annual financial statements, but it does not provide an opinion on the controls. These financial statements are presented in accordance with Generally Accepted Accounting Principles, and all supporting schedules and statistical tables have been fairly presented. Acknowledgements I would like to express my appreciation to the Governor, members of the legislature, members of the boards, staff, employers, participants, and all those whose efforts and interest combine to ensure the successful operation of our system, while protecting the integrity of the trust funds. Sincerely, Robert J. Conlin

P CP CPublic Pension Coordinating Council
Public Pension Standards Award For Funding and Administration
2013
Presented to
Wisconsin Department of Employee Trust Funds
In recognition of meeting professional standards for plan funding and administration as
set forth in the Public Pension Standards.
Presented by the Public Pension Coordinating Council, a confederation of
National Association of State Retirement Administrators (NASRA) National Conference on Public Employee Retirement Systems (NCPERS)
National Council on Teacher Retirement (NCTR)
Alan H. Winkle Program Administrator
IntroductionProgram Highlights ................................................................................................................................... 2ETF Boards and Department Organization ...........................................................................................23Legislation, Vision Statement and Annual Accomplishments .............................................................29
FinancesIndependent Auditor’s Report..... ...........................................................................................................32Financial Statements ..............................................................................................................................36Notes to Financial Statements ..............................................................................................................45Required Supplementary Information ...................................................................................................81
StatisticsWisconsin Retirement System ...............................................................................................................90Group Health Insurance ...................................................................................................................... 102Group Life Insurance ........................................................................................................................... 104Duty Disability Insurance ..................................................................................................................... 107Long-Term Disability Insurance ........................................................................................................... 109Income Continuation Insurance .......................................................................................................... 110Employee Reimbursement Accounts Program .................................................................................. 111Department of Employee Trust Funds Administrative Expenses ..................................................... 112
ActuarialActuarial Statement of Assets and Liabilities .................................................................................... 116Summary of Benefit Provisions ........................................................................................................... 117Actuarial Method and Assumptions Used in Valuations ................................................................... 119
INvestmeNtsState of Wisconsin Investment Board ................................................................................................ 134
Contributions Paid and Employer Unfunded Liability BalancesState Agencies ..................................................................................................................................... 136Public Authorities ................................................................................................................................. 136Cities ..................................................................................................................................................... 136Villages .................................................................................................................................................. 139Special Districts ................................................................................................................................... 143Towns .................................................................................................................................................... 146Counties ................................................................................................................................................ 150School Districts .................................................................................................................................... 151Technical Colleges ............................................................................................................................... 157Cooperative Educational Service Agencies (CESAs).......................................................................... 157
INTRODUCTION
TABLE OF CONTENTS

Introduction
State of WisconsinDepartment of
Employee Trust Funds
C o m p r e h e n s i v e A n n u a l F i n a n c i a l R e p o r t 2 0 1 3
Program Description
The Wisconsin Retirement System (WRS) collects and invests employee and employer contributions, and pays retirement, disability, and death benefits to former employees, and their beneficiaries, of the state and participating local governments in Wisconsin.
Financial Highlights
• For presentation purposes, the administrative fund, general fund, and fixed assets have been blended into the WRS financial statements. This blending resulted in an increase of $10.0 million in 2013 and an increase of $10.6 million in 2012 in the Net Position Held in Trust.
• The Annuity Reserve increased by 10% in 2013, from $44.1 billion to $48.5 billion. This included a 9.1% increase in the Core Annuity Reserve of $3.7 billion and a 21.0% increase in the Variable Annuity Reserve of $0.7 billion.
• The Reserve for Changes in the Market Value of Investments is the portion of the deferred investment gains and losses in the Market Recognition Account (MRA) attributable to the WRS. The MRA increased by $2.3 billion in 2013, the result of $3.8 billion in actuarial investment gains from 2013 being deferred for future recognition, and $1.5 billion of previously-deferred investment gains from 2009 through 2012 being recognized in 2013. 96.8% or $4,570.4 million
The following section presents condensed financial statements, statistical information, and analysis of the programs administered by the Department of Employee Trust Funds (ETF). All values in the Summary Financial Statements, including totals and percentages, have been rounded for presentation. As a result, totals and percentages may not appear to be calculated correctly. A percentage change of “n/a” indicates that prior year actual amounts were negative and the percentage change is not meaningful.
Wisconsin Retirement System
2INTRODUCTION
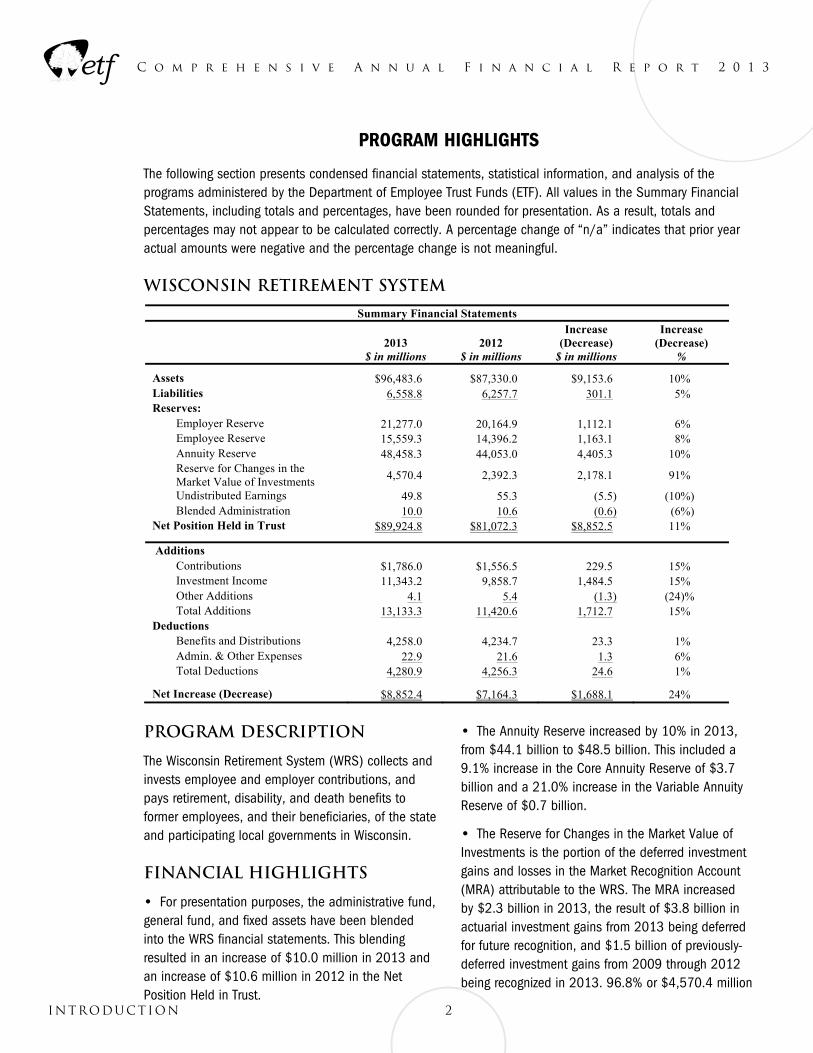
PROGRAM HIGHLIGHTS Program Highlights The following section presents condensed financial statements, statistical information, and analysis of the programs administered by the Department of Employee Trust Funds (ETF). All values in the Summary Financial Statements, including totals and percentages, have been rounded for presentation. As a result, totals and percentages may not appear to be calculated correctly. A percentage change of “n/a” indicates that prior year actual amounts were negative and the percentage change is not meaningful.
Wisconsin Retirement System
Summary Financial Statements
2013 $ in millions
2012
$ in millions
Increase (Decrease)
$ in millions
Increase (Decrease)
% Assets $96,483.6 $87,330.0 $9,153.6 10% Liabilities 6,558.8 6,257.7 301.1 5% Reserves:
Employer Reserve 21,277.0 20,164.9 1,112.1 6% Employee Reserve 15,559.3 14,396.2 1,163.1 8% Annuity Reserve 48,458.3 44,053.0 4,405.3 10% Reserve for Changes in the Market Value of Investments
4,570.4 2,392.3 2,178.1 91%
Undistributed Earnings 49.8 55.3 (5.5) (10%) Blended Administration 10.0 10.6 (0.6) (6%) Net Position Held in Trust $89,924.8 $81,072.3 $8,852.5 11% Additions
Contributions $1,786.0 $1,556.5 229.5 15% Investment Income 11,343.2 9,858.7 1,484.5 15% Other Additions 4.1 5.4 (1.3) (24)% Total Additions 13,133.3 11,420.6 1,712.7 15%
Deductions Benefits and Distributions 4,258.0 4,234.7 23.3 1% Admin. & Other Expenses 22.9 21.6 1.3 6% Total Deductions 4,280.9 4,256.3 24.6 1%
Net Increase (Decrease) $8,852.4 $7,164.3 $1,688.1 24%
Program Description The Wisconsin Retirement System (WRS) collects and invests employee and employer contributions, and pays retirement, disability, and death benefits to former employees, and their beneficiaries, of the state and participating local governments in Wisconsin. Financial Highlights For presentation purposes, the administrative fund, general fund, and fixed assets have been blended into the WRS financial
statements. This blending resulted in an increase of $10.0 million in 2013 and an increase of $10.6 million in 2012 in the Net Position Held in Trust.
The Annuity Reserve increased by 10% in 2013, from $44.1 billion to $48.5 billion. This included a 9.1% increase in the Core Annuity Reserve of $3.7 billion and a 21.0% increase in the Variable Annuity Reserve of $0.7 billion.
The Reserve for Changes in the Market Value of Investments is the portion of the deferred investment gains and losses in the Market Recognition Account (MRA) attributable to the WRS. The MRA increased by $2.3 billion in 2013, the result of $3.8 billion in actuarial investment gains from 2013 being deferred for future recognition, and $1.5 billion of previously-deferred investment gains from 2009 through 2012 being recognized in 2013. 96.8% or $4,570.4 million of the deferred gains in the MRA are attributable to the WRS.
Contributions increased 15% in 2013, from $1.56 billion to $1.79 billion. This included a 14.5% increase in employer contributions, from $799 million to $915 million, and a 15.1% increase in employee contributions, from $757 million to $871 million. The increased contributions resulted from a 2.0% increase in covered payrolls and a 12.1% increase to contribution rates in 2013. Prior to approximately July 1, 2011, most employee contributions were paid by the employer on behalf of the employee. 2011 Act 10 restricted the employer from paying the employee required contribution, unless provided for by an existing collective bargaining agreement. In 2013 employees paid more than $761 million of required contributions and more than $12.4 million of voluntary contributions.
C o m p r e h e n s i v e A n n u a l F i n a n c i a l R e p o r t 2 0 1 3
of the deferred gains in the MRA are attributable to the WRS.
• Contributions increased 15% in 2013, from $1.56 billion to $1.79 billion. This included a 14.5% increase in employer contributions, from $799 million to $915 million, and a 15.1% increase in employee contributions, from $757 million to $871 million. The increased contributions resulted from a 2.0% increase in covered payrolls and a 12.1% increase to contribu-tion rates in 2013. Prior to approximately July 1, 2011, most employee contributions were paid by the employer on behalf of the employee. 2011 Act 10 restricted the employer from paying the employee required contribution, unless provided for by an exist-ing collective bargaining agreement. In 2013 employ-ees paid more than $761 million of required contribu-tions and more than $12.4 million of voluntary contri-butions.
• Net investment income increased by approximately $1.5 billion in 2013, from a $9.9 billion gain to an $11.3 billion gain. This included an increase in Core Trust Fund income of $0.7 billion, from a $9.0 billion gain to a $9.7 billion gain, and an increase in Variable Trust Fund income of $0.8 billion, from a $0.8 billion gain to a $1.6 billion gain.
• The balanced Core Trust Fund realized a 13.6% investment return, while the equity-based Variable Trust Fund experienced a 29.0% return. The Core Trust Fund gain, after being smoothed through the MRA, resulted in a core effective rate of 10.9% being credit-ed to the Core Fund accounts and reserves. The Variable Trust Fund gain was passed through to Variable Fund accounts and reserves with a 31% Variable effective rate.
• Benefit payments increased by 0.7%, from $4.23 billion to $4.26 billion. Core annuities (including Section 62.13 Police & Firefighters) decreased by 0.4%, from $3.83 billion to $3.82 billion, while Variable annuities increased by 2.4%,
from $311 million to $318 million. Lump sum pay-ments (separations, death benefits, and minimum annuities) decreased by 33.0%, from $92.9 million to $123.5 million. See “Annuity Payments” section on page 4 for details.
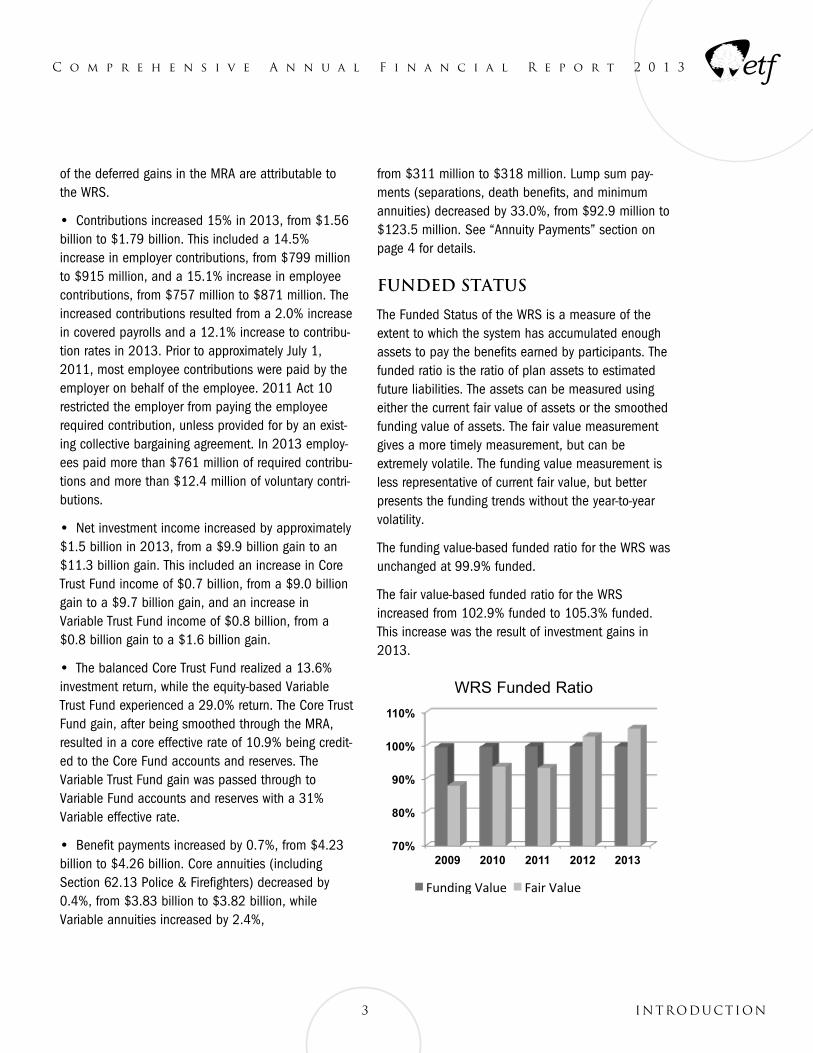
Funded Status
The Funded Status of the WRS is a measure of the extent to which the system has accumulated enough assets to pay the benefits earned by participants. The funded ratio is the ratio of plan assets to estimated future liabilities. The assets can be measured using either the current fair value of assets or the smoothed funding value of assets. The fair value measurement gives a more timely measurement, but can be extremely volatile. The funding value measurement is less representative of current fair value, but better presents the funding trends without the year-to-year volatility.
The funding value-based funded ratio for the WRS was unchanged at 99.9% funded.
The fair value-based funded ratio for the WRS increased from 102.9% funded to 105.3% funded. This increase was the result of investment gains in 2013.
Net investment income increased by approximately $1.5 billion in 2013, from a $9.9 billion gain to an $11.3 billion gain. This included an increase in Core Trust Fund income of $0.7 billion, from a $9.0 billion gain to a $9.7 billion gain, and an increase in Variable Trust Fund income of $0.8 billion, from a $0.8 billion gain to a $1.6 billion gain.
The balanced Core Trust Fund realized a 13.6% investment return, while the equity-based Variable Trust Fund experienced a 29.0% return. The Core Trust Fund gain, after being smoothed through the MRA, resulted in a core effective rate of 10.9% being credited to the Core Fund accounts and reserves. The Variable Trust Fund gain was passed through to Variable Fund accounts and reserves with a 31% Variable effective rate.
Benefit payments increased by 0.7%, from $4.23 billion to $4.26 billion. Core annuities (including Section 62.13 Police & Firefighters) decreased by 0.4%, from $3.83 billion to $3.82 billion, while variable annuities increased by 2.4%, from $311 million to $318 million. Lump sum payments (separations, death benefits, and minimum annuities) decreased by 33.0%, from $92.9 million to $123.5 million. See “Annuity Payments” section below for details.
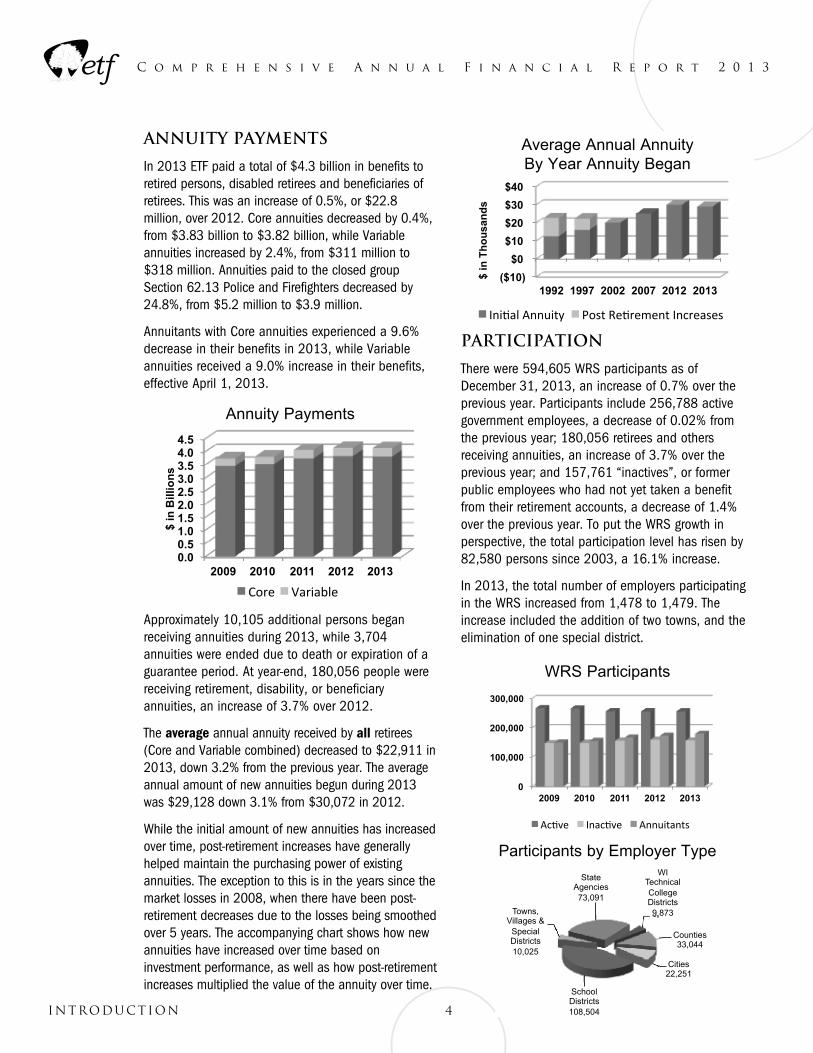
Funded Status The funded status of the WRS is a measure of the extent to which the system has accumulated enough assets to pay the benefits earned by participants. The funded ratio is the ratio of plan assets to estimated future liabilities. The assets can be measured using either the current fair value of assets or the smoothed funding value of assets. The fair value measurement gives a more timely measurement, but can be extremely volatile. The funding value measurement is less representative of current fair value, but better presents the funding trends without the year-to-year volatility. The funding value-based funded ratio for the WRS was unchanged at 99.9% funded. The fair value-based funded ratio for the WRS increased from 102.9% funded to 105.3% funded. This increase was the result of investment gains in 2013. Annuity Payments In 2013 ETF paid a total of $4.3 billion in benefits to retired persons, disabled retirees and beneficiaries of retirees. This was an increase of 0.5%, or $22.8 million, over 2012. Core annuities decreased by 0.4%, from $3.83 billion to $3.82 billion, while Variable annuities increased by 2.4%, from $311 million to $318 million. Annuities paid to the closed group Section 62.13 Police and Firefighters decreased by 24.8%, from $5.2 million to $3.9 million. Annuitants with Core annuities experienced a 9.6% decrease in their benefits in 2013, while Variable annuities received a 9.0% increase in their benefits, effective April 1, 2013. Approximately 10,105 additional persons began receiving annuities during 2013, while 3,704 annuities were ended due to death or expiration of a guarantee period. At year-end, 180,056 people were receiving retirement, disability, or beneficiary annuities, an increase of 3.7% over 2012. The average annual annuity received by all retirees (Core and Variable combined) decreased to $22,911 in 2013, down 3.2% from the previous year. The average annual amount of new annuities begun during 2013 was $29,128 down 3.1% from $30,072 in 2012. While the initial amount of new annuities has increased over time, post-retirement increases have generally helped maintain the purchasing power of existing annuities. The exception to this is in the years since the market losses in 2008, when there have been post-retirement decreases due to the losses being smoothed over 5 years. The accompanying chart shows how new annuities have increased over time based on investment performance, as well as how post-retirement increases multiplied the value of the annuity over time.
70%
80%
90%
100%
110%
2009 2010 2011 2012 2013
WRS Funded Ratio
0.0 0.5 1.0 1.5 2.0 2.5 3.0 3.5 4.0 4.5
2009 2010 2011 2012 2013
$ in
Bill
ion
s
Annuity Payments
($10)
$0
$10
$20
$30
$40
1992 1997 2002 2007 2012 2013
$ in
Th
ou
san
ds
Average Annual Annuity By Year Annuity Began
WRS Funded Ratio
3 INTRODUCTION
4INTRODUCTION
C o m p r e h e n s i v e A n n u a l F i n a n c i a l R e p o r t 2 0 1 3
Annuity Payments
In 2013 ETF paid a total of $4.3 billion in benefits to retired persons, disabled retirees and beneficiaries of retirees. This was an increase of 0.5%, or $22.8 million, over 2012. Core annuities decreased by 0.4%, from $3.83 billion to $3.82 billion, while Variable annuities increased by 2.4%, from $311 million to $318 million. Annuities paid to the closed group Section 62.13 Police and Firefighters decreased by 24.8%, from $5.2 million to $3.9 million.
Annuitants with Core annuities experienced a 9.6% decrease in their benefits in 2013, while Variable annuities received a 9.0% increase in their benefits, effective April 1, 2013.
Net investment income increased by approximately $1.5 billion in 2013, from a $9.9 billion gain to an $11.3 billion gain. This included an increase in Core Trust Fund income of $0.7 billion, from a $9.0 billion gain to a $9.7 billion gain, and an increase in Variable Trust Fund income of $0.8 billion, from a $0.8 billion gain to a $1.6 billion gain.
The balanced Core Trust Fund realized a 13.6% investment return, while the equity-based Variable Trust Fund experienced a 29.0% return. The Core Trust Fund gain, after being smoothed through the MRA, resulted in a core effective rate of 10.9% being credited to the Core Fund accounts and reserves. The Variable Trust Fund gain was passed through to Variable Fund accounts and reserves with a 31% Variable effective rate.
Benefit payments increased by 0.7%, from $4.23 billion to $4.26 billion. Core annuities (including Section 62.13 Police & Firefighters) decreased by 0.4%, from $3.83 billion to $3.82 billion, while variable annuities increased by 2.4%, from $311 million to $318 million. Lump sum payments (separations, death benefits, and minimum annuities) decreased by 33.0%, from $92.9 million to $123.5 million. See “Annuity Payments” section below for details.
Funded Status The funded status of the WRS is a measure of the extent to which the system has accumulated enough assets to pay the benefits earned by participants. The funded ratio is the ratio of plan assets to estimated future liabilities. The assets can be measured using either the current fair value of assets or the smoothed funding value of assets. The fair value measurement gives a more timely measurement, but can be extremely volatile. The funding value measurement is less representative of current fair value, but better presents the funding trends without the year-to-year volatility. The funding value-based funded ratio for the WRS was unchanged at 99.9% funded. The fair value-based funded ratio for the WRS increased from 102.9% funded to 105.3% funded. This increase was the result of investment gains in 2013. Annuity Payments In 2013 ETF paid a total of $4.3 billion in benefits to retired persons, disabled retirees and beneficiaries of retirees. This was an increase of 0.5%, or $22.8 million, over 2012. Core annuities decreased by 0.4%, from $3.83 billion to $3.82 billion, while Variable annuities increased by 2.4%, from $311 million to $318 million. Annuities paid to the closed group Section 62.13 Police and Firefighters decreased by 24.8%, from $5.2 million to $3.9 million. Annuitants with Core annuities experienced a 9.6% decrease in their benefits in 2013, while Variable annuities received a 9.0% increase in their benefits, effective April 1, 2013. Approximately 10,105 additional persons began receiving annuities during 2013, while 3,704 annuities were ended due to death or expiration of a guarantee period. At year-end, 180,056 people were receiving retirement, disability, or beneficiary annuities, an increase of 3.7% over 2012. The average annual annuity received by all retirees (Core and Variable combined) decreased to $22,911 in 2013, down 3.2% from the previous year. The average annual amount of new annuities begun during 2013 was $29,128 down 3.1% from $30,072 in 2012. While the initial amount of new annuities has increased over time, post-retirement increases have generally helped maintain the purchasing power of existing annuities. The exception to this is in the years since the market losses in 2008, when there have been post-retirement decreases due to the losses being smoothed over 5 years. The accompanying chart shows how new annuities have increased over time based on investment performance, as well as how post-retirement increases multiplied the value of the annuity over time.
70%
80%
90%
100%
110%
2009 2010 2011 2012 2013
WRS Funded Ratio
0.0 0.5 1.0 1.5 2.0 2.5 3.0 3.5 4.0 4.5
2009 2010 2011 2012 2013
$ in
Bill
ion
s
Annuity Payments
($10)
$0
$10
$20
$30
$40
1992 1997 2002 2007 2012 2013
$ in
Th
ou
san
ds
Average Annual Annuity By Year Annuity Began
Annuity Payments
Approximately 10,105 additional persons began receiving annuities during 2013, while 3,704 annuities were ended due to death or expiration of a guarantee period. At year-end, 180,056 people were receiving retirement, disability, or beneficiary annuities, an increase of 3.7% over 2012.
The average annual annuity received by all retirees (Core and Variable combined) decreased to $22,911 in 2013, down 3.2% from the previous year. The average annual amount of new annuities begun during 2013 was $29,128 down 3.1% from $30,072 in 2012.
While the initial amount of new annuities has increased over time, post-retirement increases have generally helped maintain the purchasing power of existing annuities. The exception to this is in the years since the market losses in 2008, when there have been post-retirement decreases due to the losses being smoothed over 5 years. The accompanying chart shows how new annuities have increased over time based on investment performance, as well as how post-retirement increases multiplied the value of the annuity over time.
Net investment income increased by approximately $1.5 billion in 2013, from a $9.9 billion gain to an $11.3 billion gain. This included an increase in Core Trust Fund income of $0.7 billion, from a $9.0 billion gain to a $9.7 billion gain, and an increase in Variable Trust Fund income of $0.8 billion, from a $0.8 billion gain to a $1.6 billion gain.
The balanced Core Trust Fund realized a 13.6% investment return, while the equity-based Variable Trust Fund experienced a 29.0% return. The Core Trust Fund gain, after being smoothed through the MRA, resulted in a core effective rate of 10.9% being credited to the Core Fund accounts and reserves. The Variable Trust Fund gain was passed through to Variable Fund accounts and reserves with a 31% Variable effective rate.
Benefit payments increased by 0.7%, from $4.23 billion to $4.26 billion. Core annuities (including Section 62.13 Police & Firefighters) decreased by 0.4%, from $3.83 billion to $3.82 billion, while variable annuities increased by 2.4%, from $311 million to $318 million. Lump sum payments (separations, death benefits, and minimum annuities) decreased by 33.0%, from $92.9 million to $123.5 million. See “Annuity Payments” section below for details.
Funded Status The funded status of the WRS is a measure of the extent to which the system has accumulated enough assets to pay the benefits earned by participants. The funded ratio is the ratio of plan assets to estimated future liabilities. The assets can be measured using either the current fair value of assets or the smoothed funding value of assets. The fair value measurement gives a more timely measurement, but can be extremely volatile. The funding value measurement is less representative of current fair value, but better presents the funding trends without the year-to-year volatility. The funding value-based funded ratio for the WRS was unchanged at 99.9% funded. The fair value-based funded ratio for the WRS increased from 102.9% funded to 105.3% funded. This increase was the result of investment gains in 2013. Annuity Payments In 2013 ETF paid a total of $4.3 billion in benefits to retired persons, disabled retirees and beneficiaries of retirees. This was an increase of 0.5%, or $22.8 million, over 2012. Core annuities decreased by 0.4%, from $3.83 billion to $3.82 billion, while Variable annuities increased by 2.4%, from $311 million to $318 million. Annuities paid to the closed group Section 62.13 Police and Firefighters decreased by 24.8%, from $5.2 million to $3.9 million. Annuitants with Core annuities experienced a 9.6% decrease in their benefits in 2013, while Variable annuities received a 9.0% increase in their benefits, effective April 1, 2013. Approximately 10,105 additional persons began receiving annuities during 2013, while 3,704 annuities were ended due to death or expiration of a guarantee period. At year-end, 180,056 people were receiving retirement, disability, or beneficiary annuities, an increase of 3.7% over 2012. The average annual annuity received by all retirees (Core and Variable combined) decreased to $22,911 in 2013, down 3.2% from the previous year. The average annual amount of new annuities begun during 2013 was $29,128 down 3.1% from $30,072 in 2012. While the initial amount of new annuities has increased over time, post-retirement increases have generally helped maintain the purchasing power of existing annuities. The exception to this is in the years since the market losses in 2008, when there have been post-retirement decreases due to the losses being smoothed over 5 years. The accompanying chart shows how new annuities have increased over time based on investment performance, as well as how post-retirement increases multiplied the value of the annuity over time.
70%
80%
90%
100%
110%
2009 2010 2011 2012 2013
WRS Funded Ratio
0.0 0.5 1.0 1.5 2.0 2.5 3.0 3.5 4.0 4.5
2009 2010 2011 2012 2013
$ in
Bill
ion
s
Annuity Payments
($10)
$0
$10
$20
$30
$40
1992 1997 2002 2007 2012 2013
$ in
Th
ou
san
ds
Average Annual Annuity By Year Annuity Began
Average Annual Annuity By Year Annuity Began
Participation
There were 594,605 WRS participants as of December 31, 2013, an increase of 0.7% over the previous year. Participants include 256,788 active government employees, a decrease of 0.02% from the previous year; 180,056 retirees and others receiving annuities, an increase of 3.7% over the previous year; and 157,761 “inactives”, or former public employees who had not yet taken a benefit from their retirement accounts, a decrease of 1.4% over the previous year. To put the WRS growth in perspective, the total participation level has risen by 82,580 persons since 2003, a 16.1% increase.
In 2013, the total number of employers participating in the WRS increased from 1,478 to 1,479. The increase included the addition of two towns, and the elimination of one special district.
Participation There were 594,605 WRS participants as of December 31, 2013, an increase of 0.7% over the previous year. Participants include 256,788 active government employees, a decrease of 0.02% from the previous year; 180,056 retirees and others receiving annuities, an increase of 3.7% over the previous year; and 157,761 “inactives”, or former public employees who had not yet taken a benefit from their retirement accounts, a decrease of 1.4% over the previous year. To put the WRS growth in perspective, the total participation level has risen by 82,580 persons since 2003, a 16.1% increase. In 2013, the total number of employers participating in the WRS increased from 1,478 to 1,479. The increase included the addition of two towns, and the elimination of one special district.
Deferred Compensation Plan and Trust
Summary Financial Statements
2013 $ in millions
2012 $ in millions
Increase (Decrease)
$ in millions
Increase (Decrease)
%
Net position available for plan benefits $3,650.7 $3,025.4 $625.3 21%
Additions
School Districts 108,504
Towns, Villages &
Special Districts 10,025
State Agencies 73,091
WI Technical College Districts 9,873
Counties 33,044
Cities 22,251
Participants by Employer Type
0
100,000
200,000
300,000
2009 2010 2011 2012 2013
WRS Participants WRS ParticipantsParticipation There were 594,605 WRS participants as of December 31, 2013, an increase of 0.7% over the previous year. Participants include 256,788 active government employees, a decrease of 0.02% from the previous year; 180,056 retirees and others receiving annuities, an increase of 3.7% over the previous year; and 157,761 “inactives”, or former public employees who had not yet taken a benefit from their retirement accounts, a decrease of 1.4% over the previous year. To put the WRS growth in perspective, the total participation level has risen by 82,580 persons since 2003, a 16.1% increase. In 2013, the total number of employers participating in the WRS increased from 1,478 to 1,479. The increase included the addition of two towns, and the elimination of one special district.
Deferred Compensation Plan and Trust
Summary Financial Statements
2013 $ in millions
2012 $ in millions
Increase (Decrease)
$ in millions
Increase (Decrease)
%
Net position available for plan benefits $3,650.7 $3,025.4 $625.3 21%
Additions
School Districts 108,504
Towns, Villages &
Special Districts 10,025
State Agencies 73,091
WI Technical College Districts 9,873
Counties 33,044
Cities 22,251
Participants by Employer Type
0
100,000
200,000
300,000
2009 2010 2011 2012 2013
WRS Participants Participants by Employer Type
Net investment income increased by approximately $1.5 billion in 2013, from a $9.9 billion gain to an $11.3 billion gain. This included an increase in Core Trust Fund income of $0.7 billion, from a $9.0 billion gain to a $9.7 billion gain, and an increase in Variable Trust Fund income of $0.8 billion, from a $0.8 billion gain to a $1.6 billion gain.
The balanced Core Trust Fund realized a 13.6% investment return, while the equity-based Variable Trust Fund experienced a 29.0% return. The Core Trust Fund gain, after being smoothed through the MRA, resulted in a core effective rate of 10.9% being credited to the Core Fund accounts and reserves. The Variable Trust Fund gain was passed through to Variable Fund accounts and reserves with a 31% Variable effective rate.
Benefit payments increased by 0.7%, from $4.23 billion to $4.26 billion. Core annuities (including Section 62.13 Police & Firefighters) decreased by 0.4%, from $3.83 billion to $3.82 billion, while variable annuities increased by 2.4%, from $311 million to $318 million. Lump sum payments (separations, death benefits, and minimum annuities) decreased by 33.0%, from $92.9 million to $123.5 million. See “Annuity Payments” section below for details.
Funded Status The funded status of the WRS is a measure of the extent to which the system has accumulated enough assets to pay the benefits earned by participants. The funded ratio is the ratio of plan assets to estimated future liabilities. The assets can be measured using either the current fair value of assets or the smoothed funding value of assets. The fair value measurement gives a more timely measurement, but can be extremely volatile. The funding value measurement is less representative of current fair value, but better presents the funding trends without the year-to-year volatility. The funding value-based funded ratio for the WRS was unchanged at 99.9% funded. The fair value-based funded ratio for the WRS increased from 102.9% funded to 105.3% funded. This increase was the result of investment gains in 2013. Annuity Payments In 2013 ETF paid a total of $4.3 billion in benefits to retired persons, disabled retirees and beneficiaries of retirees. This was an increase of 0.5%, or $22.8 million, over 2012. Core annuities decreased by 0.4%, from $3.83 billion to $3.82 billion, while Variable annuities increased by 2.4%, from $311 million to $318 million. Annuities paid to the closed group Section 62.13 Police and Firefighters decreased by 24.8%, from $5.2 million to $3.9 million. Annuitants with Core annuities experienced a 9.6% decrease in their benefits in 2013, while Variable annuities received a 9.0% increase in their benefits, effective April 1, 2013. Approximately 10,105 additional persons began receiving annuities during 2013, while 3,704 annuities were ended due to death or expiration of a guarantee period. At year-end, 180,056 people were receiving retirement, disability, or beneficiary annuities, an increase of 3.7% over 2012. The average annual annuity received by all retirees (Core and Variable combined) decreased to $22,911 in 2013, down 3.2% from the previous year. The average annual amount of new annuities begun during 2013 was $29,128 down 3.1% from $30,072 in 2012. While the initial amount of new annuities has increased over time, post-retirement increases have generally helped maintain the purchasing power of existing annuities. The exception to this is in the years since the market losses in 2008, when there have been post-retirement decreases due to the losses being smoothed over 5 years. The accompanying chart shows how new annuities have increased over time based on investment performance, as well as how post-retirement increases multiplied the value of the annuity over time.
70%
80%
90%
100%
110%
2009 2010 2011 2012 2013
WRS Funded Ratio
0.0 0.5 1.0 1.5 2.0 2.5 3.0 3.5 4.0 4.5
2009 2010 2011 2012 2013
$ in
Bill
ion
s
Annuity Payments
($10)
$0
$10
$20
$30
$40
1992 1997 2002 2007 2012 2013
$ in
Th
ou
san
ds
Average Annual Annuity By Year Annuity Began
C o m p r e h e n s i v e A n n u a l F i n a n c i a l R e p o r t 2 0 1 3
5 INTRODUCTION
Deferred Compensation Plan and Trust
Program Description
The State of Wisconsin Public Employees Deferred Compensation Plan and Trust (the Plan) was established in 1981 pursuant to Wisconsin State Statute Section 40.80. Under the Plan provisions, employees of the State of Wisconsin and public employers in Wisconsin that elect to participate are eligible to contribute to the Plan through payroll deductions. The Plan is governed by the Wisconsin Deferred Compensation (WDC) Board. The Plan is administered by a third party and the Wisconsin Deferred Compensation Board is trustee of the Plan.
Participation
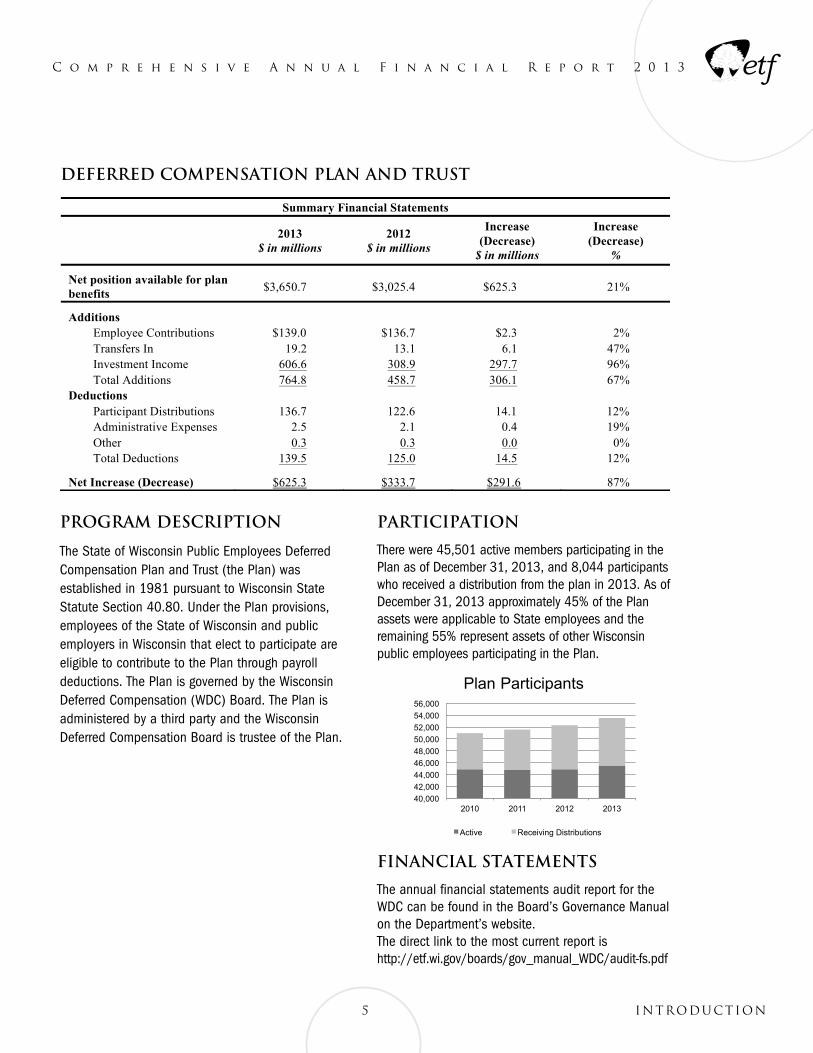
There were 45,501 active members participating in the Plan as of December 31, 2013, and 8,044 participants who received a distribution from the plan in 2013. As of December 31, 2013 approximately 45% of the Plan assets were applicable to State employees and the remaining 55% represent assets of other Wisconsin public employees participating in the Plan.
Employee Contributions $139.0 $136.7 $2.3 2% Transfers In 19.2 13.1 6.1 47% Investment Income 606.6 308.9 297.7 96% Total Additions 764.8 458.7 306.1 67%
Deductions Participant Distributions 136.7 122.6 14.1 12% Administrative Expenses 2.5 2.1 0.4 19% Other 0.3 0.3 0.0 0% Total Deductions 139.5 125.0 14.5 12%
Net Increase (Decrease) $625.3 $333.7 $291.6 87%
Program Description The State of Wisconsin Public Employees Deferred Compensation Plan and Trust (the Plan) was established in 1981 pursuant to Wisconsin State Statute Section 40.80. Under the Plan provisions, employees of the State of Wisconsin and public employers in Wisconsin that elect to participate are eligible to contribute to the Plan through payroll deductions. The Plan is governed by the Wisconsin Deferred Compensation (WDC) Board. The Plan is administered by a third party and the Wisconsin Deferred Compensation Board is trustee of the Plan. Participation There were 45,501 active members participating in the Plan as of December 31, 2013, and 8,044 participants who received a distribution from the plan in 2013. As of December 31, 2013 approximately 45% of the Plan assets were applicable to State employees and the remaining 55% represent assets of other Wisconsin public employees participating in the Plan. Financial Statements The annual financial statements audit report for the WDC can be found in the Board’s Governance Manual on the Department’s website. The direct link to the most current report is http://etf.wi.gov/boards/gov_manual_WDC/audit-fs.pdf
40,000
42,000
44,000
46,000
48,000
50,000
52,000
54,000
56,000
2010 2011 2012 2013
Plan Participants
Active Receiving Distributions
Plan Participants
Financial Statements
The annual financial statements audit report for the WDC can be found in the Board’s Governance Manual on the Department’s website. The direct link to the most current report is http://etf.wi.gov/boards/gov_manual_WDC/audit-fs.pdf
C o m p r e h e n s i v e A n n u a l F i n a n c i a l R e p o r t 2 0 1 3
6INTRODUCTION
Accumulated Sick Leave Conversion Credit (ASLCC) ProgramAccumulated Sick Leave Conversion Credit (ASLCC) Program
Summary Financial Statements
2013 $ in millions
2012
$ in millions
Increase (Decrease)
$ in millions
Increase (Decrease)
% Assets $2,363.8 $2,164.9 $198.9 9% Less: Liabilities
Estimated Future Claims 2,267.7 2,125.5 142.2 7% Other Liabilities 0.8 0.3 0.5 167%
Less: Reserves Reserve for Changes in the Market Value of Investments
119.4 56.6 62.8 111%
Unfunded Liability ($24.1) ($17.5) ($6.6) 38% Additions
Contributions $53.7 $47.8 $5.9 12% Investment Income 280.4 261.8 18.6 7% Total Additions 334.1 309.6 24.5 8%
Deductions Benefits and Distributions 276.6 95.4 181.2 190% Administration 1.2 0.6 0.6 100% Total Deductions 277.8 96.0 181.8 189%
Net Increase (Decrease) $56.3 $213.6 ($157.3) (74%)
Program Description The ASLCC Program allows retirees of the State of Wisconsin, the University of Wisconsin (UW) System, the UW Hospital & Clinics Authority, and other state Authorities, at the time of their retirement, to convert the value of their unused sick leave accumulation into an account to be used to pay for post-retirement health insurance. Financial Highlights At the end of 2013, the unfunded liability is attributable to the UW Hospital & Clinics Authority, the Wisconsin Health and
Education Facility Authority, and Wiscraft. No liability exists for state agencies or the UW. The 190% increase in the Benefits and Distributions expense is the actuarially-determined change in liabilities during the year. The Reserve for Changes in the Market Value of Investments is the portion of the deferred investment gains and losses in the
Market Recognition Account (MRA) attributable to ASLCC. 2.5% or $119.4 million of the deferred investment gains in the MRA are attributable to the ASLCC Program.
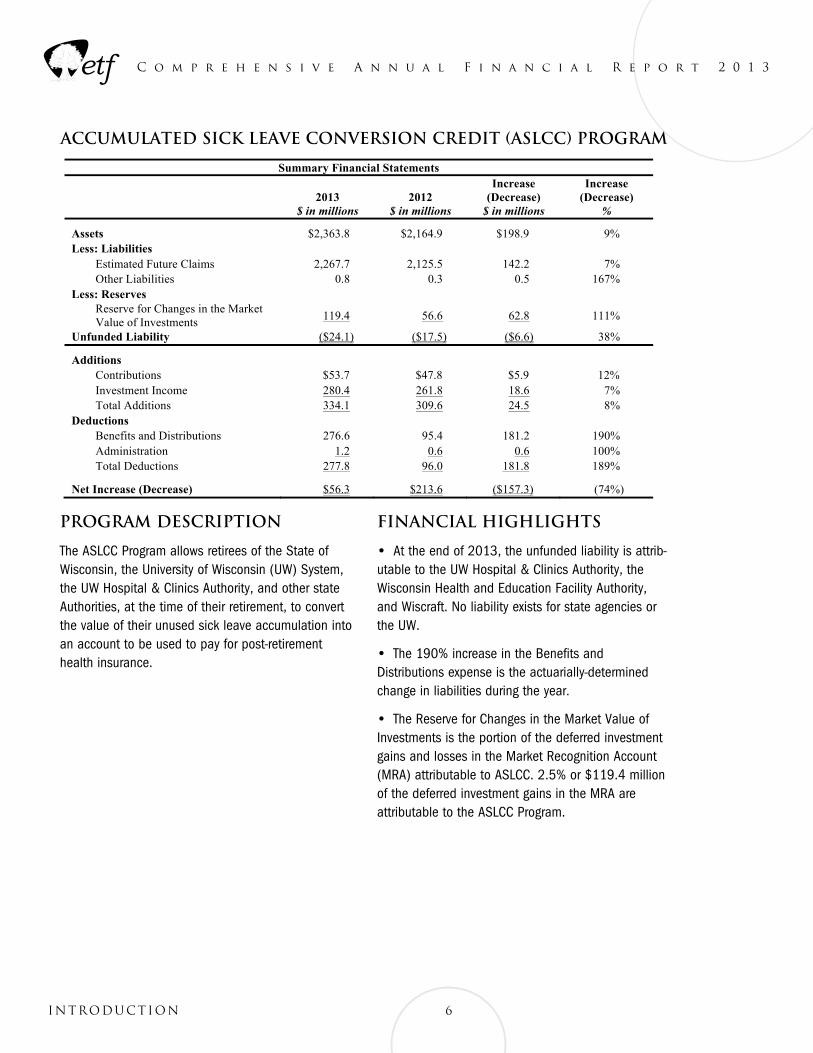
Funded Status The funded status of the ASLCC Program is a measure of the extent to which the program has accumulated enough assets to pay the benefits earned by participants. The funded ratio is the ratio of plan assets to estimated future liabilities. The assets can be measured using the current fair value of assets or the smoothed funding value of assets. The fair value measurement gives a more timely measurement, but can be extremely volatile. The funding value measurement is less representative of current fair value, but better presents the funding trends without the year-to-year volatility. The funding value-based funded ratio decreased from 99.2% funded to 98.9% funded. The fair value-based funded ratio increased from 101.8% funded to 104.2% funded. The increase in the fair value funded ratio resulted from the investment income for the year. Participation There were 88,073 ASLCC participants as of December 31, 2013, an increase of 0.9% over the previous year. Participants include 68,511 active employees, an increase of 2.5% from the previous year; 14,166 retirees and others using ASLCC credits; and 5,396 “escrowed annuitants”-- former employees who had not yet started using credits from their ASLCC accounts.
0%
20%
40%
60%
80%
100%
120%
2009 2010 2011 2012 2013
Accumulated Sick Leave Conversion Credits Funded Ratio
Funding Value Fair Value
Program Description
The ASLCC Program allows retirees of the State of Wisconsin, the University of Wisconsin (UW) System, the UW Hospital & Clinics Authority, and other state Authorities, at the time of their retirement, to convert the value of their unused sick leave accumulation into an account to be used to pay for post-retirement health insurance.
Financial Highlights
• At the end of 2013, the unfunded liability is attrib-utable to the UW Hospital & Clinics Authority, the Wisconsin Health and Education Facility Authority, and Wiscraft. No liability exists for state agencies or the UW.
• The 190% increase in the Benefits and Distributions expense is the actuarially-determined change in liabilities during the year.
• The Reserve for Changes in the Market Value of Investments is the portion of the deferred investment gains and losses in the Market Recognition Account (MRA) attributable to ASLCC. 2.5% or $119.4 million of the deferred investment gains in the MRA are attributable to the ASLCC Program.
C o m p r e h e n s i v e A n n u a l F i n a n c i a l R e p o r t 2 0 1 3
7 INTRODUCTION
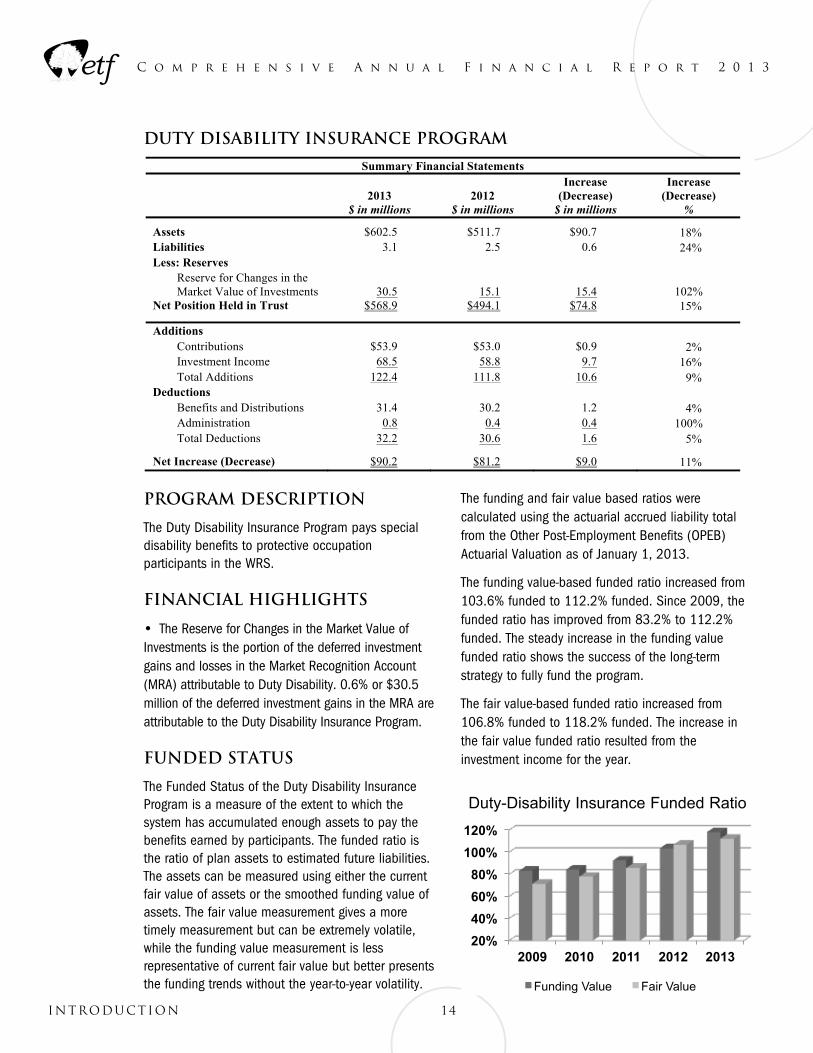
Funded Status
The Funded Status of the ASLCC Program is a measure of the extent to which the program has accumulated enough assets to pay the benefits earned by participants. The funded ratio is the ratio of plan assets to estimated future liabilities. The assets can be measured using the current fair value of assets or the smoothed funding value of assets. The fair value measurement gives a more timely measurement, but can be extremely volatile. The funding value measurement is less representative of current fair value, but better presents the funding trends without the year-to-year volatility.
The funding value-based funded ratio decreased from 99.2% funded to 98.9% funded.
The fair value-based funded ratio increased from 101.8% funded to 104.2% funded. The increase in the fair value funded ratio resulted from the investment income for the year.
Accumulated Sick Leave Conversion Credit (ASLCC) Program
Summary Financial Statements
2013 $ in millions
2012
$ in millions
Increase (Decrease)
$ in millions
Increase (Decrease)
% Assets $2,363.8 $2,164.9 $198.9 9% Less: Liabilities
Estimated Future Claims 2,267.7 2,125.5 142.2 7% Other Liabilities 0.8 0.3 0.5 167%
Less: Reserves Reserve for Changes in the Market Value of Investments
119.4 56.6 62.8 111%
Unfunded Liability ($24.1) ($17.5) ($6.6) 38% Additions
Contributions $53.7 $47.8 $5.9 12% Investment Income 280.4 261.8 18.6 7% Total Additions 334.1 309.6 24.5 8%
Deductions Benefits and Distributions 276.6 95.4 181.2 190% Administration 1.2 0.6 0.6 100% Total Deductions 277.8 96.0 181.8 189%
Net Increase (Decrease) $56.3 $213.6 ($157.3) (74%)
Program Description The ASLCC Program allows retirees of the State of Wisconsin, the University of Wisconsin (UW) System, the UW Hospital & Clinics Authority, and other state Authorities, at the time of their retirement, to convert the value of their unused sick leave accumulation into an account to be used to pay for post-retirement health insurance. Financial Highlights At the end of 2013, the unfunded liability is attributable to the UW Hospital & Clinics Authority, the Wisconsin Health and
Education Facility Authority, and Wiscraft. No liability exists for state agencies or the UW. The 190% increase in the Benefits and Distributions expense is the actuarially-determined change in liabilities during the year. The Reserve for Changes in the Market Value of Investments is the portion of the deferred investment gains and losses in the
Market Recognition Account (MRA) attributable to ASLCC. 2.5% or $119.4 million of the deferred investment gains in the MRA are attributable to the ASLCC Program.
Funded Status The funded status of the ASLCC Program is a measure of the extent to which the program has accumulated enough assets to pay the benefits earned by participants. The funded ratio is the ratio of plan assets to estimated future liabilities. The assets can be measured using the current fair value of assets or the smoothed funding value of assets. The fair value measurement gives a more timely measurement, but can be extremely volatile. The funding value measurement is less representative of current fair value, but better presents the funding trends without the year-to-year volatility. The funding value-based funded ratio decreased from 99.2% funded to 98.9% funded. The fair value-based funded ratio increased from 101.8% funded to 104.2% funded. The increase in the fair value funded ratio resulted from the investment income for the year. Participation There were 88,073 ASLCC participants as of December 31, 2013, an increase of 0.9% over the previous year. Participants include 68,511 active employees, an increase of 2.5% from the previous year; 14,166 retirees and others using ASLCC credits; and 5,396 “escrowed annuitants”-- former employees who had not yet started using credits from their ASLCC accounts.
0%
20%
40%
60%
80%
100%
120%
2009 2010 2011 2012 2013
Accumulated Sick Leave Conversion Credits Funded Ratio
Funding Value Fair Value
Accumulated Sick Leave Conversion Credits Funded Ratio
Participation
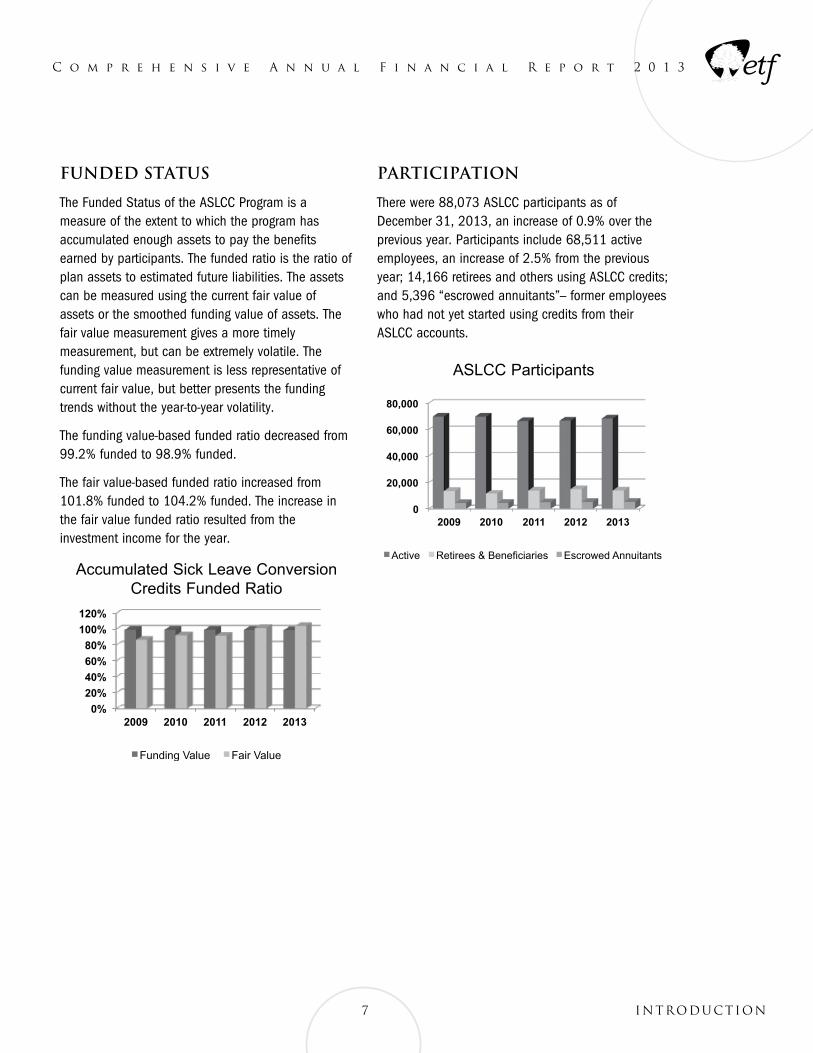
There were 88,073 ASLCC participants as of December 31, 2013, an increase of 0.9% over the previous year. Participants include 68,511 active employees, an increase of 2.5% from the previous year; 14,166 retirees and others using ASLCC credits; and 5,396 “escrowed annuitants”-- former employees who had not yet started using credits from their ASLCC accounts.
0
20,000
40,000
60,000
80,000
2009 2010 2011 2012 2013
ASLCC Participants
Active Retirees & Beneficiaries Escrowed Annuitants
ASLCC Participants
C o m p r e h e n s i v e A n n u a l F i n a n c i a l R e p o r t 2 0 1 3
8INTRODUCTION
State Retiree Life Insurance PlanState Retiree Life Insurance Plan
Summary Financial Statements
2013 $ in millions
2012 $ in millions
Increase (Decrease)
$ in millions
Increase (Decrease)
%
Net Position Held in Trust $365.9 $365.7 $0.2 0% Additions
Contributions $4.7 $5.0 ($0.3) (6%) Investment Income 14.8 15.6 (0.8) (5%) Total Additions 19.5 20.6 (1.1) (5%)
Deductions Benefits and Distributions 18.6 17.6 1.0 6% Admin. & Other Expenses 0.7 1.1 0.4 36% Total Deductions 19.3 18.7 0.6 3%
Net Increase (Decrease) $0.2 $1.9 ($1.7) (89%)
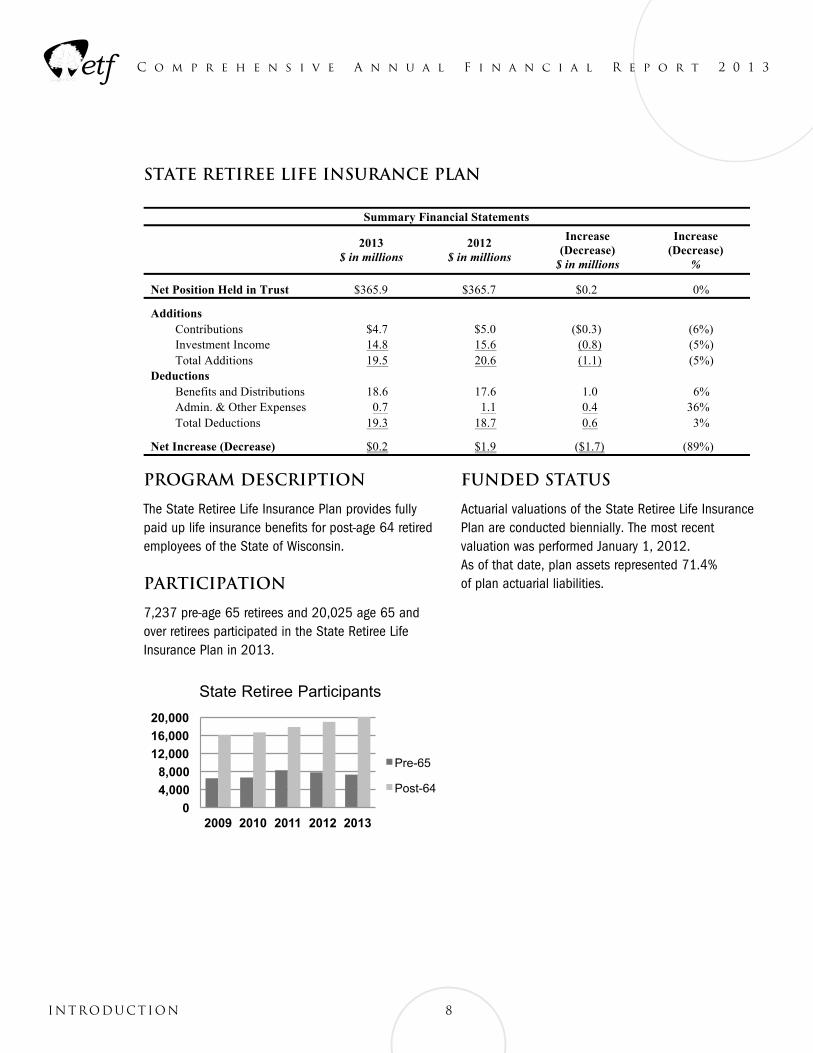
Program Description The State Retiree Life Insurance Plan provides fully paid up life insurance benefits for post-age 64 retired employees of the State of Wisconsin. Participation 7,237 pre-age 65 retirees and 20,025 age 65 and over retirees participated in the State Retiree Life Insurance Plan in 2013. Funded Status Actuarial valuations of the State Retiree Life Insurance Plan are conducted biennially. The most recent valuation was performed January 1, 2012. As of that date, plan assets represented 71.4% of plan actuarial liabilities.
0
4,000
8,000
12,000
16,000
20,000
2009 2010 2011 2012 2013
State Retiree Participants
Pre-65
Post-64
Program Description
The State Retiree Life Insurance Plan provides fully paid up life insurance benefits for post-age 64 retired employees of the State of Wisconsin.
Participation
7,237 pre-age 65 retirees and 20,025 age 65 and over retirees participated in the State Retiree Life Insurance Plan in 2013.
Funded Status
Actuarial valuations of the State Retiree Life Insurance Plan are conducted biennially. The most recent valuation was performed January 1, 2012. As of that date, plan assets represented 71.4% of plan actuarial liabilities.
State Retiree Life Insurance Plan
Summary Financial Statements
2013 $ in millions
2012 $ in millions
Increase (Decrease)
$ in millions
Increase (Decrease)
%
Net Position Held in Trust $365.9 $365.7 $0.2 0% Additions
Contributions $4.7 $5.0 ($0.3) (6%) Investment Income 14.8 15.6 (0.8) (5%) Total Additions 19.5 20.6 (1.1) (5%)
Deductions Benefits and Distributions 18.6 17.6 1.0 6% Admin. & Other Expenses 0.7 1.1 0.4 36% Total Deductions 19.3 18.7 0.6 3%
Net Increase (Decrease) $0.2 $1.9 ($1.7) (89%)
Program Description The State Retiree Life Insurance Plan provides fully paid up life insurance benefits for post-age 64 retired employees of the State of Wisconsin. Participation 7,237 pre-age 65 retirees and 20,025 age 65 and over retirees participated in the State Retiree Life Insurance Plan in 2013. Funded Status Actuarial valuations of the State Retiree Life Insurance Plan are conducted biennially. The most recent valuation was performed January 1, 2012. As of that date, plan assets represented 71.4% of plan actuarial liabilities.
0
4,000
8,000
12,000
16,000
20,000
2009 2010 2011 2012 2013
State Retiree Participants
Pre-65
Post-64
State Retiree Participants
C o m p r e h e n s i v e A n n u a l F i n a n c i a l R e p o r t 2 0 1 3
9 INTRODUCTION
Local Government Retiree Life Insurance PlanLocal Government Retiree Life Insurance Plan
Summary Financial Statements
2013 $ in millions
2012 $ in millions
Increase (Decrease)
$ in millions
Increase (Decrease)
%
Net Position Held in Trust $239.7 $235.7 $4.0 2% Additions
Contributions $7.6 $6.9 $0.7 10% Investment Income 9.6 10.0 (0.4) (4%) Total Additions 17.2 16.9 0.3 2%
Deductions Benefits and Distributions
12.0 11.6 0.4 3%
Admin. & Other Expenses
1.2 1.3 (0.1) (8%)
Total Deductions 13.2 12.9 0.3 2% Net Increase (Decrease) $4.0 $4.0 $0.0 0%
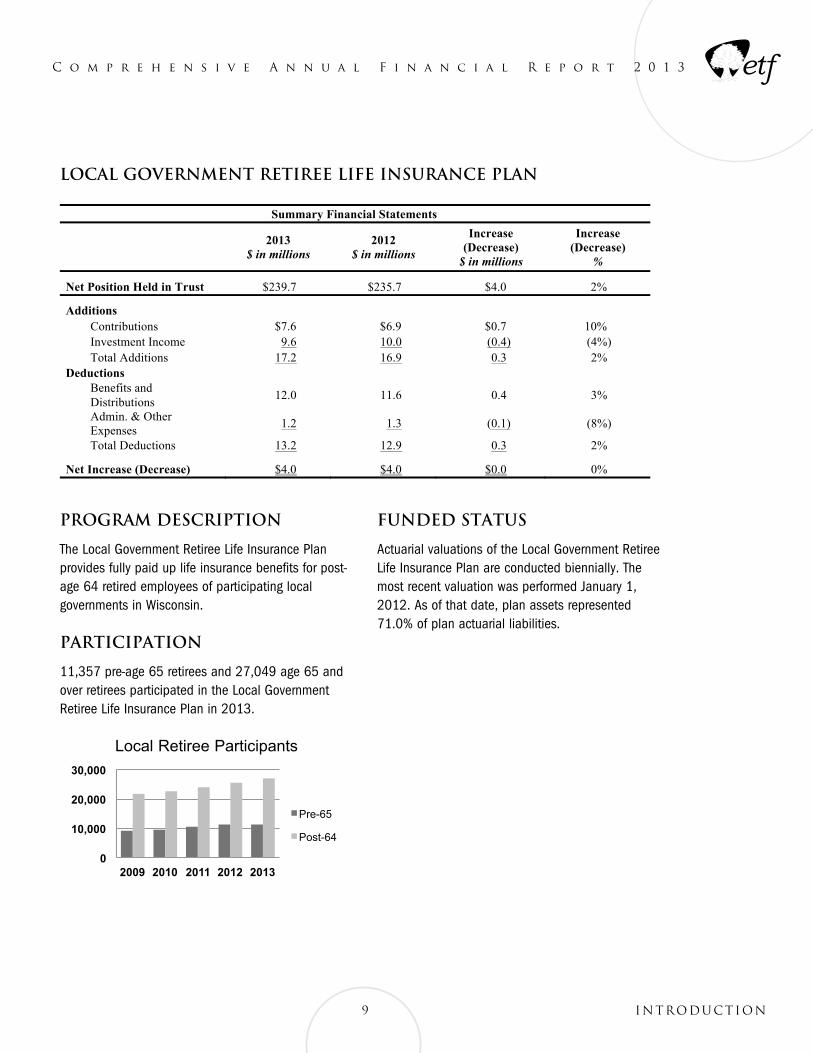
Program Description The Local Government Retiree Life Insurance Plan provides fully paid up life insurance benefits for post-age 64 retired employees of participating local governments in Wisconsin. Participation 11,357 pre-age 65 retirees and 27,049 age 65 and over retirees participated in the Local Government Retiree Life Insurance Plan in 2013. Funded Status Actuarial valuations of the Local Government Retiree Life Insurance Plan are conducted biennially. The most recent valuation was performed January 1, 2012. As of that date, plan assets represented 71.0% of plan actuarial liabilities.
0
10,000
20,000
30,000
2009 2010 2011 2012 2013
Local Retiree Participants
Pre-65
Post-64
Program Description
The Local Government Retiree Life Insurance Plan provides fully paid up life insurance benefits for post-age 64 retired employees of participating local governments in Wisconsin.
Participation
11,357 pre-age 65 retirees and 27,049 age 65 and over retirees participated in the Local Government Retiree Life Insurance Plan in 2013.
Local Government Retiree Life Insurance Plan
Summary Financial Statements
2013 $ in millions
2012 $ in millions
Increase (Decrease)
$ in millions
Increase (Decrease)
%
Net Position Held in Trust $239.7 $235.7 $4.0 2% Additions
Contributions $7.6 $6.9 $0.7 10% Investment Income 9.6 10.0 (0.4) (4%) Total Additions 17.2 16.9 0.3 2%
Deductions Benefits and Distributions
12.0 11.6 0.4 3%
Admin. & Other Expenses
1.2 1.3 (0.1) (8%)
Total Deductions 13.2 12.9 0.3 2% Net Increase (Decrease) $4.0 $4.0 $0.0 0%
Program Description The Local Government Retiree Life Insurance Plan provides fully paid up life insurance benefits for post-age 64 retired employees of participating local governments in Wisconsin. Participation 11,357 pre-age 65 retirees and 27,049 age 65 and over retirees participated in the Local Government Retiree Life Insurance Plan in 2013. Funded Status Actuarial valuations of the Local Government Retiree Life Insurance Plan are conducted biennially. The most recent valuation was performed January 1, 2012. As of that date, plan assets represented 71.0% of plan actuarial liabilities.
0
10,000
20,000
30,000
2009 2010 2011 2012 2013
Local Retiree Participants
Pre-65
Post-64
Local Retiree Participants
Funded Status
Actuarial valuations of the Local Government Retiree Life Insurance Plan are conducted biennially. The most recent valuation was performed January 1, 2012. As of that date, plan assets represented 71.0% of plan actuarial liabilities.
C o m p r e h e n s i v e A n n u a l F i n a n c i a l R e p o r t 2 0 1 3
10INTRODUCTION
Active Member Life Insurance PlanActive Member Life Insurance Plan
Summary Financial Statements
2013 $ in thousands
2012 $ in thousands
Increase (Decrease)
$ in thousands
Increase (Decrease)
%
Net Position Available for Benefits $254.2 $243.5 $10.7 4% Revenues
Administrative Reimbursement $549.2 $587.2 ($38.0) (6%) Investment Income 1.4 2.1 (0.7) (33%) Total Revenues 550.6 589.3 (38.7) (7%)
Expenses Administrative Expense 539.9 581.6 (41.7) (7%) Total Expenses 539.9 581.6 (41.7) (7%)
Net Increase (Decrease) $10.7 $7.7 $3.0 39%
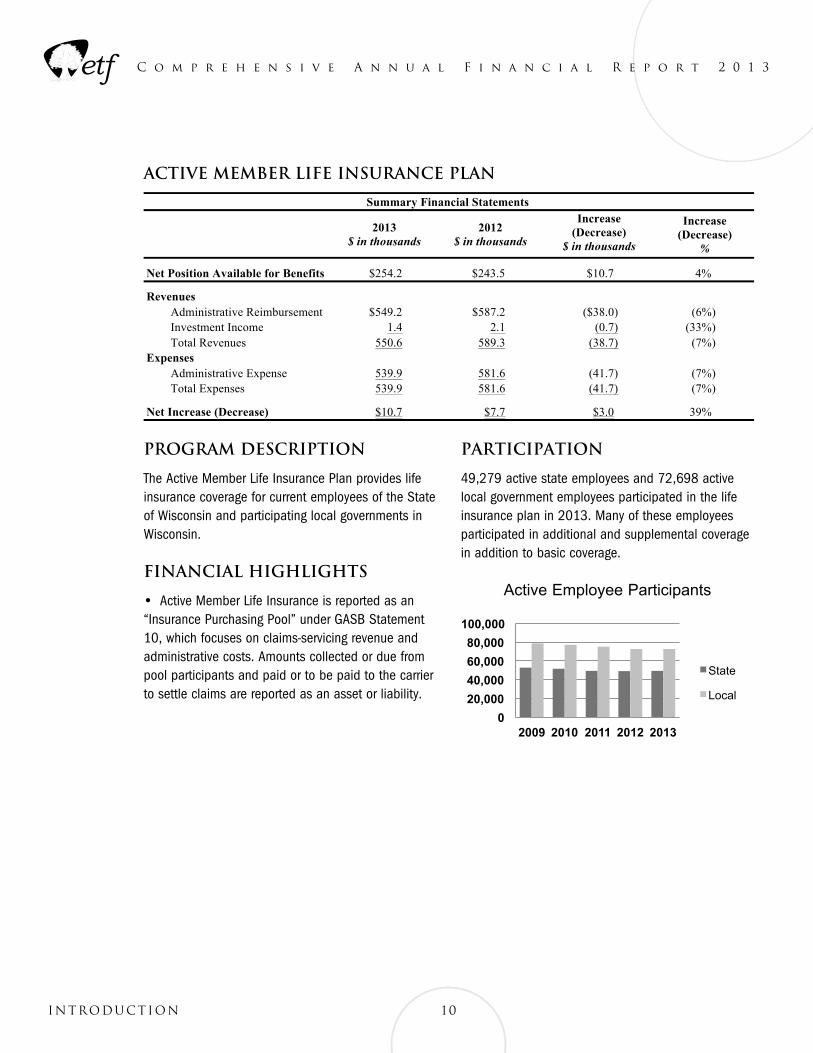
Program Description The Active Member Life Insurance Plan provides life insurance coverage for current employees of the State of Wisconsin and participating local governments in Wisconsin. Financial Highlights Active Member Life Insurance is reported as an “Insurance Purchasing Pool” under GASB Statement 10, which focuses on claims-servicing revenue and administrative costs. Amounts collected or due from pool participants and paid or to be paid to the carrier to settle claims are reported as an asset or liability. Participation 49,279 active state employees and 72,698 active local government employees participated in the life insurance plan in 2013. Many of these employees participated in additional and supplemental coverage in addition to basic coverage.
0
20,000
40,000
60,000
80,000
100,000
2009 2010 2011 2012 2013
Active Employee Participants
State
Local
Program Description
The Active Member Life Insurance Plan provides life insurance coverage for current employees of the State of Wisconsin and participating local governments in Wisconsin.
Financial Highlights
• Active Member Life Insurance is reported as an “Insurance Purchasing Pool” under GASB Statement 10, which focuses on claims-servicing revenue and administrative costs. Amounts collected or due from pool participants and paid or to be paid to the carrier to settle claims are reported as an asset or liability.
Participation
49,279 active state employees and 72,698 active local government employees participated in the life insurance plan in 2013. Many of these employees participated in additional and supplemental coverage in addition to basic coverage.
Active Member Life Insurance Plan
Summary Financial Statements
2013 $ in thousands
2012 $ in thousands
Increase (Decrease)
$ in thousands
Increase (Decrease)
%
Net Position Available for Benefits $254.2 $243.5 $10.7 4% Revenues
Administrative Reimbursement $549.2 $587.2 ($38.0) (6%) Investment Income 1.4 2.1 (0.7) (33%) Total Revenues 550.6 589.3 (38.7) (7%)
Expenses Administrative Expense 539.9 581.6 (41.7) (7%) Total Expenses 539.9 581.6 (41.7) (7%)
Net Increase (Decrease) $10.7 $7.7 $3.0 39%
Program Description The Active Member Life Insurance Plan provides life insurance coverage for current employees of the State of Wisconsin and participating local governments in Wisconsin. Financial Highlights Active Member Life Insurance is reported as an “Insurance Purchasing Pool” under GASB Statement 10, which focuses on claims-servicing revenue and administrative costs. Amounts collected or due from pool participants and paid or to be paid to the carrier to settle claims are reported as an asset or liability. Participation 49,279 active state employees and 72,698 active local government employees participated in the life insurance plan in 2013. Many of these employees participated in additional and supplemental coverage in addition to basic coverage.
0
20,000
40,000
60,000
80,000
100,000
2009 2010 2011 2012 2013
Active Employee Participants
State
Local
Active Employee Participants
C o m p r e h e n s i v e A n n u a l F i n a n c i a l R e p o r t 2 0 1 3
1 1 INTRODUCTION
Employee Reimbursement Accounts (ERA) ProgramEmployee Reimbursement Accounts (ERA) Program
Summary Financial Statements
2013 $ in thousands
2012
$ in thousands
Increase (Decrease)
$ in thousands
Increase (Decrease)
% Assets $6,514.1 $6,930.6 ($416.5) (6%) Liabilities 5,780.5 6,243.7 (463.2) (7%) Net Position Held in Trust $733.6 $686.9 $46.7 7% Additions
Contributions $25,400.3 $25,278.4 $121.9 0% Investment Income 3.9 7.3 (3.4) (47%) Other Additions 50.8 0.0 50.8 n/a Total Additions 25,454.9 25,285.7 169.3 1%
Deductions Benefits and Distributions 24,391.0 24,722.5 (331.4) (1%) Administrative Expenses 1,017.2 980.0 37.2 4% Total Deductions 25,408.2 25,702.5 (294.2) (1%)
Net Increase (Decrease) $46.7 ($416.8) $463.6 n/a
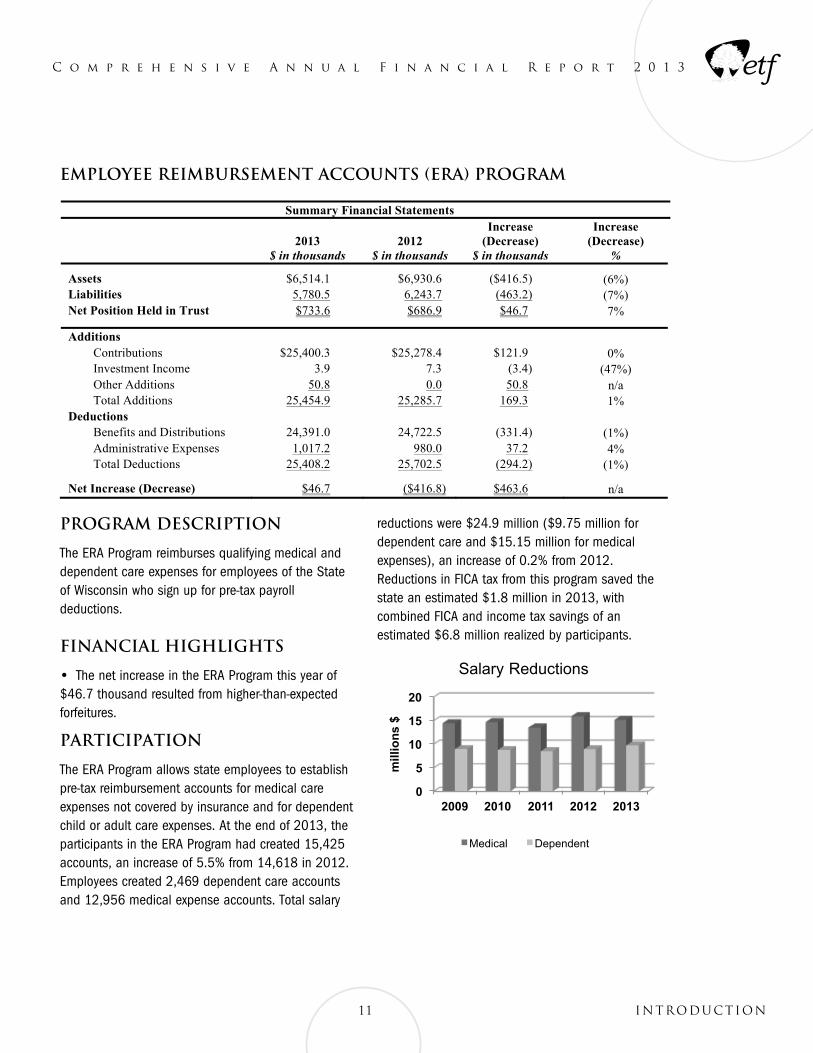
Program Description The ERA Program reimburses qualifying medical and dependent care expenses for employees of the State of Wisconsin who sign up for pre-tax payroll deductions. Financial Highlights The net increase in the ERA Program this year of $46.7 thousand resulted from higher-than-expected forfeitures. Participation The ERA Program allows state employees to establish pre-tax reimbursement accounts for medical care expenses not covered by insurance and for dependent child or adult care expenses. At the end of 2013, the participants in the ERA Program had created 15,425 accounts, an increase of 5.5% from 14,618 in 2012. Employees created 2,469 dependent care accounts and 12,956 medical expense accounts. Total salary reductions were $24.9 million ($9.75 million for dependent care and $15.15 million for medical expenses), an increase of 0.2% from 2012. Reductions in FICA tax from this program saved the state an estimated $1.8 million in 2013, with combined FICA and income tax savings of an estimated $6.8 million realized by participants.
0
5
10
15
20
2009 2010 2011 2012 2013
mill
ion
s $
Salary Reductions
Medical Dependent
Program Description
The ERA Program reimburses qualifying medical and dependent care expenses for employees of the State of Wisconsin who sign up for pre-tax payroll deductions.
Financial Highlights
• The net increase in the ERA Program this year of $46.7 thousand resulted from higher-than-expected forfeitures.
Participation
The ERA Program allows state employees to establish pre-tax reimbursement accounts for medical care expenses not covered by insurance and for dependent child or adult care expenses. At the end of 2013, the participants in the ERA Program had created 15,425 accounts, an increase of 5.5% from 14,618 in 2012. Employees created 2,469 dependent care accounts and 12,956 medical expense accounts. Total salary
reductions were $24.9 million ($9.75 million for dependent care and $15.15 million for medical expenses), an increase of 0.2% from 2012. Reductions in FICA tax from this program saved the state an estimated $1.8 million in 2013, with combined FICA and income tax savings of an estimated $6.8 million realized by participants.
Employee Reimbursement Accounts (ERA) Program
Summary Financial Statements
2013 $ in thousands
2012
$ in thousands
Increase (Decrease)
$ in thousands
Increase (Decrease)
% Assets $6,514.1 $6,930.6 ($416.5) (6%) Liabilities 5,780.5 6,243.7 (463.2) (7%) Net Position Held in Trust $733.6 $686.9 $46.7 7% Additions
Contributions $25,400.3 $25,278.4 $121.9 0% Investment Income 3.9 7.3 (3.4) (47%) Other Additions 50.8 0.0 50.8 n/a Total Additions 25,454.9 25,285.7 169.3 1%
Deductions Benefits and Distributions 24,391.0 24,722.5 (331.4) (1%) Administrative Expenses 1,017.2 980.0 37.2 4% Total Deductions 25,408.2 25,702.5 (294.2) (1%)
Net Increase (Decrease) $46.7 ($416.8) $463.6 n/a
Program Description The ERA Program reimburses qualifying medical and dependent care expenses for employees of the State of Wisconsin who sign up for pre-tax payroll deductions. Financial Highlights The net increase in the ERA Program this year of $46.7 thousand resulted from higher-than-expected forfeitures. Participation The ERA Program allows state employees to establish pre-tax reimbursement accounts for medical care expenses not covered by insurance and for dependent child or adult care expenses. At the end of 2013, the participants in the ERA Program had created 15,425 accounts, an increase of 5.5% from 14,618 in 2012. Employees created 2,469 dependent care accounts and 12,956 medical expense accounts. Total salary reductions were $24.9 million ($9.75 million for dependent care and $15.15 million for medical expenses), an increase of 0.2% from 2012. Reductions in FICA tax from this program saved the state an estimated $1.8 million in 2013, with combined FICA and income tax savings of an estimated $6.8 million realized by participants.
0
5
10
15
20
2009 2010 2011 2012 2013
mill
ion
s $
Salary Reductions
Medical Dependent
Salary Reductions
C o m p r e h e n s i v e A n n u a l F i n a n c i a l R e p o r t 2 0 1 3
Commuter Benefits Program Commuter Benefits Program
Summary Financial Statements
2013 $ in thousands
2012
$ in thousands
Increase (Decrease)
$ in thousands
Increase (Decrease)
% Assets $310.8 $438.0 ($127.2) (29%) Liabilities 260.3 404.9 (144.6) (36%) Net Position Held in Trust $50.5 $33.1 17.4 53% Additions
Contributions $1,700.7 $1,445.8 254.9 18% Investment Income (0.3) (0.3) 0.0 n/a Miscellaneous Income 2.0 0.0 2.0 100% Total Additions 1,702.4 1,445.5 256.9 18%
Deductions Benefits and Distributions 1,526.9 1,266.7 260.2 21% Admin. & Other Expenses 158.0 155.4 2.6 2% Total Deductions 1,684.9 1,422.1 262.8 18%
Net Increase (Decrease) 17.5 $23.4 (5.9) (25%)
Program Description The Commuter Benefits Program reimburses qualifying transportation expenses for employees of the State of Wisconsin who sign up for pre-tax payroll deductions. Financial Highlights The Commuter Benefits Program began in August 2002. Startup costs were funded through an advance from the state’s general
fund. As of December 31, 2013, $27,700 remained payable to the general fund. The net increase in the Commuter Benefits Program this year was $17.5 thousand in contributions that exceeded this year’s
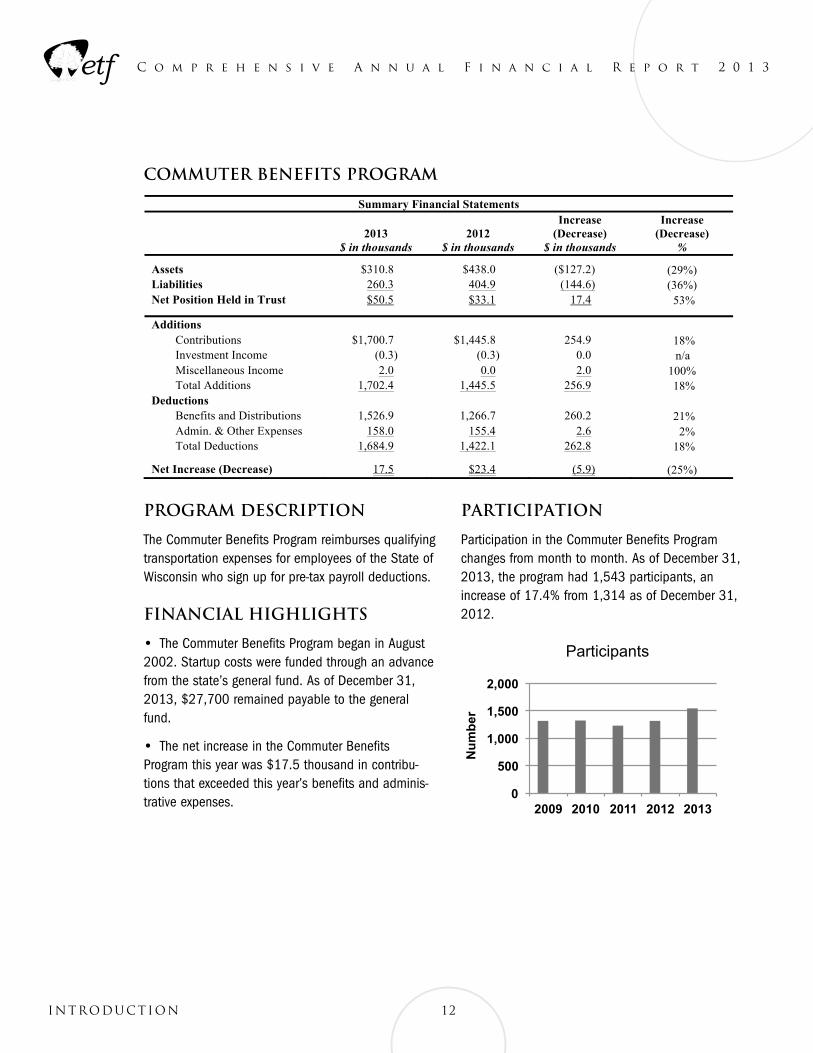
benefits and administrative expenses. Participation Participation in the Commuter Benefits Program changes from month to month. As of December 31, 2013, the program had 1,543 participants, an increase of 17.4% from 1,314 as of December 31, 2012.
0
500
1,000
1,500
2,000
2009 2010 2011 2012 2013
Nu
mb
er
Participants
Program Description
The Commuter Benefits Program reimburses qualifying transportation expenses for employees of the State of Wisconsin who sign up for pre-tax payroll deductions.
Financial Highlights
• The Commuter Benefits Program began in August 2002. Startup costs were funded through an advance from the state’s general fund. As of December 31, 2013, $27,700 remained payable to the general fund.
• The net increase in the Commuter Benefits Program this year was $17.5 thousand in contribu-tions that exceeded this year’s benefits and adminis-trative expenses.
Participation
Participation in the Commuter Benefits Program changes from month to month. As of December 31, 2013, the program had 1,543 participants, an increase of 17.4% from 1,314 as of December 31, 2012.
Commuter Benefits Program
Summary Financial Statements
2013 $ in thousands
2012
$ in thousands
Increase (Decrease)
$ in thousands
Increase (Decrease)
% Assets $310.8 $438.0 ($127.2) (29%) Liabilities 260.3 404.9 (144.6) (36%) Net Position Held in Trust $50.5 $33.1 17.4 53% Additions
Contributions $1,700.7 $1,445.8 254.9 18% Investment Income (0.3) (0.3) 0.0 n/a Miscellaneous Income 2.0 0.0 2.0 100% Total Additions 1,702.4 1,445.5 256.9 18%
Deductions Benefits and Distributions 1,526.9 1,266.7 260.2 21% Admin. & Other Expenses 158.0 155.4 2.6 2% Total Deductions 1,684.9 1,422.1 262.8 18%
Net Increase (Decrease) 17.5 $23.4 (5.9) (25%)
Program Description The Commuter Benefits Program reimburses qualifying transportation expenses for employees of the State of Wisconsin who sign up for pre-tax payroll deductions. Financial Highlights The Commuter Benefits Program began in August 2002. Startup costs were funded through an advance from the state’s general
fund. As of December 31, 2013, $27,700 remained payable to the general fund. The net increase in the Commuter Benefits Program this year was $17.5 thousand in contributions that exceeded this year’s
benefits and administrative expenses. Participation Participation in the Commuter Benefits Program changes from month to month. As of December 31, 2013, the program had 1,543 participants, an increase of 17.4% from 1,314 as of December 31, 2012.
0
500
1,000
1,500
2,000
2009 2010 2011 2012 2013
Nu
mb
er
Participants Participants
12INTRODUCTION
C o m p r e h e n s i v e A n n u a l F i n a n c i a l R e p o r t 2 0 1 3
13 INTRODUCTION
Milwaukee Retirement FundMilwaukee Retirement Fund
Summary Financial Statements
2013 $ in millions
2012
$ in millions
Increase (Decrease)
$ in millions
Increase (Decrease)
% Assets
Investment in Core Fund $162.5 $149.0 $13.5 9% Investment in Variable Fund 21.6 19.2 2.4 13%
Net Position Held in Trust $184.1 $168.2 $15.9
9%
Additions
Deposits $8.5 $11.2 ($2.7) (24%) Investment Income 24.9 21.1 3.8 18% Total Additions 33.4 32.3 1.1 3%
Deductions Benefits and Distributions 17.5 15.0 2.5 17% Total Deductions 17.5 15.0 2.5 17%
Net Increase (Decrease) $15.9 $17.3 ($1.4) (8%)
Program Description The Milwaukee Retirement Fund allows other retirement systems to have their funds invested with the WRS to maximize investment returns. Financial Highlights During 2013 and 2012, the Milwaukee Retirement Fund included only investments from the Milwaukee Public Schools Supplemental Retirement Program.
Program Description
The Milwaukee Retirement Fund allows other retirement systems to have their funds invested with the WRS to maximize investment returns.
Financial Highlights
• During 2013 and 2012, the Milwaukee Retirement Fund included only investments from the Milwaukee Public Schools Supplemental Retirement Program.
C o m p r e h e n s i v e A n n u a l F i n a n c i a l R e p o r t 2 0 1 3
Duty Disability Insurance ProgramDuty Disability Insurance Program
Summary Financial Statements
2013 $ in millions
2012
$ in millions
Increase (Decrease)
$ in millions
Increase (Decrease)
% Assets $602.5 $511.7 $90.7 18% Liabilities 3.1 2.5 0.6 24% Less: Reserves
Reserve for Changes in the Market Value of Investments
30.5
15.1
15.4
102%
Net Position Held in Trust $568.9 $494.1 $74.8 15% Additions
Contributions $53.9 $53.0 $0.9 2% Investment Income 68.5 58.8 9.7 16% Total Additions 122.4 111.8 10.6 9%
Deductions Benefits and Distributions 31.4 30.2 1.2 4% Administration 0.8 0.4 0.4 100% Total Deductions 32.2 30.6 1.6 5%
Net Increase (Decrease) $90.2 $81.2 $9.0 11%
Program Description The Duty Disability Insurance Program pays special disability benefits to protective occupation participants in the WRS. Financial Highlights The Reserve for Changes in the Market Value of Investments is the portion of the deferred investment gains and losses in the Market Recognition Account (MRA) attributable to Duty Disability. 0.6% or $30.5 million of the deferred investment gains in the MRA are attributable to the Duty Disability Insurance Program. Funded Status The funded status of the Duty Disability Insurance Program is a measure of the extent to which the system has accumulated enough assets to pay the benefits earned by participants. The funded ratio is the ratio of plan assets to estimated future liabilities. The assets can be measured using either the current fair value of assets or the smoothed funding value of assets. The fair value measurement gives a more timely measurement but can be extremely volatile, while the funding value measurement is less representative of current fair value but better presents the funding trends without the year-to-year volatility. The funding and fair value based ratios were calculated using the actuarial accrued liability total from the Other Post-Employment Benefits (OPEB) Actuarial Valuation as of January 1, 2013. The funding value-based funded ratio increased from 103.6% funded to 112.2% funded. Since 2009, the funded ratio has improved from 83.2% to 112.2% funded. The steady increase in the funding value funded ratio shows the success of the long-term strategy to fully fund the program. The fair value-based funded ratio increased from 106.8% funded to 118.2% funded. The increase in the fair value funded ratio resulted from the investment income for the year.
20%
40%
60%
80%
100%
120%
2009 2010 2011 2012 2013
Duty Disability Insurance Funded Ratio
Funding Value Fair Value
Program Description
The Duty Disability Insurance Program pays special disability benefits to protective occupation participants in the WRS.
Financial Highlights
• The Reserve for Changes in the Market Value of Investments is the portion of the deferred investment gains and losses in the Market Recognition Account (MRA) attributable to Duty Disability. 0.6% or $30.5 million of the deferred investment gains in the MRA are attributable to the Duty Disability Insurance Program.
Funded Status
The Funded Status of the Duty Disability Insurance Program is a measure of the extent to which the system has accumulated enough assets to pay the benefits earned by participants. The funded ratio is the ratio of plan assets to estimated future liabilities. The assets can be measured using either the current fair value of assets or the smoothed funding value of assets. The fair value measurement gives a more timely measurement but can be extremely volatile, while the funding value measurement is less representative of current fair value but better presents the funding trends without the year-to-year volatility.
The funding and fair value based ratios were calculated using the actuarial accrued liability total from the Other Post-Employment Benefits (OPEB) Actuarial Valuation as of January 1, 2013.
The funding value-based funded ratio increased from 103.6% funded to 112.2% funded. Since 2009, the funded ratio has improved from 83.2% to 112.2% funded. The steady increase in the funding value funded ratio shows the success of the long-term strategy to fully fund the program.
The fair value-based funded ratio increased from 106.8% funded to 118.2% funded. The increase in the fair value funded ratio resulted from the investment income for the year.
Duty Disability Insurance Program
Summary Financial Statements
2013 $ in millions
2012
$ in millions
Increase (Decrease)
$ in millions
Increase (Decrease)
% Assets $602.5 $511.7 $90.7 18% Liabilities 3.1 2.5 0.6 24% Less: Reserves
Reserve for Changes in the Market Value of Investments
30.5
15.1
15.4
102%
Net Position Held in Trust $568.9 $494.1 $74.8 15% Additions
Contributions $53.9 $53.0 $0.9 2% Investment Income 68.5 58.8 9.7 16% Total Additions 122.4 111.8 10.6 9%
Deductions Benefits and Distributions 31.4 30.2 1.2 4% Administration 0.8 0.4 0.4 100% Total Deductions 32.2 30.6 1.6 5%
Net Increase (Decrease) $90.2 $81.2 $9.0 11%
Program Description The Duty Disability Insurance Program pays special disability benefits to protective occupation participants in the WRS. Financial Highlights The Reserve for Changes in the Market Value of Investments is the portion of the deferred investment gains and losses in the Market Recognition Account (MRA) attributable to Duty Disability. 0.6% or $30.5 million of the deferred investment gains in the MRA are attributable to the Duty Disability Insurance Program. Funded Status The funded status of the Duty Disability Insurance Program is a measure of the extent to which the system has accumulated enough assets to pay the benefits earned by participants. The funded ratio is the ratio of plan assets to estimated future liabilities. The assets can be measured using either the current fair value of assets or the smoothed funding value of assets. The fair value measurement gives a more timely measurement but can be extremely volatile, while the funding value measurement is less representative of current fair value but better presents the funding trends without the year-to-year volatility. The funding and fair value based ratios were calculated using the actuarial accrued liability total from the Other Post-Employment Benefits (OPEB) Actuarial Valuation as of January 1, 2013. The funding value-based funded ratio increased from 103.6% funded to 112.2% funded. Since 2009, the funded ratio has improved from 83.2% to 112.2% funded. The steady increase in the funding value funded ratio shows the success of the long-term strategy to fully fund the program. The fair value-based funded ratio increased from 106.8% funded to 118.2% funded. The increase in the fair value funded ratio resulted from the investment income for the year.
20%
40%
60%
80%
100%
120%
2009 2010 2011 2012 2013
Duty Disability Insurance Funded Ratio
Funding Value Fair Value
Duty-Disability Insurance Funded Ratio
14INTRODUCTION
C o m p r e h e n s i v e A n n u a l F i n a n c i a l R e p o r t 2 0 1 3
15 INTRODUCTION
Income Continuation Insurance (ICI) Program Income Continuation Insurance (ICI) Program
Summary Financial Statements
2013 $ in millions
2012
$ in millions
Increase (Decrease)
$ in millions
Increase (Decrease)
% Assets $99.2 $94.2 $5.0 5% Less: Liabilities
Estimated Future Claims 90.8 82.2 8.6 10% Other Liabilities 0.4 0.1 0.3 300%
Less: Reserves Reserve for Changes in the Market Value of Investments
14.3
11.9
2.4
20%
Net Position Available for Benefits
$ (6.3) $0.0 $(6.3) n/a
Revenues
Contributions $15.0 $14.7 $0.3 2% Investment Income 10.8 10.3 0.5 6% Miscellaneous Income 0.1 0.0 0.1 n/a Total Revenues 25.9 25.0 0.9 4%
Expenses Benefits and Distributions 27.7 12.4 15.3 123% Admin. & Other Expenses 2.0 1.9 0.1 5% Total Expenses 29.7 14.3 15.4 108%
Net Income (Loss) ($3.8) $10.7 ($14.5) (136%)
Program Description The ICI Program pays disability benefits for employees of the State of Wisconsin and participating local governments in Wisconsin, who enroll in the program. Employee premiums are based on sick leave accumulation and the waiting period selected. Financial Highlights The Benefits and Distributions expense is the actuarially-determined change in liabilities during the year. During 2013 liabilities
grew more quickly than in the previous year, due to unfavorable claims experience. The Reserve for Changes in the Market Value of Investments is the portion of the deferred investment gains and losses in the
Market Recognition Account (MRA) attributable to ICI. 0.3% or $14.3 million of the deferred investment gains in the MRA are attributable to the ICI Program.
Funded Status The funded status of the ICI Program is a measure of the extent to which the system has accumulated enough assets to pay the benefits earned by participants. The funded ratio is the ratio of plan assets to estimated future liabilities. The assets can be measured using either the current fair value of assets or the smoothed funding value of assets. The fair value measurement gives a more timely measurement, but can be extremely volatile. The funding value measurement is less representative of current fair value, but better presents the funding trends without the year-to-year volatility. State Plan The funding value-based funded ratio decreased from 66% funded to 59.8% funded. This decrease is the result of an increase in the actuarially-determined liabilities in 2013. The target for this program is to maintain a funded ratio of 115% to 125% of liabilities as a hedge against adverse claims performance. Annual premium increases are anticipated for the next six years to reach the target funding level. The fair value-based funded ratio decreased from 80% funded to 74% funded. This decrease is the result of an increase in the actuarially-determined liabilities in 2013.
0%
20%
40%
60%
80%
100%
2009 2010 2011 2012 2013
State Income Continuation Insurance Funded Ratio
Funding Value Fair Value
Program Description
The ICI Program pays disability benefits for employees of the State of Wisconsin and participating local governments in Wisconsin, who enroll in the program. Employee premiums are based on sick leave accumulation and the waiting period selected.
Financial Highlights
• The Benefits and Distributions expense is the actu-arially-determined change in liabilities during the year. During 2013 liabilities grew more quickly than in the previous year, due to unfavorable claims experience.
• The Reserve for Changes in the Market Value of Investments is the portion of the deferred investment gains and losses in the Market Recognition Account (MRA) attributable to ICI. 0.3% or $14.3 million of the deferred investment gains in the MRA are attribut-able to the ICI Program.
Funded Status
The Funded Status of the ICI Program is a measure of the extent to which the system has accumulated enough assets to pay the benefits earned by participants. The funded ratio is the ratio of plan assets to estimated future liabilities. The assets can be measured using either the current fair value of assets or the smoothed funding value of assets. The fair value measurement gives a more timely measurement, but can be extremely volatile. The funding value measurement is less representative of current fair value, but better presents the funding trends without the year-to-year volatility.
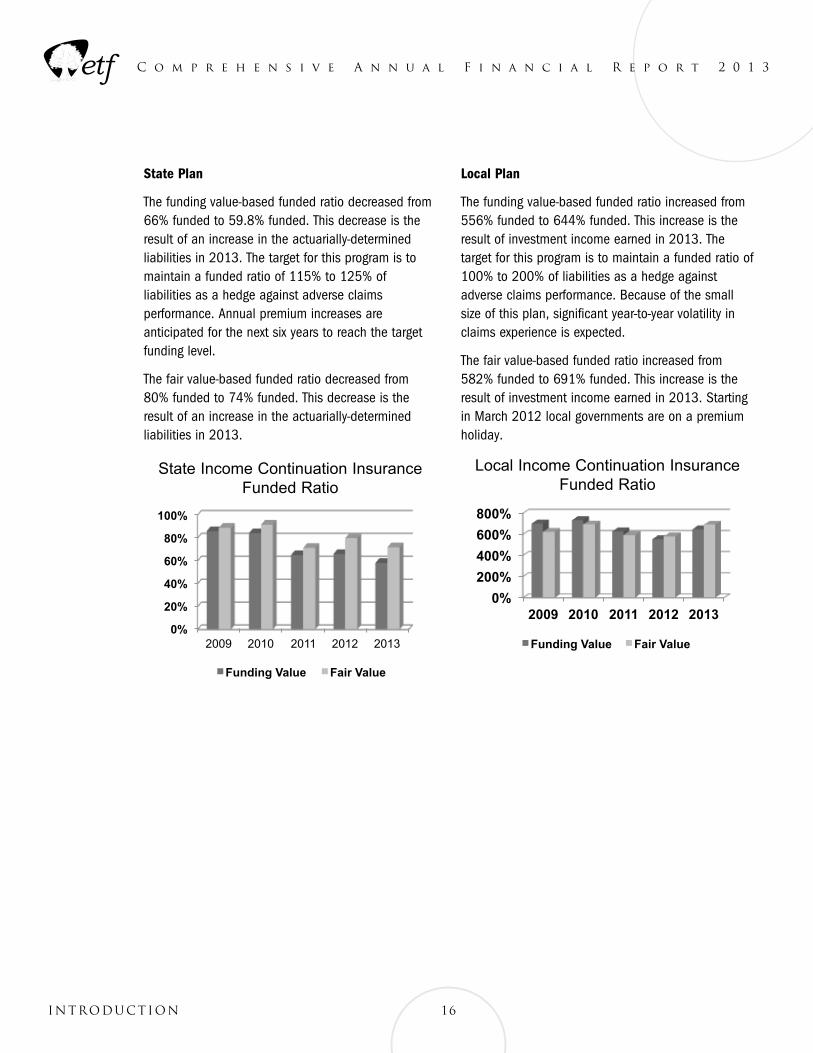
C o m p r e h e n s i v e A n n u a l F i n a n c i a l R e p o r t 2 0 1 3
16INTRODUCTION
State Plan
The funding value-based funded ratio decreased from 66% funded to 59.8% funded. This decrease is the result of an increase in the actuarially-determined liabilities in 2013. The target for this program is to maintain a funded ratio of 115% to 125% of liabilities as a hedge against adverse claims performance. Annual premium increases are anticipated for the next six years to reach the target funding level.
The fair value-based funded ratio decreased from 80% funded to 74% funded. This decrease is the result of an increase in the actuarially-determined liabilities in 2013.
Income Continuation Insurance (ICI) Program
Summary Financial Statements
2013 $ in millions
2012
$ in millions
Increase (Decrease)
$ in millions
Increase (Decrease)
% Assets $99.2 $94.2 $5.0 5% Less: Liabilities
Estimated Future Claims 90.8 82.2 8.6 10% Other Liabilities 0.4 0.1 0.3 300%
Less: Reserves Reserve for Changes in the Market Value of Investments
14.3
11.9
2.4
20%
Net Position Available for Benefits
$ (6.3) $0.0 $(6.3) n/a
Revenues
Contributions $15.0 $14.7 $0.3 2% Investment Income 10.8 10.3 0.5 6% Miscellaneous Income 0.1 0.0 0.1 n/a Total Revenues 25.9 25.0 0.9 4%
Expenses Benefits and Distributions 27.7 12.4 15.3 123% Admin. & Other Expenses 2.0 1.9 0.1 5% Total Expenses 29.7 14.3 15.4 108%
Net Income (Loss) ($3.8) $10.7 ($14.5) (136%)
Program Description The ICI Program pays disability benefits for employees of the State of Wisconsin and participating local governments in Wisconsin, who enroll in the program. Employee premiums are based on sick leave accumulation and the waiting period selected. Financial Highlights The Benefits and Distributions expense is the actuarially-determined change in liabilities during the year. During 2013 liabilities
grew more quickly than in the previous year, due to unfavorable claims experience. The Reserve for Changes in the Market Value of Investments is the portion of the deferred investment gains and losses in the
Market Recognition Account (MRA) attributable to ICI. 0.3% or $14.3 million of the deferred investment gains in the MRA are attributable to the ICI Program.
Funded Status The funded status of the ICI Program is a measure of the extent to which the system has accumulated enough assets to pay the benefits earned by participants. The funded ratio is the ratio of plan assets to estimated future liabilities. The assets can be measured using either the current fair value of assets or the smoothed funding value of assets. The fair value measurement gives a more timely measurement, but can be extremely volatile. The funding value measurement is less representative of current fair value, but better presents the funding trends without the year-to-year volatility. State Plan The funding value-based funded ratio decreased from 66% funded to 59.8% funded. This decrease is the result of an increase in the actuarially-determined liabilities in 2013. The target for this program is to maintain a funded ratio of 115% to 125% of liabilities as a hedge against adverse claims performance. Annual premium increases are anticipated for the next six years to reach the target funding level. The fair value-based funded ratio decreased from 80% funded to 74% funded. This decrease is the result of an increase in the actuarially-determined liabilities in 2013.
0%
20%
40%
60%
80%
100%
2009 2010 2011 2012 2013
State Income Continuation Insurance Funded Ratio
Funding Value Fair Value
State Income Continuation Insurance Funded Ratio
Local Plan
The funding value-based funded ratio increased from 556% funded to 644% funded. This increase is the result of investment income earned in 2013. The target for this program is to maintain a funded ratio of 100% to 200% of liabilities as a hedge against adverse claims performance. Because of the small size of this plan, significant year-to-year volatility in claims experience is expected.
The fair value-based funded ratio increased from 582% funded to 691% funded. This increase is the result of investment income earned in 2013. Starting in March 2012 local governments are on a premium holiday.
Local Plan The funding value-based funded ratio increased from 556% funded to 644% funded. This increase is the result of investment income earned in 2013. The target for this program is to maintain a funded ratio of 100% to 200% of liabilities as a hedge against adverse claims performance. Because of the small size of this plan, significant year-to-year volatility in claims experience is expected. The fair value-based funded ratio increased from 582% funded to 691% funded. This increase is the result of investment income earned in 2013. Starting in March 2012 local governments are on a premium holiday.
0%
200%
400%
600%
800%
2009 2010 2011 2012 2013
Local Income Continuation Insurance Funded Ratio
Funding Value Fair Value
Local Income Continuation Insurance Funded Ratio
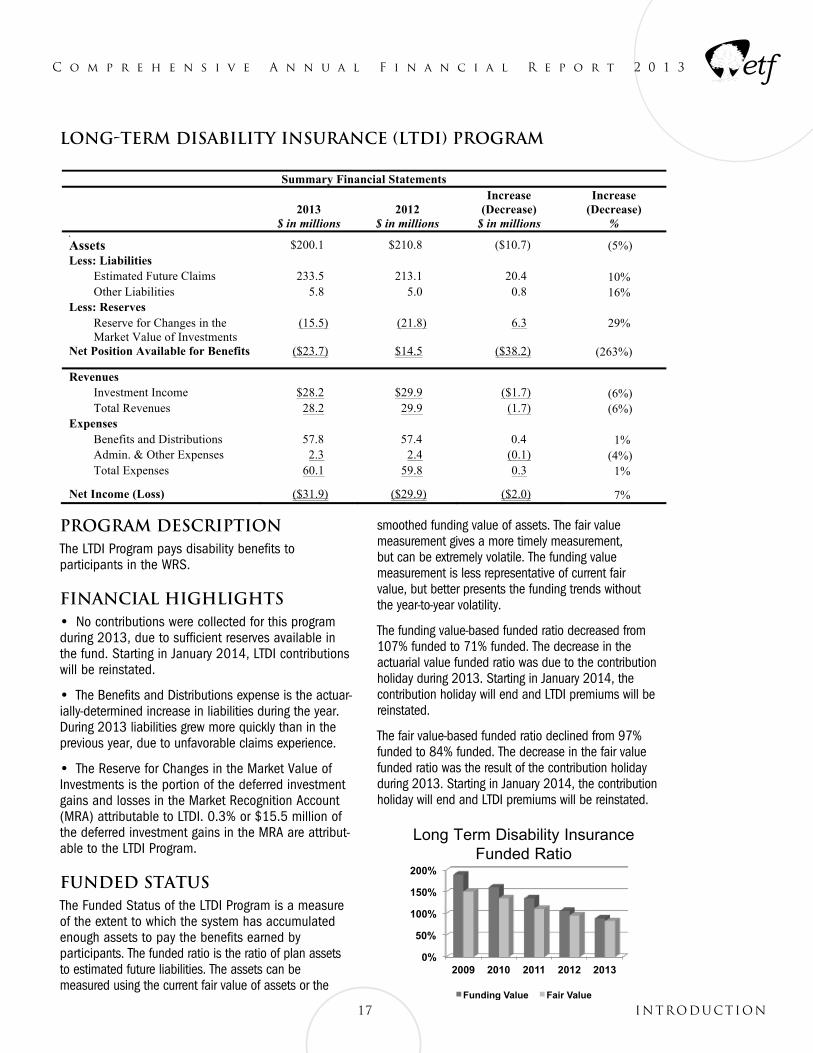
17 INTRODUCTION
C o m p r e h e n s i v e A n n u a l F i n a n c i a l R e p o r t 2 0 1 3
Long-Term Disability Insurance (LTDI) ProgramLong-Term Disability Insurance (LTDI) Program
Summary Financial Statements
2013 $ in millions
2012
$ in millions
Increase (Decrease)
$ in millions
Increase (Decrease)
% \ Assets $200.1 $210.8 ($10.7) (5%) Less: Liabilities
Estimated Future Claims 233.5 213.1 20.4 10% Other Liabilities 5.8 5.0 0.8 16%
Less: Reserves Reserve for Changes in the Market Value of Investments
(15.5) (21.8) 6.3 29%
Net Position Available for Benefits ($23.7) $14.5 ($38.2) (263%) Revenues
Investment Income $28.2 $29.9 ($1.7) (6%) 2.82 seuneveR latoT 29.9 (1.7) (6%)
Expenses Benefits and Distributions 57.8 57.4 0.4 1% Admin. & Other Expenses 2.3 2.4 (0.1) (4%)
1.06 sesnepxE latoT 59.8 0.3 1% Net Income (Loss) ($31.9) ($29.9) ($2.0) 7%
Program Description The LTDI Program pays disability benefits to participants in the WRS. Financial Highlights
No contributions were collected for this program during 2013, due to sufficient reserves available in the fund. Starting in January 2014, LTDI contributions will be reinstated.
The Benefits and Distributions expense is the actuarially-determined increase in liabilities during the year. During 2013 liabilities grew more quickly than in the previous year, due to unfavorable claims experience.
The Reserve for Changes in the Market Value of Investments is the portion of the deferred investment gains and losses in the Market Recognition Account (MRA) attributable to LTDI. 0.3% or $15.5 million of the deferred investment gains in the MRA are attributable to the LTDI Program.
Funded Status The funded status of the LTDI Program is a measure of the extent to which the system has accumulated enough assets to pay the benefits earned by participants. The funded ratio is the ratio of plan assets to estimated future liabilities. The assets can be measured using the current fair value of assets or the smoothed funding value of assets. The fair value measurement gives a more timely measurement, but can be extremely volatile. The funding value measurement is less representative of current fair value, but better presents the funding trends without the year-to-year volatility. The funding value-based funded ratio decreased from 107% funded to 71% funded. The decrease in the actuarial value funded ratio was due to the contribution holiday during 2013. Starting in January 2014, the contribution holiday will end and LTDI premiums will be reinstated. The fair value-based funded ratio declined from 97% funded to 84% funded. The decrease in the fair value funded ratio was the result of the contribution holiday during 2013. Starting in January 2014, the contribution holiday will end and LTDI premiums will be reinstated.
0%
50%
100%
150%
200%
2009 2010 2011 2012 2013
Long Term Disability Insurance Funded Ratio
Funding Value Fair Value
Program DescriptionThe LTDI Program pays disability benefits to participants in the WRS.
Financial Highlights • No contributions were collected for this program
during 2013, due to sufficient reserves available in the fund. Starting in January 2014, LTDI contributions will be reinstated.
• The Benefits and Distributions expense is the actuar-ially-determined increase in liabilities during the year. During 2013 liabilities grew more quickly than in the previous year, due to unfavorable claims experience.
• The Reserve for Changes in the Market Value of Investments is the portion of the deferred investment gains and losses in the Market Recognition Account (MRA) attributable to LTDI. 0.3% or $15.5 million of the deferred investment gains in the MRA are attribut-able to the LTDI Program.
Funded StatusThe Funded Status of the LTDI Program is a measure of the extent to which the system has accumulated enough assets to pay the benefits earned by participants. The funded ratio is the ratio of plan assets to estimated future liabilities. The assets can be measured using the current fair value of assets or the
smoothed funding value of assets. The fair value measurement gives a more timely measurement, but can be extremely volatile. The funding value measurement is less representative of current fair value, but better presents the funding trends without the year-to-year volatility.
The funding value-based funded ratio decreased from 107% funded to 71% funded. The decrease in the actuarial value funded ratio was due to the contribution holiday during 2013. Starting in January 2014, the contribution holiday will end and LTDI premiums will be reinstated.
The fair value-based funded ratio declined from 97% funded to 84% funded. The decrease in the fair value funded ratio was the result of the contribution holiday during 2013. Starting in January 2014, the contribution holiday will end and LTDI premiums will be reinstated.
Long-Term Disability Insurance (LTDI) Program
Summary Financial Statements
2013 $ in millions
2012
$ in millions
Increase (Decrease)
$ in millions
Increase (Decrease)
% \ Assets $200.1 $210.8 ($10.7) (5%) Less: Liabilities
Estimated Future Claims 233.5 213.1 20.4 10% Other Liabilities 5.8 5.0 0.8 16%
Less: Reserves Reserve for Changes in the Market Value of Investments
(15.5) (21.8) 6.3 29%
Net Position Available for Benefits ($23.7) $14.5 ($38.2) (263%) Revenues
Investment Income $28.2 $29.9 ($1.7) (6%) Total Revenues 28.2 29.9 (1.7) (6%)
Expenses Benefits and Distributions 57.8 57.4 0.4 1% Admin. & Other Expenses 2.3 2.4 (0.1) (4%) Total Expenses 60.1 59.8 0.3 1%
Net Income (Loss) ($31.9) ($29.9) ($2.0) 7%
Program Description The LTDI Program pays disability benefits to participants in the WRS. Financial Highlights No contributions were collected for this program during 2013, due to sufficient reserves available in the fund. Starting in January
2014, LTDI contributions will be reinstated. The Benefits and Distributions expense is the actuarially-determined increase in liabilities during the year. During 2013 liabilities
grew more quickly than in the previous year, due to unfavorable claims experience. The Reserve for Changes in the Market Value of Investments is the portion of the deferred investment gains and losses in the
Market Recognition Account (MRA) attributable to LTDI. 0.3% or $15.5 million of the deferred investment gains in the MRA are attributable to the LTDI Program.
Funded Status The funded status of the LTDI Program is a measure of the extent to which the system has accumulated enough assets to pay the benefits earned by participants. The funded ratio is the ratio of plan assets to estimated future liabilities. The assets can be measured using the current fair value of assets or the smoothed funding value of assets. The fair value measurement gives a more timely measurement, but can be extremely volatile. The funding value measurement is less representative of current fair value, but better presents the funding trends without the year-to-year volatility. The funding value-based funded ratio decreased from 107% funded to 71% funded. The decrease in the actuarial value funded ratio was due to the contribution holiday during 2013. Starting in January 2014, the contribution holiday will end and LTDI premiums will be reinstated. The fair value-based funded ratio declined from 97% funded to 84% funded. The decrease in the fair value funded ratio was the result of the contribution holiday during 2013. Starting in January 2014, the contribution holiday will end and LTDI premiums will be reinstated.
0%
50%
100%
150%
200%
2009 2010 2011 2012 2013
Long Term Disability Insurance Funded Ratio
Funding Value Fair Value
Long Term Disability Insurance Funded Ratio
18INTRODUCTION
C o m p r e h e n s i v e A n n u a l F i n a n c i a l R e p o r t 2 0 1 3
Group Health Insurance Program
The Group Health Insurance Program is a comprehensive benefit plan providing coverage for active and retired employees of both state and local governments. It is made up of the State Health Plan, including current and retired employees of the State, and the Wisconsin Public Employers Health Plan (Local Health Plan), which includes current and retired employees of participating local governments. The State and Local Health Plans each include separately managed risk pools for medical and pharmacy benefits. For financial reporting, the program is divided into three funds: Active Member Group Health Insurance (state and local governments combined), State Retiree Health Insurance, and Local Retiree Health Insurance.
Group Health Insurance Program The Group Health Insurance Program is a comprehensive benefit plan providing coverage for active and retired employees of both state and local governments. It is made up of the State Health Plan, including current and retired employees of the State, and the Wisconsin Public Employers Health Plan (Local Health Plan), which includes current and retired employees of participating local governments. The State and Local Health Plans each include separately managed risk pools for medical and pharmacy benefits. For financial reporting, the program is divided into three funds: Active Member Group Health Insurance (state and local governments combined), State Retiree Health Insurance, and Local Retiree Health Insurance.
Active Member Group Health Insurance Summary Financial Statements
2013
$ in millions
2012
$ in millions
Increase (Decrease)
$ in millions
Increase (Decrease)
% Assets $334.8 $311.7 $23.1 7% Less: Liabilities
Unearned Revenue 112.1 106.9 5.2 5% Estimated Future Claims 6.4 6.3 0.1 2% Other Liabilities 6.5 5.0 1.5 30%
Less: Reserves Reserve for Changes in the Market Value of Investments
4.3 (1.7) 6.0 n/a
Net Position Available for Benefits
$205.5 $195.2 ($10.4) (5%)
Revenues
Premiums $1,279.3 $1,224.0 $55.3 5% Investment Income 26.6 25.1 1.5 6% Total Revenues 1,305.9 1,249.1 56.8 5%
Expenses Benefits and Distributions 1,279.7 1,218.6 61.1 5% Administration 10.0 13.8 (3.8) (28%) Total Expenses 1,289.7 1,232.4 57.3 5%
Net Income (Loss) $16.2 $16.7 ($0.5) (3%)
Program Description Active Member Group Health Insurance pays for the purchase of health insurance coverage and health insurance claims for current employees of the State of Wisconsin and participating local government employers. Financial Highlights • These statements include activity related to health insurance coverage for the current employees of the State and participating
local government employers. Statements for the state and local government retiree health plans follow. • The assets increased by $23.1 million, or 7%, from $311.7 million in 2012 to $334.8 million in 2013, due to investment income. • The Reserve for Changes in the Market Value of Investments is the portion of the deferred investment gains and losses in the
Market Recognition Account (MRA) attributable to Active Member Group Health Insurance. 0.1% or $4.3 million of the deferred investment gains in the MRA are attributable to Active Member Group Health Insurance.
Program Description
Active Member Group Health Insurance pays for the purchase of health insurance coverage and health insurance claims for current employees of the State of Wisconsin and participating local government employers.
Financial Highlights
• These statements include activity related to health insurance coverage for the current employees of the State and participating local government employers. Statements for the state and local government retiree health plans follow.
• The assets increased by $23.1 million, or 7%, from $311.7 million in 2012 to $334.8 million in 2013, due to investment income.
• The Reserve for Changes in the Market Value of Investments is the portion of the deferred investment gains and losses in the Market Recognition Account (MRA) attributable to Active Member Group Health Insurance. 0.1% or $4.3 million of the deferred investment gains in the MRA are attributable to Active Member Group Health Insurance.
19 INTRODUCTION
C o m p r e h e n s i v e A n n u a l F i n a n c i a l R e p o r t 2 0 1 3
State Retiree Health Insurance
Summary Financial Statements
2013 $ in millions
2012
$ in millions
Increase (Decrease)
$ in millions
Increase (Decrease)
% Assets $25.3 $16.2 $9.1 56% Less: Liabilities
Estimated Future Claims 5.3 4.9 0.4 8% Unearned Revenue 16.1 15.5 0.6 4% Other Liabilities 49.8 19.4 30.4 157% Due To Employers (44.6) (23.2) (21.4) (92%)
Less: Reserves Reserve for Changes in the Market Value of Investments
(1.3) (0.4) (0.9) n/a
Net Position $0.0 $0.0 $0.0 0%
Program Description The State Retiree Health Insurance Plan pays for the purchase of health insurance coverage and health insurance claims for retired employees of the State of Wisconsin. Financial Highlights • Beginning in 2006, the State Retiree Health Insurance Plan is reported as Other Post-Employment Benefits (OPEB) in an agency
fund. Financial reporting for an agency fund is limited to reporting on the stewardship of assets, and does not include an operating statement.
•
• • Other liabilities increased from $19.4 million in 2012 to $49.8 million in 2013, an increase of 157%, mainly due to the program
needing a cash loan from another program to zero out the negative cash balances at the end of the year. • The Reserve for Changes in the Market Value of Investments is the portion of the deferred investment gains and losses in the
Market Recognition Account (MRA) attributable to the State Retiree Health Insurance Plan. Less than 0.3% or $1.3 million of the deferred investment losses in the MRA are attributable to the State Retiree Health Insurance Plan.
Local Retiree Health Insurance Summary Financial Statements
2013
$ in millions
2012
$ in millions
Increase (Decrease)
$ in millions
Increase (Decrease)
% Assets $2.9 $1.6 $1.3 81% Less: Liabilities
Estimated Future Claims 0.5 0.5 0.0 0% Unearned Revenue 1.8 1.8 0.0 0% Other Liabilities 13.6 9.6 4.0 42% Due to Employers (11.6) (9.2) (2.4) (26%)
Less: Reserves Reserve for Changes in the Market Value of Investments
(1.4) (1.1) (0.3) n/a
Net Position $0.0 $0.0 $0.0 0%
Program Description The Local Retiree Health Insurance Plan pays for the purchase of health insurance coverage and health insurance claims for retired employees of participating local government employers in Wisconsin.
Program Description
The State Retiree Health Insurance Plan pays for the purchase of health insurance coverage and health insurance claims for retired employees of the State of Wisconsin.
Financial Highlights
• Beginning in 2006, the State Retiree Health Insurance Plan is reported as Other Post-Employment Benefits (OPEB) in an agency fund. Financial report-ing for an agency fund is limited to reporting on the stewardship of assets, and does not include an oper-ating statement.
• Effective January 1, 2012, prescription drug cover-age for Medicare eligible retirees enrolled in the state’s group health insurance program is provided by a self-funded Medicare Part D Employer Group Waiver Plan (EGWP). A Medicare “wrap-around” product is also included to provide full coverage to members, as
required by uniform benefits, when they reach the Medicare coverage gap, also known as the “donut hole”.
• Assets increased from $16.2 million in 2012 to $25.3 million in 2013, an increase of 56% due to prepaid health premiums.
• Other liabilities increased from $19.4 million in 2012 to $49.8 million in 2013, an increase of 157%, mainly due to the program needing a cash loan from another program to zero out the negative cash balanc-es at the end of the year.
• The Reserve for Changes in the Market Value of Investments is the portion of the deferred investment gains and losses in the Market Recognition Account (MRA) attributable to the State Retiree Health Insurance Plan. Less than 0.3% or $1.3 million of the deferred investment losses in the MRA are attribut-able to the State Retiree Health Insurance Plan.
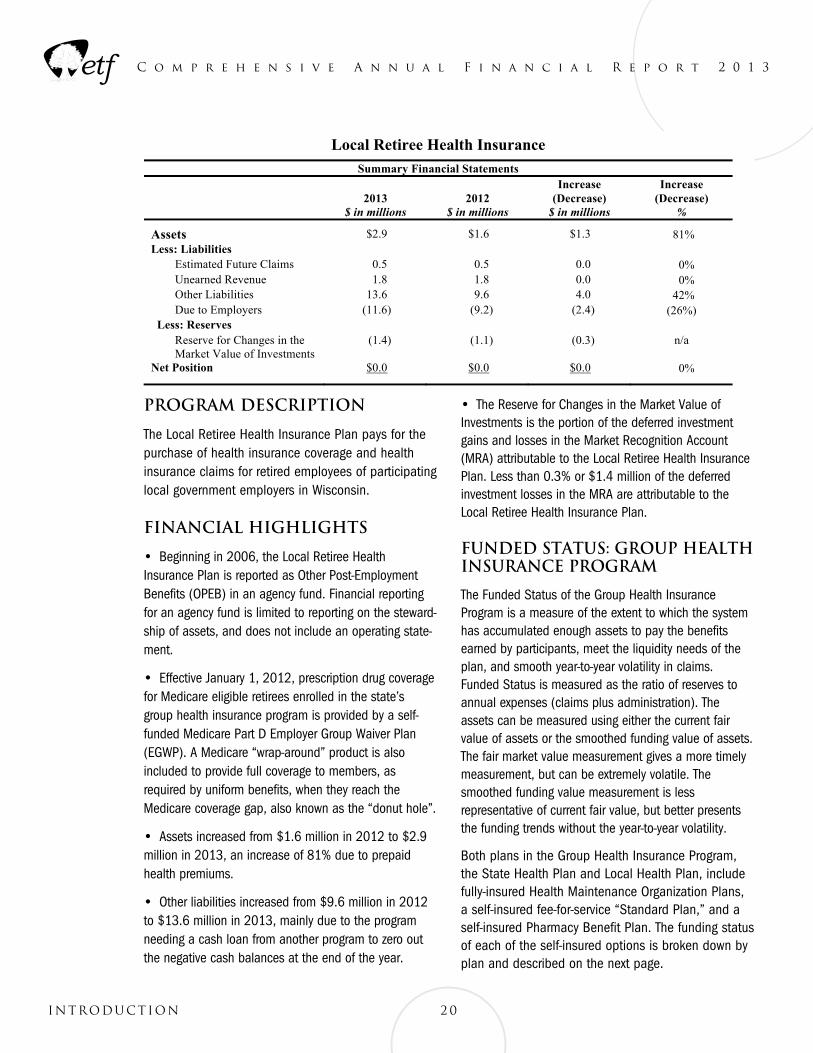
20INTRODUCTION
C o m p r e h e n s i v e A n n u a l F i n a n c i a l R e p o r t 2 0 1 3
Program Description
The Local Retiree Health Insurance Plan pays for the purchase of health insurance coverage and health insurance claims for retired employees of participating local government employers in Wisconsin.
Financial Highlights
• Beginning in 2006, the Local Retiree Health Insurance Plan is reported as Other Post-Employment Benefits (OPEB) in an agency fund. Financial reporting for an agency fund is limited to reporting on the steward-ship of assets, and does not include an operating state-ment.
• Effective January 1, 2012, prescription drug coverage for Medicare eligible retirees enrolled in the state’s group health insurance program is provided by a self-funded Medicare Part D Employer Group Waiver Plan (EGWP). A Medicare “wrap-around” product is also included to provide full coverage to members, as required by uniform benefits, when they reach the Medicare coverage gap, also known as the “donut hole”.
• Assets increased from $1.6 million in 2012 to $2.9 million in 2013, an increase of 81% due to prepaid health premiums.
• Other liabilities increased from $9.6 million in 2012 to $13.6 million in 2013, mainly due to the program needing a cash loan from another program to zero out the negative cash balances at the end of the year.
• The Reserve for Changes in the Market Value of Investments is the portion of the deferred investment gains and losses in the Market Recognition Account (MRA) attributable to the Local Retiree Health Insurance Plan. Less than 0.3% or $1.4 million of the deferred investment losses in the MRA are attributable to the Local Retiree Health Insurance Plan.
Funded Status: Group Health Insurance Program
The Funded Status of the Group Health Insurance Program is a measure of the extent to which the system has accumulated enough assets to pay the benefits earned by participants, meet the liquidity needs of the plan, and smooth year-to-year volatility in claims. Funded Status is measured as the ratio of reserves to annual expenses (claims plus administration). The assets can be measured using either the current fair value of assets or the smoothed funding value of assets. The fair market value measurement gives a more timely measurement, but can be extremely volatile. The smoothed funding value measurement is less representative of current fair value, but better presents the funding trends without the year-to-year volatility.
Both plans in the Group Health Insurance Program, the State Health Plan and Local Health Plan, include fully-insured Health Maintenance Organization Plans, a self-insured fee-for-service “Standard Plan,” and a self-insured Pharmacy Benefit Plan. The funding status of each of the self-insured options is broken down by plan and described on the next page.
State Retiree Health Insurance
Summary Financial Statements
2013 $ in millions
2012
$ in millions
Increase (Decrease)
$ in millions
Increase (Decrease)
% Assets $25.3 $16.2 $9.1 56% Less: Liabilities
Estimated Future Claims 5.3 4.9 0.4 8% Unearned Revenue 16.1 15.5 0.6 4% Other Liabilities 49.8 19.4 30.4 157% Due To Employers (44.6) (23.2) (21.4) (92%)
Less: Reserves Reserve for Changes in the Market Value of Investments
(1.3) (0.4) (0.9) n/a
Net Position $0.0 $0.0 $0.0 0%
Program Description The State Retiree Health Insurance Plan pays for the purchase of health insurance coverage and health insurance claims for retired employees of the State of Wisconsin. Financial Highlights • Beginning in 2006, the State Retiree Health Insurance Plan is reported as Other Post-Employment Benefits (OPEB) in an agency
fund. Financial reporting for an agency fund is limited to reporting on the stewardship of assets, and does not include an operating statement.
•
• • Other liabilities increased from $19.4 million in 2012 to $49.8 million in 2013, an increase of 157%, mainly due to the program
needing a cash loan from another program to zero out the negative cash balances at the end of the year. • The Reserve for Changes in the Market Value of Investments is the portion of the deferred investment gains and losses in the
Market Recognition Account (MRA) attributable to the State Retiree Health Insurance Plan. Less than 0.3% or $1.3 million of the deferred investment losses in the MRA are attributable to the State Retiree Health Insurance Plan.
Local Retiree Health Insurance Summary Financial Statements
2013
$ in millions
2012
$ in millions
Increase (Decrease)
$ in millions
Increase (Decrease)
% Assets $2.9 $1.6 $1.3 81% Less: Liabilities
Estimated Future Claims 0.5 0.5 0.0 0% Unearned Revenue 1.8 1.8 0.0 0% Other Liabilities 13.6 9.6 4.0 42% Due to Employers (11.6) (9.2) (2.4) (26%)
Less: Reserves Reserve for Changes in the Market Value of Investments
(1.4) (1.1) (0.3) n/a
Net Position $0.0 $0.0 $0.0 0%
Program Description The Local Retiree Health Insurance Plan pays for the purchase of health insurance coverage and health insurance claims for retired employees of participating local government employers in Wisconsin.
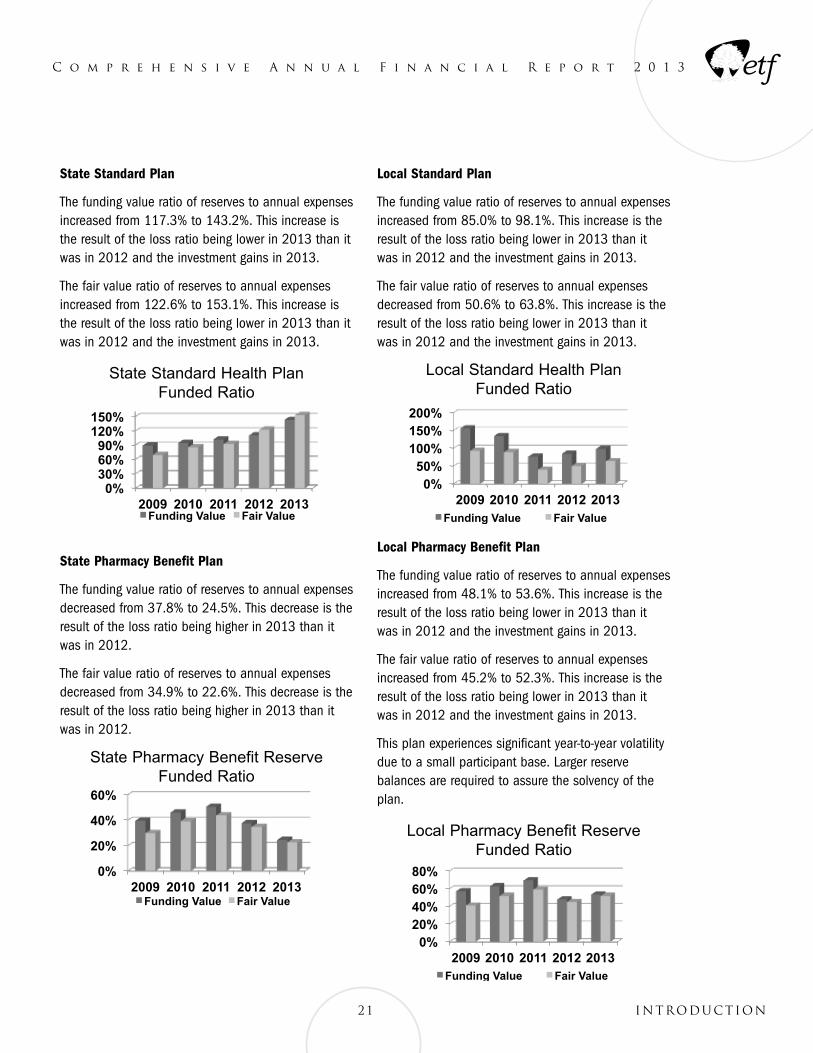
C o m p r e h e n s i v e A n n u a l F i n a n c i a l R e p o r t 2 0 1 3
State Standard Plan
The funding value ratio of reserves to annual expenses increased from 117.3% to 143.2%. This increase is the result of the loss ratio being lower in 2013 than it was in 2012 and the investment gains in 2013.
The fair value ratio of reserves to annual expenses increased from 122.6% to 153.1%. This increase is the result of the loss ratio being lower in 2013 than it was in 2012 and the investment gains in 2013.
Financial Highlights • Beginning in 2006, the Local Retiree Health Insurance Plan is reported as Other Post-Employment Benefits (OPEB) in an agency
fund. Financial reporting for an agency fund is limited to reporting on the stewardship of assets, and does not include an operating statement.
•
• • Other liabilities increased from $9.6 million in 2012 to $13.6 million in 2013, mainly due to the program needing a cash loan
from another program to zero out the negative cash balances at the end of the year. • The Reserve for Changes in the Market Value of Investments is the portion of the deferred investment gains and losses in the
Market Recognition Account (MRA) attributable to the Local Retiree Health Insurance Plan. Less than 0.3% or $1.4 million of the deferred investment losses in the MRA are attributable to the Local Retiree Health Insurance Plan.
Funded Status: Group Health Insurance Program The funded status of the Group Health Insurance Program is a measure of the extent to which the system has accumulated enough assets to pay the benefits earned by participants, meet the liquidity needs of the plan, and smooth year-to-year volatility in claims. Funded status is measured as the ratio of reserves to annual expenses (claims plus administration). The assets can be measured using either the current fair value of assets or the smoothed funding value of assets. The fair market value measurement gives a more timely measurement, but can be extremely volatile. The smoothed funding value measurement is less representative of current fair value, but better presents the funding trends without the year-to-year volatility. Both plans in the Group Health Insurance Program, the State Health Plan and Local Health Plan, include fully-insured Health Maintenance Organization Plans, a self-insured fee-for-service “Standard Plan,” and a self-insured Pharmacy Benefit Plan. The funding status of each of the self-insured options is broken down by plan and described below: State Standard Plan The funding value ratio of reserves to annual expenses increased from 117.3% to 143.2%. This increase is the result of the loss ratio being lower in 2013 than it was in 2012 and the investment gains in 2013. The fair value ratio of reserves to annual expenses increased from 122.6% to 153.1%. This increase is the result of the loss ratio being lower in 2013 than it was in 2012 and the investment gains in 2013. State Pharmacy Benefit Plan The funding value ratio of reserves to annual expenses decreased from 37.8% to 24.5%. This decrease is the result of the loss ratio being higher in 2013 than it was in 2012. The fair value ratio of reserves to annual expenses decreased from 34.9% to 22.6%. This decrease is the result of the loss ratio being higher in 2013 than it was in 2012. Local Standard Plan The funding value ratio of reserves to annual expenses increased from 85.0% to 98.1%. This increase is the result of the loss ratio being lower in 2013 than it was in 2012 and the investment gains in 2013. The fair value ratio of reserves to annual expenses decreased from 50.6% to 63.8%. This increase is the result of the loss ratio being lower in 2013 than it was in 2012 and the investment gains in 2013. Local Pharmacy Benefit Plan The funding value ratio of reserves to annual expenses increased from 48.1% to 53.6%. This increase is the result of the loss ratio being lower in 2013 than it was in 2012 and the investment gains in 2013.
0% 30% 60% 90%
120% 150%
2009 2010 2011 2012 2013
State Standard Health Plan Funded Ratio
Funding Value Fair Value
0% 50%
100% 150% 200%
2009 2010 2011 2012 2013
Local Standard Health Plan Funded Ratio
Funding Value Fair Value
0%
20%
40%
60%
2009 2010 2011 2012 2013
State Pharmacy Benefit Reserve Funded Ratio
Funding Value Fair Value
State Standard Health Plan Funded Ratio
State Pharmacy Benefit Plan
The funding value ratio of reserves to annual expenses decreased from 37.8% to 24.5%. This decrease is the result of the loss ratio being higher in 2013 than it was in 2012.
The fair value ratio of reserves to annual expenses decreased from 34.9% to 22.6%. This decrease is the result of the loss ratio being higher in 2013 than it was in 2012.
Financial Highlights • Beginning in 2006, the Local Retiree Health Insurance Plan is reported as Other Post-Employment Benefits (OPEB) in an agency
fund. Financial reporting for an agency fund is limited to reporting on the stewardship of assets, and does not include an operating statement.
•
• • Other liabilities increased from $9.6 million in 2012 to $13.6 million in 2013, mainly due to the program needing a cash loan
from another program to zero out the negative cash balances at the end of the year. • The Reserve for Changes in the Market Value of Investments is the portion of the deferred investment gains and losses in the
Market Recognition Account (MRA) attributable to the Local Retiree Health Insurance Plan. Less than 0.3% or $1.4 million of the deferred investment losses in the MRA are attributable to the Local Retiree Health Insurance Plan.
Funded Status: Group Health Insurance Program The funded status of the Group Health Insurance Program is a measure of the extent to which the system has accumulated enough assets to pay the benefits earned by participants, meet the liquidity needs of the plan, and smooth year-to-year volatility in claims. Funded status is measured as the ratio of reserves to annual expenses (claims plus administration). The assets can be measured using either the current fair value of assets or the smoothed funding value of assets. The fair market value measurement gives a more timely measurement, but can be extremely volatile. The smoothed funding value measurement is less representative of current fair value, but better presents the funding trends without the year-to-year volatility. Both plans in the Group Health Insurance Program, the State Health Plan and Local Health Plan, include fully-insured Health Maintenance Organization Plans, a self-insured fee-for-service “Standard Plan,” and a self-insured Pharmacy Benefit Plan. The funding status of each of the self-insured options is broken down by plan and described below: State Standard Plan The funding value ratio of reserves to annual expenses increased from 117.3% to 143.2%. This increase is the result of the loss ratio being lower in 2013 than it was in 2012 and the investment gains in 2013. The fair value ratio of reserves to annual expenses increased from 122.6% to 153.1%. This increase is the result of the loss ratio being lower in 2013 than it was in 2012 and the investment gains in 2013. State Pharmacy Benefit Plan The funding value ratio of reserves to annual expenses decreased from 37.8% to 24.5%. This decrease is the result of the loss ratio being higher in 2013 than it was in 2012. The fair value ratio of reserves to annual expenses decreased from 34.9% to 22.6%. This decrease is the result of the loss ratio being higher in 2013 than it was in 2012. Local Standard Plan The funding value ratio of reserves to annual expenses increased from 85.0% to 98.1%. This increase is the result of the loss ratio being lower in 2013 than it was in 2012 and the investment gains in 2013. The fair value ratio of reserves to annual expenses decreased from 50.6% to 63.8%. This increase is the result of the loss ratio being lower in 2013 than it was in 2012 and the investment gains in 2013. Local Pharmacy Benefit Plan The funding value ratio of reserves to annual expenses increased from 48.1% to 53.6%. This increase is the result of the loss ratio being lower in 2013 than it was in 2012 and the investment gains in 2013.
0% 30% 60% 90%
120% 150%
2009 2010 2011 2012 2013
State Standard Health Plan Funded Ratio
Funding Value Fair Value
0% 50%
100% 150% 200%
2009 2010 2011 2012 2013
Local Standard Health Plan Funded Ratio
Funding Value Fair Value
0%
20%
40%
60%
2009 2010 2011 2012 2013
State Pharmacy Benefit Reserve Funded Ratio
Funding Value Fair Value
State Pharmacy Benefit Reserve Funded Ratio
Local Standard Plan
The funding value ratio of reserves to annual expenses increased from 85.0% to 98.1%. This increase is the result of the loss ratio being lower in 2013 than it was in 2012 and the investment gains in 2013.
The fair value ratio of reserves to annual expenses decreased from 50.6% to 63.8%. This increase is the result of the loss ratio being lower in 2013 than it was in 2012 and the investment gains in 2013.
Financial Highlights • Beginning in 2006, the Local Retiree Health Insurance Plan is reported as Other Post-Employment Benefits (OPEB) in an agency
fund. Financial reporting for an agency fund is limited to reporting on the stewardship of assets, and does not include an operating statement.
•
• • Other liabilities increased from $9.6 million in 2012 to $13.6 million in 2013, mainly due to the program needing a cash loan
from another program to zero out the negative cash balances at the end of the year. • The Reserve for Changes in the Market Value of Investments is the portion of the deferred investment gains and losses in the
Market Recognition Account (MRA) attributable to the Local Retiree Health Insurance Plan. Less than 0.3% or $1.4 million of the deferred investment losses in the MRA are attributable to the Local Retiree Health Insurance Plan.
Funded Status: Group Health Insurance Program The funded status of the Group Health Insurance Program is a measure of the extent to which the system has accumulated enough assets to pay the benefits earned by participants, meet the liquidity needs of the plan, and smooth year-to-year volatility in claims. Funded status is measured as the ratio of reserves to annual expenses (claims plus administration). The assets can be measured using either the current fair value of assets or the smoothed funding value of assets. The fair market value measurement gives a more timely measurement, but can be extremely volatile. The smoothed funding value measurement is less representative of current fair value, but better presents the funding trends without the year-to-year volatility. Both plans in the Group Health Insurance Program, the State Health Plan and Local Health Plan, include fully-insured Health Maintenance Organization Plans, a self-insured fee-for-service “Standard Plan,” and a self-insured Pharmacy Benefit Plan. The funding status of each of the self-insured options is broken down by plan and described below: State Standard Plan The funding value ratio of reserves to annual expenses increased from 117.3% to 143.2%. This increase is the result of the loss ratio being lower in 2013 than it was in 2012 and the investment gains in 2013. The fair value ratio of reserves to annual expenses increased from 122.6% to 153.1%. This increase is the result of the loss ratio being lower in 2013 than it was in 2012 and the investment gains in 2013. State Pharmacy Benefit Plan The funding value ratio of reserves to annual expenses decreased from 37.8% to 24.5%. This decrease is the result of the loss ratio being higher in 2013 than it was in 2012. The fair value ratio of reserves to annual expenses decreased from 34.9% to 22.6%. This decrease is the result of the loss ratio being higher in 2013 than it was in 2012. Local Standard Plan The funding value ratio of reserves to annual expenses increased from 85.0% to 98.1%. This increase is the result of the loss ratio being lower in 2013 than it was in 2012 and the investment gains in 2013. The fair value ratio of reserves to annual expenses decreased from 50.6% to 63.8%. This increase is the result of the loss ratio being lower in 2013 than it was in 2012 and the investment gains in 2013. Local Pharmacy Benefit Plan The funding value ratio of reserves to annual expenses increased from 48.1% to 53.6%. This increase is the result of the loss ratio being lower in 2013 than it was in 2012 and the investment gains in 2013.
0% 30% 60% 90%
120% 150%
2009 2010 2011 2012 2013
State Standard Health Plan Funded Ratio
Funding Value Fair Value
0% 50%
100% 150% 200%
2009 2010 2011 2012 2013
Local Standard Health Plan Funded Ratio
Funding Value Fair Value
0%
20%
40%
60%
2009 2010 2011 2012 2013
State Pharmacy Benefit Reserve Funded Ratio
Funding Value Fair Value Local Standard Health Plan Funded Ratio
Local Pharmacy Benefit Plan
The funding value ratio of reserves to annual expenses increased from 48.1% to 53.6%. This increase is the result of the loss ratio being lower in 2013 than it was in 2012 and the investment gains in 2013.
The fair value ratio of reserves to annual expenses increased from 45.2% to 52.3%. This increase is the result of the loss ratio being lower in 2013 than it was in 2012 and the investment gains in 2013.
This plan experiences significant year-to-year volatility due to a small participant base. Larger reserve balances are required to assure the solvency of the plan.
The fair value ratio of reserves to annual expenses increased from 45.2% to 52.3%. This increase is the result of the loss ratio being lower in 2013 than it was in 2012 and the investment gains in 2013. This plan experiences significant year-to-year volatility due to a small participant base. Larger reserve balances are required to assure the solvency of the plan. Participation The State Health Plan covered 69,772 active employees, 367 continuants (former employees or their beneficiaries who have the right to continue health insurance coverage under federal COBRA requirements), and 25,665 retired State of Wisconsin employees at the end of 2013--about 210,000 persons when all covered dependents are included. The total amount of annual health insurance premiums for all participants was $1.3 billion. The Wisconsin Public Employers Health Insurance Plan (Local Health Plan) covered 12,749 active employees; 80 continuants and 2,548 retired participants. With their dependents, the total number of people covered was approximately 42,000. Annual premiums paid totaled $225 million.
State Employee
s & Continua
nts 70,139
State Annuitant
s 25,665 Local
Annuitants
2,548
Local Employee
s & Continua
nts 12,829
Health Insurance Participants
0% 20% 40% 60% 80%
2009 2010 2011 2012 2013
Local Pharmacy Benefit Reserve Funded Ratio
Funding Value Fair Value
Local Pharmacy Benefit Reserve Funded Ratio
21 INTRODUCTION
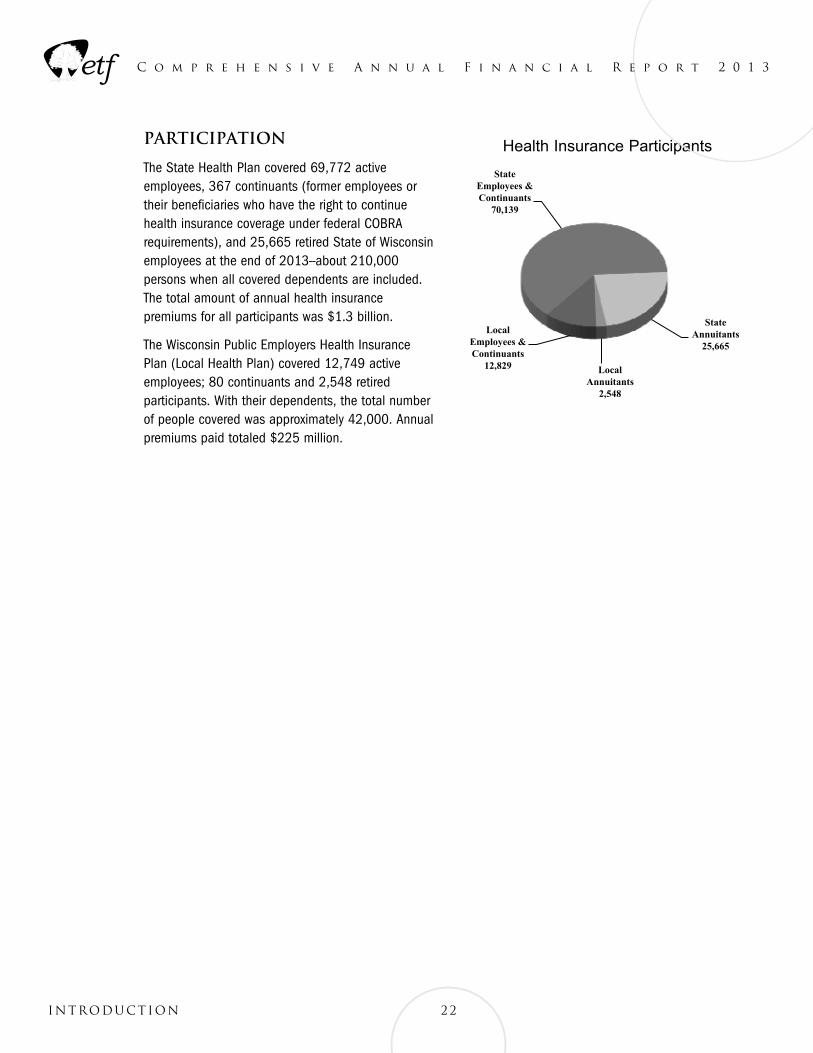
Participation
The State Health Plan covered 69,772 active employees, 367 continuants (former employees or their beneficiaries who have the right to continue health insurance coverage under federal COBRA requirements), and 25,665 retired State of Wisconsin employees at the end of 2013--about 210,000 persons when all covered dependents are included. The total amount of annual health insurance premiums for all participants was $1.3 billion.
The Wisconsin Public Employers Health Insurance Plan (Local Health Plan) covered 12,749 active employees; 80 continuants and 2,548 retired participants. With their dependents, the total number of people covered was approximately 42,000. Annual premiums paid totaled $225 million.
State Employees & Continuants
70,139
State Annuitants
25,665
Local Annuitants
2,548
Local Employees & Continuants
12,829
Health Insurance Participants
22INTRODUCTION
C o m p r e h e n s i v e A n n u a l F i n a n c i a l R e p o r t 2 0 1 3
C o m p r e h e n s i v e A n n u a l F i n a n c i a l R e p o r t 2 0 1 3
23 INTRODUCTION
ETF BOARDS AND DEPARTMENT ORGANIZATION
The individuals who serve on the boards that provide oversight for the Department of Employee Trust Funds (ETF) play important roles. Board decisions affect hundreds of thousands of individuals who participate in the retirement programs funded by the trust funds as well as other fringe benefit programs ETF operates for Wisconsin.
This section explains how board membership is determined and how membership overlaps. Under state law, members of the boards are chosen in a variety of ways. Some members are ex-officio, some are direct appointees of the governor, others are appointed to fixed terms from lists submitted to the governor by specified organizations, and still others are directly elected by active participants or retirees.
The members and officers of each board are listed below, along with a short explanation of board responsibilities. Membership on the boards as of May 1, 2013 is as follows:
Employee Trust Funds Board (13 Members)
This board has general oversight of ETF; appoints the ETF Secretary; approves tables used for computing benefits, contribution rates and actuarial assumptions; authorizes all annuities except for disability; approves or rejects ETF administrative rules; and generally oversees administration of the benefit programs, except group insurance and deferred compensation. State law sets ETF Board membership criteria, with some members appointed by the Teachers Retirement Board (TR Board) and the Wisconsin Retirement Board (WR Board).The ETF Board has established three committees to assist the Board in fulfilling its fiduciary and oversight responsibilities: an Executive Committee, an Audit Committee and a Budget and Operations Committee. The Executive Committee oversees the effective operation of Board and other Committee meetings and reviews personnel matters relating to the Department and the Secretary. The Audit Committee reviews the adequacy and effectiveness of the
Department’s system of internal controls, including those relating to information technology systems, and the Department’s accounting and financial reporting systems. The Budget and Operations Committee reviews the biennial budget process and the Department’s operating budget, as well as the Department’s strategic business and information technology planning activities.
BOARD MEMBERS
Chair: Wayne E. Koessl Appointed by the WR Board. WR Board member appointed under § 15.16 (3)(b) 1,2,4,5 or 8 (chief executive, finance officer or member of a governing body of a participating city or village, county clerk, deputy county clerk, chairperson, or member of the governing body of a participating county or town, or public member who is not a participant).
Vice Chair: John David Appointed by Wisconsin Retirement Board. Any WR Board member appointed under § 15.161(1)(b).
Secretary: Robert M. Niendorf Appointed by the TR Board. TR Board member appointed under § 15.16 (3)(a)4 (UW teacher participant).
William Ford Elected by WRS annuitants. WRS annuitant as defined for purposes other than life insurance under § 40.02 (4). § 15.16 (1)(d)
Kimberly Hall Elected by educational support personnel. WRS participant who is either a public school district educational support employee or a technical college district educational support employee. § 15.16 (1)(f)
Michael Langyel Appointed by the TR Board. TR Board member elected under § 15.165 (3)(a)7 (City of Milwaukee teacher participant). § 15.165 (1)(a)3
Jon Litscher Governor or the Governor’s designee on the Group Insurance Board. § 15.16 (1) (intro.)
C o m p r e h e n s i v e A n n u a l F i n a n c i a l R e p o r t 2 0 1 3
Jessica O’Donnell Director of the Office of State Employment Relations or the Director’s designee. § 15.16 (1) (intro.)
Roberta Rasmus Appointed by the TR Board. TR Board member appointed under § 15.16 (3)(a)3 or 5 (public school administrator or school board member). § 15.16 (3)(a)5
Victor Shier Appointed by Governor, with Senate confirmation. Public member who is not a participant in or beneficiary of the WRS, with at least five years of experience in actuarial analysis, administration of an employee benefit plan, or significant administrative responsibility in a major insurer. § 15.16 (1)(c)
Mary Von Ruden Appointed by the WR Board. WR Board member appointed under §15.16 (3)(b)3,6, or 7 (participating employee of a city or village, participating employee of a local employer other than a city or village or participating state employee). § 15.16 (1)(b)2
David Wiltgen Appointed by TR Board. TR Board member appointed or elected under § 15.165 (3)(a) 1 or 2 (public or vocational school teacher).
Vacant Appointed by Wisconsin Retirement Board. Wisconsin Retirement Board member appointed under § 15.165 (3)(b) 7 or 8 (participating state employee or public member who is not a participant). § 15.16 (1)(b) 3
Wisconsin Retirement Board (9 Members)
The WR Board advises the ETF Board on matters relating to retirement; approves or rejects administrative rules; authorizes or terminates disability benefits for non-teachers; and hears appeals of disability rulings. This board appoints four members to the ETF Board and one non-teaching member to the State of Wisconsin Investment Board.
Board Members
Chair: Wayne E. Koessl Appointed by the Governor from a list of five names submitted by the executive committee of the Wisconsin Counties Association. Chairperson or member of the governing body of a participating county or town, and from a different county than subds. 5 & 6. § 15.165 (3)(b)4
Vice Chair: John David Appointed by the Governor from a list of five names submitted by the Board of Directors of the League of Wisconsin Municipalities. Chief executive or member of the governing body of a participating city or village and from a different county than subds. 2 & 3. § 15.165 (3)(b)1
Secretary: Mary Von Ruden Appointed by the Governor. Participating employee from a participating local employer other than a city or village and from a different county than subds. 4 & 5. § 15.165 (3)(b)6
Jamie Aulik Appointed by the Governor. County clerk or deputy county clerk from a participating county different than subds. 4 & 6. § 15.165 (3)(b)5
Ted Nickel Ex officio; Commissioner of Insurance or an experienced actuary in the Office of the Commissioner designated by the Commissioner. § 15.165 (3)(b)9
Herbert Stinski Appointed by the Governor. Participating employee and principal finance officer of a participating city or village and from a different county than subds. 1 & 3. § 15.165 (3)(b)2
Steven Wilding Appointed by the Governor. Participating employee of a participating city or village and from a different county than subds. 1 & 2. § 15.165 (3)(b)3
Vacant Appointed by the Governor. Public member who is not a participant or beneficiary of the WRS. § 15.165 (3)(b)8
24INTRODUCTION

C o m p r e h e n s i v e A n n u a l F i n a n c i a l R e p o r t 2 0 1 3
25 INTRODUCTION
Vacant Appointed by the Governor. Participating state employee. § 15.165 (3)(b)7
Teachers Retirement Board (13 Members)
The TR Board advises the ETF Board on retirement and other benefit matters involving public school, technical college, state and university teachers; acts on administrative rules and authorizes or terminates teacher disability benefits and hears disability benefit appeals. Nine of the 13 members are elected. This board appoints four members to the ETF Board and one teacher participant to the State of Wisconsin Investment Board.
Board Members
Chair: Michael Langyel Elected by Milwaukee Public School District teachers who are participants. City of Milwaukee teacher who is a participant in the WRS. § 15.165 (3)(a)7
Vice Chair: Robin Starck Elected by public school teachers. Public school teacher. § 15.165 (3)(a)1
Secretary: Susan Harrison Appointed by the Governor. UW teacher participant in the WRS (not from same campus as other UW teacher representative). § 15.165 (3)(a)4
Sandra Claflin-Chalton Appointed by the Governor. UW teacher participant in the WRS (not from same campus as other UW teacher representative). § 15.165 (3)(a)4
Jon Joslin Elected by public school teachers. Public school teacher. § 15.165 (3)(a)1
Betsy Kippers Elected by public school teachers. Public school teacher. § 15.165 (3)(a)1
Mary Jo Meier Elected by public school teachers. Public school teacher. § 15.165 (3)(a)1
Dennis Murphy Elected by annuitants who were teacher participants. Annuitant who was a teacher participant in the WRS. § 15.165 (3)(a)6
R. Thomas Pedersen Elected by participating Wisconsin Technical College teachers. Public school teacher from a participating Wisconsin Technical College district and a participating employee in the WRS. § 15.165 (3)(a)2
Patrick Phair Elected by public school teachers. Public school teacher. § 15.165 (3)(a)1
Roberta Rasmus Appointed by the Governor. Member of a school board. § 15.165 (3)(a)5
David Wiltgen Elected by public school teachers. Public school teacher. § 15.165 (3)(a)1
Vacant Appointed by the Governor. Public school administrator who is not a classroom teacher. § 15.165 (3)(a)3
Group Insurance Board (11 Members)
This board sets policy for the group health, life, and income continuation insurance plans for state employees and the group health, life, and income continuation insurance plans for local employers who choose to offer them. The board also can provide other insurance plans, if employees pay the entire premium.
Board Members
Chair: Jon Litscher Ex officio; Governor or Governor’s designee. § 15.165 (2)(intro)
Secretary: Jessica O’Donnell Ex officio; Director of the Office of State Employment Relations or Director’s designee. § 15.165 (2)
C o m p r e h e n s i v e A n n u a l F i n a n c i a l R e p o r t 2 0 1 3
26INTRODUCTION
Bonnie Cyganek Ex officio; Attorney General or his/her designee. § 15.165 (2)
Herschel Day Appointed by the Governor. Insured participant in the WRS who is a teacher. § 15.165 (2)
Michael Farrell Appointed by the Governor. No membership requirement. § 15.165 (2)
Charles Grapentine Appointed by the Governor. Insured participant in the WRS who is a retired employee. § 15.165 (2)
Brian Hayes Ex officio; Secretary of Department of Administration or Secretary’s designee. § 15.165 (2)
Terri Carlson Appointed by the Governor. Insured participant in the WRS who is not a teacher. § 15.165 (2)
Daniel Schwartzer Ex officio; Commissioner of Insurance or his/her designee. § 15.165 (2)
Nancy Thompson Appointed by the Governor. Chief executive or member of the governing body of a local unit of government that is a participating employer. § 15.165 (2)
Brian Yerges Appointed by the Governor. Insured participant in the WRS who is an employee of a local unit of government. § 15.165 (2)
Deferred Compensation Board (5 Members)
This board sets policy, contracts with investment and administrative service providers, and oversees administration of the Deferred Compensation Program. The board is responsible for establishing criteria and procedures for selecting and evaluating investment options offered by the Program. The governor, with senate confirmation, appoints all board members; there are no statutory requirements for appointments.
Board Members
Chair: Edward D. Main Appointed by the Governor, with Senate confirmation. §15.165 (4)
Vice Chair: John F. Nelson Appointed by the Governor, with Senate confirmation. § 15.165 (4)
Secretary: Gail Hanson Appointed by the Governor, with Senate confirmation. § 15.165 (4)
Michael Gracz Appointed by the Governor, with Senate confirmation. § 15.165 (4)
Vacant Appointed by the Governor, with Senate confirmation. § 15.165 (4)
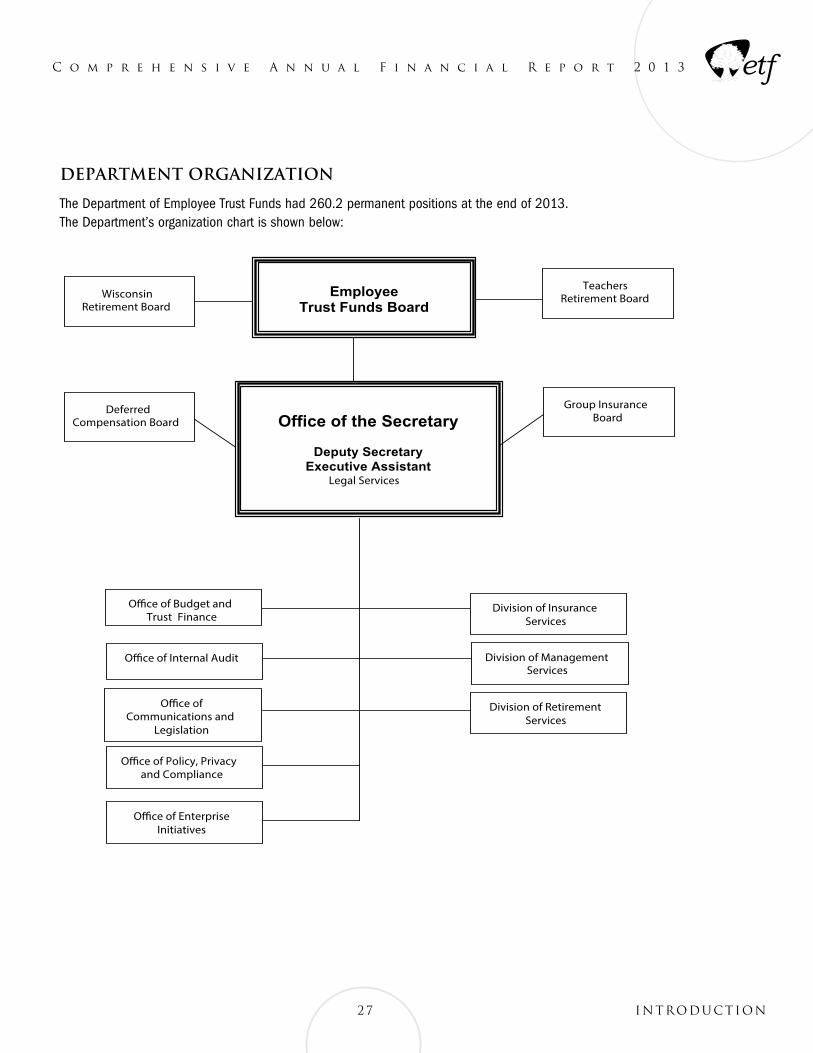
C o m p r e h e n s i v e A n n u a l F i n a n c i a l R e p o r t 2 0 1 3
27 INTRODUCTION
Department Organization
The Department of Employee Trust Funds had 260.2 permanent positions at the end of 2013. The Department’s organization chart is shown below:
Employee
Trust Funds Board
Office of the Secretary
Deputy Secretary
Executive Assistant Legal Services
Wisconsin Retirement Board
Teachers Retirement Board
Deferred Compensation Board
Group Insurance Board
O�ce of Budget and Trust Finance
O�ce of Internal Audit
Division of Insurance Services
Division of Management Services
O�ce of Communications and
Legislation
O�ce of Policy, Privacy and Compliance
O�ce of Enterprise Initiatives
Division of Retirement Services
C o m p r e h e n s i v e A n n u a l F i n a n c i a l R e p o r t 2 0 1 3
2013 ETF MANAGEMENT STAFF
Secretary: Robert J. Conlin Deputy Secretary: Robert Marchant Chief Legal Counsel: David Nispel
Division of Retirement Services Administrator: Matt Stohr
Division of Insurance Services Administrator: Lisa Ellinger
Division of Management Services Administrator: Pam Henning
Office of Budget and Trust Finance Director: Vacant
Office of Internal Audit Director: John Vincent
Office of Communications and Legislation Director: Mark Lamkins
Office of Policy, Privacy & Compliance Director: Steve Hurley
Office of Enterprise Initiatives Director: Bob Martin
PRINCIPAL CONSULTANTS AND ADMINISTRATORS
Consulting Actuaries Gabriel Roeder Smith & Company Southfield, Michigan
Deloitte Consulting Minneapolis, Minnesota
Auditors Legislative Audit Bureau Madison, Wisconsin
THIRD PARTY ADMINISTRATORS
Health Insurance WPS Health Insurance Madison, Wisconsin
Pharmacy Benefits Manager Navitus Health Solutions Appleton, Wisconsin
Income Continuation Insurance and Long-Term Disability Insurance Aetna Life Insurance Company Aetna Disability and Leave Management Lexington, Kentucky
Deferred Compensation Great-West Retirement Services Greenwood Village, Colorado
Employee Reimbursement Accounts and Commuter Benefits WageWorks Tallahassee, Florida
Life Insurance Minnesota Life Insurance Company St. Paul, Minnesota
28INTRODUCTION
29 INTRODUCTION
C o m p r e h e n s i v e A n n u a l F i n a n c i a l R e p o r t 2 0 1 3
LEGISLATION, VISION STATEMENT AND ANNUAL ACCOMPLISHMENTS
Legislation
This section describes laws that took effect in 2013 that affected the Wisconsin Retirement System or other employee benefit programs administered by the Department of Employee Trust Funds.
2013 WISCONSIN ACT 191
2013 Wisconsin Act 191 allowed members to buy WRS credit for the time they served in the active military, the National Guard or the Reserves. In order to purchase the service the member must be currently working in a WRS position (not retired); and must have an honorable or general discharge. The law became effective April 6, 2014.
2013 WISCONSIN ACT 20
2013 Wisconsin Act 20 made several changes affecting the WRS and the retirement and group health insurance programs administered by ETF. The major provisions affecting ETF and/or the WRS follow:
Retirement-Rehired Annuitants
• Increase the required minimum period of separation from employment before returning to work for a WRS-participating employer from 30 days to 75 days. This provision affected those with termination dates on or after July 1, 2013.
• Require the termination of annuities for rehired annuitants who are expected to work at least two-thirds of full time. This provision affected those with termination dates on or after July 1, 2013.
Group Health Insurance Program
• Require the offering of an optional high deductible health insurance plan and health savings account, beginning January 1, 2015. The state must make contributions to employees’ health savings accounts in an amount to be determined annually by the state.
Non-Statutory Provisions-Group Health Insurance Studies
2013 Wisconsin Act 20 directed ETF and the Office of State Employment Relations to study the following:
1. The feasibility and cost effectiveness of offering health reimbursement accounts instead of health savings accounts.
2. The feasibility of excluding from state employee health insurance coverage a spouse or domestic partner who has health insurance available from his or her employer.
3. The creation of an incentive payment program for state employees that opt not to take health insurance coverage through the state program.
The report, Act 20 Health Insurance Feasibility Study, can be found on ETF’s website, under the Forms and Publications menu.
ETF Vision Statement
The Department’s strategic plan provides the framework for achieving ETF’s vision to become a leader among large public employee benefit systems by offering best practice customer services to members and employers.
To achieve this goal:
• ETF will offer self-service tools to WRS members and employers. These tools will empower members to become better educated about their benefits, provide secure online access to their accounts, and allow them to securely update information online.
• ETF will expand outreach to more members and employers in more parts of the state. Efforts will include more timely and efficient electronic communications, a greater number of retirement planning and other informa-tion sessions that result in more user-friendly, accessible benefit program materials.
• ETF will strengthen its internal workforce training pro-grams to maintain and grow its highly-skilled and knowl-edgeable workforce. Efforts will include sophisticated training programs for new as well as existing employees.
30INTRODUCTION
C o m p r e h e n s i v e A n n u a l F i n a n c i a l R e p o r t 2 0 1 3
The Department is committed to incorporating modern best practices, continually evaluating processes for effectiveness in meeting the needs of members, safeguarding member data, and delivering the best value in benefits and services provided.
2013 ACCOMPLISHMENTS
This section highlights ETF’s accomplishments from January through December 2013. These accomplishments are linked to the following strategic business plan objectives:
1. Offer self-service tools for members and employers 2. Expand outreach to members and employers 3. Strengthen internal workforce training program
Note: Many of the following are associated with projects that are prerequisites/building blocks to larger--and in some cases, longer-term--efforts to fulfill strategic plan objectives.
1. OFFER SELF-SERVICE TOOLS FOR MEMBERS AND EMPLOYERS
• Completed critical, requisite phases in preparation for launching the Benefits Administration System project. These included: — completing and issuing the RFP; — holding a prospective vendor’s conference and later inviting three prospective vendors to demonstrate their solutions and services; — visiting three peer public employee retirement sys-tems to review and evaluate prospective vendor; and — selecting a vendor and beginning the contract nego-tiation process.
• Completed the Enterprise Business Model, which doc-umented all ETF business processes via scenario build-ing. The final EBM documentation was included in the BAS RFP to assist with the development and implemen-tation of the BAS solution.
• Launched the Data Integrity Project, a multi-year effort that will lead to a comprehensive inventory and categorization of ETF data; formalization of data authentication processes; and establishment of rules and processes surrounding data management, integrity, quality, and cleansing.
• Automated two previously-labor intensive processes, both involving the transmission of insurance information and/or premiums passing between third party administrators and ETF.
2. EXPAND OUTREACH TO MEMBERS AND EMPLOYERS
• Launched the Financial Management Information System Project, which will replace ETF’s existing system for managing financial receipts, disbursements and procurement with a more robust, single source record of all financial transactions.
• Completed various projects to implement and communicate the provisions of 2011 Wisconsin Act 32 and 2011 Wisconsin Act 10, which required substantial changes to ETF’s information technology systems.
• Enhanced the appointment scheduling process, making it easier and faster for members and staff to schedule appointments.
• Created and launched a new member outreach benefits presentation for employees who are in new or mid-career status as WRS covered employees.
• Used ETF’s e-mail notification service 200 times over the course of the year to communicate with members, employers and interested parties about important WRS topics, including rate announcements, annuity adjustments, benefit presentations, annual reporting, board meeting notices, and more.
3. STRENGTHEN INTERNAL WORKFORCE TRAINING
• Provided 19 employees with training to prepare them to identify and lead process improvement projects.
• Offered all employees more than 20 training sessions throughout the year. Topics included employee assistance programs; phases of project management; personal computing security; information technology applications, and more.
• Twenty-eight employees and two ETF Board members completed training and received certificates in the Retirement Plans and Investment Series provided by the International Foundation for Retirement Education.

Finances
State of WisconsinDepartment of
Employee Trust Funds
32
33
34

35 Finances
C o m p r e h e n s i v e A n n u a l F i n a n c i a l R e p o r t 2 0 1 3
This page has been left blank intentionally
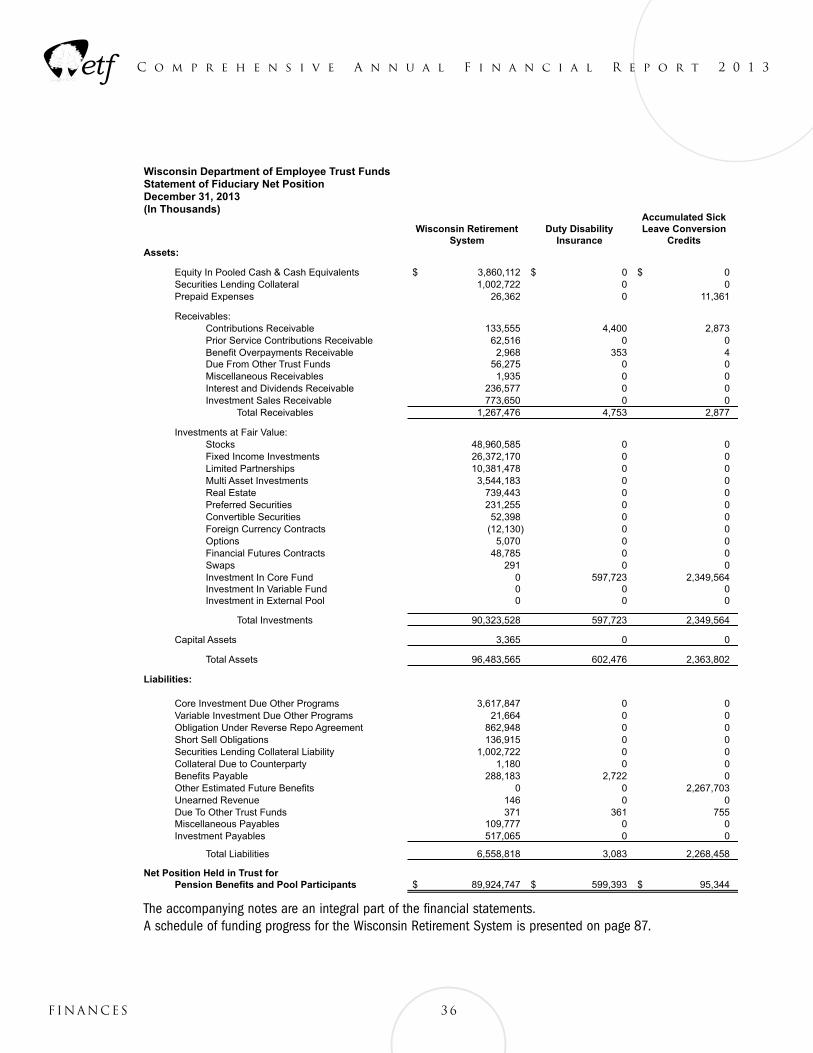
36Finances
C o m p r e h e n s i v e A n n u a l F i n a n c i a l R e p o r t 2 0 1 3
The accompanying notes are an integral part of the financial statements.A schedule of funding progress for the Wisconsin Retirement System is presented on page 87.
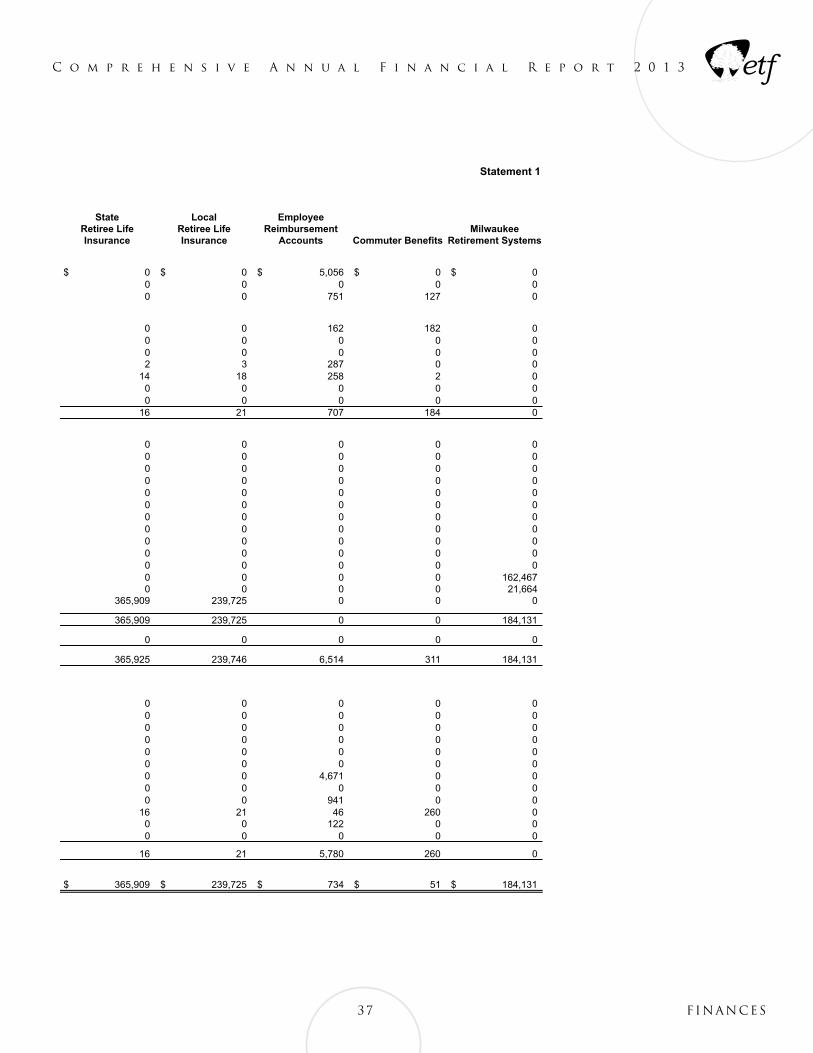
37 Finances
C o m p r e h e n s i v e A n n u a l F i n a n c i a l R e p o r t 2 0 1 3
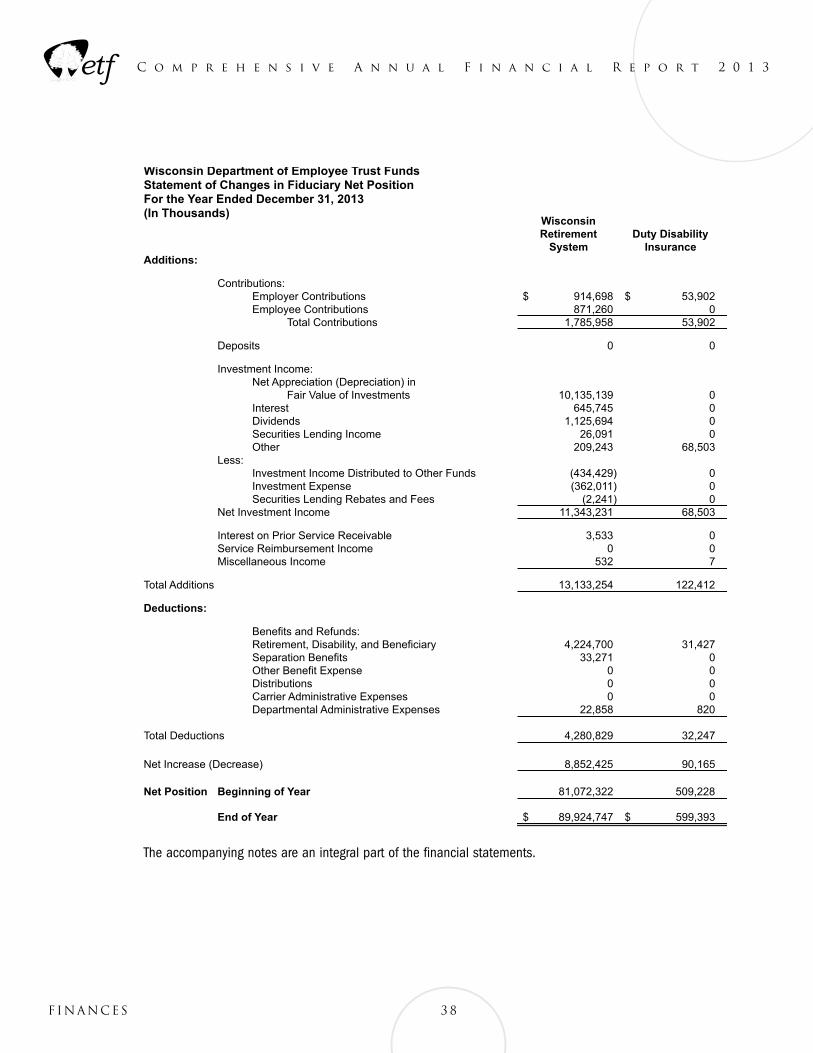
38Finances
C o m p r e h e n s i v e A n n u a l F i n a n c i a l R e p o r t 2 0 1 3
The accompanying notes are an integral part of the financial statements.
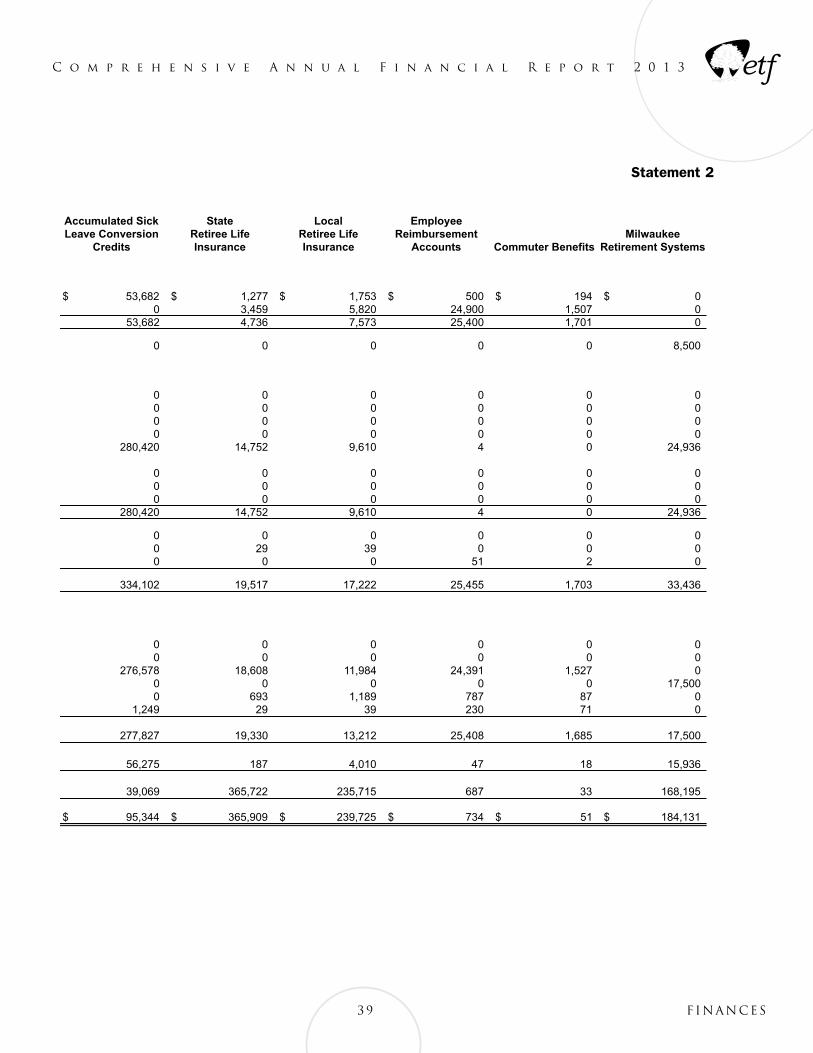
39 Finances
C o m p r e h e n s i v e A n n u a l F i n a n c i a l R e p o r t 2 0 1 3
Statement 2
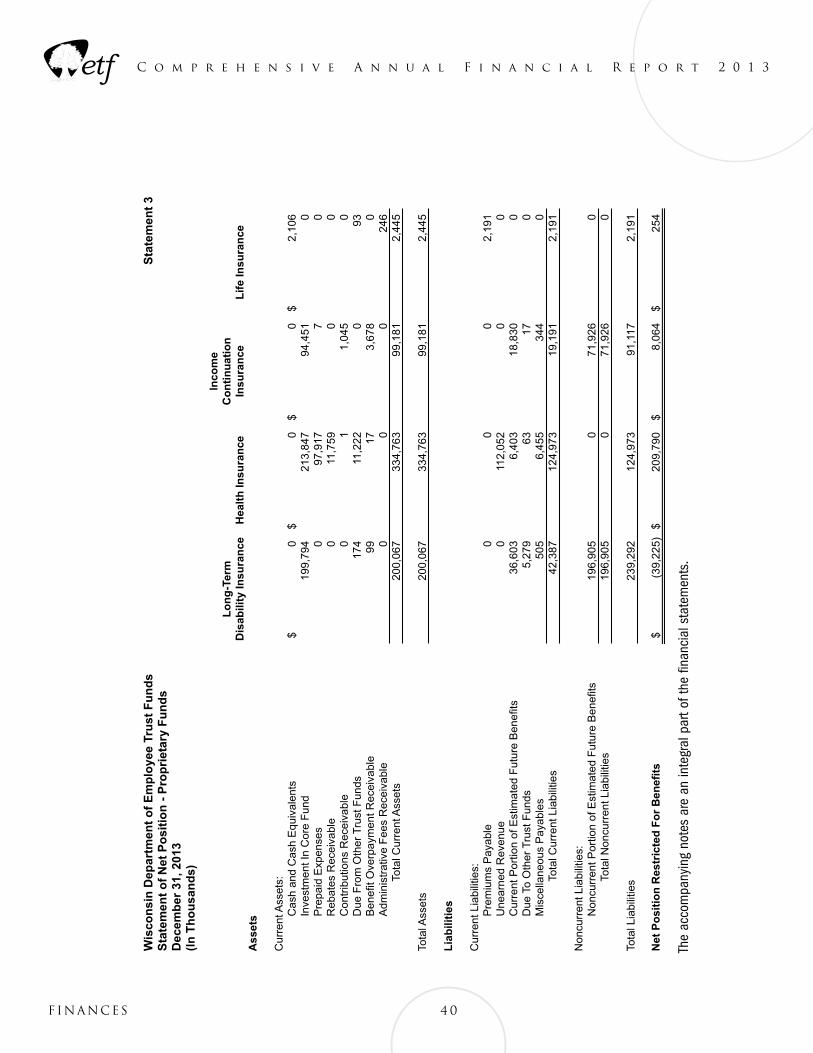
40Finances
C o m p r e h e n s i v e A n n u a l F i n a n c i a l R e p o r t 2 0 1 3
The
acco
mpa
nyin
g no
tes
are
an in
tegr
al p
art o
f the
fina
ncia
l sta
tem
ents
.
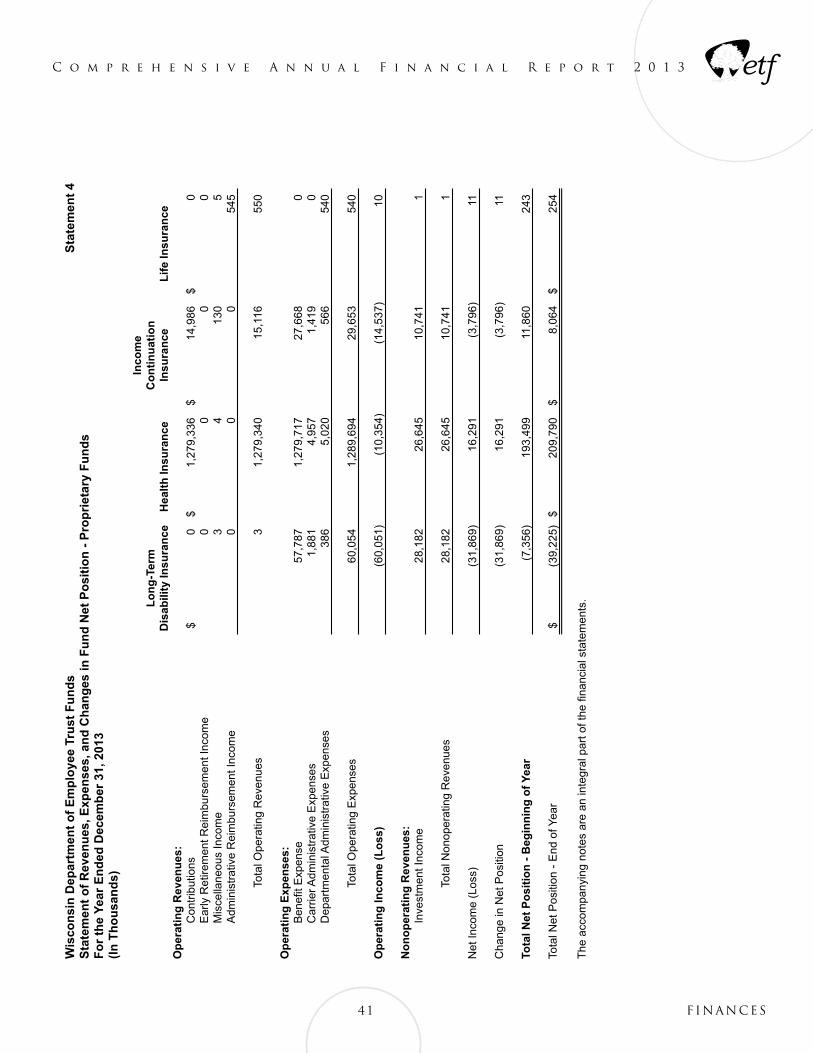
41 Finances
C o m p r e h e n s i v e A n n u a l F i n a n c i a l R e p o r t 2 0 1 3
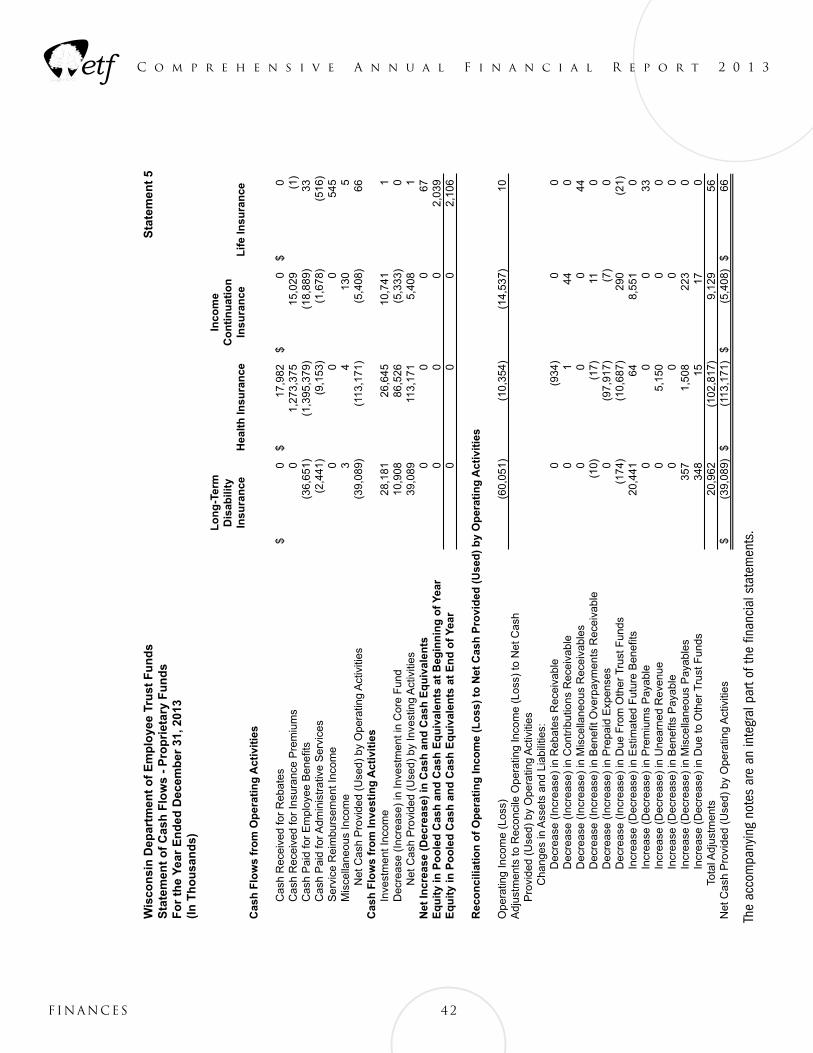
42Finances
C o m p r e h e n s i v e A n n u a l F i n a n c i a l R e p o r t 2 0 1 3
The
acco
mpa
nyin
g no
tes
are
an in
tegr
al p
art o
f the
fina
ncia
l sta
tem
ents
.
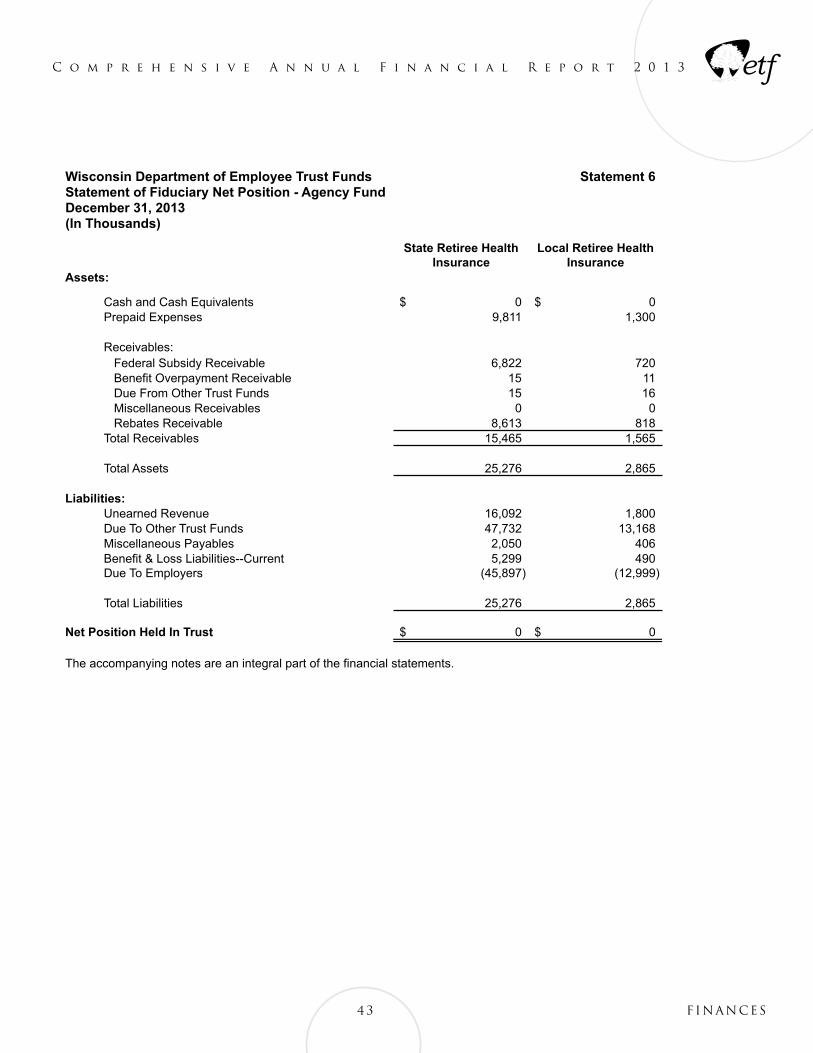
43 Finances
C o m p r e h e n s i v e A n n u a l F i n a n c i a l R e p o r t 2 0 1 3
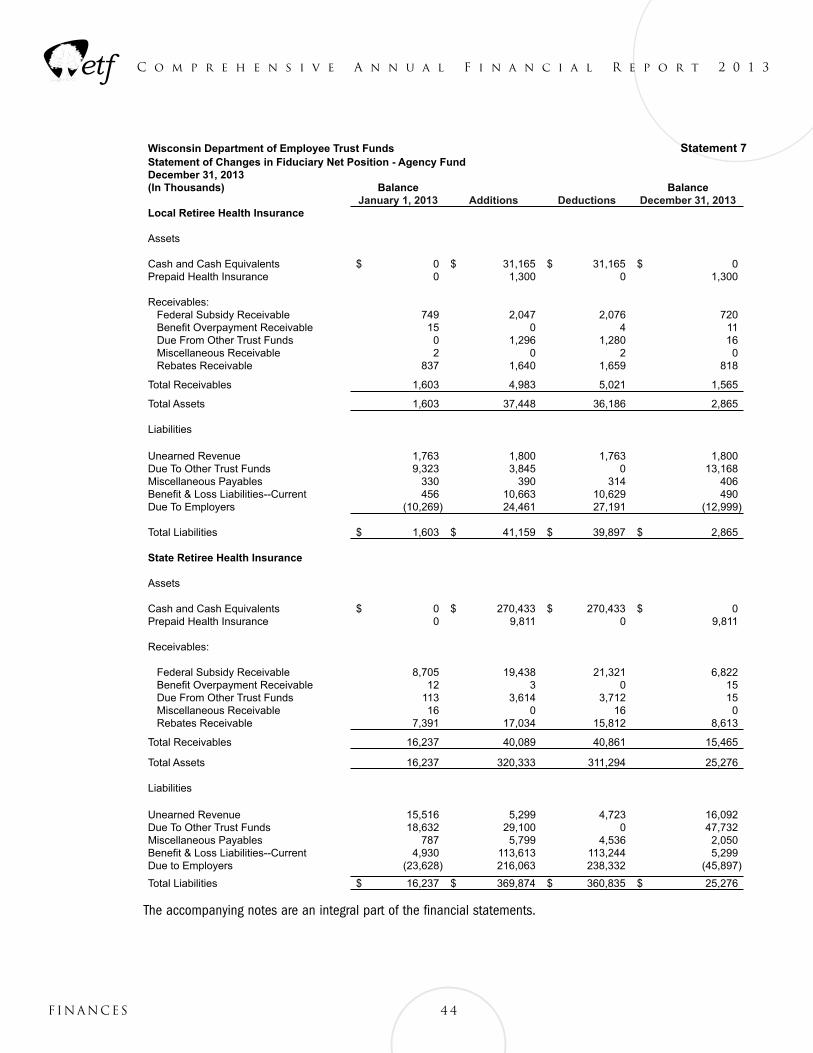
44Finances
C o m p r e h e n s i v e A n n u a l F i n a n c i a l R e p o r t 2 0 1 3
The accompanying notes are an integral part of the financial statements.
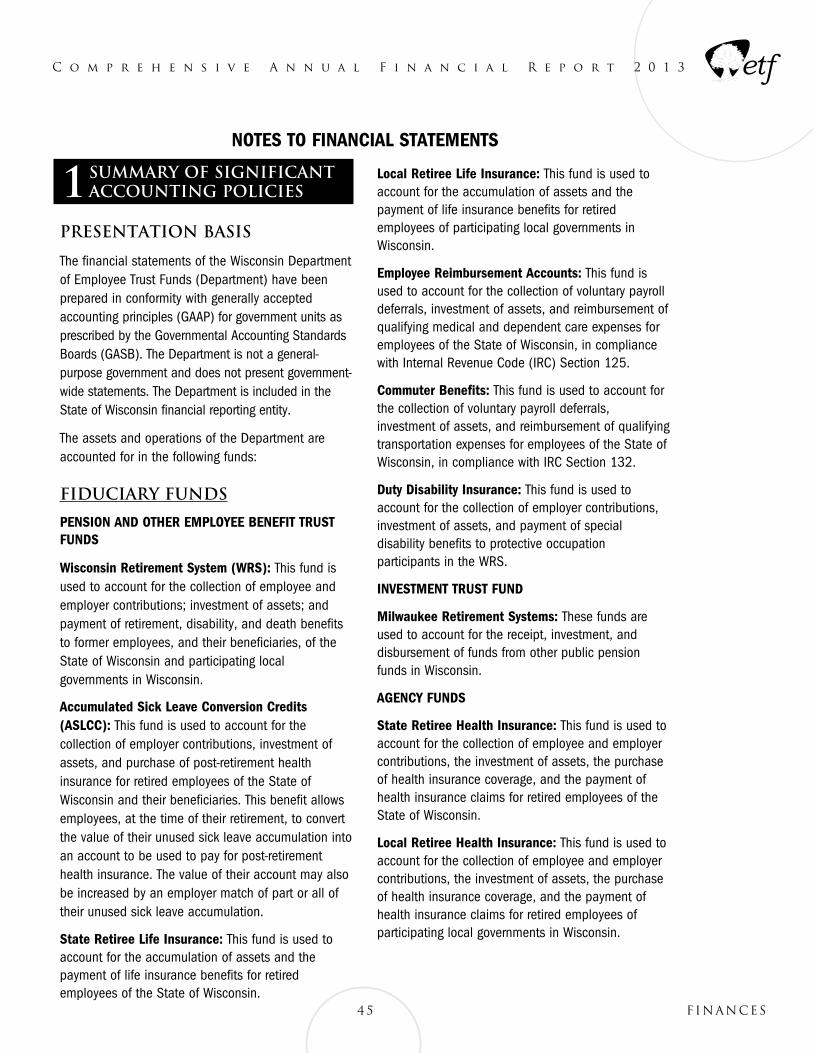
NOTES TO FINANCIAL STATEMENTS
1 SUMMARY OF SIGNIFICANT ACCOUNTING POLICIES
Presentation Basis
The financial statements of the Wisconsin Department of Employee Trust Funds (Department) have been prepared in conformity with generally accepted accounting principles (GAAP) for government units as prescribed by the Governmental Accounting Standards Boards (GASB). The Department is not a general-purpose government and does not present government-wide statements. The Department is included in the State of Wisconsin financial reporting entity.
The assets and operations of the Department are accounted for in the following funds:
Fiduciary Funds
PENSION AND OTHER EMPLOYEE BENEFIT TRUST FUNDS
Wisconsin Retirement System (WRS): This fund is used to account for the collection of employee and employer contributions; investment of assets; and payment of retirement, disability, and death benefits to former employees, and their beneficiaries, of the State of Wisconsin and participating local governments in Wisconsin.
Accumulated Sick Leave Conversion Credits (ASLCC): This fund is used to account for the collection of employer contributions, investment of assets, and purchase of post-retirement health insurance for retired employees of the State of Wisconsin and their beneficiaries. This benefit allows employees, at the time of their retirement, to convert the value of their unused sick leave accumulation into an account to be used to pay for post-retirement health insurance. The value of their account may also be increased by an employer match of part or all of their unused sick leave accumulation.
State Retiree Life Insurance: This fund is used to account for the accumulation of assets and the payment of life insurance benefits for retired employees of the State of Wisconsin.
Local Retiree Life Insurance: This fund is used to account for the accumulation of assets and the payment of life insurance benefits for retired employees of participating local governments in Wisconsin.
Employee Reimbursement Accounts: This fund is used to account for the collection of voluntary payroll deferrals, investment of assets, and reimbursement of qualifying medical and dependent care expenses for employees of the State of Wisconsin, in compliance with Internal Revenue Code (IRC) Section 125.
Commuter Benefits: This fund is used to account for the collection of voluntary payroll deferrals, investment of assets, and reimbursement of qualifying transportation expenses for employees of the State of Wisconsin, in compliance with IRC Section 132.
Duty Disability Insurance: This fund is used to account for the collection of employer contributions, investment of assets, and payment of special disability benefits to protective occupation participants in the WRS.
INVESTMENT TRUST FUND
Milwaukee Retirement Systems: These funds are used to account for the receipt, investment, and disbursement of funds from other public pension funds in Wisconsin.
AGENCY FUNDS
State Retiree Health Insurance: This fund is used to account for the collection of employee and employer contributions, the investment of assets, the purchase of health insurance coverage, and the payment of health insurance claims for retired employees of the State of Wisconsin.
Local Retiree Health Insurance: This fund is used to account for the collection of employee and employer contributions, the investment of assets, the purchase of health insurance coverage, and the payment of health insurance claims for retired employees of participating local governments in Wisconsin.
45 Finances
C o m p r e h e n s i v e A n n u a l F i n a n c i a l R e p o r t 2 0 1 3
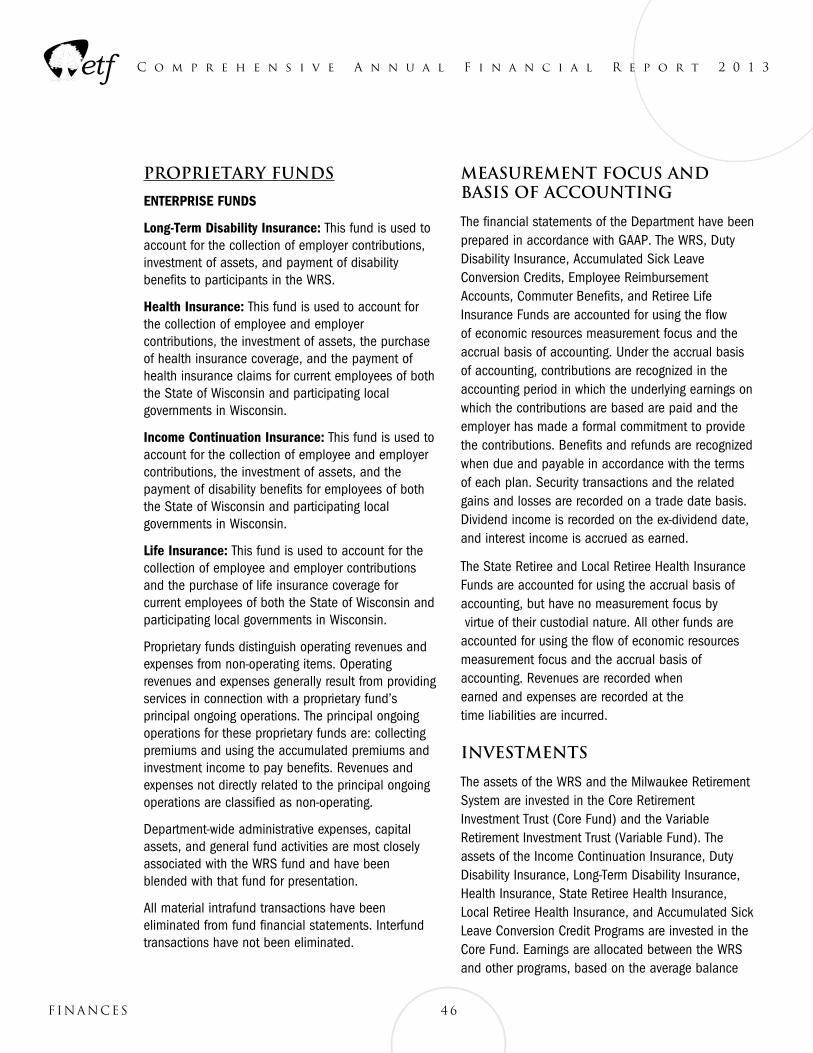
46Finances
C o m p r e h e n s i v e A n n u a l F i n a n c i a l R e p o r t 2 0 1 3
Proprietary Funds
ENTERPRISE FUNDS
Long-Term Disability Insurance: This fund is used to account for the collection of employer contributions, investment of assets, and payment of disability benefits to participants in the WRS.
Health Insurance: This fund is used to account for the collection of employee and employer contributions, the investment of assets, the purchase of health insurance coverage, and the payment of health insurance claims for current employees of both the State of Wisconsin and participating local governments in Wisconsin.
Income Continuation Insurance: This fund is used to account for the collection of employee and employer contributions, the investment of assets, and the payment of disability benefits for employees of both the State of Wisconsin and participating local governments in Wisconsin.
Life Insurance: This fund is used to account for the collection of employee and employer contributions and the purchase of life insurance coverage for current employees of both the State of Wisconsin and participating local governments in Wisconsin.
Proprietary funds distinguish operating revenues and expenses from non-operating items. Operating revenues and expenses generally result from providing services in connection with a proprietary fund’s principal ongoing operations. The principal ongoing operations for these proprietary funds are: collecting premiums and using the accumulated premiums and investment income to pay benefits. Revenues and expenses not directly related to the principal ongoing operations are classified as non-operating.
Department-wide administrative expenses, capital assets, and general fund activities are most closely associated with the WRS fund and have been blended with that fund for presentation.
All material intrafund transactions have been eliminated from fund financial statements. Interfund transactions have not been eliminated.
Measurement Focus and Basis of Accounting
The financial statements of the Department have been prepared in accordance with GAAP. The WRS, Duty Disability Insurance, Accumulated Sick Leave Conversion Credits, Employee Reimbursement Accounts, Commuter Benefits, and Retiree Life Insurance Funds are accounted for using the flow of economic resources measurement focus and the accrual basis of accounting. Under the accrual basis of accounting, contributions are recognized in the accounting period in which the underlying earnings on which the contributions are based are paid and the employer has made a formal commitment to provide the contributions. Benefits and refunds are recognized when due and payable in accordance with the terms of each plan. Security transactions and the related gains and losses are recorded on a trade date basis. Dividend income is recorded on the ex-dividend date, and interest income is accrued as earned.
The State Retiree and Local Retiree Health Insurance Funds are accounted for using the accrual basis of accounting, but have no measurement focus by virtue of their custodial nature. All other funds are accounted for using the flow of economic resources measurement focus and the accrual basis of accounting. Revenues are recorded when earned and expenses are recorded at the time liabilities are incurred.
Investments
The assets of the WRS and the Milwaukee Retirement System are invested in the Core Retirement Investment Trust (Core Fund) and the Variable Retirement Investment Trust (Variable Fund). The assets of the Income Continuation Insurance, Duty Disability Insurance, Long-Term Disability Insurance, Health Insurance, State Retiree Health Insurance, Local Retiree Health Insurance, and Accumulated Sick Leave Conversion Credit Programs are invested in the Core Fund. Earnings are allocated between the WRS and other programs, based on the average balance
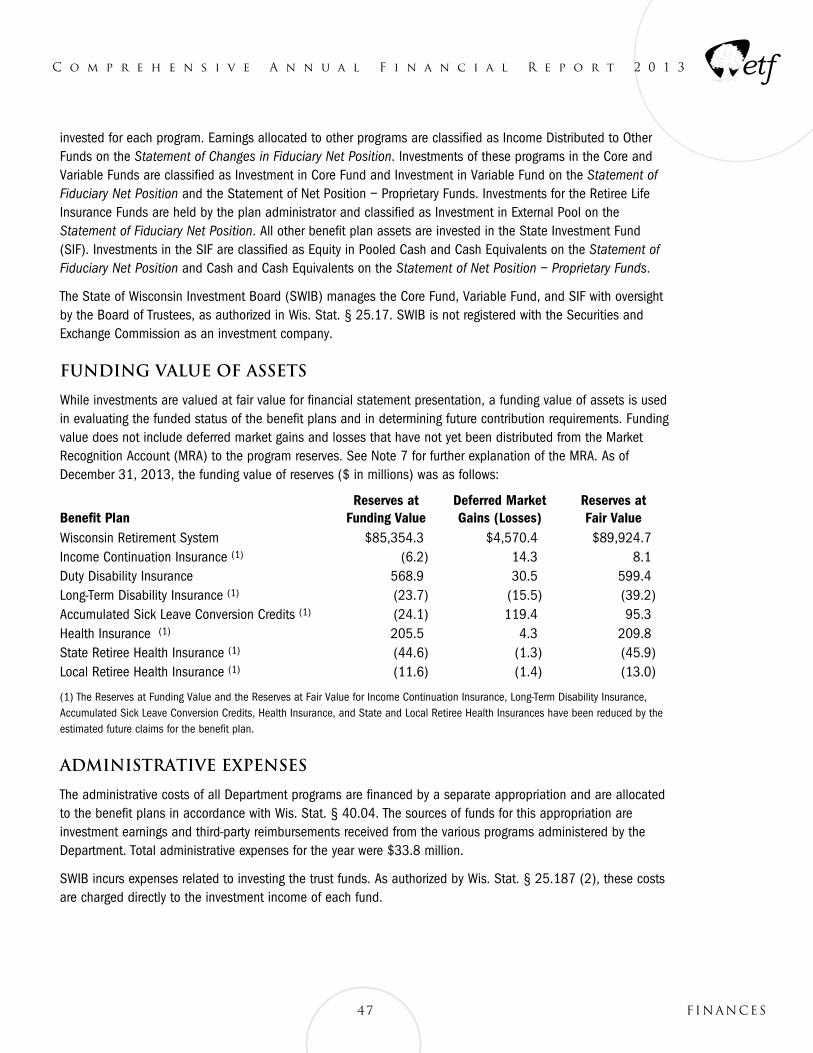
47 Finances
C o m p r e h e n s i v e A n n u a l F i n a n c i a l R e p o r t 2 0 1 3
invested for each program. Earnings allocated to other programs are classified as Income Distributed to Other Funds on the Statement of Changes in Fiduciary Net Position. Investments of these programs in the Core and Variable Funds are classified as Investment in Core Fund and Investment in Variable Fund on the Statement of Fiduciary Net Position and the Statement of Net Position – Proprietary Funds. Investments for the Retiree Life Insurance Funds are held by the plan administrator and classified as Investment in External Pool on the Statement of Fiduciary Net Position. All other benefit plan assets are invested in the State Investment Fund (SIF). Investments in the SIF are classified as Equity in Pooled Cash and Cash Equivalents on the Statement of Fiduciary Net Position and Cash and Cash Equivalents on the Statement of Net Position – Proprietary Funds.
The State of Wisconsin Investment Board (SWIB) manages the Core Fund, Variable Fund, and SIF with oversight by the Board of Trustees, as authorized in Wis. Stat. § 25.17. SWIB is not registered with the Securities and Exchange Commission as an investment company.
Funding Value of Assets
While investments are valued at fair value for financial statement presentation, a funding value of assets is used in evaluating the funded status of the benefit plans and in determining future contribution requirements. Funding value does not include deferred market gains and losses that have not yet been distributed from the Market Recognition Account (MRA) to the program reserves. See Note 7 for further explanation of the MRA. As of December 31, 2013, the funding value of reserves ($ in millions) was as follows:
Benefit PlanReserves at
Funding ValueDeferred Market Gains (Losses)
Reserves at Fair Value
Wisconsin Retirement System $85,354.3 $4,570.4 $89,924.7Income Continuation Insurance (1) (6.2) 14.3 8.1Duty Disability Insurance 568.9 30.5 599.4Long-Term Disability Insurance (1) (23.7) (15.5) (39.2)Accumulated Sick Leave Conversion Credits (1) (24.1) 119.4 95.3Health Insurance (1) 205.5 4.3 209.8State Retiree Health Insurance (1) (44.6) (1.3) (45.9)Local Retiree Health Insurance (1) (11.6) (1.4) (13.0)
(1) The Reserves at Funding Value and the Reserves at Fair Value for Income Continuation Insurance, Long-Term Disability Insurance, Accumulated Sick Leave Conversion Credits, Health Insurance, and State and Local Retiree Health Insurances have been reduced by the estimated future claims for the benefit plan.
Administrative Expenses
The administrative costs of all Department programs are financed by a separate appropriation and are allocated to the benefit plans in accordance with Wis. Stat. § 40.04. The sources of funds for this appropriation are investment earnings and third-party reimbursements received from the various programs administered by the Department. Total administrative expenses for the year were $33.8 million.
SWIB incurs expenses related to investing the trust funds. As authorized by Wis. Stat. § 25.187 (2), these costs are charged directly to the investment income of each fund.
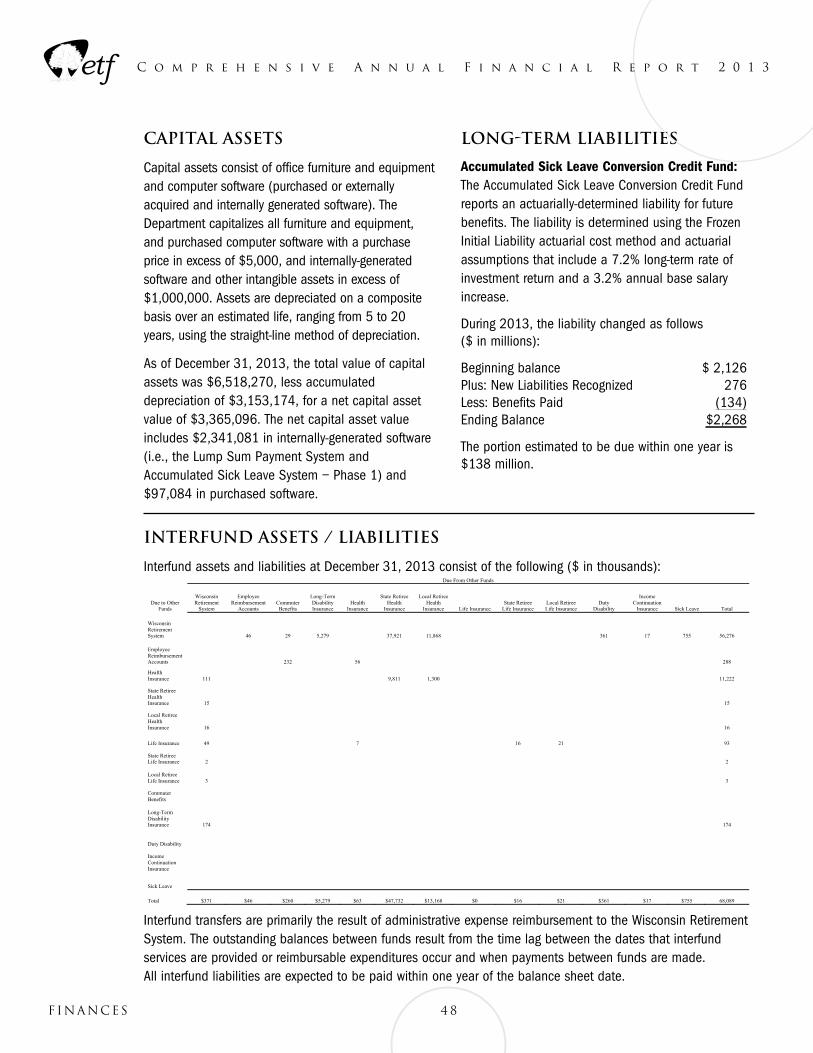
Capital Assets
Capital assets consist of office furniture and equipment and computer software (purchased or externally acquired and internally generated software). The Department capitalizes all furniture and equipment, and purchased computer software with a purchase price in excess of $5,000, and internally-generated software and other intangible assets in excess of $1,000,000. Assets are depreciated on a composite basis over an estimated life, ranging from 5 to 20 years, using the straight-line method of depreciation.
As of December 31, 2013, the total value of capital assets was $6,518,270, less accumulated depreciation of $3,153,174, for a net capital asset value of $3,365,096. The net capital asset value includes $2,341,081 in internally-generated software (i.e., the Lump Sum Payment System and Accumulated Sick Leave System – Phase 1) and $97,084 in purchased software.
Long-Term Liabilities
Accumulated Sick Leave Conversion Credit Fund: The Accumulated Sick Leave Conversion Credit Fund reports an actuarially-determined liability for future benefits. The liability is determined using the Frozen Initial Liability actuarial cost method and actuarial assumptions that include a 7.2% long-term rate of investment return and a 3.2% annual base salary increase.
During 2013, the liability changed as follows ($ in millions):
Beginning balance $ 2,126Plus: New Liabilities Recognized 276Less: Benefits Paid (134)Ending Balance $2,268
The portion estimated to be due within one year is $138 million.
Interfund Assets / Liabilities
Interfund assets and liabilities at December 31, 2013 consist of the following ($ in thousands):
Interfund transfers are primarily the result of administrative expense reimbursement to the Wisconsin Retirement System. The outstanding balances between funds result from the time lag between the dates that interfund services are provided or reimbursable expenditures occur and when payments between funds are made. All interfund liabilities are expected to be paid within one year of the balance sheet date.
48Finances
C o m p r e h e n s i v e A n n u a l F i n a n c i a l R e p o r t 2 0 1 3
6
Interfund Assets / Liabilities Interfund assets and liabilities at December 31, 2013 consist of the following ($ in thousands):
Due From Other Funds
Due to Other Funds
Wisconsin Retirement
System
Employee Reimbursement
Accounts Commuter Benefits
Long-Term Disability Insurance
Health Insurance
State Retiree Health
Insurance
Local Retiree Health
Insurance Life Insurance State Retiree
Life Insurance Local Retiree Life Insurance
Duty Disability
Income Continuation
Insurance Sick Leave Total
Wisconsin Retirement System
46
29
5,279
37,921
11,868
361
17
755
56,276
Employee Reimbursement Accounts
232
56
288
Health Insurance
111
9,811
1,300
11,222
State Retiree Health Insurance
15
15
Local Retiree Health Insurance
16
16
Life Insurance
49
7
16
21
93
State Retiree Life Insurance
2
2
Local Retiree Life Insurance
3
3
Commuter Benefits
Long-Term Disability Insurance
174
174
Duty Disability
Income Continuation Insurance
Sick Leave
Total $371 $46 $260 $5,279 $63 $47,732 $13,168 $0 $16 $21 $361 $17 $755
68,089
Interfund transfers are primarily the result of administrative expense reimbursement to the Wisconsin Retirement System. The outstanding balances between funds result from the time lag between the dates that interfund services are provided or reimbursable expenditures occur and when payments between funds are made. All interfund liabilities are expected to be paid within one year of the balance sheet date.
49 Finances
C o m p r e h e n s i v e A n n u a l F i n a n c i a l R e p o r t 2 0 1 3
Use of Estimates
The preparation of financial statements in accordance with GAAP requires management to make estimates that affect amounts reported herein. Due to the inherent uncertainty involved, actual results could differ from those estimates.
Management’s Discussion and Analysis (MD&A)
GASB Statement No. 34, Basic Financial Statements – and Management’s Discussion and Analysis – for State and Local Governments, requires that government-wide financial statements include an MD&A to provide an overview of the government’s financial activities. This requirement does not extend to Department financial statements. It was management’s determination that this type of information could be better presented in other areas of the Department’s Comprehensive Annual Financial Report. Therefore, management has not included an MD&A with the financial statements.
2ACCOUNTING CHANGES
There are no accounting changes for this year.
3 DEPOSITS, INVESTMENTS AND SECURITIES LENDING
TRANSACTIONS
Valuation of Securities
The investments of the Core and Variable Funds are reported in the Statement of Fiduciary Net Position at fair value as prescribed by GASB and per Wisconsin Statutes s. 25.17(14). Unrealized gains and losses are reflected in the Statement of Changes in Fiduciary Net Position as Net Appreciation (Depreciation) in Fair Value of Investments.
The fair value of Core and Variable Fund assets are obtained or estimated in accordance with a pricing hierarchy established with SWIB’s custodian Bank of New York Mellon (BNY Mellon). As prescribed by the
hierarchy, a variety of independent pricing sources are used to price assets based on type, class or issue.
When a portfolio includes securities or instruments for which the custodial bank does not receive fair value information from its vendor pricing sources, a variety of third party pricing methods are used, including appraisals, pricing models and other methods deemed acceptable by industry standards.
The Equity in Pooled Cash & Cash Equivalents category reported on the Statement of Fiduciary Net Position consists of short-term investments which are used to meet the liquidity requirements of the Core and Variable Funds. Equity in Pooled Cash & Cash Equivalents held by the Core and Variable Funds can include cash on deposit, foreign currencies, cash posted as collateral to counterparties, repurchase agreements, certificates of deposit, U.S. Treasury Bills, short-term investment funds, and other liquid financial instruments with maturities that are generally less than three months. Equity in Pooled Cash & Cash Equivalents are reported at fair value or cost, which approximates fair value.
Privately-held debt, which is included in Fixed Income Investments on the Statement of Fiduciary Net Position, is priced using a multi-tiered approach that prices each holding based on the best available information using the following hierarchy of pricing sources:
1. Custodian-supplied prices for assets that are in the Barclays Capital U.S. Aggregate Bond Index;
2. Prices provided by a third party with expertise in the bond market;
3. Modeled prices where interest rate spreads are supplied by a third party.
In a few instances, privately-held debt cannot be priced by one of the above three sources. In these circumstances, the investment is priced using an alternative bond index price or, if no independent quotation exists, the investment is priced by SWIB management, usually at cost.
For alternative investments where no readily-ascertainable market value exists, including limited partnerships and real estate pooled funds, fair value is estimated based on the net asset value as reported by the general partner. The capital account balance as stated in the most recent available quarterly reporting period is adjusted for subsequent cash flows to derive the fair value. Annually, the financial statements of the limited partnerships and real estate pooled funds are audited by independent auditors.
Real estate properties wholly owned by SWIB are valued by independent appraisers every three years. In years when appraisals are not performed, properties are informally appraised by the asset advisor. Each year, audited financial statements are prepared for each property.
Monthly, SWIB values hedge funds based on statements received from each of the hedge fund’s administrators. Essentially, a hedge fund administrator serves as an independent third party that protects the interests of investors. The main function of a third-party administrator is to independently calculate the net asset value of the fund. Generally, hedge fund administrators price financial instruments traded in active markets based on quoted market prices or binding dealer quotations. For certain over-the-counter instruments, fair value is determined based on valuation models used by the administrator. Annually, the financial statements prepared by the administrator are audited by independent auditors.
Derivative financial instruments are marked to fair value daily, with valuation changes recognized in income during the period the instruments are held and when the instrument is sold or expires. The nature and use of derivative instruments is discussed later in these notes.
A limited number of securities are carried at cost. Certain non-public or closely held stocks are not reported at fair value, but are carried at cost since no independent quotation is available to estimate fair value for these securities.
Investments for the Retiree Life Insurance Funds are held with the insurance carrier (the Company) in the Company’s investment pool. The methods used to value that pool’s investments are described in Note 9.
Credit Risk
Credit risk is the risk that an issuer or other counterparty to an investment will not fulfill its obligations to SWIB. Fixed income credit risk investment guidelines spell out the minimum ratings required at the time of purchase by individual portfolios, or groups of portfolios, based on the portfolios’ investment objectives. In addition, some fixed income portfolios are required to carry a minimum weighted average rating at all times. Information regarding SWIB’s credit risk related to derivatives is discussed later in these notes.
The table, Core & Variable Funds Credit Quality Distribution, displays the lowest credit rating assigned by nationally recognized statistical rating organizations on debt securities held by the Core and Variable Funds as of December 31, 2013. Included in this table are fixed income securities, including certain short term securities, classified as Equity in Pooled Cash & Cash Equivalents on the Statement of Fiduciary Net Position. Also included are interest rate sensitive investments held in the Core and Variable Funds’ securities lending collateral reinvestment pools, which are managed by SWIB’s securities custodian (additional information relating to the securities lending program is discussed later in these notes). The table also includes SWIB’s investment in commingled fixed income funds, which are not assigned ratings. Although the funds themselves are not assigned ratings, external management investment guidelines govern minimum credit quality standards for the investments within each portfolio. These standards are determined based on the investment objectives and risk parameters of each fund. The table, Core & Variable Funds Credit Quality Breakdown of Commingled Funds, presents the aggregated credit ratings for the underlying investments held by commingled fixed income investments within the Core and Variable Funds.
50Finances
C o m p r e h e n s i v e A n n u a l F i n a n c i a l R e p o r t 2 0 1 3
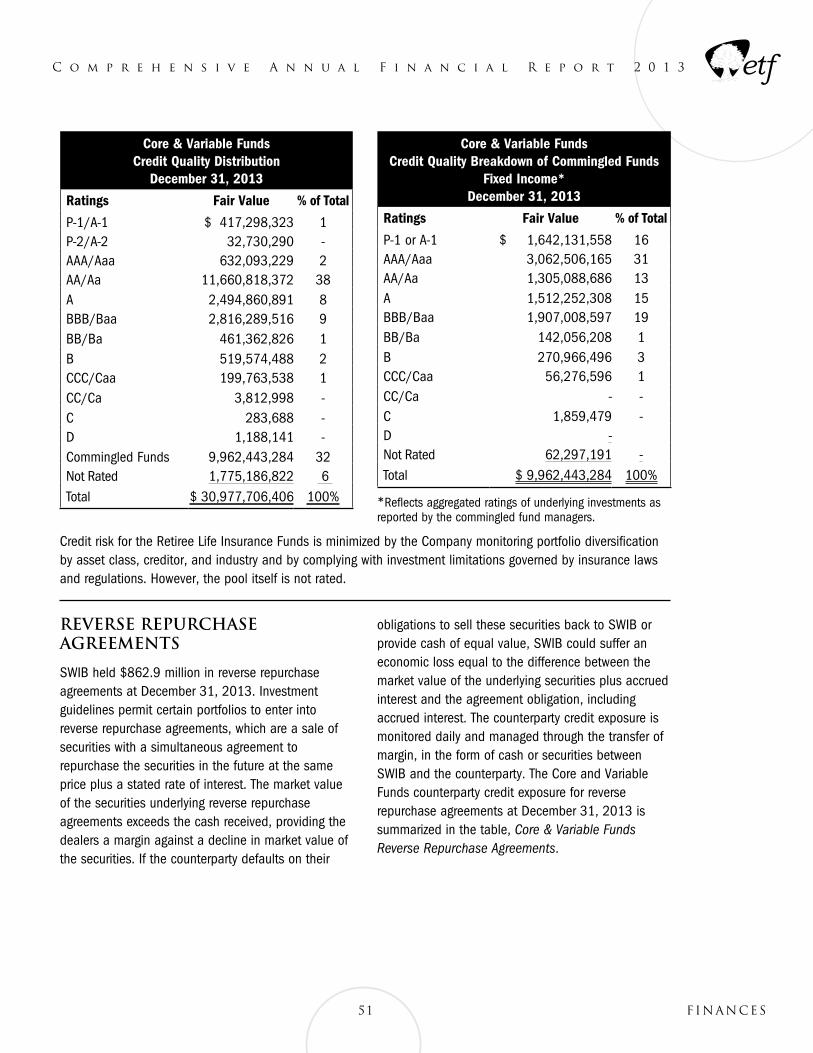
51 F inances
C o m p r e h e n s i v e A n n u a l F i n a n c i a l R e p o r t 2 0 1 3
Core & Variable Funds Credit Quality Distribution
December 31, 2013
Ratings Fair Value % of Total
P-1/A-1 $ 417,298,323 1P-2/A-2 32,730,290 -AAA/Aaa 632,093,229 2AA/Aa 11,660,818,372 38A 2,494,860,891 8BBB/Baa 2,816,289,516 9BB/Ba 461,362,826 1B 519,574,488 2CCC/Caa 199,763,538 1CC/Ca 3,812,998 -C 283,688 -D 1,188,141 -Commingled Funds 9,962,443,284 32Not Rated 1,775,186,822 6 Total $ 30,977,706,406 100%
Core & Variable Funds Credit Quality Breakdown of Commingled Funds
Fixed Income* December 31, 2013
Ratings Fair Value % of Total
P-1 or A-1 $ 1,642,131,558 16AAA/Aaa 3,062,506,165 31AA/Aa 1,305,088,686 13A 1,512,252,308 15BBB/Baa 1,907,008,597 19BB/Ba 142,056,208 1B 270,966,496 3CCC/Caa 56,276,596 1CC/Ca - -C 1,859,479 -D -Not Rated 62,297,191 -Total $ 9,962,443,284 100%
*Reflects aggregated ratings of underlying investments as reported by the commingled fund managers.
Credit risk for the Retiree Life Insurance Funds is minimized by the Company monitoring portfolio diversification by asset class, creditor, and industry and by complying with investment limitations governed by insurance laws and regulations. However, the pool itself is not rated.
Reverse Repurchase Agreements
SWIB held $862.9 million in reverse repurchase agreements at December 31, 2013. Investment guidelines permit certain portfolios to enter into reverse repurchase agreements, which are a sale of securities with a simultaneous agreement to repurchase the securities in the future at the same price plus a stated rate of interest. The market value of the securities underlying reverse repurchase agreements exceeds the cash received, providing the dealers a margin against a decline in market value of the securities. If the counterparty defaults on their
obligations to sell these securities back to SWIB or provide cash of equal value, SWIB could suffer an economic loss equal to the difference between the market value of the underlying securities plus accrued interest and the agreement obligation, including accrued interest. The counterparty credit exposure is monitored daily and managed through the transfer of margin, in the form of cash or securities between SWIB and the counterparty. The Core and Variable Funds counterparty credit exposure for reverse repurchase agreements at December 31, 2013 is summarized in the table, Core & Variable Funds Reverse Repurchase Agreements.
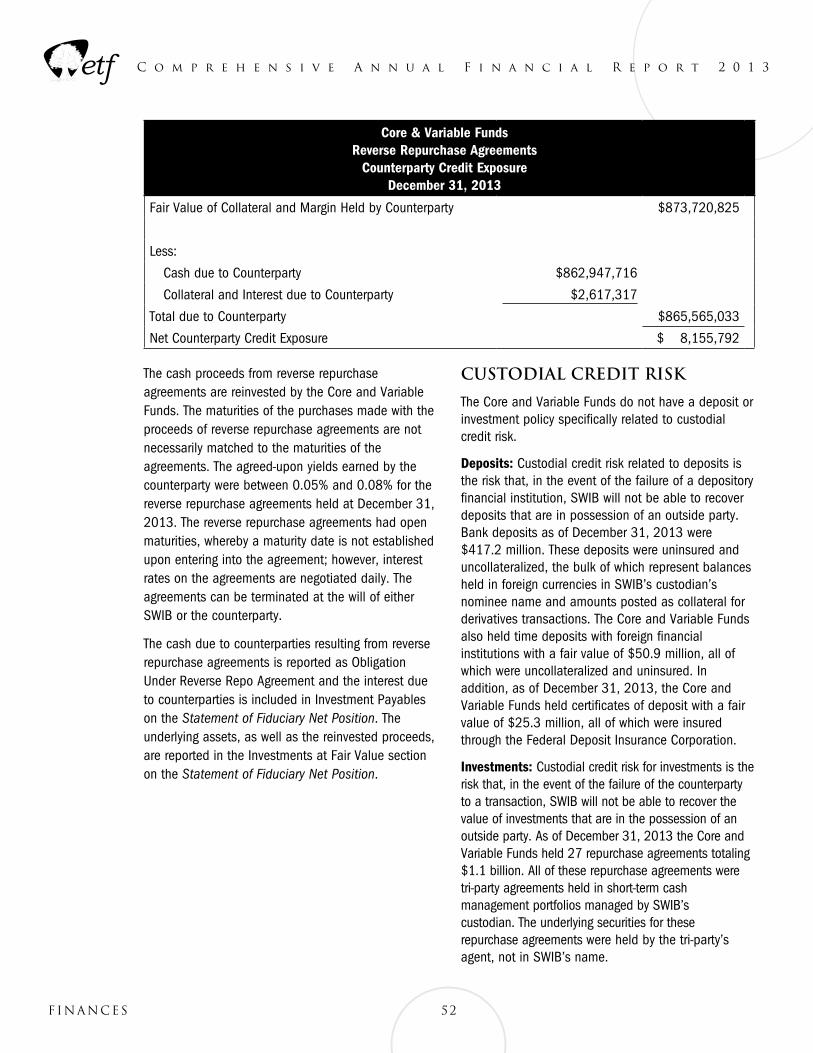
The cash proceeds from reverse repurchase agreements are reinvested by the Core and Variable Funds. The maturities of the purchases made with the proceeds of reverse repurchase agreements are not necessarily matched to the maturities of the agreements. The agreed-upon yields earned by the counterparty were between 0.05% and 0.08% for the reverse repurchase agreements held at December 31, 2013. The reverse repurchase agreements had open maturities, whereby a maturity date is not established upon entering into the agreement; however, interest rates on the agreements are negotiated daily. The agreements can be terminated at the will of either SWIB or the counterparty.
The cash due to counterparties resulting from reverse repurchase agreements is reported as Obligation Under Reverse Repo Agreement and the interest due to counterparties is included in Investment Payables on the Statement of Fiduciary Net Position. The underlying assets, as well as the reinvested proceeds, are reported in the Investments at Fair Value section on the Statement of Fiduciary Net Position.
Custodial Credit Risk
The Core and Variable Funds do not have a deposit or investment policy specifically related to custodial credit risk.
Deposits: Custodial credit risk related to deposits is the risk that, in the event of the failure of a depository financial institution, SWIB will not be able to recover deposits that are in possession of an outside party. Bank deposits as of December 31, 2013 were $417.2 million. These deposits were uninsured and uncollateralized, the bulk of which represent balances held in foreign currencies in SWIB’s custodian’s nominee name and amounts posted as collateral for derivatives transactions. The Core and Variable Funds also held time deposits with foreign financial institutions with a fair value of $50.9 million, all of which were uncollateralized and uninsured. In addition, as of December 31, 2013, the Core and Variable Funds held certificates of deposit with a fair value of $25.3 million, all of which were insured through the Federal Deposit Insurance Corporation.
Investments: Custodial credit risk for investments is the risk that, in the event of the failure of the counterparty to a transaction, SWIB will not be able to recover the value of investments that are in the possession of an outside party. As of December 31, 2013 the Core and Variable Funds held 27 repurchase agreements totaling $1.1 billion. All of these repurchase agreements were tri-party agreements held in short-term cash management portfolios managed by SWIB’s custodian. The underlying securities for these repurchase agreements were held by the tri-party’s agent, not in SWIB’s name.
52Finances
C o m p r e h e n s i v e A n n u a l F i n a n c i a l R e p o r t 2 0 1 3
Core & Variable Funds Reverse Repurchase Agreements
Counterparty Credit Exposure December 31, 2013
Fair Value of Collateral and Margin Held by Counterparty $873,720,825
Less:
Cash due to Counterparty $862,947,716
Collateral and Interest due to Counterparty $2,617,317
Total due to Counterparty $865,565,033
Net Counterparty Credit Exposure $ 8,155,792
53 Finances
C o m p r e h e n s i v e A n n u a l F i n a n c i a l R e p o r t 2 0 1 3
Concentration of Credit Risk
Concentration of credit risk is the risk of loss attributed to the magnitude of an organization’s investment in a single issuer. SWIB limits concentrations of credit risk by establishing investment guidelines for individual portfolios or groups of portfolios that generally restrict issuer concentrations in any one company or Rule 144A securities to less than 5% of the portfolio’s market value. The Core and Variable Funds did not hold any investments with a single issuer, exclusive of investments issued or explicitly guaranteed by the U.S. government, representing 5% or more of the funds’ value at December 31, 2013.
Interest Rate Risk
Fixed income instruments held by the Core and Variable Funds include investments with variable rate securities, stepped rate securities, securities with no coupon, such as discount notes and coupons that range between .01% and 16.25%. Interest rate risk is the risk that changes in interest rates will adversely affect the fair value of an investment. SWIB uses a number of different methods to manage interest rate risk.
Generally, SWIB analyzes long or intermediate term portfolios’ interest rate risk using various duration calculations. Modified duration, which is stated in years, is the measure of price sensitivity of a fixed income security to an interest rate change of 100 basis points. The calculation is based on the weighted average of the present values for all cash flows. Some pooled investments are analyzed using an option adjusted duration calculation which is similar to the modified duration method. Option adjusted duration incorporates the duration shortening effect of any embedded call provisions in the securities.
Short-term portfolios use the weighted average maturity (to next reset) to analyze interest rate risk.
Weighted average maturity is the maturity of each position in a portfolio weighted by the dollar value of the position to compute an average maturity for the portfolio as a whole. This measure indicates a portfolio’s sensitivity to interest rate changes: a longer weighted average maturity implies greater volatility in response to interest rate changes.
SWIB’s investment guidelines related to interest rate risk vary by portfolio. Some fixed income portfolios are required to be managed within a range of a targeted duration, while others are required to maintain a weighted average maturity at or below a specified number of days or years.
The table, Core & Variable Funds Interest Rate Sensitivity by Investment Type, presents the aggregated interest rate exposure for the Core and Variable Fund assets. Weighted average maturity, where reset dates are assumed to be the effective maturity date for the security, is presented for repurchase agreements and short term pooled investments. Longer term instruments held by the Core and Variable Funds are presented using modified duration, as this measure more accurately states the interest rate sensitivity of these investments. The duration statistic is calculated utilizing reset dates for some floating rate instruments, such as term loans.
Interest rate risk for the Retiree Life Insurance Funds is minimized by the Company maintaining a diversified portfolio of investments and monitoring cash flow patterns, in order to approximately match the expected maturity of liabilities. The pool’s investment objective is to maintain levels in its general account sufficient to guarantee principal amounts of reserves. The interest rate exposure of this pool, expressed in terms of duration and average remaining life, is 5.6 and 7.9 years, respectively.
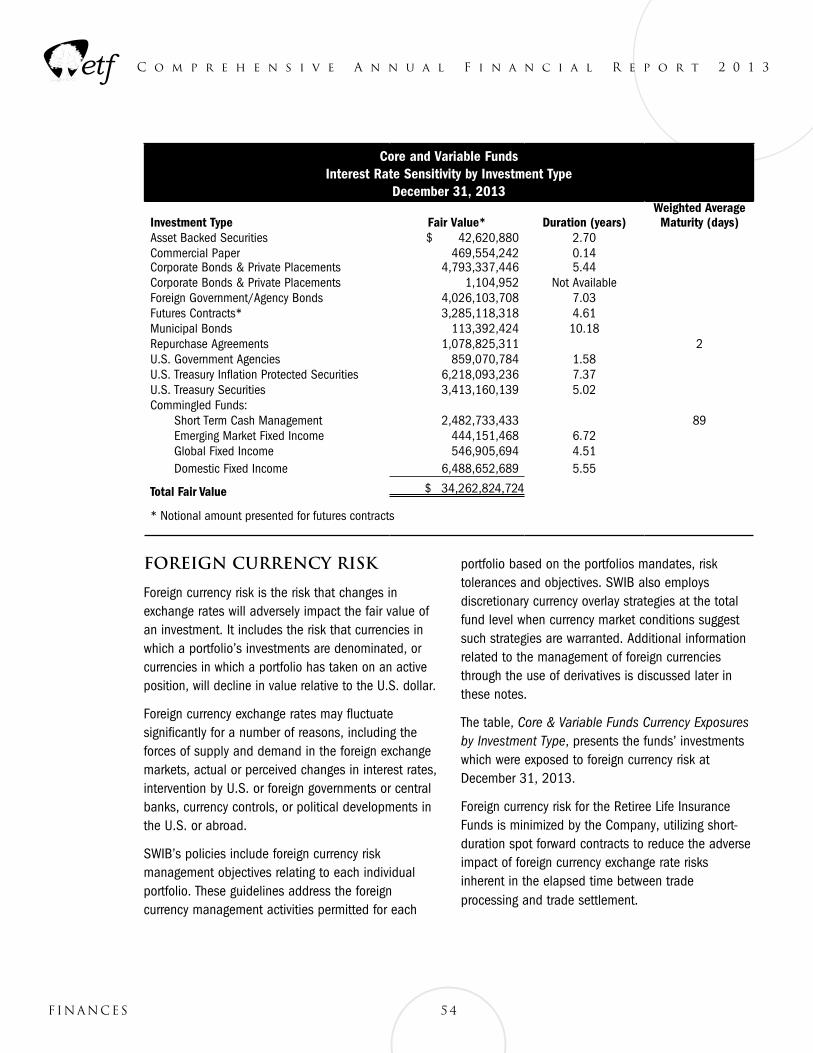
54Finances
C o m p r e h e n s i v e A n n u a l F i n a n c i a l R e p o r t 2 0 1 3
Core and Variable Funds Interest Rate Sensitivity by Investment Type
December 31, 2013
Investment Type Fair Value* Duration (years)Weighted Average Maturity (days)
Asset Backed Securities $ 42,620,880 2.70Commercial Paper 469,554,242 0.14Corporate Bonds & Private Placements 4,793,337,446 5.44Corporate Bonds & Private Placements 1,104,952 Not AvailableForeign Government/Agency Bonds 4,026,103,708 7.03Futures Contracts* 3,285,118,318 4.61Municipal Bonds 113,392,424 10.18Repurchase Agreements 1,078,825,311 2U.S. Government Agencies 859,070,784 1.58U.S. Treasury Inflation Protected Securities 6,218,093,236 7.37U.S. Treasury Securities 3,413,160,139 5.02Commingled Funds:
Short Term Cash Management 2,482,733,433 89Emerging Market Fixed Income 444,151,468 6.72Global Fixed Income 546,905,694 4.51Domestic Fixed Income 6,488,652,689 5.55
Total Fair Value $ 34,262,824,724
* Notional amount presented for futures contracts
Foreign Currency Risk
Foreign currency risk is the risk that changes in exchange rates will adversely impact the fair value of an investment. It includes the risk that currencies in which a portfolio’s investments are denominated, or currencies in which a portfolio has taken on an active position, will decline in value relative to the U.S. dollar.
Foreign currency exchange rates may fluctuate significantly for a number of reasons, including the forces of supply and demand in the foreign exchange markets, actual or perceived changes in interest rates, intervention by U.S. or foreign governments or central banks, currency controls, or political developments in the U.S. or abroad.
SWIB’s policies include foreign currency risk management objectives relating to each individual portfolio. These guidelines address the foreign currency management activities permitted for each
portfolio based on the portfolios mandates, risk tolerances and objectives. SWIB also employs discretionary currency overlay strategies at the total fund level when currency market conditions suggest such strategies are warranted. Additional information related to the management of foreign currencies through the use of derivatives is discussed later in these notes.
The table, Core & Variable Funds Currency Exposures by Investment Type, presents the funds’ investments which were exposed to foreign currency risk at December 31, 2013.
Foreign currency risk for the Retiree Life Insurance Funds is minimized by the Company, utilizing short-duration spot forward contracts to reduce the adverse impact of foreign currency exchange rate risks inherent in the elapsed time between trade processing and trade settlement.
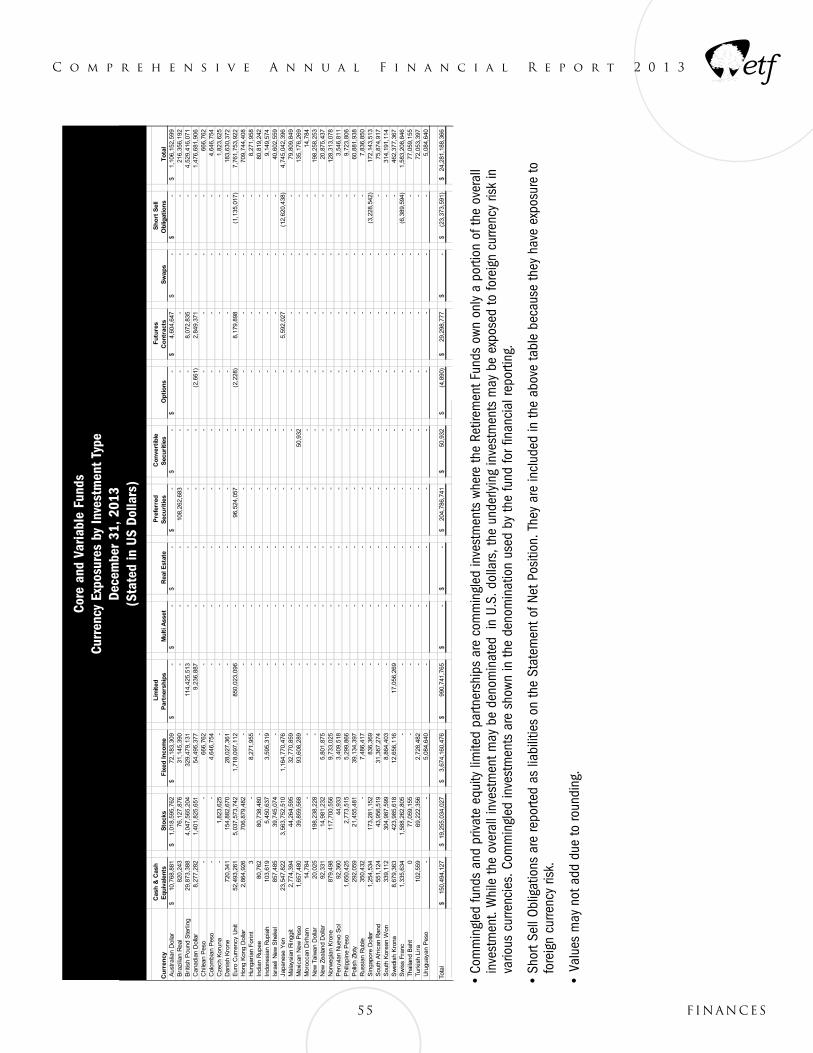
55 Finances
C o m p r e h e n s i v e A n n u a l F i n a n c i a l R e p o r t 2 0 1 3
Cu
rren
cy E
xpo
sure
s b
y In
vest
men
t T
ype
Dec
embe
r 31
, 20
13(S
tate
d in
U.S
. D
olla
rs)
Cu
rren
cy C
ash
& C
ash
E
qu
ival
ents
S
tock
s F
ixed
Inco
me
Lim
ited
P
artn
ersh
ips
Mu
lti A
sset
R
eal E
stat
e P
refe
rred
S
ecu
riti
es
Co
nve
rtib
le
Sec
uri
ties
O
pti
on
s F
utu
res
Co
ntr
acts
S
wap
s S
ho
rt S
ell
Ob
ligat
ion
s T
ota
l A
ustr
alia
n D
olla
r10
,768
,881
$
1,01
8,59
5,76
2$
72,1
83,3
09$
-$
-$
-
$
-$
-
$
-$
4,
604,
647
$
-
$
-$
1,
106,
152,
599
$
Bra
zilia
n R
eal
820,
243
76
,127
,876
31,1
45,3
90
-
-
-
10
8,26
2,68
3
-
-
-
-
-
216,
356,
192
B
ritis
h P
ound
Ste
rling
29,8
73,3
88
4,
047,
565,
204
329,
479,
131
11
4,42
5,51
3
-
-
-
-
-
8,
072,
835
-
-
4,
529,
416,
071
Can
adia
n D
olla
r8,
277,
282
1,
401,
825,
651
54,4
95,3
77
9,
236,
887
-
-
-
-
(2,6
61)
2,84
9,37
1
-
-
1,47
6,68
1,90
6
C
hile
an P
eso
-
-
66
6,76
2
-
-
-
-
-
-
-
-
-
66
6,76
2
Col
ombi
an P
eso
-
-
4,
646,
754
-
-
-
-
-
-
-
-
-
4,
646,
754
C
zech
Kor
una
-
1,
823,
625
-
-
-
-
-
-
-
-
-
-
1,
823,
625
D
anis
h K
rone
720,
341
15
4,88
2,67
0
28,0
27,3
61
-
-
-
-
-
-
-
-
-
18
3,63
0,37
2
Eur
o C
urre
ncy
Uni
t52
,493
,261
5,03
7,57
3,74
2
1,
718,
097,
112
850,
023,
096
-
-
96
,524
,057
-
(2
,228
)
8,
179,
898
-
(1,1
35,0
17)
7,
761,
753,
922
Hon
g K
ong
Dol
lar
2,86
4,92
6
706,
879,
482
-
-
-
-
-
-
-
-
-
-
70
9,74
4,40
8
Hun
gari
an F
orin
t3
-
8,27
1,95
5
-
-
-
-
-
-
-
-
-
8,27
1,95
8
Indi
an R
upee
80,7
62
80
,738
,480
-
-
-
-
-
-
-
-
-
-
80,8
19,2
42
In
done
sian
Rup
iah
103,
619
5,
450,
637
3,
595,
319
-
-
-
-
-
-
-
-
-
9,
149,
574
Is
rael
i New
She
kel
857,
485
39
,745
,074
-
-
-
-
-
-
-
-
-
-
40,6
02,5
59
Ja
pane
se Y
en23
,547
,822
3,56
3,75
2,51
0
1,
164,
770,
476
-
-
-
-
-
-
5,
592,
027
-
(12,
620,
438)
4,74
5,04
2,39
6
M
alay
sian
Rin
ggit
2,77
4,39
4
44,2
64,5
95
32
,770
,859
-
-
-
-
-
-
-
-
-
79,8
09,8
49
M
exic
an N
ew P
eso
1,65
7,48
0
39,8
59,5
68
93
,608
,289
-
-
-
-
50
,932
-
-
-
-
135,
176,
269
M
oroc
can
Dir
ham
14,7
84
-
-
-
-
-
-
-
-
-
-
-
14
,784
N
ew T
aiw
an D
olla
r20
,025
198,
238,
228
-
-
-
-
-
-
-
-
-
-
19
8,25
8,25
3
New
Zea
land
Dol
lar
92,3
31
14
,981
,232
5,80
1,87
5
-
-
-
-
-
-
-
-
-
20,8
75,4
37
N
orw
egia
n K
rone
879,
498
11
7,70
0,55
6
9,73
3,02
5
-
-
-
-
-
-
-
-
-
128,
313,
078
P
eruv
ian
Nue
vo S
ol92
,360
44,9
33
3,40
9,51
8
-
-
-
-
-
-
-
-
-
3,54
6,81
1
Phi
lippi
ne P
eso
1,65
0,42
5
2,77
3,51
5
5,29
9,86
6
-
-
-
-
-
-
-
-
-
9,72
3,80
6
Pol
ish
Zlot
y29
2,05
9
21,4
55,4
81
39
,134
,397
-
-
-
-
-
-
-
-
-
60,8
81,9
38
R
ussi
an R
uble
350,
432
-
7,
486,
417
-
-
-
-
-
-
-
-
-
7,
836,
850
S
inga
pore
Dol
lar
1,25
4,53
4
173,
281,
152
83
6,36
9
-
-
-
-
-
-
-
-
(3,2
28,5
42)
17
2,14
3,51
3
Sou
th A
fric
an R
and
551,
124
43
,956
,519
31,3
67,2
74
-
-
-
-
-
-
-
-
-
75
,874
,917
Sou
th K
orea
n W
on33
9,11
2
304,
987,
599
8,
864,
403
-
-
-
-
-
-
-
-
-
31
4,19
1,11
4
Sw
edis
h K
rona
8,67
9,36
3
423,
985,
618
12
,656
,116
17,0
56,2
69
-
-
-
-
-
-
-
-
46
2,37
7,36
7
Sw
iss
Fra
nc1,
335,
634
1,
588,
262,
805
-
-
-
-
-
-
-
-
-
(6
,389
,594
)
1,58
3,20
8,84
6
Th
aila
nd B
aht
0
77
,059
,155
-
-
-
-
-
-
-
-
-
-
77,0
59,1
55
Tu
rkis
h Li
ra10
2,55
9
69,2
22,3
56
2,
728,
482
-
-
-
-
-
-
-
-
-
72
,053
,397
Uru
guay
an P
eso
-
-
5,
084,
640
-
-
-
-
-
-
-
-
-
5,
084,
640
Tota
l15
0,49
4,12
7$
19,2
55,0
34,0
27$
3,
674,
160,
476
$
99
0,74
1,76
5$
-
$
-$
20
4,78
6,74
1$
50,9
32$
(4,8
90)
$
29,2
98,7
77$
-
$
(23,
373,
591)
$
24
,281
,188
,366
$
• C
omm
ingl
ed fu
nds
and
priv
ate
equi
ty li
mite
d pa
rtner
ship
s ar
e co
mm
ingl
ed in
vest
men
ts w
here
the
Retir
emen
t Fun
ds o
wn o
nly
a po
rtion
of t
he o
vera
ll
in
vest
men
t. W
hile
the
over
all i
nves
tmen
t may
be
deno
min
ated
in
U.S.
dol
lars
, the
und
erly
ing
inve
stm
ents
may
be
expo
sed
to fo
reig
n cu
rrenc
y ris
k in
vario
us c
urre
ncie
s. C
omm
ingl
ed in
vest
men
ts a
re s
hown
in th
e de
nom
inat
ion
used
by
the
fund
for f
inan
cial
repo
rting
.
• S
hort
Sell
Oblig
atio
ns a
re re
porte
d as
liab
ilitie
s on
the
Stat
emen
t of N
et P
ositi
on. T
hey
are
incl
uded
in th
e ab
ove
tabl
e be
caus
e th
ey h
ave
expo
sure
to
fo
reig
n cu
rrenc
y ris
k.
• V
alue
s m
ay n
ot a
dd d
ue to
roun
ding
.
Core
and
Var
iabl
e Fu
nds
Curr
ency
Exp
osur
es b
y In
vest
men
t Ty
pe
Dece
mbe
r 31
, 201
3
(Sta
ted
in U
S Do
llars
)
Securities Lending Transactions
State statutes and SWIB policies permit SWIB to use investments of the Core and Variable Funds to enter into securities lending transactions. These transactions involve the lending of securities to broker-dealers and other entities in exchange for collateral, in the form of cash or securities, with the simultaneous agreement to return the collateral for identical securities in the future. SWIB’s custodian is an agent in lending the Core and Variable Funds’ directly held domestic and international securities. When the Core and Variable Funds’ securities are delivered to a borrower as part of a securities lending agreement, the borrower is required to place collateral equal to at least 102 percent of the loaned securities’ fair value, including interest accrued, as of the delivery date with the lending agent, so long as the securities and the collateral are denominated in the same currency. In the event that securities are loaned against collateral denominated in a different currency, the borrower is required to place collateral totaling at least 105 percent of the loaned securities’ fair value, including interest accrued, as of the delivery date with the lending agent. Collateral is marked to market daily and adjusted as needed to maintain the required minimum level. Pledging or selling non-cash collateral securities cannot be done without a borrower default.
Cash collateral is reinvested by the lending agent in two separate pools: a U.S. dollar cash collateral pool and a pool denominated in Euros. These pools are administered in accordance with contractual investment guidelines which are designed to minimize the risk of principal loss and provide a modest rate of return. Investment guidelines limit credit and liquidity risk by restricting new investments to overnight repurchase agreements collateralized with high quality U.S. government and sovereign debt securities. To further reduce credit risk, SWIB’s custodian provides indemnification to SWIB against borrower default. The earnings generated from the collateral investments, plus or minus the rebates received from or paid to the dealers and less fees paid to agents, results in the net earnings from lending activities, which are then
split on a percentage basis with the lending agent. Cash from the U.S. dollar pool may be posted as collateral relating to short sale transactions and earns a comparable overnight repurchase agreement market rate of return for the duration of the posting. Additional information relating to short sales is discussed later in the notes.
At calendar year-end, the Core and Variable Funds had minimal credit risk exposure to borrowers because the amounts owed to the borrowers exceeded the amounts the borrowers owed the Core and Variable Funds. In addition to the cash collateral reinvestment indemnification, the contract with the lending agent requires it to indemnify the Core and Variable Funds if the borrowers fail to return the loaned securities and the collateral is inadequate to replace the securities lent. The Core and Variable Funds are also indemnified against losses resulting from violations of investment guidelines.
The majority of security loans are open-ended and can be terminated on demand by the Core and Variable Funds or the borrower. Maturities of investments made with cash collateral are not necessarily matched to the maturities of the securities loaned because most loans do not have a fixed maturity date. The risk that SWIB would be unable to return collateral to securities borrowers upon termination of the loan is low because the majority of investments made with cash collateral mature in one to two business days. At December 31, 2013, the average maturities of the loans and the assets of the collateral reinvestment pools did not materially differ.
Securities lending is allowed in certain commingled fund investments. As a shareholder of such funds, SWIB does not own the underlying securities and does not separately report on securities lending activity. All earnings of these funds are reported in the Statement of Changes in Fiduciary Net Position as Net Appreciation (Depreciation) in Fair Value of Investments.
56Finances
C o m p r e h e n s i v e A n n u a l F i n a n c i a l R e p o r t 2 0 1 3
Derivatives
A derivative instrument, as defined by GASB Statement No. 53, is a financial instrument or other contract that has all of the following characteristics:
• Settlement factors. It has (1) one or more refer-ence rates and (2) one or more notional amounts or payment provisions or both. Those terms determine the amount of the settlement or settlements and, in some cases, whether or not a settlement is required.
• Leverage. It requires no initial net investment or an initial net investment that is smaller than would be required for other types of contracts that would be expected to have a similar response to changes in market factors.
• Net settlement. Its terms require or permit net set-tlement, it can readily be settled net by a means out-side the contract, or it provides for delivery of an asset that puts the recipient in a position not sub-stantially different from net settlement.
Derivatives may be used to implement investment strategies for the Core and Variable Funds. All derivative instruments are subjected to risk analysis and monitoring processes at the portfolio, asset class, and fund levels. Investment guidelines define allowable derivative activity for each portfolio and are based on the investment objectives that have been approved by SWIB. Where derivatives are permitted, guidelines stipulate allowable instruments and the manner and degree to which they are to be used.
A derivative can take the form of a contract negotiated between the Core and Variable Funds and a specific counterparty. This is referred to as an over-
the-counter (OTC) contract, such as a forward contract. Alternatively, standardized derivative instruments, such as futures contracts, may be traded on an organized exchange and are referred to as “exchange-traded.”
Inherent in the use of OTC derivatives, the Core and Variable Funds may be exposed to counterparty credit risk on OTC positions. Counterparty credit risk is the risk that a derivative counterparty may fail to meet its payment obligations under the terms of the derivative contract. SWIB seeks to mitigate this risk through counterparty credit evaluations and approvals, counterparty credit limits, and exposure monitoring procedures. Additionally, policies have been established which seek to implement master netting arrangements with counterparties that permit the closeout and netting of transactions with the same counterparty upon the occurrence of certain events, such as payment default, rating downgrade, bankruptcy, illegality or force majeure. Agreements may also require daily collateral postings to further mitigate credit risk. At December 31, 2013, SWIB posted $15.1 million in cash collateral to OTC counterparties. No securities were pledged relating to OTC positions.
At December 31, 2013, the Core and Variable Funds OTC positions included foreign currency contracts, OTC options and a total return swap. The table titled Core & Variable OTC Derivative Investments Subject to Counterparty Credit Risk, summarizes, by credit rating, the Core and Variable Funds’ exposure to OTC derivative instruments’ counterparty credit risk as of December 31, 2013, without respect to any collateral or netting arrangement.
57 Finances
C o m p r e h e n s i v e A n n u a l F i n a n c i a l R e p o r t 2 0 1 3
Core & Variable FundsOTC Derivative Investments Subject to Counterparty Credit Risk
December 31, 2013
Counterparty Credit Rating Payable Receivable Fair Value
AA $ (705,692,035) $ 703,771,352 $ (1,920,683)
A (2,164,537,705) 2,154,184,791 (10,352,914)
BBB (1,437,866,329) 1,438,300,877 434,548
Total $ (4,308,096,069) $ 4,296,257,020 $ (11,839,049)
The aggregate fair value of receivables relating to OTC derivative contracts at December 31, 2013 was $4.3 billion. This represents the maximum loss that would be recognized at the reporting date if all 15 counterparties failed to perform as contracted. This maximum exposure is reduced to $245.7 million when counterparty collateral and master netting arrangements are taken into account.
Conversely, counterparty credit risk is mitigated by an intermediary for exchange-traded derivatives. For this type of derivative investment, the clearinghouse interposes itself as counterparty to all trades and extends a guarantee that trades will be settled as originally intended. To ensure performance, the exchange establishes, and the clearinghouse monitors, margin requirements to cover nearly all expected price changes for a given product within a specified time period based on market risk. Margin payments are settled daily based upon the price movements of the contracts, thereby significantly reducing counterparty credit risk. At December 31, 2013, the Core and Variable Funds posted $84.7 million in cash and $62.6 million in securities as collateral with exchange clearing brokers.
Gains and losses for all derivative instruments are reported in the Statement of Changes in Fiduciary Net Position as Net Appreciation (Depreciation) in the Fair Value of Investments.
SWIB invests in derivative investments directly, as well as indirectly through commingled or pooled investments. Information relating to investments held in commingled funds has not been separately disclosed in the financial statements or the accompanying footnotes.
Foreign Currency Spot and Forward Contracts
Foreign Currency Spot and Forward contracts are OTC agreements between two counterparties to exchange designated currencies at a specific time in the future. No cash is exchanged when a foreign exchange spot or forward contract is initiated. Amounts due are paid or received on the contracted settle date.
Currency exposure management is permitted through the use of currency derivative instruments. Direct hedging of currency exposure back to the U.S. dollar is permitted when consistent with the strategy of the portfolio. Cross-currency exposure management to transfer out of an exposed currency and into a benchmark currency is permitted. In some portfolios, currencies of non-benchmark countries may be held through the use of forward contracts, provided that the notional value of any single non-benchmark currency does not exceed 5% of the market value of the portfolio. SWIB may employ discretionary currency overlay strategies at the total fund and asset class level when currency market conditions suggest such strategies are warranted.
Losses may arise from future changes in the value of the underlying currency, or if the counterparties do not perform under the terms of the contract. Spot and forward contracts are valued daily with the changes in fair value included in Net Appreciation (Depreciation) in Fair Value of Investments on the Statement of Changes in Fiduciary Net Position. The net receivable or payable for spot and forward contracts is reflected as Foreign Currency Contracts on the Statement of Fiduciary Net Position. The table titled Core and Variable Foreign Currency Spot and Forward Contracts presents the fair value of foreign currency spot and forward contract assets and liabilities held by the Core and Variable Funds as of December 31, 2013.
58Finances
C o m p r e h e n s i v e A n n u a l F i n a n c i a l R e p o r t 2 0 1 3
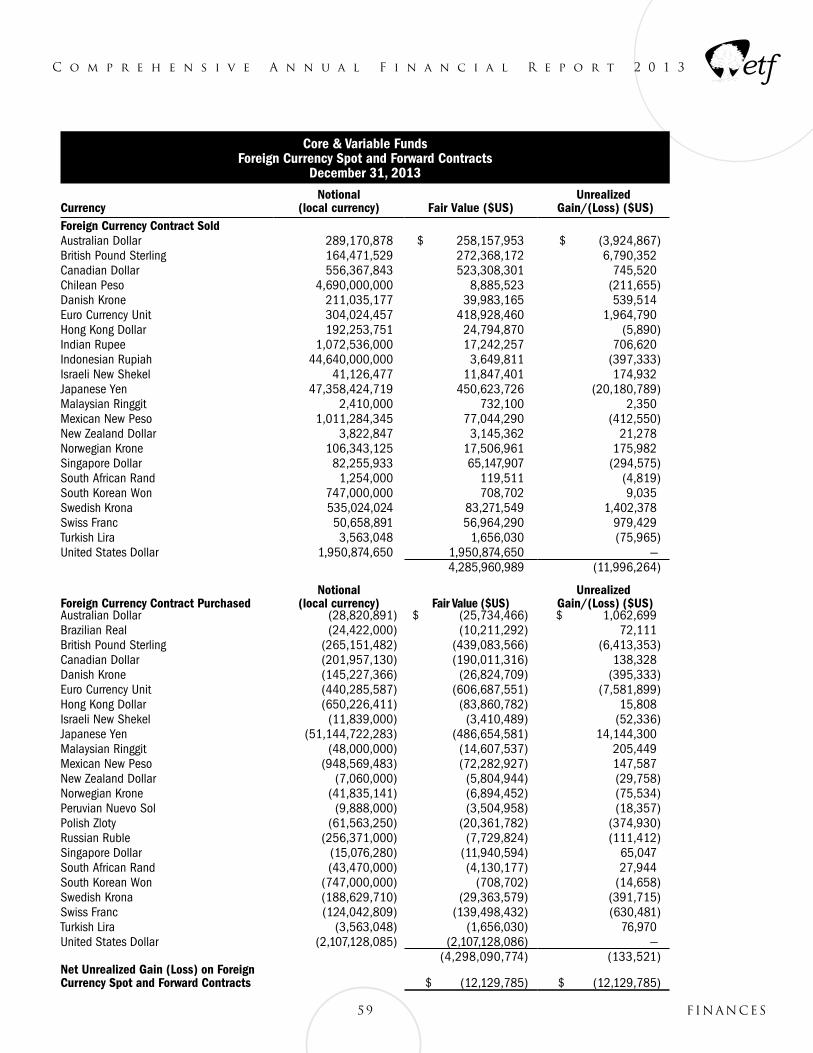
59 Finances
C o m p r e h e n s i v e A n n u a l F i n a n c i a l R e p o r t 2 0 1 3
Core & Variable FundsForeign Currency Spot and Forward Contracts
December 31, 2013
CurrencyNotional
(local currency) Fair Value ($US) Unrealized
Gain/(Loss) ($US) Foreign Currency Contract Sold Australian Dollar 289,170,878 $ 258,157,953 $ (3,924,867)British Pound Sterling 164,471,529 272,368,172 6,790,352 Canadian Dollar 556,367,843 523,308,301 745,520Chilean Peso 4,690,000,000 8,885,523 (211,655) Danish Krone 211,035,177 39,983,165 539,514 Euro Currency Unit 304,024,457 418,928,460 1,964,790 Hong Kong Dollar 192,253,751 24,794,870 (5,890)Indian Rupee 1,072,536,000 17,242,257 706,620Indonesian Rupiah 44,640,000,000 3,649,811 (397,333)Israeli New Shekel 41,126,477 11,847,401 174,932 Japanese Yen 47,358,424,719 450,623,726 (20,180,789)Malaysian Ringgit 2,410,000 732,100 2,350Mexican New Peso 1,011,284,345 77,044,290 (412,550)New Zealand Dollar 3,822,847 3,145,362 21,278 Norwegian Krone 106,343,125 17,506,961 175,982 Singapore Dollar 82,255,933 65,147,907 (294,575) South African Rand 1,254,000 119,511 (4,819)South Korean Won 747,000,000 708,702 9,035Swedish Krona 535,024,024 83,271,549 1,402,378 Swiss Franc 50,658,891 56,964,290 979,429 Turkish Lira 3,563,048 1,656,030 (75,965) United States Dollar 1,950,874,650 1,950,874,650 —
4,285,960,989 (11,996,264)
Foreign Currency Contract PurchasedNotional
(local currency) Fair Value ($US) Unrealized
Gain/(Loss) ($US) Australian Dollar (28,820,891) $ (25,734,466) $ 1,062,699Brazilian Real (24,422,000) (10,211,292) 72,111British Pound Sterling (265,151,482) (439,083,566) (6,413,353)Canadian Dollar (201,957,130) (190,011,316) 138,328 Danish Krone (145,227,366) (26,824,709) (395,333)Euro Currency Unit (440,285,587) (606,687,551) (7,581,899)Hong Kong Dollar (650,226,411) (83,860,782) 15,808 Israeli New Shekel (11,839,000) (3,410,489) (52,336)Japanese Yen (51,144,722,283) (486,654,581) 14,144,300 Malaysian Ringgit (48,000,000) (14,607,537) 205,449Mexican New Peso (948,569,483) (72,282,927) 147,587 New Zealand Dollar (7,060,000) (5,804,944) (29,758) Norwegian Krone (41,835,141) (6,894,452) (75,534)Peruvian Nuevo Sol (9,888,000) (3,504,958) (18,357)Polish Zloty (61,563,250) (20,361,782) (374,930)Russian Ruble (256,371,000) (7,729,824) (111,412)Singapore Dollar (15,076,280) (11,940,594) 65,047 South African Rand (43,470,000) (4,130,177) 27,944South Korean Won (747,000,000) (708,702) (14,658)Swedish Krona (188,629,710) (29,363,579) (391,715)Swiss Franc (124,042,809) (139,498,432) (630,481)Turkish Lira (3,563,048) (1,656,030) 76,970United States Dollar (2,107,128,085) (2,107,128,086) —
(4,298,090,774) (133,521)Net Unrealized Gain (Loss) on Foreign Currency Spot and Forward Contracts $ (12,129,785) $ (12,129,785)
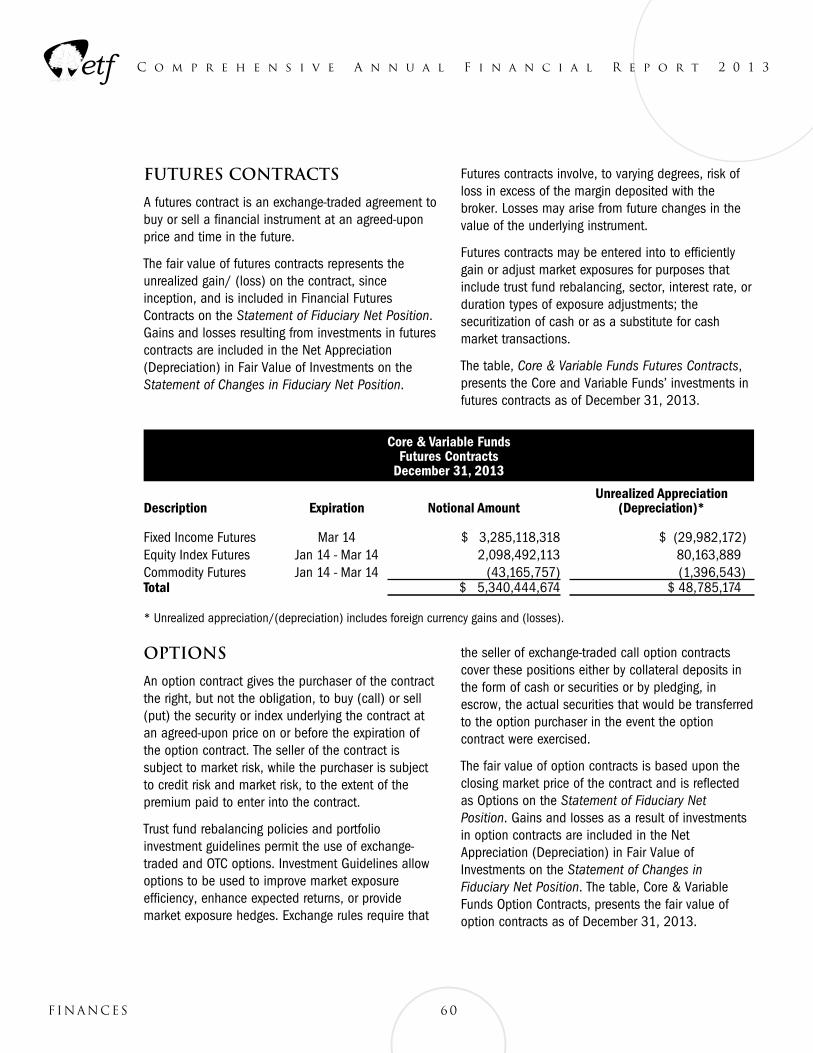
Futures Contracts
A futures contract is an exchange-traded agreement to buy or sell a financial instrument at an agreed-upon price and time in the future.
The fair value of futures contracts represents the unrealized gain/ (loss) on the contract, since inception, and is included in Financial Futures Contracts on the Statement of Fiduciary Net Position. Gains and losses resulting from investments in futures contracts are included in the Net Appreciation (Depreciation) in Fair Value of Investments on the Statement of Changes in Fiduciary Net Position.
Futures contracts involve, to varying degrees, risk of loss in excess of the margin deposited with the broker. Losses may arise from future changes in the value of the underlying instrument.
Futures contracts may be entered into to efficiently gain or adjust market exposures for purposes that include trust fund rebalancing, sector, interest rate, or duration types of exposure adjustments; the securitization of cash or as a substitute for cash market transactions.
The table, Core & Variable Funds Futures Contracts, presents the Core and Variable Funds’ investments in futures contracts as of December 31, 2013.
Options
An option contract gives the purchaser of the contract the right, but not the obligation, to buy (call) or sell (put) the security or index underlying the contract at an agreed-upon price on or before the expiration of the option contract. The seller of the contract is subject to market risk, while the purchaser is subject to credit risk and market risk, to the extent of the premium paid to enter into the contract.
Trust fund rebalancing policies and portfolio investment guidelines permit the use of exchange-traded and OTC options. Investment Guidelines allow options to be used to improve market exposure efficiency, enhance expected returns, or provide market exposure hedges. Exchange rules require that
the seller of exchange-traded call option contracts cover these positions either by collateral deposits in the form of cash or securities or by pledging, in escrow, the actual securities that would be transferred to the option purchaser in the event the option contract were exercised.
The fair value of option contracts is based upon the closing market price of the contract and is reflected as Options on the Statement of Fiduciary Net Position. Gains and losses as a result of investments in option contracts are included in the Net Appreciation (Depreciation) in Fair Value of Investments on the Statement of Changes in Fiduciary Net Position. The table, Core & Variable Funds Option Contracts, presents the fair value of option contracts as of December 31, 2013.
60Finances
C o m p r e h e n s i v e A n n u a l F i n a n c i a l R e p o r t 2 0 1 3
Core & Variable Funds Futures Contracts
December 31, 2013
Description Expiration Notional Amount Unrealized Appreciation
(Depreciation)*
Fixed Income Futures Mar 14 $ 3,285,118,318 $ (29,982,172)Equity Index Futures Jan 14 - Mar 14 2,098,492,113 80,163,889Commodity Futures Jan 14 - Mar 14 (43,165,757) (1,396,543)Total $ 5,340,444,674 $ 48,785,174
* Unrealized appreciation/(depreciation) includes foreign currency gains and (losses).
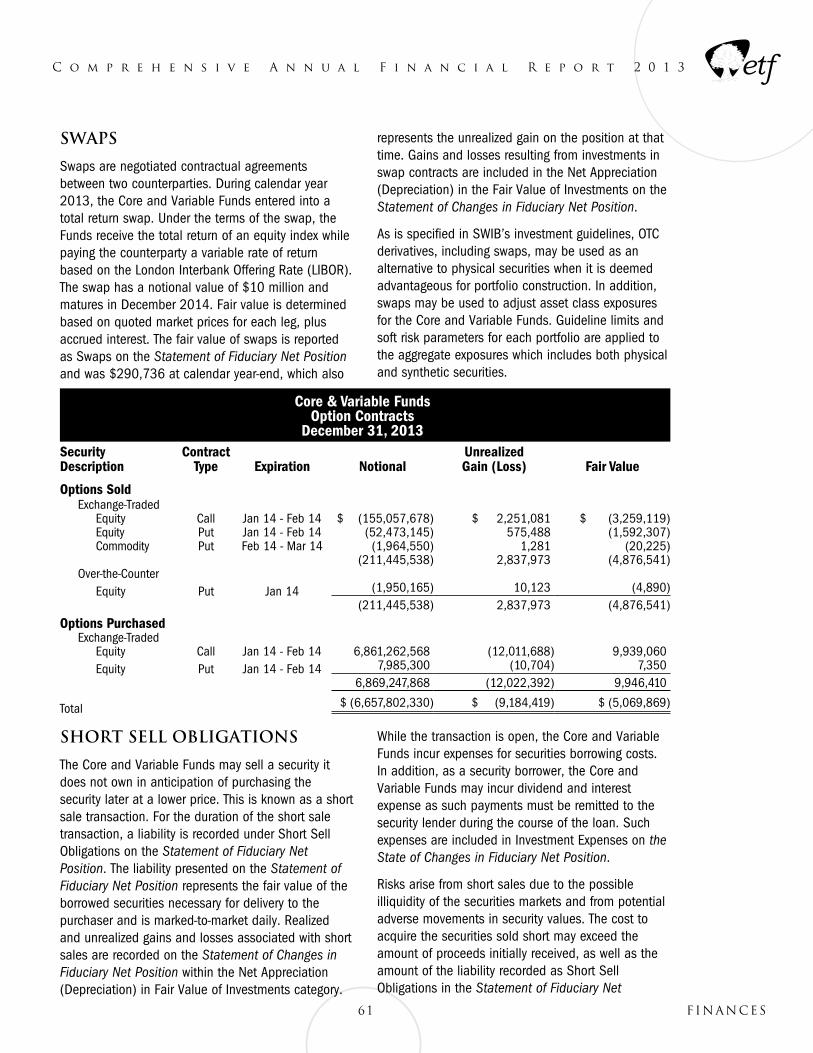
Swaps
Swaps are negotiated contractual agreements between two counterparties. During calendar year 2013, the Core and Variable Funds entered into a total return swap. Under the terms of the swap, the Funds receive the total return of an equity index while paying the counterparty a variable rate of return based on the London Interbank Offering Rate (LIBOR). The swap has a notional value of $10 million and matures in December 2014. Fair value is determined based on quoted market prices for each leg, plus accrued interest. The fair value of swaps is reported as Swaps on the Statement of Fiduciary Net Position and was $290,736 at calendar year-end, which also
represents the unrealized gain on the position at that time. Gains and losses resulting from investments in swap contracts are included in the Net Appreciation (Depreciation) in the Fair Value of Investments on the Statement of Changes in Fiduciary Net Position.
As is specified in SWIB’s investment guidelines, OTC derivatives, including swaps, may be used as an alternative to physical securities when it is deemed advantageous for portfolio construction. In addition, swaps may be used to adjust asset class exposures for the Core and Variable Funds. Guideline limits and soft risk parameters for each portfolio are applied to the aggregate exposures which includes both physical and synthetic securities.
61 Finances
C o m p r e h e n s i v e A n n u a l F i n a n c i a l R e p o r t 2 0 1 3
Core & Variable Funds Option Contracts
December 31, 2013Security Description
Contract Type Expiration Notional
Unrealized Gain (Loss) Fair Value
Options SoldExchange-Traded
Equity Call Jan 14 - Feb 14 $ (155,057,678) $ 2,251,081 $ (3,259,119)Equity Put Jan 14 - Feb 14 (52,473,145) 575,488 (1,592,307)Commodity Put Feb 14 - Mar 14 (1,964,550) 1,281 (20,225)
(211,445,538) 2,837,973 (4,876,541)Over-the-Counter
Equity Put Jan 14 (1,950,165) 10,123 (4,890)(211,445,538) 2,837,973 (4,876,541)
Options PurchasedExchange-Traded
Equity Call Jan 14 - Feb 14 6,861,262,568 (12,011,688) 9,939,060Equity Put Jan 14 - Feb 14 7,985,300 (10,704) 7,350
6,869,247,868 (12,022,392) 9,946,410
Total $ (6,657,802,330) $ (9,184,419) $ (5,069,869)
Short Sell Obligations
The Core and Variable Funds may sell a security it does not own in anticipation of purchasing the security later at a lower price. This is known as a short sale transaction. For the duration of the short sale transaction, a liability is recorded under Short Sell Obligations on the Statement of Fiduciary Net Position. The liability presented on the Statement of Fiduciary Net Position represents the fair value of the borrowed securities necessary for delivery to the purchaser and is marked-to-market daily. Realized and unrealized gains and losses associated with short sales are recorded on the Statement of Changes in Fiduciary Net Position within the Net Appreciation (Depreciation) in Fair Value of Investments category.
While the transaction is open, the Core and Variable Funds incur expenses for securities borrowing costs. In addition, as a security borrower, the Core and Variable Funds may incur dividend and interest expense as such payments must be remitted to the security lender during the course of the loan. Such expenses are included in Investment Expenses on the State of Changes in Fiduciary Net Position.
Risks arise from short sales due to the possible illiquidity of the securities markets and from potential adverse movements in security values. The cost to acquire the securities sold short may exceed the amount of proceeds initially received, as well as the amount of the liability recorded as Short Sell Obligations in the Statement of Fiduciary Net
Position. Short sales expose the short seller to potentially unlimited liability because there is no upward limit on the price a shorted security could attain. Portfolio guidelines limit the total value of short sales in any portfolio to 20% of a portfolio’s value. Portfolios which engage in short sales have long only benchmarks established by SWIB. Investment performance and risk associated with each portfolio is measured against benchmarks and monitored by management.
When a short sale occurs, the shorting portfolio must borrow the security and deliver it to the buyer. If the shorted security is owned by another Retirement Fund portfolio, investment policies allow the borrowing of securities from other Retirement Fund portfolios.
Except in the case of borrowings within the same trust fund, the Core and Variable Funds are required to post collateral to the lender, at the required rate of 102% for in-currency loans and 105% for cross-currency loans. At December 31, 2013, the Core and Variable Funds posted $198.1 million in collateral to security lenders. This represented $4.6 million in excess of the fair market value of the securities borrowed. If the security lender recalled the security and SWIB was not able to supply the lender with the security, the lender would be permitted to use SWIB’s collateral to fund the purchase of the security.
Multi Asset
SWIB employs portfolio strategies which involve investment across multiple asset classes. The Multi Asset Investments category on the Statement of Fiduciary Net Position consists of risk parity and hedge funds multi asset strategies. Risk parity and hedge fund investments are either in the form of a commingled fund, with ownership through fund shares, or a limited partnership.
The risk parity portfolios seek to equally weight asset allocation risk across multiple assets and geographies. Exposures are expected to deliver improved risk and return tradeoffs, versus conventional portfolios comprised of stocks and bonds. The risk parity portfolios also intend to provide more diversified exposure over various economic environments.
The Core and Variable Funds invest in a diversified set of hedge fund strategies, invested across multiple asset classes. In general, a hedge fund is a private investment fund that seeks to produce absolute returns using a broad range of strategies with low to moderate levels of volatility, typically employing both long and short positions. An allocation to a diversified hedge fund portfolio is intended to have low correlation to traditional publicly traded equities and contribute to overall portfolio diversification.
Hedge funds can be illiquid, either by virtue of the illiquidity of underlying assets, or due to lock-up terms in the partnership agreement. However, SWIB has taken steps to minimize this risk by investing in hedge funds with more liquid asset classes and by structuring its investments to stagger lock-up periods. Hedge funds also use leverage to varying degrees, and while it is possible that a hedge fund can lose a significant portion of its capital, SWIB has limited the amount it invests in hedge funds in total and with any individual hedge fund manager.
At calendar year-end, the majority of SWIB’s risk parity and hedge fund investments are reflected within the Multi Asset Investments category on the Statement of Fiduciary Net Position. Hedge fund portfolios with a long only equity strategy are included within the Stocks classification on the Statement of Fiduciary Net Position.
Long-Term Receivables
Included in the Core Fund’s December 31, 2013 Investment Sales Receivable balance on the Statement of Fiduciary Net Position is $176.6 million in receivables which are due on or before January 2017. These receivables represent the final payments from the sale of private equity limited partnership interests.
Asset Allocation
The WRS asset allocation policy is recommended by the Investment Committee and adopted by SWIB. SWIB undertakes a review of its strategic asset allocation plan every other year, including asset/liability modeling, to determine a suitable target
62Finances
C o m p r e h e n s i v e A n n u a l F i n a n c i a l R e p o r t 2 0 1 3
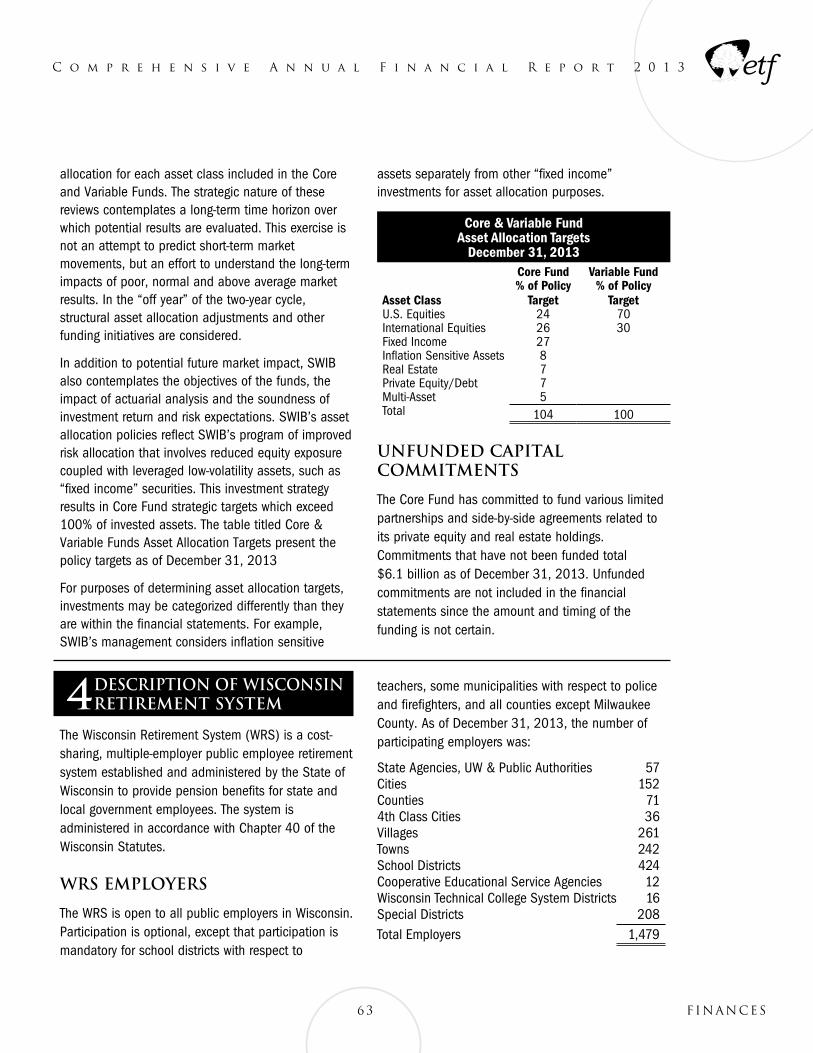
allocation for each asset class included in the Core and Variable Funds. The strategic nature of these reviews contemplates a long-term time horizon over which potential results are evaluated. This exercise is not an attempt to predict short-term market movements, but an effort to understand the long-term impacts of poor, normal and above average market results. In the “off year” of the two-year cycle, structural asset allocation adjustments and other funding initiatives are considered.
In addition to potential future market impact, SWIB also contemplates the objectives of the funds, the impact of actuarial analysis and the soundness of investment return and risk expectations. SWIB’s asset allocation policies reflect SWIB’s program of improved risk allocation that involves reduced equity exposure coupled with leveraged low-volatility assets, such as “fixed income” securities. This investment strategy results in Core Fund strategic targets which exceed 100% of invested assets. The table titled Core & Variable Funds Asset Allocation Targets present the policy targets as of December 31, 2013
For purposes of determining asset allocation targets, investments may be categorized differently than they are within the financial statements. For example, SWIB’s management considers inflation sensitive
assets separately from other “fixed income” investments for asset allocation purposes.
Core & Variable FundAsset Allocation Targets
December 31, 2013Core Fund Variable Fund
Asset Class% of Policy
Target% of Policy
TargetU.S. Equities 24 70International Equities 26 30Fixed Income 27Inflation Sensitive Assets 8Real Estate 7Private Equity/Debt 7Multi-Asset 5Total 104 100
Unfunded Capital Commitments
The Core Fund has committed to fund various limited partnerships and side-by-side agreements related to its private equity and real estate holdings. Commitments that have not been funded total $6.1 billion as of December 31, 2013. Unfunded commitments are not included in the financial statements since the amount and timing of the funding is not certain.
4DESCRIPTION OF WISCONSIN RETIREMENT SYSTEM
The Wisconsin Retirement System (WRS) is a cost-sharing, multiple-employer public employee retirement system established and administered by the State of Wisconsin to provide pension benefits for state and local government employees. The system is administered in accordance with Chapter 40 of the Wisconsin Statutes.
WRS Employers
The WRS is open to all public employers in Wisconsin. Participation is optional, except that participation is mandatory for school districts with respect to
teachers, some municipalities with respect to police and firefighters, and all counties except Milwaukee County. As of December 31, 2013, the number of participating employers was:
State Agencies, UW & Public Authorities 57Cities 152Counties 714th Class Cities 36Villages 261Towns 242School Districts 424Cooperative Educational Service Agencies 12Wisconsin Technical College System Districts 16Special Districts 208Total Employers 1,479
63 Finances
C o m p r e h e n s i v e A n n u a l F i n a n c i a l R e p o r t 2 0 1 3
WRS Membership
Prior to July 1, 2011, any employee of a participating employer who is expected to work at least 600 hours per year (440 hours per year for teachers and school district educational support employees) must be covered by the WRS. 2011 Wisconsin Act 32 increased the required expected work hours to at least 1,200 hours per year (880 hours per year for teachers and school district educational support employees). This change generally applied to any employee of a participating employer hired on or after July 1, 2011.
As of December 31, 2013, the WRS membership consisted of:
Current Employees:General 134,320Teachers 99,060Elected / Executive / Judges 1,409Protective with Social Security 19,254Protective without Social Security 2,745Total Current Employees 256,788
Inactive Participants:Terminated Participants 153,721Alternate Payees 4,040Total Inactive Participants 157,761
Retirees and Beneficiaries Currently Receiving Benefits:Retirement Annuities 172,430Disability Annuities 6,393Death Beneficiary Annuities 1,233Total Annuitants 180,056
Total Participants 594,605
WRS Benefits
The WRS provides retirement benefits as well as death and disability benefits. Vesting requirements have changed over time, as follows:
• Participants in the system prior to January 1, 1990, were fully vested at the time they met partici-pation requirements;
• For participants entering the system from January 1, 1990, to April 23, 1998, creditable service in each of five years was required for vesting;
• All active participants in the system at any time from April 24, 1998 to June 30, 2011 are fully vested;
• 2011 Wisconsin Act 32 generally required partici-pants hired on or after July 1, 2011 to have five years of creditable service to be vested.
Employees who retire at or after age 65 (54 for protective occupations and 62 for elected officials and executive service retirement plan participants) are entitled to a retirement benefit based on a formula factor, their final average earnings, and creditable service. Formula factors are shown in the table below.
Employment Category
Service Before
1/1/2000
Service Between
2000 & 2011
Service After 2011
General and Teachers
1.765% 1.6% 1.6%
Executive and Elected
2.165 2.0* 1.6*
Protective with Social Security
2.165 2.0 2.0
Protective without Social Security
2.665 2.5 2.5
*2011 Wisconsin Act 10 changed the Executive and Elected
formula factor from 2.0% to 1.6%. The effective date of the change
varies among different employee categories, and generally applies to
the services earned after Act 10 effective date (i.e., June 29, 2011).
Final average earnings is the average of the participant’s three highest annual earnings periods. Creditable service includes current service and prior service for which a participant received earnings and made contributions as required. Creditable service also includes creditable military service. The retirement benefit will be calculated as a money purchase benefit based on the employee’s contributions plus matching employer’s contributions, with interest, if that benefit is higher than the formula benefit.
Vested participants may retire at or after age 55 (50 for protective occupations) and receive an actuarially-reduced benefit. Participants terminating covered employment prior to eligibility for an annuity may either receive employee-required contributions plus interest as a separation benefit or leave contributions on deposit and defer application until eligible to receive a retirement benefit.
64Finances
C o m p r e h e n s i v e A n n u a l F i n a n c i a l R e p o r t 2 0 1 3
Post-Retirement Adjustments
The Employee Trust Funds Board may periodically adjust annuity payments from the retirement system based on annual investment performance in accordance with s. 40.27, Wis. Stat. An increase (or decrease) in annuity payments may result when investment gains (losses), together with other actuarial experience factors, create a surplus (shortfall) in the reserves, as determined by the system’s consulting actuary. Annuity increases are not based on cost of living or other similar factors. For Core annuities, decreases may be applied only to previously granted increases. By law, Core annuities cannot be reduced to an amount below the original, guaranteed amount (the “floor”) set at retirement.
The Core and Variable annuity adjustments granted during recent years are as follows:
Year Core Adjustment Variable Adjustment2004 1.4 252005 2.6 72006 0.8 32007 3.0 102008 6.6 02009 (2.1) (42)2010 (1.3) 222011 (1.2) 112012 (7.0) (7)2013 (9.6) 9
The negative Core annuity adjustments from 2009 to 2012 are primarily due to the Fund’s $21.0 billion investment decline in 2008, caused by the global economic crisis. Core Fund gains and losses are recognized over a five-year period. Therefore, 2013 is the fifth and final year that 2008 investment experience will result in a negative Core annuity adjustment.
Actuarial Liabilities
The WRS unfunded actuarial accrued liability (UAAL) is being amortized as a level percentage of payroll over a 40-year period beginning January 1, 1990, for employers in the WRS prior to 2009. The remaining balance is expected to be fully amortized by December 31, 2029. Liabilities for employers joining the WRS beginning in 2009 are amortized over 30 years. Interest is assessed on the outstanding liability
at year-end at the assumed earnings rate. The level-percentage-of-payroll amortization method results in a relatively lower dollar contribution in earlier years than in later years, when payrolls have increased. During the early years of the amortization period, payments made are less than annual interest assessments, resulting in an increase in the liability. As payrolls increase annually, prior service payments increase proportionally until they exceed annual interest and ultimately fully liquidate the liability at the end of the amortization period. State law requires the accrued retirement cost to be funded.
As of December 31, 2013, the UAAL was $53 million. The Prior Service Contributions Receivable presented on the Statement of Fiduciary Net Position includes the UAAL plus payments received in January 2014, which reduce the UAAL for actuarial purposes, but not for GAAP reporting.
Variable Retirement Option
Prior to 1980, WRS participants could opt to have one-half of their required contributions and matching employer contributions invested in the Variable Fund. Retirement benefits were adjusted for the difference between the investment experience of the Core Fund and the Variable Fund. Provisions for allowing members to withdraw from the Variable Fund were added with the passage of Chapter 221, Laws of 1979. The Variable Fund was closed to new membership after April 30, 1980. 1999 Wisconsin Act 11 reopened the Variable Fund for existing and future participants, effective January 1, 2001. As of December 31, 2013, there were 62,675 active and inactive members and 40,317 annuitants participating in the Variable Fund.
Municipal Police and Firefighters Pension Group
As of March 31, 1978, administration of certain local funds for police officers and firefighters was assumed by the Wisconsin Retirement Fund. This included approximately 2,000 members. As of December 31, 2013, approximately 141 annuitants or their beneficiaries remained in the system. This group was closed to new members after January 1, 1948.
65 Finances
C o m p r e h e n s i v e A n n u a l F i n a n c i a l R e p o r t 2 0 1 3
The liability for retirement benefits for these annuitants is funded by the employers, as benefit payments are made. Annuity reserves for these police and firefighter annuities are established by a transfer from the employer accumulation reserve at the time the annuity is approved. Earnings on these reserves are used to fund annuity adjustments on the same basis as for WRS annuitants. The unfunded liability for these annuitants as of December 31, 2013, was $4.3 million.
Annuity Supplement - General Fund
As authorized under 1985 Wis. Stats. § 40.27 (1), the General Fund provides certain supplemental annuity benefits to annuitants receiving a continuing annuity on or before September 1974. The benefit is subject to continuation of the appropriation by the Legislature. The Department serves as a clearing agent for its payment. Total supplemental annuity benefits paid were $0.3 million in 2013.
5CONTRIBUTIONS MADE AND REQUIRED
Required Contributions
Contribution rates are determined by the “entry age normal with a frozen initial liability” actuarial method. This is a “level contribution” actuarial method intended to keep employer and employee contribution rates at a level percentage of payroll over the years. This method determines the amount of contributions necessary to fund: 1) the current service cost, which represents the estimated amount necessary to pay for benefits earned by the employees during the current service year plus actuarial gains or losses arising from the difference between actual and assumed experience; and 2) the prior service cost, which represents the estimated amount necessary to pay for unfunded benefits earned prior to the employer becoming a participating employer in WRS and the past service cost of benefit improvements.
The 2013 contribution requirements were determined by the December 31, 2011, actuarial valuation.
Significant actuarial assumptions used in the 2011 valuation include:
• Net Investment rate of return: 5.5% • Weighted based on assumed rate for:
pre-retirement 7.2% post-retirement 5.0%
• Salary increases: inflation 3.2% seniority/merit 0.1% - 5.6%
• Post-retirement benefit adjustments: 2.1%*
* No post-retirement adjustment is guaranteed. Actual adjustments are based on recognized investment return, actuarial experience and other factors. 2.1% is the assumed annual adjustment based on the investment return assumption and the post-retirement discount rate.
The Department has changed how it discloses the discount rate to clarify how it has historically determined plan liabilities and contribution rates. Prior to retirement, liabilities are discounted using the investment return assumption, currently 7.2%. Post-retirement liabilities are discounted using the assumed benefit rate of 5.0%.
Employee contributions are deducted from the employee’s salary and remitted to the Department by the participating employer. Prior to June 29, 2011, part or all of the employee contributions could be paid by the employer on behalf of the employee. Effective June 29, 2011, 2011 Wisconsin Act 10 provided that employers generally may not pay the employee required contribution unless a collective bargaining agreement existed prior to the effective date. The Act also changed the contribution rates and the manner in which the contributions are allocated to the accounts of employees. Effective the first day of the first pay period on or after June 29, 2011, the employee required contribution was changed to one-half of the actuarially-determined contribution rate for General category employees, which includes teachers; and employees in the Executive Group and Elected Officials category. Required contributions for Protective Occupation category employees are the same rate as General category employees. Employers are required to contribute the remainder of the actuarially-determined contribution rate.
Prior to 2011 Wisconsin Act 10, General category employees also made an actuarially-determined benefit adjustment contribution (BAC). The BAC was
66Finances
C o m p r e h e n s i v e A n n u a l F i n a n c i a l R e p o r t 2 0 1 3
treated as an employer contribution for benefit purposes and, therefore, not included in separation benefits, death benefits, or money purchase annuities. Part or all of the BAC could be paid by the
employer on behalf of the employee. 2011 Wisconsin Act 10 eliminated the BAC, effective on the first pay period on or after June 29, 2011.
Contribution rates in effect during 2013 by employment category were:
EmployerCurrent
EmployerPrior* Employee Total
Elected Officials, State Executive Retirement Plan
7.0% 0.0% 7.0% 14.0%
Protective Occupation with Social Security 9.75 0.0 6.65 16.4Protective Occupation without Social Security 12.35 0.3 6.65 19.3General and Teachers 6.65 0.1 6.65 13.4
* The employer prior service contribution rate is a weighted average of individual employer rates.
Contributions required and made during 2013 were:
Contributions Required Contributions MadeContributions($ in millions)
Percentage of Payroll
Contributions ($ in millions)
Percentage of Payroll
Employer Current Service $905.1 7.02% $905.1 7.02%Employer Prior Service* 7.2 0.06 7.2 0.06Employee Required 858.7 6.66 858.7 6.66
* Employer Prior Service contributions are recorded on the Statement of Fiduciary Net Position as a reduction in the Prior Service Contribution Receivable. Contributions Made includes both mandatory and voluntary payments received from participating employers. Some Prior Service contributions received after year end are included in Contributions Made, but are not in the determination of Prior Service Contributions Receivable. This is due to a difference in how these payments are treated for actuarial and financial reporting purposes.
Employers also contributed $1.1 million in reimbursement for benefits paid under the s. 62.13, Wis. Stat, Police and Firefighters Pension Program.
Employee and Employer Additional Contributions
Contributions in addition to those required contributions by employees and/or employers may be made to the retirement system. These contributions are held in separate reserve accounts and are subject to certain restrictions as to amount, form of benefit payments, tax status, etc.
67 Finances
C o m p r e h e n s i v e A n n u a l F i n a n c i a l R e p o r t 2 0 1 3
6FUNDED STATUS AND FUNDING PROGRESS – WRS
The funded status of the plan as of December 31, 2013, is as follows ($ in millions):
(a)Actuarial Value of Assets
(b)Actuarial Accrued
Liability (AAL)Frozen Entry Age
(c)Unfunded Actuarial Accrued
Liability (UAAL)(b) – (a)
(d)Funded Ratio
(a) / (b)(e)
Covered Payroll
(f)UAAL as
Percentage of Covered Payroll
(c) / (e)
$85,276.1 $85,328.7 $52.6 99.9% $12,884.8 0.4%
The Schedules of Funding Progress, presented as required supplementary information following the Notes to the Financial Statements, present multiyear trend information about whether the actuarial values of plan assets are increasing or decreasing over time, relative to the actuarial accrued liabilities for benefits.
Additional information as of the latest actuarial valuations follows:
Valuation Date: December 31, 2013Actuarial Cost Method: Frozen Entry AgeAmortization Method: Level Percent – Closed Amortization PeriodAmortization Period: 30 Year closed from date of participation in WRSAsset Valuation Method: Five Year Smoothed Market (Closed)Actuarial AssumptionsNet Investment Rate of Return: 5.5%
Weighted based on assumed rate for: pre-retirement 7.2% post-retirement 5.0%
Salary increases: inflation 3.2% seniority/merit 0.1% - 5.6%Post-retirement benefit adjustments: 2.1%*
* No post-retirement adjustment is guaranteed. Actual adjustments are based on recognized investment return, actuarial experience and other factors. 2.1% is the assumed annual adjustment based on the investment return assumption and the post-retirement discount rate.
The Department has changed how it discloses the discount rate to clarify how it has historically determined plan liabilities and contribution rates. Prior to retirement, liabilities are discounted using the investment return assumption, currently 7.2%. Post-retirement liabilities are discounted using the assumed benefit rate of 5.0%.
68Finances
C o m p r e h e n s i v e A n n u a l F i n a n c i a l R e p o r t 2 0 1 3
69 Finances
C o m p r e h e n s i v e A n n u a l F i n a n c i a l R e p o r t 2 0 1 3
7RESERVES
The following reserves have been established to reflect legal restrictions on the use of pension trust funds.
Employee Accumulation Reserve
As authorized by Wis. Stats. § 40.04 (4), this reserve includes all required and voluntary employee contributions, including contributions made by the employer on behalf of the employee. This reserve may only be used to pay lump sum benefits or transfers to the Annuity Reserve to fund annuities. All legal restrictions on use of this reserve were met during the year. The Employee Accumulation Reserve is fully funded.
Employee Accumulation Reserve balances ($ in millions) as of December 31, 2013, were:
Core Variable Total
Employee Required $ 13,975.3 $ 1,432.5 $ 15,407.8
Employee Additional 135.3 16.2 151.5
Total $ 14,110.6 $ 1,448.7 $ 15,559.3
Employer Accumulation Reserve
As authorized by Wis. Stat. § 40.04 (5), this reserve includes all required employer contributions, including contributions for amortization of the unfunded accrued actuarial liability. This reserve may only be used to pay lump sum benefits or transfers to the Annuity Reserve to fund annuities. All legal restrictions on use of this reserve were met during the year. The Employer Accumulation Reserve is 99.9% funded.
Employer Accumulation Reserve balances ($ in millions) as of December 31, 2013, were:
Core VariablePolice &
Firefighters Total
Employer Accumulation $19,848.8 $1,432.5 $0.0 $21,281.3
Less: Unfunded Actuarial Accrued Liability 0.0 0.0 (4.3) (4.3)
Net Employer Accumulation $19,848.8 $1,432.5 ($4.3) $21,277.0
Annuity Reserve
As authorized by Wis. Stat. § 40.04 (6), this reserve includes the present value of all annuities. The present value of new annuities is transferred from the Employee Accumulation Reserve and the Employer Accumulation Reserve to the Annuity Reserve. This reserve may only be used for the payment of annuities and death benefits to annuitants. All legal restrictions on use of this reserve were met during the year. The Annuity Reserve is fully funded.
Annuity Reserve balances ($ in millions) as of December 31, 2013, were:
Core Variable Police & Firefighters TotalAnnuity Reserve $44,259.7 $4,188.2 $10.4 $48,458.3
Market Recognition AccountAs authorized by Wis. Stat. § 40.04 (3), this reserve is used to smooth the flow of investment income into the Employee, Employer, and Annuity Reserves and other benefit plans invested in the Core Fund. Under the Market Recognition Account (MRA), all investment income, including realized and unrealized market gains and losses, is deposited into the MRA. At year-end, income equal to the assumed earnings rate is recognized. Any surplus or shortfall in earnings is recognized equally over five years.
Year-end balances in the MRA ($ in millions) for the last five years after annual distributions were as follows:
MRADecember 31, 2009 (9,471)December 31, 2010 (5,067)December 31, 2011 (5,340)December 31, 2012 2,451December 31, 2013 2,721
8PUBLIC ENTITY RISK POOLS
The Department operates four public entity risk pools: Health Insurance, Income Continuation Insurance (ICI), Long-Term Disability Insurance (LTDI), and Life Insurance. In accordance with GASB Statement No. 10, Accounting and Financial Reporting for Risk Financing and Related Insurance Issues, these funds are accounted for as enterprise funds.
Health Insurance Fund
The Health Insurance Fund offers group health insurance for current employees of the State of Wisconsin and of participating local public employers. All public employers in the state are eligible to participate. The State of Wisconsin and 360 local employers participated during the year. The fund includes both a self-insured fee-for-service plan as well as various prepaid plans, primarily Health Maintenance Organizations (HMOs).
The Health Insurance Fund includes three separate risk pools. The first pool includes those members who have chosen health insurance coverage from an HMO. All liabilities for medical claims for these participants are the responsibility of the HMO and are not included in the unpaid claims analysis or in the Required Supplementary Information.
The second pool includes medical coverage for those members selecting the self-insured indemnity plan offered by the Department. Liabilities for this pool are
presented in the unpaid claims analysis and in the Required Supplementary Information.
The last pool includes self-insured pharmacy benefits for all members regardless of whether they receive medical coverage from an HMO or through the indemnity plan. Liabilities for this pool are presented in the unpaid claims analysis and in the Required Supplementary Information.
Income Continuation Insurance Fund
The Income Continuation Insurance (ICI) Fund offers both long-term and short-term disability benefits (up to 75% of gross salary) for current employees of the State of Wisconsin and participating local public employers. All public employers in Wisconsin are eligible to participate. The State of Wisconsin and 200 local employers currently participate in the plan, and it is self-insured. Since March 2012, premiums have been suspended for the local employers as a result of the increase in funded status of the program.
Long-Term Disability Insurance Fund
Effective October 15, 1992, the Group Insurance Board (GIB) established the Long-Term Disability Insurance (LTDI) program as an alternative to the long-term disability coverage provided through the WRS. The ETF Board purchases disability insurance coverage from the GIB for WRS participants.
70Finances
C o m p r e h e n s i v e A n n u a l F i n a n c i a l R e p o r t 2 0 1 3
71 Finances
C o m p r e h e n s i v e A n n u a l F i n a n c i a l R e p o r t 2 0 1 3
Participants who were covered by the WRS prior to October 15, 1992, have the option to select either disability benefits from LTDI or WRS at the time of disability. New WRS participants on or after October 15, 1992, are eligible only for LTDI disability benefits.
An LTDI benefit replaces 40% of the disabled participant’s final average earnings until normal retirement age or for a minimum of five years. It also provides for additional annual contributions to the participant’s WRS account equal to 7% of the participant’s final average earnings. At normal retirement age or after a minimum of five years of LTDI benefits, the LTDI benefit terminates and the participant is eligible for a WRS retirement benefit.
The WRS pays actuarially-determined premiums to the GIB for LTDI coverage. Since January 1, 1999, premiums had been suspended in recognition of the funding level in the program. Starting in January 2014, LTDI premiums will be reinstated.
Life Insurance Fund
The Life Insurance Fund offers group life insurance coverage for current State of Wisconsin employees and employees of participating local public employers. All public employers in the state are eligible to participate. The State of Wisconsin and 723 local employers currently participate in the program. Employers and active employees make premium contributions, which ETF passes on to the insurance carrier (the Company). Participants have the option to select multiple coverage levels, each of which requires different premium contributions. Assets and liabilities are recorded in this program for contributions not yet received and payments not yet remitted to the Company, respectively.
Public Entity Risk Pool Accounting Policies
Basis of Accounting: All public entity risk pools are accounted for in enterprise funds using the full accrual basis of accounting and the flow of economic resources measurement focus.
Valuation of Investments: Assets of the Health Insurance, ICI, and LTDI funds are invested in the Core Retirement Investment Trust and are valued at fair value.
Unpaid Claims Liabilities: The fund establishes claims liabilities based on estimates of the ultimate cost of claims that have been reported but not settled and of claims that have been incurred but not reported. The estimate includes the effects of inflation and other societal and economic factors. Adjustments to claims liabilities are charged or credited to expense in the periods in which they are made. Unpaid claims liability is presented at face value and is not discounted for Health Insurance. These liabilities are discounted using an interest rate of 7.2% for the ICI and LTDI programs. The liabilities of the ICI, Health Insurance, and LTDI programs were determined by actuarial methods. Face value of the liability for these programs is not available.
Administrative Expenses: All maintenance expenses are expensed in the period they are incurred. Acquisition costs are immaterial and are treated as maintenance expenses. Claim adjustment expenses are also immaterial.
Reinsurance: Health insurance plans provided by HMOs are fully insured by outside insurers. All remaining risk is self-insured with no reinsurance coverage.
Risk Transfer: Participating employers are not subject to supplemental assessments in the event of deficiencies. If the assets of a fund were exhausted, participating employers would not be responsible for the fund’s liabilities.
Premium Setting: Premiums are established by the GIB (Health Insurance, ICI, and LTDI) in consultation with actuaries.
Statutory Authority: All programs are operated under the authority of Chapter 40, Wisconsin Statutes.
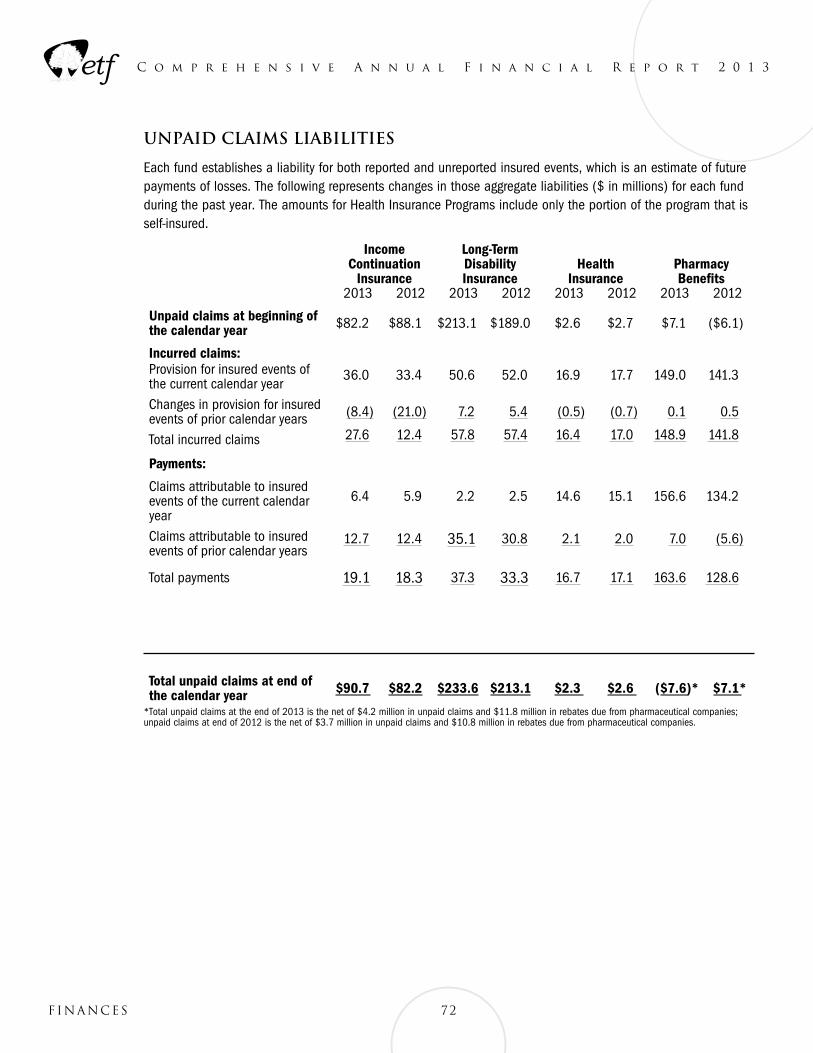
72Finances
C o m p r e h e n s i v e A n n u a l F i n a n c i a l R e p o r t 2 0 1 3
Total unpaid claims at end of the calendar year $90.7 $82.2 $233.6 $213.1 $2.3 $2.6 ($7.6)* $7.1*
*Total unpaid claims at the end of 2013 is the net of $4.2 million in unpaid claims and $11.8 million in rebates due from pharmaceutical companies; unpaid claims at end of 2012 is the net of $3.7 million in unpaid claims and $10.8 million in rebates due from pharmaceutical companies.
Unpaid Claims Liabilities
Each fund establishes a liability for both reported and unreported insured events, which is an estimate of future payments of losses. The following represents changes in those aggregate liabilities ($ in millions) for each fund during the past year. The amounts for Health Insurance Programs include only the portion of the program that is self-insured.
Income Continuation
Insurance
Long-TermDisabilityInsurance
Health Insurance
PharmacyBenefits
2013 2012 2013 2012 2013 2012 2013 2012
Unpaid claims at beginning of the calendar year $82.2 $88.1 $213.1 $189.0 $2.6 $2.7 $7.1 ($6.1)
Incurred claims:Provision for insured events of the current calendar year
36.0 33.4 50.6 52.0 16.9 17.7 149.0 141.3
Changes in provision for insured events of prior calendar years (8.4) (21.0) 7.2 5.4 (0.5) (0.7) 0.1 0.5
Total incurred claims 27.6 12.4 57.8 57.4 16.4 17.0 148.9 141.8
Payments:
Claims attributable to insured events of the current calendar year
6.4 5.9 2.2 2.5 14.6 15.1 156.6 134.2
Claims attributable to insured events of prior calendar years
12.7 12.4 35.1 30.8 2.1 2.0 7.0 (5.6)
Total payments 19.1 18.3 37.3 33.3 16.7 17.1 163.6 128.6
73 Finances
C o m p r e h e n s i v e A n n u a l F i n a n c i a l R e p o r t 2 0 1 3
9OTHER POST-EMPLOYMENT BENEFIT (OPEB) PLANS
ADMINISTERED BY THE DEPARTMENT OF EMPLOYEE TRUST FUNDS
The Department administers five OPEB plans: the Duty Disability Insurance Fund, the State Retiree Life Insurance Fund, the Local Government Retiree Life Insurance Fund, the State Retiree Health Insurance Fund and the Local Government Retiree Health Insurance Fund. The Retiree Health Insurance Funds contain certain non-OPEB components relating to post-Medicare pharmacy and health insurance benefits.
Plan Descriptions
DUTY DISABILITY FUND
The Duty Disability Insurance Fund is a cost-sharing multiple-employer defined benefit OPEB plan. The plan offers special disability insurance for State of Wisconsin and local WRS participants in protective occupations. The plan is self-insured, and risk is shared between the State of Wisconsin and local government employers in the plan. The plan is administered under Wis. Stat. § 40.65. The plan is reported as an “other employee benefit trust fund”.
Membership Participation in the program is mandatory for all WRS employers with protective occupation employees. The State of Wisconsin and 512 local government employers participate. Membership as of December 31, 2013 consisted of:
Disabled members and beneficiaries receiving benefits 981
Active plan members 21,999
Total plan members 22,980
Contributions Contributions are actuarially determined in accordance with Wis. Stats. § 40.05 (2) (ar). All contributions are employer-paid based on a graduated, experience-rated formula. During 2013 contribution rates ranged from 1.9% to 8.1% of covered payroll based on employer experience.
Description of Benefits Eligibility: Duty-related injury or disease that is likely to be permanent, which causes a protective occupation participant to retire, accept reduced pay or light duty assignment, or in some cases, that impairs promotional opportunities.
Amount: 80% of salary (75% if not a State of Wisconsin employee), less the following offsets:
• Social Security • Unemployment Compensation • Worker’s Compensation • Any other WRS benefit • All earnings from the employer under which the
disability occurred • A percent of other earnings as follows:
– 1/3 of earnings less than 40% of monthly salary – 1/2 of earnings between 40% and 80% of monthly salary – 2/3 of earnings over 80% of monthly salary
Survivor Benefit: All survivor benefits are offset by any Worker’s Compensation death benefits.
• For applications filed prior to May 3, 1988, bene-fits are based on the following:
– 1/3 of the participant’s monthly salary at time of death to surviving spouse, plus – $15/month to each unmarried child under the age of 18 – Not to exceed 65% of participant’s monthly salary at time of death
• For applications filed on or after May 3, 1988 benefits are based on the following: Local employees:
– 1/2 of the participant’s monthly salary at time of death to surviving spouse or domestic partner, less other income sources that are based on the participant’s earnings record – 1/10 of the participant’s monthly salary at time of death to each unmarried child under the age of 18 – Not to exceed 70% of participant’s monthly salary at time of death
74Finances
C o m p r e h e n s i v e A n n u a l F i n a n c i a l R e p o r t 2 0 1 3
State employees:
– 1/3 of the participant’s monthly salary at time of death to surviving spouse or domestic partner, plus – $15/month to each unmarried child under the age of 18 – Not to exceed 65% of participant’s monthly salary at time of death
• For applications received on or after May 12, 1998 in which the protective occupation participant dies as a result of a disease covered under the Cancer Presumptive Law, benefits are based on the following:
– 70% of the participant’s monthly salary at time of death to surviving spouse or domestic partner, less other income sources that are based on the participant’s earnings record – 1/10 of the participant’s monthly salary at time of death to the guardian of any minor child, as long as there is no surviving spouse – There is no maximum
Annual Increases:
• To age 60: In accordance with WRS salary index.
• After age 60: In accordance with WRS dividend increases (so long as the claimant is not also receiv-ing a disability retirement benefit).
Retiree Life Insurance FundsThe State Retiree Life Insurance Fund and the Local Government Retiree Life Insurance Fund are cost-sharing multiple-employer defined benefit OPEB plans. The State of Wisconsin and 723 local government employers currently participate. The plans provide post-employment life insurance coverage to all eligible employees of participating employers. The plans are administered under Wis. Stats. § 40.70. The plans are reported as other employee benefit trust funds.
Membership
Eligibility: Generally, members may enroll during a 30-day enrollment period once they satisfy a six-month waiting period. They may enroll after the initial 30-day enrollment period with evidence of insurability. Members under evidence of insurability enrollment must enroll in group life insurance coverage before age 55 to be eligible for Basic or Supplemental coverage.
Membership as of December 31, 2013, included:
State Local TotalActive* 49,279 72,698 121,977 Pre-Age 65 Annuitants
7,237 11,357 18,594
Post-Age 64 Annuitants
20,025 27,049 47,074
Totals 76,541 111,104 187,645
*Active members include disabled.
ContributionsEmployers are required to pay the following contributions for active members to provide them with Basic Coverage after age 65. There are no employer contributions for pre-65 annuitant coverage. All contributions are actuarially determined.
State Local50% Post Retirement Coverage
28% of employee premium
40% of employee premium
25% Post Retirement Coverage
n/a 20% of employee premium
Reserves
Active member and retiree plan reserves are commingled for investment and administrative purposes. Effective January 1, 2008, assets were permanently split between the active member and OPEB plans.
Description of Benefits
Eligibility: At retirement, the member must have active group life insurance coverage and satisfy one of the following:
• WRS coverage prior to January 1, 1989, or • At least one month of group life insurance coverage in each of five calendar years after 1989 and one of the following: - Eligible for an immediate WRS benefit, or - At least 20 years from their WRS creditable service as of January 1, 1990, plus their years of group life insurance coverage after 1989, or - At least 20 years on the payroll of their last employer.
In addition, terminating members and retirees must continue to pay the employee premiums until age 65 (age 70 if active).
75 Finances
C o m p r e h e n s i v e A n n u a l F i n a n c i a l R e p o r t 2 0 1 3
Basic Coverage Benefits: After retirement, basic coverage is continued for life in these amounts of the insurance in force before retirement:
% of Basic Coverage ContinuingAge State LocalBefore age 65 100% 100%While age 65 75% 75%While age 66 50% 50%After age 66 50% 50% / 25%
employer electionSupplemental Coverage Benefits: After retirement, Supplemental coverage may be continued until age 65 at 100% of the amount of the insurance in force before retirement at the employee’s expense.
Additional Coverage Benefits: After retirement, Additional coverage may be continued until age 65 at 100% of the amount of the insurance in force before retirement at the employee’s expense.
Spouse and Dependent Coverage Benefits: After retirement, the coverage is terminated.
Method Used to Value Investments Investments for the Retiree Life Insurance Funds are held with the insurance carrier (the Company). Each Retiree Life Insurance Fund’s investment is a share in the Company’s investment pool.
Fixed maturity securities, which may be sold prior to maturity, including fixed maturities on loan, are classified as available-for-sale and are carried at fair value. Premiums and discounts are amortized or accreted over the estimated lives of the securities based on the interest yield method.
The Company uses book value as cost for applying the retrospective adjustment method to loan-backed fixed maturity securities purchased. Prepayment assumptions for single-class and multi-class mortgage-backed securities were obtained from broker/dealer survey values or internal estimates.
Marketable equity securities are classified as available-for-sale and are carried at fair value. Mutual funds and exchange traded fund investments in select asset classes that are sub-advised are carried at the fair value of the underlying Net Position of the funds.
Available-for-sale securities are stated at fair value.
Mortgage loans are carried at amortized cost less any valuation allowances. Premiums and discounts are
amortized or accreted over the terms of the mortgage loans, based on the effective interest yield method. Impairments are determined by specific identification. A mortgage loan is considered impaired if it is probable that amounts due for principal and interest will not be collected in accordance with the contractual terms. Impaired mortgage loans are valued at the present value of expected future cash flows discounted at the loan’s effective interest rate, or the fair value of the underlying collateral, if the loan is collateral dependent.
Private equity investments in limited partnerships are carried at the amount invested, adjusted to recognize the Company’s ownership share of the earnings or losses of the investee after the date of the acquisition, adjusted for any distributions received (equity method accounting).
Investments in partnerships that represent minority interests owned in certain general agencies are carried at the amount invested, adjusted to recognize the Company’s ownership share of the earnings or losses of the investee after acquisition, adjusted for any distributions received (equity method accounting).
Fair values of fixed maturity securities are based on quoted market prices, where available. Fair values of marketable equity securities are based on quoted market prices. Fair values of private equity investments are obtained from the financial statement valuations of the underlying fund or independent broker bids. For fixed maturity securities not based on quoted market prices, generally private placement securities, securities that do not trade regularly, and embedded derivatives, an internally developed pricing model using a commercial software application is most often used. The internally-developed pricing model is developed by obtaining spreads versus the U.S. Treasury yield for corporate securities with varying weighted average lives and bond ratings.
Real estate is carried at cost, less accumulated depreciation and an allowance for estimated losses.
The Company’s derivative instrument holdings are carried at fair value. All derivatives are recorded as non-hedge transactions. Derivative instrument fair values are based on quoted market prices or dealer quotes. If a quoted market price is not available, fair value is estimated using current market assumptions and modeling techniques, which are then compared with quotes from counterparties.
76Finances
C o m p r e h e n s i v e A n n u a l F i n a n c i a l R e p o r t 2 0 1 3
For mortgage-backed securities of high credit quality, excluding interest-only securities, the Company recognizes income using a constant effective yield method based on prepayment assumptions obtained from an outside service provider or upon analyst review of the underlying collateral and the estimated economic life of the securities.
For interest-only securities and mortgage-backed securities not of high credit quality, the Company recognizes the excess of all cash flows, including estimated prepayments, attributable to the security estimated at the acquisition date over the initial investment using the effective yield method with adjustments made as a result of subsequent cash flow information recorded prospectively. If the fair value of the security has declined below its carrying amount, the Company will write the security down to fair value if the decline is deemed other-than-temporary.
Policy loans are carried at the unpaid principal balance.
Cash and cash equivalents are carried at cost, which approximates fair value. The Company considers all money market funds and commercial paper with original maturity dates of less than three months to be cash equivalents.
Finance receivables that management has the intent and ability to hold for the foreseeable future or until maturity or payoffs are reported at their outstanding unpaid principal balances reduced by any charge-offs.
The Company holds “To-Be-Announced” (TBA) Government National Mortgage Association forward contracts that require the Company to take delivery of a mortgage-backed security at a settlement date in the future. Most of the TBAs are settled at the first available period allowed under the contract. However, the deliveries of some of the Company’s TBA securities happen at a later date, thus extending the forward contract date. These securities are reported at fair value as derivative instruments with the changes in fair value reported in net realized investment gains and losses on the consolidated statements of operations.
RETIREE HEALTH INSURANCE FUNDSThe State Retiree Health Insurance Fund and the Local Government Retiree Health Insurance Fund are agent multiple-employer defined benefit OPEB plans offering group health insurance to retired State of
Wisconsin and local government employees. The Department and the Group Insurance Board (GIB) have statutory authority for program administration and oversight [Wis. Stats. §§ 15.165 (2) and 40.03 (6)]. The State of Wisconsin and 360 local government employers currently participate in the plans. The plans are reported as agency funds.
Beginning in 2007, some employers must make additional disclosures related to their Retiree Health Insurance Plans, including the funding policy, the employer’s annual OPEB cost and contributions made, the funded status and funding progress of the plan, and the actuarial methods and assumptions used. This information is available from the employer.
Membership: State of Wisconsin and local government employees participating in the State Health Insurance Plan or the Wisconsin Public Employers Insurance Plan (local government plans) are eligible to continue their health insurance coverage after leaving covered employment. Membership as of December 31, 2013, included 23,888 former state employees or their beneficiaries and 2,295 former local government employees and beneficiaries.
Description of Benefits: Employees may choose between self-insured health plans and alternate health plans with specific provider networks (i.e., HMOs). The HMOs follow GIB guidelines for eligibility and program requirements. All HMOs offer a prescribed benefit package called Uniform Benefits and participate in a yearly competitive premium rates bid process. The Standard Plan and State Maintenance Plan are self-insured by the GIB and administered by WPS Health Insurance. The Standard Plan is a preferred provider plan.
The pharmacy benefit is self-insured by the GIB and administered by Navitus Health Solutions.
Effective January 1, 2012, prescription drug coverage for Medicare eligible retirees enrolled in the State group health insurance program is provided by a self-funded Medicare Part D Employer Group Waiver Plan (EGWP). A Medicare “Wrap” product is also included to provide full coverage to members, as required by uniform benefits, when they reach the Medicare coverage gap, also known as the “donut hole”.
Contributions: Health Insurance premiums are actuarially determined or set by contract with the insurer.
77 Finances
C o m p r e h e n s i v e A n n u a l F i n a n c i a l R e p o r t 2 0 1 3
FUNDED STATUS AND FUNDING PROGRESS – OPEB PLANS
The funded status of each plan as of the most recent actuarial valuation date is as follows ($ in thousands):
Actuarial Valuation Date
(a)Actuarial Value of Assets
(b)Actuarial Accrued Liability (AAL)
(c)Unfunded Actuarial Accrued Liability (UAAL)
(b) – (a)
(d)Funded Ratio
(a) / (b)
(e)Covered Payroll
(f)UAAL as
Percentage of Covered
Payroll(c) / (e)
Duty Disability Insurance January 1, 2013
$490,137 $507,081 $16,944 96.7% $1,279,908 1.3%
State Life Insurance January 1, 2012
363,778 509,315 145,537 71.4% 2,869,087 5.1%
Local Life Insurance January 1, 2012
231,695 326,280 94,585 71.0% 3,813,576 2.5%
Actuarial valuations of an ongoing plan involve estimates of the value of reported amounts and assumptions about the probability of occurrence of events far into the future. Examples include assumptions about future employment, mortality, and the healthcare cost trend. Actuarially- determined amounts are subject to continual revision, as actual results are compared with past expectations and new estimates are made about the future. The schedules of funding progress, presented as required supplementary information following the notes to the financial statements, present multiyear trend information about whether the actuarial values of plan assets are increasing or decreasing over time relative to the actuarial accrued liabilities for benefits.
The accompanying schedules of employer contributions, included in the required supplementary information at the end of the notes, present trend information about the amounts contributed to the plan by employers in comparison to the Annual Required Contribution (ARC), an amount that is actuarially-determined in accordance with the parameters of GASB Statement 43. The ARC represents a level of funding that, if paid on an ongoing basis, is projected to cover normal cost for each year and amortize any unfunded actuarial liabilities (or funding excess) over a period not to exceed thirty years.
Projections of benefits for financial reporting purposes are based on the substantive plan (the plan as understood by the employer and plan members) and include the types of benefits provided at the time of each valuation and the historical pattern of sharing of benefit costs between the employer and plan members to that point. The actuarial methods and assumptions used include techniques that are designed to reduce the effects of short-term volatility in actuarial accrued liabilities and the actuarial value of assets, consistent with the long-term perspective of the calculations. Additional information as of the latest actuarial valuations follows:
Duty Disability Insurance State Life Insurance Local Life InsuranceValuation Date 1/1/2013 1/1/2012 1/1/2012Actuarial Cost Method Projected Unit Credit Entry Age Normal Entry Age NormalAmortization Method Closed level percentage
of payClosed level percentage of pay
Closed level percentage of pay
Remaining Amortization Period UAAL – 8 yearsFuture gains & losses – 15 years
UAAL – 30 yearsFuture gains & losses – 15 years
UAAL – 30 yearsFuture gains & losses – 15 years
Asset valuation method 5 year smoothed market Market value Market valueActuarial Assumptions:
Investment Return
Payroll Growth
7.2%
3.2%
4.65% through 2027 5.75% for 2028 and beyond
3.2%
4.65% through 2027 5.75% for 2028 and beyond
3.2%
78Finances
C o m p r e h e n s i v e A n n u a l F i n a n c i a l R e p o r t 2 0 1 3
10MILWAUKEE RETIREMENT SYSTEM
The Milwaukee Retirement System (MRS), consisting of two funds within the Milwaukee Public Schools Retirement System, is reported as an Investment Trust Fund. MRS provides assets to the Department for investing in the Core and Variable Funds, described in the Investments section of Note 1. The Core and Variable Funds are managed by the State of Wisconsin Investment Board (SWIB) with oversight by a board of trustees as authorized in Wis. Stat. § 25.17. SWIB is not registered with the Securities and Exchange Commission as an investment company. Participation of the MRS in the Core and Variable Funds is described in the Wisconsin Administrative Code, § ETF 10.12. Monthly, the Department distributes pro-rata shares of total Core Fund and total Variable Fund earnings, less administrative expenses to the MRS accounts. The MRS accounts are adjusted to fair value and gains/losses are recorded directly in the accounts per Wisconsin Administrative Code, § ETF 10.12 (2).
No state statute, legal provision, or legally-binding guarantee exists to support the value of shares. At December 31, 2013, the Core and Variable Funds held $93.7 billion in investment related accounts, of which $3.8 billion is classified as cash equivalents. In addition, the Core and Variable Funds held $1.0 billion of securities lending collateral.
Summary information by investment classification in accordance with GASB Statement No. 31, Accounting and Financial Reporting for Certain Investments and for External Investment Pools, for the Core and Variable Funds at December 31, 2013, is presented in Note 3. Condensed financial data for the Core and Variable Funds for the year ended December 31, 2013, is presented on the next page ($ in thousands):
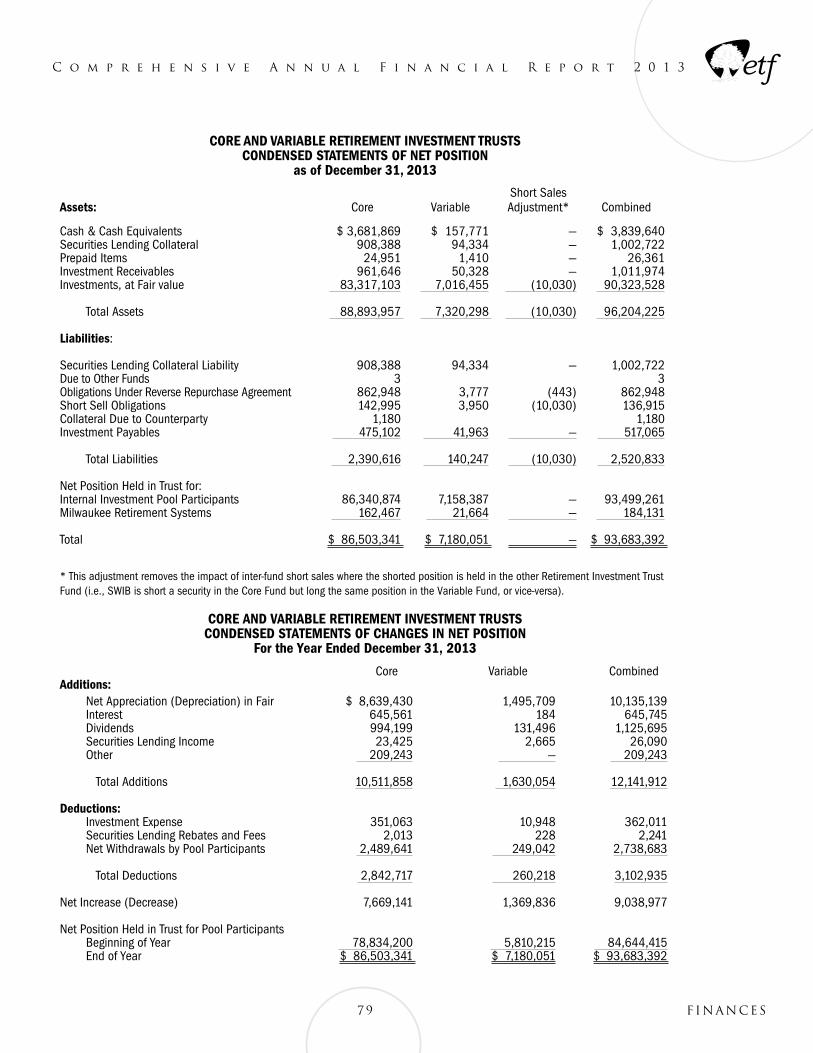
79 Finances
C o m p r e h e n s i v e A n n u a l F i n a n c i a l R e p o r t 2 0 1 3
CORE AND VARIABLE RETIREMENT INVESTMENT TRUSTS CONDENSED STATEMENTS OF NET POSITION
as of December 31, 2013
Assets: Core VariableShort Sales Adjustment* Combined
Cash & Cash Equivalents $ 3,681,869 $ 157,771 — $ 3,839,640Securities Lending Collateral 908,388 94,334 — 1,002,722Prepaid Items 24,951 1,410 — 26,361Investment Receivables 961,646 50,328 — 1,011,974Investments, at Fair value 83,317,103 7,016,455 (10,030) 90,323,528
Total Assets 88,893,957 7,320,298 (10,030) 96,204,225
Liabilities:
Securities Lending Collateral Liability 908,388 94,334 — 1,002,722Due to Other Funds 3 3Obligations Under Reverse Repurchase Agreement 862,948 3,777 (443) 862,948Short Sell Obligations 142,995 3,950 (10,030) 136,915Collateral Due to Counterparty 1,180 1,180Investment Payables 475,102 41,963 — 517,065
Total Liabilities 2,390,616 140,247 (10,030) 2,520,833
Net Position Held in Trust for:Internal Investment Pool Participants 86,340,874 7,158,387 — 93,499,261Milwaukee Retirement Systems 162,467 21,664 — 184,131
Total $ 86,503,341 $ 7,180,051 — $ 93,683,392
* This adjustment removes the impact of inter-fund short sales where the shorted position is held in the other Retirement Investment Trust Fund (i.e., SWIB is short a security in the Core Fund but long the same position in the Variable Fund, or vice-versa).
CORE AND VARIABLE RETIREMENT INVESTMENT TRUSTS CONDENSED STATEMENTS OF CHANGES IN NET POSITION
For the Year Ended December 31, 2013
Core Variable CombinedAdditions:
Net Appreciation (Depreciation) in Fair $ 8,639,430 1,495,709 10,135,139Interest 645,561 184 645,745Dividends 994,199 131,496 1,125,695Securities Lending Income 23,425 2,665 26,090Other 209,243 — 209,243
Total Additions 10,511,858 1,630,054 12,141,912
Deductions:Investment Expense 351,063 10,948 362,011Securities Lending Rebates and Fees 2,013 228 2,241Net Withdrawals by Pool Participants 2,489,641 249,042 2,738,683
Total Deductions 2,842,717 260,218 3,102,935
Net Increase (Decrease) 7,669,141 1,369,836 9,038,977
Net Position Held in Trust for Pool ParticipantsBeginning of Year 78,834,200 5,810,215 84,644,415End of Year $ 86,503,341 $ 7,180,051 $ 93,683,392
80Finances
C o m p r e h e n s i v e A n n u a l F i n a n c i a l R e p o r t 2 0 1 3
11CONTINGENCIES, UNUSUAL EVENTS, AND SUBSEQUENT EVENTS
LOSS CONTINGENCY
On September 5, 2008, the Internal Revenue Service (IRS) provided SWIB with a Notice of Transferee Liability. This claim seeks taxes, penalties and interest relating to the sale of Shockley Communications Corporation (SCC) stock in 2001.
SWIB is classified as a tax exempt entity by the IRS. However, the IRS asserts that the shareholders’ sale of SCC stock in 2001 should have been characterized as a sale of assets by SCC, on which SCC should have paid income taxes. Based on the theory of transferee liability, the IRS asserts that the former SCC shareholders, including SWIB, would be liable for those taxes, plus penalties and interest. Transferee liability is limited to the amount actually received by the putative transferee, plus interest. As a result, SWIB’s potential liability, as a putative transferee of SCC assets, is estimated to be $46.9 million, including taxes, interest, and potential penalties.
SWIB is aggressively contesting the IRS’ assertions of SWIB’s tax liability. Furthermore, SWIB believes that the loss, if any, resulting from the claim is not probable and therefore will not have a material impact on SWIB’s net investment position or net investment income in future years. As such, this loss has not been recognized in the current year, nor does it appear as a contingent liability in the Statement of Fiduciary Net Position.
81 Finances
C o m p r e h e n s i v e A n n u a l F i n a n c i a l R e p o r t 2 0 1 3
Required Supplementary Information
PUBLIC ENTITY RISK POOLSClaims Development Information
The tables on the following pages illustrate how the funds’ earned revenues and investment income compare to related costs of loss and other expenses assumed by the funds as of the end of each of the last ten years. The rows of the tables are defined as follows:
1. Net Earned Required Contribution and Investment Revenues. Shows the total of each calendar year’s earned contribution revenues and investment revenues.
2. Unallocated Expenses. Shows each calendar year’s other operating costs of the fund, including overhead and claims expense not allocable to individual claims.
3. Estimated Incurred Claims as of the End of the Policy Year. Shows the fund’s incurred claims and allocated claim adjustment expense (both paid and accrued) as originally reported at the end of the first year in which the event that triggered coverage under the contract occurred (called policy year).
4. Paid Cumulative as of Year-End. Shows the cumulative amounts paid as of the end of successive years for each policy year.
5. Re-estimated Incurred Claims. Shows how each policy years incurred claims increased or decreased as of the end of successive policy years. This annual re-estimation results from new information received on known claims, reevaluation of existing information on known claims, as well as emergence of new claims not previously known.
6. Increase (Decrease) in Estimated Incurred Claims from End of Policy Year. Compares the latest re-estimated incurred claims amount to the amount originally established (line 3) and shows whether this latest estimate of claims cost is greater or less than originally thought.
As data for individual policy years mature, the correlation between original estimates and re-estimated amounts is commonly used to evaluate the accuracy of incurred claims currently recognized in less mature policy years. The columns of the tables show data for successive policy years.
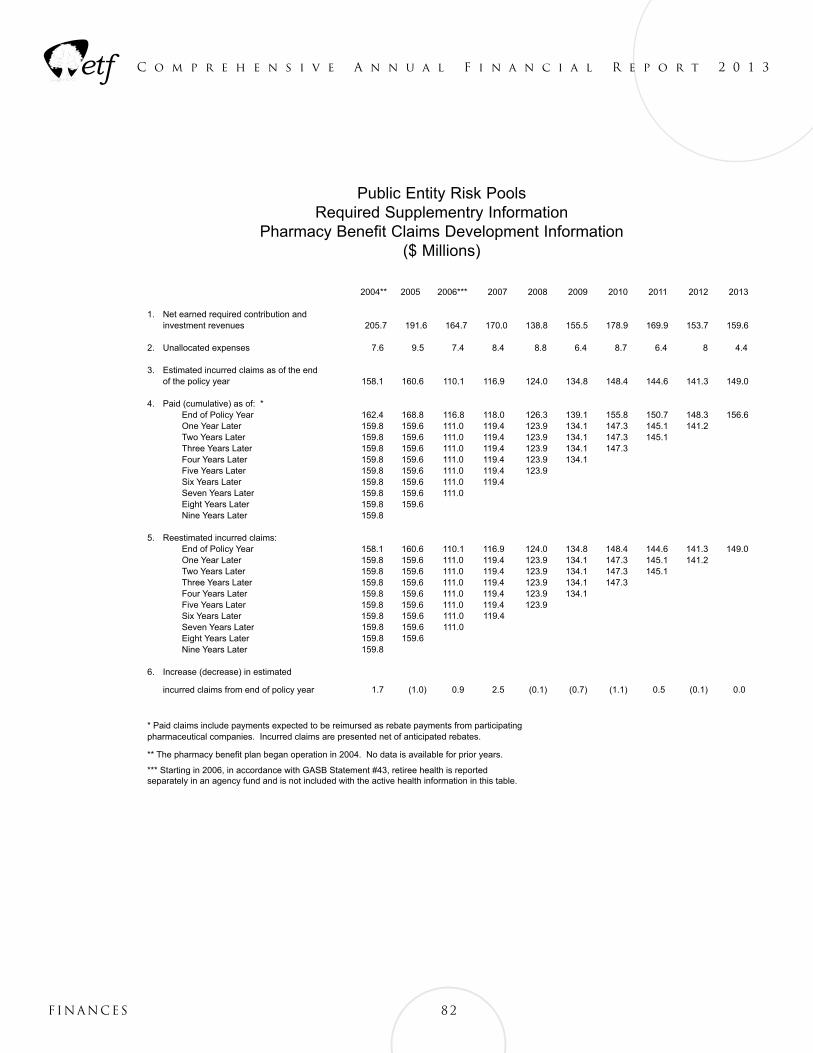
82Finances
C o m p r e h e n s i v e A n n u a l F i n a n c i a l R e p o r t 2 0 1 3
59
Public Entity Risk PoolsRequired Supplementry Information
Pharmacy Benefit Claims Development Information($ Millions)
1. Net earned required contribution andinvestment revenues
2. Unallocated expenses
3. Estimated incurred claims as of the endof the policy year
4. Paid (cumulative) as of: *End of Policy YearOne Year LaterTwo Years LaterThree Years LaterFour Years LaterFive Years LaterSix Years LaterSeven Years LaterEight Years LaterNine Years Later
5. Reestimated incurred claims:End of Policy YearOne Year LaterTwo Years LaterThree Years LaterFour Years LaterFive Years LaterSix Years LaterSeven Years LaterEight Years LaterNine Years Later
6. Increase (decrease) in estimated
incurred claims from end of policy year
* Paid claims include payments expected to be reimursed as rebate payments from participating pharmaceutical companies. Incurred claims are pre
** The pharmacy benefit plan began operation in 2004. No data is available for prior years.
*** Starting in 2006, in accordance with GASB Statement #43, retiree health is reportedseparately in an agency fund and is not included with the active health information in this table.
2004** 2005 2006*** 2007 2008 2009 2010 2011 2012 2013
205.7 191.6 164.7 170.0 138.8 155.5 178.9 169.9 153.7 159.6
7.6 9.5 7.4 8.4 8.8 6.4 8.7 6.4 8 4.4
158.1 160.6 110.1 116.9 124.0 134.8 148.4 144.6 141.3 149.0
162.4 168.8 116.8 118.0 126.3 139.1 155.8 150.7 148.3 156.6159.8 159.6 111.0 119.4 123.9 134.1 147.3 145.1 141.2159.8 159.6 111.0 119.4 123.9 134.1 147.3 145.1159.8 159.6 111.0 119.4 123.9 134.1 147.3159.8 159.6 111.0 119.4 123.9 134.1159.8 159.6 111.0 119.4 123.9159.8 159.6 111.0 119.4159.8 159.6 111.0159.8 159.6159.8
158.1 160.6 110.1 116.9 124.0 134.8 148.4 144.6 141.3 149.0159.8 159.6 111.0 119.4 123.9 134.1 147.3 145.1 141.2159.8 159.6 111.0 119.4 123.9 134.1 147.3 145.1159.8 159.6 111.0 119.4 123.9 134.1 147.3159.8 159.6 111.0 119.4 123.9 134.1159.8 159.6 111.0 119.4 123.9159.8 159.6 111.0 119.4159.8 159.6 111.0159.8 159.6159.8
1.7 (1.0) 0.9 2.5 (0.1) (0.7) (1.1) 0.5 (0.1) 0.0
sented net of anticipated rebates.
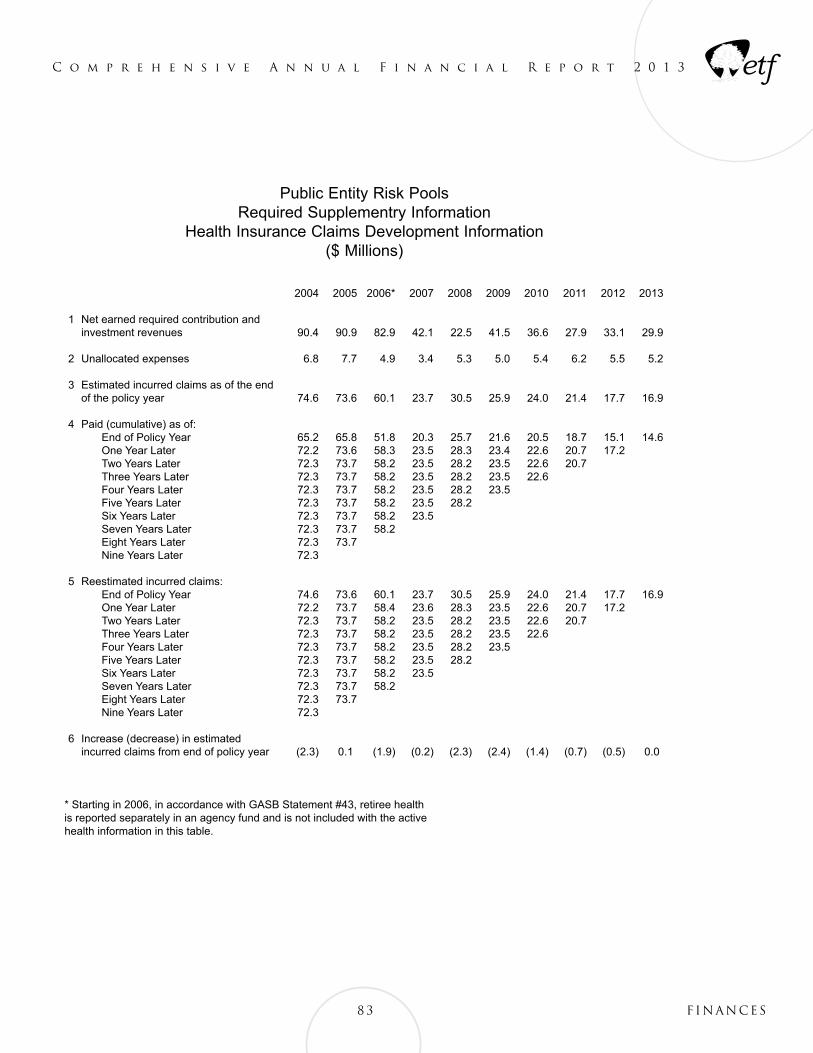
C o m p r e h e n s i v e A n n u a l F i n a n c i a l R e p o r t 2 0 1 3
83 Finances
Public Entity Risk PoolsRequired Supplementry Information
Health Insurance Claims Development Information($ Millions)
2004 2005 2006* 2007 2008 2009 2010 2011 2012 2013
190.4 90.9 82.9 42.1 22.5 41.5 36.6 27.9 33.1 29.9
2 6.8 7.7 4.9 3.4 5.3 5.0 5.4 6.2 5.5 5.2
374.6 73.6 60.1 23.7 30.5 25.9 24.0 21.4 17.7 16.9
4End of Policy Year 65.2 65.8 51.8 20.3 25.7 21.6 20.5 18.7 15.1 14.6One Year Later 72.2 73.6 58.3 23.5 28.3 23.4 22.6 20.7 17.2Two Years Later 72.3 73.7 58.2 23.5 28.2 23.5 22.6 20.7Three Years Later 72.3 73.7 58.2 23.5 28.2 23.5 22.6Four Years Later 72.3 73.7 58.2 23.5 28.2 23.5Five Years Later 72.3 73.7 58.2 23.5 28.2Six Years Later 72.3 73.7 58.2 23.5Seven Years Later 72.3 73.7 58.2Eight Years Later 72.3 73.7Nine Years Later 72.3
5End of Policy Year 74.6 73.6 60.1 23.7 30.5 25.9 24.0 21.4 17.7 16.9One Year Later 72.2 73.7 58.4 23.6 28.3 23.5 22.6 20.7 17.2Two Years Later 72.3 73.7 58.2 23.5 28.2 23.5 22.6 20.7Three Years Later 72.3 73.7 58.2 23.5 28.2 23.5 22.6Four Years Later 72.3 73.7 58.2 23.5 28.2 23.5Five Years Later 72.3 73.7 58.2 23.5 28.2Six Years Later 72.3 73.7 58.2 23.5Seven Years Later 72.3 73.7 58.2Eight Years Later 72.3 73.7Nine Years Later 72.3
6(2.3) 0.1 (1.9) (0.2) (2.3) (2.4) (1.4) (0.7) (0.5) 0.0
* Starting in 2006, in accordance with GASB Statement #43, retiree health is reported separately in an agency fund and is not included with the active health information in this table.
Net earned required contribution andinvestment revenues
Unallocated expenses
Estimated incurred claims as of the endof the policy year
Paid (cumulative) as of:
Reestimated incurred claims:
Increase (decrease) in estimatedincurred claims from end of policy year
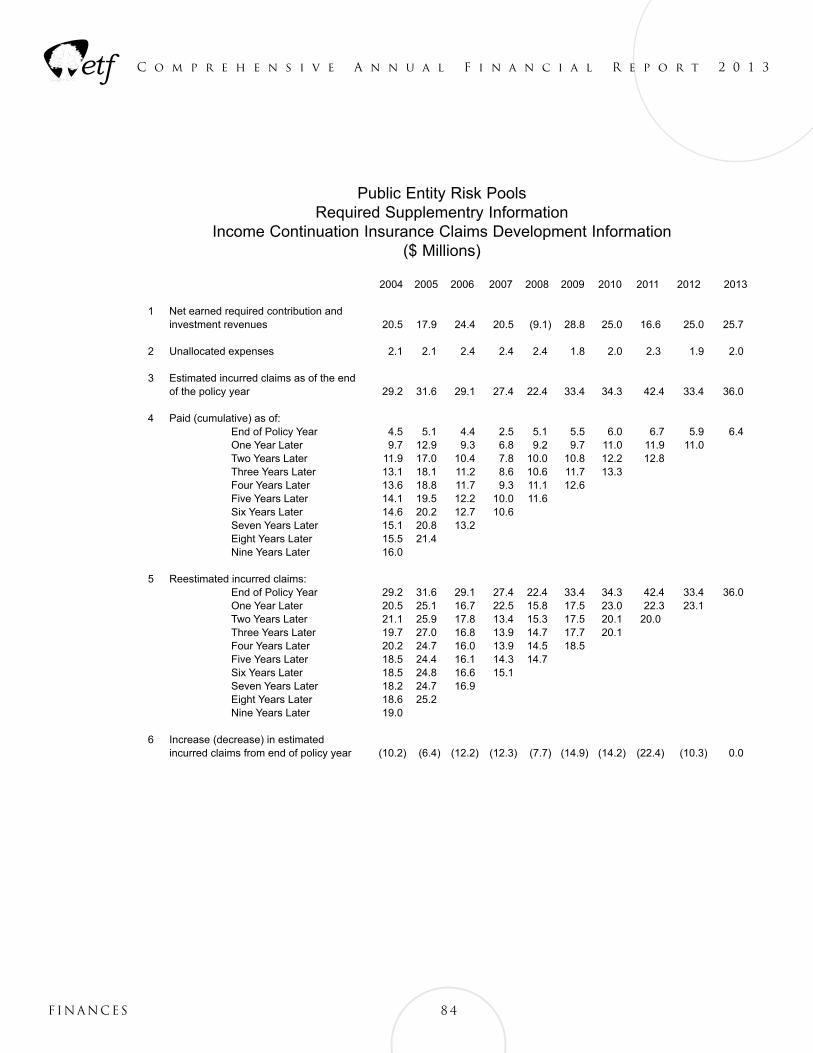
C o m p r e h e n s i v e A n n u a l F i n a n c i a l R e p o r t 2 0 1 3
84Finances
Public Entity Risk PoolsRequired Supplementry Information
Income Continuation Insurance Claims Development Information($ Millions)
2004 2005 2006 2007 2008 2009 2010 2011 2012 2013
120.5 17.9 24.4 20.5 (9.1) 28.8 25.0 16.6 25.0 25.7
2 2.1 2.1 2.4 2.4 2.4 1.8 2.0 2.3 1.9 2.0
329.2 31.6 29.1 27.4 22.4 33.4 34.3 42.4 33.4 36.0
4End of Policy Year 4.5 5.1 4.4 2.5 5.1 5.5 6.0 6.7 5.9 6.4One Year Later 9.7 12.9 9.3 6.8 9.2 9.7 11.0 11.9 11.0Two Years Later 11.9 17.0 10.4 7.8 10.0 10.8 12.2 12.8Three Years Later 13.1 18.1 11.2 8.6 10.6 11.7 13.3 Four Years Later 13.6 18.8 11.7 9.3 11.1 12.6 Five Years Later 14.1 19.5 12.2 10.0 11.6Six Years Later 14.6 20.2 12.7 10.6Seven Years Later 15.1 20.8 13.2Eight Years Later 15.5 21.4Nine Years Later 16.0
5End of Policy Year 29.2 31.6 29.1 27.4 22.4 33.4 34.3 42.4 33.4 36.0One Year Later 20.5 25.1 16.7 22.5 15.8 17.5 23.0 22.3 23.1Two Years Later 21.1 25.9 17.8 13.4 15.3 17.5 20.1 20.0Three Years Later 19.7 27.0 16.8 13.9 14.7 17.7 20.1 Four Years Later 20.2 24.7 16.0 13.9 14.5 18.5 Five Years Later 18.5 24.4 16.1 14.3 14.7Six Years Later 18.5 24.8 16.6 15.1Seven Years Later 18.2 24.7 16.9Eight Years Later 18.6 25.2Nine Years Later 19.0
6(10.2) (6.4) (12.2) (12.3) (7.7) (14.9) (14.2) (22.4) (10.3) 0.0incurred claims from end of policy year
Unallocated expenses
Estimated incurred claims as of the endof the policy year
Paid (cumulative) as of:
Reestimated incurred claims:
Increase (decrease) in estimated
investment revenuesNet earned required contribution and
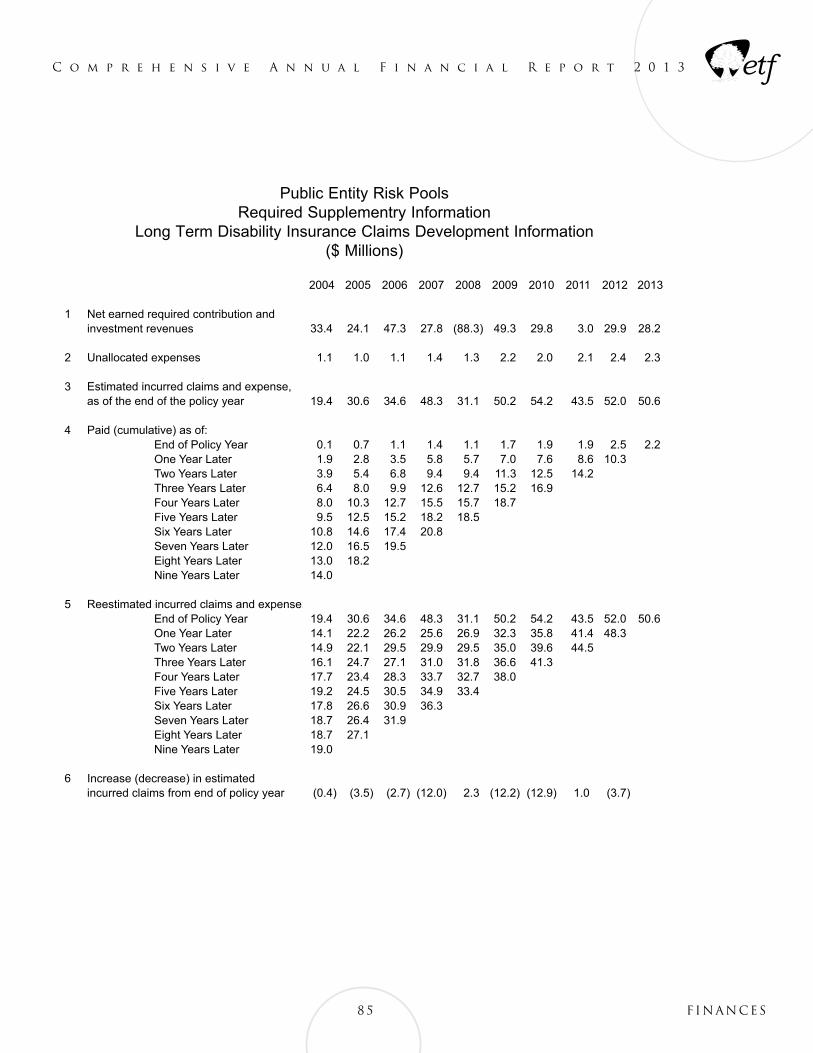
C o m p r e h e n s i v e A n n u a l F i n a n c i a l R e p o r t 2 0 1 3
85 Finances
Public Entity Risk PoolsRequired Supplementry Information
Long Term Disability Insurance Claims Development Information($ Millions)
2004 2005 2006 2007 2008 2009 2010 2011 2012 2013
1
33.4 24.1 47.3 27.8 (88.3) 49.3 29.8 3.0 29.9 28.2
2 1.1 1.0 1.1 1.4 1.3 2.2 2.0 2.1 2.4 2.3
3
19.4 30.6 34.6 48.3 31.1 50.2 54.2 43.5 52.0 50.6
4
End of Policy Year 0.1 0.7 1.1 1.4 1.1 1.7 1.9 1.9 2.5 2.2
One Year Later 1.9 2.8 3.5 5.8 5.7 7.0 7.6 8.6 10.3
Two Years Later 3.9 5.4 6.8 9.4 9.4 11.3 12.5 14.2
Three Years Later 6.4 8.0 9.9 12.6 12.7 15.2 16.9
Four Years Later 8.0 10.3 12.7 15.5 15.7 18.7
Five Years Later 9.5 12.5 15.2 18.2 18.5
Six Years Later 10.8 14.6 17.4 20.8
Seven Years Later 12.0 16.5 19.5
Eight Years Later 13.0 18.2
Nine Years Later 14.0
5
End of Policy Year 19.4 30.6 34.6 48.3 31.1 50.2 54.2 43.5 52.0 50.6
One Year Later 14.1 22.2 26.2 25.6 26.9 32.3 35.8 41.4 48.3
Two Years Later 14.9 22.1 29.5 29.9 29.5 35.0 39.6 44.5
Three Years Later 16.1 24.7 27.1 31.0 31.8 36.6 41.3
Four Years Later 17.7 23.4 28.3 33.7 32.7 38.0
Five Years Later 19.2 24.5 30.5 34.9 33.4
Six Years Later 17.8 26.6 30.9 36.3
Seven Years Later 18.7 26.4 31.9
Eight Years Later 18.7 27.1
Nine Years Later 19.0
6
(0.4) (3.5) (2.7) (12.0) 2.3 (12.2) (12.9) 1.0 (3.7)incurred claims from end of policy year
Unallocated expenses
Estimated incurred claims and expense,
as of the end of the policy year
Paid (cumulative) as of:
Reestimated incurred claims and expense:
Increase (decrease) in estimated
investment revenues
Net earned required contribution and
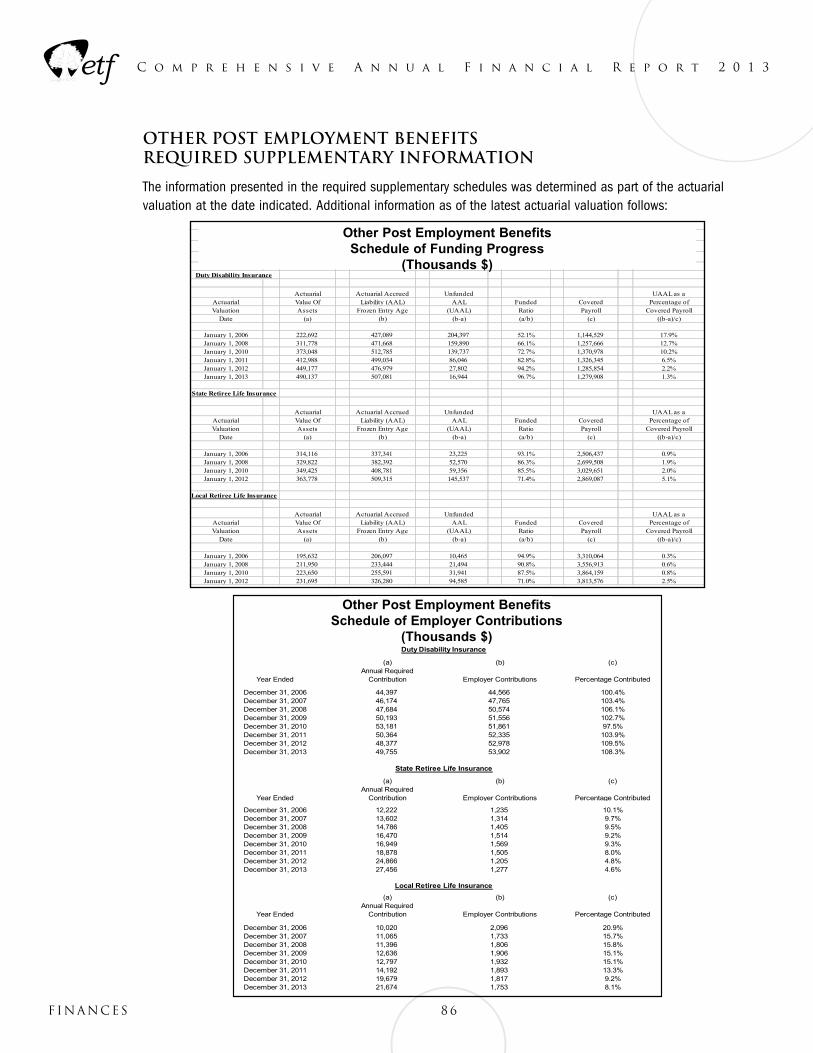
C o m p r e h e n s i v e A n n u a l F i n a n c i a l R e p o r t 2 0 1 3
86Finances
Other Post Employment Benefits REQUIRED Supplementary Information
The information presented in the required supplementary schedules was determined as part of the actuarial valuation at the date indicated. Additional information as of the latest actuarial valuation follows:
Duty Disability Insurance
Actuarial Actuarial Accrued Unfunded UAAL as aActuarial Value Of Liability (AAL) AAL Funded Covered Percentage ofValuation Assets Frozen Entry Age (UAAL) Ratio Payroll Covered Payroll
Date (a) (b) (b-a) (a/b) (c) ((b-a)/c)
January 1, 2006 222,692 427,089 204,397 52.1% 1,144,529 17.9%January 1, 2008 311,778 471,668 159,890 66.1% 1,257,666 12.7%January 1, 2010 373,048 512,785 139,737 72.7% 1,370,978 10.2%January 1, 2011 412,988 499,034 86,046 82.8% 1,326,345 6.5%January 1, 2012 449,177 476,979 27,802 94.2% 1,285,854 2.2%January 1, 2013 490,137 507,081 16,944 96.7% 1,279,908 1.3%
State Retiree Life Insurance
Actuarial Actuarial Accrued Unfunded UAAL as aActuarial Value Of Liability (AAL) AAL Funded Covered Percentage ofValuation Assets Frozen Entry Age (UAAL) Ratio Payroll Covered Payroll
Date (a) (b) (b-a) (a/b) (c) ((b-a)/c)
January 1, 2006 314,116 337,341 23,225 93.1% 2,506,437 0.9%January 1, 2008 329,822 382,392 52,570 86.3% 2,699,508 1.9%January 1, 2010 349,425 408,781 59,356 85.5% 3,029,651 2.0%January 1, 2012 363,778 509,315 145,537 71.4% 2,869,087 5.1%
Local Retiree Life Insurance
Actuarial Actuarial Accrued Unfunded UAAL as aActuarial Value Of Liability (AAL) AAL Funded Covered Percentage ofValuation Assets Frozen Entry Age (UAAL) Ratio Payroll Covered Payroll
Date (a) (b) (b-a) (a/b) (c) ((b-a)/c)
January 1, 2006 195,632 206,097 10,465 94.9% 3,310,064 0.3%January 1, 2008 211,950 233,444 21,494 90.8% 3,556,913 0.6%January 1, 2010 223,650 255,591 31,941 87.5% 3,864,159 0.8%January 1, 2012 231,695 326,280 94,585 71.0% 3,813,576 2.5%
Other Post Employment Benefits
Schedule of Funding Progress
(Thousands $)
Other Post Employment Benefits
Schedule of Employer Contributions(thousands $)
Duty Disability Insurance
(a) (b) (c)
Year EndedAnnual Required
Contribution Employer Contributions Percentage Contributed
December 31, 2006 44,397 44,566 100.4%December 31, 2007 46,174 47,765 103.4%December 31, 2008 47,684 50,574 106.1%December 31, 2009 50,193 51,556 102.7%December 31, 2010 53,181 51,861 97.5%December 31, 2011 50,364 52,335 103.9%December 31, 2012 48,377 52,978 109.5%December 31, 2013 49,755 53,902 108.3%
State Retiree Life Insurance
(a) (b) (c)
Year EndedAnnual Required
Contribution Employer Contributions Percentage Contributed
December 31, 2006 12,222 1,235 10.1%December 31, 2007 13,602 1,314 9.7%December 31, 2008 14,786 1,405 9.5%December 31, 2009 16,470 1,514 9.2%December 31, 2010 16,949 1,569 9.3%December 31, 2011 18,878 1,505 8.0%December 31, 2012 24,866 1,205 4.8%December 31, 2013 27,456 1,277 4.6%
Local Retiree Life Insurance
(a) (b) (c)
Year EndedAnnual Required
Contribution Employer Contributions Percentage Contributed
December 31, 2006 10,020 2,096 20.9%December 31, 2007 11,065 1,733 15.7%December 31, 2008 11,396 1,806 15.8%December 31, 2009 12,636 1,906 15.1%December 31, 2010 12,797 1,932 15.1%December 31, 2011 14,192 1,893 13.3%December 31, 2012 19,679 1,817 9.2%December 31, 2013 21,674 1,753 8.1%
Other Post Employment BenefitsSchedule of Employer Contributions
(thousands $)
Duty Disability
(a) (b) (c)
Year EndedAnnual Required
Contribution Employer Contributions Percentage Contributed
December 31, 2006 44,397 44,566 100.4%December 31, 2007 46,174 47,765 103.4%December 31, 2008 47,684 50,574 106.1%December 31, 2009 50,193 51,556 102.7%December 31, 2010 53,181 51,864 97.5%
State Retiree Life Insurance
(a) (b) (c)
Year EndedAnnual Required
Contribution Employer Contributions Percentage Contributed
December 31, 2006 12,222 1,235 10.1%December 31, 2007 13,602 1,314 9.7%December 31, 2008 14,786 1,405 9.5%December 31, 2009 16,470 1,514 9.2%December 31, 2010 16,949 1,569 9.3%
Local Retiree Life Insurance(a) (b) (c)
Year EndedAnnual Required
Contribution Employer Contributions Percentage Contributed
December 31, 2006 10,020 2,096 20.9%December 31, 2007 11,065 1,733 15.7%December 31, 2008 11,396 1,806 15.8%December 31, 2009 12,636 1,906 15.1%December 31, 2010 12,797 1,932 15.1%
Other Post Employment Benefits Schedule of Funding Progress
(Thousands $)
Other Post Employment Benefits Schedule of Employer Contributions
(Thousands $)
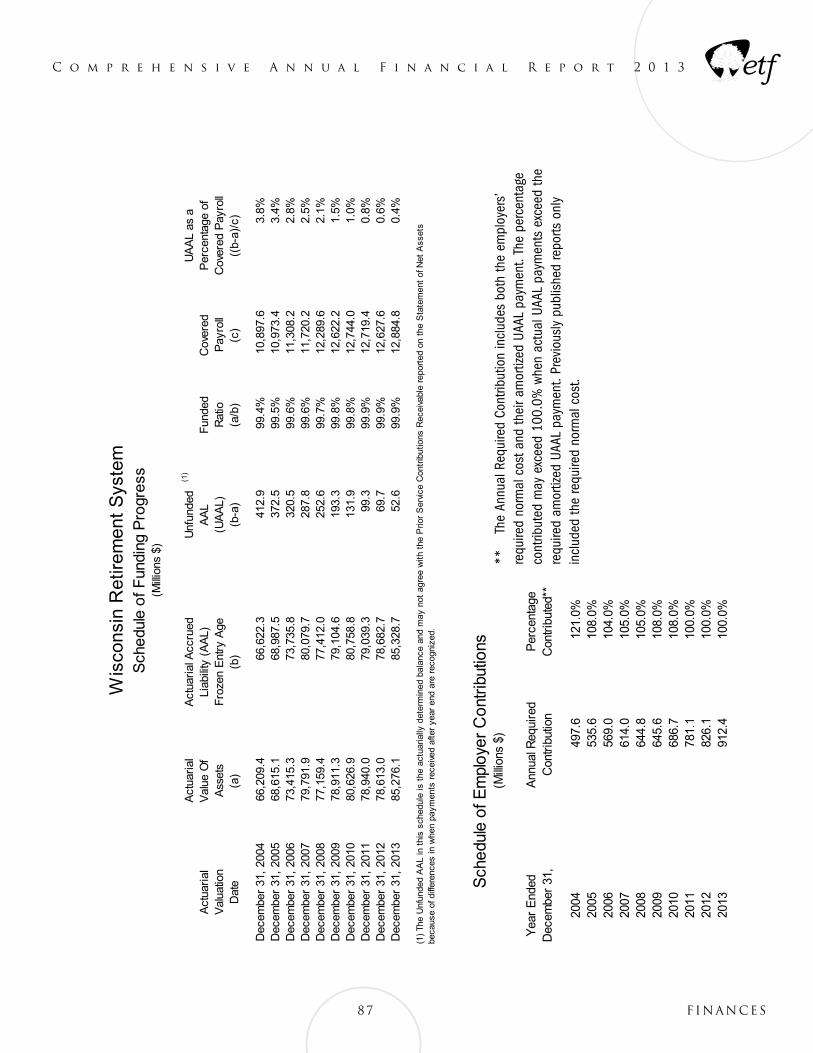
C o m p r e h e n s i v e A n n u a l F i n a n c i a l R e p o r t 2 0 1 3
87 Finances
Wis
cons
in R
etire
men
t S
yste
mS
ched
ule
of F
undi
ng P
rogr
ess
(Mill
ions
$)
Act
uari
alA
ctua
rial
Acc
rued
Unf
unde
d(1
)U
AA
L as
aA
ctua
rial
Val
ue O
fLi
abili
ty (
AA
L)A
AL
Fun
ded
Cov
ered
Per
cent
age
ofV
alua
tion
Ass
ets
Fro
zen
Ent
ry A
ge(U
AA
L)R
atio
Pay
roll
Cov
ered
Pay
roll
Dat
e(a
)(b
)(b
-a)
(a/b
)(c
)((
b-a)
/c)
Dec
embe
r 31
, 20
0466
,209
.4
66,6
22.3
412.
9
99
.4%
10,8
97.6
3.
8%D
ecem
ber
31,
2005
68,6
15.1
68
,987
.5
37
2.5
99.5
%10
,973
.4
3.4%
Dec
embe
r 31
, 20
0673
,415
.3
73,7
35.8
320.
5
99
.6%
11,3
08.2
2.
8%D
ecem
ber
31,
2007
79,7
91.9
80
,079
.7
28
7.8
99.6
%11
,720
.2
2.5%
Dec
embe
r 31
, 20
0877
,159
.4
77,4
12.0
252.
6
99
.7%
12,2
89.6
2.
1%D
ecem
ber
31,
2009
78,9
11.3
79
,104
.6
19
3.3
99.8
%12
,622
.2
1.5%
Dec
embe
r 31
, 20
1080
,626
.9
80,7
58.8
131.
9
99
.8%
12,7
44.0
1.
0%D
ecem
ber
31,
2011
78,9
40.0
79
,039
.3
99
.3
99.9
%12
,719
.4
0.8%
Dec
embe
r 31
, 20
1278
,613
.0
78,6
82.7
69.7
99
.9%
12,6
27.6
0.
6%D
ecem
ber
31,
2013
85,2
76.1
85
,328
.7
52
.6
99.9
%12
,884
.8
0.4%
(1)
The
Unf
unde
d A
AL
in t
his
sche
dule
is t
he a
ctua
rially
det
erm
ined
bal
ance
and
may
not
agr
ee w
ith t
he P
rior
Ser
vice
Con
trib
utio
ns R
ecei
vabl
e re
port
ed o
n th
e S
tate
men
t of
Net
Ass
ets
beca
use
of d
iffer
ence
s in
whe
n pa
ymen
ts r
ecei
ved
afte
r ye
ar e
nd a
re r
ecog
nize
d.
Sch
edul
e of
Em
ploy
er C
ontr
ibut
ions
(Mill
ions
$)
Yea
r E
nded
Ann
ual R
equi
red
Per
cent
age
Dec
embe
r 31
,C
ontr
ibut
ion
Con
trib
uted
**
2004
497.
6
121.
0%20
0553
5.6
10
8.0%
2006
569.
0
104.
0%20
0761
4.0
10
5.0%
2008
644.
8
105.
0%20
0964
5.6
10
8.0%
2010
686.
7
108.
0%20
1178
1.1
10
0.0%
2012
826.
1
100.
0%20
1391
2.4
10
0.0%
**
The
Ann
ual R
equi
red
Cont
ribut
ion
incl
udes
bot
h th
e em
ploy
ers’
re
quire
d no
rmal
cos
t and
thei
r am
ortiz
ed U
AAL
paym
ent.
The
perc
enta
ge
cont
ribut
ed m
ay e
xcee
d 10
0.0%
whe
n ac
tual
UAA
L pa
ymen
ts e
xcee
d th
e re
quire
d am
ortiz
ed U
AAL
paym
ent.
Prev
ious
ly p
ublis
hed
repo
rts o
nly
incl
uded
the
requ
ired
norm
al c
ost.
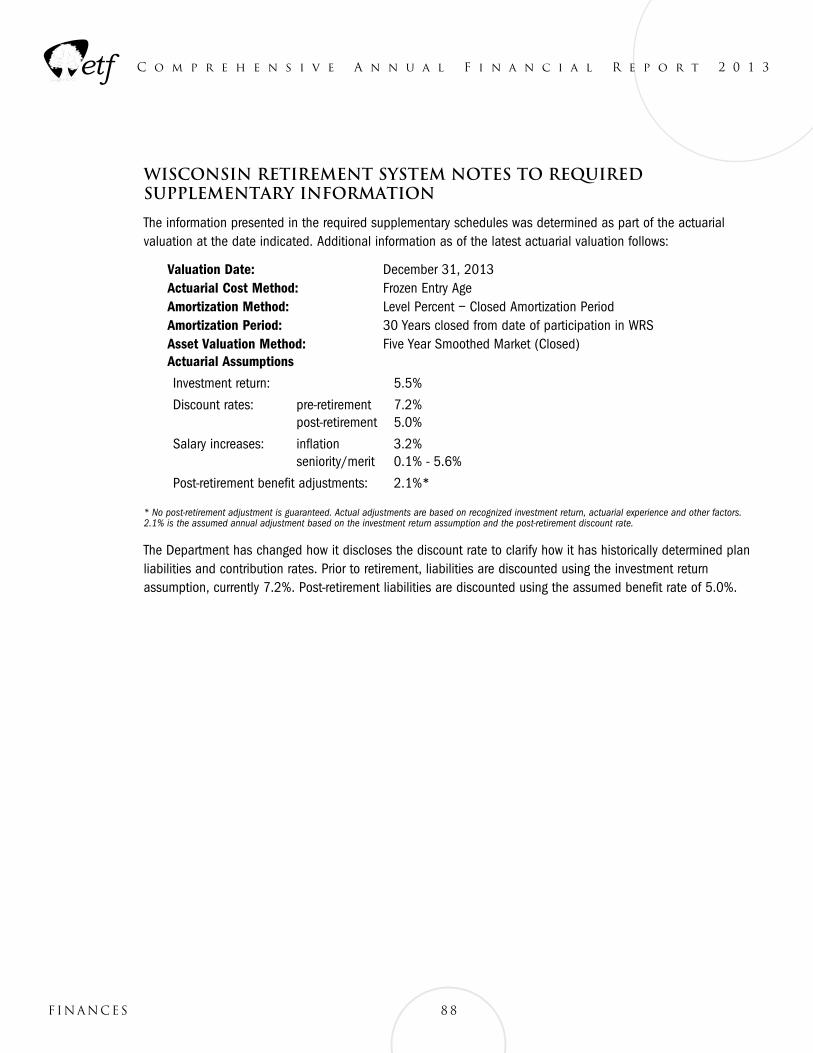
C o m p r e h e n s i v e A n n u a l F i n a n c i a l R e p o r t 2 0 1 3
88Finances
Wisconsin Retirement System Notes to Required Supplementary Information
The information presented in the required supplementary schedules was determined as part of the actuarial valuation at the date indicated. Additional information as of the latest actuarial valuation follows:
Valuation Date: December 31, 2013Actuarial Cost Method: Frozen Entry AgeAmortization Method: Level Percent – Closed Amortization PeriodAmortization Period: 30 Years closed from date of participation in WRSAsset Valuation Method: Five Year Smoothed Market (Closed)Actuarial Assumptions
Investment return: 5.5%
Discount rates: pre-retirement post-retirement
7.2% 5.0%
Salary increases: inflation seniority/merit
3.2% 0.1% - 5.6%
Post-retirement benefit adjustments: 2.1%*
* No post-retirement adjustment is guaranteed. Actual adjustments are based on recognized investment return, actuarial experience and other factors. 2.1% is the assumed annual adjustment based on the investment return assumption and the post-retirement discount rate.
The Department has changed how it discloses the discount rate to clarify how it has historically determined plan liabilities and contribution rates. Prior to retirement, liabilities are discounted using the investment return assumption, currently 7.2%. Post-retirement liabilities are discounted using the assumed benefit rate of 5.0%.
Statistics
State of WisconsinDepartment of
Employee Trust Funds
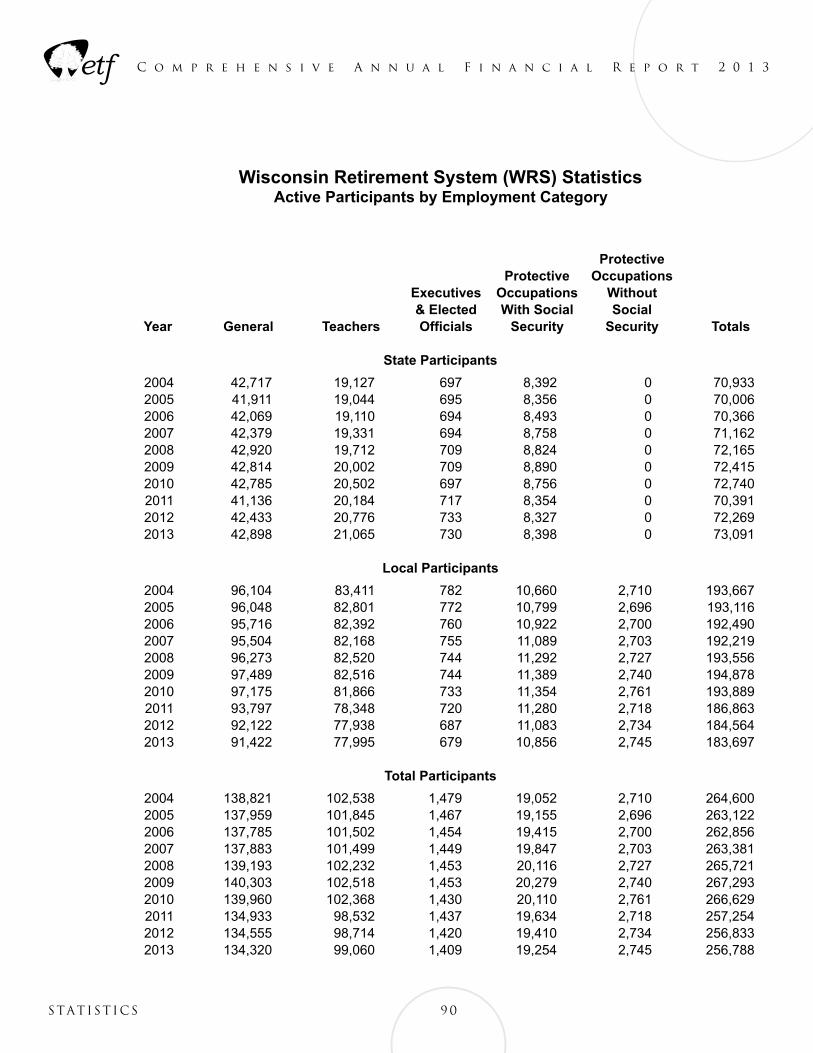
C o m p r e h e n s i v e A n n u a l F i n a n c i a l R e p o r t 2 0 1 3
90statistics
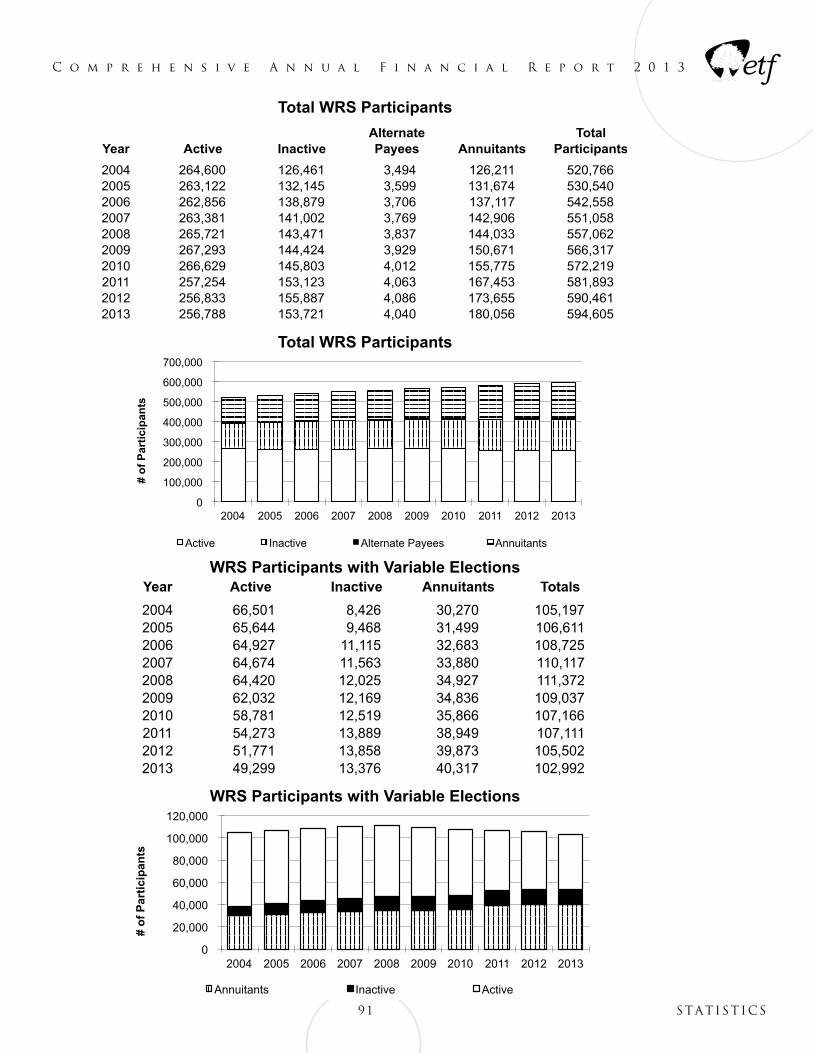
C o m p r e h e n s i v e A n n u a l F i n a n c i a l R e p o r t 2 0 1 3
91 statistics
Total WRS Participants
WRS Participants with Variable Elections
Total WRS Participants
WRS Participants with Variable Elections
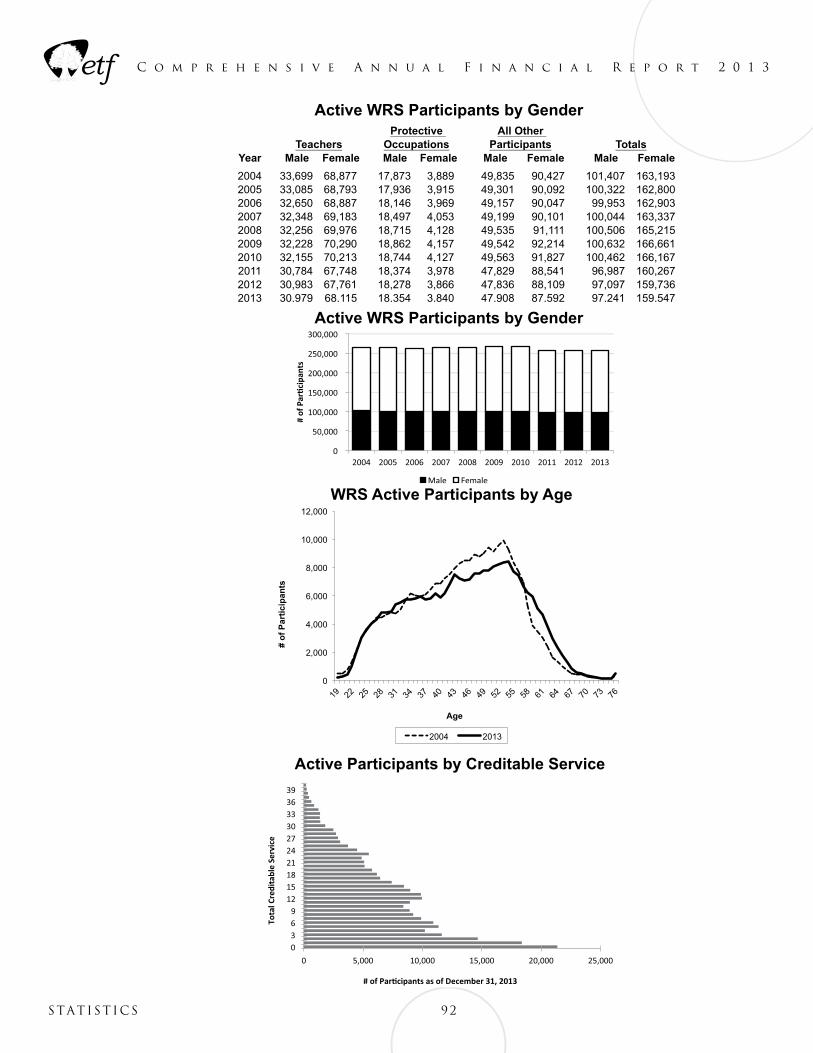
C o m p r e h e n s i v e A n n u a l F i n a n c i a l R e p o r t 2 0 1 3
92statistics
Active WRS Participants by Gender
Active WRS Participants by Gender
WRS Active Participants by Age
Active Participants by Creditable Service
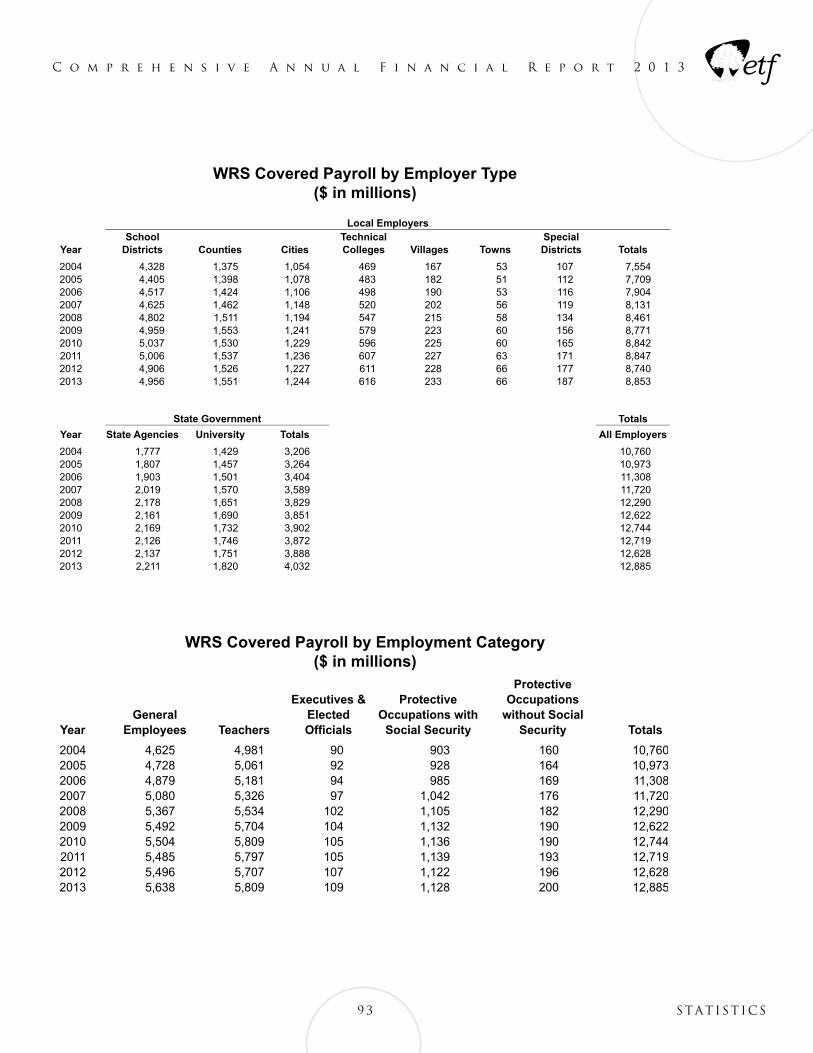
C o m p r e h e n s i v e A n n u a l F i n a n c i a l R e p o r t 2 0 1 3
93 statistics
WRS Covered Payroll by Employment Category ($ in millions)
WRS Covered Payroll by Employer Type ($ in millions)
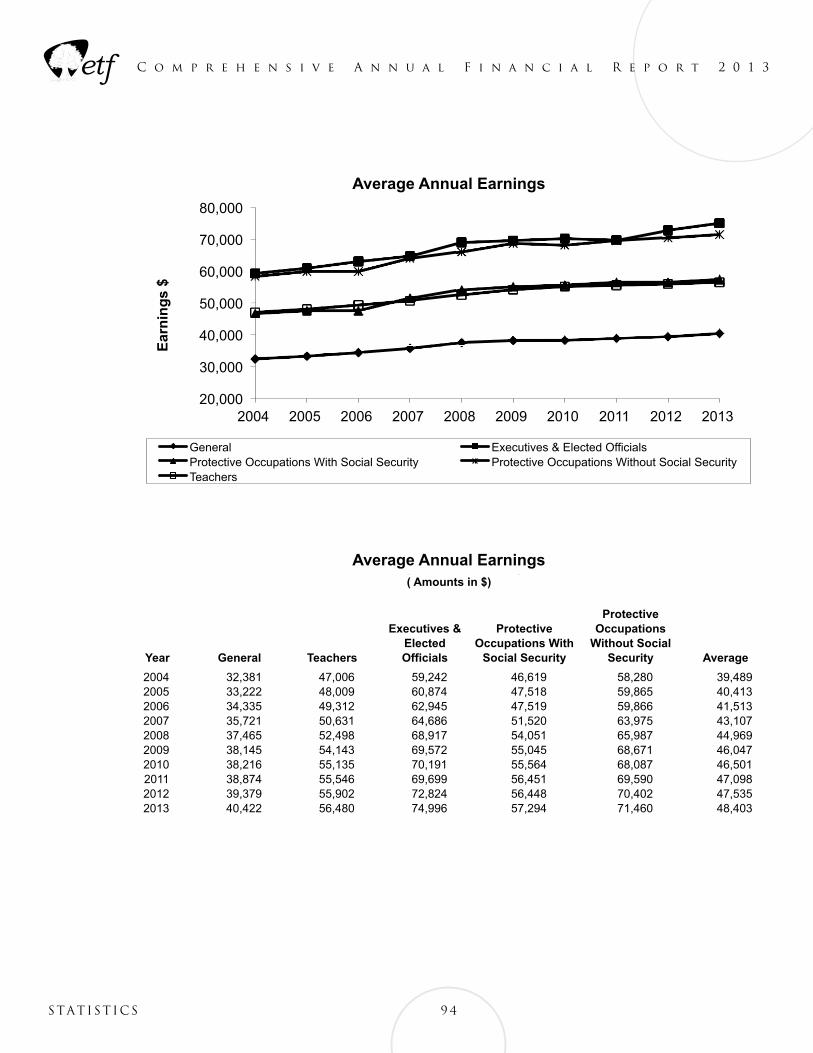
C o m p r e h e n s i v e A n n u a l F i n a n c i a l R e p o r t 2 0 1 3
94statistics
Average Annual Earnings
Average Annual Earnings
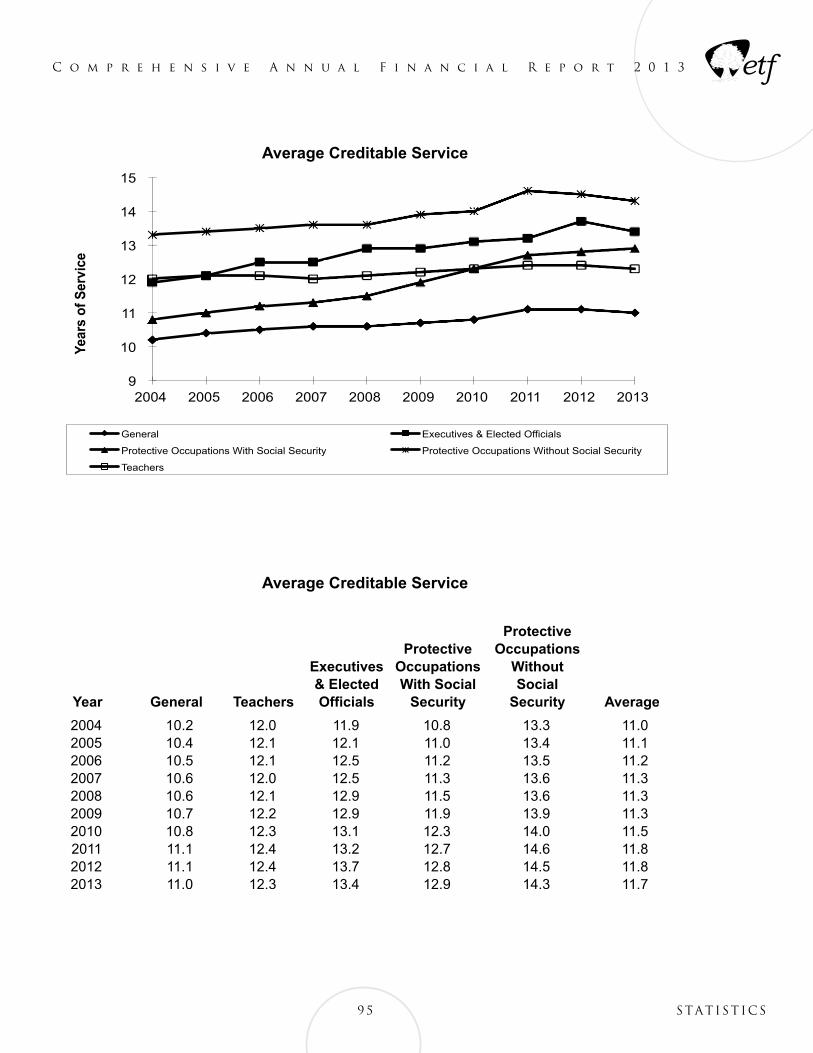
C o m p r e h e n s i v e A n n u a l F i n a n c i a l R e p o r t 2 0 1 3
95 statistics
Average Creditable Service
Average Creditable Service
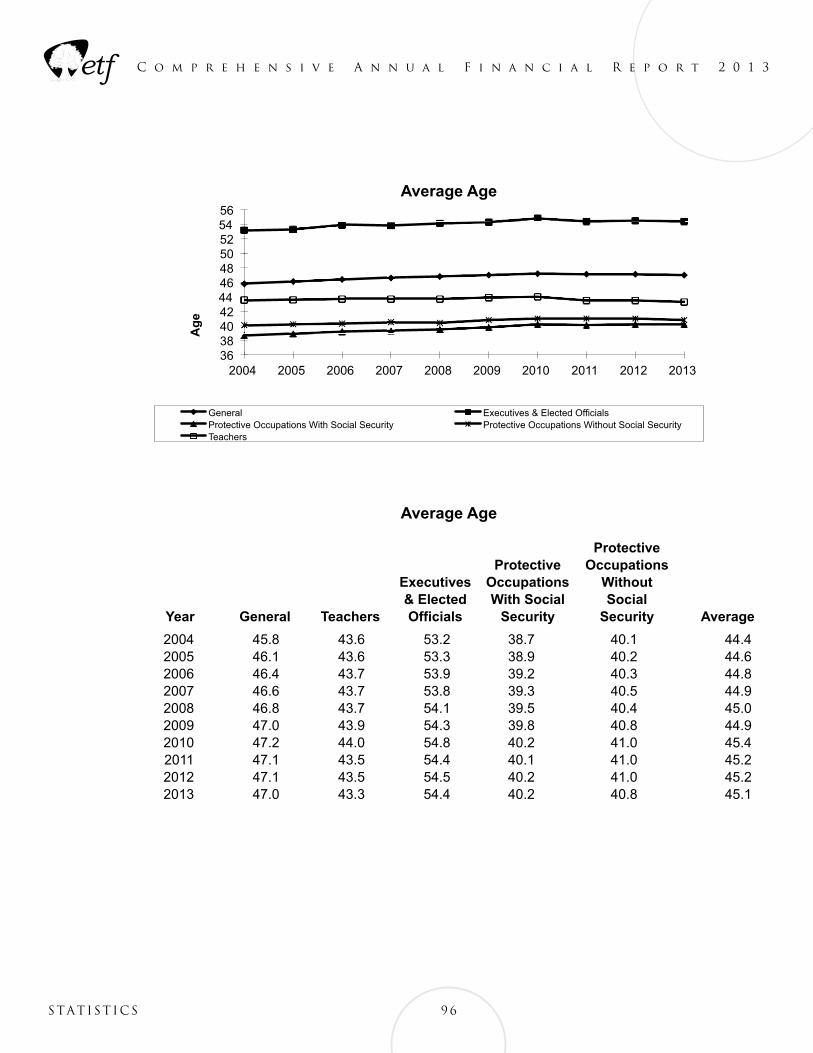
C o m p r e h e n s i v e A n n u a l F i n a n c i a l R e p o r t 2 0 1 3
96statistics
Average Age
2003 45.4 43.4 52.7 38.3 39.8 44.12004 45.8 43.6 53.2 38.7 40.1 44.42005 46.1 43.6 53.3 38.9 40.2 44.62006 46.4 43.7 53.9 39.2 40.3 44.82007 46.6 43.7 53.8 39.3 40.5 44.92008 46.8 43.7 54.1 39.5 40.4 45.02009 47.0 43.9 54.3 39.8 40.8 44.92010 47.2 44.0 54.8 40.2 41.0 45.42011 47.1 43.5 54.4 40.1 41.0 45.22012 47.1 43.5 54.5 40.2 41.0 45.2
Protective Occupations With Social
Security
Protective Occupations
Without Social
Security AverageYear General Teachers
Executives & Elected Officials
36 38 40 42 44 46 48 50 52 54 56
2003 2004 2005 2006 2007 2008 2009 2010 2011 2012
Ag
e
Average Age
General Executives & Elected Officials Protective Occupations With Social Security Protective Occupations Without Social Security Teachers
Average Age
Average Age
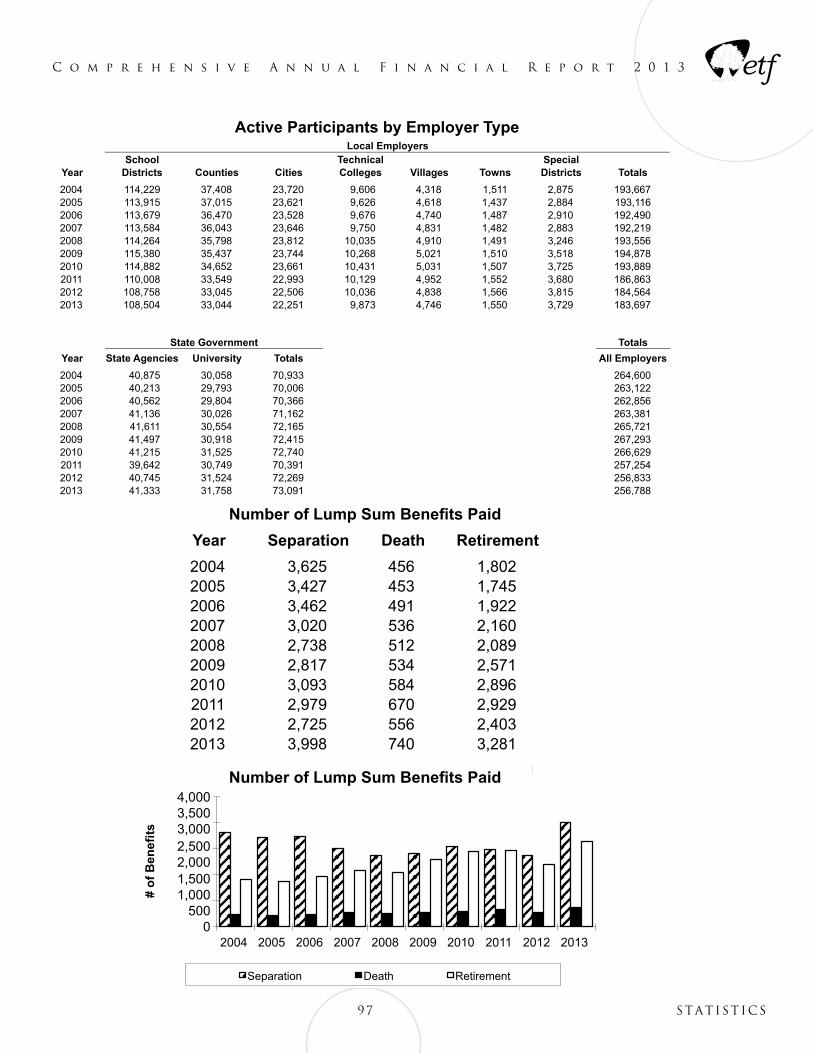
C o m p r e h e n s i v e A n n u a l F i n a n c i a l R e p o r t 2 0 1 3
Active Participants by Employer Type
97 statistics
Number of Lump Sum Benefits Paid
Number of Lump Sum Benefits Paid4,0003,5003,0002,5002,0001,5001,000
5000
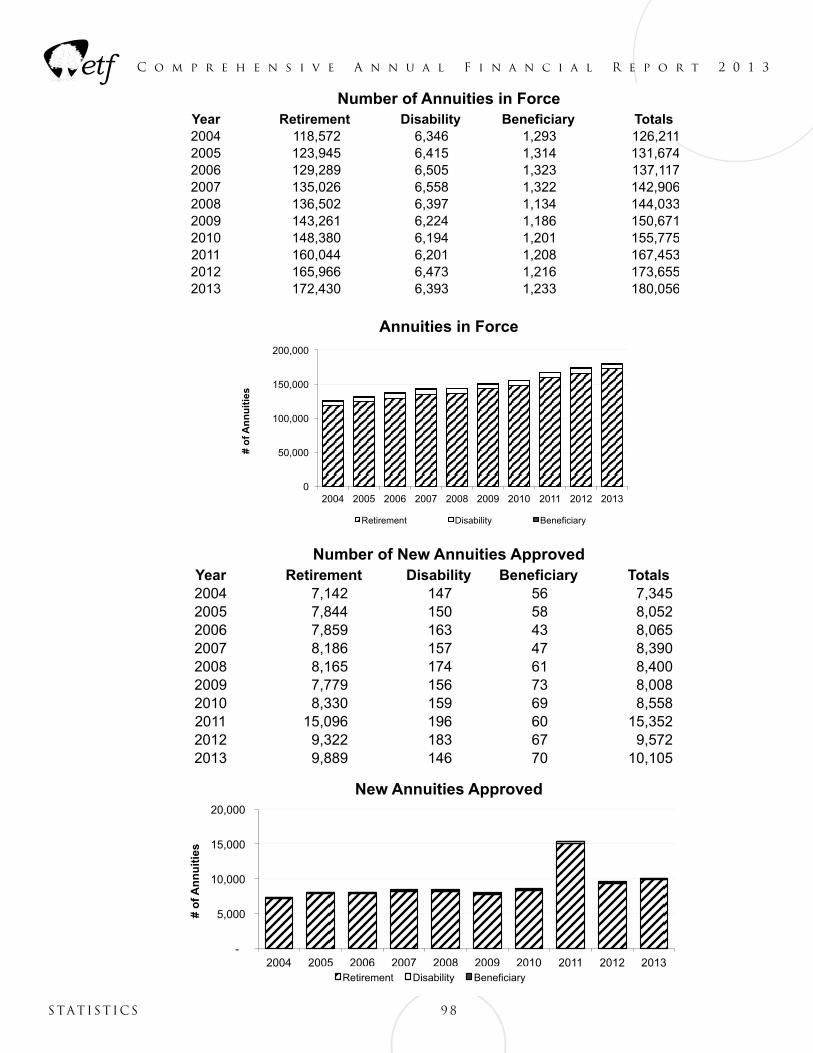
C o m p r e h e n s i v e A n n u a l F i n a n c i a l R e p o r t 2 0 1 3
98statistics
Number of New Annuities Approved
New Annuities Approved
Number of Annuities in Force
Annuities in Force
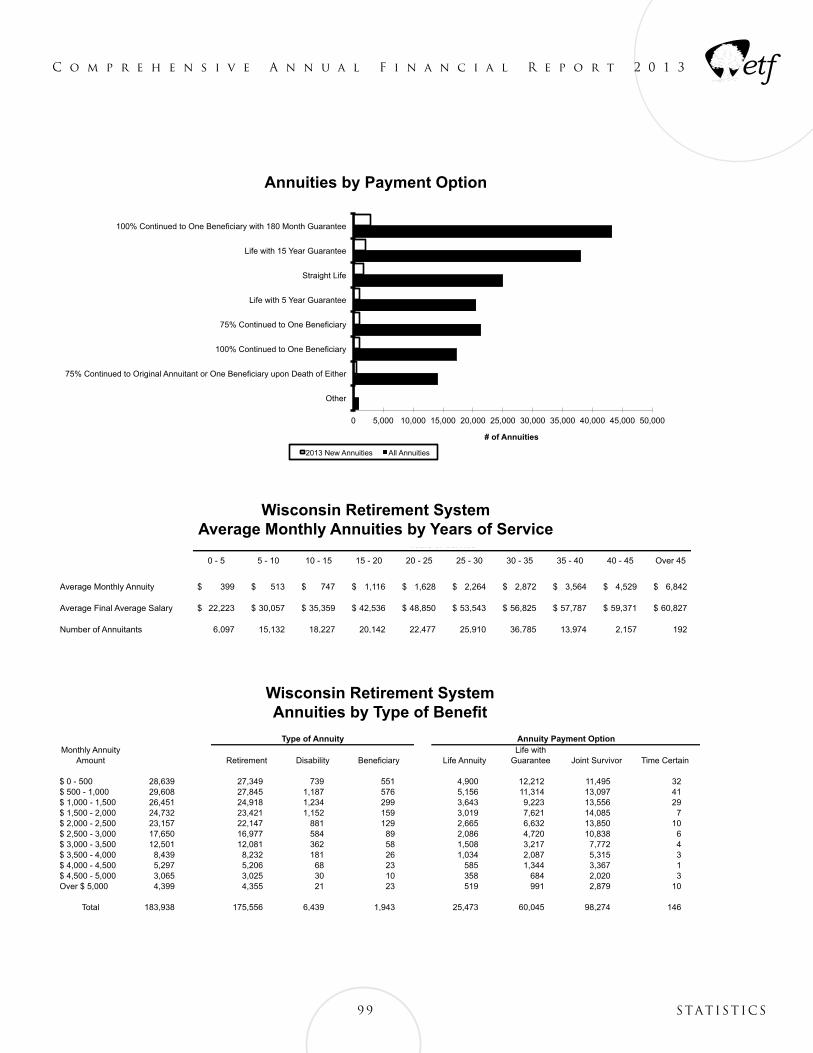
C o m p r e h e n s i v e A n n u a l F i n a n c i a l R e p o r t 2 0 1 3
99 statistics
Annuities by Payment Option
Wisconsin Retirement SystemAverage Monthly Annuities by Years of Service
Wisconsin Retirement SystemAnnuities by Type of Benefit
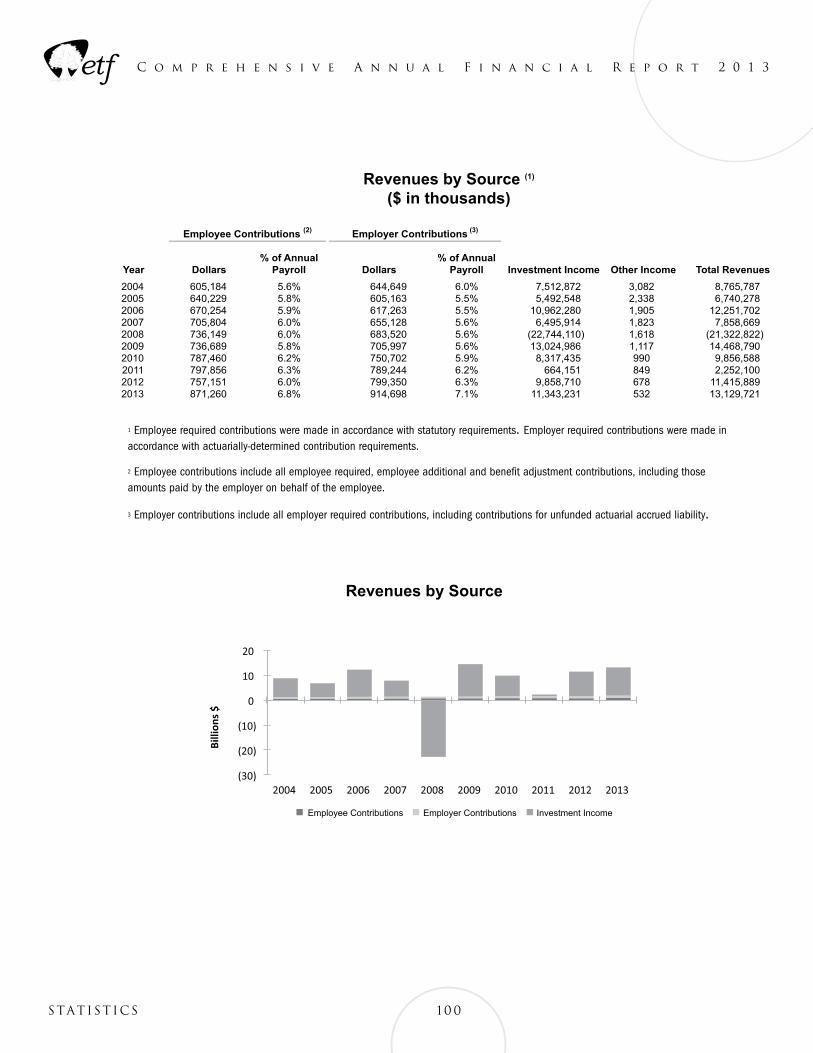
C o m p r e h e n s i v e A n n u a l F i n a n c i a l R e p o r t 2 0 1 3
100statistics
1 Employee required contributions were made in accordance with statutory requirements. Employer required contributions were made in accordance with actuarially-determined contribution requirements.
2 Employee contributions include all employee required, employee additional and benefit adjustment contributions, including those amounts paid by the employer on behalf of the employee.
3 Employer contributions include all employer required contributions, including contributions for unfunded actuarial accrued liability.
Revenues by Source (1) ($ in thousands)
Revenues by Source
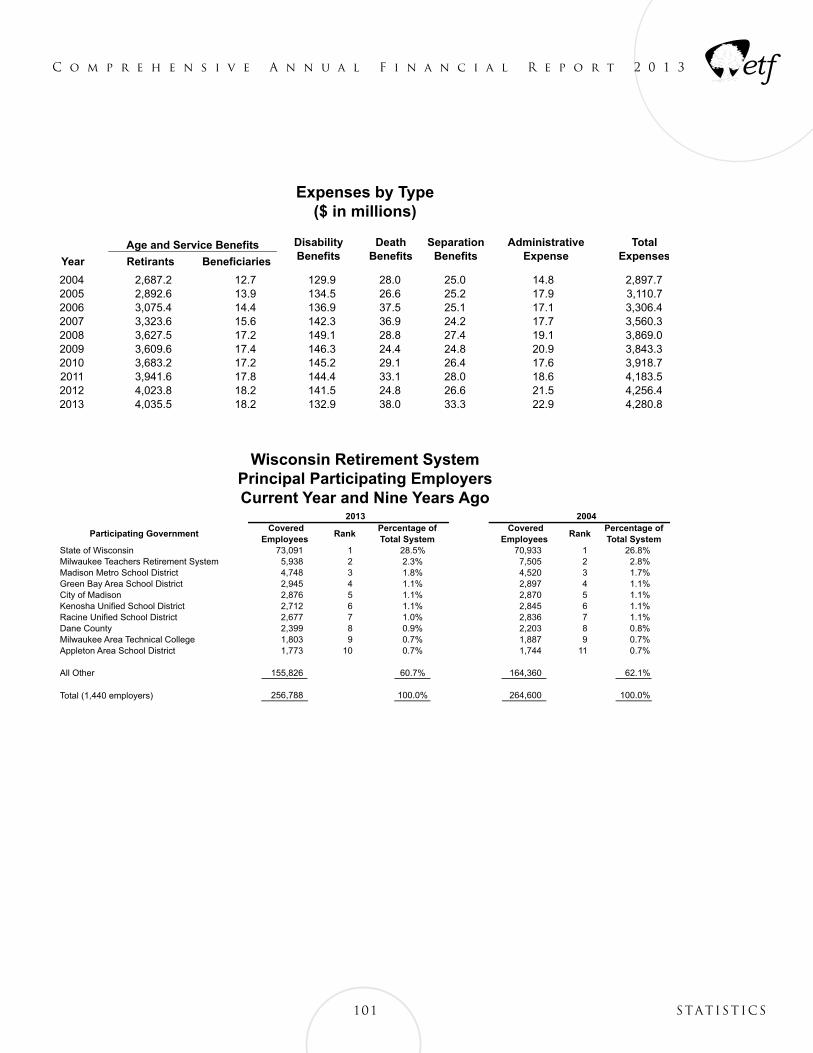
C o m p r e h e n s i v e A n n u a l F i n a n c i a l R e p o r t 2 0 1 3
101 statistics
Expenses by Type($ in millions)
Wisconsin Retirement SystemPrincipal Participating EmployersCurrent Year and Nine Years Ago
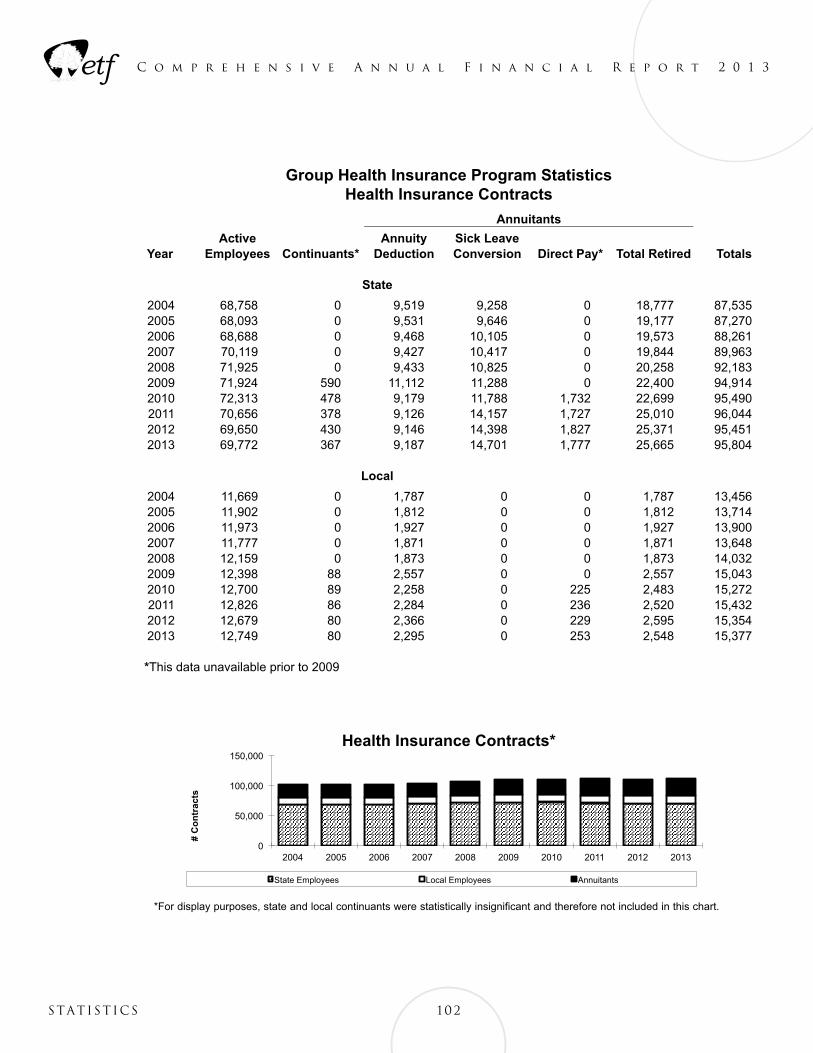
C o m p r e h e n s i v e A n n u a l F i n a n c i a l R e p o r t 2 0 1 3
102statistics
Health Insurance Contracts*
Group Health Insurance Program StatisticsHealth Insurance Contracts
*For display purposes, state and local continuants were statistically insignificant and therefore not included in this chart.
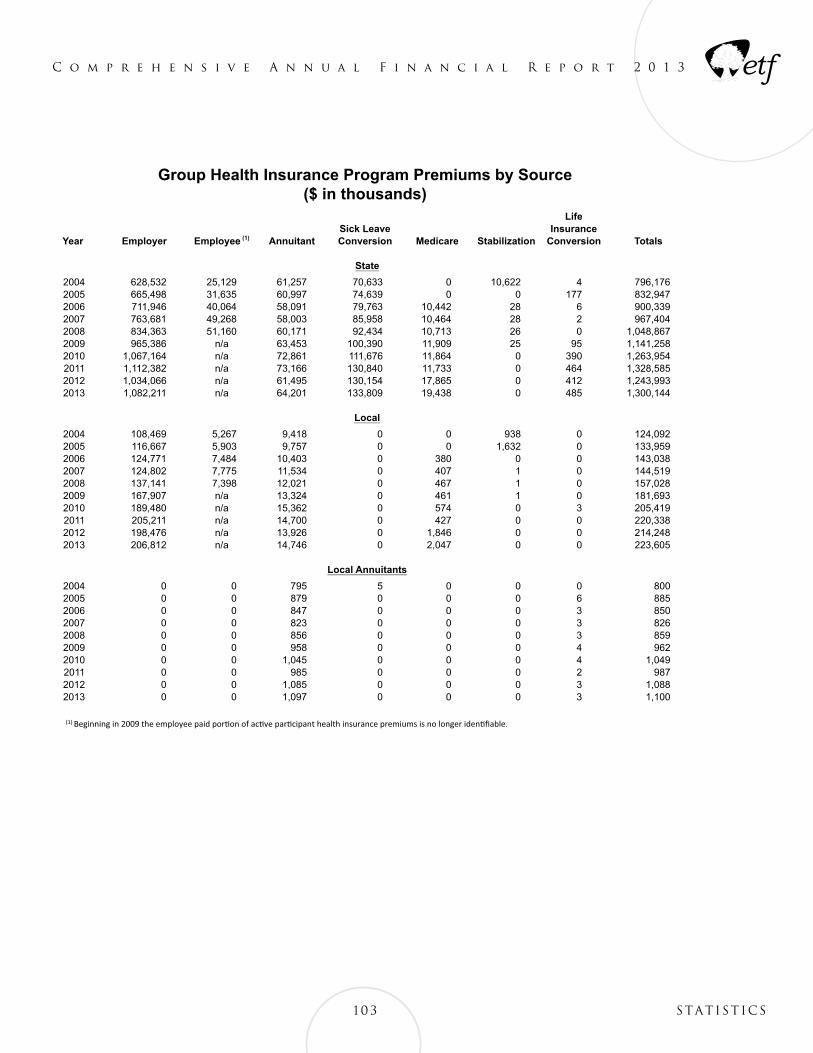
C o m p r e h e n s i v e A n n u a l F i n a n c i a l R e p o r t 2 0 1 3
103 statistics
Group Health Insurance Program Premiums by Source($ in thousands)
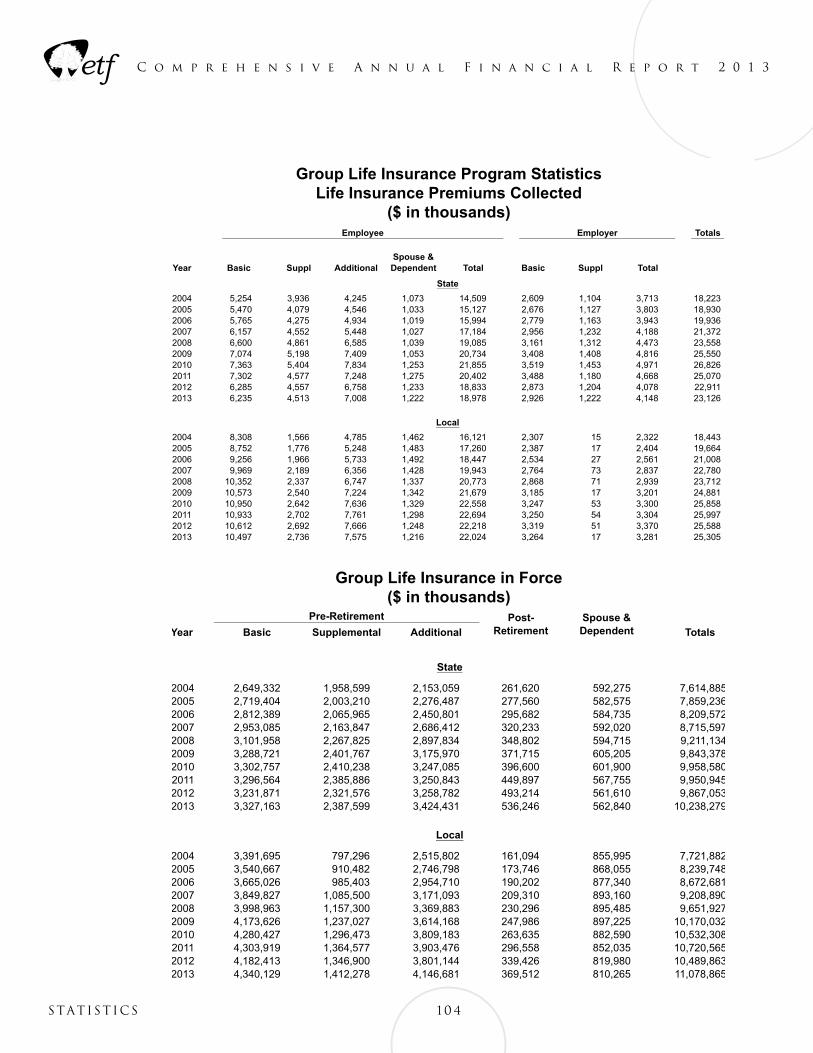
C o m p r e h e n s i v e A n n u a l F i n a n c i a l R e p o r t 2 0 1 3
104statistics
Group Life Insurance Program StatisticsLife Insurance Premiums Collected
($ in thousands)
Group Life Insurance in Force($ in thousands)
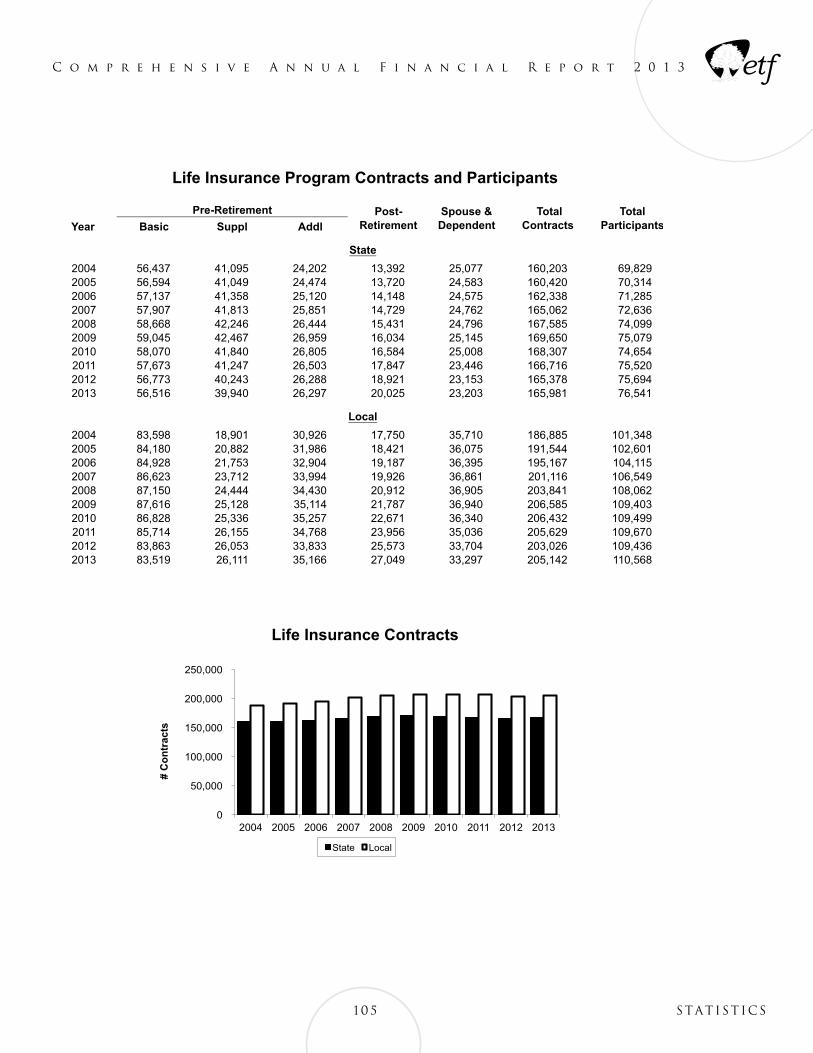
C o m p r e h e n s i v e A n n u a l F i n a n c i a l R e p o r t 2 0 1 3
105 statistics
Life Insurance Program Contracts and Participants
Life Insurance Contracts
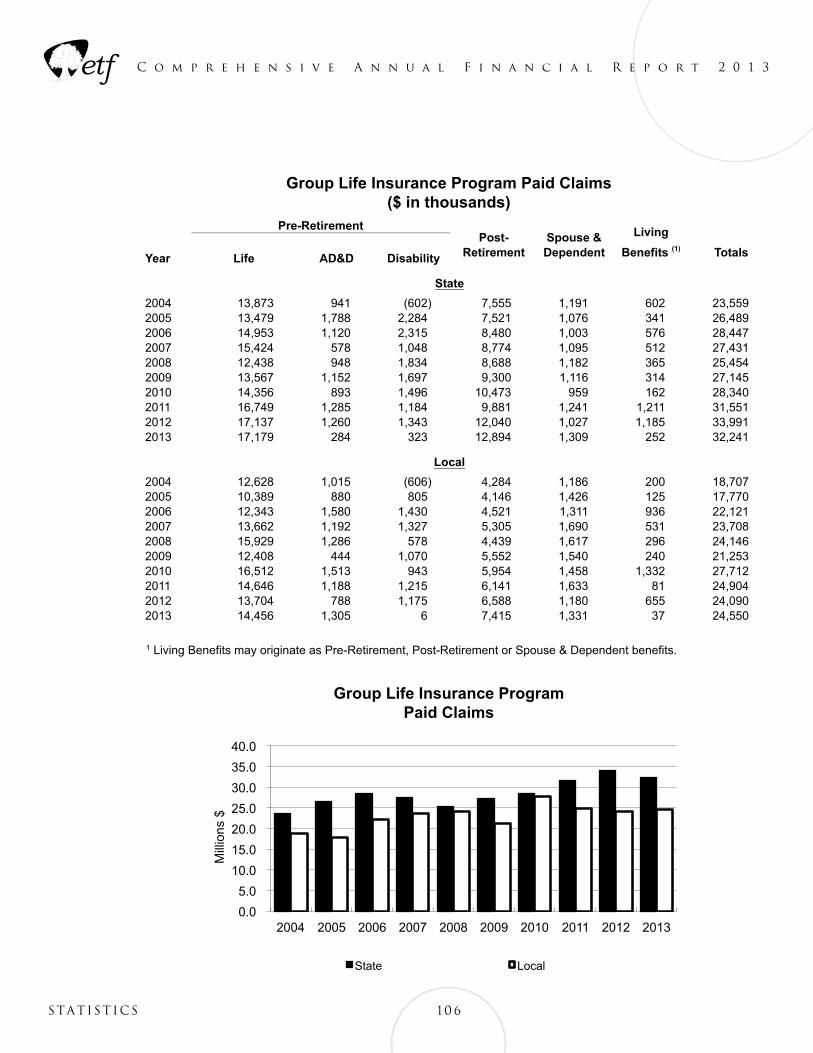
C o m p r e h e n s i v e A n n u a l F i n a n c i a l R e p o r t 2 0 1 3
106statistics
Group Life Insurance Program Paid Claims($ in thousands)
Group Life Insurance Program Paid Claims
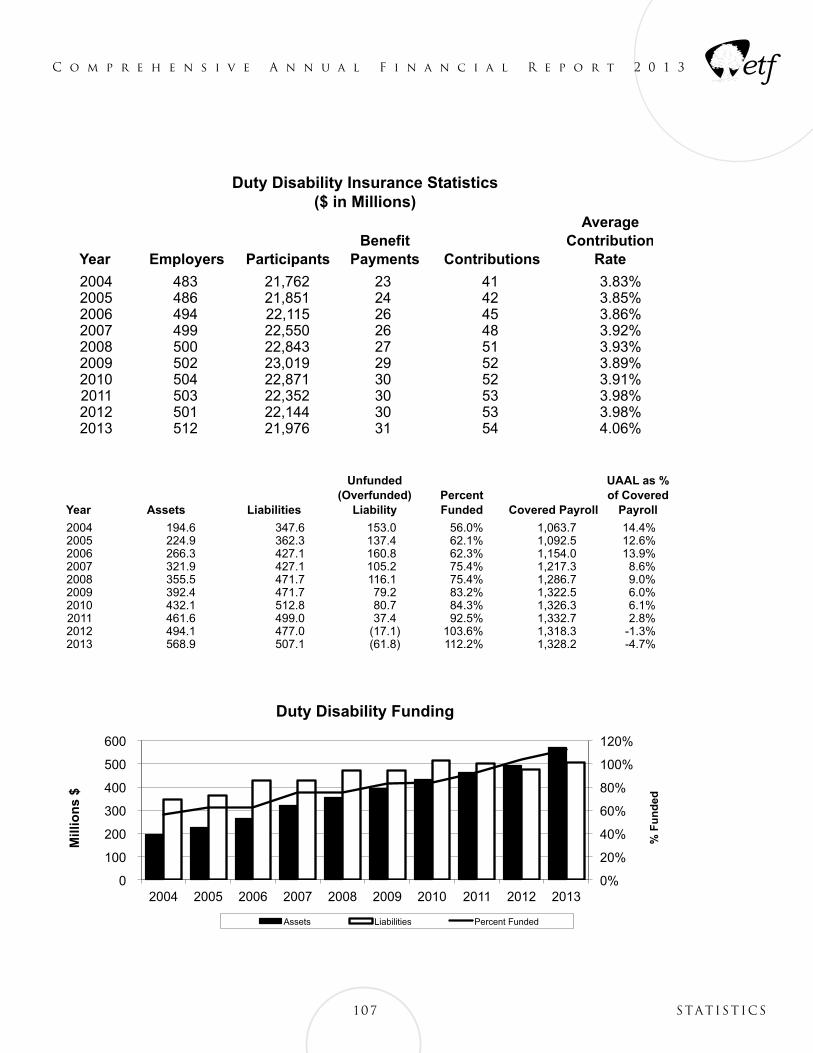
C o m p r e h e n s i v e A n n u a l F i n a n c i a l R e p o r t 2 0 1 3
107 statistics
Duty Disability Insurance Statistics($ in Millions)
Duty Disability Funding
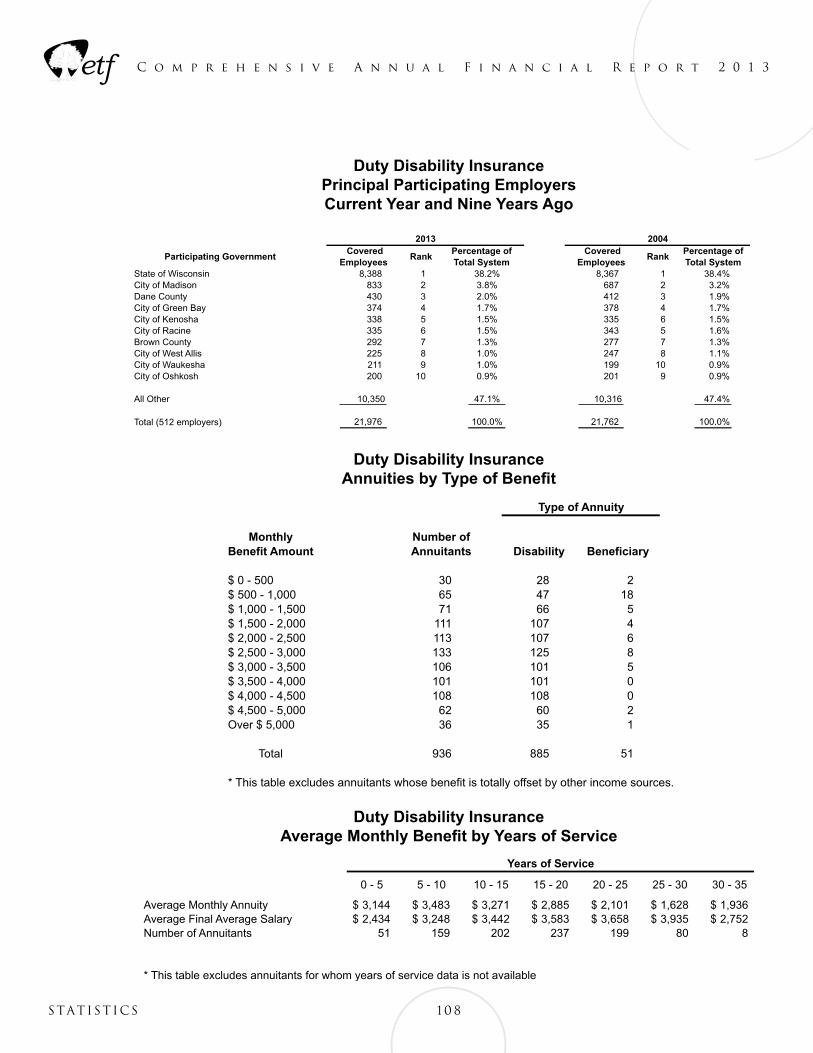
C o m p r e h e n s i v e A n n u a l F i n a n c i a l R e p o r t 2 0 1 3
108statistics
Duty Disability InsurancePrincipal Participating EmployersCurrent Year and Nine Years Ago
Duty Disability InsuranceAnnuities by Type of Benefit
Duty Disability InsuranceAverage Monthly Benefit by Years of Service
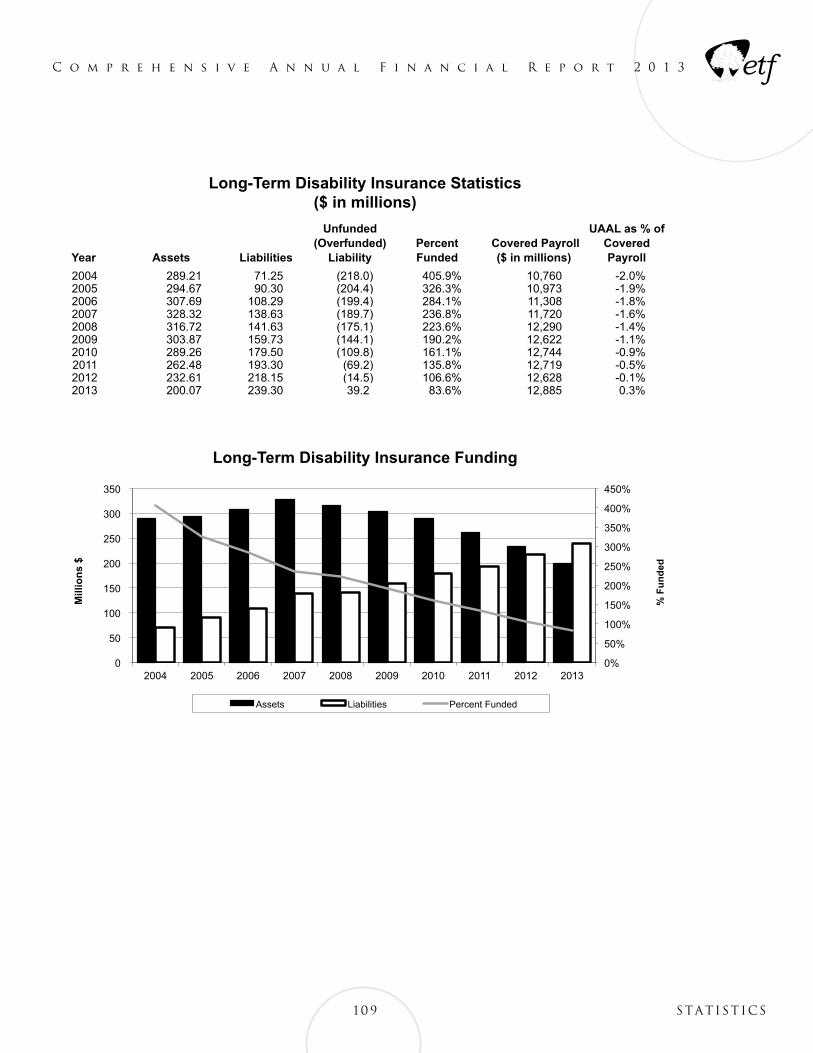
C o m p r e h e n s i v e A n n u a l F i n a n c i a l R e p o r t 2 0 1 3
109 statistics
Long-Term Disability Insurance Statistics($ in millions)
Long-Term Disability Insurance Funding
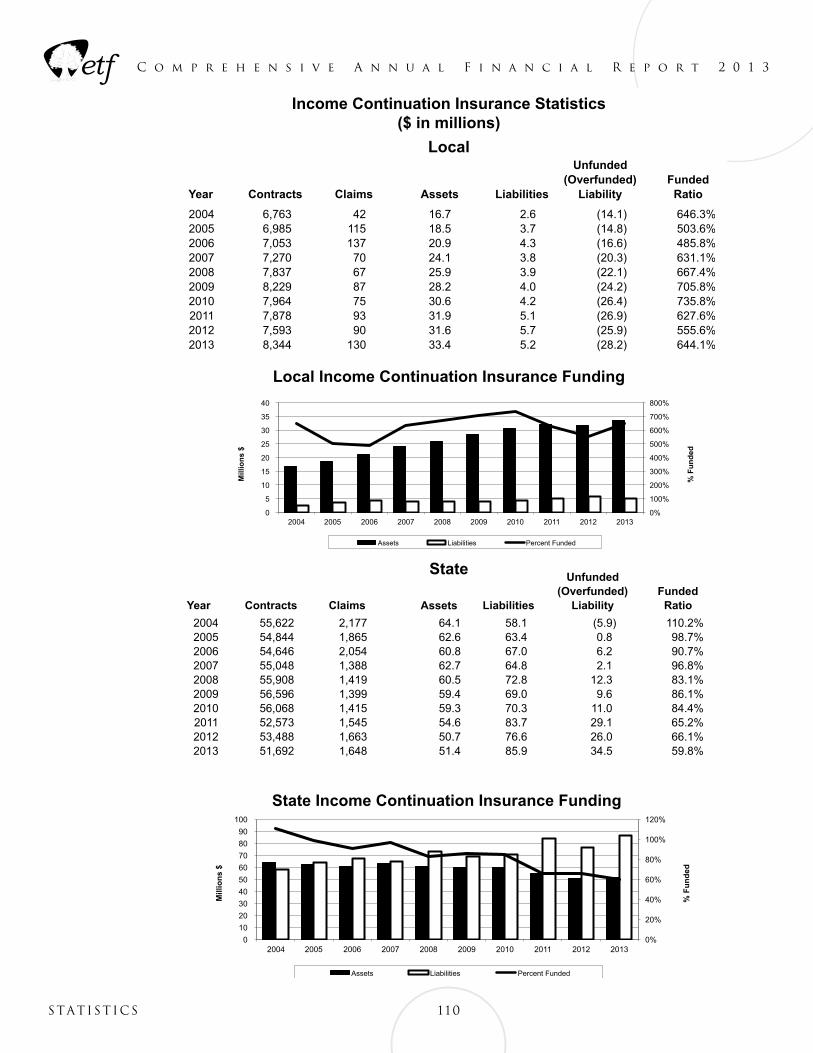
C o m p r e h e n s i v e A n n u a l F i n a n c i a l R e p o r t 2 0 1 3
Funded Ratio
Local2002 5,610 80 13.1 2.6 (10.5) 502.2%2003 6,353 75 14.7 2.3 (12.4) 639.8%2004 6,763 42 16.7 2.6 (14.1) 646.3%2005 6,985 115 18.5 3.7 (14.8) 503.6%2006 7,053 137 20.9 4.3 (16.6) 485.8%2007 7,270 70 24.1 3.8 (20.3) 631.1%2008 7,837 67 25.9 3.9 (22.1) 667.4%2009 8,229 87 28.2 4.0 (24.2) 705.8%2010 7,964 75 30.6 4.2 (26.4) 735.8%2011 7,878 93 31.9 5.1 (26.9) 627.6%
Liabilities
Unfunded (Overfunded)
Liability
Income Continuation Insurance Statistics($ in millions)
Year Contracts Claims Assets
1 10statistics
Income Continuation Insurance Statistics($ in millions)
Local
Local Income Continuation Insurance Funding
State Income Continuation Insurance Funding
Funded Ratio
2002 54,876 1,981 62.9 55.6 (7.3) 113.1%2003 55,357 2,024 63.8 54.6 (9.3) 117.0%2004 55,622 2,177 64.1 58.1 (5.9) 110.2%2005 54,844 1,865 62.6 63.4 0.8 98.7%2006 54,646 2,054 60.8 67.0 6.2 90.7%2007 55,048 1,388 62.7 64.8 2.1 96.8%2008 55,908 1,419 60.5 72.8 12.3 83.1%2009 56,596 1,399 59.4 69.0 9.6 86.1%2010 56,068 1,415 59.3 70.3 11.0 84.4%2011 52,573 1,545 54.6 83.7 29.1 65.2%
Income Continuation Insurance Statistics($ in millions)
State
Unfunded (Overfunded)
LiabilityLiabilitiesAssetsClaimsContractsYear
0%
20%
40%
60%
80%
100%
120%
140%
0
10
20
30
40
50
60
70
80
90
2002 2003 2004 2005 2006 2007 2008 2009 2010 2011
% F
un
ded
Mill
ion
s $
State Income Continuation Insurance Funding
Assets Liabilities Percent Funded Funded
Ratio
Local2002 5,610 80 13.1 2.6 (10.5) 502.2%2003 6,353 75 14.7 2.3 (12.4) 639.8%2004 6,763 42 16.7 2.6 (14.1) 646.3%2005 6,985 115 18.5 3.7 (14.8) 503.6%2006 7,053 137 20.9 4.3 (16.6) 485.8%2007 7,270 70 24.1 3.8 (20.3) 631.1%2008 7,837 67 25.9 3.9 (22.1) 667.4%2009 8,229 87 28.2 4.0 (24.2) 705.8%2010 7,964 75 30.6 4.2 (26.4) 735.8%2011 7,878 93 31.9 5.1 (26.9) 627.6%
Liabilities
Unfunded (Overfunded)
Liability
Income Continuation Insurance Statistics($ in millions)
Year Contracts Claims Assets
State
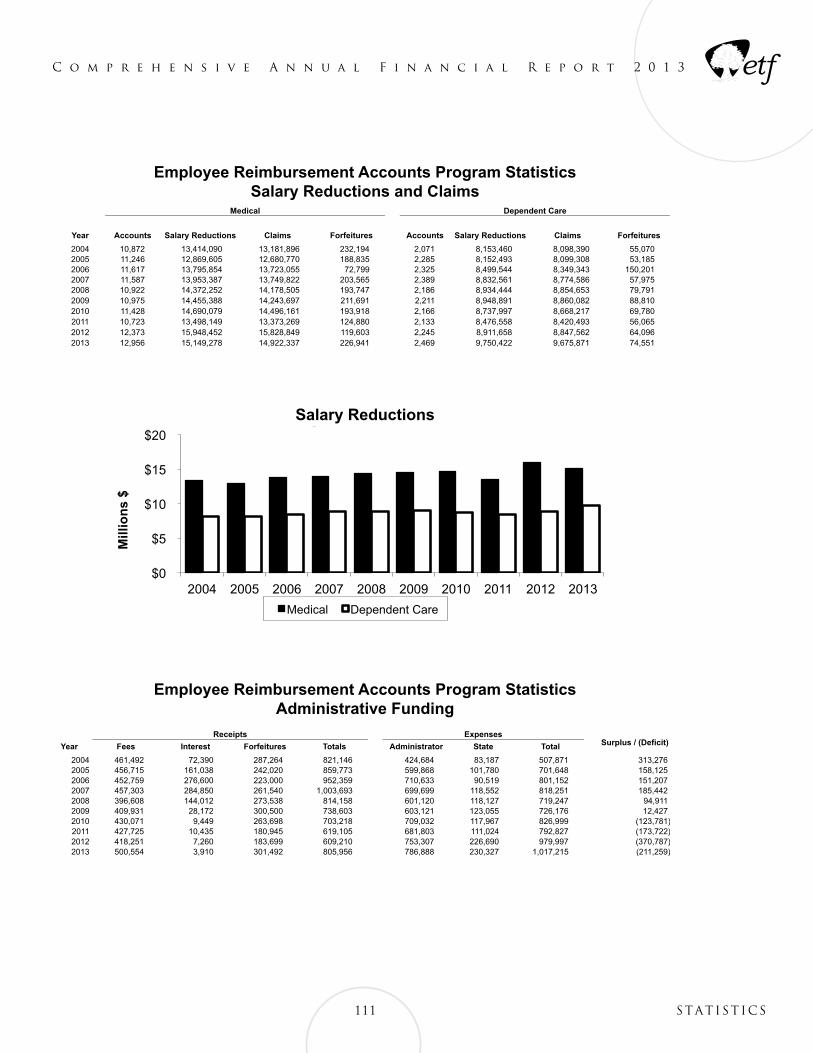
C o m p r e h e n s i v e A n n u a l F i n a n c i a l R e p o r t 2 0 1 3
1 1 1 statistics
Employee Reimbursement Accounts Program StatisticsSalary Reductions and Claims
Employee Reimbursement Accounts Program StatisticsAdministrative Funding
Salary Reductions
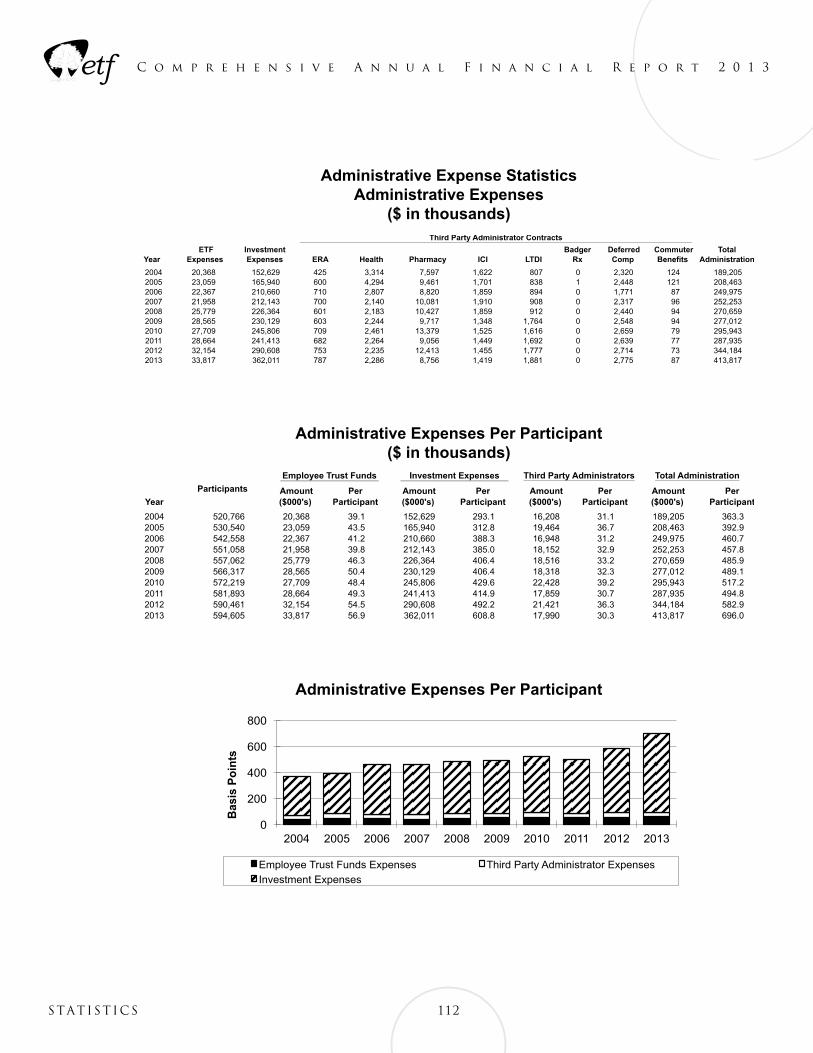
C o m p r e h e n s i v e A n n u a l F i n a n c i a l R e p o r t 2 0 1 3
1 12statistics
Administrative Expenses Per Participant
Administrative Expenses Per Participant($ in thousands)
Administrative Expense StatisticsAdministrative Expenses
($ in thousands)

Actuarial
State of WisconsinDepartment of
Employee Trust Funds
October 31, 2014 Employee Trust Funds Board 801 West Badger Road Madison, Wisconsin 53713-2526 Re: Wisconsin Retirement System (WRS) Ladies and Gentlemen: The basic financial objective of the WRS is to establish and receive contributions which:
when expressed in terms of percents of active member payroll, will remain approximately level from generation-to-generation, and
when combined with present assets and future investment return, will be sufficient to meet the financial obligations of WRS to present and future retirees and beneficiaries.
The purpose of the valuation was to determine contribution rates for the 2015 fiscal year and to provide actuarial information in connection with applicable Governmental Accounting Standards Board Statements. The valuation should not be relied upon for any other purpose. The valuation process develops contribution rates that are sufficient to fund the plan’s normal cost (i.e., the costs assigned by the valuation method to the year of service about to be rendered), as well as to fund unfunded actuarial accrued liabilities as a level percent of active member payroll over a finite period. The valuations were completed based upon population data, asset data, and plan provisions in effect on December 31, 2013. The valuation was based upon information, furnished by the plan’s administrative staff, concerning Retirement System benefits, financial transactions, and individual members, terminated members, retirees and beneficiaries. We checked the data for internal and year to year consistency, but did not otherwise audit the data. As a result, we do not assume responsibility for the accuracy or completeness of the data provided. The actuary prepared the following supporting schedules for the Comprehensive Annual Financial Report:
Percent Increase in Salaries Single Life Retirement Values Rates of Retirement for Those Eligible to Retire Early Retirement Pattern Percentage of Active Members Withdrawing (Select and Ultimate) Percentage of Active Members becoming Disabled Solvency Test Summary of Accrued and Unfunded Accrued Liabilities
Employee Trust Funds Board October 31 2014 Page 2
Assets are valued on a statutory market related basis that recognizes assumed return fully each year and spreads each year’s gain or loss above or below assumed return over a closed five-year period. Actuarial valuations are based upon assumptions regarding future activity in specific risk areas including the rates of investment return and payroll growth, eligibility for the various classes of benefits, and longevity among retired lives. The Board adopts these assumptions after considering the advice of the actuary and other professionals. The assumptions and the methods comply with the requirements of Statement No. 25 of the Governmental Accounting Standards Board and are in in conformity with generally accepted actuarial principles and practices, and with the Actuarial Standards of Practice issued by the Actuarial Standards Board. Each actuarial valuation takes into account all prior differences between actual and assumed experience in each risk area and adjusts the contribution rates as needed. The December 31, 2013 valuations were based upon assumptions that were recommended in connection with a study of experience covering the 2009-2011 period. Future actuarial measurements may differ significantly from those presented in the valuations due to such factors as experience differing from that anticipated by actuarial assumptions, changes in plan provision, actuarial assumptions/methods or applicable law. Due to the limited scope of the assignment, we did not perform an analysis of the potential range of future measurements. Based upon the results of the December 31, 2013 valuations, we are pleased to report to the Board that the Wisconsin Retirement System is meeting its basic financial objective and continues to operate in accordance with actuarial principles of level percent of payroll financing. Brian B. Murphy, Mark Buis, and James D. Anderson are Members of the American Academy of Actuaries (MAAA), and meet the Qualification Standards of the American Academy of Actuaries to render the actuarial opinion contained herein.
Respectfully submitted, Brian B. Murphy, F.S.A., M.A.A.A. Mark Buis, F.S.A, M.A.A.A James D. Anderson, F.S.A., M.A.A.A. BBM/MB/JDA:
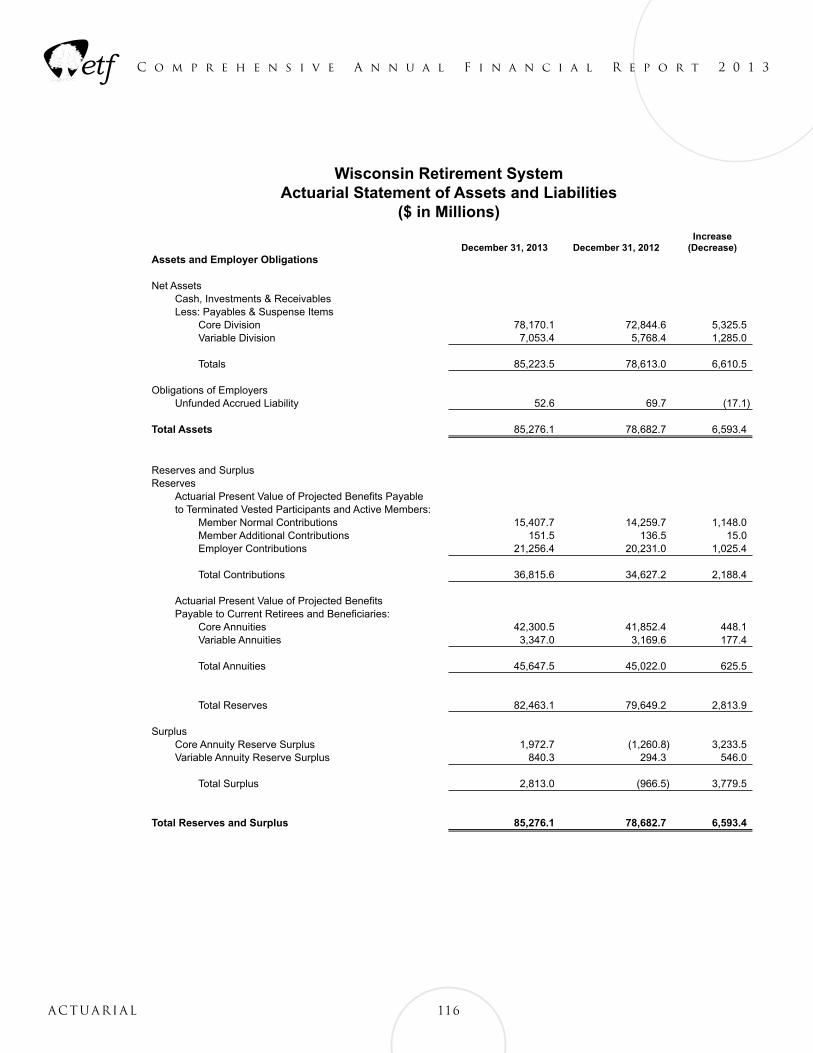
C o m p r e h e n s i v e A n n u a l F i n a n c i a l R e p o r t 2 0 1 3
actuarial
H:\anualrpt\2004 Annual Report\2004 Actuarial\Actuarial Balance Sheet_updated per LAB Comments 12.9.14.xlsx
IncreaseDecember 31, 2013 December 31, 2012 (Decrease)
Assets and Employer Obligations
Net AssetsCash, Investments & ReceivablesLess: Payables & Suspense Items
Core Division 78,170.1 72,844.6 5,325.5Variable Division 7,053.4 5,768.4 1,285.0
Totals 85,223.5 78,613.0 6,610.5
Obligations of EmployersUnfunded Accrued Liability 52.6 69.7 (17.1)
Total Assets 85,276.1 78,682.7 6,593.4
Reserves and SurplusReserves
Actuarial Present Value of Projected Benefits Payableto Terminated Vested Participants and Active Members:
Member Normal Contributions 15,407.7 14,259.7 1,148.0Member Additional Contributions 151.5 136.5 15.0Employer Contributions 21,256.4 20,231.0 1,025.4
Total Contributions 36,815.6 34,627.2 2,188.4
Actuarial Present Value of Projected BenefitsPayable to Current Retirees and Beneficiaries:
Core Annuities 42,300.5 41,852.4 448.1Variable Annuities 3,347.0 3,169.6 177.4
Total Annuities 45,647.5 45,022.0 625.5
Total Reserves 82,463.1 79,649.2 2,813.9
SurplusCore Annuity Reserve Surplus 1,972.7 (1,260.8) 3,233.5Variable Annuity Reserve Surplus 840.3 294.3 546.0
Total Surplus 2,813.0 (966.5) 3,779.5
Total Reserves and Surplus 85,276.1 78,682.7 6,593.4
0.00 0.00
Wisconsin Retirement SystemActuarial Statement of Assets and Liabilities
($ in Millions)
1 16
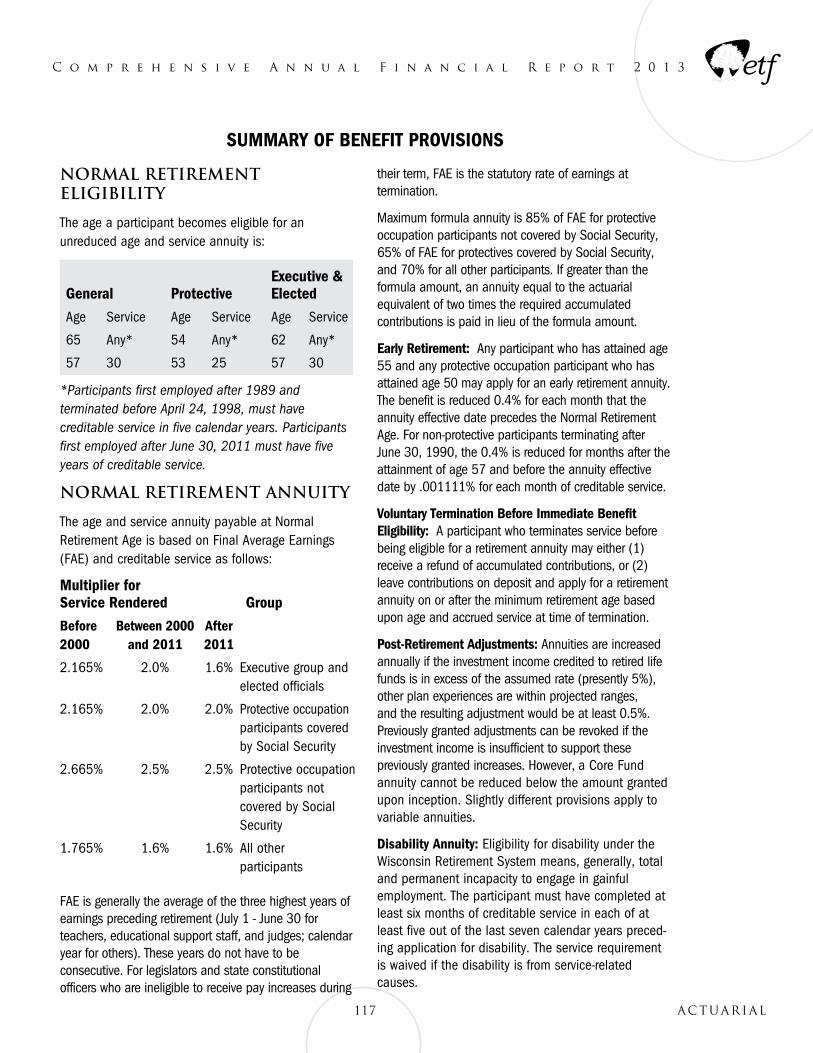
C o m p r e h e n s i v e A n n u a l F i n a n c i a l R e p o r t 2 0 1 3
Normal Retirement Eligibility
The age a participant becomes eligible for an unreduced age and service annuity is:
*Participants first employed after 1989 and terminated before April 24, 1998, must have creditable service in five calendar years. Participants first employed after June 30, 2011 must have five years of creditable service.
Normal Retirement Annuity
The age and service annuity payable at Normal Retirement Age is based on Final Average Earnings (FAE) and creditable service as follows:
Multiplier for Service Rendered GroupBefore 2000
Between 2000 and 2011
After 2011
2.165% 2.0% 1.6% Executive group and elected officials
2.165% 2.0% 2.0% Protective occupation participants covered by Social Security
2.665% 2.5% 2.5% Protective occupation participants not covered by Social Security
1.765% 1.6% 1.6% All other participants
FAE is generally the average of the three highest years of earnings preceding retirement (July 1 - June 30 for teachers, educational support staff, and judges; calendar year for others). These years do not have to be consecutive. For legislators and state constitutional officers who are ineligible to receive pay increases during
their term, FAE is the statutory rate of earnings at termination.
Maximum formula annuity is 85% of FAE for protective occupation participants not covered by Social Security, 65% of FAE for protectives covered by Social Security, and 70% for all other participants. If greater than the formula amount, an annuity equal to the actuarial equivalent of two times the required accumulated contributions is paid in lieu of the formula amount.
Early Retirement: Any participant who has attained age 55 and any protective occupation participant who has attained age 50 may apply for an early retirement annuity. The benefit is reduced 0.4% for each month that the annuity effective date precedes the Normal Retirement Age. For non-protective participants terminating after June 30, 1990, the 0.4% is reduced for months after the attainment of age 57 and before the annuity effective date by .001111% for each month of creditable service.
Voluntary Termination Before Immediate Benefit Eligibility: A participant who terminates service before being eligible for a retirement annuity may either (1) receive a refund of accumulated contributions, or (2) leave contributions on deposit and apply for a retirement annuity on or after the minimum retirement age based upon age and accrued service at time of termination.
Post-Retirement Adjustments: Annuities are increased annually if the investment income credited to retired life funds is in excess of the assumed rate (presently 5%), other plan experiences are within projected ranges, and the resulting adjustment would be at least 0.5%. Previously granted adjustments can be revoked if the investment income is insufficient to support these previously granted increases. However, a Core Fund annuity cannot be reduced below the amount granted upon inception. Slightly different provisions apply to variable annuities.
Disability Annuity: Eligibility for disability under the Wisconsin Retirement System means, generally, total and permanent incapacity to engage in gainful employment. The participant must have completed at least six months of creditable service in each of at least five out of the last seven calendar years preced-ing application for disability. The service requirement is waived if the disability is from service-related causes.
General ProtectiveExecutive & Elected
Age Service Age Service Age Service
65 Any* 54 Any* 62 Any*
57 30 53 25 57 30
actuarial
SUMMARY OF BENEFIT PROVISIONS
1 17
C o m p r e h e n s i v e A n n u a l F i n a n c i a l R e p o r t 2 0 1 3
actuarial
Disability Amounts: Amounts payable in case of disability depend upon the plan from which payment is made. Plans are described below.
Pre-10/16/92 WRS PlanPost-10/15/92 Long-Term Disability Insurance (LTDI) Plan
Participants Covered Participants hired before 10/16/92 who do not elect LTDI coverage.
Participants entering after 10/15/92 and participants on 10/15/92 who elect LTDI coverage.
Benefit to age 65* WRS formula benefit based on service projected to normal retirement age
40% of FAE for participants covered by Social Security; 50% of FAE for non-covered participants who cannot qualify for Social Security disability benefits.
Benefit at age 65* Continuation of pre-65 amount. WRS benefit accrued to date of disability plus 7% of FAE money purchase benefit during disability period, both of which are adjusted in accordance with the dividend rate.
*Conversion age is later for participants becoming disabled after age 61.
Death In Service: Prior to age 50 for protective participants and age 55 for others, the benefit is the equivalent of twice the accumulated employee required and all additional contributions and employer amounts contributed prior to 1974 for teachers or 1966 for others. After age 50 for protective occupation participants, and age 55 for others, the benefit is the amount that would have been paid if participant had retired and elected the 100% survivor option. The benefit is payable to a spouse, child, or other dependent.
Interest credits: Interest is credited on member Core Fund accounts based on the prior year ending account balance and the interest rates shown below.
Interest is credited on member Variable Fund accounts based on the prior year ending account balance and the Variable effective rate.
Interest on both Core and Variable member additional deposit accounts is based on the prior year ending account balance and the appropriate effective rate.
Contribution Rates: The financial objective of the WRS is to establish and receive contributions that will remain level from year to year and decade to decade.
Effective June 28, 2011, the employee contribution for general category employees, teachers and executives and elected officials is equal to one-half the actuarially required contribution. The employee contribution for protective occupations is the same percentage as general employees. The employer is responsible for the remainder of the actuarially determined contribution. The employer may not pay any portion of the employee contribution unless provided for by an pre-existing collective bargaining agreement.
Rate Credited For Purpose of
Date of ParticipationMoney Purchase
Minimum Refunds
Prior to 1982 Core Effective Rate Core Effective Rate
January 1, 1982 and later and terminated prior to January 1, 2000 5% 3%
January 1, 1982 and later and not terminated prior to January 1, 2000 Core Effective Rate Core Effective Rate
1 18
C o m p r e h e n s i v e A n n u a l F i n a n c i a l R e p o r t 2 0 1 3
The principal areas of risk assumption are:
1. Long-term rates of investment income likely to be generated by the assets of the retirement fund. This includes both realized and unrealized appreciation and depreciation.
2. Rates of mortality among participants, retirees and beneficiaries.
3. Rates of withdrawal of active participants.
4. Rates of disability among participants.
5. Patterns of salary increases to be experienced by participants.
6. The age and service distribution of actual retirements.
In making a valuation, the actuary must project the monetary value of each risk assumption for each distinct experience group for the next year and for each year over the next half-century or longer.
Once actual risk experience has occurred and been observed, it will not coincide exactly with assumed risk experience regardless of the skill of the actuary, the completeness of the data, and the precision of the calculations. Each valuation provides a completed recalculation of assumed future risk experience and takes into account all past differences between assumed and actual risk experience. The result is a continual series of small adjustments to the computed contribution rate. From time to time it becomes necessary to adjust the package of risk measurements to reflect basic experience trends but not random year-to-year fluctuations.
The actuarial valuation method used in the valuation was the Frozen Initial Liability Actuarial Valuation Method. Under this method, the amount of remaining unfunded accrued actuarial liabilities at any valuation date are affected only by the monthly amortization payments, compound interest, the added liability created by new employer units, and any added liabilities caused by changes in benefit provisions.
Economic Assumptions
The Investment Return Assumption for plan assets is 7.2%.
For determining plan liabilities, the Discount Rate is 5.0% for retired participants, 5.0% for active and inactive participants following retirement, and 7.2% for active participants prior to their retirement. A valuation performed assuming 5.5% discount rate for all participants at all stages of life, reproduces the results of an actuarial valuation using the 5% post-retirement and 7.2% pre-retirement assumptions. Thus, it can be said that the net discount rate assumed in the valuations was 5.5% per year, compounded annually (net after administrative expenses).
The Wage Inflation Rate assumed in this valuation was 3.20% per year. The wage inflation rate is defined to be the portion of total pay increases for an individual that are due to macroeconomic forces, including productivity, price inflation, and labor market conditions. The wage inflation rate does not include pay changes related to individual merit and seniority effects.
No specific Price Inflation assumption is required to perform this valuation because there are no benefits that are linked to price increases. However, a price inflation assumption on the order of 2.0% to 2.7% would be consistent with the other economic assumptions.
The assumed Real Rate of Return over wage inflation is defined to be the portion of total investment return that is more than the assumed total wage growth rate. Considering other economic assumptions, the 7.2% pre-retirement investment return rate translates to an assumed real rate of return over wage inflation of 4.0%. The assumed real rate of return over price inflation would be higher – on the order of 4.5% to 5.2%, considering both an inflation assumption and an average expense provision.
Pay increase assumptions for individual active participants are shown for sample services below. Part of the assumption for each age is for merit and/or seniority increase, and the other 3.2% recognizes wage inflation, including price inflation, productivity increases, and other macroeconomic forces.
1 19 actuarial
ACTUARIAL METHOD AND ASSUMPTIONS USED IN VALUATIONS
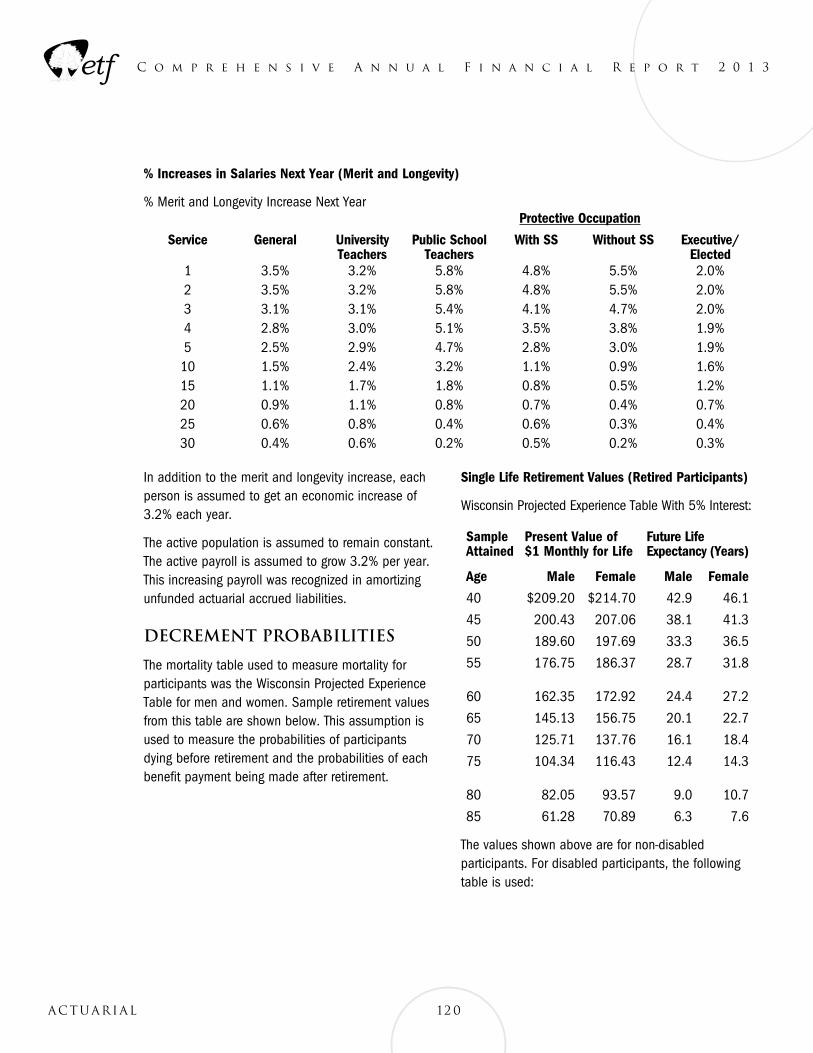
C o m p r e h e n s i v e A n n u a l F i n a n c i a l R e p o r t 2 0 1 3
In addition to the merit and longevity increase, each person is assumed to get an economic increase of 3.2% each year.
The active population is assumed to remain constant. The active payroll is assumed to grow 3.2% per year. This increasing payroll was recognized in amortizing unfunded actuarial accrued liabilities.
Decrement Probabilities
The mortality table used to measure mortality for participants was the Wisconsin Projected Experience Table for men and women. Sample retirement values from this table are shown below. This assumption is used to measure the probabilities of participants dying before retirement and the probabilities of each benefit payment being made after retirement.
Single Life Retirement Values (Retired Participants)
Wisconsin Projected Experience Table With 5% Interest:
Sample Attained
Present Value of $1 Monthly for Life
Future Life Expectancy (Years)
Age Male Female Male Female
40 $209.20 $214.70 42.9 46.1
45 200.43 207.06 38.1 41.3
50 189.60 197.69 33.3 36.5
55 176.75 186.37 28.7 31.8
60 162.35 172.92 24.4 27.2
65 145.13 156.75 20.1 22.7
70 125.71 137.76 16.1 18.4
75 104.34 116.43 12.4 14.3
80 82.05 93.57 9.0 10.7
85 61.28 70.89 6.3 7.6
The values shown above are for non-disabled participants. For disabled participants, the following table is used:
120actuarial
Protective Occupation
Service General University Teachers
Public School Teachers
With SS Without SS Executive/ Elected
1 3.5% 3.2% 5.8% 4.8% 5.5% 2.0%2 3.5% 3.2% 5.8% 4.8% 5.5% 2.0%3 3.1% 3.1% 5.4% 4.1% 4.7% 2.0%4 2.8% 3.0% 5.1% 3.5% 3.8% 1.9%5 2.5% 2.9% 4.7% 2.8% 3.0% 1.9%
10 1.5% 2.4% 3.2% 1.1% 0.9% 1.6%15 1.1% 1.7% 1.8% 0.8% 0.5% 1.2%20 0.9% 1.1% 0.8% 0.7% 0.4% 0.7%25 0.6% 0.8% 0.4% 0.6% 0.3% 0.4%30 0.4% 0.6% 0.2% 0.5% 0.2% 0.3%
% Increases in Salaries Next Year (Merit and Longevity)
% Merit and Longevity Increase Next Year
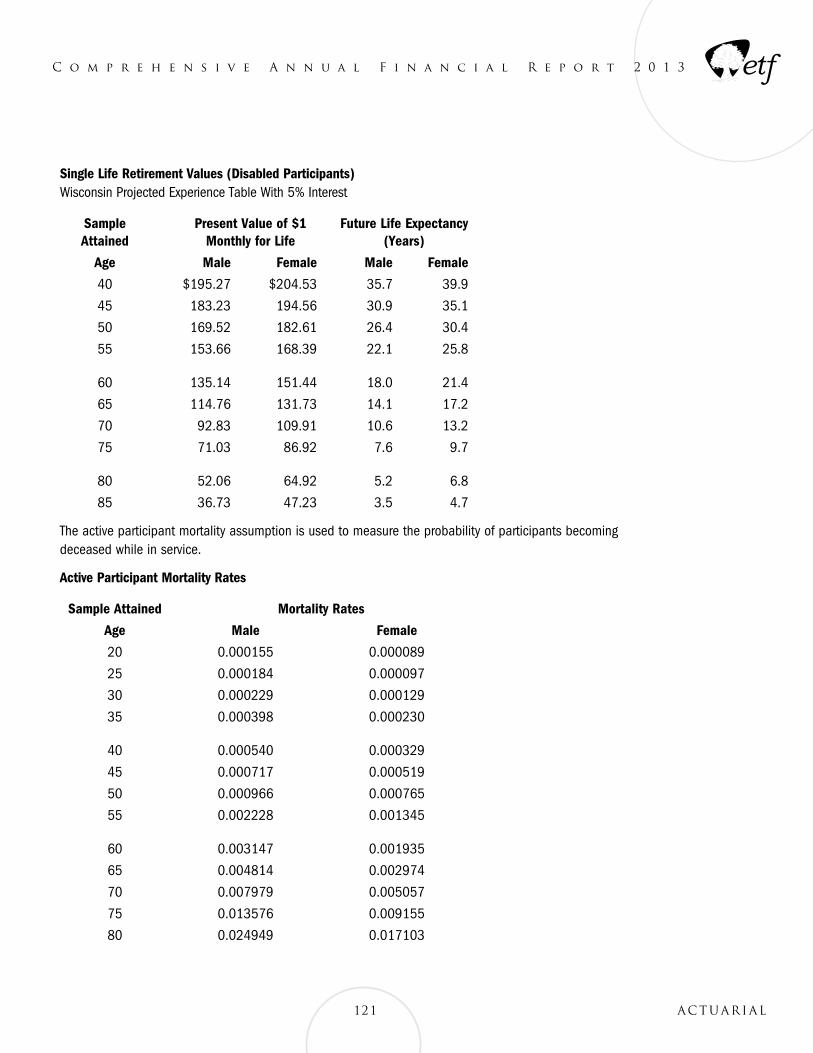
C o m p r e h e n s i v e A n n u a l F i n a n c i a l R e p o r t 2 0 1 3
Single Life Retirement Values (Disabled Participants) Wisconsin Projected Experience Table With 5% Interest
Sample Attained
Present Value of $1 Monthly for Life
Future Life Expectancy (Years)
Age Male Female Male Female
40 $195.27 $204.53 35.7 39.9
45 183.23 194.56 30.9 35.1
50 169.52 182.61 26.4 30.4
55 153.66 168.39 22.1 25.8
60 135.14 151.44 18.0 21.4
65 114.76 131.73 14.1 17.2
70 92.83 109.91 10.6 13.2
75 71.03 86.92 7.6 9.7
80 52.06 64.92 5.2 6.8
85 36.73 47.23 3.5 4.7
The active participant mortality assumption is used to measure the probability of participants becoming deceased while in service.
Active Participant Mortality Rates
Sample Attained Mortality Rates
Age Male Female
20 0.000155 0.000089
25 0.000184 0.000097
30 0.000229 0.000129
35 0.000398 0.000230
40 0.000540 0.000329
45 0.000717 0.000519
50 0.000966 0.000765
55 0.002228 0.001345
60 0.003147 0.001935
65 0.004814 0.002974
70 0.007979 0.005057
75 0.013576 0.009155
80 0.024949 0.017103
12 1 actuarial
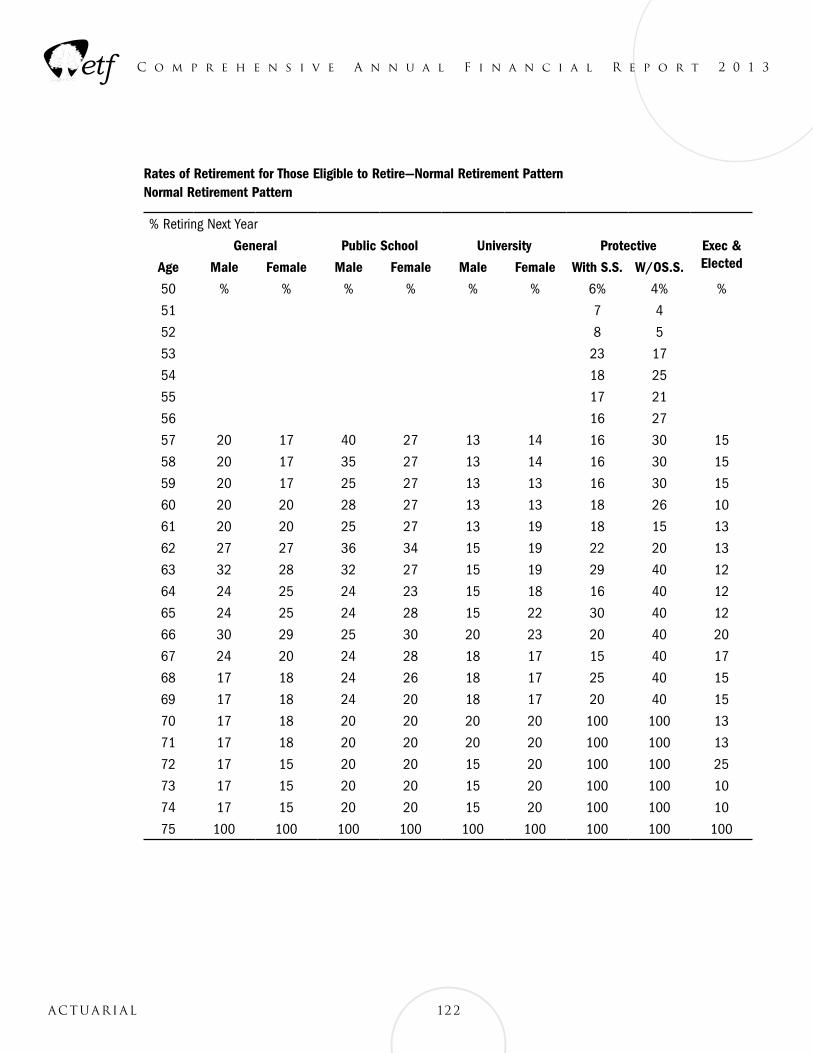
C o m p r e h e n s i v e A n n u a l F i n a n c i a l R e p o r t 2 0 1 3
Rates of Retirement for Those Eligible to Retire—Normal Retirement Pattern Normal Retirement Pattern
% Retiring Next Year
General Public School University Protective Exec & ElectedAge Male Female Male Female Male Female With S.S. W/OS.S.
50 % % % % % % 6% 4% %
51 7 4
52 8 5
53 23 17
54 18 25
55 17 21
56 16 27
57 20 17 40 27 13 14 16 30 15
58 20 17 35 27 13 14 16 30 15
59 20 17 25 27 13 13 16 30 15
60 20 20 28 27 13 13 18 26 10
61 20 20 25 27 13 19 18 15 13
62 27 27 36 34 15 19 22 20 13
63 32 28 32 27 15 19 29 40 12
64 24 25 24 23 15 18 16 40 12
65 24 25 24 28 15 22 30 40 12
66 30 29 25 30 20 23 20 40 20
67 24 20 24 28 18 17 15 40 17
68 17 18 24 26 18 17 25 40 15
69 17 18 24 20 18 17 20 40 15
70 17 18 20 20 20 20 100 100 13
71 17 18 20 20 20 20 100 100 13
72 17 15 20 20 15 20 100 100 25
73 17 15 20 20 15 20 100 100 10
74 17 15 20 20 15 20 100 100 10
75 100 100 100 100 100 100 100 100 100
122actuarial
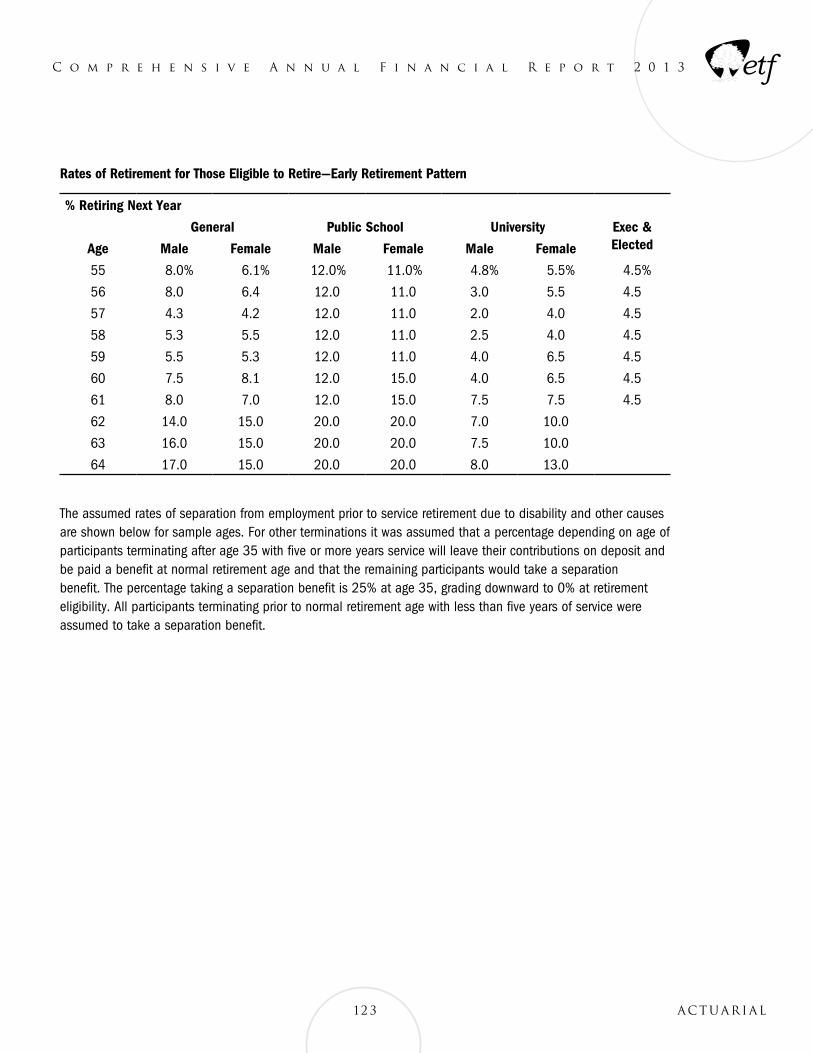
C o m p r e h e n s i v e A n n u a l F i n a n c i a l R e p o r t 2 0 1 3
Rates of Retirement for Those Eligible to Retire—Early Retirement Pattern
% Retiring Next Year
General Public School University Exec & ElectedAge Male Female Male Female Male Female
55 8.0% 6.1% 12.0% 11.0% 4.8% 5.5% 4.5%
56 8.0 6.4 12.0 11.0 3.0 5.5 4.5
57 4.3 4.2 12.0 11.0 2.0 4.0 4.5
58 5.3 5.5 12.0 11.0 2.5 4.0 4.5
59 5.5 5.3 12.0 11.0 4.0 6.5 4.5
60 7.5 8.1 12.0 15.0 4.0 6.5 4.5
61 8.0 7.0 12.0 15.0 7.5 7.5 4.5
62 14.0 15.0 20.0 20.0 7.0 10.0
63 16.0 15.0 20.0 20.0 7.5 10.0
64 17.0 15.0 20.0 20.0 8.0 13.0
123 actuarial
The assumed rates of separation from employment prior to service retirement due to disability and other causes are shown below for sample ages. For other terminations it was assumed that a percentage depending on age of participants terminating after age 35 with five or more years service will leave their contributions on deposit and be paid a benefit at normal retirement age and that the remaining participants would take a separation benefit. The percentage taking a separation benefit is 25% at age 35, grading downward to 0% at retirement eligibility. All participants terminating prior to normal retirement age with less than five years of service were assumed to take a separation benefit.
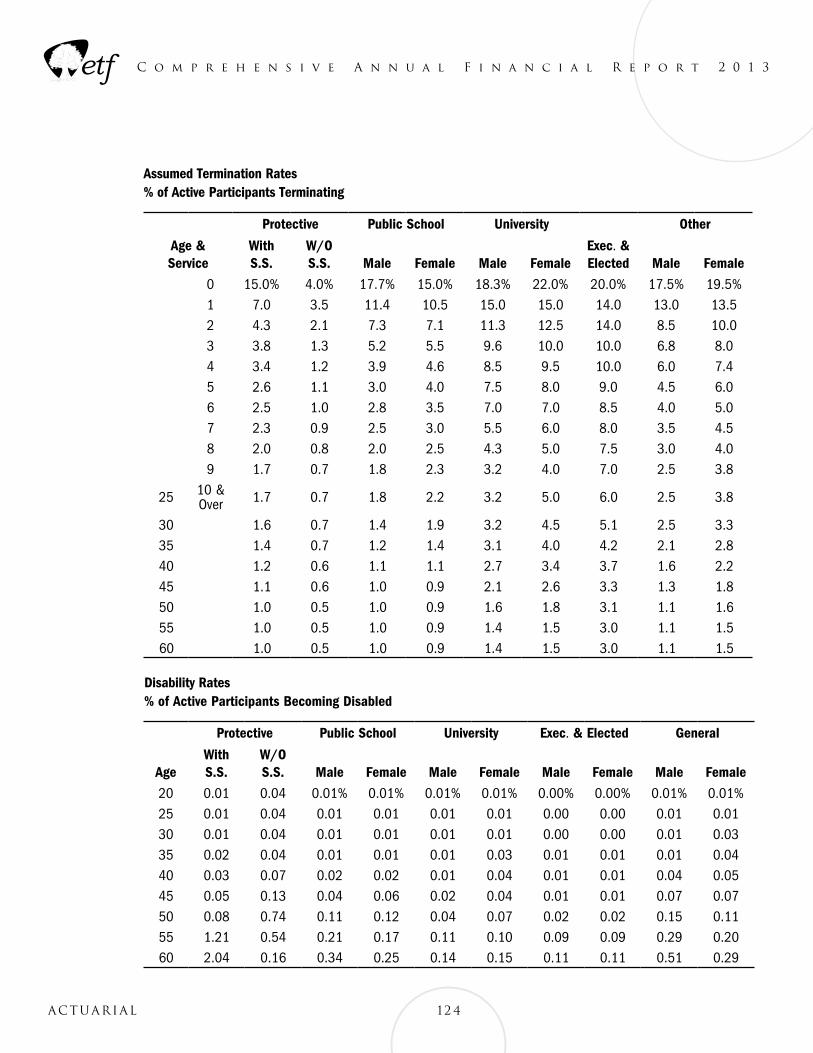
C o m p r e h e n s i v e A n n u a l F i n a n c i a l R e p o r t 2 0 1 3
Assumed Termination Rates % of Active Participants Terminating
Protective Public School University Other
Age & Service
With S.S.
W/O S.S. Male Female Male Female
Exec. & Elected Male Female
0 15.0% 4.0% 17.7% 15.0% 18.3% 22.0% 20.0% 17.5% 19.5%1 7.0 3.5 11.4 10.5 15.0 15.0 14.0 13.0 13.52 4.3 2.1 7.3 7.1 11.3 12.5 14.0 8.5 10.03 3.8 1.3 5.2 5.5 9.6 10.0 10.0 6.8 8.04 3.4 1.2 3.9 4.6 8.5 9.5 10.0 6.0 7.45 2.6 1.1 3.0 4.0 7.5 8.0 9.0 4.5 6.06 2.5 1.0 2.8 3.5 7.0 7.0 8.5 4.0 5.07 2.3 0.9 2.5 3.0 5.5 6.0 8.0 3.5 4.58 2.0 0.8 2.0 2.5 4.3 5.0 7.5 3.0 4.09 1.7 0.7 1.8 2.3 3.2 4.0 7.0 2.5 3.8
25 10 & Over 1.7 0.7 1.8 2.2 3.2 5.0 6.0 2.5 3.8
30 1.6 0.7 1.4 1.9 3.2 4.5 5.1 2.5 3.335 1.4 0.7 1.2 1.4 3.1 4.0 4.2 2.1 2.840 1.2 0.6 1.1 1.1 2.7 3.4 3.7 1.6 2.245 1.1 0.6 1.0 0.9 2.1 2.6 3.3 1.3 1.850 1.0 0.5 1.0 0.9 1.6 1.8 3.1 1.1 1.655 1.0 0.5 1.0 0.9 1.4 1.5 3.0 1.1 1.560 1.0 0.5 1.0 0.9 1.4 1.5 3.0 1.1 1.5
Disability Rates % of Active Participants Becoming Disabled
Protective Public School University Exec. & Elected General
AgeWith S.S.
W/O S.S. Male Female Male Female Male Female Male Female
20 0.01 0.04 0.01% 0.01% 0.01% 0.01% 0.00% 0.00% 0.01% 0.01%25 0.01 0.04 0.01 0.01 0.01 0.01 0.00 0.00 0.01 0.0130 0.01 0.04 0.01 0.01 0.01 0.01 0.00 0.00 0.01 0.0335 0.02 0.04 0.01 0.01 0.01 0.03 0.01 0.01 0.01 0.0440 0.03 0.07 0.02 0.02 0.01 0.04 0.01 0.01 0.04 0.0545 0.05 0.13 0.04 0.06 0.02 0.04 0.01 0.01 0.07 0.0750 0.08 0.74 0.11 0.12 0.04 0.07 0.02 0.02 0.15 0.1155 1.21 0.54 0.21 0.17 0.11 0.10 0.09 0.09 0.29 0.2060 2.04 0.16 0.34 0.25 0.14 0.15 0.11 0.11 0.51 0.29
124actuarial
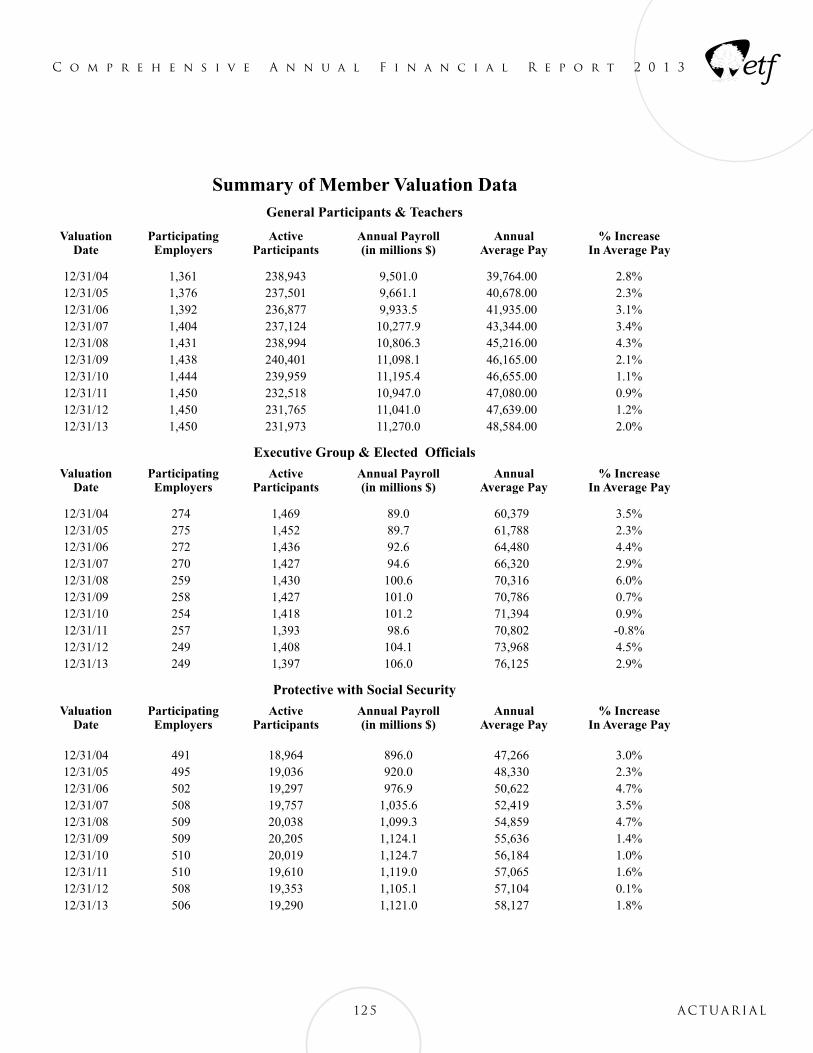
C o m p r e h e n s i v e A n n u a l F i n a n c i a l R e p o r t 2 0 1 3
125 actuarial
Summary of Member Valuation Data
General Participants & Teachers
Valuation Participating Active Annual Payroll Annual % IncreaseDate Employers Participants (in millions $) Average Pay In Average Pay
12/31/99 1,239 229,657 7,704.2 34,445.00 4.9%12/31/00 1,260 234,076 8,335.4 35,609.80 3.4%12/31/01 1,287 238,944 8,746.0 36,602.72 2.8%12/31/02 1,324 240,990 9,007.0 37,377.00 2.1%12/31/03 1,344 239,696 9,272.8 38,686.00 3.5%12/31/04 1,361 238,943 9,501.0 39,764.00 2.8%12/31/05 1,376 237,501 9,661.1 40,678.00 2.3%12/31/06 1,392 236,877 9,933.5 41,935.00 3.1%12/31/07 1,404 237,124 10,277.9 43,344.00 3.4%12/31/08 1,431 238,994 10,806.3 45,216.00 4.3%
Executive & Elected Participants
Valuation Participating Active Annual Payroll Annual % IncreaseDate Employers Participants (in millions $) Average Pay In Average Pay
12/31/99 264 1,468 77.2 53,263 5.1%12/31/00 267 1,486 82.6 55,582 4.4%12/31/01 270 1,486 84.8 57,060 2.7%12/31/02 279 1,476 86.9 58,865 3.2%12/31/03 284 1,468 85.6 58,336 -0.9%12/31/04 274 1,469 89.0 60,379 3.5%12/31/05 275 1,452 89.7 61,788 2.3%12/31/06 272 1,436 92.6 64,480 4.4%12/31/07 270 1,427 94.6 66,320 2.9%12/31/08 259 1,430 100.6 70,316 6.0%
Protective Participants Covered by Social Security
Valuation Participating Active Annual Payroll Annual % IncreaseDate Employers Participants (in millions $) Average Pay In Average Pay
12/31/99 444 16,483 648.6 39,864 3.5%12/31/00 452 16,970 717.2 42,263 6.0%12/31/01 460 17,981 771.6 42,914 1.5%12/31/02 475 18,325 803.9 43,871 2.2%12/31/03 485 18,660 856.3 45,891 4.6%12/31/04 491 18,964 896.0 47,266 3.0%12/31/05 495 19,036 920.0 48,330 2.3%12/31/06 502 19,297 976.9 50,622 4.7%12/31/07 508 19,757 1,035.6 52,419 3.5%12/31/08 509 20,038 1,099.3 54,859 4.7%
Protective Participants Not Covered by Social Security
Valuation Participating Active Annual Payroll Annual % Increase
Date Employers Participants (in millions $) Average Pay In Average Pay
12/31/99 54 2,691 130.6 48,947 2.5%12/31/00 55 2,685 135.4 50,423 3.0%12/31/01 55 2,715 142.1 52,339 3.8%12/31/02 55 2,709 147.9 54,603 4.3%12/31/03 54 2,714 153.8 56,673 3.8%12/31/04 54 2,709 159.0 58,546 3.3%12/31/05 55 2,689 162.0 60,241 2.9%12/31/06 55 2,692 167.3 62,153 3.2%12/31/07 55 2,695 173.7 64,449 3.7%12/31/08 55 2,724 181.2 66,502 3.2%
All Participants
Valuation Participating Active Annual Payroll Annual % Increase
Date Employers Participants (in millions $) Average Pay In Average Pay
12/31/99 1,266 250,299 8,560.6 34,201 2.2%12/31/00 1,289 255,217 9,270.6 36,324 6.2%12/31/01 1,321 261,126 9,744.5 37,317 2.7%12/31/02 1,359 263,500 10,045.7 38,124 2.2%12/31/03 1,380 262,538 10,368.5 39,493 3.6%12/31/04 1,397 262,085 10,645.0 40,617 2.8%12/31/05 1,412 260,678 10,832.8 41,556 2.3%12/31/06 1,432 260,302 11,170.3 42,913 3.3%12/31/07 1,438 261,003 11,581.8 44,374 3.4%12/31/08 1,462 263,186 12,187.4 46,307 4.4%
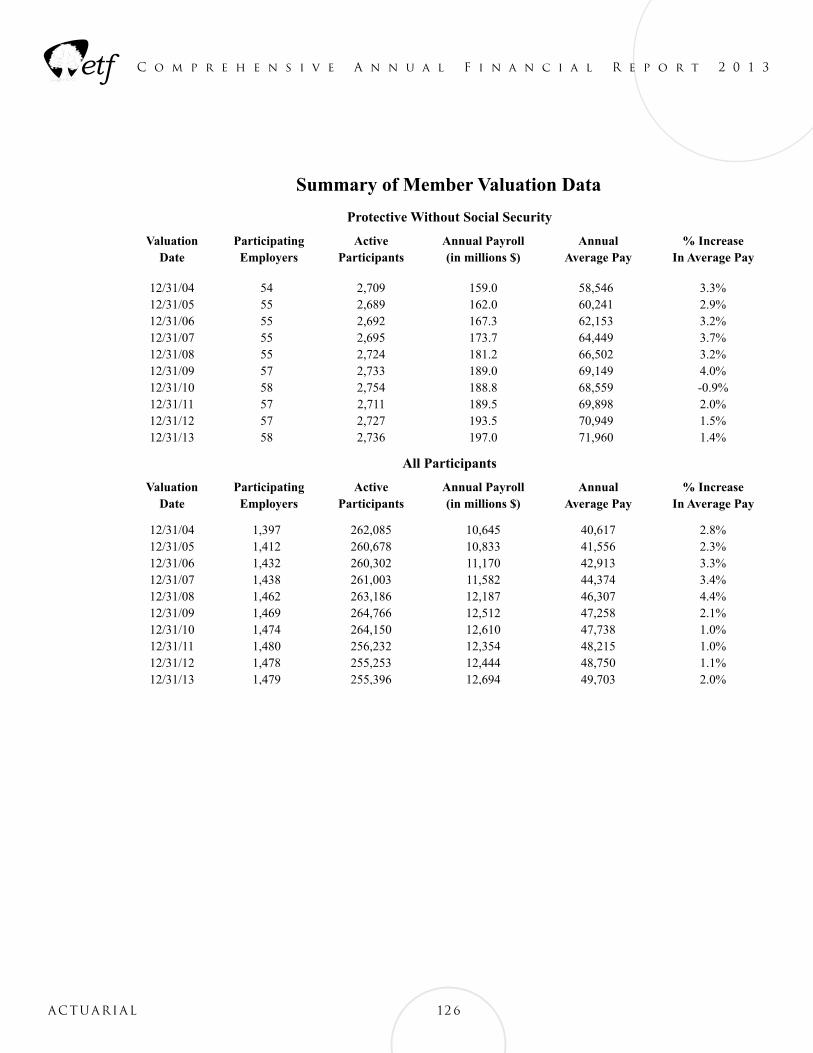
C o m p r e h e n s i v e A n n u a l F i n a n c i a l R e p o r t 2 0 1 3
Summary of Member Valuation Data
General Participants & Teachers
Valuation Participating Active Annual Payroll Annual % IncreaseDate Employers Participants (in millions $) Average Pay In Average Pay
12/31/99 1,239 229,657 7,704.2 34,445.00 4.9%12/31/00 1,260 234,076 8,335.4 35,609.80 3.4%12/31/01 1,287 238,944 8,746.0 36,602.72 2.8%12/31/02 1,324 240,990 9,007.0 37,377.00 2.1%12/31/03 1,344 239,696 9,272.8 38,686.00 3.5%12/31/04 1,361 238,943 9,501.0 39,764.00 2.8%12/31/05 1,376 237,501 9,661.1 40,678.00 2.3%12/31/06 1,392 236,877 9,933.5 41,935.00 3.1%12/31/07 1,404 237,124 10,277.9 43,344.00 3.4%12/31/08 1,431 238,994 10,806.3 45,216.00 4.3%
Executive & Elected Participants
Valuation Participating Active Annual Payroll Annual % IncreaseDate Employers Participants (in millions $) Average Pay In Average Pay
12/31/99 264 1,468 77.2 53,263 5.1%12/31/00 267 1,486 82.6 55,582 4.4%12/31/01 270 1,486 84.8 57,060 2.7%12/31/02 279 1,476 86.9 58,865 3.2%12/31/03 284 1,468 85.6 58,336 -0.9%12/31/04 274 1,469 89.0 60,379 3.5%12/31/05 275 1,452 89.7 61,788 2.3%12/31/06 272 1,436 92.6 64,480 4.4%12/31/07 270 1,427 94.6 66,320 2.9%12/31/08 259 1,430 100.6 70,316 6.0%
Protective Participants Covered by Social Security
Valuation Participating Active Annual Payroll Annual % IncreaseDate Employers Participants (in millions $) Average Pay In Average Pay
12/31/99 444 16,483 648.6 39,864 3.5%12/31/00 452 16,970 717.2 42,263 6.0%12/31/01 460 17,981 771.6 42,914 1.5%12/31/02 475 18,325 803.9 43,871 2.2%12/31/03 485 18,660 856.3 45,891 4.6%12/31/04 491 18,964 896.0 47,266 3.0%12/31/05 495 19,036 920.0 48,330 2.3%12/31/06 502 19,297 976.9 50,622 4.7%12/31/07 508 19,757 1,035.6 52,419 3.5%12/31/08 509 20,038 1,099.3 54,859 4.7%
Protective Participants Not Covered by Social Security
Valuation Participating Active Annual Payroll Annual % Increase
Date Employers Participants (in millions $) Average Pay In Average Pay
12/31/99 54 2,691 130.6 48,947 2.5%12/31/00 55 2,685 135.4 50,423 3.0%12/31/01 55 2,715 142.1 52,339 3.8%12/31/02 55 2,709 147.9 54,603 4.3%12/31/03 54 2,714 153.8 56,673 3.8%12/31/04 54 2,709 159.0 58,546 3.3%12/31/05 55 2,689 162.0 60,241 2.9%12/31/06 55 2,692 167.3 62,153 3.2%12/31/07 55 2,695 173.7 64,449 3.7%12/31/08 55 2,724 181.2 66,502 3.2%
All Participants
Valuation Participating Active Annual Payroll Annual % Increase
Date Employers Participants (in millions $) Average Pay In Average Pay
12/31/99 1,266 250,299 8,560.6 34,201 2.2%12/31/00 1,289 255,217 9,270.6 36,324 6.2%12/31/01 1,321 261,126 9,744.5 37,317 2.7%12/31/02 1,359 263,500 10,045.7 38,124 2.2%12/31/03 1,380 262,538 10,368.5 39,493 3.6%12/31/04 1,397 262,085 10,645.0 40,617 2.8%12/31/05 1,412 260,678 10,832.8 41,556 2.3%12/31/06 1,432 260,302 11,170.3 42,913 3.3%12/31/07 1,438 261,003 11,581.8 44,374 3.4%12/31/08 1,462 263,186 12,187.4 46,307 4.4%
126actuarial
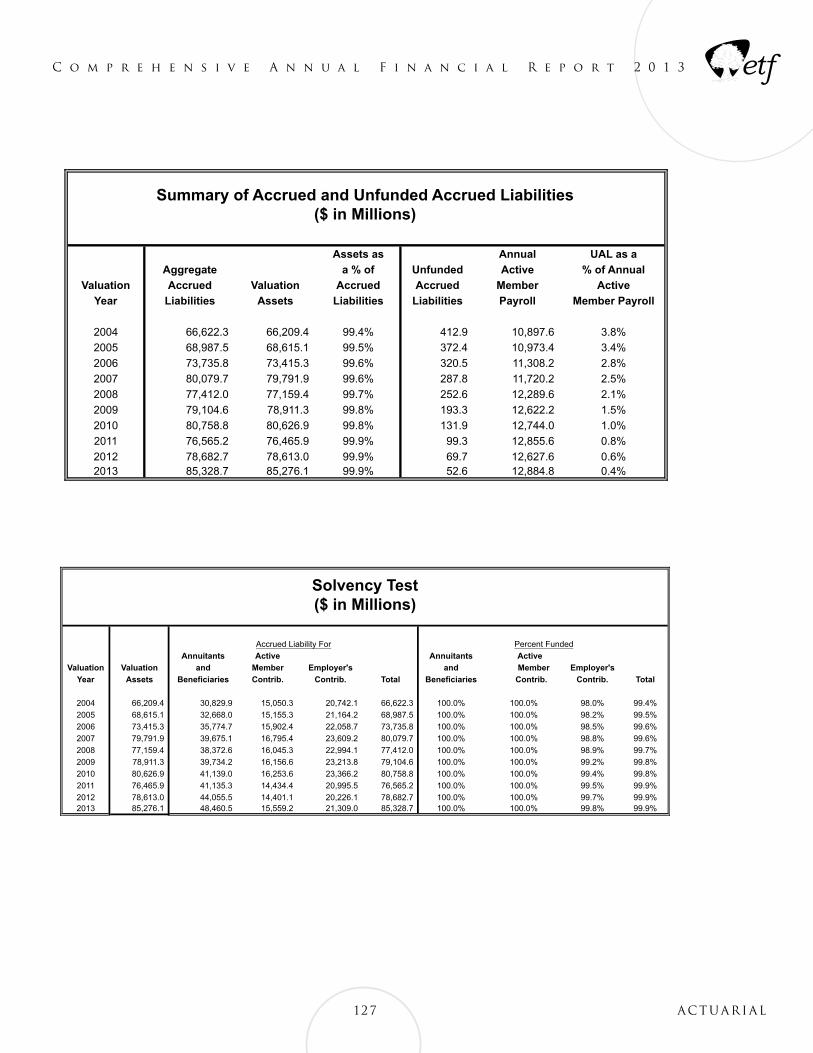
C o m p r e h e n s i v e A n n u a l F i n a n c i a l R e p o r t 2 0 1 3
127 actuarial
Summary of Accrued and Unfunded Accrued Liabilities($ in Millions)
Solvency Test ($ in Millions)
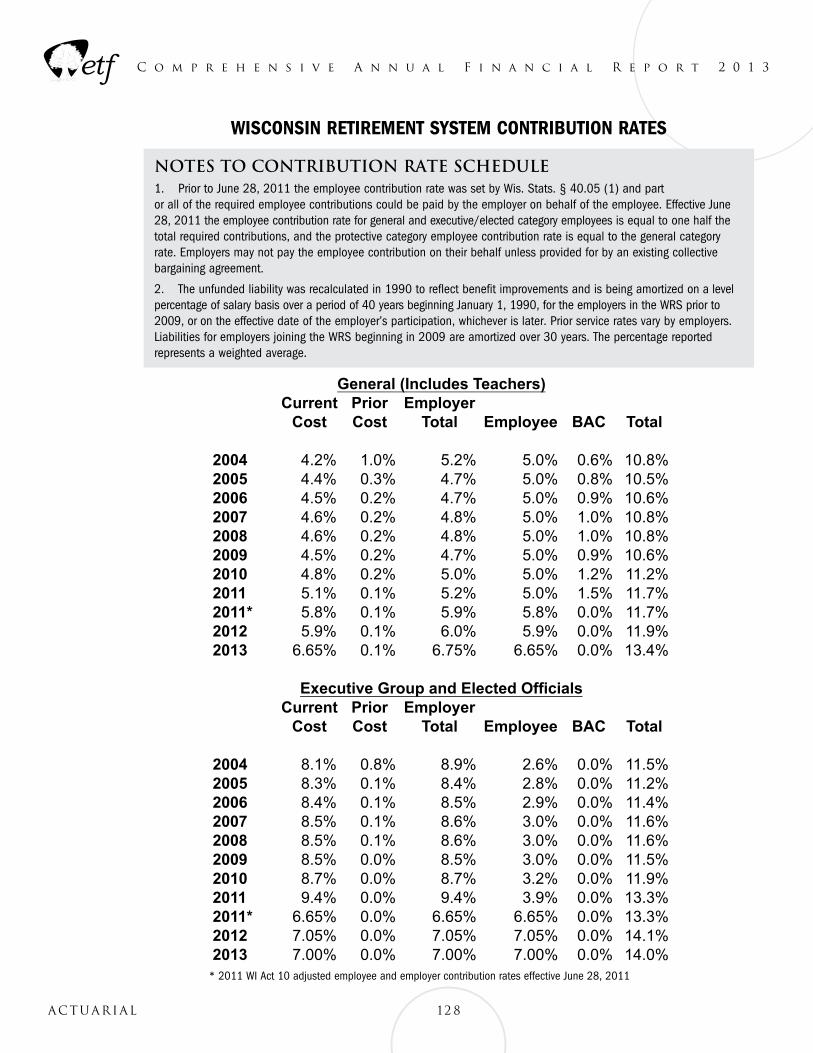
C o m p r e h e n s i v e A n n u a l F i n a n c i a l R e p o r t 2 0 1 3
NOTES TO CONTRIBUTION RATE SCHEDULE1. Prior to June 28, 2011 the employee contribution rate was set by Wis. Stats. § 40.05 (1) and part or all of the required employee contributions could be paid by the employer on behalf of the employee. Effective June 28, 2011 the employee contribution rate for general and executive/elected category employees is equal to one half the total required contributions, and the protective category employee contribution rate is equal to the general category rate. Employers may not pay the employee contribution on their behalf unless provided for by an existing collective bargaining agreement.
2. The unfunded liability was recalculated in 1990 to reflect benefit improvements and is being amortized on a level percentage of salary basis over a period of 40 years beginning January 1, 1990, for the employers in the WRS prior to 2009, or on the effective date of the employer’s participation, whichever is later. Prior service rates vary by employers. Liabilities for employers joining the WRS beginning in 2009 are amortized over 30 years. The percentage reported represents a weighted average.
128actuarial
WISCONSIN RETIREMENT SYSTEM CONTRIBUTION RATES
* 2011 WI Act 10 adjusted employee and employer contribution rates effective June 28, 2011
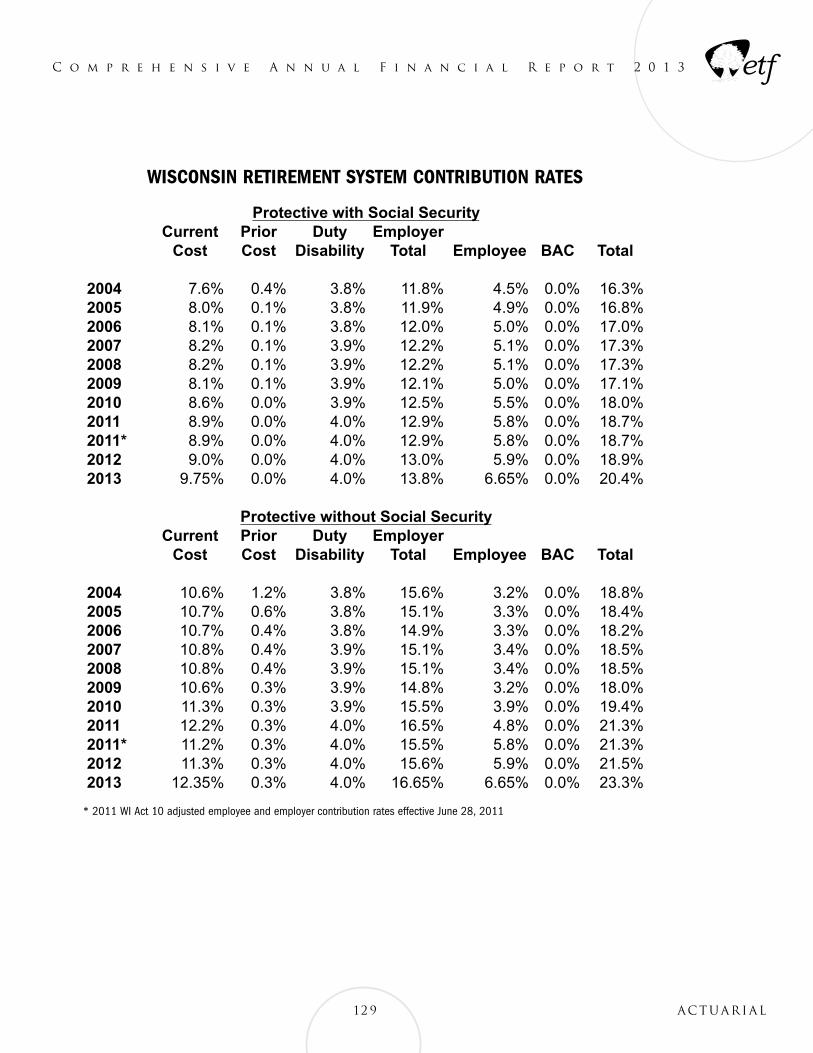
C o m p r e h e n s i v e A n n u a l F i n a n c i a l R e p o r t 2 0 1 3
129 actuarial
WISCONSIN RETIREMENT SYSTEM CONTRIBUTION RATES
* 2011 WI Act 10 adjusted employee and employer contribution rates effective June 28, 2011
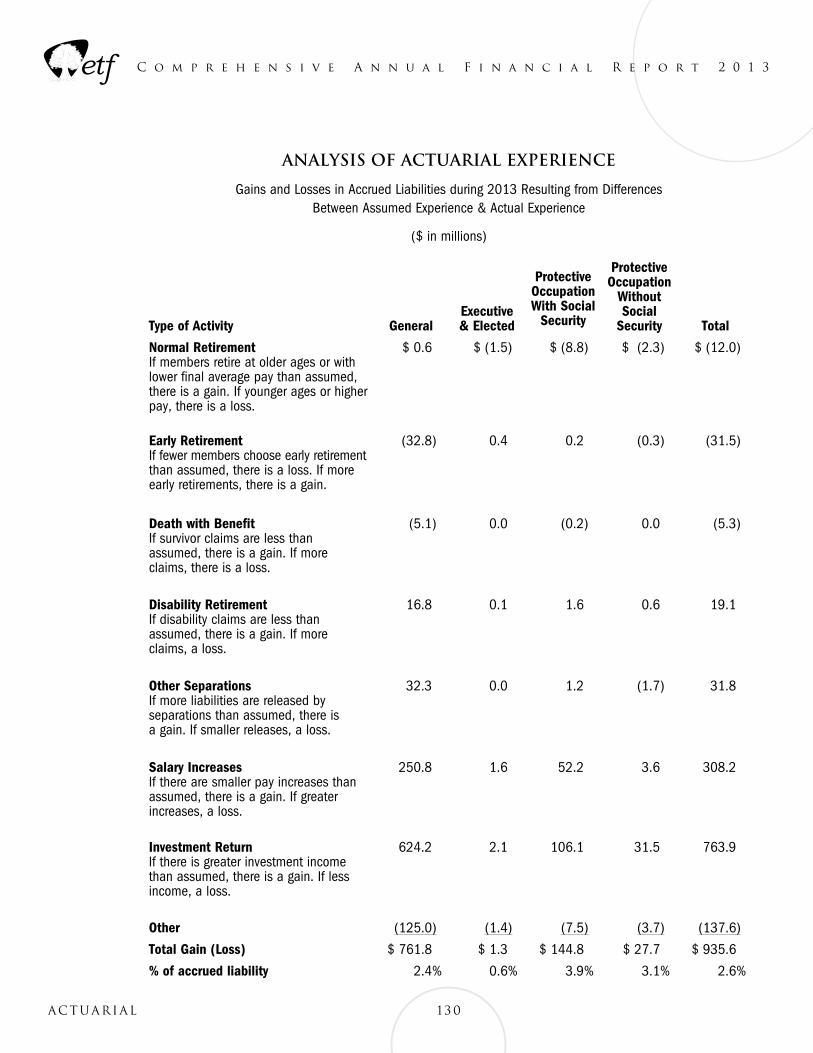
C o m p r e h e n s i v e A n n u a l F i n a n c i a l R e p o r t 2 0 1 3
130actuarial
Analysis of Actuarial Experience
Gains and Losses in Accrued Liabilities during 2013 Resulting from Differences Between Assumed Experience & Actual Experience
($ in millions)
Type of Activity GeneralExecutive & Elected
Protective Occupation With Social
Security
Protective Occupation
Without Social
Security Total
Normal Retirement If members retire at older ages or with lower final average pay than assumed, there is a gain. If younger ages or higher pay, there is a loss.
$ 0.6 $ (1.5) $ (8.8) $ (2.3) $ (12.0)
Early Retirement If fewer members choose early retirement than assumed, there is a loss. If more early retirements, there is a gain.
(32.8) 0.4 0.2 (0.3) (31.5)
Death with Benefit If survivor claims are less than assumed, there is a gain. If more claims, there is a loss.
(5.1) 0.0 (0.2) 0.0 (5.3)
Disability Retirement If disability claims are less than assumed, there is a gain. If more claims, a loss.
16.8 0.1 1.6 0.6 19.1
Other Separations If more liabilities are released by separations than assumed, there is a gain. If smaller releases, a loss.
32.3 0.0 1.2 (1.7) 31.8
Salary Increases If there are smaller pay increases than assumed, there is a gain. If greater increases, a loss.
250.8 1.6 52.2 3.6 308.2
Investment Return If there is greater investment income than assumed, there is a gain. If less income, a loss.
624.2 2.1 106.1 31.5 763.9
Other (125.0) (1.4) (7.5) (3.7) (137.6)
Total Gain (Loss) $ 761.8 $ 1.3 $ 144.8 $ 27.7 $ 935.6
% of accrued liability 2.4% 0.6% 3.9% 3.1% 2.6%
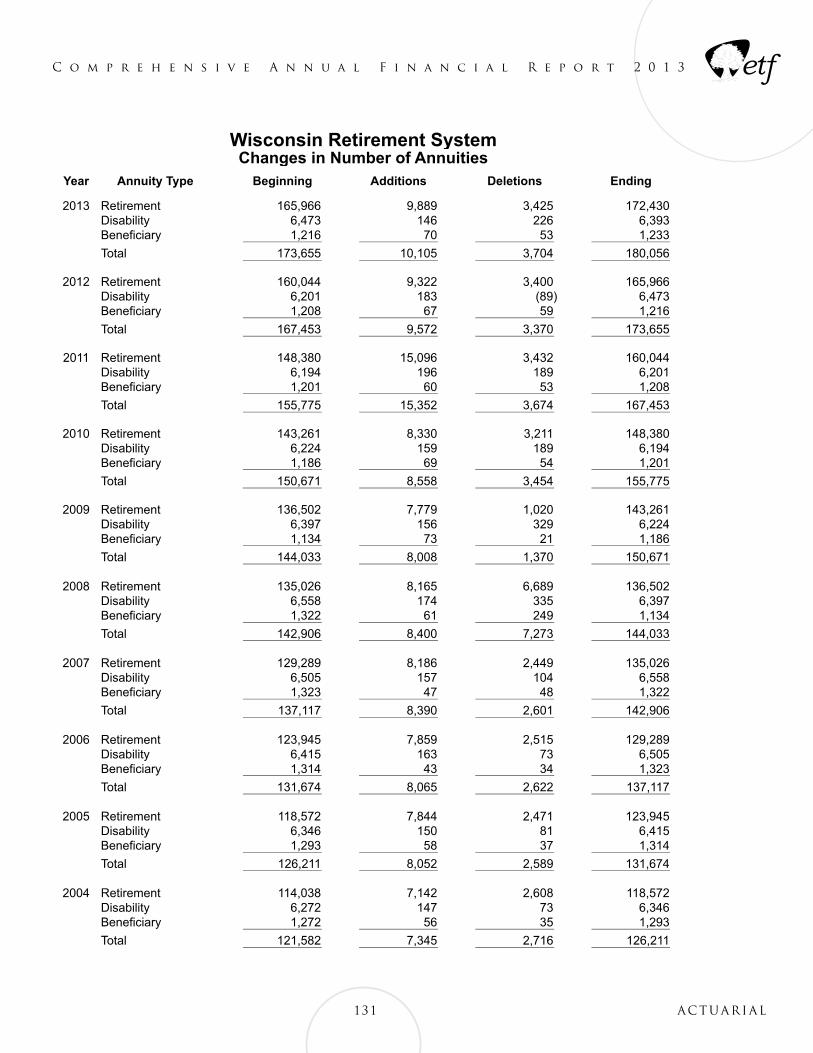
C o m p r e h e n s i v e A n n u a l F i n a n c i a l R e p o r t 2 0 1 3
131 actuarial
H:\anualrpt\2004AnnualReport\2004Actuarial\annuit.xlsx
Wisconsin Retirement SystemChanges in Number of Annuities
Year Annuity Type Beginning Additions Deletions Ending
2012 Retirement 160,044 9,322 3,400 165,966 Disability 6,201 183 (89) 6,473 Beneficiary 1,208 67 59 1,216
Total 167,453 9,572 3,370 173,655
2011 Retirement 148,380 15,096 3,432 160,044 Disability 6,194 196 189 6,201 Beneficiary 1,201 60 53 1,208
Total 155,775 15,352 3,674 167,453
2010 Retirement 143,261 8,330 3,211 148,380 Disability 6,224 159 189 6,194 Beneficiary 1,186 69 54 1,201
Total 150,671 8,558 3,454 155,775
2009 Retirement 136,502 7,779 1,020 143,261 Disability 6,397 156 329 6,224 Beneficiary 1,134 73 21 1,186
Total 144,033 8,008 1,370 150,671
2008 Retirement 135,026 8,165 6,689 136,502 Disability 6,558 174 335 6,397 Beneficiary 1,322 61 249 1,134
Total 142,906 8,400 7,273 144,033
2007 Retirement 129,289 8,186 2,449 135,026 Disability 6,505 157 104 6,558 Beneficiary 1,323 47 48 1,322
Total 137,117 8,390 2,601 142,906
2006 Retirement 123,945 7,859 2,515 129,289 Disability 6,415 163 73 6,505 Beneficiary 1,314 43 34 1,323
Total 131,674 8,065 2,622 137,117
2005 Retirement 118,572 7,844 2,471 123,945 Disability 6,346 150 81 6,415 Beneficiary 1,293 58 37 1,314
Total 126,211 8,052 2,589 131,674
2004 Retirement 114,038 7,142 2,608 118,572 Disability 6,272 147 73 6,346 Beneficiary 1,272 56 35 1,293
Total 121,582 7,345 2,716 126,211
2003 Retirement 108,901 7,308 2,171 114,038 Disability 6,158 177 63 6,272 Beneficiary 1,230 68 26 1,272
Total 116,289 7,553 2,260 121,582
2002 Retirement 104,910 6,915 2,924 108,901 Disability 6,009 191 42 6,158 Beneficiary 1,223 53 46 1,230
Total 112,142 7,159 3,012 116,289


Investments
State of WisconsinDepartment of
Employee Trust Funds
C o m p r e h e n s i v e A n n u a l F i n a n c i a l R e p o r t 2 0 1 3
134Investments
INVESTMENTS
The State of Wisconsin Investment Board (SWIB) is the state agency that invests the assets of the Wisconsin Retirement System (WRS) and other trust funds established by the State of Wisconsin. The WRS Trust Funds make up about 93% of the assets managed by SWIB. The effect of investment returns on WRS participants, determined by the Department of Employee Trust Funds, is based on the rate of return as of December 31, 2013.
SWIB publishes an annual report and a schedule of investments that includes all investment holdings as of the end of the fiscal year. To view these publications online, go to http://www.swib.state.wi.us or call (608) 266-3281 to request paper copies.
Board of Trustees
SWIB is directed by an independent Board of Trustees and staffed with professional money managers and support personnel. The SWIB Board of Trustees consists of nine members meeting specific membership requirements, as directed by Wis. Stat. § 15.76. The Board of Trustees appoints the SWIB executive director. The executive director oversees the staff, develops and recommends agency and investment policies for board adoption, and ensures adherence to state and federal law and policies. Trustee responsibilities include establishing asset allocation, investment guidelines, and performance benchmarks.
Membership on the Board of Trustees as of December 31, 2013 is as follows:
1. Six public members appointed by the governor, four of whom must have at least 10 years investment experience and one of whom must have at least 10 years of financial experience and be employed by a local government active in the Local Government Investment Pool, a fund managed by SWIB.
Chair: Lon Roberts (Public Member) Attorney, Ruder Ware, Wausau
Vice Chair: Thomas Boldt (Public Member) President, The Boldt Group, Inc. /CEO, The Boldt Co., Appleton
Norman Cummings (Local Government Member) Waukesha County Director of Administration, Waukesha
William Levit, Jr. (Public Member) Attorney, Godfrey & Kahn S.C., Milwaukee
Bruce Colburn (Public Member) Director, Central States Property Services Division, Services Employees International Union, Milwaukee County
Vacant
2. Two participants in the WRS, one must be a teacher member appointed by the Teachers Retirement Board; the other must be a non-teacher participant appointed by the Wisconsin Retirement Board.
Sandra Claflin-Chalton (WRS participant, Teachers Retirement Board appointee) Senior Lecturer-Economics, University of Wisconsin-Stout Department of Socail Science
Robert J. Conlin (WRS participant, Wisconsin Retirement Board appointee) Secretary, Department of Employee Trust Funds
3. The Secretary of the Wisconsin Department of Administration (DOA) or designee.
Michael Huebsch Secretary, DOA
Contributions Paid and Employer
Unfunded Liability Balances
State of WisconsinDepartment of
Employee Trust Funds
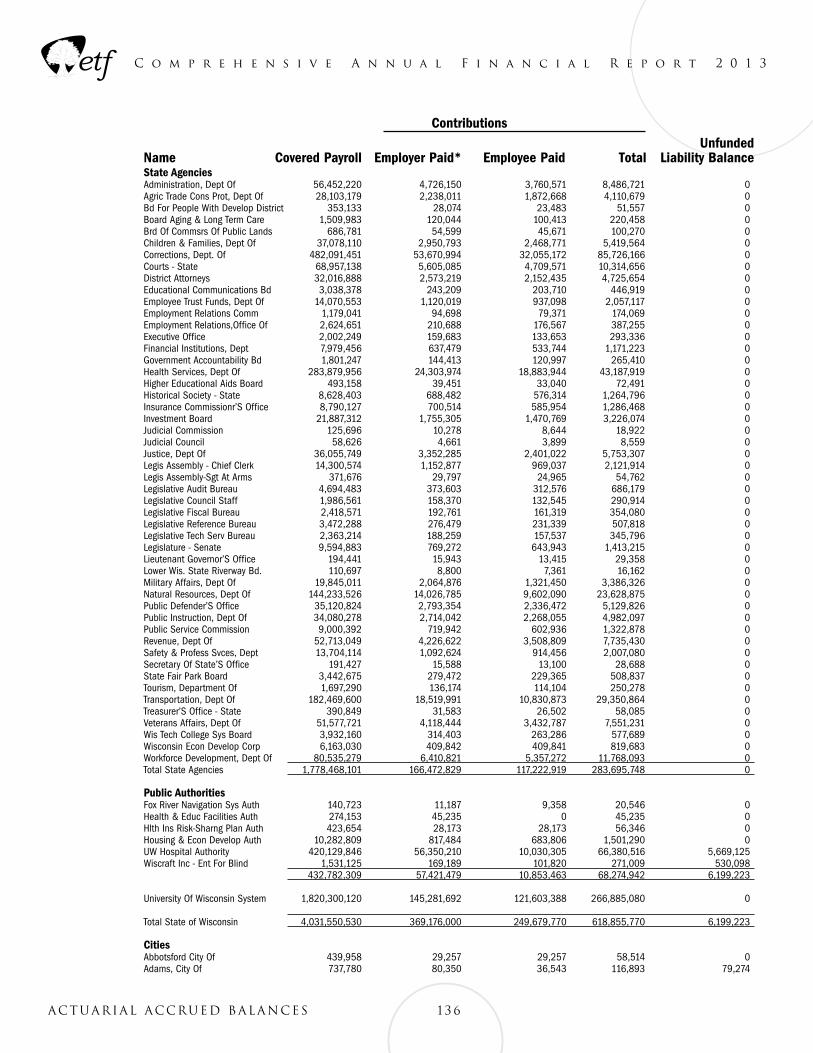
C o m p r e h e n s i v e A n n u a l F i n a n c i a l R e p o r t 2 0 1 3
State AgenciesAdministration, Dept Of 56,452,220 4,726,150 3,760,571 8,486,721 0Agric Trade Cons Prot, Dept Of 28,103,179 2,238,011 1,872,668 4,110,679 0Bd For People With Develop District 353,133 28,074 23,483 51,557 0Board Aging & Long Term Care 1,509,983 120,044 100,413 220,458 0Brd Of Commsrs Of Public Lands 686,781 54,599 45,671 100,270 0Children & Families, Dept Of 37,078,110 2,950,793 2,468,771 5,419,564 0Corrections, Dept. Of 482,091,451 53,670,994 32,055,172 85,726,166 0Courts - State 68,957,138 5,605,085 4,709,571 10,314,656 0District Attorneys 32,016,888 2,573,219 2,152,435 4,725,654 0Educational Communications Bd 3,038,378 243,209 203,710 446,919 0Employee Trust Funds, Dept Of 14,070,553 1,120,019 937,098 2,057,117 0Employment Relations Comm 1,179,041 94,698 79,371 174,069 0Employment Relations,Office Of 2,624,651 210,688 176,567 387,255 0Executive Office 2,002,249 159,683 133,653 293,336 0Financial Institutions, Dept 7,979,456 637,479 533,744 1,171,223 0Government Accountability Bd 1,801,247 144,413 120,997 265,410 0Health Services, Dept Of 283,879,956 24,303,974 18,883,944 43,187,919 0Higher Educational Aids Board 493,158 39,451 33,040 72,491 0Historical Society - State 8,628,403 688,482 576,314 1,264,796 0Insurance Commissionr’S Office 8,790,127 700,514 585,954 1,286,468 0Investment Board 21,887,312 1,755,305 1,470,769 3,226,074 0Judicial Commission 125,696 10,278 8,644 18,922 0Judicial Council 58,626 4,661 3,899 8,559 0Justice, Dept Of 36,055,749 3,352,285 2,401,022 5,753,307 0Legis Assembly - Chief Clerk 14,300,574 1,152,877 969,037 2,121,914 0Legis Assembly-Sgt At Arms 371,676 29,797 24,965 54,762 0Legislative Audit Bureau 4,694,483 373,603 312,576 686,179 0Legislative Council Staff 1,986,561 158,370 132,545 290,914 0Legislative Fiscal Bureau 2,418,571 192,761 161,319 354,080 0Legislative Reference Bureau 3,472,288 276,479 231,339 507,818 0Legislative Tech Serv Bureau 2,363,214 188,259 157,537 345,796 0Legislature - Senate 9,594,883 769,272 643,943 1,413,215 0Lieutenant Governor’S Office 194,441 15,943 13,415 29,358 0Lower Wis. State Riverway Bd. 110,697 8,800 7,361 16,162 0Military Affairs, Dept Of 19,845,011 2,064,876 1,321,450 3,386,326 0Natural Resources, Dept Of 144,233,526 14,026,785 9,602,090 23,628,875 0Public Defender’S Office 35,120,824 2,793,354 2,336,472 5,129,826 0Public Instruction, Dept Of 34,080,278 2,714,042 2,268,055 4,982,097 0Public Service Commission 9,000,392 719,942 602,936 1,322,878 0Revenue, Dept Of 52,713,049 4,226,622 3,508,809 7,735,430 0Safety & Profess Svces, Dept 13,704,114 1,092,624 914,456 2,007,080 0Secretary Of State’S Office 191,427 15,588 13,100 28,688 0State Fair Park Board 3,442,675 279,472 229,365 508,837 0Tourism, Department Of 1,697,290 136,174 114,104 250,278 0Transportation, Dept Of 182,469,600 18,519,991 10,830,873 29,350,864 0Treasurer’S Office - State 390,849 31,583 26,502 58,085 0Veterans Affairs, Dept Of 51,577,721 4,118,444 3,432,787 7,551,231 0Wis Tech College Sys Board 3,932,160 314,403 263,286 577,689 0Wisconsin Econ Develop Corp 6,163,030 409,842 409,841 819,683 0Workforce Development, Dept Of 80,535,279 6,410,821 5,357,272 11,768,093 0Total State Agencies 1,778,468,101 166,472,829 117,222,919 283,695,748 0 Public Authorities Fox River Navigation Sys Auth 140,723 11,187 9,358 20,546 0Health & Educ Facilities Auth 274,153 45,235 0 45,235 0Hlth Ins Risk-Sharng Plan Auth 423,654 28,173 28,173 56,346 0Housing & Econ Develop Auth 10,282,809 817,484 683,806 1,501,290 0UW Hospital Authority 420,129,846 56,350,210 10,030,305 66,380,516 5,669,125Wiscraft Inc - Ent For Blind 1,531,125 169,189 101,820 271,009 530,098 432,782,309 57,421,479 10,853,463 68,274,942 6,199,223 University Of Wisconsin System 1,820,300,120 145,281,692 121,603,388 266,885,080 0 Total State of Wisconsin 4,031,550,530 369,176,000 249,679,770 618,855,770 6,199,223 Cities Abbotsford City Of 439,958 29,257 29,257 58,514 0Adams, City Of 737,780 80,350 36,543 116,893 79,274
136Actuarial accrued balances
Contributions UnfundedName Covered Payroll Employer Paid* Employee Paid Total Liability Balance
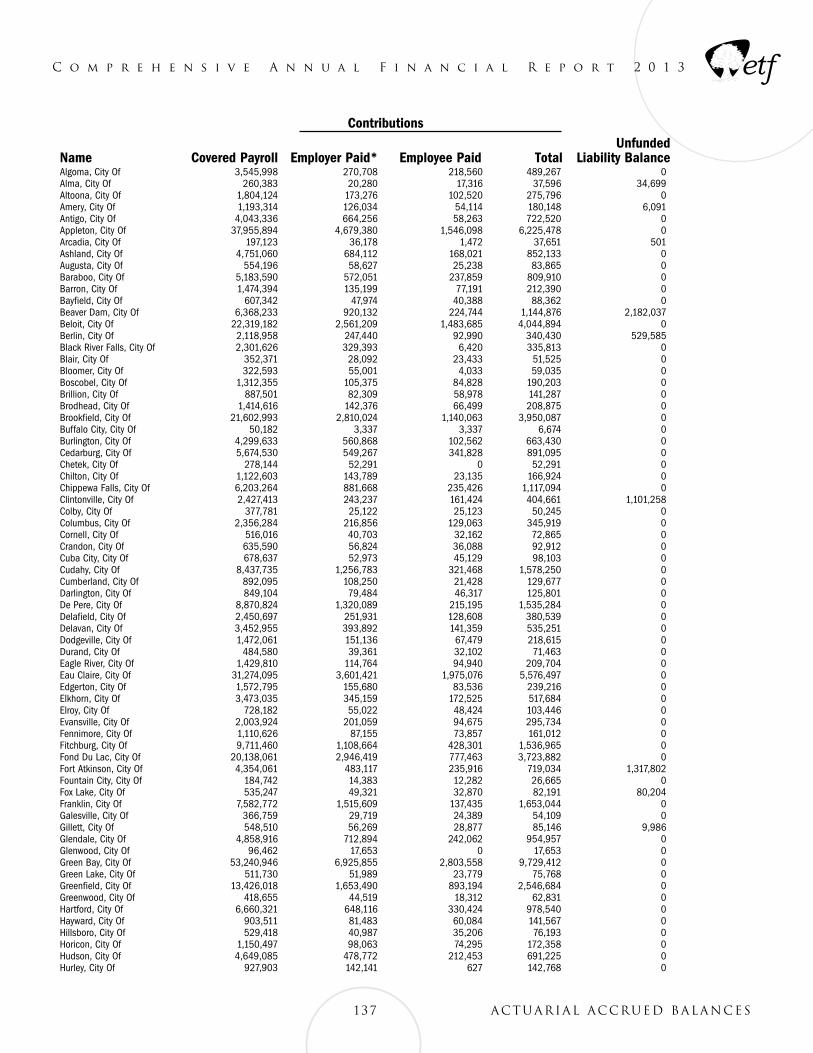
Algoma, City Of 3,545,998 270,708 218,560 489,267 0Alma, City Of 260,383 20,280 17,316 37,596 34,699Altoona, City Of 1,804,124 173,276 102,520 275,796 0Amery, City Of 1,193,314 126,034 54,114 180,148 6,091Antigo, City Of 4,043,336 664,256 58,263 722,520 0Appleton, City Of 37,955,894 4,679,380 1,546,098 6,225,478 0Arcadia, City Of 197,123 36,178 1,472 37,651 501Ashland, City Of 4,751,060 684,112 168,021 852,133 0Augusta, City Of 554,196 58,627 25,238 83,865 0Baraboo, City Of 5,183,590 572,051 237,859 809,910 0Barron, City Of 1,474,394 135,199 77,191 212,390 0Bayfield, City Of 607,342 47,974 40,388 88,362 0Beaver Dam, City Of 6,368,233 920,132 224,744 1,144,876 2,182,037Beloit, City Of 22,319,182 2,561,209 1,483,685 4,044,894 0Berlin, City Of 2,118,958 247,440 92,990 340,430 529,585Black River Falls, City Of 2,301,626 329,393 6,420 335,813 0Blair, City Of 352,371 28,092 23,433 51,525 0Bloomer, City Of 322,593 55,001 4,033 59,035 0Boscobel, City Of 1,312,355 105,375 84,828 190,203 0Brillion, City Of 887,501 82,309 58,978 141,287 0Brodhead, City Of 1,414,616 142,376 66,499 208,875 0Brookfield, City Of 21,602,993 2,810,024 1,140,063 3,950,087 0Buffalo City, City Of 50,182 3,337 3,337 6,674 0Burlington, City Of 4,299,633 560,868 102,562 663,430 0Cedarburg, City Of 5,674,530 549,267 341,828 891,095 0Chetek, City Of 278,144 52,291 0 52,291 0Chilton, City Of 1,122,603 143,789 23,135 166,924 0Chippewa Falls, City Of 6,203,264 881,668 235,426 1,117,094 0Clintonville, City Of 2,427,413 243,237 161,424 404,661 1,101,258Colby, City Of 377,781 25,122 25,123 50,245 0Columbus, City Of 2,356,284 216,856 129,063 345,919 0Cornell, City Of 516,016 40,703 32,162 72,865 0Crandon, City Of 635,590 56,824 36,088 92,912 0Cuba City, City Of 678,637 52,973 45,129 98,103 0Cudahy, City Of 8,437,735 1,256,783 321,468 1,578,250 0Cumberland, City Of 892,095 108,250 21,428 129,677 0Darlington, City Of 849,104 79,484 46,317 125,801 0De Pere, City Of 8,870,824 1,320,089 215,195 1,535,284 0Delafield, City Of 2,450,697 251,931 128,608 380,539 0Delavan, City Of 3,452,955 393,892 141,359 535,251 0Dodgeville, City Of 1,472,061 151,136 67,479 218,615 0Durand, City Of 484,580 39,361 32,102 71,463 0Eagle River, City Of 1,429,810 114,764 94,940 209,704 0Eau Claire, City Of 31,274,095 3,601,421 1,975,076 5,576,497 0Edgerton, City Of 1,572,795 155,680 83,536 239,216 0Elkhorn, City Of 3,473,035 345,159 172,525 517,684 0Elroy, City Of 728,182 55,022 48,424 103,446 0Evansville, City Of 2,003,924 201,059 94,675 295,734 0Fennimore, City Of 1,110,626 87,155 73,857 161,012 0Fitchburg, City Of 9,711,460 1,108,664 428,301 1,536,965 0Fond Du Lac, City Of 20,138,061 2,946,419 777,463 3,723,882 0Fort Atkinson, City Of 4,354,061 483,117 235,916 719,034 1,317,802Fountain City, City Of 184,742 14,383 12,282 26,665 0Fox Lake, City Of 535,247 49,321 32,870 82,191 80,204Franklin, City Of 7,582,772 1,515,609 137,435 1,653,044 0Galesville, City Of 366,759 29,719 24,389 54,109 0Gillett, City Of 548,510 56,269 28,877 85,146 9,986Glendale, City Of 4,858,916 712,894 242,062 954,957 0Glenwood, City Of 96,462 17,653 0 17,653 0Green Bay, City Of 53,240,946 6,925,855 2,803,558 9,729,412 0Green Lake, City Of 511,730 51,989 23,779 75,768 0Greenfield, City Of 13,426,018 1,653,490 893,194 2,546,684 0Greenwood, City Of 418,655 44,519 18,312 62,831 0Hartford, City Of 6,660,321 648,116 330,424 978,540 0Hayward, City Of 903,511 81,483 60,084 141,567 0Hillsboro, City Of 529,418 40,987 35,206 76,193 0Horicon, City Of 1,150,497 98,063 74,295 172,358 0Hudson, City Of 4,649,085 478,772 212,453 691,225 0Hurley, City Of 927,903 142,141 627 142,768 0
137 Actuarial accrued balances
C o m p r e h e n s i v e A n n u a l F i n a n c i a l R e p o r t 2 0 1 3
Contributions UnfundedName Covered Payroll Employer Paid* Employee Paid Total Liability Balance
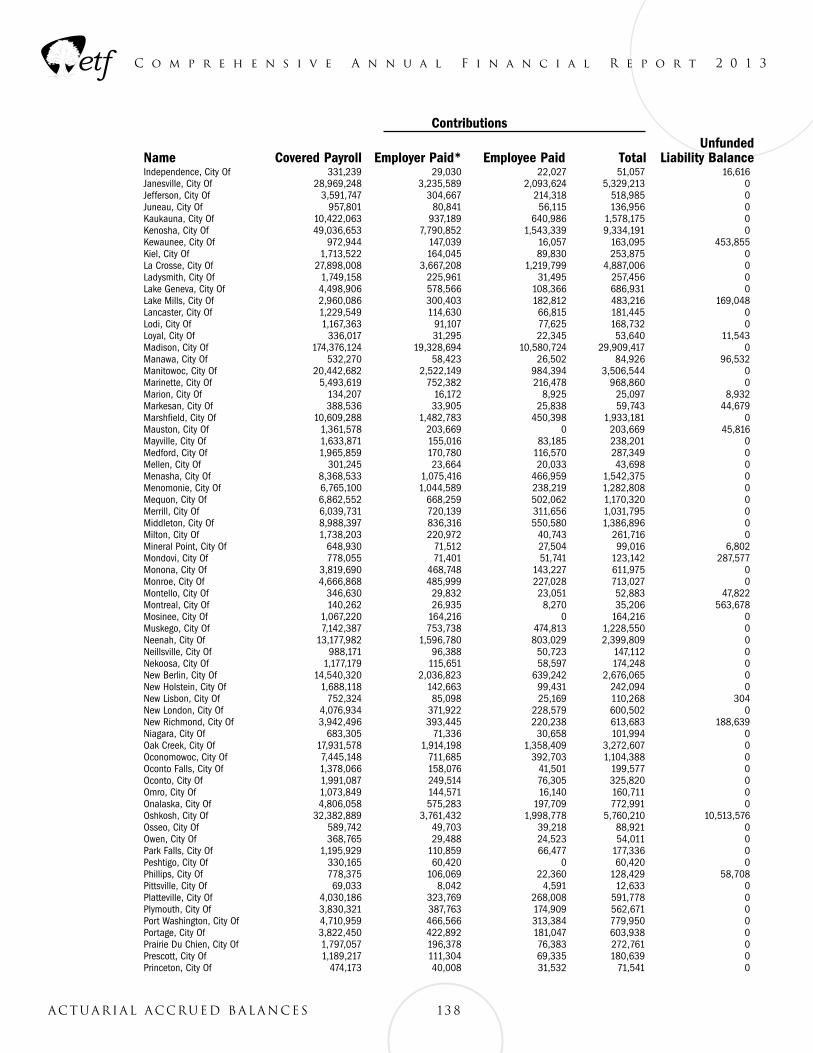
C o m p r e h e n s i v e A n n u a l F i n a n c i a l R e p o r t 2 0 1 3
Independence, City Of 331,239 29,030 22,027 51,057 16,616Janesville, City Of 28,969,248 3,235,589 2,093,624 5,329,213 0Jefferson, City Of 3,591,747 304,667 214,318 518,985 0Juneau, City Of 957,801 80,841 56,115 136,956 0Kaukauna, City Of 10,422,063 937,189 640,986 1,578,175 0Kenosha, City Of 49,036,653 7,790,852 1,543,339 9,334,191 0Kewaunee, City Of 972,944 147,039 16,057 163,095 453,855Kiel, City Of 1,713,522 164,045 89,830 253,875 0La Crosse, City Of 27,898,008 3,667,208 1,219,799 4,887,006 0Ladysmith, City Of 1,749,158 225,961 31,495 257,456 0Lake Geneva, City Of 4,498,906 578,566 108,366 686,931 0Lake Mills, City Of 2,960,086 300,403 182,812 483,216 169,048Lancaster, City Of 1,229,549 114,630 66,815 181,445 0Lodi, City Of 1,167,363 91,107 77,625 168,732 0Loyal, City Of 336,017 31,295 22,345 53,640 11,543Madison, City Of 174,376,124 19,328,694 10,580,724 29,909,417 0Manawa, City Of 532,270 58,423 26,502 84,926 96,532Manitowoc, City Of 20,442,682 2,522,149 984,394 3,506,544 0Marinette, City Of 5,493,619 752,382 216,478 968,860 0Marion, City Of 134,207 16,172 8,925 25,097 8,932Markesan, City Of 388,536 33,905 25,838 59,743 44,679Marshfield, City Of 10,609,288 1,482,783 450,398 1,933,181 0Mauston, City Of 1,361,578 203,669 0 203,669 45,816Mayville, City Of 1,633,871 155,016 83,185 238,201 0Medford, City Of 1,965,859 170,780 116,570 287,349 0Mellen, City Of 301,245 23,664 20,033 43,698 0Menasha, City Of 8,368,533 1,075,416 466,959 1,542,375 0Menomonie, City Of 6,765,100 1,044,589 238,219 1,282,808 0Mequon, City Of 6,862,552 668,259 502,062 1,170,320 0Merrill, City Of 6,039,731 720,139 311,656 1,031,795 0Middleton, City Of 8,988,397 836,316 550,580 1,386,896 0Milton, City Of 1,738,203 220,972 40,743 261,716 0Mineral Point, City Of 648,930 71,512 27,504 99,016 6,802Mondovi, City Of 778,055 71,401 51,741 123,142 287,577Monona, City Of 3,819,690 468,748 143,227 611,975 0Monroe, City Of 4,666,868 485,999 227,028 713,027 0Montello, City Of 346,630 29,832 23,051 52,883 47,822Montreal, City Of 140,262 26,935 8,270 35,206 563,678Mosinee, City Of 1,067,220 164,216 0 164,216 0Muskego, City Of 7,142,387 753,738 474,813 1,228,550 0Neenah, City Of 13,177,982 1,596,780 803,029 2,399,809 0Neillsville, City Of 988,171 96,388 50,723 147,112 0Nekoosa, City Of 1,177,179 115,651 58,597 174,248 0New Berlin, City Of 14,540,320 2,036,823 639,242 2,676,065 0New Holstein, City Of 1,688,118 142,663 99,431 242,094 0New Lisbon, City Of 752,324 85,098 25,169 110,268 304New London, City Of 4,076,934 371,922 228,579 600,502 0New Richmond, City Of 3,942,496 393,445 220,238 613,683 188,639Niagara, City Of 683,305 71,336 30,658 101,994 0Oak Creek, City Of 17,931,578 1,914,198 1,358,409 3,272,607 0Oconomowoc, City Of 7,445,148 711,685 392,703 1,104,388 0Oconto Falls, City Of 1,378,066 158,076 41,501 199,577 0Oconto, City Of 1,991,087 249,514 76,305 325,820 0Omro, City Of 1,073,849 144,571 16,140 160,711 0Onalaska, City Of 4,806,058 575,283 197,709 772,991 0Oshkosh, City Of 32,382,889 3,761,432 1,998,778 5,760,210 10,513,576Osseo, City Of 589,742 49,703 39,218 88,921 0Owen, City Of 368,765 29,488 24,523 54,011 0Park Falls, City Of 1,195,929 110,859 66,477 177,336 0Peshtigo, City Of 330,165 60,420 0 60,420 0Phillips, City Of 778,375 106,069 22,360 128,429 58,708Pittsville, City Of 69,033 8,042 4,591 12,633 0Platteville, City Of 4,030,186 323,769 268,008 591,778 0Plymouth, City Of 3,830,321 387,763 174,909 562,671 0Port Washington, City Of 4,710,959 466,566 313,384 779,950 0Portage, City Of 3,822,450 422,892 181,047 603,938 0Prairie Du Chien, City Of 1,797,057 196,378 76,383 272,761 0Prescott, City Of 1,189,217 111,304 69,335 180,639 0Princeton, City Of 474,173 40,008 31,532 71,541 0
138Actuarial accrued balances
Contributions UnfundedName Covered Payroll Employer Paid* Employee Paid Total Liability Balance
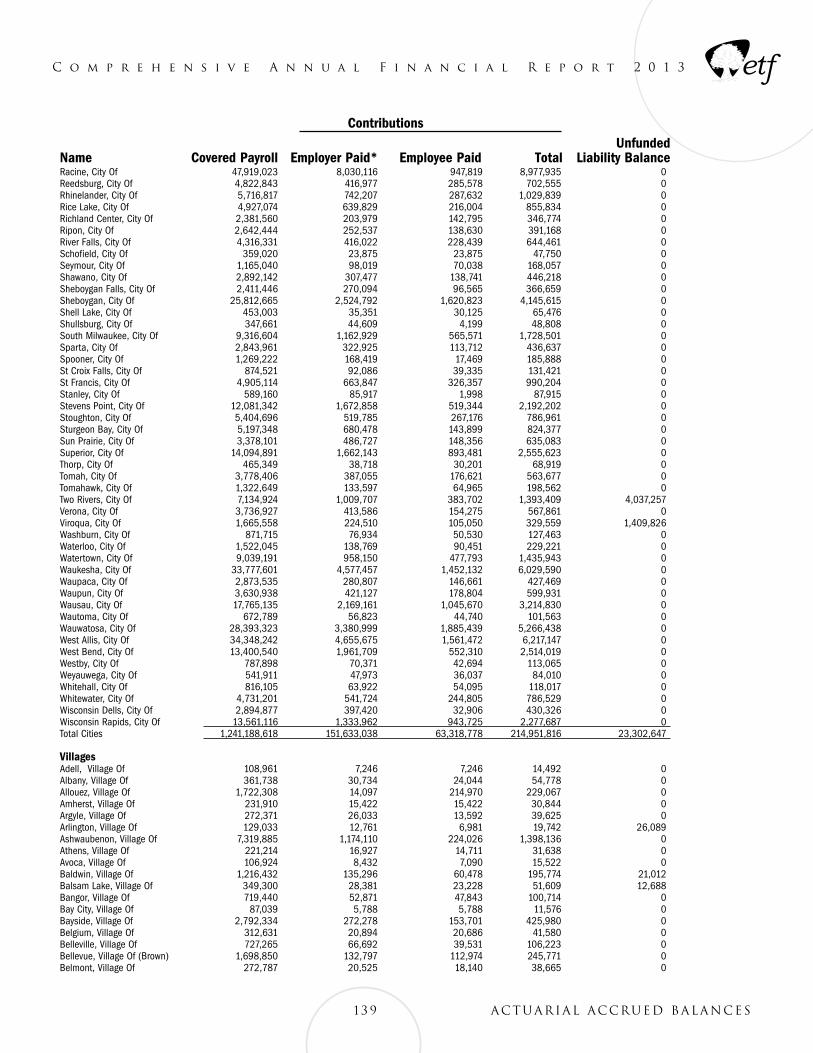
C o m p r e h e n s i v e A n n u a l F i n a n c i a l R e p o r t 2 0 1 3
Racine, City Of 47,919,023 8,030,116 947,819 8,977,935 0Reedsburg, City Of 4,822,843 416,977 285,578 702,555 0Rhinelander, City Of 5,716,817 742,207 287,632 1,029,839 0Rice Lake, City Of 4,927,074 639,829 216,004 855,834 0Richland Center, City Of 2,381,560 203,979 142,795 346,774 0Ripon, City Of 2,642,444 252,537 138,630 391,168 0River Falls, City Of 4,316,331 416,022 228,439 644,461 0Schofield, City Of 359,020 23,875 23,875 47,750 0Seymour, City Of 1,165,040 98,019 70,038 168,057 0Shawano, City Of 2,892,142 307,477 138,741 446,218 0Sheboygan Falls, City Of 2,411,446 270,094 96,565 366,659 0Sheboygan, City Of 25,812,665 2,524,792 1,620,823 4,145,615 0Shell Lake, City Of 453,003 35,351 30,125 65,476 0Shullsburg, City Of 347,661 44,609 4,199 48,808 0South Milwaukee, City Of 9,316,604 1,162,929 565,571 1,728,501 0Sparta, City Of 2,843,961 322,925 113,712 436,637 0Spooner, City Of 1,269,222 168,419 17,469 185,888 0St Croix Falls, City Of 874,521 92,086 39,335 131,421 0St Francis, City Of 4,905,114 663,847 326,357 990,204 0Stanley, City Of 589,160 85,917 1,998 87,915 0Stevens Point, City Of 12,081,342 1,672,858 519,344 2,192,202 0Stoughton, City Of 5,404,696 519,785 267,176 786,961 0Sturgeon Bay, City Of 5,197,348 680,478 143,899 824,377 0Sun Prairie, City Of 3,378,101 486,727 148,356 635,083 0Superior, City Of 14,094,891 1,662,143 893,481 2,555,623 0Thorp, City Of 465,349 38,718 30,201 68,919 0Tomah, City Of 3,778,406 387,055 176,621 563,677 0Tomahawk, City Of 1,322,649 133,597 64,965 198,562 0Two Rivers, City Of 7,134,924 1,009,707 383,702 1,393,409 4,037,257Verona, City Of 3,736,927 413,586 154,275 567,861 0Viroqua, City Of 1,665,558 224,510 105,050 329,559 1,409,826Washburn, City Of 871,715 76,934 50,530 127,463 0Waterloo, City Of 1,522,045 138,769 90,451 229,221 0Watertown, City Of 9,039,191 958,150 477,793 1,435,943 0Waukesha, City Of 33,777,601 4,577,457 1,452,132 6,029,590 0Waupaca, City Of 2,873,535 280,807 146,661 427,469 0Waupun, City Of 3,630,938 421,127 178,804 599,931 0Wausau, City Of 17,765,135 2,169,161 1,045,670 3,214,830 0Wautoma, City Of 672,789 56,823 44,740 101,563 0Wauwatosa, City Of 28,393,323 3,380,999 1,885,439 5,266,438 0West Allis, City Of 34,348,242 4,655,675 1,561,472 6,217,147 0West Bend, City Of 13,400,540 1,961,709 552,310 2,514,019 0Westby, City Of 787,898 70,371 42,694 113,065 0Weyauwega, City Of 541,911 47,973 36,037 84,010 0Whitehall, City Of 816,105 63,922 54,095 118,017 0Whitewater, City Of 4,731,201 541,724 244,805 786,529 0Wisconsin Dells, City Of 2,894,877 397,420 32,906 430,326 0Wisconsin Rapids, City Of 13,561,116 1,333,962 943,725 2,277,687 0Total Cities 1,241,188,618 151,633,038 63,318,778 214,951,816 23,302,647 Villages Adell, Village Of 108,961 7,246 7,246 14,492 0Albany, Village Of 361,738 30,734 24,044 54,778 0Allouez, Village Of 1,722,308 14,097 214,970 229,067 0Amherst, Village Of 231,910 15,422 15,422 30,844 0Argyle, Village Of 272,371 26,033 13,592 39,625 0Arlington, Village Of 129,033 12,761 6,981 19,742 26,089Ashwaubenon, Village Of 7,319,885 1,174,110 224,026 1,398,136 0Athens, Village Of 221,214 16,927 14,711 31,638 0Avoca, Village Of 106,924 8,432 7,090 15,522 0Baldwin, Village Of 1,216,432 135,296 60,478 195,774 21,012Balsam Lake, Village Of 349,300 28,381 23,228 51,609 12,688Bangor, Village Of 719,440 52,871 47,843 100,714 0Bay City, Village Of 87,039 5,788 5,788 11,576 0Bayside, Village Of 2,792,334 272,278 153,701 425,980 0Belgium, Village Of 312,631 20,894 20,686 41,580 0Belleville, Village Of 727,265 66,692 39,531 106,223 0Bellevue, Village Of (Brown) 1,698,850 132,797 112,974 245,771 0Belmont, Village Of 272,787 20,525 18,140 38,665 0
139 Actuarial accrued balances
Contributions UnfundedName Covered Payroll Employer Paid* Employee Paid Total Liability Balance
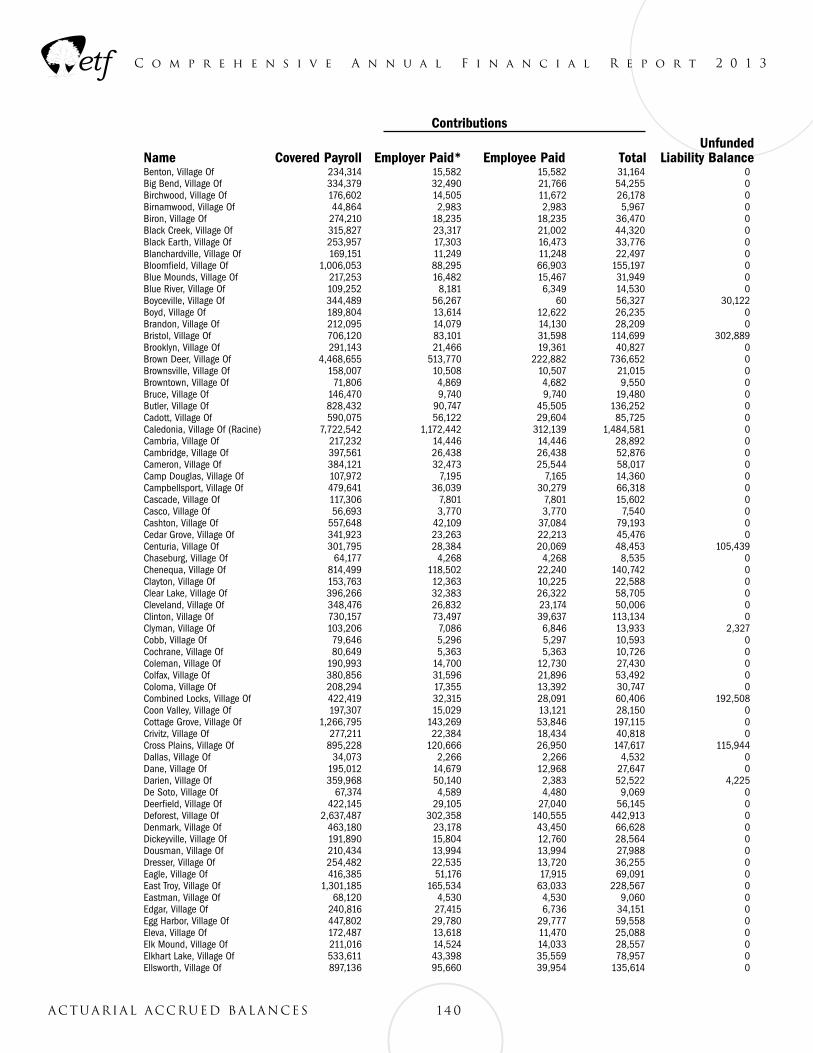
C o m p r e h e n s i v e A n n u a l F i n a n c i a l R e p o r t 2 0 1 3
Benton, Village Of 234,314 15,582 15,582 31,164 0Big Bend, Village Of 334,379 32,490 21,766 54,255 0Birchwood, Village Of 176,602 14,505 11,672 26,178 0Birnamwood, Village Of 44,864 2,983 2,983 5,967 0Biron, Village Of 274,210 18,235 18,235 36,470 0Black Creek, Village Of 315,827 23,317 21,002 44,320 0Black Earth, Village Of 253,957 17,303 16,473 33,776 0Blanchardville, Village Of 169,151 11,249 11,248 22,497 0Bloomfield, Village Of 1,006,053 88,295 66,903 155,197 0Blue Mounds, Village Of 217,253 16,482 15,467 31,949 0Blue River, Village Of 109,252 8,181 6,349 14,530 0Boyceville, Village Of 344,489 56,267 60 56,327 30,122Boyd, Village Of 189,804 13,614 12,622 26,235 0Brandon, Village Of 212,095 14,079 14,130 28,209 0Bristol, Village Of 706,120 83,101 31,598 114,699 302,889Brooklyn, Village Of 291,143 21,466 19,361 40,827 0Brown Deer, Village Of 4,468,655 513,770 222,882 736,652 0Brownsville, Village Of 158,007 10,508 10,507 21,015 0Browntown, Village Of 71,806 4,869 4,682 9,550 0Bruce, Village Of 146,470 9,740 9,740 19,480 0Butler, Village Of 828,432 90,747 45,505 136,252 0Cadott, Village Of 590,075 56,122 29,604 85,725 0Caledonia, Village Of (Racine) 7,722,542 1,172,442 312,139 1,484,581 0Cambria, Village Of 217,232 14,446 14,446 28,892 0Cambridge, Village Of 397,561 26,438 26,438 52,876 0Cameron, Village Of 384,121 32,473 25,544 58,017 0Camp Douglas, Village Of 107,972 7,195 7,165 14,360 0Campbellsport, Village Of 479,641 36,039 30,279 66,318 0Cascade, Village Of 117,306 7,801 7,801 15,602 0Casco, Village Of 56,693 3,770 3,770 7,540 0Cashton, Village Of 557,648 42,109 37,084 79,193 0Cedar Grove, Village Of 341,923 23,263 22,213 45,476 0Centuria, Village Of 301,795 28,384 20,069 48,453 105,439Chaseburg, Village Of 64,177 4,268 4,268 8,535 0Chenequa, Village Of 814,499 118,502 22,240 140,742 0Clayton, Village Of 153,763 12,363 10,225 22,588 0Clear Lake, Village Of 396,266 32,383 26,322 58,705 0Cleveland, Village Of 348,476 26,832 23,174 50,006 0Clinton, Village Of 730,157 73,497 39,637 113,134 0Clyman, Village Of 103,206 7,086 6,846 13,933 2,327Cobb, Village Of 79,646 5,296 5,297 10,593 0Cochrane, Village Of 80,649 5,363 5,363 10,726 0Coleman, Village Of 190,993 14,700 12,730 27,430 0Colfax, Village Of 380,856 31,596 21,896 53,492 0Coloma, Village Of 208,294 17,355 13,392 30,747 0Combined Locks, Village Of 422,419 32,315 28,091 60,406 192,508Coon Valley, Village Of 197,307 15,029 13,121 28,150 0Cottage Grove, Village Of 1,266,795 143,269 53,846 197,115 0Crivitz, Village Of 277,211 22,384 18,434 40,818 0Cross Plains, Village Of 895,228 120,666 26,950 147,617 115,944Dallas, Village Of 34,073 2,266 2,266 4,532 0Dane, Village Of 195,012 14,679 12,968 27,647 0Darien, Village Of 359,968 50,140 2,383 52,522 4,225De Soto, Village Of 67,374 4,589 4,480 9,069 0Deerfield, Village Of 422,145 29,105 27,040 56,145 0Deforest, Village Of 2,637,487 302,358 140,555 442,913 0Denmark, Village Of 463,180 23,178 43,450 66,628 0Dickeyville, Village Of 191,890 15,804 12,760 28,564 0Dousman, Village Of 210,434 13,994 13,994 27,988 0Dresser, Village Of 254,482 22,535 13,720 36,255 0Eagle, Village Of 416,385 51,176 17,915 69,091 0East Troy, Village Of 1,301,185 165,534 63,033 228,567 0Eastman, Village Of 68,120 4,530 4,530 9,060 0Edgar, Village Of 240,816 27,415 6,736 34,151 0Egg Harbor, Village Of 447,802 29,780 29,777 59,558 0Eleva, Village Of 172,487 13,618 11,470 25,088 0Elk Mound, Village Of 211,016 14,524 14,033 28,557 0Elkhart Lake, Village Of 533,611 43,398 35,559 78,957 0Ellsworth, Village Of 897,136 95,660 39,954 135,614 0
140Actuarial accrued balances
Contributions UnfundedName Covered Payroll Employer Paid* Employee Paid Total Liability Balance
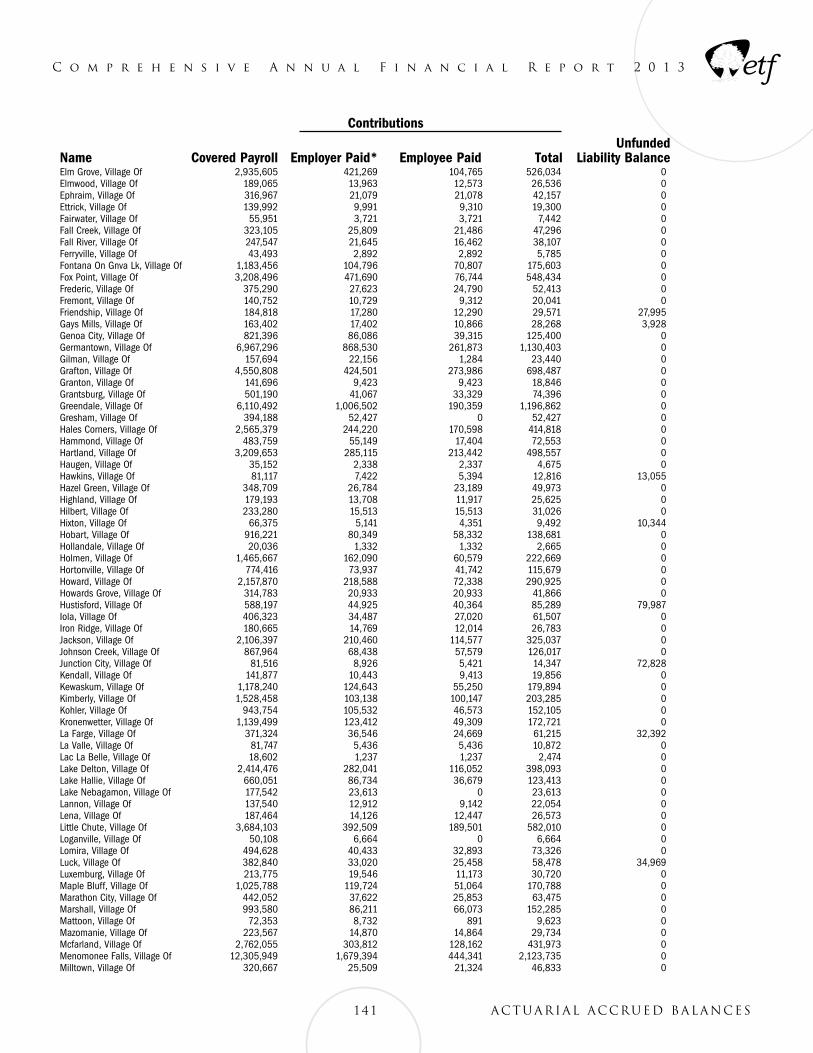
C o m p r e h e n s i v e A n n u a l F i n a n c i a l R e p o r t 2 0 1 3
Elm Grove, Village Of 2,935,605 421,269 104,765 526,034 0Elmwood, Village Of 189,065 13,963 12,573 26,536 0Ephraim, Village Of 316,967 21,079 21,078 42,157 0Ettrick, Village Of 139,992 9,991 9,310 19,300 0Fairwater, Village Of 55,951 3,721 3,721 7,442 0Fall Creek, Village Of 323,105 25,809 21,486 47,296 0Fall River, Village Of 247,547 21,645 16,462 38,107 0Ferryville, Village Of 43,493 2,892 2,892 5,785 0Fontana On Gnva Lk, Village Of 1,183,456 104,796 70,807 175,603 0Fox Point, Village Of 3,208,496 471,690 76,744 548,434 0Frederic, Village Of 375,290 27,623 24,790 52,413 0Fremont, Village Of 140,752 10,729 9,312 20,041 0Friendship, Village Of 184,818 17,280 12,290 29,571 27,995Gays Mills, Village Of 163,402 17,402 10,866 28,268 3,928Genoa City, Village Of 821,396 86,086 39,315 125,400 0Germantown, Village Of 6,967,296 868,530 261,873 1,130,403 0Gilman, Village Of 157,694 22,156 1,284 23,440 0Grafton, Village Of 4,550,808 424,501 273,986 698,487 0Granton, Village Of 141,696 9,423 9,423 18,846 0Grantsburg, Village Of 501,190 41,067 33,329 74,396 0Greendale, Village Of 6,110,492 1,006,502 190,359 1,196,862 0Gresham, Village Of 394,188 52,427 0 52,427 0Hales Corners, Village Of 2,565,379 244,220 170,598 414,818 0Hammond, Village Of 483,759 55,149 17,404 72,553 0Hartland, Village Of 3,209,653 285,115 213,442 498,557 0Haugen, Village Of 35,152 2,338 2,337 4,675 0Hawkins, Village Of 81,117 7,422 5,394 12,816 13,055Hazel Green, Village Of 348,709 26,784 23,189 49,973 0Highland, Village Of 179,193 13,708 11,917 25,625 0Hilbert, Village Of 233,280 15,513 15,513 31,026 0Hixton, Village Of 66,375 5,141 4,351 9,492 10,344Hobart, Village Of 916,221 80,349 58,332 138,681 0Hollandale, Village Of 20,036 1,332 1,332 2,665 0Holmen, Village Of 1,465,667 162,090 60,579 222,669 0Hortonville, Village Of 774,416 73,937 41,742 115,679 0Howard, Village Of 2,157,870 218,588 72,338 290,925 0Howards Grove, Village Of 314,783 20,933 20,933 41,866 0Hustisford, Village Of 588,197 44,925 40,364 85,289 79,987Iola, Village Of 406,323 34,487 27,020 61,507 0Iron Ridge, Village Of 180,665 14,769 12,014 26,783 0Jackson, Village Of 2,106,397 210,460 114,577 325,037 0Johnson Creek, Village Of 867,964 68,438 57,579 126,017 0Junction City, Village Of 81,516 8,926 5,421 14,347 72,828Kendall, Village Of 141,877 10,443 9,413 19,856 0Kewaskum, Village Of 1,178,240 124,643 55,250 179,894 0Kimberly, Village Of 1,528,458 103,138 100,147 203,285 0Kohler, Village Of 943,754 105,532 46,573 152,105 0Kronenwetter, Village Of 1,139,499 123,412 49,309 172,721 0La Farge, Village Of 371,324 36,546 24,669 61,215 32,392La Valle, Village Of 81,747 5,436 5,436 10,872 0Lac La Belle, Village Of 18,602 1,237 1,237 2,474 0Lake Delton, Village Of 2,414,476 282,041 116,052 398,093 0Lake Hallie, Village Of 660,051 86,734 36,679 123,413 0Lake Nebagamon, Village Of 177,542 23,613 0 23,613 0Lannon, Village Of 137,540 12,912 9,142 22,054 0Lena, Village Of 187,464 14,126 12,447 26,573 0Little Chute, Village Of 3,684,103 392,509 189,501 582,010 0Loganville, Village Of 50,108 6,664 0 6,664 0Lomira, Village Of 494,628 40,433 32,893 73,326 0Luck, Village Of 382,840 33,020 25,458 58,478 34,969Luxemburg, Village Of 213,775 19,546 11,173 30,720 0Maple Bluff, Village Of 1,025,788 119,724 51,064 170,788 0Marathon City, Village Of 442,052 37,622 25,853 63,475 0Marshall, Village Of 993,580 86,211 66,073 152,285 0Mattoon, Village Of 72,353 8,732 891 9,623 0Mazomanie, Village Of 223,567 14,870 14,864 29,734 0Mcfarland, Village Of 2,762,055 303,812 128,162 431,973 0Menomonee Falls, Village Of 12,305,949 1,679,394 444,341 2,123,735 0Milltown, Village Of 320,667 25,509 21,324 46,833 0
141 Actuarial accrued balances
Contributions UnfundedName Covered Payroll Employer Paid* Employee Paid Total Liability Balance
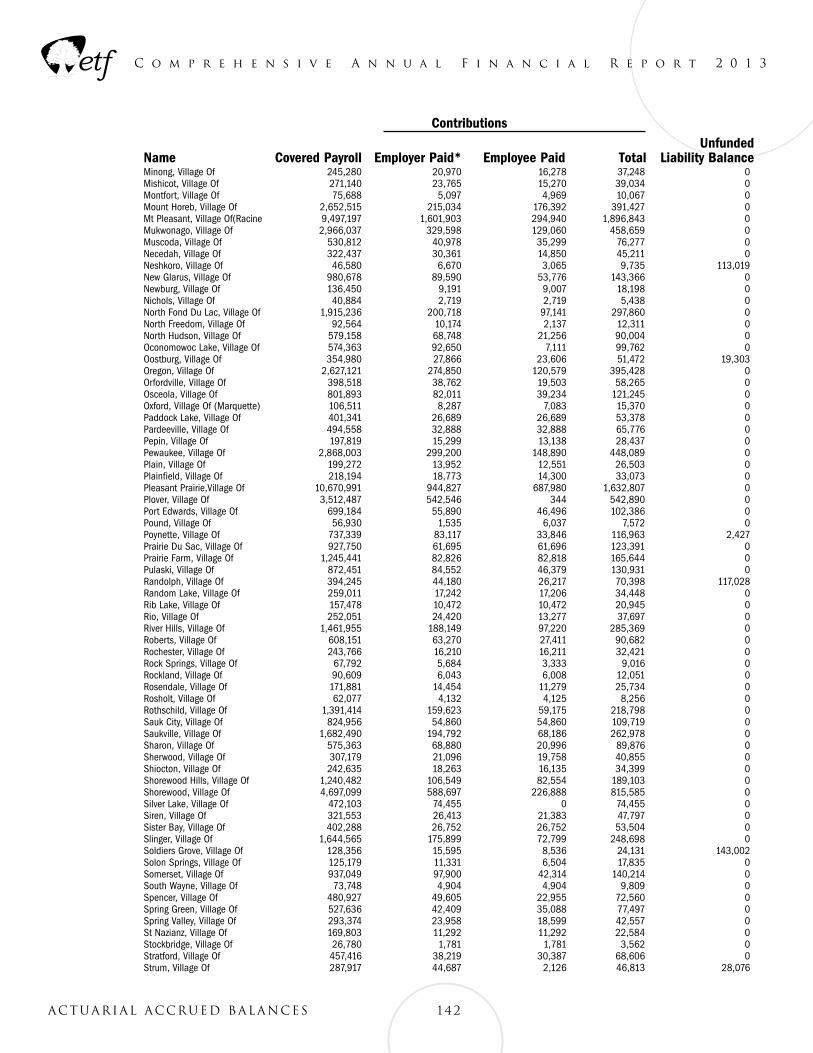
C o m p r e h e n s i v e A n n u a l F i n a n c i a l R e p o r t 2 0 1 3
Minong, Village Of 245,280 20,970 16,278 37,248 0Mishicot, Village Of 271,140 23,765 15,270 39,034 0Montfort, Village Of 75,688 5,097 4,969 10,067 0Mount Horeb, Village Of 2,652,515 215,034 176,392 391,427 0Mt Pleasant, Village Of(Racine 9,497,197 1,601,903 294,940 1,896,843 0Mukwonago, Village Of 2,966,037 329,598 129,060 458,659 0Muscoda, Village Of 530,812 40,978 35,299 76,277 0Necedah, Village Of 322,437 30,361 14,850 45,211 0Neshkoro, Village Of 46,580 6,670 3,065 9,735 113,019New Glarus, Village Of 980,678 89,590 53,776 143,366 0Newburg, Village Of 136,450 9,191 9,007 18,198 0Nichols, Village Of 40,884 2,719 2,719 5,438 0North Fond Du Lac, Village Of 1,915,236 200,718 97,141 297,860 0North Freedom, Village Of 92,564 10,174 2,137 12,311 0North Hudson, Village Of 579,158 68,748 21,256 90,004 0Oconomowoc Lake, Village Of 574,363 92,650 7,111 99,762 0Oostburg, Village Of 354,980 27,866 23,606 51,472 19,303Oregon, Village Of 2,627,121 274,850 120,579 395,428 0Orfordville, Village Of 398,518 38,762 19,503 58,265 0Osceola, Village Of 801,893 82,011 39,234 121,245 0Oxford, Village Of (Marquette) 106,511 8,287 7,083 15,370 0Paddock Lake, Village Of 401,341 26,689 26,689 53,378 0Pardeeville, Village Of 494,558 32,888 32,888 65,776 0Pepin, Village Of 197,819 15,299 13,138 28,437 0Pewaukee, Village Of 2,868,003 299,200 148,890 448,089 0Plain, Village Of 199,272 13,952 12,551 26,503 0Plainfield, Village Of 218,194 18,773 14,300 33,073 0Pleasant Prairie,Village Of 10,670,991 944,827 687,980 1,632,807 0Plover, Village Of 3,512,487 542,546 344 542,890 0Port Edwards, Village Of 699,184 55,890 46,496 102,386 0Pound, Village Of 56,930 1,535 6,037 7,572 0Poynette, Village Of 737,339 83,117 33,846 116,963 2,427Prairie Du Sac, Village Of 927,750 61,695 61,696 123,391 0Prairie Farm, Village Of 1,245,441 82,826 82,818 165,644 0Pulaski, Village Of 872,451 84,552 46,379 130,931 0Randolph, Village Of 394,245 44,180 26,217 70,398 117,028Random Lake, Village Of 259,011 17,242 17,206 34,448 0Rib Lake, Village Of 157,478 10,472 10,472 20,945 0Rio, Village Of 252,051 24,420 13,277 37,697 0River Hills, Village Of 1,461,955 188,149 97,220 285,369 0Roberts, Village Of 608,151 63,270 27,411 90,682 0Rochester, Village Of 243,766 16,210 16,211 32,421 0Rock Springs, Village Of 67,792 5,684 3,333 9,016 0Rockland, Village Of 90,609 6,043 6,008 12,051 0Rosendale, Village Of 171,881 14,454 11,279 25,734 0Rosholt, Village Of 62,077 4,132 4,125 8,256 0Rothschild, Village Of 1,391,414 159,623 59,175 218,798 0Sauk City, Village Of 824,956 54,860 54,860 109,719 0Saukville, Village Of 1,682,490 194,792 68,186 262,978 0Sharon, Village Of 575,363 68,880 20,996 89,876 0Sherwood, Village Of 307,179 21,096 19,758 40,855 0Shiocton, Village Of 242,635 18,263 16,135 34,399 0Shorewood Hills, Village Of 1,240,482 106,549 82,554 189,103 0Shorewood, Village Of 4,697,099 588,697 226,888 815,585 0Silver Lake, Village Of 472,103 74,455 0 74,455 0Siren, Village Of 321,553 26,413 21,383 47,797 0Sister Bay, Village Of 402,288 26,752 26,752 53,504 0Slinger, Village Of 1,644,565 175,899 72,799 248,698 0Soldiers Grove, Village Of 128,356 15,595 8,536 24,131 143,002Solon Springs, Village Of 125,179 11,331 6,504 17,835 0Somerset, Village Of 937,049 97,900 42,314 140,214 0South Wayne, Village Of 73,748 4,904 4,904 9,809 0Spencer, Village Of 480,927 49,605 22,955 72,560 0Spring Green, Village Of 527,636 42,409 35,088 77,497 0Spring Valley, Village Of 293,374 23,958 18,599 42,557 0St Nazianz, Village Of 169,803 11,292 11,292 22,584 0Stockbridge, Village Of 26,780 1,781 1,781 3,562 0Stratford, Village Of 457,416 38,219 30,387 68,606 0Strum, Village Of 287,917 44,687 2,126 46,813 28,076
142Actuarial accrued balances
Contributions UnfundedName Covered Payroll Employer Paid* Employee Paid Total Liability Balance
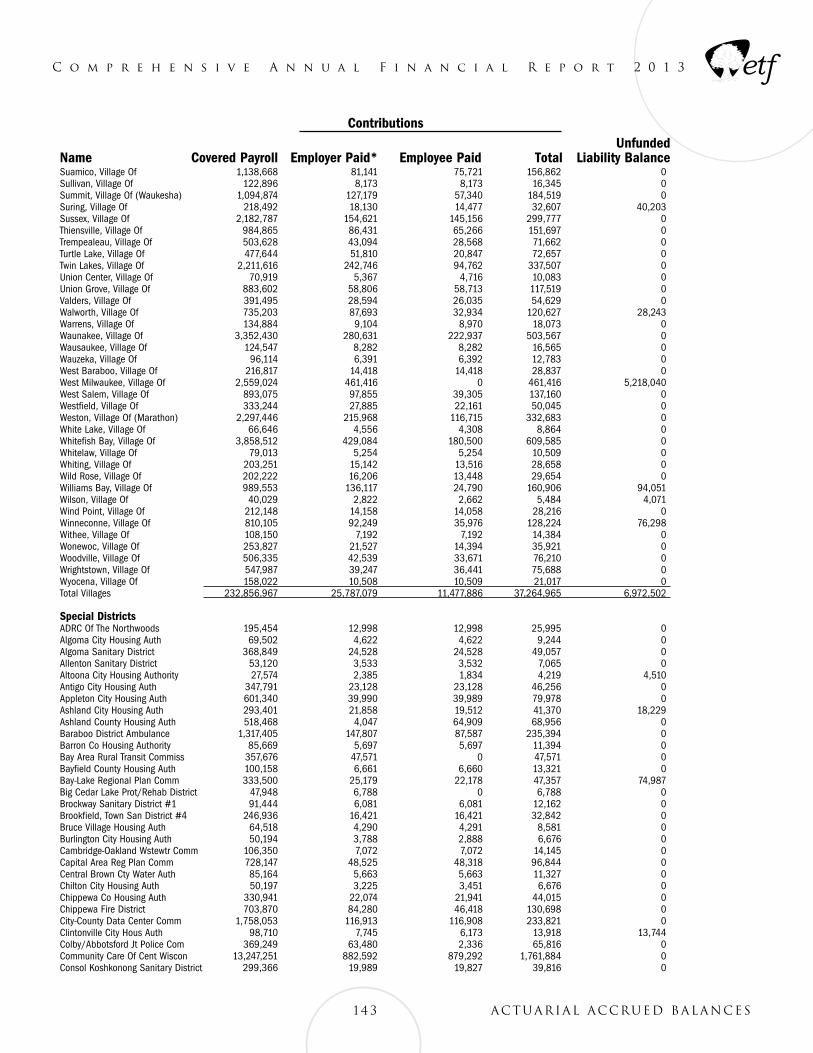
C o m p r e h e n s i v e A n n u a l F i n a n c i a l R e p o r t 2 0 1 3
Suamico, Village Of 1,138,668 81,141 75,721 156,862 0Sullivan, Village Of 122,896 8,173 8,173 16,345 0Summit, Village Of (Waukesha) 1,094,874 127,179 57,340 184,519 0Suring, Village Of 218,492 18,130 14,477 32,607 40,203Sussex, Village Of 2,182,787 154,621 145,156 299,777 0Thiensville, Village Of 984,865 86,431 65,266 151,697 0Trempealeau, Village Of 503,628 43,094 28,568 71,662 0Turtle Lake, Village Of 477,644 51,810 20,847 72,657 0Twin Lakes, Village Of 2,211,616 242,746 94,762 337,507 0Union Center, Village Of 70,919 5,367 4,716 10,083 0Union Grove, Village Of 883,602 58,806 58,713 117,519 0Valders, Village Of 391,495 28,594 26,035 54,629 0Walworth, Village Of 735,203 87,693 32,934 120,627 28,243Warrens, Village Of 134,884 9,104 8,970 18,073 0Waunakee, Village Of 3,352,430 280,631 222,937 503,567 0Wausaukee, Village Of 124,547 8,282 8,282 16,565 0Wauzeka, Village Of 96,114 6,391 6,392 12,783 0West Baraboo, Village Of 216,817 14,418 14,418 28,837 0West Milwaukee, Village Of 2,559,024 461,416 0 461,416 5,218,040West Salem, Village Of 893,075 97,855 39,305 137,160 0Westfield, Village Of 333,244 27,885 22,161 50,045 0Weston, Village Of (Marathon) 2,297,446 215,968 116,715 332,683 0White Lake, Village Of 66,646 4,556 4,308 8,864 0Whitefish Bay, Village Of 3,858,512 429,084 180,500 609,585 0Whitelaw, Village Of 79,013 5,254 5,254 10,509 0Whiting, Village Of 203,251 15,142 13,516 28,658 0Wild Rose, Village Of 202,222 16,206 13,448 29,654 0Williams Bay, Village Of 989,553 136,117 24,790 160,906 94,051Wilson, Village Of 40,029 2,822 2,662 5,484 4,071Wind Point, Village Of 212,148 14,158 14,058 28,216 0Winneconne, Village Of 810,105 92,249 35,976 128,224 76,298Withee, Village Of 108,150 7,192 7,192 14,384 0Wonewoc, Village Of 253,827 21,527 14,394 35,921 0Woodville, Village Of 506,335 42,539 33,671 76,210 0Wrightstown, Village Of 547,987 39,247 36,441 75,688 0Wyocena, Village Of 158,022 10,508 10,509 21,017 0Total Villages 232,856,967 25,787,079 11,477,886 37,264,965 6,972,502 Special Districts ADRC Of The Northwoods 195,454 12,998 12,998 25,995 0Algoma City Housing Auth 69,502 4,622 4,622 9,244 0Algoma Sanitary District 368,849 24,528 24,528 49,057 0Allenton Sanitary District 53,120 3,533 3,532 7,065 0Altoona City Housing Authority 27,574 2,385 1,834 4,219 4,510Antigo City Housing Auth 347,791 23,128 23,128 46,256 0Appleton City Housing Auth 601,340 39,990 39,989 79,978 0Ashland City Housing Auth 293,401 21,858 19,512 41,370 18,229Ashland County Housing Auth 518,468 4,047 64,909 68,956 0Baraboo District Ambulance 1,317,405 147,807 87,587 235,394 0Barron Co Housing Authority 85,669 5,697 5,697 11,394 0Bay Area Rural Transit Commiss 357,676 47,571 0 47,571 0Bayfield County Housing Auth 100,158 6,661 6,660 13,321 0Bay-Lake Regional Plan Comm 333,500 25,179 22,178 47,357 74,987Big Cedar Lake Prot/Rehab District 47,948 6,788 0 6,788 0Brockway Sanitary District #1 91,444 6,081 6,081 12,162 0Brookfield, Town San District #4 246,936 16,421 16,421 32,842 0Bruce Village Housing Auth 64,518 4,290 4,291 8,581 0Burlington City Housing Auth 50,194 3,788 2,888 6,676 0Cambridge-Oakland Wstewtr Comm 106,350 7,072 7,072 14,145 0Capital Area Reg Plan Comm 728,147 48,525 48,318 96,844 0Central Brown Cty Water Auth 85,164 5,663 5,663 11,327 0Chilton City Housing Auth 50,197 3,225 3,451 6,676 0Chippewa Co Housing Auth 330,941 22,074 21,941 44,015 0Chippewa Fire District 703,870 84,280 46,418 130,698 0City-County Data Center Comm 1,758,053 116,913 116,908 233,821 0Clintonville City Hous Auth 98,710 7,745 6,173 13,918 13,744Colby/Abbotsford Jt Police Com 369,249 63,480 2,336 65,816 0Community Care Of Cent Wiscon 13,247,251 882,592 879,292 1,761,884 0Consol Koshkonong Sanitary District 299,366 19,989 19,827 39,816 0
143 Actuarial accrued balances
Contributions UnfundedName Covered Payroll Employer Paid* Employee Paid Total Liability Balance
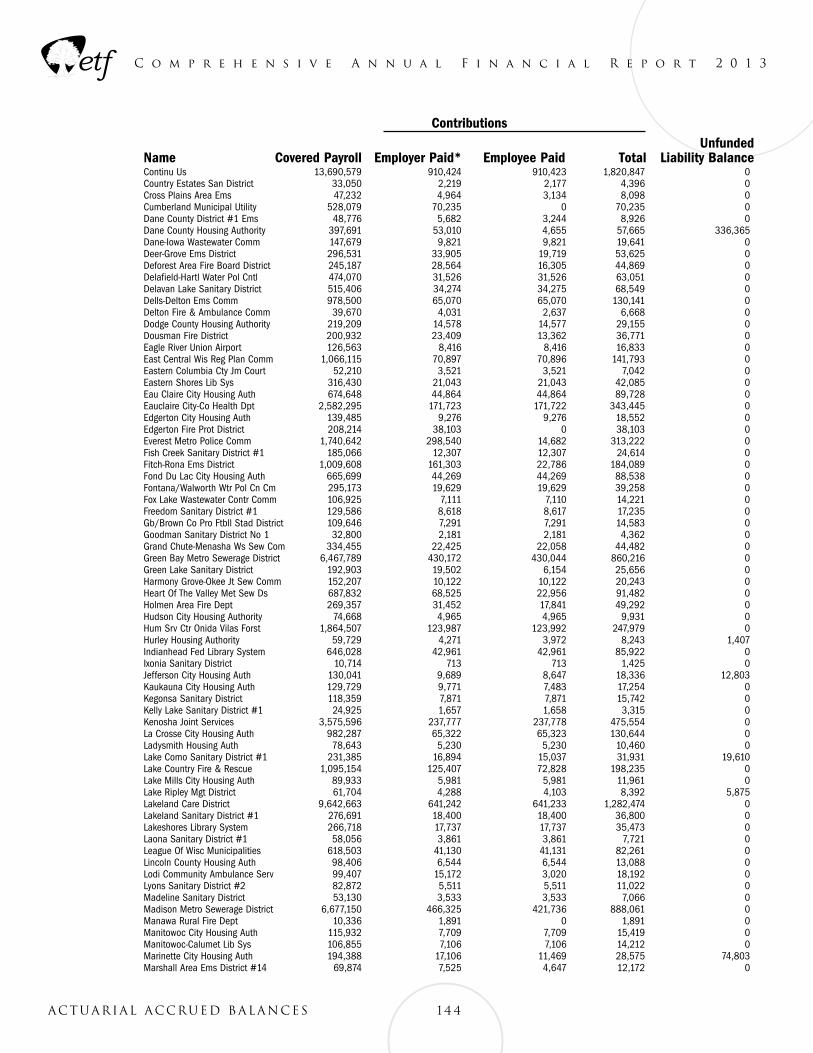
C o m p r e h e n s i v e A n n u a l F i n a n c i a l R e p o r t 2 0 1 3
Continu Us 13,690,579 910,424 910,423 1,820,847 0Country Estates San District 33,050 2,219 2,177 4,396 0Cross Plains Area Ems 47,232 4,964 3,134 8,098 0Cumberland Municipal Utility 528,079 70,235 0 70,235 0Dane County District #1 Ems 48,776 5,682 3,244 8,926 0Dane County Housing Authority 397,691 53,010 4,655 57,665 336,365Dane-Iowa Wastewater Comm 147,679 9,821 9,821 19,641 0Deer-Grove Ems District 296,531 33,905 19,719 53,625 0Deforest Area Fire Board District 245,187 28,564 16,305 44,869 0Delafield-Hartl Water Pol Cntl 474,070 31,526 31,526 63,051 0Delavan Lake Sanitary District 515,406 34,274 34,275 68,549 0Dells-Delton Ems Comm 978,500 65,070 65,070 130,141 0Delton Fire & Ambulance Comm 39,670 4,031 2,637 6,668 0Dodge County Housing Authority 219,209 14,578 14,577 29,155 0Dousman Fire District 200,932 23,409 13,362 36,771 0Eagle River Union Airport 126,563 8,416 8,416 16,833 0East Central Wis Reg Plan Comm 1,066,115 70,897 70,896 141,793 0Eastern Columbia Cty Jm Court 52,210 3,521 3,521 7,042 0Eastern Shores Lib Sys 316,430 21,043 21,043 42,085 0Eau Claire City Housing Auth 674,648 44,864 44,864 89,728 0Eauclaire City-Co Health Dpt 2,582,295 171,723 171,722 343,445 0Edgerton City Housing Auth 139,485 9,276 9,276 18,552 0Edgerton Fire Prot District 208,214 38,103 0 38,103 0Everest Metro Police Comm 1,740,642 298,540 14,682 313,222 0Fish Creek Sanitary District #1 185,066 12,307 12,307 24,614 0Fitch-Rona Ems District 1,009,608 161,303 22,786 184,089 0Fond Du Lac City Housing Auth 665,699 44,269 44,269 88,538 0Fontana/Walworth Wtr Pol Cn Cm 295,173 19,629 19,629 39,258 0Fox Lake Wastewater Contr Comm 106,925 7,111 7,110 14,221 0Freedom Sanitary District #1 129,586 8,618 8,617 17,235 0Gb/Brown Co Pro Ftbll Stad District 109,646 7,291 7,291 14,583 0Goodman Sanitary District No 1 32,800 2,181 2,181 4,362 0Grand Chute-Menasha Ws Sew Com 334,455 22,425 22,058 44,482 0Green Bay Metro Sewerage District 6,467,789 430,172 430,044 860,216 0Green Lake Sanitary District 192,903 19,502 6,154 25,656 0Harmony Grove-Okee Jt Sew Comm 152,207 10,122 10,122 20,243 0Heart Of The Valley Met Sew Ds 687,832 68,525 22,956 91,482 0Holmen Area Fire Dept 269,357 31,452 17,841 49,292 0Hudson City Housing Authority 74,668 4,965 4,965 9,931 0Hum Srv Ctr Onida Vilas Forst 1,864,507 123,987 123,992 247,979 0Hurley Housing Authority 59,729 4,271 3,972 8,243 1,407Indianhead Fed Library System 646,028 42,961 42,961 85,922 0Ixonia Sanitary District 10,714 713 713 1,425 0Jefferson City Housing Auth 130,041 9,689 8,647 18,336 12,803Kaukauna City Housing Auth 129,729 9,771 7,483 17,254 0Kegonsa Sanitary District 118,359 7,871 7,871 15,742 0Kelly Lake Sanitary District #1 24,925 1,657 1,658 3,315 0Kenosha Joint Services 3,575,596 237,777 237,778 475,554 0La Crosse City Housing Auth 982,287 65,322 65,323 130,644 0Ladysmith Housing Auth 78,643 5,230 5,230 10,460 0Lake Como Sanitary District #1 231,385 16,894 15,037 31,931 19,610Lake Country Fire & Rescue 1,095,154 125,407 72,828 198,235 0Lake Mills City Housing Auth 89,933 5,981 5,981 11,961 0Lake Ripley Mgt District 61,704 4,288 4,103 8,392 5,875Lakeland Care District 9,642,663 641,242 641,233 1,282,474 0Lakeland Sanitary District #1 276,691 18,400 18,400 36,800 0Lakeshores Library System 266,718 17,737 17,737 35,473 0Laona Sanitary District #1 58,056 3,861 3,861 7,721 0League Of Wisc Municipalities 618,503 41,130 41,131 82,261 0Lincoln County Housing Auth 98,406 6,544 6,544 13,088 0Lodi Community Ambulance Serv 99,407 15,172 3,020 18,192 0Lyons Sanitary District #2 82,872 5,511 5,511 11,022 0Madeline Sanitary District 53,130 3,533 3,533 7,066 0Madison Metro Sewerage District 6,677,150 466,325 421,736 888,061 0Manawa Rural Fire Dept 10,336 1,891 0 1,891 0Manitowoc City Housing Auth 115,932 7,709 7,709 15,419 0Manitowoc-Calumet Lib Sys 106,855 7,106 7,106 14,212 0Marinette City Housing Auth 194,388 17,106 11,469 28,575 74,803Marshall Area Ems District #14 69,874 7,525 4,647 12,172 0
144Actuarial accrued balances
Contributions UnfundedName Covered Payroll Employer Paid* Employee Paid Total Liability Balance
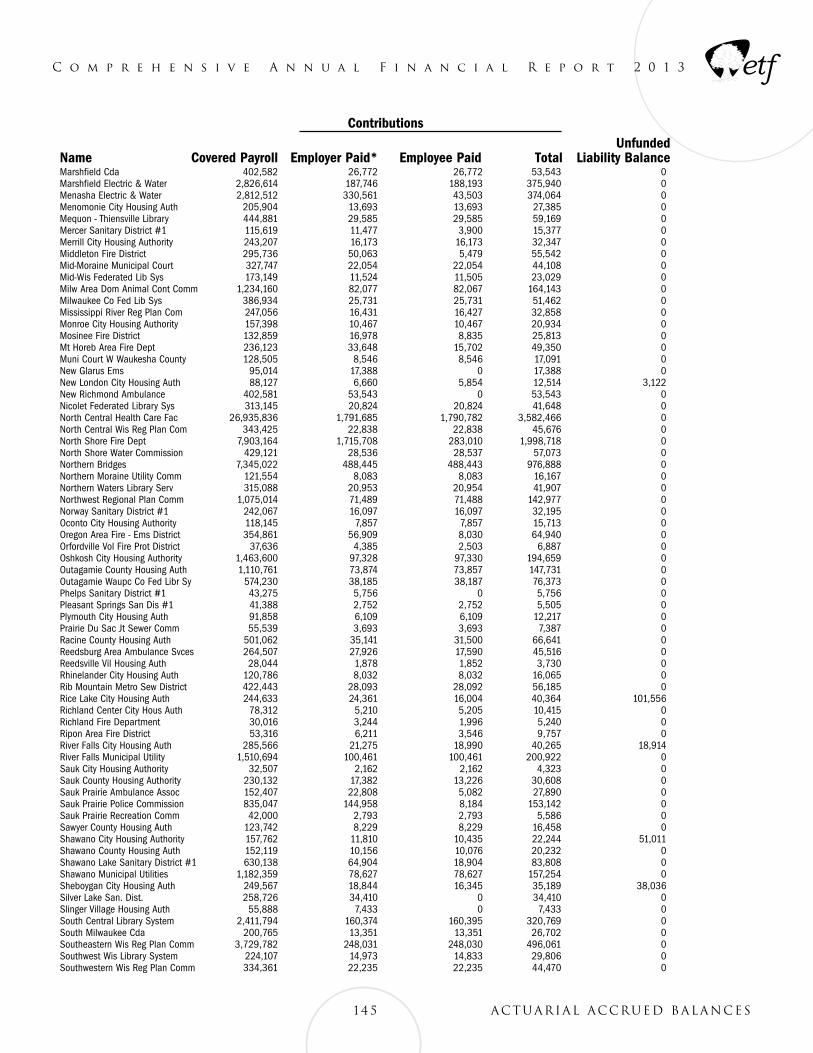
C o m p r e h e n s i v e A n n u a l F i n a n c i a l R e p o r t 2 0 1 3
Marshfield Cda 402,582 26,772 26,772 53,543 0Marshfield Electric & Water 2,826,614 187,746 188,193 375,940 0Menasha Electric & Water 2,812,512 330,561 43,503 374,064 0Menomonie City Housing Auth 205,904 13,693 13,693 27,385 0Mequon - Thiensville Library 444,881 29,585 29,585 59,169 0Mercer Sanitary District #1 115,619 11,477 3,900 15,377 0Merrill City Housing Authority 243,207 16,173 16,173 32,347 0Middleton Fire District 295,736 50,063 5,479 55,542 0Mid-Moraine Municipal Court 327,747 22,054 22,054 44,108 0Mid-Wis Federated Lib Sys 173,149 11,524 11,505 23,029 0Milw Area Dom Animal Cont Comm 1,234,160 82,077 82,067 164,143 0Milwaukee Co Fed Lib Sys 386,934 25,731 25,731 51,462 0Mississippi River Reg Plan Com 247,056 16,431 16,427 32,858 0Monroe City Housing Authority 157,398 10,467 10,467 20,934 0Mosinee Fire District 132,859 16,978 8,835 25,813 0Mt Horeb Area Fire Dept 236,123 33,648 15,702 49,350 0Muni Court W Waukesha County 128,505 8,546 8,546 17,091 0New Glarus Ems 95,014 17,388 0 17,388 0New London City Housing Auth 88,127 6,660 5,854 12,514 3,122New Richmond Ambulance 402,581 53,543 0 53,543 0Nicolet Federated Library Sys 313,145 20,824 20,824 41,648 0North Central Health Care Fac 26,935,836 1,791,685 1,790,782 3,582,466 0North Central Wis Reg Plan Com 343,425 22,838 22,838 45,676 0North Shore Fire Dept 7,903,164 1,715,708 283,010 1,998,718 0North Shore Water Commission 429,121 28,536 28,537 57,073 0Northern Bridges 7,345,022 488,445 488,443 976,888 0Northern Moraine Utility Comm 121,554 8,083 8,083 16,167 0Northern Waters Library Serv 315,088 20,953 20,954 41,907 0Northwest Regional Plan Comm 1,075,014 71,489 71,488 142,977 0Norway Sanitary District #1 242,067 16,097 16,097 32,195 0Oconto City Housing Authority 118,145 7,857 7,857 15,713 0Oregon Area Fire - Ems District 354,861 56,909 8,030 64,940 0Orfordville Vol Fire Prot District 37,636 4,385 2,503 6,887 0Oshkosh City Housing Authority 1,463,600 97,328 97,330 194,659 0Outagamie County Housing Auth 1,110,761 73,874 73,857 147,731 0Outagamie Waupc Co Fed Libr Sy 574,230 38,185 38,187 76,373 0Phelps Sanitary District #1 43,275 5,756 0 5,756 0Pleasant Springs San Dis #1 41,388 2,752 2,752 5,505 0Plymouth City Housing Auth 91,858 6,109 6,109 12,217 0Prairie Du Sac Jt Sewer Comm 55,539 3,693 3,693 7,387 0Racine County Housing Auth 501,062 35,141 31,500 66,641 0Reedsburg Area Ambulance Svces 264,507 27,926 17,590 45,516 0Reedsville Vil Housing Auth 28,044 1,878 1,852 3,730 0Rhinelander City Housing Auth 120,786 8,032 8,032 16,065 0Rib Mountain Metro Sew District 422,443 28,093 28,092 56,185 0Rice Lake City Housing Auth 244,633 24,361 16,004 40,364 101,556Richland Center City Hous Auth 78,312 5,210 5,205 10,415 0Richland Fire Department 30,016 3,244 1,996 5,240 0Ripon Area Fire District 53,316 6,211 3,546 9,757 0River Falls City Housing Auth 285,566 21,275 18,990 40,265 18,914River Falls Municipal Utility 1,510,694 100,461 100,461 200,922 0Sauk City Housing Authority 32,507 2,162 2,162 4,323 0Sauk County Housing Authority 230,132 17,382 13,226 30,608 0Sauk Prairie Ambulance Assoc 152,407 22,808 5,082 27,890 0Sauk Prairie Police Commission 835,047 144,958 8,184 153,142 0Sauk Prairie Recreation Comm 42,000 2,793 2,793 5,586 0Sawyer County Housing Auth 123,742 8,229 8,229 16,458 0Shawano City Housing Authority 157,762 11,810 10,435 22,244 51,011Shawano County Housing Auth 152,119 10,156 10,076 20,232 0Shawano Lake Sanitary District #1 630,138 64,904 18,904 83,808 0Shawano Municipal Utilities 1,182,359 78,627 78,627 157,254 0Sheboygan City Housing Auth 249,567 18,844 16,345 35,189 38,036Silver Lake San. Dist. 258,726 34,410 0 34,410 0Slinger Village Housing Auth 55,888 7,433 0 7,433 0South Central Library System 2,411,794 160,374 160,395 320,769 0South Milwaukee Cda 200,765 13,351 13,351 26,702 0Southeastern Wis Reg Plan Comm 3,729,782 248,031 248,030 496,061 0Southwest Wis Library System 224,107 14,973 14,833 29,806 0Southwestern Wis Reg Plan Comm 334,361 22,235 22,235 44,470 0
145 Actuarial accrued balances
Contributions UnfundedName Covered Payroll Employer Paid* Employee Paid Total Liability Balance
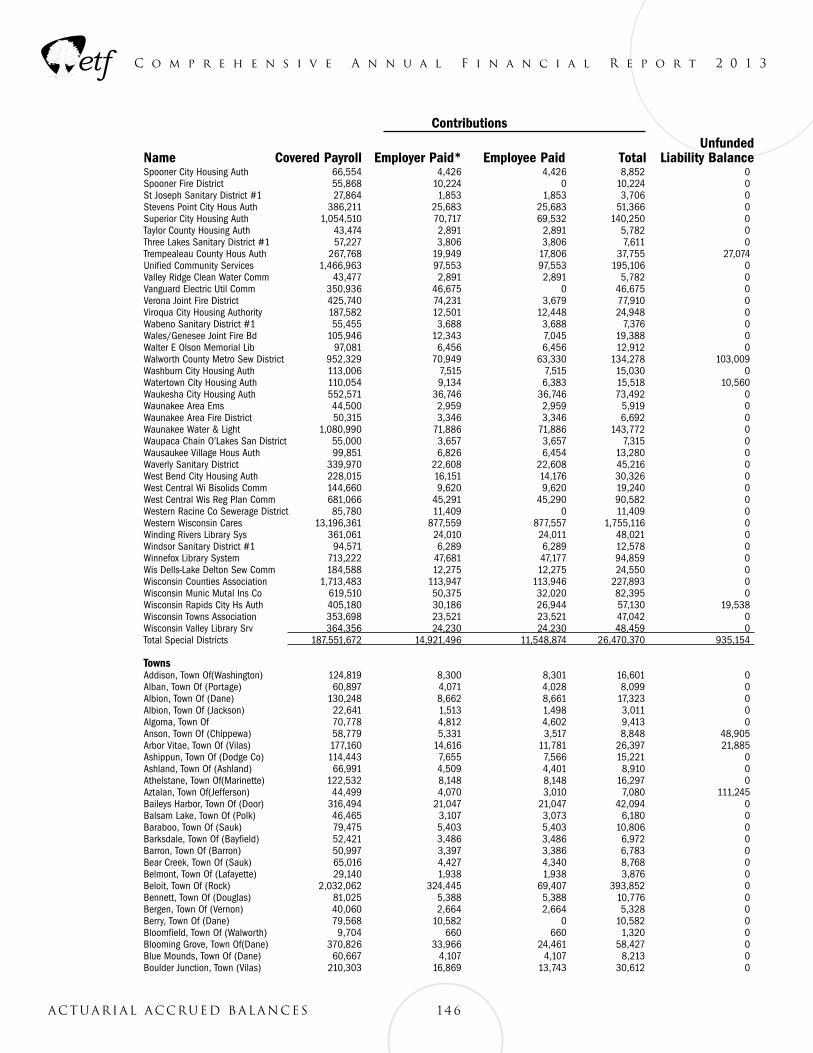
C o m p r e h e n s i v e A n n u a l F i n a n c i a l R e p o r t 2 0 1 3
Spooner City Housing Auth 66,554 4,426 4,426 8,852 0Spooner Fire District 55,868 10,224 0 10,224 0St Joseph Sanitary District #1 27,864 1,853 1,853 3,706 0Stevens Point City Hous Auth 386,211 25,683 25,683 51,366 0Superior City Housing Auth 1,054,510 70,717 69,532 140,250 0Taylor County Housing Auth 43,474 2,891 2,891 5,782 0Three Lakes Sanitary District #1 57,227 3,806 3,806 7,611 0Trempealeau County Hous Auth 267,768 19,949 17,806 37,755 27,074Unified Community Services 1,466,963 97,553 97,553 195,106 0Valley Ridge Clean Water Comm 43,477 2,891 2,891 5,782 0Vanguard Electric Util Comm 350,936 46,675 0 46,675 0Verona Joint Fire District 425,740 74,231 3,679 77,910 0Viroqua City Housing Authority 187,582 12,501 12,448 24,948 0Wabeno Sanitary District #1 55,455 3,688 3,688 7,376 0Wales/Genesee Joint Fire Bd 105,946 12,343 7,045 19,388 0Walter E Olson Memorial Lib 97,081 6,456 6,456 12,912 0Walworth County Metro Sew District 952,329 70,949 63,330 134,278 103,009Washburn City Housing Auth 113,006 7,515 7,515 15,030 0Watertown City Housing Auth 110,054 9,134 6,383 15,518 10,560Waukesha City Housing Auth 552,571 36,746 36,746 73,492 0Waunakee Area Ems 44,500 2,959 2,959 5,919 0Waunakee Area Fire District 50,315 3,346 3,346 6,692 0Waunakee Water & Light 1,080,990 71,886 71,886 143,772 0Waupaca Chain O’Lakes San District 55,000 3,657 3,657 7,315 0Wausaukee Village Hous Auth 99,851 6,826 6,454 13,280 0Waverly Sanitary District 339,970 22,608 22,608 45,216 0West Bend City Housing Auth 228,015 16,151 14,176 30,326 0West Central Wi Bisolids Comm 144,660 9,620 9,620 19,240 0West Central Wis Reg Plan Comm 681,066 45,291 45,290 90,582 0Western Racine Co Sewerage District 85,780 11,409 0 11,409 0Western Wisconsin Cares 13,196,361 877,559 877,557 1,755,116 0Winding Rivers Library Sys 361,061 24,010 24,011 48,021 0Windsor Sanitary District #1 94,571 6,289 6,289 12,578 0Winnefox Library System 713,222 47,681 47,177 94,859 0Wis Dells-Lake Delton Sew Comm 184,588 12,275 12,275 24,550 0Wisconsin Counties Association 1,713,483 113,947 113,946 227,893 0Wisconsin Munic Mutal Ins Co 619,510 50,375 32,020 82,395 0Wisconsin Rapids City Hs Auth 405,180 30,186 26,944 57,130 19,538Wisconsin Towns Association 353,698 23,521 23,521 47,042 0Wisconsin Valley Library Srv 364,356 24,230 24,230 48,459 0Total Special Districts 187,551,672 14,921,496 11,548,874 26,470,370 935,154 Towns Addison, Town Of(Washington) 124,819 8,300 8,301 16,601 0Alban, Town Of (Portage) 60,897 4,071 4,028 8,099 0Albion, Town Of (Dane) 130,248 8,662 8,661 17,323 0Albion, Town Of (Jackson) 22,641 1,513 1,498 3,011 0Algoma, Town Of 70,778 4,812 4,602 9,413 0Anson, Town Of (Chippewa) 58,779 5,331 3,517 8,848 48,905Arbor Vitae, Town Of (Vilas) 177,160 14,616 11,781 26,397 21,885Ashippun, Town Of (Dodge Co) 114,443 7,655 7,566 15,221 0Ashland, Town Of (Ashland) 66,991 4,509 4,401 8,910 0Athelstane, Town Of(Marinette) 122,532 8,148 8,148 16,297 0Aztalan, Town Of(Jefferson) 44,499 4,070 3,010 7,080 111,245Baileys Harbor, Town Of (Door) 316,494 21,047 21,047 42,094 0Balsam Lake, Town Of (Polk) 46,465 3,107 3,073 6,180 0Baraboo, Town Of (Sauk) 79,475 5,403 5,403 10,806 0Barksdale, Town Of (Bayfield) 52,421 3,486 3,486 6,972 0Barron, Town Of (Barron) 50,997 3,397 3,386 6,783 0Bear Creek, Town Of (Sauk) 65,016 4,427 4,340 8,768 0Belmont, Town Of (Lafayette) 29,140 1,938 1,938 3,876 0Beloit, Town Of (Rock) 2,032,062 324,445 69,407 393,852 0Bennett, Town Of (Douglas) 81,025 5,388 5,388 10,776 0Bergen, Town Of (Vernon) 40,060 2,664 2,664 5,328 0Berry, Town Of (Dane) 79,568 10,582 0 10,582 0Bloomfield, Town Of (Walworth) 9,704 660 660 1,320 0Blooming Grove, Town Of(Dane) 370,826 33,966 24,461 58,427 0Blue Mounds, Town Of (Dane) 60,667 4,107 4,107 8,213 0Boulder Junction, Town (Vilas) 210,303 16,869 13,743 30,612 0
146Actuarial accrued balances
Contributions UnfundedName Covered Payroll Employer Paid* Employee Paid Total Liability Balance
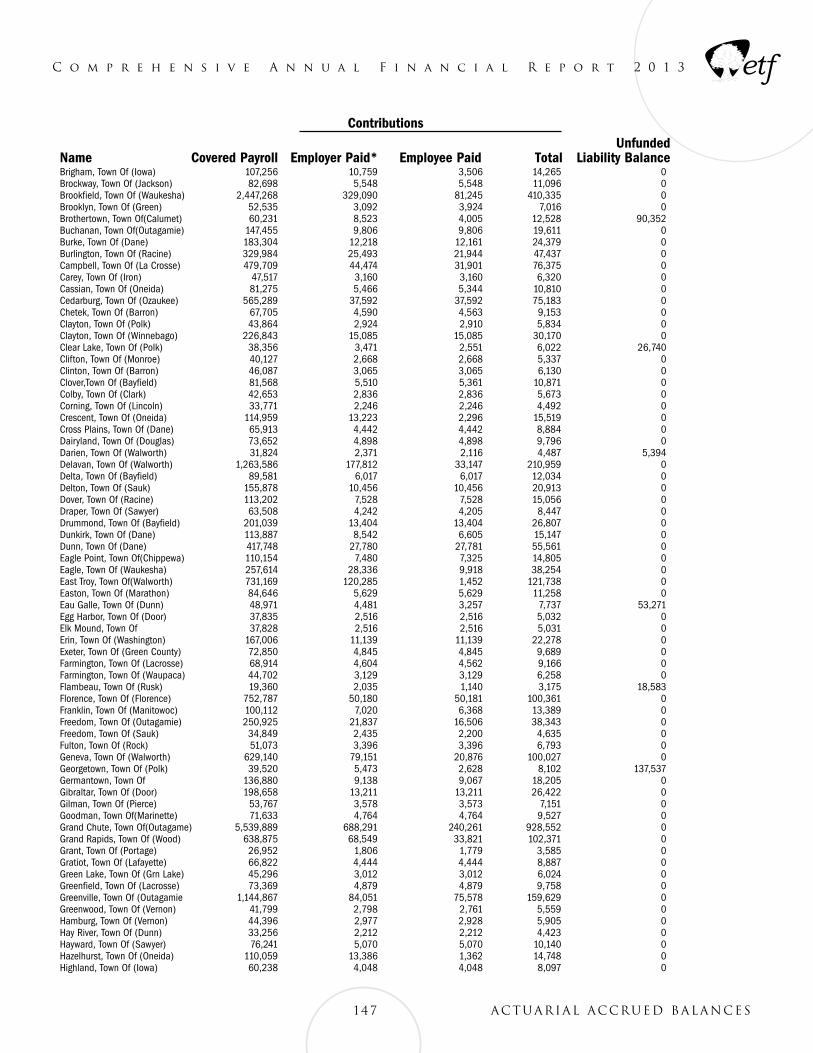
C o m p r e h e n s i v e A n n u a l F i n a n c i a l R e p o r t 2 0 1 3
Brigham, Town Of (Iowa) 107,256 10,759 3,506 14,265 0Brockway, Town Of (Jackson) 82,698 5,548 5,548 11,096 0Brookfield, Town Of (Waukesha) 2,447,268 329,090 81,245 410,335 0Brooklyn, Town Of (Green) 52,535 3,092 3,924 7,016 0Brothertown, Town Of(Calumet) 60,231 8,523 4,005 12,528 90,352Buchanan, Town Of(Outagamie) 147,455 9,806 9,806 19,611 0Burke, Town Of (Dane) 183,304 12,218 12,161 24,379 0Burlington, Town Of (Racine) 329,984 25,493 21,944 47,437 0Campbell, Town Of (La Crosse) 479,709 44,474 31,901 76,375 0Carey, Town Of (Iron) 47,517 3,160 3,160 6,320 0Cassian, Town Of (Oneida) 81,275 5,466 5,344 10,810 0Cedarburg, Town Of (Ozaukee) 565,289 37,592 37,592 75,183 0Chetek, Town Of (Barron) 67,705 4,590 4,563 9,153 0Clayton, Town Of (Polk) 43,864 2,924 2,910 5,834 0Clayton, Town Of (Winnebago) 226,843 15,085 15,085 30,170 0Clear Lake, Town Of (Polk) 38,356 3,471 2,551 6,022 26,740Clifton, Town Of (Monroe) 40,127 2,668 2,668 5,337 0Clinton, Town Of (Barron) 46,087 3,065 3,065 6,130 0Clover,Town Of (Bayfield) 81,568 5,510 5,361 10,871 0Colby, Town Of (Clark) 42,653 2,836 2,836 5,673 0Corning, Town Of (Lincoln) 33,771 2,246 2,246 4,492 0Crescent, Town Of (Oneida) 114,959 13,223 2,296 15,519 0Cross Plains, Town Of (Dane) 65,913 4,442 4,442 8,884 0Dairyland, Town Of (Douglas) 73,652 4,898 4,898 9,796 0Darien, Town Of (Walworth) 31,824 2,371 2,116 4,487 5,394Delavan, Town Of (Walworth) 1,263,586 177,812 33,147 210,959 0Delta, Town Of (Bayfield) 89,581 6,017 6,017 12,034 0Delton, Town Of (Sauk) 155,878 10,456 10,456 20,913 0Dover, Town Of (Racine) 113,202 7,528 7,528 15,056 0Draper, Town Of (Sawyer) 63,508 4,242 4,205 8,447 0Drummond, Town Of (Bayfield) 201,039 13,404 13,404 26,807 0Dunkirk, Town Of (Dane) 113,887 8,542 6,605 15,147 0Dunn, Town Of (Dane) 417,748 27,780 27,781 55,561 0Eagle Point, Town Of(Chippewa) 110,154 7,480 7,325 14,805 0Eagle, Town Of (Waukesha) 257,614 28,336 9,918 38,254 0East Troy, Town Of(Walworth) 731,169 120,285 1,452 121,738 0Easton, Town Of (Marathon) 84,646 5,629 5,629 11,258 0Eau Galle, Town Of (Dunn) 48,971 4,481 3,257 7,737 53,271Egg Harbor, Town Of (Door) 37,835 2,516 2,516 5,032 0Elk Mound, Town Of 37,828 2,516 2,516 5,031 0Erin, Town Of (Washington) 167,006 11,139 11,139 22,278 0Exeter, Town Of (Green County) 72,850 4,845 4,845 9,689 0Farmington, Town Of (Lacrosse) 68,914 4,604 4,562 9,166 0Farmington, Town Of (Waupaca) 44,702 3,129 3,129 6,258 0Flambeau, Town Of (Rusk) 19,360 2,035 1,140 3,175 18,583Florence, Town Of (Florence) 752,787 50,180 50,181 100,361 0Franklin, Town Of (Manitowoc) 100,112 7,020 6,368 13,389 0Freedom, Town Of (Outagamie) 250,925 21,837 16,506 38,343 0Freedom, Town Of (Sauk) 34,849 2,435 2,200 4,635 0Fulton, Town Of (Rock) 51,073 3,396 3,396 6,793 0Geneva, Town Of (Walworth) 629,140 79,151 20,876 100,027 0Georgetown, Town Of (Polk) 39,520 5,473 2,628 8,102 137,537Germantown, Town Of 136,880 9,138 9,067 18,205 0Gibraltar, Town Of (Door) 198,658 13,211 13,211 26,422 0Gilman, Town Of (Pierce) 53,767 3,578 3,573 7,151 0Goodman, Town Of(Marinette) 71,633 4,764 4,764 9,527 0Grand Chute, Town Of(Outagame) 5,539,889 688,291 240,261 928,552 0Grand Rapids, Town Of (Wood) 638,875 68,549 33,821 102,371 0Grant, Town Of (Portage) 26,952 1,806 1,779 3,585 0Gratiot, Town Of (Lafayette) 66,822 4,444 4,444 8,887 0Green Lake, Town Of (Grn Lake) 45,296 3,012 3,012 6,024 0Greenfield, Town Of (Lacrosse) 73,369 4,879 4,879 9,758 0Greenville, Town Of (Outagamie 1,144,867 84,051 75,578 159,629 0Greenwood, Town Of (Vernon) 41,799 2,798 2,761 5,559 0Hamburg, Town Of (Vernon) 44,396 2,977 2,928 5,905 0Hay River, Town Of (Dunn) 33,256 2,212 2,212 4,423 0Hayward, Town Of (Sawyer) 76,241 5,070 5,070 10,140 0Hazelhurst, Town Of (Oneida) 110,059 13,386 1,362 14,748 0Highland, Town Of (Iowa) 60,238 4,048 4,048 8,097 0
147 Actuarial accrued balances
Contributions UnfundedName Covered Payroll Employer Paid* Employee Paid Total Liability Balance
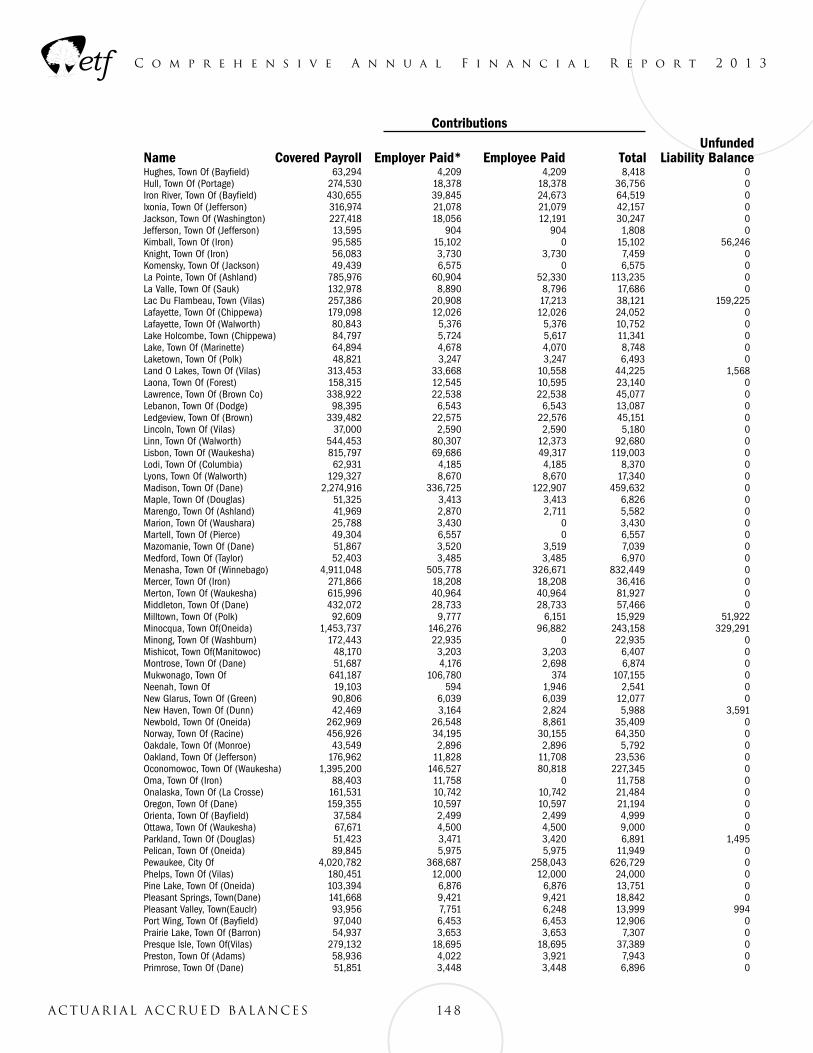
C o m p r e h e n s i v e A n n u a l F i n a n c i a l R e p o r t 2 0 1 3
Hughes, Town Of (Bayfield) 63,294 4,209 4,209 8,418 0Hull, Town Of (Portage) 274,530 18,378 18,378 36,756 0Iron River, Town Of (Bayfield) 430,655 39,845 24,673 64,519 0Ixonia, Town Of (Jefferson) 316,974 21,078 21,079 42,157 0Jackson, Town Of (Washington) 227,418 18,056 12,191 30,247 0Jefferson, Town Of (Jefferson) 13,595 904 904 1,808 0Kimball, Town Of (Iron) 95,585 15,102 0 15,102 56,246Knight, Town Of (Iron) 56,083 3,730 3,730 7,459 0Komensky, Town Of (Jackson) 49,439 6,575 0 6,575 0La Pointe, Town Of (Ashland) 785,976 60,904 52,330 113,235 0La Valle, Town Of (Sauk) 132,978 8,890 8,796 17,686 0Lac Du Flambeau, Town (Vilas) 257,386 20,908 17,213 38,121 159,225Lafayette, Town Of (Chippewa) 179,098 12,026 12,026 24,052 0Lafayette, Town Of (Walworth) 80,843 5,376 5,376 10,752 0Lake Holcombe, Town (Chippewa) 84,797 5,724 5,617 11,341 0Lake, Town Of (Marinette) 64,894 4,678 4,070 8,748 0Laketown, Town Of (Polk) 48,821 3,247 3,247 6,493 0Land O Lakes, Town Of (Vilas) 313,453 33,668 10,558 44,225 1,568Laona, Town Of (Forest) 158,315 12,545 10,595 23,140 0Lawrence, Town Of (Brown Co) 338,922 22,538 22,538 45,077 0Lebanon, Town Of (Dodge) 98,395 6,543 6,543 13,087 0Ledgeview, Town Of (Brown) 339,482 22,575 22,576 45,151 0Lincoln, Town Of (Vilas) 37,000 2,590 2,590 5,180 0Linn, Town Of (Walworth) 544,453 80,307 12,373 92,680 0Lisbon, Town Of (Waukesha) 815,797 69,686 49,317 119,003 0Lodi, Town Of (Columbia) 62,931 4,185 4,185 8,370 0Lyons, Town Of (Walworth) 129,327 8,670 8,670 17,340 0Madison, Town Of (Dane) 2,274,916 336,725 122,907 459,632 0Maple, Town Of (Douglas) 51,325 3,413 3,413 6,826 0Marengo, Town Of (Ashland) 41,969 2,870 2,711 5,582 0Marion, Town Of (Waushara) 25,788 3,430 0 3,430 0Martell, Town Of (Pierce) 49,304 6,557 0 6,557 0Mazomanie, Town Of (Dane) 51,867 3,520 3,519 7,039 0Medford, Town Of (Taylor) 52,403 3,485 3,485 6,970 0Menasha, Town Of (Winnebago) 4,911,048 505,778 326,671 832,449 0Mercer, Town Of (Iron) 271,866 18,208 18,208 36,416 0Merton, Town Of (Waukesha) 615,996 40,964 40,964 81,927 0Middleton, Town Of (Dane) 432,072 28,733 28,733 57,466 0Milltown, Town Of (Polk) 92,609 9,777 6,151 15,929 51,922Minocqua, Town Of(Oneida) 1,453,737 146,276 96,882 243,158 329,291Minong, Town Of (Washburn) 172,443 22,935 0 22,935 0Mishicot, Town Of(Manitowoc) 48,170 3,203 3,203 6,407 0Montrose, Town Of (Dane) 51,687 4,176 2,698 6,874 0Mukwonago, Town Of 641,187 106,780 374 107,155 0Neenah, Town Of 19,103 594 1,946 2,541 0New Glarus, Town Of (Green) 90,806 6,039 6,039 12,077 0New Haven, Town Of (Dunn) 42,469 3,164 2,824 5,988 3,591Newbold, Town Of (Oneida) 262,969 26,548 8,861 35,409 0Norway, Town Of (Racine) 456,926 34,195 30,155 64,350 0Oakdale, Town Of (Monroe) 43,549 2,896 2,896 5,792 0Oakland, Town Of (Jefferson) 176,962 11,828 11,708 23,536 0Oconomowoc, Town Of (Waukesha) 1,395,200 146,527 80,818 227,345 0Oma, Town Of (Iron) 88,403 11,758 0 11,758 0Onalaska, Town Of (La Crosse) 161,531 10,742 10,742 21,484 0Oregon, Town Of (Dane) 159,355 10,597 10,597 21,194 0Orienta, Town Of (Bayfield) 37,584 2,499 2,499 4,999 0Ottawa, Town Of (Waukesha) 67,671 4,500 4,500 9,000 0Parkland, Town Of (Douglas) 51,423 3,471 3,420 6,891 1,495Pelican, Town Of (Oneida) 89,845 5,975 5,975 11,949 0Pewaukee, City Of 4,020,782 368,687 258,043 626,729 0Phelps, Town Of (Vilas) 180,451 12,000 12,000 24,000 0Pine Lake, Town Of (Oneida) 103,394 6,876 6,876 13,751 0Pleasant Springs, Town(Dane) 141,668 9,421 9,421 18,842 0Pleasant Valley, Town(Eauclr) 93,956 7,751 6,248 13,999 994Port Wing, Town Of (Bayfield) 97,040 6,453 6,453 12,906 0Prairie Lake, Town Of (Barron) 54,937 3,653 3,653 7,307 0Presque Isle, Town Of(Vilas) 279,132 18,695 18,695 37,389 0Preston, Town Of (Adams) 58,936 4,022 3,921 7,943 0Primrose, Town Of (Dane) 51,851 3,448 3,448 6,896 0
148Actuarial accrued balances
Contributions UnfundedName Covered Payroll Employer Paid* Employee Paid Total Liability Balance
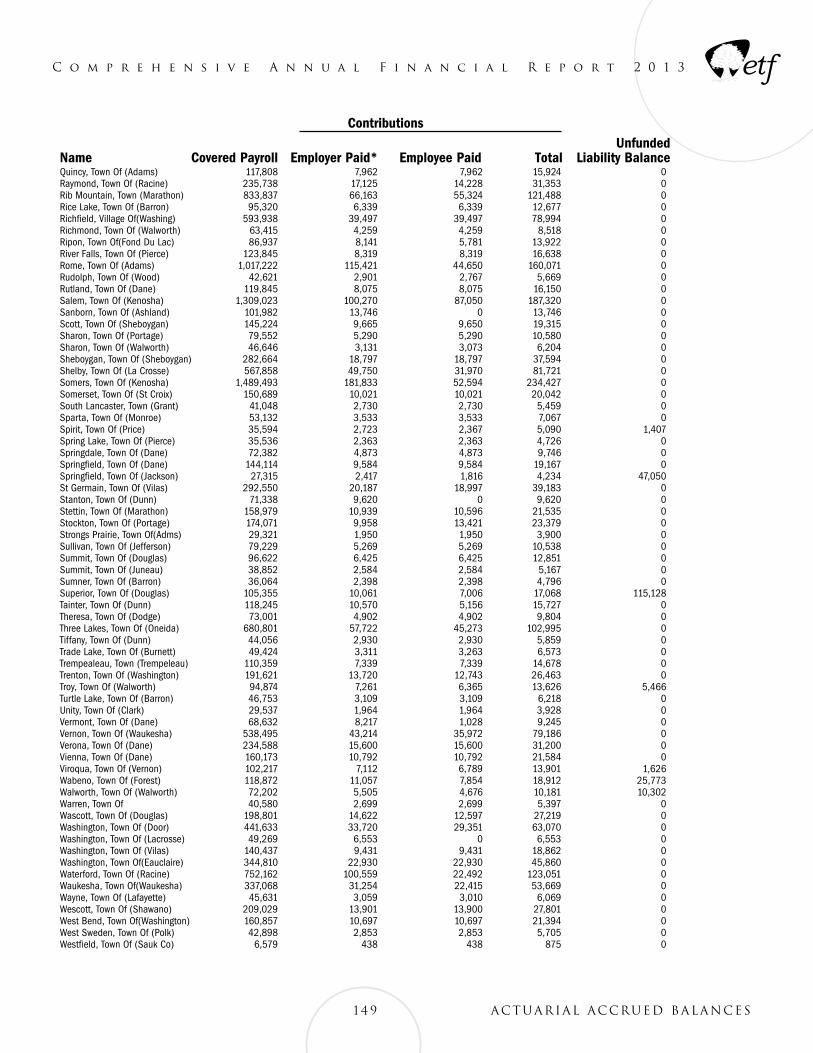
C o m p r e h e n s i v e A n n u a l F i n a n c i a l R e p o r t 2 0 1 3
Quincy, Town Of (Adams) 117,808 7,962 7,962 15,924 0Raymond, Town Of (Racine) 235,738 17,125 14,228 31,353 0Rib Mountain, Town (Marathon) 833,837 66,163 55,324 121,488 0Rice Lake, Town Of (Barron) 95,320 6,339 6,339 12,677 0Richfield, Village Of(Washing) 593,938 39,497 39,497 78,994 0Richmond, Town Of (Walworth) 63,415 4,259 4,259 8,518 0Ripon, Town Of(Fond Du Lac) 86,937 8,141 5,781 13,922 0River Falls, Town Of (Pierce) 123,845 8,319 8,319 16,638 0Rome, Town Of (Adams) 1,017,222 115,421 44,650 160,071 0Rudolph, Town Of (Wood) 42,621 2,901 2,767 5,669 0Rutland, Town Of (Dane) 119,845 8,075 8,075 16,150 0Salem, Town Of (Kenosha) 1,309,023 100,270 87,050 187,320 0Sanborn, Town Of (Ashland) 101,982 13,746 0 13,746 0Scott, Town Of (Sheboygan) 145,224 9,665 9,650 19,315 0Sharon, Town Of (Portage) 79,552 5,290 5,290 10,580 0Sharon, Town Of (Walworth) 46,646 3,131 3,073 6,204 0Sheboygan, Town Of (Sheboygan) 282,664 18,797 18,797 37,594 0Shelby, Town Of (La Crosse) 567,858 49,750 31,970 81,721 0Somers, Town Of (Kenosha) 1,489,493 181,833 52,594 234,427 0Somerset, Town Of (St Croix) 150,689 10,021 10,021 20,042 0South Lancaster, Town (Grant) 41,048 2,730 2,730 5,459 0Sparta, Town Of (Monroe) 53,132 3,533 3,533 7,067 0Spirit, Town Of (Price) 35,594 2,723 2,367 5,090 1,407Spring Lake, Town Of (Pierce) 35,536 2,363 2,363 4,726 0Springdale, Town Of (Dane) 72,382 4,873 4,873 9,746 0Springfield, Town Of (Dane) 144,114 9,584 9,584 19,167 0Springfield, Town Of (Jackson) 27,315 2,417 1,816 4,234 47,050St Germain, Town Of (Vilas) 292,550 20,187 18,997 39,183 0Stanton, Town Of (Dunn) 71,338 9,620 0 9,620 0Stettin, Town Of (Marathon) 158,979 10,939 10,596 21,535 0Stockton, Town Of (Portage) 174,071 9,958 13,421 23,379 0Strongs Prairie, Town Of(Adms) 29,321 1,950 1,950 3,900 0Sullivan, Town Of (Jefferson) 79,229 5,269 5,269 10,538 0Summit, Town Of (Douglas) 96,622 6,425 6,425 12,851 0Summit, Town Of (Juneau) 38,852 2,584 2,584 5,167 0Sumner, Town Of (Barron) 36,064 2,398 2,398 4,796 0Superior, Town Of (Douglas) 105,355 10,061 7,006 17,068 115,128Tainter, Town Of (Dunn) 118,245 10,570 5,156 15,727 0Theresa, Town Of (Dodge) 73,001 4,902 4,902 9,804 0Three Lakes, Town Of (Oneida) 680,801 57,722 45,273 102,995 0Tiffany, Town Of (Dunn) 44,056 2,930 2,930 5,859 0Trade Lake, Town Of (Burnett) 49,424 3,311 3,263 6,573 0Trempealeau, Town (Trempeleau) 110,359 7,339 7,339 14,678 0Trenton, Town Of (Washington) 191,621 13,720 12,743 26,463 0Troy, Town Of (Walworth) 94,874 7,261 6,365 13,626 5,466Turtle Lake, Town Of (Barron) 46,753 3,109 3,109 6,218 0Unity, Town Of (Clark) 29,537 1,964 1,964 3,928 0Vermont, Town Of (Dane) 68,632 8,217 1,028 9,245 0Vernon, Town Of (Waukesha) 538,495 43,214 35,972 79,186 0Verona, Town Of (Dane) 234,588 15,600 15,600 31,200 0Vienna, Town Of (Dane) 160,173 10,792 10,792 21,584 0Viroqua, Town Of (Vernon) 102,217 7,112 6,789 13,901 1,626Wabeno, Town Of (Forest) 118,872 11,057 7,854 18,912 25,773Walworth, Town Of (Walworth) 72,202 5,505 4,676 10,181 10,302Warren, Town Of 40,580 2,699 2,699 5,397 0Wascott, Town Of (Douglas) 198,801 14,622 12,597 27,219 0Washington, Town Of (Door) 441,633 33,720 29,351 63,070 0Washington, Town Of (Lacrosse) 49,269 6,553 0 6,553 0Washington, Town Of (Vilas) 140,437 9,431 9,431 18,862 0Washington, Town Of(Eauclaire) 344,810 22,930 22,930 45,860 0Waterford, Town Of (Racine) 752,162 100,559 22,492 123,051 0Waukesha, Town Of(Waukesha) 337,068 31,254 22,415 53,669 0Wayne, Town Of (Lafayette) 45,631 3,059 3,010 6,069 0Wescott, Town Of (Shawano) 209,029 13,901 13,900 27,801 0West Bend, Town Of(Washington) 160,857 10,697 10,697 21,394 0West Sweden, Town Of (Polk) 42,898 2,853 2,853 5,705 0Westfield, Town Of (Sauk Co) 6,579 438 438 875 0
149 Actuarial accrued balances
Contributions UnfundedName Covered Payroll Employer Paid* Employee Paid Total Liability Balance
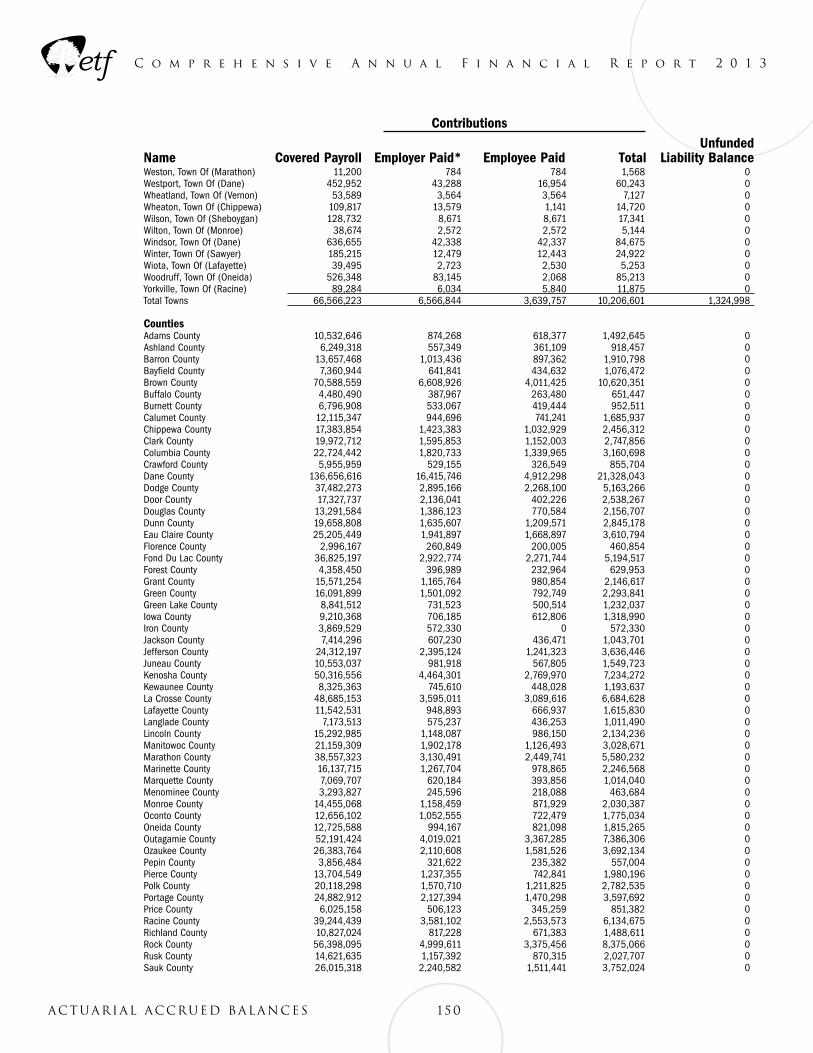
C o m p r e h e n s i v e A n n u a l F i n a n c i a l R e p o r t 2 0 1 3
Weston, Town Of (Marathon) 11,200 784 784 1,568 0Westport, Town Of (Dane) 452,952 43,288 16,954 60,243 0Wheatland, Town Of (Vernon) 53,589 3,564 3,564 7,127 0Wheaton, Town Of (Chippewa) 109,817 13,579 1,141 14,720 0Wilson, Town Of (Sheboygan) 128,732 8,671 8,671 17,341 0Wilton, Town Of (Monroe) 38,674 2,572 2,572 5,144 0Windsor, Town Of (Dane) 636,655 42,338 42,337 84,675 0Winter, Town Of (Sawyer) 185,215 12,479 12,443 24,922 0Wiota, Town Of (Lafayette) 39,495 2,723 2,530 5,253 0Woodruff, Town Of (Oneida) 526,348 83,145 2,068 85,213 0Yorkville, Town Of (Racine) 89,284 6,034 5,840 11,875 0Total Towns 66,566,223 6,566,844 3,639,757 10,206,601 1,324,998 Counties Adams County 10,532,646 874,268 618,377 1,492,645 0Ashland County 6,249,318 557,349 361,109 918,457 0Barron County 13,657,468 1,013,436 897,362 1,910,798 0Bayfield County 7,360,944 641,841 434,632 1,076,472 0Brown County 70,588,559 6,608,926 4,011,425 10,620,351 0Buffalo County 4,480,490 387,967 263,480 651,447 0Burnett County 6,796,908 533,067 419,444 952,511 0Calumet County 12,115,347 944,696 741,241 1,685,937 0Chippewa County 17,383,854 1,423,383 1,032,929 2,456,312 0Clark County 19,972,712 1,595,853 1,152,003 2,747,856 0Columbia County 22,724,442 1,820,733 1,339,965 3,160,698 0Crawford County 5,955,959 529,155 326,549 855,704 0Dane County 136,656,616 16,415,746 4,912,298 21,328,043 0Dodge County 37,482,273 2,895,166 2,268,100 5,163,266 0Door County 17,327,737 2,136,041 402,226 2,538,267 0Douglas County 13,291,584 1,386,123 770,584 2,156,707 0Dunn County 19,658,808 1,635,607 1,209,571 2,845,178 0Eau Claire County 25,205,449 1,941,897 1,668,897 3,610,794 0Florence County 2,996,167 260,849 200,005 460,854 0Fond Du Lac County 36,825,197 2,922,774 2,271,744 5,194,517 0Forest County 4,358,450 396,989 232,964 629,953 0Grant County 15,571,254 1,165,764 980,854 2,146,617 0Green County 16,091,899 1,501,092 792,749 2,293,841 0Green Lake County 8,841,512 731,523 500,514 1,232,037 0Iowa County 9,210,368 706,185 612,806 1,318,990 0Iron County 3,869,529 572,330 0 572,330 0Jackson County 7,414,296 607,230 436,471 1,043,701 0Jefferson County 24,312,197 2,395,124 1,241,323 3,636,446 0Juneau County 10,553,037 981,918 567,805 1,549,723 0Kenosha County 50,316,556 4,464,301 2,769,970 7,234,272 0Kewaunee County 8,325,363 745,610 448,028 1,193,637 0La Crosse County 48,685,153 3,595,011 3,089,616 6,684,628 0Lafayette County 11,542,531 948,893 666,937 1,615,830 0Langlade County 7,173,513 575,237 436,253 1,011,490 0Lincoln County 15,292,985 1,148,087 986,150 2,134,236 0Manitowoc County 21,159,309 1,902,178 1,126,493 3,028,671 0Marathon County 38,557,323 3,130,491 2,449,741 5,580,232 0Marinette County 16,137,715 1,267,704 978,865 2,246,568 0Marquette County 7,069,707 620,184 393,856 1,014,040 0Menominee County 3,293,827 245,596 218,088 463,684 0Monroe County 14,455,068 1,158,459 871,929 2,030,387 0Oconto County 12,656,102 1,052,555 722,479 1,775,034 0Oneida County 12,725,588 994,167 821,098 1,815,265 0Outagamie County 52,191,424 4,019,021 3,367,285 7,386,306 0Ozaukee County 26,383,764 2,110,608 1,581,526 3,692,134 0Pepin County 3,856,484 321,622 235,382 557,004 0Pierce County 13,704,549 1,237,355 742,841 1,980,196 0Polk County 20,118,298 1,570,710 1,211,825 2,782,535 0Portage County 24,882,912 2,127,394 1,470,298 3,597,692 0Price County 6,025,158 506,123 345,259 851,382 0Racine County 39,244,439 3,581,102 2,553,573 6,134,675 0Richland County 10,827,024 817,228 671,383 1,488,611 0Rock County 56,398,095 4,999,611 3,375,456 8,375,066 0Rusk County 14,621,635 1,157,392 870,315 2,027,707 0Sauk County 26,015,318 2,240,582 1,511,441 3,752,024 0
150Actuarial accrued balances
Contributions UnfundedName Covered Payroll Employer Paid* Employee Paid Total Liability Balance
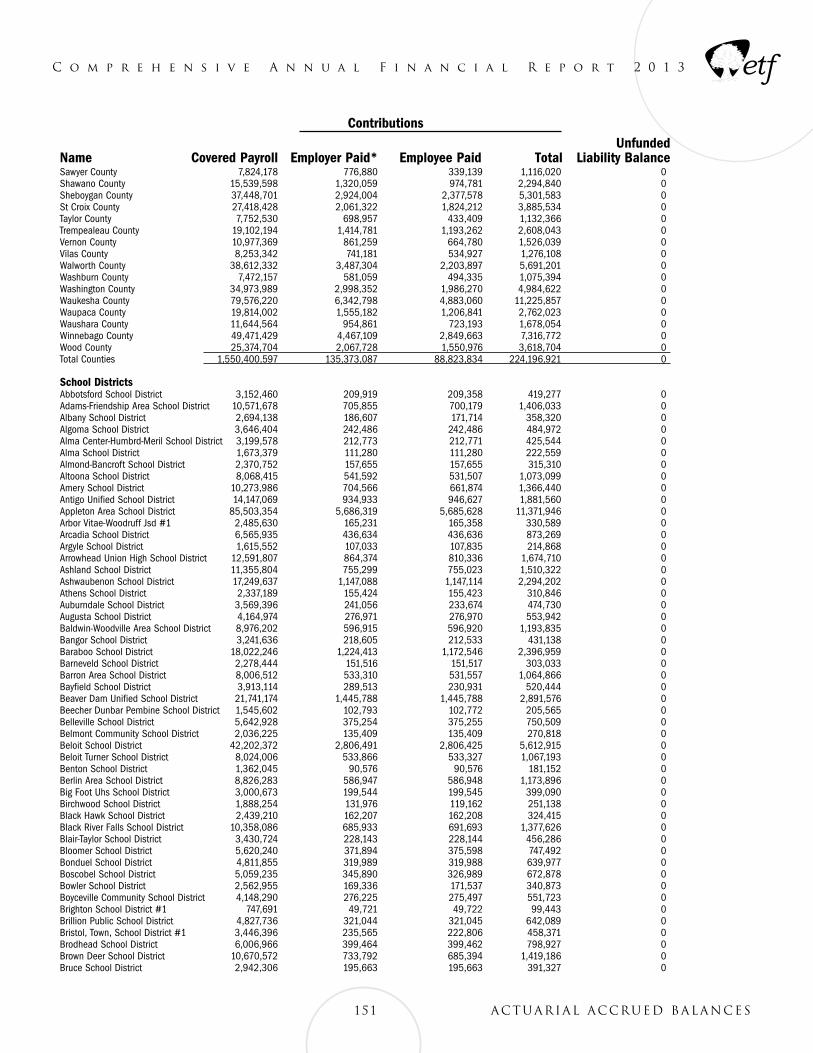
C o m p r e h e n s i v e A n n u a l F i n a n c i a l R e p o r t 2 0 1 3
Sawyer County 7,824,178 776,880 339,139 1,116,020 0Shawano County 15,539,598 1,320,059 974,781 2,294,840 0Sheboygan County 37,448,701 2,924,004 2,377,578 5,301,583 0St Croix County 27,418,428 2,061,322 1,824,212 3,885,534 0Taylor County 7,752,530 698,957 433,409 1,132,366 0Trempealeau County 19,102,194 1,414,781 1,193,262 2,608,043 0Vernon County 10,977,369 861,259 664,780 1,526,039 0Vilas County 8,253,342 741,181 534,927 1,276,108 0Walworth County 38,612,332 3,487,304 2,203,897 5,691,201 0Washburn County 7,472,157 581,059 494,335 1,075,394 0Washington County 34,973,989 2,998,352 1,986,270 4,984,622 0Waukesha County 79,576,220 6,342,798 4,883,060 11,225,857 0Waupaca County 19,814,002 1,555,182 1,206,841 2,762,023 0Waushara County 11,644,564 954,861 723,193 1,678,054 0Winnebago County 49,471,429 4,467,109 2,849,663 7,316,772 0Wood County 25,374,704 2,067,728 1,550,976 3,618,704 0Total Counties 1,550,400,597 135,373,087 88,823,834 224,196,921 0 School Districts Abbotsford School District 3,152,460 209,919 209,358 419,277 0Adams-Friendship Area School District 10,571,678 705,855 700,179 1,406,033 0Albany School District 2,694,138 186,607 171,714 358,320 0Algoma School District 3,646,404 242,486 242,486 484,972 0Alma Center-Humbrd-Meril School District 3,199,578 212,773 212,771 425,544 0Alma School District 1,673,379 111,280 111,280 222,559 0Almond-Bancroft School District 2,370,752 157,655 157,655 315,310 0Altoona School District 8,068,415 541,592 531,507 1,073,099 0Amery School District 10,273,986 704,566 661,874 1,366,440 0Antigo Unified School District 14,147,069 934,933 946,627 1,881,560 0Appleton Area School District 85,503,354 5,686,319 5,685,628 11,371,946 0Arbor Vitae-Woodruff Jsd #1 2,485,630 165,231 165,358 330,589 0Arcadia School District 6,565,935 436,634 436,636 873,269 0Argyle School District 1,615,552 107,033 107,835 214,868 0Arrowhead Union High School District 12,591,807 864,374 810,336 1,674,710 0Ashland School District 11,355,804 755,299 755,023 1,510,322 0Ashwaubenon School District 17,249,637 1,147,088 1,147,114 2,294,202 0Athens School District 2,337,189 155,424 155,423 310,846 0Auburndale School District 3,569,396 241,056 233,674 474,730 0Augusta School District 4,164,974 276,971 276,970 553,942 0Baldwin-Woodville Area School District 8,976,202 596,915 596,920 1,193,835 0Bangor School District 3,241,636 218,605 212,533 431,138 0Baraboo School District 18,022,246 1,224,413 1,172,546 2,396,959 0Barneveld School District 2,278,444 151,516 151,517 303,033 0Barron Area School District 8,006,512 533,310 531,557 1,064,866 0Bayfield School District 3,913,114 289,513 230,931 520,444 0Beaver Dam Unified School District 21,741,174 1,445,788 1,445,788 2,891,576 0Beecher Dunbar Pembine School District 1,545,602 102,793 102,772 205,565 0Belleville School District 5,642,928 375,254 375,255 750,509 0Belmont Community School District 2,036,225 135,409 135,409 270,818 0Beloit School District 42,202,372 2,806,491 2,806,425 5,612,915 0Beloit Turner School District 8,024,006 533,866 533,327 1,067,193 0Benton School District 1,362,045 90,576 90,576 181,152 0Berlin Area School District 8,826,283 586,947 586,948 1,173,896 0Big Foot Uhs School District 3,000,673 199,544 199,545 399,090 0Birchwood School District 1,888,254 131,976 119,162 251,138 0Black Hawk School District 2,439,210 162,207 162,208 324,415 0Black River Falls School District 10,358,086 685,933 691,693 1,377,626 0Blair-Taylor School District 3,430,724 228,143 228,144 456,286 0Bloomer School District 5,620,240 371,894 375,598 747,492 0Bonduel School District 4,811,855 319,989 319,988 639,977 0Boscobel School District 5,059,235 345,890 326,989 672,878 0Bowler School District 2,562,955 169,336 171,537 340,873 0Boyceville Community School District 4,148,290 276,225 275,497 551,723 0Brighton School District #1 747,691 49,721 49,722 99,443 0Brillion Public School District 4,827,736 321,044 321,045 642,089 0Bristol, Town, School District #1 3,446,396 235,565 222,806 458,371 0Brodhead School District 6,006,966 399,464 399,462 798,927 0Brown Deer School District 10,670,572 733,792 685,394 1,419,186 0Bruce School District 2,942,306 195,663 195,663 391,327 0
15 1 Actuarial accrued balances
Contributions UnfundedName Covered Payroll Employer Paid* Employee Paid Total Liability Balance
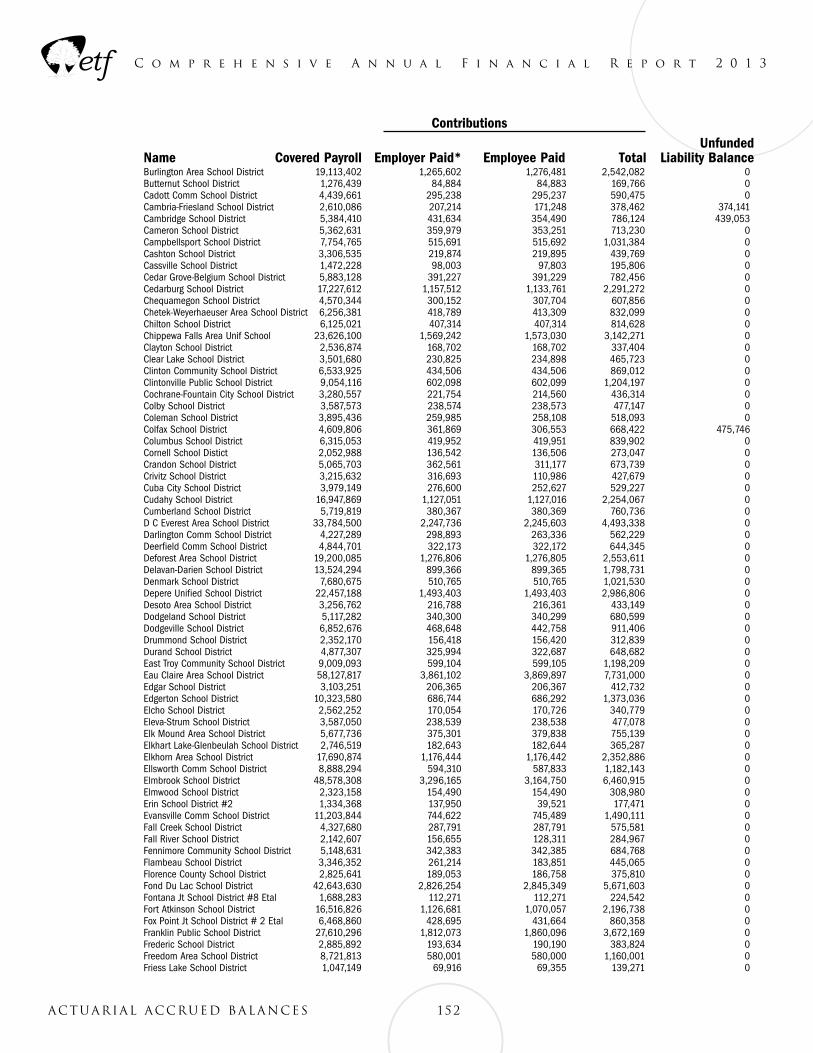
C o m p r e h e n s i v e A n n u a l F i n a n c i a l R e p o r t 2 0 1 3
Burlington Area School District 19,113,402 1,265,602 1,276,481 2,542,082 0Butternut School District 1,276,439 84,884 84,883 169,766 0Cadott Comm School District 4,439,661 295,238 295,237 590,475 0Cambria-Friesland School District 2,610,086 207,214 171,248 378,462 374,141Cambridge School District 5,384,410 431,634 354,490 786,124 439,053Cameron School District 5,362,631 359,979 353,251 713,230 0Campbellsport School District 7,754,765 515,691 515,692 1,031,384 0Cashton School District 3,306,535 219,874 219,895 439,769 0Cassville School District 1,472,228 98,003 97,803 195,806 0Cedar Grove-Belgium School District 5,883,128 391,227 391,229 782,456 0Cedarburg School District 17,227,612 1,157,512 1,133,761 2,291,272 0Chequamegon School District 4,570,344 300,152 307,704 607,856 0Chetek-Weyerhaeuser Area School District 6,256,381 418,789 413,309 832,099 0Chilton School District 6,125,021 407,314 407,314 814,628 0Chippewa Falls Area Unif School 23,626,100 1,569,242 1,573,030 3,142,271 0Clayton School District 2,536,874 168,702 168,702 337,404 0Clear Lake School District 3,501,680 230,825 234,898 465,723 0Clinton Community School District 6,533,925 434,506 434,506 869,012 0Clintonville Public School District 9,054,116 602,098 602,099 1,204,197 0Cochrane-Fountain City School District 3,280,557 221,754 214,560 436,314 0Colby School District 3,587,573 238,574 238,573 477,147 0Coleman School District 3,895,436 259,985 258,108 518,093 0Colfax School District 4,609,806 361,869 306,553 668,422 475,746Columbus School District 6,315,053 419,952 419,951 839,902 0Cornell School Distict 2,052,988 136,542 136,506 273,047 0Crandon School District 5,065,703 362,561 311,177 673,739 0Crivitz School District 3,215,632 316,693 110,986 427,679 0Cuba City School District 3,979,149 276,600 252,627 529,227 0Cudahy School District 16,947,869 1,127,051 1,127,016 2,254,067 0Cumberland School District 5,719,819 380,367 380,369 760,736 0D C Everest Area School District 33,784,500 2,247,736 2,245,603 4,493,338 0Darlington Comm School District 4,227,289 298,893 263,336 562,229 0Deerfield Comm School District 4,844,701 322,173 322,172 644,345 0Deforest Area School District 19,200,085 1,276,806 1,276,805 2,553,611 0Delavan-Darien School District 13,524,294 899,366 899,365 1,798,731 0Denmark School District 7,680,675 510,765 510,765 1,021,530 0Depere Unified School District 22,457,188 1,493,403 1,493,403 2,986,806 0Desoto Area School District 3,256,762 216,788 216,361 433,149 0Dodgeland School District 5,117,282 340,300 340,299 680,599 0Dodgeville School District 6,852,676 468,648 442,758 911,406 0Drummond School District 2,352,170 156,418 156,420 312,839 0Durand School District 4,877,307 325,994 322,687 648,682 0East Troy Community School District 9,009,093 599,104 599,105 1,198,209 0Eau Claire Area School District 58,127,817 3,861,102 3,869,897 7,731,000 0Edgar School District 3,103,251 206,365 206,367 412,732 0Edgerton School District 10,323,580 686,744 686,292 1,373,036 0Elcho School District 2,562,252 170,054 170,726 340,779 0Eleva-Strum School District 3,587,050 238,539 238,538 477,078 0Elk Mound Area School District 5,677,736 375,301 379,838 755,139 0Elkhart Lake-Glenbeulah School District 2,746,519 182,643 182,644 365,287 0Elkhorn Area School District 17,690,874 1,176,444 1,176,442 2,352,886 0Ellsworth Comm School District 8,888,294 594,310 587,833 1,182,143 0Elmbrook School District 48,578,308 3,296,165 3,164,750 6,460,915 0Elmwood School District 2,323,158 154,490 154,490 308,980 0Erin School District #2 1,334,368 137,950 39,521 177,471 0Evansville Comm School District 11,203,844 744,622 745,489 1,490,111 0Fall Creek School District 4,327,680 287,791 287,791 575,581 0Fall River School District 2,142,607 156,655 128,311 284,967 0Fennimore Community School District 5,148,631 342,383 342,385 684,768 0Flambeau School District 3,346,352 261,214 183,851 445,065 0Florence County School District 2,825,641 189,053 186,758 375,810 0Fond Du Lac School District 42,643,630 2,826,254 2,845,349 5,671,603 0Fontana Jt School District #8 Etal 1,688,283 112,271 112,271 224,542 0Fort Atkinson School District 16,516,826 1,126,681 1,070,057 2,196,738 0Fox Point Jt School District # 2 Etal 6,468,860 428,695 431,664 860,358 0Franklin Public School District 27,610,296 1,812,073 1,860,096 3,672,169 0Frederic School District 2,885,892 193,634 190,190 383,824 0Freedom Area School District 8,721,813 580,001 580,000 1,160,001 0Friess Lake School District 1,047,149 69,916 69,355 139,271 0
152Actuarial accrued balances
Contributions UnfundedName Covered Payroll Employer Paid* Employee Paid Total Liability Balance
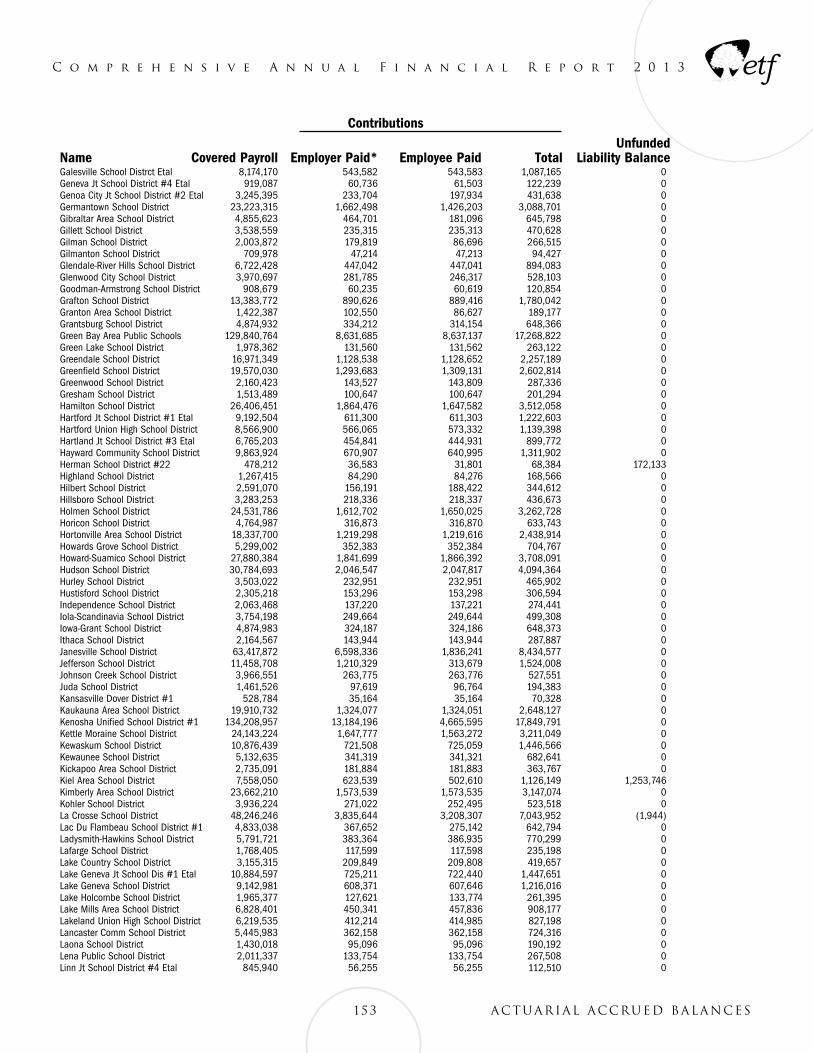
C o m p r e h e n s i v e A n n u a l F i n a n c i a l R e p o r t 2 0 1 3
Galesville School Distrct Etal 8,174,170 543,582 543,583 1,087,165 0Geneva Jt School District #4 Etal 919,087 60,736 61,503 122,239 0Genoa City Jt School District #2 Etal 3,245,395 233,704 197,934 431,638 0Germantown School District 23,223,315 1,662,498 1,426,203 3,088,701 0Gibraltar Area School District 4,855,623 464,701 181,096 645,798 0Gillett School District 3,538,559 235,315 235,313 470,628 0Gilman School District 2,003,872 179,819 86,696 266,515 0Gilmanton School District 709,978 47,214 47,213 94,427 0Glendale-River Hills School District 6,722,428 447,042 447,041 894,083 0Glenwood City School District 3,970,697 281,785 246,317 528,103 0Goodman-Armstrong School District 908,679 60,235 60,619 120,854 0Grafton School District 13,383,772 890,626 889,416 1,780,042 0Granton Area School District 1,422,387 102,550 86,627 189,177 0Grantsburg School District 4,874,932 334,212 314,154 648,366 0Green Bay Area Public Schools 129,840,764 8,631,685 8,637,137 17,268,822 0Green Lake School District 1,978,362 131,560 131,562 263,122 0Greendale School District 16,971,349 1,128,538 1,128,652 2,257,189 0Greenfield School District 19,570,030 1,293,683 1,309,131 2,602,814 0Greenwood School District 2,160,423 143,527 143,809 287,336 0Gresham School District 1,513,489 100,647 100,647 201,294 0Hamilton School District 26,406,451 1,864,476 1,647,582 3,512,058 0Hartford Jt School District #1 Etal 9,192,504 611,300 611,303 1,222,603 0Hartford Union High School District 8,566,900 566,065 573,332 1,139,398 0Hartland Jt School District #3 Etal 6,765,203 454,841 444,931 899,772 0Hayward Community School District 9,863,924 670,907 640,995 1,311,902 0Herman School District #22 478,212 36,583 31,801 68,384 172,133Highland School District 1,267,415 84,290 84,276 168,566 0Hilbert School District 2,591,070 156,191 188,422 344,612 0Hillsboro School District 3,283,253 218,336 218,337 436,673 0Holmen School District 24,531,786 1,612,702 1,650,025 3,262,728 0Horicon School District 4,764,987 316,873 316,870 633,743 0Hortonville Area School District 18,337,700 1,219,298 1,219,616 2,438,914 0Howards Grove School District 5,299,002 352,383 352,384 704,767 0Howard-Suamico School District 27,880,384 1,841,699 1,866,392 3,708,091 0Hudson School District 30,784,693 2,046,547 2,047,817 4,094,364 0Hurley School District 3,503,022 232,951 232,951 465,902 0Hustisford School District 2,305,218 153,296 153,298 306,594 0Independence School District 2,063,468 137,220 137,221 274,441 0Iola-Scandinavia School District 3,754,198 249,664 249,644 499,308 0Iowa-Grant School District 4,874,983 324,187 324,186 648,373 0Ithaca School District 2,164,567 143,944 143,944 287,887 0Janesville School District 63,417,872 6,598,336 1,836,241 8,434,577 0Jefferson School District 11,458,708 1,210,329 313,679 1,524,008 0Johnson Creek School District 3,966,551 263,775 263,776 527,551 0Juda School District 1,461,526 97,619 96,764 194,383 0Kansasville Dover District #1 528,784 35,164 35,164 70,328 0Kaukauna Area School District 19,910,732 1,324,077 1,324,051 2,648,127 0Kenosha Unified School District #1 134,208,957 13,184,196 4,665,595 17,849,791 0Kettle Moraine School District 24,143,224 1,647,777 1,563,272 3,211,049 0Kewaskum School District 10,876,439 721,508 725,059 1,446,566 0Kewaunee School District 5,132,635 341,319 341,321 682,641 0Kickapoo Area School District 2,735,091 181,884 181,883 363,767 0Kiel Area School District 7,558,050 623,539 502,610 1,126,149 1,253,746Kimberly Area School District 23,662,210 1,573,539 1,573,535 3,147,074 0Kohler School District 3,936,224 271,022 252,495 523,518 0La Crosse School District 48,246,246 3,835,644 3,208,307 7,043,952 (1,944)Lac Du Flambeau School District #1 4,833,038 367,652 275,142 642,794 0Ladysmith-Hawkins School District 5,791,721 383,364 386,935 770,299 0Lafarge School District 1,768,405 117,599 117,598 235,198 0Lake Country School District 3,155,315 209,849 209,808 419,657 0Lake Geneva Jt School Dis #1 Etal 10,884,597 725,211 722,440 1,447,651 0Lake Geneva School District 9,142,981 608,371 607,646 1,216,016 0Lake Holcombe School District 1,965,377 127,621 133,774 261,395 0Lake Mills Area School District 6,828,401 450,341 457,836 908,177 0Lakeland Union High School District 6,219,535 412,214 414,985 827,198 0Lancaster Comm School District 5,445,983 362,158 362,158 724,316 0Laona School District 1,430,018 95,096 95,096 190,192 0Lena Public School District 2,011,337 133,754 133,754 267,508 0Linn Jt School District #4 Etal 845,940 56,255 56,255 112,510 0
153 Actuarial accrued balances
Contributions UnfundedName Covered Payroll Employer Paid* Employee Paid Total Liability Balance
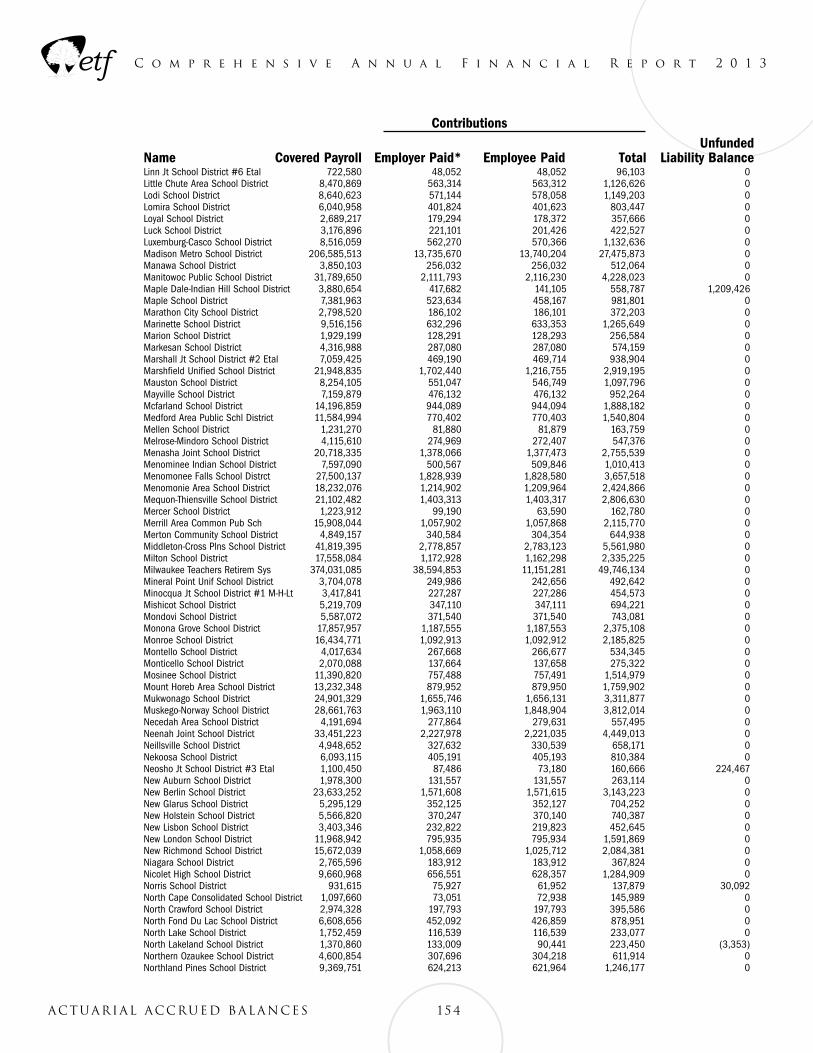
C o m p r e h e n s i v e A n n u a l F i n a n c i a l R e p o r t 2 0 1 3
Linn Jt School District #6 Etal 722,580 48,052 48,052 96,103 0Little Chute Area School District 8,470,869 563,314 563,312 1,126,626 0Lodi School District 8,640,623 571,144 578,058 1,149,203 0Lomira School District 6,040,958 401,824 401,623 803,447 0Loyal School District 2,689,217 179,294 178,372 357,666 0Luck School District 3,176,896 221,101 201,426 422,527 0Luxemburg-Casco School District 8,516,059 562,270 570,366 1,132,636 0Madison Metro School District 206,585,513 13,735,670 13,740,204 27,475,873 0Manawa School District 3,850,103 256,032 256,032 512,064 0Manitowoc Public School District 31,789,650 2,111,793 2,116,230 4,228,023 0Maple Dale-Indian Hill School District 3,880,654 417,682 141,105 558,787 1,209,426Maple School District 7,381,963 523,634 458,167 981,801 0Marathon City School District 2,798,520 186,102 186,101 372,203 0Marinette School District 9,516,156 632,296 633,353 1,265,649 0Marion School District 1,929,199 128,291 128,293 256,584 0Markesan School District 4,316,988 287,080 287,080 574,159 0Marshall Jt School District #2 Etal 7,059,425 469,190 469,714 938,904 0Marshfield Unified School District 21,948,835 1,702,440 1,216,755 2,919,195 0Mauston School District 8,254,105 551,047 546,749 1,097,796 0Mayville School District 7,159,879 476,132 476,132 952,264 0Mcfarland School District 14,196,859 944,089 944,094 1,888,182 0Medford Area Public Schl District 11,584,994 770,402 770,403 1,540,804 0Mellen School District 1,231,270 81,880 81,879 163,759 0Melrose-Mindoro School District 4,115,610 274,969 272,407 547,376 0Menasha Joint School District 20,718,335 1,378,066 1,377,473 2,755,539 0Menominee Indian School District 7,597,090 500,567 509,846 1,010,413 0Menomonee Falls School Distrct 27,500,137 1,828,939 1,828,580 3,657,518 0Menomonie Area School District 18,232,076 1,214,902 1,209,964 2,424,866 0Mequon-Thiensville School District 21,102,482 1,403,313 1,403,317 2,806,630 0Mercer School District 1,223,912 99,190 63,590 162,780 0Merrill Area Common Pub Sch 15,908,044 1,057,902 1,057,868 2,115,770 0Merton Community School District 4,849,157 340,584 304,354 644,938 0Middleton-Cross Plns School District 41,819,395 2,778,857 2,783,123 5,561,980 0Milton School District 17,558,084 1,172,928 1,162,298 2,335,225 0Milwaukee Teachers Retirem Sys 374,031,085 38,594,853 11,151,281 49,746,134 0Mineral Point Unif School District 3,704,078 249,986 242,656 492,642 0Minocqua Jt School District #1 M-H-Lt 3,417,841 227,287 227,286 454,573 0Mishicot School District 5,219,709 347,110 347,111 694,221 0Mondovi School District 5,587,072 371,540 371,540 743,081 0Monona Grove School District 17,857,957 1,187,555 1,187,553 2,375,108 0Monroe School District 16,434,771 1,092,913 1,092,912 2,185,825 0Montello School District 4,017,634 267,668 266,677 534,345 0Monticello School District 2,070,088 137,664 137,658 275,322 0Mosinee School District 11,390,820 757,488 757,491 1,514,979 0Mount Horeb Area School District 13,232,348 879,952 879,950 1,759,902 0Mukwonago School District 24,901,329 1,655,746 1,656,131 3,311,877 0Muskego-Norway School District 28,661,763 1,963,110 1,848,904 3,812,014 0Necedah Area School District 4,191,694 277,864 279,631 557,495 0Neenah Joint School District 33,451,223 2,227,978 2,221,035 4,449,013 0Neillsville School District 4,948,652 327,632 330,539 658,171 0Nekoosa School District 6,093,115 405,191 405,193 810,384 0Neosho Jt School District #3 Etal 1,100,450 87,486 73,180 160,666 224,467New Auburn School District 1,978,300 131,557 131,557 263,114 0New Berlin School District 23,633,252 1,571,608 1,571,615 3,143,223 0New Glarus School District 5,295,129 352,125 352,127 704,252 0New Holstein School District 5,566,820 370,247 370,140 740,387 0New Lisbon School District 3,403,346 232,822 219,823 452,645 0New London School District 11,968,942 795,935 795,934 1,591,869 0New Richmond School District 15,672,039 1,058,669 1,025,712 2,084,381 0Niagara School District 2,765,596 183,912 183,912 367,824 0Nicolet High School District 9,660,968 656,551 628,357 1,284,909 0Norris School District 931,615 75,927 61,952 137,879 30,092North Cape Consolidated School District 1,097,660 73,051 72,938 145,989 0North Crawford School District 2,974,328 197,793 197,793 395,586 0North Fond Du Lac School District 6,608,656 452,092 426,859 878,951 0North Lake School District 1,752,459 116,539 116,539 233,077 0North Lakeland School District 1,370,860 133,009 90,441 223,450 (3,353)Northern Ozaukee School District 4,600,854 307,696 304,218 611,914 0Northland Pines School District 9,369,751 624,213 621,964 1,246,177 0
154Actuarial accrued balances
Contributions UnfundedName Covered Payroll Employer Paid* Employee Paid Total Liability Balance
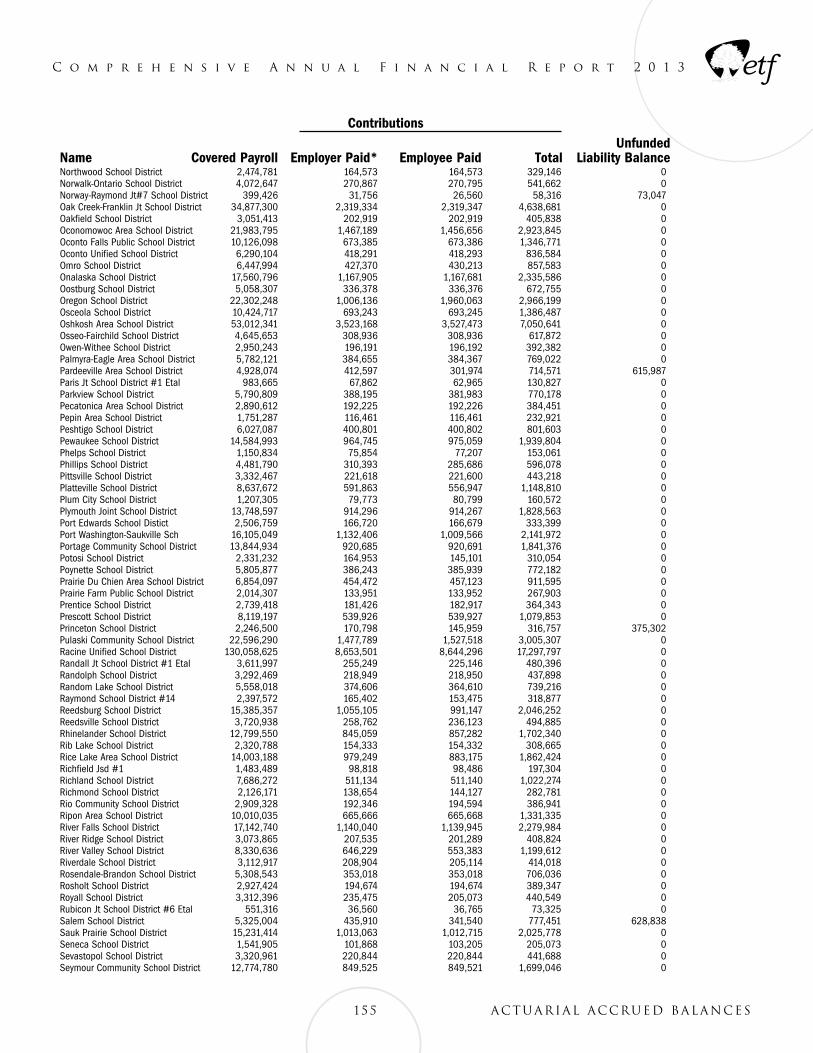
C o m p r e h e n s i v e A n n u a l F i n a n c i a l R e p o r t 2 0 1 3
Northwood School District 2,474,781 164,573 164,573 329,146 0Norwalk-Ontario School District 4,072,647 270,867 270,795 541,662 0Norway-Raymond Jt#7 School District 399,426 31,756 26,560 58,316 73,047Oak Creek-Franklin Jt School District 34,877,300 2,319,334 2,319,347 4,638,681 0Oakfield School District 3,051,413 202,919 202,919 405,838 0Oconomowoc Area School District 21,983,795 1,467,189 1,456,656 2,923,845 0Oconto Falls Public School District 10,126,098 673,385 673,386 1,346,771 0Oconto Unified School District 6,290,104 418,291 418,293 836,584 0Omro School District 6,447,994 427,370 430,213 857,583 0Onalaska School District 17,560,796 1,167,905 1,167,681 2,335,586 0Oostburg School District 5,058,307 336,378 336,376 672,755 0Oregon School District 22,302,248 1,006,136 1,960,063 2,966,199 0Osceola School District 10,424,717 693,243 693,245 1,386,487 0Oshkosh Area School District 53,012,341 3,523,168 3,527,473 7,050,641 0Osseo-Fairchild School District 4,645,653 308,936 308,936 617,872 0Owen-Withee School District 2,950,243 196,191 196,192 392,382 0Palmyra-Eagle Area School District 5,782,121 384,655 384,367 769,022 0Pardeeville Area School District 4,928,074 412,597 301,974 714,571 615,987Paris Jt School District #1 Etal 983,665 67,862 62,965 130,827 0Parkview School District 5,790,809 388,195 381,983 770,178 0Pecatonica Area School District 2,890,612 192,225 192,226 384,451 0Pepin Area School District 1,751,287 116,461 116,461 232,921 0Peshtigo School District 6,027,087 400,801 400,802 801,603 0Pewaukee School District 14,584,993 964,745 975,059 1,939,804 0Phelps School District 1,150,834 75,854 77,207 153,061 0Phillips School District 4,481,790 310,393 285,686 596,078 0Pittsville School District 3,332,467 221,618 221,600 443,218 0Platteville School District 8,637,672 591,863 556,947 1,148,810 0Plum City School District 1,207,305 79,773 80,799 160,572 0Plymouth Joint School District 13,748,597 914,296 914,267 1,828,563 0Port Edwards School Distict 2,506,759 166,720 166,679 333,399 0Port Washington-Saukville Sch 16,105,049 1,132,406 1,009,566 2,141,972 0Portage Community School District 13,844,934 920,685 920,691 1,841,376 0Potosi School District 2,331,232 164,953 145,101 310,054 0Poynette School District 5,805,877 386,243 385,939 772,182 0Prairie Du Chien Area School District 6,854,097 454,472 457,123 911,595 0Prairie Farm Public School District 2,014,307 133,951 133,952 267,903 0Prentice School District 2,739,418 181,426 182,917 364,343 0Prescott School District 8,119,197 539,926 539,927 1,079,853 0Princeton School District 2,246,500 170,798 145,959 316,757 375,302Pulaski Community School District 22,596,290 1,477,789 1,527,518 3,005,307 0Racine Unified School District 130,058,625 8,653,501 8,644,296 17,297,797 0Randall Jt School District #1 Etal 3,611,997 255,249 225,146 480,396 0Randolph School District 3,292,469 218,949 218,950 437,898 0Random Lake School District 5,558,018 374,606 364,610 739,216 0Raymond School District #14 2,397,572 165,402 153,475 318,877 0Reedsburg School District 15,385,357 1,055,105 991,147 2,046,252 0Reedsville School District 3,720,938 258,762 236,123 494,885 0Rhinelander School District 12,799,550 845,059 857,282 1,702,340 0Rib Lake School District 2,320,788 154,333 154,332 308,665 0Rice Lake Area School District 14,003,188 979,249 883,175 1,862,424 0Richfield Jsd #1 1,483,489 98,818 98,486 197,304 0Richland School District 7,686,272 511,134 511,140 1,022,274 0Richmond School District 2,126,171 138,654 144,127 282,781 0Rio Community School District 2,909,328 192,346 194,594 386,941 0Ripon Area School District 10,010,035 665,666 665,668 1,331,335 0River Falls School District 17,142,740 1,140,040 1,139,945 2,279,984 0River Ridge School District 3,073,865 207,535 201,289 408,824 0River Valley School District 8,330,636 646,229 553,383 1,199,612 0Riverdale School District 3,112,917 208,904 205,114 414,018 0Rosendale-Brandon School District 5,308,543 353,018 353,018 706,036 0Rosholt School District 2,927,424 194,674 194,674 389,347 0Royall School District 3,312,396 235,475 205,073 440,549 0Rubicon Jt School District #6 Etal 551,316 36,560 36,765 73,325 0Salem School District 5,325,004 435,910 341,540 777,451 628,838Sauk Prairie School District 15,231,414 1,013,063 1,012,715 2,025,778 0Seneca School District 1,541,905 101,868 103,205 205,073 0Sevastopol School District 3,320,961 220,844 220,844 441,688 0Seymour Community School District 12,774,780 849,525 849,521 1,699,046 0
155 Actuarial accrued balances
Contributions UnfundedName Covered Payroll Employer Paid* Employee Paid Total Liability Balance
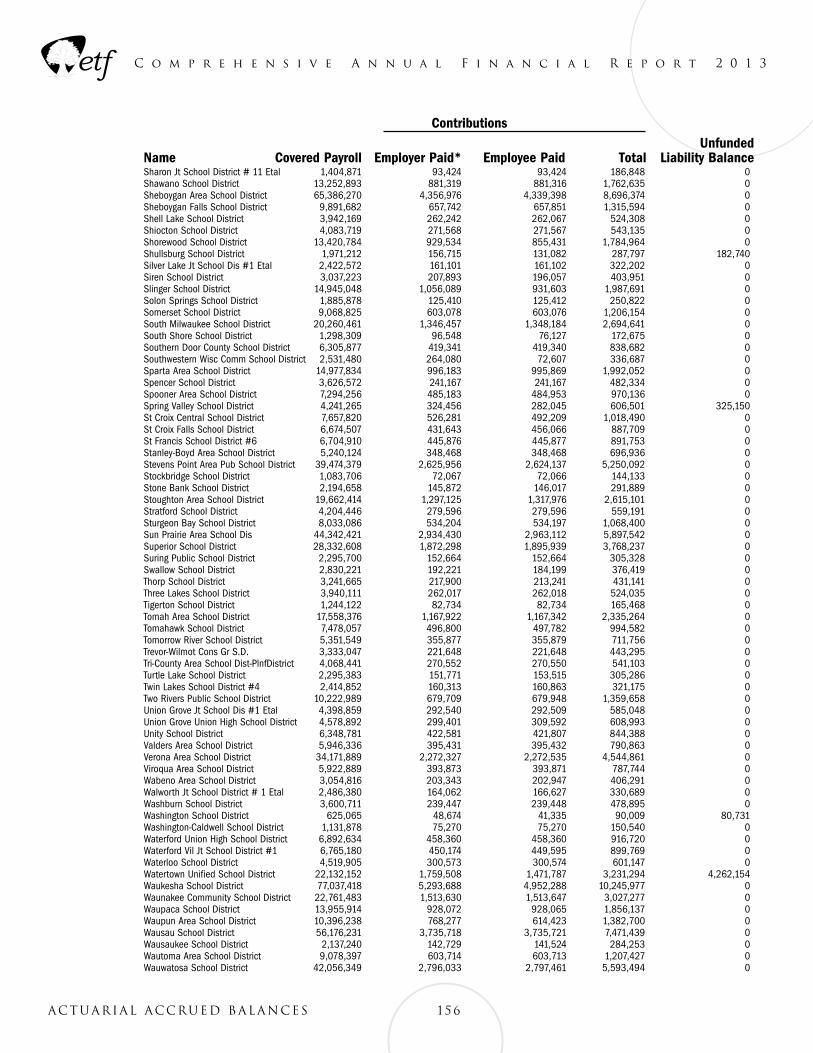
C o m p r e h e n s i v e A n n u a l F i n a n c i a l R e p o r t 2 0 1 3
Sharon Jt School District # 11 Etal 1,404,871 93,424 93,424 186,848 0Shawano School District 13,252,893 881,319 881,316 1,762,635 0Sheboygan Area School District 65,386,270 4,356,976 4,339,398 8,696,374 0Sheboygan Falls School District 9,891,682 657,742 657,851 1,315,594 0Shell Lake School District 3,942,169 262,242 262,067 524,308 0Shiocton School District 4,083,719 271,568 271,567 543,135 0Shorewood School District 13,420,784 929,534 855,431 1,784,964 0Shullsburg School District 1,971,212 156,715 131,082 287,797 182,740Silver Lake Jt School Dis #1 Etal 2,422,572 161,101 161,102 322,202 0Siren School District 3,037,223 207,893 196,057 403,951 0Slinger School District 14,945,048 1,056,089 931,603 1,987,691 0Solon Springs School District 1,885,878 125,410 125,412 250,822 0Somerset School District 9,068,825 603,078 603,076 1,206,154 0South Milwaukee School District 20,260,461 1,346,457 1,348,184 2,694,641 0South Shore School District 1,298,309 96,548 76,127 172,675 0Southern Door County School District 6,305,877 419,341 419,340 838,682 0Southwestern Wisc Comm School District 2,531,480 264,080 72,607 336,687 0Sparta Area School District 14,977,834 996,183 995,869 1,992,052 0Spencer School District 3,626,572 241,167 241,167 482,334 0Spooner Area School District 7,294,256 485,183 484,953 970,136 0Spring Valley School District 4,241,265 324,456 282,045 606,501 325,150St Croix Central School District 7,657,820 526,281 492,209 1,018,490 0St Croix Falls School District 6,674,507 431,643 456,066 887,709 0St Francis School District #6 6,704,910 445,876 445,877 891,753 0Stanley-Boyd Area School District 5,240,124 348,468 348,468 696,936 0Stevens Point Area Pub School District 39,474,379 2,625,956 2,624,137 5,250,092 0Stockbridge School District 1,083,706 72,067 72,066 144,133 0Stone Bank School District 2,194,658 145,872 146,017 291,889 0Stoughton Area School District 19,662,414 1,297,125 1,317,976 2,615,101 0Stratford School District 4,204,446 279,596 279,596 559,191 0Sturgeon Bay School District 8,033,086 534,204 534,197 1,068,400 0Sun Prairie Area School Dis 44,342,421 2,934,430 2,963,112 5,897,542 0Superior School District 28,332,608 1,872,298 1,895,939 3,768,237 0Suring Public School District 2,295,700 152,664 152,664 305,328 0Swallow School District 2,830,221 192,221 184,199 376,419 0Thorp School District 3,241,665 217,900 213,241 431,141 0Three Lakes School District 3,940,111 262,017 262,018 524,035 0Tigerton School District 1,244,122 82,734 82,734 165,468 0Tomah Area School District 17,558,376 1,167,922 1,167,342 2,335,264 0Tomahawk School District 7,478,057 496,800 497,782 994,582 0Tomorrow River School District 5,351,549 355,877 355,879 711,756 0Trevor-Wilmot Cons Gr S.D. 3,333,047 221,648 221,648 443,295 0Tri-County Area School Dist-PlnfDistrict 4,068,441 270,552 270,550 541,103 0Turtle Lake School District 2,295,383 151,771 153,515 305,286 0Twin Lakes School District #4 2,414,852 160,313 160,863 321,175 0Two Rivers Public School District 10,222,989 679,709 679,948 1,359,658 0Union Grove Jt School Dis #1 Etal 4,398,859 292,540 292,509 585,048 0Union Grove Union High School District 4,578,892 299,401 309,592 608,993 0Unity School District 6,348,781 422,581 421,807 844,388 0Valders Area School District 5,946,336 395,431 395,432 790,863 0Verona Area School District 34,171,889 2,272,327 2,272,535 4,544,861 0Viroqua Area School District 5,922,889 393,873 393,871 787,744 0Wabeno Area School District 3,054,816 203,343 202,947 406,291 0Walworth Jt School District # 1 Etal 2,486,380 164,062 166,627 330,689 0Washburn School District 3,600,711 239,447 239,448 478,895 0Washington School District 625,065 48,674 41,335 90,009 80,731Washington-Caldwell School District 1,131,878 75,270 75,270 150,540 0Waterford Union High School District 6,892,634 458,360 458,360 916,720 0Waterford Vil Jt School District #1 6,765,180 450,174 449,595 899,769 0Waterloo School District 4,519,905 300,573 300,574 601,147 0Watertown Unified School District 22,132,152 1,759,508 1,471,787 3,231,294 4,262,154Waukesha School District 77,037,418 5,293,688 4,952,288 10,245,977 0Waunakee Community School District 22,761,483 1,513,630 1,513,647 3,027,277 0Waupaca School District 13,955,914 928,072 928,065 1,856,137 0Waupun Area School District 10,396,238 768,277 614,423 1,382,700 0Wausau School District 56,176,231 3,735,718 3,735,721 7,471,439 0Wausaukee School District 2,137,240 142,729 141,524 284,253 0Wautoma Area School District 9,078,397 603,714 603,713 1,207,427 0Wauwatosa School District 42,056,349 2,796,033 2,797,461 5,593,494 0
156Actuarial accrued balances
Contributions UnfundedName Covered Payroll Employer Paid* Employee Paid Total Liability Balance
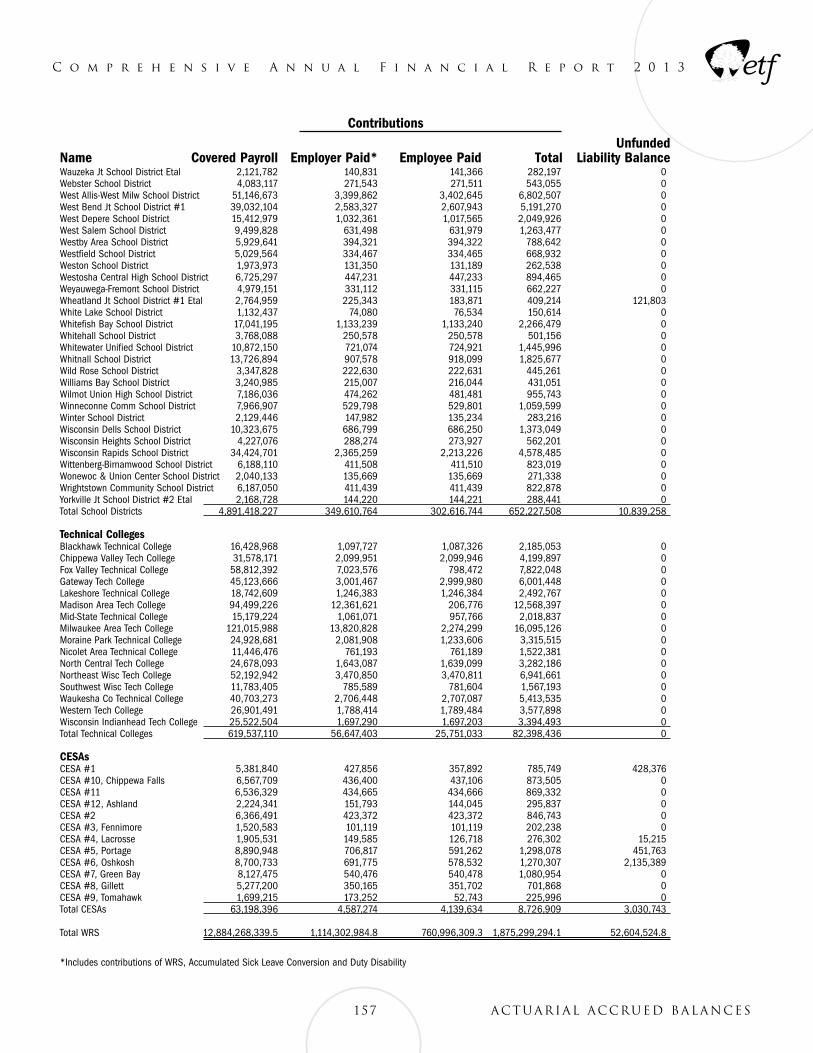
C o m p r e h e n s i v e A n n u a l F i n a n c i a l R e p o r t 2 0 1 3
Wauzeka Jt School District Etal 2,121,782 140,831 141,366 282,197 0Webster School District 4,083,117 271,543 271,511 543,055 0West Allis-West Milw School District 51,146,673 3,399,862 3,402,645 6,802,507 0West Bend Jt School District #1 39,032,104 2,583,327 2,607,943 5,191,270 0West Depere School District 15,412,979 1,032,361 1,017,565 2,049,926 0West Salem School District 9,499,828 631,498 631,979 1,263,477 0Westby Area School District 5,929,641 394,321 394,322 788,642 0Westfield School District 5,029,564 334,467 334,465 668,932 0Weston School District 1,973,973 131,350 131,189 262,538 0Westosha Central High School District 6,725,297 447,231 447,233 894,465 0Weyauwega-Fremont School District 4,979,151 331,112 331,115 662,227 0Wheatland Jt School District #1 Etal 2,764,959 225,343 183,871 409,214 121,803White Lake School District 1,132,437 74,080 76,534 150,614 0Whitefish Bay School District 17,041,195 1,133,239 1,133,240 2,266,479 0Whitehall School District 3,768,088 250,578 250,578 501,156 0Whitewater Unified School District 10,872,150 721,074 724,921 1,445,996 0Whitnall School District 13,726,894 907,578 918,099 1,825,677 0Wild Rose School District 3,347,828 222,630 222,631 445,261 0Williams Bay School District 3,240,985 215,007 216,044 431,051 0Wilmot Union High School District 7,186,036 474,262 481,481 955,743 0Winneconne Comm School District 7,966,907 529,798 529,801 1,059,599 0Winter School District 2,129,446 147,982 135,234 283,216 0Wisconsin Dells School District 10,323,675 686,799 686,250 1,373,049 0Wisconsin Heights School District 4,227,076 288,274 273,927 562,201 0Wisconsin Rapids School District 34,424,701 2,365,259 2,213,226 4,578,485 0Wittenberg-Birnamwood School District 6,188,110 411,508 411,510 823,019 0Wonewoc & Union Center School District 2,040,133 135,669 135,669 271,338 0Wrightstown Community School District 6,187,050 411,439 411,439 822,878 0Yorkville Jt School District #2 Etal 2,168,728 144,220 144,221 288,441 0Total School Districts 4,891,418,227 349,610,764 302,616,744 652,227,508 10,839,258 Technical Colleges Blackhawk Technical College 16,428,968 1,097,727 1,087,326 2,185,053 0Chippewa Valley Tech College 31,578,171 2,099,951 2,099,946 4,199,897 0Fox Valley Technical College 58,812,392 7,023,576 798,472 7,822,048 0Gateway Tech College 45,123,666 3,001,467 2,999,980 6,001,448 0Lakeshore Technical College 18,742,609 1,246,383 1,246,384 2,492,767 0Madison Area Tech College 94,499,226 12,361,621 206,776 12,568,397 0Mid-State Technical College 15,179,224 1,061,071 957,766 2,018,837 0Milwaukee Area Tech College 121,015,988 13,820,828 2,274,299 16,095,126 0Moraine Park Technical College 24,928,681 2,081,908 1,233,606 3,315,515 0Nicolet Area Technical College 11,446,476 761,193 761,189 1,522,381 0North Central Tech College 24,678,093 1,643,087 1,639,099 3,282,186 0Northeast Wisc Tech College 52,192,942 3,470,850 3,470,811 6,941,661 0Southwest Wisc Tech College 11,783,405 785,589 781,604 1,567,193 0Waukesha Co Technical College 40,703,273 2,706,448 2,707,087 5,413,535 0Western Tech College 26,901,491 1,788,414 1,789,484 3,577,898 0Wisconsin Indianhead Tech College 25,522,504 1,697,290 1,697,203 3,394,493 0Total Technical Colleges 619,537,110 56,647,403 25,751,033 82,398,436 0 CESAs CESA #1 5,381,840 427,856 357,892 785,749 428,376CESA #10, Chippewa Falls 6,567,709 436,400 437,106 873,505 0CESA #11 6,536,329 434,665 434,666 869,332 0CESA #12, Ashland 2,224,341 151,793 144,045 295,837 0CESA #2 6,366,491 423,372 423,372 846,743 0CESA #3, Fennimore 1,520,583 101,119 101,119 202,238 0CESA #4, Lacrosse 1,905,531 149,585 126,718 276,302 15,215CESA #5, Portage 8,890,948 706,817 591,262 1,298,078 451,763CESA #6, Oshkosh 8,700,733 691,775 578,532 1,270,307 2,135,389CESA #7, Green Bay 8,127,475 540,476 540,478 1,080,954 0CESA #8, Gillett 5,277,200 350,165 351,702 701,868 0CESA #9, Tomahawk 1,699,215 173,252 52,743 225,996 0Total CESAs 63,198,396 4,587,274 4,139,634 8,726,909 3,030,743 Total WRS 12,884,268,339.5 1,114,302,984.8 760,996,309.3 1,875,299,294.1 52,604,524.8
*Includes contributions of WRS, Accumulated Sick Leave Conversion and Duty Disability
157 Actuarial accrued balances
Contributions UnfundedName Covered Payroll Employer Paid* Employee Paid Total Liability Balance