annex a. atmospheric science
TRANSCRIPT
Annex A. Atmospheric Science
Yukon-Koyukuk
Alaska
0
0
0
670
1,458
92
6,613
0
19,136
145,340
88,239
23,049
1,697
8,403,258
0 2,000,000 4,000,000 6,000,000 8,000,000 10,000,000
SOLVENT UTILIZATION
MISCELLANEOUS
STORAGE & TRANSPORT
CHEMICAL & ALLIED PRODUCT MFG
PETROLEUM & RELATED INDUSTRIES
OTHER INDUSTRIAL PROCESSES
FUEL COMB. ELEC. UTIL.
METALS PROCESSING
FUEL COMB. INDUSTRIAL
WASTE DISPOSAL & RECYCLING
FUEL COMB. OTHER
FIRES
NON-ROAD EQUIPMENT
ON-ROAD VEHICLES
Emissions (tons)
AnthropogenicBiogenic
Yukon-Koyukuk Census Area
0
0
2,494
3,758
406
52
0
0
0
0
8,095,364
0
0
0
0 2,000,000 4,000,000 6,000,000 8,000,000 10,000,000
SOLVENT UTILIZATION
MISCELLANEOUS
STORAGE & TRANSPORT
CHEMICAL & ALLIED PRODUCT MFG
PETROLEUM & RELATED INDUSTRIES
OTHER INDUSTRIAL PROCESSES
FUEL COMB. ELEC. UTIL.
METALS PROCESSING
FUEL COMB. INDUSTRIAL
WASTE DISPOSAL & RECYCLING
FUEL COMB. OTHER
FIRES
NON-ROAD EQUIPMENT
ON-ROAD VEHICLES
Emissions (tons)
AnthropogenicBiogenic
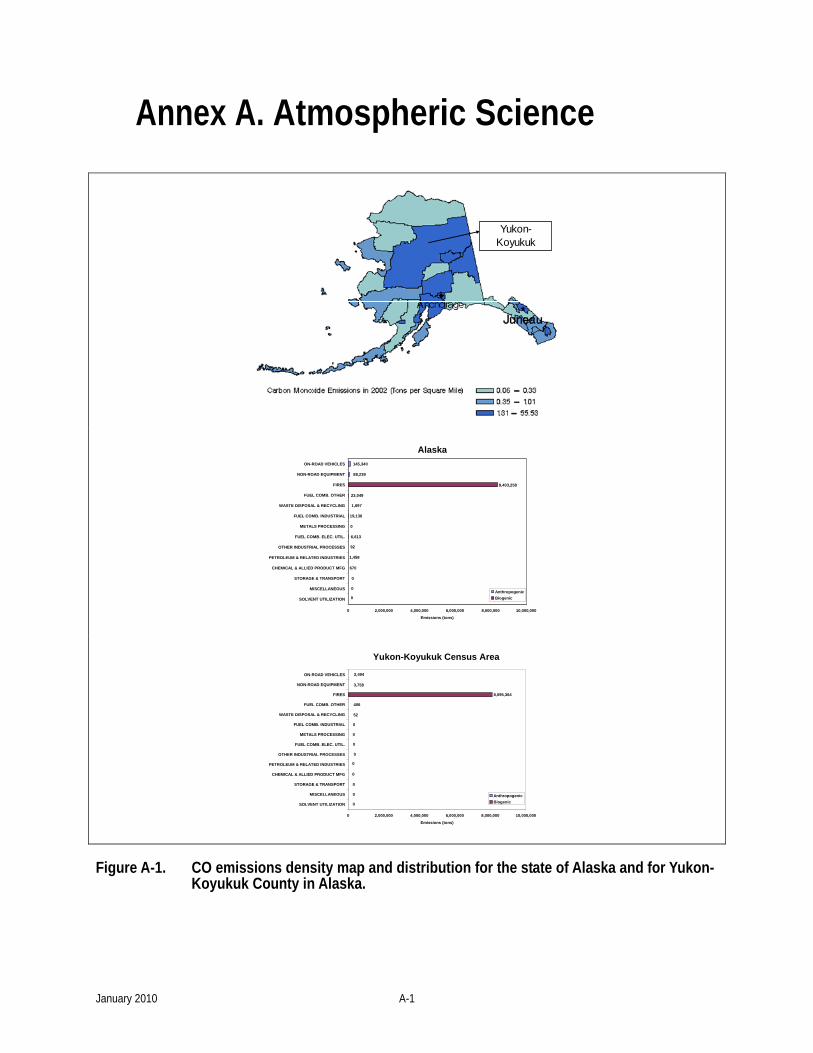
Figure A-1. CO emissions density map and distribution for the state of Alaska and for Yukon-Koyukuk County in Alaska.
January 2010 A-1

Weber
Utah
Grand
Utah
14
91
13
19
1,312
37,877
4,252
2,314
3,733
153
41,697
271,971
183,533
764,676
136,584
0 250,000 500,000 750,000 1,000,000
SOLVENT UTILIZATION
MISCELLANEOUS
STORAGE & TRANSPORT
CHEMICAL & ALLIED PRODUCT MFG
PETROLEUM & RELATED INDUSTRIES
OTHER INDUSTRIAL PROCESSES
FUEL COMB. ELEC. UTIL.
METALS PROCESSING
FUEL COMB. INDUSTRIAL
WASTE DISPOSAL & RECYCLING
FUEL COMB. OTHER
SOILS
FIRES
NON-ROAD EQUIPMENT
ON-ROAD VEHICLES
Emissions (tons)
AnthropogenicBiogenic
Weber County
2
8
0
0
25
2,038
73
2
37
0
1,521
985
932
11,842
45,690
0 25,000 50,000
SOLVENT UTILIZATION
MISCELLANEOUS
STORAGE & TRANSPORT
CHEMICAL & ALLIED PRODUCT MFG
PETROLEUM & RELATED INDUSTRIES
OTHER INDUSTRIAL PROCESSES
FUEL COMB. ELEC. UTIL.
METALS PROCESSING
FUEL COMB. INDUSTRIAL
WASTE DISPOSAL & RECYCLING
FUEL COMB. OTHER
SOILS
FIRES
NON-ROAD EQUIPMENT
ON-ROAD VEHICLES
Emissions (tons)
AnthropogenicBiogenic
Utah County
0
12
0
1
48
38
1
1,258
369
2
3,599
88,391
20,120
3,019
4,769
0 25,000 50,000 75,000 100,000
SOLVENT UTILIZATION
MISCELLANEOUS
STORAGE & TRANSPORT
CHEMICAL & ALLIED PRODUCT MFG
PETROLEUM & RELATED INDUSTRIES
OTHER INDUSTRIAL PROCESSES
FUEL COMB. ELEC. UTIL.
METALS PROCESSING
FUEL COMB. INDUSTRIAL
WASTE DISPOSAL & RECYCLING
FUEL COMB. OTHER
SOILS
FIRES
NON-ROAD EQUIPMENT
ON-ROAD VEHICLES
Emissions (tons)
AnthropogenicBiogenic
Grand County
0
0
0
0
0
5
0
0
1
0
992
7,219
2,596
6,596
3,939
0 2,500 5,000 7,500 10,000
SOLVENT UTILIZATION
MISCELLANEOUS
STORAGE & TRANSPORT
CHEMICAL & ALLIED PRODUCT MFG
PETROLEUM & RELATED INDUSTRIES
OTHER INDUSTRIAL PROCESSES
FUEL COMB. ELEC. UTIL.
METALS PROCESSING
FUEL COMB. INDUSTRIAL
WASTE DISPOSAL & RECYCLING
FUEL COMB. OTHER
SOILS
FIRES
NON-ROAD EQUIPMENT
ON-ROAD VEHICLES
Emissions (tons)
AnthropogenicBiogenic
Figure A-2. CO emissions density map and distribution for the state of Utah and for selected counties in Utah.
January 2010 A-2

Suffolk
Middlesex
Norfolk
Massachusetts
11
68
17
78
29
870
11,569
105
21,970
3,861
119,337
703
441,814
960,011
10,807
0 250,000 500,000 750,000 1,000,000
SOLVENT UTILIZATION
MISCELLANEOUS
STORAGE & TRANSPORT
CHEMICAL & ALLIED PRODUCT MFG
PETROLEUM & RELATED INDUSTRIES
OTHER INDUSTRIAL PROCESSES
FUEL COMB. ELEC. UTIL.
METALS PROCESSING
FUEL COMB. INDUSTRIAL
WASTE DISPOSAL & RECYCLING
FUEL COMB. OTHER
SOILS
FIRES
NON-ROAD EQUIPMENT
ON-ROAD VEHICLES
Emissions (tons)
AnthropogenicBiogenic
Middlesex County224,697
92,849
2
10
0
0
1
179
492
31
5,465
321
19,297
73
1,024
0 25,000 50,000 75,000 100,000 125,000 150,000 175,000 200,000 225,000 250,000
SOLVENT UTILIZATION
MISCELLANEOUS
STORAGE & TRANSPORT
CHEMICAL & ALLIED PRODUCT MFG
PETROLEUM & RELATED INDUSTRIES
OTHER INDUSTRIAL PROCESSES
FUEL COMB. ELEC. UTIL.
METALS PROCESSING
FUEL COMB. INDUSTRIAL
WASTE DISPOSAL & RECYCLING
FUEL COMB. OTHER
SOILS
FIRES
NON-ROAD EQUIPMENT
ON-ROAD VEHICLES
Emissions (tons)
AnthropogenicBiogenic
Norfolk County160,676
42,121
54
9,700
285
2,161
0
189
71
18
76
0
4
2
670
0 50,000 100,000 150,000 200,000
SOLVENT UTILIZATION
MISCELLANEOUS
STORAGE & TRANSPORT
CHEMICAL & ALLIED PRODUCT MFG
PETROLEUM & RELATED INDUSTRIES
OTHER INDUSTRIAL PROCESSES
FUEL COMB. ELEC. UTIL.
METALS PROCESSING
FUEL COMB. INDUSTRIAL
WASTE DISPOSAL & RECYCLING
FUEL COMB. OTHER
SOILS
FIRES
NON-ROAD EQUIPMENT
ON-ROAD VEHICLES
Emissions (tons)
AnthropogenicBiogenic
Suffolk County
30,901
66,491
0
0
0
0
11
114
225
0
1,295
1
3,022
99
254
0 25,000 50,000 75,000
SOLVENT UTILIZATION
MISCELLANEOUS
STORAGE & TRANSPORT
CHEMICAL & ALLIED PRODUCT MFG
PETROLEUM & RELATED INDUSTRIES
OTHER INDUSTRIAL PROCESSES
FUEL COMB. ELEC. UTIL.
METALS PROCESSING
FUEL COMB. INDUSTRIAL
WASTE DISPOSAL & RECYCLING
FUEL COMB. OTHER
SOILS
FIRES
NON-ROAD EQUIPMENT
ON-ROAD VEHICLES
Emissions (tons)
AnthropogenicBiogenic
Figure A-3. CO emissions density map and distribution for the state of Massachusetts and for selected counties in Massachusetts.
January 2010 A-3
Fulton
Dekalb
Chatham
Liberty
Glynn
Georgia
11
68
17
960,011
441,814
119,337
3,861
21,970
105
11,569
870
29
78
182,591
703
0 250,000 500,000 750,000 1,000,000 1,250,000
SOLVENT UTILIZATION
MISCELLANEOUS
STORAGE & TRANSPORT
CHEMICAL & ALLIED PRODUCT MFG
PETROLEUM & RELATED INDUSTRIES
OTHER INDUSTRIAL PROCESSES
FUEL COMB. ELEC. UTIL.
METALS PROCESSING
FUEL COMB. INDUSTRIAL
WASTE DISPOSAL & RECYCLING
FUEL COMB. OTHER
SOILS
FIRES
NON-ROAD EQUIPMENT
ON-ROAD VEHICLES
Emissions (tons)
AnthropogenicBiogenic
Fulton County
0
28
0
0
0
0
233
41
1,384
279
3,729
221,739
65,982
67
825
0 50,000 100,000 150,000 200,000 250,000
SOLVENT UTILIZATION
MISCELLANEOUS
STORAGE & TRANSPORT
CHEMICAL & ALLIED PRODUCT MFG
PETROLEUM & RELATED INDUSTRIES
OTHER INDUSTRIAL PROCESSES
FUEL COMB. ELEC. UTIL.
METALS PROCESSING
FUEL COMB. INDUSTRIAL
WASTE DISPOSAL & RECYCLING
FUEL COMB. OTHER
SOILS
FIRES
NON-ROAD EQUIPMENT
ON-ROAD VEHICLES
Emissions (tons)
AnthropogenicBiogenic
Dekalb County
62,735
141,889
0
0
5
1
0
102
0
988
254
2,938
0
812
1
0 25,000 50,000 75,000 100,000 125,000 150,000 175,000
SOLVENT UTILIZATION
MISCELLANEOUS
STORAGE & TRANSPORT
CHEMICAL & ALLIED PRODUCT MFG
PETROLEUM & RELATED INDUSTRIES
OTHER INDUSTRIAL PROCESSES
FUEL COMB. ELEC. UTIL.
METALS PROCESSING
FUEL COMB. INDUSTRIAL
WASTE DISPOSAL & RECYCLING
FUEL COMB. OTHER
SOILS
FIRES
NON-ROAD EQUIPMENT
ON-ROAD VEHICLES
Emissions (tons)
AnthropogenicBiogenic
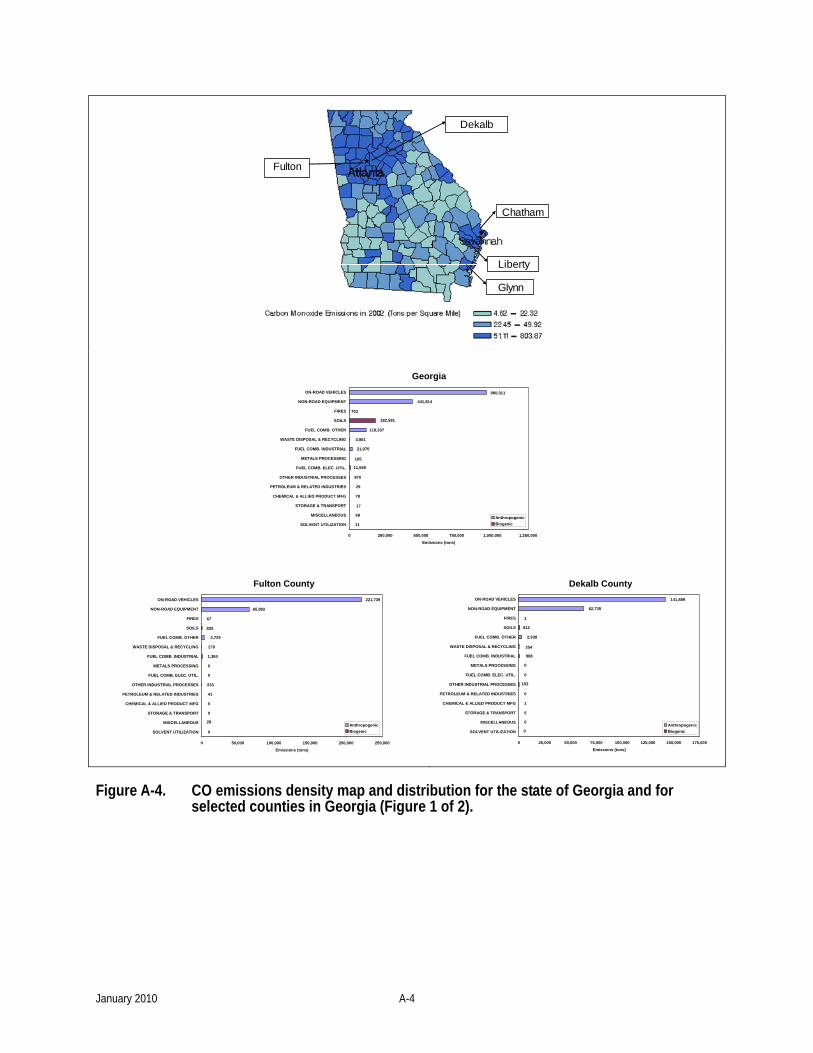
Figure A-4. CO emissions density map and distribution for the state of Georgia and for selected counties in Georgia (Figure 1 of 2).
January 2010 A-4
Chatham County
24,908
54,182
0
0
0
18
0
1,831
189
1,635
73
1,168
0
1,315
561
0 25,000 50,000
SOLVENT UTILIZATION
MISCELLANEOUS
STORAGE & TRANSPORT
CHEMICAL & ALLIED PRODUCT MFG
PETROLEUM & RELATED INDUSTRIES
OTHER INDUSTRIAL PROCESSES
FUEL COMB. ELEC. UTIL.
METALS PROCESSING
FUEL COMB. INDUSTRIAL
WASTE DISPOSAL & RECYCLING
FUEL COMB. OTHER
SOILS
FIRES
NON-ROAD EQUIPMENT
ON-ROAD VEHICLES
Emissions (tons)
AnthropogenicBiogenic
Liberty County
0
3,423
15,423
11,018
256
55,427
52
0
0
373
0
12
0
0
1,626
0 25,000 50,000
SOLVENT UTILIZATION
MISCELLANEOUS
STORAGE & TRANSPORT
CHEMICAL & ALLIED PRODUCT MFG
PETROLEUM & RELATED INDUSTRIES
OTHER INDUSTRIAL PROCESSES
FUEL COMB. ELEC. UTIL.
METALS PROCESSING
FUEL COMB. INDUSTRIAL
WASTE DISPOSAL & RECYCLING
FUEL COMB. OTHER
SOILS
FIRES
NON-ROAD EQUIPMENT
ON-ROAD VEHICLES
Emissions (tons)
AnthropogenicBiogenic
`
Glynn County
0
0
0
0
0
6,619
377
0
3,002
1,129
188
1,504
390
10,619
21,140
0 5,000 10,000 15,000 20,000 25,000
SOLVENT UTILIZATION
MISCELLANEOUS
STORAGE & TRANSPORT
CHEMICAL & ALLIED PRODUCT MFG
PETROLEUM & RELATED INDUSTRIES
OTHER INDUSTRIAL PROCESSES
FUEL COMB. ELEC. UTIL.
METALS PROCESSING
FUEL COMB. INDUSTRIAL
WASTE DISPOSAL & RECYCLING
FUEL COMB. OTHER
SOILS
FIRES
NON-ROAD EQUIPMENT
ON-ROAD VEHICLES
Emissions (tons)
AnthropogenicBiogenic
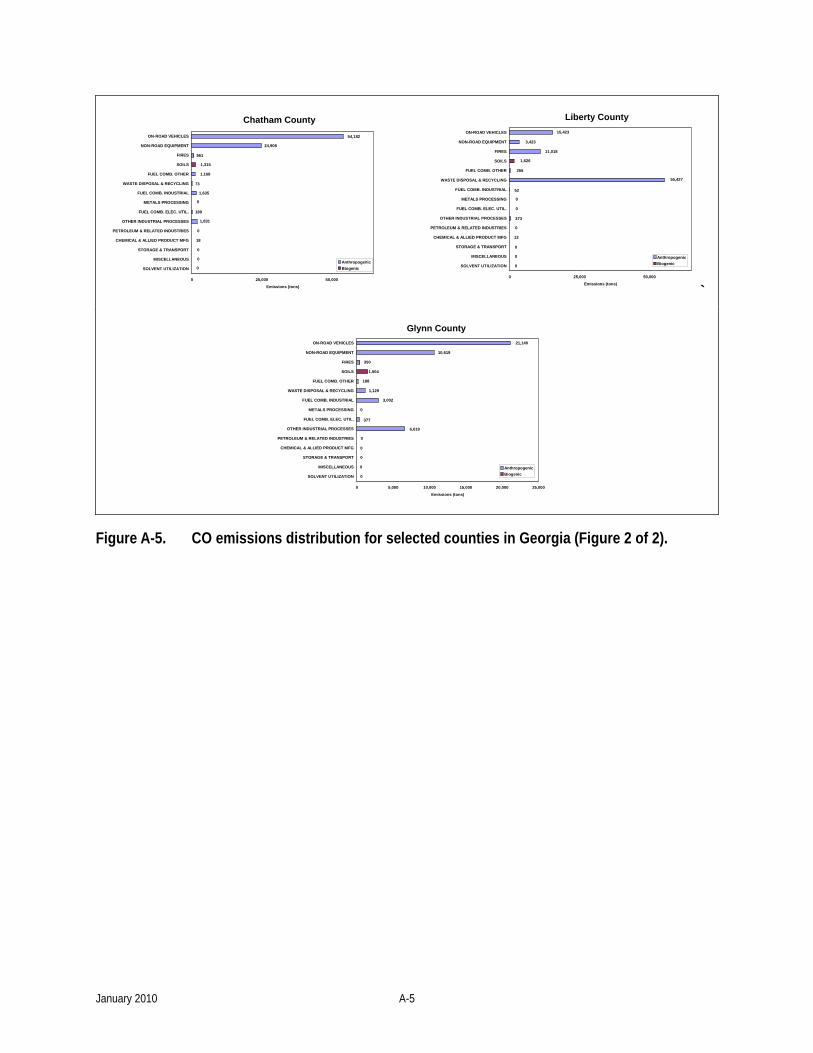
Figure A-5. CO emissions distribution for selected counties in Georgia (Figure 2 of 2).
January 2010 A-5
Los Angeles
San Diego
Orange
California3,436,059
1,170,637
736,797
410,414
321,342
22,261
85,727
498
28,707
16,763
7,225
351
277
14,322
290
0 1,000,000 2,000,000 3,000,000 4,000,000
SOLVENT UTILIZATION
MISCELLANEOUS
STORAGE & TRANSPORT
CHEMICAL & ALLIED PRODUCT MFG
PETROLEUM & RELATED INDUSTRIES
OTHER INDUSTRIAL PROCESSES
FUEL COMB. ELEC. UTIL.
METALS PROCESSING
FUEL COMB. INDUSTRIAL
WASTE DISPOSAL & RECYCLING
FUEL COMB. OTHER
SOILS
FIRES
NON-ROAD EQUIPMENT
ON-ROAD VEHICLES
Emissions (tons)
AnthropogenicBiogenic
Los Angeles County
2
86
1
12
2,425
500
9,814
79
24,537
142
10,927
8,085
63,164
212,892
824,676
0 250,000 500,000 750,000 1,000,000
SOLVENT UTILIZATION
MISCELLANEOUS
STORAGE & TRANSPORT
CHEMICAL & ALLIED PRODUCT MFG
PETROLEUM & RELATED INDUSTRIES
OTHER INDUSTRIAL PROCESSES
FUEL COMB. ELEC. UTIL.
METALS PROCESSING
FUEL COMB. INDUSTRIAL
WASTE DISPOSAL & RECYCLING
FUEL COMB. OTHER
SOILS
FIRES
NON-ROAD EQUIPMENT
ON-ROAD VEHICLES
Emissions (tons)
AnthropogenicBiogenic
San Diego County
0
5,260
0
0
132
98
895
0
4,935
162
25,768
10,580
62,392
101,515
283,597
0 100,000 200,000 300,000 400,000
SOLVENT UTILIZATION
MISCELLANEOUS
STORAGE & TRANSPORT
CHEMICAL & ALLIED PRODUCT MFG
PETROLEUM & RELATED INDUSTRIES
OTHER INDUSTRIAL PROCESSES
FUEL COMB. ELEC. UTIL.
METALS PROCESSING
FUEL COMB. INDUSTRIAL
WASTE DISPOSAL & RECYCLING
FUEL COMB. OTHER
SOILS
FIRES
NON-ROAD EQUIPMENT
ON-ROAD VEHICLES
Emissions (tons)
AnthropogenicBiogenic
Orange County
1
18
0
0
17
46
655
0
3,761
107
3,593
2,374
1,145
103,377
220,477
0 100,000 200,000
SOLVENT UTILIZATION
MISCELLANEOUS
STORAGE & TRANSPORT
CHEMICAL & ALLIED PRODUCT MFG
PETROLEUM & RELATED INDUSTRIES
OTHER INDUSTRIAL PROCESSES
FUEL COMB. ELEC. UTIL.
METALS PROCESSING
FUEL COMB. INDUSTRIAL
WASTE DISPOSAL & RECYCLING
FUEL COMB. OTHER
SOILS
FIRES
NON-ROAD EQUIPMENT
ON-ROAD VEHICLES
Emissions (tons)
AnthropogenicBiogenic
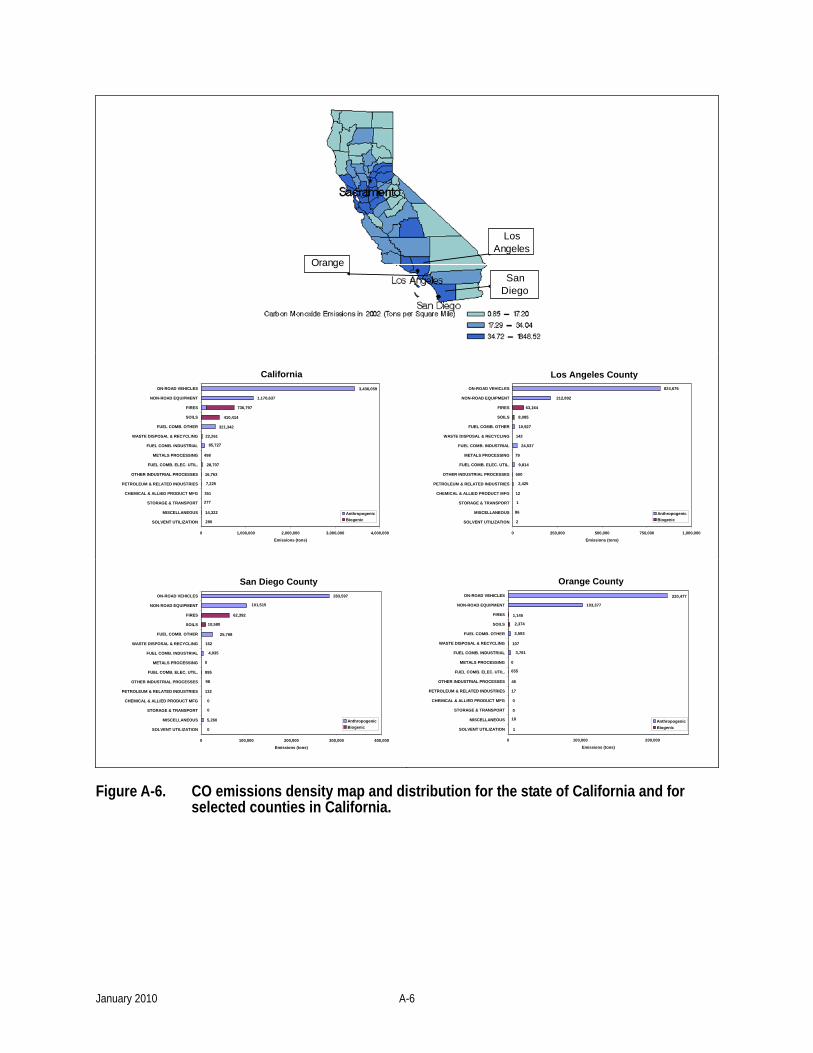
Figure A-6. CO emissions density map and distribution for the state of California and for selected counties in California.
January 2010 A-6

Jefferson
Alabama
216
128
174
5,721
13,619
48,004
11,212
38,247
67,132
104,914
71,052
146,582
308,000
389,081
1,237,459
0 500,000 1,000,000 1,500,000
SOLVENT UTILIZATION
MISCELLANEOUS
STORAGE & TRANSPORT
CHEMICAL & ALLIED PRODUCT MFG
PETROLEUM & RELATED INDUSTRIES
OTHER INDUSTRIAL PROCESSES
FUEL COMB. ELEC. UTIL.
METALS PROCESSING
FUEL COMB. INDUSTRIAL
WASTE DISPOSAL & RECYCLING
FUEL COMB. OTHER
SOILS
FIRES
NON-ROAD EQUIPMENT
ON-ROAD VEHICLES
Emissions (tons)
AnthropogenicBiogenic
Jefferson County181,846
47,932
546
2,655
2,888
2,176
38,088
27,010
3,360
13,592
145
5
54
19
8
0 50,000 100,000 150,000 200,000
SOLVENT UTILIZATION
MISCELLANEOUS
STORAGE & TRANSPORT
CHEMICAL & ALLIED PRODUCT MFG
PETROLEUM & RELATED INDUSTRIES
OTHER INDUSTRIAL PROCESSES
FUEL COMB. ELEC. UTIL.
METALS PROCESSING
FUEL COMB. INDUSTRIAL
WASTE DISPOSAL & RECYCLING
FUEL COMB. OTHER
SOILS
FIRES
NON-ROAD EQUIPMENT
ON-ROAD VEHICLES
Emissions (tons)
AnthropogenicBiogenic
Figure A-7. CO emissions density map and distribution for the state of Alabama and for Jefferson County in Alabama.
January 2010 A-7
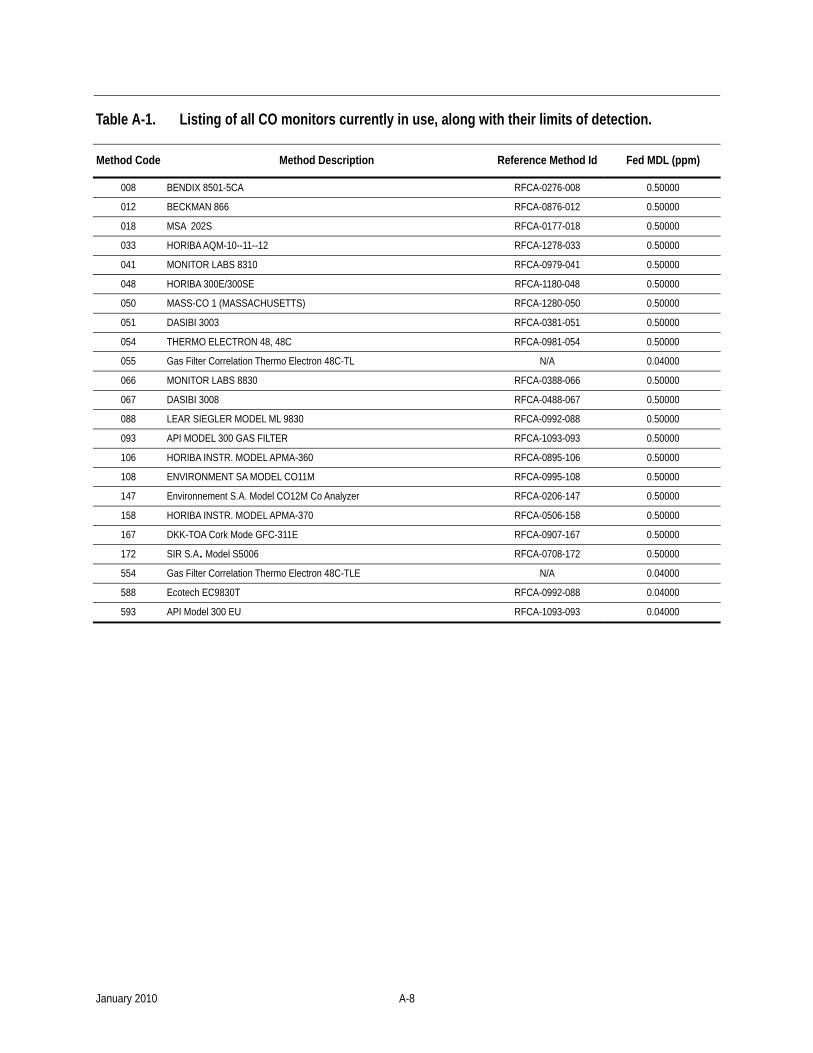
Table A-1. Listing of all CO monitors currently in use, along with their limits of detection.
Method Code Method Description Reference Method Id Fed MDL (ppm)
008 BENDIX 8501-5CA RFCA-0276-008 0.50000
012 BECKMAN 866 RFCA-0876-012 0.50000
018 MSA 202S RFCA-0177-018 0.50000
033 HORIBA AQM-10--11--12 RFCA-1278-033 0.50000
041 MONITOR LABS 8310 RFCA-0979-041 0.50000
048 HORIBA 300E/300SE RFCA-1180-048 0.50000
050 MASS-CO 1 (MASSACHUSETTS) RFCA-1280-050 0.50000
051 DASIBI 3003 RFCA-0381-051 0.50000
054 THERMO ELECTRON 48, 48C RFCA-0981-054 0.50000
055 Gas Filter Correlation Thermo Electron 48C-TL N/A 0.04000
066 MONITOR LABS 8830 RFCA-0388-066 0.50000
067 DASIBI 3008 RFCA-0488-067 0.50000
088 LEAR SIEGLER MODEL ML 9830 RFCA-0992-088 0.50000
093 API MODEL 300 GAS FILTER RFCA-1093-093 0.50000
106 HORIBA INSTR. MODEL APMA-360 RFCA-0895-106 0.50000
108 ENVIRONMENT SA MODEL CO11M RFCA-0995-108 0.50000
147 Environnement S.A. Model CO12M Co Analyzer RFCA-0206-147 0.50000
158 HORIBA INSTR. MODEL APMA-370 RFCA-0506-158 0.50000
167 DKK-TOA Cork Mode GFC-311E RFCA-0907-167 0.50000
172 SIR S.A. Model S5006 RFCA-0708-172 0.50000
554 Gas Filter Correlation Thermo Electron 48C-TLE N/A 0.04000
588 Ecotech EC9830T RFCA-0992-088 0.04000
593 API Model 300 EU RFCA-1093-093 0.04000
January 2010 A-8
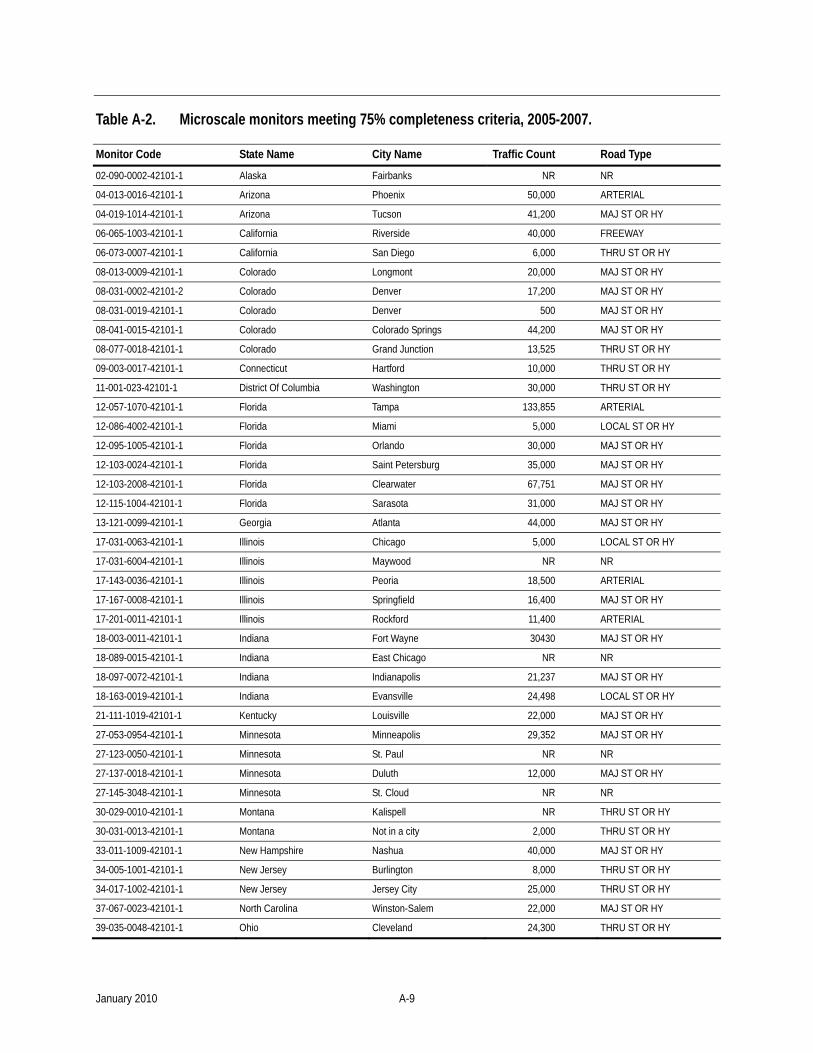
Table A-2. Microscale monitors meeting 75% completeness criteria, 2005-2007.
Monitor Code State Name City Name Traffic Count Road Type
02-090-0002-42101-1 Alaska Fairbanks NR NR
04-013-0016-42101-1 Arizona Phoenix 50,000 ARTERIAL
04-019-1014-42101-1 Arizona Tucson 41,200 MAJ ST OR HY
06-065-1003-42101-1 California Riverside 40,000 FREEWAY
06-073-0007-42101-1 California San Diego 6,000 THRU ST OR HY
08-013-0009-42101-1 Colorado Longmont 20,000 MAJ ST OR HY
08-031-0002-42101-2 Colorado Denver 17,200 MAJ ST OR HY
08-031-0019-42101-1 Colorado Denver 500 MAJ ST OR HY
08-041-0015-42101-1 Colorado Colorado Springs 44,200 MAJ ST OR HY
08-077-0018-42101-1 Colorado Grand Junction 13,525 THRU ST OR HY
09-003-0017-42101-1 Connecticut Hartford 10,000 THRU ST OR HY
11-001-023-42101-1 District Of Columbia Washington 30,000 THRU ST OR HY
12-057-1070-42101-1 Florida Tampa 133,855 ARTERIAL
12-086-4002-42101-1 Florida Miami 5,000 LOCAL ST OR HY
12-095-1005-42101-1 Florida Orlando 30,000 MAJ ST OR HY
12-103-0024-42101-1 Florida Saint Petersburg 35,000 MAJ ST OR HY
12-103-2008-42101-1 Florida Clearwater 67,751 MAJ ST OR HY
12-115-1004-42101-1 Florida Sarasota 31,000 MAJ ST OR HY
13-121-0099-42101-1 Georgia Atlanta 44,000 MAJ ST OR HY
17-031-0063-42101-1 Illinois Chicago 5,000 LOCAL ST OR HY
17-031-6004-42101-1 Illinois Maywood NR NR
17-143-0036-42101-1 Illinois Peoria 18,500 ARTERIAL
17-167-0008-42101-1 Illinois Springfield 16,400 MAJ ST OR HY
17-201-0011-42101-1 Illinois Rockford 11,400 ARTERIAL
18-003-0011-42101-1 Indiana Fort Wayne 30430 MAJ ST OR HY
18-089-0015-42101-1 Indiana East Chicago NR NR
18-097-0072-42101-1 Indiana Indianapolis 21,237 MAJ ST OR HY
18-163-0019-42101-1 Indiana Evansville 24,498 LOCAL ST OR HY
21-111-1019-42101-1 Kentucky Louisville 22,000 MAJ ST OR HY
27-053-0954-42101-1 Minnesota Minneapolis 29,352 MAJ ST OR HY
27-123-0050-42101-1 Minnesota St. Paul NR NR
27-137-0018-42101-1 Minnesota Duluth 12,000 MAJ ST OR HY
27-145-3048-42101-1 Minnesota St. Cloud NR NR
30-029-0010-42101-1 Montana Kalispell NR THRU ST OR HY
30-031-0013-42101-1 Montana Not in a city 2,000 THRU ST OR HY
33-011-1009-42101-1 New Hampshire Nashua 40,000 MAJ ST OR HY
34-005-1001-42101-1 New Jersey Burlington 8,000 THRU ST OR HY
34-017-1002-42101-1 New Jersey Jersey City 25,000 THRU ST OR HY
37-067-0023-42101-1 North Carolina Winston-Salem 22,000 MAJ ST OR HY
39-035-0048-42101-1 Ohio Cleveland 24,300 THRU ST OR HY
January 2010 A-9
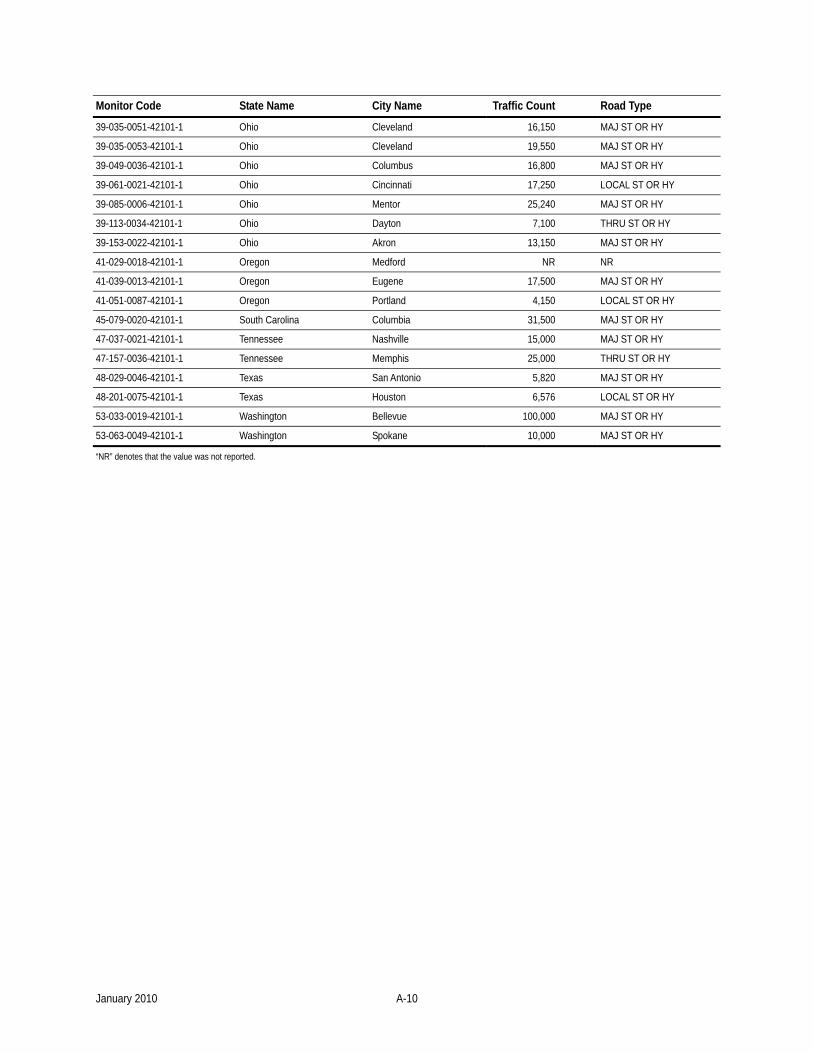
Monitor Code State Name City Name Traffic Count Road Type
39-035-0051-42101-1 Ohio Cleveland 16,150 MAJ ST OR HY
39-035-0053-42101-1 Ohio Cleveland 19,550 MAJ ST OR HY
39-049-0036-42101-1 Ohio Columbus 16,800 MAJ ST OR HY
39-061-0021-42101-1 Ohio Cincinnati 17,250 LOCAL ST OR HY
39-085-0006-42101-1 Ohio Mentor 25,240 MAJ ST OR HY
39-113-0034-42101-1 Ohio Dayton 7,100 THRU ST OR HY
39-153-0022-42101-1 Ohio Akron 13,150 MAJ ST OR HY
41-029-0018-42101-1 Oregon Medford NR NR
41-039-0013-42101-1 Oregon Eugene 17,500 MAJ ST OR HY
41-051-0087-42101-1 Oregon Portland 4,150 LOCAL ST OR HY
45-079-0020-42101-1 South Carolina Columbia 31,500 MAJ ST OR HY
47-037-0021-42101-1 Tennessee Nashville 15,000 MAJ ST OR HY
47-157-0036-42101-1 Tennessee Memphis 25,000 THRU ST OR HY
48-029-0046-42101-1 Texas San Antonio 5,820 MAJ ST OR HY
48-201-0075-42101-1 Texas Houston 6,576 LOCAL ST OR HY
53-033-0019-42101-1 Washington Bellevue 100,000 MAJ ST OR HY
53-063-0049-42101-1 Washington Spokane 10,000 MAJ ST OR HY
“NR” denotes that the value was not reported.
January 2010 A-10

Table A-3. Middle scale monitors meeting 75% completeness criteria, 2005-2007.
Monitor Code State Name City Name Traffic Count Road Type
04-013-3010-42101-1 Arizona Phoenix 18,500 ARTERIAL
06-029-0010-42101-1 California Bakersfield 30,300 ARTERIAL
06-037-1301-42101-1 California Lynwood 35,000 ARTERIAL
06-037-9033-42101-1 California Lancaster 2,320 LOCAL ST OR HY
06-059-1003-42101-1 California Costa Mesa 1,000 LOCAL ST OR HY
06-071-9004-42101-1 California San Bernardino 21,900 THRU ST OR HY
06-085-0005-42101-1 California San Jose NR LOCAL ST OR HY
12-0011-0010-42101-1 Florida Fort Lauderdale 1,000 LOCAL ST OR HY
12-031-0080-42101-1 Florida Jacksonville 1,000 LOCAL ST OR HY
12-031-0084-42101-1 Florida Jacksonville 500 LOCAL ST OR HY
12-099-1004-42101-1 Florida Palm Beach 30,000 MAJ ST OR HY
12-103-2006-42101-1 Florida Clearwater 23,400 MAJ ST OR HY
17-031-3103-42101-1 Illinois Schiller Park 47,900 ARTERIAL
20-209-0021-42101-1 Kansas Kansas City 7,720 MAJ ST OR HY
24-510-0040-42101-1 Maryland Baltimore 15,300 THRU ST OR HY
32-031-0022-42101-1 Nevada Reno NR NR
34-003-0004-42101-1 New Jersey Fort Lee 250,000 ARTERIAL
36-061-0056-42101-1 New York New York 45,000 MAJ ST OR HY
39-049-0005-42101-1 Ohio Columbus 36,600 FREEWAY
39-081-1001-42101-1 Ohio Mingo Junction 2,500 LOCAL ST OR HY
39-151-0020-42101-1 Ohio Canton 11,000 MAJ ST OR HY
40-143-0191-42101-1 Oklahoma Tulsa 50,800 FREEWAY
42-003-0038-42101-1 Pennsylvania Pittsburgh 15,000 MAJ ST OR HY
42-101-0047-42101-1 Pennsylvania Philadelphia NR NR
45-019-0046-42101-1 South Carolina Not in a city NR LOCAL ST OR HY
45-045-0008-42101-1 South Carolina Greenville NR LOCAL ST OR HY
45-045-0009-42101-1 South Carolina Taylors 9,500 LOCAL ST OR HY
47-163-0007-42101-1 Tennessee Kingsport NR NR
48-439-1002-42101-1 Texas Fort Worth 100 LOCAL ST OR HY
50-007-0014-42101-1 Vermont Burlington NR MAJ ST OR HY
72-127-0003-42101-1 Puerto Rico San Juan 64,000 MAJ ST OR HY
“NR” denotes that the value was not reported.
January 2010 A-11
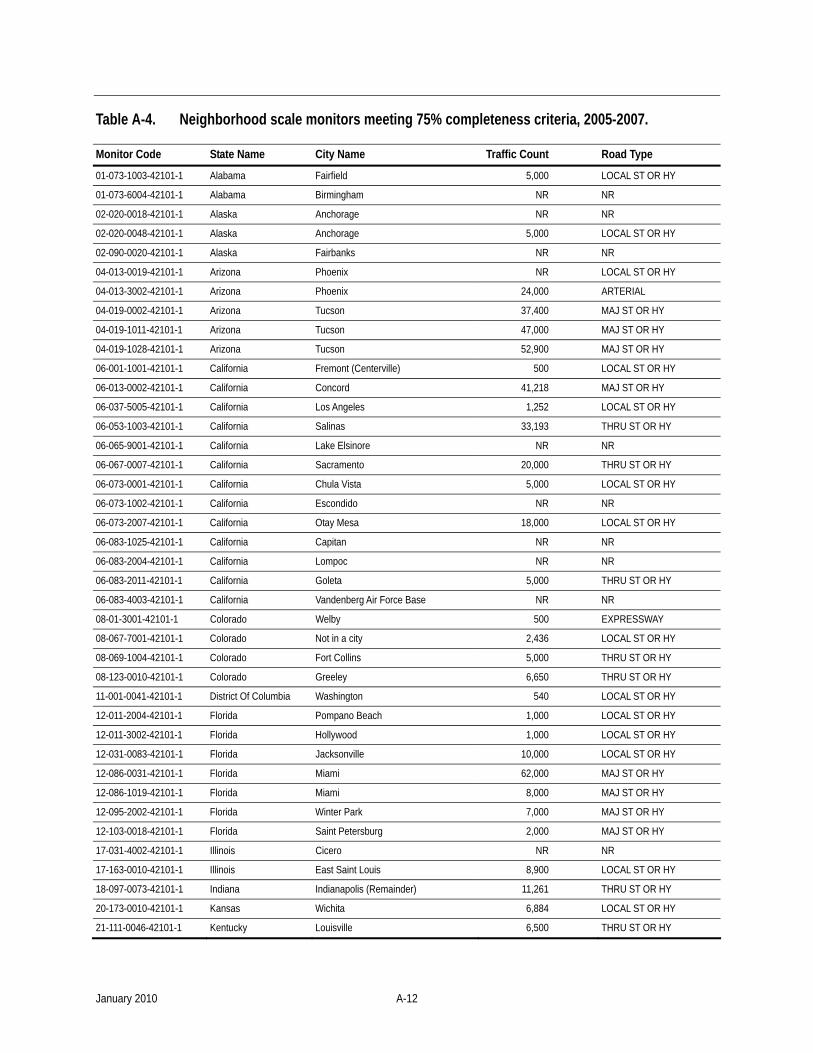
Table A-4. Neighborhood scale monitors meeting 75% completeness criteria, 2005-2007.
Monitor Code State Name City Name Traffic Count Road Type
01-073-1003-42101-1 Alabama Fairfield 5,000 LOCAL ST OR HY
01-073-6004-42101-1 Alabama Birmingham NR NR
02-020-0018-42101-1 Alaska Anchorage NR NR
02-020-0048-42101-1 Alaska Anchorage 5,000 LOCAL ST OR HY
02-090-0020-42101-1 Alaska Fairbanks NR NR
04-013-0019-42101-1 Arizona Phoenix NR LOCAL ST OR HY
04-013-3002-42101-1 Arizona Phoenix 24,000 ARTERIAL
04-019-0002-42101-1 Arizona Tucson 37,400 MAJ ST OR HY
04-019-1011-42101-1 Arizona Tucson 47,000 MAJ ST OR HY
04-019-1028-42101-1 Arizona Tucson 52,900 MAJ ST OR HY
06-001-1001-42101-1 California Fremont (Centerville) 500 LOCAL ST OR HY
06-013-0002-42101-1 California Concord 41,218 MAJ ST OR HY
06-037-5005-42101-1 California Los Angeles 1,252 LOCAL ST OR HY
06-053-1003-42101-1 California Salinas 33,193 THRU ST OR HY
06-065-9001-42101-1 California Lake Elsinore NR NR
06-067-0007-42101-1 California Sacramento 20,000 THRU ST OR HY
06-073-0001-42101-1 California Chula Vista 5,000 LOCAL ST OR HY
06-073-1002-42101-1 California Escondido NR NR
06-073-2007-42101-1 California Otay Mesa 18,000 LOCAL ST OR HY
06-083-1025-42101-1 California Capitan NR NR
06-083-2004-42101-1 California Lompoc NR NR
06-083-2011-42101-1 California Goleta 5,000 THRU ST OR HY
06-083-4003-42101-1 California Vandenberg Air Force Base NR NR
08-01-3001-42101-1 Colorado Welby 500 EXPRESSWAY
08-067-7001-42101-1 Colorado Not in a city 2,436 LOCAL ST OR HY
08-069-1004-42101-1 Colorado Fort Collins 5,000 THRU ST OR HY
08-123-0010-42101-1 Colorado Greeley 6,650 THRU ST OR HY
11-001-0041-42101-1 District Of Columbia Washington 540 LOCAL ST OR HY
12-011-2004-42101-1 Florida Pompano Beach 1,000 LOCAL ST OR HY
12-011-3002-42101-1 Florida Hollywood 1,000 LOCAL ST OR HY
12-031-0083-42101-1 Florida Jacksonville 10,000 LOCAL ST OR HY
12-086-0031-42101-1 Florida Miami 62,000 MAJ ST OR HY
12-086-1019-42101-1 Florida Miami 8,000 MAJ ST OR HY
12-095-2002-42101-1 Florida Winter Park 7,000 MAJ ST OR HY
12-103-0018-42101-1 Florida Saint Petersburg 2,000 MAJ ST OR HY
17-031-4002-42101-1 Illinois Cicero NR NR
17-163-0010-42101-1 Illinois East Saint Louis 8,900 LOCAL ST OR HY
18-097-0073-42101-1 Indiana Indianapolis (Remainder) 11,261 THRU ST OR HY
20-173-0010-42101-1 Kansas Wichita 6,884 LOCAL ST OR HY
21-111-0046-42101-1 Kentucky Louisville 6,500 THRU ST OR HY
January 2010 A-12

Monitor Code State Name City Name Traffic Count Road Type
22-033-0009-42101-1 Louisiana Baton Rouge 5,000 LOCAL ST OR HY
25-013-0016-42101-1 Massachusetts Springfield 5,000 LOCAL ST OR HY
25-017-0007-42101-1 Massachusetts Lowell 15,000 THRU ST OR HY
25-025-0042-42101-1 Massachusetts Boston 12,785 LOCAL ST OR HY
27-03-0600-42101-1 Minnesota Fridley 1,400 LOCAL ST OR HY
27-037-0020-42101-1 Minnesota Rosemount NR NR
27-037-0423-42101-1 Minnesota Inver Grove Heights (RR name Inver Grove) NR NR
29-510-0086-42101-1 Missouri St. Louis 81,850 MAJ ST OR HY
30-111-0085-42101-1 Montana Billings 5,700 THRU ST OR HY
31-055-0035-42101-1 Nebraska Omaha 2,900 LOCAL ST OR HY
32-003-0538-42101-1 Nevada Las Vegas 20,000 LOCAL ST OR HY
32-003-0539-42101-1 Nevada Las Vegas 21,000 MAJ ST OR HY
32-003-0561-42101-1 Nevada Las Vegas 28,400 MAJ ST OR HY
32-003-1021-42101-1 Nevada Las Vegas NR NR
32-003-2002-42101-1 Nevada Las Vegas 6,750 THRU ST OR HY
32-031-0016-42101-1 Nevada Reno 22,700 LOCAL ST OR HY
32-031-0020-42101-1 Nevada Reno NR NR
32-031-0025-42101-1 Nevada Reno NR NR
32-031-1005-42101-1 Nevada Sparks 2,600 LOCAL ST OR HY
32-031-2009-42101-1 Nevada Lemmon Valley-Golden Valley NR NR
32-510-0004-42101-1 Nevada Carson City 1 LOCAL ST OR HY
33-011-0020-42101-1 New Hampshire Manchester 500 LOCAL ST OR HY
34-003-5001-42101-1 New Jersey Hackensack 15,000 THRU ST OR HY
34-007-0003-42101-1 New Jersey Camden 45,000 MAJ ST OR HY
35-001-019-42101-1 New Mexico Albuquerque 1 ARTERIAL
35-001-0023-42101-1 New Mexico Albuquerque 41,200 MAJ ST OR HY
35-001-0024-42101-1 New Mexico Albuquerque 15,500 MAJ ST OR HY
35-001-0028-42101-1 New Mexico Albuquerque 2,0600 THRU ST OR HY
35-001-1014-42101-1 New Mexico Albuquerque 8,000 THRU ST OR HY
35-043-9004-42101-1 New Mexico Not in a city 100 LOCAL ST OR HY
36-063-2008-42101-1 New York Niagara Falls 5,000 LOCAL ST OR HY
37-119-0041-42101-1 North Carolina Charlotte 16,400 MAJ ST OR HY
37-119-0041-42101-3 North Carolina Charlotte 16,400 MAJ ST OR HY
39-035-0070-42101-1 Ohio Cleveland 100 LOCAL ST OR HY
39-113-0028-42101-1 Ohio Dayton 5,100 LOCAL ST OR HY
39-153-0020-42101-1 Ohio Akron 200 LOCAL ST OR HY
40-021-9002-42101-1 Oklahoma Park Hill 10,300 LOCAL ST OR HY
40-071-9010-42101-1 Oklahoma Not in a city 300 LOCAL ST OR HY
40-109-0047-42101-1 Oklahoma Oklahoma City 27,000 MAJ ST OR HY
41-051-0080-42101-1 Oregon Portland 5,000 LOCAL ST OR HY
42-003-0031-42101-1 Pennsylvania Pittsburgh 4,562 THRU ST OR HY
42-013-0801-42101-1 Pennsylvania Altoona 100 LOCAL ST OR HY
January 2010 A-13
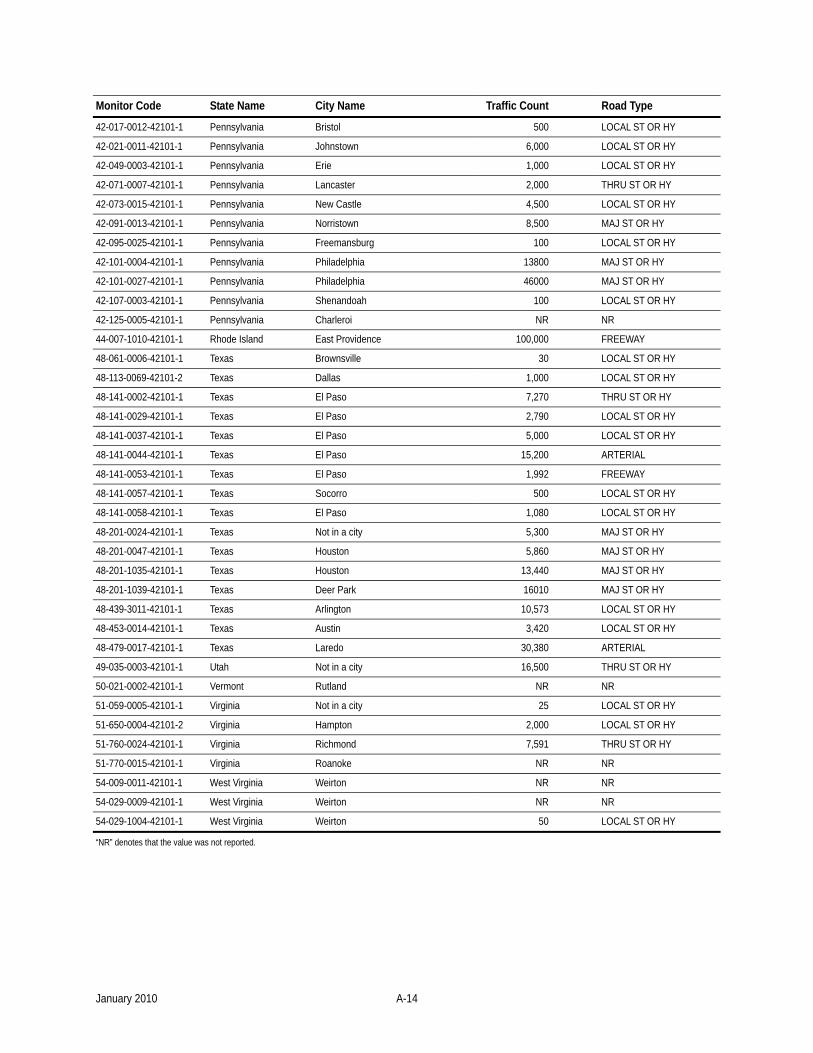
Monitor Code State Name City Name Traffic Count Road Type
42-017-0012-42101-1 Pennsylvania Bristol 500 LOCAL ST OR HY
42-021-0011-42101-1 Pennsylvania Johnstown 6,000 LOCAL ST OR HY
42-049-0003-42101-1 Pennsylvania Erie 1,000 LOCAL ST OR HY
42-071-0007-42101-1 Pennsylvania Lancaster 2,000 THRU ST OR HY
42-073-0015-42101-1 Pennsylvania New Castle 4,500 LOCAL ST OR HY
42-091-0013-42101-1 Pennsylvania Norristown 8,500 MAJ ST OR HY
42-095-0025-42101-1 Pennsylvania Freemansburg 100 LOCAL ST OR HY
42-101-0004-42101-1 Pennsylvania Philadelphia 13800 MAJ ST OR HY
42-101-0027-42101-1 Pennsylvania Philadelphia 46000 MAJ ST OR HY
42-107-0003-42101-1 Pennsylvania Shenandoah 100 LOCAL ST OR HY
42-125-0005-42101-1 Pennsylvania Charleroi NR NR
44-007-1010-42101-1 Rhode Island East Providence 100,000 FREEWAY
48-061-0006-42101-1 Texas Brownsville 30 LOCAL ST OR HY
48-113-0069-42101-2 Texas Dallas 1,000 LOCAL ST OR HY
48-141-0002-42101-1 Texas El Paso 7,270 THRU ST OR HY
48-141-0029-42101-1 Texas El Paso 2,790 LOCAL ST OR HY
48-141-0037-42101-1 Texas El Paso 5,000 LOCAL ST OR HY
48-141-0044-42101-1 Texas El Paso 15,200 ARTERIAL
48-141-0053-42101-1 Texas El Paso 1,992 FREEWAY
48-141-0057-42101-1 Texas Socorro 500 LOCAL ST OR HY
48-141-0058-42101-1 Texas El Paso 1,080 LOCAL ST OR HY
48-201-0024-42101-1 Texas Not in a city 5,300 MAJ ST OR HY
48-201-0047-42101-1 Texas Houston 5,860 MAJ ST OR HY
48-201-1035-42101-1 Texas Houston 13,440 MAJ ST OR HY
48-201-1039-42101-1 Texas Deer Park 16010 MAJ ST OR HY
48-439-3011-42101-1 Texas Arlington 10,573 LOCAL ST OR HY
48-453-0014-42101-1 Texas Austin 3,420 LOCAL ST OR HY
48-479-0017-42101-1 Texas Laredo 30,380 ARTERIAL
49-035-0003-42101-1 Utah Not in a city 16,500 THRU ST OR HY
50-021-0002-42101-1 Vermont Rutland NR NR
51-059-0005-42101-1 Virginia Not in a city 25 LOCAL ST OR HY
51-650-0004-42101-2 Virginia Hampton 2,000 LOCAL ST OR HY
51-760-0024-42101-1 Virginia Richmond 7,591 THRU ST OR HY
51-770-0015-42101-1 Virginia Roanoke NR NR
54-009-0011-42101-1 West Virginia Weirton NR NR
54-029-0009-42101-1 West Virginia Weirton NR NR
54-029-1004-42101-1 West Virginia Weirton 50 LOCAL ST OR HY
“NR” denotes that the value was not reported.
January 2010 A-14
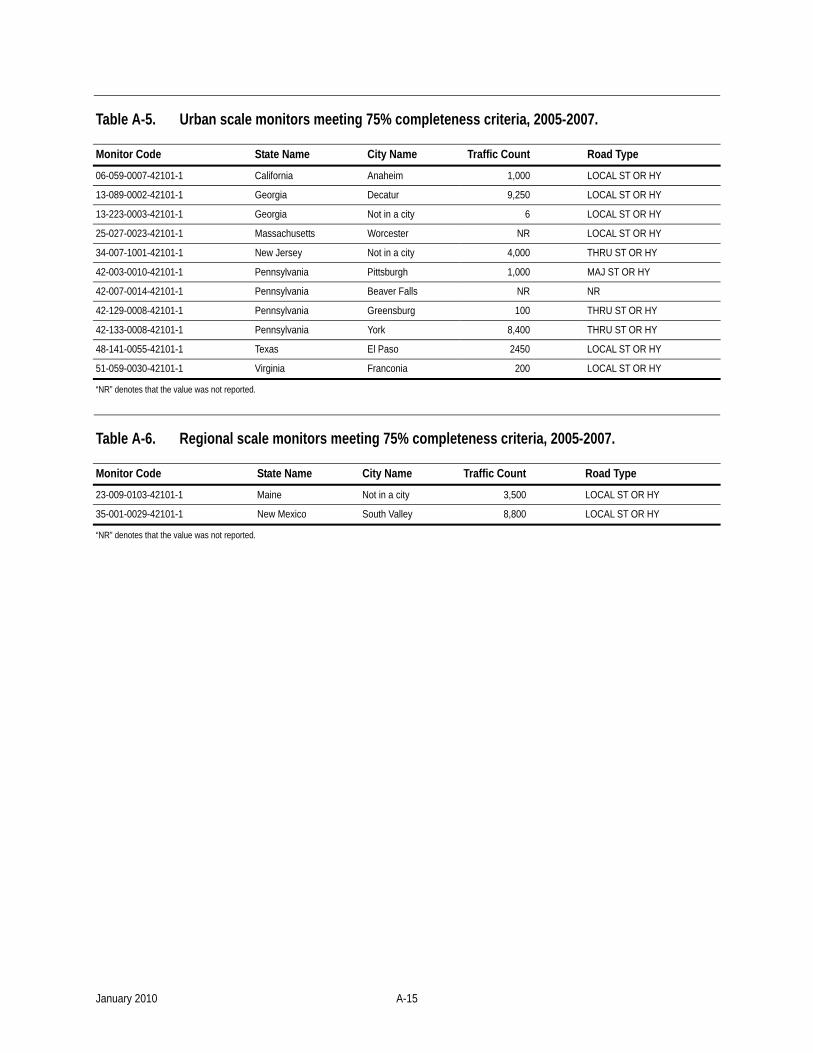
Table A-5. Urban scale monitors meeting 75% completeness criteria, 2005-2007.
Monitor Code State Name City Name Traffic Count Road Type
06-059-0007-42101-1 California Anaheim 1,000 LOCAL ST OR HY
13-089-0002-42101-1 Georgia Decatur 9,250 LOCAL ST OR HY
13-223-0003-42101-1 Georgia Not in a city 6 LOCAL ST OR HY
25-027-0023-42101-1 Massachusetts Worcester NR LOCAL ST OR HY
34-007-1001-42101-1 New Jersey Not in a city 4,000 THRU ST OR HY
42-003-0010-42101-1 Pennsylvania Pittsburgh 1,000 MAJ ST OR HY
42-007-0014-42101-1 Pennsylvania Beaver Falls NR NR
42-129-0008-42101-1 Pennsylvania Greensburg 100 THRU ST OR HY
42-133-0008-42101-1 Pennsylvania York 8,400 THRU ST OR HY
48-141-0055-42101-1 Texas El Paso 2450 LOCAL ST OR HY
51-059-0030-42101-1 Virginia Franconia 200 LOCAL ST OR HY
“NR” denotes that the value was not reported.
Table A-6. Regional scale monitors meeting 75% completeness criteria, 2005-2007.
Monitor Code State Name City Name Traffic Count Road Type
23-009-0103-42101-1 Maine Not in a city 3,500 LOCAL ST OR HY
35-001-0029-42101-1 New Mexico South Valley 8,800 LOCAL ST OR HY
“NR” denotes that the value was not reported.
January 2010 A-15
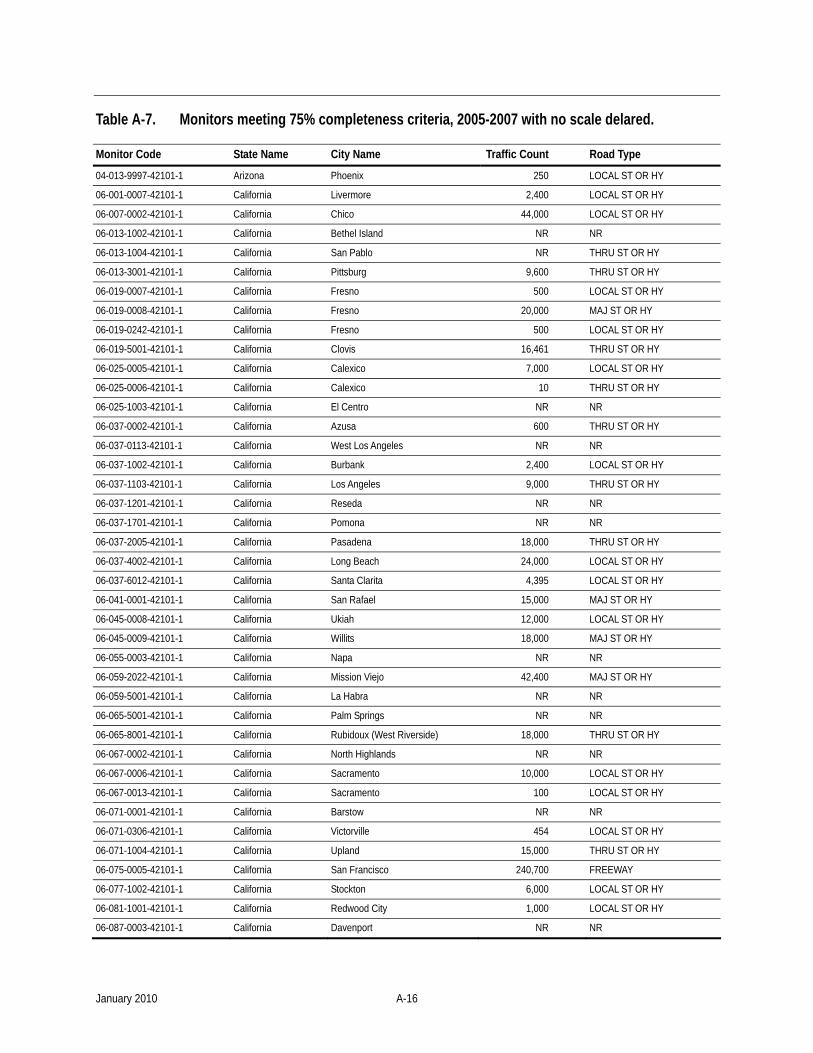
Table A-7. Monitors meeting 75% completeness criteria, 2005-2007 with no scale delared.
Monitor Code State Name City Name Traffic Count Road Type
04-013-9997-42101-1 Arizona Phoenix 250 LOCAL ST OR HY
06-001-0007-42101-1 California Livermore 2,400 LOCAL ST OR HY
06-007-0002-42101-1 California Chico 44,000 LOCAL ST OR HY
06-013-1002-42101-1 California Bethel Island NR NR
06-013-1004-42101-1 California San Pablo NR THRU ST OR HY
06-013-3001-42101-1 California Pittsburg 9,600 THRU ST OR HY
06-019-0007-42101-1 California Fresno 500 LOCAL ST OR HY
06-019-0008-42101-1 California Fresno 20,000 MAJ ST OR HY
06-019-0242-42101-1 California Fresno 500 LOCAL ST OR HY
06-019-5001-42101-1 California Clovis 16,461 THRU ST OR HY
06-025-0005-42101-1 California Calexico 7,000 LOCAL ST OR HY
06-025-0006-42101-1 California Calexico 10 THRU ST OR HY
06-025-1003-42101-1 California El Centro NR NR
06-037-0002-42101-1 California Azusa 600 THRU ST OR HY
06-037-0113-42101-1 California West Los Angeles NR NR
06-037-1002-42101-1 California Burbank 2,400 LOCAL ST OR HY
06-037-1103-42101-1 California Los Angeles 9,000 THRU ST OR HY
06-037-1201-42101-1 California Reseda NR NR
06-037-1701-42101-1 California Pomona NR NR
06-037-2005-42101-1 California Pasadena 18,000 THRU ST OR HY
06-037-4002-42101-1 California Long Beach 24,000 LOCAL ST OR HY
06-037-6012-42101-1 California Santa Clarita 4,395 LOCAL ST OR HY
06-041-0001-42101-1 California San Rafael 15,000 MAJ ST OR HY
06-045-0008-42101-1 California Ukiah 12,000 LOCAL ST OR HY
06-045-0009-42101-1 California Willits 18,000 MAJ ST OR HY
06-055-0003-42101-1 California Napa NR NR
06-059-2022-42101-1 California Mission Viejo 42,400 MAJ ST OR HY
06-059-5001-42101-1 California La Habra NR NR
06-065-5001-42101-1 California Palm Springs NR NR
06-065-8001-42101-1 California Rubidoux (West Riverside) 18,000 THRU ST OR HY
06-067-0002-42101-1 California North Highlands NR NR
06-067-0006-42101-1 California Sacramento 10,000 LOCAL ST OR HY
06-067-0013-42101-1 California Sacramento 100 LOCAL ST OR HY
06-071-0001-42101-1 California Barstow NR NR
06-071-0306-42101-1 California Victorville 454 LOCAL ST OR HY
06-071-1004-42101-1 California Upland 15,000 THRU ST OR HY
06-075-0005-42101-1 California San Francisco 240,700 FREEWAY
06-077-1002-42101-1 California Stockton 6,000 LOCAL ST OR HY
06-081-1001-42101-1 California Redwood City 1,000 LOCAL ST OR HY
06-087-0003-42101-1 California Davenport NR NR
January 2010 A-16
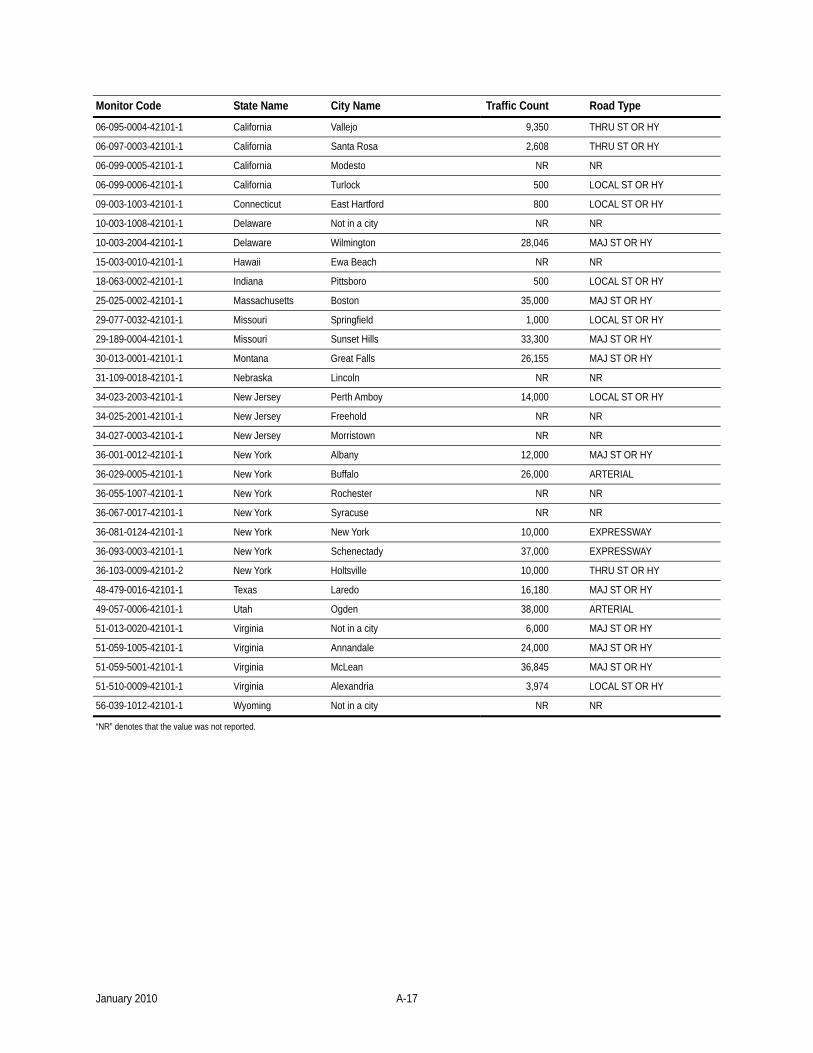
Monitor Code State Name City Name Traffic Count Road Type
06-095-0004-42101-1 California Vallejo 9,350 THRU ST OR HY
06-097-0003-42101-1 California Santa Rosa 2,608 THRU ST OR HY
06-099-0005-42101-1 California Modesto NR NR
06-099-0006-42101-1 California Turlock 500 LOCAL ST OR HY
09-003-1003-42101-1 Connecticut East Hartford 800 LOCAL ST OR HY
10-003-1008-42101-1 Delaware Not in a city NR NR
10-003-2004-42101-1 Delaware Wilmington 28,046 MAJ ST OR HY
15-003-0010-42101-1 Hawaii Ewa Beach NR NR
18-063-0002-42101-1 Indiana Pittsboro 500 LOCAL ST OR HY
25-025-0002-42101-1 Massachusetts Boston 35,000 MAJ ST OR HY
29-077-0032-42101-1 Missouri Springfield 1,000 LOCAL ST OR HY
29-189-0004-42101-1 Missouri Sunset Hills 33,300 MAJ ST OR HY
30-013-0001-42101-1 Montana Great Falls 26,155 MAJ ST OR HY
31-109-0018-42101-1 Nebraska Lincoln NR NR
34-023-2003-42101-1 New Jersey Perth Amboy 14,000 LOCAL ST OR HY
34-025-2001-42101-1 New Jersey Freehold NR NR
34-027-0003-42101-1 New Jersey Morristown NR NR
36-001-0012-42101-1 New York Albany 12,000 MAJ ST OR HY
36-029-0005-42101-1 New York Buffalo 26,000 ARTERIAL
36-055-1007-42101-1 New York Rochester NR NR
36-067-0017-42101-1 New York Syracuse NR NR
36-081-0124-42101-1 New York New York 10,000 EXPRESSWAY
36-093-0003-42101-1 New York Schenectady 37,000 EXPRESSWAY
36-103-0009-42101-2 New York Holtsville 10,000 THRU ST OR HY
48-479-0016-42101-1 Texas Laredo 16,180 MAJ ST OR HY
49-057-0006-42101-1 Utah Ogden 38,000 ARTERIAL
51-013-0020-42101-1 Virginia Not in a city 6,000 MAJ ST OR HY
51-059-1005-42101-1 Virginia Annandale 24,000 MAJ ST OR HY
51-059-5001-42101-1 Virginia McLean 36,845 MAJ ST OR HY
51-510-0009-42101-1 Virginia Alexandria 3,974 LOCAL ST OR HY
56-039-1012-42101-1 Wyoming Not in a city NR NR
“NR” denotes that the value was not reported.
January 2010 A-17
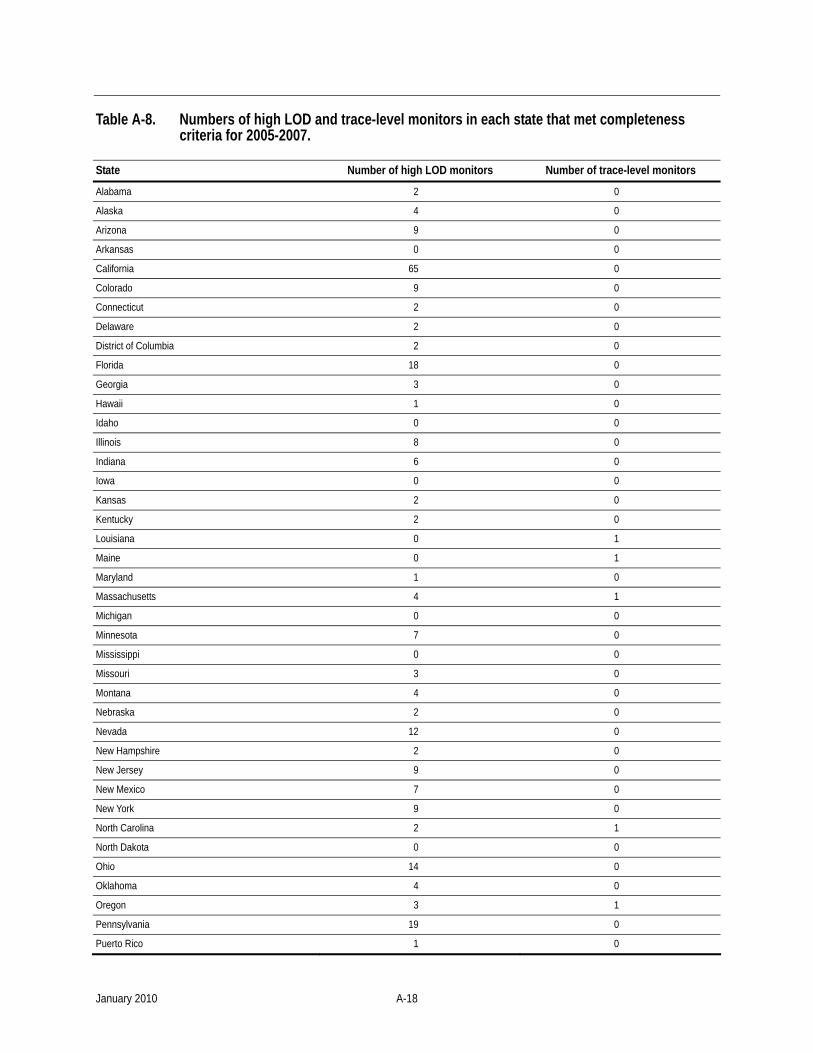
Table A-8. Numbers of high LOD and trace-level monitors in each state that met completeness criteria for 2005-2007.
State Number of high LOD monitors Number of trace-level monitors
Alabama 2 0
Alaska 4 0
Arizona 9 0
Arkansas 0 0
California 65 0
Colorado 9 0
Connecticut 2 0
Delaware 2 0
District of Columbia 2 0
Florida 18 0
Georgia 3 0
Hawaii 1 0
Idaho 0 0
Illinois 8 0
Indiana 6 0
Iowa 0 0
Kansas 2 0
Kentucky 2 0
Louisiana 0 1
Maine 0 1
Maryland 1 0
Massachusetts 4 1
Michigan 0 0
Minnesota 7 0
Mississippi 0 0
Missouri 3 0
Montana 4 0
Nebraska 2 0
Nevada 12 0
New Hampshire 2 0
New Jersey 9 0
New Mexico 7 0
New York 9 0
North Carolina 2 1
North Dakota 0 0
Ohio 14 0
Oklahoma 4 0
Oregon 3 1
Pennsylvania 19 0
Puerto Rico 1 0
January 2010 A-18
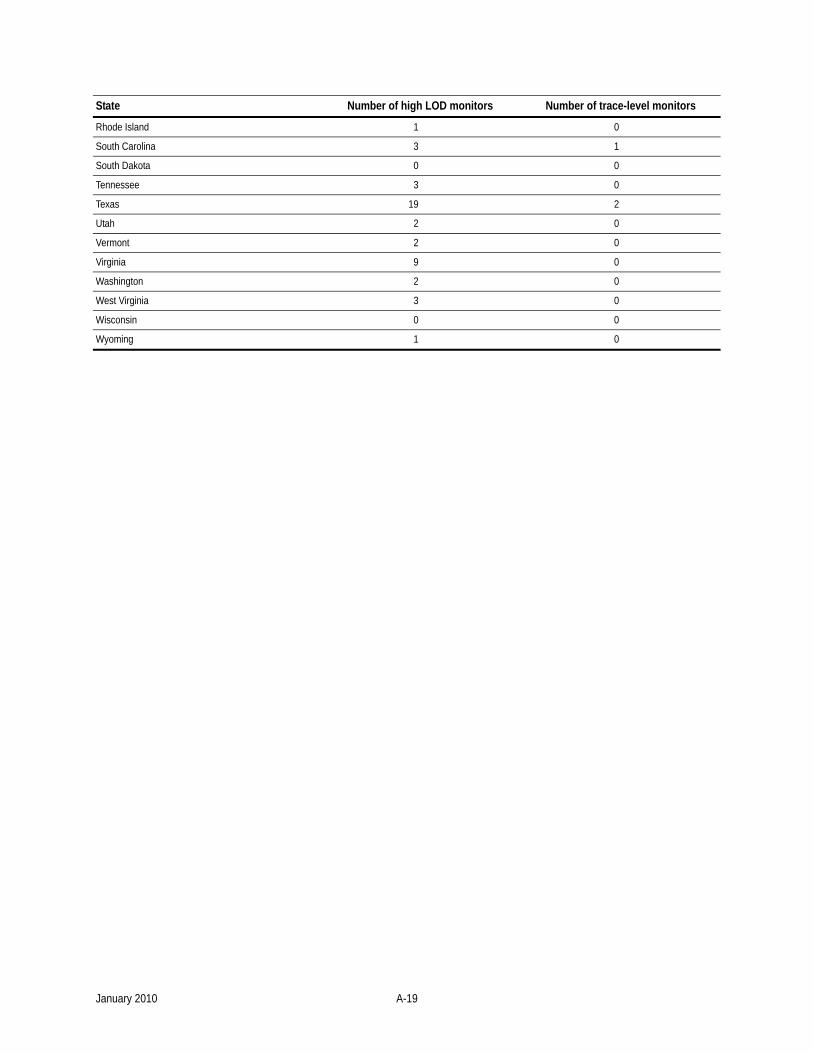
State Number of high LOD monitors Number of trace-level monitors
Rhode Island 1 0
South Carolina 3 1
South Dakota 0 0
Tennessee 3 0
Texas 19 2
Utah 2 0
Vermont 2 0
Virginia 9 0
Washington 2 0
West Virginia 3 0
Wisconsin 0 0
Wyoming 1 0
January 2010 A-19

Figure A-8. Map of CO monitor locations with respect to population density in the Anchorage CBSA, total population.
Figure A-9. Map of CO monitor locations with respect to population density in the Anchorage CBSA, ages 65 yr and older.
January 2010 A-20
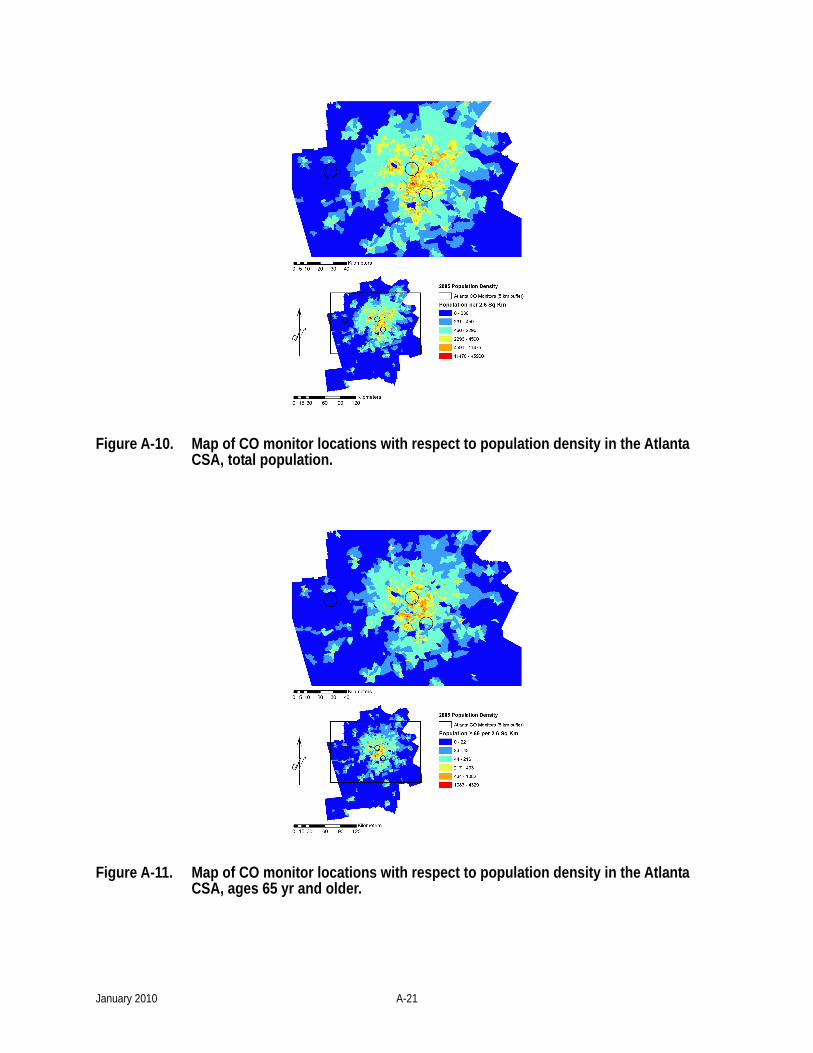
Figure A-10. Map of CO monitor locations with respect to population density in the Atlanta CSA, total population.
Figure A-11. Map of CO monitor locations with respect to population density in the Atlanta CSA, ages 65 yr and older.
January 2010 A-21

Figure A-12. Map of CO monitor locations with respect to population density in the Boston CSA, total population.
Figure A-13. Map of CO monitor locations with respect to population density in the Boston CSA, ages 65 yr and older.
January 2010 A-22
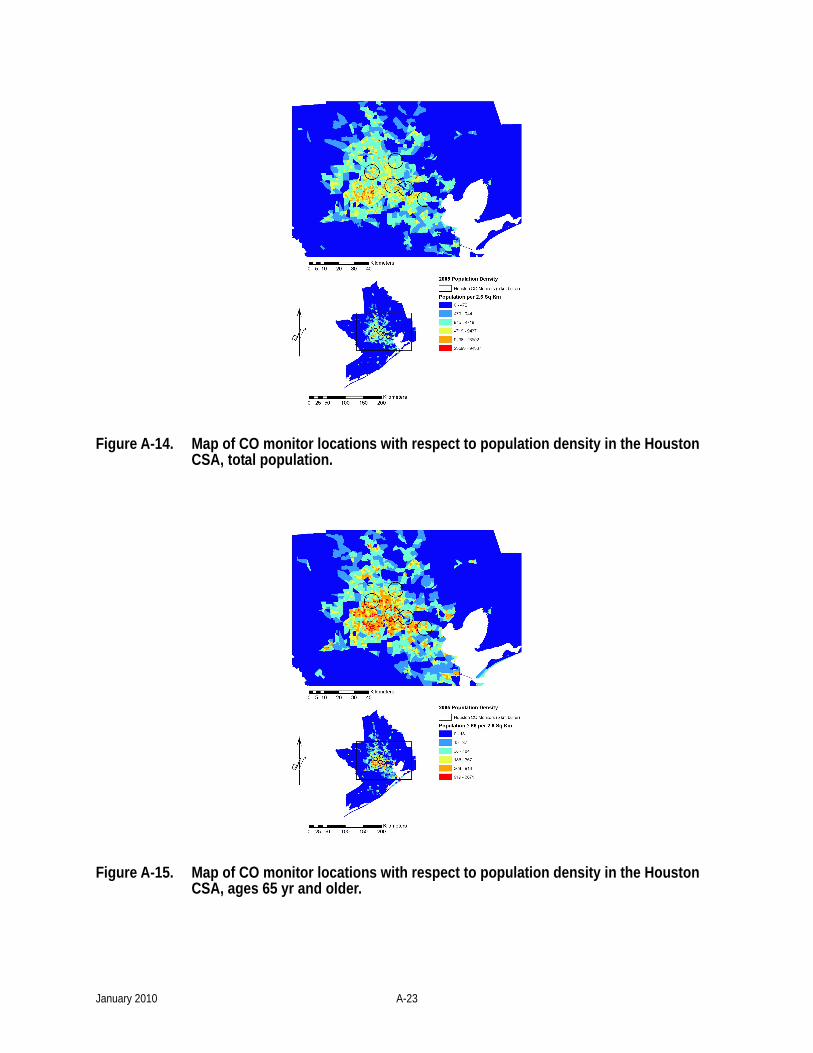
Figure A-14. Map of CO monitor locations with respect to population density in the Houston CSA, total population.
Figure A-15. Map of CO monitor locations with respect to population density in the Houston CSA, ages 65 yr and older.
January 2010 A-23
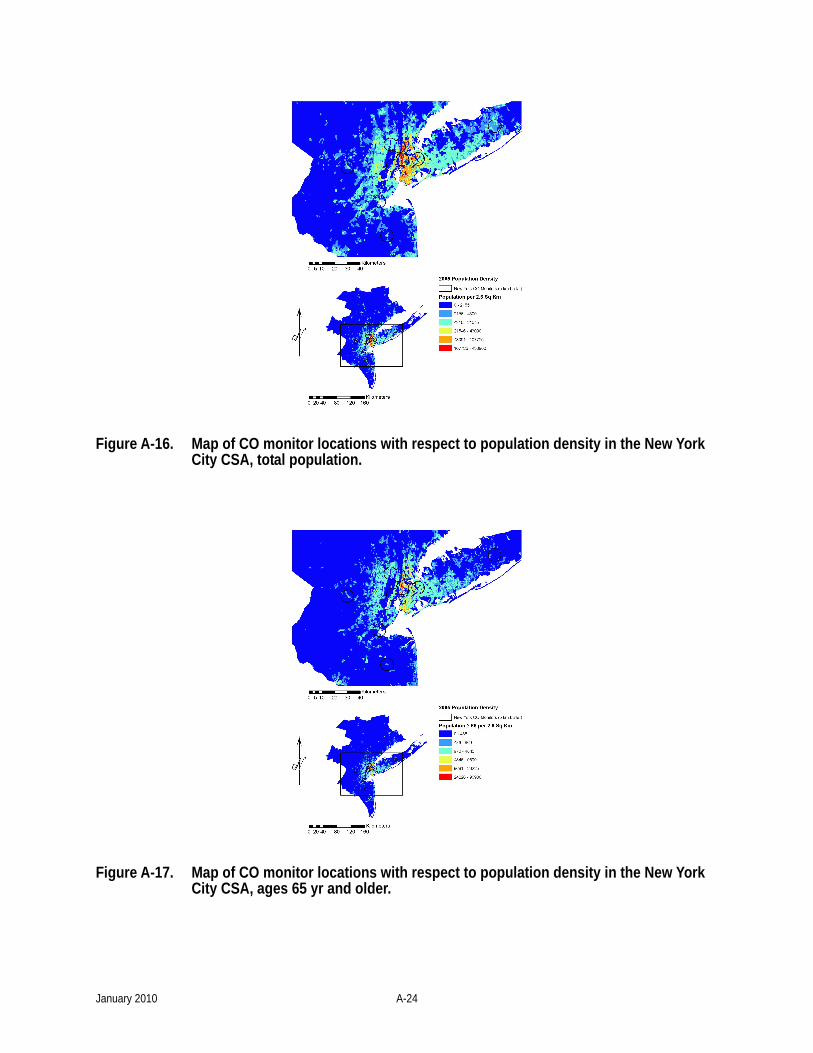
Figure A-16. Map of CO monitor locations with respect to population density in the New York City CSA, total population.
Figure A-17. Map of CO monitor locations with respect to population density in the New York City CSA, ages 65 yr and older.
January 2010 A-24
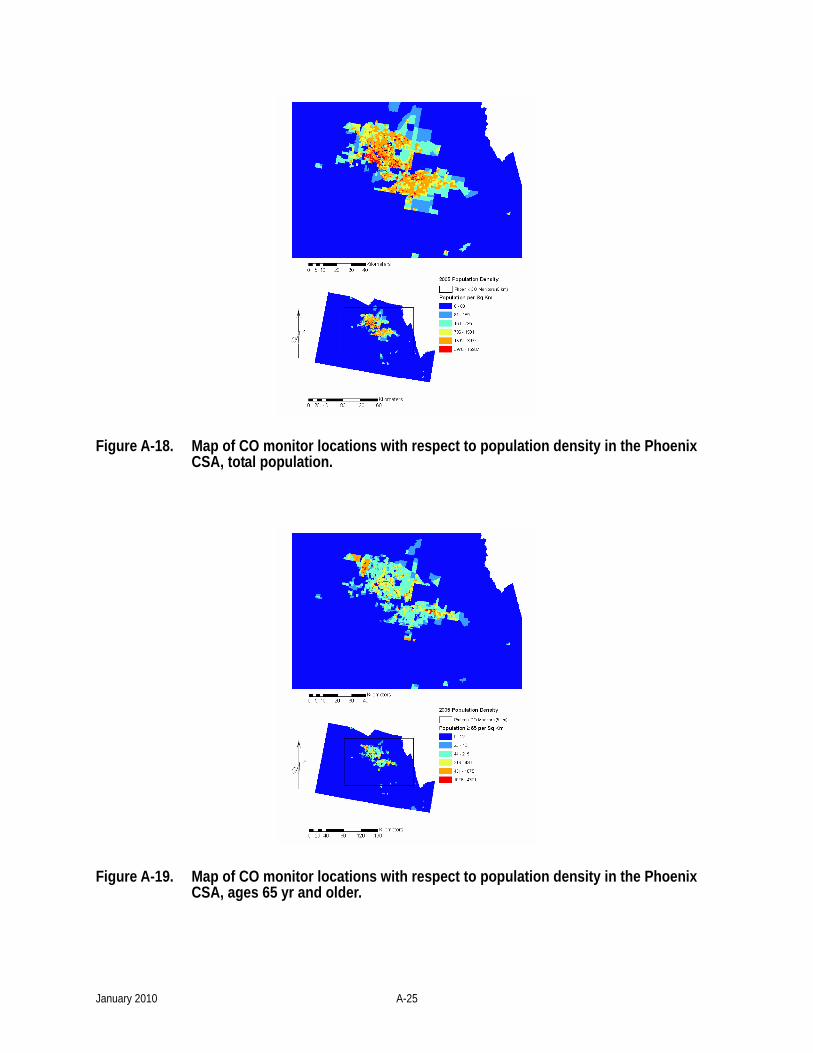
Figure A-18. Map of CO monitor locations with respect to population density in the Phoenix CSA, total population.
Figure A-19. Map of CO monitor locations with respect to population density in the Phoenix CSA, ages 65 yr and older.
January 2010 A-25
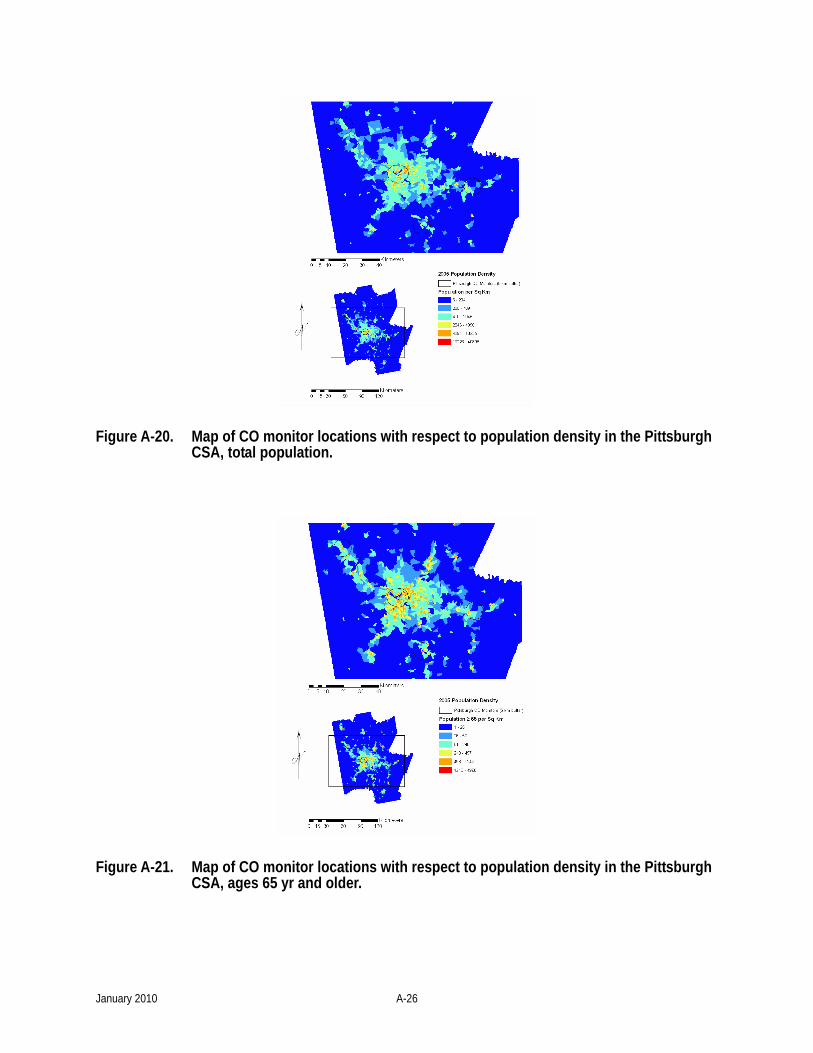
Figure A-20. Map of CO monitor locations with respect to population density in the Pittsburgh CSA, total population.
Figure A-21. Map of CO monitor locations with respect to population density in the Pittsburgh CSA, ages 65 yr and older.
January 2010 A-26
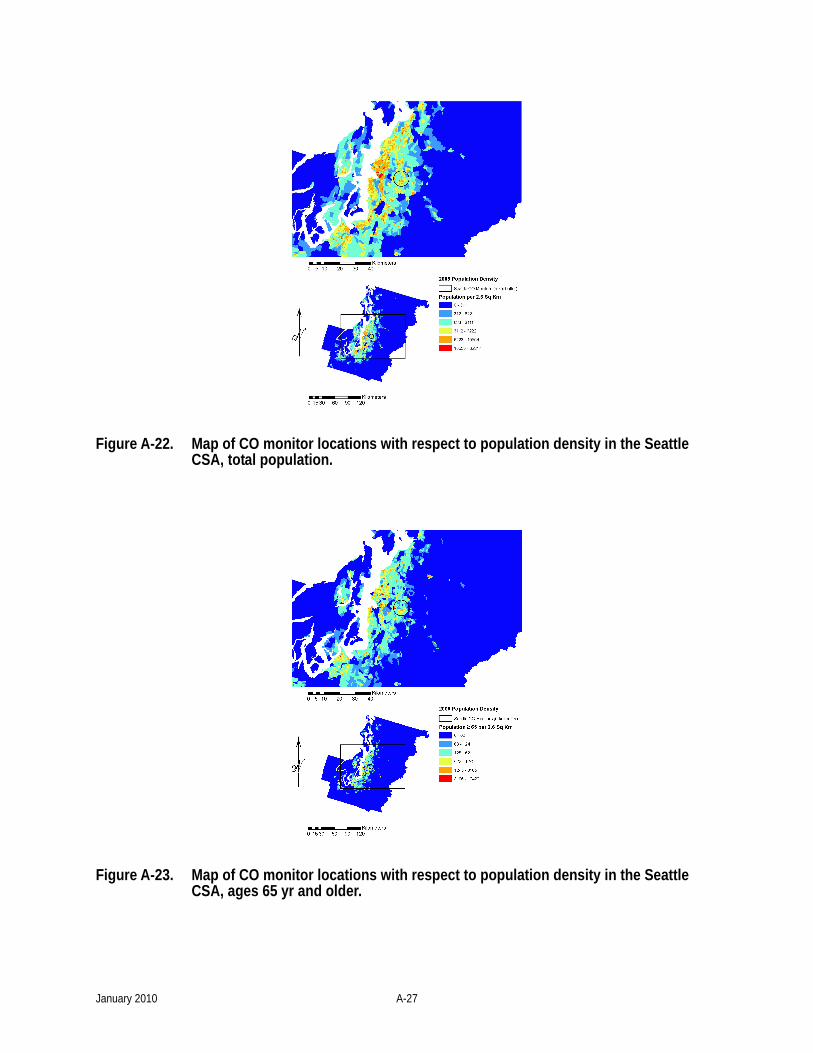
Figure A-22. Map of CO monitor locations with respect to population density in the Seattle CSA, total population.
Figure A-23. Map of CO monitor locations with respect to population density in the Seattle CSA, ages 65 yr and older.
January 2010 A-27
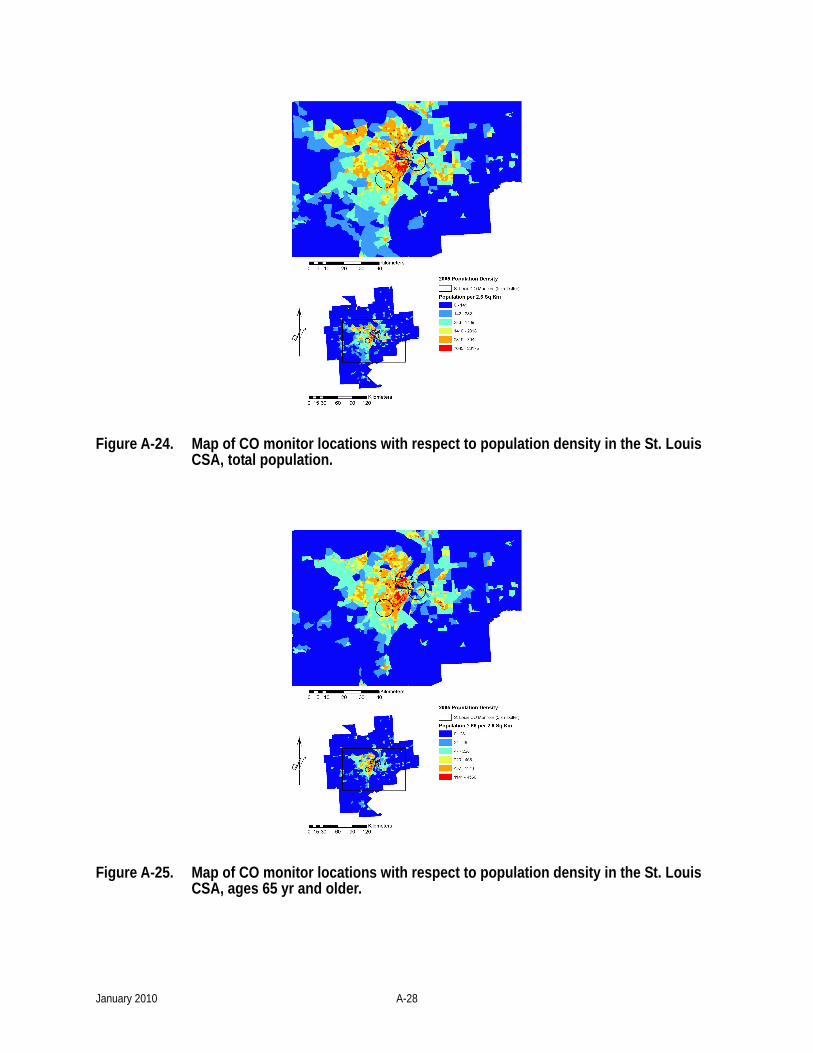
Figure A-24. Map of CO monitor locations with respect to population density in the St. Louis CSA, total population.
Figure A-25. Map of CO monitor locations with respect to population density in the St. Louis CSA, ages 65 yr and older.
January 2010 A-28
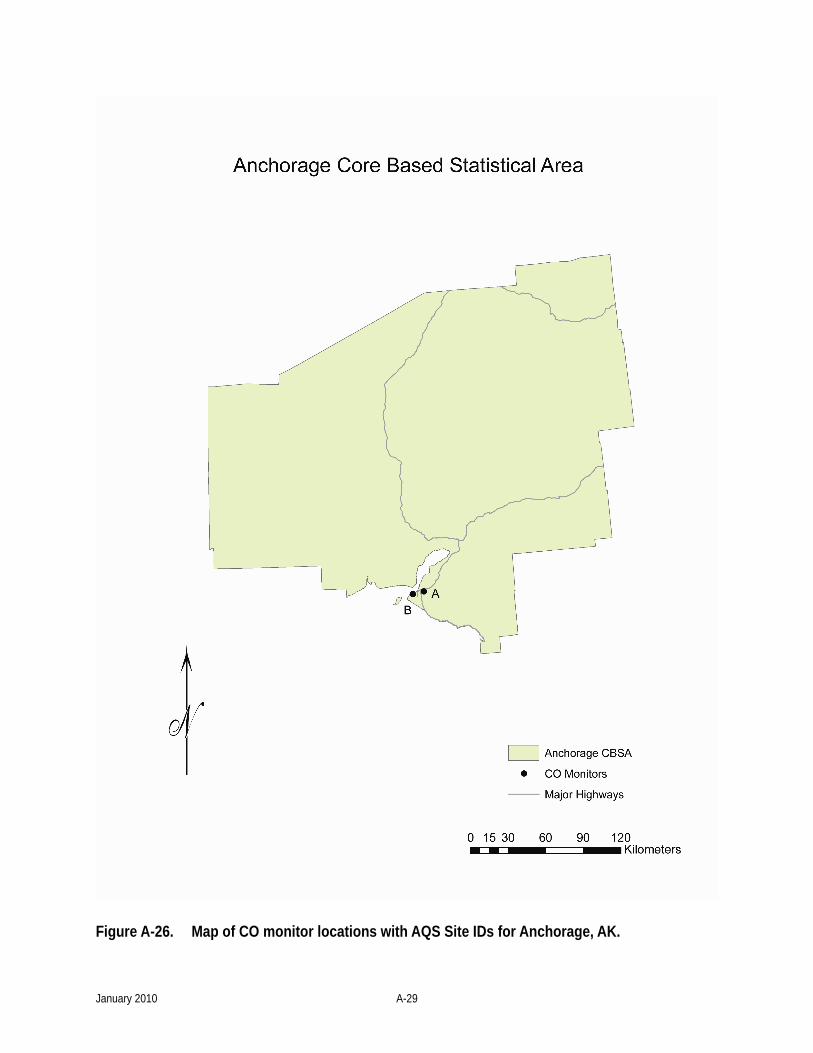
Figure A-26. Map of CO monitor locations with AQS Site IDs for Anchorage, AK.
January 2010 A-29

Table A-9. Table of inter-sampler comparison statistics, including Pearson r, P90 (ppm), COD, and d (km), as defined in the text, for each pair of hourly CO monitors reporting to AQS in Anchorage, AK.
Neighborhood
A B
A 1.00 0.73
0.0 1.1
0.00 0.32
0 9.0
B Legend 1.00
r 0.0
P90 0.00
Neig
hbor
hood
COD 0
d
January 2010 A-30
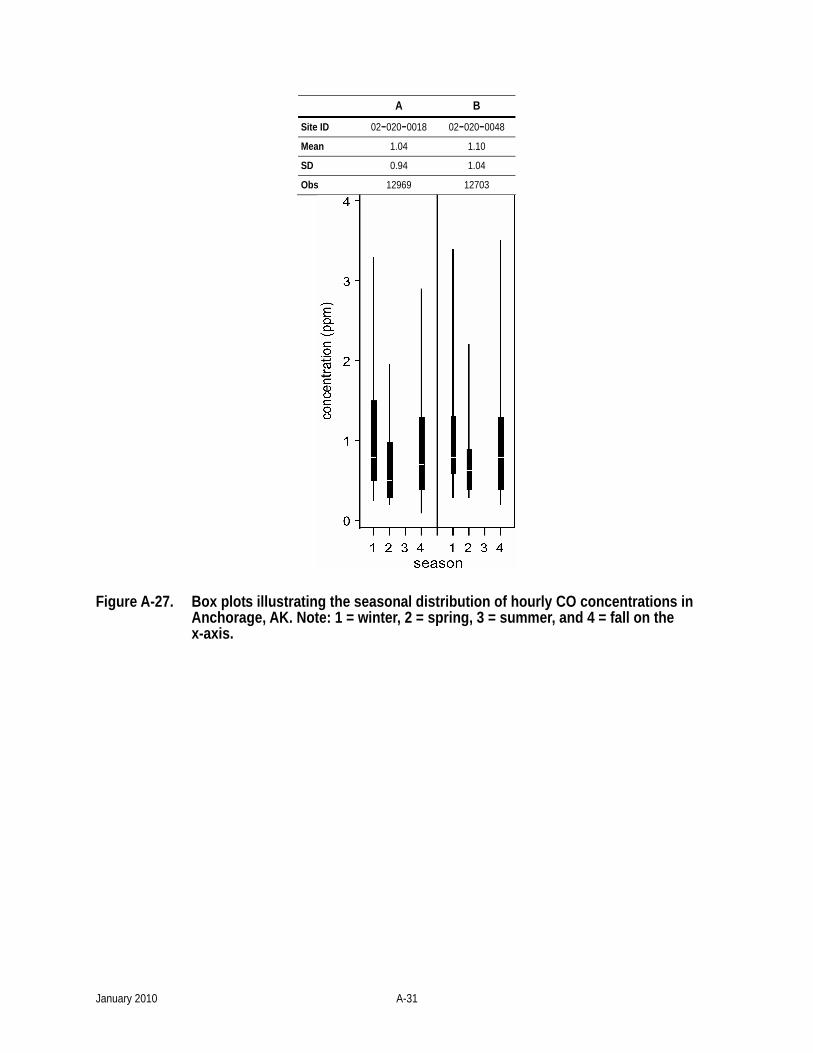
A B
Site ID 02-020-0018 02-020-0048
Mean 1.04 1.10
SD 0.94 1.04
Obs 12969 12703
Figure A-27. Box plots illustrating the seasonal distribution of hourly CO concentrations in Anchorage, AK. Note: 1 = winter, 2 = spring, 3 = summer, and 4 = fall on the x-axis.
January 2010 A-31
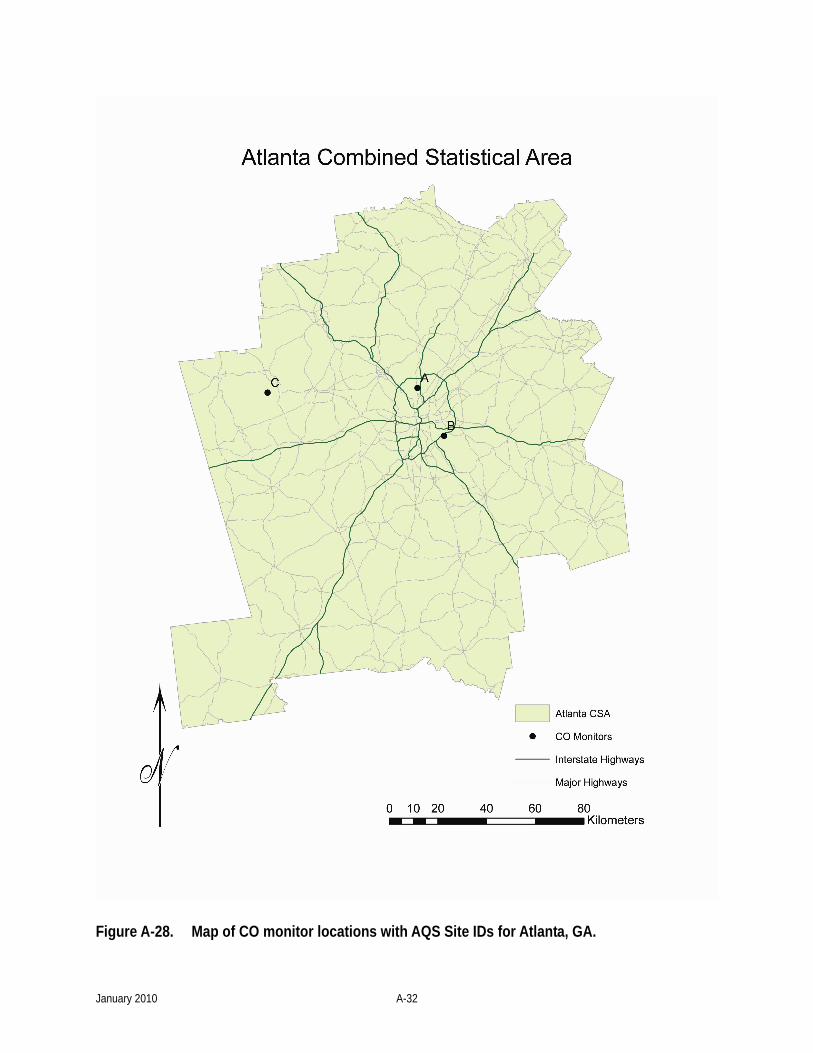
Figure A-28. Map of CO monitor locations with AQS Site IDs for Atlanta, GA.
January 2010 A-32
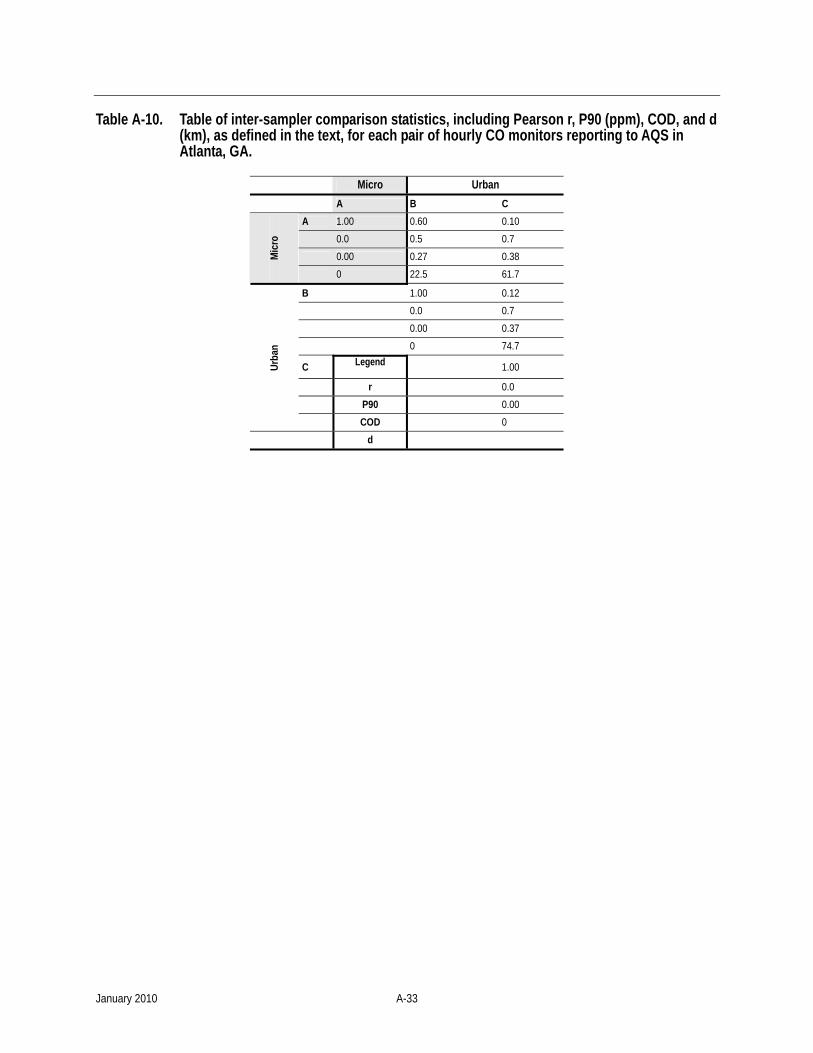
Table A-10. Table of inter-sampler comparison statistics, including Pearson r, P90 (ppm), COD, and d (km), as defined in the text, for each pair of hourly CO monitors reporting to AQS in Atlanta, GA.
Micro Urban A B C
A 1.00 0.60 0.10 0.0 0.5 0.7 0.00 0.27 0.38 M
icro
0 22.5 61.7
B 1.00 0.12 0.0 0.7 0.00 0.37 0 74.7
C Legend 1.00
r 0.0 P90 0.00
Urba
n
COD 0 d
January 2010 A-33
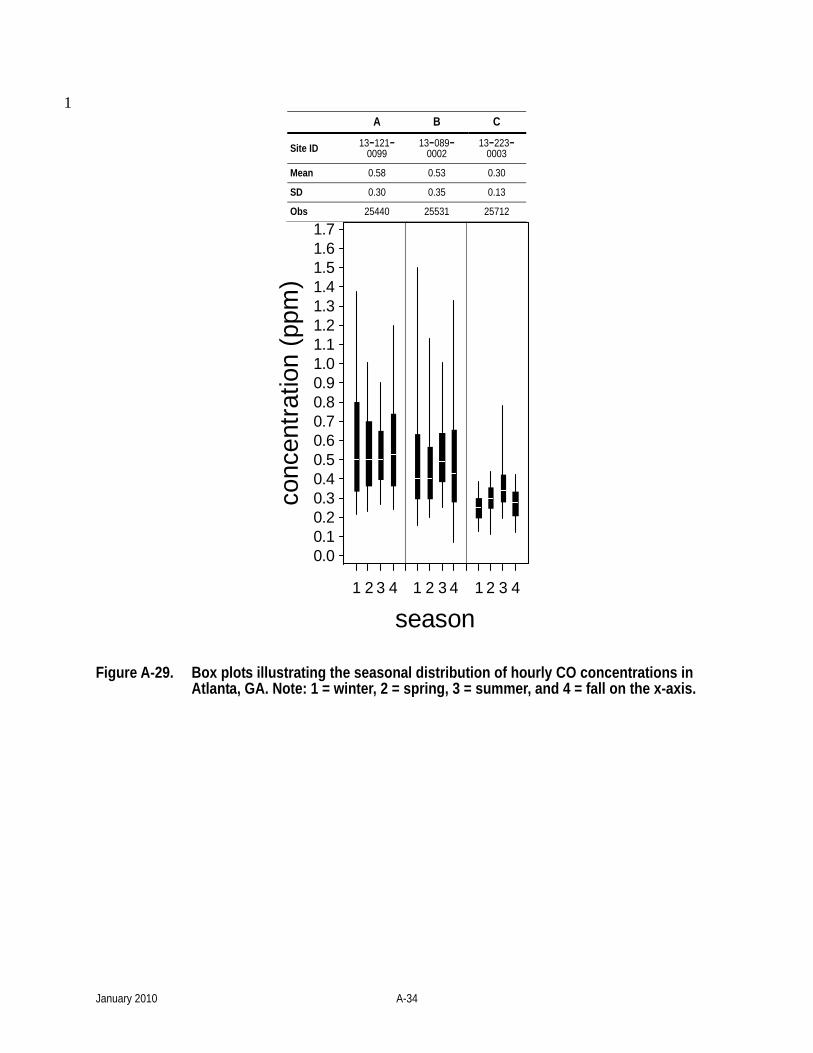
1 A B C
Site ID 13-121-0099
13-089-0002
13-223-0003
Mean 0.58 0.53 0.30
SD 0.30 0.35 0.13
Obs 25440 25531 25712
conc
entra
tion
(ppm
)
0.00.10.20.30.40.50.60.70.80.91.01.11.21.31.41.51.61.7
season1 2 3 4 1 2 3 4 1 2 3 4
Figure A-29. Box plots illustrating the seasonal distribution of hourly CO concentrations in Atlanta, GA. Note: 1 = winter, 2 = spring, 3 = summer, and 4 = fall on the x-axis.
January 2010 A-34
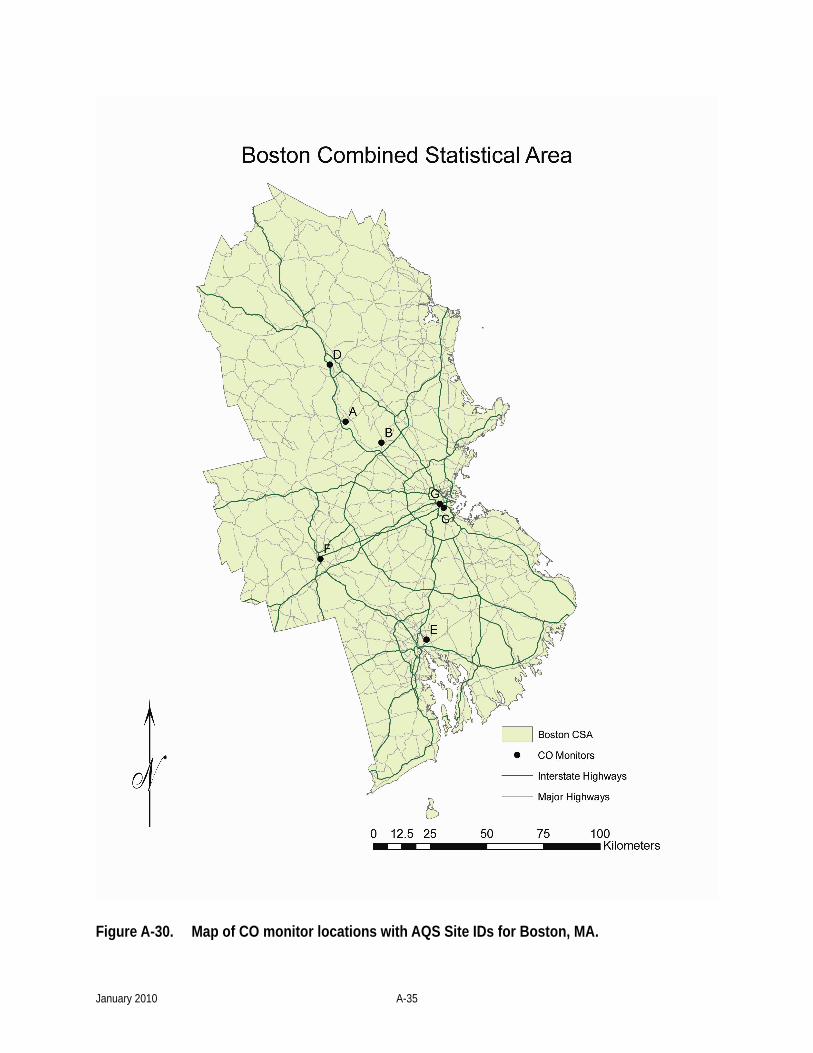
Figure A-30. Map of CO monitor locations with AQS Site IDs for Boston, MA.
January 2010 A-35
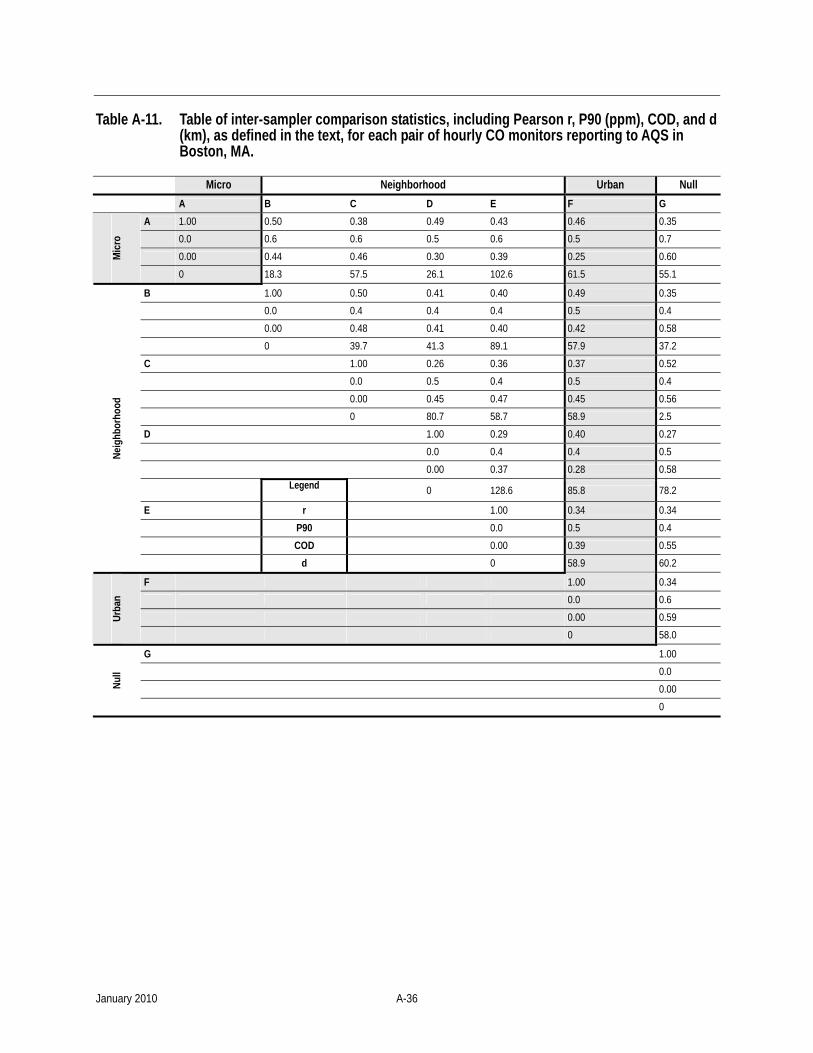
Table A-11. Table of inter-sampler comparison statistics, including Pearson r, P90 (ppm), COD, and d (km), as defined in the text, for each pair of hourly CO monitors reporting to AQS in Boston, MA.
Micro Neighborhood Urban Null A B C D E F G
A 1.00 0.50 0.38 0.49 0.43 0.46 0.35 0.0 0.6 0.6 0.5 0.6 0.5 0.7 0.00 0.44 0.46 0.30 0.39 0.25 0.60 M
icro
0 18.3 57.5 26.1 102.6 61.5 55.1
B 1.00 0.50 0.41 0.40 0.49 0.35 0.0 0.4 0.4 0.4 0.5 0.4 0.00 0.48 0.41 0.40 0.42 0.58 0 39.7 41.3 89.1 57.9 37.2 C 1.00 0.26 0.36 0.37 0.52 0.0 0.5 0.4 0.5 0.4 0.00 0.45 0.47 0.45 0.56 0 80.7 58.7 58.9 2.5 D 1.00 0.29 0.40 0.27 0.0 0.4 0.4 0.5 0.00 0.37 0.28 0.58
Legend 0 128.6 85.8 78.2
E r 1.00 0.34 0.34 P90 0.0 0.5 0.4 COD 0.00 0.39 0.55
Neig
hbor
hood
d 0 58.9 60.2
F 1.00 0.34 0.0 0.6 0.00 0.59 Ur
ban
0 58.0
G 1.00 0.0 0.00 Nu
ll
0
January 2010 A-36
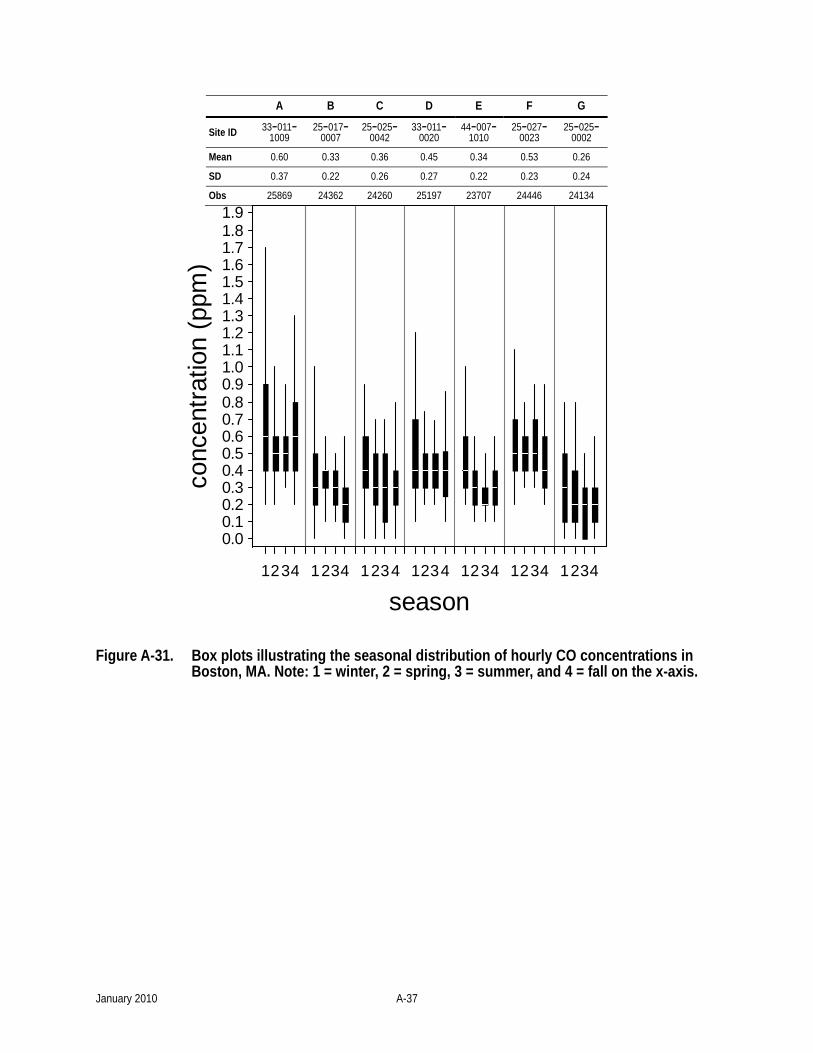
A B C D E F G
Site ID 33-011-1009
25-017-0007
25-025-0042
33-011-0020
44-007-1010
25-027-0023
25-025-0002
Mean 0.60 0.33 0.36 0.45 0.34 0.53 0.26
SD 0.37 0.22 0.26 0.27 0.22 0.23 0.24
Obs 25869 24362 24260 25197 23707 24446 24134 co
ncen
tratio
n (p
pm)
0.00.10.20.30.40.50.60.70.80.91.01.11.21.31.41.51.61.71.81.9
season1234 1234 1234 1234 1234 1234 1234
Figure A-31. Box plots illustrating the seasonal distribution of hourly CO concentrations in Boston, MA. Note: 1 = winter, 2 = spring, 3 = summer, and 4 = fall on the x-axis.
January 2010 A-37
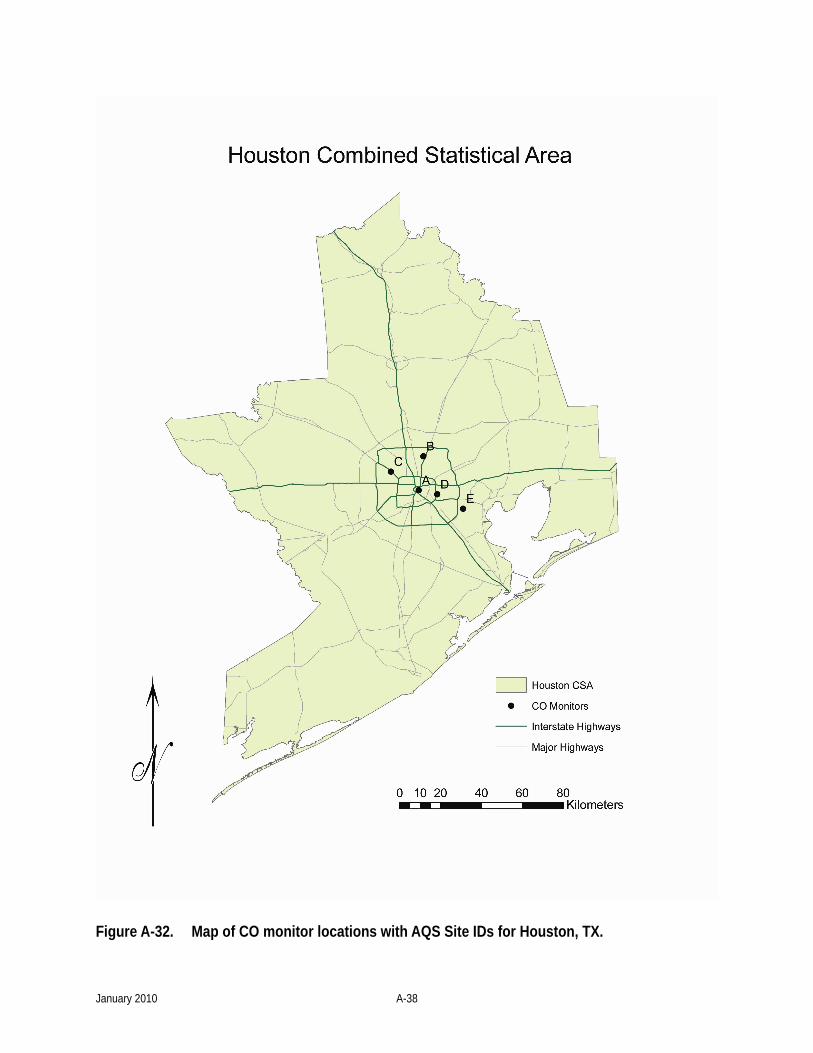
Figure A-32. Map of CO monitor locations with AQS Site IDs for Houston, TX.
January 2010 A-38
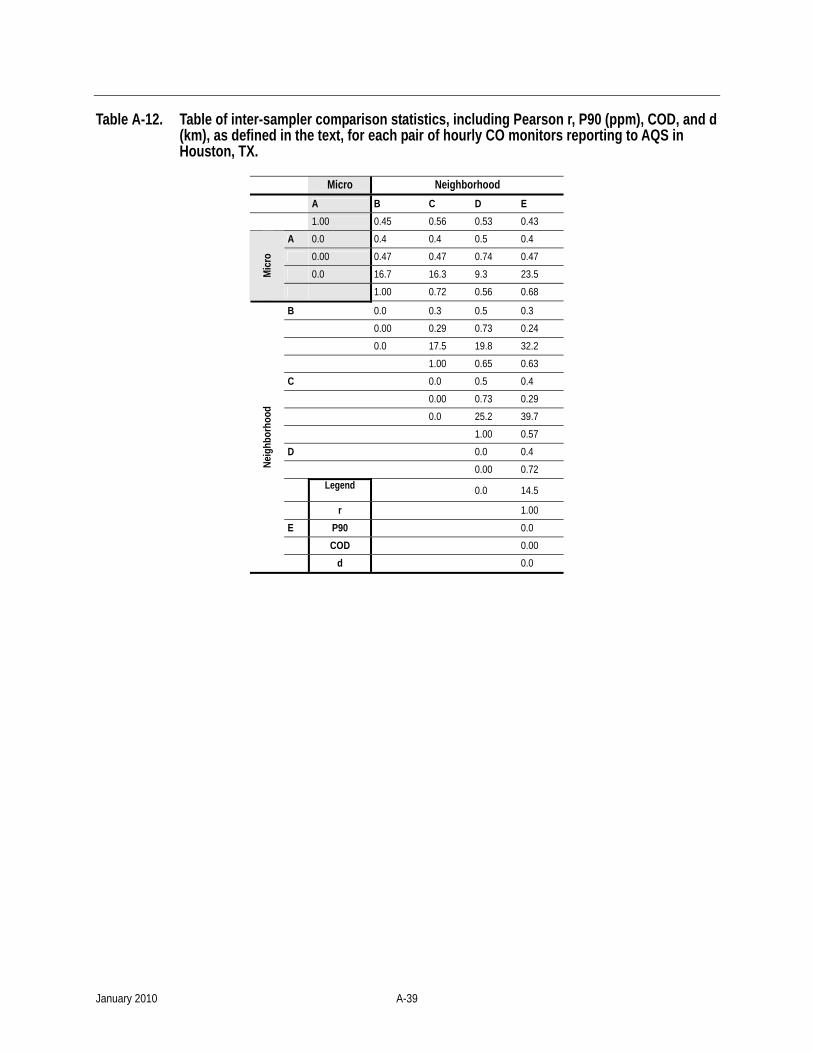
Table A-12. Table of inter-sampler comparison statistics, including Pearson r, P90 (ppm), COD, and d (km), as defined in the text, for each pair of hourly CO monitors reporting to AQS in Houston, TX.
Micro Neighborhood A B C D E 1.00 0.45 0.56 0.53 0.43
A 0.0 0.4 0.4 0.5 0.4 0.00 0.47 0.47 0.74 0.47 0.0 16.7 16.3 9.3 23.5 M
icro
1.00 0.72 0.56 0.68
B 0.0 0.3 0.5 0.3 0.00 0.29 0.73 0.24 0.0 17.5 19.8 32.2 1.00 0.65 0.63 C 0.0 0.5 0.4 0.00 0.73 0.29 0.0 25.2 39.7 1.00 0.57 D 0.0 0.4 0.00 0.72
Legend 0.0 14.5
r 1.00 E P90 0.0 COD 0.00
Neig
hbor
hood
d 0.0
January 2010 A-39
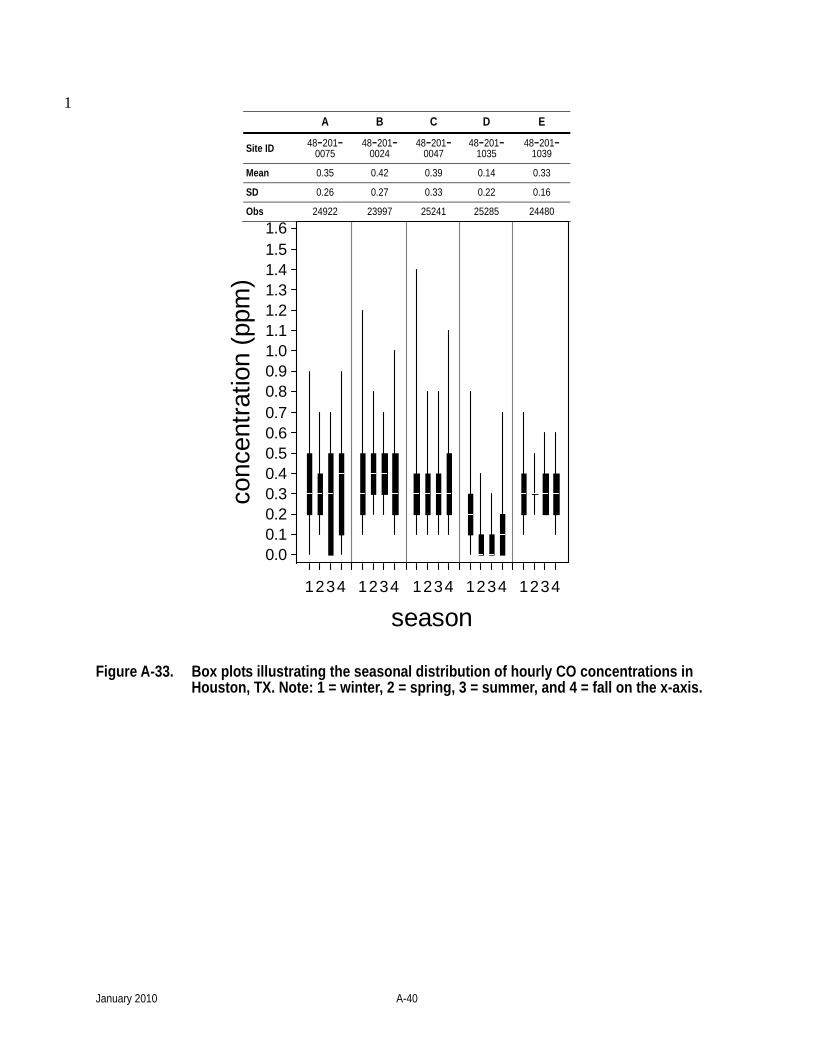
1 A B C D E
Site ID 48-201-0075
48-201-0024
48-201-0047
48-201-1035
48-201-1039
Mean 0.35 0.42 0.39 0.14 0.33
SD 0.26 0.27 0.33 0.22 0.16
Obs 24922 23997 25241 25285 24480
conc
entra
tion
(ppm
)
0.00.10.20.30.40.50.60.70.80.91.01.11.21.31.41.51.6
season1234 1234 1234 1234 1234
Figure A-33. Box plots illustrating the seasonal distribution of hourly CO concentrations in Houston, TX. Note: 1 = winter, 2 = spring, 3 = summer, and 4 = fall on the x-axis.
January 2010 A-40
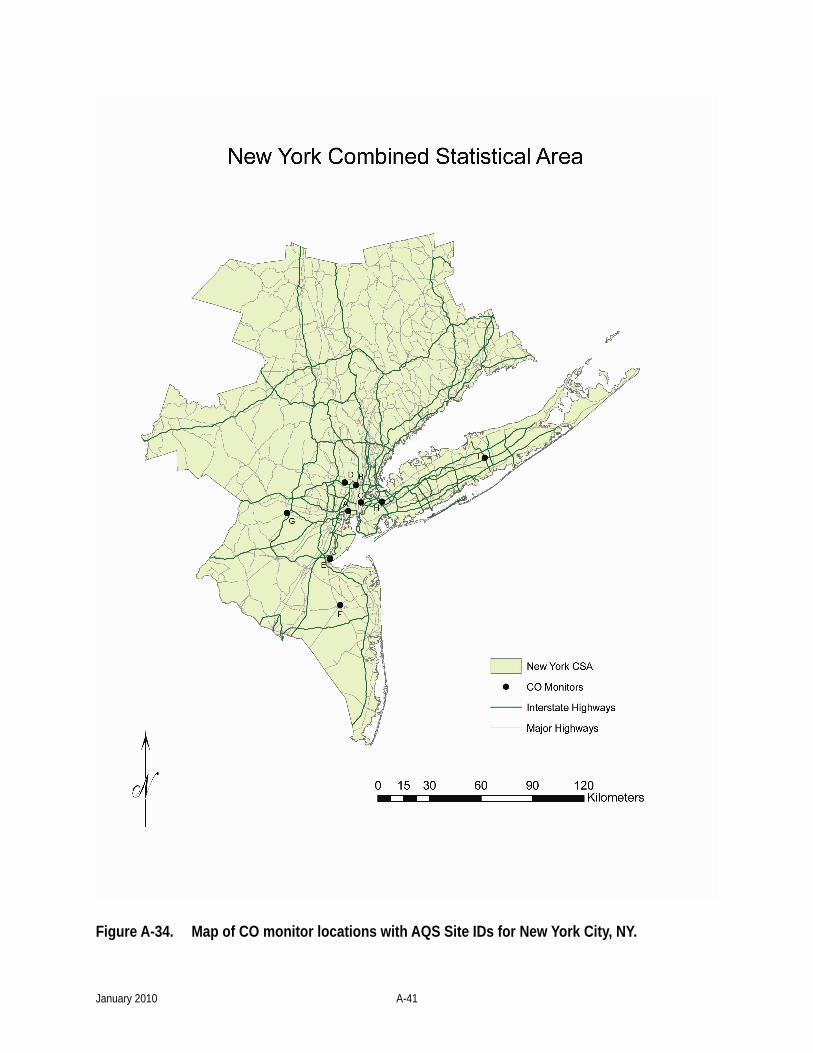
Figure A-34. Map of CO monitor locations with AQS Site IDs for New York City, NY.
January 2010 A-41
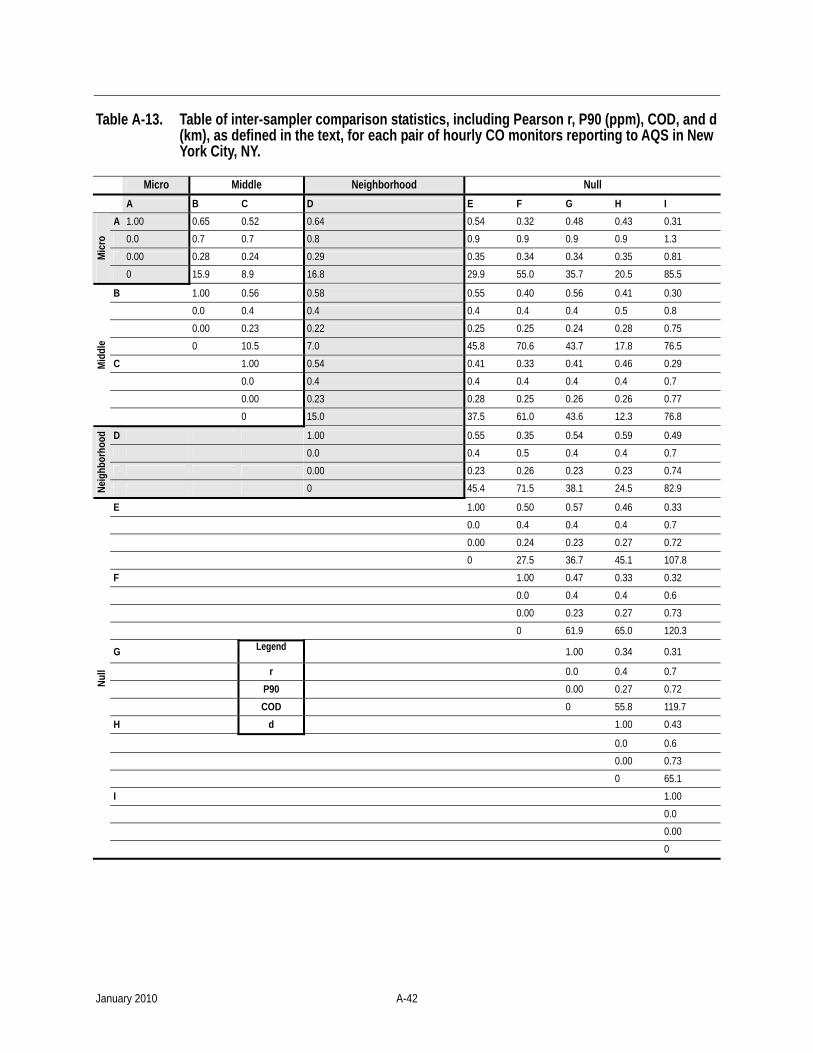
Table A-13. Table of inter-sampler comparison statistics, including Pearson r, P90 (ppm), COD, and d (km), as defined in the text, for each pair of hourly CO monitors reporting to AQS in New York City, NY.
Micro Middle Neighborhood Null A B C D E F G H I
A 1.00 0.65 0.52 0.64 0.54 0.32 0.48 0.43 0.31 0.0 0.7 0.7 0.8 0.9 0.9 0.9 0.9 1.3 0.00 0.28 0.24 0.29 0.35 0.34 0.34 0.35 0.81 M
icro
0 15.9 8.9 16.8 29.9 55.0 35.7 20.5 85.5
B 1.00 0.56 0.58 0.55 0.40 0.56 0.41 0.30 0.0 0.4 0.4 0.4 0.4 0.4 0.5 0.8 0.00 0.23 0.22 0.25 0.25 0.24 0.28 0.75 0 10.5 7.0 45.8 70.6 43.7 17.8 76.5 C 1.00 0.54 0.41 0.33 0.41 0.46 0.29 0.0 0.4 0.4 0.4 0.4 0.4 0.7 0.00 0.23 0.28 0.25 0.26 0.26 0.77
Mid
dle
0 15.0 37.5 61.0 43.6 12.3 76.8
D 1.00 0.55 0.35 0.54 0.59 0.49 0.0 0.4 0.5 0.4 0.4 0.7 0.00 0.23 0.26 0.23 0.23 0.74
Neig
hbor
hood
0 45.4 71.5 38.1 24.5 82.9
E 1.00 0.50 0.57 0.46 0.33 0.0 0.4 0.4 0.4 0.7 0.00 0.24 0.23 0.27 0.72 0 27.5 36.7 45.1 107.8 F 1.00 0.47 0.33 0.32 0.0 0.4 0.4 0.6 0.00 0.23 0.27 0.73 0 61.9 65.0 120.3
G Legend 1.00 0.34 0.31
r 0.0 0.4 0.7 P90 0.00 0.27 0.72 COD 0 55.8 119.7 H d 1.00 0.43
0.0 0.6 0.00 0.73 0 65.1 I 1.00 0.0 0.00
Null
0
January 2010 A-42
A B C D E F G H I
Site ID 34-017-1002
34-003-0004
36-061-0056
34-003-5001
34-023-2003
34-025-2001
34-027-0003
36-081-0124
36-103-0009
Mean 0.85 0.55 0.62 0.52 0.48 0.50 0.49 0.47 0.12
SD 0.43 0.27 0.21 0.30 0.27 0.24 0.25 0.23 0.17
Obs 25646 23113 25547 25150 25028 25727 25691 25022 25749
conc
entra
tion
(ppm
)
0.00.10.20.30.40.50.60.70.80.91.01.11.21.31.41.51.61.71.81.92.0
season1234 1234 1234 1234 1234 1234 1234 1234 1234
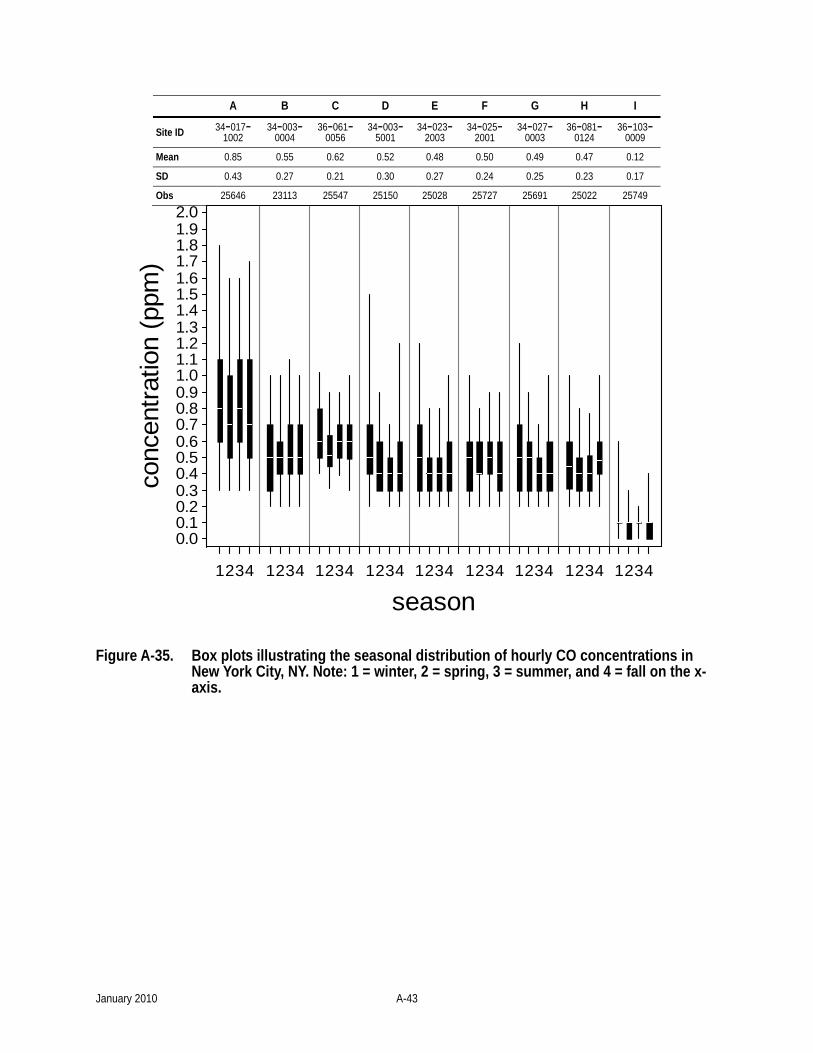
Figure A-35. Box plots illustrating the seasonal distribution of hourly CO concentrations in New York City, NY. Note: 1 = winter, 2 = spring, 3 = summer, and 4 = fall on the x-axis.
January 2010 A-43
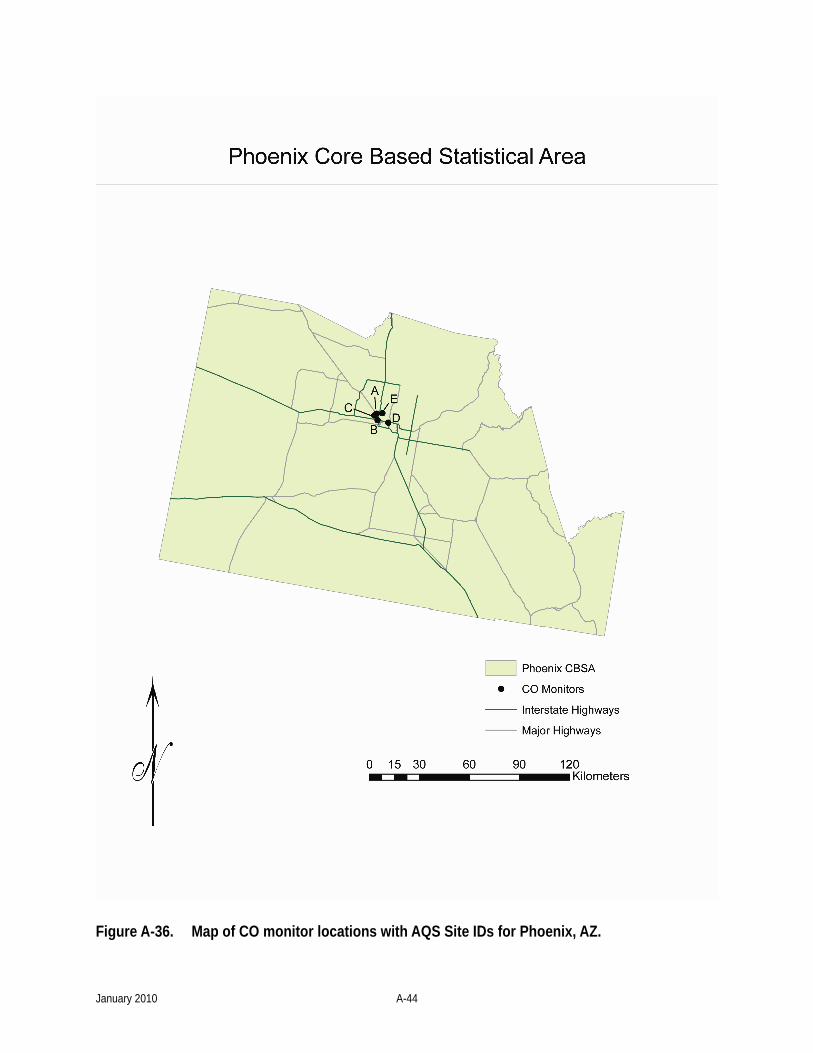
Figure A-36. Map of CO monitor locations with AQS Site IDs for Phoenix, AZ.
January 2010 A-44
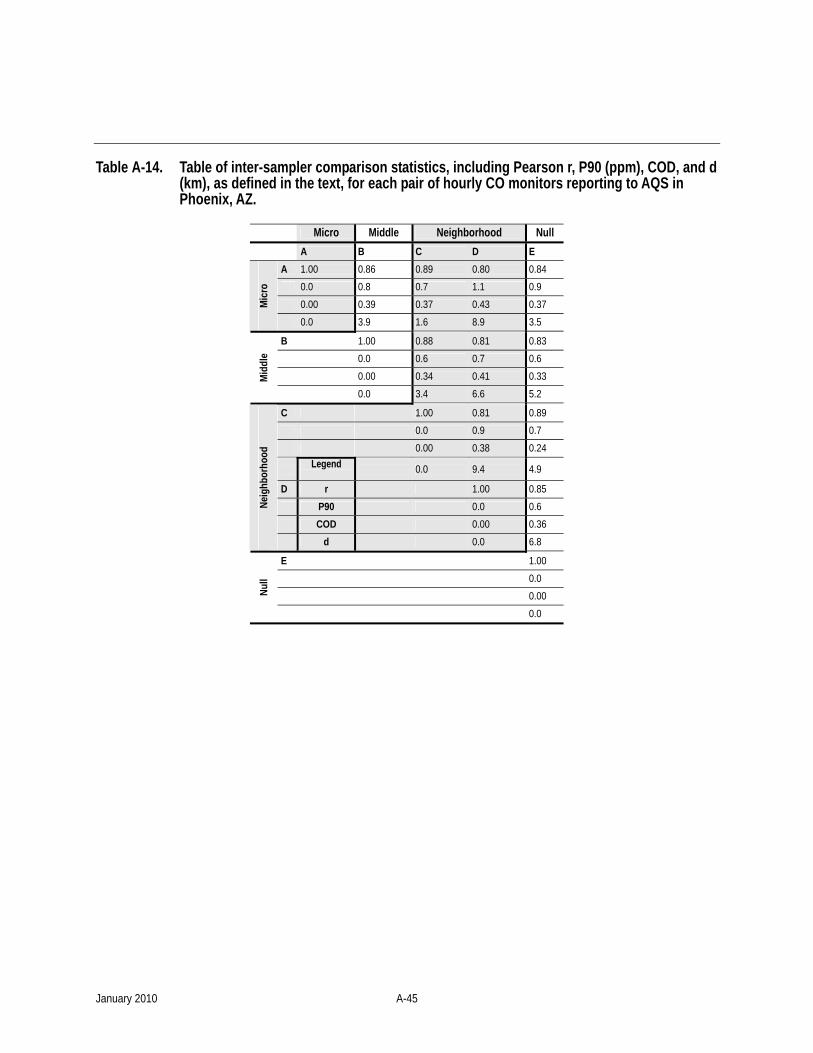
Table A-14. Table of inter-sampler comparison statistics, including Pearson r, P90 (ppm), COD, and d (km), as defined in the text, for each pair of hourly CO monitors reporting to AQS in Phoenix, AZ.
Micro Middle Neighborhood Null A B C D E
A 1.00 0.86 0.89 0.80 0.84 0.0 0.8 0.7 1.1 0.9 0.00 0.39 0.37 0.43 0.37 M
icro
0.0 3.9 1.6 8.9 3.5
B 1.00 0.88 0.81 0.83 0.0 0.6 0.7 0.6 0.00 0.34 0.41 0.33 M
iddl
e
0.0 3.4 6.6 5.2
C 1.00 0.81 0.89 0.0 0.9 0.7 0.00 0.38 0.24
Legend 0.0 9.4 4.9
D r 1.00 0.85 P90 0.0 0.6 COD 0.00 0.36
Neig
hbor
hood
d 0.0 6.8
E 1.00 0.0 0.00 Nu
ll
0.0
January 2010 A-45
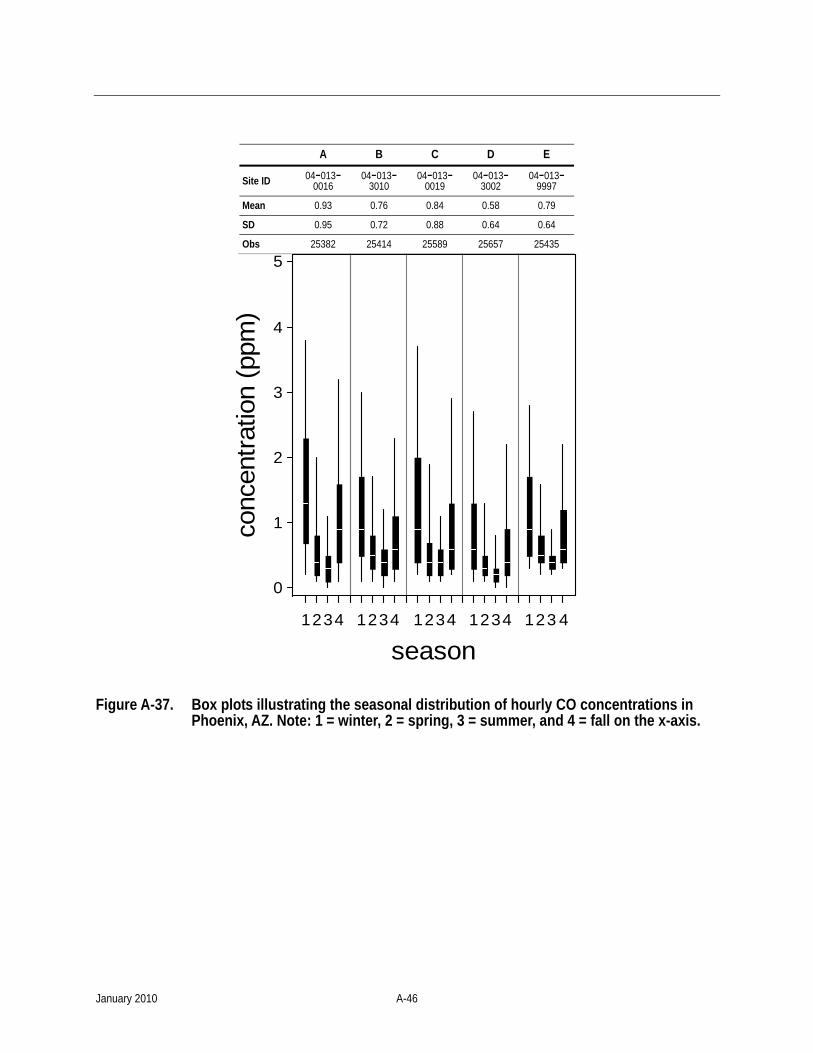
A B C D E
Site ID 04-013-0016
04-013-3010
04-013-0019
04-013-3002
04-013-9997
Mean 0.93 0.76 0.84 0.58 0.79
SD 0.95 0.72 0.88 0.64 0.64
Obs 25382 25414 25589 25657 25435 co
ncen
tratio
n (p
pm)
0
1
2
3
4
5
season1234 1234 1234 1234 123 4
Figure A-37. Box plots illustrating the seasonal distribution of hourly CO concentrations in Phoenix, AZ. Note: 1 = winter, 2 = spring, 3 = summer, and 4 = fall on the x-axis.
January 2010 A-46
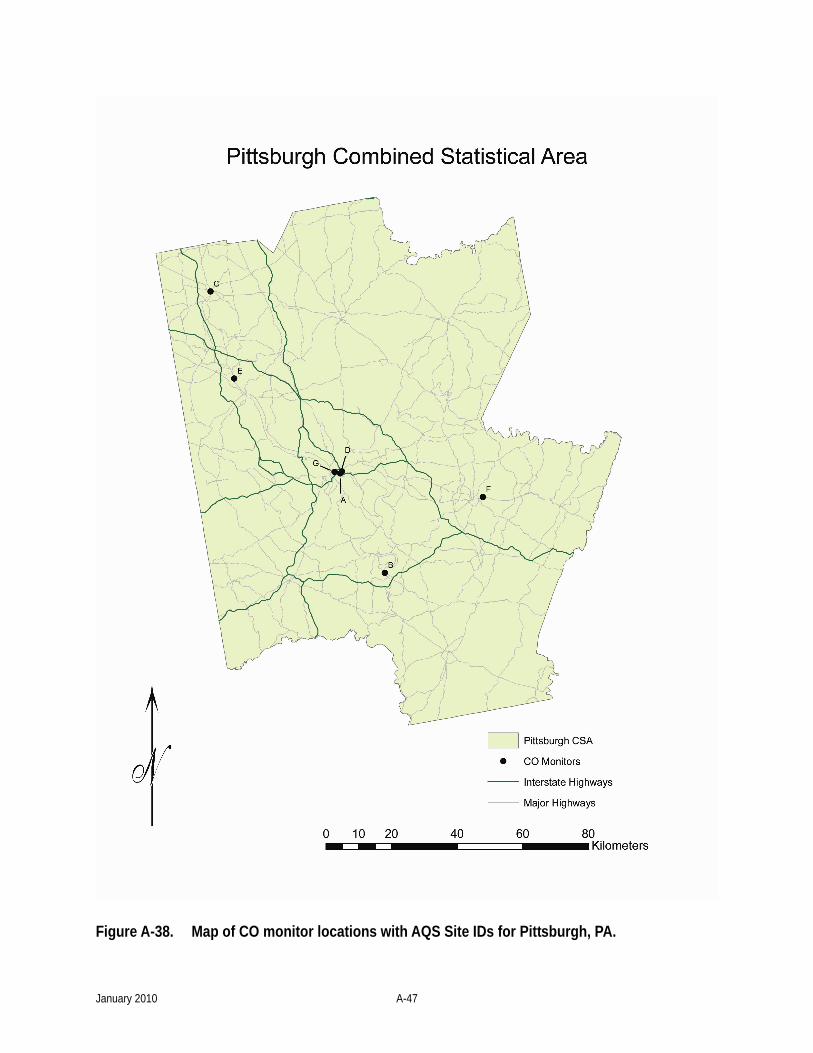
Figure A-38. Map of CO monitor locations with AQS Site IDs for Pittsburgh, PA.
January 2010 A-47
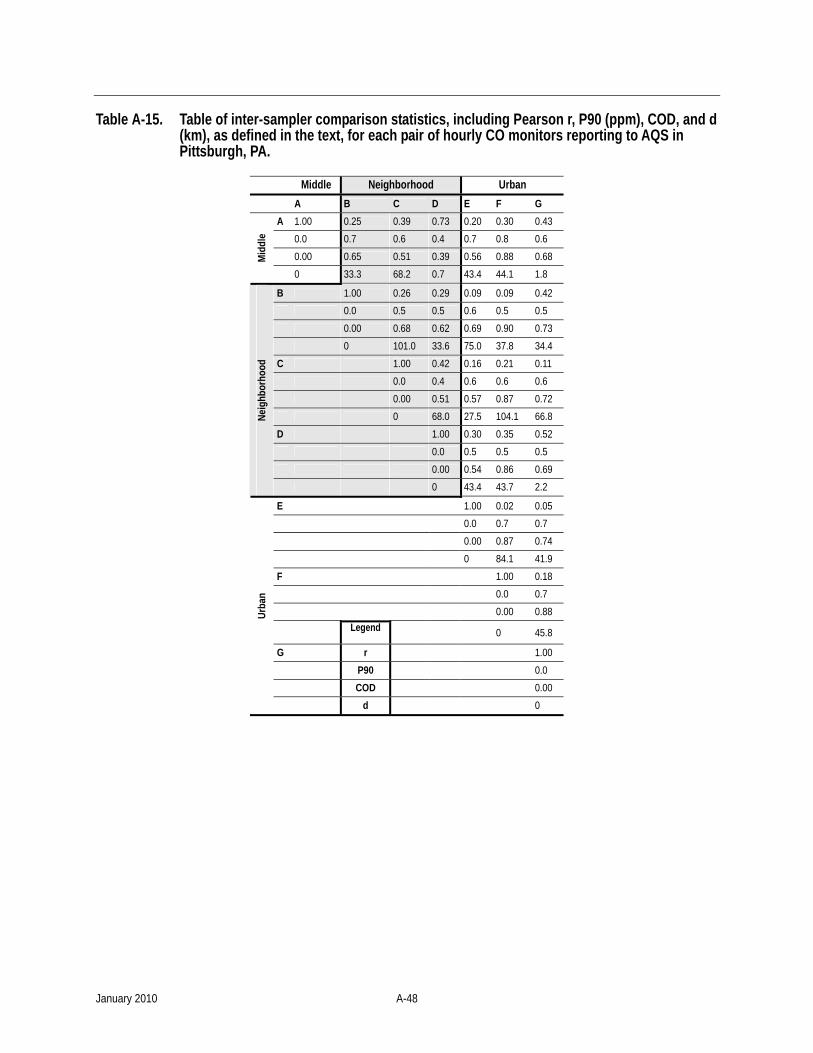
Table A-15. Table of inter-sampler comparison statistics, including Pearson r, P90 (ppm), COD, and d (km), as defined in the text, for each pair of hourly CO monitors reporting to AQS in Pittsburgh, PA.
Middle Neighborhood Urban A B C D E F G
A 1.00 0.25 0.39 0.73 0.20 0.30 0.43 0.0 0.7 0.6 0.4 0.7 0.8 0.6 0.00 0.65 0.51 0.39 0.56 0.88 0.68 M
iddl
e 0 33.3 68.2 0.7 43.4 44.1 1.8
B 1.00 0.26 0.29 0.09 0.09 0.42 0.0 0.5 0.5 0.6 0.5 0.5 0.00 0.68 0.62 0.69 0.90 0.73 0 101.0 33.6 75.0 37.8 34.4 C 1.00 0.42 0.16 0.21 0.11 0.0 0.4 0.6 0.6 0.6 0.00 0.51 0.57 0.87 0.72 0 68.0 27.5 104.1 66.8 D 1.00 0.30 0.35 0.52 0.0 0.5 0.5 0.5 0.00 0.54 0.86 0.69
Neig
hbor
hood
0 43.4 43.7 2.2
E 1.00 0.02 0.05 0.0 0.7 0.7 0.00 0.87 0.74 0 84.1 41.9 F 1.00 0.18 0.0 0.7 0.00 0.88
Legend 0 45.8
G r 1.00 P90 0.0 COD 0.00
Urba
n
d 0
January 2010 A-48
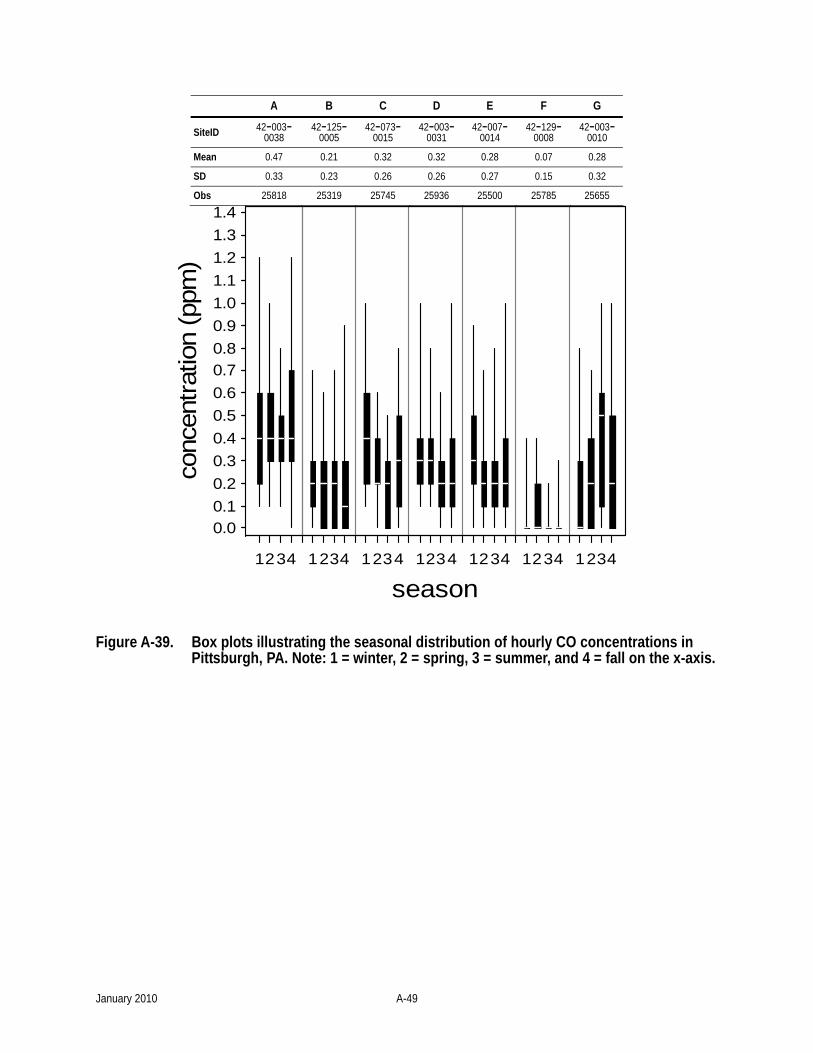
A B C D E F G
SiteID 42-003-0038
42-125-0005
42-073-0015
42-003-0031
42-007-0014
42-129-0008
42-003-0010
Mean 0.47 0.21 0.32 0.32 0.28 0.07 0.28
SD 0.33 0.23 0.26 0.26 0.27 0.15 0.32
Obs 25818 25319 25745 25936 25500 25785 25655 co
ncen
tratio
n (p
pm)
0.00.10.20.30.40.50.60.70.80.91.01.11.21.31.4
season1234 1234 1234 1234 1234 1234 1234
Figure A-39. Box plots illustrating the seasonal distribution of hourly CO concentrations in Pittsburgh, PA. Note: 1 = winter, 2 = spring, 3 = summer, and 4 = fall on the x-axis.
January 2010 A-49
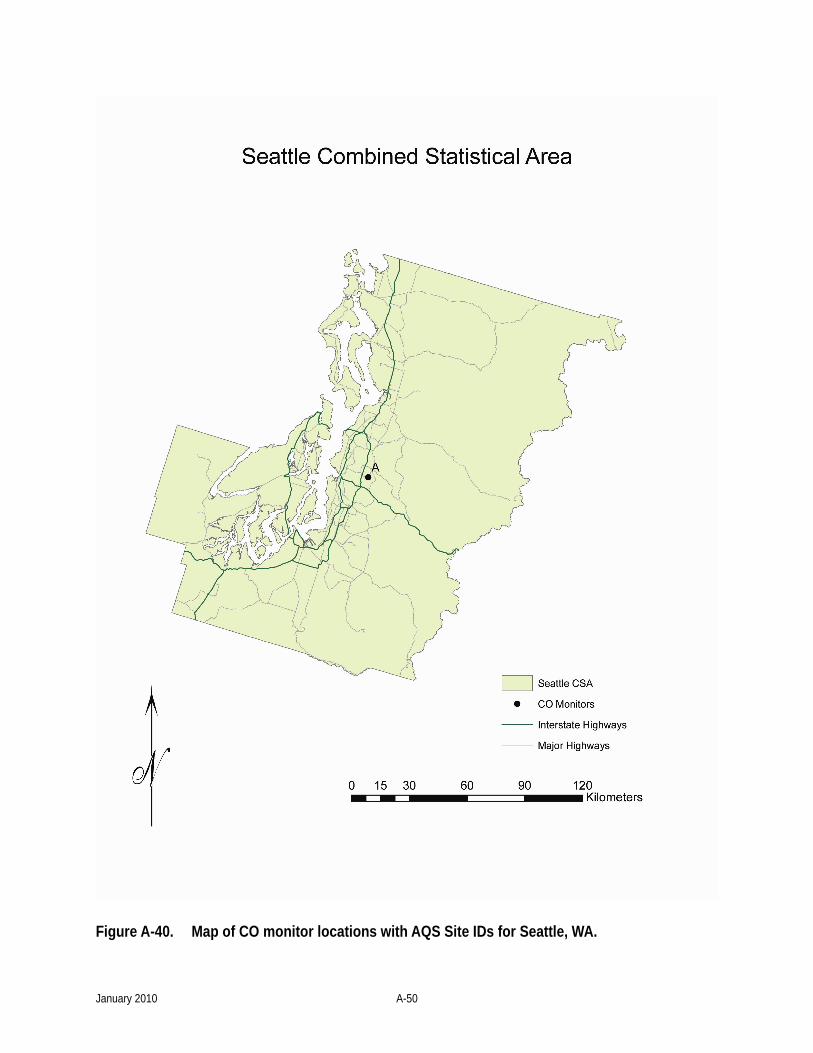
Figure A-40. Map of CO monitor locations with AQS Site IDs for Seattle, WA.
January 2010 A-50
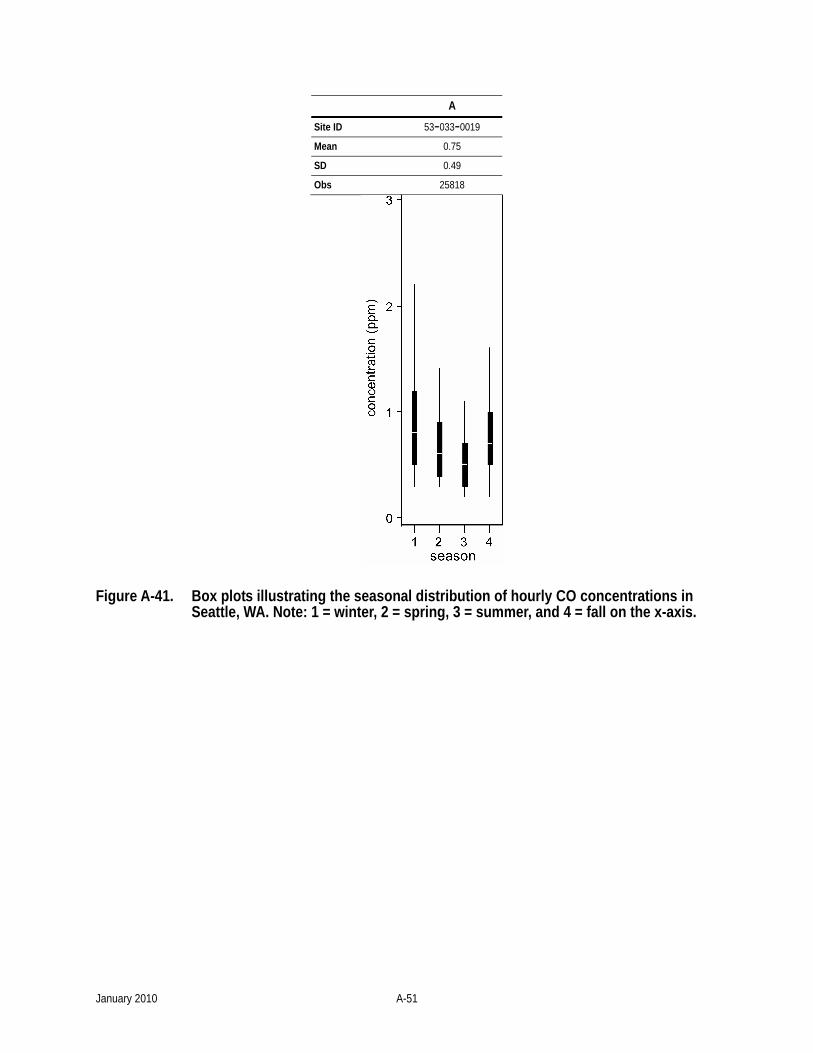
A
Site ID 53-033-0019
Mean 0.75
SD 0.49
Obs 25818
Figure A-41. Box plots illustrating the seasonal distribution of hourly CO concentrations in Seattle, WA. Note: 1 = winter, 2 = spring, 3 = summer, and 4 = fall on the x-axis.
January 2010 A-51
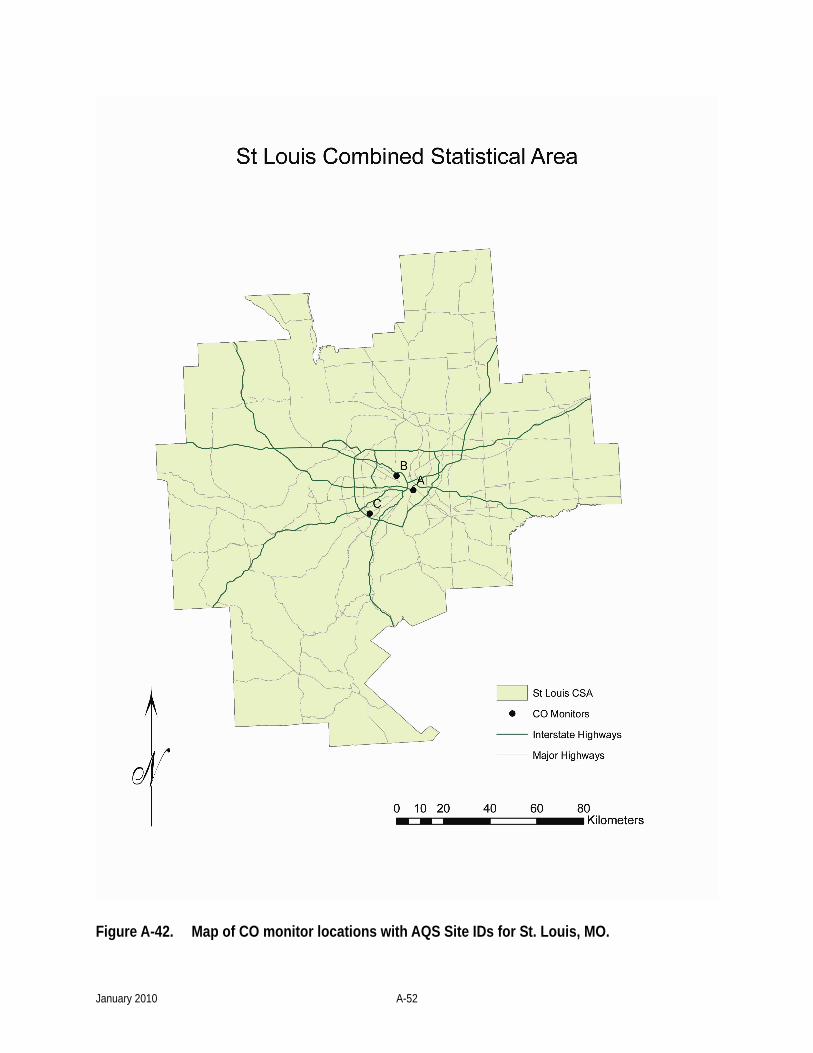
Figure A-42. Map of CO monitor locations with AQS Site IDs for St. Louis, MO.
January 2010 A-52
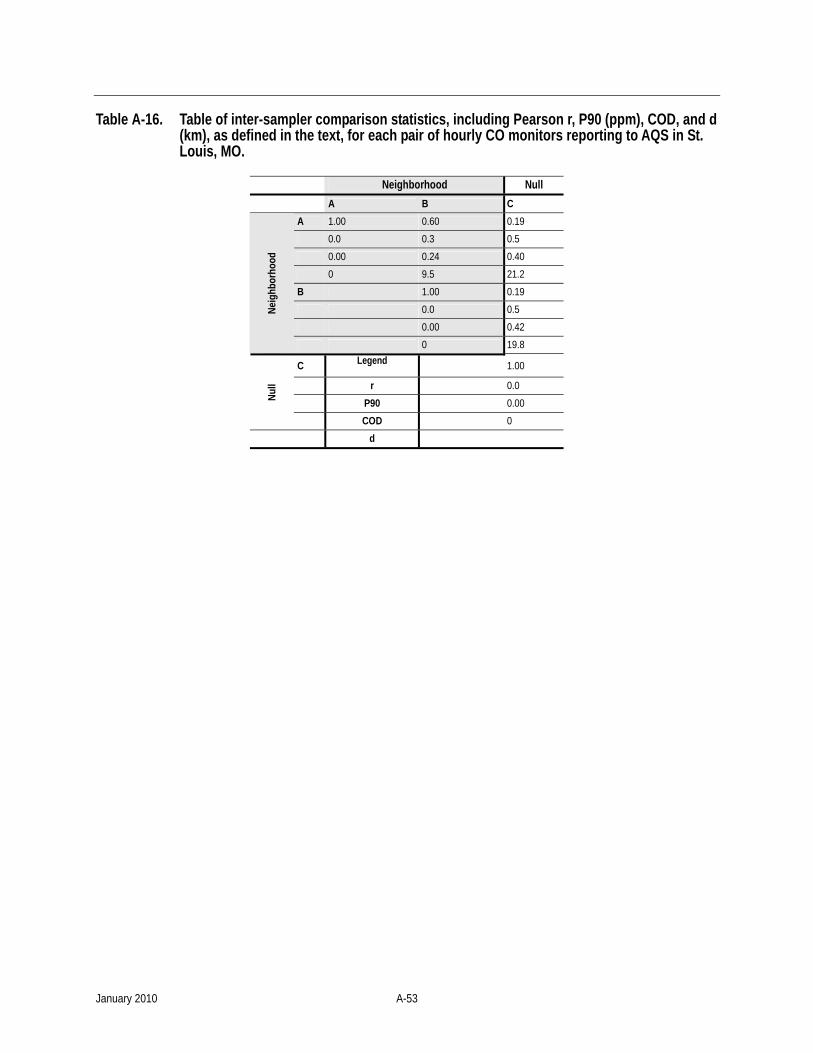
Table A-16. Table of inter-sampler comparison statistics, including Pearson r, P90 (ppm), COD, and d (km), as defined in the text, for each pair of hourly CO monitors reporting to AQS in St. Louis, MO.
Neighborhood Null A B C
A 1.00 0.60 0.19 0.0 0.3 0.5 0.00 0.24 0.40 0 9.5 21.2 B 1.00 0.19 0.0 0.5 0.00 0.42
Neig
hbor
hood
0 19.8
C Legend 1.00
r 0.0 P90 0.00 Nu
ll
COD 0 d
January 2010 A-53
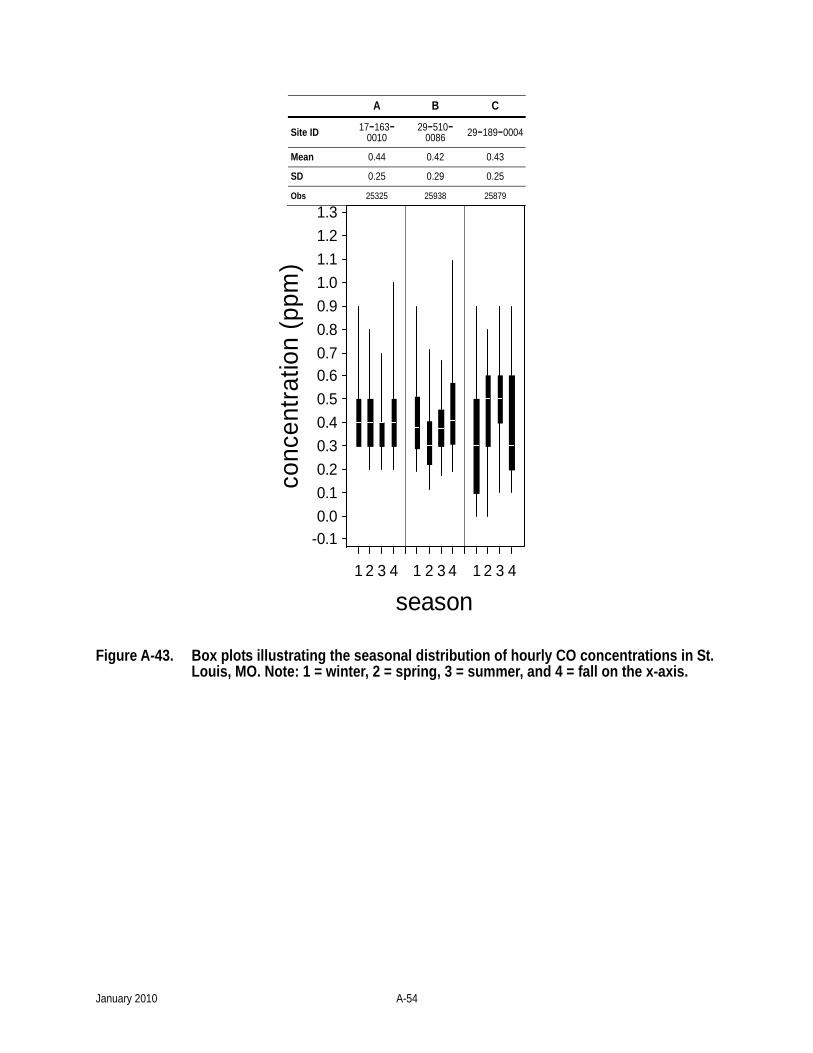
A B C
Site ID 17-163-0010
29-510-0086 29-189-0004
Mean 0.44 0.42 0.43
SD 0.25 0.29 0.25
Obs 25325 25938 25879
conc
entra
tion
(ppm
)
-0.10.00.10.20.30.40.50.60.70.80.91.01.11.21.3
season1 2 3 4 1 2 3 4 1 2 3 4
Figure A-43. Box plots illustrating the seasonal distribution of hourly CO concentrations in St. Louis, MO. Note: 1 = winter, 2 = spring, 3 = summer, and 4 = fall on the x-axis.
January 2010 A-54
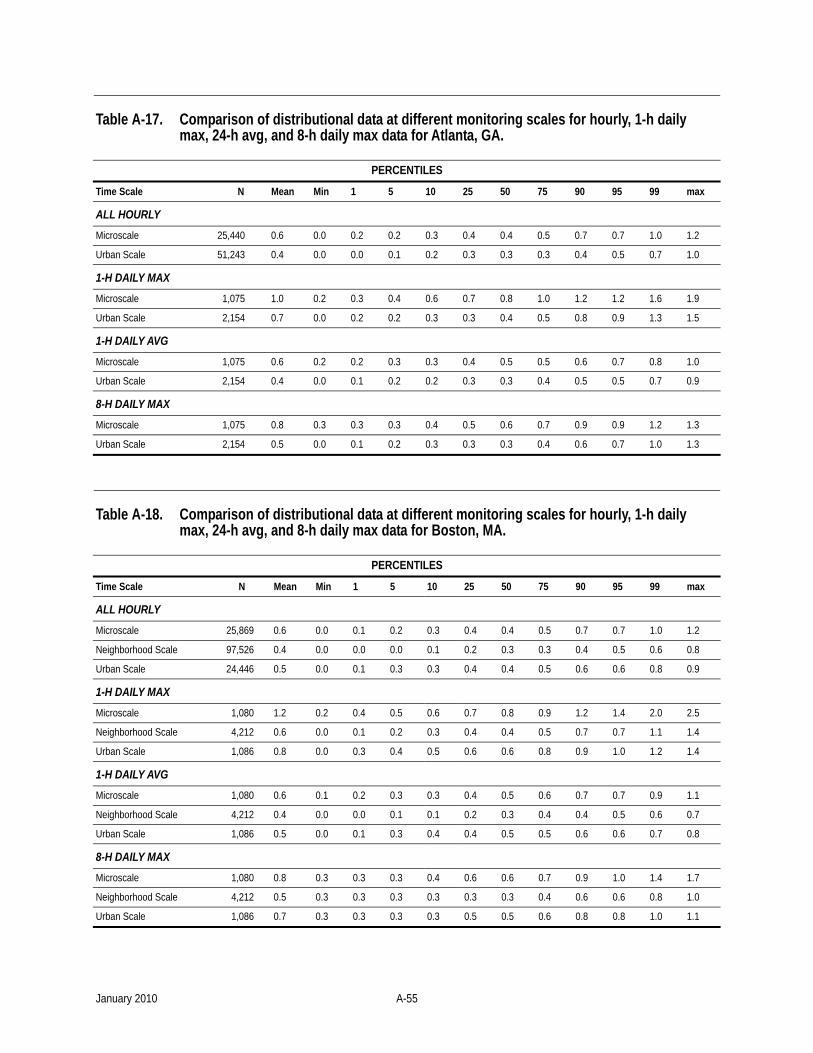
Table A-17. Comparison of distributional data at different monitoring scales for hourly, 1-h daily max, 24-h avg, and 8-h daily max data for Atlanta, GA.
PERCENTILES
Time Scale N Mean Min 1 5 10 25 50 75 90 95 99 max
ALL HOURLY Microscale 25,440 0.6 0.0 0.2 0.2 0.3 0.4 0.4 0.5 0.7 0.7 1.0 1.2
Urban Scale 51,243 0.4 0.0 0.0 0.1 0.2 0.3 0.3 0.3 0.4 0.5 0.7 1.0
1-H DAILY MAX Microscale 1,075 1.0 0.2 0.3 0.4 0.6 0.7 0.8 1.0 1.2 1.2 1.6 1.9
Urban Scale 2,154 0.7 0.0 0.2 0.2 0.3 0.3 0.4 0.5 0.8 0.9 1.3 1.5
1-H DAILY AVG Microscale 1,075 0.6 0.2 0.2 0.3 0.3 0.4 0.5 0.5 0.6 0.7 0.8 1.0
Urban Scale 2,154 0.4 0.0 0.1 0.2 0.2 0.3 0.3 0.4 0.5 0.5 0.7 0.9
8-H DAILY MAX Microscale 1,075 0.8 0.3 0.3 0.3 0.4 0.5 0.6 0.7 0.9 0.9 1.2 1.3
Urban Scale 2,154 0.5 0.0 0.1 0.2 0.3 0.3 0.3 0.4 0.6 0.7 1.0 1.3
Table A-18. Comparison of distributional data at different monitoring scales for hourly, 1-h daily max, 24-h avg, and 8-h daily max data for Boston, MA.
PERCENTILES
Time Scale N Mean Min 1 5 10 25 50 75 90 95 99 max
ALL HOURLY Microscale 25,869 0.6 0.0 0.1 0.2 0.3 0.4 0.4 0.5 0.7 0.7 1.0 1.2
Neighborhood Scale 97,526 0.4 0.0 0.0 0.0 0.1 0.2 0.3 0.3 0.4 0.5 0.6 0.8
Urban Scale 24,446 0.5 0.0 0.1 0.3 0.3 0.4 0.4 0.5 0.6 0.6 0.8 0.9
1-H DAILY MAX Microscale 1,080 1.2 0.2 0.4 0.5 0.6 0.7 0.8 0.9 1.2 1.4 2.0 2.5
Neighborhood Scale 4,212 0.6 0.0 0.1 0.2 0.3 0.4 0.4 0.5 0.7 0.7 1.1 1.4
Urban Scale 1,086 0.8 0.0 0.3 0.4 0.5 0.6 0.6 0.8 0.9 1.0 1.2 1.4
1-H DAILY AVG Microscale 1,080 0.6 0.1 0.2 0.3 0.3 0.4 0.5 0.6 0.7 0.7 0.9 1.1
Neighborhood Scale 4,212 0.4 0.0 0.0 0.1 0.1 0.2 0.3 0.4 0.4 0.5 0.6 0.7
Urban Scale 1,086 0.5 0.0 0.1 0.3 0.4 0.4 0.5 0.5 0.6 0.6 0.7 0.8
8-H DAILY MAX Microscale 1,080 0.8 0.3 0.3 0.3 0.4 0.6 0.6 0.7 0.9 1.0 1.4 1.7
Neighborhood Scale 4,212 0.5 0.3 0.3 0.3 0.3 0.3 0.3 0.4 0.6 0.6 0.8 1.0
Urban Scale 1,086 0.7 0.3 0.3 0.3 0.3 0.5 0.5 0.6 0.8 0.8 1.0 1.1
January 2010 A-55
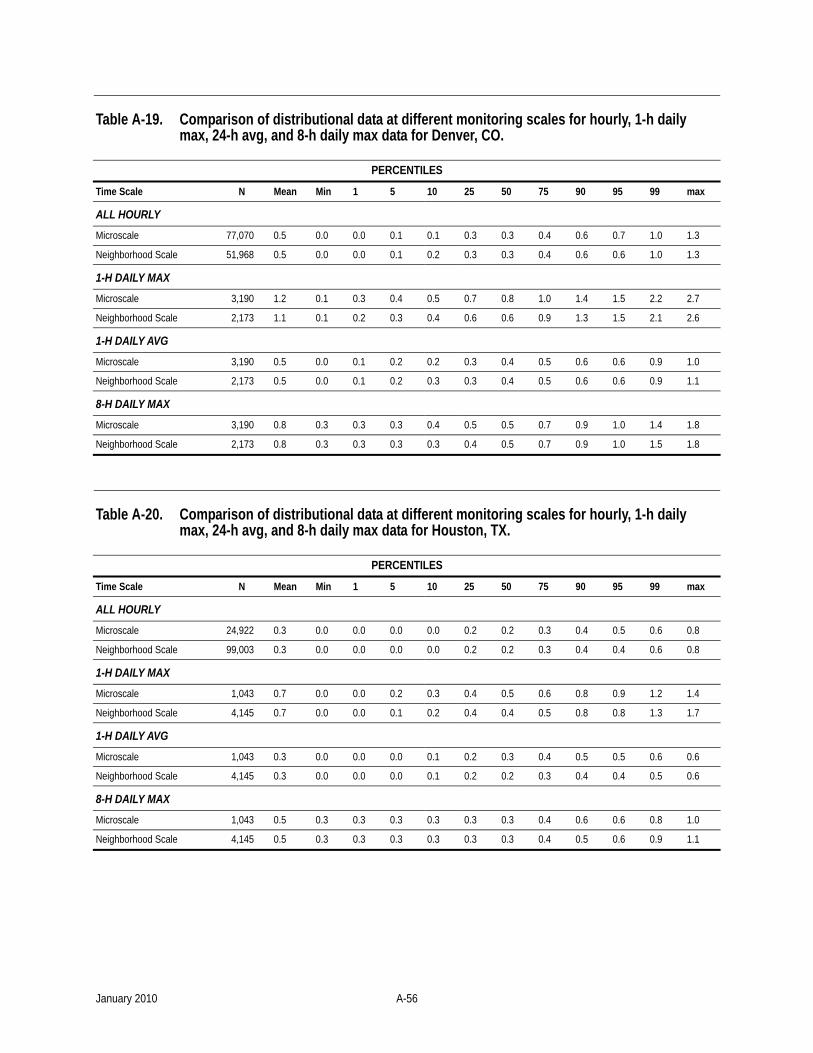
Table A-19. Comparison of distributional data at different monitoring scales for hourly, 1-h daily max, 24-h avg, and 8-h daily max data for Denver, CO.
PERCENTILES
Time Scale N Mean Min 1 5 10 25 50 75 90 95 99 max
ALL HOURLY Microscale 77,070 0.5 0.0 0.0 0.1 0.1 0.3 0.3 0.4 0.6 0.7 1.0 1.3
Neighborhood Scale 51,968 0.5 0.0 0.0 0.1 0.2 0.3 0.3 0.4 0.6 0.6 1.0 1.3
1-H DAILY MAX Microscale 3,190 1.2 0.1 0.3 0.4 0.5 0.7 0.8 1.0 1.4 1.5 2.2 2.7
Neighborhood Scale 2,173 1.1 0.1 0.2 0.3 0.4 0.6 0.6 0.9 1.3 1.5 2.1 2.6
1-H DAILY AVG Microscale 3,190 0.5 0.0 0.1 0.2 0.2 0.3 0.4 0.5 0.6 0.6 0.9 1.0
Neighborhood Scale 2,173 0.5 0.0 0.1 0.2 0.3 0.3 0.4 0.5 0.6 0.6 0.9 1.1
8-H DAILY MAX Microscale 3,190 0.8 0.3 0.3 0.3 0.4 0.5 0.5 0.7 0.9 1.0 1.4 1.8
Neighborhood Scale 2,173 0.8 0.3 0.3 0.3 0.3 0.4 0.5 0.7 0.9 1.0 1.5 1.8
Table A-20. Comparison of distributional data at different monitoring scales for hourly, 1-h daily max, 24-h avg, and 8-h daily max data for Houston, TX.
PERCENTILES
Time Scale N Mean Min 1 5 10 25 50 75 90 95 99 max
ALL HOURLY Microscale 24,922 0.3 0.0 0.0 0.0 0.0 0.2 0.2 0.3 0.4 0.5 0.6 0.8
Neighborhood Scale 99,003 0.3 0.0 0.0 0.0 0.0 0.2 0.2 0.3 0.4 0.4 0.6 0.8
1-H DAILY MAX Microscale 1,043 0.7 0.0 0.0 0.2 0.3 0.4 0.5 0.6 0.8 0.9 1.2 1.4
Neighborhood Scale 4,145 0.7 0.0 0.0 0.1 0.2 0.4 0.4 0.5 0.8 0.8 1.3 1.7
1-H DAILY AVG Microscale 1,043 0.3 0.0 0.0 0.0 0.1 0.2 0.3 0.4 0.5 0.5 0.6 0.6
Neighborhood Scale 4,145 0.3 0.0 0.0 0.0 0.1 0.2 0.2 0.3 0.4 0.4 0.5 0.6
8-H DAILY MAX Microscale 1,043 0.5 0.3 0.3 0.3 0.3 0.3 0.3 0.4 0.6 0.6 0.8 1.0
Neighborhood Scale 4,145 0.5 0.3 0.3 0.3 0.3 0.3 0.3 0.4 0.5 0.6 0.9 1.1
January 2010 A-56
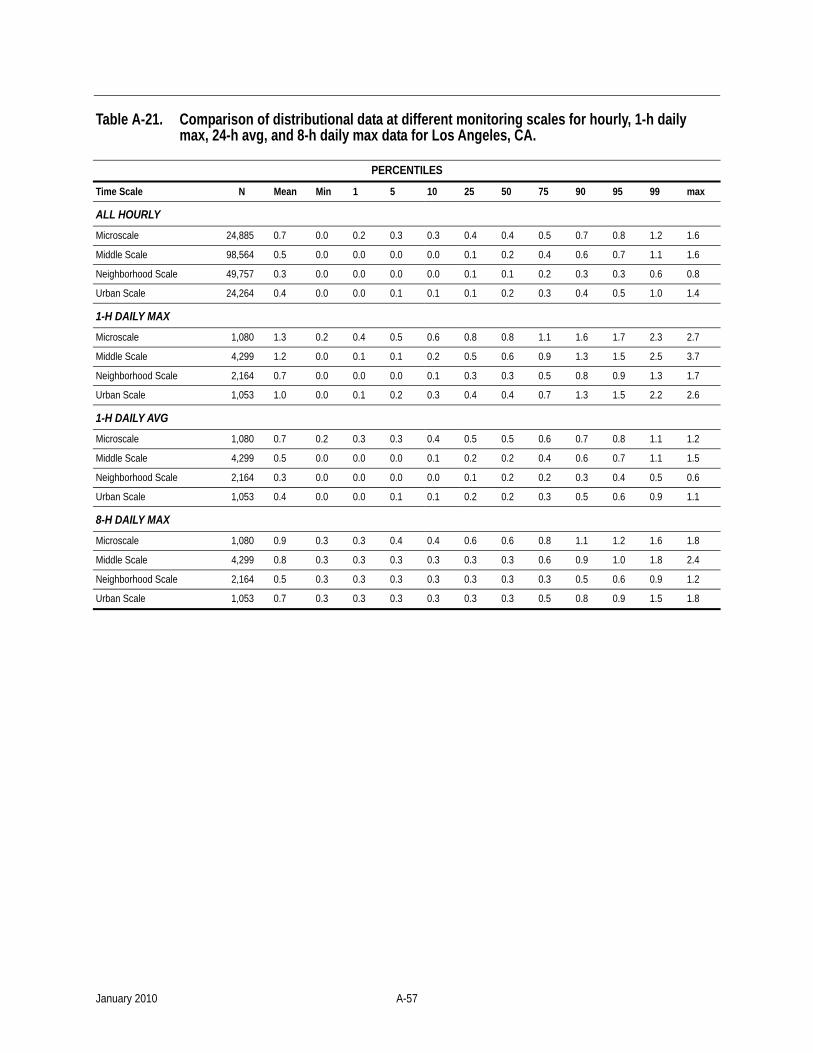
Table A-21. Comparison of distributional data at different monitoring scales for hourly, 1-h daily max, 24-h avg, and 8-h daily max data for Los Angeles, CA.
PERCENTILES
Time Scale N Mean Min 1 5 10 25 50 75 90 95 99 max
ALL HOURLY Microscale 24,885 0.7 0.0 0.2 0.3 0.3 0.4 0.4 0.5 0.7 0.8 1.2 1.6
Middle Scale 98,564 0.5 0.0 0.0 0.0 0.0 0.1 0.2 0.4 0.6 0.7 1.1 1.6
Neighborhood Scale 49,757 0.3 0.0 0.0 0.0 0.0 0.1 0.1 0.2 0.3 0.3 0.6 0.8
Urban Scale 24,264 0.4 0.0 0.0 0.1 0.1 0.1 0.2 0.3 0.4 0.5 1.0 1.4
1-H DAILY MAX Microscale 1,080 1.3 0.2 0.4 0.5 0.6 0.8 0.8 1.1 1.6 1.7 2.3 2.7
Middle Scale 4,299 1.2 0.0 0.1 0.1 0.2 0.5 0.6 0.9 1.3 1.5 2.5 3.7
Neighborhood Scale 2,164 0.7 0.0 0.0 0.0 0.1 0.3 0.3 0.5 0.8 0.9 1.3 1.7
Urban Scale 1,053 1.0 0.0 0.1 0.2 0.3 0.4 0.4 0.7 1.3 1.5 2.2 2.6
1-H DAILY AVG Microscale 1,080 0.7 0.2 0.3 0.3 0.4 0.5 0.5 0.6 0.7 0.8 1.1 1.2
Middle Scale 4,299 0.5 0.0 0.0 0.0 0.1 0.2 0.2 0.4 0.6 0.7 1.1 1.5
Neighborhood Scale 2,164 0.3 0.0 0.0 0.0 0.0 0.1 0.2 0.2 0.3 0.4 0.5 0.6
Urban Scale 1,053 0.4 0.0 0.0 0.1 0.1 0.2 0.2 0.3 0.5 0.6 0.9 1.1
8-H DAILY MAX Microscale 1,080 0.9 0.3 0.3 0.4 0.4 0.6 0.6 0.8 1.1 1.2 1.6 1.8
Middle Scale 4,299 0.8 0.3 0.3 0.3 0.3 0.3 0.3 0.6 0.9 1.0 1.8 2.4
Neighborhood Scale 2,164 0.5 0.3 0.3 0.3 0.3 0.3 0.3 0.3 0.5 0.6 0.9 1.2
Urban Scale 1,053 0.7 0.3 0.3 0.3 0.3 0.3 0.3 0.5 0.8 0.9 1.5 1.8
January 2010 A-57

Table A-22. Comparison of distributional data at different monitoring scales for hourly, 1-h daily max, 24-h avg, and 8-h daily max data for New York City, NY.
PERCENTILES
Time Scale N Mean Min 1 5 10 25 50 75 90 95 99 max
ALL HOURLY Microscale 25,646 0.8 0.0 0.2 0.3 0.4 0.5 0.6 0.8 1.0 1.1 1.4 1.6
Middle Scale 48,660 0.6 0.0 0.1 0.3 0.3 0.4 0.5 0.6 0.7 0.7 0.9 1.0
Neighborhood Scale 25,150 0.5 0.0 0.2 0.2 0.3 0.3 0.4 0.4 0.6 0.6 0.9 1.1
1-H DAILY MAX Microscale 1,077 1.4 0.3 0.4 0.6 0.8 1.0 1.1 1.4 1.7 1.8 2.1 2.4
Middle Scale 2,053 0.9 0.2 0.4 0.5 0.6 0.7 0.7 0.8 1.0 1.1 1.3 1.5
Neighborhood Scale 1,053 0.9 0.2 0.3 0.4 0.4 0.6 0.6 0.8 1.0 1.1 1.5 1.9
1-H DAILY AVG Microscale 1,077 0.8 0.2 0.3 0.4 0.5 0.6 0.7 0.8 1.0 1.0 1.3 1.4
Middle Scale 2,053 0.6 0.0 0.2 0.3 0.4 0.5 0.5 0.6 0.7 0.7 0.8 0.9
Neighborhood Scale 1,053 0.5 0.1 0.2 0.3 0.3 0.4 0.4 0.5 0.6 0.6 0.8 1.0
8-H DAILY MAX Microscale 1,077 1.2 0.3 0.4 0.6 0.7 0.9 0.9 1.1 1.4 1.4 1.7 1.9
Middle Scale 2,053 0.7 0.3 0.3 0.4 0.4 0.6 0.6 0.7 0.8 0.9 1.0 1.2
Neighborhood Scale 1,053 0.7 0.3 0.3 0.3 0.3 0.4 0.5 0.6 0.8 0.8 1.2 1.5
January 2010 A-58
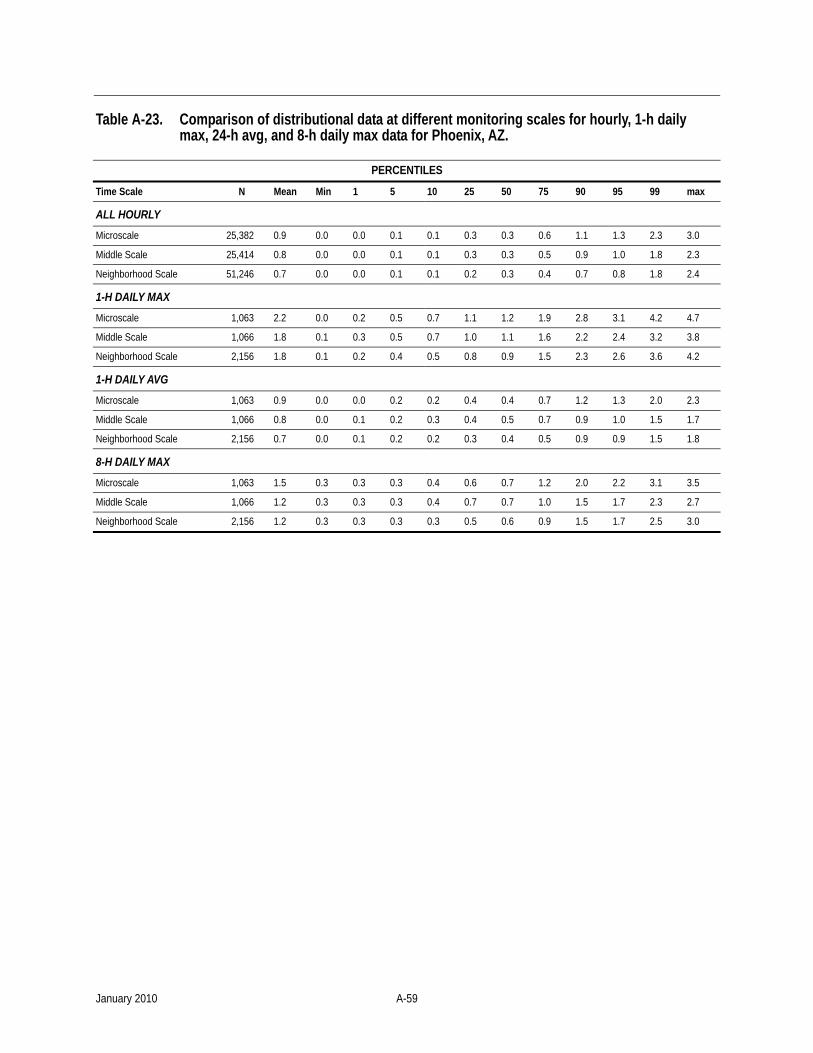
Table A-23. Comparison of distributional data at different monitoring scales for hourly, 1-h daily max, 24-h avg, and 8-h daily max data for Phoenix, AZ.
PERCENTILES
Time Scale N Mean Min 1 5 10 25 50 75 90 95 99 max
ALL HOURLY Microscale 25,382 0.9 0.0 0.0 0.1 0.1 0.3 0.3 0.6 1.1 1.3 2.3 3.0
Middle Scale 25,414 0.8 0.0 0.0 0.1 0.1 0.3 0.3 0.5 0.9 1.0 1.8 2.3
Neighborhood Scale 51,246 0.7 0.0 0.0 0.1 0.1 0.2 0.3 0.4 0.7 0.8 1.8 2.4
1-H DAILY MAX Microscale 1,063 2.2 0.0 0.2 0.5 0.7 1.1 1.2 1.9 2.8 3.1 4.2 4.7
Middle Scale 1,066 1.8 0.1 0.3 0.5 0.7 1.0 1.1 1.6 2.2 2.4 3.2 3.8
Neighborhood Scale 2,156 1.8 0.1 0.2 0.4 0.5 0.8 0.9 1.5 2.3 2.6 3.6 4.2
1-H DAILY AVG Microscale 1,063 0.9 0.0 0.0 0.2 0.2 0.4 0.4 0.7 1.2 1.3 2.0 2.3
Middle Scale 1,066 0.8 0.0 0.1 0.2 0.3 0.4 0.5 0.7 0.9 1.0 1.5 1.7
Neighborhood Scale 2,156 0.7 0.0 0.1 0.2 0.2 0.3 0.4 0.5 0.9 0.9 1.5 1.8
8-H DAILY MAX Microscale 1,063 1.5 0.3 0.3 0.3 0.4 0.6 0.7 1.2 2.0 2.2 3.1 3.5
Middle Scale 1,066 1.2 0.3 0.3 0.3 0.4 0.7 0.7 1.0 1.5 1.7 2.3 2.7
Neighborhood Scale 2,156 1.2 0.3 0.3 0.3 0.3 0.5 0.6 0.9 1.5 1.7 2.5 3.0
January 2010 A-59
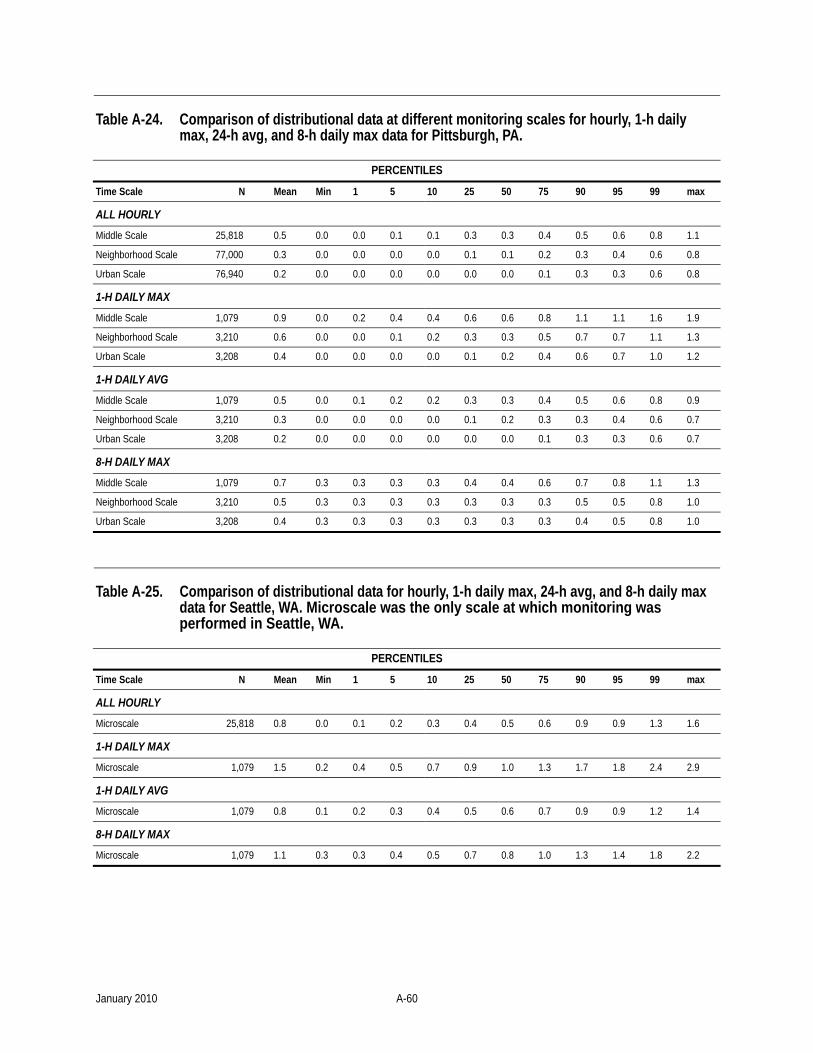
Table A-24. Comparison of distributional data at different monitoring scales for hourly, 1-h daily max, 24-h avg, and 8-h daily max data for Pittsburgh, PA.
PERCENTILES
Time Scale N Mean Min 1 5 10 25 50 75 90 95 99 max
ALL HOURLY Middle Scale 25,818 0.5 0.0 0.0 0.1 0.1 0.3 0.3 0.4 0.5 0.6 0.8 1.1
Neighborhood Scale 77,000 0.3 0.0 0.0 0.0 0.0 0.1 0.1 0.2 0.3 0.4 0.6 0.8
Urban Scale 76,940 0.2 0.0 0.0 0.0 0.0 0.0 0.0 0.1 0.3 0.3 0.6 0.8
1-H DAILY MAX Middle Scale 1,079 0.9 0.0 0.2 0.4 0.4 0.6 0.6 0.8 1.1 1.1 1.6 1.9
Neighborhood Scale 3,210 0.6 0.0 0.0 0.1 0.2 0.3 0.3 0.5 0.7 0.7 1.1 1.3
Urban Scale 3,208 0.4 0.0 0.0 0.0 0.0 0.1 0.2 0.4 0.6 0.7 1.0 1.2
1-H DAILY AVG Middle Scale 1,079 0.5 0.0 0.1 0.2 0.2 0.3 0.3 0.4 0.5 0.6 0.8 0.9
Neighborhood Scale 3,210 0.3 0.0 0.0 0.0 0.0 0.1 0.2 0.3 0.3 0.4 0.6 0.7
Urban Scale 3,208 0.2 0.0 0.0 0.0 0.0 0.0 0.0 0.1 0.3 0.3 0.6 0.7
8-H DAILY MAX Middle Scale 1,079 0.7 0.3 0.3 0.3 0.3 0.4 0.4 0.6 0.7 0.8 1.1 1.3
Neighborhood Scale 3,210 0.5 0.3 0.3 0.3 0.3 0.3 0.3 0.3 0.5 0.5 0.8 1.0
Urban Scale 3,208 0.4 0.3 0.3 0.3 0.3 0.3 0.3 0.3 0.4 0.5 0.8 1.0
Table A-25. Comparison of distributional data for hourly, 1-h daily max, 24-h avg, and 8-h daily max data for Seattle, WA. Microscale was the only scale at which monitoring was performed in Seattle, WA.
PERCENTILES
Time Scale N Mean Min 1 5 10 25 50 75 90 95 99 max
ALL HOURLY Microscale 25,818 0.8 0.0 0.1 0.2 0.3 0.4 0.5 0.6 0.9 0.9 1.3 1.6
1-H DAILY MAX Microscale 1,079 1.5 0.2 0.4 0.5 0.7 0.9 1.0 1.3 1.7 1.8 2.4 2.9
1-H DAILY AVG Microscale 1,079 0.8 0.1 0.2 0.3 0.4 0.5 0.6 0.7 0.9 0.9 1.2 1.4
8-H DAILY MAX Microscale 1,079 1.1 0.3 0.3 0.4 0.5 0.7 0.8 1.0 1.3 1.4 1.8 2.2
January 2010 A-60
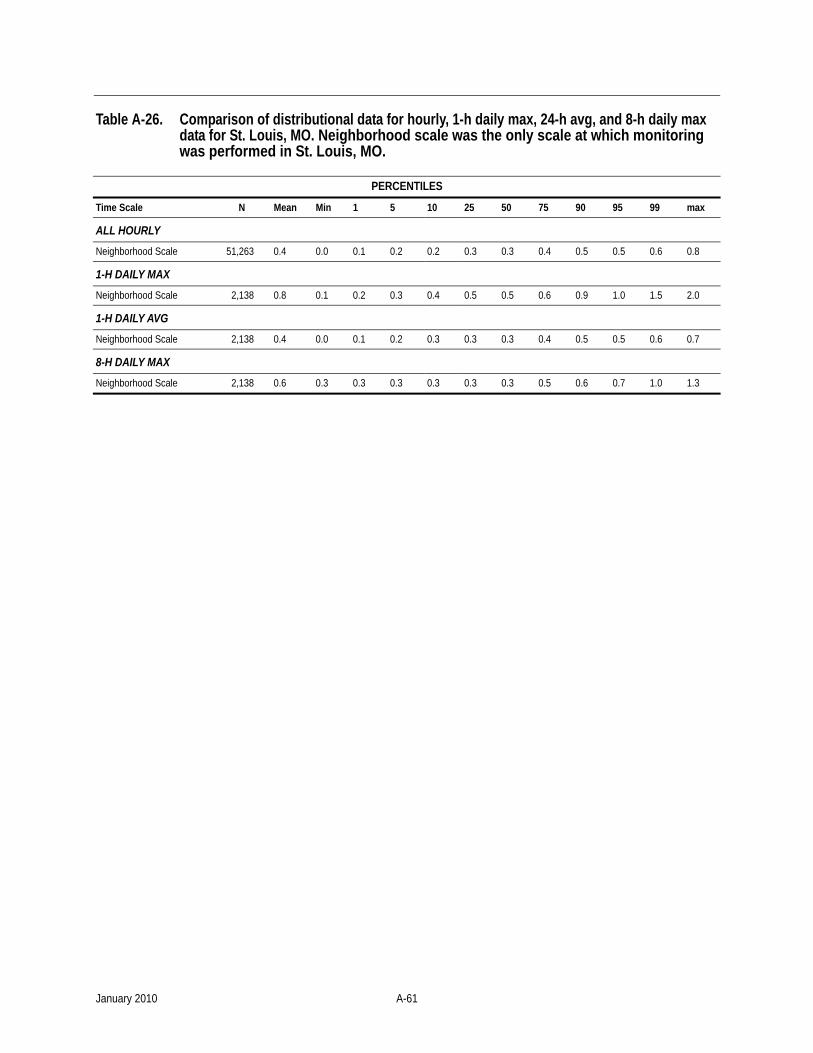
Table A-26. Comparison of distributional data for hourly, 1-h daily max, 24-h avg, and 8-h daily max data for St. Louis, MO. Neighborhood scale was the only scale at which monitoring was performed in St. Louis, MO.
PERCENTILES
Time Scale N Mean Min 1 5 10 25 50 75 90 95 99 max
ALL HOURLY Neighborhood Scale 51,263 0.4 0.0 0.1 0.2 0.2 0.3 0.3 0.4 0.5 0.5 0.6 0.8
1-H DAILY MAX Neighborhood Scale 2,138 0.8 0.1 0.2 0.3 0.4 0.5 0.5 0.6 0.9 1.0 1.5 2.0
1-H DAILY AVG Neighborhood Scale 2,138 0.4 0.0 0.1 0.2 0.3 0.3 0.3 0.4 0.5 0.5 0.6 0.7
8-H DAILY MAX Neighborhood Scale 2,138 0.6 0.3 0.3 0.3 0.3 0.3 0.3 0.5 0.6 0.7 1.0 1.3
January 2010 A-61
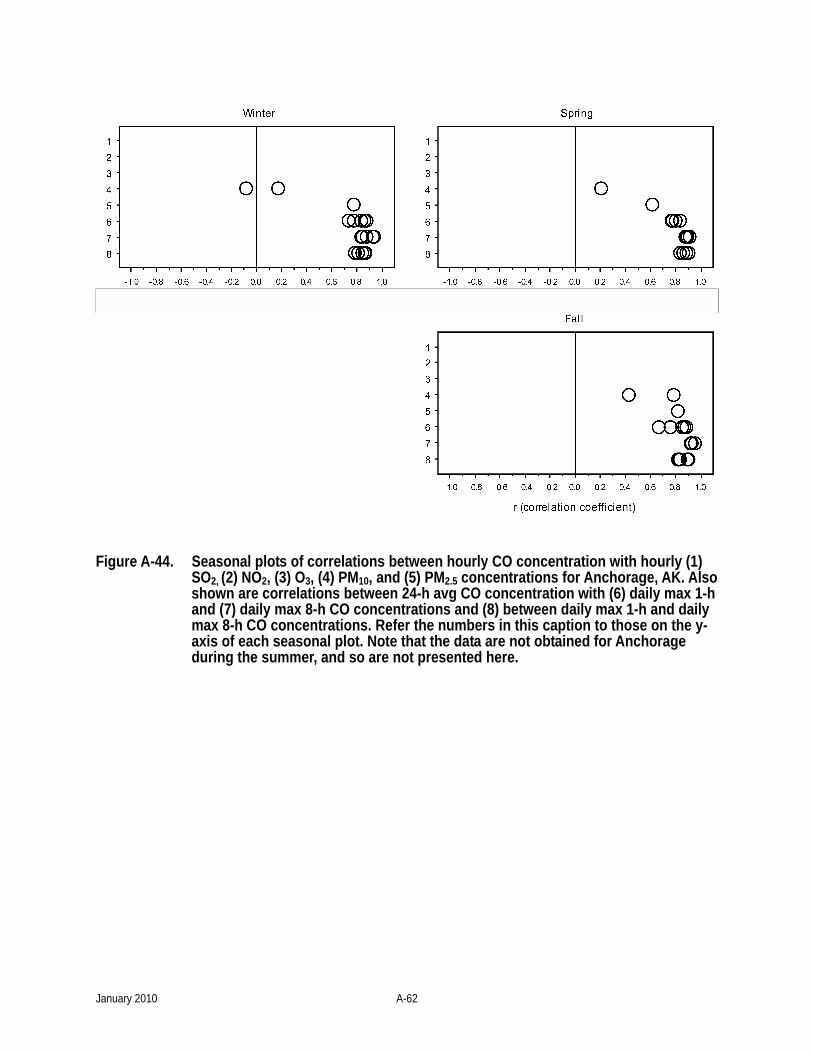
Figure A-44. Seasonal plots of correlations between hourly CO concentration with hourly (1) SO2, (2) NO2, (3) O3, (4) PM10, and (5) PM2.5 concentrations for Anchorage, AK. Also shown are correlations between 24-h avg CO concentration with (6) daily max 1-h and (7) daily max 8-h CO concentrations and (8) between daily max 1-h and daily max 8-h CO concentrations. Refer the numbers in this caption to those on the y-axis of each seasonal plot. Note that the data are not obtained for Anchorage during the summer, and so are not presented here.
January 2010 A-62
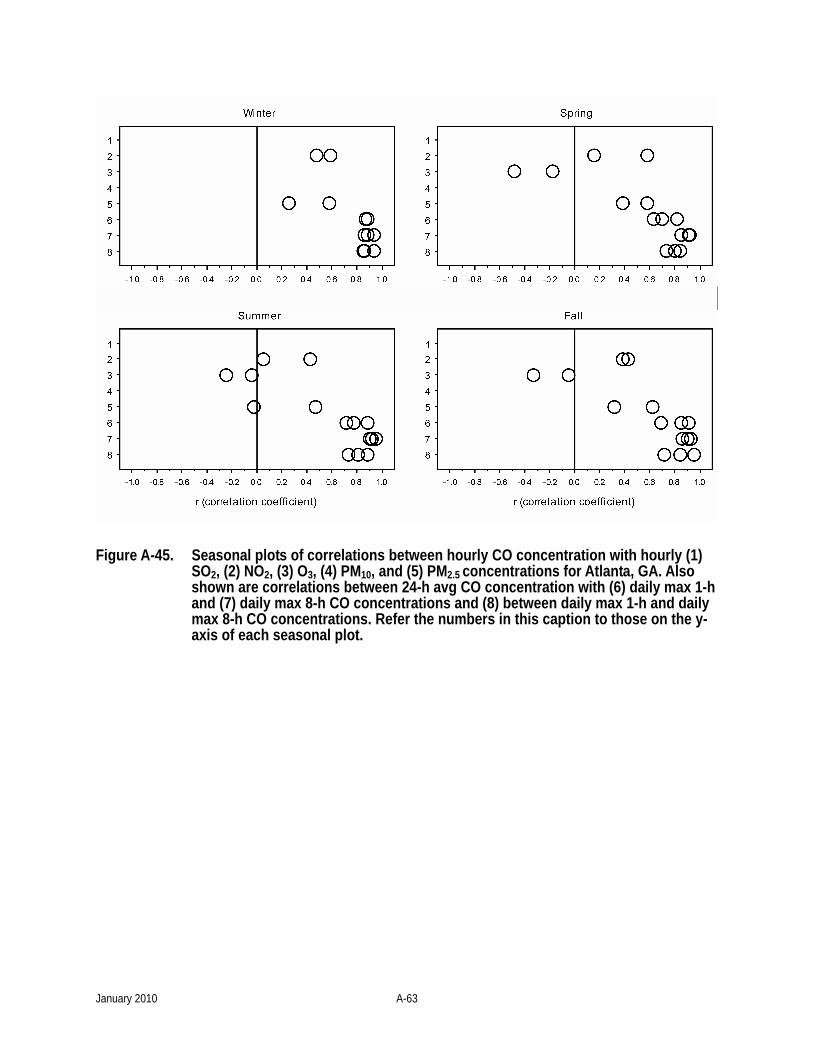
Figure A-45. Seasonal plots of correlations between hourly CO concentration with hourly (1) SO2, (2) NO2, (3) O3, (4) PM10, and (5) PM2.5 concentrations for Atlanta, GA. Also shown are correlations between 24-h avg CO concentration with (6) daily max 1-h and (7) daily max 8-h CO concentrations and (8) between daily max 1-h and daily max 8-h CO concentrations. Refer the numbers in this caption to those on the y-axis of each seasonal plot.
January 2010 A-63
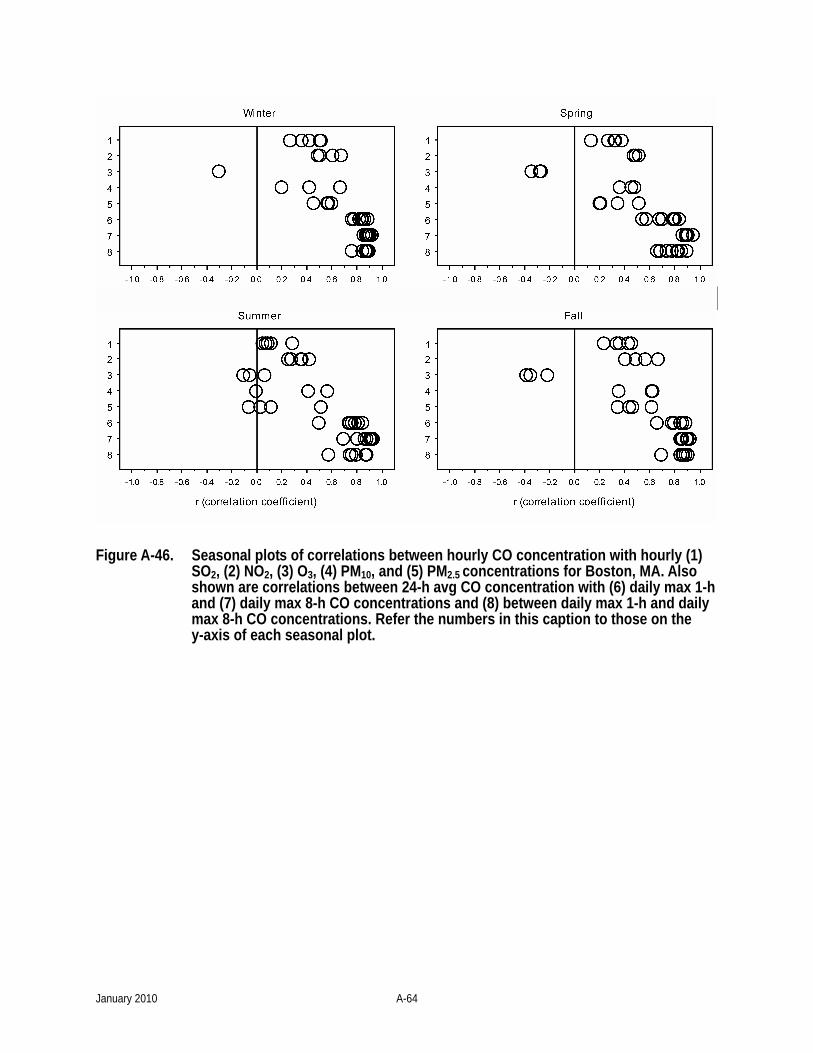
Figure A-46. Seasonal plots of correlations between hourly CO concentration with hourly (1) SO2, (2) NO2, (3) O3, (4) PM10, and (5) PM2.5 concentrations for Boston, MA. Also shown are correlations between 24-h avg CO concentration with (6) daily max 1-h and (7) daily max 8-h CO concentrations and (8) between daily max 1-h and daily max 8-h CO concentrations. Refer the numbers in this caption to those on the y-axis of each seasonal plot.
January 2010 A-64
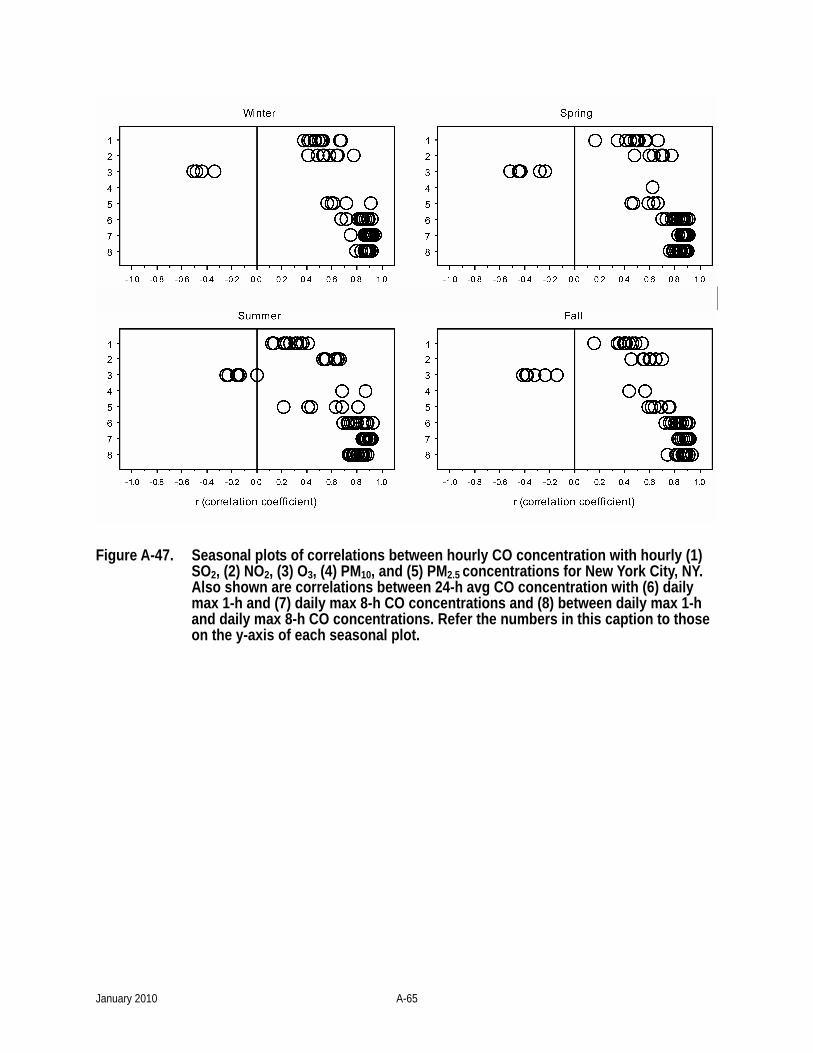
Figure A-47. Seasonal plots of correlations between hourly CO concentration with hourly (1) SO2, (2) NO2, (3) O3, (4) PM10, and (5) PM2.5 concentrations for New York City, NY. Also shown are correlations between 24-h avg CO concentration with (6) daily max 1-h and (7) daily max 8-h CO concentrations and (8) between daily max 1-h and daily max 8-h CO concentrations. Refer the numbers in this caption to those on the y-axis of each seasonal plot.
January 2010 A-65
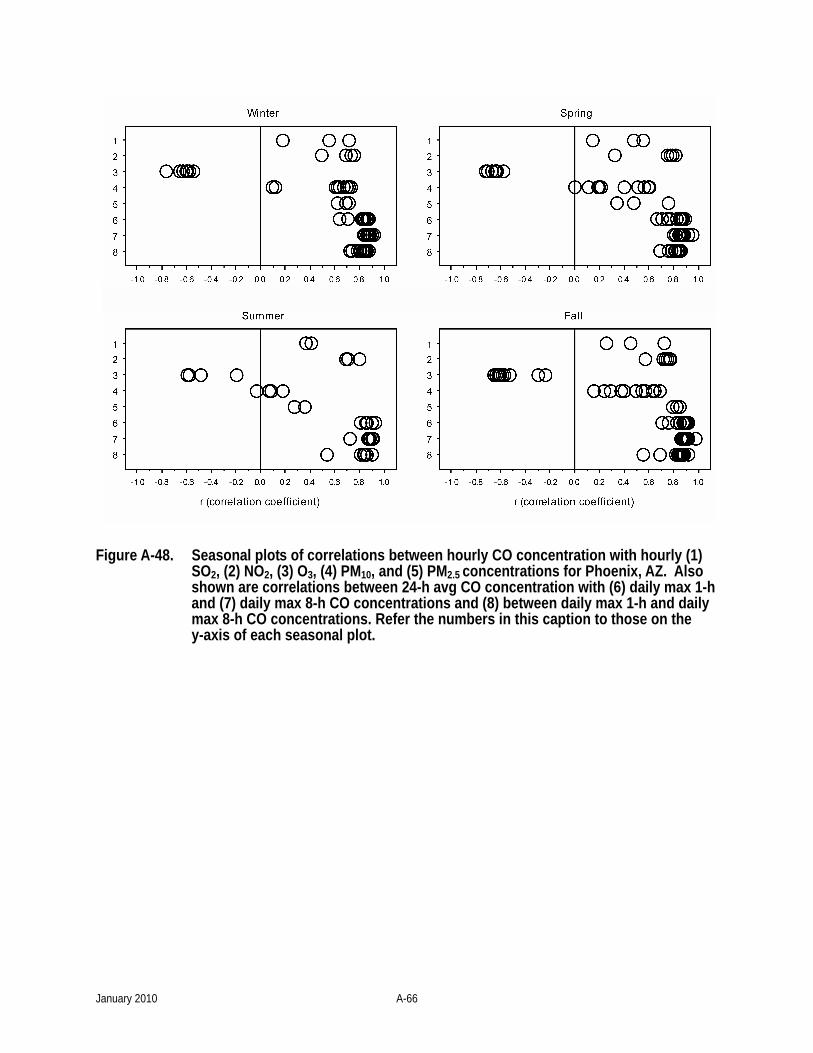
Figure A-48. Seasonal plots of correlations between hourly CO concentration with hourly (1) SO2, (2) NO2, (3) O3, (4) PM10, and (5) PM2.5 concentrations for Phoenix, AZ. Also shown are correlations between 24-h avg CO concentration with (6) daily max 1-h and (7) daily max 8-h CO concentrations and (8) between daily max 1-h and daily max 8-h CO concentrations. Refer the numbers in this caption to those on the y-axis of each seasonal plot.
January 2010 A-66
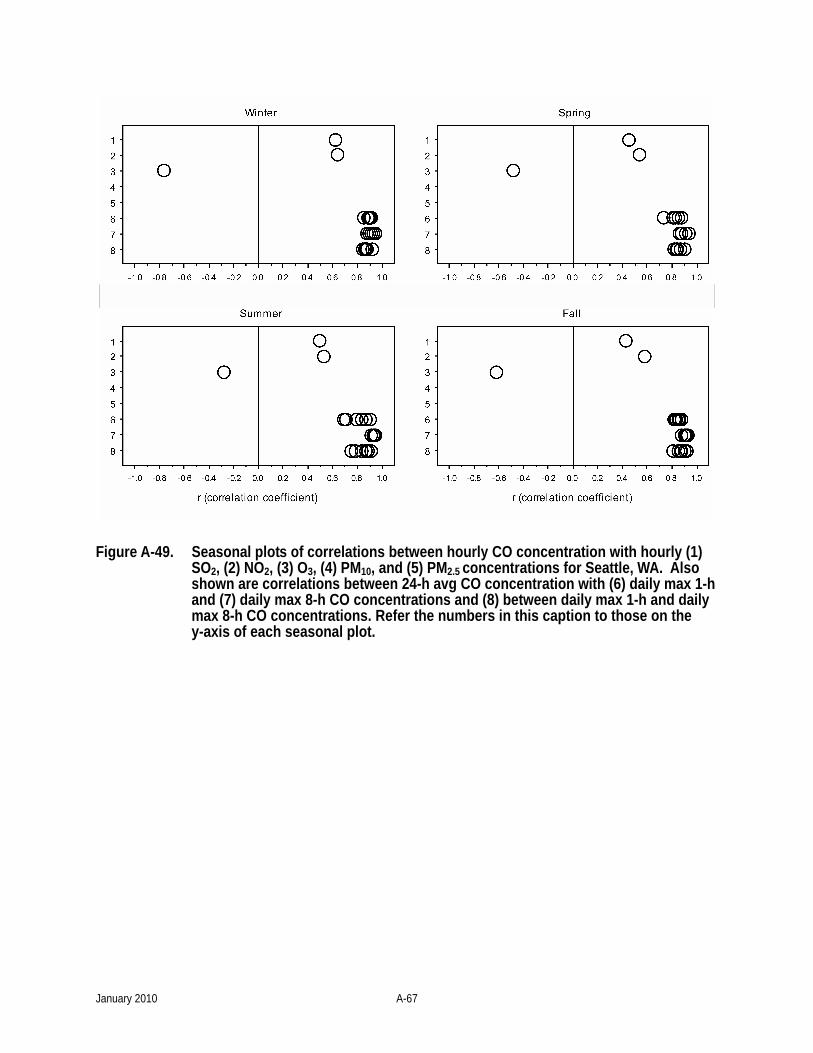
Figure A-49. Seasonal plots of correlations between hourly CO concentration with hourly (1) SO2, (2) NO2, (3) O3, (4) PM10, and (5) PM2.5 concentrations for Seattle, WA. Also shown are correlations between 24-h avg CO concentration with (6) daily max 1-h and (7) daily max 8-h CO concentrations and (8) between daily max 1-h and daily max 8-h CO concentrations. Refer the numbers in this caption to those on the y-axis of each seasonal plot.
January 2010 A-67

Figure A-50. Cross-correlation functions for each season combined across sites where CO and O3 monitors were co-located in Atlanta, Boston, Denver, Los Angeles, New York City, and Phoenix.
January 2010 A-68
Annex B. Dosimetry Studies
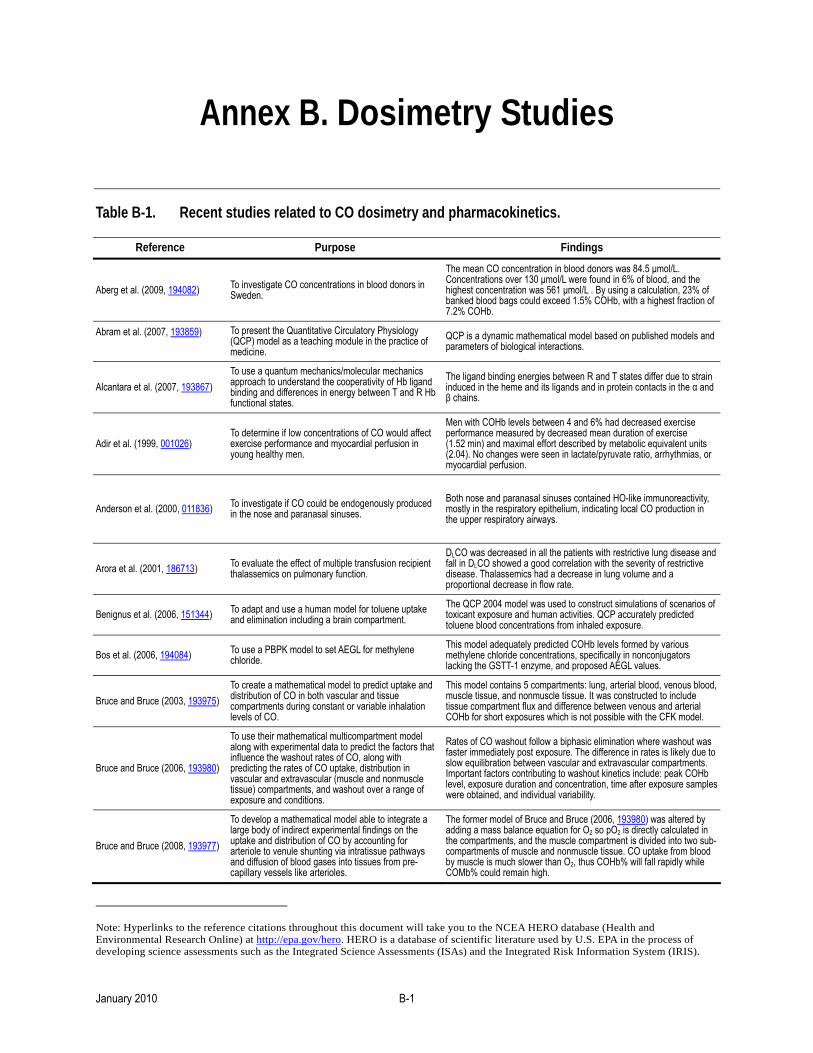
Table B-1. Recent studies related to CO dosimetry and pharmacokinetics.
Reference Purpose Findings
Aberg et al. (2009, 194082) To investigate CO concentrations in blood donors in Sweden.
The mean CO concentration in blood donors was 84.5 µmol/L. Concentrations over 130 µmol/L were found in 6% of blood, and the highest concentration was 561 µmol/L . By using a calculation, 23% of banked blood bags could exceed 1.5% COHb, with a highest fraction of 7.2% COHb.
Abram et al. (2007, 193859)
To present the Quantitative Circulatory Physiology (QCP) model as a teaching module in the practice of medicine.
QCP is a dynamic mathematical model based on published models and parameters of biological interactions.
Alcantara et al. (2007, 193867) To use a quantum mechanics/molecular mechanics approach to understand the cooperativity of Hb ligand binding and differences in energy between T and R Hb functional states.
The ligand binding energies between R and T states differ due to strain induced in the heme and its ligands and in protein contacts in the α and β chains.
Adir et al. (1999, 001026) To determine if low concentrations of CO would affect exercise performance and myocardial perfusion in young healthy men.
Men with COHb levels between 4 and 6% had decreased exercise performance measured by decreased mean duration of exercise (1.52 min) and maximal effort described by metabolic equivalent units (2.04). No changes were seen in lactate/pyruvate ratio, arrhythmias, or myocardial perfusion.
Anderson et al. (2000, 011836) To investigate if CO could be endogenously produced in the nose and paranasal sinuses.
Both nose and paranasal sinuses contained HO-like immunoreactivity, mostly in the respiratory epithelium, indicating local CO production in the upper respiratory airways.
Arora et al. (2001, 186713) To evaluate the effect of multiple transfusion recipient thalassemics on pulmonary function.
DLCO was decreased in all the patients with restrictive lung disease and fall in DLCO showed a good correlation with the severity of restrictive disease. Thalassemics had a decrease in lung volume and a proportional decrease in flow rate.
Benignus et al. (2006, 151344) To adapt and use a human model for toluene uptake and elimination including a brain compartment.
The QCP 2004 model was used to construct simulations of scenarios of toxicant exposure and human activities. QCP accurately predicted toluene blood concentrations from inhaled exposure.
Bos et al. (2006, 194084) To use a PBPK model to set AEGL for methylene chloride.
This model adequately predicted COHb levels formed by various methylene chloride concentrations, specifically in nonconjugators lacking the GSTT-1 enzyme, and proposed AEGL values.
Bruce and Bruce (2003, 193975) To create a mathematical model to predict uptake and distribution of CO in both vascular and tissue compartments during constant or variable inhalation levels of CO.
This model contains 5 compartments: lung, arterial blood, venous blood, muscle tissue, and nonmuscle tissue. It was constructed to include tissue compartment flux and difference between venous and arterial COHb for short exposures which is not possible with the CFK model.
Bruce and Bruce (2006, 193980)
To use their mathematical multicompartment model along with experimental data to predict the factors that influence the washout rates of CO, along with predicting the rates of CO uptake, distribution in vascular and extravascular (muscle and nonmuscle tissue) compartments, and washout over a range of exposure and conditions.
Rates of CO washout follow a biphasic elimination where washout was faster immediately post exposure. The difference in rates is likely due to slow equilibration between vascular and extravascular compartments. Important factors contributing to washout kinetics include: peak COHb level, exposure duration and concentration, time after exposure samples were obtained, and individual variability.
Bruce and Bruce (2008, 193977)
To develop a mathematical model able to integrate a large body of indirect experimental findings on the uptake and distribution of CO by accounting for arteriole to venule shunting via intratissue pathways and diffusion of blood gases into tissues from pre-capillary vessels like arterioles.
The former model of Bruce and Bruce (2006, 193980) was altered by adding a mass balance equation for O2 so pO2 is directly calculated in the compartments, and the muscle compartment is divided into two sub-compartments of muscle and nonmuscle tissue. CO uptake from blood by muscle is much slower than O2, thus COHb% will fall rapidly while COMb% could remain high.
Note: Hyperlinks to the reference citations throughout this document will take you to the NCEA HERO database (Health and Environmental Research Online) at http://epa.gov/hero. HERO is a database of scientific literature used by U.S. EPA in the process of developing science assessments such as the Integrated Science Assessments (ISAs) and the Integrated Risk Information System (IRIS).
January 2010 B-1
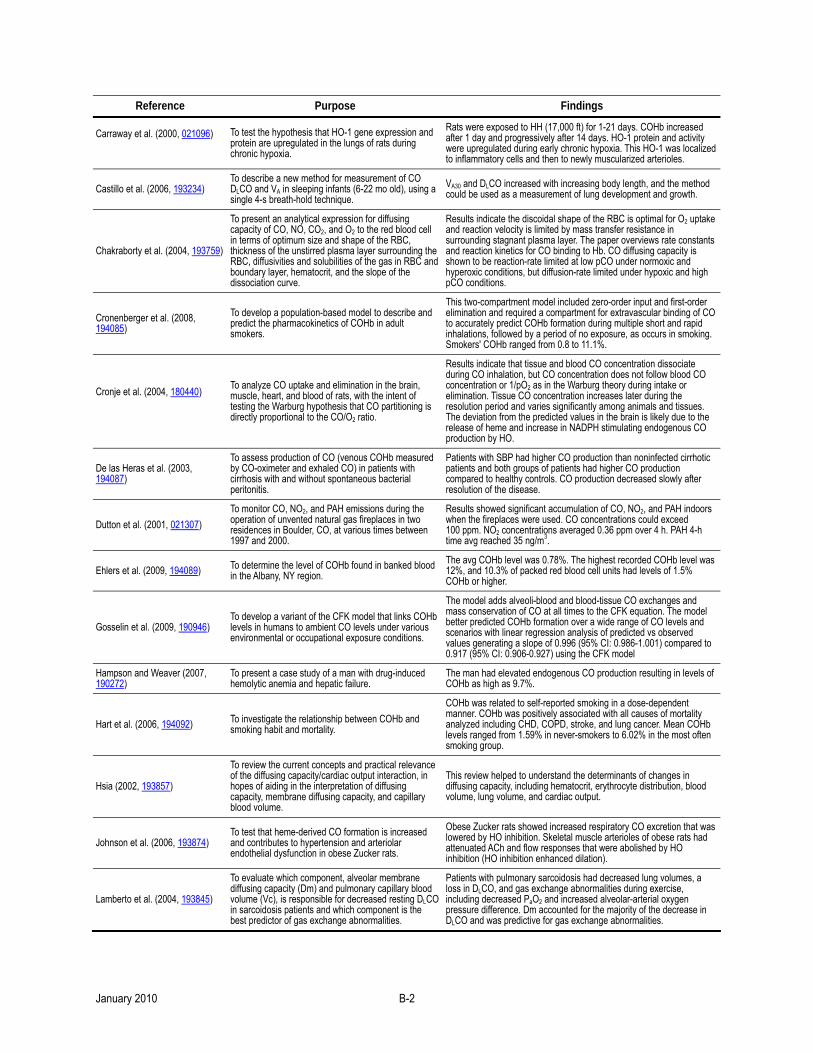
Reference Purpose Findings
Carraway et al. (2000, 021096)
To test the hypothesis that HO-1 gene expression and protein are upregulated in the lungs of rats during chronic hypoxia.
Rats were exposed to HH (17,000 ft) for 1-21 days. COHb increased after 1 day and progressively after 14 days. HO-1 protein and activity were upregulated during early chronic hypoxia. This HO-1 was localized to inflammatory cells and then to newly muscularized arterioles.
Castillo et al. (2006, 193234) To describe a new method for measurement of CO DLCO and VA in sleeping infants (6-22 mo old), using a single 4-s breath-hold technique.
VA30 and DLCO increased with increasing body length, and the method could be used as a measurement of lung development and growth.
Chakraborty et al. (2004, 193759)
To present an analytical expression for diffusing capacity of CO, NO, CO2, and O2 to the red blood cell in terms of optimum size and shape of the RBC, thickness of the unstirred plasma layer surrounding the RBC, diffusivities and solubilities of the gas in RBC and boundary layer, hematocrit, and the slope of the dissociation curve.
Results indicate the discoidal shape of the RBC is optimal for O2 uptake and reaction velocity is limited by mass transfer resistance in surrounding stagnant plasma layer. The paper overviews rate constants and reaction kinetics for CO binding to Hb. CO diffusing capacity is shown to be reaction-rate limited at low pCO under normoxic and hyperoxic conditions, but diffusion-rate limited under hypoxic and high pCO conditions.
Cronenberger et al. (2008, 194085)
To develop a population-based model to describe and predict the pharmacokinetics of COHb in adult smokers.
This two-compartment model included zero-order input and first-order elimination and required a compartment for extravascular binding of CO to accurately predict COHb formation during multiple short and rapid inhalations, followed by a period of no exposure, as occurs in smoking. Smokers' COHb ranged from 0.8 to 11.1%.
Cronje et al. (2004, 180440)
To analyze CO uptake and elimination in the brain, muscle, heart, and blood of rats, with the intent of testing the Warburg hypothesis that CO partitioning is directly proportional to the CO/O2 ratio.
Results indicate that tissue and blood CO concentration dissociate during CO inhalation, but CO concentration does not follow blood CO concentration or 1/pO2 as in the Warburg theory during intake or elimination. Tissue CO concentration increases later during the resolution period and varies significantly among animals and tissues. The deviation from the predicted values in the brain is likely due to the release of heme and increase in NADPH stimulating endogenous CO production by HO.
De las Heras et al. (2003, 194087)
To assess production of CO (venous COHb measured by CO-oximeter and exhaled CO) in patients with cirrhosis with and without spontaneous bacterial peritonitis.
Patients with SBP had higher CO production than noninfected cirrhotic patients and both groups of patients had higher CO production compared to healthy controls. CO production decreased slowly after resolution of the disease.
Dutton et al. (2001, 021307) To monitor CO, NO2, and PAH emissions during the operation of unvented natural gas fireplaces in two residences in Boulder, CO, at various times between 1997 and 2000.
Results showed significant accumulation of CO, NO2, and PAH indoors when the fireplaces were used. CO concentrations could exceed 100 ppm. NO2 concentrations averaged 0.36 ppm over 4 h. PAH 4-h time avg reached 35 ng/m3.
Ehlers et al. (2009, 194089) To determine the level of COHb found in banked blood in the Albany, NY region.
The avg COHb level was 0.78%. The highest recorded COHb level was 12%, and 10.3% of packed red blood cell units had levels of 1.5% COHb or higher.
Gosselin et al. (2009, 190946) To develop a variant of the CFK model that links COHb levels in humans to ambient CO levels under various environmental or occupational exposure conditions.
The model adds alveoli-blood and blood-tissue CO exchanges and mass conservation of CO at all times to the CFK equation. The model better predicted COHb formation over a wide range of CO levels and scenarios with linear regression analysis of predicted vs observed values generating a slope of 0.996 (95% CI: 0.986-1.001) compared to 0.917 (95% CI: 0.906-0.927) using the CFK model
Hampson and Weaver (2007, 190272)
To present a case study of a man with drug-induced hemolytic anemia and hepatic failure.
The man had elevated endogenous CO production resulting in levels of COHb as high as 9.7%.
Hart et al. (2006, 194092) To investigate the relationship between COHb and smoking habit and mortality.
COHb was related to self-reported smoking in a dose-dependent manner. COHb was positively associated with all causes of mortality analyzed including CHD, COPD, stroke, and lung cancer. Mean COHb levels ranged from 1.59% in never-smokers to 6.02% in the most often smoking group.
Hsia (2002, 193857)
To review the current concepts and practical relevance of the diffusing capacity/cardiac output interaction, in hopes of aiding in the interpretation of diffusing capacity, membrane diffusing capacity, and capillary blood volume.
This review helped to understand the determinants of changes in diffusing capacity, including hematocrit, erythrocyte distribution, blood volume, lung volume, and cardiac output.
Johnson et al. (2006, 193874) To test that heme-derived CO formation is increased and contributes to hypertension and arteriolar endothelial dysfunction in obese Zucker rats.
Obese Zucker rats showed increased respiratory CO excretion that was lowered by HO inhibition. Skeletal muscle arterioles of obese rats had attenuated ACh and flow responses that were abolished by HO inhibition (HO inhibition enhanced dilation).
Lamberto et al. (2004, 193845)
To evaluate which component, alveolar membrane diffusing capacity (Dm) and pulmonary capillary blood volume (Vc), is responsible for decreased resting DLCO in sarcoidosis patients and which component is the best predictor of gas exchange abnormalities.
Patients with pulmonary sarcoidosis had decreased lung volumes, a loss in DLCO, and gas exchange abnormalities during exercise, including decreased PaO2 and increased alveolar-arterial oxygen pressure difference. Dm accounted for the majority of the decrease in DLCO and was predictive for gas exchange abnormalities.
January 2010 B-2
Reference Purpose Findings
Levesque et al. (2000, 011886) To describe the results of air quality monitoring in an indoor ice skating rink during Monster Truck and car demolition exhibitions.
Maximum time-weighted avg levels of CO were 100 ppm, with several peaks exceeding 200 ppm (max: 1,600 ppm).
Lim et al. (2000, 126969) To investigate the expression of HO-1 and HO-2 in bronchial biopsies obtained from patients with mild asthma compared with that of subjects without asthma.
HO-1 and HO-2 expression is widely distributed equally in healthy subjects and subjects with asthma and is not modulated by inhaled corticosteroid therapy.
Mahoney et al. (1993, 013859) To compare CO-oximeter measurements of COHb against a gas chromatography reference method.
In general, the 5 CO-oximeters that were tested underestimated COHb concentrations for COHb >2.5% and overestimated COHb concentration for COHb ≤ 2.5%, when compared to reference gas chromatography method.
Marks et al. (2002, 030616) To review the analytical methods for measurement of endogenous formation of CO in a variety of tissues.
A variety of methods have been used to measure endogenous CO. The rate of formation varies over a narrow range, from 0.029 nmol/mg protein/h to 0.28 nmol/mg protein/h depending on tissue. Brain and liver regions tend to have the highest rates of CO formation, likely due to high levels of HO activity in these tissues.
Marvisi et al. (2007, 186702) To evaluate DLCO impairment and microalbuminuria in patients with active ulcerative colitis (UC) and to assess whether these tests correlate with intestinal inflammation.
Reduced DLCO was present in 67% of patients. Microalbuminuria was present in 63% of patients with ulcerative colitis.
Merx et al. (2001, 002006) To investigate the effect of CO inactivation of Mb in wild-type and myo-/- mice on hemodynamics and oxygen dynamics.
Fully oxygenated Mb treated with 20% CO had no change in left ventricular developed pressure or coronary venous pO2. Partially O2-saturated Mb (87% O2Mb) exposed to 20% CO had significantly decreased LVDP (12%) and PvO2 (30%) in wild-type but not myo-/- hearts.
Monma et al. (1999, 180426). To study whether exhaled CO levels were increased in seasonal allergic rhinitis.
Exhaled CO concentrations were higher in allergic rhinitis patients during cedar pollen season (3.6 ppm; SD 0.3 ppm) that out (1.2 ppm; SD 0.1 ppm).
Morimatsu et al. (2006, 194097) To examine exhaled CO, arterial COHb, and bilirubin IXα levels in critically ill patients.
Exhaled CO concentrations were significantly higher in critically ill patients compared to controls. There was a significant correlation between exhaled CO and COHb or bilirubin. There was no correlation between exhaled CO and disease severity or degree of inflammation. There was higher exhaled CO in survivors compared to nonsurvivors.
Muchova et al. (2007, 194098) To determine if long-term use of statins affects HO activity and blood and organ CO and bilirubin in FvB mice (6-8 wk).
Rosuvastatin and atorvastatin treatment increased COHb, plasma bilirubin, and heart tissue CO content. Both statins caused an increase in HO activity in heart tissue, whereas no changes were seen in brain or lung. Liver HO activity was inconsistent over time and between statins. Both statins decreased the heart antioxidant capacity, and changes in HO activity and antioxidant capacity can be reversed by HO inhibitor treatment.
Neto et al. (2008, 194672) To develop a model of the respiratory system to analyze CO transport in the human body submitted to several physical activity levels.
The model contains 6 compartments including: alveolar, pulmonary capillaries, arterial, venous, tissue capillary, and tissues (muscular and nonmuscular). The highest and lowest COHb levels were simulated in the walking individual, suggesting that greater variability in COHb occurs in higher physical activity levels.
Pelham et al. (2002, 025716) To review the literature on exposure and effects of mainly CO and NO2 in enclosed ice rinks.
CO levels as high as 300 ppm were recorded after episodes of malfunctioning ice resurfacing equipment or inadequate ventilation.
Paredi et al. (1999, 194102) To investigate the level of exhaled CO produced by diabetic patients.
Diabetic patients (types 1 and 2) had higher levels of exhaled CO than healthy subjects. Exhaled CO levels correlated with the incidence of glycemia and the duration of diabetes.
Paredi et al. (1999, 118798) To investigate whether cystic fibrosis patients have higher exhaled levels of CO and if this is reduced by corticosteroid therapy.
Cystic fibrosis patients had higher exhaled CO concentrations compared to healthy controls. Patients receiving corticosteroid therapy had lower exhaled CO concentrations.
Pesola et al. (2004, 193842) To determine if healthy African Americans may be misdiagnosed as having respiratory deficient due to comparison using Caucasian-derived prediction equation estimates of DLCO.
The lung volume of African-American individuals is 10-15% lower than Caucasians. The measured DLCO was consistently significantly lower in African-Americans than what would be predicted. Thus, the authors suggest a race correction reduction of the Miller PEE for diffusion of 12%.
Pesola et al. (2006, 193855) To determine if healthy Asians may be misdiagnosed as having respiratory deficient due to comparison using Caucasian-derived prediction equation estimates of DLCO.
The lung volume of Asian individuals is 10-15% lower than Caucasians. Thus a Chinese-derived prediction for DLCO should be used.
January 2010 B-3
Reference Purpose Findings
Prommer and Schmidt (2007, 180421)
To determine the error in total Hb mass measurements using the optimized CO-rebreathing method due to loss of CO to Mb
Optimal blood mixing (when venous and arterial blood COHb% are equivalent) was determined to be after 6 min. A small volume of administered CO leaves the vascular space (0.32% per min). A 2.3% increase in total Hb mass would be found if CO diffusion was not included.
Proudman et al. (2007, 186705) To review the signs of pulmonary arterial hypertension, including a drop in DLCO in patients with systemic sclerosis.
Richardson et al. (2002, 037513)
To combine invasive vascular measures of arterial and venous blood and muscle blood flow with noninvasive magnetic spectroscopy of deoxy-myoglobin and high energy phosphates to determine the effects of mild CO poisoning (20% COHb) in humans during muscular work.
Five humans were analyzed under normoxia, hypoxia, normoxia + CO (20% COHb), and 100% O2 + CO. Maximum works rates and maximal oxygen uptake were reduced in H, COnorm, and COhyper. CO and H caused elevated blood flow. Net muscle CO uptake from blood was less during 20% COHb trials than during normoxia and hypoxia (1-2%) trials.
Sakamaki et al. (2002, 186706) To evaluate the association of patients with aortic aneurysm to the prevalence obstructive airway disease.
Patients with AA had lower FEV1 and DLCO than controls. Presence of AA and male gender were associated with a higher risk of airway obstruction.
Scharte et al. (2000, 194112) To investigate whether exhaled CO concentrations are increased in critically ill patients.
Critically ill patients had higher exhaled CO concentrations and higher total CO production rates compared to healthy controls. No correlation was found between exhaled CO concentration and venous or arterial COHb.
Scharte et al. (2006, 194115) To investigate the relationship between the severity of illness and endogenous CO production in critically ill patients.
CO production rates weakly correlated with the multiple organ dysfunction score (R=0.27). Cardiac disease patients and patients undergoing dialysis produced higher amounts of CO compared to critically ill control patients.
Schachter et al. (2003, 186707) To evaluate the association between severe gastroesophageal reflux and lung function.
Patients with severe gastroesophageal reflux had reduced DLCO, remaining significant after adjusting for age, gender, BMI, and smoking.
Shimazu et al. (2000, 016420) To study the effects of short-term (min) or long-term (several h) CO exposure on COHb elimination and developing a mathematical model to simulate this event.
COHb exhibited an initial rapid decrease followed by a slower phase which is compatible with a 2-compartment model and biphasic elimination. Both exposures fit the 2-compartment, single-central-outlet mathematical model.
Shimazu (2001, 016331) To discuss the findings of Weaver et al. (2000, 016421) on COHb t1/2.
The authors discuss that CO elimination is biphasic and is heavily affected by duration of exposure which was not taken into account in the Weaver et al. (2000, 016421) paper.
Sylvester et al. (2005, 191954) To assess the usage of end tidal CO levels in children with sickle cell disease for measurement of hemolysis.
Children with sickle cell disease had higher exhaled CO levels (4.9 ppm; SD 1.7 ppm) compared to healthy controls (1.3 ppm; SD 0.4 ppm). A positive correlation existed between end-tidal CO levels and COHb and bilirubin.
Takeuchi et al. (2000, 005675) To examine the relationship between min ventilation and rate of COHb reduction during breathing 100% O2 and during normocapnic hyperoxic hyperpnea.
Patients were exposed to 400-1,000 ppm CO, resulting in 10-12% COHb. The half-time of COHb reduction was 78 ± 24 min during 100% O2 treatment and 31 ± 6 min during normocapnic hyperpnea with O2 treatment.
Tarquini et al. (2009, 194117) To measure plasma CO levels in patients with liver cirrhosis and portal hypertension.
Plasma CO was higher in ascetic patients than nonascitic patients and both were higher than healthy controls. HO activity was higher in cirrhotic patients than healthy subjects and highest in patients with ascites.
Terzano et al. (2009, 108046) To investigate the effect of postural changes on gas exchange in patients with COPD and healthy subjects.
DLCO increased in healthy individuals from upright to supine position and upright to prone position. DLCO did not significantly change in COPD patients from upright to prone position. This is explained by homogeneous perfusion in healthy individuals and increased rigidity of lung capillaries due to COPD.
Tran et al. (2007, 194120) To assess the correlation of COHb to severity of liver disease.
No correlation was found with the Model for End Stage Liver Disease score, Child Turcotte Pugh score, or other biochemical or clinical measures of disease severity, such as spleen size, bilirubin, disease duration, or AST/ALT. The mean COHb was 2.1%.
Vreman et al. (2005, 193786) To develop a sensitive and reproducible method of CO quantification in rodent (mouse and rat) tissue pre- and postexposure in hopes of understanding endogenous CO production.
Tissues were sonicated mixed with sulfosalicylic acid for 30 min at 0°C and then liberated CO was analyzed by gas chromatograph. Blood contained the highest CO concentration. Lowest concentrations were found in brain, testes, intestine, and lung (endogenously).
Vreman et al. (2006, 098272) To test a method of CO quantification in frozen postmortem human tissues from 3 determined categories of fatalities: trauma with no suspected CO exposure (controls), fire-related, and CO asphyxiation.
CO levels were analyzed in adipose, brain, muscle, heart, kidney, lung, spleen, and blood (ordered from approximate low to high tissue concentration). It was suggested that blood, muscle, brain, lung, and kidney are suitable for diagnosing death due to lethal CO exposure due to regression analysis against COHb values.
January 2010 B-4

Reference Purpose Findings
Weaver et al. (2000, 016421) To determine in COHb half-life is influenced by CO poisoning vs experimental CO exposure, loss of consciousness, concurrent tobacco smoking, or PaO2.
COHb t1/2 determined was 74 ± 25 min with a range from 26 to 148 min by a single exponential decrease function. This is shorter than most clinical studies and was inversely proportionate to PaO2, however, not influenced by age, gender, smoke inhalation, loss of consciousness, tobacco smoking, or method of O2 treatment.
Whincup et al. (2006, 195129) To report COHb levels from a population-based study in men aged 60-79 yr during the 20-yr follow-up of the British Regional Heart Study cohort.
Mean COHb: 0.46%; Median COHb: 0.5%
9.2% of men had COHb levels of 2.5% or greater (93% were smokers)
0.1% of men had COHb levels of 7.5% or greater
Smoking is the highest influence on COHb levels; however, other factors independently related were season, region, gas cooking and central heating, and active smoking
Widdop (2002, 030493) To review carbon monoxide analysis methods, including CO-oximeters and gas chromatography.
Wu and Wang (2005, 180411) To review the endogenous production of CO through HO, as well as discuss physiological roles for CO both toxic and therapeutic.
CO is produced endogenously by HO-1 and -2 and acts as a gasotransmitter, inducing cell signaling cascades. The review discusses possible roles for CO in the various organ systems and the potential pharmacological and therapeutic applications for CO.
Yamaya et al. (1998, 047525) To determine whether upper respiratory tract infections increase exhaled CO concentrations.
Exhaled CO increased in patients at the time of upper respiratory tract infection symptoms but decreased to nonsmoking healthy control levels during recovery.
Yamaya et al. (2001, 180130) To determine whether the level of CO is related to the severity of asthma.
Severe asthmatics exhaled more CO than nonsmoking controls. Exhaled CO concentrations in unstable severe asthmatics were higher than in stable severe asthmatics. Mild and moderate asthmatics did not differ from controls. Exhaled CO was correlated with FEV1 in all asthmatics.
Yasuda et al. (2002, 035206) To determine whether arterial COHb is increased in patients with inflammatory pulmonary diseases.
Arterial COHb concentrations are increased in patients with inflammatory pulmonary diseases, including exacerbated bronchial asthma (1.05%), pneumonia (1.08%), and idiopathic pulmonary fibrosis (1.03%) over controls (0.6%).
Yasuda et al. (2004, 191955)
To determine if COHb levels in the venous blood and arteriovenous COHb (a-vCOHb) differences are increased in patients with inflammatory pulmonary diseases compared to patients with extrapulmonary inflammation and control subjects.
Patients with inflammatory pulmonary diseases, including bronchial asthma and pneumonia, had a large a-vCOHb difference. Both arterial and venous blood COHb increased in patients with inflammatory pulmonary disease, such as bronchial asthma, pneumonia, pyelonephritis and active rheumatoid arthritis.
Yasuda et al. (2005, 102183) To study the relationship between COHb and disease severity in patients with COPD.
COHb concentrations increased in patients with COPD at a stable condition over controls and patients with COPD with exacerbations were further increased.
Yerushalmi et al. (2009, 186711) To evaluate the association of dose-dense chemotherapy in breast cancer patients with pulmonary dysfunction.
Patients receiving dose-dense chemotherapy for breast cancer had a significant reduction in DLCO.
Zegdi et al. (2002, 037461) To compare endogenous CO production in mechanically ventilated critically ill adult patients with and without severe sepsis.
CO production was higher in septic patients during the first 3 days of treatment compared to controls. Survivors of sepsis had a significantly higher CO production compared to nonsurvivors.
January 2010 B-5
References
Aberg AM; Sojka BN; Winsö O; Abrahamsson P; Johansson G; Larsson JE (2009). Carbon monoxide concentration in donated blood: Relation to cigarette smoking and other sources. Transfusion, 49: 347-353. 194082
Abram SR; Hodnett BL; Summers RL; Coleman TG; Hester RL (2007). Quantitative circulatory physiology: An integrative mathematical model of human physiology for medical education. Adv Physiol Educ, 31: 202-210. 193859
Adir Y; Merdler A; Haim SB; Front A; Harduf R; Bitterman H (1999). Effects of exposure to low concentrations of carbon monoxide on exercise performance and myocardial perfusion in young healthy men. Occup Environ Med, 56: 535-538. 001026
Alcantara RE; Xu C; Spiro TG; Guallar V (2007). A quantum-chemical picture of hemoglobin affinity. PNAS, 104: 18451-18455. 193867
Andersson JA; Uddman R; Cardell L-O (2000). Carbon monoxide is endogenously produced in the human nose and paranasal sinuses. J Allergy Clin Immunol, 105: 269-273. 011836
Arora M; Chandra J; Suri JC; Narayan S; Dutta AK (2001). Pulmonary function tests in beta thalassemia. Indian J Pediatr, 68: 239-242. 186713
Benignus VA; Coleman T; Eklund CR; Kenyon EM (2006). A general physiological and toxicokinetic (GPAT) model for simulating complex toluene exposure scenarios in humans. Toxicol Mech Meth, 16: 27-36. 151344
Bos PM; Zeilmaker MJ; van Eijkeren JC (2006). Application of physiologically based pharmacokinetic modeling in setting acute exposure guideline levels for methylene chloride. Toxicol Sci, 91: 576-585. 194084
Bruce EN; Bruce MC (2003). A multicompartment model of carboxyhemoglobin and carboxymyoglobin responses to inhalation of carbon monoxide. J Appl Physiol, 95: 1235-1247. 193975
Bruce EN; Bruce MC; Erupaka K (2008). Prediction of the rate of uptake of carbon monoxide from blood by extravascular tissues. Respir Physiol Neurobiol, 161: 142-159. 193977
Bruce MC; Bruce EN (2006). Analysis of factors that influence rates of carbon monoxide uptake, distribution, and washout from blood and extravascular tissues using a multicompartment model. J Appl Physiol, 100: 1171-1180. 193980
Carraway MS; Ghio AJ; Carter JD; Piantadosi CA (2000). Expression of heme oxygenase-1 in the lung in chronic hypoxia. Am J Physiol, 278: L806-L812. 021096
Castillo A; Llapur CJ; Martinez T; Kisling J; Williams-Nkomo T; Coates C; Tepper RS (2006). Measurement of single breath-hold carbon monoxide diffusing capacity in healthy infants and toddlers. Pediatr Pulmonol, 41: 544-550 . 193234
Chakraborty S; Balakotaiah V; Bidani A (2004). Diffusing capacity reexamined: relative roles of diffusion and chemical reaction in red cell uptake of O2, CO, CO2, and NO. J Appl Physiol, 97: 2284-2302. 193759
Cronenberger C; Mould DR; Roethig HJ; Sarkar M (2008). Population pharmacokinetic analysis of carboxyhaemoglobin concentrations in adult cigarette smokers. Br J Clin Pharmacol, 65: 30-39. 194085
Cronje FJ; Carraway MS; Freiberger JJ; Suliman HB; Piantadosi CA (2004). Carbon monoxide actuates O2-limited heme degradation in the rat brain. Free Radic Biol Med, 37: 1802-1812. 180440
De las Heras D; Fernández J; Ginès P; Cárdenas A; Ortega R; Navasa M; Barberá JA; Calahorra B; Guevara M; Bataller R; Jiménez W; Arroyo V; Rodés J (2003). Increased carbon monoxide production in patients with cirrhosis with and without spontaneous bacterial peritonitis. Hepatology, 38: 452-459. 194087
Dutton SJ; Hannigan MP; Miller SL (2001). Indoor pollutant levels from the use of unvented natural gas fireplaces in Boulder, Colorado. J Air Waste Manag Assoc, 51: 1654-1661. 021307
Note: Hyperlinks to the reference citations throughout this document will take you to the NCEA HERO database (Health and Environmental Research Online) at http://epa.gov/hero. HERO is a database of scientific literature used by U.S. EPA in the process of developing science assessments such as the Integrated Science Assessments (ISAs) and the Integrated Risk Information System (IRIS).
January 2010 B-6
Ehlers M; Labaze G; Hanakova M; McCloskey D; Wilner G (2009). Alarming levels of carboxyhemoglobin in banked blood. J Cardiothorac Vasc Anesth, 23: 336-338 . 194089
Gosselin NH; Brunet RC; Carrier G (2009). Determination of carboxyhaemoglobin in humans following low-level exposures to carbon monoxide. Inhal Toxicol, 21: 1077-1091. 190946
Hampson NB; Weaver LK (2007). Carbon monoxide poisoning: a new incidence for an old disease. Undersea Hyperb Med, 34: 163-168. 190272
Hart CL; Smith GD; Hole DJ; Hawthorne VM (2006). Carboxyhaemoglobin concentration, smoking habit, and mortality in 25 years in the Renfrew/Paisley prospective cohort study. Heart, 92: 321-324. 194092
Hsia CC (2002). Recruitment of lung diffusing capacity: Update of concept and application. Chest, 122: 1774-1783. 193857
Johnson FK; Johnson RA; Durante W; Jackson KE; Stevenson BK; Peyton KJ (2006). Metabolic syndrome increases endogenous carbon monoxide production to promote hypertension and endothelial dysfunction in obese Zucker rats. Am J Physiol Regul Integr Comp Physiol, 290: 601-608. 193874
Lamberto C; Nunes H; Le Toumelin P; Duperron F; Valeyre D; Clerici C (2004). Membrane and capillary blood components of diffusion capacity of the lung for carbon monoxide in pulmonary sarcoidosis: relation to exercise gas exchange. Chest, 125: 2061-2068. 193845
Levesque B; Allaire S; Prud'homme H; Dupuis K; Bellemare D (2000). Air quality monitoring during indoor monster truck and car demolition shows. J Expo Sci Environ Epidemiol, 10: 58-65. 011886
Lim S; Groneberg D; Fischer A; Oates T; Caramori G; Mattos W; Adcock I; Barnes PJ; Chung KF (2000). Expression of heme oxygenase isoenzymes 1 and 2 in normal and asthmatic airways: Effect of inhaled corticosteroids. Am J Respir Crit Care Med, 162: 1912-1918. 126969
Mahoney JJ; Vreman HJ; Stevenson DK; Van Kessel AL (1993). Measurement of carboxyhemoglobin and total hemoglobin by five specialized spectrophotometers (CO-oximeters) in comparison with reference methods. Clin Chem, 39: 1693-1700. 013859
Marks GS; Vreman HJ; McLaughlin BE; Brien JF; Nakatsu K (2002). Measurement of endogenous carbon monoxide formation in biological systems. Antioxid Redox Signal, 4: 271-277. 030616
Marvisi M; Bassi E; Bonassi R; Civardi G; Delsignore R (2007). DLCO correlates with intestinal inflammation in ulcerative colitis, but albuminuria does not. Minerva Gastroenterol Dietol, 53: 321-7. 186702
Merx MW; Flogel U; Stumpe T; Godecke A; Decking UK; Schrader J (2001). Myoglobin facilitates oxygen diffusion. FASEB J, 15: 1077-1079. 002006
Monma M; Yamaya M; Sekizawa K; Ikeda K; Suzuki N; Kikuchi T; Takasaka T; Sasaki H (1999). Increased carbon monoxide in exhaled air of patients with seasonal allergic rhinitis. Clin Exp Allergy, 29: 1537-1541. 180426
Morimatsu H; Takahashi T; Maeshima K; Inoue K; Kawakami T; Shimizu H; Takeuchi M; Yokoyama M; Katayama H; Morita K (2006). Increased heme catabolism in critically ill patients: Correlation among exhaled carbon monoxide, arterial carboxyhemoglobin, and serum bilirubin IXalpha concentrations. Am J Physiol Lung Cell Mol Physiol, 290: L114-L119. 194097
Muchova L; Wong RJ; Hsu M; Morioka I; Vitek L; Zelenka J; Schröder H; Stevenson DK (2007). Statin treatment increases formation of carbon monoxide and bilirubin in mice: A novel mechanism of in vivo antioxidant protection. Can J Physiol Pharmacol, 85: 800-810. 194098
Neto CA; Yanagihara JI; Turri F (2008). A carbon monoxide transport model of the human respiratory system applied to urban atmosphere exposure analysis. J Braz Soc Mech Sci & Eng, 30: 253-260. 194672
Paredi P; Biernacki W; Invernizzi G; Kharitonov SA; Barnes PJ (1999). Exhaled carbon monoxide levels elevated in diabetes and correlated with glucose concentration in blood: A new test for monitoring the disease? Chest, 116: 1007-1011. 194102
Paredi P; Shah PL; Montuschi P; Sullivan P; Hodson ME; Kharitonov SA; Barnes PJ (1999). Increased carbon monoxide in exhaled air of patients with cystic fibrosis. Thorax, 54: 917-20. 118798
Pelham TW; Holt LE; Moss MA (2002). Exposure to carbon monoxide and nitrogen dioxide in enclosed ice arenas. Occup Environ Med, 59: 224-233. 025716
January 2010 B-7
Pesola GR; Huggins G; Sherpa TY (2006). Abnormal predicted diffusion capacities in healthy Asians: an inequality with a solution. Respiration, 73: 799-807. 193855
Pesola GR; Sunmonu Y; Huggins G; Ford JG (2004). Measured diffusion capacity versus prediction equation estimates in blacks without lung disease. Respiration, 71: 484-492. 193842
Prommer N; Schmidt (2007). Loss of CO from the intravascular bed and its impact on the optimised CO-rebreathing method. Eur J Appl Physiol, 100: 383-391. 180421
Proudman SM; Stevens WM; Sahhar J; Celermajer D (2007). Pulmonary arterial hypertension in systemic sclerosis: the need for early detection and treatment. J Intern Med, 37: 485-94. 186705
Richardson RS; Noyszewski EA; Saltin B; Gonzalez-Alonso J (2002). Effect of mild carboxy-hemoglobin on exercising skeletal muscle: Intravascular and intracellular evidence. Am J Physiol, 283: R1131-R1139. 037513
Sakamaki F; Oya H; Nagaya N; Kyotani S; Satoh T; Nakanishi N (2002). Higher prevalence of obstructive airway disease in patients with thoracic or abdominal aortic aneurysm. J Vasc Surg, 36: 35-40. 186706
Schachter LM; Dixon J; Pierce RJ; O'Brien P (2003). Severe gastroesophageal reflux is associated with reduced carbon monoxide diffusing capacity. Chest, 123: 1932-8. 186707
Scharte M; Bone HG; Van Aken H; Meyer J (2000). Increased carbon monoxide in exhaled air of critically ill patients. Biochem Biophys Res Commun, 267: 423-426. 194112
Scharte M; von Ostrowski TA; Daudel F; Freise H; Van Aken H; Bone HG (2006). Endogenous carbon monoxide production correlates weakly with severity of acute illness. Eur J Anaesthesiol, 23: 117-122. 194115
Shimazu T (2001). Half-life of blood carboxyhemoglobin. Chest, 119: 661-663. 016331
Shimazu T; Ikeuchi H; Sugimoto H; Goodwin CW; Mason AD Jr; Pruitt BA Jr (2000). Half-life of blood carboxyhemoglobin after short-term and long-term exposure to carbon monoxide. J Trauma, 49: 126-131. 016420
Sylvester KP; Patey RA; Rafferty GF; Rees D; Thein SL; Greenough A (2005). Exhaled carbon monoxide levels in children with sickle cell disease. Eur J Pediatr, 164: 162-165. 191954
Takeuchi A; Vesely A; Rucker J; Sommer LZ; Tesler J; Lavine E; Slutsky AS; Maleck WA; Volgyesi G; Fedorko L; Iscoe S; Fisher JA (2000). A simple "new" method to accelerate clearance of carbon monoxide. Am J Respir Crit Care Med, 161: 1816-1819. 005675
Tarquini R; Masini E; La Villa G; Barletta G; Novelli M; Mastroianni R; Romanelli RG; Vizzutti F; Santosuosso U; Laffi G (2009). Increased plasma carbon monoxide in patients with viral cirrhosis and hyperdynamic circulation. Am J Gastroenterol, 104: 891-897. 194117
Terzano C; Conti V; Petroianni A; Ceccarelli D; De Vito C; Villari P (2009). Effect of Postural Variations on Carbon Monoxide Diffusing Capacity in Healthy Subjects and Patients with Chronic Obstructive Pulmonary Disease. Respiration, 77: 51-57. 108046
Tran TT; Martin P; Ly H; Balfe D; Mosenifar Z (2007). Carboxyhemoglobin and its correlation to disease severity in cirrhotics. J Clin Gastroenterol, 41: 211-215. 194120
Vreman HJ; Wong RJ; Kadotani T; Stevenson DK (2005). Determination of carbon monoxide (CO) in rodent tissue: effect of heme administration and environmental CO exposure. Anal Biochem, 341: 280-289. 193786
Vreman HJ; Wong RJ; Stevenson DK; Smialek JE; Fowler DR; Li L; Vigorito RD; Zielke HR (2006). Concentration of Carbon Monoxide (CO) in Postmortem Human Tissues: Effect of Environmental CO Exposure. J Forensic Sci, 51: 1182-1190. 098272
Weaver LK; Howe S; Hopkins R; Chan K (2000). Carboxyhemoglobin half-life in carbon monoxide-poisoned patients treated with 100% oxygen at atmospheric pressure. Chest, 117: 801-808. 016421
Whincup P; Papacosta O; Lennon L; Haines A (2006). Carboxyhaemoglobin levels and their determinants in older British men. BMC Public Health, 6: 189-197. 195129
Widdop B (2002). Analysis of carbon monoxide. Ann Clin Biochem, 39: 378-391. 030493
Wu L; Wang R (2005). Carbon monoxide: endogenous production, physiological functions, and pharmacological applications. Pharmacol Rev, 57: 585-630. 180411
January 2010 B-8
Yamaya M; Hosoda M; Ishizuka S; Monma M; Matsui T; Suzuki T; Sekizawa K; Sasaki H (2001). Relation between exhaled carbon monoxide levels and clinical severity of asthma. Clin Exp Allergy, 31: 417-422. 180130
Yamaya M; Sekizawa K; Ishizuka S; Monma M; Mizuta K; Sasaki H (1998). Increased carbon monoxide in exhaled air of subjects with upper respiratory tract infections. Am J Respir Crit Care Med, 158: 311-314. 047525
Yasuda H; Sasaki T; Yamaya M; Ebihara S; Maruyama M; Kanda A; Sasaki H (2004). Increased arteriovenous carboxyhemoglobin differences in patients with inflammatory pulmonary diseases. Chest, 125: 2160-2168. 191955
Yasuda H; Yamaya M; Nakayama K; Sasaki H (2005). Blood carbon monoxide will increase from a decline in pulmonary function alone 7. Am J Respir Crit Care Med, 172: 1231-1232. 102183
Yasuda H; Yamaya M; Yanai M; Ohrui T; Sasaki H (2002). Increased blood carboxyhaemoglobin concentrations in inflammatory pulmonary diseases. Thorax, 57: 779-783. 035206
Yerushalmi R; Kramer MR; Rizel S; Sulkes A; Gelmon K; Granot T; Neiman V; Stemmer SM (2009). Decline in pulmonary function in patients with breast cancer receiving dose-dense chemotherapy: a prospective study. Ann Oncol, 20: 437-440. 186711
Zegdi R; Perrin D; Burdin M; Boiteau R; Tenaillon A (2002). Increased endogenous carbon monoxide production in severe sepsis. Intensive Care Med, 28: 793-796. 037461
January 2010 B-9
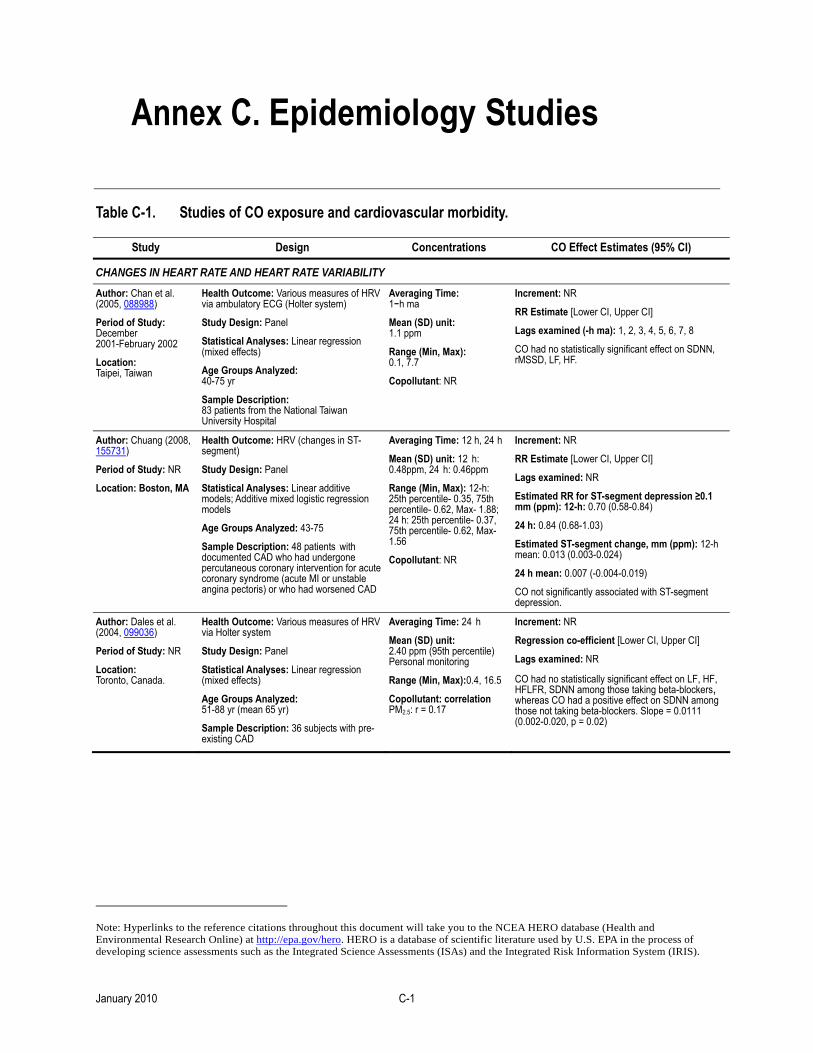
Annex C. Epidemiology Studies
Table C-1. Studies of CO exposure and cardiovascular morbidity.
Study Design Concentrations CO Effect Estimates (95% CI)
CHANGES IN HEART RATE AND HEART RATE VARIABILITY Author: Chan et al. (2005, 088988)
Period of Study: December 2001-February 2002
Location: Taipei, Taiwan
Health Outcome: Various measures of HRV via ambulatory ECG (Holter system)
Study Design: Panel
Statistical Analyses: Linear regression (mixed effects)
Age Groups Analyzed: 40-75 yr
Sample Description: 83 patients from the National Taiwan University Hospital
Averaging Time: 1-h ma
Mean (SD) unit: 1.1 ppm
Range (Min, Max): 0.1, 7.7
Copollutant: NR
Increment: NR
RR Estimate [Lower CI, Upper CI]
Lags examined (-h ma): 1, 2, 3, 4, 5, 6, 7, 8
CO had no statistically significant effect on SDNN, rMSSD, LF, HF.
Author: Chuang (2008, 155731)
Period of Study: NR
Location: Boston, MA
Health Outcome: HRV (changes in ST-segment)
Study Design: Panel
Statistical Analyses: Linear additive models; Additive mixed logistic regression models
Age Groups Analyzed: 43-75 Sample Description: 48 patients with documented CAD who had undergone percutaneous coronary intervention for acute coronary syndrome (acute MI or unstable angina pectoris) or who had worsened CAD
Averaging Time: 12 h, 24 h
Mean (SD) unit: 12 h: 0.48ppm, 24 h: 0.46ppm Range (Min, Max): 12-h: 25th percentile- 0.35, 75th percentile- 0.62, Max- 1.88; 24 h: 25th percentile- 0.37, 75th percentile- 0.62, Max- 1.56
Copollutant: NR
Increment: NR
RR Estimate [Lower CI, Upper CI]
Lags examined: NR
Estimated RR for ST-segment depression ≥0.1 mm (ppm): 12-h: 0.70 (0.58-0.84)
24 h: 0.84 (0.68-1.03)
Estimated ST-segment change, mm (ppm): 12-h mean: 0.013 (0.003-0.024)
24 h mean: 0.007 (-0.004-0.019)
CO not significantly associated with ST-segment depression.
Author: Dales et al. (2004, 099036)
Period of Study: NR
Location: Toronto, Canada.
Health Outcome: Various measures of HRV via Holter system
Study Design: Panel
Statistical Analyses: Linear regression (mixed effects)
Age Groups Analyzed: 51-88 yr (mean 65 yr)
Sample Description: 36 subjects with pre-existing CAD
Averaging Time: 24 h
Mean (SD) unit: 2.40 ppm (95th percentile) Personal monitoring
Range (Min, Max):0.4, 16.5
Copollutant: correlation PM2.5: r = 0.17
Increment: NR
Regression co-efficient [Lower CI, Upper CI]
Lags examined: NR
CO had no statistically significant effect on LF, HF, HFLFR, SDNN among those taking beta-blockers, whereas CO had a positive effect on SDNN among those not taking beta-blockers. Slope = 0.0111 (0.002-0.020, p = 0.02)
Note: Hyperlinks to the reference citations throughout this document will take you to the NCEA HERO database (Health and Environmental Research Online) at http://epa.gov/hero. HERO is a database of scientific literature used by U.S. EPA in the process of developing science assessments such as the Integrated Science Assessments (ISAs) and the Integrated Risk Information System (IRIS).
January 2010 C-1
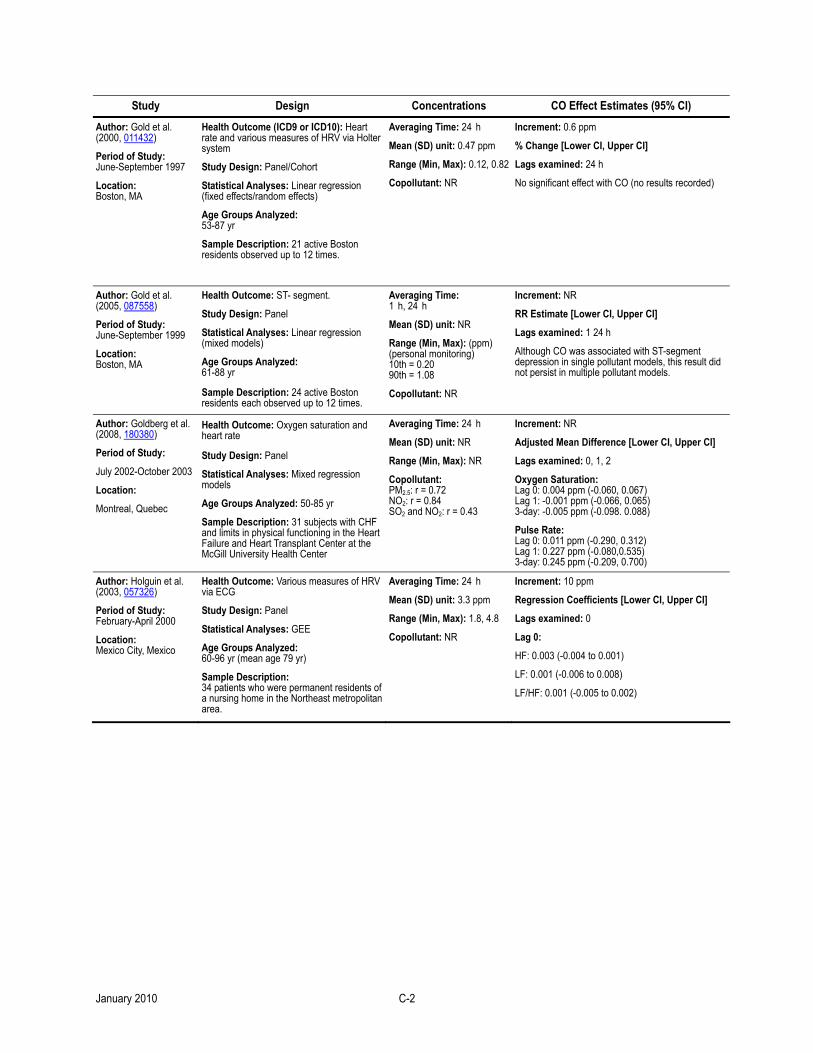
Study Design Concentrations CO Effect Estimates (95% CI)
Author: Gold et al. (2000, 011432)
Period of Study: June-September 1997
Location: Boston, MA
Health Outcome (ICD9 or ICD10): Heart rate and various measures of HRV via Holter system
Study Design: Panel/Cohort
Statistical Analyses: Linear regression (fixed effects/random effects)
Age Groups Analyzed: 53-87 yr
Sample Description: 21 active Boston residents observed up to 12 times.
Averaging Time: 24 h
Mean (SD) unit: 0.47 ppm
Range (Min, Max): 0.12, 0.82
Copollutant: NR
Increment: 0.6 ppm
% Change [Lower CI, Upper CI]
Lags examined: 24 h
No significant effect with CO (no results recorded)
Author: Gold et al. (2005, 087558)
Period of Study: June-September 1999
Location: Boston, MA
Health Outcome: ST- segment.
Study Design: Panel
Statistical Analyses: Linear regression (mixed models)
Age Groups Analyzed: 61-88 yr
Sample Description: 24 active Boston residents each observed up to 12 times.
Averaging Time: 1 h, 24 h
Mean (SD) unit: NR
Range (Min, Max): (ppm) (personal monitoring) 10th = 0.20 90th = 1.08
Copollutant: NR
Increment: NR
RR Estimate [Lower CI, Upper CI]
Lags examined: 1 24 h
Although CO was associated with ST-segment depression in single pollutant models, this result did not persist in multiple pollutant models.
Author: Goldberg et al. (2008, 180380)
Period of Study:
July 2002-October 2003
Location:
Montreal, Quebec
Health Outcome: Oxygen saturation and heart rate
Study Design: Panel
Statistical Analyses: Mixed regression models
Age Groups Analyzed: 50-85 yr
Sample Description: 31 subjects with CHF and limits in physical functioning in the Heart Failure and Heart Transplant Center at the McGill University Health Center
Averaging Time: 24 h
Mean (SD) unit: NR
Range (Min, Max): NR
Copollutant: PM2.5: r = 0.72 NO2: r = 0.84 SO2 and NO2: r = 0.43
Increment: NR
Adjusted Mean Difference [Lower CI, Upper CI]
Lags examined: 0, 1, 2
Oxygen Saturation: Lag 0: 0.004 ppm (-0.060, 0.067) Lag 1: -0.001 ppm (-0.066, 0.065) 3-day: -0.005 ppm (-0.098. 0.088)
Pulse Rate: Lag 0: 0.011 ppm (-0.290, 0.312) Lag 1: 0.227 ppm (-0.080,0.535) 3-day: 0.245 ppm (-0.209, 0.700)
Author: Holguin et al. (2003, 057326)
Period of Study: February-April 2000
Location: Mexico City, Mexico
Health Outcome: Various measures of HRV via ECG
Study Design: Panel
Statistical Analyses: GEE
Age Groups Analyzed: 60-96 yr (mean age 79 yr)
Sample Description: 34 patients who were permanent residents of a nursing home in the Northeast metropolitan area.
Averaging Time: 24 h
Mean (SD) unit: 3.3 ppm
Range (Min, Max): 1.8, 4.8
Copollutant: NR
Increment: 10 ppm
Regression Coefficients [Lower CI, Upper CI]
Lags examined: 0
Lag 0:
HF: 0.003 (-0.004 to 0.001)
LF: 0.001 (-0.006 to 0.008)
LF/HF: 0.001 (-0.005 to 0.002)
January 2010 C-2
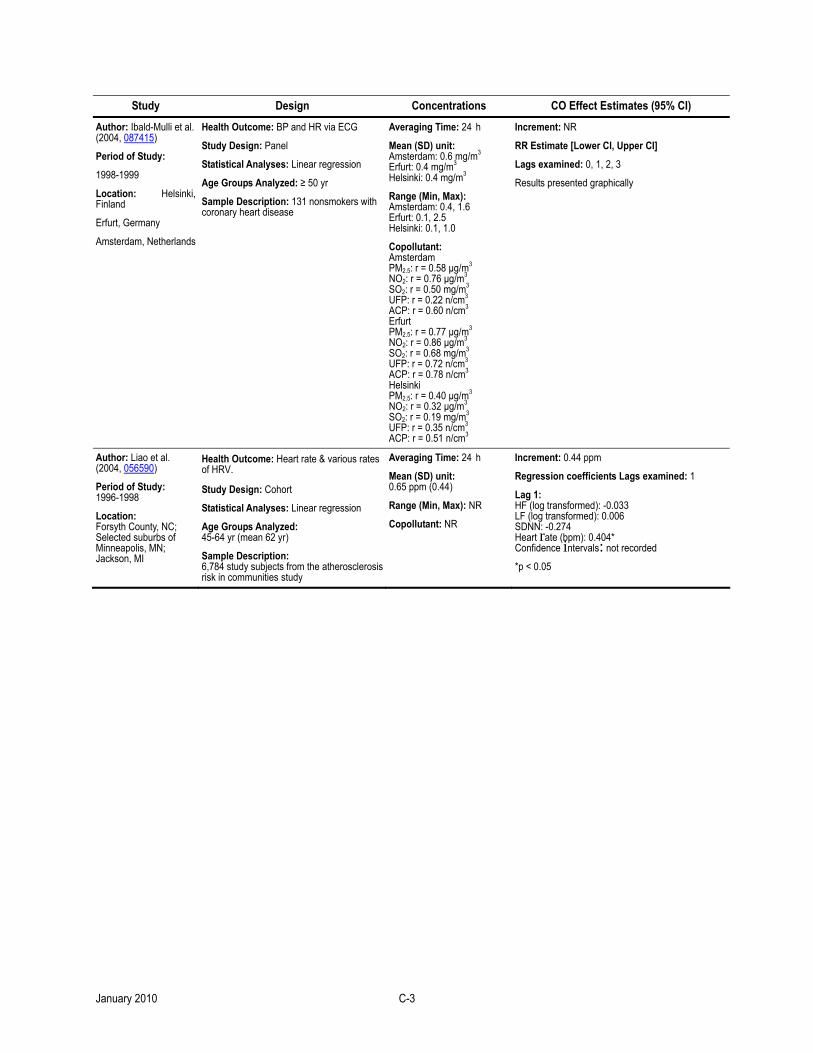
Study Design Concentrations CO Effect Estimates (95% CI)
Author: Ibald-Mulli et al. (2004, 087415)
Period of Study:
1998-1999
Location: Helsinki, Finland
Erfurt, Germany
Amsterdam, Netherlands
Health Outcome: BP and HR via ECG
Study Design: Panel
Statistical Analyses: Linear regression
Age Groups Analyzed: ≥ 50 yr
Sample Description: 131 nonsmokers with coronary heart disease
Averaging Time: 24 h
Mean (SD) unit: Amsterdam: 0.6 mg/m3 Erfurt: 0.4 mg/m3 Helsinki: 0.4 mg/m3
Range (Min, Max): Amsterdam: 0.4, 1.6 Erfurt: 0.1, 2.5 Helsinki: 0.1, 1.0
Copollutant: Amsterdam PM2.5: r = 0.58 µg/m3 NO2: r = 0.76 µg/m3 SO2: r = 0.50 mg/m3 UFP: r = 0.22 n/cm3 ACP: r = 0.60 n/cm3
Erfurt PM2.5: r = 0.77 µg/m3 NO2: r = 0.86 µg/m3 SO2: r = 0.68 mg/m3 UFP: r = 0.72 n/cm3 ACP: r = 0.78 n/cm3 Helsinki PM2.5: r = 0.40 µg/m3 NO2: r = 0.32 µg/m3 SO2: r = 0.19 mg/m3 UFP: r = 0.35 n/cm3 ACP: r = 0.51 n/cm3
Increment: NR
RR Estimate [Lower CI, Upper CI]
Lags examined: 0, 1, 2, 3
Results presented graphically
Author: Liao et al. (2004, 056590)
Period of Study: 1996-1998
Location: Forsyth County, NC; Selected suburbs of Minneapolis, MN; Jackson, MI
Health Outcome: Heart rate & various rates of HRV.
Study Design: Cohort
Statistical Analyses: Linear regression
Age Groups Analyzed: 45-64 yr (mean 62 yr)
Sample Description: 6,784 study subjects from the atherosclerosis risk in communities study
Averaging Time: 24 h
Mean (SD) unit: 0.65 ppm (0.44)
Range (Min, Max): NR
Copollutant: NR
Increment: 0.44 ppm
Regression coefficients Lags examined: 1
Lag 1: HF (log transformed): -0.033 LF (log transformed): 0.006 SDNN: -0.274 Heart rate (bpm): 0.404* Confidence intervals: not recorded
*p < 0.05
January 2010 C-3
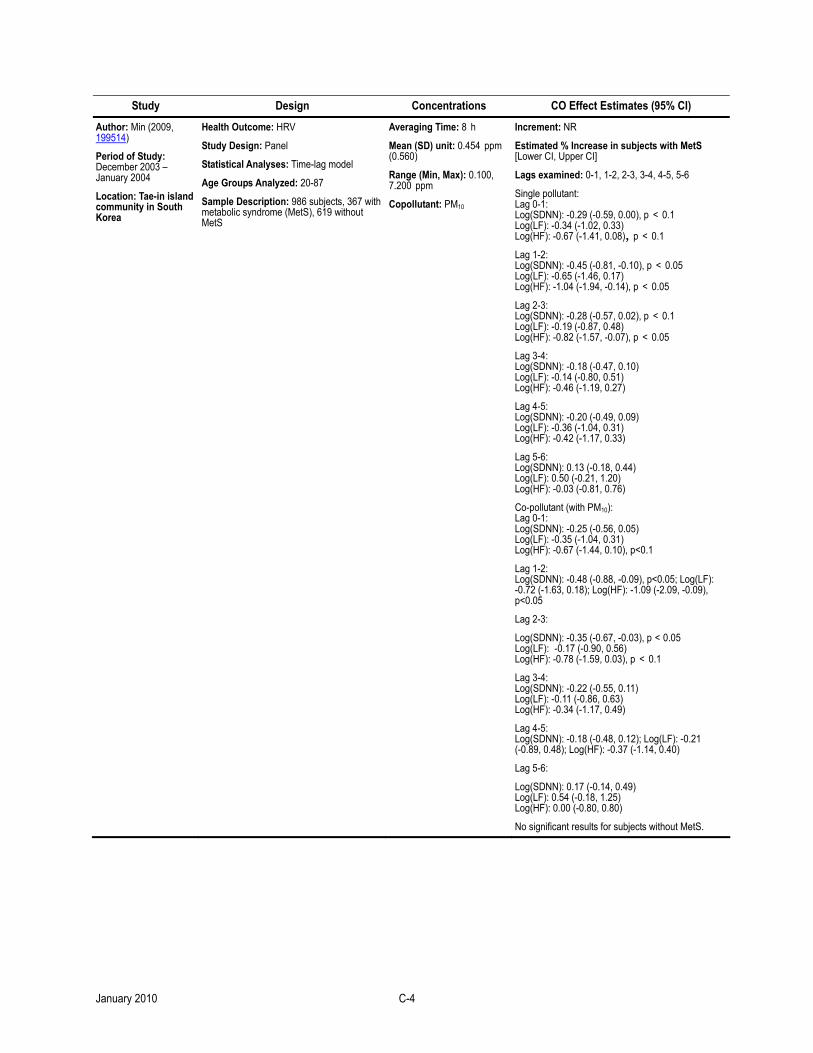
Study Design Concentrations CO Effect Estimates (95% CI)
Author: Min (2009, 199514)
Period of Study: December 2003 – January 2004
Location: Tae-in island community in South Korea
Health Outcome: HRV
Study Design: Panel
Statistical Analyses: Time-lag model
Age Groups Analyzed: 20-87 Sample Description: 986 subjects, 367 with metabolic syndrome (MetS), 619 without MetS
Averaging Time: 8 h
Mean (SD) unit: 0.454 ppm (0.560)
Range (Min, Max): 0.100, 7.200 ppm
Copollutant: PM10
Increment: NR
Estimated % Increase in subjects with MetS [Lower CI, Upper CI]
Lags examined: 0-1, 1-2, 2-3, 3-4, 4-5, 5-6
Single pollutant: Lag 0-1: Log(SDNN): -0.29 (-0.59, 0.00), p < 0.1 Log(LF): -0.34 (-1.02, 0.33) Log(HF): -0.67 (-1.41, 0.08), p < 0.1
Lag 1-2: Log(SDNN): -0.45 (-0.81, -0.10), p < 0.05 Log(LF): -0.65 (-1.46, 0.17) Log(HF): -1.04 (-1.94, -0.14), p < 0.05 Lag 2-3: Log(SDNN): -0.28 (-0.57, 0.02), p < 0.1 Log(LF): -0.19 (-0.87, 0.48) Log(HF): -0.82 (-1.57, -0.07), p < 0.05 Lag 3-4: Log(SDNN): -0.18 (-0.47, 0.10) Log(LF): -0.14 (-0.80, 0.51) Log(HF): -0.46 (-1.19, 0.27)
Lag 4-5: Log(SDNN): -0.20 (-0.49, 0.09) Log(LF): -0.36 (-1.04, 0.31) Log(HF): -0.42 (-1.17, 0.33)
Lag 5-6: Log(SDNN): 0.13 (-0.18, 0.44) Log(LF): 0.50 (-0.21, 1.20) Log(HF): -0.03 (-0.81, 0.76)
Co-pollutant (with PM10): Lag 0-1: Log(SDNN): -0.25 (-0.56, 0.05) Log(LF): -0.35 (-1.04, 0.31) Log(HF): -0.67 (-1.44, 0.10), p<0.1
Lag 1-2: Log(SDNN): -0.48 (-0.88, -0.09), p<0.05; Log(LF): -0.72 (-1.63, 0.18); Log(HF): -1.09 (-2.09, -0.09), p<0.05
Lag 2-3:
Log(SDNN): -0.35 (-0.67, -0.03), p < 0.05 Log(LF): -0.17 (-0.90, 0.56) Log(HF): -0.78 (-1.59, 0.03), p < 0.1
Lag 3-4: Log(SDNN): -0.22 (-0.55, 0.11) Log(LF): -0.11 (-0.86, 0.63) Log(HF): -0.34 (-1.17, 0.49)
Lag 4-5: Log(SDNN): -0.18 (-0.48, 0.12); Log(LF): -0.21 (-0.89, 0.48); Log(HF): -0.37 (-1.14, 0.40)
Lag 5-6:
Log(SDNN): 0.17 (-0.14, 0.49) Log(LF): 0.54 (-0.18, 1.25) Log(HF): 0.00 (-0.80, 0.80)
No significant results for subjects without MetS.
January 2010 C-4
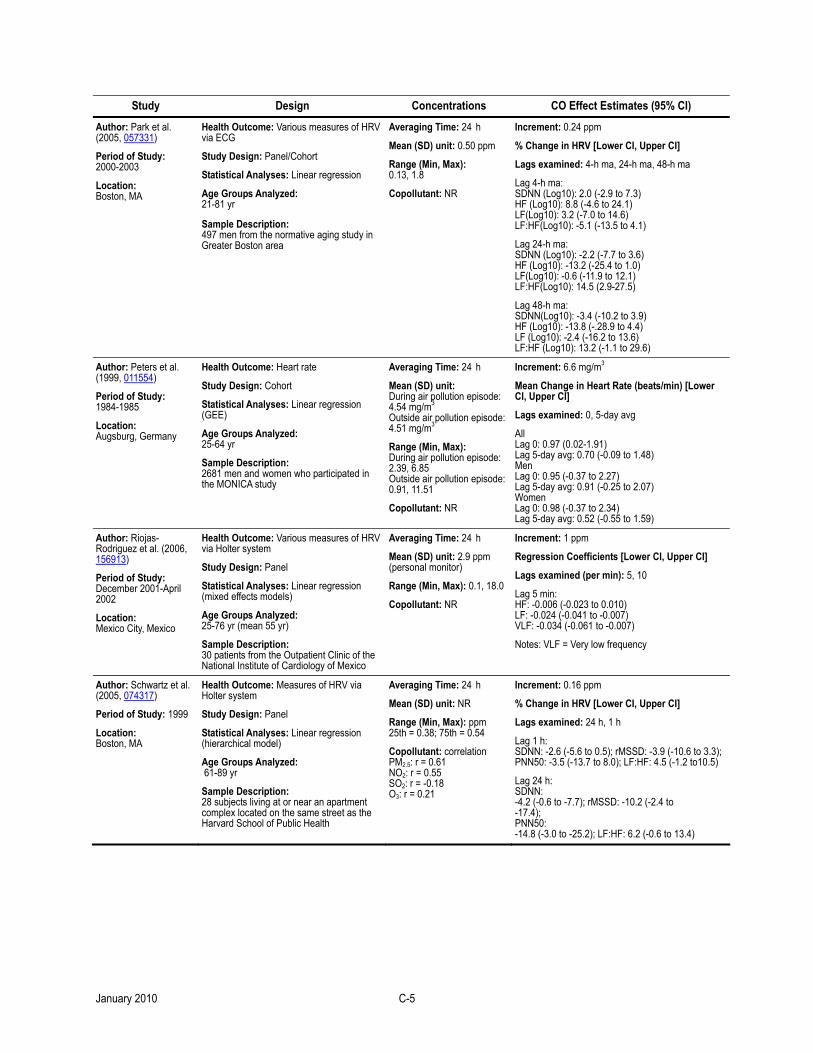
Study Design Concentrations CO Effect Estimates (95% CI)
Author: Park et al. (2005, 057331)
Period of Study: 2000-2003
Location: Boston, MA
Health Outcome: Various measures of HRV via ECG
Study Design: Panel/Cohort
Statistical Analyses: Linear regression
Age Groups Analyzed: 21-81 yr
Sample Description: 497 men from the normative aging study in Greater Boston area
Averaging Time: 24 h
Mean (SD) unit: 0.50 ppm
Range (Min, Max): 0.13, 1.8
Copollutant: NR
Increment: 0.24 ppm
% Change in HRV [Lower CI, Upper CI]
Lags examined: 4-h ma, 24-h ma, 48-h ma
Lag 4-h ma: SDNN (Log10): 2.0 (-2.9 to 7.3) HF (Log10): 8.8 (-4.6 to 24.1) LF(Log10): 3.2 (-7.0 to 14.6) LF:HF(Log10): -5.1 (-13.5 to 4.1)
Lag 24-h ma: SDNN (Log10): -2.2 (-7.7 to 3.6) HF (Log10): -13.2 (-25.4 to 1.0) LF(Log10): -0.6 (-11.9 to 12.1) LF:HF(Log10): 14.5 (2.9-27.5)
Lag 48-h ma: SDNN(Log10): -3.4 (-10.2 to 3.9) HF (Log10): -13.8 (-.28.9 to 4.4) LF (Log10): -2.4 (-16.2 to 13.6) LF:HF (Log10): 13.2 (-1.1 to 29.6)
Author: Peters et al. (1999, 011554)
Period of Study: 1984-1985
Location: Augsburg, Germany
Health Outcome: Heart rate
Study Design: Cohort
Statistical Analyses: Linear regression (GEE)
Age Groups Analyzed: 25-64 yr
Sample Description: 2681 men and women who participated in the MONICA study
Averaging Time: 24 h
Mean (SD) unit: During air pollution episode: 4.54 mg/m3 Outside air pollution episode: 4.51 mg/m3
Range (Min, Max): During air pollution episode: 2.39, 6.85 Outside air pollution episode: 0.91, 11.51 Copollutant: NR
Increment: 6.6 mg/m3
Mean Change in Heart Rate (beats/min) [Lower CI, Upper CI]
Lags examined: 0, 5-day avg
All Lag 0: 0.97 (0.02-1.91) Lag 5-day avg: 0.70 (-0.09 to 1.48) Men Lag 0: 0.95 (-0.37 to 2.27) Lag 5-day avg: 0.91 (-0.25 to 2.07) Women Lag 0: 0.98 (-0.37 to 2.34) Lag 5-day avg: 0.52 (-0.55 to 1.59)
Author: Riojas-Rodriguez et al. (2006, 156913)
Period of Study: December 2001-April 2002
Location: Mexico City, Mexico
Health Outcome: Various measures of HRV via Holter system
Study Design: Panel
Statistical Analyses: Linear regression (mixed effects models)
Age Groups Analyzed: 25-76 yr (mean 55 yr)
Sample Description: 30 patients from the Outpatient Clinic of the National Institute of Cardiology of Mexico
Averaging Time: 24 h
Mean (SD) unit: 2.9 ppm (personal monitor)
Range (Min, Max): 0.1, 18.0
Copollutant: NR
Increment: 1 ppm
Regression Coefficients [Lower CI, Upper CI]
Lags examined (per min): 5, 10
Lag 5 min: HF: -0.006 (-0.023 to 0.010) LF: -0.024 (-0.041 to -0.007) VLF: -0.034 (-0.061 to -0.007)
Notes: VLF = Very low frequency
Author: Schwartz et al. (2005, 074317)
Period of Study: 1999
Location: Boston, MA
Health Outcome: Measures of HRV via Holter system
Study Design: Panel
Statistical Analyses: Linear regression (hierarchical model)
Age Groups Analyzed: 61-89 yr
Sample Description: 28 subjects living at or near an apartment complex located on the same street as the Harvard School of Public Health
Averaging Time: 24 h
Mean (SD) unit: NR
Range (Min, Max): ppm 25th = 0.38; 75th = 0.54
Copollutant: correlation PM2.5: r = 0.61 NO2: r = 0.55 SO2: r = -0.18 O3: r = 0.21
Increment: 0.16 ppm
% Change in HRV [Lower CI, Upper CI]
Lags examined: 24 h, 1 h
Lag 1 h: SDNN: -2.6 (-5.6 to 0.5); rMSSD: -3.9 (-10.6 to 3.3); PNN50: -3.5 (-13.7 to 8.0); LF:HF: 4.5 (-1.2 to10.5)
Lag 24 h: SDNN: -4.2 (-0.6 to -7.7); rMSSD: -10.2 (-2.4 to -17.4); PNN50: -14.8 (-3.0 to -25.2); LF:HF: 6.2 (-0.6 to 13.4)
January 2010 C-5
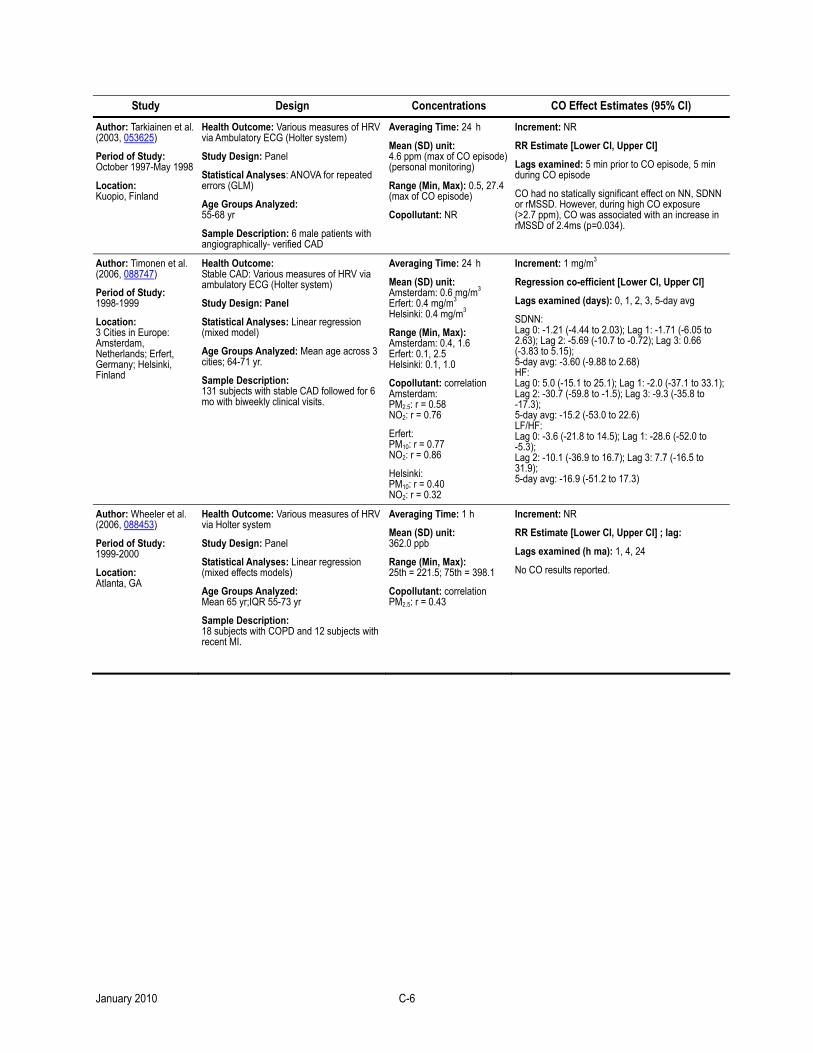
Study Design Concentrations CO Effect Estimates (95% CI)
Author: Tarkiainen et al. (2003, 053625)
Period of Study: October 1997-May 1998
Location: Kuopio, Finland
Health Outcome: Various measures of HRV via Ambulatory ECG (Holter system)
Study Design: Panel
Statistical Analyses: ANOVA for repeated errors (GLM)
Age Groups Analyzed: 55-68 yr
Sample Description: 6 male patients with angiographically- verified CAD
Averaging Time: 24 h
Mean (SD) unit: 4.6 ppm (max of CO episode) (personal monitoring)
Range (Min, Max): 0.5, 27.4 (max of CO episode)
Copollutant: NR
Increment: NR
RR Estimate [Lower CI, Upper CI]
Lags examined: 5 min prior to CO episode, 5 min during CO episode
CO had no statically significant effect on NN, SDNN or rMSSD. However, during high CO exposure (>2.7 ppm), CO was associated with an increase in rMSSD of 2.4ms (p=0.034).
Author: Timonen et al. (2006, 088747)
Period of Study: 1998-1999
Location: 3 Cities in Europe: Amsterdam, Netherlands; Erfert, Germany; Helsinki, Finland
Health Outcome: Stable CAD: Various measures of HRV via ambulatory ECG (Holter system)
Study Design: Panel
Statistical Analyses: Linear regression (mixed model)
Age Groups Analyzed: Mean age across 3 cities; 64-71 yr.
Sample Description: 131 subjects with stable CAD followed for 6 mo with biweekly clinical visits.
Averaging Time: 24 h
Mean (SD) unit: Amsterdam: 0.6 mg/m3 Erfert: 0.4 mg/m3 Helsinki: 0.4 mg/m3
Range (Min, Max): Amsterdam: 0.4, 1.6 Erfert: 0.1, 2.5 Helsinki: 0.1, 1.0
Copollutant: correlation Amsterdam: PM2.5: r = 0.58 NO2: r = 0.76
Erfert: PM10: r = 0.77 NO2: r = 0.86
Helsinki: PM10: r = 0.40 NO2: r = 0.32
Increment: 1 mg/m3
Regression co-efficient [Lower CI, Upper CI]
Lags examined (days): 0, 1, 2, 3, 5-day avg
SDNN: Lag 0: -1.21 (-4.44 to 2.03); Lag 1: -1.71 (-6.05 to 2.63); Lag 2: -5.69 (-10.7 to -0.72); Lag 3: 0.66 (-3.83 to 5.15); 5-day avg: -3.60 (-9.88 to 2.68) HF: Lag 0: 5.0 (-15.1 to 25.1); Lag 1: -2.0 (-37.1 to 33.1); Lag 2: -30.7 (-59.8 to -1.5); Lag 3: -9.3 (-35.8 to -17.3); 5-day avg: -15.2 (-53.0 to 22.6) LF/HF: Lag 0: -3.6 (-21.8 to 14.5); Lag 1: -28.6 (-52.0 to -5.3); Lag 2: -10.1 (-36.9 to 16.7); Lag 3: 7.7 (-16.5 to 31.9); 5-day avg: -16.9 (-51.2 to 17.3)
Author: Wheeler et al. (2006, 088453)
Period of Study: 1999-2000
Location: Atlanta, GA
Health Outcome: Various measures of HRV via Holter system
Study Design: Panel
Statistical Analyses: Linear regression (mixed effects models)
Age Groups Analyzed: Mean 65 yr;IQR 55-73 yr
Sample Description: 18 subjects with COPD and 12 subjects with recent MI.
Averaging Time: 1 h
Mean (SD) unit: 362.0 ppb
Range (Min, Max): 25th = 221.5; 75th = 398.1
Copollutant: correlation PM2.5: r = 0.43
Increment: NR
RR Estimate [Lower CI, Upper CI] ; lag:
Lags examined (h ma): 1, 4, 24
No CO results reported.
January 2010 C-6

Study Design Concentrations CO Effect Estimates (95% CI)
ONSET OF CARDIAC ARRHYTHMIA Author: Berger et al. (2006, 098702)
Period of Study: October 2000-April 2001
Location: Erfurt, Germany
Health Outcome: Runs of supraventricular and ventricular tachycardia recorded via 24-h ECG.
Study Design: Panel
Statistical Analyses: Poisson regression (GAM) linear regression
Age Groups Analyzed: 52-76 yr (mean 76 yr)
Sample Description: 57 men with CHD
Averaging Time: 24 h
Mean (SD) unit: 0.52 mg/m3
Range (Min, Max): 0.11, 1.93
Copollutant: correlation NR
Increment:
All: 0.27 mg/m3
5-day avg: 0.22 mg/m3
RR Estimate [Lower CI, Upper CI]
Lags examined (h): 0, 0-23, 24-47, 48-71, 72-95, 5-day avg
Supraventricular extrasystoles: Lag 0: 1.18 (1.00-1.38) Lag 0-23: 1.16 (1.02-1.31); Lag 24-47: 1.13 (1.00-1.28); Lag 48-71: 1.18 (1.03-1.36); Lag 72-95: 1.08 (0.98-1.20); 5-day avg: 1.18 (1.04-1.35)
Mean % Change [Lower CI, Upper CI]
Hourly Lags examined: 0, 0-23, 24-47, 48-71, 72-95, 5-day avg
Ventricular extrasystoles: Lag 0: 0.0 (-4.1 to 4.4); Lag 0-23: 1.1 (-3.3 to 5.7); Lag 24-47: 1.9 (-2.6 to 6.6); Lag 48-71: 4.2 (-0.3 to 8.9); Lag 72-95: 2.7 (-1.3 to 6.9); 5-day avg: 3.0 (-1.8 to 8.0)
Author: Dockery et al. (2005, 078995)
Period of Study: 1995-2002
Location: Boston, MA
Health Outcome: Tachyarrhythmias:
Study Design: Panel
Statistical Analyses: Logistic regression (GEE)
Age Groups Analyzed: 19-90 yr; mean 64 yr
Sample Description: 203 cardiac patients with ICDs within 40km of air monitoring site at Harvard School of Public Health, Boston
Averaging Time: 24 h
Mean (SD) unit: NR
Range (Min, Max): 25th = 0.53; 75th = 1.02
Copollutant: NR
Increment: 0.48 ppm
OR for Ventricular Arrhythmia [Lower CI, Upper CI]
Lags examined (days): 0, 1, 2, 3
Lag 2-day ma: 1.14 (0.95-1.29)
Among those who had an arrhythmia: within 3 days: 1.65 (1.17-2.33) later than 3 days: 1.04 (0.83-1.29)
Author: Metzger et al. (2007, 092856)
Period of Study: 1993-2002
Location: Atlanta, GA
Health Outcome: Cardiac arrhythmia, ICD, ventricular tachyarrhythmia
Study Design: Panel
Statistical Analyses: Logistic regression (GEE)
Age Groups Analyzed: 15-88 yr
Sample Description: 518 patients with ICDs with at least one ventricular tachyarrhythmic event
Averaging Time: 1 h
Mean (SD) unit: 1.7 ppm
Range (Min, Max): 0.1, 7.7
Copollutant: NR
Increment: 1 ppm
OR for Tachyarrhythmic event [Lower CI, Upper CI]
Lags examined (days): 0
Results for all events Lag 0: 0.999 (0.970-1.028) Events resulting in cardiac pacing or defibrillation Lag 0: 1.008 (0.964-1.054) Events resulting defibrillation Lag 0: 1.012 (0.925-1.10.7)
January 2010 C-7
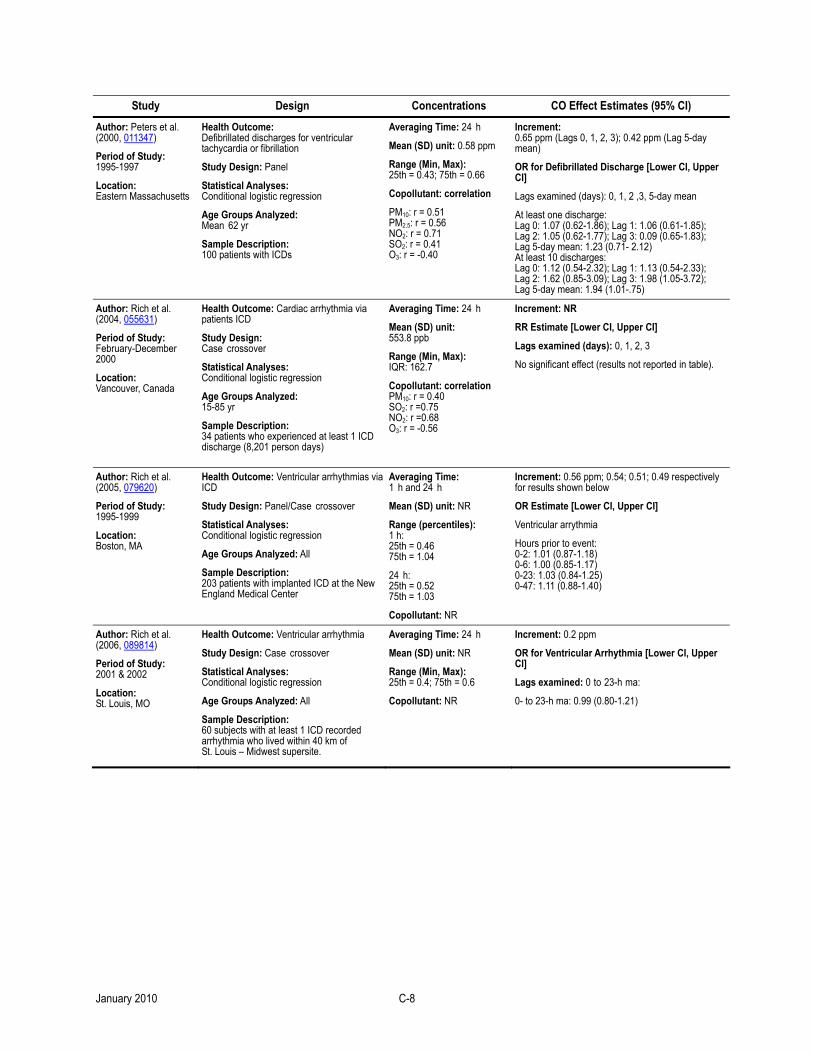
Study Design Concentrations CO Effect Estimates (95% CI)
Author: Peters et al. (2000, 011347)
Period of Study: 1995-1997
Location: Eastern Massachusetts
Health Outcome: Defibrillated discharges for ventricular tachycardia or fibrillation
Study Design: Panel
Statistical Analyses: Conditional logistic regression
Age Groups Analyzed: Mean 62 yr
Sample Description: 100 patients with ICDs
Averaging Time: 24 h
Mean (SD) unit: 0.58 ppm
Range (Min, Max): 25th = 0.43; 75th = 0.66
Copollutant: correlation
PM10: r = 0.51 PM2.5: r = 0.56 NO2: r = 0.71 SO2: r = 0.41 O3: r = -0.40
Increment: 0.65 ppm (Lags 0, 1, 2, 3); 0.42 ppm (Lag 5-day mean)
OR for Defibrillated Discharge [Lower CI, Upper CI]
Lags examined (days): 0, 1, 2 ,3, 5-day mean
At least one discharge: Lag 0: 1.07 (0.62-1.86); Lag 1: 1.06 (0.61-1.85); Lag 2: 1.05 (0.62-1.77); Lag 3: 0.09 (0.65-1.83); Lag 5-day mean: 1.23 (0.71- 2.12) At least 10 discharges: Lag 0: 1.12 (0.54-2.32); Lag 1: 1.13 (0.54-2.33); Lag 2: 1.62 (0.85-3.09); Lag 3: 1.98 (1.05-3.72); Lag 5-day mean: 1.94 (1.01-.75)
Author: Rich et al. (2004, 055631)
Period of Study: February-December 2000
Location: Vancouver, Canada
Health Outcome: Cardiac arrhythmia via patients ICD
Study Design: Case crossover
Statistical Analyses: Conditional logistic regression
Age Groups Analyzed: 15-85 yr
Sample Description: 34 patients who experienced at least 1 ICD discharge (8,201 person days)
Averaging Time: 24 h
Mean (SD) unit: 553.8 ppb
Range (Min, Max): IQR: 162.7
Copollutant: correlation PM10: r = 0.40 SO2: r =0.75 NO2: r =0.68 O3: r = -0.56
Increment: NR
RR Estimate [Lower CI, Upper CI]
Lags examined (days): 0, 1, 2, 3
No significant effect (results not reported in table).
Author: Rich et al. (2005, 079620)
Period of Study: 1995-1999
Location: Boston, MA
Health Outcome: Ventricular arrhythmias via ICD
Study Design: Panel/Case crossover
Statistical Analyses: Conditional logistic regression
Age Groups Analyzed: All
Sample Description: 203 patients with implanted ICD at the New England Medical Center
Averaging Time: 1 h and 24 h
Mean (SD) unit: NR
Range (percentiles): 1 h: 25th = 0.46 75th = 1.04
24 h: 25th = 0.52 75th = 1.03
Copollutant: NR
Increment: 0.56 ppm; 0.54; 0.51; 0.49 respectively for results shown below
OR Estimate [Lower CI, Upper CI]
Ventricular arrythmia
Hours prior to event: 0-2: 1.01 (0.87-1.18) 0-6: 1.00 (0.85-1.17) 0-23: 1.03 (0.84-1.25) 0-47: 1.11 (0.88-1.40)
Author: Rich et al. (2006, 089814)
Period of Study: 2001 & 2002
Location: St. Louis, MO
Health Outcome: Ventricular arrhythmia
Study Design: Case crossover
Statistical Analyses: Conditional logistic regression
Age Groups Analyzed: All
Sample Description: 60 subjects with at least 1 ICD recorded arrhythmia who lived within 40 km of St. Louis – Midwest supersite.
Averaging Time: 24 h
Mean (SD) unit: NR
Range (Min, Max): 25th = 0.4; 75th = 0.6
Copollutant: NR
Increment: 0.2 ppm
OR for Ventricular Arrhythmia [Lower CI, Upper CI]
Lags examined: 0 to 23-h ma:
0- to 23-h ma: 0.99 (0.80-1.21)
January 2010 C-8
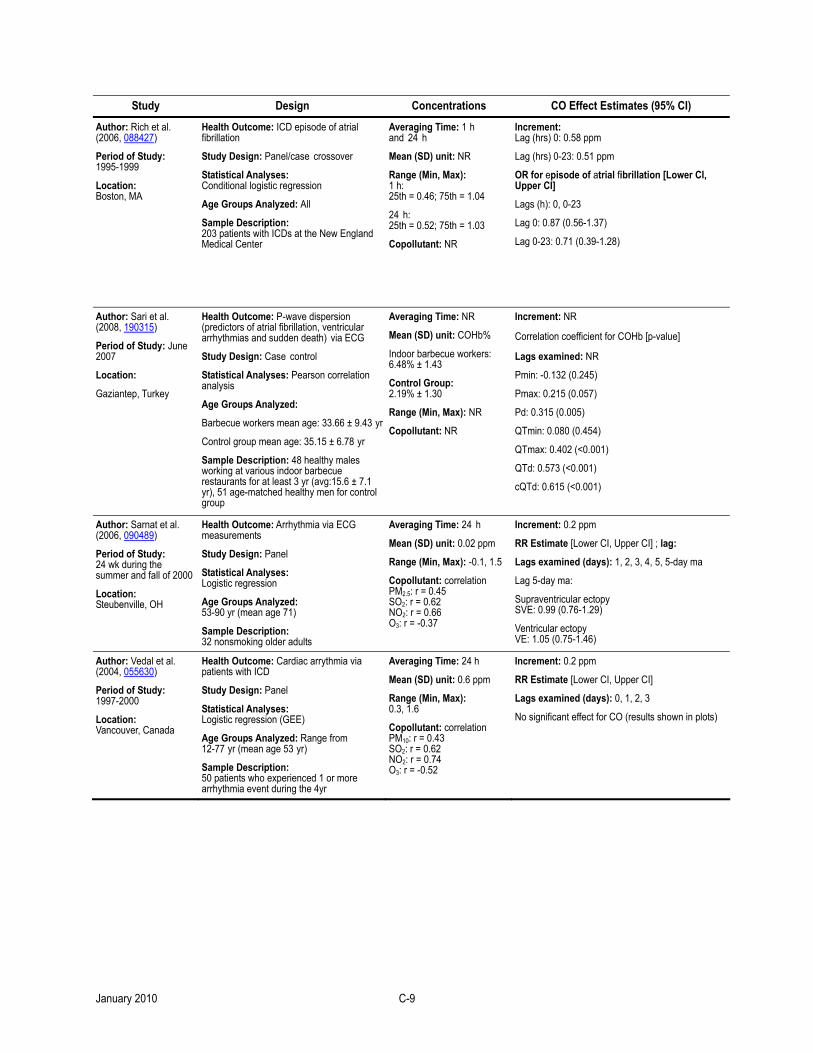
Study Design Concentrations CO Effect Estimates (95% CI)
Author: Rich et al. (2006, 088427)
Period of Study: 1995-1999
Location: Boston, MA
Health Outcome: ICD episode of atrial fibrillation
Study Design: Panel/case crossover
Statistical Analyses: Conditional logistic regression
Age Groups Analyzed: All
Sample Description: 203 patients with ICDs at the New England Medical Center
Averaging Time: 1 h and 24 h
Mean (SD) unit: NR
Range (Min, Max): 1 h: 25th = 0.46; 75th = 1.04
24 h: 25th = 0.52; 75th = 1.03
Copollutant: NR
Increment: Lag (hrs) 0: 0.58 ppm
Lag (hrs) 0-23: 0.51 ppm
OR for episode of atrial fibrillation [Lower CI, Upper CI]
Lags (h): 0, 0-23
Lag 0: 0.87 (0.56-1.37)
Lag 0-23: 0.71 (0.39-1.28)
Author: Sari et al. (2008, 190315)
Period of Study: June 2007
Location:
Gaziantep, Turkey
Health Outcome: P-wave dispersion (predictors of atrial fibrillation, ventricular arrhythmias and sudden death) via ECG
Study Design: Case control
Statistical Analyses: Pearson correlation analysis
Age Groups Analyzed:
Barbecue workers mean age: 33.66 ± 9.43 yr
Control group mean age: 35.15 ± 6.78 yr
Sample Description: 48 healthy males working at various indoor barbecue restaurants for at least 3 yr (avg:15.6 ± 7.1 yr), 51 age-matched healthy men for control group
Averaging Time: NR
Mean (SD) unit: COHb%
Indoor barbecue workers: 6.48% ± 1.43
Control Group: 2.19% ± 1.30
Range (Min, Max): NR
Copollutant: NR
Increment: NR
Correlation coefficient for COHb [p-value]
Lags examined: NR
Pmin: -0.132 (0.245)
Pmax: 0.215 (0.057)
Pd: 0.315 (0.005)
QTmin: 0.080 (0.454)
QTmax: 0.402 (<0.001)
QTd: 0.573 (<0.001)
cQTd: 0.615 (<0.001)
Author: Sarnat et al. (2006, 090489)
Period of Study: 24 wk during the summer and fall of 2000
Location: Steubenville, OH
Health Outcome: Arrhythmia via ECG measurements
Study Design: Panel
Statistical Analyses: Logistic regression
Age Groups Analyzed: 53-90 yr (mean age 71)
Sample Description: 32 nonsmoking older adults
Averaging Time: 24 h
Mean (SD) unit: 0.02 ppm
Range (Min, Max): -0.1, 1.5
Copollutant: correlation PM2.5: r = 0.45 SO2: r = 0.62 NO2: r = 0.66 O3: r = -0.37
Increment: 0.2 ppm
RR Estimate [Lower CI, Upper CI] ; lag:
Lags examined (days): 1, 2, 3, 4, 5, 5-day ma
Lag 5-day ma:
Supraventricular ectopy SVE: 0.99 (0.76-1.29)
Ventricular ectopy VE: 1.05 (0.75-1.46)
Author: Vedal et al. (2004, 055630)
Period of Study: 1997-2000
Location: Vancouver, Canada
Health Outcome: Cardiac arrythmia via patients with ICD
Study Design: Panel
Statistical Analyses: Logistic regression (GEE)
Age Groups Analyzed: Range from 12-77 yr (mean age 53 yr)
Sample Description: 50 patients who experienced 1 or more arrhythmia event during the 4yr
Averaging Time: 24 h
Mean (SD) unit: 0.6 ppm
Range (Min, Max): 0.3, 1.6
Copollutant: correlation PM10: r = 0.43 SO2: r = 0.62 NO2: r = 0.74 O3: r = -0.52
Increment: 0.2 ppm
RR Estimate [Lower CI, Upper CI]
Lags examined (days): 0, 1, 2, 3
No significant effect for CO (results shown in plots)
January 2010 C-9
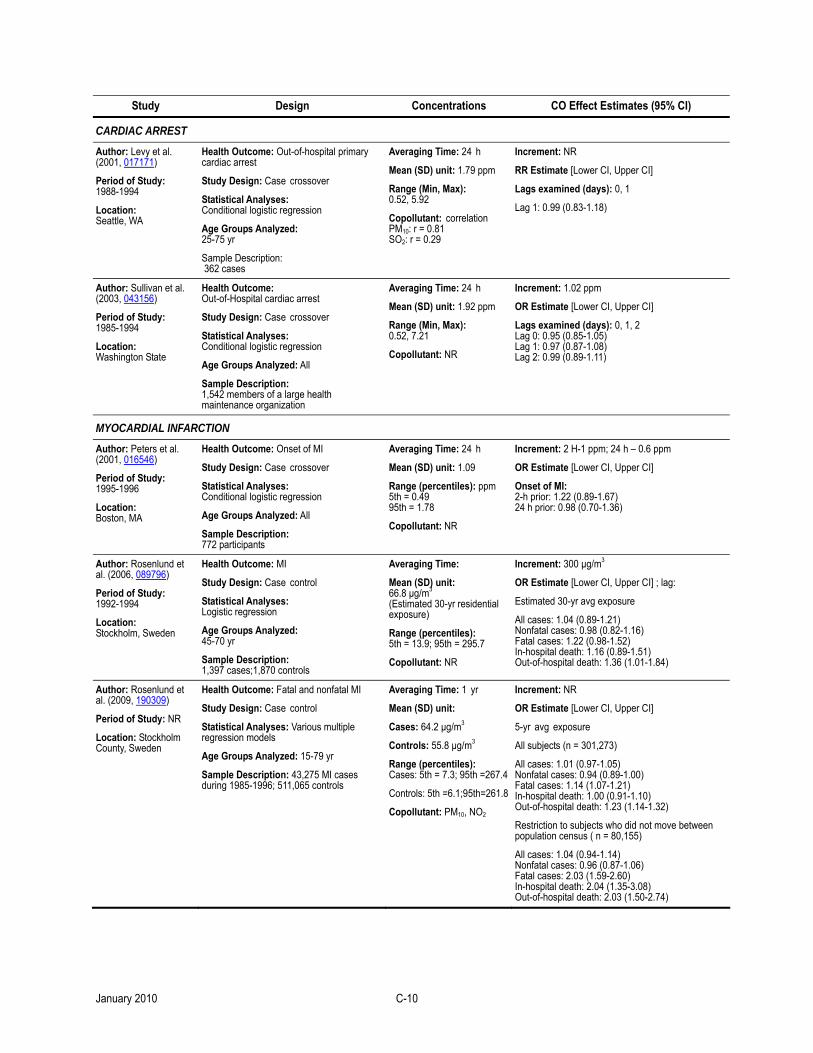
Study Design Concentrations CO Effect Estimates (95% CI)
CARDIAC ARREST Author: Levy et al. (2001, 017171)
Period of Study: 1988-1994
Location: Seattle, WA
Health Outcome: Out-of-hospital primary cardiac arrest
Study Design: Case crossover
Statistical Analyses: Conditional logistic regression
Age Groups Analyzed: 25-75 yr
Sample Description: 362 cases
Averaging Time: 24 h
Mean (SD) unit: 1.79 ppm
Range (Min, Max): 0.52, 5.92
Copollutant: correlation PM10: r = 0.81 SO2: r = 0.29
Increment: NR
RR Estimate [Lower CI, Upper CI]
Lags examined (days): 0, 1
Lag 1: 0.99 (0.83-1.18)
Author: Sullivan et al. (2003, 043156)
Period of Study: 1985-1994
Location: Washington State
Health Outcome: Out-of-Hospital cardiac arrest
Study Design: Case crossover
Statistical Analyses: Conditional logistic regression
Age Groups Analyzed: All
Sample Description: 1,542 members of a large health maintenance organization
Averaging Time: 24 h
Mean (SD) unit: 1.92 ppm
Range (Min, Max): 0.52, 7.21
Copollutant: NR
Increment: 1.02 ppm
OR Estimate [Lower CI, Upper CI]
Lags examined (days): 0, 1, 2 Lag 0: 0.95 (0.85-1.05) Lag 1: 0.97 (0.87-1.08) Lag 2: 0.99 (0.89-1.11)
MYOCARDIAL INFARCTION Author: Peters et al. (2001, 016546)
Period of Study: 1995-1996
Location: Boston, MA
Health Outcome: Onset of MI
Study Design: Case crossover
Statistical Analyses: Conditional logistic regression
Age Groups Analyzed: All
Sample Description: 772 participants
Averaging Time: 24 h
Mean (SD) unit: 1.09
Range (percentiles): ppm 5th = 0.49 95th = 1.78
Copollutant: NR
Increment: 2 H-1 ppm; 24 h – 0.6 ppm
OR Estimate [Lower CI, Upper CI]
Onset of MI: 2-h prior: 1.22 (0.89-1.67) 24 h prior: 0.98 (0.70-1.36)
Author: Rosenlund et al. (2006, 089796)
Period of Study: 1992-1994
Location: Stockholm, Sweden
Health Outcome: MI
Study Design: Case control
Statistical Analyses: Logistic regression
Age Groups Analyzed: 45-70 yr
Sample Description: 1,397 cases;1,870 controls
Averaging Time:
Mean (SD) unit: 66.8 µg/m3 (Estimated 30-yr residential exposure)
Range (percentiles): 5th = 13.9; 95th = 295.7
Copollutant: NR
Increment: 300 µg/m3
OR Estimate [Lower CI, Upper CI] ; lag:
Estimated 30-yr avg exposure
All cases: 1.04 (0.89-1.21) Nonfatal cases: 0.98 (0.82-1.16) Fatal cases: 1.22 (0.98-1.52) In-hospital death: 1.16 (0.89-1.51) Out-of-hospital death: 1.36 (1.01-1.84)
Author: Rosenlund et al. (2009, 190309)
Period of Study: NR
Location: Stockholm County, Sweden
Health Outcome: Fatal and nonfatal MI
Study Design: Case control
Statistical Analyses: Various multiple regression models
Age Groups Analyzed: 15-79 yr
Sample Description: 43,275 MI cases during 1985-1996; 511,065 controls
Averaging Time: 1 yr
Mean (SD) unit:
Cases: 64.2 µg/m3
Controls: 55.8 µg/m3
Range (percentiles): Cases: 5th = 7.3; 95th =267.4
Controls: 5th =6.1;95th=261.8
Copollutant: PM10, NO2
Increment: NR
OR Estimate [Lower CI, Upper CI]
5-yr avg exposure
All subjects (n = 301,273)
All cases: 1.01 (0.97-1.05) Nonfatal cases: 0.94 (0.89-1.00) Fatal cases: 1.14 (1.07-1.21) In-hospital death: 1.00 (0.91-1.10) Out-of-hospital death: 1.23 (1.14-1.32)
Restriction to subjects who did not move between population census ( n = 80,155)
All cases: 1.04 (0.94-1.14) Nonfatal cases: 0.96 (0.87-1.06) Fatal cases: 2.03 (1.59-2.60) In-hospital death: 2.04 (1.35-3.08) Out-of-hospital death: 2.03 (1.50-2.74)
January 2010 C-10
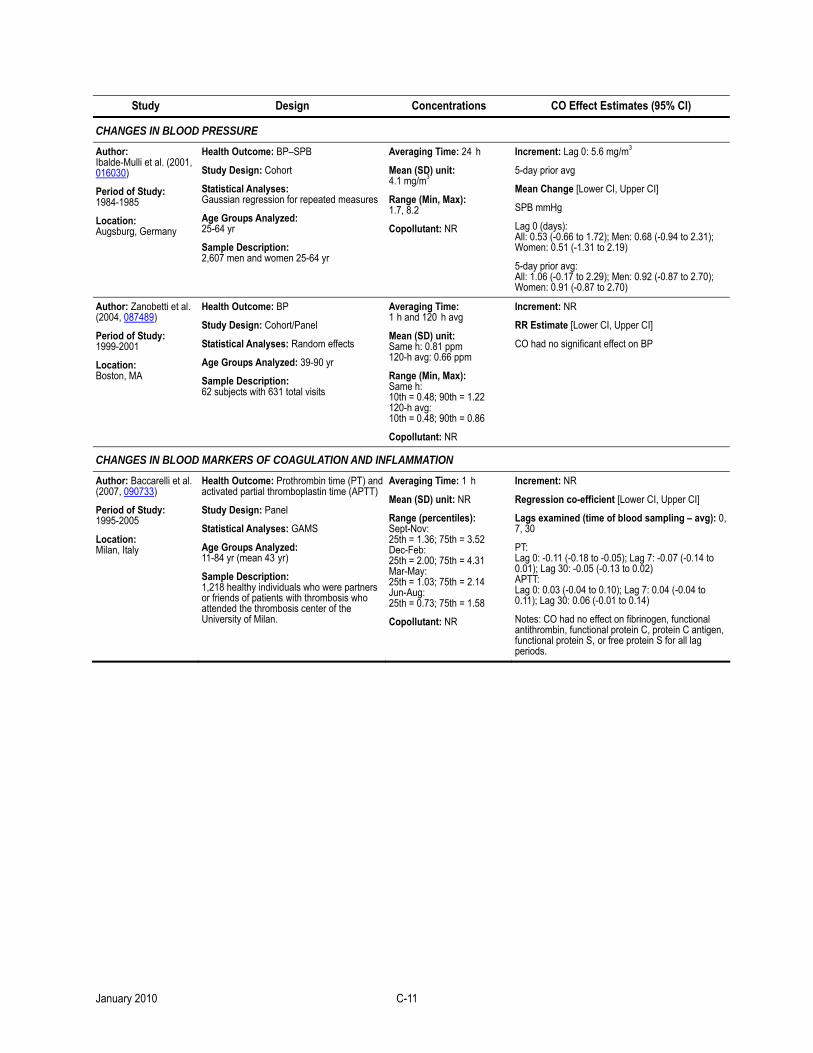
Study Design Concentrations CO Effect Estimates (95% CI)
CHANGES IN BLOOD PRESSURE Author: Ibalde-Mulli et al. (2001, 016030)
Period of Study: 1984-1985
Location: Augsburg, Germany
Health Outcome: BP–SPB
Study Design: Cohort
Statistical Analyses: Gaussian regression for repeated measures
Age Groups Analyzed: 25-64 yr
Sample Description: 2,607 men and women 25-64 yr
Averaging Time: 24 h
Mean (SD) unit: 4.1 mg/m3
Range (Min, Max): 1.7, 8.2
Copollutant: NR
Increment: Lag 0: 5.6 mg/m3
5-day prior avg
Mean Change [Lower CI, Upper CI]
SPB mmHg
Lag 0 (days): All: 0.53 (-0.66 to 1.72); Men: 0.68 (-0.94 to 2.31); Women: 0.51 (-1.31 to 2.19)
5-day prior avg: All: 1.06 (-0.17 to 2.29); Men: 0.92 (-0.87 to 2.70); Women: 0.91 (-0.87 to 2.70)
Author: Zanobetti et al. (2004, 087489)
Period of Study: 1999-2001
Location: Boston, MA
Health Outcome: BP
Study Design: Cohort/Panel
Statistical Analyses: Random effects
Age Groups Analyzed: 39-90 yr
Sample Description: 62 subjects with 631 total visits
Averaging Time: 1 h and 120 h avg
Mean (SD) unit: Same h: 0.81 ppm 120-h avg: 0.66 ppm
Range (Min, Max): Same h: 10th = 0.48; 90th = 1.22 120-h avg: 10th = 0.48; 90th = 0.86
Copollutant: NR
Increment: NR
RR Estimate [Lower CI, Upper CI]
CO had no significant effect on BP
CHANGES IN BLOOD MARKERS OF COAGULATION AND INFLAMMATION Author: Baccarelli et al. (2007, 090733)
Period of Study: 1995-2005
Location: Milan, Italy
Health Outcome: Prothrombin time (PT) and activated partial thromboplastin time (APTT)
Study Design: Panel
Statistical Analyses: GAMS
Age Groups Analyzed: 11-84 yr (mean 43 yr)
Sample Description: 1,218 healthy individuals who were partners or friends of patients with thrombosis who attended the thrombosis center of the University of Milan.
Averaging Time: 1 h
Mean (SD) unit: NR
Range (percentiles): Sept-Nov: 25th = 1.36; 75th = 3.52 Dec-Feb: 25th = 2.00; 75th = 4.31 Mar-May: 25th = 1.03; 75th = 2.14 Jun-Aug: 25th = 0.73; 75th = 1.58
Copollutant: NR
Increment: NR
Regression co-efficient [Lower CI, Upper CI]
Lags examined (time of blood sampling – avg): 0, 7, 30
PT: Lag 0: -0.11 (-0.18 to -0.05); Lag 7: -0.07 (-0.14 to 0.01); Lag 30: -0.05 (-0.13 to 0.02) APTT: Lag 0: 0.03 (-0.04 to 0.10); Lag 7: 0.04 (-0.04 to 0.11); Lag 30: 0.06 (-0.01 to 0.14)
Notes: CO had no effect on fibrinogen, functional antithrombin, functional protein C, protein C antigen, functional protein S, or free protein S for all lag periods.
January 2010 C-11
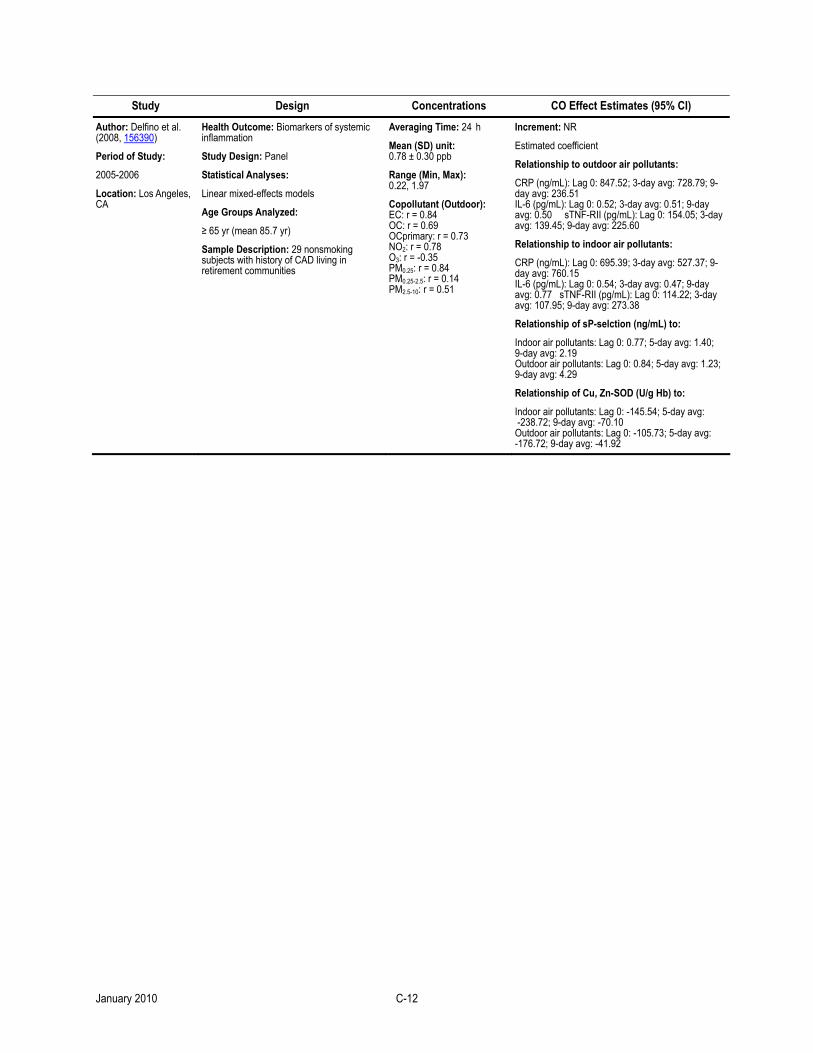
Study Design Concentrations CO Effect Estimates (95% CI)
Author: Delfino et al. (2008, 156390)
Period of Study:
2005-2006
Location: Los Angeles, CA
Health Outcome: Biomarkers of systemic inflammation
Study Design: Panel
Statistical Analyses:
Linear mixed-effects models
Age Groups Analyzed:
≥ 65 yr (mean 85.7 yr)
Sample Description: 29 nonsmoking subjects with history of CAD living in retirement communities
Averaging Time: 24 h
Mean (SD) unit: 0.78 ± 0.30 ppb
Range (Min, Max): 0.22, 1.97
Copollutant (Outdoor): EC: r = 0.84 OC: r = 0.69 OCprimary: r = 0.73 NO2: r = 0.78 O3: r = -0.35 PM0.25: r = 0.84 PM0.25-2.5: r = 0.14 PM2.5-10: r = 0.51
Increment: NR
Estimated coefficient
Relationship to outdoor air pollutants:
CRP (ng/mL): Lag 0: 847.52; 3-day avg: 728.79; 9-day avg: 236.51 IL-6 (pg/mL): Lag 0: 0.52; 3-day avg: 0.51; 9-day avg: 0.50 sTNF-RII (pg/mL): Lag 0: 154.05; 3-day avg: 139.45; 9-day avg: 225.60
Relationship to indoor air pollutants:
CRP (ng/mL): Lag 0: 695.39; 3-day avg: 527.37; 9-day avg: 760.15 IL-6 (pg/mL): Lag 0: 0.54; 3-day avg: 0.47; 9-day avg: 0.77 sTNF-RII (pg/mL): Lag 0: 114.22; 3-day avg: 107.95; 9-day avg: 273.38
Relationship of sP-selction (ng/mL) to:
Indoor air pollutants: Lag 0: 0.77; 5-day avg: 1.40; 9-day avg: 2.19 Outdoor air pollutants: Lag 0: 0.84; 5-day avg: 1.23; 9-day avg: 4.29
Relationship of Cu, Zn-SOD (U/g Hb) to:
Indoor air pollutants: Lag 0: -145.54; 5-day avg: -238.72; 9-day avg: -70.10 Outdoor air pollutants: Lag 0: -105.73; 5-day avg: -176.72; 9-day avg: -41.92
January 2010 C-12
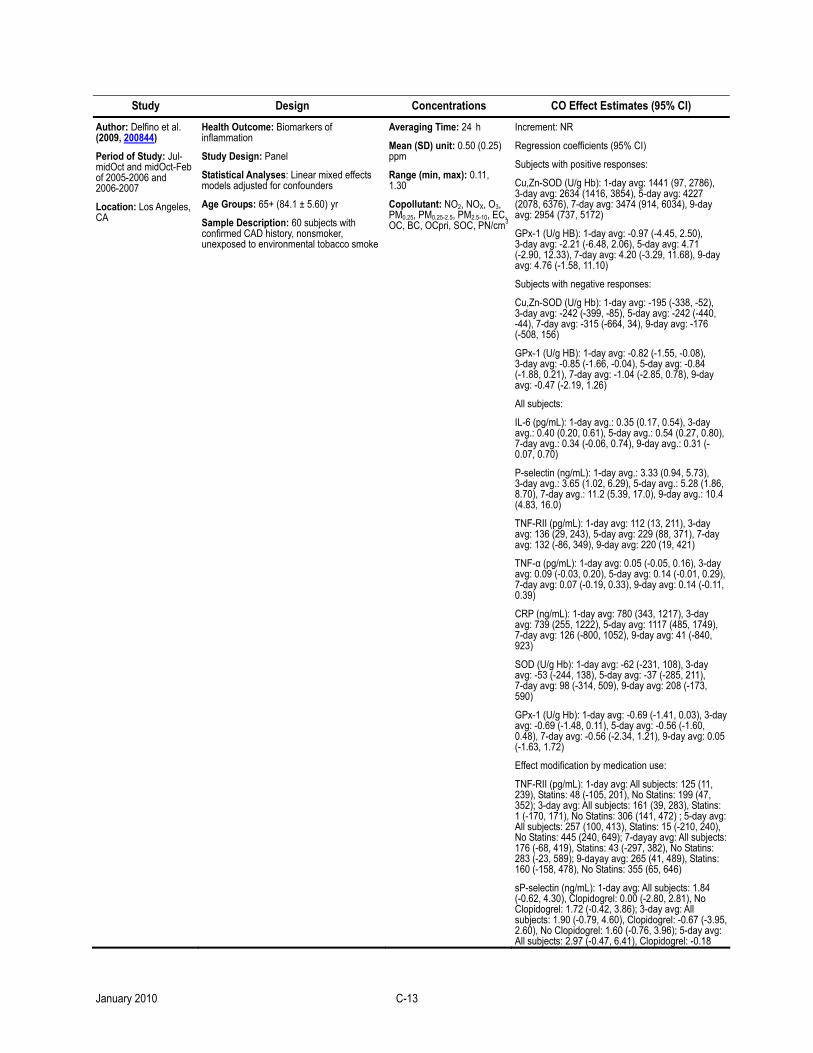
Study Design Concentrations CO Effect Estimates (95% CI)
Author: Delfino et al. (2009, 200844)
Period of Study: Jul-midOct and midOct-Feb of 2005-2006 and 2006-2007
Location: Los Angeles, CA
Health Outcome: Biomarkers of inflammation
Study Design: Panel
Statistical Analyses: Linear mixed effects models adjusted for confounders
Age Groups: 65+ (84.1 ± 5.60) yr
Sample Description: 60 subjects with confirmed CAD history, nonsmoker, unexposed to environmental tobacco smoke
Averaging Time: 24 h
Mean (SD) unit: 0.50 (0.25) ppm
Range (min, max): 0.11, 1.30
Copollutant: NO2, NOX, O3, PM0.25, PM0.25-2.5, PM2.5-10, EC, OC, BC, OCpri, SOC, PN/cm3
Increment: NR
Regression coefficients (95% CI)
Subjects with positive responses:
Cu,Zn-SOD (U/g Hb): 1-day avg: 1441 (97, 2786), 3-day avg: 2634 (1416, 3854), 5-day avg: 4227 (2078, 6376), 7-day avg: 3474 (914, 6034), 9-day avg: 2954 (737, 5172)
GPx-1 (U/g HB): 1-day avg: -0.97 (-4.45, 2.50), 3-day avg: -2.21 (-6.48, 2.06), 5-day avg: 4.71 (-2.90, 12.33), 7-day avg: 4.20 (-3.29, 11.68), 9-day avg: 4.76 (-1.58, 11.10)
Subjects with negative responses:
Cu,Zn-SOD (U/g Hb): 1-day avg: -195 (-338, -52), 3-day avg: -242 (-399, -85), 5-day avg: -242 (-440, -44), 7-day avg: -315 (-664, 34), 9-day avg: -176 (-508, 156)
GPx-1 (U/g HB): 1-day avg: -0.82 (-1.55, -0.08), 3-day avg: -0.85 (-1.66, -0.04), 5-day avg: -0.84 (-1.88, 0.21), 7-day avg: -1.04 (-2.85, 0.78), 9-day avg: -0.47 (-2.19, 1.26)
All subjects:
IL-6 (pg/mL): 1-day avg.: 0.35 (0.17, 0.54), 3-day avg.: 0.40 (0.20, 0.61), 5-day avg.: 0.54 (0.27, 0.80), 7-day avg.: 0.34 (-0.06, 0.74), 9-day avg.: 0.31 (-0.07, 0.70)
P-selectin (ng/mL): 1-day avg.: 3.33 (0.94, 5.73), 3-day avg.: 3.65 (1.02, 6.29), 5-day avg.: 5.28 (1.86, 8.70), 7-day avg.: 11.2 (5.39, 17.0), 9-day avg.: 10.4 (4.83, 16.0)
TNF-RII (pg/mL): 1-day avg: 112 (13, 211), 3-day avg: 136 (29, 243), 5-day avg: 229 (88, 371), 7-day avg: 132 (-86, 349), 9-day avg: 220 (19, 421)
TNF-α (pg/mL): 1-day avg: 0.05 (-0.05, 0.16), 3-day avg: 0.09 (-0.03, 0.20), 5-day avg: 0.14 (-0.01, 0.29), 7-day avg: 0.07 (-0.19, 0.33), 9-day avg: 0.14 (-0.11, 0.39)
CRP (ng/mL): 1-day avg: 780 (343, 1217), 3-day avg: 739 (255, 1222), 5-day avg: 1117 (485, 1749), 7-day avg: 126 (-800, 1052), 9-day avg: 41 (-840, 923)
SOD (U/g Hb): 1-day avg: -62 (-231, 108), 3-day avg: -53 (-244, 138), 5-day avg: -37 (-285, 211), 7-day avg: 98 (-314, 509), 9-day avg: 208 (-173, 590)
GPx-1 (U/g Hb): 1-day avg: -0.69 (-1.41, 0.03), 3-day avg: -0.69 (-1.48, 0.11), 5-day avg: -0.56 (-1.60, 0.48), 7-day avg: -0.56 (-2.34, 1.21), 9-day avg: 0.05 (-1.63, 1.72)
Effect modification by medication use:
TNF-RII (pg/mL): 1-day avg: All subjects: 125 (11, 239), Statins: 48 (-105, 201), No Statins: 199 (47, 352); 3-day avg: All subjects: 161 (39, 283), Statins: 1 (-170, 171), No Statins: 306 (141, 472) ; 5-day avg: All subjects: 257 (100, 413), Statins: 15 (-210, 240), No Statins: 445 (240, 649); 7-dayay avg: All subjects: 176 (-68, 419), Statins: 43 (-297, 382), No Statins: 283 (-23, 589); 9-dayay avg: 265 (41, 489), Statins: 160 (-158, 478), No Statins: 355 (65, 646)
sP-selectin (ng/mL): 1-day avg: All subjects: 1.84 (-0.62, 4.30), Clopidogrel: 0.00 (-2.80, 2.81), No Clopidogrel: 1.72 (-0.42, 3.86); 3-day avg: All subjects: 1.90 (-0.79, 4.60), Clopidogrel: -0.67 (-3.95, 2.60), No Clopidogrel: 1.60 (-0.76, 3.96); 5-day avg: All subjects: 2.97 (-0.47, 6.41), Clopidogrel: -0.18
January 2010 C-13
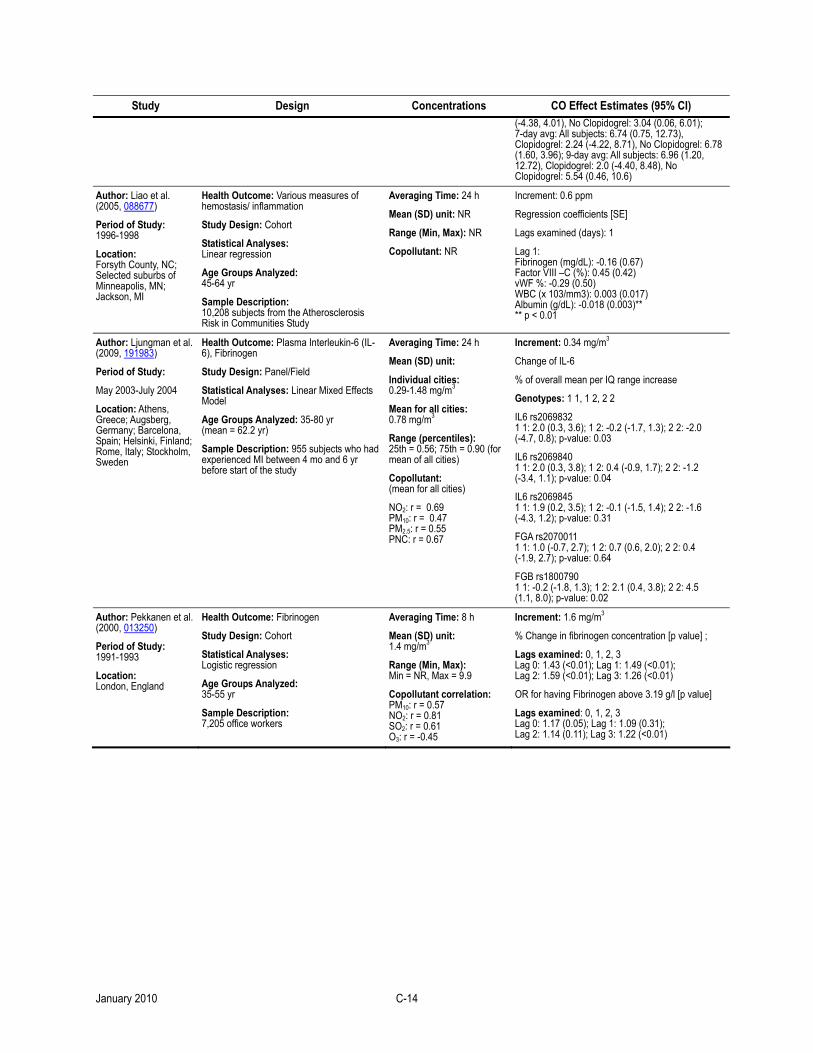
Study Design Concentrations CO Effect Estimates (95% CI) (-4.38, 4.01), No Clopidogrel: 3.04 (0.06, 6.01); 7-day avg: All subjects: 6.74 (0.75, 12.73), Clopidogrel: 2.24 (-4.22, 8.71), No Clopidogrel: 6.78 (1.60, 3.96); 9-day avg: All subjects: 6.96 (1.20, 12.72), Clopidogrel: 2.0 (-4.40, 8.48), No Clopidogrel: 5.54 (0.46, 10.6)
Author: Liao et al. (2005, 088677)
Period of Study: 1996-1998
Location: Forsyth County, NC; Selected suburbs of Minneapolis, MN; Jackson, MI
Health Outcome: Various measures of hemostasis/ inflammation
Study Design: Cohort
Statistical Analyses: Linear regression
Age Groups Analyzed: 45-64 yr
Sample Description: 10,208 subjects from the Atherosclerosis Risk in Communities Study
Averaging Time: 24 h
Mean (SD) unit: NR
Range (Min, Max): NR
Copollutant: NR
Increment: 0.6 ppm
Regression coefficients [SE]
Lags examined (days): 1
Lag 1: Fibrinogen (mg/dL): -0.16 (0.67) Factor VIII –C (%): 0.45 (0.42) vWF %: -0.29 (0.50) WBC (x 103/mm3): 0.003 (0.017) Albumin (g/dL): -0.018 (0.003)** ** p < 0.01
Author: Ljungman et al. (2009, 191983)
Period of Study:
May 2003-July 2004
Location: Athens, Greece; Augsberg, Germany; Barcelona, Spain; Helsinki, Finland; Rome, Italy; Stockholm, Sweden
Health Outcome: Plasma Interleukin-6 (IL-6), Fibrinogen
Study Design: Panel/Field
Statistical Analyses: Linear Mixed Effects Model
Age Groups Analyzed: 35-80 yr (mean = 62.2 yr)
Sample Description: 955 subjects who had experienced MI between 4 mo and 6 yr before start of the study
Averaging Time: 24 h
Mean (SD) unit:
Individual cities: 0.29-1.48 mg/m3
Mean for all cities: 0.78 mg/m3
Range (percentiles): 25th = 0.56; 75th = 0.90 (for mean of all cities)
Copollutant: (mean for all cities)
NO2: r = 0.69 PM10: r = 0.47 PM2.5: r = 0.55 PNC: r = 0.67
Increment: 0.34 mg/m3
Change of IL-6
% of overall mean per IQ range increase
Genotypes: 1 1, 1 2, 2 2
IL6 rs2069832 1 1: 2.0 (0.3, 3.6); 1 2: -0.2 (-1.7, 1.3); 2 2: -2.0 (-4.7, 0.8); p-value: 0.03
IL6 rs2069840 1 1: 2.0 (0.3, 3.8); 1 2: 0.4 (-0.9, 1.7); 2 2: -1.2 (-3.4, 1.1); p-value: 0.04
IL6 rs2069845 1 1: 1.9 (0.2, 3.5); 1 2: -0.1 (-1.5, 1.4); 2 2: -1.6 (-4.3, 1.2); p-value: 0.31
FGA rs2070011 1 1: 1.0 (-0.7, 2.7); 1 2: 0.7 (0.6, 2.0); 2 2: 0.4 (-1.9, 2.7); p-value: 0.64
FGB rs1800790 1 1: -0.2 (-1.8, 1.3); 1 2: 2.1 (0.4, 3.8); 2 2: 4.5 (1.1, 8.0); p-value: 0.02
Author: Pekkanen et al. (2000, 013250)
Period of Study: 1991-1993
Location: London, England
Health Outcome: Fibrinogen
Study Design: Cohort
Statistical Analyses: Logistic regression
Age Groups Analyzed: 35-55 yr
Sample Description: 7,205 office workers
Averaging Time: 8 h
Mean (SD) unit: 1.4 mg/m3
Range (Min, Max): Min = NR, Max = 9.9
Copollutant correlation: PM10: r = 0.57 NO2: r = 0.81 SO2: r = 0.61 O3: r = -0.45
Increment: 1.6 mg/m3
% Change in fibrinogen concentration [p value] ;
Lags examined: 0, 1, 2, 3 Lag 0: 1.43 (<0.01); Lag 1: 1.49 (<0.01); Lag 2: 1.59 (<0.01); Lag 3: 1.26 (<0.01)
OR for having Fibrinogen above 3.19 g/l [p value]
Lags examined: 0, 1, 2, 3 Lag 0: 1.17 (0.05); Lag 1: 1.09 (0.31); Lag 2: 1.14 (0.11); Lag 3: 1.22 (<0.01)
January 2010 C-14
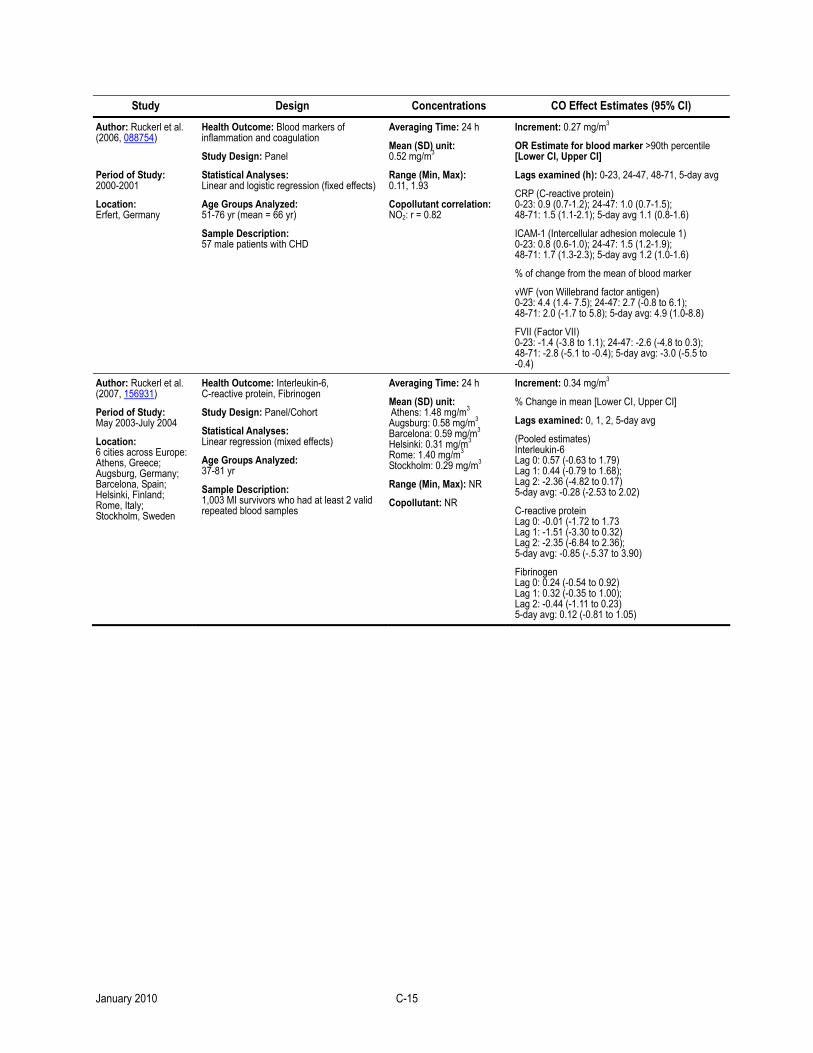
Study Design Concentrations CO Effect Estimates (95% CI)
Author: Ruckerl et al. (2006, 088754)
Period of Study: 2000-2001
Location: Erfert, Germany
Health Outcome: Blood markers of inflammation and coagulation
Study Design: Panel
Statistical Analyses: Linear and logistic regression (fixed effects)
Age Groups Analyzed: 51-76 yr (mean = 66 yr)
Sample Description: 57 male patients with CHD
Averaging Time: 24 h
Mean (SD) unit: 0.52 mg/m3
Range (Min, Max): 0.11, 1.93
Copollutant correlation: NO2: r = 0.82
Increment: 0.27 mg/m3
OR Estimate for blood marker >90th percentile [Lower CI, Upper CI]
Lags examined (h): 0-23, 24-47, 48-71, 5-day avg
CRP (C-reactive protein) 0-23: 0.9 (0.7-1.2); 24-47: 1.0 (0.7-1.5); 48-71: 1.5 (1.1-2.1); 5-day avg 1.1 (0.8-1.6)
ICAM-1 (Intercellular adhesion molecule 1) 0-23: 0.8 (0.6-1.0); 24-47: 1.5 (1.2-1.9); 48-71: 1.7 (1.3-2.3); 5-day avg 1.2 (1.0-1.6)
% of change from the mean of blood marker
vWF (von Willebrand factor antigen) 0-23: 4.4 (1.4- 7.5); 24-47: 2.7 (-0.8 to 6.1); 48-71: 2.0 (-1.7 to 5.8); 5-day avg: 4.9 (1.0-8.8)
FVII (Factor VII) 0-23: -1.4 (-3.8 to 1.1); 24-47: -2.6 (-4.8 to 0.3); 48-71: -2.8 (-5.1 to -0.4); 5-day avg: -3.0 (-5.5 to -0.4)
Author: Ruckerl et al. (2007, 156931)
Period of Study: May 2003-July 2004
Location: 6 cities across Europe: Athens, Greece; Augsburg, Germany; Barcelona, Spain; Helsinki, Finland; Rome, Italy; Stockholm, Sweden
Health Outcome: Interleukin-6, C-reactive protein, Fibrinogen
Study Design: Panel/Cohort
Statistical Analyses: Linear regression (mixed effects)
Age Groups Analyzed: 37-81 yr
Sample Description: 1,003 MI survivors who had at least 2 valid repeated blood samples
Averaging Time: 24 h
Mean (SD) unit: Athens: 1.48 mg/m3 Augsburg: 0.58 mg/m3 Barcelona: 0.59 mg/m3 Helsinki: 0.31 mg/m3 Rome: 1.40 mg/m3 Stockholm: 0.29 mg/m3
Range (Min, Max): NR
Copollutant: NR
Increment: 0.34 mg/m3
% Change in mean [Lower CI, Upper CI]
Lags examined: 0, 1, 2, 5-day avg
(Pooled estimates) Interleukin-6 Lag 0: 0.57 (-0.63 to 1.79) Lag 1: 0.44 (-0.79 to 1.68); Lag 2: -2.36 (-4.82 to 0.17) 5-day avg: -0.28 (-2.53 to 2.02)
C-reactive protein Lag 0: -0.01 (-1.72 to 1.73 Lag 1: -1.51 (-3.30 to 0.32) Lag 2: -2.35 (-6.84 to 2.36); 5-day avg: -0.85 (-.5.37 to 3.90)
Fibrinogen Lag 0: 0.24 (-0.54 to 0.92) Lag 1: 0.32 (-0.35 to 1.00); Lag 2: -0.44 (-1.11 to 0.23) 5-day avg: 0.12 (-0.81 to 1.05)
January 2010 C-15
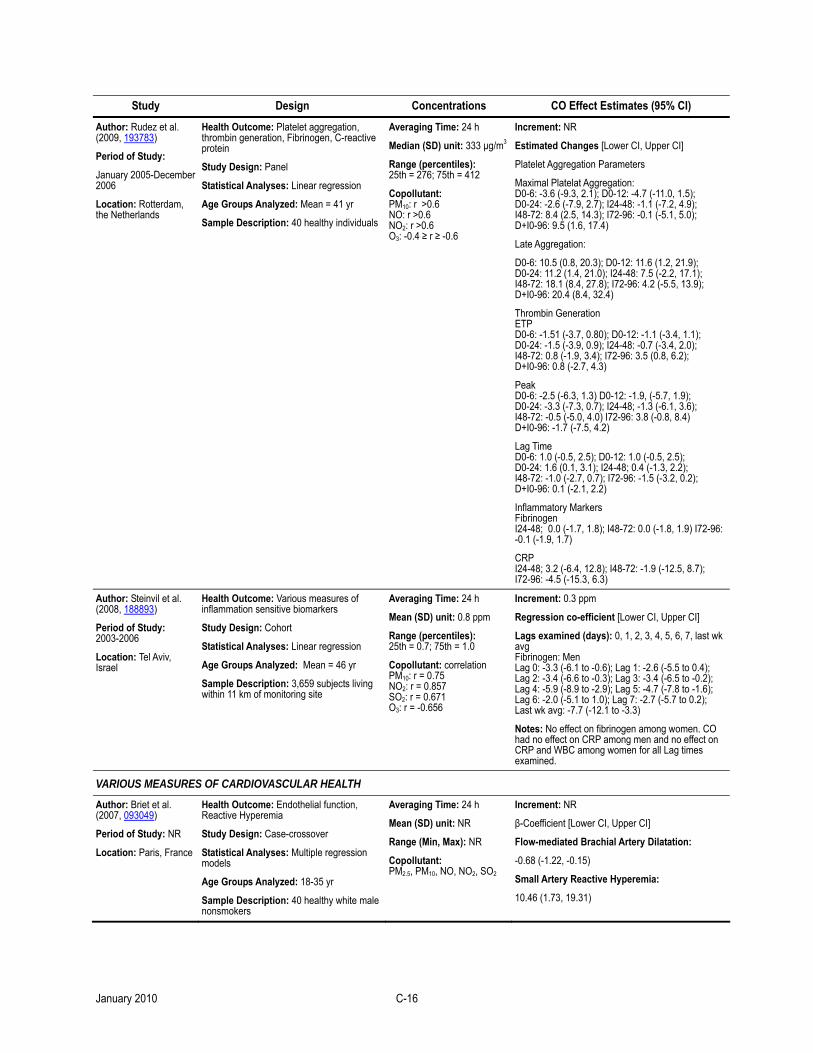
Study Design Concentrations CO Effect Estimates (95% CI)
Author: Rudez et al. (2009, 193783)
Period of Study:
January 2005-December 2006
Location: Rotterdam, the Netherlands
Health Outcome: Platelet aggregation, thrombin generation, Fibrinogen, C-reactive protein
Study Design: Panel
Statistical Analyses: Linear regression
Age Groups Analyzed: Mean = 41 yr
Sample Description: 40 healthy individuals
Averaging Time: 24 h
Median (SD) unit: 333 µg/m3
Range (percentiles): 25th = 276; 75th = 412
Copollutant: PM10: r >0.6 NO: r >0.6 NO2: r >0.6 O3: -0.4 ≥ r ≥ -0.6
Increment: NR
Estimated Changes [Lower CI, Upper CI]
Platelet Aggregation Parameters
Maximal Platelat Aggregation: D0-6: -3.6 (-9.3, 2.1); D0-12: -4.7 (-11.0, 1.5); D0-24: -2.6 (-7.9, 2.7); I24-48: -1.1 (-7.2, 4.9); I48-72: 8.4 (2.5, 14.3); I72-96: -0.1 (-5.1, 5.0); D+I0-96: 9.5 (1.6, 17.4)
Late Aggregation:
D0-6: 10.5 (0.8, 20.3); D0-12: 11.6 (1.2, 21.9); D0-24: 11.2 (1.4, 21.0); I24-48: 7.5 (-2.2, 17.1); I48-72: 18.1 (8.4, 27.8); I72-96: 4.2 (-5.5, 13.9); D+I0-96: 20.4 (8.4, 32.4)
Thrombin Generation ETP D0-6: -1.51 (-3.7, 0.80); D0-12: -1.1 (-3.4, 1.1); D0-24: -1.5 (-3.9, 0.9); I24-48: -0.7 (-3.4, 2.0); I48-72: 0.8 (-1.9, 3.4); I72-96: 3.5 (0.8, 6.2); D+I0-96: 0.8 (-2.7, 4.3)
Peak D0-6: -2.5 (-6.3, 1.3) D0-12: -1.9, (-5.7, 1.9); D0-24: -3.3 (-7.3, 0.7); I24-48; -1.3 (-6.1, 3.6); I48-72: -0.5 (-5.0, 4.0) I72-96: 3.8 (-0.8, 8.4) D+I0-96: -1.7 (-7.5, 4.2)
Lag Time D0-6: 1.0 (-0.5, 2.5); D0-12: 1.0 (-0.5, 2.5); D0-24: 1.6 (0.1, 3.1); I24-48; 0.4 (-1.3, 2.2); I48-72: -1.0 (-2.7, 0.7); I72-96: -1.5 (-3.2, 0.2); D+I0-96: 0.1 (-2.1, 2.2)
Inflammatory Markers Fibrinogen I24-48; 0.0 (-1.7, 1.8); I48-72: 0.0 (-1.8, 1.9) I72-96: -0.1 (-1.9, 1.7)
CRP I24-48; 3.2 (-6.4, 12.8); I48-72: -1.9 (-12.5, 8.7); I72-96: -4.5 (-15.3, 6.3)
Author: Steinvil et al. (2008, 188893)
Period of Study: 2003-2006
Location: Tel Aviv, Israel
Health Outcome: Various measures of inflammation sensitive biomarkers
Study Design: Cohort
Statistical Analyses: Linear regression
Age Groups Analyzed: Mean = 46 yr
Sample Description: 3,659 subjects living within 11 km of monitoring site
Averaging Time: 24 h
Mean (SD) unit: 0.8 ppm
Range (percentiles): 25th = 0.7; 75th = 1.0
Copollutant: correlation PM10: r = 0.75 NO2: r = 0.857 SO2: r = 0.671 O3: r = -0.656
Increment: 0.3 ppm
Regression co-efficient [Lower CI, Upper CI]
Lags examined (days): 0, 1, 2, 3, 4, 5, 6, 7, last wk avg Fibrinogen: Men Lag 0: -3.3 (-6.1 to -0.6); Lag 1: -2.6 (-5.5 to 0.4); Lag 2: -3.4 (-6.6 to -0.3); Lag 3: -3.4 (-6.5 to -0.2); Lag 4: -5.9 (-8.9 to -2.9); Lag 5: -4.7 (-7.8 to -1.6); Lag 6: -2.0 (-5.1 to 1.0); Lag 7: -2.7 (-5.7 to 0.2); Last wk avg: -7.7 (-12.1 to -3.3)
Notes: No effect on fibrinogen among women. CO had no effect on CRP among men and no effect on CRP and WBC among women for all Lag times examined.
VARIOUS MEASURES OF CARDIOVASCULAR HEALTH Author: Briet et al. (2007, 093049)
Period of Study: NR
Location: Paris, France
Health Outcome: Endothelial function, Reactive Hyperemia
Study Design: Case-crossover
Statistical Analyses: Multiple regression models
Age Groups Analyzed: 18-35 yr
Sample Description: 40 healthy white male nonsmokers
Averaging Time: 24 h
Mean (SD) unit: NR
Range (Min, Max): NR
Copollutant: PM2.5, PM10, NO, NO2, SO2
Increment: NR
β-Coefficient [Lower CI, Upper CI]
Flow-mediated Brachial Artery Dilatation:
-0.68 (-1.22, -0.15)
Small Artery Reactive Hyperemia:
10.46 (1.73, 19.31)
January 2010 C-16
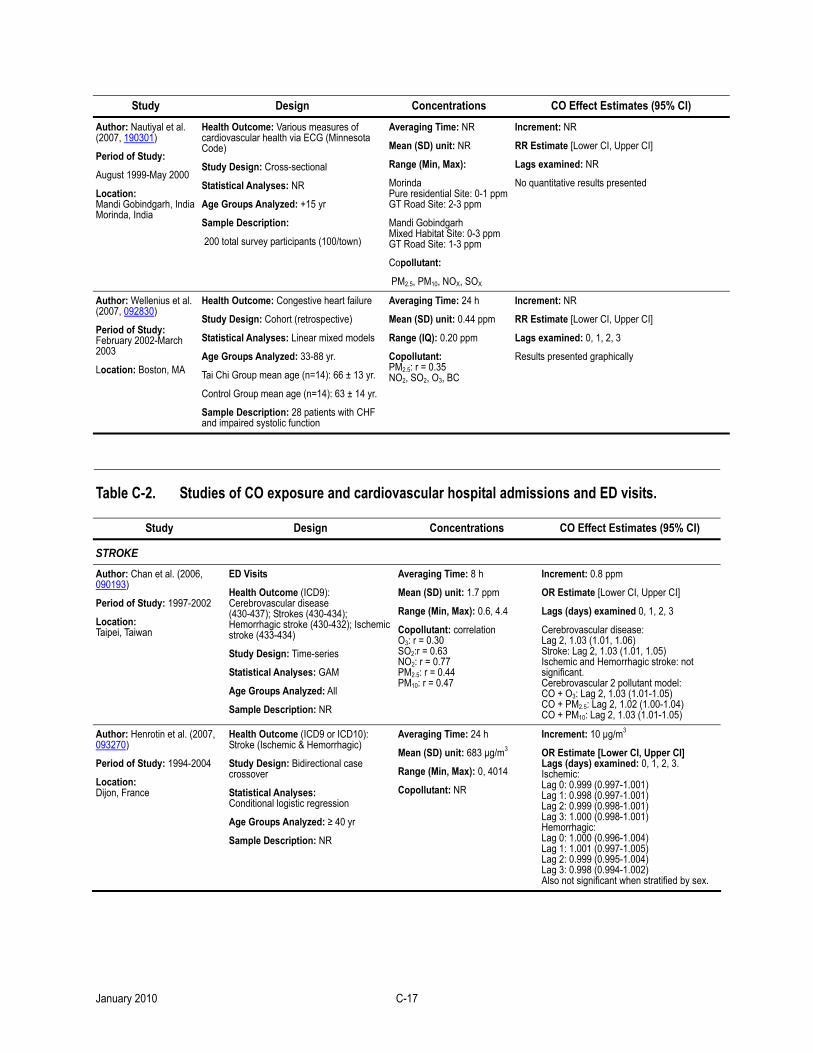
Study Design Concentrations CO Effect Estimates (95% CI)
Author: Nautiyal et al. (2007, 190301)
Period of Study:
August 1999-May 2000
Location: Mandi Gobindgarh, India Morinda, India
Health Outcome: Various measures of cardiovascular health via ECG (Minnesota Code)
Study Design: Cross-sectional
Statistical Analyses: NR
Age Groups Analyzed: +15 yr
Sample Description:
200 total survey participants (100/town)
Averaging Time: NR
Mean (SD) unit: NR
Range (Min, Max):
Morinda Pure residential Site: 0-1 ppm GT Road Site: 2-3 ppm
Mandi Gobindgarh Mixed Habitat Site: 0-3 ppm GT Road Site: 1-3 ppm
Copollutant:
PM2.5, PM10, NOX, SOX
Increment: NR
RR Estimate [Lower CI, Upper CI]
Lags examined: NR
No quantitative results presented
Author: Wellenius et al. (2007, 092830)
Period of Study: February 2002-March 2003
Location: Boston, MA
Health Outcome: Congestive heart failure
Study Design: Cohort (retrospective)
Statistical Analyses: Linear mixed models
Age Groups Analyzed: 33-88 yr.
Tai Chi Group mean age (n=14): 66 ± 13 yr.
Control Group mean age (n=14): 63 ± 14 yr.
Sample Description: 28 patients with CHF and impaired systolic function
Averaging Time: 24 h
Mean (SD) unit: 0.44 ppm
Range (IQ): 0.20 ppm
Copollutant: PM2.5: r = 0.35 NO2, SO2, O3, BC
Increment: NR
RR Estimate [Lower CI, Upper CI]
Lags examined: 0, 1, 2, 3
Results presented graphically
Table C-2. Studies of CO exposure and cardiovascular hospital admissions and ED visits.
Study Design Concentrations CO Effect Estimates (95% CI)
STROKE Author: Chan et al. (2006, 090193)
Period of Study: 1997-2002
Location: Taipei, Taiwan
ED Visits
Health Outcome (ICD9): Cerebrovascular disease (430-437); Strokes (430-434); Hemorrhagic stroke (430-432); Ischemic stroke (433-434)
Study Design: Time-series
Statistical Analyses: GAM
Age Groups Analyzed: All
Sample Description: NR
Averaging Time: 8 h
Mean (SD) unit: 1.7 ppm
Range (Min, Max): 0.6, 4.4
Copollutant: correlation O3: r = 0.30 SO2:r = 0.63 NO2: r = 0.77 PM2.5: r = 0.44 PM10: r = 0.47
Increment: 0.8 ppm
OR Estimate [Lower CI, Upper CI]
Lags (days) examined 0, 1, 2, 3
Cerebrovascular disease: Lag 2, 1.03 (1.01, 1.06) Stroke: Lag 2, 1.03 (1.01, 1.05) Ischemic and Hemorrhagic stroke: not significant. Cerebrovascular 2 pollutant model: CO + O3: Lag 2, 1.03 (1.01-1.05) CO + PM2.5: Lag 2, 1.02 (1.00-1.04) CO + PM10: Lag 2, 1.03 (1.01-1.05)
Author: Henrotin et al. (2007, 093270)
Period of Study: 1994-2004
Location: Dijon, France
Health Outcome (ICD9 or ICD10): Stroke (Ischemic & Hemorrhagic)
Study Design: Bidirectional case crossover
Statistical Analyses: Conditional logistic regression
Age Groups Analyzed: ≥ 40 yr
Sample Description: NR
Averaging Time: 24 h
Mean (SD) unit: 683 µg/m3
Range (Min, Max): 0, 4014
Copollutant: NR
Increment: 10 µg/m3
OR Estimate [Lower CI, Upper CI] Lags (days) examined: 0, 1, 2, 3. Ischemic: Lag 0: 0.999 (0.997-1.001) Lag 1: 0.998 (0.997-1.001) Lag 2: 0.999 (0.998-1.001) Lag 3: 1.000 (0.998-1.001) Hemorrhagic: Lag 0: 1.000 (0.996-1.004) Lag 1: 1.001 (0.997-1.005) Lag 2: 0.999 (0.995-1.004) Lag 3: 0.998 (0.994-1.002) Also not significant when stratified by sex.
January 2010 C-17
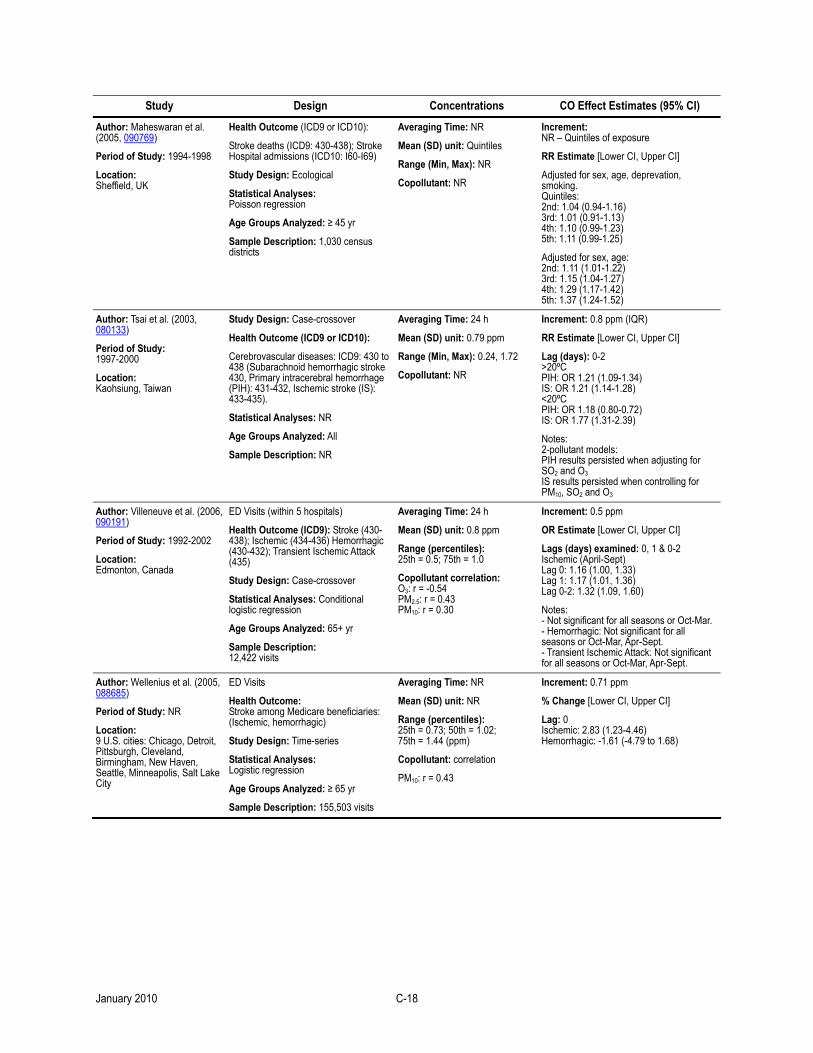
Study Design Concentrations CO Effect Estimates (95% CI)
Author: Maheswaran et al. (2005, 090769)
Period of Study: 1994-1998
Location: Sheffield, UK
Health Outcome (ICD9 or ICD10):
Stroke deaths (ICD9: 430-438); Stroke Hospital admissions (ICD10: I60-I69)
Study Design: Ecological
Statistical Analyses: Poisson regression
Age Groups Analyzed: ≥ 45 yr
Sample Description: 1,030 census districts
Averaging Time: NR
Mean (SD) unit: Quintiles
Range (Min, Max): NR
Copollutant: NR
Increment: NR – Quintiles of exposure
RR Estimate [Lower CI, Upper CI]
Adjusted for sex, age, deprevation, smoking. Quintiles: 2nd: 1.04 (0.94-1.16) 3rd: 1.01 (0.91-1.13) 4th: 1.10 (0.99-1.23) 5th: 1.11 (0.99-1.25)
Adjusted for sex, age: 2nd: 1.11 (1.01-1.22) 3rd: 1.15 (1.04-1.27) 4th: 1.29 (1.17-1.42) 5th: 1.37 (1.24-1.52)
Author: Tsai et al. (2003, 080133)
Period of Study: 1997-2000
Location: Kaohsiung, Taiwan
Study Design: Case-crossover
Health Outcome (ICD9 or ICD10):
Cerebrovascular diseases: ICD9: 430 to 438 (Subarachnoid hemorrhagic stroke 430, Primary intracerebral hemorrhage (PIH): 431-432, Ischemic stroke (IS): 433-435).
Statistical Analyses: NR
Age Groups Analyzed: All
Sample Description: NR
Averaging Time: 24 h
Mean (SD) unit: 0.79 ppm
Range (Min, Max): 0.24, 1.72
Copollutant: NR
Increment: 0.8 ppm (IQR)
RR Estimate [Lower CI, Upper CI]
Lag (days): 0-2 >20ºC PIH: OR 1.21 (1.09-1.34) IS: OR 1.21 (1.14-1.28) <20ºC PIH: OR 1.18 (0.80-0.72) IS: OR 1.77 (1.31-2.39)
Notes: 2-pollutant models: PIH results persisted when adjusting for SO2 and O3 IS results persisted when controlling for PM10, SO2 and O3
Author: Villeneuve et al. (2006, 090191)
Period of Study: 1992-2002
Location: Edmonton, Canada
ED Visits (within 5 hospitals)
Health Outcome (ICD9): Stroke (430-438); Ischemic (434-436) Hemorrhagic (430-432); Transient Ischemic Attack (435)
Study Design: Case-crossover
Statistical Analyses: Conditional logistic regression
Age Groups Analyzed: 65+ yr
Sample Description: 12,422 visits
Averaging Time: 24 h
Mean (SD) unit: 0.8 ppm
Range (percentiles): 25th = 0.5; 75th = 1.0
Copollutant correlation: O3: r = -0.54 PM2.5: r = 0.43 PM10: r = 0.30
Increment: 0.5 ppm
OR Estimate [Lower CI, Upper CI]
Lags (days) examined: 0, 1 & 0-2 Ischemic (April-Sept) Lag 0: 1.16 (1.00, 1.33) Lag 1: 1.17 (1.01, 1.36) Lag 0-2: 1.32 (1.09, 1.60)
Notes: - Not significant for all seasons or Oct-Mar.- Hemorrhagic: Not significant for all seasons or Oct-Mar, Apr-Sept. - Transient Ischemic Attack: Not significant for all seasons or Oct-Mar, Apr-Sept.
Author: Wellenius et al. (2005, 088685)
Period of Study: NR
Location: 9 U.S. cities: Chicago, Detroit, Pittsburgh, Cleveland, Birmingham, New Haven, Seattle, Minneapolis, Salt Lake City
ED Visits
Health Outcome: Stroke among Medicare beneficiaries: (Ischemic, hemorrhagic)
Study Design: Time-series
Statistical Analyses: Logistic regression
Age Groups Analyzed: ≥ 65 yr
Sample Description: 155,503 visits
Averaging Time: NR
Mean (SD) unit: NR
Range (percentiles): 25th = 0.73; 50th = 1.02; 75th = 1.44 (ppm)
Copollutant: correlation
PM10: r = 0.43
Increment: 0.71 ppm
% Change [Lower CI, Upper CI]
Lag: 0 Ischemic: 2.83 (1.23-4.46) Hemorrhagic: -1.61 (-4.79 to 1.68)
January 2010 C-18
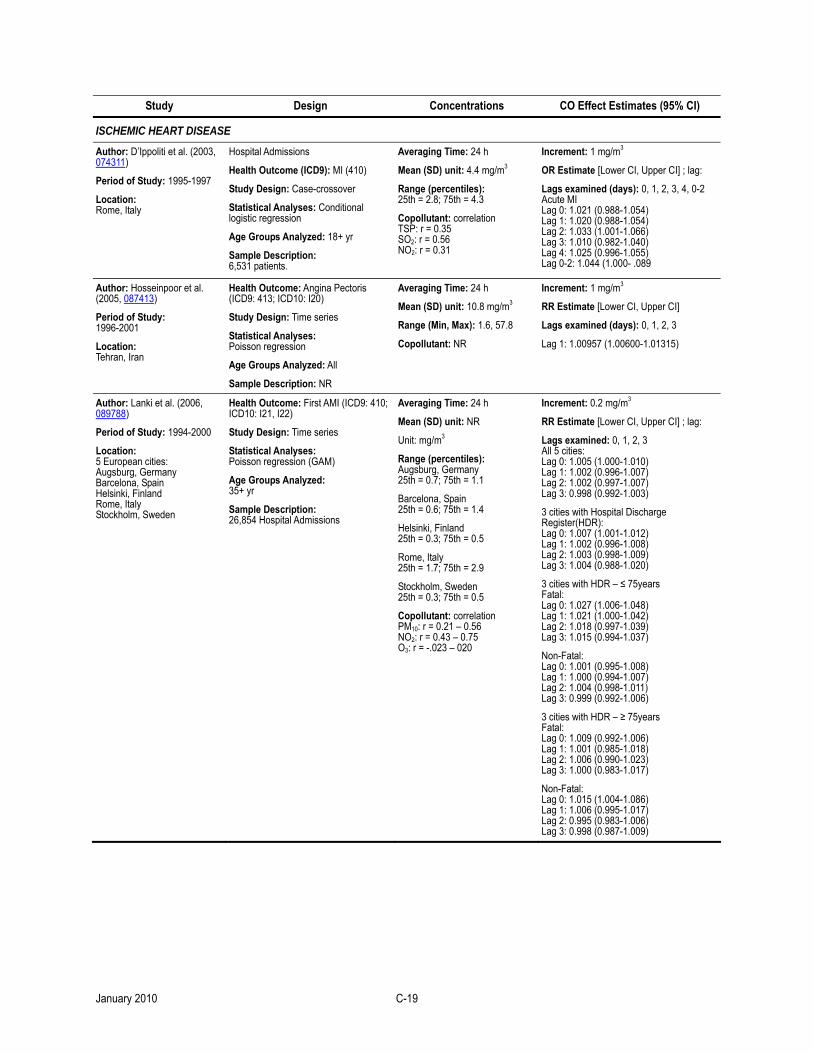
Study Design Concentrations CO Effect Estimates (95% CI)
ISCHEMIC HEART DISEASE Author: D’Ippoliti et al. (2003, 074311)
Period of Study: 1995-1997
Location: Rome, Italy
Hospital Admissions
Health Outcome (ICD9): MI (410)
Study Design: Case-crossover
Statistical Analyses: Conditional logistic regression
Age Groups Analyzed: 18+ yr
Sample Description: 6,531 patients.
Averaging Time: 24 h
Mean (SD) unit: 4.4 mg/m3
Range (percentiles): 25th = 2.8; 75th = 4.3
Copollutant: correlation TSP: r = 0.35 SO2: r = 0.56 NO2: r = 0.31
Increment: 1 mg/m3
OR Estimate [Lower CI, Upper CI] ; lag:
Lags examined (days): 0, 1, 2, 3, 4, 0-2 Acute MI Lag 0: 1.021 (0.988-1.054) Lag 1: 1.020 (0.988-1.054) Lag 2: 1.033 (1.001-1.066) Lag 3: 1.010 (0.982-1.040) Lag 4: 1.025 (0.996-1.055) Lag 0-2: 1.044 (1.000- .089
Author: Hosseinpoor et al. (2005, 087413)
Period of Study: 1996-2001
Location: Tehran, Iran
Health Outcome: Angina Pectoris (ICD9: 413; ICD10: I20)
Study Design: Time series
Statistical Analyses: Poisson regression
Age Groups Analyzed: All
Sample Description: NR
Averaging Time: 24 h
Mean (SD) unit: 10.8 mg/m3
Range (Min, Max): 1.6, 57.8
Copollutant: NR
Increment: 1 mg/m3
RR Estimate [Lower CI, Upper CI]
Lags examined (days): 0, 1, 2, 3
Lag 1: 1.00957 (1.00600-1.01315)
Author: Lanki et al. (2006, 089788)
Period of Study: 1994-2000
Location: 5 European cities: Augsburg, Germany Barcelona, Spain Helsinki, Finland Rome, Italy Stockholm, Sweden
Health Outcome: First AMI (ICD9: 410; ICD10: I21, I22)
Study Design: Time series
Statistical Analyses: Poisson regression (GAM)
Age Groups Analyzed: 35+ yr
Sample Description: 26,854 Hospital Admissions
Averaging Time: 24 h
Mean (SD) unit: NR
Unit: mg/m3
Range (percentiles): Augsburg, Germany 25th = 0.7; 75th = 1.1
Barcelona, Spain 25th = 0.6; 75th = 1.4
Helsinki, Finland 25th = 0.3; 75th = 0.5
Rome, Italy 25th = 1.7; 75th = 2.9
Stockholm, Sweden 25th = 0.3; 75th = 0.5
Copollutant: correlation PM10: r = 0.21 – 0.56 NO2: r = 0.43 – 0.75 O3: r = -.023 – 020
Increment: 0.2 mg/m3
RR Estimate [Lower CI, Upper CI] ; lag:
Lags examined: 0, 1, 2, 3 All 5 cities: Lag 0: 1.005 (1.000-1.010) Lag 1: 1.002 (0.996-1.007) Lag 2: 1.002 (0.997-1.007) Lag 3: 0.998 (0.992-1.003)
3 cities with Hospital Discharge Register(HDR): Lag 0: 1.007 (1.001-1.012) Lag 1: 1.002 (0.996-1.008) Lag 2: 1.003 (0.998-1.009) Lag 3: 1.004 (0.988-1.020)
3 cities with HDR – ≤ 75years Fatal: Lag 0: 1.027 (1.006-1.048) Lag 1: 1.021 (1.000-1.042) Lag 2: 1.018 (0.997-1.039) Lag 3: 1.015 (0.994-1.037)
Non-Fatal: Lag 0: 1.001 (0.995-1.008) Lag 1: 1.000 (0.994-1.007) Lag 2: 1.004 (0.998-1.011) Lag 3: 0.999 (0.992-1.006)
3 cities with HDR – ≥ 75years Fatal: Lag 0: 1.009 (0.992-1.006) Lag 1: 1.001 (0.985-1.018) Lag 2: 1.006 (0.990-1.023) Lag 3: 1.000 (0.983-1.017)
Non-Fatal: Lag 0: 1.015 (1.004-1.086) Lag 1: 1.006 (0.995-1.017) Lag 2: 0.995 (0.983-1.006) Lag 3: 0.998 (0.987-1.009)
January 2010 C-19
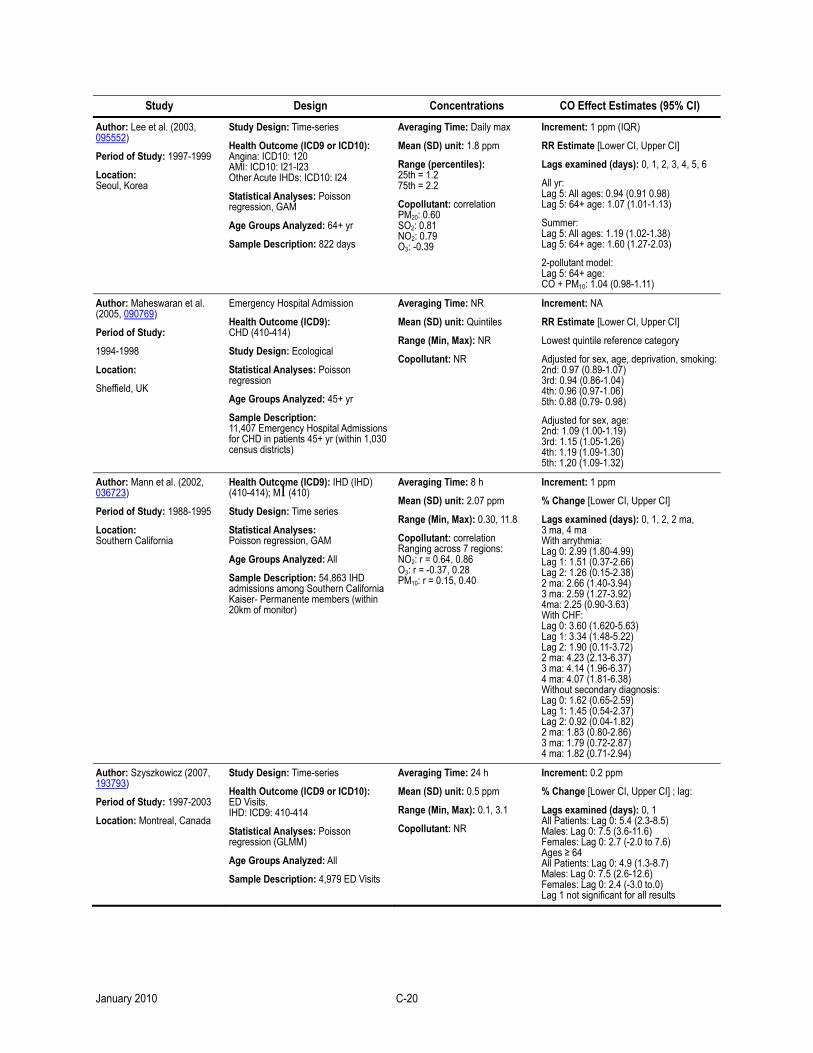
Study Design Concentrations CO Effect Estimates (95% CI)
Author: Lee et al. (2003, 095552)
Period of Study: 1997-1999
Location: Seoul, Korea
Study Design: Time-series
Health Outcome (ICD9 or ICD10): Angina: ICD10: 120 AMI: ICD10: I21-I23 Other Acute IHDs: ICD10: I24
Statistical Analyses: Poisson regression, GAM
Age Groups Analyzed: 64+ yr
Sample Description: 822 days
Averaging Time: Daily max
Mean (SD) unit: 1.8 ppm
Range (percentiles): 25th = 1.2 75th = 2.2
Copollutant: correlation PM20: 0.60 SO2: 0.81 NO2: 0.79 O3: -0.39
Increment: 1 ppm (IQR)
RR Estimate [Lower CI, Upper CI]
Lags examined (days): 0, 1, 2, 3, 4, 5, 6
All yr: Lag 5: All ages: 0.94 (0.91 0.98) Lag 5: 64+ age: 1.07 (1.01-1.13)
Summer: Lag 5: All ages: 1.19 (1.02-1.38) Lag 5: 64+ age: 1.60 (1.27-2.03)
2-pollutant model: Lag 5: 64+ age: CO + PM10: 1.04 (0.98-1.11)
Author: Maheswaran et al. (2005, 090769)
Period of Study:
1994-1998
Location:
Sheffield, UK
Emergency Hospital Admission
Health Outcome (ICD9): CHD (410-414)
Study Design: Ecological
Statistical Analyses: Poisson regression
Age Groups Analyzed: 45+ yr
Sample Description: 11,407 Emergency Hospital Admissions for CHD in patients 45+ yr (within 1,030 census districts)
Averaging Time: NR
Mean (SD) unit: Quintiles
Range (Min, Max): NR
Copollutant: NR
Increment: NA
RR Estimate [Lower CI, Upper CI]
Lowest quintile reference category
Adjusted for sex, age, deprivation, smoking:2nd: 0.97 (0.89-1.07) 3rd: 0.94 (0.86-1.04) 4th: 0.96 (0.97-1.06) 5th: 0.88 (0.79- 0.98)
Adjusted for sex, age: 2nd: 1.09 (1.00-1.19) 3rd: 1.15 (1.05-1.26) 4th: 1.19 (1.09-1.30) 5th: 1.20 (1.09-1.32)
Author: Mann et al. (2002, 036723)
Period of Study: 1988-1995
Location: Southern California
Health Outcome (ICD9): IHD (IHD) (410-414); MI (410)
Study Design: Time series
Statistical Analyses: Poisson regression, GAM
Age Groups Analyzed: All
Sample Description: 54,863 IHD admissions among Southern California Kaiser- Permanente members (within 20km of monitor)
Averaging Time: 8 h
Mean (SD) unit: 2.07 ppm
Range (Min, Max): 0.30, 11.8
Copollutant: correlation Ranging across 7 regions: NO2: r = 0.64, 0.86 O3: r = -0.37, 0.28 PM10: r = 0.15, 0.40
Increment: 1 ppm
% Change [Lower CI, Upper CI]
Lags examined (days): 0, 1, 2, 2 ma, 3 ma, 4 ma With arrythmia: Lag 0: 2.99 (1.80-4.99) Lag 1: 1.51 (0.37-2.66) Lag 2: 1.26 (0.15-2.38) 2 ma: 2.66 (1.40-3.94) 3 ma: 2.59 (1.27-3.92) 4ma: 2.25 (0.90-3.63) With CHF: Lag 0: 3.60 (1.620-5.63) Lag 1: 3.34 (1.48-5.22) Lag 2: 1.90 (0.11-3.72) 2 ma: 4.23 (2.13-6.37) 3 ma: 4.14 (1.96-6.37) 4 ma: 4.07 (1.81-6.38) Without secondary diagnosis: Lag 0: 1.62 (0.65-2.59) Lag 1: 1.45 (0.54-2.37) Lag 2: 0.92 (0.04-1.82) 2 ma: 1.83 (0.80-2.86) 3 ma: 1.79 (0.72-2.87) 4 ma: 1.82 (0.71-2.94)
Author: Szyszkowicz (2007, 193793)
Period of Study: 1997-2003
Location: Montreal, Canada
Study Design: Time-series
Health Outcome (ICD9 or ICD10): ED Visits. IHD: ICD9: 410-414
Statistical Analyses: Poisson regression (GLMM)
Age Groups Analyzed: All
Sample Description: 4,979 ED Visits
Averaging Time: 24 h
Mean (SD) unit: 0.5 ppm
Range (Min, Max): 0.1, 3.1
Copollutant: NR
Increment: 0.2 ppm
% Change [Lower CI, Upper CI] ; lag:
Lags examined (days): 0, 1 All Patients: Lag 0: 5.4 (2.3-8.5) Males: Lag 0: 7.5 (3.6-11.6) Females: Lag 0: 2.7 (-2.0 to 7.6) Ages ≥ 64 All Patients: Lag 0: 4.9 (1.3-8.7) Males: Lag 0: 7.5 (2.6-12.6) Females: Lag 0: 2.4 (-3.0 to.0) Lag 1 not significant for all results
January 2010 C-20
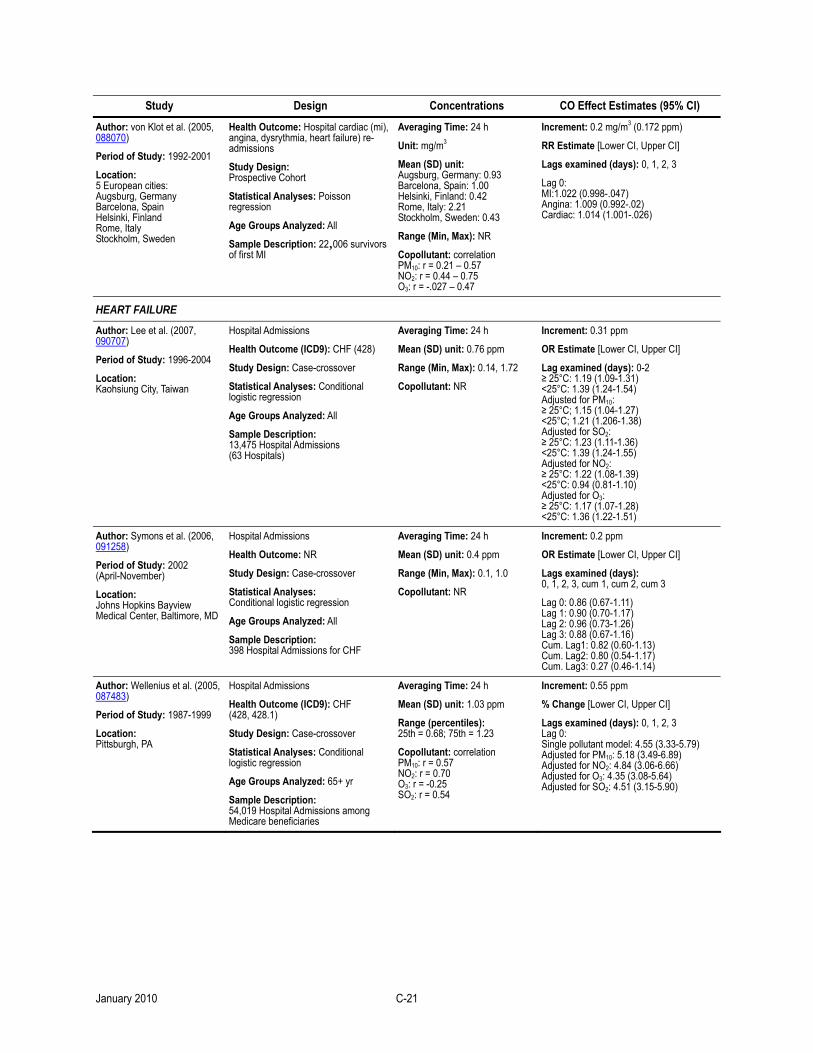
Study Design Concentrations CO Effect Estimates (95% CI)
Author: von Klot et al. (2005, 088070)
Period of Study: 1992-2001
Location: 5 European cities: Augsburg, Germany Barcelona, Spain Helsinki, Finland Rome, Italy Stockholm, Sweden
Health Outcome: Hospital cardiac (mi), angina, dysrythmia, heart failure) re-admissions
Study Design: Prospective Cohort
Statistical Analyses: Poisson regression
Age Groups Analyzed: All
Sample Description: 22,006 survivors of first MI
Averaging Time: 24 h
Unit: mg/m3
Mean (SD) unit: Augsburg, Germany: 0.93 Barcelona, Spain: 1.00 Helsinki, Finland: 0.42 Rome, Italy: 2.21 Stockholm, Sweden: 0.43
Range (Min, Max): NR
Copollutant: correlation PM10: r = 0.21 – 0.57 NO2: r = 0.44 – 0.75 O3: r = -.027 – 0.47
Increment: 0.2 mg/m3 (0.172 ppm)
RR Estimate [Lower CI, Upper CI]
Lags examined (days): 0, 1, 2, 3
Lag 0: MI:1.022 (0.998-.047) Angina: 1.009 (0.992-.02) Cardiac: 1.014 (1.001-.026)
HEART FAILURE Author: Lee et al. (2007, 090707)
Period of Study: 1996-2004
Location: Kaohsiung City, Taiwan
Hospital Admissions
Health Outcome (ICD9): CHF (428)
Study Design: Case-crossover
Statistical Analyses: Conditional logistic regression
Age Groups Analyzed: All
Sample Description: 13,475 Hospital Admissions (63 Hospitals)
Averaging Time: 24 h
Mean (SD) unit: 0.76 ppm
Range (Min, Max): 0.14, 1.72
Copollutant: NR
Increment: 0.31 ppm
OR Estimate [Lower CI, Upper CI]
Lag examined (days): 0-2 ≥ 25°C: 1.19 (1.09-1.31) <25°C: 1.39 (1.24-1.54) Adjusted for PM10: ≥ 25°C; 1.15 (1.04-1.27) <25°C; 1.21 (1.206-1.38) Adjusted for SO2: ≥ 25°C: 1.23 (1.11-1.36) <25°C: 1.39 (1.24-1.55) Adjusted for NO2: ≥ 25°C: 1.22 (1.08-1.39) <25°C: 0.94 (0.81-1.10) Adjusted for O3: ≥ 25°C: 1.17 (1.07-1.28) <25°C: 1.36 (1.22-1.51)
Author: Symons et al. (2006, 091258)
Period of Study: 2002 (April-November)
Location: Johns Hopkins Bayview Medical Center, Baltimore, MD
Hospital Admissions
Health Outcome: NR
Study Design: Case-crossover
Statistical Analyses: Conditional logistic regression
Age Groups Analyzed: All
Sample Description: 398 Hospital Admissions for CHF
Averaging Time: 24 h
Mean (SD) unit: 0.4 ppm
Range (Min, Max): 0.1, 1.0
Copollutant: NR
Increment: 0.2 ppm
OR Estimate [Lower CI, Upper CI]
Lags examined (days): 0, 1, 2, 3, cum 1, cum 2, cum 3
Lag 0: 0.86 (0.67-1.11) Lag 1: 0.90 (0.70-1.17) Lag 2: 0.96 (0.73-1.26) Lag 3: 0.88 (0.67-1.16) Cum. Lag1: 0.82 (0.60-1.13) Cum. Lag2: 0.80 (0.54-1.17) Cum. Lag3: 0.27 (0.46-1.14)
Author: Wellenius et al. (2005, 087483)
Period of Study: 1987-1999
Location: Pittsburgh, PA
Hospital Admissions
Health Outcome (ICD9): CHF (428, 428.1)
Study Design: Case-crossover
Statistical Analyses: Conditional logistic regression
Age Groups Analyzed: 65+ yr
Sample Description: 54,019 Hospital Admissions among Medicare beneficiaries
Averaging Time: 24 h
Mean (SD) unit: 1.03 ppm
Range (percentiles): 25th = 0.68; 75th = 1.23
Copollutant: correlation PM10: r = 0.57 NO2: r = 0.70 O3: r = -0.25 SO2: r = 0.54
Increment: 0.55 ppm
% Change [Lower CI, Upper CI]
Lags examined (days): 0, 1, 2, 3 Lag 0: Single pollutant model: 4.55 (3.33-5.79) Adjusted for PM10: 5.18 (3.49-6.89) Adjusted for NO2: 4.84 (3.06-6.66) Adjusted for O3: 4.35 (3.08-5.64) Adjusted for SO2: 4.51 (3.15-5.90)
January 2010 C-21
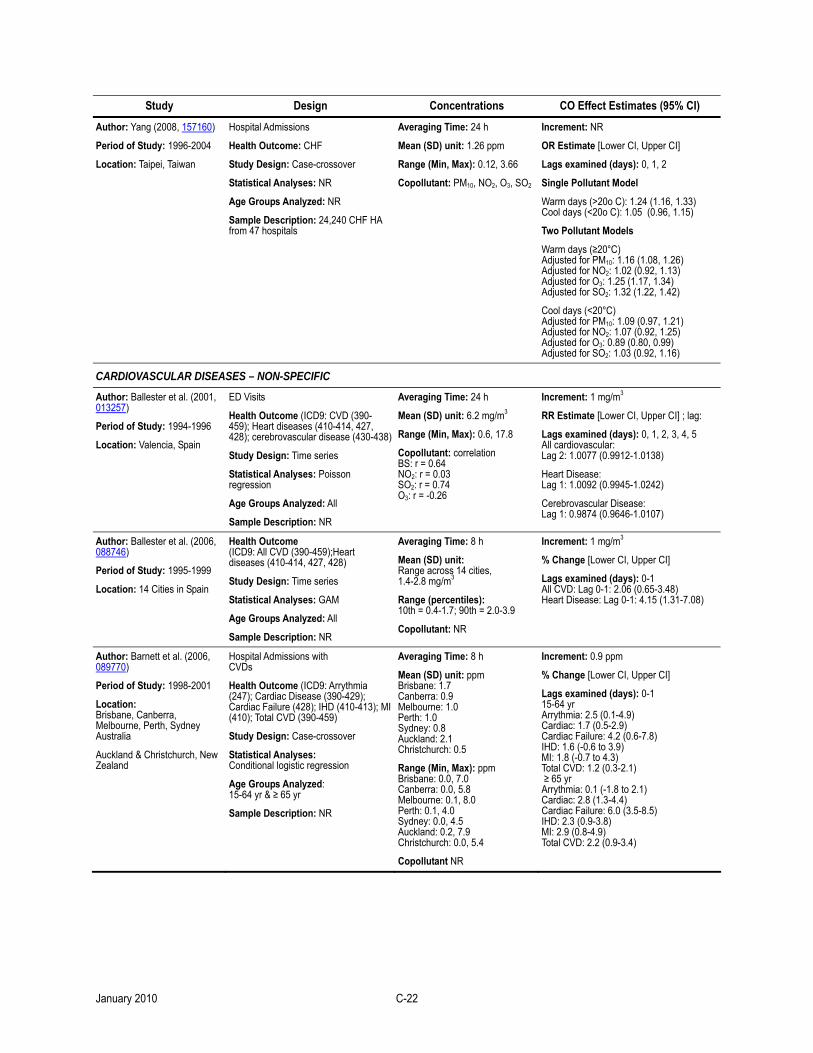
Study Design Concentrations CO Effect Estimates (95% CI)
Author: Yang (2008, 157160)
Period of Study: 1996-2004
Location: Taipei, Taiwan
Hospital Admissions
Health Outcome: CHF
Study Design: Case-crossover
Statistical Analyses: NR
Age Groups Analyzed: NR
Sample Description: 24,240 CHF HA from 47 hospitals
Averaging Time: 24 h
Mean (SD) unit: 1.26 ppm
Range (Min, Max): 0.12, 3.66
Copollutant: PM10, NO2, O3, SO2
Increment: NR
OR Estimate [Lower CI, Upper CI]
Lags examined (days): 0, 1, 2
Single Pollutant Model
Warm days (>20o C): 1.24 (1.16, 1.33) Cool days (<20o C): 1.05 (0.96, 1.15)
Two Pollutant Models
Warm days (≥20°C) Adjusted for PM10: 1.16 (1.08, 1.26) Adjusted for NO2: 1.02 (0.92, 1.13) Adjusted for O3: 1.25 (1.17, 1.34) Adjusted for SO2: 1.32 (1.22, 1.42)
Cool days (<20°C) Adjusted for PM10: 1.09 (0.97, 1.21) Adjusted for NO2: 1.07 (0.92, 1.25) Adjusted for O3: 0.89 (0.80, 0.99) Adjusted for SO2: 1.03 (0.92, 1.16)
CARDIOVASCULAR DISEASES – NON-SPECIFIC Author: Ballester et al. (2001, 013257)
Period of Study: 1994-1996
Location: Valencia, Spain
ED Visits
Health Outcome (ICD9: CVD (390-459); Heart diseases (410-414, 427, 428); cerebrovascular disease (430-438)
Study Design: Time series
Statistical Analyses: Poisson regression
Age Groups Analyzed: All
Sample Description: NR
Averaging Time: 24 h
Mean (SD) unit: 6.2 mg/m3
Range (Min, Max): 0.6, 17.8
Copollutant: correlation BS: r = 0.64 NO2: r = 0.03 SO2: r = 0.74 O3: r = -0.26
Increment: 1 mg/m3
RR Estimate [Lower CI, Upper CI] ; lag:
Lags examined (days): 0, 1, 2, 3, 4, 5 All cardiovascular: Lag 2: 1.0077 (0.9912-1.0138)
Heart Disease: Lag 1: 1.0092 (0.9945-1.0242)
Cerebrovascular Disease: Lag 1: 0.9874 (0.9646-1.0107)
Author: Ballester et al. (2006, 088746)
Period of Study: 1995-1999
Location: 14 Cities in Spain
Health Outcome (ICD9: All CVD (390-459);Heart diseases (410-414, 427, 428)
Study Design: Time series
Statistical Analyses: GAM
Age Groups Analyzed: All
Sample Description: NR
Averaging Time: 8 h
Mean (SD) unit: Range across 14 cities, 1.4-2.8 mg/m3
Range (percentiles): 10th = 0.4-1.7; 90th = 2.0-3.9
Copollutant: NR
Increment: 1 mg/m3
% Change [Lower CI, Upper CI]
Lags examined (days): 0-1 All CVD: Lag 0-1: 2.06 (0.65-3.48) Heart Disease: Lag 0-1: 4.15 (1.31-7.08)
Author: Barnett et al. (2006, 089770)
Period of Study: 1998-2001
Location: Brisbane, Canberra, Melbourne, Perth, Sydney Australia
Auckland & Christchurch, New Zealand
Hospital Admissions with CVDs
Health Outcome (ICD9: Arrythmia (247); Cardiac Disease (390-429); Cardiac Failure (428); IHD (410-413); MI (410); Total CVD (390-459)
Study Design: Case-crossover
Statistical Analyses: Conditional logistic regression
Age Groups Analyzed: 15-64 yr & ≥ 65 yr
Sample Description: NR
Averaging Time: 8 h
Mean (SD) unit: ppm Brisbane: 1.7 Canberra: 0.9 Melbourne: 1.0 Perth: 1.0 Sydney: 0.8 Auckland: 2.1 Christchurch: 0.5
Range (Min, Max): ppm Brisbane: 0.0, 7.0 Canberra: 0.0, 5.8 Melbourne: 0.1, 8.0 Perth: 0.1, 4.0 Sydney: 0.0, 4.5 Auckland: 0.2, 7.9 Christchurch: 0.0, 5.4
Copollutant NR
Increment: 0.9 ppm
% Change [Lower CI, Upper CI]
Lags examined (days): 0-1 15-64 yr Arrythmia: 2.5 (0.1-4.9) Cardiac: 1.7 (0.5-2.9) Cardiac Failure: 4.2 (0.6-7.8) IHD: 1.6 (-0.6 to 3.9) MI: 1.8 (-0.7 to 4.3) Total CVD: 1.2 (0.3-2.1) ≥ 65 yr Arrythmia: 0.1 (-1.8 to 2.1) Cardiac: 2.8 (1.3-4.4) Cardiac Failure: 6.0 (3.5-8.5) IHD: 2.3 (0.9-3.8) MI: 2.9 (0.8-4.9) Total CVD: 2.2 (0.9-3.4)
January 2010 C-22
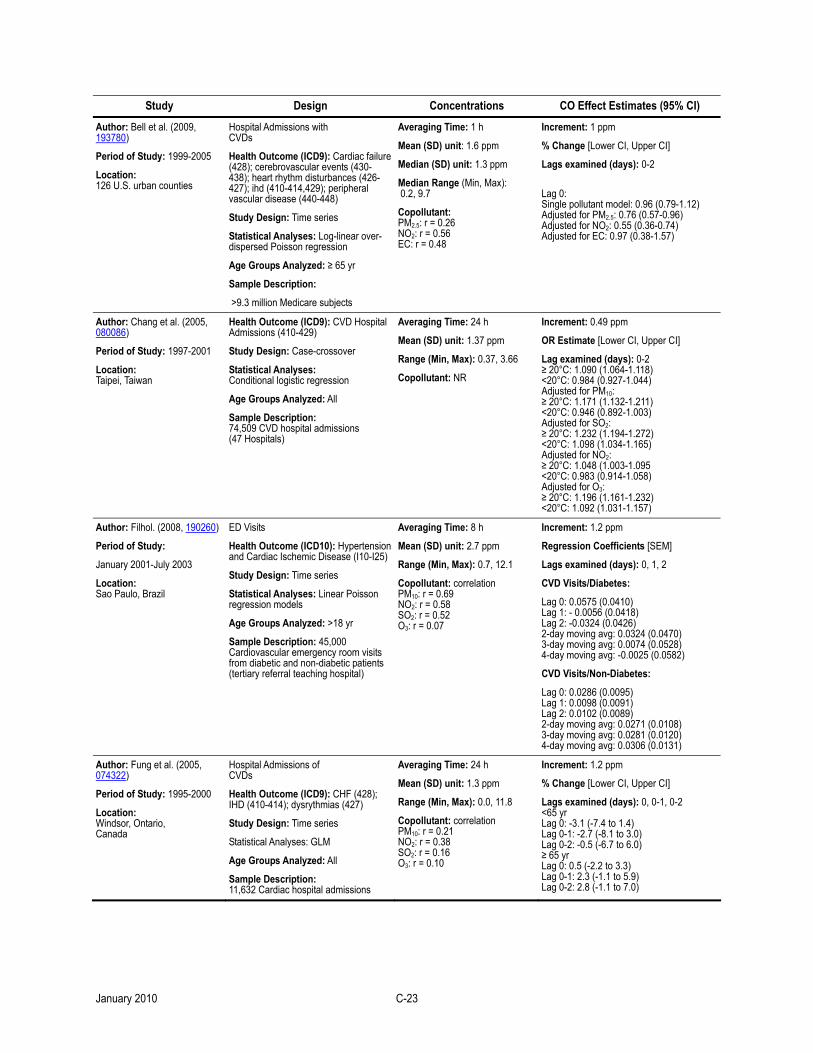
Study Design Concentrations CO Effect Estimates (95% CI)
Author: Bell et al. (2009, 193780)
Period of Study: 1999-2005
Location: 126 U.S. urban counties
Hospital Admissions with CVDs
Health Outcome (ICD9): Cardiac failure (428); cerebrovascular events (430-438); heart rhythm disturbances (426-427); ihd (410-414,429); peripheral vascular disease (440-448)
Study Design: Time series
Statistical Analyses: Log-linear over-dispersed Poisson regression
Age Groups Analyzed: ≥ 65 yr
Sample Description:
>9.3 million Medicare subjects
Averaging Time: 1 h
Mean (SD) unit: 1.6 ppm
Median (SD) unit: 1.3 ppm
Median Range (Min, Max): 0.2, 9.7
Copollutant: PM2.5: r = 0.26 NO2: r = 0.56 EC: r = 0.48
Increment: 1 ppm
% Change [Lower CI, Upper CI]
Lags examined (days): 0-2
Lag 0: Single pollutant model: 0.96 (0.79-1.12) Adjusted for PM2.5: 0.76 (0.57-0.96) Adjusted for NO2: 0.55 (0.36-0.74) Adjusted for EC: 0.97 (0.38-1.57)
Author: Chang et al. (2005, 080086)
Period of Study: 1997-2001
Location: Taipei, Taiwan
Health Outcome (ICD9): CVD Hospital Admissions (410-429)
Study Design: Case-crossover
Statistical Analyses: Conditional logistic regression
Age Groups Analyzed: All
Sample Description: 74,509 CVD hospital admissions (47 Hospitals)
Averaging Time: 24 h
Mean (SD) unit: 1.37 ppm
Range (Min, Max): 0.37, 3.66
Copollutant: NR
Increment: 0.49 ppm
OR Estimate [Lower CI, Upper CI]
Lag examined (days): 0-2 ≥ 20°C: 1.090 (1.064-1.118) <20°C: 0.984 (0.927-1.044) Adjusted for PM10: ≥ 20°C: 1.171 (1.132-1.211) <20°C: 0.946 (0.892-1.003) Adjusted for SO2: ≥ 20°C: 1.232 (1.194-1.272) <20°C: 1.098 (1.034-1.165) Adjusted for NO2: ≥ 20°C: 1.048 (1.003-1.095 <20°C: 0.983 (0.914-1.058) Adjusted for O3: ≥ 20°C: 1.196 (1.161-1.232) <20°C: 1.092 (1.031-1.157)
Author: Filhol. (2008, 190260)
Period of Study:
January 2001-July 2003
Location: Sao Paulo, Brazil
ED Visits
Health Outcome (ICD10): Hypertension and Cardiac Ischemic Disease (I10-I25)
Study Design: Time series
Statistical Analyses: Linear Poisson regression models
Age Groups Analyzed: >18 yr
Sample Description: 45,000 Cardiovascular emergency room visits from diabetic and non-diabetic patients (tertiary referral teaching hospital)
Averaging Time: 8 h
Mean (SD) unit: 2.7 ppm
Range (Min, Max): 0.7, 12.1
Copollutant: correlation PM10: r = 0.69 NO2: r = 0.58 SO2: r = 0.52 O3: r = 0.07
Increment: 1.2 ppm
Regression Coefficients [SEM]
Lags examined (days): 0, 1, 2
CVD Visits/Diabetes:
Lag 0: 0.0575 (0.0410) Lag 1: - 0.0056 (0.0418) Lag 2: -0.0324 (0.0426) 2-day moving avg: 0.0324 (0.0470) 3-day moving avg: 0.0074 (0.0528) 4-day moving avg: -0.0025 (0.0582)
CVD Visits/Non-Diabetes:
Lag 0: 0.0286 (0.0095) Lag 1: 0.0098 (0.0091) Lag 2: 0.0102 (0.0089) 2-day moving avg: 0.0271 (0.0108) 3-day moving avg: 0.0281 (0.0120) 4-day moving avg: 0.0306 (0.0131)
Author: Fung et al. (2005, 074322)
Period of Study: 1995-2000
Location: Windsor, Ontario, Canada
Hospital Admissions of CVDs
Health Outcome (ICD9): CHF (428); IHD (410-414); dysrythmias (427)
Study Design: Time series
Statistical Analyses: GLM
Age Groups Analyzed: All
Sample Description: 11,632 Cardiac hospital admissions
Averaging Time: 24 h
Mean (SD) unit: 1.3 ppm
Range (Min, Max): 0.0, 11.8
Copollutant: correlation PM10: r = 0.21 NO2: r = 0.38 SO2: r = 0.16 O3: r = 0.10
Increment: 1.2 ppm
% Change [Lower CI, Upper CI]
Lags examined (days): 0, 0-1, 0-2 <65 yr Lag 0: -3.1 (-7.4 to 1.4) Lag 0-1: -2.7 (-8.1 to 3.0) Lag 0-2: -0.5 (-6.7 to 6.0) ≥ 65 yr Lag 0: 0.5 (-2.2 to 3.3) Lag 0-1: 2.3 (-1.1 to 5.9) Lag 0-2: 2.8 (-1.1 to 7.0)
January 2010 C-23
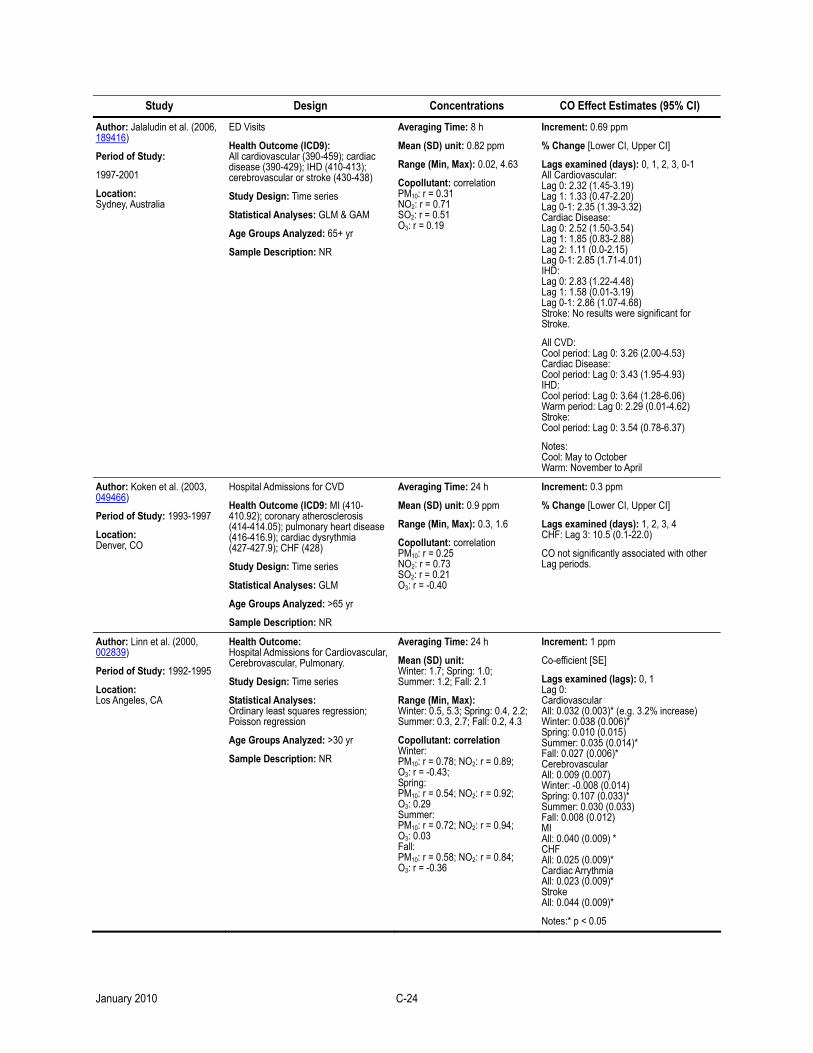
Study Design Concentrations CO Effect Estimates (95% CI)
Author: Jalaludin et al. (2006, 189416)
Period of Study:
1997-2001
Location: Sydney, Australia
ED Visits
Health Outcome (ICD9): All cardiovascular (390-459); cardiac disease (390-429); IHD (410-413); cerebrovascular or stroke (430-438)
Study Design: Time series
Statistical Analyses: GLM & GAM
Age Groups Analyzed: 65+ yr
Sample Description: NR
Averaging Time: 8 h
Mean (SD) unit: 0.82 ppm
Range (Min, Max): 0.02, 4.63
Copollutant: correlation PM10: r = 0.31 NO2: r = 0.71 SO2: r = 0.51 O3: r = 0.19
Increment: 0.69 ppm
% Change [Lower CI, Upper CI]
Lags examined (days): 0, 1, 2, 3, 0-1 All Cardiovascular: Lag 0: 2.32 (1.45-3.19) Lag 1: 1.33 (0.47-2.20) Lag 0-1: 2.35 (1.39-3.32) Cardiac Disease: Lag 0: 2.52 (1.50-3.54) Lag 1: 1.85 (0.83-2.88) Lag 2: 1.11 (0.0-2.15) Lag 0-1: 2.85 (1.71-4.01) IHD: Lag 0: 2.83 (1.22-4.48) Lag 1: 1.58 (0.01-3.19) Lag 0-1: 2.86 (1.07-4.68) Stroke: No results were significant for Stroke.
All CVD: Cool period: Lag 0: 3.26 (2.00-4.53) Cardiac Disease: Cool period: Lag 0: 3.43 (1.95-4.93) IHD: Cool period: Lag 0: 3.64 (1.28-6.06) Warm period: Lag 0: 2.29 (0.01-4.62) Stroke: Cool period: Lag 0: 3.54 (0.78-6.37)
Notes: Cool: May to October Warm: November to April
Author: Koken et al. (2003, 049466)
Period of Study: 1993-1997
Location: Denver, CO
Hospital Admissions for CVD
Health Outcome (ICD9: MI (410-410.92); coronary atherosclerosis (414-414.05); pulmonary heart disease (416-416.9); cardiac dysrythmia (427-427.9); CHF (428)
Study Design: Time series
Statistical Analyses: GLM
Age Groups Analyzed: >65 yr
Sample Description: NR
Averaging Time: 24 h
Mean (SD) unit: 0.9 ppm
Range (Min, Max): 0.3, 1.6
Copollutant: correlation PM10: r = 0.25 NO2: r = 0.73 SO2: r = 0.21 O3: r = -0.40
Increment: 0.3 ppm
% Change [Lower CI, Upper CI]
Lags examined (days): 1, 2, 3, 4 CHF: Lag 3: 10.5 (0.1-22.0)
CO not significantly associated with other Lag periods.
Author: Linn et al. (2000, 002839)
Period of Study: 1992-1995
Location: Los Angeles, CA
Health Outcome: Hospital Admissions for Cardiovascular, Cerebrovascular, Pulmonary.
Study Design: Time series
Statistical Analyses: Ordinary least squares regression; Poisson regression
Age Groups Analyzed: >30 yr
Sample Description: NR
Averaging Time: 24 h
Mean (SD) unit: Winter: 1.7; Spring: 1.0; Summer: 1.2; Fall: 2.1
Range (Min, Max): Winter: 0.5, 5.3; Spring: 0.4, 2.2; Summer: 0.3, 2.7; Fall: 0.2, 4.3
Copollutant: correlation Winter: PM10: r = 0.78; NO2: r = 0.89; O3: r = -0.43; Spring: PM10: r = 0.54; NO2: r = 0.92; O3: 0.29 Summer: PM10: r = 0.72; NO2: r = 0.94; O3: 0.03 Fall: PM10: r = 0.58; NO2: r = 0.84; O3: r = -0.36
Increment: 1 ppm
Co-efficient [SE]
Lags examined (lags): 0, 1 Lag 0: Cardiovascular All: 0.032 (0.003)* (e.g. 3.2% increase) Winter: 0.038 (0.006)* Spring: 0.010 (0.015) Summer: 0.035 (0.014)* Fall: 0.027 (0.006)* Cerebrovascular All: 0.009 (0.007) Winter: -0.008 (0.014) Spring: 0.107 (0.033)* Summer: 0.030 (0.033) Fall: 0.008 (0.012) MI All: 0.040 (0.009) * CHF All: 0.025 (0.009)* Cardiac Arrythmia All: 0.023 (0.009)* Stroke All: 0.044 (0.009)*
Notes:* p < 0.05
January 2010 C-24
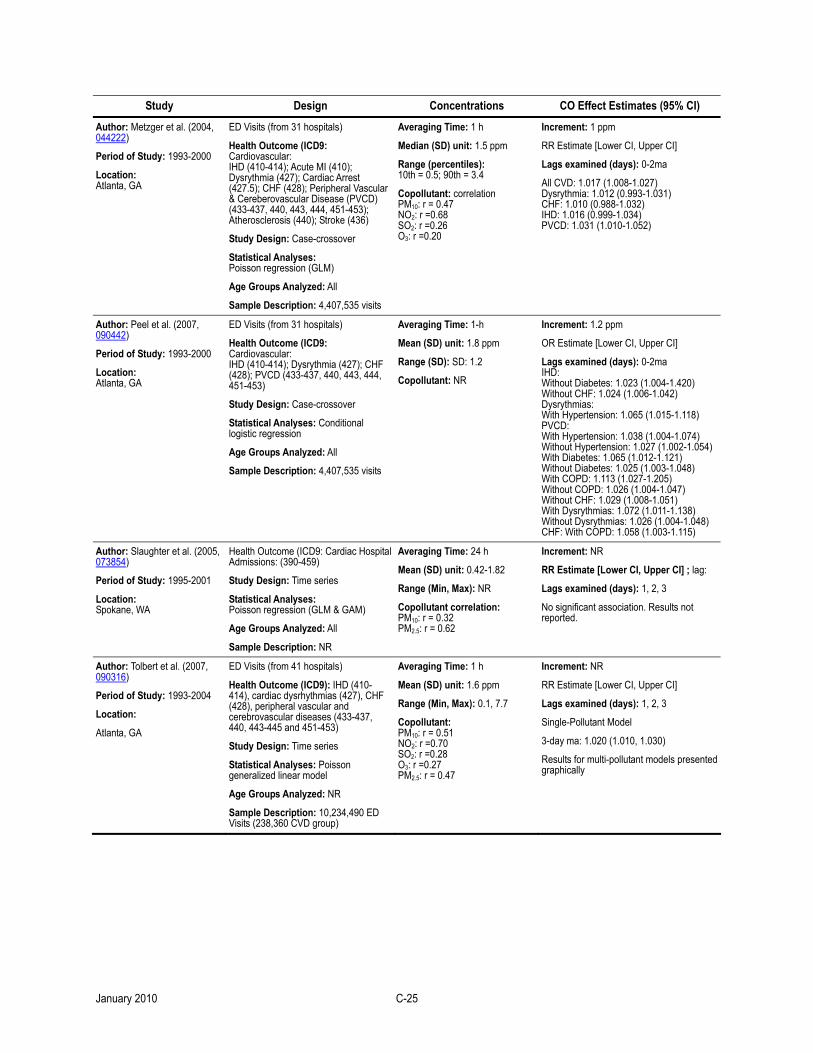
Study Design Concentrations CO Effect Estimates (95% CI)
Author: Metzger et al. (2004, 044222)
Period of Study: 1993-2000
Location: Atlanta, GA
ED Visits (from 31 hospitals)
Health Outcome (ICD9: Cardiovascular: IHD (410-414); Acute MI (410); Dysrythmia (427); Cardiac Arrest (427.5); CHF (428); Peripheral Vascular & Cereberovascular Disease (PVCD) (433-437, 440, 443, 444, 451-453); Atherosclerosis (440); Stroke (436)
Study Design: Case-crossover
Statistical Analyses: Poisson regression (GLM)
Age Groups Analyzed: All
Sample Description: 4,407,535 visits
Averaging Time: 1 h
Median (SD) unit: 1.5 ppm
Range (percentiles): 10th = 0.5; 90th = 3.4
Copollutant: correlation PM10: r = 0.47 NO2: r =0.68 SO2: r =0.26 O3: r =0.20
Increment: 1 ppm
RR Estimate [Lower CI, Upper CI]
Lags examined (days): 0-2ma
All CVD: 1.017 (1.008-1.027) Dysrythmia: 1.012 (0.993-1.031) CHF: 1.010 (0.988-1.032) IHD: 1.016 (0.999-1.034) PVCD: 1.031 (1.010-1.052)
Author: Peel et al. (2007, 090442)
Period of Study: 1993-2000
Location: Atlanta, GA
ED Visits (from 31 hospitals)
Health Outcome (ICD9: Cardiovascular: IHD (410-414); Dysrythmia (427); CHF (428); PVCD (433-437, 440, 443, 444, 451-453)
Study Design: Case-crossover
Statistical Analyses: Conditional logistic regression
Age Groups Analyzed: All
Sample Description: 4,407,535 visits
Averaging Time: 1-h
Mean (SD) unit: 1.8 ppm
Range (SD): SD: 1.2
Copollutant: NR
Increment: 1.2 ppm
OR Estimate [Lower CI, Upper CI]
Lags examined (days): 0-2ma IHD: Without Diabetes: 1.023 (1.004-1.420) Without CHF: 1.024 (1.006-1.042) Dysrythmias: With Hypertension: 1.065 (1.015-1.118) PVCD: With Hypertension: 1.038 (1.004-1.074) Without Hypertension: 1.027 (1.002-1.054)With Diabetes: 1.065 (1.012-1.121) Without Diabetes: 1.025 (1.003-1.048) With COPD: 1.113 (1.027-1.205) Without COPD: 1.026 (1.004-1.047) Without CHF: 1.029 (1.008-1.051) With Dysrythmias: 1.072 (1.011-1.138) Without Dysrythmias: 1.026 (1.004-1.048) CHF: With COPD: 1.058 (1.003-1.115)
Author: Slaughter et al. (2005, 073854)
Period of Study: 1995-2001
Location: Spokane, WA
Health Outcome (ICD9: Cardiac Hospital Admissions: (390-459)
Study Design: Time series
Statistical Analyses: Poisson regression (GLM & GAM)
Age Groups Analyzed: All
Sample Description: NR
Averaging Time: 24 h
Mean (SD) unit: 0.42-1.82
Range (Min, Max): NR
Copollutant correlation: PM10: r = 0.32 PM2.5: r = 0.62
Increment: NR
RR Estimate [Lower CI, Upper CI] ; lag:
Lags examined (days): 1, 2, 3
No significant association. Results not reported.
Author: Tolbert et al. (2007, 090316)
Period of Study: 1993-2004
Location:
Atlanta, GA
ED Visits (from 41 hospitals)
Health Outcome (ICD9): IHD (410-414), cardiac dysrhythmias (427), CHF (428), peripheral vascular and cerebrovascular diseases (433-437, 440, 443-445 and 451-453)
Study Design: Time series
Statistical Analyses: Poisson generalized linear model
Age Groups Analyzed: NR
Sample Description: 10,234,490 ED Visits (238,360 CVD group)
Averaging Time: 1 h
Mean (SD) unit: 1.6 ppm
Range (Min, Max): 0.1, 7.7
Copollutant: PM10: r = 0.51 NO2: r =0.70 SO2: r =0.28 O3: r =0.27 PM2.5: r = 0.47
Increment: NR
RR Estimate [Lower CI, Upper CI]
Lags examined (days): 1, 2, 3
Single-Pollutant Model
3-day ma: 1.020 (1.010, 1.030)
Results for multi-pollutant models presented graphically
January 2010 C-25
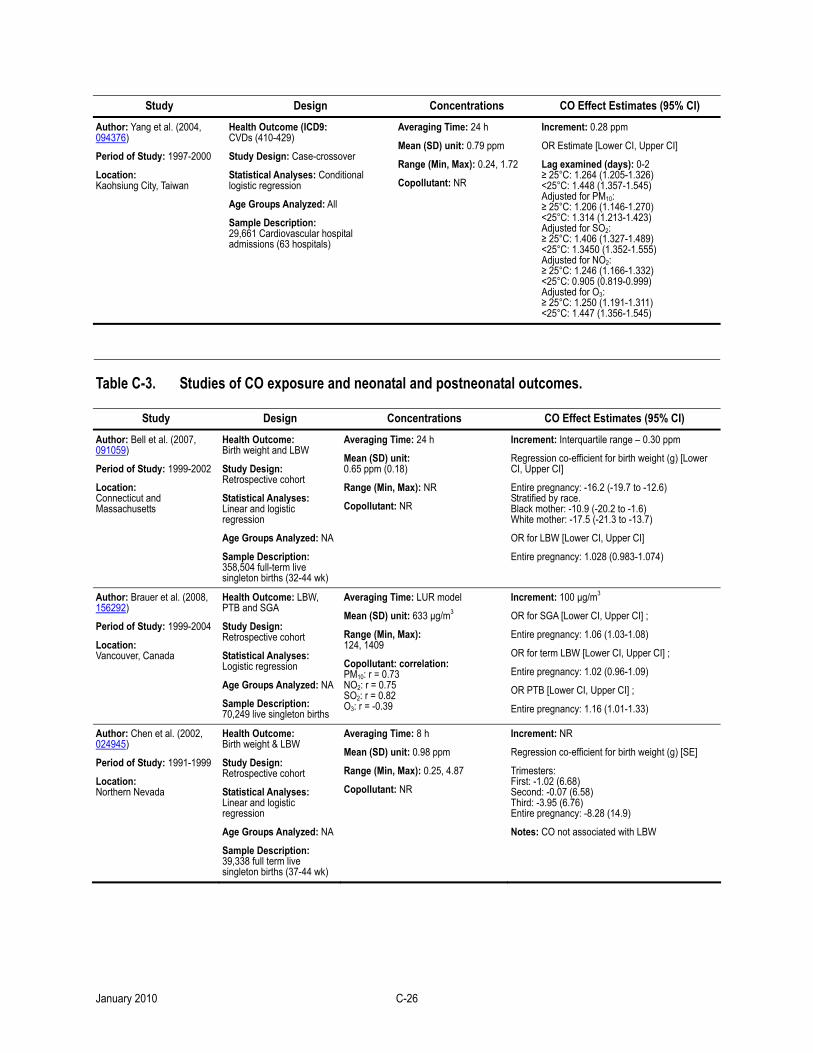
Study Design Concentrations CO Effect Estimates (95% CI)
Author: Yang et al. (2004, 094376)
Period of Study: 1997-2000
Location: Kaohsiung City, Taiwan
Health Outcome (ICD9: CVDs (410-429)
Study Design: Case-crossover
Statistical Analyses: Conditional logistic regression
Age Groups Analyzed: All
Sample Description: 29,661 Cardiovascular hospital admissions (63 hospitals)
Averaging Time: 24 h
Mean (SD) unit: 0.79 ppm
Range (Min, Max): 0.24, 1.72
Copollutant: NR
Increment: 0.28 ppm
OR Estimate [Lower CI, Upper CI]
Lag examined (days): 0-2 ≥ 25°C: 1.264 (1.205-1.326) <25°C: 1.448 (1.357-1.545) Adjusted for PM10: ≥ 25°C: 1.206 (1.146-1.270) <25°C: 1.314 (1.213-1.423) Adjusted for SO2: ≥ 25°C: 1.406 (1.327-1.489) <25°C: 1.3450 (1.352-1.555) Adjusted for NO2: ≥ 25°C: 1.246 (1.166-1.332) <25°C: 0.905 (0.819-0.999) Adjusted for O3: ≥ 25°C: 1.250 (1.191-1.311) <25°C: 1.447 (1.356-1.545)
Table C-3. Studies of CO exposure and neonatal and postneonatal outcomes.
Study Design Concentrations CO Effect Estimates (95% CI)
Author: Bell et al. (2007, 091059)
Period of Study: 1999-2002
Location: Connecticut and Massachusetts
Health Outcome: Birth weight and LBW
Study Design: Retrospective cohort
Statistical Analyses: Linear and logistic regression
Age Groups Analyzed: NA
Sample Description: 358,504 full-term live singleton births (32-44 wk)
Averaging Time: 24 h
Mean (SD) unit: 0.65 ppm (0.18)
Range (Min, Max): NR
Copollutant: NR
Increment: Interquartile range – 0.30 ppm
Regression co-efficient for birth weight (g) [Lower CI, Upper CI]
Entire pregnancy: -16.2 (-19.7 to -12.6) Stratified by race. Black mother: -10.9 (-20.2 to -1.6) White mother: -17.5 (-21.3 to -13.7)
OR for LBW [Lower CI, Upper CI]
Entire pregnancy: 1.028 (0.983-1.074)
Author: Brauer et al. (2008, 156292)
Period of Study: 1999-2004
Location: Vancouver, Canada
Health Outcome: LBW, PTB and SGA
Study Design: Retrospective cohort
Statistical Analyses: Logistic regression
Age Groups Analyzed: NA
Sample Description: 70,249 live singleton births
Averaging Time: LUR model
Mean (SD) unit: 633 µg/m3
Range (Min, Max): 124, 1409
Copollutant: correlation: PM10: r = 0.73 NO2: r = 0.75 SO2: r = 0.82 O3: r = -0.39
Increment: 100 µg/m3
OR for SGA [Lower CI, Upper CI] ;
Entire pregnancy: 1.06 (1.03-1.08)
OR for term LBW [Lower CI, Upper CI] ;
Entire pregnancy: 1.02 (0.96-1.09)
OR PTB [Lower CI, Upper CI] ;
Entire pregnancy: 1.16 (1.01-1.33)
Author: Chen et al. (2002, 024945)
Period of Study: 1991-1999
Location: Northern Nevada
Health Outcome: Birth weight & LBW
Study Design: Retrospective cohort
Statistical Analyses: Linear and logistic regression
Age Groups Analyzed: NA
Sample Description: 39,338 full term live singleton births (37-44 wk)
Averaging Time: 8 h
Mean (SD) unit: 0.98 ppm
Range (Min, Max): 0.25, 4.87
Copollutant: NR
Increment: NR
Regression co-efficient for birth weight (g) [SE]
Trimesters: First: -1.02 (6.68) Second: -0.07 (6.58) Third: -3.95 (6.76) Entire pregnancy: -8.28 (14.9)
Notes: CO not associated with LBW
January 2010 C-26
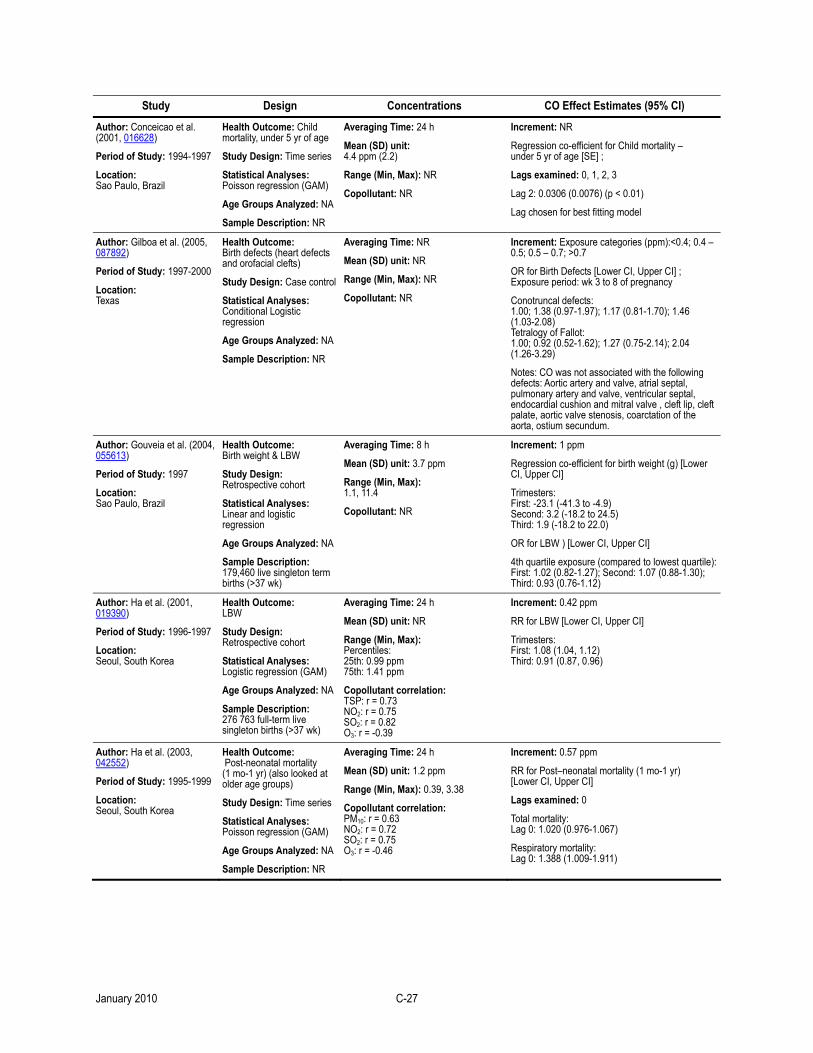
Study Design Concentrations CO Effect Estimates (95% CI)
Author: Conceicao et al. (2001, 016628)
Period of Study: 1994-1997
Location: Sao Paulo, Brazil
Health Outcome: Child mortality, under 5 yr of age
Study Design: Time series
Statistical Analyses: Poisson regression (GAM)
Age Groups Analyzed: NA
Sample Description: NR
Averaging Time: 24 h
Mean (SD) unit: 4.4 ppm (2.2)
Range (Min, Max): NR
Copollutant: NR
Increment: NR
Regression co-efficient for Child mortality – under 5 yr of age [SE] ;
Lags examined: 0, 1, 2, 3
Lag 2: 0.0306 (0.0076) (p < 0.01)
Lag chosen for best fitting model
Author: Gilboa et al. (2005, 087892)
Period of Study: 1997-2000
Location: Texas
Health Outcome: Birth defects (heart defects and orofacial clefts)
Study Design: Case control
Statistical Analyses: Conditional Logistic regression
Age Groups Analyzed: NA
Sample Description: NR
Averaging Time: NR
Mean (SD) unit: NR
Range (Min, Max): NR
Copollutant: NR
Increment: Exposure categories (ppm):<0.4; 0.4 – 0.5; 0.5 – 0.7; >0.7
OR for Birth Defects [Lower CI, Upper CI] ; Exposure period: wk 3 to 8 of pregnancy
Conotruncal defects: 1.00; 1.38 (0.97-1.97); 1.17 (0.81-1.70); 1.46 (1.03-2.08) Tetralogy of Fallot: 1.00; 0.92 (0.52-1.62); 1.27 (0.75-2.14); 2.04 (1.26-3.29)
Notes: CO was not associated with the following defects: Aortic artery and valve, atrial septal, pulmonary artery and valve, ventricular septal, endocardial cushion and mitral valve , cleft lip, cleft palate, aortic valve stenosis, coarctation of the aorta, ostium secundum.
Author: Gouveia et al. (2004, 055613)
Period of Study: 1997
Location: Sao Paulo, Brazil
Health Outcome: Birth weight & LBW
Study Design: Retrospective cohort
Statistical Analyses: Linear and logistic regression
Age Groups Analyzed: NA
Sample Description: 179,460 live singleton term births (>37 wk)
Averaging Time: 8 h
Mean (SD) unit: 3.7 ppm
Range (Min, Max): 1.1, 11.4
Copollutant: NR
Increment: 1 ppm
Regression co-efficient for birth weight (g) [Lower CI, Upper CI]
Trimesters: First: -23.1 (-41.3 to -4.9) Second: 3.2 (-18.2 to 24.5) Third: 1.9 (-18.2 to 22.0)
OR for LBW ) [Lower CI, Upper CI]
4th quartile exposure (compared to lowest quartile): First: 1.02 (0.82-1.27); Second: 1.07 (0.88-1.30); Third: 0.93 (0.76-1.12)
Author: Ha et al. (2001, 019390)
Period of Study: 1996-1997
Location: Seoul, South Korea
Health Outcome: LBW
Study Design: Retrospective cohort
Statistical Analyses: Logistic regression (GAM)
Age Groups Analyzed: NA
Sample Description: 276 763 full-term live singleton births (>37 wk)
Averaging Time: 24 h
Mean (SD) unit: NR
Range (Min, Max): Percentiles: 25th: 0.99 ppm 75th: 1.41 ppm
Copollutant correlation: TSP: r = 0.73 NO2: r = 0.75 SO2: r = 0.82 O3: r = -0.39
Increment: 0.42 ppm
RR for LBW [Lower CI, Upper CI]
Trimesters: First: 1.08 (1.04, 1.12) Third: 0.91 (0.87, 0.96)
Author: Ha et al. (2003, 042552)
Period of Study: 1995-1999
Location: Seoul, South Korea
Health Outcome: Post-neonatal mortality (1 mo-1 yr) (also looked at older age groups)
Study Design: Time series
Statistical Analyses: Poisson regression (GAM)
Age Groups Analyzed: NA
Sample Description: NR
Averaging Time: 24 h
Mean (SD) unit: 1.2 ppm
Range (Min, Max): 0.39, 3.38
Copollutant correlation: PM10: r = 0.63 NO2: r = 0.72 SO2: r = 0.75 O3: r = -0.46
Increment: 0.57 ppm
RR for Post–neonatal mortality (1 mo-1 yr) [Lower CI, Upper CI]
Lags examined: 0
Total mortality: Lag 0: 1.020 (0.976-1.067)
Respiratory mortality: Lag 0: 1.388 (1.009-1.911)
January 2010 C-27
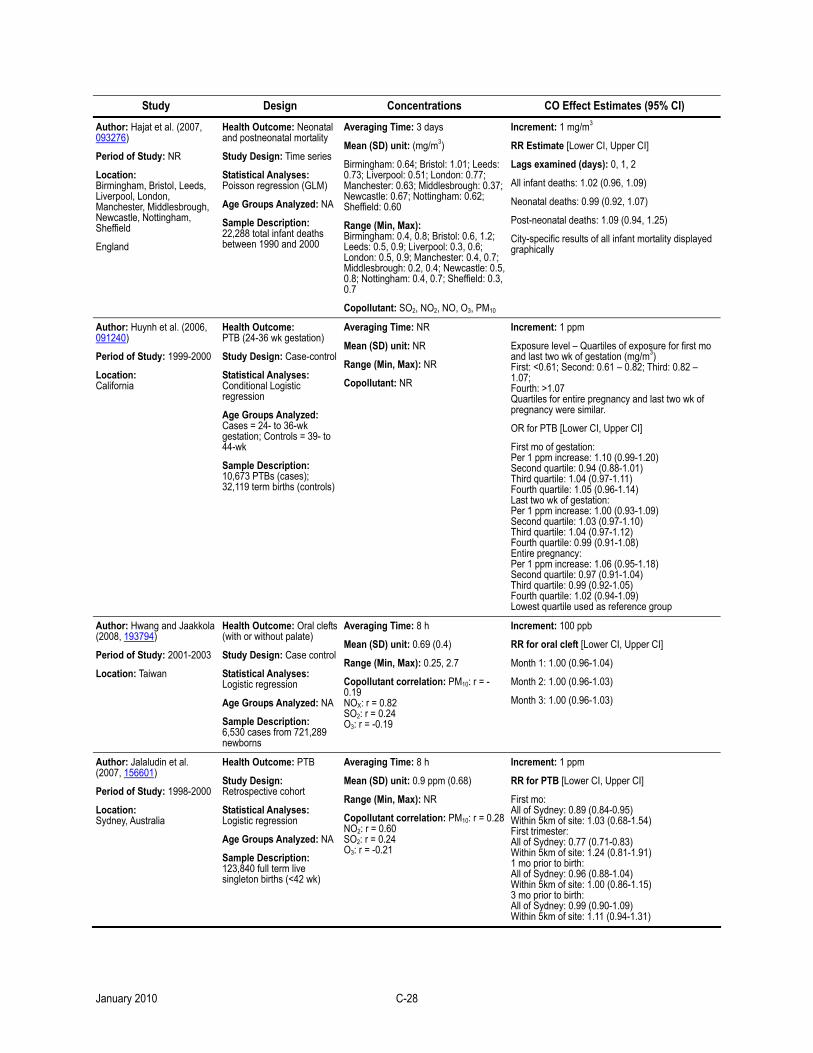
Study Design Concentrations CO Effect Estimates (95% CI)
Author: Hajat et al. (2007, 093276)
Period of Study: NR
Location: Birmingham, Bristol, Leeds, Liverpool, London, Manchester, Middlesbrough, Newcastle, Nottingham, Sheffield
England
Health Outcome: Neonatal and postneonatal mortality
Study Design: Time series
Statistical Analyses: Poisson regression (GLM)
Age Groups Analyzed: NA
Sample Description: 22,288 total infant deaths between 1990 and 2000
Averaging Time: 3 days
Mean (SD) unit: (mg/m3)
Birmingham: 0.64; Bristol: 1.01; Leeds: 0.73; Liverpool: 0.51; London: 0.77; Manchester: 0.63; Middlesbrough: 0.37; Newcastle: 0.67; Nottingham: 0.62; Sheffield: 0.60
Range (Min, Max): Birmingham: 0.4, 0.8; Bristol: 0.6, 1.2; Leeds: 0.5, 0.9; Liverpool: 0.3, 0.6; London: 0.5, 0.9; Manchester: 0.4, 0.7; Middlesbrough: 0.2, 0.4; Newcastle: 0.5, 0.8; Nottingham: 0.4, 0.7; Sheffield: 0.3, 0.7
Copollutant: SO2, NO2, NO, O3, PM10
Increment: 1 mg/m3
RR Estimate [Lower CI, Upper CI]
Lags examined (days): 0, 1, 2
All infant deaths: 1.02 (0.96, 1.09)
Neonatal deaths: 0.99 (0.92, 1.07)
Post-neonatal deaths: 1.09 (0.94, 1.25)
City-specific results of all infant mortality displayed graphically
Author: Huynh et al. (2006, 091240)
Period of Study: 1999-2000
Location: California
Health Outcome: PTB (24-36 wk gestation)
Study Design: Case-control
Statistical Analyses: Conditional Logistic regression
Age Groups Analyzed: Cases = 24- to 36-wk gestation; Controls = 39- to 44-wk
Sample Description: 10,673 PTBs (cases); 32,119 term births (controls)
Averaging Time: NR
Mean (SD) unit: NR
Range (Min, Max): NR
Copollutant: NR
Increment: 1 ppm
Exposure level – Quartiles of exposure for first mo and last two wk of gestation (mg/m3) First: <0.61; Second: 0.61 – 0.82; Third: 0.82 – 1.07; Fourth: >1.07 Quartiles for entire pregnancy and last two wk of pregnancy were similar.
OR for PTB [Lower CI, Upper CI]
First mo of gestation: Per 1 ppm increase: 1.10 (0.99-1.20) Second quartile: 0.94 (0.88-1.01) Third quartile: 1.04 (0.97-1.11) Fourth quartile: 1.05 (0.96-1.14) Last two wk of gestation: Per 1 ppm increase: 1.00 (0.93-1.09) Second quartile: 1.03 (0.97-1.10) Third quartile: 1.04 (0.97-1.12) Fourth quartile: 0.99 (0.91-1.08) Entire pregnancy: Per 1 ppm increase: 1.06 (0.95-1.18) Second quartile: 0.97 (0.91-1.04) Third quartile: 0.99 (0.92-1.05) Fourth quartile: 1.02 (0.94-1.09) Lowest quartile used as reference group
Author: Hwang and Jaakkola (2008, 193794)
Period of Study: 2001-2003
Location: Taiwan
Health Outcome: Oral clefts (with or without palate)
Study Design: Case control
Statistical Analyses: Logistic regression
Age Groups Analyzed: NA
Sample Description: 6,530 cases from 721,289 newborns
Averaging Time: 8 h
Mean (SD) unit: 0.69 (0.4)
Range (Min, Max): 0.25, 2.7
Copollutant correlation: PM10: r = -0.19 NOX: r = 0.82 SO2: r = 0.24 O3: r = -0.19
Increment: 100 ppb
RR for oral cleft [Lower CI, Upper CI]
Month 1: 1.00 (0.96-1.04)
Month 2: 1.00 (0.96-1.03)
Month 3: 1.00 (0.96-1.03)
Author: Jalaludin et al. (2007, 156601)
Period of Study: 1998-2000
Location: Sydney, Australia
Health Outcome: PTB
Study Design: Retrospective cohort
Statistical Analyses: Logistic regression
Age Groups Analyzed: NA
Sample Description: 123,840 full term live singleton births (<42 wk)
Averaging Time: 8 h
Mean (SD) unit: 0.9 ppm (0.68)
Range (Min, Max): NR
Copollutant correlation: PM10: r = 0.28NO2: r = 0.60 SO2: r = 0.24 O3: r = -0.21
Increment: 1 ppm
RR for PTB [Lower CI, Upper CI]
First mo: All of Sydney: 0.89 (0.84-0.95) Within 5km of site: 1.03 (0.68-1.54) First trimester: All of Sydney: 0.77 (0.71-0.83) Within 5km of site: 1.24 (0.81-1.91) 1 mo prior to birth: All of Sydney: 0.96 (0.88-1.04) Within 5km of site: 1.00 (0.86-1.15) 3 mo prior to birth: All of Sydney: 0.99 (0.90-1.09) Within 5km of site: 1.11 (0.94-1.31)
January 2010 C-28
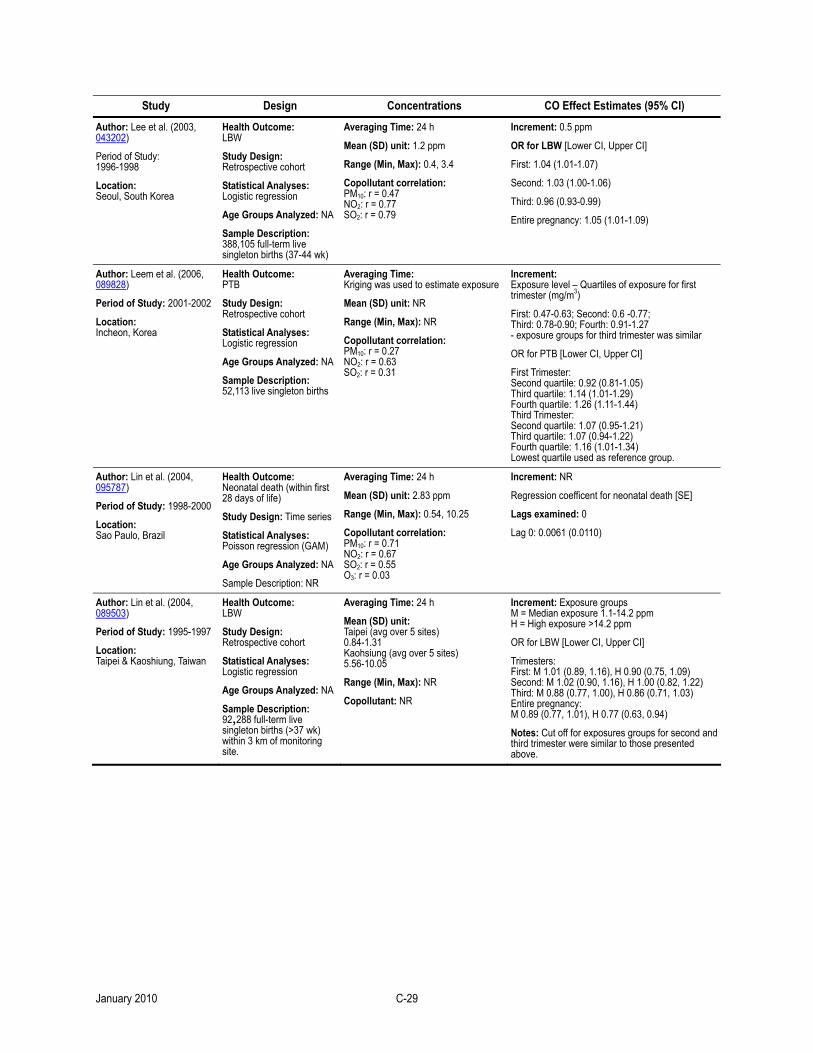
Study Design Concentrations CO Effect Estimates (95% CI)
Author: Lee et al. (2003, 043202)
Period of Study: 1996-1998
Location: Seoul, South Korea
Health Outcome: LBW
Study Design: Retrospective cohort
Statistical Analyses: Logistic regression
Age Groups Analyzed: NA
Sample Description: 388,105 full-term live singleton births (37-44 wk)
Averaging Time: 24 h
Mean (SD) unit: 1.2 ppm
Range (Min, Max): 0.4, 3.4
Copollutant correlation: PM10: r = 0.47 NO2: r = 0.77 SO2: r = 0.79
Increment: 0.5 ppm
OR for LBW [Lower CI, Upper CI]
First: 1.04 (1.01-1.07)
Second: 1.03 (1.00-1.06)
Third: 0.96 (0.93-0.99)
Entire pregnancy: 1.05 (1.01-1.09)
Author: Leem et al. (2006, 089828)
Period of Study: 2001-2002
Location: Incheon, Korea
Health Outcome: PTB
Study Design: Retrospective cohort
Statistical Analyses: Logistic regression
Age Groups Analyzed: NA
Sample Description: 52,113 live singleton births
Averaging Time: Kriging was used to estimate exposure
Mean (SD) unit: NR
Range (Min, Max): NR
Copollutant correlation: PM10: r = 0.27 NO2: r = 0.63 SO2: r = 0.31
Increment: Exposure level – Quartiles of exposure for first trimester (mg/m3)
First: 0.47-0.63; Second: 0.6 -0.77; Third: 0.78-0.90; Fourth: 0.91-1.27 - exposure groups for third trimester was similar
OR for PTB [Lower CI, Upper CI]
First Trimester: Second quartile: 0.92 (0.81-1.05) Third quartile: 1.14 (1.01-1.29) Fourth quartile: 1.26 (1.11-1.44) Third Trimester: Second quartile: 1.07 (0.95-1.21) Third quartile: 1.07 (0.94-1.22) Fourth quartile: 1.16 (1.01-1.34) Lowest quartile used as reference group.
Author: Lin et al. (2004, 095787)
Period of Study: 1998-2000
Location: Sao Paulo, Brazil
Health Outcome: Neonatal death (within first 28 days of life)
Study Design: Time series
Statistical Analyses: Poisson regression (GAM)
Age Groups Analyzed: NA
Sample Description: NR
Averaging Time: 24 h
Mean (SD) unit: 2.83 ppm
Range (Min, Max): 0.54, 10.25
Copollutant correlation: PM10: r = 0.71 NO2: r = 0.67 SO2: r = 0.55 O3: r = 0.03
Increment: NR
Regression coefficent for neonatal death [SE]
Lags examined: 0
Lag 0: 0.0061 (0.0110)
Author: Lin et al. (2004, 089503)
Period of Study: 1995-1997
Location: Taipei & Kaoshiung, Taiwan
Health Outcome: LBW
Study Design: Retrospective cohort
Statistical Analyses: Logistic regression
Age Groups Analyzed: NA
Sample Description: 92,288 full-term live singleton births (>37 wk) within 3 km of monitoring site.
Averaging Time: 24 h
Mean (SD) unit: Taipei (avg over 5 sites) 0.84-1.31 Kaohsiung (avg over 5 sites) 5.56-10.05
Range (Min, Max): NR
Copollutant: NR
Increment: Exposure groups M = Median exposure 1.1-14.2 ppm H = High exposure >14.2 ppm
OR for LBW [Lower CI, Upper CI]
Trimesters: First: M 1.01 (0.89, 1.16), H 0.90 (0.75, 1.09) Second: M 1.02 (0.90, 1.16), H 1.00 (0.82, 1.22) Third: M 0.88 (0.77, 1.00), H 0.86 (0.71, 1.03) Entire pregnancy: M 0.89 (0.77, 1.01), H 0.77 (0.63, 0.94)
Notes: Cut off for exposures groups for second and third trimester were similar to those presented above.
January 2010 C-29
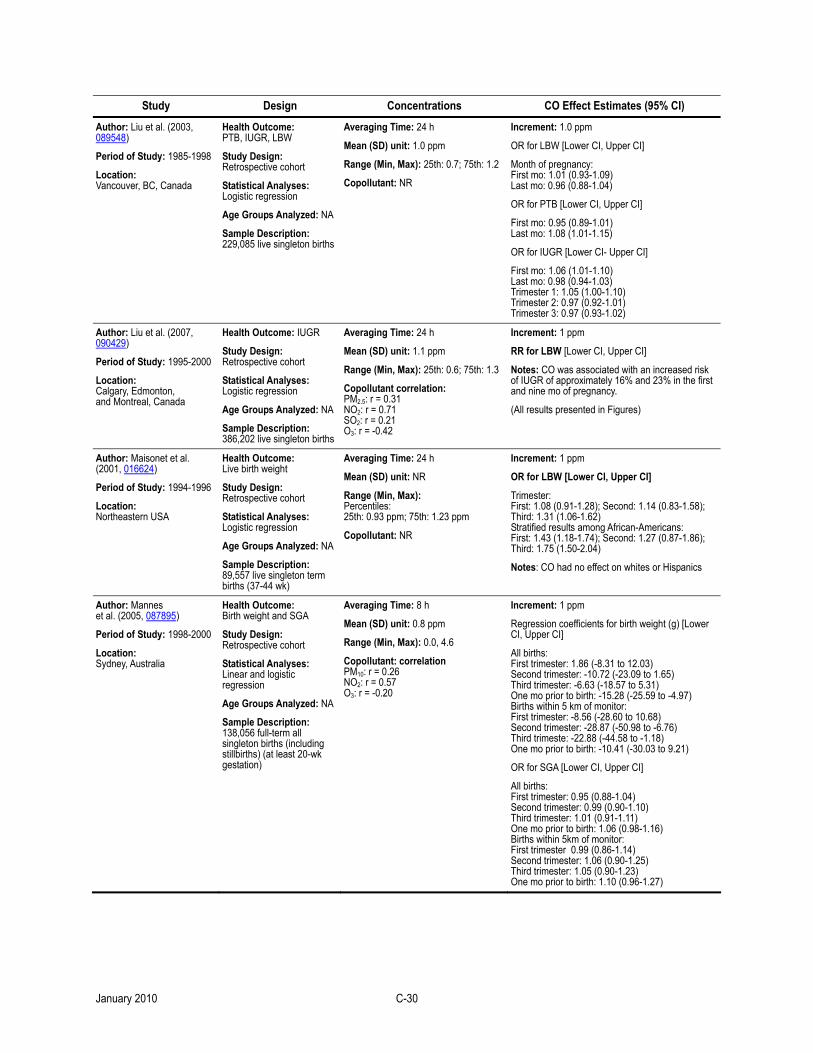
Study Design Concentrations CO Effect Estimates (95% CI)
Author: Liu et al. (2003, 089548)
Period of Study: 1985-1998
Location: Vancouver, BC, Canada
Health Outcome: PTB, IUGR, LBW
Study Design: Retrospective cohort
Statistical Analyses: Logistic regression
Age Groups Analyzed: NA
Sample Description: 229,085 live singleton births
Averaging Time: 24 h
Mean (SD) unit: 1.0 ppm
Range (Min, Max): 25th: 0.7; 75th: 1.2
Copollutant: NR
Increment: 1.0 ppm
OR for LBW [Lower CI, Upper CI]
Month of pregnancy: First mo: 1.01 (0.93-1.09) Last mo: 0.96 (0.88-1.04)
OR for PTB [Lower CI, Upper CI]
First mo: 0.95 (0.89-1.01) Last mo: 1.08 (1.01-1.15)
OR for IUGR [Lower CI- Upper CI]
First mo: 1.06 (1.01-1.10) Last mo: 0.98 (0.94-1.03) Trimester 1: 1.05 (1.00-1.10) Trimester 2: 0.97 (0.92-1.01) Trimester 3: 0.97 (0.93-1.02)
Author: Liu et al. (2007, 090429)
Period of Study: 1995-2000
Location: Calgary, Edmonton, and Montreal, Canada
Health Outcome: IUGR
Study Design: Retrospective cohort
Statistical Analyses: Logistic regression
Age Groups Analyzed: NA
Sample Description: 386,202 live singleton births
Averaging Time: 24 h
Mean (SD) unit: 1.1 ppm
Range (Min, Max): 25th: 0.6; 75th: 1.3
Copollutant correlation: PM2.5: r = 0.31 NO2: r = 0.71 SO2: r = 0.21 O3: r = -0.42
Increment: 1 ppm
RR for LBW [Lower CI, Upper CI]
Notes: CO was associated with an increased risk of IUGR of approximately 16% and 23% in the first and nine mo of pregnancy.
(All results presented in Figures)
Author: Maisonet et al. (2001, 016624)
Period of Study: 1994-1996
Location: Northeastern USA
Health Outcome: Live birth weight
Study Design: Retrospective cohort
Statistical Analyses: Logistic regression
Age Groups Analyzed: NA
Sample Description: 89,557 live singleton term births (37-44 wk)
Averaging Time: 24 h
Mean (SD) unit: NR
Range (Min, Max): Percentiles: 25th: 0.93 ppm; 75th: 1.23 ppm
Copollutant: NR
Increment: 1 ppm
OR for LBW [Lower CI, Upper CI]
Trimester: First: 1.08 (0.91-1.28); Second: 1.14 (0.83-1.58); Third: 1.31 (1.06-1.62) Stratified results among African-Americans: First: 1.43 (1.18-1.74); Second: 1.27 (0.87-1.86); Third: 1.75 (1.50-2.04)
Notes: CO had no effect on whites or Hispanics
Author: Mannes et al. (2005, 087895)
Period of Study: 1998-2000
Location: Sydney, Australia
Health Outcome: Birth weight and SGA
Study Design: Retrospective cohort
Statistical Analyses: Linear and logistic regression
Age Groups Analyzed: NA
Sample Description: 138,056 full-term all singleton births (including stillbirths) (at least 20-wk gestation)
Averaging Time: 8 h
Mean (SD) unit: 0.8 ppm
Range (Min, Max): 0.0, 4.6
Copollutant: correlation PM10: r = 0.26 NO2: r = 0.57 O3: r = -0.20
Increment: 1 ppm
Regression coefficients for birth weight (g) [Lower CI, Upper CI]
All births: First trimester: 1.86 (-8.31 to 12.03) Second trimester: -10.72 (-23.09 to 1.65) Third trimester: -6.63 (-18.57 to 5.31) One mo prior to birth: -15.28 (-25.59 to -4.97) Births within 5 km of monitor: First trimester: -8.56 (-28.60 to 10.68) Second trimester: -28.87 (-50.98 to -6.76) Third trimeste: -22.88 (-44.58 to -1.18) One mo prior to birth: -10.41 (-30.03 to 9.21)
OR for SGA [Lower CI, Upper CI]
All births: First trimester: 0.95 (0.88-1.04) Second trimester: 0.99 (0.90-1.10) Third trimester: 1.01 (0.91-1.11) One mo prior to birth: 1.06 (0.98-1.16) Births within 5km of monitor: First trimester 0.99 (0.86-1.14) Second trimester: 1.06 (0.90-1.25) Third trimester: 1.05 (0.90-1.23) One mo prior to birth: 1.10 (0.96-1.27)
January 2010 C-30
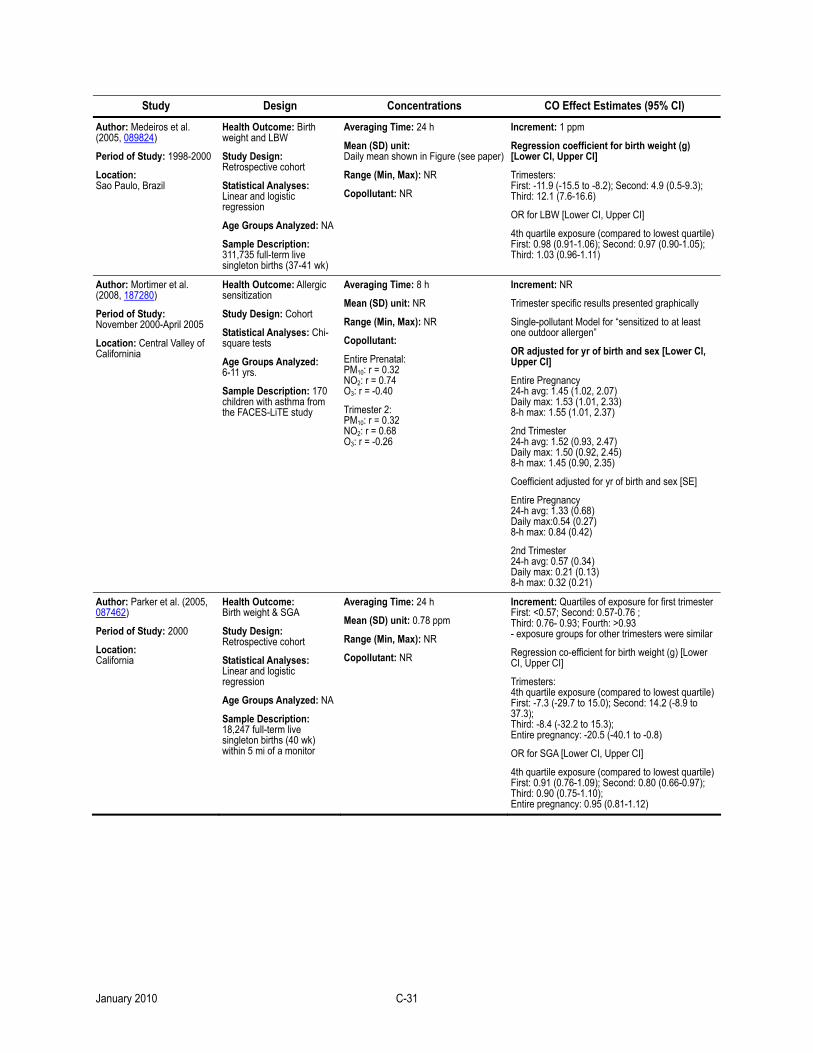
Study Design Concentrations CO Effect Estimates (95% CI)
Author: Medeiros et al. (2005, 089824)
Period of Study: 1998-2000
Location: Sao Paulo, Brazil
Health Outcome: Birth weight and LBW
Study Design: Retrospective cohort
Statistical Analyses: Linear and logistic regression
Age Groups Analyzed: NA
Sample Description: 311,735 full-term live singleton births (37-41 wk)
Averaging Time: 24 h
Mean (SD) unit: Daily mean shown in Figure (see paper)
Range (Min, Max): NR
Copollutant: NR
Increment: 1 ppm
Regression coefficient for birth weight (g) [Lower CI, Upper CI]
Trimesters: First: -11.9 (-15.5 to -8.2); Second: 4.9 (0.5-9.3); Third: 12.1 (7.6-16.6)
OR for LBW [Lower CI, Upper CI]
4th quartile exposure (compared to lowest quartile)First: 0.98 (0.91-1.06); Second: 0.97 (0.90-1.05); Third: 1.03 (0.96-1.11)
Author: Mortimer et al. (2008, 187280)
Period of Study: November 2000-April 2005
Location: Central Valley of Californinia
Health Outcome: Allergic sensitization
Study Design: Cohort
Statistical Analyses: Chi-square tests
Age Groups Analyzed: 6-11 yrs.
Sample Description: 170 children with asthma from the FACES-LiTE study
Averaging Time: 8 h
Mean (SD) unit: NR
Range (Min, Max): NR
Copollutant:
Entire Prenatal: PM10: r = 0.32 NO2: r = 0.74 O3: r = -0.40
Trimester 2: PM10: r = 0.32 NO2: r = 0.68 O3: r = -0.26
Increment: NR
Trimester specific results presented graphically
Single-pollutant Model for “sensitized to at least one outdoor allergen”
OR adjusted for yr of birth and sex [Lower CI, Upper CI]
Entire Pregnancy 24-h avg: 1.45 (1.02, 2.07) Daily max: 1.53 (1.01, 2.33) 8-h max: 1.55 (1.01, 2.37)
2nd Trimester 24-h avg: 1.52 (0.93, 2.47) Daily max: 1.50 (0.92, 2.45) 8-h max: 1.45 (0.90, 2.35)
Coefficient adjusted for yr of birth and sex [SE]
Entire Pregnancy 24-h avg: 1.33 (0.68) Daily max:0.54 (0.27) 8-h max: 0.84 (0.42)
2nd Trimester 24-h avg: 0.57 (0.34) Daily max: 0.21 (0.13) 8-h max: 0.32 (0.21)
Author: Parker et al. (2005, 087462)
Period of Study: 2000
Location: California
Health Outcome: Birth weight & SGA
Study Design: Retrospective cohort
Statistical Analyses: Linear and logistic regression
Age Groups Analyzed: NA
Sample Description: 18,247 full-term live singleton births (40 wk) within 5 mi of a monitor
Averaging Time: 24 h
Mean (SD) unit: 0.78 ppm
Range (Min, Max): NR
Copollutant: NR
Increment: Quartiles of exposure for first trimester First: <0.57; Second: 0.57-0.76 ; Third: 0.76- 0.93; Fourth: >0.93 - exposure groups for other trimesters were similar
Regression co-efficient for birth weight (g) [Lower CI, Upper CI]
Trimesters: 4th quartile exposure (compared to lowest quartile)First: -7.3 (-29.7 to 15.0); Second: 14.2 (-8.9 to 37.3); Third: -8.4 (-32.2 to 15.3); Entire pregnancy: -20.5 (-40.1 to -0.8)
OR for SGA [Lower CI, Upper CI]
4th quartile exposure (compared to lowest quartile)First: 0.91 (0.76-1.09); Second: 0.80 (0.66-0.97); Third: 0.90 (0.75-1.10); Entire pregnancy: 0.95 (0.81-1.12)
January 2010 C-31
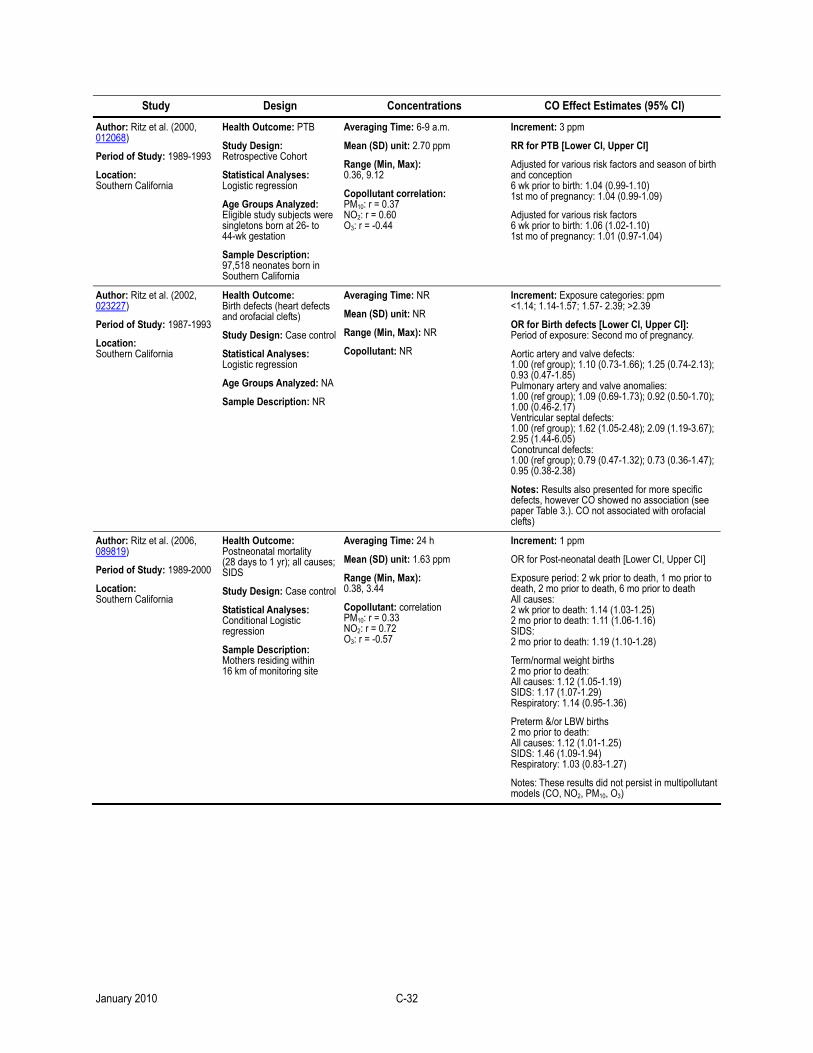
Study Design Concentrations CO Effect Estimates (95% CI)
Author: Ritz et al. (2000, 012068)
Period of Study: 1989-1993
Location: Southern California
Health Outcome: PTB
Study Design: Retrospective Cohort
Statistical Analyses: Logistic regression
Age Groups Analyzed: Eligible study subjects were singletons born at 26- to 44-wk gestation
Sample Description: 97,518 neonates born in Southern California
Averaging Time: 6-9 a.m.
Mean (SD) unit: 2.70 ppm
Range (Min, Max): 0.36, 9.12
Copollutant correlation: PM10: r = 0.37 NO2: r = 0.60 O3: r = -0.44
Increment: 3 ppm
RR for PTB [Lower CI, Upper CI]
Adjusted for various risk factors and season of birth and conception 6 wk prior to birth: 1.04 (0.99-1.10) 1st mo of pregnancy: 1.04 (0.99-1.09)
Adjusted for various risk factors 6 wk prior to birth: 1.06 (1.02-1.10) 1st mo of pregnancy: 1.01 (0.97-1.04)
Author: Ritz et al. (2002, 023227)
Period of Study: 1987-1993
Location: Southern California
Health Outcome: Birth defects (heart defects and orofacial clefts)
Study Design: Case control
Statistical Analyses: Logistic regression
Age Groups Analyzed: NA
Sample Description: NR
Averaging Time: NR
Mean (SD) unit: NR
Range (Min, Max): NR
Copollutant: NR
Increment: Exposure categories: ppm <1.14; 1.14-1.57; 1.57- 2.39; >2.39
OR for Birth defects [Lower CI, Upper CI]: Period of exposure: Second mo of pregnancy.
Aortic artery and valve defects: 1.00 (ref group); 1.10 (0.73-1.66); 1.25 (0.74-2.13); 0.93 (0.47-1.85) Pulmonary artery and valve anomalies: 1.00 (ref group); 1.09 (0.69-1.73); 0.92 (0.50-1.70); 1.00 (0.46-2.17) Ventricular septal defects: 1.00 (ref group); 1.62 (1.05-2.48); 2.09 (1.19-3.67); 2.95 (1.44-6.05) Conotruncal defects: 1.00 (ref group); 0.79 (0.47-1.32); 0.73 (0.36-1.47); 0.95 (0.38-2.38)
Notes: Results also presented for more specific defects, however CO showed no association (see paper Table 3.). CO not associated with orofacial clefts)
Author: Ritz et al. (2006, 089819)
Period of Study: 1989-2000
Location: Southern California
Health Outcome: Postneonatal mortality (28 days to 1 yr); all causes; SIDS
Study Design: Case control
Statistical Analyses: Conditional Logistic regression
Sample Description: Mothers residing within 16 km of monitoring site
Averaging Time: 24 h
Mean (SD) unit: 1.63 ppm
Range (Min, Max): 0.38, 3.44
Copollutant: correlation PM10: r = 0.33 NO2: r = 0.72 O3: r = -0.57
Increment: 1 ppm
OR for Post-neonatal death [Lower CI, Upper CI]
Exposure period: 2 wk prior to death, 1 mo prior to death, 2 mo prior to death, 6 mo prior to death All causes: 2 wk prior to death: 1.14 (1.03-1.25) 2 mo prior to death: 1.11 (1.06-1.16) SIDS: 2 mo prior to death: 1.19 (1.10-1.28)
Term/normal weight births 2 mo prior to death: All causes: 1.12 (1.05-1.19) SIDS: 1.17 (1.07-1.29) Respiratory: 1.14 (0.95-1.36)
Preterm &/or LBW births 2 mo prior to death: All causes: 1.12 (1.01-1.25) SIDS: 1.46 (1.09-1.94) Respiratory: 1.03 (0.83-1.27)
Notes: These results did not persist in multipollutant models (CO, NO2, PM10, O3)
January 2010 C-32
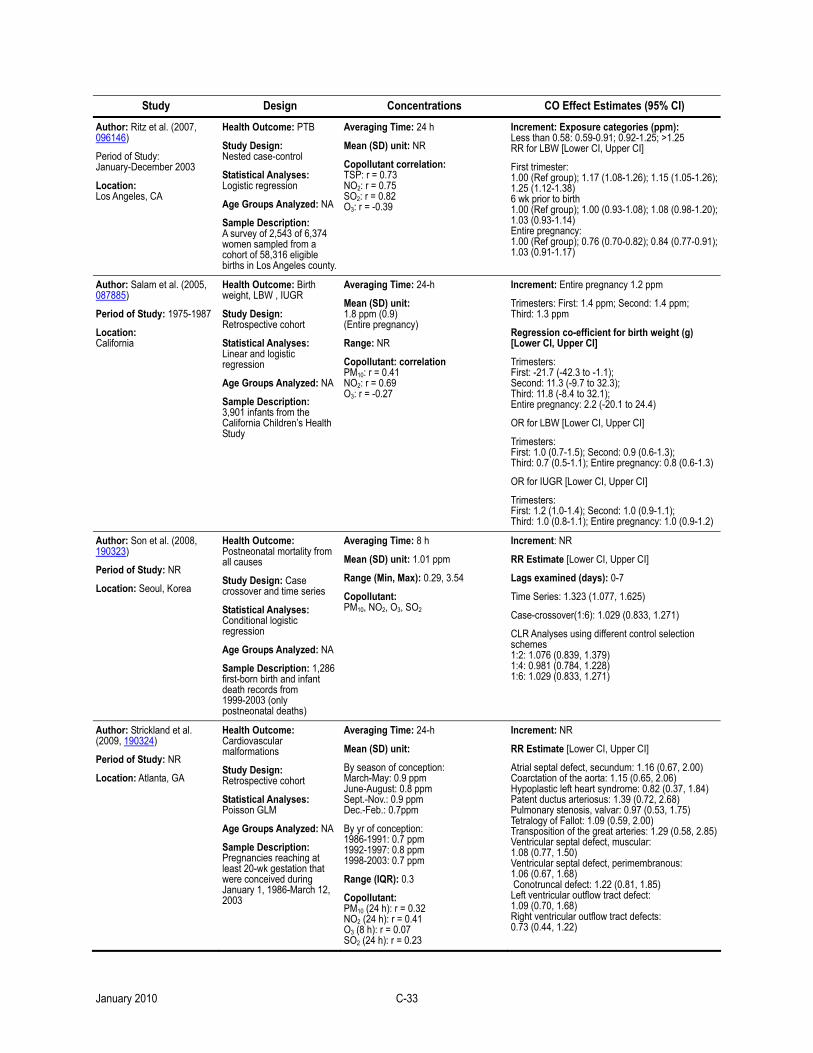
Study Design Concentrations CO Effect Estimates (95% CI)
Author: Ritz et al. (2007, 096146)
Period of Study: January-December 2003
Location: Los Angeles, CA
Health Outcome: PTB
Study Design: Nested case-control
Statistical Analyses: Logistic regression
Age Groups Analyzed: NA
Sample Description: A survey of 2,543 of 6,374 women sampled from a cohort of 58,316 eligible births in Los Angeles county.
Averaging Time: 24 h
Mean (SD) unit: NR
Copollutant correlation: TSP: r = 0.73 NO2: r = 0.75 SO2: r = 0.82 O3: r = -0.39
Increment: Exposure categories (ppm): Less than 0.58: 0.59-0.91; 0.92-1.25; >1.25 RR for LBW [Lower CI, Upper CI]
First trimester: 1.00 (Ref group); 1.17 (1.08-1.26); 1.15 (1.05-1.26); 1.25 (1.12-1.38) 6 wk prior to birth 1.00 (Ref group); 1.00 (0.93-1.08); 1.08 (0.98-1.20); 1.03 (0.93-1.14) Entire pregnancy: 1.00 (Ref group); 0.76 (0.70-0.82); 0.84 (0.77-0.91); 1.03 (0.91-1.17)
Author: Salam et al. (2005, 087885)
Period of Study: 1975-1987
Location: California
Health Outcome: Birth weight, LBW , IUGR
Study Design: Retrospective cohort
Statistical Analyses: Linear and logistic regression
Age Groups Analyzed: NA
Sample Description: 3,901 infants from the California Children’s Health Study
Averaging Time: 24-h
Mean (SD) unit: 1.8 ppm (0.9) (Entire pregnancy)
Range: NR
Copollutant: correlation PM10: r = 0.41 NO2: r = 0.69 O3: r = -0.27
Increment: Entire pregnancy 1.2 ppm
Trimesters: First: 1.4 ppm; Second: 1.4 ppm; Third: 1.3 ppm
Regression co-efficient for birth weight (g) [Lower CI, Upper CI]
Trimesters: First: -21.7 (-42.3 to -1.1); Second: 11.3 (-9.7 to 32.3); Third: 11.8 (-8.4 to 32.1); Entire pregnancy: 2.2 (-20.1 to 24.4)
OR for LBW [Lower CI, Upper CI]
Trimesters: First: 1.0 (0.7-1.5); Second: 0.9 (0.6-1.3); Third: 0.7 (0.5-1.1); Entire pregnancy: 0.8 (0.6-1.3)
OR for IUGR [Lower CI, Upper CI]
Trimesters: First: 1.2 (1.0-1.4); Second: 1.0 (0.9-1.1); Third: 1.0 (0.8-1.1); Entire pregnancy: 1.0 (0.9-1.2)
Author: Son et al. (2008, 190323)
Period of Study: NR
Location: Seoul, Korea
Health Outcome: Postneonatal mortality from all causes
Study Design: Case crossover and time series
Statistical Analyses: Conditional logistic regression
Age Groups Analyzed: NA
Sample Description: 1,286 first-born birth and infant death records from 1999-2003 (only postneonatal deaths)
Averaging Time: 8 h
Mean (SD) unit: 1.01 ppm
Range (Min, Max): 0.29, 3.54
Copollutant: PM10, NO2, O3, SO2
Increment: NR
RR Estimate [Lower CI, Upper CI]
Lags examined (days): 0-7
Time Series: 1.323 (1.077, 1.625)
Case-crossover(1:6): 1.029 (0.833, 1.271)
CLR Analyses using different control selection schemes 1:2: 1.076 (0.839, 1.379) 1:4: 0.981 (0.784, 1.228) 1:6: 1.029 (0.833, 1.271)
Author: Strickland et al. (2009, 190324)
Period of Study: NR
Location: Atlanta, GA
Health Outcome: Cardiovascular malformations
Study Design: Retrospective cohort
Statistical Analyses: Poisson GLM
Age Groups Analyzed: NA
Sample Description: Pregnancies reaching at least 20-wk gestation that were conceived during January 1, 1986-March 12, 2003
Averaging Time: 24-h
Mean (SD) unit:
By season of conception: March-May: 0.9 ppm June-August: 0.8 ppm Sept.-Nov.: 0.9 ppm Dec.-Feb.: 0.7ppm
By yr of conception: 1986-1991: 0.7 ppm 1992-1997: 0.8 ppm 1998-2003: 0.7 ppm
Range (IQR): 0.3
Copollutant: PM10 (24 h): r = 0.32 NO2 (24 h): r = 0.41 O3 (8 h): r = 0.07 SO2 (24 h): r = 0.23
Increment: NR
RR Estimate [Lower CI, Upper CI]
Atrial septal defect, secundum: 1.16 (0.67, 2.00) Coarctation of the aorta: 1.15 (0.65, 2.06) Hypoplastic left heart syndrome: 0.82 (0.37, 1.84) Patent ductus arteriosus: 1.39 (0.72, 2.68) Pulmonary stenosis, valvar: 0.97 (0.53, 1.75) Tetralogy of Fallot: 1.09 (0.59, 2.00) Transposition of the great arteries: 1.29 (0.58, 2.85)Ventricular septal defect, muscular: 1.08 (0.77, 1.50) Ventricular septal defect, perimembranous: 1.06 (0.67, 1.68) Conotruncal defect: 1.22 (0.81, 1.85) Left ventricular outflow tract defect: 1.09 (0.70, 1.68) Right ventricular outflow tract defects: 0.73 (0.44, 1.22)
January 2010 C-33
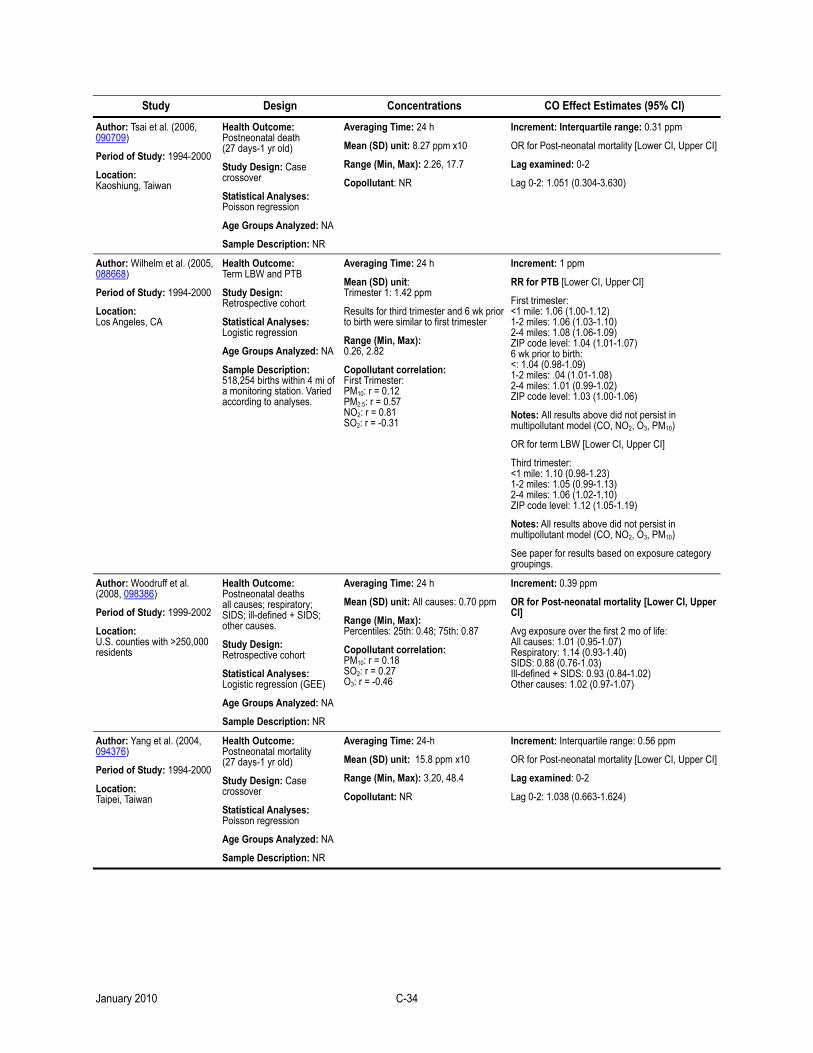
Study Design Concentrations CO Effect Estimates (95% CI)
Author: Tsai et al. (2006, 090709)
Period of Study: 1994-2000
Location: Kaoshiung, Taiwan
Health Outcome: Postneonatal death (27 days-1 yr old)
Study Design: Case crossover
Statistical Analyses: Poisson regression
Age Groups Analyzed: NA
Sample Description: NR
Averaging Time: 24 h
Mean (SD) unit: 8.27 ppm x10
Range (Min, Max): 2.26, 17.7
Copollutant: NR
Increment: Interquartile range: 0.31 ppm
OR for Post-neonatal mortality [Lower CI, Upper CI]
Lag examined: 0-2
Lag 0-2: 1.051 (0.304-3.630)
Author: Wilhelm et al. (2005, 088668)
Period of Study: 1994-2000
Location: Los Angeles, CA
Health Outcome: Term LBW and PTB
Study Design: Retrospective cohort
Statistical Analyses: Logistic regression
Age Groups Analyzed: NA
Sample Description: 518,254 births within 4 mi of a monitoring station. Varied according to analyses.
Averaging Time: 24 h
Mean (SD) unit: Trimester 1: 1.42 ppm
Results for third trimester and 6 wk prior to birth were similar to first trimester
Range (Min, Max): 0.26, 2.82
Copollutant correlation: First Trimester: PM10: r = 0.12 PM2.5: r = 0.57 NO2: r = 0.81 SO2: r = -0.31
Increment: 1 ppm
RR for PTB [Lower CI, Upper CI]
First trimester: <1 mile: 1.06 (1.00-1.12) 1-2 miles: 1.06 (1.03-1.10) 2-4 miles: 1.08 (1.06-1.09) ZIP code level: 1.04 (1.01-1.07) 6 wk prior to birth: <: 1.04 (0.98-1.09) 1-2 miles: .04 (1.01-1.08) 2-4 miles: 1.01 (0.99-1.02) ZIP code level: 1.03 (1.00-1.06)
Notes: All results above did not persist in multipollutant model (CO, NO2, O3, PM10)
OR for term LBW [Lower CI, Upper CI]
Third trimester: <1 mile: 1.10 (0.98-1.23) 1-2 miles: 1.05 (0.99-1.13) 2-4 miles: 1.06 (1.02-1.10) ZIP code level: 1.12 (1.05-1.19)
Notes: All results above did not persist in multipollutant model (CO, NO2, O3, PM10)
See paper for results based on exposure category groupings.
Author: Woodruff et al. (2008, 098386)
Period of Study: 1999-2002
Location: U.S. counties with >250,000 residents
Health Outcome: Postneonatal deaths all causes; respiratory; SIDS; ill-defined + SIDS; other causes.
Study Design: Retrospective cohort
Statistical Analyses: Logistic regression (GEE)
Age Groups Analyzed: NA
Sample Description: NR
Averaging Time: 24 h
Mean (SD) unit: All causes: 0.70 ppm
Range (Min, Max): Percentiles: 25th: 0.48; 75th: 0.87
Copollutant correlation: PM10: r = 0.18 SO2: r = 0.27 O3: r = -0.46
Increment: 0.39 ppm
OR for Post-neonatal mortality [Lower CI, Upper CI]
Avg exposure over the first 2 mo of life: All causes: 1.01 (0.95-1.07) Respiratory: 1.14 (0.93-1.40) SIDS: 0.88 (0.76-1.03) Ill-defined + SIDS: 0.93 (0.84-1.02) Other causes: 1.02 (0.97-1.07)
Author: Yang et al. (2004, 094376)
Period of Study: 1994-2000
Location: Taipei, Taiwan
Health Outcome: Postneonatal mortality (27 days-1 yr old)
Study Design: Case crossover
Statistical Analyses: Poisson regression
Age Groups Analyzed: NA
Sample Description: NR
Averaging Time: 24-h
Mean (SD) unit: 15.8 ppm x10
Range (Min, Max): 3.20, 48.4
Copollutant: NR
Increment: Interquartile range: 0.56 ppm
OR for Post-neonatal mortality [Lower CI, Upper CI]
Lag examined: 0-2
Lag 0-2: 1.038 (0.663-1.624)
January 2010 C-34
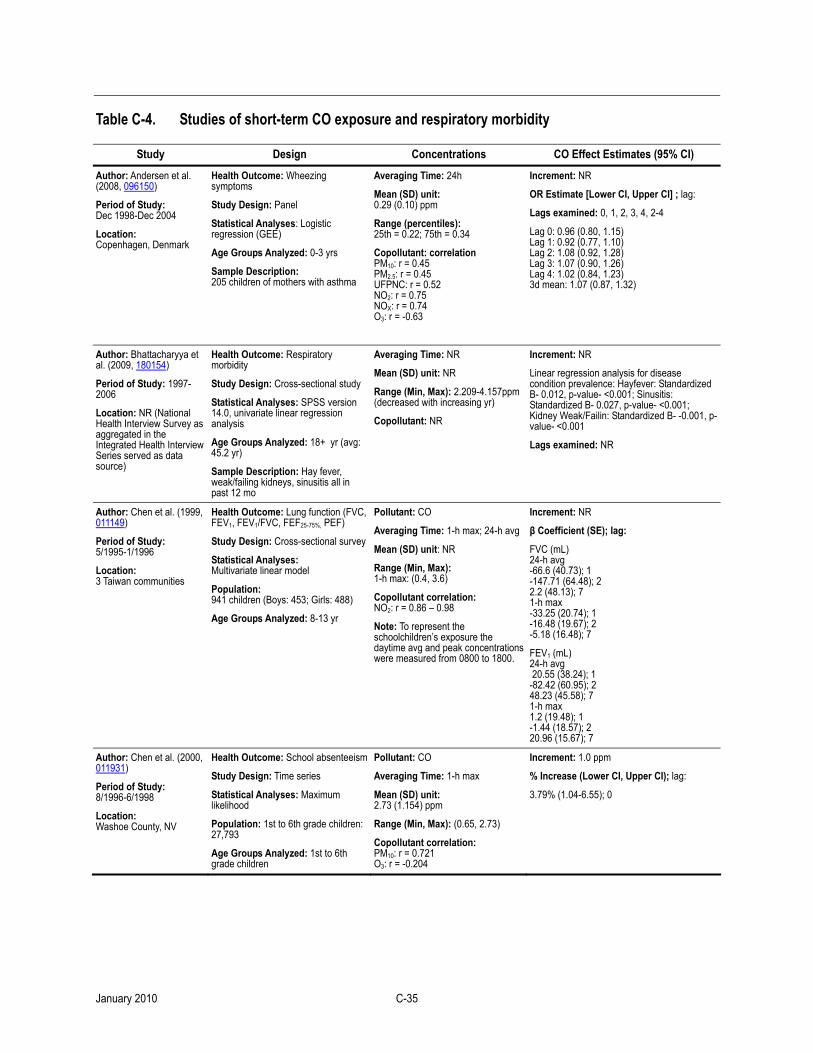
Table C-4. Studies of short-term CO exposure and respiratory morbidity
Study Design Concentrations CO Effect Estimates (95% CI)
Author: Andersen et al. (2008, 096150)
Period of Study: Dec 1998-Dec 2004
Location: Copenhagen, Denmark
Health Outcome: Wheezing symptoms
Study Design: Panel
Statistical Analyses: Logistic regression (GEE)
Age Groups Analyzed: 0-3 yrs
Sample Description: 205 children of mothers with asthma
Averaging Time: 24h
Mean (SD) unit: 0.29 (0.10) ppm
Range (percentiles): 25th = 0.22; 75th = 0.34
Copollutant: correlation PM10: r = 0.45 PM2.5: r = 0.45 UFPNC: r = 0.52 NO2: r = 0.75 NOX: r = 0.74 O3: r = -0.63
Increment: NR
OR Estimate [Lower CI, Upper CI] ; lag:
Lags examined: 0, 1, 2, 3, 4, 2-4
Lag 0: 0.96 (0.80, 1.15) Lag 1: 0.92 (0.77, 1.10) Lag 2: 1.08 (0.92, 1.28) Lag 3: 1.07 (0.90, 1.26) Lag 4: 1.02 (0.84, 1.23) 3d mean: 1.07 (0.87, 1.32)
Author: Bhattacharyya et al. (2009, 180154)
Period of Study: 1997-2006
Location: NR (National Health Interview Survey as aggregated in the Integrated Health Interview Series served as data source)
Health Outcome: Respiratory morbidity
Study Design: Cross-sectional study
Statistical Analyses: SPSS version 14.0, univariate linear regression analysis
Age Groups Analyzed: 18+ yr (avg: 45.2 yr)
Sample Description: Hay fever, weak/failing kidneys, sinusitis all in past 12 mo
Averaging Time: NR
Mean (SD) unit: NR
Range (Min, Max): 2.209-4.157ppm (decreased with increasing yr)
Copollutant: NR
Increment: NR
Linear regression analysis for disease condition prevalence: Hayfever: Standardized B- 0.012, p-value- <0.001; Sinusitis: Standardized B- 0.027, p-value- <0.001; Kidney Weak/Failin: Standardized B- -0.001, p-value- <0.001
Lags examined: NR
Author: Chen et al. (1999, 011149)
Period of Study: 5/1995-1/1996
Location: 3 Taiwan communities
Health Outcome: Lung function (FVC, FEV1, FEV1/FVC, FEF25-75%, PEF)
Study Design: Cross-sectional survey
Statistical Analyses: Multivariate linear model
Population: 941 children (Boys: 453; Girls: 488)
Age Groups Analyzed: 8-13 yr
Pollutant: CO
Averaging Time: 1-h max; 24-h avg
Mean (SD) unit: NR
Range (Min, Max): 1-h max: (0.4, 3.6)
Copollutant correlation: NO2: r = 0.86 – 0.98
Note: To represent the schoolchildren’s exposure the daytime avg and peak concentrations were measured from 0800 to 1800.
Increment: NR
β Coefficient (SE); lag:
FVC (mL) 24-h avg -66.6 (40.73); 1 -147.71 (64.48); 2 2.2 (48.13); 7 1-h max -33.25 (20.74); 1 -16.48 (19.67); 2 -5.18 (16.48); 7
FEV1 (mL) 24-h avg 20.55 (38.24); 1 -82.42 (60.95); 2 48.23 (45.58); 7 1-h max 1.2 (19.48); 1 -1.44 (18.57); 2 20.96 (15.67); 7
Author: Chen et al. (2000, 011931)
Period of Study: 8/1996-6/1998
Location: Washoe County, NV
Health Outcome: School absenteeism
Study Design: Time series
Statistical Analyses: Maximum likelihood
Population: 1st to 6th grade children: 27,793
Age Groups Analyzed: 1st to 6th grade children
Pollutant: CO
Averaging Time: 1-h max
Mean (SD) unit: 2.73 (1.154) ppm
Range (Min, Max): (0.65, 2.73)
Copollutant correlation: PM10: r = 0.721 O3: r = -0.204
Increment: 1.0 ppm
% Increase (Lower CI, Upper CI); lag:
3.79% (1.04-6.55); 0
January 2010 C-35
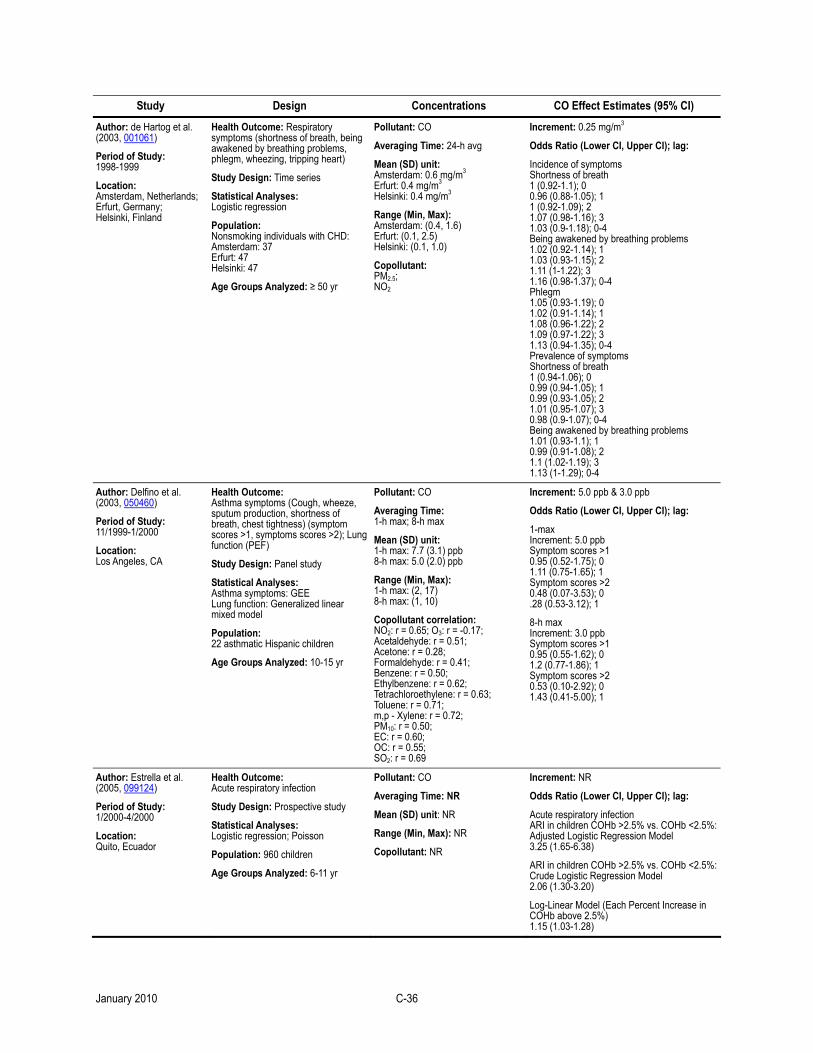
Study Design Concentrations CO Effect Estimates (95% CI)
Author: de Hartog et al. (2003, 001061)
Period of Study: 1998-1999
Location: Amsterdam, Netherlands; Erfurt, Germany; Helsinki, Finland
Health Outcome: Respiratory symptoms (shortness of breath, being awakened by breathing problems, phlegm, wheezing, tripping heart)
Study Design: Time series
Statistical Analyses: Logistic regression
Population: Nonsmoking individuals with CHD: Amsterdam: 37 Erfurt: 47 Helsinki: 47
Age Groups Analyzed: ≥ 50 yr
Pollutant: CO
Averaging Time: 24-h avg
Mean (SD) unit: Amsterdam: 0.6 mg/m3 Erfurt: 0.4 mg/m3 Helsinki: 0.4 mg/m3
Range (Min, Max): Amsterdam: (0.4, 1.6) Erfurt: (0.1, 2.5) Helsinki: (0.1, 1.0)
Copollutant: PM2.5; NO2
Increment: 0.25 mg/m3
Odds Ratio (Lower CI, Upper CI); lag:
Incidence of symptoms Shortness of breath 1 (0.92-1.1); 0 0.96 (0.88-1.05); 1 1 (0.92-1.09); 2 1.07 (0.98-1.16); 3 1.03 (0.9-1.18); 0-4 Being awakened by breathing problems 1.02 (0.92-1.14); 1 1.03 (0.93-1.15); 2 1.11 (1-1.22); 3 1.16 (0.98-1.37); 0-4 Phlegm 1.05 (0.93-1.19); 0 1.02 (0.91-1.14); 1 1.08 (0.96-1.22); 2 1.09 (0.97-1.22); 3 1.13 (0.94-1.35); 0-4 Prevalence of symptoms Shortness of breath 1 (0.94-1.06); 0 0.99 (0.94-1.05); 1 0.99 (0.93-1.05); 2 1.01 (0.95-1.07); 3 0.98 (0.9-1.07); 0-4 Being awakened by breathing problems 1.01 (0.93-1.1); 1 0.99 (0.91-1.08); 2 1.1 (1.02-1.19); 3 1.13 (1-1.29); 0-4
Author: Delfino et al. (2003, 050460)
Period of Study: 11/1999-1/2000
Location: Los Angeles, CA
Health Outcome: Asthma symptoms (Cough, wheeze, sputum production, shortness of breath, chest tightness) (symptom scores >1, symptoms scores >2); Lung function (PEF)
Study Design: Panel study
Statistical Analyses: Asthma symptoms: GEE Lung function: Generalized linear mixed model
Population: 22 asthmatic Hispanic children
Age Groups Analyzed: 10-15 yr
Pollutant: CO
Averaging Time: 1-h max; 8-h max
Mean (SD) unit: 1-h max: 7.7 (3.1) ppb 8-h max: 5.0 (2.0) ppb
Range (Min, Max): 1-h max: (2, 17) 8-h max: (1, 10)
Copollutant correlation: NO2: r = 0.65; O3: r = -0.17; Acetaldehyde: r = 0.51; Acetone: r = 0.28; Formaldehyde: r = 0.41; Benzene: r = 0.50; Ethylbenzene: r = 0.62; Tetrachloroethylene: r = 0.63; Toluene: r = 0.71; m,p - Xylene: r = 0.72; PM10: r = 0.50; EC: r = 0.60; OC: r = 0.55; SO2: r = 0.69
Increment: 5.0 ppb & 3.0 ppb
Odds Ratio (Lower CI, Upper CI); lag:
1-max Increment: 5.0 ppb Symptom scores >1 0.95 (0.52-1.75); 0 1.11 (0.75-1.65); 1 Symptom scores >2 0.48 (0.07-3.53); 0 .28 (0.53-3.12); 1
8-h max Increment: 3.0 ppb Symptom scores >1 0.95 (0.55-1.62); 0 1.2 (0.77-1.86); 1 Symptom scores >2 0.53 (0.10-2.92); 0 1.43 (0.41-5.00); 1
Author: Estrella et al. (2005, 099124)
Period of Study: 1/2000-4/2000
Location: Quito, Ecuador
Health Outcome: Acute respiratory infection
Study Design: Prospective study
Statistical Analyses: Logistic regression; Poisson
Population: 960 children
Age Groups Analyzed: 6-11 yr
Pollutant: CO
Averaging Time: NR
Mean (SD) unit: NR
Range (Min, Max): NR
Copollutant: NR
Increment: NR
Odds Ratio (Lower CI, Upper CI); lag:
Acute respiratory infection ARI in children COHb >2.5% vs. COHb <2.5%: Adjusted Logistic Regression Model 3.25 (1.65-6.38)
ARI in children COHb >2.5% vs. COHb <2.5%: Crude Logistic Regression Model 2.06 (1.30-3.20)
Log-Linear Model (Each Percent Increase in COHb above 2.5%) 1.15 (1.03-1.28)
January 2010 C-36
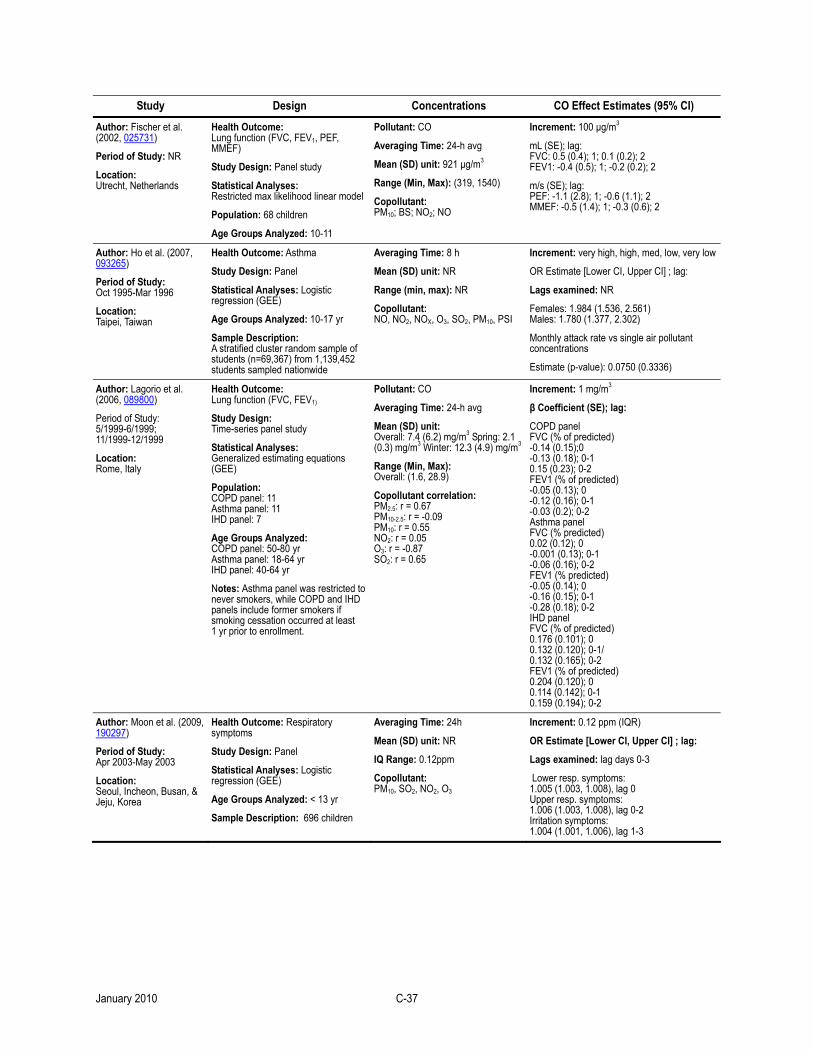
Study Design Concentrations CO Effect Estimates (95% CI)
Author: Fischer et al. (2002, 025731)
Period of Study: NR
Location: Utrecht, Netherlands
Health Outcome: Lung function (FVC, FEV1, PEF, MMEF)
Study Design: Panel study
Statistical Analyses: Restricted max likelihood linear model
Population: 68 children
Age Groups Analyzed: 10-11
Pollutant: CO
Averaging Time: 24-h avg
Mean (SD) unit: 921 µg/m3
Range (Min, Max): (319, 1540)
Copollutant: PM10; BS; NO2; NO
Increment: 100 µg/m3
mL (SE); lag: FVC: 0.5 (0.4); 1; 0.1 (0.2); 2 FEV1: -0.4 (0.5); 1; -0.2 (0.2); 2
m/s (SE); lag: PEF: -1.1 (2.8); 1; -0.6 (1.1); 2 MMEF: -0.5 (1.4); 1; -0.3 (0.6); 2
Author: Ho et al. (2007, 093265)
Period of Study: Oct 1995-Mar 1996
Location: Taipei, Taiwan
Health Outcome: Asthma
Study Design: Panel
Statistical Analyses: Logistic regression (GEE)
Age Groups Analyzed: 10-17 yr
Sample Description: A stratified cluster random sample of students (n=69,367) from 1,139,452 students sampled nationwide
Averaging Time: 8 h
Mean (SD) unit: NR
Range (min, max): NR
Copollutant: NO, NO2, NOX, O3, SO2, PM10, PSI
Increment: very high, high, med, low, very low
OR Estimate [Lower CI, Upper CI] ; lag:
Lags examined: NR
Females: 1.984 (1.536, 2.561) Males: 1.780 (1.377, 2.302)
Monthly attack rate vs single air pollutant concentrations
Estimate (p-value): 0.0750 (0.3336)
Author: Lagorio et al. (2006, 089800)
Period of Study: 5/1999-6/1999; 11/1999-12/1999
Location: Rome, Italy
Health Outcome: Lung function (FVC, FEV1)
Study Design: Time-series panel study
Statistical Analyses: Generalized estimating equations (GEE)
Population: COPD panel: 11 Asthma panel: 11 IHD panel: 7
Age Groups Analyzed: COPD panel: 50-80 yr Asthma panel: 18-64 yr IHD panel: 40-64 yr
Notes: Asthma panel was restricted to never smokers, while COPD and IHD panels include former smokers if smoking cessation occurred at least 1 yr prior to enrollment.
Pollutant: CO
Averaging Time: 24-h avg
Mean (SD) unit: Overall: 7.4 (6.2) mg/m3 Spring: 2.1 (0.3) mg/m3 Winter: 12.3 (4.9) mg/m3
Range (Min, Max): Overall: (1.6, 28.9)
Copollutant correlation: PM2.5: r = 0.67 PM10-2.5: r = -0.09 PM10: r = 0.55 NO2: r = 0.05 O3: r = -0.87 SO2: r = 0.65
Increment: 1 mg/m3
β Coefficient (SE); lag:
COPD panel FVC (% of predicted) -0.14 (0.15);0 -0.13 (0.18); 0-1 0.15 (0.23); 0-2 FEV1 (% of predicted) -0.05 (0.13); 0 -0.12 (0.16); 0-1 -0.03 (0.2); 0-2 Asthma panel FVC (% predicted) 0.02 (0.12); 0 -0.001 (0.13); 0-1 -0.06 (0.16); 0-2 FEV1 (% predicted) -0.05 (0.14); 0 -0.16 (0.15); 0-1 -0.28 (0.18); 0-2 IHD panel FVC (% of predicted) 0.176 (0.101); 0 0.132 (0.120); 0-1/ 0.132 (0.165); 0-2 FEV1 (% of predicted) 0.204 (0.120); 0 0.114 (0.142); 0-1 0.159 (0.194); 0-2
Author: Moon et al. (2009, 190297)
Period of Study: Apr 2003-May 2003
Location: Seoul, Incheon, Busan, & Jeju, Korea
Health Outcome: Respiratory symptoms
Study Design: Panel
Statistical Analyses: Logistic regression (GEE)
Age Groups Analyzed: < 13 yr
Sample Description: 696 children
Averaging Time: 24h
Mean (SD) unit: NR
IQ Range: 0.12ppm
Copollutant: PM10, SO2, NO2, O3
Increment: 0.12 ppm (IQR)
OR Estimate [Lower CI, Upper CI] ; lag:
Lags examined: lag days 0-3
Lower resp. symptoms: 1.005 (1.003, 1.008), lag 0 Upper resp. symptoms: 1.006 (1.003, 1.008), lag 0-2 Irritation symptoms: 1.004 (1.001, 1.006), lag 1-3
January 2010 C-37

Study Design Concentrations CO Effect Estimates (95% CI)
Author: Mortimer et al. (2008, 187280)
Period of Study: Nov 2000-Apr 2005
Location: Fresno, California
Health Outcome: Allergic sensitization
Study Design: Panel
Statistical Analyses: Multistep modeling
Age Groups Analyzed: 6-11 yr
Sample Description: 170 children with physician diagnosed asthma
Averaging Time: 24-h avg, 24-h max, 8-h max
Mean (SD) unit: NR
IQ Range (24-h avg, 24-h max, 8-h max): 0.28, 0.79, 0.52
Copollutant: entire prenatal correlation NO2: r = 0.74 O3: r = -0.40 PM10: r = 0.32
Increment: IQR
OR Estimate [Lower CI, Upper CI] ; lag:
Lags examined: NR
Entire Pregnancy: CO 24-h avg: 1.45 (1.02, 2.07) CO 24-h max: 1.53 (1.01, 2.33) CO 24-h avg: 1.55 (1.01, 2.37)
Author: Nkwocha et al. (2008, 190304)
Period of Study: Feb 2005-Jul 2006
Location: Port Harcourt, Nigeria
Health Outcome: Respiratory symptoms
Study Design: Panel
Statistical Analyses: Mixed Effects models
Age Groups Analyzed: 0-5 yr
Sample Description: 250 children
Averaging Time: 8 h
Mean (SD) unit: NR
Range (min, max): 1.3 µg/m3, 1.83 µg/m3
Copollutant: NO2, SO2, PM10
Increment: NR
Lags examined: NR
R Estimate:
Dry season: 0.13
Wet season: 0.25
Author: O’Connor et al. (2008, 156818)
Period of Study: Aug 1998-Jul 2001
Location: Boston, MA; the Bronx, NY; Chicago, IL; Dallas, TX; New York, NY; Seattle, WA; Tuscon, AZ
Health Outcome: respiratory symptoms
Study Design: panel
Statistical Analyses: Mixed Effects Models
Age Groups Analyzed: 5-12 yr
Sample Description: 861 children with persistent asthma and atopy living in low-income census tracts
Averaging Time: 8 h
Mean (SD) unit: NR
Range (10th-90th): 872.1 ppb
Copollutant: PM10, SO2, NO2, O3
Increment: 872.1 ppb
Lags examined: NR
Change Estimate [Lower CI, Upper CI]:
FEV1: -0.56 (-1.31, 0.20) PEFR: -0.49 (-1.24, 0.27)
Pollution Impact*[Lower CI, Upper CI]:
Wheeze-cough: 1.26 (1.03, 1.55) Nighttime asthma: 1.35 (1.07, 1.71) Slow play: 1.28 (1.04, 1.59)
OR [Lower CI, Upper CI]:
Missed School: 1.08 (0.76, 1.53)
*Coefficients from the negative binomial model and indicate the multiplicative effect per unit change
Author: Park et al. (2002, 093798)
Period of Study: 3/1996-12/1999
Location: Seoul, Korea
Health Outcome: School absenteeism
Study Design: Time series
Statistical Analyses: Poisson GAM, LOESS
Population: ~1,264 children (671 Boys, 593 girls)
Age Groups Analyzed: 1st through 6th grade students
Pollutant: CO
Averaging Time: 24-h avg
Mean (SD) unit: 1.11 (0.40) ppm
Range (Min, Max): (0.39, 2.97)
Copollutant correlation: PM10: r = 0.56; NO2: r = 0.70; SO2: r = 0.67; O3: r = -0.46
Increment: 0.52 ppm
Relative Risk (Lower CI, Upper CI); lag:
Total Absences: 0.95 (0.94-0.97); 0 Non-Illness Related Absences: 0.99 (0.96-1.02); 0 Illness-Related Absences: 0.96 (0.94-0.98); 0
Author: Park et al. (2005, 088673)
Period of Study: 3/2002-6/2002
Location: Incheon, Korea
Health Outcome: Lung function (PEF variability (>20%), Mean PEF); Respiratory symptoms (night respiratory symptoms, cough, inhaler use)
Study Design: Panel study
Statistical Analyses: GEE; Poisson GAM
Population: 64 bronchial asthmatics
Age Groups Analyzed: 16-75 yr
Pollutant: CO
Averaging Time: 24-h avg
Mean (SD) unit: Control days: 0.6368 (0.1522) ppm Dust days: 0.6462 (0.0945) ppm
Range (Min, Max): NR
Copollutant: NR
Increment: NR
Relative Risk (Lower CI, Upper CI); lag:
PEF variability (>20%): 1.43 (0.54-3.75) Night respiratory symptoms: 0.98 (0.51-1.86)
β Coefficient (SE); lag: PEF variability (>20%): 0.9737 (0.3187) Mean PEF (L/min): -10.103 (2.7146) Night respiratory symptoms: -0.018 (0.3654) Cough: 0.0855 (0.1826) Inhaler Use: 0.0796 (0.1733)
January 2010 C-38

Study Design Concentrations CO Effect Estimates (95% CI)
Author: Penttinen et al. (2001, 030335)
Period of Study: 11/1996-4/1997
Location: Helsinki, Finland
Health Outcome: Lung function (PEF)
Study Design: Panel study
Statistical Analyses: First order autoregressive linear model
Population: 57 nonsmoking adult asthmatics
Age Groups Analyzed: NR
Pollutant: CO
Averaging Time: 24-h avg
Median unit: 0.4 mg/m3
Range (Min, Max): (0.1, 1.1) mg/m3
Copollutant correlation: PM10: r = -0.03 PM10-2.5: r = -0.30 PM2.5: r = 0.32 PM1: r = 0.39 PNC: r = 0.44 NC0.01-0.1: r = 0.43 NC0.1-1: r = 0.47 NO: r = 0.60 NO2: r = 0.44
Increment: 0.2 mg/m3
β Coefficient (SE); lag:
PEF Deviations (L/min) Morning 0.27 (0.38); 0 -1.08 (0.36); 1 0.23 (0.38); 2 -1.11 (1.19); 5-day avg Afternoon -0.4 (0.43); 0 -0.13 (0.41); 1 -0.71 (0.41); 2 -3.03 (1.06); 5-day avg Evening -0.7 (0.45); 0; -0.31 (0.44); 1 0.3 (0.44); 2 -3.62 (1.19); 5-day avg Co-pollutant models with PNC Morning: -0.67 (0.64); 1 Afternoon: -0.46 (0.69); 0 Evening: -0.46 (0.73); 0
Author: Rabinovitch et al. (2004, 096753)
Period of Study: 11/1999-3/2000; 11/2000-3/2001; 11/2001-3/2002
Location: Denver, CO
Health Outcome: Lung function (FEV1); asthma exacerbation; bronchodilator use
Study Design: Panel study
Statistical Analyses: Pulmonary function: Mixed effects model; Asthma exacerbation and medication use: GLM
Population: Urban poor asthmatic children: 1999-2000: 41 2000-2001: 63 2001-2002: 43
Age Groups Analyzed: 6-12 yr
Pollutant: CO
Averaging Time: 24-h avg
Mean (SD) unit: 1.0 (0.4) ppm
Range (Min, Max): (0.3, 3.5)
Copollutant: PM2.5; PM10; NO2; SO2; O3
Increment: 0.4 ppm
β Coefficient (SE); lag: FEV1 AM: -0.001 (0.008); 3-day ma PM: 0.015 (0.01); 3-day ma
Odds Ratio (Lower CI, Upper CI); lag:
Asthma exacerbation: 1.012 (0.913-1.123); 3-day ma
Bronchodilator use: 1.065 (1.001-1.133); 3-day ma
Author: Ranzi et al. (2004, 089500)
Period of Study: 2/1999-5/1999
Location: Emilia-Romagna, Italy
Health Outcome: Lung function; respiratory symptoms, medication use
Study Design: Panel study
Statistical Analyses: GLM
Population: 120 “asthma-like” school children
Age Groups Analyzed: 6-11 yr
Pollutant: CO
Averaging Time: 24-h avg
Mean (SD) unit: Urban area: 1.54 mg Rural area: 1.22 mg
Range (Min, Max): NR
Copollutant: NO2; TSP; PM2.5
The study did not present quantitative results for CO.
Author: Rodriguez et al. (2007, 092842)
Period of Study: 1996-2003
Location: Perth, Australia
Health Outcome: Respiratory symptoms (body temperature, cough, wheeze/rattle chest, runny/blocked nose)
Study Design: Panel study
Statistical Analyses: Logistic regression, GEE
Population: 263 children at high risk of developing asthma
Age Groups Analyzed: 0-5 yr
Pollutant: CO
Averaging Time: 8-h avg
Mean (SD) unit: 1.408 ppm
Range (Min, Max): (0.012, 8.031)
Copollutant: NR
Increment: NR
Odds Ratio (Lower CI, Upper CI); lag:
Body Temperature 1.024 (0.911-1.151); 0 1.056 (0.943-1.184); 5 0.991 (0.962-1.021); 0-5 Cough 1.001 (0.996-1.005); 0 1.064 (0.941-1.02); 5 1.028 (0.996-1.061); 0-5 Wheeze/Rattle Chest 1.089 (0.968-1.226); 0 1.136 (1.016-1.26); 5 1.035 (1.005-1.066); 0-5 Runny/Blocked Nose 1.094 (0.824-1.453); 0 1.38 (1.028-1.853); 5 1.101 (1.025-1.183); 0-5
January 2010 C-39
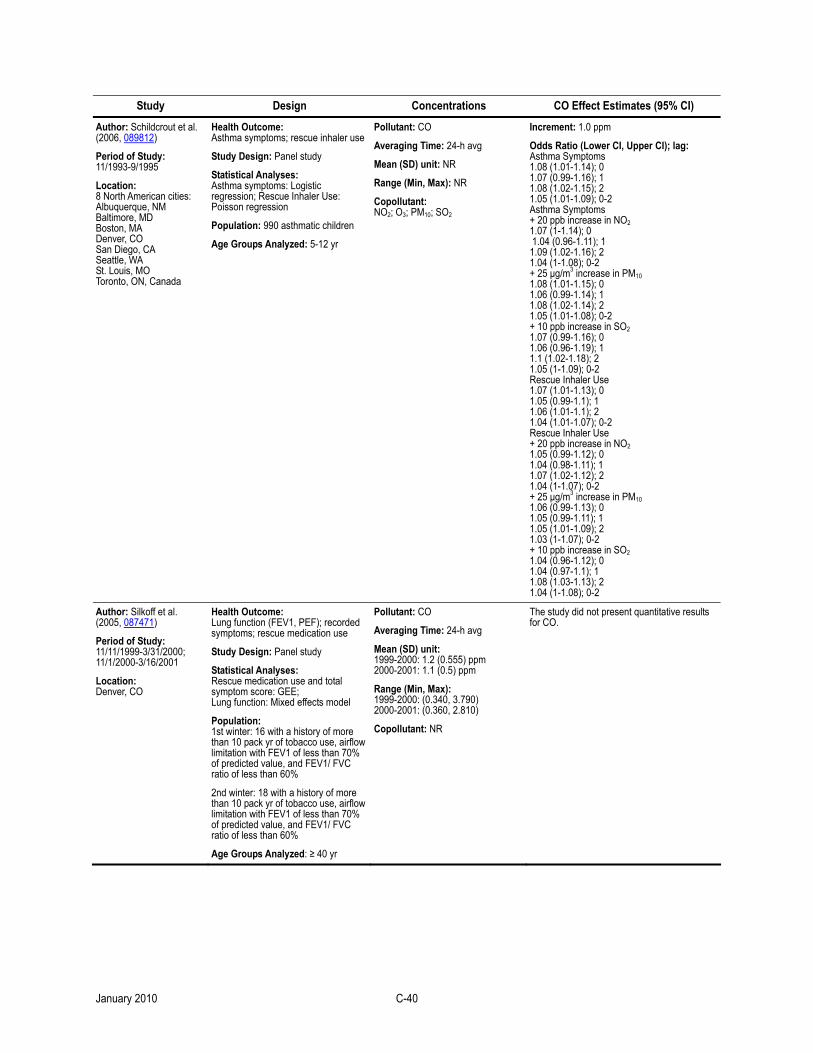
Study Design Concentrations CO Effect Estimates (95% CI)
Author: Schildcrout et al. (2006, 089812)
Period of Study: 11/1993-9/1995
Location: 8 North American cities: Albuquerque, NM Baltimore, MD Boston, MA Denver, CO San Diego, CA Seattle, WA St. Louis, MO Toronto, ON, Canada
Health Outcome: Asthma symptoms; rescue inhaler use
Study Design: Panel study
Statistical Analyses: Asthma symptoms: Logistic regression; Rescue Inhaler Use: Poisson regression
Population: 990 asthmatic children
Age Groups Analyzed: 5-12 yr
Pollutant: CO
Averaging Time: 24-h avg
Mean (SD) unit: NR
Range (Min, Max): NR
Copollutant: NO2; O3; PM10; SO2
Increment: 1.0 ppm
Odds Ratio (Lower CI, Upper CI); lag: Asthma Symptoms 1.08 (1.01-1.14); 0 1.07 (0.99-1.16); 1 1.08 (1.02-1.15); 2 1.05 (1.01-1.09); 0-2 Asthma Symptoms + 20 ppb increase in NO2 1.07 (1-1.14); 0 1.04 (0.96-1.11); 1 1.09 (1.02-1.16); 2 1.04 (1-1.08); 0-2 + 25 µg/m3 increase in PM10 1.08 (1.01-1.15); 0 1.06 (0.99-1.14); 1 1.08 (1.02-1.14); 2 1.05 (1.01-1.08); 0-2 + 10 ppb increase in SO2 1.07 (0.99-1.16); 0 1.06 (0.96-1.19); 1 1.1 (1.02-1.18); 2 1.05 (1-1.09); 0-2 Rescue Inhaler Use 1.07 (1.01-1.13); 0 1.05 (0.99-1.1); 1 1.06 (1.01-1.1); 2 1.04 (1.01-1.07); 0-2 Rescue Inhaler Use + 20 ppb increase in NO2 1.05 (0.99-1.12); 0 1.04 (0.98-1.11); 1 1.07 (1.02-1.12); 2 1.04 (1-1.07); 0-2 + 25 µg/m3 increase in PM10 1.06 (0.99-1.13); 0 1.05 (0.99-1.11); 1 1.05 (1.01-1.09); 2 1.03 (1-1.07); 0-2 + 10 ppb increase in SO2 1.04 (0.96-1.12); 0 1.04 (0.97-1.1); 1 1.08 (1.03-1.13); 2 1.04 (1-1.08); 0-2
Author: Silkoff et al. (2005, 087471)
Period of Study: 11/11/1999-3/31/2000; 11/1/2000-3/16/2001
Location: Denver, CO
Health Outcome: Lung function (FEV1, PEF); recorded symptoms; rescue medication use
Study Design: Panel study
Statistical Analyses: Rescue medication use and total symptom score: GEE; Lung function: Mixed effects model
Population: 1st winter: 16 with a history of more than 10 pack yr of tobacco use, airflow limitation with FEV1 of less than 70% of predicted value, and FEV1/ FVC ratio of less than 60%
2nd winter: 18 with a history of more than 10 pack yr of tobacco use, airflow limitation with FEV1 of less than 70% of predicted value, and FEV1/ FVC ratio of less than 60%
Age Groups Analyzed: ≥ 40 yr
Pollutant: CO
Averaging Time: 24-h avg
Mean (SD) unit: 1999-2000: 1.2 (0.555) ppm 2000-2001: 1.1 (0.5) ppm
Range (Min, Max): 1999-2000: (0.340, 3.790) 2000-2001: (0.360, 2.810)
Copollutant: NR
The study did not present quantitative results for CO.
January 2010 C-40
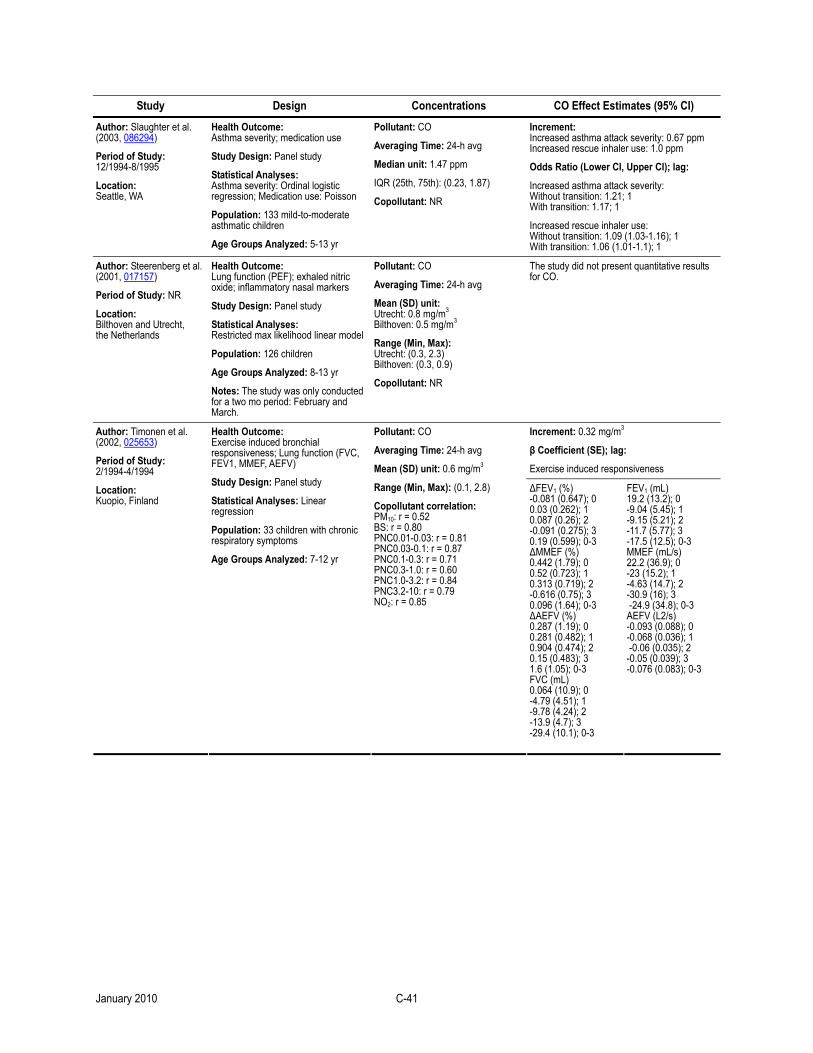
Study Design Concentrations CO Effect Estimates (95% CI)
Author: Slaughter et al. (2003, 086294)
Period of Study: 12/1994-8/1995
Location: Seattle, WA
Health Outcome: Asthma severity; medication use
Study Design: Panel study
Statistical Analyses: Asthma severity: Ordinal logistic regression; Medication use: Poisson
Population: 133 mild-to-moderate asthmatic children
Age Groups Analyzed: 5-13 yr
Pollutant: CO
Averaging Time: 24-h avg
Median unit: 1.47 ppm
IQR (25th, 75th): (0.23, 1.87)
Copollutant: NR
Increment: Increased asthma attack severity: 0.67 ppm Increased rescue inhaler use: 1.0 ppm
Odds Ratio (Lower CI, Upper CI); lag:
Increased asthma attack severity: Without transition: 1.21; 1 With transition: 1.17; 1
Increased rescue inhaler use: Without transition: 1.09 (1.03-1.16); 1 With transition: 1.06 (1.01-1.1); 1
Author: Steerenberg et al. (2001, 017157)
Period of Study: NR
Location: Bilthoven and Utrecht, the Netherlands
Health Outcome: Lung function (PEF); exhaled nitric oxide; inflammatory nasal markers
Study Design: Panel study
Statistical Analyses: Restricted max likelihood linear model
Population: 126 children
Age Groups Analyzed: 8-13 yr
Notes: The study was only conducted for a two mo period: February and March.
Pollutant: CO
Averaging Time: 24-h avg
Mean (SD) unit: Utrecht: 0.8 mg/m3 Bilthoven: 0.5 mg/m3
Range (Min, Max): Utrecht: (0.3, 2.3) Bilthoven: (0.3, 0.9)
Copollutant: NR
The study did not present quantitative results for CO.
Increment: 0.32 mg/m3
β Coefficient (SE); lag:
Exercise induced responsiveness
Author: Timonen et al. (2002, 025653)
Period of Study: 2/1994-4/1994
Location: Kuopio, Finland
Health Outcome: Exercise induced bronchial responsiveness; Lung function (FVC, FEV1, MMEF, AEFV)
Study Design: Panel study
Statistical Analyses: Linear regression
Population: 33 children with chronic respiratory symptoms
Age Groups Analyzed: 7-12 yr
Pollutant: CO
Averaging Time: 24-h avg
Mean (SD) unit: 0.6 mg/m3
Range (Min, Max): (0.1, 2.8)
Copollutant correlation: PM10: r = 0.52 BS: r = 0.80 PNC0.01-0.03: r = 0.81 PNC0.03-0.1: r = 0.87 PNC0.1-0.3: r = 0.71 PNC0.3-1.0: r = 0.60 PNC1.0-3.2: r = 0.84 PNC3.2-10: r = 0.79 NO2: r = 0.85
ΔFEV1 (%) -0.081 (0.647); 0 0.03 (0.262); 1 0.087 (0.26); 2 -0.091 (0.275); 3 0.19 (0.599); 0-3 ΔMMEF (%) 0.442 (1.79); 0 0.52 (0.723); 1 0.313 (0.719); 2 -0.616 (0.75); 3 0.096 (1.64); 0-3 ΔAEFV (%) 0.287 (1.19); 0 0.281 (0.482); 1 0.904 (0.474); 2 0.15 (0.483); 3 1.6 (1.05); 0-3 FVC (mL) 0.064 (10.9); 0 -4.79 (4.51); 1 -9.78 (4.24); 2 -13.9 (4.7); 3 -29.4 (10.1); 0-3
FEV1 (mL) 19.2 (13.2); 0 -9.04 (5.45); 1 -9.15 (5.21); 2 -11.7 (5.77); 3 -17.5 (12.5); 0-3 MMEF (mL/s) 22.2 (36.9); 0 -23 (15.2); 1 -4.63 (14.7); 2 -30.9 (16); 3 -24.9 (34.8); 0-3 AEFV (L2/s) -0.093 (0.088); 0 -0.068 (0.036); 1 -0.06 (0.035); 2 -0.05 (0.039); 3 -0.076 (0.083); 0-3
January 2010 C-41
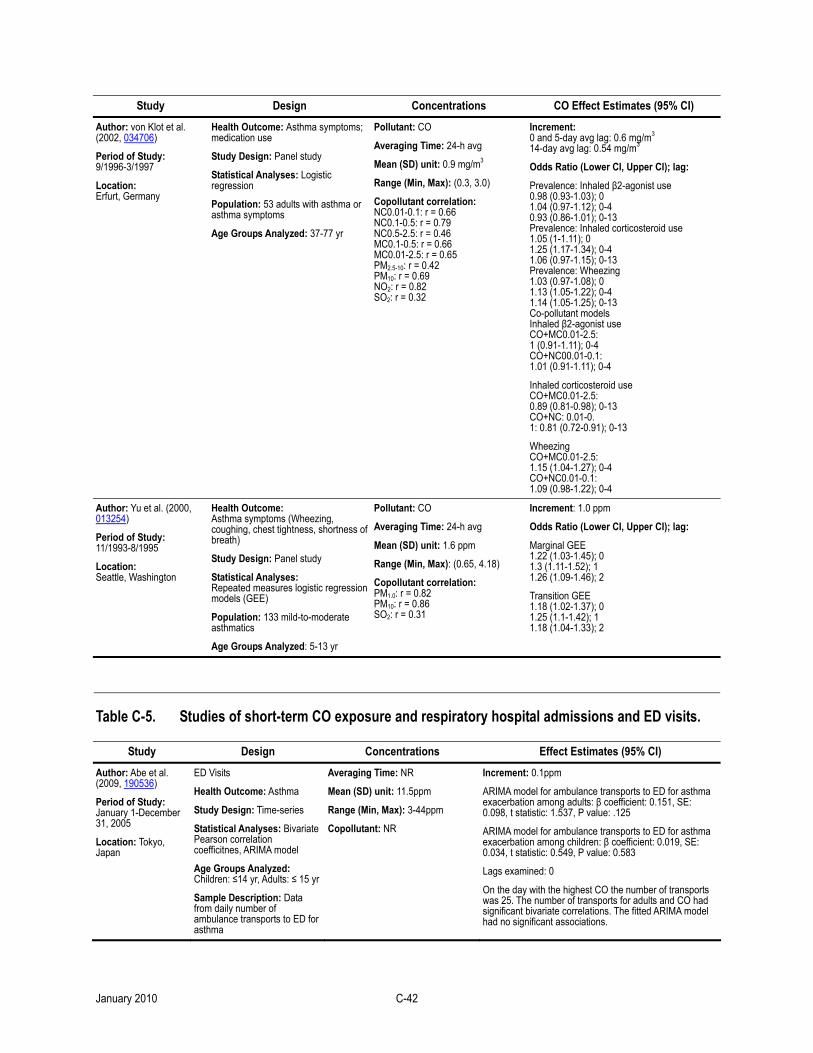
Study Design Concentrations CO Effect Estimates (95% CI)
Author: von Klot et al. (2002, 034706)
Period of Study: 9/1996-3/1997
Location: Erfurt, Germany
Health Outcome: Asthma symptoms; medication use
Study Design: Panel study
Statistical Analyses: Logistic regression
Population: 53 adults with asthma or asthma symptoms
Age Groups Analyzed: 37-77 yr
Pollutant: CO
Averaging Time: 24-h avg
Mean (SD) unit: 0.9 mg/m3
Range (Min, Max): (0.3, 3.0)
Copollutant correlation: NC0.01-0.1: r = 0.66 NC0.1-0.5: r = 0.79 NC0.5-2.5: r = 0.46 MC0.1-0.5: r = 0.66 MC0.01-2.5: r = 0.65 PM2.5-10: r = 0.42 PM10: r = 0.69 NO2: r = 0.82 SO2: r = 0.32
Increment: 0 and 5-day avg lag: 0.6 mg/m3 14-day avg lag: 0.54 mg/m3
Odds Ratio (Lower CI, Upper CI); lag:
Prevalence: Inhaled β2-agonist use 0.98 (0.93-1.03); 0 1.04 (0.97-1.12); 0-4 0.93 (0.86-1.01); 0-13 Prevalence: Inhaled corticosteroid use 1.05 (1-1.11); 0 1.25 (1.17-1.34); 0-4 1.06 (0.97-1.15); 0-13 Prevalence: Wheezing 1.03 (0.97-1.08); 0 1.13 (1.05-1.22); 0-4 1.14 (1.05-1.25); 0-13 Co-pollutant models Inhaled β2-agonist use CO+MC0.01-2.5: 1 (0.91-1.11); 0-4 CO+NC00.01-0.1: 1.01 (0.91-1.11); 0-4
Inhaled corticosteroid use CO+MC0.01-2.5: 0.89 (0.81-0.98); 0-13 CO+NC: 0.01-0. 1: 0.81 (0.72-0.91); 0-13
Wheezing CO+MC0.01-2.5: 1.15 (1.04-1.27); 0-4 CO+NC0.01-0.1: 1.09 (0.98-1.22); 0-4
Author: Yu et al. (2000, 013254)
Period of Study: 11/1993-8/1995
Location: Seattle, Washington
Health Outcome: Asthma symptoms (Wheezing, coughing, chest tightness, shortness of breath)
Study Design: Panel study
Statistical Analyses: Repeated measures logistic regression models (GEE)
Population: 133 mild-to-moderate asthmatics
Age Groups Analyzed: 5-13 yr
Pollutant: CO
Averaging Time: 24-h avg
Mean (SD) unit: 1.6 ppm
Range (Min, Max): (0.65, 4.18)
Copollutant correlation: PM1.0: r = 0.82 PM10: r = 0.86 SO2: r = 0.31
Increment: 1.0 ppm
Odds Ratio (Lower CI, Upper CI); lag:
Marginal GEE 1.22 (1.03-1.45); 0 1.3 (1.11-1.52); 1 1.26 (1.09-1.46); 2
Transition GEE 1.18 (1.02-1.37); 0 1.25 (1.1-1.42); 1 1.18 (1.04-1.33); 2
Table C-5. Studies of short-term CO exposure and respiratory hospital admissions and ED visits.
Study Design Concentrations Effect Estimates (95% CI)
Author: Abe et al. (2009, 190536)
Period of Study: January 1-December 31, 2005
Location: Tokyo, Japan
ED Visits
Health Outcome: Asthma
Study Design: Time-series
Statistical Analyses: Bivariate Pearson correlation coefficitnes, ARIMA model
Age Groups Analyzed: Children: ≤14 yr, Adults: ≤ 15 yr
Sample Description: Data from daily number of ambulance transports to ED for asthma
Averaging Time: NR
Mean (SD) unit: 11.5ppm
Range (Min, Max): 3-44ppm
Copollutant: NR
Increment: 0.1ppm
ARIMA model for ambulance transports to ED for asthma exacerbation among adults: β coefficient: 0.151, SE: 0.098, t statistic: 1.537, P value: .125
ARIMA model for ambulance transports to ED for asthma exacerbation among children: β coefficient: 0.019, SE: 0.034, t statistic: 0.549, P value: 0.583
Lags examined: 0
On the day with the highest CO the number of transports was 25. The number of transports for adults and CO had significant bivariate correlations. The fitted ARIMA model had no significant associations.
January 2010 C-42
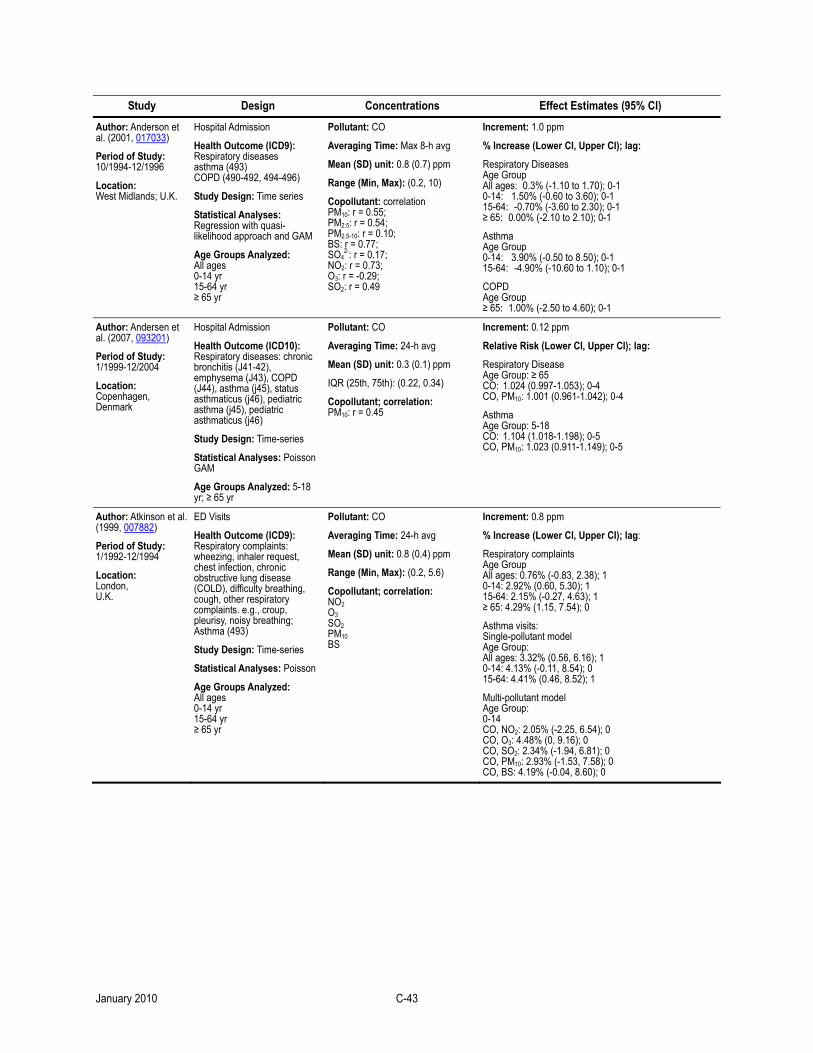
Study Design Concentrations Effect Estimates (95% CI)
Author: Anderson et al. (2001, 017033)
Period of Study: 10/1994-12/1996
Location: West Midlands; U.K.
Hospital Admission
Health Outcome (ICD9): Respiratory diseases asthma (493) COPD (490-492, 494-496)
Study Design: Time series
Statistical Analyses: Regression with quasi-likelihood approach and GAM
Age Groups Analyzed: All ages 0-14 yr 15-64 yr ≥ 65 yr
Pollutant: CO
Averaging Time: Max 8-h avg
Mean (SD) unit: 0.8 (0.7) ppm
Range (Min, Max): (0.2, 10)
Copollutant: correlation PM10: r = 0.55; PM2.5: r = 0.54; PM2.5-10: r = 0.10; BS: r = 0.77; SO4
2-: r = 0.17; NO2: r = 0.73; O3: r = -0.29; SO2: r = 0.49
Increment: 1.0 ppm
% Increase (Lower CI, Upper CI); lag:
Respiratory Diseases Age Group All ages: 0.3% (-1.10 to 1.70); 0-1 0-14: 1.50% (-0.60 to 3.60); 0-1 15-64: -0.70% (-3.60 to 2.30); 0-1 ≥ 65: 0.00% (-2.10 to 2.10); 0-1
Asthma Age Group 0-14: 3.90% (-0.50 to 8.50); 0-1 15-64: -4.90% (-10.60 to 1.10); 0-1
COPD Age Group ≥ 65: 1.00% (-2.50 to 4.60); 0-1
Author: Andersen et al. (2007, 093201)
Period of Study: 1/1999-12/2004
Location: Copenhagen, Denmark
Hospital Admission
Health Outcome (ICD10): Respiratory diseases: chronic bronchitis (J41-42), emphysema (J43), COPD (J44), asthma (j45), status asthmaticus (j46), pediatric asthma (j45), pediatric asthmaticus (j46)
Study Design: Time-series
Statistical Analyses: Poisson GAM
Age Groups Analyzed: 5-18 yr; ≥ 65 yr
Pollutant: CO
Averaging Time: 24-h avg
Mean (SD) unit: 0.3 (0.1) ppm
IQR (25th, 75th): (0.22, 0.34)
Copollutant; correlation: PM10: r = 0.45
Increment: 0.12 ppm
Relative Risk (Lower CI, Upper CI); lag:
Respiratory Disease Age Group: ≥ 65 CO: 1.024 (0.997-1.053); 0-4 CO, PM10: 1.001 (0.961-1.042); 0-4
Asthma Age Group: 5-18 CO: 1.104 (1.018-1.198); 0-5 CO, PM10: 1.023 (0.911-1.149); 0-5
Author: Atkinson et al. (1999, 007882)
Period of Study: 1/1992-12/1994
Location: London, U.K.
ED Visits
Health Outcome (ICD9): Respiratory complaints: wheezing, inhaler request, chest infection, chronic obstructive lung disease (COLD), difficulty breathing, cough, other respiratory complaints. e.g., croup, pleurisy, noisy breathing; Asthma (493)
Study Design: Time-series
Statistical Analyses: Poisson
Age Groups Analyzed: All ages 0-14 yr 15-64 yr ≥ 65 yr
Pollutant: CO
Averaging Time: 24-h avg
Mean (SD) unit: 0.8 (0.4) ppm
Range (Min, Max): (0.2, 5.6)
Copollutant; correlation: NO2 O3 SO2 PM10 BS
Increment: 0.8 ppm
% Increase (Lower CI, Upper CI); lag:
Respiratory complaints Age Group All ages: 0.76% (-0.83, 2.38); 1 0-14: 2.92% (0.60, 5.30); 1 15-64: 2.15% (-0.27, 4.63); 1 ≥ 65: 4.29% (1.15, 7.54); 0
Asthma visits: Single-pollutant model Age Group: All ages: 3.32% (0.56, 6.16); 1 0-14: 4.13% (-0.11, 8.54); 0 15-64: 4.41% (0.46, 8.52); 1
Multi-pollutant model Age Group: 0-14 CO, NO2: 2.05% (-2.25, 6.54); 0 CO, O3: 4.48% (0, 9.16); 0 CO, SO2: 2.34% (-1.94, 6.81); 0 CO, PM10: 2.93% (-1.53, 7.58); 0 CO, BS: 4.19% (-0.04, 8.60); 0
January 2010 C-43
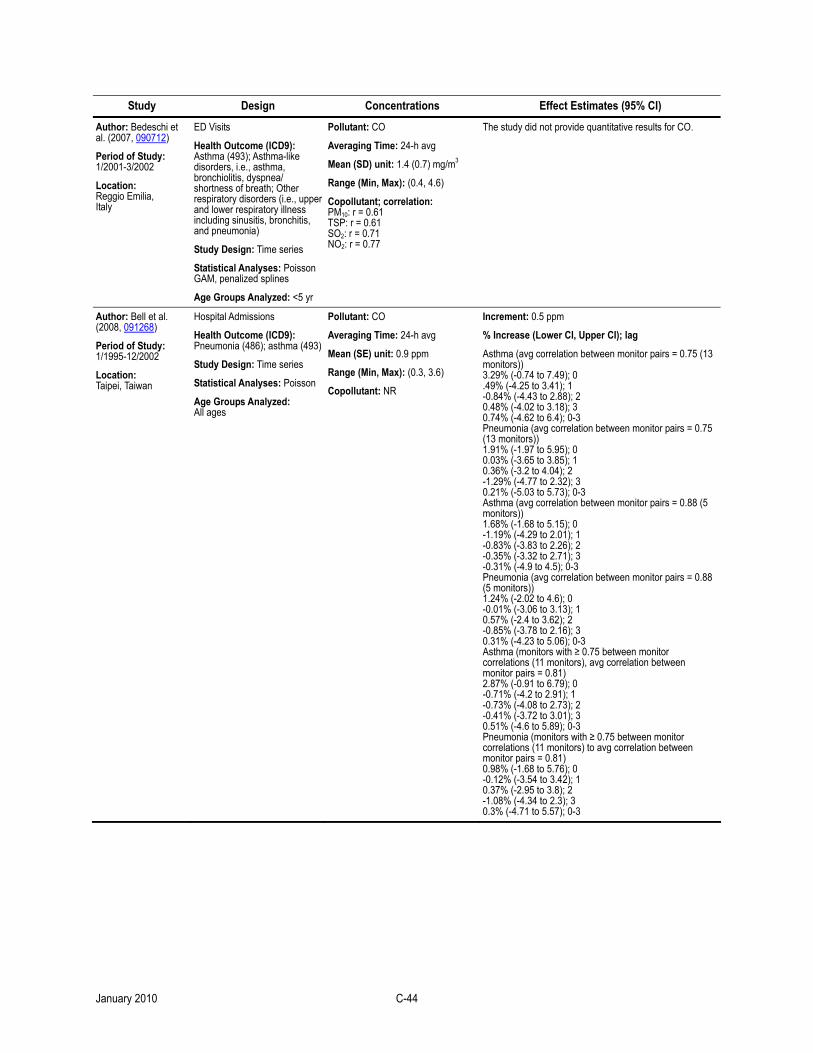
Study Design Concentrations Effect Estimates (95% CI)
Author: Bedeschi et al. (2007, 090712)
Period of Study: 1/2001-3/2002
Location: Reggio Emilia, Italy
ED Visits
Health Outcome (ICD9): Asthma (493); Asthma-like disorders, i.e., asthma, bronchiolitis, dyspnea/ shortness of breath; Other respiratory disorders (i.e., upper and lower respiratory illness including sinusitis, bronchitis, and pneumonia)
Study Design: Time series
Statistical Analyses: Poisson GAM, penalized splines
Age Groups Analyzed: <5 yr
Pollutant: CO
Averaging Time: 24-h avg
Mean (SD) unit: 1.4 (0.7) mg/m3
Range (Min, Max): (0.4, 4.6)
Copollutant; correlation: PM10: r = 0.61 TSP: r = 0.61 SO2: r = 0.71 NO2: r = 0.77
The study did not provide quantitative results for CO.
Author: Bell et al. (2008, 091268)
Period of Study: 1/1995-12/2002
Location: Taipei, Taiwan
Hospital Admissions
Health Outcome (ICD9): Pneumonia (486); asthma (493)
Study Design: Time series
Statistical Analyses: Poisson
Age Groups Analyzed: All ages
Pollutant: CO
Averaging Time: 24-h avg
Mean (SE) unit: 0.9 ppm
Range (Min, Max): (0.3, 3.6)
Copollutant: NR
Increment: 0.5 ppm
% Increase (Lower CI, Upper CI); lag
Asthma (avg correlation between monitor pairs = 0.75 (13 monitors)) 3.29% (-0.74 to 7.49); 0 .49% (-4.25 to 3.41); 1 -0.84% (-4.43 to 2.88); 2 0.48% (-4.02 to 3.18); 3 0.74% (-4.62 to 6.4); 0-3 Pneumonia (avg correlation between monitor pairs = 0.75 (13 monitors)) 1.91% (-1.97 to 5.95); 0 0.03% (-3.65 to 3.85); 1 0.36% (-3.2 to 4.04); 2 -1.29% (-4.77 to 2.32); 3 0.21% (-5.03 to 5.73); 0-3 Asthma (avg correlation between monitor pairs = 0.88 (5 monitors)) 1.68% (-1.68 to 5.15); 0 -1.19% (-4.29 to 2.01); 1 -0.83% (-3.83 to 2.26); 2 -0.35% (-3.32 to 2.71); 3 -0.31% (-4.9 to 4.5); 0-3 Pneumonia (avg correlation between monitor pairs = 0.88 (5 monitors)) 1.24% (-2.02 to 4.6); 0 -0.01% (-3.06 to 3.13); 1 0.57% (-2.4 to 3.62); 2 -0.85% (-3.78 to 2.16); 3 0.31% (-4.23 to 5.06); 0-3 Asthma (monitors with ≥ 0.75 between monitor correlations (11 monitors), avg correlation between monitor pairs = 0.81) 2.87% (-0.91 to 6.79); 0 -0.71% (-4.2 to 2.91); 1 -0.73% (-4.08 to 2.73); 2 -0.41% (-3.72 to 3.01); 3 0.51% (-4.6 to 5.89); 0-3 Pneumonia (monitors with ≥ 0.75 between monitor correlations (11 monitors) to avg correlation between monitor pairs = 0.81) 0.98% (-1.68 to 5.76); 0 -0.12% (-3.54 to 3.42); 1 0.37% (-2.95 to 3.8); 2 -1.08% (-4.34 to 2.3); 3 0.3% (-4.71 to 5.57); 0-3
January 2010 C-44
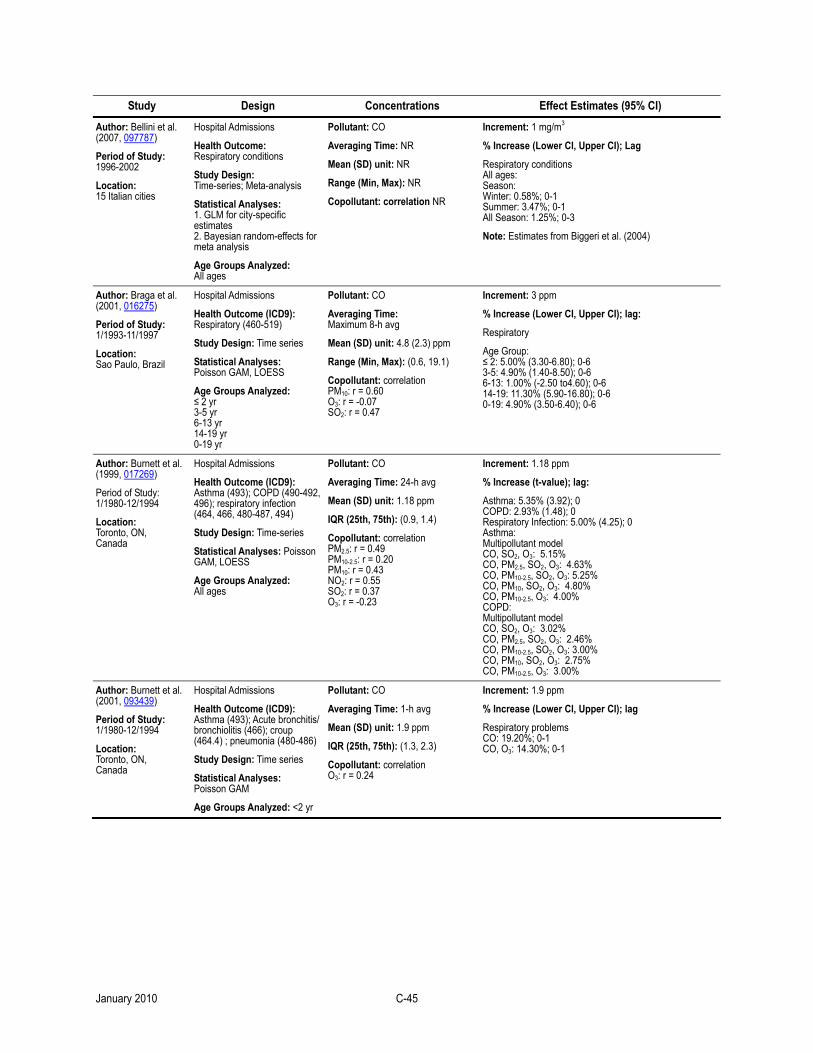
Study Design Concentrations Effect Estimates (95% CI)
Author: Bellini et al. (2007, 097787)
Period of Study: 1996-2002
Location: 15 Italian cities
Hospital Admissions
Health Outcome: Respiratory conditions
Study Design: Time-series; Meta-analysis
Statistical Analyses: 1. GLM for city-specific estimates 2. Bayesian random-effects for meta analysis
Age Groups Analyzed: All ages
Pollutant: CO
Averaging Time: NR
Mean (SD) unit: NR
Range (Min, Max): NR
Copollutant: correlation NR
Increment: 1 mg/m3
% Increase (Lower CI, Upper CI); Lag
Respiratory conditions All ages: Season: Winter: 0.58%; 0-1 Summer: 3.47%; 0-1 All Season: 1.25%; 0-3
Note: Estimates from Biggeri et al. (2004)
Author: Braga et al. (2001, 016275)
Period of Study: 1/1993-11/1997
Location: Sao Paulo, Brazil
Hospital Admissions
Health Outcome (ICD9): Respiratory (460-519)
Study Design: Time series
Statistical Analyses: Poisson GAM, LOESS
Age Groups Analyzed: ≤ 2 yr 3-5 yr 6-13 yr 14-19 yr 0-19 yr
Pollutant: CO
Averaging Time: Maximum 8-h avg
Mean (SD) unit: 4.8 (2.3) ppm
Range (Min, Max): (0.6, 19.1)
Copollutant: correlation PM10: r = 0.60 O3: r = -0.07 SO2: r = 0.47
Increment: 3 ppm
% Increase (Lower CI, Upper CI); lag:
Respiratory
Age Group: ≤ 2: 5.00% (3.30-6.80); 0-6 3-5: 4.90% (1.40-8.50); 0-6 6-13: 1.00% (-2.50 to4.60); 0-6 14-19: 11.30% (5.90-16.80); 0-6 0-19: 4.90% (3.50-6.40); 0-6
Author: Burnett et al. (1999, 017269)
Period of Study: 1/1980-12/1994
Location: Toronto, ON, Canada
Hospital Admissions
Health Outcome (ICD9): Asthma (493); COPD (490-492, 496); respiratory infection (464, 466, 480-487, 494)
Study Design: Time-series
Statistical Analyses: Poisson GAM, LOESS
Age Groups Analyzed: All ages
Pollutant: CO
Averaging Time: 24-h avg
Mean (SD) unit: 1.18 ppm
IQR (25th, 75th): (0.9, 1.4)
Copollutant: correlation PM2.5: r = 0.49 PM10-2.5: r = 0.20 PM10: r = 0.43 NO2: r = 0.55 SO2: r = 0.37 O3: r = -0.23
Increment: 1.18 ppm
% Increase (t-value); lag:
Asthma: 5.35% (3.92); 0 COPD: 2.93% (1.48); 0 Respiratory Infection: 5.00% (4.25); 0 Asthma: Multipollutant model CO, SO2, O3: 5.15% CO, PM2.5, SO2, O3: 4.63% CO, PM10-2.5, SO2, O3: 5.25% CO, PM10, SO2, O3: 4.80% CO, PM10-2.5, O3: 4.00% COPD: Multipollutant model CO, SO2, O3: 3.02% CO, PM2.5, SO2, O3: 2.46% CO, PM10-2.5, SO2, O3: 3.00% CO, PM10, SO2, O3: 2.75% CO, PM10-2.5, O3: 3.00%
Author: Burnett et al. (2001, 093439)
Period of Study: 1/1980-12/1994
Location: Toronto, ON, Canada
Hospital Admissions
Health Outcome (ICD9): Asthma (493); Acute bronchitis/ bronchiolitis (466); croup (464.4) ; pneumonia (480-486)
Study Design: Time series
Statistical Analyses: Poisson GAM
Age Groups Analyzed: <2 yr
Pollutant: CO
Averaging Time: 1-h avg
Mean (SD) unit: 1.9 ppm
IQR (25th, 75th): (1.3, 2.3)
Copollutant: correlation O3: r = 0.24
Increment: 1.9 ppm
% Increase (Lower CI, Upper CI); lag
Respiratory problems CO: 19.20%; 0-1 CO, O3: 14.30%; 0-1
January 2010 C-45

Study Design Concentrations Effect Estimates (95% CI)
Author: Cakmak et al. (2006, 093272)
Period of Study: 4/1993-3/2000
Location: 10 Canadian cities
Hospital Admissions
Health Outcome (ICD9): Actue bronchitis/bronchiolitis (466); pneumonia (480-486); chronic/ unspecified bronchitis (490, 491); emphysema (492); asthma (493); bronchiectasis (494); chronic airway obstruction (496)
Study Design: Time series
Statistical Analyses: 1. Poisson 2. Restricted Maximum Likelihood Method
Age Groups Analyzed: All ages
Pollutant: CO
Averaging Time: 24-h avg
Mean (SD) unit: 0.8 ppm
Range (Min, Max): (0.0, 6.5)
Copollutant: correlation SO2 NO2 O3
Increment: 0.8 ppm
% Increase (Lower CI, Upper CI); lag:
Respiratory disease
CO: 0.60% (0.20, 1); 2.8 CO, SO2, NO2, O3: -0.20% (-0.70- 0.30); 2.8
Author: Cheng et al. (2007, 093034)
Period of Study: 1996-2004
Location: Kaohsiung, Taiwan
Hospital Admissions
Health Outcome (ICD9): Pneumonia (480-486)
Study Design: Bidirectional case-crossover
Statistical Analyses: Conditional logistic regression
Age Groups Analyzed: All ages
Pollutant: CO
Averaging Time: 24-h avg
Mean (SD) unit: 0.76 ppm
Range (Min, Max): (0.14, 1.72)
Copollutant: correlation PM10 SO2 NO2 O3
Increment: 0.31 ppm
Odds Ratio (Lower CI, Upper CI); lag:
OR for pneumonia and exposure to various pollutants for all ages in areas ≥ 25°C or <25°C
Pollutant and Temperature CO, ≥ 25 ºC: 1.18 (1.14-1.23); 0-2 CO, <25 ºC: 1.47 (1.41-1.53); 0-2
CO, PM10, ≥ 25 ºC: 1.15 (1.11-1.2); 0-2 CO, PM10, <25 ºC: 1.28 (1.21-1.35); 0-2
CO, SO2, ≥ 25 ºC: 1.22 (1.17-1.27); 0-2 CO, SO2, <25 ºC: 1.49 (1.42-1.56); 0-2
CO, NO2, ≥ 25 ºC: 1.2 (1.15-1.27); 0-2 CO, NO2, <25 ºC: 1.01 (0.95-1.08); 0-2
CO, O3, ≥ 25 ºC: 1.16 (1.12-1.2); 0-2 CO, O3, <25 ºC: 1.44 (1.38-1.5); 0-2
Author: Chiu et al. (2009, 190249)
Period of Study: 1996-2004
Location: Taipei, Taiwan
Hospital Admissions
Health Outcome: pneumonia HA
Study Design: case-crossover
Statistical Analyses: Conditional Logistic regression
Age Groups Analyzed: All ages
Sample Description: 152,594 HA for 47 hospitals in Taipei city
Averaging Time: 24h
Mean (SD) unit: 1.26 ppm
Range (min, max): 0.12, 3.66
Copollutant: correlation PM10: r = 0.34 SO2: r = 0.57 NO2: r = 0.69 O3: r = -0.31
Increment: 0.57 ppm (IQR)
OR Estimate [Lower CI, Upper CI] ; lag:
Lags examined: one wk before to one wk after
CO: ≥23°C: 1.25 (1.21, 1.29) <23°C: 1.12 (1.09, 1.15)
CO + PM10: ≥23°C: 1.23 (1.19, 1.27) <23°C: 1.05 (1.02, 1.09)
CO + SO2: ≥23°C: 1.25 (1.21, 1.30) <23°C: 1.27 (1.22,1.31)
CO + NO2: ≥23°C: 0.97 (0.93, 1.02) <23°C: 1.14 (1.09, 1.20)
CO + O3: ≥23°C: 1.24 (1.20, 1.28) <23°C: 1.21 (1.17, 1.24)
January 2010 C-46
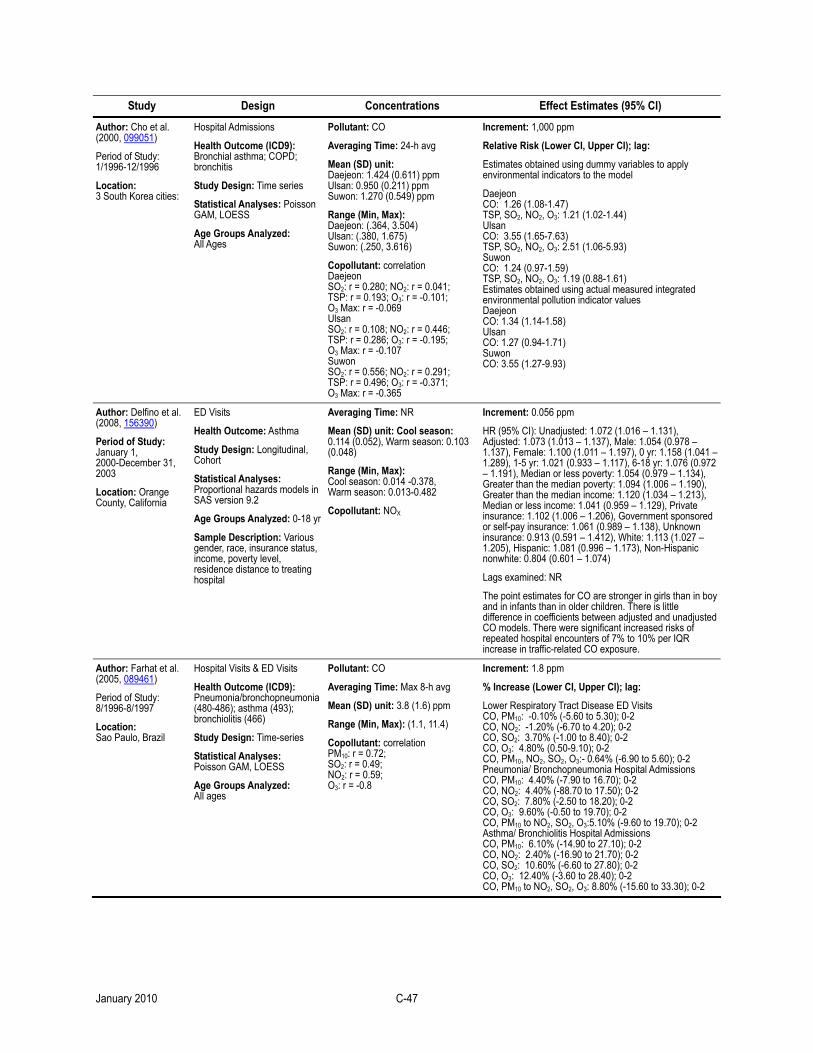
Study Design Concentrations Effect Estimates (95% CI)
Author: Cho et al. (2000, 099051)
Period of Study: 1/1996-12/1996
Location: 3 South Korea cities:
Hospital Admissions
Health Outcome (ICD9): Bronchial asthma; COPD; bronchitis
Study Design: Time series
Statistical Analyses: Poisson GAM, LOESS
Age Groups Analyzed: All Ages
Pollutant: CO
Averaging Time: 24-h avg
Mean (SD) unit: Daejeon: 1.424 (0.611) ppm Ulsan: 0.950 (0.211) ppm Suwon: 1.270 (0.549) ppm
Range (Min, Max): Daejeon: (.364, 3.504) Ulsan: (.380, 1.675) Suwon: (.250, 3.616)
Copollutant: correlation Daejeon SO2: r = 0.280; NO2: r = 0.041; TSP: r = 0.193; O3: r = -0.101; O3 Max: r = -0.069 Ulsan SO2: r = 0.108; NO2: r = 0.446; TSP: r = 0.286; O3: r = -0.195; O3 Max: r = -0.107 Suwon SO2: r = 0.556; NO2: r = 0.291; TSP: r = 0.496; O3: r = -0.371; O3 Max: r = -0.365
Increment: 1,000 ppm
Relative Risk (Lower CI, Upper CI); lag:
Estimates obtained using dummy variables to apply environmental indicators to the model
Daejeon CO: 1.26 (1.08-1.47) TSP, SO2, NO2, O3: 1.21 (1.02-1.44) Ulsan CO: 3.55 (1.65-7.63) TSP, SO2, NO2, O3: 2.51 (1.06-5.93) Suwon CO: 1.24 (0.97-1.59) TSP, SO2, NO2, O3: 1.19 (0.88-1.61) Estimates obtained using actual measured integrated environmental pollution indicator values Daejeon CO: 1.34 (1.14-1.58) Ulsan CO: 1.27 (0.94-1.71) Suwon CO: 3.55 (1.27-9.93)
Author: Delfino et al. (2008, 156390)
Period of Study: January 1, 2000-December 31, 2003
Location: Orange County, California
ED Visits
Health Outcome: Asthma
Study Design: Longitudinal, Cohort
Statistical Analyses: Proportional hazards models in SAS version 9.2
Age Groups Analyzed: 0-18 yr
Sample Description: Various gender, race, insurance status, income, poverty level, residence distance to treating hospital
Averaging Time: NR
Mean (SD) unit: Cool season: 0.114 (0.052), Warm season: 0.103 (0.048)
Range (Min, Max): Cool season: 0.014 -0.378, Warm season: 0.013-0.482
Copollutant: NOX
Increment: 0.056 ppm
HR (95% CI): Unadjusted: 1.072 (1.016 – 1.131), Adjusted: 1.073 (1.013 – 1.137), Male: 1.054 (0.978 – 1.137), Female: 1.100 (1.011 – 1.197), 0 yr: 1.158 (1.041 – 1.289), 1-5 yr: 1.021 (0.933 – 1.117), 6-18 yr: 1.076 (0.972 – 1.191), Median or less poverty: 1.054 (0.979 – 1.134), Greater than the median poverty: 1.094 (1.006 – 1.190), Greater than the median income: 1.120 (1.034 – 1.213), Median or less income: 1.041 (0.959 – 1.129), Private insurance: 1.102 (1.006 – 1.206), Government sponsored or self-pay insurance: 1.061 (0.989 – 1.138), Unknown insurance: 0.913 (0.591 – 1.412), White: 1.113 (1.027 – 1.205), Hispanic: 1.081 (0.996 – 1.173), Non-Hispanic nonwhite: 0.804 (0.601 – 1.074)
Lags examined: NR
The point estimates for CO are stronger in girls than in boy and in infants than in older children. There is little difference in coefficients between adjusted and unadjusted CO models. There were significant increased risks of repeated hospital encounters of 7% to 10% per IQR increase in traffic-related CO exposure.
Author: Farhat et al. (2005, 089461)
Period of Study: 8/1996-8/1997
Location: Sao Paulo, Brazil
Hospital Visits & ED Visits
Health Outcome (ICD9): Pneumonia/bronchopneumonia (480-486); asthma (493); bronchiolitis (466)
Study Design: Time-series
Statistical Analyses: Poisson GAM, LOESS
Age Groups Analyzed: All ages
Pollutant: CO
Averaging Time: Max 8-h avg
Mean (SD) unit: 3.8 (1.6) ppm
Range (Min, Max): (1.1, 11.4)
Copollutant: correlation PM10: r = 0.72; SO2: r = 0.49; NO2: r = 0.59; O3: r = -0.8
Increment: 1.8 ppm
% Increase (Lower CI, Upper CI); lag:
Lower Respiratory Tract Disease ED Visits CO, PM10: -0.10% (-5.60 to 5.30); 0-2 CO, NO2: -1.20% (-6.70 to 4.20); 0-2 CO, SO2: 3.70% (-1.00 to 8.40); 0-2 CO, O3: 4.80% (0.50-9.10); 0-2 CO, PM10, NO2, SO2, O3:- 0.64% (-6.90 to 5.60); 0-2 Pneumonia/ Bronchopneumonia Hospital Admissions CO, PM10: 4.40% (-7.90 to 16.70); 0-2 CO, NO2: 4.40% (-88.70 to 17.50); 0-2 CO, SO2: 7.80% (-2.50 to 18.20); 0-2 CO, O3: 9.60% (-0.50 to 19.70); 0-2 CO, PM10 to NO2, SO2, O3:5.10% (-9.60 to 19.70); 0-2 Asthma/ Bronchiolitis Hospital Admissions CO, PM10: 6.10% (-14.90 to 27.10); 0-2 CO, NO2: 2.40% (-16.90 to 21.70); 0-2 CO, SO2: 10.60% (-6.60 to 27.80); 0-2 CO, O3: 12.40% (-3.60 to 28.40); 0-2 CO, PM10 to NO2, SO2, O3: 8.80% (-15.60 to 33.30); 0-2
January 2010 C-47
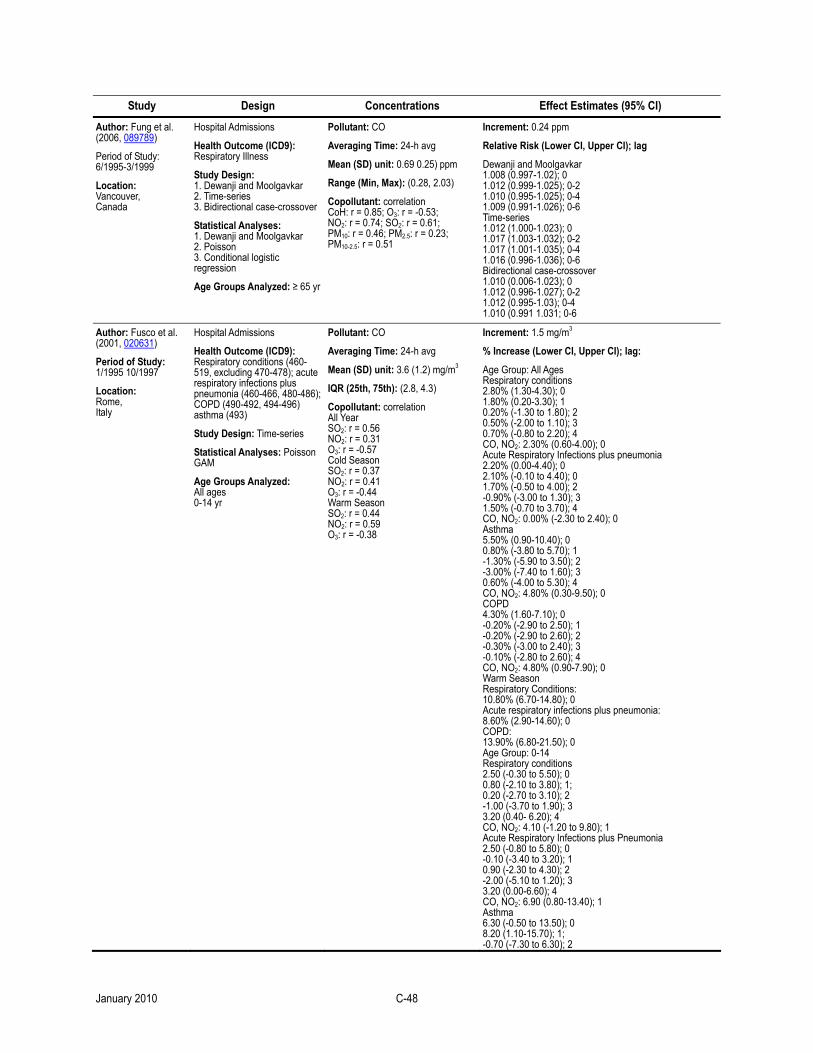
Study Design Concentrations Effect Estimates (95% CI)
Author: Fung et al. (2006, 089789)
Period of Study: 6/1995-3/1999
Location: Vancouver, Canada
Hospital Admissions
Health Outcome (ICD9): Respiratory Illness
Study Design: 1. Dewanji and Moolgavkar 2. Time-series 3. Bidirectional case-crossover
Statistical Analyses: 1. Dewanji and Moolgavkar 2. Poisson 3. Conditional logistic regression
Age Groups Analyzed: ≥ 65 yr
Pollutant: CO
Averaging Time: 24-h avg
Mean (SD) unit: 0.69 0.25) ppm
Range (Min, Max): (0.28, 2.03)
Copollutant: correlation CoH: r = 0.85; O3: r = -0.53; NO2: r = 0.74; SO2: r = 0.61; PM10: r = 0.46; PM2.5: r = 0.23; PM10-2.5: r = 0.51
Increment: 0.24 ppm
Relative Risk (Lower CI, Upper CI); lag
Dewanji and Moolgavkar 1.008 (0.997-1.02); 0 1.012 (0.999-1.025); 0-2 1.010 (0.995-1.025); 0-4 1.009 (0.991-1.026); 0-6 Time-series 1.012 (1.000-1.023); 0 1.017 (1.003-1.032); 0-2 1.017 (1.001-1.035); 0-4 1.016 (0.996-1.036); 0-6 Bidirectional case-crossover 1.010 (0.006-1.023); 0 1.012 (0.996-1.027); 0-2 1.012 (0.995-1.03); 0-4 1.010 (0.991 1.031; 0-6
Author: Fusco et al. (2001, 020631)
Period of Study: 1/1995 10/1997
Location: Rome, Italy
Hospital Admissions
Health Outcome (ICD9): Respiratory conditions (460-519, excluding 470-478); acute respiratory infections plus pneumonia (460-466, 480-486); COPD (490-492, 494-496) asthma (493)
Study Design: Time-series
Statistical Analyses: Poisson GAM
Age Groups Analyzed: All ages 0-14 yr
Pollutant: CO
Averaging Time: 24-h avg
Mean (SD) unit: 3.6 (1.2) mg/m3
IQR (25th, 75th): (2.8, 4.3)
Copollutant: correlation All Year SO2: r = 0.56 NO2: r = 0.31 O3: r = -0.57 Cold Season SO2: r = 0.37 NO2: r = 0.41 O3: r = -0.44 Warm Season SO2: r = 0.44 NO2: r = 0.59 O3: r = -0.38
Increment: 1.5 mg/m3
% Increase (Lower CI, Upper CI); lag:
Age Group: All Ages Respiratory conditions 2.80% (1.30-4.30); 0 1.80% (0.20-3.30); 1 0.20% (-1.30 to 1.80); 2 0.50% (-2.00 to 1.10); 3 0.70% (-0.80 to 2.20); 4 CO, NO2: 2.30% (0.60-4.00); 0 Acute Respiratory Infections plus pneumonia 2.20% (0.00-4.40); 0 2.10% (-0.10 to 4.40); 0 1.70% (-0.50 to 4.00); 2 -0.90% (-3.00 to 1.30); 3 1.50% (-0.70 to 3.70); 4 CO, NO2: 0.00% (-2.30 to 2.40); 0 Asthma 5.50% (0.90-10.40); 0 0.80% (-3.80 to 5.70); 1 -1.30% (-5.90 to 3.50); 2 -3.00% (-7.40 to 1.60); 3 0.60% (-4.00 to 5.30); 4 CO, NO2: 4.80% (0.30-9.50); 0 COPD 4.30% (1.60-7.10); 0 -0.20% (-2.90 to 2.50); 1 -0.20% (-2.90 to 2.60); 2 -0.30% (-3.00 to 2.40); 3 -0.10% (-2.80 to 2.60); 4 CO, NO2: 4.80% (0.90-7.90); 0 Warm Season Respiratory Conditions: 10.80% (6.70-14.80); 0 Acute respiratory infections plus pneumonia: 8.60% (2.90-14.60); 0 COPD: 13.90% (6.80-21.50); 0 Age Group: 0-14 Respiratory conditions 2.50 (-0.30 to 5.50); 0 0.80 (-2.10 to 3.80); 1; 0.20 (-2.70 to 3.10); 2 -1.00 (-3.70 to 1.90); 3 3.20 (0.40- 6.20); 4 CO, NO2: 4.10 (-1.20 to 9.80); 1 Acute Respiratory Infections plus Pneumonia 2.50 (-0.80 to 5.80); 0 -0.10 (-3.40 to 3.20); 1 0.90 (-2.30 to 4.30); 2 -2.00 (-5.10 to 1.20); 3 3.20 (0.00-6.60); 4 CO, NO2: 6.90 (0.80-13.40); 1 Asthma 6.30 (-0.50 to 13.50); 0 8.20 (1.10-15.70); 1; -0.70 (-7.30 to 6.30); 2
January 2010 C-48
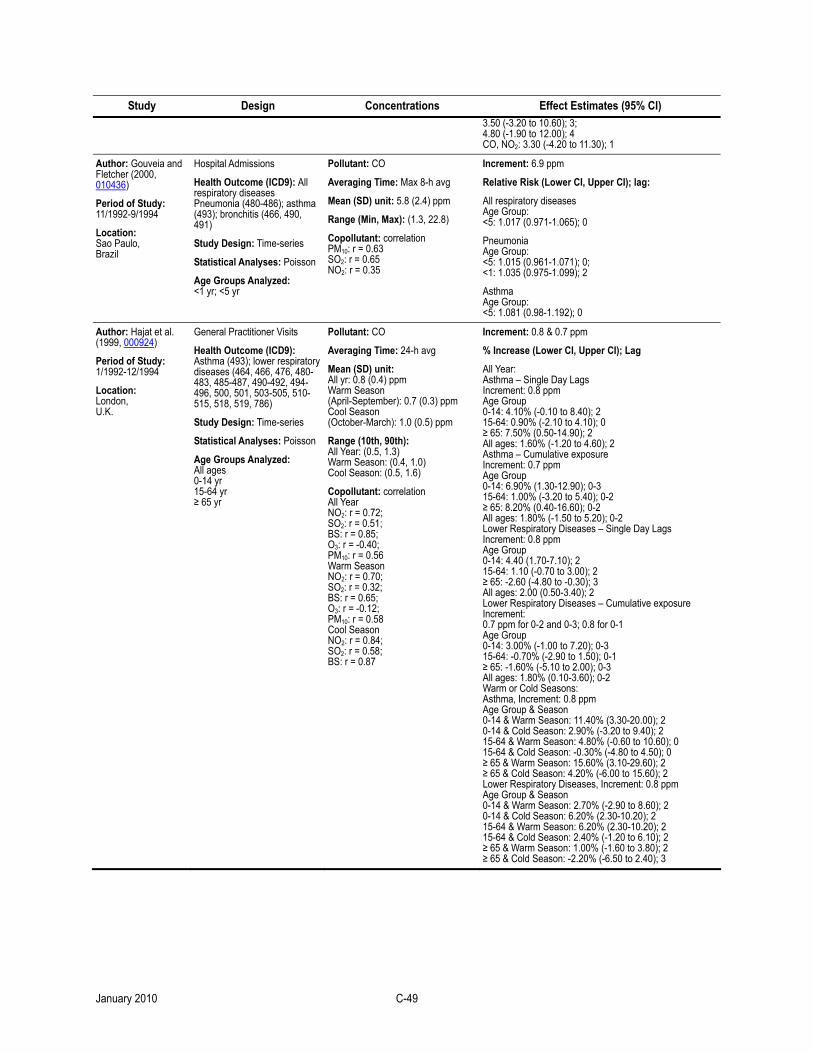
Study Design Concentrations Effect Estimates (95% CI) 3.50 (-3.20 to 10.60); 3; 4.80 (-1.90 to 12.00); 4 CO, NO2: 3.30 (-4.20 to 11.30); 1
Author: Gouveia and Fletcher (2000, 010436)
Period of Study: 11/1992-9/1994
Location: Sao Paulo, Brazil
Hospital Admissions
Health Outcome (ICD9): All respiratory diseases Pneumonia (480-486); asthma (493); bronchitis (466, 490, 491)
Study Design: Time-series
Statistical Analyses: Poisson
Age Groups Analyzed: <1 yr; <5 yr
Pollutant: CO
Averaging Time: Max 8-h avg
Mean (SD) unit: 5.8 (2.4) ppm
Range (Min, Max): (1.3, 22.8)
Copollutant: correlation PM10: r = 0.63 SO2: r = 0.65 NO2: r = 0.35
Increment: 6.9 ppm
Relative Risk (Lower CI, Upper CI); lag:
All respiratory diseases Age Group: <5: 1.017 (0.971-1.065); 0
Pneumonia Age Group: <5: 1.015 (0.961-1.071); 0; <1: 1.035 (0.975-1.099); 2
Asthma Age Group: <5: 1.081 (0.98-1.192); 0
Author: Hajat et al. (1999, 000924)
Period of Study: 1/1992-12/1994
Location: London, U.K.
General Practitioner Visits
Health Outcome (ICD9): Asthma (493); lower respiratory diseases (464, 466, 476, 480-483, 485-487, 490-492, 494-496, 500, 501, 503-505, 510-515, 518, 519, 786)
Study Design: Time-series
Statistical Analyses: Poisson
Age Groups Analyzed: All ages 0-14 yr 15-64 yr ≥ 65 yr
Pollutant: CO
Averaging Time: 24-h avg
Mean (SD) unit: All yr: 0.8 (0.4) ppm Warm Season (April-September): 0.7 (0.3) ppm Cool Season (October-March): 1.0 (0.5) ppm
Range (10th, 90th): All Year: (0.5, 1.3) Warm Season: (0.4, 1.0) Cool Season: (0.5, 1.6)
Copollutant: correlation All Year NO2: r = 0.72; SO2: r = 0.51; BS: r = 0.85; O3: r = -0.40; PM10: r = 0.56 Warm Season NO2: r = 0.70; SO2: r = 0.32; BS: r = 0.65; O3: r = -0.12; PM10: r = 0.58 Cool Season NO2: r = 0.84; SO2: r = 0.58; BS: r = 0.87
Increment: 0.8 & 0.7 ppm
% Increase (Lower CI, Upper CI); Lag
All Year: Asthma – Single Day Lags Increment: 0.8 ppm Age Group 0-14: 4.10% (-0.10 to 8.40); 2 15-64: 0.90% (-2.10 to 4.10); 0 ≥ 65: 7.50% (0.50-14.90); 2 All ages: 1.60% (-1.20 to 4.60); 2 Asthma – Cumulative exposure Increment: 0.7 ppm Age Group 0-14: 6.90% (1.30-12.90); 0-3 15-64: 1.00% (-3.20 to 5.40); 0-2 ≥ 65: 8.20% (0.40-16.60); 0-2 All ages: 1.80% (-1.50 to 5.20); 0-2 Lower Respiratory Diseases – Single Day Lags Increment: 0.8 ppm Age Group 0-14: 4.40 (1.70-7.10); 2 15-64: 1.10 (-0.70 to 3.00); 2 ≥ 65: -2.60 (-4.80 to -0.30); 3 All ages: 2.00 (0.50-3.40); 2 Lower Respiratory Diseases – Cumulative exposure Increment: 0.7 ppm for 0-2 and 0-3; 0.8 for 0-1 Age Group 0-14: 3.00% (-1.00 to 7.20); 0-3 15-64: -0.70% (-2.90 to 1.50); 0-1 ≥ 65: -1.60% (-5.10 to 2.00); 0-3 All ages: 1.80% (0.10-3.60); 0-2 Warm or Cold Seasons: Asthma, Increment: 0.8 ppm Age Group & Season 0-14 & Warm Season: 11.40% (3.30-20.00); 2 0-14 & Cold Season: 2.90% (-3.20 to 9.40); 2 15-64 & Warm Season: 4.80% (-0.60 to 10.60); 0 15-64 & Cold Season: -0.30% (-4.80 to 4.50); 0 ≥ 65 & Warm Season: 15.60% (3.10-29.60); 2 ≥ 65 & Cold Season: 4.20% (-6.00 to 15.60); 2 Lower Respiratory Diseases, Increment: 0.8 ppm Age Group & Season 0-14 & Warm Season: 2.70% (-2.90 to 8.60); 2 0-14 & Cold Season: 6.20% (2.30-10.20); 2 15-64 & Warm Season: 6.20% (2.30-10.20); 2 15-64 & Cold Season: 2.40% (-1.20 to 6.10); 2 ≥ 65 & Warm Season: 1.00% (-1.60 to 3.80); 2 ≥ 65 & Cold Season: -2.20% (-6.50 to 2.40); 3
January 2010 C-49

Study Design Concentrations Effect Estimates (95% CI)
Author: Hajat et al. (2002, 030358)
Period of Study:
1/1992-12/1994
Location:
London, U.K.
General Practitioner Visits
Health Outcome (ICD9): Upper respiratory diseases (URD)
Study Design: Time-series
Statistical Analyses: Poisson, GAM, LOESS
Age Groups Analyzed: 0-14 yr 15-64 yr ≥ 65 yr
Pollutant: CO
Averaging Time: 24-h avg
Mean (SD) unit: All yr: 0.8 (0.4) ppm Warm Season (April-September): 0.7 (0.3) ppm Cool Season (October-March): 1.0 (0.5) ppm
Range (10th, 90th): All Year: (0.5, 1.3) Warm Season: (0.4, 1.0) Cool Season: (0.5, 1.6)
Copollutant: NR
Increment: 0.6 ppm, 0.8 ppm, & 1.1 ppm
% Increase (Lower CI, Upper CI); lag:
Warm Season, Increment: 0.6 ppm Age Group 0-14: 2.90% (-0.60 to 6.40); 1 14-64: 7.90% (4.80-11.10); 1 ≥ 65: 4.90% (-1.80 to 12.10); 3 Cold Season, Increment: 1.1 ppm Age Group 0-14: -2.50% (-4.90 to 0.10); 1 14-64: 0.60% (-1.60 to 2.90); 1 ≥ 65: 5.60% (0.90-10.60); 3 All Year, Increment: 0.8 ppm Age Group 0-14: -2.20% (-4.00 to -0.30); 1 14-64: 2.70% (0.10-5.50); 1 ≥ 65: 5.80% (2.40 to 9.30); 3
Author: Hapcioglu et al. (2006, 093263)
Period of Study: 1/1997-12/2001
Location: Istanbul, Turkey
Hospital Admissions
Health Outcome (ICD9): COPD (490-492, 494-496)
Study Design: Cross sectional
Statistical Analyses: Pearson Correlation Coefficient
Age Groups Analyzed: All ages
Pollutant: CO
Averaging Time: Monthly
Mean (SD) unit: NR
Range (Min, Max): NR
Copollutant: NR
Correlation Coefficient:
Between CO exposure and COPD: 0.57
Between CO exposure and COPD when controlling for temperature: 0.25
Author: Hinwood et al. (2006, 088976)
Period of Study: 1/1992-12/1998
Location: Perth, Australia
Hospital Admissions
Health Outcome (ICD9): COPD (490.00-496.99 excluding asthma); pneumonia/ influenza (480.00-489.99); Asthma (493)
Study Design: Case crossover
Statistical Analyses: Conditional logistic regression
Age Groups Analyzed: All ages
Pollutant: CO
Averaging Time: Max 8-h avg
Mean (SD) unit: All Year: 2.3 (1.3) ppm; November-April: 2.2 (1.3) ppm; May-October: 2.4 (1.2) ppm
Range (10th, 90th): All Year: (0.9, 4.2) November-April: (0.8, 4.2) May-October: (1.1, 4.2)
Copollutant: correlation All Year: NO2: r = 0.57 O3: r = 0.00 November-April: NO2: r = 0.55 O3: r = 0.00 May-October: NO2: r = 0.57 O3: r = 0.16
Increment: 2.3 ppm
Odds Ratio (Lower CI, Upper CI); Lag
Pneumonia 0.99999 (0.9737-1.0268); 0 1.00650 (0.9806-1.0331); 1 1.00351 (0.9779-1.0298); 2 1.00424 (0.9790-1.0301); 3 1.00581 (0.9752-1.0374); 0-1 1.01005 (0.9755-1.0458); 0-2 1.00805 (0.9701-1.0474); 0-3
COPD 0.99915 (0.9693-1.0297); 0 1.00205 (0.9727-1.0323); 1 0.98630 (0.9577-1.0158); 2 0.98970 (0.9619-1.0182); 3 0.99960 (0.9647-1.0357); 0-1 0.99260 (0.9538-1.0329); 0-2 0.99160 (0.9493-1.0357); 0-3
Author: Hwang and Chan (2002, 023222)
Period of Study: 1998
Location: 50 communities in Taiwan
Clinic Visits
Health Outcome (ICD9): Lower respiratory tract infections (466, 480-486)
Study Design: Time series
Statistical Analyses: 1. General linear regression 2. Bayesian hierarchical modeling
Age Groups Analyzed: All Ages 0-14 yr 15-64 yr ≥ 65 yr
Pollutant: CO
Averaging Time: Max 8-h avg
Mean (SD) unit: 1.00 (0.30) ppm
Range (Min, Max): (0.51, 1.71)
Copollutant: NR
Increment: 0.1 ppm
% Increase (Lower CI, Upper CI); Lag
Age Group: All Ages 0.80% (0.60-1.00); 0 0.10% (-0.10 to 0.30); 1 0.10% (-0.10 to 0.30); 2 Age Group: 0-14 0.70% (0.50-1.00); 0 0.10% (-0.20 to 0.30); 1 0.20% (-0.10 to 0.40); 2 Age Group: 15-64 0.90% (0.60-1.10); 0 0.20% (0.00-0.50); 1 0.20% (-0.10 to 0.40); 2 Age Group: ≥ 65 1.10% (0.80-1.50); 0 0.60% (0.30-1.00); 1 0.40% (0.10-0.80); 2
January 2010 C-50
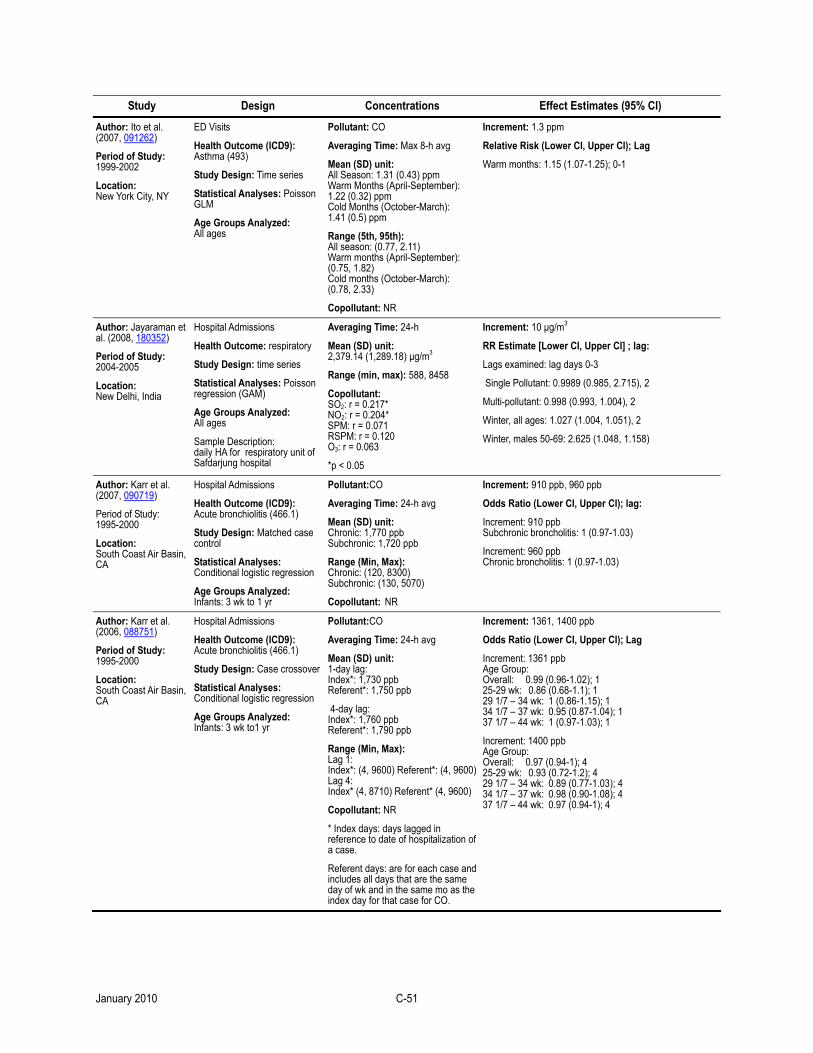
Study Design Concentrations Effect Estimates (95% CI)
Author: Ito et al. (2007, 091262)
Period of Study: 1999-2002
Location: New York City, NY
ED Visits
Health Outcome (ICD9): Asthma (493)
Study Design: Time series
Statistical Analyses: Poisson GLM
Age Groups Analyzed: All ages
Pollutant: CO
Averaging Time: Max 8-h avg
Mean (SD) unit: All Season: 1.31 (0.43) ppm Warm Months (April-September): 1.22 (0.32) ppm Cold Months (October-March): 1.41 (0.5) ppm
Range (5th, 95th): All season: (0.77, 2.11) Warm months (April-September): (0.75, 1.82) Cold months (October-March): (0.78, 2.33)
Copollutant: NR
Increment: 1.3 ppm
Relative Risk (Lower CI, Upper CI); Lag
Warm months: 1.15 (1.07-1.25); 0-1
Author: Jayaraman et al. (2008, 180352)
Period of Study: 2004-2005
Location: New Delhi, India
Hospital Admissions
Health Outcome: respiratory
Study Design: time series
Statistical Analyses: Poisson regression (GAM)
Age Groups Analyzed: All ages
Sample Description: daily HA for respiratory unit of Safdarjung hospital
Averaging Time: 24-h
Mean (SD) unit: 2,379.14 (1,289.18) µg/m3
Range (min, max): 588, 8458
Copollutant: SO2: r = 0.217* NO2: r = 0.204* SPM: r = 0.071 RSPM: r = 0.120 O3: r = 0.063
*p < 0.05
Increment: 10 µg/m3
RR Estimate [Lower CI, Upper CI] ; lag:
Lags examined: lag days 0-3
Single Pollutant: 0.9989 (0.985, 2.715), 2
Multi-pollutant: 0.998 (0.993, 1.004), 2
Winter, all ages: 1.027 (1.004, 1.051), 2
Winter, males 50-69: 2.625 (1.048, 1.158)
Author: Karr et al. (2007, 090719)
Period of Study: 1995-2000
Location: South Coast Air Basin, CA
Hospital Admissions
Health Outcome (ICD9): Acute bronchiolitis (466.1)
Study Design: Matched case control
Statistical Analyses: Conditional logistic regression
Age Groups Analyzed: Infants: 3 wk to 1 yr
Pollutant:CO
Averaging Time: 24-h avg
Mean (SD) unit: Chronic: 1,770 ppb Subchronic: 1,720 ppb
Range (Min, Max): Chronic: (120, 8300) Subchronic: (130, 5070)
Copollutant: NR
Increment: 910 ppb, 960 ppb
Odds Ratio (Lower CI, Upper CI); lag:
Increment: 910 ppb Subchronic broncholitis: 1 (0.97-1.03)
Increment: 960 ppb Chronic broncholitis: 1 (0.97-1.03)
Author: Karr et al. (2006, 088751)
Period of Study: 1995-2000
Location: South Coast Air Basin, CA
Hospital Admissions
Health Outcome (ICD9): Acute bronchiolitis (466.1)
Study Design: Case crossover
Statistical Analyses: Conditional logistic regression
Age Groups Analyzed: Infants: 3 wk to1 yr
Pollutant:CO
Averaging Time: 24-h avg
Mean (SD) unit: 1-day lag: Index*: 1,730 ppb Referent*: 1,750 ppb
4-day lag: Index*: 1,760 ppb Referent*: 1,790 ppb
Range (Min, Max): Lag 1: Index*: (4, 9600) Referent*: (4, 9600) Lag 4: Index* (4, 8710) Referent* (4, 9600)
Copollutant: NR
* Index days: days lagged in reference to date of hospitalization of a case.
Referent days: are for each case and includes all days that are the same day of wk and in the same mo as the index day for that case for CO.
Increment: 1361, 1400 ppb
Odds Ratio (Lower CI, Upper CI); Lag
Increment: 1361 ppb Age Group: Overall: 0.99 (0.96-1.02); 1 25-29 wk: 0.86 (0.68-1.1); 1 29 1/7 – 34 wk: 1 (0.86-1.15); 1 34 1/7 – 37 wk: 0.95 (0.87-1.04); 1 37 1/7 – 44 wk: 1 (0.97-1.03); 1
Increment: 1400 ppb Age Group: Overall: 0.97 (0.94-1); 4 25-29 wk: 0.93 (0.72-1.2); 4 29 1/7 – 34 wk: 0.89 (0.77-1.03); 4 34 1/7 – 37 wk: 0.98 (0.90-1.08); 4 37 1/7 – 44 wk: 0.97 (0.94-1); 4
January 2010 C-51

Study Design Concentrations Effect Estimates (95% CI)
Author: Kim et al. (2007, 092837)
Period of Study: 2002
Location: Seoul, Korea
Hospital Admissions
Health Outcome (ICD10): Asthma (J45 and J46)
Study Design: Bidirectional case crossover
Statistical Analyses: Conditional logistic regression
Age Groups Analyzed: All Ages
Pollutant: CO
Averaging Time: Max 8-h avg
Mean (SD) unit: Daily Concentration: 8.6 (4.6) ppm Relevant Concentration: 2.8 (2.8) ppm
Range (Min, Max): Daily Concentration: (0.8, 44.0) Relevant Concentration: (0.0, 30.4)
Copollutant: NR
Relative Risk (Lower CI, Upper CI); lag:
Individual Level SEP Quintile 1: 1.06 (1.02-1.09); 1-3 ma Quintile 2: 1.05 (1.02-1.09); 1-3 ma Quintile 3: 1.05 (1.01-1.08); 1-3 ma Quintile 4: 1.07 (1.03-1.11); 1-3 ma Quintile 5: 1.05 (1.00-1.09); 1-3 ma
Regional Level SEP Quintile 1: 0.99 (0.92-1.07); 1-3 ma Quintile 2: 1.06 (1.02-1.11); 1-3 ma Quintile 3: 1.04 (1.02-1.07); 1-3 ma Quintile 4: 1.10 (1.06-1.15); 1-3 ma Quintile 5: 1.06 (1.03-1.09); 1-3 ma Overall: 1.06 (1.04-1.07); 1-3 ma
Relative Effect Modification for SES
Individual Level SEP Quintile 1: 1 Quintile 2: 1 (0.95.1.04); 1-3 ma Quintile 3: 0.99 (0.94-1.03); 1-3 ma Quintile 4: 1.02 (0.97-1.06); 1-3 ma Quintile 5: 0.99 (0.94-1.04); 1-3 ma
Regional Level SEP Quintile 1: 1 Quintile 2: 1.05 (0.97-1.14); 1-3 ma Quintile 3: 1.03 (0.96-1.11); 1-3 ma Quintile 4: 1.08 (1-1.16); 1-3 ma Quintile 5: 1.05 (0.97-1.13); 1-3 ma
Author: Kontos et al. (1999, 011326) Period of Study: 1/1987-12/1992
Location: Piraeus, Greece
Hospital Admissions
Health Outcome (ICD9): Respiratory conditions (laryngitis, bronchiolitis, tonsillitis, acute rhinopharyngitis, otitis, bronchopneumonia, pneumonia, asthma)
Study Design: Time series
Statistical Analyses: Stochastic dynamical system approach
Age Groups Analyzed: 0-14 yr
Pollutant: CO
Averaging Time: 24-h avg
Mean Range (SD) unit: 1987: 4.2 mg/m3 1992: 3.6 mg/m3
Range (Min, Max): NR
Copollutant: correlation 1987-1989 Smoke: r = 0.2979; SO2: r = 0.2166; NO2: r = 0.1913 1990-1992 Smoke: r = 0.5383; SO2: r = 0.43283; NO2: 0.5223
This study did not present quantitative results for CO.
Author: Lee et al. (2002, 034826)
Period of Study: 12/1997-12/1999
Location: Seoul, Korea
Hospital Admissions
Health Outcome (ICD10): Asthma (J45, J46)
Study Design: Time series
Statistical Analyses: Poisson GAM, LOESS
Age Groups Analyzed: <5 yr
Pollutant: CO
Averaging Time: 1-h max
Mean Range (SD) unit: 1.8 (0.7) ppm
IQR (25th, 75th): (1.2, 2.2)
Copollutant: correlation PM10: r = 0.598 SO2: r = 0.812 NO2: r = 0.785 O3: r = -0.388
Increment: 1.0 ppm
Relative Risk (Lower CI, Upper CI); lag:
RR for asthma and exposure to various pollutants for children under 15 yr old
Pollutant: CO: 1.16 (1.10-1.22); 2-3 avg CO, PM10: 1.13 (1.07-1.20); 2-3 avg CO, SO2: 1.17 (1.08-1.27); 2-3 avg CO, NO2: 1.04 (0.95-1.14); 2-3 avg CO, O3: 1.16 (1.11-1.22); 2-3 avg CO, O3, PM10: 1.148 (1.084-1.217); 2-3 avg CO, O3, PM10, SO2: 1.168 (1.075-1.269); 2-3 avg CO, O3, PM10, SO2, NO2: 1.098 (0.994-1.214); 2-3 avg
January 2010 C-52
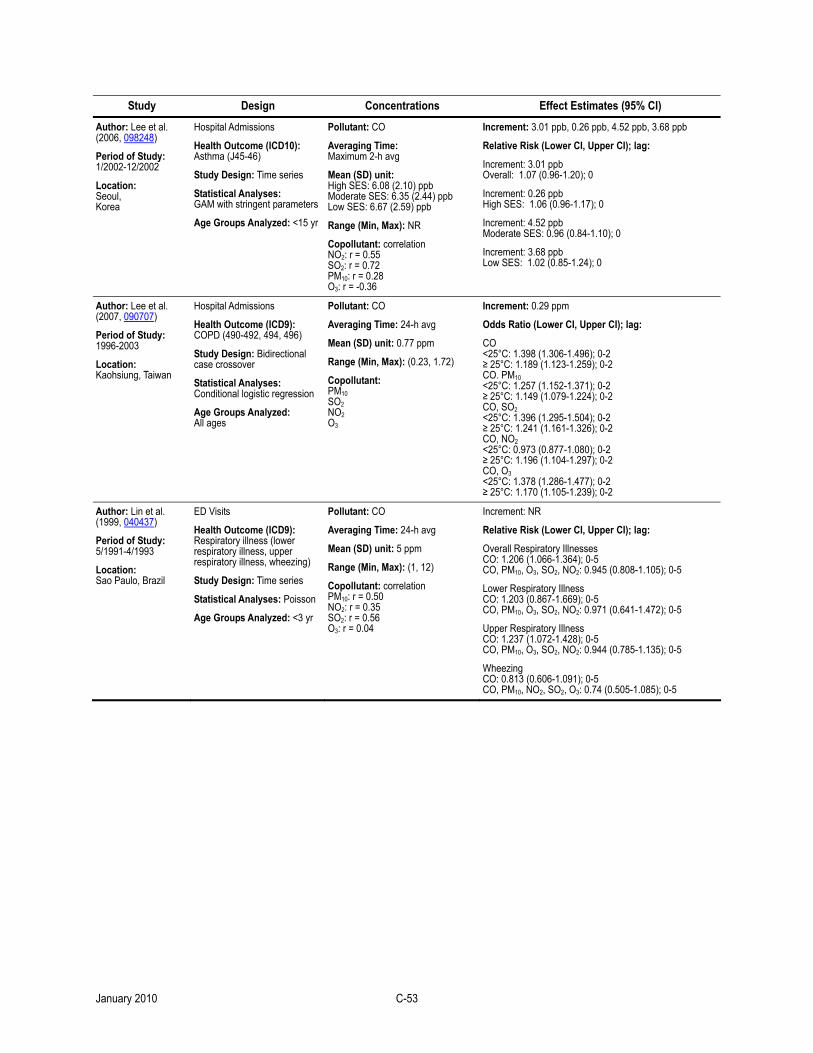
Study Design Concentrations Effect Estimates (95% CI)
Author: Lee et al. (2006, 098248)
Period of Study: 1/2002-12/2002
Location: Seoul, Korea
Hospital Admissions
Health Outcome (ICD10): Asthma (J45-46)
Study Design: Time series
Statistical Analyses: GAM with stringent parameters
Age Groups Analyzed: <15 yr
Pollutant: CO
Averaging Time: Maximum 2-h avg
Mean (SD) unit: High SES: 6.08 (2.10) ppb Moderate SES: 6.35 (2.44) ppb Low SES: 6.67 (2.59) ppb
Range (Min, Max): NR
Copollutant: correlation NO2: r = 0.55 SO2: r = 0.72 PM10: r = 0.28 O3: r = -0.36
Increment: 3.01 ppb, 0.26 ppb, 4.52 ppb, 3.68 ppb
Relative Risk (Lower CI, Upper CI); lag:
Increment: 3.01 ppb Overall: 1.07 (0.96-1.20); 0
Increment: 0.26 ppb High SES: 1.06 (0.96-1.17); 0
Increment: 4.52 ppb Moderate SES: 0.96 (0.84-1.10); 0
Increment: 3.68 ppb Low SES: 1.02 (0.85-1.24); 0
Author: Lee et al. (2007, 090707)
Period of Study: 1996-2003
Location: Kaohsiung, Taiwan
Hospital Admissions
Health Outcome (ICD9): COPD (490-492, 494, 496)
Study Design: Bidirectional case crossover
Statistical Analyses: Conditional logistic regression
Age Groups Analyzed: All ages
Pollutant: CO
Averaging Time: 24-h avg
Mean (SD) unit: 0.77 ppm
Range (Min, Max): (0.23, 1.72)
Copollutant: PM10 SO2 NO2 O3
Increment: 0.29 ppm
Odds Ratio (Lower CI, Upper CI); lag:
CO <25°C: 1.398 (1.306-1.496); 0-2 ≥ 25°C: 1.189 (1.123-1.259); 0-2 CO. PM10 <25°C: 1.257 (1.152-1.371); 0-2 ≥ 25°C: 1.149 (1.079-1.224); 0-2 CO, SO2 <25°C: 1.396 (1.295-1.504); 0-2 ≥ 25°C: 1.241 (1.161-1.326); 0-2 CO, NO2 <25°C: 0.973 (0.877-1.080); 0-2 ≥ 25°C: 1.196 (1.104-1.297); 0-2 CO, O3 <25°C: 1.378 (1.286-1.477); 0-2 ≥ 25°C: 1.170 (1.105-1.239); 0-2
Author: Lin et al. (1999, 040437)
Period of Study: 5/1991-4/1993
Location: Sao Paulo, Brazil
ED Visits
Health Outcome (ICD9): Respiratory illness (lower respiratory illness, upper respiratory illness, wheezing)
Study Design: Time series
Statistical Analyses: Poisson
Age Groups Analyzed: <3 yr
Pollutant: CO
Averaging Time: 24-h avg
Mean (SD) unit: 5 ppm
Range (Min, Max): (1, 12)
Copollutant: correlation PM10: r = 0.50 NO2: r = 0.35 SO2: r = 0.56 O3: r = 0.04
Increment: NR
Relative Risk (Lower CI, Upper CI); lag:
Overall Respiratory Illnesses CO: 1.206 (1.066-1.364); 0-5 CO, PM10, O3, SO2, NO2: 0.945 (0.808-1.105); 0-5
Lower Respiratory Illness CO: 1.203 (0.867-1.669); 0-5 CO, PM10, O3, SO2, NO2: 0.971 (0.641-1.472); 0-5
Upper Respiratory Illness CO: 1.237 (1.072-1.428); 0-5 CO, PM10, O3, SO2, NO2: 0.944 (0.785-1.135); 0-5
Wheezing CO: 0.813 (0.606-1.091); 0-5 CO, PM10, NO2, SO2, O3: 0.74 (0.505-1.085); 0-5
January 2010 C-53
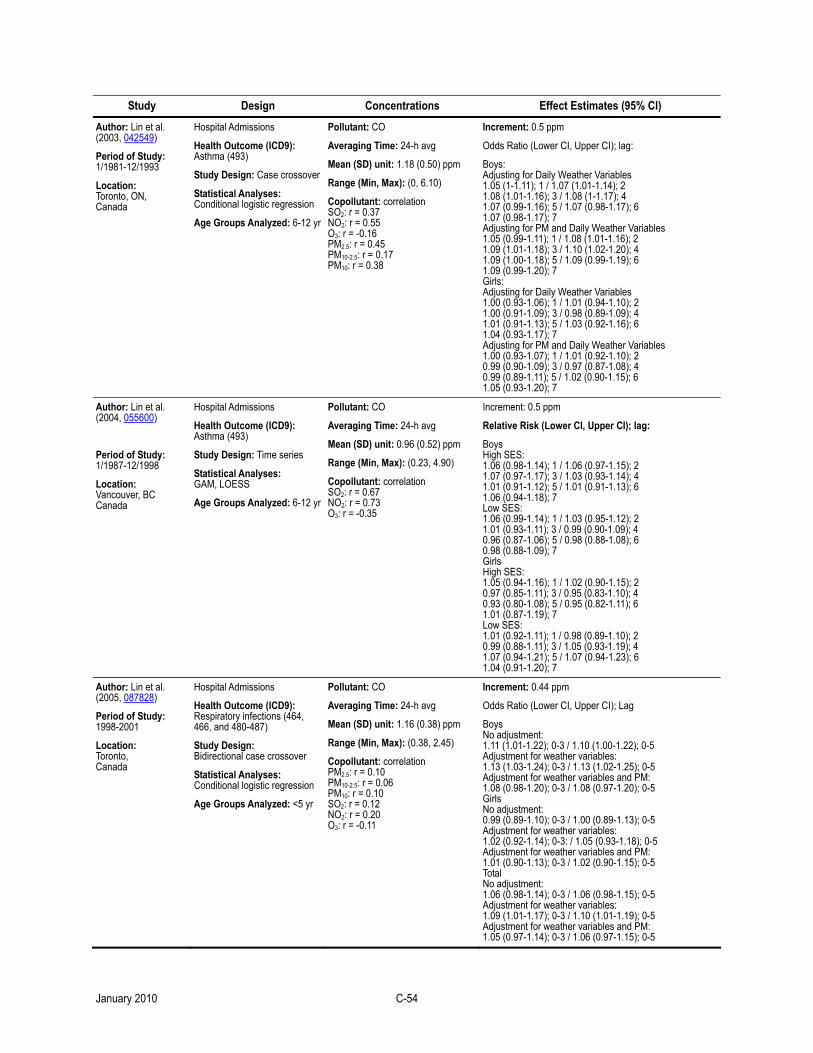
Study Design Concentrations Effect Estimates (95% CI)
Author: Lin et al. (2003, 042549)
Period of Study: 1/1981-12/1993
Location: Toronto, ON, Canada
Hospital Admissions
Health Outcome (ICD9): Asthma (493)
Study Design: Case crossover
Statistical Analyses: Conditional logistic regression
Age Groups Analyzed: 6-12 yr
Pollutant: CO
Averaging Time: 24-h avg
Mean (SD) unit: 1.18 (0.50) ppm
Range (Min, Max): (0, 6.10)
Copollutant: correlation SO2: r = 0.37 NO2: r = 0.55 O3: r = -0.16 PM2.5: r = 0.45 PM10-2.5: r = 0.17 PM10: r = 0.38
Increment: 0.5 ppm
Odds Ratio (Lower CI, Upper CI); lag:
Boys: Adjusting for Daily Weather Variables 1.05 (1-1.11); 1 / 1.07 (1.01-1.14); 2 1.08 (1.01-1.16); 3 / 1.08 (1-1.17); 4 1.07 (0.99-1.16); 5 / 1.07 (0.98-1.17); 6 1.07 (0.98-1.17); 7 Adjusting for PM and Daily Weather Variables 1.05 (0.99-1.11); 1 / 1.08 (1.01-1.16); 2 1.09 (1.01-1.18); 3 / 1.10 (1.02-1.20); 4 1.09 (1.00-1.18); 5 / 1.09 (0.99-1.19); 6 1.09 (0.99-1.20); 7 Girls: Adjusting for Daily Weather Variables 1.00 (0.93-1.06); 1 / 1.01 (0.94-1.10); 2 1.00 (0.91-1.09); 3 / 0.98 (0.89-1.09); 4 1.01 (0.91-1.13); 5 / 1.03 (0.92-1.16); 6 1.04 (0.93-1.17); 7 Adjusting for PM and Daily Weather Variables 1.00 (0.93-1.07); 1 / 1.01 (0.92-1.10); 2 0.99 (0.90-1.09); 3 / 0.97 (0.87-1.08); 4 0.99 (0.89-1.11); 5 / 1.02 (0.90-1.15); 6 1.05 (0.93-1.20); 7
Author: Lin et al. (2004, 055600)
Period of Study: 1/1987-12/1998
Location: Vancouver, BC Canada
Hospital Admissions
Health Outcome (ICD9): Asthma (493)
Study Design: Time series
Statistical Analyses: GAM, LOESS
Age Groups Analyzed: 6-12 yr
Pollutant: CO
Averaging Time: 24-h avg
Mean (SD) unit: 0.96 (0.52) ppm
Range (Min, Max): (0.23, 4.90)
Copollutant: correlation SO2: r = 0.67 NO2: r = 0.73 O3: r = -0.35
Increment: 0.5 ppm
Relative Risk (Lower CI, Upper CI); lag:
Boys High SES: 1.06 (0.98-1.14); 1 / 1.06 (0.97-1.15); 2 1.07 (0.97-1.17); 3 / 1.03 (0.93-1.14); 4 1.01 (0.91-1.12); 5 / 1.01 (0.91-1.13); 6 1.06 (0.94-1.18); 7 Low SES: 1.06 (0.99-1.14); 1 / 1.03 (0.95-1.12); 2 1.01 (0.93-1.11); 3 / 0.99 (0.90-1.09); 4 0.96 (0.87-1.06); 5 / 0.98 (0.88-1.08); 6 0.98 (0.88-1.09); 7 Girls High SES: 1.05 (0.94-1.16); 1 / 1.02 (0.90-1.15); 2 0.97 (0.85-1.11); 3 / 0.95 (0.83-1.10); 4 0.93 (0.80-1.08); 5 / 0.95 (0.82-1.11); 6 1.01 (0.87-1.19); 7 Low SES: 1.01 (0.92-1.11); 1 / 0.98 (0.89-1.10); 2 0.99 (0.88-1.11); 3 / 1.05 (0.93-1.19); 4 1.07 (0.94-1.21); 5 / 1.07 (0.94-1.23); 6 1.04 (0.91-1.20); 7
Author: Lin et al. (2005, 087828)
Period of Study: 1998-2001
Location: Toronto, Canada
Hospital Admissions
Health Outcome (ICD9): Respiratory infections (464, 466, and 480-487)
Study Design: Bidirectional case crossover
Statistical Analyses: Conditional logistic regression
Age Groups Analyzed: <5 yr
Pollutant: CO
Averaging Time: 24-h avg
Mean (SD) unit: 1.16 (0.38) ppm
Range (Min, Max): (0.38, 2.45)
Copollutant: correlation PM2.5: r = 0.10 PM10-2.5: r = 0.06 PM10: r = 0.10 SO2: r = 0.12 NO2: r = 0.20 O3: r = -0.11
Increment: 0.44 ppm
Odds Ratio (Lower CI, Upper CI); Lag
Boys No adjustment: 1.11 (1.01-1.22); 0-3 / 1.10 (1.00-1.22); 0-5 Adjustment for weather variables: 1.13 (1.03-1.24); 0-3 / 1.13 (1.02-1.25); 0-5 Adjustment for weather variables and PM: 1.08 (0.98-1.20); 0-3 / 1.08 (0.97-1.20); 0-5 Girls No adjustment: 0.99 (0.89-1.10); 0-3 / 1.00 (0.89-1.13); 0-5 Adjustment for weather variables: 1.02 (0.92-1.14); 0-3: / 1.05 (0.93-1.18); 0-5 Adjustment for weather variables and PM: 1.01 (0.90-1.13); 0-3 / 1.02 (0.90-1.15); 0-5 Total No adjustment: 1.06 (0.98-1.14); 0-3 / 1.06 (0.98-1.15); 0-5 Adjustment for weather variables: 1.09 (1.01-1.17); 0-3 / 1.10 (1.01-1.19); 0-5 Adjustment for weather variables and PM: 1.05 (0.97-1.14); 0-3 / 1.06 (0.97-1.15); 0-5
January 2010 C-54
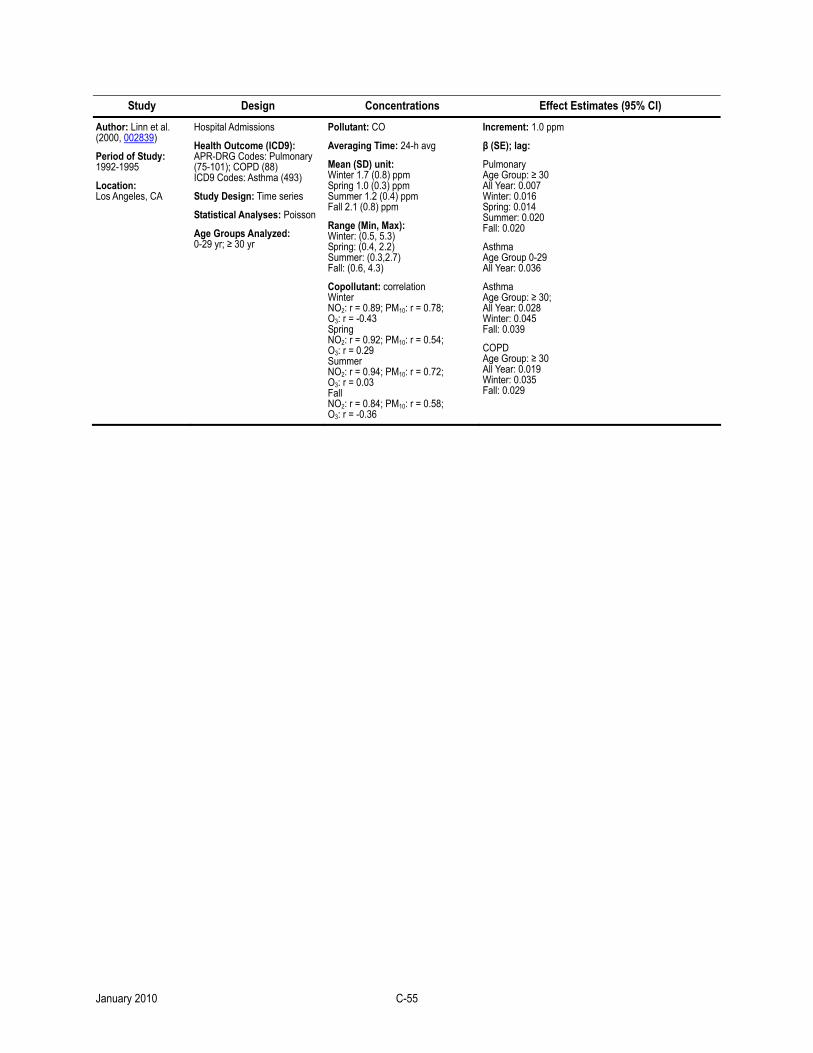
Study Design Concentrations Effect Estimates (95% CI)
Author: Linn et al. (2000, 002839)
Period of Study: 1992-1995
Location: Los Angeles, CA
Hospital Admissions
Health Outcome (ICD9): APR-DRG Codes: Pulmonary (75-101); COPD (88) ICD9 Codes: Asthma (493)
Study Design: Time series
Statistical Analyses: Poisson
Age Groups Analyzed: 0-29 yr; ≥ 30 yr
Pollutant: CO
Averaging Time: 24-h avg
Mean (SD) unit: Winter 1.7 (0.8) ppm Spring 1.0 (0.3) ppm Summer 1.2 (0.4) ppm Fall 2.1 (0.8) ppm
Range (Min, Max): Winter: (0.5, 5.3) Spring: (0.4, 2.2) Summer: (0.3,2.7) Fall: (0.6, 4.3)
Copollutant: correlation Winter NO2: r = 0.89; PM10: r = 0.78; O3: r = -0.43 Spring NO2: r = 0.92; PM10: r = 0.54; O3: r = 0.29 Summer NO2: r = 0.94; PM10: r = 0.72; O3: r = 0.03 Fall NO2: r = 0.84; PM10: r = 0.58; O3: r = -0.36
Increment: 1.0 ppm
β (SE); lag:
Pulmonary Age Group: ≥ 30 All Year: 0.007 Winter: 0.016 Spring: 0.014 Summer: 0.020 Fall: 0.020
Asthma Age Group 0-29 All Year: 0.036
Asthma Age Group: ≥ 30; All Year: 0.028 Winter: 0.045 Fall: 0.039
COPD Age Group: ≥ 30 All Year: 0.019 Winter: 0.035 Fall: 0.029
January 2010 C-55

Study Design Concentrations Effect Estimates (95% CI)
Author: Luginaah et al. (2005, 057327)
Period of Study: 4/1995-12/2000
Location: Windsor, ON, Canada
Hospital Admissions
Health Outcome (ICD9): Respiratory illness (460-519)
Study Design: Time series and case crossover
Statistical Analyses: 1. Time-series: Poisson 2. Case-crossover: conditional logistic regression
Age Groups Analyzed: All ages 0-14 yr 15-64 yr ≥ 65 yr
Pollutant: CO
Averaging Time: 1-h max
Mean (SD) unit: 1.3 (1.0) ppm
Range (Min, Max): (0, 11.82)
Copollutant: correlation NO2: r = 0.38 SO2: r = 0.16 O3: r = 0.10 CoH: r = 0.31 PM10: r = 0.21
Increment: 1.17 ppm
Relative Risk (Lower CI, Upper CI); Lag
Females and Case-crossover study design Age Group: All ages: 1.037 (0.968-1.111); 1 1.063 (0.976-1.158); 2 1.087 (0.982-1.203); 3 Age Group: 0-14: 1.147 (1.006-1.307); 1 1.186 (1.020-1.379); 2 1.221 (1.022-1.459); 3 Age Group: 15-64: 1.005 (0.884-1.141); 1 1.007 (0.859-1.181); 2 1.032 (0.858-1.240); 3 Age Group: ≥ 65: 1.014 (0.922-1.116); 1 1.024 (0.907-1.156); 2 1.035 (0.893-1.200); 3 Males and Case-crossover study design Age Group: All Ages: 0.950 (0.884-1.020); 1 0.945 (0.862-1.036); 2 0.965 (0.866-1.075); 3 Age Group: 0-14: 1.003 (0.904-1.113); 1 0.997 (0.871-1.141); 2 0.970 (0.824-1.141); 3 Age Group: 15-64: 1.036 (0.870-1.233); 1 1.033 (0.821-1.299); 2 0.991 (0.760-1.293); 3 Age Group: ≥ 65: 0.867 (0.775-0.970); 1 0.865 (0.752-0.994); 2 0.946 (0.807-1.109); 3 Female and Time-series study design Age Group: All Ages: 1.049 (0.993-1.108); 1 1.032 (0.993-1.188); 2 1.051 (0.993-1.112); 3 Age Group: 0-14: 1.077 (0.979-1.184); 1 1.068 (1.001-1.139); 2 1.100 (0.997-1.213); 3 Age Group: 15-64: 1.072 (0.962-1.195); 1 1.025 ( 0.944-1.112); 2 1.081 (0.963-1.213); 3 Age Group: ≥ 65: 1.029 (0.957-1.118); 1 1.030 (0.928-1.144); 2 1.013 (0.899-1.142); 3 Male and Time-series study design Age Group: All Ages: 0.989 (0.932-1.049); 1 0.986 (0.946-1.029); 2 0.987 (0.929-1.048); 3 Age Group: 0-14: 1.034 (0.949-1.126); 1 0.996 (0.933-1.062); 2 0.968 (0.881-1.064); 3 Age Group: 15-64: 0.994 (0.854-1.157); 1 0.988 (0.884-1.104); 2 0.951 (0.806-1.121); 3 Age Group: ≥ 65: 0.901 (0.817-0.994); 1 0.904 (0.803-1.019); 2 0.963 (0.845-1.098); 3
January 2010 C-56
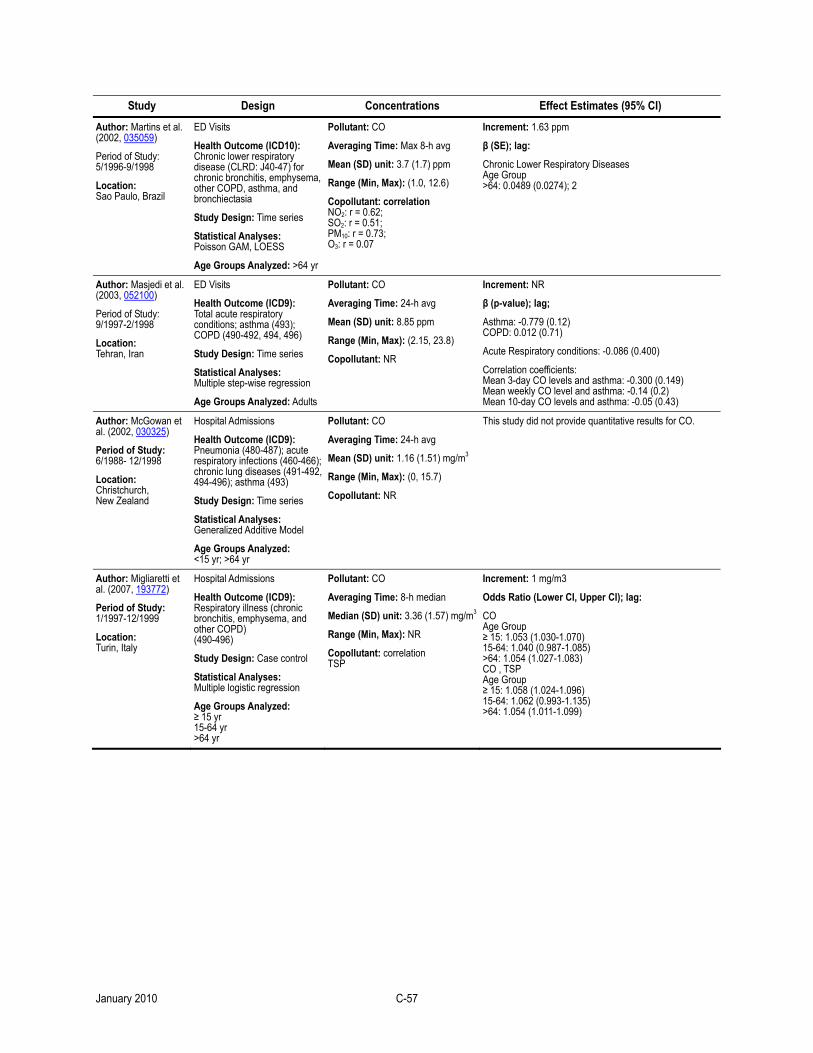
Study Design Concentrations Effect Estimates (95% CI)
Author: Martins et al. (2002, 035059)
Period of Study: 5/1996-9/1998
Location: Sao Paulo, Brazil
ED Visits
Health Outcome (ICD10): Chronic lower respiratory disease (CLRD: J40-47) for chronic bronchitis, emphysema, other COPD, asthma, and bronchiectasia
Study Design: Time series
Statistical Analyses: Poisson GAM, LOESS
Age Groups Analyzed: >64 yr
Pollutant: CO
Averaging Time: Max 8-h avg
Mean (SD) unit: 3.7 (1.7) ppm
Range (Min, Max): (1.0, 12.6)
Copollutant: correlation NO2: r = 0.62; SO2: r = 0.51; PM10: r = 0.73; O3: r = 0.07
Increment: 1.63 ppm
β (SE); lag:
Chronic Lower Respiratory Diseases Age Group >64: 0.0489 (0.0274); 2
Author: Masjedi et al. (2003, 052100)
Period of Study: 9/1997-2/1998
Location: Tehran, Iran
ED Visits
Health Outcome (ICD9): Total acute respiratory conditions; asthma (493); COPD (490-492, 494, 496)
Study Design: Time series
Statistical Analyses: Multiple step-wise regression
Age Groups Analyzed: Adults
Pollutant: CO
Averaging Time: 24-h avg
Mean (SD) unit: 8.85 ppm
Range (Min, Max): (2.15, 23.8)
Copollutant: NR
Increment: NR
β (p-value); lag;
Asthma: -0.779 (0.12) COPD: 0.012 (0.71)
Acute Respiratory conditions: -0.086 (0.400)
Correlation coefficients: Mean 3-day CO levels and asthma: -0.300 (0.149) Mean weekly CO level and asthma: -0.14 (0.2) Mean 10-day CO levels and asthma: -0.05 (0.43)
Author: McGowan et al. (2002, 030325)
Period of Study: 6/1988- 12/1998
Location: Christchurch, New Zealand
Hospital Admissions
Health Outcome (ICD9): Pneumonia (480-487); acute respiratory infections (460-466); chronic lung diseases (491-492, 494-496); asthma (493)
Study Design: Time series
Statistical Analyses: Generalized Additive Model
Age Groups Analyzed: <15 yr; >64 yr
Pollutant: CO
Averaging Time: 24-h avg
Mean (SD) unit: 1.16 (1.51) mg/m3
Range (Min, Max): (0, 15.7)
Copollutant: NR
This study did not provide quantitative results for CO.
Author: Migliaretti et al. (2007, 193772)
Period of Study: 1/1997-12/1999
Location: Turin, Italy
Hospital Admissions
Health Outcome (ICD9): Respiratory illness (chronic bronchitis, emphysema, and other COPD) (490-496)
Study Design: Case control
Statistical Analyses: Multiple logistic regression
Age Groups Analyzed: ≥ 15 yr 15-64 yr >64 yr
Pollutant: CO
Averaging Time: 8-h median
Median (SD) unit: 3.36 (1.57) mg/m3
Range (Min, Max): NR
Copollutant: correlation TSP
Increment: 1 mg/m3
Odds Ratio (Lower CI, Upper CI); lag:
CO Age Group ≥ 15: 1.053 (1.030-1.070) 15-64: 1.040 (0.987-1.085) >64: 1.054 (1.027-1.083) CO , TSP Age Group ≥ 15: 1.058 (1.024-1.096) 15-64: 1.062 (0.993-1.135) >64: 1.054 (1.011-1.099)
January 2010 C-57
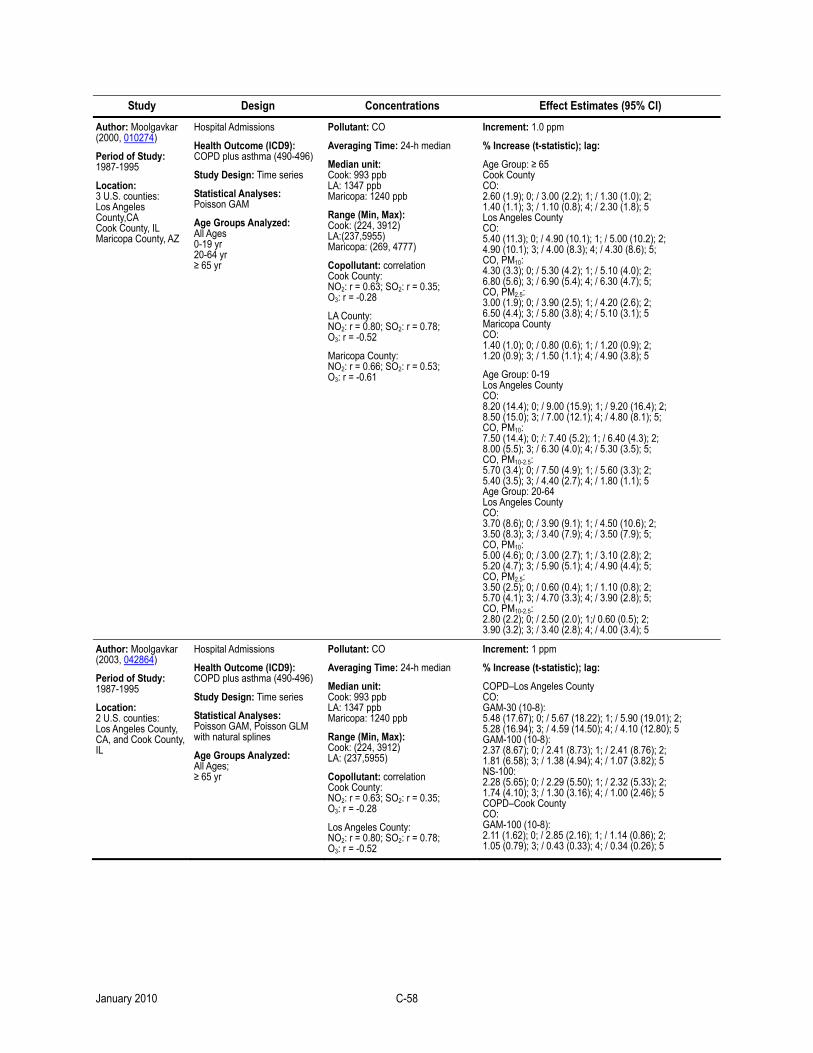
Study Design Concentrations Effect Estimates (95% CI)
Author: Moolgavkar (2000, 010274)
Period of Study: 1987-1995
Location: 3 U.S. counties: Los Angeles County,CA Cook County, IL Maricopa County, AZ
Hospital Admissions
Health Outcome (ICD9): COPD plus asthma (490-496)
Study Design: Time series
Statistical Analyses: Poisson GAM
Age Groups Analyzed: All Ages 0-19 yr 20-64 yr ≥ 65 yr
Pollutant: CO
Averaging Time: 24-h median
Median unit: Cook: 993 ppb LA: 1347 ppb Maricopa: 1240 ppb
Range (Min, Max): Cook: (224, 3912) LA:(237,5955) Maricopa: (269, 4777)
Copollutant: correlation Cook County: NO2: r = 0.63; SO2: r = 0.35; O3: r = -0.28
LA County: NO2: r = 0.80; SO2: r = 0.78; O3: r = -0.52
Maricopa County: NO2: r = 0.66; SO2: r = 0.53; O3: r = -0.61
Increment: 1.0 ppm
% Increase (t-statistic); lag:
Age Group: ≥ 65 Cook County CO: 2.60 (1.9); 0; / 3.00 (2.2); 1; / 1.30 (1.0); 2; 1.40 (1.1); 3; / 1.10 (0.8); 4; / 2.30 (1.8); 5 Los Angeles County CO: 5.40 (11.3); 0; / 4.90 (10.1); 1; / 5.00 (10.2); 2; 4.90 (10.1); 3; / 4.00 (8.3); 4; / 4.30 (8.6); 5; CO, PM10: 4.30 (3.3); 0; / 5.30 (4.2); 1; / 5.10 (4.0); 2; 6.80 (5.6); 3; / 6.90 (5.4); 4; / 6.30 (4.7); 5; CO, PM2.5: 3.00 (1.9); 0; / 3.90 (2.5); 1; / 4.20 (2.6); 2; 6.50 (4.4); 3; / 5.80 (3.8); 4; / 5.10 (3.1); 5 Maricopa County CO: 1.40 (1.0); 0; / 0.80 (0.6); 1; / 1.20 (0.9); 2; 1.20 (0.9); 3; / 1.50 (1.1); 4; / 4.90 (3.8); 5
Age Group: 0-19 Los Angeles County CO: 8.20 (14.4); 0; / 9.00 (15.9); 1; / 9.20 (16.4); 2; 8.50 (15.0); 3; / 7.00 (12.1); 4; / 4.80 (8.1); 5; CO, PM10: 7.50 (14.4); 0; /: 7.40 (5.2); 1; / 6.40 (4.3); 2; 8.00 (5.5); 3; / 6.30 (4.0); 4; / 5.30 (3.5); 5; CO, PM10-2.5: 5.70 (3.4); 0; / 7.50 (4.9); 1; / 5.60 (3.3); 2; 5.40 (3.5); 3; / 4.40 (2.7); 4; / 1.80 (1.1); 5 Age Group: 20-64 Los Angeles County CO: 3.70 (8.6); 0; / 3.90 (9.1); 1; / 4.50 (10.6); 2; 3.50 (8.3); 3; / 3.40 (7.9); 4; / 3.50 (7.9); 5; CO, PM10: 5.00 (4.6); 0; / 3.00 (2.7); 1; / 3.10 (2.8); 2; 5.20 (4.7); 3; / 5.90 (5.1); 4; / 4.90 (4.4); 5; CO, PM2.5: 3.50 (2.5); 0; / 0.60 (0.4); 1; / 1.10 (0.8); 2; 5.70 (4.1); 3; / 4.70 (3.3); 4; / 3.90 (2.8); 5; CO, PM10-2.5: 2.80 (2.2); 0; / 2.50 (2.0); 1;/ 0.60 (0.5); 2; 3.90 (3.2); 3; / 3.40 (2.8); 4; / 4.00 (3.4); 5
Author: Moolgavkar (2003, 042864)
Period of Study: 1987-1995
Location: 2 U.S. counties: Los Angeles County, CA, and Cook County, IL
Hospital Admissions
Health Outcome (ICD9): COPD plus asthma (490-496)
Study Design: Time series
Statistical Analyses: Poisson GAM, Poisson GLM with natural splines
Age Groups Analyzed: All Ages; ≥ 65 yr
Pollutant: CO
Averaging Time: 24-h median
Median unit: Cook: 993 ppb LA: 1347 ppb Maricopa: 1240 ppb
Range (Min, Max): Cook: (224, 3912) LA: (237,5955)
Copollutant: correlation Cook County: NO2: r = 0.63; SO2: r = 0.35; O3: r = -0.28
Los Angeles County: NO2: r = 0.80; SO2: r = 0.78; O3: r = -0.52
Increment: 1 ppm
% Increase (t-statistic); lag:
COPD–Los Angeles County CO: GAM-30 (10-8): 5.48 (17.67); 0; / 5.67 (18.22); 1; / 5.90 (19.01); 2; 5.28 (16.94); 3; / 4.59 (14.50); 4; / 4.10 (12.80); 5 GAM-100 (10-8): 2.37 (8.67); 0; / 2.41 (8.73); 1; / 2.41 (8.76); 2; 1.81 (6.58); 3; / 1.38 (4.94); 4; / 1.07 (3.82); 5 NS-100: 2.28 (5.65); 0; / 2.29 (5.50); 1; / 2.32 (5.33); 2; 1.74 (4.10); 3; / 1.30 (3.16); 4; / 1.00 (2.46); 5 COPD–Cook County CO: GAM-100 (10-8): 2.11 (1.62); 0; / 2.85 (2.16); 1; / 1.14 (0.86); 2; 1.05 (0.79); 3; / 0.43 (0.33); 4; / 0.34 (0.26); 5
January 2010 C-58

Study Design Concentrations Effect Estimates (95% CI)
Author: Neidell et al. (2004, 057330)
Period of Study: 1992-1998
Location: California
Hospital Admissions
Health Outcome (ICD9): Asthma (493)
Study Design: Time series
Statistical Analyses: Linear Regression
Age Groups Analyzed: 0-1 yr 1-3 yr 3-6 yr 6-12 yr 12-18 yr
Pollutant: CO
Averaging Time: 24-h avg
Mean (SD) unit: 1.777 (1.037) ppm
Range (Min, Max): NR
Copollutant: correlation O3 PM10 NO2
Increment: NR
β (SE); lag;
Single-pollutant model
Age Group 0-1: -0.007 (0.009); 1-3: 0.027 (0.009); 3-6: 0.053 (0.010); 6-12: 0.047 (0.009); 12-18: 0.025 (0.008) Fixed effect controlling for O3, PM10, and NO2 Age Group 0-1: -0.01 (0.01); 1-3: 0.024 (0.011); 3-6: 0.049 (0.011); 6-12: 0.023 (0.011); 12-18: 0.021 (0.009) Fixed effect controlling for O3, PM10, NO2 and avoidance behavior Age Group 0-1: -0.010 (0.010); 1-3: 0.027 (0.011); 3-6: 0.051 (0.011); 6-12: 0.025 (0.011); 12-18: 0.021 (0.009)
Author: Norris et al. (1999, 040774)
Period of Study: 9/1995- 12/1996
Location: Seattle, WA
ED Visits
Health Outcome (ICD9): Asthma (493)
Study Design: Time series
Statistical Analyses: Semiparametric Poisson GAM
Age Groups Analyzed: <8 yr
Pollutant: CO
Averaging Time: 24-h avg
Mean (SD) unit: 1.6 (0.5) ppm
Range (Min, Max): (0.6, 4.1)
Copollutant: correlation PM10: r = 0.74 NO2 (1-h max): r = 0.47 NO2 (24-h avg.): r = 0.66 SO2 (1-h max): r = 0.15 SO2 (24-h avg.): r = 0.32
Increment: 0.6 ppm
Relative Risk (Lower CI, Upper CI); Lag
High Utilization: 1.04 (0.93-1.16); 1
Low Utilization: 1.15 (1.05-1.28); 1
All: 1.10 (1.02-1.19); 1
Author: Peel et al. (2005, 056305)
Period of Study: 1/1993- 8/2000
Location: Atlanta, GA
ED Visits
Health Outcome (ICD9): Asthma (493, 786.09); COPD (491, 492, 496); URI (460-466, 477); pneumonia (480-486)
Study Design: Time series
Statistical Analyses: 1. Poisson GEE or asthma, URI, all respiratory 2. Poisson GLM for pneumonia and COPD
Age Groups Analyzed: Primary Analysis: All Ages Secondary Analysis: 2-18 yr
Pollutant: CO
Averaging Time: 1-h max
Mean (SD) unit: 1.8 (1.2) ppm
Range (10th, 90th): (0.5, 3.4)
Copollutant: NR
Increment: 1.0 ppm
Relative Risk (Lower CI, Upper CI); Lag
Health Condition All respiratory illnesses: 1.011 (1.004-1.019); 0-2 URI: 1.012 (1.003-1.021); 0-2 / 1.066 (1.045-1.087); 0-13 Asthma: 1.010 (0.999-1.022); 0-2 1.076 (1.047-1.105); 0-13 Pneumonia: 1.009 (0.996-1.021); 0-2 1.045 (1.011-1.080); 0-13 COPD: 1.026 (1.004-1.048); 0-2 1.032 (0.975-1.092); 0-13
RR for asthma and exposure to CO for children age 2-18: 1.019 (1.004-1.035); 0-2
RR for all respiratory illnesses and CO exposure for all ages AQS (1/1/93- 8/31/00): 1.011 (1.004-1.019); 0-2 AQS (8/1/98- 8/31/00): 1.010 (1.000-1.021); 0-2 ARIES (8/1/98- 8/31/00): 1.018 (1.003-1.033); 0-2
January 2010 C-59
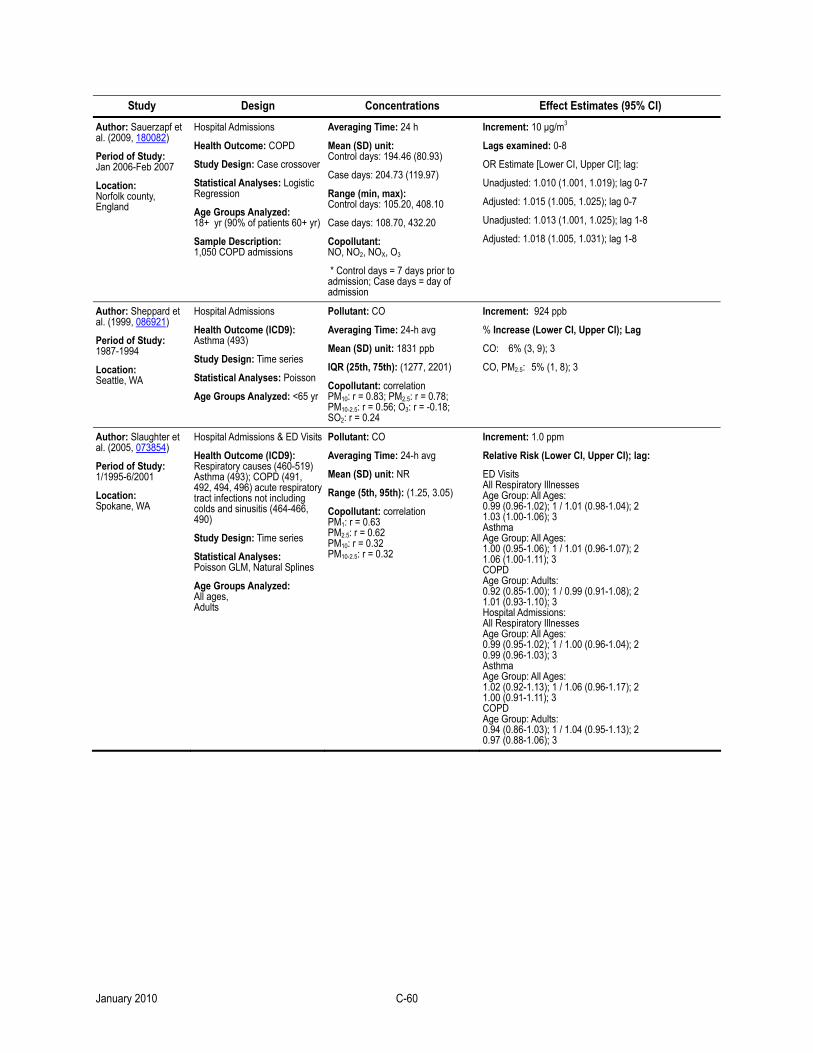
Study Design Concentrations Effect Estimates (95% CI)
Author: Sauerzapf et al. (2009, 180082)
Period of Study: Jan 2006-Feb 2007
Location: Norfolk county, England
Hospital Admissions
Health Outcome: COPD
Study Design: Case crossover
Statistical Analyses: Logistic Regression
Age Groups Analyzed: 18+ yr (90% of patients 60+ yr)
Sample Description: 1,050 COPD admissions
Averaging Time: 24 h
Mean (SD) unit: Control days: 194.46 (80.93)
Case days: 204.73 (119.97)
Range (min, max): Control days: 105.20, 408.10
Case days: 108.70, 432.20
Copollutant: NO, NO2, NOX, O3
* Control days = 7 days prior to admission; Case days = day of admission
Increment: 10 µg/m3
Lags examined: 0-8
OR Estimate [Lower CI, Upper CI]; lag:
Unadjusted: 1.010 (1.001, 1.019); lag 0-7
Adjusted: 1.015 (1.005, 1.025); lag 0-7
Unadjusted: 1.013 (1.001, 1.025); lag 1-8
Adjusted: 1.018 (1.005, 1.031); lag 1-8
Author: Sheppard et al. (1999, 086921)
Period of Study: 1987-1994
Location: Seattle, WA
Hospital Admissions
Health Outcome (ICD9): Asthma (493)
Study Design: Time series
Statistical Analyses: Poisson
Age Groups Analyzed: <65 yr
Pollutant: CO
Averaging Time: 24-h avg
Mean (SD) unit: 1831 ppb
IQR (25th, 75th): (1277, 2201)
Copollutant: correlation PM10: r = 0.83; PM2.5: r = 0.78; PM10-2.5: r = 0.56; O3: r = -0.18; SO2: r = 0.24
Increment: 924 ppb
% Increase (Lower CI, Upper CI); Lag
CO: 6% (3, 9); 3
CO, PM2.5: 5% (1, 8); 3
Author: Slaughter et al. (2005, 073854)
Period of Study: 1/1995-6/2001
Location: Spokane, WA
Hospital Admissions & ED Visits
Health Outcome (ICD9): Respiratory causes (460-519) Asthma (493); COPD (491, 492, 494, 496) acute respiratory tract infections not including colds and sinusitis (464-466, 490)
Study Design: Time series
Statistical Analyses: Poisson GLM, Natural Splines
Age Groups Analyzed: All ages, Adults
Pollutant: CO
Averaging Time: 24-h avg
Mean (SD) unit: NR
Range (5th, 95th): (1.25, 3.05)
Copollutant: correlation PM1: r = 0.63 PM2.5: r = 0.62 PM10: r = 0.32 PM10-2.5: r = 0.32
Increment: 1.0 ppm
Relative Risk (Lower CI, Upper CI); lag:
ED Visits All Respiratory Illnesses Age Group: All Ages: 0.99 (0.96-1.02); 1 / 1.01 (0.98-1.04); 2 1.03 (1.00-1.06); 3 Asthma Age Group: All Ages: 1.00 (0.95-1.06); 1 / 1.01 (0.96-1.07); 2 1.06 (1.00-1.11); 3 COPD Age Group: Adults: 0.92 (0.85-1.00); 1 / 0.99 (0.91-1.08); 2 1.01 (0.93-1.10); 3 Hospital Admissions: All Respiratory Illnesses Age Group: All Ages: 0.99 (0.95-1.02); 1 / 1.00 (0.96-1.04); 2 0.99 (0.96-1.03); 3 Asthma Age Group: All Ages: 1.02 (0.92-1.13); 1 / 1.06 (0.96-1.17); 2 1.00 (0.91-1.11); 3 COPD Age Group: Adults: 0.94 (0.86-1.03); 1 / 1.04 (0.95-1.13); 2 0.97 (0.88-1.06); 3
January 2010 C-60
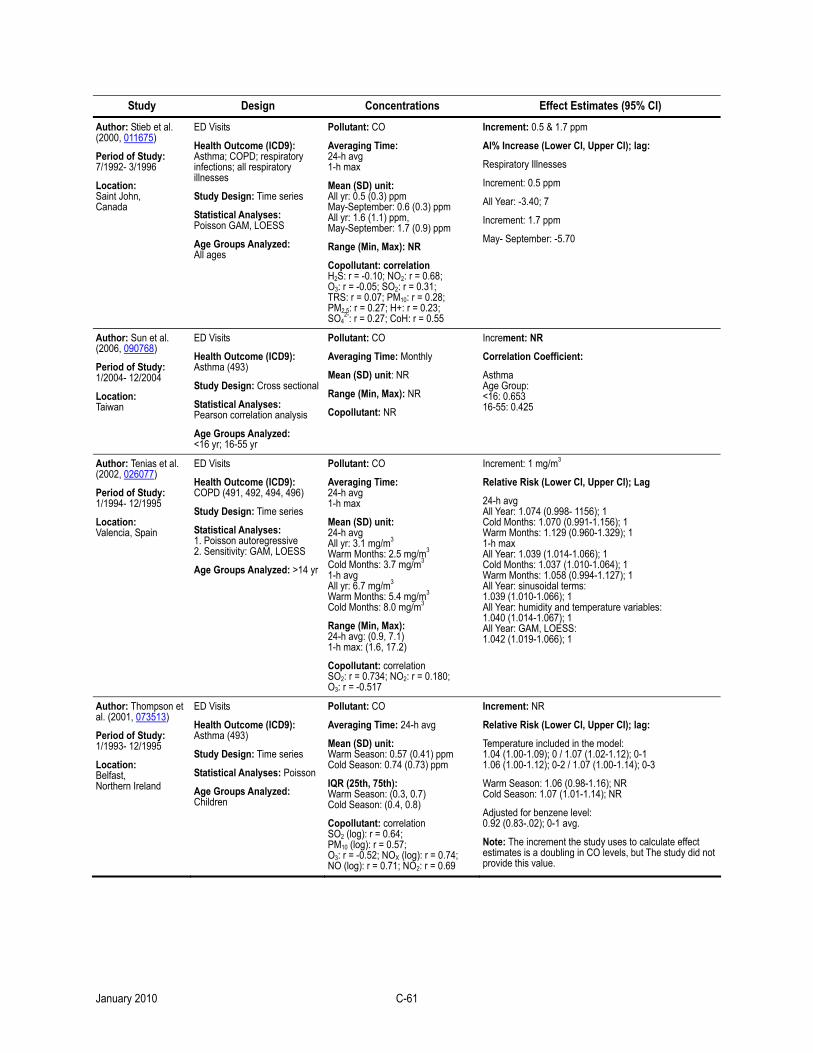
Study Design Concentrations Effect Estimates (95% CI)
Author: Stieb et al. (2000, 011675)
Period of Study: 7/1992- 3/1996
Location: Saint John, Canada
ED Visits
Health Outcome (ICD9): Asthma; COPD; respiratory infections; all respiratory illnesses
Study Design: Time series
Statistical Analyses: Poisson GAM, LOESS
Age Groups Analyzed: All ages
Pollutant: CO
Averaging Time: 24-h avg 1-h max
Mean (SD) unit: All yr: 0.5 (0.3) ppm May-September: 0.6 (0.3) ppm All yr: 1.6 (1.1) ppm, May-September: 1.7 (0.9) ppm
Range (Min, Max): NR
Copollutant: correlation H2S: r = -0.10; NO2: r = 0.68; O3: r = -0.05; SO2: r = 0.31; TRS: r = 0.07; PM10: r = 0.28; PM2.5: r = 0.27; H+: r = 0.23; SO4
2-: r = 0.27; CoH: r = 0.55
Increment: 0.5 & 1.7 ppm
Al% Increase (Lower CI, Upper CI); lag:
Respiratory Illnesses
Increment: 0.5 ppm
All Year: -3.40; 7
Increment: 1.7 ppm
May- September: -5.70
Author: Sun et al. (2006, 090768)
Period of Study: 1/2004- 12/2004
Location: Taiwan
ED Visits
Health Outcome (ICD9): Asthma (493)
Study Design: Cross sectional
Statistical Analyses: Pearson correlation analysis
Age Groups Analyzed: <16 yr; 16-55 yr
Pollutant: CO
Averaging Time: Monthly
Mean (SD) unit: NR
Range (Min, Max): NR
Copollutant: NR
Increment: NR
Correlation Coefficient:
Asthma Age Group: <16: 0.653 16-55: 0.425
Author: Tenias et al. (2002, 026077)
Period of Study: 1/1994- 12/1995
Location: Valencia, Spain
ED Visits
Health Outcome (ICD9): COPD (491, 492, 494, 496)
Study Design: Time series
Statistical Analyses: 1. Poisson autoregressive 2. Sensitivity: GAM, LOESS
Age Groups Analyzed: >14 yr
Pollutant: CO
Averaging Time: 24-h avg 1-h max
Mean (SD) unit: 24-h avg All yr: 3.1 mg/m3 Warm Months: 2.5 mg/m3 Cold Months: 3.7 mg/m3 1-h avg All yr: 6.7 mg/m3 Warm Months: 5.4 mg/m3 Cold Months: 8.0 mg/m3
Range (Min, Max): 24-h avg: (0.9, 7.1) 1-h max: (1.6, 17.2)
Copollutant: correlation SO2: r = 0.734; NO2: r = 0.180; O3: r = -0.517
Increment: 1 mg/m3
Relative Risk (Lower CI, Upper CI); Lag
24-h avg All Year: 1.074 (0.998- 1156); 1 Cold Months: 1.070 (0.991-1.156); 1 Warm Months: 1.129 (0.960-1.329); 1 1-h max All Year: 1.039 (1.014-1.066); 1 Cold Months: 1.037 (1.010-1.064); 1 Warm Months: 1.058 (0.994-1.127); 1 All Year: sinusoidal terms: 1.039 (1.010-1.066); 1 All Year: humidity and temperature variables: 1.040 (1.014-1.067); 1 All Year: GAM, LOESS: 1.042 (1.019-1.066); 1
Author: Thompson et al. (2001, 073513)
Period of Study: 1/1993- 12/1995
Location: Belfast, Northern Ireland
ED Visits
Health Outcome (ICD9): Asthma (493)
Study Design: Time series
Statistical Analyses: Poisson
Age Groups Analyzed: Children
Pollutant: CO
Averaging Time: 24-h avg
Mean (SD) unit: Warm Season: 0.57 (0.41) ppm Cold Season: 0.74 (0.73) ppm
IQR (25th, 75th): Warm Season: (0.3, 0.7) Cold Season: (0.4, 0.8)
Copollutant: correlation SO2 (log): r = 0.64; PM10 (log): r = 0.57; O3: r = -0.52; NOX (log): r = 0.74; NO (log): r = 0.71; NO2: r = 0.69
Increment: NR
Relative Risk (Lower CI, Upper CI); lag:
Temperature included in the model: 1.04 (1.00-1.09); 0 / 1.07 (1.02-1.12); 0-1 1.06 (1.00-1.12); 0-2 / 1.07 (1.00-1.14); 0-3
Warm Season: 1.06 (0.98-1.16); NR Cold Season: 1.07 (1.01-1.14); NR
Adjusted for benzene level: 0.92 (0.83-.02); 0-1 avg.
Note: The increment the study uses to calculate effect estimates is a doubling in CO levels, but The study did not provide this value.
January 2010 C-61
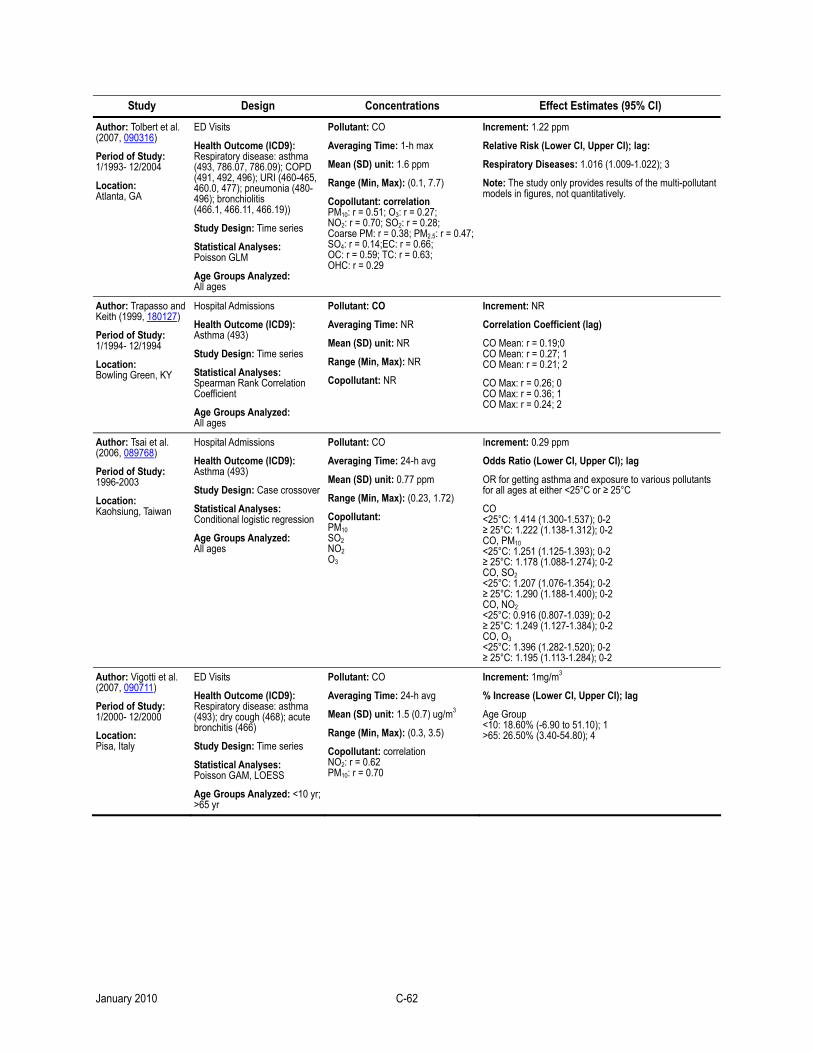
Study Design Concentrations Effect Estimates (95% CI)
Author: Tolbert et al. (2007, 090316)
Period of Study: 1/1993- 12/2004
Location: Atlanta, GA
ED Visits
Health Outcome (ICD9): Respiratory disease: asthma (493, 786.07, 786.09); COPD (491, 492, 496); URI (460-465, 460.0, 477); pneumonia (480-496); bronchiolitis (466.1, 466.11, 466.19))
Study Design: Time series
Statistical Analyses: Poisson GLM
Age Groups Analyzed: All ages
Pollutant: CO
Averaging Time: 1-h max
Mean (SD) unit: 1.6 ppm
Range (Min, Max): (0.1, 7.7)
Copollutant: correlation PM10: r = 0.51; O3: r = 0.27; NO2: r = 0.70; SO2: r = 0.28; Coarse PM: r = 0.38; PM2.5: r = 0.47; SO4: r = 0.14;EC: r = 0.66; OC: r = 0.59; TC: r = 0.63; OHC: r = 0.29
Increment: 1.22 ppm
Relative Risk (Lower CI, Upper CI); lag:
Respiratory Diseases: 1.016 (1.009-1.022); 3
Note: The study only provides results of the multi-pollutant models in figures, not quantitatively.
Author: Trapasso and Keith (1999, 180127)
Period of Study: 1/1994- 12/1994
Location: Bowling Green, KY
Hospital Admissions
Health Outcome (ICD9): Asthma (493)
Study Design: Time series
Statistical Analyses: Spearman Rank Correlation Coefficient
Age Groups Analyzed: All ages
Pollutant: CO
Averaging Time: NR
Mean (SD) unit: NR
Range (Min, Max): NR
Copollutant: NR
Increment: NR
Correlation Coefficient (lag)
CO Mean: r = 0.19;0 CO Mean: r = 0.27; 1 CO Mean: r = 0.21; 2
CO Max: r = 0.26; 0 CO Max: r = 0.36; 1 CO Max: r = 0.24; 2
Author: Tsai et al. (2006, 089768)
Period of Study: 1996-2003
Location: Kaohsiung, Taiwan
Hospital Admissions
Health Outcome (ICD9): Asthma (493)
Study Design: Case crossover
Statistical Analyses: Conditional logistic regression
Age Groups Analyzed: All ages
Pollutant: CO
Averaging Time: 24-h avg
Mean (SD) unit: 0.77 ppm
Range (Min, Max): (0.23, 1.72)
Copollutant: PM10 SO2 NO2 O3
Increment: 0.29 ppm
Odds Ratio (Lower CI, Upper CI); lag
OR for getting asthma and exposure to various pollutants for all ages at either <25°C or ≥ 25°C
CO <25°C: 1.414 (1.300-1.537); 0-2 ≥ 25°C: 1.222 (1.138-1.312); 0-2 CO, PM10 <25°C: 1.251 (1.125-1.393); 0-2 ≥ 25°C: 1.178 (1.088-1.274); 0-2 CO, SO2 <25°C: 1.207 (1.076-1.354); 0-2 ≥ 25°C: 1.290 (1.188-1.400); 0-2 CO, NO2 <25°C: 0.916 (0.807-1.039); 0-2 ≥ 25°C: 1.249 (1.127-1.384); 0-2 CO, O3 <25°C: 1.396 (1.282-1.520); 0-2 ≥ 25°C: 1.195 (1.113-1.284); 0-2
Author: Vigotti et al. (2007, 090711)
Period of Study: 1/2000- 12/2000
Location: Pisa, Italy
ED Visits
Health Outcome (ICD9): Respiratory disease: asthma (493); dry cough (468); acute bronchitis (466)
Study Design: Time series
Statistical Analyses: Poisson GAM, LOESS
Age Groups Analyzed: <10 yr; >65 yr
Pollutant: CO
Averaging Time: 24-h avg
Mean (SD) unit: 1.5 (0.7) ug/m3
Range (Min, Max): (0.3, 3.5)
Copollutant: correlation NO2: r = 0.62 PM10: r = 0.70
Increment: 1mg/m3
% Increase (Lower CI, Upper CI); lag
Age Group <10: 18.60% (-6.90 to 51.10); 1 >65: 26.50% (3.40-54.80); 4
January 2010 C-62

Study Design Concentrations Effect Estimates (95% CI)
Author: Villeneuve et al. (2006, 091179)
Period of Study: 1995-2000
Location: Toronto, ON, Canada
Physician Visits
Health Outcome (ICD9): Allergic rhinitis (177)
Study Design: Time series
Statistical Analyses: Poisson GLM
Age Groups Analyzed: >65 yr
Pollutant: CO
Averaging Time: 24-h avg
Mean (SD) unit: 1.1 (0.4) ppm
Range (Min, Max): (0.0, 2.2)
Copollutant: PM2.5 PM10 PM10-2.5 SO2 NO2 O3
Increment: 0.4 ppm
Odds Ratio (Lower CI, Upper CI); Lag
The study did not present quantitative results for CO.
Author: Xirasagar et al. (2006, 093267)
Period of Study: 1998- 2001
Location: Taiwan
Hospital Admissions
Health Outcome (ICD9): Asthma (493)
Study Design: Cross sectional
Statistical Analyses: Spearman Rank Correlations
Age Groups Analyzed: 0-14 yr; <2 yr; 2-5 yr; >5 yr
Pollutant: CO
Averaging Time: Monthly
Mean (SD) unit: NR
Range (Min, Max): NR
Copollutant: NR
Increment: NR
Correlation Coefficient (Lag)
Age Group: <2: r = -0.208 2-5: r = -0.281 >5: r = -0.134
Author: Yang et al. (2007, 092848)
Period of Study: 1996-2003
Location: Taipei, Taiwan
Hospital Admissions
Health Outcome (ICD9): Asthma (493)
Study Design: Case crossover
Statistical Analyses: Conditional logistic regression
Age Groups Analyzed: All ages
Pollutant: CO
Averaging Time: 24-h avg
Mean (SD) unit: 1.33 ppm
Range (Min, Max): (0.32, 3.62)
Copollutant: PM10 SO2 NO2 O3
Increment: 0.53 ppm
Odds Ratio (Lower CI, Upper CI); Lag
CO <25°C: 1.076 (1.019-1.136); 0-2 ≥ 25°C: 1.277 (1.179-1.383); 0-2 CO, PM10 <25°C: 1.050 (0.983-1.122); 0-2 ≥ 25°C: 1.332 (1.216-1.459); 0-2 CO, SO2 <25°C: 1.131 (1.059-1.207); 0-2 ≥ 25°C: 1.278 (1.174-1.392); 0-2 CO, NO2 <25°C: 0.915 (0.839-0.997); 0-2 ≥ 25°C: 1.177 (1.049-1.320); 0-2 CO, O3 <25°C: 1.169 (1.102-1.240); 0-2 ≥ 25°C: 1.275 (1.177-1.382); 0-2
Author: Yang et al. (2007, 092847)
Period of Study: 1996-2003
Location: Taipei, Taiwan
Hospital Admissions
Health Outcome (ICD9): COPD: (490-492, 494, 496)
Study Design: Case crossover
Statistical Analyses: Conditional logistic regression
Age Groups Analyzed: All ages
Pollutant: CO
Averaging Time: 24-h avg
Mean (SD) unit: 1.33 ppm
Range (Min, Max): (0.32, 3.66) ppm
Copollutant: PM10 SO2 NO2 O3
Increment: 0.53 ppm
Odds Ratio (Lower CI, Upper CI); Lag
CO <20°C: 0.975 (0.921,1.033); 0-2 ≥ 20°C: 1.227 (1.178-1.277); 0-2 CO, PM10 <20°C: 0.925 (0.863-0.992); 0-2 ≥ 20°C: 1.177 (1.123-1.235); 0-2 CO, SO2 <20°C: 0.895 (0.832-0.962); 0-2 ≥ 20°C: 1.274 (1.219-1.331); 0-2 CO, NO2 <20°C: 1.000 (0.910-1.099); 0-2 ≥ 20°C: 1.061 (0.998-1.129); 0-2 CO, O3 <20°C: 0.935 (0.875-0.999); 0-2 ≥ 20°C: 1.234 (1.185-1.285); 0-2
January 2010 C-63
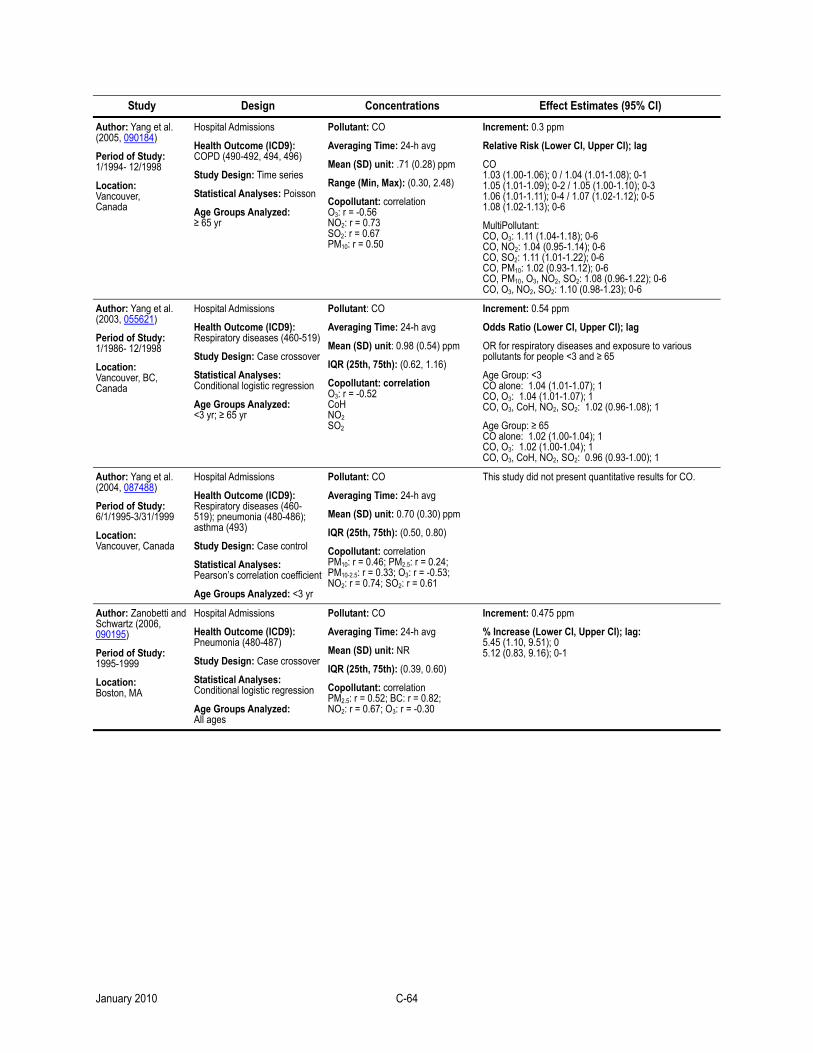
Study Design Concentrations Effect Estimates (95% CI)
Author: Yang et al. (2005, 090184)
Period of Study: 1/1994- 12/1998
Location: Vancouver, Canada
Hospital Admissions
Health Outcome (ICD9): COPD (490-492, 494, 496)
Study Design: Time series
Statistical Analyses: Poisson
Age Groups Analyzed: ≥ 65 yr
Pollutant: CO
Averaging Time: 24-h avg
Mean (SD) unit: .71 (0.28) ppm
Range (Min, Max): (0.30, 2.48)
Copollutant: correlation O3: r = -0.56 NO2: r = 0.73 SO2: r = 0.67 PM10: r = 0.50
Increment: 0.3 ppm
Relative Risk (Lower CI, Upper CI); lag
CO 1.03 (1.00-1.06); 0 / 1.04 (1.01-1.08); 0-1 1.05 (1.01-1.09); 0-2 / 1.05 (1.00-1.10); 0-3 1.06 (1.01-1.11); 0-4 / 1.07 (1.02-1.12); 0-5 1.08 (1.02-1.13); 0-6
MultiPollutant: CO, O3: 1.11 (1.04-1.18); 0-6 CO, NO2: 1.04 (0.95-1.14); 0-6 CO, SO2: 1.11 (1.01-1.22); 0-6 CO, PM10: 1.02 (0.93-1.12); 0-6 CO, PM10, O3, NO2, SO2: 1.08 (0.96-1.22); 0-6 CO, O3, NO2, SO2: 1.10 (0.98-1.23); 0-6
Author: Yang et al. (2003, 055621)
Period of Study: 1/1986- 12/1998
Location: Vancouver, BC, Canada
Hospital Admissions
Health Outcome (ICD9): Respiratory diseases (460-519)
Study Design: Case crossover
Statistical Analyses: Conditional logistic regression
Age Groups Analyzed: <3 yr; ≥ 65 yr
Pollutant: CO
Averaging Time: 24-h avg
Mean (SD) unit: 0.98 (0.54) ppm
IQR (25th, 75th): (0.62, 1.16)
Copollutant: correlation O3: r = -0.52 CoH NO2 SO2
Increment: 0.54 ppm
Odds Ratio (Lower CI, Upper CI); lag
OR for respiratory diseases and exposure to various pollutants for people <3 and ≥ 65
Age Group: <3 CO alone: 1.04 (1.01-1.07); 1 CO, O3: 1.04 (1.01-1.07); 1 CO, O3, CoH, NO2, SO2: 1.02 (0.96-1.08); 1
Age Group: ≥ 65 CO alone: 1.02 (1.00-1.04); 1 CO, O3: 1.02 (1.00-1.04); 1 CO, O3, CoH, NO2, SO2: 0.96 (0.93-1.00); 1
Author: Yang et al. (2004, 087488)
Period of Study: 6/1/1995-3/31/1999
Location: Vancouver, Canada
Hospital Admissions
Health Outcome (ICD9): Respiratory diseases (460-519); pneumonia (480-486); asthma (493)
Study Design: Case control
Statistical Analyses: Pearson’s correlation coefficient
Age Groups Analyzed: <3 yr
Pollutant: CO
Averaging Time: 24-h avg
Mean (SD) unit: 0.70 (0.30) ppm
IQR (25th, 75th): (0.50, 0.80)
Copollutant: correlation PM10: r = 0.46; PM2.5: r = 0.24; PM10-2.5: r = 0.33; O3: r = -0.53; NO2: r = 0.74; SO2: r = 0.61
This study did not present quantitative results for CO.
Author: Zanobetti and Schwartz (2006, 090195)
Period of Study: 1995-1999
Location: Boston, MA
Hospital Admissions
Health Outcome (ICD9): Pneumonia (480-487)
Study Design: Case crossover
Statistical Analyses: Conditional logistic regression
Age Groups Analyzed: All ages
Pollutant: CO
Averaging Time: 24-h avg
Mean (SD) unit: NR
IQR (25th, 75th): (0.39, 0.60)
Copollutant: correlation PM2.5: r = 0.52; BC: r = 0.82; NO2: r = 0.67; O3: r = -0.30
Increment: 0.475 ppm
% Increase (Lower CI, Upper CI); lag: 5.45 (1.10, 9.51); 0 5.12 (0.83, 9.16); 0-1
January 2010 C-64
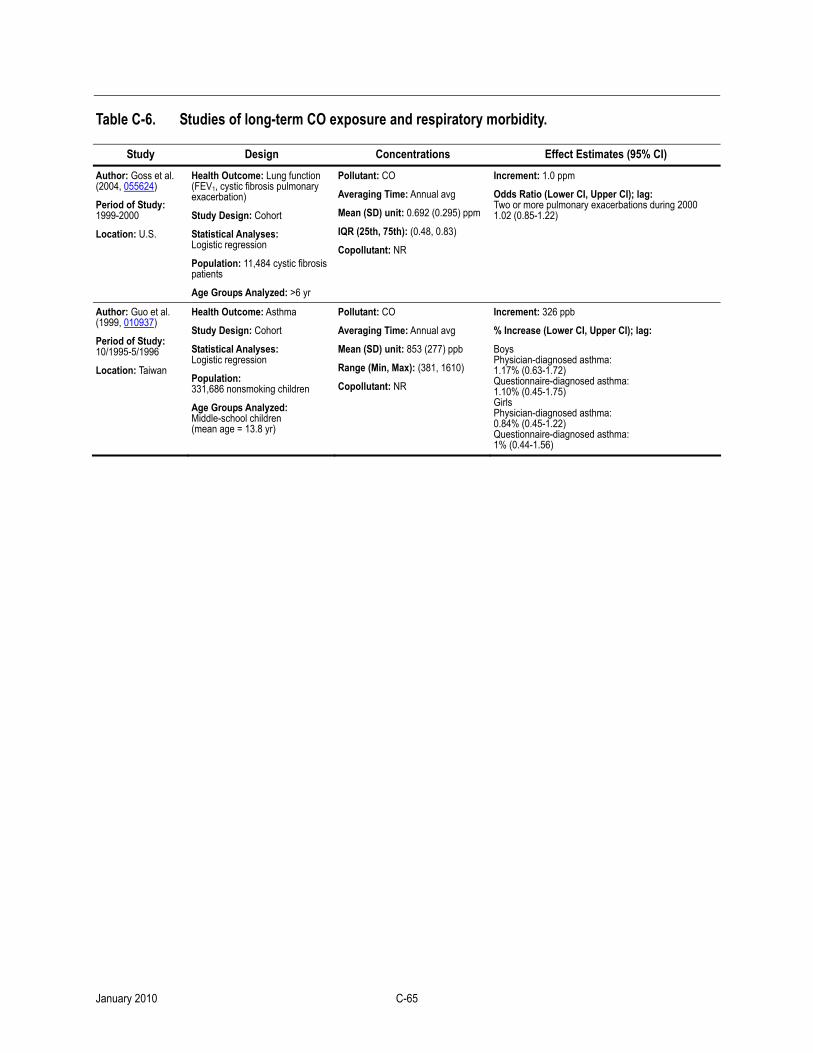
Table C-6. Studies of long-term CO exposure and respiratory morbidity.
Study Design Concentrations Effect Estimates (95% CI)
Author: Goss et al. (2004, 055624)
Period of Study: 1999-2000
Location: U.S.
Health Outcome: Lung function (FEV1, cystic fibrosis pulmonary exacerbation)
Study Design: Cohort
Statistical Analyses: Logistic regression
Population: 11,484 cystic fibrosis patients
Age Groups Analyzed: >6 yr
Pollutant: CO
Averaging Time: Annual avg
Mean (SD) unit: 0.692 (0.295) ppm
IQR (25th, 75th): (0.48, 0.83)
Copollutant: NR
Increment: 1.0 ppm
Odds Ratio (Lower CI, Upper CI); lag: Two or more pulmonary exacerbations during 2000 1.02 (0.85-1.22)
Author: Guo et al. (1999, 010937)
Period of Study: 10/1995-5/1996
Location: Taiwan
Health Outcome: Asthma
Study Design: Cohort
Statistical Analyses: Logistic regression
Population: 331,686 nonsmoking children
Age Groups Analyzed: Middle-school children (mean age = 13.8 yr)
Pollutant: CO
Averaging Time: Annual avg
Mean (SD) unit: 853 (277) ppb
Range (Min, Max): (381, 1610)
Copollutant: NR
Increment: 326 ppb
% Increase (Lower CI, Upper CI); lag:
Boys Physician-diagnosed asthma: 1.17% (0.63-1.72) Questionnaire-diagnosed asthma: 1.10% (0.45-1.75) Girls Physician-diagnosed asthma: 0.84% (0.45-1.22) Questionnaire-diagnosed asthma: 1% (0.44-1.56)
January 2010 C-65

Study Design Concentrations Effect Estimates (95% CI)
Author: Hirsch et al. (1999, 003537)
Period of Study: Population: 9/1995-6/1996 Air: 4/1994-4/1995
Location: Dresden, Germany
Health Outcome: Asthma symptoms in the past 12 mo (wheeze, morning cough); Doctor's diagnosis (asthma, bronchitis); Lung function (bronchial hyperresponsiveness (BHR), FEV1 <85% pred., FEF25-75% <70% pred.)
Study Design: Cross sectional
Statistical Analyses: Multiple logistic regression
Population: 5-7: 2,796; 9-11: 2,625
Age Groups Analyzed: 5-7 and 9-11 yr
Pollutant: CO
Averaging Time: Annual avg
Mean (SD) unit: 0.69 mg/m3
Range (Min, Max): (0.32, 1.54)
Copollutant: NR
Increment: 0.2 µg/m3
Prevalence Odds Ratio (Lower CI, Upper CI); lag:
Symptoms in the past 12 mo: Wheeze Home Exposure Age Groups: 5-7; 9-11: 1.05 (0.93-1.18) Home/School Exposure Age Groups: 9-11: 1.02 (0.85-1.22)
Morning Cough Home Exposure Age Groups: 5-7; 9-11: 1.12 (1.01-1.23) Age Group: 9-11: 1.13 (0.98-1.3)
Doctor’s diagnosis: Asthma Home Exposure Age Groups: 5-7; 9-11: 1.07 (0.94-1.21) Age Groups: 9-11: 1.16 (0.97-1.38)
Doctor’s diagnosis: Bronchitis Age Groups: 5-7; 9-11: 1.19 (1.11-1.27) Age Group: 9-11: 1.24 (1.12-1.38)
Lung function: BHR Age Groups: 5-7; 9-11: 0.79 (0.63-0.99) Age Group: 9-11: 0.77 (0.6-0.99)
Lung function: FEV1 <85% pred. Age Groups: 5-7; 9-11: 1.09 (0.81-1.47) Age Group: 9-11: 1.01 (0.73-1.41)
Lung function: FEV25-75% <70% pred. Age Groups: 5-7; 9-11: 1.15 (0.94-1.39) Age Group: 9-11: 1.07 (0.86-1.34)
Symptoms in the past 12 mo: Wheeze Age Groups: 5-7; 9-11 Atopic children: 1 (0.81-1.24) Nonatopic children: 1.05 (0.83-1.31) Morning cough Age Groups: 5-7; 9-11 Atopic children: 1.03 (0.82-1.29) Nonatopic children: 1.22 (1.05-1.41) Doctor’s diagnosis: Asthma Atopic children: 1.05 (0.83-1.32) Nonatopic children: 1.29 (1.05-1.59) Doctor’s diagnosis: Bronchitis Age Groups: 5-7; 9-11 Atopic children: 1 (0.86-1.16) Nonatopic children: 1.21 (1.1-1.33)
Notes: Atopic Children were defined as those children with specific IgE to aeroallergens >0.7 kU-L-1; Nonatopic Children were defined as those children with specific IgE to aeroallergens ≤ 0.7 kU-L-1.
Author: Hwang et al. (2006, 088971)
Period of Study: 2001
Location: Taiwan
Health Outcome: Allergic rhinitis
Study Design: Cross sectional
Statistical Analyses: Two-stage hierarchical model (logistic and linear regression)
Population: 32,143 Taiwanese school children
Age Groups Analyzed: 6-15 yr
Pollutant: CO
Averaging Time: Annual avg
Mean (SD) unit: 664 (153) ppb
Range (Min, Max): (416, 964)
Copollutant: correlation NOX: r = 0.88 O3: r = -0.37 PM10: r = 0.27 SO2: r = 0.40
Increment: 100 ppb
Adjusted Odds Ratio (Lower CI, Upper CI); lag:
Physician-diagnosed allergic rhinitis 1.05 (1.04-1.07)
CO, SO2: 1.04 (1.02-1.06) CO, PM10: 1.05 (1.03-1.07) CO, O3: 1.07 (1.05-1.09)
Male: 1.06 (1.03-1.08); Female: 1.05 (1.02-1.08)
Parental atopy: Yes: 1.05 (1.02-1.08) Parental atopy: No: 1.06 (1.03-1.08) Parental Education: <6: 1 (0.91-1.09) Parental Education: 6-8: 1.07 (1.02-.12) Parental Education: 9-11: 1.05 (1.02-1.08) Parental Education: ≥ 12: 1.06 (1.03-1.09)
ETS: Yes: 1.06 (1.03-1.08); ETS: No: 1.05 (1.02-1.08) Visible Mold: Yes: 1.07 (1.03-1.11) Visible Mold: No: 1.05 (1.03-1.07)
January 2010 C-66
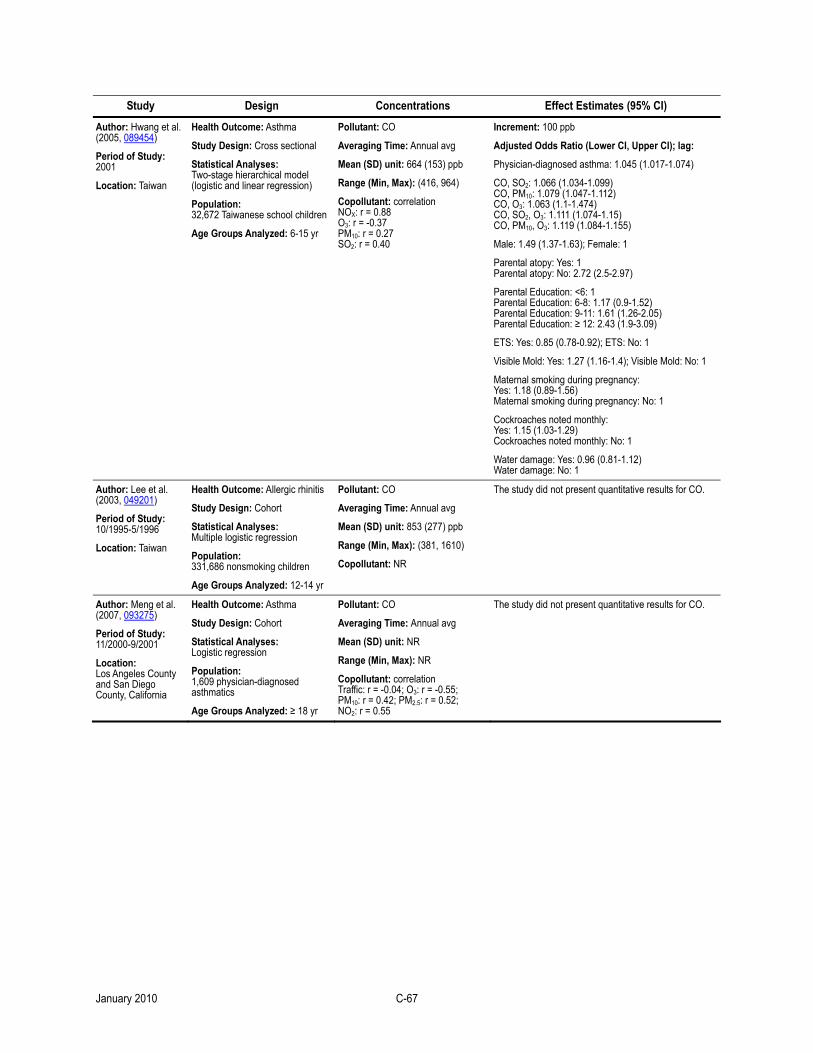
Study Design Concentrations Effect Estimates (95% CI)
Author: Hwang et al. (2005, 089454)
Period of Study: 2001
Location: Taiwan
Health Outcome: Asthma
Study Design: Cross sectional
Statistical Analyses: Two-stage hierarchical model (logistic and linear regression)
Population: 32,672 Taiwanese school children
Age Groups Analyzed: 6-15 yr
Pollutant: CO
Averaging Time: Annual avg
Mean (SD) unit: 664 (153) ppb
Range (Min, Max): (416, 964)
Copollutant: correlation NOX: r = 0.88 O3: r = -0.37 PM10: r = 0.27 SO2: r = 0.40
Increment: 100 ppb
Adjusted Odds Ratio (Lower CI, Upper CI); lag:
Physician-diagnosed asthma: 1.045 (1.017-1.074)
CO, SO2: 1.066 (1.034-1.099) CO, PM10: 1.079 (1.047-1.112) CO, O3: 1.063 (1.1-1.474) CO, SO2, O3: 1.111 (1.074-1.15) CO, PM10, O3: 1.119 (1.084-1.155)
Male: 1.49 (1.37-1.63); Female: 1
Parental atopy: Yes: 1 Parental atopy: No: 2.72 (2.5-2.97)
Parental Education: <6: 1 Parental Education: 6-8: 1.17 (0.9-1.52) Parental Education: 9-11: 1.61 (1.26-2.05) Parental Education: ≥ 12: 2.43 (1.9-3.09)
ETS: Yes: 0.85 (0.78-0.92); ETS: No: 1
Visible Mold: Yes: 1.27 (1.16-1.4); Visible Mold: No: 1
Maternal smoking during pregnancy: Yes: 1.18 (0.89-1.56) Maternal smoking during pregnancy: No: 1
Cockroaches noted monthly: Yes: 1.15 (1.03-1.29) Cockroaches noted monthly: No: 1
Water damage: Yes: 0.96 (0.81-1.12) Water damage: No: 1
Author: Lee et al. (2003, 049201)
Period of Study: 10/1995-5/1996
Location: Taiwan
Health Outcome: Allergic rhinitis
Study Design: Cohort
Statistical Analyses: Multiple logistic regression
Population: 331,686 nonsmoking children
Age Groups Analyzed: 12-14 yr
Pollutant: CO
Averaging Time: Annual avg
Mean (SD) unit: 853 (277) ppb
Range (Min, Max): (381, 1610)
Copollutant: NR
The study did not present quantitative results for CO.
Author: Meng et al. (2007, 093275)
Period of Study: 11/2000-9/2001
Location: Los Angeles County and San Diego County, California
Health Outcome: Asthma
Study Design: Cohort
Statistical Analyses: Logistic regression
Population: 1,609 physician-diagnosed asthmatics
Age Groups Analyzed: ≥ 18 yr
Pollutant: CO
Averaging Time: Annual avg
Mean (SD) unit: NR
Range (Min, Max): NR
Copollutant: correlation Traffic: r = -0.04; O3: r = -0.55; PM10: r = 0.42; PM2.5: r = 0.52; NO2: r = 0.55
The study did not present quantitative results for CO.
January 2010 C-67
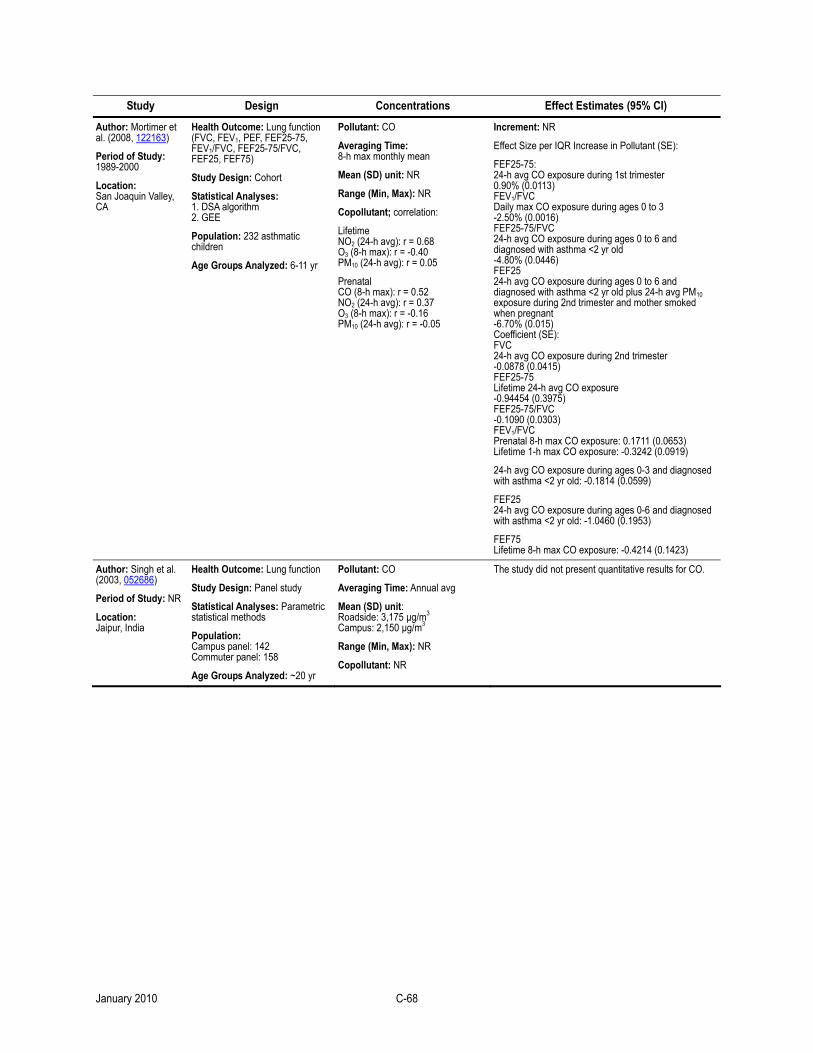
Study Design Concentrations Effect Estimates (95% CI)
Author: Mortimer et al. (2008, 122163)
Period of Study: 1989-2000
Location: San Joaquin Valley, CA
Health Outcome: Lung function (FVC, FEV1, PEF, FEF25-75, FEV1/FVC, FEF25-75/FVC, FEF25, FEF75)
Study Design: Cohort
Statistical Analyses: 1. DSA algorithm 2. GEE
Population: 232 asthmatic children
Age Groups Analyzed: 6-11 yr
Pollutant: CO
Averaging Time: 8-h max monthly mean
Mean (SD) unit: NR
Range (Min, Max): NR
Copollutant; correlation:
Lifetime NO2 (24-h avg): r = 0.68 O3 (8-h max): r = -0.40 PM10 (24-h avg): r = 0.05
Prenatal CO (8-h max): r = 0.52 NO2 (24-h avg): r = 0.37 O3 (8-h max): r = -0.16 PM10 (24-h avg): r = -0.05
Increment: NR
Effect Size per IQR Increase in Pollutant (SE):
FEF25-75: 24-h avg CO exposure during 1st trimester 0.90% (0.0113) FEV1/FVC Daily max CO exposure during ages 0 to 3 -2.50% (0.0016) FEF25-75/FVC 24-h avg CO exposure during ages 0 to 6 and diagnosed with asthma <2 yr old -4.80% (0.0446) FEF25 24-h avg CO exposure during ages 0 to 6 and diagnosed with asthma <2 yr old plus 24-h avg PM10 exposure during 2nd trimester and mother smoked when pregnant -6.70% (0.015) Coefficient (SE): FVC 24-h avg CO exposure during 2nd trimester -0.0878 (0.0415) FEF25-75 Lifetime 24-h avg CO exposure -0.94454 (0.3975) FEF25-75/FVC -0.1090 (0.0303) FEV1/FVC Prenatal 8-h max CO exposure: 0.1711 (0.0653) Lifetime 1-h max CO exposure: -0.3242 (0.0919)
24-h avg CO exposure during ages 0-3 and diagnosed with asthma <2 yr old: -0.1814 (0.0599)
FEF25 24-h avg CO exposure during ages 0-6 and diagnosed with asthma <2 yr old: -1.0460 (0.1953)
FEF75 Lifetime 8-h max CO exposure: -0.4214 (0.1423)
Author: Singh et al. (2003, 052686)
Period of Study: NR
Location: Jaipur, India
Health Outcome: Lung function
Study Design: Panel study
Statistical Analyses: Parametric statistical methods
Population: Campus panel: 142 Commuter panel: 158
Age Groups Analyzed: ~20 yr
Pollutant: CO
Averaging Time: Annual avg
Mean (SD) unit: Roadside: 3,175 µg/m3 Campus: 2,150 µg/m3
Range (Min, Max): NR
Copollutant: NR
The study did not present quantitative results for CO.
January 2010 C-68
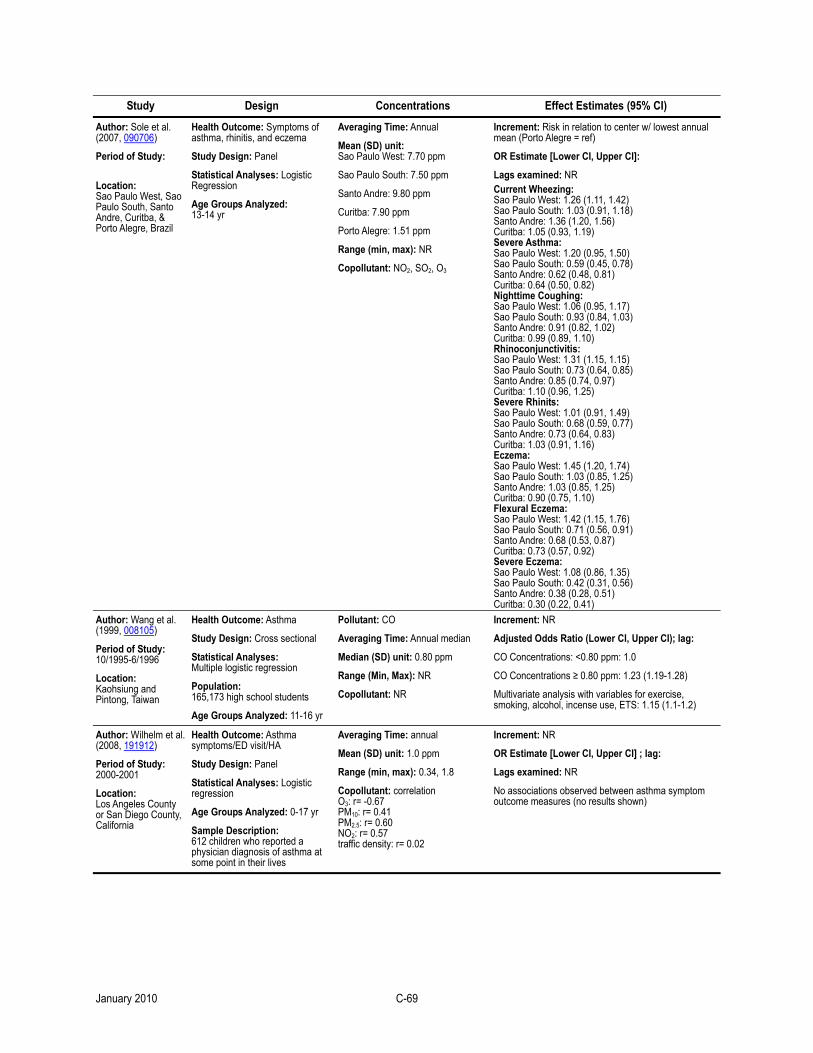
Study Design Concentrations Effect Estimates (95% CI)
Author: Sole et al. (2007, 090706)
Period of Study:
Location: Sao Paulo West, Sao Paulo South, Santo Andre, Curitba, & Porto Alegre, Brazil
Health Outcome: Symptoms of asthma, rhinitis, and eczema
Study Design: Panel
Statistical Analyses: Logistic Regression
Age Groups Analyzed: 13-14 yr
Averaging Time: Annual
Mean (SD) unit: Sao Paulo West: 7.70 ppm
Sao Paulo South: 7.50 ppm
Santo Andre: 9.80 ppm
Curitba: 7.90 ppm
Porto Alegre: 1.51 ppm
Range (min, max): NR
Copollutant: NO2, SO2, O3
Increment: Risk in relation to center w/ lowest annual mean (Porto Alegre = ref)
OR Estimate [Lower CI, Upper CI]:
Lags examined: NR Current Wheezing: Sao Paulo West: 1.26 (1.11, 1.42) Sao Paulo South: 1.03 (0.91, 1.18) Santo Andre: 1.36 (1.20, 1.56) Curitba: 1.05 (0.93, 1.19) Severe Asthma: Sao Paulo West: 1.20 (0.95, 1.50) Sao Paulo South: 0.59 (0.45, 0.78) Santo Andre: 0.62 (0.48, 0.81) Curitba: 0.64 (0.50, 0.82) Nighttime Coughing: Sao Paulo West: 1.06 (0.95, 1.17) Sao Paulo South: 0.93 (0.84, 1.03) Santo Andre: 0.91 (0.82, 1.02) Curitba: 0.99 (0.89, 1.10) Rhinoconjunctivitis: Sao Paulo West: 1.31 (1.15, 1.15) Sao Paulo South: 0.73 (0.64, 0.85) Santo Andre: 0.85 (0.74, 0.97) Curitba: 1.10 (0.96, 1.25) Severe Rhinits: Sao Paulo West: 1.01 (0.91, 1.49) Sao Paulo South: 0.68 (0.59, 0.77) Santo Andre: 0.73 (0.64, 0.83) Curitba: 1.03 (0.91, 1.16) Eczema: Sao Paulo West: 1.45 (1.20, 1.74) Sao Paulo South: 1.03 (0.85, 1.25) Santo Andre: 1.03 (0.85, 1.25) Curitba: 0.90 (0.75, 1.10) Flexural Eczema: Sao Paulo West: 1.42 (1.15, 1.76) Sao Paulo South: 0.71 (0.56, 0.91) Santo Andre: 0.68 (0.53, 0.87) Curitba: 0.73 (0.57, 0.92) Severe Eczema: Sao Paulo West: 1.08 (0.86, 1.35) Sao Paulo South: 0.42 (0.31, 0.56) Santo Andre: 0.38 (0.28, 0.51) Curitba: 0.30 (0.22, 0.41)
Author: Wang et al. (1999, 008105)
Period of Study: 10/1995-6/1996
Location: Kaohsiung and Pintong, Taiwan
Health Outcome: Asthma
Study Design: Cross sectional
Statistical Analyses: Multiple logistic regression
Population: 165,173 high school students
Age Groups Analyzed: 11-16 yr
Pollutant: CO
Averaging Time: Annual median
Median (SD) unit: 0.80 ppm
Range (Min, Max): NR
Copollutant: NR
Increment: NR
Adjusted Odds Ratio (Lower CI, Upper CI); lag:
CO Concentrations: <0.80 ppm: 1.0
CO Concentrations ≥ 0.80 ppm: 1.23 (1.19-1.28)
Multivariate analysis with variables for exercise, smoking, alcohol, incense use, ETS: 1.15 (1.1-1.2)
Author: Wilhelm et al. (2008, 191912)
Period of Study: 2000-2001
Location: Los Angeles County or San Diego County, California
Health Outcome: Asthma symptoms/ED visit/HA
Study Design: Panel
Statistical Analyses: Logistic regression
Age Groups Analyzed: 0-17 yr
Sample Description: 612 children who reported a physician diagnosis of asthma at some point in their lives
Averaging Time: annual
Mean (SD) unit: 1.0 ppm
Range (min, max): 0.34, 1.8
Copollutant: correlation O3: r= -0.67 PM10: r= 0.41 PM2.5: r= 0.60 NO2: r= 0.57 traffic density: r= 0.02
Increment: NR
OR Estimate [Lower CI, Upper CI] ; lag:
Lags examined: NR
No associations observed between asthma symptom outcome measures (no results shown)
January 2010 C-69
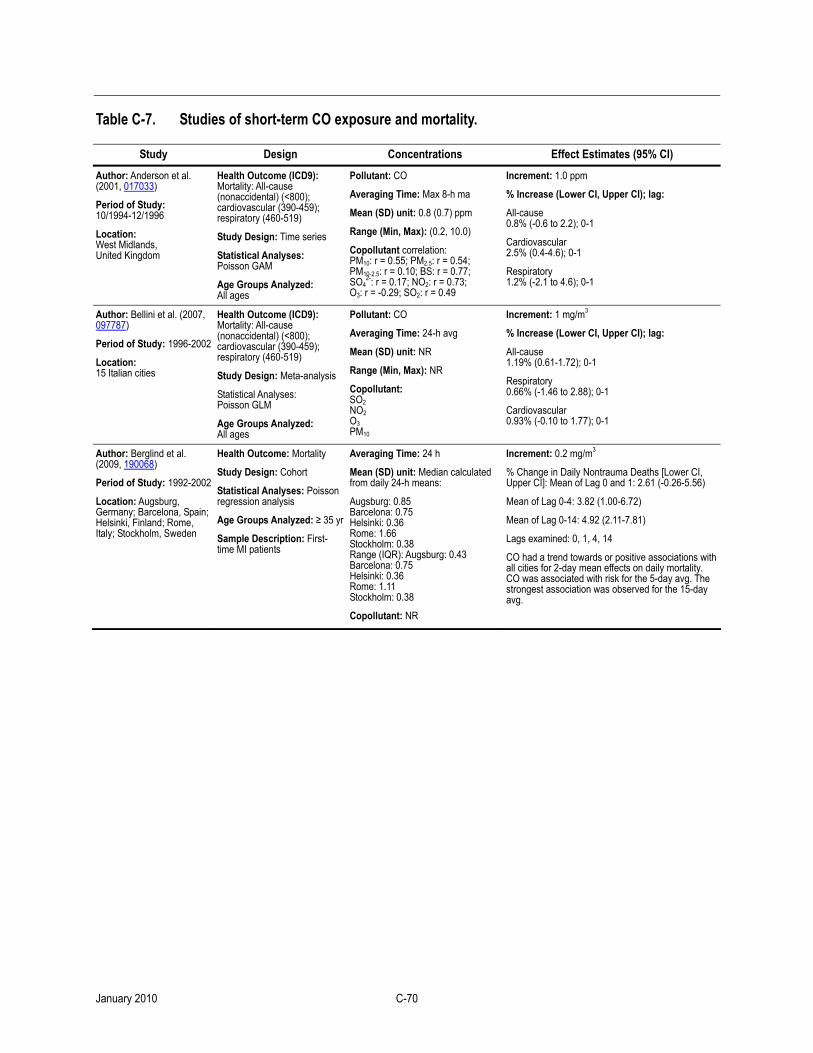
Table C-7. Studies of short-term CO exposure and mortality.
Study Design Concentrations Effect Estimates (95% CI)
Author: Anderson et al. (2001, 017033)
Period of Study: 10/1994-12/1996
Location: West Midlands, United Kingdom
Health Outcome (ICD9): Mortality: All-cause (nonaccidental) (<800); cardiovascular (390-459); respiratory (460-519)
Study Design: Time series
Statistical Analyses: Poisson GAM
Age Groups Analyzed: All ages
Pollutant: CO
Averaging Time: Max 8-h ma
Mean (SD) unit: 0.8 (0.7) ppm
Range (Min, Max): (0.2, 10.0)
Copollutant correlation: PM10: r = 0.55; PM2.5: r = 0.54; PM10-2.5: r = 0.10; BS: r = 0.77; SO4
2-: r = 0.17; NO2: r = 0.73; O3: r = -0.29; SO2: r = 0.49
Increment: 1.0 ppm
% Increase (Lower CI, Upper CI); lag:
All-cause 0.8% (-0.6 to 2.2); 0-1
Cardiovascular 2.5% (0.4-4.6); 0-1
Respiratory 1.2% (-2.1 to 4.6); 0-1
Author: Bellini et al. (2007, 097787)
Period of Study: 1996-2002
Location: 15 Italian cities
Health Outcome (ICD9): Mortality: All-cause (nonaccidental) (<800); cardiovascular (390-459); respiratory (460-519)
Study Design: Meta-analysis
Statistical Analyses: Poisson GLM
Age Groups Analyzed: All ages
Pollutant: CO
Averaging Time: 24-h avg
Mean (SD) unit: NR
Range (Min, Max): NR
Copollutant: SO2 NO2 O3 PM10
Increment: 1 mg/m3
% Increase (Lower CI, Upper CI); lag:
All-cause 1.19% (0.61-1.72); 0-1
Respiratory 0.66% (-1.46 to 2.88); 0-1
Cardiovascular 0.93% (-0.10 to 1.77); 0-1
Author: Berglind et al. (2009, 190068)
Period of Study: 1992-2002
Location: Augsburg, Germany; Barcelona, Spain; Helsinki, Finland; Rome, Italy; Stockholm, Sweden
Health Outcome: Mortality
Study Design: Cohort
Statistical Analyses: Poisson regression analysis
Age Groups Analyzed: ≥ 35 yr
Sample Description: First-time MI patients
Averaging Time: 24 h
Mean (SD) unit: Median calculated from daily 24-h means:
Augsburg: 0.85 Barcelona: 0.75 Helsinki: 0.36 Rome: 1.66 Stockholm: 0.38 Range (IQR): Augsburg: 0.43 Barcelona: 0.75 Helsinki: 0.36 Rome: 1.11 Stockholm: 0.38
Copollutant: NR
Increment: 0.2 mg/m3
% Change in Daily Nontrauma Deaths [Lower CI, Upper CI]: Mean of Lag 0 and 1: 2.61 (-0.26-5.56)
Mean of Lag 0-4: 3.82 (1.00-6.72)
Mean of Lag 0-14: 4.92 (2.11-7.81)
Lags examined: 0, 1, 4, 14
CO had a trend towards or positive associations with all cities for 2-day mean effects on daily mortality. CO was associated with risk for the 5-day avg. The strongest association was observed for the 15-day avg.
January 2010 C-70
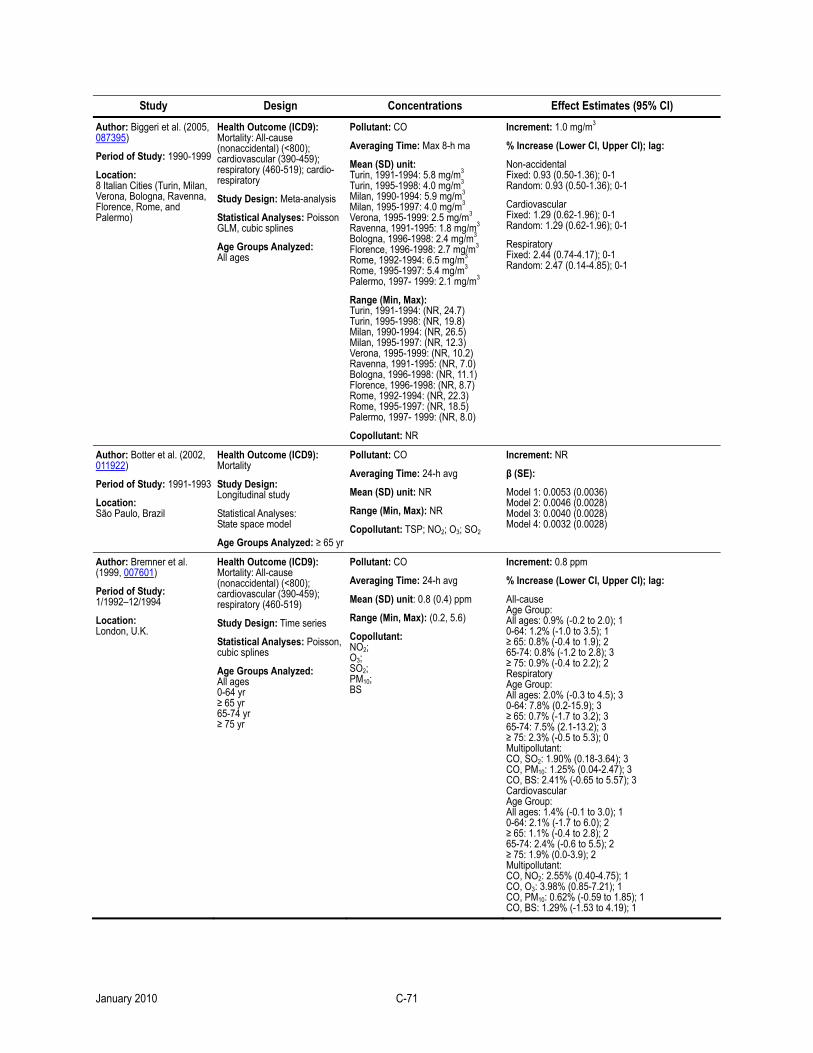
Study Design Concentrations Effect Estimates (95% CI)
Author: Biggeri et al. (2005, 087395)
Period of Study: 1990-1999
Location: 8 Italian Cities (Turin, Milan, Verona, Bologna, Ravenna, Florence, Rome, and Palermo)
Health Outcome (ICD9): Mortality: All-cause (nonaccidental) (<800); cardiovascular (390-459); respiratory (460-519); cardio-respiratory
Study Design: Meta-analysis
Statistical Analyses: Poisson GLM, cubic splines
Age Groups Analyzed: All ages
Pollutant: CO
Averaging Time: Max 8-h ma
Mean (SD) unit: Turin, 1991-1994: 5.8 mg/m3 Turin, 1995-1998: 4.0 mg/m3 Milan, 1990-1994: 5.9 mg/m3 Milan, 1995-1997: 4.0 mg/m3 Verona, 1995-1999: 2.5 mg/m3 Ravenna, 1991-1995: 1.8 mg/m3 Bologna, 1996-1998: 2.4 mg/m3 Florence, 1996-1998: 2.7 mg/m3 Rome, 1992-1994: 6.5 mg/m3 Rome, 1995-1997: 5.4 mg/m3 Palermo, 1997- 1999: 2.1 mg/m3
Range (Min, Max): Turin, 1991-1994: (NR, 24.7) Turin, 1995-1998: (NR, 19.8) Milan, 1990-1994: (NR, 26.5) Milan, 1995-1997: (NR, 12.3) Verona, 1995-1999: (NR, 10.2) Ravenna, 1991-1995: (NR, 7.0) Bologna, 1996-1998: (NR, 11.1) Florence, 1996-1998: (NR, 8.7) Rome, 1992-1994: (NR, 22.3) Rome, 1995-1997: (NR, 18.5) Palermo, 1997- 1999: (NR, 8.0)
Copollutant: NR
Increment: 1.0 mg/m3
% Increase (Lower CI, Upper CI); lag:
Non-accidental Fixed: 0.93 (0.50-1.36); 0-1 Random: 0.93 (0.50-1.36); 0-1
Cardiovascular Fixed: 1.29 (0.62-1.96); 0-1 Random: 1.29 (0.62-1.96); 0-1
Respiratory Fixed: 2.44 (0.74-4.17); 0-1 Random: 2.47 (0.14-4.85); 0-1
Author: Botter et al. (2002, 011922)
Period of Study: 1991-1993
Location: São Paulo, Brazil
Health Outcome (ICD9): Mortality
Study Design: Longitudinal study
Statistical Analyses: State space model
Age Groups Analyzed: ≥ 65 yr
Pollutant: CO
Averaging Time: 24-h avg
Mean (SD) unit: NR
Range (Min, Max): NR
Copollutant: TSP; NO2; O3; SO2
Increment: NR
β (SE):
Model 1: 0.0053 (0.0036) Model 2: 0.0046 (0.0028) Model 3: 0.0040 (0.0028) Model 4: 0.0032 (0.0028)
Author: Bremner et al. (1999, 007601)
Period of Study: 1/1992–12/1994
Location: London, U.K.
Health Outcome (ICD9): Mortality: All-cause (nonaccidental) (<800); cardiovascular (390-459); respiratory (460-519)
Study Design: Time series
Statistical Analyses: Poisson, cubic splines
Age Groups Analyzed: All ages 0-64 yr ≥ 65 yr 65-74 yr ≥ 75 yr
Pollutant: CO
Averaging Time: 24-h avg
Mean (SD) unit: 0.8 (0.4) ppm
Range (Min, Max): (0.2, 5.6)
Copollutant: NO2; O3; SO2; PM10; BS
Increment: 0.8 ppm
% Increase (Lower CI, Upper CI); lag:
All-cause Age Group: All ages: 0.9% (-0.2 to 2.0); 1 0-64: 1.2% (-1.0 to 3.5); 1 ≥ 65: 0.8% (-0.4 to 1.9); 2 65-74: 0.8% (-1.2 to 2.8); 3 ≥ 75: 0.9% (-0.4 to 2.2); 2 Respiratory Age Group: All ages: 2.0% (-0.3 to 4.5); 3 0-64: 7.8% (0.2-15.9); 3 ≥ 65: 0.7% (-1.7 to 3.2); 3 65-74: 7.5% (2.1-13.2); 3 ≥ 75: 2.3% (-0.5 to 5.3); 0 Multipollutant: CO, SO2: 1.90% (0.18-3.64); 3 CO, PM10: 1.25% (0.04-2.47); 3 CO, BS: 2.41% (-0.65 to 5.57); 3 Cardiovascular Age Group: All ages: 1.4% (-0.1 to 3.0); 1 0-64: 2.1% (-1.7 to 6.0); 2 ≥ 65: 1.1% (-0.4 to 2.8); 2 65-74: 2.4% (-0.6 to 5.5); 2 ≥ 75: 1.9% (0.0-3.9); 2 Multipollutant: CO, NO2: 2.55% (0.40-4.75); 1 CO, O3: 3.98% (0.85-7.21); 1 CO, PM10: 0.62% (-0.59 to 1.85); 1 CO, BS: 1.29% (-1.53 to 4.19); 1
January 2010 C-71
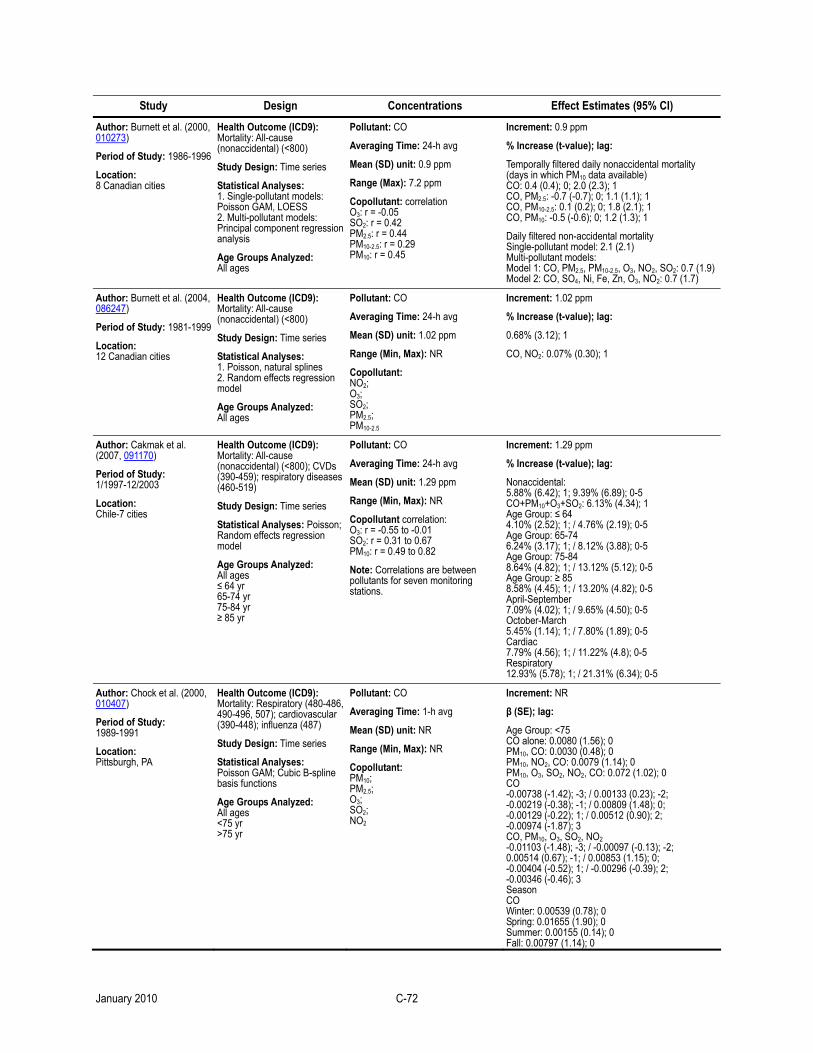
Study Design Concentrations Effect Estimates (95% CI)
Author: Burnett et al. (2000, 010273)
Period of Study: 1986-1996
Location: 8 Canadian cities
Health Outcome (ICD9): Mortality: All-cause (nonaccidental) (<800)
Study Design: Time series
Statistical Analyses: 1. Single-pollutant models: Poisson GAM, LOESS 2. Multi-pollutant models: Principal component regression analysis
Age Groups Analyzed: All ages
Pollutant: CO
Averaging Time: 24-h avg
Mean (SD) unit: 0.9 ppm
Range (Max): 7.2 ppm
Copollutant: correlation O3: r = -0.05 SO2: r = 0.42 PM2.5: r = 0.44 PM10-2.5: r = 0.29 PM10: r = 0.45
Increment: 0.9 ppm
% Increase (t-value); lag:
Temporally filtered daily nonaccidental mortality (days in which PM10 data available) CO: 0.4 (0.4); 0; 2.0 (2.3); 1 CO, PM2.5: -0.7 (-0.7); 0; 1.1 (1.1); 1 CO, PM10-2.5: 0.1 (0.2); 0; 1.8 (2.1); 1 CO, PM10: -0.5 (-0.6); 0; 1.2 (1.3); 1
Daily filtered non-accidental mortality Single-pollutant model: 2.1 (2.1) Multi-pollutant models: Model 1: CO, PM2.5, PM10-2.5, O3, NO2, SO2: 0.7 (1.9)Model 2: CO, SO4, Ni, Fe, Zn, O3, NO2: 0.7 (1.7)
Author: Burnett et al. (2004, 086247)
Period of Study: 1981-1999
Location: 12 Canadian cities
Health Outcome (ICD9): Mortality: All-cause (nonaccidental) (<800)
Study Design: Time series
Statistical Analyses: 1. Poisson, natural splines 2. Random effects regression model
Age Groups Analyzed: All ages
Pollutant: CO
Averaging Time: 24-h avg
Mean (SD) unit: 1.02 ppm
Range (Min, Max): NR
Copollutant: NO2; O3; SO2; PM2.5; PM10-2.5
Increment: 1.02 ppm
% Increase (t-value); lag:
0.68% (3.12); 1
CO, NO2: 0.07% (0.30); 1
Author: Cakmak et al. (2007, 091170)
Period of Study: 1/1997-12/2003
Location: Chile-7 cities
Health Outcome (ICD9): Mortality: All-cause (nonaccidental) (<800); CVDs (390-459); respiratory diseases (460-519)
Study Design: Time series
Statistical Analyses: Poisson; Random effects regression model
Age Groups Analyzed: All ages ≤ 64 yr 65-74 yr 75-84 yr ≥ 85 yr
Pollutant: CO
Averaging Time: 24-h avg
Mean (SD) unit: 1.29 ppm
Range (Min, Max): NR
Copollutant correlation: O3: r = -0.55 to -0.01 SO2: r = 0.31 to 0.67 PM10: r = 0.49 to 0.82
Note: Correlations are between pollutants for seven monitoring stations.
Increment: 1.29 ppm
% Increase (t-value); lag:
Nonaccidental: 5.88% (6.42); 1; 9.39% (6.89); 0-5 CO+PM10+O3+SO2: 6.13% (4.34); 1 Age Group: ≤ 64 4.10% (2.52); 1; / 4.76% (2.19); 0-5 Age Group: 65-74 6.24% (3.17); 1; / 8.12% (3.88); 0-5 Age Group: 75-84 8.64% (4.82); 1; / 13.12% (5.12); 0-5 Age Group: ≥ 85 8.58% (4.45); 1; / 13.20% (4.82); 0-5 April-September 7.09% (4.02); 1; / 9.65% (4.50); 0-5 October-March 5.45% (1.14); 1; / 7.80% (1.89); 0-5 Cardiac 7.79% (4.56); 1; / 11.22% (4.8); 0-5 Respiratory 12.93% (5.78); 1; / 21.31% (6.34); 0-5
Author: Chock et al. (2000, 010407)
Period of Study: 1989-1991
Location: Pittsburgh, PA
Health Outcome (ICD9): Mortality: Respiratory (480-486, 490-496, 507); cardiovascular (390-448); influenza (487)
Study Design: Time series
Statistical Analyses: Poisson GAM; Cubic B-spline basis functions
Age Groups Analyzed: All ages <75 yr >75 yr
Pollutant: CO
Averaging Time: 1-h avg
Mean (SD) unit: NR
Range (Min, Max): NR
Copollutant: PM10; PM2.5; O3; SO2; NO2
Increment: NR
β (SE); lag:
Age Group: <75 CO alone: 0.0080 (1.56); 0 PM10, CO: 0.0030 (0.48); 0 PM10, NO2, CO: 0.0079 (1.14); 0 PM10, O3, SO2, NO2, CO: 0.072 (1.02); 0 CO -0.00738 (-1.42); -3; / 0.00133 (0.23); -2; -0.00219 (-0.38); -1; / 0.00809 (1.48); 0; -0.00129 (-0.22); 1; / 0.00512 (0.90); 2; -0.00974 (-1.87); 3 CO, PM10, O3, SO2, NO2 -0.01103 (-1.48); -3; / -0.00097 (-0.13); -2; 0.00514 (0.67); -1; / 0.00853 (1.15); 0; -0.00404 (-0.52); 1; / -0.00296 (-0.39); 2; -0.00346 (-0.46); 3 Season CO Winter: 0.00539 (0.78); 0 Spring: 0.01655 (1.90); 0 Summer: 0.00155 (0.14); 0 Fall: 0.00797 (1.14); 0
January 2010 C-72
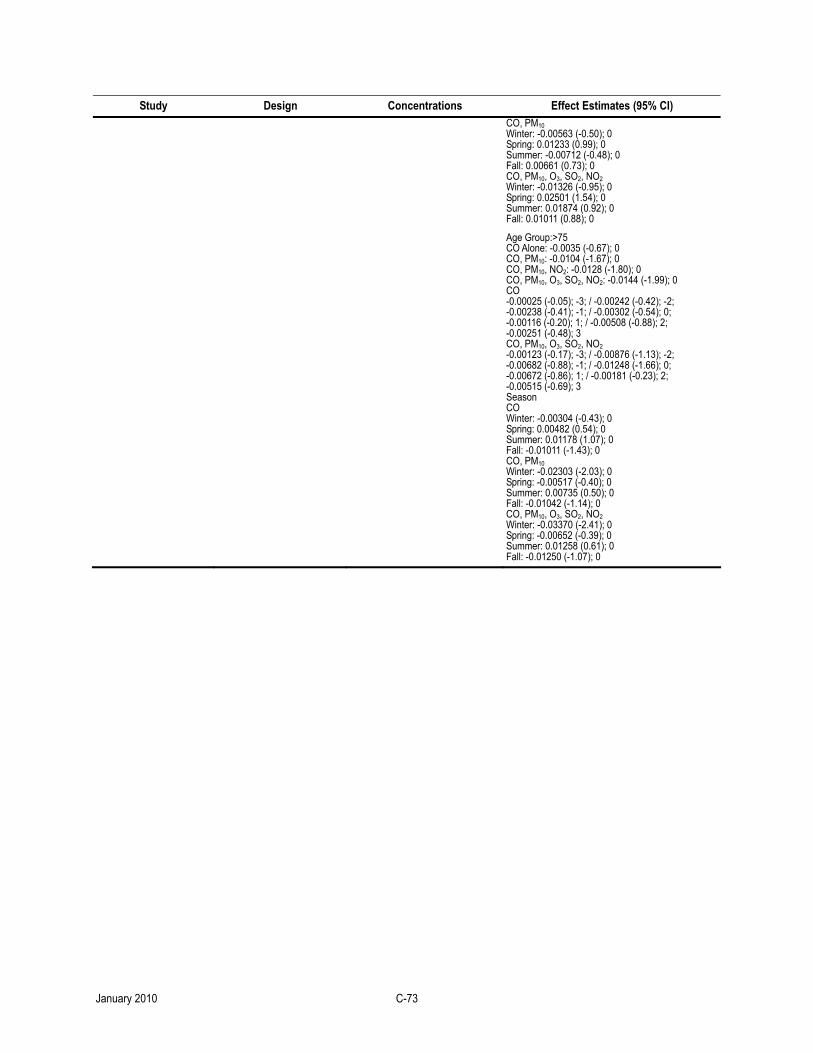
Study Design Concentrations Effect Estimates (95% CI) CO, PM10 Winter: -0.00563 (-0.50); 0 Spring: 0.01233 (0.99); 0 Summer: -0.00712 (-0.48); 0 Fall: 0.00661 (0.73); 0 CO, PM10, O3, SO2, NO2 Winter: -0.01326 (-0.95); 0 Spring: 0.02501 (1.54); 0 Summer: 0.01874 (0.92); 0 Fall: 0.01011 (0.88); 0
Age Group:>75 CO Alone: -0.0035 (-0.67); 0 CO, PM10: -0.0104 (-1.67); 0 CO, PM10, NO2: -0.0128 (-1.80); 0 CO, PM10, O3, SO2, NO2: -0.0144 (-1.99); 0 CO -0.00025 (-0.05); -3; / -0.00242 (-0.42); -2; -0.00238 (-0.41); -1; / -0.00302 (-0.54); 0; -0.00116 (-0.20); 1; / -0.00508 (-0.88); 2; -0.00251 (-0.48); 3 CO, PM10, O3, SO2, NO2 -0.00123 (-0.17); -3; / -0.00876 (-1.13); -2; -0.00682 (-0.88); -1; / -0.01248 (-1.66); 0; -0.00672 (-0.86); 1; / -0.00181 (-0.23); 2; -0.00515 (-0.69); 3 Season CO Winter: -0.00304 (-0.43); 0 Spring: 0.00482 (0.54); 0 Summer: 0.01178 (1.07); 0 Fall: -0.01011 (-1.43); 0 CO, PM10 Winter: -0.02303 (-2.03); 0 Spring: -0.00517 (-0.40); 0 Summer: 0.00735 (0.50); 0 Fall: -0.01042 (-1.14); 0 CO, PM10, O3, SO2, NO2 Winter: -0.03370 (-2.41); 0 Spring: -0.00652 (-0.39); 0 Summer: 0.01258 (0.61); 0 Fall: -0.01250 (-1.07); 0
January 2010 C-73
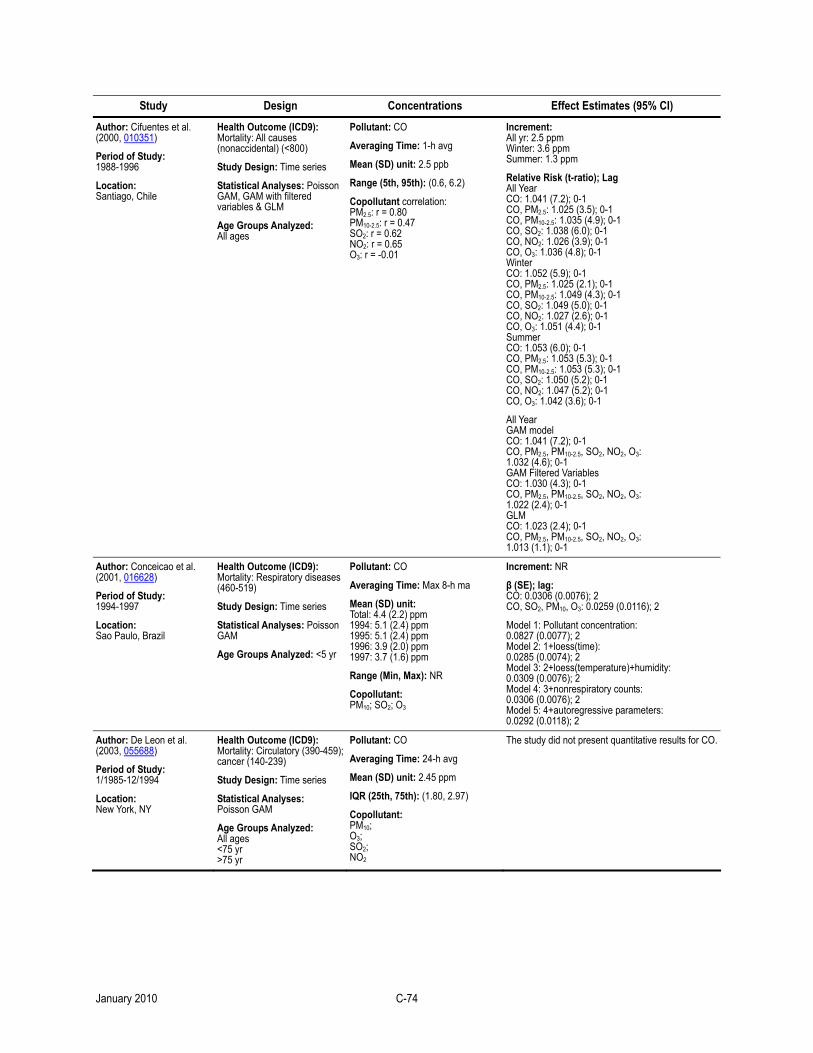
Study Design Concentrations Effect Estimates (95% CI)
Author: Cifuentes et al. (2000, 010351)
Period of Study: 1988-1996
Location: Santiago, Chile
Health Outcome (ICD9): Mortality: All causes (nonaccidental) (<800)
Study Design: Time series
Statistical Analyses: Poisson GAM, GAM with filtered variables & GLM
Age Groups Analyzed: All ages
Pollutant: CO
Averaging Time: 1-h avg
Mean (SD) unit: 2.5 ppb
Range (5th, 95th): (0.6, 6.2)
Copollutant correlation: PM2.5: r = 0.80 PM10-2.5: r = 0.47 SO2: r = 0.62 NO2: r = 0.65 O3: r = -0.01
Increment: All yr: 2.5 ppm Winter: 3.6 ppm Summer: 1.3 ppm
Relative Risk (t-ratio); Lag All Year CO: 1.041 (7.2); 0-1 CO, PM2.5: 1.025 (3.5); 0-1 CO, PM10-2.5: 1.035 (4.9); 0-1 CO, SO2: 1.038 (6.0); 0-1 CO, NO2: 1.026 (3.9); 0-1 CO, O3: 1.036 (4.8); 0-1 Winter CO: 1.052 (5.9); 0-1 CO, PM2.5: 1.025 (2.1); 0-1 CO, PM10-2.5: 1.049 (4.3); 0-1 CO, SO2: 1.049 (5.0); 0-1 CO, NO2: 1.027 (2.6); 0-1 CO, O3: 1.051 (4.4); 0-1 Summer CO: 1.053 (6.0); 0-1 CO, PM2.5: 1.053 (5.3); 0-1 CO, PM10-2.5: 1.053 (5.3); 0-1 CO, SO2: 1.050 (5.2); 0-1 CO, NO2: 1.047 (5.2); 0-1 CO, O3: 1.042 (3.6); 0-1
All Year GAM model CO: 1.041 (7.2); 0-1 CO, PM2.5, PM10-2.5, SO2, NO2, O3: 1.032 (4.6); 0-1 GAM Filtered Variables CO: 1.030 (4.3); 0-1 CO, PM2.5, PM10-2.5, SO2, NO2, O3: 1.022 (2.4); 0-1 GLM CO: 1.023 (2.4); 0-1 CO, PM2.5, PM10-2.5, SO2, NO2, O3: 1.013 (1.1); 0-1
Author: Conceicao et al. (2001, 016628)
Period of Study: 1994-1997
Location: Sao Paulo, Brazil
Health Outcome (ICD9): Mortality: Respiratory diseases (460-519)
Study Design: Time series
Statistical Analyses: Poisson GAM
Age Groups Analyzed: <5 yr
Pollutant: CO
Averaging Time: Max 8-h ma
Mean (SD) unit: Total: 4.4 (2.2) ppm 1994: 5.1 (2.4) ppm 1995: 5.1 (2.4) ppm 1996: 3.9 (2.0) ppm 1997: 3.7 (1.6) ppm
Range (Min, Max): NR
Copollutant: PM10; SO2; O3
Increment: NR
β (SE); lag: CO: 0.0306 (0.0076); 2 CO, SO2, PM10, O3: 0.0259 (0.0116); 2
Model 1: Pollutant concentration: 0.0827 (0.0077); 2 Model 2: 1+loess(time): 0.0285 (0.0074); 2 Model 3: 2+loess(temperature)+humidity: 0.0309 (0.0076); 2 Model 4: 3+nonrespiratory counts: 0.0306 (0.0076); 2 Model 5: 4+autoregressive parameters: 0.0292 (0.0118); 2
Author: De Leon et al. (2003, 055688)
Period of Study: 1/1985-12/1994
Location: New York, NY
Health Outcome (ICD9): Mortality: Circulatory (390-459); cancer (140-239)
Study Design: Time series
Statistical Analyses: Poisson GAM
Age Groups Analyzed: All ages <75 yr >75 yr
Pollutant: CO
Averaging Time: 24-h avg
Mean (SD) unit: 2.45 ppm
IQR (25th, 75th): (1.80, 2.97)
Copollutant: PM10; O3; SO2; NO2
The study did not present quantitative results for CO.
January 2010 C-74
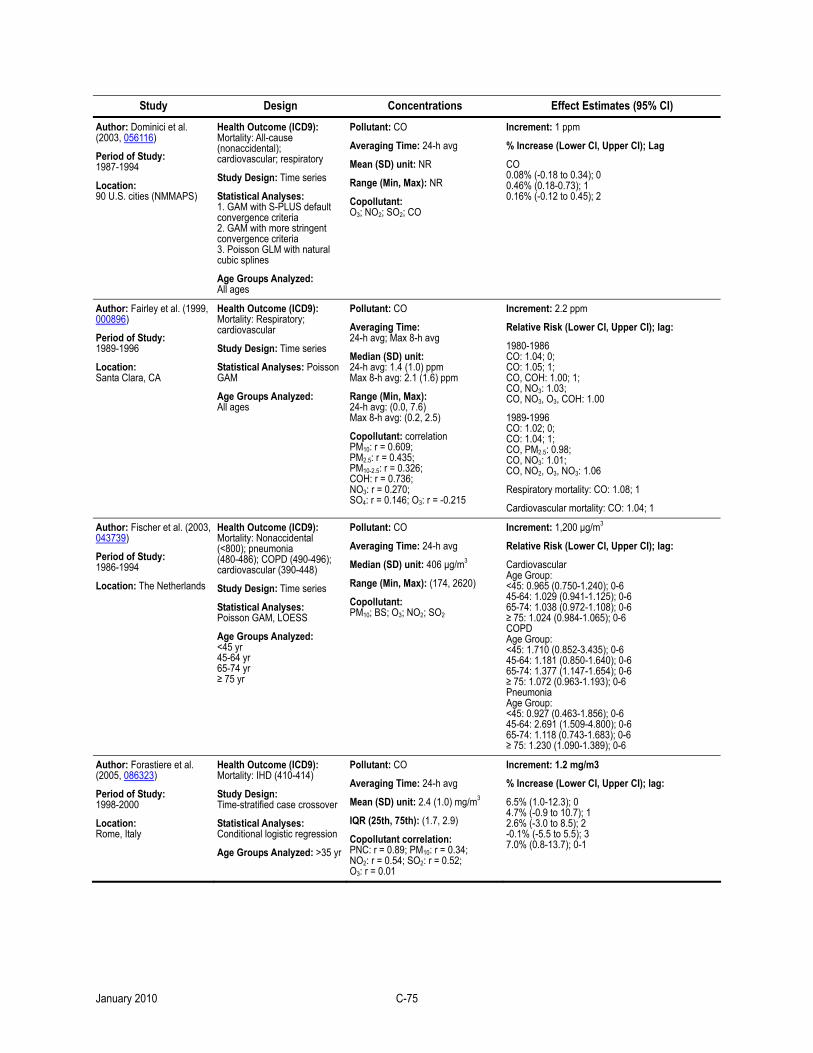
Study Design Concentrations Effect Estimates (95% CI)
Author: Dominici et al. (2003, 056116)
Period of Study: 1987-1994
Location: 90 U.S. cities (NMMAPS)
Health Outcome (ICD9): Mortality: All-cause (nonaccidental); cardiovascular; respiratory
Study Design: Time series
Statistical Analyses: 1. GAM with S-PLUS default convergence criteria 2. GAM with more stringent convergence criteria 3. Poisson GLM with natural cubic splines
Age Groups Analyzed: All ages
Pollutant: CO
Averaging Time: 24-h avg
Mean (SD) unit: NR
Range (Min, Max): NR
Copollutant: O3; NO2; SO2; CO
Increment: 1 ppm
% Increase (Lower CI, Upper CI); Lag
CO 0.08% (-0.18 to 0.34); 0 0.46% (0.18-0.73); 1 0.16% (-0.12 to 0.45); 2
Author: Fairley et al. (1999, 000896)
Period of Study: 1989-1996
Location: Santa Clara, CA
Health Outcome (ICD9): Mortality: Respiratory; cardiovascular
Study Design: Time series
Statistical Analyses: Poisson GAM
Age Groups Analyzed: All ages
Pollutant: CO
Averaging Time: 24-h avg; Max 8-h avg
Median (SD) unit: 24-h avg: 1.4 (1.0) ppm Max 8-h avg: 2.1 (1.6) ppm
Range (Min, Max): 24-h avg: (0.0, 7.6) Max 8-h avg: (0.2, 2.5)
Copollutant: correlation PM10: r = 0.609; PM2.5: r = 0.435; PM10-2.5: r = 0.326; COH: r = 0.736; NO3: r = 0.270; SO4: r = 0.146; O3: r = -0.215
Increment: 2.2 ppm
Relative Risk (Lower CI, Upper CI); lag:
1980-1986 CO: 1.04; 0; CO: 1.05; 1; CO, COH: 1.00; 1; CO, NO3: 1.03; CO, NO3, O3, COH: 1.00
1989-1996 CO: 1.02; 0; CO: 1.04; 1; CO, PM2.5: 0.98; CO, NO3: 1.01; CO, NO2, O3, NO3: 1.06
Respiratory mortality: CO: 1.08; 1
Cardiovascular mortality: CO: 1.04; 1
Author: Fischer et al. (2003, 043739)
Period of Study: 1986-1994
Location: The Netherlands
Health Outcome (ICD9): Mortality: Nonaccidental (<800); pneumonia (480-486); COPD (490-496); cardiovascular (390-448)
Study Design: Time series
Statistical Analyses: Poisson GAM, LOESS
Age Groups Analyzed: <45 yr 45-64 yr 65-74 yr ≥ 75 yr
Pollutant: CO
Averaging Time: 24-h avg
Median (SD) unit: 406 µg/m3
Range (Min, Max): (174, 2620)
Copollutant: PM10; BS; O3; NO2; SO2
Increment: 1,200 µg/m3
Relative Risk (Lower CI, Upper CI); lag:
Cardiovascular Age Group: <45: 0.965 (0.750-1.240); 0-6 45-64: 1.029 (0.941-1.125); 0-6 65-74: 1.038 (0.972-1.108); 0-6 ≥ 75: 1.024 (0.984-1.065); 0-6 COPD Age Group: <45: 1.710 (0.852-3.435); 0-6 45-64: 1.181 (0.850-1.640); 0-6 65-74: 1.377 (1.147-1.654); 0-6 ≥ 75: 1.072 (0.963-1.193); 0-6 Pneumonia Age Group: <45: 0.927 (0.463-1.856); 0-6 45-64: 2.691 (1.509-4.800); 0-6 65-74: 1.118 (0.743-1.683); 0-6 ≥ 75: 1.230 (1.090-1.389); 0-6
Author: Forastiere et al. (2005, 086323)
Period of Study: 1998-2000
Location: Rome, Italy
Health Outcome (ICD9): Mortality: IHD (410-414)
Study Design: Time-stratified case crossover
Statistical Analyses: Conditional logistic regression
Age Groups Analyzed: >35 yr
Pollutant: CO
Averaging Time: 24-h avg
Mean (SD) unit: 2.4 (1.0) mg/m3
IQR (25th, 75th): (1.7, 2.9)
Copollutant correlation: PNC: r = 0.89; PM10: r = 0.34; NO2: r = 0.54; SO2: r = 0.52; O3: r = 0.01
Increment: 1.2 mg/m3
% Increase (Lower CI, Upper CI); lag:
6.5% (1.0-12.3); 0 4.7% (-0.9 to 10.7); 1 2.6% (-3.0 to 8.5); 2 -0.1% (-5.5 to 5.5); 3 7.0% (0.8-13.7); 0-1
January 2010 C-75
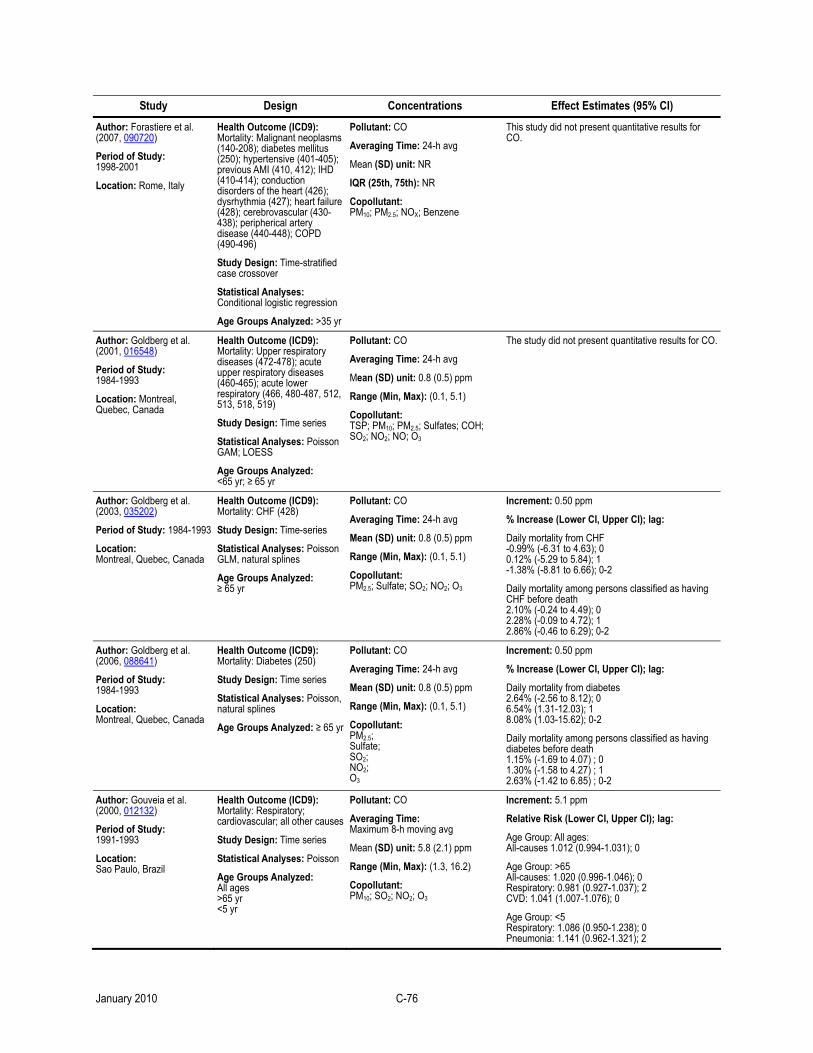
Study Design Concentrations Effect Estimates (95% CI)
Author: Forastiere et al. (2007, 090720)
Period of Study: 1998-2001
Location: Rome, Italy
Health Outcome (ICD9): Mortality: Malignant neoplasms (140-208); diabetes mellitus (250); hypertensive (401-405); previous AMI (410, 412); IHD (410-414); conduction disorders of the heart (426); dysrhythmia (427); heart failure (428); cerebrovascular (430-438); peripherical artery disease (440-448); COPD (490-496)
Study Design: Time-stratified case crossover
Statistical Analyses: Conditional logistic regression
Age Groups Analyzed: >35 yr
Pollutant: CO
Averaging Time: 24-h avg
Mean (SD) unit: NR
IQR (25th, 75th): NR
Copollutant: PM10; PM2.5; NOX; Benzene
This study did not present quantitative results for CO.
Author: Goldberg et al. (2001, 016548)
Period of Study: 1984-1993
Location: Montreal, Quebec, Canada
Health Outcome (ICD9): Mortality: Upper respiratory diseases (472-478); acute upper respiratory diseases (460-465); acute lower respiratory (466, 480-487, 512, 513, 518, 519)
Study Design: Time series
Statistical Analyses: Poisson GAM; LOESS
Age Groups Analyzed: <65 yr; ≥ 65 yr
Pollutant: CO
Averaging Time: 24-h avg
Mean (SD) unit: 0.8 (0.5) ppm
Range (Min, Max): (0.1, 5.1)
Copollutant: TSP; PM10; PM2.5; Sulfates; COH; SO2; NO2; NO; O3
The study did not present quantitative results for CO.
Author: Goldberg et al. (2003, 035202)
Period of Study: 1984-1993
Location: Montreal, Quebec, Canada
Health Outcome (ICD9): Mortality: CHF (428)
Study Design: Time-series
Statistical Analyses: Poisson GLM, natural splines
Age Groups Analyzed: ≥ 65 yr
Pollutant: CO
Averaging Time: 24-h avg
Mean (SD) unit: 0.8 (0.5) ppm
Range (Min, Max): (0.1, 5.1)
Copollutant: PM2.5; Sulfate; SO2; NO2; O3
Increment: 0.50 ppm
% Increase (Lower CI, Upper CI); lag:
Daily mortality from CHF -0.99% (-6.31 to 4.63); 0 0.12% (-5.29 to 5.84); 1 -1.38% (-8.81 to 6.66); 0-2
Daily mortality among persons classified as having CHF before death 2.10% (-0.24 to 4.49); 0 2.28% (-0.09 to 4.72); 1 2.86% (-0.46 to 6.29); 0-2
Author: Goldberg et al. (2006, 088641)
Period of Study: 1984-1993
Location: Montreal, Quebec, Canada
Health Outcome (ICD9): Mortality: Diabetes (250)
Study Design: Time series
Statistical Analyses: Poisson, natural splines
Age Groups Analyzed: ≥ 65 yr
Pollutant: CO
Averaging Time: 24-h avg
Mean (SD) unit: 0.8 (0.5) ppm
Range (Min, Max): (0.1, 5.1)
Copollutant: PM2.5; Sulfate; SO2; NO2; O3
Increment: 0.50 ppm
% Increase (Lower CI, Upper CI); lag:
Daily mortality from diabetes 2.64% (-2.56 to 8.12); 0 6.54% (1.31-12.03); 1 8.08% (1.03-15.62); 0-2
Daily mortality among persons classified as having diabetes before death 1.15% (-1.69 to 4.07) ; 0 1.30% (-1.58 to 4.27) ; 1 2.63% (-1.42 to 6.85) ; 0-2
Author: Gouveia et al. (2000, 012132)
Period of Study: 1991-1993
Location: Sao Paulo, Brazil
Health Outcome (ICD9): Mortality: Respiratory; cardiovascular; all other causes
Study Design: Time series
Statistical Analyses: Poisson
Age Groups Analyzed: All ages >65 yr <5 yr
Pollutant: CO
Averaging Time: Maximum 8-h moving avg
Mean (SD) unit: 5.8 (2.1) ppm
Range (Min, Max): (1.3, 16.2)
Copollutant: PM10; SO2; NO2; O3
Increment: 5.1 ppm
Relative Risk (Lower CI, Upper CI); lag:
Age Group: All ages: All-causes 1.012 (0.994-1.031); 0
Age Group: >65 All-causes: 1.020 (0.996-1.046); 0 Respiratory: 0.981 (0.927-1.037); 2 CVD: 1.041 (1.007-1.076); 0
Age Group: <5 Respiratory: 1.086 (0.950-1.238); 0 Pneumonia: 1.141 (0.962-1.321); 2
January 2010 C-76
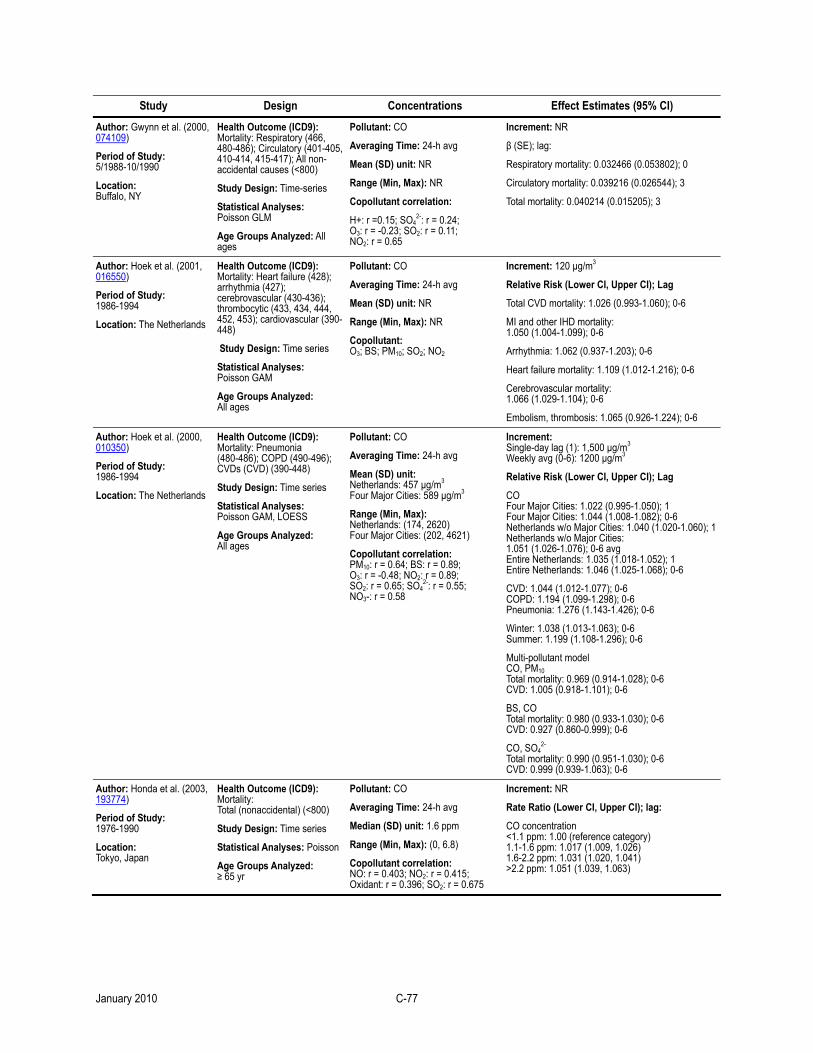
Study Design Concentrations Effect Estimates (95% CI)
Author: Gwynn et al. (2000, 074109)
Period of Study: 5/1988-10/1990
Location: Buffalo, NY
Health Outcome (ICD9): Mortality: Respiratory (466, 480-486); Circulatory (401-405, 410-414, 415-417); All non-accidental causes (<800)
Study Design: Time-series
Statistical Analyses: Poisson GLM
Age Groups Analyzed: All ages
Pollutant: CO
Averaging Time: 24-h avg
Mean (SD) unit: NR
Range (Min, Max): NR
Copollutant correlation:
H+: r =0.15; SO42-: r = 0.24;
O3: r = -0.23; SO2: r = 0.11; NO2: r = 0.65
Increment: NR
β (SE); lag:
Respiratory mortality: 0.032466 (0.053802); 0
Circulatory mortality: 0.039216 (0.026544); 3
Total mortality: 0.040214 (0.015205); 3
Author: Hoek et al. (2001, 016550)
Period of Study: 1986-1994
Location: The Netherlands
Health Outcome (ICD9): Mortality: Heart failure (428); arrhythmia (427); cerebrovascular (430-436); thrombocytic (433, 434, 444, 452, 453); cardiovascular (390-448)
Study Design: Time series
Statistical Analyses: Poisson GAM
Age Groups Analyzed: All ages
Pollutant: CO
Averaging Time: 24-h avg
Mean (SD) unit: NR
Range (Min, Max): NR
Copollutant: O3; BS; PM10; SO2; NO2
Increment: 120 µg/m3
Relative Risk (Lower CI, Upper CI); Lag
Total CVD mortality: 1.026 (0.993-1.060); 0-6
MI and other IHD mortality: 1.050 (1.004-1.099); 0-6
Arrhythmia: 1.062 (0.937-1.203); 0-6
Heart failure mortality: 1.109 (1.012-1.216); 0-6
Cerebrovascular mortality: 1.066 (1.029-1.104); 0-6
Embolism, thrombosis: 1.065 (0.926-1.224); 0-6
Author: Hoek et al. (2000, 010350)
Period of Study: 1986-1994
Location: The Netherlands
Health Outcome (ICD9): Mortality: Pneumonia (480-486); COPD (490-496); CVDs (CVD) (390-448)
Study Design: Time series
Statistical Analyses: Poisson GAM, LOESS
Age Groups Analyzed: All ages
Pollutant: CO
Averaging Time: 24-h avg
Mean (SD) unit: Netherlands: 457 µg/m3 Four Major Cities: 589 µg/m3
Range (Min, Max): Netherlands: (174, 2620) Four Major Cities: (202, 4621)
Copollutant correlation: PM10: r = 0.64; BS: r = 0.89; O3: r = -0.48; NO2: r = 0.89; SO2: r = 0.65; SO4
2-: r = 0.55; NO3-: r = 0.58
Increment: Single-day lag (1): 1,500 µg/m3 Weekly avg (0-6): 1200 µg/m3
Relative Risk (Lower CI, Upper CI); Lag
CO Four Major Cities: 1.022 (0.995-1.050); 1 Four Major Cities: 1.044 (1.008-1.082); 0-6 Netherlands w/o Major Cities: 1.040 (1.020-1.060); 1Netherlands w/o Major Cities: 1.051 (1.026-1.076); 0-6 avg Entire Netherlands: 1.035 (1.018-1.052); 1 Entire Netherlands: 1.046 (1.025-1.068); 0-6
CVD: 1.044 (1.012-1.077); 0-6 COPD: 1.194 (1.099-1.298); 0-6 Pneumonia: 1.276 (1.143-1.426); 0-6
Winter: 1.038 (1.013-1.063); 0-6 Summer: 1.199 (1.108-1.296); 0-6
Multi-pollutant model CO, PM10 Total mortality: 0.969 (0.914-1.028); 0-6 CVD: 1.005 (0.918-1.101); 0-6
BS, CO Total mortality: 0.980 (0.933-1.030); 0-6 CVD: 0.927 (0.860-0.999); 0-6
CO, SO42-
Total mortality: 0.990 (0.951-1.030); 0-6 CVD: 0.999 (0.939-1.063); 0-6
Author: Honda et al. (2003, 193774)
Period of Study: 1976-1990
Location: Tokyo, Japan
Health Outcome (ICD9): Mortality: Total (nonaccidental) (<800)
Study Design: Time series
Statistical Analyses: Poisson
Age Groups Analyzed: ≥ 65 yr
Pollutant: CO
Averaging Time: 24-h avg
Median (SD) unit: 1.6 ppm
Range (Min, Max): (0, 6.8)
Copollutant correlation: NO: r = 0.403; NO2: r = 0.415; Oxidant: r = 0.396; SO2: r = 0.675
Increment: NR
Rate Ratio (Lower CI, Upper CI); lag:
CO concentration <1.1 ppm: 1.00 (reference category) 1.1-1.6 ppm: 1.017 (1.009, 1.026) 1.6-2.2 ppm: 1.031 (1.020, 1.041) >2.2 ppm: 1.051 (1.039, 1.063)
January 2010 C-77
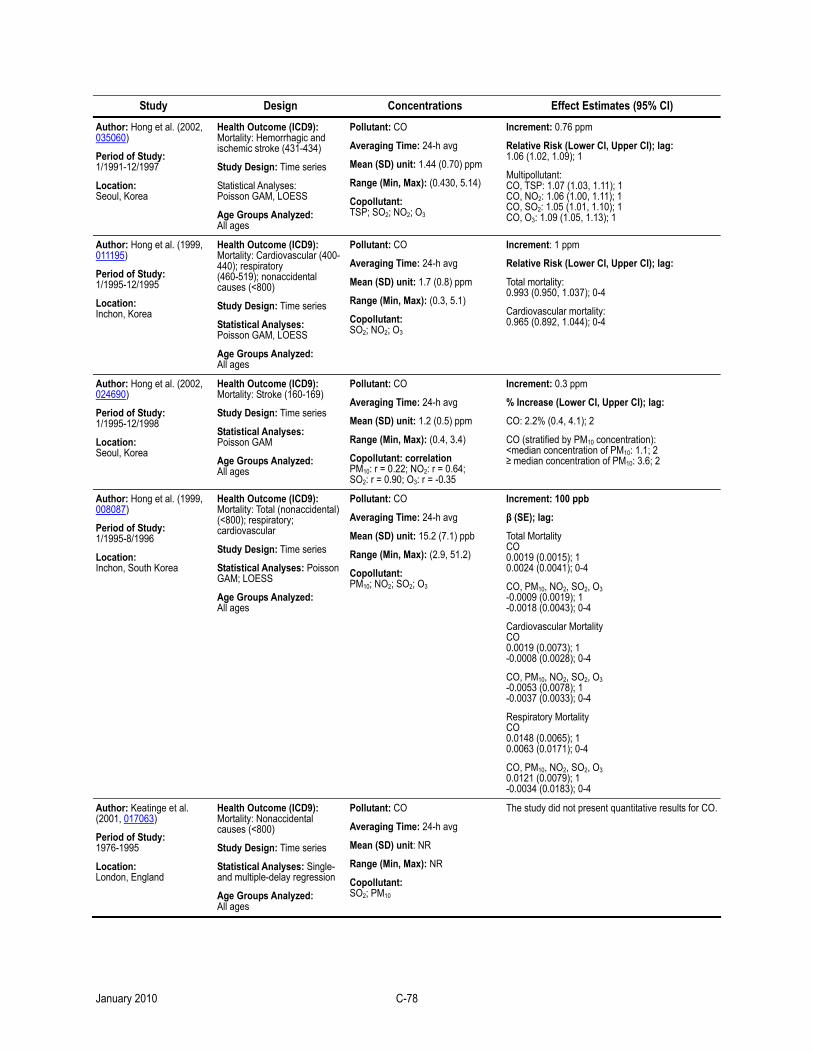
Study Design Concentrations Effect Estimates (95% CI)
Author: Hong et al. (2002, 035060)
Period of Study: 1/1991-12/1997
Location: Seoul, Korea
Health Outcome (ICD9): Mortality: Hemorrhagic and ischemic stroke (431-434)
Study Design: Time series
Statistical Analyses: Poisson GAM, LOESS
Age Groups Analyzed: All ages
Pollutant: CO
Averaging Time: 24-h avg
Mean (SD) unit: 1.44 (0.70) ppm
Range (Min, Max): (0.430, 5.14)
Copollutant: TSP; SO2; NO2; O3
Increment: 0.76 ppm
Relative Risk (Lower CI, Upper CI); lag: 1.06 (1.02, 1.09); 1
Multipollutant: CO, TSP: 1.07 (1.03, 1.11); 1 CO, NO2: 1.06 (1.00, 1.11); 1 CO, SO2: 1.05 (1.01, 1.10); 1 CO, O3: 1.09 (1.05, 1.13); 1
Author: Hong et al. (1999, 011195)
Period of Study: 1/1995-12/1995
Location: Inchon, Korea
Health Outcome (ICD9): Mortality: Cardiovascular (400-440); respiratory (460-519); nonaccidental causes (<800)
Study Design: Time series
Statistical Analyses: Poisson GAM, LOESS
Age Groups Analyzed: All ages
Pollutant: CO
Averaging Time: 24-h avg
Mean (SD) unit: 1.7 (0.8) ppm
Range (Min, Max): (0.3, 5.1)
Copollutant: SO2; NO2; O3
Increment: 1 ppm
Relative Risk (Lower CI, Upper CI); lag:
Total mortality: 0.993 (0.950, 1.037); 0-4
Cardiovascular mortality: 0.965 (0.892, 1.044); 0-4
Author: Hong et al. (2002, 024690)
Period of Study: 1/1995-12/1998
Location: Seoul, Korea
Health Outcome (ICD9): Mortality: Stroke (160-169)
Study Design: Time series
Statistical Analyses: Poisson GAM
Age Groups Analyzed: All ages
Pollutant: CO
Averaging Time: 24-h avg
Mean (SD) unit: 1.2 (0.5) ppm
Range (Min, Max): (0.4, 3.4)
Copollutant: correlation PM10: r = 0.22; NO2: r = 0.64; SO2: r = 0.90; O3: r = -0.35
Increment: 0.3 ppm
% Increase (Lower CI, Upper CI); lag:
CO: 2.2% (0.4, 4.1); 2
CO (stratified by PM10 concentration): <median concentration of PM10: 1.1; 2 ≥ median concentration of PM10: 3.6; 2
Author: Hong et al. (1999, 008087)
Period of Study: 1/1995-8/1996
Location: Inchon, South Korea
Health Outcome (ICD9): Mortality: Total (nonaccidental) (<800); respiratory; cardiovascular
Study Design: Time series
Statistical Analyses: Poisson GAM; LOESS
Age Groups Analyzed: All ages
Pollutant: CO
Averaging Time: 24-h avg
Mean (SD) unit: 15.2 (7.1) ppb
Range (Min, Max): (2.9, 51.2)
Copollutant: PM10; NO2; SO2; O3
Increment: 100 ppb
β (SE); lag:
Total Mortality CO 0.0019 (0.0015); 1 0.0024 (0.0041); 0-4
CO, PM10, NO2, SO2, O3 -0.0009 (0.0019); 1 -0.0018 (0.0043); 0-4
Cardiovascular Mortality CO 0.0019 (0.0073); 1 -0.0008 (0.0028); 0-4
CO, PM10, NO2, SO2, O3 -0.0053 (0.0078); 1 -0.0037 (0.0033); 0-4
Respiratory Mortality CO 0.0148 (0.0065); 1 0.0063 (0.0171); 0-4
CO, PM10, NO2, SO2, O3 0.0121 (0.0079); 1 -0.0034 (0.0183); 0-4
Author: Keatinge et al. (2001, 017063)
Period of Study: 1976-1995
Location: London, England
Health Outcome (ICD9): Mortality: Nonaccidental causes (<800)
Study Design: Time series
Statistical Analyses: Single- and multiple-delay regression
Age Groups Analyzed: All ages
Pollutant: CO
Averaging Time: 24-h avg
Mean (SD) unit: NR
Range (Min, Max): NR
Copollutant: SO2; PM10
The study did not present quantitative results for CO.
January 2010 C-78
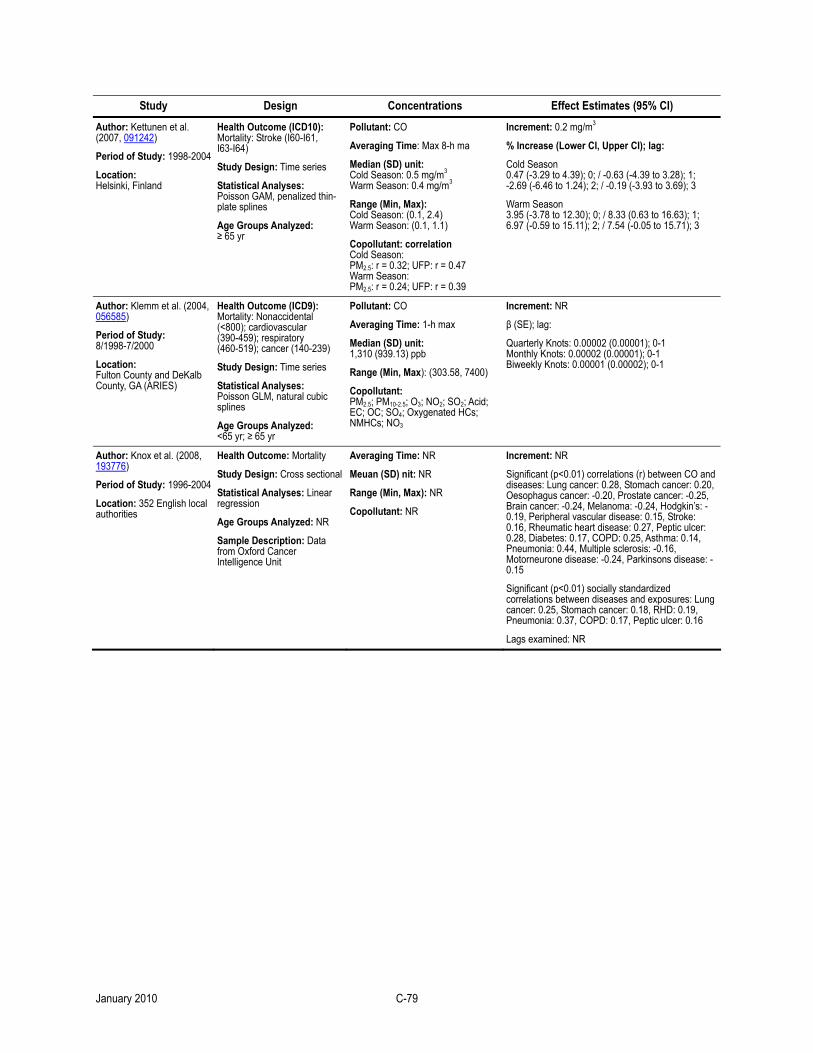
Study Design Concentrations Effect Estimates (95% CI)
Author: Kettunen et al. (2007, 091242)
Period of Study: 1998-2004
Location: Helsinki, Finland
Health Outcome (ICD10): Mortality: Stroke (I60-I61, I63-I64)
Study Design: Time series
Statistical Analyses: Poisson GAM, penalized thin-plate splines
Age Groups Analyzed: ≥ 65 yr
Pollutant: CO
Averaging Time: Max 8-h ma
Median (SD) unit: Cold Season: 0.5 mg/m3 Warm Season: 0.4 mg/m3
Range (Min, Max): Cold Season: (0.1, 2.4) Warm Season: (0.1, 1.1)
Copollutant: correlation Cold Season: PM2.5: r = 0.32; UFP: r = 0.47 Warm Season: PM2.5: r = 0.24; UFP: r = 0.39
Increment: 0.2 mg/m3
% Increase (Lower CI, Upper CI); lag:
Cold Season 0.47 (-3.29 to 4.39); 0; / -0.63 (-4.39 to 3.28); 1; -2.69 (-6.46 to 1.24); 2; / -0.19 (-3.93 to 3.69); 3
Warm Season 3.95 (-3.78 to 12.30); 0; / 8.33 (0.63 to 16.63); 1; 6.97 (-0.59 to 15.11); 2; / 7.54 (-0.05 to 15.71); 3
Author: Klemm et al. (2004, 056585)
Period of Study: 8/1998-7/2000
Location: Fulton County and DeKalb County, GA (ARIES)
Health Outcome (ICD9): Mortality: Nonaccidental (<800); cardiovascular (390-459); respiratory (460-519); cancer (140-239)
Study Design: Time series
Statistical Analyses: Poisson GLM, natural cubic splines
Age Groups Analyzed: <65 yr; ≥ 65 yr
Pollutant: CO
Averaging Time: 1-h max
Median (SD) unit: 1,310 (939.13) ppb
Range (Min, Max): (303.58, 7400)
Copollutant: PM2.5; PM10-2.5; O3; NO2; SO2; Acid; EC; OC; SO4; Oxygenated HCs; NMHCs; NO3
Increment: NR
β (SE); lag:
Quarterly Knots: 0.00002 (0.00001); 0-1 Monthly Knots: 0.00002 (0.00001); 0-1 Biweekly Knots: 0.00001 (0.00002); 0-1
Author: Knox et al. (2008, 193776)
Period of Study: 1996-2004
Location: 352 English local authorities
Health Outcome: Mortality
Study Design: Cross sectional
Statistical Analyses: Linear regression
Age Groups Analyzed: NR
Sample Description: Data from Oxford Cancer Intelligence Unit
Averaging Time: NR
Meuan (SD) nit: NR
Range (Min, Max): NR
Copollutant: NR
Increment: NR
Significant (p<0.01) correlations (r) between CO and diseases: Lung cancer: 0.28, Stomach cancer: 0.20, Oesophagus cancer: -0.20, Prostate cancer: -0.25, Brain cancer: -0.24, Melanoma: -0.24, Hodgkin’s: -0.19, Peripheral vascular disease: 0.15, Stroke: 0.16, Rheumatic heart disease: 0.27, Peptic ulcer: 0.28, Diabetes: 0.17, COPD: 0.25, Asthma: 0.14, Pneumonia: 0.44, Multiple sclerosis: -0.16, Motorneurone disease: -0.24, Parkinsons disease: -0.15
Significant (p<0.01) socially standardized correlations between diseases and exposures: Lung cancer: 0.25, Stomach cancer: 0.18, RHD: 0.19, Pneumonia: 0.37, COPD: 0.17, Peptic ulcer: 0.16
Lags examined: NR
January 2010 C-79
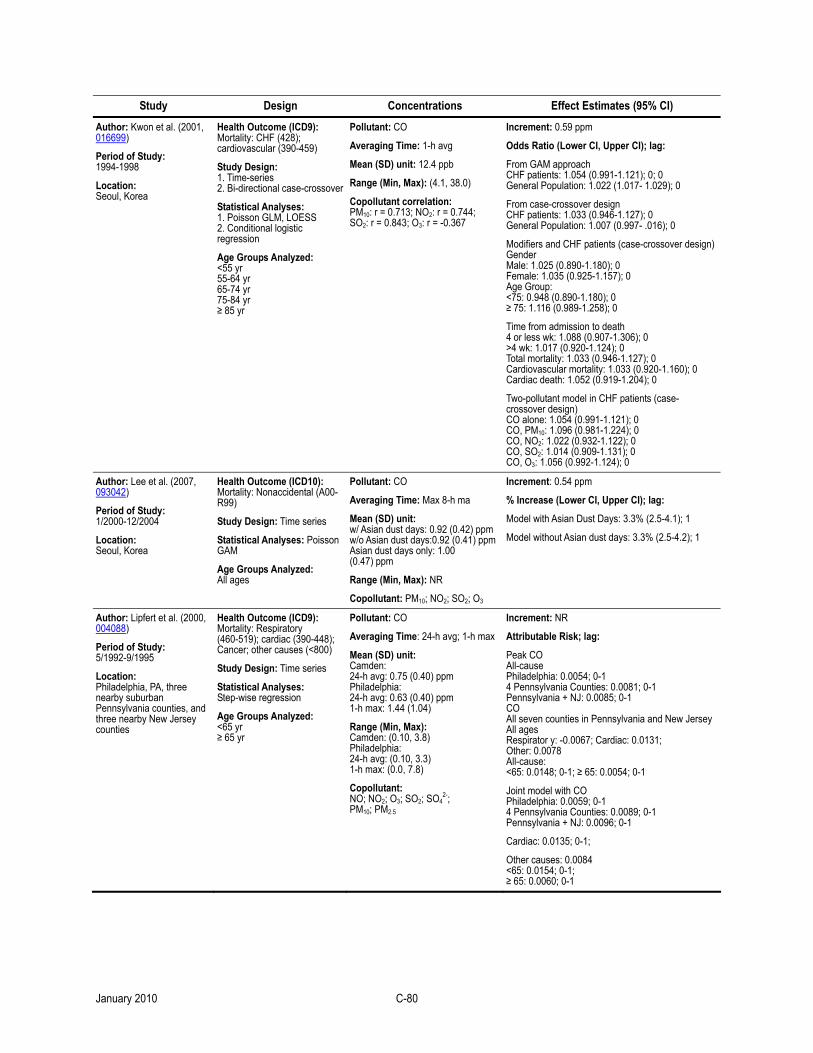
Study Design Concentrations Effect Estimates (95% CI)
Author: Kwon et al. (2001, 016699)
Period of Study: 1994-1998
Location: Seoul, Korea
Health Outcome (ICD9): Mortality: CHF (428); cardiovascular (390-459)
Study Design: 1. Time-series 2. Bi-directional case-crossover
Statistical Analyses: 1. Poisson GLM, LOESS 2. Conditional logistic regression
Age Groups Analyzed: <55 yr 55-64 yr 65-74 yr 75-84 yr ≥ 85 yr
Pollutant: CO
Averaging Time: 1-h avg
Mean (SD) unit: 12.4 ppb
Range (Min, Max): (4.1, 38.0)
Copollutant correlation: PM10: r = 0.713; NO2: r = 0.744; SO2: r = 0.843; O3: r = -0.367
Increment: 0.59 ppm
Odds Ratio (Lower CI, Upper CI); lag:
From GAM approach CHF patients: 1.054 (0.991-1.121); 0; 0 General Population: 1.022 (1.017- 1.029); 0
From case-crossover design CHF patients: 1.033 (0.946-1.127); 0 General Population: 1.007 (0.997- .016); 0
Modifiers and CHF patients (case-crossover design)Gender Male: 1.025 (0.890-1.180); 0 Female: 1.035 (0.925-1.157); 0 Age Group: <75: 0.948 (0.890-1.180); 0 ≥ 75: 1.116 (0.989-1.258); 0
Time from admission to death 4 or less wk: 1.088 (0.907-1.306); 0 >4 wk: 1.017 (0.920-1.124); 0 Total mortality: 1.033 (0.946-1.127); 0 Cardiovascular mortality: 1.033 (0.920-1.160); 0 Cardiac death: 1.052 (0.919-1.204); 0
Two-pollutant model in CHF patients (case-crossover design) CO alone: 1.054 (0.991-1.121); 0 CO, PM10: 1.096 (0.981-1.224); 0 CO, NO2: 1.022 (0.932-1.122); 0 CO, SO2: 1.014 (0.909-1.131); 0 CO, O3: 1.056 (0.992-1.124); 0
Author: Lee et al. (2007, 093042)
Period of Study: 1/2000-12/2004
Location: Seoul, Korea
Health Outcome (ICD10): Mortality: Nonaccidental (A00-R99)
Study Design: Time series
Statistical Analyses: Poisson GAM
Age Groups Analyzed: All ages
Pollutant: CO
Averaging Time: Max 8-h ma
Mean (SD) unit: w/ Asian dust days: 0.92 (0.42) ppm w/o Asian dust days:0.92 (0.41) ppmAsian dust days only: 1.00 (0.47) ppm
Range (Min, Max): NR
Copollutant: PM10; NO2; SO2; O3
Increment: 0.54 ppm
% Increase (Lower CI, Upper CI); lag:
Model with Asian Dust Days: 3.3% (2.5-4.1); 1
Model without Asian dust days: 3.3% (2.5-4.2); 1
Author: Lipfert et al. (2000, 004088)
Period of Study: 5/1992-9/1995
Location: Philadelphia, PA, three nearby suburban Pennsylvania counties, and three nearby New Jersey counties
Health Outcome (ICD9): Mortality: Respiratory (460-519); cardiac (390-448); Cancer; other causes (<800)
Study Design: Time series
Statistical Analyses: Step-wise regression
Age Groups Analyzed: <65 yr ≥ 65 yr
Pollutant: CO
Averaging Time: 24-h avg; 1-h max
Mean (SD) unit: Camden: 24-h avg: 0.75 (0.40) ppm Philadelphia: 24-h avg: 0.63 (0.40) ppm 1-h max: 1.44 (1.04)
Range (Min, Max): Camden: (0.10, 3.8) Philadelphia: 24-h avg: (0.10, 3.3) 1-h max: (0.0, 7.8)
Copollutant: NO; NO2; O3; SO2; SO4
2-; PM10; PM2.5
Increment: NR
Attributable Risk; lag:
Peak CO All-cause Philadelphia: 0.0054; 0-1 4 Pennsylvania Counties: 0.0081; 0-1 Pennsylvania + NJ: 0.0085; 0-1 CO All seven counties in Pennsylvania and New JerseyAll ages Respirator y: -0.0067; Cardiac: 0.0131; Other: 0.0078 All-cause: <65: 0.0148; 0-1; ≥ 65: 0.0054; 0-1
Joint model with CO Philadelphia: 0.0059; 0-1 4 Pennsylvania Counties: 0.0089; 0-1 Pennsylvania + NJ: 0.0096; 0-1
Cardiac: 0.0135; 0-1;
Other causes: 0.0084 <65: 0.0154; 0-1; ≥ 65: 0.0060; 0-1
January 2010 C-80
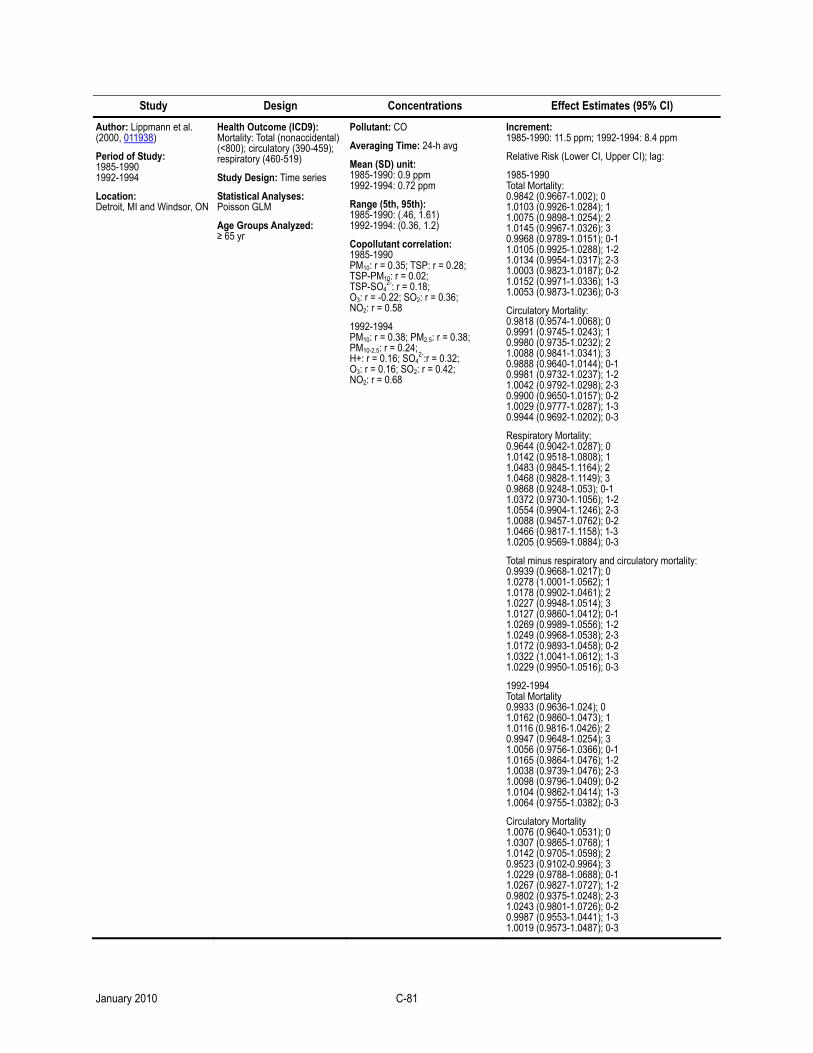
Study Design Concentrations Effect Estimates (95% CI)
Author: Lippmann et al. (2000, 011938)
Period of Study: 1985-1990 1992-1994
Location: Detroit, MI and Windsor, ON
Health Outcome (ICD9): Mortality: Total (nonaccidental) (<800); circulatory (390-459); respiratory (460-519)
Study Design: Time series
Statistical Analyses: Poisson GLM
Age Groups Analyzed: ≥ 65 yr
Pollutant: CO
Averaging Time: 24-h avg
Mean (SD) unit: 1985-1990: 0.9 ppm 1992-1994: 0.72 ppm
Range (5th, 95th): 1985-1990: (.46, 1.61) 1992-1994: (0.36, 1.2)
Copollutant correlation: 1985-1990 PM10: r = 0.35; TSP: r = 0.28; TSP-PM10: r = 0.02; TSP-SO4
2-: r = 0.18; O3: r = -0.22; SO2: r = 0.36; NO2: r = 0.58
1992-1994 PM10: r = 0.38; PM2.5: r = 0.38; PM10-2.5: r = 0.24; H+: r = 0.16; SO4
2-:r = 0.32; O3: r = 0.16; SO2: r = 0.42; NO2: r = 0.68
Increment: 1985-1990: 11.5 ppm; 1992-1994: 8.4 ppm
Relative Risk (Lower CI, Upper CI); lag:
1985-1990 Total Mortality: 0.9842 (0.9667-1.002); 0 1.0103 (0.9926-1.0284); 1 1.0075 (0.9898-1.0254); 2 1.0145 (0.9967-1.0326); 3 0.9968 (0.9789-1.0151); 0-1 1.0105 (0.9925-1.0288); 1-2 1.0134 (0.9954-1.0317); 2-3 1.0003 (0.9823-1.0187); 0-2 1.0152 (0.9971-1.0336); 1-3 1.0053 (0.9873-1.0236); 0-3
Circulatory Mortality: 0.9818 (0.9574-1.0068); 0 0.9991 (0.9745-1.0243); 1 0.9980 (0.9735-1.0232); 2 1.0088 (0.9841-1.0341); 3 0.9888 (0.9640-1.0144); 0-1 0.9981 (0.9732-1.0237); 1-2 1.0042 (0.9792-1.0298); 2-3 0.9900 (0.9650-1.0157); 0-2 1.0029 (0.9777-1.0287); 1-3 0.9944 (0.9692-1.0202); 0-3
Respiratory Mortality; 0.9644 (0.9042-1.0287); 0 1.0142 (0.9518-1.0808); 1 1.0483 (0.9845-1.1164); 2 1.0468 (0.9828-1.1149); 3 0.9868 (0.9248-1.053); 0-1 1.0372 (0.9730-1.1056); 1-2 1.0554 (0.9904-1.1246); 2-3 1.0088 (0.9457-1.0762); 0-2 1.0466 (0.9817-1.1158); 1-3 1.0205 (0.9569-1.0884); 0-3
Total minus respiratory and circulatory mortality: 0.9939 (0.9668-1.0217); 0 1.0278 (1.0001-1.0562); 1 1.0178 (0.9902-1.0461); 2 1.0227 (0.9948-1.0514); 3 1.0127 (0.9860-1.0412); 0-1 1.0269 (0.9989-1.0556); 1-2 1.0249 (0.9968-1.0538); 2-3 1.0172 (0.9893-1.0458); 0-2 1.0322 (1.0041-1.0612); 1-3 1.0229 (0.9950-1.0516); 0-3
1992-1994 Total Mortality 0.9933 (0.9636-1.024); 0 1.0162 (0.9860-1.0473); 1 1.0116 (0.9816-1.0426); 2 0.9947 (0.9648-1.0254); 3 1.0056 (0.9756-1.0366); 0-1 1.0165 (0.9864-1.0476); 1-2 1.0038 (0.9739-1.0476); 2-3 1.0098 (0.9796-1.0409); 0-2 1.0104 (0.9862-1.0414); 1-3 1.0064 (0.9755-1.0382); 0-3
Circulatory Mortality 1.0076 (0.9640-1.0531); 0 1.0307 (0.9865-1.0768); 1 1.0142 (0.9705-1.0598); 2 0.9523 (0.9102-0.9964); 3 1.0229 (0.9788-1.0688); 0-1 1.0267 (0.9827-1.0727); 1-2 0.9802 (0.9375-1.0248); 2-3 1.0243 (0.9801-1.0726); 0-2 0.9987 (0.9553-1.0441); 1-3 1.0019 (0.9573-1.0487); 0-3
January 2010 C-81
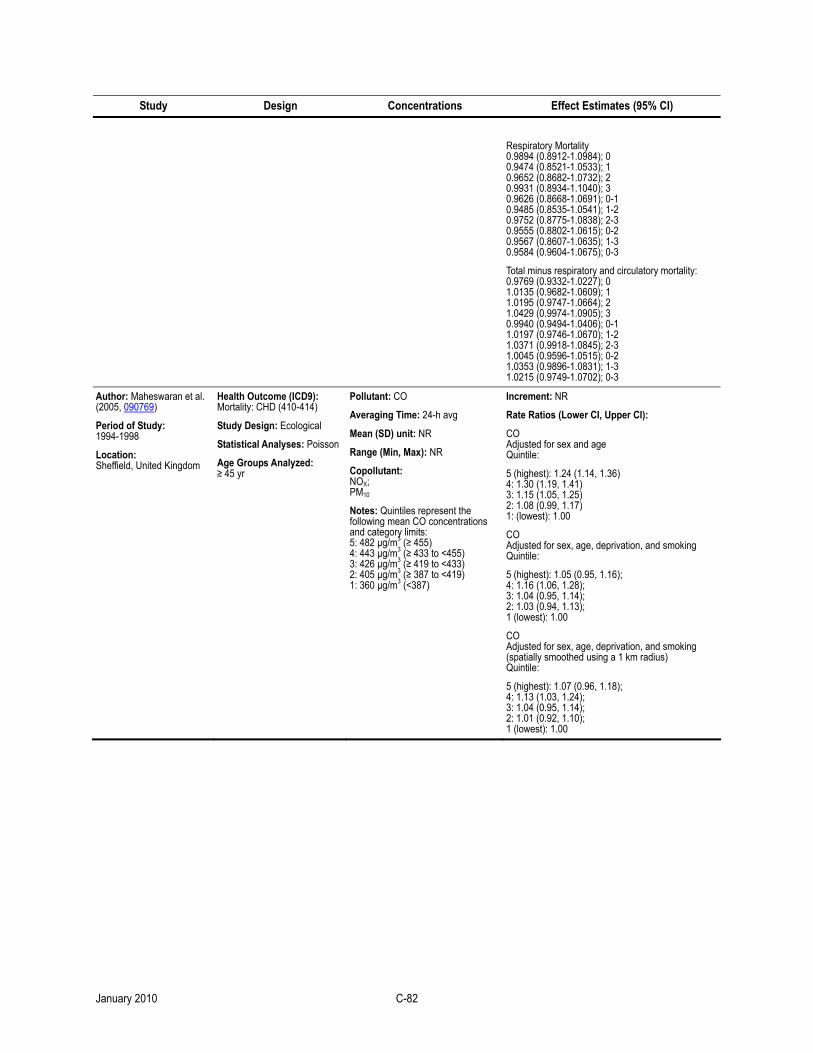
Study Design Concentrations Effect Estimates (95% CI)
Respiratory Mortality 0.9894 (0.8912-1.0984); 0 0.9474 (0.8521-1.0533); 1 0.9652 (0.8682-1.0732); 2 0.9931 (0.8934-1.1040); 3 0.9626 (0.8668-1.0691); 0-1 0.9485 (0.8535-1.0541); 1-2 0.9752 (0.8775-1.0838); 2-3 0.9555 (0.8802-1.0615); 0-2 0.9567 (0.8607-1.0635); 1-3 0.9584 (0.9604-1.0675); 0-3
Total minus respiratory and circulatory mortality: 0.9769 (0.9332-1.0227); 0 1.0135 (0.9682-1.0609); 1 1.0195 (0.9747-1.0664); 2 1.0429 (0.9974-1.0905); 3 0.9940 (0.9494-1.0406); 0-1 1.0197 (0.9746-1.0670); 1-2 1.0371 (0.9918-1.0845); 2-3 1.0045 (0.9596-1.0515); 0-2 1.0353 (0.9896-1.0831); 1-3 1.0215 (0.9749-1.0702); 0-3
Author: Maheswaran et al. (2005, 090769)
Period of Study: 1994-1998
Location: Sheffield, United Kingdom
Health Outcome (ICD9): Mortality: CHD (410-414)
Study Design: Ecological
Statistical Analyses: Poisson
Age Groups Analyzed: ≥ 45 yr
Pollutant: CO
Averaging Time: 24-h avg
Mean (SD) unit: NR
Range (Min, Max): NR
Copollutant: NOX; PM10
Notes: Quintiles represent the following mean CO concentrations and category limits: 5: 482 µg/m3 (≥ 455) 4: 443 µg/m3 (≥ 433 to <455) 3: 426 µg/m3 (≥ 419 to <433) 2: 405 µg/m3 (≥ 387 to <419) 1: 360 µg/m3 (<387)
Increment: NR
Rate Ratios (Lower CI, Upper CI):
CO Adjusted for sex and age Quintile:
5 (highest): 1.24 (1.14, 1.36) 4: 1.30 (1.19, 1.41) 3: 1.15 (1.05, 1.25) 2: 1.08 (0.99, 1.17) 1: (lowest): 1.00
CO Adjusted for sex, age, deprivation, and smoking Quintile:
5 (highest): 1.05 (0.95, 1.16); 4: 1.16 (1.06, 1.28); 3: 1.04 (0.95, 1.14); 2: 1.03 (0.94, 1.13); 1 (lowest): 1.00
CO Adjusted for sex, age, deprivation, and smoking (spatially smoothed using a 1 km radius) Quintile:
5 (highest): 1.07 (0.96, 1.18); 4: 1.13 (1.03, 1.24); 3: 1.04 (0.95, 1.14); 2: 1.01 (0.92, 1.10); 1 (lowest): 1.00
January 2010 C-82
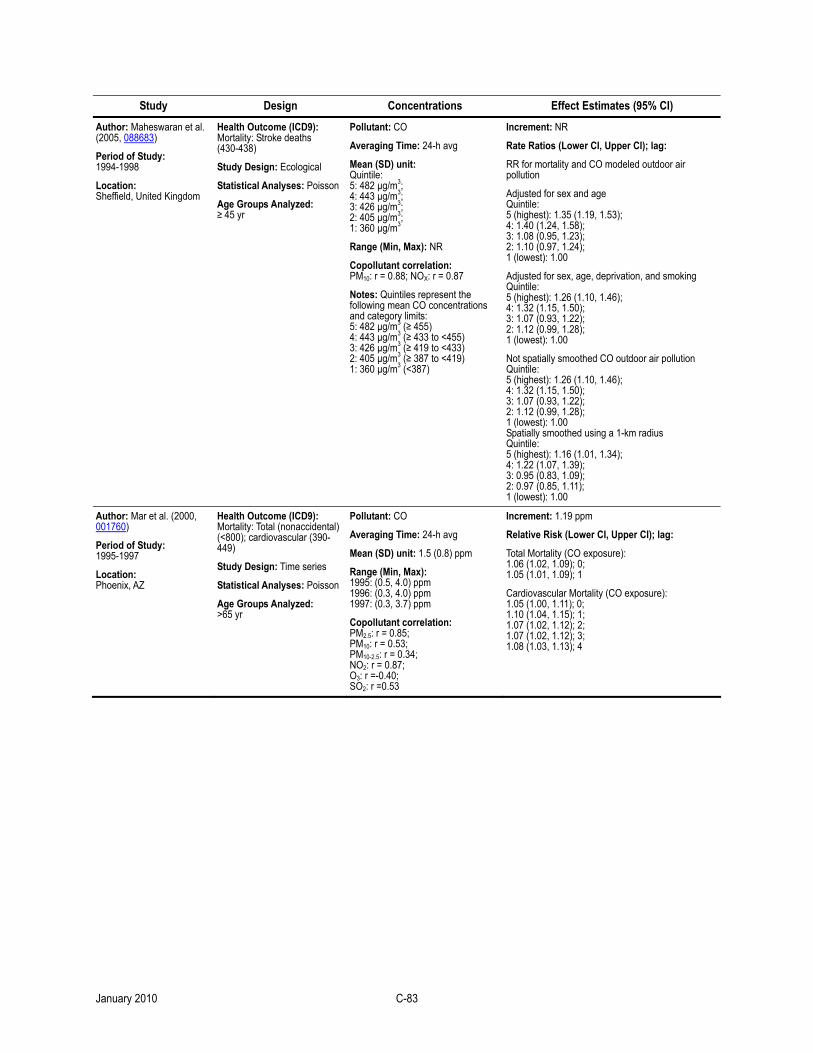
Study Design Concentrations Effect Estimates (95% CI)
Author: Maheswaran et al. (2005, 088683)
Period of Study: 1994-1998
Location: Sheffield, United Kingdom
Health Outcome (ICD9): Mortality: Stroke deaths (430-438)
Study Design: Ecological
Statistical Analyses: Poisson
Age Groups Analyzed: ≥ 45 yr
Pollutant: CO
Averaging Time: 24-h avg
Mean (SD) unit: Quintile: 5: 482 µg/m3; 4: 443 µg/m3; 3: 426 µg/m3; 2: 405 µg/m3; 1: 360 µg/m3
Range (Min, Max): NR
Copollutant correlation: PM10: r = 0.88; NOX: r = 0.87
Notes: Quintiles represent the following mean CO concentrations and category limits: 5: 482 µg/m3 (≥ 455) 4: 443 µg/m3 (≥ 433 to <455) 3: 426 µg/m3 (≥ 419 to <433) 2: 405 µg/m3 (≥ 387 to <419) 1: 360 µg/m3 (<387)
Increment: NR
Rate Ratios (Lower CI, Upper CI); lag:
RR for mortality and CO modeled outdoor air pollution
Adjusted for sex and age Quintile: 5 (highest): 1.35 (1.19, 1.53); 4: 1.40 (1.24, 1.58); 3: 1.08 (0.95, 1.23); 2: 1.10 (0.97, 1.24); 1 (lowest): 1.00
Adjusted for sex, age, deprivation, and smoking Quintile: 5 (highest): 1.26 (1.10, 1.46); 4: 1.32 (1.15, 1.50); 3: 1.07 (0.93, 1.22); 2: 1.12 (0.99, 1.28); 1 (lowest): 1.00
Not spatially smoothed CO outdoor air pollution Quintile: 5 (highest): 1.26 (1.10, 1.46); 4: 1.32 (1.15, 1.50); 3: 1.07 (0.93, 1.22); 2: 1.12 (0.99, 1.28); 1 (lowest): 1.00 Spatially smoothed using a 1-km radius Quintile: 5 (highest): 1.16 (1.01, 1.34); 4: 1.22 (1.07, 1.39); 3: 0.95 (0.83, 1.09); 2: 0.97 (0.85, 1.11); 1 (lowest): 1.00
Author: Mar et al. (2000, 001760)
Period of Study: 1995-1997
Location: Phoenix, AZ
Health Outcome (ICD9): Mortality: Total (nonaccidental) (<800); cardiovascular (390-449)
Study Design: Time series
Statistical Analyses: Poisson
Age Groups Analyzed: >65 yr
Pollutant: CO
Averaging Time: 24-h avg
Mean (SD) unit: 1.5 (0.8) ppm
Range (Min, Max): 1995: (0.5, 4.0) ppm 1996: (0.3, 4.0) ppm 1997: (0.3, 3.7) ppm
Copollutant correlation: PM2.5: r = 0.85; PM10: r = 0.53; PM10-2.5: r = 0.34; NO2: r = 0.87; O3: r =-0.40; SO2: r =0.53
Increment: 1.19 ppm
Relative Risk (Lower CI, Upper CI); lag:
Total Mortality (CO exposure): 1.06 (1.02, 1.09); 0; 1.05 (1.01, 1.09); 1
Cardiovascular Mortality (CO exposure): 1.05 (1.00, 1.11); 0; 1.10 (1.04, 1.15); 1; 1.07 (1.02, 1.12); 2; 1.07 (1.02, 1.12); 3; 1.08 (1.03, 1.13); 4
January 2010 C-83
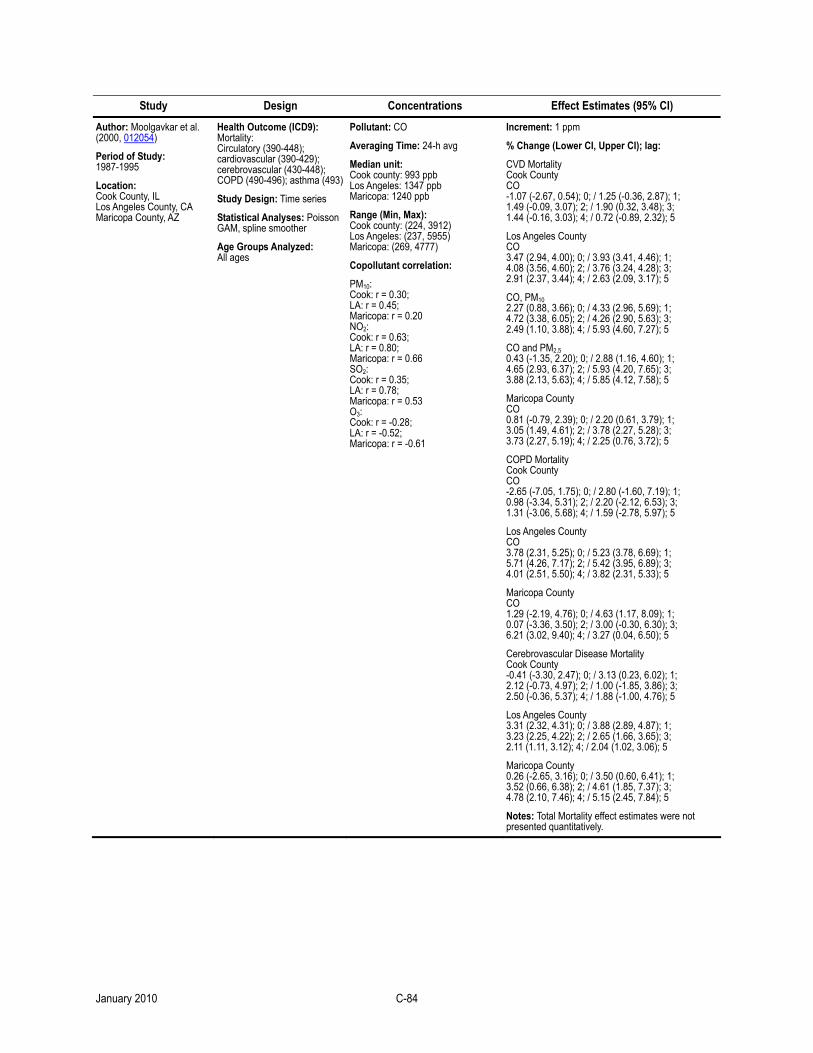
Study Design Concentrations Effect Estimates (95% CI)
Author: Moolgavkar et al. (2000, 012054)
Period of Study: 1987-1995
Location: Cook County, IL Los Angeles County, CA Maricopa County, AZ
Health Outcome (ICD9): Mortality: Circulatory (390-448); cardiovascular (390-429); cerebrovascular (430-448); COPD (490-496); asthma (493)
Study Design: Time series
Statistical Analyses: Poisson GAM, spline smoother
Age Groups Analyzed: All ages
Pollutant: CO
Averaging Time: 24-h avg
Median unit: Cook county: 993 ppb Los Angeles: 1347 ppb Maricopa: 1240 ppb
Range (Min, Max): Cook county: (224, 3912) Los Angeles: (237, 5955) Maricopa: (269, 4777)
Copollutant correlation:
PM10: Cook: r = 0.30; LA: r = 0.45; Maricopa: r = 0.20 NO2: Cook: r = 0.63; LA: r = 0.80; Maricopa: r = 0.66 SO2: Cook: r = 0.35; LA: r = 0.78; Maricopa: r = 0.53 O3: Cook: r = -0.28; LA: r = -0.52; Maricopa: r = -0.61
Increment: 1 ppm
% Change (Lower CI, Upper CI); lag:
CVD Mortality Cook County CO -1.07 (-2.67, 0.54); 0; / 1.25 (-0.36, 2.87); 1; 1.49 (-0.09, 3.07); 2; / 1.90 (0.32, 3.48); 3; 1.44 (-0.16, 3.03); 4; / 0.72 (-0.89, 2.32); 5
Los Angeles County CO 3.47 (2.94, 4.00); 0; / 3.93 (3.41, 4.46); 1; 4.08 (3.56, 4.60); 2; / 3.76 (3.24, 4.28); 3; 2.91 (2.37, 3.44); 4; / 2.63 (2.09, 3.17); 5
CO, PM10 2.27 (0.88, 3.66); 0; / 4.33 (2.96, 5.69); 1; 4.72 (3.38, 6.05); 2; / 4.26 (2.90, 5.63); 3; 2.49 (1.10, 3.88); 4; / 5.93 (4.60, 7.27); 5
CO and PM2.5 0.43 (-1.35, 2.20); 0; / 2.88 (1.16, 4.60); 1; 4.65 (2.93, 6.37); 2; / 5.93 (4.20, 7.65); 3; 3.88 (2.13, 5.63); 4; / 5.85 (4.12, 7.58); 5
Maricopa County CO 0.81 (-0.79, 2.39); 0; / 2.20 (0.61, 3.79); 1; 3.05 (1.49, 4.61); 2; / 3.78 (2.27, 5.28); 3; 3.73 (2.27, 5.19); 4; / 2.25 (0.76, 3.72); 5
COPD Mortality Cook County CO -2.65 (-7.05, 1.75); 0; / 2.80 (-1.60, 7.19); 1; 0.98 (-3.34, 5.31); 2; / 2.20 (-2.12, 6.53); 3; 1.31 (-3.06, 5.68); 4; / 1.59 (-2.78, 5.97); 5
Los Angeles County CO 3.78 (2.31, 5.25); 0; / 5.23 (3.78, 6.69); 1; 5.71 (4.26, 7.17); 2; / 5.42 (3.95, 6.89); 3; 4.01 (2.51, 5.50); 4; / 3.82 (2.31, 5.33); 5
Maricopa County CO 1.29 (-2.19, 4.76); 0; / 4.63 (1.17, 8.09); 1; 0.07 (-3.36, 3.50); 2; / 3.00 (-0.30, 6.30); 3; 6.21 (3.02, 9.40); 4; / 3.27 (0.04, 6.50); 5
Cerebrovascular Disease Mortality Cook County -0.41 (-3.30, 2.47); 0; / 3.13 (0.23, 6.02); 1; 2.12 (-0.73, 4.97); 2; / 1.00 (-1.85, 3.86); 3; 2.50 (-0.36, 5.37); 4; / 1.88 (-1.00, 4.76); 5
Los Angeles County 3.31 (2.32, 4.31); 0; / 3.88 (2.89, 4.87); 1; 3.23 (2.25, 4.22); 2; / 2.65 (1.66, 3.65); 3; 2.11 (1.11, 3.12); 4; / 2.04 (1.02, 3.06); 5
Maricopa County 0.26 (-2.65, 3.16); 0; / 3.50 (0.60, 6.41); 1; 3.52 (0.66, 6.38); 2; / 4.61 (1.85, 7.37); 3; 4.78 (2.10, 7.46); 4; / 5.15 (2.45, 7.84); 5
Notes: Total Mortality effect estimates were not presented quantitatively.
January 2010 C-84
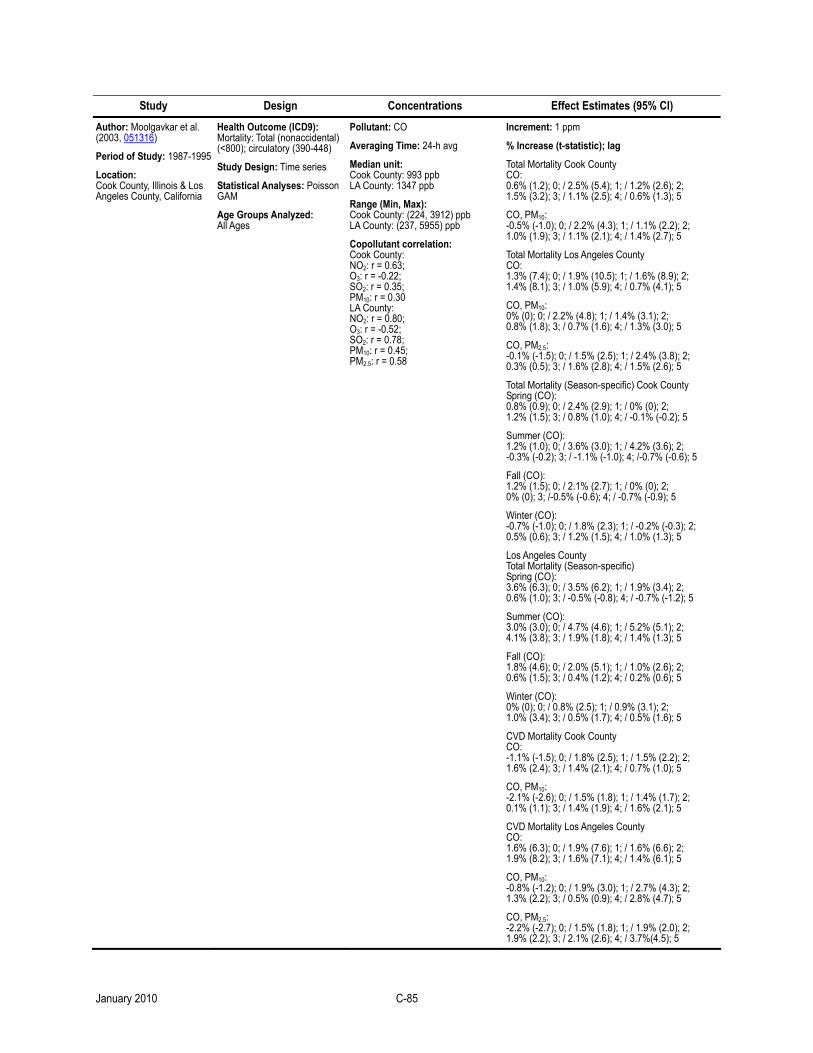
Study Design Concentrations Effect Estimates (95% CI)
Author: Moolgavkar et al. (2003, 051316)
Period of Study: 1987-1995
Location: Cook County, Illinois & Los Angeles County, California
Health Outcome (ICD9): Mortality: Total (nonaccidental) (<800); circulatory (390-448)
Study Design: Time series
Statistical Analyses: Poisson GAM
Age Groups Analyzed: All Ages
Pollutant: CO
Averaging Time: 24-h avg
Median unit: Cook County: 993 ppb LA County: 1347 ppb
Range (Min, Max): Cook County: (224, 3912) ppb LA County: (237, 5955) ppb
Copollutant correlation: Cook County: NO2: r = 0.63; O3: r = -0.22; SO2: r = 0.35; PM10: r = 0.30 LA County: NO2: r = 0.80; O3: r = -0.52; SO2: r = 0.78; PM10: r = 0.45; PM2.5: r = 0.58
Increment: 1 ppm
% Increase (t-statistic); lag
Total Mortality Cook County CO: 0.6% (1.2); 0; / 2.5% (5.4); 1; / 1.2% (2.6); 2; 1.5% (3.2); 3; / 1.1% (2.5); 4; / 0.6% (1.3); 5
CO, PM10: -0.5% (-1.0); 0; / 2.2% (4.3); 1; / 1.1% (2.2); 2; 1.0% (1.9); 3; / 1.1% (2.1); 4; / 1.4% (2.7); 5
Total Mortality Los Angeles County CO: 1.3% (7.4); 0; / 1.9% (10.5); 1; / 1.6% (8.9); 2; 1.4% (8.1); 3; / 1.0% (5.9); 4; / 0.7% (4.1); 5
CO, PM10: 0% (0); 0; / 2.2% (4.8); 1; / 1.4% (3.1); 2; 0.8% (1.8); 3; / 0.7% (1.6); 4; / 1.3% (3.0); 5
CO, PM2.5: -0.1% (-1.5); 0; / 1.5% (2.5); 1; / 2.4% (3.8); 2; 0.3% (0.5); 3; / 1.6% (2.8); 4; / 1.5% (2.6); 5
Total Mortality (Season-specific) Cook County Spring (CO): 0.8% (0.9); 0; / 2.4% (2.9); 1; / 0% (0); 2; 1.2% (1.5); 3; / 0.8% (1.0); 4; / -0.1% (-0.2); 5
Summer (CO): 1.2% (1.0); 0; / 3.6% (3.0); 1; / 4.2% (3.6); 2; -0.3% (-0.2); 3; / -1.1% (-1.0); 4; /-0.7% (-0.6); 5
Fall (CO): 1.2% (1.5); 0; / 2.1% (2.7); 1; / 0% (0); 2; 0% (0); 3; /-0.5% (-0.6); 4; / -0.7% (-0.9); 5
Winter (CO): -0.7% (-1.0); 0; / 1.8% (2.3); 1; / -0.2% (-0.3); 2; 0.5% (0.6); 3; / 1.2% (1.5); 4; / 1.0% (1.3); 5
Los Angeles County Total Mortality (Season-specific) Spring (CO): 3.6% (6.3); 0; / 3.5% (6.2); 1; / 1.9% (3.4); 2; 0.6% (1.0); 3; / -0.5% (-0.8); 4; / -0.7% (-1.2); 5
Summer (CO): 3.0% (3.0); 0; / 4.7% (4.6); 1; / 5.2% (5.1); 2; 4.1% (3.8); 3; / 1.9% (1.8); 4; / 1.4% (1.3); 5
Fall (CO): 1.8% (4.6); 0; / 2.0% (5.1); 1; / 1.0% (2.6); 2; 0.6% (1.5); 3; / 0.4% (1.2); 4; / 0.2% (0.6); 5
Winter (CO): 0% (0); 0; / 0.8% (2.5); 1; / 0.9% (3.1); 2; 1.0% (3.4); 3; / 0.5% (1.7); 4; / 0.5% (1.6); 5
CVD Mortality Cook County CO: -1.1% (-1.5); 0; / 1.8% (2.5); 1; / 1.5% (2.2); 2; 1.6% (2.4); 3; / 1.4% (2.1); 4; / 0.7% (1.0); 5
CO, PM10: -2.1% (-2.6); 0; / 1.5% (1.8); 1; / 1.4% (1.7); 2; 0.1% (1.1); 3; / 1.4% (1.9); 4; / 1.6% (2.1); 5
CVD Mortality Los Angeles County CO: 1.6% (6.3); 0; / 1.9% (7.6); 1; / 1.6% (6.6); 2; 1.9% (8.2); 3; / 1.6% (7.1); 4; / 1.4% (6.1); 5
CO, PM10: -0.8% (-1.2); 0; / 1.9% (3.0); 1; / 2.7% (4.3); 2; 1.3% (2.2); 3; / 0.5% (0.9); 4; / 2.8% (4.7); 5
CO, PM2.5: -2.2% (-2.7); 0; / 1.5% (1.8); 1; / 1.9% (2.0); 2; 1.9% (2.2); 3; / 2.1% (2.6); 4; / 3.7%(4.5); 5
January 2010 C-85
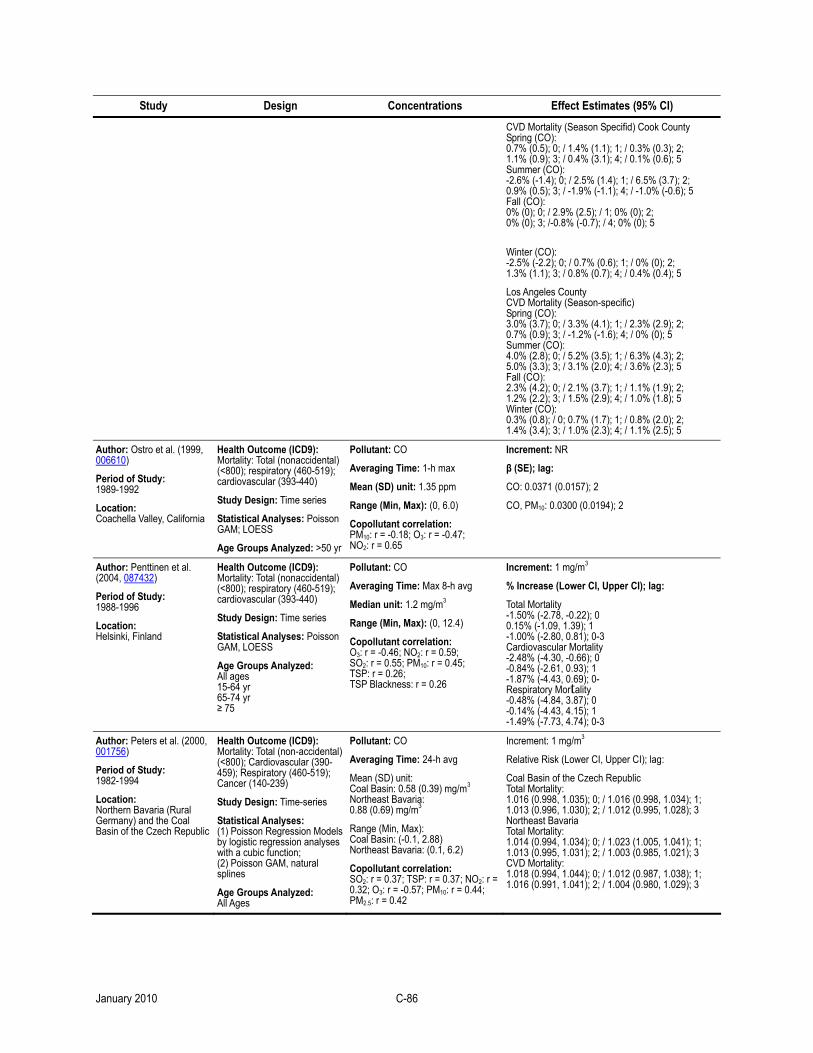
Study Design Concentrations Effect Estimates (95% CI)
CVD Mortality (Season Specifid) Cook County Spring (CO): 0.7% (0.5); 0; / 1.4% (1.1); 1; / 0.3% (0.3); 2; 1.1% (0.9); 3; / 0.4% (3.1); 4; / 0.1% (0.6); 5 Summer (CO): -2.6% (-1.4); 0; / 2.5% (1.4); 1; / 6.5% (3.7); 2; 0.9% (0.5); 3; / -1.9% (-1.1); 4; / -1.0% (-0.6); 5 Fall (CO): 0% (0); 0; / 2.9% (2.5); / 1; 0% (0); 2; 0% (0); 3; /-0.8% (-0.7); / 4; 0% (0); 5
Winter (CO): -2.5% (-2.2); 0; / 0.7% (0.6); 1; / 0% (0); 2; 1.3% (1.1); 3; / 0.8% (0.7); 4; / 0.4% (0.4); 5
Los Angeles County CVD Mortality (Season-specific) Spring (CO): 3.0% (3.7); 0; / 3.3% (4.1); 1; / 2.3% (2.9); 2; 0.7% (0.9); 3; / -1.2% (-1.6); 4; / 0% (0); 5 Summer (CO): 4.0% (2.8); 0; / 5.2% (3.5); 1; / 6.3% (4.3); 2; 5.0% (3.3); 3; / 3.1% (2.0); 4; / 3.6% (2.3); 5 Fall (CO): 2.3% (4.2); 0; / 2.1% (3.7); 1; / 1.1% (1.9); 2; 1.2% (2.2); 3; / 1.5% (2.9); 4; / 1.0% (1.8); 5 Winter (CO): 0.3% (0.8); / 0; 0.7% (1.7); 1; / 0.8% (2.0); 2; 1.4% (3.4); 3; / 1.0% (2.3); 4; / 1.1% (2.5); 5
Author: Ostro et al. (1999, 006610)
Period of Study: 1989-1992
Location: Coachella Valley, California
Health Outcome (ICD9): Mortality: Total (nonaccidental) (<800); respiratory (460-519); cardiovascular (393-440)
Study Design: Time series
Statistical Analyses: Poisson GAM; LOESS
Age Groups Analyzed: >50 yr
Pollutant: CO
Averaging Time: 1-h max
Mean (SD) unit: 1.35 ppm
Range (Min, Max): (0, 6.0)
Copollutant correlation: PM10: r = -0.18; O3: r = -0.47; NO2: r = 0.65
Increment: NR
β (SE); lag:
CO: 0.0371 (0.0157); 2
CO, PM10: 0.0300 (0.0194); 2
Author: Penttinen et al. (2004, 087432)
Period of Study: 1988-1996
Location: Helsinki, Finland
Health Outcome (ICD9): Mortality: Total (nonaccidental) (<800); respiratory (460-519); cardiovascular (393-440)
Study Design: Time series
Statistical Analyses: Poisson GAM, LOESS
Age Groups Analyzed: All ages 15-64 yr 65-74 yr ≥ 75
Pollutant: CO
Averaging Time: Max 8-h avg
Median unit: 1.2 mg/m3
Range (Min, Max): (0, 12.4)
Copollutant correlation: O3: r = -0.46; NO2: r = 0.59; SO2: r = 0.55; PM10: r = 0.45; TSP: r = 0.26; TSP Blackness: r = 0.26
Increment: 1 mg/m3
% Increase (Lower CI, Upper CI); lag:
Total Mortality -1.50% (-2.78, -0.22); 0 0.15% (-1.09, 1.39); 1 -1.00% (-2.80, 0.81); 0-3 Cardiovascular Mortality -2.48% (-4.30, -0.66); 0 -0.84% (-2.61, 0.93); 1 -1.87% (-4.43, 0.69); 0- Respiratory Mortality -0.48% (-4.84, 3.87); 0 -0.14% (-4.43, 4.15); 1 -1.49% (-7.73, 4.74); 0-3
Author: Peters et al. (2000, 001756)
Period of Study: 1982-1994
Location: Northern Bavaria (Rural Germany) and the Coal Basin of the Czech Republic
Health Outcome (ICD9): Mortality: Total (non-accidental) (<800); Cardiovascular (390-459); Respiratory (460-519); Cancer (140-239)
Study Design: Time-series
Statistical Analyses: (1) Poisson Regression Models by logistic regression analyses with a cubic function; (2) Poisson GAM, natural splines
Age Groups Analyzed: All Ages
Pollutant: CO
Averaging Time: 24-h avg
Mean (SD) unit: Coal Basin: 0.58 (0.39) mg/m3 Northeast Bavaria: 0.88 (0.69) mg/m3
Range (Min, Max): Coal Basin: (-0.1, 2.88) Northeast Bavaria: (0.1, 6.2)
Copollutant correlation: SO2: r = 0.37; TSP: r = 0.37; NO2: r = 0.32; O3: r = -0.57; PM10: r = 0.44; PM2.5: r = 0.42
Increment: 1 mg/m3
Relative Risk (Lower CI, Upper CI); lag:
Coal Basin of the Czech Republic Total Mortality: 1.016 (0.998, 1.035); 0; / 1.016 (0.998, 1.034); 1; 1.013 (0.996, 1.030); 2; / 1.012 (0.995, 1.028); 3 Northeast Bavaria Total Mortality: 1.014 (0.994, 1.034); 0; / 1.023 (1.005, 1.041); 1; 1.013 (0.995, 1.031); 2; / 1.003 (0.985, 1.021); 3 CVD Mortality: 1.018 (0.994, 1.044); 0; / 1.012 (0.987, 1.038); 1; 1.016 (0.991, 1.041); 2; / 1.004 (0.980, 1.029); 3
January 2010 C-86
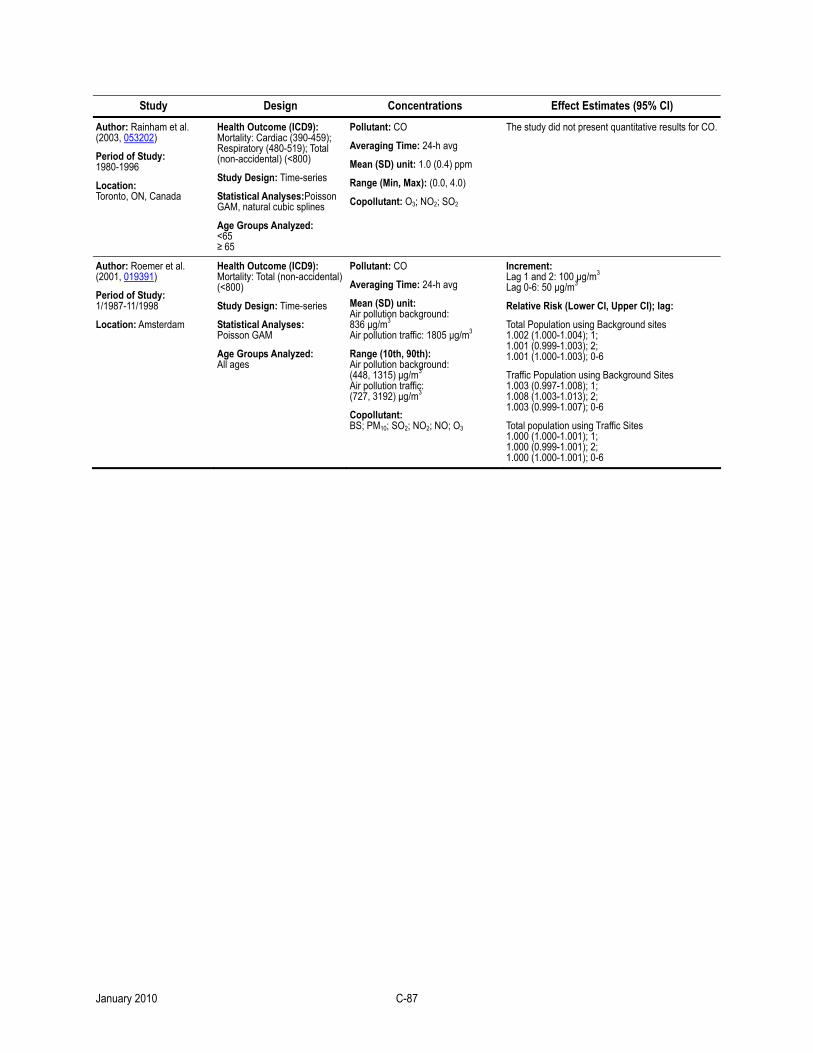
Study Design Concentrations Effect Estimates (95% CI)
Author: Rainham et al. (2003, 053202)
Period of Study: 1980-1996
Location: Toronto, ON, Canada
Health Outcome (ICD9): Mortality: Cardiac (390-459); Respiratory (480-519); Total (non-accidental) (<800)
Study Design: Time-series
Statistical Analyses:Poisson GAM, natural cubic splines
Age Groups Analyzed: <65 ≥ 65
Pollutant: CO
Averaging Time: 24-h avg
Mean (SD) unit: 1.0 (0.4) ppm
Range (Min, Max): (0.0, 4.0)
Copollutant: O3; NO2; SO2
The study did not present quantitative results for CO.
Author: Roemer et al. (2001, 019391)
Period of Study: 1/1987-11/1998
Location: Amsterdam
Health Outcome (ICD9): Mortality: Total (non-accidental) (<800)
Study Design: Time-series
Statistical Analyses: Poisson GAM
Age Groups Analyzed: All ages
Pollutant: CO
Averaging Time: 24-h avg
Mean (SD) unit: Air pollution background: 836 µg/m3 Air pollution traffic: 1805 µg/m3
Range (10th, 90th): Air pollution background: (448, 1315) µg/m3 Air pollution traffic: (727, 3192) µg/m3
Copollutant: BS; PM10; SO2; NO2; NO; O3
Increment: Lag 1 and 2: 100 µg/m3 Lag 0-6: 50 µg/m3
Relative Risk (Lower CI, Upper CI); lag:
Total Population using Background sites 1.002 (1.000-1.004); 1; 1.001 (0.999-1.003); 2; 1.001 (1.000-1.003); 0-6
Traffic Population using Background Sites 1.003 (0.997-1.008); 1; 1.008 (1.003-1.013); 2; 1.003 (0.999-1.007); 0-6
Total population using Traffic Sites 1.000 (1.000-1.001); 1; 1.000 (0.999-1.001); 2; 1.000 (1.000-1.001); 0-6
January 2010 C-87
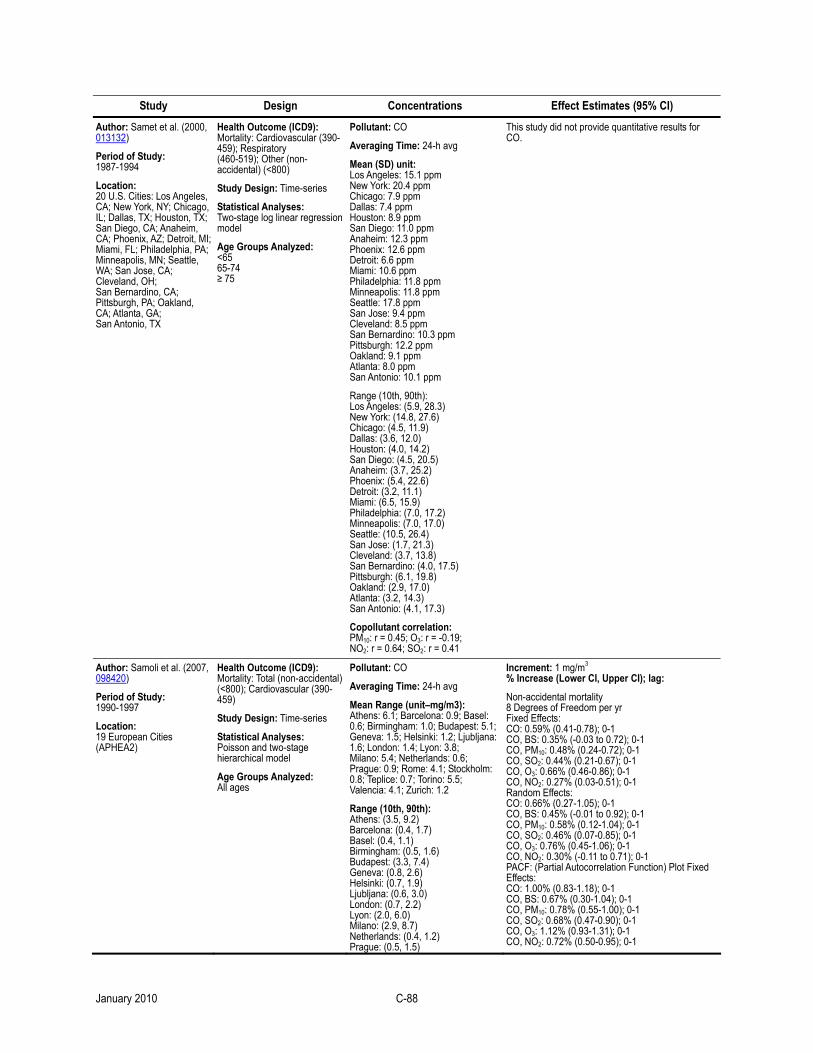
Study Design Concentrations Effect Estimates (95% CI)
Author: Samet et al. (2000, 013132)
Period of Study: 1987-1994
Location: 20 U.S. Cities: Los Angeles, CA; New York, NY; Chicago, IL; Dallas, TX; Houston, TX; San Diego, CA; Anaheim, CA; Phoenix, AZ; Detroit, MI; Miami, FL; Philadelphia, PA; Minneapolis, MN; Seattle, WA; San Jose, CA; Cleveland, OH; San Bernardino, CA; Pittsburgh, PA; Oakland, CA; Atlanta, GA; San Antonio, TX
Health Outcome (ICD9): Mortality: Cardiovascular (390-459); Respiratory (460-519); Other (non-accidental) (<800)
Study Design: Time-series
Statistical Analyses: Two-stage log linear regression model
Age Groups Analyzed: <65 65-74 ≥ 75
Pollutant: CO
Averaging Time: 24-h avg
Mean (SD) unit: Los Angeles: 15.1 ppm New York: 20.4 ppm Chicago: 7.9 ppm Dallas: 7.4 ppm Houston: 8.9 ppm San Diego: 11.0 ppm Anaheim: 12.3 ppm Phoenix: 12.6 ppm Detroit: 6.6 ppm Miami: 10.6 ppm Philadelphia: 11.8 ppm Minneapolis: 11.8 ppm Seattle: 17.8 ppm San Jose: 9.4 ppm Cleveland: 8.5 ppm San Bernardino: 10.3 ppm Pittsburgh: 12.2 ppm Oakland: 9.1 ppm Atlanta: 8.0 ppm San Antonio: 10.1 ppm
Range (10th, 90th): Los Angeles: (5.9, 28.3) New York: (14.8, 27.6) Chicago: (4.5, 11.9) Dallas: (3.6, 12.0) Houston: (4.0, 14.2) San Diego: (4.5, 20.5) Anaheim: (3.7, 25.2) Phoenix: (5.4, 22.6) Detroit: (3.2, 11.1) Miami: (6.5, 15.9) Philadelphia: (7.0, 17.2) Minneapolis: (7.0, 17.0) Seattle: (10.5, 26.4) San Jose: (1.7, 21.3) Cleveland: (3.7, 13.8) San Bernardino: (4.0, 17.5) Pittsburgh: (6.1, 19.8) Oakland: (2.9, 17.0) Atlanta: (3.2, 14.3) San Antonio: (4.1, 17.3)
Copollutant correlation: PM10: r = 0.45; O3: r = -0.19; NO2: r = 0.64; SO2: r = 0.41
This study did not provide quantitative results for CO.
Author: Samoli et al. (2007, 098420)
Period of Study: 1990-1997
Location: 19 European Cities (APHEA2)
Health Outcome (ICD9): Mortality: Total (non-accidental) (<800); Cardiovascular (390-459)
Study Design: Time-series
Statistical Analyses: Poisson and two-stage hierarchical model
Age Groups Analyzed: All ages
Pollutant: CO
Averaging Time: 24-h avg
Mean Range (unit–mg/m3): Athens: 6.1; Barcelona: 0.9; Basel: 0.6; Birmingham: 1.0; Budapest: 5.1; Geneva: 1.5; Helsinki: 1.2; Ljubljana: 1.6; London: 1.4; Lyon: 3.8; Milano: 5.4; Netherlands: 0.6; Prague: 0.9; Rome: 4.1; Stockholm: 0.8; Teplice: 0.7; Torino: 5.5; Valencia: 4.1; Zurich: 1.2
Range (10th, 90th): Athens: (3.5, 9.2) Barcelona: (0.4, 1.7) Basel: (0.4, 1.1) Birmingham: (0.5, 1.6) Budapest: (3.3, 7.4) Geneva: (0.8, 2.6) Helsinki: (0.7, 1.9) Ljubljana: (0.6, 3.0) London: (0.7, 2.2) Lyon: (2.0, 6.0) Milano: (2.9, 8.7) Netherlands: (0.4, 1.2) Prague: (0.5, 1.5)
Increment: 1 mg/m3 % Increase (Lower CI, Upper CI); lag:
Non-accidental mortality 8 Degrees of Freedom per yr Fixed Effects: CO: 0.59% (0.41-0.78); 0-1 CO, BS: 0.35% (-0.03 to 0.72); 0-1 CO, PM10: 0.48% (0.24-0.72); 0-1 CO, SO2: 0.44% (0.21-0.67); 0-1 CO, O3: 0.66% (0.46-0.86); 0-1 CO, NO2: 0.27% (0.03-0.51); 0-1 Random Effects: CO: 0.66% (0.27-1.05); 0-1 CO, BS: 0.45% (-0.01 to 0.92); 0-1 CO, PM10: 0.58% (0.12-1.04); 0-1 CO, SO2: 0.46% (0.07-0.85); 0-1 CO, O3: 0.76% (0.45-1.06); 0-1 CO, NO2: 0.30% (-0.11 to 0.71); 0-1 PACF: (Partial Autocorrelation Function) Plot Fixed Effects: CO: 1.00% (0.83-1.18); 0-1 CO, BS: 0.67% (0.30-1.04); 0-1 CO, PM10: 0.78% (0.55-1.00); 0-1 CO, SO2: 0.68% (0.47-0.90); 0-1 CO, O3: 1.12% (0.93-1.31); 0-1 CO, NO2: 0.72% (0.50-0.95); 0-1
January 2010 C-88
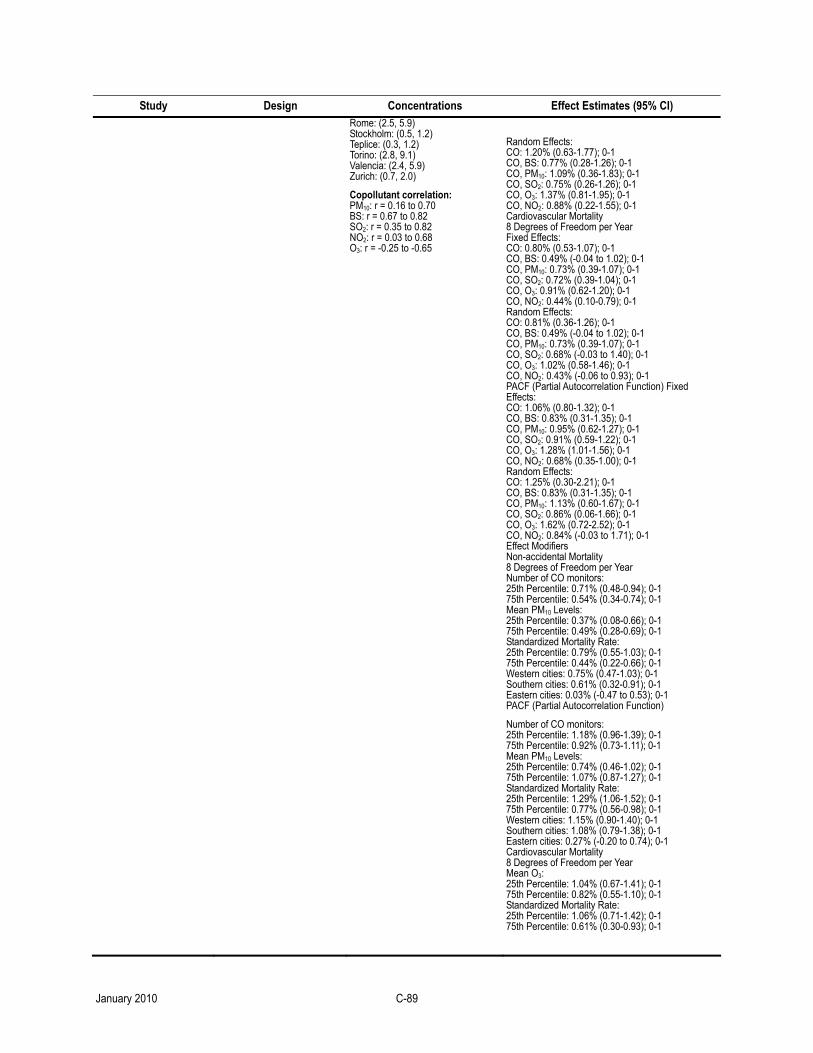
Study Design Concentrations Effect Estimates (95% CI) Rome: (2.5, 5.9) Stockholm: (0.5, 1.2) Teplice: (0.3, 1.2) Torino: (2.8, 9.1) Valencia: (2.4, 5.9) Zurich: (0.7, 2.0)
Copollutant correlation: PM10: r = 0.16 to 0.70 BS: r = 0.67 to 0.82 SO2: r = 0.35 to 0.82 NO2: r = 0.03 to 0.68 O3: r = -0.25 to -0.65
Random Effects: CO: 1.20% (0.63-1.77); 0-1 CO, BS: 0.77% (0.28-1.26); 0-1 CO, PM10: 1.09% (0.36-1.83); 0-1 CO, SO2: 0.75% (0.26-1.26); 0-1 CO, O3: 1.37% (0.81-1.95); 0-1 CO, NO2: 0.88% (0.22-1.55); 0-1 Cardiovascular Mortality 8 Degrees of Freedom per Year Fixed Effects: CO: 0.80% (0.53-1.07); 0-1 CO, BS: 0.49% (-0.04 to 1.02); 0-1 CO, PM10: 0.73% (0.39-1.07); 0-1 CO, SO2: 0.72% (0.39-1.04); 0-1 CO, O3: 0.91% (0.62-1.20); 0-1 CO, NO2: 0.44% (0.10-0.79); 0-1 Random Effects: CO: 0.81% (0.36-1.26); 0-1 CO, BS: 0.49% (-0.04 to 1.02); 0-1 CO, PM10: 0.73% (0.39-1.07); 0-1 CO, SO2: 0.68% (-0.03 to 1.40); 0-1 CO, O3: 1.02% (0.58-1.46); 0-1 CO, NO2: 0.43% (-0.06 to 0.93); 0-1 PACF (Partial Autocorrelation Function) Fixed Effects: CO: 1.06% (0.80-1.32); 0-1 CO, BS: 0.83% (0.31-1.35); 0-1 CO, PM10: 0.95% (0.62-1.27); 0-1 CO, SO2: 0.91% (0.59-1.22); 0-1 CO, O3: 1.28% (1.01-1.56); 0-1 CO, NO2: 0.68% (0.35-1.00); 0-1 Random Effects: CO: 1.25% (0.30-2.21); 0-1 CO, BS: 0.83% (0.31-1.35); 0-1 CO, PM10: 1.13% (0.60-1.67); 0-1 CO, SO2: 0.86% (0.06-1.66); 0-1 CO, O3: 1.62% (0.72-2.52); 0-1 CO, NO2: 0.84% (-0.03 to 1.71); 0-1 Effect Modifiers Non-accidental Mortality 8 Degrees of Freedom per Year Number of CO monitors: 25th Percentile: 0.71% (0.48-0.94); 0-1 75th Percentile: 0.54% (0.34-0.74); 0-1 Mean PM10 Levels: 25th Percentile: 0.37% (0.08-0.66); 0-1 75th Percentile: 0.49% (0.28-0.69); 0-1 Standardized Mortality Rate: 25th Percentile: 0.79% (0.55-1.03); 0-1 75th Percentile: 0.44% (0.22-0.66); 0-1 Western cities: 0.75% (0.47-1.03); 0-1 Southern cities: 0.61% (0.32-0.91); 0-1 Eastern cities: 0.03% (-0.47 to 0.53); 0-1 PACF (Partial Autocorrelation Function)
Number of CO monitors: 25th Percentile: 1.18% (0.96-1.39); 0-1 75th Percentile: 0.92% (0.73-1.11); 0-1 Mean PM10 Levels: 25th Percentile: 0.74% (0.46-1.02); 0-1 75th Percentile: 1.07% (0.87-1.27); 0-1 Standardized Mortality Rate: 25th Percentile: 1.29% (1.06-1.52); 0-1 75th Percentile: 0.77% (0.56-0.98); 0-1 Western cities: 1.15% (0.90-1.40); 0-1 Southern cities: 1.08% (0.79-1.38); 0-1 Eastern cities: 0.27% (-0.20 to 0.74); 0-1 Cardiovascular Mortality 8 Degrees of Freedom per Year Mean O3: 25th Percentile: 1.04% (0.67-1.41); 0-1 75th Percentile: 0.82% (0.55-1.10); 0-1 Standardized Mortality Rate: 25th Percentile: 1.06% (0.71-1.42); 0-1 75th Percentile: 0.61% (0.30-0.93); 0-1
January 2010 C-89
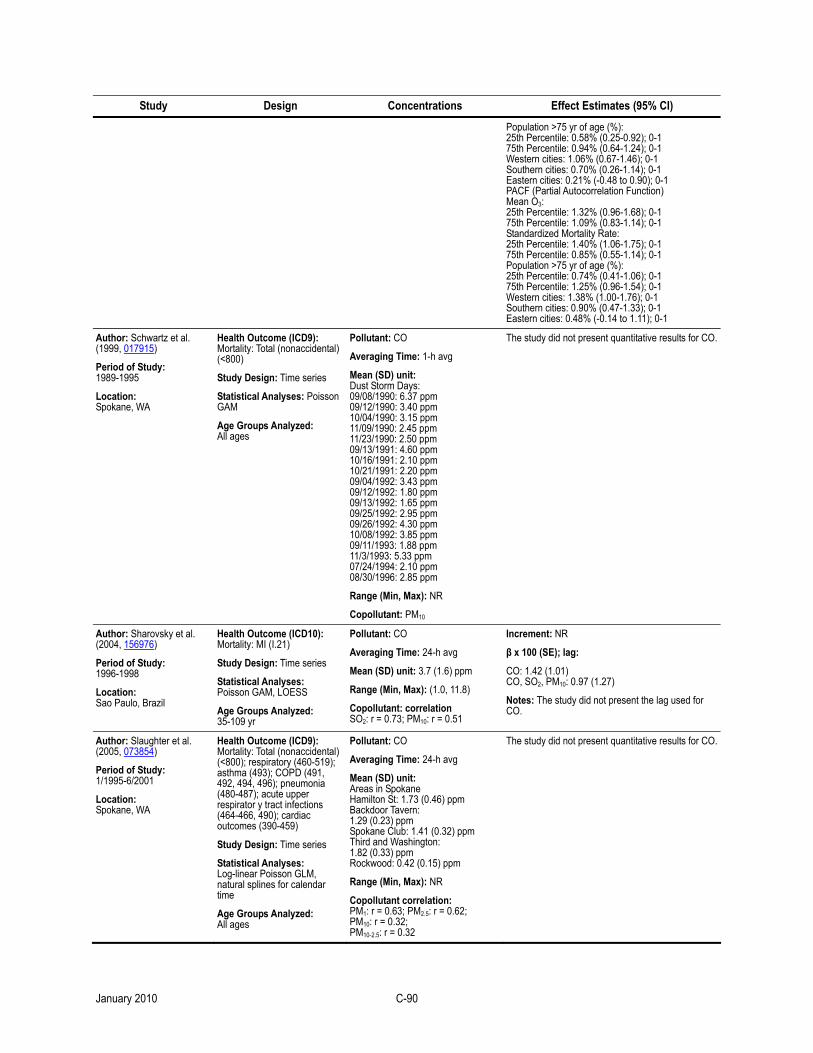
Study Design Concentrations Effect Estimates (95% CI)
Population >75 yr of age (%): 25th Percentile: 0.58% (0.25-0.92); 0-1 75th Percentile: 0.94% (0.64-1.24); 0-1 Western cities: 1.06% (0.67-1.46); 0-1 Southern cities: 0.70% (0.26-1.14); 0-1 Eastern cities: 0.21% (-0.48 to 0.90); 0-1 PACF (Partial Autocorrelation Function) Mean O3: 25th Percentile: 1.32% (0.96-1.68); 0-1 75th Percentile: 1.09% (0.83-1.14); 0-1 Standardized Mortality Rate: 25th Percentile: 1.40% (1.06-1.75); 0-1 75th Percentile: 0.85% (0.55-1.14); 0-1 Population >75 yr of age (%): 25th Percentile: 0.74% (0.41-1.06); 0-1 75th Percentile: 1.25% (0.96-1.54); 0-1 Western cities: 1.38% (1.00-1.76); 0-1 Southern cities: 0.90% (0.47-1.33); 0-1 Eastern cities: 0.48% (-0.14 to 1.11); 0-1
Author: Schwartz et al. (1999, 017915)
Period of Study: 1989-1995
Location: Spokane, WA
Health Outcome (ICD9): Mortality: Total (nonaccidental) (<800)
Study Design: Time series
Statistical Analyses: Poisson GAM
Age Groups Analyzed: All ages
Pollutant: CO
Averaging Time: 1-h avg
Mean (SD) unit: Dust Storm Days: 09/08/1990: 6.37 ppm 09/12/1990: 3.40 ppm 10/04/1990: 3.15 ppm 11/09/1990: 2.45 ppm 11/23/1990: 2.50 ppm 09/13/1991: 4.60 ppm 10/16/1991: 2.10 ppm 10/21/1991: 2.20 ppm 09/04/1992: 3.43 ppm 09/12/1992: 1.80 ppm 09/13/1992: 1.65 ppm 09/25/1992: 2.95 ppm 09/26/1992: 4.30 ppm 10/08/1992: 3.85 ppm 09/11/1993: 1.88 ppm 11/3/1993: 5.33 ppm 07/24/1994: 2.10 ppm 08/30/1996: 2.85 ppm
Range (Min, Max): NR
Copollutant: PM10
The study did not present quantitative results for CO.
Author: Sharovsky et al. (2004, 156976)
Period of Study: 1996-1998
Location: Sao Paulo, Brazil
Health Outcome (ICD10): Mortality: MI (I.21)
Study Design: Time series
Statistical Analyses: Poisson GAM, LOESS
Age Groups Analyzed: 35-109 yr
Pollutant: CO
Averaging Time: 24-h avg
Mean (SD) unit: 3.7 (1.6) ppm
Range (Min, Max): (1.0, 11.8)
Copollutant: correlation SO2: r = 0.73; PM10: r = 0.51
Increment: NR
β x 100 (SE); lag:
CO: 1.42 (1.01) CO, SO2, PM10: 0.97 (1.27)
Notes: The study did not present the lag used for CO.
Author: Slaughter et al. (2005, 073854)
Period of Study: 1/1995-6/2001
Location: Spokane, WA
Health Outcome (ICD9): Mortality: Total (nonaccidental) (<800); respiratory (460-519); asthma (493); COPD (491, 492, 494, 496); pneumonia (480-487); acute upper respirator y tract infections (464-466, 490); cardiac outcomes (390-459)
Study Design: Time series
Statistical Analyses: Log-linear Poisson GLM, natural splines for calendar time
Age Groups Analyzed: All ages
Pollutant: CO
Averaging Time: 24-h avg
Mean (SD) unit: Areas in Spokane Hamilton St: 1.73 (0.46) ppm Backdoor Tavern: 1.29 (0.23) ppm Spokane Club: 1.41 (0.32) ppm Third and Washington: 1.82 (0.33) ppm Rockwood: 0.42 (0.15) ppm
Range (Min, Max): NR
Copollutant correlation: PM1: r = 0.63; PM2.5: r = 0.62; PM10: r = 0.32; PM10-2.5: r = 0.32
The study did not present quantitative results for CO.
January 2010 C-90
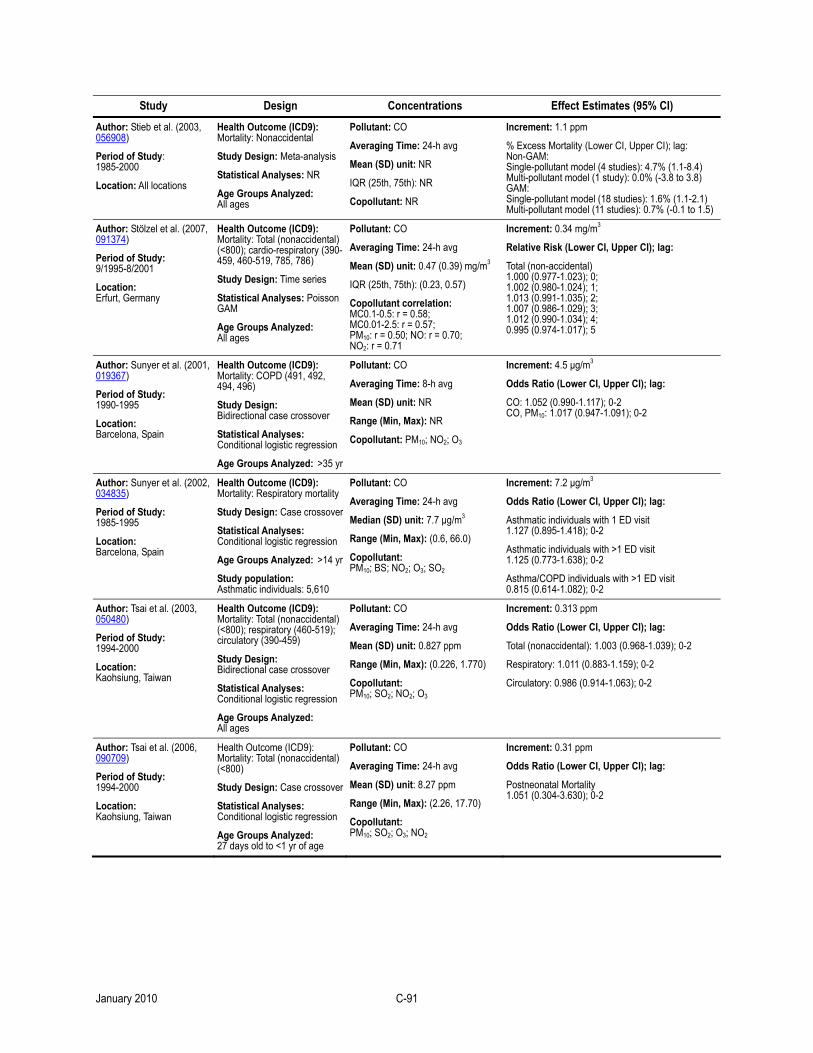
Study Design Concentrations Effect Estimates (95% CI)
Author: Stieb et al. (2003, 056908)
Period of Study: 1985-2000
Location: All locations
Health Outcome (ICD9): Mortality: Nonaccidental
Study Design: Meta-analysis
Statistical Analyses: NR
Age Groups Analyzed: All ages
Pollutant: CO
Averaging Time: 24-h avg
Mean (SD) unit: NR
IQR (25th, 75th): NR
Copollutant: NR
Increment: 1.1 ppm
% Excess Mortality (Lower CI, Upper CI); lag: Non-GAM: Single-pollutant model (4 studies): 4.7% (1.1-8.4) Multi-pollutant model (1 study): 0.0% (-3.8 to 3.8) GAM: Single-pollutant model (18 studies): 1.6% (1.1-2.1) Multi-pollutant model (11 studies): 0.7% (-0.1 to 1.5)
Author: Stölzel et al. (2007, 091374)
Period of Study: 9/1995-8/2001
Location: Erfurt, Germany
Health Outcome (ICD9): Mortality: Total (nonaccidental) (<800); cardio-respiratory (390-459, 460-519, 785, 786)
Study Design: Time series
Statistical Analyses: Poisson GAM
Age Groups Analyzed: All ages
Pollutant: CO
Averaging Time: 24-h avg
Mean (SD) unit: 0.47 (0.39) mg/m3
IQR (25th, 75th): (0.23, 0.57)
Copollutant correlation: MC0.1-0.5: r = 0.58; MC0.01-2.5: r = 0.57; PM10: r = 0.50; NO: r = 0.70; NO2: r = 0.71
Increment: 0.34 mg/m3
Relative Risk (Lower CI, Upper CI); lag:
Total (non-accidental) 1.000 (0.977-1.023); 0; 1.002 (0.980-1.024); 1; 1.013 (0.991-1.035); 2; 1.007 (0.986-1.029); 3; 1.012 (0.990-1.034); 4; 0.995 (0.974-1.017); 5
Author: Sunyer et al. (2001, 019367)
Period of Study: 1990-1995
Location: Barcelona, Spain
Health Outcome (ICD9): Mortality: COPD (491, 492, 494, 496)
Study Design: Bidirectional case crossover
Statistical Analyses: Conditional logistic regression
Age Groups Analyzed: >35 yr
Pollutant: CO
Averaging Time: 8-h avg
Mean (SD) unit: NR
Range (Min, Max): NR
Copollutant: PM10; NO2; O3
Increment: 4.5 µg/m3
Odds Ratio (Lower CI, Upper CI); lag:
CO: 1.052 (0.990-1.117); 0-2 CO, PM10: 1.017 (0.947-1.091); 0-2
Author: Sunyer et al. (2002, 034835)
Period of Study: 1985-1995
Location: Barcelona, Spain
Health Outcome (ICD9): Mortality: Respiratory mortality
Study Design: Case crossover
Statistical Analyses: Conditional logistic regression
Age Groups Analyzed: >14 yr
Study population: Asthmatic individuals: 5,610
Pollutant: CO
Averaging Time: 24-h avg
Median (SD) unit: 7.7 µg/m3
Range (Min, Max): (0.6, 66.0)
Copollutant: PM10; BS; NO2; O3; SO2
Increment: 7.2 µg/m3
Odds Ratio (Lower CI, Upper CI); lag:
Asthmatic individuals with 1 ED visit 1.127 (0.895-1.418); 0-2
Asthmatic individuals with >1 ED visit 1.125 (0.773-1.638); 0-2
Asthma/COPD individuals with >1 ED visit 0.815 (0.614-1.082); 0-2
Author: Tsai et al. (2003, 050480)
Period of Study: 1994-2000
Location: Kaohsiung, Taiwan
Health Outcome (ICD9): Mortality: Total (nonaccidental) (<800); respiratory (460-519); circulatory (390-459)
Study Design: Bidirectional case crossover
Statistical Analyses: Conditional logistic regression
Age Groups Analyzed: All ages
Pollutant: CO
Averaging Time: 24-h avg
Mean (SD) unit: 0.827 ppm
Range (Min, Max): (0.226, 1.770)
Copollutant: PM10; SO2; NO2; O3
Increment: 0.313 ppm
Odds Ratio (Lower CI, Upper CI); lag:
Total (nonaccidental): 1.003 (0.968-1.039); 0-2
Respiratory: 1.011 (0.883-1.159); 0-2
Circulatory: 0.986 (0.914-1.063); 0-2
Author: Tsai et al. (2006, 090709)
Period of Study: 1994-2000
Location: Kaohsiung, Taiwan
Health Outcome (ICD9): Mortality: Total (nonaccidental) (<800)
Study Design: Case crossover
Statistical Analyses: Conditional logistic regression
Age Groups Analyzed: 27 days old to <1 yr of age
Pollutant: CO
Averaging Time: 24-h avg
Mean (SD) unit: 8.27 ppm
Range (Min, Max): (2.26, 17.70)
Copollutant: PM10; SO2; O3; NO2
Increment: 0.31 ppm
Odds Ratio (Lower CI, Upper CI); lag:
Postneonatal Mortality 1.051 (0.304-3.630); 0-2
January 2010 C-91
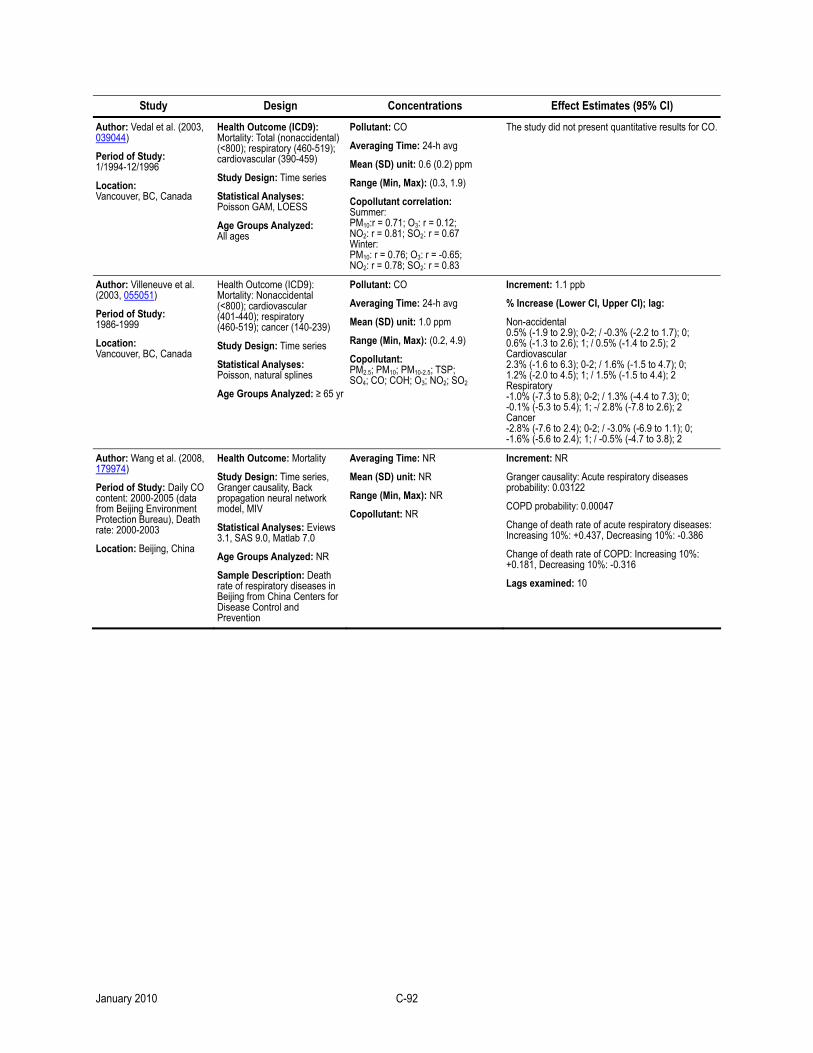
Study Design Concentrations Effect Estimates (95% CI)
Author: Vedal et al. (2003, 039044)
Period of Study: 1/1994-12/1996
Location: Vancouver, BC, Canada
Health Outcome (ICD9): Mortality: Total (nonaccidental) (<800); respiratory (460-519); cardiovascular (390-459)
Study Design: Time series
Statistical Analyses: Poisson GAM, LOESS
Age Groups Analyzed: All ages
Pollutant: CO
Averaging Time: 24-h avg
Mean (SD) unit: 0.6 (0.2) ppm
Range (Min, Max): (0.3, 1.9)
Copollutant correlation: Summer: PM10:r = 0.71; O3: r = 0.12; NO2: r = 0.81; SO2: r = 0.67 Winter: PM10: r = 0.76; O3: r = -0.65; NO2: r = 0.78; SO2: r = 0.83
The study did not present quantitative results for CO.
Author: Villeneuve et al. (2003, 055051)
Period of Study: 1986-1999
Location: Vancouver, BC, Canada
Health Outcome (ICD9): Mortality: Nonaccidental (<800); cardiovascular (401-440); respiratory (460-519); cancer (140-239)
Study Design: Time series
Statistical Analyses: Poisson, natural splines
Age Groups Analyzed: ≥ 65 yr
Pollutant: CO
Averaging Time: 24-h avg
Mean (SD) unit: 1.0 ppm
Range (Min, Max): (0.2, 4.9)
Copollutant: PM2.5; PM10; PM10-2.5; TSP; SO4; CO; COH; O3; NO2; SO2
Increment: 1.1 ppb
% Increase (Lower CI, Upper CI); lag:
Non-accidental 0.5% (-1.9 to 2.9); 0-2; / -0.3% (-2.2 to 1.7); 0; 0.6% (-1.3 to 2.6); 1; / 0.5% (-1.4 to 2.5); 2 Cardiovascular 2.3% (-1.6 to 6.3); 0-2; / 1.6% (-1.5 to 4.7); 0; 1.2% (-2.0 to 4.5); 1; / 1.5% (-1.5 to 4.4); 2 Respiratory -1.0% (-7.3 to 5.8); 0-2; / 1.3% (-4.4 to 7.3); 0; -0.1% (-5.3 to 5.4); 1; -/ 2.8% (-7.8 to 2.6); 2 Cancer -2.8% (-7.6 to 2.4); 0-2; / -3.0% (-6.9 to 1.1); 0; -1.6% (-5.6 to 2.4); 1; / -0.5% (-4.7 to 3.8); 2
Author: Wang et al. (2008, 179974)
Period of Study: Daily CO content: 2000-2005 (data from Beijing Environment Protection Bureau), Death rate: 2000-2003
Location: Beijing, China
Health Outcome: Mortality
Study Design: Time series, Granger causality, Back propagation neural network model, MIV
Statistical Analyses: Eviews 3.1, SAS 9.0, Matlab 7.0
Age Groups Analyzed: NR
Sample Description: Death rate of respiratory diseases in Beijing from China Centers for Disease Control and Prevention
Averaging Time: NR
Mean (SD) unit: NR
Range (Min, Max): NR
Copollutant: NR
Increment: NR
Granger causality: Acute respiratory diseases probability: 0.03122
COPD probability: 0.00047
Change of death rate of acute respiratory diseases: Increasing 10%: +0.437, Decreasing 10%: -0.386
Change of death rate of COPD: Increasing 10%: +0.181, Decreasing 10%: -0.316
Lags examined: 10
January 2010 C-92
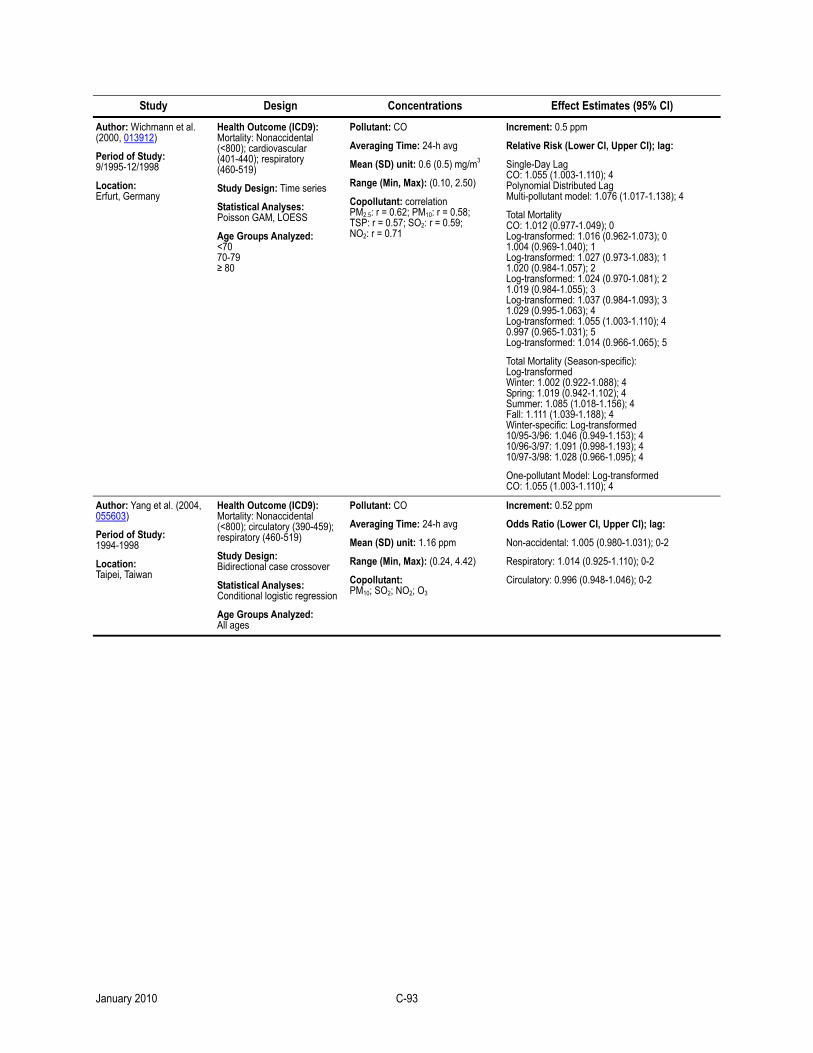
Study Design Concentrations Effect Estimates (95% CI)
Author: Wichmann et al. (2000, 013912)
Period of Study: 9/1995-12/1998
Location: Erfurt, Germany
Health Outcome (ICD9): Mortality: Nonaccidental (<800); cardiovascular (401-440); respiratory (460-519)
Study Design: Time series
Statistical Analyses: Poisson GAM, LOESS
Age Groups Analyzed: <70 70-79 ≥ 80
Pollutant: CO
Averaging Time: 24-h avg
Mean (SD) unit: 0.6 (0.5) mg/m3
Range (Min, Max): (0.10, 2.50)
Copollutant: correlation PM2.5: r = 0.62; PM10: r = 0.58; TSP: r = 0.57; SO2: r = 0.59; NO2: r = 0.71
Increment: 0.5 ppm
Relative Risk (Lower CI, Upper CI); lag:
Single-Day Lag CO: 1.055 (1.003-1.110); 4 Polynomial Distributed Lag Multi-pollutant model: 1.076 (1.017-1.138); 4
Total Mortality CO: 1.012 (0.977-1.049); 0 Log-transformed: 1.016 (0.962-1.073); 0 1.004 (0.969-1.040); 1 Log-transformed: 1.027 (0.973-1.083); 1 1.020 (0.984-1.057); 2 Log-transformed: 1.024 (0.970-1.081); 2 1.019 (0.984-1.055); 3 Log-transformed: 1.037 (0.984-1.093); 3 1.029 (0.995-1.063); 4 Log-transformed: 1.055 (1.003-1.110); 4 0.997 (0.965-1.031); 5 Log-transformed: 1.014 (0.966-1.065); 5
Total Mortality (Season-specific): Log-transformed Winter: 1.002 (0.922-1.088); 4 Spring: 1.019 (0.942-1.102); 4 Summer: 1.085 (1.018-1.156); 4 Fall: 1.111 (1.039-1.188); 4 Winter-specific: Log-transformed 10/95-3/96: 1.046 (0.949-1.153); 4 10/96-3/97: 1.091 (0.998-1.193); 4 10/97-3/98: 1.028 (0.966-1.095); 4
One-pollutant Model: Log-transformed CO: 1.055 (1.003-1.110); 4
Author: Yang et al. (2004, 055603)
Period of Study: 1994-1998
Location: Taipei, Taiwan
Health Outcome (ICD9): Mortality: Nonaccidental (<800); circulatory (390-459); respiratory (460-519)
Study Design: Bidirectional case crossover
Statistical Analyses: Conditional logistic regression
Age Groups Analyzed: All ages
Pollutant: CO
Averaging Time: 24-h avg
Mean (SD) unit: 1.16 ppm
Range (Min, Max): (0.24, 4.42)
Copollutant: PM10; SO2; NO2; O3
Increment: 0.52 ppm
Odds Ratio (Lower CI, Upper CI); lag:
Non-accidental: 1.005 (0.980-1.031); 0-2
Respiratory: 1.014 (0.925-1.110); 0-2
Circulatory: 0.996 (0.948-1.046); 0-2
January 2010 C-93
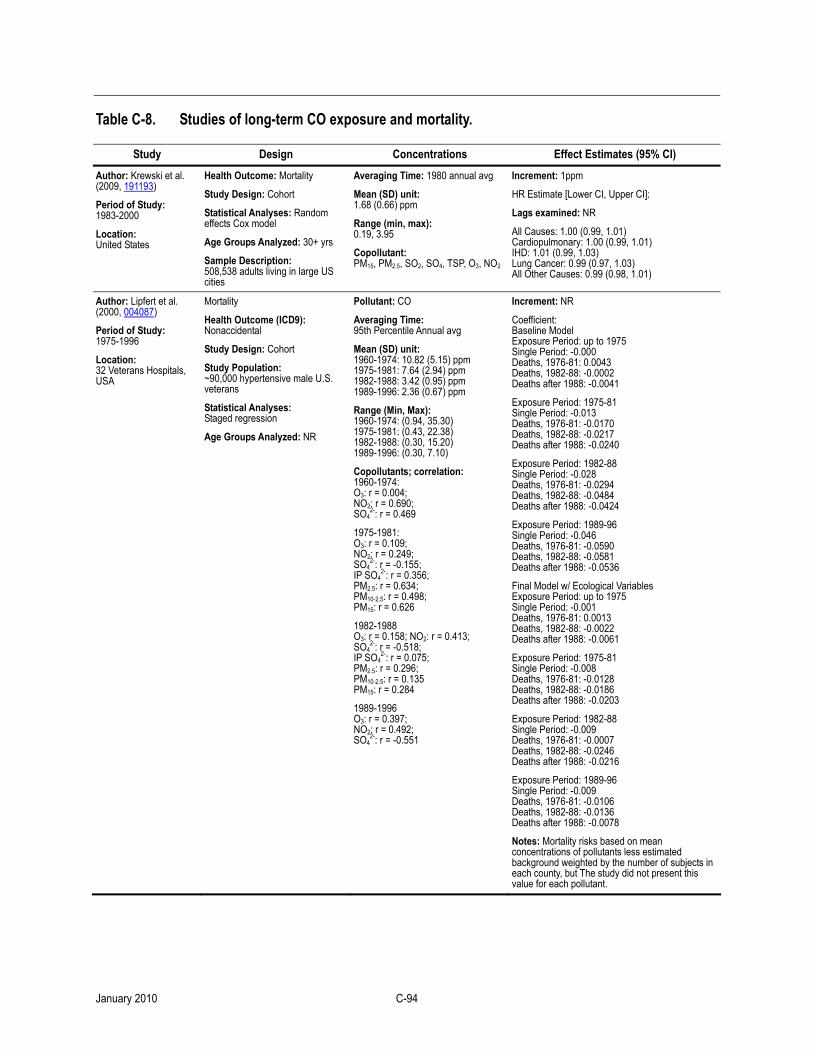
Table C-8. Studies of long-term CO exposure and mortality.
Study Design Concentrations Effect Estimates (95% CI)
Author: Krewski et al. (2009, 191193)
Period of Study: 1983-2000
Location: United States
Health Outcome: Mortality
Study Design: Cohort
Statistical Analyses: Random effects Cox model
Age Groups Analyzed: 30+ yrs
Sample Description: 508,538 adults living in large US cities
Averaging Time: 1980 annual avg
Mean (SD) unit: 1.68 (0.66) ppm
Range (min, max): 0.19, 3.95
Copollutant: PM15, PM2.5, SO2, SO4, TSP, O3, NO2
Increment: 1ppm
HR Estimate [Lower CI, Upper CI]:
Lags examined: NR
All Causes: 1.00 (0.99, 1.01) Cardiopulmonary: 1.00 (0.99, 1.01) IHD: 1.01 (0.99, 1.03) Lung Cancer: 0.99 (0.97, 1.03) All Other Causes: 0.99 (0.98, 1.01)
Author: Lipfert et al. (2000, 004087)
Period of Study: 1975-1996
Location: 32 Veterans Hospitals, USA
Mortality
Health Outcome (ICD9): Nonaccidental
Study Design: Cohort
Study Population: ~90,000 hypertensive male U.S. veterans
Statistical Analyses: Staged regression
Age Groups Analyzed: NR
Pollutant: CO
Averaging Time: 95th Percentile Annual avg
Mean (SD) unit: 1960-1974: 10.82 (5.15) ppm 1975-1981: 7.64 (2.94) ppm 1982-1988: 3.42 (0.95) ppm 1989-1996: 2.36 (0.67) ppm
Range (Min, Max): 1960-1974: (0.94, 35.30) 1975-1981: (0.43, 22.38) 1982-1988: (0.30, 15.20) 1989-1996: (0.30, 7.10)
Copollutants; correlation: 1960-1974: O3: r = 0.004; NO2: r = 0.690; SO4
2-: r = 0.469
1975-1981: O3: r = 0.109; NO2: r = 0.249; SO4
2-: r = -0.155; IP SO4
2-: r = 0.356; PM2.5: r = 0.634; PM10-2.5: r = 0.498; PM15: r = 0.626
1982-1988 O3: r = 0.158; NO2: r = 0.413; SO4
2-: r = -0.518; IP SO4
2-: r = 0.075; PM2.5: r = 0.296; PM10-2.5: r = 0.135 PM15: r = 0.284
1989-1996 O3: r = 0.397; NO2: r = 0.492; SO4
2-: r = -0.551
Increment: NR
Coefficient: Baseline Model Exposure Period: up to 1975 Single Period: -0.000 Deaths, 1976-81: 0.0043 Deaths, 1982-88: -0.0002 Deaths after 1988: -0.0041
Exposure Period: 1975-81 Single Period: -0.013 Deaths, 1976-81: -0.0170 Deaths, 1982-88: -0.0217 Deaths after 1988: -0.0240
Exposure Period: 1982-88 Single Period: -0.028 Deaths, 1976-81: -0.0294 Deaths, 1982-88: -0.0484 Deaths after 1988: -0.0424
Exposure Period: 1989-96 Single Period: -0.046 Deaths, 1976-81: -0.0590 Deaths, 1982-88: -0.0581 Deaths after 1988: -0.0536
Final Model w/ Ecological Variables Exposure Period: up to 1975 Single Period: -0.001 Deaths, 1976-81: 0.0013 Deaths, 1982-88: -0.0022 Deaths after 1988: -0.0061
Exposure Period: 1975-81 Single Period: -0.008 Deaths, 1976-81: -0.0128 Deaths, 1982-88: -0.0186 Deaths after 1988: -0.0203
Exposure Period: 1982-88 Single Period: -0.009 Deaths, 1976-81: -0.0007 Deaths, 1982-88: -0.0246 Deaths after 1988: -0.0216
Exposure Period: 1989-96 Single Period: -0.009 Deaths, 1976-81: -0.0106 Deaths, 1982-88: -0.0136 Deaths after 1988: -0.0078
Notes: Mortality risks based on mean concentrations of pollutants less estimated background weighted by the number of subjects in each county, but The study did not present this value for each pollutant.
January 2010 C-94
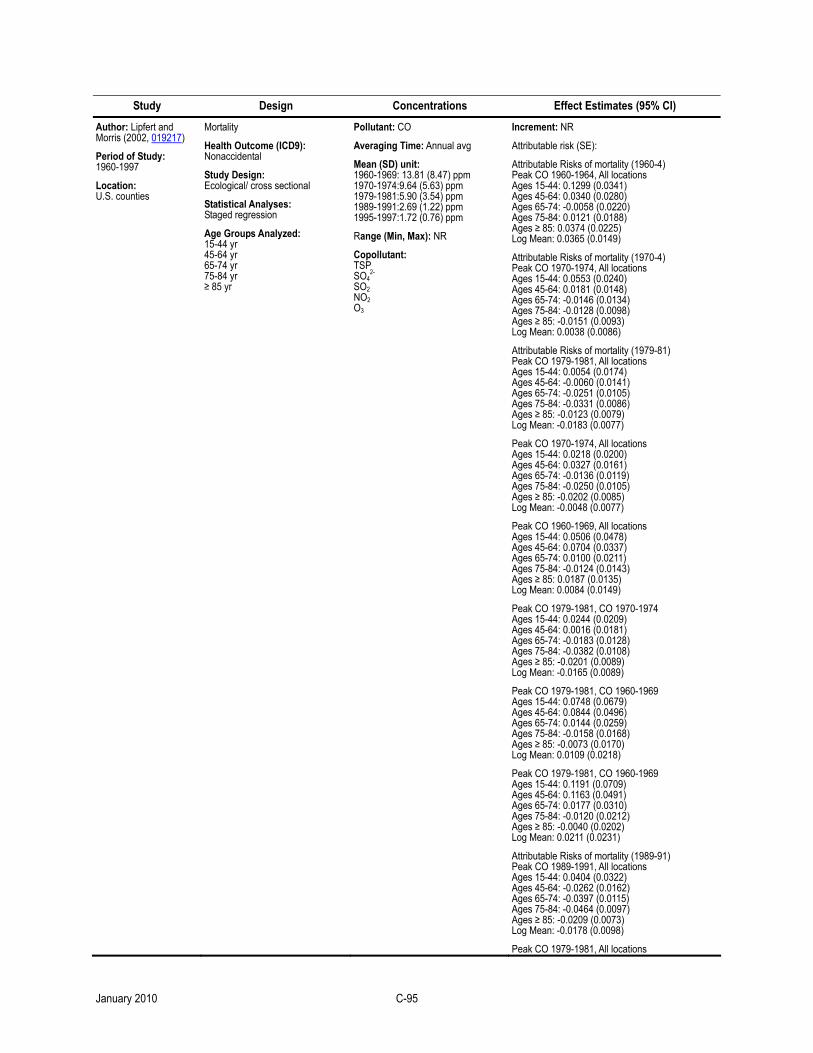
Study Design Concentrations Effect Estimates (95% CI)
Author: Lipfert and Morris (2002, 019217)
Period of Study: 1960-1997
Location: U.S. counties
Mortality
Health Outcome (ICD9): Nonaccidental
Study Design: Ecological/ cross sectional
Statistical Analyses: Staged regression
Age Groups Analyzed: 15-44 yr 45-64 yr 65-74 yr 75-84 yr ≥ 85 yr
Pollutant: CO
Averaging Time: Annual avg
Mean (SD) unit: 1960-1969: 13.81 (8.47) ppm 1970-1974:9.64 (5.63) ppm 1979-1981:5.90 (3.54) ppm 1989-1991:2.69 (1.22) ppm 1995-1997:1.72 (0.76) ppm
Range (Min, Max): NR
Copollutant: TSP SO4
2- SO2 NO2 O3
Increment: NR
Attributable risk (SE):
Attributable Risks of mortality (1960-4) Peak CO 1960-1964, All locations Ages 15-44: 0.1299 (0.0341) Ages 45-64: 0.0340 (0.0280) Ages 65-74: -0.0058 (0.0220) Ages 75-84: 0.0121 (0.0188) Ages ≥ 85: 0.0374 (0.0225) Log Mean: 0.0365 (0.0149)
Attributable Risks of mortality (1970-4) Peak CO 1970-1974, All locations Ages 15-44: 0.0553 (0.0240) Ages 45-64: 0.0181 (0.0148) Ages 65-74: -0.0146 (0.0134) Ages 75-84: -0.0128 (0.0098) Ages ≥ 85: -0.0151 (0.0093) Log Mean: 0.0038 (0.0086)
Attributable Risks of mortality (1979-81) Peak CO 1979-1981, All locations Ages 15-44: 0.0054 (0.0174) Ages 45-64: -0.0060 (0.0141) Ages 65-74: -0.0251 (0.0105) Ages 75-84: -0.0331 (0.0086) Ages ≥ 85: -0.0123 (0.0079) Log Mean: -0.0183 (0.0077)
Peak CO 1970-1974, All locations Ages 15-44: 0.0218 (0.0200) Ages 45-64: 0.0327 (0.0161) Ages 65-74: -0.0136 (0.0119) Ages 75-84: -0.0250 (0.0105) Ages ≥ 85: -0.0202 (0.0085) Log Mean: -0.0048 (0.0077)
Peak CO 1960-1969, All locations Ages 15-44: 0.0506 (0.0478) Ages 45-64: 0.0704 (0.0337) Ages 65-74: 0.0100 (0.0211) Ages 75-84: -0.0124 (0.0143) Ages ≥ 85: 0.0187 (0.0135) Log Mean: 0.0084 (0.0149)
Peak CO 1979-1981, CO 1970-1974 Ages 15-44: 0.0244 (0.0209) Ages 45-64: 0.0016 (0.0181) Ages 65-74: -0.0183 (0.0128) Ages 75-84: -0.0382 (0.0108) Ages ≥ 85: -0.0201 (0.0089) Log Mean: -0.0165 (0.0089)
Peak CO 1979-1981, CO 1960-1969 Ages 15-44: 0.0748 (0.0679) Ages 45-64: 0.0844 (0.0496) Ages 65-74: 0.0144 (0.0259) Ages 75-84: -0.0158 (0.0168) Ages ≥ 85: -0.0073 (0.0170) Log Mean: 0.0109 (0.0218)
Peak CO 1979-1981, CO 1960-1969 Ages 15-44: 0.1191 (0.0709) Ages 45-64: 0.1163 (0.0491) Ages 65-74: 0.0177 (0.0310) Ages 75-84: -0.0120 (0.0212) Ages ≥ 85: -0.0040 (0.0202) Log Mean: 0.0211 (0.0231)
Attributable Risks of mortality (1989-91) Peak CO 1989-1991, All locations Ages 15-44: 0.0404 (0.0322) Ages 45-64: -0.0262 (0.0162) Ages 65-74: -0.0397 (0.0115) Ages 75-84: -0.0464 (0.0097) Ages ≥ 85: -0.0209 (0.0073) Log Mean: -0.0178 (0.0098)
Peak CO 1979-1981, All locations
January 2010 C-95
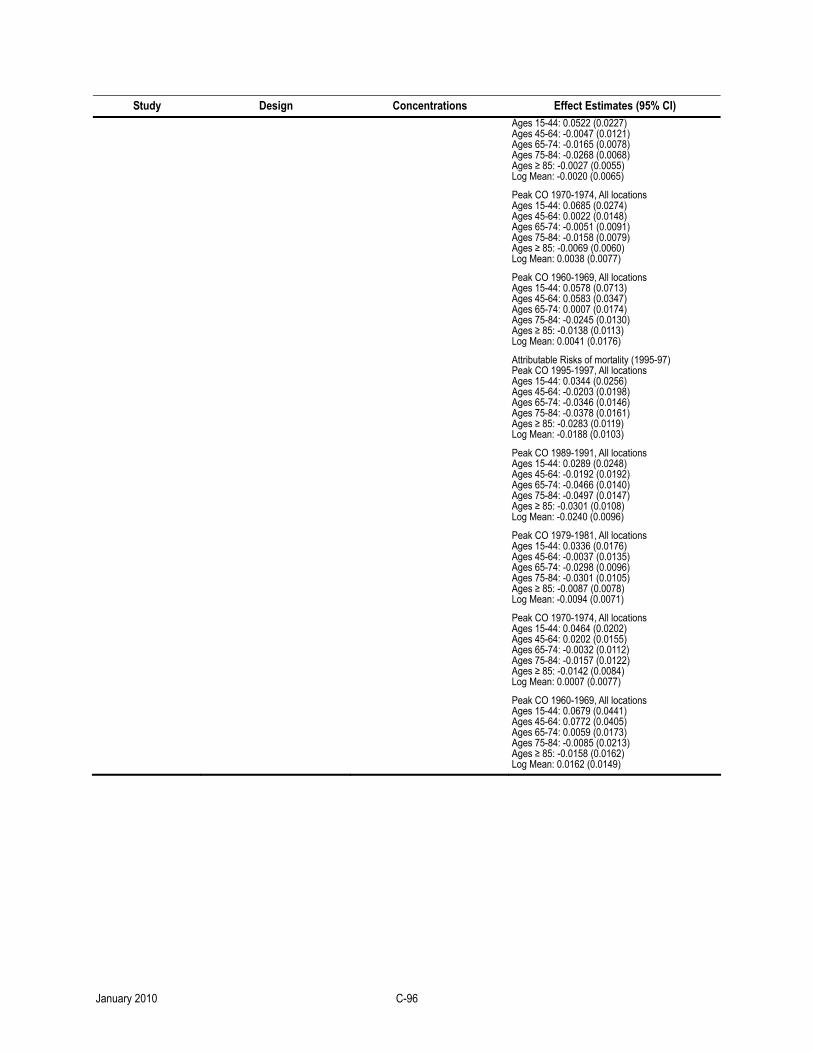
Study Design Concentrations Effect Estimates (95% CI) Ages 15-44: 0.0522 (0.0227) Ages 45-64: -0.0047 (0.0121) Ages 65-74: -0.0165 (0.0078) Ages 75-84: -0.0268 (0.0068) Ages ≥ 85: -0.0027 (0.0055) Log Mean: -0.0020 (0.0065)
Peak CO 1970-1974, All locations Ages 15-44: 0.0685 (0.0274) Ages 45-64: 0.0022 (0.0148) Ages 65-74: -0.0051 (0.0091) Ages 75-84: -0.0158 (0.0079) Ages ≥ 85: -0.0069 (0.0060) Log Mean: 0.0038 (0.0077)
Peak CO 1960-1969, All locations Ages 15-44: 0.0578 (0.0713) Ages 45-64: 0.0583 (0.0347) Ages 65-74: 0.0007 (0.0174) Ages 75-84: -0.0245 (0.0130) Ages ≥ 85: -0.0138 (0.0113) Log Mean: 0.0041 (0.0176)
Attributable Risks of mortality (1995-97) Peak CO 1995-1997, All locations Ages 15-44: 0.0344 (0.0256) Ages 45-64: -0.0203 (0.0198) Ages 65-74: -0.0346 (0.0146) Ages 75-84: -0.0378 (0.0161) Ages ≥ 85: -0.0283 (0.0119) Log Mean: -0.0188 (0.0103)
Peak CO 1989-1991, All locations Ages 15-44: 0.0289 (0.0248) Ages 45-64: -0.0192 (0.0192) Ages 65-74: -0.0466 (0.0140) Ages 75-84: -0.0497 (0.0147) Ages ≥ 85: -0.0301 (0.0108) Log Mean: -0.0240 (0.0096)
Peak CO 1979-1981, All locations Ages 15-44: 0.0336 (0.0176) Ages 45-64: -0.0037 (0.0135) Ages 65-74: -0.0298 (0.0096) Ages 75-84: -0.0301 (0.0105) Ages ≥ 85: -0.0087 (0.0078) Log Mean: -0.0094 (0.0071)
Peak CO 1970-1974, All locations Ages 15-44: 0.0464 (0.0202) Ages 45-64: 0.0202 (0.0155) Ages 65-74: -0.0032 (0.0112) Ages 75-84: -0.0157 (0.0122) Ages ≥ 85: -0.0142 (0.0084) Log Mean: 0.0007 (0.0077)
Peak CO 1960-1969, All locations Ages 15-44: 0.0679 (0.0441) Ages 45-64: 0.0772 (0.0405) Ages 65-74: 0.0059 (0.0173) Ages 75-84: -0.0085 (0.0213) Ages ≥ 85: -0.0158 (0.0162) Log Mean: 0.0162 (0.0149)
January 2010 C-96
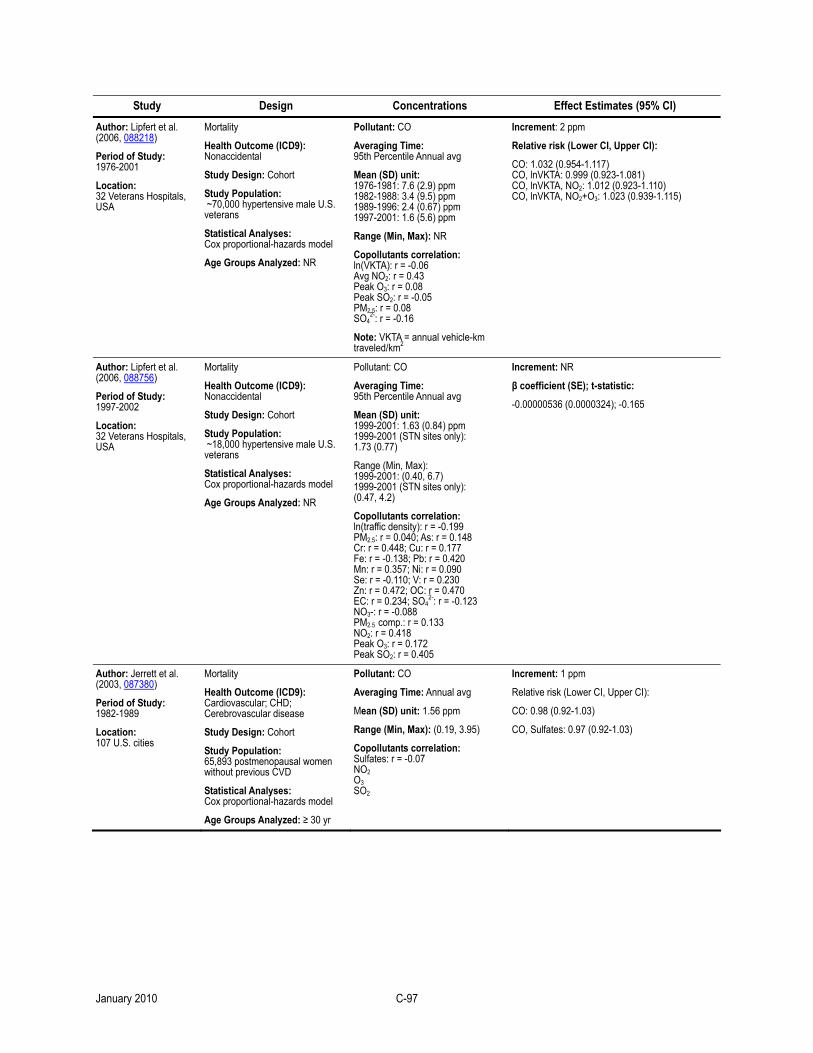
Study Design Concentrations Effect Estimates (95% CI)
Author: Lipfert et al. (2006, 088218)
Period of Study: 1976-2001
Location: 32 Veterans Hospitals, USA
Mortality
Health Outcome (ICD9): Nonaccidental
Study Design: Cohort
Study Population: ~70,000 hypertensive male U.S. veterans
Statistical Analyses: Cox proportional-hazards model
Age Groups Analyzed: NR
Pollutant: CO
Averaging Time: 95th Percentile Annual avg
Mean (SD) unit: 1976-1981: 7.6 (2.9) ppm 1982-1988: 3.4 (9.5) ppm 1989-1996: 2.4 (0.67) ppm 1997-2001: 1.6 (5.6) ppm
Range (Min, Max): NR
Copollutants correlation: ln(VKTA): r = -0.06 Avg NO2: r = 0.43 Peak O3: r = 0.08 Peak SO2: r = -0.05 PM2.5: r = 0.08 SO4
2-: r = -0.16
Note: VKTA = annual vehicle-km traveled/km2
Increment: 2 ppm
Relative risk (Lower CI, Upper CI):
CO: 1.032 (0.954-1.117) CO, lnVKTA: 0.999 (0.923-1.081) CO, lnVKTA, NO2: 1.012 (0.923-1.110) CO, lnVKTA, NO2+O3: 1.023 (0.939-1.115)
Author: Lipfert et al. (2006, 088756)
Period of Study: 1997-2002
Location: 32 Veterans Hospitals, USA
Mortality
Health Outcome (ICD9): Nonaccidental
Study Design: Cohort
Study Population: ~18,000 hypertensive male U.S. veterans
Statistical Analyses: Cox proportional-hazards model
Age Groups Analyzed: NR
Pollutant: CO
Averaging Time: 95th Percentile Annual avg
Mean (SD) unit: 1999-2001: 1.63 (0.84) ppm 1999-2001 (STN sites only): 1.73 (0.77)
Range (Min, Max): 1999-2001: (0.40, 6.7) 1999-2001 (STN sites only): (0.47, 4.2)
Copollutants correlation: ln(traffic density): r = -0.199 PM2.5: r = 0.040; As: r = 0.148 Cr: r = 0.448; Cu: r = 0.177 Fe: r = -0.138; Pb: r = 0.420 Mn: r = 0.357; Ni: r = 0.090 Se: r = -0.110; V: r = 0.230 Zn: r = 0.472; OC: r = 0.470 EC: r = 0.234; SO4
2-: r = -0.123 NO3-: r = -0.088 PM2.5 comp.: r = 0.133 NO2: r = 0.418 Peak O3: r = 0.172 Peak SO2: r = 0.405
Increment: NR
β coefficient (SE); t-statistic:
-0.00000536 (0.0000324); -0.165
Author: Jerrett et al. (2003, 087380)
Period of Study: 1982-1989
Location: 107 U.S. cities
Mortality
Health Outcome (ICD9): Cardiovascular; CHD; Cerebrovascular disease
Study Design: Cohort
Study Population: 65,893 postmenopausal women without previous CVD
Statistical Analyses: Cox proportional-hazards model
Age Groups Analyzed: ≥ 30 yr
Pollutant: CO
Averaging Time: Annual avg
Mean (SD) unit: 1.56 ppm
Range (Min, Max): (0.19, 3.95)
Copollutants correlation: Sulfates: r = -0.07 NO2 O3 SO2
Increment: 1 ppm
Relative risk (Lower CI, Upper CI):
CO: 0.98 (0.92-1.03)
CO, Sulfates: 0.97 (0.92-1.03)
January 2010 C-97

Study Design Concentrations Effect Estimates (95% CI)
Author: Miller et al. (2007, 090130)
Period of Study: 1994-1998
Location: 36 U.S. cities
Mortality
Health Outcome (ICD9): Cardiovascular; CHD; Cerebrovascular disease
Study Design: Cohort
Study Population: 65,893 postmenopausal women without previous CVD
Statistical Analyses: Cox proportional-hazards model
Age Groups Analyzed: 50-79 yr
Pollutant: CO
Averaging Time: Annual avg
Mean (SD) unit: NR
Range (Min, Max): NR
Copollutants: PM2.5 PM10-2.5 SO2 NO2 O3
Increment: 1 ppm
Hazard ratio (Lower CI, Upper CI):
All subjects
CO: 1.0 (0.81-1.22)
Only subjects with non-missing exposure data
CO: 0.92 (0.71-1.21)
CO, PM2.5, PM10-2.5, SO2, NO2, O3: 0.93 (0.67, 1.30)
Author: Pope et al. (2002, 024689)
Period of Study: 1980-1998
Location: All 50 States, Washington DC, and Puerto Rico (ACS-CPS-II)
Mortality
Health Outcome (ICD9): Total (nonaccidental) (<800); lung cancer (162); cardiopulmonary (401-440, 460-519)
Study Design: Prospective cohort
Statistical Analyses: Cox proportional hazards model
Age Groups Analyzed: ≥ 30 yr
Pollutant: CO
Averaging Time: 24-h avg
Mean (SD) unit: 1980: 1.7 (0.7) ppm 1982-1998: 1.1 (0.4) ppm
Range (Min, Max): NR
Copollutant: PM2.5; PM10; TSP; SO2; NO2; O3
The study presents results for CO graphically.
January 2010 C-98
References
Abe T; Tokuda Y; Ohde S; Ishimatsu S; Nakamura T; Birrer RB (2009). The relationship of short-term air pollution and weather to ED visits for asthma in Japan. Am J Emerg Med, 27: 153-159. 190536
Andersen ZJ; Loft S; Ketzel M; Stage M; Scheike T; Mette MN; Bisgaard H (2008). Ambient Air Pollution Triggers Wheezing Symptoms in Infants. Thorax, 63: 710-716. 096150
Andersen ZJ; Wahlin P; Raaschou-Nielsen O; Scheike T; Loft S (2007). Ambient particle source apportionment and daily hospital admissions among children and elderly in Copenhagen. J Expo Sci Environ Epidemiol, 17: 625-636. 093201
Anderson HR; Bremner SA; Atkinson RW; Harrison RM; Walters S (2001). Particulate matter and daily mortality and hospital admissions in the west midlands conurbation of the United Kingdom: associations with fine and coarse particles, black smoke and sulphate. Occup Environ Med, 58: 504-510. 017033
Atkinson RW; Bremner SA; Anderson HR; Strachan DP; Bland JM; Ponce de Leon A (1999). Short-term associations between emergency hospital admissions for respiratory and cardiovascular disease and outdoor air pollution in London. Arch Environ Occup Health, 54: 398-411. 007882
Baccarelli A; Zanobetti A; Martinelli I; Grillo P; Hou L; Giacomini S; Bonzini M; Lanzani G; Mannucci PM; Bertazzi PA; Schwartz J (2007). Effects of exposure to air pollution on blood coagulation. J Thromb Haemost, 5: 252-260. 090733
Ballester F; Rodriguez P; Iniguez C; Saez M; Daponte A; Galan I; Taracido M; Arribas F; Bellido J; Cirarda FB; Canada A; Guillen JJ; Guillen-Grima F; Lopez E; Perez-Hoyos S; Lertxundi A; Toro S (2006). Air pollution and cardiovascular admisisons association in Spain: results within the EMECAS project. J Epidemiol Community Health, 60: 328-336. 088746
Ballester F; Tenias JM; Perez-Hoyos S (2001). Air pollution and emergency hospital admissions for cardiovascular diseases in Valencia, Spain. J Epidemiol Community Health, 55: 57-65. 013257
Barnett AG; Williams GM; Schwartz J; Best TL; Neller AH; Petroeschevsky AL; Simpson RW (2006). The effects of air pollution on hospitalizations for cardiovascular disease in elderly people in Australian and New Zealand cities. Environ Health Perspect, 114: 1018-1023. 089770
Bedeschi E; Campari C; Candela S; Collini G; Caranci N; Frasca G; Galassi C; Francesca G; Vigotti MA (2007). Urban air pollution and respiratory emergency visits at pediatric unit, Reggio Emilia, Italy. J Toxicol Environ Health A Curr Iss, 70: 261-265. 090712
Bell ML; Ebisu K; Belanger K (2007). Ambient air pollution and low birth weight in Connecticut and Massachusetts. Environ Health Perspect, 115: 1118-24. 091059
Bell ML; Levy JK; Lin Z (2008). The effect of sandstorms and air pollution on cause-specific hospital admissions in Taipei, Taiwan. Occup Environ Med, 65: 104-111. 091268
Bell ML; Peng RD; Dominici F; Samet JM (2009). Emergency admissions for cardiovascular disease and ambient levels of carbon monoxide: Results for 126 U.S. urban counties, 1999-2005. Circulation, 120: 949-955. 193780
Bellini P; Baccini M; Biggeri A; Terracini B (2007). The meta-analysis of the Italian studies on short-term effects of air pollution (MISA): Old and new issues on the interpretation of the statistical evidences. Environmetrics, 18: 219-229. 097787
Berger A; Zareba W; Schneider A; Ruckerl R; Ibald-Mulli A; Cyrys J; Wichmann HE; Peters A (2006). Runs of ventricular and supraventricular tachycardia triggered by air pollution in patients with coronary heart disease. J Occup Environ Med, 48: 1149-58. 098702
Note: Hyperlinks to the reference citations throughout this document will take you to the NCEA HERO database (Health and Environmental Research Online) at http://epa.gov/hero. HERO is a database of scientific literature used by U.S. EPA in the process of developing science assessments such as the Integrated Science Assessments (ISAs) and the Integrated Risk Information System (IRIS).
January 2010 C-99
Berglind N; Bellander T; Forastiere F; von Klot S; Aalto P; Elosua R; Kulmala M; Lanki T; Löwel H; Peters A; Picciotto S; Salomaa V; Stafoggia M; Sunyer J; Nyberg F (2009). Ambient air pollution and daily mortality among survivors of myocardial infarction. Epidemiology, 20: 110-118. 190068
Bhattacharyya N (2009). Air quality influences the prevalence of hay fever and sinusitis. Laryngoscope, 119: 429-433. 180154
Biggeri A; Baccini M; Bellini P; Terracini B (2005). Meta-analysis of the Italian studies of short-term effects of air pollution (MISA), 1990-1999. Int J Occup Environ Health, 11: 107-122. 087395
Botter DA; Jorgensen B; Peres AAQ (2002). A longitudinal study of mortality and air pollution for Sao Paulo, Brazil. J Expo Sci Environ Epidemiol, 12: 335-343. 011922
Braga ALF; Saldiva PHN; Pereira LAA; Menezes JJC; Conceicao GMC; Lin CA; Zanobetti A; Schwartz J; Dockery DW (2001). Health effects of air pollution exposure on children and adolescents in Sao Paulo, Brazil. Pediatr Pulmonol, 31: 106-113. 016275
Brauer M; Lencar C; Tamburic L; Koehoorn M; Demers P; Karr C (2008). A cohort study of traffic-related air pollution impacts on birth outcomes. Environ Health Perspect, 116: 680-686. 156292
Bremner SA; Anderson HR; Atkinson RW; McMichael AJ; Strachan DP; Bland JM; Bower JS (1999). Short term associations between outdoor air pollution and mortality in London 1992-4. Occup Environ Med, 56: 237-244. 007601
Briet M; Collin C; Laurent S; Tan A; Azizi M; Agharazii M; Jeunemaitre X; Alhenc-Gelas F; Boutouyrie P (2007). Endothelial function and chronic exposure to air pollution in normal male subjects. Hypertension, 50: 970-976. 093049
Burnett RT; Brook J; Dann T; Delocla C; Philips O; Cakmak S; Vincent R; Goldberg MS; Krewski D (2000). Association between particulate- and gas-phase components of urban air pollution and daily mortality in eight Canadian cities. Inhal Toxicol, 12: 15-39. 010273
Burnett RT; Smith-Doiron M; Stieb D; Cakmak S; Brook JR (1999). Effects of particulate and gaseous air pollution on cardiorespiratory hospitalizations. Arch Environ Occup Health, 54: 130-139. 017269
Burnett RT; Smith-Doiron M; Stieb D; Raizenne ME; Brook JR; Dales RE; Leech JA; Cakmak S; Krewski D (2001). Association between ozone and hospitalization for acute respiratory diseases in children less than 2 years of age. Am J Epidemiol, 153: 444-452. 093439
Burnett RT; Stieb D; Brook JR; Cakmak S; Dales R; Raizenne M; Vincent R; Dann T (2004). Associations between short-term changes in nitrogen dioxide and mortality in Canadian cities. Arch Environ Occup Health, 59: 228-236. 086247
Cakmak S; Dales RE; Judek S (2006). Respiratory health effects of air pollution gases: modification by education and income. Arch Environ Occup Health, 61: 5-10. 093272
Cakmak S; Dales RE; Vidal CB (2007). Air pollution and mortality in Chile: Susceptibility among the elderly. Environ Health Perspect, 115: 524-7. 091170
Chan C-C; Chuang K-J; Chien L-C; Chen W-J; Chang W-T (2006). Urban air pollution and emergency admissions for cerebrovascular diseases in Taipei, Taiwan. Eur Heart J, 27: 1238-1244. 090193
Chan C-C; Chuang K-J; Su T-C; Lin L-Y (2005). Association between nitrogen dioxide and heart rate variability in a susceptible population. Eur J Cardiovasc Prev Rehabil, 12: 580-586. 088988
Chang C-C; Tsai S-S; Ho S-C; Yang C-Y (2005). Air pollution and hospital admissions for cardiovascular disease in Taipei, Taiwan. Environ Res, 98: 114-119. 080086
Chen L; Jennison BL; Yang W; Omaye ST (2000). Elementary school absenteeism and air pollution. Inhal Toxicol, 12: 997-1016. 011931
Chen L; Yang W; Jennison BL; Goodrich A; Omaye ST (2002). Air pollution and birth weight in northern Nevada, 1991-1999. Inhal Toxicol, 14: 141-157. 024945
Chen P-C; Lai Y-M; Chan C-C; Hwang J-S; Yang C-Y; Wang J-D (1999). Short-term effect of ozone on the pulmonary function of children in primary school. Environ Health Perspect, 107: 921-925. 011149
January 2010 C-100
Cheng M-F; Tsai S-S; Wu T-N; Chen P-S; Yang C-Y (2007). Air pollution and hospital admissions for pneumonia in a tropical city: Kaohsiung, Taiwan. J Toxicol Environ Health A Curr Iss, 70: 2021-2026. 093034
Chiu HF; Cheng MH; Yang CY (2009). Air pollution and hospital admissions for pneumonia in a subtropical city: Taipei, Taiwan. Inhal Toxicol, 21: 32-37. 190249
Cho B; Choi J; Yum YT (2000). Air pollution and hospital admissions for respiratory disease in certain areas of Korea. J Occup Health, 42: 185-191. 099051
Chock DP; Winkler SL; Chen C (2000). A study of the association between daily mortality and ambient air pollutant concentrations in Pittsburgh, Pennsylvania. J Air Waste Manag Assoc, 50: 1481-1500. 010407
Chuang KJ; Coull BA; Zanobetti A; Suh H; Schwartz J; Stone PH; Litonjua A; Speizer FE; Gold DR (2008). Particulate Air Pollution as a Risk Factor for ST-Segment Depression in Patients With Coronary Artery Disease. Circulation, 118: 1314-1320. 155731
Cifuentes LA; Vega J; Kopfer K; Lave LB (2000). Effect of the fine fraction of particulate matter versus the coarse mass and other pollutants on daily mortality in Santiago, Chile. J Air Waste Manag Assoc, 50: 1287-1298. 010351
Conceicao GMS; Miraglia SGEK; Kishi HS; Saldiva PHN; Singer JM (2001). Air pollution and child mortality: a time-series study in Sao Paulo, Brazil. Environ Health Perspect, 1093: 347-350. 016628
D'Ippoliti D; Forastiere F; Ancona C; Agabiti N; Fusco D; Michelozzi P; Perucci CA (2003). Air pollution and myocardial infarction in Rome: a case-crossover analysis. Epidemiology, 14: 528-535. 074311
Dales R (2004). Ambient carbon monoxide may influence heart rate variability in subjects with coronary artery disease. J Occup Environ Med, 46: 1217-1221. 099036
Delfino RJ: Staimer N; Tjoa T; Gillen DL; Polidori A; Arhami M; Kleinman MT; Vaziri ND; Longhurst J; Sioutas C (2009). Air pollution exposures and circulating biomarkers of effect in a susceptible population: clues to potential causal component mixtures and mechanisms. Environ Health Perspect, 117: 1232-1238. 200844
Delfino RJ; Gone H; Linn WS; Pellizzari ED; Hu Y (2003). Asthma symptoms in Hispanic children and daily ambient exposures to toxic and criteria air pollutants. Environ Health Perspect, 111: 647-656. 050460
Delfino RJ; Staimer N; Tjoa T; Polidori A; Arhami M; Gillen DL; Kleinman MT; Vaziri ND; Longhurst J; Zaldivar F; Sioutas C (2008). Circulating biomarkers of inflammation, antioxidant activity, and platelet activation are associated with primary combustion aerosols in subjects with coronary artery disease. Environ Health Perspect, 116: 898-906. 156390
De Hartog JJ; Hoek G; Peters A; Timonen KL; Ibald-Mulli A; Brunekreef B; Heinrich J; Tiittanen P; Van Wijnen JH; Kreyling W; Kulmala M; Pekkanen J (2003). Effects of fine and ultrafine particles on cardiorespiratory symptoms in elderly subjects with coronary heart disease: the ULTRA study. Am J Epidemiol, 157: 613-623. 001061
De Leon SF; Thurston GD; Ito K (2003). Contribution of respiratory disease to nonrespiratory mortality associations with air pollution. Am J Respir Crit Care Med, 167: 1117-1123. 055688
Dockery DW; Luttmann-Gibson H; Rich DQ; Link MS; Mittleman MA; Gold DR; Koutrakis P; Schwartz JD; Verrier RL (2005). Association of air pollution with increased incidence of ventricular tachyarrhythmias recorded by implanted cardioverter defibrillators. Environ Health Perspect, 113: 670-674. 078995
Dominici F; McDermott A; Daniels M; Zeger SL; Samet JM (2003). Mortality among residents of 90 cities. In: Revised analyses of time-series studies of air pollution and health. Health Effects Institute. Boston, MA. HEI Special Report. http://www.healtheffects.org/Pubs/TimeSeries.pdf. 056116
Estrella B; Estrella R; Oviedo J; Narvaez X; Reyes MT; Gutierrez M; Naumova EN (2005). Acute respiratory diseases and carboxyhemoglobin status in school children of Quito, Ecuador. Environ Health Perspect, 113: 607-11. 099124
Fairley D (1999). Daily mortality and air pollution in Santa Clara County, California: 1989-1996. Environ Health Perspect, 107: 637-641. 000896
Farhat SCL; Paulo RLP; Shimoda TM; Conceicao GMS; Lin CA; Braga ALF; Warth MPN; Saldiva PHN (2005). Effect of air pollution on pediatric respiratory emergency room visits and hospital admissions. Braz J Med Biol Res, 38: 227-235. 089461
Fischer P; Hoek G; Brunekreef B; Verhoeff A; van Wijnen J (2003). Air pollution and mortality in the Netherlands: are the elderly more at risk? Eur Respir J, 40: 34S-38S. 043739
January 2010 C-101

Fischer PH; Steerenberg PA; Snelder JD; Van Loveren H; Van Amsterdam JGC (2002). Association between exhaled nitric oxide, ambient air pollution and respiratory health in school children. Int Arch Occup Environ Health, 75: 348-353. 025731
Forastiere F; Stafoggia M; Picciotto S; Bellander T; D'Ippoliti D; Lanki T; Von Klot S; Nyberg F; Paatero P; Peters A; Pekkanen J; Sunyer J; Perucci CA (2005). A case-crossover analysis of out-of-hospital coronary deaths and air pollution in Rome, Italy. Am J Respir Crit Care Med, 172: 1549-1555. 086323
Forastiere F; Stafoggia M; Tasco C; Picciotto S; Agabiti N; Cesaroni G; Perucci CA (2007). Socioeconomic status, particulate air pollution, and daily mortality: differential exposure or differential susceptibility. Am J Ind Med, 50: 208-216. 090720
Fung KY; Khan S; Krewski D; Chen Y (2006). Association between air pollution and multiple respiratory hospitalizations among the elderly in Vancouver, Canada. Inhal Toxicol, 18: 1005-1011. 089789
Fung KY; Luginaah I; Gorey KM; Webster G (2005). Air pollution and daily hospital admissions for cardiovascular diseases in Windsor, Ontario. Can J Public Health, 96: 29-33. 074322
Fusco D; Forastiere F; Michelozzi P; Spadea T; Ostro B; Arca M; Perucci CA (2001). Air pollution and hospital admissions for respiratory conditions in Rome, Italy. Eur Respir J, 17: 1143-1150. 020631
Gilboa SM; Mendola P; Olshan AF; Langlois PH; Savitz DA; Loomis D; Herring AH; Fixler DE (2005). Relation between ambient air quality and selected birth defects, seven county study, Texas, 1997-2000. Am J Epidemiol, 162: 238-252. 087892
Gold DR; Litonjua A; Schwartz J; Lovett E; Larson A; Nearing B; Allen G; Verrier M; Cherry R; Verrier R (2000). Ambient pollution and heart rate variability. Chest, 101: 1267-1273. 011432
Gold DR; Litonjua AA; Zanobetti A; Coull BA; Schwartz J; MacCallum G; Verrier RL; Nearing BD; Canner MJ; Suh H; Stone PH (2005). Air pollution and ST-segment depression in elderly subjects. Environ Health Perspect, 113: 883-887. 087558
Goldberg MS; Burnett RT; Bailar JC III; Brook J; Bonvalot Y; Tamblyn R; Singh R; Valois M-F (2001). The association between daily mortality and ambient air particle pollution in Montreal, Quebec 1 Nonaccidental mortality. Environ Res, 86: 12-25. 016548
Goldberg MS; Burnett RT; Valois M-F; Flegel K; Bailar JC III; Brook J; Vincent R; Radon K (2003). Associations between ambient air pollution and daily mortality among persons with congestive heart failure. Environ Res, 91: 8-20. 035202
Goldberg MS; Burnett RT; Yale JF; Valois MF; Brook JR (2006). Associations between ambient air pollution and daily mortality among persons with diabetes and cardiovascular disease. Environ Res, 100: 255-267. 088641
Goldberg MS; Giannetti N; Burnett RT; Mayo NE; Valois MF; Brophy JM (2008). A panel study in congestive heart failure to estimate the short-term effects from personal factors and environmental conditions on oxygen saturation and pulse rate. Occup Environ Med, 65: 659-666. 180380
Goss CH; Newsom SA; Schildcrout JS; Sheppard L; Kaufman JD (2004). Effect of ambient air pollution on pulmonary exacerbations and lung function in cystic fibrosis. Am J Respir Crit Care Med, 169: 816-821. 055624
Gouveia N; Bremner SA; Novaes HMD (2004). Association between ambient air pollution and birth weight in Sao Paulo, Brazil. J Epidemiol Community Health, 58: 11-17. 055613
Gouveia N; Fletcher T (2000). Respiratory diseases in children and outdoor air pollution in Sao Paulo, Brazil: a time series analysis. Occup Environ Med, 57: 477-483. 010436
Gouveia N; Fletcher T (2000). Time series analysis of air pollution and mortality: effects by cause, age and socioeconomic status. J Epidemiol Community Health, 54: 750-755. 012132
Guo YL; Lin Y-C; Sung F-C; Huang S-L; Ko Y-C; Lai J-S; Su H-J; Shaw C-K; Lin R-S; Dockery DW (1999). Climate, traffic-related air pollutants, and asthma prevalence in middle-school children in Taiwan. Environ Health Perspect, 107: 1001-1006. 010937
Gwynn RC; Burnett RT; Thurston GD (2000). A time-series analysis of acidic particulate matter and daily mortality and morbidity in the Buffalo, New York, region. Environ Health Perspect, 108: 125-133. 074109
January 2010 C-102
Ha E-H; Hong Y-C; Lee B-E; Woo B-H; Schwartz J; Christiani DC (2001). Is air pollution a risk factor for low birth weight in Seoul? Epidemiology, 12: 643-648. 019390
Ha E-H; Lee J-T; Kim H; Hong Y-C; Lee (2003). Infant susceptibility of mortality to air pollution in Seoul, South Korea. Pediatrics, 111: 284-290. 042552
Hajat S; Anderson HR; Atkinson RW; Haines A (2002). Effects of air pollution on general practitioner consultations for upper respiratory diseases in London. Occup Environ Med, 59: 294-299. 030358
Hajat S; Armstrong B; Wilkinson P; Busby A; Dolk H (2007). Outdoor air pollution and infant mortality: Analysis of daily time-series data in 10 English cities. J Epidemiol Community Health, 61: 719-722. 093276
Hajat S; Haines A; Goubet SA; Atkinson RW; Anderson HR (1999). Association of air pollution with daily GP consultations for asthma and other lower respiratory conditions in London. Thorax, 54: 597-605. 000924
Hapcioglu B; Issever H; Kocyigit E; Disci R; Vatansever S; Ozdilli K (2006). The effect of air pollution and meteorological parameters on chronic obstructive pulmonary disease at an Istanbul hospital. Indoor Built Environ, 15: 147-153. 093263
Henrotin JB; Besancenot JP; Bejot Y; Giroud M (2007). Short-term effects of ozone air pollution on ischaemic stroke occurrence: A case-crossover analysis from a 10-year population-based study in Dijon, France. Occup Environ Med, 64: 439-445. 093270
Hinwood AL; De Klerk N; Rodriguez C; Jacoby P; Runnion T; Rye P; Landau L; Murray F; Feldwick M; Spickett J (2006). The relationship between changes in daily air pollution and hospitalizations in Perth, Australia 1992-1998: A case-crossover study. Int J Environ Health Res, 16: 27-46. 088976
Hirsch T; Weiland SK; Von Mutius E; Safeca AF; Grafe H; Csaplovics E; Duhme H; Keil U; Leupold W (1999). Inner city air pollution and respiratory health and atopy in children. Eur Respir J, 14: 669-677. 003537
Ho W-C; Hartley WR; Myers L; Lin M-H; (2007). Air pollution, weather, and associated risk factors related to asthma prevalence and attack rate. Environ Res, 104: 402-409. 093265
Hoek G; Brunekreef B; Fischer P; Van Wijnen J (2001). The association between air pollution and heart failure, arrhythmia, embolism, thrombosis, and other cardiovascular causes of death in a time series study. Epidemiology, 12: 355-357. 016550
Hoek G; Brunekreef B; Verhoeff A; Van Wijnen J; Fischer P (2000). Daily mortality and air pollution in the Netherlands. J Air Waste Manag Assoc, 50: 1380-1389. 010350
Holguin F; Tellez-Rojo MM; Hernandez M; Cortez M; Chow JC; Watson JG; Mannino D; Romieu I (2003). Air pollution and heart rate variability among the elderly in Mexico City. Epidemiology, 14: 521-527. 057326
Honda Y; Nitta H; Ono M (2003). Low level carbon monoxide and mortality of persons aged 65 or older in Tokyo, Japan 1976-1990. Eisei Kagaku, 49: 454-458. 193774
Hong Y-C; Lee J-T; Kim H; Ha E-H; Schwartz J; Christiani DC (2002). Effects of air pollutants on acute stroke mortality. Environ Health Perspect, 110: 187-191. 024690
Hong Y-C; Lee J-T; Kim H; Kwon H-J (2002). Air pollution: A new risk factor in ischemic stroke mortality. Stroke, 33: 2165-2169. 035060
Hong Y-C; Leem J-H; Ha E-H; Christiani DC (1999). PM10 exposure, gaseous pollutants, and daily mortality in Inchon, South Korea. Environ Health Perspect, 107: 873-8. 008087
Hong YC; Leem JH; Ha EH (1999). Air pollution and daily mortality in Inchon, Korea. J Korean Med Sci, 14: 239-244. 011195
Hosseinpoor AR; Forouzanfar MH; Yunesian M; Asghari F; Naieni KH; Farhood D (2005). Air pollution and hospitalization due to angina pectoris in Tehran, Iran: A time-series study. Environ Res, 99: 126-131. 087413
Huynh M; Woodruff TJ; Parker JD; Schoendorf KC (2006). Relationships between air pollution and preterm birth in California. Paediatr Perinat Epidemiol, 20: 454-461. 091240
Hwang B-F; Jaakkola JJK; Lee Y-L; Lin Y-C; Guo Y-LL (2006). Relation between air pollution and allergic rhinitis in Taiwanese schoolchildren. Respir Res, 7: 23. 088971
January 2010 C-103
Hwang B-F; Lee Y-L; Lin Y-C; Jaakkola JJK; Guo YL (2005). Traffic related air pollution as a determinant of asthma among Taiwanese school children. Thorax, 60: 467-473. 089454
Hwang BF; Jaakkola JJ (2008). Ozone and other air pollutants and the risk of oral clefts. Environ Health Perspect, 116: 1411-1415. 193794
Hwang J-S; Chan C-C (2002). Effects of air pollution on daily clinic visits for lower respiratory tract illness. Am J Epidemiol, 155: 1-10. 023222
Ibald-Mulli A; Stieber J; Wichmann H-E; Koenig W; Peters A (2001). Effects of air pollution on blood pressure: A population-based approach. Am J Public Health, 91: 571-577. 016030
Ibald-Mulli A; Timonen KL; Peters A; Heinrich J; Wolke G; Lanki T; Buzorius G; Kreyling WG; De Hartog J; Hoek G; Ten Brink HM; Pekkanen J (2004). Effects of particulate air pollution on blood pressure and heart rate in subjects with cardiovascular disease: a multicenter approach. Environ Health Perspect, 112: 369-377. 087415
Ito K; Thurston GD; Silverman RA; (2007). Association between coarse particles and asthma emergency department (ED) visits in New York City. Presented at American Thoracic Society international conference 2007, San Francisco, CA. 091262
Jalaludin B; Mannes T; Morgan G; Lincoln D; Sheppeard V; Corbett S (2007). Impact of ambient air pollution on gestational age is modified by season in Sydney, Australia. Environ Health, 6: 16. 156601
Jalaludin B; Morgan G; Lincoln D; Sheppeard V; Simpson R; Corbett S (2006). Associations between ambient air pollution and daily emergency department attendances for cardiovascular disease in the elderly (65+ years), Sydney, Australia. J Expo Sci Environ Epidemiol, 16: 225-237. 189416
Jayaraman G; Nidhi (2008). Air pollution and associated respiratory morbidity in Delhi. Health Care Manag Sci, 11: 132-138. 180352
Jerrett M; Burnett RT; Willis A; Krewski D; Goldberg MS; DeLuca P; Finkelstein N (2003). Spatial analysis of the air pollution-mortality relationship in the context of ecologic confounders. J Toxicol Environ Health A Curr Iss, 66: 1735-1777. 087380
Karr C; Lumley T; Schreuder A; Davis R; Larson T; Ritz B; Kaufman J (2007). Effects of subchronic and chronic exposure to ambient air pollutants on infant bronchiolitis. Am J Epidemiol, 165: 553-560. 090719
Karr C; Lumley T; Shepherd K; Davis R; Larson T; Ritz B; Kaufman J (2006). A case-crossover study of wintertime ambient air pollution and infant bronchiolitis. Environ Health Perspect, 114: 277-281. 088751
Keatinge WR; Donaldson GC (2001). Mortality related to cold and air pollution in London after allowance for effects of associated weather patterns. Environ Res, 86: 209-216. 017063
Kettunen J; Lanki T; Tiittanen P; Aalto PP; Koskentalo T; Kulmala M; Salomaa V; Pekkanen J (2007). Associations of fine and ultrafine particulate air pollution with stroke mortality in an area of low air pollution levels. Stroke, 38: 918-922. 091242
Kim SY; O'Neill MS; Lee JT; Cho Y; Kim J; Kim H (2007). Air pollution, socioeconomic position, and emergency hospital visits for asthma in Seoul, Korea. Int Arch Occup Environ Health, 80: 701-710. 092837
Klemm RJ; Lipfert FW; Wyzga RE; Gust C (2004). Daily mortality and air pollution in Atlanta: two years of data from ARIES. Inhal Toxicol, 16 Suppl 1: 131-141. 056585
Knox EG (2008). Atmospheric pollutants and mortalities in English local authority areas. J Epidemiol Community Health, 62: 442-447. 193776
Koken PJM; Piver WT; Ye F; Elixhauser A; Olsen LM; Portier CJ (2003). Temperature, air pollution, and hospitalization for cardiovascular diseases among elderly people in Denver. Environ Health Perspect, 111: 1312-1317. 049466
Kontos AS; Fassois SD; Deli MF (1999). Short-term effects of air pollution on childhood respiratory illness in Piraeus, Greece, 1987-1992: nonparametric stochastic dynamic analysis. Environ Res, 81: 275-296. 011326
Krewski D; Jerrett M; Burnett RT; Ma R; Hughes E; Shi Y; Turner MC; Pope AC III; Thurston G; Calle EE; Thun MJ (2009). Extended follow-up and spatial analysis of the American Cancer Society study linking particulate air pollution and mortality. Health Effects Institute. Cambridge, MA. Report Nr. 140. 191193
Kwon H-J; Cho S-H; Nyberg F; Pershagen G (2001). Effects of ambient air pollution on daily mortality in a cohort of patients with congestive heart failure. Epidemiology, 12: 413-419. 016699
January 2010 C-104
Lagorio S; Forastiere F; Pistelli R; Iavarone I; Michelozzi P; Fano V; Marconi A; Ziemacki G; Ostro BD (2006). Air pollution and lung function among susceptible adult subjects: a panel study. Environ Health, 5: 11. 089800
Lanki T; Pekkanen J; Aalto P; Elosua R; Berglind N; D'Ippoliti D; Kulmala M; Nyberg F; Peters A; Picciotto S; Salomaa V; Sunyer J; Tiittanen P; Von Klot S; Forastiere F; for the HEAPSS Study Group (2006). Associations of traffic-related air pollutants with hospitalisation for first acute myocardial infarction: the HEAPSS study. Occup Environ Med, 63: 844-851. 089788
Lee BE; Ha EH; Park HS; Kim YJ; Hong YC; Kim H; Lee JT (2003). Exposure to air pollution during different gestational phases contributes to risks of low birth weight. Hum Reprod, 18: 638-643. 043202
Lee I-M; Tsai S-S; Chang C-C; Ho C-K; Yang C-Y (2007). Air pollution and hospital admissions for chronic obstructive pulmonary disease in a tropical city: Kaohsiung, Taiwan. Inhal Toxicol, 19: 393-398. 090707
Lee J-T; Kim H; Song H; Hong Y-C; Cho Y-S; Shin S-Y; Hyun Y-J; Kim Y-S (2002). Air pollution and asthma among children in Seoul, Korea. Epidemiology, 13: 481-484. 034826
Lee J-T; Son J-Y; Cho Y-S (2007). A comparison of mortality related to urban air particles between periods with Asian dust days and without Asian dust days in Seoul, Korea, 2000-2004. Environ Res, 105: 409-13. 093042
Lee JT; Kim H; Cho YS; Hong YC; Ha EH; Park H (2003). Air pollution and hospital admissions for ischemic heart diseases among individuals 64+ years of age residing in Seoul, Korea. Arch Environ Health, 58: 617-623. 095552
Lee JT; Son JY; Kim H; Kim SY (2006). Effect of air pollution on asthma-related hospital admissions for children by socioeconomic status associated with area of residence. Arch Environ Occup Health, 61: 123-130. 098248
Lee Y-L; Shaw C-K; Su H-J; Lai J-S; Ko Y-C; Huang S-L; Sung F-C; Guo Y-L (2003). Climate, traffic-related air pollutants and allergic rhinitis prevalence in middle-school children in Taiwan. Eur Respir J, 21: 964-970. 049201
Leem J-H; Kaplan BM; Shim YK; Pohl HR; Gotway CA; Bullard SM; Rogers JF; Smith MM; Tylenda CA (2006). Exposures to air pollutants during pregnancy and preterm delivery. Environ Health Perspect, 114: 905-910. 089828
Levy D; Sheppard L; Checkoway H; Kaufman J; Lumley T; Koenig J; Siscovick D (2001). A case-crossover analysis of particulate matter air pollution and out-of-hospital primary cardiac arrest. Epidemiology, 12: 193-199. 017171
Liao D; Duan Y; Whitsel EA; Zheng Z-J; Heiss G; Chinchilli VM; Lin H-M (2004). Association of higher levels of ambient criteria pollutants with impaired cardiac autonomic control: a population-based study. Am J Epidemiol, 159: 768-777. 056590
Liao D; Heiss G; Chinchilli VM; Duan Y; Folsom AR; Lin HM; Salomaa V (2005). Association of criteria pollutants with plasma hemostatic/inflammatory markers: a population-based study. J Expo Sci Environ Epidemiol, 15: 319-328. 088677
Lin C-M; Li C-Y; Yang G-Y; Mao I-F (2004). Association between maternal exposure to elevated ambient sulfur dioxide during pregnancy and term low birth weight. Environ Res, 96: 41-50. 089503
Lin CA; Martins MA; Farhat SCL; Pope CA III; Conceicao GMS; Anastacio VM; Hatanaka M; Andrade WC; Hamaue WR; Bohm GM; Saldiva PHN (1999). Air pollution and respiratory illness of children in Sao Paulo, Brazil. Paediatr Perinat Epidemiol, 13: 475-488. 040437
Lin CA; Pereira LAA; Nishioka DC; Conceicao GMS; Graga ALF; Saldiva PHN (2004). Air pollution and neonatal deaths in Sao Paulo, Brazil. Braz J Med Biol Res, 37: 765-770. 095787
Lin M; Chen Y; Burnett RT; Villeneuve PJ; Krewski D (2003). Effect of short-term exposure to gaseous pollution on asthma hospitalisation in children: a bi-directional case-crossover analysis. J Epidemiol Community Health, 57: 50-55. 042549
Lin M; Chen Y; Villeneuve PJ; Burnett RT; Lemyre L; Hertzman C; McGrail KM; Krewski D (2004). Gaseous air pollutants and asthma hospitalization of children with low household income in Vancouver, British Columbia, Canada. Am J Epidemiol, 159: 294-303. 055600
Lin M; Stieb DM; Chen Y (2005). Coarse particulate matter and hospitalization for respiratory infections in children younger than 15 years in Toronto: a case-crossover analysis. Pediatrics, 116: 235-240. 087828
Linn WS; Szlachcic Y; Gong H Jr; Kinney PL; Berhane KT (2000). Air pollution and daily hospital admissions in metropolitan Los Angeles. Environ Health Perspect, 108: 427-434. 002839
January 2010 C-105
Lipfert FW; Baty JD; Miller JP; Wyzga RE (2006). PM2.5 constituents and related air quality variables as predictors of survival in a cohort of U.S. military veterans. Inhal Toxicol, 18: 645-657. 088756
Lipfert FW; Morris SC (2002). Temporal and spacial relationships between age-specific mortality and ambient air quality in the United States: preliminary results for counties, 1960-97. Occup Environ Med, 59: 156-174. 019217
Lipfert FW; Morris SC; Wyzga RE (2000). Daily mortality in the Philadelphia metropolitan area and size-classified particulate matter. J Air Waste Manag Assoc, 50: 1501-1513. 004088
Lipfert FW; Perry HM Jr; Miller JP; Baty JD; Wyzga RE; Carmody SE (2000). The Washington University-EPRI veterans' cohort mortality study: preliminary results. Inhal Toxicol, 4: 41-73. 004087
Lipfert FW; Wyzga RE; Baty JD; Miller JP (2006). Traffic density as a surrogate measure of environmental exposures in studies of air pollution health effects: long-term mortality in a cohort of US veterans. Atmos Environ, 40: 154-169. 088218
Lippmann M; Ito K; Nadas A; Burnett RT (2000). Association of particulate matter components with daily mortality and morbidity in urban populations. Health Effects Institute. Cambridge, MA. 011938
Liu S; Krewski D; Shi Y; Chen Y; Burnett R (2007). Association between maternal exposure to ambient air pollutants during pregnancy and fetal growth restriction. J Expo Sci Environ Epidemiol, 17: 426-432. 090429
Liu S; Krewski D; Shi Y; Chen Y; Burnett RT (2003). Association between gaseous ambient air pollutants and adverse pregnancy outcomes in Vancouver, Canada. Environ Health Perspect, 111: 1773-1778. 089548
Ljungman P; Bellander T; Schneider A; Breitner S; Forastiere F; Hampel R; Illig T; Jacquemin B; Katsouyanni K; von Klot S (2009). Modification of the interleukin-6 response to air pollution by interleukin-6 and fibrinogen polymorphisms. Environ Health Perspect, 117: 1373-1379. 191983
Luginaah IN; Fung KY; Gorey KM; Webster G; Wills C (2005). Association of ambient air pollution with respiratory hospitalization in a government designated "area of concern": the case of Windsor, Ontario. Environ Health Perspect, 113: 290-296. 057327
Maheswaran R; Haining RP; Brindley P; Law J; Pearson T; Fryers PR; Wise S; Campbell MJ (2005). Outdoor air pollution and stroke in Sheffield, United Kingdom: A small-area level geographical study. Stroke, 36: 239-243. 088683
Maheswaran R; Haining RP; Brindley P; Law J; Pearson T; Fryers PR; Wise S; Campbell MJ (2005). Outdoor air pollution, mortality, and hospital admissions from coronary heart disease in Sheffield, UK: A small-area level ecological study. Eur Heart J, 26: 2543-2549. 090769
Maisonet M; Bush TJ; Correa A; Jaakkola JJK (2001). Relation between ambient air pollution and low birth weight in the northeastern United States. Environ Health Perspect, 1093: 351-356. 016624
Mann JK; Tager IB; Lurmann F; Segal M; Quesenberry CP Jr; Lugg MM; Shan J; Van den Eeden SK (2002). Air pollution and hospital admissions for ischemic heart disease in persons with congestive heart failure or arrhythmia. Environ Health Perspect, 110: 1247-1252. 036723
Mannes T; Jalaludin B; Morgan G; Lincoln D; Sheppeard V; Corbett S (2005). Impact of ambient air pollution on birth weight in Sydney, Australia. Occup Environ Med, 62: 524-530. 087895
Mar TF; Norris GA; Koenig JQ; Larson TV (2000). Associations between air pollution and mortality in Phoenix, 1995-1997. Environ Health Perspect, 108: 347-353. 001760
Martins LC; Latorre MRDO; Saldiva PHN; Braga ALF (2002). Air pollution and emergency room visits due to chronic lower respiratory diseases in the elderly: An ecological time-series study in Sao Paulo, Brazil. J Occup Environ Med, 44: 622-627. 035059
Masjedi MR; Jamaati HR; Dokouhaki P; Ahmadzadeh Z; Taheri SA; Bigdeli M; Izadi S; Rostamian A; Aagin K; Ghavam SM (2003). The effects of air pollution on acute respiratory conditions. Respirology, 8: 213-230. 052100
McGowan JA; Hider PN; Chacko E; Town GI (2002). Particulate air pollution and hospital admissions in Christchurch, New Zealand. Aust N Z J Public Health, 26: 23-29. 030325
Medeiros A; Gouveia N (2005). Relacao entre baixo peso ao nascer e a poluicao do ar no Municipio de Sao Paulo [Relationship between low birthweight and air pollution in the city of Sao Paulo, Brazil]. Rev Saude Publica, 39: 965-972. 089824
January 2010 C-106
Meng YY; Wilhelm M; Rull RP; English P; Ritz B (2007). Traffic and outdoor air pollution levels near residences and poorly controlled asthma in adults. Ann Allergy Asthma Immunol, 98: 455-463. 093275
Metzger KB; Klein M; Flanders WD; Peel JL; Mulholland JA; Langberg JJ; Tolbert PE (2007). Ambient air pollution and cardiac arrhythmias in patients with implantable defibrillators. Epidemiology, 18: 585-592. 092856
Metzger KB; Tolbert PE; Klein M; Peel JL; Flanders WD; Todd KH; Mulholland JA; Ryan PB; Frumkin H (2004). Ambient air pollution and cardiovascular emergency department visits. Epidemiology, 15: 46-56. 044222
Migliaretti G; Dalmasso P; Gregori D (2007). Air pollution effects on the respiratory health of the resident adult population in Turin, Italy. Int J Environ Health Res, 17: 369-379. 193772
Miller KA; Siscovick DS; Sheppard L; Shepherd K; Sullivan JH; Anderson GL; Kaufman JD (2007). Long-term exposure to air pollution and incidence of cardiovascular events in women. N Engl J Med, 356: 447-458. 090130
Min JY; Paek D; Cho SI; Min KB (2009). Exposure to environmental carbon monoxide may have a greater negative effect on cardiac autonomic function in people with metabolic syndrome. Sci Total Environ, 407: 4807-4811. 199514
Moolgavkar SH (2000). Air pollution and daily mortality in three US counties. Environ Health Perspect, 108: 777-784. 012054
Moolgavkar SH (2000). Air pollution and hospital admissions for chronic obstructive pulmonary disease in three metropolitan areas in the United States. Inhal Toxicol, 12: 75-90. 010274
Moolgavkar SH (2003). Air pollution and daily deaths and hospital admissions in Los Angeles and Cook counties. Health Effects Institute. Boston, MA. 042864
Moolgavkar SH (2003). Air pollution and daily mortality in two US counties: season-specific analyses and exposure-response relationships. Inhal Toxicol, 15: 877-907. 051316
Moon JS; Kim YS; Kim JH; Son BS; Kim DS; Yang W (2009). Respiratory health effects among schoolchildren and their relationship to air pollutants in Korea. Int J Environ Health Res, 19: 31-48. 190297
Mortimer K; Neugebauer R; Lurmann F; Alcorn S; Balmes J; Tager I (2008). Air pollution and pulmonary function in asthmatic children: Effects of prenatal and lifetime exposures. Epidemiology, 19: 550-557. 122163
Mortimer K; Neugebauer R; Lurmann F; Alcorn S; Balmes J; Tager I (2008). Early-Lifetime exposure to air pollution and allergic sensitization in children with asthma. J Asthma, 45: 874-881. 187280
Nautiyal J 3rd; Garg ML; Kumar MS; Khan AA; Thakur JS; Kumar R (2007). Air pollution and cardiovascular health in Mandi-Gobindgarh, Punjab, India - a pilot study. Int J Environ Health Res, 4: 268-82. 190301
Neidell MJ (2004). Air pollution, health, and socio-economic status: The effect of outdoor air quality on childhood asthma. J Health Econ, 23: 1209-1236. 057330
Nkwocha EE; Egejuru RO (2008). Effects of industrial air pollution on the respiratory health of children. Int J Environ Sci Tech, 5: 509-516. 190304
Norris G; Young-Pong SN; Koenig JQ; Larson TV; Sheppard L; Stout JW (1999). An association between fine particles and asthma emergency department visits for children in Seattle. Environ Health Perspect, 107: 489-493. 040774
O'Connor GT; Neas L; Vaughn B; Kattan M; Mitchell H; Crain EF; Evans R 3rd; Gruchalla R; Morgan W; Stout J; Adams GK; Lippmann M (2008). Acute respiratory health effects of air pollution on children with asthma in US inner cities. J Allergy Clin Immunol, 121: 1133-1139. 156818
Ostro BD; Hurley S; Lipsett MJ (1999). Air pollution and daily mortality in the Coachella Valley, California: A study of PM10 dominated by coarse particles. Environ Res, 81: 231-238. 006610
Park H; Lee B; Ha E-H; Lee J-T; Kim H; Hong Y-C (2002). Association of air pollution with school absenteeism due to illness. Arch Pediatr Adolesc Med, 156: 1235-1239. 093798
Park JW; Lim YH; Kyung SY; An CH; Lee SP; Jeong SH; Ju S-Y (2005). Effects of ambient particulate matter on peak expiratory flow rates and respiratory symptoms of asthmatics during Asian dust periods in Korea. Respirology, 10: 470-476. 088673
Park SK; O'Neill MS; Vokonas PS; Sparrow D; Schwartz J (2005). Effects of air pollution on heart rate variability: The VA normative aging study. Environ Health Perspect, 113: 304-309. 057331
January 2010 C-107
Parker JD; Woodruff TJ; Basu R; Schoendorf KC (2005). Air pollution and birth weight among term infants in California. Pediatrics, 115: 121-128. 087462
Peel JL; Metzger KB; Klein M; Flanders WD; Mulholland JA; Tolbert PE (2007). Ambient air pollution and cardiovascular emergency department visits in potentially sensitive groups. Am J Epidemiol, 165: 625-633. 090442
Peel JL; Tolbert PE; Klein M; Metzger KB; Flanders WD; Knox T; Mulholland JA; Ryan PB; Frumkin H (2005). Ambient air pollution and respiratory emergency department visits. Epidemiology, 16: 164-174. 056305
Pekkanen J; Brunner EJ; Anderson HR; Tiittanen P; Atkinson RW (2000). Daily concentrations of air pollution and plasma fibrinogen in London. Occup Environ Med, 57: 818-822. 013250
Penttinen P; Tiittanen P; Pekkanen J (2004). Mortality and air pollution in metropolitan Helsinki, 1988-1996. Scand J Work Environ Health, 2: 19-27. 087432
Penttinen P; Timonen KL; Tiittanen P; Mirme A; Ruuskanen J; Pekkanen J (2001). Ultrafine particles in urban air and respiratory health among adult asthmatics. Eur Respir J, 17: 428-435. 030335
Pereira Filho MA; Pereira LAA; Arbex FF; Arbex M; Conceição GM; Santos UP; Lopes AC; Saldiva PHN; Braga ALF; Cendon S (2008). Effect of air pollution on diabetes and cardiovascular diseases in São Paulo, Brazil. Braz J Med Biol Res, 41: 526-532. 190260
Peters A; Dockery DW; Muller JE; Mittleman MA (2001). Increased particulate air pollution and the triggering of myocardial infarction. Circulation, 103: 2810-2815. 016546
Peters A; Liu E; Verrier RL; Schwartz J; Gold DR; Mittleman M; Baliff J; Oh JA; Allen G; Monahan K; Dockery DW (2000). Air pollution and incidence of cardiac arrhythmia. Epidemiology, 11: 11-17. 011347
Peters A; Perz S; Doring A; Stieber J; Koenig W; Wichmann H-E (1999). Increases in heart rate during an air pollution episode. Am J Epidemiol, 150: 1094-1098. 011554
Peters A; Skorkovsky J; Kotesovec F; Brynda J; Spix C; Wichmann HE; Heinrich J (2000). Associations between mortality and air pollution in central Europe. Environ Health Perspect, 108: 283-287. 001756
Pope CA III; Burnett RT; Thun MJ; Calle EE; Krewski D; Ito K; Thurston GD (2002). Lung cancer, cardiopulmonary mortality, and long-term exposure to fine particulate air pollution. JAMA, 287: 1132-1141. 024689
Rabinovitch N; Zhang LN; Murphy JR; Vedal S; Dutton SJ; Gelfand EW (2004). Effects of wintertime ambient air pollutants on asthma exacerbations in urban minority children with moderate to severe disease. J Allergy Clin Immunol, 114: 1131-1137. 096753
Rainham DGC; Smoyer-Tomic KE (2003). The role of air pollution in the relationship between a heat stress index and human mortality in Toronto. Environ Res, 93: 9-19. 053202
Ranzi A; Gambini M; Spattini A; Galassi C; Sesti D; Bedeschi M; Messori A; Baroni A; Cavagni G; Lauriola P (2004). Air pollution and respiratory status in asthmatic children: Hints for a locally based preventive strategy AIRE study. Eur J Epidemiol, 19: 567-576. 089500
Rich DQ; Kim MH; Turner JR; Mittleman MA; Schwartz J; Catalano PJ; Dockery DW (2006). Association of ventricular arrhythmias detected by implantable cardioverter defibrillator and ambient air pollutants in the St Louis, Missouri metropolitan area. Occup Environ Med, 63: 591-596. 089814
Rich DQ; Mittleman MA; Link MS; Schwartz J; Luttmann-Gibson H; Catalano PJ; Speizer FE; Gold DR; Dockery DW (2006). Increased risk of paroxysmal atrial fibrillation episodes associated with acute increases in ambient air pollution. Environ Health Perspect, 114: 120-123. 088427
Rich DQ; Schwartz J; Mittleman MA; Link M; Luttmann-Gibson H; Catalano PJ; Speizer FE; Dockery DW (2005). Association of short-term ambient air pollution concentrations and ventricular arrhythmias. Am J Epidemiol, 161: 1123-1132. 079620
Rich KE; Petkau J; Vedal S; Brauer M (2004). A case-crossover analysis of particulate air pollution and cardiac arrhythmia in patients with implantable cardioverter defibrillators. Inhal Toxicol, 16: 363-372. 055631
Riojas-Rodriguez H; Escamilla-Cejudo JA; Gonzalez-Hermosillo JA; Tellez-Rojo MM; Vallejo M; Santos-Burgoa C; Rojas-Bracho L (2006). Personal PM2.5 and CO exposures and heart rate variability in subjects with known ischemic heart disease in Mexico City. J Expo Sci Environ Epidemiol, 16: 131-137. 156913
January 2010 C-108
Ritz B; Wilhelm M; Hoggatt KJ; Ghosh JK (2007). Ambient air pollution and preterm birth in the environment and pregnancy outcomes study at the University of California, Los Angeles. Am J Epidemiol, 166: 1045-1052. 096146
Ritz B; Wilhelm M; Zhao Y (2006). Air pollution and infant death in southern California, 1989-2000. Pediatrics, 118: 493-502. 089819
Ritz B; Yu F; Chapa G; Fruin S (2000). Effect of air pollution on preterm birth among children born in Southern California between 1989 and 1993. Epidemiology, 11: 502-511. 012068
Ritz B; Yu F; Fruin S; Chapa G; Shaw GM; Harris JA (2002). Ambient air pollution and risk of birth defects in Southern California. Am J Epidemiol, 155: 17-25. 023227
Rodriguez C; Tonkin R; Heyworth J; Kusel M; De Klerk N; Sly PD; Franklin P; Runnion T; Blockley A; Landau L; Hinwood AL (2007). The relationship between outdoor air quality and respiratory symptoms in young children. Int J Environ Health Res, 17: 351-360 . 092842
Roemer WH; Van Wijnen JH (2001). Daily mortality and air pollution along busy streets in Amsterdam, 1987-1998. Epidemiology, 12: 649-653. 019391
Rosenlund M; Bellander T; Nordquist T; Alfredsson L (2009). Traffic-generated air pollution and myocardial infarction. Epidemiology, 20: 265-71. 190309
Rosenlund M; Berglind N; Pershagen G; Hallqvist J; Jonson T; Bellander T (2006). Long-term exposure to urban air pollution and myocardial infarction. Epidemiology, 17: 383-390. 089796
Ruckerl R; Greven S; Ljungman P; Aalto P; Antoniades C; Bellander T; Berglind N; Chrysohoou C; Forastiere F; Jacquemin B; von Klot S; Koenig W; Kuchenhoff H; Lanki T; Pekkanen J; Perucci CA; Schneider A; Sunyer J; Peters A (2007). Air pollution and inflammation (interleukin-6, C-reactive protein, fibrinogen) in myocardial infarction survivors. Environ Health Perspect, 115: 1072-1080. 156931
Ruckerl R; Ibald-Mulli A; Koenig WSchneider A; Woelke G; Cyrys J; Heinrich J; Marder V; Frampton M; Wichmann HE; Peters A (2006). Air pollution and markers of inflammation and coagulation in patients with coronary heart disease. Environ Health Perspect, 173: 432-441. 088754
Rudez G; Janssen NA; Kilinc E; Leebeek FW; Gerlofs-Nijland ME; Spronk HM; ten Cate H; Cassee FR; de Maat MP (2009). Effects of ambient air pollution on hemostasis and inflammation. Environ Health Perspect, 117: 995-1001. 193783
Salam MT; Millstein J; Li Y-F; Lurmann FW; Margolis HG; Gilliland FD (2005). Birth outcomes and prenatal exposure to ozone, carbon monoxide, and particulate matter: results from the Children's Health Study. Environ Health Perspect, 113: 1638-1644. 087885
Samet JM; Dominici F; Curriero FC; Coursac I; Zeger SL (2000). Fine particulate air pollution and mortality in 20 US cities, 1987-1994. N Engl J Med, 343: 1742-1749. 013132
Samoli E; Touloumi G; Schwartz J; Anderson HR; Schindler C; Forsberg B; Vigotti MA; Vonk J; Kosnik M; Skorkovsky J; Katsouyanni K (2007). Short-term effects of carbon monoxide on mortality: An analysis within the APHEA project. Environ Health Perspect, 115: 1578-1583. 098420
Sari I; Zengin S; Ozer O; Davutoglu V; Yildirim C; Aksoy M (2008). Chronic carbon monoxide exposure increases electrocardiographic P-wave and QT dispersion. Inhal Toxicol, 20: 879-84. 190315
Sarnat SE; Suh HH; Coull BA; Schwartz J; Stone PH; Gold DR (2006). Ambient particulate air pollution and cardiac arrhythmia in a panel of older adults in Steubenville, Ohio. Occup Environ Med, 63: 700-706. 090489
Sauerzapf V; Jones AP; Cross J (2009). Environmental factors and hospitalisation for chronic obstructive pulmonary disease in a rural county of England. J Epidemiol Community Health, 63: 324-328. 180082
Schildcrout JS; Sheppard L; Lumley T; Slaughter JC; Koenig JQ; Shapiro GG (2006). Ambient air pollution and asthma exacerbations in children: An eight-city analysis. Am J Epidemiol, 164: 505-517. 089812
Schwartz J; Litonjua A; Suh H; Verrier M; Zanobetti A; Syring M; Nearing B; Verrier R; Stone P; MacCallum G; Speizer FE; Gold DR (2005). Traffic related pollution and heart rate variability in a panel of elderly subjects. Thorax, 60: 455-461. 074317
Schwartz J; Norris G; Larson T; Sheppard L; Claiborne C; Koenig J (1999). Episodes of high coarse particle concentrations are not associated with increased mortality. Environ Health Perspect, 107: 339-342. 017915
January 2010 C-109
Sharovsky R; Cesar LA; Ramires JA (2004). Temperature, air pollution, and mortality from myocardial infarction in Sao Paulo, Brazil. Braz J Med Biol Res, 37: 1651-1657. 156976
Sheppard L; Levy D; Norris G; Larson TV; Koenig JQ (1999). Effects of ambient air pollution on nonelderly asthma hospital admissions in Seattle, Washington, 1987-1994. Epidemiology, 10: 23-30. 086921
Silkoff PE; Zhang L; Dutton S; Langmack EL; Vedal S; Murphy J; Make B (2005). Winter air pollution and disease parameters in advanced chronic obstructive pulmonary disease panels residing in Denver, Colorado. J Allergy Clin Immunol, 115: 337-344. 087471
Singh V; Khandelwal R; Gupta AB (2003). Effect of air pollution on peak expiratory flow rate variability. J Asthma, 40: 81-86. 052686
Slaughter JC; Kim E; Sheppard L; Sullivan JH; Larson TV; Claiborn C (2005). Association between particulate matter and emergency room visits, hospital admissions and mortality in Spokane, Washington. J Expo Sci Environ Epidemiol, 15: 153-159. 073854
Slaughter JC; Lumley T; Sheppard L; Koenig JQ; Shapiro GG (2003). Effects of ambient air pollution on symptom severity and medication use in children with asthma. Ann Allergy Asthma Immunol, 91: 346-353. 086294
Sole D; Camelo-Nunes IC; Wandalsen GF; Pastorino AC; Jacob CMA; Gonzalez C; Wandalsen NF; Rosario Filho NA; Fischer GB; Naspitz CK (2007). Prevalence of symptoms of asthma, rhinitis, and atopic eczema in Brazilian adolescents related to exposure to gaseous air pollutants and socioeconomic status. J Investig Allergol Clin Immunol, 17: 6-13. 090706
Son JY; Cho YS; Lee JT (2008). Effects of air pollution on postneonatal infant mortality among firstborn infants in Seoul, Korea: case-crossover and time-series analyses. Arch Environ Occup Health, 63: 108-13. 190323
Steerenberg PA; Nierkens S; Fischer PH; Van Loveren H; Opperhuizen A; Vos JG; Van Amsterdam JG (2001). Traffic-related air pollution affects peak expiratory flow, exhaled nitric oxide, and inflammatory nasal markers. Arch Environ Occup Health, 56: 167-174. 017157
Steinvil A; Kordova-Biezuner L; Shapira I; Berliner S; Rogowski O (2008). Short-term exposure to air pollution and inflammation-sensitive biomarkers. Environ Res, 106: 51-61. 188893
Stieb DM; Beveridge RC; Brook JR; Smith-Doiron M; Burnett RT; Dales RE; Beaulieu S; Judek S; Mamedov A (2000). Air pollution, aeroallergens and cardiorespiratory emergency department visits in Saint John, Canada. J Expo Sci Environ Epidemiol, 10: 461-477. 011675
Stieb DM; Judek S; Burnett RT (2003). Meta-analysis of time-series studies of air pollution and mortality: Update in relation to the use of generalized additive models. J Air Waste Manag Assoc, 53: 258-261. 056908
Stölzel M; Breitner S; Cyrys J; Pitz M; Wolke G; Kreyling W; Heinrich J; Wichmann H-E; Peters A (2007). Daily mortality and particulate matter in different size classes in Erfurt, Germany. J Expo Sci Environ Epidemiol, 17: 458-467. 091374
Strickland MJ; Klein M; Correa A; Reller MD; Mahle WT; Riehle-Colarusso TJ; Botto LD; Flanders WD; Mulholland JA; Siffel C; Marcus M; Tolbert PE (2009). Ambient air pollution and cardiovascular malformations in Atlanta, Georgia, 1986-2003. Am J Epidemiol, 169: 1004-14. 190324
Sullivan J; Ishikawa N; Sheppard L; Siscovick D; Checkoway H; Kaufman J (2003). Exposure to ambient fine particulate matter and primary cardiac arrest among persons with and without clinically recognized heart disease. Am J Epidemiol, 157: 501-509. 043156
Sun HL; Chou MC; Lue KH (2006). The relationship of air pollution to ED visits for asthma differ between children and adults. Am J Emerg Med, 24: 709-713. 090768
Sunyer J; Basagana X (2001). Particles, and not gases, are associated with the risk of death in patients with chronic obstructive pulmonary disease. Int J Epidemiol, 30: 1138-1140. 019367
Sunyer J; Basagana X; Belmonte J; Anto JM (2002). Effect of nitrogen dioxide and ozone on the risk of dying in patients with severe asthma. Thorax, 57: 687-693. 034835
Symons JM; Wang L; Guallar E; Howell E; Dominici F; Schwab M; Ange BA; Samet J; Ondov J; Harrison D; Geyh A (2006). A case-crossover study of fine particulate matter air pollution and onset of congestive heart failure symptom exacerbation leading to hospitalization. Am J Epidemiol, 164: 421-433. 091258
January 2010 C-110
Szyszkowicz M (2007). Air pollution and emergency department visits for ischemic heart disease in Montreal, Canada. Int J Occup Med Environ Health, 20: 167-173. 193793
Tarkiainen TH; Timonen KL; Vanninen EJ; Alm S; Hartikainen JEK; Pekkanen J (2003). Effect of acute carbon monoxide exposure on heart rate variability in patients with coronary artery disease. Clin Physiol Funct Imaging, 23: 98-102. 053625
Tenias JM; Ballester F; Perez-Hoyos S; Rivera ML (2002). Air pollution and hospital emergency room admissions for chronic obstructive pulmonary disease in Valencia, Spain. Arch Environ Occup Health, 57: 41-47. 026077
Thompson AJ; Shields MD; Patterson CC (2001). Acute asthma exacerbations and air pollutants in children living in Belfast, Northern Ireland. Arch Environ Occup Health, 56: 234-241. 073513
Timonen KL; Pekkanen J; Tiittanen P; Salonen RO (2002). Effects of air pollution on changes in lung function induced by exercise in children with chronic respiratory symptoms. Occup Environ Med, 59: 129-134. 025653
Timonen KL; Vanninen E; De Hartog J; Ibald-Mulli A; Brunekreef B; Gold DR; Henrich J; Hoek G; Lanki T; Peters A; Tarkiainen T; Tiittanen P; Kreyling W; Pekkanen J (2006). Effects of ultrafine and fine particulate and gaseous air pollution on cardiac autonomic control in subjects with coronary artery disease: The ULTRA study. J Expo Sci Environ Epidemiol, 16: 332-341. 088747
Tolbert PE; Klein M; Peel JL; Sarnat SE; Sarnat JA (2007). Multipollutant modeling issues in a study of ambient air quality and emergency department visits in Atlanta. J Expo Sci Environ Epidemiol, 17: S29-S35. 090316
Trapasso LM; Keith L (1999). Relationships between selected meteorological/pollution parameters and hospital admissions for asthma in south central kentucky . J Ky Acad Sci, 60: 73-77. 180127
Tsai S-S; Chen C-C; Hsieh H-J; Chang C-C; Yang C-Y (2006). Air pollution and postneonatal mortality in a tropical city: Kaohsiung, Taiwan. Inhal Toxicol, 18: 185-189. 090709
Tsai S-S; Cheng M-H; Chiu H-F; Wu T-N; Yang C-Y (2006). Air pollution and hospital admissions for asthma in a tropical city: Kaohsiung, Taiwan. Inhal Toxicol, 18: 549-554. 089768
Tsai S-S; Goggins WB; Chiu H-F; Yang C-Y (2003). Evidence for an association between air pollution and daily stroke admissions in Kaohsiung, Taiwan. Stroke, 34: 2612-2616. 080133
Tsai S-S; Huang C-H; Goggins WB; Wu T-N; Yang C-Y (2003). Relationship between air pollution and daily mortality in a tropical city: Kaohsiung, Taiwan. J Toxicol Environ Health A Curr Iss, 66: 1341-1349. 050480
Vedal S; Brauer M; White R; Petkau J (2003). Air pollution and daily mortality in a city with low levels of pollution. Environ Health Perspect, 111: 45-51. 039044
Vedal S; Rich K; Brauer M; White R; Petkau J (2004). Air pollution and cardiac arrhythmias in patients with implantable cardiovascular defibrillators. Inhal Toxicol, 16: 353-362. 055630
Vigotti MA; Chiaverini F; Biagiola P; Rossi G (2007). Urban air pollution and emergency visits for respiratory complaints in Pisa, Italy. J Toxicol Environ Health A Curr Iss, 70: 266-269. 090711
Villeneuve PJ; Burnett RT; Shi Y; Krewski D; Goldberg MS; Hertzman C; Chen Y; Brook J (2003). A time-series study of air pollution, socioeconomic status, and mortality in Vancouver, Canada. J Expo Sci Environ Epidemiol, 13: 427-435. 055051
Villeneuve PJ; Chen L; Stieb D; Rowe BH (2006). Associations between outdoor air pollution and emergency department visits for stroke in Edmonton, Canada. Eur J Epidemiol, 21: 689-700. 090191
Villeneuve PJ; Doiron M-S; Stieb D; Dales R; Burnett RT; Dugandzic R (2006). Is outdoor air pollution associated with physician visits for allergic rhinitis among the elderly in Toronto, Canada? Allergy, 61: 750-758. 091179
Von Klot S; Wolke G; Tuch T; Heinrich J; Dockery DW; Schwartz J; Kreyling WG; Wichmann HE; Peters A (2002). Increased asthma medication use in association with ambient fine and ultrafine particles. Eur Respir J, 20: 691-702. 034706
Von Klot S; Peters A; Aalto P; Bellander T; Berglind N; D'Ippoliti D; Elosua R; Hormann A; Kulmala M; Lanki T; Lowel H; Pekkanen J; Picciotto S; Sunyer J; Forastiere F; Health Effects of Particles on Susceptible Subpopulations (HEAPSS) Study Group (2005). Ambient air pollution is associated with increased risk of hospital cardiac readmissions of myocardial infarction survivors in five European cities. Circulation, 112: 3073-3079. 088070
January 2010 C-111
Wang Q; Liu Y; Pan X (2008). Atmosphere pollutants and mortality rate of respiratory diseases in Beijing. Sci Total Environ, 391: 143-148. 179974
Wang T-N; Ko Y-C; Chao Y-Y; Huang C-C; Lin R-S (1999). Association between indoor and outdoor air pollution and adolescent asthma from 1995 to 1996 in Taiwan. Environ Res, 81: 239-247. 008105
Wellenius GA; Bateson TF; Mittleman MA; Schwartz J (2005). Particulate air pollution and the rate of hospitalization for congestive heart failure among medicare beneficiaries in Pittsburgh, Pennsylvania. Am J Epidemiol, 161: 1030-1036. 087483
Wellenius GA; Schwartz J; Mittleman MA (2005). Air pollution and hospital admissions for ischemic and hemorrhagic stroke among medicare beneficiaries. Stroke, 36: 2549-2553. 088685
Wellenius GA; Yeh GY; Coull BA; Suh HH; Phillips RS; Mittleman MA (2007). Effects of ambient air pollution on functional status in patients with chronic congestive heart failure: a repeated-measures study. Environ Health, 6: 1-7. 092830
Wheeler A; Zanobetti A; Gold DR; Schwartz J; Stone P; Suh HH (2006). The relationship between ambient air pollution and heart rate variability differs for individuals with heart and pulmonary disease. Environ Health Perspect, 114: 560-566. 088453
Wichmann H-E; Spix C; Tuch T; Wolke G; Peters A; Heinrich J; Kreyling WG; Heyder J (2000). Daily mortality and fine and ultrafine particles in Erfurt, Germany Part I: role of particle number and particle mass. Health Effects Institute. Boston, MA. 013912
Wilhelm M; Meng YY; Rull RP; English P; Balmes J; Ritz B (2008). Environmental public health tracking of childhood asthma using California health interview survey, traffic, and outdoor air pollution data. Environ Health Perspect, 116: 1254-1260. 191912
Wilhelm M; Ritz B (2005). Local variations in CO and particulate air pollution and adverse birth outcomes in Los Angeles County, California, USA. Environ Health Perspect, 113: 1212-1221. 088668
Woodruff TJ; Darrow LA; Parker JD (2008). Air pollution and postneonatal infant mortality in the United States, 1999-2002. Environ Health Perspect, 116: 110-115. 098386
Xirasagar S; Lin HC; Liu TC (2006). Seasonality in pediatric asthma admissions: the role of climate and environmental factors. Eur J Pediatr, 165: 747-752. 093267
Yang C-Y; Chang C-C; Chuang H-Y; Tsai S-S; Wu T-N; Ho C-K (2004). Relationship between air pollution and daily mortality in a subtropical city: Taipei, Taiwan. Environ Int, 30: 519-523. 055603
Yang C-Y; Chen Y-S; Yang C-H; Ho S-C (2004). Relationship between ambient air pollution and hospital admissions for cardiovascular diseases in Kaohsiung, Taiwan. J Toxicol Environ Health A Curr Iss, 67: 483-493. 094376
Yang CY (2008). Air pollution and hospital admissions for congestive heart failure in a subtropical city: Taipei, Taiwan. J Toxicol Environ Health A Curr Iss, 71: 1085-1090. 157160
Yang CY; Chen CC; Chen CY; Kuo HW (2007). Air pollution and hospital admissions for asthma in a subtropical city: Taipei, Taiwan. J Toxicol Environ Health A Curr Iss, 70: 111-117. 092848
Yang CY; Chen CJ (2007). Air pollution and hospital admissions for chronic obstructive pulmonary disease in a subtropical city: Taipei, Taiwan. J Toxicol Environ Health A Curr Iss, 70: 1214-1219. 092847
Yang Q; Chen Y; Krewski D; Burnett RT; Shi Y; McGrail KM (2005). Effect of short-term exposure to low levels of gaseous pollutants on chronic obstructive pulmonary disease hospitalizations. Environ Res, 99: 99-105. 090184
Yang Q; Chen Y; Krewski D; Shi Y; Burnett RT; McGrail KM (2004). Association between particulate air pollution and first hospital admission for childhood respiratory illness in Vancouver, Canada. Arch Environ Occup Health, 59: 14-21. 087488
Yang Q; Chen Y; Shi Y; Burnett RT; McGrail KM; Krewski D (2003). Association between ozone and respiratory admissions among children and the elderly in Vancouver, Canada. Inhal Toxicol, 15: 1297-1308. 055621
Yu O; Sheppard L; Lumley T; Koenig JQ; S (2000). Effects of ambient air pollution on symptoms of asthma in Seattle-area children enrolled in the CAMP study. Environ Health Perspect, 108: 1209-1214. 013254
January 2010 C-112

Zanobetti A; Canner MJ; Stone PH; Schwartz J; Sher D; Eagan-Bengston E; Gates KA; Hartley LH; Suh H; Gold DR (2004). Ambient pollution and blood pressure in cardiac rehabilitation patients. Circulation, 110: 2184-2189. 087489
Zanobetti A; Schwartz J (2006). Air pollution and emergency admissions in Boston, MA. J Epidemiol Community Health, 60: 890-895. 090195
January 2010 C-113

Annex D. Controlled Human Exposure Studies
Table D-1. Controlled human exposure studies.
Study Subjects Exposure Findings
Adir et al. (1999, 001026)
15 healthy nonsmokers
Gender: M
Age: 22-34 yr
Inhaled Concentration: Not provided
Exposure Duration: 3 min 45 s
COHb Concentration: 4-6%
COHb Analysis: CO-oximeter (IL-282)
Exposures to CO and room air were separated by 1 mo, with the order of exposure randomly assigned.
Exposure to CO resulted in a decrease in postexposure exercise duration (Bruce protocol) relative to clean air exposure in 13 out of 15 subjects (p = 0.0012). Statistically significant decreases in METs were also reported following CO exposure (p = 0.0001). No CO-induced changes in HR, BP, ECG parameters, or myocardial perfusion were observed.
Bathoorn et al. (2007, 193963)
19 former smokers with COPD
Gender: 18 M/1 F
Age: 66-70 yr
Inhaled Concentration: 100 ppm (9 subjects) or 125 ppm (10 subjects)
Exposure Duration: 2 h on each of 4 consecutive days
COHb Concentration: 2.7% (following 4th day exposure)
COHb Analysis: Not provided
Exposures to CO and room air conducted were separated by at least 1 wk, using a randomized crossover design.
Following the 4th day of exposure, CO inhalation reduced sputum eosinophils relative to room air and also increased the provocative concentration of methacholine required to cause a 20% reduction in FEV1. Neither of these effects were shown to reach statistical significance. No changes in sputum neutrophils, white blood cell counts or serum C-reactive protein (CRP) were observed. Although this study appears to demonstrate some evidence of an anti-inflammatory effect of CO among subjects with COPD, it must be noted that 2 of these patients experienced exacerbations of COPD during or following CO exposure, with 1 patient requiring hospitalization 2 mo after exposure (initial symptoms first experienced 1 wk postexposure).
Hanada et al. (2003, 193915)
20 healthy adults
Gender: M
Age: 26 ± 1 yr
Inhaled Concentration: Not provided
Exposure Duration: 20 min
COHb Concentration: 20-24%
COHb Analysis: CO-oximeter (OSM-3)
15 subjects exposed for 20 min (10 min rest, 5 min handgrip exercise, 2 min postexercise ischemia, 3 min recovery) under the following 4 conditions: (1) normoxia (inspiratory O2 fraction 21.4%); (2) hypoxia (inspiratory O2 fraction 10.3%); (3) CO + normoxia; and (4) CO + hyperoxia (inspiratory O2 fraction 95.9%). Trials involving exposure to CO were conducted last in this sequence. Each of the 4 conditions was separated from the next by 20 min of rest. 5 subjects served as controls (4 consecutive 20 min periods of normoxia).
Blood oxygenation, BP, HR and respiratory rate were measured during exposure. Muscle sympathetic nerve activity (MSNA) and leg hemodynamics were evaluated in two subsets of the study group (n = 8 and 7, respectively). Arterial oxygen saturation (pulse oximetry) was significantly lower, and resting HR and ventilation significantly higher during the period of hypoxia compared to the other periods; none of these measures were affected by exposure to CO. MSNA was shown to increase during hypoxia and CO exposure relative to normoxia. Neither hypoxia nor CO was found to affect leg blood flow or vasoconstriction.
Note: Hyperlinks to the reference citations throughout this document will take you to the NCEA HERO database (Health and Environmental Research Online) at http://epa.gov/hero. HERO is a database of scientific literature used by U.S. EPA in the process of developing science assessments such as the Integrated Science Assessments (ISAs) and the Integrated Risk Information System (IRIS).
January 2010 D-1
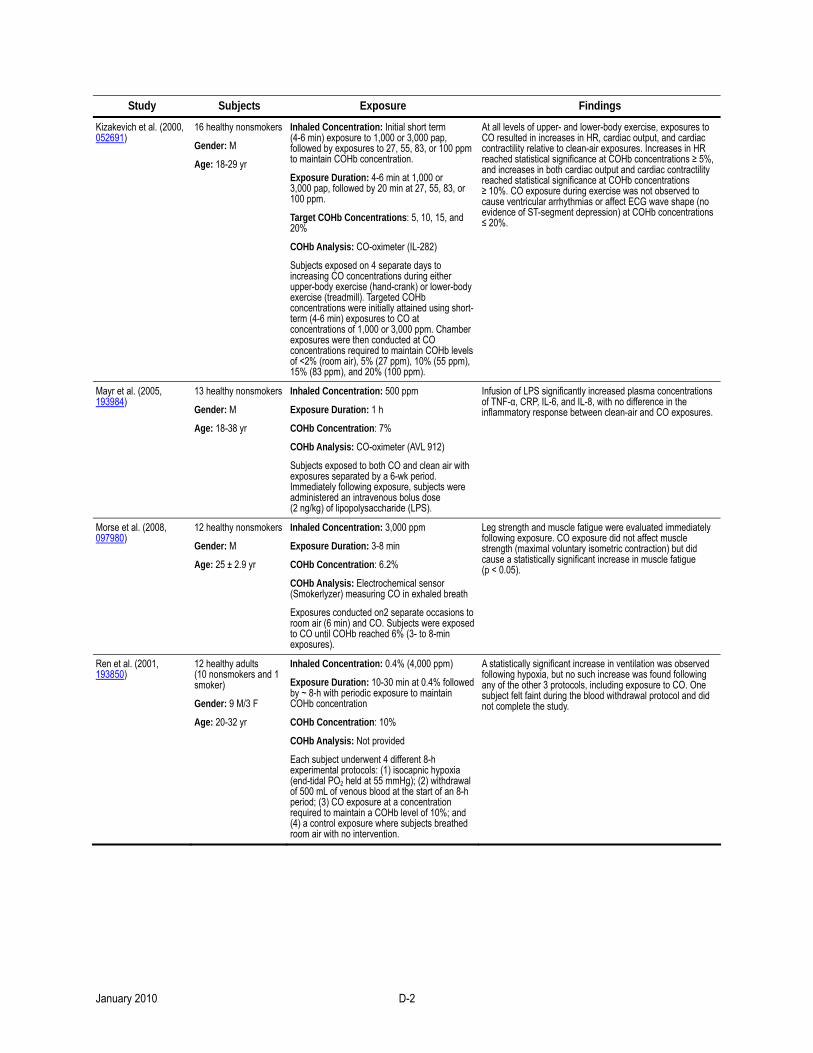
Study Subjects Exposure Findings
Kizakevich et al. (2000, 052691)
16 healthy nonsmokers
Gender: M
Age: 18-29 yr
Inhaled Concentration: Initial short term (4-6 min) exposure to 1,000 or 3,000 pap, followed by exposures to 27, 55, 83, or 100 ppm to maintain COHb concentration.
Exposure Duration: 4-6 min at 1,000 or 3,000 pap, followed by 20 min at 27, 55, 83, or 100 ppm.
Target COHb Concentrations: 5, 10, 15, and 20%
COHb Analysis: CO-oximeter (IL-282)
Subjects exposed on 4 separate days to increasing CO concentrations during either upper-body exercise (hand-crank) or lower-body exercise (treadmill). Targeted COHb concentrations were initially attained using short-term (4-6 min) exposures to CO at concentrations of 1,000 or 3,000 ppm. Chamber exposures were then conducted at CO concentrations required to maintain COHb levels of <2% (room air), 5% (27 ppm), 10% (55 ppm), 15% (83 ppm), and 20% (100 ppm).
At all levels of upper- and lower-body exercise, exposures to CO resulted in increases in HR, cardiac output, and cardiac contractility relative to clean-air exposures. Increases in HR reached statistical significance at COHb concentrations ≥ 5%, and increases in both cardiac output and cardiac contractility reached statistical significance at COHb concentrations ≥ 10%. CO exposure during exercise was not observed to cause ventricular arrhythmias or affect ECG wave shape (no evidence of ST-segment depression) at COHb concentrations ≤ 20%.
Mayr et al. (2005, 193984)
13 healthy nonsmokers
Gender: M
Age: 18-38 yr
Inhaled Concentration: 500 ppm
Exposure Duration: 1 h
COHb Concentration: 7%
COHb Analysis: CO-oximeter (AVL 912)
Subjects exposed to both CO and clean air with exposures separated by a 6-wk period. Immediately following exposure, subjects were administered an intravenous bolus dose (2 ng/kg) of lipopolysaccharide (LPS).
Infusion of LPS significantly increased plasma concentrations of TNF-α, CRP, IL-6, and IL-8, with no difference in the inflammatory response between clean-air and CO exposures.
Morse et al. (2008, 097980)
12 healthy nonsmokers
Gender: M
Age: 25 ± 2.9 yr
Inhaled Concentration: 3,000 ppm
Exposure Duration: 3-8 min
COHb Concentration: 6.2%
COHb Analysis: Electrochemical sensor (Smokerlyzer) measuring CO in exhaled breath
Exposures conducted on2 separate occasions to room air (6 min) and CO. Subjects were exposed to CO until COHb reached 6% (3- to 8-min exposures).
Leg strength and muscle fatigue were evaluated immediately following exposure. CO exposure did not affect muscle strength (maximal voluntary isometric contraction) but did cause a statistically significant increase in muscle fatigue (p < 0.05).
Ren et al. (2001, 193850)
12 healthy adults (10 nonsmokers and 1 smoker)
Gender: 9 M/3 F
Age: 20-32 yr
Inhaled Concentration: 0.4% (4,000 ppm)
Exposure Duration: 10-30 min at 0.4% followed by ~ 8-h with periodic exposure to maintain COHb concentration
COHb Concentration: 10%
COHb Analysis: Not provided
Each subject underwent 4 different 8-h experimental protocols: (1) isocapnic hypoxia (end-tidal PO2 held at 55 mmHg); (2) withdrawal of 500 mL of venous blood at the start of an 8-h period; (3) CO exposure at a concentration required to maintain a COHb level of 10%; and (4) a control exposure where subjects breathed room air with no intervention.
A statistically significant increase in ventilation was observed following hypoxia, but no such increase was found following any of the other 3 protocols, including exposure to CO. One subject felt faint during the blood withdrawal protocol and did not complete the study.
January 2010 D-2
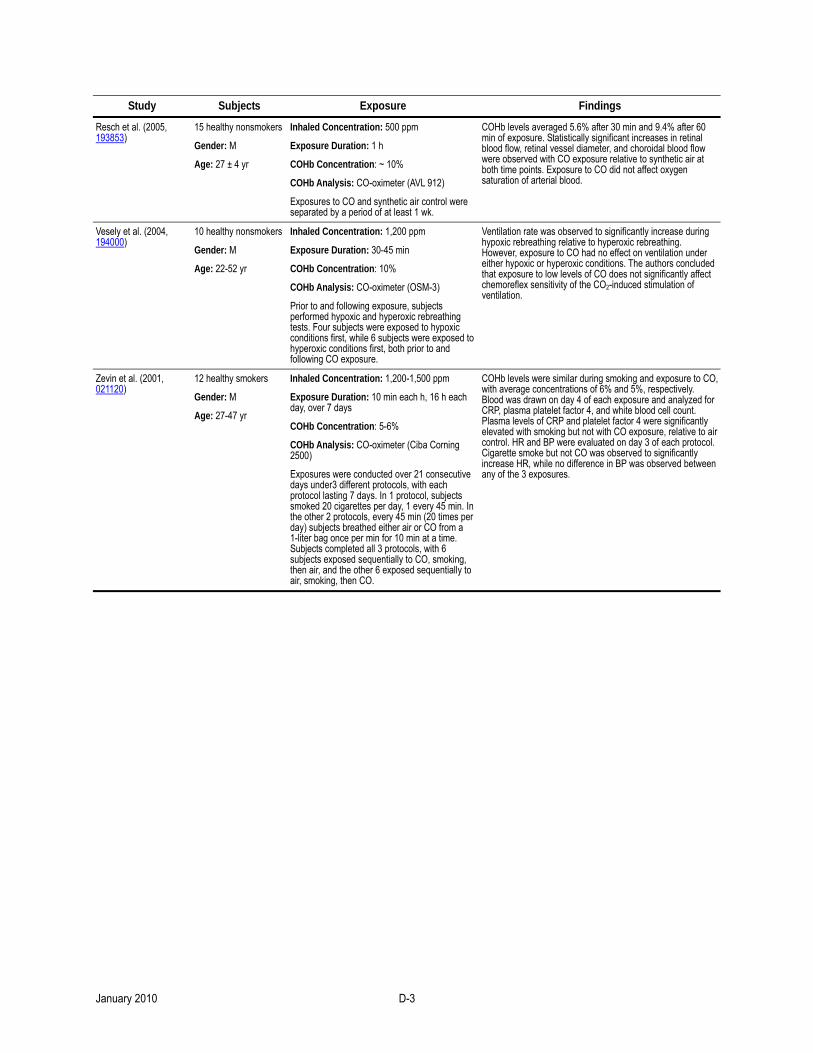
Study Subjects Exposure Findings
Resch et al. (2005, 193853)
15 healthy nonsmokers
Gender: M
Age: 27 ± 4 yr
Inhaled Concentration: 500 ppm
Exposure Duration: 1 h
COHb Concentration: ~ 10%
COHb Analysis: CO-oximeter (AVL 912)
Exposures to CO and synthetic air control were separated by a period of at least 1 wk.
COHb levels averaged 5.6% after 30 min and 9.4% after 60 min of exposure. Statistically significant increases in retinal blood flow, retinal vessel diameter, and choroidal blood flow were observed with CO exposure relative to synthetic air at both time points. Exposure to CO did not affect oxygen saturation of arterial blood.
Vesely et al. (2004, 194000)
10 healthy nonsmokers
Gender: M
Age: 22-52 yr
Inhaled Concentration: 1,200 ppm
Exposure Duration: 30-45 min
COHb Concentration: 10%
COHb Analysis: CO-oximeter (OSM-3)
Prior to and following exposure, subjects performed hypoxic and hyperoxic rebreathing tests. Four subjects were exposed to hypoxic conditions first, while 6 subjects were exposed to hyperoxic conditions first, both prior to and following CO exposure.
Ventilation rate was observed to significantly increase during hypoxic rebreathing relative to hyperoxic rebreathing. However, exposure to CO had no effect on ventilation under either hypoxic or hyperoxic conditions. The authors concluded that exposure to low levels of CO does not significantly affect chemoreflex sensitivity of the CO2-induced stimulation of ventilation.
Zevin et al. (2001, 021120)
12 healthy smokers
Gender: M
Age: 27-47 yr
Inhaled Concentration: 1,200-1,500 ppm
Exposure Duration: 10 min each h, 16 h each day, over 7 days
COHb Concentration: 5-6%
COHb Analysis: CO-oximeter (Ciba Corning 2500)
Exposures were conducted over 21 consecutive days under3 different protocols, with each protocol lasting 7 days. In 1 protocol, subjects smoked 20 cigarettes per day, 1 every 45 min. In the other 2 protocols, every 45 min (20 times per day) subjects breathed either air or CO from a 1-liter bag once per min for 10 min at a time. Subjects completed all 3 protocols, with 6 subjects exposed sequentially to CO, smoking, then air, and the other 6 exposed sequentially to air, smoking, then CO.
COHb levels were similar during smoking and exposure to CO, with average concentrations of 6% and 5%, respectively. Blood was drawn on day 4 of each exposure and analyzed for CRP, plasma platelet factor 4, and white blood cell count. Plasma levels of CRP and platelet factor 4 were significantly elevated with smoking but not with CO exposure, relative to air control. HR and BP were evaluated on day 3 of each protocol. Cigarette smoke but not CO was observed to significantly increase HR, while no difference in BP was observed between any of the 3 exposures.
January 2010 D-3
References
Adir Y; Merdler A; Haim SB; Front A; Harduf R; Bitterman H (1999). Effects of exposure to low concentrations of carbon monoxide on exercise performance and myocardial perfusion in young healthy men. Occup Environ Med, 56: 535-538. 001026
Bathoorn E; Slebos DJ; Postma DS; Koeter GH; van Oosterhout AJ; van der Toorn M; Boezen HM; Kerstjens HA (2007). Anti-inflammatory effects of inhaled carbon monoxide in patients with COPD: A pilot study. Eur Respir J, 30: 1131-1137. 193963
Hanada A; Sander M; González-Alonso J (2003). Human skeletal muscle sympathetic nerve activity, heart rate and limb haemodynamics with reduced blood oxygenation and exercise. J Physiol, 551: 635-647. 193915
Kizakevich PN; McCartney ML; Hazucha MJ; Sleet LH; Jochem WJ; Hackney AC; Bolick K (2000). Noninvasive ambulatory assessment of cardiac function in healthy men exposed to carbon monoxide during upper and lower body exercise. Eur J Appl Physiol, 83: 7-16. 052691
Mayr FB; Spiel A; Leitner J; Marsik C; Germann P; Ullrich R; Wagner O; Jilma B (2005). Effects of carbon monoxide inhalation during experimental endotoxemia in humans. Am J Respir Crit Care Med, 171: 354-360. 193984
Morse CI; Pritchard LJ; Wust RC; Jones DA; Degens H (2008). Carbon monoxide inhalation reduces skeletal muscle fatigue resistance. Eur Phys J A, 192: 397-401. 097980
Ren X; Dorrington KL; Robbins PA (2001). Respiratory control in humans after 8 h of lowered arterial PO2, hemodilution, or carboxyhemoglobinemia. J Appl Physiol, 90: 1189-1195. 193850
Resch H; Zawinka C; Weigert G; Schmetterer L; Garhofer G (2005). Inhaled carbon monoxide increases retinal and choroidal blood flow in healthy humans. Invest Ophthalmol Vis Sci, 46: 4275-4280. 193853
Vesely AE; Somogyi RB; Sasano H; Sasano N; Fisher JA; Duffin J (2004). The effects of carbon monoxide on respiratory chemoreflexes in humans. Environ Res, 94: 227-233. 194000
Zevin S; Saunders S; Gourlay SG; Jacob P III; Benowitz NL (2001). Cardiovascular effects of carbon monoxide and cigarette smoking. J Am Coll Cardiol, 38: 1633-1638. 021120
Note: Hyperlinks to the reference citations throughout this document will take you to the NCEA HERO database (Health and Environmental Research Online) at http://epa.gov/hero. HERO is a database of scientific literature used by U.S. EPA in the process of developing science assessments such as the Integrated Science Assessments (ISAs) and the Integrated Risk Information System (IRIS).
January 2010 D-4
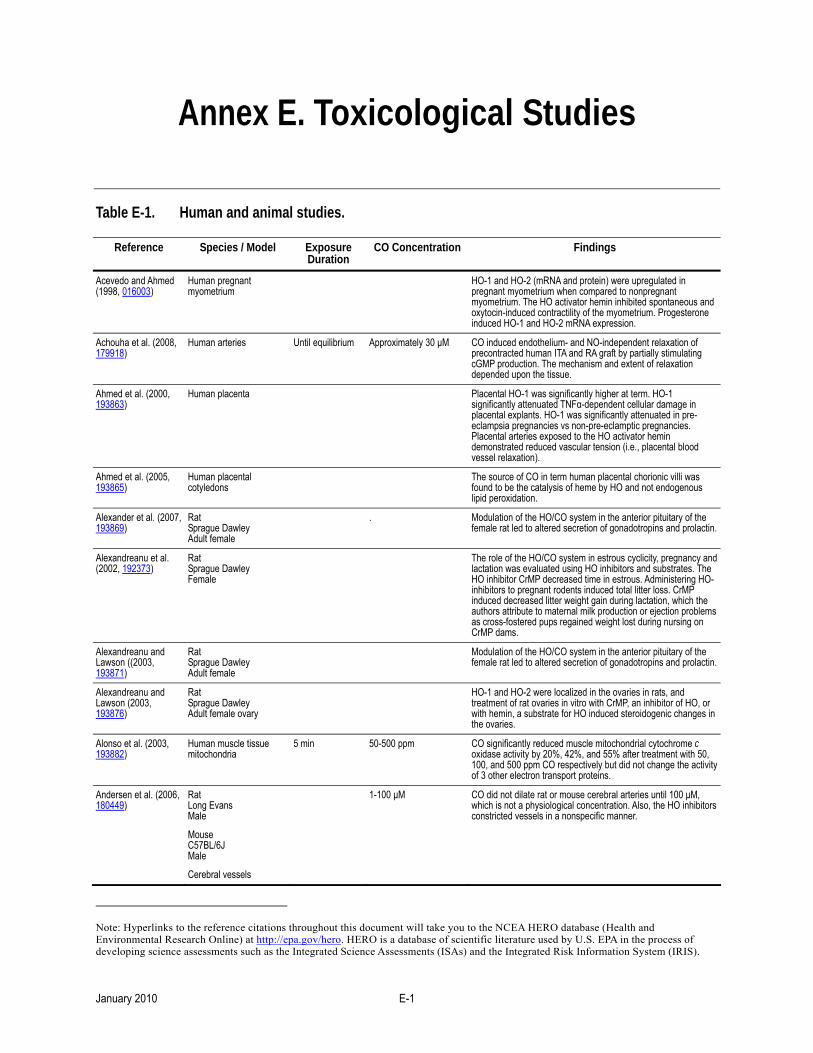
Annex E. Toxicological Studies
Table E-1. Human and animal studies.
Reference Species / Model Exposure Duration
CO Concentration Findings
Acevedo and Ahmed (1998, 016003)
Human pregnant myometrium
HO-1 and HO-2 (mRNA and protein) were upregulated in pregnant myometrium when compared to nonpregnant myometrium. The HO activator hemin inhibited spontaneous and oxytocin-induced contractility of the myometrium. Progesterone induced HO-1 and HO-2 mRNA expression.
Achouha et al. (2008, 179918)
Human arteries Until equilibrium Approximately 30 μM CO induced endothelium- and NO-independent relaxation of precontracted human ITA and RA graft by partially stimulating cGMP production. The mechanism and extent of relaxation depended upon the tissue.
Ahmed et al. (2000, 193863)
Human placenta Placental HO-1 was significantly higher at term. HO-1 significantly attenuated TNFα-dependent cellular damage in placental explants. HO-1 was significantly attenuated in pre-eclampsia pregnancies vs non-pre-eclamptic pregnancies. Placental arteries exposed to the HO activator hemin demonstrated reduced vascular tension (i.e., placental blood vessel relaxation).
Ahmed et al. (2005, 193865)
Human placental cotyledons
The source of CO in term human placental chorionic villi was found to be the catalysis of heme by HO and not endogenous lipid peroxidation.
Alexander et al. (2007, 193869)
Rat Sprague Dawley Adult female
. Modulation of the HO/CO system in the anterior pituitary of the female rat led to altered secretion of gonadotropins and prolactin.
Alexandreanu et al. (2002, 192373)
Rat Sprague Dawley Female
The role of the HO/CO system in estrous cyclicity, pregnancy and lactation was evaluated using HO inhibitors and substrates. The HO inhibitor CrMP decreased time in estrous. Administering HO-inhibitors to pregnant rodents induced total litter loss. CrMP induced decreased litter weight gain during lactation, which the authors attribute to maternal milk production or ejection problems as cross-fostered pups regained weight lost during nursing on CrMP dams.
Alexandreanu and Lawson ((2003, 193871)
Rat Sprague Dawley Adult female
Modulation of the HO/CO system in the anterior pituitary of the female rat led to altered secretion of gonadotropins and prolactin.
Alexandreanu and Lawson (2003, 193876)
Rat Sprague Dawley Adult female ovary
HO-1 and HO-2 were localized in the ovaries in rats, and treatment of rat ovaries in vitro with CrMP, an inhibitor of HO, or with hemin, a substrate for HO induced steroidogenic changes in the ovaries.
Alonso et al. (2003, 193882)
Human muscle tissue mitochondria
5 min 50-500 ppm CO significantly reduced muscle mitochondrial cytochrome c oxidase activity by 20%, 42%, and 55% after treatment with 50, 100, and 500 ppm CO respectively but did not change the activity of 3 other electron transport proteins.
Andersen et al. (2006, 180449)
Rat Long Evans Male
Mouse C57BL/6J Male
Cerebral vessels
1-100 µM CO did not dilate rat or mouse cerebral arteries until 100 µM, which is not a physiological concentration. Also, the HO inhibitors constricted vessels in a nonspecific manner.
Note: Hyperlinks to the reference citations throughout this document will take you to the NCEA HERO database (Health and Environmental Research Online) at http://epa.gov/hero. HERO is a database of scientific literature used by U.S. EPA in the process of developing science assessments such as the Integrated Science Assessments (ISAs) and the Integrated Risk Information System (IRIS).
January 2010 E-1
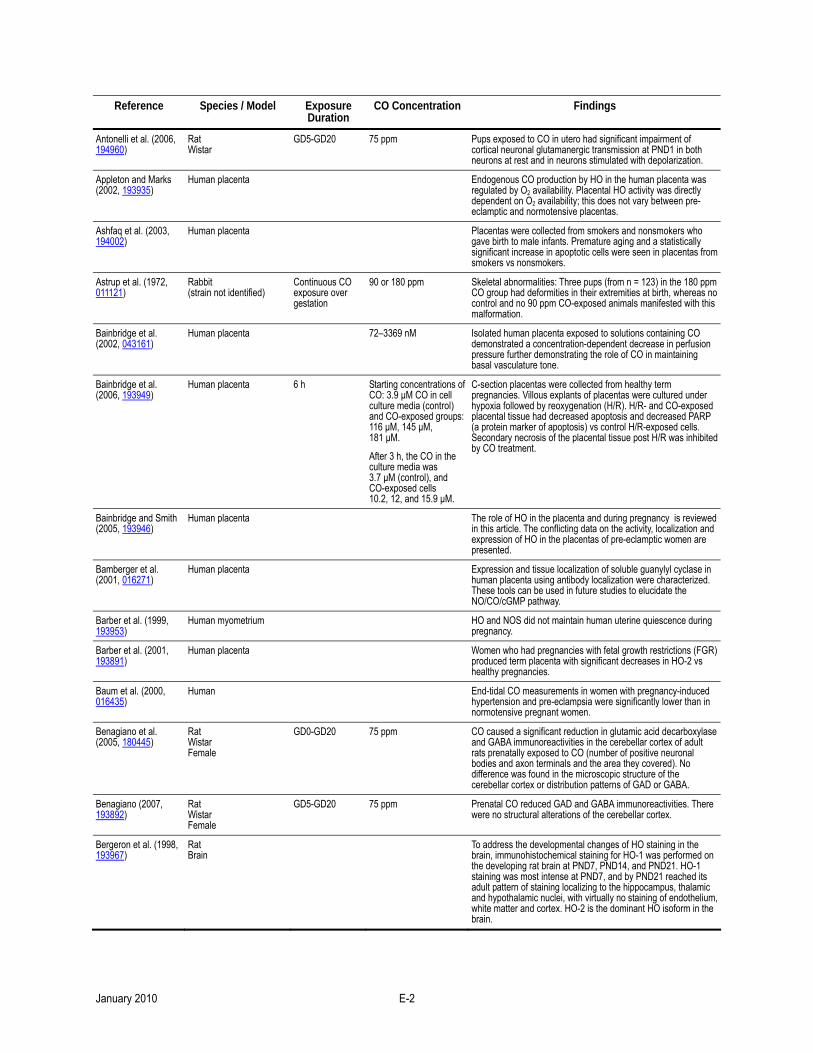
Reference Species / Model Exposure Duration
CO Concentration Findings
Antonelli et al. (2006, 194960)
Rat Wistar
GD5-GD20 75 ppm Pups exposed to CO in utero had significant impairment of cortical neuronal glutamanergic transmission at PND1 in both neurons at rest and in neurons stimulated with depolarization.
Appleton and Marks (2002, 193935)
Human placenta Endogenous CO production by HO in the human placenta was regulated by O2 availability. Placental HO activity was directly dependent on O2 availability; this does not vary between pre-eclamptic and normotensive placentas.
Ashfaq et al. (2003, 194002)
Human placenta Placentas were collected from smokers and nonsmokers who gave birth to male infants. Premature aging and a statistically significant increase in apoptotic cells were seen in placentas from smokers vs nonsmokers.
Astrup et al. (1972, 011121)
Rabbit (strain not identified)
Continuous CO exposure over gestation
90 or 180 ppm Skeletal abnormalities: Three pups (from n = 123) in the 180 ppm CO group had deformities in their extremities at birth, whereas no control and no 90 ppm CO-exposed animals manifested with this malformation.
Bainbridge et al. (2002, 043161)
Human placenta 72–3369 nM Isolated human placenta exposed to solutions containing CO demonstrated a concentration-dependent decrease in perfusion pressure further demonstrating the role of CO in maintaining basal vasculature tone.
Bainbridge et al. (2006, 193949)
Human placenta 6 h Starting concentrations of CO: 3.9 µM CO in cell culture media (control) and CO-exposed groups: 116 µM, 145 µM, 181 µM.
After 3 h, the CO in the culture media was 3.7 µM (control), and CO-exposed cells 10.2, 12, and 15.9 µM.
C-section placentas were collected from healthy term pregnancies. Villous explants of placentas were cultured under hypoxia followed by reoxygenation (H/R). H/R- and CO-exposed placental tissue had decreased apoptosis and decreased PARP (a protein marker of apoptosis) vs control H/R-exposed cells. Secondary necrosis of the placental tissue post H/R was inhibited by CO treatment.
Bainbridge and Smith (2005, 193946)
Human placenta The role of HO in the placenta and during pregnancy is reviewed in this article. The conflicting data on the activity, localization and expression of HO in the placentas of pre-eclamptic women are presented.
Bamberger et al. (2001, 016271)
Human placenta Expression and tissue localization of soluble guanylyl cyclase in human placenta using antibody localization were characterized. These tools can be used in future studies to elucidate the NO/CO/cGMP pathway.
Barber et al. (1999, 193953)
Human myometrium HO and NOS did not maintain human uterine quiescence during pregnancy.
Barber et al. (2001, 193891)
Human placenta Women who had pregnancies with fetal growth restrictions (FGR) produced term placenta with significant decreases in HO-2 vs healthy pregnancies.
Baum et al. (2000, 016435)
Human End-tidal CO measurements in women with pregnancy-induced hypertension and pre-eclampsia were significantly lower than in normotensive pregnant women.
Benagiano et al. (2005, 180445)
Rat Wistar Female
GD0-GD20 75 ppm CO caused a significant reduction in glutamic acid decarboxylase and GABA immunoreactivities in the cerebellar cortex of adult rats prenatally exposed to CO (number of positive neuronal bodies and axon terminals and the area they covered). No difference was found in the microscopic structure of the cerebellar cortex or distribution patterns of GAD or GABA.
Benagiano (2007, 193892)
Rat Wistar Female
GD5-GD20 75 ppm Prenatal CO reduced GAD and GABA immunoreactivities. There were no structural alterations of the cerebellar cortex.
Bergeron et al. (1998, 193967)
Rat Brain
To address the developmental changes of HO staining in the brain, immunohistochemical staining for HO-1 was performed on the developing rat brain at PND7, PND14, and PND21. HO-1 staining was most intense at PND7, and by PND21 reached its adult pattern of staining localizing to the hippocampus, thalamic and hypothalamic nuclei, with virtually no staining of endothelium, white matter and cortex. HO-2 is the dominant HO isoform in the brain.
January 2010 E-2
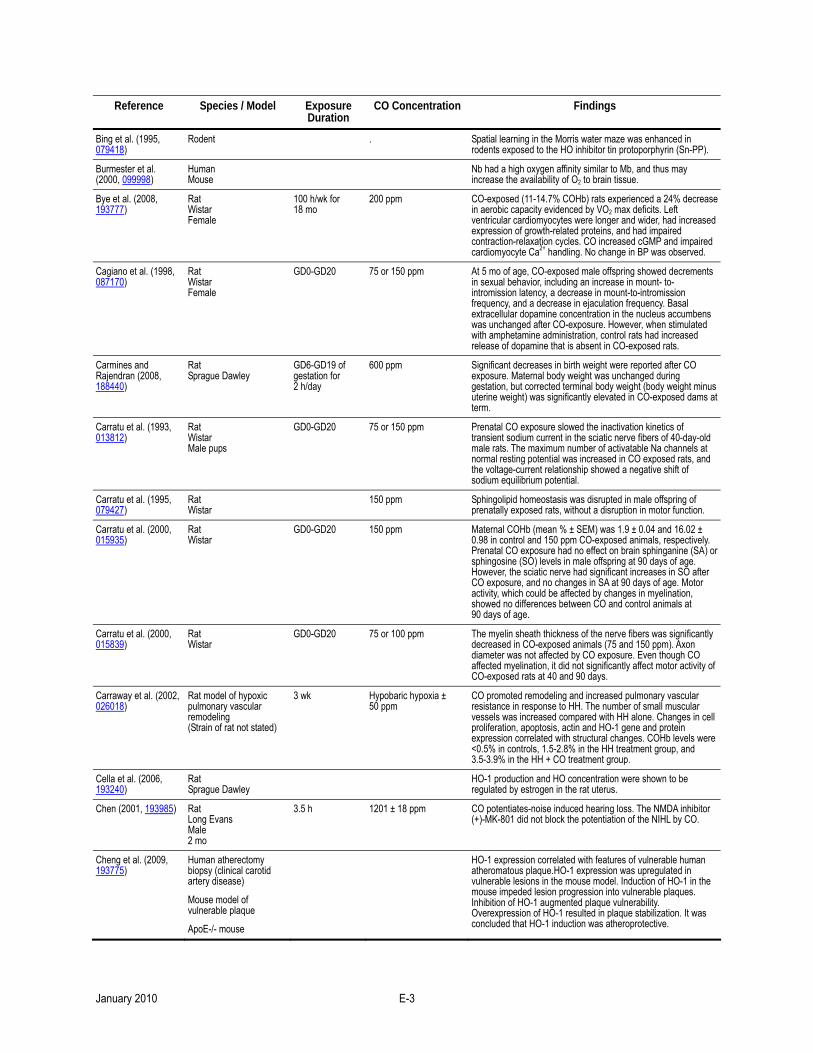
Reference Species / Model Exposure Duration
CO Concentration Findings
Bing et al. (1995, 079418)
Rodent . Spatial learning in the Morris water maze was enhanced in rodents exposed to the HO inhibitor tin protoporphyrin (Sn-PP).
Burmester et al. (2000, 099998)
Human Mouse
Nb had a high oxygen affinity similar to Mb, and thus may increase the availability of O2 to brain tissue.
Bye et al. (2008, 193777)
Rat Wistar Female
100 h/wk for 18 mo
200 ppm
CO-exposed (11-14.7% COHb) rats experienced a 24% decrease in aerobic capacity evidenced by VO2 max deficits. Left ventricular cardiomyocytes were longer and wider, had increased expression of growth-related proteins, and had impaired contraction-relaxation cycles. CO increased cGMP and impaired cardiomyocyte Ca2+ handling. No change in BP was observed.
Cagiano et al. (1998, 087170)
Rat Wistar Female
GD0-GD20 75 or 150 ppm At 5 mo of age, CO-exposed male offspring showed decrements in sexual behavior, including an increase in mount- to- intromission latency, a decrease in mount-to-intromission frequency, and a decrease in ejaculation frequency. Basal extracellular dopamine concentration in the nucleus accumbens was unchanged after CO-exposure. However, when stimulated with amphetamine administration, control rats had increased release of dopamine that is absent in CO-exposed rats.
Carmines and Rajendran (2008, 188440)
Rat Sprague Dawley
GD6-GD19 of gestation for 2 h/day
600 ppm Significant decreases in birth weight were reported after CO exposure. Maternal body weight was unchanged during gestation, but corrected terminal body weight (body weight minus uterine weight) was significantly elevated in CO-exposed dams at term.
Carratu et al. (1993, 013812)
Rat Wistar Male pups
GD0-GD20 75 or 150 ppm Prenatal CO exposure slowed the inactivation kinetics of transient sodium current in the sciatic nerve fibers of 40-day-old male rats. The maximum number of activatable Na channels at normal resting potential was increased in CO exposed rats, and the voltage-current relationship showed a negative shift of sodium equilibrium potential.
Carratu et al. (1995, 079427)
Rat Wistar
150 ppm Sphingolipid homeostasis was disrupted in male offspring of prenatally exposed rats, without a disruption in motor function.
Carratu et al. (2000, 015935)
Rat Wistar
GD0-GD20 150 ppm Maternal COHb (mean % ± SEM) was 1.9 ± 0.04 and 16.02 ± 0.98 in control and 150 ppm CO-exposed animals, respectively. Prenatal CO exposure had no effect on brain sphinganine (SA) or sphingosine (SO) levels in male offspring at 90 days of age. However, the sciatic nerve had significant increases in SO after CO exposure, and no changes in SA at 90 days of age. Motor activity, which could be affected by changes in myelination, showed no differences between CO and control animals at 90 days of age.
Carratu et al. (2000, 015839)
Rat Wistar
GD0-GD20 75 or 100 ppm
The myelin sheath thickness of the nerve fibers was significantly decreased in CO-exposed animals (75 and 150 ppm). Axon diameter was not affected by CO exposure. Even though CO affected myelination, it did not significantly affect motor activity of CO-exposed rats at 40 and 90 days.
Carraway et al. (2002, 026018)
Rat model of hypoxic pulmonary vascular remodeling (Strain of rat not stated)
3 wk Hypobaric hypoxia ± 50 ppm
CO promoted remodeling and increased pulmonary vascular resistance in response to HH. The number of small muscular vessels was increased compared with HH alone. Changes in cell proliferation, apoptosis, actin and HO-1 gene and protein expression correlated with structural changes. COHb levels were <0.5% in controls, 1.5-2.8% in the HH treatment group, and 3.5-3.9% in the HH + CO treatment group.
Cella et al. (2006, 193240)
Rat Sprague Dawley
HO-1 production and HO concentration were shown to be regulated by estrogen in the rat uterus.
Chen (2001, 193985) Rat Long Evans Male 2 mo
3.5 h 1201 ± 18 ppm CO potentiates-noise induced hearing loss. The NMDA inhibitor (+)-MK-801 did not block the potentiation of the NIHL by CO.
Cheng et al. (2009, 193775)
Human atherectomy biopsy (clinical carotid artery disease)
Mouse model of vulnerable plaque
ApoE-/- mouse
HO-1 expression correlated with features of vulnerable human atheromatous plaque.HO-1 expression was upregulated in vulnerable lesions in the mouse model. Induction of HO-1 in the mouse impeded lesion progression into vulnerable plaques. Inhibition of HO-1 augmented plaque vulnerability. Overexpression of HO-1 resulted in plaque stabilization. It was concluded that HO-1 induction was atheroprotective.
January 2010 E-3

Reference Species / Model Exposure Duration
CO Concentration Findings
Chung et al. (2006, 193987)
Rat Sprague Dawley Male
3-6% CO inactivation of Mb did not induce any change in the respiration rate, contractile function or high-energy phosphate levels in perfused rat hearts.
Cronje et al. (2004, 180440)
Rat Sprague Dawley Male 240-325 g
45 min 2,500 ppm Results indicate that tissue and blood (CO) (66-72% COHb) dissociate during CO inhalation, but tissue (CO) does not follow blood (CO) or 1/pO2 as in the Warburg theory during intake or elimination. Tissue (CO) increases later during the resolution period and varies significantly among animals and tissues. The deviation from the predicted values in the brain is likely due to the release of heme and increase in NADPH stimulating endogenous CO production by HO. Immediately following exposure, tissue CO concentrations were found to be:
Blood: 27,500 (800) pmol/mg Heart: 800 (300) pmol/mg Muscle: 90 (80) pmol/mg Brain: 60 (40) pmol/mg
These values are estimates taken from a graph, with control levels in parentheses
A later report stated that these tissue CO values were too high due to a computational error (Piantadosi et al., 2006, 180424)
Cudmore et al. (2007, 193991)
Human placenta
Human (HUVEC)
Mouse (HO-1 deficient mouse on 129/SV × C57BL/6 background)
Pig (Porcine aortic endothelial cells)
HUVEC cells, porcine aortic endothelial cells, HO-1 null mice and placental villous explants (normotensive and pre-eclamptic pregnancies) were used in this study. The HO-1/CO system inhibited sFlt-1 and sEng release, two factors upregulated in pre-eclampsia.
D'Amico et al. (2006, 193992)
Human embryonic kidney (HEK293) cells
0-30 min 20 µM Exogenous CO inhibited respiration in HEK293 cells under ambient O2 concentration (21%). Inhibition was enhanced under hypoxic conditions. Increased endogenous CO resulting from HO-1 overexpression inhibited respiration by 12% and cytochrome c oxidase activity by 23%. This effect was enhanced under hypoxic conditions.
Dani et al. (2007, 193994)
Human (neonatal blood)
CO was lower at birth and 48-72 h postpartum in infants born by elective C-section and higher in vaginally born infants.
De Luca et al. (1996, 080911)
Rat Wistar Female Male pups
GD0-GD20 75 or 150 ppm Prenatal CO (150 ppm) delayed development of the ion channels responsible for passive and active membrane electrical properties of skeletal muscle. CO-induced lower values of resting chloride conductance was reversed at PND80. CO-induced delayed developmental reduction of resting potassium conductance was reversed at PND60.
De Salvia et al. (1995, 079441)
Rat Wistar
GD0-GD20 75 or 150 ppm Animals exposed to the higher dose of CO (150 ppm) in utero had significantly impaired acquisition (at 3 and 18 mo) and reacquisition (at 18 mo) of conditioned avoidance behavior.
Denschlag et al. (2004, 193894)
Human Genetic polymorphisms in human HO-1 are linked to idiopathic recurrent miscarriages.
Dewilde et al. (2001, 019318)
Nb exists as a reversibly hexacoordinated Hb type with a His-Fe2+-His binding scheme. Dissociation of the internal ligand by O2 or CO is the rate limiting step.
Di Giovanni et al. (1993, 013822)
Rat Wistar Female
GD0-GD20 75 and 150 ppm CO (150 ppm) reduced the minimum frequency of ultrasonic calls as well as decreased responsiveness to a challenge dose of diazepam. There was no change in locomotion; however CO impaired learning in a two-way active avoidance task.
Dubois et al. (2002, 193911)
Rat Wistar Adult female 250 g
3 wk 530 ppm Intrapulmonary resistance artery smooth muscle cells were isolated from control and exposed rats. Electrophysiological re-cordings provided evidence of increased Ca2+-activated K+ current consequent to chronic CO exposure. The authors specu-lated that this could in part explain the vasodilatory effect of CO in the pulmonary circulation.
January 2010 E-4
Reference Species / Model Exposure Duration
CO Concentration Findings
Dubois et al. (2005, 180435)
Rat Wistar Male
21 days 50 ppm CO attenuated PAHT by activating BKca channels in PA myocytes and reduced hemodynamic changes of PAHT.
Dubois et al. (2003, 180439)
Rat Wistar Male
21 days 50 ppm CO induced relaxation of pulmonary artery rings in normoxic, hypoxic, and hypoxic-CO rats, and it was not endothelium dependent. Chronic hypoxia decreased acute CO sensitivity, while CO-hypoxia increased it. K+
channel blocker reduced this effect while sGC blocker did not.
Durante et al. (2006, 193778)
Reviews the role of CO in cardiovascular function.
Favory et al. (2006, 184462)
Rat 250-300 g (Strain not stated)
90 min 250 ppm CO inhibited myocardial permeabilized fiber respiration (complex IV), increased coronary perfusion pressure and left ventricular developed pressure (LVDP) first derivative and decreased the cGMP/cAMP ratio in the heart. These changes were maintained over 24-48 h of recovery in air. Cardiac function and vasodilatory responses were evaluated at 3-h recovery in air. β-adrenergic blockade had no effect on coronary perfusion pressure or LVDP first derivative. Total inhibition of vasodilator response to acetylcholine and partial inhibition of vasodilator response to nitroprusside were observed. An increase in myofilament calcium sensitivity was also observed. Thus CO promotes abnormalities in mitochondrial respiration, coronary vascular relaxation and myocardial contractility. The authors speculated that CO may have a detrimental effect on heart O2 supply-to-utilization which could potentially lead to myocardial hypoxia because of the increased O2 demand resulting from increased contractility, the inhibited mitochondrial respiration and the reduced coronary blood-flow reserve resulting from the decreased vasodilatory capacity.
COHb was found to be 11% immediately after exposure. COHb levels gradually returned to baseline (1.5%) over the next 96 h.
Fechter and Annau (1977, 010688)
Rat Long Evans
Continuous CO exposure throughout pregnancy
150 ppm CO The authors found a 5% significantly decreased birth weights at PND1 in gestationally CO-exposed pups vs control animals with weight decrements persisting to weaning; lactational cross fostering did not ameliorate the CO-dependent reduced growth rates. Dams exposed to CO during gestation had COHb over gestation of 15% with control dams having less than 1%. Decreased birth weight and pre-weaning weight were seen in CO-exposed pups despite a lack of weight decrement in CO-exposed dams vs air-exposed control dams.
Fechter et al. (1980, 011294)
Rat Long Evans
Continuous CO exposure throughout pregnancy
150 ppm CO-exposed animals had cardiomegaly at birth (wet heart weight) that dissipated by PND4.
Fechter and Annau (1980, 011295)
Rat Long Evans
Continuous CO exposure throughout pregnancy
150 ppm CO-exposed animals had decreased birth weight, impaired righting reflexes, impaired negative geotaxis, and delayed homing behavior.
Fechter et al. (1987, 012194)
Rat Long-Evans Male
1-4 mL/100 g BW (ip) High-dose CO led to dose-dependent, reversible loss of the compound action potential sensitivity for high frequency tone bursts. Also, CO produced a dose-dependent elevation in the cochlear blood flow.
Fechter et al.(1987, 012259)
Rat Long Evans Male
Continuous CO exposure throughout pregnancy or from GD0 to PND10
75, 150, or 300 ppm The neostriatum of each PND21 rat brains was collected and showed disrupted development following CO exposure (GD0-PND10 group, 300 ppm CO). Dopamine levels were also significantly elevated in CO-exposed animals (GD0-PND10, 150 and 300 ppm CO).
Fechter et al. (1997, 081322)
Guinea pigs 35 ml/kg gas (ip)
40% COHb
CO impairs high-frequency auditory sensitivity, shown by increased compound action potential threshold at higher test frequencies. Free radical inhibitors blocked this response.
Fechter et al. (1986, 012030)
Reviews the effects of carbon monoxide on brain development.
January 2010 E-5
Reference Species / Model Exposure Duration
CO Concentration Findings
Garofolo et al. (2002, 193930)
Human infants
Rat
Rat: PND2-PND5
Human infants who die from SIDS showed decreased brainstem muscarinic receptor binding vs infants dying from other causes. ß-adrenergic modulation of muscarinic receptors in developing heart was observed.
Rodent ß-adrenergic agonists at PND2-PND5 induced muscarinic receptor decrement in adenylyl cyclase.
Gautier et al. (2007, 096471)
Rat Wistar Adult male
Model of right ventricular hypertrophy secondary to chronic hypoxia
3 wk of HH ± CO in final wk
Or 1 wk of CO
50 ppm CO altered the right ventricular adaptive response to pulmonary hypertension which occurs secondarily to chronic hypoxia. Right ventricular end-systolic pressure (RVESP) and right ventricular shortening fraction (RVSF) were smaller in rats treated with CO+HH compared with rats treated with HH alone. CO alone had no effect on these measures. Hypobaric hypoxia had no effect on left ventricular function while CO+ HH led to an increased left ventricular shortening fraction (LVSF). CO alone led to a decrease in LVSF and the mitral E-to-A ratio, indicative of an LV- filling impairment. Hypobaric hypoxia decreased the relative RV perfusion and increased the relative LV perfusion. These effects were prevented with concomitant exposure to CO, although exposure to CO alone had no effects on myocardial perfusion. Morphologic and histologic analysis demonstrated RV hyper-trophy in both the HH group and the CO+HH group and fibrotic lesions in the CO+HH group. The authors concluded that the 1-wk exposure to 50 ppm CO had a deleterious effect on RV myocardial perfusion adaptation to chronic hypoxia and pressure overload. Although the reduced RV pressure overload was beneficial, it was counterbalanced by impaired RV perfusion and redistribution of perfusion toward the LV.
Gaworski et al. (2004, 193933)
Rat Sprague Dawley
2 h/day, 7 days/wk by nose-only inhalation
Males: 4 wk prior to and during mating; and
Females: 2 wk prior to mating; during mating; and through weaning to PND21
Cigarette smoke: 150, 300, or 600 mg/m3
Total Particulate Matter (TPM)
Maternal exposure to high concentrations of cigarette smoke during gestation and lactation reduced pup birth weight and retarded neonatal pup growth. Developmental and neurobehavioral testing of neonates did not show any behavioral effects following parental smoke exposure.
Rat Sprague Dawley Adult male
24 h
50 ppm
Mild neutrophil accumulation was observed in BALF, accompanied by increases in BALF MIP-2, protein and LDH. Iron status was altered since CO exposure led to an increase in BALF iron and ferritin, a decrease in lung non-heme iron and an increase in liver non-heme iron.
Ghio et al. (2008, 096321)
Human bronchial epithelial cells (BEAS-2B)
2-24 h 10-100 ppm CO exposure for 24 h led to a dose-dependent decrease in cellular non-heme iron, with the effect at 10 ppm statistically significant and the effect at 50 ppm maximal. This effect was reversible since removing the cells after 2 h of CO and incubating them in air restored non-heme iron concentrations at 24 h. A dose-dependent decrease in cellular ferritin was observed following exposure for 24 h to 50-500 ppm CO. In addition, exposure to 50 ppm CO for 20 h blocked iron uptake by cells, while exposure to 50 ppm CO for 2 h increased iron release from cells. Increased protein expression of the iron transporter DMT-1 was also noted after 24 h exposure to 50 ppm CO. Oxidative stress, mediator release and cell proliferation were also decreased by exposure to 50 ppm for 24 h. This effect was also reversible upon removal to air. Effects of CO on cell proliferation indices were mimicked by with the iron-depleting agent deferoxamine. The authors concluded that CO exposure altered lung iron homeostasis possibly by initially causing heme release from proteins.
Giustino et al. (1999, 011538)
Rat Wistar Male and pregnant female
GD0-GD20 75 or 150 ppm
This study showed that CO- exposed (75 and 150 ppm) male animals at 40 days of age had a significantly decreased time of exploration of novel objects. The 150 ppm CO group showed a lack of habituation after the second exposure to a previously viewed object. Blood COHb concentrations (mean % ± SEM) on GD20 were reported (0 ppm: 1.6 ± 0.1; CO 75 ppm: 7.36 ± 0.2; CO 150 ppm: 16.1 ± 0.9).
January 2010 E-6
Reference Species / Model Exposure Duration
CO Concentration Findings
Giustino et al. (1993, 013833)
Rat Wistar
GD0-GD20 75 or 150 ppm CO exposure in utero led to a reversible and dose-dependent loss of function of splenic macrophages, with decreased killing ability, decreased phagocytosis, and decreased ROS production during the macrophage respiratory burst.
Giustino et al. (1994, 076343)
Rat Wistar Male pups
GD0-GD20 75 or 150 ppm CO (150 ppm) decreased the number of leukocyte common antigen (LCA+) cells at PND21. This was reversed by PND540. CO (75 ppm), and other measures of immunological changes showed trends toward reduction (macrophages, T cells, B cells, and MHC II cells).
Glabe et al. (1998, 086704)
Rat Sprague Dawley Male, Myocardium
pCO = 0-107 Torr Increased pCO and increased COMb saturation did not alter high-energy phosphate signals (ATP, phosphocreatine, Pi). MVO2 began to decline at 87.6% COMb and is likely not due to cytochrome c oxidase inhibition.
Grover et al. (2000, 010465)
Fetal lamb (mixed breed)
10 min 500 ppm Fetal methoxyhemoglobin (COHb%) ranged from 3.8 ± 0.2 to 8.1 ± 2.0 at 0 and 500 ppm CO, respectively. Inhaled 0-500 ppm CO administered to near-term fetal lambs did not induce pulmonary vasodilation (main pulmonary artery, left pulmonary artery, aorta and left atrium), and the HO inhibitor zinc protoporphyrin IX failed to affect baseline vascular tone.
Hara et al. (2002, 037497)
Rat Sprague Dawley Male
40 min 1,000-3,000 ppm CO exposure increased extracellular dopamine levels and decreased its major metabolites in a Na+-dependent pathway. CO withdrawal and reoxygenation caused levels to return to control or overshoot, which may suggest an increase in oxidative metabolism of CO, mediated by MAO-A.
Harada et al. (2004, 193920)
Pig Granulosa cells
In this porcine model, HO was able to augment granulosa cell apoptosis allowing for proper follicular maturation.
Hendler and Baum (2004, 193925)
Human End-tidal breath CO measurements in pregnant women with contractions (term and pre-term) were lower than those measurements in noncontracting women.
Hofmann and Brittain (1998, 052019)
Human Partitioning of O2 and CO in the human embryonic Hb is discussed.
Iheagwara et al. (2007, 193861)
Mouse C57BL/6 Male
3 h 1,000 ppm CO significantly reduced cytochrome c oxidase activity and Vmax but not Km in myocardial mitochondria. Cytochrome c oxidase protein levels and heme content were significantly decreased. The average COHb level was 61%, but no tissue hypoxia was observed in the heart.
Imai et al. (2001, 193864)
HO-1 transgenic mice which specifically over-express HO-1 in smooth muscle
Transgenic mice had a significant increase in arterial pressure and impaired nitrovasodilatory aortic responses. The mice had enhanced NO production and impaired sGC activity. The authors speculated that the effect of HO-1 overexpression was to suppress vasodilatory responses to NO in vascular smooth muscle.
Ischiropoulos et al. (1996, 079491)
Rat Wistar Male 200-290 g
60 min
40-60 min
1,000-3,000 ppm
1,000 ppm
CO poisoning resulted in free NO in brains as measured by electron paramagnetic resonance spectroscopy and in a 10-fold increase in nitrotyrosine as measured by immunohistochemical staining. These responses were blocked by pretreatment with a NOS inhibitor but not by neutrophil depletion.
Brain nitrotyrosine formation was blocked by platelet depletion following 40-min but not 60-min exposure to 1,000 ppm CO.
Following CO poisoning, myeloperoxidase activity, a measure of leukocyte sequestration, was increased in brain microvessels. This response was blocked by NOS inhibition but not by platelet depletion. Similar effects were noted for xanthine oxidase activation.
The authors concluded that perivascular reactions mediated by peroxynitrite are key to CO poisoning effects in brain.
Johnson and Johnson (2003, 053611)
Rat Sprague Dawley Male 250-300 g
0-100 µM CO produced a concentration-dependent, endothelium-dependent vasoconstriction in isolated gracilis muscle arterioles, evident at 1 µM CO. Pretreatment with a NOS substrate prevented this response, while pretreatment with a NOS inhibitor converted this response to a vasodilation. The authors concluded that exogenous CO was acting through NOS inhibition.
January 2010 E-7
Reference Species / Model Exposure Duration
CO Concentration Findings
Johnson et al. (2003, 193868)
Rat Dahl/Rapp salt-resistant and salt-sensitive model Male
High-salt diet increased COHb, BP, and aortic HO-1 protein levels in salt-sensitive Dahl rats. Enhanced immunostaining was observed for HO-1 but not HO-2 in isolated gracilis muscle arterioles. Compared with the low-salt diet, the high-salt diet resulted in a smaller vasoconstrictor response when NOS was inhibited. Vasoconstriction was exacerbated in arterioles from both low-salt- and high-salt-treated rats using both NOS and HO inhibitors. Acetylcholine-induced vasodilation was diminished in the high-salt diet group compared with the low-salt diet group. This effect was not seen using the HO inhibitor. The high-salt diet did not alter endothelium-independent vasodilation. The authors concluded that HO-derived CO caused dysfunction of the NO• system in salt-sensitive rats treated with a high-salt diet.
Johnson et al. (2004, 193870)
Rat Sprague Dawley Male
Deoxycorticosterone acetate (DOCA)-salt hypertension model
Rats WKY
Rats Spontaneously hypertensive (SHR)
Salt-sensitive DOCA rats, but not SHR, had elevated aortic HO-1 expression and blood COHb levels. Both had elevated mean arterial BP compared with controls. Acetylcholine-mediated vasodilation of isolated gracilis muscle arterioles was attenuated in DOCA rats but not SHR. Pretreatment with an HO inhibitor restored the response in DOCA rats. The authors concluded that HO-1-derived CO contributes to endothelial dysfunction in DOCA but not SHR.
Johnson et al. (2006, 193874)
Rat Zucker Lean and obese Male
100 µM CO The obese rats had increased CO expiration and mean arterial pressure, which was decreased by pretreatment with a HO inhibitor. No difference was observed in HO-1 protein between lean and obese rats. Acetylcholine- and flow-mediated vasodila-tion of isolated gracilis muscle arterioles was attenuated in obese but not lean rats. Pretreatment with a HO inhibitor restored the response in obese rats. Exogenous CO prevented the restoration of flow-induced dilation by the HO inhibitor. The authors concluded that HO-derived CO contributes to endothelial dysfunction in this model of metabolic syndrome.
Katoue et al. (2005, 193896)
Rat Wistar
HO activity in the aorta is significantly increased during pregnancy, but aortic AVP-dependent vasoconstriction appears to be HO/CO independent.
Katoue et al. (2006, 193954)
Rat Wistar
Pregnancy-induced modulation of calcium mobilization and downregulation of Rho-kinase expression contributed to attenuated vasopressin-induced contraction of the rat aorta.
Khan et al. (2006, 193955)
Nb overexpressing BDF × CD1 mice
Cerebral and myocardial infarcts were decreased in neuroglobin overexpressing mice, decreasing ischemic injury.
Kim et al. (2005, 193959)
Primary rat pulmonary artery smooth muscle cells
Rat Inbred LEW Sprague Dawley
200-250 g
24 h or pretreatment for 1-2 h followed by 24 h post- treatment
250 ppm
Exposure of cells in culture to 250 ppm CO for 24 h inhibited serum-stimulated cell proliferation, increased expression of p21Waf1/Cip1, and decreased expression of cyclin A. CO also inhibited PDGF-stimulated cell proliferation and reversed the inhibitory effect of PDGF on caveolin-1 expression. Genetic silencing of caveolin-1 using siRNA, prevented the antiproliferative effect of CO. Endogenous CO, derived from HO-1 in an overexpression system, was found to upregulate caveolin-1 expression. Effects of CO on caveolin-1 were found to be mediated by p38 MAPK and cGMP. Experiments in fibroblasts deficient in p38 confirmed a role for p38 in CO-mediated inhibition of cellular proliferation via effects on p21Waf1/Cip1, cyclin A and caveolin-1. Experiments in fibroblasts deficient in caveolin-1 confirmed the role of caveolin-1 in the anti-proliferative effects of CO.
In a model of neointimal injuries induced by balloon injuries in intact animals, exposure to CO inhibited neointimal formation and increased caveolin-1 expression in the intima and media.
January 2010 E-8

Reference Species / Model Exposure Duration
CO Concentration Findings
Kim et al. (2008, 193961)
Primary rat hepatocytes
Primary mouse hepatocytes
Respiration-deficient human Hep3B cells
10-60 min 250 ppm Exposure of cells in culture to 250 CO for 1 h twice a day prevented spontaneous hepatocyte death over 6 days in culture. CO also decreased caspase-3 activity. Cell death was deter-mined to be partly due to apoptosis. CO also increased ROS as measured by dichlorofluorescein fluorescence in rat hepatocytes, mouse hepatocytes, and Hep3B cells but not in respiration-deficient Hep3B cells, indicating that ROS were mitochondrial in origin. An increase in mitochondrial oxidized glutathione was noted in rat hepatocytes treated with CO for 30 min. Increased Akt phosphorylation occurred following 10-30 min CO and was diminished by treatment with antioxidants. CO was found to activate NFκB through a PI3K and oxidant-dependent pathway. CO mediated spontaneous cell death was found to be dependent on ROS and Akt phosphorylation. The authors concluded that CO prevents hepatocyte apoptosis through redox mechanisms, leading to cytoprotection.
Kinobe et al. (2006, 188447)
Sheep Gravid and nongravid sheep and their near-term fetuses
There were no significant differences in hypoxic adult and hypoxic fetal sheep when compared to their normoxic controls.
Knuckles et al. (2008, 191987)
Mouse 4 h Diesel emissions: 350 μg/m3
Diesel exhaust enhanced vasoconstriction in veins but not arteries. It were suggested that this is through the uncoupling of eNOS.
Korres et al. (2007, 190908)
Human Transient evoked otoacoustic emissions response and amplitude at 4,000 Hz was lower in neonates with prenatal exposure to cigarette smoke. There was no dose-dependent change in response depending on the amount cigarettes per day that was smoked.
Kreiser et al. (2004, 193948)
Human End-tidal CO concentrations were lower in pregnant women with gestational hypertension and pre-eclampsia than normotensive women.
Lash et al. (2003, 193849)
Human
Term placental chroionic villi from healthy or pre-eclamptic placentas
Infarcted areas of placenta had decreased HO expression (in pre-eclamptic placenta only).
Li et al. (2008, 187003)
Mouse ICR (CD-1) Pregnant
The effect of maternal LPS exposure on fetal liver HO was measured. HO-1 was upregulated in fetal livers post-LPS exposure, and this HO-1 upregulation was attenuated with the spin trap agent PBN, pointing to a ROS-dependent HO-1 upregulation post-maternal LPS treatment.
Liu and Fechter (1995, 076524)
Guinea pig Male
35 mL/kg (ip) CO increased the compound action potential threshold at high frequencies. This could be blocked by inhibition of the glutamate receptor.
Loennechen et al. (1999, 011549)
Rat Sprague Dawley Female 220-240g
1 wk 1 wk 100 ppm and 1 wk 200 pm
100 ppm
100-200 ppm
Endothelin-1 expression increased by 53% and 54% in the left and right ventricle, respectively, during the 2-wk exposure, and by 43% and 12% in the left and right ventricle, respectively, during the 1-wk exposure. Right ventricular to body weight ratio was increased by 18% and 16% in the 2-wk and 1-wk exposure groups, respectively. COHb levels were 23% and 12% in the 2-wk and 1-wk exposure groups, respectively.
Longo et al. (1999, 011548)
Rat uterine tissue and tail artery rings Sprague Dawley
Human uterine biopsies
10-4 M The addition of exogenous CO to isolated human and rat uterine tissue failed to induce relaxation of uterine tissue. Isolated rat aortic rings and tail artery rings from pregnant dams can be relaxed by submersion in exogenous CO solutions.
January 2010 E-9
Reference Species / Model Exposure Duration
CO Concentration Findings
Lopez et al. (2008, 097343)
Rat Sprague Dawley
Pregnant rats exposed to CO GD5-GD20 (Group A) or
GD5-GD20 plus PND5-PND20 (Group B);
Group C (control air exposure).
10-18 h/day
25 ppm CO exposure induced damage to the spiral ganglia neurons and inner hair cells, with oxidative stress seen in cochlear blood vessels. At PND20 groups A and B showed vacuolization of afferent terminals at the base of the cochlea. At PND3, group A showed decreased synapsin-1 staining of the efferent nerve terminals. At PND20, groups A and B showed decreased neurofilament-IR (staining) in type I spiral ganglia neurons and afferent nerve fibers. At PND12 and PND20, group B showed in-creased HO-1 and SOD-1-IR in blood vessels of the stria vasularis; group A was similar to controls. From PND3-PND20, there was increased iNOS and increased nitrotyrosine-IR in blood vessels of the cochlea.
Lopez et al. (2003, 193901)
Rat Sprague Dawley
PND6 to weaning (PND19-PND20)
12 or 25 ppm
In the cochlea, atrophy or vacuolization of the nerve cells that innervate the inner (not outer) hair cells was seen. Fibers of the 8th cranial nerve (internal auditory canal of the ARCO animals, 25 ppm) had distorted myelination and vacuolization of the axoplasm. In the organ of corti and spiral ganglion neurons, cytochrome c oxidase and NADH-TR were significantly decreased in 25 ppm exposure group vs control. Expression of the calcium-mediated myosin ATPase in the organ of corti and spiral ganglion neurons was significantly decreased in the 25 ppm CO exposure group vs controls.
Lund et al. (2007, 125741)
Mouse ApoE-/- Male
High-fat diet
6 h/day, 7days/wk, 7 wk
8, 40, or 60 μg/m3 PM whole-gasoline exhaust; or filtered exhaust with gases matching the 60 μg/m3 concentration. CO concentrations were 9, 50, and 80 ppm, corresponding to the 8, 40, and 60 μg/m3 PM whole-exhaust exposures
Both whole-gasoline and filtered-gasoline exhaust increased aortic mRNA expression of matrix metalloproteinase-3 (MMP-3), MMP-7, and MMP-9, tissue inhibitor of metalloproteinases-2, endothelin-1 and HO-1 at 60 μg/m3. Aortas also showed increased immunostaining for MMP-9 and nitrotyrosine in 60 μg/m3 PM whole exhaust and PM-filtered exhaust exposed groups. Aortic TBARS, a measure of lipid peroxidation, was also increased in all treatment groups.
Lund et al. (2009, 180257)
Mouse ApoE-/- Male
High-fat diet
6 h/day, 1 or 7 days
Gasoline engine exhaust containing 60 μg/m3 PM and 80 ppm CO
Gasoline exhaust exposure increased aortic MMP-2/9 activity at 1 and 7 days. Protein levels of aortic MMP-9, MMP-2, TMP-2 and plasma MMP-9 were also increased after 7 days. Lipid peroxidation in aorta, resulting from gasoline exhaust exposure, was inhibited by treatment with the antioxidant Tempol, while increases in mRNA for ET-1 and MMP-9 in aortas were inhibited by treatment with BQ-123, an antagonist of ETA receptor. Treatment with BQ-123 also reduced aortic MMP-2/9 activity in aortas following gasoline exhaust exposure. The authors concluded that ETA receptor pathway is a key mediator of gasoline engine exhaust effects in the vasculature.
Lyall and Myatt (2002, 193971)
Human Women with pre-eclampsia produced term placenta with significant decreases in HO-2 vs women with healthy pregnancies.
Lyall et al. (2000, 193902)
Human (placentas from 8-to19- wk pregnancy and term placentas)
The use of a HO inhibitor ZnPP increased placental perfusion pressure. HO-1 and HO-2 were expressed in the placenta and placental bed and vary in expression over the course of pregnancy. HO may thus be involved in trophoblast invasion, placental function, and perfusion pressure.
Mactutus and Fechter (1984, 011355)
Rat Long Evans
Continuous exposure to CO over gestation
150 ppm Acquisition as measured in a two-way conditioned avoidance (flashing light warnings followed by mild footshock) test failed to improve with age of in utero CO-exposed (150 ppm, dam COHb 15%) rats (male and female offspring) in contrast to air-exposed controls who improved with age/maturation, indicating a failure in the associative process of learning. The authors also found impairments in reacquisition performance, an index of retention, in PND31 rats that had received continuous in utero CO exposure. Prenatal CO exposure induced learning and memory deficits in male and female offspring.
McGregor et al. (1998, 085342)
Guinea pig GD23-GD25 until term (approximately 68 days)
10 h/day
200 ppm Aberrant respiratory responses (to asphyxia and CO2) of offspring with prenatal CO exposure. The authors hypothesized that this may be related to changes in the brainstem. COHb was measuerd in maternal (8.53 ± 0.6% vs 0.25 ± 0.1%) and fetal blood (13.0 ± 0.4% vs 1.6 ± 0.1%) from CO-treated vs controls.
January 2010 E-10
Reference Species / Model Exposure Duration
CO Concentration Findings
McLaughlin et al. (2001, 193823)
Human placenta Various pathologies of pregnancy including IUGR and pre-eclampsia are associated with significant decreases in placental HO activity. The endogenous generation of CO in the placenta has been demonstrated in chroionic villi of term placenta.
McLaughlin et al. (2000, 015815)
Human placenta Placental regional localization of HO was explored. The chorionic plate, chorionic villi, basal plate, and choorio-decidua had significantly higher HO activity than the amnion.
McLaughlin et al. (2003, 193827)
Human placenta HO expression in various regions of term placentas was explored. Microsomal HO-2 protein content was not different between normotensive and milk pre-eclamptic pregnancies. There was increased expression of microsomal HO-1 protein in chorionic villi and fetal membranes from pre-eclamptic pregnancies vs normotensive pregnancies.
McLean et al. (2000, 016269)
Human placenta HO activity was highest in the placenta near term.
Melin et al. (2002, 037502)
Rat Dark Agouti Male
Model of right ventricle hypertrophy secondary to chronic hypoxia (HH 10 wk)
10 wk 50 ppm alone or concomitant with HH
Hb and hematocrit levels were increased above controls in HH rats, CO rats and HH+CO rats, with the increase due to the combined treatment significantly higher than the increase due to HH. COHb levels were 1.1% in controls, 1.3% in HH rats, 4.7% in CO rats and 9.1% in HH plus CO rats. HH treatment significantly increased right ventricular (RV) heart weight above controls while CO treatment had no effect on any postmortem heart weights. Combined treatment with HH+CO resulted in a significant increase in left ventricular plus septum (LV+S) weight and RV weight compared with HH treatment alone. Echocardiographic left ventricular morphology and mass also showed the greatest changes in the HH+CO group. Hemodynamic measurements of LV function demonstrated significant effects in the HH+CO group for left ventricular end diastolic pressure (LVESP), left ventricular maximal first derived pressure (+dP/dtLV), and left ventricular work (LVW) compared with controls. Hemodynamic measurements of RV function demonstrated significant effects in the HH group for right ventricular end systolic and diastolic pressure (RVESP, RVEDP), right ventricular maximal and minimal first derived pressure (+dP/dtRV, -dP/dtRV) and right ventricular work (RVW). CO significantly enhanced the effects of HH on RVEDP and significantly diminished the effects of HH on dP/dtRV and RVW. The authors concluded that CO intensified the HH-induce RV hypertrophy, increased LV weight, and induced severe hematological responses that could hamper adaptation.
Melin et al. (2005, 193833)
Rat Dark Agouti Male and female
Model of right ventricle hypertrophy secondary to chronic hypoxia (HH, 10 wk)
Half of the animals were exercise trained to induce LV hypertrophy
10 wk 50 ppm alone or concomitant with HH
In untrained animals, combined treatment with HH+CO led to increased LV+S and RV weights compared with HH treatment alone. HH+CO led to several changes in measured echocardiographic parameters, including increased anterior and posterior wall thickness in diastole (AWTd, PWTd), and to increased fraction of shortening. These effects were not seen with HH alone. In addition, RVEDP was enhanced in HH+CO compared with HH alone. HRV components were altered by HH+CO but not by CO alone.
Mereu et al (2000, 193838)
Rat Wistar
GD0-GD20 continuous CO exposure
150 ppm In utero exposure to CO disrupted hippocampal LTP with concomitant HO-2 and nNOS reductions. The authors surmised that these changes may be related to the memory deficits seen in animals exposed to CO in utero.
Middendorff et al. (2000, 015842)
Human Adult males aged 65-75 yr Testicular tissue from orchiectomy
Zn protoporphryin (ZnPP) and Hb both significantly reduced seminiferous tubular cGMP generation, suggesting a role for CO in human testicular tissue.
Montagnani et al. (1996, 080902)
Rat Wistar Male pups
GD0-GD20 75 or 150 ppm CO caused an increase in tetrodotoxin-induced inhibition of perivascular nerve stimulation PNS-evoked vasoconstriction, increased the time to NO-related relaxant effect by ACh, and decreased the contractile response evoked by ACh on resting tone.
January 2010 E-11
Reference Species / Model Exposure Duration
CO Concentration Findings
Naik and Walker (2003, 193852)
Rat Sprague Dawley Male
210 µL of CO/100 mL of physiological saline solution
Endogenous CO-mediated vasorelaxation involved cGMP-independent activation of vascular smooth muscle large-conduc-tance Ca2+-activated K+ channels. However, exogenous CO vasodilation was cGMP dependent.
Ndisang et al. (2004, 180425)
Review of CO and hypertension. CO is a vasorelaxant due to activation of the big conductance calcium-activated potassium channels and soluble guanylate cyclase/cGMP pathway. Developmental stage and tissue type will determine which of these pathways plays more of a role in vasorelaxation.
Neggers and Singh (2006, 193964)
Mouse CD-1
GD8-GD18 500 ppm Developmental toxicitiy of CO was attenuated by protein supplementation, i.e., protein supplemented animals (27%) showed a significantly lower incidence of fetal mortality vs 8% and 16% protein groups. Further, dietary restriction of both protein and zinc with CO exposure to during gestation increased the incidence of pup mortality and malformations including gastroschisis. Zinc supplementation to a protein-deficient diet in CO-exposed mice decreased fetal mortality and malformation.
Newby et al. (2005, 193966)
Human placental cells in culture
Term human placental cells were grown in cell culture under basal and hypoxic conditions to explore changes in HO expression. HO-1 was unchanged in cytotrophoblasts under hypoxia, but HO-1 was significantly decreased in hypoxic syncytiotrophoblasts. HO-2 was unchanged in either cell type with hypoxia. These cell culture data can give insight into what cell types might be responsive to hypoxia through the HO/CO system in the human placenta.
Odrcich et al. (1998, 193958)
Guinea pig Immunohistochemical localization of HO in guinea pig placentae showed that HO-1 staining was highest near term (PND62) and lesser at term or earlier in pregnancy. HO-1 was localized in the advential layer of fetal blood vessels.
Ozawa et al. (2002, 193841)
Rat Wistar Adult male
The role of HO-1 in spermatogenesis was explored. CdCl2 induced testicular HO-1 and reduced HO-2 protein in rats. Pretreatment with ZnPPIX attenuated CdCl2-dependent apoptosis. Leydig cells use HO-1-derived CO to trigger apoptosis of pre-meiotic germ cells and modulate spermatogenesis under CdCl2 dependent oxidative stress.
Patel et al. (2003, 043155)
Rat Sprague Dawley Male 262 ± 30 g
Isolated hearts
30 min Buffer saturated with 0.01 and 0.05% CO
The ventricular glutathione content, both reduced and oxidized, decreased by 76% and 84% 90 min post-exposure to 0.01% and 0.05% CO, respectively. Treatment with antioxidants partially blocked the decreases in glutathione. Increased creatine kinase activity was observed in heart perfusate during and after treatment.
Penney et al. (1983, 011385)
Rat (strain not reported)
GD17-GD22 157, 166 or 200 ppm In utero CO exposure induced decreased fetal body weight, decreased placental weight, increased wet heart weight at birth, and altered cardiac enzymes at birth.
Penney et al. (1982, 011387)
Rat COBS
GD0-GD32 350 ppm PND1-PND3, then 425 ppm PND4-PND7, then 500 ppm PND8-PND32
Postnatal CO exposure decreased body weight, to a greater extent in male pups. The heart to body weight ratio and left ventricle plus interventricular septum and right ventricle weight increased after birth in CO exposed pups. This persistent cardiomegaly was not explained by increasing in DNA or hydroxyproline.
Piantadosi (2002, 037463)
Reviews the biochemical activities of CO, including various heme protein binding. The review stresses the importance of the CO/O2 ratio in determining the physiological effects of CO.
Piantadosi (2008, 180423)
Reviews the physiologic responses to exogenous and endogenous CO and biochemical effects, including the binding to heme proteins, the generation of reactive O2 species, and activation-related signaling pathways.
January 2010 E-12
Reference Species / Model Exposure Duration
CO Concentration Findings
Piantadosi et al. (2006, 180424)
Rat Sprague Dawley Adult male
1, 3, or 7 days 50 ppm or HH COHb produced COHb levels of 4-5% (controls approximately 1%) and liver CO concentration of 30-40 pmol/mg wet weight (controls approximately 10 pmol/mg wet weight). Both CO and HH led to increased expression of hypoxia-sensitive proteins HO-1 and HIF-1α and mitochondrial antioxidant protein SOD-2. CO caused a greater change in mitochondrial GSH/GSSG than HH. Only CO increased mitochondrial 3-nitrotyrosine and protein mixed disulfides. Mitochondria isolated from CO-exposed rats, but not from HH-exposed rats, showed an increase in the calcium sensitivity of the mitochondrial permeability transition (MPT). Exposure to CO or HH resulted in a loss of the ability of adenine nucleotides to protect mitochondria from MPT. This effect was restored in the presence of a strong reductant. The authors concluded that CO caused mitochondrial pore stress independently of its hypoxic effects
Prigge and Hochrainer (1977, 012326)
Rat Wistar, SPF
GD0-GD20 60, 100, 250, 500 ppm Fetuses were collected by C-section after 21-days exposure. Significant increases in fetal heart weight were seen in fetuses exposed to CO in all dose groups. Fetal body weight was signifi-cantly decreased (NOAEL 125 ppm CO).
(Raub and Benignus, 2002, 041616)
Reviews the physiology of CO and the effects on the nervous system. It is estimated that COHb would have to rise to 15-20% before a 10% reduction in any behavioral or visual measurement could be observed.
Richardson et al. (2002, 037513)
Human Male
20% COHb 20% COHb did not influence O2Mb binding indicated by unaltered deoxy-myoglobin signal. Resting skeletal muscle metabolic rate was unaffected by 20% COHb. VO2 max was decreased. No decrement in intracellular PO2 was found. 20% COHb altered exercising bioenergetics, pH, PCr, and ATP levels.
Ryter et al. (2006, 193765)
Reviews the basic science of exogenous and endogenous CO including HO-1 regulation. It also reviews some therapeutic applications for CO.
Sartiani et al. (2004, 190898)
Rat Wistar
In utero inhalationexposure
150 ppm At 4 wk of age, the action potential duration APD of isolated cardiac myocytes from CO-exposed animals failed to shorten or mature as did the APD of control animals. Further, the two ion conduction channels Ito (transient outward current, K+-mediated) and ICa,L (L-type Ca2+ current), which largely control the rat APD, were significantly different from control animals after CO exposure at 4 wk of age. All of these CO-dependent changes were no longer different from controls at 8 wk of age, showing a delayed maturation.
Schwetz et al. (1979, 011855)
Mouse CF-1
Rabbit New Zealand
7 or 24-h/day
GD6-GD15 (Mice)
GD6-GD18 (Rabbits)
250 ppm In mice there was a significant increase in number of skeletal abnormalities in CO-exposed mice. Decreased birth weight in mice exposed to 24 h/day CO vs control. Increased birth weight in mice exposed to 7 h/day CO vs controls. No similar effects were seen in rabbits.
Singh et al. (1992, 013759)
Mouse CD-1
GD8-GD18 65, 125, or 250 ppm CO exposure concomitant with a low-protein diet exacerbated the percent of skeletal malformations in offspring. The percent of dead, resorbed, or grossly malformed fetuses was directly related to CO concentration and inversely related to maternal dietary protein levels. CO and maternal dietary protein restriction had a synergistic effect on offspring survival and an additive effect on malformations.
Singh (2006, 190512) Mouse CD-1
6 h/day during the first 2nd wk of pregnancy
65 or 125 ppm
Modulating dam protein intake during in utero CO exposure altered pup mortality.
Singh et al. (1993, 013892)
Mouse Albino CD-1
GD8-GD18 65, 125, 250, or 500 ppm Mice were given various protein diets (4, 8, 16, or 27% protein) during pregnancy, along with CO exposure. All concentrations of CO exposure within each maternal dietary protein level significantly increased the percentage of litters with malformations in a dose-dependent manner. CO exposure concomitant with a low protein diet exacerbated the percent of skeletal malformations in offspring. The percent of dead, resorbed, or grossly malformed fetuses was directly related to CO concentration and inversely related to maternal dietary protein levels. CO and maternal dietary protein restriction had a synergistic effect on mouse offspring mortality and an additive effect on malformations.
January 2010 E-13
Reference Species / Model Exposure Duration
CO Concentration Findings
Singh (2003, 053624) Mouse Albino CD-1
GD8-GD18 500 ppm CO decreased the mean implants per litter and increased the incidence of fetal mortality. Under low protein conditions, CO exposure increased the incidence of malformations (9.4% vs 0%) when Zn levels were normal and increased the incidence of gastroschisis (5% vs 0%) when Zn levels were low.
Singh and Scott (1984, 011409)
Mouse Albino CD-1
GD7-GD18 65, 125, 250, or 500 ppm All concentration of CO decreased fetal weight in mouse pups. Near-term fetal body weight was decreased at GD18 in mice exposed from GD7-GD18 to 125, 250, and 500 ppm CO but not at 65 ppm CO.
Singh (1986, 012827) Mouse Albino CD-1
GD7-GD18 65 or 125 ppm Impaired aerial righting score at PND14 (65 and 125 ppm), impaired negative geotaxis at PND10 and righting reflex on PND1 (125 ppm)
Sitdikova et al. (2007, 180417)
Frog neuro-muscular junctions
20 min 96 µM CO-induced acetylcholine release, without effects on the pre-synaptic action potential or functional properties of post-synaptic receptors in frog neuro-muscular preparations.
Song et al. (2002, 037531)
Human Primary human airway smooth muscle cells
0-48 h 10-250 ppm CO inhibited SMC proliferation at concentrations from 50-500 ppm. The cell cycle arrest occurred at the G0/G1 phase of the cell cycle. CO increased expression of the cell cycle inhibitor p21Cip1 at 1 h and decreased expression of cyclin D1 over 24-48 h. The antiproliferative actions of CO were found to be independent of sGC, but instead exerted through the inhibition of ERK MAPK activation since 15 min exposure to 250 ppm CO blocked serum-mediated ERK phosphorylation.
Sorhaug et al. (2006, 180414)
Rat Wistar Female 169 ± 4.5 g
20 h/day, x 5 days/wk, x 72 wk
200 ppm COHb was 14.7% in CO-exposed animals and 0.3% in controls. Total Hb was also increased in following CO exposure. CO caused no changes in lung morphology or pulmonary hypertenstion. No atherosclerotic lesions were found in aorta or femoral artery. Weight increases of 20% and 14% were observed in the right ventricle and left ventricle plus septum, respectively, indicative of ventricular hypertrophy following chronic CO exposure.
Stevens and Wang (1993, 188458)
Mouse C57/Bl-6J
Rat Sprague Dawley
Hippocampal brain slices
HO inhibition blocked long-term potentiation but not long-term depression.
Stockard-Sullivan et al. (2003, 190947)
Rat Sprague Dawley
22 h/day, PND6-PND22
12, 25, 50, or 100 ppm Using functional OAE testing and ABR showed that with perinatal CO exposure (50 and 100 ppm CO) there were significant decrements in OAE in CO-exposed animals. ABR showed no functional deficits with CO exposure. Using another otoacoustic test revealed significant attenuation of the AP of the 8th cranial nerve with CO exposure (12, 25, and 50 ppm CO) vs controls at PND22.
Storm and Fechter (1985, 011653)
Rat Long Evans
GD0-parturition 150 ppm Prenatal CO exposure increased mean and total cerebellar norepinephrine concentration from PND14-PND42 but not in the cortex.
Storm and Fechter (1985, 011652)
Rat Long Evans
GD0-GD20 75, 150, and 300 ppm
CO transiently decreased 5HT and NE in the pons/medulla and increased NE in the cortex and hippocampus at PND42. CO dose-dependently reduced cerebellum wet weight. Maternal COHb: 2.5%, 11.5%, 18.5%, and 26.8% (0, 75, 150, and 300 ppm, respectively).
Storm et al. (1986, 012136)
Rat Long Evans
GD0-PND10
75, 150, and 300 ppm
CO decreased cerebellar weight (150-300 ppm at PND10, 75-300 ppm at PND21) and decreased total cerebellar GABA (150-300 ppm at PND10 and PND21). CO- exposed (300 ppm) cerebella had fewer fissures.
Styka and Penney (1978, 011166)
Rat Charles River Male
6 wk 400 ppm or gradual increase from 500 to 1,100 ppm
CO caused increased heart weight to body weight that regressed within a couple of mo after CO exposure. COHb: 400 ppm – 35%; 1,100 ppm – 58%
January 2010 E-14
Reference Species / Model Exposure Duration
CO Concentration Findings
Suliman et al. (2007, 193768)
Mouse C57BL/6 Wild-type and eNOS deficient Male
Rat Embryonic cardiomyocytes H9c2 cells
1 h 50-1,250 ppm
Or HH
Or 100 mM dichloromethane
One-h exposure of mice to 1,250 ppm CO increased cardiac mitochondrial content of all 5 respiratory complexes 24 h later. The volume density of interfibrillar mitochondria was increased by 30% after 24 h demonstrating that CO caused cardiac mitochondrial biogenesis. The CO concentration in heart increased from 9 pmol/mg to 50-150 pmol/mg in mice exposed to 50-1,250 ppm CO for 1 h. These levels declined to baseline by 6 h. Peroxisome proliferator-activated receptor gamma coactivator 1 alpha (PGC-1α) expression was increased 6 h following exposure to 50-1,250 ppm CO. Expression of DNA polymerase and mitochondrial transcription factor A (TFAM) was increased 6 and 24 h after exposure, while mitochondrial DNA was increased two- to threefold 24 h after exposure. CO activated gene expression of these proteins involved in cardiac mitochondrial biogenesis beginning at 2 h postexposure for PGC-1α, nuclear respiratory factors 1 and 2 (NRF-1 and -2) and at 6 h postexposure for TFAM. These effects were independent of NOS and not seen with HH. CO exposure resulted in phosphorylation of p38 MAPK and Akt at 2 and 6 h postexposure to 1,250 ppm CO for 1 h. Inhibition of p38 activation failed to inhibit the CO-mediated increase in cardiac mitochondrial biogenesis.
In cell culture experiments, CO derived from dichloromethane metabolism resulted in increased cGMP, protein levels of SOD2, TFAM, NRF-1, NRF-2, PGC-1,mitochondrial ROS, Akt phosphorylation, and mitochondrial DNA. Inhibition of GC or PI3K/Akt but not p38 blocked the responses to CO. A role for mitochondrial H2O2 in Akt regulation was demonstrated. Mitochondrial H2O2 and the PI3K/Akt pathway were important mediators of TFAM expression.
The authors concluded that CO exposure increased mitochondrial ROS, which promoted mitochondrial biogenesis in the heart.
Sun et al. (2001, 026022)
Mouse Neuronal cultures prepared from the cerebral hemispheres of 16-day Charles River CD1 mouse embryos
Nb expression was increased by neuronal hypoxia in vitro and focal cerebral ischemia in vivo. Inhibiting Nb reduced neuronal survival after hypoxia whereas Nb overexpression enhanced neuronal survival.
Tattoli et al. (1999, 011557)
Rat Wistar Male and pregnant female
PND1-PND10 75 and 150 ppm Cognitive function was assessed in rats after postnatal CO exposure at 3 and 18 mo of age. Postnatal CO exposure did not affect the acquisition and reacquisition of an active avoidance task. This is different from previous findings by the same laboratory, indicating that in utero exposure to CO (75 and 150 ppm) induced long-lasting learning and memory deficits.
Telfer et al. (2001, 193769)
Human Myometrium tissue obtained from gravid (pre-term [25- to 34 wk gestation], term not in labor or term in labor) and non-gravid women
cGMP was monitored in various myometrial tissues. cGMP was significantly higher than that from nonpregnant tissue and decreased at term, especially in tissue from laboring women.
Teran et al. (2005, 193770)
Rat Dahl/Rapp salt-sensitive rats Male
100 µM A high-salt diet for 1-4 wk resulted in increased aortic HO-1 protein expression, an increase in mean arterial pressure, and time-dependent inhibition of flow- and acetylcholine-mediated vasodilation in isolated gracilis muscle arterioles. A smaller degree of inhibition of acetylcholine-mediated vasodilation was observed with a low-salt diet for 1-4 wk. Pretreatment with a HO inhibitor restored these responses, but this effect was reversed in the presence of exogenous CO. Mean arterial pressure was decreased in intact animals fed a high-salt diet for 4 wk and then treated with a HO inhibitor. The authors concluded that the HO-derived CO contributed to the development of hypertension and the impairment of endothelium-dependent vasodilator responses in this model.
January 2010 E-15

Reference Species / Model Exposure Duration
CO Concentration Findings
Thom et al. (1994, 076459)
Rat Wistar Male
Isolated blood cells
1 h
Or
>1 h
30 min
1,000 ppm
Or
1,000-3,000 and higher ppm
0.5 mL of pure CO
CO poisoning inhibited B2 integrin-dependent PMN adherence in heparinized blood obtained from rats immediately after exposure. Adherence was restored when platelet number was decreased. Adherence was also decreased when PMN from control animals were incubated with platelets from poisoned animals. Adherence of activated PMN was reduced in the presence of SOD and enhanced by NOS inhibition. Platelet production of NO was significantly greater while platelet NOS activity was significantly inhibited after poisoning.
When whole blood or platelet-rich plasma was incubated with CO, PMN adherence was inhibited.
The authors concluded that PMN B2 integrin activity was inhibited by CO-dependent release of NO from the platelets into the blood.
Thom and Ischiropoulos (1997, 085644)
Ra Wistar Male 200-290 g
Platelet-rich plasma from rats was used as the source of platelets
Bovine pulmonary artery endothelial cells
1 h
30 min or 2 h
1 h
20-1,000 ppm
10-20 ppm
10-100 ppm
Platelets isolated from rats exposed to 20-1,000 ppm CO for 1-h released NO in a dose-dependent manner. COHb levels were 0.7% in controls and 3.2%, 7.8% and 51.0% in 20, 100 and 1,000 ppm exposure groups, respectively.
Isolated platelets released NO when incubated for 30 min with 20-100 ppm CO. NOS activity was not enhanced by 100 ppm CO. Platelets released NO in response to 10-100 ppm CO after 30-min pretreatment with a NOS inhibitor, suggesting that CO displaces NO from heme-binding sites. Longer incubations (2 h) with the NOS inhibitor led to a diminished response to 100 ppm CO. There appears to be a discrepancy in the results, depending on howNOwas measured (electrode vs Greiss reaction).
Endothelial cells released NO in response to 20-100 ppm CO. NOS inhibition blocked the response to 100 ppm CO. CO was found not to affect arginine transport or NOS activity in endothelial cells. Exposure to 40-100 ppm CO resulted in the release of short-lived oxidants. This response was blocked by NOS inhibition. Lysates from cells exposed to 50 and 100 ppm CO had increased nitrotyrosine content. This response was blocked by NOS inhibition. Cellular reduced sulfhydryls were not decreased by 100 ppm CO. Dihydrorhodamine 123 oxidation, a measure of peroxynitrite formation, was increased by exposure to 100 ppm CO. This effect was blocked by NOS inhibition. Cytotoxicity of CO was evaluated by the release of 51chromium. Cytotoxicity was evident 4 h following a 2-h incubation with 100 ppm CO but not immediately after exposure. This response was not blocked by NOS inhibition, although NOS inhibition had protective effects under conditions of continuous CO exposure of 4 h. Exposure to 20 and 100 ppm CO for 2 h led to the loss of membrane integrity (measured by ethidium homodimer-1 staining) 18 h later.
Results demonstrate that 10-20 ppm CO released NO from platelets and endothelial cells in vitro. Platelets from rats that in-haled 20 ppm CO also released NO in vitro. The authors suggested that CO-mediated NO release from platelets and endothelial cells resulted from disrupted intracellular scavenging for NO. They also suggested that peroxynitrite may have been generated in response to CO.
January 2010 E-16
Reference Species / Model Exposure Duration
CO Concentration Findings
Thom et al. (1997, 084337)
Bovine pulmonary artery endothelial cells
30 min-4 h
10-100 ppm (11-110 nM) One-h exposure to 111-110 nM CO led to a dose-dependent increase in NO release, as measured by nitrite+nitrate. Signifi-cance was achieved at 22 nM (corresponding to an interstitial partial pressure of 20 ppm and a blood COHb level of 7%). NOS inhibition blocked the response to 110 nM CO. A dose- dependent increase in cellular nitrotyrosine was also observed following a 2-h exposure to CO, with significance achieved at 55 nM CO. NOS inhibition blocked the response to 110 nM. CO exposure failed to decrease the concentration of reduced sulfhydryls but did result in the extracellular release of a short-lived oxidant species, which was blocked by NOS inhibition. Dihydrorhodamine oxidation, a measure of peroxynitrite formation, occurred in response to 110 nM CO, an effect which was blocked by NOS inhibition. Cytotoxicity of CO was evaluated by the release of 51chromium. Cytotoxicity was evident 4 h following a 2-h incubation with 110 nM CO but not immediately after exposure. This response was not blocked by NOS inhibition, although NOS inhibition had protective effects under conditions of continuous CO exposure of 4 h. Exposure to 110 nM CO for 2 h led to the loss of membrane integrity ( measured by ethidium homodimer-1 staining) 18 h later. This response was blocked by NOS inhibition. Exposure to 110 nM CO had no effect on O2 con-sumption, production of intracellular H2O2 or cellular redox activity. Exposure to 110 nM did not alter arginine transport or NOS activity. NO release from cells which had been pretreated with a NOS inhibitor and then exposed briefly to 5% CO was measured using a NO-selective electrode, suggesting that CO competed with intracellular binding sites of NO.
The authors concluded that endothelial cells release NO and NO- derived oxidants in response to CO. A delayed cell death occurred following exposures to 22 nM and higher concentrations of CO.
Thom et al. (1999, 016753)
Rat Wistar Male 200-290 g
Some rats were fed a high cholesterol diet
1 h 50-1,000 ppm Nitrotyrosine immunoreactivity was found in aortic intima in rats exposed to CO for 1 h but not in controls. Nitrotyrosine content was quantitated and found to be increased in a dose-dependent manner following 1-h exposure to 50-1,000 ppm CO. The effect was significant at 50 ppm but the COHb content measured immediately after exposure was not different than controls. Plate-let and neutrophil depletion did not alter nitrotyrosine content following CO exposure. Leukocyte adherence to the aorta occurred 18 h but not immediately after a 1-h exposure to 100 ppm CO. This effect was blocked by NOS inhibition. The influx of albumin from the microvasculature into skeletal muscle increased during the 3 h after exposure to 100 ppm CO but was not seen 18 h later. This effect was blocked by NOS inhibition.
Rats fed a high-cholesterol diet and exposed to 100 ppm CO for 1 h had increased aortic nitrotyrosine content, which was not different than that in CO-exposed rats fed the standard diet. However, rats on the high-cholesterol diet had a six-fold increase in LDL oxidation immediately after 1-h exposure to 100 ppm CO. This effect was not blocked by NOS inhibition.
The authors concluded that CO can alter vascular status by several mechanisms linked to NO-derived oxidants.
January 2010 E-17
Reference Species / Model Exposure Duration
CO Concentration Findings
Thom et al. (1999, 016757)
Rat Wistar Male 200-290 g
1 h 50-1,000 ppm Leakage of albumin into lung parenchyma occurred 18 h after rats were exposed to 100 ppm CO for 1 h. This response was not observed at earlier timepoints following CO exposure. This response was also observed using 50 and 1,000 ppm but not 20 ppm CO. Leakage resolved by 48 h. Furthermore, no leakage occurred when rats which were exposed to 100 ppm CO were pretreated with a NOS inhibitor. COHb levels were 0.9% in controls and 4.8%, 10.6% and 53.7% following 1-h exposure to 50, 100 and 1,000 ppm CO, respectively. Elevated free NO (determined by EPR) was observed in lungs of rats exposed to 100 ppm CO for 1 h. This effect was blocked when rats were pretreated with a NOS inhibitor. Lung H2O2 was elevated by exposure to 100 ppm CO for 1 h, and this effect was blocked when rats were pretreated with a NOS inhibitor. Elevated nitrotyrosine content was observed in lung homogenates 2-4 h following 1-h exposure of rats to 100 ppm CO. This effect was also blocked by pretreatment with a NOS inhibitor. No leukocyte sequestration was observed in lungs 18 h following exposure to 100 ppm CO. CO-induced lung leak was not affected by neutrophil depletion.
The authors concluded that CO causes lung vascular injury which is dependent on NO.
Thom et al. (2000, 011574)
Bovine pulmonary artery endothelial cells
40 min-2 h 11-110 nM (10-100 ppm)
Increased uptake of ethidium homodimer-1, a measure of decreased membrane integrity and cell death, was observed in endothelial cells 18 h after exposure to 110 nM for 60-120 min. Exposures of 20-40 nM were ineffective in this regard. Ethidium uptake was also increased by 2-h exposure to 88 nM CO. Preincubation for 2 h with an inhibitor of eNOS, an antioxidant, and an inhibitor of peroxynitrite reactions blocked the CO-mediated cell death. Morphological changes in cells were ob-served 2 h following a 2-h exposure to 110 nM CO. Cell death induced by 110 nM CO was also blocked by inhibition of protein synthesis and inhibition of caspase-1 but of caspase-3. Caspase-1 activity was increased following 2-h exposure to 110 nM CO; this effect was blocked by inhibiting eNOS. Pre-exposure of cells to 11 nM CO for 40 min followed by a 3-h incubation period resulted in an increased level of MnSOD and protection against cell death 18 h following a 2-h exposure to 110 nM CO.
The authors concluded that exposure to 11 nM CO led to an adaptive response which protected cells from injury and apoptosis resulting from NO-derived oxidants.
Thom et al. (2001, 193779)
Rat Until lost consciousness
1,000-3,000 ppm Neutrophils sequestration was observed in the brain vessels of rats exposed to high-dose CO. CO also led to increased nitrotyrosine formation in the brain vessels. These events were blocked by pretreatment with a peroxynitrite scavenger or a PAF receptor antagonist.
Thom et al. (2006, 098418)
Human
Rat Wistar Male
Mouse C57B6J MPO-deficient
Blood samples and brain tissue
1 h Humans: Acute CO poisoning
Rats and mice: 1,000-3,000 ppm
In humans, COHb was 20-30.5%. Increased cell surface expression of CD18 and PAC1 was observed in neutrophils from people with CO poisoning. Increased surface-bound myeloperoxidase (MPO, indicative of neutrophil degranulation), increased plasma MPO, and more numerous platelet-neutrophil aggregates were also observed.
Similar changes were observed in blood of CO-poisoned rats. Platelet depletion, inhibition of NOS, and inhibition of platelet integrin-dependent adhesion blocked these responses. Brains from poisoned rats had significant elevations in MPO, which could reflect either an increase number of neutrophils or an increase in neutrophil degranulation. Perivascular MPO and nitrotyrosine were CO-localized in brain. CO poisoning also resulted in altered brain myelin basic protein.
Similar changes were observed in blood of CO-poisoned mice. MPO deficiency blocked the CO-mediated alteration in brain myelin basic protein.
The authors concluded that exposure to CO triggers intravascular interactions between platelets and neutrophils that lead to neutrophil degranulation in experimental animals and people with CO poisoning.
January 2010 E-18
Reference Species / Model Exposure Duration
CO Concentration Findings
Thorup et al. (1999, 193782)
Rat Sprague Dawley Male 200-250 g
0.01-10 μM Perfusion of isolated rat renal resistance arteries with CO-containing buffer (0.001-10 μM) led to the biphasic release of NO, peaking at 100 nM and declining to undetectable responses at 10 μM. Sequential pulses of 100 nM resulted in a blunting of NO release with consecutive pulses, consistent with a depletion of intracellular NO stores. NO release was dependent on arginine concentrations and was inhibited by pretreatment with a NOS inhibitor. Perfusion with 100 nM CO blocked carbachol-dependent NO release from vessels.
Rats were treated with a HO-1 inducer, and renal resistance arteries were isolated 12 h later. Carbachol-induced NO release was smaller in the HO-1-induced rats compared with controls, suggesting that endogenous CO has a similar effect as 100 nM exogenous CO. This effect was reversed in the presence of excess arginine.
Vasodilation was measured in blood-perfused afferent arterioles perfused with CO in solution. A biphasic vasodilatory response was observed as well as a blunted muscarinic vasorelaxation.
CO (0.1-10 μM) suppressed the release of NO from purified recombinant eNOS in solution.
The authors concluded that low levels of CO may release NO and elicit vasorelaxation and modulate basal vascular tone, while higher levels of CO may inhibit eNOS and NO generation.
Tolcos et al. (2000, 015997)
Guinea pig 10 h/day over the last 60% of gestation
200 ppm Fetal nd maternal COHb were 13% and 8.5%, respectively. Neurotransmitter systems were affected after CO exposure. The catecholaminergic system of the brainstem displayed significant decreases in immunoreactivity for tyrosine hydroxylase (TH), which was likely due to decreased cell number in specific medullar regions. The cholinergic system was also affected by prenatal CO exposure with significant increases in ChAT immunoreactivity of the medulla and no changes in muscarinic acetylcholine receptor.
Tolcos et al. (2000, 010468)
Guinea pig 10 h/day for the last 60% of gestation
200 ppm Brains were collected at 1 and 8 wk of age. These data showed that CO exposure in utero sensitized the brain to hyperthermia at PND4 leading to generation of necrotic lesions in the brain and changes in neurotransmitter levels.
Toyada et al. (1996, 079945)
Tschugguel et al. (2001, 193785)
Human
HUVEC
CO was generated by primary endothelial cells from human umbilical veins and uterine arteries after exogenous 17-ß estra-diol administration.
Vallone et al. (2004, 193993)
Mouse protein The authors presented the X-ray structure of CO-bound ferrous murine Nb. When CO binds, the heme group slides deeper into the protein crevice.
Villamor et al. (2000, 015838)
Vreman et al. (2000, 096915)
Human Umbilical cord (artery and vein)
Rat Aorta, vena cavae, liver and heart
HO activity was quantified in human umbilical cord and in the rat vasculature (aorta and vena cavae). Human umbilical artery and vein HO activity were equal. The rat aorta and vena cavae produced equal amounts of HO activity (wet weight/g tissue) but generated 3 times greater HO than the heart and 0.2 times of the liver. HO activity in rat vasculature was 3 times that of the human cord tissues. Use of the HO inhibitor CrMP effectively blocked HO activity in the rat liver and heart but was less effective at blocking HO activity in the human umbilical cord or the rat vasculature (only 50% effective). The activity of HO in the umbilical vessels may provide a role for CO in control of vasculature tone during pregnancy.
January 2010 E-19
Reference Species / Model Exposure Duration
CO Concentration Findings
Vreman et al. (2005, 193786)
Mouse BALB/c
30 min 500 ppm
OR Heme arginate
30 μmol/kg body weight i.v.
Following CO exposure, COHb levels were 28%. Tissue concentrations of CO were as follows with control levels in parenthesis.
Blood: 2648 ± 400 (45) pmol/mg Heart: 100 ±18 (6) pmol/mg Muscle: 14 ± 1 (10) pmol/mg Brain: 18 ± 4 (2) pmol/mg Kidney: 120 ± 12 (7) pmol/mg Spleen: 229 ± 55 (6) pmol/mg Liver: 115 ± 31 (5) pmol/mg Lung: 250 ± 2 (3) pmol/mg Intestine: 9 ± 7 (4) pmol/mg Testes: 6 ± 3 (2) pmol/mg
CO concentration relative to 100% blood: Lung: 9.4%, Spleen: 8.6% Kidney: 4.5%, Liver: 4.3%, Heart: 3.8%, Brain: 0.7%, Muscle: 0.5%, Intestine: 0.3%, Testes: 0.2%
Injection of heme arginate resulted in a threefold increase in CO excretion, reaching a maximum at 60 min. Animals were sacri-ficed at 90 min. COHb levels were 0.9%. Tissue concentrations of CO were as follows with control levels in parenthesis:
Blood: 88 ±10 (45) pmol/mg Heart: 14 ± 3 (6) pmol/mg Muscle: 7 ± 1 (10) pmol/mg Brain: 2 ± 0 (2) pmol/mg Kidney: 7 ± 2 (7) pmol/mg Spleen: 11 ± 1 (6) pmol/mg Liver: 8 ± 3 (5) pmol/mg Lung: 8 ± 3 (3) pmol/mg Intestine: 3 ± 1 (4) pmol/mg Testes: 2 ± 0 (2) pmol/mg
CO concentration relative to 100% blood:
Heart: 16% Spleen: 13% Lung: 9% Liver: 9% Kidney: 8% Muscle: 8% Intestine: 3% Brain: 2% Testes: 2%
Weaver et al. (2007, 193939)
Human Acute CO poisoning Mean COHb in humans with acute CO poisoning was 35%. Hyperbaric O2 reduces cognitive sequelae in a randomized clinical trial of CO-poisoned patients. Risk factors for cognitive sequelae without hyperbaric O2 included older age and longer CO exposures. Patients with loss of consciousness or high initial COHb levels should also be treated with hyperbaric O2.
Webber et al. (2003, 190515)
Rat (Strain not stated)
PND8-PND22 12.5, 25, or 50 ppm Immunostaining of c-Fos, a marker of neuronal activation in the nervous system, was followed. C-Fos immunoreactivity in the central IC was significantly decreased in the CO-exposed animals at both PND27 and PND75-PND77 over all dose groups of CO; immnunostaining of other subregions of the IC were not affected by CO. These studies show exposure to CO during development can lead to permanent changes in the auditory system of rats that persist into adulthood.
January 2010 E-20
Reference Species / Model Exposure Duration
CO Concentration Findings
Webber et al. (2005, 190514)
Rat (Strain not stated)
PND9-PND24 25 or 100 ppm Neurofilament loss from the spiral ganglion neurons and somas after ARCO treatment was rescued (no detectable neurofilament loss) with low iron+CO (ARIDCO); ARID (Iow iron) treatment induced no change in neurofilaments. CuZn superoxide dismutase (SOD1) was significantly increased with CO exposure (ARCO) and rescued in ARIDCO animals; SOD1 was unchanged in low-iron-only animals (ARID). Low-iron treatment or CO exposure alone led to significant decreases in c-fos positive cell numbers of the central IC, but c-fos levels were unchanged after low-iron diet concomitant with CO exposure (ARIDCO).
Wellenius et al. (2004, 087874)
Rat Sprague Dawley 250 g Diazepam-sedated
Model of acute MI induced by thermocoagulation
1 h, 12-18 h after surgery
35 ppm CO exposure decreased ventricular premature beat frequency by 60.4% during the exposure period compared to controls. 1-h exposure to CAPs (318 μg/m3) decreased ventricular premature beat frequency in specific subgroups. Neither CAPs nor CO had an effect on heart rate. There were no significant interactions between their effects when rats were exposed to both CO and CAPs.
Wellenius et al. (2006, 156152)
Rat Sprague Dawley 250 g Diazepam-sedated
Model of acute MI induced by thermocoagulation
1 h, 12-18 h after surgery
35 ppm Exposure to CO failed to increase the probability of observing supraventricular ectopic beats (SVEB). Exposure to CAPs (646 μg/m3) for 1 h decreased the frequency of SVEB. There were no significant effects observed when rats were exposed to both CO and CAPs. Among a subset of rats with one or more SVEB at baseline, a significant decrease in number of SVEB during the exposure period was observed with either CO or CAPs exposure compared with controls.
Yoshiki et al.(2001, 193790)
Human HO localization in human endometrium and its changes in expression over the menstrual cycle were explored in this study. HO-1 was constitutively expressed throughout the menstrual cycle, and HO-2 was greater in the secretory than the proliferative phase of the menstrual cycle. HO-1 was localized to the epithelial cells and macrophages. HO-2 was found in endothelial cells and smooth muscle cells of endometrial blood vessels.
Yu et al. (2008, 192384)
Guinea pig
Allergic rhinitis model using nasal ovalbumin sensitization
Indicators of allergic rhinitis were enhanced by treatment with a HO-1 inducer and decreased by treatment with a HO-1 inhibitor. Immunoreactivity for HO-1 was shown in the lamina of mucosa of sensitized guinea pigs. Endogenous CO may play a role in the inflammation process of allergic rhinitis.
Zamudio et al. (1995, 193908)
Human Women living at high altitude had an increased risk of adverse pregnancy outcomes vs women living at lower altitudes.
Zenclussen et al. (2006, 193873)
Mouse CBA/J x DBA/2J
To evaluate the role of HO-1 in spontaneous abortion, a mouse model that spontaneously undergoes abortion (CBA/J x DBA/2J mice) was used with and without HO adenovirus treatment to see if pregnancy outcome could be modulated by changing HO concentration. Pregnancy outcome was significantly better (abortion rate significantly decreased) in mice overexpressing HO due to adenovirus transfer.
Zhang et al. (2005, 184460)
Rat Pulmonary artery endothelial cells
8-28 h 15 ppm Exposure to 15 ppm CO during anoxia resulted in decreased phosphorylation of STAT1 and increased phosphorylation of STAT3 at 8-24 h. Similar responses were observed when 24-h anoxia was followed by a period of reoxygenation (0.5-4 h). DNA binding of STAT1 was decreased while that of STAT3 was enhanced by CO treatment during anoxia/reoxygenation. Exposure to 15 ppm during 8-24-h anoxia or 24 h anoxia followed by 0.5-4 h reoxygenation resulted in increased phosphorylation of Akt and p38 MAPK. Inhibitor studies demonstrated that activation of the PI3K pathway by CO was upstream of p38 MAPK activation during anoxia/reoxygenation. Similarly, the PI3K and p38 MAPK pathways were found to be upstream of STAT modulation. The anti-apoptotic effects of 15 ppm CO during anoxia-reoxygenation involved decreased FAS expression and decreased caspase 3 acvitiry. These effects were dependent on activation of the PI3K, p38 MAPK and STAT3 pathways.
The authors concluded that CO blocks anoxia-reoxygenation mediated apoptosis through modulation of PI3K/Akt/p38 MAPK and STAT1 and STAT3.
January 2010 E-21
Reference Species / Model Exposure Duration
CO Concentration Findings
Zhang et al. (2007, 193879)
Mouse A single dose of LPS administered to pregnant mice induced up-regulation of HO-1 but not HO-2 in the mouse placenta 12-48 h postLPS treatment. Pretreatment of mice with the spin trap agent PBN or the TNF α inhibitor pentoxifylline prevented the LPS-dependent HO-1 upregulation. Thus ROS may mediate the LPS-dependent upregulation of HO-1.
Zhao et al. (2008, 193883)
Mouse FVB
With pregnancy, there was an increased blood volume without a concurrent increase in systemic BP; this was accomplished by a decrease in total vascular resistance, to which CO contributed as determined by using HO inhibitors.
Zhuo et al. (1993, 013905)
Guinea pig Adult male
Hippocampal LTP of brain sections is significantly affected by CO exposure with ZnPP IX, a HO inhibitor, blocking hippocampal LTP.
Zuckerbraun et al. (2007, 193884)
Macrophages
RAW 264.7
THP-1 cells, wild-type and respiration-deficient
10 min-24 h 50-500 ppm Exposure of RAW macrophages to 250 ppm CO for 10-60 min increased ROS generation, measured as dichlorofluorescein (DCF) fluorescence. ROS generation at 1 h was dose dependent with significant effects observed at 50, 250 and 500 ppm CO. This response was not blocked with a NOS inhibitor. A 1-h exposure to 250 ppm resulted in decreased intracellular glutathione levels. CO treatment was found to block TNFα production and to enhance p38 MAPK phosphorylation in LPS-stimulated cells. These effects were diminished by pretreatment with antioxidants. The source of CO-derived oxidants was determined to be mitochondrial since respiration-deficient THP-1 macrophages, unlike wild-type cells, failed to generate ROS in response to 250 ppm CO. Furthermore, treatment of RAW cells with the mitochondrial complex III inhibitor antimycin C, blocked ROS generation in response to 250 ppm CO. Exposure of RAW cells to 250 ppm CO for 1 h inhibited cytochrome c oxidase activity by 50%. Exposure to 250 ppm CO for 6 h had no effect on cellular ATP levels or mitochondrial membrane potential. Antimycin C treatment was found to reverse the effects of CO on LPS-mediated responses (TNFα and p38 MAPK), suggesting that mitochondrial-derived ROS mediated the effects of CO.
The authors concluded that CO increased the generation of mitochondrial-derived ROS.
January 2010 E-22
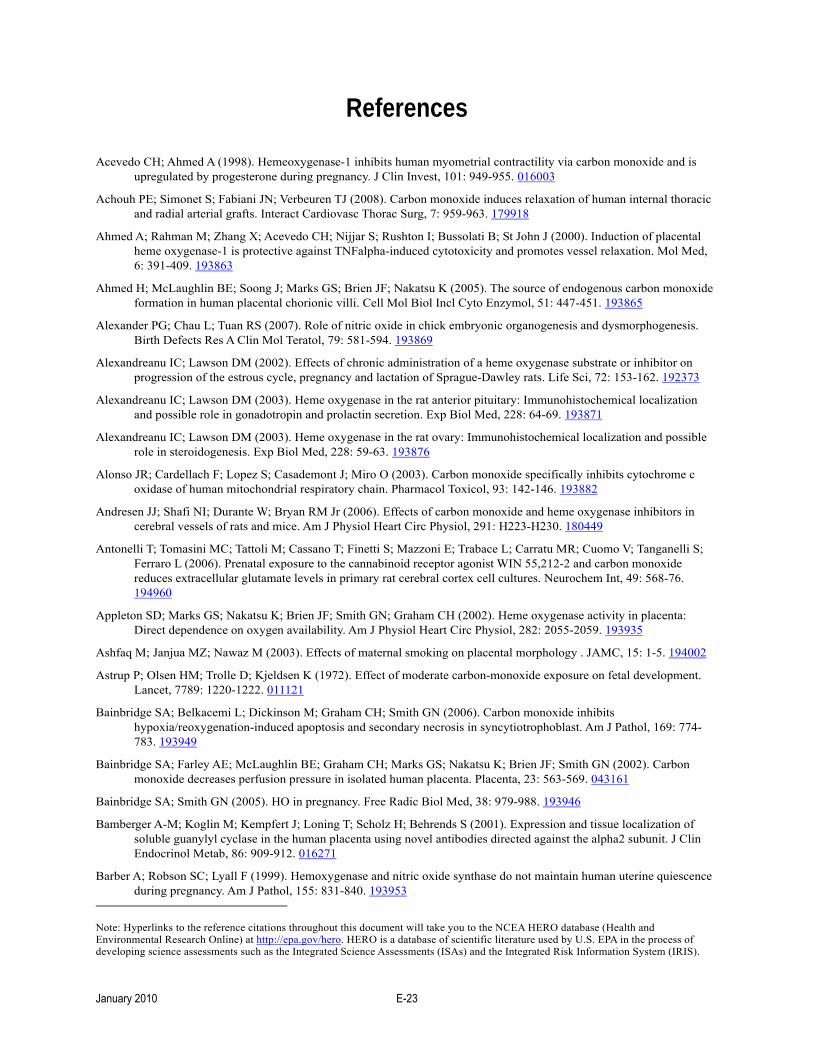
References
Acevedo CH; Ahmed A (1998). Hemeoxygenase-1 inhibits human myometrial contractility via carbon monoxide and is upregulated by progesterone during pregnancy. J Clin Invest, 101: 949-955. 016003
Achouh PE; Simonet S; Fabiani JN; Verbeuren TJ (2008). Carbon monoxide induces relaxation of human internal thoracic and radial arterial grafts. Interact Cardiovasc Thorac Surg, 7: 959-963. 179918
Ahmed A; Rahman M; Zhang X; Acevedo CH; Nijjar S; Rushton I; Bussolati B; St John J (2000). Induction of placental heme oxygenase-1 is protective against TNFalpha-induced cytotoxicity and promotes vessel relaxation. Mol Med, 6: 391-409. 193863
Ahmed H; McLaughlin BE; Soong J; Marks GS; Brien JF; Nakatsu K (2005). The source of endogenous carbon monoxide formation in human placental chorionic villi. Cell Mol Biol Incl Cyto Enzymol, 51: 447-451. 193865
Alexander PG; Chau L; Tuan RS (2007). Role of nitric oxide in chick embryonic organogenesis and dysmorphogenesis. Birth Defects Res A Clin Mol Teratol, 79: 581-594. 193869
Alexandreanu IC; Lawson DM (2002). Effects of chronic administration of a heme oxygenase substrate or inhibitor on progression of the estrous cycle, pregnancy and lactation of Sprague-Dawley rats. Life Sci, 72: 153-162. 192373
Alexandreanu IC; Lawson DM (2003). Heme oxygenase in the rat anterior pituitary: Immunohistochemical localization and possible role in gonadotropin and prolactin secretion. Exp Biol Med, 228: 64-69. 193871
Alexandreanu IC; Lawson DM (2003). Heme oxygenase in the rat ovary: Immunohistochemical localization and possible role in steroidogenesis. Exp Biol Med, 228: 59-63. 193876
Alonso JR; Cardellach F; Lopez S; Casademont J; Miro O (2003). Carbon monoxide specifically inhibits cytochrome c oxidase of human mitochondrial respiratory chain. Pharmacol Toxicol, 93: 142-146. 193882
Andresen JJ; Shafi NI; Durante W; Bryan RM Jr (2006). Effects of carbon monoxide and heme oxygenase inhibitors in cerebral vessels of rats and mice. Am J Physiol Heart Circ Physiol, 291: H223-H230. 180449
Antonelli T; Tomasini MC; Tattoli M; Cassano T; Finetti S; Mazzoni E; Trabace L; Carratu MR; Cuomo V; Tanganelli S; Ferraro L (2006). Prenatal exposure to the cannabinoid receptor agonist WIN 55,212-2 and carbon monoxide reduces extracellular glutamate levels in primary rat cerebral cortex cell cultures. Neurochem Int, 49: 568-76. 194960
Appleton SD; Marks GS; Nakatsu K; Brien JF; Smith GN; Graham CH (2002). Heme oxygenase activity in placenta: Direct dependence on oxygen availability. Am J Physiol Heart Circ Physiol, 282: 2055-2059. 193935
Ashfaq M; Janjua MZ; Nawaz M (2003). Effects of maternal smoking on placental morphology . JAMC, 15: 1-5. 194002
Astrup P; Olsen HM; Trolle D; Kjeldsen K (1972). Effect of moderate carbon-monoxide exposure on fetal development. Lancet, 7789: 1220-1222. 011121
Bainbridge SA; Belkacemi L; Dickinson M; Graham CH; Smith GN (2006). Carbon monoxide inhibits hypoxia/reoxygenation-induced apoptosis and secondary necrosis in syncytiotrophoblast. Am J Pathol, 169: 774-783. 193949
Bainbridge SA; Farley AE; McLaughlin BE; Graham CH; Marks GS; Nakatsu K; Brien JF; Smith GN (2002). Carbon monoxide decreases perfusion pressure in isolated human placenta. Placenta, 23: 563-569. 043161
Bainbridge SA; Smith GN (2005). HO in pregnancy. Free Radic Biol Med, 38: 979-988. 193946
Bamberger A-M; Koglin M; Kempfert J; Loning T; Scholz H; Behrends S (2001). Expression and tissue localization of soluble guanylyl cyclase in the human placenta using novel antibodies directed against the alpha2 subunit. J Clin Endocrinol Metab, 86: 909-912. 016271
Barber A; Robson SC; Lyall F (1999). Hemoxygenase and nitric oxide synthase do not maintain human uterine quiescence during pregnancy. Am J Pathol, 155: 831-840. 193953
Note: Hyperlinks to the reference citations throughout this document will take you to the NCEA HERO database (Health and Environmental Research Online) at http://epa.gov/hero. HERO is a database of scientific literature used by U.S. EPA in the process of developing science assessments such as the Integrated Science Assessments (ISAs) and the Integrated Risk Information System (IRIS).
January 2010 E-23
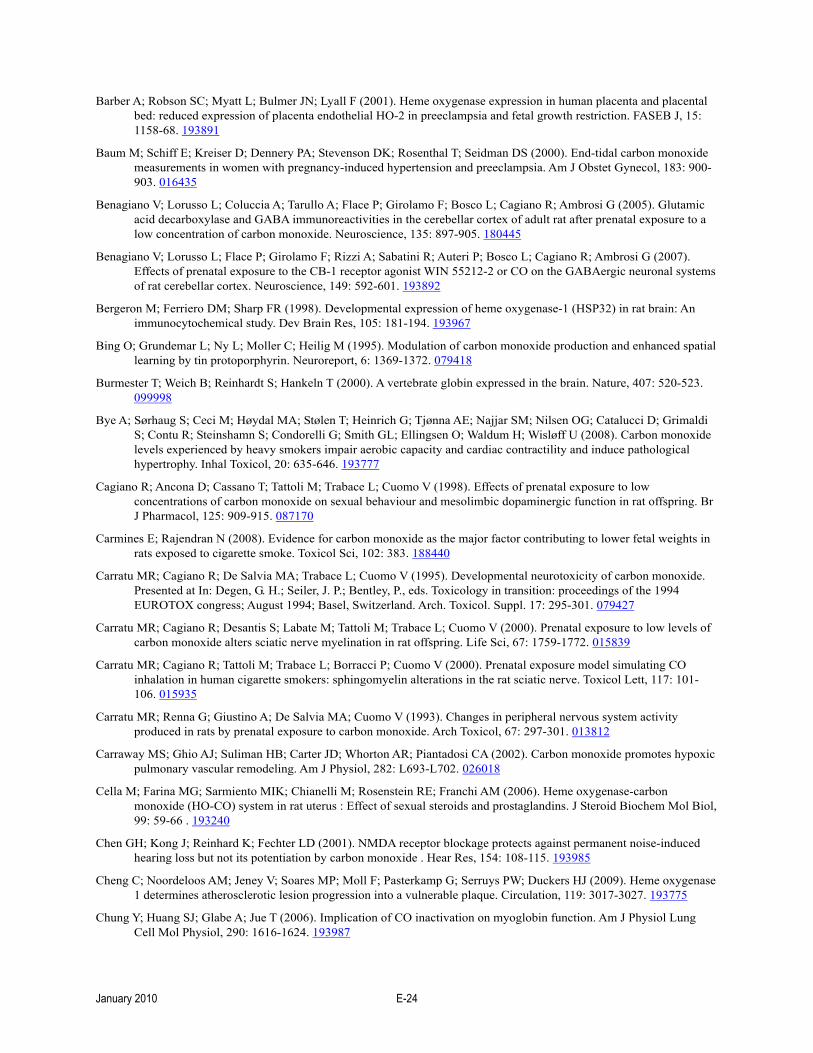
Barber A; Robson SC; Myatt L; Bulmer JN; Lyall F (2001). Heme oxygenase expression in human placenta and placental bed: reduced expression of placenta endothelial HO-2 in preeclampsia and fetal growth restriction. FASEB J, 15: 1158-68. 193891
Baum M; Schiff E; Kreiser D; Dennery PA; Stevenson DK; Rosenthal T; Seidman DS (2000). End-tidal carbon monoxide measurements in women with pregnancy-induced hypertension and preeclampsia. Am J Obstet Gynecol, 183: 900-903. 016435
Benagiano V; Lorusso L; Coluccia A; Tarullo A; Flace P; Girolamo F; Bosco L; Cagiano R; Ambrosi G (2005). Glutamic acid decarboxylase and GABA immunoreactivities in the cerebellar cortex of adult rat after prenatal exposure to a low concentration of carbon monoxide. Neuroscience, 135: 897-905. 180445
Benagiano V; Lorusso L; Flace P; Girolamo F; Rizzi A; Sabatini R; Auteri P; Bosco L; Cagiano R; Ambrosi G (2007). Effects of prenatal exposure to the CB-1 receptor agonist WIN 55212-2 or CO on the GABAergic neuronal systems of rat cerebellar cortex. Neuroscience, 149: 592-601. 193892
Bergeron M; Ferriero DM; Sharp FR (1998). Developmental expression of heme oxygenase-1 (HSP32) in rat brain: An immunocytochemical study. Dev Brain Res, 105: 181-194. 193967
Bing O; Grundemar L; Ny L; Moller C; Heilig M (1995). Modulation of carbon monoxide production and enhanced spatial learning by tin protoporphyrin. Neuroreport, 6: 1369-1372. 079418
Burmester T; Weich B; Reinhardt S; Hankeln T (2000). A vertebrate globin expressed in the brain. Nature, 407: 520-523. 099998
Bye A; Sørhaug S; Ceci M; Høydal MA; Stølen T; Heinrich G; Tjønna AE; Najjar SM; Nilsen OG; Catalucci D; Grimaldi S; Contu R; Steinshamn S; Condorelli G; Smith GL; Ellingsen O; Waldum H; Wisløff U (2008). Carbon monoxide levels experienced by heavy smokers impair aerobic capacity and cardiac contractility and induce pathological hypertrophy. Inhal Toxicol, 20: 635-646. 193777
Cagiano R; Ancona D; Cassano T; Tattoli M; Trabace L; Cuomo V (1998). Effects of prenatal exposure to low concentrations of carbon monoxide on sexual behaviour and mesolimbic dopaminergic function in rat offspring. Br J Pharmacol, 125: 909-915. 087170
Carmines E; Rajendran N (2008). Evidence for carbon monoxide as the major factor contributing to lower fetal weights in rats exposed to cigarette smoke. Toxicol Sci, 102: 383. 188440
Carratu MR; Cagiano R; De Salvia MA; Trabace L; Cuomo V (1995). Developmental neurotoxicity of carbon monoxide. Presented at In: Degen, G. H.; Seiler, J. P.; Bentley, P., eds. Toxicology in transition: proceedings of the 1994 EUROTOX congress; August 1994; Basel, Switzerland. Arch. Toxicol. Suppl. 17: 295-301. 079427
Carratu MR; Cagiano R; Desantis S; Labate M; Tattoli M; Trabace L; Cuomo V (2000). Prenatal exposure to low levels of carbon monoxide alters sciatic nerve myelination in rat offspring. Life Sci, 67: 1759-1772. 015839
Carratu MR; Cagiano R; Tattoli M; Trabace L; Borracci P; Cuomo V (2000). Prenatal exposure model simulating CO inhalation in human cigarette smokers: sphingomyelin alterations in the rat sciatic nerve. Toxicol Lett, 117: 101-106. 015935
Carratu MR; Renna G; Giustino A; De Salvia MA; Cuomo V (1993). Changes in peripheral nervous system activity produced in rats by prenatal exposure to carbon monoxide. Arch Toxicol, 67: 297-301. 013812
Carraway MS; Ghio AJ; Suliman HB; Carter JD; Whorton AR; Piantadosi CA (2002). Carbon monoxide promotes hypoxic pulmonary vascular remodeling. Am J Physiol, 282: L693-L702. 026018
Cella M; Farina MG; Sarmiento MIK; Chianelli M; Rosenstein RE; Franchi AM (2006). Heme oxygenase-carbon monoxide (HO-CO) system in rat uterus : Effect of sexual steroids and prostaglandins. J Steroid Biochem Mol Biol, 99: 59-66 . 193240
Chen GH; Kong J; Reinhard K; Fechter LD (2001). NMDA receptor blockage protects against permanent noise-induced hearing loss but not its potentiation by carbon monoxide . Hear Res, 154: 108-115. 193985
Cheng C; Noordeloos AM; Jeney V; Soares MP; Moll F; Pasterkamp G; Serruys PW; Duckers HJ (2009). Heme oxygenase 1 determines atherosclerotic lesion progression into a vulnerable plaque. Circulation, 119: 3017-3027. 193775
Chung Y; Huang SJ; Glabe A; Jue T (2006). Implication of CO inactivation on myoglobin function. Am J Physiol Lung Cell Mol Physiol, 290: 1616-1624. 193987
January 2010 E-24
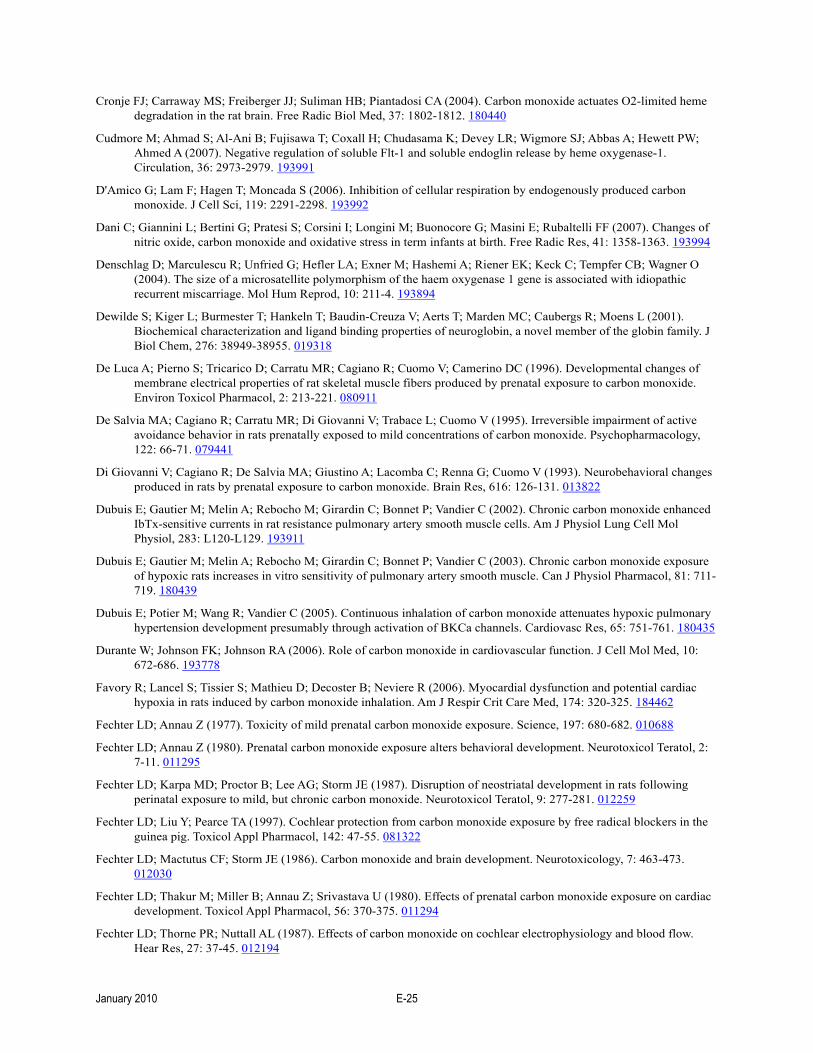
Cronje FJ; Carraway MS; Freiberger JJ; Suliman HB; Piantadosi CA (2004). Carbon monoxide actuates O2-limited heme degradation in the rat brain. Free Radic Biol Med, 37: 1802-1812. 180440
Cudmore M; Ahmad S; Al-Ani B; Fujisawa T; Coxall H; Chudasama K; Devey LR; Wigmore SJ; Abbas A; Hewett PW; Ahmed A (2007). Negative regulation of soluble Flt-1 and soluble endoglin release by heme oxygenase-1. Circulation, 36: 2973-2979. 193991
D'Amico G; Lam F; Hagen T; Moncada S (2006). Inhibition of cellular respiration by endogenously produced carbon monoxide. J Cell Sci, 119: 2291-2298. 193992
Dani C; Giannini L; Bertini G; Pratesi S; Corsini I; Longini M; Buonocore G; Masini E; Rubaltelli FF (2007). Changes of nitric oxide, carbon monoxide and oxidative stress in term infants at birth. Free Radic Res, 41: 1358-1363. 193994
Denschlag D; Marculescu R; Unfried G; Hefler LA; Exner M; Hashemi A; Riener EK; Keck C; Tempfer CB; Wagner O (2004). The size of a microsatellite polymorphism of the haem oxygenase 1 gene is associated with idiopathic recurrent miscarriage. Mol Hum Reprod, 10: 211-4. 193894
Dewilde S; Kiger L; Burmester T; Hankeln T; Baudin-Creuza V; Aerts T; Marden MC; Caubergs R; Moens L (2001). Biochemical characterization and ligand binding properties of neuroglobin, a novel member of the globin family. J Biol Chem, 276: 38949-38955. 019318
De Luca A; Pierno S; Tricarico D; Carratu MR; Cagiano R; Cuomo V; Camerino DC (1996). Developmental changes of membrane electrical properties of rat skeletal muscle fibers produced by prenatal exposure to carbon monoxide. Environ Toxicol Pharmacol, 2: 213-221. 080911
De Salvia MA; Cagiano R; Carratu MR; Di Giovanni V; Trabace L; Cuomo V (1995). Irreversible impairment of active avoidance behavior in rats prenatally exposed to mild concentrations of carbon monoxide. Psychopharmacology, 122: 66-71. 079441
Di Giovanni V; Cagiano R; De Salvia MA; Giustino A; Lacomba C; Renna G; Cuomo V (1993). Neurobehavioral changes produced in rats by prenatal exposure to carbon monoxide. Brain Res, 616: 126-131. 013822
Dubuis E; Gautier M; Melin A; Rebocho M; Girardin C; Bonnet P; Vandier C (2002). Chronic carbon monoxide enhanced IbTx-sensitive currents in rat resistance pulmonary artery smooth muscle cells. Am J Physiol Lung Cell Mol Physiol, 283: L120-L129. 193911
Dubuis E; Gautier M; Melin A; Rebocho M; Girardin C; Bonnet P; Vandier C (2003). Chronic carbon monoxide exposure of hypoxic rats increases in vitro sensitivity of pulmonary artery smooth muscle. Can J Physiol Pharmacol, 81: 711-719. 180439
Dubuis E; Potier M; Wang R; Vandier C (2005). Continuous inhalation of carbon monoxide attenuates hypoxic pulmonary hypertension development presumably through activation of BKCa channels. Cardiovasc Res, 65: 751-761. 180435
Durante W; Johnson FK; Johnson RA (2006). Role of carbon monoxide in cardiovascular function. J Cell Mol Med, 10: 672-686. 193778
Favory R; Lancel S; Tissier S; Mathieu D; Decoster B; Neviere R (2006). Myocardial dysfunction and potential cardiac hypoxia in rats induced by carbon monoxide inhalation. Am J Respir Crit Care Med, 174: 320-325. 184462
Fechter LD; Annau Z (1977). Toxicity of mild prenatal carbon monoxide exposure. Science, 197: 680-682. 010688
Fechter LD; Annau Z (1980). Prenatal carbon monoxide exposure alters behavioral development. Neurotoxicol Teratol, 2: 7-11. 011295
Fechter LD; Karpa MD; Proctor B; Lee AG; Storm JE (1987). Disruption of neostriatal development in rats following perinatal exposure to mild, but chronic carbon monoxide. Neurotoxicol Teratol, 9: 277-281. 012259
Fechter LD; Liu Y; Pearce TA (1997). Cochlear protection from carbon monoxide exposure by free radical blockers in the guinea pig. Toxicol Appl Pharmacol, 142: 47-55. 081322
Fechter LD; Mactutus CF; Storm JE (1986). Carbon monoxide and brain development. Neurotoxicology, 7: 463-473. 012030
Fechter LD; Thakur M; Miller B; Annau Z; Srivastava U (1980). Effects of prenatal carbon monoxide exposure on cardiac development. Toxicol Appl Pharmacol, 56: 370-375. 011294
Fechter LD; Thorne PR; Nuttall AL (1987). Effects of carbon monoxide on cochlear electrophysiology and blood flow. Hear Res, 27: 37-45. 012194
January 2010 E-25
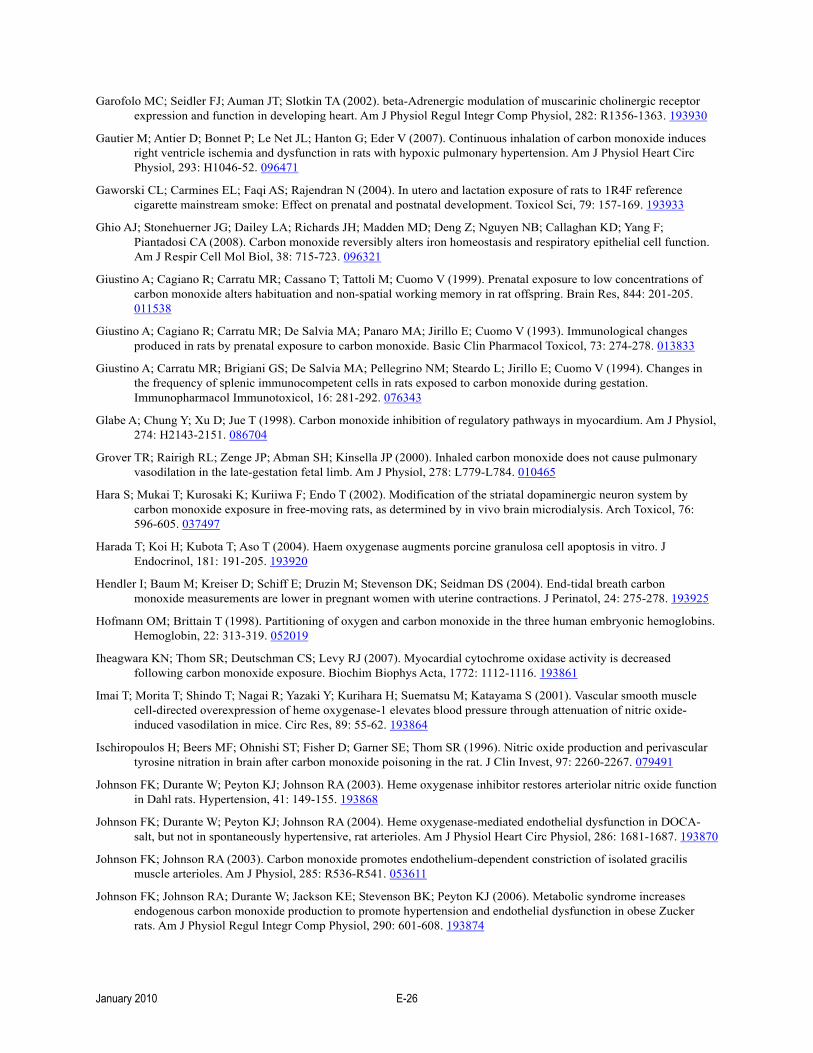
Garofolo MC; Seidler FJ; Auman JT; Slotkin TA (2002). beta-Adrenergic modulation of muscarinic cholinergic receptor expression and function in developing heart. Am J Physiol Regul Integr Comp Physiol, 282: R1356-1363. 193930
Gautier M; Antier D; Bonnet P; Le Net JL; Hanton G; Eder V (2007). Continuous inhalation of carbon monoxide induces right ventricle ischemia and dysfunction in rats with hypoxic pulmonary hypertension. Am J Physiol Heart Circ Physiol, 293: H1046-52. 096471
Gaworski CL; Carmines EL; Faqi AS; Rajendran N (2004). In utero and lactation exposure of rats to 1R4F reference cigarette mainstream smoke: Effect on prenatal and postnatal development. Toxicol Sci, 79: 157-169. 193933
Ghio AJ; Stonehuerner JG; Dailey LA; Richards JH; Madden MD; Deng Z; Nguyen NB; Callaghan KD; Yang F; Piantadosi CA (2008). Carbon monoxide reversibly alters iron homeostasis and respiratory epithelial cell function. Am J Respir Cell Mol Biol, 38: 715-723. 096321
Giustino A; Cagiano R; Carratu MR; Cassano T; Tattoli M; Cuomo V (1999). Prenatal exposure to low concentrations of carbon monoxide alters habituation and non-spatial working memory in rat offspring. Brain Res, 844: 201-205. 011538
Giustino A; Cagiano R; Carratu MR; De Salvia MA; Panaro MA; Jirillo E; Cuomo V (1993). Immunological changes produced in rats by prenatal exposure to carbon monoxide. Basic Clin Pharmacol Toxicol, 73: 274-278. 013833
Giustino A; Carratu MR; Brigiani GS; De Salvia MA; Pellegrino NM; Steardo L; Jirillo E; Cuomo V (1994). Changes in the frequency of splenic immunocompetent cells in rats exposed to carbon monoxide during gestation. Immunopharmacol Immunotoxicol, 16: 281-292. 076343
Glabe A; Chung Y; Xu D; Jue T (1998). Carbon monoxide inhibition of regulatory pathways in myocardium. Am J Physiol, 274: H2143-2151. 086704
Grover TR; Rairigh RL; Zenge JP; Abman SH; Kinsella JP (2000). Inhaled carbon monoxide does not cause pulmonary vasodilation in the late-gestation fetal limb. Am J Physiol, 278: L779-L784. 010465
Hara S; Mukai T; Kurosaki K; Kuriiwa F; Endo T (2002). Modification of the striatal dopaminergic neuron system by carbon monoxide exposure in free-moving rats, as determined by in vivo brain microdialysis. Arch Toxicol, 76: 596-605. 037497
Harada T; Koi H; Kubota T; Aso T (2004). Haem oxygenase augments porcine granulosa cell apoptosis in vitro. J Endocrinol, 181: 191-205. 193920
Hendler I; Baum M; Kreiser D; Schiff E; Druzin M; Stevenson DK; Seidman DS (2004). End-tidal breath carbon monoxide measurements are lower in pregnant women with uterine contractions. J Perinatol, 24: 275-278. 193925
Hofmann OM; Brittain T (1998). Partitioning of oxygen and carbon monoxide in the three human embryonic hemoglobins. Hemoglobin, 22: 313-319. 052019
Iheagwara KN; Thom SR; Deutschman CS; Levy RJ (2007). Myocardial cytochrome oxidase activity is decreased following carbon monoxide exposure. Biochim Biophys Acta, 1772: 1112-1116. 193861
Imai T; Morita T; Shindo T; Nagai R; Yazaki Y; Kurihara H; Suematsu M; Katayama S (2001). Vascular smooth muscle cell-directed overexpression of heme oxygenase-1 elevates blood pressure through attenuation of nitric oxide-induced vasodilation in mice. Circ Res, 89: 55-62. 193864
Ischiropoulos H; Beers MF; Ohnishi ST; Fisher D; Garner SE; Thom SR (1996). Nitric oxide production and perivascular tyrosine nitration in brain after carbon monoxide poisoning in the rat. J Clin Invest, 97: 2260-2267. 079491
Johnson FK; Durante W; Peyton KJ; Johnson RA (2003). Heme oxygenase inhibitor restores arteriolar nitric oxide function in Dahl rats. Hypertension, 41: 149-155. 193868
Johnson FK; Durante W; Peyton KJ; Johnson RA (2004). Heme oxygenase-mediated endothelial dysfunction in DOCA-salt, but not in spontaneously hypertensive, rat arterioles. Am J Physiol Heart Circ Physiol, 286: 1681-1687. 193870
Johnson FK; Johnson RA (2003). Carbon monoxide promotes endothelium-dependent constriction of isolated gracilis muscle arterioles. Am J Physiol, 285: R536-R541. 053611
Johnson FK; Johnson RA; Durante W; Jackson KE; Stevenson BK; Peyton KJ (2006). Metabolic syndrome increases endogenous carbon monoxide production to promote hypertension and endothelial dysfunction in obese Zucker rats. Am J Physiol Regul Integr Comp Physiol, 290: 601-608. 193874
January 2010 E-26

Katoue MG; Khan I; Oriowo MA (2005). Increased expression and activity of heme oxygenase-2 in pregnant rat aorta is not involved in attenuated vasopressin-induced contraction. Naunyn Schmiedebergs Arch Pharmacol, 372: 220-7. 193896
Katoue MG; Khan I; Oriowo MA (2006). Pregnancy-induced modulation of calcium mobilization and down-regulation of Rho-kinase expression contribute to attenuated vassopressin-induced contraction of the rat aorta. Vascul Pharmacol, 44: 170-176. 193954
Khan AA; Wang Y; Sun Y; Mao XO; Xie L; Miles E; Graboski J; Chen S; Ellerby LM; Jin K; Greenberg DA (2006). Neuroglobin-overexpressing transgenic mice are resistant to cerebral and myocardial ischemia. PNAS, 103: 17944-17948. 193955
Kim HP; Wang X; Nakao A; Kim SI; Murase N; Choi ME; Ryter SW; Choi AM (2005). Caveolin-1 expression by means of p38beta mitogen-activated protein kinase mediates the antiproliferative effect of carbon monoxide. PNAS, 102: 11319-11324. 193959
Kim HS; Loughran PA; Rao J; Billar TR; Zuckerbraun BS (2008). Carbon monoxide activates NF-kappaB via ROS generation and Akt pathways to protect against cell death of hepatocytes. Am J Physiol Gastrointest Liver Physiol, 295: G146-G152. 193961
Kinobe R; Vlahakis J; Soong J; Szarek W; Brien J; Longo L; Nakatsu K (2006). Heme oxygenase activity in fetal and adult sheep is not altered by acclimatization to high altitude hypoxia. Can J Physiol Pharmacol, 84: 893 - 901. 188447
Knuckles TL; Lund AK; Lucas SN; Campen MJ (2008). Diesel exhaust exposure enhances venoconstriction via uncoupling of eNOS. Toxicol Appl Pharmacol, 230: 346-351. 191987
Korres S; Riga M; Balatsouras D; Papadakis C; Kanellos P; Ferekidis E (2007). Influence of smoking on developing cochlea: Does smoking during pregnancy affect the amplitudes of transient evoked otoacoustic emissions in newborns? Int J Pediatr Otorhinolaryngol, 71: 781-786. 190908
Kreiser D; Baum M; Seidman DS; Fanaroff A; Shah D; Hendler I; Stevenson DK; Schiff E; Druzin ML (2004). End tidal carbon monoxide levels are lower in women with gestational hypertension and pre-eclampsia. J Perinatol, 24: 213-217. 193948
Lash GE; McLaughlin BE; MacDonald-Goodfellow SK; Smith GN; Brien JF; Marks GS; Nakatsu K; Graham CH (2003). Relationship between tissue damage and heme oxygenase expression in chorionic villi of term human placenta. Am J Physiol Heart Circ Physiol, 284: H160-H167. 193849
Li X; Zhang C; Wang S; Ji Y; Wang H; Zhao L; Xu D (2008). Maternally administered lipopolysaccharide (LPS) upregulates the expression of heme oxygenase-1 in fetal liver: The role of reactive oxygen species. Toxicol Lett, 176: 169-177. 187003
Liu Y; Fechter LD (1995). MK-801 protects against carbon monoxide-induced hearing loss. Toxicol Appl Pharmacol, 132: 196-202. 076524
Loennechen JP; Beisvag V; Arbo I; Waldum HL; Sandvik AK; Knardahl S; Ellingsen O (1999). Chronic carbon monoxide exposure in vivo induces myocardial endothelin-1 expression and hypertrophy in rat. Pharmacol Toxicol, 85: 192-197. 011549
Longo M; Jain V; Vedernikov YP; Saade GR; Goodrum L; Facchinetti F; Garfield RE (1999). Effect of nitric oxide and carbon monoxide on uterine contractility during human and rat pregnancy. Am J Obstet Gynecol, 181: 981-988. 011548
Lopez I; Acuna D; Webber DS; Korsak RA; Edmond J (2003). Mild carbon monoxide exposure diminishes selectively the integrity of the cochlea of the developing rat. J Neurosci Res, 74: 666-75. 193901
Lopez IA; Acuna D; Beltran-Parrazal L; Espinosa-Jeffrey A; Edmond J (2008). Oxidative stress and the deleterious consequences to the rat cochlea after prenatal chronic mild exposure to carbon monoxide in air. Neuroscience, 151: 854-867. 097343
Lund AK; Knuckles TL; Obot Akata C; Shohet R; McDonald JD; Gigliotti A; Seagrave JC; Campen MJ (2007). Gasoline exhaust emissions induce vascular remodeling pathways involved in atherosclerosis. Toxicol Sci, 95: 485-94. 125741
January 2010 E-27
Lund AK; Lucero J; Lucas S; Madden MC; McDonald JD; Seagrave JC; Knuckles TL; Campen MJ (2009). Vehicular emissions induce vascular MMP-9 expression and activity associated with endothelin-1 mediated pathways. Arterioscler Thromb Vasc Biol, 29: 511-517. 180257
Lyall F; Barber A; Myatt L; Bulmer JN; Robson SC (2000). Hemeoxygenase expression in human placenta and placental bed implies a role in regulation of trophoblast invasion and placental function. FASEB J, 14: 208-19. 193902
Lyall F; Myatt L (2002). The role of the placenta in pre-eclampsia -- a workshop report. Placenta, 23: S142-145. 193971
Mactutus CF; Fechter LD (1984). Prenatal exposure to carbon monoxide: learning and memory deficits. Science, 223: 409-411. 011355
McGregor HP; Westcott K; Walker DW (1998). The effect of prenatal exposure to carbon monoxide on breathing and growth of the newborn guinea pig. Pediatr Res, 43: 126-131. 085342
McLaughlin BE; Hutchinson JM; Graham CH; Smith GN; Marks GS; Nakatsu K; Brien JF (2000). Heme oxygenase activity in term human placenta. Placenta, 21: 870-873. 015815
McLaughlin BE; Lash GE; Graham CH; Smith GN; Vreman HJ; Stevenson DK; Marks GS; Nakatsu K; Brien JF (2001). Endogenous carbon monoxide formation by chorionic villi of term human placenta. Placenta, 22: 886-888. 193823
McLaughlin BE; Lash GE; Smith GN; Marks GS; Nakatsu K; Graham CH; Brien JF (2003). Heme oxygenase expression in selected regions of term human placenta. Exp Biol Med, 228: 564-567. 193827
McLean M; Bowman M; Clifton V; Smith R; Grossman AB (2000). Expression of the heme oxygenase - carbon monoxide signalling system in human placenta. J Clin Endocrinol Metab, 85: 2345-2349. 016269
Melin A; Bonnet P; Eder V; Antier D; Obert P; Fauchier L (2005). Direct implication of carbon monoxide in the development of heart failure in rats with cardiac hypertrophy subjected to air pollution. Cardiovasc Toxicol, 5: 311-320. 193833
Melin A; Obert P; Rebocho M; Bonnet P (2002). Cardiac morphology and function following long-term exposure to carbon monoxide at high altitude in rats. J Toxicol Environ Health A Curr Iss, 65: 1981-1998. 037502
Mereu G; Cammalleri M; Fà M; Francesconi W; Saba P; Tattoli M; Trabace L; Vaccari A; Cuomo V (2000). Prenatal exposure to a low concentration of carbon monoxide disrupts hippocampal long-term potentiation in rat offspring. J Pharmacol Exp Ther, 294: 728-734. 193838
Middendorff R; Kumm M; Davidoff MS; Holstein AF; Muller D (2000). Generation of cyclic guanosine monophosphate by heme oxygenases in the human testis--a regulatory role for carbon monoxide in Sertoli cells? Biol Reprod, 63: 651-657. 015842
Montagnani M; Serio M; Potenza MA; Mansi G; De Salvia MA; Cagiano R; Cuomo V; Mitolo-Chieppa D (1996). Prenatal exposure to carbon monoxide and vascular responsiveness of rat resistance vessels. Life Sci, 59: 1553-1561. 080902
Naik JS; Walker BR (2003). Heme oxygenase-mediated vasodilation involves vascular smooth muscle cell hyperpolarization. Am J Physiol Heart Circ Physiol, 285: 220-228. 193852
Ndisang JF; Tabien HE; Wang R (2004). Carbon monoxide and hypertension. Am J Hypertens, 22: 1057-1074. 180425
Neggers YH; Singh J (2006). Zinc supplementation to protein-deficient diet in CO-exposed mice decreased fetal mortality and malformation. Biol Trace Elem Res, 114: 269-279. 193964
Newby D; Cousins F; Myatt L; Lyall F (2005). Heme oxygenase expression in cultured human trophoblast cells during in vitro differentiation: Effects of hypoxia. Placenta, 26: 201-209. 193966
Odrcich MJ; Graham CH; Kimura KA; McLaughlin BE; Marks GS; Nakatsu K; Brien JF (1998). Heme oxygenase and nitric oxide synthase in the placenta of the guinea-pig during gestation. Placenta, 19: 509-516. 193958
Ozawa N; Goda N; Makino N; Yamaguchi T; Yoshimura Y; Suematsu M (2002). Leydig cell-derived heme oxygenase-1 regulates apoptosis of premeiotic germ cells in response to stress. J Clin Invest, 109: 457-467. 193841
Patel AP; Moody JA; Handy RD; Sneyd JR (2003). Carbon monoxide exposure in rat heart: glutathione depletion is prevented by antioxidants. Biochem Biophys Res Commun, 302: 392-396. 043155
Penney DG; Baylerian MS; Thill JE; Fanning CM; Yedavally S (1982). Postnatal carbon monoxide exposure: immediate and lasting effects in the rat. Am J Physiol, 243: H328-H339. 011387
January 2010 E-28

Penney DG; Baylerian MS; Thill JE; Yedavally S; Fanning CM (1983). Cardiac response of the fetal rat to carbon monoxide exposure. Am J Physiol, 244: H289-H297. 011385
Piantadosi CA (2002). Biological chemistry of carbon monoxide. Antioxid Redox Signal, 4: 259-270. 037463
Piantadosi CA (2008). Carbon monoxide, reactive oxygen signaling, and oxidative stress. Free Radic Biol Med, 45: 562-569. 180423
Piantadosi CA; Carraway MS; Suliman HB (2006). Carbon monoxide, oxidative stress, and mitochondrial permeability pore transition. Free Radic Biol Med, 40: 1332-1339. 180424
Prigge E; Hochrainer D (1977). Effects of carbon monoxide inhalation on erythropoiesis and cardiac hypertrophy in fetal rats. Toxicol Appl Pharmacol, 42: 225-228. 012326
Raub JA; Benignus VA (2002). Carbon monoxide and the nervous system. Neurosci Biobehav Rev, 26: 925-940. 041616
Richardson RS; Noyszewski EA; Saltin B; Gonzalez-Alonso J (2002). Effect of mild carboxy-hemoglobin on exercising skeletal muscle: Intravascular and intracellular evidence. Am J Physiol, 283: R1131-R1139. 037513
Ryter SW; Alam J; Choi AMK (2006). Heme oxygenase-1/carbon monoxide: From basic science to therapeutic applications. Physiol Rev, 86: 583-650. 193765
Sartiani L; Cerbai E; Lonardo G; DePaoli P; Tattoli M; Cagiano R; Carratu M; Cuomo V; Mugelli A (2004). Prenatal exposure to carbon monoxide affects postnatal cellular electrophysiological maturation of the rat heart: a potential substrate for arrhythmogenesis in infancy. Circulation, 109-: 419-423. 190898
Schwetz BA; Smith FA; Leong BKJ; Staples RE (1979). Teratogenic potential of inhaled carbon monoxide in mice and rabbits. Teratology, 19: 385-391. 011855
Shaoqing Y; Ruxin Z; Yinjian C; Jianqiu C; Chunsheng Z; Jiangfeng T; Genhong L (2008). Possible contribution of endogenous carbon monoxide to the development of allergic rhinitis in guinea pigs. J Inflamm, 5: 23. 192384
Singh J (1986). Early behavioral alterations in mice following prenatal carbon monoxide exposure. Neurotoxicology, 7: 475-481. 012827
Singh J (2003). Gastroschisis is caused by the combination of carbon monoxide and protein-zinc deficiencies in mice. Birth Defects Res B Dev Reprod Toxicol, 68: 355-362. 053624
Singh J (2006). Interaction of maternal protein and carbon monoxide on pup mortality in mice: implications for global infant mortality. Birth Defects Res B Dev Reprod Toxicol, 77: 216-26. 190512
Singh J; Aggison L Jr; Moore-Cheatum L (1993). Teratogenicity and developmental toxicity of carbon monoxide in protein-deficient mice. Teratology, 48: 149-159. 013892
Singh J; Scott LH (1984). Threshold for carbon monoxide induced fetotoxicity. Teratology, 30: 253-257. 011409
Singh J; Smith CB; Moore-Cheatum L (1992). Additivity of protein deficiency and carbon monoxide on placental carboxyhemoglobin in mice. Am J Obstet Gynecol, 167: 843-846. 013759
Sitdikova GF; Islamov RR; Mukhamedyarov MA; Permyakova VV; Zefirov AL; Palotas A (2007). Modulation of neurotransmitter release by carbon monoxide at the frog neuro-muscular junction. Curr Drug Metab, 8: 177-184. 180417
Song R; Mahidhara RS; Liu F; Ning W; Otterbein LE; Choi AMK (2002). Carbon monoxide inhibits human airway smooth muscle cell proliferation via mitogen-activated protein kinase pathway. Am J Respir Cell Mol Biol, 27: 603-610. 037531
Sorhaug S; Steinshamn S; Nilsen OG; Waldum HL (2006). Chronic inhalation of carbon monoxide: Effects on the respiratory and cardiovascular system at doses corresponding to tobacco smoking. Toxicology, 228: 280-290. 180414
Stevens CF; Wang Y (1993). Reversal of long-term potentiation by inhibitors of haem oxygenase. Nature, 364: 147-149. 188458
Stockard-Sullivan JE; Korsak RA; Webber DS; Edmond J (2003). Mild carbon monoxide exposure and auditory function in the developing rat. J Neurosci Res, 74: 644-654. 190947
Storm JE; Fechter LD (1985). Alteration in the postnatal ontogeny of cerebellar norepinephrine content following chronic prenatal carbon monoxide. J Neurochem, 45: 965-969. 011653
January 2010 E-29
Storm JE; Fechter LD (1985). Prenatal carbon monoxide exposure differentially affects postnatal weight and monoamine concentration of rat brain regions. Toxicol Appl Pharmacol, 81: 139-146. 011652
Storm JE; Valdes JJ; Fechter LD (1986). Postnatal alterations in cerebellar GABA content, GABA uptake and morphology following exposure to carbon monoxide early in development. Dev Neurosci, 8: 251-261. 012136
Styka PE; Penney DG (1978). Regression of carbon monoxide-induced cardiomegaly. Am J Physiol, 235: H516-H522. 011166
Suliman HB; Carraway MS; Tatro LG; Piantadosi CA (2007). A new activating role for CO in cardiac mitochondrial biogenesis. J Cell Sci, 120: 299-308. 193768
Sun Y; Jin K; Mao XO; Zhu Y; Greenberg DA (2001). Neuroglobin is up-regulated by and protects neurons from hypoxic-ischemic injury. PNAS, 98: 15,306-15,311. 026022
Tattoli M; Carratu MR; Cassano T; Cortese I; Di Giovanni V; Elia G; Renna G; Cagiano R (1999). Effects of early postnatal exposure to low concentrations of carbon monoxide on cognitive functions in rats. Pharmacol Res, 40: 271-274. 011557
Telfer JF; Itoh H; Thomson AJ; Norman JE; Nakao K; Campa JS; Poston L; Tribe RM; Magness RR (2001). Activity and expression of soluble and particulate guanylate cyclases in myometrium from nonpregnant and pregnant women: down-regulation of soluble guanylate cyclase at term. J Clin Endocrinol Metab, 86: 5934-5943. 193769
Teran FJ; Johnson RA; Stevenson BK; Peyton KJ; Jackson KE; Appleton SD; Durante W; Johnson FK (2005). Heme oxygenase-derived carbon monoxide promotes arteriolar endothelial dysfunction and contributes to salt-induced hypertension in Dahl salt-sensitive rats. Am J Physiol Regul Integr Comp Physiol, 288: 615-622. 193770
Thom SR; Bhopale VM; Han ST; Clark JM; Hardy KR (2006). Intravascular neutrophil activation due to carbon monoxide poisoning. Am J Respir Crit Care Med, 174: 1239-1248. 098418
Thom SR; Fisher D; Manevich Y (2001). Roles for platelet-activating factor and NO-derived oxidants causing neutrophil adherence after CO poisoning. Am J Physiol Heart Circ Physiol, 281: H923-H930. 193779
Thom SR; Fisher D; Xu YA; Garner S; Ischiropoulos H (1999). Role of nitric oxide-derived oxidants in vascular injury from carbon monoxide in the rat. Am J Physiol, 276: H984-H992. 016753
Thom SR; Fisher D; Xu YA; Notarfrancesco K; Ischiropoulos H (2000). Adaptive responses and apoptosis in endothelial cells exposed to carbon monoxide. PNAS, 97: 1305-1310. 011574
Thom SR; Ischiropoulos H (1997). Mechanism of oxidative stress from low levels of carbon monoxide. Health Effects Institute. Boston, MA. 085644
Thom SR; Ohnishi ST; Fisher D; Xu YA; Ischiropoulos H (1999). Pulmonary vascular stress from carbon monoxide. Toxicol Appl Pharmacol, 154: 12-19. 016757
Thom SR; Ohnishi ST; Ischiropoulos H (1994). Nitric oxide released by platelets inhibits neutrophil B2 integrin function following acute carbon monoxide poisoning. Toxicol Appl Pharmacol, 128: 105-110. 076459
Thom SR; Xu YA; Ischiropoulos H (1997). Vascular endothelial cells generate peroxynitrite in response to carbon monoxide exposure. Chem Res Toxicol, 10: 1023-1031. 084337
Thorup C; Jones CL; Gross SS; Moore LC; Goligorsky MS (1999). Carbon monoxide induces vasodilation and nitric oxide release but suppresses endothelial NOS. Am J Physiol, 277: F882-F889. 193782
Tolcos M; Mallard C; McGregor H; Walker D; Rees S (2000). Exposure to prenatal carbon monoxide and postnatal hyperthermia: short and long-term effects on neurochemicals and neuroglia in the developing brain. Exp Neurol, 162: 235-246. 010468
Tolcos M; McGregor H; Walker D; Rees S (2000). Chronic prenatal exposure to carbon monoxide results in a reduction in tyrosine hydroxylase-immunoreactivity and an increase in choline acetyltransferase-immunoreactivity in the fetal medulla: implications for sudden infant death syndrome. J Neuropathol Exp Neurol, 59: 218-228. 015997
Toyoda M; Saito H; Matsuki N (1996). Nitric oxide but not carbon monoxide is involved in spatial learning of mice. J Pharmacol Sci, 71: 205-211. 079945
Tschugguel W; Stonek F; Zhegu Z; Dietrich W; Schneeberger C; Stimpfl T; Waldhoer T; Vycudilik W; Huber JC (2001). Estrogen increases endothelial carbon monoxide, heme oxygenase 2, and carbon monoxide-derived cGMP by a receptor-mediated system. J Clin Endocrinol Metab, 86: 3833-3839. 193785
January 2010 E-30
Vallone B; Nienhaus K; Matthes A; Brunori M; Nienhaus GU (2004). The structure of carbonmonoxy neuroglobin reveals a heme-sliding mechanism for control of ligand affinity. PNAS, 101: 17351-17356. 193993
Villamor E; Perez-Vizcaino F; Cogolludo AL; Conde-Oviedo J; Zaragoza-Arnaez F; Lopez-Lopez JG; Tamargo J (2000). Relaxant effects of carbon monoxide compared with nitric oxide in pulmonary and systemic vessels of newborn piglets. Pediatr Res, 48: 546-553. 015838
Vreman HJ; Wong RJ; Kadotani T; Stevenson DK (2005). Determination of carbon monoxide (CO) in rodent tissue: effect of heme administration and environmental CO exposure. Anal Biochem, 341: 280-289. 193786
Vreman HJ; Wong RJ; Kim EC; Nabseth DC; Marks GS; Stevenson DK (2000). Haem oxygenase activity in human umbilical cord and rat vascular tissues. Placenta, 21: 337-44. 096915
Weaver LK; Valentine KJ; Hopkins RO (2007). Carbon monoxide poisoning: risk factors for cognitive sequelae and the role of hyperbaric oxygen. Am J Respir Crit Care Med, 176: 491 - 497. 193939
Webber D; Lopez I; Korsak R; Hirota S; Acuna D; Edmond J (2005). Limiting iron availability confers neuroprotection from chronic mild carbon monoxide exposure in the developing auditory system of the rat. J Neurosci Res, 80: 620-633. 190514
Webber DS; Korsak RA; Sininger LK; Sampogna SL; Edmond J (2003). Mild carbon monoxide exposure impairs the developing auditory system of the rat. J Neurosci Res, 74: 655-665. 190515
Wellenius GA; Batalha JRF; Diaz EA; Lawrence J; Coull BA; Katz T; Verrier RL; Godleski JJ (2004). Cardiac effects of carbon monoxide and ambient particles in a rat model of myocardial infarction. Toxicol Sci, 80: 367-376. 087874
Wellenius GA; Coull BA; Batalha JRF; Diaz EA; Lawrence J; Godleski JJ (2006). Effects of ambient particles and carbon monoxide on supraventricular arrhythmias in a rat model of myocardial infarction. Inhal Toxicol, 18: 1077-1082. 156152
Yoshiki N; Kubota T; Aso T (2001). Identification of heme oxygenase in human endometrium. J Clin Endocrinol Metab, 86: 5033-5038. 193790
Zamudio S; Palmer SK; Dahms TE; Berman JC; Young DA; Moore LG (1995). Alterations in uteroplacental blood flow precede hypertension in preeclampsia at high altitude. J Appl Physiol, 79: 15-22. 193908
Zenclussen ML; Anegon I; Bertoja AZ; Chauveau C; Vogt K; Gerlof K; Sollwedel A; Volk HD; Ritter T; Zenclussen AC (2006). Over-expression of heme oxygenase-1 by adenoviral gene transfer improves pregnancy outcome in a murine model of abortion. Am J Reprod Immunol, 69: 35-52. 193873
Zhang C; Li XY; Zhao L; Wang H; Xu DX (2007). Lipopolysaccharide (LPS) up-regulates the expression of haem oxygenase-1 in mouse placenta. Placenta, 28: 951-957. 193879
Zhang X; Shan P; Alam J; Fu XY; Lee PJ (2005). Carbon monoxide differentially modulates STAT1 and STAT3 and inhibits apoptosis via a phosphatidylinositol 3-kinase/akt and p38 kinase-dependent STAT3 pathway during anoxia-reoxygenation injury. J Biol Chem, 280: 8714-8721. 184460
Zhao H; Wong RJ; Doyle TC; Nayak N; Vreman HJ; Contag CH; Stevenson DK (2008). Regulation of maternal and fetal hemodynamics by heme oxygenase in mice. Biol Reprod, 78: 744-751. 193883
Zhuo M; Small SA; Kandel ER; Hawkins RD (1993). Nitric oxide and carbon monoxide produce activity-dependent long-term synaptic enhancement in hippocampus. Science, 260: 1946-1950. 013905
Zuckerbraun BS; Chin BY; Bilban M; d'Avila JC; Rao J; Billiar TR; Otterbein LE (2007). Carbon monoxide signals via inhibition of cytochrome c oxidase and generation of mitochondrial reactive oxygen species. FASEB J, 21: 1099-1106. 193884
January 2010 E-31