analyzing the discharge regime of a large tropical river through remote sensing, ground-based...
TRANSCRIPT
Analyzing the discharge regime of a large tropical riverthrough remote sensing, ground-based climatic data,and modeling
Charles J. Vorosmarty,1 Cort J. Willmott,2 Bhaskar J. Choudhury,3
Annette L. Schloss,1 Timothy K. Stearns,1 Scott M. Robeson,4
and Timothy J. Dorman5
Abstract. This study demonstrates the potential for applying passive microwave satellitesensor data to infer the discharge dynamics of large river systems using the main stemAmazon as a test case. The methodology combines (1) interpolated ground-basedmeteorological station data, (2) horizontally and vertically polarized temperaturedifferences (HVPTD) from the 37-GHz scanning multichannel microwave radiometer(SMMR) aboard the Nimbus 7 satellite, and (3) a calibrated water balance/water transportmodel (WBM/WTM). Monthly HVPTD values at 0.258 (latitude by longitude) resolutionwere resampled spatially and temporally to produce an enhanced HVPTD time series at0.58 resolution for the period May 1979 through February 1985. Enhanced HVPTD valueswere regressed against monthly discharge derived from the WBM/WTM for each of 40grid cells along the main stem over a calibration period from May 1979 to February 1983to provide a spatially contiguous estimate of time-varying discharge. HVPTD-estimatedflows generated for a validation period from March 1983 to February 1985 were found tobe in good agreement with both observed and modeled discharges over a 1400-km sectionof the main stem Amazon. This span of river is bounded downstream by a region of tidalinfluence and upstream by low sensor response associated with dense forest canopy. Boththe WBM/WTM and HVPTD-derived flow rates reflect the significant impact of the 1982–1983 El Nino–Southern Oscillation (ENSO) event on water balances within the drainagebasin.
Introduction
The water cycle is an important component of the Earthsystem, and numerous uncertainties remain about pool sizes,their dynamics, and their changes due to human activities[Committee on Global Change, 1988; World Climate ResearchProgramme, 1992; Chahine, 1992; Watson et al., 1996]. Partic-ular attention has been paid toward refining our representationof the dynamics of evapotranspiration [Wood, 1991; Hender-son-Sellers and Brown, 1992; Kalma and Calder, 1994], soilmoisture [Mintz and Serafini, 1984, 1989; Willmott et al., 1985a;Serafini and Sud, 1987; Mintz and Walker, 1993; Webb andRosenzweig, 1993], and precipitation [Legates and Willmott,1990b; Arkin and Janowiak, 1991; Global Precipitation Clima-tology Centre (GPCC), 1992; Simpson, 1992]. Much less atten-tion has been paid to the dynamics of river systems, althoughriver discharge can provide validation for both empirical waterbalance models and climate simulations. River heights and
flows are also of importance to a myriad of landscape processesincluding the generation and transport of sediment, nutrients,and carbon; the ecology of lotic and wetland ecosystems; andthrough floodplain inundation the consequent generation ofradiatively important gases.Global inventories of river discharge are available [Global
Runoff Data Centre, 1993; United Nations Educational, Scien-tific, and Cultural Organization (UNESCO), Discharge of Se-lected Rivers of the World, various years], and have been exer-cised recently in studies of the water cycle over broad spatialdomains [Arnell and Reynard, 1989; Mintz and Serafini, 1989;Vorosmarty et al., 1989, 1991; Dumenil and Todini, 1992]. Thedecline in hydrometeorological monitoring stations [World Me-teorological Organization/United Nations Educational, Scientific,and Cultural Organization (WMO/UNESCO), 1991; Rodda etal., 1993] over the last decades has important implications forour understanding of the hydrologic cycle. The loss is partic-ularly acute in the tropics, where demands for water resourcesand hence reliable engineering information have been risingdramatically.Remote sensing of inland waters is a potentially important
source of information in light of such losses in ground-basedmonitoring capacity. Recent work using Geosat altimetry[Koblinsky et al., 1993; Morris and Gill, 1994; Birkett, 1994] tomeasure river and lake levels have shown promise. Imhoff et al.[1987] used L band synthetic aperture radar (SIR-B) in con-junction with Landsat Multispectral Scanner (MSS) andground-based stage data to determine flood boundaries alongthe lower Ganges River.
1Institute for the Study of Earth, Oceans and Space, University ofNew Hampshire, Durham.2Center for Climatic Research, Department of Geography, Univer-
sity of Delaware, Newark.3Hydrological Sciences Branch, NASA Goddard Space Flight Cen-
ter, Greenbelt, Maryland.4Department of Geography, Indiana University, Bloomington.5Science Systems and Applications, Inc., Lanham, Maryland.
Copyright 1996 by the American Geophysical Union.
Paper number 96WR01333.0043-1397/96/96WR-01333$09.00
WATER RESOURCES RESEARCH, VOL. 32, NO. 10, PAGES 3137–3150, OCTOBER 1996
3137
Giddings and Choudhury [1989] demonstrated that passivemicrowave sensors also could be used in this context. Thescanning multichannel microwave radiometer (SMMR)launched aboard the Nimbus 7 satellite collected coincidentobservations of horizontally and vertically polarized brightnesstemperature (Th and Tv, respectively) at 37 GHz from No-vember 1978 through August 1987 at a spatial resolution ofabout 25 km. Inspection of these observations, together withradiative transfer analysis, show that in the tropics, the spatialand temporal variations of the 37-GHz polarization tempera-ture difference (DT 5 Tv 2 Th) are determined primarily bythe structure and phenology of vegetation and seasonal inun-dation of major rivers and wetlands. Seasonal variation ofatmospheric precipitable water has a modulating effect on theseasonal variation of DT [Choudhury et al., 1992]. In the con-text of the current study these horizontally and vertically po-larized temperature differences (HVPTD) have been shown tobe positively correlated with variations in water level for manylarge South American rivers and wetland systems [Giddingsand Choudhury, 1989]. Since the SMMR is global in coverageand maintains a 6-day return period, it offers an opportunityfor monitoring the changing hydrologic status of such systemsover broad geographic domains.Choudhury [1989] reviewed numerous theoretical aspects
associated with the 37-GHz data obtained from the Nimbus 7SMMR. Polarization temperature differences at this frequencyare related to the dipolar moment of water and the sensorshould yield an HVPTD value of 608K for pixels composedentirely of open water, 48K for closed canopy, and intermedi-ate values for vegetated floodplains. For the 25-km pixel of theSMMR, mixtures of open water, uplands, and floodplains willbe common, and each sensor reading will be a composite ofHVPTD values determined by the distribution of these con-trasting landscapes. In regions dominated by periodically in-undated floodplains, HVPTD values show the greatest tempo-ral variation since flooding reduces the proportionalcontribution of upland landscapes to the overall HVPTD sig-nal, while recession has the opposite effect. This concept wastested by Sippel et al. [1994] in a 35,000-km2 area located on themain stem Amazon to determine the area of fractional flood-plain inundation. They determined that inundated floodplainwas associated with an HVPTD of 17.48K and used time vari-ations in the composite HVPTD signal, together with linearmixing models of the end-member microwave signatures, toconstruct a time series of flooding over this domain.In large floodplain-dominated rivers, variations in water
heights therefore impart a hydrological signal detectablethrough the use of 37-GHz SMMR imagery. Since variations instage are related to variations in discharge, there is also apotential for monitoring river flows remotely. In the Amazon,stage-discharge relationships (i.e., rating curves) are a standardhydrometric technique used routinely by the Brazilian Depart-mento Nacional de Aguas Energia Electrica to compute flowsalong the main stem Amazon and its tributaries [Richey et al.,1989]. We will exploit the connection between stage, seasonalinundation, and discharge and relate these to time series of37-GHz SMMR HVPTD. The purpose of this study is to dem-onstrate the potential for applying 37-GHz passive microwavedata to generate remotely sensed, contiguous discharge hydro-graphs along the main stem Amazon River and to test thelimits of the approach. It prepares a framework for monitoringother large rivers and for exploring the use of contemporary
and future passive microwave data sets in conjunction withhydrological models.
MethodsStudy Area
The setting for this analysis is the Amazon River drainagebasin (Figure 1), a river system that encompasses 5.8 millionkm2 [van der Leeden et al., 1990]. The basin is complex from ahydrological standpoint. It includes upland mountainousreaches, granitic shield areas, and an extensive lowland flood-plain system. Although it still maintains the world’s largeststand of natural tropical evergreen forest, it drains a variety ofother natural forested and nonforested ecosystems (see Table1) and lands subject to human disturbance [Skole and Tucker,1993]. Water recycling is prevalent [Salati and Vose, 1984], andits disruption by land use change poses grave concerns aboutregional and global climate [Dickinson and Henderson-Sellers,1988; Lean and Warrilow, 1989; Shukla et al., 1990].In this study we consider the main stem Amazon River to
begin in the Brazilian state of Amazonas (about 71.58W, 4.08S),progress downstream through the large floodplain-dominatedchannel system, and end at a point close to the city of Obidos(about 56.08W, 2.08S). We limited our analysis to this portionof the river to avoid complications associated with coastaltides. Floodplain extent within Brazil has been estimated at92,400 km2 along the main stem with an additional 62,000 km2
along the major tributaries [Sippel et al., 1992]. Vorosmarty etal. [1989] and Richey et al. [1989] analyzed hydrographs alongthe main stem and found that floodplain inundation must beconsidered in any analysis of discharge within the main stem.The Amazon has a final entry to the sea located approximately1000 km downstream of Obidos, with discharges of over200,000 m3/s. This flow represents approximately 15% of theglobal delivery of fresh water to the oceans. Comprehensivedescriptions of the hydrography of the river system can befound in work by Sioli [1984] and Rzoska [1978].
Climatic Time Series
Representative climatic time series of monthly precipitation(P) and air temperature (T) were estimated from station-dataarchives compiled by Legates and Willmott [1990a, b] and Voseet al. [1992] and a spatial interpolation methodology presentedand evaluated by Willmott and Robeson [1995]. Willmott andRobeson’s algorithm makes use of a climatological (long-termaverage) monthly P or T field to assist in interpolating anyparticular monthly P or T field of interest. It also relies onWillmott et al.’s [1985b] spherical implementation of Shepard’s[1968] inverse-distance weighting procedure. All interpola-tions, whether to stations or a spherical grid, are made with theWillmott et al. [1985b] algorithm. Termed “climatologicallyaided interpolation” (CAI), Willmott and Robeson’s proce-dure improves upon the simple interpolation from station ob-servations by exploiting the spatial colinearity between P and P(or between T and T) and the fact that observations of P andT are available at meaningfully higher spatial resolutions thanare observations of P and T. Using CAI, monthly fields of Pand T were interpolated to a 0.58 of latitude by 0.58 of longi-tude resolution for each month within the period April 1979through March 1985.Illustrating CAI for monthly (January 1980) precipitation,
long-term January means from Legates and Willmott’s high-resolution station climatology (P) first are interpolated to all
VOROSMARTY ET AL.: DISCHARGE REGIME OF A LARGE TROPICAL RIVER3138
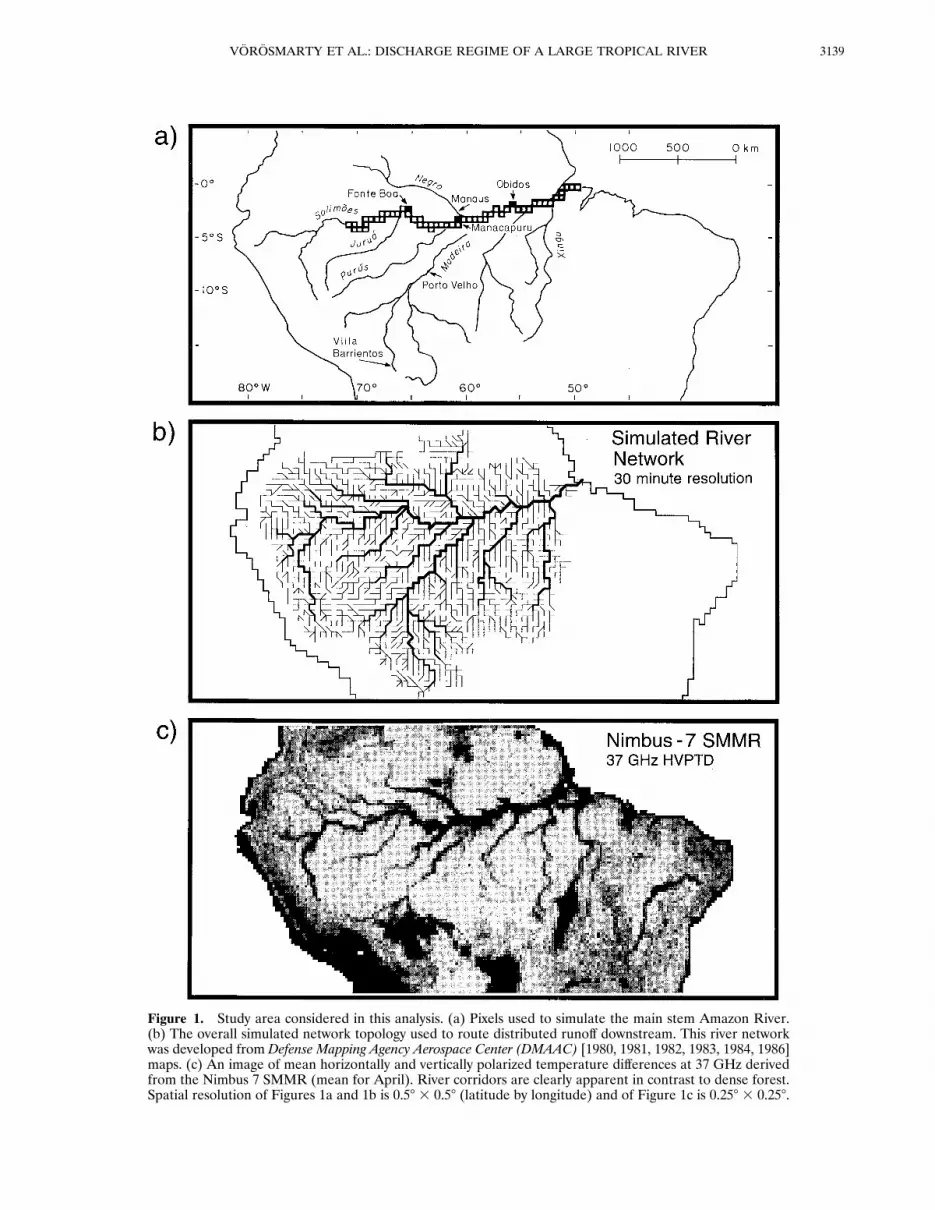
Figure 1. Study area considered in this analysis. (a) Pixels used to simulate the main stem Amazon River.(b) The overall simulated network topology used to route distributed runoff downstream. This river networkwas developed from Defense Mapping Agency Aerospace Center (DMAAC) [1980, 1981, 1982, 1983, 1984, 1986]maps. (c) An image of mean horizontally and vertically polarized temperature differences at 37 GHz derivedfrom the Nimbus 7 SMMR (mean for April). River corridors are clearly apparent in contrast to dense forest.Spatial resolution of Figures 1a and 1b is 0.58 3 0.58 (latitude by longitude) and of Figure 1c is 0.258 3 0.258.
3139VOROSMARTY ET AL.: DISCHARGE REGIME OF A LARGE TROPICAL RIVER
Vose et al. [1992] stations ( j) for which January 1980 Pj areavailable. Among other variables, the Vose et al. [1992] stationarchive contains monthly time series of P and T, and some ofthe station records extend back well into the nineteenth cen-tury. Each interpolated long-term mean ( Pj) then is subtractedfrom the January 1980 station precipitation value (Pj) at thecorresponding Vose et al. station ( j). A monthly (January1980) precipitation deviation (dPj 5 Pj 2 Pj) is obtained inthis fashion for each station. These station deviations (dPj)then are interpolated to a 0.58 3 0.58 spherical grid. At eachnode of the grid (i), the CAI estimate (Pi) is obtained byadding the interpolated deviation (d P i) to an estimatedLegates and Willmott [1990a, b] long-term average ( Pi), whereeach Pi was previously interpolated from Legates and Will-mott’s 1,640 long-term station averages for South America.When dPi is interpolated by Shepard’s [1968] distance-relatedweighting, the CAI estimate can be written as
P i 5 dP i 1 Pi (1a)
where
dP i 5 Oj51
ni
wij@dPj 1 D~dPj!#Y Oj51
ni
wij (1b)
and ni is the number of nearby stations used to interpolateprecipitation to grid node i, and wij represents the influencethat the precipitation deviation at station j (dPj) and its esti-mated spatial gradient (D(dPj)) at j have on the deviationestimate at grid node i. In addition to its inverse-distanceweighting, Shepard’s algorithm contains procedures for damp-ing the deleterious influences of spatially clustered (autocor-related) nearby stations and extrapolating beyond the range ofni nearby stations when the estimated spatial gradients at thenearby stations (D(dPj)) warrant it. Mean absolute (interpo-lation) errors (MAEs), determined from cross validation at allof the stations, were on the order of 0.88C for monthly tem-perature and about 40 mm for monthly precipitation, althoughthe precipitation MAEs exhibit a strong seasonal oscillationthat ranges from approximately 25 to 55 mm.Two biases contribute to the underestimation of areal pre-
cipitation averages made from the South American historicalstation record. Rain gauge undercatch contributes systematicerrors on the order of 5% [Legates and Willmott, 1990b]. Con-siderably larger errors, however, arise from the inability of the
historical rain gauge networks to adequately resolve the spatialvariability within precipitation [Willmott et al., 1994]. Ill-conditioned precipitation networks exist on most other conti-nents; however, they tend to produce overestimates of large-scale spatially averaged precipitation. Network-inducedunderestimation of large-scale areal averages in South Amer-ica then is distinct [Willmott et al., 1994]. Reporting rain gaugesin South America are sparse over most of the continent butespecially so in the interior, where it is wet (e.g., within theAmazon Basin). It is this relative undersampling of the wetterregions that gives rise to the underestimation. Using typicalnetwork densities for South America, Willmott et al. [1994]illustrated that the network-induced underestimates in conti-nental averages can be on the order of several hundred milli-meters per year.Our use of CAI reduces the magnitude of underestimation.
In addition, for 11 sub-basins within the Amazon Basin, ourgridded monthly precipitation estimates (obtained from CAI)were adjusted toward a balance with observed runoff and es-timated evapotranspiration rates. Adjustment factors rangedbetween 0.90 and 1.45. Within most of the 11 sub-basins, inother words, CAI-estimated monthly precipitation was ad-justed in an upward direction. Our precipitation forcing ofAmazon hydrology, in turn, is greater than that in most previ-ous studies, but we believe it is relatively more accurate.Substantial spatial and temporal variability are evident
within the estimated P and T fields, especially within P (Plate1). Within South America the Amazon Basin maintains pre-cipitation rates that are among the continent’s highest. In ad-dition, the basin is the major contributor to the total volume ofprecipitation delivered at the continental scale. Basin-wideyearly averages, made for each of the five complete water years(September through August) within the time frame of ourstudy, exhibit single-year extrema of 2200 and 2450 mm (Table2). Intra-annual variability also is quite large, primarily in re-sponse to the seasonal migration of the Intertropical Conver-gence Zone (ITCZ) over the basin (Plate 1). Temperature isless variable on virtually all spatial and temporal scales. Mostof the Amazon basin is at or above 248C throughout the year.Standard deviations of yearly average T are about 0.68C, whilecorresponding monthly values are approximately 2.08C. It isworth noting that our analysis encompasses the El Nino–Southern Oscillation (ENSO) event that began in late 1982.
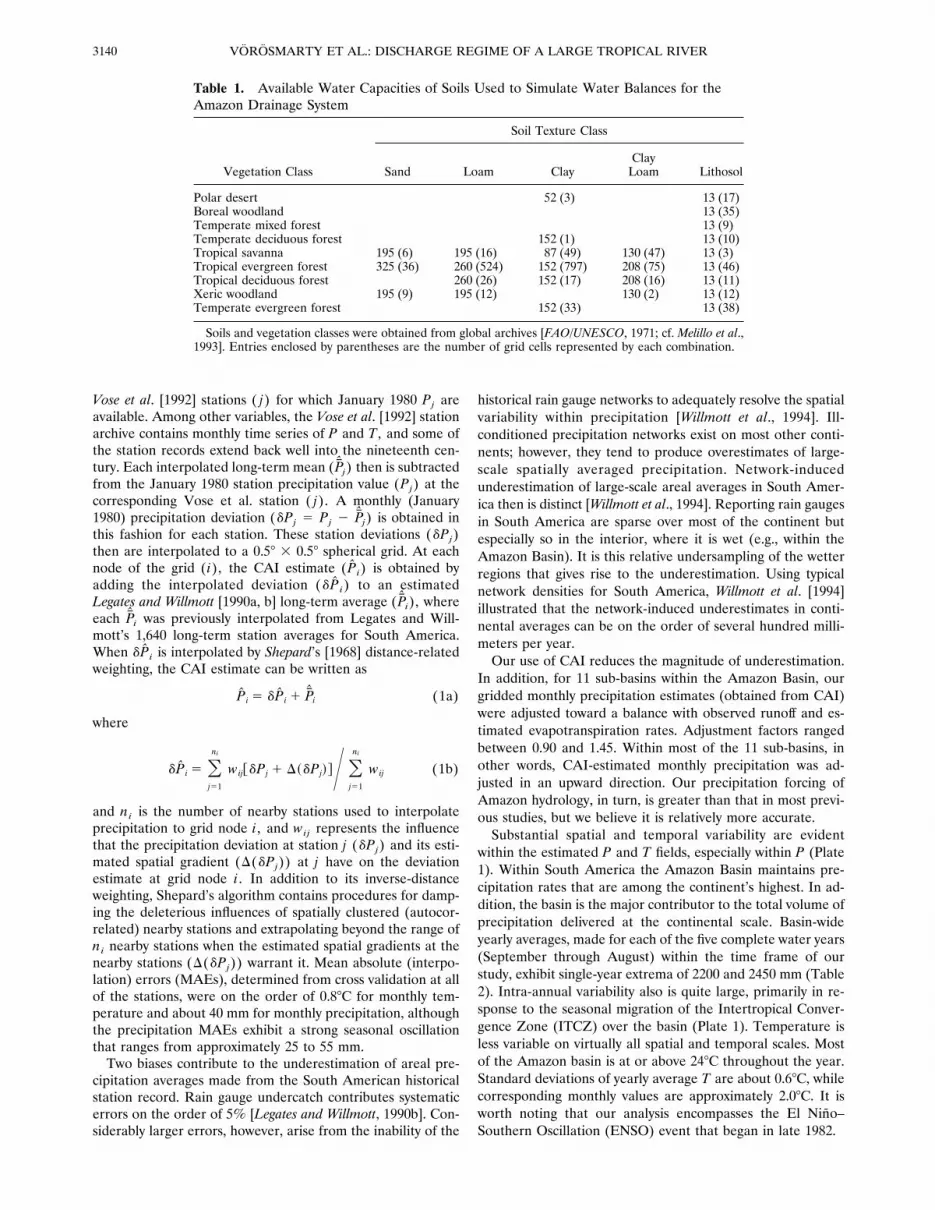
Table 1. Available Water Capacities of Soils Used to Simulate Water Balances for theAmazon Drainage System
Vegetation Class
Soil Texture Class
Sand Loam ClayClayLoam Lithosol
Polar desert 52 (3) 13 (17)Boreal woodland 13 (35)Temperate mixed forest 13 (9)Temperate deciduous forest 152 (1) 13 (10)Tropical savanna 195 (6) 195 (16) 87 (49) 130 (47) 13 (3)Tropical evergreen forest 325 (36) 260 (524) 152 (797) 208 (75) 13 (46)Tropical deciduous forest 260 (26) 152 (17) 208 (16) 13 (11)Xeric woodland 195 (9) 195 (12) 130 (2) 13 (12)Temperate evergreen forest 152 (33) 13 (38)
Soils and vegetation classes were obtained from global archives [FAO/UNESCO, 1971; cf. Melillo et al.,1993]. Entries enclosed by parentheses are the number of grid cells represented by each combination.
VOROSMARTY ET AL.: DISCHARGE REGIME OF A LARGE TROPICAL RIVER3140
Simulated Discharges
The Water Balance/Water Transport Model (WBM/WTM)was used to generate a 6-year monthly time series of dischargefor each 0.58 cell representing the Amazon drainage basin. Themodel is described in the appendix to this paper and is basedon work by Vorosmarty [1991], Vorosmarty and Moore [1991],and Vorosmarty et al. [1989, 1991]. The model relies on a series
of biophysical data sets which specify land surface propertiesand climatic drivers depicting time-varying fields of precipita-tion and temperature. The combination of soils, vegetation,and available water capacities used here are given in Table 1.The WBM predicts monthly water balances, specifically soilmoisture, evapotranspiration, and runoff on independent 0.58grid cells. This application of the WBM utilized a Thornth-
Plate 1. A portion of the 6-year time series for precipitation used in this study. These fields were developedusing the climatologically aided interpolation (CAI) procedure described in the text. Simulated runoff andriver discharge reflect the spatial and temporal variations embodied within such climatic forcings.
Table 2. Elements of the Computed Water Balance for the Amazon Basin,Upriver of Obidos
Water Year*
1979–1980 1980–1981 1981–1982 1982–1983 1983–1984
Precipitation 2229 2306 2450 2200 2323Evapotranspiration 1194 1210 1260 1263 1180Runoff 1042 1091 1211 953 1131Discharge 1030 1038 1222 975 1022D Basin storage† 15 158 232 238 1121D Soil moisture 0 18 217 24 16
All units are in millimeters per year.*Each water year begins in September.†Represents aggregate change in the following pools: soil moisture, runoff detention, channels, and
floodplains. Water extraction by deeply rooted vegetation is not included in these calculations.
3141VOROSMARTY ET AL.: DISCHARGE REGIME OF A LARGE TROPICAL RIVER
waite and Mather potential evapotranspiration (PET) function(as applied by Mintz and Walker [1993], Mintz and Serafini[1989], and Willmott et al. [1985a]) in conjunction with a sta-tistical scaling function that accounts for submonthly soil mois-ture dynamics. The model yielded mean PET values for theentire basin (1349 mm/yr) that were close to those determinedfrom digitized versions of maps given by Korzoun et al. [1977](1327 mm/yr).The WTM routes runoff using a simulated network topology
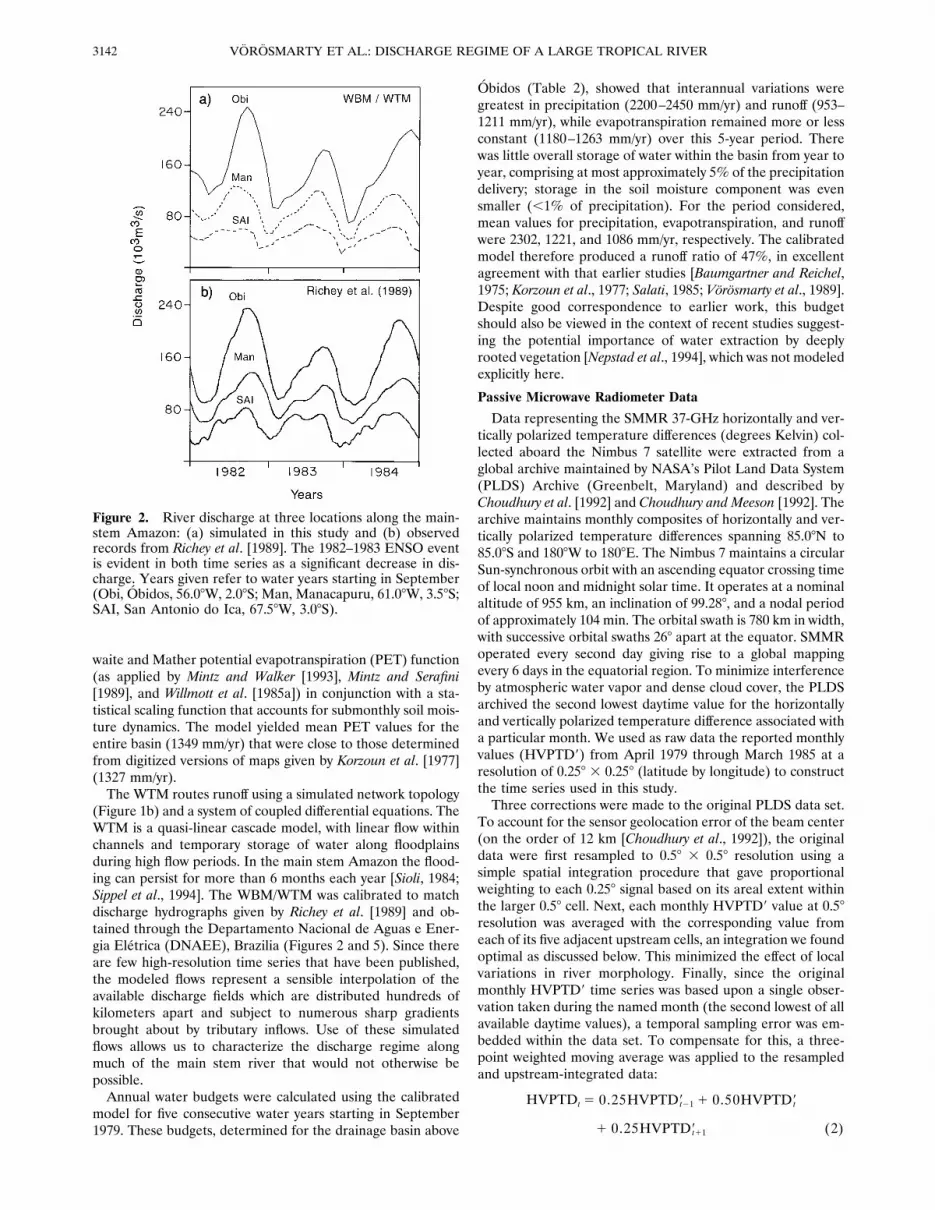
(Figure 1b) and a system of coupled differential equations. TheWTM is a quasi-linear cascade model, with linear flow withinchannels and temporary storage of water along floodplainsduring high flow periods. In the main stem Amazon the flood-ing can persist for more than 6 months each year [Sioli, 1984;Sippel et al., 1994]. The WBM/WTM was calibrated to matchdischarge hydrographs given by Richey et al. [1989] and ob-tained through the Departamento Nacional de Aguas e Ener-gia Eletrica (DNAEE), Brazilia (Figures 2 and 5). Since thereare few high-resolution time series that have been published,the modeled flows represent a sensible interpolation of theavailable discharge fields which are distributed hundreds ofkilometers apart and subject to numerous sharp gradientsbrought about by tributary inflows. Use of these simulatedflows allows us to characterize the discharge regime alongmuch of the main stem river that would not otherwise bepossible.Annual water budgets were calculated using the calibrated
model for five consecutive water years starting in September1979. These budgets, determined for the drainage basin above
Obidos (Table 2), showed that interannual variations weregreatest in precipitation (2200–2450 mm/yr) and runoff (953–1211 mm/yr), while evapotranspiration remained more or lessconstant (1180–1263 mm/yr) over this 5-year period. Therewas little overall storage of water within the basin from year toyear, comprising at most approximately 5% of the precipitationdelivery; storage in the soil moisture component was evensmaller (,1% of precipitation). For the period considered,mean values for precipitation, evapotranspiration, and runoffwere 2302, 1221, and 1086 mm/yr, respectively. The calibratedmodel therefore produced a runoff ratio of 47%, in excellentagreement with that earlier studies [Baumgartner and Reichel,1975; Korzoun et al., 1977; Salati, 1985; Vorosmarty et al., 1989].Despite good correspondence to earlier work, this budgetshould also be viewed in the context of recent studies suggest-ing the potential importance of water extraction by deeplyrooted vegetation [Nepstad et al., 1994], which was not modeledexplicitly here.
Passive Microwave Radiometer Data
Data representing the SMMR 37-GHz horizontally and ver-tically polarized temperature differences (degrees Kelvin) col-lected aboard the Nimbus 7 satellite were extracted from aglobal archive maintained by NASA’s Pilot Land Data System(PLDS) Archive (Greenbelt, Maryland) and described byChoudhury et al. [1992] and Choudhury and Meeson [1992]. Thearchive maintains monthly composites of horizontally and ver-tically polarized temperature differences spanning 85.08N to85.08S and 1808W to 1808E. The Nimbus 7 maintains a circularSun-synchronous orbit with an ascending equator crossing timeof local noon and midnight solar time. It operates at a nominalaltitude of 955 km, an inclination of 99.288, and a nodal periodof approximately 104 min. The orbital swath is 780 km in width,with successive orbital swaths 268 apart at the equator. SMMRoperated every second day giving rise to a global mappingevery 6 days in the equatorial region. To minimize interferenceby atmospheric water vapor and dense cloud cover, the PLDSarchived the second lowest daytime value for the horizontallyand vertically polarized temperature difference associated witha particular month. We used as raw data the reported monthlyvalues (HVPTD9) from April 1979 through March 1985 at aresolution of 0.258 3 0.258 (latitude by longitude) to constructthe time series used in this study.Three corrections were made to the original PLDS data set.
To account for the sensor geolocation error of the beam center(on the order of 12 km [Choudhury et al., 1992]), the originaldata were first resampled to 0.58 3 0.58 resolution using asimple spatial integration procedure that gave proportionalweighting to each 0.258 signal based on its areal extent withinthe larger 0.58 cell. Next, each monthly HVPTD9 value at 0.58resolution was averaged with the corresponding value fromeach of its five adjacent upstream cells, an integration we foundoptimal as discussed below. This minimized the effect of localvariations in river morphology. Finally, since the originalmonthly HVPTD9 time series was based upon a single obser-vation taken during the named month (the second lowest of allavailable daytime values), a temporal sampling error was em-bedded within the data set. To compensate for this, a three-point weighted moving average was applied to the resampledand upstream-integrated data:
HVPTDt 5 0.25HVPTD9t21 1 0.50HVPTD9t
1 0.25HVPTD9t11 (2)
Figure 2. River discharge at three locations along the main-stem Amazon: (a) simulated in this study and (b) observedrecords from Richey et al. [1989]. The 1982–1983 ENSO eventis evident in both time series as a significant decrease in dis-charge. Years given refer to water years starting in September(Obi, Obidos, 56.08W, 2.08S; Man, Manacapuru, 61.08W, 3.58S;SAI, San Antonio do Ica, 67.58W, 3.08S).
VOROSMARTY ET AL.: DISCHARGE REGIME OF A LARGE TROPICAL RIVER3142
where HVPTD represents a particular month’s corrected 37-GHz polarized temperature difference and t is month. Thetime series so constructed spanned May 1979 through Febru-ary 1985.Figure 3 shows an example of the sequential improvement in
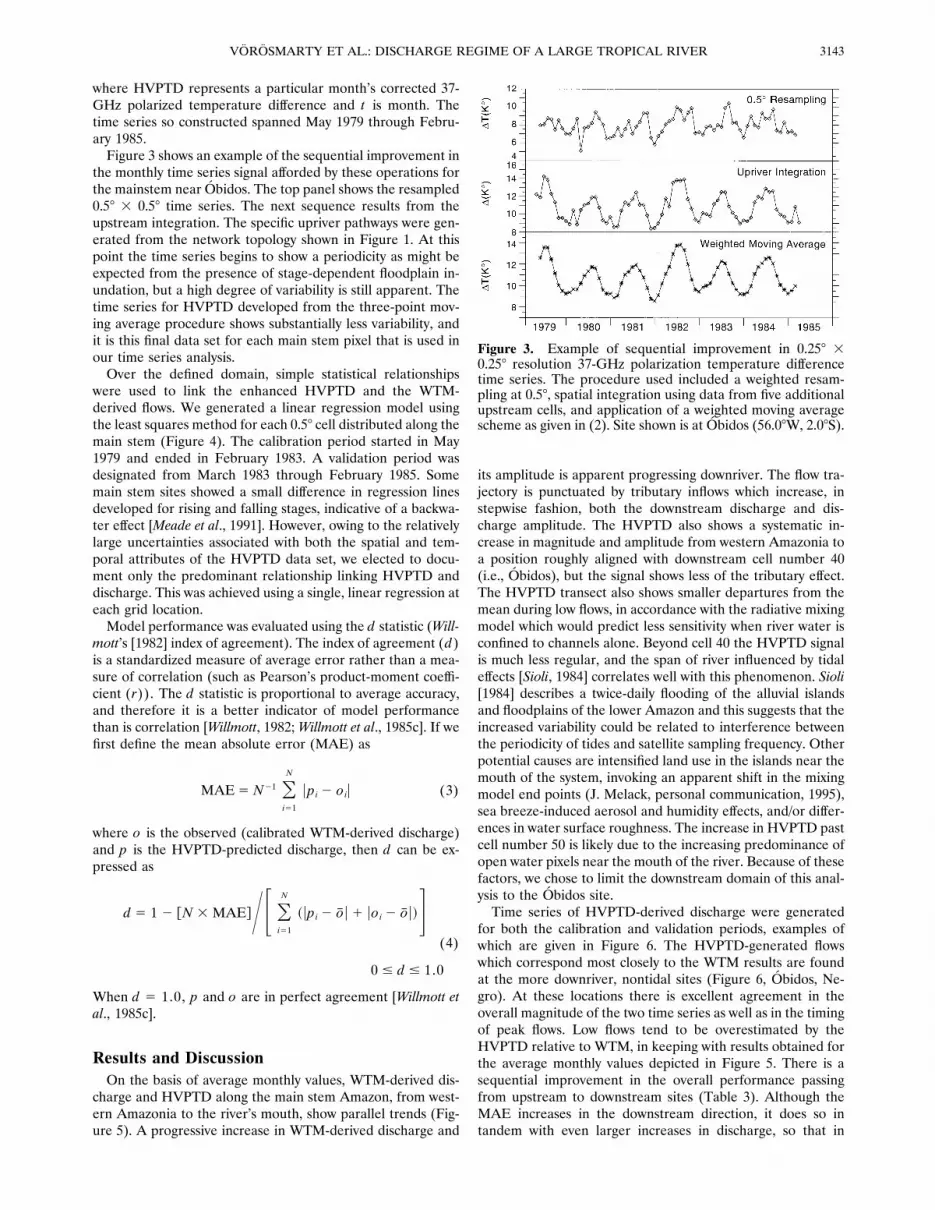
the monthly time series signal afforded by these operations forthe mainstem near Obidos. The top panel shows the resampled0.58 3 0.58 time series. The next sequence results from theupstream integration. The specific upriver pathways were gen-erated from the network topology shown in Figure 1. At thispoint the time series begins to show a periodicity as might beexpected from the presence of stage-dependent floodplain in-undation, but a high degree of variability is still apparent. Thetime series for HVPTD developed from the three-point mov-ing average procedure shows substantially less variability, andit is this final data set for each main stem pixel that is used inour time series analysis.Over the defined domain, simple statistical relationships
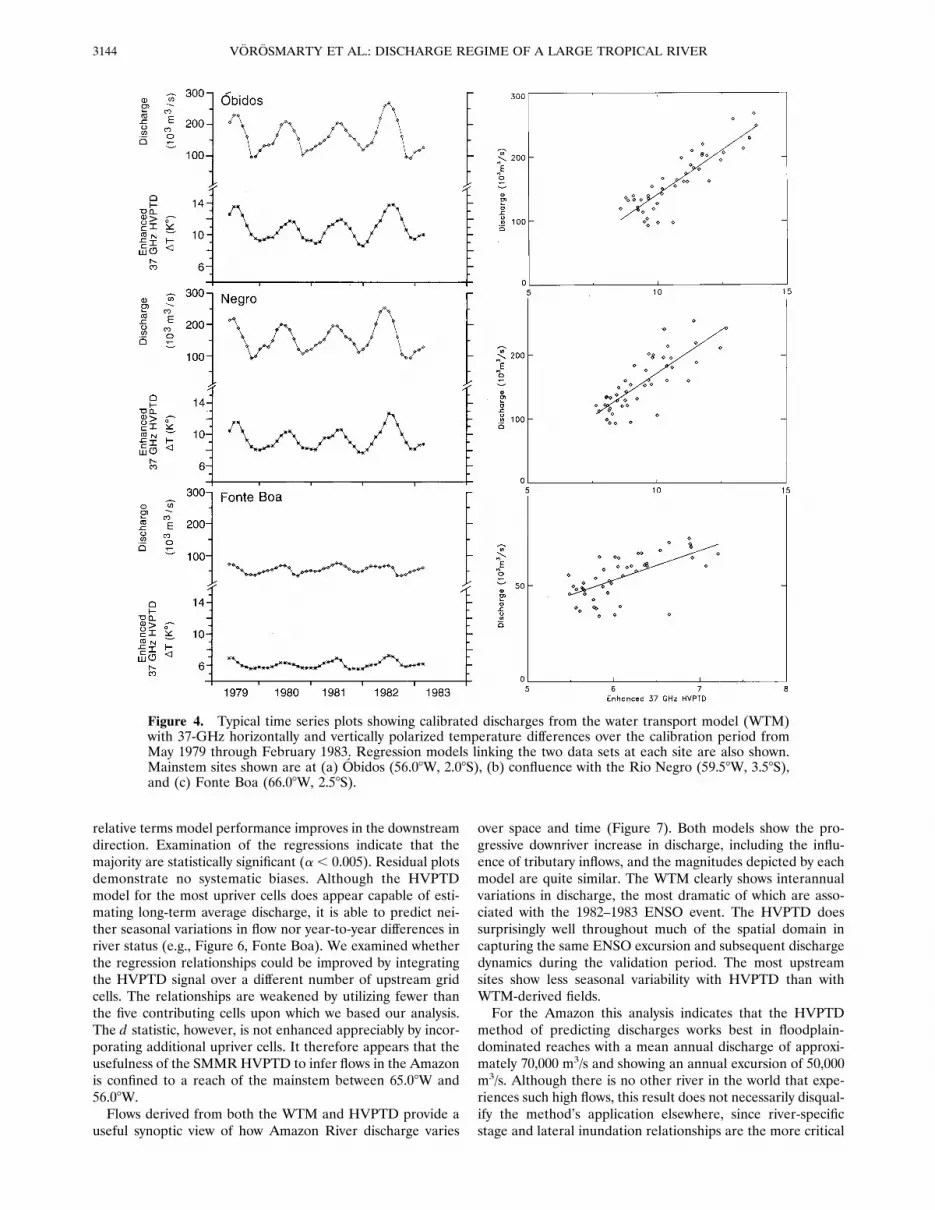
were used to link the enhanced HVPTD and the WTM-derived flows. We generated a linear regression model usingthe least squares method for each 0.58 cell distributed along themain stem (Figure 4). The calibration period started in May1979 and ended in February 1983. A validation period wasdesignated from March 1983 through February 1985. Somemain stem sites showed a small difference in regression linesdeveloped for rising and falling stages, indicative of a backwa-ter effect [Meade et al., 1991]. However, owing to the relativelylarge uncertainties associated with both the spatial and tem-poral attributes of the HVPTD data set, we elected to docu-ment only the predominant relationship linking HVPTD anddischarge. This was achieved using a single, linear regression ateach grid location.Model performance was evaluated using the d statistic (Will-
mott’s [1982] index of agreement). The index of agreement (d)is a standardized measure of average error rather than a mea-sure of correlation (such as Pearson’s product-moment coeffi-cient (r)). The d statistic is proportional to average accuracy,and therefore it is a better indicator of model performancethan is correlation [Willmott, 1982;Willmott et al., 1985c]. If wefirst define the mean absolute error (MAE) as
MAE5 N21 Oi51
N
upi 2 oiu (3)
where o is the observed (calibrated WTM-derived discharge)and p is the HVPTD-predicted discharge, then d can be ex-pressed as
d 5 1 2 @N 3 MAE#YF Oi51
N
~ upi 2 o u 1 uoi 2 o u!G(4)
0 # d # 1.0
When d 5 1.0, p and o are in perfect agreement [Willmott etal., 1985c].
Results and DiscussionOn the basis of average monthly values, WTM-derived dis-
charge and HVPTD along the main stem Amazon, from west-ern Amazonia to the river’s mouth, show parallel trends (Fig-ure 5). A progressive increase in WTM-derived discharge and
its amplitude is apparent progressing downriver. The flow tra-jectory is punctuated by tributary inflows which increase, instepwise fashion, both the downstream discharge and dis-charge amplitude. The HVPTD also shows a systematic in-crease in magnitude and amplitude from western Amazonia toa position roughly aligned with downstream cell number 40(i.e., Obidos), but the signal shows less of the tributary effect.The HVPTD transect also shows smaller departures from themean during low flows, in accordance with the radiative mixingmodel which would predict less sensitivity when river water isconfined to channels alone. Beyond cell 40 the HVPTD signalis much less regular, and the span of river influenced by tidaleffects [Sioli, 1984] correlates well with this phenomenon. Sioli[1984] describes a twice-daily flooding of the alluvial islandsand floodplains of the lower Amazon and this suggests that theincreased variability could be related to interference betweenthe periodicity of tides and satellite sampling frequency. Otherpotential causes are intensified land use in the islands near themouth of the system, invoking an apparent shift in the mixingmodel end points (J. Melack, personal communication, 1995),sea breeze-induced aerosol and humidity effects, and/or differ-ences in water surface roughness. The increase in HVPTD pastcell number 50 is likely due to the increasing predominance ofopen water pixels near the mouth of the river. Because of thesefactors, we chose to limit the downstream domain of this anal-ysis to the Obidos site.Time series of HVPTD-derived discharge were generated
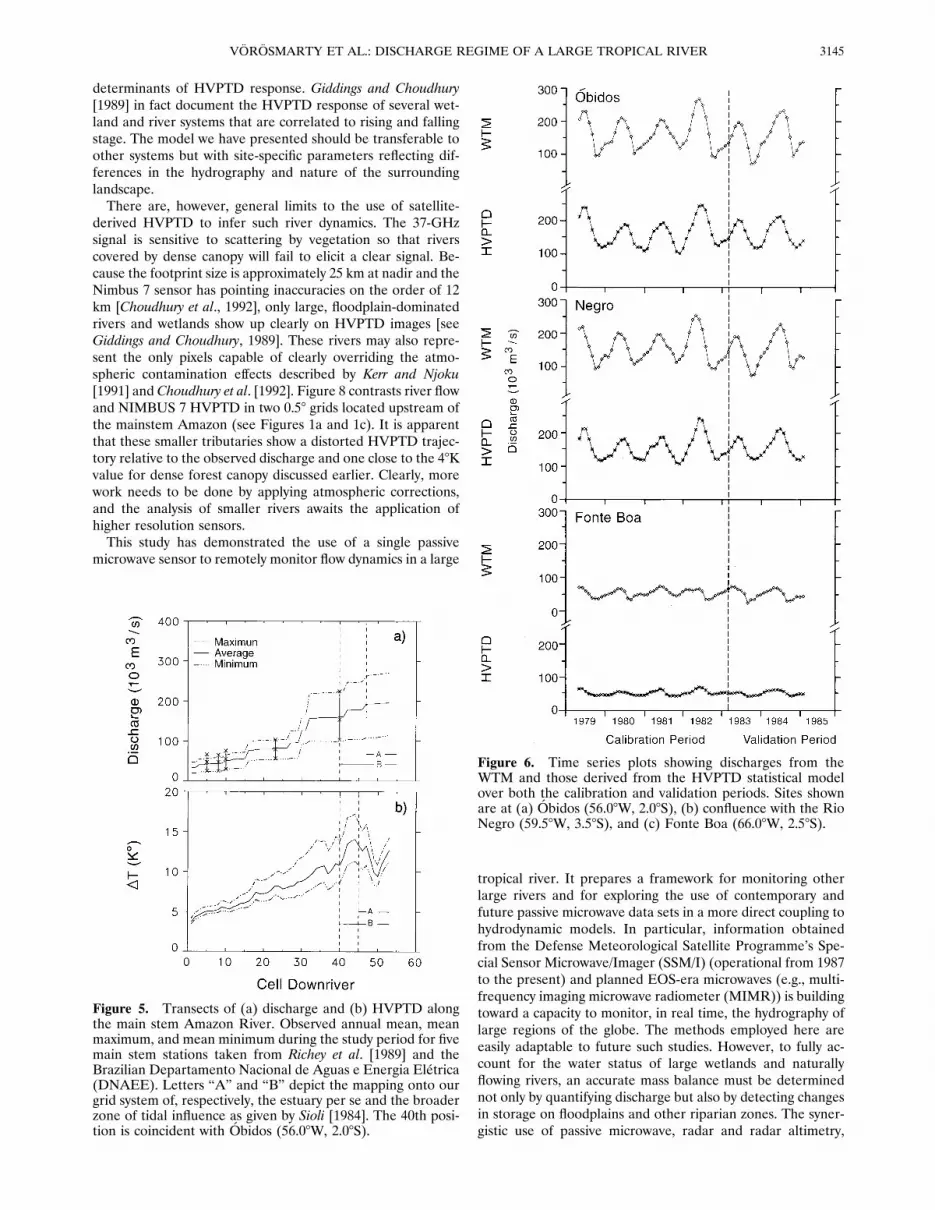
for both the calibration and validation periods, examples ofwhich are given in Figure 6. The HVPTD-generated flowswhich correspond most closely to the WTM results are foundat the more downriver, nontidal sites (Figure 6, Obidos, Ne-gro). At these locations there is excellent agreement in theoverall magnitude of the two time series as well as in the timingof peak flows. Low flows tend to be overestimated by theHVPTD relative to WTM, in keeping with results obtained forthe average monthly values depicted in Figure 5. There is asequential improvement in the overall performance passingfrom upstream to downstream sites (Table 3). Although theMAE increases in the downstream direction, it does so intandem with even larger increases in discharge, so that in
Figure 3. Example of sequential improvement in 0.258 30.258 resolution 37-GHz polarization temperature differencetime series. The procedure used included a weighted resam-pling at 0.58, spatial integration using data from five additionalupstream cells, and application of a weighted moving averagescheme as given in (2). Site shown is at Obidos (56.08W, 2.08S).
3143VOROSMARTY ET AL.: DISCHARGE REGIME OF A LARGE TROPICAL RIVER
relative terms model performance improves in the downstreamdirection. Examination of the regressions indicate that themajority are statistically significant (a , 0.005). Residual plotsdemonstrate no systematic biases. Although the HVPTDmodel for the most upriver cells does appear capable of esti-mating long-term average discharge, it is able to predict nei-ther seasonal variations in flow nor year-to-year differences inriver status (e.g., Figure 6, Fonte Boa). We examined whetherthe regression relationships could be improved by integratingthe HVPTD signal over a different number of upstream gridcells. The relationships are weakened by utilizing fewer thanthe five contributing cells upon which we based our analysis.The d statistic, however, is not enhanced appreciably by incor-porating additional upriver cells. It therefore appears that theusefulness of the SMMRHVPTD to infer flows in the Amazonis confined to a reach of the mainstem between 65.08W and56.08W.Flows derived from both the WTM and HVPTD provide a
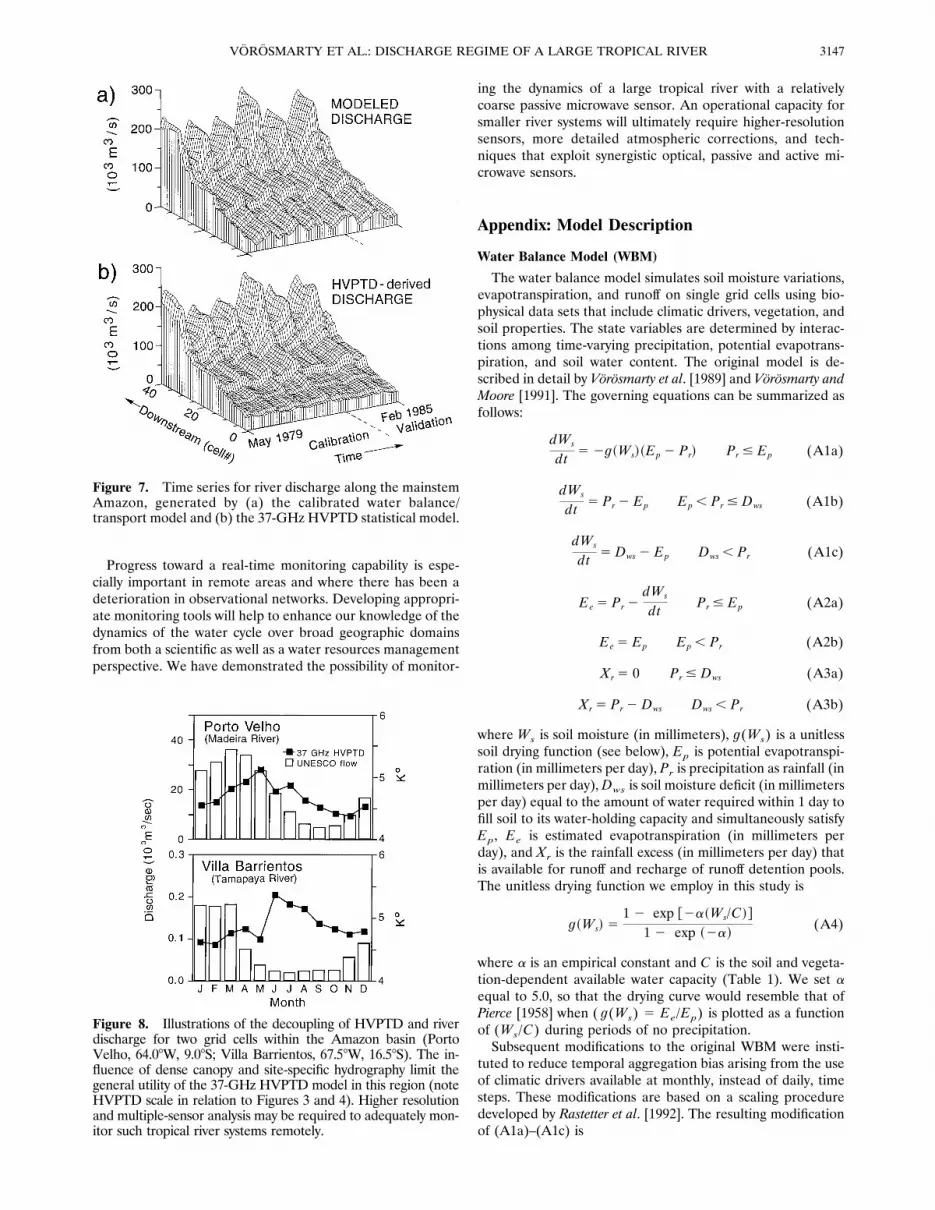
useful synoptic view of how Amazon River discharge varies
over space and time (Figure 7). Both models show the pro-gressive downriver increase in discharge, including the influ-ence of tributary inflows, and the magnitudes depicted by eachmodel are quite similar. The WTM clearly shows interannualvariations in discharge, the most dramatic of which are asso-ciated with the 1982–1983 ENSO event. The HVPTD doessurprisingly well throughout much of the spatial domain incapturing the same ENSO excursion and subsequent dischargedynamics during the validation period. The most upstreamsites show less seasonal variability with HVPTD than withWTM-derived fields.For the Amazon this analysis indicates that the HVPTD
method of predicting discharges works best in floodplain-dominated reaches with a mean annual discharge of approxi-mately 70,000 m3/s and showing an annual excursion of 50,000m3/s. Although there is no other river in the world that expe-riences such high flows, this result does not necessarily disqual-ify the method’s application elsewhere, since river-specificstage and lateral inundation relationships are the more critical
Figure 4. Typical time series plots showing calibrated discharges from the water transport model (WTM)with 37-GHz horizontally and vertically polarized temperature differences over the calibration period fromMay 1979 through February 1983. Regression models linking the two data sets at each site are also shown.Mainstem sites shown are at (a) Obidos (56.08W, 2.08S), (b) confluence with the Rio Negro (59.58W, 3.58S),and (c) Fonte Boa (66.08W, 2.58S).
VOROSMARTY ET AL.: DISCHARGE REGIME OF A LARGE TROPICAL RIVER3144
determinants of HVPTD response. Giddings and Choudhury[1989] in fact document the HVPTD response of several wet-land and river systems that are correlated to rising and fallingstage. The model we have presented should be transferable toother systems but with site-specific parameters reflecting dif-ferences in the hydrography and nature of the surroundinglandscape.There are, however, general limits to the use of satellite-
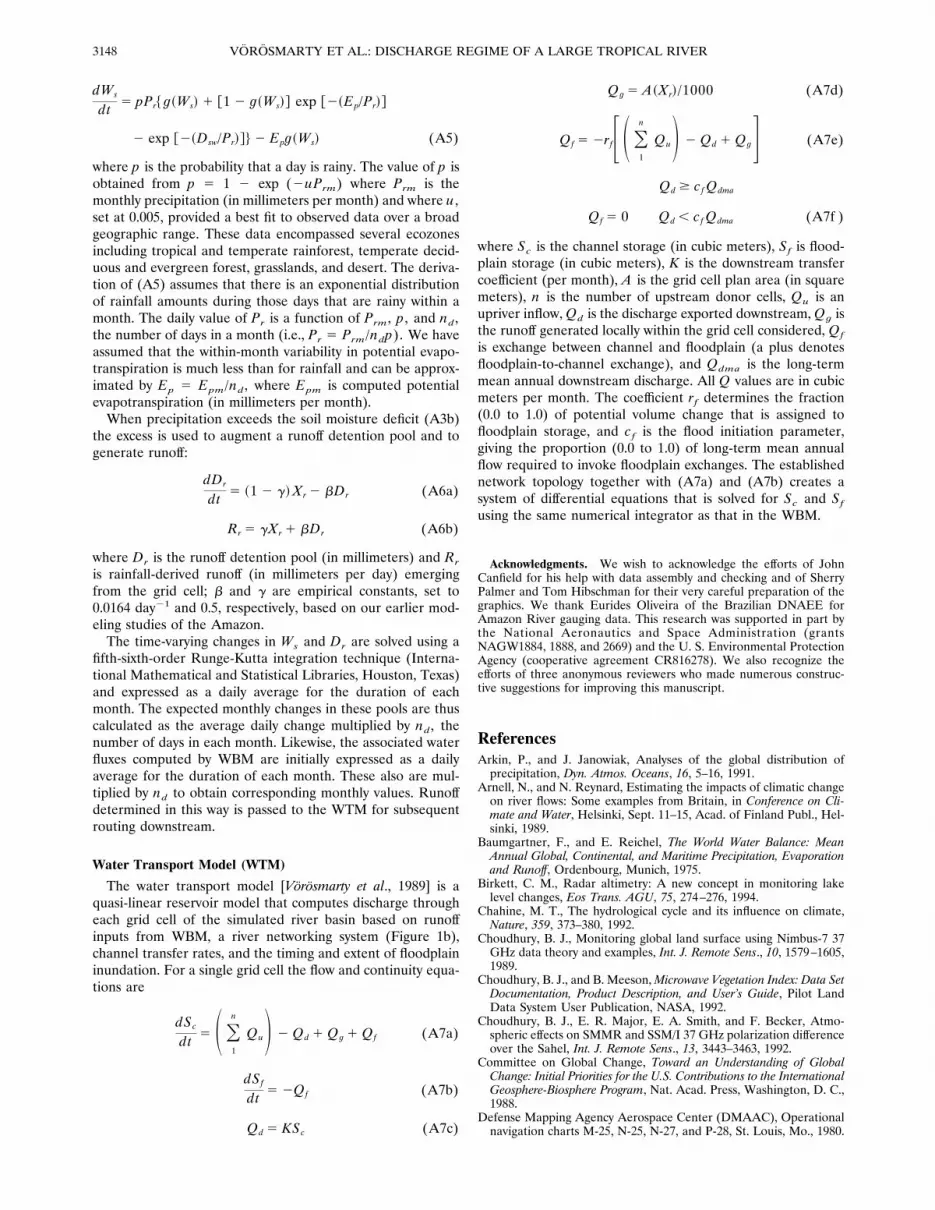
derived HVPTD to infer such river dynamics. The 37-GHzsignal is sensitive to scattering by vegetation so that riverscovered by dense canopy will fail to elicit a clear signal. Be-cause the footprint size is approximately 25 km at nadir and theNimbus 7 sensor has pointing inaccuracies on the order of 12km [Choudhury et al., 1992], only large, floodplain-dominatedrivers and wetlands show up clearly on HVPTD images [seeGiddings and Choudhury, 1989]. These rivers may also repre-sent the only pixels capable of clearly overriding the atmo-spheric contamination effects described by Kerr and Njoku[1991] and Choudhury et al. [1992]. Figure 8 contrasts river flowand NIMBUS 7 HVPTD in two 0.58 grids located upstream ofthe mainstem Amazon (see Figures 1a and 1c). It is apparentthat these smaller tributaries show a distorted HVPTD trajec-tory relative to the observed discharge and one close to the 48Kvalue for dense forest canopy discussed earlier. Clearly, morework needs to be done by applying atmospheric corrections,and the analysis of smaller rivers awaits the application ofhigher resolution sensors.This study has demonstrated the use of a single passive
microwave sensor to remotely monitor flow dynamics in a large
tropical river. It prepares a framework for monitoring otherlarge rivers and for exploring the use of contemporary andfuture passive microwave data sets in a more direct coupling tohydrodynamic models. In particular, information obtainedfrom the Defense Meteorological Satellite Programme’s Spe-cial Sensor Microwave/Imager (SSM/I) (operational from 1987to the present) and planned EOS-era microwaves (e.g., multi-frequency imaging microwave radiometer (MIMR)) is buildingtoward a capacity to monitor, in real time, the hydrography oflarge regions of the globe. The methods employed here areeasily adaptable to future such studies. However, to fully ac-count for the water status of large wetlands and naturallyflowing rivers, an accurate mass balance must be determinednot only by quantifying discharge but also by detecting changesin storage on floodplains and other riparian zones. The syner-gistic use of passive microwave, radar and radar altimetry,
Figure 5. Transects of (a) discharge and (b) HVPTD alongthe main stem Amazon River. Observed annual mean, meanmaximum, and mean minimum during the study period for fivemain stem stations taken from Richey et al. [1989] and theBrazilian Departamento Nacional de Aguas e Energia Eletrica(DNAEE). Letters “A” and “B” depict the mapping onto ourgrid system of, respectively, the estuary per se and the broaderzone of tidal influence as given by Sioli [1984]. The 40th posi-tion is coincident with Obidos (56.08W, 2.08S).
Figure 6. Time series plots showing discharges from theWTM and those derived from the HVPTD statistical modelover both the calibration and validation periods. Sites shownare at (a) Obidos (56.08W, 2.08S), (b) confluence with the RioNegro (59.58W, 3.58S), and (c) Fonte Boa (66.08W, 2.58S).
3145VOROSMARTY ET AL.: DISCHARGE REGIME OF A LARGE TROPICAL RIVER
optical sensors, and satellite telemetry for ground-based datatransmission requires suitable exploration in this context.
Summary and ConclusionsThis study demonstrated the concurrent use of ground-
based meteorological station data, passive microwave radiom-eter data, and calibrated water balance and transport modelsto infer flow regime in a large, floodplain-dominated river. Thestudy applied these tools in a quantitative assessment of waterstatus in the Amazon drainage basin for each month from May1979 through February 1985. This research showed that datafrom the SMMR aboard the Nimbus 7 satellite can be used toreasonably estimate discharge along the mainstem Amazonusing regression relationships linking horizontally and verti-cally polarized temperature differences at 37 GHz to flow re-gime determined by a calibrated model. The exercise requiredpreprocessing of the satellite data to correct for spatial andtemporal sampling errors. The domain under which the satel-
lite-derived discharges appear to be reasonable was identified,and this reach spans more than 1400 km of main stem river. Inthis domain both modeled and satellite-derived dischargesshowed large within-year variations. Both approaches werecapable of simulating the effect of the 1982–1983 ENSO, show-ing sharply decreased flows associated with the event.Although there are limits to the use of such satellite-derived
discharge models, this research has clearly demonstrated theirpotential to remotely monitor the status of river systems in realtime. Through collaborative research with the University ofCalifornia (Santa Barbara) we are currently developing meth-ods to more directly couple 37-GHz microwave time seriesdata from both the SMMR and its successor, the SSM/I, to ourhydrology model. The strategy is to use remote sensing data inconjunction with ground-based observations to more accu-rately invoke within our hydrology model both the onset andcessation of floodplain inundation and to provide an indicationof the extent of such flooding.
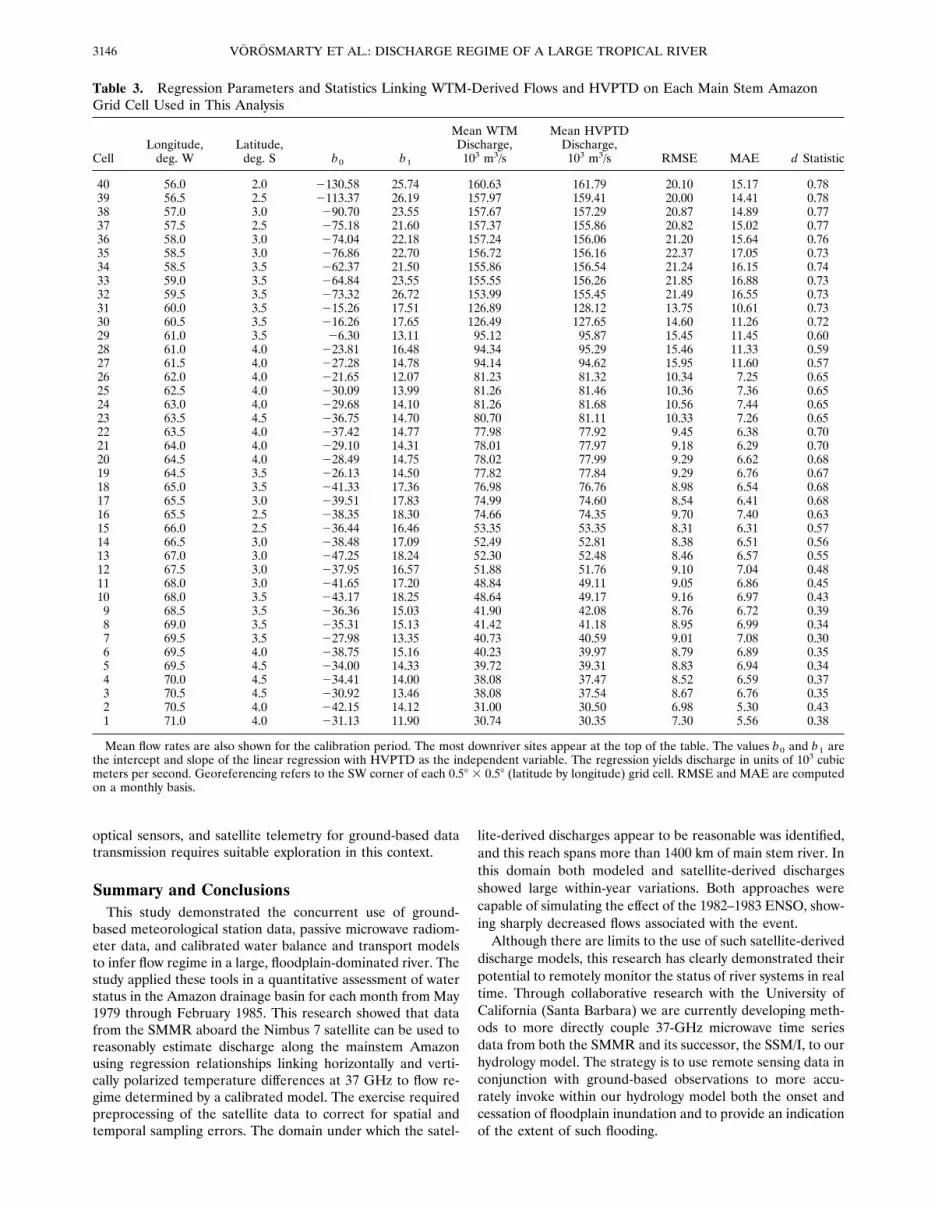
Table 3. Regression Parameters and Statistics Linking WTM-Derived Flows and HVPTD on Each Main Stem AmazonGrid Cell Used in This Analysis
CellLongitude,deg. W
Latitude,deg. S b0 b1
Mean WTMDischarge,103 m3/s
Mean HVPTDDischarge,103 m3/s RMSE MAE d Statistic
40 56.0 2.0 2130.58 25.74 160.63 161.79 20.10 15.17 0.7839 56.5 2.5 2113.37 26.19 157.97 159.41 20.00 14.41 0.7838 57.0 3.0 290.70 23.55 157.67 157.29 20.87 14.89 0.7737 57.5 2.5 275.18 21.60 157.37 155.86 20.82 15.02 0.7736 58.0 3.0 274.04 22.18 157.24 156.06 21.20 15.64 0.7635 58.5 3.0 276.86 22.70 156.72 156.16 22.37 17.05 0.7334 58.5 3.5 262.37 21.50 155.86 156.54 21.24 16.15 0.7433 59.0 3.5 264.84 23.55 155.55 156.26 21.85 16.88 0.7332 59.5 3.5 273.32 26.72 153.99 155.45 21.49 16.55 0.7331 60.0 3.5 215.26 17.51 126.89 128.12 13.75 10.61 0.7330 60.5 3.5 216.26 17.65 126.49 127.65 14.60 11.26 0.7229 61.0 3.5 26.30 13.11 95.12 95.87 15.45 11.45 0.6028 61.0 4.0 223.81 16.48 94.34 95.29 15.46 11.33 0.5927 61.5 4.0 227.28 14.78 94.14 94.62 15.95 11.60 0.5726 62.0 4.0 221.65 12.07 81.23 81.32 10.34 7.25 0.6525 62.5 4.0 230.09 13.99 81.26 81.46 10.36 7.36 0.6524 63.0 4.0 229.68 14.10 81.26 81.68 10.56 7.44 0.6523 63.5 4.5 236.75 14.70 80.70 81.11 10.33 7.26 0.6522 63.5 4.0 237.42 14.77 77.98 77.92 9.45 6.38 0.7021 64.0 4.0 229.10 14.31 78.01 77.97 9.18 6.29 0.7020 64.5 4.0 228.49 14.75 78.02 77.99 9.29 6.62 0.6819 64.5 3.5 226.13 14.50 77.82 77.84 9.29 6.76 0.6718 65.0 3.5 241.33 17.36 76.98 76.76 8.98 6.54 0.6817 65.5 3.0 239.51 17.83 74.99 74.60 8.54 6.41 0.6816 65.5 2.5 238.35 18.30 74.66 74.35 9.70 7.40 0.6315 66.0 2.5 236.44 16.46 53.35 53.35 8.31 6.31 0.5714 66.5 3.0 238.48 17.09 52.49 52.81 8.38 6.51 0.5613 67.0 3.0 247.25 18.24 52.30 52.48 8.46 6.57 0.5512 67.5 3.0 237.95 16.57 51.88 51.76 9.10 7.04 0.4811 68.0 3.0 241.65 17.20 48.84 49.11 9.05 6.86 0.4510 68.0 3.5 243.17 18.25 48.64 49.17 9.16 6.97 0.439 68.5 3.5 236.36 15.03 41.90 42.08 8.76 6.72 0.398 69.0 3.5 235.31 15.13 41.42 41.18 8.95 6.99 0.347 69.5 3.5 227.98 13.35 40.73 40.59 9.01 7.08 0.306 69.5 4.0 238.75 15.16 40.23 39.97 8.79 6.89 0.355 69.5 4.5 234.00 14.33 39.72 39.31 8.83 6.94 0.344 70.0 4.5 234.41 14.00 38.08 37.47 8.52 6.59 0.373 70.5 4.5 230.92 13.46 38.08 37.54 8.67 6.76 0.352 70.5 4.0 242.15 14.12 31.00 30.50 6.98 5.30 0.431 71.0 4.0 231.13 11.90 30.74 30.35 7.30 5.56 0.38
Mean flow rates are also shown for the calibration period. The most downriver sites appear at the top of the table. The values b0 and b1 arethe intercept and slope of the linear regression with HVPTD as the independent variable. The regression yields discharge in units of 103 cubicmeters per second. Georeferencing refers to the SW corner of each 0.58 3 0.58 (latitude by longitude) grid cell. RMSE and MAE are computedon a monthly basis.
VOROSMARTY ET AL.: DISCHARGE REGIME OF A LARGE TROPICAL RIVER3146
Progress toward a real-time monitoring capability is espe-cially important in remote areas and where there has been adeterioration in observational networks. Developing appropri-ate monitoring tools will help to enhance our knowledge of thedynamics of the water cycle over broad geographic domainsfrom both a scientific as well as a water resources managementperspective. We have demonstrated the possibility of monitor-
ing the dynamics of a large tropical river with a relativelycoarse passive microwave sensor. An operational capacity forsmaller river systems will ultimately require higher-resolutionsensors, more detailed atmospheric corrections, and tech-niques that exploit synergistic optical, passive and active mi-crowave sensors.
Appendix: Model Description
Water Balance Model (WBM)
The water balance model simulates soil moisture variations,evapotranspiration, and runoff on single grid cells using bio-physical data sets that include climatic drivers, vegetation, andsoil properties. The state variables are determined by interac-tions among time-varying precipitation, potential evapotrans-piration, and soil water content. The original model is de-scribed in detail by Vorosmarty et al. [1989] and Vorosmarty andMoore [1991]. The governing equations can be summarized asfollows:
dWs
dt 5 2g~Ws!~Ep 2 Pr! Pr # Ep (A1a)
dWs
dt 5 Pr 2 Ep Ep , Pr # Dws (A1b)
dWs
dt 5 Dws 2 Ep Dws , Pr (A1c)
Ee 5 Pr 2dWs
dt Pr # Ep (A2a)
Ee 5 Ep Ep , Pr (A2b)
Xr 5 0 Pr # Dws (A3a)
Xr 5 Pr 2 Dws Dws , Pr (A3b)
where Ws is soil moisture (in millimeters), g(Ws) is a unitlesssoil drying function (see below), Ep is potential evapotranspi-ration (in millimeters per day), Pr is precipitation as rainfall (inmillimeters per day),Dws is soil moisture deficit (in millimetersper day) equal to the amount of water required within 1 day tofill soil to its water-holding capacity and simultaneously satisfyEp, Ee is estimated evapotranspiration (in millimeters perday), and Xr is the rainfall excess (in millimeters per day) thatis available for runoff and recharge of runoff detention pools.The unitless drying function we employ in this study is
g~Ws! 51 2 exp @2a~Ws/C!#
1 2 exp ~2a!(A4)
where a is an empirical constant and C is the soil and vegeta-tion-dependent available water capacity (Table 1). We set aequal to 5.0, so that the drying curve would resemble that ofPierce [1958] when ( g(Ws) 5 Ee/Ep) is plotted as a functionof (Ws/C) during periods of no precipitation.Subsequent modifications to the original WBM were insti-
tuted to reduce temporal aggregation bias arising from the useof climatic drivers available at monthly, instead of daily, timesteps. These modifications are based on a scaling proceduredeveloped by Rastetter et al. [1992]. The resulting modificationof (A1a)–(A1c) is
Figure 7. Time series for river discharge along the mainstemAmazon, generated by (a) the calibrated water balance/transport model and (b) the 37-GHz HVPTD statistical model.
Figure 8. Illustrations of the decoupling of HVPTD and riverdischarge for two grid cells within the Amazon basin (PortoVelho, 64.08W, 9.08S; Villa Barrientos, 67.58W, 16.58S). The in-fluence of dense canopy and site-specific hydrography limit thegeneral utility of the 37-GHz HVPTD model in this region (noteHVPTD scale in relation to Figures 3 and 4). Higher resolutionand multiple-sensor analysis may be required to adequately mon-itor such tropical river systems remotely.
3147VOROSMARTY ET AL.: DISCHARGE REGIME OF A LARGE TROPICAL RIVER
dWs
dt 5 pPr$ g~Ws! 1 @1 2 g~Ws!# exp @2~Ep/Pr!#
2 exp @2~Dsw/Pr!#% 2 Epg~Ws! (A5)
where p is the probability that a day is rainy. The value of p isobtained from p 5 1 2 exp (2uPrm) where Prm is themonthly precipitation (in millimeters per month) and where u ,set at 0.005, provided a best fit to observed data over a broadgeographic range. These data encompassed several ecozonesincluding tropical and temperate rainforest, temperate decid-uous and evergreen forest, grasslands, and desert. The deriva-tion of (A5) assumes that there is an exponential distributionof rainfall amounts during those days that are rainy within amonth. The daily value of Pr is a function of Prm, p , and nd,the number of days in a month (i.e., Pr 5 Prm/ndp). We haveassumed that the within-month variability in potential evapo-transpiration is much less than for rainfall and can be approx-imated by Ep 5 Epm/nd, where Epm is computed potentialevapotranspiration (in millimeters per month).When precipitation exceeds the soil moisture deficit (A3b)
the excess is used to augment a runoff detention pool and togenerate runoff:
dDrdt 5 ~1 2 g!Xr 2 bDr (A6a)
Rr 5 gXr 1 bDr (A6b)
where Dr is the runoff detention pool (in millimeters) and Rris rainfall-derived runoff (in millimeters per day) emergingfrom the grid cell; b and g are empirical constants, set to0.0164 day21 and 0.5, respectively, based on our earlier mod-eling studies of the Amazon.The time-varying changes in Ws and Dr are solved using a
fifth-sixth-order Runge-Kutta integration technique (Interna-tional Mathematical and Statistical Libraries, Houston, Texas)and expressed as a daily average for the duration of eachmonth. The expected monthly changes in these pools are thuscalculated as the average daily change multiplied by nd, thenumber of days in each month. Likewise, the associated waterfluxes computed by WBM are initially expressed as a dailyaverage for the duration of each month. These also are mul-tiplied by nd to obtain corresponding monthly values. Runoffdetermined in this way is passed to the WTM for subsequentrouting downstream.
Water Transport Model (WTM)
The water transport model [Vorosmarty et al., 1989] is aquasi-linear reservoir model that computes discharge througheach grid cell of the simulated river basin based on runoffinputs from WBM, a river networking system (Figure 1b),channel transfer rates, and the timing and extent of floodplaininundation. For a single grid cell the flow and continuity equa-tions are
dScdt 5 S O
1
n
QuD 2 Qd 1 Qg 1 Qf (A7a)
dSfdt 5 2Qf (A7b)
Qd 5 KSc (A7c)
Qg 5 A~Xr!/1000 (A7d)
Qf 5 2rfF S O1
n
QuD 2 Qd 1 QgG (A7e)
Qd $ cf Qdma
Qf 5 0 Qd , cf Qdma (A7f )
where Sc is the channel storage (in cubic meters), Sf is flood-plain storage (in cubic meters), K is the downstream transfercoefficient (per month), A is the grid cell plan area (in squaremeters), n is the number of upstream donor cells, Qu is anupriver inflow, Qd is the discharge exported downstream, Qg isthe runoff generated locally within the grid cell considered, Qfis exchange between channel and floodplain (a plus denotesfloodplain-to-channel exchange), and Qdma is the long-termmean annual downstream discharge. All Q values are in cubicmeters per month. The coefficient rf determines the fraction(0.0 to 1.0) of potential volume change that is assigned tofloodplain storage, and cf is the flood initiation parameter,giving the proportion (0.0 to 1.0) of long-term mean annualflow required to invoke floodplain exchanges. The establishednetwork topology together with (A7a) and (A7b) creates asystem of differential equations that is solved for Sc and Sfusing the same numerical integrator as that in the WBM.
Acknowledgments. We wish to acknowledge the efforts of JohnCanfield for his help with data assembly and checking and of SherryPalmer and Tom Hibschman for their very careful preparation of thegraphics. We thank Eurides Oliveira of the Brazilian DNAEE forAmazon River gauging data. This research was supported in part bythe National Aeronautics and Space Administration (grantsNAGW1884, 1888, and 2669) and the U. S. Environmental ProtectionAgency (cooperative agreement CR816278). We also recognize theefforts of three anonymous reviewers who made numerous construc-tive suggestions for improving this manuscript.
ReferencesArkin, P., and J. Janowiak, Analyses of the global distribution ofprecipitation, Dyn. Atmos. Oceans, 16, 5–16, 1991.
Arnell, N., and N. Reynard, Estimating the impacts of climatic changeon river flows: Some examples from Britain, in Conference on Cli-mate and Water, Helsinki, Sept. 11–15, Acad. of Finland Publ., Hel-sinki, 1989.
Baumgartner, F., and E. Reichel, The World Water Balance: MeanAnnual Global, Continental, and Maritime Precipitation, Evaporationand Runoff, Ordenbourg, Munich, 1975.
Birkett, C. M., Radar altimetry: A new concept in monitoring lakelevel changes, Eos Trans. AGU, 75, 274–276, 1994.
Chahine, M. T., The hydrological cycle and its influence on climate,Nature, 359, 373–380, 1992.
Choudhury, B. J., Monitoring global land surface using Nimbus-7 37GHz data theory and examples, Int. J. Remote Sens., 10, 1579–1605,1989.
Choudhury, B. J., and B. Meeson,Microwave Vegetation Index: Data SetDocumentation, Product Description, and User’s Guide, Pilot LandData System User Publication, NASA, 1992.
Choudhury, B. J., E. R. Major, E. A. Smith, and F. Becker, Atmo-spheric effects on SMMR and SSM/I 37 GHz polarization differenceover the Sahel, Int. J. Remote Sens., 13, 3443–3463, 1992.
Committee on Global Change, Toward an Understanding of GlobalChange: Initial Priorities for the U.S. Contributions to the InternationalGeosphere-Biosphere Program, Nat. Acad. Press, Washington, D. C.,1988.
Defense Mapping Agency Aerospace Center (DMAAC), Operationalnavigation charts M-25, N-25, N-27, and P-28, St. Louis, Mo., 1980.
VOROSMARTY ET AL.: DISCHARGE REGIME OF A LARGE TROPICAL RIVER3148
Defense Mapping Agency Aerospace Center (DMAAC), Operationalnavigation chart P-26, St. Louis, Mo., 1981.
Defense Mapping Agency Aerospace Center (DMAAC), Operationalnavigation chart L-27, St. Louis, Mo., 1982.
Defense Mapping Agency Aerospace Center (DMAAC), Operationalnavigation charts N-26 and P-27, St. Louis, Mo., 1983.
Defense Mapping Agency Aerospace Center (DMAAC), Operationalnavigation charts L-28, M-26 and M-27, St. Louis, Mo., 1984.
Defense Mapping Agency Aerospace Center (DMAAC), Operationalnavigation chart L-26, St. Louis, Mo., 1986.
Dickinson, R. E., and A. Henderson-Sellers, Modeling tropical defor-estation: A study of GCM land-surface parameterizations, Q. J. R.Meteorol. Soc., 114, 439–462, 1988.
Dumenil, L. and E. Todini, A rainfall-runoff scheme for use in theHamburg climate model, in Advances in Theoretical Hydrology, ATribute to James Dooge, Eur. Geophys. Soc. Ser. of Hydrol. Sci., vol. 1,edited by J. P. O’Kane, pp. 129–157, Elsevier, New York, 1992.
Food and Agriculture Organization–United Nations Educational, Sci-entific, and Cultural Organization (FAO-UNESCO), Soil map ofthe world, 1:5,000,000, vol. IV, South America, U. N. Educ., Sci., andCult. Org., Paris, 1971.
Giddings, L., and B. J. Choudhury, Observation of hydrological fea-tures with Nimbus-7 37 GHz data, applied to South America, Int. J.Remote Sens., 10, 1673–1686, 1989.
Global Precipitation Climatology Centre (GPCC), Monthly precipita-tion estimates based on gauge measurements on the continents forthe year 1987 (preliminary results) and future requirements, Rep.DWD/K7/WZN-1992/08-1, World Clim. Res. Prog. and DeutscherWetterdienst, Offenbach, Germany, 1992.
Global Runoff Data Centre (GRDC), Global Runoff Data Centre(GRDC), Fed. Inst. of Hydrol., Koblenz, Germany, 1993.
Henderson-Sellers, A., and V. B. Brown (Eds.), PILPS, Global Energyand Water Cycle Experiment, Project for intercomparison of land-surface parameterization schemes, PILPS Workshop Report and FirstScience Plan, Columbia, Md., June, 1992.
Imhoff, M. L., C. Vermillion, M. H. Story, A. M. Choudhury,A. Gafoor, and F. Polycn, Monsoon flood boundary delineation anddamage assessment using space borne imaging radar and Landsatdata, Photogramm. Eng. Remote Sens., 53, 405–413, 1987.
Kalma, J. D., and I. R. Calder, Land Surface Processes in Large-scaleHydrology, WMO Oper. Hydrol. Rep. 40, World Meteorol. Org., Ge-neva, 1994.
Kerr, Y. H., and E. G. Njoku, On the use of passive microwaves at 37GHz, paper presented at 5th International Colloquium on PhysicalMeasurements and Signatures in Remote Sensing, Toulouse,France, Jan. 14–18, 1991.
Koblinsky, C. J., R. T. Clarke, A. C. Brenner, and H. Frey, Themeasurement of river levels with satellite altimetry, Wat. Resour.Res., 29, 1839–1848, 1993.
Korzoun, V. I., A. A. Sokolov, M. I. Budyko, K. P. Voskresensky, G. P.Kalinin, A. A. Konoplyantsev, E. S. Korotkevich, and M. I. Lvovich,Atlas of World Water Balance, U. N. Educ., Sci., and Cult. Org., Paris,1977.
Lean, J., and D. A. Warrilow, Simulation of the regional climaticimpact of Amazon deforestation, Nature, 342, 411–413, 1989.
Legates, D. R., and C. J. Willmott, Mean seasonal and spatial vari-ability in global surface air temperature, Theor. Appl. Clim., 41,11–21, 1990a.
Legates, D. R., and C. J. Willmott, Mean seasonal and spatial vari-ability in gauge-corrected, global precipitation, Int. J. Climatol., 10,111–127, 1990b.
Meade, R. H., J. M. Rayol, S. C. DaConceicao, and J. R. G. Nativ-idade, Backwater effects in the Amazon River basin of Brazil, En-viron. Geol. Water Sci., 18, 105–114, 1991.
Melillo, J. M., A. D. McGuire, D. W. Kicklighter, B. Moore III, C. J.Vorosmarty, and A. L. Schloss, Global climate change and terres-trial net primary production, Nature, 363, 234–240, 1993.
Mintz, Y., and Y. V. Serafini, Global Fields of Monthly Normal SoilMoisture, as Derived From Observed Precipitation and an EstimatedPotential Evapotranspiration, Lab. for Atmos. Sci., Natl. Aeronaut.and Space Admin., Goddard Space Flight Cent., Greenbelt, Md.,1984.
Mintz, Y., and Y. V. Serafini, Global Monthly Climatology of SoilMoisture and Water Balance, UNESCO Studies and Reports in Hy-drology, 1989.
Mintz, Y., and G. K. Walker, Global fields of soil moisture and land
surface evapotranspiration derived from observed precipitation andsurface air temperature, J. Appl. Meteorol., 32, 1305–1334, 1993.
Morris, C. S., and S. K. Gill, Variation in Great Lakes water levelsderived from Geosat altimetry, Wat. Resour. Res., 30, 1009–1017,1994.
Nepstad, D., C. R. de Carvalho, E. A. Davidson, P. H. Jipp, P. A.Lefebvre, G. H. Negreiros, E. D. da Silva, T. A. Stone, S. E. Trum-bore, and S. Vieira, The role of deep roots in the hydrological andcarbon cycles of Amazon forests and pastures, Nature, 372, 666–669,1994.
Pierce, L. T., Estimating seasonal and short-term fluctuations inevapotranspiration from meadow crops, Bull. Am. Meteorol. Soc., 39,73–78, 1958.
Rastetter, E. B., A. W. King, B. J. Cosby, G. M. Hornberger, R. V.O’Neill, and J. E. Hobbie, Aggregating fine-scale ecological knowl-edge to modeling coarser-scale attributes of ecosystems, Ecol. Appl.,2, 55–70, 1992.
Richey, J. E., L. A. K. Mertes, T. Dunne, R. L. Victoria, B. R. Fors-berg, A. Tancredi, and E. Oliveira, Sources and routing of theAmazon River flood wave, Global Biogeochem. Cycles, 3, 191–204,1989.
Rodda, G. C., S. A. Pieyns, N. S. Sehmi, and G. Matthews, Towards aworld hydrological cycle observing system, Hydrol. Sci., 38, 373–378,1993.
Rzoska, J., On the Nature of Rivers, with Case Stories of Nile, Zaire andAmazon, 67 pp., Dr. W. Junk, Norwell, Mass., 1978.
Salati, E., The climatology and hydrology of Amazonia, in Key Envi-ronments: Amazonia, edited by G. T. Prance and T. E. Lovejoy, pp.18–48, Pergamon, Tarrytown, N. Y., 1985.
Salati, E., and P. B. Vose, Amazon Basin: A system in equilibrium,Science, 225, 129–138, 1984.
Serafini, Y. V., and Y. C. Sud, The time scale of the soil hydrologyusing a simple water budget model, J. Clim., 7, 585–591, 1987.
Shepard, D., A two dimensional interpolation function for irregularlyspaced data, Proceedings of the 23rd National Conference, pp. 517–523, Assoc. for Comput. Mach., Princeton, N. J., 1968.
Shukla, J., C. Nobre, and P. Sellers, Amazon deforestation and climatechange, Science, 247, 1322–1325, 1990.
Simpson, J. (Ed.), TRMM, A Satellite Mission to Measure TropicalRainfall, Report of the Scientific Steering Group, Natl. Aeronaut. andSpace Admin., Goddard Space Flight Cent., Greenbelt, Md., 1992.
Sioli, H., The Amazon and its main affluents: Hydrography, morphol-ogy of the courses, and river types, in The Amazon, Limnology andLandscape Ecology of a Mighty Tropical River and Its Basin, Monogr.Biol., vol. 56, edited by H. Sioli, pp. 127–165, Kluwer Acad., Norwell,Mass., 1984.
Sippel, S. J., S. K. Hamilton, and J. M. Melack, Inundation area andmorphometry of lakes on the Amazon River floodplain, Brazil, Arch.Hydrobiol., 123, 385–400, 1992.
Sippel, S. J., S. K. Hamilton, J. M. Melack, and B. J. Choudhury,Determination of inundation area in the Amazon River floodplainusing the SMMR 37 GHz polarization difference, Remote Sens.Environ., 48, 70–76, 1994.
Skole, D., and C. Tucker, Tropical deforestation and habitat fragmen-tation in the Amazon: Satellite data from 1978–1988, Science, 260,1905–1910, 1993.
van der Leeden, F., F. L. Troise, and D. K. Todd, The Water Encyclo-pedia, 2nd ed., A. F. Lewis, New York, 1990.
Vorosmarty, C. J., Models of macro-scale hydrology for use in globalchange research: Tests on two tropical river systems, Ph.D. disser-tation, 255 pp., Univ. of N. H., Durham, 1991.
Vorosmarty, C. J., and B. Moore III, Modeling basin-scale hydrologyin support of physical climate and global biogeochemical studies: Anexample using the Zambezi River, Stud. Geophys., 12, 271–311, 1991.
Vorosmarty, C. J., B. Moore, A. Grace, B. J. Peterson, E. B. Rastetter,and J. Melillo, Distributed parameter models to analyze the impactof human disturbance of the surface hydrology of a large tropicaldrainage basin in southern Africa, in Hydrology for the Water Man-agement of Large River Basins, IAHS Publ. 201, edited by F. H. M.van de Ven, D. Gutnecht, D. P. Loucks, and K. A. Salewicz, pp.233–44, 1991.
Vorosmarty, C. J., B. Moore, A. L. Grace, M. P. Gildea, J. M. Melillo,B. J. Peterson, E. B. Rastetter, and P. A. Steudler, Continental scalemodels of water balance and fluvial transport: An application toSouth America, Global Biogeochem. Cycles, 3, 241–265, 1989.
Vose, R. S., R. L. Schmoyer, P. M. Steurer, T. C. Peterson, R. Heim,
3149VOROSMARTY ET AL.: DISCHARGE REGIME OF A LARGE TROPICAL RIVER

T. R. Karl, and J. K. Eisheid, The Global Historical ClimatologyNetwork: Long-Term Monthly Temperature, Precipitation, Pressure,and Station Pressure Data, CDIAC-53, NDP-041, Oak Ridge Natl.Lab., Oak Ridge, Tenn., 1992.
Watson, R. T., M. C. Zinyowera, and R. H. Moss (Eds.), ClimateChange 1995: Impacts, Adaptations, and Mitigation of ClimateChange: Scientific-Technical Analyses, Cambridge Univ. Press, NewYork, 1996.
Webb, R. W., and C. E. Rosenzweig, Specifying land surface charac-teristics in general circulation models: Soil profile data set andderived water-holding capacities, Global Biogeochem. Cycles, 7, 97–108, 1993.
Willmott, C. J., Some comments on the evaluation of model perfor-mance, Bull. Am. Meteorol. Soc., 63, 1309–1313, 1982.
Willmott, C. J., and S. M. Robeson, Climatologically-aided interpola-tion (CAI) of terrestrial air temperature, Int. J. Climatol., 15, 221–229, 1995.
Willmott, C. J., C. M. Rowe, and Y. Mintz, Climatology of the terres-trial seasonal water cycle, J. Clim., 5, 589–606, 1985a.
Willmott, C. J., C. M. Rowe, and W. D. Philpot, Small-scale climatemaps: A sensitivity analysis of some common assumptions associatedwith grid point interpolation and contouring, Am. Cartogr., 12, 5–16,1985b.
Willmott, C. J., S. G. Ackleson, R. E. Davis, J. J. Feddema, K. M.Klink, D. R. Legates, J. O’Donnell, and C. M. Rowe, Statistics forthe evaluation and comparison of models, J. Geophys. Res., 90,8995–9005, 1985c.
Willmott, C. J., S. M. Robeson, and J. J. Feddema, Estimating conti-
nental and terrestrial precipitation averages from raingauge net-works, Int. J. Climatol., 14, 403–14, 1994.
World Meteorological Organization/United Nations Educational, Sci-entific, and Cultural Organization, (WMO/UNESCO), Report onWater Resources Assessment, Progress in the Implementation of theMar del Plata Action Plan and a Strategy for the 1990s, UN WaterConference, Argentina, U. N. Educ., Sci., and Cult. Org., Paris, 1991.
Wood, E. F. (Ed.), Land Surface-Atmosphere Interactions for ClimateModeling: Observations, Models and Analysis, Kluwer Acad., Norwell,Mass., 1991.
World Climate Research Programme, Scientific plan for the GEWEXContinental Scale International Project (GCIP), WCRP-67WMO/TD 461, 1992.
B. J. Choudhury, Hydrological Sciences Branch, NASA GoddardSpace Flight Center, Greenbelt, MD 20771.T. J. Dorman, Science Systems and Applications, Inc., Lanham, MD
20703.S. M. Robeson, Department of Geography, Indiana University,
Bloomington, IN 47401.A. L. Schloss, T. K. Stearns, and C. J. Vorosmarty, Institute for the
Study of Earth, Oceans, and Space, University of New Hampshire,Durham, NH 03824.C. J. Willmott, Center for Climatic Research, Department of Ge-
ography, University of Delaware, Newark, DE 19716.
(Received September 12, 1995; revised April 17, 1996;accepted April 29, 1996.)
VOROSMARTY ET AL.: DISCHARGE REGIME OF A LARGE TROPICAL RIVER3150