analyzing covid-19 vaccination opinions dynamics from
TRANSCRIPT
Received February 8, 2021, accepted February 12, 2021, date of publication February 16, 2021, date of current version March 3, 2021.
Digital Object Identifier 10.1109/ACCESS.2021.3059821
The Longest Month: AnalyzingCOVID-19 Vaccination Opinions Dynamics FromTweets in the Month Following the First VaccineAnnouncementLIVIU-ADRIAN COTFAS 1, CAMELIA DELCEA 1, IOAN ROXIN2, CORINA IOANĂŞ3,DANA SIMONA GHERAI4, AND FEDERICO TAJARIOL21Department of Economic Informatics and Cybernetics, Bucharest University of Economic Studies, 010552 Bucharest, Romania2ELLIADD Laboratory, University of Bourgogne Franche-Comté, 25200 Montbéliard, France3Department of Accounting and Audit, Bucharest University of Economic Studies, 010552 Bucharest, Romania4Department of Finance-Accounting, University of Oradea, 410087 Oradea, Romania
Corresponding author: Camelia Delcea ([email protected])
ABSTRACT The coronavirus outbreak has brought unprecedented measures, which forced the authoritiesto make decisions related to the instauration of lockdowns in the areas most hit by the pandemic. Socialmedia has been an important support for people while passing through this difficult period. On November 9,2020, when the first vaccine with more than 90% effective rate has been announced, the social media hasreacted and people worldwide have started to express their feelings related to the vaccination, which was nolonger a hypothesis but closer, each day, to become a reality. The present paper aims to analyze the dynamicsof the opinions regarding COVID-19 vaccination by considering the one-month period following the firstvaccine announcement, until the first vaccination took place in UK, in which the civil society has manifesteda higher interest regarding the vaccination process. Classical machine learning and deep learning algorithmshave been compared to select the best performing classifier. 2 349 659 tweets have been collected, analyzed,and put in connection with the events reported by the media. Based on the analysis, it can be observed thatmost of the tweets have a neutral stance, while the number of in favor tweets overpasses the number ofagainst tweets. As for the news, it has been observed that the occurrence of tweets follows the trend ofthe events. Even more, the proposed approach can be used for a longer monitoring campaign that can helpthe governments to create appropriate means of communication and to evaluate them in order to provideclear and adequate information to the general public, which could increase the public trust in a vaccinationcampaign.
INDEX TERMS Opinion mining, social media, COVID-19, SARS-CoV-2, stance classification, vaccine.
I. INTRODUCTIONThe coronavirus outbreak caused by the novel coronavirusSARS-CoV-2 has brought a series of changes in many aspectsof people’s economic and social life. Since its occurrence,the coronavirus pandemic has continued to monopolize thedifferent parts of the world, reaching 220 countries andterritories by December 9, 2020 [1]. Governments have triedto address the outbreak by considering a series of measures,not all of them in accordance with the general public opinion.
The associate editor coordinating the review of this manuscript and
approving it for publication was Derek Abbott .
In all this time, the rapid growth of the number of cases glob-ally has produced panic, fear and anxiety among people [2].
Due to the current situation generated by the lockdownin some parts of the world and social distancing in others,the use of social media globally has intensified [2], as itsucceeds in connecting people from geographically differentplaces and allows them to exchange ideas and informationrelated to a series of aspects that have occurred in this period.Even more, people seem to rely on the information posted onsocial media. As a result, social media platforms have becomemediator channels between each individual and the rest ofthe world and have gained more and more attention, being
VOLUME 9, 2021 This work is licensed under a Creative Commons Attribution 4.0 License. For more information, see https://creativecommons.org/licenses/by/4.0/ 33203
L.-A. Cotfas et al.: Longest Month: Analyzing COVID-19 Vaccination Opinions Dynamics From Tweets
one of the fastest growing information systems for socialapplications [3], [4]. On this channel, individuals show theirdifferent views, opinions and emotions during the variousevents that occur due to the coronavirus pandemic [3].
Among some of the well-known social media platforms,Twitter has gained a particular attention as the users caneasily broadcast information about their opinions on a giventopic through a public message, called tweet [5]. Besides theinformation voluntarily offered by the user, a tweet may alsoretain information related to the location of the user andmightcontain links, emoticons and hashtags which can help the userin better expressing his/her sentiments, making it a source ofvaluable information [5], [6]. Even more, Twitter has beenused by government officials and political figures for inform-ing the general public either regarding their activity or in thecase of major events occurrence [7].
Over time, the information extracted from Twitter has beenused in various studies, featuring, but not being limited to:analyzing public opinion related to refugee crisis [8], naturaldisasters and social movements [9], evaluating companies’services [10] and reputation [11], sports’ fans sentiments [12],[13], forecasting the prices of cryptocurrencies [14], pre-dicting vehicle sales [15], political attitudes in multi-partycontexts [16], healthcare [17], infectious disease [3], [18],celiac disease [19] and cancer patients sentiments [20], vac-cination [5].
The vaccination topic has been, over time, one of thethemes which have raised a series of questions in socialmedia, most of them related to the safety of the entireprocess. As a result, a series of studies have analyzed theimpact of different social media campaigns on vaccinationhesitancy [21]–[23] or the general public sentiment in con-nection with the vaccination process [5], [24]. Addition-ally, compared to other vaccination situations studied in thescientific literature, the COVID-19 vaccination comes withnew inquietudes related to the relatively short period of timeneeded for the vaccine development. As known, the processof developing a vaccine typically takes a decade [25]. Note,however, that the fastest vaccine development before hasbeen four years [26] in the case of mumps vaccine and that,almost forty years after the discovery of HIV, no effectivevaccine has yet been developed. However, the vaccine time-lines for COVID-19 are reduced due to the emergency [25].On December 18, 2020, the web site COVID-19 VaccineTracker,1 held by Milken Institute, shows 236 vaccines arein development, 38 are now in clinical testing and 7 havereached a regulatory decision. Nevertheless, on December 8,2020 the first vaccine has been administrated in UK.
In this context, the present paper analyzes the public opin-ion related to the vaccination process in the case of COVID-19, by considering themessages posted on Twitter. The periodbetween November 9, 2020 – when Pfizer and BioNTechannounced the development of a vaccine that is more than90% effective, to December 8, 2020 – when the vaccination
1https://www.covid19vaccinetracker.org
process has started in UK, has been considered. A numberof 2 349 659 tweets have been collected and a cleaneddataset containing 752 951 tweets has been extracted. Theperformance for stance detection of several machine learningalgorithms (both classical machine learning and deep learn-ing algorithms) has been compared on an annotated dataset.The best performing algorithm has been selected and used foranalyzing both the entire and the cleaned datasets.
The contribution of the paper is three-folded: we havecollected and annotated a COVID-19 vaccination dataset,we have determined the best performing classifier forCOVID-19 vaccination stance detection and we have put inrelation the number of tweets and the stance (e.g. in favor,against or neutral) with the events reported by the media inthe analyzed period.
The chosen approach can be easily integrated in a systemwhich can allow interested organizations a proper monitoringof the public opinion regarding the vaccination process in thecase of the new coronavirus.
The remainder of the paper is organized as follows.Section 2 provides a literature review structured in twomain parts: natural language processing – focusing on sen-timent analysis and stance detection from social media mes-sages, and recent studies analyzing public opinion based onCOVID-19 data extracted from Twitter. Section 3 describesthe proposed methodology, while Section 4 focuses on thedataset collection and annotation process. Section 5 describesthe steps required for stance detection and analyzes the per-formance of the classification algorithms. Section 6 presentsthe dynamics of opinions in the analyzed period. The lim-itations of the present study are mentioned in Section 7.The paper closes with a conclusion section and references.A series of supplementary materials accompany the paper,in the form of the collected and annotated datasets, along withthe extracted unigrams, bigrams and trigrams for each day inthe selected period.
II. LITERATURE REVIEWIn the following, a short literature review regarding senti-ment analysis and stance detection is conducted in order tounderline the current approaches in the research literature.Afterwards, a series of studies that have analyzed the publicopinion, in the context of the COVID-19 pandemic, using dataextracted from Twitter are discussed.
A. SENTIMENT ANALYSIS AND STANCE DETECTIONOpinion mining is a growing area of the Natural LanguageProcessing field commonly used to determine viewpointstowards targets of interest using computational methods [27].It is also known as sentiment analysis and includes manysub-tasks, such as polarity detection – in which the goal isto determine whether a text has positive, negative or neu-tral connotation [28], emotion identification – in which theobjective is to uncover specific emotions such as happiness,fear or sadness [29], subjectivity detection – in which the goalis to determine if the text is objective or subjective [30].
33204 VOLUME 9, 2021
L.-A. Cotfas et al.: Longest Month: Analyzing COVID-19 Vaccination Opinions Dynamics From Tweets
Stance detection [31], [32] is an opinion mining task usedin debate analysis, for determining the opinions towards aspecific target. It can be formalized as the task of identifyingthe tuple < t, s >, in which t represents the target entity,while s represents the opinion. The target entity (t) can beany discussion topic, including products, services, economicmeasures, or life choices, such as vaccination. The opinion(s) towards the target is identified as in favor, against or neu-tral [27].While similar in some respects to polarity detection,
stance detection is a different natural language processingtask, given the fact that positive tweets can be against thetarget entity, while on the contrary, negative tweets cansometimes express a favorable view of the target entity.Moreover, when compared to polarity detection, stancedetection always determines the agreement or disagree-ment in relation to a specific target, even in cases inwhich the target is not explicitly mentioned in the analyzedtext [5].
The types of approaches that can be used for polarityanalysis and stance detection include: lexicon-based methods[33], machine learning methods [34] and hybrid methods – inwhich lexicons andmachine learning are combined [35], [36].
Lexicon based methods rely on sentiment lexicons, suchas Bing Liu’s opinion lexicon [37], MaxDiff [38], Senti-ment140 [39], VaderSentiment [40], SentiWordNet [41] orSenticNet [42], which contain words and sequences of words,together with the polarity score, indicating the strength ofthe positive, neutral or negative perception. For performingpolarity detection, the sentiment lexicons are used togetherwith semantic methods, which typically consider negationsand booster words [40]. A simple rule-based model incorpo-rating a sentiment lexicon, as well as grammatical and syn-tactical conventions, called Vader, is proposed by Hutto andGilbert [40]. The authors show that the proposed model out-performs individual human raters. When compared to clas-sical machine learning algorithms (such as Support VectorMachines, Naïve Bayes and Maximum Entropy), the authorsshow that Vader offers a better performance on the datasetscollected from Twitter, Amazon reviews and NYT editorials.Given the fact that the creation of lexicons is time consum-ing, Cotfas et al. [33] have shown that multiple existinglexicons can be combined to create more comprehensivelexicons through the advantages brought by the grey sys-tems theory. Compared to machine learning, lexicon-basedapproaches have the advantage of not requiring the collec-tion and annotation of training data, making them preferablewhen the volume or the quality of the training data is notsufficient [43], [44].
Machine Learning approaches use supervised classifica-tion algorithms to extract knowledge regarding the sentimentpolarity or the stance of a text. As a preliminary step, beforeapplyingmachine learning, the text needs to be first convertedinto numerical vectors, using schemes such as Bag-of-Wordsand word embeddings. The Bag-of-Words approach is a flex-ible text representation scheme that describes the number
of occurrences of words in the encoded document. As adisadvantage, this scheme does not consider the sequence inwhich the words appear in the document, thus ignoring thecontext in which they are used [45]. Word embeddings are atext representation approach in which each word is mappedto a vector having the values computed in such a way thatallows words which frequently appear in similar contexts tohave a similar representation [46]. The main benefit of thisrepresentation is that additional clues become available forthe classification algorithms. Another advantage resides inthe fact that the number of required dimensions is greatlyreduced when compared to a sparse vector representation,such as one-hot encoding, in which each term is as a binaryvector that contains only zeros, besides a single one-value,corresponding to the term’s index in the vocabulary [45].Among the most popular word embedding techniques, onecan mention: embedding layer, Word2Vec [47], GloVe [48]and FastText [49].
Machine learning approaches include classical machinelearning and deep learning algorithms. Frequently used clas-sical machine learning algorithms for stance detection areSupport Vector Machines (SVM) [5], [31], [50] and NaïveBayes (NB) [5]. In the context of the ‘‘SemEval-2016 Task6: Detecting Stance in Tweets’’ [51], the SVM classifierwith unigram features, used as a baseline for the algorithmsdeveloped by the competing teams, has achieved and F-Scoreof 63.31. By incorporating also word n-grams (unigrams,bigrams and trigrams) and character n-grams (with lengths{2, 3, 4, 5}) the F-Score has increased to 68.98, higher thanall the scores recorded by the algorithms proposed duringthe competition [51]. D’Andrea et al. [5] have comparedseveral classical machine learning (including SVM and NB)and deep learning algorithms for detecting the stance towardsvaccination in Italian tweets, achieving the best results whenusing SVM. The approach proposed by D’Andrea et al. [5]has constituted the basis for the current study.
Deep Learning algorithms have become particularly popu-lar in recent years for both stance detection [31] and sentimentanalysis [52]. The Deep Learning based techniques have pre-dominantly used Convolutional Neural Networks (CNN) [5],[53] and Recurrent Neural Networks (RNN) [54], [55], withits variant Long Short-TermMemory (LSTM) [5], [56]–[58].Zarrella and Marsh [58] have proposed a LSTM approachthat has achieved an F-Score of 67.82, one of the highestscores among the competing teams at ‘‘SemEval-2016 Task6: Detecting Stance in Tweets’’. However, the algorithm hasperformed worse than the baseline SVM n-grams algorithm.
As an alternative to RNN and CNN, Vaswani et al. [59]have proposed transformers, an attention-based architec-ture, replacing the recurrent layers with multi-headed self-attention, achieving state of the art results for machinetranslation [59], document generation [60] and syntactic pars-ing [61]. Transformer-based language models, pre-trainedon large and diverse corpuses of unlabeled data, such asGenerative Pre-trained Transformer (Open-AI GPT) [62] andBidirectional Encoder Representations from Transformers
VOLUME 9, 2021 33205
L.-A. Cotfas et al.: Longest Month: Analyzing COVID-19 Vaccination Opinions Dynamics From Tweets
(BERT) [63] can be afterwards easily fine-tuned for a widerange of Natural Language Processing (NLP) tasks [62],[63]. While Open-AI GPT uses a unidirectional left-to-rightarchitecture, BERT relies on a bidirectional approach, pro-viding better results on many NLP tasks, including sentimentanalysis [63].
Hybrid methods feature a combination of lexicons andmachine learning algorithms. Aloufi and Saddik [35] haveperformed polarity detection from football-specific tweetsusing several machine learning algorithms and a sentimentlexicon automatically generated starting from a manuallylabeled dataset. Even though some improvements have beennoticed by the authors in comparison to using general lex-icons, the best results have been achieved by SVM withunigrams.
Comparisons between various stance analysis approachesused in social media analysis are included in Wang et al. [31]and Mohammad et al. [51].
B. TWITTER SENTIMENT ANALYSIS ON COVID-19 DATAIn the case of epidemics, Merchant and Lurie [64] haveobserved that besides the role assumed by social media ofbecoming the fastest channel of communication between peo-ple found in situations of social distancing due to lockdown,the social media can also act as a tool which can be usedfor anticipating the circumstances related to the spread ofepidemics around the world. The authors have observed ahigh correlation between the information posted on Twitterregarding the evolution of an epidemic and the official datareleased by the Center for Disease Control and Prevention.As a result, the authors have concluded that Twitter canprovide real-time estimations and predictions in the case ofepidemic-related activities. Based on this research, Kaur et al.[65] have used the data extracted from Twitter to monitorthe dynamics of emotions during the first months after theCOVID-19 has become known to the public. A total numberof 16 138 tweets have been extracted and analyzed using IBMWatson Tome Analyzer. As expected, the number of negativetweets exceeded the number of neutral and positive tweetsin all the three months considered in the paper. Comparingthe sentiments extracted for June with the ones extracted forFebruary, it has been observed that the proportion of negativesentiments has decreased (from 43.92% to 38.05%), while thepositive sentiments proportion has increased (from 21.38% to27.01%). The proportion of the neutral sentiments has beenalmost the same (34.07% in February vs. 34.94% in June).
The prevalence of negative sentiments over the positiveones in the case of the COVID-19 pandemic has been alsounderlined by Singh et al. [66], while Boon-Itt and Skunkan[67] have recorded a high discrepancy between the negativesentiments (covering 77.88% of tweets) and the positive sen-timents (covering the rest of 22.12%).
Xue et al. [68] have analyzed the public sentiment relatedto 11 selected topics determined using Latent Dirichlet Allo-cation on COVID-19 tweets. The authors have concludedthat fear is the most dominant emotion in all the considered
topics and that the findings are in line with other studies onCOVID-19 which state that human psychological conditionsare significantly impacted by the coronavirus outbreak [68].
On the other hand, Bhat et al. [69] found that the mostprominent sentiment was positive in the analysis conductedin their paper. The authors state that the occurrence of thepositive sentiments in 51.97% of tweets can be a sign that theusers who have posted themessages are hopeful and enjoy thesocialization experience shared with the family in this periodof lockdown and limited social interaction.
At regional level, Kruspe et al. [70] have analyzed geo-tagged tweets in Europe regarding COVID-19 through the useof a neural network, featuring amultilingual version of BERT,which has been trained on an external dataset, not connectedto the COVID-19 outbreak. Based on their results, the authorsstate that they have observed a general downward trend of thenegative sentiments as the time passes.
At national level, several studies have been conductedfor different countries around the world. For example, in astudy conducted on tweets extracted for Nepal, Pokharel [71]observed that the public opinion faced positive sentiments(58% of the tweets), while the negative sentiments haveonly been expressed in 15% of the tweets. The study useda Naïve Bayes model applied on a limited number of tweets(615 tweets). Barkur et al. [72] determined that in the case ofthe tweets from India, the positive sentiment was dominantwhen analyzing the national lockdown situation announcedby the government. Similar conclusions have been reachedby Khan et al. [73] in a research that has used Naïve Bayesclassifier. The difference between the reactions towards thepandemic in different cultures has been studied by Imranet al. [74] through sentiment and emotion analysis, imple-mented with deep learning classifiers. Besides the correlationbetween tweets’ polarity from different countries, the authorsalso state that NLP can be used to link the emotions expressedon social platforms to the actual events during the coronaviruspandemic. Samuel et al. [75] have shown insights related tothe evolution of the fear-sentiment over time in the UnitedStates.
At regional level, Zhou et al. [76] analyzed the sentimentsin local government areas located in Australia and found thatthe general sentiment during the COVID-19 pandemic was apositive one, but there have been observed decreases in thepositive polarity as the pandemic advanced, with significantchanges from positive to negative sentiments depending onthe government policies or social events. Wang et al. [77]made a comparative analysis between the tweets posted inCalifornia and New York and concluded that California hadmore negative sentiments than New York and that the fluctu-ation in sentiment scores can be correlated with the severityof COVID-19 pandemic and policy changes. Pastor [78] ana-lyzed the sentiment of the Filipinos located in Luzon area andconcluded that most Filipinos had negative sentiments, mostof them due to the extreme community quarantine.
Some other analyses on Twitter in the context ofCOVID-19 have focused, but have not been limited to: topical
33206 VOLUME 9, 2021
L.-A. Cotfas et al.: Longest Month: Analyzing COVID-19 Vaccination Opinions Dynamics From Tweets
sentiment analysis regarding the use of masks [79], moni-toring depression trends [80], sentiment dynamics related tocruise tourism [81], identifying discussion topics and emo-tions [82], thematic analysis [83], detecting misleading infor-mation [84].
As shown above, the prominent sentiments related toCOVID-19 have been found to be either positive or nega-tive. The expressed sentiments have been shown to dependon the geographic area, government decisions and numberof recorded cases. A more in-depth analysis related to thestudies on sentiment analysis featuring COVID-19 and otherinfectious diseases can be found in Alamoodi et al. [3].In this context, the present paper aims to analyze the stance
of the Twitter users in connection to the new upcomingvaccines for COVID-19 in the first month after Pfizer andBioNTech announced their results on the new vaccine. Themethodology and data collection process are presented in thefollowing sections.
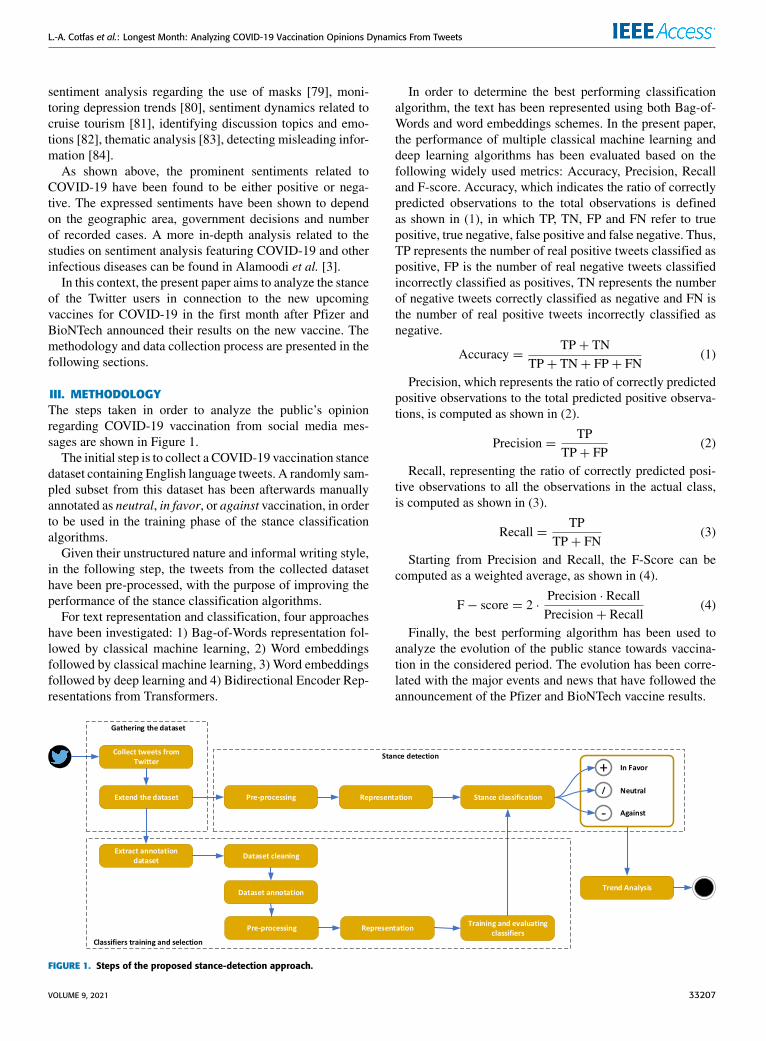
III. METHODOLOGYThe steps taken in order to analyze the public’s opinionregarding COVID-19 vaccination from social media mes-sages are shown in Figure 1.
The initial step is to collect a COVID-19 vaccination stancedataset containing English language tweets. A randomly sam-pled subset from this dataset has been afterwards manuallyannotated as neutral, in favor, or against vaccination, in orderto be used in the training phase of the stance classificationalgorithms.
Given their unstructured nature and informal writing style,in the following step, the tweets from the collected datasethave been pre-processed, with the purpose of improving theperformance of the stance classification algorithms.
For text representation and classification, four approacheshave been investigated: 1) Bag-of-Words representation fol-lowed by classical machine learning, 2) Word embeddingsfollowed by classical machine learning, 3) Word embeddingsfollowed by deep learning and 4) Bidirectional Encoder Rep-resentations from Transformers.
In order to determine the best performing classificationalgorithm, the text has been represented using both Bag-of-Words and word embeddings schemes. In the present paper,the performance of multiple classical machine learning anddeep learning algorithms has been evaluated based on thefollowing widely used metrics: Accuracy, Precision, Recalland F-score. Accuracy, which indicates the ratio of correctlypredicted observations to the total observations is definedas shown in (1), in which TP, TN, FP and FN refer to truepositive, true negative, false positive and false negative. Thus,TP represents the number of real positive tweets classified aspositive, FP is the number of real negative tweets classifiedincorrectly classified as positives, TN represents the numberof negative tweets correctly classified as negative and FN isthe number of real positive tweets incorrectly classified asnegative.
Accuracy =TP+ TN
TP+ TN+ FP+ FN(1)
Precision, which represents the ratio of correctly predictedpositive observations to the total predicted positive observa-tions, is computed as shown in (2).
Precision =TP
TP+ FP(2)
Recall, representing the ratio of correctly predicted posi-tive observations to all the observations in the actual class,is computed as shown in (3).
Recall =TP
TP+ FN(3)
Starting from Precision and Recall, the F-Score can becomputed as a weighted average, as shown in (4).
F− score = 2 ·Precision · RecallPrecision+ Recall
(4)
Finally, the best performing algorithm has been used toanalyze the evolution of the public stance towards vaccina-tion in the considered period. The evolution has been corre-lated with the major events and news that have followed theannouncement of the Pfizer and BioNTech vaccine results.
FIGURE 1. Steps of the proposed stance-detection approach.
VOLUME 9, 2021 33207
L.-A. Cotfas et al.: Longest Month: Analyzing COVID-19 Vaccination Opinions Dynamics From Tweets
IV. COVID-19 VACCINE STANCE DATASETA machine learning approach has been chosen for detectingthe stance of the tweets, which requires a labeled dataset fortraining the classification models. Since we have not identi-fied an already labeled dataset for stance towards COVID-19 vaccination in the scientific literature, a domain-specificdataset, having Twitter as a data source, has been collectedand manually annotated. It should be also mentioned, thataccording to [31], there is a general lack of annotated cor-puses for stance detection.
A. DATASET COLLECTIONSeveral public datasets including large-scale collections oftweets related to the coronavirus pandemic have been pro-posed in the scientific literature, including the ones presentedin [85]–[88]. Some of the datasets, such as [86], [88], aremulti-lingual, while others, such as [85], [87] are languagespecific, including only tweets written in English.
In order to collect a dataset centered around COVID-19vaccination, a hybrid approach has been chosen, in whichthe tweets that we have fetched through the Twitter API forthe keywords in Table 1, have been supplemented with theones in the dataset described in [86], selected using the samekeywords.
Gathering the tweets from the Twitter API has been per-formed through the Twitter Filtered StreamAPI, with the helpof the TweetInvi2 library.
While the approach proposed in this paper can beextended to other languages, in the present study only tweetswritten in English have been considered. Thus, between
2https://github.com/linvi/tweetinvi
TABLE 1. Set of keywords used to fetch tweets.
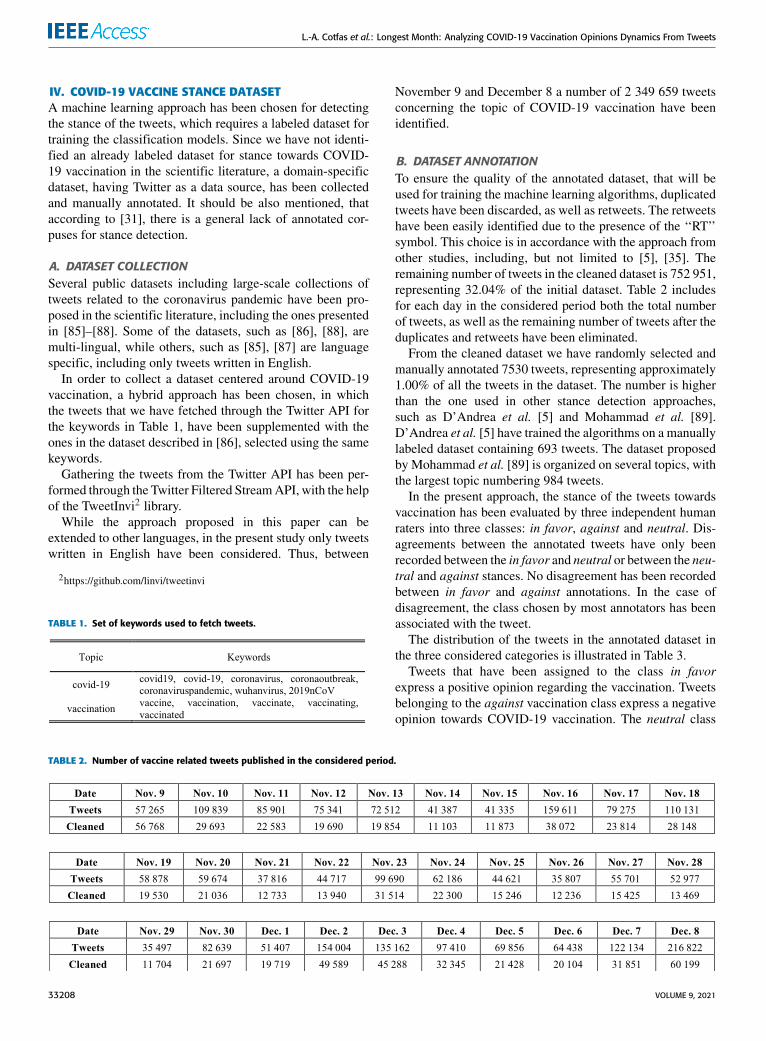
November 9 and December 8 a number of 2 349 659 tweetsconcerning the topic of COVID-19 vaccination have beenidentified.
B. DATASET ANNOTATIONTo ensure the quality of the annotated dataset, that will beused for training the machine learning algorithms, duplicatedtweets have been discarded, as well as retweets. The retweetshave been easily identified due to the presence of the ‘‘RT’’symbol. This choice is in accordance with the approach fromother studies, including, but not limited to [5], [35]. Theremaining number of tweets in the cleaned dataset is 752 951,representing 32.04% of the initial dataset. Table 2 includesfor each day in the considered period both the total numberof tweets, as well as the remaining number of tweets after theduplicates and retweets have been eliminated.
From the cleaned dataset we have randomly selected andmanually annotated 7530 tweets, representing approximately1.00% of all the tweets in the dataset. The number is higherthan the one used in other stance detection approaches,such as D’Andrea et al. [5] and Mohammad et al. [89].D’Andrea et al. [5] have trained the algorithms on a manuallylabeled dataset containing 693 tweets. The dataset proposedby Mohammad et al. [89] is organized on several topics, withthe largest topic numbering 984 tweets.
In the present approach, the stance of the tweets towardsvaccination has been evaluated by three independent humanraters into three classes: in favor, against and neutral. Dis-agreements between the annotated tweets have only beenrecorded between the in favor and neutral or between the neu-tral and against stances. No disagreement has been recordedbetween in favor and against annotations. In the case ofdisagreement, the class chosen by most annotators has beenassociated with the tweet.
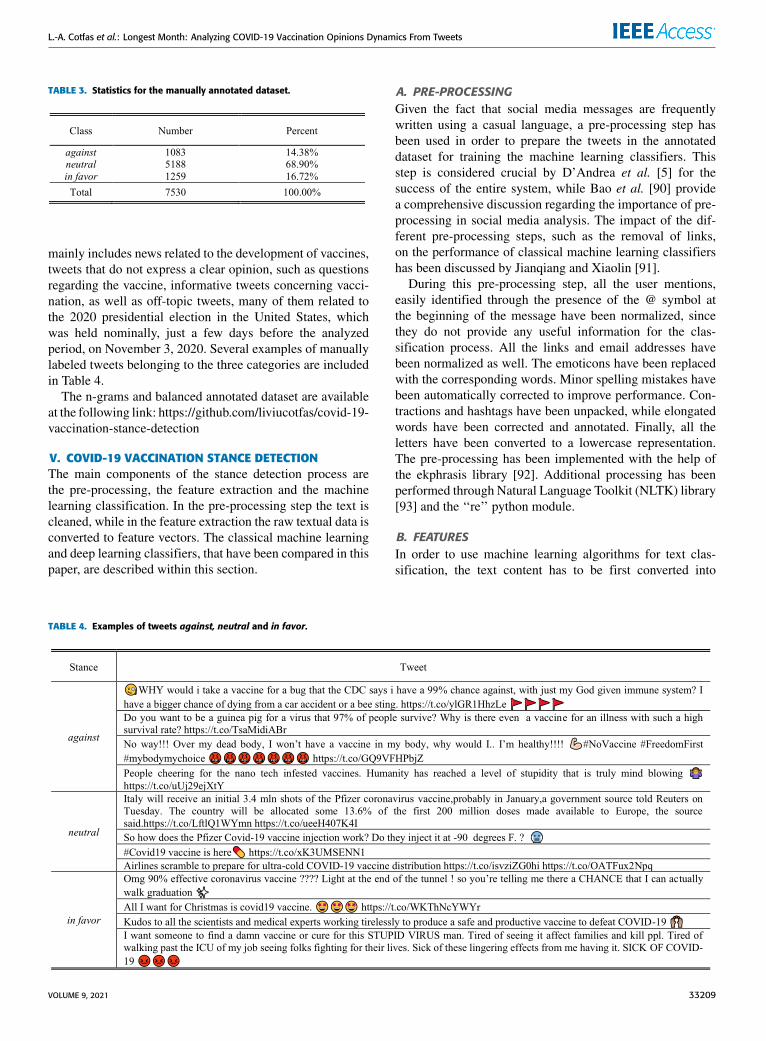
The distribution of the tweets in the annotated dataset inthe three considered categories is illustrated in Table 3.
Tweets that have been assigned to the class in favorexpress a positive opinion regarding the vaccination. Tweetsbelonging to the against vaccination class express a negativeopinion towards COVID-19 vaccination. The neutral class
TABLE 2. Number of vaccine related tweets published in the considered period.
33208 VOLUME 9, 2021
L.-A. Cotfas et al.: Longest Month: Analyzing COVID-19 Vaccination Opinions Dynamics From Tweets
TABLE 3. Statistics for the manually annotated dataset.
mainly includes news related to the development of vaccines,tweets that do not express a clear opinion, such as questionsregarding the vaccine, informative tweets concerning vacci-nation, as well as off-topic tweets, many of them related tothe 2020 presidential election in the United States, whichwas held nominally, just a few days before the analyzedperiod, on November 3, 2020. Several examples of manuallylabeled tweets belonging to the three categories are includedin Table 4.
The n-grams and balanced annotated dataset are availableat the following link: https://github.com/liviucotfas/covid-19-vaccination-stance-detection
V. COVID-19 VACCINATION STANCE DETECTIONThe main components of the stance detection process arethe pre-processing, the feature extraction and the machinelearning classification. In the pre-processing step the text iscleaned, while in the feature extraction the raw textual data isconverted to feature vectors. The classical machine learningand deep learning classifiers, that have been compared in thispaper, are described within this section.
A. PRE-PROCESSINGGiven the fact that social media messages are frequentlywritten using a casual language, a pre-processing step hasbeen used in order to prepare the tweets in the annotateddataset for training the machine learning classifiers. Thisstep is considered crucial by D’Andrea et al. [5] for thesuccess of the entire system, while Bao et al. [90] providea comprehensive discussion regarding the importance of pre-processing in social media analysis. The impact of the dif-ferent pre-processing steps, such as the removal of links,on the performance of classical machine learning classifiershas been discussed by Jianqiang and Xiaolin [91].
During this pre-processing step, all the user mentions,easily identified through the presence of the @ symbol atthe beginning of the message have been normalized, sincethey do not provide any useful information for the clas-sification process. All the links and email addresses havebeen normalized as well. The emoticons have been replacedwith the corresponding words. Minor spelling mistakes havebeen automatically corrected to improve performance. Con-tractions and hashtags have been unpacked, while elongatedwords have been corrected and annotated. Finally, all theletters have been converted to a lowercase representation.The pre-processing has been implemented with the help ofthe ekphrasis library [92]. Additional processing has beenperformed through Natural Language Toolkit (NLTK) library[93] and the ‘‘re’’ python module.
B. FEATURESIn order to use machine learning algorithms for text clas-sification, the text content has to be first converted into
TABLE 4. Examples of tweets against, neutral and in favor.
VOLUME 9, 2021 33209
L.-A. Cotfas et al.: Longest Month: Analyzing COVID-19 Vaccination Opinions Dynamics From Tweets
numerical feature vectors. The Bag-of-Words (BoW) schemeconverts the text to a numerical representation, having as astarting point the frequency of the words. Given a vocabularyV = {w1, . . . ,wN , containing N tokens, denoted using wi,a tweet, or any other textual document d , belonging to acorpus D, can be represented using a feature vector X ={x1, .., xN , in which xi can either represent a binary variablethat indicates whether the word wi appears in the text or anumeric variable indicating the number of times the word wiappears in the text.
Given the fact that very frequent words can sometimescarry little ‘‘informational content’’, the performance of clas-sification algorithms that rely on word frequencies can beimproved using amore complex feature representation, calledTerm Frequency - Inverse Document Frequency (TF-IDF),that reduces the weight associated to words that frequentlyappear in all the documents in the corpus. TF-IDF is com-puted as shown in (5):
TF − IDF (wi) = TF (wi) × log|D|
DF (wi)(5)
where TF(wi) represents the number of appearances of theword wi, |D| stands for the number of documents and DF(wi)is the number of documents containing the term wi. The TF-IDF statistical measure is used throughout the present studyfor features representation.
By only focusing on the number of times a word occursin a given text, the Bag-of-Words approach does not provideany information regarding the succession of the words. Thisissue can be addressed if the n-gram language model is used,in which the text is represented through successions of Nconsecutive words. Common types of n-grams include gramsof size one, called unigrams (1-grams), grams of size two,called bigrams (2-grams), and grams of size three, calledtrigrams (3-grams) [94].
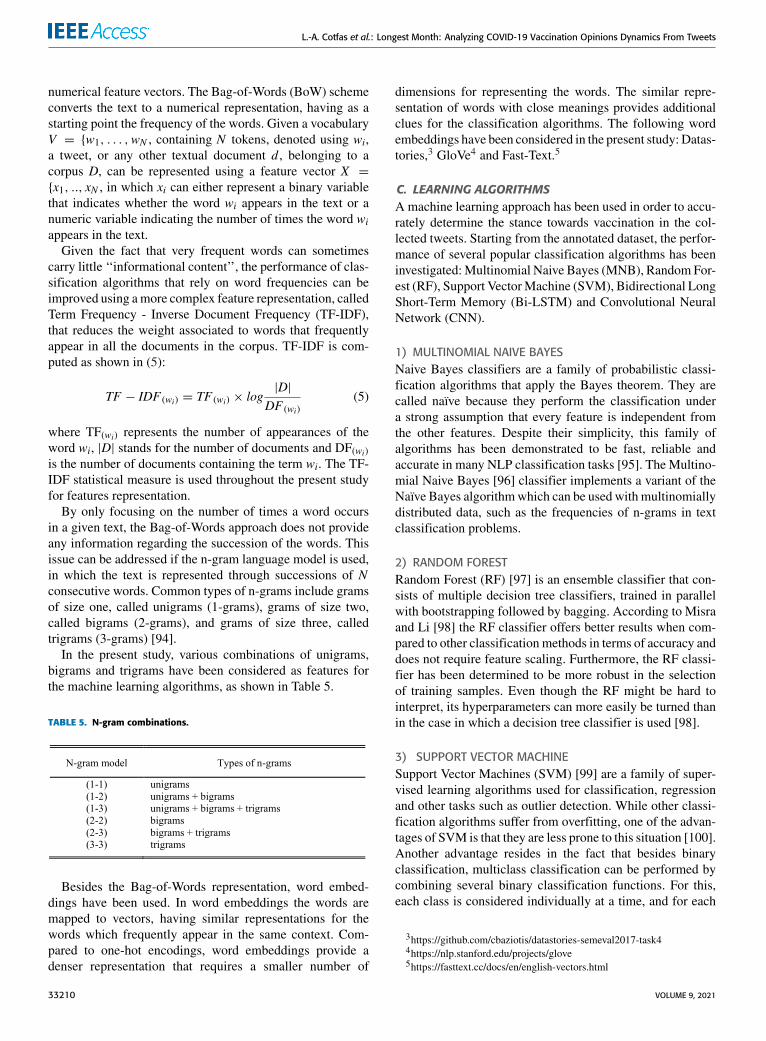
In the present study, various combinations of unigrams,bigrams and trigrams have been considered as features forthe machine learning algorithms, as shown in Table 5.
TABLE 5. N-gram combinations.
Besides the Bag-of-Words representation, word embed-dings have been used. In word embeddings the words aremapped to vectors, having similar representations for thewords which frequently appear in the same context. Com-pared to one-hot encodings, word embeddings provide adenser representation that requires a smaller number of
dimensions for representing the words. The similar repre-sentation of words with close meanings provides additionalclues for the classification algorithms. The following wordembeddings have been considered in the present study: Datas-tories,3 GloVe4 and Fast-Text.5
C. LEARNING ALGORITHMSA machine learning approach has been used in order to accu-rately determine the stance towards vaccination in the col-lected tweets. Starting from the annotated dataset, the perfor-mance of several popular classification algorithms has beeninvestigated:Multinomial Naive Bayes (MNB), Random For-est (RF), Support VectorMachine (SVM), Bidirectional LongShort-Term Memory (Bi-LSTM) and Convolutional NeuralNetwork (CNN).
1) MULTINOMIAL NAIVE BAYESNaive Bayes classifiers are a family of probabilistic classi-fication algorithms that apply the Bayes theorem. They arecalled naïve because they perform the classification undera strong assumption that every feature is independent fromthe other features. Despite their simplicity, this family ofalgorithms has been demonstrated to be fast, reliable andaccurate in many NLP classification tasks [95]. The Multino-mial Naive Bayes [96] classifier implements a variant of theNaïve Bayes algorithmwhich can be used with multinomiallydistributed data, such as the frequencies of n-grams in textclassification problems.
2) RANDOM FORESTRandom Forest (RF) [97] is an ensemble classifier that con-sists of multiple decision tree classifiers, trained in parallelwith bootstrapping followed by bagging. According to Misraand Li [98] the RF classifier offers better results when com-pared to other classification methods in terms of accuracy anddoes not require feature scaling. Furthermore, the RF classi-fier has been determined to be more robust in the selectionof training samples. Even though the RF might be hard tointerpret, its hyperparameters can more easily be turned thanin the case in which a decision tree classifier is used [98].
3) SUPPORT VECTOR MACHINESupport Vector Machines (SVM) [99] are a family of super-vised learning algorithms used for classification, regressionand other tasks such as outlier detection. While other classi-fication algorithms suffer from overfitting, one of the advan-tages of SVM is that they are less prone to this situation [100].Another advantage resides in the fact that besides binaryclassification, multiclass classification can be performed bycombining several binary classification functions. For this,each class is considered individually at a time, and for each
3https://github.com/cbaziotis/datastories-semeval2017-task44https://nlp.stanford.edu/projects/glove5https://fasttext.cc/docs/en/english-vectors.html
33210 VOLUME 9, 2021
L.-A. Cotfas et al.: Longest Month: Analyzing COVID-19 Vaccination Opinions Dynamics From Tweets
class a classifier is searched that separates it from the otherclasses [101].
4) LONG SHORT-TERM MEMORYThe Long Short-Term Memory (LSTM) [102] is a type ofRecurrent Neural Network (RNN). In the current paper, abidirectional LSTM approach has been used (Bi-LSTM),that follows the architecture proposed by Baziotis et al. [92],which has ranked among the best two submissions at‘‘SemEval-2017 Task 4’’ [103]. The architecture consists ofthe following layers: word embedding (none, 50, 300), Gaus-sian noise (none, 50, 300), bidirectional LSTM (none, 50,300), bidirectional LSTM (none, 50, 300), attention (none,300), dropout (none, 300), dense (none, 3) and activation(none, 3). The Gaussian noise and bidirectional LSTM layersare followed by dropout (none, 50, 300) layers.
5) CONVOLUTIONAL NEURAL NETWORKConvolutional Neural Networks (CNN) are a type of neuralnetworks that are specialized for processing data that fea-tures a grid-like topology [46]. CNNs have already beensuccessfully used in different NLP tasks, including stanceclassification [5], [104], [105].
In the current paper, we have followed the approach usedby Cliché [104] and Baziotis et al. [106] regarding the filterlengths of [3]–[5]. Additionally, the architecture of the net-work is similar to the one presented in [106]. In the approachused in the current paper, the word embedding layer (none,50, 300) is followed by a Gaussian noise layer (none, 50,300) and by a dropout layer (50, 300). After this layer, three1-D convolutional layers (using ReLU activation) have beenadded, each followed by a max pooling layer and a flatteninglayer. The outputs of these layers are merged in a concatena-tion layer (none, 7000). The dropout layer (none, 7000) anda dense layer (none, 3) conclude the network.
6) BIDIRECTIONAL ENCODER REPRESENTATIONS FROMTRANSFORMERSBidirectional Encoder Representations from Transformers(BERT) [63] is a pre-trained transformer-based languagemodel. Compared to word embeddings such as GloVe, BERThas the advantage of taking into account the context for eachoccurrence of a given word. The model has been pre-trainedon a diverse corpus of unlabeled text extracted from theEnglish Wikipedia and the BookCorpus [107].
Pre-trained BERT models with a wide range of sizes exist,varying the number of layers L from 2 to 24 and the hiddensize H from 128 to 1024 [63], [108]. In the present paper,the BERTBASE
6 model has been chosen, having L = 12,H = 768 and the number of self-attention heads A = 12. Theneural network architecture has a total of 110M parameters.In comparison, BERTLARGE (L = 24, H = 1024, A =16), having 340M parameters, has been shown to provide
6https://huggingface.co/bert-base-uncased
improvements in accuracy of no more than 5% [63], whilebeing far more compute intensive.
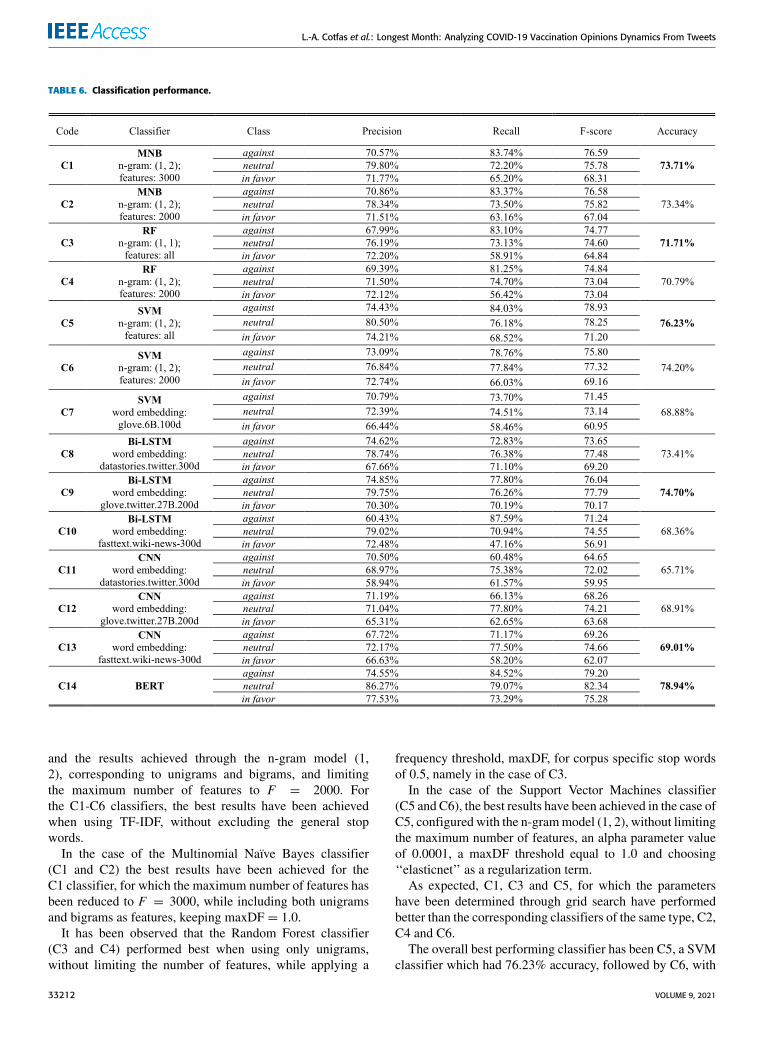
D. EXPERIMENTS AND RESULTSThe classical machine learning algorithms have been imple-mented using the scikit-learn [109] library, while the deeplearning algorithms have been implemented using the Keras7
library, having TensorFlow8 as a backend.Cross-validation using either 5-folds [51] or 10-folds [5]
is a widely-used approach for comparing and selecting clas-sifiers. In this paper, following the approach described byMohammad et al. [51], the classifiers have been evaluatedthrough a 5-fold cross-validation procedure, during whichthe classification model is trained using k-1 of the folds astraining data, while the resulting model is validated on theremaining part of the data. The performance of the classifieris then computed as an average of the values computed duringthe k consecutive runs. Since the balanced dataset includes3249 tweets (1083 in each class), at each iteration, the classi-fication models are trained using 2600 tweets and evaluatedusing the remaining 649 tweets. The results of the consideredmethods are shown in Table 6 and further discussed in thesub-sections below.
1) BOW AND CLASSICAL MACHINE LEARNINGThe best parameters for the developed natural languageprocessing pipeline have been determined through the gridsearch approach. Thus, different numbers of features havebeen tested, including using all the features and reducing thenumber of features, F , to a maximum of 1500, 2000 and3000 values.
Different n-gram combinations, ranging from (1,1) to (1,3),as listed in Table 5, have been investigated for the stringvectorizer, as well. Additionally, the algorithms have beenevaluated considering both the case in which the general stopwords are kept and the one in which they are excluded. Thestop word list that has been considered is the one includedin the NLTK library. In the case of the corpus-specific stopwords, the document frequency thresholds, maxDF, that havebeen considered are 0.5, 0.75 and 1.0. Besides, the evalu-ation has also analyzed whether applying Term Frequency(TF) or Term Frequency - Inverse Document Frequency (TF-IDF) can improve the stance classification results.
We have experimented with different settings for the clas-sifiers, including varying, in the case of the SGDClassifier,the alpha parameter, which multiplies the regularization term.Different regularization terms have been tested, including‘‘l1’’, ‘‘l2’’ and ‘‘elasticnet’’. The loss function of the SGD-Classifier has been configured as ‘‘hinge’’, corresponding toa linear SVM.
For each considered classical machine learning classifier(C1-C6), Table 6 includes both the results achieved usingthe parameters determined through grid search (C1, C3, C5)
7https://keras.io8https://www.tensorflow.org
VOLUME 9, 2021 33211
L.-A. Cotfas et al.: Longest Month: Analyzing COVID-19 Vaccination Opinions Dynamics From Tweets
TABLE 6. Classification performance.
and the results achieved through the n-gram model (1,2), corresponding to unigrams and bigrams, and limitingthe maximum number of features to F = 2000. Forthe C1-C6 classifiers, the best results have been achievedwhen using TF-IDF, without excluding the general stopwords.
In the case of the Multinomial Naïve Bayes classifier(C1 and C2) the best results have been achieved for theC1 classifier, for which the maximum number of features hasbeen reduced to F = 3000, while including both unigramsand bigrams as features, keeping maxDF = 1.0.It has been observed that the Random Forest classifier
(C3 and C4) performed best when using only unigrams,without limiting the number of features, while applying a
frequency threshold, maxDF, for corpus specific stop wordsof 0.5, namely in the case of C3.
In the case of the Support Vector Machines classifier(C5 and C6), the best results have been achieved in the case ofC5, configured with the n-grammodel (1, 2), without limitingthe maximum number of features, an alpha parameter valueof 0.0001, a maxDF threshold equal to 1.0 and choosing‘‘elasticnet’’ as a regularization term.
As expected, C1, C3 and C5, for which the parametershave been determined through grid search have performedbetter than the corresponding classifiers of the same type, C2,C4 and C6.
The overall best performing classifier has been C5, a SVMclassifier which had 76.23% accuracy, followed by C6, with
33212 VOLUME 9, 2021
L.-A. Cotfas et al.: Longest Month: Analyzing COVID-19 Vaccination Opinions Dynamics From Tweets
74.20% accuracy. In terms of precision and F-score, C5 over-performed all the other classifiers for each of the three consid-ered classes, in favor, against and neutral. A small differenceis recorded in the case of recall, where the value for theneutral class is slightly lower for C5 than for C6 (76.18%versus 77.84%).
The worst performing classifier has been C4, a RF classi-fier, with an accuracy of 70.79%. In terms of precision andrecall, the classifier C4 performed worse than C5 and C6 onall three classes, in favor, against and neutral.
2) WORD EMBEDINGS AND CLASSICAL MACHINELEARNINGStarting from the algorithm that has provided the best resultsin the context of the Bag-of-Words approach, C5, in thefollowing we have analyzed if the performance can be fur-ther improved by considering pre-trained word embeddings.Similar approaches, using word embeddings with classicalmachine learning algorithms, have been investigated in [5]and [110].
To this end, a word embedding, called glove.6B, thatincludes six billion tokens, created through the Gloveapproach from a corpus extracted from Wikipedia and fromthe news archive Gigaword [111], has been used. This imple-mentation is marked in Table 6, as C7.
As shown in Table 6, the values of all the four con-sidered metrics (precision, recall, F-score and accuracy)of the C7 classifier are worse than those achieved in thecase of C5.
3) WORD EMBEDINGS AND DEEP LEARNINGIn the case of the deep learning classifiers, in the presentpaper, the Adam approach has been applied for tuning thelearning rate [112]. The resulting classifiers are listed inTable 6 under the C8 – C13 classifiers.
As shown in Table 6, among the Bi-LSTM classifiers (C8-C10), the best results have been achieved by the C9 classifier,with an accuracy of 74.70%, higher than in the case of C8,(73.41%) and C10 (68.36%). The C9 classifier has used theword embeddings created through the Glove approach froma corpus composed of 2 billion tweets.
In the case of CNN classfieirs (C11-C13) the best resultshave been achieved by the C13 classifier, using the wordembeding created through the FastText approach on a cor-pus extracted from Wikipedia and news stories (accuracy69.01%).
Classifiers C8 and C11, ranked second in the Bi-LSTMcategory (73.41%) and third in the CNN category (65.71%)based on accuracy, have used the Datastories word embed-dings, created from a corpus of 330 million tweets, by apply-ing the GloVe approach.
The best performing deep learning classifier has been C9,implementing Bi-LSTM, which outperforms C8, C10-C13classifiers, both in terms of accuracy and F-score.
4) BIDIRECTIONAL ENCODER REPRESENTATIONS FROMTRANSFORMERSIn order to establish the best values for the hyperparametersof the BERT language model (C14), the approach recom-mended by Devlin et al. [63] has been followed during thefine-tuning procedure in regarding the batch sizes (16, 32),learning rate (5e-5, 3e-5, 2e-5) and number or epochs (2, 3,4). The best results have been achieved when using a batchsize of 16, a learning rate of 3e-5 and a number of epochsequal to 3. Having an accuracy of 78.94%, the C14 classifieroutperforms all the other classifiers. Moreover, it clearly out-performs the second-best performing classifier, C5, in termsof precision, recall and F-score, for all the considered classes.
E. DISCUSSIONThe results achieved by the deep learning classifier C9 areworse than the ones obtained in the case of the classicalmachine learning classifier C5 in terms of accuracy andF-score. This result is consistent with the ones in otherstudies, such as D’Andrea et al. [5], in which classicalmachine learning algorithms have outperformed deep learn-ing approaches, such as CNN and LSTM, in the case ofvaccine stance classification.
As noted in the review paper of Wang et al. [31], stancedetection approaches typically do not perform extremelywell. The reasons mentioned by the authors include the spar-sity, the colloquial language and the absence of large, labeleddatasets that could be used for training. Moreover, Moham-mad et al. [51] summarize the results of the ‘‘SemEval-2016 Task 6: Detecting Stance in Tweets’’ mentioning thatthe SVM baseline with n-grams has performed relatively wellcompared to other machine learning approaches.
In the following we have used the best performing classi-fier, C14, to analyze the tweets collected over the consideredperiod of time. The model has been trained on all the tweetsin the annotated dataset.
VI. ANALYZING SOCIAL MEDIAThe evolution of the daily number of tweets is discussed inthis section in connection with the major events which haveoccurred around the world related to COVID-19 vaccination,with an accent on the English-speaking countries.
A. MAJOR EVENTSThe major events have been extracted from the news pub-lished online in each day of the analyzed period usinggoogle.com search engine by selecting the ‘‘News’’ sectionand ‘‘COVID’’ keyword and by pointing one-by-one the daysin the mentioned period. Each time, the first 10 pages ofNews titles have been considered and the most relevant newshave been extracted in connection to the COVID-19 vacci-nation theme, relevance being given by the connection to theCOVID-19 vaccination and the amount of news on a specifictopic.
VOLUME 9, 2021 33213
L.-A. Cotfas et al.: Longest Month: Analyzing COVID-19 Vaccination Opinions Dynamics From Tweets
As a result, it has been observed that in all the ana-lyzed days there have been news regarding the COVID-19vaccination theme, starting from the announcement of thevaccine effectiveness by different producers, the amount ofmoney funded by various organizations for COVD-19 vac-cine, adverse events encountered in the pre-test phase, ethicalissues related to whom should have first access to the vaccine,the predicted quantity of vaccines to be distributed in differentcountries and areas and ending with the vaccination in Russiaand UK.
The following events have been put in connection with thenumber of tweets recorded daily, which might have deter-mined the variation in the tweets’ number:
E1. Nov. 9: Pfizer and BioNTech announcement regardingtheir COVID-19 vaccine effectiveness9
E2. Nov. 10: Positive news regarding stock trading, oilfutures and cruise bookings rise as a result of COVID-19 vaccine10,11
E3. Nov. 13: World Health Organization exceeded the tar-get of $ 2 billion to buy and distribute COVID-19 curesto poorer countries12
E4. Nov. 16: Moderna’s COVID-19 vaccine shows 94.5%efficiency in clinical trials13
E5. Nov. 18: Sinovac’s COVID-19 vaccine induces a quickimmune response14
E6. Nov. 20: Pfizer’s announcement regarding COVID-19 vaccine emergency authorization15
E7. Nov. 23: Oxford AstraZeneca COVID-19 vaccineshows an up to 90% efficacy16
E8. Nov. 27: UK hospitals start preparing for the arrival ofthe COVID-19 vaccine in 10-day time17
E9. Nov. 30: Moderna seeks approval for the COVID-19vaccine in Europe and United States18
9https://www.cnbc.com/2020/11/09/covid-vaccine-pfizer-drug-is-more-than-90percent-effective-in-preventing-infection.html (accessedDecember 9, 2020)
10https://www.cnbc.com/2020/11/10/cruise-bookings-rise-on-coronavirus-vaccine-news-norwegian-cruise-line-ceo-says.html (accessedDecember 9, 2020)
11https://in.reuters.com/article/global-oil/oil-gains-after-stockpile-draw-amid-hopes-for-coronavirus-vaccine-idINL4N2HX0O6 (accessedDecember 9, 2020)
12https://uk.reuters.com/article/uk-health-coronavirus-vaccines-covax-idUKKBN27T138 (accessed December 9, 2020)
13https://www.ft.com/content/9d7a2e24-aea0-4c45-82ab-509dc80ed5a1(accessed December 9, 2020)
14https://www.reuters.com/article/uk-health-coronavirus-sinovac/sinovacs-covid-19-vaccine-induces-quick-immune-response-study-idUKKBN27× 35I (accessed December 9, 2020)
15https://www.technologyreview.com/2020/11/20/1012391/pfizer-authorization-covid-19-vaccine-christmas/ (accessed December 9, 2020)
16https://www.theguardian.com/society/2020/nov/23/astrazeneca-says-its-coronavirus-vaccine-has-70-per-cent-efficacy-covid-oxford-university(accessed December 9, 2020)
17https://www.theguardian.com/world/2020/nov/27/hospitals-england-told-prepare-early-december-covid-vaccine-rollout-nhs (accessedDecember 9, 2020)
18https://www.bbc.com/news/health-55129336 (accessed December 9,2020)
E10. Dec. 2: UK authorize the Pfizer BioNTech COVID-19vaccine19
E11. Dec. 3: The first batch of vaccines arrived in UK20
E12. Dec. 8: UK starts COVID-19 vaccination21
In order to validate the correspondence between the eventsand the analyzed tweets we have extracted for each date in theanalyzed period the unigrams, bigrams and trigrams sortedaccording to the number of appearances. The analysis hasbeen performed for both the cleaned dataset and the wholedataset, that also includes the retweets. Before the n-gramextraction, the tweets have been minimally pre-processed byremoving stop words and duplicated white spaces.
From the events presented above, we have selected twoevents, one that has generated a large number of tweets,namely E10, and another one that has generated a compar-atively smaller number of tweets, namely E6.
Analyzing the n-grams for the 154?004 tweets collectedfor December 2, the day of E10, it has been observedthat among the top-15 unigrams, besides the specificCOVID-19 terms (e.g. ‘‘vaccine’’, ‘‘covid’’, ‘‘19’’, ‘‘coron-avirus’’, ‘‘covid19’’, ‘‘vaccines’’) in this day ‘‘Pfizer’’ hasbeen referred 57?342 times, followed by ‘‘UK’’ referred48 789 times, ‘‘first’’ referred 39 438 times, ‘‘BioNTech’’referred 30 993 times and ‘‘approve’’ referred 18 949 times.Based on the top-10 bigrams and trigrams, it can be observedthe occurrence of the following words’ combinations: ‘‘PfizerBioNTech’’ referred 29 714 times, ‘‘first country’’ referred18 085 times, ‘‘approve Pfizer’’ referred 15 453 times. Con-sidering the extracted unigrams, bigrams and trigrams andthe E10 event, UK authorization of the Pfizer and BioNTechCOVID-19 vaccine, it can easily be noted that there exists acorrespondence between E10 and the analyzed tweets fromDecember 2.
On November 20, there have been collected 59 674 tweets.From the top-15 unigram analysis, the following havebeen extracted: ‘‘Pfizer’’ (17 639 times), ‘‘emergency’’(13 466 times), ‘‘authorization’’ (7251 times), ‘‘fda’’(6622 times) and ‘‘BioNTech’’ (5347 times). As for thetop-10 bigrams and trigrams, the words’ combinations havebeen: ‘‘emergency use’’ (9613 times), ‘‘use authorization’’(4769 times), ‘‘emergency use authorization’’ (4768 times)and ‘‘Pfizer BioNTech’’ (4583 times). It can thus be observedthat even in the case of a less significant event (‘‘Pfizer’sannouncement regarding COVID-19 vaccine emergencyauthorization’’) the correspondence between the tweets andthe event exists.
B. STANCE ANALYSISIn the following, the best performing classifier - determinedin Section V, BERT (C14) - is used to perform stance analysison the gathered dataset. As it will be observed, not all the
19https://www.economist.com/science-and-technology/2020/12/01/britain-becomes-the-first-country-to-license-a-fully-tested-covid-19-vaccine (accessed December 9, 2020)
20https://www.bbc.com/news/uk-55181665 (accessed December 9, 2020)21https://www.bbc.com/news/uk-55227325 (accessed December 9, 2020)
33214 VOLUME 9, 2021
L.-A. Cotfas et al.: Longest Month: Analyzing COVID-19 Vaccination Opinions Dynamics From Tweets
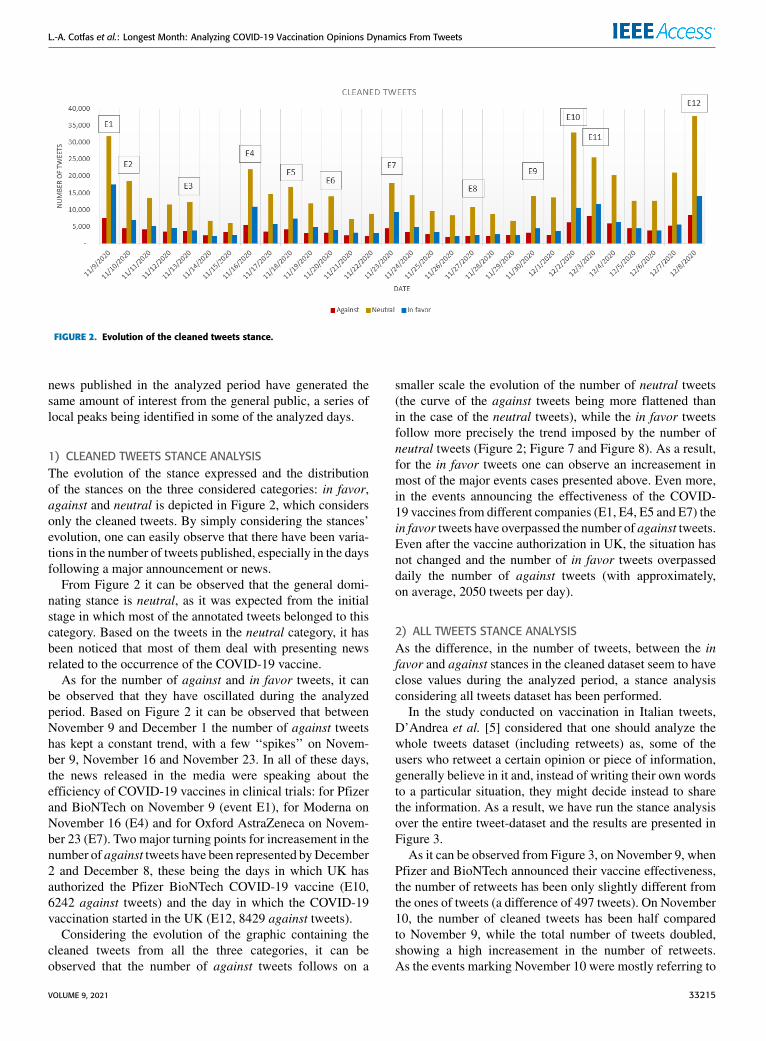
FIGURE 2. Evolution of the cleaned tweets stance.
news published in the analyzed period have generated thesame amount of interest from the general public, a series oflocal peaks being identified in some of the analyzed days.
1) CLEANED TWEETS STANCE ANALYSISThe evolution of the stance expressed and the distributionof the stances on the three considered categories: in favor,against and neutral is depicted in Figure 2, which considersonly the cleaned tweets. By simply considering the stances’evolution, one can easily observe that there have been varia-tions in the number of tweets published, especially in the daysfollowing a major announcement or news.
From Figure 2 it can be observed that the general domi-nating stance is neutral, as it was expected from the initialstage in which most of the annotated tweets belonged to thiscategory. Based on the tweets in the neutral category, it hasbeen noticed that most of them deal with presenting newsrelated to the occurrence of the COVID-19 vaccine.
As for the number of against and in favor tweets, it canbe observed that they have oscillated during the analyzedperiod. Based on Figure 2 it can be observed that betweenNovember 9 and December 1 the number of against tweetshas kept a constant trend, with a few ‘‘spikes’’ on Novem-ber 9, November 16 and November 23. In all of these days,the news released in the media were speaking about theefficiency of COVID-19 vaccines in clinical trials: for Pfizerand BioNTech on November 9 (event E1), for Moderna onNovember 16 (E4) and for Oxford AstraZeneca on Novem-ber 23 (E7). Two major turning points for increasement in thenumber of against tweets have been represented byDecember2 and December 8, these being the days in which UK hasauthorized the Pfizer BioNTech COVID-19 vaccine (E10,6242 against tweets) and the day in which the COVID-19vaccination started in the UK (E12, 8429 against tweets).Considering the evolution of the graphic containing the
cleaned tweets from all the three categories, it can beobserved that the number of against tweets follows on a
smaller scale the evolution of the number of neutral tweets(the curve of the against tweets being more flattened thanin the case of the neutral tweets), while the in favor tweetsfollow more precisely the trend imposed by the number ofneutral tweets (Figure 2; Figure 7 and Figure 8). As a result,for the in favor tweets one can observe an increasement inmost of the major events cases presented above. Even more,in the events announcing the effectiveness of the COVID-19 vaccines from different companies (E1, E4, E5 and E7) thein favor tweets have overpassed the number of against tweets.Even after the vaccine authorization in UK, the situation hasnot changed and the number of in favor tweets overpasseddaily the number of against tweets (with approximately,on average, 2050 tweets per day).
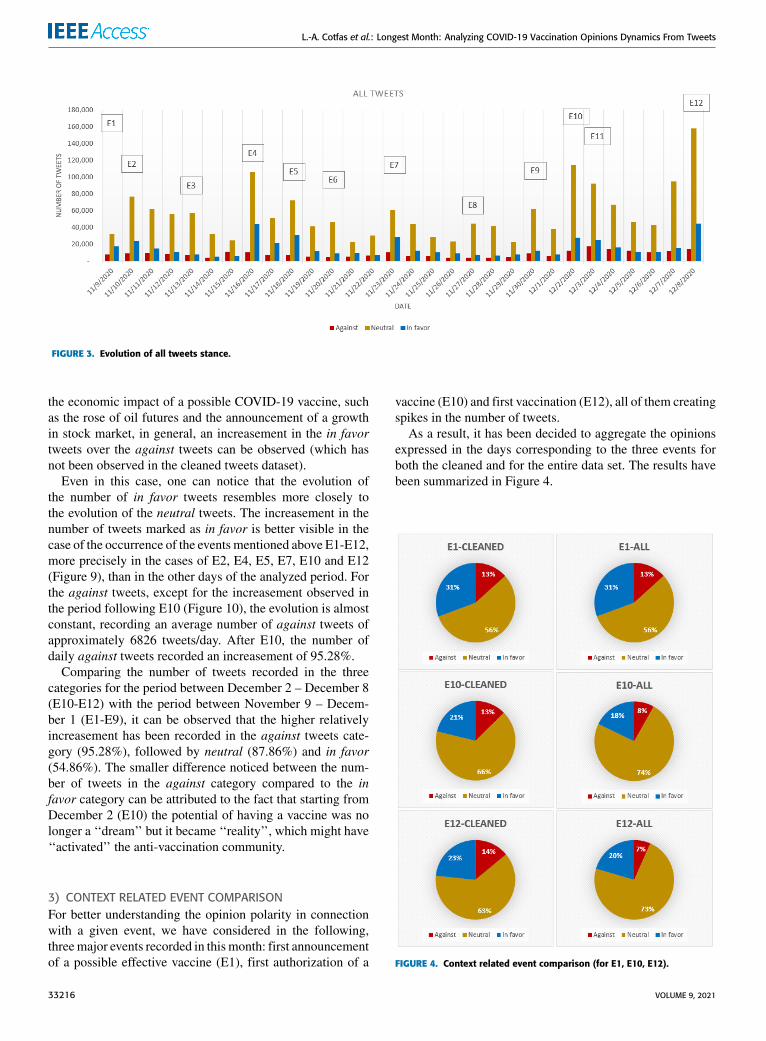
2) ALL TWEETS STANCE ANALYSISAs the difference, in the number of tweets, between the infavor and against stances in the cleaned dataset seem to haveclose values during the analyzed period, a stance analysisconsidering all tweets dataset has been performed.
In the study conducted on vaccination in Italian tweets,D’Andrea et al. [5] considered that one should analyze thewhole tweets dataset (including retweets) as, some of theusers who retweet a certain opinion or piece of information,generally believe in it and, instead of writing their own wordsto a particular situation, they might decide instead to sharethe information. As a result, we have run the stance analysisover the entire tweet-dataset and the results are presented inFigure 3.
As it can be observed from Figure 3, on November 9, whenPfizer and BioNTech announced their vaccine effectiveness,the number of retweets has been only slightly different fromthe ones of tweets (a difference of 497 tweets). On November10, the number of cleaned tweets has been half comparedto November 9, while the total number of tweets doubled,showing a high increasement in the number of retweets.As the events marking November 10 were mostly referring to
VOLUME 9, 2021 33215
L.-A. Cotfas et al.: Longest Month: Analyzing COVID-19 Vaccination Opinions Dynamics From Tweets
FIGURE 3. Evolution of all tweets stance.
the economic impact of a possible COVID-19 vaccine, suchas the rose of oil futures and the announcement of a growthin stock market, in general, an increasement in the in favortweets over the against tweets can be observed (which hasnot been observed in the cleaned tweets dataset).
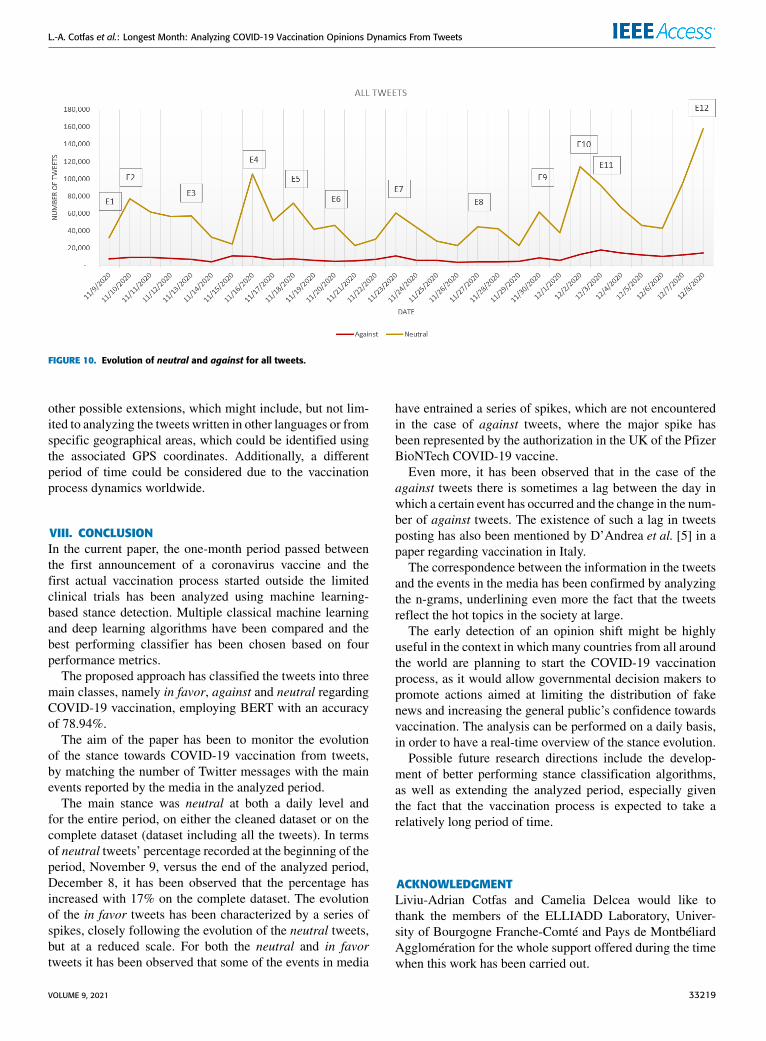
Even in this case, one can notice that the evolution ofthe number of in favor tweets resembles more closely tothe evolution of the neutral tweets. The increasement in thenumber of tweets marked as in favor is better visible in thecase of the occurrence of the events mentioned above E1-E12,more precisely in the cases of E2, E4, E5, E7, E10 and E12(Figure 9), than in the other days of the analyzed period. Forthe against tweets, except for the increasement observed inthe period following E10 (Figure 10), the evolution is almostconstant, recording an average number of against tweets ofapproximately 6826 tweets/day. After E10, the number ofdaily against tweets recorded an increasement of 95.28%.
Comparing the number of tweets recorded in the threecategories for the period between December 2 – December 8(E10-E12) with the period between November 9 – Decem-ber 1 (E1-E9), it can be observed that the higher relativelyincreasement has been recorded in the against tweets cate-gory (95.28%), followed by neutral (87.86%) and in favor(54.86%). The smaller difference noticed between the num-ber of tweets in the against category compared to the infavor category can be attributed to the fact that starting fromDecember 2 (E10) the potential of having a vaccine was nolonger a ‘‘dream’’ but it became ‘‘reality’’, which might have‘‘activated’’ the anti-vaccination community.
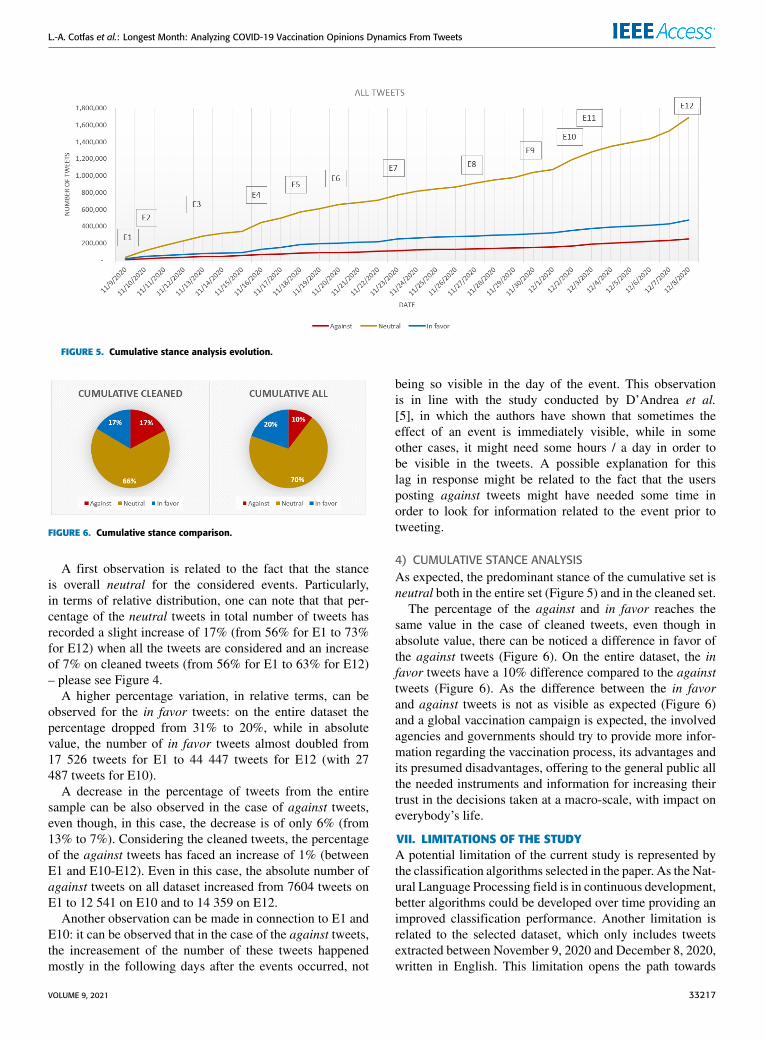
3) CONTEXT RELATED EVENT COMPARISONFor better understanding the opinion polarity in connectionwith a given event, we have considered in the following,threemajor events recorded in thismonth: first announcementof a possible effective vaccine (E1), first authorization of a
vaccine (E10) and first vaccination (E12), all of them creatingspikes in the number of tweets.
As a result, it has been decided to aggregate the opinionsexpressed in the days corresponding to the three events forboth the cleaned and for the entire data set. The results havebeen summarized in Figure 4.
FIGURE 4. Context related event comparison (for E1, E10, E12).
33216 VOLUME 9, 2021
L.-A. Cotfas et al.: Longest Month: Analyzing COVID-19 Vaccination Opinions Dynamics From Tweets
FIGURE 5. Cumulative stance analysis evolution.
FIGURE 6. Cumulative stance comparison.
A first observation is related to the fact that the stanceis overall neutral for the considered events. Particularly,in terms of relative distribution, one can note that that per-centage of the neutral tweets in total number of tweets hasrecorded a slight increase of 17% (from 56% for E1 to 73%for E12) when all the tweets are considered and an increaseof 7% on cleaned tweets (from 56% for E1 to 63% for E12)– please see Figure 4.
A higher percentage variation, in relative terms, can beobserved for the in favor tweets: on the entire dataset thepercentage dropped from 31% to 20%, while in absolutevalue, the number of in favor tweets almost doubled from17 526 tweets for E1 to 44 447 tweets for E12 (with 27487 tweets for E10).
A decrease in the percentage of tweets from the entiresample can be also observed in the case of against tweets,even though, in this case, the decrease is of only 6% (from13% to 7%). Considering the cleaned tweets, the percentageof the against tweets has faced an increase of 1% (betweenE1 and E10-E12). Even in this case, the absolute number ofagainst tweets on all dataset increased from 7604 tweets onE1 to 12 541 on E10 and to 14 359 on E12.
Another observation can be made in connection to E1 andE10: it can be observed that in the case of the against tweets,the increasement of the number of these tweets happenedmostly in the following days after the events occurred, not
being so visible in the day of the event. This observationis in line with the study conducted by D’Andrea et al.[5], in which the authors have shown that sometimes theeffect of an event is immediately visible, while in someother cases, it might need some hours / a day in order tobe visible in the tweets. A possible explanation for thislag in response might be related to the fact that the usersposting against tweets might have needed some time inorder to look for information related to the event prior totweeting.
4) CUMULATIVE STANCE ANALYSISAs expected, the predominant stance of the cumulative set isneutral both in the entire set (Figure 5) and in the cleaned set.
The percentage of the against and in favor reaches thesame value in the case of cleaned tweets, even though inabsolute value, there can be noticed a difference in favor ofthe against tweets (Figure 6). On the entire dataset, the infavor tweets have a 10% difference compared to the againsttweets (Figure 6). As the difference between the in favorand against tweets is not as visible as expected (Figure 6)and a global vaccination campaign is expected, the involvedagencies and governments should try to provide more infor-mation regarding the vaccination process, its advantages andits presumed disadvantages, offering to the general public allthe needed instruments and information for increasing theirtrust in the decisions taken at a macro-scale, with impact oneverybody’s life.
VII. LIMITATIONS OF THE STUDYA potential limitation of the current study is represented bythe classification algorithms selected in the paper. As the Nat-ural Language Processing field is in continuous development,better algorithms could be developed over time providing animproved classification performance. Another limitation isrelated to the selected dataset, which only includes tweetsextracted between November 9, 2020 and December 8, 2020,written in English. This limitation opens the path towards
VOLUME 9, 2021 33217
L.-A. Cotfas et al.: Longest Month: Analyzing COVID-19 Vaccination Opinions Dynamics From Tweets
FIGURE 7. Evolution of neutral and in favor cleaned tweets.
FIGURE 8. Evolution of neutral and against cleaned tweets.
FIGURE 9. Evolution of neutral and in favor for all tweets.
33218 VOLUME 9, 2021
L.-A. Cotfas et al.: Longest Month: Analyzing COVID-19 Vaccination Opinions Dynamics From Tweets
FIGURE 10. Evolution of neutral and against for all tweets.
other possible extensions, which might include, but not lim-ited to analyzing the tweets written in other languages or fromspecific geographical areas, which could be identified usingthe associated GPS coordinates. Additionally, a differentperiod of time could be considered due to the vaccinationprocess dynamics worldwide.
VIII. CONCLUSIONIn the current paper, the one-month period passed betweenthe first announcement of a coronavirus vaccine and thefirst actual vaccination process started outside the limitedclinical trials has been analyzed using machine learning-based stance detection. Multiple classical machine learningand deep learning algorithms have been compared and thebest performing classifier has been chosen based on fourperformance metrics.
The proposed approach has classified the tweets into threemain classes, namely in favor, against and neutral regardingCOVID-19 vaccination, employing BERT with an accuracyof 78.94%.
The aim of the paper has been to monitor the evolutionof the stance towards COVID-19 vaccination from tweets,by matching the number of Twitter messages with the mainevents reported by the media in the analyzed period.
The main stance was neutral at both a daily level andfor the entire period, on either the cleaned dataset or on thecomplete dataset (dataset including all the tweets). In termsof neutral tweets’ percentage recorded at the beginning of theperiod, November 9, versus the end of the analyzed period,December 8, it has been observed that the percentage hasincreased with 17% on the complete dataset. The evolutionof the in favor tweets has been characterized by a series ofspikes, closely following the evolution of the neutral tweets,but at a reduced scale. For both the neutral and in favortweets it has been observed that some of the events in media
have entrained a series of spikes, which are not encounteredin the case of against tweets, where the major spike hasbeen represented by the authorization in the UK of the PfizerBioNTech COVID-19 vaccine.
Even more, it has been observed that in the case of theagainst tweets there is sometimes a lag between the day inwhich a certain event has occurred and the change in the num-ber of against tweets. The existence of such a lag in tweetsposting has also been mentioned by D’Andrea et al. [5] in apaper regarding vaccination in Italy.
The correspondence between the information in the tweetsand the events in the media has been confirmed by analyzingthe n-grams, underlining even more the fact that the tweetsreflect the hot topics in the society at large.
The early detection of an opinion shift might be highlyuseful in the context in which many countries from all aroundthe world are planning to start the COVID-19 vaccinationprocess, as it would allow governmental decision makers topromote actions aimed at limiting the distribution of fakenews and increasing the general public’s confidence towardsvaccination. The analysis can be performed on a daily basis,in order to have a real-time overview of the stance evolution.
Possible future research directions include the develop-ment of better performing stance classification algorithms,as well as extending the analyzed period, especially giventhe fact that the vaccination process is expected to take arelatively long period of time.
ACKNOWLEDGMENTLiviu-Adrian Cotfas and Camelia Delcea would like tothank the members of the ELLIADD Laboratory, Univer-sity of Bourgogne Franche-Comté and Pays de MontbéliardAgglomération for the whole support offered during the timewhen this work has been carried out.
VOLUME 9, 2021 33219
L.-A. Cotfas et al.: Longest Month: Analyzing COVID-19 Vaccination Opinions Dynamics From Tweets
REFERENCES[1] Worldometer. (Dec. 9, 2020). Coronavirus Update (Live): 63,777,845
Cases and 1,477,777 Deaths FromCOVID-19 Virus Pandemic. Accessed:Dec. 9, 2020. [Online]. Available: https://www.worldometers.info/coronavirus/
[2] K. Chakraborty, S. Bhatia, S. Bhattacharyya, J. Platos, R. Bag, andA. E. Hassanien, ‘‘Sentiment analysis of COVID-19 tweets by deep learn-ing classifiers—A study to show how popularity is affecting accuracy insocial media,’’ Appl. Soft Comput., vol. 97, Dec. 2020, Art. no. 106754,doi: 10.1016/j.asoc.2020.106754.
[3] A. H. Alamoodi, B. B. Zaidan, A. A. Zaidan, O. S. Albahri,K. I. Mohammed, R. Q. Malik, E. M. Almahdi, M. A. Chyad, Z. Tareq,A. S. Albahri, H. Hameed, and M. Alaa, ‘‘Sentiment analysis and itsapplications in fighting COVID-19 and infectious diseases: A systematicreview,’’ Expert Syst. Appl., vol. 167, Apr. 2021, Art. no. 114155, doi:10.1016/j.eswa.2020.114155.
[4] G. Appel, L. Grewal, R. Hadi, and A. T. Stephen, ‘‘The future of socialmedia in marketing,’’ J. Acad. Marketing Sci., vol. 48, no. 1, pp. 79–95,Jan. 2020, doi: 10.1007/s11747-019-00695-1.
[5] E. D’Andrea, P. Ducange, A. Bechini, A. Renda, and F. Marcelloni,‘‘Monitoring the public opinion about the vaccination topic from tweetsanalysis,’’ Expert Syst. Appl., vol. 116, pp. 209–226, Feb. 2019, doi:10.1016/j.eswa.2018.09.009.
[6] A. Giachanou and F. Crestani, ‘‘Like it or not: A survey of Twitter senti-ment analysis methods,’’ ACM Comput. Surv., vol. 49, no. 2, Nov. 2016,Art. no. 28, doi: 10.1145/2938640.
[7] J. Golbeck, J. M. Grimes, and A. Rogers, ‘‘Twitter use by the U.S.Congress,’’ J. Amer. Soc. Inf. Sci. Technol., vol. 61, no. 8, pp. 1612–1621,May 2010, doi: 10.1002/asi.21344.
[8] N. Öztürk and S. Ayvaz, ‘‘Sentiment analysis on Twitter: A text miningapproach to the syrian refugee crisis,’’ Telematics Informat., vol. 35, no. 1,pp. 136–147, Apr. 2018, doi: 10.1016/j.tele.2017.10.006.
[9] G. A. Ruz, P. A. Henríquez, and A. Mascareño, ‘‘Sentiment analysisof Twitter data during critical events through Bayesian networks classi-fiers,’’ Future Gener. Comput. Syst., vol. 106, pp. 92–104, May 2020, doi:10.1016/j.future.2020.01.005.
[10] P. Tiwari, P. Yadav, S. Kumar, B. K. Mishra, G. N. Nguyen,S. P. Gochhayat, J. Singhk, and M. Prasad, ‘‘Sentiment analysis for air-lines services based on Twitter dataset,’’ in Social Network Analytics,N. Dey, S. Borah, R. Babo, and A. S. Ashour, Eds. New York, NY, USA:Academic, 2019, pp. 149–162.
[11] N. A. Vidya, M. I. Fanany, and I. Budi, ‘‘Twitter sentiment to analyzenet brand reputation of mobile phone providers,’’ Procedia Comput. Sci.,vol. 72, pp. 519–526, Jan. 2015, doi: 10.1016/j.procs.2015.12.159.
[12] Y. Yu and X. Wang, ‘‘World cup 2014 in the Twitter world: A big dataanalysis of sentiments inU.S. Sports fans’ tweets,’’Comput. Hum. Behav.,vol. 48, pp. 392–400, Jul. 2015, doi: 10.1016/j.chb.2015.01.075.
[13] R. P. Schumaker, A. T. Jarmoszko, and C. S. Labedz, ‘‘Predictingwins and spread in the premier league using a sentiment analysis ofTwitter,’’ Decis. Support Syst., vol. 88, pp. 76–84, Aug. 2016, doi:10.1016/j.dss.2016.05.010.
[14] O. Kraaijeveld and J. De Smedt, ‘‘The predictive power of publicTwitter sentiment for forecasting cryptocurrency prices,’’ J. Int. Finan-cial Markets, Inst. Money, vol. 65, Mar. 2020, Art. no. 101188, doi:10.1016/j.intfin.2020.101188.
[15] P.-F. Pai and C.-H. Liu, ‘‘Predicting vehicle sales by sentiment anal-ysis of Twitter data and stock market values,’’ IEEE Access, vol. 6,pp. 57655–57662, 2018, doi: 10.1109/ACCESS.2018.2873730.
[16] A.Khatua, A. Khatua, and E. Cambria, ‘‘Predicting political sentiments ofvoters from Twitter in multi-party contexts,’’ Appl. Soft Comput., vol. 97,Dec. 2020, Art. no. 106743, doi: 10.1016/j.asoc.2020.106743.
[17] Y. Pershad, P. Hangge, H. Albadawi, and R. Oklu, ‘‘Social medicine:Twitter in healthcare,’’ J. Clin. Med., vol. 7, no. 6, p. 121, May 2018, doi:10.3390/jcm7060121.
[18] R. Kullar, D. A. Goff, T. P. Gauthier, and T. C. Smith, ‘‘To tweet or notto tweet—A review of the viral power of Twitter for infectious diseases,’’Current Infectious Disease Rep., vol. 22, no. 6, Apr. 2020, Art. no. 14,doi: 10.1007/s11908-020-00723-0.
[19] C. M. Trovato, M. Montuori, S. Oliva, S. Cucchiara, A. Cignarelli,and A. Sansone, ‘‘Assessment of public perceptions and concernsof celiac disease: A Twitter-based sentiment analysis study,’’ Diges-tive Liver Disease, vol. 52, no. 4, pp. 464–466, Apr. 2020, doi:10.1016/j.dld.2020.02.004.
[20] W. C. Crannell, E. Clark, C. Jones, T. A. James, and J. Moore,‘‘A pattern-matched Twitter analysis of US cancer-patient sentiments,’’J. Surgical Res., vol. 206, no. 2, pp. 536–542, Dec. 2016, doi:10.1016/j.jss.2016.06.050.
[21] E. A. Pedersen, L. H. Loft, S. U. Jacobsen, B. Søborg, and J. Bigaard,‘‘Strategic health communication on social media: Insights from aDanish social media campaign to address HPV vaccination hesi-tancy,’’ Vaccine, vol. 38, no. 31, pp. 4909–4915, Jun. 2020, doi:10.1016/j.vaccine.2020.05.061.
[22] L. H. Loft, E. A. Pedersen, S. U. Jacobsen, B. Søborg, and J. Bigaard,‘‘Using facebook to increase coverage of HPV vaccination amongDanish girls: An assessment of a Danish social media campaign,’’Vaccine, vol. 38, no. 31, pp. 4901–4908, Jun. 2020, doi: 10.1016/j.vaccine.2020.04.032.
[23] K. Dedominicis, A. M. Buttenheim, A. C. Howa, P. L. Delamater,D. Salmon, S. B. Omer, and N. P. Klein, ‘‘Shouting at eachother into the void: A linguistic network analysis of vaccine hes-itance and support in online discourse regarding California lawSB277,’’ Social Sci. Med., vol. 266, Dec. 2020, Art. no. 113216, doi:10.1016/j.socscimed.2020.113216.
[24] S. Martin, E. Kilich, S. Dada, P. E. Kummervold, C. Denny, P. Paterson,and H. J. Larson, ‘‘Vaccines for pregnant women· · · ?! Absurd’—Mapping maternal vaccination discourse and stance on social media oversix months,’’ Vaccine, vol. 38, no. 42, pp. 6627–6637, Sep. 2020, doi:10.1016/j.vaccine.2020.07.072.
[25] T. T. Le, Z. Andreadakis, A. Kumar, R. G. Román, S. Tollefsen,M. Saville, and S. Mayhew, ‘‘The COVID-19 vaccine developmentlandscape,’’ Nature Rev. Drug Discovery, vol. 19, no. 5, pp. 305–306,Apr. 2020, doi: 10.1038/d41573-020-00073-5.
[26] J. F. Modlin, W. A. Orenstein, and A. D. Brandling-Bennett, ‘‘Currentstatus of mumps in the united states,’’ J. Infectious Diseases, vol. 132,no. 1, pp. 106–109, Jul. 1975.
[27] B. Liu, Sentiment Analysis: Mining Opinions, Sentiments, andEmotions, 1st ed. Cambridge, U.K.: Cambridge Univ. Press,2015.
[28] B. Liu, Sentiment Analysis and Opinion Mining, vol. 5. San Rafael, CA,USA: Morgan & Claypool, 2012.
[29] L.-A. Cotfas, C. Delcea, A. Segault, and I. Roxin, ‘‘Semantic Web-basedsocial media analysis,’’ in Transactions on Computational CollectiveIntelligence XXII, vol. 9655, N. T. Nguyen andR.Kowalczyk, Eds. Berlin,Germany: Springer, 2016, pp. 147–166.
[30] I. Chaturvedi, E. Ragusa, P. Gastaldo, R. Zunino, and E. Cambria,‘‘Bayesian network based extreme learning machine for subjectivitydetection,’’ J. Franklin Inst., vol. 355, no. 4, pp. 1780–1797, Mar. 2018,doi: 10.1016/j.jfranklin.2017.06.007.
[31] R. Wang, D. Zhou, M. Jiang, J. Si, and Y. Yang, ‘‘A surveyon opinion mining: From stance to product aspect,’’ IEEEAccess, vol. 7, pp. 41101–41124, 2019, doi: 10.1109/ACCESS.2019.2906754.
[32] K. S. Hasan andV. Ng, ‘‘Extra-linguistic constraints on stance recognitionin ideological debates,’’ in Proc. 51st Annu. Meeting Assoc. Comput.Linguistics, Sofia, Bulgaria, vol. 2, Aug. 2013, pp. 816–821. Accessed:Dec. 9, 2020. [Online]. Available: https://www.aclweb.org/anthology/P13-2142.
[33] L.-A. Cotfas, C. Delcea, and I. Roxin, ‘‘Grey sentiment analysis usingmultiple lexicons,’’ in Proc. 15th Int. Conf. Informat. Economy (IE),Cluj-Napoca, Romania, 2016, pp. 428–433.
[34] L.-A. Cotfas, C. Delcea, and I. Nica, ‘‘Analysing customers’ opinionstowards product characteristics using social media,’’ inEurasian BusinessPerspectives. Cham, Switzerland: Springer, Jun. 2020, pp. 129–138, doi:10.1007/978-3-030-48505-4_9.
[35] S. Aloufi and A. E. Saddik, ‘‘Sentiment identification in football-specific tweets,’’ IEEE Access, vol. 6, pp. 78609–78621, Dec. 2018, doi:10.1109/ACCESS.2018.2885117.
[36] E. Cambria, Y. Li, F. Z. Xing, S. Poria, and K. Kwok, ‘‘SenticNet 6:Ensemble application of symbolic and subsymbolic AI for sentimentanalysis,’’ in Proc. 29th ACM Int. Conf. Inf. Knowl. Manage., New York,NY, USA, Oct. 2020, pp. 105–114, doi: 10.1145/3340531.3412003.
[37] M. Hu and B. Liu, ‘‘Mining and summarizing customer reviews,’’in Proc. ACM SIGKDD Int. Conf. Knowl. Discovery Data Mining(KDD), New York, NY, USA, 2004, pp. 168–177, doi: 10.1145/1014052.1014073.
33220 VOLUME 9, 2021
L.-A. Cotfas et al.: Longest Month: Analyzing COVID-19 Vaccination Opinions Dynamics From Tweets
[38] S. Kiritchenko, X. Zhu, and S. M. Mohammad, ‘‘Sentiment analysisof short informal texts,’’ J. Artif. Intell. Res., vol. 50, pp. 723–762,Aug. 2014, doi: 10.1613/jair.4272.
[39] S. Mohammad, S. Kiritchenko, and X. Zhu, ‘‘NRC-Canada: Building thestate-of-the-art in sentiment analysis of tweets,’’ in Proc. 2nd Joint Conf.Lexical Comput. Semantics (SEM), 7th Int. Workshop Semantic Eval.(SemEval), Atlanta, GA, USA, vol. 2, Jun. 2013, pp. 321–327. Accessed:Dec. 9, 2020. [Online]. Available: https://www.aclweb.org/anthology/S13-2053
[40] C. J. Hutto and E. Gilbert, ‘‘VADER: A parsimonious rule-based model for sentiment analysis of social media text,’’presented at the 8th Int. AAAI Conf. Weblogs Social Media, AnnArbor, MI, USA, May 2014. Accessed: Nov. 8, 2020. [Online].Available: http://www.aaai.org/ocs/index.php/ICWSM/ICWSM14/paper/view/8109
[41] S. Baccianella, A. Esuli, and F. Sebastiani, ‘‘SentiWordNet 3.0:An enhanced lexical resource for sentiment analysis and opinionmining,’’ in Proc. LREC, vol. 10, 2010, pp. 2200–2204. Accessed:Nov. 10, 2020. [Online]. Available: http://lrec-conf.org/proceedings/lrec2010/pdf/769_Paper.pdf
[42] E. Cambria, C. Havasi, and A. Hussain, ‘‘SenticNet 2: A semantic andaffective resource for opinion mining and sentiment analysis,’’ presentedat the 25h Int. Florida Artif. Intell. Res. Soc. Conf., Marco Island, FL,USA, May 2012.
[43] A. Dey, M. Jenamani, and J. J. Thakkar, ‘‘Senti-N-Gram: An n-gramlexicon for sentiment analysis,’’ Expert Syst. Appl., vol. 103, pp. 92–105,Aug. 2018, doi: 10.1016/j.eswa.2018.03.004.
[44] N. Mukhtar, M. A. Khan, and N. Chiragh, ‘‘Lexicon-based approachoutperforms supervised machine learning approach for urdusentiment analysis in multiple domains,’’ Telematics Informat.,vol. 35, no. 8, pp. 2173–2183, Dec. 2018, doi: 10.1016/j.tele.2018.08.003.
[45] J. Brownlee, Deep Learning for Natural Language Processing: DevelopDeep Learning Models for Your Natural Language Problems. Vermont,VIC, USA: Machine Learning Mastery, 2017.
[46] I. Goodfellow, Y. Bengio, and A. Courville, Deep Learning. Cambridge,MA, USA: MIT Press, 2016.
[47] T. Mikolov, I. Sutskever, K. Chen, G. Corrado, and J. Dean, ‘‘Distributedrepresentations of words and phrases and their compositionality,’’ inProc.26th Int. Conf. Neural Inf. Process. Syst., Red Hook, NY, USA, vol. 2,Dec. 2013, pp. 3111–3119. Accessed: Dec. 10, 2020.
[48] J. Pennington, R. Socher, and C. Manning, ‘‘Glove: Global vectorsfor word representation,’’ in Proc. Conf. Empirical Methods NaturalLang. Process. (EMNLP), Doha, Qatar, Oct. 2014, pp. 1532–1543, doi:10.3115/v1/D14-1162.
[49] A. Joulin, E. Grave, P. Bojanowski, and T. Mikolov, ‘‘Bag of tricks forefficient text classification,’’ in Proc. 15th Conf. Eur. Chapter Assoc.Comput. Linguistics, Valencia, Spain, vol. 2, Apr. 2017, pp. 427–431.Accessed: Feb. 6, 2021. [Online]. Available: https://www.aclweb.org/anthology/E17-2068
[50] K. Dey, R. Shrivastava, and S. Kaushik, ‘‘Twitter stance detection—A subjectivity and sentiment polarity inspired two-phase approach,’’ inProc. IEEE Int. Conf. Data Mining Workshops (ICDMW), Nov. 2017,pp. 365–372, doi: 10.1109/ICDMW.2017.53.
[51] S. Mohammad, S. Kiritchenko, P. Sobhani, X. Zhu, and C. Cherry,‘‘SemEval-2016 task 6: Detecting stance in tweets,’’ in Proc. 10thInt. Workshop Semantic Eval. (SemEval), San Diego, CA, USA, 2016,pp. 31–41, doi: 10.18653/v1/S16-1003.
[52] L. Zhang, S. Wang, and B. Liu, ‘‘Deep learning for sentiment analysis:A survey,’’Wiley Interdiscipl. Rev., DataMiningKnowl. Discovery, vol. 8,no. 4, Jul. 2018, Art. no. e1253, doi: 10.1002/widm.1253.
[53] N. Kalchbrenner, E. Grefenstette, and P. Blunsom, ‘‘A convolutionalneural network for modelling sentences,’’ in Proc. 52nd Annu. MeetingAssoc. Comput. Linguistics, Baltimore, MD, USA, 2014, pp. 655–665,doi: 10.3115/v1/P14-1062.
[54] T. Mikolov, M. Karafiát, L. Burget, and S. Khudanpur,‘‘Recurrent neural network based language model,’’ in Proc.INTERSPEECH, Japan, Sep. 2010, pp. 1045–1048. [Online]. Available:https://www.isca-speech.org/archive/archive_papers/interspeech_2010/i10_1045.pdf
[55] A. Benton and M. Dredze, ‘‘Using author embeddings to improvetweet stance classification,’’ in Proc. 4th Workshop Noisy User-Gener.Text EMNLP Workshop (W-NUT), Brussels, Belgium, Nov. 2018,pp. 184–194, doi: 10.18653/v1/W18-6124.
[56] Q. Sun, Z. Wang, Q. Zhu, and G. Zhou, ‘‘Stance detection with hier-archical attention network,’’ in Proc. 27th Int. Conf. Comput. Lin-guistics, Santa Fe, NM, USA, Aug. 2018, pp. 2399–2409. Accessed:Dec. 9, 2020. [Online]. Available: https://www.aclweb.org/anthology/C18-1203
[57] J. Du, R. Xu, Y. He, and L. Gui, ‘‘Stance classification with target-specific neural attention networks,’’ in Proc. 26th Int. Joint Conf.Artif. Intell. (IJCAI), Int. Joint Conf. Artif. Intell. (AUS), 2017,pp. 3988–3994.
[58] G. Zarrella and A. Marsh, ‘‘MITRE at SemEval-2016 task 6: Transferlearning for stance detection,’’ in Proc. 10th Int. Workshop SemanticEval. (SemEval), San Diego, CA, USA, Jun. 2016, pp. 458–463, doi:10.18653/v1/S16-1074.
[59] A. Vaswani, N. Shazeer, N. Parmar, J. Uszkoreit, L. Jones, A. N. Gomez,L. Kaiser, and I. Polosukhin, ‘‘Attention is all you need,’’ in Proc. 31stInt. Conf. Neural Inf., Long Beach, CA, USA, Dec. 2017, pp. 6000–6010.Accessed: Jan. 24, 2021. [Online]. Available: https://dl.acm.org/doi/pdf/10.5555/3295222.3295349
[60] P. J. Liu, M. Saleh, E. Pot, B. Goodrich, R. Sepassi, L. Kaiser, andN. Shazeer, ‘‘Generating wikipedia by summarizing long sequences,’’presented at the 6th Int. Conf. Learn. Represent., Apr. 2018. [Online].Available: https://openreview.net/forum?id=Hyg0vbWC-
[61] N. Kitaev and D. Klein, ‘‘Constituency parsing with a self-attentiveencoder,’’ in Proc. 56th Annu. Meeting Assoc. Comput. Linguis-tics, Melbourne, VIC, Australia, Jul. 2018, pp. 2676–2686, doi:10.18653/v1/P18-1249.
[62] A. Radford, K. Narasimhan, T. Salimans, and I. Sutskever. (2018).Improving Language Understanding by Generative Pre-Training.[Online]. Available: https://cdn.openai.com/research-covers/language-unsupervised/language_understanding_paper.pdf
[63] J. Devlin, M.-W. Chang, K. Lee, and K. Toutanova, ‘‘BERT: Pre-training of deep bidirectional transformers for language understanding,’’in Proc. Conf. North Amer. Chapter Assoc. Comput. Linguistics, Hum.Lang. Technol., Minneapolis, MN, USA, Jun. 2019, pp. 4171–4186, doi:10.18653/v1/N19-1423.
[64] R.M.Merchant andN. Lurie, ‘‘Social media and emergency preparednessin response to novel coronavirus,’’ J. Amer. Med. Assoc., vol. 323, no. 20,pp. 2011–2012, May 2020, doi: 10.1001/jama.2020.4469.
[65] S. Kaur, P. Kaul, and P. M. Zadeh, ‘‘Monitoring the dynamics of emotionsduring COVID-19 using Twitter data,’’ Procedia Comput. Sci., vol. 177,pp. 423–430, Jan. 2020, doi: 10.1016/j.procs.2020.10.056.
[66] P. Singh, S. Singh, M. Sohal, Y. K. Dwivedi, K. S. Kahlon, andR. S. Sawhney, ‘‘Psychological fear and anxiety caused by COVID-19:Insights from Twitter analytics,’’ Asian J. Psychiatry, vol. 54, Dec. 2020,Art. no. 102280, doi: 10.1016/j.ajp.2020.102280.
[67] S. Boon-Itt and Y. Skunkan, ‘‘Public perception of the COVID-19 pan-demic on Twitter: Sentiment analysis and topic modeling study,’’ JMIRPublic Health Surveill., vol. 6, no. 4, Nov. 2020, Art. no. e21978, doi:10.2196/21978.
[68] J. Xue, J. Chen, C. Chen, C. Zheng, S. Li, and T. Zhu, ‘‘Pub-lic discourse and sentiment during the COVID 19 pandemic: Usinglatent Dirichlet allocation for topic modeling on Twitter,’’ PLoS ONE,vol. 15, no. 9, Sep. 2020, Art. no. e0239441, doi: 10.1371/journal.pone.0239441.
[69] M. Bhat, M. Qadri, N.-U.-A. Beg, M. Kundroo, N. Ahanger, andB. Agarwal, ‘‘Sentiment analysis of social media response on theCOVID19 outbreak,’’ Brain, Behav., Immunity, vol. 87, pp. 136–137,Jul. 2020, doi: 10.1016/j.bbi.2020.05.006.
[70] A. Kruspe, M. Häberle, I. Kuhn, and X. X. Zhu, ‘‘Cross-language sen-timent analysis of European Twitter messages during the COVID-19pandemic,’’ presented at the ACL-NLP-COVID, Jul. 2020. Accessed:Feb. 6, 2021. [Online]. Available: https://www.aclweb.org/anthology/2020.nlpcovid19-acl.14
[71] B. P. Pokharel, ‘‘Twitter sentiment analysis during COVID-19 outbreak innepal,’’ Social Sci. Res. Netw., Rochester, NY, USA, Tech. Rep. 3624719,Jun. 2020, doi: 10.2139/ssrn.3624719.
[72] G. Barkur, Vibha, and G. B. Kamath, ‘‘Sentiment analysis ofnationwide lockdown due to COVID 19 outbreak: Evidence fromindia,’’ Asian J. Psychiatry, vol. 51, Jun. 2020, Art. no. 102089, doi:10.1016/j.ajp.2020.102089.
[73] R. Khan, P. Shrivastava, A. Kapoor, A. Tiwari, and A. Mittal, ‘‘Socialmedia analysis with AI: Sentiment analysis techniques for the analysisof Twitter COVID-19 Data,’’ J. Crit. Rev., vol. 7, no. 9, pp. 2761–2774,2020.
VOLUME 9, 2021 33221
L.-A. Cotfas et al.: Longest Month: Analyzing COVID-19 Vaccination Opinions Dynamics From Tweets
[74] A. S. Imran, S. M. Daudpota, Z. Kastrati, and R. Batra, ‘‘Cross-culturalpolarity and emotion detection using sentiment analysis and deep learningon COVID-19 related tweets,’’ IEEE Access, vol. 8, pp. 181074–181090,Sep. 2020, doi: 10.1109/ACCESS.2020.3027350.
[75] J. Samuel, G. G. M. N. Ali, M. M. Rahman, E. Esawi, and Y. Samuel,‘‘COVID-19 public sentiment insights and machine learning for tweetsclassification,’’ Information, vol. 11, no. 6, p. 314, Jun. 2020, doi:10.3390/info11060314.
[76] J. Zhou, S. Yang, C. Xiao, and F. Chen, ‘‘Examination of commu-nity sentiment dynamics due to COVID-19 pandemic: A case studyfrom Australia,’’ Jun. 2020, arXiv:2006.12185. Accessed: Dec. 3, 2020.[Online]. Available: http://arxiv.org/abs/2006.12185
[77] X. Wang, C. Zou, Z. Xie, and D. Li, ‘‘Public Opinions towards COVID-19 in California and New York on Twitter,’’ medRxiv, Jul. 2020, doi:10.1101/2020.07.12.20151936.
[78] C. K. Pastor, ‘‘Sentiment analysis of filipinos and effects of extremecommunity quarantine due to coronavirus (COVID-19) pandemic,’’J. Crit. Rev., vol. 7, no. 7, pp. 91–95, Apr. 2020, doi: 10.31838/jcr.07.07.15.
[79] A. Sanders, R. White, L. Severson, R. Ma, R. McQueen, H. C. A. Paulo,Y. Zhang, J. S. Erickson, and K. P. Bennett, ‘‘Unmasking the con-versation on masks: Natural language processing for topical sentimentanalysis of COVID-19 Twitter discourse,’’ medRxiv, Sep. 2020, doi:10.1101/2020.08.28.20183863.
[80] Y. Zhang, H. Lyu, Y. Liu, X. Zhang, Y. Wang, and J. Luo, ‘‘Moni-toring depression trend on Twitter during the COVID-19 pandemic,’’Jul. 2020, arXiv:2007.00228. Accessed: Dec. 3, 2020. [Online]. Avail-able: http://arxiv.org/abs/2007.00228
[81] Y. Lu and Q. Zheng, ‘‘Twitter public sentiment dynamicson cruise tourism during the COVID-19 pandemic,’’ CurrentIssues Tourism, pp. 1–7, Nov. 2020, doi: 10.1080/13683500.2020.1843607.
[82] J. Xue, J. Chen, R. Hu, C. Chen, C. Zheng, Y. Su, and T. Zhu, ‘‘Twitterdiscussions and emotions about the COVID-19 pandemic: Machinelearning approach,’’ J. Med. Internet Res., vol. 22, no. 11, Nov. 2020,Art. no. e20550, doi: 10.2196/20550.
[83] S. Noor, Y. Guo, S. H. H. Shah, P. Fournier-Viger, and M. S. Nawaz,‘‘Analysis of public reactions to the novel Coronavirus (COVID-19)outbreak on Twitter,’’ Kybernetes, 2020, doi: 10.1108/K-05-2020-0258.
[84] M. K. Elhadad, K. F. Li, and F. Gebali, ‘‘COVID-19-FAKES:A Twitter (Arabic/English) dataset for detecting misleading informationon COVID-19,’’ in Advances in Intelligent Networking and Collabo-rative Systems, vol. 1263. Cham, Switzerland: Springer, Aug. 2020,pp. 256–268, doi: 10.1007/978-3-030-57796-4_25.
[85] R. K. Gupta, A. Vishwanath, and Y. Yang, ‘‘COVID-19 Twitter datasetwith latent topics, sentiments and emotions attributes,’’ Sep. 2020,arXiv:2007.06954. Accessed: Nov. 12, 2020. [Online]. Available:http://arxiv.org/abs/2007.06954
[86] J. M. Banda, R. Tekumalla, G. Wang, J. Yu, T. Liu, Y. Ding, K. Artemova,E. Tutubalina, and G. Chowell, ‘‘A large-scale COVID-19 Twitter chatterdataset for open scientific research—An international collaboration,’’Nov. 2020, arXiv:2004.03688. Accessed: Dec. 1, 2020. [Online]. Avail-able: http://arxiv.org/abs/2004.03688
[87] R. Lamsal, ‘‘Design and analysis of a large-scale COVID-19 Tweetsdataset,’’ Appl. Intell., 2020, doi: 10.1007/s10489-020-02029-z.
[88] E. Chen, K. Lerman, and E. Ferrara, ‘‘Tracking social media discourseabout the COVID-19 pandemic: Development of a public coronavirusTwitter data set,’’ JMIR Public Health Surveill., vol. 6, no. 2, May 2020,Art. no. e19273, doi: 10.2196/19273.
[89] S. Mohammad, S. Kiritchenko, P. Sobhani, X. Zhu, and C. Cherry,‘‘A dataset for detecting stance in tweets,’’ in Proc. 10th Int. Conf. Lang.Resour. Eval. (LREC), Portorož, Slovenia, May 2016, pp. 3945–3952.Accessed: Dec. 11, 2020. [Online]. Available: https://www.aclweb.org/anthology/L16-1623
[90] Y. Bao, C. Quan, L. Wang, and F. Ren, ‘‘The role of pre-processingin Twitter sentiment analysis,’’ in Intelligent Computing Methodolo-gies, vol. 8589. Cham, Switzerland: Springer, 2014, pp. 615–624, doi:10.1007/978-3-319-09339-0_62.
[91] Z. Jianqiang and G. Xiaolin, ‘‘Comparison research on text pre-processing methods on Twitter sentiment analysis,’’ IEEE Access,vol. 5, pp. 2870–2879, Feb. 2017, doi: 10.1109/ACCESS.2017.2672677.
[92] C. Baziotis, N. Pelekis, and C. Doulkeridis, ‘‘DataStories at SemEval-2017 task 4: Deep LSTM with attention for message-level and topic-based sentiment analysis,’’ in Proc. 11th Int. Workshop Semantic Eval.(SemEval), Vancouver, BC, Canada, Aug. 2017, pp. 747–754, doi:10.18653/v1/S17-2126.
[93] S. Bird, E. Klein, and E. Loper, Natural Language Processing WithPython: Analyzing Text With the Natural Language Toolkit, 1st ed.Beijing, China: O’Reilly Media, 2009.
[94] F. C. Peng and D. Schuurmans, ‘‘Combining naive Bayes and n-gramlanguage models for text classification,’’ in Advances in InformationRetrieval, vol. 2633. Berlin, Germany: Springer, Apr. 2003, pp. 335–350.
[95] M.-L. Zhang, J.M. Peña, andV. Robles, ‘‘Feature selection formulti-labelnaive Bayes classification,’’ Inf. Sci., vol. 179, no. 19, pp. 3218–3229,Sep. 2009, doi: 10.1016/j.ins.2009.06.010.
[96] A. McCallum, K. Nigam, and others, ‘‘A comparison of event modelsfor naive Bayes text classification,’’ in Proc. AAAI Workshop Learn. TextCategorization, 1998, vol. 752, no. 1, pp. 41–48.
[97] L. Breiman, ‘‘Random forests,’’ Mach. Learn., vol. 45, no. 1, pp. 5–32,2001.
[98] S. Misra and H. Li, ‘‘Noninvasive fracture characterization based onthe classification of sonic wave travel times,’’ in Machine Learning forSubsurface Characterization, S. Misra, H. Li, and J. He, Eds. Pittsburgh,PA, USA: Gulf Professional Publishing, 2020, pp. 243–287.
[99] J. C. Platt, ‘‘Fast training of support vector machines using sequentialminimal optimization,’’ in Advances in Kernel Methods: Support VectorLearning. Cambridge, MA, USA: MIT Press, 1999, pp. 185–208.
[100] V. Mohammadi and S. Minaei, ‘‘Artificial intelligence in the pro-duction process,’’ in Engineering Tools in the Beverage Industry,A. M. Grumezescu and A. M. Holban, Eds. Sawston, U.K.: WoodheadPublishing, 2019, pp. 27–63.
[101] D. Ballabio and R. Todeschini, ‘‘Multivariate classification for qualitativeanalysis,’’ in Infrared Spectroscopy for Food Quality Analysis and Con-trol, D.-W. Sun, Ed. San Diego, CA, USA: Academic, 2009, pp. 83–104.
[102] S. Hochreiter and J. Schmidhuber, ‘‘Long short-term memory,’’Neural Comput., vol. 9, no. 8, pp. 1735–1780, Nov. 1997, doi:10.1162/neco.1997.9.8.1735.
[103] S. Rosenthal, N. Farra, and P. Nakov, ‘‘SemEval-2017 task 4: Sen-timent analysis in Twitter,’’ in Proc. 11th Int. Workshop SemanticEval. (SemEval), Vancouver, BC, Canada, Aug. 2017, pp. 502–518, doi:10.18653/v1/S17-2088.
[104] M. Cliche, ‘‘BB_twtr at SemEval-2017 task 4: Twitter sentiment anal-ysis with CNNs and LSTMs,’’ in Proc. 11th Int. Workshop SemanticEval. (SemEval), Vancouver, BC, Canada, Aug. 2017, pp. 573–580, doi:10.18653/v1/S17-2094.
[105] W.Wei, X. Zhang, X. Liu,W. Chen, and T.Wang, ‘‘pkudblab at SemEval-2016 task 6: A specific convolutional neural network system for effectivestance detection,’’ in Proc. 10th Int. Workshop Semantic Eval. (SemEval),San Diego, CA, USA, Jun. 2016, pp. 384–388, doi: 10.18653/v1/S16-1062.
[106] C. Baziotis. (2020). Deep-Learning Model Presented in ‘DataS-tories at SemEval-2017 Task 4: Deep LSTM With Attention forMessage-Level and Topic-based Sentiment Analysis’. [Online]. Available:https://github.com/cbaziotis/datastories-semeval2017-task4
[107] C. Chelba, T. Mikolov, M. Schuster, Q. Ge, T. Brants, P. Koehn, andT. Robinson, ‘‘One billion word benchmark for measuring progressin statistical language modeling,’’ in Proc. INTERSPEECH, Singapore,Sep. 2014, pp. 2635–2639. Accessed: Jan. 24, 2021. [Online]. Available:http://arxiv.org/abs/1312.3005.
[108] I. Turc, M.-W. Chang, K. Lee, and K. Toutanova, ‘‘Well-read stu-dents learn better: On the importance of pre-training compact models,’’Sep. 2019, arXiv:1908.08962. Accessed: Jan. 24, 2021. [Online]. Avail-able: http://arxiv.org/abs/1908.08962
[109] F. Pedregosa, G. Varoquaux, A. Gramfort, V. Michel, B. Thirion,O. Grisel, M. Blondel, P. Prettenhofer, R. Weiss, V. Dubourg,J. Vanderplas, A. Passos, and D. Cournapeau, ‘‘Scikit-learn: MachineLearning in Python,’’ J. Mach. Learn. Res., vol. 12, pp. 2825–2830,Nov. 2011.
[110] S. M. Mohammad, P. Sobhani, and S. Kiritchenko, ‘‘Stance and senti-ment in tweets,’’ ACM Trans. Internet Technol., vol. 17, no. 3, pp. 1–23,Jul. 2017.
[111] R. Parker, D. Graff, J. Kong, K. Chen, and K. Maeda, English Giga-word, 5th ed. Philadelphia, PA, USA: Linguistic Data Consortium, doi:10.35111/WK4F-QT80.
[112] D. P. Kingma and J. Ba, ‘‘Adam: A method for stochastic optimization,’’presented at the 3rd Int. Conf. Learn. Represent., San Diego, CA, USA,May 2015. [Online]. Available: https://arxiv.org/pdf/1412.6980.pdf
33222 VOLUME 9, 2021
L.-A. Cotfas et al.: Longest Month: Analyzing COVID-19 Vaccination Opinions Dynamics From Tweets
LIVIU-ADRIAN COTFAS received the Ph.D.degree in economic informatics from theBucharest University of Economic Studies,Bucharest, Romania.
In 2018, he has been a Visiting Professor withUniversité de Technologie Belfort-Montbéliard,France. He is currently with the Economic Cyber-netics and Informatics Department, BucharestUniversity of Economic Studies. His researchinterests include machine learning and deep learn-
ing techniques, semantic Web, agent-based modeling, social media analysis,sentiment analysis, recommender systems, grey systems theory, and geo-graphic information systems.
Dr. Cotfas has received several research awards, including the GeorgescuRoegenAward for excellent scientific research. He is an activemember of theGrey Uncertainty Analysis Association and of the INFOREC Association.
CAMELIA DELCEA received the Ph.D. degreein economic cybernetics and statistics fromthe Bucharest University of Economic Studies,Bucharest, Romania.
She is currently with the Economic Cyberneticsand Informatics Department, Bucharest Universityof Economic Studies. She is an active memberin the area of grey systems theory, agent-basedmodeling, and sentiment analysis. Since 2009, shehas obtained 25 international and national awards
(Best Paper Award, Georgescu Roegen for excellent scientific research,Excellent Paper Award, and Top reviewers) and has been invited to delivera keynote speech on grey systems themes in 2013, 2016, and 2017, at theIEEE GSIS conference and in 2018 at the GSUA conference. She is an activemember of the Grey Uncertainty Analysis Association.
IOAN ROXIN received the Ph.D. degree in statis-tics from the Bucharest University of EconomicStudies.
He is currently with the University of Franche-Comté and the Head of the ELLIADD Laboratory.His research interests include the area of knowl-edge organization, artificial intelligence, the IoT,and semantic Web, with applications in social net-works and learning. Over the years, he has man-aged or has acted as a Board Member in several
research projects on topics related to learning and communication. He hasbeen a Visiting Professor or an Invited Speaker at several universities fromCanada, Finland, Japan, Liban, Mexic, Romania, and Vietnam.
Dr. Roxin is an active member of the ACM and IEEE associations.
CORINA IOANĂŞ received the Ph.D. degree ineconomic studies from the Bucharest University ofEconomic Studies, Bucharest, Romania.
Over the last years, she has been a member ineight national and international projects, havingten books written in the economic field. She iscurrently with the Accounting and Audit Depart-ment, Bucharest University of Economic Studies.Her main research interests include accounting,audit, consumer behavior, economic modeling,
economic policies, and risk analysis.Dr. Ioanăş is an active member of the Centre for the Accounting and Man-
agement Information Systems, ARACIS (RomanianAgency for Ensuring theHigher Education Quality), and CECCAR (The Body of Expert and LicensedAccountants of Romania).
DANA SIMONA GHERAI received the Ph.D.degree from the Faculty of Economics and Busi-ness Administration, Timisoara West University.
Over the last years, she has been a member infive European research projects, having four bookswritten in the economic field. She is currently withthe Finance-Accounting Department, Universityof Oradea. Her main research interests includeaccounting, audit, consumer behavior, economicpolicies, economic entities, economic modeling,
ethics, and risk analysis.Dr. Gherai is an active member of the CECCAR (The Body of Expert and
Licensed Accountants of Romania).
FEDERICO TAJARIOL received the M.S. degreein cognitive science from the National PolytechnicInstitute, Grenoble, and the Ph.D. degree in cog-nitive science from Grenoble University. After anexperience as a Researcher with IT internationalcompany, he joined the University of Franche-Comté, in 2009, where he currently works as Asso-ciate Professor in information science. He is alsowith the University of Franche-Comté and a mem-ber of the ELLIADD Laboratory. His research
interests include the user experience design and evaluation of digital servicesin learning and crisis settings. He is a member of the Design Society, ICA,and ISCRAM scientific associations.
VOLUME 9, 2021 33223