analytics in a big data environment
TRANSCRIPT
Front cover
Analytics in a Big Data Environment
Dr. Lisa SokolRobert Ames
Learn strategies to make sense of your data
Explore technologies that are used to gather intelligence
Take a look at the future of analytics
Redguidesfor Business Leaders

Introduction
The intelligence community is facing a grand analytics challenge. The volume, velocity, and variety of data are growing exponentially, and the needle-in-the-haystack problem threatens to become significantly worse. Whether an organization wants to better detect enemies, protect its infrastructure from cyber terrorism, or formalize its understanding of a situation, it uses analytics to help make sense of the available information and choose an appropriate action. As adversaries adopt new methods, analytic systems must evolve to stay one step ahead of them. To succeed, organizations must embrace and use the power of the volume, velocity, and variety of data, rather than being overwhelmed by it.
Through analytics, organizations can discover patterns and relationships that enable better decision making. Smart business decisions demand that these discoveries are made within the right context, which is called situational awareness. Organizations gather data and use internal relevance-detection and situational assessment algorithms to assess the data, and alert us on the arrival of a high interest observation. Without context, misguided findings result in poor decisions and non-competitive offerings in the marketplace. For government, they can result in wasted resources, misdirected aggression, and unforeseen attacks on society. In many cases, these issues result from too little data, not too much data.
Experience shows that traditional analytic systems are challenged as data becomes bigger, faster, and increasingly unstructured. Recent technology innovations allows organizations to use all their data, in near real time, to provide accurate and timely analysis. The analytic process becomes more accurate (reduction of false positive and false negatives) when there is more data. Analytic model accuracy is further enhanced by adding a rich and correct cumulative context.
Humans perform complex analytics daily. As an example, they analyze traffic patterns many times each day and decide when to cross intersections. This situation is complex, with moving actors and a highly dynamic environment. Situational awareness implies an understanding of relevant history (car behavior and speed), learned behavior (look left, right, and left), knowledge of traffic laws, and the current environment (number of cars and speed of cars). This situational data can help people decide how a new event, such as crossing a street, will impact the objective of staying safe. Imagine making these decisions based on five-minute old data, rather than real-time data. New analytic capabilities can enable computing systems to augment human decision making and help over-burdened analysts cope with the inevitable crush of data.
© Copyright IBM Corp. 2012. All rights reserved. 1
Better, more accurate decisions can be generated when all of the available data is used to create a persistent context. Context serves as a “ground truth” of understanding, offering a current description of the entities that are relevant to the decision analytics (people, organizations, and connections between the entities and events).
This IBM® Redguides™ publication introduces ideas and concepts that IBM Research is exploring about deriving information and knowledge from data. This guide provides examples of using these concepts to effectively analyze and fuse seemingly unrelated data, helping analysts to make well-informed decisions. In addition, this guide highlights key technologies that IBM Research is exploring and takes a glimpse of the future.
Big data analytics
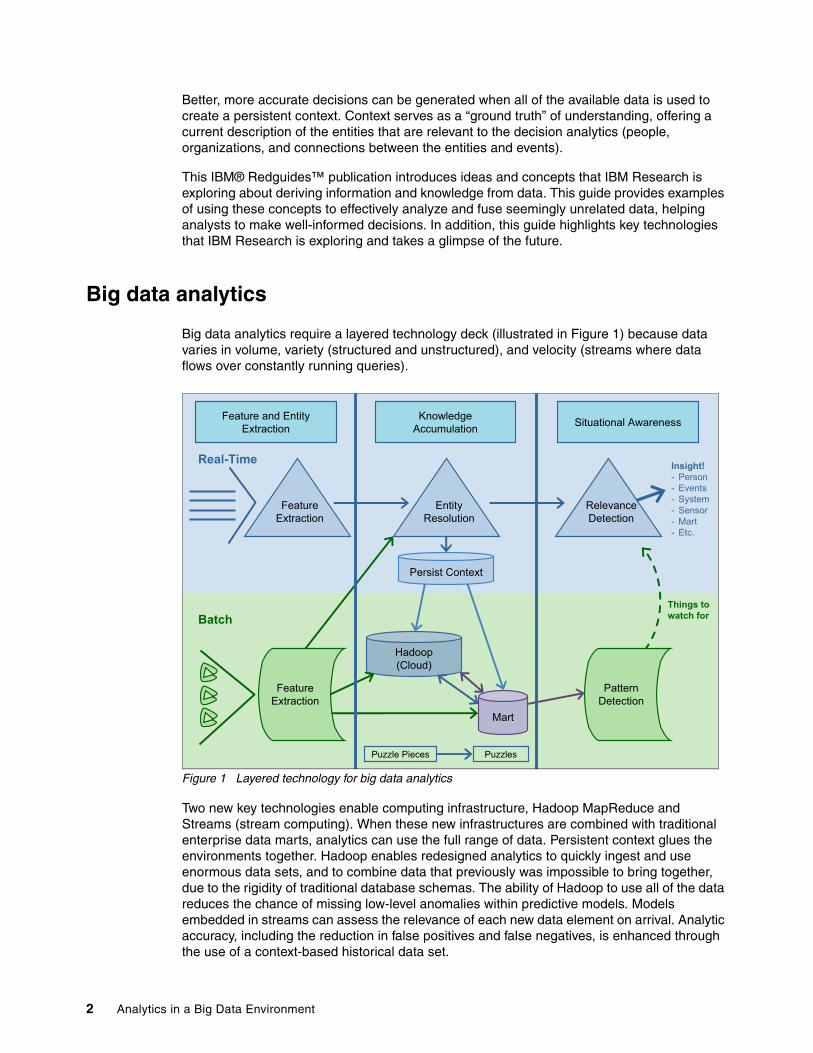
Big data analytics require a layered technology deck (illustrated in Figure 1) because data varies in volume, variety (structured and unstructured), and velocity (streams where data flows over constantly running queries).
Figure 1 Layered technology for big data analytics
Two new key technologies enable computing infrastructure, Hadoop MapReduce and Streams (stream computing). When these new infrastructures are combined with traditional enterprise data marts, analytics can use the full range of data. Persistent context glues the environments together. Hadoop enables redesigned analytics to quickly ingest and use enormous data sets, and to combine data that previously was impossible to bring together, due to the rigidity of traditional database schemas. The ability of Hadoop to use all of the data reduces the chance of missing low-level anomalies within predictive models. Models embedded in streams can assess the relevance of each new data element on arrival. Analytic accuracy, including the reduction in false positives and false negatives, is enhanced through the use of a context-based historical data set.
Hadoop(Cloud)
FeatureExtraction
Feature and EntityExtraction
KnowledgeAccumulation Situational Awareness
RelevanceDetection
EntityResolution
Batch
Real-Time
Things to
watch for
Insight!
- Person- Events- System- Sensor- Mart- Etc.
Puzzle Pieces Puzzles
FeatureExtraction
PatternDetection
Mart
Persist Context
2 Analytics in a Big Data Environment
Persistent context can be used to identify emergent patterns within the data, such as patterns of life, and anomalies in the data. The combination of streams and persistent context allows for the real-time assessment of each new data for cumulative relevance or contributions to models such as threat scores.
The following key technologies, among others, are vital to ensure effective intelligence:
� Feature extraction� Context and situational awareness� Predictive modeling� Data analysis upon arrival
In most cases, these technologies have existed for some time, but are now enjoying much greater scale and performance due to new computing capabilities and architectures. When looked at individually, each is powerful. If you can envision using them collectively, the opportunity is vast.
Feature extraction
Analytics requires relevant structured data. Unstructured data requires work to extract relevant information. To facilitate extraction on enormous amounts of text data, IBM Research created a scalable, high performing rule-based extraction system with a higher level language, similar to SQL. This extraction system is less domain specific to abstract the complexity of the underlying compute environment and to ease the text analytics challenge. This IBM Research tool, known as SystemT, runs on top of Hadoop. System T can automatically extract structured information. For example, PERSON has PHONE, COMPANY1 acquired COMPANY2 on DATE. Alternatively, SystemT can extract more complex concepts such as sentiment from various unstructured or semistructured sources such as blogs or text documents. A persistent context engine can use the extracted data.
Context and situational awareness
An organization is only as intelligent as its ability to use analytics to make sense of data about relevant events and entities in terms of strategic, operational, or tactical goals. Data comes in the form of observations collected across various enterprise sensors, such as transactional systems and open source data. However, more data does not necessarily mean more intelligence. Intelligence comes from ability to understand and use the current context.
Effective analytics require detailed and aggregated data, for example, about people, places, things, and organizations. If the detailed data is not associated with the correct entity, the analytical calculations are incorrect. As an example of an entity normalization problem, consider that banks must report cash transactions over $10,000. A bank might have ten $5,000 cash transactions. It must determine whether these transactions involve ten people, each with $5,000, or one person with $50,000. The determination that the individuals described in the two
Hadoop and Streams: For more information about Apache Hadoop, see the What is Hadoop page at:
http://www.ibm.com/software/data/infosphere/hadoop/
For more information about stream computing, see the IBM Stream Computing page at:
http://www.ibm.com/software/data/infosphere/stream-computing/
3
banking transactions are the same person is an assertion. Without clear and current assertions about entities, decisions will be inaccurate and opportunities will be missed.
Observations have two important (and sometimes overlapping) aspects:
� Identity data � Event data
In general, the amount of data associated with different identities is small and slowly evolving when compared to the data about their events or behaviors. Most people, even those people who seek to hide themselves, have a limited number of identities. In contrast, the actions taken by those entities occur constantly, have a far more dynamic nature, and can be discovered by different sensors. As an example, consider that the social network of an individual shifts constantly through events, but the individual’s identity remains fixed.
Creating the data environment for modeling: Predictive modeling
Consider the scenario where a mega bank acquires new banks and wants to create a special refinancing promotion for good customers. The mega bank wants to create an updated loan scoring model that uses historical data about loans for customers (entities) and about past loans (events) within multiple data silos. Some customers have accounts in multiple banks. If all customers used their real names and addresses consistently, and provided all details comprehensively and unambiguously, the grouping of data for each individual might be trivial. In most circumstances, the data needed for resolution is incomplete and ambiguous. Further, this data is in diverse data sources for different operational activities that share few overlapping fields.
Accurate loan models determine the likelihood of an individual to pay back a loan and are based on previous loan histories, such as the amount and the payback interval. If an individual has multiple loans, the predictive model must assess that individual’s complete history. If the identity information is inconsistent, the scoring algorithm considers each loan separately, rather than assessing the customer’s ability to pay back all outstanding loans. In this scenario, the data is available, but proper context required for effective decision making is not available. Without context and normalization, analytic models are inaccurate and misleading.
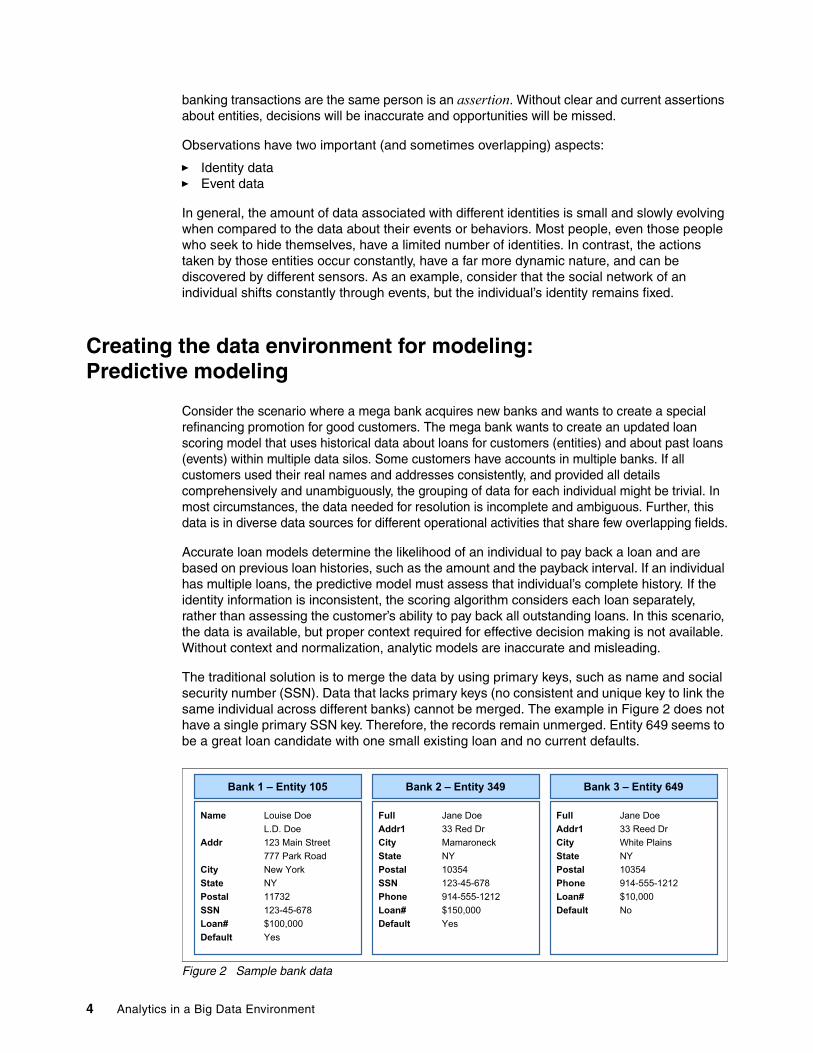
The traditional solution is to merge the data by using primary keys, such as name and social security number (SSN). Data that lacks primary keys (no consistent and unique key to link the same individual across different banks) cannot be merged. The example in Figure 2 does not have a single primary SSN key. Therefore, the records remain unmerged. Entity 649 seems to be a great loan candidate with one small existing loan and no current defaults.
Figure 2 Sample bank data
Bank 1 – Entity 105
Name Louise DoeL.D. Doe
Addr 123 Main Street777 Park Road
City New YorkState NYPostal 11732SSN 123-45-678Loan# $100,000Default Yes
Bank 2 – Entity 349
Full Jane DoeAddr1 33 Red DrCity MamaroneckState NYPostal 10354SSN 123-45-678Phone 914-555-1212Loan# $150,000Default Yes
Bank 3 – Entity 649
Full Jane DoeAddr1 33 Reed DrCity White PlainsState NYPostal 10354Phone 914-555-1212Loan# $10,000Default No
4 Analytics in a Big Data Environment
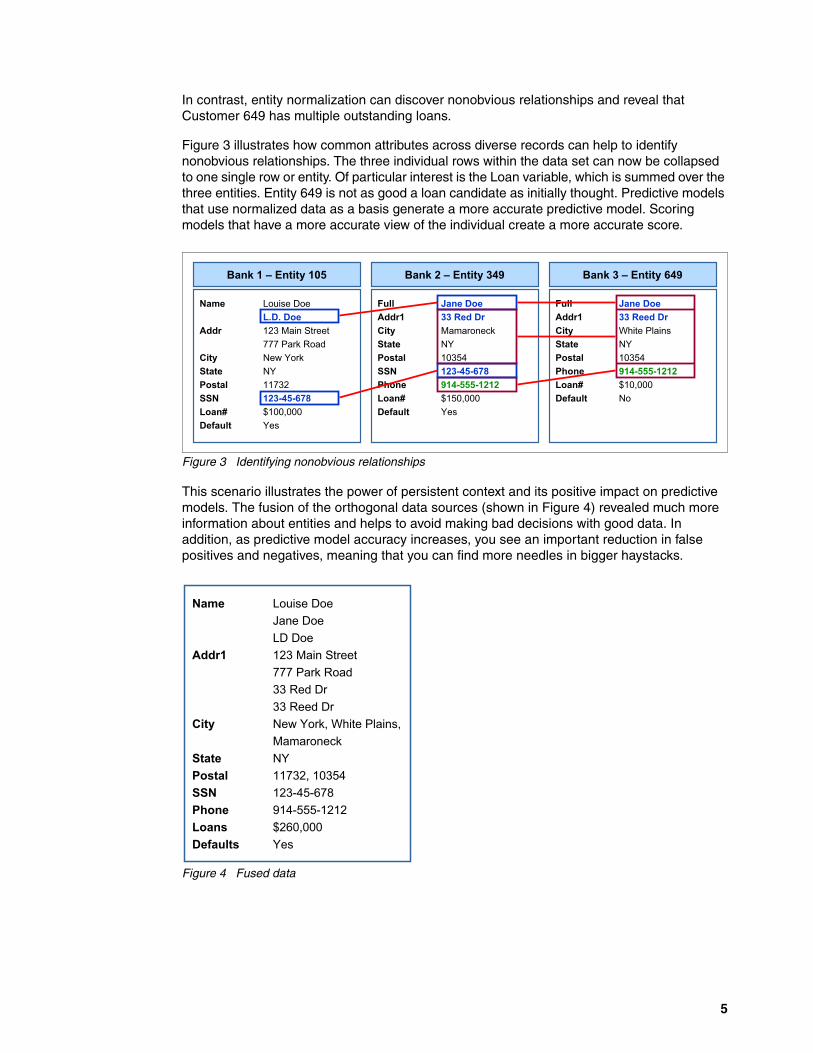
In contrast, entity normalization can discover nonobvious relationships and reveal that Customer 649 has multiple outstanding loans.
Figure 3 illustrates how common attributes across diverse records can help to identify nonobvious relationships. The three individual rows within the data set can now be collapsed to one single row or entity. Of particular interest is the Loan variable, which is summed over the three entities. Entity 649 is not as good a loan candidate as initially thought. Predictive models that use normalized data as a basis generate a more accurate predictive model. Scoring models that have a more accurate view of the individual create a more accurate score.
Figure 3 Identifying nonobvious relationships
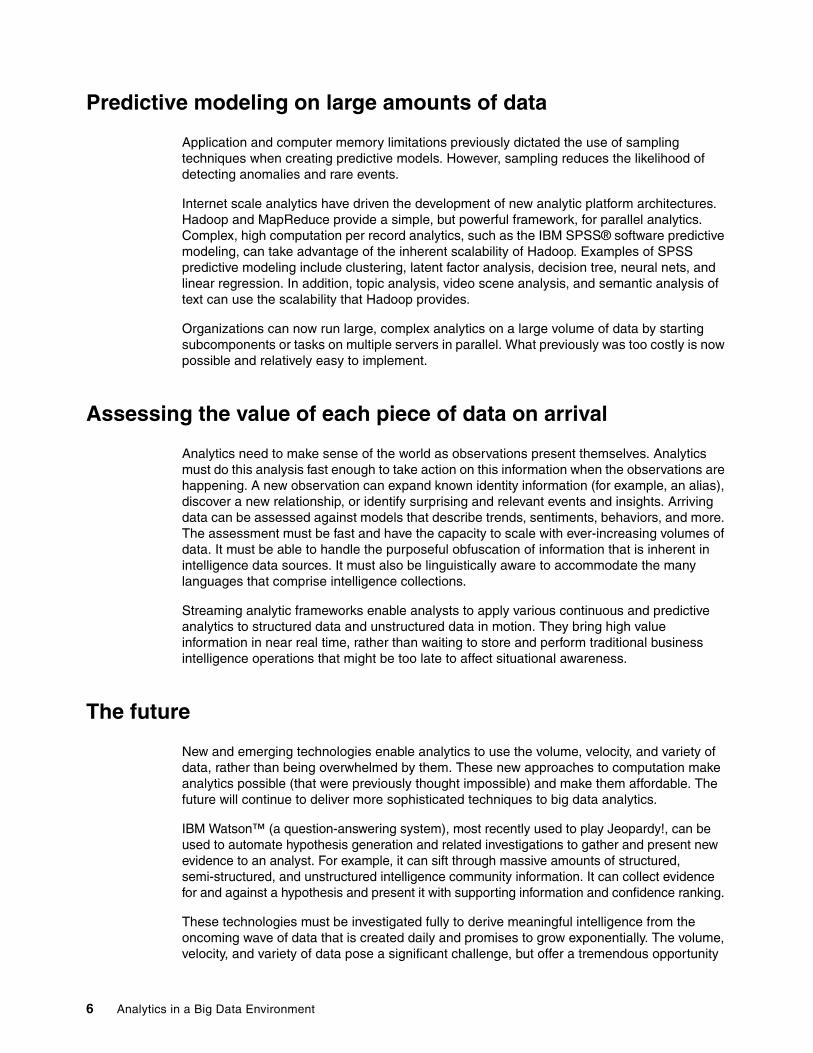
This scenario illustrates the power of persistent context and its positive impact on predictive models. The fusion of the orthogonal data sources (shown in Figure 4) revealed much more information about entities and helps to avoid making bad decisions with good data. In addition, as predictive model accuracy increases, you see an important reduction in false positives and negatives, meaning that you can find more needles in bigger haystacks.
Figure 4 Fused data
Bank 1 – Entity 105
Name Louise DoeL.D. Doe
Addr 123 Main Street777 Park Road
City New YorkState NYPostal 11732SSN 123-45-678
Loan# $100,000Default Yes
Bank 2 – Entity 349
Full Jane Doe
Addr1 33 Red Dr
City MamaroneckState NYPostal 10354SSN 123-45-678
Phone 914-555-1212
Loan# $150,000Default Yes
Bank 3 – Entity 649
Full Jane Doe
Addr1 33 Reed Dr
City White PlainsState NYPostal 10354Phone 914-555-1212
Loan# $10,000Default No
Name Louise DoeJane DoeLD Doe
Addr1 123 Main Street777 Park Road33 Red Dr33 Reed Dr
City New York, White Plains,Mamaroneck
State NYPostal 11732, 10354SSN 123-45-678Phone 914-555-1212Loans $260,000Defaults Yes
5
Predictive modeling on large amounts of data
Application and computer memory limitations previously dictated the use of sampling techniques when creating predictive models. However, sampling reduces the likelihood of detecting anomalies and rare events.
Internet scale analytics have driven the development of new analytic platform architectures. Hadoop and MapReduce provide a simple, but powerful framework, for parallel analytics. Complex, high computation per record analytics, such as the IBM SPSS® software predictive modeling, can take advantage of the inherent scalability of Hadoop. Examples of SPSS predictive modeling include clustering, latent factor analysis, decision tree, neural nets, and linear regression. In addition, topic analysis, video scene analysis, and semantic analysis of text can use the scalability that Hadoop provides.
Organizations can now run large, complex analytics on a large volume of data by starting subcomponents or tasks on multiple servers in parallel. What previously was too costly is now possible and relatively easy to implement.
Assessing the value of each piece of data on arrival
Analytics need to make sense of the world as observations present themselves. Analytics must do this analysis fast enough to take action on this information when the observations are happening. A new observation can expand known identity information (for example, an alias), discover a new relationship, or identify surprising and relevant events and insights. Arriving data can be assessed against models that describe trends, sentiments, behaviors, and more. The assessment must be fast and have the capacity to scale with ever-increasing volumes of data. It must be able to handle the purposeful obfuscation of information that is inherent in intelligence data sources. It must also be linguistically aware to accommodate the many languages that comprise intelligence collections.
Streaming analytic frameworks enable analysts to apply various continuous and predictive analytics to structured data and unstructured data in motion. They bring high value information in near real time, rather than waiting to store and perform traditional business intelligence operations that might be too late to affect situational awareness.
The future
New and emerging technologies enable analytics to use the volume, velocity, and variety of data, rather than being overwhelmed by them. These new approaches to computation make analytics possible (that were previously thought impossible) and make them affordable. The future will continue to deliver more sophisticated techniques to big data analytics.
IBM Watson™ (a question-answering system), most recently used to play Jeopardy!, can be used to automate hypothesis generation and related investigations to gather and present new evidence to an analyst. For example, it can sift through massive amounts of structured, semi-structured, and unstructured intelligence community information. It can collect evidence for and against a hypothesis and present it with supporting information and confidence ranking.
These technologies must be investigated fully to derive meaningful intelligence from the oncoming wave of data that is created daily and promises to grow exponentially. The volume, velocity, and variety of data pose a significant challenge, but offer a tremendous opportunity
6 Analytics in a Big Data Environment
to expand enterprise knowledge, bringing new efficiencies, greater safety, and the promise of a smarter planet toward reality.
Other resources for more information
For more information about the topics mentioned in the paper, go to the following web pages:
� IBM InfoSphere® platform
http://www.ibm.com/software/data/infosphere/
� Big data analytics
http://www.ibm.com/software/data/infosphere/bigdata-analytics.html
� IBM SPSS software
http://www.ibm.com/software/analytics/spss/
� IBM Watson
http://www.ibm.com/innovation/us/watson/index.html
� IBM DeepQA Project
http://www.research.ibm.com/deepqa/deepqa.shtml
� SystemT project
http://www.almaden.ibm.com/cs/projects/systemt/
� SystemT: A System for Declarative Information Extraction
http://www.almaden.ibm.com/cs/people/yunyaoli/publication/sigmodRecord2009.pdf
The team who wrote this guide
This content in this guide was adapted from the original version published in IQT QUARTERLY in the Spring 2011 edition. The authors of both versions worked with the IBM International Technical Support Organization (ITSO) to provide this publication.
Dr. Lisa Sokol is an architect within the IBM Government Services CTO office. Her primary areas of interest are assisting government communities in dealing with the decision overload problem and using analytics to discover actionable information buried within large amounts of data. She has designed several systems that detect and assess threat risk relative to fraud, terrorism, counter intelligence, and criminal activity. She has a doctorate in Operations Research from the University of Massachusetts.
Robert Ames was, at the time this guide was written, the Director of Advanced Analytics and Big Data at IBM. In this capacity, he advised senior leaders and technologists across the government who were grappling with its biggest challenges. Robert worked to ensure that the unique needs of the government were reflected in the activities of IBM Research and Development. He also worked to ensure effective collaboration between the government, its partners, and IBM in delivering advanced technologies to the mission.
Thanks to LindaMay Patterson of the ITSO in Rochester, MN, for her contributions to this project.
7
Now you can become a published author, too!
Here’s an opportunity to spotlight your skills, grow your career, and become a published author—all at the same time! Join an ITSO residency project and help write a book in your area of expertise, while honing your experience using leading-edge technologies. Your efforts will help to increase product acceptance and customer satisfaction, as you expand your network of technical contacts and relationships. Residencies run from two to six weeks in length, and you can participate either in person or as a remote resident working from your home base.
Find out more about the residency program, browse the residency index, and apply online at:
ibm.com/redbooks/residencies.html
Stay connected to IBM Redbooks
� Find us on Facebook:
http://www.facebook.com/IBMRedbooks
� Follow us on Twitter:
http://twitter.com/ibmredbooks
� Look for us on LinkedIn:
http://www.linkedin.com/groups?home=&gid=2130806
� Explore new IBM Redbooks® publications, residencies, and workshops with the IBM Redbooks weekly newsletter:
https://www.redbooks.ibm.com/Redbooks.nsf/subscribe?OpenForm
� Stay current on recent Redbooks publications with RSS Feeds:
http://www.redbooks.ibm.com/rss.html
8 Analytics in a Big Data Environment

Notices
This information was developed for products and services offered in the U.S.A.
IBM may not offer the products, services, or features discussed in this document in other countries. Consult your local IBM representative for information on the products and services currently available in your area. Any reference to an IBM product, program, or service is not intended to state or imply that only that IBM product, program, or service may be used. Any functionally equivalent product, program, or service that does not infringe any IBM intellectual property right may be used instead. However, it is the user's responsibility to evaluate and verify the operation of any non-IBM product, program, or service.
IBM may have patents or pending patent applications covering subject matter described in this document. The furnishing of this document does not grant you any license to these patents. You can send license inquiries, in writing, to: IBM Director of Licensing, IBM Corporation, North Castle Drive, Armonk, NY 10504-1785 U.S.A.
The following paragraph does not apply to the United Kingdom or any other country where such provisions are inconsistent with local law: INTERNATIONAL BUSINESS MACHINES CORPORATION PROVIDES THIS PUBLICATION "AS IS" WITHOUT WARRANTY OF ANY KIND, EITHER EXPRESS OR IMPLIED, INCLUDING, BUT NOT LIMITED TO, THE IMPLIED WARRANTIES OF NON-INFRINGEMENT, MERCHANTABILITY OR FITNESS FOR A PARTICULAR PURPOSE. Some states do not allow disclaimer of express or implied warranties in certain transactions, therefore, this statement may not apply to you.
This information could include technical inaccuracies or typographical errors. Changes are periodically made to the information herein; these changes will be incorporated in new editions of the publication. IBM may make improvements and/or changes in the product(s) and/or the program(s) described in this publication at any time without notice.
Any references in this information to non-IBM Web sites are provided for convenience only and do not in any manner serve as an endorsement of those Web sites. The materials at those Web sites are not part of the materials for this IBM product and use of those Web sites is at your own risk.
IBM may use or distribute any of the information you supply in any way it believes appropriate without incurring any obligation to you.
Any performance data contained herein was determined in a controlled environment. Therefore, the results obtained in other operating environments may vary significantly. Some measurements may have been made on development-level systems and there is no guarantee that these measurements will be the same on generally available systems. Furthermore, some measurements may have been estimated through extrapolation. Actual results may vary. Users of this document should verify the applicable data for their specific environment.
Information concerning non-IBM products was obtained from the suppliers of those products, their published announcements or other publicly available sources. IBM has not tested those products and cannot confirm the accuracy of performance, compatibility or any other claims related to non-IBM products. Questions on the capabilities of non-IBM products should be addressed to the suppliers of those products.
This information contains examples of data and reports used in daily business operations. To illustrate them as completely as possible, the examples include the names of individuals, companies, brands, and products. All of these names are fictitious and any similarity to the names and addresses used by an actual business enterprise is entirely coincidental.
COPYRIGHT LICENSE:
This information contains sample application programs in source language, which illustrate programming techniques on various operating platforms. You may copy, modify, and distribute these sample programs in any form without payment to IBM, for the purposes of developing, using, marketing or distributing application programs conforming to the application programming interface for the operating platform for which the sample programs are written. These examples have not been thoroughly tested under all conditions. IBM, therefore, cannot guarantee or imply reliability, serviceability, or function of these programs.
© Copyright IBM Corp. 2012. All rights reserved. 9
This document, REDP-4877-00, was created or updated on July 8, 2013.
Trademarks
IBM, the IBM logo, and ibm.com are trademarks or registered trademarks of International Business Machines Corporation in the United States, other countries, or both. These and other IBM trademarked terms are marked on their first occurrence in this information with the appropriate symbol (® or ™), indicating US registered or common law trademarks owned by IBM at the time this information was published. Such trademarks may also be registered or common law trademarks in other countries. A current list of IBM trademarks is available on the Web at http://www.ibm.com/legal/copytrade.shtml
The following terms are trademarks of the International Business Machines Corporation in the United States, other countries, or both:
IBM Watson™IBM®InfoSphere®
Redbooks®Redguides™Redbooks (logo) ®
SPSS®
The following terms are trademarks of other companies:
Other company, product, or service names may be trademarks or service marks of others.
®
Redbooks®
10 Analytics in a Big Data Environment