analytic use of bitmap indices
TRANSCRIPT

Analytic Use of Bitmap Indices Carlo DELL’AQUILA, Ezio LEFONS, and Filippo TANGORRA
Dipartimento di Informatica Università di Bari
via Orabona 4, 70125 Bari ITALY
Abstract: - We introduce the use of Bitmap indices as very useful tools to represent analytical views of user’s data. This approach differs from the conventional definition and use of bitmaps in that it allows us not only to index different domain attribute values, but also to pre-compute (any) legal relational algebra query expression from the user for analytic purposes. The paper discusses deeply the meaning and our use of analytical bitmaps, and shows some applications using a real context for solving integration and analytic problems. Key Words: - Bitmap index, Data semantics, Data semantic integration, Analytical data view, Complex query pre-processing, Decisional user. 1 Introduction Decisional users need access to a large amount of data collected in data warehouses to obtain analytic information on phenomena under investigation. De-riving qualitative assessments from quantitative data is a challenge of the front end technology (data min-ing, reporting, statistical analysis…). This decisional activity employs algorithms and models of a wide variety of technologies from artificial intelligence, statistics, and databases. In particular, the perspec-tives coming from database expertise regard mainly the aspects of data querying, data model, and user interface. Since most business data reside in very large enterprise databases and data warehouses, the decisional user requires a sophisticated form of data-base querying that solves transparently problems such as data integration and efficient access to huge volumes of stored data. Data analysis deals with ba-sic objects resulting from the execution of complex data queries and requires to combine such objects in an unforeseeable way. Therefore, the development of interactive techniques for exploring databases becomes a crucial aspect to make effective the user’s investigation activity. Different tools have been developed in the database field to supply the analytical needs. The solution commonly adopted is to build the data warehouse, a very large repository that integrates data from opera-tional databases of several enterprise sectors for de-cisional analyses. Accessing the data in warehouse in an efficient and flexible way is a difficult objective to obtain, because efficiency and flexibility are contrasting characteris-tics to be both implemented in data management. In fact, on one part, the efficiency of accesses takes ad vantage when queries are repetitive and predefined
because this situation allows to predispose adequate internal structures, such as indices [2, 7, 9], material-ized views [1, 5], summary tables [11], and statistical data profiles [6, 10]. On the other hand, data analysis is an iterative and exploratory process in nature char-acterized by a sequence of unpredictable and occa-sional queries, in which each successive query against the data warehouse could be influenced by the results of previous ones. This process can vanish the advantages that can be gained by the use of pre-defined structures, because it requires flexible data organization.
Bitmap indexing is a very popular technique for processing complex queries in the data warehouse environment supporting decisional and OLAP appli-cations. In fact, this methodology is particularly adapt to provide fast query processing in a decisional context characterized by non-volatile and read-mostly data.
The bitmap indices have been considered by re-searchers pre-eminently from the physical point of view and they satisfy the efficiency needs for access-ing very large databases.
In this paper, we introduce the analytic bitmap approach, which allows one to consider not only the domain attribute values for defining bitmaps, but also values coming from any pre-computed queries dy-namically derived during the analytic activity. There-fore, analytic bitmaps are defined at a higher abstrac-tion level than traditional bitmap indices. As they al-low us to capture data semantics, analytic bitmaps are profitably usable to answer efficiently to complex analytical queries and to also solve integration prob-lems, which cannot be solved at the data loading phase.
Proceedings of the 6th WSEAS Int. Conf. on Artificial Intelligence, Knowledge Engineering and Data Bases, Corfu Island, Greece, February 16-19, 2007 159
2 Analytic Bitmap indices Bitmap indices are widely used in data warehousing environments, that typically have large amounts of data and ad hoc queries, but a low level of concurrent updating transactions [3, 4, 8, 12, 13].
In its simplest form, a bitmap index on an attrib-ute consists of one vector of bits (or, bitmap) per each data attribute value, where the size of the bit-map is equal to the number of records in the relation (so, each bitmap index is dense with respect to the data in the relation). The bitmaps are encoded so that the ith record (identified with a row identifier RID) has a value v in the indexed attribute if and only if (a) the ith bit in the bitmap associated with the attribute value v is set to 1 and (b) the ith bit is set to 0 in each of the other bitmaps related to the same indexed at-tribute.
In the analytic approach we introduce here, bit-maps are created and used not only to index the do-main attribute values, but also for pre-computing any legal relational algebra query expression qi useful for the analytic purposes. In the latter case, the vector of bits encodes by setting to 1 the bits corresponding to those and only records which satisfy the query qi.
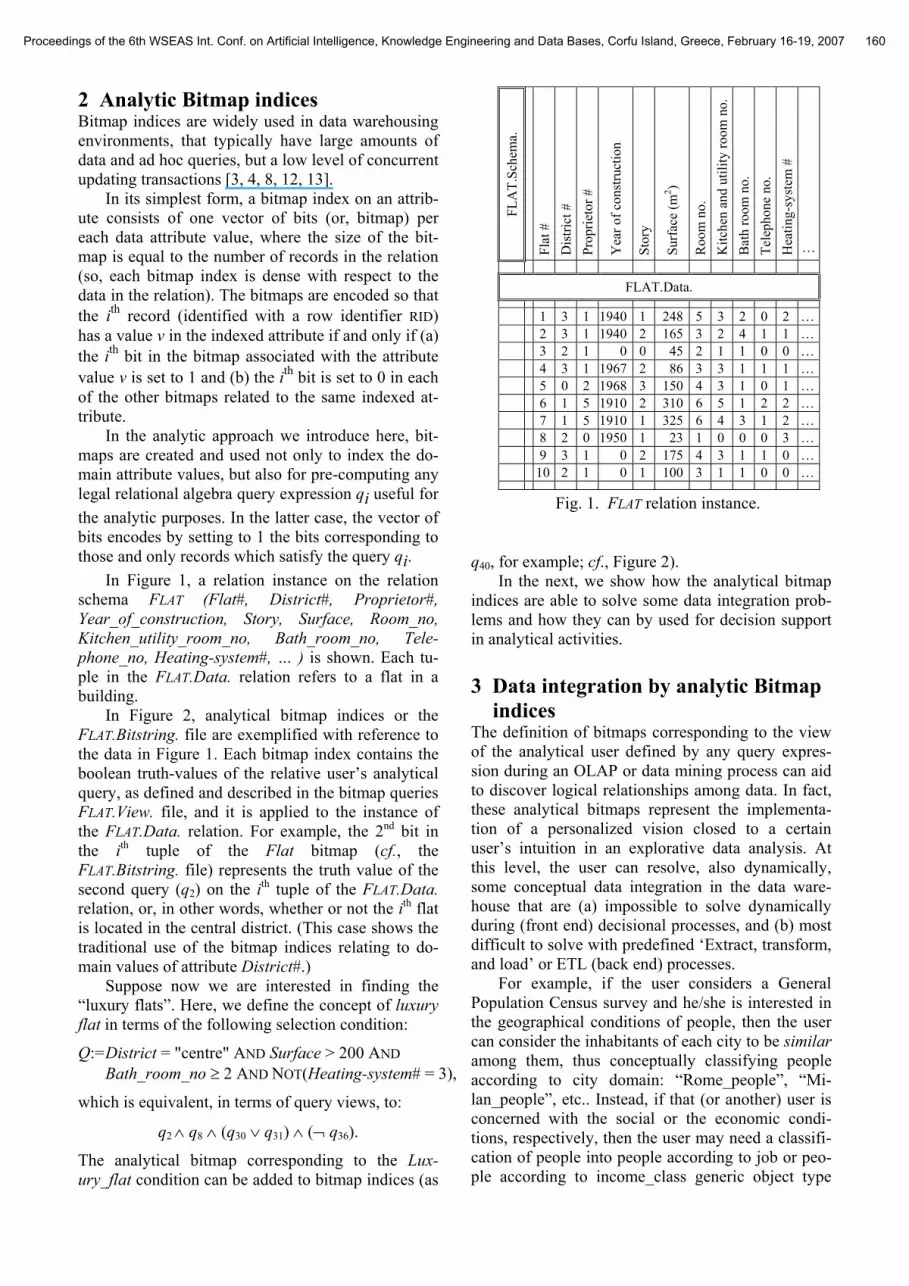
In Figure 1, a relation instance on the relation schema FLAT (Flat#, District#, Proprietor#, Year_of_construction, Story, Surface, Room_no, Kitchen_utility_room_no, Bath_room_no, Tele-phone_no, Heating-system#, … ) is shown. Each tu-ple in the FLAT.Data. relation refers to a flat in a building.
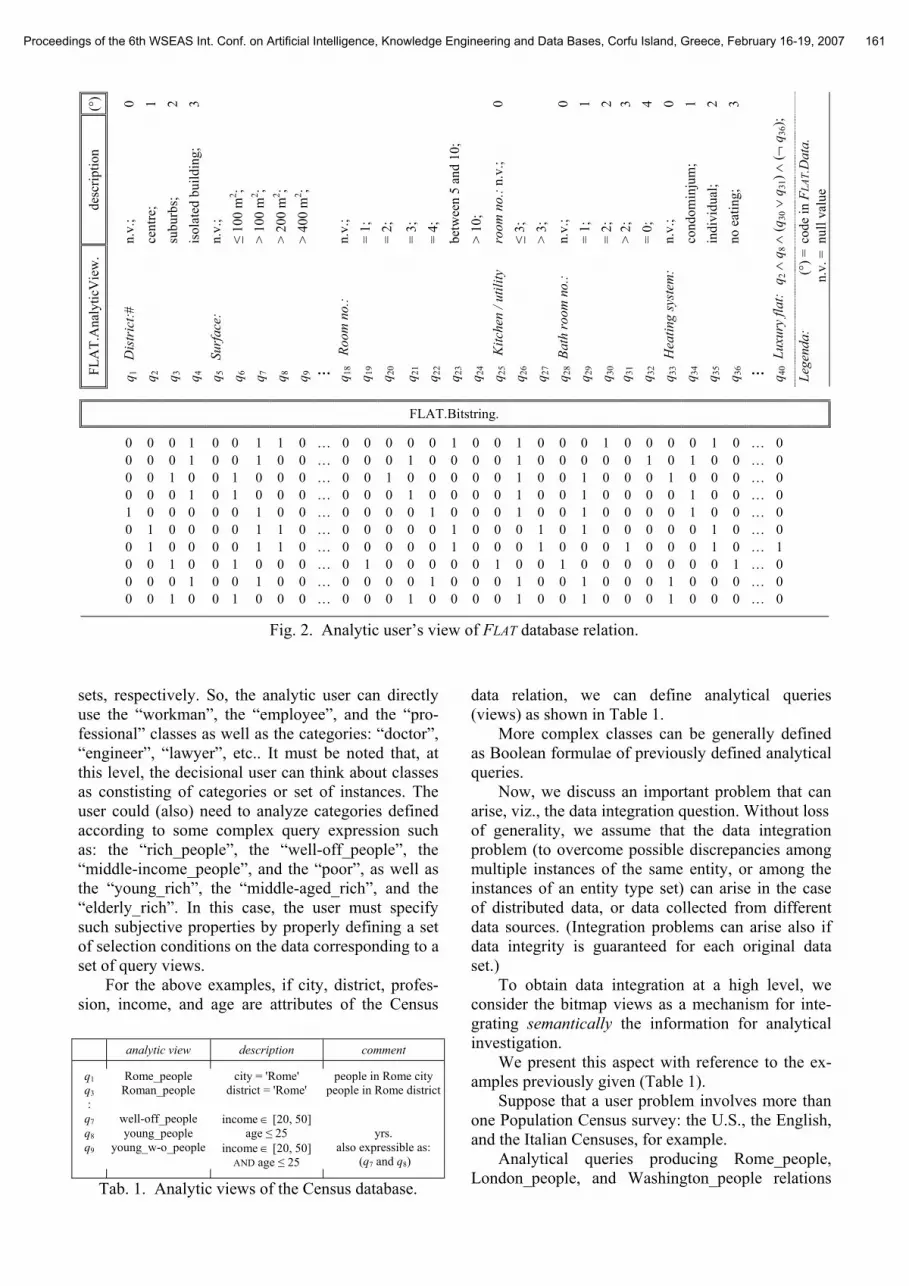
In Figure 2, analytical bitmap indices or the FLAT.Bitstring. file are exemplified with reference to the data in Figure 1. Each bitmap index contains the boolean truth-values of the relative user’s analytical query, as defined and described in the bitmap queries FLAT.View. file, and it is applied to the instance of the FLAT.Data. relation. For example, the 2nd bit in the ith tuple of the Flat bitmap (cf., the FLAT.Bitstring. file) represents the truth value of the second query (q2) on the ith tuple of the FLAT.Data. relation, or, in other words, whether or not the ith flat is located in the central district. (This case shows the traditional use of the bitmap indices relating to do-main values of attribute District#.)
Suppose now we are interested in finding the “luxury flats”. Here, we define the concept of luxury flat in terms of the following selection condition:
Q:= District = "centre" AND Surface > 200 AND Bath_room_no ≥ 2 AND NOT(Heating-system# = 3),
which is equivalent, in terms of query views, to:
q2 ∧ q8 ∧ (q30 ∨ q31) ∧ (¬ q36).
The analytical bitmap corresponding to the Lux-ury_flat condition can be added to bitmap indices (as
q40, for example; cf., Figure 2). In the next, we show how the analytical bitmap
indices are able to solve some data integration prob-lems and how they can by used for decision support in analytical activities. 3 Data integration by analytic Bitmap
indices The definition of bitmaps corresponding to the view of the analytical user defined by any query expres-sion during an OLAP or data mining process can aid to discover logical relationships among data. In fact, these analytical bitmaps represent the implementa-tion of a personalized vision closed to a certain user’s intuition in an explorative data analysis. At this level, the user can resolve, also dynamically, some conceptual data integration in the data ware-house that are (a) impossible to solve dynamically during (front end) decisional processes, and (b) most difficult to solve with predefined ‘Extract, transform, and load’ or ETL (back end) processes.
For example, if the user considers a General Population Census survey and he/she is interested in the geographical conditions of people, then the user can consider the inhabitants of each city to be similar among them, thus conceptually classifying people according to city domain: “Rome_people”, “Mi-lan_people”, etc.. Instead, if that (or another) user is concerned with the social or the economic condi-tions, respectively, then the user may need a classifi-cation of people into people according to job or peo-ple according to income_class generic object type
FLA
T.Sc
hem
a.
Flat
#
Dis
trict
#
Prop
rieto
r #
Yea
r of c
onst
ruct
ion
Stor
y
Surf
ace
(m2 )
Roo
m n
o.
Kitc
hen
and
utili
ty ro
om n
o.
Bat
h ro
om n
o.
Tele
phon
e no
. H
eatin
g-sy
stem
#
…
FLAT.Data.
1 3 1 1940 1 248 5 3 2 0 2 … 2 3 1 1940 2 165 3 2 4 1 1 … 3 2 1 0 0 45 2 1 1 0 0 … 4 3 1 1967 2 86 3 3 1 1 1 … 5 0 2 1968 3 150 4 3 1 0 1 … 6 1 5 1910 2 310 6 5 1 2 2 … 7 1 5 1910 1 325 6 4 3 1 2 … 8 2 0 1950 1 23 1 0 0 0 3 … 9 3 1 0 2 175 4 3 1 1 0 … 10 2 1 0 1 100 3 1 1 0 0 …
Fig. 1. FLAT relation instance.
Proceedings of the 6th WSEAS Int. Conf. on Artificial Intelligence, Knowledge Engineering and Data Bases, Corfu Island, Greece, February 16-19, 2007 160
(°) 0 1 2 3 0 0 1 2 3 4 0 1 2 3
desc
riptio
n n.
v.;
cent
re;
subu
rbs;
is
olat
ed b
uild
ing;
n.
v.;
≤ 10
0 m
2 ; >
100
m2 ;
> 20
0 m
2 ; >
400
m2 ;
n.v.
; =
1;
= 2;
= 3;
=
4;
betw
een
5 an
d 10
; >
10;
room
no.
: n.v
.; ≤
3;
> 3;
n.
v.;
= 1;
=
2;
> 2;
=
0;
n.v.
; co
ndom
inju
m;
indi
vidu
al;
no e
atin
g;
∧ (q
30 ∨
q31
) ∧ (¬
q36
);
code
in F
LAT.
Dat
a.
null
valu
e
FLA
T.A
naly
ticV
iew
. q 1
D
istr
ict:#
q 2
q 3
q 4
q 5
Su
rfac
e:
q 6
q 7
q 8
q 9 … q 18
Roo
m n
o.:
q 19
q 20
q 21
q 22
q 23
q 24
q 25
Kitc
hen
/ util
ity
q 26
q 2
7
q 28
Bath
room
no.
: q 2
9
q 30
q 3
1
q 32
q 3
3 H
eatin
g sy
stem
: q 3
4
q 35
q 3
6
… q 40
Luxu
ry fl
at:
q2 ∧
q8
Lege
nda:
(°
) =
n
.v. =
FLAT.Bitstring.
0 0 0 1 0 0 1 1 0 … 0 0 0 0 0 1 0 0 1 0 0 0 1 0 0 0 0 1 0 … 0 0 0 0 1 0 0 1 0 0 … 0 0 0 1 0 0 0 0 1 0 0 0 0 0 1 0 1 0 0 … 0 0 0 1 0 0 1 0 0 0 … 0 0 1 0 0 0 0 0 1 0 0 1 0 0 0 1 0 0 0 … 0 0 0 0 1 0 1 0 0 0 … 0 0 0 1 0 0 0 0 1 0 0 1 0 0 0 0 1 0 0 … 0 1 0 0 0 0 0 1 0 0 … 0 0 0 0 1 0 0 0 1 0 0 1 0 0 0 0 1 0 0 … 0 0 1 0 0 0 0 1 1 0 … 0 0 0 0 0 1 0 0 0 1 0 1 0 0 0 0 0 1 0 … 0 0 1 0 0 0 0 1 1 0 … 0 0 0 0 0 1 0 0 0 1 0 0 0 1 0 0 0 1 0 … 1 0 0 1 0 0 1 0 0 0 … 0 1 0 0 0 0 0 1 0 0 1 0 0 0 0 0 0 0 1 … 0 0 0 0 1 0 0 1 0 0 … 0 0 0 0 1 0 0 0 1 0 0 1 0 0 0 1 0 0 0 … 0 0 0 1 0 0 1 0 0 0 … 0 0 0 1 0 0 0 0 1 0 0 1 0 0 0 1 0 0 0 … 0
Fig. 2. Analytic user’s view of FLAT database relation.
sets, respectively. So, the analytic user can directly use the “workman”, the “employee”, and the “pro-fessional” classes as well as the categories: “doctor”, “engineer”, “lawyer”, etc.. It must be noted that, at this level, the decisional user can think about classes as constisting of categories or set of instances. The user could (also) need to analyze categories defined according to some complex query expression such as: the “rich_people”, the “well-off_people”, the “middle-income_people”, and the “poor”, as well as the “young_rich”, the “middle-aged_rich”, and the “elderly_rich”. In this case, the user must specify such subjective properties by properly defining a set of selection conditions on the data corresponding to a set of query views.
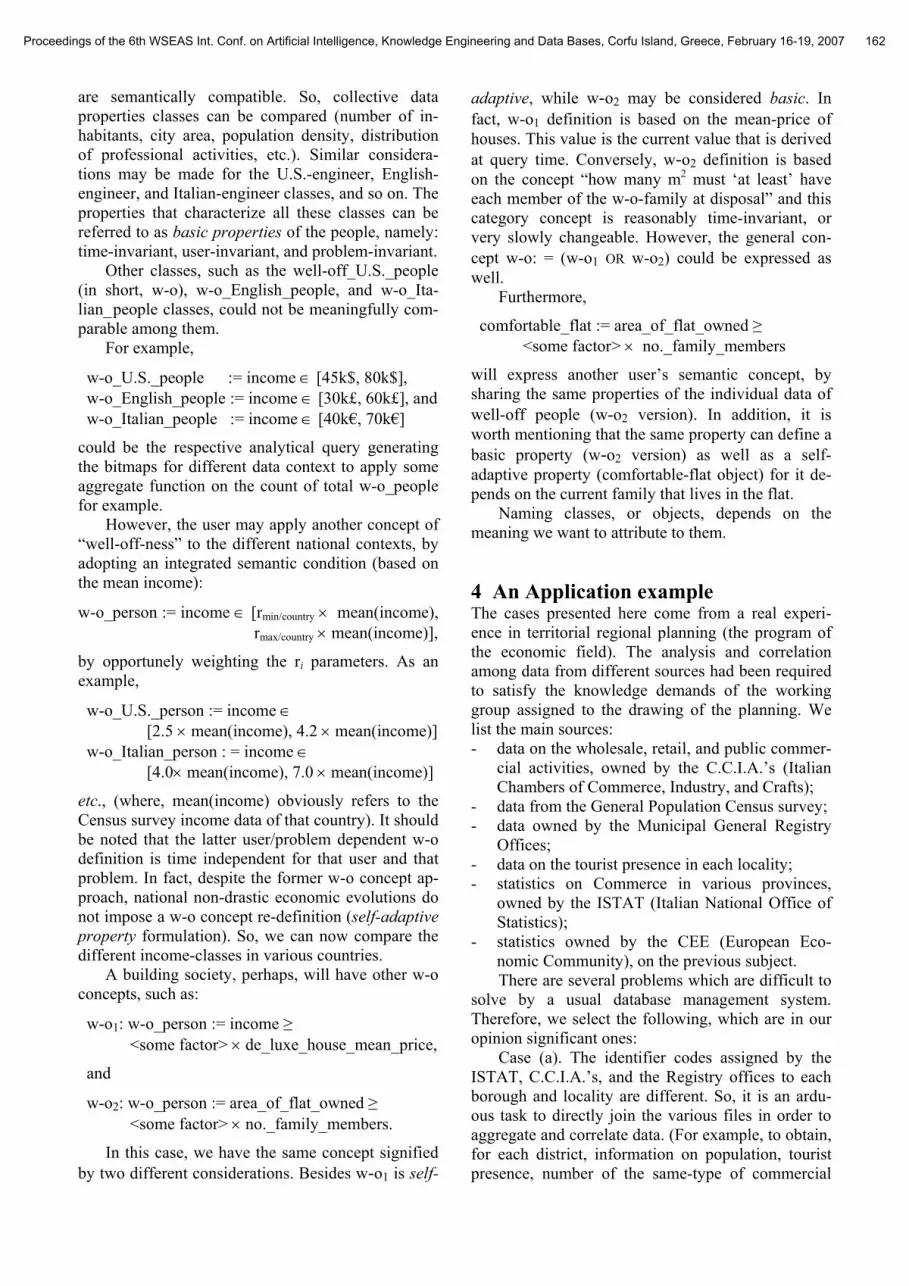
For the above examples, if city, district, profes-sion, income, and age are attributes of the Census
data relation, we can define analytical queries (views) as shown in Table 1.
More complex classes can be generally defined as Boolean formulae of previously defined analytical queries.
Now, we discuss an important problem that can arise, viz., the data integration question. Without loss of generality, we assume that the data integration problem (to overcome possible discrepancies among multiple instances of the same entity, or among the instances of an entity type set) can arise in the case of distributed data, or data collected from different data sources. (Integration problems can arise also if data integrity is guaranteed for each original data set.)
To obtain data integration at a high level, we consider the bitmap views as a mechanism for inte-grating semantically the information for analytical investigation.
We present this aspect with reference to the ex-amples previously given (Table 1).
Suppose that a user problem involves more than one Population Census survey: the U.S., the English, and the Italian Censuses, for example.
Analytical queries producing Rome_people, London_people, and Washington_people relations
analytic view description comment
q1 Rome_people city = 'Rome' people in Rome city q3 Roman_people district = 'Rome' people in Rome district:
q7 well-off_people income ∈ [20, 50] q8 young_people age ≤ 25 yrs. q9 young_w-o_people income ∈ [20, 50]
AND age ≤ 25 also expressible as:
(q7 and q8)
Tab. 1. Analytic views of the Census database.
Proceedings of the 6th WSEAS Int. Conf. on Artificial Intelligence, Knowledge Engineering and Data Bases, Corfu Island, Greece, February 16-19, 2007 161
are semantically compatible. So, collective data properties classes can be compared (number of in-habitants, city area, population density, distribution of professional activities, etc.). Similar considera-tions may be made for the U.S.-engineer, English-engineer, and Italian-engineer classes, and so on. The properties that characterize all these classes can be referred to as basic properties of the people, namely: time-invariant, user-invariant, and problem-invariant.
Other classes, such as the well-off_U.S._people (in short, w-o), w-o_English_people, and w-o_Ita-lian_ people classes, could not be meaningfully com-parable among them.
For example,
w-o_U.S._people := income ∈ [45k$, 80k$], w-o_English_people := income ∈ [30k£, 60k£], and w-o_Italian_people := income ∈ [40k€, 70k€]
could be the respective analytical query generating the bitmaps for different data context to apply some aggregate function on the count of total w-o_people for example.
However, the user may apply another concept of “well-off-ness” to the different national contexts, by adopting an integrated semantic condition (based on the mean income):
w-o_person := income ∈ [rmin/country × mean(income), rmax/country × mean(income)],
by opportunely weighting the ri parameters. As an example,
w-o_U.S._person := income ∈ [2.5 × mean(income), 4.2 × mean(income)]
w-o_Italian_person : = income ∈ [4.0× mean(income), 7.0 × mean(income)]
etc., (where, mean(income) obviously refers to the Census survey income data of that country). It should be noted that the latter user/problem dependent w-o definition is time independent for that user and that problem. In fact, despite the former w-o concept ap-proach, national non-drastic economic evolutions do not impose a w-o concept re-definition (self-adaptive property formulation). So, we can now compare the different income-classes in various countries.
A building society, perhaps, will have other w-o concepts, such as:
w-o1: w-o_person := income ≥ <some factor> × de_luxe_house_mean_price,
and
w-o2: w-o_person := area_of_flat_owned ≥ <some factor> × no._family_members.
In this case, we have the same concept signified by two different considerations. Besides w-o1 is self-
adaptive, while w-o2 may be considered basic. In fact, w-o1 definition is based on the mean-price of houses. This value is the current value that is derived at query time. Conversely, w-o2 definition is based on the concept “how many m2 must ‘at least’ have each member of the w-o-family at disposal” and this category concept is reasonably time-invariant, or very slowly changeable. However, the general con-cept w-o: = (w-o1 OR w-o2) could be expressed as well.
Furthermore,
comfortable_flat := area_of_flat_owned ≥ <some factor> × no._family_members
will express another user’s semantic concept, by sharing the same properties of the individual data of well-off people (w-o2 version). In addition, it is worth mentioning that the same property can define a basic property (w-o2 version) as well as a self-adaptive property (comfortable-flat object) for it de-pends on the current family that lives in the flat.
Naming classes, or objects, depends on the meaning we want to attribute to them.
4 An Application example The cases presented here come from a real experi-ence in territorial regional planning (the program of the economic field). The analysis and correlation among data from different sources had been required to satisfy the knowledge demands of the working group assigned to the drawing of the planning. We list the main sources: - data on the wholesale, retail, and public commer-
cial activities, owned by the C.C.I.A.’s (Italian Chambers of Commerce, Industry, and Crafts);
- data from the General Population Census survey; - data owned by the Municipal General Registry
Offices; - data on the tourist presence in each locality; - statistics on Commerce in various provinces,
owned by the ISTAT (Italian National Office of Statistics);
- statistics owned by the CEE (European Eco-nomic Community), on the previous subject. There are several problems which are difficult to
solve by a usual database management system. Therefore, we select the following, which are in our opinion significant ones:
Case (a). The identifier codes assigned by the ISTAT, C.C.I.A.’s, and the Registry offices to each borough and locality are different. So, it is an ardu-ous task to directly join the various files in order to aggregate and correlate data. (For example, to obtain, for each district, information on population, tourist presence, number of the same-type of commercial
Proceedings of the 6th WSEAS Int. Conf. on Artificial Intelligence, Knowledge Engineering and Data Bases, Corfu Island, Greece, February 16-19, 2007 162
activities, min/max degree of profit of each type of trade, territorial characteristics, and so on).
Case (b). Some current statistics supplied by the ISTAT on the province under consideration are not directly comparable with the disaggregate elemental data supplied by the borough councils and C.C.I.A.’s. (For example, the activities generically classified Alimentary by the ISTAT, are on the con-trary divided up on the basis of the trading-licence, i.e., butcher’s, fish-monger’s, grocer’s, etc., by the C.C.I.A.’s and borough councils).
Case (c). The planning requires a distinction be-tween large- and middle-small- sized premises. To make the example easier, we define ‘large-sized’ those premises whose sales area is greater than twice the average area of the same-type activities (in each borough).
Case (d). The planning requires, at least for big cities, the individualization of the premises situated in the old part of the city. For simplicity, let us as-sume that the old part is defined as a proper set of (ISTAT) urban sections of statistical survey, and that an ISTAT section is defined by the quadruplet <ISTAT section code, street (name), init.building_no., final.building_no.>. That is, an ad-dress <street, building_no.> belongs to the ISTAT section such that:
address.street = section.street AND section.init.building_no. ≤ address.building_no. AND address.building_no. ≤ section.final.building_no,
taking into consideration the even and the odd build-ing numberings, depending on the side of the street.
Possible solutions to the cited cases that we schematize below refer only to the conditions of classification of the data, by means of opportune ana-lytic queries performing the data analyses required by the territorial planning.
Case (a). For each file (relation) produced by the
several sources (ISTAT, C.C.I.A.’s, Registry Offices, etc.) an analytical query, named Borough, can be de-fined:
qi: Borough := borough# ∈ <code_list-k>;
where <code_list-k> represents the ordered list of the codes assigned to the boroughs by the source k. The ordering is induced by the lexicographical order of the list of the Borough names. In so doing, an iden-tity correspondence is obtained among all the Bor-ough[i] codes in the various files, for each given i (i.e., for the i-th borough (name)).
Case (b). On the files produced by the Boroughs
and/or the C.C.I.A.’s, we can define either the simple analytic view
qi: Alimentary := trading-licence# ∈ <licence_code_set>;
where <licence_code_set> is the set of the trading-licence codes of the activities grouped as Alimentary by the ISTAT, or an analytic query defined on a set of simple analytic queries
qi: Alimentary := Butcher’s OR Fishmonger’s OR...;
where
qi1: Butcher’s := trading-licence# = meat#;
qi2: Fishmonger’s := trading-licence = fish#; etc..
On the data selected by the Alimentary view, it is possible to compute the same aggregate functions applied by the ISTAT. So, the statistics become comparable.
Case (c). For each type i of trade, the following
analytic query can be defined:
qi: Large(i) := Area > 2 × avg_area(i) AND trading_licence# = (i)#;
being
avg_area(i) := avg(premises_area; trading_licence# = (i)#);
and, eventually, a global analytic query (catalogued procedure pc):
pc Large: Large(1) OR … Large(i) OR … ;.
It should be noted that, in this way, the computa-tion of the aggregate function avg_area is performed only once, during the materialization of the Bitstring relation. Whereas normally (i.e., in usual systems), this function is re-applied at every query formulation (also at a re-formulation on the same particular type of trade). Of course, the eventual updating of primary data requires a (system) re-running of the statistical procedure on the updated data. Since the changes in the area of premises that occur in the course of the analysis are never considered, problems of statistical integrity do not generally arise.
Case (d). Premises situated in the Old Part of
Borough i, for each Borough i, can be defined so:
pc Premises_in_O.P.:= borough = Borough[i] AND Old_Part[i];
where Borough[i] is the same as that defined in case (a), and the Old Part of the Borough i is the follow-ing catalogued procedure:
pc Old_Part[i]: Section[1] OR … Section[j] OR …
with
Proceedings of the 6th WSEAS Int. Conf. on Artificial Intelligence, Knowledge Engineering and Data Bases, Corfu Island, Greece, February 16-19, 2007 163
pc Section[j] : address = address(j) AND building_no. ∈ <init.building_no.(j), final.building_no.(j); step 2>; .
5 Conclusions In this paper, we have shown that, in addition to
the commonly recognized advantages in the physical organization of data warehouse systems, bitmaps can be used to represent information at the conceptual level.
Analytical bitmap indices might often be consid-ered redundant with regard to the data relation which they refer to. However, bitstring relations always have the following characteristics: (a) they contain only the more relevant properties of data for the user; (b) they represent a classification made by the user, who can manage better semantic ambiguities in the data, and (c) they are internally processed as a se-quence of bits, and have a machine-independent rep-resentation.
This approach to data modelling is not merely a theoretical tool: it has been successfully applied both to scientific (in particular, to high energy physics ex-periments) as well as to decisional (environmental data management, territorial planning) fields. The system we utilize does not use internally indices structured as inverted lists or trees. This choice, that would surely be considered inefficient for operative applications, is not so for the analytic ones, in which large volumes of data are generally processed. We favoured the simplicity of the internal data structures, rather than some criteria of efficiency. Our personal experiences have taught us that in scientific and deci-sional distributed environments, optimality in re-sponse time to particular applications is not so fun-damental to users, and that – provided the response time to predictable queries is reasonable – it is very important to allow the users flexible strategies for solving complex, unpredictable queries.
References:
[1] Agrawal D., El Abbadi A., Singh A., and Yurek T., Efficient View Maintenance at Data Ware-houses, Proc. of the 1997 ACM SIGMOD Conf., Tucson, Arizona, 1997, pp. 417-427.
[2] Amer-Yahia S., and Johnson T., Optimizing
Queries on Compressed Bitmaps, Proc. of the 26th VLDB Conf., Cairo, Egypt, 2000, pp. 329-338.
[3] Chan C.Y., and Ioannidis Y. E., An Efficient Bitmap Encoding Scheme for Selection Que-ries, Proc. of the 1999 SIGMOD Conf., Phila-delphia, Pennsylvania, 1999, pp. 215-226.
[4] Chan C.Y., and Ioannidis Y. E., Bitmap Index Design and Evaluation, Proc. of the1998 SIG-MOD Conf., Seattle, Washington, 1998, pp. 355-366.
[5] dell’Aquila C., Lefons E., and Tangorra F., Building Data Warehouse: Design and Case Analysis, WSEAS Transactions on Information Science and Applications, vol. 3, no. 3, 2006, pp. 510-517.
[6] dell’Aquila C., Lefons E., and Tangorra F., De-cision Portal Using Approximate Query Proc-essing, WSEAS Transactions on Computers, vol. 2, no. 2, 2003, pp. 386-392.
[7] Gupta H., Harinarayan V., Rajaraman A., and Ullman J.D., Index Selection for OLAP, Proc. of the 1997 IEEE ICDE Conf., Birmingham, UK, 1997, pp. 208-219.
[8] Johnson T., Performance Measurements of Compressed Bitmap Indices, Proc. of the 25th VLDB Conf., Edinburgh, Scotland, 1999, pp. 278-289.
[9] Johnson T., and Shasha D., Some Approaches to Index Design for Cube Forests, IEEE Data Engineering Bull., vol. 22, no. 4, 1999, pp. 22-30.
[10] Mannino M.V., Chu P., and Sager T., Statistical Profile Estimation in Database Systems, ACM Computing Surveys, vol. 20, no. 3, 1988, pp. 191-221.
[11] Mumick I.S., Quass D., and Mumick B.S., Maintenance of Data Cubes and Summary Ta-bles in a Warehouse, Proc. of the 1997 ACM SIGMOD Conf., Tucson, Arizona, 1997, pp. 100-111.
[12] O’Neil P., and Quass D., Improved Query Per-formance with Variant Indexes, Proc. of the 1997 ACM SIGMOD Conf., Tucson, Arizona, 1997, pp. 38-49.
[13] Wu K., and Shoshani A., On the Performance of Bitmap Indices for High Cardinality Attributes, Proc. of the 30th VLDB Conf., Toronto, Canada, 2004, pp. 24-35.
Proceedings of the 6th WSEAS Int. Conf. on Artificial Intelligence, Knowledge Engineering and Data Bases, Corfu Island, Greece, February 16-19, 2007 164