analyte flux at a biomaterial-tissue interface over time: implications for sensors for type 1 and 2...
TRANSCRIPT

1063
Analyte Flux at a Biomaterial–Tissue Interface over Time: Implications for Sensors for Type 1 and 2 Diabetes Mellitus
Neda Rajamand Ekberg, M.D., Ph.D.,1 Kerstin Brismar, M.D., Ph.D.,1 Jonas Malmstedt, M.D., Ph.D.,1 Mari-Anne Hedblad, M.D.,2 Ulf Adamson M.D., Ph.D.,3 Urban Ungerstedt, Ph.D.,4
and Natalie Wisniewski, Ph.D.5
Author Affiliations: 1Department of Molecular Medicine and Surgery, Karolinska Institutet, Stockholm, Sweden; 2Department of Dermatology, Karolinska University Hospital, Stockholm, Sweden; 3Department of Medicine, Danderyd Hospital, Stockholm, Sweden; 4Department of Physiology and Pharmacology, Karolinska Institutet, Stockholm, Sweden; and 5Medical Device Consultancy, San Francisco, California
Abbreviation: (ANOVA) analysis of variance, (BMI) body mass index, (DM) diabetes mellitus, (GLUT) glucose transporter, (sc) subcutaneous, (SEM) standard error of the mean, (T1DM) type 1 diabetes mellitus, (T2DM) type 2 diabetes mellitus
Keywords: biosensors, diabetes mellitus, foreign body response, glucose metabolism, material–tissue interaction, microdialysis
Corresponding Author: Neda Rajamand Ekberg, M.D., Ph.D., Department of Molecular Medicine and Surgery, Karolinska Institutet, Stockholm, Sweden; email address [email protected]
Journal of Diabetes Science and Technology Volume 4, Issue 5, September 2010 © Diabetes Technology Society
Abstract
Objective:The very presence of an implanted sensor (a foreign body) causes changes in the adjacent tissue that may alter the analytes being sensed. The objective of this study was to investigate changes in glucose availability and local tissue metabolism at the sensor–tissue interface in patients with type 1 diabetes mellitus (T1DM) and type 2 diabetes mellitus (T2DM).
Method:Microdialysis was used to model implanted sensors. Capillary glucose and subcutaneous (sc) microdialysate analytes were monitored in five T1DM and five T2DM patients. Analytes included glucose, glycolysis metabolites (lactate, pyruvate), a lipolysis metabolite (glycerol), and a protein degradation byproduct (urea). On eight consecutive days, four measurements were taken during a period of steady state blood glucose.
Results:Microdialysate glucose and microdialysate-to-blood-glucose ratio increased over the first several days in all patients. Although glucose recovery eventually stabilized, the lactate levels continued to rise. These trends were explained by local inflammatory and microvascular changes observed in histological analysis of biopsy samples. Urea concentrations mirrored glucose trends. Urea is neither produced nor consumed in sc tissue, and so the initially increasing urea trend is explained by increased local capillary presence during the inflammatory process. Pyruvate in T2DM microdialysate was significantly higher than in T1DM, an observation that is possibly explained by mitochondrial dysfunction in T2DM. Glycerol in T2DM microdialysate (but not in T1DM) was higher than in healthy volunteers, which is likely explained by sc insulin resistance (insulin is a potent antilipolytic hormone). Urea was also higher in microdialysate of patients with diabetes mellitus compared to healthy volunteers. Urea is a byproduct of protein degradation, which is known to be inhibited by insulin. Therefore, insulin deficiency or resistance may explain the higher urea levels. To our knowledge, this is the first histological evaluation of a human tissue biopsy containing an implanted glucose monitoring device.
continued
SYMPOSIUM

1064
Analyte Flux at a Biomaterial–Tissue Interface over Time: Implications for Sensors for Type 1 and 2 Diabetes Mellitus Ekberg
www.journalofdst.orgJ Diabetes Sci Technol Vol 4, Issue 5, September 2010
Introduction
Lack of glycemic control in diabetes mellitus (DM) causes complications.1–5 It is a long-standing goal to enable continuous monitoring of glucose and lipid metabolism to assist patients with type 1 diabetes mellitus (T1DM) and type 2 diabetes mellitus (T2DM) to achieve metabolic control.
In developing in vivo continuous monitors for glucose and other analytes, a key reason that long-term implantable sensors have not been successful to date is the lack of similarity of analyte concentrations in the interstitial fluid at the sensor-tissue interface compared to blood. The process of introducing a sensor into the tissue itself creates a blood-clotting and wound-healing reaction to repair the microdamage done to the tissue during insertion.6 Beyond the initial inflammation and wound-healing reaction, the presence of a foreign body creates additional tissue changes at the interface of a sensor, and these tissue changes may alter the concentrations of various analytes detectable by the implanted sensor.7–9
Microdialysis is an in vivo diffusion-based sampling technique for studying metabolism in different tissues,10 and it is a simple analogue to in vivo analyte sensors.11,12
It permits concurrent study of numerous small molecules that diffuse from the tissue through a semipermeable membrane, similar to the semipermeable membrane of sensors, but without the complexities of detection enzymes, electronics, and other components of implanted sensors.
Figure 1 describes the relation of various metabolites of interest for continuous monitoring in the subcutaneous (sc) tissue. Glucose freely diffuses from capillaries into interstitial fluid. In insulin-responsive tissues (skeletal
muscle, adipose, and heart tissue), the glucose transport into the cells is facilitated by insulin-responsive glucose transporter-4 (GLUT-4). In the cell cytoplasm, glucose undergoes glycolysis and is converted to pyruvate. There are three pathways for pyruvate that are in balance with each other depending on cellular conditions: (1) a small amount pyruvate diffuses outside the cell and can be detected in the interstitium; (2) some pyruvate is converted to lactate in the cytoplasm, and the relative amounts are increased during hypoxia; and (3) for optimal cellular energy production, pyruvate enters the mitochondria to be converted to energy (adenosine-5’-triphosphate) via the citric acid cycle.
Abstract cont.
Conclusions:Monitoring metabolic changes at a material–tissue interface combined with biopsy histology helped to formulate an understanding of physiological changes adjacent to implanted glucose sensors. Microdialysate glucose trends were similar over 1-week in T1DM and T2DM; however, differences in other analytes indicated wound healing and metabolic activities in the two patient groups differ. We propose explanations for the specific observed differences based on differential insulin insufficiency/resistance and mitochondrial dysfunction in T1DM versus T2DM.
J Diabetes Sci Technol 2010;4(5):1063-1072
Figure 1. Insulin stimulates GLUT-4-associated glucose transport into the fat and muscle cell and inhibits lipolysis. Glucose enters glycolysis and is converted to pyruvate and lactate. 1, insulin receptor; 2, vesicle containing GLUT-4; 3, GLUT-4; 4, mitochondria; 5, vesicle containing fat droplet; FFA, free fatty acid.
1065
Analyte Flux at a Biomaterial–Tissue Interface over Time: Implications for Sensors for Type 1 and 2 Diabetes Mellitus Ekberg
www.journalofdst.orgJ Diabetes Sci Technol Vol 4, Issue 5, September 2010
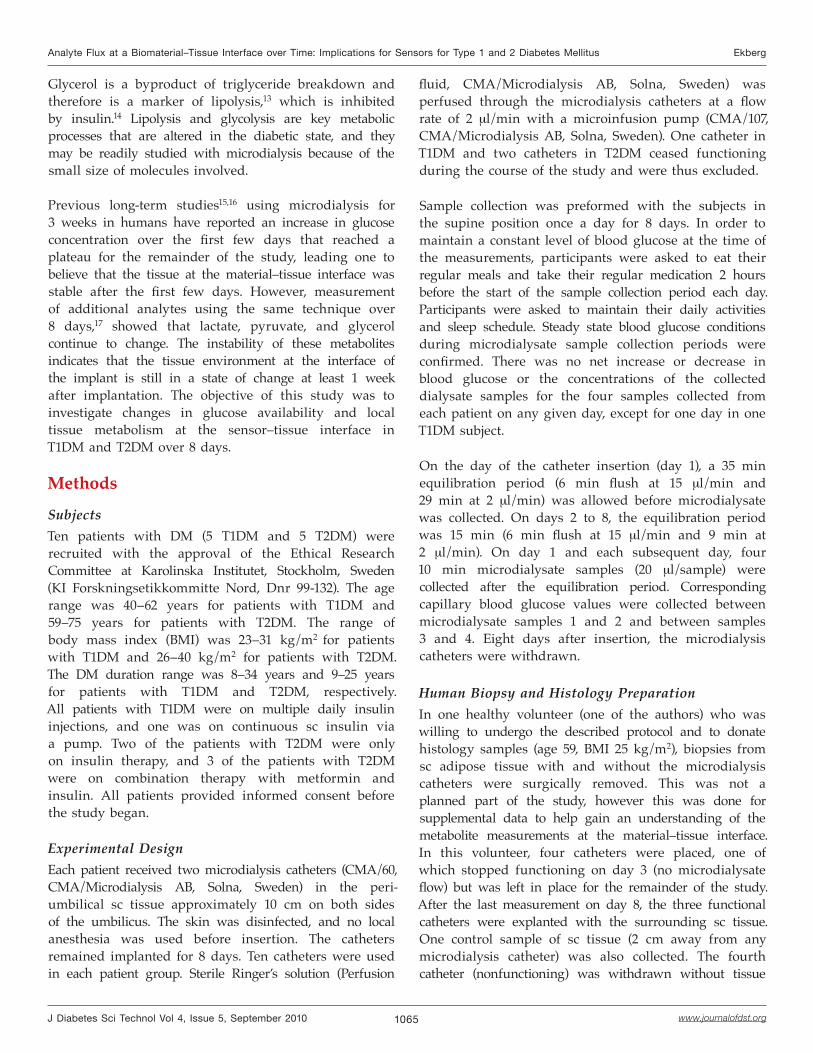
Glycerol is a byproduct of triglyceride breakdown and therefore is a marker of lipolysis,13 which is inhibited by insulin.14 Lipolysis and glycolysis are key metabolic processes that are altered in the diabetic state, and they may be readily studied with microdialysis because of the small size of molecules involved.
Previous long-term studies15,16 using microdialysis for 3 weeks in humans have reported an increase in glucose concentration over the first few days that reached a plateau for the remainder of the study, leading one to believe that the tissue at the material–tissue interface was stable after the first few days. However, measurement of additional analytes using the same technique over 8 days,17 showed that lactate, pyruvate, and glycerol continue to change. The instability of these metabolites indicates that the tissue environment at the interface of the implant is still in a state of change at least 1 week after implantation. The objective of this study was to investigate changes in glucose availability and local tissue metabolism at the sensor–tissue interface in T1DM and T2DM over 8 days.
Methods
SubjectsTen patients with DM (5 T1DM and 5 T2DM) were recruited with the approval of the Ethical Research Committee at Karolinska Institutet, Stockholm, Sweden (KI Forskningsetikkommitte Nord, Dnr 99-132). The age range was 40–62 years for patients with T1DM and 59–75 years for patients with T2DM. The range of body mass index (BMI) was 23–31 kg/m2 for patients with T1DM and 26–40 kg/m2 for patients with T2DM. The DM duration range was 8–34 years and 9–25 years for patients with T1DM and T2DM, respectively. All patients with T1DM were on multiple daily insulin injections, and one was on continuous sc insulin via a pump. Two of the patients with T2DM were only on insulin therapy, and 3 of the patients with T2DM were on combination therapy with metformin and insulin. All patients provided informed consent before the study began.
Experimental DesignEach patient received two microdialysis catheters (CMA/60, CMA/Microdialysis AB, Solna, Sweden) in the peri-umbilical sc tissue approximately 10 cm on both sides of the umbilicus. The skin was disinfected, and no local anesthesia was used before insertion. The catheters remained implanted for 8 days. Ten catheters were used in each patient group. Sterile Ringer’s solution (Perfusion
fluid, CMA/Microdialysis AB, Solna, Sweden) was perfused through the microdialysis catheters at a flow rate of 2 µl/min with a microinfusion pump (CMA/107, CMA/Microdialysis AB, Solna, Sweden). One catheter in T1DM and two catheters in T2DM ceased functioning during the course of the study and were thus excluded.
Sample collection was preformed with the subjects in the supine position once a day for 8 days. In order to maintain a constant level of blood glucose at the time of the measurements, participants were asked to eat their regular meals and take their regular medication 2 hours before the start of the sample collection period each day. Participants were asked to maintain their daily activities and sleep schedule. Steady state blood glucose conditions during microdialysate sample collection periods were confirmed. There was no net increase or decrease in blood glucose or the concentrations of the collected dialysate samples for the four samples collected from each patient on any given day, except for one day in one T1DM subject.
On the day of the catheter insertion (day 1), a 35 min equilibration period (6 min flush at 15 µl/min and 29 min at 2 µl/min) was allowed before microdialysate was collected. On days 2 to 8, the equilibration period was 15 min (6 min flush at 15 µl/min and 9 min at 2 µl/min). On day 1 and each subsequent day, four 10 min microdialysate samples (20 µl/sample) were collected after the equilibration period. Corresponding capillary blood glucose values were collected between microdialysate samples 1 and 2 and between samples 3 and 4. Eight days after insertion, the microdialysis catheters were withdrawn.
Human Biopsy and Histology PreparationIn one healthy volunteer (one of the authors) who was willing to undergo the described protocol and to donate histology samples (age 59, BMI 25 kg/m2), biopsies from sc adipose tissue with and without the microdialysis catheters were surgically removed. This was not a planned part of the study, however this was done for supplemental data to help gain an understanding of the metabolite measurements at the material–tissue interface. In this volunteer, four catheters were placed, one of which stopped functioning on day 3 (no microdialysate flow) but was left in place for the remainder of the study. After the last measurement on day 8, the three functional catheters were explanted with the surrounding sc tissue. One control sample of sc tissue (2 cm away from any microdialysis catheter) was also collected. The fourth catheter (nonfunctioning) was withdrawn without tissue

1066
Analyte Flux at a Biomaterial–Tissue Interface over Time: Implications for Sensors for Type 1 and 2 Diabetes Mellitus Ekberg
www.journalofdst.orgJ Diabetes Sci Technol Vol 4, Issue 5, September 2010
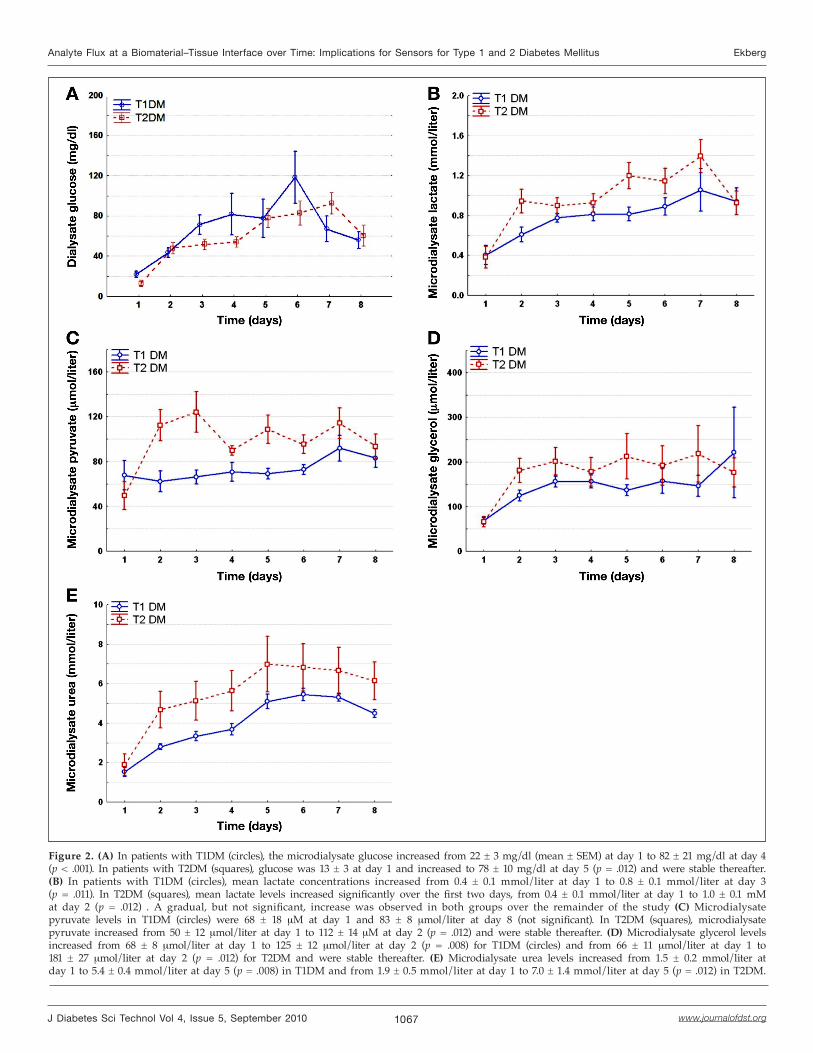
levels increased significantly in both groups over the first four to five days, and after that time, changes detected were not significant (Figure 2A). There was no significant difference between the microdialysate glucose levels in T1DM and T2DM (p ≥ .05).
Lactate at the Material–Tissue InterfaceThe lactate levels increased significantly from day 1 to day 2 in patients with T2DM and from day 1 to day 3 in patients with T1DM. An overall more gradual, but not significant, increase was observed in both groups over the remainder of the study. The lactate levels were higher although not significantly in patients with T2DM compared to patients with T1DM (Figure 2B).
Pyruvate at the Material–Tissue InterfaceIn patients with T1DM, the mean microdialysate pyruvate levels were stable over the study period. In patients with T2DM, mean pyruvate levels increased until day 2, and observed changes after that time were not significant. The microdialysate pyruvate levels in patients with T2DM were significantly higher compared to patients with T1DM (p = .017; Figure 2C).
Glycerol at the Material–Tissue InterfaceThe mean microdialysate glycerol levels increased significantly from day 1 to day 2 and were stable thereafter in both groups. There were no significant differences between the two groups (Figure 2D).
Urea at the Material–Tissue InterfaceThe mean microdialysate urea levels increased over the first five days in both groups, and observed changes after that time were not significant. A gradual but not significant decrease was observed in both groups after a peak around day 5. Urea levels were higher although not significantly in patients with T2DM compared to patients with T1DM (Figure 2E).
Glucose at the Material–Tissue Interface Compared to Capillary GlucoseThe mean capillary glucose levels were similar in the two groups on day 1 and did not change significantly on the subsequent days due to the fasting schedule followed before daily measurements. Although capillary glucose levels remained constant, the ratio of the glucose microdialysate to capillary glucose increased significantly during the first five out of eight days (Figure 3). The glucose detected at the material–tissue surface on day 1 was only 10–15% of capillary glucose, but this increased to a plateau of around 50% by day 5.
biopsy and processed for histology as the other biopsies. Tissue samples were fixed in 4% buffered formaldehyde, routinely prepared by embedding in paraffin. Histopathological examination of sections stained with hematoxylin and eosin was performed.
Sample AnalysisThe concentrations of glucose, lactate, pyruvate, urea, and glycerol were analyzed in all microdialysis samples using a CMA/600 Microdialysis Analyzer (CMA/Microdialysis AB, Stockholm, Sweden).18 Capillary blood samples were taken from the fingertips and immediately analyzed on a hand-held glucose meter (Glucotrend, Roche Diagnostics, Mannheim, Germany, or Free Style, Abbott Laboratories, Abbott Park, Illinois).
Data AnalysisThe transport of glucose from the capillaries through the interstitial fluid and through the microdialysis membrane was compared to blood glucose (microdialysate glucose/capillary blood glucose) and converted to a percentage (×100) termed “relative glucose recovery.” Mean relative glucose recovery was calculated for each catheter on each day based on the four collected microdialysate samples.
Statistical AnalysisFor each metabolite, the mean and standard error of the mean (SEM) in each group on each day were calculated from the individual catheter averages (average of the four data points collected on any given day from any given catheter). The significance of each metabolite trend over time was tested using repeated measured analysis of variance (ANOVA). Significant differences between values obtained on each day in the same group were tested using Wilcoxon Matched Pairs test (e.g., comparing whether day 1 is different from day 2). Significant differences between the groups on the same day were tested using the Mann–Whitney U test. Differences between the two groups for all metabolites were tested using repeated measures ANOVA. A p value < .05 was considered significant.
ResultsThe microdialysate glucose, lactate, pyruvate, glycerol, and urea levels over the study period in the two DM groups are shown in Figure 2.
Glucose at the Material–Tissue InterfaceMicrodialysate glucose levels and trends were similar in patients with T1DM and T2DM. Microdiaysate glucose
1067
Analyte Flux at a Biomaterial–Tissue Interface over Time: Implications for Sensors for Type 1 and 2 Diabetes Mellitus Ekberg
www.journalofdst.orgJ Diabetes Sci Technol Vol 4, Issue 5, September 2010
Figure 2. (A) In patients with T1DM (circles), the microdialysate glucose increased from 22 ± 3 mg/dl (mean ± SEM) at day 1 to 82 ± 21 mg/dl at day 4(p < .001). In patients with T2DM (squares), glucose was 13 ± 3 at day 1 and increased to 78 ± 10 mg/dl at day 5 (p = .012) and were stable thereafter. (B) In patients with T1DM (circles), mean lactate concentrations increased from 0.4 ± 0.1 mmol/liter at day 1 to 0.8 ± 0.1 mmol/liter at day 3 (p = .011). In T2DM (squares), mean lactate levels increased significantly over the first two days, from 0.4 ± 0.1 mmol/liter at day 1 to 1.0 ± 0.1 mM at day 2 (p = .012) . A gradual, but not significant, increase was observed in both groups over the remainder of the study (C) Microdialysate pyruvate levels in T1DM (circles) were 68 ± 18 µM at day 1 and 83 ± 8 µmol/liter at day 8 (not significant). In T2DM (squares), microdialysate pyruvate increased from 50 ± 12 µmol/liter at day 1 to 112 ± 14 µM at day 2 (p = .012) and were stable thereafter. (D) Microdialysate glycerol levels increased from 68 ± 8 µmol/liter at day 1 to 125 ± 12 µmol/liter at day 2 (p = .008) for T1DM (circles) and from 66 ± 11 µmol/liter at day 1 to 181 ± 27 µmol/liter at day 2 (p = .012) for T2DM and were stable thereafter. (E) Microdialysate urea levels increased from 1.5 ± 0.2 mmol/liter at day 1 to 5.4 ± 0.4 mmol/liter at day 5 (p = .008) in T1DM and from 1.9 ± 0.5 mmol/liter at day 1 to 7.0 ± 1.4 mmol/liter at day 5 (p = .012) in T2DM.

1068
Analyte Flux at a Biomaterial–Tissue Interface over Time: Implications for Sensors for Type 1 and 2 Diabetes Mellitus Ekberg
www.journalofdst.orgJ Diabetes Sci Technol Vol 4, Issue 5, September 2010
Histology of the Material–Tissue Interface in One Healthy SubjectInflammatory cells and capillaries were observed in close proximity to the microdialysis catheter after one week implantation (Figure 4A). The tissue at the surface of the microdialysis catheter was characterized by an epithelioid granulomatous reaction containing activated macrophages. Further from the catheter surface, fibroblasts and a variety of immune cells (eosinophils, histiocytes, and lymphocytes) were observed. Within a 1 to 150 µm distance of the microdialysis catheter surface, numerous large capillaries were observed. In contrast, no inflam-matory cells and fewer, smaller capillaries were observed in the sc adipose tissue taken at a distance from the microdialysis catheter (Figure 4B).
DiscussionWe have previously observed that the levels of glucose detected at a biomaterial–tissue interface in the subcutis of healthy volunteers increased during the first several days after implantation and then plateaued.17 It is known that persons with DM have impaired microvasculature and wound healing19–21 and increased levels of macrophages in their adipose tissue22,23 and that hyperglycemia impairs the proliferation and adhesion of fibroblasts, key players in wound healing.24,25 Therefore, it was hypothesized that the DM condition may have an impact on the local tissue reaction to long-term sc implantation of sensors or microdialysis catheters. The objective of this study was to investigate long-term changes in
Figure 3. Mean ± SEM for relative glucose recovery, calculated as (microdialysate glucose/capillary glucose) × 100, for a flow rate of 2 µl/min in patients with T1DM (circles) and T2DM (squares) over one week. The relative glucose recovery increased from 13 ± 2% to 49 ± 3% at day 5 in T1DM (p = .000) and from 10 ± 2% to 46 ± 3% in T2DM at day 5 (p = .000).
Figure 4. Histological images of human sc tissue. (A) Biopsy of amicrodialysis catheter that resided in healthy subcutis for one week. a, adipocytes; b, red blood cells; c, capillaries; e, eosinophils; g, epithelioid granulomatous reaction containing activated macrophages; f, fibroblasts; h, histiocytes (tissue macrophages); m, microdialysis membrane; l, lymphocytes. (B) Intact sc tissue in the same healthy subject: a, adipocytes; c, capillaries.
glucose and tissue metabolites at the sensor–tissue interface in patients with T1DM compared to T2DM.
Glucose at the Tissue–Material Interface Increases after InsertionThe sc microdialysate glucose compared to blood glucose increased over five days and did not change significantly thereafter in both patients with T1DM and patients with T2DM (Figure 3). This finding is in accordance with our previous study in healthy subjects.17 Almost 50% of the increase was observed during the first 24 hours after catheter insertion. Increased glucose detected in the microdialysate suggests that the glucose delivery

1069
Analyte Flux at a Biomaterial–Tissue Interface over Time: Implications for Sensors for Type 1 and 2 Diabetes Mellitus Ekberg
www.journalofdst.orgJ Diabetes Sci Technol Vol 4, Issue 5, September 2010
to the area around the catheter may have been initially depressed by the microtrauma of insertion and then increased over time, likely due to angiogenesis near the material–tissue interface. Previous studies in patients with T1DM who were treated with continuous sc insulin infusion pumps have shown faster absorption of injected insulin when the same infusion site has been in use continuously for several days.26,27 These results may indicate an increased blood flow, an increased capillary density, or changes in other factors that would increase transport around the infusion site. Other possible explanations for the increased glucose levels include increased catheter membrane permeability (though this is not likely since other analytes, e.g., pyruvate, did not increase during this time period) or decreased localized cellular uptake of glucose (also not likely, because the wound-healing environment may actually be hypermetabolic28).
Evaluating urea concentrations at the material–tissue inter- face can help elucidate glucose availability. Both glucose and urea are delivered to the tissue by the blood supply and are not produced in the sc tissue. Urea, unlike glucose, is not metabolized in sc tissue. In this study, urea increased similarly to glucose over the same period (Figure 2E), indicating enhanced capillary delivery. Increased angiogenesis in the wound-healing stage around implanted materials has been well characterized.29,30 It is also a possibility that localized inflammation after insertion may have led to enhanced diffusion (e.g., increased interstitial space or increased permeability of capillaries), thereby increasing delivery of glucose and urea from the blood.
Metabolite Fluctuations Linked to Changes at Material–Tissue InterfaceThe levels of lactate at the catheter–tissue interface increased in both T1DM and T2DM over time. One possible explanation for this increase in lactate is insufficient oxygen delivery, creating a hypoxic state, which would increase lactate production; however, the lactate/pyruvate ratio did not significantly change over time, indicating an adequate local oxygen supply.31,32
Another explanation for the increased microdialysate lactate may be enhanced glucose availability and metabolic conversion to lactate in the wound-healing environment (e.g., healing of the microtrauma caused by catheter insertion) and infiltration and activation of immune cells such as macrophages as part of the inflammatory and foreign body response. As part of the localized wound-healing and inflammatory response, macrophages have
heightened metabolic activity, and it has been shown that activated macrophages in wounded areas can produce extremely high levels of lactate.33,34 These findings have ramifications for implanted lactate sensors since localized lactate measurements over the first week after implantation may be more representative of localized inflammation and foreign body response than overall body chemistry.
It is known that tissue remodeling via inflammatory cell infiltration, extracellular matrix deposition, and angiogenesis occurs over a period of days to weeks, and so it is not unexpected that metabolites at a sensor–tissue interface may not be stable during this process of repair after sensor implantation. Previous studies have demonstrated a causal link between tissue environment and sensor performance.35 For example, Dungel et al.36 showed the impact of the foreign body capsule on degrading sensor performance over time. Cunningham and Stenken7 found improvement in signals from sensor near angiogenic growth inspired by vascular endothelial growth factor release. Koschwanez and colleagues37 showed other factors likely effect sensor performance such as micromotion, which influences the local inflammatory response.
Klueh et al.35 showed that mast cells play a critical role in influencing glucose sensor function over time. To shed more light on the localized tissue changes around the implanted microdialysis catheters, we preformed a histological analysis in one healthy subject. Indeed, we observed increased amount of inflammatory cells at one week and an increased number of capillaries in close proximity to the microdialysis membrane, suggesting increased angiogenesis and recruitment of inflammatory cells around the catheters. The immune response observed histologically in this study in healthy human tissue may have a different time course or magnitude compared to DM tissues due to the increased number of sc macrophages, slower wound healing, and microvascular angiopathy known to exist in diabetic states. Nevertheless, this first histological evaluation of human tissue adjacent to a functional glucose monitor helps reveal changes that have previously been characterized only in animals.
Differences in the Material–Tissue Interface in Patients with Diabetes Mellitus versus Healthy VolunteersTissue factors affecting analyte transport into implanted sensors can be categorized as follows: (1) physical factors that affect the rate of diffusion (e.g., capsule formation), (2) vascular factors that affect the supply and/or removal,

1070
Analyte Flux at a Biomaterial–Tissue Interface over Time: Implications for Sensors for Type 1 and 2 Diabetes Mellitus Ekberg
www.journalofdst.orgJ Diabetes Sci Technol Vol 4, Issue 5, September 2010
and (3) metabolic factors that affect cellular consumption or production. It is known that the DM disease state is associated with impaired microvasculature and wound healing,19–21 and hyperglycemia impairs the proliferation and adhesion of fibroblasts, key players in wound healing.24 Therefore, the foreign body response and availability of analytes at a tissue–sensor interface may differ in the DM and healthy state.
In this study, we found the metabolite trends detected by microdialysis in patients with DM were generally similar to the metabolite trends observed in healthy volunteers in a previous study;17 however, there were some differences. As expected, due to the tendency toward hyperglycemia in DM, we observed higher levels of capillary and microdialysate glucose in patients with DM compared to the healthy subjects previously studied.17 The microdialysate urea levels were also higher in patients with DM compared to the healthy volunteers. Urea is a byproduct of protein degradation, which is known to be inhibited by insulin. Therefore, the state of insulin deficiency or insulin resistance likely leads to higher levels of systemic urea, which are detected in the peripheral tissues by microdialysis.38,39 Pyruvate is the only metabolite that does not increase in patients with T1DM. The microdialysate pyruvate levels in patients with T1DM are similar to the levels in healthy subjects (p = .710, ANOVA repeated measure). The pyruvate level in healthy subjects studied previously was stable during the first seven days after catheter implantation, and the increase in pyruvate levels reported previously occurred on the last day of the study.17 Type 1 diabetes mellitus is a state of insulin deficiency, even when the patients are on multiple daily insulin injection regimes. A hypermetabolic state demands higher local insulin levels for glucose uptake in the cells. If the local insulin levels are not adequate, which may be the case in patients with T1DM, the glucose uptake into the cell cannot be increased and the pyruvate levels will not increase as well.
In patients with T2DM, but not T1DM, we observed higher levels of glycerol compared to healthy subjects previously studied.17 Glycerol is a byproduct of fat degra-dation (lipolysis). These results are most likely indicating insulin resistance in sc adipose tissue in T2DM, as insulin is known to be a potent antilipolytic hormone.40,41
Differences in the Material–Tissue Interface in Type 1 Diabetes Mellitus versus Type 2 Diabetes Mellitus The pyruvate levels in patients with T2DM were significantly higher compared to patients with T1DM.
Pyruvate is an intermediate of glucose breakdown (glycolysis). Pyruvate is transported into the mitochon-dria to enter the citric acid cycle for production of adenosine-5’-triphosphate (Figure 1). Therefore, we hypo-thesize that higher pyruvate levels observed in patients with T2DM may be explained by mitochondrial dysfunction known to be present patients with T2DM.42–45
The lactate levels were higher although not significantly in patients with T2DM compared to patients with T1DM. This may be explained by the higher levels of pyruvate in T2DM. Increased levels of macrophages in adipose tissue in patients with T2DM has been reported23,46 and is perhaps another reason for the directionally higher microdialysate lactate concentrations in T2DM subjects.
Interestingly, variability of metabolites in the T2DM group was clearly higher than in the T1DM group for all metabolites except glucose (Figure 2). Glucose in the T1DM group showed more person-to-person variability than in T2DM due to poorer control (e.g., higher observed variability in blood glucose measurements from person-to-person in the T1DM group). Therefore, we would expect other metabolites to fluctuate more in the T1DM group compared to T2DM (especially those metabolites that are byproducts of glycolysis), but in fact, we observed the opposite. The reason is not entirely clear for the high person-to-person variability in T2DM, but we hypothesize that there is a wide spectrum of insulin resistance and adipose macrophage density47–49 that gives rise to the relatively high person-to-person variability observed in microdialysis metabolites in T2DM.
Limitations and Future StudiesOne limitation of this study was the lack of systemic blood data for the various metabolites, except glucose. Future extensions of this work will plan for clinical chemistry measurements for all metabolites. Another limitation was the inherent biological variability. Some analytes were found to be significantly different between groups, but others appeared only directionally higher. Larger sample sizes would be desirable; nevertheless, some interesting conclusions could be drawn on the provided data. Finally, the biopsies for histology were only collected as supplemental data. A future study that would allow each biopsy to be assessed quantitatively (e.g., proximity of capillaries, capillary density, fibrous capsule thickness, and immune cell type) and to be related to the metabolite data from each specific catheter would help provide a better understanding of the relation of tissue structure/composition and sensor function. In addition, immunohistochemical analysis of cell type

1071
Analyte Flux at a Biomaterial–Tissue Interface over Time: Implications for Sensors for Type 1 and 2 Diabetes Mellitus Ekberg
www.journalofdst.orgJ Diabetes Sci Technol Vol 4, Issue 5, September 2010
and location (e.g., mast cells and macrophage typing) and analysis of microdialysate for inflammatory markers (e.g., mast cells marker trypas or chymases) would be desirable to increase our knowledge of the inflammation and cellular activity around the microdialysis catheter or a glucose sensor.
ConclusionThis article advances the understanding of the human foreign body response that contributes to the difficulty of long-term glucose monitoring. The flux of glucose to and through the material–tissue interface increased over the first few days, and changes were not significant thereafter. Almost 50% of the increase was observed during the first 24 hours after catheter insertion, indicating that glucose measurements taken directly after sensor insertion will be greatly affected by the localized trauma. Trends in glucose flux (increasing and then plateau) were similar over one week in T1DM and T2DM. This trend was similar to that previously measured in healthy subjects, indicating that the longevity of glucose sensors can be adequately studied in healthy volunteers over one week. Other metabolites differed between T1DM and T2DM, indicating physiological processes such as wound healing and metabolic activities at the sensor–tissue interface may be different in the two patient groups. Also, changes in other analytes over time indicated that the tissue at the tissue–sensor interface is not, in fact, stable over one week, as might be assumed from the plateau reached by glucose. This has ramifications for the interpretation of data from in vivo metabolite sensors other than glucose sensors. We propose explanations for the specific observed differences based on differential inflammatory responses, insulin resistance, and mito-chondrial dysfunction in T1DM versus T2DM.
Funding:
This study was supported by grants from the Swedish Diabetes Association, the Swedish Society for Medical Research, CMA/Microdialysis AB (Sweden), Roche Diagnostic (Germany), the Swedish Medical Research Council (VR 04224), and the S. Persson Family Foundation.
Acknowledgments:
We are grateful to Gloria Ursu for exceptional help with performing the histology preparations.
References:
1. Reichard P, Britz A, Carlsson P, Cars I, Lindblad L, Nilsson BY, Rosenqvist U. Metabolic control and complications over 3 years in patients with insulin dependent diabetes (IDDM): the Stockholm Diabetes Intervention Study (SDIS). J Intern Med. 1990;228(5):511–7.
2. Wang PH, Lau J, Chalmers TC. Meta-analysis of effects of intensive blood-glucose control on late complications of type I diabetes. Lancet. 1993;341(8856):1306–9.
3. UK Prospective Diabetes Study (UKPDS) Group. Intensive blood-glucose control with sulphonylureas or insulin compared with conventional treatment and risk of complications in patients with type 2 diabetes (UKPDS 33). Lancet. 1998;352(9131):837–53.
4. UK Prospective Diabetes Study (UKPDS) Group. Effect of intensive blood-glucose control with metformin on complications in overweight patients with type 2 diabetes (UKPDS 34). Lancet. 1998;352(9131):854–65.
5. Nathan DM, Cleary PA, Backlund JY, Genuth SM, Lachin JM, Orchard TJ, Raskin P, Zinman B, Diabetes Control and Complications Trial/Epidemiology of Diabetes Interventions and Complications (DCCT/EDIC) Study Research Group. Intensive diabetes treatment and cardiovascular disease in patients with type 1 diabetes. N Engl J Med. 2005;353(25):2643–53.
6. Klueh U, Liu Z, Ouyang T, Cho B, Feldman B, Henning TP, Kreutzer D. Blood-induced interference of glucose sensor function in vitro: implications for in vivo sensor function. J Diabetes Sci Technol. 2007;1(6):842–9.
7. Cunningham DD, Stenken JA. In vivo glucose sensing. Hoboken: Wiley; 2010.
8. Wisniewski N, Reichert M. Methods for reducing biosensor membrane biofouling. Colloids Surf B Biointerfaces. 2000;18(3-4):197–219.
9. Wisniewski N, Moussy F, Reichert WM. Characterization of implantable biosensor membrane biofouling. Fresenius J Anal Chem. 2000;366(6-7):611–21.
10. Ungerstedt U. Microdialysis--principles and applications for studies in animals and man. J Intern Med. 1991;230(4):365–73.
11. Mou X, Stenken JA. Microdialysis sampling extraction efficiency of 2-deoxyglucose: role of macrophages in vitro and in vivo. Anal Chem. 2006;78(22):7778–84.
12. Wisniewski N, Klitzman B, Miller B, Reichert WM. Decreased analyte transport through implanted membranes: differentiation of biofouling from tissue effects. J Biomed Mater Res. 2001;57(4):513–21.
13. Arvidsson E, Viguerie N, Andersson I, Verdich C, Langin D, Arner P. Effects of different hypocaloric diets on protein secretion from adipose tissue of obese women. Diabetes. 2004;53(8):1966–71.
14. Langin D. Adipose tissue lipolysis as a metabolic pathway to define pharmacological strategies against obesity and the metabolic syndrome. Pharmacol Res. 2006;53(6):482–91.
15. Lutgers HL, Hullegie LM, Hoogenberg K, Sluiter WJ, Dullaart RP, Wientjes KJ, Schoonen AJ. Microdialysis measurement of glucose in subcutaneous adipose tissue up to three weeks in type 1 diabetic patients. Neth J Med. 2000;57(1):7–12.
1072
Analyte Flux at a Biomaterial–Tissue Interface over Time: Implications for Sensors for Type 1 and 2 Diabetes Mellitus Ekberg
www.journalofdst.orgJ Diabetes Sci Technol Vol 4, Issue 5, September 2010
16. Wientjes KJ, Vonk P, Vonk-van Klei Y, Schoonen AJ, Kossen NW. Microdialysis of glucose in subcutaneous adipose tissue up to 3 weeks in healthy volunteers. Diabetes Care. 1998;21(9):1481–8.
17. Wisniewski N, Rajamand N, Adamsson U, Lins PE, Reichert WM, Klitzman B, Ungerstedt U. Analyte flux through chronically implanted subcutaneous polyamide membranes differs in humans and rats. Am J Physiol Endocrinol Metab. 2002;282(6):E1316–23.
18. Ekberg NR, Wisniewski N, Brismar K, Ungerstedt U. Measurement of glucose and metabolites in subcutaneous adipose tissue during hyperglycemia with microdialysis at various perfusion flow rates. Clin Chim Acta. 2005;359(1-2):53–64.
19. Huijberts MS, Schaper NC, Schalkwijk CG. Advanced glycation end products and diabetic foot disease. Diabetes Metab Res Rev. 2008;24 Suppl 1:S19–24.
20. Markuson M, Hanson D, Anderson J, Langemo D, Hunter S, Thompson P, Paulson R, Rustvang D. The relationship between hemoglobin A(1c) values and healing time for lower extremity ulcers in individuals with diabetes. Adv Skin Wound Care. 2009;22(8):365–72.
21. Marston WA, Dermagraft Diabetic Foot Ulcer Study Group. Risk factors associated with healing chronic diabetic foot ulcers: the importance of hyperglycemia. Ostomy Wound Manage. 2006;52(3):26–8.
22. Ortega Martinez de Victoria E, Xu X, Koska J, Francisco AM, Scalise M, Ferrante AW Jr, Krakoff J. Macrophage content in subcutaneous adipose tissue: associations with adiposity, age, inflammatory markers, and whole-body insulin action in healthy Pima Indians. Diabetes. 2009;58(2):385–93.
23. Weisberg SP, McCann D, Desai M, Rosenbaum M, Leibel RL, Ferrante AW Jr. Obesity is associated with macrophage accumulation in adipose tissue. J Clin Invest. 2003;112(12):1796–808.
24. Hehenberger K, Heilborn JD, Brismar K, Hansson A. Inhibited proliferation of fibroblasts derived from chronic diabetic wounds and normal dermal fibroblasts treated with high glucose is associated with increased formation of l-lactate. Wound Repair Regen. 1998;6(2):135–41.
25. Hehenberger K, Hansson A, Heilborn JD, Abdel-Halim SM, Ostensson CG, Brismar K. Impaired proliferation and increased L-lactate production of dermal fibroblasts in the GK-rat, a spontaneous model of non-insulin dependent diabetes mellitus. Wound Repair Regen. 1999;7(1):65–71.
26. Liu D, Moberg E, Wredling R, Lins PE, Adamson U. Insulin absorption is faster when keeping the infusion site in use for three days during continuous subcutaneous insulin infusion. Diabetes Res Clin Pract. 1991;12(1):19–24.
27. Swan KL, Dziura JD, Steil GM, Voskanyan GR, Sikes KA, Steffen AT, Martin ML, Tamborlane WV, Weinzimer SA. Effect of age of infusion site and type of rapid-acting analog on pharmacodynamic parameters of insulin boluses in youth with type 1 diabetes receiving insulin pump therapy. Diabetes Care. 2009 Feb;32(2):240–4.
28. Kim PK, Deutschman CS. Inflammatory responses and mediators. Surg Clin North Am. 2000;80(3):885–94.
29. Brauker JH, Carr-Brendel VE, Martinson LA, Crudele J, Johnston WD, Johnson RC. Neovascularization of synthetic membranes directed by membrane microarchitecture. J Biomed Mater Res. 1995;29(12):1517–24.
30. Sharkawy AA, Klitzman B, Truskey GA, Reichert WM. Engineering the tissue which encapsulates subcutaneous implants. I. Diffusion properties. J Biomed Mater Res. 1997;37(3):401–12.
31. Contaldo C, Plock J, Djonov V, Leunig M, Banic A, Erni D. The influence of trauma and ischemia on carbohydrate metabolites monitored in hamster flap tissue. Anesth Analg. 2005;100(3):817–22.
32. Edsander-Nord A, Röjdmark J, Wickman M. Metabolism in pedicled and free TRAM flaps: a comparison using the microdialysis technique. Plast Reconstr Surg. 2002;109(2):664–73.
33. Caldwell MD, Shearer J, Morris A, Mastrofrancesco B, Henry W, Albina JE. Evidence for aerobic glycolysis in lambda-carrageenan-wounded skeletal muscle. J Surg Res. 1984;37(1):63–8.
34. Forster J, Morris AS, Shearer JD, Mastrofrancesco B, Inman KC, Lawler RG, Bowen W, Caldwell MD. Glucose uptake and flux through phosphofructokinase in wounded rat skeletal muscle. Am J Physiol. 1989;256(6 Pt 1):E788–97.
35. Klueh U, Kaur M, Qiao Y, Kreutzer DL. Critical role of tissue mast cells in controlling long-term glucose sensor function in vivo. Biomaterials. 2010;31(16):4540–51.
36. Dungel P, Long N, Yu B, Moussy Y, Moussy F. Study of the effects of tissue reactions on the function of implanted glucose sensors. J Biomed Mater Res A. 2008;85(3):699–706.
37. Koschwanez HE, Reichert WM, Klitzman B. Intravital microscopy evaluation of angiogenesis and its effects on glucose sensor performance. J Biomed Mater Res A. 2010;93(4):1348–57.
38. Guillet C, Delcourt I, Rance M, Giraudet C, Walrand S, Bedu M, Duche P, Boirie Y. Changes in basal and insulin and amino acid response of whole body and skeletal muscle proteins in obese men. J Clin Endocrinol Metab. 2009;94(8):3044–50.
39. Luzi L, Castellino P, DeFronzo RA. Insulin and hyperamino-acidemia regulate by a different mechanism leucine turnover and oxidation in obesity. Am J Physiol. 1996;270(2 Pt 1):E273–81.
40. Kahn SE, Hull RL, Utzschneider KM. Mechanisms linking obesity to insulin resistance and type 2 diabetes. Nature. 2006;444(7121):840–6.
41. Large V, Arner P. Regulation of lipolysis in humans. Pathophysiological modulation in obesity, diabetes, and hyperlipidaemia. Diabetes Metab. 1998;24(5):409–18.
42. Lowell BB, Shulman GI. Mitochondrial dysfunction and type 2 diabetes. Science. 2005;307(5708):384–7.
43. MacDonald MJ, Longacre MJ, Langberg EC, Tibell A, Kendrick MA, Fukao T, Ostenson CG. Decreased levels of metabolic enzymes in pancreatic islets of patients with type 2 diabetes. Diabetologia. 2009;52(6):1087–91.
44. Rabøl R, Boushel R, Dela F. Mitochondrial oxidative function and type 2 diabetes. Appl Physiol Nutr Metab. 2006;31(6):675–83.
45. Schummer CM, Werner U, Tennagels N, Schmoll D, Haschke G, Juretschke HP, Patel MS, Gerl M, Kramer W, Herling AW. Dysregulated pyruvate dehydrogenase complex in Zucker diabetic fatty rats. Am J Physiol Endocrinol Metab. 2008;294(1):E88–96.
46. Fain JN. Release of interleukins and other inflammatory cytokines by human adipose tissue is enhanced in obesity and primarily due to the nonfat cells. Vitam Horm. 2006;74:443–77.
47. Morino K, Petersen KF, Shulman GI. Molecular mechanisms of insulin resistance in humans and their potential links with mitochondrial dysfunction. Diabetes. 2006;55 Suppl 2:S9–15.
48. Pickup JC. Inflammation and activated innate immunity in the pathogenesis of type 2 diabetes. Diabetes Care. 2004;27(3):813–23.
49. Pickup JC, Crook MA. Is type II diabetes mellitus a disease of the innate immune system? Diabetologia. 1998;41(10):1241–8.