analysis of wrinkling in deep drawing processes
TRANSCRIPT

ANALYSIS OF WRINKLING IN DEEP DRAWING PROCESSES
A THESIS SUBMITTED TOTHE GRADUATE SCHOOL OF NATURAL AND APPLIED SCIENCES
OFMIDDLE EAST TECHNICAL UNIVERSITY
BY
SANIYE RABIA DAL
IN PARTIAL FULFILLMENT OF THE REQUIREMENTSFOR
THE DEGREE OF MASTER OF SCIENCEIN
MECHANICAL ENGINEERING
SEPTEMBER 2019


Approval of the thesis:
ANALYSIS OF WRINKLING IN DEEP DRAWING PROCESSES
submitted by SANIYE RABIA DAL in partial fulfillment of the requirements for thedegree of Master of Science in Mechanical Engineering Department, MiddleEast Technical University by,
Prof. Dr. Halil KalıpçılarDean, Graduate School of Natural and Applied Sciences
Prof. Dr. M. A. Sahir ArıkanHead of Department, Mechanical Engineering
Prof. Dr. Haluk DarendelilerSupervisor, Mechanical Engineering, METU
Examining Committee Members:
Prof. Dr. Suha OralMechanical Engineering, METU
Prof. Dr. Haluk DarendelilerMechanical Engineering, METU
Prof. Dr. F. Suat KadıogluMechanical Engineering, METU
Prof. Dr. Can ÇogunMechatronics Engineering, Çankaya University
Assist. Prof. Dr. Orkun ÖzsahinMechanical Engineering, METU
Date:

I hereby declare that all information in this document has been obtained andpresented in accordance with academic rules and ethical conduct. I also declarethat, as required by these rules and conduct, I have fully cited and referenced allmaterial and results that are not original to this work.
Name, Surname: Saniye Rabia Dal
Signature :
iv

ABSTRACT
ANALYSIS OF WRINKLING IN DEEP DRAWING PROCESSES
Dal, Saniye Rabia
M.S., Department of Mechanical Engineering
Supervisor: Prof. Dr. Haluk Darendeliler
September 2019, 88 pages
Wrinkling, observed due to compressive instability, is one of the main failure modes
in deep drawing processes. The prediction and prevention of wrinkles are critical for
production of stamping parts which require good surface quality. In the current work,
the occurrence of wrinkling in square and cylindrical cup deep drawing processes are
investigated considering various constitutive models; formed by using CPB06ex2,
Hill’48, BBC2008-8p, BBC2008-16p, and von Mises yield criterion with isotropic,
kinematic and combined hardening. Numerical simulations were performed by
implementing CPB06ex2, BBC2008-8p and BBC2008-16p models to a commercial
finite element code through user subroutines. In the simulations, AA5042-H2
aluminum alloy with 1 mm thickness were employed. First a comparison is made
between the predictions of the constitutive models and the experimental results of the
previous works to evaluate the accuracy of the developed models. It was found that
the predictions of all constitutive models for the number of wrinkles are in good
agreement with experimental data. The CPB06ex2 model gives closer numerical
results with experiments for the wrinkling profile and the punch force evolution
comparing to the other models. Moreover, square cup drawing process needs higher
v

blank holding forces to prevent wrinkling than cylindrical cup drawing at the same
punch travel.
Keywords: Wrinkling, Sheet Metal Forming, Deep drawing, Finite Element Method
vi

ÖZ
DERIN ÇEKME ISLEMLERINDE KIRISMA ANALIZI
Dal, Saniye Rabia
Yüksek Lisans, Makina Mühendisligi Bölümü
Tez Yöneticisi: Prof. Dr. Haluk Darendeliler
Eylül 2019 , 88 sayfa
Sıkıstırma kararsızlıgının neden oldugu kırısma, sac metal sekillendirme islemlerinde
yaygın olarak görülen hatalardan biridir. Iyi yüzey kalitesinin gerektigi parçaların
derin çekme islemi ile üretiminde kırısmanın öngörülmesi ve önlenmesi önemlidir.
Bu çalısmada, kare ve silindirik derin çekme islemlerinde görülen burusma von Mises,
CPB06ex2, BBC2008-8p, BBC2008-16p, Hill’48 akma kriterleri ve izotropik,
kinematik ve birlesik peklesme modelleri kullanılarak elde edilen bünye denklemleri
ile incelenmistir. Sayısal analizler, BBC2008-8p, BBC2008-16p ve CPB06ex2
modelleri bir ticari sonlu elemanlar yazılımına kullanıcı malzeme altprogramı
eklenerek gerçeklestirilmistir. Analizlerde sac metal olarak 1 mm kalınlıgındaki
AA5042-H2 alüminyum alasımı kullanılmıstır. Ayrıca, gelistirilen modellerin
dogruluklarını degerlendirebilmek için literatürden elde edilen deneysel sonuçlar ile
karsılastırılmıstır. Analizler sonucunda modellerce belirlenen kırısıklık sayılarının
deneysel sonuçlarla uyumlu oldugu gözlenmistir. CPB06ex2 modeli, kırısıklık profili
ve zımba kuvveti tespitinde diger modellere göre deneylere daha yakın sonuçlar
vermistir. Ek olarak, kare plakalarının kullanıldıgı derin çekme islemlerinde, silindirik
kap derin çekme islemlerine kıyasla kırısıklıgı önlemek için daha fazla baskı plakası
vii

kuvvetinin gerektigi görülmüstür.
Anahtar Kelimeler: Burusma, Sac Metal Sekillendirme, Derin Çekme, Sonlu
Elemanlar Metodu
viii

To my lovely family
ix

ACKNOWLEDGMENTS
First of all, I would like to present my special thanks to my supervisor Prof. Dr.
Haluk DARENDELILER for his generous advices throughout my thesis and sparing
time whenever I approached him. It was an honor to work with him.
Also, I am.profoundly grateful to my colleagues in.ROKETSAN for their valuable
support.
Most importantly, I wish to thank my loving and supportive husband Fırat DAL for
his endless patience, understanding and faith. Every time I need some motivation
and help, he is always there for me. My thesis would have not finished without his
encouragement.
Finally, I am profoundly grateful to the biggest source of my strength, my family. I
can not thank them enough for everything they have ever done for me. It means the
world to me.
x

TABLE OF CONTENTS
ABSTRACT . . . . . . . . . . . . . . . . . . . . . . . . . . . . . . . . . . . . v
ÖZ . . . . . . . . . . . . . . . . . . . . . . . . . . . . . . . . . . . . . . . . . vii
ACKNOWLEDGMENTS . . . . . . . . . . . . . . . . . . . . . . . . . . . . . x
TABLE OF CONTENTS . . . . . . . . . . . . . . . . . . . . . . . . . . . . . xi
LIST OF TABLES . . . . . . . . . . . . . . . . . . . . . . . . . . . . . . . . xiv
LIST OF FIGURES . . . . . . . . . . . . . . . . . . . . . . . . . . . . . . . . xv
CHAPTERS
1 INTRODUCTION . . . . . . . . . . . . . . . . . . . . . . . . . . . . . . . 1
1.1 Background . . . . . . . . . . . . . . . . . . . . . . . . . . . . . . . 1
1.2 Motivation . . . . . . . . . . . . . . . . . . . . . . . . . . . . . . . 2
1.3 Objective and Scope of the Thesis . . . . . . . . . . . . . . . . . . . 3
1.4 Outline of the Thesis . . . . . . . . . . . . . . . . . . . . . . . . . . 3
2 LITERATURE SURVEY . . . . . . . . . . . . . . . . . . . . . . . . . . . 5
2.1 Studies about Analytical and Numerical Approach to the Predictionof Wrinkling . . . . . . . . . . . . . . . . . . . . . . . . . . . . . . 5
2.2 Studies about Implementations of Yield Criteria into Finite ElementSoftware . . . . . . . . . . . . . . . . . . . . . . . . . . . . . . . . 10
2.3 Studies about the Effect of Various Parameters on Simulation of CupDrawing Operations . . . . . . . . . . . . . . . . . . . . . . . . . . 13
xi

3 CONSTITUTIVE RELATIONS . . . . . . . . . . . . . . . . . . . . . . . . 15
3.1 Hardening Models . . . . . . . . . . . . . . . . . . . . . . . . . . . 15
3.1.1 Isotropic Hardening . . . . . . . . . . . . . . . . . . . . . . . 15
3.1.2 Kinematic Hardening . . . . . . . . . . . . . . . . . . . . . . 16
3.1.3 Combined Isotropic and Kinematic Hardening . . . . . . . . . 18
3.2 Yield Criteria . . . . . . . . . . . . . . . . . . . . . . . . . . . . . . 19
3.2.1 Von Mises Yield Criterion . . . . . . . . . . . . . . . . . . . . 19
3.2.1.1 Von Mises Yield Criterion with Isotropic Hardening . . 20
3.2.1.2 Von Mises Yield Criterion with Kinematic Hardening . 20
3.2.1.3 Von Mises Yield Criterion with Combined Hardening . 21
3.2.2 Hill’s 48 Yield Criterion with Isotropic Hardening . . . . . . . 21
3.2.3 CPB06ex2 Yield Criterion with Isotropic Hardening . . . . . . 24
3.2.4 BBC2008 Yield Criterion with Isotropic Hardening . . . . . . 28
4 FINITE ELEMENT ANALYSIS . . . . . . . . . . . . . . . . . . . . . . . 33
4.1 Explicit Dynamic Analysis . . . . . . . . . . . . . . . . . . . . . . 34
4.2 Radial Return Algorithm . . . . . . . . . . . . . . . . . . . . . . . . 35
4.3 The Finite Element Model . . . . . . . . . . . . . . . . . . . . . . . 36
4.3.1 Model for Verification . . . . . . . . . . . . . . . . . . . . . . 37
4.3.2 Model for Side-Wall Wrinkling Analysis . . . . . . . . . . . . 38
4.3.3 Model for Flange Wrinkling Analysis in Cylindrical Cup Drawing. . . . . . . . . . . . . . . . . . . . . . . . . . . . . . . . . . 40
4.3.4 Model for Flange Wrinkling Analysis in Square Cup Drawing 41
5 RESULTS AND DISCUSSION . . . . . . . . . . . . . . . . . . . . . . . 43
xii

5.1 Verification of the FE Model . . . . . . . . . . . . . . . . . . . . . . 45
5.2 Side-Wall Wrinkling Analysis . . . . . . . . . . . . . . . . . . . . . 46
5.3 Flange Wrinkling Analysis in Cylindrical Cup Drawing . . . . . . . 62
5.4 Flange Wrinkling Analysis in Square Cup Drawing . . . . . . . . . . 71
6 CONCLUSIONS AND FUTURE WORKS . . . . . . . . . . . . . . . . . . 81
6.1 Conclusions . . . . . . . . . . . . . . . . . . . . . . . . . . . . . . . 81
6.2 Future Works . . . . . . . . . . . . . . . . . . . . . . . . . . . . . . 83
REFERENCES . . . . . . . . . . . . . . . . . . . . . . . . . . . . . . . . . . 85
xiii

LIST OF TABLES
TABLES
Table 4.1 Dimensions of the tools used for verification . . . . . . . . . . . . 37
Table 4.2 Dimensions of the tools used in the Benchmark 4 of the Numisheet
2014 conference . . . . . . . . . . . . . . . . . . . . . . . . . . . . . . . 38
Table 4.3 Dimensions of the tools used in the cylindrical cup drawing . . . . 40
Table 4.4 Dimensions of the drawing tool for the deep drawing process using
square plate . . . . . . . . . . . . . . . . . . . . . . . . . . . . . . . . . 42
Table 5.1 Mechanical properties of AA5042-H2 . . . . . . . . . . . . . . . . 43
Table 5.2 Anisotropy coefficients of CPB06ex2 with increasing plastic work
level . . . . . . . . . . . . . . . . . . . . . . . . . . . . . . . . . . . . . 44
Table 5.3 Material parameters of BBC2008-8p for AA5042-H2 . . . . . . . . 45
Table 5.4 Material parameters of BBC2008-16p for AA5042-H2 . . . . . . . 45
xiv

LIST OF FIGURES
FIGURES
Figure 3.1 Isotropic Hardening . . . . . . . . . . . . . . . . . . . . . . . . 15
Figure 3.2 Kinematic Hardening . . . . . . . . . . . . . . . . . . . . . . . 17
Figure 3.3 Combined Isotropic and Kinematic Hardening . . . . . . . . . . 18
Figure 4.1 Schematic views of the tools and blank used for verification . . . 37
Figure 4.2 The FE model used for verification . . . . . . . . . . . . . . . . 38
Figure 4.3 Schematic views of the tools and blank used in the Benchmark
4 of the Numisheet 2014 conference . . . . . . . . . . . . . . . . . . . 39
Figure 4.4 Coordinate system of the tools used in the Benchmark 4 of the
Numisheet 2014 conference . . . . . . . . . . . . . . . . . . . . . . . . 39
Figure 4.5 The FE model used in the Benchmark 4 of the Numisheet 2014
conference . . . . . . . . . . . . . . . . . . . . . . . . . . . . . . . . . 40
Figure 4.6 Schematic views of the tools and blank used in the cylindrical
cup drawing . . . . . . . . . . . . . . . . . . . . . . . . . . . . . . . . 41
Figure 4.7 The FE model of the cylindirical.cup drawing . . . . . . . . . . 41
Figure 4.8 Schematic views of the tools and blank used in the square cup
drawing . . . . . . . . . . . . . . . . . . . . . . . . . . . . . . . . . . 42
Figure 4.9 The FE model of the square cup.drawing process . . . . . . . . . 42
Figure 5.1 Earing profiles of completely drawn cup . . . . . . . . . . . . . 46
xv

Figure 5.2 Punch load variation at different punch displacement during the
drawing process . . . . . . . . . . . . . . . . . . . . . . . . . . . . . . 47
Figure 5.3 Wrinkling profile in the plane z = −3.5mm obtained from the
von Mises with isotropic hardening model . . . . . . . . . . . . . . . . 48
Figure 5.4 (a) The completely drawn cup using the von Mises with isotropic
hardening model (b) The drawn cup in the plane z = −3.5mm using
the von Mises with isotropic hardening model . . . . . . . . . . . . . . 48
Figure 5.5 Wrinkling profile in the plane z = −3.5mm obtained from the
von Mises with kinematic hardening model . . . . . . . . . . . . . . . 49
Figure 5.6 (a) The completely drawn cup using the von Mises with kinematic
hardening model (b) The drawn cup in the plane z = −3.5mm using
the von Mises with kinematic hardening model . . . . . . . . . . . . . 49
Figure 5.7 Wrinkling profile in the plane z = −3.5mm obtained from the
von Mises with combined hardening model . . . . . . . . . . . . . . . 50
Figure 5.8 (a) The completely drawn cup using the von Mises with combined
hardening model (b) The drawn cup in the plane z = −3.5mm using
the von Mises with combined hardening model . . . . . . . . . . . . . 50
Figure 5.9 Wrinkling profile in the plane z = −3.5mm obtained from the
Hill’48 model . . . . . . . . . . . . . . . . . . . . . . . . . . . . . . . 51
Figure 5.10 (a) The completely drawn cup using the Hill’48 model (b) The
drawn cup in the plane z = −3.5mm using the Hill’48 model . . . . . . 51
Figure 5.11 Wrinkling profile in the plane z = −3.5mm obtained from the
CPB06ex2 model . . . . . . . . . . . . . . . . . . . . . . . . . . . . . 52
Figure 5.12 (a) The completely drawn cup using the CPB06ex2 model (b)
The drawn cup in the plane z = −3.5mm using the CPB06ex2 model . 52
Figure 5.13 Wrinkling profile in the plane z = −3.5mm obtained from the
BBC2008-8p model . . . . . . . . . . . . . . . . . . . . . . . . . . . . 53
xvi

Figure 5.14 (a) The completely drawn cup using the BBC2008-8p model (b)
The drawn cup in the plane z = −3.5mm using the BBC2008-8p model 53
Figure 5.15 Wrinkling profile in the plane z = −3.5mm obtained from the
BBC2008-16p model . . . . . . . . . . . . . . . . . . . . . . . . . . . 54
Figure 5.16 (a) The completely drawn cup using the BBC2008-16p model
(b) The drawn cup in the plane z = −3.5mm using the BBC2008-16p
model . . . . . . . . . . . . . . . . . . . . . . . . . . . . . . . . . . . 54
Figure 5.17 Wrinkling profile in the plane z = −5.5mm obtained from the
von Mises with isotropic hardening model . . . . . . . . . . . . . . . . 55
Figure 5.18 The drawn cup in the plane z = −5.5mm using the von Mises
with isotropic hardening model . . . . . . . . . . . . . . . . . . . . . . 55
Figure 5.19 Wrinkling profile in the plane z = −5.5mm obtained from the
von Mises with kinematic hardening model . . . . . . . . . . . . . . . 56
Figure 5.20 The drawn cup in the plane z = −5.5mm using the von Mises
with kinematic hardening model . . . . . . . . . . . . . . . . . . . . . 56
Figure 5.21 Wrinkling profiled in the plane z = −5.5mm obtained from the
von Mises with combined hardening model . . . . . . . . . . . . . . . 57
Figure 5.22 The drawn cup in the plane z = −5.5mm using the von Mises
with combined hardening model . . . . . . . . . . . . . . . . . . . . . 57
Figure 5.23 Wrinkling profile in the plane z = −5.5mm obtained from the
Hill’48 model . . . . . . . . . . . . . . . . . . . . . . . . . . . . . . . 58
Figure 5.24 The drawn cup in the plane z = −5.5mm using the Hill’48 model 58
Figure 5.25 Wrinkling profile in the plane z = −5.5mm obtained from the
CPB06ex2 model . . . . . . . . . . . . . . . . . . . . . . . . . . . . . 59
Figure 5.26 The drawn cup in the plane z = −5.5mm using the CPB06ex2
model . . . . . . . . . . . . . . . . . . . . . . . . . . . . . . . . . . . 59
xvii

Figure 5.27 Wrinkling profile in the plane z = −5.5mm obtained from the
BBC2008-8p model . . . . . . . . . . . . . . . . . . . . . . . . . . . . 60
Figure 5.28 The drawn cup in the plane z = −5.5mm using the BBC2008-
8p model . . . . . . . . . . . . . . . . . . . . . . . . . . . . . . . . . 60
Figure 5.29 Wrinkling profile in the plane z = −5.5mm obtained from the
BBC2008-16p model . . . . . . . . . . . . . . . . . . . . . . . . . . . 61
Figure 5.30 The drawn cup in the plane z = −5.5mm using the BBC2008-
16p model . . . . . . . . . . . . . . . . . . . . . . . . . . . . . . . . . 61
Figure 5.31 Evolution of wrinkle heights with different blank holding force
at 15 mm punch travel in cylindrical cup drawing . . . . . . . . . . . . 62
Figure 5.32 Evolution of wrinkle heights with different blank holding force
at 20 mm punch travel in cylindrical cup drawing . . . . . . . . . . . . 63
Figure 5.33 Evolution of wrinkle heights with different blank holding force
at 25 mm punch travel in cylindrical cup drawing . . . . . . . . . . . . 63
Figure 5.34 Maximum cup forming height variation at several blank holding
force in cylindrical cup forming . . . . . . . . . . . . . . . . . . . . . 64
Figure 5.35 Wrinkling profile with 0.7 kN blank holding force at 15 mm
punch travel using the von Mises yield criteria with the isotropic, kinematic
and combined hardening models in cylindrical cup drawing . . . . . . . 64
Figure 5.36 In cylindrical cup drawing, the drawn cup with 0.7 kN blank
holding force at 15 mm punch travel using the von Mises yield criteria
with (a) the isotropic hardening model (b) the kinematic hardening
model (c) the combined hardening model . . . . . . . . . . . . . . . . 65
Figure 5.37 Wrinkling profile with 1.0 kN blank holding force at 15 mm
punch travel using the BBC2008-8p, BBC2008-16p models in cylindrical
cup drawing . . . . . . . . . . . . . . . . . . . . . . . . . . . . . . . . 66
xviii

Figure 5.38 In cylindrical cup drawing, the drawn cup with 1.0 kN blank
holding force at 15 mm punch travel using (a) the BBC2008-8p model
(b) the BBC2008-16p model . . . . . . . . . . . . . . . . . . . . . . . 66
Figure 5.39 Wrinkling profile with 1.0 kN blank holding force at 15 mm
punch travel using the Hill’48 model in cylindrical cup drawing . . . . . 67
Figure 5.40 In cylindrical cup drawing, the drawn cup with 1.0 kN blank
holding force at 15 mm punch travel using the Hill’48 model . . . . . . 67
Figure 5.41 Wrinkling profile with 3.4 kN blank holding force at 25 mm
punch travel using the CPB06ex2 model in cylindrical cup drawing . . . 68
Figure 5.42 In cylindrical cup drawing, the drawn cup with 3.4 kN blank
holding force at 25 mm punch travel using the CPB06ex2 model . . . . 68
Figure 5.43 Wrinkling profile with 0.7 kN blank holding force at 15 mm
punch travel . . . . . . . . . . . . . . . . . . . . . . . . . . . . . . . . 69
Figure 5.44 Wrinkling profile with 0.7 kN blank holding force at 15 mm
punch travel by using the von Mises with isotropic, kinematic and combined
hardening models . . . . . . . . . . . . . . . . . . . . . . . . . . . . . 70
Figure 5.45 Wrinkling profile with 0.7 kN blank holding force at 15 mm
punch travel by using the Hill’48 and CPB06ex2 models . . . . . . . . 70
Figure 5.46 Wrinkling profile with 0.7 kN blank holding force at 15 mm
punch travel by using the BBC2008-8p and BBC2008-16p models . . . 71
Figure 5.47 Evolution of wrinkle heights with different blank holding force
at 10 mm punch travel in square cup drawing . . . . . . . . . . . . . . 72
Figure 5.48 Evolution of wrinkle heights with different blank holding force
at 15 mm punch travel in square cup drawing . . . . . . . . . . . . . . 72
Figure 5.49 Evolution of wrinkle heights with different blank holding force
at 20 mm punch travel in square cup drawing . . . . . . . . . . . . . . 73
xix

Figure 5.50 Maximum cup forming height variation at several blank holding
force in square cup drawing . . . . . . . . . . . . . . . . . . . . . . . . 73
Figure 5.51 Wrinkling profile with 2.4 kN blank holding force at 20 mm
punch travel using the von Mises yield criteria with the isotropic, kinematic
and combined hardening models in square cup drawing . . . . . . . . . 74
Figure 5.52 Wrinkling profile with 2.4 kN blank holding force at 15 mm
punch travel using the Hill’48, BBC2008-8p and BBC2008-16p models
in square cup drawing . . . . . . . . . . . . . . . . . . . . . . . . . . . 74
Figure 5.53 In square cup drawing, the drawn cup with 2.4 kN blank holding
force at 20 mm punch travel using the von Mises yield criteria with (a)
the isotropic hardening model (b) the kinematic hardening model (c)
the combined hardening model . . . . . . . . . . . . . . . . . . . . . . 75
Figure 5.54 In square cup drawing, the drawn cup with 2.4 kN blank holding
force at 15 mm punch travel using (a) the Hill’48 model (b) the BBC2008-
8p model (c) the BBC2008-16p model . . . . . . . . . . . . . . . . . . 76
Figure 5.55 Wrinkling profile with 2.8 kN blank holding force at 10 mm
punch travel using the CPB06ex2 model in square cup drawing . . . . . 77
Figure 5.56 In square cup drawing, the drawn cup with 2.8 kN blank holding
force at 10 mm punch travel using the CPB06ex2 model . . . . . . . . 77
Figure 5.57 Wrinkling profile with 2.4 kN blank holding force at 20 mm
punch travel . . . . . . . . . . . . . . . . . . . . . . . . . . . . . . . . 78
Figure 5.58 Wrinkling profile with 0.7 kN blank holding force at 15 mm
punch travel by using the von Mises with isotropic, kinematic and combined
hardening models . . . . . . . . . . . . . . . . . . . . . . . . . . . . . 78
Figure 5.59 Wrinkling profile with 0.7 kN blank holding force at 15 mm
punch travel by using the Hill’48 and CPB06ex2 models . . . . . . . . 79
Figure 5.60 Wrinkling profile with 0.7 kN blank holding force at 15 mm
punch travel by using the BBC2008-8p and BBC2008-16p models . . . 79
xx

CHAPTER 1
INTRODUCTION
1.1 Background
A material undergoes plastic deformation when the tensile, compressive, torsional or
bending stresses occured due to applied loads exceed its yield strength and that causes
the material to change its shape permanently. In metal forming processes, materials
are plastically deformed intentionally by tools in order to obtain the desired shape.
In sheet metal forming process, a piece of sheet metal is deformed with a small change
of thickness [1]. In recent years, sheet metal forming becomes a widely used process
in the industry because of increasing demand for sheet metals with complex shapes
and different properties. Deep drawing, which is one of the sheet metal forming
processes, is applied especially in automotive, aerospace, marine industries and even
in the production of cooking utensil and beverage cans. In the deep drawing process,
the sheet metal is held by the blank holder and then the punch pushes the sheet metal
plate into the die cavity to achieve the desired shape. During deep drawing process,
sheet metal may fail when it is subjected to stretching, shearing or compression.
Necking, excessive thinning, earing and tearing are some examples of failures.
Wrinkling is one of the ways to fail due to compressive instability in deep drawing
operations. It is a kind of buckling which is developed due to compressive hoop
stresses. It depends on several factors such as values of friction coefficient between
tools and blank, blank holding force, tool geometry, mechanical properties of blank,
blank thickness, lubrication etc.
Blank holding force can be used in order to eliminate excessive material draw-in
1

and apply restraining force to the blank. If the blank holding force is higher than
necessary, tears may occur on the sheet plate. However, if it is less than required,
wrinkling may be formed. For successful deep drawing process, adequate blank
holding force should be determined. In addition, wrinkling tendency decreases with
increasing sheet thickness, increasing strain hardening and decreasing flange length
[2].
1.2 Motivation
In recent years, usage of high strength sheet metals with low thickness is excessively
in industry and that increases the occurrence of wrinkling. Therefore, wrinkling
becomes more prevalent than other failure modes. In stamping of automotive parts,
eighty percent of the part failure is caused by wrinkling whereas twenty percent of the
part failure is caused by excessive tearing. In spite of this ratio, tensile instabilities
have been investigated more in the last two decades [3] .
Wrinkling is not desired in stamping parts because of its aesthetic and functional
reasons. The part assembly and part operations, like sealing and welding can be
severely affected due to wrinkling. Large wrinkles can damage dies and causes blank
material to be out of usage [4]. Therefore, it is important to predict and prevent
wrinkling in sheet metal forming processes.
Deep.drawing is one.of the expensive.sheet metal forming processes due to high
die costs. Therefore, preventing wrinkling will not only increase the quality and
efficiency of the process, but also reduce the cost in the current competitive industry.
For this purpose, numerical solution of the deep drawing process is a requirement.
Finite element analysis is a cheap procedure that can be used to simulate the process,
understanding of the factors that affect the formation and development of wrinkles
and finally, designing optimal tools and process parameters. For finite element
analysis, various constitutive models were proposed to predict behaviour of material
under plastic deformation. Selection of suitable constitutive models is crucial for
simulation and forecast of wrinkling at early stage. Consequently, researches on
prediction and prevention of wrinkling occurrence and correspondingly, selection of
2

a proper constitutive model for wrinkling simulations should be carried out.
1.3 Objective and Scope of the Thesis
The main objective of this study is to demonstrate the capabilities of various
constitutive models in simulation of wrinkling for different cup drawing processes.
The amplitude of wrinkles at several blank holding forces for changing punch
displacements are presented by employing these constitutive models.
This thesis describes numerical results concerning the wrinkle formation in cylindrical
and square cup drawing processes. The effects of seven constitutive models namely;
Hill’48, CPB06ex2, BBC2008-8p and BBC2008-16p yield criteria with isotropic
hardening and von Mises yield criteria with kinematic, isotropic and combined
hardening on simulation of wrinkling are found. AA5042-H2 aluminum alloy is
selected as a sheet material with 1 mm thickness. Numerical simulations are done
with a commercial finite element code. CPB06ex2, BBC2008-8p, BBC2008-16p
yield criteria are implemented to the code by means of a developed user subroutine.
Other constitutive models are used directly from the program’s library. For the
verification of codes, the predictions of the constitutive models for the wrinkling
profile and punch load are compared with experimental data reported by Neto et al.
[5].
1.4 Outline of the Thesis
This current work is divided.into six chapters and references. Chapter 1 will provide
a brief background, motivation and scope of the thesis.
In Chapter 2, a brief history of the past researches is explained. In the first part,
previous researches about analytical and numerical approaches that were made to
improve prediction of wrinkling are summarized. In the second part, previous studies
about implementations of yield functions into a finite element software and
verification of numerical results are included. Eventually, in the third part, studies
about the effect of various parameters on failure modes of deep drawing simulation
3

are described.
In Chapter 3, theoretical formulations of yield criteria and hardening models used in
this work are given.
In Chapter 4, details of the finite element method used in this study are described.
In Chapter 5, numerical results of the finite element analyses of the square and
cylindrical cup deep drawing operations at various punch displacements by using
different constitutive models and the comparison of the related models with
experimental results of Numisheet 2014 benchmark 4 are given. The verification
of the CPB06ex2 code is also presented.
Finally, in Chapter 6, conclusions of this thesis and suggestions for future work are
discussed.
4

CHAPTER 2
LITERATURE SURVEY
This chapter is split into three sections. The first section presents studies in literature
about analytical and numerical approaches to the prediction of wrinkling. Second
section contains past studies about implementations of several yield functions into a
finite element software. In the last section, past studies and papers about the effect of
various parameters on simulation of cup drawing operations are explained.
2.1 Studies about Analytical and Numerical Approach to the Prediction of
Wrinkling
There are many analytical.and numerical.methods to predict the occurrence of
wrinkling in literature. Firstly, previous researches about energy method are
summarized.
Wang et al. [4] introduced a modified energy approach so as to forecast the
side-wall wrinkling in deep drawing processes. In this approach, firsly, the external
work done by membrane forces and the bending energy is equated so that the critical
buckling stress is calculated in.terms of the in-plane stress ratio, thickness of sheet,
geometry parameters, material properties. Secondly, the actual applied compressive
stress is obtained from the FEM simulations. When the actual applied stress is higher
than the calculated buckling stress, wrinkling can be observed. Also, the applied
stress found from the FEM simulations was not compressive in all region. Therefore,
the effective dimensions of the compressive area was introduced to decide the critical
buckling state. Additionally, the comparison was made between experimental results
of the conical cup forming, square cup forming and Yoshida.buckling test and the
5

analysis results in order to validate the proposed energy approach. It was observed
that the predictions of the modified energy method fit the experimental investigations
well. According to the Yoshida buckling test, it was stated that higher material
strength component and lower hardening exponent provide higher wrinkling limit.
Moreover, according to the conical cup forming, the critical buckling stress for the
curved sheet is related with the local curvature of the wrinkling region. Also, FEM
simulations with different integration methods and element types were investigated
in this study. According to the results, while no wrinkling were observed in the
implicit method with four node shell elements (ABAQUS S4R), wrinkling appeared
at very early stage in the explicit method with four node shell elements by using
LS-DYNA. The disadvantage of the explicit model was very sensitive to simulation
input parameters such as the element size, the punch velocity, etc. On the contrary,
this sensitivity was not observed where the proposed energy method was implemented
to the implicit FEM analysis. As a result, the modified energy approach provides
reliable results for the prediction of the side-wall wrinkling.
Agrawal et al. [6] studied on axisymmetric deep drawing process. The minimum
blank holding load needed to avoid the development of wrinkling in the flange area
was determined in this study. To find the critical condition for the onset of wrinkling,
the energy method was used. In this method, radial and circumferential stresses can
be written in terms of blank holding force and then the expression of the work done
by in-plane membrane forces can be obtained. The predictions of the model for the
minimum blank holding force were in good agreement with experimental results. It
was found that as normal anisotropy value decreases, the thickening of the flange area
increases; therefore, the energy needed to bend the blank increases. Additionally, if
initial thickness of the sheet metal increases, the number of developed wrinkles will
decrease and the required minimum blank holding load will increase.
Kaftanoglu [7] studied flange wrinkling observed in axisymmetrical deep drawing
by using the energy method. According to the study, there are two modes in the
flange area, wrinkling and drawing. During the process, deformation of materials
is in favour of which mode that requires least energy. In other words, if the energy
requires for drawing is less than that for wrinkling, wrinkling would not occur. It
was also indicated that as the number of wrinkles increases, the wrinkling energy
6

becomes higher. In addition to that, the required blank holding force for successful
drawing were calculated theoretically. For verification, experiments were carried out
by selecting mild steel, stainless steel, half-hard and hard aluminum as a material
of round blanks in different sizes. The blank holding forces calculated theoretically
were applied to the blanks and no wrinkling was observed in the experiments. So, the
theoretical results agreed well with the empirical results in this study.
Shafaat et al. [8] studied about side-wall wrinkling of a galvanized steel sheet during
the conical cup deep drawing processes by utilizing energy method. In this study, a
new deflection function was proposed and compared with Wong and Cao’s deflection
function [4] in order to observe its performance. The effect of material anisotropy
on the onset of wrinkling was obtained using Hosford and Hill’s 48 yield criteria.
According to the numerical results, effective stress based on the Hosford yield
criterion was greater than that of Hill’48 yield criterion for all anisotropy
conditions. Also it was investigated that enhancement of effective stress decreases
the instantaneous moduli, critical wrinkling stress and consequently the critical cup
height. These lead to contraction of yield locus. As a result, wrinkling occurs at
smaller punch displacement in the deep drawing analysis by using Hosford yield
criteria. Additionally, it was observed that the critical strain energy of wrinkling
is affected by the deflection function . The strain energy based on the new deflection
function was lower than that related to the Cao’s deflection function. Since the
required strain energy for wrinkling was provided at smaller punch displacement, the
predicted results related to the new deflection function were better agreement with the
experimental results. Moreover, when the application of anisotropy condition
compared with the experimental investigations, numerical results shows similar
behavior.
In Senior’s study [9], the number of wrinkle was found by using energy method.
In energy method, there are 3 energy terms. Those are the energy formed due to
bendingcinto a half wave segment.of the flange (EB), the energy formed due to the
shortening of the flange circumferentially (EH) and finally the energy formed due to
the loading of the flange laterally (EL). By adding (EB) and (EL) and then equating
to (EH), the number of flange wrinkle was found in this study. Also, the effect of the
blank holding force on the number of wrinkle was researched.
7

Another method is general bifurcation theory in order to find out the onset of
wrinkling.
Correia et al. [10] have worked on the onset of wrinkling in anisotropic metal sheets
by using analytical approach and finite element simulations with ABAQUS/ Explicit.
For analytical approach, wrinkling analyses were carried out using bifurcation theory
for thin and shallow shells under bi-axial plane stress loading. Also, Ferron’s yield
criterion [11] was employed for both analytical and numerical approach. In this study,
two different deep drawing simulations were examined. One of them was the conical
cup deep drawing and the other is the deep drawing through a tractrix die. In the
numerical simulation of conical cup deep drawing, 12 wrinkles were predicted while
in analytical approach, the number of wrinkles was 10. Both of these results were
found close to 11 wrinkles observed experimentally. In the deep drawing through a
tractrix die, it was observed that when the blank diameter increases, the percentage
of draw deformation decreases. Moreover,in analytical approach, it was reported
that when the principal stress axes, the geometric axes of principal curvature and the
principal orthotropic axes all coincide, the direction of the wrinkling is along one of
the principal stress axes.
Chu and Xu [3] were examined the flange wrinkling observed in deep drawing process
by using the general bifurcation theory for critical condition causing wrinkling. In
order to calculate the critical drawing stress, the deformation theory of plasticity
reported by Trientofyllidis and Needleman [12] was employed. The forecasts of the
deformation.theory.for the onset of.wrinkling were compared with the forecasts of
the smooth yield.surface flow theory of plasticity, the experimental values provided
by Senior’s study and the Senior’s one dimensional theory [9]. According to the
results, for the case of the drawing ratio bigger than or equal to 1.6, the predictions
of both the deformation and flow theory in state of the critical drawing stress were
the same. However, for the case of the drawing ratio smaller than 1.6, the predicted
critical drawing stress in terms of the flow theory was larger than that calculated
by the deformation theory. Also,the average hoop stresses related with both the
deformation theory and flow theory were larger than the stresses predicted by Senior’s
one dimensional theory. According to the comparison of the wrinkle number between
the deformation theory and Senior’s theory, the deformation theory predicted more
8

wrinkle and correlated well with the experimental data. The main reason of this
differences between the Senior’s one dimensional theory and deformation theory
is replacing the Young’s modulus with the reduced modulus in the elastic stability
equation is not enough to involve plasticity in buckling problems. Moreover, the
effects of material anisotropy, drawing ratios and strain hardening on the onset of
wrinkling were examined. The critical drawing stress increases with increasing
drawing ratio, plastic anisotropy and work hardening index. Also it was investigated
that plastic anisotropy has very little effect on the predictions of the wrinkle wave
number.
In addition, in literature, there are different approaches from the energy method and
bifurcation theory. Below are some examples that illustrate other methods.
The wrinkling phenomenon was analyzed by a simplified method in Weili et al. work
[13]. This method was proposed so that complicated plastic bifurcation theory, an
initial imperfection of the sheet and a wrinkling criterion may not be needed for
wrinkling simulation.In the simplified method, direct node projection in the contact
algorithm and blank holding gap in the blank holder treatment were taken into
consideration. There are three different methods used in contact algorithms; these are
the Lagrange multiplier method, the penalty function method and finally the direct
node projection method. The direct node projection method was selected since it was
simple and reliable. In their study,the deep drawing of a square cup, a hemispherical
cup, a cylindrical cup and a real auto-body panel was simulated by applying the
simplified method. The agreement between the analytical results and the empirical
results were found to be satisfactory.
Nordlund et al. [14] proposed an algorithmic procedure to predict the onset and
distribution of wrinkles at early stage of a sheet metal forming analysis. This
procedure can be applied for all loading conditions and it is independent of the
material model employed.In this procedure, the wrinkle indicator was introduced to
compute the closeness to wrinkling. The value of indicator, based on the second order
incremental work, is in the interval [-1,1]. In the study, it was implemented into an
explicit finite element code, Dyna3d, and two different tests were done to show its
performance. These tests were the Yoshida buckling test and the fluid forming test.
9

In both tests, it was observed that wrinkles were developed in regions where the value
of wrinkle indicator was negative. And during deformation, the negative wrinkle
indicator firstly seen in the outer boundary of area where wrinkling starts. It was also
stated that the most negative values were detected at the inflexion points.
2.2 Studies about Implementations of Yield Criteria into Finite Element
Software
This part includes past studies about implementations of different yield functions
to deep drawing simulations via a.finite.element software and confirmation of the
numerical results of related yield functions.
In Nowak et al. study [15], a newly-developed yield function which is continuation
of Burzynski isotropic yield function [16], was implemented to ABAQUS/Explicit
with a VUMAT subroutine. The square cup deep drawing process was studied. The
proposed yield function is for the transversally isotropic materials under the state of
plane stress. It was shown that the yield function gave reasonable results. However,
comparing with the von Mises yield criteria, the yield function should be developed.
In Yoon et al. study [17], CPB06ex2 yield function was implemented to
ABAQUS/Standard for materials with no tension/compression asymmetry. In order
to validate the analysis results, for AA6111-T4 alloy, the finite element results and the
experimental earing profile in Numisheet 2002 were compared. Moreover,
AA5042-H2 alloy was employed in order to compare CPB06ex2 and Yld2000-2D
yield function with experimental results. According to experimental results, the eight
ears was observed at the final stage of the deep drawing process. CPB06ex2 can
predict 8 ears and Yld2000-2D can predict only 4 ears. The reason of that is the
CPB06ex2 yield function includes more anisotropy coefficients. Second purpose of
the study is to investigate the effect of the evolution of anisotropy. In both yield
criterion, anisotropy coefficients are not fixed. For CPB06ex2 yield criterion, the
anisotropy coefficients corresponds to different level of plastic work were determined
by using a UMAT subroutine. For Yld2000-2D yield criterion, the flow stresses in 0°,
45°and 90°, the biaxial flow stress, r values were found in experiment for different
10

value of plastic work and that values were used as an input data. In conclusion, the
evolution of anisotropy does not affect the prediction of number of ears but it affects
the prediction of cup height distribution.
Another study was done by Jia and Bai [18] on ductile fracture prediction by using
anisotropic eMMC model. The MMC fracture model which is on the basis of the
stress invariant was imported into the eMMC model which is on the basis of strain
under the plane stress state. The Yld2000-2D yield criterion was assigned to the
TRIP780 high strength steel and the CPB06ex2 yield criterion was assigned to the
AZ31B-H24 magnesium alloy. For different loads, the finite element analyses were
done in ABAQUS/Explicit via VUMAT subroutine and good agreement between
experimental and analysis results was observed.
M. Vrh et al. [19] studied the ability of prediction of the BBC2008 plane stress
yield criterion. For the purpose of validation of the constitutive model, AA5042-H2
and AA2090-T3 aluminum alloys were selected. The constitutive equations were
integrated by using the NICE scheme in ABAQUS/Explicit via VUMAT subroutine.
There are two alternative in BBC2008 yield function. One of them is the BBC2008
yield function with 8 anisotropic coefficient, the other is the yield function with 16
anisotropic coefficient. In order to compare the predictions of normalized
uni-axial yield stress ratios and the planar distribution of r-coefficient for AA2090
aluminum alloy, experiment results, CPB06ex2 yield criterion, Yld2000-2d yield
criterion, Yld2004-18p, BBC2008-16p and BBC2008-8p yield criterion have been
utilized. The results show that the r-coefficient predictions of the BBC2008-16p is the
closest to the experimental results comparing to other yield criteria. For predicting
the planar.distribution of the the uni-axial.yield stress ratios, BBC2008-16p predicts
better than the BBC2008-8p, as expected. BBC2008-16p version, CPB06ex2 and
Yld2004-18p yield.criterion predict the planar distribution of the uni-axial yield stress
ratios similarly. According to the experiment, the material should yield 6 ears and
only the BBC2008-16p can predict the correct number of ears. For the AA5042-H2
aluminum alloy, the comparison of the planar distribution of the r-coefficient and uni-
axial yield stress ratios between the BBC2008-16p, the BBC2008-8p, the CPB06ex2
yield criterion and experimental results have been made. Again, the predictions of
r-coefficients for BBC2008-16p yield criteria is better than the BBC2008-8p and the
11

CPB06ex2. For stress ratios, BBC2008-16p and CPB06ex2 have similar predictions.
For the prediction of the number of ears,the BBC2008-16p can predict 8 ears however
the BBC2008-8p can predict just 4 ears. Moreover, to prove the flexibility of the
BBC2008 yield function, a highly anisotropic fictitious model was employed. This
model can yield 12 ears according to the theory. In the paper, it is stated that the
BBC2008-16p yield criterion is capable of predicting 12 ears in the cup deep drawing
simulation.
Yoon et al. [20] implemented the Yld2004-18p yield criterion into a finite element
code to show its performance about defining the anisotropic behaviour of materials.
The cup drawing tests were simulated for.an AA2090-T3 aluminum sheet sample by
using LS-DYNA3D. In numerical simulations, a multi-stage.return mapping
procedure was used for stress increments. Also, experiments were conducted for
verification. It was found that the experimental and simulated cup heights were in
excellent agreements. Moreover, the Yld96 model results was added for comparison
purpose. As stated in the study, the finite element code with.Yld2004-18p was able
to.predict six ears while the Yld96 model [21] predicted only four ears. Additionally,
an analytical approach was derived to calculate cup heights of materials. In this
analytical approach, it is possible that using the r- values measured every 15°, initial
blank geometry and cup geometry, the first.approximation of the earing.profile can be
determined.
Moreira et al. [22] were performed a study on experimental and numerical results
of the cylindrical cup deep drawing test. Ferron’s anisotropic yield criterion [11]
and Hill’s quadratic yield criterion [23] were used for numerical simulations. The
anisotropic yield criterion of Ferron was implemented into the ABAQUS/Explicit
code by employing the radial return algorithm via a VUMAT subroutine. The
coefficients of Ferron’s function were determined according to the both experimental
σ(α) and R(α) values. Then, predicted radial strain distributions and earing profiles
of an IF steel and an tinplate steel were.compared with.experimental data. It was
found that the earing profile for the IF steel related to Ferron’s.model adjusted.to σ(α)
was in improved agreement with experimental data than the earing profiles obtained
from the other models.In addition, for the tinplate steel, both Ferron’s model adjusted
to R(α) and Hill’s criterion predicted the radial strain values closer to experimental
12

values at 45°. However, at 0°and 90°, Hill’s model underestimated the radial strains.
According to the study, the reason of that was the differences in.the shape of the
yield.surfaces of Hill’s and.Ferron’s model. In conclusion, Ferron’s yield criterion
predicts strain distributions and earing profiles of materials more
accurately comparing with Hill’s yield criterion.
Tang et al. [24] were studied on the cylindrical cup drawing of AA2090-T3 aluminium
alloy by considering Hill’48, Yld2000-2d and Drucker yield criteria with
non-associated flow rule in order to predict earing profile. For stress integration,
three different integration scheme were used, namely tangent cutting plane explicit
method (TCPE), semi explicit method (SEMIE) and simple explicit method (SIMPE).
These integration algorithms with yield functions were compared to evaluate their
computation stability and computation times. Moreover, the predictions of related
yield functions for earing profile were compared with results of experiment. It was
found that while Drucker under non-associated flow rule got fast results compared
with Hill’48 and Yld2000-2d, the most accurate results were calculated using non-
associated plastic model for Yld2000-2d with tangent cutting plane explicit and
semi-explicit algorithms.
2.3 Studies about the Effect of Various Parameters on Simulation of Cup
Drawing Operations
In this part, past studies about the effect of different parameters on cup drawing
simulations are involved. During design of tooling and optimization of process
parameters, the information in this part is crucial.
Foudeh et al. [25] studied.the effect of different parameters on.wrinkling during
square cup deep drawing.process. These parameters are die and punch radii, the
friction coefficient between the sheet metal and the die surfaces, blank holder gap,
force of the blank holder and material of the sheet..In this study, 3 different aluminum
alloys were selected for deep drawing process such as A6111-T4, AA5754-O and
Al-1050. For simulations, ABAQUS/ Explicit was preferred.In accordance with the
results, A6111-T4 is more inclined to wrinkle than other aluminum alloys. On the
13

other hand, the least blank holding force is required to prevent wrinkling for Al-1050
alloy. Also, it was observed from the experimental test, the blank holding force is
needed to avoid wrinkling but too much force may lead to tearing. The increase in
the friction.coefficient value provides reduction in wrinkling; nevertheless,excessive
increase in the friction.coefficient may cause rupture in.the sheet metal. In addition,
the blank holder gap should be between 1 to 1.3 and the die radius should be between
5 to 7 times the blank thickness to avoid wrinkling. As well, too small punch radius
may cause an increase in the stress in the sheet metal and excessively large punch
radius may cause the insufficient contact surface between the sheet and punch. So it
should be between 5 to 9 times the sheet thickness.
The effects of tool design parameters on the distribution of the thickness in sheet metal
in deep drawing process in Zein et al. work [26]. ABAQUS /Explicit was selected as
a finite element program. In order to validate the results, the comparison of thickness
values with Colgan and Monaghan’s [27] numerical and experimental analysis was
done. For analysis, material property of steel was used. The experimental results
imply that the blank holding force should be less than three tons and the punch radius
should be more.than three.times the thickness of the blank in order.to avoid increased
thinning.Also, for the die shoulder radius, the recommended value is eight times the
thickness of the sheet. In addition, both Zein and Nowak’s work, the punch, die and
blank.holder were meshed with R3D4 elements while for the meshing of sheet metal,
S4R element type was used.
14

CHAPTER 3
CONSTITUTIVE RELATIONS
3.1 Hardening Models
3.1.1 Isotropic Hardening
The yield surface in case of the isotropic hardening model enlarges uniformly without
any movement in space. Figure 3.1 represents the change of yield surface with
isotropic hardening [28].
Figure 3.1: Isotropic Hardening
The yield function for the isotropic hardening can be written as [28],
f(σ, εp) = σe(σ)− σY (εp) = 0 (3.1)
where σY is the current uni-axial yield strength that depends on effective plastic strain,
εp. From the consistency condition,
f(σ + dσ, εp + dεp) = 0 (3.2)
15

f(σ + dσ, εp + dεp) = f(σ, εp) +∂f
∂σ: dσ +
∂f
∂εpdεp = 0 (3.3)
where the inner product is denoted by ":". Combining Equation (3.2) and Equation
(3.3) gives,
∂f
∂σ: dσ +
∂f
∂εpdεp = 0 (3.4)
From the normality rule,
∂f
∂σ: dσ +
∂f
∂εpdλ
(2
3
∂f
∂σ:∂f
∂σ
)1/2
= 0 (3.5)
Rearranging Equation (3.5), the plastic multiplier can be found from the following
equation ;
dλ =−(∂f/∂σ) : dσ
(∂f/∂εp)[(2/3)
[(∂f/∂σ) : (∂f/∂σ)
]]1/2(3.6)
3.1.2 Kinematic Hardening
Kinematic hardening is inspired with the Bauschinger effect which is the decrease in
the yield stress when a material is loaded in opposite direction after plastic
deformation. In kinematic hardening, the shape and size of the yield surface do not
change, but translates in the stress space. The yield surface.can be expressed as
F = f(σ −α)−K = 0 (3.7)
where K represents a material constant that depends on the size.of the yield surface
and α is often called as back stress. Figure 3.2 represents the change of yield surface
with kinematic hardening [28].
16

Figure 3.2: Kinematic Hardening
According to the linear kinematic model of Ziegler, the back stress can be written as
dα = (σ −α) dµ (3.8)
where dµ is a scalar constant. In order to find the plastic multiplier, dλ, df can be set
equal to zero due to the consistency condition.
∂f
∂σ: dσ +
∂f
∂α: (σ −α)dµ = 0 (3.9)
then∂f
∂σ: dσ =
∂f
∂σ: (σ −α)dµ = 0 (3.10)
and dµ can be written as
dµ =(∂f/∂σ) : dσ
(∂f/∂σ) : (σ −α)(3.11)
The back stress is
dα =(σ −α)[(∂f/∂σ) : dσ]
(∂f/∂σ) : (σ −α)(3.12)
The plastic multiplier, dλ, can be found the normality condition.
(n : dσ)n = Kp dεp (3.13)
where Kp is the plastic modulus and n is the unit normal at the surface.Then∂f∂σ
: dσ(∂f∂σ
: ∂f∂σ
) 12
∂f∂σ(
∂f∂σ
: ∂f∂σ
) 12
= Kp dεp (3.14)
17

dεp =dσ
Kp[∂f∂σ
: ∂f∂σ
] :
[∂f
∂σ⊗ ∂f
∂σ
](3.15)
where the tensor product is denoted by ⊗. From the normality condition, the plastic
multiplier is
dλ =1
Kp
∂f∂σ
: dσ∂f∂σ
: ∂f∂σ
(3.16)
3.1.3 Combined Isotropic and Kinematic Hardening
In combined hardening, the material hardens both isotropically and kinematically but
the dominant hardening is kinematic hardening. Figure 3.3 represents the change of
yield surface with combined hardening [28].
Figure 3.3: Combined Isotropic and Kinematic Hardening
18

In numerical analyses, the Chaboche-Zeigler combined model was used. According
to the model, the back stress rate is
dα = C1
σ(σ −α)− γαdεp (3.17)
where
σ = σY +Q(1− e−bεp) (3.18)
In Equation (3.17),C and γ are material constants related with the nonlinear kinematic
hardening part. In Equation (3.18), b and Q are material parameters related with the
isotropic part and σY is the initial yield stress.
The equivalent plastic strain can be calculated as
dεp =dfdσ
: C : dε
Qbe−bεp
+ C − γ dfdσ
: C : dα+ dfdσ
: C : dfdσ
(3.19)
where C is a fourth order tensor.
3.2 Yield Criteria
3.2.1 Von Mises Yield Criterion
For von Mises yield criterion, materials yield when the state of stresses provide the
below condition
f = σ − σY =
√3
2σ
′: σ
′ − σY (3.20)
in which the deviatoric stress tensor is denoted as σ′ . The yield function can be
written in terms of principal stress such as
f =1√2
[(σ1 − σ2)2 + (σ2 − σ3)2 + (σ3 − σ1)2
]1/2
− σY (3.21)
For plane stress condition,
f =1√2
[(σ1 − σ2)2 + σ2
1 + σ22
]1/2
− σY (3.22)
19

3.2.1.1 Von Mises Yield Criterion with Isotropic Hardening
For a material that yields according to isotropic hardening,
∂f
∂σ: dσ − ∂σY
∂εpdεp = 0 (3.23)
And from Equation (3.20)
∂f
∂σ=
3
2
σ′
σ(3.24)
This gives
3
2
σ′
σ: dσ − ∂σY
∂εpdεp = 0 (3.25)
Then,
dεp =32(σ′/σ) : dσ
(∂σY /∂εp)
(3.26)
From the general flow rule,
dεp = dλ∂f
∂σ(3.27)
and
dεp =
√2
3dεp : dεp (3.28)
Thus,
dεp =
√√√√2
3
(dλ∂f
∂σ
):
(dλ∂f
∂σ
)= dλ
√3
2
σ′
σ:σ′
σ= dλ
√32σ′ : σ′
σ2 = dλ (3.29)
So the plastic multiplier can be written as
dλ =32(σ′/σ) : dσ
(∂σY /∂εp)
(3.30)
3.2.1.2 Von Mises Yield Criterion with Kinematic Hardening
The yield function using kinematic hardening according to von Mises criterion is
f =[3
2(σ′ −α) : (σ′ −α)
]1/2
− σY (3.31)
20

The normal of the yield surface is of the form
∂f
∂σ=
3
2
σ′ −ασ
(3.32)
Then the plastic strain rate can be calculated as
dεp = dλ
(3
2
σ′ −ασ
)(3.33)
The equivalent plastic strain rate can be determined by using Equation (3.28). The
back stress rate can be written as
dα =2
3Hdεp (3.34)
where H represents the slope of the yield stress-plastic strain curve.
3.2.1.3 Von Mises Yield Criterion with Combined Hardening
In combined hardening, the yield function includes the back stress as in kinematic
hardening.
f =[3
2(σ′ −α) : (σ′ −α)
]1/2
− σY (3.35)
C and γ can be calculated by using the stress-strain curve acquired from the first
half cyle of a uniaxial tension or compression test data [29]. The back stress can be
calculated for each data point as
αi = σi − (σY )i (3.36)
where (σY )i represents the size of the yield surface. Also, the back stress evolution
law for a half cycle is
α =C
γ(1− e−γεp) (3.37)
Combining Equation (3.36) and (3.37), C and γ can be found.
3.2.2 Hill’s 48 Yield Criterion with Isotropic Hardening
Hill proposed a yield criterion for orthotropic materials [23] that can be defined as
2f(σij) = H(σxx − σyy)2 + F (σyy − σzz)2 +G(σzz − σxx)2 + 2Lσ2yz+
2Mσ2zx + 2Nσ2
xy − 1(3.38)
21

where F , G, H , L, M and N are defined as anisotropy material constants. In this
criterion, Bauschinger effect and the effect of hydrostatic pressure on yielding are
not taken into consideration. Also, the principal axes of anisotropy are selected as
Cartesian reference axes. Assuming X , Y and Z are described as the tensile yield
stresses in the principal anisotropic directions,
1
X2= G+H (3.39)
1
Y 2= H + F (3.40)
1
Z2= F +G (3.41)
Then, the anisotropy constants are expressed as
F =1
2
(1
Z2+
1
Y 2− 1
X2
)(3.42)
G =1
2
(1
Z2+
1
X2− 1
Y 2
)(3.43)
H =1
2
(1
Y 2+
1
X2− 1
Z2
)(3.44)
By denoting the shear yield stresses in yz, xz, xy planes by R, S and T , respectively,
L, M , N can be calculated as
2L =1
R2, 2M =
1
S2, 2N =
1
T 2(3.45)
22

When the associated flow rule is employed, the plastic strain increments become
dεpxx = dγ[H(σxx − σyy) +G(σxx − σzz)
]
dεpyy = dγ[F (σyy − σzz) +H(σyy − σxx)
]
dεpzz = dγ[G(σzz − σxx) + F (σzz − σyy)
]
dεpxy = dγNσxy
dεpyz = dγLσyz
dεpxz = dγMσxz
(3.46)
The equivalent stress can be calculated from
σ =
√√√√√√√√√√√3
2
F (σyy − σzz)2 +H(σxx − σyy)2+ G(σzz − σxx)2 + 2Lσ2
yz
+2Mσ2zx + 2Nσ2
xy
F +G+H
(3.47)
For the plane stress case, the yield function gives
2f(σij) = (G+H)σ2xx − 2Hσxxσyy + (H + F )σ2
yy + 2Nσ2xy − 1 = 0 (3.48)
The yield function can be rearranged in terms of Lankford parameters.
σ2xx −
2r0
1 + r0
σxxσyy +r0(1 + r90)
r90(1 + r0)σ2yy +
r0 + r90
r90(r0 + 1)(1 + 2r45)σ2
xy = (σY )2 (3.49)
where
r0 =dεpyydεpzz
=H
G
r90 =dεpxxdεpzz
=H
F
r45 =2N − (F +G)
2(F +G)
(3.50)
23
In above equation, σY represents the yield stress in x direction.
3.2.3 CPB06ex2 Yield Criterion with Isotropic Hardening
Cazacu et al. [30] proposed an isotropic yield function in order to take into account
of tension/ compression asymmetry, as shown below
Φ(σ′1, σ′2, σ
′3, k, a) = (| σ′1 − kσ′1 |)a + (| σ′2 − kσ′2 |)a + (| σ′3 − kσ′3 |)a (3.51)
where σ′i, i=1...3 are the principal values of the deviatoric stress tensor σ′ while a
describes the degree of the homogeneity and k is the parameter of strength differential
that can be expressed as
k =1−
(2a−2(σT /σC)a
2(σT /σC)a−2
) 1a
1 +(
2a−2(σT /σC)a
2(σT /σC)a−2
) 1a
(3.52)
where σT and σC is the uni-axial yield in tension and compression, respectively.
Cazacu et al. [30] applied a fourth-order tensor C on the deviatoric stress tensor
σ′ to import anisotropic characteristic to the isotropic yield function. Hence, the
CPB06 yield function can be written in the form:
F = Φ(Σ1,Σ2,Σ3, k, a) = (| Σ1 | −kΣ1)a + (| Σ2 | −kΣ2)a + (| Σ3 | −kΣ3)a
(3.53)
with
Σ = C : σ′
Then, Plunkett et al. [31] have demonstrated that if additional linear transformations
are integrated into the CPB06 yield function, better representation of anisotropy can
be observed. The following anisotropic yield function, called CPB06ex2, is defined
as
F (Σ,Σ′, k, k′, a) =(| Σ1 | −kΣ1)a + (| Σ2 | −kΣ2)a + (| Σ3 | −kΣ3)a+
(| Σ′1 | −kΣ′1)a + (| Σ′2 | −kΣ′2)a + (| Σ′3 | −kΣ′3)a(3.54)
For materials has same tension and compression yield strenght, the effective stress of
the CPB06ex2 orthotropic yield function is of the form [17]
σ = (| Σ1 |a+ | Σ2 |a+ | Σ3 |a+ | Σ′1 |a+ | Σ′2 |
a+ | Σ′3 |
a)1a (3.55)
24

where (Σ1,Σ2,Σ3) and (Σ′1,Σ
′2,Σ
′3) are the principal values of Σ and Σ
′ , respectively.
The transformed tensors are
Σ = C : σ′ (3.56)
Σ′ = C′ : σ′ (3.57)
where the fourth-order tensors C and C′ are symmetric and orthotropic material
parameters. For a three-dimensional state of stress, they can be represented by
C =
C11 C12 C13 0 0 0
C12 C22 C23 0 0 0
C13 C23 C33 0 0 0
0 0 0 C44 0 0
0 0 0 0 C55 0
0 0 0 0 0 C66
(3.58)
C′ =
C ′11 C ′12 C ′13 0 0 0
C ′12 C ′22 C ′23 0 0 0
C ′13 C ′23 C ′33 0 0 0
0 0 0 C ′44 0 0
0 0 0 0 C ′55 0
0 0 0 0 0 C ′66
(3.59)
The parametersCij andC ′ij with i, j = 1...3 and the shear coefficientsC66 andC ′66 are
associated with in-plane anisotropic properties while C44, C ′44, C55, C ′55 are related
with out-of-plane properties of the sheet. C11 and C ′11 can be set as equal to one,
without any loss in generality.
For plane stress, the components of the transformed tensor Σ are:
Σxx = Φ1 σxx + Ψ1 σyy, Σyy = Φ2 σxx + Ψ2 σyy
Σzz = Φ3 σxx + Ψ3 σyy, Σxy = C66 σxy(3.60)
25

where
Φ1 = 13(2C11 − C13 − C12), Ψ1 = 1
3(2C12 − C11 − C13)
Φ2 = 13(2C12 − C22 − C23), Ψ2 = 1
3(2C22 − C12 − C23)
Φ3 = 13(2C13 − C33 − C23), Ψ3 = 1
3(2 C23 − C13 − C33)
(3.61)
In a similar way, the components of the Σ′ can be defined by using Φ′1,Φ′2,Φ
′3 and
Ψ′1,Ψ′2,Ψ
′3 in terms of the coefficients C ′ij . For the both transformed tensors, the
principal values are
Σ1 = 12
(Σxx + Σyy +
√(Σxx − Σyy)2 + 4 Σ2
xy
)
Σ′1 = 1
2
(Σ′xx + Σ
′yy +
√(Σ′xx − Σ′yy)
2 + 4 Σ′2xy
)
Σ2 = 12
(Σxx + Σyy −
√(Σxx − Σyy)2 + 4 Σ2
xy
)
Σ′2 = 1
2
(Σ′xx + Σ
′yy −
√(Σ′xx − Σ′yy)
2 + 4 Σ′2xy
)
Σ3 = Σzz and Σ′3 = Σ
′zz
(3.62)
The anisotropy coefficients Cij and C ′ij with i, j = 1...3 and C66, C ′66 can be found
on the basis of the experimental normalized flow stress values, Lankford parameters,
experimental bi-axial tension and experimental rb. The yield stress in a direction at
angle θ with the rolling direction x is determined by
σθ = σ0Y
{| Φ1 |a+ | Φ2 |a+ | Φ3 |a+ | Φ′1 |
a+ | Φ′2 |a+ | Φ′3 |
a
| A1 |a+ | A2 |a+ | A3 |a+ | A′1 |
a+ | A′2 |
a+ | A′3 |
a
} 1a
(3.63)
26

where σ0Y is the tensile yield stress in the rolling direction and
2A1 =
{(Φ1 + Φ2) cos2 θ + (Ψ1 + Ψ2) sin2 θ+√
((Φ1 − Φ2)cos2θ + (Ψ1 −Ψ2) sin2 θ)2 + 4C266 sin2 θ cos2 θ
}
2A2 =
{(Φ1 + Φ2) cos2 θ + (Ψ1 + Ψ2) sin2 θ−√
((Φ1 − Φ2)cos2θ + (Ψ1 −Ψ2) sin2 θ)2 + 4C266 sin2 θ cos2 θ
}
A3 = Φ3 cos2 θ + Ψ3 sin2 θ
(3.64)
with similar expression for A′1,A′2 and A′3. The bi-axial flow stress can be written as
σb = σ0Y
{|Φ1|a+|Φ2|a+|Φ3|a+|Φ′1|
a+|Φ′2|a+|Φ′3|
a
|Φ1+Ψ1|a+|Φ2+Ψ2|a+|Φ3+Ψ3|a+|Φ′1+Ψ′1|a+|Φ′2+Ψ
′2|a+|Φ′3+Ψ
′3|a
} 1a
(3.65)
The plastic potential is assumed to overlap with the yield functions. The width to
thickness strain ratio, rθ, under uni-axial tensile or compression loading in a direction
at angle θ with the rolling direction in the xy plane is given by
rθ = −sin2 θ( σ
σxx)− sin(2θ)( σ
σxy) + cos2 θ( σ
σyy)
( σσxx
) + ( σσyy
)(3.66)
where σ is given by Equation (3.55). The strain ratios in the rolling and transverse
direction arer0 = −Λ1+Λ′1
Λ2+Λ′2
r90 = −Λ3+Λ′3Λ4+Λ′4
(3.67)
with
Λ1 = Φa−11 Ψ1 + (−1)a(Φa−1
2 Ψ2 + Φa−13 Ψ3)
Λ2 = Φa−11 (Φ1 + Ψ1) + (−1)a(Φa−1
2 Ψ2 + Φa−13 Ψ3 + Φa
2 + Φa3)
Λ3 = −Ψa−12 Φ2 + (−1)a(Ψa−1
1 Φ1 + Ψa−13 Φ3)
Λ4 = −Ψa−12 (Φ2 + Ψ2) + (−1)a(Ψa−1
1 Φ1 + Ψa−13 Φ3 + Ψa
1 + Ψa3)
(3.68)
27

In a similar manner, Λ′1, Λ′2, Λ′3, Λ′4 can be determined. The shear coefficients C66 and
C ′66 can be calculated from the theoretical expression of the pure shear yield stress.
Hence
(σxy)Y =σ0Y
2
{| Φ1 |a+ | Φ2 |a+ | Φ3 |a+ | Φ′1 |
a+ | Φ′2 |a+ | Φ′3 |
a
| C66 |a+ | C ′66 |a
} 1a
(3.69)
Finally, minimization of the error function can provide the anisotropy coefficientsCij ,
C ′ij with i, j = 1...3 and C66, C ′66. The error function is
F =n∑i
ηi
(1− (σθ)
thi
(σθ)datai
)2
+m∑j
γj
(1−
rthjrdataj
)2
+ w
(1− σthb
σdatab
)2
(3.70)
where n is the number of experimental directional flow stresses and m is the number
of the experimental r-ratios, whilst ηi, γj and w are weight factors. Moreover, the
superscripts in the above equation represent whether the value is experimental data
or calculated from the yield function. For three dimensional stress states, the out-
of-plane anisotropy coefficients C44, C ′44, C55, C ′55 can be found from yield stress
for simple shear in yz and xz planes and uni-axial tension at 45° between x and z,
and between y and z. Thus
(σyz)Y =σ0Y
2
{|Φ1|a+|Φ2|a+|Φ3|a+|Φ′1|
a+|Φ′2|a+|Φ′3|
a
|C44|a+|C′44|a
} 1a
(σxz)Y =σ0Y
2
{|Φ1|a+|Φ2|a+|Φ3|a+|Φ′1|
a+|Φ′2|a+|Φ′3|
a
|C55|a+|C′55|a
} 1a
(3.71)
In plane stress condition, the coefficients C44, C ′44, C55, C ′55 are equal to zero [18].
3.2.4 BBC2008 Yield Criterion with Isotropic Hardening
The BBC2008 plane-stress yield criterion is proposed by Comsa and Banabic
for highly orthotropic sheet metals [19]. The yield surface can be written in the form:
F (σ11, σ22, σ12 = σ21, σY ) = σ(σ11, σ22, σ12 = σ21, σY )− σY (εp) = 0 (3.72)
28

where σY is the yield stress. The equivalent stress, σ, is expressed as follows
σ2k
w−1=∑s
r=1
{wr−1
{[Lr +M r
]2k
+[Lr −M r
]2k}+ws−r
{[M r +N r
]2k
+[M r −N r
]2k}}Lr = lr1σ11 + lr2σ22
M r =
√[mr
1σ11 −mr2σ22
]2
+[mr
3(σ12 + σ21)]2
N r =
√[nr1σ11 − nr2σ22
]2
+[nr2(σ12 + σ21)
]2
k, s ∈ N \ (0), w = (3/2)1/s > 1,
lr1, lr2, m
r1, m
r2, m
r3, n
r1, n
r2, n
r2 ∈ R
(3.73)
where k, lr1, lr2,m
r1,m
r2,m
r3, n
r1, n
r2, n
r2 are material parameters. For BCC alloys, k is
equal to 3 and for FCC alloys, k is equal to 4. Other quantities can be found by the
minimization of an error function . The planar stress components are defined by the
formula
σ11 |θ= σθY cos2 θ
σ22 |θ= σθY sin2 θ
σ12 |θ= σ21 |θ= σθY cos θ sin θ
(3.74)
where σθY is the yield stress in the case of uni-axial traction along a direction that is
denoted by the angle θ measured from the rolling direction . By using Equation (3.73)
and Equation (3.74), the equivalent stress can be defined as follows
σ |θ= σθY Fθ (3.75)
29

in which Fθ is
F 2kθ
w−1=∑s
r=1
{wr−1
{[Lrθ +M r
θ
]2k
+[Lrθ −M r
θ
]2k}+ws−r
{[M r
θ +N rθ
]2k
+[M r
θ −N rθ
]2k}}Lrθ = lr1 cos2 θ + lr2 sin2 θ
M rθ =
√[mr
1 cos2 θ −mr2 sin2 θ
]2
+[mr
3 sin 2θ]2
N rθ =
√[nr1 cos2 θ − nr2 sin2 θ
]2
+[nr2 sin 2θ
]2
(3.76)
Then the normalized uni-axial yield stress can be calculated from Equation 3.77
yθ =σθYσY
=1
Fθ(3.77)
The r-coefficient along a direction that is inclined by the angle θ from the rolling
direction is
rθ =dεpθ+90
dεp33
(3.78)
where dεpθ+90 is the plastic strain rate along θ + 90 direction and dεp33 is the plastic
strain along thickness. After some manipulations,
rθ =FθGθ
− 1 (3.79)
where Gθ is given as
F 2k−1θ Gθw−1
=∑s
r=1
{wr−1
[Lrθ + M r
θ
][Lrθ +M r
θ
]2k−1
+wr−1[Lrθ − M r
θ
][Lrθ −M r
θ
]2k−1
+ws−r[M r
θ + N rθ
][M r
θ +N rθ
]2k−1
+ws−r[M r
θ − N rθ
][M r
θ −N rθ
]2k−1}(3.80)
in the above equation
Lrθ = lr1 + lr2
M rθ =
[mr
1 −mr2
][mr
1 cos2 θ −mr2 sin2 θ
]/M r
θ
N rθ =
[nr1 − nr2
][nr1 cos2 θ − nr2 sin2 θ
]/N r
θ
(3.81)
30
In the case of in-plane bi-axial traction, the planar stress components are
σ11 |b= σbY , σ22 |b= σbY , σ12 |b= σ21 |b= 0 (3.82)
By replacing Equation (3.75), the associated equivalent stress
σ |b= FbσbY (3.83)
where Fb is
F 2kb
w−1=∑s
r=1
{wr−1
{[M r
b + Lrb
]2k
+{[Lrb −M r
b
]2k}+ws−r
{[N rb +M r
b
]2k
+{[M r
b −N rb
]2k}} (3.84)
with
Lrb = lr1 + lr2,Mrb = mr
1 −mr2, N
rb = nr1 − nr2 (3.85)
The normalized bi-axial yield stress is
yb =σbYσY
=1
Fb(3.86)
In the case of bi-axial traction, the r-coefficient is
rb =dεp22
dεp11
(3.87)
After some manipulations, the r-coefficient becomes
rb =FbGb
− 1 (3.88)
where Gb is given as
F 2k−1b Gbw−1
=∑s
r=1
{wr−1
[M r
b + Lrb
][M r
b + Lrb
]2k−1
+wr−1[Lrb − M r
b
][Lrb −M r
b
]2k−1
+ws−r[N rb + M r
b
][N rb +M r
b
]2k−1
+ws−r[M r
b − N rb
][M r
b −N rb
]2k−1}(3.89)
here
Lrb = lr1, Mrb = mr
1, Nrb = nr1 (3.90)
In order to find material parameters, authors proposed a method based on the
minimization of the error function given as
E[lr1, l
r2,m
r1,m
r2,m
r3, n
r1, n
r2, n
r3 | r = 1, ..., s
]=
∑θj
[y(exp)θj
yθj− 1]2
+∑θj
[r
(exp)θj− rθj
]2
+[y(exp)
b
yb− 1]2
+[r
(exp)b − rb
]2 (3.91)
31

32
CHAPTER 4
FINITE ELEMENT ANALYSIS
Engineering problems can be handled with analytical or numerical methods.
However, analytical solutions of some problems are very complex or not possible.
For such problems, numerical methods can come into use.
Among other numerical methods, finite element method (FEM) has great importance
to solve many engineering problems. In this method, a large solution domain is split
into small and interconnected elements. Then it provides piecewise approximations
to the governing equations using several variational methods [32].
ABAQUS/Explicit is selected as the finite element analysis code for the simulation of
deep drawing operations in this study. It provides a wide range of user subroutines
that allow to program to fit in user’s special analysis requirements. In this thesis,
VUMAT user material subroutines were employed to implement different constitutive
models into the program. These constitutive models implemented were obtained
by using BBC2008-8p, BBC2008-16p and CPB06ex2 yield criteria. Hill’48 yield
criterion and von Mises yield criterion with combined, kinematic and isotropic
hardening are already available in ABAQUS library. The VUMAT subroutines are
Fortran codes that can be run through the use of Microsoft Visual Studio 2012 and
Intel Fortran XE 2013 to ABAQUS/ Explicit. In the VUMAT subprograms,
related constitutive models were combined with radial return mapping algorithm.
Also, all finite element analyses that have been in the current study were on the basis
of elasto-plastic material models.
33

4.1 Explicit Dynamic Analysis
The dynamic equilibrium equation can be given as
Mu(j) = F (j) −R(j) (4.1)
In the above equation, the mass matrix is denoted asM , the forces obtained internally
are denoted as R, the forces applied externally are denoted as F , u is the acceleration
and the superscripts mean the increment number. FEM software utilizes the rule of
explicit central-difference time integration to calculate the displacements, velocities
and accelerations for each increment [29]. The following equation represents the
formula of explicit central-difference time integration
u(j+1/2) =4t(j) +4t(j+1)
2u(j) + u(j−1/2) (4.2)
u(j+1) = 4t(j+1)u(j+1/2) + u(j) (4.3)
Using the results of the previous increments, the values of the next increment can be
calculated. During analysis, these increments are very small and for the stability, the
following condition should be satisfied:
4t ≤ 2
ωmax(4.4)
where ωmax is the highest frequency of the system. If damping is included, the
condition of the stable time increment will become
4t ≤ 2
ωmax
(√1 + ξ2
max − ξmax
)(4.5)
where ξmax is the critical damping fraction in the mode where the maximum frequency
is acquired. ABAQUS/Explicit includes a small viscosity value for a damping effect
to avoid high frequency oscillations. The stable time increment can be approximated
as
4t ≈ Lmincd
(4.6)
where the minimum element size in the mesh of the part is denoted as Lmin and cd is
the dilatational speed of wave formulated as
cd =
√2µ+ λ
ρ(4.7)
34

where λ and µ are.defined as Lame’s.first and second parameters and the material
density is presented as ρ.
4.2 Radial Return Algorithm
The calculation of the stress state is done by using radial return algorithm at the stage
of the development of VUMAT which is detailed as follows [11]. The yielding surface
can be described as
F (σij, εp) = σ − σY (εp) (4.8)
where the effective stress and effective plastic strain is denoted as σ and εp, respectively.
The increment of strain is divided.into an elastic part and plastic part.
4εij = 4εeij +4εpij (4.9)
The elastic stress-strain relationships is written in the incremental form as
4σij = Cijkl
(4εkl −4εpkl
)(4.10)
where Cijkl is defined as elasticity tensor. From the normality rule, the plastic strain
rate is acquired as
4εpij = 4λ ∂F∂σij
(4.11)
where plastic multiplier is denoted as4λ. With the assumption of isotropic hardening,
4εpij = 4εp ∂F∂σij
(4.12)
The plastic stress-strain relationship is of the form
4σ = H(σ)4εp (4.13)
Radial return algorithm operates on the basis of an elastic forecaster and plastic
corrector. First step of the increment is the calculation of the trial elastic stress by
using following equation
(σtrialij )(n+1) = σ(n)ij + λtr(4ε)δij + 2µ4εij (4.14)
where the subscripts represents the increment number. If the trial elastic stress is
lower than the current yield stress, the elastic deformation occurs and the new state
35

of stress becomes equal to the trial stress. Otherwise, the new state of stress can be
calculated with plastic corrector.
σ(n+1)ij = (σtrialij )(n+1) − 2µ4εpij (4.15)
Many past researches about implementing of a new yield criteria to a software were
done by using radial return algorithm [17, 22, 33, 34]. In the thesis, this algorithm
was chosen to determine the new states of stress and strain values since it provides
reasonable results according to the results of the past researches.
4.3 The Finite Element Model
In this study, the simulation of the cylindrical and square cup drawing operations are
performed. In addition, the experimental results of the Benchmark 4 in Numisheet
2014 and the predictions of the constitutive models of this study were compared.
For the verification of the codes, the predicted earing profile with the CPB06ex2
model and the experimental data reported by Yoon et al. [17] were compared with the
predictions of the CPB06ex2 model used in the current study.
In all finite element analyses, the material properties of AA5042 aluminum alloy
was employed for elasto-plastic material model. Due to the symmetries, the quarter
of the cups were analyzed so the computational time was reduced apparently. In
the numerical simulations of the square and cylindrical cup drawing operations, the
friction model of Coulomb was used between die, punch, blank holder and sheet
metal.
In FEM analyses, there are 3 types of elements for sheet metal forming simulations,
namely, membrane element, continuum element and shell element. Membrane
elements are preferred due to its simplicity and lower computation time for thin
surfaces. However, bending stiffness is not included in membrane elements so it may
not be suitable for the simulation of wrinkling which is a kind of buckling. Continuum
elements can be used for the analysis of wrinkling; however, computation time is
very large. Shell elements considers the effect of bending and computation time is
comparably small [4]. For these reasons, the blank was modelled by four node shell
36

elements with reduced integration control (S4R) in this study. Also the drawn tools
such as.punch, die.and blank holder were modelled as a rigid part for all cases.
4.3.1 Model for Verification
In the current study, for the verification of the CPB06ex2 code, the results of the
cyclindrical cup drawing analysis and experimental results obtained by Yoon et al.
[17] were employed. The tool dimensions are given in Table 4.1. Schematic view
and the FE model are depicted in Figure 4.1 and 4.2, respectively. The blank holding
force is equal to 10 kN. The Coulomb friction coefficient is 0.008 and the initial mesh
number is specified as 600 in quarter of the sheet.
Table 4.1: Dimensions of the tools used for verification
Parameter t rd rp db dd dp
Dimension [mm] 0.274 2.28 2.28 76.07 46.74 45.72
BlankHolder
Sheet
t
d
Figure 4.1: Schematic views of the tools and blank used for verification
37

Figure 4.2: The FE model used for verification
4.3.2 Model for Side-Wall Wrinkling Analysis
In this thesis, the experimental data of the Numisheet 2014 Benchmark 4 reported by
Neto et al.[5] were compared with the predictions of the constitutive models of the
current study. Schematic views of.the tools and blank are shown in Figure 4.3 [35].
In Table 4.2, dimensions of the drawing tools are given. The blank holding force is
of magnitude 8.9 kN and the friction coefficient is set equal to 0.03. The whole sheet
is pull into the die cavity. The coordinate system used for results is given in Figure
4.4 [35]. The FE model used in the numerical analysis is depicted in Figure 4.5. The
initial mesh number is about 1800 in quarter of the sheet.
Table 4.2: Dimensions of the tools used in the Benchmark 4 of the Numisheet 2014
conference
Parameter T1 R1 R2 R3 H1 H2 D1. D2 D3. D4 D5 D6
Dimension [mm] 0.2083 1.016 3.180 1.905 5.207 34.29 15.24 31.75 45.72 45.72 46.74 64.77
38

Figure 4.3: Schematic views of the tools and blank used in the Benchmark 4 of the
Numisheet 2014 conference
Figure 4.4: Coordinate system of the tools used in the Benchmark 4 of the Numisheet
2014 conference
39

Figure 4.5: The FE model used in the Benchmark 4 of the Numisheet 2014 conference
4.3.3 Model for Flange Wrinkling Analysis in Cylindrical Cup Drawing
Schematic views of the tools and blank are shown in Figure 4.6. Dimensions of the
drawn tools are given in Table 4.3. Initial mesh number is set equal to 1600 in quarter
of the sheet. The value of the friction coefficient is set equal to 0.06. The FE model
of the cylindrical cup drawing process is shown in Figure 4.7.
Table 4.3: Dimensions of the tools used in the cylindrical cup drawing
Parameter t rd rp db dd dp
Dimension [mm] 1 13.5 5 110 53 50
40

BlankHolder
Sheet
t
d
Figure 4.6: Schematic views of the tools and blank used in the cylindrical cup drawing
Figure 4.7: The FE model of the cylindirical.cup drawing
4.3.4 Model for Flange Wrinkling Analysis in Square Cup Drawing
Schematic views of the tools and blank are presented in Figure 4.8. Initial element
number is equal to 1600 in quarter of the sheet. The tool dimensions are provided in
Table 4.4. The friction coefficient is equal to 0.06. The FE model of the square cup
drawing process is presented in Figure 4.9.
41

Table 4.4: Dimensions of the drawing tool for the deep drawing process using square
plate
Parameter t rd rp db dd dp
Dimension [mm] 1 4.5 4.5 80 42.5 40
BlankHolder
Sheet
t
d
Figure 4.8: Schematic views of the tools and blank used in the square cup drawing
Figure 4.9: The FE model of the square cup.drawing process
42

CHAPTER 5
RESULTS AND DISCUSSION
In this chapter, the verification of the developed models will be given and the
numerical results of the cylindrical and square cup drawing analyses are provided
by taking into account seven constitutive models formed by using von Mises with
kinematic, isotropic and combined hardening, Hill’48 with isotropic hardening,
BBC2008-8p with isotropic hardening, BBC2008-16p with isotropic hardening and
CPB06ex2 with isotropic hardening. In addition, the comparison between the
experimental data from Numisheet 2014 Benchmark 4 and the predictions of the
constitutive models for wrinkling profile and punch load for different punch
displacements are presented. For the validation of the code, the predicted earing
profile using CPB06ex2 yield criterion and experimental findings reported by Yoon
et al. [17] are compared with the prediction of the CPB06ex2 model used in this
study. For all analyses, AA5042-H2 was used as the blank material. Table 5.1 shows
mechanical properties of the material [35].
Table 5.1: Mechanical properties of AA5042-H2
Mechanical Properties
Stress-strain curve 404.16-107.17 e−18.416εp MPa
Poisson’s.ratio 0.33
Young’s modulus 68.9 GPa
r0 0.354
r45 1.069
r90 1.396
43

For CPB06ex2 model, the anisotropy coefficients Cij ,C ′ij with i, j = 1...3 and C66,
C ′66 were found by minimizing the error function shown in Equation (3.70). Table 5.2
presents the anisotropy coefficients of CPB06ex2 for AA5042-H2 [17].
Table 5.2: Anisotropy coefficients of CPB06ex2 with increasing plastic work level
Plastic work
per unit volume Wp [MPa]Anisotropy coefficients of CPB06ex2
Initial Yielding
C12 C13 C22 C23 C33 C66
-0.0272 -0.6011 1.2870 0.6864 -0.2736 1.1514
C′12 C′13 C′22 C′23 C′33 C′66
-0.0897 0.0112 1.1322 -0.1092 -1.2009 1.3093
Wp = 27.85
C12 C13 C22 C23 C33 C66
0.0001 -0.5513 1.1368 0.8049 0.0133 1.2630
C′12 C′13 C′22 C′23 C′33 C′66
0.2413 0.0351 1.5201 0.2806 -1.0053 -1.2713
Wp = 35.52
C12 C13 C22 C23 C33 C66
0.00011 -0.5999 0.9926 0.8037 0.0867 1.2343
C′12 C′13 C′22 C′23 C′33 C′66
0.0684 -0.0790 1.3981 0.1279 -1.1592 -1.3359
44

For BBC2008-8p and BBC2008-16p constitutive models, material parameters can
be found by minifying the error function given in Equation (3.91). The identified
material parameters of the BBC2008-8p and BBC2008-16p can be seen in Table 5.3
and Table 5.4, respectively [19].
Table 5.3: Material parameters of BBC2008-8p for AA5042-H2
k s w l(1)1 l(1)
2 m(1)1 m(1)
2 m(1)3
4 1 1.5 0.6473 0.3478 0.5540 0.5914 0.5813
n(1)1 n(1)
2 n(1)3
0.2796 0.5388 0.4866
Table 5.4: Material parameters of BBC2008-16p for AA5042-H2
k s w l(1)1 l(1)
2 m(1)1 m(1)
2 m(1)3
4 2 1.2247 0.3527 -0.7187 0 0 -0.8769
n(1)1 n(1)
2 n(1)3 l(2)
1 l(2)2 m(2)
1 m(2)2 m(2)
3
-0.4479 -0.0714 -0.2061 0.7275 0.3431 -0.5720 -0.6217 0.5675
n(2)1 n(2)
2 n(2)3
-0.2992 -0.6359 0
5.1 Verification of the FE Model
Experimental findings and the earing profile predicted by using the CPB06ex2 yield
criteria reported in the study of Yoon et al. [17] are compared with the predictions
of the CPB06ex2 model developed in this thesis. Figure 5.1 shows the agreement
between the predictions of the developed CPB06ex2 model of the thesis, experimental
values and the results of the CPB06ex2 model of the study of Yoon et al. are found to
be satisfactory.
45

18.8
19
19.2
19.4
19.6
19.8
20
20.2
20.4
20.6
20.8
0 10 20 30 40 50 60 70 80 90
Cup H
eig
ht
[mm
]
Angle from rolling direction [°]
CPB06ex2 (Yoon et al.)CPB06ex2
Experimental
Figure 5.1: Earing profiles of completely drawn cup
5.2 Side-Wall Wrinkling Analysis
The comparison between predicted punch force variation by the developed models
at several punch displacements and experimental data is shown in Figure 5.2. All
experimental data of Numisheet 2014 Benchmark 4 have been obtained from the
study of Neto et al. [5]. The simulation results show that the predicted punch
force variation for CPB06ex2, von Mises with isotropic, kinematic and combined
hardening are in good agreement with experiments. Especially, CPB06ex2 yield
criterion gives the closest results to experimental data. However, BBC2008-8p and
BB2008-16p underestimates the punch force.
46

0
0.5
1
1.5
2
2.5
3
3.5
4
4.5
0 2 4 6 8 10 12 14 16 18
Punch L
oad [
kN
]
Punch Displacement [mm]
Experimentalvon M�ses + isotropic hardening
von M�ses + kinematic hardeningvon M�ses + combined hardening
CPB06ex2Hill ' 48
BBC2008-16pBBC2008-8p
Figure 5.2: Punch load variation at different punch displacement during the drawing
process
The wrinkling profile is investigated in two different cross sections perpendicular to
the drawn cup axis at 3.5 mm and 5.5 mm in the negative z direction. In order to
draw the cup completely, 20 mm punch displacement is given. The wrinkling profile
is measured.from the outer surface of the completelyxdrawn cup. In experiments,
13 wrinkles were observed in both cross-sections. The numerical results present that
while CPB06ex2 and Hill’48 predict 14 wrinkles, other constitutive models predict
12 wrinkles. Since the finite element models involves symmetry, even number of
wrinkles are predicted in full models also. In experiments, it is believed that
experimental errors such as eccentricity may result variation in wrinkle number.
Therefore, it is observed that the agreement between the estimates of the constitutive
models for the number of wrinkle and the experimental investigations are found to be
satisfactory.
Furthermore, the comparison of the predicted wrinkling profile using related
constitutive models and experimental results is given below. According to Figures
5.3-5.15, in the plane z = −3.5mm, the experimental results are in good agreement
with the models, except the von Mises with kinematic hardening model. The most
accurate prediction is obtained using CPB06ex2 yield criterion. However, the
BBC2008-8p and BBC20008-16p models are better in predicting the wrinkling profile
at the regions correspond to the transverse and rolling directions of the sheet metal.
47

18.5
19
19.5
20
20.5
21
21.5
0 10 20 30 40 50 60 70 80 90
Radia
l C
oord
inate
[m
m]
Angle From Rolling Direction [ ° ]
Experimentalvon Mises + isotropic hardening
Figure 5.3: Wrinkling profile in the plane z = −3.5mm obtained from the von Mises
with isotropic hardening model
a) b)
Figure 5.4: (a) The completely drawn cup using the von Mises with isotropic
hardening model (b) The drawn cup in the plane z = −3.5mm using the von Mises
with isotropic hardening model
48

18.5
19
19.5
20
20.5
21
21.5
0 10 20 30 40 50 60 70 80 90
Radia
l C
oord
inate
[m
m]
Angle From Rolling Direction [ ° ]
Experimentalvon Mises + kinematic hardening
Figure 5.5: Wrinkling profile in the plane z = −3.5mm obtained from the von Mises
with kinematic hardening model
a) b)
Figure 5.6: (a) The completely drawn cup using the von Mises with kinematic
hardening model (b) The drawn cup in the plane z = −3.5mm using the von Mises
with kinematic hardening model
49

18.5
19
19.5
20
20.5
21
21.5
0 10 20 30 40 50 60 70 80 90
Radia
l C
oord
inate
[m
m]
Angle From Rolling Direction [ ° ]
Experimentalvon Mises + combined hardening
Figure 5.7: Wrinkling profile in the plane z = −3.5mm obtained from the von Mises
with combined hardening model
a) b)
Figure 5.8: (a) The completely drawn cup using the von Mises with combined
hardening model (b) The drawn cup in the plane z = −3.5mm using the von Mises
with combined hardening model
50

18.5
19
19.5
20
20.5
21
21.5
0 10 20 30 40 50 60 70 80 90
Radia
l C
oord
inate
[m
m]
Angle From Rolling Direction [ ° ]
ExperimentalHill ' 48
Figure 5.9: Wrinkling profile in the plane z = −3.5mm obtained from the Hill’48
model
a) b)
Figure 5.10: (a) The completely drawn cup using the Hill’48 model (b) The drawn
cup in the plane z = −3.5mm using the Hill’48 model
51

18.5
19
19.5
20
20.5
21
21.5
0 10 20 30 40 50 60 70 80 90
Radia
l C
oord
inate
[m
m]
Angle From Rolling Direction [ ° ]
ExperimentalCPB06ex2
Figure 5.11: Wrinkling profile in the plane z = −3.5mm obtained from the
CPB06ex2 model
a) b)
Figure 5.12: (a) The completely drawn cup using the CPB06ex2 model (b) The drawn
cup in the plane z = −3.5mm using the CPB06ex2 model
52

18.5
19
19.5
20
20.5
21
21.5
0 10 20 30 40 50 60 70 80 90
Radia
l C
oord
inate
[m
m]
Angle From Rolling Direction [ ° ]
ExperimentalBBC2008-8p
Figure 5.13: Wrinkling profile in the plane z = −3.5mm obtained from the
BBC2008-8p model
a) b)
Figure 5.14: (a) The completely drawn cup using the BBC2008-8p model (b) The
drawn cup in the plane z = −3.5mm using the BBC2008-8p model
53

18.5
19
19.5
20
20.5
21
21.5
22
0 10 20 30 40 50 60 70 80 90
Radia
l C
oord
inate
[m
m]
Angle From Rolling Direction [ ° ]
ExperimentalBBC2008-16p
Figure 5.15: Wrinkling profile in the plane z = −3.5mm obtained from the
BBC2008-16p model
a) b)
Figure 5.16: (a) The completely drawn cup using the BBC2008-16p model (b) The
drawn cup in the plane z = −3.5mm using the BBC2008-16p model
54

In the plane z = −5.5mm, it can be seen from Figures 5.17-5.29 that there are
considerably deviations between the experimental data and the numerical results. The
predicted amplitude of wrinkling is higher than the experimental one. The coefficient
of friction value can be one the cause of dissimilarity between the experimental
and numerical results. The recommended friction coefficient is 0.03 but the friction
coefficient may vary as the punch moves. The contact pressure, the surface roughness
of tools and sheet and the lubrication conditions can affect the value of friction
coefficient.
21
21.5
22
22.5
23
23.5
0 10 20 30 40 50 60 70 80 90
Radia
l C
oord
inate
[m
m]
Angle From Rolling Direction [°]
Experimentalvon Mises + isotropic hardening
Figure 5.17: Wrinkling profile in the plane z = −5.5mm obtained from the von
Mises with isotropic hardening model
Figure 5.18: The drawn cup in the plane z = −5.5mm using the von Mises with
isotropic hardening model
55

21
21.5
22
22.5
23
23.5
0 10 20 30 40 50 60 70 80 90
Radia
l C
oord
inate
[m
m]
Angle From Rolling Direction [°]
Experimentalvon Mises + kinematic hardening
Figure 5.19: Wrinkling profile in the plane z = −5.5mm obtained from the von
Mises with kinematic hardening model
Figure 5.20: The drawn cup in the plane z = −5.5mm using the von Mises with
kinematic hardening model
56

21
21.5
22
22.5
23
23.5
0 10 20 30 40 50 60 70 80 90
Radia
l C
oord
inate
[m
m]
Angle From Rolling Direction [°]
Experimentalvon Mises + combined hardening
Figure 5.21: Wrinkling profiled in the plane z = −5.5mm obtained from the von
Mises with combined hardening model
Figure 5.22: The drawn cup in the plane z = −5.5mm using the von Mises with
combined hardening model
57

21
21.5
22
22.5
23
23.5
0 10 20 30 40 50 60 70 80 90
Radia
l C
oord
inate
[m
m]
Angle From Rolling Direction [°]
ExperimentalHill'48
Figure 5.23: Wrinkling profile in the plane z = −5.5mm obtained from the Hill’48
model
Figure 5.24: The drawn cup in the plane z = −5.5mm using the Hill’48 model
58

21
21.5
22
22.5
23
23.5
0 10 20 30 40 50 60 70 80 90
Radia
l C
oord
inate
[m
m]
Angle From Rolling Direction [ ° ]
ExperimentalCPB06ex2
Figure 5.25: Wrinkling profile in the plane z = −5.5mm obtained from the
CPB06ex2 model
Figure 5.26: The drawn cup in the plane z = −5.5mm using the CPB06ex2 model
59

21
21.5
22
22.5
23
23.5
0 10 20 30 40 50 60 70 80 90
Radia
l C
oord
inate
[m
m]
Angle From Rolling Direction [°]
ExperimentalBBC2008-8p
Figure 5.27: Wrinkling profile in the plane z = −5.5mm obtained from the
BBC2008-8p model
Figure 5.28: The drawn cup in the plane z = −5.5mm using the BBC2008-8p model
60

21
21.5
22
22.5
23
23.5
0 10 20 30 40 50 60 70 80 90
Radia
l C
oord
inate
[m
m]
Angle From Rolling Direction [°]
ExperimentalBBC2008-16p
Figure 5.29: Wrinkling profile in the plane z = −5.5mm obtained from the
BBC2008-16p model
Figure 5.30: The drawn cup in the plane z = −5.5mm using the BBC2008-16p
model
61

According to the results, the von Mises with kinematic hardening model can not
predict the side-wall wrinkling profile in the plane z = −5.5mm. However, the
CPB06ex2 model shows the most similar trend with the experimental results
comparing to other constitutive models.
5.3 Flange Wrinkling Analysis in Cylindrical Cup Drawing
Figures 5.31, 5.32 and 5.33 show the evolution of wrinkle heights in cylindrical
cup drawing process at 15 mm, 20 mm and 25 mm punch displacement, respectively.
The wrinkling amplitude of the von Mises with isotropic, kinematic and combined
hardening, BBC2008-8p and BBC2008-16p models are generally consistent with
each other. However, the Hill’48 and CPB06ex2 models predict higher than the
other constitutive models considering same punch displacement and blank holding
force. Figure 5.34 shows the maximum cup forming heights without occurence of
wrinkling at various blank holding force in cylindrical cup drawing. Considering
the same forming height, the yield criterion CPB06ex2 calculates the greatest blank
holding force.
0
0.5
1
1.5
2
2.5
3
0.6 0.8 1 1.2 1.4 1.6 1.8 2 2.2 2.4
Maxim
um
wri
nkle
heig
ht
[mm
]
Blank holding force [kN]
von Mises + isotropic hardeningvon Mises + kinematic hardeningvon Mises + combined hardening
CPB06ex2Hill ' 48
BBC2008-8pBBC2008-16p
Figure 5.31: Evolution of wrinkle heights with different blank holding force at 15
mm punch travel in cylindrical cup drawing
62

0
0.2
0.4
0.6
0.8
1
1.2
0.5 1 1.5 2 2.5 3 3.5 4 4.5
Maxim
um
wri
nkle
heig
ht
[mm
]
Blank holding force [kN]
von Mises + isotropic hardeningvon Mises + kinematic hardeningvon Mises + combined hardening
CPB06ex2Hill ' 48
BBC2008-8pBBC2008-16p
Figure 5.32: Evolution of wrinkle heights with different blank holding force at 20
mm punch travel in cylindrical cup drawing
0
0.5
1
1.5
2
2.5
1 1.5 2 2.5 3 3.5 4 4.5 5 5.5
Maxim
um
wri
nkle
heig
ht
[mm
]
Blank holding force [kN]
von Mises + isotropic hardeningvon Mises + kinematic hardeningvon Mises + combined hardening
CPB06ex2Hill ' 48
BBC2008-8pBBC2008-16p
Figure 5.33: Evolution of wrinkle heights with different blank holding force at 25
mm punch travel in cylindrical cup drawing
63

14
16
18
20
22
24
26
1 1.5 2 2.5 3 3.5 4 4.5 5 5.5
Maxim
um
Cup F
orm
ing H
eig
ht
[mm
]
Blank Holding Force [kN]
von Mises + isotropic hardeningvon Mises + kinematic hardeningvon Mises + combined hardening
CPB06ex2Hill'48
BBC2008-8pBBC2008-16p
Figure 5.34: Maximum cup forming height variation at several blank holding force in
cylindrical cup forming
Figures 5.35-5.42 show some sample drawn cups and their wrinkling profiles using
the related constitutive models in the cylindrical cup drawing analyses. Measurements
are done from the bottom of the drawn cup.
14.5
15
15.5
16
16.5
17
17.5
18
0 10 20 30 40 50 60 70 80 90
Wri
nkling P
ro
�
le [
mm
]
Angle from rolling direction [°]
von Mises + isotropic hardeningvon Mises + kinematic hardeningvon Mises + combined hardening
Figure 5.35: Wrinkling profile with 0.7 kN blank holding force at 15 mm punch
travel using the von Mises yield criteria with the isotropic, kinematic and combined
hardening models in cylindrical cup drawing
64
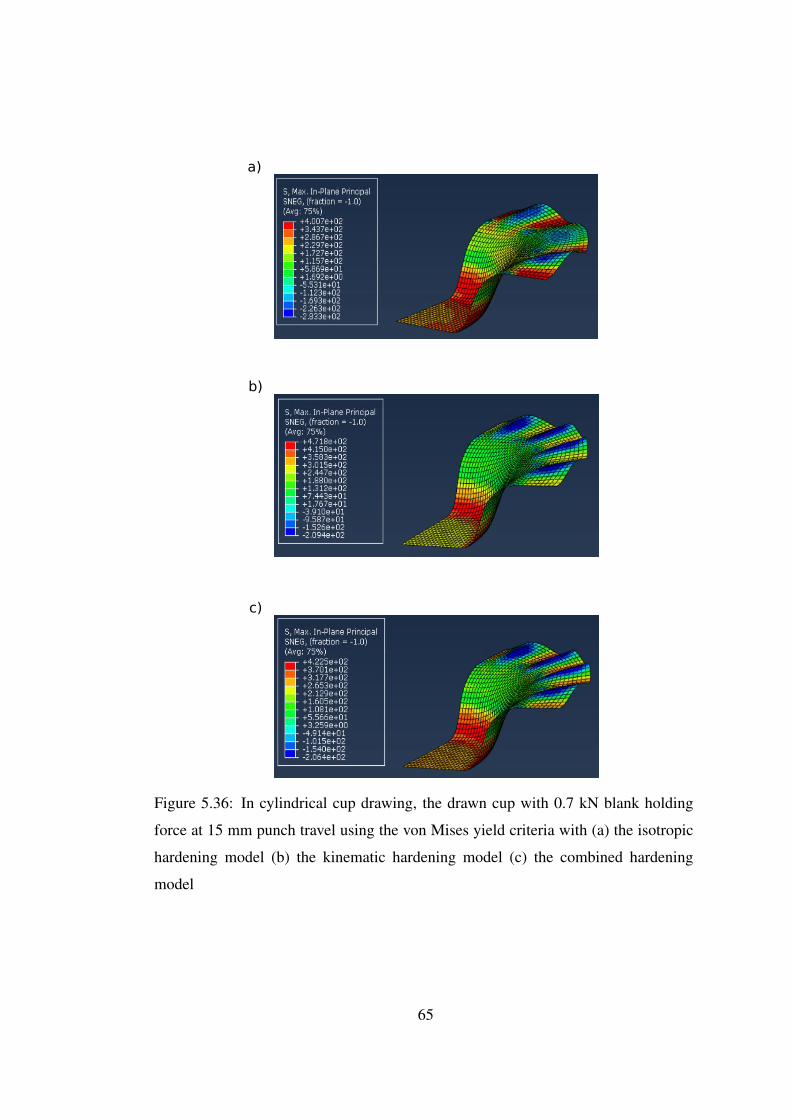
a)
b)
c)
Figure 5.36: In cylindrical cup drawing, the drawn cup with 0.7 kN blank holding
force at 15 mm punch travel using the von Mises yield criteria with (a) the isotropic
hardening model (b) the kinematic hardening model (c) the combined hardening
model
65
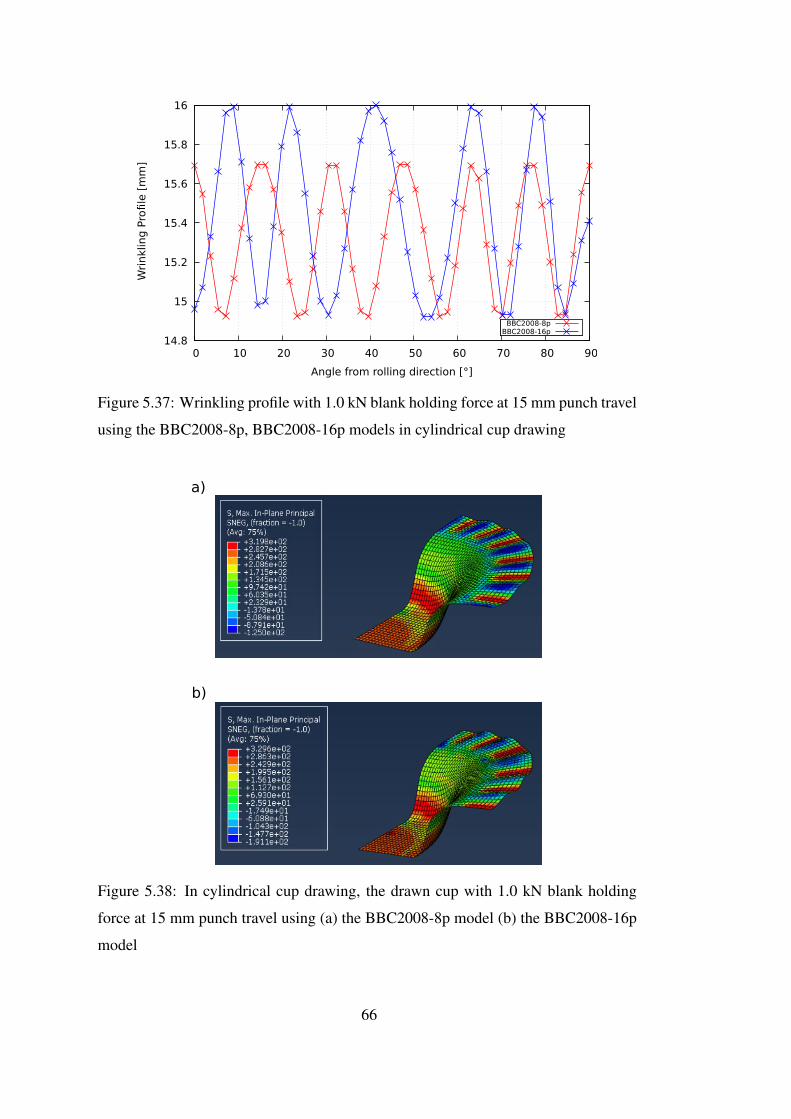
14.8
15
15.2
15.4
15.6
15.8
16
0 10 20 30 40 50 60 70 80 90
Wri
nkling P
ro
�
le [
mm
]
Angle from rolling direction [°]
BBC2008-8pBBC2008-16p
Figure 5.37: Wrinkling profile with 1.0 kN blank holding force at 15 mm punch travel
using the BBC2008-8p, BBC2008-16p models in cylindrical cup drawing
a)
b)
Figure 5.38: In cylindrical cup drawing, the drawn cup with 1.0 kN blank holding
force at 15 mm punch travel using (a) the BBC2008-8p model (b) the BBC2008-16p
model
66

14.5
15
15.5
16
16.5
17
17.5
0 10 20 30 40 50 60 70 80 90
Wri
nkling P
ro
�
le [
mm
]
Angle from rolling direction [°]
Hill'48
Figure 5.39: Wrinkling profile with 1.0 kN blank holding force at 15 mm punch travel
using the Hill’48 model in cylindrical cup drawing
Figure 5.40: In cylindrical cup drawing, the drawn cup with 1.0 kN blank holding
force at 15 mm punch travel using the Hill’48 model
67

25
25.5
26
26.5
27
27.5
0 10 20 30 40 50 60 70 80 90
Wri
nkling P
ro
�
le [
mm
]
Angle from rolling direction [°]
CPB06ex2
Figure 5.41: Wrinkling profile with 3.4 kN blank holding force at 25 mm punch travel
using the CPB06ex2 model in cylindrical cup drawing
Figure 5.42: In cylindrical cup drawing, the drawn cup with 3.4 kN blank holding
force at 25 mm punch travel using the CPB06ex2 model
68

Moreover, the flange wrinkling profiles with 0.7 kN blank holding force at 15 mm
punch travel are presented in Figure 5.43 in order to compare the predictions of the
developed models.
14
16
18
20
22
24
26
28
30
0 10 20 30 40 50 60 70 80 90
Wri
nkling P
ro
�
le [
mm
]
Angle from rolling direction [°]
von Mises + isotropic hardeningvon Mises + kinematic hardeningvon Mises + combined hardening
Hill '48 CPB06ex2
BBC2008-8pBBC2008-16p
Figure 5.43: Wrinkling profile with 0.7 kN blank holding force at 15 mm punch travel
According to the Figures 5.44- 5.46, while the von Mises with kinematic and combined
hardening models predict four wrinkles, the von Mises with isotropic hardening model
predicts three wrinkles considering the same punch travel and blank holding force.
The predictions of the Hill’48 and CPB06ex2 models show similar trend. Wrinkle
is not observed at the regions correspond to the rolling direction of the sheet metal
according to the the Hill’48 and CPB06ex2 models. The reason of these predictions
can be high anisotropic behavior of the material. Moreover, the predictions of the
BBC2008-8p and BBC2008-16p models for the number of wrinkle are different from
each other.
69

14.5
15
15.5
16
16.5
17
17.5
18
0 10 20 30 40 50 60 70 80 90
Wri
nkling P
ro
�
le [
mm
]
Angle from rolling direction [°]
von Mises + isotropic hardeningvon Mises + kinematic hardeningvon Mises + combined hardening
Figure 5.44: Wrinkling profile with 0.7 kN blank holding force at 15 mm punch travel
by using the von Mises with isotropic, kinematic and combined hardening models
16
18
20
22
24
26
28
0 10 20 30 40 50 60 70 80 90
Wri
nkling P
ro
�
le [
mm
]
Angle from rolling direction [°]
Hill '48 CPB06ex2
Figure 5.45: Wrinkling profile with 0.7 kN blank holding force at 15 mm punch travel
by using the Hill’48 and CPB06ex2 models
70

15.5
16
16.5
17
17.5
18
18.5
19
19.5
20
20.5
0 10 20 30 40 50 60 70 80 90
Wri
nkling P
ro
�
le [
mm
]
Angle from rolling direction [°]
BBC2008-8pBBC2008-16p
Figure 5.46: Wrinkling profile with 0.7 kN blank holding force at 15 mm punch travel
by using the BBC2008-8p and BBC2008-16p models
5.4 Flange Wrinkling Analysis in Square Cup Drawing
In Figures 5.47, 5.48 and 5.49, the predicted wrinkle heights of the aluminum sheet
are given for various blank holding forces at three different punch displacements
considering the seven constitutive models. The maximum cup forming heights without
occurence of wrinkling at different blank holding force are presented in Figure 5.50.
It can be observed that the model of CPB06ex2 estimates the required blank holding
forces to prevent wrinkling comparably higher. In the von Mises with isotropic,
kinematic and combined hardening models, there are an abrupt change in the wrinkle
heights for small variation of blank holding force at all punch displacements. Similar
trends are observed mostly for the BBC2008-8p and BBC2008-16p models.
Moreover, the predictions of the Hill’48 model for the blank holding force required
for successful cup drawing are close to the predictions of the CPB06ex2 model.
71

0
0.5
1
1.5
2
2.5
1.5 2 2.5 3 3.5 4 4.5
Maxim
um
wri
nkle
heig
ht
[mm
]
Blank holding force [kN]
von Mises + isotropic hardeningvon Mises + kinematic hardeningvon Mises + combined hardening
CPB06ex2Hill ' 48
BBC2008-8pBBC2008-16p
Figure 5.47: Evolution of wrinkle heights with different blank holding force at 10
mm punch travel in square cup drawing
0
0.5
1
1.5
2
2.5
3
3.5
2 2.5 3 3.5 4 4.5 5 5.5 6 6.5
Maxim
um
wri
nkle
heig
ht
[mm
]
Blank holding force [kN]
von Mises + isotropic hardeningvon Mises + kinematic hardeningvon Mises + combined hardening
CPB06ex2Hill ' 48
BBC2008-8pBBC2008-16p
Figure 5.48: Evolution of wrinkle heights with different blank holding force at 15
mm punch travel in square cup drawing
72

0
0.2
0.4
0.6
0.8
1
1.2
1.4
2 2.5 3 3.5 4 4.5 5 5.5 6 6.5 7
Maxim
um
wri
nkle
heig
ht
[mm
]
Blank holding force [kN]
von Mises + isotropic hardeningvon Mises + kinematic hardeningvon Mises + combined hardening
CPB06ex2Hill ' 48
BBC2008-8pBBC2008-16p
Figure 5.49: Evolution of wrinkle heights with different blank holding force at 20
mm punch travel in square cup drawing
10
12
14
16
18
20
2 2.5 3 3.5 4 4.5 5 5.5 6 6.5 7
Maxim
um
Cup F
orm
ing H
eig
ht
[mm
]
Blank Holding Force [kN]
von Mises + isotropic hardeningvon Mises + kinematic hardeningvon Mises + combined hardening
CPB06ex2Hill'48
BBC2008-8pBBC2008-16p
Figure 5.50: Maximum cup forming height variation at several blank holding force in
square cup drawing
73

In Figures 5.51-5.56,the sample drawn cups and their wrinkling profiles are shown by
using the related constitutive models in the square cup drawing analyses.
20.8
21
21.2
21.4
21.6
21.8
22
22.2
22.4
22.6
22.8
0 10 20 30 40 50 60 70 80 90
Wri
nkling P
ro
�
le [
mm
]
Angle from rolling direction [°]
von Mises + isotropic hardeningvon Mises + kinematic hardeningvon Mises + combined hardening
Figure 5.51: Wrinkling profile with 2.4 kN blank holding force at 20 mm punch
travel using the von Mises yield criteria with the isotropic, kinematic and combined
hardening models in square cup drawing
15
15.5
16
16.5
17
17.5
0 10 20 30 40 50 60 70 80 90
Wri
nkling P
ro
�
le [
mm
]
Angle from rolling direction [°]
BBC2008-8pBBC2008-16p
Hill'48
Figure 5.52: Wrinkling profile with 2.4 kN blank holding force at 15 mm punch travel
using the Hill’48, BBC2008-8p and BBC2008-16p models in square cup drawing
74

a)
b)
c)
Figure 5.53: In square cup drawing, the drawn cup with 2.4 kN blank holding force at
20 mm punch travel using the von Mises yield criteria with (a) the isotropic hardening
model (b) the kinematic hardening model (c) the combined hardening model
75

a)
b)
c)
Figure 5.54: In square cup drawing, the drawn cup with 2.4 kN blank holding force
at 15 mm punch travel using (a) the Hill’48 model (b) the BBC2008-8p model (c) the
BBC2008-16p model
76
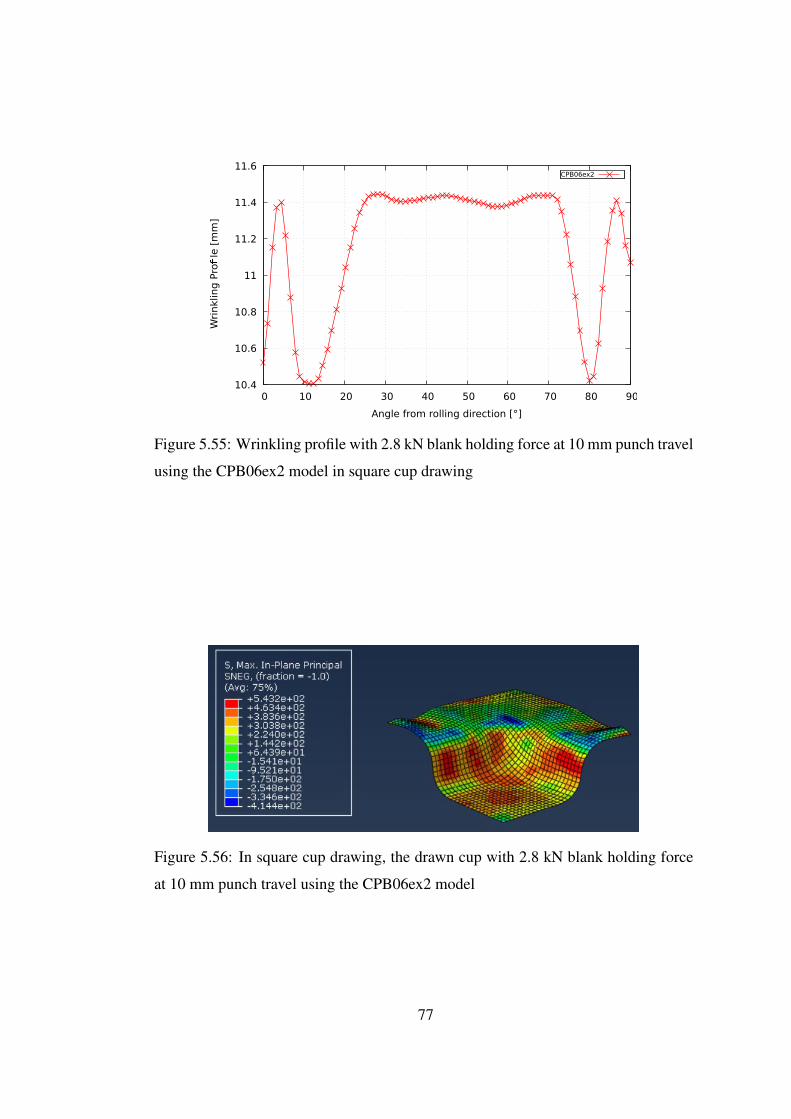
10.4
10.6
10.8
11
11.2
11.4
11.6
0 10 20 30 40 50 60 70 80 90
Wri
nkling P
ro
�
le [
mm
]
Angle from rolling direction [°]
CPB06ex2
Figure 5.55: Wrinkling profile with 2.8 kN blank holding force at 10 mm punch travel
using the CPB06ex2 model in square cup drawing
Figure 5.56: In square cup drawing, the drawn cup with 2.8 kN blank holding force
at 10 mm punch travel using the CPB06ex2 model
77

Moreover, the flange wrinkling profiles with 2.4 kN blank holding force at 20 mm
punch travel in the square cup drawing are presented in Figure 5.57 in order to
compare the predictions of the developed models.
20
22
24
26
28
30
0 10 20 30 40 50 60 70 80 90
Wri
nkling P
ro
�
le [
mm
]
Angle from rolling direction [°]
von Mises + isotropic hardeningvon Mises + kinematic hardeningvon Mises + combined hardening
Hill '48 CPB06ex2
BBC2008-8pBBC2008-16p
Figure 5.57: Wrinkling profile with 2.4 kN blank holding force at 20 mm punch travel
21
21.5
22
22.5
23
0 10 20 30 40 50 60 70 80 90
Wri
nkling P
ro
�
le [
mm
]
Angle from rolling direction [°]
von Mises + isotropic hardeningvon Mises + kinematic hardeningvon Mises + combined hardening
Figure 5.58: Wrinkling profile with 0.7 kN blank holding force at 15 mm punch travel
by using the von Mises with isotropic, kinematic and combined hardening models
78

21
22
23
24
25
26
27
28
0 10 20 30 40 50 60 70 80 90
Wri
nkling P
ro
�
le [
mm
]
Angle from rolling direction [°]
Hill '48 CPB06ex2
Figure 5.59: Wrinkling profile with 0.7 kN blank holding force at 15 mm punch travel
by using the Hill’48 and CPB06ex2 models
21.4
21.6
21.8
22
22.2
22.4
22.6
22.8
23
23.2
23.4
23.6
0 10 20 30 40 50 60 70 80 90
Wri
nkling P
ro
�
le [
mm
]
Angle from rolling direction [°]
BBC2008-8pBBC2008-16p
Figure 5.60: Wrinkling profile with 0.7 kN blank holding force at 15 mm punch travel
by using the BBC2008-8p and BBC2008-16p models
79

According to the Figures 5.58- 5.60, the predictions of the von Mises with isotropic,
kinematic and combined hardening models for the number of wrinkles are similar
to each other. The results obtained by using the BBC2008-8p and BBC2008-16p
models are in good agreement. Additionally, while the predictions of the Hill’48
and CPB06ex2 models for the flange wrinkling profile are similar in cylindrical cup
drawing, there are some difference between the predictions of these two models in
square cup drawing.
80

CHAPTER 6
CONCLUSIONS AND FUTURE WORKS
6.1 Conclusions
In this study, the capability of the constitutive models formed by the von Mises
yield criterion with isotropic, kinematic and combined hardening and CPB06ex2,
BBC2008-8p, BBC2008-16p and Hill’48 yield criteria with isotropic hardening on
the simulation of wrinkling is investigated. The CPB06ex2, BBC2008-8p and
BBC2008-16p yield criteria are implemented to ABAQUS through the user subroutine
VUMAT. In order to validate the developed code for the CPB06ex2 model and the
numerical results of the side-wall wrinkling analysis, the results from literature are
employed. Also, the deep drawing process using cylindrical and square plates are
analyzed to find out the effect of blank holding force on wrinkling. Following
conclusions have been achieved from this study:
1. The diagram of the the punch force variation at different punch displacement
shows that, for the completely drawn cup, the results of the CPB06ex2 model
and the empirical data coincides excellently. The results of the von Mises yield
criterion with isotropic hardening, kinematic hardening, combined hardening
and Hill’48 models and experiment are also shown to be in good agreement.
However, the punch force variation is underestimated by the BBC2008-8p and
BBC2008-16p models.
2. The comparison of the experimental and numerical side-wall wrinkling profile
is made for two cross sections at 3.5 mm and 5.5 mm from the cup bottom.
At 3.5 mm, the predicted radial coordinates of the constitutive models are
compatible with the experimental investigations, except the von Mises with
81

kinematic hardening model. In the transverse and rolling direction of the sheet
metal, the predictions of the two versions of the BBC2008 model, the BBC2008-
8p and BBC2008-16p, give similar results comparing with the experimental
data. The CPB06ex2 model gives the most accurate results comparing to the
other models excluding the regions near the rolling direction.
3. For the side-wall wrinkling profile at 5.5 mm, there are appreciable deviations
between experimental wrinkle amplitude and numerical results.
Additionally, the diagrams show that the kinematic hardening model is found
to be unsuccessful in forecasting of wrinkling profile.
4. In experiments of the side-wall wrinkling, 13 wrinkles were observed. The
agreement between the predictions of wrinkle number for the related
constitutive models and experiment is found to be satisfactory.
5. The effect of blank holding force on wrinkling in cylindrical cup drawing was
studied at 15 mm, 20 mm and 25 mm punch travel. In accordance with the
numerical results, the predictions of CPB06ex2 for the wrinkling height are
found significantly greater comparing with the other models in the case of the
same blank holding force applied for all punch travels. The von Mises yield
criterion with isotropic hardening, kinematic hardening, combined hardening
and BBC2008-8p and BBC2008-16p criteria generally give the similar results.
6. The effect of blank holding force on wrinkling in square cup drawing was
examined at 10 mm, 15mm and 20 mm punch travel. According to the
simulation results, in view of the same punch travel conditions, the predicted
blank holding force so as to prevent wrinkling has the highest value for the
case of the CPB06ex2 and Hill’48 models. The results of the von Mises with
isotropic hardening, kinematic hardening and combined hardening models show
similar behaviour. The two versions of the BBC2008 yield criterion give also
the similar results for the change of wrinkling amplitude under different blank
holding force at all punch travels. Comparing the BBC2008 and von Mises
yield criteria, the BBC2008 yield criterion predicts greater blank holding force
for the same cup height. Additionally, it can be seen that the required blank
holding force to avoid the wrinkling occurrence in square cup drawing is found
82

to be higher than that in cylindrical cup drawing considering the cases of the
same punch travel.
7. For the earing profile, the predictions of the CPB06ex2 model developed in the
current study and the experimental data show similar trend.
6.2 Future Works
As a future work, different stress integration algorithms can be implemented in order
to check their consistency with experimental findings. Also, experiments for the
square and cylindrical cup drawing processes can be conducted using AA5042-H2
aluminum alloy in order to find which constitutive model can represent how the blank
holding force affects the wrinkling occurence more accurately.
83

84

REFERENCES
[1] E. Ghassemali, X. Song, M. Zarinejad, A. Danno, and M. Tan, Bulk Metal
Forming Processes in Manufacturing. 09 2014.
[2] H. E. Theis, Handbook of Metalforming Processes. CRC Press, 1999.
[3] E. Chu and Y. Xu, “An elastoplastic analysis of flange wrinkling in deep drawing
process,” International Journal of Mechanical Sciences, vol. 43, pp. 1421–1440,
06 2001.
[4] X. Wang and J. Cao, “On the prediction of side-wall wrinkling in sheet metal
forming processes,” International Journal of Mechanical Sciences, vol. 42,
no. 12, pp. 2369–2394, 2000.
[5] D. Neto, M. Oliveira, R. Dick, P. Barros, J. Alves, and L. Menezes, “Numerical
and experimental analysis of wrinkling during the cup drawing of an aa5042
aluminium alloy,” International Journal of Material Forming, vol. 10, no. 1,
pp. 125–138, 2017.
[6] A. Agrawal, N. V. Reddy, and P. Dixit, “Determination of optimum process
parameters for wrinkle free products in deep drawing process,” Journal of
Materials Processing Technology, vol. 191, no. 1-3, pp. 51–54, 2007.
[7] B. Kaftanoglu, “Plastic analysis of flange wrinkling in axisymmetrical deep-
drawing,” in Proceedings of the Twenty-First International Machine Tool Design
and Research Conference, pp. 21–28, Springer, 1981.
[8] M. A. Shafaat, M. Abbasi, and M. Ketabchi, “Investigation into wall wrinkling
in deep drawing process of conical cups,” Journal of Materials Processing
Technology, vol. 211, no. 11, pp. 1783–1795, 2011.
[9] B. W. Senior, “Flange wrinkling in deep-drawing operations,” Journal of the
Mechanics and Physics of Solids, vol. 4, no. 4, pp. 235–246, 1956.
85

[10] J. D. M. Correia and G. Ferron, “Wrinkling of anisotropic metal sheets under
deep-drawing: analytical and numerical study,” Journal of Materials Processing
Technology, vol. 155, pp. 1604–1610, 2004.
[11] G. Ferron, R. Makkouk, and J. Morreale, “A parametric description of
orthotropic plasticity in metal sheets,” International Journal of Plasticity,
vol. 10, no. 5, pp. 431–449, 1994.
[12] N. Triantafyllidis and A. Needleman, “An analysis of wrinkling in the swift
cup test,” Journal of Engineering Materials and Technology, vol. 102, no. 3,
pp. 241–248, 1980.
[13] X. Weili, W. Huibao, Y. Yuying, and Z. Wang, “A simplified method of
wrinkling simulation,” Journal of Materials Processing Technology, vol. 121,
no. 1, pp. 19–22, 2002.
[14] P. Nordlund and B. Häggblad, “Prediction of wrinkle tendencies in explicit
sheet metal-forming simulations,” International journal for numerical methods
in engineering, vol. 40, no. 22, pp. 4079–4095, 1997.
[15] Z. Nowak, M. Nowak, and R. Pecherski, “A plane stress elastic-plastic analysis
of sheet metal cup deep drawing processes,” Shell structures: Theory and
Applications, vol. 3, p. 129, 2013.
[16] W. Burzynski, “Über die anstrengungshypothesen,” Schweizerische Bauzeitung,
vol. 94, no. 21, pp. 259–262, 1929.
[17] J.-H. Yoon, O. Cazacu, J. W. Yoon, and R. E. Dick, “Earing predictions
for strongly textured aluminum sheets,” International Journal of Mechanical
Sciences, vol. 52, no. 12, pp. 1563–1578, 2010.
[18] Y. Jia and Y. Bai, “Ductile fracture prediction for metal sheets using all-strain-
based anisotropic emmc model,” International Journal of Mechanical Sciences,
vol. 115, pp. 516–531, 2016.
[19] M. Vrh, M. Halilovic, B. Starman, B. Štok, D.-S. Comsa, and D. Banabic,
“Capability of the bbc2008 yield criterion in predicting the earing profile in cup
deep drawing simulations,” European Journal of Mechanics-A/Solids, vol. 45,
pp. 59–74, 2014.
86
[20] J. W. Yoon, F. Barlat, R. Dick, and M. Karabin, “Prediction of six or eight ears
in a drawn cup based on a new anisotropic yield function,” International Journal
of Plasticity, vol. 22, no. 1, pp. 174–193, 2006.
[21] F. Barlat, Y. Maeda, K. Chung, M. Yanagawa, J. Brem, Y. Hayashida, D. Lege,
K. Matsui, S. Murtha, S. Hattori, et al., “Yield function development for
aluminum alloy sheets,” Journal of the Mechanics and Physics of Solids, vol. 45,
no. 11-12, pp. 1727–1763, 1997.
[22] L. Moreira, G. Ferron, and G. Ferran, “Experimental and numerical analysis
of the cup drawing test for orthotropic metal sheets,” Journal of materials
processing technology, vol. 108, no. 1, pp. 78–86, 2000.
[23] R. Hill, “A theory of the yielding and plastic flow of anisotropic metals,”
Proceedings of the Royal Society of London. Series A. Mathematical and
Physical Sciences, vol. 193, no. 1033, pp. 281–297, 1948.
[24] B. Tang, F. Wu, Z. Wang, and S. Zhang, “Study on non-associated plasticity with
various forward euler stress integration algorithms and its prediction of earing
in cylindrical cup drawing,” International Journal of Mechanical Sciences,
vol. 157, pp. 384–402, 2019.
[25] M. R. Foudeh, S. Daneshmand, and H. I. Demirci, “Investigating aluminium
sheet wrinkling during the deep drawing process,” Transactions of FAMENA,
vol. 37, no. 4, pp. 43–54, 2014.
[26] H. Zein, M. El-Sherbiny, M. Abd-Rabou, and M. El Shazly, “Effect of die design
parameters on thinning of sheet metal in the deep drawing process,” American
Journal of Mechanical Engineering, vol. 1, no. 2, pp. 20–29, 2013.
[27] M. Colgan and J. Monaghan, “Deep drawing process: analysis and experiment,”
Journal of materials processing technology, vol. 132, no. 1-3, pp. 35–41, 2003.
[28] F. Dunne and N. Petrinic, Introduction to computational plasticity. Oxford
University Press on Demand, 2005.
[29] D. Systèmes, “Abaqus 6.10: Analysis user’s manual,” Providence, RI: Dassault
Systèmes Simulia Corp, 2010.
87

[30] O. Cazacu, B. Plunkett, and F. Barlat, “Orthotropic yield criterion for hexagonal
closed packed metals,” International Journal of Plasticity, vol. 22, no. 7,
pp. 1171–1194, 2006.
[31] B. Plunkett, O. Cazacu, and F. Barlat, “Orthotropic yield criteria for description
of the anisotropy in tension and compression of sheet metals,” International
Journal of Plasticity, vol. 24, no. 5, pp. 847–866, 2008.
[32] K. H. Huebner, E. Thornton, and E. Byrom, “The finite element method for
engineers john wiley & sons,” New York, 1982.
[33] K. Lange, M. Herrmann, P. Keck, and M. Wilhelm, “Application of an elasto-
plastic finite-element code to the simulation of metal forming processes,”
Journal of Materials Processing Technology, vol. 27, no. 1-3, pp. 239–261,
1991.
[34] P. Vacher, R. Arrieux, and L. Tabourot, “Analysis of a criterion of deep
drawing operation capability for thin orthotropic sheets,” Journal of Materials
Processing Technology, vol. 78, no. 1-3, pp. 190–197, 1998.
[35] R. Dick, R. Cardoso, M. Paulino, and J. W. Yoon, “Benchmark 4-wrinkling
during cup drawing,” in AIP Conference Proceedings, vol. 1567, pp. 262–327,
AIP, 2013.
88