analysis of slitless holographic spectrometers implemented by spherical beam volume holograms
TRANSCRIPT

Analysis of slitless holographic spectrometersimplemented by spherical beam volume holograms
Omid Momtahan, Chao Ray Hsieh, Ali Adibi, and David J. Brady
The analysis of a slitless volume holographic spectrometer is presented in detail. The spectrometer isbased on a spherical beam volume hologram followed by a Fourier-transforming lens and a CCD. It isshown that the spectrometer is not sensitive to the incident angle of the input beam for the practical rangeof applications. A holographic spectrometer based on the conventional implementation is also analyzed,and the results are used to compare the performance of the proposed method with the conventional one.The experimental results are consistent with the theoretical study. It is also shown that the slitlessvolume holographic spectrometer lumps three elements (the entrance slit, the collimator, and the dif-fractive element) of the conventional spectrometer into one spherical beam volume hologram. Based onthe unique features of the slitless volume holographic spectrometer, we believe it is a good candidate forportable spectroscopy for environmental and biological applications. © 2006 Optical Society of America
OCIS codes: 090.7330, 300.6190, 070.2590.
1. Introduction
Diffractive elements such as gratings are the basis ofmost spectrometers.1,2 The ambiguity between the in-cident angle and the wavelength of the input beam,imposed by the basic properties of the grating, is themain limitation on the performance of grating-basedspectrometers. The ambiguity is usually removed byusing a spatial filter (e.g., the entrance slit) in theinput, followed by a collimator, which directly reducesthe throughput and increases the total size of the spec-trometer. We recently proposed the idea of using aslitless spectrometer to reduce this ambiguity withoutusing the input slit to increase the throughput of thespectrometer and reduce its size.3 The improvement inthroughput is limited by the Lagrange invariantof the optics.4 Particularly for the incoherent inputbeam, the throughput of the spectrometer is con-strained by the constant radiance theorem.5 Anotherfeature of using a slitless spectrometer is the capabilityof obtaining more flexibility in the design and imple-
mentation. For example, the need for optical align-ment of the slit and the collimator with the rest of thespectrometer elements (which is necessary in conven-tional spectrometers) is completely avoided by usingslitless spectrometers. In this paper we present a prac-tical technique for implementing slitless spectrome-ters that is based on spherical beam volume holograms(SBVHs). We show that a compact and low-cost spec-trometer can be designed by using a SBVH, thus mak-ing it a good candidate as a portable device forenvironmental and biological applications. We re-cently proposed the idea of using a SBVH as a diffrac-tive element for spectroscopy.3,6–8 We showed thatwhen the SBVH is read with a collimated beam, a darkcrescent forms on the back face of the hologram. Theposition of the dark crescent is a function of the readingwavelength. Using this method, one can measure thespectral contents of a collimated reading beam basedon the location and the intensity of the dark crescents.Besides using the dark crescent, we also showed thatthe diffracted crescent could be used for spectroscopicapplications.6,7 The diffracted crescents correspondingto different incident wavelengths propagate in differ-ent directions and focus in different locations. Themain limitation imposed on the performance of a sim-ple SBVH spectrometer based on these two approachesis the ambiguity between the reading incident angleand the wavelength. Any change in the incident angleof the reading beam at a fixed wavelength also changesthe location of the dark crescent and the location wherethe diffracted beam is focused. Therefore neither the
O. Momtahan ([email protected]), C. R. Hsieh, and A. Abidiare with the School of Electrical and Computer Engineering,Georgia Institute of Technology, Atlanta, Georgia 30332-0250. D. J.Brady is with the Fitzpatrick Center for Photonics and Communi-cation Systems, Duke University, Durham, North Carolina 27708.
Received 10 August 2005; accepted 31 October 2005; posted 11January 2006 (Doc. ID 64082).
0003-6935/06/132955-10$15.00/0© 2006 Optical Society of America
1 May 2006 � Vol. 45, No. 13 � APPLIED OPTICS 2955

dark crescent nor the diffracted crescent can be useddirectly to resolve the spectrum when the hologram isread with a noncollimated or a spatially incoherentbeam. Although using a SBVH recorded in reflectiongeometry can reduce this ambiguity, it cannot elimi-nate it completely.8 We recently demonstrated a slit-less volume holographic spectrometer based on SBVHthat solves the ambiguity problem in the SBVH spec-trometers by using a Fourier-transforming lens afterthe hologram.3 In this implementation the effect of theincident angle of the reading beam on the locations ofthe output is minimal. Different wavelength compo-nents are separated in different locations at the Fou-rier plane of the lens even when the input beam isspatially incoherent. As a result, there is no need to usea slit in the input plane of the spectrometer. This is thereason we refer to this spectrometer as a slitless vol-ume holographic spectrometer.
In this paper we focus on the exact analysis of theseslitless spectrometers. We also provide an analysis ofconventional spectrometers and use the results tocompare slitless spectrometers with conventionalspectrometers. This analysis is important for under-standing the main features and limitations of slitlessspectrometers. Furthermore, it is also useful fordesigning and optimizing these spectrometers bothfor general spectroscopy and for specific applications.In Section 2 we derive the transfer function of theslitless volume holographic spectrometer. For latercomparison, the transfer function of a conventional(slit-based) spectrometer, having a simple plane-wave hologram as a diffractive element, is derived inSection 3. The theoretical evaluations are comparedwith the experimental results for both cases in Sec-tion 4. In Section 5 we compare the performance ofthe proposed slitless spectrometer with the slit-basedholographic spectrometer. Final conclusions aremade in Section 6.
2. Transfer Function of the Slitless VolumeHolographic Spectrometer
The slitless volume holographic spectrometer isbased on a SBVH as a diffractive element. The SBVHis recorded in a holographic medium with thickness Lby using a point source and a plane wave as shown inFig. 1(a). The hologram thickness (L), the incidentangle of the plane wave ��r�, the location of the pointsource ��a, 0, �d�, and the wavelength of the record-ing beams ��� are the design parameters for therecording. The hologram is recorded in the trans-mission geometry as shown in Fig. 1(a).
The hologram is then used in the spectrometer ar-rangement shown in Fig. 1(b). The reading beam il-luminates the hologram primarily in the direction ofthe recording spherical beam. Therefore, for thedesired range of wavelength, the diffracted beamdiffracts mainly in the direction of the recordingplane wave as indicated in Fig. 1(b). The Fourier-transforming lens is placed in the main direction ofthe diffracted beam, and the output is captured in thefocal (or Fourier) plane of the lens by using a CCDcamera. The focal length of the lens (f) is another
design parameter of the spectrometer. The SBVH inthis arrangement can be directly read with a noncol-limated beam, and there is no need to use a slit in theinput of the spectrometer.3 Therefore the SBVH ispositioned at the very beginning of the system.
To analyze the slitless spectrometer, we first findthe optical transfer function of the system shown inFig. 1(b). The transfer function is defined as the out-put of the system [at the CCD plane in Fig. 1(b)] to anarbitrary input plane wave (with arbitrary propaga-tion direction) at an arbitrary wavelength ��.9 Ingeneral, any input beam at wavelength �� can berepresented as a summation of several plane wavesat that wavelength. Therefore, using the transferfunction, the output of the system to an arbitrarybeam can be found at any wavelength. As a result, theoutput corresponding to any input beam can be foundby the analysis of different wavelength components ofthe beam.
We recently presented the complete analysis of aSBVH when it is read by a collimated beam from thedirection of the point source at an arbitrary wave-length.7 In that analysis the spherical beam was de-composed into several plane-wave components. Eachplane wave was assumed to form a hologram with thereference beam. To estimate the diffracted beam, wefound the superposition of the diffracted plane waves
Fig. 1. (a) Recording geometry of a spherical beam volume holo-gram. The point source is located at (�a, 0, �d). The referencebeam (plane-wave) incident angle is �r. A line from the coordinateorigin to the point source makes an angle �s with the z axis. Thethickness of the holographic material is L. (b) Slitless spectrometerconfiguration. The reading beam is the input to the spectrometerwith an incident angle of �si=. The focal length of the lens is f. TheCCD is located at the back focal plane of the lens.
2956 APPLIED OPTICS � Vol. 45, No. 13 � 1 May 2006

from the corresponding holograms when they areread by a collimated beam at wavelength ��. All thediffraction components were calculated by using theBorn approximation. We can use the same approach(as presented in Ref. 7) to study the properties of theslitless volume holographic spectrometer under dif-fuse light illumination at wavelength ��. To calculatethe output, we first find the transfer function (i.e., theoutput from a specific input plane wave at wave-length ��) and then incoherently add the outputcomponents corresponding to different plane-wavecomponents of the input beam. We assume that thereading beam consists of several plane waves propa-gating in different directions and with independentrandom phases with a uniform probability distribu-tion. Throughout the analysis, we also assume thatboth recording and reading beams have TE polariza-tion [i.e. electric field normal to the incident x–z planein Fig. 1(a)]. Calculation for the TM polarization (i.e.magnetic field normal to the incident x–z plane) canbe found in a similar way.
To find the transfer function, we assume that theelectric field of a reading plane wave propagating inthe direction ki� � kix�ax � kiy�ay � kiz�az with am-plitude Ai and phase �i is represented by
Ei�kix�, kiy�, kiz�� � Ai exp�j�kix�x � kiy�y � kiz�z� � �i�.(1)
From the analysis of Ref. 7, the electric field of thediffracted beam �Eid� from a SBVH can be written as
Eid�x, y, z� �exp�j�krx � kix��x�exp�jkiy�y�
4�2
��� Eid�kx, ky, z�exp��j�kxx
� kyy��dkxdky, (2)
where krx represent the x component of the recordingplane wave in Fig. 1(a) and the diffracted field in thespatial–spectral domain �i.e., Eid�kx, ky, z�� is repre-sented by7
Eid�kx, ky, z� �j2�2k�2LAiexp�j�i�
kidz�exp�jkidz�z�
� sinc� L2� �Kgz � kiz� � kidz���. (3)
In Eq. (3) � is the permittivity of the holographicrecording material, is the amplitude of the modu-lated permittivity, k� is the wavenumber at wave-length ��, and Kgz and kidz are given by
Kgz � krz � �k2 � kx2 � ky
2�1�2, (4)
kidz� � �k�2 � �Kgx � kix��2
� �Kgy � kiy��2�1�2, (5)
where k is the wavenumber at wavelength �,Kgx � krx � kx, Kgy � �ky, and kr � krxax � krzaz is thepropagation vector of the recording plane wave.
Now we assume that the Fourier-transforming lensis located at a distance f from the hologram as shownin Fig. 1(b). Although this is not a necessary assump-tion for the operation of the spectrometer (i.e., theFourier transform can be obtained by other arrange-ments of the lens), it simplifies the calculations byeliminating the quadratic phase term that resultsfrom the Fourier-transform operation of the lens.9 Inthis configuration the CCD is located exactly at theback focal plane (or Fourier plane) of the lens. Byassuming the lens is very large compared with thesize of the hologram and by using the paraxial ap-proximation, one can write the electric field of theoutput beam in the Fourier plane of the lens as9
Eio�u, v, z � 2f�
�Ai
j��f FEid�x, y, L�2�|fx�u����f� and fy�v����f�,
(6)
where u and v are the output coordinates in the focalplane and fx and fy are the frequency variables of thetwo-dimensional Fourier-transform operator F{ } de-fined as9
P�2�fx, 2�fy, z� � Fp�x, y, z�
��� p�x, y, z�
� exp��j2��fxx � fyy��dxdy. (7)
From Eq. (2) it is clear that the diffracted beam �Eid�can be also represented as a Fourier transform.Therefore Eq. (6) can be rewritten as
Eio�u, v, 2f� �Ai
j��f Fexp�j�krx � kix��x�exp�jkiy�y�F�1Edi�kx, ky, 2f�x→�x
y→�yfx�u����f �and fy�v����f�
�Ai
j��f Eid���2�fx � krx � kix��, � �2�fy � kiy��, 2f�|fx�u����f� and fy�v����f�
�Ai
j��f Eid��k�u�f � krx � kix�, � k�v�f � kiy�, 2f�. (8)
1 May 2006 � Vol. 45, No. 13 � APPLIED OPTICS 2957

Substituting Eid�kx, ky, z� from Eq. (3) and replacingkx and ky by their corresponding arguments accord-ing to Eq. (8), the transfer function (the output elec-tric field) can be written as
H�u, v, z � 2f, ���� Eio�u, v, 2f���Ai exp�j�i��
�j2�2k�2L
0�k�2 � �k�u�f�2 � �k�v�f�2�1�2
� expj2f�k�2 � �k�u�f�2
� �k�v�f�2�1�2sinc(L�2�krz � �k2
� �k�u�f � krx � kix��2 � �k�v�f � kiy��2�1�2
� kiz� � �k�2 � �k�u�f�2 � �k�v�f�2�1�2�.(9)
As seen from Eq. (9), the amplitude of the transferfunction (the electric field in the output, Eio) is afunction of the output coordinate (u, v). Note that themaximum of H occurs at the output coordinates forwhich the argument of the sinc function in Eq. (9) iszero. The locus of the maximum electric field is also afunction of the reading-beam direction representedby kix� and kiy� in Eq. (9). However, the effect of thedirection of the reading beam on the location of thediffracted beam in the output is minimal for the prac-tical range of angles as we will examine below.
To find the output to an incoherent beam, weshould add the output intensities of all of the inputplane-wave components [each one is a plane wave inEq. (1) with a random phase]. Therefore the totaloutput intensity is
Io�u, v, 2f� ��Ai2�kix�, kiy��|H�u, v, z
� 2f, ���|2dkx�dky�
�� �Eio�u, v, 2f��2dkx�dky�, (10)
where the integration is over all the spatial-frequency components �kix� and kiy�� of the input read-ing beam. It should be noted that all the parametersshould be calculated considering the refractive indexof the holographic material.
Figure 2 shows the intensity distribution in theoutput for the region corresponding to the CCD area�6.9 mm � 4.6 mm� when a typical hologram is readwith a spatially incoherent beam. In this calculationthe reading beam is modeled as a series of plane-wavecomponents with equal amplitudes and independentrandom phases for the incident angles in the rangefrom ��s� to �s� with 2�s� the actual divergence angleof the input beam in the actual experiments in both
x and y directions. The hologram is assumed to berecorded by using the setup in Fig. 1(a) withd � 4 cm, L � 300 �m, �r � 46°, and �s � �9°. Thereading wavelength is �� � 532 nm and is equal tothe recording wavelength (�). The refractive index ofthe recording material is assumed to be 1.5. The re-sults in Fig. 2 are calculated by using �s� � 5°. As isseen from Fig. 2, the output is a single crescent,which is very similar to the output when a singlecollimated beam reads the hologram. Therefore theoutputs of different plane-wave components (or direc-tions) of the reading beam at a single wavelengthalmost overlap at the same location in the outputplane.
Note that for the experimental measurements, theFourier-transforming lens is mounted perpendicularto the direction of the diffracted beam as shown inFig. 3. Compared with the arrangement shown in Fig.1(b), the experimental configuration is rotated andalso shifted in the space domain. The rotation of the
Fig. 2. Theoretical intensity distribution in the output of theslitless holographic spectrometer estimated for the region corre-sponding to the CCD area when the hologram is read with aspatially incoherent reading beam. The incident angle of the read-ing beam is assumed to be from �5° to 5° measured in the air inboth the x and the y directions corresponding to the total solidangle of 0.03 sr. The hologram is assumed to be recorded by usingthe setup in Fig. 1(a) with d � 4 cm, L � 300 �m, �r � 46°, and �s
� �9°. The reading wavelength is 532 nm, which is equal to therecording wavelength. The refractive index of the recording mate-rial is assumed to be 1.5.
Fig. 3. Experimental arrangement of the slitless spectrometer.All the parameters are the same as those given in the caption ofFig. 1 (b).
2958 APPLIED OPTICS � Vol. 45, No. 13 � 1 May 2006

lens is equivalent to the rotation (or a phase shift) ofthe incident beam in paraxial approximation. There-fore the effect is equivalent to a shift in the Fourierdomain or a shift in the position of the diffractedcrescent in the Fourier plane of the lens. Also, theshifts in the lens coordinate, as it is seen in Fig. 3compared with Fig. 1(b), results in a shift in theFourier coordinates. Therefore the difference in thetheoretical configuration with the experimentalsetup is a shift in the Fourier plane and can be com-pensated for with a constant shift. The theoreticalconfiguration reduces complicated conversions be-tween rotated coordinates and is easier to analyze.On the other hand, the main benefit of mounting thelens in the direction of the diffracted beam in theexperimental setup is to reduce the vignetting effectcaused by the limited size of the lens. Also, the aber-ration introduced by the lens is minimal in this con-figuration.9
3. Transfer Function of a Spectrometer Based ona Plane-Wave Hologram
To better understand the properties of the slitlessvolume holographic spectrometer, we compare it witha spectrometer based on a conventional implementa-tion shown in Fig. 4. This spectrometer consists of a4f-like system that images the input to the output ateach wavelength. The hologram crosses the Fourierplane of the first lens and contains its focal point asshown in Fig. 4. The angle between the hologram andthe input plane (�) in the spectrometer setup is de-termined by the desired wavelength range of opera-tion and the hologram recording parameters (i.e., thedirection and the period of the grating). The hologramis recorded with two interfering plane waves at wave-length � by using transmission geometry. The total
angle between the recording beams in the air is 2�,and the beams have equal incident angles (measuredbetween each beam and the normal to the hologramsurface). Therefore the grating vector �Kg� is parallelto the hologram’s larger surface (parallel to the x axisin Fig. 4), and its magnitude is 4� sin�����. Using theBorn approximation,10 we can write the output cor-responding to a monochromatic input point source atwavelength �� located at �xi, yi� (i.e., the point-spreadfunction) as
h�xi, yi; xo, yo; ��� � C sinc�L1
2�k1�
� sinc�L2
2�k2�sinc�L3
2�k3�,
(11)
k1 �2�
�� ���xi
f � 1�cos� �
� �xo
f � 1�sin� ��� Kg, (12)
k2 �2�
�� �yi
f �yo
f �, (13)
k3 � n2�
�� ����xi
f � 1�sin� �
� �xo
f � 1�cos� ��, (14)
where �xo, yo� represent the output coordinates; f isthe focal length of the lenses; n is the index of refrac-tion of the holographic material; Kg is the magnitudeof the grating vector; and L1, L2, and L3 are thehologram dimensions in the x, y, and z directions,respectively. The amplitude factor C is a function ofthe diffraction efficiency of the hologram and can beestimated from the Born approximation when theamplitude modulation of the permittivity (or themodulated refractive index) of the hologram is given.Since the throughput of the spectrometer is an im-portant design factor, the hologram should have ahigh diffraction efficiency. The ideal case would be ahologram with 100% diffraction efficiency. Thereforethe Born approximation is not accurate for estimat-ing such diffraction efficiencies, and more accuratemodels, such as the Kogelnik method11 or the rigor-ous coupled-wave analysis (RCWA) method,12 mustbe used. The RCWA method considers all the re-flected and transmitted orders for diffraction andyields to accurate numerical estimation in mostcases.12 In the Kogelnik method, which provides theclosed-form solution, only the zeroth and first-orderdiffraction for the transmitted beam is consideredand might not result in a very accurate estimationwhen reflection at the boundaries is significant. Itshould be noted that the results from the Kogelnikand RCWA approaches are exactly the same if we
Fig. 4. Basic arrangement of a spectrometer that uses a plane-wave hologram as the diffractive element. The hologram dimen-sions are shown in the figure. The hologram height (the dimensionin the y direction) is assumed to be L2 (not shown in the figure). Thefocal length of both lenses is f. The input object is usually a slit inthe yi direction.
1 May 2006 � Vol. 45, No. 13 � APPLIED OPTICS 2959
consider that there is no reflection from the faces ofthe hologram due to a change in the refractive indexfrom air to material and that the hologram is a Bragggrating (only zeroth and first-order diffraction).
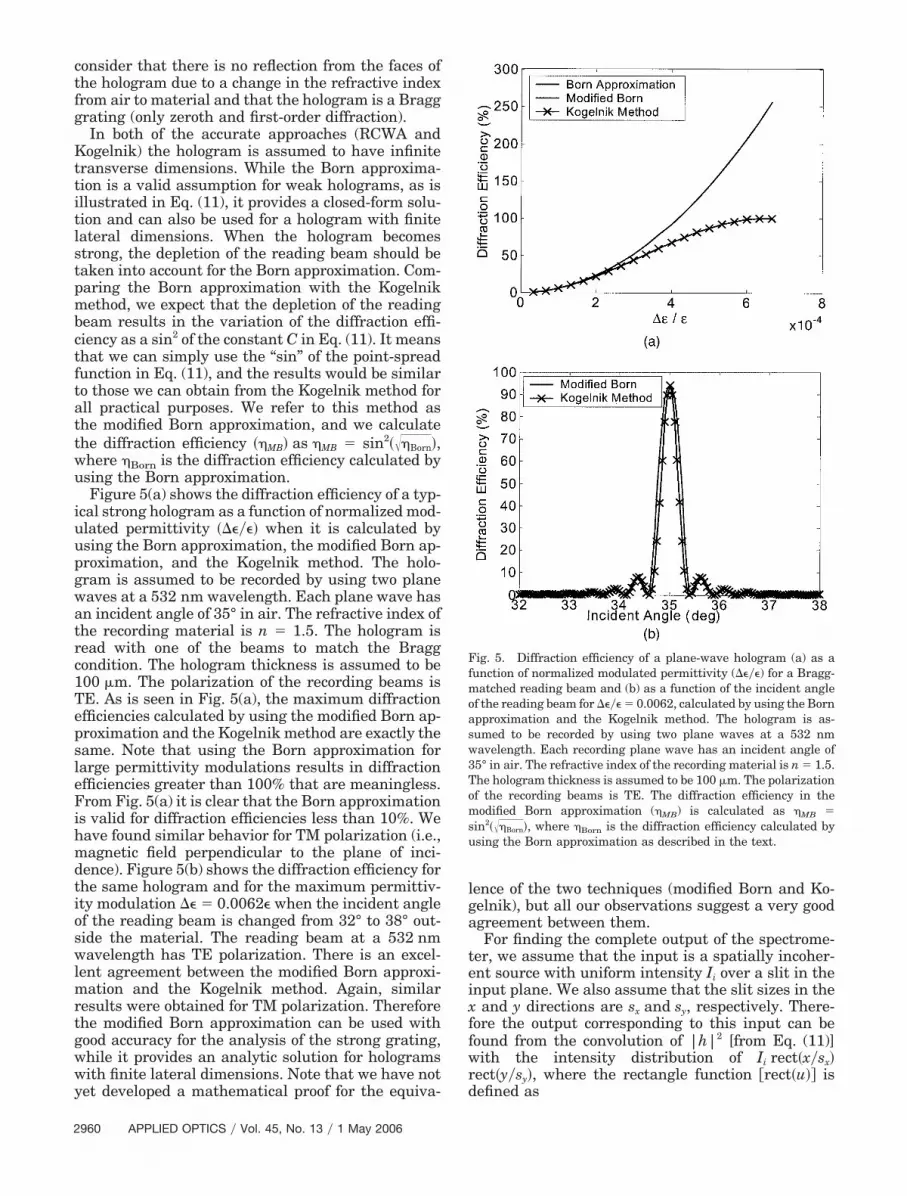
In both of the accurate approaches (RCWA andKogelnik) the hologram is assumed to have infinitetransverse dimensions. While the Born approxima-tion is a valid assumption for weak holograms, as isillustrated in Eq. (11), it provides a closed-form solu-tion and can also be used for a hologram with finitelateral dimensions. When the hologram becomesstrong, the depletion of the reading beam should betaken into account for the Born approximation. Com-paring the Born approximation with the Kogelnikmethod, we expect that the depletion of the readingbeam results in the variation of the diffraction effi-ciency as a sin2 of the constant C in Eq. (11). It meansthat we can simply use the “sin” of the point-spreadfunction in Eq. (11), and the results would be similarto those we can obtain from the Kogelnik method forall practical purposes. We refer to this method asthe modified Born approximation, and we calculatethe diffraction efficiency ��MB� as �MB � sin2� �Born�,where �Born is the diffraction efficiency calculated byusing the Born approximation.
Figure 5(a) shows the diffraction efficiency of a typ-ical strong hologram as a function of normalized mod-ulated permittivity ��� when it is calculated byusing the Born approximation, the modified Born ap-proximation, and the Kogelnik method. The holo-gram is assumed to be recorded by using two planewaves at a 532 nm wavelength. Each plane wave hasan incident angle of 35° in air. The refractive index ofthe recording material is n � 1.5. The hologram isread with one of the beams to match the Braggcondition. The hologram thickness is assumed to be100 �m. The polarization of the recording beams isTE. As is seen in Fig. 5(a), the maximum diffractionefficiencies calculated by using the modified Born ap-proximation and the Kogelnik method are exactly thesame. Note that using the Born approximation forlarge permittivity modulations results in diffractionefficiencies greater than 100% that are meaningless.From Fig. 5(a) it is clear that the Born approximationis valid for diffraction efficiencies less than 10%. Wehave found similar behavior for TM polarization (i.e.,magnetic field perpendicular to the plane of inci-dence). Figure 5(b) shows the diffraction efficiency forthe same hologram and for the maximum permittiv-ity modulation � 0.0062 when the incident angleof the reading beam is changed from 32° to 38° out-side the material. The reading beam at a 532 nmwavelength has TE polarization. There is an excel-lent agreement between the modified Born approxi-mation and the Kogelnik method. Again, similarresults were obtained for TM polarization. Thereforethe modified Born approximation can be used withgood accuracy for the analysis of the strong grating,while it provides an analytic solution for hologramswith finite lateral dimensions. Note that we have notyet developed a mathematical proof for the equiva-
lence of the two techniques (modified Born and Ko-gelnik), but all our observations suggest a very goodagreement between them.
For finding the complete output of the spectrome-ter, we assume that the input is a spatially incoher-ent source with uniform intensity Ii over a slit in theinput plane. We also assume that the slit sizes in thex and y directions are sx and sy, respectively. There-fore the output corresponding to this input can befound from the convolution of |h|2 [from Eq. (11)]with the intensity distribution of Ii rect�x�sx�rect�y�sy�, where the rectangle function �rect�u�� isdefined as
Fig. 5. Diffraction efficiency of a plane-wave hologram (a) as afunction of normalized modulated permittivity (���) for a Bragg-matched reading beam and (b) as a function of the incident angleof the reading beam for ��� � 0.0062, calculated by using the Bornapproximation and the Kogelnik method. The hologram is as-sumed to be recorded by using two plane waves at a 532 nmwavelength. Each recording plane wave has an incident angle of35° in air. The refractive index of the recording material is n � 1.5.The hologram thickness is assumed to be 100 �m. The polarizationof the recording beams is TE. The diffraction efficiency in themodified Born approximation (�MB) is calculated as �MB �sin2� �Born�, where �Born is the diffraction efficiency calculated byusing the Born approximation as described in the text.
2960 APPLIED OPTICS � Vol. 45, No. 13 � 1 May 2006

rect�u� ��1 �u� � 1�20 otherwise. (15)
When the diffraction efficiency of the hologram ishigh, we can use the modified Born approximation bythe convolution of sin��h��2 with the intensity distri-bution of the input slit.
4. Experiments
In this section the theoretical results are comparedwith the experimental results for both the slitlessvolume holographic spectrometer and the conven-tional holographic spectrometer. For all the experi-ments, the holograms were recorded in an Aprilisphotopolymer13 with a refractive index of 1.5. Therecording wavelength was 532 nm. The polarizationof the recording beams was TE, and the hologramswere recorded in transmission geometry.
For the SBVH, the hologram was recorded by usingthe setup in Fig. 1(a) with d � 4 cm, �r � 46° (in air),�s � –9° (in air), and L � 300 �m. For the conven-tional spectroscopy, we used a plane-wave hologramrecorded by using two coherent plane waves at� � 532 nm, each having an incident angle of� � 35° in air with respect to the normal to thesurface of the recording material. The hologram di-mensions were 1 cm, 1 cm, and 100 �m, correspond-ing to L1, L2, and L3 in Fig. 4, respectively. Thereason that a thinner hologram was used for this casewas to obtain broader wavelength selectivity.
The reading configuration for the SBVH is shownin Fig. 3. A beam from a monochromator with anoutput aperture size of 1 mm reads the SBVH after itpasses through a rotating diffuser. The full width athalf-maximum (FWHM) of the output of the mono-chromator was �7.5 nm for the range of wavelengthused in the experiment. The rotating diffuser isplaced adjacent to the hologram (not shown in Fig. 3)to generate a spatially incoherent reading beam thatreads the hologram from almost every direction. Thefocal length (f) of the Fourier-transform lens was10 cm. The diffracted beam was monitored by usinga cooled CCD camera with 9 �m � 9 �m pixelsmounted at the focal plane of the lens. The experi-mental result for the reading beam with three wave-length components at 492, 532, and 562 nm (from leftto right, respectively) is shown in Fig. 6(a). The out-put corresponding to each wavelength was obtainedseparately, and the results were added to obtain thisfigure. The theoretical results corresponding to theexperimental ones are shown in Fig. 6(b). The theo-retical results were obtained from the analysis pre-sented in Section 2 for the experimental parameters.Figure 6 shows good agreement between the theoret-ical and the experimental results. Note that the side-lobes in the experimental results [Fig. 6(b)] lookstronger than those in the theoretical results [Fig.6(a)]. We believe this is because of the high diffractionefficiency of the SBVH in the experimental case thatis not precisely modeled using the Born approxima-tion.
For the conventional plane-wave holographic spec-trometer (with slit present), the hologram was readby a beam obtained by passing white light throughthe monochromator described earlier, with a FWHMof 7.5 nm centered at a 532 nm wavelength. Thebeam was collimated and passed through a squareopening (or slit) with dimensions of 140 �m� 140 �m. The focal length of the lenses was 6.5 cm.The output was monitored by using a commercialCCD camera with a pixel size of 9.8 �m � 9.8 �m.Note that the CCD in this case is different from thatused in the previous experiment; however, this doesnot affect our results. The intensity distributionalong the x axis in the output plane (xo axis in Fig. 4)is shown in Fig. 7(a). The intensity distribution wasalso found theoretically by taking into account the
Fig. 6. Output of the slitless spectrometer for an input beam withwavelength components at 492, 532, and 562 nm obtained from(a) experiment and (b) theory. The SBVH was recorded by usingthe parameters in Fig. 1 (a) with d � 4 cm, �r � 46° (in air), �s ��9° (in air), L � 300 �m, and f � 10 cm. The recording wavelengthwas 532 nm. The pixel size of the CCD camera was 9 �m 9 �m.Note that the sidelobes in the experimental results look strongerthan those in the theoretical results. We believe this is because ofthe high diffraction efficiency of the SBVH in the experimentalcase that is not precisely modeled using the Born approximation.
1 May 2006 � Vol. 45, No. 13 � APPLIED OPTICS 2961
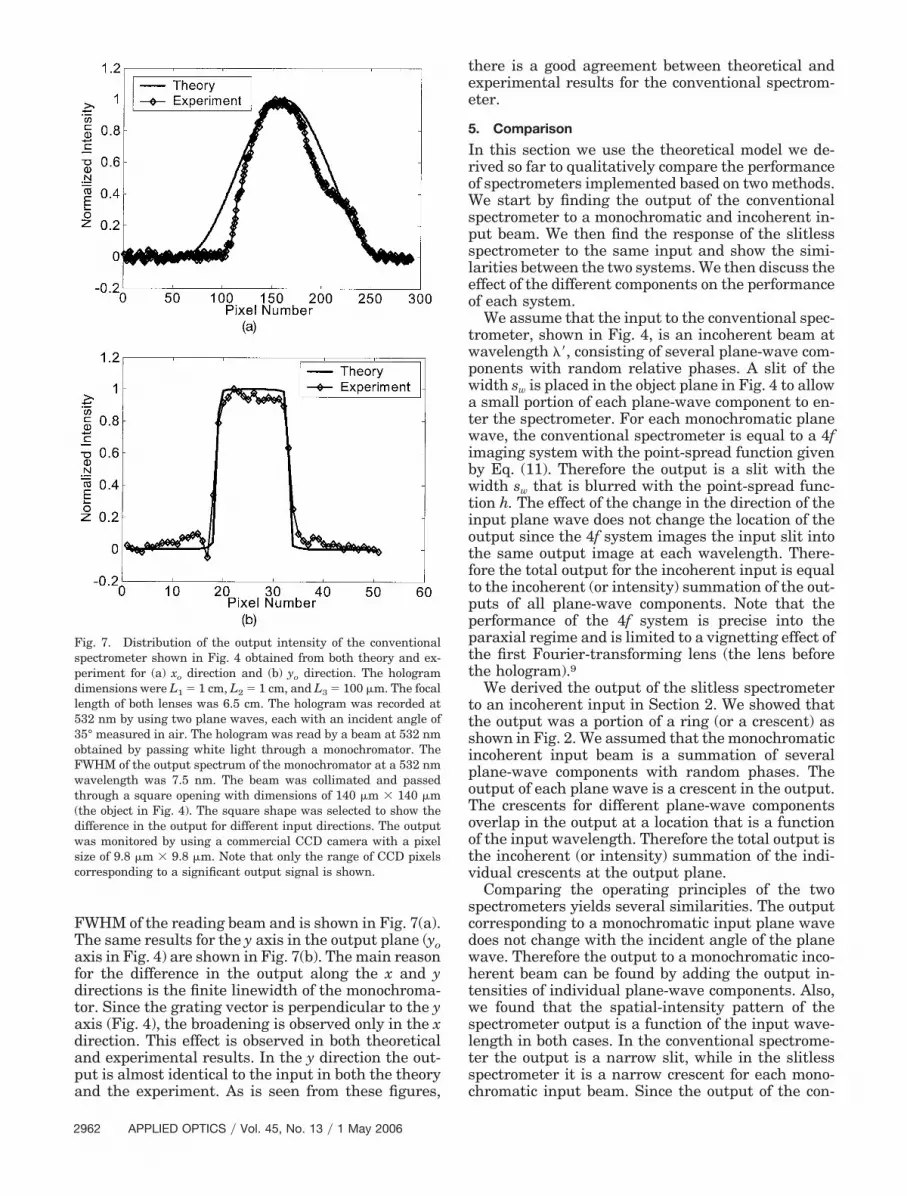
FWHM of the reading beam and is shown in Fig. 7(a).The same results for the y axis in the output plane (yoaxis in Fig. 4) are shown in Fig. 7(b). The main reasonfor the difference in the output along the x and ydirections is the finite linewidth of the monochroma-tor. Since the grating vector is perpendicular to the yaxis (Fig. 4), the broadening is observed only in the xdirection. This effect is observed in both theoreticaland experimental results. In the y direction the out-put is almost identical to the input in both the theoryand the experiment. As is seen from these figures,
there is a good agreement between theoretical andexperimental results for the conventional spectrom-eter.
5. Comparison
In this section we use the theoretical model we de-rived so far to qualitatively compare the performanceof spectrometers implemented based on two methods.We start by finding the output of the conventionalspectrometer to a monochromatic and incoherent in-put beam. We then find the response of the slitlessspectrometer to the same input and show the simi-larities between the two systems. We then discuss theeffect of the different components on the performanceof each system.
We assume that the input to the conventional spec-trometer, shown in Fig. 4, is an incoherent beam atwavelength ��, consisting of several plane-wave com-ponents with random relative phases. A slit of thewidth sw is placed in the object plane in Fig. 4 to allowa small portion of each plane-wave component to en-ter the spectrometer. For each monochromatic planewave, the conventional spectrometer is equal to a 4fimaging system with the point-spread function givenby Eq. (11). Therefore the output is a slit with thewidth sw that is blurred with the point-spread func-tion h. The effect of the change in the direction of theinput plane wave does not change the location of theoutput since the 4f system images the input slit intothe same output image at each wavelength. There-fore the total output for the incoherent input is equalto the incoherent (or intensity) summation of the out-puts of all plane-wave components. Note that theperformance of the 4f system is precise into theparaxial regime and is limited to a vignetting effect ofthe first Fourier-transforming lens (the lens beforethe hologram).9
We derived the output of the slitless spectrometerto an incoherent input in Section 2. We showed thatthe output was a portion of a ring (or a crescent) asshown in Fig. 2. We assumed that the monochromaticincoherent input beam is a summation of severalplane-wave components with random phases. Theoutput of each plane wave is a crescent in the output.The crescents for different plane-wave componentsoverlap in the output at a location that is a functionof the input wavelength. Therefore the total output isthe incoherent (or intensity) summation of the indi-vidual crescents at the output plane.
Comparing the operating principles of the twospectrometers yields several similarities. The outputcorresponding to a monochromatic input plane wavedoes not change with the incident angle of the planewave. Therefore the output to a monochromatic inco-herent beam can be found by adding the output in-tensities of individual plane-wave components. Also,we found that the spatial-intensity pattern of thespectrometer output is a function of the input wave-length in both cases. In the conventional spectrome-ter the output is a narrow slit, while in the slitlessspectrometer it is a narrow crescent for each mono-chromatic input beam. Since the output of the con-
Fig. 7. Distribution of the output intensity of the conventionalspectrometer shown in Fig. 4 obtained from both theory and ex-periment for (a) xo direction and (b) yo direction. The hologramdimensions were L1 � 1 cm, L2 � 1 cm, and L3 � 100 �m. The focallength of both lenses was 6.5 cm. The hologram was recorded at532 nm by using two plane waves, each with an incident angle of35° measured in air. The hologram was read by a beam at 532 nmobtained by passing white light through a monochromator. TheFWHM of the output spectrum of the monochromator at a 532 nmwavelength was 7.5 nm. The beam was collimated and passedthrough a square opening with dimensions of 140 �m 140 �m(the object in Fig. 4). The square shape was selected to show thedifference in the output for different input directions. The outputwas monitored by using a commercial CCD camera with a pixelsize of 9.8 �m 9.8 �m. Note that only the range of CCD pixelscorresponding to a significant output signal is shown.
2962 APPLIED OPTICS � Vol. 45, No. 13 � 1 May 2006
ventional spectrometer is almost the image of theinput slit, we can substitute the rectangular input slitwith a crescent-shaped slit (a transparency functionsimilar to the beam shape in Fig. 2), and the resultsof the conventional spectrometer would be the sameas those of the slitless spectrometer. This suggeststhat the two systems operate similarly. By comparingthe configuration of the slitless spectrometer (Fig. 3)with the conventional spectrometer (Fig. 4), we con-clude that the role of the SBVH is to implement threeelements of the conventional spectrometer [i.e., theinput slit, the input lens, and the diffractive element(plane-wave hologram)] into one element (i.e., theSBVH). To be more specific, in the slitless spectrom-eter the input lens is implemented with a gratingformed by a spherical beam and a plane wave. Also,the role of the slit in the conventional spectrometer isimplemented by the Bragg selectivity of the volumehologram.
To further compare the two systems we must takeinto account some practical limitations such as thenumerical aperture (NA) of the lenses. For example,the NA of the lens used to form the point source forrecording the SBVH is the key parameter that spec-ifies the range of the incident angle of the input beamof the spectrometer (reading beam), which by itselfdefines the throughput. Similarly, the NA of the firstlens in the arrangement of the conventional imple-mentation is the important parameter in finding therange of the incident angle of the input beam to thesystem. For example, if the input source is a fullyincoherent source that emits light in all directions,only a portion of the energy that is distributed over a4� sr solid angle goes into the system. Therefore alimitation exists on the acceptance input power owingto the limited NA of the practical lenses in both cases.Lenses with high NA are difficult and costly to make.For the conventional spectrometer, the lens is a partof the actual system. However, in the slitless spec-trometer, the lens is used to record the hologram thatis installed in the system. Therefore the cost per de-vice of the slitless spectrometer with a lens with highNA is much less than that of the conventional spec-trometer with a similar input-lens performance.
For the dispersive element that should be used ineach system, both the diffraction efficiency and thewavelength selectivity of the holograms are impor-tant. In the conventional spectrometer the gratingshould be thin (thickness in the range of a few mi-crometers) to diffract a large range of the wavelengthwith a high diffraction efficiency. On the other hand,the diffraction efficiency of the hologram reduces withdecreasing material thickness.10–12 The main chal-lenge in fabricating the holograms for conventionalspectrometers is maximizing the diffraction efficiencyfor thin material. In the slitless spectrometer, in con-trast to the conventional spectrometer, the range ofthe diffracted wavelength is limited by the divergenceangle of the recording point source. The wider theangle is, the larger the wavelength range of the op-eration is. Therefore there is no direct relation (ortrade-off) between the operating range of the wave-
length and the thickness of the material. However,the hologram thickness defines the crescent thick-ness and therefore the wavelength resolution. Thethicker the hologram, the narrower the crescent, andthe higher the resolution. The role of the thicknessof the hologram in the slitless spectrometer is similarto the width of the slit in the conventional spectrom-eter. As we mentioned before, increasing the materialthickness results in a higher dynamic range for ho-lographic recording. In the slitless spectrometer in-creasing the material thickness improves the peakdiffraction efficiency of the crescent. Therefore thepeak diffraction efficiency and the wavelength reso-lution can be improved simultaneously by using athicker hologram. This makes the fabrication of theSBVH very easy for the slitless spectrometer. Fur-thermore, we can multiplex more SBVHs to obtainmultiple (thin) crescents for each wavelength to avoidlosing the throughput of the spectrometer. The detec-tion parts of both devices are almost the same, and wedo not consider the effects of the CCD in our analysis.
Implementing three different elements of the con-ventional spectrometer into one element in the pro-posed slitless spectrometer makes the device morecompact. Also, the Fourier-transform lens can beplaced quite close to the hologram to further reducethe total size of the device. Since the slitless spec-trometer uses fewer optical elements, it is less sensi-tive to alignment. Also, removing the input slit andlens reduces the total cost of the device. The SBVH isplaced at the very beginning of the device, and thecoupling to the device is very easy. All these featuresmake the proposed slitless spectrometer a very goodcandidate for low-cost, portable spectrometers. Fur-thermore, replacing the input slit and lens with avolume hologram provides us with more design flex-ibility, especially for application-specific spectrome-ters, through optimization of the volume hologramthat we record. Some possibilities include multi-plexing several SBVHs to develop a more complexspatial–spectral pattern in the spectrometer output(compared with a simple crescent) to implementmultimode–multiplex spectroscopy. Such complex(and, in the ideal case, optimal) volume holograms inthe slitless architecture would implement complexslits in conventional architecture that are more ex-pensive and more alignment sensitive. Note that byusing a more complex volume hologram, it is evenpossible to remove the Fourier-transform lens and todevelop an ultracompact spectrometer, which is com-posed of only a volume hologram and a CCD camera(or a detector array).
6. Conclusion
We presented here a complete analysis of the slitlessspectrometer based on a spherical beam volume ho-logram (SBVH). The proposed spectrometer consistsof a SBVH, followed by a Fourier-transform lens anda CCD. We derived the transfer function of the slit-less spectrometer and showed that the output wasnot sensitive to the incident angle of the input beam.We showed that the theoretical results agree well
1 May 2006 � Vol. 45, No. 13 � APPLIED OPTICS 2963

with the experimental data. Also, we found the trans-fer function of the conventional spectrometer thatconsists of an entrance slit, a collimating lens, aplane-wave hologram, a collector lens, and a CCD.Again, the agreement between the theoretical andthe experimental results was very good. Using thetheoretical models, we showed that the slitless spec-trometer is a compact implementation of the con-ventional spectrometer when the slit is implementedby the Bragg selectivity of the volume hologram andthat the function of the collimating lens is included inthe SBVH. Therefore the proposed method enables usto make compact and low-cost spectrometers suitablefor portable applications. Since the hologram isplaced at the input of the spectrometer, light caneasily couple into the device.
We also showed that the slitless architecture hasmore design flexibility, as the dependency of the per-formance on the design parameters is different fromthat of the conventional spectrometer. In particular,we showed that the wavelength range of operationdepends on the recording parameters of the SBVH(basically, the divergence angle of the recordingspherical beam) in the slitless spectrometer in con-trast to that dependency on the thickness of the ho-lographic material in the conventional spectrometer.We also showed that the resolution of the slitlessspectrometer is a function of hologram thickness andthat it is possible to design an optimal spectrometerby simply recording an optimal volume hologram,which does not add to the hardware complexity of thespectrometer.
This research was supported by the National Insti-tute on Alcohol Abuse and Alcoholism through theIntegrated Alcohol Sensing and Data Analysis pro-gram under contract N01-AA-23013 and by the Davidand Lucile Packard Foundation. The authors thankBabak Momeni and Arash Karbaschi for their helpfuldiscussions.
References1. R. G. Bingham, “Grating spectrometers and spectrographs re-
examined,” Q. J. R. Astron. Soc. 20, 395–421 (1979).2. S. Singh, “Diffraction gratings: aberrations and applications,”
Opt. Laser Technol. 31, 195–218 (1999).3. C. Hsieh, O. Momtahan, A. Karbaschi, A. Adibi, M. E. Sullivan,
and D. J. Brady, “A compact Fourier transform volume holo-graphic spectrometer for diffuse source spectroscopy,” Opt.Lett. 30, 836–838 (2005).
4. W. Cassarly, “Nonimaging optics: concentration and illumina-tion,” in OSA Handbook of Optics, 2nd ed. (McGraw-Hill,2001), Vol. 3, Chap. 2.
5. D. J. Brady, “Multiplex sensors and the constant radiancetheorem,” Opt. Lett. 27, 16–18 (2002).
6. A. Karbaschi, C. Hsieh, O. Momtahan, A. Adibi, M. E. Sullivan,and D. J. Brady, “Qualitative demonstration of spectral diver-sity filtering using spherical beam volume holograms,” Opt.Express 12, 3018–3024 (2004).
7. O. Momtahan, C. Hsieh, A. Karbaschi, A. Adibi, M. E. Sullivan,and D. J. Brady, “Spherical beam volume holograms for spec-troscopic applications: modeling and implementation,” Appl.Opt. 43, 6557–6567 (2004).
8. C. Hsieh, O. Momtahan, A. Karbaschi, A. Adibi, M. E. Sullivan,and D. J. Brady, “Role of recording geometry in the perfor-mance of spectral diversity filters using spherical beam volumeholograms,” Opt. Lett. 30, 186–188 (2005).
9. J. W. Goodman, Introduction to Fourier Optics, 2nd ed.(McGraw-Hill, 1996).
10. G. Barbastathis and D. Psaltis, “Volume holographic multi-plexing methods,” in Holographic Data Storage, H. J.Coufal, D. Psaltis, and G. T. Sincerbox, eds. (Springer, 2000),pp. 21–59.
11. H. Kogelnik, “Coupled wave theory for thick hologram grat-ings,” Bell Syst. Tech. J. 48, 2909–2947 (1969).
12. T. K. Gaylord and M. G. Moharam, “Analysis and applicationsof optical diffraction by gratings,” Proc. IEEE 73, 894–937(1985).
13. R. T. Ingwall and D. Waldman, “Photopolymer systems,” inHolographic Data Storage, H. J. Coufal, D. Psaltis, and G. T.Sincerbox, eds. (Springer, 2000), pp. 171–197. Also see www.aprilisinc.com.
2964 APPLIED OPTICS � Vol. 45, No. 13 � 1 May 2006