analysis of impediments to fair housing choice - pasco-wa.gov
TRANSCRIPT

Analysis of Impediments to Fair Housing Choice Draft Version 9/30/19
Contents Executive Summary ..............................................................................................................................................3
Fair Housing Laws .................................................................................................................................................5
Background Information ......................................................................................................................................7
Fair Housing Zoning and Policies In Tri-Cities .................................................................................................... 19
Fair Housing Complaints .................................................................................................................................... 23
Current Fair Housing Action .............................................................................................................................. 26

Executive Summary
This document contains an updated Analysis of Impediments to Fair Housing Choice (AI) for the Tri-
Cities Consortium. Richland, Kennewick, and Pasco are entitlement communities under the U.S.
Department of Housing and Urban Development’s (HUD) Community Development Block Grant
Program (CDBG) and the HOME Investment Partnerships Program (HOME). In accordance with the
Housing and Community Development Act of 1974, as amended, each entitlement community must
“affirmatively further fair housing.” In order to demonstrate that the entitlement community is
“affirmatively further fairing housing,” the community must conduct a Fair Housing Analysis which
identifies any impediments to fair housing choice and what actions it will take to overcome the
effects of any impediments identified.
This report provides the cities with an assessment of the impediments to fair housing found in the
area and recommends steps to overcome the impacts of the identified impediments. It is intended
to be a tool to the cities in working with other agencies, and organizations, including the banking
and real estate industries toward the elimination of unfair housing practices.
From January 2017 to August 2019, the Northwest Fair Housing Alliance (NWFHA) referred to three
(3) fair housing complaints to HUD or the Washington State Human Rights Commission (WSHRC).
These complaints are then reviewed and addressed HUD or WSHRC. From January 2015 to the end
of 2018, NWFHA received 22 allegations of fair housing violations.
To better understand the conditions associated with housing complaints the Tri-Cities conducted a
thorough quantitative analysis of demographic, housing, socioeconomic, employment, mortgage
lending, and bank location data to understand the current conditions in the Cities. The City
complemented this data profile with a community survey, stakeholder interviews as well as a
review and assessment of City plans, policies, and other resources to understand current conditions
and identify potential impediments to fair housing choice.
Introduction
Equal and unimpeded access to residential housing is a fundamental civil right that enables
members of protected classes, as defined in the federal Fair Housing Act, to pursue personal,
educational, employment, or other goals. Because housing choice is so critical to personal
development, fair housing is a goal that government, public officials, and private citizens must
embrace if social equity is to become a reality. The federal Fair Housing Act prohibits discrimination
in housing based on a person’s race, color, religion, gender, disability, familial status, or national
origin. In addition, the U.S. Department of Housing and Urban Development (HUD) issued a Final
Rule on February 3, 2012, that prohibits entitlement communities, public housing authorities, and

other recipients of federal housing resources from discriminating on the basis of actual or
perceived sexual orientation, gender identity, or marital status. Persons who are protected from
discrimination by fair housing laws are referred to as members of the protected classes.
A growing body of research has demonstrated that limited housing choice has negative outcomes
for child well-being, social mobility, and, ultimately, human capital development—all factors in
public sector dependency. Limited housing choice for low-income households, therefore, can
inhibit a city’s economic growth.
To ensure the prevention and elimination of housing discrimination and housing segregation as it
pertains to fair housing choice, HUD requires all entitlements or jurisdictions directly receiving any
of the four HUD formula grant programs, Community Development Block Grant (CDBG), Emergency
Solutions Grant (ESG), HOME Investment Partnership Program (HOME), and Housing
Opportunities for Persons With Aids (HOPWA), to certify that the jurisdiction will “affirmatively
further fair housing choice” within their area of authority. “Affirmatively furthering fair housing” is
defined by HUD as requiring a local jurisdiction to analyze to identify impediments to fair housing
choice within the jurisdiction; to take appropriate actions to overcome the effects of any
impediments identified through the analysis, and to maintain records reflecting the AI and actions
taken in this regard.
Communities receiving HUD entitlement funds are required to:
Examine and attempt to alleviate housing discrimination within their jurisdiction
Promote fair housing choice for all persons
Provide opportunities for all persons to reside in any given housing development, regardless of race, color, religion, gender, disability, familial status, national origin, actual or perceived sexual orientation, gender identity, or marital status
Promote housing that is accessible to and usable by persons with disabilities, and
Comply with the non-discrimination requirements of the Fair Housing Act. An AI is a review of a jurisdiction’s laws, regulations, and administrative policies, procedures, and
practices affecting the location, availability, and accessibility of housing. It is also an assessment of
conditions, within both the public and private market, affecting fair housing choice.
TRI-CITIES Population and Housing
The Tri-Cities has a very diverse population, with marked differences between the cities. These
differences between cities continue to narrow. However, the demographic differences are still
relatively significant. A substantial portion of the population is Hispanic, particularly in Pasco.

While Pasco is home to the majority of the Tri-Cities Hispanic population, Kennewick and
Richland are both seeing greater number of Hispanic households. In addition to this demographic
trend, the Tri-Cities can expect an increase in the relative number of elderly residents. Some of
this will be due to the aging of the baby boomers in the region that choose to stay into
retirement age. Also, in-migration of elderly residents because some will be due to the aging of
the baby boomers and some to in-migration as people seek to take advantage of the more
moderate climate, slower pace of living, and more attractive costs of living. In-migration will
result in changes in demand for housing and services – including types and costs of units, location
of housing, access to services and care, and increased transportation options.
Housing development in the Tri-Cities has tended toward single-family and, to a much lesser
extent, higher-end multifamily, in recent years. Housing costs in the Tri-Cities have rapidly
increased, as they have in other areas. A significant issue discussed by individuals interviewed for
this report is the lack of available rental housing, particularly housing affordable to lower-income
households, the elderly and persons with disabilities. Vacancy rates hovering around 1% provide
limited choice and increase barriers to attaining housing stability.
Fair Housing Laws The Federal Fair Housing Act
Title VIII of the Civil Rights Act of 1968, as amended (Fair Housing Act), prohibits discrimination
based on:
Race or color
National origin
Religion
Sex
Familial status (including children under the age of 18 living with parents of legal
custodians, pregnant women, and people securing custody of children under age 18)
Disability
Further, the Fair Housing Act prohibits anyone taking any of the following actions based on the
above outlined classes:
Refusal to rent or sell housing
Refusal to negotiate for housing
Make housing unavailable
Deny a dwelling
Set different terms, conditions, or privileges for the sale or rental of a dwelling
Provide different housing services or facilities

Falsely deny that housing is available for inspection, sale or rental
Persuade owners to sell or rent at a loss
Deny access to or membership in a facility or service
Refusal to make a mortgage loan
Refusal to provide information regarding loans
Impose different terms or conditions on a loan
Discriminate in appraising property
Refuse to purchase a loan
Set different terms or conditions for purchasing a loan
Threaten, coerce, intimidate or interfere with anyone exercising fair housing right
Advertise or make any statement that indicates a limitation or preference based on race, color, religion, gender, disability, familial status or national origin
Refuse to let a person with a disability make reasonable modifications
Refuse to make reasonable accommodations in rules, policies, and practices if necessary
Unless a building qualifies as housing for older persons, it may not discriminate based on familial status
The US Department of Housing and Urban Development (HUD) has received the authority
and responsibility for administering this law. This authority includes handling of complaints,
engaging in conciliation, monitoring conciliation, protecting individual’s rights regarding
public disclosure of information, authorizing prompt judicial action when necessary, and
referring to the State or local proceedings whenever a complaint alleges a discriminatory
housing practice.
Washington State Law
Washington State has adopted a law that supplements the Federal Fair Housing Act, the
Washington State Law Against Discrimination (RCW Chapter 49.60). The State law prohibits
discriminatory practices in the areas of employment, places of public resort, accommodation, or
amusement, in real estate transactions, and credit and insurance transactions on the basis of race,
creed, color, national origin, families with children, sex, marital status, sexual orientation, gender
identity, age, honorably discharged veteran or military status, or the presence of any sensory
mental, or physical disability or the use of a trained dog guide or service animal by a person with a
disability; and prohibits retaliation against persons who oppose a discriminatory practice, and those
who file health care and state employee whistleblower complaints. (www.hum.wa.gov).
The Washington State Human Rights Commission has a cooperative agreement with the
Department of Housing and Urban Development to process and investigate dual-filed housing
complaints for which the Commission receives funding under the Fair Housing Assistance
Program (FHAP). Most of the Commission’s housing cases are dual-filed with HUD – the
exceptions are cases covered under State but not covered under federal law.

Background Information
The Tri-Cities today is experiencing rapid population growth, including an increase in seniors
because of the climate, pace of life, and cost of living. The economy remains strong compared to
most of the country and, importantly, while its economy has become more diversified over the
years, its workforce needs are still heavily tied to the 586 square mile Hanford cleanup site and
associated high- tech industries.
With the advent of the wine industry, the nature of the agricultural sector continues to evolve
with less reliance on the food processing industry. While these and other factors bond the three
communities, each of the communities has a special degree of distinction and its own identity.
Demographics
All parts of the Tri-Cities have seen substantial growth between 2010 and 2017, most notably
Pasco with a 30% growth in population. Most of the growth is the result of in-migration, given the
status of the growing economy, increased job prospects, a lower cost of living, and leisure
activities nearby, Tri-Cities expects to see a steady increase in population over the next several
decades.
Rapid growth creates demand for housing and services. The current low vacancy rates (1%) are
indicative of this demand. Several factors have contributed to the population growth, including
an increase in mobility between the three cities with the I-182 bridge over the Columbia River,
and the development of several new residential subdivisions offering housing at relatively
modest prices.
Tri-Cities Population 1990-2017
Location Year Change
1990 2000 2010 2017 2010-2017 Kennewick 42,155 54,693 70,341 78,858 12% Pasco 20,337 32,066 54,116 70,607 30% Richland 32,315 38,708 45,780 53,991 18% Benton County 112,560 142,475 167,077 190,559 14% Franklin County 37,473 49,347 71,329 89,124 25% Washington State 9% Sources: US Census; ACS 1990, 2000, 2010, 2017.
A major impact in the following years will be a large population influx as a result of new jobs
and increased educational opportunities. The Tri-Cities continues to grow at a rapid pace; it is
also important to note that both Benton and Franklin Counties also continue to grow rapidly.
This is indicative of regional growth and not just metropolitan growth because there are many

smaller cities within the region that are also experiencing large levels of growth. Inevitably, the
growth in the smaller surrounding cities will increase pressure on both services and housing in
the Tri-Cities.
Demographic Trends in Hispanic Population: 2010-2017 2010 2017 Difference
Kennewick 22.9 26.9 4.0 Pasco 55.5 55.1 -0.4 Richland 7.4 11.0 3.6 Benton County 17.4 20.8 3.4 Franklin County 50.4 52.5 2.1 Washington State 10.5 12.3 1.8
Source: US Census
Race/Ethnicity: 2017
Location
2017 Race Ethnicity*
White Alone
Non- White Hispanic
Non- Hispanic
Kennewick 76% 24% 27% 73% Pasco 70% 30% 55% 45% Richland 84% 16% 11% 89% Benton County 80% 20% 21% 79% Franklin County 72% 28% 53% 47% Washington State 77% 23% 12% 88% *May be of any race. Source: US Census.
The Tri-Cities has an increasingly diverse population. Pasco, in particular, has a large Hispanic
population, and that population in Pasco continues to grow. Agriculture and associated seasonal
workers were historical origins. Over the years, those workers have settled in the area, built
families and businesses and are an integral part of Pasco, the Tri-Cities, and other cities within the
Benton/Franklin County area. Of those Hispanic families in the region, the vast majority are
Mexican, with some representation Puerto Rican and Cuban families.
Detailed Race: 2017
Race
Location
Kennewick Pasco Richland Benton County
Franklin County
Washington State
American Indian and Alaska Native 1% 1% 1% 1% 1% 1% Asian 2% 3% 5% 3% 2% 8% Black or African American 2% 3% 2% 2% 2% 4% Native Hawaiian and Other Pacific Islander
0.1% 0.2% 0.1% 0.1% 0.2% 1%
White 76% 70% 84% 80% 72% 77% Two or more races 5% 4% 4% 4% 4% 6%
Source: US Census.

There continues to be a large percentage of foreign-born residents – Hispanic and non-Hispanic.
People look for opportunities in agriculture and other economic sectors. Inability to speak English
well, or at all, can be a barrier for those speaking Spanish, as well as those with other native
languages (for example, Russian and Ukrainian). Inability to read English, or read at all, affects
people’s ability to understand contracts. This lack of understanding was noted as a concern
during stakeholder/public meetings on the topic of fair housing issues in the Tri-Cities region. This
lack of understanding is involved in rental agreements, banking documentation, and plays an
important role in predatory lending practices.
Population by Race/Ethnicity Trend: 1990 to 2010
The shifts in demographics experienced in the Tri-Cities since 1990 are highlighted in the maps
above. It’s apparent that the Hispanic populations have been moving to Pasco and Kennewick
predominately. Most specifically, Eastern Pasco and Eastern Kennewick, on both sides of the
Columbia River.
RCAPS and ECAPS
A large body of social research has demonstrated the powerful negative effects of residential
segregation on income and opportunity for minority families. Historically, the Department of
Housing and Urban Development (HUD) has relied on identifying racially and ethnically
concentrated areas of poverty (RCAPs and ECAPs), geographic areas where both high poverty rates
and a high percentage of minorities are clustered. The rationale for this analysis was to help
communities determine where to invest housing resources by pinpointing the areas of the greatest
existing need. However, current evidence suggests that adding more subsidized housing to places
that already have a high concentration of social and economic issues (i.e. RCAPs and ECAPs) could
be counter-productive and not meet the spirit of the goals of HUD programs.
This does not mean RCAP/ECAPs should be ignored by communities, however. Residents in
RCAP/ECAPs still need services and high-quality places to live, and stabilizing and improving
conditions in the lowest-income neighborhoods remains a key priority of HUD programs. Instead,
investment should be balanced between existing RCAP/ECAPs and other neighborhoods that offer
opportunities and advantages for families.
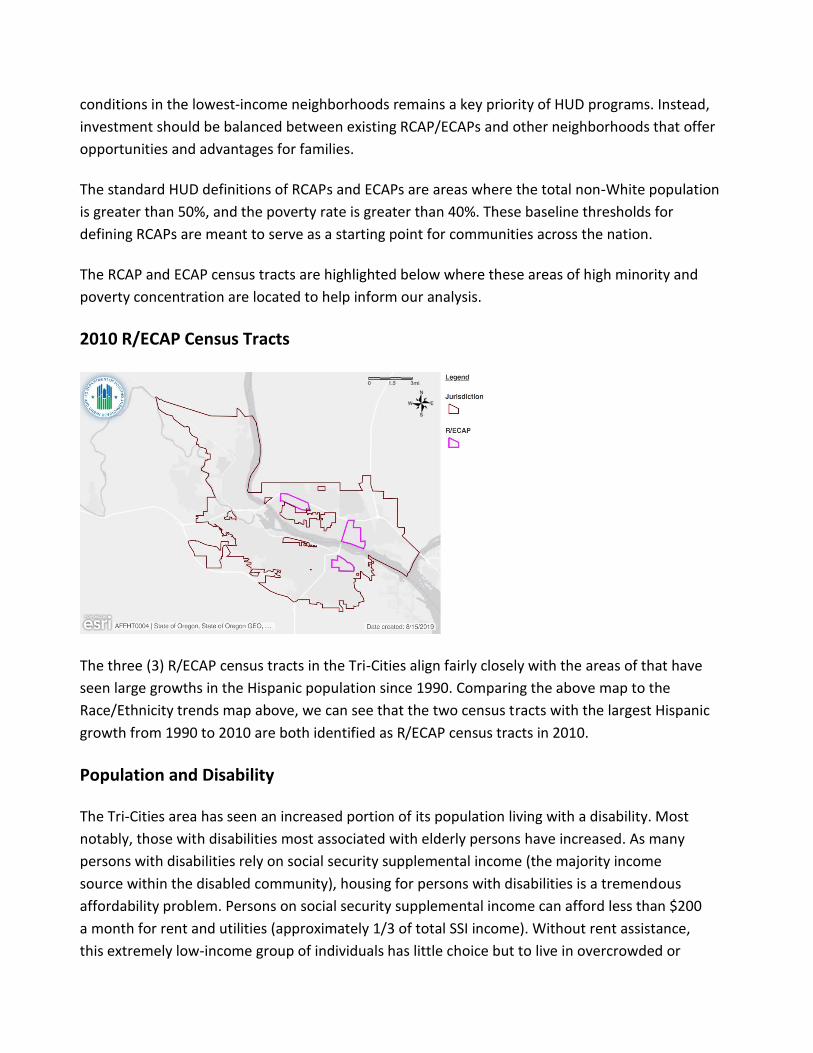
The standard HUD definitions of RCAPs and ECAPs are areas where the total non-White population
is greater than 50%, and the poverty rate is greater than 40%. These baseline thresholds for
defining RCAPs are meant to serve as a starting point for communities across the nation.
The RCAP and ECAP census tracts are highlighted below where these areas of high minority and
poverty concentration are located to help inform our analysis.
2010 R/ECAP Census Tracts
The three (3) R/ECAP census tracts in the Tri-Cities align fairly closely with the areas of that have
seen large growths in the Hispanic population since 1990. Comparing the above map to the
Race/Ethnicity trends map above, we can see that the two census tracts with the largest Hispanic
growth from 1990 to 2010 are both identified as R/ECAP census tracts in 2010.
Population and Disability
The Tri-Cities area has seen an increased portion of its population living with a disability. Most
notably, those with disabilities most associated with elderly persons have increased. As many
persons with disabilities rely on social security supplemental income (the majority income
source within the disabled community), housing for persons with disabilities is a tremendous
affordability problem. Persons on social security supplemental income can afford less than $200
a month for rent and utilities (approximately 1/3 of total SSI income). Without rent assistance,
this extremely low-income group of individuals has little choice but to live in overcrowded or

sub-standard units, residing in homes of parents or siblings well into adulthood, couch surfing, or
at risk of becoming homeless.
Overall Change in Population with a Disability
Kennewick Pasco Richland Benton County
Franklin County
Washington State
2010 10.8% 9.5% 11.1% 11.1% 9.3% 12.0%
2017 14.1% 10.1% 14.3% 13.9% 10.1% 12.8%
Percentage Point Change
3.3 0.6 3.2 2.8 0.8 0.8
Source: US Census; 2010 & 2017
Richland and Kennewick have seen an overall increase in a population that is living with a disability
at a rate that is above both Franklin and Benton County as well as Washington state. This does not
necessarily mean that the region is seeing a disproportionately high number of people with a
disability moving to the area, rather it is more indicative of a region that is outpacing the general
growth trend of its county and state.
2017 Population by Disability Type
Kennewick Pasco Richland
Hearing 4.1% 3.0% 4.0%
Vision 2.4% 2.3% 2.5%
Cognitive 6.5% 4.3% 6.9%
Ambulatory 8.1% 5.4% 7.3%
Self-Care 2.6% 2.0% 2.7%
Independent Living 7.2% 4.4% 7.6% Source: US Census; 2017
Population by Disability Type: 2010

The map above shows that there is no clear concentration of those persons living with a disability.
However, it is notable that there is some clustering of just South of the Columbia River in
Kennewick, where the R/ECAP census tract is located. Because these disability types are more often
associated with elderly populations, it likely that those individuals identified in this map within the
R/ECAP census tract are both elderly and a minority population.
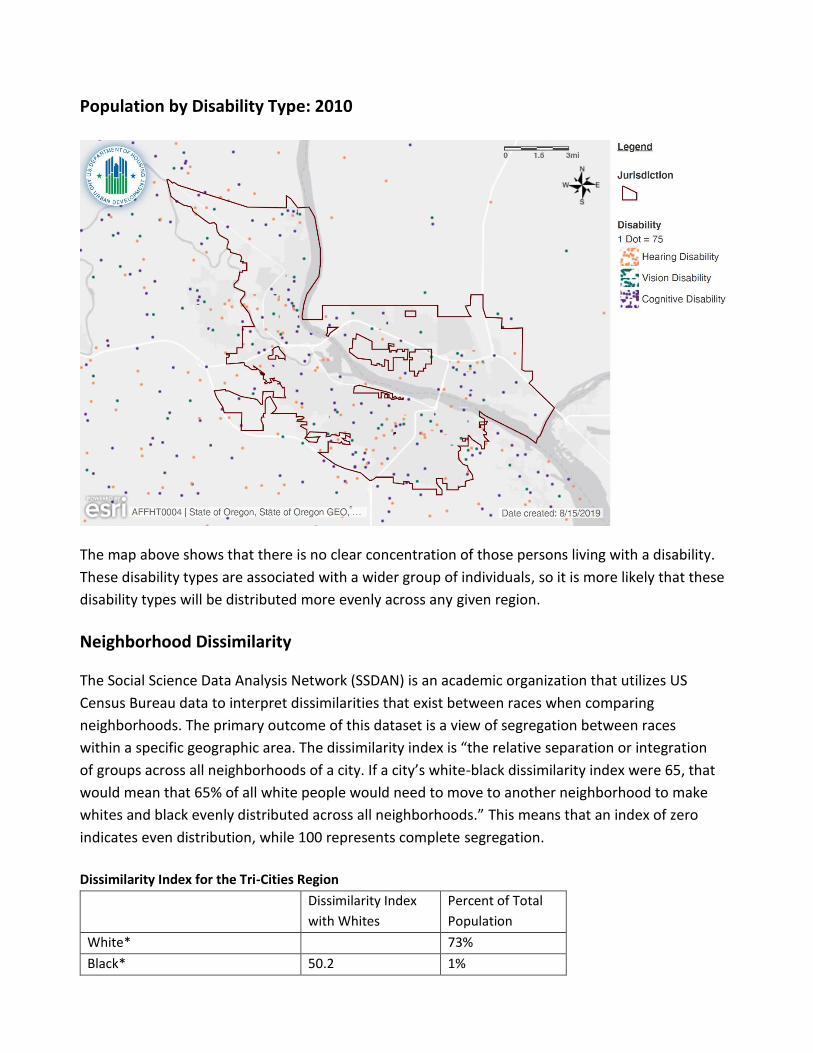
Population by Disability Type: 2010
The map above shows that there is no clear concentration of those persons living with a disability.
These disability types are associated with a wider group of individuals, so it is more likely that these
disability types will be distributed more evenly across any given region.
Neighborhood Dissimilarity
The Social Science Data Analysis Network (SSDAN) is an academic organization that utilizes US
Census Bureau data to interpret dissimilarities that exist between races when comparing
neighborhoods. The primary outcome of this dataset is a view of segregation between races
within a specific geographic area. The dissimilarity index is “the relative separation or integration
of groups across all neighborhoods of a city. If a city’s white-black dissimilarity index were 65, that
would mean that 65% of all white people would need to move to another neighborhood to make
whites and black evenly distributed across all neighborhoods.” This means that an index of zero
indicates even distribution, while 100 represents complete segregation.
Dissimilarity Index for the Tri-Cities Region
Dissimilarity Index
with Whites
Percent of Total
Population
White* 73%
Black* 50.2 1%

American Indian* 38.8 0.6%
Asian* 39.0 2%
Native Hawaiian* 73.3 0.1%
Other* 70.3 0.1%
Two or more races* 30.2 2%
Hispanic 55.9 21%
Source: Dissimilarity Index: www.censusscope.org
* Non-Hispanic Only
**When a group’s population is small, its dissimilarity index may be high even if the group’s members are evenly distributed.
Thus, use caution in interpreting dissimilarities among populations with less than 1,000 people (Native Hawaiian and Other)
It is important to note the above data is from the 2000 Census, and the Tri-Cities has grown
significantly among Hispanic and non-white populations. Maps below will further outline racial
and ethnic concentrations in the Tri-Cities.
From the above chart, the index number identifies what percentage of that demographic would
need to disperse to a different neighborhood to be evenly distributed as compared to the
majority population (in this case, whites). The most significant indexes are among the Native
Hawaiian, Other, and Hispanic populations. Notably, the proportion of the population that is
Native Hawaiian and Other are small, both under 250 respectively. However, the Hispanic
population makes up a large percentage of the Tri-Cities population and their dissimilarity index is
55.9, meaning the Hispanic population is most likely concentrated in a few areas of the Tri-Cities.
Households
Nearly 70 percent of the households in the Tri-Cities are family households. In 2017 there were
more large families (5 or more persons) in Pasco than in the other two cities. The number of
households comprised of single individuals is important to note. In 2017 about 25% of households
in the Tri-Cities were comprised of single persons. As the “baby boomers” age and retired persons
look for living opportunities in the Tri-Cities, this will increase the demand for specific types of
housing and services.
Types of Households 2017
Location Family Households Non-Family Households
2-4* 5+* Singles Other
Kennewick 55% 12% 26% 7%
Pasco 54% 22% 20% 4%
Richland 57% 9% 28% 6%
Benton County 58% 11% 25% 6%
Franklin County 55% 22% 19% 4%
Washington State 56% 9% 27% 8% Source: US Census.

Income
The chart reflects the substantial diversity in household income between the three cities. It is
also clear that median earnings for women and men differ, due in no small part to different
occupations. This has implications, of course, for women raising children on their own and for
elderly-women whose financial circumstances may be reduced upon the death of a spouse.
Median household income varies by race and ethnicity as well.
Disparities in median income, as shown in the table below affect the ability to secure suitable,
affordable housing. Also, median income is the mid-point – 50% of households are earning less,
often substantially less.
Household Income 2017
Income Location
Measure Kennewick Pasco Richland
Median household $54,420 $59,969 $71,025
Median family $63,372 $63,468 $91,623
Median earnings male* $51,560 $42,629 $73,691
Median earnings female* $33,931 $34,841 $47,656
Median household white alone** $57,481 $64,569 $71,601
Median household Hispanic** $40,999 $44,578 $45,900 *Working full-time, year-round. Source: US Census.
The table below examines the level of poverty in each of the cities as of 2017. Nearly a quarter of
women with children under 5 years of age (and no husband present) were living in poverty in
Kennewick and Pasco, and nearly half in Richland. Persons with disabilities who must rely on SSI as
a major or exclusive source of income and elderly residents living on limited fixed incomes are
examples of community members living in often extreme poverty. Poverty, compounded with
special needs, reduces housing choice.
Persons Living in Poverty 2017
Population Location
Kennewick Pasco Richland
Individuals 17% 17% 10%
Females alone w/children <5 27% 28% 41% Source: US Census.
Analysis of Home Mortgage Disclosure Act (HMDA) Data
Unfettered access to fair housing choice requires impartial and equal access to the mortgage
lending market. The Fair Housing Act prohibits lenders from discriminating against members of the
protected classes in granting mortgage loans, providing information on loans, imposing the terms
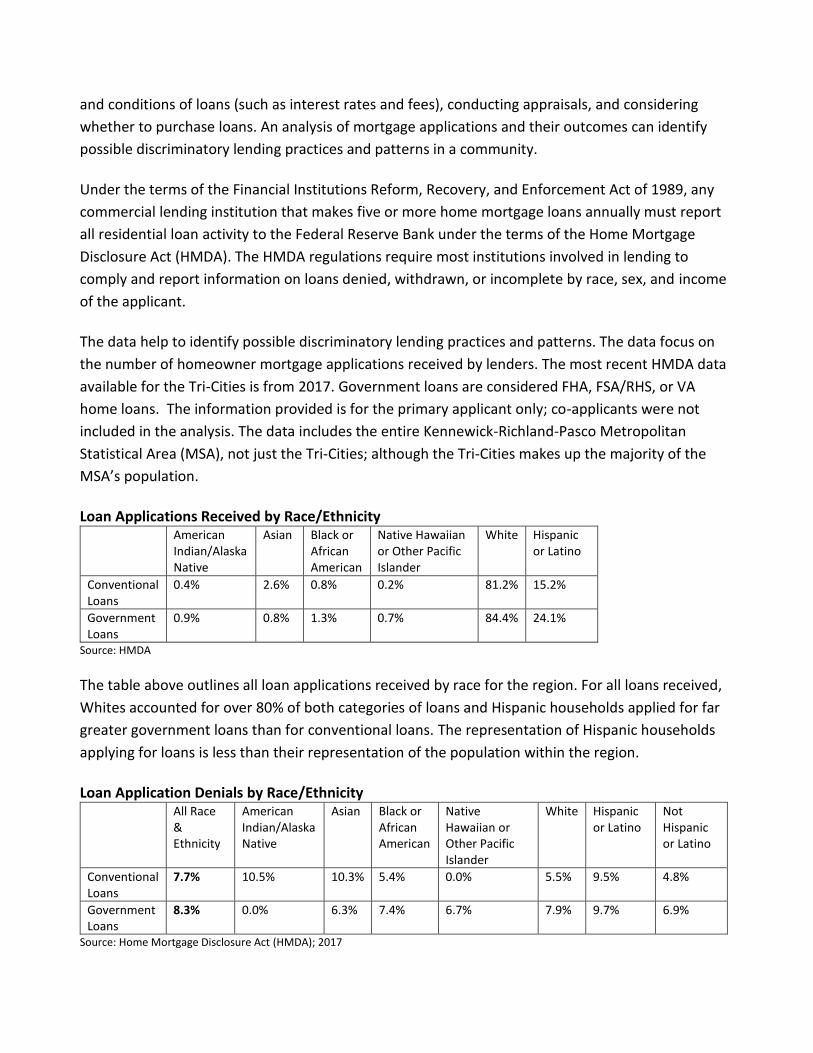
and conditions of loans (such as interest rates and fees), conducting appraisals, and considering
whether to purchase loans. An analysis of mortgage applications and their outcomes can identify
possible discriminatory lending practices and patterns in a community.
Under the terms of the Financial Institutions Reform, Recovery, and Enforcement Act of 1989, any
commercial lending institution that makes five or more home mortgage loans annually must report
all residential loan activity to the Federal Reserve Bank under the terms of the Home Mortgage
Disclosure Act (HMDA). The HMDA regulations require most institutions involved in lending to
comply and report information on loans denied, withdrawn, or incomplete by race, sex, and income
of the applicant.
The data help to identify possible discriminatory lending practices and patterns. The data focus on
the number of homeowner mortgage applications received by lenders. The most recent HMDA data
available for the Tri-Cities is from 2017. Government loans are considered FHA, FSA/RHS, or VA
home loans. The information provided is for the primary applicant only; co-applicants were not
included in the analysis. The data includes the entire Kennewick-Richland-Pasco Metropolitan
Statistical Area (MSA), not just the Tri-Cities; although the Tri-Cities makes up the majority of the
MSA’s population.
Loan Applications Received by Race/Ethnicity American
Indian/Alaska Native
Asian Black or African American
Native Hawaiian or Other Pacific Islander
White Hispanic or Latino
Conventional Loans
0.4% 2.6% 0.8% 0.2% 81.2% 15.2%
Government Loans
0.9% 0.8% 1.3% 0.7% 84.4% 24.1%
Source: HMDA
The table above outlines all loan applications received by race for the region. For all loans received,
Whites accounted for over 80% of both categories of loans and Hispanic households applied for far
greater government loans than for conventional loans. The representation of Hispanic households
applying for loans is less than their representation of the population within the region.
Loan Application Denials by Race/Ethnicity All Race
& Ethnicity
American Indian/Alaska Native
Asian Black or African American
Native Hawaiian or Other Pacific Islander
White Hispanic or Latino
Not Hispanic or Latino
Conventional Loans
7.7% 10.5% 10.3% 5.4% 0.0% 5.5% 9.5% 4.8%
Government Loans
8.3% 0.0% 6.3% 7.4% 6.7% 7.9% 9.7% 6.9%
Source: Home Mortgage Disclosure Act (HMDA); 2017

The tables above outline the HMDA data as of 2017, reporting on loan application denials by
race/ethnicity. The first column identifies what the denial rate is for the MSA as a whole, creating a
comparison point from which to base possible discrimination when looking at loan denial rates.
Loan Application Denials by Race/Ethnicity – Percentage Point Difference from Jurisdiction as a Whole
American Indian/Alaska Native
Asian Black or African American
Native Hawaiian or Other Pacific Islander
White Hispanic or Latino
Not Hispanic or Latino
Conventional Loans
2.8 2.6 -2.3 - -2.2 1.8 -2.9
Government Loans
- -2.0 -0.9 -1.6 -0.4 1.4 -1.4
Source: Home Mortgage Disclosure Act; 2017
The table above outlines the percentage points difference from the jurisdiction as a whole. A
negative number indicates that the demographic experiences a denial rate that is above the
jurisdiction as a whole. Those places where the rate for a race/ethnicity is higher than the
jurisdictional rate are highlighted in yellow.
Loan Application Denials by Income Category & Race All Race
and Ethnicity
American Indian/Alaska Native
Asian Black or African American
Native Hawaiian or Other Pacific Islander
White Hispanic or Latino
Not Hispanic or Latino
Conventional Loans
< 50% Median Income
18.4% 0.0% 33.3% 0.0% - 12.2% 14.5% 10.3%
50-79% Median Income
11.9% 25.0% 0.0% 0.0% - 7.9% 11.7% 5.5%
80-99% Median Income
6.3% 0.0% 0.0% 0.0% 0.0% 4.3% 6.7% 3.3%
100-119% Median Income
7.6% 0.0% 0.0% 16.7% 0.0% 5.5% 9.7% 4.3%
>120% Median Income
5.2% 11.1% 13.9% 7.1% 0.0% 4.0% 5.2% 4.5%
Government Loans
< 50% Median Income
20.3% 0.0% 0.0% 0.0% 0.0% 20.3% 19.8% 19.7%
50-79% Median Income
6.3% 0.0% 20.0% 0.0% 0.0% 6.2% 6.2% 5.6%
80-99% Median Income
6.3% 0.0% 0.0% 0.0% 0.0% 6.0% 8.0% 4.3%
100-119% Median Income
10.3% 0.0% 0.0% 20.0% 0.0% 10.9% 13.3% 10.8%
>120% Median Income
7.4% 0.0% 0.0% 20.0% 50.0% 6.2% 6.5% 6.1%
Source: Home Mortgage Disclosure Act; 2017

Loan Application Denials by Income Category & Race – Percentage Point Difference From Jurisdiction as a Whole
American Indian/Alaska
Native Asian
Black or African
American
Native Hawaiian or Other Pacific
Islander White Hispanic or Latino
Not Hispanic or Latino
Conventional Loans
< 50% Median Income 0 -14.90 0 - 6.20 3.90 8.10
50-79% Median Income -13.10 0 0 - 4.00 0.20 6.40
80-99% Median Income 0 0 0 0 2.00 -0.40 3.00
100-119% Median Income 0 0 -9.10 0 2.10 -2.10 3.30
>120% Median Income -5.90 -8.70 -1.90 0 1.20 0 0.70
Government Loans
< 50% Median Income 0 0 0 0 0 0.50 0.60
50-79% Median Income 0 -13.70 0 0 0.10 0.10 0.70
80-99% Median Income 0 0 0 0 0.30 -1.70 2.00
100-119% Median Income 0 0 -9.70 0 -0.60 -3.00 -0.50 >120% Median
Income 0 0 -12.60 -42.60 1.20 0.90 1.30 Source: Home Mortgage Disclosure Act; 2017
Similar to the table outlining loan application denials based on race, the table above identifies the
percentage point difference of loan denial based on a household’s race and income. The negative
numbers above show the places where the denial rate is above the rate of the jurisdiction as a
whole.

Community Reinvestment Act
The Community Reinvestment Act (CRA) was enacted by Congress in 1977 to encourage
depository institutions to help meet the credit needs of the communities in which they operate,
including low- and moderate-income neighborhoods. The CRA requires supervisory agencies to
assess performance periodically. The four federal bank supervisory agencies are Office of the
Comptroller of the Currency (OCC), Board of Governors of the Federal Reserve System (FRB),
Office of Thrift Supervision (OTS), and Federal Deposit Insurance Corporation (FDIC).
Performance is evaluated in terms of the institution (capacity, constraints and business
strategies), the community (demographic and economic data, lending, investment, and service
opportunities), and competitors and peers. Ratings assigned range from: outstanding,
satisfactory, needs to improve, and substantial noncompliance.
The following ratings pertain to banks rated between 2010 and 2019 in Pasco and Kennewick.
Note that this is not an exhaustive list of banks in the Tri-Cities, only the banks tested since 2010.
No banks in the Tri-Cities have received a “needs to improve” or “substantial noncompliance”
since testing results have been made public. No listings were shown for financial institutions in
Richland. All institutions shown had satisfactory or better ratings.
CRA Bank Ratings – 2010-2019 Bank City Agency Rating Exam Method Exam Date
Community First Bank Kennewick FDIC Satisfactory Small bank 2/1/2010 Community First Bank Kennewick FDIC Outstanding Small bank 2/1/2016 Community First Bank Kennewick FDIC Outstanding Small bank 1/1/2019 Bank Reale Pasco FDIC Satisfactory Small bank 1/1/2012
Source: ffiec.gov/craratings
Fair Housing Zoning and Policies In Tri-Cities
The Fair Housing Planning Guide was established by HUD as a guiding tool, identifying topics
and issues to investigate when developing the Analysis of Impediments to Fair Housing Choice.
Similarly, the 2016 HUD-DOJ guidance on fair housing asks local jurisdictions to consider “How
does the Fair Housing Act apply to state and local land use and zoning?” This section covers
those topics.
Administrative Actions Outreach and Testing
Each of the three cities makes written materials available on tenants’ rights and enforceable
fair housing laws in the area. The materials are made readily available at the city building
where residents may go to pay utility bills or meet with city staff. Occasionally, fair housing
information is included in utility bills that are mailed out to residents.

The Tri-Cities partner to host Fair Housing training, completed by the Northwest Fair Housing
Alliance (NWFHA). Also, NWFHA conducts fair housing testing in the Tri-Cities, both complaint-
based testing and audit testing. The audit testing conducted between January 2017 and
December 2018, a two-year period, found a discrimination rate of 5%. This audit testing
consisted of 44 total tests conducted, testing in four aspects:
1. Rental – Religion
2. Rental – National Origin
3. Lending
4. Accessibility
Of those two audit tests that found discrimination, both were within the Rental – National
Origin category.
Waitlists
None of the cities operate public housing, so none of the cities have waitlists to manage. There are
two Housing Authorities (HA) that operate within the Tri-Cities: The Housing Authority of the City of
Pasco and Franklin County and the Kennewick Housing Authority (KHA). Both Housing Authorities
manage a Housing Choice Voucher (HCV) waitlist, and both put into place localized preferences, as
permitted by HUD.
The Kennewick Housing Authority identifies HCV application preferences in its Administrative Plan.
Those preferences are (1) domestic violence victims, (2) elderly or disabled, (3) veteran household.
The City of Pasco and Franklin County Housing Authority also utilizes application preferences for
their HCV program. Those preferences are (1) elderly family, (2) disabled family, (3) working family,
(4) veteran status.
Building Codes Each of the three cities updates their local Building Codes related to handicapped accessibility
as the Washington State Building Codes is adopted (2009 ICC/ANSI A117.1-09, Accessible and
Usable Buildings and Facilities, with statewide amendments, adopted as part of the IBC). The
updates assure that construction considers the latest standards to improve accessibility for
the elderly and disabled.
Zoning Ordinances Family Definition
Each of the cities explicitly defines family in their Municipal Codes. In each of the cities, “family” is
defined broadly as one or more persons occupying a single housing unit. The definition of family in
the Tri-Cities does not discriminate based on family type or size. Below are the definitions for each
City:
Richland: “Family” means one or more persons occupying a premises and living as a single,
nonprofit housekeeping unit, as distinguished from a group occupying a hotel, club, boardinghouse
or rooming house, fraternity or sorority house.1
Pasco: “Family” means one or more persons (but not more than six unrelated persons) living
together as a single housekeeping unit. For purposes of this definition and notwithstanding any
other provision of this code, children with familial status within the meaning of 42 USC § 3602(k)
and persons with handicaps within the meaning of 42 USC § 3602(h) will not be counted as
unrelated persons.2
Kennewick: Family means one or more persons living together as a single housekeeping unit. 3
Accessory Dwelling
Each of the cities has zoning ordinances that address the use of accessory dwelling units (ADUs).
Accessory dwelling units are not restricted to any single neighborhood. Associated ordinances
would not seemingly cause a concentration of accessory dwelling units to a specific region of any
given City. Restrictions of the physical structure and its relationship with the primary building vary
between the cities, however accessory dwelling units are permitted on residential parcels in each of
the cities.
For complete ordinance language, please see the following references for accessory dwellings:
Richland: Municipal Code 23.42.020
Pasco: Municipal Code 25.165.040
Kennewick: Municipal Code 18.27.010
Density
As of June 2018, the Pasco City Council passed Resolution Number 3845, declaring the preferred
Urban Area Growth (UGA) boundary for the City. Given the substantial growth of the City,
expecting the need of just over 15,000 new housing units in the next 20 years, the City needs to
expand its footprint to accommodate new housing as well as other broader use spaces. This
Resolution has been forwarded to Franklin County for its consideration.
The City of Pasco revised its Municipal Code to allow for an increase in housing density in its R-2
to R-4 zoning classifications which will impact the number of units developed, with the aim of
increasing affordability.
Richland updated its zoning ordinance in 2009 to provide for mixed-use development in
1 Municipal Code 23.06.340 2 Municipal Code 25.15.080 3 Municipal Code 18.09.680

the Central Business District. The zoning ordinance will allow less expensive smaller
apartments in the core area next to transportation and services. It will also potentially
improve access to affordable housing for the elderly and persons with disabilities.
Kennewick allows accessory apartments in all residential zones provided they are built within
the existing structure. Its Alternative Residential Provisions allow densities to increase in all
residentially- zoned properties. Recently, Kennewick began allowing both attached and
detached ADUs. Also, Kennewick has adopted a Mixed Use Comprehensive Plan Land Use
designation and the Urban Mixed Use (UMU) zoning district that allows residential uses either
in conjunction with commercial development or as stand-alone uses. There are two areas
zoned as UMU which are in the Bridge-to-Bridge subarea and at Vista Field.
Comprehensive Plans A City’s Comprehensive Plan sets the policies on which current and future development of a
community is based. They provide a guide to local public planning which may impact fair housing.
Pasco’s 2007-2027 Comprehensive Plan4 Housing Element outlines the need and strategy for
housing development in the City. Described in the plan are five (5) housing goals/policies that will
guide the City’s development in the future. Several of these goals directly address the City’s need
for mixed development and the need to mitigate concentrations of populations to specific
neighborhoods or regions. Those goals are:
1. Encourage housing for all economic segments of the City’s population
a. Avoid large concentrations of high-density housing
b. Support dispersal of special needs housing throughout the community
c. Encourage medium/high density housing near arterial and
neighborhood/community shopping facilities and employment areas
2. Strive to maintain a variety of housing consistent with the local and regional market
a. Allow for a full range of residential environments
3. Support efforts to provide affordable housing to meet the needs of low- and moderate-
income households in the community
a. The city shall work with public and private sector developers to ensure that lower
income housing is developed on scattered sites and in such a manner that it blends
with surrounding neighborhoods
The 2017-2037 Kennewick Comprehensive Plan5 outlines three (3) goals, also aligning with
Countywide Planning Principles. The goals work to address the critical housing needs of the
region while understanding the need to do so in a manner that does not concentrate
4 https://www.pasco-wa.gov/DocumentCenter/View/2592/Comprehensive-Plan-2007-2027-Volume-1-of-2-PDF 5 https://www.go2kennewick.com/DocumentCenter/View/9723/Comprehensive-Plan-Together-we-are-One-Kennewick

populations or contribute to discriminatory practices. Those goals are:
1. Support and develop a variety of housing types and densities to meet the diverse
needs of the population
a. Support special needs housing within a variety of residential environments
b. Promote the development of senior housing in proximity to needed services
c. Allow residential developments such as condominiums, zero lot lines,
accessory apartments, and other innovative housing techniques
2. Promote affordable housing for all economic segments of the community
a. Explore the use of density bonuses, parking reductions, multi-family tax
exemptions, and permit expediting to encourage the development of housing
affordable at below-market-rate
Richland’s 2017 Comprehensive Plan6 identifies six (6) primary goals considering housing for the
City. Several of those goals directly address fair housing considerations in the region. Those goals
are:
1. Provide a range of housing densities, sizes, and types for all income and age groups
a. Encourage mixed-use developments
b. Support senior housing and long-term care/assisted living facilities in the City
within close proximity to commercial uses and medical services and facilities
2. Encourage the maintenance and preservation of existing housing stock and residential
neighborhoods
a. Continue to allow accessory dwelling units in single-family residential districts
b. Accommodate non-profit and public agencies’ efforts to purchase, construct and
rehabilitate housing to meet the affordable and other housing needs of the
community
Fair Housing Complaints
Federal, State, and local agencies have roles in working with persons who believe have
encountered housing discrimination based on any of the protected classes outlined above. The
Washington State Human Rights Commission has a cooperative agreement with the Department
of Housing and Urban Development to process and investigate dual-filed housing complaints for
which the Commission receives funding under the Fair Housing Assistance Program (FHAP).
Generally, a complaint sent directly to HUD is referred to the state or local agency for
investigation and enforcement activities. HUD identifies that utilizing housing professionals “in
the locality where the alleged discrimination occurred benefits all parties to a housing
6 https://www.ci.richland.wa.us/home/showdocument?id=7462

discrimination complaint.”7
The Northwest Fair Housing Alliance (NWFHA) has an established mission to eliminate housing
discrimination and to ensure equal housing opportunity for the people of Washington State
through education, counseling, and advocacy. The NWFHA is located in Spokane, WA and covers
Eastern and Central Washington as the primary state level Fair Housing organization.
The Northwest Justice Project, located in Kennewick, is the local legal-aid organization that lists
“subsidized or public housing evictions and fair housing discrimination” as one of their general
case service priorities. The Northwest Justice Project is active in the Tri-Cities conducting
landlord-tenant workshops and tenants’ rights education. Complaints and allegations understood
by the Justice Project may include the NWFHA for further enforcement.
National & State Trends According to HUD’s Annual Report to Congress: 20178, there were a total of 8,186 complaints
filed with HUD and FHAP agencies in 2017. Of those filed, 6,878 (84%) were filed with FHAP
agencies. The basis of those complaints are as follows:
Basis of Complaint Number of Complaints Percentage of Complaints
Disability 4,865 59%
Race 2,132 26%
Familial Status 871 11%
Retaliation 834 10%
National Origin 826 10%
Sex 800 10%
Religion 232 3%
Color 192 2% Source: HUD’s Annual Report to Congress: 2017, HUD Enforcement Management Database
Fair housing discrimination based on disability has steadily increased its proportion of those
complaints received by HUD. In 2013 discrimination based on disability comprised 53% of all
complaints, as of 2017 the percentage was 59%.
Within Washington, there were a total of 170 HUD and FHAP complaints in 2017. Of those
complaints filed, 85% were with the FHAP, Northwest Fair Housing Alliance.
7 https://www.hud.gov/program_offices/fair_housing_equal_opp/partners/FHAP#FHAP1 8 https://www.hud.gov/sites/dfiles/FHEO/images/FHEO_Annual_Report_2017-508c.pdf

Fair Housing Complaints – HUD
According to HUD records, between 1/1/2011 and 12/31/2017, there were a total of 24 fair housing
complaints in Benton and Franklin Counties. Of those 24 complaints, three (3) were within Franklin
County, all within Pasco; while 21 were in Benton County. The Benton County complaints are
subdivided by location as follows:
11 in Kennewick
9 in Richland
1 in Benton City
The basis for the 25 fair housing complaints in Benton and Franklin counties combined are as
follows (some complaints have multiples bases):
Disability (21)
National Origin (3)
Race (1)
Religion (1)
The majority of the cases outlined above are closed. Below is the breakdown of the reason for the
case closure:
Conciliation/Settlement successful (13)
No cause determination (6)
Complaint withdrawn by complainant after resolution (4)
Fair Housing Complaints – Washington State Human Right Commission
Over the same period of time as above, 2011 to 2018, the Washington Human Right Commission
database reveals a total of 20 complaints. Of those 20 complaints, 15 were in Benton County while
the remaining five were in Franklin County. It is important to note that there may be overlap in
these identified cases and the complaints outlined in the above section. The Washington State
Human Rights Commission has responsibility for violations of State law; however there are
complaints based on Federal law included in this database.
The most common issue for submission of a complaint was around rental terms and conditions,
followed by a refusal to rent. Half (50%) of the complaints filed with the Human Rights Commission
were found to have “No Reasonable Cause” meaning upon investigation there was no
discrimination found in that particular instance.

Fair Housing Complaints – Northwest Fair Housing Alliance Complaints
Since 2015, the Northwest Fair Housing Alliance (NWFHA) have referred three complaints to HUD
or the Washington State Human Rights Commission. Of those complaints referred, three were
based on disability, and one was based on national origin (one complaint had multiple bases).
NWFHA also conducts fair housing testing in the region. Testing conducted from 1/1/2017 to
12/31/2018 revealed discrimination in 2 of 3 complaint-based rental tests. One of those was on the
basis of assistance animal while the other was based on religion. Of the audit-based testing in the
region 5% revealed discrimination; all testing that found discrimination was due to national origin.
Current Fair Housing Action
Since the last Analysis of Impediments to Fair Housing Choice (AI) was completed the three cities
have taken several steps in addressing the fair housing issues in the region. Many of these activities
have been carried out while partnering with other agencies, including the cities’ partnership with
each other. The notable activities are listed below:
Partnership with the Northwest Fair Housing Alliance (NWFHA)
o Annual workshop for lenders and realtors on fair housing requirements and
principles
o Each city readily makes available the NWFHA fair housing education materials to the
public through online channels
In Pasco, all landlords and property managers of rental units go through fair housing training
The two housing authorities operating in the Tri-Cities partner with the cities to conduct fair
housing workshops and ensure access to fair housing materials in efforts to continually
educate the public
In Richland, every April fair housing materials from the NWFHA are included in the City’s
utility bills that are sent to residents
In each city, fair housing materials are made available in City public areas such as libraries
and common areas in city buildings
The cities have adopted zoning policies in respect to Accessory Dwelling Units (ADUs) that
aims to address an aspect of the affordable housing issue the region is facing
Impediments to Fair Housing
1. Vacancy rates throughout the Tri-Cities have been stubbornly low for many years, reaching a
rate below 2% in 2018.
An extremely low vacancy rate creates ripple effects through the market which may have impacts
on fair housing issues. The low vacancy rates increase housing costs across the spectrum of housing
options due to the increase in demand the limited supply. This increase in cost has a
disproportionate impact on those low-income households. Similarly, in a low-vacancy market,
landlords have larger pool of potential clients and are more able to filter applicants that they may
deem less risky.
Recommendation
Continue a proactive orientation towards zoning and density regulations that will minimize
the housing crunch felt in the region.
The changes to the Accessory Dwelling Units (ADUs) was a good step in acknowledging the
need for creative solutions to the affordable housing issue in the area.
Continue to integrate each City’s comprehensive plans, particularly focusing on those
housing elements that will increase housing supply at various unit sizes.
2. Supply of housing, particularly affordable housing, for those individuals with a disability and
those elderly households remains very small in relation to the overall housing market.
The population in the Tri-Cities has grown rapidly, even more notably the population living with a
disability and those elderly individuals have become an increasingly large portion of the population.
This fact, paired with the extremely low-vacnacy rate, will put an increasing amount of pressure on
those elderly individuals and those living with a disability to find adequate housing that suits their
needs.
Recommendation
Continue building code enforcement, ensuring units are accessible to those with special
needs.
Incentivize landlords and property owners to provide housing that is ADA accessible and
meets the needs of the growing elderly population.
3. Residents, landlords, and property owners do not readily understand all of the fair housing laws
that are applicable in their housing situation.
Increasingly diverse, especially Hispanic, population in the region increases the amount of
protected classes in the Tri-Cities area. Landlords and property owners need to be made completely
aware of the fair housing regulations that apply to their housing units and understand the
consequences of not complying with the fair housing laws. Similarly, residents need to be made
aware of the fair housing regulations that apply when looking for appropriate housing in the Tri-
Cities.
Recommendation
Continue outreach and media campaign efforts to increase awareness to residents on the
fair housing laws.
Continue to partner with the Housing Authorities operating in the Tri-Cities, Northwest Fair
Housing Alliance, and the Northwest Justice Projects, to educate residents, landlords, and
property owners on fair housing regulations.
Because of the increase in diversity and primary languages spoken in the Tri-Cities, it will be
important to make fair housing information available in languages that meet the needs of
the residents.
Make targeted outreach to landlords and property owners on fair housing regulations.
Given the tight housing market and the increasingly diverse population since the last
Analysis of Impediments was completed, this is a an imperative.