analisis-kasus-coca-cola-company 2
TRANSCRIPT
MANAJEMEN STRATEGIK
ANALISIS KASUS
COCA-COLA COMPANY Dosen Pengampu: Lilik Wahyudi, S.E., M.Si.
Kelompok H
1. Fatania Latifa F0307049
2. Hermin Arifianti F0307055
3. Jarmiatun F0307059
4. Ratih Indah F0307075
JURUSAN AKUNTANSI FAKULTAS EKONOMI
UNIVERSITAS SEBELAS MARET SURAKARTA
2009
1
Kelompok H
PENDAHULUAN
Industri Minuman Ringan
Sekarang ini perkembangan dunia industri semakin maju, hal itu terbukti dengan banyaknya
industri-industri baru yang mengelola berbagai macam produk. Dengan demikian, kebutuhan akan
faktor-faktor produksi menjadi bertambah banyak.
Di Indonesia, minuman ringan mudah sekali diperoleh di berbagai tempat, mulai dari
warung sampai toko-toko kecil. Minuman ringan dikonsumsi oleh semua lapisan masyarakat dari
berbagai latar belakang pendidikan dan pekerjaan. Dengan konsumsi minuman ringan yang
sedemikian luasnya, produk minuman ringan bukanlah barang mewah melainkan barang biasa.
Saat ini, Indonesia mencatat tingkat konsumsi produk-produk Coca-Cola terendah (hanya 13
porsi saji seukuran 236 ml per orang per tahun), dibandingkan dengan Malaysia (33), Filipina (122)
dan Singapura (141). Karena minuman ringan merupakan barang yang permintaannya elastis
terhadap harga, berbagai upaya dilakukan agar harga produk-produk minuman ringan tetap
terjangkau. Elastisitas harga minuman ringan terhadap permintaan adalah -1.19 yang berarti bahwa
saat terjadi kenaikan harga, volume penjualan akan berkurang dengan prosentase yang lebih besar
daripada prosentase kenaikan harga tersebut.
Ditinjau dari segi penciptaan kesempatan kerja, industri minuman ringan memiliki efek
multiplier yang besar pada tenaga kerja. Dengan rasio sebesar 4,025, industri minuman ringan
menduduki pringkat ke - 14 dari 66 sektor industri lainya di seluruh Indonesia. Ini berarti bahwa
untuk setiap peluang pekerjaan yang tercipta, atau hilang, di industri minuman ringan, empat
kesempatan kerja akan tercipta, atau hilang, di tingkat nasional.
Delapan puluh persen penjualan minuman ringan dilakukan oleh
pengecer dan pedagang grosir dimana 90% diantaranya termasuk
dalam kategori pengusaha kecil. Bagi para pengusaha kecil tersebut,
produk minuman ringan merupakan barang dagangan terpenting
mereka dengan kontribusi sebesar 35% dari total penjualan dan nilai keuntungan sebesar 34%.
Industri-industri penunjang lainnya yang terkena dampak kegiatan industri minuman ringan
meliputi gelas, tutup botol, transportasi dan media.
2
Kelompok H
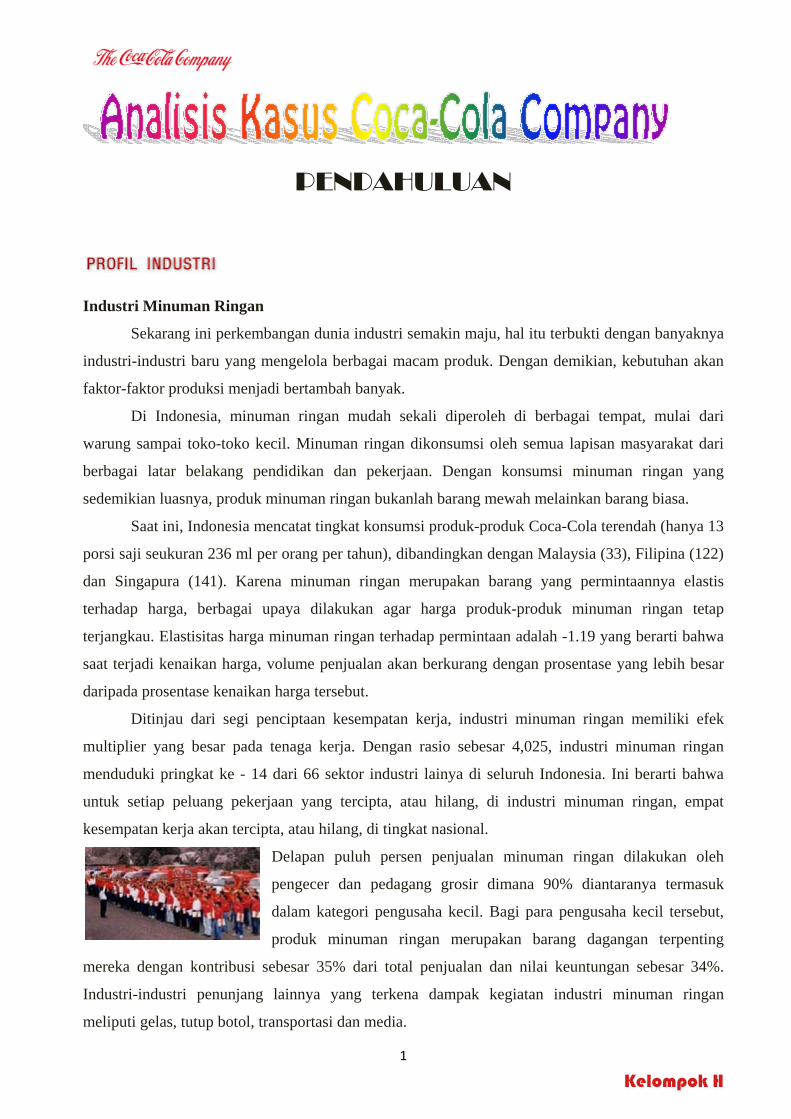
Coca-Cola Bottling Indonesia merupakan salah satu produsen
dan distributor minuman ringan terkemuka di Indonesia. Perusahaan
ini memproduksi dan mendistribusikan produk-produk berlisensi dari
The Coca-Cola Company.
Coca-Cola Bottling Indonesia merupakan nama dagang yang
terdiri dari perusahaan-perusahaan patungan antara perusahaan-
perusahaan lokal yang dimiliki oleh pengusaha-pengusaha
independen dan Coca-Cola Amatil Limited, yang merupakan salah
satu produsen dan distributor terbesar produk-produk Coca-Cola di
dunia.
asi yang tinggi dalam memproduksi dan mengelola
berbagai aspek teknis dan pengawasan mutu.
tur melaksanakan
audit di bidang pengawasan mutu, lingkungan, kesehatan dan keselamatan kerja.
melampaui standar yang ditetapkan untuk
pabrik-pabrik sejenis di berbagai lokasi lain di dunia.
PEMBUATAN COCA-COLA
sumen berawal dari bahan baku pilihan
berkualitas tinggi yang diproses melalui beberapa tahapan:
Semua produk yang dijual dan didistribusikan oleh Coca-Cola
Bottling Indonesia diproduksi di Indonesia. Saat ini terdapat 10 pabrik
pembotolan yang tersebar di seluruh Indonesia. Walaupun kebijakan
dan pengembangan produksi diarahkan oleh National Office yang
berkedudukan di Cibitung, Bekasi, setiap pabrik memiliki manajemen
yang memiliki pengalaman luas dan kualifik
Semua pabrik diwajibkan mematuhi dan bahkan kerap kali melampaui berbagai ketentuan
internasional dan peraturan perundang-undangan yang berlaku, dan secara tera
Selama ini pabrik-pabrik kami di Indonesia telah menerima berbagai penghargaan dari The
Coca-Cola Company atas pencapaian standar yang
Minuman Coca-Cola sebelum sampai ke tangan kon
3
Kelompok H
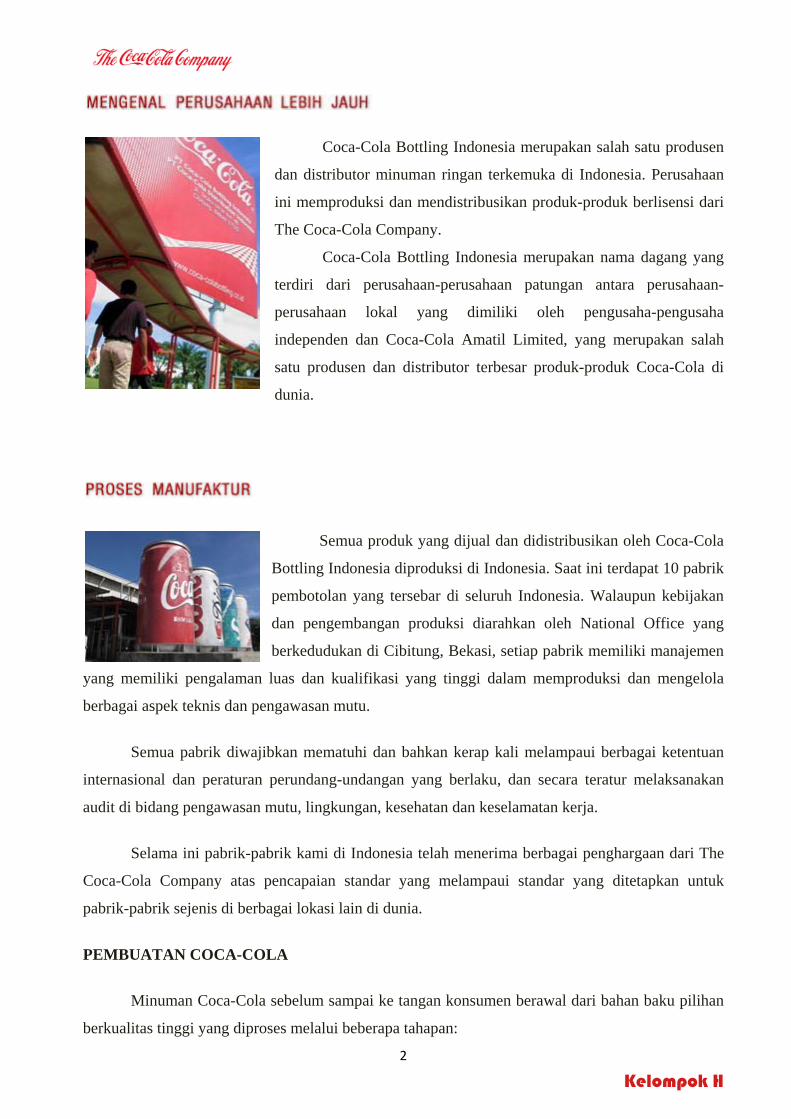
1. Tahap pertama untuk menhasilkan Coca-Cola sangat
sederhana, yaitu membuat sirup yang terdiri dari gula
dan air. Airnya disaring dengan seksama karena bagi
"Coca-Cola" bahan baku berkualitas tinggi sangat
mutlak diperlukan.
2. Untuk memastikan bahwa air yang digunakan untuk
produk botol dan kaleng benar-benar bersih dan murni,
air tersebut disaring. Para teknisi pengawasan mutu
menguji air tersebut berkali-kali sebelum digunakan
untuk membuat produk akhir.
3. Pemeriksaan dan pengujian berlanjut. Perangkat
canggih membantu para teknisi memeriksa segala segi
proses, mulai dari kondisi tiap kemasan hingga kadar
karbondioksida, rasa dan kandungan sirup. Pada tahap
ini, campuran sirup diperiksa.
4
Kelompok H
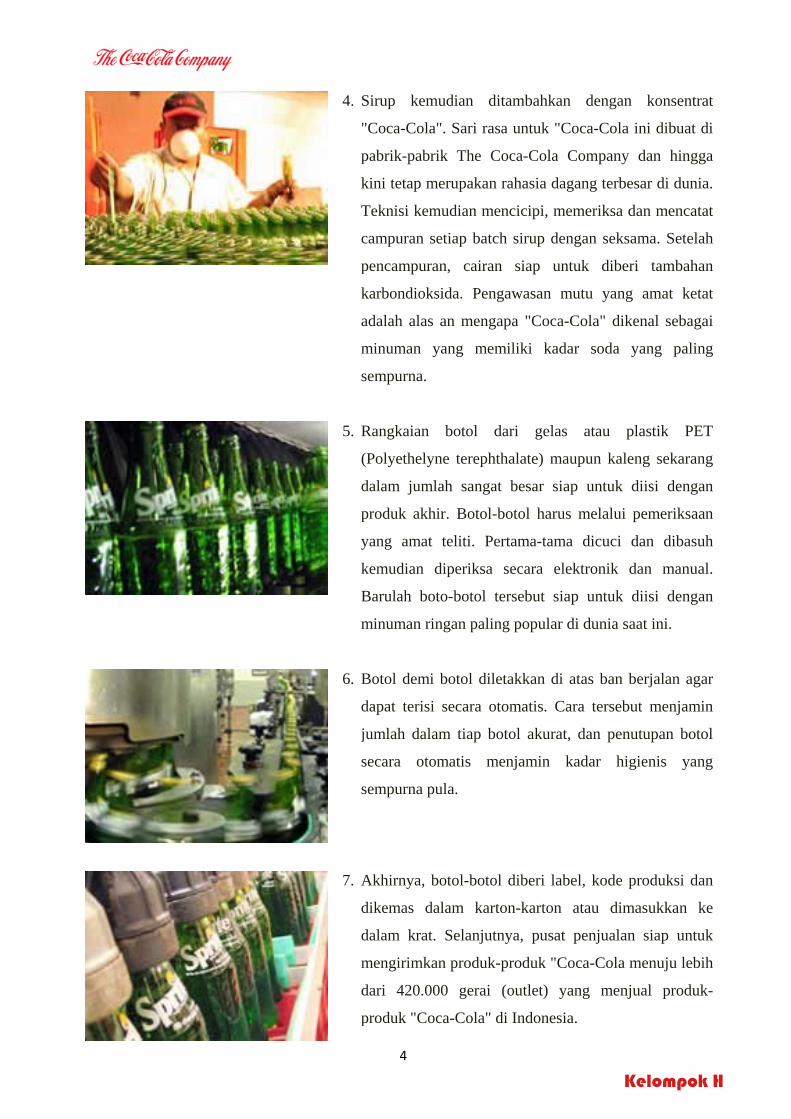
4. Sirup kemudian ditambahkan dengan konsentrat
"Coca-Cola". Sari rasa untuk "Coca-Cola ini dibuat di
pabrik-pabrik The Coca-Cola Company dan hingga
kini tetap merupakan rahasia dagang terbesar di dunia.
Teknisi kemudian mencicipi, memeriksa dan mencatat
campuran setiap batch sirup dengan seksama. Setelah
pencampuran, cairan siap untuk diberi tambahan
karbondioksida. Pengawasan mutu yang amat ketat
adalah alas an mengapa "Coca-Cola" dikenal sebagai
minuman yang memiliki kadar soda yang paling
sempurna.
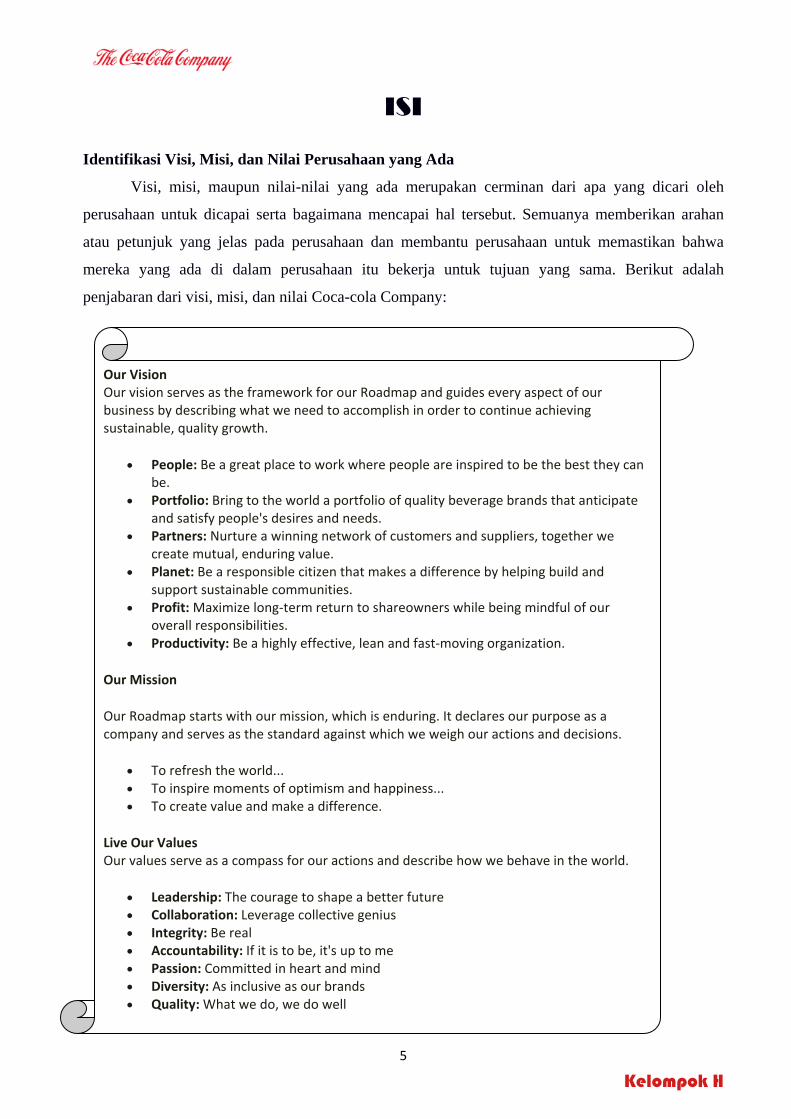
5. Rangkaian botol dari gelas atau plastik PET
(Polyethelyne terephthalate) maupun kaleng sekarang
dalam jumlah sangat besar siap untuk diisi dengan
produk akhir. Botol-botol harus melalui pemeriksaan
yang amat teliti. Pertama-tama dicuci dan dibasuh
kemudian diperiksa secara elektronik dan manual.
Barulah boto-botol tersebut siap untuk diisi dengan
minuman ringan paling popular di dunia saat ini.
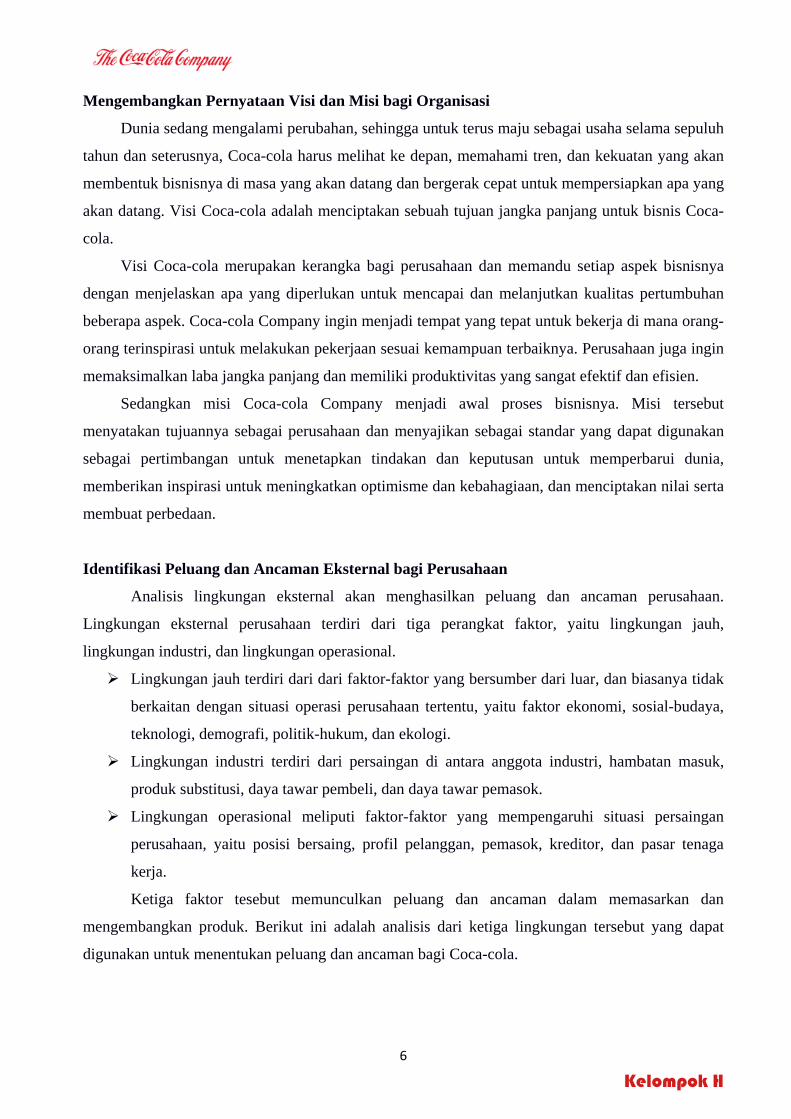
6. Botol demi botol diletakkan di atas ban berjalan agar
dapat terisi secara otomatis. Cara tersebut menjamin
jumlah dalam tiap botol akurat, dan penutupan botol
secara otomatis menjamin kadar higienis yang
sempurna pula.
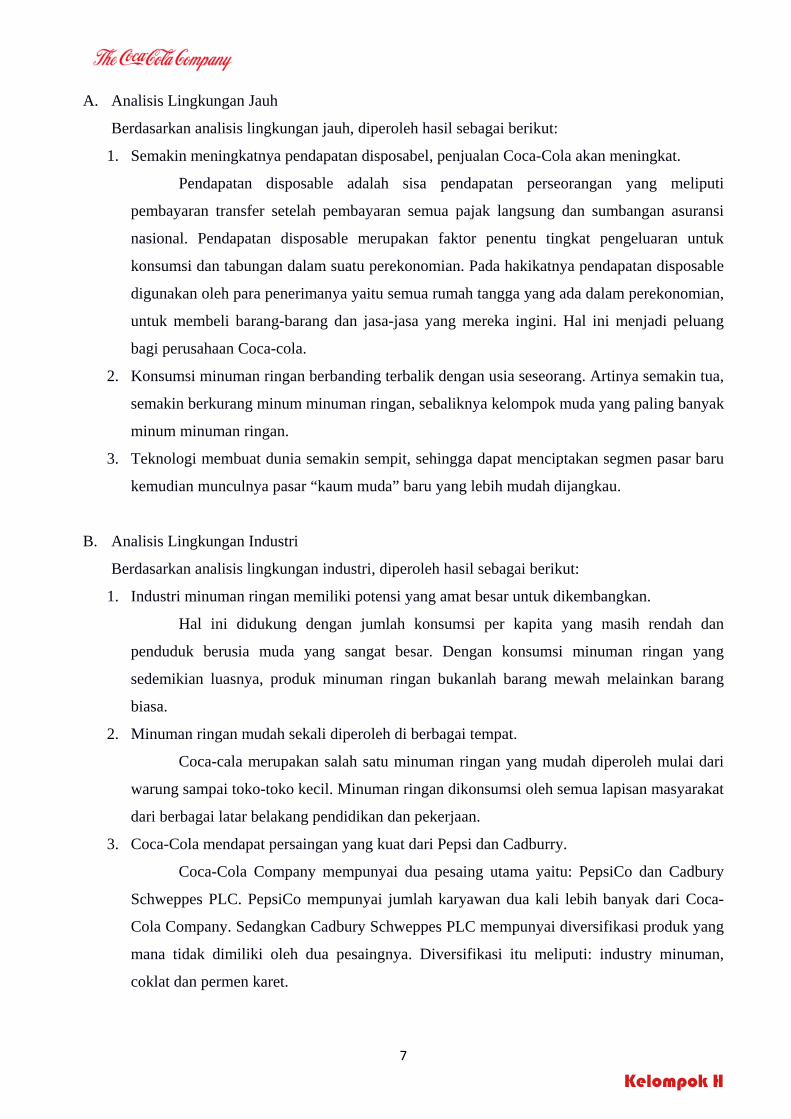
7. Akhirnya, botol-botol diberi label, kode produksi dan
dikemas dalam karton-karton atau dimasukkan ke
dalam krat. Selanjutnya, pusat penjualan siap untuk
mengirimkan produk-produk "Coca-Cola menuju lebih
dari 420.000 gerai (outlet) yang menjual produk-
produk "Coca-Cola" di Indonesia.
5
Kelompok H
ISI
Identifikasi Visi, Misi, dan Nilai Perusahaan yang Ada
Visi, misi, maupun nilai-nilai yang ada merupakan cerminan dari apa yang dicari oleh
perusahaan untuk dicapai serta bagaimana mencapai hal tersebut. Semuanya memberikan arahan
atau petunjuk yang jelas pada perusahaan dan membantu perusahaan untuk memastikan bahwa
mereka yang ada di dalam perusahaan itu bekerja untuk tujuan yang sama. Berikut adalah
penjabaran dari visi, misi, dan nilai Coca-cola Company:
Our Vision Our vision serves as the framework for our Roadmap and guides every aspect of our business by describing what we need to accomplish in order to continue achieving sustainable, quality growth.
• People: Be a great place to work where people are inspired to be the best they can be.
• Portfolio: Bring to the world a portfolio of quality beverage brands that anticipate and satisfy people's desires and needs.
• Partners: Nurture a winning network of customers and suppliers, together we create mutual, enduring value.
• Planet: Be a responsible citizen that makes a difference by helping build and support sustainable communities.
• Profit: Maximize long‐term return to shareowners while being mindful of our overall responsibilities.
• Productivity: Be a highly effective, lean and fast‐moving organization.
Our Mission
Our Roadmap starts with our mission, which is enduring. It declares our purpose as a company and serves as the standard against which we weigh our actions and decisions.
• To refresh the world... • To inspire moments of optimism and happiness... • To create value and make a difference.
Live Our Values Our values serve as a compass for our actions and describe how we behave in the world.
• Leadership: The courage to shape a better future • Collaboration: Leverage collective genius • Integrity: Be real • Accountability: If it is to be, it's up to me • Passion: Committed in heart and mind • Diversity: As inclusive as our brands • Quality: What we do, we do well
6
Kelompok H
Mengembangkan Pernyataan Visi dan Misi bagi Organisasi
Dunia sedang mengalami perubahan, sehingga untuk terus maju sebagai usaha selama sepuluh
tahun dan seterusnya, Coca-cola harus melihat ke depan, memahami tren, dan kekuatan yang akan
membentuk bisnisnya di masa yang akan datang dan bergerak cepat untuk mempersiapkan apa yang
akan datang. Visi Coca-cola adalah menciptakan sebuah tujuan jangka panjang untuk bisnis Coca-
cola.
Visi Coca-cola merupakan kerangka bagi perusahaan dan memandu setiap aspek bisnisnya
dengan menjelaskan apa yang diperlukan untuk mencapai dan melanjutkan kualitas pertumbuhan
beberapa aspek. Coca-cola Company ingin menjadi tempat yang tepat untuk bekerja di mana orang-
orang terinspirasi untuk melakukan pekerjaan sesuai kemampuan terbaiknya. Perusahaan juga ingin
memaksimalkan laba jangka panjang dan memiliki produktivitas yang sangat efektif dan efisien.
Sedangkan misi Coca-cola Company menjadi awal proses bisnisnya. Misi tersebut
menyatakan tujuannya sebagai perusahaan dan menyajikan sebagai standar yang dapat digunakan
sebagai pertimbangan untuk menetapkan tindakan dan keputusan untuk memperbarui dunia,
memberikan inspirasi untuk meningkatkan optimisme dan kebahagiaan, dan menciptakan nilai serta
membuat perbedaan.
Identifikasi Peluang dan Ancaman Eksternal bagi Perusahaan
Analisis lingkungan eksternal akan menghasilkan peluang dan ancaman perusahaan.
Lingkungan eksternal perusahaan terdiri dari tiga perangkat faktor, yaitu lingkungan jauh,
lingkungan industri, dan lingkungan operasional.
Lingkungan jauh terdiri dari dari faktor-faktor yang bersumber dari luar, dan biasanya tidak
berkaitan dengan situasi operasi perusahaan tertentu, yaitu faktor ekonomi, sosial-budaya,
teknologi, demografi, politik-hukum, dan ekologi.
Lingkungan industri terdiri dari persaingan di antara anggota industri, hambatan masuk,
produk substitusi, daya tawar pembeli, dan daya tawar pemasok.
Lingkungan operasional meliputi faktor-faktor yang mempengaruhi situasi persaingan
perusahaan, yaitu posisi bersaing, profil pelanggan, pemasok, kreditor, dan pasar tenaga
kerja.
Ketiga faktor tesebut memunculkan peluang dan ancaman dalam memasarkan dan
mengembangkan produk. Berikut ini adalah analisis dari ketiga lingkungan tersebut yang dapat
digunakan untuk menentukan peluang dan ancaman bagi Coca-cola.
7
Kelompok H
A. Analisis Lingkungan Jauh
Berdasarkan analisis lingkungan jauh, diperoleh hasil sebagai berikut:
1. Semakin meningkatnya pendapatan disposabel, penjualan Coca-Cola akan meningkat.
Pendapatan disposable adalah sisa pendapatan perseorangan yang meliputi
pembayaran transfer setelah pembayaran semua pajak langsung dan sumbangan asuransi
nasional. Pendapatan disposable merupakan faktor penentu tingkat pengeluaran untuk
konsumsi dan tabungan dalam suatu perekonomian. Pada hakikatnya pendapatan disposable
digunakan oleh para penerimanya yaitu semua rumah tangga yang ada dalam perekonomian,
untuk membeli barang-barang dan jasa-jasa yang mereka ingini. Hal ini menjadi peluang
bagi perusahaan Coca-cola.
2. Konsumsi minuman ringan berbanding terbalik dengan usia seseorang. Artinya semakin tua,
semakin berkurang minum minuman ringan, sebaliknya kelompok muda yang paling banyak
minum minuman ringan.
3. Teknologi membuat dunia semakin sempit, sehingga dapat menciptakan segmen pasar baru
kemudian munculnya pasar “kaum muda” baru yang lebih mudah dijangkau.
B. Analisis Lingkungan Industri
Berdasarkan analisis lingkungan industri, diperoleh hasil sebagai berikut:
1. Industri minuman ringan memiliki potensi yang amat besar untuk dikembangkan.
Hal ini didukung dengan jumlah konsumsi per kapita yang masih rendah dan
penduduk berusia muda yang sangat besar. Dengan konsumsi minuman ringan yang
sedemikian luasnya, produk minuman ringan bukanlah barang mewah melainkan barang
biasa.
2. Minuman ringan mudah sekali diperoleh di berbagai tempat.
Coca-cala merupakan salah satu minuman ringan yang mudah diperoleh mulai dari
warung sampai toko-toko kecil. Minuman ringan dikonsumsi oleh semua lapisan masyarakat
dari berbagai latar belakang pendidikan dan pekerjaan.
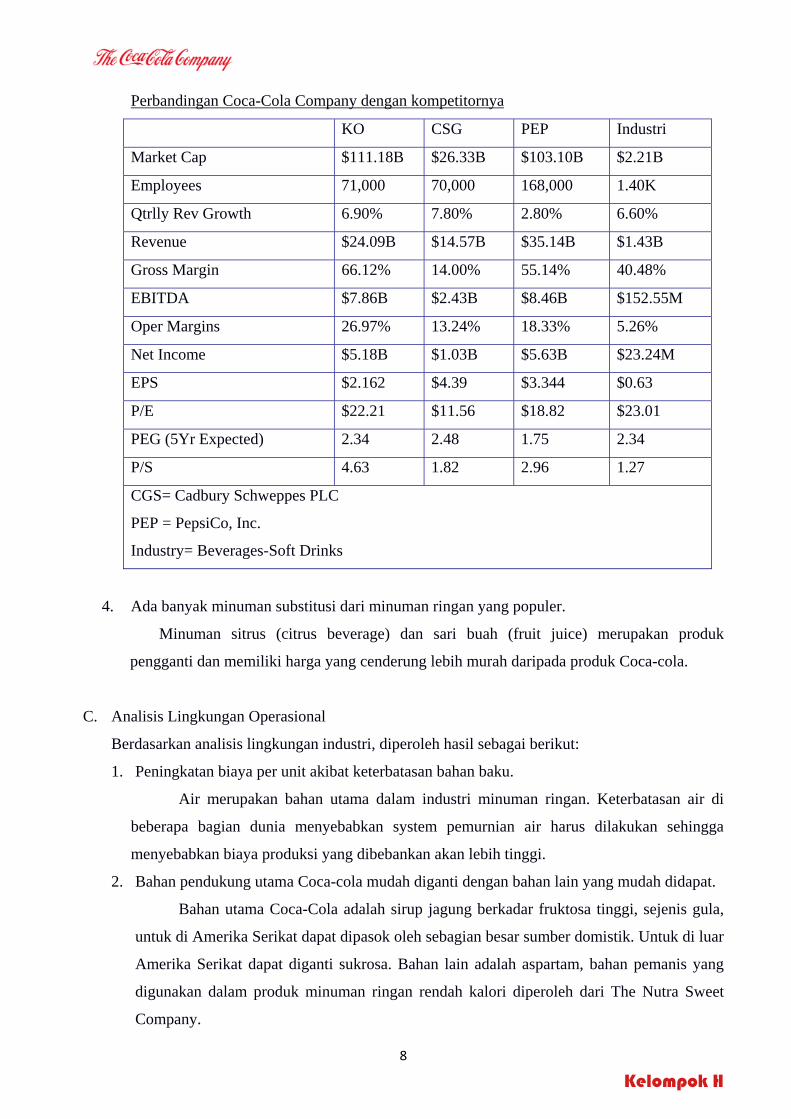
3. Coca-Cola mendapat persaingan yang kuat dari Pepsi dan Cadburry.
Coca-Cola Company mempunyai dua pesaing utama yaitu: PepsiCo dan Cadbury
Schweppes PLC. PepsiCo mempunyai jumlah karyawan dua kali lebih banyak dari Coca-
Cola Company. Sedangkan Cadbury Schweppes PLC mempunyai diversifikasi produk yang
mana tidak dimiliki oleh dua pesaingnya. Diversifikasi itu meliputi: industry minuman,
coklat dan permen karet.
8
Kelompok H
Perbandingan Coca-Cola Company dengan kompetitornya
KO CSG PEP Industri
Market Cap $111.18B $26.33B $103.10B $2.21B
Employees 71,000 70,000 168,000 1.40K
Qtrlly Rev Growth 6.90% 7.80% 2.80% 6.60%
Revenue $24.09B $14.57B $35.14B $1.43B
Gross Margin 66.12% 14.00% 55.14% 40.48%
EBITDA $7.86B $2.43B $8.46B $152.55M
Oper Margins 26.97% 13.24% 18.33% 5.26%
Net Income $5.18B $1.03B $5.63B $23.24M
EPS $2.162 $4.39 $3.344 $0.63
P/E $22.21 $11.56 $18.82 $23.01
PEG (5Yr Expected) 2.34 2.48 1.75 2.34
P/S 4.63 1.82 2.96 1.27
CGS= Cadbury Schweppes PLC
PEP = PepsiCo, Inc.
Industry= Beverages-Soft Drinks
4. Ada banyak minuman substitusi dari minuman ringan yang populer.
Minuman sitrus (citrus beverage) dan sari buah (fruit juice) merupakan produk
pengganti dan memiliki harga yang cenderung lebih murah daripada produk Coca-cola.
C. Analisis Lingkungan Operasional
Berdasarkan analisis lingkungan industri, diperoleh hasil sebagai berikut:
1. Peningkatan biaya per unit akibat keterbatasan bahan baku.
Air merupakan bahan utama dalam industri minuman ringan. Keterbatasan air di
beberapa bagian dunia menyebabkan system pemurnian air harus dilakukan sehingga
menyebabkan biaya produksi yang dibebankan akan lebih tinggi.
2. Bahan pendukung utama Coca-cola mudah diganti dengan bahan lain yang mudah didapat.
Bahan utama Coca-Cola adalah sirup jagung berkadar fruktosa tinggi, sejenis gula,
untuk di Amerika Serikat dapat dipasok oleh sebagian besar sumber domistik. Untuk di luar
Amerika Serikat dapat diganti sukrosa. Bahan lain adalah aspartam, bahan pemanis yang
digunakan dalam produk minuman ringan rendah kalori diperoleh dari The Nutra Sweet
Company.
9
Kelompok H
Identifikasi Kekuatan dan Kelemahan Internal bagi Perusahaan
Analisis lingkuangan internal akan menghasilkan kekuatan dan kelemahan perusahaan.
Analisis Internal Perusahaan dikenal juga dengan nama Analisis Profil Perusahaan. Analisis ini
menggambarkan kekuatan perusahaan, baik kuantitas maupun kualitas pemasaran, sumberdaya
manusia, sumberdaya fisik, operasi, keuangan, manajemen dan organisasi.
Kekuatan dan kelemahan pemasaran dapat dilihat dari reputasi perusahaan, pangsa pasar,
kualitas produk, kualitas pelayanan, efektifitas penetapan harga, efektifitas distribusi, efektifitas
promosi, kekuatan penjualan, efektifitas inovasi dan cakupan geografis.
Kekuatan dan kelemahan sumberdaya manusia dapat ditunjukkan dari manajemen
sumberdaya manusia, ketrampilan dan moral karyawan, kemampuan dan perhatian manajemen
puncak, produktivitas karyawan, kualitas kehidupan karyawan, fleksibilitas karyawan, ketaatan
hokum karyawan, efektivitas imbalan dalam memotivasi karyawan, dan pengalaman karyawan.
Keuangan terdiri dari ketersediaan modal, arus kas, stabilitas keuangan, hubungan dengan
pemilik dan investor, kemampuan berhubungan dengan bank, besarnya modal yang ditanam,
keuntungan yang diperoleh (nilai saham), efektivitas dan efisiensi system akuntansi untuk
perencanaan biaya-anggaran dan keuntungan dan sumber tingkat perusahaan.
Operasi meliputi fasilitas perusahaan, skala ekonomi, kapasitas produksi, kemampuan
berproduksi tepat waktu, keahlian dalam berproduksi, biaya bahan baku dan ketersediaan pemasok,
lokasi, layout, optimalisasi fasilitas, persediaan, penelitian dan pengembangan, hak paten, merk
dagang, proteksi hokum, pengendalian operasi dan efisiensi serta biaya-manfaat peralatan.
Kekuatan dan kelemahan organisasi dan manajemen dapat diperoleh dari struktur organisasi,
citra dan prestasi perusahaan, catatan perusahaan dalam mencapai sasaran, komunikasi dalam
organisasi, system pengendalian organisasi keseluruhan, budaya dan iklim organisasi, penggunaan
system yang efektif dalam pengambilan keputusan, system perencanaan strategik, sinergi dalam
organisasi, sistem informasi yang baik dan manajemen kualitas yang baik.
Kekuatan Internal Coca-Cola Company
1. Brand Image yang sudah dikenal masyarakat luas.
Brand Image menyebabkan kesetiaan pelanggan terhadap produk (brand loyalty).
2. Ramuan rahasia yang tidak dimiliki produk lain.
Sari rasa untuk "Coca-Cola” dibuat di pabrik-pabrik The Coca-Cola Company dan
hingga kini tetap merupakan rahasia dagang terbesar di dunia.
3. Memilik Sumber Daya Manusia yang besar dan terlatih.
Coca-cola Company memiliki tim khusus yang bertugas meningkatkan keterampilan
fungsi teknis, bidang manajemen, dan kepemimpinan karyawan.
10
Kelompok H
4. Pelayanan terhadap pelanggan dan konsumen.
Misalnya, Coca-Cola Bottling Indonesia (CCBI) menyediakan National Contact
Centre (NCC), yaitu pusat layanan bagi pelanggan dan konsumen di seluruh Indonesia.
NCC berfungsi sebagai media bagi para pelanggan dan konsumen yang membutuhkan
informasi atau layanan apapun terkait dengan Perusahaan dan produk-produk Coca-Cola.
Layanan dari NCC meliputi:
• Layanan Pelanggan yang mencakup permohonan menjadi pelanggan, alat pendingin,
pemesanan produk baik dari outlet tradisional maupun modern, serta hal lain yang
terkait dengan distribusi atau penjualan;
• Layanan Konsumen yang mencakup informasi produk, kualitas produk dan kemasan,
kegiatan promosi produk;
• Pertanyaan Umum yang mencakup penelitian, praktek kerja/magang dan lowongan
pekerjaan di CCBI, permohonan kunjungan ke pabrik CCBI, penawaran jasa dan
produk untuk CCBI.
5. Memiliki kepedulian terhadap lingkungan.
PT Coca-Cola Bottling Indonesia memiliki komitmen untuk senantiasa memahami,
mencegah dan memperkecil setiap dampak buruk terhadap lingkungan sehubungan dengan
kegiatan produksi minuman ringan, serta terus berupaya memberikan pelayanan dan produk
berkualitas yang diharapkan konsumen maupun pelanggan, dan menciptakan lingkungan
kerja yang aman bagi seluruh karyawan.
6. Perkembangan inovasi secara terus-menerus.
Selain berinovasi pada produk-produk baru, Coca-Cola selalu meningkatkan
kualitasnya.
7. Strategi pemasaran yang baik.
Strategi pemasaran Coca-Cola mempunyai ciri khas tersendiri, yang unik dan kreatif.
Berbagai program promosi diadakan sesuai dengan event yang sedang berlangsung, baik
melalui konser musik, pameran, promo penukaran tutup botol, hadiah kejutan, maupun iklan
TV.
8. Sistem Informasi yang memadai.
Pengembangan pendekatan manajemen Sistem Informasi (Information System / IS)
yang terarah pada organisasi merupakan bentuk pengaruh evolusi teknologi terhadap dunia
usaha dewasa ini.
9. Kemasan produk yang menarik dan harga yang kompetitif.
Coca-Cola juga mencoba mengembangkan desain kemasan minuman, serta
meningkatkan kualitasnya. Setelah meluncurkan Frestea dalam kemasan botol, pada akhir
11
Kelompok H
tahun 2002, Coca-Cola Indonesia meluncurkan Frestea dalam kemasan Tetra Wedge yang
lebih mudah dan praktis untuk dibawa. Pada akhir 2003, Coca-Cola, Sprite, dan Fanta hadir
dalam kemasan kaleng ramping baru yang unik. Pada tahun 2004 ini, Coca-Cola hadir
dengan inovasi terbaru yaitu botol gelas berbobot lebih ringan 30 % dengan desain mungil,
imut, tapi kuat. Inovasi kemasan produk akan terus dikembangkan sesuai dengan
perkembangan teknologi terbaru.
Kelemahan Internal Coca-cola Company
1. Coca-cola Company tidak menghasilkan produk organik
Di Amerika sedang mengembangkan produk organik, dan perkembangannya telah
mencapai 70%. Dan sampai saat ini pun produk organik semakin popular. Sedangkan Coca-cola
Company tidak mengadakan inovasi dalam hal produk organik, padahal hal ini dapat dijadikan
peluang bisnis yang potensial.
2. Sebagian pengecer mempunyai kontrak ekslusif dengan PepsiCo.
Sebagian perusahaan beverage seperti Pepsi Co. telah melakukan kontrak ekslusif dengan
restoran-restoran misalnya saja KFC, Mac D, dan lainnya. Sehingga Coca Cola tidak bisa masuk
ke area tersebut.
3. Soft drinks tidak baik untuk kesehatan
Soft drinks tidak punya nilai gizi (dalam hal vitamin dan mineral). Mereka punya
kandungan gula lebih tinggi, lebih asam, dan banyak zat aditif seperti pengawet dan pewarna.
Sementara orang suka meminum soft drink dingin setelah makan, Akibatnya, Tubuh kita
mempunyai suhu optimum 37 supaya enzim pencernaan berfungsi. Suhu dari soft drink dingin
jauh di bawah 37, terkadang mendekati 0. Hal ini mengurangi keefektivan dari enzim dan
memberi tekanan pada sistem pencernaan kita, mencerna lebih sedikit makanan. Bahkan
makanan tersebut difermentasi. Makanan yang difermentasi menghasilkan bau, gas, sisa busuk
dan racun, yang diserap oleh usus, di edarkan oleh darah ke seluruh tubuh. Penyebaran racun ini
mengakibatkan pembentukan macam-macam penyakit.
12
Kelompok H
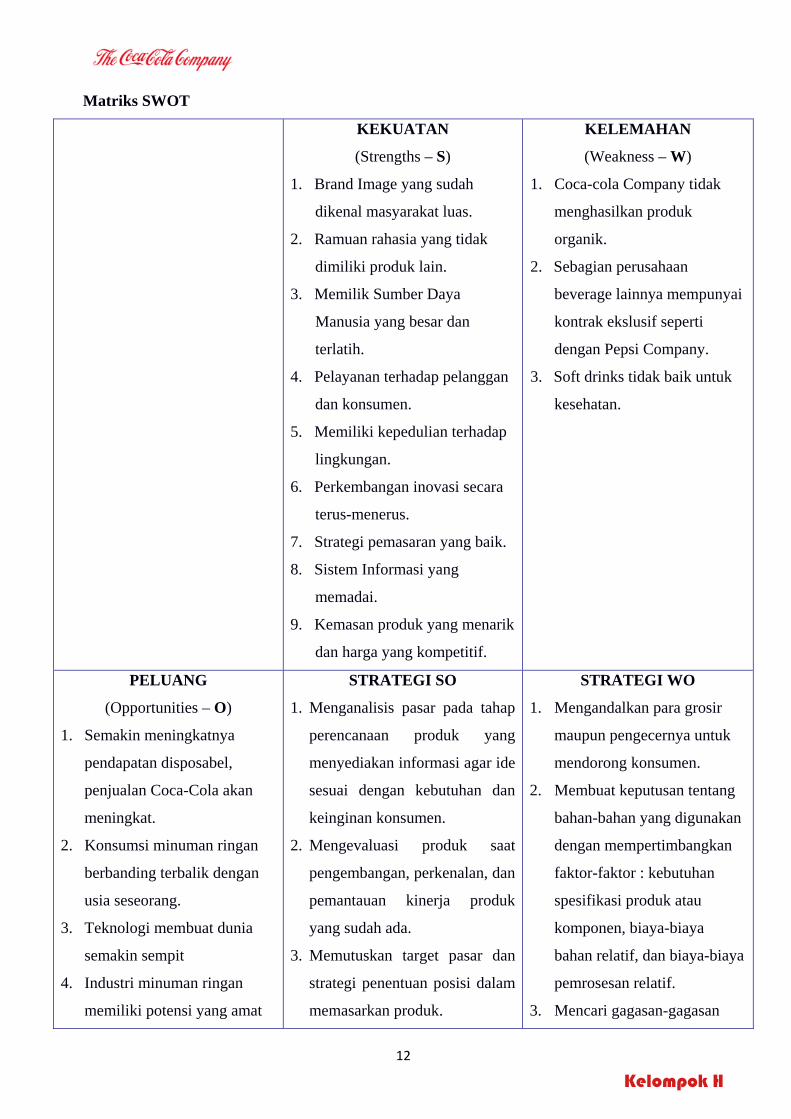
Matriks SWOT
KEKUATAN
(Strengths – S)
1. Brand Image yang sudah
dikenal masyarakat luas.
2. Ramuan rahasia yang tidak
dimiliki produk lain.
3. Memilik Sumber Daya
Manusia yang besar dan
terlatih.
4. Pelayanan terhadap pelanggan
dan konsumen.
5. Memiliki kepedulian terhadap
lingkungan.
6. Perkembangan inovasi secara
terus-menerus.
7. Strategi pemasaran yang baik.
8. Sistem Informasi yang
memadai.
9. Kemasan produk yang menarik
dan harga yang kompetitif.
KELEMAHAN
(Weakness – W)
1. Coca-cola Company tidak
menghasilkan produk
organik.
2. Sebagian perusahaan
beverage lainnya mempunyai
kontrak ekslusif seperti
dengan Pepsi Company.
3. Soft drinks tidak baik untuk
kesehatan.
PELUANG
(Opportunities – O)
1. Semakin meningkatnya
pendapatan disposabel,
penjualan Coca-Cola akan
meningkat.
2. Konsumsi minuman ringan
berbanding terbalik dengan
usia seseorang.
3. Teknologi membuat dunia
semakin sempit
4. Industri minuman ringan
memiliki potensi yang amat
STRATEGI SO
1. Menganalisis pasar pada tahap
perencanaan produk yang
menyediakan informasi agar ide
sesuai dengan kebutuhan dan
keinginan konsumen.
2. Mengevaluasi produk saat
pengembangan, perkenalan, dan
pemantauan kinerja produk
yang sudah ada.
3. Memutuskan target pasar dan
strategi penentuan posisi dalam
memasarkan produk.
STRATEGI WO
1. Mengandalkan para grosir
maupun pengecernya untuk
mendorong konsumen.
2. Membuat keputusan tentang
bahan-bahan yang digunakan
dengan mempertimbangkan
faktor-faktor : kebutuhan
spesifikasi produk atau
komponen, biaya-biaya
bahan relatif, dan biaya-biaya
pemrosesan relatif.
3. Mencari gagasan-gagasan
13
Kelompok H
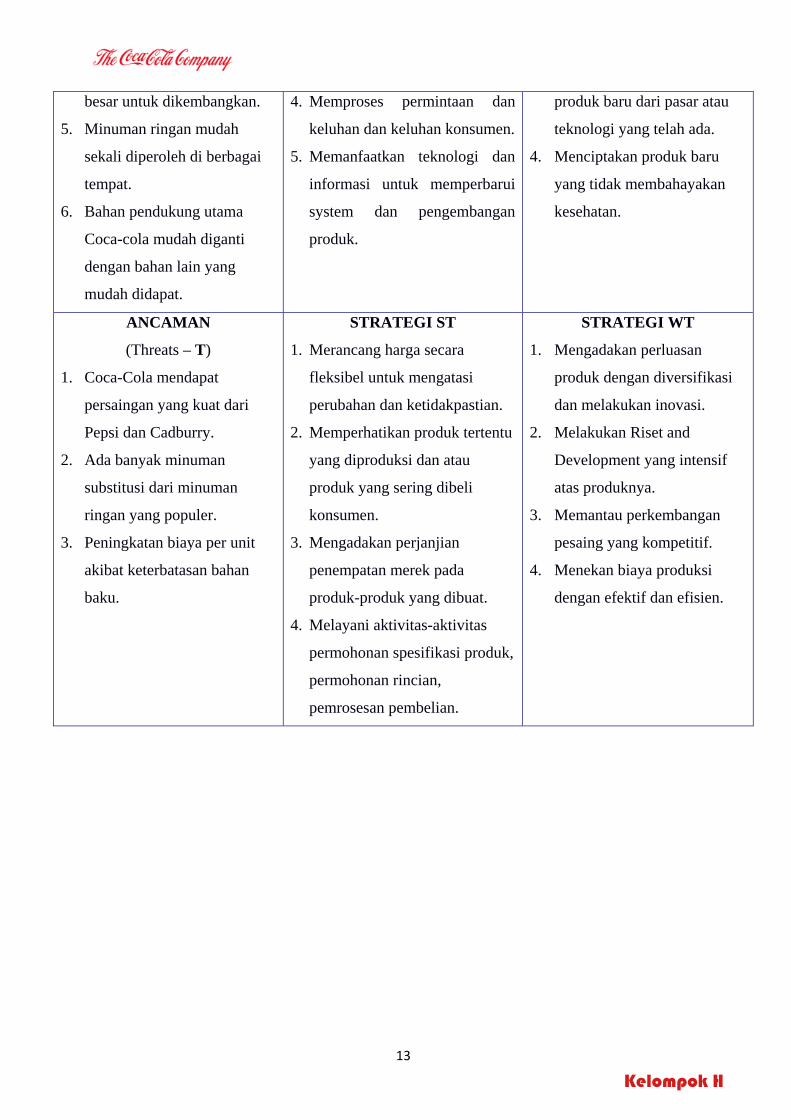
besar untuk dikembangkan.
5. Minuman ringan mudah
sekali diperoleh di berbagai
tempat.
6. Bahan pendukung utama
Coca-cola mudah diganti
dengan bahan lain yang
mudah didapat.
4. Memproses permintaan dan
keluhan dan keluhan konsumen.
5. Memanfaatkan teknologi dan
informasi untuk memperbarui
system dan pengembangan
produk.
produk baru dari pasar atau
teknologi yang telah ada.
4. Menciptakan produk baru
yang tidak membahayakan
kesehatan.
ANCAMAN
(Threats – T)
1. Coca-Cola mendapat
persaingan yang kuat dari
Pepsi dan Cadburry.
2. Ada banyak minuman
substitusi dari minuman
ringan yang populer.
3. Peningkatan biaya per unit
akibat keterbatasan bahan
baku.
STRATEGI ST
1. Merancang harga secara
fleksibel untuk mengatasi
perubahan dan ketidakpastian.
2. Memperhatikan produk tertentu
yang diproduksi dan atau
produk yang sering dibeli
konsumen.
3. Mengadakan perjanjian
penempatan merek pada
produk-produk yang dibuat.
4. Melayani aktivitas-aktivitas
permohonan spesifikasi produk,
permohonan rincian,
pemrosesan pembelian.
STRATEGI WT
1. Mengadakan perluasan
produk dengan diversifikasi
dan melakukan inovasi.
2. Melakukan Riset and
Development yang intensif
atas produknya.
3. Memantau perkembangan
pesaing yang kompetitif.
4. Menekan biaya produksi
dengan efektif dan efisien.
14
Kelompok H
PENUTUP
KESIMPULAN
1. Persaingan Industri dan Globalisasi era sekarang ini menuntut organisasi / perusahaan untuk
lebih mengembangkan kreativitas dan inovasi demi kemajuan organisasi / perusahaan
khususnya dalam menghasilkan produk demi kemajuan perusahaan dan tidak kalah dalam
persaingan.
2. Produk adalah sesuatu atau kebutuhan yang dapat memberikan kepuasan, bagi
konsumen ataupun pemakai produk.
3. Posisi PT. Coca-Cola Bottling Indonesia berada pada kuadran I dengan wilayah kekuatan lebih
besar dari pada peluang sehingga perusahaan harus bisa menggunakan kekuatan dengan
memanfaatkan peluang.
SARAN
Perusahaan harus menerapkan strategi pemasaran yang cukup agresif agar dapat tetap
mempertahankan persaingan pada industri minuman ringan. Dengan perubahan dan penyesuaian
sistem perekonomian di Indonesia maupun dunia saat ini, di mana sistem perekonomian saat ini
mengacu pada persaiangan dalam penciptaan produk/jasa pada sistem pembelajaran berbasis Mutu
dan Kualitas serta formasi produk / jasa di mata konsumen yang ke depan dihadapkan pada sistem
perekonomian global.
Sumber:
David, Fred R. 2006. Strategic Management: Concepts and Cases, 10th edition. Jakarta: Salemba
Empat
Handoko, Hani T. 1984. Dasar-dasar Manajemen Produksi dan Operasi. Yogyakarta: BPFE
Pratama, Yudha, SE, dkk. 2006. Kamus Ekonomi Lengkap. Jakarta: Wipress
Sukirno, Sadono. 2003. Pengantar Teori Makroekonomi. Jakarta: PT Raja Grafindo Persada
http://www.coca-cola.com
http://finance.yahoo.com
http://www.indosripsi.com
http://www.medanonline.net
http://www.google.com

1998
1988
2008
Per Capita Consumption of Company Beverage Products*
© 2009 The Coca-Cola Company, all rights reserved
* Based on U.S. 8 fluid ounces of a finished beverage
United States
Australia
Argentina
Spain
South Africa
Panama
Canada
Romania
Brazil
Great Britain
Greece
Germany
Japan
Italy
Turkey
France
Philippines
Poland
Colombia
Worldwide
Morocco
Thailand
Russia
Egypt
Kenya
China
Nigeria
Indonesia
India
Mexico
Chile
0
0
3
7
8
13
22
29
27
0.4
8
28
45
31
36
22
31
49
1.3
21
69
31
60
81
24
65
81
39
65
85
102
104
94
3
50
108
87
142
130
31
96
130
12
74
140
78
99
141
94
148
176
127
200
179
132
203
187
72
122
196
84
132
199
4
72
223
168
232
237
61
132
249
123
154
252
118
219
303
119
218
312
205
282
324
275
406
412
110
325
427
229
408
635

20FEB200406462039
UNITED STATESSECURITIES AND EXCHANGE COMMISSION
Washington, D.C. 20549
FORM 10-K� ANNUAL REPORT PURSUANT TO SECTION 13 OR 15(d) OF THE SECURITIES
EXCHANGE ACT OF 1934For the fiscal year ended December 31, 2005
OR
� TRANSITION REPORT PURSUANT TO SECTION 13 OR 15(d) OF THESECURITIES EXCHANGE ACT OF 1934
For the transition period from to
Commission File No. 1-2217
(Exact name of Registrant as specified in its charter)
DELAWARE 58-0628465(State or other jurisdiction of (IRS Employerincorporation or organization) Identification No.)
One Coca-Cola PlazaAtlanta, Georgia 30313
(Address of principal executive offices) (Zip Code)Registrant’s telephone number, including area code: (404) 676-2121
Securities registered pursuant to Section 12(b) of the Act:
Title of each class Name of each exchange on which registered
COMMON STOCK, $0.25 PAR VALUE NEW YORK STOCK EXCHANGESecurities registered pursuant to Section 12(g) of the Act: None
Indicate by check mark if the Registrant is a well-known seasoned issuer, as defined in Rule 405 of the Securities Act.Yes � No �
Indicate by check mark if the Registrant is not required to file reports pursuant to Section 13 or Section 15(d) of theExchange Act. Yes � No �
Indicate by check mark whether the Registrant (1) has filed all reports required to be filed by Section 13 or 15(d) ofthe Securities Exchange Act of 1934 during the preceding 12 months and (2) has been subject to such filing requirementsfor the past 90 days. Yes � No �
Indicate by check mark if disclosure of delinquent filers pursuant to Item 405 of Regulation S-K is not containedherein, and will not be contained, to the best of Registrant’s knowledge, in definitive proxy or information statementsincorporated by reference in Part III of this Form 10-K or any amendment to this Form 10-K. �
Indicate by check mark whether the Registrant is a large accelerated filer, an accelerated filer or a non-acceleratedfiler. See definition of ‘‘accelerated filer’’ or ‘‘large accelerated filer’’ in Rule 12b-2 of the Exchange Act.
Large accelerated filer � Accelerated filer � Non-accelerated filer �Indicate by check mark if the Registrant is a shell company (as defined in Rule 12b-2 of the Exchange Act).
Yes � No �The aggregate market value of the common equity held by non-affiliates of the Registrant (assuming for these
purposes, but without conceding, that all executive officers and Directors are ‘‘affiliates’’ of the Registrant) as of July 1,2005, the last business day of the Registrant’s most recently completed second fiscal quarter, was $87,349,477,246 (basedon the closing sale price of the Registrant’s Common Stock on that date as reported on the New York Stock Exchange).
The number of shares outstanding of the Registrant’s Common Stock as of February 21, 2006 was 2,367,883,247.DOCUMENTS INCORPORATED BY REFERENCE
Portions of the Company’s Proxy Statement for the Annual Meeting of Shareowners to be held on April 19, 2006, areincorporated by reference in Part III.

Table of Contents
Page
Forward-Looking Statements . . . . . . . . . . . . . . . . . . . . . . . . . . . . . . . . . . . . . . . . . . . . . . . . . . . . . 1
Part I
Item 1. Business . . . . . . . . . . . . . . . . . . . . . . . . . . . . . . . . . . . . . . . . . . . . . . . . . . . . . . . . . . . . . . . . . . . . 1Item 1A. Risk Factors . . . . . . . . . . . . . . . . . . . . . . . . . . . . . . . . . . . . . . . . . . . . . . . . . . . . . . . . . . . . . . . . . 12Item 1B. Unresolved Staff Comments . . . . . . . . . . . . . . . . . . . . . . . . . . . . . . . . . . . . . . . . . . . . . . . . . . . . . 18Item 2. Properties . . . . . . . . . . . . . . . . . . . . . . . . . . . . . . . . . . . . . . . . . . . . . . . . . . . . . . . . . . . . . . . . . . . 18Item 3. Legal Proceedings . . . . . . . . . . . . . . . . . . . . . . . . . . . . . . . . . . . . . . . . . . . . . . . . . . . . . . . . . . . . . 19Item 4. Submission of Matters to a Vote of Security Holders . . . . . . . . . . . . . . . . . . . . . . . . . . . . . . . . . . . . 23Item X. Executive Officers of the Company . . . . . . . . . . . . . . . . . . . . . . . . . . . . . . . . . . . . . . . . . . . . . . . . 24
Part II
Item 5. Market for the Registrant’s Common Equity, Related Stockholder Matters and Issuer Purchases ofEquity Securities . . . . . . . . . . . . . . . . . . . . . . . . . . . . . . . . . . . . . . . . . . . . . . . . . . . . . . . . . . . . 27
Item 6. Selected Financial Data . . . . . . . . . . . . . . . . . . . . . . . . . . . . . . . . . . . . . . . . . . . . . . . . . . . . . . . . . 29Item 7. Management’s Discussion and Analysis of Financial Condition and Results of Operations . . . . . . . . . 30Item 7A. Quantitative and Qualitative Disclosures About Market Risk . . . . . . . . . . . . . . . . . . . . . . . . . . . . . . 62Item 8. Financial Statements and Supplementary Data . . . . . . . . . . . . . . . . . . . . . . . . . . . . . . . . . . . . . . . . 63Item 9. Changes in and Disagreements with Accountants on Accounting and Financial Disclosure . . . . . . . . . 124Item 9A. Controls and Procedures . . . . . . . . . . . . . . . . . . . . . . . . . . . . . . . . . . . . . . . . . . . . . . . . . . . . . . . . 124Item 9B. Other Information . . . . . . . . . . . . . . . . . . . . . . . . . . . . . . . . . . . . . . . . . . . . . . . . . . . . . . . . . . . . 124
Part III
Item 10. Directors and Executive Officers of the Registrant . . . . . . . . . . . . . . . . . . . . . . . . . . . . . . . . . . . . . 125Item 11. Executive Compensation . . . . . . . . . . . . . . . . . . . . . . . . . . . . . . . . . . . . . . . . . . . . . . . . . . . . . . . . 125Item 12. Security Ownership of Certain Beneficial Owners and Management and Related Stockholder Matters 125Item 13. Certain Relationships and Related Transactions . . . . . . . . . . . . . . . . . . . . . . . . . . . . . . . . . . . . . . . 125Item 14. Principal Accountant Fees and Services . . . . . . . . . . . . . . . . . . . . . . . . . . . . . . . . . . . . . . . . . . . . . 125
Part IV
Item 15. Exhibits and Financial Statement Schedules . . . . . . . . . . . . . . . . . . . . . . . . . . . . . . . . . . . . . . . . . . 126Signatures . . . . . . . . . . . . . . . . . . . . . . . . . . . . . . . . . . . . . . . . . . . . . . . . . . . . . . . . . . . . . . . . . . 132

FORWARD-LOOKING STATEMENTS
This report contains information that may constitute ‘‘forward-looking statements.’’ Generally, the words‘‘believe,’’ ‘‘expect,’’ ‘‘intend,’’ ‘‘estimate,’’ ‘‘anticipate,’’ ‘‘project,’’ ‘‘will’’ and similar expressions identify forward-looking statements, which generally are not historical in nature. All statements that address operating performance,events or developments that we expect or anticipate will occur in the future—including statements relating to volumegrowth, share of sales and earnings per share growth, and statements expressing general optimism about futureoperating results—are forward-looking statements. As and when made, management believes that these forward-looking statements are reasonable. However, caution should be taken not to place undue reliance on any suchforward-looking statements because such statements speak only as of the date when made. Our Company undertakesno obligation to publicly update or revise any forward-looking statements, whether as a result of new information,future events or otherwise. In addition, forward-looking statements are subject to certain risks and uncertainties thatcould cause actual results to differ materially from our Company’s historical experience and our present expectationsor projections. These risks and uncertainties include, but are not limited to, those described in Part I, ‘‘Item 1A. RiskFactors’’ and elsewhere in this report and those described from time to time in our future reports filed with theSecurities and Exchange Commission.
PART I
ITEM 1. BUSINESS
General
The Coca-Cola Company is the largest manufacturer, distributor and marketer of nonalcoholic beverageconcentrates and syrups in the world. Finished beverage products bearing our trademarks, sold in the UnitedStates since 1886, are now sold in more than 200 countries and include the leading soft drink products in most ofthese countries. In this report, the terms ‘‘Company,’’ ‘‘we,’’ ‘‘us’’ or ‘‘our’’ mean The Coca-Cola Company andall subsidiaries included in our consolidated financial statements.
Our business is nonalcoholic beverages—principally carbonated soft drinks, but also a variety ofnoncarbonated beverages. We manufacture beverage concentrates and syrups, which we sell to bottling andcanning operations, fountain wholesalers and some fountain retailers, as well as some finished beverages, whichwe sell primarily to distributors. We also produce, market and distribute certain juice and juice drinks andcertain water products. In addition, we have ownership interests in numerous bottling and canning operations,although most of these operations are independently owned and managed.
We were incorporated in September 1919 under the laws of the State of Delaware and succeeded to thebusiness of a Georgia corporation with the same name that had been organized in 1892.
Our Company is one of numerous competitors in the commercial beverages market. Of the approximately50 billion beverage servings of all types consumed worldwide every day, beverages bearing trademarks owned byor licensed to us account for more than 1.3 billion.
We believe that our success depends on our ability to connect with consumers by providing them with awide variety of choices to meet their desires, needs and lifestyle choices. Our success further depends on theability of our people to execute effectively, every day.
Our goal is to use our Company’s assets—our brands, financial strength, unrivaled distribution system, andthe strong commitment of management and employees—to become more competitive and to accelerate growthin a manner that creates value for our shareowners.
1

Operating Segments
The Company’s operating structure is the basis for our Company’s internal financial reporting. As ofDecember 31, 2005, our operating structure included the following operating segments, the first six of which aresometimes referred to as ‘‘operating groups’’ or ‘‘groups.’’
• North America
• Africa
• East, South Asia and Pacific Rim
• European Union
• Latin America
• North Asia, Eurasia and Middle East
• Corporate
Our operating structure as of December 31, 2005, reflected the changes we made during the second quarterof 2005, when we replaced our then existing Europe, Eurasia and Middle East operating segment and Asiaoperating segment with three new operating segments: European Union; East, South Asia and Pacific Rim; andNorth Asia, Eurasia and Middle East. The North America operating segment included the United States,Canada and Puerto Rico. The European Union operating segment included our operations in all currentmember states of the European Union as well as the European Free Trade Association countries, Switzerland,Israel and the Palestinian Territories, and Greenland. The North Asia, Eurasia and Middle East operatingsegment included our operations in China, Japan, Eurasia, the Middle East (other than Israel and thePalestinian Territories), Russia, Ukraine and Belarus, and those in other European countries not included in theEuropean Union operating segment. The East, South Asia and Pacific Rim operating segment included ouroperations in India, the Philippines, Southeast and West Asia, and South Pacific and Korea.
In the first quarter of 2006, the Company made certain changes to its operating structure primarily toestablish a new, separate internal organization for its consolidated bottling operations and its unconsolidatedbottling investments. This new structure will result in the reporting of a separate operating segment, along withthe six existing geographic operating segments and Corporate, beginning with the first quarter of 2006.
Except to the extent that differences between operating segments are material to an understanding of ourbusiness taken as a whole, the description of our business in this report is presented on a consolidated basis.
For financial information about our operating segments and geographic areas, refer to Note 5 and Note 20of Notes to Consolidated Financial Statements set forth in Part II, ‘‘Item 8. Financial Statements andSupplementary Data’’ of this report, incorporated herein by reference. For certain risks attendant to ournon-U.S. operations, refer to ‘‘Item 1A. Risk Factors’’ below.
Products and Distribution
Our Company manufactures and sells beverage concentrates, sometimes referred to as ‘‘beverage bases,’’and syrups, including fountain syrups. We also manufacture and sell some finished beverages, both carbonatedand noncarbonated, including certain juice and juice-drink products; sports drinks; ready-to-drink coffees andteas; and water products.
As used in this report:
• ‘‘concentrates’’ means flavoring ingredients and, depending on the product, sweeteners used to preparebeverage syrups or finished beverages;
2

• ‘‘syrups’’ means the beverage ingredients produced by combining concentrates and, depending on theproduct, sweeteners and added water;
• ‘‘fountain syrups’’ means syrups that are sold to fountain retailers, such as restaurants, that use dispensingequipment to mix the syrups with carbonated or noncarbonated water at the time of purchase to producefinished beverages that are served in cups or glasses for immediate consumption;
• ‘‘soft drinks’’ means nonalcoholic carbonated beverages containing flavorings and sweeteners, excluding,among others, waters and flavored waters, juice and juice drinks, sports drinks, teas and coffees;
• ‘‘noncarbonated beverages’’ means nonalcoholic beverages without carbonation including, but not limitedto, waters and flavored waters, juice and juice drinks, sports drinks, teas and coffees;
• ‘‘Company Trademark Beverages’’ means beverages bearing our trademarks and certain other beverageproducts licensed to us for which we provide marketing support and from the sale of which we derive netrevenues; and
• additional terms used in this report are defined in the Glossary beginning on page 122.
We sell the concentrates and syrups for bottled and canned beverages to authorized bottling and canningoperations. In addition to concentrates and syrups for soft-drink products and flavored noncarbonatedbeverages, we also sell concentrates for purified water products such as Dasani to authorized bottlingoperations.
Authorized bottlers or canners either combine our syrups with carbonated water or combine ourconcentrates with sweeteners (depending on the product), water and carbonated water to produce finished softdrinks. The finished soft drinks are packaged in authorized containers bearing our trademarks—such as cans andrefillable and nonrefillable glass and plastic bottles (‘‘bottle/can products’’)—and are then sold to retailers(‘‘bottle/can retailers’’) or, in some cases, wholesalers.
For our fountain products in the United States, we manufacture fountain syrups and sell them to authorizedfountain wholesalers and some fountain retailers. The wholesalers are authorized to sell the Company’s fountainsyrups by a nonexclusive appointment from us that neither restricts us in setting the prices at which we sellfountain syrups to the wholesalers, nor restricts the territory in which the wholesalers may resell in the UnitedStates. Outside the United States, fountain syrups typically are manufactured by authorized bottlers fromconcentrates sold to them by the Company. The bottlers then typically sell the fountain syrups to wholesalers ordirectly to fountain retailers.
Finished beverages manufactured by us include a variety of carbonated and noncarbonated beverages. Wesell most of these finished beverages and certain water products to authorized bottlers or distributors, who inturn sell these products to retailers or, in some cases, wholesalers. We manufacture and sell juice and juice-drinkproducts and certain water products to retailers and wholesalers in the United States and numerous othercountries both directly and through a network of business partners, including certain Coca-Cola bottlers.
Our beverage products include Coca-Cola, Coca-Cola Classic, caffeine free Coca-Cola, caffeine freeCoca-Cola Classic, Diet Coke (sold under the trademark Coca-Cola Light in many countries other than theUnited States), caffeine free Diet Coke, Diet Coke Sweetened with Splenda, Coca-Cola with Lime, Diet Cokewith Lime, Cherry Coke, Diet Cherry Coke, Coca-Cola C2, Coca-Cola Zero, Fanta brand soft drinks, Sprite,Diet Sprite Zero/Sprite Zero (sold under the trademark Sprite Light in many countries other than the UnitedStates), Sprite Remix, Pibb Xtra, Mello Yello, Tab, Fresca brand soft drinks, Barq’s, Powerade, Minute Maidbrand soft drinks, Aquarius, Sokenbicha, Ciel, Bonaqa/Bonaqua, Dasani, Dasani brand flavored waters, Lift,Thums Up, Kinley, Pop Cola, Eight O’Clock, Qoo, Full Throttle, DOBRIY, Rich, Nico and other productsdeveloped for specific countries (including Georgia brand ready-to-drink coffees). In many countries (excludingthe United States, among others), our Company’s beverage products also include Schweppes, Canada Dry, DrPepper and Crush. Our Company produces, distributes and markets juice and juice-drink products including
3

Minute Maid juice and juice drinks, Simply Orange orange juice, Odwalla nutritional juices, Five Aliverefreshment beverages, Bacardi tropical fruit mixers concentrate (manufactured and marketed under a licensefrom Bacardi & Company Limited) and Hi-C ready-to-serve fruit drinks. We have a license to manufacture andsell concentrates for Seagram’s mixers, a line of carbonated drinks, in the United States and certain othercountries. Our Company is the exclusive master distributor of Evian bottled water in the United States andCanada and of Rockstar, an energy drink, in most of the United States and in Canada. Beverage PartnersWorldwide (‘‘BPW’’), the Company’s 50 percent-owned joint venture with Nestlé S.A. (‘‘Nestlé’’), marketsready-to-drink teas and coffees in certain countries.
Consumer demand determines the optimal menu of Company product offerings. Consumer demand canvary from one locale to another and can change over time within a single locale. Employing our businessstrategy, and with special focus on core brands, our Company seeks to build its existing brands and, at the sametime, to broaden its historical family of brands, products and services in order to create and satisfy consumerdemand locale by locale.
Our Company introduced a variety of new brands, brand extensions and new beverage products in 2005.Among numerous examples, we introduced Nanairo-Acha in Japan; Bonaqua BonActive in Hong Kong; andnew Fanta flavors including strawberry, pineapple and apple in Angola, Ghana and Nigeria, respectively. InNorth America, we launched Coca-Cola Zero, a new calorie-free cola, Diet Coke Sweetened with Splenda brandsweetener, Sugar Free Full Throttle; and Powerade Option, a new low-calorie, low-carbohydrate sports drinks.We also rebranded our Fresca line and added two new calorie-free extensions—Sparkling Peach Citrus Frescaand Sparkling Black Cherry Citrus Fresca. In Thailand and Vietnam we launched Minute Maid juice and juicedrinks under the Splash brand name. We extended the rebranding of Diet Sprite to Diet Sprite Zero/SpriteZero, which began in Greece in 2002, to now include a total of 77 countries, including the United States. In2006, we launched Black Cherry Vanilla Coca-Cola, Diet Black Cherry Vanilla Coca-Cola, Full Throttle Fury,Tab Energy and Coca-Cola Blak, a new Coca-Cola and coffee fusion beverage designed to appeal to adultconsumers, in France, and we plan to introduce this beverage in the United States later in 2006.
Our Company measures the volume of products sold in two ways: (1) unit cases of finished products and(2) gallons. As used in this report, ‘‘unit case’’ means a unit of measurement equal to 192 U.S. fluid ounces offinished beverage (24 eight-ounce servings); and ‘‘unit case volume’’ means the number of unit cases (or unitcase equivalents) of Company beverage products directly or indirectly sold by the Coca-Cola bottling system tocustomers. Unit case volume primarily consists of beverage products bearing Company trademarks. Alsoincluded in unit case volume are certain products licensed to, or distributed by, our Company, and brands ownedby Coca-Cola system bottlers for which our Company provides marketing support and from the sale of which itderives income. Such products licensed to, or distributed by, our Company or owned by Coca-Cola systembottlers account for a minimal portion of total unit case volume. In addition, unit case volume includes sales byjoint ventures in which the Company is a partner. Although most of our Company’s revenues are not baseddirectly on unit case volume, we believe unit case volume is one of the measures of the underlying strength of theCoca-Cola system because it measures trends at the consumer level. The unit case volume numbers used in thisreport are based on estimates received by the Company from its bottling partners and distributors. As used inthis report, ‘‘gallon’’ means a unit of measurement for concentrates (sometimes referred to as ‘‘beveragebases’’), syrups, finished beverages and powders (in all cases, expressed in equivalent gallons of syrup) sold byour Company to its bottling partners or other customers. Most of our revenues are based on gallon sales, aprimarily ‘‘wholesale’’ activity. Unit case volume and gallon sales growth rates are not necessarily equal duringany given period. Items such as seasonality, bottlers’ inventory practices, supply point changes, timing of priceincreases, new product introductions and changes in product mix can impact unit case volume and gallon salesand can create differences between unit case volume and gallon sales growth rates.
4

In 2005, concentrates and syrups for beverages bearing the trademark ‘‘Coca-Cola’’ or including thetrademark ‘‘Coke’’ (‘‘Coca-Cola Trademark Beverages’’) accounted for approximately 55 percent of theCompany’s total gallon sales.
In 2005, gallon sales in the United States (‘‘U.S. gallon sales’’) represented approximately 27 percent of theCompany’s worldwide gallon sales. Approximately 58 percent of U.S. gallon sales for 2005 was attributable tosales of beverage concentrates and syrups to 78 authorized bottler ownership groups in 393 licensed territories.Those bottlers prepare and sell finished beverages bearing our trademarks for the food store and vendingmachine distribution channels and for other distribution channels supplying products for home and immediateconsumption. Approximately 33 percent of 2005 U.S. gallon sales was attributable to fountain syrups sold tofountain retailers and to 522 authorized fountain wholesalers, some of which are authorized bottlers. Theremaining approximately 9 percent of 2005 U.S. gallon sales was attributable to sales by the Company of finishedbeverages, including juice and juice-drink products and certain water products. Coca-Cola Enterprises Inc.,including its bottling subsidiaries and divisions (‘‘CCE’’), accounted for approximately 50 percent of theCompany’s U.S. gallon sales in 2005. At December 31, 2005, our Company held an ownership interest ofapproximately 36 percent in CCE, which is the world’s largest bottler of Company Trademark Beverages.
In 2005, gallon sales outside the United States represented approximately 73 percent of the Company’sworldwide gallon sales. The countries outside the United States in which our gallon sales were the largest in2005 were Mexico, Brazil, China and Japan, which together accounted for approximately 27 percent of ourworldwide gallon sales. Approximately 91 percent of non-U.S. unit case volume for 2005 was attributable to salesof beverage concentrates and syrups to authorized bottlers together with sales by the Company of finishedbeverages other than juice and juice-drink products, in 511 licensed territories. Approximately 5 percent of 2005non-U.S. unit case volume was attributable to fountain syrups. The remaining approximately 4 percent of 2005non-U.S. unit case volume was attributable to juice and juice-drink products.
In addition to conducting our own independent advertising and marketing activities, we may providepromotional and marketing services or funds to our bottlers. In most cases, we do this on a discretionary basisunder the terms of commitment letters or agreements, even though we are not obligated to do so under theterms of the bottling or distribution agreements between our Company and the bottlers. Also, on a discretionarybasis in most cases, our Company may develop and introduce new products, packages and equipment to assist itsbottlers. Likewise, in many instances, we provide promotional and marketing services and/or funds and/ordispensing equipment and repair services to fountain and bottle/can retailers, typically pursuant to marketingagreements. The aggregate amount of funds provided by our Company to bottlers, resellers or other customersof our Company’s products, principally for participation in promotional and marketing programs wasapproximately $3.7 billion in 2005.
Bottler’s Agreements and Distribution Agreements
Most of our products are manufactured and sold by our bottling partners. We typically sell concentrates andsyrups to our bottling partners who convert them into finished packaged products which they sell to distributorsand other customers. Separate contracts (‘‘Bottler’s Agreements’’) exist between our Company and each of ourbottling partners regarding the manufacture and sale of Company products. Subject to specified terms andconditions and certain variations, the Bottler’s Agreements generally authorize the bottlers to prepare specifiedCompany Trademark Beverages, to package the same in authorized containers, and to distribute and sell thesame in (but, subject to applicable local law, generally only in) an identified territory. The bottler is obligated topurchase its entire requirement of concentrates or syrups for the designated Company Trademark Beveragesfrom the Company or Company-authorized suppliers. We typically agree to refrain from selling or distributing,or from authorizing third parties to sell or distribute, the designated Company Trademark Beverages throughoutthe identified territory in the particular authorized containers; however, we typically reserve for ourselves or ourdesignee the right (1) to prepare and package such beverages in such containers in the territory for sale outside
5

the territory, and (2) to prepare, package, distribute and sell such beverages in the territory, in any other manneror form. Territorial restrictions on bottlers vary in some cases in accordance with local law.
The Bottler’s Agreements between us and our authorized bottlers in the United States differ in certainrespects from those in the other countries in which Company Trademark Beverages are sold. As furtherdiscussed below, the principal differences involve the duration of the agreements; the inclusion or exclusion ofcanned beverage production rights; the inclusion or exclusion of authorizations to manufacture and distributefountain syrups; in some cases, the degree of flexibility on the part of the Company to determine the pricing ofsyrups and concentrates; and the extent, if any, of the Company’s obligation to provide marketing support.
Outside the United States
The Bottler’s Agreements between us and our authorized bottlers outside the United States generally are ofstated duration, subject in some cases to possible extensions or renewals of the term of the contract. Generally,these contracts are subject to termination by the Company following the occurrence of certain designated events.These events include defined events of default and certain changes in ownership or control of the bottler.
In certain parts of the world outside the United States, we have not granted comprehensive beverageproduction rights to the bottlers. In such instances, we or our authorized suppliers sell Company TrademarkBeverages to the bottlers for sale and distribution throughout the designated territory, often on a nonexclusivebasis. A majority of the Bottler’s Agreements in force between us and bottlers outside the United Statesauthorize the bottlers to manufacture and distribute fountain syrups, usually on a nonexclusive basis.
Our Company generally has complete flexibility to determine the price and other terms of sale of theconcentrates and syrups we sell to bottlers outside the United States. In some instances, however, we haveagreed or may in the future agree with the bottler with respect to concentrate pricing on a prospective basis forspecified time periods. Outside the United States, in most cases, we have no obligation to provide marketingsupport to the bottlers. Nevertheless, we may, at our discretion, contribute toward bottler expenditures foradvertising and marketing. We may also elect to undertake independent or cooperative advertising andmarketing activities.
Within the United States
In the United States, with certain very limited exceptions, the Bottler’s Agreements for Coca-ColaTrademark Beverages and other cola-flavored beverages have no stated expiration date. Our standard contractsfor other soft-drink flavors and for noncarbonated beverages are of stated duration, subject to bottler renewalrights. The Bottler’s Agreements in the United States are subject to termination by the Company fornonperformance or upon the occurrence of certain defined events of default that may vary from contract tocontract. The ‘‘1987 Contract,’’ described below, is terminable by the Company upon the occurrence of certainevents, including:
• the bottler’s insolvency, dissolution, receivership or the like;
• any disposition by the bottler or any of its subsidiaries of any voting securities of any bottler subsidiarywithout the consent of the Company;
• any material breach of any obligation of the bottler under the 1987 Contract; or
• except in the case of certain bottlers, if a person or affiliated group acquires or obtains any right toacquire beneficial ownership of more than 10 percent of any class or series of voting securities of thebottler without authorization by the Company.
Under the terms of the Bottler’s Agreements, bottlers in the United States are authorized to manufactureand distribute Company Trademark Beverages in bottles and cans. However, these bottlers generally are notauthorized to manufacture fountain syrups. Rather, as described above, our Company manufactures and sells
6

fountain syrups to authorized fountain wholesalers (including certain authorized bottlers) and some fountainretailers. These wholesalers in turn sell the syrups or deliver them on our behalf to restaurants and otherretailers.
In the United States, the form of Bottler’s Agreement for cola-flavored soft drinks that covers the largestamount of U.S. gallon sales (the ‘‘1987 Contract’’) gives us complete flexibility to determine the price and otherterms of sale of concentrates and syrups for Company Trademark Beverages. In some instances, we have agreedor may in the future agree with the bottler with respect to concentrate pricing on a prospective basis for specifiedtime periods. Bottlers operating under the 1987 Contract accounted for approximately 89 percent of ourCompany’s total U.S. gallon sales for bottled and canned beverages in 2005, excluding direct sales by theCompany of juice and juice-drink products and other finished beverages (‘‘U.S. bottle/can gallon sales’’). Certainother forms of U.S. Bottler’s Agreements, entered into prior to 1987, provide for concentrates or syrups forcertain Coca-Cola Trademark Beverages and other cola-flavored Company Trademark Beverages to be pricedpursuant to a stated formula. Bottlers accounting for approximately 10 percent of U.S. bottle/can gallon sales in2005 have contracts for certain Coca-Cola Trademark Beverages and other cola-flavored Company TrademarkBeverages with pricing formulas that generally provide for a baseline price. This baseline price may be adjustedperiodically by the Company, up to a maximum indexed ceiling price, and is adjusted quarterly based uponchanges in certain sugar or sweetener prices, as applicable. Bottlers accounting for the remaining (less than1 percent) U.S. bottle/can gallon sales in 2005 operate under our oldest form of contract, which provides for afixed price for Coca-Cola syrup used in bottles and cans. This price is subject to quarterly adjustments to reflectchanges in the quoted price of sugar.
We have standard contracts with bottlers in the United States for the sale of concentrates and syrups fornon-cola-flavored soft drinks and certain noncarbonated beverages in bottles and cans; and, in certain cases, forthe sale of finished noncarbonated beverages in bottles and cans. All of these standard contracts give theCompany complete flexibility to determine the price and other terms of sale.
Under the 1987 Contract and most of our other standard soft-drink and noncarbonated beverage contractswith bottlers in the United States, our Company has no obligation to participate with bottlers in expenditures foradvertising and marketing. Nevertheless, at our discretion, we may contribute toward such expenditures andundertake independent or cooperative advertising and marketing activities. Some U.S. Bottler’s Agreementsthat predate the 1987 Contract impose certain marketing obligations on us with respect to certain CompanyTrademark Beverages.
As a practical matter, our Company’s ability to exercise its contractual flexibility to determine the price andother terms of sale of its syrups, concentrates and finished beverages under various agreements described aboveis subject, both outside and within the United States, to competitive market conditions.
Significant Equity Method Investments and Company Bottling Operations
Our Company maintains business relationships with three types of bottlers:
• bottlers in which the Company has no ownership interest;
• bottlers in which the Company has invested and has a noncontrolling ownership interest; and
• bottlers in which the Company has invested and has a controlling ownership interest.
In 2005, bottling operations in which we had no ownership interest produced and distributed approximately25 percent of our worldwide unit case volume. We have equity positions in 51 unconsolidated bottling, canningand distribution operations for our products worldwide. These cost or equity method investees produced anddistributed approximately 58 percent of our worldwide unit case volume in 2005. Controlled and consolidatedbottling operations produced and distributed approximately 7 percent of our worldwide unit case volume in2005. The remaining approximately 10 percent of our worldwide unit case volume in 2005 was produced and
7

distributed by our fountain operations plus our juice and juice drink, sports drink and other finished beverageoperations.
We make equity investments in selected bottling operations with the intention of maximizing the strengthand efficiency of the Coca-Cola system’s production, distribution and marketing systems around the world.These investments are intended to result in increases in unit case volume, net revenues and profits at the bottlerlevel, which in turn generate increased gallon sales for our Company’s concentrate and syrup business. Whenthis occurs, both we and our bottling partners benefit from long-term growth in volume, improved cash flows andincreased shareowner value.
The level of our investment generally depends on the bottler’s capital structure and its available resourcesat the time of the investment. Historically, in certain situations, we have viewed it as advantageous to acquire acontrolling interest in a bottling operation, often on a temporary basis. Owning such a controlling interest hasallowed us to compensate for limited local resources and has enabled us to help focus the bottler’s sales andmarketing programs and assist in the development of the bottler’s business and information systems and theestablishment of appropriate capital structures.
In line with our long-term bottling strategy, we may periodically consider options for reducing ourownership interest in a bottler. One such option is to combine our bottling interests with the bottling interests ofothers to form strategic business alliances. Another option is to sell our interest in a bottling operation to one ofour equity method investee bottlers. In both of these situations, our Company continues to participate in thebottler’s results of operations through our share of the strategic business alliances’ or equity method investees’earnings or losses.
In cases where our investments in bottlers represent noncontrolling interests, our intention is to provideexpertise and resources to strengthen those businesses.
Significant investees in which we have noncontrolling ownership interests include the following:
Coca-Cola Enterprises Inc. Our ownership interest in CCE was approximately 36 percent atDecember 31, 2005. CCE is the world’s largest bottler of the Company’s beverage products. In 2005, sales ofconcentrates, syrups and finished products by the Company to CCE were approximately $5.1 billion. CCEestimates that the territories in which it markets beverage products to retailers (which include portions of 46states and the District of Columbia in the United States, the United States Virgin Islands, Canada, GreatBritain, continental France, the Netherlands, Luxembourg, Belgium and Monaco) contain approximately78 percent of the United States population, 98 percent of the population of Canada, and 100 percent of thepopulations of Great Britain, continental France, the Netherlands, Luxembourg, Belgium and Monaco. In 2005,CCE’s net operating revenues were approximately $18.7 billion. Excluding fountain products, in 2005,approximately 62 percent of the unit case volume of CCE consisted of Coca-Cola Trademark Beverages, 31percent of its unit case volume consisted of other Company Trademark Beverages and 7 percent of its unit casevolume consisted of beverage products of other companies.
Coca-Cola Hellenic Bottling Company S.A. (‘‘Coca-Cola HBC’’). At December 31, 2005, our ownershipinterest in Coca-Cola HBC was approximately 24 percent. Coca-Cola HBC has bottling and distribution rights,through direct ownership or joint ventures, in Armenia, Austria, Belarus, Bosnia-Herzegovina, Bulgaria,Croatia, the Czech Republic, Estonia, Former Yugoslavian Republic of Macedonia, Greece, Hungary, Italy,Latvia, Lithuania, Moldova, Nigeria, Northern Ireland, Poland, Republic of Ireland, Romania, Russia, Serbiaand Montenegro, Slovakia, Slovenia, Switzerland and Ukraine. Coca-Cola HBC estimates that the territories inwhich it markets beverage products contain approximately 67 percent of the population of Italy and 100 percentof the populations of the other countries named above in which Coca-Cola HBC has bottling and distributionrights. In 2005, Coca-Cola HBC’s net sales of beverage products were approximately $5.8 billion. In 2005,approximately 46 percent of the unit case volume of Coca-Cola HBC consisted of Coca-Cola TrademarkBeverages, approximately 47 percent of its unit case volume consisted of other Company Trademark Beverages
8

and approximately 7 percent of its unit case volume consisted of beverage products of Coca-Cola HBC or othercompanies.
Coca-Cola FEMSA, S.A. de C.V. (‘‘Coca-Cola FEMSA’’). Our ownership interest in Coca-Cola FEMSAwas approximately 40 percent at December 31, 2005. Coca-Cola FEMSA is a Mexican holding company withbottling subsidiaries in a substantial part of central Mexico, including Mexico City and southeastern Mexico;greater São Paulo, Campinas, Santos, the state of Matto Grosso do Sul and part of the state of Goias in Brazil;central Guatemala; most of Colombia; all of Costa Rica, Nicaragua, Panama and Venezuela; and greater BuenosAires, Argentina. Coca-Cola FEMSA estimates that the territories in which it markets beverage productscontain approximately 48 percent of the population of Mexico, 16 percent of the population of Brazil, 98 percentof the population of Colombia, 47 percent of the population of Guatemala, 100 percent of the populations ofCosta Rica, Nicaragua, Panama and Venezuela and 30 percent of the population of Argentina. In 2005,Coca-Cola FEMSA’s net sales of beverage products were approximately $4.5 billion. In 2005, approximately62 percent of the unit case volume of Coca-Cola FEMSA consisted of Coca-Cola Trademark Beverages,34 percent of its unit case volume consisted of other Company Trademark Beverages and 4 percent of its unitcase volume consisted of beverage products of Coca-Cola FEMSA or other companies.
Coca-Cola Amatil Limited (‘‘Coca-Cola Amatil’’). At December 31, 2005, our Company’s ownershipinterest in Coca-Cola Amatil was approximately 32 percent. Coca-Cola Amatil has bottling and distributionrights, through direct ownership or joint ventures, in Australia, New Zealand, Fiji, Papua New Guinea,Indonesia and South Korea. Coca-Cola Amatil estimates that the territories in which it markets beverageproducts contain 100 percent of the populations of Australia, New Zealand, Fiji, South Korea and Papua NewGuinea, and 98 percent of the population of Indonesia. In 2005, Coca-Cola Amatil’s net sales of beverageproducts were approximately $3.0 billion. In 2005, approximately 51 percent of the unit case volume ofCoca-Cola Amatil consisted of Coca-Cola Trademark Beverages, approximately 40 percent of its unit casevolume consisted of other Company Trademark Beverages, approximately 8 percent of its unit case volumeconsisted of beverage products of Coca-Cola Amatil and less than 1 percent of its unit case volume consisted ofbeverage products of other companies.
Other Interests. We own a 50 percent interest in BPW, a joint venture with Nestlé and certain of itssubsidiaries that is focused upon the ready-to-drink tea and coffee businesses. BPW had sales in the UnitedStates and 65 other countries during the year ended December 31, 2005. BPW serves as the exclusive vehiclethrough which our Company and Nestlé participate in the ready-to-drink tea and coffee businesses, except inJapan. BPW markets ready-to-drink tea products primarily under the Nestea, Belté, Yang Guang, Nagomi,Heaven and Earth, Funchum, Frestea, Ten Ren, Modern Tea Workshop, Café Zu, Shizen and Tian Teytrademarks, and ready-to-drink coffee products primarily under the Nescafé, Taster’s Choice and Georgia Clubtrademarks. We also own a 50 percent interest in Multon, a Russian juice business (‘‘Multon’’), which weacquired in April 2005 jointly with Coca-Cola HBC. Multon produces and distributes juice products under theDOBRIY, Rich, Nico and other trademarks in Russia, Ukraine and Belarus.
Seasonality
Sales of our ready-to-drink nonalcoholic beverages are somewhat seasonal, with the second and thirdcalendar quarters accounting for the highest sales volumes. The volume of sales in the beverages business maybe affected by weather conditions.
Competition
Our Company competes in the nonalcoholic beverages segment of the commercial beverages industry.Based on internally available data and a variety of industry sources, we believe that, in 2005, worldwide sales ofCompany products accounted for approximately 10 percent of total worldwide sales of nonalcoholic beverageproducts. The nonalcoholic beverages segment of the commercial beverages industry is highly competitive,
9

consisting of numerous firms. These include firms that, like our Company, compete in multiple geographic areasas well as firms that are primarily local in operation. Competitive products include carbonated soft drinks;packaged water; juices and nectars; fruit drinks and dilutables (including syrups and powdered drinks); sportsand energy drinks; coffee and tea; still drinks and other beverages. Nonalcoholic beverages are sold toconsumers in both ready-to-drink and not-ready-to-drink form. In many of the countries in which we dobusiness, including the United States, PepsiCo, Inc. is one of our primary competitors. Other significantcompetitors include Nestlé, Cadbury Schweppes plc, Groupe Danone and Kraft Foods Inc.
Most of our beverages business currently is in soft drinks, as that term is defined in this report. The softdrink business, which is part of the nonalcoholic beverages segment, is itself highly competitive, and soft drinksface significant competition from other nonalcoholic beverages. Our Company is the leading seller of soft drinkconcentrates and syrups in the world. Numerous firms, however, compete in that business. These consist of arange of firms, from local to international, that compete against our Company in numerous geographic areas.
Competitive factors impacting our business include pricing, advertising, sales promotion programs, productinnovation, increased efficiency in production techniques, the introduction of new packaging, new vending anddispensing equipment, and brand and trademark development and protection.
Our competitive strengths include powerful brands with a high level of consumer acceptance; a worldwidenetwork of bottlers and distributors of Company products; sophisticated marketing capabilities; and a talentedgroup of dedicated employees. Our competitive challenges include strong competition in all geographicalregions and, in many countries, a concentrated retail sector with powerful buyers able to freely choose amongCompany products, products of competitive beverage suppliers and individual retailers’ own store-brandbeverages.
Raw Materials
The principal raw materials used by our business are nutritive and non-nutritive sweeteners. In the UnitedStates, the principal nutritive sweetener is high fructose corn syrup, a form of sugar, which is available fromnumerous domestic sources and is historically subject to fluctuations in its market price. The principal nutritivesweetener used by our business outside the United States is sucrose, another form of sugar, which is alsoavailable from numerous sources and is historically subject to fluctuations in its market price. Our Companygenerally has not experienced any difficulties in obtaining its requirements for nutritive sweeteners. In theUnited States, we purchase high fructose corn syrup to meet our and our bottlers’ requirements with theassistance of Coca-Cola Bottlers’ Sales & Services Company LLC (‘‘CCBSS’’). CCBSS is a limited liabilitycompany that is owned by authorized Coca-Cola bottlers doing business in the United States. Among otherthings, CCBSS provides procurement services to our Company for the purchase of various goods and services inthe United States, including high fructose corn syrup.
The principal non-nutritive sweeteners we use in our business are aspartame, saccharin, sucralose,acesulfame potassium and cyclamate. Generally, these raw materials are readily available from numeroussources. However, our Company purchases aspartame, an important non-nutritive sweetener that is used aloneor in combination with other important non-nutritive sweeteners such as saccharin or acesulfame potassium inour low-calorie soft drink products, primarily from The NutraSweet Company, Holland Sweetener Companyand Ajinomoto Co., Inc., which we consider to be our only viable sources for the supply of this product. Wecurrently purchase acesulfame potassium from Nutrinova Nutrition Specialties & Food Ingredients GmbH,which we consider to be our only viable source for the supply of this product. Our Company generally has notexperienced any difficulties in obtaining its requirements for non-nutritive sweeteners.
Our Company sells a number of products sweetened with sucralose, a non-nutritive sweetener. We workclosely with Tate & Lyle, our sucralose supplier, to maintain continuity of supply. Although Tate & Lyle is oursingle source for sucralose, we do not anticipate difficulties in obtaining our requirements for sucralose.
10

With regard to juice and juice-drink products, citrus fruit, particularly orange juice concentrate, is ourprincipal raw material. The citrus industry is subject to the variability of weather conditions. In particular,freezing weather or hurricanes in central Florida may result in shortages and higher prices for orange juiceconcentrate throughout the industry. Due to our ability to source orange juice concentrate from the SouthernHemisphere (particularly from Brazil), the supply of orange juice concentrate available that meets ourCompany’s standards is normally adequate to meet demand.
Patents, Copyrights, Trade Secrets and Trademarks
Our Company owns numerous patents, copyrights and trade secrets, as well as substantial know-how andtechnology, which we collectively refer to in this report as ‘‘technology.’’ This technology generally relates to ourCompany’s products and the processes for their production; the packages used for our products; the design andoperation of various processes and equipment used in our business; and certain quality assurance software.Some of the technology is licensed to suppliers and other parties. Our soft-drink and other beverage formulaeare among the important trade secrets of our Company.
We own numerous trademarks that are very important to our business. Depending upon the jurisdiction,trademarks are valid as long as they are in use and/or their registrations are properly maintained. Pursuant toour Bottler’s Agreements, we authorize our bottlers to use applicable Company trademarks in connection withtheir manufacture, sale and distribution of Company products. In addition, we grant licenses to third partiesfrom time to time to use certain of our trademarks in conjunction with certain merchandise and food products.
Governmental Regulation
Our Company is required to comply, and it is our policy to comply, with applicable laws in the numerouscountries throughout the world in which we do business. In many jurisdictions, compliance with competition lawsis of special importance to us, and our operations may come under special scrutiny by competition lawauthorities due to our competitive position in those jurisdictions.
The production, distribution and sale in the United States of many of our Company’s products are subjectto the Federal Food, Drug and Cosmetic Act; the Occupational Safety and Health Act; the Lanham Act; variousenvironmental statutes; and various other federal, state and local statutes and regulations applicable to theproduction, transportation, sale, safety, advertising, labeling and ingredients of such products. Outside theUnited States, the production, distribution and sale of our many products are also subject to numerous statutesand regulations.
A California law requires that a specific warning appear on any product that contains a component listed bythe state as having been found to cause cancer or birth defects. The law exposes all food and beverage producersto the possibility of having to provide warnings on their products. This is because the law recognizes no generallyapplicable quantitative thresholds below which a warning is not required. Consequently, even trace amounts oflisted components can expose affected products to the prospect of warning labels. Products containing listedsubstances that occur naturally or that are contributed to such products solely by a municipal water supply aregenerally exempt from the warning requirement. No Company beverages produced for sale in California arecurrently required to display warnings under this law. However, we are unable to predict whether a componentfound in a Company product might be added to the California list in the future. Furthermore, we are also unableto predict when or whether the increasing sensitivity of detection methodology that may become applicableunder this law and related regulations as they currently exist, or as they may be amended, might result in thedetection of an infinitesimal quantity of a listed substance in a Company beverage produced for sale inCalifornia.
Bottlers of our beverage products presently offer nonrefillable, recyclable containers in the United Statesand various other markets around the world. Some of these bottlers also offer refillable containers, which arealso recyclable. Legal requirements have been enacted in jurisdictions in the United States and overseas
11

requiring that deposits or certain ecotaxes or fees be charged for the sale, marketing and use of certainnonrefillable beverage containers. The precise requirements imposed by these measures vary. Other beveragecontainer-related deposit, recycling, ecotax and/or product stewardship proposals have been introduced invarious jurisdictions in the United States and overseas. We anticipate that similar legislation or regulations maybe proposed in the future at local, state and federal levels, both in the United States and elsewhere.
All of our Company’s facilities in the United States and elsewhere around the world are subject to variousenvironmental laws and regulations. Compliance with these provisions has not had, and we do not expect suchcompliance to have, any material adverse effect on our Company’s capital expenditures, net income orcompetitive position.
Employees
As of December 31, 2005, our Company employed approximately 55,000 persons, compared toapproximately 50,000 at the end of 2004. The increase in the number of employees was primarily due to anincrease in bottling operations activity, mainly in Brazil, offset by a decrease resulting from the sale of certainbottling and canning operations. At the end of 2005, approximately 10,400 Company employees were located inthe United States.
Our Company, through its divisions and subsidiaries, has entered into numerous collective bargainingagreements. We currently expect that we will be able to renegotiate such agreements on satisfactory terms whenthey expire. The Company believes that its relations with its employees are generally satisfactory.
Securities Exchange Act Reports
The Company maintains an internet website at the following address: www.coca-cola.com. The informationon the Company’s website is not incorporated by reference in this annual report on Form 10-K.
We make available on or through our website certain reports and amendments to those reports that we filewith or furnish to the Securities and Exchange Commission (the ‘‘SEC’’) in accordance with the SecuritiesExchange Act of 1934, as amended (the ‘‘Exchange Act’’). These include our annual reports on Form 10-K, ourquarterly reports on Form 10-Q and our current reports on Form 8-K. We make this information available onour website free of charge as soon as reasonably practicable after we electronically file the information with, orfurnish it to, the SEC.
ITEM 1A. RISK FACTORS
In addition to the other information set forth in this report, you should carefully consider the followingfactors which could materially affect our business, financial condition or future results. The risks described beloware not the only risks facing our Company. Additional risks and uncertainties not currently known to us or thatwe currently deem to be immaterial also may materially adversely affect our business, financial condition and/oroperating results.
Obesity concerns may reduce demand for some of our products.
Consumers, public health officials and government officials are becoming increasingly aware of andconcerned about the public health consequences associated with obesity, particularly among young people. Inaddition, recent press reports indicate that lawyers and consumer advocates have publicly threatened to instigatelitigation against companies in our industry, including us, alleging unfair and/or deceptive practices related tocontracts to sell soft drinks and other beverages in schools. Increasing public awareness about these issues andnegative publicity resulting from actual or threatened legal actions may reduce demand for our non-dietcarbonated beverages, which could affect our profitability.
12

Water scarcity and poor quality could negatively impact the Coca-Cola system’s production costs and capacity.
Water is the main ingredient in substantially all of our products. It is also a limited resource in many parts ofthe world, facing unprecedented challenges from overexploitation, increasing pollution and poor management.As demand for water continues to increase around the world and as the quality of available water deteriorates,our system may incur increasing production costs or face capacity constraints which could adversely affect ourprofitability in the long run.
Changes in the nonalcoholic beverages business environment could impact our financial results.
The nonalcoholic beverages business environment is rapidly evolving as a result of, among other things,changes in consumer preferences, including changes based on health and nutrition considerations and obesityconcerns, shifting consumer preferences and needs, changes in consumer lifestyles, increased consumerinformation and competitive product and pricing pressures. In addition, the industry is being affected by thetrend toward consolidation in the retail channel, particularly in Europe and the United States. If we are unableto successfully adapt to this rapidly changing environment, our net income, share of sales and volume growthcould be negatively affected.
Increased competition could hurt our business.
The nonalcoholic beverages segment of the commercial beverages industry is highly competitive. Wecompete with major international beverage companies that, like our Company, operate in multiple geographicareas, as well as numerous firms that are primarily local in operation. In many countries in which we do business,including the United States, PepsiCo, Inc. is a primary competitor. Other significant competitors include Nestlé,Cadbury Schweppes plc, Groupe Danone and Kraft Foods Inc. Our ability to gain or maintain share of sales orgross margins in the global market or in various local markets may be limited as a result of actions bycompetitors.
If we are unable to enter or expand our operations in developing and emerging markets, our growth rate could benegatively affected.
Our success depends in part on our ability to penetrate developing and emerging markets, which in turndepends on economic and political conditions in these markets and on our ability to acquire or form strategicbusiness alliances with local bottlers and to make necessary infrastructure enhancements to production facilities,distribution networks, sales equipment and technology. Moreover, the supply of our products in developing andemerging markets must match customers’ demand for those products. Due to product price, limited purchasingpower and cultural differences, there can be no assurance that our products will be accepted in any particulardeveloping or emerging market.
Fluctuations in foreign currency exchange and interest rates could affect our financial results.
We earn revenues, pay expenses, own assets and incur liabilities in countries using currencies other than theU.S. dollar, including the euro, the Japanese yen, the Brazilian real and the Mexican peso. In 2005, we used 45functional currencies in addition to the U.S. dollar and derived approximately 71 percent of our net operatingrevenues from operations outside of our North America operating group. Because our consolidated financialstatements are presented in U.S. dollars, we must translate revenues, income and expenses as well as assets andliabilities into U.S. dollars at exchange rates in effect during or at the end of each reporting period. Therefore,increases or decreases in the value of the U.S. dollar against other major currencies will affect our net revenues,operating income and the value of balance sheet items denominated in foreign currencies. Because of thegeographic diversity of our operations, weaknesses in some currencies might be offset by strengths in others overtime. We also use derivative financial instruments to further reduce our net exposure to currency exchange ratefluctuations. However, we cannot assure you that fluctuations in foreign currency exchange rates, particularly thestrengthening of the U.S. dollar against major currencies, would not materially affect our financial results. In
13

addition, we are exposed to adverse changes in interest rates. When appropriate, we use derivative financialinstruments to reduce our exposure to interest rate risks. We cannot assure you, however, that our financial riskmanagement program will be successful in reducing the risks inherent in exposures to interest rate fluctuations.
We rely on our bottling partners for a significant portion of our business. If we are unable to maintain goodrelationships with our bottling partners, our business could suffer.
We generate a significant portion of our net revenues by selling concentrates and syrups to bottlers in whichwe do not have any ownership interest or in which we have a noncontrolling ownership interest. In 2005,approximately 83 percent of our worldwide unit case volume was produced and distributed by bottling partnersin which the Company did not have controlling interests. As independent companies, our bottling partners, someof which are publicly traded companies, make their own business decisions that may not always align with ourinterests. In addition, many of our bottling partners have the right to manufacture or distribute their ownproducts or certain products of other beverage companies. If we are unable to provide an appropriate mix ofincentives to our bottling partners through a combination of pricing and marketing and advertising support, theymay take actions that, while maximizing their own short-term profits, may be detrimental to our Company or ourbrands, or they may devote more of their energy and resources to business opportunities or products other thanthose of the Company. Such actions could, in the long run, have an adverse effect on our profitability. Inaddition, the loss of one or more major customers by one of our major bottling partners, or disruptions ofbottling operations that may be caused by strikes, work stoppages or labor unrest affecting such bottlers, couldindirectly affect our results.
If our bottling partners’ financial condition deteriorates, our business and financial results could be affected.
The success of our business depends on the financial strength and viability of our bottling partners. Ourbottling partners’ financial condition is affected in large part by conditions and events that are beyond ourcontrol, including competitive and general market conditions in the territories in which they operate and theavailability of capital and other financing sources on reasonable terms. While under our bottlers’ agreements wegenerally have the right to unilaterally change the prices we charge for our concentrates and syrups, our abilityto do so may be materially limited by the financial condition of the applicable bottlers and their ability to passprice increases along to their customers. In addition, because we have investments in certain of our bottlingpartners, which we account for under the equity method, our operating results include our proportionate shareof such bottling partners’ income or loss. Also, a deterioration of the financial condition of bottling partners inwhich we have investments could affect the carrying value of such investments and result in write-offs.Therefore, a significant deterioration of our bottling partners’ financial condition could adversely affect ourfinancial results.
If we are unable to renew collective bargaining agreements on satisfactory terms or we experience strikes or workstoppages, our business could suffer.
Many of our employees at our key manufacturing locations are covered by collective bargaining agreements.If we are unable to renew such agreements on satisfactory terms, our labor costs could increase, which wouldaffect our profit margins. In addition, strikes or work stoppages at any of our major manufacturing plants couldimpair our ability to supply concentrates and syrups to our customers, which would reduce our revenues andcould expose us to customer claims.
Increase in the cost of energy could affect our profitability.
Our Company-owned bottling operations and our bottling partners operate a large fleet of trucks and othermotor vehicles. In addition, we and our bottlers use a significant amount of electricity, natural gas and otherenergy sources to operate our concentrate and bottling plants. An increase in the price of fuel and other energy
14

sources would increase our and the Coca-Cola system’s operating costs and, therefore could negatively impactour profitability.
Increase in cost, disruption of supply or shortage of raw materials could harm our business.
We and our bottling partners use various raw materials in our business including high fructose corn syrup,sucrose, aspartame, saccharin, acesulfame potassium, sucralose and orange juice concentrate. The prices forthese raw materials fluctuate depending on market conditions. Substantial increases in the prices for our rawmaterials, to the extent they cannot be recouped through increases in the prices of finished beverage products,would increase our and the Coca-Cola system’s operating costs and could reduce our profitability. Increases inthe prices of our finished products resulting from higher raw material costs could affect affordability in somemarkets and reduce Coca-Cola system sales. In addition, some of these raw materials, such as aspartame,acesulfame potassium and sucralose, are available from a limited number of suppliers. We cannot assure youthat we will be able to maintain favorable arrangements and relationships with these suppliers. An increase inthe cost or a sustained interruption in the supply or shortage of some of these raw materials that may be causedby a deterioration of our relationships with suppliers or by events such as natural disasters, power outages, laborstrikes or the like, could negatively impact our net revenues and profits.
Changes in laws and regulations relating to beverage containers and packaging could increase our costs and reducedemand for our products.
We and our bottlers currently offer nonrefillable, recyclable containers in the United States and in variousother markets around the world. Legal requirements have been enacted in various jurisdictions in the UnitedStates and overseas requiring that deposits or certain ecotaxes or fees be charged for the sale, marketing and useof certain nonrefillable beverage containers. Other beverage container-related deposit, recycling, ecotax and/orproduct stewardship proposals have been introduced in various jurisdictions in the United States and overseasand we anticipate that similar legislation or regulations may be proposed in the future at local, state and federallevels, both in the United States and elsewhere. If these types of requirements are adopted and implemented ona large scale in any of the major markets in which we operate, they could affect our costs or require changes inour distribution model, which could reduce our profitability or revenues. In addition, container-deposit laws, orregulations that impose additional burdens on retailers, could cause a shift away from our products to retailer-proprietary brands, which could impact the demand for our products in the affected markets.
Significant additional labeling or warning requirements may inhibit sales of affected products.
Various jurisdictions may seek to adopt significant additional product labeling or warning requirementsrelating to the chemical content or perceived adverse health consequences of certain of our products. Thesetypes of requirements, if they become applicable to one or more of our major products under current or futureenvironmental or health laws or regulations, may inhibit sales of such products. In California, a law requires thata specific warning appear on any product that contains a component listed by the state as having been found tocause cancer or birth defects. This law recognizes no generally applicable quantitative thresholds below which awarning is not required. If a component found in one of our products is added to the list, or if the increasingsensitivity of detection methodology that may become available under this law and related regulations as theycurrently exist, or as they may be amended, results in the detection of an infinitesimal quantity of a listedsubstance in one of our beverages produced for sale in California, the resulting warning requirements or adversepublicity could affect our sales.
Unfavorable economic and political conditions in international markets could hurt our business.
We derive a significant portion of our net revenues from sales of our products in international markets. In2005, our operations outside of our North America operating group accounted for approximately 71 percent ofour net operating revenues. Unfavorable economic and political conditions in these markets, including civil
15

unrest and governmental changes, could undermine consumer confidence and reduce the consumers’ purchasingpower, thereby reducing demand for our products. In addition, product boycotts resulting from political activismcould reduce demand for our products, while restrictions on our ability to transfer earnings or capital acrossborders that may be imposed or expanded as a result of political and economic instability could impact ourprofitability. Without limiting the generality of the preceding sentence, the current unstable economic andpolitical conditions and civil unrest and political activism in the Middle East, India or the Philippines, theunstable situation in Iraq, or the continuation or escalation of terrorist activities could adversely impact ourinternational business.
Changes in commercial and market practices within the European Economic Area may affect the sales of ourproducts.
We and our bottlers are subject to an Undertaking, rendered legally binding in June 2005 by a decision ofthe European Commission, pursuant to which we committed to make certain changes in our commercial andmarket practices in the European Economic Area Member States. The Undertaking potentially applies in 27countries and in all channels of distribution where our carbonated soft drinks account for over 40 percent ofnational sales and twice the nearest competitor’s share. The commitments we and our bottlers made in theUndertaking relate broadly to exclusivity, percentage-based purchasing commitments, transparency, targetrebates, tying, assortment or range commitments, and agreements concerning products of other suppliers. TheUndertaking also applies to shelf space commitments in agreements with take-home customers and to financingand availability agreements in the on-premise channel. In addition, the Undertaking includes commitments thatare applicable to commercial arrangements concerning the installation and use of technical equipment (such ascoolers, fountain equipment and vending machines). Adjustments to our business model in the EuropeanEconomic Area Member States as a result of these commitments or of future interpretations of EuropeanUnion competition laws and regulations could adversely affect our sales in the European Economic Areamarkets.
Litigation or legal proceedings could expose us to significant liabilities and thus negatively affect our financialresults.
We are party to various litigation claims and legal proceedings. We evaluate these litigation claims and legalproceedings to assess the likelihood of unfavorable outcomes and to estimate, if possible, the amount ofpotential losses. Based on these assessments and estimates, if any, we establish reserves and/or disclose therelevant litigation claims or legal proceedings, as appropriate. These assessments and estimates are based on theinformation available to management at the time and involve a significant amount of management judgment. Wecaution you that actual outcomes or losses may differ materially from those envisioned by our currentassessments and estimates. In addition, new or adverse developments in existing litigation claims or legalproceedings involving our Company could require us to establish or increase litigation reserves or enter intounfavorable settlements or satisfy judgments for monetary damages for amounts significantly in excess of currentreserves, which could adversely affect our financial results for future periods.
Adverse weather conditions could reduce the demand for our products.
The sales of our products are influenced to some extent by weather conditions in the markets in which weoperate. Unusually cold weather during the summer months may have a temporary effect on the demand for ourproducts and contribute to lower sales, which could have an adverse effect on our results of operations for thoseperiods.
16

If we are unable to maintain brand image and product quality, or if we encounter other product issues such asproduct recalls, our business may suffer.
Our success depends on our ability to maintain brand image for our existing products and effectively buildup brand image for new products and brand extensions. We cannot assure you, however, that additionalexpenditures and our renewed commitment to advertising and marketing will have the desired impact on ourproducts’ brand image and on consumer preferences. Product quality issues, real or imagined, or allegations ofproduct contamination, even when false or unfounded, could tarnish the image of the affected brands and maycause consumers to choose other products. In addition, because of changing government regulations orimplementation thereof, allegations of product contamination or lack of consumer interest in certain products,we may be required from time to time to recall products entirely or from specific markets. Product recalls couldaffect our profitability and could negatively affect brand image. Also, adverse publicity surrounding obesityconcerns, water usage, labor relations and the like could negatively affect our Company’s overall reputation andour products’ acceptance by consumers.
Changes in the legal and regulatory environment in the countries in which we operate could increase our costs orreduce our revenues.
Our Company’s business is subject to various laws and regulations in the numerous countries throughoutthe world in which we do business, including laws and regulations relating to competition, product safety,advertising and labeling, container deposits, recycling or stewardship, the protection of the environment, andemployment and labor practices. In the United States, the production, distribution and sale of many of ourproducts are subject to, among others, the Federal Food, Drug and Cosmetic Act, the Occupational Safety andHealth Act, the Lanham Act, as well as various state and local statutes and regulations. Outside the UnitedStates, the production, distribution, sale, advertising and labeling of many of our products are also subject tovarious laws and regulations. Changes in applicable laws or regulations or evolving interpretations thereof could,in certain circumstances result in increased compliance costs or capital expenditures, which could affect ourprofitability, or impede the production or distribution of our products, which could affect our revenues.
Changes in accounting standards and taxation requirements could affect our financial results.
New accounting standards or pronouncements that may become applicable to our Company from time totime, or changes in the interpretation of existing standards and pronouncements, could have a significant effecton our reported results for the affected periods. We are also subject to income tax in the numerous jurisdictionsin which we generate revenues. In addition, our products are subject to import and excise duties and/or sales orvalue-added taxes in many jurisdictions in which we operate. Increases in income tax rates could reduce ourafter-tax income from affected jurisdictions, while increases in indirect taxes could affect our products’affordability and therefore reduce our sales.
If we are not able to achieve our overall long term goals, the value of an investment in our Company could benegatively affected.
We have established and publicly announced certain long-term growth objectives. These objectives werebased on our evaluation of our growth prospects, which are generally based on volume and sales potential ofmany product types, some of which are more profitable than others, and on an assessment of potential level ormix of product sales. There can be no assurance that we will achieve the required volume or revenue growth ormix of products necessary to achieve our growth objectives.
If we are unable to protect our information systems against data corruption, cyber-based attacks or network securitybreaches, our operations could be disrupted.
We are increasingly dependent on information technology networks and systems, including the Internet, toprocess, transmit and store electronic information. In particular, we depend on our information technology
17

infrastructure for digital marketing activities and electronic communications among our locations around theworld and between Company personnel and our bottlers, other customers and suppliers. Security breaches ofthis infrastructure can create system disruptions, shutdowns or unauthorized disclosure of confidentialinformation. If we are unable to prevent such breaches, our operations could be disrupted or we may sufferfinancial damage or loss because of lost or misappropriated information.
We may be required to recognize additional impairment charges.
We assess our goodwill, trademarks and other intangible assets and our long-lived assets as and whenrequired by generally accepted accounting principles in the United States to determine whether they areimpaired. In 2005, we recorded impairment charges of approximately $89 million related to our operations andinvestments in the Philippines, while in 2004 we recorded impairment charges of approximately $374 millionprimarily related to franchise rights at Coca-Cola Erfrischungsgetraenke AG (‘‘CCEAG’’). If market conditionsin Germany, India or the Philippines deteriorate further or structural changes we have implemented havenegative effects on our operating results in these markets, we may be required to record additional impairmentcharges. In addition, unexpected declines in our operating results and future structural changes or divestitures inthese and other markets may also result in impairment charges. Additional impairment charges would reduceour reported earnings for the periods in which they are recorded.
Global or regional catastrophic events could impact our operations and financial results.
Because of our global presence and worldwide operations, our business can be affected by large-scaleterrorist acts, especially those directed against the United States or other major industrialized countries; theoutbreak or escalation of armed hostilities; major natural disasters; or widespread outbreaks of infectiousdiseases such as avian influenza or severe acute respiratory syndrome (generally known as SARS). Such eventscould impair our ability to manage our business around the world, could disrupt our supply of raw materials, andcould impact production, transportation and delivery of concentrates, syrups and finished products. In addition,such events could cause disruption of regional or global economic activity, which can affect consumers’purchasing power in the affected areas and, therefore, reduce demand for our products.
ITEM 1B. UNRESOLVED STAFF COMMENTS
None.
ITEM 2. PROPERTIES
Our worldwide headquarters is located on a 35-acre office complex in Atlanta, Georgia. The complexincludes the approximately 621,000 square foot headquarters building, the approximately 870,000 square footCoca-Cola North America building and the approximately 264,000 square foot Coca-Cola Plaza building. Thecomplex also includes several other buildings, including the technical and engineering facilities, the learningcenter and the reception center. Our Company leases approximately 250,000 square feet of office space at 10Glenlake Parkway, Atlanta, Georgia, which we currently sublease to third parties. In addition, we leaseapproximately 174,000 square feet of office space at Northridge Business Park, Dunwoody, Georgia. The NorthAmerica operating segment owns and occupies an office building located in Houston, Texas, that containsapproximately 330,000 square feet. The Company has facilities for administrative operations, manufacturing,processing, packaging, packing, storage and warehousing throughout the United States.
As of December 31, 2005, our Company owned and operated 33 principal beverage concentrate and/orsyrup manufacturing plants located throughout the world. In addition, we own, hold a majority interest in orotherwise consolidate under applicable accounting rules 34 operations with 80 principal beverage bottling andcanning plants located outside the United States. We also own four bottled water production facilities and leaseone such facility in the United States.
18

Our North America operating segment operates nine noncarbonated beverage production facilities, inaddition to the bottled water facilities mentioned above, located throughout the United States and Canada. Italso utilizes a system of contract packers to produce and/or distribute certain products where appropriate. Inaddition, our North America operating segment owns a facility that manufactures juice concentrates forfoodservice use.
We own or lease additional real estate, including a Company-owned office and retail building, at 711 FifthAvenue in New York, New York and approximately 315,000 square feet of Company-owned office and technicalspace in Brussels, Belgium. Additional owned or leased real estate located throughout the world is used by theCompany as office space; for bottling operations, warehouse or retail operations; or, in the case of some ownedproperty, is leased to others.
Management believes that our Company’s facilities for the production of our products are suitable andadequate, that they are being appropriately utilized in line with past experience, and that they have sufficientproduction capacity for their present intended purposes. The extent of utilization of such facilities varies basedupon seasonal demand for our products. It is not possible to measure with any degree of certainty or uniformitythe productive capacity and extent of utilization of these facilities. However, management believes thatadditional production can be obtained at the existing facilities by adding personnel and capital equipment and,at some facilities, by adding shifts of personnel or expanding the facilities. We continuously review ouranticipated requirements for facilities and, on the basis of that review, may from time to time acquire additionalfacilities and/or dispose of existing facilities.
ITEM 3. LEGAL PROCEEDINGS
On October 27, 2000, a class action lawsuit (Carpenters Health & Welfare Fund of Philadelphia & Vicinity v.The Coca-Cola Company, et al.) was filed in the United States District Court for the Northern District ofGeorgia alleging that the Company, M. Douglas Ivester, Jack L. Stahl and James E. Chestnut violated antifraudprovisions of the federal securities laws by making misrepresentations or material omissions relating to theCompany’s financial condition and prospects in late 1999 and early 2000. A second, largely identical lawsuit(Gaetan LaValla v. The Coca-Cola Company, et al.) was filed in the same court on November 9, 2000. Thecomplaints allege that the Company and the individual named officers: (1) forced certain Coca-Cola systembottlers to accept ‘‘excessive, unwanted and unneeded’’ sales of concentrate during the third and fourth quartersof 1999, thus creating a misleading sense of improvement in our Company’s performance in those quarters;(2) failed to write down the value of impaired assets in Russia, Japan and elsewhere on a timely basis, againresulting in the presentation of misleading interim financial results in the third and fourth quarters of 1999; and(3) misrepresented the reasons for Mr. Ivester’s departure from the Company and then misleadingly reassuredthe financial community that there would be no changes in the Company’s core business strategy or financialoutlook following that departure. Damages in an unspecified amount are sought in both complaints.
On January 8, 2001, an order was entered by the United States District Court for the Northern District ofGeorgia consolidating the two cases for all purposes. The Court also ordered the plaintiffs to file a ConsolidatedAmended Complaint. On July 25, 2001, the plaintiffs filed a Consolidated Amended Complaint, which largelyrepeated the allegations made in the original complaints and added Douglas N. Daft as an additional defendant.
On September 25, 2001, the defendants filed a Motion to Dismiss all counts of the Consolidated AmendedComplaint. On August 20, 2002, the Court granted in part and denied in part the defendants’ Motion to Dismiss.The Court also granted the plaintiffs’ Motion for Leave to Amend the Complaint. On September 4, 2002, thedefendants filed a Motion for Partial Reconsideration of the Court’s August 20, 2002 ruling. The motion wasdenied by the Court on April 15, 2003.
On June 2, 2003, the plaintiffs filed an Amended Consolidated Complaint. The defendants moved todismiss the Amended Complaint on June 30, 2003. On March 31, 2004, the Court granted in part and denied inpart the defendants’ Motion to Dismiss the Amended Complaint. In its order, the Court dismissed a number of
19

the plaintiffs’ allegations, including the claim that the Company made knowingly false statements to financialanalysts. The Court permitted the remainder of the allegations to proceed to discovery. The Court denied theplaintiffs’ request for leave to further amend and replead their complaint. Discovery commenced on May 14,2004, and is ongoing. The discovery cutoff is September 30, 2006.
The Company believes it has substantial legal and factual defenses to the plaintiffs’ claims.
On December 20, 2002, the Company filed a lawsuit (The Coca-Cola Company v. Aqua-Chem, Inc., CivilAction No. 2002CV631-50) in the Superior Court, Fulton County, Georgia (the ‘‘Georgia Case’’), seeking adeclaratory judgment that the Company has no obligation to its former subsidiary, Aqua-Chem, Inc.(‘‘Aqua-Chem’’), for any past, present or future liabilities or expenses in connection with any claims or lawsuitsagainst Aqua-Chem. Subsequent to the Company’s filing but on the same day, Aqua-Chem filed a lawsuit(Aqua-Chem, Inc. v. The Coca-Cola Company, Civil Action No. 02CV012179) in the Circuit Court, Civil Divisionof Milwaukee County, Wisconsin (the ‘‘Wisconsin Case’’). In the Wisconsin Case, Aqua-Chem sought adeclaratory judgment that the Company is responsible for all liabilities and expenses not covered by insurance inconnection with certain of Aqua-Chem’s general and product liability claims arising from occurrences prior tothe Company’s sale of Aqua-Chem in 1981, and a judgment for breach of contract in an amount exceeding$9 million for costs incurred by Aqua-Chem to date in connection with such claims. The Wisconsin Case initiallywas stayed, pending final resolution of the Georgia Case, and later was voluntarily dismissed without prejudiceby Aqua-Chem.
The Company owned Aqua-Chem from 1970 to 1981. During that time, the Company purchased over$400 million of insurance coverage, of which approximately $350 million is still available to cover Aqua-Chem’scosts for certain product liability and other claims. The Company sold Aqua-Chem to Lyonnaise AmericanHolding, Inc. in 1981 under the terms of a stock sale agreement. The 1981 agreement, and a subsequent 1983settlement agreement, outlined the parties’ rights and obligations concerning past and future claims and lawsuitsinvolving Aqua-Chem. Cleaver Brooks, a division of Aqua-Chem, manufactured boilers, some of whichcontained asbestos gaskets. Aqua-Chem was first named as a defendant in asbestos lawsuits in or around 1985and currently has more than 100,000 claims pending against it.
The parties agreed in 2004 to stay the Georgia Case pending the outcome of insurance coverage litigationfiled by certain Aqua-Chem insurers on March 26, 2004. In the coverage action, five plaintiff insurancecompanies filed suit (Century Indemnity Company, et al. v. Aqua-Chem, Inc., The Coca-Cola Company, et al., CaseNo. 04CV002852) in the Circuit Court, Civil Division of Milwaukee County, Wisconsin, against our Company,Aqua-Chem and 16 insurance companies. Several of the policies that are the subject of the coverage action wereissued to the Company during the period (1970 to 1981) when our Company owned Aqua-Chem. The complaintseeks a determination of the respective rights and obligations under the insurance policies issued with regard toasbestos-related claims against Aqua-Chem. The action also seeks a monetary judgment reimbursing anyamounts paid by the plaintiffs in excess of their obligations. One of the insurers with a $15 million policy limithas asserted a cross-claim against the Company, alleging that the Company and/or its insurers are responsiblefor Aqua-Chem’s asbestos liabilities before any obligation is triggered on the part of that cross-claimant insurerto pay for those costs under its policy.
Aqua-Chem and the Company filed and obtained a partial summary judgment determination in thecoverage action that the insurers for Aqua-Chem and the Company were jointly and severally liable for coverageamounts, but reserving judgment on other defenses that might apply. Aqua-Chem and the Companysubsequently reached a settlement agreement with five of the insurers in the Wisconsin insurance coveragelitigation, and those insurers will pay funds into an escrow account for payment of costs arising from the asbestosclaims against Aqua-Chem. Aqua-Chem also has reached a settlement agreement with an additional insurerregarding payment of that insurer’s policy proceeds for Aqua-Chem’s asbestos claims. Aqua-Chem and theCompany continue to negotiate their claims for coverage with the 15 remaining insurers that are parties to thecoverage case. To the extent that these negotiations do not result in settlements, the Company believes that there
20

are substantial legal and factual arguments supporting the position that the insurance policies at issue providecoverage for the asbestos-related claims against Aqua-Chem, and both the Company and Aqua-Chem haveasserted these arguments in response to the complaint. The Company also believes it has substantial legal andfactual defenses to the claims of the cross-claimant insurer.
The Company is discussing with the European Commission issues relating to parallel trade within theEuropean Union arising out of comments received by the European Commission from third parties. TheCompany is fully cooperating with the European Commission and is providing information on these issues andthe measures taken and to be taken to address any issues raised. The Company is unable to predict at this timewith any reasonable degree of certainty what action, if any, the European Commission will take with respect tothese issues.
On June 18, 2004, Michael Hall filed what was purported to be a shareholder derivative suit on behalf of theCompany in the Superior Court of Fulton County, Georgia. The defendants in this action were the then-currentmembers of the Company’s Board of Directors (other than E. Neville Isdell and Donald R. Keough), and formerCompany officers Douglas N. Daft and Steven J. Heyer. The Company was also named as a nominal defendant.The complaint alleged, among other things, that in connection with certain alleged Company accounting andbusiness practices that were originally the subject of litigation brought by former employee Matthew Whitley in2003; approvals of executive compensation and severance packages; and dealings between the Company andentities with which the defendants are affiliated, the defendants breached their fiduciary duties to the Companythrough gross mismanagement, waste of corporate assets, abuse of their positions of authority within theCompany, and by unjustly enriching themselves.
The plaintiff, on behalf of the Company, sought declaratory relief; a monetary judgment requiring thedefendants to pay the Company unspecified amounts by which the Company allegedly has been damaged byreason of the conduct complained of; an award to the plaintiff of the costs and disbursements incurred inconnection with the action, including reasonable attorneys’ and experts’ fees; extraordinary equitable and/orinjunctive relief; and such other further relief as the Court may have deemed just and proper.
In early April 2005, after several weeks of informal settlement negotiations, the parties reached a settlementof this matter that provides for certain nonmonetary undertakings by the Company and for payment of plaintiff’sattorneys’ fees. By order of the court dated August 30, 2005, a final hearing on the approval of the settlementwas held on November 22, 2005, at which time the settlement was approved by order of the court, dated thesame day. This matter is now concluded.
In May and July 2005, two putative class action lawsuits (Selbst v. The Coca-Cola Company and Douglas N.Daft and Amalgamated Bank, et al. v. The Coca-Cola Company, Douglas N. Daft, E. Neville Isdell, Steven J. Heyerand Gary P. Fayard) alleging violations of the anti-fraud provisions of the federal securities laws were filed in theUnited States District Court for the Northern District of Georgia against the Company and certain current andformer executive officers. These cases were subsequently consolidated, and an amended and consolidatedcomplaint was filed in September 2005. The purported class consists of persons, except the defendants, whopurchased Company stock between January 30, 2003, and September 15, 2004, and were damaged thereby. Theamended and consolidated complaint alleges, among other things, that during the class period the defendantsmade false and misleading statements about (a) the Company’s new business strategy/model, (b) the Company’sexecution of its new business strategy/model, (c) the state of the Company’s critical bottler relationships, (d) theCompany’s North American business, (e) the Company’s European operations, with a particular emphasis onGermany, (f) the Company’s marketing and introduction of new products, particularly Coca-Cola C2, and(g) the Company’s forecast for growth going forward. The plaintiffs claim that as a result of these allegedly falseand misleading statements, the price of the Company stock increased dramatically during the purported classperiod. The amended and consolidated complaint also alleges that in September and November of 2004, theCompany and E. Neville Isdell acknowledged that the Company’s performance had been below expectations,that various corrective actions were needed, that the Company was lowering its forecasts, and that there would
21

be no quick fixes. In addition, the amended and consolidated complaint alleges that the charge announced bythe Company in November 2004 should have been taken early in 2003 and that, as a result, the Company’sfinancial statements were materially misstated during 2003 and the first three quarters of 2004. The plaintiffs, onbehalf of the putative class, seek compensatory damages in an amount to be proved at trial, extraordinary,equitable and/or injunctive relief as permitted by law to assure that the class has an effective remedy, award ofreasonable costs and expenses, including counsel and expert fees, and such other further relief as the Court maydeem just and proper. On November 21, 2005, the Company and the individual parties filed a motion to dismissthe amended and consolidated complaint. The plaintiffs filed their response to that motion on January 27, 2006.
The Company believes that it has meritorious defenses to this consolidated action and will vigorouslydefend itself therein.
On June 30, 2005, Maryann Chapman filed a purported shareholder derivative action (Chapman v. Isdell, etal.) in the Superior Court of Fulton County, Georgia, alleging violations of state law by certain individual currentand former members of the Board of Directors of the Company and senior management, including breaches offiduciary duties, abuse of control, gross mismanagement, waste of corporate assets, and unjust enrichmentbetween January 2003 and the date of filing of the complaint that have caused substantial losses to the Companyand other damages, such as to its reputation and goodwill. The defendants named in the lawsuit include NevilleIsdell, Douglas Daft, Gary Fayard, Ronald Allen, Cathleen Black, Warren Buffett, Herbert Allen, Barry Diller,Donald McHenry, Sam Nunn, James Robinson, Peter Ueberroth, James Williams, Donald Keough, MariaLagomasino, Pedro Reinhard, Robert Nardelli and Susan Bennett King. The Company is also named a nominaldefendant. The complaint further alleges that the September 2004 earnings warning issued by the Companyresulted from factors known by the individual defendants as early as January 2003 that were not adequatelydisclosed to the investing public until the earnings warning. The factors cited in the complaint include (i) aflawed business strategy and a business model that was not working; (ii) a workforce so depleted by layoffs that itwas unable to properly react to changing market conditions; (iii) impaired relationships with key bottlers; and(iv) the fact that the foregoing conditions would lead to diminished earnings. The plaintiff, purportedly onbehalf of the Company, seeks damages in an unspecified amount, extraordinary equitable and/or injunctiverelief, restitution and disgorgement of profits, reimbursement for costs and disbursements of the action, andsuch other and further relief as the Court deems just and proper. The Company’s motion to dismiss thecomplaint and the plaintiff’s response have been filed and fully briefed. The parties now are awaiting a ruling.The Company intends to vigorously defend its interests in this matter.
During May, June and July 2005, three similar putative class action lawsuits (Pedraza v. The Coca-ColaCompany, et al. Shamrey, et al. v. The Coca-Cola Company, et al. and Jackson v. The Coca-Cola Company, et al.)were filed in the United States District Court for the Northern District of Georgia by participants in theCompany’s Thrift & Investment Plan (the ‘‘Plan’’) alleging breach of fiduciary duties under the EmployeeRetirement Income Security Act of 1974 by the Company, certain current and former executive officers, and theCompany’s Benefits Committee. The purported class in each of these cases consists of the Plan and persons whowere participants in or beneficiaries of the Plan between May 13, 1997 and April 18, 2005 and whose accountsincluded investments in Company stock. The complaints allege that, among other things, the defendants failedto exercise the required care, skill, prudence and diligence in managing the Plan and its assets, take steps toeliminate or reduce the amount of Company stock in the Plan, adequately diversify the Plan’s investments inCompany stock, appoint qualified administrators and properly monitor their and the Plan’s performance anddisclose accurate information about the Company. The plaintiffs, on behalf of the putative class, seek, amongother things, declaratory relief, damages for Plan losses and lost profits, imposition of constructive trust as aremedy for unjust enrichment, injunctive relief, costs and attorneys’ fees, equitable restitution and otherappropriate equitable and monetary relief. By order of the Court, an amended complaint was filed in theJackson case on September 16, 2005. The amended complaint supplements the detailed allegations of theoriginal complaint and names specific individual defendants who served on the Benefits Committee and theAsset Management Committee. Identical amended complaints were also filed in Pedraza and Shamrey. In each
22

of the three cases, the plaintiff has voluntarily dismissed three individual defendants. The Company filedmotions to dismiss all claims in each case. Briefings on these motions are complete and the parties are waitingfor the court’s rulings.
The Company believes that it has meritorious defenses in each of these cases and intends to vigorouslydefend its interests therein.
On February 7, 2006, the International Brotherhood of Teamsters, a purported shareholder of CCE, filed aderivative action (International Brotherhood of Teamsters v. The Coca-Cola Company, et al.) in the DelawareCourt of Chancery for New Castle County on behalf of CCE against the Company and certain current andformer directors and officers of CCE. The lawsuit alleges, among other things, that the Company is a controllingshareholder of CCE and, as such, it owes a fiduciary duty to CCE. The lawsuit further alleges that the Companyhas breached such fiduciary duty by causing CCE to be operated and to undertake numerous business decisionsfor the primary benefit of the Company and its shareowners in a manner adverse to the interests of CCE and itsshareholders. In addition, the lawsuit alleges that the individual defendants have breached their fiduciary dutiesby, among other things, permitting the Company to control CCE and to abuse such control in a manner designedto maximize the Company’s profits at the expense of CCE’s financial condition. The plaintiff, purportedly onbehalf of CCE, is seeking, from or with respect to the Company, declaratory relief, an accounting for lossessustained by CCE as a result of the wrongs alleged compensatory damages in an amount to be determined attrial, injunctive relief and the implementation of certain corrective measures, assumption by the Company of alldebts and liabilities allegedly incurred by CCE on behalf of the Company, award of costs and expenses, includingreasonable attorneys’ fees and expenses, and such other further relief as the court may deem just and proper.The Company believes that it has substantial legal and factual defenses to the plaintiff’s allegations and intendsto vigorously defend itself in this lawsuit.
In February 2006, two largely identical cases were filed against the Company and CCE, one in the CircuitCourt of Jefferson County, Alabama (Coca-Cola Bottling Company United, et al. v. The Coca-Cola Company andCoca-Cola Enterprises Inc.) and the other in the United States District Court for the Western District ofMissouri, Southern Division (Ozarks Coca-Cola/Dr Pepper Bottling Company, et al. v. The Coca-Cola Companyand Coca-Cola Enterprises Inc.) by bottlers that collectively represented approximately 10 percent of theCompany’s U.S. unit case volume for 2005. The plaintiffs in these lawsuits allege, among other things, that theCompany and CCE are acting in concert to establish a warehouse delivery system to supply Powerade to a majorcustomer, which the plaintiffs contend would be detrimental to their interests as authorized distributors of thisproduct. The plaintiffs claim that the alleged conduct constitutes breach of contract, implied covenant of goodfaith and fair dealing and expressed covenant of good faith by the Company and CCE. In addition, the plaintiffsseek remedies against the Company and CCE on a promissory estoppel theory. The plaintiffs seek actual andpunitive damages, interest and costs and attorneys’ fees, as well as permanent injunctive relief, in the Alabamacase and preliminary and permanent injunctive relief in the federal case. The Company believes it hassubstantial factual and legal defenses to the plaintiffs’ claims and intends to defend itself vigorously in theselawsuits.
The Company is involved in various other legal proceedings. Management of the Company believes that anyliability to the Company that may arise as a result of these proceedings, including the proceedings specificallydiscussed above, will not have a material adverse effect on the financial condition of the Company and itssubsidiaries taken as a whole.
ITEM 4. SUBMISSION OF MATTERS TO A VOTE OF SECURITY HOLDERS
Not applicable.
23

ITEM X. EXECUTIVE OFFICERS OF THE COMPANY
The following are the executive officers of our Company as of February 21, 2006:
Alexander B. Cummings, 49, is President, Africa Group and a member of the Company’s ExecutiveCommittee. Mr. Cummings joined the Company in 1997 as Deputy Region Manager, Nigeria, based in Lagos,Nigeria. In 1998, he was made Managing Director/Region Manager, Nigeria. In 2000, Mr. Cummings becamePresident of the North West Africa Division based in Morocco and in 2001 became President of the AfricaGroup overseeing the entire African continent. Mr. Cummings started his career in 1982 with The PillsburyCompany and held various positions within that company, the last position being Vice President of Finance forall of Pillsbury’s international businesses. Mr. Cummings was appointed to his current position in March 2001.
J. Alexander M. Douglas, Jr., 44, is Senior Vice President and Chief Customer Officer of the Company and amember of the Company’s Executive Committee. Mr. Douglas joined the Company in January 1988 as a DistrictSales Manager for the Foodservice Division of Coca-Cola USA. In May 1994, he was named Vice President ofCoca-Cola USA, initially assuming leadership of the CCE Sales & Marketing Group and eventually assumingleadership of the entire North American Field Sales and Marketing Groups. In January 2000, Mr. Douglas wasappointed President of the North American Division within the North America operating group. Mr. Douglaswas elected to his current position in February 2003.
Gary P. Fayard, 53, is Executive Vice President and Chief Financial Officer of the Company and a memberof the Company’s Executive Committee. Mr. Fayard joined the Company in April 1994. In July 1994, he waselected Vice President and Controller. In December 1999, he was elected Senior Vice President and ChiefFinancial Officer. Prior to joining the Company, Mr. Fayard was a partner with Ernst & Young. Mr. Fayard waselected Executive Vice President of the Company in February 2003.
Irial Finan, 48, is Executive Vice President of the Company and President, Bottling Investments and amember of the Company’s Executive Committee. Mr. Finan joined the Coca-Cola system in 1981 withCoca-Cola Bottlers Ireland, Ltd., where for several years he held a variety of accounting positions. From 1987until 1990, Mr. Finan served as Finance Director of Coca-Cola Bottlers Ireland, Ltd. From 1991 to 1993, heserved as Managing Director of Coca-Cola Bottlers Ulster, Ltd. He was Managing Director of Coca-ColaBottlers in Romania and Bulgaria until late 1994. From 1995 to 1999, he served as Managing Director of MolinoBeverages, with responsibility for expanding markets including the Republic of Ireland, Northern Ireland,Romania, Moldova, Russia and Nigeria. Mr. Finan served from May 2001 until 2003 as Chief Executive Officerof Coca-Cola HBC. In August 2004, Mr. Finan joined the Company and was named President BottlingInvestments. He was elected Executive Vice President of the Company in October 2004.
E. Neville Isdell, 62, is Chairman of the Board of Directors and Chief Executive Officer of the Company andChairman of the Company’s Executive Committee. Mr. Isdell joined the Coca-Cola system in 1966 with the localbottling company in Zambia. In 1972, he became General Manager of Coca-Cola Bottling of Johannesburg, thelargest Coca-Cola bottler in South Africa at the time. Mr. Isdell was named Region Manager for Australia in1980. In 1981, he became President of Coca-Cola Bottlers Philippines, Inc., the bottling joint venture betweenthe Company and San Miguel Corporation in the Philippines. Mr. Isdell was appointed President of the CentralEuropean Division of the Company in 1985. In January 1989, he was elected Senior Vice President of theCompany and was appointed President of the Northeast Europe/Africa Group, which was renamed theNortheast Europe/Middle East Group in 1992. In 1995, Mr. Isdell was named President of the Greater EuropeGroup. From July 1998 to September 2000, he was Chairman and Chief Executive Officer of Coca-ColaBeverages Plc in Great Britain, where he oversaw that company’s merger with Hellenic Bottling and theformation of Coca-Cola HBC, one of the Company’s largest bottlers. Mr. Isdell served as Chief ExecutiveOfficer of Coca-Cola HBC from September 2000 until May 2001 and served as Vice Chairman of Coca-ColaHBC from May 2001 until December 2001. From January 2002 to May 2004, Mr. Isdell was an internationalconsultant to the Company. He was elected to his current positions on June 1, 2004.
24

Glenn G. Jordan S., 49, is President, East, South Asia and Pacific Rim Group and a member of theExecutive Committee. Mr. Jordan joined the Company in 1978 as a field representative for Coca-Cola deColombia where, for several years, he held various positions, including Region Manager. From 1985 to 1989Mr. Jordan served as Marketing Operations Manager, Pacific Group. He served as Vice President of Coca-ColaInternational from 1989 to 1991 and also as Executive Assistant to the President of the Pacific Group from 1990to 1991. Mr. Jordan served as Senior Vice President, Marketing and Operations, for the Brazil Division from1991 to 1995, as President of the River Plate Division, which comprised Argentina, Uruguay and Paraguay, from1995 to 2000, and as President of the South Latin America Division, comprising Argentina, Bolivia, Chile,Ecuador, Paraguay, Peru and Uruguay, from 2000 to 2003. In February 2003, Mr. Jordan was appointedExecutive Vice President and Director of Operations for the Latin America Group and served in that capacityuntil February 2006. Mr. Jordan was appointed President, East, South Asia and Pacific Rim Group effectiveFebruary 8, 2006.
Geoffrey J. Kelly, 61, is Senior Vice President and General Counsel of the Company and a member of theCompany’s Executive Committee. Mr. Kelly joined the Company in 1970 in Australia as manager of the LegalDepartment for the Australasia Area. Since then he has held a number of key roles, including Senior Counselfor the Pacific Group and subsequently for the Middle and Far East Group. In 2000, Mr. Kelly was appointedSenior Counsel for International Operations. He became Chief Deputy General Counsel in 2003 and waselected Senior Vice President in 2004. In January 2005, he assumed the role of Acting General Counsel to theCompany, and in July 2005, he was elected General Counsel of the Company.
Muhtar Kent, 54, is Executive Vice President of the Company, President, Coca-Cola International andPresident, North Asia, Eurasia and Middle East Group and a member of the Company’s Executive Committee.Mr. Kent joined the Company in 1978 and held a variety of marketing and operations roles throughout hiscareer with the Company. In 1985, he was appointed General Manager of Coca-Cola Turkey and Central Asia.From 1989 to 1995, Mr. Kent served as President of the East Central Europe Division and Senior Vice Presidentof Coca-Cola International. Between 1995 and 1998, he served as Managing Director of Coca-Cola Amatil-Europe, and from 1999 until 2005, he served as President and Chief Executive Officer of Efes Beverage Groupand as a board member of Coca-Cola Icecek. Mr. Kent rejoined the Company in May 2005 as President, NorthAsia, Eurasia and Middle East Group, was appointed President, Coca-Cola International in January 2006 andwas elected Executive Vice President in February 2006.
Donald R. Knauss, 55, is President, North America and a member of the Company’s Executive Committee.Mr. Knauss joined the Company in 1994 as Senior Vice President of Marketing for The Minute Maid Company,and was named Senior Vice President and General Manager, U.S. Division, in 1996. He served from March 1998until January 2000 as President of the Southern Africa Division of the Company. In January 2000, Mr. Knausswas named President and Chief Executive Officer of The Minute Maid Company, formerly a division of theCompany, and became President of the Retail Division of Coca-Cola North America in January 2003. He wasappointed to his current position in February 2004.
Thomas G. Mattia, 57, is Senior Vice President of the Company and Director of Worldwide Public Affairsand Communications and a member of the Company’s Executive Committee. Prior to joining the Company,Mr. Mattia served since 2000 as Vice President of Global Communications at technology services leader EDS,where he was responsible for a wide range of activities from brand management and media relations toadvertising and on-line marketing and communications. From 1995 to 2000, Mr. Mattia held a variety ofexecutive positions with Ford Motor Company, including head of International Public Affairs, Vice President ofLincoln Mercury and Director of North American Public Affairs. Mr. Mattia was appointed Director ofWorldwide Public Affairs and Communications effective January 20, 2006, and was elected Senior VicePresident of the Company in February 2006.
Cynthia P. McCague, 55, is Senior Vice President of the Company and Director of Human Resources and amember of the Company’s Executive Committee. Ms. McCague initially joined the Company in 1982, and since
25

then has worked across the Coca-Cola business system in a variety of human resources and business roles inEurope and the United States. In 1998, she was appointed to lead the human resources function for Coca-ColaBeverages Plc in Great Britain, which in 2000 became Coca-Cola HBC. Ms. McCague rejoined the Company inJune 2004 as Director of Human Resources. She was elected to her current position in July 2004.
Mary E. Minnick, 46, is Executive Vice President of the Company and President, Marketing, Strategy andInnovation and a member of the Company’s Executive Committee. Ms. Minnick joined the Company in 1983and spent 10 years working in Fountain Sales and the Bottle/Can Division of Coca-Cola USA. In 1993, shejoined Corporate Marketing. In 1996, she was appointed Vice President and Director, Middle and Far EastMarketing, and served in that capacity until 1997 when she was appointed President of the South PacificDivision. In 2000, she was named President of Coca-Cola (Japan) Company, Limited. Ms. Minnick served asPresident and Chief Operating Officer of the Asia Group from January 2002 until May 2005. She was electedExecutive Vice President of the Company in February 2002 and was appointed President, Marketing, Strategyand Innovation effective May 2005.
Dominique Reiniche, 50, is President, European Union Group and a member of the Company’s ExecutiveCommittee. Ms. Reiniche joined the Company in May 2005 and was appointed to her current position at thattime. Prior to joining the Company, she held a number of marketing, sales and general management positionswith CCE. From May 1998 until December 2002, she served as General Manager of France for CCE, and fromJanuary 2003 until May 2005, Ms. Reiniche was President of CCE Europe. Before joining the Coca-Cola system,she was Director of Marketing and Strategy with Kraft Jacobs-Suchard.
José Octavio Reyes, 53, is President, the Latin America Group and a member of the Company’s ExecutiveCommittee. He began his career with The Coca-Cola Company in 1980 at Coca-Cola de México as Manager ofStrategic Planning. In 1987, he was appointed Manager of the Sprite and Diet Coke brands at CorporateHeadquarters. In 1990, he was appointed Marketing Director for the Brazil Division, and later becameMarketing and Operations Vice President for the Mexico Division. Mr. Reyes assumed the role of DeputyDivision President for the Mexico Division in January 1996 and was named Division President for the MexicoDivision in May 1996. In 2000, Venezuela, Colombia, Central America and the Caribbean were incorporatedinto the Division. He assumed his position as President, Latin America Group in December 2002.
Danny L. Strickland, 58, is Senior Vice President and Chief Innovation/Research and Development Officerof the Company and a member of the Company’s Executive Committee. Mr. Strickland joined the Company inApril 2003 and was elected Senior Vice President in June 2003. Prior to joining the Company, Mr. Stricklandserved as Senior Vice President, Innovation, Technology & Quality at General Mills, Inc. from January 1997until March 2003. There he was responsible for building a strong product pipeline, innovation culture andorganization. Prior to his position with General Mills, Mr. Strickland held several research and development,innovation, engineering, quality and strategy roles in the United States and abroad with Johnson & Johnsonfrom March 1993 until December 1996, Kraft Foods Inc. from February 1988 until March 1993, and theProcter & Gamble Company from June 1970 until February 1988.
All executive officers serve at the pleasure of the Board of Directors. There is no family relationshipbetween any of the directors or executive officers of the Company.
26

PART II
ITEM 5. MARKET FOR THE REGISTRANT’S COMMON EQUITY, RELATED STOCKHOLDERMATTERS AND ISSUER PURCHASES OF EQUITY SECURITIES
In the United States, the Company’s common stock is listed and traded on the New York Stock Exchange(the principal market for our common stock) and is traded on the Boston, Chicago, National, Pacific andPhiladelphia stock exchanges.
The following table sets forth, for the calendar periods indicated, the high and low sales prices per share forthe Company’s common stock, as reported on the New York Stock Exchange composite tape, and dividend pershare information:
Common Stock MarketPrice
DividendsHigh Low Declared
2005Fourth quarter $ 43.60 $ 40.31 $ 0.28Third quarter 44.75 41.39 0.28Second quarter 45.26 40.74 0.28First quarter 44.15 40.55 0.28
2004Fourth quarter $ 41.91 $ 38.30 $ 0.25Third quarter 51.39 39.23 0.25Second quarter 53.50 49.17 0.25First quarter 52.78 47.58 0.25
As of February 21, 2006, there were approximately 326,685 shareowner accounts of record.
The information under the heading ‘‘Equity Compensation Plan Information’’ in the Company’s definitiveProxy Statement for the Annual Meeting of Shareowners to be held on April 19, 2006, to be filed with the SEC(the ‘‘Company’s 2006 Proxy Statement’’), is incorporated herein by reference.
During the fiscal year ended December 31, 2005, no equity securities of the Company were sold by theCompany that were not registered under the Securities Act of 1933, as amended.
27

The following table presents information with respect to purchases of common stock of the Company madeduring the three months ended December 31, 2005 by the Company or any ‘‘affiliated purchaser’’ of theCompany as defined in Rule 10b-18(a)(3) under the Exchange Act.
Total Number of Maximum Number ofShares Purchased Shares that May
Average as Part of Publicly Yet Be PurchasedTotal Number of Price Paid Announced Plans Under the Plans
Period Shares Purchased1 Per Share or Programs2 or Programs
October 1, 2005 through October 28, 2005 2,553,671 $ 42.78 2,350,000 71,203,540October 29, 2005 through November 25, 2005 3,075,000 $ 42.43 3,075,000 68,128,540November 26, 2005 through December 31, 2005 5,077,519 $ 41.70 5,075,000 63,053,540
Total 10,706,190 $ 42.17 10,500,000
1 The total number of shares purchased includes (i) shares purchased pursuant to the 1996 Plan described in footnote (2)below; and (ii) shares surrendered to the Company to pay the exercise price and/or to satisfy tax withholding obligationsin connection with so-called ‘‘stock swap exercises’’ of employee stock options and/or the vesting of restricted stock issuedto employees, totaling 203,671 shares, 0 shares and 2,519 shares, for the months of October, November and December2005, respectively.
2 On October 17, 1996, we publicly announced that our Board of Directors had authorized a plan (the ‘‘1996 Plan’’) for theCompany to purchase up to 206 million shares of the Company’s common stock prior to October 31, 2006. This was inaddition to approximately 44 million shares authorized for purchase under a previous plan, which shares had not beenpurchased by the Company as of October 16, 1996 but were purchased by the Company prior to the commencement ofpurchases under the 1996 Plan in 1998. This column discloses the number of shares purchased pursuant to the 1996 Planduring the indicated time periods.
28

ITEM 6. SELECTED FINANCIAL DATA
The following selected financial data should be read in conjunction with ‘‘Item 7. Management’s Discussionand Analysis of Financial Condition and Results of Operations’’ and consolidated financial statements and notesthereto contained in ‘‘Item 8. Financial Statements and Supplementary Data’’ of this report.
Year Ended December 31, 20051,2 20041,2 2003 20023,4 20015
(In millions except per share data)
SUMMARY OF OPERATIONSNet operating revenues $ 23,104 $ 21,742 $ 20,857 $ 19,394 $ 17,374Cost of goods sold 8,195 7,674 7,776 7,118 6,054
Gross profit 14,909 14,068 13,081 12,276 11,320Selling, general and administrative expenses 8,739 7,890 7,287 6,818 5,968Other operating charges 85 480 573 — —
Operating income 6,085 5,698 5,221 5,458 5,352Interest income 235 157 176 209 325Interest expense 240 196 178 199 289Equity income — net 680 621 406 384 152Other (loss) income — net (93) (82) (138) (353) 39Gains on issuances of stock by equity investees 23 24 8 — 91
Income before income taxes and changes in accountingprinciples 6,690 6,222 5,495 5,499 5,670
Income taxes 1,818 1,375 1,148 1,523 1,691
Net income before changes in accounting principles $ 4,872 $ 4,847 $ 4,347 $ 3,976 $ 3,979
Net income $ 4,872 $ 4,847 $ 4,347 $ 3,050 $ 3,969
Average shares outstanding 2,392 2,426 2,459 2,478 2,487Average shares outstanding assuming dilution 2,393 2,429 2,462 2,483 2,487
PER SHARE DATANet income before changes in accounting principles — basic $ 2.04 $ 2.00 $ 1.77 $ 1.60 $ 1.60Net income before changes in accounting principles — diluted 2.04 2.00 1.77 1.60 1.60Basic net income 2.04 2.00 1.77 1.23 1.60Diluted net income 2.04 2.00 1.77 1.23 1.60Cash dividends 1.12 1.00 0.88 0.80 0.72Market price on December 31, $ 40.31 $ 41.64 $ 50.75 $ 43.84 $ 47.15
TOTAL MARKET VALUE OF COMMON STOCK $ 95,504 $ 100,325 $ 123,908 $ 108,328 $ 117,226
BALANCE SHEET DATACash, cash equivalents and current marketable securities $ 4,767 $ 6,768 $ 3,482 $ 2,345 $ 1,934Property, plant and equipment — net 5,786 6,091 6,097 5,911 4,453Depreciation 752 715 667 614 502Capital expenditures 899 755 812 851 769Total assets 29,427 31,441 27,410 24,470 22,550Long-term debt 1,154 1,157 2,517 2,701 1,219Shareowners’ equity 16,355 15,935 14,090 11,800 11,366
NET CASH PROVIDED BY OPERATING ACTIVITIES $ 6,423 $ 5,968 $ 5,456 $ 4,742 $ 4,110
Certain prior year amounts have been reclassified to conform to the current year presentation.1 We adopted FSP No. 109-2, ‘‘Accounting and Disclosure Guidance for the Foreign Earnings Repatriation Provision within the
American Jobs Creation Act of 2004’’ in 2004. FSP No. 109-2 allowed the Company to record the tax expense associated with therepatriation of foreign earnings in 2005 when the previously unremitted foreign earnings were actually repatriated.
2 We adopted FASB Interpretation No. 46 (revised December 2003), ‘‘Consolidation of Variable Interest Entities,’’ effectiveApril 2, 2004.
3 In 2002, we adopted SFAS No. 142, ‘‘Goodwill and Other Intangible Assets.’’4 In 2002, we adopted the fair value method provisions of SFAS No. 123, ‘‘Accounting for Stock-Based Compensation,’’ and we adopted
SFAS No. 148, ‘‘Accounting for Stock-Based Compensation—Transition and Disclosure.’’5 In 2001, we adopted SFAS No. 133, ‘‘Accounting for Derivative Instruments and Hedging Activities.’’
29

ITEM 7. MANAGEMENT’S DISCUSSION AND ANALYSIS OF FINANCIAL CONDITION AND RESULTSOF OPERATIONS
Overview
The following Management’s Discussion and Analysis of Financial Condition and Results of Operations(‘‘MD&A’’) is intended to help the reader understand The Coca-Cola Company, our operations and our presentbusiness environment. MD&A is provided as a supplement to—and should be read in conjunction with—ourconsolidated financial statements and the accompanying notes thereto contained in Item 8 of this report. Thisoverview summarizes the MD&A, which includes the following sections:
• Our Business — a general description of our business and the nonalcoholic beverages segment of thecommercial beverages industry; our objective; our areas of focus; and challenges and risks of ourbusiness.
• Critical Accounting Policies and Estimates — a discussion of accounting policies that require criticaljudgments and estimates.
• Operations Review — an analysis of our Company’s consolidated results of operations for the three yearspresented in our consolidated financial statements. Except to the extent that differences among ouroperating segments are material to an understanding of our business as a whole, we present thediscussion in the MD&A on a consolidated basis.
• Liquidity, Capital Resources and Financial Position — an analysis of cash flows; off-balance sheetarrangements and aggregate contractual obligations; the impact of foreign exchange; an overview offinancial position; and the impact of inflation and changing prices.
Our Business
General
We are the largest manufacturer, distributor and marketer of nonalcoholic beverage concentrates andsyrups in the world. We also manufacture, distribute and market some finished beverages. Along withCoca-Cola, which is recognized as the world’s most valuable brand, we market four of the world’s top five softdrink brands, including Diet Coke, Fanta and Sprite. Our Company owns or licenses more than 400 brands,including carbonated soft drinks, juice and juice drinks, sports drinks, water products, teas, coffees and otherbeverages to meet consumers’ desires, needs and lifestyle choices. More than 1.3 billion servings of our productsare consumed worldwide each day. Our Company generates revenues, income and cash flows by manufacturingand selling beverage concentrates and syrups as well as some finished beverages. We generally sell theseproducts to bottling and canning operations, fountain wholesalers and some fountain retailers and, in the case offinished products, to distributors. Our bottlers sell our branded products in more than 200 countries on sixcontinents to businesses and institutions including retail chains, supermarkets, restaurants, small neighborhoodgrocers, sports and entertainment venues, and schools and colleges. We continue to expand our marketingpresence and increase our unit case volume growth in most emerging economies. Our strong and stable systemhelps us to capture growth by manufacturing, distributing and marketing existing, enhanced and new innovativeproducts to our consumers throughout the world.
We have three types of bottling relationships: bottlers in which our Company has no ownership interest,bottlers in which our Company has a noncontrolling ownership interest and bottlers in which our Company has acontrolling ownership interest. We authorize our bottling partners to manufacture and package products madefrom our concentrates and syrups into branded finished products that they then distribute and sell. Bottlingpartners in which our Company has no ownership interest or a noncontrolling ownership interest produced anddistributed approximately 83 percent of our 2005 worldwide unit case volume.
30

We make significant marketing expenditures in support of our brands, including expenditures foradvertising, sponsorship fees and special promotional events. As part of our marketing activities, we, at ourdiscretion, provide retailers and distributors with promotions and point-of-sale displays; our bottling partnerswith advertising support and funds designated for the purchase of cold-drink equipment; and our consumerswith coupons, discounts and promotional incentives. These marketing expenditures help to enhance awarenessof and increase consumer preference for our brands. We believe that greater awareness and preferencepromotes long-term growth in unit case volume, per capita consumption and our share of worldwidenonalcoholic beverage sales.
The Nonalcoholic Beverages Segment of the Commercial Beverages Industry
We operate in the highly competitive nonalcoholic beverages segment of the commercial beveragesindustry. We face strong competition from numerous other general and specialty beverage companies. We, alongwith other beverage companies, are affected by a number of factors, including, but not limited to, cost tomanufacture and distribute products, consumer spending, economic conditions, availability and quality of water,consumer preferences, inflation, political climate, local and national laws and regulations, foreign currencyexchange fluctuations, fuel prices and weather patterns.
Our Objective
Our objective is to use our formidable assets—brands, financial strength, unrivaled distribution system,global reach, and a strong commitment by our management and employees worldwide—to achieve long-termsustainable growth. Our vision for sustainable growth includes the following:
• People: Being a great place to work where people are inspired to be the best they can be.
• Portfolio: Bringing to the world a portfolio of beverage brands that anticipates and satisfies people’sdesires and needs.
• Profit: Maximizing return to shareowners while being mindful of our overall responsibilities.
• Partners: Nurturing a winning network of partners and building mutual loyalty.
• Planet: Being a responsible global citizen that makes a difference.
Areas of Focus
Revitalizing the Organization
We are focused on driving accountability throughout the organization, leveraging our internal talent andstrengthening the corporate culture. We realize that our bench strength has been weakened as a result of priororganizational realignments. Therefore, we are investing in building capability by training our existing associatesand hiring experienced individuals from outside the Company. We are revising our organizational structure tohelp improve execution around the world. We are simplifying and clarifying individual roles and responsibilities.
Unleashing Our System’s Potential
Our goal is to drive efficiency and effectiveness throughout the global Coca-Cola system. This begins withthe alignment of our system around shared goals and performance targets. We must work in a collaborativemanner with our bottling partners throughout the world.
Driving enhanced revenue growth across the system is a key focus area for both the Company and ourbottling partners. Our plans in this area are centered on tailoring strategies to match shopping occasions,offering differentiated packages, building value collaboratively with customers, strengthening in-marketexecution and supporting our family of brands with strong marketing activities. We are building system capability
31

in this area, sharing learning across the system and capitalizing on immediate-consumption opportunities.Focusing on revenue growth is an enabler for the financial health of the Coca-Cola system as a whole. Marketswhere we effectively implemented a segmented brand, package, price and channel strategy as a system have seenstrong results.
At the same time that we are focused on revenue growth, we are also focused on working with our bottlingpartners to reduce system costs and improve system efficiencies. Together with our bottling partners, we havecreated a supply chain management company in Japan and supported the creation of a bottler-owned supplychain organization in North America. By pooling the resources of bottling partners, we have reduced the costs tomanufacture our products. This type of supply chain initiative is being replicated in China and Africa and anumber of other markets. We recognize that our ability to respond to customers’ needs as a system provides asignificant opportunity for future growth. Therefore, we are committed to improving our route to market andour response to customers. For example, in Mexico, we created a joint sales company for noncarbonatedbeverages. This sales company is focused on the efficient sale and distribution of noncarbonated beverages tocustomers that span multiple bottler territories.
Executing with Excellence Globally
Our business demands excellence in execution. Our business is not overly complicated, but we operate in adynamic, fast-paced environment of global markets and competitive economies. Excellent execution requiresdiscipline, concrete objectives, routines, reporting, follow-up, asking hard questions and the desire to take risks.We must efficiently transfer the knowledge and insights we have gained from successes and failures from onemarket to other markets around the world. The nonalcoholic beverages segment of the commercial beveragesindustry provides opportunities for growth, but it will take a relentless focus on execution to capitalize on thoseopportunities.
We have identified several specific areas that provide opportunities for growth. We believe significantgrowth potential exists in diet and light products, and we intend to make investments to accelerate the growth ofsuch products. We also believe that the immediate-consumption channel offers significant growth potential, andwe plan to expand our offerings in this channel. We must ensure that our family of brands is selectively andprofitably expanded to address consumers’ changing preferences. In every market, we must focus on thefinancial health of the entire Coca-Cola system. We must look for new opportunities with each customer andallocate resources to maximize the impact of these opportunities. We believe we can capture this growth byfocusing on our core brands to maximize the potential of each brand and through additional innovation.
Reestablishing Our Marketing Leadership
In 2005, we created our new Marketing, Strategy and Innovation group. We created this distinct group toensure that these three functional areas are fully aligned and integrated. Carbonated soft drinks remain afundamental and profitable part of our family of brands, and we believe we should invest in marketing our familyof brands more aggressively than we have in the past few years. In addition, we need to further expand our newproducts pipeline and continue to develop our innovation capabilities. Accordingly, we increased our marketingand innovation spending in 2005 and intend to maintain the increased spending level for the foreseeable future.
Challenges and Risks
Operating in more than 200 countries provides unique opportunities for our Company. Challenges and risksaccompany those opportunities.
Looking forward, management has identified certain challenges and risks that demand the attention of thenonalcoholic beverages segment of the commercial beverages industry and our Company. Of these, four keychallenges and risks are discussed below.
32

Obesity and Inactive Lifestyles. Increasing awareness among consumers, public health professionals andgovernment agencies of the potential health problems associated with obesity and inactive lifestyles represents asignificant challenge to our industry. We recognize that obesity is a complex public health problem. Ourcommitment to consumers begins with our broad product line, which includes a wide selection of diet and lightbeverages, juice and juice drinks, sports drinks and water products. Our commitment also includes adhering toresponsible policies in schools and in the marketplace; supporting programs to encourage physical activity and topromote nutrition education; and continuously meeting changing consumer needs through beverage innovation,choice and variety. We are committed to playing an appropriate role in helping address this issue in cooperationwith governments, educators and consumers through science-based solutions and programs.
Water Quality and Quantity. Water quality and quantity is an issue that increasingly requires ourCompany’s attention and collaboration with the nonalcoholic beverages segment of the commercial beveragesindustry, governments, nongovernmental organizations and communities where we operate. Water is the mainingredient in substantially all of our products. It is also a limited natural resource facing unprecedentedchallenges from overexploitation, increasing pollution and poor management. Our Company is in an excellentposition to share the water-related knowledge we have developed in the communities we serve—water-resourcemanagement, water treatment, wastewater treatment systems, and models for working with communities andpartners in addressing water and sanitation needs. We are actively engaged in assessing the specific water-relatedrisks that we and many of our bottling partners face and have implemented a formal water risk managementprogram. We are working with our global partners to develop water sustainability projects. We are activelyencouraging improved water efficiency and conservation efforts throughout our system. As demand for watercontinues to increase around the world, we expect commitment, and continued action on our part will be crucialin the successful long-term stewardship of this critical natural resource.
Evolving Consumer Preferences. Consumers want more choices. We are impacted by shifting consumerdemographics and needs, on-the-go lifestyles, aging populations in developed markets and consumers who areempowered with more information than ever. We are committed to generating new avenues for growth throughour core brands with a focus on diet and light products. We are also committed to continuing to expand thevariety of choices we provide to consumers to meet their needs, desires and lifestyle choices.
Increased Competition and Capabilities in the Marketplace. Our Company is facing strong competition fromsome well-established global companies and many local players. We must continue to selectively expand intoother profitable segments of the nonalcoholic beverages segment of the commercial beverages industry andre-energize our marketing and innovation in order to maintain our brand loyalty and share.
See also ‘‘Item 1A. Risk Factors’’ in Part I of this report for additional information about risks anduncertainties facing our Company.
All four of these challenges and risks—obesity and inactive lifestyles, water quality and quantity, evolvingconsumer preferences and increased competition and capabilities in the marketplace—have the potential tohave a material adverse effect on the nonalcoholic beverages segment of the commercial beverages industry andon our Company; however, we believe our Company is well positioned to appropriately address these challengesand risks.
33

Critical Accounting Policies and Estimates
Our consolidated financial statements are prepared in accordance with generally accepted accountingprinciples in the United States, which require management to make estimates, judgments and assumptions thataffect the amounts reported in the consolidated financial statements and accompanying notes. We believe thatour most critical accounting policies and estimates relate to the following:
• Basis of Presentation and Consolidation
• Recoverability of Noncurrent Assets
• Revenue Recognition
• Income Taxes
• Contingencies
Management has discussed the development, selection and disclosure of critical accounting policies andestimates with the Audit Committee of the Company’s Board of Directors. While our estimates and assumptionsare based on our knowledge of current events and actions we may undertake in the future, actual results mayultimately differ from these estimates and assumptions. For a discussion of the Company’s significant accountingpolicies, refer to Note 1 of Notes to Consolidated Financial Statements.
Basis of Presentation and Consolidation
In December 2003, the Financial Accounting Standards Board (‘‘FASB’’) issued FASB InterpretationNo. 46 (revised December 2003), ‘‘Consolidation of Variable Interest Entities’’ (‘‘Interpretation 46(R)’’). Weadopted Interpretation 46(R) effective April 2, 2004. Refer to Note 1 of Notes to Consolidated FinancialStatements.
Our Company consolidates all entities that we control by ownership of a majority voting interest as well asvariable interest entities for which our Company is the primary beneficiary. Our judgment in determining if weare the primary beneficiary of the variable interest entities includes assessing our Company’s level ofinvolvement in setting up the entity, determining if the activities of the entity are substantially conducted onbehalf of our Company, determining whether the Company provides more than half of the subordinatedfinancial support to the entity, and determining if we absorb the majority of the entity’s expected losses orreturns.
We use the equity method to account for investments for which we have the ability to exercise significantinfluence over operating and financial policies. Our consolidated net income includes our Company’s share ofthe net earnings of these companies. Our judgment regarding the level of influence over each equity methodinvestment includes considering key factors such as our ownership interest, representation on the board ofdirectors, participation in policy-making decisions and material intercompany transactions.
We use the cost method to account for investments in companies that we do not control and for which wedo not have the ability to exercise significant influence over operating and financial policies. In accordance withthe cost method, these investments are recorded at cost or fair value, as appropriate. We record dividend incomewhen applicable dividends are declared.
Our Company eliminates from financial results all significant intercompany transactions, including theintercompany portion of transactions with equity method investees.
Recoverability of Noncurrent Assets
Management’s assessments of the recoverability of noncurrent assets involve critical accounting estimates.These assessments reflect management’s best assumptions, which, when appropriate, are consistent with theassumptions that we believe hypothetical marketplace participants would use. Factors that management must
34

estimate when performing recoverability and impairment tests include, among others, sales volume, prices,inflation, cost of capital, marketing spending, foreign currency exchange rates, tax rates and capital spending.These factors are often interdependent and therefore do not change in isolation. These factors include inherentuncertainties, and significant management judgment is involved in estimating their impact. However, whenappropriate, the assumptions we use for financial reporting purposes are consistent with those we use in ourinternal planning and we believe are consistent with those that a hypothetical marketplace participant would use.Management periodically evaluates and updates the estimates based on the conditions that influence thesefactors. The variability of these factors depends on a number of conditions, including uncertainty about futureevents, and thus our accounting estimates may change from period to period. If other assumptions and estimateshad been used in the current period, the balances for noncurrent assets could have been materially impacted.Furthermore, if management uses different assumptions or if different conditions occur in future periods, futureoperating results could be materially impacted.
Operating in more than 200 countries subjects our Company to many uncertainties and risks related tovarious economic, political and regulatory environments. Refer to the headings ‘‘Our Business—Challenges andRisks’’ above and ‘‘Item 1A. Risk Factors’’ in Part I of this report. As a result, management must makenumerous assumptions which involve a significant amount of judgment when determining the recoverability ofnoncurrent assets in various regions around the world.
For the noncurrent assets listed in the table below, we perform tests of impairment, as appropriate. Forapplicable assets, we perform tests when certain conditions exist that indicate the carrying value may not berecoverable. For certain assets, we perform tests at least annually or more frequently if events or circumstancesindicate that an asset may be impaired:
PercentageCarrying of Total
December 31, 2005 Value Assets
(In millions except percentages)
Tested for impairment when conditions exist that indicate carryingvalue may be impaired:
Equity method investments $ 6,562 22%Cost method investments, principally bottling companies 360 1Other assets 2,648 9Property, plant and equipment, net 5,786 20Amortized intangible assets, net (various, principally trademarks) 146 1
Total $15,502 53%
Tested for impairment at least annually or when events indicate thatan asset may be impaired:
Trademarks with indefinite lives $ 1,946 6%Goodwill 1,047 3Bottlers’ franchise rights 521 2Other intangible assets not subject to amortization 161 1
Total $ 3,675 12%
Many of the noncurrent assets listed above are located in markets that we consider to be developing or tohave changing political environments. These markets include, but are not limited to, Germany, where thenonrefillable deposit law creates uncertainty; the Middle East and Egypt, where political and civil unrestcontinues; the Philippines, where affordable packaging and availability of beverages in the marketplace continueto impact operating results; India, where affordability and bottler execution issues remain; and certain marketsin Latin America, Asia and Africa, where local economic and political conditions are unstable. We have bottling
35

assets and investments in many of these markets. The list in the table below reflects the Company’s carryingvalue of noncurrent assets in these markets.
Percentage ofApplicable
Carrying Line ItemDecember 31, 2005 Value Above
(In millions except percentages)
Tested for impairment when conditions exist that indicate carryingvalue may be impaired:
Equity method investments $ 363 6%Cost method investments, principally bottling companies 36 10Other assets 31 1Property, plant and equipment, net 1,663 29Amortized intangible assets, net (various, principally trademarks) 33 23
Total $ 2,126 14
Tested for impairment at least annually or when events indicate thatan asset may be impaired:
Trademarks with indefinite lives $ 411 21%Goodwill 165 16Bottlers’ franchise rights 49 9Other intangible assets not subject to amortization 42 26
Total $ 667 18
Equity Method and Cost Method Investments
We review our equity and cost method investments in every reporting period to determine whether asignificant event or change in circumstances has occurred that may have an adverse effect on the fair value ofeach investment. When such events or changes occur, we evaluate the fair value compared to the carrying valueof the related investments. We also perform this evaluation every reporting period for each investment for whichthe carrying value has exceeded the fair value in the prior period. The fair values of most of our Company’sinvestments in publicly traded companies are often readily available based on quoted market prices. Forinvestments in nonpublicly traded companies, management’s assessment of fair value is based on valuationmethodologies including discounted cash flows, estimates of sales proceeds and external appraisals, asappropriate. We consider the assumptions that we believe hypothetical marketplace participants would use inevaluating estimated future cash flows when employing the discounted cash flows or estimates of sales proceedsvaluation methodologies. The ability to accurately predict future cash flows, especially in developing andunstable markets, may impact the determination of fair value.
In the event a decline in fair value of an investment occurs, management may be required to determine ifthe decline in fair value is other than temporary. Management’s assessments as to the nature of a decline in fairvalue are based on the valuation methodologies discussed above, our ability and intent to hold the investment,and whether evidence indicating the cost of the investment is recoverable within a reasonable period of timeoutweighs evidence to the contrary. We consider most of our equity method investees to be strategic long-terminvestments. If the fair value of an investment is less than its carrying value and the decline in value is consideredto be other than temporary, a write-down is recorded. Management’s assessments of fair value represent ourbest estimates as of the time of the impairment review and are consistent with the assumptions that we believehypothetical marketplace participants would use. If different fair values were estimated, this could have amaterial impact on our consolidated financial statements.
36

The following table presents the difference between calculated fair values, based on quoted closing prices ofpublicly traded shares, and our Company’s carrying values for significant investments in publicly traded bottlersaccounted for as equity method investees (in millions):
Fair CarryingDecember 31, 2005 Value Value Difference
Coca-Cola Enterprises Inc. $ 3,239 $ 1,731 $ 1,508Coca-Cola Hellenic Bottling Company S.A. 1,645 1,039 606Coca-Cola FEMSA, S.A. de C.V. 2,016 982 1,034Coca-Cola Amatil Limited 1,367 748 619Grupo Continental, S.A. 262 160 102Coca-Cola Embonor S.A. 164 186 (22)1
Coca-Cola Bottling Company Consolidated 107 66 41Coca-Cola West Japan Company Ltd. 94 116 (22)1
Embotelladoras Polar S.A. 85 56 29
$ 8,979 $ 5,084 $ 3,895
1 The current decline in value is considered to be temporary.
Other Assets
Our Company invests in infrastructure programs with our bottlers that are directed at strengthening ourbottling system and increasing unit case volume. Additionally, our Company advances payments to certaincustomers to fund future marketing activities intended to generate profitable volume and expenses suchpayments over the period benefited. Advance payments are also made to certain customers for distributionrights. Payments under these programs are generally capitalized and reported as other assets in our consolidatedbalance sheets. Management evaluates the recoverability of the carrying value of these assets when facts andcircumstances indicate that the carrying value of these assets may not be recoverable by preparing estimates ofsales volume and the resulting gross profit and cash flows. If the carrying value of the assets is assessed to berecoverable, it is amortized over the periods benefited. If the carrying value of these assets is considered to benot recoverable, an impairment is recognized, resulting in a write-down of assets.
Property, Plant and Equipment
Certain events or changes in circumstances may indicate that the recoverability of the carrying amount ofproperty, plant and equipment should be assessed. Such events or changes may include a significant decrease inmarket value, a significant change in the business climate in a particular market, or a current-period operating orcash flow loss combined with historical losses or projected future losses. If an event occurs or changes incircumstances are present, we estimate the future cash flows expected to result from the use of the asset and itseventual disposition. If the sum of the expected future cash flows (undiscounted and without interest charges) isless than the carrying amount, we recognize an impairment loss. The impairment loss recognized is the amountby which the carrying amount exceeds the fair value.
Goodwill, Trademarks and Other Intangible Assets
Statement of Financial Accounting Standards (‘‘SFAS’’) No. 142, ‘‘Goodwill and Other Intangible Assets,’’classifies intangible assets into three categories: (1) intangible assets with definite lives subject to amortization;(2) intangible assets with indefinite lives not subject to amortization; and (3) goodwill. For intangible assets withdefinite lives, tests for impairment must be performed if conditions exist that indicate the carrying value may notbe recoverable. For intangible assets with indefinite lives and goodwill, tests for impairment must be performedat least annually or more frequently if events or circumstances indicate that assets might be impaired. Our equitymethod investees also perform such tests for impairment for intangible assets and/or goodwill. If an impairment
37

charge was recorded by one of our equity method investees the Company would record its proportionate shareof such charge.
Our trademarks and other intangible assets determined to have definite lives are amortized over theiruseful lives. In accordance with SFAS No. 142, if conditions exist that indicate the carrying value may not berecoverable, we review such trademarks and other intangible assets with definite lives for impairment to ensurethey are appropriately valued. Such conditions may include an economic downturn in a market or a change inthe assessment of future operations. Trademarks and other intangible assets determined to have indefinite usefullives are not amortized. We test such trademarks and other intangible assets with indefinite useful lives forimpairment annually, or more frequently if events or circumstances indicate that assets might be impaired.Goodwill is not amortized. We also perform tests for impairment of goodwill annually, or more frequently ifevents or circumstances indicate it might be impaired. All goodwill is assigned to reporting units, which are onelevel below our operating segments. Goodwill is assigned to the reporting unit that benefits from the synergiesarising from each business combination. We perform our impairment tests of goodwill at our reporting unitlevel. Impairment tests for goodwill include comparing the fair value of the respective reporting unit with itscarrying value, including goodwill. We use a variety of methodologies in conducting these impairmentassessments, including cash flow analyses that, when appropriate, are consistent with the assumptions we believehypothetical marketplace participants would use, estimates of sales proceeds and independent appraisals. Whereapplicable, we use an appropriate discount rate, based on the Company’s cost of capital rate or location-specificeconomic factors.
In 2005, our Company recorded impairment charges of approximately $84 million related to intangibleassets. These intangible assets relate to trademarks for beverages sold in the Philippines. The Philippines is acomponent of our East, South Asia and Pacific Rim operating segment. The carrying value of our trademarks inthe Philippines, prior to the recording of the impairment charges in 2005, was approximately $268 million. Theimpairment was the result of our revised outlook of the Philippines, which has been unfavorably impacted bydeclines in volume and income before income taxes resulting from the continued lack of an affordable packageoffering and the continued limited availability of these trademark beverages in the marketplace. We determinedthe amount of the impairment by comparing the fair value of the intangible assets to the current carrying value.Fair values were derived using discounted cash flow analyses with a number of scenarios that were weightedbased on the probability of different outcomes. Because the fair values were less than the carrying values of theassets, we recorded impairment charges to reduce the carrying values of the assets to fair values. In addition, in2005, we recorded an impairment charge of approximately $4 million in the line item equity income—net relatedto our proportionate share of a write-down of intangible assets recorded by our equity method investee bottler inthe Philippines. Our Company is evaluating and implementing new strategies for the Philippines to addressstructural issues with the bottling system and product affordability and availability issues. If the results of thesestrategies do not achieve our current expectations, future charges could result related to both our remainingintangible assets as well as our equity method investment in the Philippines bottling operation. Management willcontinue to monitor the Philippines and conduct impairment reviews as required.
In 2004, our Company recorded impairment charges related to intangible assets of approximately$374 million, primarily related to franchise rights at CCEAG in the European Union operating segment. TheCCEAG impairment was the result of our revised outlook for the German market, which was unfavorablyimpacted by volume declines resulting from market shifts related to the deposit law on nonrefillable beveragepackages and the corresponding lack of availability of our products in the discount retail channel. The depositlaw in Germany had led to discount chains creating proprietary nonrefillable packages that could only bereturned to their own stores. We determined the amount of the impairment by comparing the fair value of theintangible assets to the current carrying value. Fair values were derived using discounted cash flow analyses witha number of scenarios that were weighted based on the probability of different outcomes. Because the fair valuewas less than the carrying value of the assets, we recorded an impairment charge to reduce the carrying value ofthe assets to fair value. These impairment charges were recorded in the line item other operating charges in our
38

consolidated statement of income for 2004. At the end of 2004, the German government passed an amendmentto the mandatory deposit legislation that requires retailers, including discount chains, to accept returns of eachtype of nonrefillable beverage packages they sell, regardless of where the beverage package type was purchased.In addition, the mandatory deposit requirement was expanded to other beverage categories. The amendmentallows for a transition period to enable manufacturers and retailers to establish a national take-back system fornonrefillable containers by mid-2006. In the second half of 2005, the Company achieved a limited range ofavailability of our products in most discounters. As a result, the business in Germany stabilized in the secondhalf of 2005. We currently expect that the national take-back system, when fully implemented, will create anopportunity to improve package choice and differentiation for nonrefillable packages. We expect the Germanbusiness to continue to stabilize in 2006.
Our Company evaluated our strategies for the German operations, including addressing significantstructural issues that limit the system’s ability to respond effectively to the evolving retail and consumerlandscape, by assessing market changes and determining our expectations related to the political environment.We concluded that, in order to better serve our customers and control the costs in our supply chain, we need tosimplify our bottling and distribution operations in Germany and work toward a single bottler system. As aresult, we informed our independent bottling partners in Germany that their Bottlers’ Agreements will not berenewed when they expire, from 2007 through 2011. The independent bottling partners in Germany and ourCompany signed a letter of understanding with respect to the formation of a single bottler system and areworking to agree to an approach.
If the results of our strategies in Germany do not achieve our current expectations, or delays and changesoccur in the establishment of the national take-back system for nonrefillable packages, future impairmentcharges could result. Management will continue to monitor these factors.
Revenue Recognition
We recognize revenue when persuasive evidence of an arrangement exists, delivery of products hasoccurred, the sales price is fixed or determinable, and collectibility is reasonably assured. For our Company, thisgenerally means that we recognize revenue when title to our products is transferred to our bottling partners,resellers or other customers. In particular, title usually transfers upon shipment to or receipt at our customers’locations, as determined by the specific sales terms of the transaction.
In addition, our customers can earn certain incentives, which are included in deductions from revenue, acomponent of net operating revenues in the consolidated statements of income. These incentives include, butare not limited to, cash discounts, funds for promotional and marketing activities, volume-based incentiveprograms, and support for infrastructure programs. Refer to Note 1 of Notes to Consolidated FinancialStatements. The aggregate deductions from revenue recorded by the Company in relation to these programs,including amortization expense on infrastructure programs, was approximately $3.7 billion, $3.6 billion and$3.6 billion for the years ended December 31, 2005, 2004 and 2003, respectively.
Income Taxes
Our annual tax rate is based on our income, statutory tax rates and tax planning opportunities available tous in the various jurisdictions in which we operate. Significant judgment is required in determining our annualtax expense and in evaluating our tax positions. We establish reserves at the time we determine it is probable wewill be liable to pay additional taxes related to certain matters. We adjust these reserves, including any impact onthe related interest and penalties, in light of changing facts and circumstances, such as the progress of a taxaudit.
A number of years may elapse before a particular matter for which we have established a reserve is auditedand finally resolved. The number of years with open tax audits varies depending on the tax jurisdiction. While itis often difficult to predict the final outcome or the timing of resolution of any particular tax matter, we record a
39

reserve when we determine the likelihood of loss is probable. Such liabilities are recorded in the line itemaccrued income taxes in the Company’s consolidated balance sheets. Settlement of any particular issue wouldusually require the use of cash. Favorable resolutions of tax matters for which we have previously establishedreserves are recognized as a reduction to our income tax expense when the amounts involved become known.
Tax law requires items to be included in the tax return at different times than when these items are reflectedin the consolidated financial statements. As a result, our annual tax rate reflected in our consolidated financialstatements is different than that reported in our tax return (our cash tax rate). Some of these differences arepermanent, such as expenses that are not deductible in our tax return, and some differences reverse over time,such as depreciation expense. These timing differences create deferred tax assets and liabilities. Deferred taxassets and liabilities are determined based on temporary differences between the financial reporting and taxbases of assets and liabilities. The tax rates used to determine deferred tax assets or liabilities are the enacted taxrates in effect for the year in which the differences are expected to reverse. Based on the evaluation of allavailable information, the Company recognizes future tax benefits, such as net operating loss carryforwards, tothe extent that realizing these benefits is considered more likely than not.
We evaluate our ability to realize the tax benefits associated with deferred tax assets by analyzing ourforecasted taxable income using both historical and projected future operating results, the reversal of existingtemporary differences, taxable income in prior carryback years (if permitted) and the availability of tax planningstrategies. A valuation allowance is required to be established unless management determines that it is morelikely than not that the Company will ultimately realize the tax benefit associated with a deferred tax asset.
Additionally, undistributed earnings of a subsidiary are accounted for as a temporary difference, except thatdeferred tax liabilities are not recorded for undistributed earnings of a foreign subsidiary that are deemed to beindefinitely reinvested in the foreign jurisdiction. The Company has formulated a specific plan for reinvestmentof undistributed earnings of its foreign subsidiaries which demonstrates that such earnings will be indefinitelyreinvested in the applicable jurisdictions. Should we change our plans, we would be required to record asignificant amount of deferred tax liabilities.
The American Jobs Creation Act of 2004 (the ‘‘Jobs Creation Act’’) was enacted in October 2004. Amongother things, it provided a one-time benefit related to foreign tax credits generated by equity investments in prioryears. In 2004, the Company recorded an income tax benefit of approximately $50 million as a result of this newlaw. The Jobs Creation Act also included a temporary incentive for U.S. multinationals to repatriate foreignearnings at an approximate 5.25 percent effective tax rate. During 2005, the Company repatriated approximately$6.1 billion in previously unremitted foreign earnings, with an associated tax liability of approximately$315 million. The reinvestment requirements of this repatriation are expected to be fulfilled by 2008 and are notexpected to require any material change in the nature, amount or timing of future expenditures from what wasotherwise expected. Refer to Note 1 and Note 16 of Notes to Consolidated Financial Statements.
The Company’s effective tax rate is expected to be approximately 24 percent in 2006. This estimated tax ratedoes not reflect the impact of any unusual or special items that may affect our tax rate in 2006.
Contingencies
Our Company is subject to various claims and contingencies, mostly related to legal proceedings. Due totheir nature, such legal proceedings involve inherent uncertainties including, but not limited to, court rulings,negotiations between affected parties and governmental actions. Management assesses the probability of loss forsuch contingencies and accrues a liability and/or discloses the relevant circumstances, as appropriate.Management believes that any liability to the Company that may arise as a result of currently pending legalproceedings or other contingencies will not have a material adverse effect on the financial condition of theCompany taken as a whole. Refer to Note 12 of Notes to Consolidated Financial Statements.
40

Recent Accounting Standards and Pronouncements
Refer to Note 1 of Notes to Consolidated Financial Statements for a discussion of recent accountingstandards and pronouncements.
Operations Review
We manufacture, distribute and market nonalcoholic beverage concentrates and syrups in more than 200countries around the world. We also manufacture, distribute and market some finished beverages. Due to ourglobal presence, we are primarily managed by geographic regions. Our organizational structure as ofDecember 31, 2005 consisted of the following operating segments, the first six of which are sometimes referredto as ‘‘operating groups’’ or ‘‘groups’’: North America; Africa; East, South Asia and Pacific Rim; EuropeanUnion; Latin America; North Asia, Eurasia and Middle East; and Corporate. For further information regardingour operating segments, including a discussion of changes made to our operating segments during 2005, refer toNote 20 of Notes to Consolidated Financial Statements.
Volume
We measure our sales volume in two ways: (1) unit cases of finished products and (2) gallons. A ‘‘unit case’’is a unit of measurement equal to 192 U.S. fluid ounces of finished beverage (24 eight-ounce servings). Unit casevolume represents the number of unit cases of Company beverage products directly or indirectly sold by theCoca-Cola system to customers. Unit case volume primarily consists of beverage products bearing Companytrademarks. Also included in unit case volume are certain products licensed to, or distributed by, our Company,and brands owned by Coca-Cola system bottlers for which our Company provides marketing support and fromthe sale of which it derives income. Such products licensed to, or distributed by, our Company or owned byCoca-Cola system bottlers account for a minimal portion of total unit case volume. In addition, unit case volumeincludes sales by joint ventures in which the Company is a partner. Unit case volume is derived based onestimates supplied by our bottling partners and distributors. A ‘‘gallon’’ is a unit of measurement forconcentrates, syrups, beverage bases, finished beverages and powders (in all cases expressed in equivalentgallons of syrup) sold by the Company to its bottling partners or other customers. Most of our revenues arebased on gallon sales, a primarily wholesale activity, as discussed under ‘‘Item 1. Business’’ in Part I of this reportand the heading ‘‘Operations Review—Net Operating Revenues,’’ below. Unit case volume and gallon salesgrowth rates are not necessarily equal during any given period. Items such as seasonality, bottlers’ inventorypractices, supply point changes, timing of price increases and new product introductions and changes in productmix can impact unit case volume and gallon sales and can create differences between unit case volume andgallon sales growth rates.
Information about our volume growth by operating segment is as follows:Percentage Change
2005 vs. 2004 2004 vs. 2003Year Ended December 31, Unit Cases Gallons Unit Cases Gallons
Worldwide 4% 3% 2% 2%North America operations 2 1 0 2International operations—total 5 4 3 2
Africa 6 7 3 4East, South Asia and Pacific Rim (4) (6) 1 (2)European Union 0 (1) (3) (3)Latin America 6 6 3 3North Asia, Eurasia and Middle East 15 12 12 12
41

Unit Case Volume
Although most of our Company’s revenues are not based directly on unit case volume, we believe unit casevolume is one of the measures of the underlying strength of the Coca-Cola system because it measures trends atthe consumer level. The Coca-Cola system sold approximately 20.6 billion unit cases of our products in 2005,approximately 19.8 billion unit cases in 2004, and approximately 19.4 billion unit cases in 2003.
In the North America operating segment, unit case volume in the Retail Division increased 2 percent in2005 versus 2004, reflecting improved performance in the bottle-delivered business primarily related to Dasani,Coca-Cola Zero and noncarbonated beverages, along with growth in the warehouse juice and warehouse wateroperations. The Foodservice and Hospitality Division had a 1 percent increase in 2005 compared to 2004,reflecting improved trends in restaurant traffic and the impact of new customer conversion partially offset by theimpact of higher fuel costs and Hurricane Katrina on consumer restaurant spending.
In the Africa operating segment, unit case volume increased 6 percent in 2005 compared to 2004. Thisincrease was driven by growth in core carbonated soft drinks as well as noncarbonated beverages across alldivisions in this operating segment.
In the East, South Asia and Pacific Rim operating segment, unit case volume decreased 4 percent in 2005compared to 2004, primarily due to declines in India and the Philippines. The decline in India was related to theimpact of price increases to cover rising raw material and distribution costs and the lingering effects of the 2003pesticide allegations. The decline in the Philippines was primarily related to affordability and availability issues.Both markets are expected to remain challenging in 2006.
Unit case volume in the European Union operating segment was even in 2005 versus 2004, primarily due tostrong growth in Spain and Central Europe partially offset by declines primarily in Germany and NorthwestEurope. Unit case volume in Germany declined 2 percent in 2005 due to the continued impact of the mandatorydeposit legislation on the availability of nonrefillable packages and the corresponding limited availability of ourproducts in the discount retail channel, along with overall industry weakness. In the second half of 2005, theCompany achieved a limited range of availability of its products in most discounters. Results in Germanystabilized in the second half of 2005, and we expect this to continue into 2006. Unit case volume in NorthwestEurope declined 3 percent in 2005, primarily due to the soft economic environment and declines in thecarbonated soft drink category, which is associated with a decrease in prices at retailers, and the discountchannel becoming a larger part of the retail market, together with a shift in consumer preferences away fromregular carbonated soft drinks driven by health and wellness trends and the associated public opinion, media andgovernment attention.
Unit case volume for the Latin America operating segment increased 6 percent in 2005 versus 2004,reflecting strong growth in Brazil, Argentina and Mexico, primarily due to growth in carbonated soft drinks. Theincrease in Brazil and Mexico was primarily due to strong marketing, execution and package innovation.
In the North Asia, Eurasia and Middle East operating segment, unit case volume grew 15 percent in 2005versus 2004, led by 22 percent growth in China, 2 percent growth in Japan, 54 percent growth in Russia and14 percent growth in Turkey. The increase in unit case volume in China was led by significant growth in bothcarbonated soft drinks and noncarbonated beverages. Japan’s growth was primarily due to new productintroductions. The unit case volume growth in Turkey was largely due to improving macroeconomic trends,strong bottler execution and successful marketing programs. The unit case volume growth in Russia was theresult of the joint acquisition of Multon as well as improving macroeconomic trends, strong bottler executionand successful marketing programs.
In the North America operating segment, unit case volume for 2004 was even compared to 2003. The RetailDivision had a 1 percent decrease in unit case volume in 2004 versus 2003, primarily due to poor weather in thethird quarter, higher retail pricing and lower than expected results from Coca-Cola C2. The Foodservice and
42

Hospitality Division’s unit case volume increased 2 percent as a result of effective customer programs andimproved restaurant traffic.
In the Africa operating segment, unit case volume increased 3 percent in 2004 compared to 2003, primarilyas a result of the growth in South Africa, where unit case volume increased 7 percent, and in Morocco andKenya. These increases were partially offset by unit case volume declines in Nigeria, due to de-emphasis onless-profitable water packages and weakness in noncore brands, and in Egypt.
In the East, South Asia and Pacific Rim operating segment, unit case volume increased 1 percent in 2004versus 2003, primarily as a result of the growth in the South East and West Asia Division, partially offset by an8 percent decline in the Philippines due to affordability and availability issues.
Unit case volume in the European Union operating segment decreased 3 percent in 2004 versus 2003,primarily due to limited brand and package availability in the discount retail channel in Germany resulting fromthe mandatory deposit legislation and poor weather conditions in northern Europe.
Unit case volume for the Latin America operating segment increased 3 percent in 2004 versus 2003,primarily reflecting strong growth in Brazil, Argentina and Venezuela resulting from the execution of theCompany’s long-term investment strategy with an emphasis on brand building, new package alternatives, andclose coordination with bottling partners to drive superior local marketplace execution, offset by a de-emphasison large-format water and powdered drinks in Mexico.
The North Asia, Eurasia and Middle East operating segment’s unit case volume increased 12 percent in2004 compared to 2003, primarily led by 22 percent growth in China as a result of a new advertising campaign,innovative packaging and promotion in the cities, and affordable 200ml packaging in the towns. Japan’s growthof 4 percent was driven by Trademark Coca-Cola unit case volume growth of 3 percent and Trademark Fantagrowth of 17 percent. Unit case volume growth in Turkey, Russia and the Middle East was mainly due tosuccessful promotions and continued positive economic trends.
Gallon Sales
In 2005, the 1 percent increase in gallon sales in the North America operating segment was primarilyrelated to the Retail Division. In Africa, the 7 percent gallon sales growth was led by South Africa, Nigeria andEgypt. In Latin America, the 6 percent gallon sales increase was led by growth in Brazil, Mexico and Argentina.The 12 percent increase in gallon sales in the North Asia, Eurasia and Middle East operating segment wasprimarily due to growth in China, Russia and Turkey. Japan gallon sales were slightly higher in 2005 compared to2004. The increases in gallon sales in the North America; the Africa; the Latin America; and the North Asia,Eurasia and Middle East operating segments were offset by a 1 percent decrease in the European Unionoperating segment and a 6 percent decrease in the East, South Asia and Pacific Rim operating segment. In theEuropean Union operating segment, gallon sales decreased 1 percent, with the largest declines occurring inGermany and Northwest Europe, partially offset by growth in Spain and Central Europe. In the East, South Asiaand Pacific Rim operating segment, gallon sales decreased 6 percent, primarily due to the continuing challengingconditions in India and the Philippines.
The decrease in gallon sales in Germany was primarily due to the continuing impact of the mandatorydeposit legislation on nonrefillable beverage packages and the corresponding limited availability of our productsin the discount retail channel, along with overall industry weakness. In the second half of 2005, the Companyachieved a limited range of availability of its products in most discounters. Results in Germany stabilized in thesecond half of 2005. The German legislature passed an amendment to the mandatory deposit legislation that willrequire retailers, including discounters, to accept returns of each type of nonrefillable beverage containers theysell, regardless of where the beverage package type was purchased, the amendment allows for a transition perioduntil mid-2006. We expect the German business to continue to stabilize during 2006. For a discussion of theoperating environment in Germany, refer to the heading ‘‘Critical Accounting Policies and Estimates—
43

Goodwill, Trademarks and Other Intangible Assets.’’ We will continue to focus on improving our short-termperformance and strengthening our system’s long-term capabilities in Germany. The decrease in gallon sales inNorthwest Europe was primarily due to the soft economic environment and declines in the carbonated soft drinkcategory, which is associated with a decrease in prices at retailers, and the discount channel becoming a largerpart of the retail market, together with a shift in consumer preferences away from regular carbonated soft drinksdriven by health and wellness trends and the associated public opinion, media and government attention.
The decrease in gallon sales in India was primarily due to the impact of price increases to cover rising rawmaterial and distribution costs and the lingering effects of the 2003 pesticide allegations. The decline in gallonsales in the Philippines was primarily due to continued affordability and availability issues. The Company iscontinuing to focus on improving our performance in these markets; however, India and the Philippines willremain difficult during 2006.
Company-wide gallon sales grew 3 percent while unit case volume grew 4 percent in 2005 compared to 2004.In the North America operating segment, gallon sales increased 1 percent while unit case volume increased2 percent in 2005 compared to 2004, primarily due to the impact of higher gallon sales in 2004 related to thelaunch of Coca-Cola C2 and a change in shipping routes in 2004. In the Africa operating segment, gallon salesgrowth of 7 percent exceeded unit case volume growth of 6 percent, primarily due to timing of gallon shipments.In the European Union operating segment, gallon sales declined by 1 percent while unit case volume was even in2005, mostly due to the timing of 2004 gallon sales throughout most of the operating segment and plannedinventory reductions primarily in Spain, Greece and Israel. In the East, South Asia and Pacific Rim operatingsegment, gallon sales declines were ahead of unit case volume declines primarily due to timing of gallon sales inIndia and the Philippines and planned inventory reductions in Australia. In the North Asia, Eurasia and MiddleEast operating segment, unit case volume increased ahead of gallon sales volume due to the joint acquisition ofMulton, which contributed to unit case volume in 2005, along with timing of 2004 gallon sales impacting most ofthe remaining divisions in the operating segment. Multon had full year unit case volume of approximately80 million unit cases in 2004. The Company reports only unit case volume related to Multon, as the Companydoes not sell concentrate to Multon. In the Latin America operating segment, gallon sales growth and unit casevolume growth were approximately equal in 2005 compared to 2004.
The 2 percent increase in gallon sales in the North America operating segment in 2004 compared to 2003was primarily related to 4 percent growth in the Foodservice and Hospitality Division and 1 percent growth inthe Retail Division. The 4 percent growth in the Africa operating segment was led mainly by South Africa. The3 percent increase in the Latin America operating segment was primarily driven by growth in Brazil, Mexico andArgentina. The North Asia, Eurasia and Middle East operating segment’s growth of 12 percent was driven bygallon sales growth in China, Turkey and Russia. The 3 percent decrease in gallon sales in the European Unionresulted primarily from the decline in Germany primarily due to market shifts related to the deposit law onnonrefillable beverage packages and the corresponding lack of availability of our products in the discount retailchannel. The East, South Asia and Pacific Rim operating segment’s gallon sales decreased 2 percent in 2004compared to 2003 primarily due to inventory reductions in India and challenging conditions in the Philippines.
Company-wide gallon sales growth of 2 percent was in line with unit case volume growth in 2004 comparedto 2003. However, in the North America operating segment, gallon sales increased 2 percent while unit casevolume was even due to lower gallon sales in 2003, additional 2004 shipments related to new productintroductions, changes in our shipping routes and higher than expected year end sales. In the East, South Asiaand Pacific Rim operating segment, gallon sales declined 2 percent while unit case sales increased 1 percentprimarily due to timing of gallon sales.
44

Analysis of Consolidated Statements of IncomePercent Change
Year Ended December 31, 2005 2004 2003 05 vs. 04 04 vs. 03(In millions except per share data and percentages)
NET OPERATING REVENUES $ 23,104 $ 21,742 $ 20,857 6% 4%Cost of goods sold 8,195 7,674 7,776 7 (1)
GROSS PROFIT 14,909 14,068 13,081 6 8GROSS PROFIT MARGIN 64.5% 64.7% 62.7%Selling, general and administrative expenses 8,739 7,890 7,287 11 8Other operating charges 85 480 573 * *
OPERATING INCOME 6,085 5,698 5,221 7 9OPERATING MARGIN 26.3% 26.2% 25.0%Interest income 235 157 176 50 (11)Interest expense 240 196 178 22 10Equity income — net 680 621 406 10 53Other loss — net (93) (82) (138) * *Gains on issuances of stock by equity investees 23 24 8 * *
INCOME BEFORE INCOME TAXES 6,690 6,222 5,495 8 13Income taxes 1,818 1,375 1,148 32 20Effective tax rate 27.2% 22.1% 20.9%
NET INCOME $ 4,872 $ 4,847 $ 4,347 1% 12%
PERCENTAGE OF NET OPERATING REVENUES 21.1% 22.3% 20.8%
NET INCOME PER SHARE:Basic $ 2.04 $ 2.00 $ 1.77 2% 13%
Diluted $ 2.04 $ 2.00 $ 1.77 2% 13%
* Calculation is not meaningful.
45

Net Operating Revenues
Net operating revenues increased by $1,362 million or 6 percent in 2005 versus 2004. Net operatingrevenues increased by $885 million or 4 percent in 2004 versus 2003.
The following table indicates, on a percentage basis, the estimated impact of key factors resulting insignificant increases (decreases) in net operating revenues:
Percent Change2005 vs. 2004 2004 vs. 2003
Increase in gallon sales 3% 2%Structural changes 0 (3)Price and product/geographic mix 1 0Impact of currency fluctuations versus the U.S. dollar 2 5
Total percentage increase 6% 4%
Refer to the heading ‘‘Volume’’ for a detailed discussion on gallon sales.
Structural changes refers to acquisitions or dispositions of bottling or canning operations and consolidationor deconsolidation of entities for accounting purposes. During the third quarter of 2005, our Company acquiredthe German soft drink bottling company Bremer Erfrischungsgetraenke GmbH (‘‘Bremer’’). Refer to Note 19 ofNotes to Consolidated Financial Statements. Structural changes also reflect the impact of a full year of revenuein 2005 for variable interest entities compared to a partial year in 2004. Under Interpretation 46(R), the resultsof operations of variable interest entities in which the Company was determined to be the primary beneficiarywere included in our consolidated results beginning April 2, 2004. Refer to Note 1 of Notes to ConsolidatedFinancial Statements.
The favorable impact of foreign currency fluctuations in 2005 versus 2004 resulted from the strength ofmost key foreign currencies versus the U.S. dollar, especially a stronger euro that favorably impacted theEuropean Union operating segment, and a stronger Brazilian real and Mexican peso that favorably impactedour Latin America operating segment. The favorable impact of fluctuation in these currencies was offset by aweaker Japanese yen that unfavorably impacted the North Asia, Eurasia and Middle East operating segment.Refer to the heading ‘‘Liquidity, Capital Resources and Financial Position—Foreign Exchange.’’
Structural changes resulted in a decrease in net operating revenues in 2004 compared to 2003, primarily dueto the creation of a national supply chain company in Japan in 2003. Effective October 1, 2003, the Companyand all of our bottling partners in Japan created a nationally integrated supply chain management company tocentralize procurement, production and logistics operations for the entire Coca-Cola system in Japan. As aresult, a portion of our Company’s business was essentially converted from a finished product business model toa concentrate business model. This shift of certain products to a concentrate business model resulted inreductions in our revenues and cost of goods sold, each in the same amount. This change in the business modeldid not impact gross profit. The decrease in net revenues from 2003 to 2004 attributable to the Japan structuralchange was approximately $780 million, which was partially offset by an approximately $260 million increase inrevenues associated with the consolidation as of April 2, 2004 of certain bottling operations that are consideredvariable interest entities under Interpretation 46(R). Refer to Note 1 of Notes to Consolidated FinancialStatements.
The impact of foreign currency fluctuations versus the U.S. dollar in 2004 versus 2003 was driven primarilyby the stronger euro, which favorably impacted the European Union operating segment, and the strongerJapanese yen, which favorably impacted the North Asia, Eurasia and Middle East operating segment.
46

Information about our net operating revenues by operating segment on a percentage basis is as follows:
Year Ended December 31, 2005 2004 2003
North America 28.9% 29.5% 29.5%Africa 5.5 4.9 4.0East, South Asia and Pacific Rim 5.4 5.9 6.4European Union 29.4 30.2 29.2Latin America 10.9 9.8 9.8North Asia, Eurasia and Middle East 19.5 19.2 20.7Corporate 0.4 0.5 0.4
100.0% 100.0% 100.0%
The percentage contribution of each operating segment has changed due to net operating revenues incertain segments growing at a faster rate compared to the other operating segments and the impact of foreigncurrency fluctuations.
Effective January 1, 2006, the Company granted our bottling partners in Spain the rights to manufactureand distribute Company trademarked products in can packages. Prior to granting these rights to our bottlingpartners, the Company held the manufacturing and distribution rights for these can packages in Spain. As aresult of granting these rights, the Company will reduce our planned future annual marketing support paymentsmade to our bottling partners in Spain. As a result, a portion of our Company’s business has essentially beenconverted from a finished product business model to a concentrate business model. This shift to a concentratebusiness model will result in an annual reduction to net revenues. The Company estimates the decrease inannual net revenues from this structural change to be approximately $775 million. We do not believe this changein business model will have a significant impact on gross profit.
The size and timing of structural changes, including acquisitions or dispositions of bottling and canningoperations, do not occur consistently from period to period. As a result, anticipating the impact of such eventson future increases or decreases in net operating revenues (and other financial statement line items) usually isnot possible. However, we expect to continue to sell bottling and canning interests and buy bottling and canninginterests in limited circumstances and, as a result, structural changes will continue to affect our consolidatedfinancial statements in future periods.
Gross Profit
Our gross profit margin decreased to 64.5 percent in 2005 from 64.7 percent in 2004, primarily due to higherraw material and freight costs driven by rising oil prices. This decrease was partially offset by the receipt ofsettlement proceeds of approximately $109 million related to a class action lawsuit settlement concerning price-fixing in the sale of high fructose corn syrup purchased by the Company during the years 1991 to 1995.Subsequent to the receipt of this settlement, the Company distributed approximately $62 million to certainbottlers in North America. From 1991 to 1995, the Company purchased high fructose corn syrup on behalf ofthese bottlers; therefore, these bottlers were ultimately entitled to the proceeds of the settlement. TheCompany’s portion of the settlement was approximately $47 million, which was recorded as a reduction of costof goods sold and impacted the Corporate operating segment. Refer to Note 17 of Notes to ConsolidatedFinancial Statements. Our gross margin was also impacted by the consolidation of certain bottling operationsunder Interpretation 46(R) as of April 2, 2004. Refer to Note 1 of Notes to Consolidated Financial Statements.Generally, bottling and finished product operations produce higher net revenues but lower gross profit marginscompared to concentrate and syrup operations.
Gross profit margin was approximately 2 percentage points higher in 2004 versus 2003. This increase wasprimarily the result of the creation of a nationally integrated supply chain management company in Japan inOctober 2003 (refer to the heading ‘‘Net Operating Revenues,’’ above), partially offset by the consolidation as of
47

April 2, 2004, of variable interest entities under Interpretation 46(R). Generally, bottling and finished productoperations, such as our Japan tea business, which was integrated into the supply chain company, produce highernet revenues but lower gross profit margins compared to concentrate and syrup operations.
Selling, General and Administrative Expenses
The following table sets forth the significant components of selling, general and administrative expenses (inmillions):
Year Ended December 31, 2005 2004 2003
Selling expenses $ 3,453 $ 3,031 $ 2,937Advertising expenses 2,475 2,165 1,822General and administrative expenses 2,487 2,349 2,121Stock-based compensation expense 324 345 407
Selling, general and administrative expenses $ 8,739 $ 7,890 $ 7,287
Selling, general and administrative expenses were approximately 11 percent higher in 2005 versus 2004.Approximately 1 percentage point of this increase was due to an overall weaker U.S. dollar (especially comparedto the Brazilian real, the Mexican peso and the euro). The increase in selling, advertising and general andadministrative expenses is primarily related to increased marketing and innovation expenses and the full-yearimpact of the consolidation of certain bottling operations under Interpretation 46(R). Our Company intends tomaintain the increased level in marketing and innovation spending for the foreseeable future. The decrease instock-based compensation expense is primarily related to the lower average fair value per share of stock optionsexpensed in the current year compared to the average fair value per share expensed in 2004. This decrease waspartially offset by approximately $50 million of accelerated amortization of compensation expense related to achange in our estimated service period for retirement-eligible participants when the terms of their stock-basedcompensation awards provided for accelerated vesting upon early retirement. Refer to Note 14 of Notes toConsolidated Financial Statements.
Selling, general and administrative expenses were approximately 8 percent higher in 2004 versus 2003.Approximately 3 percentage points of this increase was due to an overall weaker U.S. dollar (especiallycompared to the euro and Japanese yen). Increased selling expenses were due to increased delivery costs relatedto our Company’s finished products business and structural changes. Increased advertising expenses were theresult of investments in marketing activities, such as the launch of new products in North America and Japan.Additionally, general and administrative expenses increased due to higher legal expenses, asset write-offs andstructural changes. Finally, we received a $75 million insurance settlement related to the class action lawsuit thatwas settled in 2000. The Company subsequently donated $75 million to The Coca-Cola Foundation.
Other Operating Charges
The other operating charges incurred by operating segment were as follows (in millions):
Year Ended December 31, 2005 2004 2003
North America $ — $ 18 $ 273Africa — — 12East, South Asia and Pacific Rim 85 15 11European Union — 368 157Latin America — 6 20North Asia, Eurasia and Middle East — 9 33Corporate — 64 67
Total $ 85 $ 480 $ 573
48

Other operating charges in 2005 reflected the impact of approximately $84 million of expenses related toimpairment charges for intangible assets and approximately $1 million related to an impairment of other assets.These intangible assets primarily relate to trademark beverages sold in the Philippines, which is part of the East,South Asia and Pacific Rim operating segment. Refer to the heading ‘‘Critical Accounting Policies andEstimates—Goodwill, Trademarks and Other Intangible Assets.’’
Other operating charges in 2004 reflected the impact of approximately $480 million of expenses primarilyrelated to impairment charges for franchise rights and certain manufacturing assets. The European Unionoperating segment accounted for approximately $368 million of the impairment charges, which were primarilyrelated to the impairment of franchise rights at CCEAG. For a discussion of the operating environment inGermany, refer to the heading ‘‘Critical Accounting Policies and Estimates—Goodwill, Trademarks and OtherIntangible Assets.’’ The Corporate operating segment accounted for approximately $64 million of impairmentcharges, which were primarily related to the impairment of certain manufacturing assets.
Other operating charges in 2003 included the impact of approximately $561 million of expenses related tothe 2003 streamlining initiatives. A majority of the charges related to initiatives in North America and Germany.In North America, the Company integrated the operations of three separate North American business units—Coca-Cola North America, The Minute Maid Company and Coca-Cola Fountain. In Germany, CCEAG tooksteps to improve its efficiency in sales, distribution and manufacturing, and our German Division office alsoimplemented streamlining initiatives. Selected other locations also took steps to streamline their operations toimprove overall efficiency and effectiveness. These initiatives resulted in the separation of approximately 3,700associates in 2003, primarily in North America and Germany, and certain countries in the East, South Asia andPacific Rim operating segment. Refer to Note 18 of Notes to Consolidated Financial Statements.
Operating Income and Operating Margin
Information about our operating income by operating segment on a percentage basis is as follows:
Year Ended December 31, 2005 2004 2003
North America 25.6% 28.2% 24.6%Africa 6.8 6.0 4.8East, South Asia and Pacific Rim 3.3 6.0 7.0European Union 36.9 31.8 36.3Latin America 19.8 18.8 18.6North Asia, Eurasia and Middle East 28.1 28.6 28.5Corporate (20.5) (19.4) (19.8)
100.0% 100.0% 100.0%
Information about our operating margin by operating segment is as follows:
Year Ended December 31, 2005 2004 2003
Consolidated 26.3% 26.2% 25.0%
North America 23.3% 25.0% 20.8%Africa 32.9 31.9 30.1East, South Asia and Pacific Rim 16.0 27.0 27.6European Union 33.0 27.6 31.2Latin America 47.8 50.4 47.5North Asia, Eurasia and Middle East 38.0 39.0 34.4Corporate * * *
* Calculation is not meaningful.
49

As demonstrated by the tables above, the percentage contribution to operating income and operatingmargin by each operating segment fluctuated from year to year. Operating income and operating margin byoperating segment were influenced by a variety of factors and events, primarily the following:
• In 2005, operating income increased approximately 7 percent. Of this amount, 4 percent was due tofavorable foreign currency exchange primarily related to the Brazilian real and the Mexican peso, whichimpacted the Latin America operating segment, and the euro, which impacted the European Unionoperating segment.
• In 2005, the increase in net operating revenues and gross profit was partially offset by increased spendingon marketing and innovation activities in each operating segment. Refer to the headings ‘‘Net OperatingRevenues’’ and ‘‘Selling, General and Administrative Expenses.’’
• In 2005, as a result of impairment charges totaling approximately $85 million related to the Philippines,operating margins in the East, South Asia and Pacific Rim operating segment decreased. Refer to theheading ‘‘Other Operating Charges.’’
• In 2005, operating income in the Corporate operating segment decreased $146 million, primarily due toincreased marketing and innovation expenses, which were partially offset by our receipt of a netsettlement of approximately $47 million related to a class action lawsuit concerning the purchase of highfructose corn syrup. Refer to the headings ‘‘Gross Profit’’ and ‘‘Selling, General and AdministrativeExpenses.’’
• In 2004, operating income was reduced by approximately $18 million for the North America operatingsegment; $15 million for the East, South Asia and Pacific Rim operating segment; $368 million for theEuropean Union operating segment; $6 million for the Latin America operating segment; $9 million forthe North Asia, Eurasia and Middle East operating segment and $64 million for Corporate as a result ofimpairment charges. Refer to the heading ‘‘Other Operating Charges.’’
• In 2004, operating income increased approximately 9 percent. Of this amount, 8 percent was due tofavorable foreign currency exchange primarily related to the euro, which impacted the European Unionoperating segment, and the Japanese yen, which impacted the North Asia, Eurasia and Middle Eastoperating segment.
• In 2004, as a result of the creation of a nationally integrated supply chain management company in Japan,operating margins in the North Asia, Eurasia and Middle East operating segment increased. Generally,finished product operations produce higher net revenues but lower operating margins compared toconcentrate and syrup operations. Refer to the heading ‘‘Net Operating Revenues.’’
• In 2004, operating income in the Corporate operating segment increased $75 million due to the receipt ofan insurance settlement related to the class action lawsuit which was settled in 2000.
• In 2004, operating income in the Corporate operating segment decreased $75 million due to a donationto The Coca-Cola Foundation.
• In 2004, as a result of the consolidation of certain bottling operations that are considered variable interestentities under Interpretation 46(R), operating margins for the Africa; East, South Asia and Pacific Rim;European Union; and North Asia, Eurasia and Middle East operating segments were reduced. Generally,bottling operations produce higher net revenues but lower operating margins compared to concentrateand syrup operations.
• As a result of streamlining charges, 2003 operating income was reduced by approximately $273 million forthe North America operating segment, $12 million for the Africa operating segment, $11 million for theEast, South Asia and Pacific Rim operating segments, $157 million for the European Union operatingsegment, $8 million for the Latin America operating segment, $33 million for North Asia, Eurasia and
50

Middle East operating segment and $67 million for the Corporate operating segment. Refer to Note 18 ofNotes to Consolidated Financial Statements.
• In 2003, operating income of the European Union operating segment significantly increased due toinnovation and strong marketing strategies, rigorous cost management, positive currency trends andfavorable weather during the summer months.
• As a result of the Company’s receipt of a settlement related to a vitamin antitrust litigation matteroperating income in 2003 increased by approximately $52 million for Corporate. Refer to Note 17 ofNotes to Consolidated Financial Statements.
Interest Income and Interest Expense
We monitor our mix of fixed-rate and variable-rate debt as well as our mix of term debt versus non-termdebt. From time to time we enter into interest rate swap agreements to manage our mix of fixed-rate andvariable-rate debt.
In 2005, interest income increased by $78 million compared to 2004, primarily due to higher averageshort-term investment balances and higher average interest rates on U.S. dollar denominated deposits. Interestexpense in 2005 increased by $44 million compared to 2004, primarily due to higher average interest rates oncommercial paper borrowings in the United States, partially offset by lower interest expense at CCEAG due tothe repayment of current maturities of long-term debt in 2005.
In 2004, interest income decreased by $19 million compared to 2003, primarily due to lower interest incomeearned on short-term investments and interest income in 2003 related to certain tax receivables. While ourCompany’s average short-term investment balances increased during 2004, significant amounts of these balanceswere held in lower interest-earning locations than in prior years while the Company analyzed the impact of theJobs Creation Act. Interest expense in 2004 increased by $18 million compared to 2003, primarily as a result ofhigher average interest rates and higher average balances on commercial paper borrowings in the United States.
Equity Income—Net
Our Company’s share of income from equity method investments for 2005 totaled $680 million compared to$621 million in 2004, an increase of approximately $59 million or 10 percent, primarily due to the overallimproving health of the Coca-Cola bottling system in most of the world and the joint acquisition of Multon inApril 2005. The increase was offset by approximately $33 million related to our proportionate share of certaincharges recorded by CCE. These charges included approximately $51 million, primarily related to the taxliability resulting from the repatriation of previously unremitted foreign earnings under the Jobs Creation Act,and approximately $18 million due to restructuring charges recorded by CCE. These charges were offset byapproximately $37 million from CCE’s high fructose corn syrup lawsuit settlement and changes in certain ofCCE’s state and provincial tax rates.
Our Company’s share of income from equity method investments for 2004 totaled $621 million compared to$406 million in 2003, an increase of $215 million or 53 percent. Equity income for 2004 benefited byapproximately $37 million from our proportionate share of a favorable tax settlement related to Coca-ColaFEMSA. Additionally, our equity income for 2003 was negatively impacted by a $102 million charge primarilyrelated to Coca-Cola FEMSA, as described below. Comparing 2004 to 2003, our equity income also benefitedfrom favorable pricing at key bottling operations, the positive impact of the strength of most key currenciesversus the U.S. dollar, especially a stronger euro, and the overall improving health of the Coca-Cola bottlingsystem in most of the world.
Effective May 6, 2003, one of our Company’s Latin American equity method investees, Coca-Cola FEMSA,consummated a merger with another of the Company’s Latin American equity method investees, PanamericanBeverages, Inc. (‘‘Panamco’’). Our Company received new Coca-Cola FEMSA shares in exchange for all the
51

Panamco shares previously held by the Company. Our Company’s ownership interest in Coca-Cola FEMSAincreased from 30 percent to approximately 40 percent as a result of this merger. This exchange of shares wastreated as a nonmonetary exchange of similar productive assets, and no gain was recorded by our Company as aresult of this merger. In connection with the merger, Coca-Cola FEMSA management initiated steps tostreamline and integrate the operations. This process included the closing of various distribution centers andmanufacturing plants. Furthermore, due to the challenging economic conditions and an uncertain politicalsituation in Venezuela, certain intangible assets were determined to be impaired and written down to their fairmarket value. During 2003, our Company recorded a noncash charge of $102 million primarily related to ourproportionate share of these matters. This charge is included in the line item equity income—net.
Other Loss—Net
Other loss—net amounted to a net loss of $93 million for 2005 compared to a net loss of $82 million for2004. This line item in 2005 primarily consisted of $23 million in foreign currency exchange losses, the accretionof $60 million for the discounted value of our liability to purchase CCEAG shares (refer to Note 7 of Notes toConsolidated Financial Statements) and the minority shareowners’ proportional share of net income of certainconsolidated subsidiaries.
Other loss—net amounted to a net loss of $82 million for 2004 compared to a net loss of $138 million for2003, a difference of $56 million. Approximately $37 million of this difference is related to a reduction in foreignexchange losses. This line item in 2004 primarily consisted of foreign exchange losses of approximately$39 million, the accretion of $58 million for the discounted value of our liability to purchase CCEAG shares(refer to Note 7 of Notes to Consolidated Financial Statements) and the minority shareowners’ proportionalshare of net income on certain consolidated subsidiaries.
Gains on Issuances of Stock by Equity Method Investees
When one of our equity method investees issues additional shares to third parties, our percentageownership interest in the investee decreases. In the event the issuance price per share is higher or lower than ouraverage carrying amount per share, we recognize a noncash gain or loss on the issuance, when appropriate. Thisnoncash gain or loss, net of any deferred taxes, is recognized in our net income in the period the change ofownership interest occurs.
In 2005, our Company recorded approximately $23 million of noncash pretax gains on the issuances of stockby equity method investees. The issuances primarily related to Coca-Cola Amatil’s issuance of common stock inconnection with the acquisition of SPC Ardmona Pty. Ltd., an Australian packaged fruit company. Theseissuances of common stock reduced our ownership interest in the total outstanding shares of Coca-Cola Amatilfrom approximately 34 percent to approximately 32 percent.
In 2004, our Company recorded approximately $24 million of noncash pretax gains due to the issuances ofstock by CCE. The issuances primarily related to the exercise of CCE stock options by CCE employees atamounts greater than the book value per share of our investment in CCE. These issuances of stock reduced ourownership interest in the total outstanding shares of CCE common stock from approximately 37 percent toapproximately 36 percent.
In 2003, our Company recorded approximately $8 million of noncash pretax gains on issuances of stock byequity method investees. These gains primarily related to the issuance by CCE of common stock valued at anamount greater than the book value per share of our investment in CCE. These issuances of stock reduced ourownership interest in the total outstanding shares of CCE common stock by less than 1 percent.
Income Taxes
Our effective tax rate reflects tax benefits derived from significant operations outside the United States,which are generally taxed at rates lower than the U.S. statutory rate of 35 percent.
52

Our effective tax rate of approximately 27.2 percent for the year ended December 31, 2005, included thefollowing:
• an income tax benefit primarily related to the Philippines impairment charges at a rate of approximately4 percent;
• an income tax benefit of approximately $101 million related to the reversal of previously accrued taxesresulting from the favorable resolution of various tax matters; and
• a tax provision of approximately $315 million related to repatriation of previously unremitted foreignearnings under the Jobs Creation Act.
Our effective tax rate of approximately 22.1 percent for the year ended December 31, 2004, included thefollowing:
• an income tax benefit of approximately $128 million related to the reversal of previously accrued taxesresulting from the favorable resolution of various tax matters;
• an income tax benefit on ‘‘Other Operating Charges,’’ discussed above, at a rate of approximately36 percent;
• an income tax provision of approximately $75 million related to the recording of a valuation allowance ondeferred tax assets of CCEAG; and
• an income tax benefit of approximately $50 million as a result of the realization of certain tax creditsrelated to the Jobs Creation Act.
Our effective tax rate of approximately 20.9 percent for the year ended December 31, 2003, included thefollowing:
• an income tax benefit of approximately $50 million related to the reversal of previously accrued taxesresulting from the favorable resolution of various tax matters partially offset by additional taxes primarilyrelated to the repatriation of funds;
• the effective tax rate for the costs related to the streamlining initiatives of approximately 33 percent;
• the effective tax rate for the proceeds received related to the vitamin antitrust litigation matter ofapproximately 34 percent (refer to Note 17 of Notes to Consolidated Financial Statements); and
• the effective tax rate for the charge related to a Latin American equity method investee of approximately3 percent.
Based on current tax laws, the Company’s effective tax rate in 2006 is expected to be approximately24 percent before considering the effect of any unusual or special items that may affect our tax rate in futureyears.
Liquidity, Capital Resources and Financial Position
We believe our ability to generate cash from operating activities is one of our fundamental financialstrengths. We expect cash flows from operating activities to be strong in 2006 and in future years. For thefive-year period from 2006 through 2010, we currently estimate that cumulative net cash provided by operatingactivities will be at least $30 billion. Accordingly, our Company expects to meet all of our financial commitmentsand operating needs during this time frame. We expect to use cash generated from operating activities primarilyfor dividends, share repurchases, acquisitions and aggregate contractual obligations.
53

Cash Flows from Operating Activities
Net cash provided by operating activities for the years ended December 31, 2005, 2004 and 2003 wasapproximately $6.4 billion, $6.0 billion and $5.5 billion, respectively.
Cash flows from operating activities increased by 8 percent for 2005 compared to 2004. The increase wasprimarily related to an increase in cash receipts from customers, which was driven by a 6 percent growth in netoperating revenues. These higher cash collections were offset by increased payments to suppliers and vendors,including payments related to our increased marketing spending. Our cash flows from operating activities in2005 also improved versus 2004 as a result of a $137 million reduction in payments related to our 2003streamlining initiatives. Refer to Note 18 of Notes to Consolidated Financial Statements. Cash flows fromoperating activities in the current year were unfavorably impacted by a $176 million increase in income taxpayments primarily related to payment of a portion of the tax provision associated with the repatriation ofpreviously unremitted foreign earnings under the Jobs Creation Act.
Cash flows from operating activities increased by 9 percent for 2004 compared to 2003. The increase wasprimarily related to an increase in cash receipts from customers, which was driven by a 4 percent growth in netoperating revenues. Our cash flows from operating activities in 2004 also improved versus 2003 due to a$62 million reduction in payments related to our 2003 streamlining initiatives. Refer to Note 18 of Notes toConsolidated Financial Statements. Cash flows from operating activities in 2004 were unfavorably impacted by a$175 million increase in income tax payments.
Cash Flows from Investing Activities
Our cash flows used in investing activities are summarized as follows (in millions):
Year Ended December 31, 2005 2004 2003
Cash flows (used in) provided by investing activities:Acquisitions and investments, principally trademarks and
bottling companies $ (637) $ (267) $ (359)Purchases of investments and other assets (53) (46) (177)Proceeds from disposals of investments and other assets 33 161 147Purchases of property, plant and equipment (899) (755) (812)Proceeds from disposals of property, plant and equipment 88 341 87Other investing activities (28) 63 178
Net cash used in investing activities $ (1,496) $ (503) $ (936)
Purchases of property, plant and equipment accounted for the most significant cash outlays for investingactivities in each of the three years ended December 31, 2005. Our Company currently estimates that purchasesof property, plant and equipment in 2006 will be approximately $1.3 billion.
Total capital expenditures for property, plant and equipment (including our investments in informationtechnology) and the percentage of such totals by operating segment for 2005, 2004 and 2003 were as follows:
Year Ended December 31, 2005 2004 2003
Capital expenditures (in millions) $ 899 $ 755 $ 812
North America 29.5% 32.7% 38.1%Africa 4.5 3.7 1.6East, South Asia and Pacific Rim 5.0 5.4 11.2European Union 24.1 29.8 23.2Latin America 6.3 5.0 4.3North Asia, Eurasia and Middle East 14.0 7.9 8.2Corporate 16.6 15.5 13.4
54

Acquisitions and investments represented the next most significant investing activity, accounting for$637 million in 2005, $267 million in 2004 and $359 million in 2003.
On April 20, 2005, our Company and Coca-Cola HBC jointly acquired Multon for a total purchase price ofapproximately $501 million, split equally between the Company and Coca-Cola HBC. During the third quarterof 2005, our Company acquired the German soft drink bottling company Bremer for approximately $160 millionfrom InBev SA. Also in 2005, the Company acquired Sucos Mais, a Brazilian juice company, and completed theacquisition of the remaining 49 percent interest in the business of CCDA Waters L.L.C. (‘‘CCDA’’) notpreviously owned by our Company. Refer to Note 19 of Notes to Consolidated Financial Statements.
In 2004, proceeds from disposals of property, plant and equipment of approximately $341 million relatedprimarily to the sale of production assets in Japan. Refer to Note 2 of Notes to Consolidated FinancialStatements. In 2004, cash payments for acquisitions and investments were primarily related to the purchase oftrademarks in Latin America.
In 2003, our single largest acquisition requiring the use of cash was the purchase of a 100 percent ownershipinterest in Truesdale Packaging Company LLC (‘‘Truesdale’’) from our equity method investee CCE forapproximately $58 million. Truesdale owns a noncarbonated beverage production facility. In 2003, acquisitionsof intangible assets totaled approximately $142 million. Of this amount, approximately $88 million was related tothe Company’s acquisition of certain intangible assets with indefinite lives, primarily trademarks and brands invarious parts of the world. None of these trademarks and brands were considered individually significant.Additionally, the Company acquired certain indefinite-lived brands and related definite-lived contractual rights,with an estimated useful life of 10 years, from Panamco valued at $54 million in the Latin America operatingsegment.
In July 2003, we made a convertible loan of approximately $133 million to The Coca-Cola BottlingCompany of Egypt (‘‘TCCBCE’’) which is included in the line item purchases of investments and other assets inour consolidated statement of cash flows. The loan is convertible into preferred shares of TCCBCE upon receiptof governmental approvals. Additionally, upon certain defaults under either the loan agreement or the terms ofthe preferred shares, we have the ability to convert the loan or the preferred shares into common shares. AtDecember 31, 2003, our Company owned approximately 42 percent of the common shares of TCCBCE. TheCompany consolidated TCCBCE under Interpretation 46(R) effective April 2, 2004. Refer to Note 1 and Note 2of Notes to Consolidated Financial Statements.
In November 2003, Coca-Cola HBC approved a share capital reduction totaling approximately 473 millioneuros and the return of 2 euros per share to all shareowners. In December 2003, our Company received ourshare capital return payment from Coca-Cola HBC equivalent to $136 million which is included in the line itemother investing activities in our consolidated statement of cash flows. Refer to Note 2 of Notes to ConsolidatedFinancial Statements.
Cash Flows from Financing Activities
Our cash flows used in financing activities were as follows (in millions):
Year Ended December 31, 2005 2004 2003
Cash flows provided by (used in) financing activities:Issuances of debt $ 178 $ 3,030 $ 1,026Payments of debt (2,460) (1,316) (1,119)Issuances of stock 230 193 98Purchases of stock for treasury (2,055) (1,739) (1,440)Dividends (2,678) (2,429) (2,166)
Net cash used in financing activities $ (6,785) $ (2,261) $ (3,601)
55

Debt Financing
Our Company maintains debt levels we consider prudent based on our cash flow, interest coverage ratioand percentage of debt to capital. We use debt financing to lower our overall cost of capital, which increases ourreturn on shareowners’ equity.
As of December 31, 2005, our long-term debt was rated ‘‘A+’’ by Standard & Poor’s and ‘‘Aa3’’ by Moody’s,and our commercial paper program was rated ‘‘A-1’’ and ‘‘P-1’’ by Standard & Poor’s and Moody’s, respectively.In assessing our credit strength, both Standard & Poor’s and Moody’s consider our capital structure andfinancial policies as well as the aggregated balance sheet and other financial information for the Company andcertain bottlers, including CCE and Coca-Cola HBC. While the Company has no legal obligation for the debt ofthese bottlers, the rating agencies believe the strategic importance of the bottlers to the Company’s businessmodel provides the Company with an incentive to keep these bottlers viable. If our credit ratings were reducedby the rating agencies, our interest expense could increase. Additionally, if certain bottlers’ credit ratings were todecline, the Company’s share of equity income could be reduced as a result of the potential increase in interestexpense for these bottlers.
We monitor our interest coverage ratio and, as indicated above, the rating agencies consider our ratio inassessing our credit ratings. However, the rating agencies aggregate financial data for certain bottlers along withour Company when assessing our debt rating. As such, the key measure to rating agencies is the aggregateinterest coverage ratio of the Company and certain bottlers. Both Standard & Poor’s and Moody’s employdifferent aggregation methodologies and have different thresholds for the aggregate interest coverage ratio.These thresholds are not necessarily permanent, nor are they fully disclosed to our Company.
Our global presence and strong capital position give us access to key financial markets around the world,enabling us to raise funds at a low effective cost. This posture, coupled with active management of our mix ofshort-term and long-term debt and our mix of fixed-rate and variable-rate debt, results in a lower overall cost ofborrowing. Our debt management policies, in conjunction with our share repurchase programs and investmentactivity, can result in current liabilities exceeding current assets.
Issuances and payments of debt included both short-term and long-term financing activities. OnDecember 31, 2005, we had $1,794 million in lines of credit and other short-term credit facilities available, ofwhich approximately $266 million was outstanding. This entire $266 million related to our internationaloperations.
The issuances of debt in 2005 primarily included approximately $144 million of issuances of commercialpaper with maturities of 90 days or more. The payments of debt primarily included approximately $1,037 millionrelated to net repayments of commercial paper with maturities of less than 90 days, repayments of commercialpaper with maturities greater than 90 days of approximately $32 million and repayment of approximately$1,363 million of long-term debt.
The issuances of debt in 2004 primarily included approximately $2,109 million of net issuances ofcommercial paper with maturities of 90 days or less, and approximately $818 million of issuances of commercialpaper with maturities of more than 90 days. The payments of debt in 2004 primarily included approximately$927 million related to commercial paper with maturities of more than 90 days and $367 million of long-termdebt.
The issuances of debt in 2003 primarily included approximately $304 million of net issuances of commercialpaper with maturities of 90 days or less, and approximately $715 million of issuances of commercial paper withmaturities of more than 90 days. The payments of debt in 2003 primarily included approximately $907 millionrelated to commercial paper with maturities of more than 90 days and $150 million of long-term debt.
56

Share Repurchases
In October 1996, our Board of Directors authorized the 1996 Plan to repurchase up to 206 million shares ofour Company’s common stock through 2006. The table below presents shares repurchased and average price pershare under the 1996 Plan:
Year Ended December 31, 2005 2004 2003
Number of shares repurchased (in millions) 46 38 33Average price per share $ 43.26 $ 46.33 $ 44.33
Since the inception of our initial share repurchase program in 1984 through our current program as ofDecember 31, 2005, we have purchased more than 1.1 billion shares of our Company’s common stock at anaverage price per share of $16.24. This represents approximately 36 percent of the shares outstanding as ofJanuary 1, 1984.
During 2005, 2004 and 2003, the Company repurchased common stock under the 1996 Plan. As strong cashflows are expected to continue in the future, the Company currently expects 2006 share repurchases to be in therange of $2.0 billion to $2.5 billion.
Dividends
At its February 2006 meeting, our Board of Directors increased our quarterly dividend by 11 percent,raising it to $0.31 per share, equivalent to a full-year dividend of $1.24 per share in 2006. This is our 44th
consecutive annual increase. Our annual common stock dividend was $1.12 per share, $1.00 per share and $0.88per share in 2005, 2004 and 2003, respectively. The 2005 dividend represented a 12 percent increase from 2004,and the 2004 dividend represented a 14 percent increase from 2003.
Off-Balance Sheet Arrangements and Aggregate Contractual Obligations
Off-Balance Sheet Arrangements
In accordance with the definition under SEC rules, the following qualify as off-balance sheet arrangements:
• any obligation under certain guarantee contracts;
• a retained or contingent interest in assets transferred to an unconsolidated entity or similar arrangementthat serves as credit, liquidity or market risk support to that entity for such assets;
• any obligation under certain derivative instruments; and
• any obligation arising out of a material variable interest held by the registrant in an unconsolidated entitythat provides financing, liquidity, market risk or credit risk support to the registrant, or engages inleasing, hedging or research and development services with the registrant.
The following discusses certain obligations and arrangements involving our Company.
On December 31, 2005, our Company was contingently liable for guarantees of indebtedness owed by thirdparties in the amount of approximately $248 million. Management concluded that the likelihood of any materialamounts being paid by our Company is not probable. As of December 31, 2005, we were not directly liable forthe debt of any unconsolidated entity, and we did not have any retained or contingent interest in assets asdefined above.
Our Company recognizes all derivative instruments as either assets or liabilities at fair value in ourconsolidated balance sheets. Refer to Note 11 and Note 12 of Notes to Consolidated Financial Statements.
In December 2003, we granted a $250 million standby line of credit to Coca-Cola FEMSA with normalmarket terms. As of December 31, 2005, no amounts have been drawn against this line of credit. This standbyline of credit expires in December 2006.
57

Aggregate Contractual Obligations
As of December 31, 2005, the Company’s contractual obligations, including payments due by period, wereas follows (in millions):
Payments Due by Period2011 and
Total 2006 2007-2008 2009-2010 Thereafter
Short-term loans and notes payable1:Commercial paper borrowings $ 3,311 $ 3,311 $ — $ — $ —Lines of credit and other short-term
borrowings 266 266 — — —Current maturities of long-term debt2 28 28 — — —Long-term debt, net of current maturities2 1,154 — 99 418 637Estimated interest payments3 1,033 70 135 130 698Marketing and other commitments4 4,022 1,437 870 611 1,104Purchase commitments5 6,173 2,620 930 548 2,075Liability to CCEAG shareowners6 1,022 1,022 — — —Other contractual obligations7 448 144 145 83 76
Total contractual obligations $ 17,457 $ 8,898 $ 2,179 $ 1,790 $ 4,590
1 Refer to Note 7 of Notes to Consolidated Financial Statements for information regarding short-termloans and notes payable. Upon payment of commercial paper borrowings, we typically issue newcommercial paper borrowings. Lines of credit and other short-term borrowings are expected tofluctuate depending upon current liquidity needs, especially at international subsidiaries.
2 Refer to Note 8 of Notes to Consolidated Financial Statements for information regarding long-termdebt. We will consider several alternatives to settle this long-term debt, including the use of cash flowsfrom operating activities, issuance of commercial paper or issuance of other long-term debt.
3 We calculated estimated interest payments for long-term debt as follows: for fixed-rate debt and termdebt, we calculated interest based on the applicable rates and payment dates; for variable-rate debtand/or non-term debt, we estimated interest rates and payment dates based on our determination ofthe most likely scenarios for each relevant debt instrument. We typically expect to settle such interestpayments with cash flows from operating activities and/or short-term borrowings.
4 We expect to fund these marketing and other commitments with cash flows from operating activities.We have excluded expected payments for marketing programs that are generally determined andcommitted to on an annual basis.
5 The purchase commitments include agreements to purchase goods or services that are enforceableand legally binding and that specify all significant terms, including open purchase orders. We expectto fund these commitments with cash flows from operating activities.
6 The amount represents the estimated cash to be paid to CCEAG shareowners. Refer to Note 7 ofNotes to Consolidated Financial Statements for a discussion of the present value of our liability toCCEAG shareowners. We will consider several alternatives to settle this liability, including the use ofcash flows from operating activities, issuance of commercial paper or issuance of other long-termdebt.
7 Other contractual obligations consist primarily of future minimum lease payments under our non-cancelable leasing arrangements, with an initial term in excess of one year.
In accordance with SFAS No. 87, ‘‘Employers’ Accounting for Pensions,’’ and SFAS No. 106, ‘‘Employers’Accounting for Postretirement Benefits Other Than Pensions,’’ the total accrued benefit liability for pension andother postretirement benefit plans recognized as of December 31, 2005, was $1,221 million. Refer to Note 15 ofNotes to Consolidated Financial Statements. This accrued liability is included in the consolidated balance sheetline item other liabilities. This amount is impacted by, among other items, funding levels, changes in plan
58

demographics and assumptions, and investment return on plan assets. Because the accrued liability does notrepresent expected liquidity needs, we did not include this amount in the contractual obligations table.
We fund our U.S. qualified pension plans in accordance with Employee Retirement Income Security Act of1974 regulations for the minimum annual required contribution and in accordance with Internal RevenueService regulations for the maximum annual allowable tax deduction. The minimum required contribution forour primary qualified U.S. pension plan for the 2006 plan year is $0 and is anticipated to remain $0 for at leastthe next several years due to contributions made to the plan between 2001 and 2005. Therefore, we did notinclude any amounts as a contractual obligation in the above table. We do, however, anticipate contributing upto the maximum deductible amount to the primary U.S. qualified pension plan in 2006, which is estimated to beapproximately $60 million. Furthermore, we expect to contribute up to $9 million to the U.S. postretirementhealth care benefit plan during 2006. We generally expect to fund all future contributions with cash flows fromoperating activities.
Our international pension plans are funded in accordance with local laws and income tax regulations. Wedo not expect contributions to these plans to be material in 2006 or thereafter. Therefore, no amounts have beenincluded in the table above.
As of December 31, 2005, the projected benefit obligation of the U.S. qualified pension plans was$1,626 million, and the fair value of plan assets was $1,881 million. As of December 31, 2005, the projectedbenefit obligation of all pension plans other than the U.S. qualified pension plans was $1,415 million, and thefair value of all other pension plan assets was $756 million. The majority of this underfunding is attributable toan international pension plan for certain non-U.S. employees that is unfunded due to tax law restrictions, as wellas our unfunded U.S. nonqualified pension plans. These U.S. nonqualified pension plans provide, for certainassociates, benefits that are not permitted to be funded through a qualified plan because of limits imposed bythe Internal Revenue Code of 1986. Disclosure of amounts in the above table regarding expected benefitpayments for our unfunded pension plans and our other postretirement benefit plans cannot be properlyreflected for 2011 and thereafter due to the ongoing nature of the obligations of these plans. However, in orderto inform the reader about expected benefit payments for these unfunded plans over the next several years, weanticipate annual benefit payments to be in the range of approximately $50 million to $60 million in 2006 andremain at or near this annual level for the next several years.
Deferred income tax liabilities as of December 31, 2005, were $511 million. Refer to Note 16 of Notes toConsolidated Financial Statements. This amount is not included in the total contractual obligations tablebecause we believe this presentation would not be meaningful. Deferred income tax liabilities are calculatedbased on temporary differences between the tax basis of assets and liabilities and their book basis, which willresult in taxable amounts in future years when the book basis is settled. The results of these calculations do nothave a direct connection with the amount of cash taxes to be paid in any future periods. As a result, schedulingdeferred income tax liabilities as payments due by period could be misleading, because this scheduling would notrelate to liquidity needs.
Minority interests of $151 million as of December 31, 2005, for consolidated entities in which we do nothave a 100 percent ownership interest were recorded in the consolidated balance sheet line item other liabilities.Such minority interests are not liabilities requiring the use of cash or other resources; therefore, this amount isexcluded from the contractual obligations table.
Foreign Exchange
Our international operations are subject to opportunities and risks relating to foreign currency fluctuations.We closely monitor our operations in each country and seek to adopt appropriate strategies that are responsiveto fluctuations in foreign currency exchange rates.
59

We use 46 functional currencies. Due to our global operations, weaknesses in some of these currenciesmight be offset by strengths in others. In 2005, 2004 and 2003, the weighted-average exchange rates for foreigncurrencies in which the Company conducted operations (all operating currencies), and for certain individualcurrencies, strengthened (weakened) against the U.S. dollar as follows:
Year Ended December 31, 2005 2004 2003
All operating currencies 2 % 6 % 8 %
Brazilian real 21 % 5 % (11)%Mexican peso 4 % (5)% (11)%Australian dollar 3 % 13 % 20 %Euro 1 % 9 % 21 %South African rand 1 % 18 % 41 %British pound 0 % 12 % 8 %Japanese yen (1)% 7 % 8 %
These percentages do not include the effects of our hedging activities and, therefore, do not reflect theactual impact of fluctuations in exchange rates on our operating results. Our foreign currency managementprogram is designed to mitigate, over time, a portion of the impact of exchange rates on net income and earningsper share. The total currency impact on operating income, including the effect of our hedging activities, was anincrease of approximately 4 percent, 8 percent and 2 percent in 2005, 2004 and 2003, respectively. In 2006, theCompany expects a negative impact on operating income from currencies.
Exchange losses—net amounted to approximately $23 million in 2005, $39 million in 2004 and $76 millionin 2003 and were recorded in other loss—net in our consolidated statements of income. Exchange losses—netinclude the remeasurement of monetary assets and liabilities from certain currencies into functional currenciesand the costs of hedging certain exposures of our consolidated balance sheets. Refer to Note 11 of Notes toConsolidated Financial Statements.
The Company will continue to manage its foreign currency exposure to mitigate, over time, a portion of theimpact of exchange rate changes on net income and earnings per share.
Overview of Financial Position
Our consolidated balance sheet as of December 31, 2005, compared to our consolidated balance sheet as ofDecember 31, 2004, was impacted by the following:
• The decrease in loans and notes payable of $13 million was primarily due to the decrease of commercialpaper borrowings during 2005 of $924 million and was offset by the reclassification of the payment to bemade to CCEAG shareholders from other liabilities to loans and notes payable. Refer to Note 7 of Notesto Consolidated Financial Statements.
• The increase in our equity method investments in 2005 of $665 million was primarily due to the paymentof approximately $250 million for our share of the joint acquisition of Multon. The increase also includesthe impact of the strength in most key currencies versus the U.S. dollar and equity income, net ofdividends. Refer to Note 2 of Notes to Consolidated Financial Statements.
• The overall decrease in total assets of $2,014 million as of December 31, 2005, compared toDecember 31, 2004, was primarily related to the decrease in cash and cash equivalents, which impactedthe Corporate operating segment. The decrease was also due to impairment charges primarily fortrademarks amounting to approximately $85 million. The decrease was partially offset by the impact ofthe strength in most key currencies versus the U.S. dollar, especially a stronger Brazilian real andMexican peso (which impacted the Latin America operating segment) and a stronger euro (which
60

impacted the European Union operating segment). Refer to the heading ‘‘Operations Review—OtherOperating Charges’’ for a discussion of the impairment charges.
Impact of Inflation and Changing Prices
Inflation affects the way we operate in many markets around the world. In general, we believe that, overtime, we are able to increase prices to counteract the majority of the inflationary effects of increasing costs andto generate sufficient cash flows to maintain our productive capability.
Additional Information
In the first quarter of 2006, the Company made certain changes to its operating structure primarily toestablish a new, separate internal organization for its consolidated bottling operations and its unconsolidatedbottling investments. This new structure will result in the reporting of a separate operating segment, along withthe six existing geographic operating segments and Corporate, beginning with the first quarter of 2006.
For additional information concerning our operating segments as of December 31, 2005, refer to Note 20 ofNotes to Consolidated Financial Statements.
61

ITEM 7A. QUANTITATIVE AND QUALITATIVE DISCLOSURES ABOUT MARKET RISK
Our Company uses derivative financial instruments primarily to reduce our exposure to adverse fluctuationsin foreign currency exchange rates and, to a lesser extent, adverse fluctuations in interest rates and commodityprices and other market risks. We do not enter into derivative financial instruments for trading purposes. As amatter of policy, all our derivative positions are used to reduce risk by hedging an underlying economicexposure. Because of the high correlation between the hedging instrument and the underlying exposure,fluctuations in the value of the instruments are generally offset by reciprocal changes in the value of theunderlying exposure. Virtually all of our derivatives are straightforward, over-the-counter instruments withliquid markets.
Foreign Exchange
We manage most of our foreign currency exposures on a consolidated basis, which allows us to net certainexposures and take advantage of any natural offsets. In 2005, we generated approximately 71 percent of our netoperating revenues from operations outside of our North America operating group; therefore, weakness in oneparticular currency might be offset by strengths in others over time. We use derivative financial instruments tofurther reduce our net exposure to currency fluctuations.
Our Company enters into forward exchange contracts and purchases currency options (principally euro andJapanese yen) and collars to hedge certain portions of forecasted cash flows denominated in foreign currencies.Additionally, we enter into forward exchange contracts to offset the earnings impact relating to exchange ratefluctuations on certain monetary assets and liabilities. We also enter into forward exchange contracts as hedgesof net investments in international operations.
Interest Rates
We monitor our mix of fixed-rate and variable-rate debt, as well as our mix of term debt versus non-termdebt. From time to time we enter into interest rate swap agreements to manage our mix of fixed-rate andvariable-rate debt.
Value-at-Risk
We monitor our exposure to financial market risks using several objective measurement systems, includingvalue-at-risk models. Our value-at-risk calculations use a historical simulation model to estimate potential futurelosses in the fair value of our derivatives and other financial instruments that could occur as a result of adversemovements in foreign currency and interest rates. We have not considered the potential impact of favorablemovements in foreign currency and interest rates on our calculations. We examined historical weekly returnsover the previous 10 years to calculate our value-at-risk. The average value-at-risk represents the simple averageof quarterly amounts over the past year. As a result of our foreign currency value-at-risk calculations, weestimate with 95 percent confidence that the fair values of our foreign currency derivatives and other financialinstruments, over a one-week period, would decline by less than $9 million, $17 million and $26 million,respectively, using 2005, 2004 or 2003 average fair values, and by less than $9 million and $18 million,respectively, using December 31, 2005 and 2004 fair values. According to our interest rate value-at-riskcalculations, we estimate with 95 percent confidence that any increase in our net interest expense due to anadverse move in our 2005 average or in our December 31, 2005, interest rates over a one-week period would nothave a material impact on our consolidated financial statements. Our December 31, 2004 and 2003 estimatesalso were not material to our consolidated financial statements.
62

ITEM 8. FINANCIAL STATEMENTS AND SUPPLEMENTARY DATA
TABLE OF CONTENTS
Page
Consolidated Statements of Income . . . . . . . . . . . . . . . . . . . . . . . . . . . . . . . . . . . . . . . . . . . . . . . . . . . . 64
Consolidated Balance Sheets . . . . . . . . . . . . . . . . . . . . . . . . . . . . . . . . . . . . . . . . . . . . . . . . . . . . . . . . . . 65
Consolidated Statements of Cash Flows . . . . . . . . . . . . . . . . . . . . . . . . . . . . . . . . . . . . . . . . . . . . . . . . . 66
Consolidated Statements of Shareowners’ Equity . . . . . . . . . . . . . . . . . . . . . . . . . . . . . . . . . . . . . . . . . . 67
Notes to Consolidated Financial Statements . . . . . . . . . . . . . . . . . . . . . . . . . . . . . . . . . . . . . . . . . . . . . . 68
Report of Management on Internal Control Over Financial Reporting . . . . . . . . . . . . . . . . . . . . . . . . . . 117
Report of Independent Registered Public Accounting Firm . . . . . . . . . . . . . . . . . . . . . . . . . . . . . . . . . . 118
Report of Independent Registered Public Accounting Firm on Internal Control Over FinancialReporting . . . . . . . . . . . . . . . . . . . . . . . . . . . . . . . . . . . . . . . . . . . . . . . . . . . . . . . . . . . . . . . . . . . . . . 119
Quarterly Data (Unaudited) . . . . . . . . . . . . . . . . . . . . . . . . . . . . . . . . . . . . . . . . . . . . . . . . . . . . . . . . . . 120
Glossary . . . . . . . . . . . . . . . . . . . . . . . . . . . . . . . . . . . . . . . . . . . . . . . . . . . . . . . . . . . . . . . . . . . . . . . . . 122
63

THE COCA-COLA COMPANY AND SUBSIDIARIES
CONSOLIDATED STATEMENTS OF INCOME
Year Ended December 31, 2005 2004 2003(In millions except per share data)
NET OPERATING REVENUES $ 23,104 $ 21,742 $ 20,857Cost of goods sold 8,195 7,674 7,776
GROSS PROFIT 14,909 14,068 13,081Selling, general and administrative expenses 8,739 7,890 7,287Other operating charges 85 480 573
OPERATING INCOME 6,085 5,698 5,221Interest income 235 157 176Interest expense 240 196 178Equity income — net 680 621 406Other loss — net (93) (82) (138)Gains on issuances of stock by equity investees 23 24 8
INCOME BEFORE INCOME TAXES 6,690 6,222 5,495Income taxes 1,818 1,375 1,148
NET INCOME $ 4,872 $ 4,847 $ 4,347
BASIC NET INCOME PER SHARE $ 2.04 $ 2.00 $ 1.77
DILUTED NET INCOME PER SHARE $ 2.04 $ 2.00 $ 1.77
AVERAGE SHARES OUTSTANDING 2,392 2,426 2,459Effect of dilutive securities 1 3 3
AVERAGE SHARES OUTSTANDING ASSUMING DILUTION 2,393 2,429 2,462
Refer to Notes to Consolidated Financial Statements.
64

THE COCA-COLA COMPANY AND SUBSIDIARIES
CONSOLIDATED BALANCE SHEETS
December 31, 2005 2004(In millions except par value)
ASSETSCURRENT ASSETS
Cash and cash equivalents $ 4,701 $ 6,707Marketable securities 66 61Trade accounts receivable, less allowances of $72 and $69, respectively 2,281 2,244Inventories 1,424 1,420Prepaid expenses and other assets 1,778 1,849
TOTAL CURRENT ASSETS 10,250 12,281
INVESTMENTSEquity method investments:
Coca-Cola Enterprises Inc. 1,731 1,569Coca-Cola Hellenic Bottling Company S.A. 1,039 1,067Coca-Cola FEMSA, S.A. de C.V. 982 792Coca-Cola Amatil Limited 748 736Other, principally bottling companies 2,062 1,733
Cost method investments, principally bottling companies 360 355
TOTAL INVESTMENTS 6,922 6,252
OTHER ASSETS 2,648 2,981PROPERTY, PLANT AND EQUIPMENT — net 5,786 6,091TRADEMARKS WITH INDEFINITE LIVES 1,946 2,037GOODWILL 1,047 1,097OTHER INTANGIBLE ASSETS 828 702
TOTAL ASSETS $ 29,427 $ 31,441
LIABILITIES AND SHAREOWNERS’ EQUITYCURRENT LIABILITIES
Accounts payable and accrued expenses $ 4,493 $ 4,403Loans and notes payable 4,518 4,531Current maturities of long-term debt 28 1,490Accrued income taxes 797 709
TOTAL CURRENT LIABILITIES 9,836 11,133
LONG-TERM DEBT 1,154 1,157OTHER LIABILITIES 1,730 2,814DEFERRED INCOME TAXES 352 402SHAREOWNERS’ EQUITY
Common stock, $0.25 par value; Authorized — 5,600 shares;Issued — 3,507 and 3,500 shares, respectively 877 875
Capital surplus 5,492 4,928Reinvested earnings 31,299 29,105Accumulated other comprehensive income (loss) (1,669) (1,348)Treasury stock, at cost — 1,138 and 1,091 shares, respectively (19,644) (17,625)
TOTAL SHAREOWNERS’ EQUITY 16,355 15,935
TOTAL LIABILITIES AND SHAREOWNERS’ EQUITY $ 29,427 $ 31,441
Refer to Notes to Consolidated Financial Statements.
65

THE COCA-COLA COMPANY AND SUBSIDIARIES
CONSOLIDATED STATEMENTS OF CASH FLOWS
Year Ended December 31, 2005 2004 2003(In millions)
OPERATING ACTIVITIESNet income $ 4,872 $ 4,847 $ 4,347Depreciation and amortization 932 893 850Stock-based compensation expense 324 345 422Deferred income taxes (88) 162 (188)Equity income or loss, net of dividends (446) (476) (294)Foreign currency adjustments 47 (59) (79)Gains on issuances of stock by equity investees (23) (24) (8)Gains on sales of assets, including bottling interests (9) (20) (5)Other operating charges 85 480 330Other items 299 437 249Net change in operating assets and liabilities 430 (617) (168)
Net cash provided by operating activities 6,423 5,968 5,456
INVESTING ACTIVITIESAcquisitions and investments, principally trademarks and bottling companies (637) (267) (359)Purchases of investments and other assets (53) (46) (177)Proceeds from disposals of investments and other assets 33 161 147Purchases of property, plant and equipment (899) (755) (812)Proceeds from disposals of property, plant and equipment 88 341 87Other investing activities (28) 63 178
Net cash used in investing activities (1,496) (503) (936)
FINANCING ACTIVITIESIssuances of debt 178 3,030 1,026Payments of debt (2,460) (1,316) (1,119)Issuances of stock 230 193 98Purchases of stock for treasury (2,055) (1,739) (1,440)Dividends (2,678) (2,429) (2,166)
Net cash used in financing activities (6,785) (2,261) (3,601)
EFFECT OF EXCHANGE RATE CHANGES ON CASH AND CASHEQUIVALENTS (148) 141 183
CASH AND CASH EQUIVALENTSNet increase (decrease) during the year (2,006) 3,345 1,102Balance at beginning of year 6,707 3,362 2,260
Balance at end of year $ 4,701 $ 6,707 $ 3,362
Refer to Notes to Consolidated Financial Statements.
66

THE COCA-COLA COMPANY AND SUBSIDIARIES
CONSOLIDATED STATEMENTS OF SHAREOWNERS’ EQUITY
Year Ended December 31, 2005 2004 2003(In millions except per share data)
NUMBER OF COMMON SHARES OUTSTANDINGBalance at beginning of year 2,409 2,442 2,471
Stock issued to employees exercising stock options 7 5 4Purchases of stock for treasury1 (47) (38) (33)
Balance at end of year 2,369 2,409 2,442
COMMON STOCKBalance at beginning of year $ 875 $ 874 $ 873
Stock issued to employees exercising stock options 2 1 1
Balance at end of year 877 875 874
CAPITAL SURPLUSBalance at beginning of year 4,928 4,395 3,857
Stock issued to employees exercising stock options 229 175 105Tax benefit from employees’ stock option and restricted stock plans 11 13 11Stock-based compensation 324 345 422
Balance at end of year 5,492 4,928 4,395
REINVESTED EARNINGSBalance at beginning of year 29,105 26,687 24,506
Net income 4,872 4,847 4,347Dividends (per share — $1.12, $1.00 and $0.88 in 2005, 2004 and 2003, respectively) (2,678) (2,429) (2,166)
Balance at end of year 31,299 29,105 26,687
ACCUMULATED OTHER COMPREHENSIVE INCOME (LOSS)Balance at beginning of year (1,348) (1,995) (3,047)
Net foreign currency translation adjustment (396) 665 921Net gain (loss) on derivatives 57 (3) (33)Net change in unrealized gain on available-for-sale securities 13 39 40Net change in minimum pension liability 5 (54) 124
Net other comprehensive income adjustments (321) 647 1,052
Balance at end of year (1,669) (1,348) (1,995)
TREASURY STOCKBalance at beginning of year (17,625) (15,871) (14,389)
Purchases of treasury stock (2,019) (1,754) (1,482)
Balance at end of year (19,644) (17,625) (15,871)
TOTAL SHAREOWNERS’ EQUITY $ 16,355 $ 15,935 $ 14,090
COMPREHENSIVE INCOMENet income $ 4,872 $ 4,847 $ 4,347Net other comprehensive income adjustments (321) 647 1,052
TOTAL COMPREHENSIVE INCOME $ 4,551 $ 5,494 $ 5,399
1 Common stock purchased from employees exercising stock options numbered 0.5 shares, 0.4 shares and 0.4 shares for the yearsended December 31, 2005, 2004 and 2003, respectively.
Refer to Notes to Consolidated Financial Statements.
67

THE COCA-COLA COMPANY AND SUBSIDIARIES
NOTES TO CONSOLIDATED FINANCIAL STATEMENTS
NOTE 1: BUSINESS AND SUMMARY OF SIGNIFICANT ACCOUNTING POLICIES
Description of Business
The Coca-Cola Company is predominantly a manufacturer, distributor and marketer of nonalcoholicbeverage concentrates and syrups. We also manufacture, distribute and market some finished beverages. Inthese notes, the terms ‘‘Company,’’ ‘‘we,’’ ‘‘us’’ or ‘‘our’’ mean The Coca-Cola Company and all subsidiariesincluded in the consolidated financial statements. Operating in more than 200 countries worldwide, we primarilysell our concentrates and syrups, as well as some finished beverages, to bottling and canning operations,distributors, fountain wholesalers and fountain retailers. We also market and distribute juice and juice drinks,sports drinks, water products, teas, coffees and other beverage products. Additionally, we have ownershipinterests in numerous bottling and canning operations. Significant markets for our products exist in all theworld’s geographic regions.
Basis of Presentation and Consolidation
Our consolidated financial statements are prepared in accordance with accounting principles generallyaccepted in the United States. Our Company consolidates all entities that we control by ownership of a majorityvoting interest as well as variable interest entities for which our Company is the primary beneficiary. Refer to theheading ‘‘Variable Interest Entities,’’ below, for a discussion of variable interest entities.
We use the equity method to account for our investments for which we have the ability to exercisesignificant influence over operating and financial policies. Consolidated net income includes our Company’sshare of the net income of these companies.
We use the cost method to account for our investments in companies that we do not control and for whichwe do not have the ability to exercise significant influence over operating and financial policies. In accordancewith the cost method, these investments are recorded at cost or fair value, as appropriate.
We eliminate from our financial results all significant intercompany transactions, including theintercompany transactions with variable interest entities and the intercompany portion of transactions withequity method investees.
Certain amounts in the prior years’ consolidated financial statements have been reclassified to conform tothe current-year presentation.
Variable Interest Entities
In December 2003, the Financial Accounting Standards Board (‘‘FASB’’) issued FASB InterpretationNo. 46 (revised December 2003), ‘‘Consolidation of Variable Interest Entities’’ (‘‘Interpretation 46(R)’’).Application of this interpretation was required in our consolidated financial statements for the year endedDecember 31, 2003, for interests in variable interest entities that were considered to be special-purpose entities.Our Company determined that we did not have any arrangements or relationships with special-purpose entities.Application of Interpretation 46(R) for all other types of variable interest entities was required for our Companyeffective April 2, 2004.
Interpretation 46(R) addresses the consolidation of business enterprises to which the usual condition(ownership of a majority voting interest) of consolidation does not apply. This interpretation focuses oncontrolling financial interests that may be achieved through arrangements that do not involve voting interests. Itconcludes that in the absence of clear control through voting interests, a company’s exposure (variable interest)to the economic risks and potential rewards from the variable interest entity’s assets and activities is the best
68

THE COCA-COLA COMPANY AND SUBSIDIARIES
NOTES TO CONSOLIDATED FINANCIAL STATEMENTS
NOTE 1: BUSINESS AND SUMMARY OF SIGNIFICANT ACCOUNTING POLICIES (Continued)
evidence of control. If an enterprise holds a majority of the variable interests of an entity, it would be consideredthe primary beneficiary. Upon consolidation, the primary beneficiary is generally required to include assets,liabilities and noncontrolling interests at fair value and subsequently account for the variable interest as if it wereconsolidated based on majority voting interest.
In our consolidated financial statements as of December 31, 2003, and prior to December 31, 2003, weconsolidated all entities that we controlled by ownership of a majority of voting interests. As a result ofInterpretation 46(R), effective as of April 2, 2004, our consolidated balance sheets include the assets andliabilities of:
• all entities in which the Company has ownership of a majority of voting interests; and, additionally,
• all variable interest entities for which we are the primary beneficiary.
Our Company holds interests in certain entities, primarily bottlers, previously accounted for under theequity method of accounting that are considered variable interest entities. These variable interests relate toprofit guarantees or subordinated financial support for these entities. Upon adoption of Interpretation 46(R) asof April 2, 2004, we consolidated assets of approximately $383 million and liabilities of approximately$383 million that were previously not recorded on our consolidated balance sheets. We did not record acumulative effect of an accounting change, and prior periods were not restated. The results of operations ofthese variable interest entities were included in our consolidated results beginning April 3, 2004, and did nothave a material impact for the year ended December 31, 2004. Our Company’s investment, plus any loans andguarantees, related to these variable interest entities totaled approximately $263 million and $313 million atDecember 31, 2005 and 2004, respectively, representing our maximum exposures to loss. Any creditors of thevariable interest entities do not have recourse against the general credit of the Company as a result of includingthese variable interest entities in our consolidated financial statements.
Use of Estimates and Assumptions
The preparation of our consolidated financial statements requires us to make estimates and assumptionsthat affect the reported amounts of assets, liabilities, revenues and expenses and the disclosure of contingentassets and liabilities in our consolidated financial statements and accompanying notes. Although these estimatesare based on our knowledge of current events and actions we may undertake in the future, actual results mayultimately differ from estimates and assumptions.
Risks and Uncertainties
Factors that could adversely impact the Company’s operations or financial results include, but are notlimited to, the following: obesity concerns; water scarcity and quality; changes in the nonalcoholic beveragesbusiness environment; increased competition; an inability to enter or expand in developing and emergingmarkets; fluctuations in foreign currency exchange and interest rates; the ability to maintain good relationshipswith our bottling partners; a deterioration in our bottling partners’ financial condition; strikes or work stoppages(including at key manufacturing locations); increased cost of energy; increased cost, disruption of supply orshortage of raw materials; changes in laws and regulations relating to our business, including those regardingbeverage containers and packaging; additional labeling or warning requirements; unfavorable economic andpolitical conditions in international markets; changes in commercial and market practices within the EuropeanEconomic Area; litigation or legal proceedings; adverse weather conditions; an inability to maintain brand imageand product issues such as product recalls; changes in the legal and regulatory environment in various countries
69

THE COCA-COLA COMPANY AND SUBSIDIARIES
NOTES TO CONSOLIDATED FINANCIAL STATEMENTS
NOTE 1: BUSINESS AND SUMMARY OF SIGNIFICANT ACCOUNTING POLICIES (Continued)
in which we operate; changes in accounting and taxation standards including an increase in tax rates; an inabilityto achieve our overall long-term goals; an inability to protect our information systems; future impairmentcharges; and global or regional catastrophic events.
Our Company monitors our operations with a view to minimizing the impact to our overall business thatcould arise as a result of the risks and uncertainties inherent in our business.
Revenue Recognition
Our Company recognizes revenue when persuasive evidence of an arrangement exists, delivery of productshas occurred, the sales price charged is fixed or determinable, and collectibility is reasonably assured. For ourCompany, this generally means that we recognize revenue when title to our products is transferred to ourbottling partners, resellers or other customers. In particular, title usually transfers upon shipment to or receipt atour customers’ locations, as determined by the specific sales terms of the transactions.
In addition, our customers can earn certain incentives, which are included in deductions from revenue, acomponent of net operating revenues in the consolidated statements of income. These incentives include, butare not limited to, cash discounts, funds for promotional and marketing activities, volume-based incentiveprograms and support for infrastructure programs (refer to the heading ‘‘Other Assets’’). The aggregatedeductions from revenue recorded by the Company in relation to these programs, including amortizationexpense on infrastructure initiatives, was approximately $3.7 billion, $3.6 billion and $3.6 billion for the yearsended December 31, 2005, 2004 and 2003, respectively.
Advertising Costs
Our Company expenses production costs of print, radio, television and other advertisements as of the firstdate the advertisements take place. Advertising costs included in selling, general and administrative expenseswere approximately $2.5 billion, $2.2 billion and $1.8 billion for the years ended December 31, 2005, 2004 and2003, respectively. As of December 31, 2005 and 2004, advertising and production costs of approximately$170 million and $171 million, respectively, were recorded in prepaid expenses and other assets and innoncurrent other assets in our consolidated balance sheets.
Stock-Based Compensation
Our Company currently sponsors stock option plans and restricted stock award plans. Effective January 1,2002, our Company adopted the preferable fair value recognition provisions of Statement of FinancialAccounting Standards (‘‘SFAS’’) No. 123, ‘‘Accounting for Stock-Based Compensation.’’ The fair values of thestock awards are determined using a single estimated expected life. The compensation expense is recognized ona straight-line basis over the vesting period. Refer to Note 14.
Issuances of Stock by Equity Method Investees
When one of our equity method investees issues additional shares to third parties, our percentageownership interest in the investee decreases. In the event the issuance price per share is higher or lower than ouraverage carrying amount per share, we recognize a noncash gain or loss on the issuance. This noncash gain orloss, net of any deferred taxes, is generally recognized in our net income in the period the change of ownershipinterest occurs.
70

THE COCA-COLA COMPANY AND SUBSIDIARIES
NOTES TO CONSOLIDATED FINANCIAL STATEMENTS
NOTE 1: BUSINESS AND SUMMARY OF SIGNIFICANT ACCOUNTING POLICIES (Continued)
If gains have been previously recognized on issuances of an equity method investee’s stock and shares of theequity method investee are subsequently repurchased by the equity method investee, gain recognition does notoccur on issuances subsequent to the date of a repurchase until shares have been issued in an amount equivalentto the number of repurchased shares. This type of transaction is reflected as an equity transaction, and the neteffect is reflected in our consolidated balance sheets. Refer to Note 3.
Income Taxes
Income tax expense includes United States, state, local and international income taxes, plus a provision forU.S. taxes on undistributed earnings of foreign subsidiaries not deemed to be indefinitely reinvested. Deferredtax assets and liabilities are recognized for the tax consequences of temporary differences between the financialreporting and the tax basis of existing assets and liabilities. The tax rate used to determine the deferred tax assetsand liabilities is the enacted tax rate for the year in which the differences are expected to reverse. Valuationallowances are recorded to reduce deferred tax assets to the amount that will more likely than not be realized.Refer to Note 16.
Net Income Per Share
Basic net income per share is computed by dividing net income by the weighted average number of commonshares outstanding during the reporting period. Diluted net income per share is computed similarly to basic netincome per share except that it includes the potential dilution that could occur if dilutive securities wereexercised. Approximately 180 million, 151 million and 145 million stock option awards were excluded from thecomputations of diluted net income per share in 2005, 2004 and 2003, respectively, because the awards wouldhave been antidilutive for the periods presented.
Cash Equivalents
We classify marketable securities that are highly liquid and have maturities of three months or less at thedate of purchase as cash equivalents. We manage our exposure to counterparty credit risk through specificminimum credit standards, diversification of counterparties and procedures to monitor our credit riskconcentrations.
Trade Accounts Receivable
We record trade accounts receivable at net realizable value. This value includes an appropriate allowancefor estimated uncollectible accounts to reflect any loss anticipated on the trade accounts receivable balances andcharged to the provision for doubtful accounts. We calculate this allowance based on our history of write-offs,level of past due-accounts based on the contractual terms of the receivables, and our relationships with andeconomic status of our bottling partners and customers.
A significant portion of our net revenues is derived from sales of our products in international markets.Refer to Note 20. We also generate a significant portion of our net revenues by selling concentrates and syrupsto bottlers in which we have a noncontrolling interest, including Coca-Cola Enterprises Inc. (‘‘CCE’’),Coca-Cola Hellenic Bottling Company S.A. (‘‘Coca-Cola HBC’’), Coca-Cola FEMSA, S.A. de C.V. (‘‘Coca-ColaFEMSA’’) and Coca-Cola Amatil Limited (‘‘Coca-Cola Amatil’’). Refer to Note 2.
71

THE COCA-COLA COMPANY AND SUBSIDIARIES
NOTES TO CONSOLIDATED FINANCIAL STATEMENTS
NOTE 1: BUSINESS AND SUMMARY OF SIGNIFICANT ACCOUNTING POLICIES (Continued)
Inventories
Inventories consist primarily of raw materials, supplies, concentrates and syrups and are valued at the lowerof cost or market. We determine cost on the basis of average cost or first-in, first-out methods.
Recoverability of Equity Method and Cost Method Investments
Management periodically assesses the recoverability of our Company’s equity method and cost methodinvestments. For publicly traded investments, readily available quoted market prices are an indication of the fairvalue of our Company’s investments. For nonpublicly traded investments, if an identified event or change incircumstances requires an impairment evaluation, management assesses fair value based on valuationmethodologies, including discounted cash flows, estimates of sales proceeds and external appraisals, asappropriate. We consider the assumptions that we believe hypothetical marketplace participants would use inevaluating estimated future cash flows when employing the discounted cash flows and estimates of salesproceeds valuation methodologies. If an investment is considered to be impaired and the decline in value isother than temporary, we record a write-down.
Other Assets
Our Company advances payments to certain customers for marketing to fund future activities intended togenerate profitable volume, and we expense such payments over the applicable period. Advance payments arealso made to certain customers for distribution rights. Additionally, our Company invests in infrastructureprograms with our bottlers that are directed at strengthening our bottling system and increasing unit casevolume. When facts and circumstances indicate that the carrying value of the assets may not be recoverable,management evaluates the recoverability of these assets by preparing estimates of sales volume, the resultinggross profit and cash flows. Costs of these programs are recorded in prepaid expenses and other assets andnoncurrent other assets and are being amortized over the remaining periods to be directly benefited, whichrange from 1 to 13 years. Amortization expense for infrastructure programs was approximately $134 million,$136 million and $153 million for the years ended December 31, 2005, 2004 and 2003, respectively. Refer toheading ‘‘Revenue Recognition,’’ above, and Note 2.
Property, Plant and Equipment
Property, plant and equipment are stated at cost. Repair and maintenance costs that do not improve servicepotential or extend economic life are expensed as incurred. Depreciation is recorded principally by thestraight-line method over the estimated useful lives of our assets, which generally have the following ranges:buildings and improvements: 40 years or less; machinery and equipment: 15 years or less; containers: 10 years orless. Land is not depreciated, and construction in progress is not depreciated until ready for service andcapitalized. Leasehold improvements are amortized using the straight-line method over the shorter of theremaining lease term or the estimated useful life of the improvement. Depreciation expense totaledapproximately $752 million, $715 million and $667 million for the years ended December 31, 2005, 2004 and2003, respectively. Amortization expense for leasehold improvements totaled approximately $17 million,$7 million and $7 million for the years ended December 31, 2005, 2004 and 2003, respectively. Refer to Note 4.
Management assesses the recoverability of the carrying amount of property, plant and equipment if certainevents or changes in circumstances indicate that the carrying value of such assets may not be recoverable, such asa significant decrease in market value of the assets or a significant change in the business conditions in aparticular market. If we determine that the carrying value of an asset is not recoverable based on expected
72

THE COCA-COLA COMPANY AND SUBSIDIARIES
NOTES TO CONSOLIDATED FINANCIAL STATEMENTS
NOTE 1: BUSINESS AND SUMMARY OF SIGNIFICANT ACCOUNTING POLICIES (Continued)
undiscounted future cash flows, excluding interest charges, we record an impairment loss equal to the excess ofthe carrying amount of the asset over its fair value.
Goodwill, Trademarks and Other Intangible Assets
In accordance with SFAS No. 142, ‘‘Goodwill and Other Intangible Assets,’’ we classify intangible assetsinto three categories: (1) intangible assets with definite lives subject to amortization; (2) intangible assets withindefinite lives not subject to amortization; and (3) goodwill. We do not amortize intangible assets withindefinite lives and goodwill. We test intangible assets with definite lives for impairment if conditions exist thatindicate the carrying value may not be recoverable. Such conditions may include an economic downturn in ageographic market or a change in the assessment of future operations. For intangible assets with indefinite livesand goodwill, we perform tests for impairment at least annually or more frequently if events or circumstancesindicate that assets might be impaired. Such tests for impairment are also required for intangible assets and/orgoodwill recorded by our equity method investees. All goodwill is assigned to reporting units, which are one levelbelow our operating segments. Goodwill is assigned to the reporting unit that benefits from the synergies arisingfrom each business combination. We perform our impairment tests of goodwill at our reporting unit level. Suchimpairment tests for goodwill include comparing the fair value of a reporting unit with its carrying value,including goodwill. We record an impairment charge if the carrying value of the asset exceeds its fair value. Fairvalues are derived using discounted cash flow analyses with a number of scenarios, where applicable, that areweighted based on the probability of different outcomes. When appropriate, we consider the assumptions thatwe believe hypothetical marketplace participants would use in estimating future cash flows. In addition, whereapplicable, an appropriate discount rate is used, based on the Company’s cost of capital rate or location-specificeconomic factors. In case the fair value is less than the carrying value of the assets, we record an impairmentcharge to reduce the carrying value of the assets to fair value. These impairment charges are generally recordedin the line item other operating charges or equity income—net in the consolidated statements of income.
Our Company determines the useful lives of our identifiable intangible assets after considering the specificfacts and circumstances related to each intangible asset. Factors we consider when determining useful livesinclude the contractual term of any agreement, the history of the asset, the Company’s long-term strategy for theuse of the asset, any laws or other local regulations which could impact the useful life of the asset and, othereconomic factors, including competition and specific market conditions. Intangible assets that are deemed tohave definite lives are amortized, generally on a straight-line basis, over their useful lives, ranging from 1 to48 years. Refer to Note 5.
Derivative Financial Instruments
Our Company accounts for derivative financial instruments in accordance with SFAS No. 133, ‘‘Accountingfor Derivative Instruments and Hedging Activities,’’ as amended by SFAS No. 137, ‘‘Accounting for DerivativeInstruments and Hedging Activities—Deferral of the Effective Date of FASB Statement No. 133—anamendment of FASB Statement No. 133,’’ SFAS No. 138, ‘‘Accounting for Certain Derivative Instruments andCertain Hedging Activities—an amendment of FASB Statement No. 133,’’ and SFAS No. 149, ‘‘Amendment ofStatement 133 on Derivative Instruments and Hedging Activities.’’ We recognize all derivative instruments aseither assets or liabilities at fair value in our consolidated balance sheets, with fair values of foreign currencyderivatives estimated based on quoted market prices or pricing models using current market rates. Refer toNote 11.
73

THE COCA-COLA COMPANY AND SUBSIDIARIES
NOTES TO CONSOLIDATED FINANCIAL STATEMENTS
NOTE 1: BUSINESS AND SUMMARY OF SIGNIFICANT ACCOUNTING POLICIES (Continued)
Retirement-Related Benefits
Using appropriate actuarial methods and assumptions, our Company accounts for defined benefit pensionplans in accordance with SFAS No. 87, ‘‘Employers’ Accounting for Pensions.’’ We account for our nonpensionpostretirement benefits in accordance with SFAS No. 106, ‘‘Employers’ Accounting for Postretirement BenefitsOther Than Pensions.’’ In 2003, we adopted SFAS No. 132 (revised 2003), ‘‘Employers’ Disclosures aboutPensions and Other Postretirement Benefits,’’ (‘‘SFAS No. 132(R)’’) for all U.S. plans. As permitted by thisstandard, in 2004, we adopted the disclosure provisions for all foreign plans. SFAS No. 132(R) requiresadditional disclosures about the assets, obligations, cash flows and net periodic benefit cost of defined benefitpension plans and other defined benefit postretirement plans. This statement did not change the measurementor recognition of those plans required by SFAS No. 87, SFAS No. 88, ‘‘Employers’ Accounting for Settlementsand Curtailments of Defined Benefit Pension Plans and for Termination Benefits,’’ or SFAS No. 106. Refer toNote 15 for a description of how we determine our principal assumptions for pension and postretirement benefitaccounting.
Contingencies
Our Company is involved in various legal proceedings and tax matters. Due to their nature, such legalproceedings and tax matters involve inherent uncertainties including, but not limited to, court rulings,negotiations between affected parties and governmental actions. Management assesses the probability of loss forsuch contingencies and accrues a liability and/or discloses the relevant circumstances, as appropriate. Refer toNote 12.
Business Combinations
In accordance with SFAS No. 141, ‘‘Business Combinations,’’ we account for all business combinations bythe purchase method. Furthermore, we recognize intangible assets apart from goodwill if they arise fromcontractual or legal rights or if they are separable from goodwill.
Recent Accounting Standards and Pronouncements
In May 2005, the FASB issued SFAS No. 154, ‘‘Accounting Changes and Error Corrections, a replacementof Accounting Principles Board (‘‘APB’’) Opinion No. 20 and FASB Statement No. 3.’’ SFAS No. 154 requiresretrospective application to prior periods’ financial statements of a voluntary change in accounting principleunless it is impracticable. APB Opinion No. 20, ‘‘Accounting Changes,’’ previously required that most voluntarychanges in accounting principle be recognized by including in net income of the period of the change thecumulative effect of changing to the new accounting principle. SFAS No. 154 became effective for our Companyon January 1, 2006. We believe that the adoption of SFAS No. 154 will not have a material impact on ourconsolidated financial statements.
In December 2004, the FASB issued SFAS No. 153, ‘‘Exchanges of Nonmonetary Assets, an amendment ofAPB Opinion No. 29.’’ SFAS No. 153 is based on the principle that exchanges of nonmonetary assets should bemeasured based on the fair value of the assets exchanged. APB Opinion No. 29, ‘‘Accounting for NonmonetaryTransactions,’’ provided an exception to its basic measurement principle (fair value) for exchanges of similarproductive assets. Under APB Opinion No. 29, an exchange of a productive asset for a similar productive assetwas based on the recorded amount of the asset relinquished. SFAS No. 153 eliminates this exception andreplaces it with an exception for exchanges of nonmonetary assets that do not have commercial substance. SFASNo. 153 became effective for our Company as of July 2, 2005, and did not have a material impact on our
74

THE COCA-COLA COMPANY AND SUBSIDIARIES
NOTES TO CONSOLIDATED FINANCIAL STATEMENTS
NOTE 1: BUSINESS AND SUMMARY OF SIGNIFICANT ACCOUNTING POLICIES (Continued)
consolidated financial statements. The Company will continue to apply the requirements of SFAS No. 153 onany future nonmonetary exchange transactions.
In December 2004, the FASB issued SFAS No. 123 (revised 2004), ‘‘Share Based Payment’’ (‘‘SFASNo. 123(R)’’). SFAS No. 123(R) supercedes APB Opinion No. 25, ‘‘Accounting for Stock Issued to Employees,’’and amends SFAS No. 95, ‘‘Statement of Cash Flows.’’ Generally, the approach in SFAS No. 123(R) is similar tothe approach described in SFAS No. 123. In 2005, our Company used the Black-Scholes-Merton formula toestimate the fair value of stock options granted to employees. Our Company adopted SFAS No. 123(R), usingthe modified-prospective method, beginning January 1, 2006. Based on the terms of our plans, our Company didnot have a cumulative effect related to its plans. We do not expect the adoption of SFAS No. 123(R) to have amaterial impact on our Company’s future stock-based compensation expense. Additionally, our equity methodinvestees are also required to adopt SFAS No. 123(R) no later than January 1, 2006. Our proportionate share ofthe stock-based compensation expense resulting from the adoption of SFAS No. 123(R) by our equity methodinvestees will be recognized as a reduction to equity income. We do not believe the adoption of SFASNo. 123(R) by our equity method investees will have a material impact on our consolidated financial statements.
During 2004, the FASB issued FASB Staff Position 106-2, ‘‘Accounting and Disclosure RequirementsRelated to the Medicare Prescription Drug, Improvement and Modernization Act of 2003’’ (‘‘FSP 106-2’’). FSP106-2 relates to the Medicare Prescription Drug, Improvement and Modernization Act of 2003 (the ‘‘Act’’). TheAct introduced a prescription drug benefit under Medicare known as Medicare Part D. The Act also establisheda federal subsidy to sponsors of retiree health care plans that provide a benefit that is at least actuariallyequivalent to Medicare Part D. During the second quarter of 2004, our Company adopted the provisions of FSP106-2 retroactive to January 1, 2004. The adoption of FSP 106-2 did not have a material impact on ourconsolidated financial statements. Refer to Note 15.
In November 2004, the FASB issued SFAS No. 151, ‘‘Inventory Costs, an amendment of AccountingResearch Bulletin No. 43, Chapter 4.’’ SFAS No. 151 requires that abnormal amounts of idle facility expense,freight, handling costs and wasted materials (spoilage) be recorded as current period charges and that theallocation of fixed production overheads to inventory be based on the normal capacity of the productionfacilities. The Company adopted SFAS No. 151 on January 1, 2006. The Company does not believe that theadoption of SFAS No. 151 will have a material impact on our consolidated financial statements.
In October 2004, the American Jobs Creation Act of 2004 (the ‘‘Jobs Creation Act’’) was signed into law.The Jobs Creation Act includes a temporary incentive for U.S. multinationals to repatriate foreign earnings atan approximate 5.25 percent effective tax rate. Such repatriations must occur in either an enterprise’s last taxyear that began before the enactment date, or the first tax year that begins during the one-year period beginningon the date of enactment.
Issued in December 2004, FASB Staff Position 109-2, ‘‘Accounting and Disclosure Guidance for the ForeignEarnings Repatriation Provision within the American Jobs Creation Act of 2004’’ (‘‘FSP 109-2’’), indicated thatthe lack of clarification of certain provisions within the Jobs Creation Act and the timing of the enactmentnecessitated a practical exception to the SFAS No. 109, ‘‘Accounting for Income Taxes,’’ requirement to reflect inthe period of enactment the effect of a new tax law. Accordingly, enterprises were allowed time beyond 2004 toevaluate the effect of the Jobs Creation Act on their plans for reinvestment or repatriation of foreign earningsfor purposes of applying SFAS No. 109. Accordingly, in 2005, the Company repatriated $6.1 billion of itspreviously unremitted earnings and recorded an associated tax expense of approximately $315 million. Refer toNote 16.
75

THE COCA-COLA COMPANY AND SUBSIDIARIES
NOTES TO CONSOLIDATED FINANCIAL STATEMENTS
NOTE 1: BUSINESS AND SUMMARY OF SIGNIFICANT ACCOUNTING POLICIES (Continued)
In 2004, our Company recorded an income tax benefit of approximately $50 million as a result of therealization of certain tax credits related to certain provisions of the Jobs Creation Act not related to repatriationprovisions. Refer to Note 16.
Effective January 1, 2003, the Company adopted SFAS No. 146, ‘‘Accounting for Costs Associated with Exitor Disposal Activities.’’ SFAS No. 146 addresses financial accounting and reporting for costs associated with exitor disposal activities and nullifies Emerging Issues Task Force (‘‘EITF’’) Issue No. 94-3, ‘‘Liability Recognitionfor Certain Employee Termination Benefits and Other Costs to Exit an Activity (including Certain CostsIncurred in a Restructuring).’’ SFAS No. 146 requires that a liability for a cost associated with an exit or disposalplan be recognized when the liability is incurred. Under SFAS No. 146, an exit or disposal plan exists when thefollowing criteria are met:
• Management, having the authority to approve the action, commits to a plan of termination.
• The plan identifies the number of employees to be terminated, their job classifications or functions andtheir locations, and the expected completion date.
• The plan establishes the terms of the benefit arrangement, including the benefits that employees willreceive upon termination (including but not limited to cash payments), in sufficient detail to enableemployees to determine the type and amount of benefits they will receive if they are involuntarilyterminated.
• Actions required to complete the plan indicate that it is unlikely that significant changes to the plan willbe made or that the plan will be withdrawn.
SFAS No. 146 establishes that fair value is the objective for initial measurement of the liability. In caseswhere employees are required to render service beyond a minimum retention period until they are terminated inorder to receive termination benefits, a liability for termination benefits is recognized ratably over the futureservice period. Under the previous rule, EITF Issue No. 94-3, a liability for the entire amount of the exit cost wasrecognized at the date that the entity met the four criteria described above. Refer to Note 18.
Effective January 1, 2003, our Company adopted the recognition and measurement provisions of FASBInterpretation No. 45, ‘‘Guarantor’s Accounting and Disclosure Requirements for Guarantees, IncludingIndirect Guarantees of Indebtedness of Others’’ (‘‘Interpretation 45’’). This interpretation elaborates on thedisclosures to be made by a guarantor in interim and annual financial statements about the obligations undercertain guarantees. Interpretation 45 also clarifies that a guarantor is required to recognize, at the inception of aguarantee, a liability for the fair value of the obligation undertaken in issuing the guarantee. The initialrecognition and initial measurement provisions of this interpretation were applicable on a prospective basis toguarantees issued or modified after December 31, 2002. We do not currently provide significant guarantees on aroutine basis. As a result, this interpretation has not had a material impact on our consolidated financialstatements.
76

THE COCA-COLA COMPANY AND SUBSIDIARIES
NOTES TO CONSOLIDATED FINANCIAL STATEMENTS
NOTE 2: BOTTLING INVESTMENTS
Coca-Cola Enterprises Inc.
CCE is a marketer, producer and distributor of bottle and can nonalcoholic beverages, operating in eightcountries. On December 31, 2005, our Company owned approximately 36 percent of the outstanding commonstock of CCE. We account for our investment by the equity method of accounting and, therefore, our operatingresults include our proportionate share of income resulting from our investment in CCE. As of December 31,2005, our proportionate share of the net assets of CCE exceeded our investment by approximately $281 million.This difference is not amortized.
A summary of financial information for CCE is as follows (in millions):
December 31, 2005 2004
Current assets $ 3,395 $ 3,371Noncurrent assets 21,962 23,090
Total assets $ 25,357 $ 26,461
Current liabilities $ 3,846 $ 3,451Noncurrent liabilities 15,868 17,632
Total liabilities $ 19,714 $ 21,083
Shareowners’ equity $ 5,643 $ 5,378
Company equity investment $ 1,731 $ 1,569
Year Ended December 31, 2005 2004 2003
Net operating revenues $ 18,706 $ 18,158 $ 17,330Cost of goods sold 11,185 10,771 10,165
Gross profit $ 7,521 $ 7,387 $ 7,165
Operating income $ 1,431 $ 1,436 $ 1,577
Net income $ 514 $ 596 $ 676
Net income available to common shareowners $ 514 $ 596 $ 674
A summary of our significant transactions with CCE is as follows (in millions):
Year Ended December 31, 2005 2004 2003
Concentrate, syrup and finished product sales to CCE $ 5,125 $ 5,203 $ 5,084Syrup and finished product purchases from CCE 428 428 403CCE purchases of sweeteners through our Company 275 309 311Marketing payments made by us directly to CCE 482 609 880Marketing payments made to third parties on behalf of CCE 136 104 115Local media and marketing program reimbursements from CCE 245 246 221Payments made to CCE for dispensing equipment repair services 70 63 62
Syrup and finished product purchases from CCE represent purchases of fountain syrup in certain territoriesthat have been resold by our Company to major customers and purchases of bottle and can products. Marketing
77

THE COCA-COLA COMPANY AND SUBSIDIARIES
NOTES TO CONSOLIDATED FINANCIAL STATEMENTS
NOTE 2: BOTTLING INVESTMENTS (Continued)
payments made by us directly to CCE represent support of certain marketing activities and our participationwith CCE in cooperative advertising and other marketing activities to promote the sale of Company trademarkproducts within CCE territories. These programs are agreed to on an annual basis. Marketing payments made tothird parties on behalf of CCE represent support of certain marketing activities and programs to promote thesale of Company trademark products within CCE’s territories in conjunction with certain of CCE’s customers.Pursuant to cooperative advertising and trade agreements with CCE, we received funds from CCE for localmedia and marketing program reimbursements. Payments made to CCE for dispensing equipment repairservices represent reimbursement to CCE for its costs of parts and labor for repairs on cooler, dispensing, orpost-mix equipment owned by us or our customers.
In 2005, our equity income related to CCE decreased by approximately $33 million as compared to 2004,related to our proportionate share of certain charges and gains recorded by CCE. Our proportionate share ofCCE’s charges included an approximate $51 million decrease to equity income, primarily related to the taxliability recorded by CCE in the fourth quarter of 2005 resulting from the repatriation of previously unremittedforeign earnings under the Jobs Creation Act and approximately $18 million due to restructuring chargesrecorded by CCE. These restructuring charges were primarily related to workforce reductions associated withthe reorganization of CCE’s North American operations, changes in executive management and elimination ofcertain positions in CCE’s corporate headquarters. These charges were partially offset by an approximate$37 million increase to equity income in the second quarter of 2005 resulting from CCE’s high fructose cornsyrup (‘‘HFCS’’) lawsuit settlement proceeds and changes in certain of CCE’s state and provincial tax rates.Refer to Note 17.
In the second quarter of 2004, our Company and CCE agreed to terminate the Sales Growth Initiative(‘‘SGI’’) agreement and certain other marketing funding programs that were previously in place. Due totermination of these agreements, a significant portion of the cash payments to be made by us directly to CCEwas eliminated prospectively. At the termination of these agreements, we agreed that the concentrate price thatCCE pays us for sales made in the United States and Canada would be reduced. Total cash support paid by ourCompany under the SGI agreement prior to its termination was approximately $58 million and approximately$161 million for 2004 and 2003, respectively. These amounts are included in the line item marketing paymentsmade by us directly to CCE in the table above.
In the second quarter of 2004, our Company and CCE agreed to establish a Global Marketing Fund, underwhich we expect to pay CCE $62 million annually through December 31, 2014, as support for certain marketingactivities. The term of the agreement will automatically be extended for successive 10-year periods thereafterunless either party gives written notice of termination of this agreement. The marketing activities to be fundedunder this agreement will be agreed upon each year as part of the annual joint planning process and will beincorporated into the annual marketing plans of both companies. We paid CCE $62 million in 2005 and a prorata amount of $42 million for 2004. These amounts are included in the line item marketing payments made byus directly to CCE in the table above.
78

THE COCA-COLA COMPANY AND SUBSIDIARIES
NOTES TO CONSOLIDATED FINANCIAL STATEMENTS
NOTE 2: BOTTLING INVESTMENTS (Continued)
Our Company previously entered into programs with CCE designed to help develop cold-drinkinfrastructure. Under these programs, our Company paid CCE for a portion of the cost of developing theinfrastructure necessary to support accelerated placements of cold-drink equipment. These payments support acommon objective of increased sales of Company trademarked beverages from increased availability andconsumption in the cold-drink channel. In connection with these programs, CCE agreed to:
(1) purchase and place specified numbers of Company-approved cold-drink equipment each year through2010;
(2) maintain the equipment in service, with certain exceptions, for a period of at least 12 years afterplacement;
(3) maintain and stock the equipment in accordance with specified standards; and
(4) annual reporting to our Company of minimum average annual unit case volume throughout theeconomic life of the equipment and other specified information.
CCE must achieve minimum average unit case volume for a 12-year period following the placement ofequipment. These minimum average unit case volume levels ensure adequate gross profit from sales ofconcentrate to fully recover the capitalized costs plus a return on the Company’s investment. Should CCE fail topurchase the specified numbers of cold-drink equipment for any calendar year through 2010, the parties agreedto mutually develop a reasonable solution. Should no mutually agreeable solution be developed, or in the eventthat CCE otherwise breaches any material obligation under the contracts and such breach is not remedied withina stated period, then CCE would be required to repay a portion of the support funding as determined by ourCompany. In the third quarter of 2004, our Company and CCE agreed to amend the contract to defer theplacement of some equipment from 2004 and 2005, as previously agreed under the original contract, to 2009 and2010. In connection with this amendment, CCE agreed to pay the Company approximately $2 million in 2004,$3 million annually in 2005 through 2008, and $1 million in 2009. In 2005, our Company and CCE agreed toamend the contract for North America to move to a system of purchase and placement credits, whereby CCEearns credit toward its annual purchase and placement requirements based upon the type of equipment itpurchases and places. The amended contract also provides that no breach by CCE will occur even if they do notachieve the required number of purchase and placement credits in any given year, so long as (1) the shortfalldoes not exceed 20 percent of the required purchase and placement credits for that year; (2) a compensatingpayment is made to our Company by CCE; (3) the shortfall is corrected in the following year; and (4) CCEmeets all specified purchase and placement credit requirements by the end of 2010. The payments we made toCCE under these programs are recorded in prepaid expenses and other assets and in noncurrent other assetsand amortized as deductions from revenues over the 10-year period following the placement of the equipment.Our carrying values for these infrastructure programs with CCE were approximately $662 million and$759 million as of December 31, 2005 and 2004, respectively. The Company has no further commitments underthese programs.
In March 2004, the Company and CCE launched the Dasani water brand in Great Britain. The product wasvoluntarily recalled. During 2004, our Company reimbursed CCE $32 million for product recall costs incurred byCCE.
In March 2003, our Company acquired a 100 percent ownership interest in Truesdale Packaging CompanyLLC (‘‘Truesdale’’) from CCE. Refer to Note 19.
79

THE COCA-COLA COMPANY AND SUBSIDIARIES
NOTES TO CONSOLIDATED FINANCIAL STATEMENTS
NOTE 2: BOTTLING INVESTMENTS (Continued)
If valued at the December 31, 2005 quoted closing price of CCE shares, the fair value of our investment inCCE would have exceeded our carrying value by approximately $1.5 billion.
Other Equity Method Investments
Our other equity method investments include our ownership interests in Coca-Cola HBC, Coca-ColaFEMSA and Coca-Cola Amatil for which we own 24 percent, 40 percent and 32 percent of their common shares,respectively.
Operating results include our proportionate share of income (loss) from our equity method investments. Asummary of financial information for our equity method investments in the aggregate, other than CCE, is asfollows (in millions):
December 31, 2005 2004
Current assets $ 7,803 $ 6,723Noncurrent assets 20,698 19,107
Total assets $ 28,501 $ 25,830
Current liabilities $ 7,705 $ 5,507Noncurrent liabilities 8,395 8,924
Total liabilities $ 16,100 $ 14,431
Shareowners’ equity $ 12,401 $ 11,399
Company equity investment $ 4,831 $ 4,328
Year Ended December 31, 2005 2004 2003
Net operating revenues $ 24,389 $ 21,202 $ 19,797Cost of goods sold 14,141 12,132 11,661
Gross profit $ 10,248 $ 9,070 $ 8,136
Operating income $ 2,669 $ 2,406 $ 1,666
Net income (loss) $ 1,501 $ 1,389 $ 580
Net income (loss) available to common shareowners $ 1,477 $ 1,364 $ 580
Net sales to equity method investees other than CCE, the majority of which are located outside the UnitedStates, were approximately $7.4 billion in 2005, $5.2 billion in 2004 and $4.0 billion in 2003. Total supportpayments, primarily marketing, made to equity method investees other than CCE were approximately$475 million, $442 million and $511 million in 2005, 2004 and 2003, respectively.
Our Company owns a 50 percent interest in Multon, a Russian juice business (‘‘Multon’’), which weacquired in April 2005 jointly with Coca-Cola HBC, for a total purchase price of approximately $501 million,split equally between the Company and Coca-Cola HBC. Multon produces and distributes juice products underthe DOBRIY, Rich, Nico and other trademarks in Russia, Ukraine and Belarus. Equity income—net includesour proportionate share of Multon’s net income beginning April 20, 2005. Refer to Note 19.
80

THE COCA-COLA COMPANY AND SUBSIDIARIES
NOTES TO CONSOLIDATED FINANCIAL STATEMENTS
NOTE 2: BOTTLING INVESTMENTS (Continued)
During the second quarter of 2004, the Company’s equity income benefited by approximately $37 millionfor its share of a favorable tax settlement related to Coca-Cola FEMSA.
In December 2004, the Company sold to an unrelated financial institution certain of its production assetsthat were previously leased to the Japanese supply chain management company (refer to discussion below). Theassets were sold for approximately $271 million, and the sale resulted in no gain or loss. The financial institutionentered into a leasing arrangement with the Japanese supply chain management company. These assets werepreviously reported in our consolidated balance sheet line item property, plant and equipment—net andassigned to our North Asia, Eurasia and Middle East operating segment.
During 2004, our Company sold our bottling operations in Vietnam, Cambodia, Sri Lanka and Nepal toCoca-Cola Sabco (Pty) Ltd. (‘‘Sabco’’) for a total consideration of $29 million. In addition, Sabco assumedcertain debts of these bottling operations. The proceeds from the sale of these bottlers were approximately equalto the carrying value of the investment.
Effective May 6, 2003, one of our Company’s equity method investees, Coca-Cola FEMSA, consummated amerger with another of the Company’s equity method investees, Panamerican Beverages, Inc. (‘‘Panamco’’). OurCompany received new Coca-Cola FEMSA shares in exchange for all Panamco shares previously held by theCompany. Our Company’s ownership interest in Coca-Cola FEMSA increased from 30 percent to approximately40 percent as a result of this merger. This exchange of shares was treated as a nonmonetary exchange of similarproductive assets, and no gain was recorded by our Company as a result of this merger.
In connection with the merger, Coca-Cola FEMSA management initiated steps to streamline and integrateoperations. This process included the closing of various distribution centers and manufacturing plants.Furthermore, due to the challenging economic conditions and an uncertain political situation in Venezuela,certain intangible assets were determined to be impaired and written down to their fair market value. During2003, our Company recorded a noncash pretax charge of $102 million primarily related to our proportionateshare of these matters. This charge is included in the consolidated statement of income line item equityincome—net.
In December 2003, the Company issued a standby line of credit to Coca-Cola FEMSA. Refer to Note 12.
The Company and the major shareowner of Coca-Cola FEMSA have an understanding that will permit thisshareowner to purchase from our Company an amount of Coca-Cola FEMSA shares sufficient for thisshareowner to regain a 51 percent ownership interest in Coca-Cola FEMSA. Pursuant to this understanding,which is in place until May 2006, this shareowner would pay the higher of the prevailing market price per shareat the time of the sale or the sum of approximately $2.22 per share plus the Company’s carrying costs. Bothresulting amounts are in excess of our Company’s carrying value.
In July 2003, we made a convertible loan of approximately $133 million to The Coca-Cola BottlingCompany of Egypt (‘‘TCCBCE’’). The loan is convertible into preferred shares of TCCBCE upon receipt ofgovernmental approvals. Additionally, upon certain defaults under either the loan agreement or the terms of thepreferred shares, we have the ability to convert the loan or the preferred shares into common shares. As ofDecember 31, 2005, our Company owned approximately 42 percent of the common shares of TCCBCE. Sincethe adoption of Interpretation 46(R) in 2004, TCCBCE has been consolidated in our consolidated financialstatements.
81

THE COCA-COLA COMPANY AND SUBSIDIARIES
NOTES TO CONSOLIDATED FINANCIAL STATEMENTS
NOTE 2: BOTTLING INVESTMENTS (Continued)
Effective October 1, 2003, the Company and all of its bottling partners in Japan created a nationallyintegrated supply chain management company to centralize procurement, production and logistics operationsfor the entire Coca-Cola system in Japan. As a result of the creation of this supply chain management companyin Japan, a portion of our Company’s business was essentially converted from a finished product business modelto a concentrate business model, thus reducing our net operating revenues and cost of goods sold by the sameamounts. The formation of this entity included the sale of Company inventory and leasing of certain Companyassets to this new entity on October 1, 2003, as well as our recording of a liability for certain contractualobligations to Japanese bottlers. Such amounts were not material to the Company’s results of operations.
In November 2003, Coca-Cola HBC approved a share capital reduction totaling approximately 473 millioneuros and the return of 2 euros per share to all shareowners. In December 2003, our Company received ourshare capital return payment from Coca-Cola HBC equivalent to $136 million, and we recorded a reduction toour investment in Coca-Cola HBC.
If valued at the December 31, 2005 quoted closing prices of shares actively traded on stock markets, thevalue of our equity method investments in publicly traded bottlers other than CCE would have exceeded ourcarrying value by approximately $2.4 billion.
Net Receivables and Dividends from Equity Method Investees
The total amount of net receivables due from equity method investees, including CCE, was approximately$644 million and $573 million as of December 31, 2005 and 2004, respectively. The total amount of dividendsreceived from equity method investees, including CCE, was approximately $234 million, $145 million and$112 million for the years ended December 31, 2005, 2004 and 2003, respectively.
NOTE 3: ISSUANCES OF STOCK BY EQUITY METHOD INVESTEES
In 2005, our Company recorded approximately $23 million of noncash pretax gains on issuances of stock byequity method investees. We recorded deferred taxes of approximately $8 million on these gains. These gainsprimarily related to an issuance of common stock by Coca-Cola Amatil, which was valued at an amount greaterthan the book value per share of our investment in Coca-Cola Amatil. Coca-Cola Amatil issued approximately34 million shares of common stock with a fair value of $5.78 each in connection with the acquisition of SPCArdmona Pty. Ltd., an Australian packaged fruit company. This issuance of common stock reduced ourownership interest in the total outstanding shares of Coca-Cola Amatil from approximately 34.0 percent toapproximately 32.4 percent.
In 2004, our Company recorded approximately $24 million of noncash pretax gains on issuances of stock byCCE. The issuances primarily related to the exercise of CCE stock options by CCE employees at amountsgreater than the book value per share of our investment in CCE. We recorded deferred taxes of approximately$9 million on these gains. These issuances of stock reduced our ownership interest in the total outstandingshares of CCE from approximately 37.2 percent to approximately 36.0 percent.
In 2003, our Company recorded approximately $8 million of noncash pretax gains on issuances of stock byequity method investees. These gains primarily related to the issuance by CCE of common stock valued at anamount greater than the book value per share of our investment in CCE. These transactions reduced ourownership interest in the total outstanding shares of CCE from approximately 37.3 percent to approximately37.2 percent.
82

THE COCA-COLA COMPANY AND SUBSIDIARIES
NOTES TO CONSOLIDATED FINANCIAL STATEMENTS
NOTE 4: PROPERTY, PLANT AND EQUIPMENT
The following table summarizes our property, plant and equipment (in millions):
December 31, 2005 2004
Land $ 447 $ 479Buildings and improvements 2,692 2,822Machinery and equipment 6,226 6,138Containers 468 480Construction in progress 306 230
$ 10,139 $ 10,149Less accumulated depreciation 4,353 4,058
Property, plant and equipment — net $ 5,786 $ 6,091
NOTE 5: GOODWILL, TRADEMARKS AND OTHER INTANGIBLE ASSETS
The following tables set forth information for intangible assets subject to amortization and for intangibleassets not subject to amortization (in millions):
December 31, 2005 2004
Amortized intangible assets (various, principally trademarks):Gross carrying amount $ 314 $ 292Less accumulated amortization 168 128
Amortized intangible assets—net $ 146 $ 164
Unamortized intangible assets:Trademarks1 $ 1,946 $ 2,037Goodwill2 1,047 1,097Bottlers’ franchise rights3 521 374Other 161 164
Unamortized intangible assets $ 3,675 $ 3,672
1 The decrease in 2005 was primarily the result of impairment charges of approximately $84 millionrelated to trademarks in the Philippines and the effect of translation adjustments, partially offset byacquisitions of trademarks and brands in 2005 totaling approximately $22 million, none of which wereindividually significant. Refer to Note 17.
2 The decrease in 2005 was primarily the result of translation adjustments, partially offset by goodwillrecognized in connection with the Bremer acquisition. Refer to Note 19.
3 The increase in 2005 was primarily related to the Bremer and Sucos Mais acquisitions. Refer toNote 19.
Total amortization expense for intangible assets subject to amortization was approximately $29 million,$35 million and $23 million for the years ended December 31, 2005, 2004 and 2003, respectively.
83

THE COCA-COLA COMPANY AND SUBSIDIARIES
NOTES TO CONSOLIDATED FINANCIAL STATEMENTS
NOTE 5: GOODWILL, TRADEMARKS AND OTHER INTANGIBLE ASSETS (Continued)
Information about estimated amortization expense for intangible assets subject to amortization for the fiveyears succeeding December 31, 2005, is as follows (in millions):
AmortizationExpense
2006 $ 162007 152008 142009 142010 13
Goodwill by operating segment was as follows (in millions):
December 31, 2005 2004
North America $ 141 $ 140Africa — —East, South Asia and Pacific Rim 26 26European Union 772 816Latin America 85 92North Asia, Eurasia and Middle East 23 23
$ 1,047 $ 1,097
In 2005, our Company recorded an impairment charge related to trademarks for beverages sold in thePhilippines of approximately $84 million. The Philippines is a component of our East, South Asia and PacificRim operating segment. The carrying value of our trademarks in the Philippines, prior to the recording of theimpairment charges in 2005, was approximately $268 million. The impairment was the result of our revisedoutlook of the Philippines, which has been unfavorably impacted by declines in volume and income beforeincome taxes resulting from the continued lack of an affordable package offering and the continued limitedavailability of these trademark beverages in the marketplace. We determined the amount of this impairmentcharge by comparing the fair value of the intangible assets to the carrying value. Fair values were derived usingdiscounted cash flow analyses with a number of scenarios that were weighted based on the probability ofdifferent outcomes. Because the fair value was less than the carrying value of the assets, we recorded animpairment charge to reduce the carrying value of the assets to fair value. This impairment charge was recordedin the line item other operating charges in the consolidated statement of income.
In 2004, acquisition of intangible assets totaled approximately $89 million. This amount is primarily relatedto the Company’s acquisition of trademarks with indefinite lives in the Latin America operating segment.
In 2004, our Company recorded impairment charges related to intangible assets of approximately$374 million. The decrease in bottlers’ franchise rights in 2004 was primarily due to this impairment charge,offset by an increase due to translation adjustment. These impairment charges primarily were in the EuropeanUnion operating segment and were included in other operating charges in our consolidated statement ofincome. The charges were primarily related to franchise rights at Coca-Cola Erfrischungsgetraenke AG(‘‘CCEAG’’). The impairment was the result of our revised outlook for the German market, which has beenunfavorably impacted by volume declines resulting from market shifts related to the deposit law on nonrefillablebeverage packages and the corresponding lack of availability for our products in the discount retail channel. The
84

THE COCA-COLA COMPANY AND SUBSIDIARIES
NOTES TO CONSOLIDATED FINANCIAL STATEMENTS
NOTE 5: GOODWILL, TRADEMARKS AND OTHER INTANGIBLE ASSETS (Continued)
deposit laws in Germany led to discount chains creating proprietary packages that could only be returned totheir own stores. These proprietary packages were continuing to gain market share and customer acceptance.
At the end of 2004, the German government passed an amendment to the mandatory deposit legislationthat requires retailers, including discount chains, to accept returns of each type of nonrefillable beveragecontainers that retailers sell, regardless of where the beverage package type was purchased. In addition, themandatory deposit requirement was expanded to other beverage categories. The amendment allows for atransition period to enable manufacturers and retailers to establish a national take-back system for nonrefillablepackages. The transition period is expected to last at least until mid-2006. In the second half of 2005, theCompany was able to gain limited availability of our products in the discount retail channel.
NOTE 6: ACCOUNTS PAYABLE AND ACCRUED EXPENSES
Accounts payable and accrued expenses consisted of the following (in millions):
December 31, 2005 2004
Trade accounts payable and other accrued expenses $ 2,315 $ 2,309Accrued marketing 1,268 1,194Accrued compensation 468 438Sales, payroll and other taxes 215 222Container deposits 209 199Accrued streamlining costs (refer to Note 18) 18 41
Accounts payable and accrued expenses $ 4,493 $ 4,403
NOTE 7: SHORT-TERM BORROWINGS AND CREDIT ARRANGEMENTS
Loans and notes payable consist primarily of commercial paper issued in the United States and a liability toacquire the remaining approximate 59 percent of CCEAG’s outstanding stock. The Company currently owns 41percent of CCEAG’s outstanding stock. In February 2002, the Company acquired control of CCEAG and agreedto put/call agreements with the other shareowners of CCEAG, which resulted in the recording of a liability toacquire the remaining shares in CCEAG no later than December 31, 2006. The present value of the totalamount likely to be paid by our Company to all other CCEAG shareowners was approximately $941 million atDecember 31, 2005, and approximately $1,041 million at December 31, 2004. This amount increased from theinitial liability of approximately $600 million due to the accretion of the discounted value to the ultimatematurity of the liability, as well as approximately $222 million of translation adjustment related to this liability.The accretion of the discounted value to its ultimate maturity value is recorded in the line item other loss—net,and this amount was approximately $60 million, $58 million and $51 million, respectively, for the years endedDecember 31, 2005, 2004 and 2003.
As of December 31, 2005 and 2004, we had approximately $3,311 million and $4,235 million, respectively,outstanding in commercial paper borrowings. Our weighted-average interest rates for commercial paperoutstanding were approximately 4.2 percent and 2.2 percent per year at December 31, 2005 and 2004,respectively. In addition, we had $1,794 million in lines of credit and other short-term credit facilities available asof December 31, 2005, of which approximately $266 million was outstanding. This entire outstanding amount ofapproximately $266 million related to our international operations. Included in the available credit facilities
85

THE COCA-COLA COMPANY AND SUBSIDIARIES
NOTES TO CONSOLIDATED FINANCIAL STATEMENTS
NOTE 7: SHORT-TERM BORROWINGS AND CREDIT ARRANGEMENTS (Continued)
discussed above, the Company had $1,150 million in lines of credit for general corporate purposes, includingcommercial paper backup. There were no borrowings under these lines of credit during 2005.
These credit facilities are subject to normal banking terms and conditions. Some of the financialarrangements require compensating balances, none of which is presently significant to our Company.
NOTE 8: LONG-TERM DEBT
Long-term debt consisted of the following (in millions):
December 31, 2005 2004
57⁄8% euro notes due 2005 $ — $ 6634% U.S. dollar notes due 2005 — 75053⁄4% U.S. dollar notes due 2009 399 39953⁄4% U.S. dollar notes due 2011 499 49973⁄8% U.S. dollar notes due 2093 116 116Other, due through 20141,2 168 220
$ 1,182 $ 2,647Less current portion 28 1,490
Long-term debt $ 1,154 $ 1,157
1 2004 balance includes a $5 million fair value adjustment related to interest rate swap agreements.Refer to Note 11.
2 The weighted-average interest rate on outstanding balances was 6% and 4% for the years endedDecember 31, 2005 and 2004, respectively.
The above notes include various restrictions, none of which is presently significant to our Company.
After giving effect to interest rate management instruments, the principal amount of our long-term debtthat had fixed and variable interest rates, respectively, was $1,181 million and $1 million on December 31, 2005.After giving effect to interest rate management instruments, the principal amount of our long-term debt that hadfixed and variable interest rates, respectively, was $1,895 million and $752 million on December 31, 2004.Including the effect of interest rate management instruments, the weighted-average interest rate on theoutstanding balances of our Company’s long-term debt was 6.0 percent and 4.4 percent per year for the yearsended December 31, 2005 and 2004, respectively.
Total interest paid was approximately $233 million, $188 million and $180 million in 2005, 2004 and 2003,respectively. For a more detailed discussion of interest rate management, refer to Note 11.
Maturities of long-term debt for the five years succeeding December 31, 2005, are as follows (in millions):
Maturities ofLong-Term Debt
2006 $ 282007 292008 702009 4092010 9
86

THE COCA-COLA COMPANY AND SUBSIDIARIES
NOTES TO CONSOLIDATED FINANCIAL STATEMENTS
NOTE 9: COMPREHENSIVE INCOME
Accumulated Other Comprehensive Income (Loss) (‘‘AOCI’’), including our proportionate share of equitymethod investees’ AOCI, consisted of the following (in millions):
December 31, 2005 2004
Foreign currency translation adjustment $ (1,587) $ (1,191)Accumulated derivative net losses (23) (80)Unrealized gain on available-for-sale securities 104 91Minimum pension liability (163) (168)
Accumulated other comprehensive income (loss) $ (1,669) $ (1,348)
A summary of the components of other comprehensive income (loss), including our proportionate share ofequity method investees’ other comprehensive income (loss), for the years ended December 31, 2005, 2004 and2003, is as follows (in millions):
Before-Tax Income After-TaxAmount Tax Amount
2005Net foreign currency translation adjustment $ (440) $ 44 $ (396)Net gain on derivatives 94 (37) 57Net change in unrealized gain on available-for-sale securities 20 (7) 13Net change in minimum pension liability 5 — 5
Other comprehensive income (loss) $ (321) $ — $ (321)
Before-Tax Income After-TaxAmount Tax Amount
2004Net foreign currency translation adjustment $ 766 $ (101) $ 665Net loss on derivatives (4) 1 (3)Net change in unrealized gain on available-for-sale securities 48 (9) 39Net change in minimum pension liability (81) 27 (54)
Other comprehensive income (loss) $ 729 $ (82) $ 647
Before-Tax Income After-TaxAmount Tax Amount
2003Net foreign currency translation adjustment $ 913 $ 8 $ 921Net loss on derivatives (63) 30 (33)Net change in unrealized gain on available-for-sale securities 65 (25) 40Net change in minimum pension liability 181 (57) 124
Other comprehensive income (loss) $ 1,096 $ (44) $ 1,052
87

THE COCA-COLA COMPANY AND SUBSIDIARIES
NOTES TO CONSOLIDATED FINANCIAL STATEMENTS
NOTE 10: FINANCIAL INSTRUMENTS
Certain Debt and Marketable Equity Securities
Investments in debt and marketable equity securities, other than investments accounted for by the equitymethod, are categorized as trading, available-for-sale or held-to-maturity. On December 31, 2005 and 2004, wehad no trading securities. Our marketable equity investments are categorized as available-for-sale with their costbasis determined by the specific identification method. We record available-for-sale instruments at fair value,with unrealized gains and losses, net of deferred income taxes, reported as a component of AOCI. Debtsecurities categorized as held-to-maturity are stated at amortized cost.
As of December 31, 2005 and 2004, available-for-sale and held-to-maturity securities consisted of thefollowing (in millions):
Gross UnrealizedEstimated
Cost Gains Losses Fair Value
2005Available-for-sale securities:
Equity securities $ 138 $ 167 $ (2) $ 303Other securities 13 — — 13
$ 151 $ 167 $ (2) $ 316
Held-to-maturity securities:Bank and corporate debt $ 348 $ — $ — $ 348
Gross UnrealizedEstimated
Cost Gains Losses Fair Value
2004Available-for-sale securities:
Equity securities $ 144 $ 146 $ (2) $ 288Other securities 5 — (1) 4
$ 149 $ 146 $ (3) $ 292
Held-to-maturity securities:Bank and corporate debt $ 68 $ — $ — $ 68
88

THE COCA-COLA COMPANY AND SUBSIDIARIES
NOTES TO CONSOLIDATED FINANCIAL STATEMENTS
NOTE 10: FINANCIAL INSTRUMENTS (Continued)
As of December 31, 2005 and 2004, these investments were included in the following captions (in millions):
Available- Held-to-for-Sale Maturity
Securities Securities
2005Cash and cash equivalents $ — $ 346Current marketable securities 64 2Cost method investments, principally bottling companies 239 —Other assets 13 —
$ 316 $ 348
Available- Held-to-for-Sale Maturity
Securities Securities
2004Cash and cash equivalents $ — $ 68Current marketable securities 61 —Cost method investments, principally bottling companies 229 —Other assets 2 —
$ 292 $ 68
The contractual maturities of these investments as of December 31, 2005, were as follows (in millions):
Available-for-Sale Held-to-MaturitySecurities Securities
Fair Amortized FairCost Value Cost Value
2006 $ — $ — $ 348 $ 3482007-2010 — — — —2011-2015 — — — —After 2015 13 13 — —Equity securities 138 303 — —
$ 151 $ 316 $ 348 $ 348
For the years ended December 31, 2005, 2004 and 2003, gross realized gains and losses on sales ofavailable-for-sale securities were not material. The cost of securities sold is based on the specific identificationmethod.
Fair Value of Other Financial Instruments
The carrying amounts of cash and cash equivalents, non-marketable cost method investments, receivables,accounts payable and accrued expenses, and loans and notes payable approximate their fair values because ofthe relatively short-term maturity of these instruments.
We carry our non-marketable cost method investments at cost or, if a decline in the value of the investmentis deemed to be other than temporary, at fair value. Estimates of fair value are generally based upon discountedcash flow analyses.
89

THE COCA-COLA COMPANY AND SUBSIDIARIES
NOTES TO CONSOLIDATED FINANCIAL STATEMENTS
NOTE 10: FINANCIAL INSTRUMENTS (Continued)
We recognize all derivative instruments as either assets or liabilities at fair value in our consolidated balancesheets, with fair values estimated based on quoted market prices or pricing models using current market rates.Virtually all of our derivatives are straightforward, over-the-counter instruments with liquid markets. For furtherdiscussion of our derivatives, including a disclosure of derivative values, refer to Note 11.
The fair value of our long-term debt is estimated based on quoted prices for those or similar instruments.As of December 31, 2005, the carrying amounts and fair values of our long-term debt, including the currentportion, were approximately $1,182 million and approximately $1,240 million, respectively. As of December 31,2004, these carrying amounts and fair values were approximately $2,647 million and approximately$2,736 million, respectively.
NOTE 11: HEDGING TRANSACTIONS AND DERIVATIVE FINANCIAL INSTRUMENTS
Our Company uses derivative financial instruments primarily to reduce our exposure to adverse fluctuationsin interest rates and foreign currency exchange rates and, to a lesser extent, in commodity prices and othermarket risks. When entered into, the Company formally designates and documents the financial instrument as ahedge of a specific underlying exposure, as well as the risk management objectives and strategies for undertakingthe hedge transactions. The Company formally assesses, both at the inception and at least quarterly thereafter,whether the financial instruments that are used in hedging transactions are effective at offsetting changes ineither the fair value or cash flows of the related underlying exposure. Because of the high degree of effectivenessbetween the hedging instrument and the underlying exposure being hedged, fluctuations in the value of thederivative instruments are generally offset by changes in the fair values or cash flows of the underlying exposuresbeing hedged. Any ineffective portion of a financial instrument’s change in fair value is immediately recognizedin earnings. Virtually all of our derivatives are straightforward over-the-counter instruments with liquid markets.Our Company does not enter into derivative financial instruments for trading purposes.
The fair values of derivatives used to hedge or modify our risks fluctuate over time. We do not view thesefair value amounts in isolation, but rather in relation to the fair values or cash flows of the underlying hedgedtransactions or other exposures. The notional amounts of the derivative financial instruments do not necessarilyrepresent amounts exchanged by the parties and, therefore, are not a direct measure of our exposure to thefinancial risks described above. The amounts exchanged are calculated by reference to the notional amounts andby other terms of the derivatives, such as interest rates, foreign currency exchange rates or other financialindices.
Our Company recognizes all derivative instruments as either assets or liabilities in our consolidated balancesheets at fair value. The accounting for changes in fair value of a derivative instrument depends on whether ithas been designated and qualifies as part of a hedging relationship and, further, on the type of hedgingrelationship. At the inception of the hedging relationship, the Company must designate the instrument as a fairvalue hedge, a cash flow hedge, or a hedge of a net investment in a foreign operation. This designation is basedupon the exposure being hedged.
We have established strict counterparty credit guidelines and enter into transactions only with financialinstitutions of investment grade or better. We monitor counterparty exposures daily and review any downgradein credit rating immediately. If a downgrade in the credit rating of a counterparty were to occur, we haveprovisions requiring collateral in the form of U.S. government securities for substantially all of our transactions.To mitigate presettlement risk, minimum credit standards become more stringent as the duration of thederivative financial instrument increases. To minimize the concentration of credit risk, we enter into derivative
90

THE COCA-COLA COMPANY AND SUBSIDIARIES
NOTES TO CONSOLIDATED FINANCIAL STATEMENTS
NOTE 11: HEDGING TRANSACTIONS AND DERIVATIVE FINANCIAL INSTRUMENTS (Continued)
transactions with a portfolio of financial institutions. The Company has master netting agreements with most ofthe financial institutions that are counterparties to the derivative instruments. These agreements allow for thenet settlement of assets and liabilities arising from different transactions with the same counterparty. Based onthese factors, we consider the risk of counterparty default to be minimal.
Interest Rate Management
Our Company monitors our mix of fixed-rate and variable-rate debt as well as our mix of term debt versusnon-term debt. This monitoring includes a review of business and other financial risks. We also enter intointerest rate swap agreements to manage our mix of fixed-rate and variable-rate debt. Interest rate swapagreements that meet certain conditions required under SFAS No. 133 for fair value hedges are accounted for assuch, with the offset recorded to adjust the fair value of the underlying exposure being hedged. During 2005,2004 and 2003, there was no ineffectiveness related to fair value hedges. At December 31, 2005, our Companyhad no outstanding interest rate swap agreements. At December 31, 2004, the fair value of our Company’sinterest rate swap agreements was approximately $6 million. The Company estimates the fair value of its interestrate derivatives based on quoted market prices.
Foreign Currency Management
The purpose of our foreign currency hedging activities is to reduce the risk that our eventual U.S. dollar netcash inflows resulting from sales outside the United States will be adversely affected by changes in foreigncurrency exchange rates.
We enter into forward exchange contracts and purchase foreign currency options (principally euro andJapanese yen) and collars to hedge certain portions of forecasted cash flows denominated in foreign currencies.The effective portion of the changes in fair value for these contracts, which have been designated as cash flowhedges, are reported in AOCI and reclassified into earnings in the same financial statement line item and in thesame period or periods during which the hedged transaction affects earnings. Any ineffective portion (which wasnot significant in 2005, 2004 or 2003) of the change in fair value of these instruments is immediately recognizedin earnings. These contracts had maturities up to one year as of December 31, 2005.
Additionally, the Company enters into forward exchange contracts that are not designated as hedginginstruments under SFAS No. 133. These instruments are used to offset the earnings impact relating to thevariability in foreign currency exchange rates on certain monetary assets and liabilities denominated innonfunctional currencies. Changes in the fair value of these instruments are immediately recognized in earningsin the line item other loss—net of our consolidated statements of income to offset the effect of remeasurementof the monetary assets and liabilities.
The Company also enters into forward exchange contracts to hedge its net investment position in certainmajor currencies. Under SFAS No. 133, changes in the fair value of these instruments are recognized in foreigncurrency translation adjustment, a component of AOCI, to offset the change in the value of the net investmentbeing hedged. For the years ended December 31, 2005, 2004 and 2003, approximately $40 million, $8 million and$29 million, respectively, of losses relating to derivative financial instruments were recorded in foreign currencytranslation adjustment.
91

THE COCA-COLA COMPANY AND SUBSIDIARIES
NOTES TO CONSOLIDATED FINANCIAL STATEMENTS
NOTE 11: HEDGING TRANSACTIONS AND DERIVATIVE FINANCIAL INSTRUMENTS (Continued)
The following table presents the fair values, carrying values and maturities of the Company’s foreigncurrency derivative instruments outstanding as of December 31, 2005 and 2004 (in millions):
Carrying FairValues Values Maturity
2005Forward contracts $ 28 $ 28 2006Options and collars 11 11 2006
$ 39 $ 39
Carrying FairValues Values Maturity
2004Forward contracts $ 27 $ 27 2005Options and collars 12 12 2005
$ 39 $ 39
The Company estimates the fair value of its foreign currency derivatives based on quoted market prices orpricing models using current market rates. These amounts are primarily reflected in prepaid expenses and otherassets in our consolidated balance sheets.
Summary of AOCI
For the years ended December 31, 2005, 2004 and 2003, we recorded a net gain (loss) to AOCI ofapproximately $55 million, $6 million and $(31) million, respectively, net of both income taxes andreclassifications to earnings, primarily related to gains and losses on foreign currency cash flow hedges. Theseitems will generally offset cash flow gains and losses relating to the underlying exposures being hedged in futureperiods. The Company estimates that it will reclassify into earnings during the next 12 months gains ofapproximately $21 million from the after-tax amount recorded in AOCI as of December 31, 2005, as theanticipated foreign currency cash flows occur.
92

THE COCA-COLA COMPANY AND SUBSIDIARIES
NOTES TO CONSOLIDATED FINANCIAL STATEMENTS
NOTE 11: HEDGING TRANSACTIONS AND DERIVATIVE FINANCIAL INSTRUMENTS (Continued)
The following table summarizes activity in AOCI related to derivatives designated as cash flow hedges heldby the Company during the applicable periods (in millions):
Before-Tax Income After-TaxAmount Tax Amount
2005Accumulated derivative net losses as of January 1, 2005 $ (56) $ 22 $ (34)Net changes in fair value of derivatives 135 (53) 82Net gains reclassified from AOCI into earnings (44) 17 (27)
Accumulated derivative net gains as of December 31, 2005 $ 35 $ (14) $ 21
Before-Tax Income After-TaxAmount Tax Amount
2004Accumulated derivative net losses as of January 1, 2004 $ (66) $ 26 $ (40)Net changes in fair value of derivatives (76) 30 (46)Net losses reclassified from AOCI into earnings 86 (34) 52
Accumulated derivative net losses as of December 31, 2004 $ (56) $ 22 $ (34)
Before-Tax Income After-TaxAmount Tax Amount
2003Accumulated derivative net losses as of January 1, 2003 $ (15) $ 6 $ (9)Net changes in fair value of derivatives (165) 65 (100)Net losses reclassified from AOCI into earnings 114 (45) 69
Accumulated derivative net losses as of December 31, 2003 $ (66) $ 26 $ (40)
The Company did not discontinue any cash flow hedge relationships during the years ended December 31,2005, 2004 and 2003.
NOTE 12: COMMITMENTS AND CONTINGENCIES
As of December 31, 2005, we were contingently liable for guarantees of indebtedness owed by third partiesin the amount of approximately $248 million. These guarantees primarily are related to third-party customers,bottlers and vendors and have arisen through the normal course of business. These guarantees have variousterms, and none of these guarantees is individually significant. The amount represents the maximum potentialfuture payments that we could be required to make under the guarantees; however, we do not consider itprobable that we will be required to satisfy these guarantees.
In December 2003, we granted a $250 million standby line of credit to Coca-Cola FEMSA with normalmarket terms. As of December 31, 2005 and 2004, no amounts have been drawn against this line of credit. Thisstandby line of credit expires in December 2006.
We believe our exposure to concentrations of credit risk is limited due to the diverse geographic areascovered by our operations.
93

THE COCA-COLA COMPANY AND SUBSIDIARIES
NOTES TO CONSOLIDATED FINANCIAL STATEMENTS
NOTE 12: COMMITMENTS AND CONTINGENCIES (Continued)
The Company is involved in various legal proceedings. We establish reserves for specific legal proceedingswhen we determine that the likelihood of an unfavorable outcome is probable and the amount of loss can bereasonably estimated. Management has also identified certain other legal matters where we believe anunfavorable outcome is reasonably possible and/or for which no estimate of possible losses can be made.Management believes that any liability to the Company that may arise as a result of currently pending legalproceedings, including those discussed below, will not have a material adverse effect on the financial conditionof the Company taken as a whole.
In 2003, the Securities and Exchange Commission (‘‘SEC’’) initiated an investigation into whether theCompany, or certain persons associated with the Company, violated federal securities laws in connection withthe conduct alleged by a former employee of the Company. Additionally in 2003, the United States Attorney’sOffice for the Northern District of Georgia commenced a criminal investigation of the allegations raised by thesame former employee. On April 18, 2005, the Company announced that it had reached a settlement ending theSEC’s investigation. Pursuant to the settlement, the Company agreed to maintain certain measures implementedprior to or during the preceding two years and to undertake additional remedial measures in the areas ofcorporate compliance and disclosure. The settlement did not require the payment of a fine or other monetarysanction. On April 18, 2005, the Company also announced that it had received notification that the UnitedStates Attorney’s Office was terminating its investigation without taking further action.
During the period from 1970 to 1981, our Company owned Aqua-Chem, Inc. (‘‘Aqua-Chem’’). A division ofAqua-Chem manufactured certain boilers that contained gaskets that Aqua-Chem purchased from outsidesuppliers. Several years after our Company sold this entity, Aqua-Chem received its first lawsuit relating toasbestos, a component of some of the gaskets. In September 2002, Aqua-Chem notified our Company that itbelieves we are obligated for certain costs and expenses associated with its asbestos litigations. Aqua-Chemdemanded that our Company reimburse it for approximately $10 million for out-of-pocket litigation-relatedexpenses. Aqua-Chem has also demanded that the Company acknowledge a continuing obligation toAqua-Chem for any future liabilities and expenses that are excluded from coverage under the applicableinsurance or for which there is no insurance. Our Company disputes Aqua-Chem’s claims, and we believe wehave no obligation to Aqua-Chem for any of its past, present or future liabilities, costs or expenses. Furthermore,we believe we have substantial legal and factual defenses to Aqua-Chem’s claims. The parties entered intolitigation to resolve this dispute, which was stayed by agreement of the parties pending the outcome of litigationfiled in Wisconsin by certain insurers of Aqua-Chem. In that case, five plaintiff insurance companies filed adeclaratory judgment action against Aqua-Chem, the Company and 16 defendant insurance companies seeking adetermination of the parties’ rights and liabilities under policies issued by the insurers and reimbursement foramounts paid by plaintiffs in excess of their obligations. That litigation remains pending, and the Companybelieves it has substantial legal and factual defenses to the insurers’ claims. Aqua-Chem and the Companysubsequently reached a settlement agreement with five of the insurers in the Wisconsin insurance coveragelitigation, and those insurers will pay funds into an escrow account for payment of costs arising from the asbestosclaims against Aqua-Chem. Aqua-Chem has also reached a settlement agreement with an additional insurerregarding payment of that insurer’s policy proceeds for Aqua-Chem’s asbestos claims. Aqua-Chem and theCompany will continue to negotiate with the 15 other insurers that are parties to the Wisconsin insurancecoverage case and will litigate their claims against such insurers to the extent negotiations do not result insettlements. The Company also believes Aqua-Chem has substantial insurance coverage to pay Aqua-Chem’sasbestos claimants.
94

THE COCA-COLA COMPANY AND SUBSIDIARIES
NOTES TO CONSOLIDATED FINANCIAL STATEMENTS
NOTE 12: COMMITMENTS AND CONTINGENCIES (Continued)
In 1999, the Competition Directorate of the European Commission (the ‘‘Commission’’) began aninvestigation of various commercial and market practices of the Company and its bottlers in Austria, Belgium,Denmark, Germany and Great Britain. On October 19, 2004, the Company and certain of its bottlers submitteda formal Undertaking to the Commission, and the Commission accepted the Undertaking, subject to formalreview by third parties. Following the comment period, the Commission presented to the Company certaincomments it had received from third parties, as well as certain additional comments of the Commission’s legalstaff. The Company addressed those additional comments, revised the Undertaking accordingly and submittedthe final Undertaking to the Commission. On June 22, 2005, the Commission adopted a decision pursuant toArticle 9(1) of Regulation (EC) 1/2003. The decision renders legally binding the commitments set forth in theUndertaking submitted by the Company and certain of its bottlers on October 19, 2004, as such Undertaking wasrevised following consultations with national competition authorities of European Economic Area MemberStates and industry participants. The final Undertaking is substantially similar to the Undertaking initiallysubmitted on October 19, 2004. In light of the commitments, the Commission declared that there were nofurther grounds for action on its part and, without prejudice to Article 9(2) of Regulation (EC) 1/2003, that theproceedings in the case should therefore be brought to an end. The Undertaking potentially applies in 27countries and in all channels of distribution where the Company’s carbonated soft drinks account for over40 percent of national sales and twice the nearest competitor’s share. The commitments the Company made inthe Undertaking relate broadly to exclusivity, percentage-based purchasing commitments, transparency, targetrebates, tying, assortment or range commitments, and agreements concerning products of other suppliers. TheUndertaking also applies to shelf space commitments in agreements with take-home customers and to financingand availability agreements in the on-premise channel. In addition, the Undertaking includes commitments thatare applicable to commercial arrangements concerning the installation and use of technical equipment (such ascoolers, fountain equipment and vending machines). The Undertaking does not imply any recognition on theCompany’s or the bottlers’ part of any infringement of European Union competition rules. The Companybelieves that the Undertaking, while imposing restrictions, clarifies the application of competition rules to itspractices in Europe and will allow the Coca-Cola system to be able to compete vigorously while adhering to theUndertaking’s provisions.
The Spanish Competition Service (the ‘‘Service’’) made unannounced visits to the Company’s offices andthose of certain of its bottlers in Spain in 2000. In December 2003, the Service suspended its investigation untilthe Commission notified the Service how the Commission would proceed in its commercial and market practicesinvestigation referred to above. On June 22, 2005, the Commission informed the Service that the Commissionhad adopted the above referenced decision pursuant to Article 9(1) of Regulation (EC) 1/2003. OnJune 24, 2005, the Company received an Order from the Service, informing us of the Service’s proposal todiscontinue its investigation and dismiss the proceedings. On July 15, 2005, the Service issued its decisiondiscontinuing its investigation and dismissing the proceedings, and this decision has become final.
The French Competition Directorate (the ‘‘Directorate’’) has also initiated an inquiry into commercialpractices related to the soft drink sector in France. This inquiry has been conducted through visits to the officesof the Company; however, no conclusions have been communicated to the Company by the Directorate. As aresult of the Undertaking given by the Company and certain of its bottlers to the Commission referenced above,the Company believes the investigation has been discontinued.
The Company is discussing with the Commission issues relating to parallel trade within the EuropeanUnion arising out of comments received by the Commission from third parties. The Company is cooperatingfully with the Commission and is providing information on these issues and the measures taken and to be taken
95

THE COCA-COLA COMPANY AND SUBSIDIARIES
NOTES TO CONSOLIDATED FINANCIAL STATEMENTS
NOTE 12: COMMITMENTS AND CONTINGENCIES (Continued)
to address any issues raised. The Company is unable to predict at this time with any reasonable degree ofcertainty what action, if any, the Commission will take with respect to these issues.
At the time we acquire or divest our interest in an entity, we sometimes agree to indemnify the seller orbuyer for specific contingent liabilities. Management believes that any liability to the Company that may arise asa result of any such indemnification agreements will not have a material adverse effect on the financial conditionof the Company taken as a whole.
The Company is involved in various tax matters. We establish reserves at the time that we determine it isprobable we will be liable to pay additional taxes related to certain matters and the amounts of such possibleadditional taxes are reasonably estimable. We adjust these reserves, including any impact on the related interestand penalties, in light of changing facts and circumstances, such as the progress of a tax audit. A number of yearsmay elapse before a particular matter, for which we may have established a reserve, is audited and finallyresolved or when a tax assessment is raised. The number of years with open tax audits varies depending on thetax jurisdiction. While it is often difficult to predict the final outcome or the timing of resolution of anyparticular tax matter, we record a reserve when we determine the likelihood of loss is probable and the amountof loss is reasonably estimable. Such liabilities are recorded in the line item accrued income taxes in theCompany’s consolidated balance sheets. Favorable resolution of tax matters that had been previously reservedwould be recognized as a reduction to our income tax expense, when known.
The Company is also involved in various tax matters where we have determined that the probability of anunfavorable outcome is reasonably possible. Management believes that any liability to the Company that mayarise as a result of currently pending tax matters will not have a material adverse effect on the financial conditionof the Company taken as a whole.
NOTE 13: NET CHANGE IN OPERATING ASSETS AND LIABILITIES
Net cash provided by (used in) operating activities attributable to the net change in operating assets andliabilities is composed of the following (in millions):
Year Ended December 31, 2005 2004 2003
(Increase) decrease in trade accounts receivable $ (79) $ (5) $ 80(Increase) decrease in inventories (79) (57) 111Decrease (increase) in prepaid expenses and other assets 244 (397) (276)Increase (decrease) in accounts payable and accrued expenses 280 45 (164)Increase (decrease) in accrued taxes 145 (194) 53(Decrease) increase in other liabilities (81) (9) 28
$ 430 $ (617) $ (168)
NOTE 14: STOCK COMPENSATION PLANS
Effective January 1, 2002, our Company adopted the preferable fair value recognition provisions of SFASNo. 123. In accordance with the provisions of SFAS No. 123, $324 million, $345 million and $422 million wererecorded for total stock-based compensation expense in 2005, 2004 and 2003, respectively. The $324 million and$345 million recorded in 2005 and 2004, respectively, were recorded in selling, general and administrativeexpenses. Of the $422 million recorded in 2003, $407 million was recorded in selling, general and administrativeexpenses, and $15 million was recorded in other operating charges. Refer to Note 18.
96

THE COCA-COLA COMPANY AND SUBSIDIARIES
NOTES TO CONSOLIDATED FINANCIAL STATEMENTS
NOTE 14: STOCK COMPENSATION PLANS (Continued)
During 2005, the Company changed its estimated service period for retirement-eligible participants in itsplans when the terms of their stock-based compensation awards provide for accelerated vesting upon earlyretirement. The full-year impact of this change in our estimated service period was approximately $50 million for2005.
Stock Option Plans
Under our 1991 Stock Option Plan (the ‘‘1991 Option Plan’’), a maximum of 120 million shares of ourcommon stock was approved to be issued or transferred to certain officers and employees pursuant to stockoptions granted under the 1991 Option Plan. Options to purchase common stock under the 1991 Option Planhave been granted to Company employees at fair market value at the date of grant.
The 1999 Stock Option Plan (the ‘‘1999 Option Plan’’) was approved by shareowners in April 1999.Following the approval of the 1999 Option Plan, no grants were made from the 1991 Option Plan, and sharesavailable under the 1991 Option Plan were no longer available to be granted. Under the 1999 Option Plan, amaximum of 120 million shares of our common stock was approved to be issued or transferred to certain officersand employees pursuant to stock options granted under the 1999 Option Plan. Options to purchase commonstock under the 1999 Option Plan have been granted to Company employees at fair market value at the date ofgrant.
The 2002 Stock Option Plan (the ‘‘2002 Option Plan’’) was approved by shareowners in April 2002. Anamendment to the 2002 Option Plan which permitted the issuance of stock appreciation rights was approved byshareowners in April 2003. Under the 2002 Option Plan, a maximum of 120 million shares of our common stockwas approved to be issued or transferred to certain officers and employees pursuant to stock options and stockappreciation rights granted under the 2002 Option Plan. The stock appreciation rights permit the holder, uponsurrendering all or part of the related stock option, to receive common stock in an amount up to 100 percent ofthe difference between the market price and the option price. No stock appreciation rights have been issuedunder the 2002 Option Plan as of December 31, 2005. Options to purchase common stock under the 2002Option Plan have been granted to Company employees at fair market value at the date of grant.
Stock options granted in December 2003 and thereafter generally become exercisable over a four-yearannual vesting period and expire 10 years from the date of grant. Stock options granted from 1999 throughJuly 2003 generally become exercisable over a four-year annual vesting period and expire 15 years from the dateof grant. Prior to 1999, stock options generally became exercisable over a three-year vesting period and expired10 years from the date of grant.
The following table sets forth information about the weighted-average fair value of options granted duringthe year using the Black-Scholes-Merton option-pricing model and the weighted-average assumptions used forsuch grants:
2005 2004 2003
Weighted-average fair value of options at grant date $ 8.23 $ 8.84 $ 13.49Dividend yields 2.6% 2.5% 1.9%Expected volatility 19.9% 23.0% 28.1%Risk-free interest rates 4.3% 3.8% 3.5%Expected lives 6 years 6 years 6 years
97

THE COCA-COLA COMPANY AND SUBSIDIARIES
NOTES TO CONSOLIDATED FINANCIAL STATEMENTS
NOTE 14: STOCK COMPENSATION PLANS (Continued)
To ensure the best market-based assumptions were used to determine the estimated fair value of stockoptions granted in 2005, 2004 and 2003, we obtained two independent market quotes. Our Black-Scholes-Merton option-pricing model value was not materially different from the independent quotes.
A summary of stock option activity under all plans is as follows (shares in millions):
2005 2004 2003Weighted- Weighted- Weighted-
Average Average AverageShares Price Shares Price Shares Price
Outstanding on January 1 183 $ 49.41 167 $ 50.56 159 $ 50.24Granted1 34 41.26 31 41.63 24 49.67Exercised (7) 35.63 (5) 35.54 (4) 26.96Forfeited/expired2 (7) 49.11 (10) 51.64 (12) 51.45
Outstanding on December 31 203 $ 48.50 183 $ 49.41 167 $ 50.56
Exercisable on December 31 131 $ 51.61 116 $ 52.02 102 $ 51.97
Shares available on December 31 foroptions that may be granted 58 85 108
1 No grants were made from the 1991 Option Plan during 2005, 2004 or 2003.2 Shares forfeited/expired relate to the 1991, 1999 and 2002 Option Plans.
The following table summarizes information about stock options as of December 31, 2005 (shares inmillions):
Outstanding Stock Options Exercisable Stock OptionsWeighted-Average
Remaining Weighted-Average Weighted-AverageRange of Exercise Prices Shares Contractual Life Exercise Price Shares Exercise Price
$ 40.00 to $ 50.00 147 9.4 years $ 44.93 76 $ 46.96$ 50.01 to $ 60.00 46 8.1 years $ 56.25 45 $ 56.29$ 60.01 to $ 86.75 10 2.8 years $ 65.85 10 $ 65.85
$ 40.00 to $ 86.75 203 8.8 years $ 48.50 131 $ 51.61
Restricted Stock Award Plans
Under the amended 1989 Restricted Stock Award Plan and the amended 1983 Restricted Stock Award Plan(the ‘‘Restricted Stock Award Plans’’), 40 million and 24 million shares of restricted common stock, respectively,were originally available to be granted to certain officers and key employees of our Company.
On December 31, 2005, 31 million shares remain available for grant under the Restricted Stock AwardPlans. Participants are entitled to vote and receive dividends on the shares and, under the 1983 Restricted StockAward Plan, participants are reimbursed by our Company for income taxes imposed on the award, but not fortaxes generated by the reimbursement payment. The shares are subject to certain transfer restrictions and maybe forfeited if a participant leaves our Company for reasons other than retirement, disability or death, absent achange in control of our Company.
98

THE COCA-COLA COMPANY AND SUBSIDIARIES
NOTES TO CONSOLIDATED FINANCIAL STATEMENTS
NOTE 14: STOCK COMPENSATION PLANS (Continued)
The following awards were outstanding as of December 31, 2005:
• 422,700 shares of time-based restricted stock in which the restrictions lapse upon the achievement ofcontinued employment over a specified period of time. An additional 10,000 shares were promised for anemployee based outside of the United States;
• 713,000 shares of performance-based restricted stock in which restrictions lapse upon the achievement ofspecific performance goals over a specified performance period. An additional 75,000 shares werepromised, based upon achievement of relevant performance criteria, for an employee based outside ofthe United States; and
• 2,356,728 performance share unit awards which could result in a future grant of restricted stock after theachievement of specific performance goals over a specified performance period. Such awards are subjectto adjustment based on the final performance relative to the goals, resulting in a minimum grant of noshares and a maximum grant of 3,499,092 shares.
In the third quarter of 2004, in connection with Douglas N. Daft’s retirement, the CompensationCommittee of the Board of Directors released to Mr. Daft 200,000 shares of restricted stock previously grantedto him during the period from April 1992 to October 1998. The terms of these grants provided that the restrictedshares be released upon retirement after age 62 but not earlier than five years from the date of grant. TheCompensation Committee determined to release the shares in recognition of Mr. Daft’s 27 years of service tothe Company and the fact that he would turn 62 in March 2005. Mr. Daft forfeited 500,000 shares of restrictedstock granted to him in November 2000, since as of the date of his retirement, he had not held these shares forfive years from the date of grant. In addition, Mr. Daft forfeited 1,000,000 shares of performance-basedrestricted stock, since Mr. Daft retired prior to the completion of the performance period.
Time-Based Restricted Stock Awards
The following table summarizes information about time-based restricted stock awards:
Number of Shares2005 2004 2003
Outstanding on January 1 513,700 1,224,900 1,506,485Granted1 9,000 140,000 —Released (100,000) (296,800) (254,585)Cancelled/Forfeited — (554,400) (27,000)
Outstanding on December 31 422,7002 513,700 1,224,900
1 In 2005 and 2004, the Company granted time-based restricted stock awards with average fair value of$41.80 per share and $48.97 per share, respectively.
2 In 2005, the Company promised to grant an additional 10,000 shares upon completion of three yearsof service. This award is similar to time-based restricted stock, including the payment of dividendequivalents, but was granted in this manner because the employee was based outside of the UnitedStates.
99

THE COCA-COLA COMPANY AND SUBSIDIARIES
NOTES TO CONSOLIDATED FINANCIAL STATEMENTS
NOTE 14: STOCK COMPENSATION PLANS (Continued)
Performance-Based Restricted Stock Awards
In 2001, shareowners approved an amendment to the 1989 Restricted Stock Award Plan to allow for thegrant of performance-based awards. These awards are released only upon the achievement of specificmeasurable performance criteria. These awards pay dividends during the performance period. The majority ofawards have specific earnings per share targets for achievement. If the earnings per share targets are not met,the awards will be cancelled.
The following table summarizes information about performance-based restricted stock awards:
Number of Shares2005 2004 2003
Outstanding on January 1 713,000 2,507,720 2,655,000Granted1 50,000 — 52,720Released — (110,000) —Cancelled/Forfeited (50,000) (1,684,720) (200,000)
Outstanding on December 31 713,0002 713,0002 2,507,7202
1 In 2005, 50,000 shares of three-year performance-based restricted stock were granted at an averagefair value of $42.40 per share. In 2003, 52,720 shares of three-year performance-based restricted stockwere granted at an average fair value of $42.91 per share.
2 In 2002, the Company promised to grant an additional 50,000 shares at the end of three years and anadditional 75,000 shares at the end of four years, at an average fair value of $46.88 per share, if theCompany achieved predefined performance targets over the respective measurement periods. Theseawards are similar to the performance-based restricted stock, including the payment of dividendequivalents, but were granted in this manner because the employees were based outside of the UnitedStates. The award to grant 50,000 shares was cancelled during 2005 because the performance targetwas not met. The award to grant 75,000 shares was outstanding as of December 31, 2005.
The Company did not recognize compensation expense for the majority of these awards, as it is notprobable the performance targets will be achieved.
Performance Share Unit Awards
In 2003, the Company modified its use of performance-based awards and established a program to grantperformance share unit awards under the 1989 Restricted Stock Award Plan to executives. The number ofperformance share units earned shall be determined at the end of each performance period, generally threeyears, based on performance criteria determined by the Board of Directors and may result in an award ofrestricted stock for U.S. participants and certain international participants at that time. The restricted stock maybe granted to other international participants shortly before the fifth anniversary of the original award.Restrictions on such stock generally lapse on the fifth anniversary of the original award date. Generally,performance share unit awards are subject to the performance criteria of compound annual growth in earningsper share over the performance period, as adjusted for certain items approved by the Compensation Committeeof the Board of Directors (‘‘adjusted EPS’’). The purpose of these adjustments is to ensure a consistent year toyear comparison of the specified performance criteria. Performance share units do not pay dividends during theperformance period. Accordingly, the fair value of these units is the quoted market value of the Company stock
100

THE COCA-COLA COMPANY AND SUBSIDIARIES
NOTES TO CONSOLIDATED FINANCIAL STATEMENTS
NOTE 14: STOCK COMPENSATION PLANS (Continued)
on the date of the grant less the present value of the expected dividends not received during the performanceperiod.
Performance share unit Target Awards for the 2004-2006, 2005-2007 and 2006-2008 performance periodsrequire adjusted EPS growth in line with our Company’s internal projections over the performance periods. Inthe event adjusted EPS exceeds the target projection, additional shares up to the Maximum Award may begranted. In the event adjusted EPS falls below the target projection, a reduced number of shares as few as theThreshold Award may be granted. If adjusted EPS falls below the Threshold Award performance level, noshares will be granted. Of the outstanding granted performance share unit awards as of December 31, 2005,726,379; 862,649; and 695,700 awards are for the 2004-2006, 2005-2007 and 2006-2008 performance periods,respectively. In addition, 72,000 performance share unit awards, with predefined qualitative performance criteriaand release criteria that differ from the program described above, were granted in 2004 and were outstanding asof December 31, 2005.
The following table summarizes information about performance share unit awards:
Number of Share Units2005 2004 2003
Outstanding on January 1 1,583,447 798,931 —Granted1 835,440 953,196 798,931Cancelled/Forfeited (62,159) (168,680) —
Outstanding on December 31 2,356,728 1,583,447 798,931
Threshold Award 1,352,388 950,837 399,466Target Award 2,356,728 1,583,447 798,931Maximum Award 3,499,092 2,339,171 1,198,397
1 In 2005, 2004 and 2003, the Company granted performance share unit awards with average fair valueof $37.71 per share, $38.71 per share and $46.78 per share, respectively.
The Company recognizes compensation expense when it becomes probable that the performance criteriaspecified in the plan will be achieved. The compensation expense is recognized over the remaining performanceperiod and is recorded in selling, general and administrative expenses. The Company has concluded that it is notprobable the performance criteria for the 2004-2006 performance period will be achieved; accordingly, nocompensation expense has been recognized for awards related to this performance period.
NOTE 15: PENSION AND OTHER POSTRETIREMENT BENEFIT PLANS
Our Company sponsors and/or contributes to pension and postretirement health care and life insurancebenefit plans covering substantially all U.S. employees. We also sponsor nonqualified, unfunded defined benefitpension plans for certain associates. In addition, our Company and its subsidiaries have various pension plansand other forms of postretirement arrangements outside the United States. We use a measurement date ofDecember 31 for substantially all of our pension and postretirement benefit plans.
101

THE COCA-COLA COMPANY AND SUBSIDIARIES
NOTES TO CONSOLIDATED FINANCIAL STATEMENTS
NOTE 15: PENSION AND OTHER POSTRETIREMENT BENEFIT PLANS (Continued)
Obligations and Funded Status
The following table sets forth the change in benefit obligations for our benefit plans (in millions):
Pension Benefits Other BenefitsDecember 31, 2005 2004 2005 2004
Benefit obligation at beginning of year1 $ 2,800 $ 2,495 $ 801 $ 761Service cost 91 85 28 27Interest cost 156 147 43 44Foreign currency exchange rate changes (69) 71 — 1Amendments 2 — — —Actuarial (gain) loss2 223 124 (63) (11)Benefits paid3 (133) (125) (25) (25)Settlements (28) — — —Curtailments (7) 3 — —Other 6 — 3 4
Benefit obligation at end of year1 $ 3,041 $ 2,800 $ 787 $ 801
1 For pension benefit plans, the benefit obligation is the projected benefit obligation. For other benefitplans, the benefit obligation is the accumulated postretirement benefit obligation.
2 During 2004, our accumulated postretirement benefit obligation was reduced by $67 million due tothe adoption of FSP 106-2. Refer to Note 1.
3 Benefits paid from pension benefit plans during 2005 and 2004 included $28 million and $25 million,respectively, in payments related to unfunded pension plans that were paid from Company assets. Allof the benefits paid from other benefit plans during 2005 and 2004 were paid from Company assets.
The accumulated benefit obligation for our pension plans was $2,650 million and $2,440 million atDecember 31, 2005 and 2004, respectively.
For pension plans with projected benefit obligations in excess of plan assets, the total projected benefitobligation and fair value of plan assets were $1,391 million and $702 million, respectively, as ofDecember 31, 2005, and $1,112 million and $388 million, respectively, as of December 31, 2004. For pensionplans with accumulated benefit obligations in excess of plan assets, the total accumulated benefit obligation andfair value of plan assets were $875 million and $331 million, respectively, as of December 31, 2005, and$916 million and $341 million, respectively, as of December 31, 2004.
102

THE COCA-COLA COMPANY AND SUBSIDIARIES
NOTES TO CONSOLIDATED FINANCIAL STATEMENTS
NOTE 15: PENSION AND OTHER POSTRETIREMENT BENEFIT PLANS (Continued)
The following table sets forth the change in the fair value of plan assets for our benefit plans (in millions):
Pension Benefits Other BenefitsDecember 31, 2005 2004 2005 2004
Fair value of plan assets at beginning of year1 $ 2,397 $ 2,024 $ 10 $ —Actual return on plan assets 233 243 1 1Employer contributions 163 179 8 9Foreign currency exchange rate changes (47) 51 — —Benefits paid (105) (100) — —Other (4) — — —
Fair value of plan assets at end of year1 $ 2,637 $ 2,397 $ 19 $ 10
1 Plan assets include 1.6 million shares of common stock of our Company with a fair value of $65million and $67 million as of December 31, 2005 and 2004, respectively. Dividends received oncommon stock of our Company during 2005 and 2004 were $1.8 million and $1.6 million, respectively.
The pension and other benefit amounts recognized in our consolidated balance sheets are as follows (inmillions):
Pension Benefits Other BenefitsDecember 31, 2005 2004 2005 2004
Funded status — plan assets less than benefit obligations $ (404) $ (403) $ (768) $ (791)Unrecognized net actuarial loss 550 447 123 187Unrecognized prior service cost (benefit) 44 47 (6) (6)
Net prepaid asset (liability) recognized $ 190 $ 91 $ (651) $ (610)
Prepaid benefit cost $ 620 $ 527 $ — $ —Accrued benefit liability (570) (595) (651) (610)Intangible asset 12 15 — —Accumulated other comprehensive income 128 144 — —
Net prepaid asset (liability) recognized $ 190 $ 91 $ (651) $ (610)
103

THE COCA-COLA COMPANY AND SUBSIDIARIES
NOTES TO CONSOLIDATED FINANCIAL STATEMENTS
NOTE 15: PENSION AND OTHER POSTRETIREMENT BENEFIT PLANS (Continued)
Components of Net Periodic Benefit Cost
Net periodic benefit cost for our pension and other postretirement benefit plans consisted of the following(in millions):
Pension Benefits Other BenefitsYear Ended December 31, 2005 2004 2003 2005 2004 2003
Service cost $ 91 $ 85 $ 76 $ 28 $ 27 $ 25Interest cost 156 147 140 43 44 44Expected return on plan assets (167) (153) (130) (1) — —Amortization of prior service cost (benefit) 7 8 7 — (1) —Recognized net actuarial loss 43 35 27 1 3 6
Net periodic benefit cost1 $ 130 $ 122 $ 120 $ 71 $ 73 $ 75
1 During 2004, net periodic benefit cost for our other postretirement benefit plans was reduced by$12 million due to our adoption of FSP 106-2. Refer to Note 1.
In 2003, the Company recorded a charge of $23 million for special retirement benefits and curtailment costsas part of the streamlining costs. Refer to Note 18.
Assumptions
Certain weighted-average assumptions used in computing the benefit obligations are as follows:
Pension Benefits Other BenefitsDecember 31, 2005 2004 2005 2004
Discount rate 51⁄4% 51⁄2% 53⁄4% 6%Rate of increase in compensation levels 4% 4% 41⁄2% 41⁄2%
Certain weighted-average assumptions used in computing net periodic benefit cost are as follows:
Pension Benefits Other BenefitsYear Ended December 31, 2005 2004 2003 2005 2004 2003
Discount rate1 51⁄2% 6% 6% 6% 61⁄4% 61⁄2%Rate of increase in compensation levels 4% 41⁄4% 41⁄4% 41⁄2% 41⁄2% 41⁄2%Expected long-term rate of return on plan assets 73⁄4% 73⁄4% 73⁄4% 81⁄2% 81⁄2% —%
1 On March 27, 2003, the primary qualified and nonqualified U.S. pension plans, as well as the U.S.postretirement health care plan, were remeasured to reflect the effect of the curtailment resultingfrom the Company’s streamlining initiatives. Refer to Note 18. The discount rate assumption used todetermine 2003 net periodic benefit cost for these U.S. plans was 63⁄4 percent prior to theremeasurement and 61⁄2 percent subsequent to the remeasurement. This change in the discount rate isreflected in the 2003 weighted-average discount rate of 6 percent for all pension benefit plans and 61⁄2percent for other benefit plans.
104

THE COCA-COLA COMPANY AND SUBSIDIARIES
NOTES TO CONSOLIDATED FINANCIAL STATEMENTS
NOTE 15: PENSION AND OTHER POSTRETIREMENT BENEFIT PLANS (Continued)
The assumed health care cost trend rates are as follows:
December 31, 2005 2004
Health care cost trend rate assumed for next year 9% 91⁄2%Rate to which the cost trend rate is assumed to decline (the ultimate trend rate) 51⁄4% 51⁄4%Year that the rate reaches the ultimate trend rate 2010 2010
Assumed health care cost trend rates have a significant effect on the amounts reported for thepostretirement health care plans. A one percentage point change in the assumed health care cost trend ratewould have the following effects (in millions):
One Percentage Point One Percentage PointIncrease Decrease
Effect on accumulated postretirement benefit obligationas of December 31, 2005 $ 125 $ (108)
Effect on total of service cost and interest cost in 2005 $ 14 $ (12)
The discount rate assumptions used to account for pension and other postretirement benefit plans reflectthe rates at which the benefit obligations could be effectively settled. These rates were determined using a cashflow matching technique whereby a hypothetical portfolio of high quality debt securities was constructed thatmirrors the specific benefit obligations for each of our primary U.S. plans. The rate of compensation increaseassumption is determined by the Company based upon annual reviews. We review external data and our ownhistorical trends for health care costs to determine the health care cost trend rate assumptions.
Plan Assets
The following table sets forth the actual asset allocation and weighted-average target asset allocation forour U.S. and non-U.S. pension plan assets:
Target AssetDecember 31, 2005 2004 Allocation
Equity securities1 58% 60% 57%Debt securities 29 31 33Real estate and other2 13 9 10Total 100% 100% 100%
1 As of December 31, 2005 and 2004, 2 percent and 3 percent, respectively, of total pension plan assetswere invested in common stock of our Company.
2 As of December 31, 2005 and 2004, 6 percent and 4 percent, respectively, of total pension plan assetswere invested in real estate.
Investment objectives for the Company’s U.S. pension plan assets, which comprise 71 percent of totalpension plan assets as of December 31, 2005, are to:
(1) optimize the long-term return on plan assets at an acceptable level of risk;
(2) maintain a broad diversification across asset classes and among investment managers;
(3) maintain careful control of the risk level within each asset class; and
(4) focus on a long-term return objective.
105

THE COCA-COLA COMPANY AND SUBSIDIARIES
NOTES TO CONSOLIDATED FINANCIAL STATEMENTS
NOTE 15: PENSION AND OTHER POSTRETIREMENT BENEFIT PLANS (Continued)
Asset allocation targets promote optimal expected return and volatility characteristics given the long-termtime horizon for fulfilling the obligations of the pension plans. Selection of the targeted asset allocation for U.S.plan assets was based upon a review of the expected return and risk characteristics of each asset class, as well asthe correlation of returns among asset classes.
Investment guidelines are established with each investment manager. These guidelines provide theparameters within which the investment managers agree to operate, including criteria that determine eligibleand ineligible securities, diversification requirements and credit quality standards, where applicable. Unlessexceptions have been approved, investment managers are prohibited from buying or selling commodities, futuresor option contracts, as well as from short selling of securities. Furthermore, investment managers agree to obtainwritten approval for deviations from stated investment style or guidelines.
As of December 31, 2005, no investment manager was responsible for more than 10 percent of total U.S.plan assets. In addition, diversification requirements for each investment manager prevent a single security orother investment from exceeding 10 percent, at historical cost, of the total U.S. plan assets.
The expected long-term rate of return assumption for U.S. plan assets is based upon the target assetallocation and is determined using forward-looking assumptions in the context of historical returns andvolatilities for each asset class, as well as correlations among asset classes. We evaluate the rate of returnassumption on an annual basis. The expected long-term rate of return assumption used in computing 2005 netperiodic pension cost for the U.S. plans was 8.5 percent. As of December 31, 2005, the 10-year annualized returnon U.S. plan assets was 9.6 percent, the 15-year annualized return was 11.6 percent, and the annualized returnsince inception was 12.7 percent.
Plan assets for our pension plans outside the United States are insignificant on an individual plan basis.
Cash Flows
Information about the expected cash flows for our pension and other postretirement benefit plans is asfollows (in millions):
Pension OtherBenefits Benefits
Expected employer contributions:2006 $ 103 $ 9Expected benefit payments1:2006 $ 125 $ 302007 131 322008 134 342009 135 372010 140 392011-2015 782 233
1 The expected benefit payments for our other postretirement benefit plans do not reflect anyestimated federal subsidies expected to be received under the Medicare Prescription Drug,Improvement and Modernization Act of 2003. Federal subsidies are estimated to range from$1.9 million in 2006 to $3.0 million in 2010 and are estimated to be $19.8 million for the period2011-2015.
106

THE COCA-COLA COMPANY AND SUBSIDIARIES
NOTES TO CONSOLIDATED FINANCIAL STATEMENTS
NOTE 15: PENSION AND OTHER POSTRETIREMENT BENEFIT PLANS (Continued)
Defined Contribution Plans
Our Company sponsors a qualified defined contribution plan covering substantially all U.S. employees.Under this plan, we match 100 percent of participants’ contributions up to a maximum of 3 percent ofcompensation. Company contributions to the U.S. plan were approximately $21 million, $18 million and$20 million in 2005, 2004 and 2003, respectively. We also sponsor defined contribution plans in certain locationsoutside the United States. Company contributions to those plans were approximately $14 million, $8 million and$7 million in 2005, 2004 and 2003, respectively.
NOTE 16: INCOME TAXES
Income before income taxes consisted of the following (in millions):
Year Ended December 31, 2005 2004 2003
United States $ 2,268 $ 2,535 $ 2,029International 4,422 3,687 3,466
$ 6,690 $ 6,222 $ 5,495
Income tax expense (benefit) consisted of the following for the years ended December 31, 2005, 2004 and2003 (in millions):
United State andStates Local International Total
2005Current $ 873 $ 188 $ 845 $ 1,906Deferred (72) (25) 9 (88)
2004Current $ 350 $ 64 $ 799 $ 1,213Deferred 209 29 (76) 162
2003Current $ 426 $ 84 $ 826 $ 1,336Deferred (145) (11) (32) (188)
We made income tax payments of approximately $1,676 million, $1,500 million and $1,325 million in 2005,2004 and 2003, respectively.
107

THE COCA-COLA COMPANY AND SUBSIDIARIES
NOTES TO CONSOLIDATED FINANCIAL STATEMENTS
NOTE 16: INCOME TAXES (Continued)
A reconciliation of the statutory U.S. federal tax rate and effective tax rates is as follows:
Year Ended December 31, 2005 2004 2003
Statutory U.S. federal rate 35.0 % 35.0 % 35.0 %State and local income taxes — net of federal benefit 1.2 1.0 0.9Earnings in jurisdictions taxed at rates different from the statutory U.S. federal
rate (12.1)1 (9.4)5,6 (10.6)10
Equity income or loss (2.3) (3.1)7 (2.4)11
Other operating charges 0.42 (0.9)8 (1.1)12
Other — net 0.33 (0.5)9 (0.9)Repatriation under the Jobs Creation Act 4.74 — —
Effective rates 27.2 % 22.1 % 20.9 %
1 Includes approximately $29 million (or 0.4 percent) tax benefit related to the favorable resolution ofcertain tax matters in various international jurisdictions.
2 Includes approximately $4 million tax benefit related to the Philippines impairment charges. Refer toNote 5 and Note 17.
3 Includes approximately $72 million (or 1.1 percent) tax benefit related to the favorable resolution ofcertain domestic tax matters.
4 Related to repatriation of approximately $6.1 billion of previously unremitted foreign earnings underthe Jobs Creation Act, resulting in a tax provision of approximately $315 million.
5 Includes approximately $92 million (or 1.4 percent) tax benefit related to the favorable resolution ofcertain tax matters in various international jurisdictions.
6 Includes a tax charge of approximately $75 million (or 1.2 percent) related to the recording of avaluation allowance on various deferred tax assets recorded in Germany.
7 Includes an approximate $50 million (or 0.8 percent) tax benefit related to the realization of certainforeign tax credits per provisions of the Jobs Creation Act.
8 Includes a tax benefit of approximately $171 million primarily related to impairment of franchise rightsat CCEAG and certain manufacturing investments. Refer to Note 17.
9 Includes an approximate $36 million (or 0.6 percent) tax benefit related to the favorable resolution ofvarious domestic tax matters.
10 Includes an approximate $50 million (or 0.8 percent) tax benefit related primarily to the favorableresolution of certain tax matters in various international jurisdictions.
11 Includes the tax benefit of approximately $3 million related to the write-down of certain intangibleassets held by bottling investments in Latin America. Refer to Note 2.
12 Includes the tax benefit of approximately $186 million related to charges for streamlining initiatives.Refer to Note 18.
Our effective tax rate reflects the tax benefits from having significant operations outside the United Statesthat are taxed at rates lower than the statutory U.S. rate of 35 percent.
Undistributed earnings of the Company’s foreign subsidiaries amounted to approximately $5.1 billion atDecember 31, 2005. Those earnings are considered to be indefinitely reinvested and, accordingly, no U.S.federal and state income taxes have been provided thereon. Upon distribution of those earnings in the form ofdividends or otherwise, the Company would be subject to both U.S. income taxes (subject to an adjustment forforeign tax credits) and withholding taxes payable to the various foreign countries. Determination of the amountof unrecognized deferred U.S. income tax liability is not practical because of the complexities associated with itshypothetical calculation; however, unrecognized foreign tax credits would be available to reduce a portion of theU.S. liability.
108

THE COCA-COLA COMPANY AND SUBSIDIARIES
NOTES TO CONSOLIDATED FINANCIAL STATEMENTS
NOTE 16: INCOME TAXES (Continued)
As discussed in Note 1, the Jobs Creation Act was enacted in October 2004. One of the provisions providesa one-time benefit related to foreign tax credits generated by equity investments in prior years. The Companyrecorded an income tax benefit of approximately $50 million as a result of this law change in 2004. The JobsCreation Act also included a temporary incentive for U.S. multinationals to repatriate foreign earnings at anapproximate 5.25 percent effective tax rate. During the first quarter of 2005, the Company decided to repatriateapproximately $2.5 billion in previously unremitted foreign earnings. Therefore, the Company recorded aprovision for taxes on such previously unremitted foreign earnings of approximately $152 million in the firstquarter of 2005. Also, during 2005, the United States Internal Revenue Service and the United StatesDepartment of Treasury issued additional guidance related to the Jobs Creation Act. As a result of thisguidance, the Company reduced the accrued taxes previously provided on such unremitted earnings by$25 million in the second quarter of 2005. Also, during the fourth quarter of 2005, the Company repatriated anadditional $3.6 billion, with an associated tax liability of approximately $188 million. Therefore, the totalpreviously unremitted earnings that was repatriated during the full year of 2005 was $6.1 billion with anassociated tax liability of approximately $315 million. This liability was recorded in the current year as federaland state and local tax expenses in the amount of $301 million and $14 million, respectively.
The tax effects of temporary differences and carryforwards that give rise to deferred tax assets and liabilitiesconsist of the following (in millions):
December 31, 2005 2004
Deferred tax assets:Property, plant and equipment $ 60 $ 71Trademarks and other intangible assets 64 65Equity method investments (including translation adjustment) 445 530Other liabilities 200 149Benefit plans 649 594Net operating/capital loss carryforwards 750 856Other 295 257
Gross deferred tax assets 2,463 2,522Valuation allowances (786) (854)Total deferred tax assets1,2 $ 1,677 $ 1,668
Deferred tax liabilities:Property, plant and equipment $ (641) $ (684)Trademarks and other intangible assets (278) (247)Equity method investments (including translation adjustment) (674) (612)Other liabilities (80) (71)Other (170) (180)
Total deferred tax liabilities3 $ (1,843) $ (1,794)Net deferred tax assets (liabilities) $ (166) $ (126)
1 Noncurrent deferred tax assets of $192 million and $251 million were included in the consolidatedbalance sheets line item other assets at December 31, 2005 and 2004, respectively.
2 Current deferred tax assets of $153 million and $146 million were included in the consolidatedbalance sheets line item prepaid expenses and other assets at December 31, 2005 and 2004,respectively.
3 Current deferred tax liabilities of $159 million and $121 million were included in the consolidatedbalance sheets line item accounts payable and accrued expenses at December 31, 2005 and 2004,respectively.
109

THE COCA-COLA COMPANY AND SUBSIDIARIES
NOTES TO CONSOLIDATED FINANCIAL STATEMENTS
NOTE 16: INCOME TAXES (Continued)
On December 31, 2005 and 2004, we had approximately $116 million and $194 million, respectively, of netdeferred tax assets located in countries outside the United States.
On December 31, 2005, we had approximately $3,345 million of loss carryforwards available to reducefuture taxable income. Loss carryforwards of approximately $1,365 million must be utilized within the next fiveyears; $123 million must be utilized within the next 10 years, and the remainder can be utilized over a periodgreater than 10 years.
As of December 31, 2005, 2004 and 2003, the Company had valuation allowances of $786 million,$854 million and $630 million, respectively, which were primarily related to the realization of recorded taxbenefits on tax loss carryforwards from operations in various jurisdictions. In 2005, the Company recognized adecrease in its valuation allowances of $68 million. In 2004, the Company recognized an increase in its valuationallowances of $224 million. In 2003, the Company recognized a decrease in its valuation allowances of$108 million.
NOTE 17: SIGNIFICANT OPERATING AND NONOPERATING ITEMS
In 2005, our Company received approximately $109 million related to the settlement of a class actionlawsuit concerning price-fixing in the sale of HFCS purchased by the Company during the years 1991 to 1995.Subsequent to the receipt of this settlement amount, the Company distributed approximately $62 million tocertain bottlers in North America. From 1991 to 1995, the Company purchased HFCS on behalf of thesebottlers. Therefore, these bottlers were ultimately entitled to a portion of the proceeds of the settlement. Of theapproximately $62 million we distributed to certain bottlers in North America, approximately $49 million wasdistributed to CCE. The Company’s remaining share of the settlement was approximately $47 million, which wasrecorded as a reduction of cost of goods sold and impacted the Corporate operating segment.
During 2005, we recorded approximately $23 million of noncash pretax gains on the issuances of stock byequity method investees. Refer to Note 3.
The Company recorded approximately $50 million of expense in 2005 as a result of a change in ourestimated service period for the acceleration of certain stock-based compensation awards. Refer to Note 14.
Equity income in 2005 was reduced by approximately $33 million for the Corporate segment, primarilyrelated to our proportionate share of the tax liability recorded by CCE resulting from its repatriation ofpreviously unremitted foreign earnings under the Jobs Creation Act, as well as our proportionate share ofrestructuring charges. Those amounts were partially offset by our proportionate share of CCE’s HFCS lawsuitsettlement proceeds and changes in certain of CCE’s state and provincial tax rates. Refer to Note 2.
Our Company recorded impairment charges during 2005 of approximately $84 million related to certaintrademarks for beverages sold in the Philippines and approximately $1 million related to impairment of otherassets. These impairment charges were recorded in the consolidated statement of income line item otheroperating charges. Refer to Note 5.
During 2004, our Company’s equity income benefited by approximately $37 million for our proportionateshare of a favorable tax settlement related to Coca-Cola FEMSA.
In 2004, we recorded approximately $24 million of noncash pretax gains on the issuances of stock by CCE.Refer to Note 3.
110

THE COCA-COLA COMPANY AND SUBSIDIARIES
NOTES TO CONSOLIDATED FINANCIAL STATEMENTS
NOTE 17: SIGNIFICANT OPERATING AND NONOPERATING ITEMS (Continued)
We recorded impairment charges during 2004 of approximately $374 million, primarily related to theimpairment of franchise rights at CCEAG and approximately $18 million related to other assets. Theseimpairment charges were recorded in the consolidated statement of income line item other operating charges.Refer to Note 5.
We recorded additional impairment charges in 2004 of approximately $88 million. These impairmentsprimarily related to the write-downs of certain manufacturing investments and an intangible asset. As a result ofoperating losses, management prepared analyses of cash flows expected to result from the use of the assets andtheir eventual disposition. Because the sum of the undiscounted cash flows was less than the carrying value ofsuch assets, we recorded an impairment charge to reduce the carrying value of the assets to fair value. Theseimpairment charges were recorded in the consolidated statement of income line item other operating charges.
Also in 2004, our Company received a $75 million insurance settlement related to the class action lawsuitthat was settled in 2000. The Company donated $75 million to The Coca-Cola Foundation in 2004.
In 2003, the Company reached a settlement with certain defendants in a vitamin antitrust litigation matter.In that litigation, the Company alleged that certain vitamin manufacturers participated in a global conspiracy tofix the price of some vitamins, including vitamins used in the manufacture of some of the Company’s products.Also in 2003, the Company received a settlement relating to this litigation of approximately $52 million, whichwas recorded as a reduction to cost of goods sold.
Refer to Note 2 for disclosure regarding the merger of Coca-Cola FEMSA and Panamco in 2003 and therecording of a $102 million noncash pretax charge to the consolidated statement of income line item equityincome—net.
During 2003, we recorded approximately $8 million of noncash pretax gains on the issuances of stock byequity method investees. Refer to Note 3.
NOTE 18: STREAMLINING COSTS
During 2003, the Company took steps to streamline and simplify its operations, primarily in North Americaand Germany. In North America, the Company integrated the operations of three formerly separate NorthAmerican business units—Coca-Cola North America, The Minute Maid Company and Coca-Cola Fountain. InGermany, CCEAG took steps to improve its efficiency in sales, distribution and manufacturing, and our GermanDivision office also implemented streamlining initiatives. Selected other operations also took steps to streamlinetheir operations to improve overall efficiency and effectiveness. As disclosed in Note 1, under SFAS No. 146, aliability is accrued only when certain criteria are met. All of the Company’s streamlining initiatives met thecriteria of SFAS No. 146 as of December 31, 2003, and all related costs were incurred as of December 31, 2003.
Employees separated from the Company as a result of these streamlining initiatives were offered severanceor early retirement packages, as appropriate, which included both financial and nonfinancial components. Theexpenses recorded during the year ended December 31, 2003 included costs associated with involuntaryterminations and other direct costs associated with implementing these initiatives. As of December 31, 2003,approximately 3,700 associates were separated pursuant to these streamlining initiatives. Other direct costsincluded the relocation of employees; contract termination costs; costs associated with the development,communication and administration of these initiatives; and asset write-offs. During 2003, the Company incurredtotal pretax expenses related to these streamlining initiatives of approximately $561 million, or $0.15 per share
111

THE COCA-COLA COMPANY AND SUBSIDIARIES
NOTES TO CONSOLIDATED FINANCIAL STATEMENTS
NOTE 18: STREAMLINING COSTS (Continued)
after-tax. These expenses were recorded in our consolidated statements of income line item other operatingcharges.
The table below summarizes the costs incurred in 2003, the balances of accrued streamlining expenses, andthe movement in those balances as of and for the years ended December 31, 2003, 2004 and 2005 (in millions):
Accrued Accrued AccruedCosts Noncash Balance Noncash Balance Noncash Balance
Incurred and December 31, and December 31, and December 31,in 2003 Payments Exchange 2003 Payments Exchange 2004 Payments Exchange 2005
Severance pay andbenefits $ 248 $ (113) $ 3 $ 138 $ (118) $ (2) $ 18 $ (14) $ (2) $ 2
Retirement relatedbenefits 43 — (14) 29 — (29) — — — —
Outside services—legal,outplacement,consulting 36 (25) — 11 (10) (1) — — — —
Other direct costs 133 (81) (1) 51 (29) 1 23 (6) (1) 16
Total1 $ 460 $ (219) $ (12) $ 229 $ (157) $ (31) $ 41 $ (20) $ (3) $ 18
Asset impairments $ 101
Total costs incurred $ 561
1 As of December 31, 2004 and 2005, $41 million and $18 million, respectively, was included in our consolidated balance sheets line item accountspayable and accrued expenses.
The total streamlining initiative costs incurred for the year ended December 31, 2003 by operating segmentwere as follows (in millions):
North America $ 273Africa 12East, South Asia and Pacific Rim 11European Union 157Latin America 8North Asia, Eurasia and Middle East 33Corporate 67
Total $ 561
NOTE 19: ACQUISITIONS AND INVESTMENTS
During 2005, our Company’s acquisition and investment activity totaled approximately $637 million andincluded the acquisition of the German soft drink bottling company Bremer Erfrischungsgetraenke GmbH(‘‘Bremer’’) for approximately $160 million from InBev SA. This transaction was accounted for as a businesscombination, and the results of Bremer’s operations have been included in the Company’s consolidated financialstatements beginning in September 2005. The Company recorded approximately $54 million of property, plantand equipment, approximately $85 million of franchise rights and approximately $58 million of goodwill relatedto this acquisition. The franchise rights have been assigned an indefinite life, and the goodwill was allocated tothe Germany and Nordic reporting unit within the European Union operating segment.
112

THE COCA-COLA COMPANY AND SUBSIDIARIES
NOTES TO CONSOLIDATED FINANCIAL STATEMENTS
NOTE 19: ACQUISITIONS AND INVESTMENTS (Continued)
In August 2005, we completed the acquisition of the remaining 49 percent interest in the business of CCDAWaters L.L.C. (‘‘CCDA’’) not previously owned by our Company. Our Company and Danone Waters of NorthAmerica, Inc. (‘‘DWNA’’) had formed CCDA in July 2002 for the production, marketing and distribution ofDWNA’s bottled spring and source water business in the United States. This transaction was accounted for as abusiness combination, and the consolidated results of CCDA’s operations have been included in the Company’sconsolidated financial statements since July 2002. CCDA is included in our North America operating segment.In July 2005, the Company acquired Sucos Mais, a Brazilian juice company. The results of Sucos Mais have beenincluded in our consolidated financial statements since July 2005.
Assuming the results of these businesses had been included in operations beginning on January 1, 2005, proforma financial data would not be required due to immateriality.
On April 20, 2005, our Company and Coca-Cola HBC jointly acquired Multon for a total purchase price ofapproximately $501 million, split equally between the Company and Coca-Cola HBC. The Company’sinvestment in Multon is accounted for under the equity method. Equity income—net includes our proportionateshare of the results of Multon’s operations beginning April 20, 2005.
During 2004, our Company’s acquisition and investment activity totaled approximately $267 million,primarily related to the purchase of trademarks, brands and related contractual rights in Latin America, none ofwhich was individually significant.
During 2003, our Company’s acquisition and investment activity totaled approximately $359 million. Theseacquisitions included purchases of trademarks, brands and related contractual rights of approximately$142 million, none of which was individually significant. Other acquisition and investing activity totaledapproximately $217 million, none of which were individually significant. In March 2003, our Company acquired a100 percent ownership interest in Truesdale from our equity method investee CCE for cash consideration ofapproximately $58 million. Truesdale owns a noncarbonated beverage production facility. The purchase pricewas allocated primarily to property, plant and equipment acquired. No amount was allocated to intangibleassets. Truesdale is included in our North America operating segment.
NOTE 20: OPERATING SEGMENTS
During 2005, the Company made certain changes to its operating structure impacting its Europe, Eurasiaand Middle East operating segment and its Asia operating segment. The Company replaced these operatingsegments with three new operating segments: the European Union operating segment; the North Asia, Eurasiaand Middle East operating segment; and the East, South Asia and Pacific Rim operating segment. TheEuropean Union operating segment includes the Company’s operations in all of the current member states ofthe European Union as well as the European Free Trade Association countries, Switzerland, Israel and thePalestinian Territories, and Greenland. The North Asia, Eurasia and Middle East operating segment includesthe Company’s operations in China, Japan, Eurasia and Middle East (other than Israel and the PalestinianTerritories), Russia, Ukraine and Belarus, and other European countries not included in the European Unionoperating segment. The East, South Asia and Pacific Rim operating segment includes the Company’s operationsin India, the Philippines, Southeast and West Asia, and South Pacific and Korea. As of December 31, 2005, ourCompany’s operating structure consisted of the following operating segments: North America; Africa; East,South Asia and Pacific Rim; European Union; Latin America; North Asia, Eurasia and Middle East; andCorporate. Prior year amounts have been reclassified to conform with the new operating structure describedabove.
113

THE COCA-COLA COMPANY AND SUBSIDIARIES
NOTES TO CONSOLIDATED FINANCIAL STATEMENTS
NOTE 20: OPERATING SEGMENTS (Continued)
Segment Products and Services
The business of our Company is nonalcoholic beverages. Our operating segments derive a majority of theirrevenues from the manufacture and sale of beverage concentrates and syrups and, in some cases, the sale offinished beverages. The following table summarizes the contribution to net operating revenues from Companyoperations (in millions):
Year Ended December 31, 2005 2004 2003
Company operations, excluding bottling operations $ 19,687 $ 18,651 $ 17,990Company-owned bottling operations 3,417 3,091 2,867
Consolidated net operating revenues $ 23,104 $ 21,742 $ 20,857
Method of Determining Segment Income or Loss
Management evaluates the performance of our operating segments separately to individually monitor thedifferent factors affecting financial performance. Segment income or loss includes substantially all of thesegment’s costs of production, distribution and administration. Our Company typically manages and evaluatesequity method investments and related income on a segment level. However, we manage certain investments,such as our equity interests in CCE and Coca-Cola HBC, within the Corporate operating segment. OurCompany manages income taxes and financial costs, such as interest income and expense, on a global basiswithin the Corporate operating segment. We evaluate segment performance based on income or loss beforeincome taxes.
114

THE COCA-COLA COMPANY AND SUBSIDIARIES
NOTES TO CONSOLIDATED FINANCIAL STATEMENTS
NOTE 20: OPERATING SEGMENTS (Continued)
Information about our Company’s operations by operating segment is as follows (in millions):
East, South North Asia,North Asia and European Latin Eurasia and
America Africa Pacific Rim Union America Middle East Corporate Consolidated
2005Net operating revenues $ 6,676 $ 1,263 $ 1,258 $ 6,803 $ 2,527 $ 4,4941 $ 83 $ 23,104Operating income (loss)2 1,554 415 2013 2,247 1,207 1,709 (1,248)4 6,085Interest income 235 235Interest expense 240 240Depreciation and amortization 348 29 75 245 40 61 134 932Equity income — net 10 13 70 2 207 59 319 5 680Income (loss) before income taxes2 1,559 414 3033,6 2,191 1,429 1,749 (955)4,5 6,690Identifiable operating assets 4,621 758 761 4,7117 1,622 1,140 8,892 8 22,505Investments9 124 161 1,099 36 1,853 784 2,865 6,922Capital expenditures 265 40 45 217 57 126 149 899
2004Net operating revenues $ 6,423 $ 1,067 $ 1,276 $ 6,570 $ 2,123 $ 4,1821 $ 101 $ 21,742Operating income (loss)10 1,606 340 344 1,812 1,069 1,629 (1,102)11 5,698Interest income 157 157Interest expense 196 196Depreciation and amortization 345 28 60 234 42 84 100 893Equity income — net 11 12 72 1 185 12 26 314 621Income (loss) before income taxes10 1,629 337 429 1,747 1,270 12 1,641 (831)11,13 6,222Identifiable operating assets 4,731 789 753 5,1447 1,405 1,108 11,259 8 25,189Investments9 116 162 1,097 67 1,580 493 2,737 6,252Capital expenditures 247 28 41 225 38 59 117 755
2003Net operating revenues $ 6,157 $ 827 $ 1,331 $ 6,086 $ 2,042 $ 4,3211 $ 93 $ 20,857Operating income (loss)14 1,282 249 367 1,897 970 1,487 (1,031)15 5,221Interest income 176 176Interest expense 178 178Depreciation and amortization 305 27 53 220 52 81 112 850Equity income — net 13 13 59 3 (5)16 18 305 406Income (loss) before income taxes14 1,326 249 423 1,847 975 16 1,483 (808)15 5,495Identifiable operating assets 4,953 721 887 5,1187 1,440 1,051 7,702 8 21,872Investments9 109 156 1,015 71 1,348 547 2,292 5,538Capital expenditures 309 13 91 188 35 67 109 812
Intercompany transfers between operating segments are not material and are eliminated.Certain prior year amounts have been reclassified to conform to the current year presentation.1 Net operating revenues in Japan represented approximately 66 percent of total North Asia, Eurasia and Middle East operating segment net operating
revenues in 2005, 72 percent in 2004 and 82 percent in 2003.2 Operating income (loss) and income (loss) before income taxes were reduced by approximately $12 million for North America, $3 million for Africa,
$3 million for East, South Asia and Pacific Rim, $3 million for European Union, $4 million for Latin America, $3 million for North Asia, Eurasia andMiddle East and $22 million for Corporate as a result of accelerated amortization of stock-based compensation expense due to a change in ourestimated service period for retirement-eligible participants. Refer to Note 14.
3 Operating income (loss) and income (loss) before income taxes were reduced by approximately $85 million and $89 million, respectively, for East, SouthAsia and Pacific Rim related to the Philippines impairment charges. Refer to Note 17.
4 Operating income (loss) and income (loss) before income taxes benefited by approximately $47 million for Corporate related to the settlement of a classaction lawsuit related to HFCS purchases. Refer to Note 17.
115

THE COCA-COLA COMPANY AND SUBSIDIARIES
NOTES TO CONSOLIDATED FINANCIAL STATEMENTS
NOTE 20: OPERATING SEGMENTS (Continued)5 Equity income—net and income (loss) before income taxes were impacted by approximately $33 million for Corporate primarily related to our
proportionate share of the tax liability recorded as a result of CCE’s repatriation of unremitted foreign earnings under the Jobs Creation Act,restructuring charges, offset by CCE’s HFCS lawsuit settlement proceeds, and changes in certain of CCE’s state and provincial tax rates. Refer to Note17.
6 Income (loss) before income taxes benefited by approximately $22 million for East, South Asia and Pacific Rim due to issuances of stock by Coca-ColaAmatil, one of our equity method investees. Refer to Note 3.
7 Identifiable operating assets in Germany represented approximately 48 percent of total European Union identifiable operating assets in 2005, 48percent in 2004 and 51 percent in 2003.
8 Principally cash and cash equivalents, marketable securities, finance subsidiary receivables, goodwill, trademarks and other intangible assets andproperty, plant and equipment.
9 Principally equity and cost method investments in bottling companies.10 Operating income (loss) and income (loss) before income taxes were reduced by approximately $18 million for North America, $15 million for East,
South Asia and Pacific Rim, $368 million for European Union, $6 million for Latin America, $9 million for North Asia, Eurasia and Middle East and$64 million for Corporate as a result of other operating charges recorded for asset impairments. Refer to Note 17.
11 Operating income (loss) and income (loss) before income taxes for Corporate were impacted as a result of the Company’s receipt of a $75 millioninsurance settlement related to the class action lawsuit settled in 2000. The Company subsequently donated $75 million to The Coca-Cola Foundation.
12 Equity income—net and income (loss) before income taxes for Latin America were increased by approximately $37 million as a result of a favorable taxsettlement related to Coca-Cola FEMSA, one of our equity method investees. Refer to Note 2.
13 Income (loss) before income taxes was increased by approximately $24 million for Corporate due to noncash pre-tax gains that were recognized on theissuances of stock by CCE, one of our equity method investees. Refer to Note 3.
14 Operating income (loss) and income (loss) before income taxes were reduced by approximately $273 million for North America, $12 million for Africa,$11 million for East, South Asia and Pacific Rim, $157 million for European Union, $8 million for Latin America, $33 million for North Asia, Eurasiaand Middle East and $67 million for Corporate as a result of streamlining charges. Refer to Note 18.
15 Operating income (loss) and income (loss) before income taxes were increased by approximately $52 million for Corporate as a result of the Company’sreceipt of a settlement related to a vitamin antitrust litigation matter. Refer to Note 17.
16 Equity income—net and income (loss) before income taxes for Latin America were reduced by approximately $102 million primarily for a charge relatedto one of our equity method investees. Refer to Note 2.
Five-Year Compound Growth Rates
NetOperating Operating
Five Years Ended December 31, 2005 Revenues Income
Consolidated 6.2% 10.5%
North America 4.2% 1.8%Africa 15.4% 21.3%East, South Asia and Pacific Rim 3.7% *%European Union 15.6% 13.7%Latin America 4.4% 5.5%North Asia, Eurasia and Middle East (0.2)% 6.9%Corporate * *
* Calculation is not meaningful.
116

23FEB20042218446024JAN200522210514
25FEB200412544370
REPORT OF MANAGEMENT ON INTERNAL CONTROL OVER FINANCIAL REPORTINGThe Coca-Cola Company and Subsidiaries
Management of the Company is responsible for the preparation and integrity of the Consolidated Financial Statementsappearing in our Annual Report on Form 10-K. The financial statements were prepared in conformity with generallyaccepted accounting principles appropriate in the circumstances and, accordingly, include certain amounts based on ourbest judgments and estimates. Financial information in this Annual Report on Form 10-K is consistent with that in thefinancial statements.
Management of the Company is responsible for establishing and maintaining adequate internal control over financialreporting as such term is defined in Rules 13a-15(f) under the Securities Exchange Act of 1934 (‘‘Exchange Act’’). TheCompany’s internal control over financial reporting is designed to provide reasonable assurance regarding the reliability offinancial reporting and the preparation of the Consolidated Financial Statements. Our internal control over financialreporting is supported by a program of internal audits and appropriate reviews by management, written policies andguidelines, careful selection and training of qualified personnel and a written Code of Business Conduct adopted by ourCompany’s Board of Directors, applicable to all Company Directors and all officers and employees of our Company andsubsidiaries.
Because of its inherent limitations, internal control over financial reporting may not prevent or detect misstatementsand even when determined to be effective, can only provide reasonable assurance with respect to financial statementpreparation and presentation. Also, projections of any evaluation of effectiveness to future periods are subject to the riskthat controls may become inadequate because of changes in conditions, or that the degree of compliance with the policiesor procedures may deteriorate.
The Audit Committee of our Company’s Board of Directors, composed solely of Directors who are independent inaccordance with the requirements of the New York Stock Exchange listing standards, the Exchange Act and the Company’sCorporate Governance Guidelines, meets with the independent auditors, management and internal auditors periodically todiscuss internal control over financial reporting and auditing and financial reporting matters. The Committee reviews withthe independent auditors the scope and results of the audit effort. The Committee also meets periodically with theindependent auditors and the chief internal auditor without management present to ensure that the independent auditorsand the chief internal auditor have free access to the Committee. Our Audit Committee’s Report can be found in theCompany’s 2006 Proxy statement.
Management assessed the effectiveness of the Company’s internal control over financial reporting as of December 31,2005. In making this assessment, management used the criteria set forth by the Committee of Sponsoring Organizations ofthe Treadway Commission (COSO) in Internal Control—Integrated Framework. Based on our assessment, managementbelieves that the Company maintained effective internal control over financial reporting as of December 31, 2005.
The Company’s independent auditors, Ernst & Young LLP, a registered public accounting firm, are appointed by theAudit Committee of the Company’s Board of Directors, subject to ratification by our Company’s shareowners. Ernst &Young LLP have audited and reported on the Consolidated Financial Statements of The Coca-Cola Company andsubsidiaries, management’s assessment of the effectiveness of the Company’s internal control over financial reporting andthe effectiveness of the Company’s internal control over financial reporting. The reports of the independent auditors arecontained in this Annual Report.
E. Neville Isdell Connie D. McDanielChairman, Board of Directors, Vice Presidentand Chief Executive Officer and Controller
February 24, 2006 February 24, 2006
Gary P. FayardExecutive Vice Presidentand Chief Financial Officer
February 24, 2006
117

Report of Independent Registered Public Accounting Firm
Board of Directors and ShareownersThe Coca-Cola Company
We have audited the accompanying consolidated balance sheets of The Coca-Cola Company andsubsidiaries as of December 31, 2005 and 2004, and the related consolidated statements of income, shareowners’equity, and cash flows for each of the three years in the period ended December 31, 2005. Our audits alsoincluded the financial statement schedule listed in the Index at Item 15(a). These financial statements andschedule are the responsibility of the Company’s management. Our responsibility is to express an opinion onthese financial statements and schedule based on our audits.
We conducted our audits in accordance with the standards of the Public Company Accounting OversightBoard (United States). Those standards require that we plan and perform the audit to obtain reasonableassurance about whether the financial statements are free of material misstatement. An audit includesexamining, on a test basis, evidence supporting the amounts and disclosures in the financial statements. An auditalso includes assessing the accounting principles used and significant estimates made by management, as well asevaluating the overall financial statement presentation. We believe that our audits provide a reasonable basis forour opinion.
In our opinion, the financial statements referred to above present fairly, in all material respects, theconsolidated financial position of The Coca-Cola Company and subsidiaries at December 31, 2005 and 2004, andthe consolidated results of their operations and their cash flows for each of the three years in the period endedDecember 31, 2005, in conformity with U.S. generally accepted accounting principles. Also, in our opinion, therelated financial statement schedule, when considered in relation to the basic financial statements taken as awhole, presents fairly in all material respects the information set forth therein.
As discussed in Note 1 to the consolidated financial statements, in 2004 the Company adopted theprovisions of FASB Interpretation No. 46 (revised December 2003) regarding the consolidation of variableinterest entities.
We also have audited, in accordance with the standards of the Public Company Accounting Oversight Board(United States), the effectiveness of The Coca-Cola Company and subsidiaries’ internal control over financialreporting as of December 31, 2005, based on criteria established in Internal Control—Integrated Frameworkissued by the Committee of Sponsoring Organizations of the Treadway Commission and our report datedFebruary 24, 2006, expressed an unqualified opinion thereon.
Atlanta, GeorgiaFebruary 24, 2006
118

Report of Independent Registered Public Accounting Firmon Internal Control Over Financial Reporting
Board of Directors and ShareownersThe Coca-Cola Company
We have audited management’s assessment, included in the accompanying Report of Management onInternal Control Over Financial Reporting, that The Coca-Cola Company and subsidiaries maintained effectiveinternal control over financial reporting as of December 31, 2005, based on criteria established in InternalControl—Integrated Framework issued by the Committee of Sponsoring Organizations of the TreadwayCommission (the COSO criteria). The Coca-Cola Company’s management is responsible for maintainingeffective internal control over financial reporting and for its assessment of the effectiveness of internal controlover financial reporting. Our responsibility is to express an opinion on management’s assessment and an opinionon the effectiveness of the Company’s internal control over financial reporting based on our audit.
We conducted our audit in accordance with the standards of the Public Company Accounting OversightBoard (United States). Those standards require that we plan and perform the audit to obtain reasonableassurance about whether effective internal control over financial reporting was maintained in all materialrespects. Our audit included obtaining an understanding of internal control over financial reporting, evaluatingmanagement’s assessment, testing and evaluating the design and operating effectiveness of internal control, andperforming such other procedures as we considered necessary in the circumstances. We believe that our auditprovides a reasonable basis for our opinion.
A company’s internal control over financial reporting is a process designed to provide reasonable assuranceregarding the reliability of financial reporting and the preparation of financial statements for external purposesin accordance with generally accepted accounting principles. A company’s internal control over financialreporting includes those policies and procedures that (1) pertain to the maintenance of records that, inreasonable detail, accurately and fairly reflect the transactions and dispositions of the assets of the company;(2) provide reasonable assurance that transactions are recorded as necessary to permit preparation of financialstatements in accordance with generally accepted accounting principles, and that receipts and expenditures ofthe company are being made only in accordance with authorizations of management and directors of thecompany; and (3) provide reasonable assurance regarding prevention or timely detection of unauthorizedacquisition, use, or disposition of the company’s assets that could have a material effect on the financialstatements.
Because of its inherent limitations, internal control over financial reporting may not prevent or detectmisstatements. Also, projections of any evaluation of effectiveness to future periods are subject to the risk thatcontrols may become inadequate because of changes in conditions, or that the degree of compliance with thepolicies or procedures may deteriorate.
In our opinion, management’s assessment that The Coca-Cola Company and subsidiaries maintainedeffective internal control over financial reporting as of December 31, 2005, is fairly stated, in all materialrespects, based on the COSO criteria. Also, in our opinion, The Coca-Cola Company and subsidiariesmaintained, in all material respects, effective internal control over financial reporting as of December 31, 2005,based on the COSO criteria.
We also have audited, in accordance with the standards of the Public Company Accounting Oversight Board(United States), the consolidated balance sheets of The Coca-Cola Company and subsidiaries as ofDecember 31, 2005 and 2004, and the related consolidated statements of income, shareowners’ equity, and cashflows for each of the three years in the period ended December 31, 2005, and our report dated February 24,2006, expressed an unqualified opinion thereon.
Atlanta, GeorgiaFebruary 24, 2006
119

Quarterly Data (Unaudited)First Second Third Fourth
Year Ended December 31, Quarter Quarter Quarter Quarter Full Year
(In millions, except per share data)
2005Net operating revenues $ 5,206 $ 6,310 $ 6,037 $ 5,551 $ 23,104Gross profit 3,388 4,164 3,802 3,555 14,909Net income 1,002 1,723 1,283 864 4,872
Basic net income per share $ 0.42 $ 0.72 $ 0.54 $ 0.36 $ 2.04
Diluted net income per share $ 0.42 $ 0.72 $ 0.54 $ 0.36 $ 2.04
2004Net operating revenues $ 5,028 $ 5,914 $ 5,596 $ 5,204 $ 21,742Gross profit 3,267 3,875 3,535 3,391 14,068Net income 1,127 1,584 935 1,201 4,847
Basic net income per share $ 0.46 $ 0.65 $ 0.39 $ 0.50 $ 2.00
Diluted net income per share $ 0.46 $ 0.65 $ 0.39 $ 0.50 $ 2.00
Our reporting period ends on the Friday closest to the last day of the quarterly calendar period. Our fiscalyear ends on December 31 regardless of the day of the week on which December 31 falls.
Certain amounts previously reported in our 2005 and 2004 Quarterly Reports on Form 10-Q werereclassified to conform to our year-end presentation.
The Company’s first quarter of 2005 results were impacted by two fewer shipping days as compared to thefirst quarter of 2004. Additionally, the Company recorded the following transactions which impacted results:
• Provision for taxes on unremitted foreign earnings of approximately $152 million. Refer to Note 16.
• Approximately $22 million of noncash pretax gains on issuances of stock by Coca-Cola Amatil in connection with theacquisition of SPC Ardmona Pty. Ltd., an Australian fruit company. Refer to Note 3.
• An income tax benefit of approximately $56 million related to the reversal of previously accrued taxes resulting fromfavorable resolution of tax matters. Refer to Note 16.
• Approximately $50 million of accelerated amortization of stock-based compensation expense related to a change inour estimated service period for retirement-eligible participants. Refer to Note 14.
In the second quarter of 2005, the Company recorded the following transactions which impacted results:
• The receipt of approximately $42 million related to the settlement of a class action lawsuit concerning the purchaseof HFCS. Refer to Note 17.
• An approximate $21 million benefit to equity income for our proportionate share of CCE’s HFCS lawsuitsettlement. Refer to Note 2.
• An income tax benefit of approximately $17 million related to the reversal of previously accrued taxes resulting fromfavorable resolution of tax matters. Refer to Note 16.
• An income tax benefit of approximately $25 million as a result of additional guidance issued by the United StatesInternal Revenue Service and the United States Department of Treasury related to the Jobs Creation Act. Refer toNote 16.
In the third quarter of 2005, the Company recorded the following transactions which impacted results:
• Approximately $89 million of impairment charges primarily related to intangible assets (mainly trademark beveragessold in the Philippines market). Approximately $85 million and $4 million of these impairment charges are recordedin the line items other operating charges and equity income — net, respectively, in our consolidated statements ofincome. Refer to Note 17.
120

• Approximately $5 million of a pretax noncash charge to equity income — net due to our proportionate share ofCCE’s restructuring charges. Refer to Note 2.
• Approximately $18 million in income tax benefit related to the reversal of previously accrued taxes resulting fromfavorable resolution of tax matters. Refer to Note 16.
The Company’s fourth quarter of 2005 results were impacted by one additional shipping day as compared tothe fourth quarter of 2004. Additionally, the Company recorded the following transactions in the fourth quarterof 2005 which impacted results:
• A receipt of approximately $5 million related to the settlement of a class action lawsuit concerning the purchase ofHFCS. Refer to Note 17.
• An approximate $49 million reduction to our equity income due to our proportionate share of CCE’s tax expenserelated to repatriation of previously unremitted foreign earnings under the Jobs Creation Act and restructuringcharges recorded by CCE, partially offset by changes in certain of CCE’s state and provincial tax rates and additionalproceeds from CCE’s HFCS lawsuit settlement. Refer to Note 2.
• An income tax benefit of approximately $10 million related to the reversal of previously accrued taxes resulting fromfavorable resolution of tax matters. Refer to Note 16.
• A provision for taxes on unremitted foreign earnings of approximately $188 million. Refer to Note 16.
In the second quarter of 2004, the Company recorded the following transactions which impacted results:
• Equity income benefited by approximately $37 million for our proportionate share of a favorable tax settlementrelated to Coca-Cola FEMSA. Refer to Note 2.
• Impairment charges totaling approximately $88 million primarily related to write-downs of certain manufacturinginvestments and an intangible asset. Refer to Note 17.
• Approximately $49 million of noncash pretax gains on issuances of stock by CCE. Refer to Note 3.
• An income tax benefit of approximately $41 million related to the reversal of previously accrued taxes resulting froma favorable agreement with authorities. Refer to Note 16.
In the third quarter of 2004, the Company recorded the following transactions which impacted results:
• An income tax benefit of approximately $39 million related to the reversal of previously accrued taxes resulting fromfavorable resolution of tax matters. Refer to Note 16.
• An income tax expense of approximately $75 million related to the recognition of a valuation allowance on certaindeferred taxes of CCEAG. Refer to Note 16.
• Impairment charges totaling approximately $392 million primarily related to franchise rights at CCEAG. Refer toNote 17.
In the fourth quarter of 2004, the Company recorded the following transactions which impacted results:
• A receipt of $75 million for an insurance settlement related to the class action lawsuit that was settled in 2000 and adonation of $75 million to The Coca-Cola Foundation. Refer to Note 17.
• An income tax benefit of approximately $48 million related to the reversal of previously accrued taxes resulting fromfavorable resolution of tax matters. Refer to Note 16.
• An income tax benefit of approximately $50 million related to the realization of certain foreign tax credits perprovisions of the Jobs Creation Act. Refer to Note 16.
• Approximately $25 million of noncash pretax losses to adjust the amount of the gain recognized in the secondquarter of 2004 on issuances of stock by CCE. Refer to Note 3.
121

GLOSSARY
As used in this report, the following terms have the meanings indicated.
Bottler or Bottling Partner: business that buys concentrates (sometimes referred to as ‘‘beverage bases’’) orsyrups from the Company, converts them into finished packaged products and sells them to customers.
Carbonated Soft Drink: nonalcoholic carbonated beverage (sometimes referred to as ‘‘soft drinks’’) containingflavorings and sweeteners. Excludes, among others, waters and flavored waters, juice and juice drinks, sportsdrinks, and teas and coffees.
The Coca-Cola System: the Company and its bottling partners.
Coca-Cola Trademark Beverages: cola-flavored Company Trademark Beverages bearing the Coca-Colatrademark.
Company: The Coca-Cola Company together with its subsidiaries.
Company Trademark Beverages: beverages bearing our trademarks and certain other beverage products licensedto our Company for which our Company provides marketing support and from the sale of which it derivesincome.
Concentrate: material manufactured from Company-defined ingredients and sold to bottlers to prepare finishedbeverages through the addition of water and, depending on the product, sweeteners and/or carbonated water,marketed under trademarks of the Company.
Consumer: person who drinks Company products.
Cost of Capital: after-tax blended cost of equity and borrowed funds used to invest in operating capital requiredfor business.
Customer: retail outlet, restaurant or other operation that sells or serves Company products directly toconsumers.
Derivatives: contracts or agreements, the value of which may change based on changes in interest rates,exchange rates, prices of securities, or financial or commodity indices. The Company uses derivatives to reduceour exposure to adverse fluctuations in interest and foreign currency exchange rates and other market risks.
Fountain: system used by retail outlets to dispense product into cups or glasses for immediate consumption.
Gallon: unit of physical volume measurement for concentrates (sometimes referred to as ‘‘beverage bases’’),syrups, finished beverages and powders (in all cases, expressed in equivalent gallons of syrup) sold by theCompany to its bottling partners or other customers. Most of the Company’s revenues are based on gallon sales,a measure of primarily ‘‘wholesale’’ activity.
Gross Profit Margin: gross profit divided by net operating revenues.
Market: when used in reference to geographic areas, territory in which the Company and its bottling partnersdo business, often defined by national boundaries.
Noncarbonated Beverages: nonalcoholic beverages without carbonation including, but not limited to, waters andflavored waters, juice and juice drinks, sports drinks, and teas and coffees.
Operating Margin: operating income divided by net operating revenues.
Per Capita Consumption: average number of servings consumed per person, per year in a specific market. Percapita consumption of Company beverage products is calculated by multiplying our unit case volume by 24, anddividing by the population.
Serving: eight U.S. fluid ounces of a finished beverage.
122

GLOSSARY (Continued)
Syrup: concentrate mixed with sweetener and water, sold to bottlers and customers who add carbonated waterto produce finished carbonated soft drinks.
Unit Case: unit of volume measurement equal to 192 U.S. fluid ounces of finished beverage (24 eight-ounceservings).
Unit Case Volume, or Volume: the number of unit cases (or unit case equivalents) of Company beverage productsdirectly or indirectly sold by the Coca-Cola system to customers. Unit case volume primarily consists of beverageproducts bearing Company trademarks. Unit case volume also includes sales by joint ventures in which theCompany is a partner and beverage products licensed to, or distributed by, our Company, and brands owned byour bottling partners for which our Company provides marketing support and from the sale of which it derivesincome. Such beverage products licensed to, or distributed by, our Company or owned by our bottling partnersaccount for a minimal portion of total unit case volume. Unit case volume is derived based on estimates receivedby the Company from its bottling partners and distributors.
123

ITEM 9. CHANGES IN AND DISAGREEMENTS WITH ACCOUNTANTS ON ACCOUNTING ANDFINANCIAL DISCLOSURE
Not applicable.
ITEM 9A. CONTROLS AND PROCEDURES
The Company, under the supervision and with the participation of its management, including the ChiefExecutive Officer and the Chief Financial Officer, evaluated the effectiveness of the design and operation of theCompany’s ‘‘disclosure controls and procedures’’ (as defined in Rule 13a-15(e) under the Securities ExchangeAct of 1934, as amended (the ‘‘Exchange Act’’)) as of the end of the period covered by this report. Based on thatevaluation, the Chief Executive Officer and the Chief Financial Officer concluded that the Company’s disclosurecontrols and procedures are effective in timely making known to them material information relating to theCompany and the Company’s consolidated subsidiaries required to be disclosed in the Company’s reports filedor submitted under the Exchange Act.
The report called for by Item 308(a) of Regulation S-K is incorporated herein by reference to Report ofManagement on Internal Control Over Financial Reporting, included in Part II, ‘‘Item 8. Financial Statementsand Supplementary Data’’ of this report.
The attestation report called for by Item 308(b) of Regulation S-K is incorporated herein by reference toReport of Independent Registered Public Accounting Firm on Internal Control Over Financial Reporting,included in Part II, ‘‘Item 8. Financial Statements and Supplementary Data’’ of this report.
There has been no change in the Company’s internal control over financial reporting during the quarterended December 31, 2005 that has materially affected, or is reasonably likely to materially affect, the Company’sinternal control over financial reporting.
ITEM 9B. OTHER INFORMATION
Not applicable.
124

PART III
ITEM 10. DIRECTORS AND EXECUTIVE OFFICERS OF THE REGISTRANT
The information under the headings ‘‘Board of Directors,’’ ‘‘Section 16(a) Beneficial Ownership ReportingCompliance,’’ ‘‘Information About the Board of Directors and Corporate Governance—The Audit Committee’’and ‘‘Information About the Board of Directors and Corporate Governance—The Board and BoardCommittees’’ in the Company’s 2006 Proxy Statement is incorporated herein by reference. See Item X in Part Iof this report for information regarding executive officers of the Company.
The Company has adopted a code of business conduct and ethics applicable to the Company’s Directors,officers (including the Company’s principal executive officer, principal financial officer and controller) andemployees, known as the Code of Business Conduct. The Code of Business Conduct is available on theCompany’s website. In the event that we amend or waive any of the provisions of the Code of Business Conductapplicable to our principal executive officer, principal financial officer or controller that relates to any elementof the code of ethics definition enumerated in Item 406(b) of Regulation S-K, we intend to disclose the same onthe Company’s website at www.coca-cola.com.
On May 16, 2005, we filed with the New York Stock Exchange (‘‘NYSE’’) the Annual CEO Certificationregarding the Company’s compliance with the NYSE’s Corporate Governance listing standards as required bySection 303A-12(a) of the NYSE Listed Company Manual. In addition, the Company has filed as exhibits to thisannual report and to the annual report on Form 10-K for the year ended December 31, 2004, the applicablecertifications of its Chief Executive Officer and its Chief Financial Officer required under Section 302 of theSarbanes-Oxley Act of 2002, regarding the quality of the Company’s public disclosures.
ITEM 11. EXECUTIVE COMPENSATION
The information under the headings ‘‘Information About the Board of Directors and CorporateGovernance—Director Compensation’’ and ‘‘Compensation Committee Interlocks and Insider Participation,’’and the information under the principal heading ‘‘EXECUTIVE COMPENSATION’’ in the Company’s 2006Proxy Statement is incorporated herein by reference.
ITEM 12. SECURITY OWNERSHIP OF CERTAIN BENEFICIAL OWNERS AND MANAGEMENT ANDRELATED STOCKHOLDER MATTERS
The information under the headings ‘‘Equity Compensation Plan Information,’’ ‘‘Ownership of EquitySecurities in the Company,’’ ‘‘Principal Shareowners’’ and ‘‘Ownership of Securities in Investee Companies’’ inthe Company’s 2006 Proxy Statement is incorporated herein by reference.
ITEM 13. CERTAIN RELATIONSHIPS AND RELATED TRANSACTIONS
The information under the headings ‘‘Information About the Board of Directors and CorporateGovernance,’’ ‘‘Certain Transactions and Relationships’’ and ‘‘Compensation Committee Interlocks and InsiderParticipation,’’ and the information under the principal heading ‘‘CERTAIN INVESTEE COMPANIES’’ in theCompany’s 2006 Proxy Statement is incorporated herein by reference.
ITEM 14. PRINCIPAL ACCOUNTANT FEES AND SERVICES
The information under the heading ‘‘Audit Fees and All Other Fees’’ in the Company’s 2006 ProxyStatement is incorporated herein by reference.
125

PART IV
ITEM 15. EXHIBITS AND FINANCIAL STATEMENT SCHEDULES
(a) The following documents are filed as part of this report:
1. Financial Statements:
Consolidated Statements of Income—Years ended December 31, 2005, 2004 and 2003.
Consolidated Balance Sheets—December 31, 2005 and 2004.
Consolidated Statements of Cash Flows—Years ended December 31, 2005, 2004 and 2003.
Consolidated Statements of Shareowners’ Equity—Years ended December 31, 2005, 2004 and2003.
Notes to Consolidated Financial Statements.
Report of Independent Registered Public Accounting Firm.
Report of Independent Registered Public Accounting Firm on Internal Control OverFinancial Reporting.
2. Financial Statement Schedules:
Schedule II—Valuation and Qualifying Accounts.
All other schedules for which provision is made in the applicable accounting regulations of theSEC are not required under the related instructions or are inapplicable and, therefore, have beenomitted.
3. ExhibitsExhibit No.
2.1 Control and Profit and Loss Transfer Agreement, dated November 21, 2001, between Coca-Cola GmbHand Coca-Cola Erfrischungsgetraenke AG—incorporated herein by reference to Exhibit 2 of theCompany’s Form 10-Q Quarterly Report for the quarter ended March 31, 2002. (With regard toapplicable cross-references in this report, the Company’s Current, Quarterly and Annual Reports arefiled with the SEC under File No. 1-2217.)
3.1 Certificate of Incorporation of the Company, including Amendment of Certificate of Incorporation,effective May 1, 1996—incorporated herein by reference to Exhibit 3 of the Company’s Form 10-QQuarterly Report for the quarter ended March 31, 1996.
3.2 By-Laws of the Company, as amended and restated through October 20, 2005—incorporated herein byreference to Exhibit 99.1 of the Company’s Current Report on Form 8-K, filed October 26, 2005.
4.1 The Company agrees to furnish to the Securities and Exchange Commission, upon request, a copy of anyinstrument defining the rights of holders of long-term debt of the Company and all of its consolidatedsubsidiaries and unconsolidated subsidiaries for which financial statements are required to be filed withthe SEC.
10.1.1 The Key Executive Retirement Plan of the Company, as amended—incorporated herein by reference toExhibit 10.2 of the Company’s Form 10-K Annual Report for the year ended December 31, 1995.*
10.1.2 Third Amendment to the Key Executive Retirement Plan of the Company, dated as of July 9, 1998—incorporated herein by reference to Exhibit 10.1.2 of the Company’s Form 10-K Annual Report for theyear ended December 31, 1999.*
10.1.3 Fourth Amendment to the Key Executive Retirement Plan of the Company, dated as of February 16,1999—incorporated herein by reference to Exhibit 10.1.3 of the Company’s Form 10-K Annual Reportfor the year ended December 31, 1999.*
126

Exhibit No.
10.1.4 Fifth Amendment to the Key Executive Retirement Plan of the Company, dated as of January 25, 2000—incorporated herein by reference to Exhibit 10.1.4 of the Company’s Form 10-K Annual Report for theyear ended December 31, 1999.*
10.1.5 Amendment Number Six to the Key Executive Retirement Plan of the Company, dated as of February 27,2003—incorporated herein by reference to Exhibit 10.3 of the Company’s Form 10-Q Quarterly Reportfor the quarter ended March 31, 2003.*
10.1.6 Amendment Number Seven to the Key Executive Retirement Plan of the Company, dated July 28, 2004,effective as of June 1, 2004—incorporated herein by reference to Exhibit 10.4 of the Company’sForm 10-Q Quarterly Report for the quarter ended September 30, 2004.*
10.2 Supplemental Disability Plan of the Company, as amended and restated effective January 1, 2003—incorporated herein by reference to Exhibit 10.2 of the Company’s Form 10-K Annual Report for theyear ended December 31, 2002.*
10.3 The Performance Incentive Plan of the Company, as amended and restated December 17, 2003, effectiveas of January 1, 2004—incorporated herein by reference to Exhibit 10.3 of the Company’s Form 10-KAnnual Report for the year ended December 31, 2003.*
10.4 1991 Stock Option Plan of the Company, as amended and restated through April 20, 1999—incorporatedherein by reference to Exhibit 10.2 of the Company’s Form 10-Q Quarterly Report for the quarterended March 31, 1999.*
10.5 1999 Stock Option Plan of the Company, as amended and restated through July 20, 2005—incorporatedherein by reference to Exhibit 10.1 of the Company’s Form 10-Q Quarterly Report for the quarterended September 30, 2005.*
10.6 2002 Stock Option Plan of the Company, as amended and restated July 20, 2005—incorporated herein byreference to Exhibit 10.2 of the Company’s Form 10-Q Quarterly Report for the quarter endedSeptember 30, 2005.*
10.6.1 Form of Stock Option Agreement in connection with the 2002 Stock Option Plan, as amended—incorporated by reference to Exhibit 99.1 of the Company’s Form 8-K Current Report filed onDecember 8, 2004.*
10.6.2 Form of Stock Option Agreement for E. Neville Isdell in connection with the 2002 Stock Option Plan, asamended—incorporated by reference to Exhibit 99.1 of the Company’s Form 8-K Current Report filedFebruary 23, 2005.*
10.7 1983 Restricted Stock Award Plan of the Company, as amended through February 17, 2000—incorporatedherein by reference to Exhibit 10.7 of the Company’s Form 10-K Annual Report for the year endedDecember 31, 1999.*
10.8.1 1989 Restricted Stock Award Plan of the Company, as amended and restated July 20, 2005—incorporatedherein by reference to Exhibit 10.3 of the Company’s Form 10-Q Quarterly Report for the quarterended September 30, 2005.*
10.8.2 Form of Restricted Stock Agreement (Performance Share Unit Agreement) in connection with the 1989Restricted Stock Award Plan of the Company—incorporated herein by reference to Exhibit 10.1 of theCompany’s Form 8-K Current Report filed April 19, 2005.*
10.8.2.1 Form of Restricted Stock Agreement (Performance Share Unit Agreement) in connection with the 1989Restricted Stock Award Plan of the Company, effective as of December 2005—incorporated herein byreference to Exhibit 99.1 of the Company’s Form 8-K Current Report filed December 14, 2005.*
10.8.3 Form of Restricted Stock Agreement (Performance Share Unit Agreement) for E. Neville Isdell inconnection with the 1989 Restricted Stock Award Plan of the Company, as amended—incorporatedherein by reference to Exhibit 99.2 of the Company’s Form 8-K Current Report filed on February 23,2005.*
127

Exhibit No.
10.8.4 Form of Restricted Stock Award Agreement for Mary E. Minnick in connection with the 1989 RestrictedStock Award Plan of the Company, as amended—incorporated herein by reference to Exhibit 10.7 ofthe Company’s Form 10-Q Quarterly Report for the quarter ended July 1, 2005.*
10.9.1 Compensation Deferral & Investment Program of the Company, as amended, including AmendmentNumber Four dated November 28, 1995—incorporated herein by reference to Exhibit 10.13 of theCompany’s Form 10-K Annual Report for the year ended December 31, 1995.*
10.9.2 Amendment Number Five to the Compensation Deferral & Investment Program of the Company,effective as of January 1, 1998—incorporated herein by reference to Exhibit 10.8.2 of the Company’sForm 10-K Annual Report for the year ended December 31, 1997.*
10.9.3 Amendment Number Six to the Compensation Deferral & Investment Program of the Company, dated asof January 12, 2004, effective January 1, 2004—incorporated herein by reference to Exhibit 10.9.3 of theCompany’s Form 10-K Annual Report for the year ended December 31, 2003.*
10.10.1 Executive Medical Plan of the Company, as amended and restated effective January 1, 2001—incorporated herein by reference to Exhibit 10.10 of the Company’s Form 10-K Annual Report for theyear ended December 31, 2002.*
10.10.2 Amendment Number One to the Executive Medical Plan of the Company, dated April 15, 2003—incorporated herein by reference to Exhibit 10.1 of the Company’s Form 10-Q Quarterly Report for thequarter ended June 30, 2003.*
10.10.3 Amendment Number Two to the Executive Medical Plan of the Company, dated August 27, 2003—incorporated herein by reference to Exhibit 10 of the Company’s Form 10-Q Quarterly Report for thequarter ended September 30, 2003.*
10.10.4 Amendment Number Three to the Executive Medical Plan of the Company, dated December 29, 2004,effective January 1, 2005—incorporated herein by reference to Exhibit 10.10.4 of the Company’sForm 10-K Annual Report for the year ended December 31, 2004.*
10.10.5 Amendment Number Four to the Executive Medical Plan of the Company—incorporated herein byreference to Exhibit 10.6 of the Company’s Form 10-Q Quarterly Report for the quarter ended July 1,2005.*
10.10.6 Amendment Number Five to the Executive Medical Plan of the Company.*
10.11.2 Amendment One to the Supplemental Benefit Plan of the Company, dated as of February 27, 2003—incorporated herein by reference to Exhibit 10.5 of the Company’s Form 10-Q Quarterly Report for thequarter ended March 31, 2003.*
10.11.3 Amendment Two to the Supplemental Benefit Plan of the Company, dated as of November 14, 2003,effective October 21, 2003—incorporated herein by reference to Exhibit 10.11.3 of the Company’sForm 10-K Annual Report for the year ended December 31, 2003.*
10.11.4 Amendment Three to the Supplemental Benefit Plan of the Company, dated April 14, 2004, effective as ofJanuary 1, 2004—incorporated herein by reference to Exhibit 10.3 of the Company’s Form 10-QQuarterly Report for the quarter ended March 31, 2004.*
10.11.5 Amendment Four to the Supplemental Benefit Plan of the Company, dated December 15, 2004, effectiveJanuary 1, 2005—incorporated herein by reference to Exhibit 10.11.5 of the Company’s Form 10-KAnnual Report for the year ended December 31, 2004.*
10.11.6 Amendment Five to the Supplemental Benefit Plan of the Company, dated December 21, 2005.*
10.12 Retirement Plan for the Board of Directors of the Company, as amended—incorporated herein byreference to Exhibit 10.22 of the Company’s Form 10-K Annual Report for the year endedDecember 31, 1991.*
128

Exhibit No.
10.13.1 Deferred Compensation Plan for Non-Employee Directors of the Company, as amended and restatedthrough October 16, 2003—incorporated herein by reference to Exhibit 10.13 of the Company’s Form10-K Annual Report for the year ended December 31, 2003.*
10.15 Letter Agreement, dated March 4, 2003, between the Company and Stephen C. Jones—incorporatedherein by reference to Exhibit 10.6 of the Company’s Form 10-Q Quarterly Report for the quarterended March 31, 2003.*
10.16.1 Letter Agreement, dated December 6, 1999, between the Company and M. Douglas Ivester—incorporated herein by reference to Exhibit 10.17.1 of the Company’s Form 10-K Annual Report for theyear ended December 31, 1999.*
10.16.2 Letter Agreement, dated December 15, 1999, between the Company and M. Douglas Ivester—incorporated herein by reference to Exhibit 10.17.2 of the Company’s Form 10-K Annual Report for theyear ended December 31, 1999.*
10.16.3 Letter Agreement, dated February 17, 2000, between the Company and M. Douglas Ivester—incorporatedherein by reference to Exhibit 10.17.3 of the Company’s Form 10-K Annual Report for the year endedDecember 31, 1999.*
10.17 Group Long-Term Performance Incentive Plan of the Company, as amended and restated effectiveFebruary 17, 2000—incorporated herein by reference to Exhibit 10.18 of the Company’s Form 10-KAnnual Report for the year ended December 31, 1999.*
10.18 Executive Incentive Plan of the Company, adopted as of February 14, 2001—incorporated herein byreference to Exhibit 10.19 of the Company’s Form 10-K Annual Report for the year endedDecember 31, 2000.*
10.19 Form of United States Master Bottler Contract, as amended, between the Company and Coca-ColaEnterprises Inc. (‘‘Coca-Cola Enterprises’’) or its subsidiaries—incorporated herein by reference toExhibit 10.24 of Coca-Cola Enterprises’ Annual Report on Form 10-K for the fiscal year endedDecember 30, 1988 (File No. 01-09300).
10.24.1 Deferred Compensation Plan of the Company, as amended and restated as of December 17, 2003—incorporated herein by reference to Exhibit 10.26.1 of the Company’s Form 10-K Annual Report for theyear ended December 31, 2003.*
10.24.2 Deferred Compensation Plan Delegation of Authority from the Compensation Committee to theManagement Committee, adopted as of December 17, 2003—incorporated herein by reference toExhibit 10.26.2 of the Company’s Form 10-K Annual Report for the year ended December 31, 2003.*
10.24.3 Amendment One to the Deferred Compensation Plan of the Company, as amended and restated as ofDecember 17, 2003.*
10.25 Letter Agreement, dated October 24, 2002, between the Company and Carl Ware—incorporated hereinby reference to Exhibit 10.30 of the Company’s Form 10-K Annual Report for the year endedDecember 31, 2002.*
10.26 The Coca-Cola Export Corporation Employee Share Plan, effective as of March 13, 2002—incorporatedherein by reference to Exhibit 10.31 of the Company’s Form 10-K Annual Report for the year endedDecember 31, 2002.*
10.27 Employees’ Savings and Share Ownership Plan of Coca-Cola Ltd., effective as of January 1, 1990—incorporated herein by reference to Exhibit 10.32 of the Company’s Form 10-K Annual Report for theyear ended December 31, 2002.*
10.28 Share Purchase Plan—Denmark, effective as of 1991—incorporated herein by reference to Exhibit 10.33of the Company’s Form 10-K Annual Report for the year ended December 31, 2002.*
129

Exhibit No.
10.29 Letter Agreement, dated June 19, 2003, between the Company and Daniel Palumbo—incorporated hereinby reference to Exhibit 10.2 of the Company’s Form 10-Q Quarterly Report for the quarter endedJune 30, 2003.*
10.30 Consulting Agreement, dated January 22, 2004, effective as of August 1, 2003, between the Company andChatham International Corporation, regarding consulting services to be provided by Brian G. Dyson—incorporated herein by reference to Exhibit 10.32 of the Company’s Form 10-K Annual Report for theyear ended December 31, 2003.*
10.31.1 The Coca-Cola Company Benefits Plan for Members of the Board of Directors, as amended and restatedthrough April 14, 2004—incorporated herein by reference to Exhibit 10.1 of the Company’s Form 10-QQuarterly Report for the quarter ended March 31, 2004.*
10.31.2 Amendment Number One to the Company’s Benefits Plan for Members of the Board of Directors.*
10.32 Letter Agreement, dated March 2, 2004, between the Company and Jeffrey T. Dunn—incorporated hereinby reference to Exhibit 10.2 of the Company’s Form 10-Q Quarterly Report for the quarter endedMarch 31, 2004.*
10.33 Full and Complete Release, dated June 8, 2004, between the Company and Steven J. Heyer—incorporated herein by reference to Exhibit 10.1 of the Company’s Form 10-Q Quarterly Report for thequarter ended June 30, 2004.*
10.34 Employment Agreement, dated as of March 11, 2002, between the Company and Alexander R.C. Allan—incorporated herein by reference to Exhibit 10.3 of the Company’s Form 10-Q Quarterly Report for thequarter ended June 30, 2004.*
10.35 Employment Agreement, dated as of March 11, 2002, between The Coca-Cola Export Corporation andAlexander R.C. Allan—incorporated herein by reference to Exhibit 10.4 of the Company’s Form 10-QQuarterly Report for the quarter ended June 30, 2004.*
10.36 Letter, dated September 16, 2004, from the Company to E. Neville Isdell—incorporated herein byreference to Exhibit 99.1 of the Company’s Form 8-K Current Report filed on September 17, 2004.*
10.37 Stock Award Agreement for E. Neville Isdell, dated September 14, 2004, under the 1989 Restricted StockAward Plan of the Company—incorporated herein by reference to Exhibit 99.2 of the Company’sForm 8-K Current Report filed on September 17, 2004.*
10.38 Stock Option Agreement for E. Neville Isdell, dated July 22, 2004, under the 2002 Stock Option Plan ofthe Company, as amended—incorporated herein by reference to Exhibit 10.3 of the Company’sForm 10-Q Quarterly Report for the quarter ended September 30, 2004.*
10.39 Letter, dated August 6, 2004, from the Chairman of the Compensation Committee of the Board ofDirectors of the Company to Douglas N. Daft—incorporated herein by reference to Exhibit 10.5 of theCompany’s Form 10-Q Quarterly Report for the quarter ended September 30, 2004.*
10.40 Letter, dated January 4, 2006, from the Company to Tom Mattia.*
10.41 Letter Agreement, dated October 7, 2004, between the Company and Daniel Palumbo—incorporatedherein by reference to Exhibit 10.41 of the Company’s Form 10-K Annual Report for the year endedDecember 31, 2004.*
10.42 Letter, dated February 12, 2005, from the Company to Mary E. Minnick—incorporated herein byreference to Exhibit 99.3 to the Company’s Form 8-K Current Report filed on February 23, 2005.*
10.43.1 Employment Agreement, dated as of February 20, 2003, between the Company and José Octavio Reyes—incorporated herein by reference to Exhibit 10.43 of the Company’s Form 10-K Annual Report for theyear ended December 31, 2004.*
130

Exhibit No.
10.45.1 Employment Agreement, dated as of July 18, 2002, between the Company and Alexander B. Cummings—incorporated herein by reference to Exhibit 10.45 of the Company’s Form 10-K Annual Report for theyear ended December 31, 2004.*
10.46 Employment Agreement, dated as of July 18, 2002, between The Coca-Cola Export Corporation andAlexander B. Cummings—incorporated herein by reference to Exhibit 10.46 of the Company’s Form10-K Annual Report for the year ended December 31, 2004.*
10.47 Letter, dated as of April 1, 2005, from Cynthia P. McCague, Senior Vice President of the Company, toDeval L. Patrick—incorporated herein by reference to Exhibit 10.1 of the Company’s Form 10-QQuarterly Report for the quarter ended July 1, 2005.*
10.48 Full and Complete Release and Agreement on Competition, Trade Secrets and Confidentiality betweenthe Company and Deval L. Patrick—incorporated herein by reference to Exhibit 10.2 of the Company’sForm 10-Q Quarterly Report for the quarter ended July 1, 2005.*
10.49 Order Instituting Cease and Desist Proceedings, Making Findings and Imposing a Cease-and-DesistOrder Pursuant to Section 8A of the Securities Act of 1933 and Section 21C of the Securities ExchangeAct of 1934—incorporated herein by reference to Exhibit 10.3 of the Company’s Form 10-Q QuarterlyReport for the quarter ended July 1, 2005.
10.50 Offer of Settlement of The Coca-Cola Company—incorporated herein by reference to Exhibit 10.4 of theCompany’s Form 10-Q Quarterly Report for the quarter ended July 1, 2005.
10.51 Final Undertaking from The Coca-Cola Company and certain of its bottlers, adopted by the EuropeanCommission on June 22, 2005, relating to various commercial practices in the European EconomicArea—incorporated herein by reference to Exhibit 10.5 of the Company’s Form 10-Q Quarterly Reportfor the quarter ended July 1, 2005.
12.1 Computation of Ratios of Earnings to Fixed Charges for the years ended December 31, 2005, 2004, 2003,2002 and 2001.
21.1 List of subsidiaries of the Company as of December 31, 2005.
23.1 Consent of Independent Registered Public Accounting Firm.
24.1 Powers of Attorney of Officers and Directors signing this report.
31.1 Rule 13a-14(a)/15d-14(a) Certification, executed by E. Neville Isdell, Chairman, Board of Directors, andChief Executive Officer of The Coca-Cola Company.
31.2 Rule 13a-14(a)/15d-14(a) Certification, executed by Gary P. Fayard, Executive Vice President and ChiefFinancial Officer of The Coca-Cola Company.
32.1 Certifications required by Rule 13a-14(b) or Rule 15d-14(b) and Section 1350 of Chapter 63 of Title 18 ofthe United States Code (18 U.S.C. 1350), executed by E. Neville Isdell, Chairman, Board of Directors,and Chief Executive Officer of The Coca-Cola Company and by Gary P. Fayard, Executive VicePresident and Chief Financial Officer of The Coca-Cola Company.
* Management contracts and compensatory plans and arrangements required to be filed as exhibits pursuant to Item15(c) of this report.
131

SIGNATURES
Pursuant to the requirements of Section 13 or 15(d) of the Securities Exchange Act of 1934, the Registrant has dulycaused this report to be signed on its behalf by the undersigned, thereunto duly authorized.
THE COCA-COLA COMPANY
(Registrant)
By: /s/ E. NEVILLE ISDELL
E. NEVILLE ISDELL
Chairman, Board of Directors, ChiefExecutive Officer
Date: February 28, 2006
Pursuant to the requirements of the Securities Exchange Act of 1934, this report has been signed below by thefollowing persons on behalf of the Registrant and in the capacities and on the dates indicated.
/s/ E. NEVILLE ISDELL *
E. NEVILLE ISDELL RONALD W. ALLEN
Chairman, Board of Directors, Chief Executive Officer Directorand a Director(Principal Executive Officer)
February 28, 2006 February 28, 2006
/s/ GARY P. FAYARD *
GARY P. FAYARD CATHLEEN P. BLACK
Executive Vice President and Chief Financial Officer Director(Principal Financial Officer)
February 28, 2006 February 28, 2006
/s/ CONNIE D. MCDANIEL *
CONNIE D. MCDANIEL WARREN E. BUFFETT
Vice President and Controller (Principal Accounting DirectorOfficer)
February 28, 2006 February 28, 2006
* *
HERBERT A. ALLEN BARRY DILLER
Director Director
February 28, 2006 February 28, 2006
132

* *
DONALD R. KEOUGH J. PEDRO REINHARD
Director Director
February 28, 2006 February 28, 2006
* *
MARIA ELENA LAGOMASINO JAMES D. ROBINSON IIIDirector Director
February 28, 2006 February 28, 2006
* *
DONALD F. MCHENRY PETER V. UEBERROTH
Director Director
February 28, 2006 February 28, 2006
* *
SAM NUNN JAMES B. WILLIAMS
Director Director
February 28, 2006 February 28, 2006
By: /s/ CAROL CROFOOT HAYES
CAROL CROFOOT HAYES
Attorney-in-factFebruary 28, 2006
133

THE COCA-COLA COMPANY AND SUBSIDIARIESSCHEDULE II—VALUATION AND QUALIFYING ACCOUNTS
Year Ended December 31, 2005(in millions)
COL. A COL. B COL. C COL. D COL. EAdditions
Net ChargesBalance at to Costs Net Charges Balance
Beginning of and to Other at EndDescription Period Expenses Accounts Deductions2 of Period
RESERVES DEDUCTED IN THE BALANCESHEET FROM THE ASSETS TO WHICH THEYAPPLYAllowance for losses on:
Trade accounts receivable $ 69 $ 17 $ 1 $ 15 $ 72Other assets 79 13 — 15 77Deferred tax assets 854 431 — 111 786
$ 1,002 $ 73 $ 1 $ 141 $ 935
1 Net charges shown here only represent those related to the valuation allowance account for deferred tax assets. Forfurther discussion regarding deferred tax assets, see Note 16 of Notes to Consolidated Financial Statements.
2 The amounts shown in Column D consist of the following:
Trade DeferredAccounts Tax
Receivable Other Assets Assets Total
Write-offs $ 12 $ 7 $ 64 $ 83Other3 3 8 47 58
$ 15 $ 15 $ 111 $ 141
3 Other includes Company dispositions and fluctuations in foreign currency exchange rates.
S-1

THE COCA-COLA COMPANY AND SUBSIDIARIESSCHEDULE II—VALUATION AND QUALIFYING ACCOUNTS
Year Ended December 31, 2004(in millions)
COL. A COL. B COL. C COL. D COL. EAdditions(1) (2)
Balance at Charged Charged BalanceBeginning of to Costs and to Other Deductions at End
Description Period Expenses Accounts (Note 1) of Period
RESERVES DEDUCTED IN THE BALANCESHEET FROM THE ASSETS TO WHICH THEYAPPLYAllowance for losses on:
Trade accounts receivable $ 61 $ 28 $ 4 $ 24 $ 69Miscellaneous investments and other assets 55 21 17 14 79Deferred tax assets 630 291 — 67 854
$ 746 $ 340 $ 21 $ 105 $ 1,002
Note 1—The amounts shown in Column D consist of the following:
Trade Miscellaneous DeferredAccounts Investments Tax
Receivable and Other Assets Assets Total
Charge off of uncollectible accounts $ 19 $ 6 $ — $ 25Write-off of impaired assets — 4 40 44Other transactions and change in assessments about the realization of
deferred tax assets 5 4 27 36
$ 24 $ 14 $ 67 $ 105
S-2

THE COCA-COLA COMPANY AND SUBSIDIARIESSCHEDULE II—VALUATION AND QUALIFYING ACCOUNTS
Year Ended December 31, 2003(in millions)
COL. A COL. B COL. C COL. D COL. EAdditions
Balance at Charged Charged BalanceBeginning of to Costs and to Other Deductions at End
Description Period Expenses Accounts (Note 1) of Period
RESERVES DEDUCTED IN THE BALANCESHEET FROM THE ASSETS TO WHICH THEYAPPLYAllowance for losses on:
Trade accounts receivable $ 55 $ 28 $ — $ 22 $ 61Miscellaneous investments and other assets 203 7 — 155 55Deferred tax assets 738 69 — 177 630
$ 996 $ 104 $ — $ 354 $ 746
Note 1—The amounts shown in Column D consist of the following:
Trade Miscellaneous DeferredAccounts Investments Tax
Receivable and Other Assets Assets Total
Charge off of uncollectible accounts $ 22 $ 13 $ — $ 35Write-off of impaired assets — 129 54 183Other transactions and change in assessments about the realization of
deferred tax assets — 13 123 136
$ 22 $ 155 $ 177 $ 354
S-3

EXHIBIT 31.1
CERTIFICATIONS
I, E. Neville Isdell, Chairman, Board of Directors, and Chief Executive Officer of The Coca-Cola Company,certify that:
1. I have reviewed this annual report on Form 10-K of The Coca-Cola Company;
2. Based on my knowledge, this report does not contain any untrue statement of a material fact or omit tostate a material fact necessary to make the statements made, in light of the circumstances under whichsuch statements were made, not misleading with respect to the period covered by this report;
3. Based on my knowledge, the financial statements, and other financial information included in thisreport, fairly present in all material respects the financial condition, results of operations and cashflows of the registrant as of, and for, the periods presented in this report;
4. The registrant’s other certifying officer(s) and I are responsible for establishing and maintainingdisclosure controls and procedures (as defined in Exchange Act Rules 13a-15(e) and 15d-15(e)) andinternal control over financial reporting (as defined in Exchange Act Rules 13a-15(f) and 15d-15(f)) forthe registrant and have:
(a) Designed such disclosure controls and procedures, or caused such disclosure controls andprocedures to be designed under our supervision, to ensure that material information relating tothe registrant, including its consolidated subsidiaries, is made known to us by others within thoseentities, particularly during the period in which this report is being prepared;
(b) Designed such internal control over financial reporting, or caused such internal control overfinancial reporting to be designed under our supervision, to provide reasonable assuranceregarding the reliability of financial reporting and the preparation of financial statements forexternal purposes in accordance with generally accepted accounting principles;
(c) Evaluated the effectiveness of the registrant’s disclosure controls and procedures and presented inthis report our conclusions about the effectiveness of the disclosure controls and procedures, as ofthe end of the period covered by this report based on such evaluation; and
(d) Disclosed in this report any change in the registrant’s internal control over financial reporting thatoccurred during the registrant’s most recent fiscal quarter (the registrant’s fourth fiscal quarter inthe case of an annual report) that has materially affected, or is reasonably likely to materiallyaffect, the registrant’s internal control over financial reporting; and
5. The registrant’s other certifying officer(s) and I have disclosed, based on our most recent evaluation ofinternal control over financial reporting, to the registrant’s auditors and the audit committee of theregistrant’s board of directors (or persons performing the equivalent functions):
(a) All significant deficiencies and material weaknesses in the design or operation of internal controlover financial reporting which are reasonably likely to adversely affect the registrant’s ability torecord, process, summarize and report financial information; and
(b) Any fraud, whether or not material, that involves management or other employees who have asignificant role in the registrant’s internal control over financial reporting.
Date: February 28, 2006
/s/ E. NEVILLE ISDELL
E. Neville IsdellChairman, Board of Directors, andChief Executive Officer

EXHIBIT 31.2
CERTIFICATIONS
I, Gary P. Fayard, Executive Vice President and Chief Financial Officer of The Coca-Cola Company, certify that:
1. I have reviewed this annual report on Form 10-K of The Coca-Cola Company;
2. Based on my knowledge, this report does not contain any untrue statement of a material fact or omit tostate a material fact necessary to make the statements made, in light of the circumstances under whichsuch statements were made, not misleading with respect to the period covered by this report;
3. Based on my knowledge, the financial statements, and other financial information included in thisreport, fairly present in all material respects the financial condition, results of operations and cashflows of the registrant as of, and for, the periods presented in this report;
4. The registrant’s other certifying officer(s) and I are responsible for establishing and maintainingdisclosure controls and procedures (as defined in Exchange Act Rules 13a-15(e) and 15d-15(e)) andinternal control over financial reporting (as defined in Exchange Act Rules 13a-15(f) and 15d-15(f)) forthe registrant and have:
(a) Designed such disclosure controls and procedures, or caused such disclosure controls andprocedures to be designed under our supervision, to ensure that material information relating tothe registrant, including its consolidated subsidiaries, is made known to us by others within thoseentities, particularly during the period in which this report is being prepared;
(b) Designed such internal control over financial reporting, or caused such internal control overfinancial reporting to be designed under our supervision, to provide reasonable assuranceregarding the reliability of financial reporting and the preparation of financial statements forexternal purposes in accordance with generally accepted accounting principles;
(c) Evaluated the effectiveness of the registrant’s disclosure controls and procedures and presented inthis report our conclusions about the effectiveness of the disclosure controls and procedures, as ofthe end of the period covered by this report based on such evaluation; and
(d) Disclosed in this report any change in the registrant’s internal control over financial reporting thatoccurred during the registrant’s most recent fiscal quarter (the registrant’s fourth fiscal quarter inthe case of an annual report) that has materially affected, or is reasonably likely to materiallyaffect, the registrant’s internal control over financial reporting; and
5. The registrant’s other certifying officer(s) and I have disclosed, based on our most recent evaluation ofinternal control over financial reporting, to the registrant’s auditors and the audit committee of theregistrant’s board of directors (or persons performing the equivalent functions):
(a) All significant deficiencies and material weaknesses in the design or operation of internal controlover financial reporting which are reasonably likely to adversely affect the registrant’s ability torecord, process, summarize and report financial information; and
(b) Any fraud, whether or not material, that involves management or other employees who have asignificant role in the registrant’s internal control over financial reporting.
Date: February 28, 2006
/s/ GARY P. FAYARD
Gary P. FayardExecutive Vice President andChief Financial Officer

EXHIBIT 32.1
CERTIFICATION PURSUANT TO18 U.S.C. SECTION 1350,
AS ADOPTED PURSUANT TOSECTION 906 OF THE SARBANES-OXLEY ACT OF 2002
In connection with the annual report of The Coca-Cola Company (the ‘‘Company’’) on Form 10-K for theperiod ended December 31, 2005 (the ‘‘Report’’), I, E. Neville Isdell, Chairman, Board of Directors, and ChiefExecutive Officer of the Company and I, Gary P. Fayard, Executive Vice President and Chief Financial Officer ofthe Company, each certify, pursuant to 18 U.S.C. Section 1350, as adopted pursuant to Section 906 of theSarbanes-Oxley Act of 2002, that:
(1) to my knowledge, the Report fully complies with the requirements of Section 13(a) or 15(d) of theSecurities Exchange Act of 1934; and
(2) the information contained in the Report fairly presents, in all material respects, the financial conditionand results of operations of the Company.
/s/ E. NEVILLE ISDELL
E. Neville IsdellChairman, Board of Directors, and
Chief Executive OfficerFebruary 28, 2006
/s/ GARY P. FAYARD
Gary P. FayardExecutive Vice President and
Chief Financial OfficerFebruary 28, 2006

L
Printed on Recycled Paper

ITEM 8. FINANCIAL STATEMENTS AND SUPPLEMENTARY DATA
TABLE OF CONTENTS
Page
Consolidated Statements of Income . . . . . . . . . . . . . . . . . . . . . . . . . . . . . . . . . . . . . . . . . . . . . . . . . . . . 64
Consolidated Balance Sheets . . . . . . . . . . . . . . . . . . . . . . . . . . . . . . . . . . . . . . . . . . . . . . . . . . . . . . . . . . 65
Consolidated Statements of Cash Flows . . . . . . . . . . . . . . . . . . . . . . . . . . . . . . . . . . . . . . . . . . . . . . . . . 66
Consolidated Statements of Shareowners’ Equity . . . . . . . . . . . . . . . . . . . . . . . . . . . . . . . . . . . . . . . . . . 67
Notes to Consolidated Financial Statements . . . . . . . . . . . . . . . . . . . . . . . . . . . . . . . . . . . . . . . . . . . . . . 68
Report of Management on Internal Control Over Financial Reporting . . . . . . . . . . . . . . . . . . . . . . . . . . 117
Report of Independent Registered Public Accounting Firm . . . . . . . . . . . . . . . . . . . . . . . . . . . . . . . . . . 118
Report of Independent Registered Public Accounting Firm on Internal Control Over FinancialReporting . . . . . . . . . . . . . . . . . . . . . . . . . . . . . . . . . . . . . . . . . . . . . . . . . . . . . . . . . . . . . . . . . . . . . . 119
Quarterly Data (Unaudited) . . . . . . . . . . . . . . . . . . . . . . . . . . . . . . . . . . . . . . . . . . . . . . . . . . . . . . . . . . 120
Glossary . . . . . . . . . . . . . . . . . . . . . . . . . . . . . . . . . . . . . . . . . . . . . . . . . . . . . . . . . . . . . . . . . . . . . . . . . 122
63

THE COCA-COLA COMPANY AND SUBSIDIARIES
CONSOLIDATED STATEMENTS OF INCOME
Year Ended December 31, 2005 2004 2003(In millions except per share data)
NET OPERATING REVENUES $ 23,104 $ 21,742 $ 20,857Cost of goods sold 8,195 7,674 7,776
GROSS PROFIT 14,909 14,068 13,081Selling, general and administrative expenses 8,739 7,890 7,287Other operating charges 85 480 573
OPERATING INCOME 6,085 5,698 5,221Interest income 235 157 176Interest expense 240 196 178Equity income — net 680 621 406Other loss — net (93) (82) (138)Gains on issuances of stock by equity investees 23 24 8
INCOME BEFORE INCOME TAXES 6,690 6,222 5,495Income taxes 1,818 1,375 1,148
NET INCOME $ 4,872 $ 4,847 $ 4,347
BASIC NET INCOME PER SHARE $ 2.04 $ 2.00 $ 1.77
DILUTED NET INCOME PER SHARE $ 2.04 $ 2.00 $ 1.77
AVERAGE SHARES OUTSTANDING 2,392 2,426 2,459Effect of dilutive securities 1 3 3
AVERAGE SHARES OUTSTANDING ASSUMING DILUTION 2,393 2,429 2,462
Refer to Notes to Consolidated Financial Statements.
64

THE COCA-COLA COMPANY AND SUBSIDIARIES
CONSOLIDATED BALANCE SHEETS
December 31, 2005 2004(In millions except par value)
ASSETSCURRENT ASSETS
Cash and cash equivalents $ 4,701 $ 6,707Marketable securities 66 61Trade accounts receivable, less allowances of $72 and $69, respectively 2,281 2,244Inventories 1,424 1,420Prepaid expenses and other assets 1,778 1,849
TOTAL CURRENT ASSETS 10,250 12,281
INVESTMENTSEquity method investments:
Coca-Cola Enterprises Inc. 1,731 1,569Coca-Cola Hellenic Bottling Company S.A. 1,039 1,067Coca-Cola FEMSA, S.A. de C.V. 982 792Coca-Cola Amatil Limited 748 736Other, principally bottling companies 2,062 1,733
Cost method investments, principally bottling companies 360 355
TOTAL INVESTMENTS 6,922 6,252
OTHER ASSETS 2,648 2,981PROPERTY, PLANT AND EQUIPMENT — net 5,786 6,091TRADEMARKS WITH INDEFINITE LIVES 1,946 2,037GOODWILL 1,047 1,097OTHER INTANGIBLE ASSETS 828 702
TOTAL ASSETS $ 29,427 $ 31,441
LIABILITIES AND SHAREOWNERS’ EQUITYCURRENT LIABILITIES
Accounts payable and accrued expenses $ 4,493 $ 4,403Loans and notes payable 4,518 4,531Current maturities of long-term debt 28 1,490Accrued income taxes 797 709
TOTAL CURRENT LIABILITIES 9,836 11,133
LONG-TERM DEBT 1,154 1,157OTHER LIABILITIES 1,730 2,814DEFERRED INCOME TAXES 352 402SHAREOWNERS’ EQUITY
Common stock, $0.25 par value; Authorized — 5,600 shares;Issued — 3,507 and 3,500 shares, respectively 877 875
Capital surplus 5,492 4,928Reinvested earnings 31,299 29,105Accumulated other comprehensive income (loss) (1,669) (1,348)Treasury stock, at cost — 1,138 and 1,091 shares, respectively (19,644) (17,625)
TOTAL SHAREOWNERS’ EQUITY 16,355 15,935
TOTAL LIABILITIES AND SHAREOWNERS’ EQUITY $ 29,427 $ 31,441
Refer to Notes to Consolidated Financial Statements.
65

THE COCA-COLA COMPANY AND SUBSIDIARIES
CONSOLIDATED STATEMENTS OF CASH FLOWS
Year Ended December 31, 2005 2004 2003(In millions)
OPERATING ACTIVITIESNet income $ 4,872 $ 4,847 $ 4,347Depreciation and amortization 932 893 850Stock-based compensation expense 324 345 422Deferred income taxes (88) 162 (188)Equity income or loss, net of dividends (446) (476) (294)Foreign currency adjustments 47 (59) (79)Gains on issuances of stock by equity investees (23) (24) (8)Gains on sales of assets, including bottling interests (9) (20) (5)Other operating charges 85 480 330Other items 299 437 249Net change in operating assets and liabilities 430 (617) (168)
Net cash provided by operating activities 6,423 5,968 5,456
INVESTING ACTIVITIESAcquisitions and investments, principally trademarks and bottling companies (637) (267) (359)Purchases of investments and other assets (53) (46) (177)Proceeds from disposals of investments and other assets 33 161 147Purchases of property, plant and equipment (899) (755) (812)Proceeds from disposals of property, plant and equipment 88 341 87Other investing activities (28) 63 178
Net cash used in investing activities (1,496) (503) (936)
FINANCING ACTIVITIESIssuances of debt 178 3,030 1,026Payments of debt (2,460) (1,316) (1,119)Issuances of stock 230 193 98Purchases of stock for treasury (2,055) (1,739) (1,440)Dividends (2,678) (2,429) (2,166)
Net cash used in financing activities (6,785) (2,261) (3,601)
EFFECT OF EXCHANGE RATE CHANGES ON CASH AND CASHEQUIVALENTS (148) 141 183
CASH AND CASH EQUIVALENTSNet increase (decrease) during the year (2,006) 3,345 1,102Balance at beginning of year 6,707 3,362 2,260
Balance at end of year $ 4,701 $ 6,707 $ 3,362
Refer to Notes to Consolidated Financial Statements.
66

THE COCA-COLA COMPANY AND SUBSIDIARIES
CONSOLIDATED STATEMENTS OF SHAREOWNERS’ EQUITY
Year Ended December 31, 2005 2004 2003(In millions except per share data)
NUMBER OF COMMON SHARES OUTSTANDINGBalance at beginning of year 2,409 2,442 2,471
Stock issued to employees exercising stock options 7 5 4Purchases of stock for treasury1 (47) (38) (33)
Balance at end of year 2,369 2,409 2,442
COMMON STOCKBalance at beginning of year $ 875 $ 874 $ 873
Stock issued to employees exercising stock options 2 1 1
Balance at end of year 877 875 874
CAPITAL SURPLUSBalance at beginning of year 4,928 4,395 3,857
Stock issued to employees exercising stock options 229 175 105Tax benefit from employees’ stock option and restricted stock plans 11 13 11Stock-based compensation 324 345 422
Balance at end of year 5,492 4,928 4,395
REINVESTED EARNINGSBalance at beginning of year 29,105 26,687 24,506
Net income 4,872 4,847 4,347Dividends (per share — $1.12, $1.00 and $0.88 in 2005, 2004 and 2003, respectively) (2,678) (2,429) (2,166)
Balance at end of year 31,299 29,105 26,687
ACCUMULATED OTHER COMPREHENSIVE INCOME (LOSS)Balance at beginning of year (1,348) (1,995) (3,047)
Net foreign currency translation adjustment (396) 665 921Net gain (loss) on derivatives 57 (3) (33)Net change in unrealized gain on available-for-sale securities 13 39 40Net change in minimum pension liability 5 (54) 124
Net other comprehensive income adjustments (321) 647 1,052
Balance at end of year (1,669) (1,348) (1,995)
TREASURY STOCKBalance at beginning of year (17,625) (15,871) (14,389)
Purchases of treasury stock (2,019) (1,754) (1,482)
Balance at end of year (19,644) (17,625) (15,871)
TOTAL SHAREOWNERS’ EQUITY $ 16,355 $ 15,935 $ 14,090
COMPREHENSIVE INCOMENet income $ 4,872 $ 4,847 $ 4,347Net other comprehensive income adjustments (321) 647 1,052
TOTAL COMPREHENSIVE INCOME $ 4,551 $ 5,494 $ 5,399
1 Common stock purchased from employees exercising stock options numbered 0.5 shares, 0.4 shares and 0.4 shares for the yearsended December 31, 2005, 2004 and 2003, respectively.
Refer to Notes to Consolidated Financial Statements.
67

THE COCA-COLA COMPANY AND SUBSIDIARIES
NOTES TO CONSOLIDATED FINANCIAL STATEMENTS
NOTE 1: BUSINESS AND SUMMARY OF SIGNIFICANT ACCOUNTING POLICIES
Description of Business
The Coca-Cola Company is predominantly a manufacturer, distributor and marketer of nonalcoholicbeverage concentrates and syrups. We also manufacture, distribute and market some finished beverages. Inthese notes, the terms ‘‘Company,’’ ‘‘we,’’ ‘‘us’’ or ‘‘our’’ mean The Coca-Cola Company and all subsidiariesincluded in the consolidated financial statements. Operating in more than 200 countries worldwide, we primarilysell our concentrates and syrups, as well as some finished beverages, to bottling and canning operations,distributors, fountain wholesalers and fountain retailers. We also market and distribute juice and juice drinks,sports drinks, water products, teas, coffees and other beverage products. Additionally, we have ownershipinterests in numerous bottling and canning operations. Significant markets for our products exist in all theworld’s geographic regions.
Basis of Presentation and Consolidation
Our consolidated financial statements are prepared in accordance with accounting principles generallyaccepted in the United States. Our Company consolidates all entities that we control by ownership of a majorityvoting interest as well as variable interest entities for which our Company is the primary beneficiary. Refer to theheading ‘‘Variable Interest Entities,’’ below, for a discussion of variable interest entities.
We use the equity method to account for our investments for which we have the ability to exercisesignificant influence over operating and financial policies. Consolidated net income includes our Company’sshare of the net income of these companies.
We use the cost method to account for our investments in companies that we do not control and for whichwe do not have the ability to exercise significant influence over operating and financial policies. In accordancewith the cost method, these investments are recorded at cost or fair value, as appropriate.
We eliminate from our financial results all significant intercompany transactions, including theintercompany transactions with variable interest entities and the intercompany portion of transactions withequity method investees.
Certain amounts in the prior years’ consolidated financial statements have been reclassified to conform tothe current-year presentation.
Variable Interest Entities
In December 2003, the Financial Accounting Standards Board (‘‘FASB’’) issued FASB InterpretationNo. 46 (revised December 2003), ‘‘Consolidation of Variable Interest Entities’’ (‘‘Interpretation 46(R)’’).Application of this interpretation was required in our consolidated financial statements for the year endedDecember 31, 2003, for interests in variable interest entities that were considered to be special-purpose entities.Our Company determined that we did not have any arrangements or relationships with special-purpose entities.Application of Interpretation 46(R) for all other types of variable interest entities was required for our Companyeffective April 2, 2004.
Interpretation 46(R) addresses the consolidation of business enterprises to which the usual condition(ownership of a majority voting interest) of consolidation does not apply. This interpretation focuses oncontrolling financial interests that may be achieved through arrangements that do not involve voting interests. Itconcludes that in the absence of clear control through voting interests, a company’s exposure (variable interest)to the economic risks and potential rewards from the variable interest entity’s assets and activities is the best
68

THE COCA-COLA COMPANY AND SUBSIDIARIES
NOTES TO CONSOLIDATED FINANCIAL STATEMENTS
NOTE 1: BUSINESS AND SUMMARY OF SIGNIFICANT ACCOUNTING POLICIES (Continued)
evidence of control. If an enterprise holds a majority of the variable interests of an entity, it would be consideredthe primary beneficiary. Upon consolidation, the primary beneficiary is generally required to include assets,liabilities and noncontrolling interests at fair value and subsequently account for the variable interest as if it wereconsolidated based on majority voting interest.
In our consolidated financial statements as of December 31, 2003, and prior to December 31, 2003, weconsolidated all entities that we controlled by ownership of a majority of voting interests. As a result ofInterpretation 46(R), effective as of April 2, 2004, our consolidated balance sheets include the assets andliabilities of:
• all entities in which the Company has ownership of a majority of voting interests; and, additionally,
• all variable interest entities for which we are the primary beneficiary.
Our Company holds interests in certain entities, primarily bottlers, previously accounted for under theequity method of accounting that are considered variable interest entities. These variable interests relate toprofit guarantees or subordinated financial support for these entities. Upon adoption of Interpretation 46(R) asof April 2, 2004, we consolidated assets of approximately $383 million and liabilities of approximately$383 million that were previously not recorded on our consolidated balance sheets. We did not record acumulative effect of an accounting change, and prior periods were not restated. The results of operations ofthese variable interest entities were included in our consolidated results beginning April 3, 2004, and did nothave a material impact for the year ended December 31, 2004. Our Company’s investment, plus any loans andguarantees, related to these variable interest entities totaled approximately $263 million and $313 million atDecember 31, 2005 and 2004, respectively, representing our maximum exposures to loss. Any creditors of thevariable interest entities do not have recourse against the general credit of the Company as a result of includingthese variable interest entities in our consolidated financial statements.
Use of Estimates and Assumptions
The preparation of our consolidated financial statements requires us to make estimates and assumptionsthat affect the reported amounts of assets, liabilities, revenues and expenses and the disclosure of contingentassets and liabilities in our consolidated financial statements and accompanying notes. Although these estimatesare based on our knowledge of current events and actions we may undertake in the future, actual results mayultimately differ from estimates and assumptions.
Risks and Uncertainties
Factors that could adversely impact the Company’s operations or financial results include, but are notlimited to, the following: obesity concerns; water scarcity and quality; changes in the nonalcoholic beveragesbusiness environment; increased competition; an inability to enter or expand in developing and emergingmarkets; fluctuations in foreign currency exchange and interest rates; the ability to maintain good relationshipswith our bottling partners; a deterioration in our bottling partners’ financial condition; strikes or work stoppages(including at key manufacturing locations); increased cost of energy; increased cost, disruption of supply orshortage of raw materials; changes in laws and regulations relating to our business, including those regardingbeverage containers and packaging; additional labeling or warning requirements; unfavorable economic andpolitical conditions in international markets; changes in commercial and market practices within the EuropeanEconomic Area; litigation or legal proceedings; adverse weather conditions; an inability to maintain brand imageand product issues such as product recalls; changes in the legal and regulatory environment in various countries
69

THE COCA-COLA COMPANY AND SUBSIDIARIES
NOTES TO CONSOLIDATED FINANCIAL STATEMENTS
NOTE 1: BUSINESS AND SUMMARY OF SIGNIFICANT ACCOUNTING POLICIES (Continued)
in which we operate; changes in accounting and taxation standards including an increase in tax rates; an inabilityto achieve our overall long-term goals; an inability to protect our information systems; future impairmentcharges; and global or regional catastrophic events.
Our Company monitors our operations with a view to minimizing the impact to our overall business thatcould arise as a result of the risks and uncertainties inherent in our business.
Revenue Recognition
Our Company recognizes revenue when persuasive evidence of an arrangement exists, delivery of productshas occurred, the sales price charged is fixed or determinable, and collectibility is reasonably assured. For ourCompany, this generally means that we recognize revenue when title to our products is transferred to ourbottling partners, resellers or other customers. In particular, title usually transfers upon shipment to or receipt atour customers’ locations, as determined by the specific sales terms of the transactions.
In addition, our customers can earn certain incentives, which are included in deductions from revenue, acomponent of net operating revenues in the consolidated statements of income. These incentives include, butare not limited to, cash discounts, funds for promotional and marketing activities, volume-based incentiveprograms and support for infrastructure programs (refer to the heading ‘‘Other Assets’’). The aggregatedeductions from revenue recorded by the Company in relation to these programs, including amortizationexpense on infrastructure initiatives, was approximately $3.7 billion, $3.6 billion and $3.6 billion for the yearsended December 31, 2005, 2004 and 2003, respectively.
Advertising Costs
Our Company expenses production costs of print, radio, television and other advertisements as of the firstdate the advertisements take place. Advertising costs included in selling, general and administrative expenseswere approximately $2.5 billion, $2.2 billion and $1.8 billion for the years ended December 31, 2005, 2004 and2003, respectively. As of December 31, 2005 and 2004, advertising and production costs of approximately$170 million and $171 million, respectively, were recorded in prepaid expenses and other assets and innoncurrent other assets in our consolidated balance sheets.
Stock-Based Compensation
Our Company currently sponsors stock option plans and restricted stock award plans. Effective January 1,2002, our Company adopted the preferable fair value recognition provisions of Statement of FinancialAccounting Standards (‘‘SFAS’’) No. 123, ‘‘Accounting for Stock-Based Compensation.’’ The fair values of thestock awards are determined using a single estimated expected life. The compensation expense is recognized ona straight-line basis over the vesting period. Refer to Note 14.
Issuances of Stock by Equity Method Investees
When one of our equity method investees issues additional shares to third parties, our percentageownership interest in the investee decreases. In the event the issuance price per share is higher or lower than ouraverage carrying amount per share, we recognize a noncash gain or loss on the issuance. This noncash gain orloss, net of any deferred taxes, is generally recognized in our net income in the period the change of ownershipinterest occurs.
70

THE COCA-COLA COMPANY AND SUBSIDIARIES
NOTES TO CONSOLIDATED FINANCIAL STATEMENTS
NOTE 1: BUSINESS AND SUMMARY OF SIGNIFICANT ACCOUNTING POLICIES (Continued)
If gains have been previously recognized on issuances of an equity method investee’s stock and shares of theequity method investee are subsequently repurchased by the equity method investee, gain recognition does notoccur on issuances subsequent to the date of a repurchase until shares have been issued in an amount equivalentto the number of repurchased shares. This type of transaction is reflected as an equity transaction, and the neteffect is reflected in our consolidated balance sheets. Refer to Note 3.
Income Taxes
Income tax expense includes United States, state, local and international income taxes, plus a provision forU.S. taxes on undistributed earnings of foreign subsidiaries not deemed to be indefinitely reinvested. Deferredtax assets and liabilities are recognized for the tax consequences of temporary differences between the financialreporting and the tax basis of existing assets and liabilities. The tax rate used to determine the deferred tax assetsand liabilities is the enacted tax rate for the year in which the differences are expected to reverse. Valuationallowances are recorded to reduce deferred tax assets to the amount that will more likely than not be realized.Refer to Note 16.
Net Income Per Share
Basic net income per share is computed by dividing net income by the weighted average number of commonshares outstanding during the reporting period. Diluted net income per share is computed similarly to basic netincome per share except that it includes the potential dilution that could occur if dilutive securities wereexercised. Approximately 180 million, 151 million and 145 million stock option awards were excluded from thecomputations of diluted net income per share in 2005, 2004 and 2003, respectively, because the awards wouldhave been antidilutive for the periods presented.
Cash Equivalents
We classify marketable securities that are highly liquid and have maturities of three months or less at thedate of purchase as cash equivalents. We manage our exposure to counterparty credit risk through specificminimum credit standards, diversification of counterparties and procedures to monitor our credit riskconcentrations.
Trade Accounts Receivable
We record trade accounts receivable at net realizable value. This value includes an appropriate allowancefor estimated uncollectible accounts to reflect any loss anticipated on the trade accounts receivable balances andcharged to the provision for doubtful accounts. We calculate this allowance based on our history of write-offs,level of past due-accounts based on the contractual terms of the receivables, and our relationships with andeconomic status of our bottling partners and customers.
A significant portion of our net revenues is derived from sales of our products in international markets.Refer to Note 20. We also generate a significant portion of our net revenues by selling concentrates and syrupsto bottlers in which we have a noncontrolling interest, including Coca-Cola Enterprises Inc. (‘‘CCE’’),Coca-Cola Hellenic Bottling Company S.A. (‘‘Coca-Cola HBC’’), Coca-Cola FEMSA, S.A. de C.V. (‘‘Coca-ColaFEMSA’’) and Coca-Cola Amatil Limited (‘‘Coca-Cola Amatil’’). Refer to Note 2.
71

THE COCA-COLA COMPANY AND SUBSIDIARIES
NOTES TO CONSOLIDATED FINANCIAL STATEMENTS
NOTE 1: BUSINESS AND SUMMARY OF SIGNIFICANT ACCOUNTING POLICIES (Continued)
Inventories
Inventories consist primarily of raw materials, supplies, concentrates and syrups and are valued at the lowerof cost or market. We determine cost on the basis of average cost or first-in, first-out methods.
Recoverability of Equity Method and Cost Method Investments
Management periodically assesses the recoverability of our Company’s equity method and cost methodinvestments. For publicly traded investments, readily available quoted market prices are an indication of the fairvalue of our Company’s investments. For nonpublicly traded investments, if an identified event or change incircumstances requires an impairment evaluation, management assesses fair value based on valuationmethodologies, including discounted cash flows, estimates of sales proceeds and external appraisals, asappropriate. We consider the assumptions that we believe hypothetical marketplace participants would use inevaluating estimated future cash flows when employing the discounted cash flows and estimates of salesproceeds valuation methodologies. If an investment is considered to be impaired and the decline in value isother than temporary, we record a write-down.
Other Assets
Our Company advances payments to certain customers for marketing to fund future activities intended togenerate profitable volume, and we expense such payments over the applicable period. Advance payments arealso made to certain customers for distribution rights. Additionally, our Company invests in infrastructureprograms with our bottlers that are directed at strengthening our bottling system and increasing unit casevolume. When facts and circumstances indicate that the carrying value of the assets may not be recoverable,management evaluates the recoverability of these assets by preparing estimates of sales volume, the resultinggross profit and cash flows. Costs of these programs are recorded in prepaid expenses and other assets andnoncurrent other assets and are being amortized over the remaining periods to be directly benefited, whichrange from 1 to 13 years. Amortization expense for infrastructure programs was approximately $134 million,$136 million and $153 million for the years ended December 31, 2005, 2004 and 2003, respectively. Refer toheading ‘‘Revenue Recognition,’’ above, and Note 2.
Property, Plant and Equipment
Property, plant and equipment are stated at cost. Repair and maintenance costs that do not improve servicepotential or extend economic life are expensed as incurred. Depreciation is recorded principally by thestraight-line method over the estimated useful lives of our assets, which generally have the following ranges:buildings and improvements: 40 years or less; machinery and equipment: 15 years or less; containers: 10 years orless. Land is not depreciated, and construction in progress is not depreciated until ready for service andcapitalized. Leasehold improvements are amortized using the straight-line method over the shorter of theremaining lease term or the estimated useful life of the improvement. Depreciation expense totaledapproximately $752 million, $715 million and $667 million for the years ended December 31, 2005, 2004 and2003, respectively. Amortization expense for leasehold improvements totaled approximately $17 million,$7 million and $7 million for the years ended December 31, 2005, 2004 and 2003, respectively. Refer to Note 4.
Management assesses the recoverability of the carrying amount of property, plant and equipment if certainevents or changes in circumstances indicate that the carrying value of such assets may not be recoverable, such asa significant decrease in market value of the assets or a significant change in the business conditions in aparticular market. If we determine that the carrying value of an asset is not recoverable based on expected
72

THE COCA-COLA COMPANY AND SUBSIDIARIES
NOTES TO CONSOLIDATED FINANCIAL STATEMENTS
NOTE 1: BUSINESS AND SUMMARY OF SIGNIFICANT ACCOUNTING POLICIES (Continued)
undiscounted future cash flows, excluding interest charges, we record an impairment loss equal to the excess ofthe carrying amount of the asset over its fair value.
Goodwill, Trademarks and Other Intangible Assets
In accordance with SFAS No. 142, ‘‘Goodwill and Other Intangible Assets,’’ we classify intangible assetsinto three categories: (1) intangible assets with definite lives subject to amortization; (2) intangible assets withindefinite lives not subject to amortization; and (3) goodwill. We do not amortize intangible assets withindefinite lives and goodwill. We test intangible assets with definite lives for impairment if conditions exist thatindicate the carrying value may not be recoverable. Such conditions may include an economic downturn in ageographic market or a change in the assessment of future operations. For intangible assets with indefinite livesand goodwill, we perform tests for impairment at least annually or more frequently if events or circumstancesindicate that assets might be impaired. Such tests for impairment are also required for intangible assets and/orgoodwill recorded by our equity method investees. All goodwill is assigned to reporting units, which are one levelbelow our operating segments. Goodwill is assigned to the reporting unit that benefits from the synergies arisingfrom each business combination. We perform our impairment tests of goodwill at our reporting unit level. Suchimpairment tests for goodwill include comparing the fair value of a reporting unit with its carrying value,including goodwill. We record an impairment charge if the carrying value of the asset exceeds its fair value. Fairvalues are derived using discounted cash flow analyses with a number of scenarios, where applicable, that areweighted based on the probability of different outcomes. When appropriate, we consider the assumptions thatwe believe hypothetical marketplace participants would use in estimating future cash flows. In addition, whereapplicable, an appropriate discount rate is used, based on the Company’s cost of capital rate or location-specificeconomic factors. In case the fair value is less than the carrying value of the assets, we record an impairmentcharge to reduce the carrying value of the assets to fair value. These impairment charges are generally recordedin the line item other operating charges or equity income—net in the consolidated statements of income.
Our Company determines the useful lives of our identifiable intangible assets after considering the specificfacts and circumstances related to each intangible asset. Factors we consider when determining useful livesinclude the contractual term of any agreement, the history of the asset, the Company’s long-term strategy for theuse of the asset, any laws or other local regulations which could impact the useful life of the asset and, othereconomic factors, including competition and specific market conditions. Intangible assets that are deemed tohave definite lives are amortized, generally on a straight-line basis, over their useful lives, ranging from 1 to48 years. Refer to Note 5.
Derivative Financial Instruments
Our Company accounts for derivative financial instruments in accordance with SFAS No. 133, ‘‘Accountingfor Derivative Instruments and Hedging Activities,’’ as amended by SFAS No. 137, ‘‘Accounting for DerivativeInstruments and Hedging Activities—Deferral of the Effective Date of FASB Statement No. 133—anamendment of FASB Statement No. 133,’’ SFAS No. 138, ‘‘Accounting for Certain Derivative Instruments andCertain Hedging Activities—an amendment of FASB Statement No. 133,’’ and SFAS No. 149, ‘‘Amendment ofStatement 133 on Derivative Instruments and Hedging Activities.’’ We recognize all derivative instruments aseither assets or liabilities at fair value in our consolidated balance sheets, with fair values of foreign currencyderivatives estimated based on quoted market prices or pricing models using current market rates. Refer toNote 11.
73

THE COCA-COLA COMPANY AND SUBSIDIARIES
NOTES TO CONSOLIDATED FINANCIAL STATEMENTS
NOTE 1: BUSINESS AND SUMMARY OF SIGNIFICANT ACCOUNTING POLICIES (Continued)
Retirement-Related Benefits
Using appropriate actuarial methods and assumptions, our Company accounts for defined benefit pensionplans in accordance with SFAS No. 87, ‘‘Employers’ Accounting for Pensions.’’ We account for our nonpensionpostretirement benefits in accordance with SFAS No. 106, ‘‘Employers’ Accounting for Postretirement BenefitsOther Than Pensions.’’ In 2003, we adopted SFAS No. 132 (revised 2003), ‘‘Employers’ Disclosures aboutPensions and Other Postretirement Benefits,’’ (‘‘SFAS No. 132(R)’’) for all U.S. plans. As permitted by thisstandard, in 2004, we adopted the disclosure provisions for all foreign plans. SFAS No. 132(R) requiresadditional disclosures about the assets, obligations, cash flows and net periodic benefit cost of defined benefitpension plans and other defined benefit postretirement plans. This statement did not change the measurementor recognition of those plans required by SFAS No. 87, SFAS No. 88, ‘‘Employers’ Accounting for Settlementsand Curtailments of Defined Benefit Pension Plans and for Termination Benefits,’’ or SFAS No. 106. Refer toNote 15 for a description of how we determine our principal assumptions for pension and postretirement benefitaccounting.
Contingencies
Our Company is involved in various legal proceedings and tax matters. Due to their nature, such legalproceedings and tax matters involve inherent uncertainties including, but not limited to, court rulings,negotiations between affected parties and governmental actions. Management assesses the probability of loss forsuch contingencies and accrues a liability and/or discloses the relevant circumstances, as appropriate. Refer toNote 12.
Business Combinations
In accordance with SFAS No. 141, ‘‘Business Combinations,’’ we account for all business combinations bythe purchase method. Furthermore, we recognize intangible assets apart from goodwill if they arise fromcontractual or legal rights or if they are separable from goodwill.
Recent Accounting Standards and Pronouncements
In May 2005, the FASB issued SFAS No. 154, ‘‘Accounting Changes and Error Corrections, a replacementof Accounting Principles Board (‘‘APB’’) Opinion No. 20 and FASB Statement No. 3.’’ SFAS No. 154 requiresretrospective application to prior periods’ financial statements of a voluntary change in accounting principleunless it is impracticable. APB Opinion No. 20, ‘‘Accounting Changes,’’ previously required that most voluntarychanges in accounting principle be recognized by including in net income of the period of the change thecumulative effect of changing to the new accounting principle. SFAS No. 154 became effective for our Companyon January 1, 2006. We believe that the adoption of SFAS No. 154 will not have a material impact on ourconsolidated financial statements.
In December 2004, the FASB issued SFAS No. 153, ‘‘Exchanges of Nonmonetary Assets, an amendment ofAPB Opinion No. 29.’’ SFAS No. 153 is based on the principle that exchanges of nonmonetary assets should bemeasured based on the fair value of the assets exchanged. APB Opinion No. 29, ‘‘Accounting for NonmonetaryTransactions,’’ provided an exception to its basic measurement principle (fair value) for exchanges of similarproductive assets. Under APB Opinion No. 29, an exchange of a productive asset for a similar productive assetwas based on the recorded amount of the asset relinquished. SFAS No. 153 eliminates this exception andreplaces it with an exception for exchanges of nonmonetary assets that do not have commercial substance. SFASNo. 153 became effective for our Company as of July 2, 2005, and did not have a material impact on our
74

THE COCA-COLA COMPANY AND SUBSIDIARIES
NOTES TO CONSOLIDATED FINANCIAL STATEMENTS
NOTE 1: BUSINESS AND SUMMARY OF SIGNIFICANT ACCOUNTING POLICIES (Continued)
consolidated financial statements. The Company will continue to apply the requirements of SFAS No. 153 onany future nonmonetary exchange transactions.
In December 2004, the FASB issued SFAS No. 123 (revised 2004), ‘‘Share Based Payment’’ (‘‘SFASNo. 123(R)’’). SFAS No. 123(R) supercedes APB Opinion No. 25, ‘‘Accounting for Stock Issued to Employees,’’and amends SFAS No. 95, ‘‘Statement of Cash Flows.’’ Generally, the approach in SFAS No. 123(R) is similar tothe approach described in SFAS No. 123. In 2005, our Company used the Black-Scholes-Merton formula toestimate the fair value of stock options granted to employees. Our Company adopted SFAS No. 123(R), usingthe modified-prospective method, beginning January 1, 2006. Based on the terms of our plans, our Company didnot have a cumulative effect related to its plans. We do not expect the adoption of SFAS No. 123(R) to have amaterial impact on our Company’s future stock-based compensation expense. Additionally, our equity methodinvestees are also required to adopt SFAS No. 123(R) no later than January 1, 2006. Our proportionate share ofthe stock-based compensation expense resulting from the adoption of SFAS No. 123(R) by our equity methodinvestees will be recognized as a reduction to equity income. We do not believe the adoption of SFASNo. 123(R) by our equity method investees will have a material impact on our consolidated financial statements.
During 2004, the FASB issued FASB Staff Position 106-2, ‘‘Accounting and Disclosure RequirementsRelated to the Medicare Prescription Drug, Improvement and Modernization Act of 2003’’ (‘‘FSP 106-2’’). FSP106-2 relates to the Medicare Prescription Drug, Improvement and Modernization Act of 2003 (the ‘‘Act’’). TheAct introduced a prescription drug benefit under Medicare known as Medicare Part D. The Act also establisheda federal subsidy to sponsors of retiree health care plans that provide a benefit that is at least actuariallyequivalent to Medicare Part D. During the second quarter of 2004, our Company adopted the provisions of FSP106-2 retroactive to January 1, 2004. The adoption of FSP 106-2 did not have a material impact on ourconsolidated financial statements. Refer to Note 15.
In November 2004, the FASB issued SFAS No. 151, ‘‘Inventory Costs, an amendment of AccountingResearch Bulletin No. 43, Chapter 4.’’ SFAS No. 151 requires that abnormal amounts of idle facility expense,freight, handling costs and wasted materials (spoilage) be recorded as current period charges and that theallocation of fixed production overheads to inventory be based on the normal capacity of the productionfacilities. The Company adopted SFAS No. 151 on January 1, 2006. The Company does not believe that theadoption of SFAS No. 151 will have a material impact on our consolidated financial statements.
In October 2004, the American Jobs Creation Act of 2004 (the ‘‘Jobs Creation Act’’) was signed into law.The Jobs Creation Act includes a temporary incentive for U.S. multinationals to repatriate foreign earnings atan approximate 5.25 percent effective tax rate. Such repatriations must occur in either an enterprise’s last taxyear that began before the enactment date, or the first tax year that begins during the one-year period beginningon the date of enactment.
Issued in December 2004, FASB Staff Position 109-2, ‘‘Accounting and Disclosure Guidance for the ForeignEarnings Repatriation Provision within the American Jobs Creation Act of 2004’’ (‘‘FSP 109-2’’), indicated thatthe lack of clarification of certain provisions within the Jobs Creation Act and the timing of the enactmentnecessitated a practical exception to the SFAS No. 109, ‘‘Accounting for Income Taxes,’’ requirement to reflect inthe period of enactment the effect of a new tax law. Accordingly, enterprises were allowed time beyond 2004 toevaluate the effect of the Jobs Creation Act on their plans for reinvestment or repatriation of foreign earningsfor purposes of applying SFAS No. 109. Accordingly, in 2005, the Company repatriated $6.1 billion of itspreviously unremitted earnings and recorded an associated tax expense of approximately $315 million. Refer toNote 16.
75

THE COCA-COLA COMPANY AND SUBSIDIARIES
NOTES TO CONSOLIDATED FINANCIAL STATEMENTS
NOTE 1: BUSINESS AND SUMMARY OF SIGNIFICANT ACCOUNTING POLICIES (Continued)
In 2004, our Company recorded an income tax benefit of approximately $50 million as a result of therealization of certain tax credits related to certain provisions of the Jobs Creation Act not related to repatriationprovisions. Refer to Note 16.
Effective January 1, 2003, the Company adopted SFAS No. 146, ‘‘Accounting for Costs Associated with Exitor Disposal Activities.’’ SFAS No. 146 addresses financial accounting and reporting for costs associated with exitor disposal activities and nullifies Emerging Issues Task Force (‘‘EITF’’) Issue No. 94-3, ‘‘Liability Recognitionfor Certain Employee Termination Benefits and Other Costs to Exit an Activity (including Certain CostsIncurred in a Restructuring).’’ SFAS No. 146 requires that a liability for a cost associated with an exit or disposalplan be recognized when the liability is incurred. Under SFAS No. 146, an exit or disposal plan exists when thefollowing criteria are met:
• Management, having the authority to approve the action, commits to a plan of termination.
• The plan identifies the number of employees to be terminated, their job classifications or functions andtheir locations, and the expected completion date.
• The plan establishes the terms of the benefit arrangement, including the benefits that employees willreceive upon termination (including but not limited to cash payments), in sufficient detail to enableemployees to determine the type and amount of benefits they will receive if they are involuntarilyterminated.
• Actions required to complete the plan indicate that it is unlikely that significant changes to the plan willbe made or that the plan will be withdrawn.
SFAS No. 146 establishes that fair value is the objective for initial measurement of the liability. In caseswhere employees are required to render service beyond a minimum retention period until they are terminated inorder to receive termination benefits, a liability for termination benefits is recognized ratably over the futureservice period. Under the previous rule, EITF Issue No. 94-3, a liability for the entire amount of the exit cost wasrecognized at the date that the entity met the four criteria described above. Refer to Note 18.
Effective January 1, 2003, our Company adopted the recognition and measurement provisions of FASBInterpretation No. 45, ‘‘Guarantor’s Accounting and Disclosure Requirements for Guarantees, IncludingIndirect Guarantees of Indebtedness of Others’’ (‘‘Interpretation 45’’). This interpretation elaborates on thedisclosures to be made by a guarantor in interim and annual financial statements about the obligations undercertain guarantees. Interpretation 45 also clarifies that a guarantor is required to recognize, at the inception of aguarantee, a liability for the fair value of the obligation undertaken in issuing the guarantee. The initialrecognition and initial measurement provisions of this interpretation were applicable on a prospective basis toguarantees issued or modified after December 31, 2002. We do not currently provide significant guarantees on aroutine basis. As a result, this interpretation has not had a material impact on our consolidated financialstatements.
76

THE COCA-COLA COMPANY AND SUBSIDIARIES
NOTES TO CONSOLIDATED FINANCIAL STATEMENTS
NOTE 2: BOTTLING INVESTMENTS
Coca-Cola Enterprises Inc.
CCE is a marketer, producer and distributor of bottle and can nonalcoholic beverages, operating in eightcountries. On December 31, 2005, our Company owned approximately 36 percent of the outstanding commonstock of CCE. We account for our investment by the equity method of accounting and, therefore, our operatingresults include our proportionate share of income resulting from our investment in CCE. As of December 31,2005, our proportionate share of the net assets of CCE exceeded our investment by approximately $281 million.This difference is not amortized.
A summary of financial information for CCE is as follows (in millions):
December 31, 2005 2004
Current assets $ 3,395 $ 3,371Noncurrent assets 21,962 23,090
Total assets $ 25,357 $ 26,461
Current liabilities $ 3,846 $ 3,451Noncurrent liabilities 15,868 17,632
Total liabilities $ 19,714 $ 21,083
Shareowners’ equity $ 5,643 $ 5,378
Company equity investment $ 1,731 $ 1,569
Year Ended December 31, 2005 2004 2003
Net operating revenues $ 18,706 $ 18,158 $ 17,330Cost of goods sold 11,185 10,771 10,165
Gross profit $ 7,521 $ 7,387 $ 7,165
Operating income $ 1,431 $ 1,436 $ 1,577
Net income $ 514 $ 596 $ 676
Net income available to common shareowners $ 514 $ 596 $ 674
A summary of our significant transactions with CCE is as follows (in millions):
Year Ended December 31, 2005 2004 2003
Concentrate, syrup and finished product sales to CCE $ 5,125 $ 5,203 $ 5,084Syrup and finished product purchases from CCE 428 428 403CCE purchases of sweeteners through our Company 275 309 311Marketing payments made by us directly to CCE 482 609 880Marketing payments made to third parties on behalf of CCE 136 104 115Local media and marketing program reimbursements from CCE 245 246 221Payments made to CCE for dispensing equipment repair services 70 63 62
Syrup and finished product purchases from CCE represent purchases of fountain syrup in certain territoriesthat have been resold by our Company to major customers and purchases of bottle and can products. Marketing
77

THE COCA-COLA COMPANY AND SUBSIDIARIES
NOTES TO CONSOLIDATED FINANCIAL STATEMENTS
NOTE 2: BOTTLING INVESTMENTS (Continued)
payments made by us directly to CCE represent support of certain marketing activities and our participationwith CCE in cooperative advertising and other marketing activities to promote the sale of Company trademarkproducts within CCE territories. These programs are agreed to on an annual basis. Marketing payments made tothird parties on behalf of CCE represent support of certain marketing activities and programs to promote thesale of Company trademark products within CCE’s territories in conjunction with certain of CCE’s customers.Pursuant to cooperative advertising and trade agreements with CCE, we received funds from CCE for localmedia and marketing program reimbursements. Payments made to CCE for dispensing equipment repairservices represent reimbursement to CCE for its costs of parts and labor for repairs on cooler, dispensing, orpost-mix equipment owned by us or our customers.
In 2005, our equity income related to CCE decreased by approximately $33 million as compared to 2004,related to our proportionate share of certain charges and gains recorded by CCE. Our proportionate share ofCCE’s charges included an approximate $51 million decrease to equity income, primarily related to the taxliability recorded by CCE in the fourth quarter of 2005 resulting from the repatriation of previously unremittedforeign earnings under the Jobs Creation Act and approximately $18 million due to restructuring chargesrecorded by CCE. These restructuring charges were primarily related to workforce reductions associated withthe reorganization of CCE’s North American operations, changes in executive management and elimination ofcertain positions in CCE’s corporate headquarters. These charges were partially offset by an approximate$37 million increase to equity income in the second quarter of 2005 resulting from CCE’s high fructose cornsyrup (‘‘HFCS’’) lawsuit settlement proceeds and changes in certain of CCE’s state and provincial tax rates.Refer to Note 17.
In the second quarter of 2004, our Company and CCE agreed to terminate the Sales Growth Initiative(‘‘SGI’’) agreement and certain other marketing funding programs that were previously in place. Due totermination of these agreements, a significant portion of the cash payments to be made by us directly to CCEwas eliminated prospectively. At the termination of these agreements, we agreed that the concentrate price thatCCE pays us for sales made in the United States and Canada would be reduced. Total cash support paid by ourCompany under the SGI agreement prior to its termination was approximately $58 million and approximately$161 million for 2004 and 2003, respectively. These amounts are included in the line item marketing paymentsmade by us directly to CCE in the table above.
In the second quarter of 2004, our Company and CCE agreed to establish a Global Marketing Fund, underwhich we expect to pay CCE $62 million annually through December 31, 2014, as support for certain marketingactivities. The term of the agreement will automatically be extended for successive 10-year periods thereafterunless either party gives written notice of termination of this agreement. The marketing activities to be fundedunder this agreement will be agreed upon each year as part of the annual joint planning process and will beincorporated into the annual marketing plans of both companies. We paid CCE $62 million in 2005 and a prorata amount of $42 million for 2004. These amounts are included in the line item marketing payments made byus directly to CCE in the table above.
78

THE COCA-COLA COMPANY AND SUBSIDIARIES
NOTES TO CONSOLIDATED FINANCIAL STATEMENTS
NOTE 2: BOTTLING INVESTMENTS (Continued)
Our Company previously entered into programs with CCE designed to help develop cold-drinkinfrastructure. Under these programs, our Company paid CCE for a portion of the cost of developing theinfrastructure necessary to support accelerated placements of cold-drink equipment. These payments support acommon objective of increased sales of Company trademarked beverages from increased availability andconsumption in the cold-drink channel. In connection with these programs, CCE agreed to:
(1) purchase and place specified numbers of Company-approved cold-drink equipment each year through2010;
(2) maintain the equipment in service, with certain exceptions, for a period of at least 12 years afterplacement;
(3) maintain and stock the equipment in accordance with specified standards; and
(4) annual reporting to our Company of minimum average annual unit case volume throughout theeconomic life of the equipment and other specified information.
CCE must achieve minimum average unit case volume for a 12-year period following the placement ofequipment. These minimum average unit case volume levels ensure adequate gross profit from sales ofconcentrate to fully recover the capitalized costs plus a return on the Company’s investment. Should CCE fail topurchase the specified numbers of cold-drink equipment for any calendar year through 2010, the parties agreedto mutually develop a reasonable solution. Should no mutually agreeable solution be developed, or in the eventthat CCE otherwise breaches any material obligation under the contracts and such breach is not remedied withina stated period, then CCE would be required to repay a portion of the support funding as determined by ourCompany. In the third quarter of 2004, our Company and CCE agreed to amend the contract to defer theplacement of some equipment from 2004 and 2005, as previously agreed under the original contract, to 2009 and2010. In connection with this amendment, CCE agreed to pay the Company approximately $2 million in 2004,$3 million annually in 2005 through 2008, and $1 million in 2009. In 2005, our Company and CCE agreed toamend the contract for North America to move to a system of purchase and placement credits, whereby CCEearns credit toward its annual purchase and placement requirements based upon the type of equipment itpurchases and places. The amended contract also provides that no breach by CCE will occur even if they do notachieve the required number of purchase and placement credits in any given year, so long as (1) the shortfalldoes not exceed 20 percent of the required purchase and placement credits for that year; (2) a compensatingpayment is made to our Company by CCE; (3) the shortfall is corrected in the following year; and (4) CCEmeets all specified purchase and placement credit requirements by the end of 2010. The payments we made toCCE under these programs are recorded in prepaid expenses and other assets and in noncurrent other assetsand amortized as deductions from revenues over the 10-year period following the placement of the equipment.Our carrying values for these infrastructure programs with CCE were approximately $662 million and$759 million as of December 31, 2005 and 2004, respectively. The Company has no further commitments underthese programs.
In March 2004, the Company and CCE launched the Dasani water brand in Great Britain. The product wasvoluntarily recalled. During 2004, our Company reimbursed CCE $32 million for product recall costs incurred byCCE.
In March 2003, our Company acquired a 100 percent ownership interest in Truesdale Packaging CompanyLLC (‘‘Truesdale’’) from CCE. Refer to Note 19.
79

THE COCA-COLA COMPANY AND SUBSIDIARIES
NOTES TO CONSOLIDATED FINANCIAL STATEMENTS
NOTE 2: BOTTLING INVESTMENTS (Continued)
If valued at the December 31, 2005 quoted closing price of CCE shares, the fair value of our investment inCCE would have exceeded our carrying value by approximately $1.5 billion.
Other Equity Method Investments
Our other equity method investments include our ownership interests in Coca-Cola HBC, Coca-ColaFEMSA and Coca-Cola Amatil for which we own 24 percent, 40 percent and 32 percent of their common shares,respectively.
Operating results include our proportionate share of income (loss) from our equity method investments. Asummary of financial information for our equity method investments in the aggregate, other than CCE, is asfollows (in millions):
December 31, 2005 2004
Current assets $ 7,803 $ 6,723Noncurrent assets 20,698 19,107
Total assets $ 28,501 $ 25,830
Current liabilities $ 7,705 $ 5,507Noncurrent liabilities 8,395 8,924
Total liabilities $ 16,100 $ 14,431
Shareowners’ equity $ 12,401 $ 11,399
Company equity investment $ 4,831 $ 4,328
Year Ended December 31, 2005 2004 2003
Net operating revenues $ 24,389 $ 21,202 $ 19,797Cost of goods sold 14,141 12,132 11,661
Gross profit $ 10,248 $ 9,070 $ 8,136
Operating income $ 2,669 $ 2,406 $ 1,666
Net income (loss) $ 1,501 $ 1,389 $ 580
Net income (loss) available to common shareowners $ 1,477 $ 1,364 $ 580
Net sales to equity method investees other than CCE, the majority of which are located outside the UnitedStates, were approximately $7.4 billion in 2005, $5.2 billion in 2004 and $4.0 billion in 2003. Total supportpayments, primarily marketing, made to equity method investees other than CCE were approximately$475 million, $442 million and $511 million in 2005, 2004 and 2003, respectively.
Our Company owns a 50 percent interest in Multon, a Russian juice business (‘‘Multon’’), which weacquired in April 2005 jointly with Coca-Cola HBC, for a total purchase price of approximately $501 million,split equally between the Company and Coca-Cola HBC. Multon produces and distributes juice products underthe DOBRIY, Rich, Nico and other trademarks in Russia, Ukraine and Belarus. Equity income—net includesour proportionate share of Multon’s net income beginning April 20, 2005. Refer to Note 19.
80

THE COCA-COLA COMPANY AND SUBSIDIARIES
NOTES TO CONSOLIDATED FINANCIAL STATEMENTS
NOTE 2: BOTTLING INVESTMENTS (Continued)
During the second quarter of 2004, the Company’s equity income benefited by approximately $37 millionfor its share of a favorable tax settlement related to Coca-Cola FEMSA.
In December 2004, the Company sold to an unrelated financial institution certain of its production assetsthat were previously leased to the Japanese supply chain management company (refer to discussion below). Theassets were sold for approximately $271 million, and the sale resulted in no gain or loss. The financial institutionentered into a leasing arrangement with the Japanese supply chain management company. These assets werepreviously reported in our consolidated balance sheet line item property, plant and equipment—net andassigned to our North Asia, Eurasia and Middle East operating segment.
During 2004, our Company sold our bottling operations in Vietnam, Cambodia, Sri Lanka and Nepal toCoca-Cola Sabco (Pty) Ltd. (‘‘Sabco’’) for a total consideration of $29 million. In addition, Sabco assumedcertain debts of these bottling operations. The proceeds from the sale of these bottlers were approximately equalto the carrying value of the investment.
Effective May 6, 2003, one of our Company’s equity method investees, Coca-Cola FEMSA, consummated amerger with another of the Company’s equity method investees, Panamerican Beverages, Inc. (‘‘Panamco’’). OurCompany received new Coca-Cola FEMSA shares in exchange for all Panamco shares previously held by theCompany. Our Company’s ownership interest in Coca-Cola FEMSA increased from 30 percent to approximately40 percent as a result of this merger. This exchange of shares was treated as a nonmonetary exchange of similarproductive assets, and no gain was recorded by our Company as a result of this merger.
In connection with the merger, Coca-Cola FEMSA management initiated steps to streamline and integrateoperations. This process included the closing of various distribution centers and manufacturing plants.Furthermore, due to the challenging economic conditions and an uncertain political situation in Venezuela,certain intangible assets were determined to be impaired and written down to their fair market value. During2003, our Company recorded a noncash pretax charge of $102 million primarily related to our proportionateshare of these matters. This charge is included in the consolidated statement of income line item equityincome—net.
In December 2003, the Company issued a standby line of credit to Coca-Cola FEMSA. Refer to Note 12.
The Company and the major shareowner of Coca-Cola FEMSA have an understanding that will permit thisshareowner to purchase from our Company an amount of Coca-Cola FEMSA shares sufficient for thisshareowner to regain a 51 percent ownership interest in Coca-Cola FEMSA. Pursuant to this understanding,which is in place until May 2006, this shareowner would pay the higher of the prevailing market price per shareat the time of the sale or the sum of approximately $2.22 per share plus the Company’s carrying costs. Bothresulting amounts are in excess of our Company’s carrying value.
In July 2003, we made a convertible loan of approximately $133 million to The Coca-Cola BottlingCompany of Egypt (‘‘TCCBCE’’). The loan is convertible into preferred shares of TCCBCE upon receipt ofgovernmental approvals. Additionally, upon certain defaults under either the loan agreement or the terms of thepreferred shares, we have the ability to convert the loan or the preferred shares into common shares. As ofDecember 31, 2005, our Company owned approximately 42 percent of the common shares of TCCBCE. Sincethe adoption of Interpretation 46(R) in 2004, TCCBCE has been consolidated in our consolidated financialstatements.
81

THE COCA-COLA COMPANY AND SUBSIDIARIES
NOTES TO CONSOLIDATED FINANCIAL STATEMENTS
NOTE 2: BOTTLING INVESTMENTS (Continued)
Effective October 1, 2003, the Company and all of its bottling partners in Japan created a nationallyintegrated supply chain management company to centralize procurement, production and logistics operationsfor the entire Coca-Cola system in Japan. As a result of the creation of this supply chain management companyin Japan, a portion of our Company’s business was essentially converted from a finished product business modelto a concentrate business model, thus reducing our net operating revenues and cost of goods sold by the sameamounts. The formation of this entity included the sale of Company inventory and leasing of certain Companyassets to this new entity on October 1, 2003, as well as our recording of a liability for certain contractualobligations to Japanese bottlers. Such amounts were not material to the Company’s results of operations.
In November 2003, Coca-Cola HBC approved a share capital reduction totaling approximately 473 millioneuros and the return of 2 euros per share to all shareowners. In December 2003, our Company received ourshare capital return payment from Coca-Cola HBC equivalent to $136 million, and we recorded a reduction toour investment in Coca-Cola HBC.
If valued at the December 31, 2005 quoted closing prices of shares actively traded on stock markets, thevalue of our equity method investments in publicly traded bottlers other than CCE would have exceeded ourcarrying value by approximately $2.4 billion.
Net Receivables and Dividends from Equity Method Investees
The total amount of net receivables due from equity method investees, including CCE, was approximately$644 million and $573 million as of December 31, 2005 and 2004, respectively. The total amount of dividendsreceived from equity method investees, including CCE, was approximately $234 million, $145 million and$112 million for the years ended December 31, 2005, 2004 and 2003, respectively.
NOTE 3: ISSUANCES OF STOCK BY EQUITY METHOD INVESTEES
In 2005, our Company recorded approximately $23 million of noncash pretax gains on issuances of stock byequity method investees. We recorded deferred taxes of approximately $8 million on these gains. These gainsprimarily related to an issuance of common stock by Coca-Cola Amatil, which was valued at an amount greaterthan the book value per share of our investment in Coca-Cola Amatil. Coca-Cola Amatil issued approximately34 million shares of common stock with a fair value of $5.78 each in connection with the acquisition of SPCArdmona Pty. Ltd., an Australian packaged fruit company. This issuance of common stock reduced ourownership interest in the total outstanding shares of Coca-Cola Amatil from approximately 34.0 percent toapproximately 32.4 percent.
In 2004, our Company recorded approximately $24 million of noncash pretax gains on issuances of stock byCCE. The issuances primarily related to the exercise of CCE stock options by CCE employees at amountsgreater than the book value per share of our investment in CCE. We recorded deferred taxes of approximately$9 million on these gains. These issuances of stock reduced our ownership interest in the total outstandingshares of CCE from approximately 37.2 percent to approximately 36.0 percent.
In 2003, our Company recorded approximately $8 million of noncash pretax gains on issuances of stock byequity method investees. These gains primarily related to the issuance by CCE of common stock valued at anamount greater than the book value per share of our investment in CCE. These transactions reduced ourownership interest in the total outstanding shares of CCE from approximately 37.3 percent to approximately37.2 percent.
82

THE COCA-COLA COMPANY AND SUBSIDIARIES
NOTES TO CONSOLIDATED FINANCIAL STATEMENTS
NOTE 4: PROPERTY, PLANT AND EQUIPMENT
The following table summarizes our property, plant and equipment (in millions):
December 31, 2005 2004
Land $ 447 $ 479Buildings and improvements 2,692 2,822Machinery and equipment 6,226 6,138Containers 468 480Construction in progress 306 230
$ 10,139 $ 10,149Less accumulated depreciation 4,353 4,058
Property, plant and equipment — net $ 5,786 $ 6,091
NOTE 5: GOODWILL, TRADEMARKS AND OTHER INTANGIBLE ASSETS
The following tables set forth information for intangible assets subject to amortization and for intangibleassets not subject to amortization (in millions):
December 31, 2005 2004
Amortized intangible assets (various, principally trademarks):Gross carrying amount $ 314 $ 292Less accumulated amortization 168 128
Amortized intangible assets—net $ 146 $ 164
Unamortized intangible assets:Trademarks1 $ 1,946 $ 2,037Goodwill2 1,047 1,097Bottlers’ franchise rights3 521 374Other 161 164
Unamortized intangible assets $ 3,675 $ 3,672
1 The decrease in 2005 was primarily the result of impairment charges of approximately $84 millionrelated to trademarks in the Philippines and the effect of translation adjustments, partially offset byacquisitions of trademarks and brands in 2005 totaling approximately $22 million, none of which wereindividually significant. Refer to Note 17.
2 The decrease in 2005 was primarily the result of translation adjustments, partially offset by goodwillrecognized in connection with the Bremer acquisition. Refer to Note 19.
3 The increase in 2005 was primarily related to the Bremer and Sucos Mais acquisitions. Refer toNote 19.
Total amortization expense for intangible assets subject to amortization was approximately $29 million,$35 million and $23 million for the years ended December 31, 2005, 2004 and 2003, respectively.
83

THE COCA-COLA COMPANY AND SUBSIDIARIES
NOTES TO CONSOLIDATED FINANCIAL STATEMENTS
NOTE 5: GOODWILL, TRADEMARKS AND OTHER INTANGIBLE ASSETS (Continued)
Information about estimated amortization expense for intangible assets subject to amortization for the fiveyears succeeding December 31, 2005, is as follows (in millions):
AmortizationExpense
2006 $ 162007 152008 142009 142010 13
Goodwill by operating segment was as follows (in millions):
December 31, 2005 2004
North America $ 141 $ 140Africa — —East, South Asia and Pacific Rim 26 26European Union 772 816Latin America 85 92North Asia, Eurasia and Middle East 23 23
$ 1,047 $ 1,097
In 2005, our Company recorded an impairment charge related to trademarks for beverages sold in thePhilippines of approximately $84 million. The Philippines is a component of our East, South Asia and PacificRim operating segment. The carrying value of our trademarks in the Philippines, prior to the recording of theimpairment charges in 2005, was approximately $268 million. The impairment was the result of our revisedoutlook of the Philippines, which has been unfavorably impacted by declines in volume and income beforeincome taxes resulting from the continued lack of an affordable package offering and the continued limitedavailability of these trademark beverages in the marketplace. We determined the amount of this impairmentcharge by comparing the fair value of the intangible assets to the carrying value. Fair values were derived usingdiscounted cash flow analyses with a number of scenarios that were weighted based on the probability ofdifferent outcomes. Because the fair value was less than the carrying value of the assets, we recorded animpairment charge to reduce the carrying value of the assets to fair value. This impairment charge was recordedin the line item other operating charges in the consolidated statement of income.
In 2004, acquisition of intangible assets totaled approximately $89 million. This amount is primarily relatedto the Company’s acquisition of trademarks with indefinite lives in the Latin America operating segment.
In 2004, our Company recorded impairment charges related to intangible assets of approximately$374 million. The decrease in bottlers’ franchise rights in 2004 was primarily due to this impairment charge,offset by an increase due to translation adjustment. These impairment charges primarily were in the EuropeanUnion operating segment and were included in other operating charges in our consolidated statement ofincome. The charges were primarily related to franchise rights at Coca-Cola Erfrischungsgetraenke AG(‘‘CCEAG’’). The impairment was the result of our revised outlook for the German market, which has beenunfavorably impacted by volume declines resulting from market shifts related to the deposit law on nonrefillablebeverage packages and the corresponding lack of availability for our products in the discount retail channel. The
84

THE COCA-COLA COMPANY AND SUBSIDIARIES
NOTES TO CONSOLIDATED FINANCIAL STATEMENTS
NOTE 5: GOODWILL, TRADEMARKS AND OTHER INTANGIBLE ASSETS (Continued)
deposit laws in Germany led to discount chains creating proprietary packages that could only be returned totheir own stores. These proprietary packages were continuing to gain market share and customer acceptance.
At the end of 2004, the German government passed an amendment to the mandatory deposit legislationthat requires retailers, including discount chains, to accept returns of each type of nonrefillable beveragecontainers that retailers sell, regardless of where the beverage package type was purchased. In addition, themandatory deposit requirement was expanded to other beverage categories. The amendment allows for atransition period to enable manufacturers and retailers to establish a national take-back system for nonrefillablepackages. The transition period is expected to last at least until mid-2006. In the second half of 2005, theCompany was able to gain limited availability of our products in the discount retail channel.
NOTE 6: ACCOUNTS PAYABLE AND ACCRUED EXPENSES
Accounts payable and accrued expenses consisted of the following (in millions):
December 31, 2005 2004
Trade accounts payable and other accrued expenses $ 2,315 $ 2,309Accrued marketing 1,268 1,194Accrued compensation 468 438Sales, payroll and other taxes 215 222Container deposits 209 199Accrued streamlining costs (refer to Note 18) 18 41
Accounts payable and accrued expenses $ 4,493 $ 4,403
NOTE 7: SHORT-TERM BORROWINGS AND CREDIT ARRANGEMENTS
Loans and notes payable consist primarily of commercial paper issued in the United States and a liability toacquire the remaining approximate 59 percent of CCEAG’s outstanding stock. The Company currently owns 41percent of CCEAG’s outstanding stock. In February 2002, the Company acquired control of CCEAG and agreedto put/call agreements with the other shareowners of CCEAG, which resulted in the recording of a liability toacquire the remaining shares in CCEAG no later than December 31, 2006. The present value of the totalamount likely to be paid by our Company to all other CCEAG shareowners was approximately $941 million atDecember 31, 2005, and approximately $1,041 million at December 31, 2004. This amount increased from theinitial liability of approximately $600 million due to the accretion of the discounted value to the ultimatematurity of the liability, as well as approximately $222 million of translation adjustment related to this liability.The accretion of the discounted value to its ultimate maturity value is recorded in the line item other loss—net,and this amount was approximately $60 million, $58 million and $51 million, respectively, for the years endedDecember 31, 2005, 2004 and 2003.
As of December 31, 2005 and 2004, we had approximately $3,311 million and $4,235 million, respectively,outstanding in commercial paper borrowings. Our weighted-average interest rates for commercial paperoutstanding were approximately 4.2 percent and 2.2 percent per year at December 31, 2005 and 2004,respectively. In addition, we had $1,794 million in lines of credit and other short-term credit facilities available asof December 31, 2005, of which approximately $266 million was outstanding. This entire outstanding amount ofapproximately $266 million related to our international operations. Included in the available credit facilities
85

THE COCA-COLA COMPANY AND SUBSIDIARIES
NOTES TO CONSOLIDATED FINANCIAL STATEMENTS
NOTE 7: SHORT-TERM BORROWINGS AND CREDIT ARRANGEMENTS (Continued)
discussed above, the Company had $1,150 million in lines of credit for general corporate purposes, includingcommercial paper backup. There were no borrowings under these lines of credit during 2005.
These credit facilities are subject to normal banking terms and conditions. Some of the financialarrangements require compensating balances, none of which is presently significant to our Company.
NOTE 8: LONG-TERM DEBT
Long-term debt consisted of the following (in millions):
December 31, 2005 2004
57⁄8% euro notes due 2005 $ — $ 6634% U.S. dollar notes due 2005 — 75053⁄4% U.S. dollar notes due 2009 399 39953⁄4% U.S. dollar notes due 2011 499 49973⁄8% U.S. dollar notes due 2093 116 116Other, due through 20141,2 168 220
$ 1,182 $ 2,647Less current portion 28 1,490
Long-term debt $ 1,154 $ 1,157
1 2004 balance includes a $5 million fair value adjustment related to interest rate swap agreements.Refer to Note 11.
2 The weighted-average interest rate on outstanding balances was 6% and 4% for the years endedDecember 31, 2005 and 2004, respectively.
The above notes include various restrictions, none of which is presently significant to our Company.
After giving effect to interest rate management instruments, the principal amount of our long-term debtthat had fixed and variable interest rates, respectively, was $1,181 million and $1 million on December 31, 2005.After giving effect to interest rate management instruments, the principal amount of our long-term debt that hadfixed and variable interest rates, respectively, was $1,895 million and $752 million on December 31, 2004.Including the effect of interest rate management instruments, the weighted-average interest rate on theoutstanding balances of our Company’s long-term debt was 6.0 percent and 4.4 percent per year for the yearsended December 31, 2005 and 2004, respectively.
Total interest paid was approximately $233 million, $188 million and $180 million in 2005, 2004 and 2003,respectively. For a more detailed discussion of interest rate management, refer to Note 11.
Maturities of long-term debt for the five years succeeding December 31, 2005, are as follows (in millions):
Maturities ofLong-Term Debt
2006 $ 282007 292008 702009 4092010 9
86

THE COCA-COLA COMPANY AND SUBSIDIARIES
NOTES TO CONSOLIDATED FINANCIAL STATEMENTS
NOTE 9: COMPREHENSIVE INCOME
Accumulated Other Comprehensive Income (Loss) (‘‘AOCI’’), including our proportionate share of equitymethod investees’ AOCI, consisted of the following (in millions):
December 31, 2005 2004
Foreign currency translation adjustment $ (1,587) $ (1,191)Accumulated derivative net losses (23) (80)Unrealized gain on available-for-sale securities 104 91Minimum pension liability (163) (168)
Accumulated other comprehensive income (loss) $ (1,669) $ (1,348)
A summary of the components of other comprehensive income (loss), including our proportionate share ofequity method investees’ other comprehensive income (loss), for the years ended December 31, 2005, 2004 and2003, is as follows (in millions):
Before-Tax Income After-TaxAmount Tax Amount
2005Net foreign currency translation adjustment $ (440) $ 44 $ (396)Net gain on derivatives 94 (37) 57Net change in unrealized gain on available-for-sale securities 20 (7) 13Net change in minimum pension liability 5 — 5
Other comprehensive income (loss) $ (321) $ — $ (321)
Before-Tax Income After-TaxAmount Tax Amount
2004Net foreign currency translation adjustment $ 766 $ (101) $ 665Net loss on derivatives (4) 1 (3)Net change in unrealized gain on available-for-sale securities 48 (9) 39Net change in minimum pension liability (81) 27 (54)
Other comprehensive income (loss) $ 729 $ (82) $ 647
Before-Tax Income After-TaxAmount Tax Amount
2003Net foreign currency translation adjustment $ 913 $ 8 $ 921Net loss on derivatives (63) 30 (33)Net change in unrealized gain on available-for-sale securities 65 (25) 40Net change in minimum pension liability 181 (57) 124
Other comprehensive income (loss) $ 1,096 $ (44) $ 1,052
87

THE COCA-COLA COMPANY AND SUBSIDIARIES
NOTES TO CONSOLIDATED FINANCIAL STATEMENTS
NOTE 10: FINANCIAL INSTRUMENTS
Certain Debt and Marketable Equity Securities
Investments in debt and marketable equity securities, other than investments accounted for by the equitymethod, are categorized as trading, available-for-sale or held-to-maturity. On December 31, 2005 and 2004, wehad no trading securities. Our marketable equity investments are categorized as available-for-sale with their costbasis determined by the specific identification method. We record available-for-sale instruments at fair value,with unrealized gains and losses, net of deferred income taxes, reported as a component of AOCI. Debtsecurities categorized as held-to-maturity are stated at amortized cost.
As of December 31, 2005 and 2004, available-for-sale and held-to-maturity securities consisted of thefollowing (in millions):
Gross UnrealizedEstimated
Cost Gains Losses Fair Value
2005Available-for-sale securities:
Equity securities $ 138 $ 167 $ (2) $ 303Other securities 13 — — 13
$ 151 $ 167 $ (2) $ 316
Held-to-maturity securities:Bank and corporate debt $ 348 $ — $ — $ 348
Gross UnrealizedEstimated
Cost Gains Losses Fair Value
2004Available-for-sale securities:
Equity securities $ 144 $ 146 $ (2) $ 288Other securities 5 — (1) 4
$ 149 $ 146 $ (3) $ 292
Held-to-maturity securities:Bank and corporate debt $ 68 $ — $ — $ 68
88

THE COCA-COLA COMPANY AND SUBSIDIARIES
NOTES TO CONSOLIDATED FINANCIAL STATEMENTS
NOTE 10: FINANCIAL INSTRUMENTS (Continued)
As of December 31, 2005 and 2004, these investments were included in the following captions (in millions):
Available- Held-to-for-Sale Maturity
Securities Securities
2005Cash and cash equivalents $ — $ 346Current marketable securities 64 2Cost method investments, principally bottling companies 239 —Other assets 13 —
$ 316 $ 348
Available- Held-to-for-Sale Maturity
Securities Securities
2004Cash and cash equivalents $ — $ 68Current marketable securities 61 —Cost method investments, principally bottling companies 229 —Other assets 2 —
$ 292 $ 68
The contractual maturities of these investments as of December 31, 2005, were as follows (in millions):
Available-for-Sale Held-to-MaturitySecurities Securities
Fair Amortized FairCost Value Cost Value
2006 $ — $ — $ 348 $ 3482007-2010 — — — —2011-2015 — — — —After 2015 13 13 — —Equity securities 138 303 — —
$ 151 $ 316 $ 348 $ 348
For the years ended December 31, 2005, 2004 and 2003, gross realized gains and losses on sales ofavailable-for-sale securities were not material. The cost of securities sold is based on the specific identificationmethod.
Fair Value of Other Financial Instruments
The carrying amounts of cash and cash equivalents, non-marketable cost method investments, receivables,accounts payable and accrued expenses, and loans and notes payable approximate their fair values because ofthe relatively short-term maturity of these instruments.
We carry our non-marketable cost method investments at cost or, if a decline in the value of the investmentis deemed to be other than temporary, at fair value. Estimates of fair value are generally based upon discountedcash flow analyses.
89

THE COCA-COLA COMPANY AND SUBSIDIARIES
NOTES TO CONSOLIDATED FINANCIAL STATEMENTS
NOTE 10: FINANCIAL INSTRUMENTS (Continued)
We recognize all derivative instruments as either assets or liabilities at fair value in our consolidated balancesheets, with fair values estimated based on quoted market prices or pricing models using current market rates.Virtually all of our derivatives are straightforward, over-the-counter instruments with liquid markets. For furtherdiscussion of our derivatives, including a disclosure of derivative values, refer to Note 11.
The fair value of our long-term debt is estimated based on quoted prices for those or similar instruments.As of December 31, 2005, the carrying amounts and fair values of our long-term debt, including the currentportion, were approximately $1,182 million and approximately $1,240 million, respectively. As of December 31,2004, these carrying amounts and fair values were approximately $2,647 million and approximately$2,736 million, respectively.
NOTE 11: HEDGING TRANSACTIONS AND DERIVATIVE FINANCIAL INSTRUMENTS
Our Company uses derivative financial instruments primarily to reduce our exposure to adverse fluctuationsin interest rates and foreign currency exchange rates and, to a lesser extent, in commodity prices and othermarket risks. When entered into, the Company formally designates and documents the financial instrument as ahedge of a specific underlying exposure, as well as the risk management objectives and strategies for undertakingthe hedge transactions. The Company formally assesses, both at the inception and at least quarterly thereafter,whether the financial instruments that are used in hedging transactions are effective at offsetting changes ineither the fair value or cash flows of the related underlying exposure. Because of the high degree of effectivenessbetween the hedging instrument and the underlying exposure being hedged, fluctuations in the value of thederivative instruments are generally offset by changes in the fair values or cash flows of the underlying exposuresbeing hedged. Any ineffective portion of a financial instrument’s change in fair value is immediately recognizedin earnings. Virtually all of our derivatives are straightforward over-the-counter instruments with liquid markets.Our Company does not enter into derivative financial instruments for trading purposes.
The fair values of derivatives used to hedge or modify our risks fluctuate over time. We do not view thesefair value amounts in isolation, but rather in relation to the fair values or cash flows of the underlying hedgedtransactions or other exposures. The notional amounts of the derivative financial instruments do not necessarilyrepresent amounts exchanged by the parties and, therefore, are not a direct measure of our exposure to thefinancial risks described above. The amounts exchanged are calculated by reference to the notional amounts andby other terms of the derivatives, such as interest rates, foreign currency exchange rates or other financialindices.
Our Company recognizes all derivative instruments as either assets or liabilities in our consolidated balancesheets at fair value. The accounting for changes in fair value of a derivative instrument depends on whether ithas been designated and qualifies as part of a hedging relationship and, further, on the type of hedgingrelationship. At the inception of the hedging relationship, the Company must designate the instrument as a fairvalue hedge, a cash flow hedge, or a hedge of a net investment in a foreign operation. This designation is basedupon the exposure being hedged.
We have established strict counterparty credit guidelines and enter into transactions only with financialinstitutions of investment grade or better. We monitor counterparty exposures daily and review any downgradein credit rating immediately. If a downgrade in the credit rating of a counterparty were to occur, we haveprovisions requiring collateral in the form of U.S. government securities for substantially all of our transactions.To mitigate presettlement risk, minimum credit standards become more stringent as the duration of thederivative financial instrument increases. To minimize the concentration of credit risk, we enter into derivative
90

THE COCA-COLA COMPANY AND SUBSIDIARIES
NOTES TO CONSOLIDATED FINANCIAL STATEMENTS
NOTE 11: HEDGING TRANSACTIONS AND DERIVATIVE FINANCIAL INSTRUMENTS (Continued)
transactions with a portfolio of financial institutions. The Company has master netting agreements with most ofthe financial institutions that are counterparties to the derivative instruments. These agreements allow for thenet settlement of assets and liabilities arising from different transactions with the same counterparty. Based onthese factors, we consider the risk of counterparty default to be minimal.
Interest Rate Management
Our Company monitors our mix of fixed-rate and variable-rate debt as well as our mix of term debt versusnon-term debt. This monitoring includes a review of business and other financial risks. We also enter intointerest rate swap agreements to manage our mix of fixed-rate and variable-rate debt. Interest rate swapagreements that meet certain conditions required under SFAS No. 133 for fair value hedges are accounted for assuch, with the offset recorded to adjust the fair value of the underlying exposure being hedged. During 2005,2004 and 2003, there was no ineffectiveness related to fair value hedges. At December 31, 2005, our Companyhad no outstanding interest rate swap agreements. At December 31, 2004, the fair value of our Company’sinterest rate swap agreements was approximately $6 million. The Company estimates the fair value of its interestrate derivatives based on quoted market prices.
Foreign Currency Management
The purpose of our foreign currency hedging activities is to reduce the risk that our eventual U.S. dollar netcash inflows resulting from sales outside the United States will be adversely affected by changes in foreigncurrency exchange rates.
We enter into forward exchange contracts and purchase foreign currency options (principally euro andJapanese yen) and collars to hedge certain portions of forecasted cash flows denominated in foreign currencies.The effective portion of the changes in fair value for these contracts, which have been designated as cash flowhedges, are reported in AOCI and reclassified into earnings in the same financial statement line item and in thesame period or periods during which the hedged transaction affects earnings. Any ineffective portion (which wasnot significant in 2005, 2004 or 2003) of the change in fair value of these instruments is immediately recognizedin earnings. These contracts had maturities up to one year as of December 31, 2005.
Additionally, the Company enters into forward exchange contracts that are not designated as hedginginstruments under SFAS No. 133. These instruments are used to offset the earnings impact relating to thevariability in foreign currency exchange rates on certain monetary assets and liabilities denominated innonfunctional currencies. Changes in the fair value of these instruments are immediately recognized in earningsin the line item other loss—net of our consolidated statements of income to offset the effect of remeasurementof the monetary assets and liabilities.
The Company also enters into forward exchange contracts to hedge its net investment position in certainmajor currencies. Under SFAS No. 133, changes in the fair value of these instruments are recognized in foreigncurrency translation adjustment, a component of AOCI, to offset the change in the value of the net investmentbeing hedged. For the years ended December 31, 2005, 2004 and 2003, approximately $40 million, $8 million and$29 million, respectively, of losses relating to derivative financial instruments were recorded in foreign currencytranslation adjustment.
91

THE COCA-COLA COMPANY AND SUBSIDIARIES
NOTES TO CONSOLIDATED FINANCIAL STATEMENTS
NOTE 11: HEDGING TRANSACTIONS AND DERIVATIVE FINANCIAL INSTRUMENTS (Continued)
The following table presents the fair values, carrying values and maturities of the Company’s foreigncurrency derivative instruments outstanding as of December 31, 2005 and 2004 (in millions):
Carrying FairValues Values Maturity
2005Forward contracts $ 28 $ 28 2006Options and collars 11 11 2006
$ 39 $ 39
Carrying FairValues Values Maturity
2004Forward contracts $ 27 $ 27 2005Options and collars 12 12 2005
$ 39 $ 39
The Company estimates the fair value of its foreign currency derivatives based on quoted market prices orpricing models using current market rates. These amounts are primarily reflected in prepaid expenses and otherassets in our consolidated balance sheets.
Summary of AOCI
For the years ended December 31, 2005, 2004 and 2003, we recorded a net gain (loss) to AOCI ofapproximately $55 million, $6 million and $(31) million, respectively, net of both income taxes andreclassifications to earnings, primarily related to gains and losses on foreign currency cash flow hedges. Theseitems will generally offset cash flow gains and losses relating to the underlying exposures being hedged in futureperiods. The Company estimates that it will reclassify into earnings during the next 12 months gains ofapproximately $21 million from the after-tax amount recorded in AOCI as of December 31, 2005, as theanticipated foreign currency cash flows occur.
92

THE COCA-COLA COMPANY AND SUBSIDIARIES
NOTES TO CONSOLIDATED FINANCIAL STATEMENTS
NOTE 11: HEDGING TRANSACTIONS AND DERIVATIVE FINANCIAL INSTRUMENTS (Continued)
The following table summarizes activity in AOCI related to derivatives designated as cash flow hedges heldby the Company during the applicable periods (in millions):
Before-Tax Income After-TaxAmount Tax Amount
2005Accumulated derivative net losses as of January 1, 2005 $ (56) $ 22 $ (34)Net changes in fair value of derivatives 135 (53) 82Net gains reclassified from AOCI into earnings (44) 17 (27)
Accumulated derivative net gains as of December 31, 2005 $ 35 $ (14) $ 21
Before-Tax Income After-TaxAmount Tax Amount
2004Accumulated derivative net losses as of January 1, 2004 $ (66) $ 26 $ (40)Net changes in fair value of derivatives (76) 30 (46)Net losses reclassified from AOCI into earnings 86 (34) 52
Accumulated derivative net losses as of December 31, 2004 $ (56) $ 22 $ (34)
Before-Tax Income After-TaxAmount Tax Amount
2003Accumulated derivative net losses as of January 1, 2003 $ (15) $ 6 $ (9)Net changes in fair value of derivatives (165) 65 (100)Net losses reclassified from AOCI into earnings 114 (45) 69
Accumulated derivative net losses as of December 31, 2003 $ (66) $ 26 $ (40)
The Company did not discontinue any cash flow hedge relationships during the years ended December 31,2005, 2004 and 2003.
NOTE 12: COMMITMENTS AND CONTINGENCIES
As of December 31, 2005, we were contingently liable for guarantees of indebtedness owed by third partiesin the amount of approximately $248 million. These guarantees primarily are related to third-party customers,bottlers and vendors and have arisen through the normal course of business. These guarantees have variousterms, and none of these guarantees is individually significant. The amount represents the maximum potentialfuture payments that we could be required to make under the guarantees; however, we do not consider itprobable that we will be required to satisfy these guarantees.
In December 2003, we granted a $250 million standby line of credit to Coca-Cola FEMSA with normalmarket terms. As of December 31, 2005 and 2004, no amounts have been drawn against this line of credit. Thisstandby line of credit expires in December 2006.
We believe our exposure to concentrations of credit risk is limited due to the diverse geographic areascovered by our operations.
93

THE COCA-COLA COMPANY AND SUBSIDIARIES
NOTES TO CONSOLIDATED FINANCIAL STATEMENTS
NOTE 12: COMMITMENTS AND CONTINGENCIES (Continued)
The Company is involved in various legal proceedings. We establish reserves for specific legal proceedingswhen we determine that the likelihood of an unfavorable outcome is probable and the amount of loss can bereasonably estimated. Management has also identified certain other legal matters where we believe anunfavorable outcome is reasonably possible and/or for which no estimate of possible losses can be made.Management believes that any liability to the Company that may arise as a result of currently pending legalproceedings, including those discussed below, will not have a material adverse effect on the financial conditionof the Company taken as a whole.
In 2003, the Securities and Exchange Commission (‘‘SEC’’) initiated an investigation into whether theCompany, or certain persons associated with the Company, violated federal securities laws in connection withthe conduct alleged by a former employee of the Company. Additionally in 2003, the United States Attorney’sOffice for the Northern District of Georgia commenced a criminal investigation of the allegations raised by thesame former employee. On April 18, 2005, the Company announced that it had reached a settlement ending theSEC’s investigation. Pursuant to the settlement, the Company agreed to maintain certain measures implementedprior to or during the preceding two years and to undertake additional remedial measures in the areas ofcorporate compliance and disclosure. The settlement did not require the payment of a fine or other monetarysanction. On April 18, 2005, the Company also announced that it had received notification that the UnitedStates Attorney’s Office was terminating its investigation without taking further action.
During the period from 1970 to 1981, our Company owned Aqua-Chem, Inc. (‘‘Aqua-Chem’’). A division ofAqua-Chem manufactured certain boilers that contained gaskets that Aqua-Chem purchased from outsidesuppliers. Several years after our Company sold this entity, Aqua-Chem received its first lawsuit relating toasbestos, a component of some of the gaskets. In September 2002, Aqua-Chem notified our Company that itbelieves we are obligated for certain costs and expenses associated with its asbestos litigations. Aqua-Chemdemanded that our Company reimburse it for approximately $10 million for out-of-pocket litigation-relatedexpenses. Aqua-Chem has also demanded that the Company acknowledge a continuing obligation toAqua-Chem for any future liabilities and expenses that are excluded from coverage under the applicableinsurance or for which there is no insurance. Our Company disputes Aqua-Chem’s claims, and we believe wehave no obligation to Aqua-Chem for any of its past, present or future liabilities, costs or expenses. Furthermore,we believe we have substantial legal and factual defenses to Aqua-Chem’s claims. The parties entered intolitigation to resolve this dispute, which was stayed by agreement of the parties pending the outcome of litigationfiled in Wisconsin by certain insurers of Aqua-Chem. In that case, five plaintiff insurance companies filed adeclaratory judgment action against Aqua-Chem, the Company and 16 defendant insurance companies seeking adetermination of the parties’ rights and liabilities under policies issued by the insurers and reimbursement foramounts paid by plaintiffs in excess of their obligations. That litigation remains pending, and the Companybelieves it has substantial legal and factual defenses to the insurers’ claims. Aqua-Chem and the Companysubsequently reached a settlement agreement with five of the insurers in the Wisconsin insurance coveragelitigation, and those insurers will pay funds into an escrow account for payment of costs arising from the asbestosclaims against Aqua-Chem. Aqua-Chem has also reached a settlement agreement with an additional insurerregarding payment of that insurer’s policy proceeds for Aqua-Chem’s asbestos claims. Aqua-Chem and theCompany will continue to negotiate with the 15 other insurers that are parties to the Wisconsin insurancecoverage case and will litigate their claims against such insurers to the extent negotiations do not result insettlements. The Company also believes Aqua-Chem has substantial insurance coverage to pay Aqua-Chem’sasbestos claimants.
94

THE COCA-COLA COMPANY AND SUBSIDIARIES
NOTES TO CONSOLIDATED FINANCIAL STATEMENTS
NOTE 12: COMMITMENTS AND CONTINGENCIES (Continued)
In 1999, the Competition Directorate of the European Commission (the ‘‘Commission’’) began aninvestigation of various commercial and market practices of the Company and its bottlers in Austria, Belgium,Denmark, Germany and Great Britain. On October 19, 2004, the Company and certain of its bottlers submitteda formal Undertaking to the Commission, and the Commission accepted the Undertaking, subject to formalreview by third parties. Following the comment period, the Commission presented to the Company certaincomments it had received from third parties, as well as certain additional comments of the Commission’s legalstaff. The Company addressed those additional comments, revised the Undertaking accordingly and submittedthe final Undertaking to the Commission. On June 22, 2005, the Commission adopted a decision pursuant toArticle 9(1) of Regulation (EC) 1/2003. The decision renders legally binding the commitments set forth in theUndertaking submitted by the Company and certain of its bottlers on October 19, 2004, as such Undertaking wasrevised following consultations with national competition authorities of European Economic Area MemberStates and industry participants. The final Undertaking is substantially similar to the Undertaking initiallysubmitted on October 19, 2004. In light of the commitments, the Commission declared that there were nofurther grounds for action on its part and, without prejudice to Article 9(2) of Regulation (EC) 1/2003, that theproceedings in the case should therefore be brought to an end. The Undertaking potentially applies in 27countries and in all channels of distribution where the Company’s carbonated soft drinks account for over40 percent of national sales and twice the nearest competitor’s share. The commitments the Company made inthe Undertaking relate broadly to exclusivity, percentage-based purchasing commitments, transparency, targetrebates, tying, assortment or range commitments, and agreements concerning products of other suppliers. TheUndertaking also applies to shelf space commitments in agreements with take-home customers and to financingand availability agreements in the on-premise channel. In addition, the Undertaking includes commitments thatare applicable to commercial arrangements concerning the installation and use of technical equipment (such ascoolers, fountain equipment and vending machines). The Undertaking does not imply any recognition on theCompany’s or the bottlers’ part of any infringement of European Union competition rules. The Companybelieves that the Undertaking, while imposing restrictions, clarifies the application of competition rules to itspractices in Europe and will allow the Coca-Cola system to be able to compete vigorously while adhering to theUndertaking’s provisions.
The Spanish Competition Service (the ‘‘Service’’) made unannounced visits to the Company’s offices andthose of certain of its bottlers in Spain in 2000. In December 2003, the Service suspended its investigation untilthe Commission notified the Service how the Commission would proceed in its commercial and market practicesinvestigation referred to above. On June 22, 2005, the Commission informed the Service that the Commissionhad adopted the above referenced decision pursuant to Article 9(1) of Regulation (EC) 1/2003. OnJune 24, 2005, the Company received an Order from the Service, informing us of the Service’s proposal todiscontinue its investigation and dismiss the proceedings. On July 15, 2005, the Service issued its decisiondiscontinuing its investigation and dismissing the proceedings, and this decision has become final.
The French Competition Directorate (the ‘‘Directorate’’) has also initiated an inquiry into commercialpractices related to the soft drink sector in France. This inquiry has been conducted through visits to the officesof the Company; however, no conclusions have been communicated to the Company by the Directorate. As aresult of the Undertaking given by the Company and certain of its bottlers to the Commission referenced above,the Company believes the investigation has been discontinued.
The Company is discussing with the Commission issues relating to parallel trade within the EuropeanUnion arising out of comments received by the Commission from third parties. The Company is cooperatingfully with the Commission and is providing information on these issues and the measures taken and to be taken
95

THE COCA-COLA COMPANY AND SUBSIDIARIES
NOTES TO CONSOLIDATED FINANCIAL STATEMENTS
NOTE 12: COMMITMENTS AND CONTINGENCIES (Continued)
to address any issues raised. The Company is unable to predict at this time with any reasonable degree ofcertainty what action, if any, the Commission will take with respect to these issues.
At the time we acquire or divest our interest in an entity, we sometimes agree to indemnify the seller orbuyer for specific contingent liabilities. Management believes that any liability to the Company that may arise asa result of any such indemnification agreements will not have a material adverse effect on the financial conditionof the Company taken as a whole.
The Company is involved in various tax matters. We establish reserves at the time that we determine it isprobable we will be liable to pay additional taxes related to certain matters and the amounts of such possibleadditional taxes are reasonably estimable. We adjust these reserves, including any impact on the related interestand penalties, in light of changing facts and circumstances, such as the progress of a tax audit. A number of yearsmay elapse before a particular matter, for which we may have established a reserve, is audited and finallyresolved or when a tax assessment is raised. The number of years with open tax audits varies depending on thetax jurisdiction. While it is often difficult to predict the final outcome or the timing of resolution of anyparticular tax matter, we record a reserve when we determine the likelihood of loss is probable and the amountof loss is reasonably estimable. Such liabilities are recorded in the line item accrued income taxes in theCompany’s consolidated balance sheets. Favorable resolution of tax matters that had been previously reservedwould be recognized as a reduction to our income tax expense, when known.
The Company is also involved in various tax matters where we have determined that the probability of anunfavorable outcome is reasonably possible. Management believes that any liability to the Company that mayarise as a result of currently pending tax matters will not have a material adverse effect on the financial conditionof the Company taken as a whole.
NOTE 13: NET CHANGE IN OPERATING ASSETS AND LIABILITIES
Net cash provided by (used in) operating activities attributable to the net change in operating assets andliabilities is composed of the following (in millions):
Year Ended December 31, 2005 2004 2003
(Increase) decrease in trade accounts receivable $ (79) $ (5) $ 80(Increase) decrease in inventories (79) (57) 111Decrease (increase) in prepaid expenses and other assets 244 (397) (276)Increase (decrease) in accounts payable and accrued expenses 280 45 (164)Increase (decrease) in accrued taxes 145 (194) 53(Decrease) increase in other liabilities (81) (9) 28
$ 430 $ (617) $ (168)
NOTE 14: STOCK COMPENSATION PLANS
Effective January 1, 2002, our Company adopted the preferable fair value recognition provisions of SFASNo. 123. In accordance with the provisions of SFAS No. 123, $324 million, $345 million and $422 million wererecorded for total stock-based compensation expense in 2005, 2004 and 2003, respectively. The $324 million and$345 million recorded in 2005 and 2004, respectively, were recorded in selling, general and administrativeexpenses. Of the $422 million recorded in 2003, $407 million was recorded in selling, general and administrativeexpenses, and $15 million was recorded in other operating charges. Refer to Note 18.
96

THE COCA-COLA COMPANY AND SUBSIDIARIES
NOTES TO CONSOLIDATED FINANCIAL STATEMENTS
NOTE 14: STOCK COMPENSATION PLANS (Continued)
During 2005, the Company changed its estimated service period for retirement-eligible participants in itsplans when the terms of their stock-based compensation awards provide for accelerated vesting upon earlyretirement. The full-year impact of this change in our estimated service period was approximately $50 million for2005.
Stock Option Plans
Under our 1991 Stock Option Plan (the ‘‘1991 Option Plan’’), a maximum of 120 million shares of ourcommon stock was approved to be issued or transferred to certain officers and employees pursuant to stockoptions granted under the 1991 Option Plan. Options to purchase common stock under the 1991 Option Planhave been granted to Company employees at fair market value at the date of grant.
The 1999 Stock Option Plan (the ‘‘1999 Option Plan’’) was approved by shareowners in April 1999.Following the approval of the 1999 Option Plan, no grants were made from the 1991 Option Plan, and sharesavailable under the 1991 Option Plan were no longer available to be granted. Under the 1999 Option Plan, amaximum of 120 million shares of our common stock was approved to be issued or transferred to certain officersand employees pursuant to stock options granted under the 1999 Option Plan. Options to purchase commonstock under the 1999 Option Plan have been granted to Company employees at fair market value at the date ofgrant.
The 2002 Stock Option Plan (the ‘‘2002 Option Plan’’) was approved by shareowners in April 2002. Anamendment to the 2002 Option Plan which permitted the issuance of stock appreciation rights was approved byshareowners in April 2003. Under the 2002 Option Plan, a maximum of 120 million shares of our common stockwas approved to be issued or transferred to certain officers and employees pursuant to stock options and stockappreciation rights granted under the 2002 Option Plan. The stock appreciation rights permit the holder, uponsurrendering all or part of the related stock option, to receive common stock in an amount up to 100 percent ofthe difference between the market price and the option price. No stock appreciation rights have been issuedunder the 2002 Option Plan as of December 31, 2005. Options to purchase common stock under the 2002Option Plan have been granted to Company employees at fair market value at the date of grant.
Stock options granted in December 2003 and thereafter generally become exercisable over a four-yearannual vesting period and expire 10 years from the date of grant. Stock options granted from 1999 throughJuly 2003 generally become exercisable over a four-year annual vesting period and expire 15 years from the dateof grant. Prior to 1999, stock options generally became exercisable over a three-year vesting period and expired10 years from the date of grant.
The following table sets forth information about the weighted-average fair value of options granted duringthe year using the Black-Scholes-Merton option-pricing model and the weighted-average assumptions used forsuch grants:
2005 2004 2003
Weighted-average fair value of options at grant date $ 8.23 $ 8.84 $ 13.49Dividend yields 2.6% 2.5% 1.9%Expected volatility 19.9% 23.0% 28.1%Risk-free interest rates 4.3% 3.8% 3.5%Expected lives 6 years 6 years 6 years
97

THE COCA-COLA COMPANY AND SUBSIDIARIES
NOTES TO CONSOLIDATED FINANCIAL STATEMENTS
NOTE 14: STOCK COMPENSATION PLANS (Continued)
To ensure the best market-based assumptions were used to determine the estimated fair value of stockoptions granted in 2005, 2004 and 2003, we obtained two independent market quotes. Our Black-Scholes-Merton option-pricing model value was not materially different from the independent quotes.
A summary of stock option activity under all plans is as follows (shares in millions):
2005 2004 2003Weighted- Weighted- Weighted-
Average Average AverageShares Price Shares Price Shares Price
Outstanding on January 1 183 $ 49.41 167 $ 50.56 159 $ 50.24Granted1 34 41.26 31 41.63 24 49.67Exercised (7) 35.63 (5) 35.54 (4) 26.96Forfeited/expired2 (7) 49.11 (10) 51.64 (12) 51.45
Outstanding on December 31 203 $ 48.50 183 $ 49.41 167 $ 50.56
Exercisable on December 31 131 $ 51.61 116 $ 52.02 102 $ 51.97
Shares available on December 31 foroptions that may be granted 58 85 108
1 No grants were made from the 1991 Option Plan during 2005, 2004 or 2003.2 Shares forfeited/expired relate to the 1991, 1999 and 2002 Option Plans.
The following table summarizes information about stock options as of December 31, 2005 (shares inmillions):
Outstanding Stock Options Exercisable Stock OptionsWeighted-Average
Remaining Weighted-Average Weighted-AverageRange of Exercise Prices Shares Contractual Life Exercise Price Shares Exercise Price
$ 40.00 to $ 50.00 147 9.4 years $ 44.93 76 $ 46.96$ 50.01 to $ 60.00 46 8.1 years $ 56.25 45 $ 56.29$ 60.01 to $ 86.75 10 2.8 years $ 65.85 10 $ 65.85
$ 40.00 to $ 86.75 203 8.8 years $ 48.50 131 $ 51.61
Restricted Stock Award Plans
Under the amended 1989 Restricted Stock Award Plan and the amended 1983 Restricted Stock Award Plan(the ‘‘Restricted Stock Award Plans’’), 40 million and 24 million shares of restricted common stock, respectively,were originally available to be granted to certain officers and key employees of our Company.
On December 31, 2005, 31 million shares remain available for grant under the Restricted Stock AwardPlans. Participants are entitled to vote and receive dividends on the shares and, under the 1983 Restricted StockAward Plan, participants are reimbursed by our Company for income taxes imposed on the award, but not fortaxes generated by the reimbursement payment. The shares are subject to certain transfer restrictions and maybe forfeited if a participant leaves our Company for reasons other than retirement, disability or death, absent achange in control of our Company.
98

THE COCA-COLA COMPANY AND SUBSIDIARIES
NOTES TO CONSOLIDATED FINANCIAL STATEMENTS
NOTE 14: STOCK COMPENSATION PLANS (Continued)
The following awards were outstanding as of December 31, 2005:
• 422,700 shares of time-based restricted stock in which the restrictions lapse upon the achievement ofcontinued employment over a specified period of time. An additional 10,000 shares were promised for anemployee based outside of the United States;
• 713,000 shares of performance-based restricted stock in which restrictions lapse upon the achievement ofspecific performance goals over a specified performance period. An additional 75,000 shares werepromised, based upon achievement of relevant performance criteria, for an employee based outside ofthe United States; and
• 2,356,728 performance share unit awards which could result in a future grant of restricted stock after theachievement of specific performance goals over a specified performance period. Such awards are subjectto adjustment based on the final performance relative to the goals, resulting in a minimum grant of noshares and a maximum grant of 3,499,092 shares.
In the third quarter of 2004, in connection with Douglas N. Daft’s retirement, the CompensationCommittee of the Board of Directors released to Mr. Daft 200,000 shares of restricted stock previously grantedto him during the period from April 1992 to October 1998. The terms of these grants provided that the restrictedshares be released upon retirement after age 62 but not earlier than five years from the date of grant. TheCompensation Committee determined to release the shares in recognition of Mr. Daft’s 27 years of service tothe Company and the fact that he would turn 62 in March 2005. Mr. Daft forfeited 500,000 shares of restrictedstock granted to him in November 2000, since as of the date of his retirement, he had not held these shares forfive years from the date of grant. In addition, Mr. Daft forfeited 1,000,000 shares of performance-basedrestricted stock, since Mr. Daft retired prior to the completion of the performance period.
Time-Based Restricted Stock Awards
The following table summarizes information about time-based restricted stock awards:
Number of Shares2005 2004 2003
Outstanding on January 1 513,700 1,224,900 1,506,485Granted1 9,000 140,000 —Released (100,000) (296,800) (254,585)Cancelled/Forfeited — (554,400) (27,000)
Outstanding on December 31 422,7002 513,700 1,224,900
1 In 2005 and 2004, the Company granted time-based restricted stock awards with average fair value of$41.80 per share and $48.97 per share, respectively.
2 In 2005, the Company promised to grant an additional 10,000 shares upon completion of three yearsof service. This award is similar to time-based restricted stock, including the payment of dividendequivalents, but was granted in this manner because the employee was based outside of the UnitedStates.
99

THE COCA-COLA COMPANY AND SUBSIDIARIES
NOTES TO CONSOLIDATED FINANCIAL STATEMENTS
NOTE 14: STOCK COMPENSATION PLANS (Continued)
Performance-Based Restricted Stock Awards
In 2001, shareowners approved an amendment to the 1989 Restricted Stock Award Plan to allow for thegrant of performance-based awards. These awards are released only upon the achievement of specificmeasurable performance criteria. These awards pay dividends during the performance period. The majority ofawards have specific earnings per share targets for achievement. If the earnings per share targets are not met,the awards will be cancelled.
The following table summarizes information about performance-based restricted stock awards:
Number of Shares2005 2004 2003
Outstanding on January 1 713,000 2,507,720 2,655,000Granted1 50,000 — 52,720Released — (110,000) —Cancelled/Forfeited (50,000) (1,684,720) (200,000)
Outstanding on December 31 713,0002 713,0002 2,507,7202
1 In 2005, 50,000 shares of three-year performance-based restricted stock were granted at an averagefair value of $42.40 per share. In 2003, 52,720 shares of three-year performance-based restricted stockwere granted at an average fair value of $42.91 per share.
2 In 2002, the Company promised to grant an additional 50,000 shares at the end of three years and anadditional 75,000 shares at the end of four years, at an average fair value of $46.88 per share, if theCompany achieved predefined performance targets over the respective measurement periods. Theseawards are similar to the performance-based restricted stock, including the payment of dividendequivalents, but were granted in this manner because the employees were based outside of the UnitedStates. The award to grant 50,000 shares was cancelled during 2005 because the performance targetwas not met. The award to grant 75,000 shares was outstanding as of December 31, 2005.
The Company did not recognize compensation expense for the majority of these awards, as it is notprobable the performance targets will be achieved.
Performance Share Unit Awards
In 2003, the Company modified its use of performance-based awards and established a program to grantperformance share unit awards under the 1989 Restricted Stock Award Plan to executives. The number ofperformance share units earned shall be determined at the end of each performance period, generally threeyears, based on performance criteria determined by the Board of Directors and may result in an award ofrestricted stock for U.S. participants and certain international participants at that time. The restricted stock maybe granted to other international participants shortly before the fifth anniversary of the original award.Restrictions on such stock generally lapse on the fifth anniversary of the original award date. Generally,performance share unit awards are subject to the performance criteria of compound annual growth in earningsper share over the performance period, as adjusted for certain items approved by the Compensation Committeeof the Board of Directors (‘‘adjusted EPS’’). The purpose of these adjustments is to ensure a consistent year toyear comparison of the specified performance criteria. Performance share units do not pay dividends during theperformance period. Accordingly, the fair value of these units is the quoted market value of the Company stock
100

THE COCA-COLA COMPANY AND SUBSIDIARIES
NOTES TO CONSOLIDATED FINANCIAL STATEMENTS
NOTE 14: STOCK COMPENSATION PLANS (Continued)
on the date of the grant less the present value of the expected dividends not received during the performanceperiod.
Performance share unit Target Awards for the 2004-2006, 2005-2007 and 2006-2008 performance periodsrequire adjusted EPS growth in line with our Company’s internal projections over the performance periods. Inthe event adjusted EPS exceeds the target projection, additional shares up to the Maximum Award may begranted. In the event adjusted EPS falls below the target projection, a reduced number of shares as few as theThreshold Award may be granted. If adjusted EPS falls below the Threshold Award performance level, noshares will be granted. Of the outstanding granted performance share unit awards as of December 31, 2005,726,379; 862,649; and 695,700 awards are for the 2004-2006, 2005-2007 and 2006-2008 performance periods,respectively. In addition, 72,000 performance share unit awards, with predefined qualitative performance criteriaand release criteria that differ from the program described above, were granted in 2004 and were outstanding asof December 31, 2005.
The following table summarizes information about performance share unit awards:
Number of Share Units2005 2004 2003
Outstanding on January 1 1,583,447 798,931 —Granted1 835,440 953,196 798,931Cancelled/Forfeited (62,159) (168,680) —
Outstanding on December 31 2,356,728 1,583,447 798,931
Threshold Award 1,352,388 950,837 399,466Target Award 2,356,728 1,583,447 798,931Maximum Award 3,499,092 2,339,171 1,198,397
1 In 2005, 2004 and 2003, the Company granted performance share unit awards with average fair valueof $37.71 per share, $38.71 per share and $46.78 per share, respectively.
The Company recognizes compensation expense when it becomes probable that the performance criteriaspecified in the plan will be achieved. The compensation expense is recognized over the remaining performanceperiod and is recorded in selling, general and administrative expenses. The Company has concluded that it is notprobable the performance criteria for the 2004-2006 performance period will be achieved; accordingly, nocompensation expense has been recognized for awards related to this performance period.
NOTE 15: PENSION AND OTHER POSTRETIREMENT BENEFIT PLANS
Our Company sponsors and/or contributes to pension and postretirement health care and life insurancebenefit plans covering substantially all U.S. employees. We also sponsor nonqualified, unfunded defined benefitpension plans for certain associates. In addition, our Company and its subsidiaries have various pension plansand other forms of postretirement arrangements outside the United States. We use a measurement date ofDecember 31 for substantially all of our pension and postretirement benefit plans.
101

THE COCA-COLA COMPANY AND SUBSIDIARIES
NOTES TO CONSOLIDATED FINANCIAL STATEMENTS
NOTE 15: PENSION AND OTHER POSTRETIREMENT BENEFIT PLANS (Continued)
Obligations and Funded Status
The following table sets forth the change in benefit obligations for our benefit plans (in millions):
Pension Benefits Other BenefitsDecember 31, 2005 2004 2005 2004
Benefit obligation at beginning of year1 $ 2,800 $ 2,495 $ 801 $ 761Service cost 91 85 28 27Interest cost 156 147 43 44Foreign currency exchange rate changes (69) 71 — 1Amendments 2 — — —Actuarial (gain) loss2 223 124 (63) (11)Benefits paid3 (133) (125) (25) (25)Settlements (28) — — —Curtailments (7) 3 — —Other 6 — 3 4
Benefit obligation at end of year1 $ 3,041 $ 2,800 $ 787 $ 801
1 For pension benefit plans, the benefit obligation is the projected benefit obligation. For other benefitplans, the benefit obligation is the accumulated postretirement benefit obligation.
2 During 2004, our accumulated postretirement benefit obligation was reduced by $67 million due tothe adoption of FSP 106-2. Refer to Note 1.
3 Benefits paid from pension benefit plans during 2005 and 2004 included $28 million and $25 million,respectively, in payments related to unfunded pension plans that were paid from Company assets. Allof the benefits paid from other benefit plans during 2005 and 2004 were paid from Company assets.
The accumulated benefit obligation for our pension plans was $2,650 million and $2,440 million atDecember 31, 2005 and 2004, respectively.
For pension plans with projected benefit obligations in excess of plan assets, the total projected benefitobligation and fair value of plan assets were $1,391 million and $702 million, respectively, as ofDecember 31, 2005, and $1,112 million and $388 million, respectively, as of December 31, 2004. For pensionplans with accumulated benefit obligations in excess of plan assets, the total accumulated benefit obligation andfair value of plan assets were $875 million and $331 million, respectively, as of December 31, 2005, and$916 million and $341 million, respectively, as of December 31, 2004.
102

THE COCA-COLA COMPANY AND SUBSIDIARIES
NOTES TO CONSOLIDATED FINANCIAL STATEMENTS
NOTE 15: PENSION AND OTHER POSTRETIREMENT BENEFIT PLANS (Continued)
The following table sets forth the change in the fair value of plan assets for our benefit plans (in millions):
Pension Benefits Other BenefitsDecember 31, 2005 2004 2005 2004
Fair value of plan assets at beginning of year1 $ 2,397 $ 2,024 $ 10 $ —Actual return on plan assets 233 243 1 1Employer contributions 163 179 8 9Foreign currency exchange rate changes (47) 51 — —Benefits paid (105) (100) — —Other (4) — — —
Fair value of plan assets at end of year1 $ 2,637 $ 2,397 $ 19 $ 10
1 Plan assets include 1.6 million shares of common stock of our Company with a fair value of $65million and $67 million as of December 31, 2005 and 2004, respectively. Dividends received oncommon stock of our Company during 2005 and 2004 were $1.8 million and $1.6 million, respectively.
The pension and other benefit amounts recognized in our consolidated balance sheets are as follows (inmillions):
Pension Benefits Other BenefitsDecember 31, 2005 2004 2005 2004
Funded status — plan assets less than benefit obligations $ (404) $ (403) $ (768) $ (791)Unrecognized net actuarial loss 550 447 123 187Unrecognized prior service cost (benefit) 44 47 (6) (6)
Net prepaid asset (liability) recognized $ 190 $ 91 $ (651) $ (610)
Prepaid benefit cost $ 620 $ 527 $ — $ —Accrued benefit liability (570) (595) (651) (610)Intangible asset 12 15 — —Accumulated other comprehensive income 128 144 — —
Net prepaid asset (liability) recognized $ 190 $ 91 $ (651) $ (610)
103

THE COCA-COLA COMPANY AND SUBSIDIARIES
NOTES TO CONSOLIDATED FINANCIAL STATEMENTS
NOTE 15: PENSION AND OTHER POSTRETIREMENT BENEFIT PLANS (Continued)
Components of Net Periodic Benefit Cost
Net periodic benefit cost for our pension and other postretirement benefit plans consisted of the following(in millions):
Pension Benefits Other BenefitsYear Ended December 31, 2005 2004 2003 2005 2004 2003
Service cost $ 91 $ 85 $ 76 $ 28 $ 27 $ 25Interest cost 156 147 140 43 44 44Expected return on plan assets (167) (153) (130) (1) — —Amortization of prior service cost (benefit) 7 8 7 — (1) —Recognized net actuarial loss 43 35 27 1 3 6
Net periodic benefit cost1 $ 130 $ 122 $ 120 $ 71 $ 73 $ 75
1 During 2004, net periodic benefit cost for our other postretirement benefit plans was reduced by$12 million due to our adoption of FSP 106-2. Refer to Note 1.
In 2003, the Company recorded a charge of $23 million for special retirement benefits and curtailment costsas part of the streamlining costs. Refer to Note 18.
Assumptions
Certain weighted-average assumptions used in computing the benefit obligations are as follows:
Pension Benefits Other BenefitsDecember 31, 2005 2004 2005 2004
Discount rate 51⁄4% 51⁄2% 53⁄4% 6%Rate of increase in compensation levels 4% 4% 41⁄2% 41⁄2%
Certain weighted-average assumptions used in computing net periodic benefit cost are as follows:
Pension Benefits Other BenefitsYear Ended December 31, 2005 2004 2003 2005 2004 2003
Discount rate1 51⁄2% 6% 6% 6% 61⁄4% 61⁄2%Rate of increase in compensation levels 4% 41⁄4% 41⁄4% 41⁄2% 41⁄2% 41⁄2%Expected long-term rate of return on plan assets 73⁄4% 73⁄4% 73⁄4% 81⁄2% 81⁄2% —%
1 On March 27, 2003, the primary qualified and nonqualified U.S. pension plans, as well as the U.S.postretirement health care plan, were remeasured to reflect the effect of the curtailment resultingfrom the Company’s streamlining initiatives. Refer to Note 18. The discount rate assumption used todetermine 2003 net periodic benefit cost for these U.S. plans was 63⁄4 percent prior to theremeasurement and 61⁄2 percent subsequent to the remeasurement. This change in the discount rate isreflected in the 2003 weighted-average discount rate of 6 percent for all pension benefit plans and 61⁄2percent for other benefit plans.
104

THE COCA-COLA COMPANY AND SUBSIDIARIES
NOTES TO CONSOLIDATED FINANCIAL STATEMENTS
NOTE 15: PENSION AND OTHER POSTRETIREMENT BENEFIT PLANS (Continued)
The assumed health care cost trend rates are as follows:
December 31, 2005 2004
Health care cost trend rate assumed for next year 9% 91⁄2%Rate to which the cost trend rate is assumed to decline (the ultimate trend rate) 51⁄4% 51⁄4%Year that the rate reaches the ultimate trend rate 2010 2010
Assumed health care cost trend rates have a significant effect on the amounts reported for thepostretirement health care plans. A one percentage point change in the assumed health care cost trend ratewould have the following effects (in millions):
One Percentage Point One Percentage PointIncrease Decrease
Effect on accumulated postretirement benefit obligationas of December 31, 2005 $ 125 $ (108)
Effect on total of service cost and interest cost in 2005 $ 14 $ (12)
The discount rate assumptions used to account for pension and other postretirement benefit plans reflectthe rates at which the benefit obligations could be effectively settled. These rates were determined using a cashflow matching technique whereby a hypothetical portfolio of high quality debt securities was constructed thatmirrors the specific benefit obligations for each of our primary U.S. plans. The rate of compensation increaseassumption is determined by the Company based upon annual reviews. We review external data and our ownhistorical trends for health care costs to determine the health care cost trend rate assumptions.
Plan Assets
The following table sets forth the actual asset allocation and weighted-average target asset allocation forour U.S. and non-U.S. pension plan assets:
Target AssetDecember 31, 2005 2004 Allocation
Equity securities1 58% 60% 57%Debt securities 29 31 33Real estate and other2 13 9 10Total 100% 100% 100%
1 As of December 31, 2005 and 2004, 2 percent and 3 percent, respectively, of total pension plan assetswere invested in common stock of our Company.
2 As of December 31, 2005 and 2004, 6 percent and 4 percent, respectively, of total pension plan assetswere invested in real estate.
Investment objectives for the Company’s U.S. pension plan assets, which comprise 71 percent of totalpension plan assets as of December 31, 2005, are to:
(1) optimize the long-term return on plan assets at an acceptable level of risk;
(2) maintain a broad diversification across asset classes and among investment managers;
(3) maintain careful control of the risk level within each asset class; and
(4) focus on a long-term return objective.
105

THE COCA-COLA COMPANY AND SUBSIDIARIES
NOTES TO CONSOLIDATED FINANCIAL STATEMENTS
NOTE 15: PENSION AND OTHER POSTRETIREMENT BENEFIT PLANS (Continued)
Asset allocation targets promote optimal expected return and volatility characteristics given the long-termtime horizon for fulfilling the obligations of the pension plans. Selection of the targeted asset allocation for U.S.plan assets was based upon a review of the expected return and risk characteristics of each asset class, as well asthe correlation of returns among asset classes.
Investment guidelines are established with each investment manager. These guidelines provide theparameters within which the investment managers agree to operate, including criteria that determine eligibleand ineligible securities, diversification requirements and credit quality standards, where applicable. Unlessexceptions have been approved, investment managers are prohibited from buying or selling commodities, futuresor option contracts, as well as from short selling of securities. Furthermore, investment managers agree to obtainwritten approval for deviations from stated investment style or guidelines.
As of December 31, 2005, no investment manager was responsible for more than 10 percent of total U.S.plan assets. In addition, diversification requirements for each investment manager prevent a single security orother investment from exceeding 10 percent, at historical cost, of the total U.S. plan assets.
The expected long-term rate of return assumption for U.S. plan assets is based upon the target assetallocation and is determined using forward-looking assumptions in the context of historical returns andvolatilities for each asset class, as well as correlations among asset classes. We evaluate the rate of returnassumption on an annual basis. The expected long-term rate of return assumption used in computing 2005 netperiodic pension cost for the U.S. plans was 8.5 percent. As of December 31, 2005, the 10-year annualized returnon U.S. plan assets was 9.6 percent, the 15-year annualized return was 11.6 percent, and the annualized returnsince inception was 12.7 percent.
Plan assets for our pension plans outside the United States are insignificant on an individual plan basis.
Cash Flows
Information about the expected cash flows for our pension and other postretirement benefit plans is asfollows (in millions):
Pension OtherBenefits Benefits
Expected employer contributions:2006 $ 103 $ 9Expected benefit payments1:2006 $ 125 $ 302007 131 322008 134 342009 135 372010 140 392011-2015 782 233
1 The expected benefit payments for our other postretirement benefit plans do not reflect anyestimated federal subsidies expected to be received under the Medicare Prescription Drug,Improvement and Modernization Act of 2003. Federal subsidies are estimated to range from$1.9 million in 2006 to $3.0 million in 2010 and are estimated to be $19.8 million for the period2011-2015.
106

THE COCA-COLA COMPANY AND SUBSIDIARIES
NOTES TO CONSOLIDATED FINANCIAL STATEMENTS
NOTE 15: PENSION AND OTHER POSTRETIREMENT BENEFIT PLANS (Continued)
Defined Contribution Plans
Our Company sponsors a qualified defined contribution plan covering substantially all U.S. employees.Under this plan, we match 100 percent of participants’ contributions up to a maximum of 3 percent ofcompensation. Company contributions to the U.S. plan were approximately $21 million, $18 million and$20 million in 2005, 2004 and 2003, respectively. We also sponsor defined contribution plans in certain locationsoutside the United States. Company contributions to those plans were approximately $14 million, $8 million and$7 million in 2005, 2004 and 2003, respectively.
NOTE 16: INCOME TAXES
Income before income taxes consisted of the following (in millions):
Year Ended December 31, 2005 2004 2003
United States $ 2,268 $ 2,535 $ 2,029International 4,422 3,687 3,466
$ 6,690 $ 6,222 $ 5,495
Income tax expense (benefit) consisted of the following for the years ended December 31, 2005, 2004 and2003 (in millions):
United State andStates Local International Total
2005Current $ 873 $ 188 $ 845 $ 1,906Deferred (72) (25) 9 (88)
2004Current $ 350 $ 64 $ 799 $ 1,213Deferred 209 29 (76) 162
2003Current $ 426 $ 84 $ 826 $ 1,336Deferred (145) (11) (32) (188)
We made income tax payments of approximately $1,676 million, $1,500 million and $1,325 million in 2005,2004 and 2003, respectively.
107

THE COCA-COLA COMPANY AND SUBSIDIARIES
NOTES TO CONSOLIDATED FINANCIAL STATEMENTS
NOTE 16: INCOME TAXES (Continued)
A reconciliation of the statutory U.S. federal tax rate and effective tax rates is as follows:
Year Ended December 31, 2005 2004 2003
Statutory U.S. federal rate 35.0 % 35.0 % 35.0 %State and local income taxes — net of federal benefit 1.2 1.0 0.9Earnings in jurisdictions taxed at rates different from the statutory U.S. federal
rate (12.1)1 (9.4)5,6 (10.6)10
Equity income or loss (2.3) (3.1)7 (2.4)11
Other operating charges 0.42 (0.9)8 (1.1)12
Other — net 0.33 (0.5)9 (0.9)Repatriation under the Jobs Creation Act 4.74 — —
Effective rates 27.2 % 22.1 % 20.9 %
1 Includes approximately $29 million (or 0.4 percent) tax benefit related to the favorable resolution ofcertain tax matters in various international jurisdictions.
2 Includes approximately $4 million tax benefit related to the Philippines impairment charges. Refer toNote 5 and Note 17.
3 Includes approximately $72 million (or 1.1 percent) tax benefit related to the favorable resolution ofcertain domestic tax matters.
4 Related to repatriation of approximately $6.1 billion of previously unremitted foreign earnings underthe Jobs Creation Act, resulting in a tax provision of approximately $315 million.
5 Includes approximately $92 million (or 1.4 percent) tax benefit related to the favorable resolution ofcertain tax matters in various international jurisdictions.
6 Includes a tax charge of approximately $75 million (or 1.2 percent) related to the recording of avaluation allowance on various deferred tax assets recorded in Germany.
7 Includes an approximate $50 million (or 0.8 percent) tax benefit related to the realization of certainforeign tax credits per provisions of the Jobs Creation Act.
8 Includes a tax benefit of approximately $171 million primarily related to impairment of franchise rightsat CCEAG and certain manufacturing investments. Refer to Note 17.
9 Includes an approximate $36 million (or 0.6 percent) tax benefit related to the favorable resolution ofvarious domestic tax matters.
10 Includes an approximate $50 million (or 0.8 percent) tax benefit related primarily to the favorableresolution of certain tax matters in various international jurisdictions.
11 Includes the tax benefit of approximately $3 million related to the write-down of certain intangibleassets held by bottling investments in Latin America. Refer to Note 2.
12 Includes the tax benefit of approximately $186 million related to charges for streamlining initiatives.Refer to Note 18.
Our effective tax rate reflects the tax benefits from having significant operations outside the United Statesthat are taxed at rates lower than the statutory U.S. rate of 35 percent.
Undistributed earnings of the Company’s foreign subsidiaries amounted to approximately $5.1 billion atDecember 31, 2005. Those earnings are considered to be indefinitely reinvested and, accordingly, no U.S.federal and state income taxes have been provided thereon. Upon distribution of those earnings in the form ofdividends or otherwise, the Company would be subject to both U.S. income taxes (subject to an adjustment forforeign tax credits) and withholding taxes payable to the various foreign countries. Determination of the amountof unrecognized deferred U.S. income tax liability is not practical because of the complexities associated with itshypothetical calculation; however, unrecognized foreign tax credits would be available to reduce a portion of theU.S. liability.
108

THE COCA-COLA COMPANY AND SUBSIDIARIES
NOTES TO CONSOLIDATED FINANCIAL STATEMENTS
NOTE 16: INCOME TAXES (Continued)
As discussed in Note 1, the Jobs Creation Act was enacted in October 2004. One of the provisions providesa one-time benefit related to foreign tax credits generated by equity investments in prior years. The Companyrecorded an income tax benefit of approximately $50 million as a result of this law change in 2004. The JobsCreation Act also included a temporary incentive for U.S. multinationals to repatriate foreign earnings at anapproximate 5.25 percent effective tax rate. During the first quarter of 2005, the Company decided to repatriateapproximately $2.5 billion in previously unremitted foreign earnings. Therefore, the Company recorded aprovision for taxes on such previously unremitted foreign earnings of approximately $152 million in the firstquarter of 2005. Also, during 2005, the United States Internal Revenue Service and the United StatesDepartment of Treasury issued additional guidance related to the Jobs Creation Act. As a result of thisguidance, the Company reduced the accrued taxes previously provided on such unremitted earnings by$25 million in the second quarter of 2005. Also, during the fourth quarter of 2005, the Company repatriated anadditional $3.6 billion, with an associated tax liability of approximately $188 million. Therefore, the totalpreviously unremitted earnings that was repatriated during the full year of 2005 was $6.1 billion with anassociated tax liability of approximately $315 million. This liability was recorded in the current year as federaland state and local tax expenses in the amount of $301 million and $14 million, respectively.
The tax effects of temporary differences and carryforwards that give rise to deferred tax assets and liabilitiesconsist of the following (in millions):
December 31, 2005 2004
Deferred tax assets:Property, plant and equipment $ 60 $ 71Trademarks and other intangible assets 64 65Equity method investments (including translation adjustment) 445 530Other liabilities 200 149Benefit plans 649 594Net operating/capital loss carryforwards 750 856Other 295 257
Gross deferred tax assets 2,463 2,522Valuation allowances (786) (854)Total deferred tax assets1,2 $ 1,677 $ 1,668
Deferred tax liabilities:Property, plant and equipment $ (641) $ (684)Trademarks and other intangible assets (278) (247)Equity method investments (including translation adjustment) (674) (612)Other liabilities (80) (71)Other (170) (180)
Total deferred tax liabilities3 $ (1,843) $ (1,794)Net deferred tax assets (liabilities) $ (166) $ (126)
1 Noncurrent deferred tax assets of $192 million and $251 million were included in the consolidatedbalance sheets line item other assets at December 31, 2005 and 2004, respectively.
2 Current deferred tax assets of $153 million and $146 million were included in the consolidatedbalance sheets line item prepaid expenses and other assets at December 31, 2005 and 2004,respectively.
3 Current deferred tax liabilities of $159 million and $121 million were included in the consolidatedbalance sheets line item accounts payable and accrued expenses at December 31, 2005 and 2004,respectively.
109

THE COCA-COLA COMPANY AND SUBSIDIARIES
NOTES TO CONSOLIDATED FINANCIAL STATEMENTS
NOTE 16: INCOME TAXES (Continued)
On December 31, 2005 and 2004, we had approximately $116 million and $194 million, respectively, of netdeferred tax assets located in countries outside the United States.
On December 31, 2005, we had approximately $3,345 million of loss carryforwards available to reducefuture taxable income. Loss carryforwards of approximately $1,365 million must be utilized within the next fiveyears; $123 million must be utilized within the next 10 years, and the remainder can be utilized over a periodgreater than 10 years.
As of December 31, 2005, 2004 and 2003, the Company had valuation allowances of $786 million,$854 million and $630 million, respectively, which were primarily related to the realization of recorded taxbenefits on tax loss carryforwards from operations in various jurisdictions. In 2005, the Company recognized adecrease in its valuation allowances of $68 million. In 2004, the Company recognized an increase in its valuationallowances of $224 million. In 2003, the Company recognized a decrease in its valuation allowances of$108 million.
NOTE 17: SIGNIFICANT OPERATING AND NONOPERATING ITEMS
In 2005, our Company received approximately $109 million related to the settlement of a class actionlawsuit concerning price-fixing in the sale of HFCS purchased by the Company during the years 1991 to 1995.Subsequent to the receipt of this settlement amount, the Company distributed approximately $62 million tocertain bottlers in North America. From 1991 to 1995, the Company purchased HFCS on behalf of thesebottlers. Therefore, these bottlers were ultimately entitled to a portion of the proceeds of the settlement. Of theapproximately $62 million we distributed to certain bottlers in North America, approximately $49 million wasdistributed to CCE. The Company’s remaining share of the settlement was approximately $47 million, which wasrecorded as a reduction of cost of goods sold and impacted the Corporate operating segment.
During 2005, we recorded approximately $23 million of noncash pretax gains on the issuances of stock byequity method investees. Refer to Note 3.
The Company recorded approximately $50 million of expense in 2005 as a result of a change in ourestimated service period for the acceleration of certain stock-based compensation awards. Refer to Note 14.
Equity income in 2005 was reduced by approximately $33 million for the Corporate segment, primarilyrelated to our proportionate share of the tax liability recorded by CCE resulting from its repatriation ofpreviously unremitted foreign earnings under the Jobs Creation Act, as well as our proportionate share ofrestructuring charges. Those amounts were partially offset by our proportionate share of CCE’s HFCS lawsuitsettlement proceeds and changes in certain of CCE’s state and provincial tax rates. Refer to Note 2.
Our Company recorded impairment charges during 2005 of approximately $84 million related to certaintrademarks for beverages sold in the Philippines and approximately $1 million related to impairment of otherassets. These impairment charges were recorded in the consolidated statement of income line item otheroperating charges. Refer to Note 5.
During 2004, our Company’s equity income benefited by approximately $37 million for our proportionateshare of a favorable tax settlement related to Coca-Cola FEMSA.
In 2004, we recorded approximately $24 million of noncash pretax gains on the issuances of stock by CCE.Refer to Note 3.
110

THE COCA-COLA COMPANY AND SUBSIDIARIES
NOTES TO CONSOLIDATED FINANCIAL STATEMENTS
NOTE 17: SIGNIFICANT OPERATING AND NONOPERATING ITEMS (Continued)
We recorded impairment charges during 2004 of approximately $374 million, primarily related to theimpairment of franchise rights at CCEAG and approximately $18 million related to other assets. Theseimpairment charges were recorded in the consolidated statement of income line item other operating charges.Refer to Note 5.
We recorded additional impairment charges in 2004 of approximately $88 million. These impairmentsprimarily related to the write-downs of certain manufacturing investments and an intangible asset. As a result ofoperating losses, management prepared analyses of cash flows expected to result from the use of the assets andtheir eventual disposition. Because the sum of the undiscounted cash flows was less than the carrying value ofsuch assets, we recorded an impairment charge to reduce the carrying value of the assets to fair value. Theseimpairment charges were recorded in the consolidated statement of income line item other operating charges.
Also in 2004, our Company received a $75 million insurance settlement related to the class action lawsuitthat was settled in 2000. The Company donated $75 million to The Coca-Cola Foundation in 2004.
In 2003, the Company reached a settlement with certain defendants in a vitamin antitrust litigation matter.In that litigation, the Company alleged that certain vitamin manufacturers participated in a global conspiracy tofix the price of some vitamins, including vitamins used in the manufacture of some of the Company’s products.Also in 2003, the Company received a settlement relating to this litigation of approximately $52 million, whichwas recorded as a reduction to cost of goods sold.
Refer to Note 2 for disclosure regarding the merger of Coca-Cola FEMSA and Panamco in 2003 and therecording of a $102 million noncash pretax charge to the consolidated statement of income line item equityincome—net.
During 2003, we recorded approximately $8 million of noncash pretax gains on the issuances of stock byequity method investees. Refer to Note 3.
NOTE 18: STREAMLINING COSTS
During 2003, the Company took steps to streamline and simplify its operations, primarily in North Americaand Germany. In North America, the Company integrated the operations of three formerly separate NorthAmerican business units—Coca-Cola North America, The Minute Maid Company and Coca-Cola Fountain. InGermany, CCEAG took steps to improve its efficiency in sales, distribution and manufacturing, and our GermanDivision office also implemented streamlining initiatives. Selected other operations also took steps to streamlinetheir operations to improve overall efficiency and effectiveness. As disclosed in Note 1, under SFAS No. 146, aliability is accrued only when certain criteria are met. All of the Company’s streamlining initiatives met thecriteria of SFAS No. 146 as of December 31, 2003, and all related costs were incurred as of December 31, 2003.
Employees separated from the Company as a result of these streamlining initiatives were offered severanceor early retirement packages, as appropriate, which included both financial and nonfinancial components. Theexpenses recorded during the year ended December 31, 2003 included costs associated with involuntaryterminations and other direct costs associated with implementing these initiatives. As of December 31, 2003,approximately 3,700 associates were separated pursuant to these streamlining initiatives. Other direct costsincluded the relocation of employees; contract termination costs; costs associated with the development,communication and administration of these initiatives; and asset write-offs. During 2003, the Company incurredtotal pretax expenses related to these streamlining initiatives of approximately $561 million, or $0.15 per share
111

THE COCA-COLA COMPANY AND SUBSIDIARIES
NOTES TO CONSOLIDATED FINANCIAL STATEMENTS
NOTE 18: STREAMLINING COSTS (Continued)
after-tax. These expenses were recorded in our consolidated statements of income line item other operatingcharges.
The table below summarizes the costs incurred in 2003, the balances of accrued streamlining expenses, andthe movement in those balances as of and for the years ended December 31, 2003, 2004 and 2005 (in millions):
Accrued Accrued AccruedCosts Noncash Balance Noncash Balance Noncash Balance
Incurred and December 31, and December 31, and December 31,in 2003 Payments Exchange 2003 Payments Exchange 2004 Payments Exchange 2005
Severance pay andbenefits $ 248 $ (113) $ 3 $ 138 $ (118) $ (2) $ 18 $ (14) $ (2) $ 2
Retirement relatedbenefits 43 — (14) 29 — (29) — — — —
Outside services—legal,outplacement,consulting 36 (25) — 11 (10) (1) — — — —
Other direct costs 133 (81) (1) 51 (29) 1 23 (6) (1) 16
Total1 $ 460 $ (219) $ (12) $ 229 $ (157) $ (31) $ 41 $ (20) $ (3) $ 18
Asset impairments $ 101
Total costs incurred $ 561
1 As of December 31, 2004 and 2005, $41 million and $18 million, respectively, was included in our consolidated balance sheets line item accountspayable and accrued expenses.
The total streamlining initiative costs incurred for the year ended December 31, 2003 by operating segmentwere as follows (in millions):
North America $ 273Africa 12East, South Asia and Pacific Rim 11European Union 157Latin America 8North Asia, Eurasia and Middle East 33Corporate 67
Total $ 561
NOTE 19: ACQUISITIONS AND INVESTMENTS
During 2005, our Company’s acquisition and investment activity totaled approximately $637 million andincluded the acquisition of the German soft drink bottling company Bremer Erfrischungsgetraenke GmbH(‘‘Bremer’’) for approximately $160 million from InBev SA. This transaction was accounted for as a businesscombination, and the results of Bremer’s operations have been included in the Company’s consolidated financialstatements beginning in September 2005. The Company recorded approximately $54 million of property, plantand equipment, approximately $85 million of franchise rights and approximately $58 million of goodwill relatedto this acquisition. The franchise rights have been assigned an indefinite life, and the goodwill was allocated tothe Germany and Nordic reporting unit within the European Union operating segment.
112

THE COCA-COLA COMPANY AND SUBSIDIARIES
NOTES TO CONSOLIDATED FINANCIAL STATEMENTS
NOTE 19: ACQUISITIONS AND INVESTMENTS (Continued)
In August 2005, we completed the acquisition of the remaining 49 percent interest in the business of CCDAWaters L.L.C. (‘‘CCDA’’) not previously owned by our Company. Our Company and Danone Waters of NorthAmerica, Inc. (‘‘DWNA’’) had formed CCDA in July 2002 for the production, marketing and distribution ofDWNA’s bottled spring and source water business in the United States. This transaction was accounted for as abusiness combination, and the consolidated results of CCDA’s operations have been included in the Company’sconsolidated financial statements since July 2002. CCDA is included in our North America operating segment.In July 2005, the Company acquired Sucos Mais, a Brazilian juice company. The results of Sucos Mais have beenincluded in our consolidated financial statements since July 2005.
Assuming the results of these businesses had been included in operations beginning on January 1, 2005, proforma financial data would not be required due to immateriality.
On April 20, 2005, our Company and Coca-Cola HBC jointly acquired Multon for a total purchase price ofapproximately $501 million, split equally between the Company and Coca-Cola HBC. The Company’sinvestment in Multon is accounted for under the equity method. Equity income—net includes our proportionateshare of the results of Multon’s operations beginning April 20, 2005.
During 2004, our Company’s acquisition and investment activity totaled approximately $267 million,primarily related to the purchase of trademarks, brands and related contractual rights in Latin America, none ofwhich was individually significant.
During 2003, our Company’s acquisition and investment activity totaled approximately $359 million. Theseacquisitions included purchases of trademarks, brands and related contractual rights of approximately$142 million, none of which was individually significant. Other acquisition and investing activity totaledapproximately $217 million, none of which were individually significant. In March 2003, our Company acquired a100 percent ownership interest in Truesdale from our equity method investee CCE for cash consideration ofapproximately $58 million. Truesdale owns a noncarbonated beverage production facility. The purchase pricewas allocated primarily to property, plant and equipment acquired. No amount was allocated to intangibleassets. Truesdale is included in our North America operating segment.
NOTE 20: OPERATING SEGMENTS
During 2005, the Company made certain changes to its operating structure impacting its Europe, Eurasiaand Middle East operating segment and its Asia operating segment. The Company replaced these operatingsegments with three new operating segments: the European Union operating segment; the North Asia, Eurasiaand Middle East operating segment; and the East, South Asia and Pacific Rim operating segment. TheEuropean Union operating segment includes the Company’s operations in all of the current member states ofthe European Union as well as the European Free Trade Association countries, Switzerland, Israel and thePalestinian Territories, and Greenland. The North Asia, Eurasia and Middle East operating segment includesthe Company’s operations in China, Japan, Eurasia and Middle East (other than Israel and the PalestinianTerritories), Russia, Ukraine and Belarus, and other European countries not included in the European Unionoperating segment. The East, South Asia and Pacific Rim operating segment includes the Company’s operationsin India, the Philippines, Southeast and West Asia, and South Pacific and Korea. As of December 31, 2005, ourCompany’s operating structure consisted of the following operating segments: North America; Africa; East,South Asia and Pacific Rim; European Union; Latin America; North Asia, Eurasia and Middle East; andCorporate. Prior year amounts have been reclassified to conform with the new operating structure describedabove.
113

THE COCA-COLA COMPANY AND SUBSIDIARIES
NOTES TO CONSOLIDATED FINANCIAL STATEMENTS
NOTE 20: OPERATING SEGMENTS (Continued)
Segment Products and Services
The business of our Company is nonalcoholic beverages. Our operating segments derive a majority of theirrevenues from the manufacture and sale of beverage concentrates and syrups and, in some cases, the sale offinished beverages. The following table summarizes the contribution to net operating revenues from Companyoperations (in millions):
Year Ended December 31, 2005 2004 2003
Company operations, excluding bottling operations $ 19,687 $ 18,651 $ 17,990Company-owned bottling operations 3,417 3,091 2,867
Consolidated net operating revenues $ 23,104 $ 21,742 $ 20,857
Method of Determining Segment Income or Loss
Management evaluates the performance of our operating segments separately to individually monitor thedifferent factors affecting financial performance. Segment income or loss includes substantially all of thesegment’s costs of production, distribution and administration. Our Company typically manages and evaluatesequity method investments and related income on a segment level. However, we manage certain investments,such as our equity interests in CCE and Coca-Cola HBC, within the Corporate operating segment. OurCompany manages income taxes and financial costs, such as interest income and expense, on a global basiswithin the Corporate operating segment. We evaluate segment performance based on income or loss beforeincome taxes.
114

THE COCA-COLA COMPANY AND SUBSIDIARIES
NOTES TO CONSOLIDATED FINANCIAL STATEMENTS
NOTE 20: OPERATING SEGMENTS (Continued)
Information about our Company’s operations by operating segment is as follows (in millions):
East, South North Asia,North Asia and European Latin Eurasia and
America Africa Pacific Rim Union America Middle East Corporate Consolidated
2005Net operating revenues $ 6,676 $ 1,263 $ 1,258 $ 6,803 $ 2,527 $ 4,4941 $ 83 $ 23,104Operating income (loss)2 1,554 415 2013 2,247 1,207 1,709 (1,248)4 6,085Interest income 235 235Interest expense 240 240Depreciation and amortization 348 29 75 245 40 61 134 932Equity income — net 10 13 70 2 207 59 319 5 680Income (loss) before income taxes2 1,559 414 3033,6 2,191 1,429 1,749 (955)4,5 6,690Identifiable operating assets 4,621 758 761 4,7117 1,622 1,140 8,892 8 22,505Investments9 124 161 1,099 36 1,853 784 2,865 6,922Capital expenditures 265 40 45 217 57 126 149 899
2004Net operating revenues $ 6,423 $ 1,067 $ 1,276 $ 6,570 $ 2,123 $ 4,1821 $ 101 $ 21,742Operating income (loss)10 1,606 340 344 1,812 1,069 1,629 (1,102)11 5,698Interest income 157 157Interest expense 196 196Depreciation and amortization 345 28 60 234 42 84 100 893Equity income — net 11 12 72 1 185 12 26 314 621Income (loss) before income taxes10 1,629 337 429 1,747 1,270 12 1,641 (831)11,13 6,222Identifiable operating assets 4,731 789 753 5,1447 1,405 1,108 11,259 8 25,189Investments9 116 162 1,097 67 1,580 493 2,737 6,252Capital expenditures 247 28 41 225 38 59 117 755
2003Net operating revenues $ 6,157 $ 827 $ 1,331 $ 6,086 $ 2,042 $ 4,3211 $ 93 $ 20,857Operating income (loss)14 1,282 249 367 1,897 970 1,487 (1,031)15 5,221Interest income 176 176Interest expense 178 178Depreciation and amortization 305 27 53 220 52 81 112 850Equity income — net 13 13 59 3 (5)16 18 305 406Income (loss) before income taxes14 1,326 249 423 1,847 975 16 1,483 (808)15 5,495Identifiable operating assets 4,953 721 887 5,1187 1,440 1,051 7,702 8 21,872Investments9 109 156 1,015 71 1,348 547 2,292 5,538Capital expenditures 309 13 91 188 35 67 109 812
Intercompany transfers between operating segments are not material and are eliminated.Certain prior year amounts have been reclassified to conform to the current year presentation.1 Net operating revenues in Japan represented approximately 66 percent of total North Asia, Eurasia and Middle East operating segment net operating
revenues in 2005, 72 percent in 2004 and 82 percent in 2003.2 Operating income (loss) and income (loss) before income taxes were reduced by approximately $12 million for North America, $3 million for Africa,
$3 million for East, South Asia and Pacific Rim, $3 million for European Union, $4 million for Latin America, $3 million for North Asia, Eurasia andMiddle East and $22 million for Corporate as a result of accelerated amortization of stock-based compensation expense due to a change in ourestimated service period for retirement-eligible participants. Refer to Note 14.
3 Operating income (loss) and income (loss) before income taxes were reduced by approximately $85 million and $89 million, respectively, for East, SouthAsia and Pacific Rim related to the Philippines impairment charges. Refer to Note 17.
4 Operating income (loss) and income (loss) before income taxes benefited by approximately $47 million for Corporate related to the settlement of a classaction lawsuit related to HFCS purchases. Refer to Note 17.
115

THE COCA-COLA COMPANY AND SUBSIDIARIES
NOTES TO CONSOLIDATED FINANCIAL STATEMENTS
NOTE 20: OPERATING SEGMENTS (Continued)5 Equity income—net and income (loss) before income taxes were impacted by approximately $33 million for Corporate primarily related to our
proportionate share of the tax liability recorded as a result of CCE’s repatriation of unremitted foreign earnings under the Jobs Creation Act,restructuring charges, offset by CCE’s HFCS lawsuit settlement proceeds, and changes in certain of CCE’s state and provincial tax rates. Refer to Note17.
6 Income (loss) before income taxes benefited by approximately $22 million for East, South Asia and Pacific Rim due to issuances of stock by Coca-ColaAmatil, one of our equity method investees. Refer to Note 3.
7 Identifiable operating assets in Germany represented approximately 48 percent of total European Union identifiable operating assets in 2005, 48percent in 2004 and 51 percent in 2003.
8 Principally cash and cash equivalents, marketable securities, finance subsidiary receivables, goodwill, trademarks and other intangible assets andproperty, plant and equipment.
9 Principally equity and cost method investments in bottling companies.10 Operating income (loss) and income (loss) before income taxes were reduced by approximately $18 million for North America, $15 million for East,
South Asia and Pacific Rim, $368 million for European Union, $6 million for Latin America, $9 million for North Asia, Eurasia and Middle East and$64 million for Corporate as a result of other operating charges recorded for asset impairments. Refer to Note 17.
11 Operating income (loss) and income (loss) before income taxes for Corporate were impacted as a result of the Company’s receipt of a $75 millioninsurance settlement related to the class action lawsuit settled in 2000. The Company subsequently donated $75 million to The Coca-Cola Foundation.
12 Equity income—net and income (loss) before income taxes for Latin America were increased by approximately $37 million as a result of a favorable taxsettlement related to Coca-Cola FEMSA, one of our equity method investees. Refer to Note 2.
13 Income (loss) before income taxes was increased by approximately $24 million for Corporate due to noncash pre-tax gains that were recognized on theissuances of stock by CCE, one of our equity method investees. Refer to Note 3.
14 Operating income (loss) and income (loss) before income taxes were reduced by approximately $273 million for North America, $12 million for Africa,$11 million for East, South Asia and Pacific Rim, $157 million for European Union, $8 million for Latin America, $33 million for North Asia, Eurasiaand Middle East and $67 million for Corporate as a result of streamlining charges. Refer to Note 18.
15 Operating income (loss) and income (loss) before income taxes were increased by approximately $52 million for Corporate as a result of the Company’sreceipt of a settlement related to a vitamin antitrust litigation matter. Refer to Note 17.
16 Equity income—net and income (loss) before income taxes for Latin America were reduced by approximately $102 million primarily for a charge relatedto one of our equity method investees. Refer to Note 2.
Five-Year Compound Growth Rates
NetOperating Operating
Five Years Ended December 31, 2005 Revenues Income
Consolidated 6.2% 10.5%
North America 4.2% 1.8%Africa 15.4% 21.3%East, South Asia and Pacific Rim 3.7% *%European Union 15.6% 13.7%Latin America 4.4% 5.5%North Asia, Eurasia and Middle East (0.2)% 6.9%Corporate * *
* Calculation is not meaningful.
116

23FEB20042218446024JAN200522210514
25FEB200412544370
REPORT OF MANAGEMENT ON INTERNAL CONTROL OVER FINANCIAL REPORTINGThe Coca-Cola Company and Subsidiaries
Management of the Company is responsible for the preparation and integrity of the Consolidated Financial Statementsappearing in our Annual Report on Form 10-K. The financial statements were prepared in conformity with generallyaccepted accounting principles appropriate in the circumstances and, accordingly, include certain amounts based on ourbest judgments and estimates. Financial information in this Annual Report on Form 10-K is consistent with that in thefinancial statements.
Management of the Company is responsible for establishing and maintaining adequate internal control over financialreporting as such term is defined in Rules 13a-15(f) under the Securities Exchange Act of 1934 (‘‘Exchange Act’’). TheCompany’s internal control over financial reporting is designed to provide reasonable assurance regarding the reliability offinancial reporting and the preparation of the Consolidated Financial Statements. Our internal control over financialreporting is supported by a program of internal audits and appropriate reviews by management, written policies andguidelines, careful selection and training of qualified personnel and a written Code of Business Conduct adopted by ourCompany’s Board of Directors, applicable to all Company Directors and all officers and employees of our Company andsubsidiaries.
Because of its inherent limitations, internal control over financial reporting may not prevent or detect misstatementsand even when determined to be effective, can only provide reasonable assurance with respect to financial statementpreparation and presentation. Also, projections of any evaluation of effectiveness to future periods are subject to the riskthat controls may become inadequate because of changes in conditions, or that the degree of compliance with the policiesor procedures may deteriorate.
The Audit Committee of our Company’s Board of Directors, composed solely of Directors who are independent inaccordance with the requirements of the New York Stock Exchange listing standards, the Exchange Act and the Company’sCorporate Governance Guidelines, meets with the independent auditors, management and internal auditors periodically todiscuss internal control over financial reporting and auditing and financial reporting matters. The Committee reviews withthe independent auditors the scope and results of the audit effort. The Committee also meets periodically with theindependent auditors and the chief internal auditor without management present to ensure that the independent auditorsand the chief internal auditor have free access to the Committee. Our Audit Committee’s Report can be found in theCompany’s 2006 Proxy statement.
Management assessed the effectiveness of the Company’s internal control over financial reporting as of December 31,2005. In making this assessment, management used the criteria set forth by the Committee of Sponsoring Organizations ofthe Treadway Commission (COSO) in Internal Control—Integrated Framework. Based on our assessment, managementbelieves that the Company maintained effective internal control over financial reporting as of December 31, 2005.
The Company’s independent auditors, Ernst & Young LLP, a registered public accounting firm, are appointed by theAudit Committee of the Company’s Board of Directors, subject to ratification by our Company’s shareowners. Ernst &Young LLP have audited and reported on the Consolidated Financial Statements of The Coca-Cola Company andsubsidiaries, management’s assessment of the effectiveness of the Company’s internal control over financial reporting andthe effectiveness of the Company’s internal control over financial reporting. The reports of the independent auditors arecontained in this Annual Report.
E. Neville Isdell Connie D. McDanielChairman, Board of Directors, Vice Presidentand Chief Executive Officer and Controller
February 24, 2006 February 24, 2006
Gary P. FayardExecutive Vice Presidentand Chief Financial Officer
February 24, 2006
117

Report of Independent Registered Public Accounting Firm
Board of Directors and ShareownersThe Coca-Cola Company
We have audited the accompanying consolidated balance sheets of The Coca-Cola Company andsubsidiaries as of December 31, 2005 and 2004, and the related consolidated statements of income, shareowners’equity, and cash flows for each of the three years in the period ended December 31, 2005. Our audits alsoincluded the financial statement schedule listed in the Index at Item 15(a). These financial statements andschedule are the responsibility of the Company’s management. Our responsibility is to express an opinion onthese financial statements and schedule based on our audits.
We conducted our audits in accordance with the standards of the Public Company Accounting OversightBoard (United States). Those standards require that we plan and perform the audit to obtain reasonableassurance about whether the financial statements are free of material misstatement. An audit includesexamining, on a test basis, evidence supporting the amounts and disclosures in the financial statements. An auditalso includes assessing the accounting principles used and significant estimates made by management, as well asevaluating the overall financial statement presentation. We believe that our audits provide a reasonable basis forour opinion.
In our opinion, the financial statements referred to above present fairly, in all material respects, theconsolidated financial position of The Coca-Cola Company and subsidiaries at December 31, 2005 and 2004, andthe consolidated results of their operations and their cash flows for each of the three years in the period endedDecember 31, 2005, in conformity with U.S. generally accepted accounting principles. Also, in our opinion, therelated financial statement schedule, when considered in relation to the basic financial statements taken as awhole, presents fairly in all material respects the information set forth therein.
As discussed in Note 1 to the consolidated financial statements, in 2004 the Company adopted theprovisions of FASB Interpretation No. 46 (revised December 2003) regarding the consolidation of variableinterest entities.
We also have audited, in accordance with the standards of the Public Company Accounting Oversight Board(United States), the effectiveness of The Coca-Cola Company and subsidiaries’ internal control over financialreporting as of December 31, 2005, based on criteria established in Internal Control—Integrated Frameworkissued by the Committee of Sponsoring Organizations of the Treadway Commission and our report datedFebruary 24, 2006, expressed an unqualified opinion thereon.
Atlanta, GeorgiaFebruary 24, 2006
118

Report of Independent Registered Public Accounting Firmon Internal Control Over Financial Reporting
Board of Directors and ShareownersThe Coca-Cola Company
We have audited management’s assessment, included in the accompanying Report of Management onInternal Control Over Financial Reporting, that The Coca-Cola Company and subsidiaries maintained effectiveinternal control over financial reporting as of December 31, 2005, based on criteria established in InternalControl—Integrated Framework issued by the Committee of Sponsoring Organizations of the TreadwayCommission (the COSO criteria). The Coca-Cola Company’s management is responsible for maintainingeffective internal control over financial reporting and for its assessment of the effectiveness of internal controlover financial reporting. Our responsibility is to express an opinion on management’s assessment and an opinionon the effectiveness of the Company’s internal control over financial reporting based on our audit.
We conducted our audit in accordance with the standards of the Public Company Accounting OversightBoard (United States). Those standards require that we plan and perform the audit to obtain reasonableassurance about whether effective internal control over financial reporting was maintained in all materialrespects. Our audit included obtaining an understanding of internal control over financial reporting, evaluatingmanagement’s assessment, testing and evaluating the design and operating effectiveness of internal control, andperforming such other procedures as we considered necessary in the circumstances. We believe that our auditprovides a reasonable basis for our opinion.
A company’s internal control over financial reporting is a process designed to provide reasonable assuranceregarding the reliability of financial reporting and the preparation of financial statements for external purposesin accordance with generally accepted accounting principles. A company’s internal control over financialreporting includes those policies and procedures that (1) pertain to the maintenance of records that, inreasonable detail, accurately and fairly reflect the transactions and dispositions of the assets of the company;(2) provide reasonable assurance that transactions are recorded as necessary to permit preparation of financialstatements in accordance with generally accepted accounting principles, and that receipts and expenditures ofthe company are being made only in accordance with authorizations of management and directors of thecompany; and (3) provide reasonable assurance regarding prevention or timely detection of unauthorizedacquisition, use, or disposition of the company’s assets that could have a material effect on the financialstatements.
Because of its inherent limitations, internal control over financial reporting may not prevent or detectmisstatements. Also, projections of any evaluation of effectiveness to future periods are subject to the risk thatcontrols may become inadequate because of changes in conditions, or that the degree of compliance with thepolicies or procedures may deteriorate.
In our opinion, management’s assessment that The Coca-Cola Company and subsidiaries maintainedeffective internal control over financial reporting as of December 31, 2005, is fairly stated, in all materialrespects, based on the COSO criteria. Also, in our opinion, The Coca-Cola Company and subsidiariesmaintained, in all material respects, effective internal control over financial reporting as of December 31, 2005,based on the COSO criteria.
We also have audited, in accordance with the standards of the Public Company Accounting Oversight Board(United States), the consolidated balance sheets of The Coca-Cola Company and subsidiaries as ofDecember 31, 2005 and 2004, and the related consolidated statements of income, shareowners’ equity, and cashflows for each of the three years in the period ended December 31, 2005, and our report dated February 24,2006, expressed an unqualified opinion thereon.
Atlanta, GeorgiaFebruary 24, 2006
119

Quarterly Data (Unaudited)First Second Third Fourth
Year Ended December 31, Quarter Quarter Quarter Quarter Full Year
(In millions, except per share data)
2005Net operating revenues $ 5,206 $ 6,310 $ 6,037 $ 5,551 $ 23,104Gross profit 3,388 4,164 3,802 3,555 14,909Net income 1,002 1,723 1,283 864 4,872
Basic net income per share $ 0.42 $ 0.72 $ 0.54 $ 0.36 $ 2.04
Diluted net income per share $ 0.42 $ 0.72 $ 0.54 $ 0.36 $ 2.04
2004Net operating revenues $ 5,028 $ 5,914 $ 5,596 $ 5,204 $ 21,742Gross profit 3,267 3,875 3,535 3,391 14,068Net income 1,127 1,584 935 1,201 4,847
Basic net income per share $ 0.46 $ 0.65 $ 0.39 $ 0.50 $ 2.00
Diluted net income per share $ 0.46 $ 0.65 $ 0.39 $ 0.50 $ 2.00
Our reporting period ends on the Friday closest to the last day of the quarterly calendar period. Our fiscalyear ends on December 31 regardless of the day of the week on which December 31 falls.
Certain amounts previously reported in our 2005 and 2004 Quarterly Reports on Form 10-Q werereclassified to conform to our year-end presentation.
The Company’s first quarter of 2005 results were impacted by two fewer shipping days as compared to thefirst quarter of 2004. Additionally, the Company recorded the following transactions which impacted results:
• Provision for taxes on unremitted foreign earnings of approximately $152 million. Refer to Note 16.
• Approximately $22 million of noncash pretax gains on issuances of stock by Coca-Cola Amatil in connection with theacquisition of SPC Ardmona Pty. Ltd., an Australian fruit company. Refer to Note 3.
• An income tax benefit of approximately $56 million related to the reversal of previously accrued taxes resulting fromfavorable resolution of tax matters. Refer to Note 16.
• Approximately $50 million of accelerated amortization of stock-based compensation expense related to a change inour estimated service period for retirement-eligible participants. Refer to Note 14.
In the second quarter of 2005, the Company recorded the following transactions which impacted results:
• The receipt of approximately $42 million related to the settlement of a class action lawsuit concerning the purchaseof HFCS. Refer to Note 17.
• An approximate $21 million benefit to equity income for our proportionate share of CCE’s HFCS lawsuitsettlement. Refer to Note 2.
• An income tax benefit of approximately $17 million related to the reversal of previously accrued taxes resulting fromfavorable resolution of tax matters. Refer to Note 16.
• An income tax benefit of approximately $25 million as a result of additional guidance issued by the United StatesInternal Revenue Service and the United States Department of Treasury related to the Jobs Creation Act. Refer toNote 16.
In the third quarter of 2005, the Company recorded the following transactions which impacted results:
• Approximately $89 million of impairment charges primarily related to intangible assets (mainly trademark beveragessold in the Philippines market). Approximately $85 million and $4 million of these impairment charges are recordedin the line items other operating charges and equity income — net, respectively, in our consolidated statements ofincome. Refer to Note 17.
120

• Approximately $5 million of a pretax noncash charge to equity income — net due to our proportionate share ofCCE’s restructuring charges. Refer to Note 2.
• Approximately $18 million in income tax benefit related to the reversal of previously accrued taxes resulting fromfavorable resolution of tax matters. Refer to Note 16.
The Company’s fourth quarter of 2005 results were impacted by one additional shipping day as compared tothe fourth quarter of 2004. Additionally, the Company recorded the following transactions in the fourth quarterof 2005 which impacted results:
• A receipt of approximately $5 million related to the settlement of a class action lawsuit concerning the purchase ofHFCS. Refer to Note 17.
• An approximate $49 million reduction to our equity income due to our proportionate share of CCE’s tax expenserelated to repatriation of previously unremitted foreign earnings under the Jobs Creation Act and restructuringcharges recorded by CCE, partially offset by changes in certain of CCE’s state and provincial tax rates and additionalproceeds from CCE’s HFCS lawsuit settlement. Refer to Note 2.
• An income tax benefit of approximately $10 million related to the reversal of previously accrued taxes resulting fromfavorable resolution of tax matters. Refer to Note 16.
• A provision for taxes on unremitted foreign earnings of approximately $188 million. Refer to Note 16.
In the second quarter of 2004, the Company recorded the following transactions which impacted results:
• Equity income benefited by approximately $37 million for our proportionate share of a favorable tax settlementrelated to Coca-Cola FEMSA. Refer to Note 2.
• Impairment charges totaling approximately $88 million primarily related to write-downs of certain manufacturinginvestments and an intangible asset. Refer to Note 17.
• Approximately $49 million of noncash pretax gains on issuances of stock by CCE. Refer to Note 3.
• An income tax benefit of approximately $41 million related to the reversal of previously accrued taxes resulting froma favorable agreement with authorities. Refer to Note 16.
In the third quarter of 2004, the Company recorded the following transactions which impacted results:
• An income tax benefit of approximately $39 million related to the reversal of previously accrued taxes resulting fromfavorable resolution of tax matters. Refer to Note 16.
• An income tax expense of approximately $75 million related to the recognition of a valuation allowance on certaindeferred taxes of CCEAG. Refer to Note 16.
• Impairment charges totaling approximately $392 million primarily related to franchise rights at CCEAG. Refer toNote 17.
In the fourth quarter of 2004, the Company recorded the following transactions which impacted results:
• A receipt of $75 million for an insurance settlement related to the class action lawsuit that was settled in 2000 and adonation of $75 million to The Coca-Cola Foundation. Refer to Note 17.
• An income tax benefit of approximately $48 million related to the reversal of previously accrued taxes resulting fromfavorable resolution of tax matters. Refer to Note 16.
• An income tax benefit of approximately $50 million related to the realization of certain foreign tax credits perprovisions of the Jobs Creation Act. Refer to Note 16.
• Approximately $25 million of noncash pretax losses to adjust the amount of the gain recognized in the secondquarter of 2004 on issuances of stock by CCE. Refer to Note 3.
121

GLOSSARY
As used in this report, the following terms have the meanings indicated.
Bottler or Bottling Partner: business that buys concentrates (sometimes referred to as ‘‘beverage bases’’) orsyrups from the Company, converts them into finished packaged products and sells them to customers.
Carbonated Soft Drink: nonalcoholic carbonated beverage (sometimes referred to as ‘‘soft drinks’’) containingflavorings and sweeteners. Excludes, among others, waters and flavored waters, juice and juice drinks, sportsdrinks, and teas and coffees.
The Coca-Cola System: the Company and its bottling partners.
Coca-Cola Trademark Beverages: cola-flavored Company Trademark Beverages bearing the Coca-Colatrademark.
Company: The Coca-Cola Company together with its subsidiaries.
Company Trademark Beverages: beverages bearing our trademarks and certain other beverage products licensedto our Company for which our Company provides marketing support and from the sale of which it derivesincome.
Concentrate: material manufactured from Company-defined ingredients and sold to bottlers to prepare finishedbeverages through the addition of water and, depending on the product, sweeteners and/or carbonated water,marketed under trademarks of the Company.
Consumer: person who drinks Company products.
Cost of Capital: after-tax blended cost of equity and borrowed funds used to invest in operating capital requiredfor business.
Customer: retail outlet, restaurant or other operation that sells or serves Company products directly toconsumers.
Derivatives: contracts or agreements, the value of which may change based on changes in interest rates,exchange rates, prices of securities, or financial or commodity indices. The Company uses derivatives to reduceour exposure to adverse fluctuations in interest and foreign currency exchange rates and other market risks.
Fountain: system used by retail outlets to dispense product into cups or glasses for immediate consumption.
Gallon: unit of physical volume measurement for concentrates (sometimes referred to as ‘‘beverage bases’’),syrups, finished beverages and powders (in all cases, expressed in equivalent gallons of syrup) sold by theCompany to its bottling partners or other customers. Most of the Company’s revenues are based on gallon sales,a measure of primarily ‘‘wholesale’’ activity.
Gross Profit Margin: gross profit divided by net operating revenues.
Market: when used in reference to geographic areas, territory in which the Company and its bottling partnersdo business, often defined by national boundaries.
Noncarbonated Beverages: nonalcoholic beverages without carbonation including, but not limited to, waters andflavored waters, juice and juice drinks, sports drinks, and teas and coffees.
Operating Margin: operating income divided by net operating revenues.
Per Capita Consumption: average number of servings consumed per person, per year in a specific market. Percapita consumption of Company beverage products is calculated by multiplying our unit case volume by 24, anddividing by the population.
Serving: eight U.S. fluid ounces of a finished beverage.
122

GLOSSARY (Continued)
Syrup: concentrate mixed with sweetener and water, sold to bottlers and customers who add carbonated waterto produce finished carbonated soft drinks.
Unit Case: unit of volume measurement equal to 192 U.S. fluid ounces of finished beverage (24 eight-ounceservings).
Unit Case Volume, or Volume: the number of unit cases (or unit case equivalents) of Company beverage productsdirectly or indirectly sold by the Coca-Cola system to customers. Unit case volume primarily consists of beverageproducts bearing Company trademarks. Unit case volume also includes sales by joint ventures in which theCompany is a partner and beverage products licensed to, or distributed by, our Company, and brands owned byour bottling partners for which our Company provides marketing support and from the sale of which it derivesincome. Such beverage products licensed to, or distributed by, our Company or owned by our bottling partnersaccount for a minimal portion of total unit case volume. Unit case volume is derived based on estimates receivedby the Company from its bottling partners and distributors.
123

20FEB200406462039
UNITED STATESSECURITIES AND EXCHANGE COMMISSION
Washington, D.C. 20549
FORM 10-K� ANNUAL REPORT PURSUANT TO SECTION 13 OR 15(d) OF THE SECURITIES
EXCHANGE ACT OF 1934For the fiscal year ended December 31, 2006
OR
� TRANSITION REPORT PURSUANT TO SECTION 13 OR 15(d) OF THE SECURITIESEXCHANGE ACT OF 1934
For the transition period from to Commission File No. 1-2217
(Exact name of Registrant as specified in its charter)
DELAWARE 58-0628465(State or other jurisdiction of (IRS Employerincorporation or organization) Identification No.)
One Coca-Cola PlazaAtlanta, Georgia 30313
(Address of principal executive offices) (Zip Code)Registrant’s telephone number, including area code: (404) 676-2121
Securities registered pursuant to Section 12(b) of the Act:Title of each class Name of each exchange on which registered
COMMON STOCK, $0.25 PAR VALUE NEW YORK STOCK EXCHANGESecurities registered pursuant to Section 12(g) of the Act: None
Indicate by check mark if the Registrant is a well-known seasoned issuer, as defined in Rule 405 of the Securities Act.Yes � No �
Indicate by check mark if the Registrant is not required to file reports pursuant to Section 13 or Section 15(d) of theExchange Act. Yes � No �
Indicate by check mark whether the Registrant (1) has filed all reports required to be filed by Section 13 or 15(d) of theSecurities Exchange Act of 1934 during the preceding 12 months and (2) has been subject to such filing requirements for the past90 days. Yes � No �
Indicate by check mark if disclosure of delinquent filers pursuant to Item 405 of Regulation S-K is not contained herein, andwill not be contained, to the best of Registrant’s knowledge, in definitive proxy or information statements incorporated byreference in Part III of this Form 10-K or any amendment to this Form 10-K. �
Indicate by check mark whether the Registrant is a large accelerated filer, an accelerated filer or a non-accelerated filer. Seedefinition of ‘‘accelerated filer’’ or ‘‘large accelerated filer’’ in Rule 12b-2 of the Exchange Act.
Large accelerated filer � Accelerated filer � Non-accelerated filer �Indicate by check mark if the Registrant is a shell company (as defined in Rule 12b-2 of the Exchange Act). Yes � No �The aggregate market value of the common equity held by non-affiliates of the Registrant (assuming for these purposes, but
without conceding, that all executive officers and Directors are ‘‘affiliates’’ of the Registrant) as of June 30, 2006, the last businessday of the Registrant’s most recently completed second fiscal quarter, was $95,705,925,512 (based on the closing sale price of theRegistrant’s Common Stock on that date as reported on the New York Stock Exchange).
The number of shares outstanding of the Registrant’s Common Stock as of February 20, 2007 was 2,315,288,508.DOCUMENTS INCORPORATED BY REFERENCE
Portions of the Company’s Proxy Statement for the Annual Meeting of Shareowners to be held on April 18, 2007, areincorporated by reference in Part III.

Table of Contents
Page
Forward-Looking Statements . . . . . . . . . . . . . . . . . . . . . . . . . . . . . . . . . . . . . . . . . . . . . . . . . . . . . 1
Part I
Item 1. Business . . . . . . . . . . . . . . . . . . . . . . . . . . . . . . . . . . . . . . . . . . . . . . . . . . . . . . . . . . . . . . . . . . . . 1Item 1A. Risk Factors . . . . . . . . . . . . . . . . . . . . . . . . . . . . . . . . . . . . . . . . . . . . . . . . . . . . . . . . . . . . . . . . . 12Item 1B. Unresolved Staff Comments . . . . . . . . . . . . . . . . . . . . . . . . . . . . . . . . . . . . . . . . . . . . . . . . . . . . . 19Item 2. Properties . . . . . . . . . . . . . . . . . . . . . . . . . . . . . . . . . . . . . . . . . . . . . . . . . . . . . . . . . . . . . . . . . . . 19Item 3. Legal Proceedings . . . . . . . . . . . . . . . . . . . . . . . . . . . . . . . . . . . . . . . . . . . . . . . . . . . . . . . . . . . . . 20Item 4. Submission of Matters to a Vote of Security Holders . . . . . . . . . . . . . . . . . . . . . . . . . . . . . . . . . . . . 24Item X. Executive Officers of the Company . . . . . . . . . . . . . . . . . . . . . . . . . . . . . . . . . . . . . . . . . . . . . . . . 24
Part II
Item 5. Market for Registrant’s Common Equity, Related Stockholder Matters and Issuer Purchases ofEquity Securities . . . . . . . . . . . . . . . . . . . . . . . . . . . . . . . . . . . . . . . . . . . . . . . . . . . . . . . . . . . . 28
Item 6. Selected Financial Data . . . . . . . . . . . . . . . . . . . . . . . . . . . . . . . . . . . . . . . . . . . . . . . . . . . . . . . . . 31Item 7. Management’s Discussion and Analysis of Financial Condition and Results of Operations . . . . . . . . . 32Item 7A. Quantitative and Qualitative Disclosures About Market Risk . . . . . . . . . . . . . . . . . . . . . . . . . . . . . . 65Item 8. Financial Statements and Supplementary Data . . . . . . . . . . . . . . . . . . . . . . . . . . . . . . . . . . . . . . . . 66Item 9. Changes in and Disagreements with Accountants on Accounting and Financial Disclosure . . . . . . . . . 131Item 9A. Controls and Procedures . . . . . . . . . . . . . . . . . . . . . . . . . . . . . . . . . . . . . . . . . . . . . . . . . . . . . . . . 131Item 9B. Other Information . . . . . . . . . . . . . . . . . . . . . . . . . . . . . . . . . . . . . . . . . . . . . . . . . . . . . . . . . . . . 131
Part III
Item 10. Directors, Executive Officers and Corporate Governance . . . . . . . . . . . . . . . . . . . . . . . . . . . . . . . . 132Item 11. Executive Compensation . . . . . . . . . . . . . . . . . . . . . . . . . . . . . . . . . . . . . . . . . . . . . . . . . . . . . . . . 132Item 12. Security Ownership of Certain Beneficial Owners and Management and Related Stockholder Matters . 132Item 13. Certain Relationships and Related Transactions, and Director Independence . . . . . . . . . . . . . . . . . . 132Item 14. Principal Accountant Fees and Services . . . . . . . . . . . . . . . . . . . . . . . . . . . . . . . . . . . . . . . . . . . . . 132
Part IV
Item 15. Exhibits and Financial Statement Schedules . . . . . . . . . . . . . . . . . . . . . . . . . . . . . . . . . . . . . . . . . . 133Signatures . . . . . . . . . . . . . . . . . . . . . . . . . . . . . . . . . . . . . . . . . . . . . . . . . . . . . . . . . . . . . . . . . . 139

FORWARD-LOOKING STATEMENTS
This report contains information that may constitute ‘‘forward-looking statements.’’ Generally, the words‘‘believe,’’ ‘‘expect,’’ ‘‘intend,’’ ‘‘estimate,’’ ‘‘anticipate,’’ ‘‘project,’’ ‘‘will’’ and similar expressions identify forward-looking statements, which generally are not historical in nature. All statements that address operating performance,events or developments that we expect or anticipate will occur in the future—including statements relating to volumegrowth, share of sales and earnings per share growth, and statements expressing general views about future operatingresults—are forward-looking statements. Management believes that these forward-looking statements are reasonableas and when made. However, caution should be taken not to place undue reliance on any such forward-lookingstatements because such statements speak only as of the date when made. Our Company undertakes no obligation topublicly update or revise any forward-looking statements, whether as a result of new information, future events orotherwise. In addition, forward-looking statements are subject to certain risks and uncertainties that could causeactual results to differ materially from our Company’s historical experience and our present expectations orprojections. These risks and uncertainties include, but are not limited to, those described in Part I, ‘‘Item 1A. RiskFactors’’ and elsewhere in this report and those described from time to time in our future reports filed with theSecurities and Exchange Commission.
PART I
ITEM 1. BUSINESS
General
The Coca-Cola Company is the largest manufacturer, distributor and marketer of nonalcoholic beverageconcentrates and syrups in the world. Finished beverage products bearing our trademarks, sold in the UnitedStates since 1886, are now sold in more than 200 countries. Along with Coca-Cola, which is recognized as theworld’s most valuable brand, we market four of the world’s top five nonalcoholic sparkling brands, includingDiet Coke, Fanta and Sprite. In this report, the terms ‘‘Company,’’ ‘‘we,’’ ‘‘us’’ or ‘‘our’’ mean The Coca-ColaCompany and all entities included in our consolidated financial statements.
Our business is nonalcoholic beverages—principally sparkling beverages, but also a variety of stillbeverages. We manufacture beverage concentrates and syrups, which we sell to bottling and canning operations,fountain wholesalers and some fountain retailers, as well as some finished beverages, which we sell primarily todistributors. Our Company owns or licenses more than 400 brands, including diet and light beverages, waters,juice and juice drinks, teas, coffees, and energy and sports drinks. In addition, we have ownership interests innumerous bottling and canning operations, although most of these operations are independently owned andmanaged.
We were incorporated in September 1919 under the laws of the State of Delaware and succeeded to thebusiness of a Georgia corporation with the same name that had been organized in 1892.
Our Company is one of numerous competitors in the commercial beverages market. Of the approximately52 billion beverage servings of all types consumed worldwide every day, beverages bearing trademarks owned byor licensed to us account for more than 1.4 billion.
We believe that our success depends on our ability to connect with consumers by providing them with awide variety of choices to meet their desires, needs and lifestyle choices. Our success further depends on theability of our people to execute effectively, every day.
Our goal is to use our Company’s assets—our brands, financial strength, unrivaled distribution system, andthe strong commitment of management and employees—to become more competitive and to accelerate growthin a manner that creates value for our shareowners.
1

Operating Segments
The Company’s operating structure is the basis for our Company’s internal financial reporting. As ofDecember 31, 2006, our operating structure included the following operating segments, the first seven of whichare sometimes referred to as ‘‘operating groups’’ or ‘‘groups:’’
• Africa
• East, South Asia and Pacific Rim
• European Union
• Latin America
• North America
• North Asia, Eurasia and Middle East
• Bottling Investments
• Corporate
Our operating structure as of December 31, 2006, reflected changes we made during the first quarter of2006, primarily to establish a separate internal organization for our consolidated bottling operations and ourunconsolidated bottling investments. As a result of such changes, we began reporting Bottling Investments as anew operating segment beginning with the first quarter of 2006.
Effective January 1, 2007, we combined the Eurasia and Middle East Division, and the Russia, Ukraine andBelarus Division, both of which were previously included in the North Asia, Eurasia and Middle East operatingsegment, with the India Division, previously included in the East, South Asia and Pacific Rim operating segment,to form the Eurasia operating segment; and we combined the China Division and the Japan Division, previouslyincluded in the North Asia, Eurasia and Middle East operating segment, with the remaining East, South Asiaand Pacific Rim operating segment to form the Pacific operating segment. As a result, beginning with the firstquarter of 2007, we will report the following operating segments: Africa; Eurasia; European Union; LatinAmerica; North America; Pacific; Bottling Investments; and Corporate.
Except to the extent that differences among operating segments are material to an understanding of ourbusiness taken as a whole, the description of our business in this report is presented on a consolidated basis.
For financial information about our operating segments and geographic areas, refer to Note 6 and Note 20of Notes to Consolidated Financial Statements set forth in Part II, ‘‘Item 8. Financial Statements andSupplementary Data’’ of this report, incorporated herein by reference. For certain risks attendant to ournon-U.S. operations, refer to ‘‘Item 1A. Risk Factors,’’ below.
Products and Distribution
Our Company manufactures and sells beverage concentrates, sometimes referred to as ‘‘beverage bases,’’and syrups, including fountain syrups, and some finished beverages.
As used in this report:
• ‘‘concentrates’’ means flavoring ingredients and, depending on the product, sweeteners used to preparesyrups or finished beverages;
• ‘‘syrups’’ means the beverage ingredients produced by combining concentrates and, depending on theproduct, sweeteners and added water;
2

• ‘‘fountain syrups’’ means syrups that are sold to fountain retailers, such as restaurants, that use dispensingequipment to mix the syrups with sparkling or still water at the time of purchase to produce finishedbeverages that are served in cups or glasses for immediate consumption;
• ‘‘sparkling beverages’’ means nonalcoholic ready-to-drink beverages with carbonation, including energydrinks and waters and flavored waters with carbonation;
• ‘‘still beverages’’ means nonalcoholic beverages without carbonation, including waters and flavoredwaters without carbonation, juice and juice drinks, teas, coffees and sports drinks; and
• ‘‘Company Trademark Beverages’’ means beverages bearing our trademarks and certain other beverageproducts licensed to us for which we provide marketing support and from the sale of which we deriveincome.
We sell the concentrates and syrups for bottled and canned beverages to authorized bottling and canningoperations. In addition to concentrates and syrups for sparkling beverages and flavored still beverages, we alsosell concentrates (in powder form) for purified water products such as Dasani to authorized bottling operations.
Authorized bottlers and canners either combine our syrups with sparkling water or combine ourconcentrates with sweeteners (depending on the product), water and sparkling water to produce finishedsparkling beverages. The finished sparkling beverages are packaged in authorized containers bearing ourtrademarks—such as cans and refillable and nonrefillable glass and plastic bottles (‘‘bottle/can products’’)—andare then sold to retailers (‘‘bottle/can retailers’’) or, in some cases, wholesalers.
For our fountain products in the United States, we manufacture fountain syrups and sell them to authorizedfountain wholesalers and some fountain retailers. The wholesalers are authorized to sell the Company’s fountainsyrups by a nonexclusive appointment from us that neither restricts us in setting the prices at which we sellfountain syrups to the wholesalers, nor restricts the territory in which the wholesalers may resell in the UnitedStates. Outside the United States, fountain syrups typically are manufactured by authorized bottlers fromconcentrates sold to them by the Company. The bottlers then typically sell the fountain syrups to wholesalers ordirectly to fountain retailers.
Finished beverages manufactured by us include a variety of sparkling and still beverages. We sell most ofthese beverages to authorized bottlers or distributors, who in turn sell these products to retailers or, in somecases, wholesalers. We manufacture and sell juice and juice-drink products and certain water products toretailers and wholesalers in the United States and numerous other countries, both directly and through anetwork of business partners, including certain Coca-Cola bottlers.
Our beverage products include Coca-Cola, Coca-Cola Classic, caffeine free Coca-Cola, caffeine freeCoca-Cola Classic, Cherry Coke, Diet Coke (sold under the trademark Coca-Cola Light in many countries otherthan the United States), caffeine free Diet Coke, Diet Coke Sweetened with Splenda, Diet Coke with Lime, DietCherry Coke, Black Cherry Vanilla Diet Coke, Coca-Cola Zero (sold under the trademark Coke Zero in somecountries), Fanta brand sparkling beverages, Sprite, Diet Sprite/Sprite Zero (sold under the trademark SpriteLight in many countries other than the United States), Sprite Remix, Pibb Xtra, Mello Yello, Tab, Fresca brandsparkling beverages, Barq’s, Powerade, Minute Maid brand sparkling beverages, Aquarius, Sokenbicha, Ciel,Bonaqa/Bonaqua, Dasani, Dasani brand flavored waters, Lift, Thums Up, Kinley, Eight O’Clock, Qoo, Vault,Full Throttle and other products developed for specific countries (including Georgia brand ready-to-drinkcoffees). In many countries (excluding the United States, among others), our Company’s beverage products alsoinclude Schweppes, Canada Dry, Dr Pepper and Crush. Our Company produces, distributes and markets juiceand juice-drink products including Minute Maid Premium juice and juice drinks, Simply juices and juice drinks,Odwalla nourishing health beverages, Five Alive refreshment beverages, Bacardi mixers concentrate(manufactured and marketed under license agreements from Bacardi & Company Limited) and Hi-Cready-to-serve juice drinks. We have a license to manufacture and sell concentrates for Seagram’s mixers, a lineof sparkling drinks, in the United States and certain other countries. Our Company is the exclusive master
3

distributor of Evian bottled water in the United States and Canada, and of Rockstar, an energy drink, in most ofthe United States and in Canada. Multon, a Russian juice business (‘‘Multon’’) operated as a joint venture withCoca-Cola Hellenic Bottling Company S.A. (‘‘Coca-Cola HBC’’), markets juice products under varioustrademarks, including Dobriy, Rich and Nico, in Russia, Ukraine and Belarus. Beverage Partners Worldwide(‘‘BPW’’), the Company’s joint venture with Nestlé S.A. (‘‘Nestlé’’) and certain of its subsidiaries, marketsready-to-drink tea products under the trademarks Enviga, Gold Peak, Nestea, Belté, Yang Guang, Nagomi,Heaven and Earth, Frestea, Ten Ren, Modern Tea Workshop, Café Zu, Shizen and Tian Tey, and ready-to-drinkcoffee products under the trademarks Nescafé, Taster’s Choice and Georgia Club.
Consumer demand determines the optimal menu of Company product offerings. Consumer demand canvary from one locale to another and can change over time within a single locale. Employing our businessstrategy, and with special focus on core brands, our Company seeks to build its existing brands and, at the sametime, to broaden its historical family of brands, products and services in order to create and satisfy consumerdemand locale by locale.
Our Company introduced a variety of new brands, brand extensions and new beverage products in 2006.Among numerous examples, in North America, the Company launched Coca-Cola Blak, a new Coca-Cola andcoffee fusion beverage designed to appeal to adult consumers, Black Cherry Vanilla Coca-Cola and BlackCherry Vanilla Diet Coke, Vault Zero, Tab Energy, Full Throttle Fury, Simply Lemonade and Limeade. Incollaboration with Godiva Chocolatier, Inc., the Company also launched a new line of premium blendedindulgent beverages called Godiva Belgian Blends. BPW, our joint venture with Nestlé, launched both Enviga, asparkling green tea product, and Gold Peak, a premium ready-to-drink iced tea in five flavors. The Companyintroduced Dasani Sparkling in Kenya and Mauritius; Five Alive and Coca-Cola Light in Kenya; PoweradeBalance, Five Alive, Fanta Free and Bonaqua flavored waters in South Africa; and Burn in Nigeria, Ghana andMorocco. We introduced Karada Meguri Cha in Japan and Healthworks in China. Multon, our joint venturewith Coca-Cola HBC, introduced new Diva juice in Russia. In addition, we launched Coke Zero in Australia andKorea, Haru Tea in Korea, and Schweppes Clear Lemonade in Serbia, Romania and Bulgaria. In Europe, theCompany launched Coca-Cola Zero/Coke Zero in the United Kingdom, Germany, Spain, Norway, Belgium, theNetherlands and Luxembourg; Burn in Norway; and Chaudfontaine (a still and sparkling water) in Belgium, theNetherlands and Luxembourg. In Latin America, the products launched included Minute Maid Forte, CielNaturae (a sparkling flavored water) and Coca-Cola Light Caffeine Free. The Company unveiled Far Coast, anew brand of premium brewed beverages, and Chaqwa, a line of brewed beverages for quick service restaurantsand convenience stores, in Canada and Singapore.
Our Company measures the volume of products sold in two ways: (1) unit cases of finished products and(2) gallons. As used in this report, ‘‘unit case’’ means a unit of measurement equal to 192 U.S. fluid ounces offinished beverage (24 eight-ounce servings); and ‘‘unit case volume’’ means the number of unit cases (or unitcase equivalents) of Company beverage products directly or indirectly sold by the Company and its bottlingpartners (‘‘Coca-Cola system’’) to customers. Unit case volume primarily consists of beverage products bearingCompany trademarks. Also included in unit case volume are certain products licensed to, or distributed by, ourCompany, and brands owned by Coca-Cola system bottlers for which our Company provides marketing supportand from the sale of which it derives income. Such products licensed to, or distributed by, our Company orowned by Coca-Cola system bottlers account for a minimal portion of total unit case volume. In addition, unitcase volume includes sales by joint ventures in which the Company is a partner. Although most of ourCompany’s revenues are not based directly on unit case volume, we believe unit case volume is one of themeasures of the underlying strength of the Coca-Cola system because it measures trends at the consumer level.The unit case volume numbers used in this report are based on estimates received by the Company from itsbottling partners and distributors. As used in this report, ‘‘gallon’’ means a unit of measurement for concentrates(sometimes referred to as ‘‘beverage bases’’), syrups, finished beverages and powders (in all cases, expressed inequivalent gallons of syrup) sold by our Company to its bottling partners or other customers. Most of ourrevenues are based on gallon sales, a primarily ‘‘wholesale’’ activity. Unit case volume and gallon sales growth
4

rates are not necessarily equal during any given period. Items such as seasonality, bottlers’ inventory practices,supply point changes, timing of price increases, new product introductions and changes in product mix canimpact unit case volume and gallon sales and can create differences between unit case volume and gallon salesgrowth rates.
In 2006, concentrates and syrups for beverages bearing the trademark ‘‘Coca-Cola’’ or including thetrademark ‘‘Coke’’ (‘‘Coca-Cola Trademark Beverages’’) accounted for approximately 55 percent of theCompany’s total gallon sales.
In 2006, gallon sales in the United States (‘‘U.S. gallon sales’’) represented approximately 26 percent of theCompany’s worldwide gallon sales. Approximately 54 percent of U.S. gallon sales for 2006 was attributable tosales of beverage concentrates and syrups to 76 authorized bottler ownership groups in 393 licensed territories.Those bottlers prepare and sell finished beverages bearing our trademarks for the food store and vendingmachine distribution channels and for other distribution channels supplying products for home and immediateconsumption. Approximately 34 percent of 2006 U.S. gallon sales was attributable to fountain syrups sold tofountain retailers and to 507 authorized fountain wholesalers, some of which are authorized bottlers. Theremaining approximately 12 percent of 2006 U.S. gallon sales was attributable to sales by the Company offinished beverages, including juice and juice-drink products and certain water products. Coca-ColaEnterprises Inc., including its bottling subsidiaries and divisions (‘‘CCE’’), accounted for approximately51 percent of the Company’s U.S. gallon sales in 2006. At December 31, 2006, our Company held an ownershipinterest of approximately 35 percent in CCE, which is the world’s largest bottler of Company TrademarkBeverages.
In 2006, gallon sales outside the United States represented approximately 74 percent of the Company’sworldwide gallon sales. The countries outside the United States in which our gallon sales were the largest in2006 were Mexico, Brazil, China and Japan, which together accounted for approximately 27 percent of ourworldwide gallon sales. Approximately 90 percent of non-U.S. unit case volume for 2006 was attributable to salesof beverage concentrates and syrups to authorized bottlers together with sales by the Company of finishedbeverages other than juice and juice-drink products, in 535 licensed territories. Approximately 5 percent of 2006non-U.S. unit case volume was attributable to fountain syrups. The remaining approximately 5 percent of 2006non-U.S. unit case volume was attributable to juice and juice-drink products.
In addition to conducting our own independent advertising and marketing activities, we may providepromotional and marketing services or funds to our bottlers. In most cases, we do this on a discretionary basisunder the terms of commitment letters or agreements, even though we are not obligated to do so under theterms of the bottling or distribution agreements between our Company and the bottlers. Also, on a discretionarybasis in most cases, our Company may develop and introduce new products, packages and equipment to assist itsbottlers. Likewise, in many instances, we provide promotional and marketing services and/or funds and/ordispensing equipment and repair services to fountain and bottle/can retailers, typically pursuant to marketingagreements. The aggregate amount of funds provided by our Company to bottlers, resellers or other customersof our Company’s products, principally for participation in promotional and marketing programs wasapproximately $3.8 billion in 2006.
Bottler’s Agreements and Distribution Agreements
Most of our products are manufactured and sold by our bottling partners. We typically sell concentrates andsyrups to our bottling partners who convert them into finished packaged products which they sell to distributorsand other customers. Separate contracts (‘‘Bottler’s Agreements’’) exist between our Company and each of ourbottling partners regarding the manufacture and sale of Company products. Subject to specified terms andconditions and certain variations, the Bottler’s Agreements generally authorize the bottlers to prepare specifiedCompany Trademark Beverages, to package the same in authorized containers, and to distribute and sell thesame in (but, subject to applicable local law, generally only in) an identified territory. The bottler is obligated to
5

purchase its entire requirement of concentrates or syrups for the designated Company Trademark Beveragesfrom the Company or Company-authorized suppliers. We typically agree to refrain from selling or distributing,or from authorizing third parties to sell or distribute, the designated Company Trademark Beverages throughoutthe identified territory in the particular authorized containers; however, we typically reserve for ourselves or ourdesignee the right (1) to prepare and package such beverages in such containers in the territory for sale outsidethe territory, and (2) to prepare, package, distribute and sell such beverages in the territory, in any other manneror form. Territorial restrictions on bottlers vary in some cases in accordance with local law.
The Bottler’s Agreements between us and our authorized bottlers in the United States differ in certainrespects from those in the other countries in which Company Trademark Beverages are sold. As furtherdiscussed below, the principal differences involve the duration of the agreements; the inclusion or exclusion ofcanned beverage production rights; the inclusion or exclusion of authorizations to manufacture and distributefountain syrups; in some cases, the degree of flexibility on the part of the Company to determine the pricing ofsyrups and concentrates; and the extent, if any, of the Company’s obligation to provide marketing support.
Outside the United States
The Bottler’s Agreements between us and our authorized bottlers outside the United States generally are ofstated duration, subject in some cases to possible extensions or renewals of the term of the contract. Generally,these contracts are subject to termination by the Company following the occurrence of certain designated events.These events include defined events of default and certain changes in ownership or control of the bottler.
In certain parts of the world outside the United States, we have not granted comprehensive beverageproduction rights to the bottlers. In such instances, we or our authorized suppliers sell Company TrademarkBeverages to the bottlers for sale and distribution throughout the designated territory, often on a nonexclusivebasis. A majority of the Bottler’s Agreements in force between us and bottlers outside the United Statesauthorize the bottlers to manufacture and distribute fountain syrups, usually on a nonexclusive basis.
Our Company generally has complete flexibility to determine the price and other terms of sale of theconcentrates and syrups we sell to bottlers outside the United States. In some instances, however, we haveagreed or may in the future agree with the bottler with respect to concentrate pricing on a prospective basis forspecified time periods. Outside the United States, in most cases, we have no obligation to provide marketingsupport to the bottlers. Nevertheless, we may, at our discretion, contribute toward bottler expenditures foradvertising and marketing. We may also elect to undertake independent or cooperative advertising andmarketing activities.
Within the United States
In the United States, with certain very limited exceptions, the Bottler’s Agreements for Coca-ColaTrademark Beverages and other cola-flavored beverages have no stated expiration date. Our standard contractsfor other sparkling beverage flavors and for still beverages are of stated duration, subject to bottler renewalrights. The Bottler’s Agreements in the United States are subject to termination by the Company fornonperformance or upon the occurrence of certain defined events of default that may vary from contract tocontract. The ‘‘1987 Contract,’’ described below, is terminable by the Company upon the occurrence of certainevents, including:
• the bottler’s insolvency, dissolution, receivership or the like;
• any disposition by the bottler or any of its subsidiaries of any voting securities of any bottler subsidiarywithout the consent of the Company;
• any material breach of any obligation of the bottler under the 1987 Contract; or
6

• except in the case of certain bottlers, if a person or affiliated group acquires or obtains any right toacquire beneficial ownership of more than 10 percent of any class or series of voting securities of thebottler without authorization by the Company.
Under the terms of the Bottler’s Agreements, bottlers in the United States are authorized to manufactureand distribute Company Trademark Beverages in bottles and cans. However, these bottlers generally are notauthorized to manufacture fountain syrups. Rather, as described above, our Company manufactures and sellsfountain syrups to authorized fountain wholesalers (including certain authorized bottlers) and some fountainretailers. These wholesalers in turn sell the syrups or deliver them on our behalf to restaurants and otherretailers.
In the United States, the form of Bottler’s Agreement for cola-flavored sparkling beverages that covers thelargest amount of U.S. gallon sales (the ‘‘1987 Contract’’) gives us complete flexibility to determine the price andother terms of sale of concentrates and syrups for Company Trademark Beverages. In some instances, we haveagreed or may in the future agree with the bottler with respect to concentrate pricing on a prospective basis forspecified time periods. Bottlers operating under the 1987 Contract accounted for approximately 90 percent ofour Company’s total U.S. gallon sales for bottled and canned beverages in 2006, excluding direct sales by theCompany of juice and juice-drink products and other finished beverages (‘‘U.S. bottle/can gallon sales’’). Certainother forms of U.S. Bottler’s Agreements, entered into prior to 1987, provide for concentrates or syrups forcertain Coca-Cola Trademark Beverages and other cola-flavored Company Trademark Beverages to be pricedpursuant to a stated formula. Bottlers accounting for approximately 9.8 percent of U.S. bottle/can gallon sales in2006 have contracts for certain Coca-Cola Trademark Beverages and other cola-flavored Company TrademarkBeverages with pricing formulas that generally provide for a baseline price. This baseline price may be adjustedperiodically by the Company, up to a maximum indexed ceiling price, and is adjusted quarterly based uponchanges in certain sugar or sweetener prices, as applicable. Bottlers accounting for the remaining approximately0.2 percent of U.S. bottle/can gallon sales in 2006 operate under our oldest form of contract, which provides fora fixed price for Coca-Cola syrup used in bottles and cans. This price is subject to quarterly adjustments toreflect changes in the quoted price of sugar.
We have standard contracts with bottlers in the United States for the sale of concentrates and syrups fornon-cola-flavored sparkling beverages and certain still beverages in bottles and cans; and, in certain cases, forthe sale of finished still beverages in bottles and cans. All of these standard contracts give the Companycomplete flexibility to determine the price and other terms of sale.
Under the 1987 Contract and most of our other standard beverage contracts with bottlers in the UnitedStates, our Company has no obligation to participate with bottlers in expenditures for advertising and marketing.Nevertheless, at our discretion, we may contribute toward such expenditures and undertake independent orcooperative advertising and marketing activities. Some U.S. Bottler’s Agreements that predate the 1987Contract impose certain marketing obligations on us with respect to certain Company Trademark Beverages.
As a practical matter, our Company’s ability to exercise its contractual flexibility to determine the price andother terms of sale of its syrups, concentrates and finished beverages under various agreements described aboveis subject, both outside and within the United States, to competitive market conditions.
Significant Equity Method Investments and Company Bottling Operations
Our Company maintains business relationships with three types of bottlers:
• bottlers in which the Company has no ownership interest;
• bottlers in which the Company has invested and has a noncontrolling ownership interest; and
• bottlers in which the Company has invested and has a controlling ownership interest.
7

In 2006, bottling operations in which we had no ownership interest produced and distributed approximately25 percent of our worldwide unit case volume. We have equity positions in 52 unconsolidated bottling, canningand distribution operations for our products worldwide. These cost or equity method investees produced anddistributed approximately 58 percent of our worldwide unit case volume in 2006. Controlled and consolidatedbottling operations produced and distributed approximately 7 percent of our worldwide unit case volume in2006. The remaining approximately 10 percent of our worldwide unit case volume in 2006 was produced anddistributed by our fountain operations and our juice and juice drink, sports drink and other finished beverageoperations.
We make equity investments in selected bottling operations with the intention of maximizing the strengthand efficiency of the Coca-Cola system’s production, distribution and marketing systems around the world.These investments are intended to result in increases in unit case volume, net revenues and profits at the bottlerlevel, which in turn generate increased gallon sales for our Company’s concentrate and syrup business. Whenthis occurs, both we and our bottling partners benefit from long-term growth in volume, improved cash flows andincreased shareowner value.
The level of our investment generally depends on the bottler’s capital structure and its available resourcesat the time of the investment. Historically, in certain situations, we have viewed it as advantageous to acquire acontrolling interest in a bottling operation, often on a temporary basis. Owning such a controlling interest hasallowed us to compensate for limited local resources and has enabled us to help focus the bottler’s sales andmarketing programs and assist in the development of the bottler’s business and information systems and theestablishment of appropriate capital structures.
In line with our long-term bottling strategy, we may periodically consider options for reducing ourownership interest in a bottler. One such option is to combine our bottling interests with the bottling interests ofothers to form strategic business alliances. Another option is to sell our interest in a bottling operation to one ofour equity method investee bottlers. In both of these situations, our Company continues to participate in thebottler’s results of operations through our share of the strategic business alliances’ or equity method investees’earnings or losses.
In cases where our investments in bottlers represent noncontrolling interests, our intention is to provideexpertise and resources to strengthen those businesses.
Significant investees in which we have noncontrolling ownership interests include the following:
Coca-Cola Enterprises Inc. (‘‘CCE’’). Our ownership interest in CCE was approximately 35 percent atDecember 31, 2006. CCE is the world’s largest bottler of the Company’s beverage products. In 2006, sales ofconcentrates, syrups and finished products by the Company to CCE were approximately $5.4 billion. CCEestimates that the territories in which it markets beverage products to retailers (which include portions of 46states and the District of Columbia in the United States, the United States Virgin Islands, Canada, GreatBritain, continental France, the Netherlands, Luxembourg, Belgium and Monaco) contain approximately79 percent of the United States population, 98 percent of the population of Canada, and 100 percent of thepopulations of Great Britain, continental France, the Netherlands, Luxembourg, Belgium and Monaco. In 2006,CCE’s net operating revenues were approximately $19.8 billion. Excluding fountain products, in 2006,approximately 60 percent of the unit case volume of CCE consisted of Coca-Cola Trademark Beverages,33 percent of its unit case volume consisted of other Company Trademark Beverages and 7 percent of its unitcase volume consisted of beverage products of other companies.
Coca-Cola Hellenic Bottling Company S.A. (‘‘Coca-Cola HBC’’). At December 31, 2006, our ownershipinterest in Coca-Cola HBC was approximately 23 percent. Coca-Cola HBC has bottling and distribution rights,through direct ownership or joint ventures, in Armenia, Austria, Belarus, Bosnia-Herzegovina, Bulgaria,Croatia, Cyprus, the Czech Republic, Estonia, Former Yugoslavian Republic of Macedonia, Greece, Hungary,Italy, Latvia, Lithuania, Moldova, Nigeria, Northern Ireland, Poland, Republic of Ireland, Romania, Russia,
8

Serbia and Montenegro, Slovakia, Slovenia, Switzerland and Ukraine. Coca-Cola HBC estimates that theterritories in which it markets beverage products contain approximately 67 percent of the population of Italy and100 percent of the populations of the other countries named above in which Coca-Cola HBC has bottling anddistribution rights. In 2006, Coca-Cola HBC’s net sales of beverage products were approximately $7 billion. In2006, approximately 44 percent of the unit case volume of Coca-Cola HBC consisted of Coca-Cola TrademarkBeverages, approximately 49 percent of its unit case volume consisted of other Company Trademark Beveragesand approximately 7 percent of its unit case volume consisted of beverage products of Coca-Cola HBC or othercompanies.
Coca-Cola FEMSA, S.A.B. de C.V. (‘‘Coca-Cola FEMSA’’). Our ownership interest in Coca-Cola FEMSAwas approximately 32 percent at December 31, 2006. Coca-Cola FEMSA is a Mexican holding company withbottling subsidiaries in a substantial part of central Mexico, including Mexico City and southeastern Mexico;greater São Paulo, Campinas, Santos, the state of Matto Grosso do Sul and part of the state of Goias in Brazil;central Guatemala; most of Colombia; all of Costa Rica, Nicaragua, Panama and Venezuela; and greater BuenosAires, Argentina. Coca-Cola FEMSA estimates that the territories in which it markets beverage productscontain approximately 48 percent of the population of Mexico, 16 percent of the population of Brazil, 98 percentof the population of Colombia, 47 percent of the population of Guatemala, 100 percent of the populations ofCosta Rica, Nicaragua, Panama and Venezuela and 30 percent of the population of Argentina. In 2006,Coca-Cola FEMSA’s net sales of beverage products were approximately $5.2 billion. In 2006, approximately62 percent of the unit case volume of Coca-Cola FEMSA consisted of Coca-Cola Trademark Beverages,34 percent of its unit case volume consisted of other Company Trademark Beverages and 4 percent of its unitcase volume consisted of beverage products of Coca-Cola FEMSA or other companies.
Coca-Cola Amatil Limited (‘‘Coca-Cola Amatil’’). At December 31, 2006, our Company’s ownershipinterest in Coca-Cola Amatil was approximately 32 percent. Coca-Cola Amatil has bottling and distributionrights, through direct ownership or joint ventures, in Australia, New Zealand, Fiji, Papua New Guinea,Indonesia and South Korea. Coca-Cola Amatil estimates that the territories in which it markets beverageproducts contain 100 percent of the populations of Australia, New Zealand, Fiji, South Korea and Papua NewGuinea, and 98 percent of the population of Indonesia. In 2006, Coca-Cola Amatil’s net sales of beverageproducts were approximately $3 billion. In 2006, approximately 50 percent of the unit case volume of Coca-ColaAmatil consisted of Coca-Cola Trademark Beverages, approximately 40 percent of its unit case volume consistedof other Company Trademark Beverages and approximately 10 percent of its unit case volume consisted ofbeverage products of Coca-Cola Amatil.
Other Interests. BPW, our joint venture with Nestlé and certain of its subsidiaries, is focused upon theready-to-drink tea and coffee businesses. BPW products were sold in the United States and 63 other countriesduring the year ended December 31, 2006. BPW serves as the exclusive vehicle through which our Company andNestlé participate in the ready-to-drink tea and coffee businesses worldwide, except in Japan. InNovember 2006, our Company and Nestlé jointly announced an agreement to refocus BPW’s activities on blacktea beverages and Enviga. The implementation of this agreement, which is subject to certain regulatoryapprovals, would allow our Company and Nestlé to independently develop, produce and market ready-to-drinkcoffee and non-black tea-based beverages, other than Enviga. Multon, a Russian juice business operated as ajoint venture with Coca-Cola HBC, generated revenues from sales of juice products in Russia, Ukraine andBelarus in 2006.
9

Seasonality
Sales of our ready-to-drink nonalcoholic beverages are somewhat seasonal, with the second and thirdcalendar quarters accounting for the highest sales volumes. The volume of sales in the beverages business maybe affected by weather conditions.
Competition
Our Company competes in the nonalcoholic beverages segment of the commercial beverages industry.Based on internally available data and a variety of industry sources, we believe that, in 2006, worldwide sales ofCompany products accounted for approximately 10 percent of total worldwide sales of nonalcoholic beverageproducts. The nonalcoholic beverages segment of the commercial beverages industry is highly competitive,consisting of numerous firms. These include firms that, like our Company, compete in multiple geographic areasas well as firms that are primarily local in operation. Competitive products include numerous nonalcoholicsparkling beverages; various water products, including packaged water; juices and nectars; fruit drinks anddilutables (including syrups and powdered drinks); coffees and teas; energy and sports drinks; and various othernonalcoholic beverages. These competitive beverages are sold to consumers in both ready-to-drink andnot-ready-to-drink form. In many of the countries in which we do business, including the United States,PepsiCo, Inc. is one of our primary competitors. Other significant competitors include, but are not limited to,Nestlé, Cadbury Schweppes plc, Groupe Danone and Kraft Foods Inc. We also compete against numerous localfirms in various geographic areas in which we operate.
Competitive factors impacting our business include pricing, advertising, sales promotion programs, productinnovation, increased efficiency in production techniques, the introduction of new packaging, new vending anddispensing equipment, and brand and trademark development and protection.
Our competitive strengths include powerful brands with a high level of consumer acceptance; a worldwidenetwork of bottlers and distributors of Company products; sophisticated marketing capabilities; and a talentedgroup of dedicated employees. Our competitive challenges include strong competition in all geographic regionsand, in many countries, a concentrated retail sector with powerful buyers able to freely choose among Companyproducts, products of competitive beverage suppliers and individual retailers’ own store-brand beverages.
Raw Materials
The principal raw materials used by our business are nutritive and non-nutritive sweeteners. In the UnitedStates, the principal nutritive sweetener is high fructose corn syrup, a form of sugar, which is available fromnumerous domestic sources and is historically subject to fluctuations in its market price. The principal nutritivesweetener used by our business outside the United States is sucrose, another form of sugar, which is alsoavailable from numerous sources and is historically subject to fluctuations in its market price. Our Companygenerally has not experienced any difficulties in obtaining its requirements for nutritive sweeteners. In theUnited States, we purchase high fructose corn syrup to meet our and our bottlers’ requirements with theassistance of Coca-Cola Bottlers’ Sales & Services Company LLC (‘‘CCBSS’’). CCBSS is a limited liabilitycompany that is owned by authorized Coca-Cola bottlers doing business in the United States. Among otherthings, CCBSS provides procurement services to our Company for the purchase of various goods and services inthe United States, including high fructose corn syrup.
The principal non-nutritive sweeteners we use in our business are aspartame, acesulfame potassium,saccharin, cyclamate and sucralose. Generally, these raw materials are readily available from numerous sources.However, our Company purchases aspartame, an important non-nutritive sweetener that is used alone or incombination with other important non-nutritive sweeteners such as saccharin or acesulfame potassium in ourlow-calorie sparkling beverage products, primarily from The NutraSweet Company and Ajinomoto Co., Inc.,which we consider to be our only viable sources for the supply of this product. We currently purchase acesulfamepotassium from Nutrinova Nutrition Specialties & Food Ingredients GmbH, which we consider to be our only
10

viable source for the supply of this product. Our Company generally has not experienced any difficulties inobtaining its requirements for non-nutritive sweeteners.
Our Company sells a number of products sweetened with sucralose, a non-nutritive sweetener. We workclosely with Tate & Lyle, our sucralose supplier, to maintain continuity of supply. Although Tate & Lyle is oursingle source for sucralose, we do not anticipate difficulties in obtaining our requirements for sucralose.
With regard to juice and juice-drink products, citrus fruit, particularly orange juice concentrate, is ourprincipal raw material. The citrus industry is subject to the variability of weather conditions. In particular,freezing weather or hurricanes in central Florida may result in shortages and higher prices for orange juiceconcentrate throughout the industry. Due to our ability to also source orange juice concentrate from theSouthern Hemisphere (particularly from Brazil), we normally have an adequate supply of orange juiceconcentrate that meets our Company’s standards.
Patents, Copyrights, Trade Secrets and Trademarks
Our Company owns numerous patents, copyrights and trade secrets, as well as substantial know-how andtechnology, which we collectively refer to in this report as ‘‘technology.’’ This technology generally relates to ourCompany’s products and the processes for their production; the packages used for our products; the design andoperation of various processes and equipment used in our business; and certain quality assurance software.Some of the technology is licensed to suppliers and other parties. Our sparkling beverage and other beverageformulae are among the important trade secrets of our Company.
We own numerous trademarks that are very important to our business. Depending upon the jurisdiction,trademarks are valid as long as they are in use and/or their registrations are properly maintained. Pursuant toour Bottler’s Agreements, we authorize our bottlers to use applicable Company trademarks in connection withtheir manufacture, sale and distribution of Company products. In addition, we grant licenses to third partiesfrom time to time to use certain of our trademarks in conjunction with certain merchandise and food products.
Governmental Regulation
Our Company is required to comply, and it is our policy to comply, with applicable laws in the numerouscountries throughout the world in which we do business. In many jurisdictions, compliance with competition lawsis of special importance to us, and our operations may come under special scrutiny by competition lawauthorities due to our competitive position in those jurisdictions.
The production, distribution and sale in the United States of many of our Company’s products are subjectto the Federal Food, Drug, and Cosmetic Act, the Federal Trade Commission Act, the Lanham Act, stateconsumer protection laws, the Occupational Safety and Health Act, various environmental statutes; and variousother federal, state and local statutes and regulations applicable to the production, transportation, sale, safety,advertising, labeling and ingredients of such products. Outside the United States, the production, distributionand sale of our many products are also subject to numerous statutes and regulations.
A California law requires that a specific warning appear on any product that contains a component listed bythe state as having been found to cause cancer or birth defects. The law exposes all food and beverage producersto the possibility of having to provide warnings on their products. This is because the law recognizes no generallyapplicable quantitative thresholds below which a warning is not required. Consequently, even trace amounts oflisted components can expose affected products to the prospect of warning labels. Products containing listedsubstances that occur naturally or that are contributed to such products solely by a municipal water supply aregenerally exempt from the warning requirement. No Company beverages produced for sale in California arecurrently required to display warnings under this law. However, we are unable to predict whether a componentfound in a Company product might be added to the California list in the future. Furthermore, we are also unableto predict when or whether the increasing sensitivity of detection methodology that may become applicable
11

under this law and related regulations as they currently exist, or as they may be amended, might result in thedetection of an infinitesimal quantity of a listed substance in a Company beverage produced for sale inCalifornia.
Bottlers of our beverage products presently offer nonrefillable, recyclable containers in the United Statesand various other markets around the world. Some of these bottlers also offer refillable containers, which arealso recyclable. Legal requirements have been enacted in jurisdictions in the United States and overseasrequiring that deposits or certain ecotaxes or fees be charged for the sale, marketing and use of certainnonrefillable beverage containers. The precise requirements imposed by these measures vary. Other beveragecontainer–related deposit, recycling, ecotax and/or product stewardship proposals have been introduced invarious jurisdictions in the United States and overseas. We anticipate that similar legislation or regulations maybe proposed in the future at local, state and federal levels, both in the United States and elsewhere.
All of our Company’s facilities in the United States and elsewhere around the world are subject to variousenvironmental laws and regulations. Compliance with these provisions has not had, and we do not expect suchcompliance to have, any material adverse effect on our Company’s capital expenditures, net income orcompetitive position.
Employees
As of December 31, 2006 and 2005, our Company had approximately 71,000 and 55,000 employees,respectively, of which 13,600 and 9,800, respectively, were employed by entities that we have consolidated underthe Financial Accounting Standards Board Interpretation No. 46 (revised December 2003), ‘‘Consolidation ofVariable Interest Entities’’ (‘‘Interpretation No. 46(R)’’). At the end of 2006 and 2005, our Company hadapproximately 12,200 and 10,400 employees, respectively, located in the United States, of which approximately1,200 and none, respectively, were employed by entities that we have consolidated under InterpretationNo. 46(R). The increase in the number of employees in 2006 was primarily due to the acquisitions and theconsolidation of certain bottling operations, mainly in China and the United States.
Our Company, through its divisions and subsidiaries, has entered into numerous collective bargainingagreements. We currently expect that we will be able to renegotiate such agreements on satisfactory terms whenthey expire. The Company believes that its relations with its employees are generally satisfactory.
Securities Exchange Act Reports
The Company maintains an internet website at the following address: www.thecoca-colacompany.com. Theinformation on the Company’s website is not incorporated by reference in this annual report on Form 10-K.
We make available on or through our website certain reports and amendments to those reports that we filewith or furnish to the Securities and Exchange Commission (the ‘‘SEC’’) in accordance with the SecuritiesExchange Act of 1934, as amended (the ‘‘Exchange Act’’). These include our annual reports on Form 10-K, ourquarterly reports on Form 10-Q, our current reports on Form 8-K, and Section 16 filings. We make thisinformation available on our website free of charge as soon as reasonably practicable after we electronically filethe information with, or furnish it to, the SEC.
ITEM 1A. RISK FACTORS
In addition to the other information set forth in this report, you should carefully consider the followingfactors, which could materially affect our business, financial condition or future results. The risks describedbelow are not the only risks facing our Company. Additional risks and uncertainties not currently known to us orthat we currently deem to be immaterial also may materially adversely affect our business, financial condition orresults of operations.
12

Obesity concerns may reduce demand for some of our products.
Consumers, public health officials and government officials are becoming increasingly aware of andconcerned about the public health consequences associated with obesity, particularly among young people. Inaddition, press reports indicate that lawyers and consumer advocates have publicly threatened to instigatelitigation against companies in our industry, including us, alleging unfair and/or deceptive practices related tocontracts to sell sparkling and other beverages in schools. Increasing public awareness about these issues andnegative publicity resulting from actual or threatened legal actions may reduce demand for our sparklingbeverages, which could affect our profitability.
Water scarcity and poor quality could negatively impact the Coca-Cola system’s production costs and capacity.
Water is the main ingredient in substantially all of our products. It is also a limited resource in many parts ofthe world, facing unprecedented challenges from overexploitation, increasing pollution and poor management.As demand for water continues to increase around the world and as the quality of available water deteriorates,our system may incur increasing production costs or face capacity constraints which could adversely affect ourprofitability or net operating revenues in the long run.
Changes in the nonalcoholic beverages business environment could impact our financial results.
The nonalcoholic beverages business environment is rapidly evolving as a result of, among other things,changes in consumer preferences, including changes based on health and nutrition considerations and obesityconcerns, shifting consumer tastes and needs, changes in consumer lifestyles, increased consumer informationand competitive product and pricing pressures. In addition, the industry is being affected by the trend towardconsolidation in the retail channel, particularly in Europe and the United States. If we are unable to successfullyadapt to this rapidly changing environment, our net income, share of sales and volume growth could benegatively affected.
Increased competition could hurt our business.
The nonalcoholic beverages segment of the commercial beverages industry is highly competitive. Wecompete with major international beverage companies that, like our Company, operate in multiple geographicareas, as well as numerous firms that are primarily local in operation. In many countries in which we do business,including the United States, PepsiCo, Inc. is a primary competitor. Other significant competitors include, but arenot limited to, Nestlé, Cadbury Schweppes plc, Groupe Danone and Kraft Foods Inc. Our ability to gain ormaintain share of sales or gross margins in the global market or in various local markets may be limited as aresult of actions by competitors.
If we are unable to expand our operations in developing and emerging markets, our growth rate could be negativelyaffected.
Our success depends in part on our ability to grow our business in developing and emerging markets, whichin turn depends on economic and political conditions in those markets and on our ability to acquire or formstrategic business alliances with local bottlers and to make necessary infrastructure enhancements to productionfacilities, distribution networks, sales equipment and technology. Moreover, the supply of our products indeveloping and emerging markets must match customers’ demand for those products. Due to product price,limited purchasing power and cultural differences, there can be no assurance that our products will be acceptedin any particular developing or emerging market.
Fluctuations in foreign currency exchange and interest rates could affect our financial results.
We earn revenues, pay expenses, own assets and incur liabilities in countries using currencies other than theU.S. dollar, including the euro, the Japanese yen, the Brazilian real and the Mexican peso. In 2006, we used 63
13

functional currencies in addition to the U.S. dollar and derived approximately 72 percent of our net operatingrevenues from operations outside of the United States. Because our consolidated financial statements arepresented in U.S. dollars, we must translate revenues, income and expenses, as well as assets and liabilities, intoU.S. dollars at exchange rates in effect during or at the end of each reporting period. Therefore, increases ordecreases in the value of the U.S. dollar against other major currencies will affect our net operating revenues,operating income and the value of balance sheet items denominated in foreign currencies. Because of thegeographic diversity of our operations, weaknesses in some currencies might be offset by strengths in others overtime. We also use derivative financial instruments to further reduce our net exposure to currency exchange ratefluctuations. However, we cannot assure you that fluctuations in foreign currency exchange rates, particularly thestrengthening of the U.S. dollar against major currencies, would not materially affect our financial results. Inaddition, we are exposed to adverse changes in interest rates. When appropriate, we use derivative financialinstruments to reduce our exposure to interest rate risks. We cannot assure you, however, that our financial riskmanagement program will be successful in reducing the risks inherent in exposures to interest rate fluctuations.
We rely on our bottling partners for a significant portion of our business. If we are unable to maintain goodrelationships with our bottling partners, our business could suffer.
We generate a significant portion of our net operating revenues by selling concentrates and syrups tobottlers in which we do not have any ownership interest or in which we have a noncontrolling ownership interest.In 2006, approximately 83 percent of our worldwide unit case volume was produced and distributed by bottlingpartners in which the Company did not have controlling interests. As independent companies, our bottlingpartners, some of which are publicly traded companies, make their own business decisions that may not alwaysalign with our interests. In addition, many of our bottling partners have the right to manufacture or distributetheir own products or certain products of other beverage companies. If we are unable to provide an appropriatemix of incentives to our bottling partners through a combination of pricing and marketing and advertisingsupport, they may take actions that, while maximizing their own short-term profits, may be detrimental to ourCompany or our brands, or they may devote more of their energy and resources to business opportunities orproducts other than those of the Company. Such actions could, in the long run, have an adverse effect on ourprofitability. In addition, the loss of one or more major customers by one of our major bottling partners, ordisruptions of bottling operations that may be caused by strikes, work stoppages or labor unrest affecting suchbottlers, could indirectly affect our results.
If our bottling partners’ financial condition deteriorates, our business and financial results could be affected.
The success of our business depends on the financial strength and viability of our bottling partners. Ourbottling partners’ financial condition is affected in large part by conditions and events that are beyond ourcontrol, including competitive and general market conditions in the territories in which they operate and theavailability of capital and other financing resources on reasonable terms. While under our bottlers’ agreementswe generally have the right to unilaterally change the prices we charge for our concentrates and syrups, ourability to do so may be materially limited by the financial condition of the applicable bottlers and their ability topass price increases along to their customers. In addition, because we have investments in certain of our bottlingpartners, which we account for under the equity method, our operating results include our proportionate shareof such bottling partners’ income or loss. Also, a deterioration of the financial condition of bottling partners inwhich we have investments could affect the carrying values of such investments and result in write-offs.Therefore, a significant deterioration of our bottling partners’ financial condition could adversely affect ourfinancial results.
14

If we are unable to renew collective bargaining agreements on satisfactory terms or we experience strikes or workstoppages, our business could suffer.
Many of our employees at our key manufacturing locations are covered by collective bargaining agreements.If we are unable to renew such agreements on satisfactory terms, our labor costs could increase, which wouldaffect our profit margins. In addition, strikes or work stoppages at any of our major manufacturing plants couldimpair our ability to supply concentrates and syrups to our customers, which would reduce our revenues andcould expose us to customer claims.
Increase in the cost of energy could affect our profitability.
Our Company-owned bottling operations and our bottling partners operate a large fleet of trucks and othermotor vehicles. In addition, we and our bottlers use a significant amount of electricity, natural gas and otherenergy sources to operate our concentrate and bottling plants. An increase in the price of fuel and other energysources would increase our and the Coca-Cola system’s operating costs and, therefore, could negatively impactour profitability.
Increase in cost, disruption of supply or shortage of raw materials could harm our business.
We and our bottling partners use various raw materials in our business including high fructose corn syrup,sucrose, aspartame, saccharin, acesulfame potassium, sucralose and orange juice concentrate. The prices forthese raw materials fluctuate depending on market conditions. Substantial increases in the prices for our rawmaterials, to the extent they cannot be recouped through increases in the prices of finished beverage products,would increase our and the Coca-Cola system’s operating costs and could reduce our profitability. Increases inthe prices of our finished products resulting from higher raw material costs could affect affordability in somemarkets and reduce Coca-Cola system sales. In addition, some of these raw materials, such as aspartame,acesulfame potassium and sucralose, are available from a limited number of suppliers. We cannot assure youthat we will be able to maintain favorable arrangements and relationships with these suppliers. An increase inthe cost or a sustained interruption in the supply or shortage of some of these raw materials that may be causedby a deterioration of our relationships with suppliers or by events such as natural disasters, power outages, laborstrikes or the like, could negatively impact our net revenues and profits.
Changes in laws and regulations relating to beverage containers and packaging could increase our costs and reducedemand for our products.
We and our bottlers currently offer nonrefillable, recyclable containers in the United States and in variousother markets around the world. Legal requirements have been enacted in various jurisdictions in the UnitedStates and overseas requiring that deposits or certain ecotaxes or fees be charged for the sale, marketing and useof certain nonrefillable beverage containers. Other beverage container-related deposit, recycling, ecotax and/orproduct stewardship proposals have been introduced in various jurisdictions in the United States and overseasand we anticipate that similar legislation or regulations may be proposed in the future at local, state and federallevels, both in the United States and elsewhere. If these types of requirements are adopted and implemented ona large scale in any of the major markets in which we operate, they could affect our costs or require changes inour distribution model, which could reduce our net operating revenues or profitability. In addition, container-deposit laws, or regulations that impose additional burdens on retailers, could cause a shift away from ourproducts to retailer-proprietary brands, which could impact the demand for our products in the affectedmarkets.
Significant additional labeling or warning requirements may inhibit sales of affected products.
Various jurisdictions may seek to adopt significant additional product labeling or warning requirementsrelating to the chemical content or perceived adverse health consequences of certain of our products. Thesetypes of requirements, if they become applicable to one or more of our major products under current or future
15

environmental or health laws or regulations, may inhibit sales of such products. In California, a law requires thata specific warning appear on any product that contains a component listed by the state as having been found tocause cancer or birth defects. This law recognizes no generally applicable quantitative thresholds below which awarning is not required. If a component found in one of our products is added to the list, or if the increasingsensitivity of detection methodology that may become available under this law and related regulations as theycurrently exist, or as they may be amended, results in the detection of an infinitesimal quantity of a listedsubstance in one of our beverages produced for sale in California, the resulting warning requirements or adversepublicity could affect our sales.
Unfavorable economic and political conditions in international markets could hurt our business.
We derive a significant portion of our net operating revenues from sales of our products in internationalmarkets. In 2006, our operations outside of the United States accounted for approximately 72 percent of our netoperating revenues. Unfavorable economic and political conditions in certain of our international markets,including civil unrest and governmental changes, could undermine consumer confidence and reduce theconsumers’ purchasing power, thereby reducing demand for our products. In addition, product boycottsresulting from political activism could reduce demand for our products, while restrictions on our ability totransfer earnings or capital across borders that may be imposed or expanded as a result of political andeconomic instability could impact our profitability. Without limiting the generality of the preceding sentence, thecurrent unstable economic and political conditions and civil unrest and political activism in the Middle East,India or the Philippines, the unstable situation in Iraq, or the continuation or escalation of terrorist activitiescould adversely impact our international business.
Changes in commercial and market practices within the European Economic Area may affect the sales of ourproducts.
We and our bottlers are subject to an Undertaking, rendered legally binding in June 2005 by a decision ofthe European Commission, pursuant to which we committed to make certain changes in our commercial andmarket practices in the European Economic Area Member States. The Undertaking potentially applies in27 countries and in all channels of distribution where our sparkling beverages account for over 40 percent ofnational sales and twice the nearest competitor’s share. The commitments we and our bottlers made in theUndertaking relate broadly to exclusivity, percentage–based purchasing commitments, transparency, targetrebates, tying, assortment or range commitments, and agreements concerning products of other suppliers. TheUndertaking also applies to shelf space commitments in agreements with take-home customers and to financingand availability agreements in the on-premise channel. In addition, the Undertaking includes commitments thatare applicable to commercial arrangements concerning the installation and use of technical equipment (such ascoolers, fountain equipment and vending machines). Adjustments to our business model in the EuropeanEconomic Area Member States as a result of these commitments or of future interpretations of EuropeanUnion competition laws and regulations could adversely affect our sales in the European Economic Areamarkets.
Litigation or legal proceedings could expose us to significant liabilities and damage our reputation.
We are party to various litigation claims and legal proceedings. We evaluate these litigation claims and legalproceedings to assess the likelihood of unfavorable outcomes and to estimate, if possible, the amount ofpotential losses. Based on these assessments and estimates, we establish reserves and/or disclose the relevantlitigation claims or legal proceedings, as appropriate. These assessments and estimates are based on theinformation available to management at the time and involve a significant amount of management judgment. Wecaution you that actual outcomes or losses may differ materially from those envisioned by our currentassessments and estimates. In addition, we have bottling and other business operations in emerging ordeveloping markets with high risk legal compliance environments. Our policies and procedures require strict
16

compliance by our employees and agents with all United States and local laws and regulations applicable to ourbusiness operations, including those prohibiting improper payments to government officials. Nonetheless, wecannot assure you that our policies, procedures and related training programs will always ensure full complianceby our employees and agents with all applicable legal requirements. Improper conduct by our employees oragents could damage our reputation in the United States and internationally or lead to litigation or legalproceedings that could result in civil or criminal penalties, including substantial monetary fines, as well asdisgorgement of profits.
Adverse weather conditions could reduce the demand for our products.
The sales of our products are influenced to some extent by weather conditions in the markets in which weoperate. Unusually cold weather during the summer months may have a temporary effect on the demand for ourproducts and contribute to lower sales, which could have an adverse effect on our results of operations for thoseperiods.
If we are unable to maintain brand image and product quality, or if we encounter other product issues such asproduct recalls, our business may suffer.
Our success depends on our ability to maintain brand image for our existing products and effectively buildup brand image for new products and brand extensions. We cannot assure you, however, that additionalexpenditures and our renewed commitment to advertising and marketing will have the desired impact on ourproducts’ brand image and on consumer preferences. Product quality issues, real or imagined, or allegations ofproduct contamination, even when false or unfounded, could tarnish the image of the affected brands and maycause consumers to choose other products. In addition, because of changing government regulations orimplementation thereof, allegations of product contamination or lack of consumer interest in certain products,we may be required from time to time to recall products entirely or from specific markets. Product recalls couldaffect our profitability and could negatively affect brand image. Also, adverse publicity surrounding obesityconcerns, water usage, labor relations and the like could negatively affect our Company’s overall reputation andour products’ acceptance by consumers.
Changes in the legal and regulatory environment in the countries in which we operate could increase our costs orreduce our net operating revenues.
Our Company’s business is subject to various laws and regulations in the numerous countries throughoutthe world in which we do business, including laws and regulations relating to competition, product safety,advertising and labeling, container deposits, recycling or stewardship, the protection of the environment, andemployment and labor practices. In the United States, the production, distribution and sale of many of ourproducts are subject to, among others, the Federal Food, Drug, and Cosmetic Act, the Federal TradeCommission Act, the Lanham Act, state consumer protection laws, the Occupational Safety and Health Act,various environmental statutes, as well as various state and local statutes and regulations. Outside the UnitedStates, the production, distribution, sale, advertising and labeling of many of our products are also subject tovarious laws and regulations. Changes in applicable laws or regulations or evolving interpretations thereof could,in certain circumstances result in increased compliance costs or capital expenditures, which could affect ourprofitability, or impede the production or distribution of our products, which could affect our net operatingrevenues.
Changes in accounting standards and taxation requirements could affect our financial results.
New accounting standards or pronouncements that may become applicable to our Company from time totime, or changes in the interpretation of existing standards and pronouncements, could have a significant effecton our reported results for the affected periods. We are also subject to income tax in the numerous jurisdictionsin which we generate net operating revenues. In addition, our products are subject to import and excise duties
17

and/or sales or value-added taxes in many jurisdictions in which we operate. Increases in income tax rates couldreduce our after-tax income from affected jurisdictions, while increases in indirect taxes could affect ourproducts’ affordability and therefore reduce demand for our products.
If we are not able to achieve our overall long term goals, the value of an investment in our Company could benegatively affected.
We have established and publicly announced certain long-term growth objectives. These objectives werebased on our evaluation of our growth prospects, which are generally based on volume and sales potential ofmany product types, some of which are more profitable than others, and on an assessment of potential level ormix of product sales. There can be no assurance that we will achieve the required volume or revenue growth ormix of products necessary to achieve our growth objectives.
If we are unable to protect our information systems against data corruption, cyber-based attacks or network securitybreaches, our operations could be disrupted.
We are increasingly dependent on information technology networks and systems, including the Internet, toprocess, transmit and store electronic information. In particular, we depend on our information technologyinfrastructure for digital marketing activities and electronic communications among our locations around theworld and between Company personnel and our bottlers and other customers and suppliers. Security breaches ofthis infrastructure can create system disruptions, shutdowns or unauthorized disclosure of confidentialinformation. If we are unable to prevent such breaches, our operations could be disrupted or we may sufferfinancial damage or loss because of lost or misappropriated information.
We may be required to recognize additional impairment charges.
We assess our goodwill, trademarks and other intangible assets and our long-lived assets as and whenrequired by generally accepted accounting principles in the United States to determine whether they areimpaired. In 2006, we recorded a charge of approximately $602 million to equity income resulting from theimpact of our proportionate share of an impairment charge recorded by CCE, and impairment charges ofapproximately $41 million primarily related to trademarks for beverages sold in the Philippines and Indonesia;in 2005, we recorded impairment charges of approximately $89 million primarily related to our operations andinvestments in the Philippines; and in 2004, we recorded impairment charges of approximately $374 millionprimarily related to franchise rights at Coca-Cola Erfrischungsgetraenke AG (‘‘CCEAG’’). If market conditionsin North America, India, Indonesia or the Philippines do not improve or deteriorate further, we may be requiredto record additional impairment charges. In addition, unexpected declines in our operating results and structuralchanges or divestitures in these and other markets may also result in impairment charges. Additionalimpairment charges would reduce our reported earnings for the periods in which they are recorded.
If we do not successfully manage our Company-owned bottling operations, our results could suffer.
While we primarily manufacture, market and sell concentrates and syrups to our bottling partners, fromtime to time we do acquire or take control of bottling operations. Often, though not always, these bottlingoperations are in underperforming markets where we believe we can use our resources and expertise to improveperformance. We may incur unforeseen liabilities and obligations in connection with acquiring, taking control ofor managing such bottling operations and may encounter unexpected difficulties and costs in restructuring andintegrating them into our Company’s operating and internal control structures. In addition, our financialperformance and the strength and efficiency of the Coca-Cola system depend in part on how well we canmanage and improve the performance of Company-owned or controlled bottling operations. We cannot assureyou, however, that we will be able to achieve our strategic and financial objectives for such bottling operations.
18

Global or regional catastrophic events could impact our operations and financial results.
Because of our global presence and worldwide operations, our business can be affected by large-scaleterrorist acts, especially those directed against the United States or other major industrialized countries; theoutbreak or escalation of armed hostilities; major natural disasters; or widespread outbreaks of infectiousdiseases such as avian influenza or severe acute respiratory syndrome (generally known as SARS). Such eventscould impair our ability to manage our business around the world, could disrupt our supply of raw materials, andcould impact production, transportation and delivery of concentrates, syrups and finished products. In addition,such events could cause disruption of regional or global economic activity, which can affect consumers’purchasing power in the affected areas and, therefore, reduce demand for our products.
ITEM 1B. UNRESOLVED STAFF COMMENTS
None.
ITEM 2. PROPERTIES
Our worldwide headquarters is located on a 35-acre office complex in Atlanta, Georgia. The complexincludes the approximately 621,000 square foot headquarters building, the approximately 870,000 square footCoca-Cola North America building and the approximately 264,000 square foot Coca-Cola Plaza building. Thecomplex also includes several other buildings, including technical and engineering facilities, a learning centerand a reception center. Our Company leases approximately 250,000 square feet of office space at 10 GlenlakeParkway, Atlanta, Georgia, which we currently sublease to third parties. In addition, we lease approximately218,000 square feet of office space at Northridge Business Park, Dunwoody, Georgia. The North Americaoperating segment owns and occupies an office building located in Houston, Texas, that contains approximately330,000 square feet. The Company has facilities for administrative operations, manufacturing, processing,packaging, packing, storage and warehousing throughout the United States.
As of December 31, 2006, our Company owned and operated 32 principal beverage concentrate and/orsyrup manufacturing plants located throughout the world. In addition, we own, hold a majority interest in orotherwise consolidate under applicable accounting rules 37 operations with 95 principal beverage bottling andcanning plants located outside the United States. We also own four bottled water production facilities and leaseone such facility in the United States.
Our North America operating segment operates nine still beverage production facilities, in addition to thebottled water facilities mentioned above, located throughout the United States and Canada. It also utilizes asystem of contract packers to produce and/or distribute certain products where appropriate. In addition, ourNorth America operating segment owns a facility that manufactures juice concentrates for foodservice use.
We own or lease additional real estate, including a Company-owned office and retail building at 711 FifthAvenue in New York, New York, and approximately 315,000 square feet of Company-owned office and technicalspace in Brussels, Belgium. Additional owned or leased real estate located throughout the world is used by theCompany as office space; for bottling operations, warehouse or retail operations; or, in the case of some ownedproperty, is leased to others.
19

Management believes that our Company’s facilities for the production of our products are suitable andadequate, that they are being appropriately utilized in line with past experience, and that they have sufficientproduction capacity for their present intended purposes. The extent of utilization of such facilities varies basedupon seasonal demand for our products. It is not possible to measure with any degree of certainty or uniformitythe productive capacity and extent of utilization of these facilities. However, management believes thatadditional production can be obtained at the existing facilities by adding personnel and capital equipment and,at some facilities, by adding shifts of personnel or expanding the facilities. We continuously review ouranticipated requirements for facilities and, on the basis of that review, may from time to time acquire additionalfacilities and/or dispose of existing facilities.
ITEM 3. LEGAL PROCEEDINGS
On October 27, 2000, a class action lawsuit (Carpenters Health & Welfare Fund of Philadelphia & Vicinity v.The Coca-Cola Company, et al.) was filed in the United States District Court for the Northern District ofGeorgia alleging that the Company, M. Douglas Ivester, Jack L. Stahl and James E. Chestnut violated antifraudprovisions of the federal securities laws by making misrepresentations or material omissions relating to theCompany’s financial condition and prospects in late 1999 and early 2000. A second, largely identical lawsuit(Gaetan LaValla v. The Coca-Cola Company, et al.) was filed in the same court on November 9, 2000. Thecomplaints allege that the Company and the individual named officers: (1) forced certain Coca-Cola systembottlers to accept ‘‘excessive, unwanted and unneeded’’ sales of concentrate during the third and fourth quartersof 1999, thus creating a misleading sense of improvement in our Company’s performance in those quarters;(2) failed to write down the value of impaired assets in Russia, Japan and elsewhere on a timely basis, againresulting in the presentation of misleading interim financial results in the third and fourth quarters of 1999; and(3) misrepresented the reasons for Mr. Ivester’s departure from the Company and then misleadingly reassuredthe financial community that there would be no changes in the Company’s core business strategy or financialoutlook following that departure. Damages in an unspecified amount are sought in both complaints.
On January 8, 2001, an order was entered by the United States District Court for the Northern District ofGeorgia consolidating the two cases for all purposes. The Court also ordered the plaintiffs to file a ConsolidatedAmended Complaint. On July 25, 2001, the plaintiffs filed a Consolidated Amended Complaint, which largelyrepeated the allegations made in the original complaints and added Douglas N. Daft as an additional defendant.
On September 25, 2001, the defendants filed a Motion to Dismiss all counts of the Consolidated AmendedComplaint. On August 20, 2002, the Court granted in part and denied in part the defendants’ Motion to Dismiss.The Court also granted the plaintiffs’ Motion for Leave to Amend the Complaint. On September 4, 2002, thedefendants filed a Motion for Partial Reconsideration of the Court’s August 20, 2002 ruling. The motion wasdenied by the Court on April 15, 2003.
On June 2, 2003, the plaintiffs filed an Amended Consolidated Complaint. The defendants moved todismiss the Amended Complaint on June 30, 2003. On March 31, 2004, the Court granted in part and denied inpart the defendants’ Motion to Dismiss the Amended Complaint. In its order, the Court dismissed a number ofthe plaintiffs’ allegations, including the claim that the Company made knowingly false statements to financialanalysts. The Court permitted the remainder of the allegations to proceed to discovery. The Court denied theplaintiffs’ request for leave to further amend and replead their complaint. Discovery commenced on May 14,2004, and is ongoing. The fact discovery cutoff currently is March 23, 2007.
The Company believes it has substantial legal and factual defenses to the plaintiffs’ claims.
On December 20, 2002, the Company filed a lawsuit (The Coca-Cola Company v. Aqua-Chem, Inc., CivilAction No. 2002CV631-50) in the Superior Court, Fulton County, Georgia (the ‘‘Georgia Case’’), seeking adeclaratory judgment that the Company has no obligation to its former subsidiary, Aqua-Chem, Inc., now knownas Cleaver-Brooks, Inc. (‘‘Aqua-Chem’’), for any past, present or future liabilities or expenses in connection withany claims or lawsuits against Aqua-Chem. Subsequent to the Company’s filing but on the same day,
20

Aqua-Chem filed a lawsuit (Aqua-Chem, Inc. v. The Coca-Cola Company, Civil Action No. 02CV012179) in theCircuit Court, Civil Division of Milwaukee County, Wisconsin (the ‘‘Wisconsin Case’’). In the Wisconsin Case,Aqua-Chem sought a declaratory judgment that the Company is responsible for all liabilities and expenses notcovered by insurance in connection with certain of Aqua-Chem’s general and product liability claims arisingfrom occurrences prior to the Company’s sale of Aqua-Chem in 1981, and a judgment for breach of contract inan amount exceeding $9 million for costs incurred by Aqua-Chem to date in connection with such claims. TheWisconsin Case initially was stayed, pending final resolution of the Georgia Case, and later was voluntarilydismissed without prejudice by Aqua-Chem.
The Company owned Aqua-Chem from 1970 to 1981. During that time, the Company purchased over$400 million of insurance coverage, of which approximately $350 million is still available to cover Aqua-Chem’scosts for certain product liability and other claims. The Company sold Aqua-Chem to Lyonnaise AmericanHolding, Inc. in 1981 under the terms of a stock sale agreement. The 1981 agreement, and a subsequent 1983settlement agreement, outlined the parties’ rights and obligations concerning past and future claims and lawsuitsinvolving Aqua-Chem. Cleaver Brooks, a division of Aqua-Chem, manufactured boilers, some of whichcontained asbestos gaskets. Aqua-Chem was first named as a defendant in asbestos lawsuits in or around 1985and currently has more than 100,000 claims pending against it.
The parties agreed in 2004 to stay the Georgia Case pending the outcome of insurance coverage litigationfiled by certain Aqua-Chem insurers on March 26, 2004. In the coverage action, five plaintiff insurancecompanies filed suit (Century Indemnity Company, et al. v. Aqua-Chem, Inc., The Coca-Cola Company, et al., CaseNo. 04CV002852) in the Circuit Court, Civil Division of Milwaukee County, Wisconsin, against the Company,Aqua-Chem and 16 insurance companies. Several of the policies that are the subject of the coverage action wereissued to the Company during the period (1970 to 1981) when the Company owned Aqua-Chem. The complaintseeks a determination of the respective rights and obligations under the insurance policies issued with regard toasbestos-related claims against Aqua-Chem. The action also seeks a monetary judgment reimbursing anyamounts paid by the plaintiffs in excess of their obligations. Two of the insurers, one with a $15 million policylimit and one with a $25 million policy limit, have asserted cross-claims against the Company, alleging that theCompany and/or its insurers are responsible for Aqua-Chem’s asbestos liabilities before any obligation istriggered on the part of that cross-claimant insurers to pay for those costs under their policies.
Aqua-Chem and the Company filed and obtained a partial summary judgment determination in thecoverage action that the insurers for Aqua-Chem and the Company were jointly and severally liable for coverageamounts, but reserving judgment on other defenses that might apply. Aqua-Chem and the Companysubsequently reached settlements with six of the insurers in the Wisconsin insurance coverage litigation, andthose insurers will pay funds into an escrow account for payment of costs arising from the asbestos claims againstAqua-Chem. Aqua-Chem also has reached a settlement with an additional insurer regarding payment of thatinsurer’s policy proceeds for Aqua-Chem’s asbestos claims. Aqua-Chem and the Company continue to negotiatetheir claims for coverage with the remaining insurers that are parties to the Wisconsin insurance coverage case.To the extent that these negotiations do not result in settlements, the Company believes that there aresubstantial legal and factual arguments supporting the position that the insurance policies at issue providecoverage for the asbestos-related claims against Aqua-Chem, and both the Company and Aqua-Chem haveasserted these arguments in response to the complaint. The Company also believes it has substantial legal andfactual defenses to the claims of the cross-claimant insurer.
The Company is discussing with the Competition Directorate of the European Commission (the ‘‘EuropeanCommission’’) issues relating to parallel trade within the European Union arising out of comments received bythe European Commission from third parties. The Company is fully cooperating with the European Commissionand is providing information on these issues and the measures taken and to be taken to address any issuesraised. The Company is unable to predict at this time with any reasonable degree of certainty what action, if any,the European Commission will take with respect to these issues.
21

In May and July 2005, two putative class action lawsuits (Selbst v. The Coca-Cola Company and Douglas N.Daft and Amalgamated Bank, et al. v. The Coca-Cola Company, Douglas N. Daft, E. Neville Isdell, Steven J. Heyerand Gary P. Fayard) alleging violations of the anti-fraud provisions of the federal securities laws were filed in theUnited States District Court for the Northern District of Georgia against the Company and certain current andformer executive officers. These cases were subsequently consolidated, and an amended and consolidatedcomplaint was filed in September 2005. The purported class consists of persons, except the defendants, whopurchased Company stock between January 30, 2003, and September 15, 2004, and were damaged thereby. Theamended and consolidated complaint alleges, among other things, that during the class period the defendantsmade false and misleading statements about (a) the Company’s new business strategy/model, (b) the Company’sexecution of its new business strategy/model, (c) the state of the Company’s critical bottler relationships, (d) theCompany’s North American business, (e) the Company’s European operations, with a particular emphasis onGermany, (f) the Company’s marketing and introduction of new products, particularly Coca-Cola C2, and(g) the Company’s forecast for growth going forward. The plaintiffs claim that as a result of these allegedly falseand misleading statements, the price of the Company stock increased dramatically during the purported classperiod. The amended and consolidated complaint also alleges that in September and November of 2004, theCompany and E. Neville Isdell acknowledged that the Company’s performance had been below expectations,that various corrective actions were needed, that the Company was lowering its forecasts, and that there wouldbe no quick fixes. In addition, the amended and consolidated complaint alleges that the charge announced bythe Company in November 2004 should have been taken early in 2003 and that, as a result, the Company’sfinancial statements were materially misstated during 2003 and the first three quarters of 2004. The plaintiffs, onbehalf of the putative class, seek compensatory damages in an amount to be proved at trial, extraordinary,equitable and/or injunctive relief as permitted by law to assure that the class has an effective remedy, award ofreasonable costs and expenses, including counsel and expert fees, and such other further relief as the Court maydeem just and proper. On November 21, 2005, the Company and the individual parties filed a motion to dismissthe amended and consolidated complaint. The plaintiffs filed their response to that motion on January 27, 2006.On September 29, 2006, the Court entered its order granting the Company’s motion to dismiss the amendedcomplaint in its entirety and granted the plaintiffs 20 days from its date of entry within which to seek leave tofile a second amended complaint to attempt to correct deficiencies noted therein. On October 23, 2006,plaintiffs advised the court that they would not seek leave to file a second amended complaint therebyconcluding this matter.
On June 30, 2005, Maryann Chapman filed a purported shareholder derivative action (Chapman v. Isdell, etal.) in the Superior Court of Fulton County, Georgia, alleging violations of state law by certain individual currentand former members of the Board of Directors of the Company and senior management, including breaches offiduciary duties, abuse of control, gross mismanagement, waste of corporate assets and unjust enrichment,between January 2003 and the date of filing of the complaint that have caused substantial losses to the Companyand other damages, such as to its reputation and goodwill. The defendants named in the lawsuit include NevilleIsdell, Douglas Daft, Gary Fayard, Ronald Allen, Cathleen Black, Warren Buffett, Herbert Allen, Barry Diller,Donald McHenry, Sam Nunn, James Robinson, Peter Ueberroth, James Williams, Donald Keough, MariaLagomasino, Pedro Reinhard, Robert Nardelli and Susan Bennett King. The Company is also named a nominaldefendant. The complaint further alleges that the September 2004 earnings warning issued by the Companyresulted from factors known by the individual defendants as early as January 2003 that were not adequatelydisclosed to the investing public until the earnings warning. The factors cited in the complaint include (i) aflawed business strategy and a business model that was not working; (ii) a workforce so depleted by layoffs that itwas unable to properly react to changing market conditions; (iii) impaired relationships with key bottlers; and(iv) the fact that the foregoing conditions would lead to diminished earnings. The plaintiff, purportedly onbehalf of the Company, seeks damages in an unspecified amount, extraordinary equitable and/or injunctiverelief, restitution and disgorgement of profits, reimbursement for costs and disbursements of the action, andsuch other and further relief as the Court deems just and proper. The Company’s motion to dismiss thecomplaint and the plaintiff’s response were filed and fully briefed. The Court heard oral argument on the
22

Company’s motion to dismiss on June 6, 2006. Following the hearing, the Court took the matter underadvisement and the parties are awaiting a ruling. The Company intends to vigorously defend its interests in thismatter.
During May, June and July 2005, three similar putative class action lawsuits (Pedraza v. The Coca-ColaCompany, et al., Shamrey, et al. v. The Coca-Cola Company, et al. and Jackson v. The Coca-Cola Company, et al.)were filed in the United States District Court for the Northern District of Georgia by participants in theCompany’s Thrift & Investment Plan (the ‘‘Plan’’) alleging breach of fiduciary duties under the EmployeeRetirement Income Security Act of 1974 by the Company, certain current and former executive officers, and theCompany’s Benefits Committee. The purported class in each of these cases consists of the Plan and persons whowere participants in or beneficiaries of the Plan between May 13, 1997 and April 18, 2005 and whose accountsincluded investments in Company stock. The complaints allege that, among other things, the defendants failedto exercise the required care, skill, prudence and diligence in managing the Plan and its assets; take steps toeliminate or reduce the amount of Company stock in the Plan; adequately diversify the Plan’s investments inCompany stock, appoint qualified administrators and properly monitor their and the Plan’s performance; anddisclose accurate information about the Company. The plaintiffs, on behalf of the putative class, seek, amongother things, declaratory relief, damages for Plan losses and lost profits, imposition of constructive trust as aremedy for unjust enrichment, injunctive relief, costs and attorneys’ fees, equitable restitution and otherappropriate equitable and monetary relief. By order of the Court, an amended complaint was filed in theJackson case on September 16, 2005. The amended complaint supplements the detailed allegations of theoriginal complaint and names specific individual defendants who served on the Benefits Committee. Identicalamended complaints were also filed in Pedraza and Shamrey. In each of the three cases, the plaintiff voluntarilydismissed three individual defendants. The Company filed motions to dismiss all claims in each case.
On September 29, 2006, the Court dismissed all but one claim against the Benefits Committee and itsmembers. The Court ordered plaintiffs to replead the remaining claim against the Benefits Committee withspecificity within 20 days. On November 14, 2006, the Court entered a stipulation and order to dismiss theremaining claim with prejudice thereby concluding this matter.
In February 2006, the International Brotherhood of Teamsters, a purported shareholder of CCE, filed aderivative suit (International Brotherhood of Teamsters v. The Coca-Cola Company, et al.) in the Delaware Courtof Chancery for New Castle County naming the Company and current and former CCE board members,including certain current and former Company officers who serve or served on CCE’s board, as defendants. Theplaintiff alleged that the Company breached fiduciary duties owed to CCE shareholders based upon allegedcontrol of CCE by the Company. The complaint also alleged that the Company had actual control over CCE andthat the Company abused its control by maximizing its own financial condition at the expense of CCE’s financialcondition. Subsequently, two lawsuits virtually identical to Teamsters were filed in the same court: Lang v. TheCoca-Cola Company, et al., filed March 30, 2006, and Gordon v. The Coca-Cola Company, et al., filed April 10,2006. On April 6, 2006, the Company moved to dismiss Teamsters or, in the alternative, for a stay of discovery(the ‘‘Dismissal Motion’’). On May 19, 2006, the Chancery Court entered an order consolidating Teamsters, Langand Gordon under the caption In re Coca-Cola Enterprises, Inc. Shareholders Litigation and requiring theplaintiffs to file an amended consolidated complaint in the consolidated action as soon as practicable.
On September 29, 2006, plaintiffs filed their Consolidated Amended Shareholders’ Derivative Complaint(the ‘‘Amended Complaint’’). The Amended Complaint omits certain former Company officers from the groupof individual defendants and defines the ‘‘relevant time period’’ for purposes of the claims as October 15, 2003,through the date of the filing. The original complaint did not identify any specific dates. The AmendedComplaint also includes additional allegations about the conduct of the Company and certain of its executiveofficers, including new allegations about the Company’s purported control over CCE and allegations ofimproper conduct in connection with the establishment of a warehouse delivery system to supply Powerade to amajor customer. On December 7, 2006, the Company filed its motion to dismiss the amended complaint andaccompanying brief. The plaintiffs’ reply brief was filed on January 22, 2007.
23

The Company believes it has substantial factual and legal defenses to the plaintiffs’ claims and intends todefend itself vigorously.
In February 2006, two largely identical cases were filed against the Company and CCE, one in the CircuitCourt of Jefferson County, Alabama (Coca-Cola Bottling Company United, et al. v. The Coca-Cola Company andCoca-Cola Enterprises Inc.), and the other in the United States District Court for the Western District ofMissouri, Southern Division (Ozarks Coca-Cola/Dr Pepper Bottling Company, et al. v. The Coca-Cola Companyand Coca-Cola Enterprises Inc.) by bottlers that collectively represented approximately 10 percent of theCompany’s U.S. unit case volume for 2005. The plaintiffs in these lawsuits allege, among other things, that theCompany and CCE are acting in concert to establish a warehouse delivery system to supply Powerade to a majorcustomer, which the plaintiffs contend would be detrimental to their interests as authorized distributors of thisproduct. The plaintiffs claim that the alleged conduct constitutes breach of contract, implied covenant of goodfaith and fair dealing, and expressed covenant of good faith by the Company and CCE. In addition, the plaintiffsseek remedies against the Company and CCE on a promissory estoppel theory. The plaintiffs seek actual andpunitive damages, interest, and costs and attorneys’ fees, as well as permanent injunctive relief, in the Alabamacase, and preliminary and permanent injunctive relief in the federal case. The Company and CCE filed motionsto dismiss the plaintiffs’ complaint in the Alabama case, and the Court scheduled a hearing on these motions forearly May 2006. In the federal case, the Court granted the Company’s and CCE’s motion to change venue to theUnited States District Court for the Northern District of Georgia. Shortly thereafter, the plaintiffs in the federalcase withdrew their request for preliminary injunctive relief. The Company and CCE also filed motions todismiss the plaintiffs’ complaint in the federal case.
During the third quarter of 2006, a motion by Coca-Cola Bottling Co. Consolidated (‘‘Consolidated’’) tointervene in the federal case was granted, and the plaintiffs in both cases amended their pleadings to add claimschallenging warehouse delivery programs for Dasani and Minute Maid juices. Also, during the fourth quarter of2006, the parties engaged in a temporary ‘‘slow-down’’ of the litigation in order to explore business discussionsthat might lead to resolution of the issues in the case. As a result of these discussions, the parties have agreed towork together to develop and test new customer service and distribution systems to supplement their direct storedelivery system. Pursuant to that agreement, as of February 13, 2007, all but five of the plaintiffs in these lawsuitshave signed settlement agreements and will dismiss their lawsuits without prejudice. CCE and Consolidatedhave also signed agreements in which they have committed to participate in the new customer service anddelivery systems as part of the settlement arrangements.
In the event settlement is not reached with the remaining plaintiffs in these lawsuits, the Company believesthat it has substantial factual and legal defenses to the remaining plaintiffs’ claims and intends to defend thecases vigorously.
The Company is involved in various other legal proceedings. Management of the Company believes that anyliability to the Company that may arise as a result of these proceedings, including the proceedings specificallydiscussed above, will not have a material adverse effect on the financial condition of the Company and itssubsidiaries taken as a whole.
ITEM 4. SUBMISSION OF MATTERS TO A VOTE OF SECURITY HOLDERS
Not applicable.
ITEM X. EXECUTIVE OFFICERS OF THE COMPANY
The following are the executive officers of our Company as of February 20, 2007:
Ahmet Bozer, 46, is President of the Eurasia Group. Mr. Bozer joined the Company in 1990 as a FinancialControl Manager for Coca-Cola USA and held a number of other roles in the finance organization. In 1994, hejoined Coca-Cola Bottlers of Turkey (now Coca-Cola Icecek A.S.), a joint venture between the Company, The
24

Anadolu Group and Özgörkey Companies, as Chief Financial Officer and was later named Managing Directorin 1998. In 2000, Mr. Bozer was named President of the Eurasia Division of the Company. During the period2000 until 2006, the Eurasia & Middle East Division was expanded to include 34 countries and, in 2006, he wasgiven the additional leadership responsibility for the Russia, Ukraine and Belarus Division. He was appointed tohis current position, effective January 1, 2007.
Alexander B. Cummings, 50, is President of the Africa Group. Mr. Cummings joined the Company in 1997 asDeputy Region Manager, Nigeria, based in Lagos, Nigeria. In 1998, he was made Managing Director/RegionManager, Nigeria. In 2000, Mr. Cummings became President of the North West Africa Division based inMorocco and in 2001 became President of the Africa Group overseeing the entire African continent.Mr. Cummings started his career in 1982 with The Pillsbury Company and held various positions withinPillsbury, the last position being Vice President of Finance for all of Pillsbury’s international businesses.Mr. Cummings was appointed to his current position in March 2001.
J. Alexander M. Douglas, Jr., 45, is Senior Vice President and President of the North America Group.Mr. Douglas joined the Company in January 1988 as a District Sales Manager for the Foodservice Division ofCoca-Cola USA. In May 1994, he was named Vice President of Coca-Cola USA, initially assuming leadership ofthe CCE Sales & Marketing Group and eventually assuming leadership of the entire North American FieldSales and Marketing Groups. In January 2000, Mr. Douglas was appointed President of the North AmericanDivision within the North America operating group. He served as Senior Vice President and Chief CustomerOfficer of the Company from February 2003 until August 2006. Mr. Douglas was elected to his current positionin August 2006.
Gary P. Fayard, 54, is Executive Vice President and Chief Financial Officer of the Company. Mr. Fayardjoined the Company in April 1994. In July 1994, he was elected Vice President and Controller. InDecember 1999, he was elected Senior Vice President and Chief Financial Officer. Mr. Fayard was electedExecutive Vice President of the Company in February 2003.
Irial Finan, 49, is Executive Vice President of the Company and President, Bottling Investments and SupplyChain. Mr. Finan joined the Coca-Cola system in 1981 with Coca-Cola Bottlers Ireland, Ltd., where for severalyears he held a variety of accounting positions. From 1987 until 1990, Mr. Finan served as Finance Director ofCoca-Cola Bottlers Ireland, Ltd. From 1991 to 1993, he served as Managing Director of Coca-Cola BottlersUlster, Ltd. He was Managing Director of Coca-Cola Bottlers in Romania and Bulgaria until late 1994. From1995 to 1999, he served as Managing Director of Molino Beverages, with responsibility for expanding marketsincluding the Republic of Ireland, Northern Ireland, Romania, Moldova, Russia and Nigeria. Mr. Finan servedfrom May 2001 until 2003 as Chief Executive Officer of Coca-Cola HBC. In August 2004, Mr. Finan joined theCompany and was named President, Bottling Investments. He was elected Executive Vice President of theCompany in October 2004.
E. Neville Isdell, 63, is Chairman of the Board of Directors and Chief Executive Officer of the Company.Mr. Isdell joined the Coca-Cola system in 1966 with the local bottling company in Zambia. In 1972, he becameGeneral Manager of Coca-Cola Bottling of Johannesburg, the largest Coca-Cola bottler in South Africa at thetime. Mr. Isdell was named Region Manager for Australia in 1980. In 1981, he became President of Coca-ColaBottlers Philippines, Inc., the bottling joint venture between the Company and San Miguel Corporation in thePhilippines. Mr. Isdell was appointed President of the Central European Division of the Company in 1985. InJanuary 1989, he was elected Senior Vice President of the Company and was appointed President of theNortheast Europe/Africa Group, which was renamed the Northeast Europe/Middle East Group in 1992. In1995, Mr. Isdell was named President of the Greater Europe Group. From July 1998 to September 2000, he wasChairman and Chief Executive Officer of Coca-Cola Beverages Plc in Great Britain, where he oversaw thatcompany’s merger with Hellenic Bottling and the formation of Coca-Cola HBC, one of the Company’s largestbottlers. Mr. Isdell served as Chief Executive Officer of Coca-Cola HBC from September 2000 until May 2001and served as Vice Chairman of Coca-Cola HBC from May 2001 until December 2001. From January 2002 to
25

May 2004, Mr. Isdell was an international consultant to the Company. He was elected to his current positions onJune 1, 2004.
Glenn G. Jordan S., 50, is President of the Pacific Group. Mr. Jordan joined the Company in 1978 as a fieldrepresentative for Coca-Cola de Colombia where, for several years, he held various positions, including RegionManager from 1985 to 1989. Mr. Jordan served as Marketing Operations Manager, Pacific Group from 1989 to1990 and as Vice President of Coca-Cola International and Executive Assistant to the Pacific Group Presidentfrom 1990 to 1991. Mr. Jordan served as Senior Vice President, Marketing and Operations, for the BrazilDivision from 1991 to 1995, as President of the River Plate Division, which comprised Argentina, Uruguay andParaguay from 1995 to 2000, and as President of the South Latin America Division, comprising Argentina,Bolivia, Chile, Ecuador, Paraguay, Peru and Uruguay from 2000 to 2003. In February 2003, Mr. Jordan wasappointed Executive Vice President and Director of Operations for the Latin America Group and served in thatcapacity until February 2006. Mr. Jordan was appointed President of the East, South Asia and Pacific RimGroup in February 2006. The East, South Asia and Pacific Rim Group was reconfigured and renamed the PacificGroup, effective January 1, 2007.
Geoffrey J. Kelly, 62, is Senior Vice President and General Counsel of the Company. Mr. Kelly joined theCompany in 1970 in Australia as manager of the Legal Department for the Australasia Area. Since then he hasheld a number of key roles, including Senior Counsel for the Pacific Group and subsequently for the Middle andFar East Group. In 2000, Mr. Kelly was appointed Senior Counsel for International Operations. He becameChief Deputy General Counsel in 2003 and was elected Senior Vice President in 2004. In January 2005, heassumed the role of Acting General Counsel to the Company, and in July 2005, he was elected General Counselof the Company.
Muhtar Kent, 54, is President and Chief Operating Officer of the Company. Mr. Kent joined the Companyin 1978 and held a variety of marketing and operations roles throughout his career with the Company. In 1985,he was appointed General Manager of Coca-Cola Turkey and Central Asia. From 1989 to 1995, Mr. Kent servedas President of the East Central Europe Division and Senior Vice President of Coca-Cola International.Between 1995 and 1998, he served as Managing Director of Coca-Cola Amatil-Europe, and from 1999 until2005, he served as President and Chief Executive Officer of Efes Beverage Group and as a board member ofCoca-Cola Icecek. Mr. Kent rejoined the Company in May 2005 as President, North Asia, Eurasia and MiddleEast Group, was appointed President, Coca-Cola International in January 2006 and was elected Executive VicePresident in February 2006. He was elected to his current positions in December 2006.
Thomas G. Mattia, 58, is Senior Vice President of the Company and Director of Worldwide Public Affairsand Communications. Prior to joining the Company, Mr. Mattia served since 2000 as Vice President of GlobalCommunications at technology services leader EDS, where he was responsible for a wide range of activities frombrand management and media relations to advertising and on-line marketing and communications. From 1995 to2000, Mr. Mattia held a variety of executive positions with Ford Motor Company, including head ofInternational Public Affairs, Vice President of Lincoln Mercury and Director of North American Public Affairs.Mr. Mattia was appointed Director of Worldwide Public Affairs and Communications effective January 20, 2006,and was elected Senior Vice President of the Company in February 2006.
Cynthia P. McCague, 56, is Senior Vice President of the Company and Director of Human Resources.Ms. McCague initially joined the Company in 1982, and since then has worked across the Coca-Cola businesssystem in a variety of human resources and business roles in Europe and the United States. In 1998, she wasappointed to lead the human resources function for Coca-Cola Beverages Plc in Great Britain, which in 2000became Coca-Cola HBC, a large publicly traded Coca-Cola bottler. Ms. McCague rejoined the Company inJune 2004 as Director of Human Resources. She was elected Senior Vice President in July 2004.
Mary E. Minnick, 47, is Executive Vice President of the Company and President, Marketing, Strategy andInnovation. Ms. Minnick joined the Company in 1983 and spent 10 years working in Fountain Sales and theBottle/Can Division of Coca-Cola USA. In 1993, she joined Corporate Marketing. In 1996, she was appointed
26

Vice President and Director, Middle and Far East Marketing, and served in that capacity until 1997 when shewas appointed President of the South Pacific Division. In 2000, she was named President of Coca-Cola (Japan)Company, Limited. Ms. Minnick served as President and Chief Operating Officer of the Asia-Pacific Groupfrom January 2002 until May 2005. She was elected Executive Vice President of the Company in February 2002and was appointed President, Marketing, Strategy and Innovation in May 2005. On January 18, 2007, theCompany announced that Ms. Minnick will be leaving the Company, effective February 28, 2007.
Dominique Reiniche, 51, is President of the European Union Group. Ms. Reiniche joined the Company inMay 2005 and was appointed to her current position at that time. Prior to joining the Company, she held anumber of marketing, sales and general management positions with CCE. From May 1998 until December 2002,she served as General Manager of France for CCE, and from January 2003 until May 2005, Ms. Reiniche wasPresident of CCE Europe. Before joining the Coca-Cola system, she was Director of Marketing and Strategywith Kraft Jacobs-Suchard.
José Octavio Reyes, 54, is President of the Latin America Group. He began his career with The Coca-ColaCompany in 1980 at Coca-Cola de México as Manager of Strategic Planning. In 1987, he was appointedManager of the Sprite and Diet Coke brands at Corporate Headquarters. In 1990, he was appointed MarketingDirector for the Brazil Division, and later became Marketing and Operations Vice President for the MexicoDivision. Mr. Reyes assumed the role of Deputy Division President for the Mexico Division in January 1996 andwas named Division President for the Mexico Division in May 1996. He assumed his position as President of theLatin America Group in December 2002.
Danny L. Strickland, 58, is Senior Vice President and Chief Innovation/Research and Development Officerof the Company. Mr. Strickland joined the Company in April 2003 and was elected Senior Vice President inJune 2003. Prior to joining the Company, Mr. Strickland served as Senior Vice President, Innovation,Technology & Quality at General Mills, Inc. from January 1997 until March 2003. There he was responsible forbuilding a strong product pipeline, innovation culture and organization. Prior to his position with General Mills,Mr. Strickland held several research and development, innovation, engineering, quality and strategy roles in theUnited States and abroad with Johnson & Johnson from March 1993 until December 1996, Kraft Foods Inc.from February 1988 until March 1993, and the Procter & Gamble Company from June 1970 until February 1988.
All executive officers serve at the pleasure of the Board of Directors. There is no family relationshipbetween any of the directors or executive officers of the Company.
27

PART II
ITEM 5. MARKET FOR REGISTRANT’S COMMON EQUITY, RELATED STOCKHOLDER MATTERSAND ISSUER PURCHASES OF EQUITY SECURITIES
In the United States, the Company’s common stock is listed and traded on the New York Stock Exchange(the principal market for our common stock) and is traded on the Boston, Chicago, National and Philadelphiastock exchanges.
The following table sets forth, for the calendar periods indicated, the high and low sales prices per share forthe Company’s common stock, as reported on the New York Stock Exchange composite tape, and dividend pershare information:
Common Stock MarketPrice
DividendsHigh Low Declared
2006Fourth quarter $ 49.35 $ 43.72 $ 0.31Third quarter 45.40 42.37 0.31Second quarter 44.76 40.86 0.31First quarter 42.99 39.36 0.31
2005Fourth quarter $ 43.60 $ 40.31 $ 0.28Third quarter 44.75 41.39 0.28Second quarter 45.26 40.74 0.28First quarter 44.15 40.55 0.28
As of February 20, 2007, there were approximately 315,505 shareowner accounts of record.
The information under the principal heading ‘‘EQUITY COMPENSATION PLAN INFORMATION’’ inthe Company’s definitive Proxy Statement for the Annual Meeting of Shareowners to be held on April 18, 2007,to be filed with the SEC (the ‘‘Company’s 2007 Proxy Statement’’), is incorporated herein by reference.
During the fiscal year ended December 31, 2006, no equity securities of the Company were sold by theCompany that were not registered under the Securities Act of 1933, as amended.
28

The following table presents information with respect to purchases of common stock of the Company madeduring the three months ended December 31, 2006, by the Company or any ‘‘affiliated purchaser’’ of theCompany as defined in Rule 10b-18(a)(3) under the Exchange Act.
Maximum Number ofTotal Number of Shares That May
Shares Purchased Yet Be PurchasedAverage as Part of Publicly Under the Publicly
Total Number of Price Paid Announced Plans Announced PlansPeriod Shares Purchased1 Per Share or Programs2 or Programs3
September 30, 2006 through October 27, 2006 0 $ 0.00 0 35,444,540October 28, 2006 through November 24, 2006 6,530,640 $ 46.91 6,530,640 293,469,360November 25, 2006 through December 31, 2006 20,586,137 $ 48.09 20,586,137 272,883,223
Total 27,116,777 $ 47.81 27,116,777
1 The total number of shares purchased includes (i) shares purchased pursuant to the 1996 Plan prior to October 31, 2006and pursuant to the 2006 Plan thereafter (the 1996 Plan and 2006 Plan are described in footnote 2 below); and (ii) sharessurrendered to the Company to pay the exercise price and/or to satisfy tax withholding obligations in connection with so-called stock swap exercises of employee stock options and/or the vesting of restricted stock issued to employees, of whichthere were none for the months of October, November and December 2006.
2 On October 17, 1996, we publicly announced that our Board of Directors had authorized a plan (the ‘‘1996 Plan’’) for theCompany to purchase up to 206 million shares of the Company’s common stock prior to October 31, 2006. This was inaddition to approximately 44 million shares authorized for purchase under a previous plan, which shares had not beenpurchased by the Company as of October 16, 1996, but were purchased by the Company prior to the commencement ofpurchases under the 1996 Plan in 1998. On July 20, 2006, the Board of Directors authorized a new share repurchaseprogram (the ‘‘2006 Plan’’) of up to 300 million shares of the Company’s common stock. The 2006 Plan took effect uponthe expiration of the 1996 Plan. This column discloses the number of shares purchased pursuant to the 1996 Plan prior toOctober 31, 2006 and pursuant to the 2006 Plan thereafter.
3 Shares authorized for purchase under the 1996 Plan but not purchased prior to its expiration were not carried over to the2006 Plan.
29

20FEB200719225952
Performance Graph
Comparison of Five-Year Cumulative Total Return AmongThe Coca-Cola Company, the Peer Group Index and the S&P 500 Index
Total ReturnStock Price Plus Reinvested Dividends
$0
$50
$100
$200
$150
12/31/0612/31/0512/31/0412/31/0312/31/0212/31/01
KO Peer
Group S&P12/31/01 $100 $100 $100 12/31/02 $ 94 $ 98 $ 78 12/31/03 $112 $115 $100 12/31/04 $ 94 $134 $111 12/31/05 $ 93 $144 $117 12/31/06 $115 $170 $135
Peer GroupIndex
(FBT)
The S&P500
(S&P)
$135
$170
$115
The Coca-ColaCompany
(KO)
The total return assumes that dividends were reinvested quarterly and is based on a $100 investment onDecember 31, 2001.
The Peer Group Index is a self-constructed peer group of companies included in the Food, Beverage andTobacco Groups of companies as published in The Wall Street Journal, from which the Company has beenexcluded.
The Peer Group Index consists of the following companies: Altria Group, Inc., Anheuser-BuschCompanies, Inc., Archer-Daniels-Midland Company, Brown-Forman Corporation, Bunge Limited, CampbellSoup Company, Loews Corporation (Carolina Group tracking stock), Chiquita Brands International, Inc.,Coca-Cola Enterprises Inc., ConAgra Foods, Inc., Constellation Brands, Inc., Corn Products International, Inc.,Dean Foods Company, Del Monte Foods Company, Flowers Foods, Inc., General Mills, Inc., Hansen NaturalCorporation, Herbalife Ltd., H.J. Heinz Company, Hormel Foods Corporation, Kellogg Company, KraftFoods Inc., Lancaster Colony Corporation, Martek Biosciences Corporation, McCormick & Company,Incorporated, Molson Coors Brewing Company, NBTY, Inc., Nu Skin Enterprises, Inc., Nutrisystem, Inc.,PepsiAmericas, Inc., PepsiCo, Inc., Ralcorp Holdings, Inc., Reynolds American Inc., Sara Lee Corporation,Smithfield Foods, Inc., The Hain Celestial Group, Inc., The Hershey Company, The J.M. Smucker Company,The Pepsi Bottling Group, Inc., Tootsie Roll Industries, Inc., TreeHouse Foods, Inc., Tyson Foods, Inc.,Universal Corporation, UST Inc., Weight Watchers International, Inc. and Wm. Wrigley Jr. Company. The WallStreet Journal periodically changes the companies reported as a part of the Food, Beverage and Tobacco Groupsof companies. This year, the Groups include Hansen Natural Corporation, Herbalife Ltd., Nu SkinEnterprises, Inc. and Nutrisystem, Inc., which were not included in the Groups last year. Dreyer’s Grand IceCream Holdings, Inc., which was included in the Groups last year, is not included in the Groups this year.
30

ITEM 6. SELECTED FINANCIAL DATA
The following selected financial data should be read in conjunction with ‘‘Item 7. Management’s Discussionand Analysis of Financial Condition and Results of Operations’’ and consolidated financial statements and notesthereto contained in ‘‘Item 8. Financial Statements and Supplementary Data’’ of this report.
Year Ended December 31, 20061 20052 20042,3 2003 20024,5
(In millions except per share data)
SUMMARY OF OPERATIONSNet operating revenues $ 24,088 $ 23,104 $ 21,742 $ 20,857 $ 19,394Cost of goods sold 8,164 8,195 7,674 7,776 7,118Gross profit 15,924 14,909 14,068 13,081 12,276Selling, general and administrative expenses 9,431 8,739 7,890 7,287 6,818Other operating charges 185 85 480 573 —Operating income 6,308 6,085 5,698 5,221 5,458Interest income 193 235 157 176 209Interest expense 220 240 196 178 199Equity income — net 102 680 621 406 384Other income (loss) — net 195 (93) (82) (138) (353)Gains on issuances of stock by equity investees — 23 24 8 —Income before income taxes and changes in accounting
principles 6,578 6,690 6,222 5,495 5,499Income taxes 1,498 1,818 1,375 1,148 1,523Net income before changes in accounting principles $ 5,080 $ 4,872 $ 4,847 $ 4,347 $ 3,976
Net income $ 5,080 $ 4,872 $ 4,847 $ 4,347 $ 3,050
Average shares outstanding 2,348 2,392 2,426 2,459 2,478Average shares outstanding assuming dilution 2,350 2,393 2,429 2,462 2,483
PER SHARE DATANet income before changes in accounting principles — basic $ 2.16 $ 2.04 $ 2.00 $ 1.77 $ 1.60Net income before changes in accounting principles — diluted 2.16 2.04 2.00 1.77 1.60Basic net income 2.16 2.04 2.00 1.77 1.23Diluted net income 2.16 2.04 2.00 1.77 1.23Cash dividends 1.24 1.12 1.00 0.88 0.80Market price on December 31 48.25 40.31 41.64 50.75 43.84
TOTAL MARKET VALUE OF COMMON STOCK $ 111,857 $ 95,504 $ 100,325 $ 123,908 $ 108,328
BALANCE SHEET DATACash, cash equivalents and current marketable securities $ 2,590 $ 4,767 $ 6,768 $ 3,482 $ 2,345Property, plant and equipment — net 6,903 5,831 6,091 6,097 5,911Depreciation 763 752 715 667 614Capital expenditures 1,407 899 755 812 851Total assets 29,963 29,427 31,441 27,410 24,470Long-term debt 1,314 1,154 1,157 2,517 2,701Shareowners’ equity 16,920 16,355 15,935 14,090 11,800
NET CASH PROVIDED BY OPERATING ACTIVITIES $ 5,957 $ 6,423 $ 5,968 $ 5,456 $ 4,742
Certain prior year amounts have been reclassified to conform to the current year presentation.1 In 2006, we adopted SFAS No.158, ‘‘Employers’ Accounting for Defined Benefit Pension and Other Postretirement Plans—an
amendment of FASB Statements No. 87, 88, 106, and 132(R).’’2 We adopted FSP No. 109-2, ‘‘Accounting and Disclosure Guidance for the Foreign Earnings Repatriation Provision within the
American Jobs Creation Act of 2004’’ in 2004. FSP No. 109-2 allowed the Company to record the tax expense associated with therepatriation of foreign earnings in 2005 when the previously unremitted foreign earnings were actually repatriated.
3 We adopted FASB Interpretation No. 46 (revised December 2003), ‘‘Consolidation of Variable Interest Entities,’’ effectiveApril 2, 2004.
4 In 2002, we adopted SFAS No. 142, ‘‘Goodwill and Other Intangible Assets.’’5 In 2002, we adopted the fair value method provisions of SFAS No. 123, ‘‘Accounting for Stock-Based Compensation,’’ and we adopted
SFAS No. 148, ‘‘Accounting for Stock-Based Compensation—Transition and Disclosure.’’
31

ITEM 7. MANAGEMENT’S DISCUSSION AND ANALYSIS OF FINANCIAL CONDITION AND RESULTSOF OPERATIONS
Overview
The following Management’s Discussion and Analysis of Financial Condition and Results of Operations(‘‘MD&A’’) is intended to help the reader understand The Coca-Cola Company, our operations and our presentbusiness environment. MD&A is provided as a supplement to—and should be read in conjunction with—ourconsolidated financial statements and the accompanying notes thereto contained in ‘‘Item 8. FinancialStatements and Supplementary Data’’ of this report. This overview summarizes the MD&A, which includes thefollowing sections:
• Our Business — a general description of our business and the nonalcoholic beverages segment of thecommercial beverages industry; our objective; our areas of focus; and challenges and risks of ourbusiness.
• Critical Accounting Policies and Estimates — a discussion of accounting policies that require criticaljudgments and estimates.
• Operations Review — an analysis of our Company’s consolidated results of operations for the three yearspresented in our consolidated financial statements. Except to the extent that differences among ouroperating segments are material to an understanding of our business as a whole, we present thediscussion in the MD&A on a consolidated basis.
• Liquidity, Capital Resources and Financial Position — an analysis of cash flows; off–balance sheetarrangements and aggregate contractual obligations; foreign exchange; an overview of financial position;and the impact of inflation and changing prices.
Our Business
General
We are the largest manufacturer, distributor and marketer of nonalcoholic beverage concentrates andsyrups in the world. Along with Coca-Cola, which is recognized as the world’s most valuable brand, we marketfour of the world’s top five nonalcoholic sparkling brands, including Diet Coke, Fanta and Sprite. Our Companyowns or licenses more than 400 brands, including diet and light beverages, waters, juice and juice drinks, teas,coffees, and energy and sports drinks. Through the world’s largest beverage distribution system, consumers inmore than 200 countries enjoy the Company’s beverages at a rate exceeding 1.4 billion servings each day. OurCompany generates revenues, income and cash flows by selling beverage concentrates and syrups as well as somefinished beverages. We generally sell these products to bottling and canning operations, fountain wholesalersand some fountain retailers and, in the case of finished products, to distributors. Our bottlers sell our brandedproducts to businesses and institutions including retail chains, supermarkets, restaurants, small neighborhoodgrocers, sports and entertainment venues, and schools and colleges. We continue to expand our marketingpresence and increase our unit case volume in most developing and emerging markets. Our strong and stablesystem helps us to capture growth by manufacturing, distributing and marketing existing, enhanced and newinnovative products to our consumers throughout the world.
We have three types of bottling relationships: bottlers in which our Company has no ownership interest,bottlers in which our Company has a noncontrolling ownership interest and bottlers in which our Company has acontrolling ownership interest. We authorize our bottling partners to manufacture and package products madefrom our concentrates and syrups into branded finished products that they then distribute and sell. In 2006,bottling partners in which our Company has no ownership interest or a noncontrolling ownership interestproduced and distributed approximately 83 percent of our worldwide unit case volume.
32

We make significant marketing expenditures in support of our brands, including expenditures foradvertising, sponsorship fees and special promotional events. As part of our marketing activities, we, at ourdiscretion, provide retailers and distributors with promotions and point-of-sale displays; our bottling partnerswith advertising support and funds designated for the purchase of cold-drink equipment; and our consumerswith coupons, discounts and promotional incentives. These marketing expenditures help to enhance awarenessof and increase consumer preference for our brands. We believe that greater awareness and preferencepromotes long-term growth in unit case volume, per capita consumption and our share of worldwidenonalcoholic beverage sales.
The Nonalcoholic Beverages Segment of the Commercial Beverages Industry
We operate in the highly competitive nonalcoholic beverages segment of the commercial beveragesindustry. We face strong competition from numerous other general and specialty beverage companies. We, alongwith other beverage companies, are affected by a number of factors, including, but not limited to, cost tomanufacture and distribute products, consumer spending, economic conditions, availability and quality of water,consumer preferences, inflation, political climate, local and national laws and regulations, foreign currencyexchange fluctuations, fuel prices and weather patterns.
Our Objective
Our objective is to use our formidable assets—brands, financial strength, unrivaled distribution system,global reach, and a strong commitment by our management and employees worldwide—to achieve long-termsustainable growth. Our vision for sustainable growth includes the following:
• People: Being a great place to work where people are inspired to be the best they can be.
• Portfolio: Bringing to the world a portfolio of beverage brands that anticipates and satisfies people’sdesires and needs.
• Partners: Nurturing a winning network of partners and building mutual loyalty.
• Planet: Being a responsible global citizen that makes a difference.
• Profit: Maximizing return to shareowners while being mindful of our overall responsibilities.
Areas of Focus
We intend to continue to strengthen our capabilities in consumer marketing, customer and commercialleadership, and franchise leadership to create long-term sustainable growth for our Company and the Coca-Colasystem and value for our shareowners.
Consumer Marketing
Marketing investments are designed to enhance consumer awareness and increase consumer preference forour brands. This produces long-term growth in unit case volume, per capita consumption and our share ofworldwide nonalcoholic beverage sales. We heighten consumer awareness of and product appeal for our brandsusing integrated marketing programs. Through our relationships with our bottling partners and those who sellour products in the marketplace, we create and implement marketing programs both globally and locally. Indeveloping a strategy for a Company brand, we conduct product and packaging research, establish brandpositioning, develop precise consumer communications and solicit consumer feedback. Our integrated globaland local marketing programs include activities such as advertising, point-of-sale merchandising and salespromotions.
33

Customer and Commercial Leadership
The Coca-Cola system has millions of customers around the world who sell or serve our products directly toconsumers. We focus on enhancing value for our customers and providing solutions to grow their beveragebusinesses. Our approach includes understanding each customer’s business and needs, whether that customer isa sophisticated retailer in a developed market or a kiosk owner in an emerging market. We focus on ensuringthat our customers have the right product and package offerings and the right promotional tools to deliverenhanced value to themselves and the Company. We are constantly looking to build new beverage consumptionoccasions in our customers’ outlets through unique and innovative consumer experiences, product availabilityand delivery systems, and beverage merchandising and displays.
Franchise Leadership
We are renewing our franchise leadership to give our Company and our bottling partners the ability to growtogether through shared values, aligned incentives and a sense of urgency and flexibility that supportsconsumers’ always changing needs and tastes. The financial health and success of our bottling partners arecritical components of the Company’s success. We work with our bottling partners to continuously look for waysto improve system economics, and we share best practices throughout the bottling system. We also designbusiness models for still beverages in specific markets to ensure that we appropriately share the value created bythese beverages with our bottling partners. We will continue to build a supply chain network that leverages thesize and scale of the Coca-Cola system to gain a competitive advantage.
Challenges and Risks
Being a global company provides unique opportunities for our Company. Challenges and risks accompanythose opportunities.
Our management has identified certain challenges and risks that demand the attention of the nonalcoholicbeverages segment of the commercial beverages industry and our Company. Of these, four key challenges andrisks are discussed below.
Obesity and Inactive Lifestyles. Increasing awareness among consumers, public health professionals andgovernment agencies of the potential health problems associated with obesity and inactive lifestyles represents asignificant challenge to our industry. We recognize that obesity is a complex public health problem. Ourcommitment to consumers begins with our broad product line, which includes a wide selection of diet and lightbeverages, juice and juice drinks, sports drinks and water products. Our commitment also includes adhering toresponsible policies in schools and in the marketplace; supporting programs to encourage physical activity andpromote nutrition education; and continuously meeting changing consumer needs through beverage innovation,choice and variety. We are committed to playing an appropriate role in helping address this issue in cooperationwith governments, educators and consumers through science-based solutions and programs.
Water Quality and Quantity. Water quality and quantity is an issue that increasingly requires ourCompany’s attention and collaboration with the nonalcoholic beverages segment of the commercial beveragesindustry, governments, nongovernmental organizations and communities where we operate. Water is the mainingredient in substantially all of our products. It is also a limited natural resource facing unprecedentedchallenges from overexploitation, increasing pollution and poor management. Our Company is in an excellentposition to share the water-related knowledge we have developed in the communities we serve—water-resourcemanagement, water treatment, wastewater treatment systems, and models for working with communities andpartners in addressing water and sanitation needs. We are actively engaged in assessing the specific water-relatedrisks that we and many of our bottling partners face and have implemented a formal water risk managementprogram. We are working with our global partners to develop water sustainability projects. We are activelyencouraging improved water efficiency and conservation efforts throughout our system. As demand for water
34

continues to increase around the world, we expect commitment and continued action on our part will be crucialin the successful long-term stewardship of this critical natural resource.
Evolving Consumer Preferences. Consumers want more choices. We are impacted by shifting consumerdemographics and needs, on-the-go lifestyles, aging populations in developed markets and consumers who areempowered with more information than ever. We are committed to generating new avenues for growth throughour core brands with a focus on diet and light products. We are also committed to continuing to expand thevariety of choices we provide to consumers to meet their needs, desires and lifestyle choices.
Increased Competition and Capabilities in the Marketplace. Our Company is facing strong competition fromsome well-established global companies and many local players. We must continue to selectively expand intoother profitable segments of the nonalcoholic beverages segment of the commercial beverages industry andstrengthen our capabilities in marketing and innovation in order to maintain our brand loyalty and market share.
All four of these challenges and risks—obesity and inactive lifestyles, water quality and quantity, evolvingconsumer preferences and increased competition and capabilities in the marketplace—have the potential tohave a material adverse effect on the nonalcoholic beverages segment of the commercial beverages industry andon our Company; however, we believe our Company is well positioned to appropriately address these challengesand risks.
See also ‘‘Item 1A. Risk Factors’’ in Part I of this report for additional information about risks anduncertainties facing our Company.
Critical Accounting Policies and Estimates
Our consolidated financial statements are prepared in accordance with generally accepted accountingprinciples in the United States, which require management to make estimates, judgments and assumptions thataffect the amounts reported in the consolidated financial statements and accompanying notes. We believe thatour most critical accounting policies and estimates relate to the following:
• Basis of Presentation and Consolidation
• Recoverability of Noncurrent Assets
• Revenue Recognition
• Income Taxes
• Contingencies
Management has discussed the development, selection and disclosure of critical accounting policies andestimates with the Audit Committee of the Company’s Board of Directors. While our estimates and assumptionsare based on our knowledge of current events and actions we may undertake in the future, actual results mayultimately differ from these estimates and assumptions. For a discussion of the Company’s significant accountingpolicies, refer to Note 1 of Notes to Consolidated Financial Statements.
Basis of Presentation and Consolidation
In December 2003, the Financial Accounting Standards Board (‘‘FASB’’) issued Interpretation No. 46(R).We adopted Interpretation No. 46(R) effective April 2, 2004. Refer to Note 1 of Notes to ConsolidatedFinancial Statements.
Our Company consolidates all entities that we control by ownership of a majority voting interest as well asvariable interest entities for which our Company is the primary beneficiary. Our judgment in determining if weare the primary beneficiary of the variable interest entities includes assessing our Company’s level ofinvolvement in setting up the entity, determining if the activities of the entity are substantially conducted on
35

behalf of our Company, determining whether the Company provides more than half of the subordinatedfinancial support to the entity, and determining if we absorb the majority of the entity’s expected losses orreturns.
We use the equity method to account for investments for which we have the ability to exercise significantinfluence over operating and financial policies. Our consolidated net income includes our Company’s share ofthe net earnings of these companies. Our judgment regarding the level of influence over each equity methodinvestment includes considering key factors such as our ownership interest, representation on the board ofdirectors, participation in policy-making decisions and material intercompany transactions.
We use the cost method to account for investments in companies that we do not control and for which wedo not have the ability to exercise significant influence over operating and financial policies. In accordance withthe cost method, these investments are recorded at cost or fair value, as appropriate. We record dividend incomewhen applicable dividends are declared.
Our Company eliminates from financial results all significant intercompany transactions, including theintercompany portion of transactions with equity method investees.
Recoverability of Noncurrent Assets
Management’s assessments of the recoverability of noncurrent assets involve critical accounting estimates.These assessments reflect management’s best assumptions, which, when appropriate, are consistent with theassumptions that we believe hypothetical marketplace participants would use. Factors that management mustestimate when performing recoverability and impairment tests include, among others, sales volume, prices,inflation, cost of capital, marketing spending, foreign currency exchange rates, tax rates and capital spending.These factors are often interdependent and therefore do not change in isolation. These factors include inherentuncertainties, and significant management judgment is involved in estimating their impact. However, whenappropriate, the assumptions we use for financial reporting purposes are consistent with those we use in ourinternal planning and we believe are consistent with those that a hypothetical marketplace participant would use.Management periodically evaluates and updates the estimates based on the conditions that influence thesefactors. The variability of these factors depends on a number of conditions, including uncertainty about futureevents, and thus our accounting estimates may change from period to period. If other assumptions and estimateshad been used in the current period, the balances for noncurrent assets could have been materially impacted.Furthermore, if management uses different assumptions or if different conditions occur in future periods, futureoperating results could be materially impacted.
Our Company faces many uncertainties and risks related to various economic, political and regulatoryenvironments in the countries in which we operate. Refer to the heading ‘‘Our Business—Challenges andRisks,’’ above, and ‘‘Item 1A. Risk Factors’’ in Part I of this report. As a result, management must makenumerous assumptions which involve a significant amount of judgment when determining the recoverability ofnoncurrent assets in various regions around the world.
For the noncurrent assets listed in the table below, we perform tests of impairment as appropriate. Forapplicable assets, we perform these tests when certain conditions exist that indicate the carrying value may not
36

be recoverable. For other applicable assets, we perform these tests at least annually or more frequently if eventsor circumstances indicate that an asset may be impaired:
PercentageCarrying of Total
December 31, 2006 Value Assets
(In millions except percentages)
Tested for impairment when conditions exist that indicate carrying valuemay be impaired:
Equity method investments $ 6,310 21%Cost method investments, principally bottling companies 473 2Other assets 2,701 9Property, plant and equipment, net 6,903 23Amortized intangible assets, net (various, principally trademarks) 198 0
Total $ 16,585 55%
Tested for impairment at least annually or when events indicate that anasset may be impaired:
Trademarks with indefinite lives $ 2,045 7%Goodwill 1,403 5Bottlers’ franchise rights 1,359 5Other intangible assets not subject to amortization 130 0
Total $ 4,937 17%
Many of the noncurrent assets listed above are located in markets that we consider to be developing or tohave changing political environments. These markets include, but are not limited to, the Middle East and Egypt,where political and civil unrest continues; the Philippines, where affordability and availability of beverages in themarketplace continue to impact operating results; India, where affordability issues remain; and certain marketsin Latin America, Asia and Africa, where local economic and political conditions are unstable. We have bottlingassets and investments in many of these markets. The table below reflects the Company’s carrying value ofnoncurrent assets in these markets.
Percentage ofApplicable
Carrying Line ItemDecember 31, 2006 Value Above
(In millions except percentages)
Tested for impairment when conditions exist that indicate carrying valuemay be impaired:
Equity method investments $ 533 8%Cost method investments, principally bottling companies 123 26Other assets 83 3Property, plant and equipment, net 2,150 31Amortized intangible assets, net (various, principally trademarks) 11 6
Total $ 2,900 17
Tested for impairment at least annually or when events indicate that anasset may be impaired:
Trademarks with indefinite lives $ 394 19%Goodwill — 0Bottlers’ franchise rights 52 4Other intangible assets not subject to amortization 23 18
Total $ 469 9
37

Equity Method and Cost Method Investments
We review our equity and cost method investments in every reporting period to determine whether asignificant event or change in circumstances has occurred that may have an adverse effect on the fair value ofeach investment. When such events or changes occur, we evaluate the fair value compared to the carrying valueof the related investment. We also perform this evaluation every reporting period for each investment for whichthe carrying value has exceeded the fair value in the prior period. The fair values of most of our Company’sinvestments in publicly traded companies are often readily available based on quoted market prices. Forinvestments in nonpublicly traded companies, management’s assessment of fair value is based on valuationmethodologies including discounted cash flows, estimates of sales proceeds and external appraisals, asappropriate. We consider the assumptions that we believe hypothetical marketplace participants would use inevaluating estimated future cash flows when employing the discounted cash flow or estimate of sales proceedsvaluation methodologies. The ability to accurately predict future cash flows, especially in developing andunstable markets, may impact the determination of fair value.
In the event a decline in fair value of an investment occurs, management may be required to determine ifthe decline in fair value is other than temporary. Management’s assessment as to the nature of a decline in fairvalue is based on the valuation methodologies discussed above, our ability and intent to hold the investment, andwhether evidence indicating the cost of the investment is recoverable within a reasonable period of timeoutweighs evidence to the contrary. We consider most of our equity method investees to be strategic long-terminvestments. If the fair value of an investment is less than its carrying value and the decline in value is consideredto be other than temporary, a write-down is recorded. Management’s assessments of fair value represent ourbest estimates as of the time of the impairment review and are consistent with the assumptions that we believehypothetical marketplace participants would use. If different assessments were made, this could have a materialimpact on our consolidated financial statements.
The following table presents the difference between calculated fair values, based on quoted closing prices ofpublicly traded shares, and our Company’s carrying values for significant investments in publicly traded bottlersaccounted for as equity method investees (in millions):
Fair CarryingDecember 31, 2006 Value Value Difference
Coca-Cola Enterprises Inc. $ 3,450 $ 1,3121 $ 2,138Coca-Cola Hellenic Bottling Company S.A. 2,247 1,251 996Coca-Cola FEMSA, S.A.B. de C.V. 2,172 835 1,337Coca-Cola Amatil Limited 1,456 817 639Coca-Cola Icecek A.S. 372 110 262Grupo Continental, S.A. 327 165 162Coca-Cola Embonor S.A. 228 189 39Coca-Cola Bottling Company Consolidated 170 68 102Embotelladoras Polar S.A. 93 59 34
$ 10,515 $ 4,806 $ 5,709
1 In 2006, our carrying value of CCE was reduced by our proportionate share of an impairment chargerecorded by CCE. Refer to Note 3 of Notes to Consolidated Financial Statements.
Other Assets
Our Company invests in infrastructure programs with our bottlers that are directed at strengthening ourbottling system and increasing unit case volume. Additionally, our Company advances payments to certaincustomers to fund future marketing activities intended to generate profitable volume and expenses suchpayments over the periods benefited. Advance payments are also made to certain customers for distributionrights. Payments under these programs are generally capitalized and reported as other assets in our consolidated
38

balance sheets. Management evaluates the recoverability of the carrying value of these assets when facts andcircumstances indicate that the carrying value of these assets may not be recoverable by preparing estimates ofsales volume and the resulting gross profit and cash flows. If the carrying value of these assets is assessed to berecoverable, it is amortized over the periods benefited. If the carrying value of these assets is considered to benot recoverable, an impairment is recognized, resulting in a write-down of assets.
Property, Plant and Equipment
Certain events or changes in circumstances may indicate that the recoverability of the carrying amount ofproperty, plant and equipment should be assessed. Such events or changes may include a significant decrease inmarket value, a significant change in the business climate in a particular market, or a current-period operating orcash flow loss combined with historical losses or projected future losses. If an event occurs or changes incircumstances are present, we estimate the future cash flows expected to result from the use of the asset and itseventual disposition. If the sum of the expected future cash flows (undiscounted and without interest charges) isless than the carrying amount, we recognize an impairment loss. The impairment loss recognized is the amountby which the carrying amount exceeds the fair value.
Goodwill, Trademarks and Other Intangible Assets
Statement of Financial Accounting Standards (‘‘SFAS’’) No. 142, ‘‘Goodwill and Other Intangible Assets,’’classifies intangible assets into three categories: (1) intangible assets with definite lives subject to amortization;(2) intangible assets with indefinite lives not subject to amortization; and (3) goodwill. For intangible assets withdefinite lives, tests for impairment must be performed if conditions exist that indicate the carrying value may notbe recoverable. For intangible assets with indefinite lives and goodwill, tests for impairment must be performedat least annually or more frequently if events or circumstances indicate that assets might be impaired. Our equitymethod investees also perform such tests for impairment for intangible assets and/or goodwill. If an impairmentcharge was recorded by one of our equity method investees, the Company would record its proportionate shareof such charge.
In 2006, our Company recorded a charge of approximately $602 million in the line item equity income—netresulting from the impact of our proportionate share of an impairment charge recorded by CCE, whichimpacted Bottling Investments. Refer to the heading ‘‘Operations Review—Equity Income—Net’’ and Note 3 ofNotes to Consolidated Financial Statements.
Our trademarks and other intangible assets determined to have definite lives are amortized over theiruseful lives. In accordance with SFAS No. 142, if conditions exist that indicate the carrying value may not berecoverable, we review such trademarks and other intangible assets with definite lives for impairment to ensurethey are appropriately valued. Such conditions may include an economic downturn in a market or a change inthe assessment of future operations. Trademarks and other intangible assets determined to have indefinite usefullives are not amortized. We test such trademarks and other intangible assets with indefinite useful lives forimpairment annually, or more frequently if events or circumstances indicate that assets might be impaired.Goodwill is not amortized. We also perform tests for impairment of goodwill annually, or more frequently ifevents or circumstances indicate it might be impaired. All goodwill is assigned to reporting units, which are onelevel below our operating segments. Goodwill is assigned to the reporting unit that benefits from the synergiesarising from each business combination. We perform our impairment tests of goodwill at our reporting unitlevel. Impairment tests for goodwill include comparing the fair value of the respective reporting unit with itscarrying value, including goodwill. We use a variety of methodologies in conducting these impairmentassessments, including cash flow analyses that, when appropriate, are consistent with the assumptions we believehypothetical marketplace participants would use, estimates of sales proceeds and independent appraisals. Whereapplicable, we use an appropriate discount rate based on the Company’s cost of capital rate or location-specificeconomic factors.
39

In 2006, our Company recorded impairment charges of approximately $41 million primarily related totrademarks for beverages sold in the Philippines and Indonesia. The Philippines and Indonesia are componentsof East, South Asia and Pacific Rim. The amount of these impairment charges was determined by comparing thefair values of the intangible assets to their respective carrying values. The fair values were determined usingdiscounted cash flow analyses. Because the fair values were less than the carrying values of the assets, werecorded impairment charges to reduce the carrying values of the assets to their respective fair values. Theseimpairment charges were recorded in the line item other operating charges in the consolidated statement ofincome.
In December 2006, the Company entered into a purchase agreement with San Miguel Corporation and twoof its subsidiaries (collectively, ‘‘SMC’’) to acquire all of the shares of capital stock of Coca-Cola BottlersPhilippines, Inc. (‘‘CCBPI’’) held by SMC, representing 65 percent of all the issued and outstanding capital stockof CCBPI. CCBPI is the Company’s authorized bottler in the Philippines. The transaction is subject to certainconditions. Upon the closing of this transaction, the Company will own 100 percent of the issued andoutstanding capital stock of CCBPI. Management will continue to monitor the Philippines and conductimpairment reviews as required.
In 2005, our Company recorded impairment charges of approximately $84 million related to intangibleassets. These intangible assets related to trademarks for beverages sold in the Philippines. The carrying value ofour trademarks in the Philippines, prior to the recording of the impairment charges in 2005, was approximately$268 million. The impairments were the result of our revised outlook for the Philippines, which had beenunfavorably impacted by declines in volume and income before income taxes resulting from the continued lackof an affordable package offering and the continued limited availability of these trademark beverages in themarketplace. We determined the amounts of the impairment charges by comparing the fair values of theintangible assets to their then carrying values. Fair values were derived using discounted cash flow analyses witha number of scenarios that were weighted based on the probability of different outcomes. Because the fair valueswere less than the carrying values of the assets, we recorded impairment charges to reduce the carrying values ofthe assets to fair values. In addition, in 2005, we recorded an impairment charge of approximately $4 million inthe line item equity income—net related to our proportionate share of a write-down of intangible assetsrecorded by our equity method investee bottler in the Philippines.
In 2004, our Company recorded impairment charges related to intangible assets of approximately$374 million, primarily related to franchise rights at CCEAG. CCEAG is a component of Bottling Investments.The CCEAG impairment charges were the result of our revised outlook for the German market, which wasunfavorably impacted by volume declines resulting from market shifts related to the deposit law on nonrefillablebeverage packages and the corresponding lack of availability of our products in the discount retail channel. Thedeposit law in Germany had led to discount chains creating proprietary nonrefillable packages that could only bereturned to their own stores. We determined the amount of the impairment by comparing the fair value of theintangible assets to its then carrying value. Fair values were derived using discounted cash flow analyses with anumber of scenarios that were weighted based on the probability of different outcomes. Because the fair valuewas less than the carrying value of the assets, we recorded an impairment charge to reduce the carrying value ofthe assets to fair value. These impairment charges were recorded in the line item other operating charges in ourconsolidated statement of income for 2004. At the end of 2004, the German government passed an amendmentto the mandatory deposit legislation that requires retailers, including discount chains, to accept returns of eachtype of nonrefillable beverage package they sell, regardless of where the beverage package type was purchased.In addition, the mandatory deposit requirement was expanded to other beverage categories.
In August 2006, the Company announced that it had reached an agreement in principle with itsindependent bottlers in Germany regarding the creation of a single bottler. A non-binding letter of intent wassigned containing the financial framework and the key conditions under which CCEAG and the sevenindependent bottlers will become one bottler. We currently expect that this consolidation will occur in 2007. TheCompany will be the majority owner of the consolidated bottling operation in Germany. The Company has
40

considered and will continue to consider the effect of these future structural changes on the recoverability ofnoncurrent assets and investments in bottling operations in Germany.
Revenue Recognition
We recognize revenue when persuasive evidence of an arrangement exists, delivery of products hasoccurred, the sales price is fixed or determinable, and collectibility is reasonably assured. For our Company, thisgenerally means that we recognize revenue when title to our products is transferred to our bottling partners,resellers or other customers. In particular, title usually transfers upon shipment to or receipt at our customers’locations, as determined by the specific sales terms of each transaction.
In addition, our customers can earn certain incentives, which are included in deductions from revenue, acomponent of net operating revenues in the consolidated statements of income. These incentives include, butare not limited to, cash discounts, funds for promotional and marketing activities, volume-based incentiveprograms and support for infrastructure programs. Refer to Note 1 of Notes to Consolidated FinancialStatements. The aggregate deductions from revenue recorded by the Company in relation to these programs,including amortization expense on infrastructure programs, was approximately $3.8 billion, $3.7 billion and$3.6 billion for the years ended December 31, 2006, 2005 and 2004, respectively.
Income Taxes
In July 2006, the FASB issued FASB Interpretation No. 48, ‘‘Accounting for Uncertainty in Income Taxes’’(‘‘Interpretation No. 48’’). Interpretation No. 48 clarifies the accounting for uncertainty in income taxesrecognized in an enterprise’s financial statements in accordance with FASB Statement No. 109, ‘‘Accounting forIncome Taxes.’’ Interpretation No. 48 prescribes a recognition threshold and measurement attribute for thefinancial statement recognition and measurement of a tax position taken or expected to be taken in a tax return.Interpretation No. 48 also provides guidance on derecognition, classification, interest and penalties, accountingin interim periods, disclosure and transition. For our Company, Interpretation No. 48 was effective beginningJanuary 1, 2007, and the cumulative effect adjustment will be recorded in the first quarter of 2007. We believethat the adoption of Interpretation No. 48 will not have a material impact on our consolidated financialstatements.
Our annual tax rate is based on our income, statutory tax rates and tax planning opportunities available tous in the various jurisdictions in which we operate. Significant judgment is required in determining our annualtax expense and in evaluating our tax positions. We establish reserves at the time we determine it is probable wewill be liable to pay additional taxes related to certain matters. We adjust these reserves, including any impact onthe related interest and penalties, in light of changing facts and circumstances, such as the progress of a taxaudit.
A number of years may elapse before a particular matter for which we have established a reserve is auditedand finally resolved. The number of years with open tax audits varies depending on the tax jurisdiction. While itis often difficult to predict the final outcome or the timing of resolution of any particular tax matter, we record areserve when we determine the likelihood of loss is probable. Such liabilities are recorded in the line itemaccrued income taxes in the Company’s consolidated balance sheets. Settlement of any particular issue wouldusually require the use of cash. Favorable resolutions of tax matters for which we have previously establishedreserves are recognized as a reduction to our income tax expense when the amounts involved become known.
Tax law requires items to be included in the tax return at different times than when these items are reflectedin the consolidated financial statements. As a result, the annual tax rate reflected in our consolidated financialstatements is different than that reported in our tax return (our cash tax rate). Some of these differences arepermanent, such as expenses that are not deductible in our tax return, and some differences reverse over time,such as depreciation expense. These timing differences create deferred tax assets and liabilities. Deferred taxassets and liabilities are determined based on temporary differences between the financial reporting and tax
41

bases of assets and liabilities. The tax rates used to determine deferred tax assets or liabilities are the enacted taxrates in effect for the year in which the differences are expected to reverse. Based on the evaluation of allavailable information, the Company recognizes future tax benefits, such as net operating loss carryforwards, tothe extent that realizing these benefits is considered more likely than not.
We evaluate our ability to realize the tax benefits associated with deferred tax assets by analyzing ourforecasted taxable income using both historical and projected future operating results, the reversal of existingtemporary differences, taxable income in prior carryback years (if permitted) and the availability of tax planningstrategies. A valuation allowance is required to be established unless management determines that it is morelikely than not that the Company will ultimately realize the tax benefit associated with a deferred tax asset.
Additionally, undistributed earnings of a subsidiary are accounted for as a temporary difference, except thatdeferred tax liabilities are not recorded for undistributed earnings of a foreign subsidiary that are deemed to beindefinitely reinvested in the foreign jurisdiction. The Company has formulated a specific plan for reinvestmentof undistributed earnings of its foreign subsidiaries which demonstrates that such earnings will be indefinitelyreinvested in the applicable tax jurisdictions. Should we change our plans, we would be required to record asignificant amount of deferred tax liabilities.
The American Jobs Creation Act of 2004 (the ‘‘Jobs Creation Act’’) was enacted in October 2004. Amongother things, it provided a one-time benefit related to foreign tax credits generated by equity investments in prioryears. In 2004, the Company recorded an income tax benefit of approximately $50 million as a result of this newlaw. The Jobs Creation Act also included a temporary incentive for U.S. multinationals to repatriate foreignearnings at an approximate 5.25 percent effective tax rate. During 2005, the Company repatriated approximately$6.1 billion in previously unremitted foreign earnings, with an associated tax liability of approximately$315 million. The reinvestment requirements of this repatriation are expected to be fulfilled by 2008 and are notexpected to require any material change in the nature, amount or timing of future expenditures from what wasotherwise expected. Refer to Note 1 and Note 17 of Notes to Consolidated Financial Statements.
The Company’s effective tax rate is expected to be approximately 23 percent in 2007. This estimated tax ratedoes not reflect the impact of any unusual or special items that may affect our tax rate in 2007.
Contingencies
Our Company is subject to various claims and contingencies, mostly related to legal proceedings. Due totheir nature, such legal proceedings involve inherent uncertainties including, but not limited to, court rulings,negotiations between affected parties and governmental actions. Management assesses the probability of loss forsuch contingencies and accrues a liability and/or discloses the relevant circumstances, as appropriate.Management believes that any liability to the Company that may arise as a result of currently pending legalproceedings or other contingencies will not have a material adverse effect on the financial condition of theCompany taken as a whole. Refer to Note 13 of Notes to Consolidated Financial Statements.
Recent Accounting Standards and Pronouncements
Refer to Note 1 of Notes to Consolidated Financial Statements for a discussion of recent accountingstandards and pronouncements.
Operations Review
We manufacture, distribute and market nonalcoholic beverage concentrates and syrups. We alsomanufacture, distribute and market some finished beverages. Our organizational structure as of December 31,2006 consisted of the following operating segments, the first seven of which are sometimes referred to as‘‘operating groups’’ or ‘‘groups’’: Africa; East, South Asia and Pacific Rim; European Union; Latin America;North America; North Asia, Eurasia and Middle East; Bottling Investments; and Corporate. For furtherinformation regarding our operating segments, including a discussion of changes made to our operatingsegments during 2006, refer to Note 20 of Notes to Consolidated Financial Statements.
42

Volume
We measure our sales volume in two ways: (1) unit cases of finished products and (2) gallons. A ‘‘unit case’’is a unit of measurement equal to 192 U.S. fluid ounces of finished beverage (24 eight-ounce servings). Unit casevolume represents the number of unit cases of Company beverage products directly or indirectly sold by theCompany and its bottling partners (‘‘Coca-Cola system’’) to consumers. Unit case volume primarily consists ofbeverage products bearing Company trademarks. Also included in unit case volume are certain productslicensed to, or distributed by, our Company, and brands owned by Coca-Cola system bottlers for which ourCompany provides marketing support and from the sale of which it derives income. Such products licensed to, ordistributed by, our Company or owned by Coca-Cola system bottlers account for a minimal portion of total unitcase volume. In addition, unit case volume includes sales by joint ventures in which the Company is a partner.Unit case volume is derived based on estimates supplied by our bottling partners and distributors. A ‘‘gallon’’ is aunit of measurement for concentrates, syrups, beverage bases, finished beverages and powders (in all casesexpressed in equivalent gallons of syrup) sold by the Company to its bottling partners or other customers. Mostof our revenues are based on gallon sales, a primarily wholesale activity, as discussed under ‘‘Item 1. Business’’ inPart I of this report and the heading ‘‘Net Operating Revenues,’’ below. Unit case volume and gallon salesgrowth rates are not necessarily equal during any given period. Items such as seasonality, bottlers’ inventorypractices, supply point changes, timing of price increases and new product introductions and changes in productmix can impact unit case volume and gallon sales and can create differences between unit case volume andgallon sales growth rates.
Information about our volume growth by operating segment is as follows:
Percentage Change
2006 vs. 2005 2005 vs. 2004
Year Ended December 31, Unit Cases1,2 Gallons Unit Cases1,2 Gallons
Worldwide 4% 4% 4% 3%
International 6 5 5 4
Africa 4 3 6 7East, South Asia and Pacific Rim (5) (4) (4) (6)European Union 6 4 — —Latin America 7 7 6 6North America — — 2 1North Asia, Eurasia and Middle East 11 7 15 10
Bottling Investments 16 N/A 6 N/A
1 Bottling Investments segment data reflects unit case volume growth for consolidated bottlers only.2 Geographic segment data reflects unit case volume growth for all bottlers in the applicable
geographic areas, both consolidated and unconsolidated.
Unit Case Volume
Although most of our Company’s revenues are not based directly on unit case volume, we believe unit casevolume is one of the measures of the underlying strength of the Coca-Cola system because it measures ourproduct trends at the consumer level. The Coca-Cola system sold approximately 21.4 billion unit cases of ourproducts in 2006, approximately 20.6 billion unit cases in 2005, and approximately 19.8 billion unit cases in 2004.
In Africa, unit case volume increased 4 percent in 2006 compared to 2005, reflecting growth across themajority of divisions, which was partially offset by a slight decline in Nigeria primarily related to affordabilityissues and competitive and economic pressure. The unit case volume increase in Africa was also partially offset
43

by an industrywide temporary shortage in the supply of carbon dioxide in South Africa in the fourth quarterof 2006.
Unit case volume in East, South Asia and Pacific Rim decreased 5 percent in 2006 versus 2005, primarilydue to a double-digit decline in the Philippines, which was mainly driven by the continued impact of affordabilityand availability issues. In December 2006, the Company and SMC entered into an agreement for the Companyto acquire, subject to the fulfillment of certain conditions, the 65 percent ownership interest in CCBPI held bySMC. Upon the closing of the acquisition, the Company will own 100 percent of the issued and outstandingcapital stock of CCBPI. The transaction is expected to close during the first quarter of 2007. The Companyexpects performance in the Philippines to remain weak during 2007. Performance in this operating segment wasalso impacted by a 5 percent decline in India primarily due to price increases in the second half of 2005 and stepstaken to drive revenue growth and improve operating and working capital efficiency. The results in Indiareflected high single-digit declines in sparkling beverages which was partially offset by growth in still beverages.Continued investment in marketing initiatives around the quality and safety of our products and focus onexecution in the consolidated bottling operations delivered positive results during the second half of 2006,despite the renewed unfounded allegations of unsafe pesticide levels in the Company’s products.
Unit case volume in the European Union increased 6 percent in 2006 compared to 2005, primarily due tosolid growth across all divisions driven by successful marketing campaigns, launches of Coca-Cola Zero in ninecountries and favorable weather in the second half of 2006. In addition, the acquisition of Apollinaris GmbH, aGerman premium source water brand (‘‘Apollinaris’’), and the joint acquisition of Fonti del Vulture S.r.l., alsoknown as Traficante, an Italian mineral water company, with Coca-Cola HBC during 2006 contributedapproximately 2 percentage points of unit case volume growth in 2006. Unit case volume in Germany increased5 percent in 2006 versus 2005, and reflected strong growth of Trademark Coca-Cola in 2006 compared to 2005.The results were driven by improved marketplace execution capabilities, the launch of Coca-Cola Zero inJuly 2006, increased availability in the discounter channel and generally favorable weather. As mentioned above,the acquisition of Apollinaris also contributed to unit case volume growth in Germany. The Company expectsstabilizing trends in Germany to continue during 2007. Unit case volume in Northwest Europe increased3 percent in 2006 versus 2005 as performance stabilized. The results reflected 3 percent unit case volume growthin sparkling beverages, led by growth of Trademark Coca-Cola, and solid growth in still beverages. In addition,the successful launch of Coca-Cola Zero in Great Britain at the end of June 2006 and generally favorableweather during the second half of the year contributed to the performance. Unit case volume in Iberia increased6 percent in 2006 versus 2005, led by strong growth in Spain.
In Latin America, unit case volume increased 7 percent in 2006 versus 2005, primarily due to growth insparkling beverages led by growth of Trademark Coca-Cola. This performance was seen in all key markets,especially Brazil, Mexico and Argentina. In Mexico, the increase in unit case volume was driven by strong growthin Trademark Coca-Cola. In Brazil, strong marketing and bottler execution led to unit case volume growth insparkling beverages. In Argentina, consumer marketing activities and bottler execution drove unit case volumegrowth. Additionally, in December 2006, the Company and Coca-Cola FEMSA entered into an agreement tojointly acquire Jugos del Valle, S.A.B. de C.V., the second largest producer of packaged juices, nectars and fruit-flavored beverages in Mexico and the largest producer of such products in Brazil.
Unit case volume in North America was even in 2006 versus 2005. Foodservice and Hospitality unit casevolume increased 1 percent in 2006, reflecting growth in all key beverage categories. Unit case volume in Retaildecreased 1 percent primarily driven by weak sparkling beverage trends in the second half of 2006, declines inthe warehouse-delivered water business resulting from the strategic decision to refocus resources behind themore profitable Dasani business and declines in the warehouse-delivered juice business as a result of priceincreases to cover higher ingredient costs. These declines in Retail were partially offset by the continued successof Dasani, Coca-Cola Zero and Powerade, as well as the introduction of Black Cherry Vanilla Coca-Cola and thenational rollout of Vault. In February 2007, our Company entered into an agreement to purchase Fuze
44

Beverage, LLC, maker of Fuze enhanced juices, teas, waters and energy drinks. The Company expectsperformance in North America to be weak during 2007.
In North Asia, Eurasia and Middle East, unit case volume grew 11 percent in 2006 compared to 2005, led bydouble-digit growth in China, Russia and Turkey, partially offset by a 3 percent decline in Japan. The increase inunit case volume in China was led by significant growth in both sparkling and still beverages. The unit casevolume growth in Russia and Turkey was the result of improving macroeconomic trends, strong bottler executionand successful marketing programs. Unit case volume in Russia also benefited from the full-year impact of thejoint acquisition of Multon, compared to a partial year in 2005. The Company and Coca-Cola HBC jointlyacquired Multon, a Russian juice company, in April 2005. The decrease in unit case volume in Japan wasprimarily due to weakness across core brands including Trademark Coca-Cola, Georgia Coffee and our greentea brands. However, results in Japan gradually improved during 2006 and position Japan for growth in 2007.
Unit case volume for Bottling Investments increased 16 percent in 2006 versus 2005, primarily due to theacquisition of Kerry Beverages Limited, which was subsequently renamed Coca-Cola China Industries Limited(‘‘CCCIL’’), and the acquisitions of TJC Holdings (Pty) Ltd., a South African bottling company (‘‘TJC’’), andApollinaris. The Company intends to sell a portion of its investment in TJC to Black Economic Empowermententities at a future date. Unit case volume for Bottling Investments also increased due to the consolidation ofBrucephil, Inc. (‘‘Brucephil’’), the parent company of The Philadelphia Coca-Cola Bottling Company. In thethird quarter of 2006, our Company signed agreements with J. Bruce Llewellyn and Brucephil for the potentialpurchase of the remaining shares of Brucephil not currently owned by the Company. The agreements providefor the Company’s purchase of the shares upon the election of Mr. Llewellyn or the election of the Company.Based on the terms of these agreements, the Company concluded that it must consolidate Brucephil underInterpretation No. 46(R). Brucephil’s financial statements were consolidated effective September 29, 2006. Theacquisition of the German bottling company Bremer Erfrischungsgetraenke GmbH (‘‘Bremer’’) during the thirdquarter of 2005 also contributed to unit case volume increases in 2006, reflecting the impact of full-year unit casevolume in 2006 for Bremer compared to a partial year in 2005. The unit case volume increase was partially offsetby a decline in India.
In Africa, unit case volume increased 6 percent in 2005 compared to 2004. This increase was driven bygrowth in core sparkling beverages as well as still beverages across all divisions in this operating segment.
In East, South Asia and Pacific Rim, unit case volume decreased 4 percent in 2005 compared to 2004,primarily due to declines in India and the Philippines. The decline in India was related to the impact of priceincreases to cover rising raw material and distribution costs and the lingering effects of the 2003 pesticideallegations. The decline in the Philippines was primarily related to affordability and availability issues.
Unit case volume in the European Union was even in 2005 versus 2004, primarily due to strong growth inSpain and Central Europe partially offset by declines primarily in Germany and Northwest Europe. Unit casevolume in Germany declined 2 percent in 2005 due to the continued impact of the mandatory deposit legislationon the availability of nonrefillable packages and the corresponding limited availability of our products in thediscount retail channel, along with overall industry weakness. In the second half of 2005, the Company achievedavailability of a limited range of its products in most discounters. Results in Germany stabilized in the secondhalf of 2005. Unit case volume in Northwest Europe declined 3 percent in 2005, primarily due to the softeconomic environment and declines in sparkling beverages, which was associated with a decrease in competitors’prices at retailers, and the discount channel becoming a larger part of the retail market, together with a shift inconsumer preferences away from regular sparkling beverages driven by health and wellness trends and theassociated public opinion, media and government attention.
Unit case volume for Latin America increased 6 percent in 2005 versus 2004, reflecting strong growth inBrazil, Argentina and Mexico, primarily due to growth in sparkling beverages. The increase in Brazil and Mexicowas primarily due to strong marketing, execution and package innovation.
45

In North America, unit case volume in Retail increased 2 percent in 2005 versus 2004, reflecting improvedperformance in the bottler-delivered business primarily related to Dasani, Coca-Cola Zero and still beverages,along with growth in the warehouse juice and warehouse water operations. Foodservice and Hospitality had a1 percent increase in 2005 compared to 2004, reflecting improved trends in restaurant traffic and the impact of anew customer conversion partially offset by the impact of higher fuel costs and Hurricane Katrina on consumerrestaurant spending.
In North Asia, Eurasia and Middle East, unit case volume grew 15 percent in 2005 versus 2004, led by22 percent growth in China, 2 percent growth in Japan, 54 percent growth in Russia and 14 percent growth inTurkey. The increase in unit case volume in China was led by significant growth in both sparkling and stillbeverages. Japan’s growth was primarily due to new product introductions. The unit case volume growth inTurkey was largely due to improving macroeconomic trends, strong bottler execution and successful marketingprograms. The unit case volume growth in Russia was the result of the joint acquisition of Multon as well asimproving macroeconomic trends, strong bottler execution and successful marketing programs.
Unit case volume for Bottling Investments increased 6 percent in 2005 versus 2004, primarily related to theacquisitions and full-year impact of consolidation of certain bottling operations under Interpretation No. 46(R).The unit case volume increase in 2005 was partially offset by a decline in India bottling operations anddispositions of certain bottling operations.
Gallon Sales
Company-wide gallon sales and unit case volume both grew 4 percent in 2006 when compared to 2005. InAfrica, the gallon sales increase was lower than the unit case volume increase mostly due to planned inventoryreductions in Nigeria. In East, South Asia and Pacific Rim, the gallon sales decline was lower than the unit casevolume decline due to demand for Coca-Cola Zero in Australia and timing of gallon sales in India. In theEuropean Union, unit case volume increased ahead of gallon sales volume due to timing of gallon sales. Both inLatin America and North America, gallon sales and unit case volume were approximately equal. In North Asia,Eurasia and Middle East, unit case volume increased ahead of gallon sales primarily due to inventory reductionsin Russia. Unit case volume growth also reflected the impact of a full-year of unit case volume compared to apartial year in 2005 due to the joint acquisition of Multon with Coca-Cola HBC in the second quarter of 2005.The Company only reports unit case volume related to Multon, as the Company does not sell concentrates orsyrups to Multon.
Company-wide gallon sales grew 3 percent while unit case volume grew 4 percent in 2005 compared to 2004.In Africa, gallon sales growth of 7 percent exceeded unit case volume growth of 6 percent in 2005 compared to2004, primarily due to timing of gallon shipments. In East, South Asia and Pacific Rim, the gallon sales declinewas higher than the unit case volume decline primarily due to timing of gallon sales in India and the impact of2005 planned inventory reductions in Australia. Both in the European Union and in Latin America, gallon salesgrowth and unit case volume growth were even in 2005 versus 2004. In North America, gallon sales increased1 percent while unit case volume increased 2 percent, primarily due to the impact of higher gallon sales in 2004related to the launch of Coca-Cola C2 and a change in shipping routes in 2004. In North Asia, Eurasia andMiddle East, unit case volume increased ahead of gallon sales volume due to the joint acquisition of Multon,which contributed to unit case volume in 2005, along with timing of 2004 gallon sales, which impacted most ofthe remaining divisions in the operating segment. Multon had full-year unit case volume of approximately80 million unit cases in 2004.
46

Analysis of Consolidated Statements of IncomePercent Change
Year Ended December 31, 2006 2005 2004 2006 vs. 2005 2005 vs. 2004(In millions except per share data and percentages)
NET OPERATING REVENUES $ 24,088 $ 23,104 $ 21,742 4% 6%Cost of goods sold 8,164 8,195 7,674 0 7
GROSS PROFIT 15,924 14,909 14,068 7 6GROSS PROFIT MARGIN 66.1% 64.5% 64.7%Selling, general and administrative expenses 9,431 8,739 7,890 8 11Other operating charges 185 85 480 * *
OPERATING INCOME 6,308 6,085 5,698 4 7OPERATING MARGIN 26.2% 26.3% 26.2%Interest income 193 235 157 (18) 50Interest expense 220 240 196 (8) 22Equity income — net 102 680 621 (85) 10Other income (loss) — net 195 (93) (82) * *Gains on issuances of stock by equity investees — 23 24 * *
INCOME BEFORE INCOME TAXES 6,578 6,690 6,222 (2) 8Income taxes 1,498 1,818 1,375 (18) 32Effective tax rate 22.8% 27.2% 22.1%
NET INCOME $ 5,080 $ 4,872 $ 4,847 4% 1%
PERCENTAGE OF NET OPERATING REVENUES 21.1% 21.1% 22.3%
NET INCOME PER SHARE:Basic $ 2.16 $ 2.04 $ 2.00 6% 2%
Diluted $ 2.16 $ 2.04 $ 2.00 6% 2%
* Calculation is not meaningful.
47

Net Operating Revenues
Net operating revenues increased by $984 million or 4 percent in 2006 versus 2005. Net operating revenuesincreased by $1,362 million or 6 percent in 2005 versus 2004.
The following table indicates, on a percentage basis, the estimated impact of key factors resulting insignificant increases (decreases) in net operating revenues:
Percent ChangeYear Ended December 31, 2006 vs. 2005 2005 vs. 2004
Increase in gallon sales 4% 3%Structural changes (2) 0Price and product/geographic mix 2 1Impact of currency fluctuations versus the U.S. dollar 0 2
Total percentage increase 4% 6%
Refer to the heading ‘‘Volume’’ for a detailed discussion on gallon sales.
‘‘Structural changes’’ refers to acquisitions or dispositions of bottling or canning operations andconsolidation or deconsolidation of bottling entities for accounting purposes. In 2006, structural changesdecreased net operating revenues by 2 percent compared to 2005, primarily due to the change of the businessmodel in Spain, partially offset by the acquisitions of Bremer in the third quarter of 2005, TJC in the first quarterof 2006, CCCIL in the third quarter of 2006 and the consolidation of Brucephil under Interpretation No. 46(R)effective September 29, 2006. Refer to Note 19 of Notes to Consolidated Financial Statements. EffectiveJanuary 1, 2006, the Company granted our bottling partners in Spain the rights to manufacture and distributeCompany trademarked products in can packages. Prior to granting these rights to our bottling partners, theCompany held the manufacturing and distribution rights for these can packages in Spain. In connection withgranting these rights, the Company reduced our planned future annual marketing support payments to ourbottling partners in Spain. These changes resulted in a reduction of net operating revenues and cost of goodssold. This change did not materially impact gross profit for 2006. If the change had occurred as of January 1,2005, net operating revenues for 2005 would have been reduced by approximately $779 million.
Price and product/geographic mix increased net operating revenues by 2 percent in 2006 compared to 2005,primarily due to price increases across the majority of the operating segments and improved pricing andproduct/package mix in Bottling Investments partially offset by unfavorable product mix primarily in Japan.
In 2005, structural changes reflect the impact of a full year of revenue in 2005 for variable interest entitiescompared to a partial year in 2004. Under Interpretation No. 46(R), the results of operations of variable interestentities in which the Company was determined to be the primary beneficiary were included in our consolidatedresults beginning April 2, 2004. Refer to Note 1 of Notes to Consolidated Financial Statements. The acquisitionof Bremer during the third quarter of 2005 also favorably impacted net operating revenues. Refer to Note 19 ofNotes to Consolidated Financial Statements. These increases in net operating revenues were offset by thedispositions of certain bottling and canning operations which were not material individually or in aggregate.
The favorable impact of foreign currency fluctuations in 2005 versus 2004 resulted from the strength ofmost key foreign currencies versus the U.S. dollar, especially a stronger euro, which favorably impacted theEuropean Union and Bottling Investments, and a stronger Brazilian real and Mexican peso, that favorablyimpacted Latin America and Bottling Investments. The favorable impact of fluctuation in these currencies waspartially offset by a weaker Japanese yen, which unfavorably impacted North Asia, Eurasia and Middle East.Refer to the heading ‘‘Liquidity, Capital Resources and Financial Position—Foreign Exchange.’’
Price and product/geographic mix increased net operating revenues by 1 percent in 2005 compared to 2004,primarily due to price increases across the majority of the operating segments and improved product/packagemix in Bottling Investments, partially offset by unfavorable country mix.
48

Information about our net operating revenues by operating segment as a percentage of Company netoperating revenues is as follows:
Year Ended December 31, 2006 2005 2004
Africa 4.6% 4.8% 4.4%East, South Asia and Pacific Rim 3.3 3.1 3.2European Union 14.6 17.8 18.0Latin America 10.3 8.9 8.2North America 29.1 28.9 29.5North Asia, Eurasia and Middle East 16.5 17.7 17.9Bottling Investments 21.2 18.4 18.3Corporate 0.4 0.4 0.5
100.0% 100.0% 100.0%
The percentage contribution of each operating segment has changed due to net operating revenues incertain segments growing at a faster rate compared to the other operating segments, the impact of foreigncurrency fluctuations; and the acquisitions of CCCIL and TJC, and the consolidation of Brucephil underInterpretation No. 46(R), which impacted Bottling Investments. The acquisition of Bremer during the thirdquarter of 2005 also increased net operating revenues in 2006, reflecting the impact of full-year net operatingrevenues in 2006 for Bremer compared to a partial year in 2005.
The size and timing of structural changes, including acquisitions or dispositions of bottling and canningoperations, do not occur consistently from period to period. As a result, anticipating the impact of such eventson future increases or decreases in net operating revenues (and other financial statement line items) usually isnot possible. However, we expect to continue to buy and sell bottling interests in limited circumstances and, as aresult, structural changes will continue to affect our consolidated financial statements in future periods.
Gross Profit
Our gross profit margin increased to 66.1 percent in 2006 from 64.5 percent in 2005. Our gross margin wasfavorably impacted by the change in the business model in Spain, as discussed above. Other structural changes,which included the consolidation of Brucephil under Interpretation No. 46(R) in 2006, the acquisitions ofCCCIL and TJC in 2006, and the acquisition of Bremer in 2005, unfavorably impacted our gross profit margin.Generally, bottling and finished product operations produce higher net operating revenues but lower gross profitmargins compared to concentrate and syrup operations. Our gross margin in 2006 was also impacted favorablyby price increases, partially offset by increases in the cost of raw materials and freight, primarily in NorthAmerica, and by an unfavorable product mix, primarily in Japan. Gross profit margin in 2005 was favorablyimpacted by the receipt of approximately $109 million in proceeds related to a class action lawsuit settlementconcerning price-fixing in the sale of high fructose corn syrup (‘‘HFCS’’) purchased by the Company during theyears 1991 to 1995. Subsequent to the receipt of this settlement, the Company distributed approximately$62 million to certain bottlers in North America. From 1991 to 1995, the Company purchased HFCS on behalfof those bottlers. Therefore, those bottlers ultimately were entitled to a portion of the proceeds. The Company’sportion of the settlement was approximately $47 million, which was recorded as a reduction of cost of goods soldand impacted Corporate. Refer to Note 18 of Notes to Consolidated Financial Statements.
In 2007, the Company expects the cost of raw materials to increase, primarily in North America. We willattempt to mitigate the overall impact on our business through appropriate pricing and other strategies.
Our gross profit margin decreased to 64.5 percent in 2005 from 64.7 percent in 2004, primarily due to higherraw material and freight costs driven by rising oil prices. This decrease was partially offset by the receipt of netsettlement proceeds of approximately $47 million, as discussed above. Our gross margin was also impacted bythe consolidation of certain bottling operations under Interpretation No. 46(R) as of April 2, 2004. Refer toNote 1 of Notes to Consolidated Financial Statements.
49

Selling, General and Administrative Expenses
The following table sets forth the significant components of selling, general and administrative expenses (inmillions):
Year Ended December 31, 2006 2005 2004
Selling expenses $ 3,924 $ 3,453 $ 3,031Advertising expenses 2,553 2,475 2,165General and administrative expenses 2,630 2,487 2,349Stock-based compensation expense 324 324 345
Selling, general and administrative expenses $ 9,431 $ 8,739 $ 7,890
Total selling, general and administrative expenses were approximately 8 percent higher in 2006 versus 2005.The increases in selling and advertising expenses were primarily related to increased investments in marketingactivities, including World Cup and Winter Olympics promotions in the European Union, combined with newproduct innovation activities and increased costs in our consolidated bottling investments as a result ofacquisitions and consolidation of certain bottling operations. General and administrative expenses increased dueto higher costs in Bottling Investments related to the acquisitions of CCCIL and TJC and the consolidation ofBrucephil under Interpretation No. 46(R). The acquisition of Bremer during the third quarter of 2005 alsoincreased general and administrative expenses in 2006, reflecting a full-year impact in 2006 for Bremercompared to a partial year in 2005. General and administrative expenses in 2006 also reflected the impact of a$100 million donation made to The Coca-Cola Foundation, which impacted Corporate. Stock-basedcompensation expense was flat in 2006 compared to 2005. Stock-based compensation expense in 2005 includedapproximately $50 million of expense due to a change in our estimated service period for retirement-eligibleparticipants in our plans. This amount was offset primarily by the impact of the timing of stock-basedcompensation grants in prior years.
As of December 31, 2006, we had approximately $376 million of total unrecognized compensation costrelated to nonvested share-based compensation arrangements granted under our plans. This cost is expected tobe recognized as stock-based compensation expense over a weighted-average period of 1.7 years. This expectedcost does not include the impact of any future stock-based compensation awards. Refer to Note 15 of Notes toConsolidated Financial Statements.
Total selling, general and administrative expenses were approximately 11 percent higher in 2005 versus2004. Approximately 1 percentage point of this increase was due to an overall weaker U.S. dollar (especiallycompared to the Brazilian real, the Mexican peso and the euro). The increase in selling, advertising and generaland administrative expenses was primarily related to increased marketing and innovation expenses and thefull-year impact of the consolidation of certain bottling operations under Interpretation No. 46(R). The decreasein stock-based compensation expense was primarily related to the lower average fair value per share of stockoptions expensed in 2005 compared to the average fair value per share expensed in 2004. This decrease waspartially offset by approximately $50 million of accelerated amortization of compensation expense related to achange in our estimated service period for retirement-eligible participants when the terms of their stock-basedcompensation awards provided for accelerated vesting upon early retirement. Refer to Note 15 of Notes toConsolidated Financial Statements.
50

Other Operating Charges
The other operating charges incurred by operating segment were as follows (in millions):
Year Ended December 31, 2006 2005 2004
Africa $ 3 $ — $ —East, South Asia and Pacific Rim 44 85 —European Union 36 — —Latin America — — —North America — — 18North Asia, Eurasia and Middle East 17 — —Bottling Investments 84 — 398Corporate 1 — 64
Total $ 185 $ 85 $ 480
During 2006, our Company recorded other operating charges of $185 million. Of these charges,approximately $108 million were primarily related to the impairment of assets and investments in our bottlingoperations, approximately $53 million were for contract termination costs related to production capacityefficiencies and approximately $24 million were related to other restructuring costs. None of these charges wasindividually significant. The impairment charges were primarily the result of a revised outlook for certain assetsand bottling operations in Asia, which have been impacted by unfavorable market conditions and declines involume. Refer to the discussion under ‘‘Critical Accounting Policies and Estimates—Goodwill, Trademarks andOther Intangible Assets,’’ above.
Other operating charges in 2005 reflected the impact of approximately $84 million of expenses related toimpairment charges for intangible assets and approximately $1 million related to impairments of other assets.These intangible assets primarily relate to trademark beverages sold in the Philippines, which is part of East,South Asia and Pacific Rim. Refer to the heading ‘‘Critical Accounting Policies and Estimates—Goodwill,Trademarks and Other Intangible Assets.’’
Other operating charges in 2004 reflected the impact of approximately $480 million of expenses primarilyrelated to impairment charges for franchise rights and certain manufacturing assets. Bottling Investmentsaccounted for approximately $398 million of the impairment charges, which were primarily related to theimpairment of franchise rights at CCEAG. For a discussion of the operating environment in Germany, refer tothe heading ‘‘Critical Accounting Policies and Estimates—Goodwill, Trademarks and Other Intangible Assets.’’Corporate accounted for approximately $64 million of impairment charges, which were primarily related to theimpairment of certain manufacturing assets.
51

Operating Income and Operating Margin
Information about our operating income contribution by operating segment on a percentage basis is asfollows:
Year Ended December 31, 2006 2005 2004
Africa 6.7% 6.5% 5.9%East, South Asia and Pacific Rim 5.7 4.6 7.7European Union 35.7 36.5 37.3Latin America 23.0 19.3 18.5North America 26.7 25.5 28.2North Asia, Eurasia and Middle East 24.7 29.0 29.3Bottling Investments — (1.0) (8.0)Corporate (22.5) (20.4) (18.9)
100.0% 100.0% 100.0%
Information about our operating margin on a consolidated basis and by operating segment is as follows:
Year Ended December 31, 2006 2005 2004
Consolidated 26.2% 26.3% 26.2%
Africa 38.4% 35.8% 35.0%East, South Asia and Pacific Rim 45.0 39.5 62.2European Union 64.3 54.1 54.3Latin America 57.9 57.0 59.2North America 24.0 23.3 25.0North Asia, Eurasia and Middle East 39.1 42.4 43.0Bottling Investments — (1.0) (11.4)Corporate * * *
* Calculation is not meaningful.
As demonstrated by the tables above, the percentage contribution to operating income and operatingmargin by each operating segment fluctuated from year to year. Operating income and operating margin byoperating segment were influenced by a variety of factors and events including the following:
• In 2006, foreign currency exchange rates unfavorably impacted operating income by approximately1 percent, primarily related to a weaker Japanese yen, which impacted North Asia, Eurasia and MiddleEast. The unfavorable impact from the weaker Japanese yen was partially offset by favorable foreigncurrency exchange rate changes primarily related to the euro, which impacted the European Union andBottling Investments, and the Brazilian real, which impacted Latin America and Bottling Investments.
• In 2006, price increases across the majority of operating segments favorably impacted both operatingincome and operating margins.
• In 2006, increased spending on marketing and innovation activities impacted the majority of theoperating segments’ operating income and operating margins. Refer to the heading ‘‘Selling, General andAdministrative Expenses.’’
• In 2006, operating income was reduced by approximately $3 million for Africa, $44 million for East,South Asia and Pacific Rim, $36 million for the European Union, $17 million for North Asia, Eurasia andMiddle East, $88 million for Bottling Investments and $1 million for Corporate primarily due to contracttermination costs related to production capacity efficiencies, asset impairments and other restructuringcosts. Refer to Note 20 of Notes to Consolidated Financial Statements.
52

• In 2006, the increase in operating margin for the European Union was primarily due to a change in thebusiness model in Spain. Refer to the headings ‘‘Net Operating Revenues’’ and ‘‘Gross Profit,’’ above.
• In 2006, the decrease in operating income and operating margin for North Asia, Eurasia and Middle Eastwas primarily due to unfavorable product mix in Japan, which was partially offset by increased operatingincome in Russia and Turkey. Operating margins in Japan are higher than the operating margins inRussia and Turkey.
• In 2006, the increase in operating income and operating margin for Bottling Investments was primarilydue to price increases, favorable package mix and actions to improve efficiency.
• In 2006, operating income was reduced by $100 million for Corporate as a result of a donation made toThe Coca-Cola Foundation.
• In 2005, operating income increased approximately 7 percent. Of this amount, 4 percent was due tofavorable foreign currency exchange primarily related to the Brazilian real and the Mexican peso, whichimpacted Latin America and Bottling Investments, and the euro, which impacted the European Unionand Bottling Investments.
• In 2005, operating income was impacted by an increase in net operating revenues and gross profit,partially offset by increased spending on marketing and innovation activities in each operating segment.Refer to the headings ‘‘Net Operating Revenues’’ and ‘‘Selling, General and Administrative Expenses.’’
• In 2005, as a result of impairment charges totaling approximately $85 million related to the Philippines,operating margins in the East, South Asia and Pacific Rim operating segment decreased. Refer to theheading ‘‘Other Operating Charges.’’
• In 2005, operating income in Corporate decreased $146 million, primarily due to increased marketingand innovation expenses, which were partially offset by our receipt of a net settlement of approximately$47 million related to a class action lawsuit concerning the purchase of HFCS. Refer to the headings‘‘Gross Profit’’ and ‘‘Selling, General and Administrative Expenses.’’
• In 2004, operating income was reduced by approximately $18 million for North America, $398 million forBottling Investments and $64 million for Corporate as a result of impairment charges. Refer to theheading ‘‘Other Operating Charges.’’
• In 2004, operating income increased approximately 9 percent. Of this amount, 8 percent was due tofavorable foreign currency exchange primarily related to the euro, which impacted the European Union,and the Japanese yen, which impacted North Asia, Eurasia and Middle East.
• In 2004, as a result of the creation of a nationally integrated supply chain management company in Japan,operating margins in North Asia, Eurasia and Middle East increased. Effective October 1, 2003, theCompany and all of our bottling partners in Japan created a nationally integrated supply chainmanagement company to centralize procurement, production and logistics operations for the entireCoca-Cola system in Japan. As a result, a portion of our Company’s business was essentially convertedfrom a finished product business model to a concentrate business model. This shift of certain products toa concentrate business model resulted in reductions in our revenues and cost of goods sold, each in thesame amount. This change in the business model did not impact gross profit. Generally, concentrate andsyrup operations produce lower net revenues but higher operating margins compared to finished productoperations.
• In 2004, as a result of the consolidation of certain bottling operations that are considered variable interestentities under Interpretation No. 46(R), operating margin for Bottling Investments was reduced.Generally, bottling operations produce higher net revenues but lower operating margins compared toconcentrate and syrup operations.
53

• In 2004, operating income in Corporate increased $75 million due to the receipt of an insurancesettlement related to the class action lawsuit which was settled in 2000.
• In 2004, operating income in Corporate decreased $75 million due to a donation to The Coca-ColaFoundation.
Interest Income and Interest Expense
We monitor our mix of fixed-rate and variable-rate debt as well as our mix of short-term debt versuslong-term debt. From time to time we enter into interest rate swap agreements to manage our mix of fixed-rateand variable-rate debt.
In 2006, interest income decreased by $42 million compared to 2005, primarily due to lower averageshort-term investment balances, partially offset by higher average interest rates. Interest expense in 2006decreased by $20 million compared to 2005. This decrease is primarily the result of lower average balances oncommercial paper borrowings, partially offset by higher average interest rates. We expect 2007 net interestexpense to increase due to forecasted lower cash balances and higher debt balances.
In 2005, interest income increased by $78 million compared to 2004, primarily due to higher averageshort-term investment balances and higher average interest rates on U.S. dollar denominated deposits. Interestexpense in 2005 increased by $44 million compared to 2004, primarily due to higher average interest rates oncommercial paper borrowings in the United States, partially offset by lower interest expense at CCEAG due tothe repayment of current maturities of long-term debt in 2005.
Equity Income—Net
Our Company’s share of income from equity method investments for 2006 totaled $102 million, comparedto $680 million in 2005, a decrease of $578 million. Equity income in 2006 was reduced by approximately$602 million resulting from the impact of our proportionate share of an impairment charge recorded by CCE.CCE recorded a $2.9 billion pretax ($1.8 billion after tax) impairment of its North American franchise rights.The decline in the estimated fair value of CCE’s North American franchise rights was the result of severalfactors, including but not limited to (1) CCE’s revised outlook on 2007 raw material costs driven by significantincreases in aluminum and HFCS; (2) a challenging marketplace environment with increased pricing pressuresin several high-growth beverage categories; and (3) increased interest rates contributing to a higher discount rateand corresponding capital charge. Our 2006 equity income—net also reflected a net decrease of approximately$37 million primarily related to other impairment and restructuring charges recorded by CCE and certain otherequity method investees, partially offset by approximately $33 million related to our proportionate share offavorable changes in certain of CCE’s state and Canadian federal and provincial tax rates. In addition, our 2006equity income was slightly impacted by the Company’s sale of shares representing 8 percent of the capital stockof Coca-Cola FEMSA. The Company sold these shares to Fomento Economico Mexicano, S.A.B. de C.V.(‘‘FEMSA’’), the major shareowner of Coca-Cola FEMSA, in November 2006. As a result of this sale, ourownership interest in Coca-Cola FEMSA was reduced from approximately 40 percent to approximately32 percent. The decrease in 2006 equity income was also the result of the sale of a portion of our investment inCoca-Cola Icecek A.S. (‘‘Coca-Cola Icecek’’) in an initial public offering during the second quarter of 2006. As aresult of this public offering, our Company’s interest in Coca-Cola Icecek decreased from approximately36 percent to approximately 20 percent. These reductions in ownership of Coca-Cola FEMSA and Coca-ColaIcecek will reduce our future equity income related to these equity method investees. Refer to Note 3 of Notesto Consolidated Financial Statements. The decrease in equity income for 2006 was partially offset by ourCompany’s proportionate share of increased net income from certain of the equity method investees and ourproportionate share of the net income of the Multon juice joint venture in Russia.
In February 2007, CCE announced that it would restructure segments of its Corporate, North America andEuropean operations. As a part of the restructuring, CCE expects a net job reduction of approximately 3,500
54

positions, or 5 percent of its total workforce. CCE expects this restructuring will result in a charge ofapproximately $300 million, with the majority to be recognized in 2007 and 2008. The Company’s equity incomein 2007 and 2008 will reflect our proportionate share of the restructuring charges recorded by CCE.
Our Company’s share of income from equity method investments for 2005 totaled $680 million compared to$621 million in 2004, an increase of $59 million or 10 percent, primarily due to the overall improving health ofthe Coca-Cola bottling system in most of the world and the joint acquisition of Multon in April 2005. Theincrease was offset by approximately $33 million related to our proportionate share of certain charges recordedby CCE. These charges included approximately $51 million, primarily related to the tax liability resulting fromthe repatriation of previously unremitted foreign earnings under the Jobs Creation Act, and approximately$18 million due to restructuring charges recorded by CCE. These charges were offset by approximately$37 million from CCE’s HFCS lawsuit settlement and changes in certain of CCE’s state and provincial tax rates.
Other Income (Loss)—Net
Other income (loss)—net was a net income of $195 million for 2006 compared to a net loss of $93 millionfor 2005, a difference of $288 million. In 2006, other income (loss)—net included a gain of approximately$175 million resulting from the sale of a portion of our Coca-Cola FEMSA shares to FEMSA and a gain ofapproximately $123 million resulting from the sale of a portion of our investment in Coca-Cola Icecek shares inan initial public offering. Refer to Note 18 of Notes to Consolidated Financial Statements. This line item in 2006also included $15 million in foreign currency exchange losses, the accretion of $58 million for the discountedvalue of our liability to purchase CCEAG shares (refer to Note 8 of Notes to Consolidated FinancialStatements) and the minority shareowners’ proportional share of net income of certain consolidatedsubsidiaries.
Other income (loss)—net amounted to a net loss of $93 million for 2005 compared to a net loss of$82 million for 2004, a difference of $11 million. The difference was primarily related to a reduction in foreignexchange losses. This line item in 2005 primarily consisted of $23 million in foreign currency exchange losses, theaccretion of $60 million for the discounted value of our liability to purchase CCEAG shares (refer to Note 8 ofNotes to Consolidated Financial Statements) and the minority shareowners’ proportional share of net income ofcertain consolidated subsidiaries.
Gains on Issuances of Stock by Equity Method Investees
When one of our equity method investees issues additional shares to third parties, our percentageownership interest in the investee decreases. In the event the issuance price per share is higher or lower than ouraverage carrying amount per share, we recognize a noncash gain or loss on the issuance, when appropriate. Thisnoncash gain or loss, net of any deferred taxes, is recognized in our net income in the period the change ofownership interest occurs.
In 2006, our equity method investees did not issue any additional shares to third parties that resulted in ourCompany recording any noncash pretax gains.
In 2005, our Company recorded approximately $23 million of noncash pretax gains on the issuances of stockby equity method investees. The issuances primarily related to Coca-Cola Amatil’s issuance of common stock inconnection with the acquisition of SPC Ardmona Pty. Ltd., an Australian packaged fruit company. Theseissuances of common stock reduced our ownership interest in the total outstanding shares of Coca-Cola Amatilfrom approximately 34 percent to approximately 32 percent.
In 2004, our Company recorded approximately $24 million of noncash pretax gains on issuances of stock byCCE. The issuances primarily related to the exercise of CCE stock options by CCE employees at amountsgreater than the book value per share of our investment in CCE. These issuances of stock reduced our
55

ownership interest in the total outstanding shares of CCE common stock from approximately 37 percent toapproximately 36 percent.
Income Taxes
Our effective tax rate reflects tax benefits derived from significant operations outside the United States,which are generally taxed at rates lower than the U.S. statutory rate of 35 percent.
Our effective tax rate of approximately 22.8 percent for the year ended December 31, 2006, included thefollowing:
• a tax benefit of approximately 1.8 percent primarily related to the sale of a portion of our investments inCoca-Cola Icecek and Coca-Cola FEMSA. The tax benefit was a result of the reversal of a valuationallowance that covered certain deferred tax assets recorded on capital loss carryforwards. The reversal ofthe valuation allowance was offset by a reduction of deferred tax assets due to the utilization of thesecapital loss carryforwards. These capital loss carryforwards offset the taxable gain on the sale of a portionof our investments in Coca-Cola Icecek and Coca-Cola FEMSA. Also included in this tax benefit is thereversal of the deferred tax liability recorded for the differences between the financial reporting and taxbases in the stock sold;
• an income tax benefit primarily related to the impairment of assets and investments in our bottlingoperations, contract termination costs related to production capacity efficiencies and other restructuringcharges at a rate of approximately 16 percent;
• a tax charge of approximately $24 million related to the resolution of certain tax matters; and
• an income tax benefit related to our proportionate share of CCE’s charges recorded at a rate ofapproximately 8.8 percent. Refer to Note 3 and Note 18 of Notes to Consolidated Financial Statements.
Our effective tax rate of approximately 27.2 percent for the year ended December 31, 2005, included thefollowing:
• an income tax benefit primarily related to the Philippines impairment charges at a rate of approximately4 percent;
• an income tax benefit of approximately $101 million related to the reversal of previously accrued taxesresulting from the favorable resolution of various tax matters; and
• a tax provision of approximately $315 million related to repatriation of previously unremitted foreignearnings under the Jobs Creation Act.
Our effective tax rate of approximately 22.1 percent for the year ended December 31, 2004, included thefollowing:
• an income tax benefit of approximately $128 million related to the reversal of previously accrued taxesresulting from the favorable resolution of various tax matters;
• an income tax benefit on ‘‘Other Operating Charges,’’ discussed above, at a rate of approximately36 percent;
• an income tax provision of approximately $75 million related to the recording of a valuation allowance ondeferred tax assets of CCEAG; and
• an income tax benefit of approximately $50 million as a result of the realization of certain tax creditsrelated to the Jobs Creation Act.
56

Based on current tax laws, the Company’s effective tax rate in 2007 is expected to be approximately23 percent before considering the effect of any unusual or special items that may affect our tax rate in futureyears.
Liquidity, Capital Resources and Financial Position
We believe our ability to generate cash from operating activities is one of our fundamental financialstrengths. We expect cash flows from operating activities to be strong in 2007 and in future years. Accordingly,our Company expects to meet all of our financial commitments and operating needs for the foreseeable future.We expect to use cash generated from operating activities primarily for dividends, share repurchases,acquisitions and aggregate contractual obligations.
Cash Flows from Operating Activities
Net cash provided by operating activities for the years ended December 31, 2006, 2005 and 2004 wasapproximately $6.0 billion, $6.4 billion and $6.0 billion, respectively.
Cash flows from operating activities decreased 7 percent in 2006 compared to 2005. This decrease wasprimarily the result of payments in 2006 of marketing accruals recorded in 2005 related to increased marketingand innovation activities and increased tax payments made in the first quarter of 2006 related to the 2005repatriation of foreign earnings under the Jobs Creation Act. This decrease was partially offset by an increase incash receipts in 2006 from customers, which was driven by a 4 percent growth in net operating revenues. Ourcash flows from operating activities in 2006 also decreased versus 2005 as a result of a contribution ofapproximately $216 million to a U.S. Voluntary Employee Beneficiary Association (‘‘VEBA’’), a tax-qualifiedtrust to fund retiree medical benefits (refer to Note 16 of Notes to Consolidated Financial Statements) and a$100 million donation made to The Coca-Cola Foundation.
Cash flows from operating activities increased 8 percent in 2005 compared to 2004. The increase wasprimarily related to an increase in cash receipts from customers, which was driven by a 6 percent growth in netoperating revenues. These higher cash collections were offset by increased payments to suppliers and vendors,including payments related to our increased marketing spending. Our cash flows from operating activities in2005 also improved versus 2004 as a result of a $137 million reduction in payments related to our 2003streamlining initiatives. Cash flows from operating activities in 2005 were unfavorably impacted by a $176 millionincrease in income tax payments primarily related to payment of a portion of the tax provision associated withthe repatriation of previously unremitted foreign earnings under the Jobs Creation Act.
Cash Flows from Investing Activities
Our cash flows used in investing activities are summarized as follows (in millions):
Year Ended December 31, 2006 2005 2004
Cash flows (used in) provided by investing activities:Acquisitions and investments, principally trademarks and
bottling companies $ (901) $ (637) $ (267)Purchases of other investments (82) (53) (46)Proceeds from disposals of other investments 640 33 161Purchases of property, plant and equipment (1,407) (899) (755)Proceeds from disposals of property, plant and equipment 112 88 341Other investing activities (62) (28) 63
Net cash used in investing activities $ (1,700) $ (1,496) $ (503)
Purchases of property, plant and equipment accounted for the most significant cash outlays for investingactivities in each of the three years ended December 31, 2006. Our Company currently estimates that purchasesof property, plant and equipment in 2007 will be approximately $1.5 billion.
57

Total capital expenditures for property, plant and equipment (including our investments in informationtechnology) and the percentage of such totals by operating segment for 2006, 2005 and 2004 were as follows:
Year Ended December 31, 2006 2005 2004
Capital expenditures (in millions) $ 1,407 $ 899 $ 755
Africa 2.7% 2.5% 2.3%East, South Asia and Pacific Rim 0.7 0.8 0.9European Union 6.6 8.6 5.1Latin America 3.1 2.7 3.4North America 29.9 29.5 32.7North Asia, Eurasia and Middle East 9.2 9.9 6.0Bottling Investments 29.7 29.4 34.1Corporate 18.1 16.6 15.5
Acquisitions and investments represented the next most significant investing activity, accounting for$901 million in 2006, $637 million in 2005 and $267 million in 2004.
In 2006, our Company acquired a controlling interest in CCCIL and acquired Apollinaris and TJC. Refer toNote 19 of Notes to Consolidated Financial Statements. The remaining amount of cash used for acquisitions andinvestments was primarily related to the acquisition of various trademarks and brands, none of which wereindividually significant.
Investing activities in 2006 also included proceeds of approximately $198 million received from the sale ofshares in connection with the initial public offering of Coca-Cola Icecek and proceeds of approximately$427 million received from the sale of a portion of Coca-Cola FEMSA shares to FEMSA. Refer to Note 3 ofNotes to Consolidated Financial Statements.
In April 2005, our Company and Coca-Cola HBC jointly acquired Multon for a total purchase price ofapproximately $501 million, split equally between the Company and Coca-Cola HBC. During the third quarterof 2005, our Company acquired the German bottling company Bremer for approximately $160 million fromInBev SA. Also in 2005, the Company acquired Sucos Mais, a Brazilian juice company, and completed theacquisition of the remaining 49 percent interest in the business of CCDA Waters L.L.C. not previously owned byour Company. Refer to Note 19 of Notes to Consolidated Financial Statements.
In 2004, proceeds from disposals of property, plant and equipment of approximately $341 million relatedprimarily to the sale of production assets in Japan. Refer to Note 3 of Notes to Consolidated FinancialStatements. In 2004, cash payments for acquisitions and investments were primarily related to the purchase oftrademarks in Latin America.
Cash Flows from Financing Activities
Our cash flows used in financing activities were as follows (in millions):
Year Ended December 31, 2006 2005 2004
Cash flows provided by (used in) financing activities:Issuances of debt $ 617 $ 178 $ 3,030Payments of debt (2,021) (2,460) (1,316)Issuances of stock 148 230 193Purchases of stock for treasury (2,416) (2,055) (1,739)Dividends (2,911) (2,678) (2,429)
Net cash used in financing activities $ (6,583) $ (6,785) $ (2,261)
58

Debt Financing
Our Company maintains debt levels we consider prudent based on our cash flows, interest coverage ratioand percentage of debt to capital. We use debt financing to lower our overall cost of capital, which increases ourreturn on shareowners’ equity.
As of December 31, 2006, our long-term debt was rated ‘‘A+’’ by Standard & Poor’s and ‘‘Aa3’’ by Moody’s,and our commercial paper program was rated ‘‘A-1’’ and ‘‘P-1’’ by Standard & Poor’s and Moody’s, respectively.In assessing our credit strength, both Standard & Poor’s and Moody’s consider our capital structure andfinancial policies as well as the aggregated balance sheet and other financial information for the Company andcertain bottlers, including CCE and Coca-Cola HBC. While the Company has no legal obligation for the debt ofthese bottlers, the rating agencies believe the strategic importance of the bottlers to the Company’s businessmodel provides the Company with an incentive to keep these bottlers viable. If our credit ratings were reducedby the rating agencies, our interest expense could increase. Additionally, if certain bottlers’ credit ratings were todecline, the Company’s share of equity income could be reduced as a result of the potential increase in interestexpense for these bottlers.
We monitor our interest coverage ratio and, as indicated above, the rating agencies consider our ratio inassessing our credit ratings. However, the rating agencies aggregate financial data for certain bottlers along withour Company when assessing our debt rating. As such, the key measure to rating agencies is the aggregateinterest coverage ratio of the Company and certain bottlers. Both Standard & Poor’s and Moody’s employdifferent aggregation methodologies and have different thresholds for the aggregate interest coverage ratio.These thresholds are not necessarily permanent, nor are they fully disclosed to our Company.
Our global presence and strong capital position give us access to key financial markets around the world,enabling us to raise funds at a low effective cost. This posture, coupled with active management of our mix ofshort-term and long-term debt and our mix of fixed-rate and variable-rate debt, results in a lower overall cost ofborrowing. Our debt management policies, in conjunction with our share repurchase programs and investmentactivity, can result in current liabilities exceeding current assets.
Issuances and payments of debt included both short-term and long-term financing activities. OnDecember 31, 2006, we had $1,952 million in lines of credit and other short-term credit facilities available, ofwhich approximately $225 million was outstanding. The outstanding amount of $225 million was primarilyrelated to our international operations.
The issuances of debt in 2006 primarily included approximately $484 million of issuances of commercialpaper and short-term debt with maturities of greater than 90 days. The payments of debt in 2006 primarilyincluded approximately $580 million related to commercial paper and short-term debt with maturities of greaterthan 90 days and approximately $1,383 million of net repayments of commercial paper and short-term debt withmaturities of 90 days or less.
The issuances of debt in 2005 primarily included approximately $144 million of issuances of commercialpaper with maturities of 90 days or more. The payments of debt primarily included approximately $1,037 millionrelated to net repayments of commercial paper with maturities of less than 90 days, repayments of commercialpaper with maturities greater than 90 days of approximately $32 million and repayment of approximately$1,363 million of long-term debt.
The issuances of debt in 2004 primarily included approximately $2,109 million of net issuances ofcommercial paper with maturities of 90 days or less, and approximately $818 million of issuances of commercialpaper with maturities of more than 90 days. The payments of debt in 2004 primarily included approximately$927 million related to commercial paper with maturities of more than 90 days and $367 million of long-termdebt.
59

Share Repurchases
In October 1996, our Board of Directors authorized a plan (‘‘1996 Plan’’) to repurchase up to 206 millionshares of our Company’s common stock through 2006. On July 20, 2006, the Board of Directors of the Companyauthorized a new share repurchase program of up to 300 million shares of the Company’s common stock. Thenew program took effect upon the expiration of the 1996 Plan on October 31, 2006. The table below presentsannual shares repurchased and average price per share:
Year Ended December 31, 2006 2005 2004
Number of shares repurchased (in millions) 55 46 38Average price per share $ 45.19 $ 43.26 $ 46.33
Since the inception of our initial share repurchase program in 1984 through our current program as ofDecember 31, 2006, we have purchased more than 1.2 billion shares of our Company’s common stock at anaverage price per share of $17.53.
As strong cash flows are expected to continue in the future, the Company currently expects 2007 sharerepurchases to be in the range of $2.5 billion to $3.0 billion.
Dividends
At its February 2007 meeting, our Board of Directors increased our quarterly dividend by 10 percent,raising it to $0.34 per share, equivalent to a full-year dividend of $1.36 per share in 2007. This is our 45th
consecutive annual increase. Our annual common stock dividend was $1.24 per share, $1.12 per share and $1.00per share in 2006, 2005 and 2004, respectively. The 2006 dividend represented a 10 percent increase from 2005,and the 2005 dividend represented a 12 percent increase from 2004.
Off–Balance Sheet Arrangements and Aggregate Contractual Obligations
Off–Balance Sheet Arrangements
In accordance with the definition under SEC rules, the following qualify as off–balance sheet arrangements:
• any obligation under certain guarantee contracts;
• a retained or contingent interest in assets transferred to an unconsolidated entity or similar arrangementthat serves as credit, liquidity or market risk support to that entity for such assets;
• any obligation under certain derivative instruments; and
• any obligation arising out of a material variable interest held by the registrant in an unconsolidated entitythat provides financing, liquidity, market risk or credit risk support to the registrant, or engages inleasing, hedging or research and development services with the registrant.
As of December 31, 2006, our Company was contingently liable for guarantees of indebtedness owed bythird parties in the amount of approximately $270 million. Management concluded that the likelihood of anymaterial amounts being paid by our Company under these guarantees is not probable. As of December 31, 2006,we were not directly liable for the debt of any unconsolidated entity, and we did not have any retained orcontingent interest in assets as defined above.
Our Company recognizes all derivatives as either assets or liabilities at fair value in our consolidatedbalance sheets. Refer to Note 12 of Notes to Consolidated Financial Statements.
In December 2003, we granted a $250 million standby line of credit to Coca-Cola FEMSA with normalmarket terms. This standby line of credit expired in December 2006.
60

Aggregate Contractual Obligations
As of December 31, 2006, the Company’s contractual obligations, including payments due by period, wereas follows (in millions):
Payments Due by Period2012 and
Total 2007 2008-2009 2010-2011 Thereafter
Short-term loans and notes payable1:Commercial paper borrowings $ 1,942 $ 1,942 $ — $ — $ —Lines of credit and other short-term
borrowings 225 225 — — —Liability to CCEAG shareowners2 1,068 1,068 — — —Current maturities of long-term debt3 33 33 — — —Long-term debt, net of current maturities3 1,314 — 611 576 127Estimated interest payments4 993 80 135 73 705Purchase obligations5 8,401 4,815 1,237 636 1,713Marketing obligations6 3,925 1,579 832 583 931Lease obligations 545 141 193 127 84
Total contractual obligations $ 18,446 $ 9,883 $ 3,008 $ 1,995 $ 3,560
1 Refer to Note 8 of Notes to Consolidated Financial Statements for information regarding short-termloans and notes payable. Upon payment of outstanding commercial paper, we typically issue newcommercial paper. Lines of credit and other short-term borrowings are expected to fluctuatedepending upon current liquidity needs, especially at international subsidiaries.
2 Refer to Note 8 of Notes to Consolidated Financial Statements for a discussion of our liability toCCEAG shareowners as of December 31, 2006. We paid the amount due to CCEAG shareowners inJanuary 2007 to discharge our liability.
3 Refer to Note 9 of Notes to Consolidated Financial Statements for information regarding long-termdebt. We will consider several alternatives to settle this long-term debt, including the use of cash flowsfrom operating activities, issuance of commercial paper or issuance of other long-term debt.
4 We calculated estimated interest payments for long-term debt as follows: for fixed-rate debt and termdebt, we calculated interest based on the applicable rates and payment dates; for variable-rate debtand/or non-term debt, we estimated interest rates and payment dates based on our determination ofthe most likely scenarios for each relevant debt instrument. We typically expect to settle such interestpayments with cash flows from operating activities and/or short-term borrowings.
5 The purchase obligations include agreements to purchase goods or services that are enforceable andlegally binding and that specify all significant terms, including long-term contractual obligations, openpurchase orders, accounts payable and certain accrued liabilities. We expect to fund these obligationswith cash flows from operating activities.
6 We expect to fund these marketing obligations with cash flows from operating activities.
In accordance with SFAS No. 87, ‘‘Employers’ Accounting for Pensions,’’ and SFAS No. 106, ‘‘Employers’Accounting for Postretirement Benefits Other Than Pensions,’’ as amended by SFAS No. 158, ‘‘Employers’Accounting for Defined Benefit Pension and Other Postretirement Plans—an amendment of FASB StatementsNo. 87, 88, 106, and 132(R),’’ the total accrued benefit liability for pension and other postretirement benefitplans recognized as of December 31, 2006, was $1,273 million. Refer to Note 16 of Notes to ConsolidatedFinancial Statements. This accrued liability is included in the consolidated balance sheet line item otherliabilities. This amount is impacted by, among other items, pension expense funding levels, changes in plandemographics and assumptions, investment return on plan assets, and the application of SFAS No. 158. Becausethe accrued liability does not represent expected liquidity needs, we did not include this amount in thecontractual obligations table.
61

The Pension Protection Act of 2006 (‘‘PPA’’) was enacted in August 2006 and established, among otherthings, new standards for funding of U.S. defined benefit pension plans. One of the primary objectives of thePPA is to improve the financial integrity of underfunded plans through the requirement of additionalcontributions. The requirements of the PPA will not have a significant impact on our financial condition because,under the provisions of the PPA, the minimum required contribution for the primary funded U.S. plan isprojected to be zero through 2017 as a result of contributions we have made to the plan since 2001. Therefore,we did not include any amounts as a contractual obligation in the above table. We may, however, decide to makeadditional discretionary contributions to our pension and other benefit plans in future years. In addition, as aresult of contributions totaling approximately $224 million in 2006 to fund a portion of our U.S. postretirementhealthcare obligation, including a contribution of $216 million to a VEBA trust, we do not expect to contributeto our U.S. postretirement healthcare plan in 2007. We generally expect to fund all future contributions withcash flows from operating activities.
Our international pension plans are funded in accordance with local laws and income tax regulations. Wedo not expect contributions to these plans to be material in 2007 or thereafter. Therefore, no amounts have beenincluded in the table above.
As of December 31, 2006, the projected benefit obligation of the U.S. qualified pension plans was$1,660 million, and the fair value of plan assets was $2,120 million. As of December 31, 2006, the projectedbenefit obligation of all pension plans other than the U.S. qualified pension plans was $1,385 million, and thefair value of all other pension plan assets was $723 million. The majority of this underfunding is attributable toan international pension plan for certain non-U.S. employees that is unfunded due to tax law restrictions, as wellas our unfunded U.S. nonqualified pension plans. These U.S. nonqualified pension plans provide, for certainassociates, benefits that are not permitted to be funded through a qualified plan because of limits imposed bythe Internal Revenue Code of 1986. Disclosure of amounts are not included in the above table regardingexpected benefit payments for our unfunded pension plans. However, we anticipate annual benefit payments tobe in the range of approximately $25 million to $30 million in 2007 and to remain at or near this annual level forthe next several years. We can not reasonably estimate these payments for 2012 and thereafter due to theongoing nature of the obligations under these plans.
Deferred income tax liabilities as of December 31, 2006, were $641 million. Refer to Note 17 of Notes toConsolidated Financial Statements. This amount is not included in the total contractual obligations tablebecause we believe this presentation would not be meaningful. Deferred income tax liabilities are calculatedbased on temporary differences between the tax bases of assets and liabilities and their respective book bases,which will result in taxable amounts in future years when the liabilities are settled at their reported financialstatement amounts. The results of these calculations do not have a direct connection with the amount of cashtaxes to be paid in any future periods. As a result, scheduling deferred income tax liabilities as payments due byperiod could be misleading, because this scheduling would not relate to liquidity needs.
Minority interests of $358 million as of December 31, 2006, for consolidated entities in which we do nothave a 100 percent ownership interest were recorded in the consolidated balance sheet line item other liabilities.Such minority interests are not liabilities requiring the use of cash or other resources; therefore, this amount isexcluded from the contractual obligations table.
Foreign Exchange
Our international operations are subject to opportunities and risks relating to foreign currency fluctuationsand governmental actions. We closely monitor our operations in each country and seek to adopt appropriatestrategies that are responsive to fluctuations in foreign currency exchange rates.
We use 64 functional currencies. Due to our global operations, weaknesses in some of these currenciesmight be offset by strength in others. In 2006, 2005 and 2004, the weighted-average exchange rates for foreign
62

currencies in which the Company conducted operations (all operating currencies), and for certain individualcurrencies, strengthened (weakened) against the U.S. dollar as follows:
Year Ended December 31, 2006 2005 2004
All operating currencies (1)% 2 % 6 %
Brazilian real 10 % 21 % 5 %Mexican peso 0 % 4 % (5)%Australian dollar (1)% 3 % 13 %South African rand (7)% 1 % 18 %British pound 1 % 0 % 12 %Euro 1 % 1 % 9 %Japanese yen (6)% (1)% 7 %
These percentages do not include the effects of our hedging activities and, therefore, do not reflect theactual impact of fluctuations in exchange rates on our operating results. Our foreign currency managementprogram is designed to mitigate, over time, a portion of the impact of exchange rate changes on our net incomeand earnings per share. The total currency impact on operating income, including the effect of our hedgingactivities, was a decrease of approximately 1 percent in 2006. The impact of a weaker U.S. dollar increased ouroperating income by approximately 4 percent and 8 percent in 2005 and 2004, respectively. The Companycurrently expects currencies to have little impact on operating income in 2007.
Exchange losses—net amounted to approximately $15 million in 2006, $23 million in 2005 and $39 millionin 2004 and were recorded in other income (loss)—net in our consolidated statements of income. Exchangelosses—net include the remeasurement of monetary assets and liabilities from certain currencies into functionalcurrencies and the costs of hedging certain exposures of our consolidated balance sheets. Refer to Note 12 ofNotes to Consolidated Financial Statements.
The Company will continue to manage its foreign currency exposure to mitigate, over time, a portion of theimpact of exchange rate changes on net income and earnings per share.
Overview of Financial Position
Our consolidated balance sheet as of December 31, 2006, compared to our consolidated balance sheet as ofDecember 31, 2005, was impacted by the following:
• increases in trademarks with indefinite lives, goodwill and other intangible assets of $99 million,$356 million and $859 million, respectively, primarily due to our acquisitions of CCCIL, Apollinaris andTJC as well as the consolidation of Brucephil in 2006;
• an increase in property, plant and equipment of $1,727 million, primarily due to 2006 purchases andacquisitions and consolidation under Interpretation No. 46(R), as discussed above; and
• a decrease in loans and notes payable of $1,283 million, primarily due to the net repayment ofcommercial paper and short-term debt during 2006.
Impact of Inflation and Changing Prices
Inflation affects the way we operate in many markets around the world. In general, we believe that, overtime, we are able to increase prices to counteract the majority of the inflationary effects of increasing costs andto generate sufficient cash flows to maintain our productive capability.
63

Additional Information
Effective January 1, 2007, we combined the Eurasia and Middle East Division, and the Russia, Ukraine andBelarus Division, both of which were previously included in the North Asia, Eurasia and Middle East operatingsegment, with the India Division, previously included in the East, South Asia and Pacific Rim operating segment,to form the Eurasia operating segment; and we combined the China Division and the Japan Division, previouslyincluded in the North Asia, Eurasia and Middle East operating segment, with the remaining East, South Asiaand Pacific Rim operating segment to form the Pacific operating segment. As a result, beginning with the firstquarter of 2007, our organizational structure will consist of the following operating segments: Africa; Eurasia;European Union; Latin America; North America; Pacific; Bottling Investments; and Corporate.
For information concerning our operating segments as of December 31, 2006, refer to Note 20 of Notes toConsolidated Financial Statements.
64

ITEM 7A. QUANTITATIVE AND QUALITATIVE DISCLOSURES ABOUT MARKET RISK
Our Company uses derivative financial instruments primarily to reduce our exposure to adverse fluctuationsin foreign currency exchange rates and, to a lesser extent, adverse fluctuations in interest rates and commodityprices and other market risks. We do not enter into derivative financial instruments for trading purposes. As amatter of policy, all our derivative positions are used to reduce risk by hedging an underlying economicexposure. Because of the high correlation between the hedging instrument and the underlying exposure,fluctuations in the value of the instruments are generally offset by reciprocal changes in the value of theunderlying exposure. Virtually all of our derivatives are straightforward, over-the-counter instruments withliquid markets.
Foreign Exchange
We manage most of our foreign currency exposures on a consolidated basis, which allows us to net certainexposures and take advantage of any natural offsets. In 2006, we generated approximately 72 percent of our netoperating revenues from operations outside of the United States; therefore, weakness in one particular currencymight be offset by strengths in other currencies over time. We use derivative financial instruments to furtherreduce our net exposure to currency fluctuations.
Our Company enters into forward exchange contracts and purchases currency options (principally euro andJapanese yen) and collars to hedge certain portions of forecasted cash flows denominated in foreign currencies.Additionally, we enter into forward exchange contracts to offset the earnings impact relating to exchange ratefluctuations on certain monetary assets and liabilities. We also enter into forward exchange contracts as hedgesof net investments in international operations.
Interest Rates
We monitor our mix of fixed-rate and variable-rate debt, as well as our mix of term debt versus non-termdebt. From time to time we enter into interest rate swap agreements to manage our mix of fixed-rate andvariable-rate debt.
Value-at-Risk
We monitor our exposure to financial market risks using several objective measurement systems, includingvalue-at-risk models. Our value-at-risk calculations use a historical simulation model to estimate potential futurelosses in the fair value of our derivatives and other financial instruments that could occur as a result of adversemovements in foreign currency and interest rates. We have not considered the potential impact of favorablemovements in foreign currency and interest rates on our calculations. We examined historical weekly returnsover the previous 10 years to calculate our value-at-risk. The average value-at-risk represents the simple averageof quarterly amounts over the past year. As a result of our foreign currency value-at-risk calculations, weestimate with 95 percent confidence that the fair values of our foreign currency derivatives and other financialinstruments, over a one-week period, would decline by approximately $14 million, $9 million and $17 million,respectively, using 2006, 2005 or 2004 average fair values, and by approximately $14 million and $9 million,respectively, using December 31, 2006 and 2005 fair values. According to our interest rate value-at-riskcalculations, we estimate with 95 percent confidence that any increase in our net interest expense due to anadverse move in our 2006 average or in our December 31, 2006, interest rates over a one-week period would nothave a material impact on our consolidated financial statements. Our December 31, 2005 and 2004 estimatesalso were not material to our consolidated financial statements.
65

ITEM 8. FINANCIAL STATEMENTS AND SUPPLEMENTARY DATA
TABLE OF CONTENTS
Page
Consolidated Statements of Income . . . . . . . . . . . . . . . . . . . . . . . . . . . . . . . . . . . . . . . . . . . . . . . . . . . . 67
Consolidated Balance Sheets . . . . . . . . . . . . . . . . . . . . . . . . . . . . . . . . . . . . . . . . . . . . . . . . . . . . . . . . . . 68
Consolidated Statements of Cash Flows . . . . . . . . . . . . . . . . . . . . . . . . . . . . . . . . . . . . . . . . . . . . . . . . . 69
Consolidated Statements of Shareowners’ Equity . . . . . . . . . . . . . . . . . . . . . . . . . . . . . . . . . . . . . . . . . . 70
Notes to Consolidated Financial Statements . . . . . . . . . . . . . . . . . . . . . . . . . . . . . . . . . . . . . . . . . . . . . . 71
Report of Management on Internal Control Over Financial Reporting . . . . . . . . . . . . . . . . . . . . . . . . . . 125
Report of Independent Registered Public Accounting Firm . . . . . . . . . . . . . . . . . . . . . . . . . . . . . . . . . . 126
Report of Independent Registered Public Accounting Firm on Internal Control Over FinancialReporting . . . . . . . . . . . . . . . . . . . . . . . . . . . . . . . . . . . . . . . . . . . . . . . . . . . . . . . . . . . . . . . . . . . . . . 127
Quarterly Data (Unaudited) . . . . . . . . . . . . . . . . . . . . . . . . . . . . . . . . . . . . . . . . . . . . . . . . . . . . . . . . . . 128
66

THE COCA-COLA COMPANY AND SUBSIDIARIES
CONSOLIDATED STATEMENTS OF INCOME
Year Ended December 31, 2006 2005 2004(In millions except per share data)
NET OPERATING REVENUES $ 24,088 $ 23,104 $ 21,742Cost of goods sold 8,164 8,195 7,674
GROSS PROFIT 15,924 14,909 14,068Selling, general and administrative expenses 9,431 8,739 7,890Other operating charges 185 85 480
OPERATING INCOME 6,308 6,085 5,698Interest income 193 235 157Interest expense 220 240 196Equity income — net 102 680 621Other income (loss) — net 195 (93) (82)Gains on issuances of stock by equity method investees — 23 24
INCOME BEFORE INCOME TAXES 6,578 6,690 6,222Income taxes 1,498 1,818 1,375
NET INCOME $ 5,080 $ 4,872 $ 4,847
BASIC NET INCOME PER SHARE $ 2.16 $ 2.04 $ 2.00
DILUTED NET INCOME PER SHARE $ 2.16 $ 2.04 $ 2.00
AVERAGE SHARES OUTSTANDING 2,348 2,392 2,426Effect of dilutive securities 2 1 3
AVERAGE SHARES OUTSTANDING ASSUMING DILUTION 2,350 2,393 2,429
Refer to Notes to Consolidated Financial Statements.
67

THE COCA-COLA COMPANY AND SUBSIDIARIES
CONSOLIDATED BALANCE SHEETS
December 31, 2006 2005(In millions except par value)
ASSETSCURRENT ASSETS
Cash and cash equivalents $ 2,440 $ 4,701Marketable securities 150 66Trade accounts receivable, less allowances of $63 and $72, respectively 2,587 2,281Inventories 1,641 1,379Prepaid expenses and other assets 1,623 1,778
TOTAL CURRENT ASSETS 8,441 10,205
INVESTMENTSEquity method investments:
Coca-Cola Enterprises Inc. 1,312 1,731Coca-Cola Hellenic Bottling Company S.A. 1,251 1,039Coca-Cola FEMSA, S.A.B. de C.V. 835 982Coca-Cola Amatil Limited 817 748Other, principally bottling companies 2,095 2,062
Cost method investments, principally bottling companies 473 360
TOTAL INVESTMENTS 6,783 6,922
OTHER ASSETS 2,701 2,648PROPERTY, PLANT AND EQUIPMENT — net 6,903 5,831TRADEMARKS WITH INDEFINITE LIVES 2,045 1,946GOODWILL 1,403 1,047OTHER INTANGIBLE ASSETS 1,687 828
TOTAL ASSETS $ 29,963 $ 29,427
LIABILITIES AND SHAREOWNERS’ EQUITYCURRENT LIABILITIES
Accounts payable and accrued expenses $ 5,055 $ 4,493Loans and notes payable 3,235 4,518Current maturities of long-term debt 33 28Accrued income taxes 567 797
TOTAL CURRENT LIABILITIES 8,890 9,836
LONG-TERM DEBT 1,314 1,154OTHER LIABILITIES 2,231 1,730DEFERRED INCOME TAXES 608 352SHAREOWNERS’ EQUITY
Common stock, $0.25 par value; Authorized — 5,600 shares;Issued — 3,511 and 3,507 shares, respectively 878 877
Capital surplus 5,983 5,492Reinvested earnings 33,468 31,299Accumulated other comprehensive income (loss) (1,291) (1,669)Treasury stock, at cost — 1,193 and 1,138 shares, respectively (22,118) (19,644)
TOTAL SHAREOWNERS’ EQUITY 16,920 16,355
TOTAL LIABILITIES AND SHAREOWNERS’ EQUITY $ 29,963 $ 29,427
Refer to Notes to Consolidated Financial Statements.
68

THE COCA-COLA COMPANY AND SUBSIDIARIES
CONSOLIDATED STATEMENTS OF CASH FLOWS
Year Ended December 31, 2006 2005 2004(In millions)
OPERATING ACTIVITIESNet income $ 5,080 $ 4,872 $ 4,847Depreciation and amortization 938 932 893Stock-based compensation expense 324 324 345Deferred income taxes (35) (88) 162Equity income or loss, net of dividends 124 (446) (476)Foreign currency adjustments 52 47 (59)Gains on issuances of stock by equity investees — (23) (24)Gains on sales of assets, including bottling interests (303) (9) (20)Other operating charges 159 85 480Other items 233 299 437Net change in operating assets and liabilities (615) 430 (617)
Net cash provided by operating activities 5,957 6,423 5,968
INVESTING ACTIVITIESAcquisitions and investments, principally trademarks and bottling companies (901) (637) (267)Purchases of other investments (82) (53) (46)Proceeds from disposals of other investments 640 33 161Purchases of property, plant and equipment (1,407) (899) (755)Proceeds from disposals of property, plant and equipment 112 88 341Other investing activities (62) (28) 63
Net cash used in investing activities (1,700) (1,496) (503)
FINANCING ACTIVITIESIssuances of debt 617 178 3,030Payments of debt (2,021) (2,460) (1,316)Issuances of stock 148 230 193Purchases of stock for treasury (2,416) (2,055) (1,739)Dividends (2,911) (2,678) (2,429)
Net cash used in financing activities (6,583) (6,785) (2,261)
EFFECT OF EXCHANGE RATE CHANGES ON CASH AND CASHEQUIVALENTS 65 (148) 141
CASH AND CASH EQUIVALENTSNet (decrease) increase during the year (2,261) (2,006) 3,345Balance at beginning of year 4,701 6,707 3,362
Balance at end of year $ 2,440 $ 4,701 $ 6,707
Refer to Notes to Consolidated Financial Statements.
69

THE COCA-COLA COMPANY AND SUBSIDIARIES
CONSOLIDATED STATEMENTS OF SHAREOWNERS’ EQUITY
Year Ended December 31, 2006 2005 2004(In millions except per share data)
NUMBER OF COMMON SHARES OUTSTANDINGBalance at beginning of year 2,369 2,409 2,442
Stock issued to employees exercising stock options 4 7 5Purchases of stock for treasury1 (55) (47) (38)
Balance at end of year 2,318 2,369 2,409
COMMON STOCKBalance at beginning of year $ 877 $ 875 $ 874
Stock issued to employees exercising stock options 1 2 1
Balance at end of year 878 877 875
CAPITAL SURPLUSBalance at beginning of year 5,492 4,928 4,395
Stock issued to employees exercising stock options 164 229 175Tax benefit from employees’ stock option and restricted stock plans 3 11 13Stock-based compensation 324 324 345
Balance at end of year 5,983 5,492 4,928
REINVESTED EARNINGSBalance at beginning of year 31,299 29,105 26,687
Net income 5,080 4,872 4,847Dividends (per share — $1.24, $1.12 and $1.00 in 2006, 2005 and 2004, respectively) (2,911) (2,678) (2,429)
Balance at end of year 33,468 31,299 29,105
ACCUMULATED OTHER COMPREHENSIVE INCOME (LOSS)Balance at beginning of year (1,669) (1,348) (1,995)
Net foreign currency translation adjustment 603 (396) 665Net gain (loss) on derivatives (26) 57 (3)Net change in unrealized gain on available-for-sale securities 43 13 39Net change in pension liability, prior to adoption of SFAS No. 158 46 5 (54)
Net other comprehensive income adjustments 666 (321) 647Adjustment to initially apply SFAS No. 158 (288) — —
Balance at end of year (1,291) (1,669) (1,348)
TREASURY STOCKBalance at beginning of year (19,644) (17,625) (15,871)
Purchases of treasury stock (2,474) (2,019) (1,754)
Balance at end of year (22,118) (19,644) (17,625)
TOTAL SHAREOWNERS’ EQUITY $ 16,920 $ 16,355 $ 15,935
COMPREHENSIVE INCOMENet income $ 5,080 $ 4,872 $ 4,847Net other comprehensive income adjustments 666 (321) 647
TOTAL COMPREHENSIVE INCOME $ 5,746 $ 4,551 $ 5,494
1 Common stock purchased from employees exercising stock options numbered approximately zero shares, 0.5 shares and 0.4 sharesfor the years ended December 31, 2006, 2005 and 2004, respectively.
Refer to Notes to Consolidated Financial Statements.
70

THE COCA-COLA COMPANY AND SUBSIDIARIES
NOTES TO CONSOLIDATED FINANCIAL STATEMENTS
NOTE 1: BUSINESS AND SUMMARY OF SIGNIFICANT ACCOUNTING POLICIES
Description of Business
The Coca-Cola Company is predominantly a manufacturer, distributor and marketer of nonalcoholicbeverage concentrates and syrups. We also manufacture, distribute and market some finished beverages. Inthese notes, the terms ‘‘Company,’’ ‘‘we,’’ ‘‘us’’ or ‘‘our’’ mean The Coca-Cola Company and all subsidiariesincluded in the consolidated financial statements. We primarily sell concentrates and syrups, as well as somefinished beverages, to bottling and canning operations, distributors, fountain wholesalers and fountain retailers.Our Company owns or licenses more than 400 brands, including Coca-Cola, Diet Coke, Fanta and Sprite, and avariety of diet and light beverages, waters, juice and juice drinks, teas, coffees, and energy and sports drinks.Additionally, we have ownership interests in numerous bottling and canning operations. Significant markets forour products exist in all the world’s geographic regions.
Basis of Presentation and Consolidation
Our consolidated financial statements are prepared in accordance with accounting principles generallyaccepted in the United States. Our Company consolidates all entities that we control by ownership of a majorityvoting interest as well as variable interest entities for which our Company is the primary beneficiary. Refer to theheading ‘‘Variable Interest Entities,’’ below, for a discussion of variable interest entities.
We use the equity method to account for our investments for which we have the ability to exercisesignificant influence over operating and financial policies. Consolidated net income includes our Company’sshare of the net income of these companies.
We use the cost method to account for our investments in companies that we do not control and for whichwe do not have the ability to exercise significant influence over operating and financial policies. In accordancewith the cost method, these investments are recorded at cost or fair value, as appropriate.
We eliminate from our financial results all significant intercompany transactions, including theintercompany transactions with variable interest entities and the intercompany portion of transactions withequity method investees.
Certain amounts in the prior years’ consolidated financial statements and notes have been reclassified toconform to the current year presentation.
Variable Interest Entities
Financial Accounting Standards Board (‘‘FASB’’) Interpretation No. 46 (revised December 2003),‘‘Consolidation of Variable Interest Entities’’ (‘‘Interpretation No. 46(R)’’) addresses the consolidation ofbusiness enterprises to which the usual condition (ownership of a majority voting interest) of consolidation doesnot apply. Interpretation No. 46(R) focuses on controlling financial interests that may be achieved througharrangements that do not involve voting interests. It concludes that in the absence of clear control throughvoting interests, a company’s exposure (variable interest) to the economic risks and potential rewards from thevariable interest entity’s assets and activities is the best evidence of control. If an enterprise holds a majority ofthe variable interests of an entity, it would be considered the primary beneficiary. Upon consolidation, theprimary beneficiary is generally required to include assets, liabilities and noncontrolling interests at fair valueand subsequently account for the variable interest as if it were consolidated based on majority voting interest.
71

THE COCA-COLA COMPANY AND SUBSIDIARIES
NOTES TO CONSOLIDATED FINANCIAL STATEMENTS
NOTE 1: BUSINESS AND SUMMARY OF SIGNIFICANT ACCOUNTING POLICIES (Continued)
In our consolidated financial statements as of December 31, 2003, and prior to December 31, 2003, weconsolidated all entities that we controlled by ownership of a majority of voting interests. As a result ofInterpretation No. 46(R), effective as of April 2, 2004, our consolidated balance sheets include the assets andliabilities of the following:
• all entities in which the Company has ownership of a majority of voting interests; and
• all variable interest entities for which we are the primary beneficiary.
Our Company holds interests in certain entities, primarily bottlers accounted for under the equity methodof accounting prior to April 2, 2004 that are considered variable interest entities. These variable interests relateto profit guarantees or subordinated financial support for these entities. Upon adoption of InterpretationNo. 46(R) as of April 2, 2004, we consolidated assets of approximately $383 million and liabilities ofapproximately $383 million that were previously not recorded on our consolidated balance sheets. We did notrecord a cumulative effect of an accounting change, and prior periods were not restated. The results ofoperations of these variable interest entities were included in our consolidated results beginning April 3, 2004,and did not have a material impact for the year ended December 31, 2004. Our Company’s investment, plus anyloans and guarantees, related to these variable interest entities totaled approximately $429 million and$263 million at December 31, 2006 and 2005, respectively, representing our maximum exposures to loss. Anycreditors of the variable interest entities do not have recourse against the general credit of the Company as aresult of including these variable interest entities in our consolidated financial statements.
Use of Estimates and Assumptions
The preparation of our consolidated financial statements requires us to make estimates and assumptionsthat affect the reported amounts of assets, liabilities, revenues and expenses and the disclosure of contingentassets and liabilities in our consolidated financial statements and accompanying notes. Although these estimatesare based on our knowledge of current events and actions we may undertake in the future, actual results mayultimately differ from estimates and assumptions.
Risks and Uncertainties
Factors that could adversely impact the Company’s operations or financial results include, but are notlimited to, the following: obesity concerns; water scarcity and quality; changes in the nonalcoholic beveragesbusiness environment; increased competition; inability to expand operations in developing and emergingmarkets; fluctuations in foreign currency exchange and interest rates; inability to maintain good relationshipswith our bottling partners; a deterioration in our bottling partners’ financial condition; strikes or work stoppages(including at key manufacturing locations); increased cost of energy; increased cost, disruption of supply orshortage of raw materials; changes in laws and regulations relating to our business, including those regardingbeverage containers and packaging; additional labeling or warning requirements; unfavorable economic andpolitical conditions in international markets; changes in commercial and market practices within the EuropeanEconomic Area; litigation or legal proceedings; adverse weather conditions; an inability to maintain brand imageand product issues such as product recalls; changes in the legal and regulatory environment in various countriesin which we operate; changes in accounting and taxation standards including an increase in tax rates; an inabilityto achieve our overall long-term goals; an inability to protect our information systems; future impairmentcharges; an inability to successfully manage our Company-owned bottling operations; and global or regionalcatastrophic events.
72

THE COCA-COLA COMPANY AND SUBSIDIARIES
NOTES TO CONSOLIDATED FINANCIAL STATEMENTS
NOTE 1: BUSINESS AND SUMMARY OF SIGNIFICANT ACCOUNTING POLICIES (Continued)
Our Company monitors our operations with a view to minimizing the impact to our overall business thatcould arise as a result of the risks and uncertainties inherent in our business.
Revenue Recognition
Our Company recognizes revenue when persuasive evidence of an arrangement exists, delivery of productshas occurred, the sales price charged is fixed or determinable, and collectibility is reasonably assured. For ourCompany, this generally means that we recognize revenue when title to our products is transferred to ourbottling partners, resellers or other customers. In particular, title usually transfers upon shipment to or receipt atour customers’ locations, as determined by the specific sales terms of the transactions.
In addition, our customers can earn certain incentives, which are included in deductions from revenue, acomponent of net operating revenues in the consolidated statements of income. These incentives include, butare not limited to, cash discounts, funds for promotional and marketing activities, volume-based incentiveprograms and support for infrastructure programs (refer to the heading ‘‘Other Assets’’). The aggregatedeductions from revenue recorded by the Company in relation to these programs, including amortizationexpense on infrastructure initiatives, was approximately $3.8 billion, $3.7 billion and $3.6 billion for the yearsended December 31, 2006, 2005 and 2004, respectively.
Advertising Costs
Our Company expenses production costs of print, radio, television and other advertisements as of the firstdate the advertisements take place. Advertising costs included in selling, general and administrative expenseswere approximately $2.6 billion, $2.5 billion and $2.2 billion for the years ended December 31, 2006, 2005 and2004, respectively. As of December 31, 2006 and 2005, advertising and production costs of approximately$214 million and $170 million, respectively, were recorded in prepaid expenses and other assets and innoncurrent other assets in our consolidated balance sheets.
Stock-Based Compensation
Our Company currently sponsors stock option plans and restricted stock award plans. Refer to Note 15.Prior to January 1, 2006, the Company accounted for these plans under the fair value recognition andmeasurement provisions of Statement of Financial Accounting Standards (‘‘SFAS’’) No. 123, ‘‘Accounting forStock-Based Compensation.’’ Effective January 1, 2006, the Company adopted SFAS No. 123 (revised 2004),‘‘Share Based Payment’’ (‘‘SFAS No. 123(R)’’). Our Company adopted SFAS No. 123(R) using the modifiedprospective method. Based on the terms of our plans, our Company did not have a cumulative effect related toour plans. The adoption of SFAS No. 123(R) did not have a material impact on our stock-based compensationexpense for the year ended December 31, 2006. Further, we believe the adoption of SFAS No. 123(R) will nothave a material impact on our Company’s future stock-based compensation expense. The fair values of the stockawards are determined using an estimated expected life. The Company recognizes compensation expense on astraight-line basis over the period the award is earned by the employee.
Our equity method investees also adopted SFAS No. 123(R) effective January 1, 2006. Our proportionateshare of the stock-based compensation expense resulting from the adoption of SFAS No. 123(R) by our equitymethod investees is recognized as a reduction of equity income. The adoption of SFAS No. 123(R) by our equitymethod investees did not have a material impact on our consolidated financial statements.
73

THE COCA-COLA COMPANY AND SUBSIDIARIES
NOTES TO CONSOLIDATED FINANCIAL STATEMENTS
NOTE 1: BUSINESS AND SUMMARY OF SIGNIFICANT ACCOUNTING POLICIES (Continued)
Issuances of Stock by Equity Method Investees
When one of our equity method investees issues additional shares to third parties, our percentageownership interest in the investee decreases. In the event the issuance price per share is higher or lower than ouraverage carrying amount per share, we recognize a noncash gain or loss on the issuance. This noncash gain orloss, net of any deferred taxes, is generally recognized in our net income in the period the change in ownershipinterest occurs.
If gains or losses have been previously recognized on issuances of an equity method investee’s stock andshares of the equity method investee are subsequently repurchased by the equity method investee, gain or lossrecognition does not occur on issuances subsequent to the date of a repurchase until shares have been issued inan amount equivalent to the number of repurchased shares. This type of transaction is reflected as an equitytransaction, and the net effect is reflected in our consolidated balance sheets. Refer to Note 4.
Income Taxes
Income tax expense includes United States, state, local and international income taxes, plus a provision forU.S. taxes on undistributed earnings of foreign subsidiaries not deemed to be indefinitely reinvested. Deferredtax assets and liabilities are recognized for the tax consequences of temporary differences between the financialreporting and the tax basis of existing assets and liabilities. The tax rate used to determine the deferred tax assetsand liabilities is the enacted tax rate for the year in which the differences are expected to reverse. Valuationallowances are recorded to reduce deferred tax assets to the amount that will more likely than not be realized.Refer to Note 17.
Net Income Per Share
Basic net income per share is computed by dividing net income by the weighted average number of commonshares outstanding during the reporting period. Diluted net income per share is computed similarly to basic netincome per share except that it includes the potential dilution that could occur if dilutive securities wereexercised. Approximately 175 million, 180 million and 151 million stock option awards were excluded from thecomputations of diluted net income per share in 2006, 2005 and 2004, respectively, because the awards wouldhave been antidilutive for the periods presented.
Cash Equivalents
We classify marketable securities that are highly liquid and have maturities of three months or less at thedate of purchase as cash equivalents. We manage our exposure to counterparty credit risk through specificminimum credit standards, diversification of counterparties and procedures to monitor our credit riskconcentrations.
Trade Accounts Receivable
We record trade accounts receivable at net realizable value. This value includes an appropriate allowancefor estimated uncollectible accounts to reflect any loss anticipated on the trade accounts receivable balances andcharged to the provision for doubtful accounts. We calculate this allowance based on our history of write-offs,level of past-due accounts based on the contractual terms of the receivables, and our relationships with and theeconomic status of our bottling partners and customers.
74

THE COCA-COLA COMPANY AND SUBSIDIARIES
NOTES TO CONSOLIDATED FINANCIAL STATEMENTS
NOTE 1: BUSINESS AND SUMMARY OF SIGNIFICANT ACCOUNTING POLICIES (Continued)
Activity in the allowance for doubtful accounts was as follows (in millions):
Year Ended December 31, 2006 2005 2004
Balance, beginning of year $ 72 $ 69 $ 61Net charges to costs and expenses 2 17 28Write-offs (12) (12) (19)Other1 1 (2) (1)
Balance, end of year $ 63 $ 72 $ 69
1 Other includes acquisitions, divestitures and currency translation.
A significant portion of our net operating revenues is derived from sales of our products in internationalmarkets. Refer to Note 20. We also generate a significant portion of our net operating revenues by sellingconcentrates and syrups to bottlers in which we have a noncontrolling interest, including Coca-ColaEnterprises Inc. (‘‘CCE’’), Coca-Cola Hellenic Bottling Company S.A. (‘‘Coca-Cola HBC’’), Coca-ColaFEMSA, S.A.B. de C.V. (‘‘Coca-Cola FEMSA’’) and Coca-Cola Amatil Limited (‘‘Coca-Cola Amatil’’). Refer toNote 3.
Inventories
Inventories consist primarily of raw materials and packaging (which includes ingredients and supplies) andfinished goods (which includes concentrates and syrups in our concentrate and foodservice operations, andfinished beverages in our bottling and canning operations). Inventories are valued at the lower of cost or market.We determine cost on the basis of the average cost or first-in, first-out methods. Refer to Note 2.
Recoverability of Equity Method and Cost Method Investments
Management periodically assesses the recoverability of our Company’s equity method and cost methodinvestments. For publicly traded investments, readily available quoted market prices are an indication of the fairvalue of our Company’s investments. For nonpublicly traded investments, if an identified event or change incircumstances requires an impairment evaluation, management assesses fair value based on valuationmethodologies, including discounted cash flows, estimates of sales proceeds and external appraisals, asappropriate. We consider the assumptions that we believe hypothetical marketplace participants would use inevaluating estimated future cash flows when employing the discounted cash flows and estimates of salesproceeds valuation methodologies. If an investment is considered to be impaired and the decline in value isother than temporary, we record a write-down.
Other Assets
Our Company advances payments to certain customers for marketing to fund future activities intended togenerate profitable volume, and we expense such payments over the applicable period. Advance payments arealso made to certain customers for distribution rights. Additionally, our Company invests in infrastructureprograms with our bottlers that are directed at strengthening our bottling system and increasing unit casevolume. When facts and circumstances indicate that the carrying value of the assets may not be recoverable,management evaluates the recoverability of these assets by preparing estimates of sales volume, the resultinggross profit and cash flows. Costs of these programs are recorded in prepaid expenses and other assets and
75

THE COCA-COLA COMPANY AND SUBSIDIARIES
NOTES TO CONSOLIDATED FINANCIAL STATEMENTS
NOTE 1: BUSINESS AND SUMMARY OF SIGNIFICANT ACCOUNTING POLICIES (Continued)
noncurrent other assets and are being amortized over the remaining periods to be directly benefited, whichrange from 1 to 12 years. Amortization expense for infrastructure programs was approximately $136 million,$134 million and $136 million for the years ended December 31, 2006, 2005 and 2004, respectively. Refer toheading ‘‘Revenue Recognition,’’ above, and Note 3.
Property, Plant and Equipment
Property, plant and equipment are stated at cost. Repair and maintenance costs that do not improve servicepotential or extend economic life are expensed as incurred. Depreciation is recorded principally by thestraight-line method over the estimated useful lives of our assets, which generally have the following ranges:buildings and improvements: 40 years or less; machinery and equipment: 15 years or less; containers: 10 years orless. Land is not depreciated, and construction in progress is not depreciated until ready for service andcapitalized. Leasehold improvements are amortized using the straight-line method over the shorter of theremaining lease term, including renewals that are deemed to be reasonably assured, or the estimated useful lifeof the improvement. Depreciation expense totaled approximately $763 million, $752 million and $715 million forthe years ended December 31, 2006, 2005 and 2004, respectively. Amortization expense for leaseholdimprovements totaled approximately $21 million, $17 million and $7 million for the years ended December 31,2006, 2005 and 2004, respectively. Refer to Note 5.
Management assesses the recoverability of the carrying amount of property, plant and equipment if certainevents or changes in circumstances indicate that the carrying value of such assets may not be recoverable, such asa significant decrease in market value of the assets or a significant change in the business conditions in aparticular market. If we determine that the carrying value of an asset is not recoverable based on expectedundiscounted future cash flows, excluding interest charges, we record an impairment loss equal to the excess ofthe carrying amount of the asset over its fair value.
Goodwill, Trademarks and Other Intangible Assets
In accordance with SFAS No. 142, ‘‘Goodwill and Other Intangible Assets,’’ we classify intangible assetsinto three categories: (1) intangible assets with definite lives subject to amortization, (2) intangible assets withindefinite lives not subject to amortization, and (3) goodwill. We test intangible assets with definite lives forimpairment if conditions exist that indicate the carrying value may not be recoverable. Such conditions mayinclude an economic downturn in a geographic market or a change in the assessment of future operations. Werecord an impairment charge when the carrying value of the definite lived intangible asset is not recoverable bythe cash flows generated from the use of the asset.
Intangible assets with indefinite lives and goodwill are not amortized. We test these intangible assets andgoodwill for impairment at least annually or more frequently if events or circumstances indicate that suchintangible assets or goodwill might be impaired. Such tests for impairment are also required for intangible assetswith indefinite lives and/or goodwill recorded by our equity method investees. All goodwill is assigned toreporting units, which are one level below our operating segments. Goodwill is assigned to the reporting unitthat benefits from the synergies arising from each business combination. We perform our impairment tests ofgoodwill at our reporting unit level. Such impairment tests for goodwill include comparing the fair value of therespective reporting unit with its carrying value, including goodwill. We use a variety of methodologies inconducting these impairment tests, including discounted cash flow analyses with a number of scenarios, whereapplicable, that are weighted based on the probability of different outcomes. When appropriate, we consider the
76

THE COCA-COLA COMPANY AND SUBSIDIARIES
NOTES TO CONSOLIDATED FINANCIAL STATEMENTS
NOTE 1: BUSINESS AND SUMMARY OF SIGNIFICANT ACCOUNTING POLICIES (Continued)
assumptions that we believe hypothetical marketplace participants would use in estimating future cash flows. Inaddition, where applicable, an appropriate discount rate is used, based on the Company’s cost of capital rate orlocation-specific economic factors. When the fair value is less than the carrying value of the intangible assets orthe reporting unit, we record an impairment charge to reduce the carrying value of the assets to fair value. Theseimpairment charges are generally recorded in the line item other operating charges or, to the extent they relateto equity method investees, as a reduction of equity income—net, in the consolidated statements of income.
Our Company determines the useful lives of our identifiable intangible assets after considering the specificfacts and circumstances related to each intangible asset. Factors we consider when determining useful livesinclude the contractual term of any agreement, the history of the asset, the Company’s long-term strategy for theuse of the asset, any laws or other local regulations which could impact the useful life of the asset, and othereconomic factors, including competition and specific market conditions. Intangible assets that are deemed tohave definite lives are amortized, generally on a straight-line basis, over their useful lives, ranging from 1 to45 years. Intangible assets with definite lives have estimated remaining useful lives ranging from 1 to 35 years.Refer to Note 6.
Derivative Financial Instruments
Our Company accounts for derivative financial instruments in accordance with SFAS No. 133, ‘‘Accountingfor Derivative Instruments and Hedging Activities,’’ as amended by SFAS No. 137, ‘‘Accounting for DerivativeInstruments and Hedging Activities—Deferral of the Effective Date of FASB Statement No. 133—anamendment of FASB Statement No. 133,’’ SFAS No. 138, ‘‘Accounting for Certain Derivative Instruments andCertain Hedging Activities—an amendment of FASB Statement No. 133,’’ and SFAS No. 149, ‘‘Amendment ofStatement 133 on Derivative Instruments and Hedging Activities.’’ We recognize all derivative instruments aseither assets or liabilities at fair value in our consolidated balance sheets, with fair values of foreign currencyderivatives estimated based on quoted market prices or pricing models using current market rates. Refer toNote 12.
Retirement-Related Benefits
Using appropriate actuarial methods and assumptions, our Company accounts for defined benefit pensionplans in accordance with SFAS No. 87, ‘‘Employers’ Accounting for Pensions,’’ and we account for ournonpension postretirement benefits in accordance with SFAS No. 106, ‘‘Employers’ Accounting forPostretirement Benefits Other Than Pensions,’’ as amended by SFAS No. 158, ‘‘Employers’ Accounting forDefined Benefit Pension and Other Postretirement Plans—an amendment of FASB Statements No. 87, 88, 106,and 132(R).’’ Effective December 31, 2006 for our Company, SFAS No. 158 requires that previouslyunrecognized actuarial gains or losses, prior service costs or credits and transition obligations or assets berecognized generally through adjustments to accumulated other comprehensive income and credits to prepaidbenefit cost or accrued benefit liability. As a result of these adjustments, the current funded status of definedbenefit pension plans and other postretirement benefit plans is reflected in the Company’s consolidated balancesheet as of December 31, 2006. Refer to Note 16.
Our equity method investees also adopted SFAS No. 158 effective December 31, 2006. Refer to Note 3 forthe impact on our consolidated balance sheet resulting from the adoption of SFAS No. 158 by our equity methodinvestees.
77

THE COCA-COLA COMPANY AND SUBSIDIARIES
NOTES TO CONSOLIDATED FINANCIAL STATEMENTS
NOTE 1: BUSINESS AND SUMMARY OF SIGNIFICANT ACCOUNTING POLICIES (Continued)Contingencies
Our Company is involved in various legal proceedings and tax matters. Due to their nature, such legalproceedings and tax matters involve inherent uncertainties including, but not limited to, court rulings,negotiations between affected parties and governmental actions. Management assesses the probability of loss forsuch contingencies and accrues a liability and/or discloses the relevant circumstances, as appropriate. Refer toNote 13.
Business CombinationsIn accordance with SFAS No. 141, ‘‘Business Combinations,’’ we account for all business combinations by
the purchase method. Furthermore, we recognize intangible assets apart from goodwill if they arise fromcontractual or legal rights or if they are separable from goodwill.
Recent Accounting Standards and PronouncementsIn February 2007, the FASB issued SFAS No. 159, ‘‘The Fair Value Option for Financial Assets and
Financial Liabilities—Including an amendment of FASB Statement No. 115.’’ SFAS No. 159 permits entities tochoose to measure many financial instruments and certain other items at fair value. Unrealized gains and losseson items for which the fair value option has been elected will be recognized in earnings at each subsequentreporting date. SFAS No. 159 is effective for our Company January 1, 2008. The Company is evaluating theimpact that the adoption of SFAS No. 159 will have on our consolidated financial statements.
In September 2006, the Securities and Exchange Commission staff published Staff Accounting Bulletin(‘‘SAB’’) No. 108, ‘‘Considering the Effects of Prior Year Misstatements when Quantifying Misstatements inCurrent Year Financial Statements.’’ SAB No. 108 addresses quantifying the financial statement effects ofmisstatements, specifically, how the effects of prior year uncorrected errors must be considered in quantifyingmisstatements in the current year financial statements. SAB No. 108 is effective for fiscal years ending afterNovember 15, 2006. The adoption of SAB No. 108 by our Company in the fourth quarter of 2006 did not have amaterial impact on our consolidated financial statements.
As previously discussed, our Company adopted SFAS No. 158 related to defined benefit pension and otherpostretirement plans. Refer to Note 16.
In September 2006, the FASB issued SFAS No. 157, ‘‘Fair Value Measurements.’’ SFAS No. 157 defines fairvalue, establishes a framework for measuring fair value and expands disclosure requirements about fair valuemeasurements. SFAS No. 157 is effective for our Company January 1, 2008. We believe that the adoption ofSFAS No. 157 will not have a material impact on our consolidated financial statements.
In July 2006, the FASB issued FASB Interpretation No. 48, ‘‘Accounting for Uncertainty in Income Taxes’’(‘‘Interpretation No. 48’’). Interpretation No. 48 clarifies the accounting for uncertainty in income taxesrecognized in an enterprise’s financial statements in accordance with SFAS No. 109, ‘‘Accounting for IncomeTaxes.’’ Interpretation No. 48 prescribes a recognition threshold and measurement attribute for the financialstatement recognition and measurement of a tax position taken or expected to be taken in a tax return.Interpretation No. 48 also provides guidance on derecognition, classification, interest and penalties, accountingin interim periods, disclosure and transition. For our Company, Interpretation No. 48 was effective beginningJanuary 1, 2007, and the cumulative effect adjustment will be recorded in the first quarter of 2007. We believethat the adoption of Interpretation No. 48 will not have a material impact on our consolidated financialstatements.
In May 2005, the FASB issued SFAS No. 154, ‘‘Accounting Changes and Error Corrections, a replacementof Accounting Principles Board (‘‘APB’’) Opinion No. 20 and FASB Statement No. 3.’’ SFAS No. 154 requires
78

THE COCA-COLA COMPANY AND SUBSIDIARIES
NOTES TO CONSOLIDATED FINANCIAL STATEMENTS
NOTE 1: BUSINESS AND SUMMARY OF SIGNIFICANT ACCOUNTING POLICIES (Continued)retrospective application to prior periods’ financial statements of a voluntary change in accounting principleunless it is impracticable. APB Opinion No. 20, ‘‘Accounting Changes,’’ previously required that most voluntarychanges in accounting principle be recognized by including in net income of the period of the change thecumulative effect of changing to the new accounting principle. SFAS No. 154 became effective for our Companyon January 1, 2006. The adoption of SFAS No. 154 did not have a material impact on our consolidated financialstatements.
In December 2004, the FASB issued SFAS No. 153, ‘‘Exchanges of Nonmonetary Assets, an amendment ofAPB Opinion No. 29.’’ SFAS No. 153 is based on the principle that exchanges of nonmonetary assets should bemeasured based on the fair value of the assets exchanged. APB Opinion No. 29, ‘‘Accounting for NonmonetaryTransactions,’’ provided an exception to its basic measurement principle (fair value) for exchanges of similarproductive assets. Under APB Opinion No. 29, an exchange of a productive asset for a similar productive assetwas based on the recorded amount of the asset relinquished. SFAS No. 153 eliminates this exception andreplaces it with an exception for exchanges of nonmonetary assets that do not have commercial substance. SFASNo. 153 became effective for our Company as of July 2, 2005, and did not have a material impact on ourconsolidated financial statements.
As previously discussed, our Company adopted SFAS No. 123(R) related to share based payments. Refer toNote 15.
During 2004, the FASB issued FASB Staff Position 106-2, ‘‘Accounting and Disclosure RequirementsRelated to the Medicare Prescription Drug, Improvement and Modernization Act of 2003’’ (‘‘FSP 106-2’’). FSP106-2 relates to the Medicare Prescription Drug, Improvement and Modernization Act of 2003 (the ‘‘Act’’). TheAct introduced a prescription drug benefit under Medicare known as Medicare Part D. The Act also establisheda federal subsidy to sponsors of retiree health care plans that provide a benefit that is at least actuariallyequivalent to Medicare Part D. During the second quarter of 2004, our Company adopted the provisions of FSP106-2 retroactive to January 1, 2004. The adoption of FSP 106-2 did not have a material impact on ourconsolidated financial statements. Refer to Note 16.
In November 2004, the FASB issued SFAS No. 151, ‘‘Inventory Costs, an amendment of AccountingResearch Bulletin No. 43, Chapter 4.’’ SFAS No. 151 requires that abnormal amounts of idle facility expense,freight, handling costs and wasted materials (spoilage) be recorded as current period charges and that theallocation of fixed production overheads to inventory be based on the normal capacity of the productionfacilities. The Company adopted SFAS No. 151 on January 1, 2006. The adoption of SFAS No. 151 did not havea material impact on our consolidated financial statements.
In October 2004, the American Jobs Creation Act of 2004 (the ‘‘Jobs Creation Act’’) was signed into law.The Jobs Creation Act includes a temporary incentive for U.S. multinationals to repatriate foreign earnings atan approximate 5.25 percent effective tax rate. Issued in December 2004, FASB Staff Position 109-2,‘‘Accounting and Disclosure Guidance for the Foreign Earnings Repatriation Provision within the AmericanJobs Creation Act of 2004’’ (‘‘FSP 109-2’’), indicated that the lack of clarification of certain provisions within theJobs Creation Act and the timing of the enactment necessitated a practical exception to the SFAS No. 109,‘‘Accounting for Income Taxes,’’ requirement to reflect in the period of enactment the effect of a new tax law.Accordingly, enterprises were allowed time beyond 2004 to evaluate the effect of the Jobs Creation Act on theirplans for reinvestment or repatriation of foreign earnings for purposes of applying SFAS No. 109. Accordingly,in 2005, the Company repatriated $6.1 billion of its previously unremitted earnings and recorded an associatedtax expense of approximately $315 million. Refer to Note 17.
In 2004, our Company recorded an income tax benefit of approximately $50 million as a result of therealization of certain tax credits related to certain provisions of the Jobs Creation Act not related to repatriationprovisions. Refer to Note 17.
79

THE COCA-COLA COMPANY AND SUBSIDIARIES
NOTES TO CONSOLIDATED FINANCIAL STATEMENTS
NOTE 2: INVENTORIES
Inventories consisted of the following (in millions):
December 31, 2006 2005
Raw materials and packaging $ 923 $ 704Finished goods 548 512Other 170 163
Inventories $ 1,641 $ 1,379
NOTE 3: BOTTLING INVESTMENTS
Coca-Cola Enterprises Inc.
CCE is a marketer, producer and distributor of bottle and can nonalcoholic beverages, operating in eightcountries. As of December 31, 2006, our Company owned approximately 35 percent of the outstanding commonstock of CCE. We account for our investment by the equity method of accounting and, therefore, our net incomeincludes our proportionate share of income resulting from our investment in CCE. As of December 31, 2006,our proportionate share of the net assets of CCE exceeded our investment by approximately $282 million. Thisdifference is not amortized.
A summary of financial information for CCE is as follows (in millions):
December 31, 2006 2005
Current assets $ 3,691 $ 3,395Noncurrent assets 19,534 21,962
Total assets $ 23,225 $ 25,357
Current liabilities $ 3,818 $ 3,846Noncurrent liabilities 14,881 15,868
Total liabilities $ 18,699 $ 19,714
Shareowners’ equity $ 4,526 $ 5,643
Company equity investment $ 1,312 $ 1,731
Year Ended December 31, 2006 2005 2004
Net operating revenues $ 19,804 $ 18,743 $ 18,190Cost of goods sold 11,986 11,185 10,771
Gross profit $ 7,818 $ 7,558 $ 7,419
Operating (loss) income $ (1,495) $ 1,431 $ 1,436
Net (loss) income $ (1,143) $ 514 $ 596
80

THE COCA-COLA COMPANY AND SUBSIDIARIES
NOTES TO CONSOLIDATED FINANCIAL STATEMENTS
NOTE 3: BOTTLING INVESTMENTS (Continued)
A summary of our significant transactions with CCE is as follows (in millions):
Year Ended December 31, 2006 2005 2004
Concentrate, syrup and finished product sales to CCE $ 5,378 $ 5,125 $ 5,203Syrup and finished product purchases from CCE 415 428 428CCE purchases of sweeteners through our Company 274 275 309Marketing payments made by us directly to CCE 514 482 609Marketing payments made to third parties on behalf of CCE 113 136 104Local media and marketing program reimbursements from CCE 279 245 246Payments made to CCE for dispensing equipment repair services 74 70 63Other payments — net 99 81 19
Syrup and finished product purchases from CCE represent purchases of fountain syrup in certain territoriesthat have been resold by our Company to major customers and purchases of bottle and can products. Marketingpayments made by us directly to CCE represent support of certain marketing activities and our participationwith CCE in cooperative advertising and other marketing activities to promote the sale of Company trademarkproducts within CCE territories. These programs are agreed to on an annual basis. Marketing payments made tothird parties on behalf of CCE represent support of certain marketing activities and programs to promote thesale of Company trademark products within CCE’s territories in conjunction with certain of CCE’s customers.Pursuant to cooperative advertising and trade agreements with CCE, we received funds from CCE for localmedia and marketing program reimbursements. Payments made to CCE for dispensing equipment repairservices represent reimbursement to CCE for its costs of parts and labor for repairs on cooler, dispensing, orpost-mix equipment owned by us or our customers. The Other payments—net line in the table above representspayments made to and received from CCE that are individually not significant.
In 2006, our Company’s equity income related to CCE decreased by approximately $587 million, related toour proportionate share of certain items recorded by CCE. Our proportionate share of these items includedapproximately $602 million resulting from the impact of an impairment charge recorded by CCE. CCE recordeda $2.9 billion pretax ($1.8 billion after tax) impairment of its North American franchise rights. The decline in theestimated fair value of CCE’s North American franchise rights was the result of several factors, including but notlimited to (1) CCE’s revised outlook on 2007 raw material costs driven by significant increases in aluminum andhigh fructose corn syrup (‘‘HFCS’’); (2) a challenging marketplace environment with increased pricing pressuresin several high-growth beverage categories; and (3) increased interest rates contributing to a higher discount rateand corresponding capital charge. Our proportionate share of CCE’s charges also included approximately$18 million due to restructuring charges recorded by CCE. These charges were partially offset by approximately$33 million related to our proportionate share of changes in certain of CCE’s state and Canadian federal andprovincial tax rates. All of these charges and changes impacted our Bottling Investments operating segment.
In 2005, our equity income related to CCE was reduced by approximately $33 million related to ourproportionate share of certain charges and gains recorded by CCE. Our proportionate share of CCE’s chargesincluded an approximate $51 million decrease to equity income, primarily related to the tax liability recorded byCCE in the fourth quarter of 2005 resulting from the repatriation of previously unremitted foreign earningsunder the Jobs Creation Act and approximately $18 million due to restructuring charges recorded by CCE.These restructuring charges were primarily related to workforce reductions associated with the reorganization ofCCE’s North American operations, changes in executive management and elimination of certain positions in
81

THE COCA-COLA COMPANY AND SUBSIDIARIES
NOTES TO CONSOLIDATED FINANCIAL STATEMENTS
NOTE 3: BOTTLING INVESTMENTS (Continued)
CCE’s corporate headquarters. These charges were partially offset by an approximate $37 million increase toequity income in the second quarter of 2005 resulting from CCE’s HFCS lawsuit settlement proceeds andchanges in certain of CCE’s state and provincial tax rates. Refer to Note 18.
In the second quarter of 2004, our Company and CCE agreed to terminate the Sales Growth Initiative(‘‘SGI’’) agreement and certain other marketing funding programs that were previously in place. Due totermination of these agreements, a significant portion of the cash payments to be made by us directly to CCEwas eliminated prospectively. At the termination of these agreements, we agreed that the concentrate price thatCCE pays us for sales made in the United States and Canada would be reduced. Total cash support paid by ourCompany under the SGI agreement prior to its termination was approximately $58 million and approximately$161 million for 2004 and 2003, respectively. These amounts are included in the line item marketing paymentsmade by us directly to CCE in the table above.
In the second quarter of 2004, our Company and CCE agreed to establish a Global Marketing Fund, underwhich we expect to pay CCE $62 million annually through December 31, 2014, as support for certain marketingactivities. The term of the agreement will automatically be extended for successive 10-year periods thereafterunless either party gives written notice of termination of this agreement. The marketing activities to be fundedunder this agreement will be agreed upon each year as part of the annual joint planning process and will beincorporated into the annual marketing plans of both companies. We paid CCE a prorated amount of$42 million for 2004. The prorated amount was determined based on the agreement date. These amounts areincluded in the line item marketing payments made by us directly to CCE in the table above.
Our Company previously entered into programs with CCE designed to help develop cold-drinkinfrastructure. Under these programs, our Company paid CCE for a portion of the cost of developing theinfrastructure necessary to support accelerated placements of cold-drink equipment. These payments support acommon objective of increased sales of Company trademarked beverages from increased availability andconsumption in the cold-drink channel. In connection with these programs, CCE agreed to:
(1) purchase and place specified numbers of Company-approved cold-drink equipment each year through2010;
(2) maintain the equipment in service, with certain exceptions, for a period of at least 12 years afterplacement;
(3) maintain and stock the equipment in accordance with specified standards; and
(4) annual reporting to our Company of minimum average annual unit case volume throughout theeconomic life of the equipment and other specified information.
CCE must achieve minimum average unit case volume for a 12-year period following the placement ofequipment. These minimum average unit case volume levels ensure adequate gross profit from sales ofconcentrate to fully recover the capitalized costs plus a return on the Company’s investment. Should CCE fail topurchase the specified numbers of cold-drink equipment for any calendar year through 2010, the parties agreedto mutually develop a reasonable solution. Should no mutually agreeable solution be developed, or in the eventthat CCE otherwise breaches any material obligation under the contracts and such breach is not remedied withina stated period, then CCE would be required to repay a portion of the support funding as determined by ourCompany. In the third quarter of 2004, our Company and CCE agreed to amend the contract to defer theplacement of some equipment from 2004 and 2005, as previously agreed under the original contract, to 2009 and
82

THE COCA-COLA COMPANY AND SUBSIDIARIES
NOTES TO CONSOLIDATED FINANCIAL STATEMENTS
NOTE 3: BOTTLING INVESTMENTS (Continued)
2010. In connection with this amendment, CCE agreed to pay the Company approximately $2 million in 2004,$3 million annually in 2005 through 2008, and $1 million in 2009. In 2005, our Company and CCE agreed toamend the contract for North America to move to a system of purchase and placement credits, whereby CCEearns credit toward its annual purchase and placement requirements based upon the type of equipment itpurchases and places. The amended contract also provides that no breach by CCE will occur even if they do notachieve the required number of purchase and placement credits in any given year, so long as (1) the shortfalldoes not exceed 20 percent of the required purchase and placement credits for that year; (2) a compensatingpayment is made to our Company by CCE; (3) the shortfall is corrected in the following year; and (4) CCEmeets all specified purchase and placement credit requirements by the end of 2010. The payments we made toCCE under these programs are recorded in prepaid expenses and other assets and in noncurrent other assetsand amortized as deductions from revenues over the 10-year period following the placement of the equipment.Our carrying values for these infrastructure programs with CCE were approximately $576 million and$662 million as of December 31, 2006 and 2005, respectively. The Company has no further commitments underthese programs.
In March 2004, the Company and CCE launched the Dasani water brand in Great Britain. The product wasvoluntarily recalled. During 2004, our Company reimbursed CCE $32 million for product recall costs incurred byCCE.
Effective December 31, 2006, CCE adopted SFAS No. 158. Our proportionate share of the impact of CCE’sadoption of SFAS No. 158 was an approximate $132 million pretax ($84 million after tax) reduction in both thecarrying value of our investment in CCE and our accumulated other comprehensive income (loss) (‘‘AOCI’’).Refer to Note 10 and Note 16.
If valued at the December 31, 2006 quoted closing price of CCE shares, the fair value of our investment inCCE would have exceeded our carrying value by approximately $2.1 billion.
Other Equity Method Investments
Our other equity method investments include our ownership interests in Coca-Cola HBC, Coca-ColaFEMSA and Coca-Cola Amatil. As of December 31, 2006, we owned approximately 23 percent, 32 percent and32 percent, respectively, of these companies’ common shares.
Operating results include our proportionate share of income (loss) from our equity method investments. Asof December 31, 2006, our investment in our equity method investees in the aggregate, other than CCE,exceeded our proportionate share of the net assets of these equity method investees by approximately$1,375 million. This difference is not amortized.
83

THE COCA-COLA COMPANY AND SUBSIDIARIES
NOTES TO CONSOLIDATED FINANCIAL STATEMENTS
NOTE 3: BOTTLING INVESTMENTS (Continued)
A summary of financial information for our equity method investees in the aggregate, other than CCE, is asfollows (in millions):
December 31, 2006 2005
Current assets $ 8,778 $ 7,803Noncurrent assets 21,304 20,698
Total assets $ 30,082 $ 28,501
Current liabilities $ 8,030 $ 7,705Noncurrent liabilities 9,469 8,395
Total liabilities $ 17,499 $ 16,100
Shareowners’ equity $ 12,583 $ 12,401
Company equity investment $ 4,998 $ 4,831
Year Ended December 31, 2006 2005 2004
Net operating revenues $ 24,990 $ 24,389 $ 21,202Cost of goods sold 14,717 14,141 12,132
Gross profit $ 10,273 $ 10,248 $ 9,070
Operating income $ 2,697 $ 2,669 $ 2,406
Net income (loss) $ 1,475 $ 1,501 $ 1,389
Net income (loss) available to common shareowners $ 1,455 $ 1,477 $ 1,364
Net sales to equity method investees other than CCE, the majority of which are located outside the UnitedStates, were approximately $7.6 billion in 2006, $7.4 billion in 2005 and $5.2 billion in 2004. Total supportpayments, primarily marketing, made to equity method investees other than CCE were approximately$512 million, $475 million and $442 million in 2006, 2005 and 2004, respectively.
In 2003, one of our Company’s equity method investees, Coca-Cola FEMSA, consummated a merger withanother of the Company’s equity method investees, Panamerican Beverages, Inc. At the time of the merger, theCompany and Fomento Economico Mexicano, S.A.B. de C.V. (‘‘FEMSA’’), the major shareowner of Coca-ColaFEMSA, reached an understanding under which this shareowner could purchase from our Company an amountof Coca-Cola FEMSA shares sufficient for this shareowner to regain majority ownership interest in Coca-ColaFEMSA. That understanding expired in May 2006; however, in the third quarter of 2006, the Company and theshareowner reached an agreement under which the Company would sell a number of shares representing8 percent of the capital stock of Coca-Cola FEMSA to FEMSA. As a result of this sale, which occurred in thefourth quarter of 2006, the Company received cash proceeds of approximately $427 million and realized a gainof approximately $175 million, which was recorded in the consolidated statement of income line item otherincome (loss)—net and impacted the Corporate operating segment. Also as a result of this sale, our ownershipinterest in Coca-Cola FEMSA was reduced from approximately 40 percent to approximately 32 percent. Referto Note 18.
84

THE COCA-COLA COMPANY AND SUBSIDIARIES
NOTES TO CONSOLIDATED FINANCIAL STATEMENTS
NOTE 3: BOTTLING INVESTMENTS (Continued)
In 2006, our Company sold a portion of our investment in Coca-Cola Icecek A.S. (‘‘Coca-Cola Icecek’’), anequity method investee bottler incorporated in Turkey, in an initial public offering. Our Company received cashproceeds of approximately $198 million and realized a gain of approximately $123 million, which was recorded inthe consolidated statement of income line item other income (loss)—net and impacted the Corporate operatingsegment. As a result of this public offering, our Company’s interest in Coca-Cola Icecek decreased fromapproximately 36 percent to approximately 20 percent. Refer to Note 18.
Our Company owns a 50 percent interest in Multon, a Russian juice business (‘‘Multon’’), which weacquired in April 2005 jointly with Coca-Cola HBC, for a total purchase price of approximately $501 million,split equally between the Company and Coca-Cola HBC. Multon produces and distributes juice products underthe Dobriy, Rich, Nico and other trademarks in Russia, Ukraine and Belarus. Equity income—net includes ourproportionate share of Multon’s net income beginning April 20, 2005. Refer to Note 19.
During the second quarter of 2004, the Company’s equity income benefited by approximately $37 millionfor its share of a favorable tax settlement related to Coca-Cola FEMSA.
In December 2004, the Company sold to an unrelated financial institution certain of its production assetsthat were previously leased to the Japanese supply chain management company (refer to discussion below). Theassets were sold for approximately $271 million, and the sale resulted in no gain or loss. The financial institutionentered into a leasing arrangement with the Japanese supply chain management company. These assets werepreviously reported in our consolidated balance sheet line item property, plant and equipment—net andassigned to our North Asia, Eurasia and Middle East operating segment.
During 2004, our Company sold our bottling operations in Vietnam, Cambodia, Sri Lanka and Nepal toCoca-Cola Sabco (Pty) Ltd. (‘‘Sabco’’) for a total consideration of $29 million. In addition, Sabco assumedcertain debts of these bottling operations. The proceeds from the sale of these bottlers were approximately equalto the carrying value of the investment.
Effective October 1, 2003, the Company and all of its bottling partners in Japan created a nationallyintegrated supply chain management company to centralize procurement, production and logistics operationsfor the entire Coca-Cola system in Japan. As a result of the creation of this supply chain management companyin Japan, a portion of our Company’s business was essentially converted from a finished product business modelto a concentrate business model, thus reducing our net operating revenues and cost of goods sold by the sameamounts. The formation of this entity included the sale of Company inventory and leasing of certain Companyassets to this new entity on October 1, 2003, as well as our recording of a liability for certain contractualobligations to Japanese bottlers. Such amounts were not material to the Company’s results of operations.
Effective December 31, 2006, our equity method investees other than CCE also adopted SFAS No. 158. Ourproportionate share of the impact of the adoption of SFAS No. 158 by our equity method investees other thanCCE was an approximate $18 million pretax ($12 million after tax) reduction in the carrying value of ourinvestments in those equity method investees and our AOCI. Refer to Note 10 and Note 16.
If valued at the December 31, 2006, quoted closing prices of shares actively traded on stock markets, thevalue of our equity method investments in publicly traded bottlers other than CCE would have exceeded ourcarrying value by approximately $3.6 billion.
85

THE COCA-COLA COMPANY AND SUBSIDIARIES
NOTES TO CONSOLIDATED FINANCIAL STATEMENTS
NOTE 3: BOTTLING INVESTMENTS (Continued)
Net Receivables and Dividends from Equity Method Investees
The total amount of net receivables due from equity method investees, including CCE, was approximately$857 million and $644 million as of December 31, 2006 and 2005, respectively. The total amount of dividendsreceived from equity method investees, including CCE, was approximately $226 million, $234 million and$145 million for the years ended December 31, 2006, 2005 and 2004, respectively.
NOTE 4: ISSUANCES OF STOCK BY EQUITY METHOD INVESTEES
In 2006, our equity method investees did not issue any additional shares to third parties that resulted in ourCompany recording any noncash pretax gains.
In 2005, our Company recorded approximately $23 million of noncash pretax gains on issuances of stock byequity method investees. We recorded deferred taxes of approximately $8 million on these gains. These gainsprimarily related to an issuance of common stock by Coca-Cola Amatil, which was valued at an amount greaterthan the book value per share of our investment in Coca-Cola Amatil. Coca-Cola Amatil issued approximately34 million shares of common stock with a fair value of $5.78 each in connection with the acquisition of SPCArdmona Pty. Ltd., an Australian packaged fruit company. This issuance of common stock reduced ourownership interest in the total outstanding shares of Coca-Cola Amatil from approximately 34 percent toapproximately 32 percent.
In 2004, our Company recorded approximately $24 million of noncash pretax gains on issuances of stock byCCE. The issuances primarily related to the exercise of CCE stock options by CCE employees at amountsgreater than the book value per share of our investment in CCE. We recorded deferred taxes of approximately$9 million on these gains. These issuances of stock reduced our ownership interest in the total outstandingshares of CCE from approximately 37 percent to approximately 36 percent.
NOTE 5: PROPERTY, PLANT AND EQUIPMENT
The following table summarizes our property, plant and equipment (in millions):
December 31, 2006 2005
Land $ 495 $ 447Buildings and improvements 3,020 2,692Machinery and equipment 7,333 6,271Containers 556 468Construction in progress 507 306
$ 11,911 $ 10,184Less accumulated depreciation 5,008 4,353
Property, plant and equipment — net $ 6,903 $ 5,831
86

THE COCA-COLA COMPANY AND SUBSIDIARIES
NOTES TO CONSOLIDATED FINANCIAL STATEMENTS
NOTE 6: GOODWILL, TRADEMARKS AND OTHER INTANGIBLE ASSETS
The following tables set forth information for intangible assets subject to amortization and for intangibleassets not subject to amortization (in millions):
December 31, 2006 2005
Amortized intangible assets (various, principally trademarks):Gross carrying amount1 $ 372 $ 314Less accumulated amortization 174 168
Amortized intangible assets — net $ 198 $ 146
Unamortized intangible assets:Trademarks2 $ 2,045 $ 1,946Goodwill3 1,403 1,047Bottlers’ franchise rights3 1,359 521Other 130 161
Unamortized intangible assets $ 4,937 $ 3,675
1 The increase in 2006 is primarily related to business combinations and acquisitions of trademarkswith definite lives totaling approximately $75 million and the effect of translation adjustments, whichwere partially offset by impairment charges of approximately $9 million and disposals. Refer toNote 19.
2 The increase in 2006 is primarily related to business combinations and acquisitions of trademarks andbrands totaling approximately $118 million and the effect of translation adjustments, which werepartially offset by impairment charges of approximately $32 million. Refer to Note 19.
3 The increase in 2006 is primarily related to the acquisition of Kerry Beverages Limited, TJC Holdings(Pty) Ltd. and Apollinaris GmbH, the consolidation of Brucephil, Inc., and the effect of translationadjustments. Refer to Note 19.
Total amortization expense for intangible assets subject to amortization was approximately $18 million,$29 million and $35 million for the years ended December 31, 2006, 2005 and 2004, respectively.
Information about estimated amortization expense for intangible assets subject to amortization for the fiveyears succeeding December 31, 2006, is as follows (in millions):
AmortizationExpense
2007 $ 262008 242009 232010 222011 22
87

THE COCA-COLA COMPANY AND SUBSIDIARIES
NOTES TO CONSOLIDATED FINANCIAL STATEMENTS
NOTE 6: GOODWILL, TRADEMARKS AND OTHER INTANGIBLE ASSETS (Continued)
Goodwill by operating segment was as follows (in millions):
December 31, 2006 2005
Africa $ — $ —East, South Asia and Pacific Rim 22 22European Union 696 593Latin America 119 82North America 141 141North Asia, Eurasia and Middle East 21 21Bottling Investments 404 188
$ 1,403 $ 1,047
In 2006, our Company recorded impairment charges of approximately $41 million primarily related totrademarks for beverages sold in the Philippines and Indonesia. The Philippines and Indonesia are componentsof our East, South Asia and Pacific Rim operating segment. The amount of these impairment charges wasdetermined by comparing the fair values of the intangible assets to their respective carrying values. The fairvalues were determined using discounted cash flow analyses. Because the fair values were less than the carryingvalues of the assets, we recorded impairment charges to reduce the carrying values of the assets to theirrespective fair values. These impairment charges were recorded in the line item other operating charges in theconsolidated statement of income. Refer to Note 18.
In 2005, our Company recorded an impairment charge related to trademarks for beverages sold in thePhilippines of approximately $84 million. The carrying value of our trademarks in the Philippines, prior to therecording of the impairment charges in 2005, was approximately $268 million. The impairment was the result ofour revised outlook for the Philippines, which had been unfavorably impacted by declines in volume and incomebefore income taxes resulting from the continued lack of an affordable package offering and the continuedlimited availability of these trademark beverages in the marketplace. We determined the amount of thisimpairment charge by comparing the fair value of the intangible assets to the carrying value. Fair values werederived using discounted cash flow analyses with a number of scenarios that were weighted based on theprobability of different outcomes. Because the fair value was less than the carrying value of the assets, werecorded an impairment charge to reduce the carrying value of the assets to fair value. This impairment chargewas recorded in the line item other operating charges in the consolidated statement of income.
88

THE COCA-COLA COMPANY AND SUBSIDIARIES
NOTES TO CONSOLIDATED FINANCIAL STATEMENTS
NOTE 7: ACCOUNTS PAYABLE AND ACCRUED EXPENSES
Accounts payable and accrued expenses consisted of the following (in millions):
December 31, 2006 2005
Other accrued expenses $ 1,653 $ 1,413Accrued marketing 1,348 1,268Trade accounts payable 929 902Accrued compensation 550 468Sales, payroll and other taxes 264 215Container deposits 264 209Accrued streamlining costs 47 18
Accounts payable and accrued expenses $ 5,055 $ 4,493
NOTE 8: SHORT-TERM BORROWINGS AND CREDIT ARRANGEMENTS
Loans and notes payable consist primarily of commercial paper issued in the United States and a liability toacquire the remaining approximate 59 percent of the outstanding stock of Coca-Cola Erfrischungsgetraenke AG(‘‘CCEAG’’). As of December 31, 2006, the Company owned approximately 41 percent of CCEAG’s outstandingstock. In February 2002, the Company acquired control of CCEAG and agreed to put/call agreements with theother shareowners of CCEAG, which resulted in the recording of a liability to acquire the remaining shares inCCEAG. The present value of the total amount to be paid by our Company to all other CCEAG shareownerswas approximately $1,068 million at December 31, 2006, and approximately $941 million at December 31, 2005.This amount increased from the initial liability of approximately $600 million due to the accretion of thediscounted value to the ultimate maturity of the liability and the translation adjustment related to this liability,partially offset by payments made to the other CCEAG shareowners during the term of the agreements. Theaccretion of the discounted value to its ultimate maturity value is recorded in the line item other income (loss)—net, and this amount was approximately $58 million, $60 million and $58 million, respectively, for the yearsended December 31, 2006, 2005 and 2004.
As of December 31, 2006 and 2005, we had approximately $1,942 million and $3,311 million, respectively,outstanding in commercial paper borrowings. Our weighted-average interest rates for commercial paperoutstanding were approximately 5.2 percent and 4.2 percent per year at December 31, 2006 and 2005,respectively. In addition, we had $1,952 million in lines of credit and other short-term credit facilities available asof December 31, 2006, of which approximately $225 million was outstanding. The outstanding amount ofapproximately $225 million was primarily related to our international operations. Included in the available creditfacilities discussed above, the Company had $1,150 million in lines of credit for general corporate purposes,including commercial paper backup. There were no borrowings under these lines of credit during 2006.
These credit facilities are subject to normal banking terms and conditions. Some of the financialarrangements require compensating balances, none of which is presently significant to our Company.
89

THE COCA-COLA COMPANY AND SUBSIDIARIES
NOTES TO CONSOLIDATED FINANCIAL STATEMENTS
NOTE 9: LONG-TERM DEBT
Long-term debt consisted of the following (in millions):
December 31, 2006 2005
53⁄4% U.S. dollar notes due 2009 $ 399 $ 39953⁄4% U.S. dollar notes due 2011 499 49973⁄8% U.S. dollar notes due 2093 116 116Other, due through 20141 333 168
$ 1,347 $ 1,182Less current portion 33 28
Long-term debt $ 1,314 $ 1,154
1 The weighted-average interest rate on outstanding balances was 6% for both the years endedDecember 31, 2006 and 2005.
The above notes include various restrictions, none of which is presently significant to our Company.
The principal amount of our long-term debt that had fixed and variable interest rates, respectively, was$1,346 million and $1 million on December 31, 2006. The principal amount of our long-term debt that had fixedand variable interest rates, respectively, was $1,181 million and $1 million on December 31, 2005. The weighted-average interest rate on the outstanding balances of our Company’s long-term debt was 6.0 percent for both theyears ended December 31, 2006 and 2005.
Total interest paid was approximately $212 million, $233 million and $188 million in 2006, 2005 and 2004,respectively. For a more detailed discussion of interest rate management, refer to Note 12.
Maturities of long-term debt for the five years succeeding December 31, 2006, are as follows (in millions):
Maturities ofLong-Term Debt
2007 $ 332008 1752009 4362010 542011 522
90

THE COCA-COLA COMPANY AND SUBSIDIARIES
NOTES TO CONSOLIDATED FINANCIAL STATEMENTS
NOTE 10: COMPREHENSIVE INCOME
AOCI, including our proportionate share of equity method investees’ AOCI, consisted of the following(in millions):
December 31, 2006 2005
Foreign currency translation adjustment $ (984) $ (1,587)Accumulated derivative net losses (49) (23)Unrealized gain on available-for-sale securities 147 104Adjustment to pension and other benefit liabilities (405)1 (163)
Accumulated other comprehensive income (loss) $ (1,291) $ (1,669)
1 Includes adjustment of $(288) million, net of tax, relating to the initial adoption of SFAS No. 158.Refer to Note 16.
A summary of the components of other comprehensive income (loss), including our proportionate share ofequity method investees’ other comprehensive income (loss), for the years ended December 31, 2006, 2005 and2004, is as follows (in millions):
Before-Tax Income After-TaxAmount Tax Amount
2006Net foreign currency translation adjustment $ 685 $ (82) $ 603Net loss on derivatives (44) 18 (26)Net change in unrealized gain on available-for-sale securities 53 (10) 43Net change in pension liability, prior to adoption of SFAS No. 158 68 (22) 46
Other comprehensive income (loss) $ 762 $ (96) $ 666
Before-Tax Income After-TaxAmount Tax Amount
2005Net foreign currency translation adjustment $ (440) $ 44 $ (396)Net gain on derivatives 94 (37) 57Net change in unrealized gain on available-for-sale securities 20 (7) 13Net change in pension liability, prior to adoption of SFAS No. 158 5 — 5
Other comprehensive income (loss) $ (321) $ — $ (321)
Before-Tax Income After-TaxAmount Tax Amount
2004Net foreign currency translation adjustment $ 766 $ (101) $ 665Net loss on derivatives (4) 1 (3)Net change in unrealized gain on available-for-sale securities 48 (9) 39Net change in pension liability, prior to adoption of SFAS No. 158 (81) 27 (54)
Other comprehensive income (loss) $ 729 $ (82) $ 647
91

THE COCA-COLA COMPANY AND SUBSIDIARIES
NOTES TO CONSOLIDATED FINANCIAL STATEMENTS
NOTE 11: FINANCIAL INSTRUMENTS
Certain Debt and Marketable Equity Securities
Investments in debt and marketable equity securities, other than investments accounted for by the equitymethod, are categorized as trading, available-for-sale or held-to-maturity. Our marketable equity investmentsare categorized as trading or available-for-sale with their cost basis determined by the specific identificationmethod. Trading securities are carried at fair value with realized and unrealized gains and losses included in netincome. We record available-for-sale instruments at fair value, with unrealized gains and losses, net of deferredincome taxes, reported as a component of AOCI. Debt securities categorized as held-to-maturity are stated atamortized cost.
As of December 31, 2006 and 2005, trading, available-for-sale and held-to-maturity securities consisted ofthe following (in millions):
Gross UnrealizedEstimated
Cost Gains Losses Fair Value
2006Trading Securities:
Equity securities $ 60 $ 6 $ — $ 66
Available-for-sale securities:Equity securities $ 240 $ 219 $ (1) $ 458Other securities 13 — — 13
$ 253 $ 219 $ (1) $ 471
Held-to-maturity securities:Bank and corporate debt $ 83 $ — $ — $ 83
Gross UnrealizedEstimated
Cost Gains Losses Fair Value
2005Trading Securities:
Equity securities $ — $ — $ — $ —
Available-for-sale securities:Equity securities $ 138 $ 167 $ (2) $ 303Other securities 13 — — 13
$ 151 $ 167 $ (2) $ 316
Held-to-maturity securities:Bank and corporate debt $ 348 $ — $ — $ 348
92

THE COCA-COLA COMPANY AND SUBSIDIARIES
NOTES TO CONSOLIDATED FINANCIAL STATEMENTS
NOTE 11: FINANCIAL INSTRUMENTS (Continued)
As of December 31, 2006 and 2005, these investments were included in the following captions (in millions):
Available- Held-to-Trading for-Sale Maturity
Securities Securities Securities
2006Cash and cash equivalents $ — $ — $ 82Current marketable securities 66 83 1Cost method investments, principally bottling companies — 372 —Other assets — 16 —
$ 66 $ 471 $ 83
Available- Held-to-Trading for-Sale Maturity
Securities Securities Securities
2005Cash and cash equivalents $ — $ — $ 346Current marketable securities — 64 2Cost method investments, principally bottling companies — 239 —Other assets — 13 —
$ — $ 316 $ 348
The contractual maturities of these investments as of December 31, 2006, were as follows (in millions):
Trading Available-for-Sale Held-to-MaturitySecurities Securities Securities
Fair Fair Amortized FairCost Value Cost Value Cost Value
2007 $ — $ — $ — $ — $ 83 $ 832008-2011 — — — — — —2012-2016 — — — — — —After 2016 — — 13 13 — —Equity securities 60 66 240 458 — —
$ 60 $ 66 $ 253 $ 471 $ 83 $ 83
For the years ended December 31, 2006, 2005 and 2004, gross realized gains and losses on sales of tradingand available-for-sale securities were not material. The cost of securities sold is based on the specificidentification method.
Fair Value of Other Financial Instruments
The carrying amounts of cash and cash equivalents, receivables, accounts payable and accrued expenses,and loans and notes payable approximate their fair values because of the relatively short-term maturity of theseinstruments.
We estimate that the fair values of non-marketable cost method investments approximate their carryingamounts.
93

THE COCA-COLA COMPANY AND SUBSIDIARIES
NOTES TO CONSOLIDATED FINANCIAL STATEMENTS
NOTE 11: FINANCIAL INSTRUMENTS (Continued)
We carry our non-marketable cost method investments at cost or, if a decline in the value of the investmentis deemed to be other than temporary, at fair value. Estimates of fair value are generally based upon discountedcash flow analyses.
We recognize all derivative instruments as either assets or liabilities at fair value in our consolidated balancesheets, with fair values estimated based on quoted market prices or pricing models using current market rates.Virtually all of our derivatives are straightforward, over-the-counter instruments with liquid markets. For furtherdiscussion of our derivatives, including a disclosure of derivative values, refer to Note 12.
The fair value of our long-term debt is estimated based on quoted prices for those or similar instruments.As of December 31, 2006, the carrying amounts and fair values of our long-term debt, including the currentportion, were approximately $1,347 million and approximately $1,386 million, respectively. As of December 31,2005, these carrying amounts and fair values were approximately $1,182 million and approximately$1,240 million, respectively.
NOTE 12: HEDGING TRANSACTIONS AND DERIVATIVE FINANCIAL INSTRUMENTS
When deemed appropriate our Company uses derivative financial instruments primarily to reduce ourexposure to adverse fluctuations in interest rates and foreign currency exchange rates, commodity prices andother market risks. Derivative instruments used to manage fluctuations in commodity prices were not material tothe consolidated financial statements for the three years ended December 31, 2006. The Company formallydesignates and documents the financial instrument as a hedge of a specific underlying exposure, as well as therisk management objectives and strategies for undertaking the hedge transactions. The Company formallyassesses, both at the inception and at least quarterly thereafter, whether the financial instruments that are usedin hedging transactions are effective at offsetting changes in either the fair value or cash flows of the relatedunderlying exposure. Because of the high degree of effectiveness between the hedging instrument and theunderlying exposure being hedged, fluctuations in the value of the derivative instruments are generally offset bychanges in the fair values or cash flows of the underlying exposures being hedged. Any ineffective portion of afinancial instrument’s change in fair value is immediately recognized in earnings. Virtually all of our derivativesare straightforward over-the-counter instruments with liquid markets. Our Company does not enter intoderivative financial instruments for trading purposes.
The fair values of derivatives used to hedge or modify our risks fluctuate over time. We do not view thesefair value amounts in isolation, but rather in relation to the fair values or cash flows of the underlying hedgedtransactions or other exposures. The notional amounts of the derivative financial instruments do not necessarilyrepresent amounts exchanged by the parties and, therefore, are not a direct measure of our exposure to thefinancial risks described above. The amounts exchanged are calculated by reference to the notional amounts andby other terms of the derivatives, such as interest rates, foreign currency exchange rates or other financialindices.
Our Company recognizes all derivative instruments as either assets or liabilities in our consolidated balancesheets at fair value. The accounting for changes in fair value of a derivative instrument depends on whether ithas been designated and qualifies as part of a hedging relationship and, further, on the type of hedgingrelationship. At the inception of the hedging relationship, the Company must designate the instrument as a fairvalue hedge, a cash flow hedge, or a hedge of a net investment in a foreign operation. This designation is basedupon the exposure being hedged.
94

THE COCA-COLA COMPANY AND SUBSIDIARIES
NOTES TO CONSOLIDATED FINANCIAL STATEMENTS
NOTE 12: HEDGING TRANSACTIONS AND DERIVATIVE FINANCIAL INSTRUMENTS (Continued)
We have established strict counterparty credit guidelines and enter into transactions only with financialinstitutions of investment grade or better. We monitor counterparty exposures daily and review any downgradein credit rating immediately. If a downgrade in the credit rating of a counterparty were to occur, we haveprovisions requiring collateral in the form of U.S. government securities for substantially all of our transactions.To mitigate presettlement risk, minimum credit standards become more stringent as the duration of thederivative financial instrument increases. To minimize the concentration of credit risk, we enter into derivativetransactions with a portfolio of financial institutions. The Company has master netting agreements with most ofthe financial institutions that are counterparties to the derivative instruments. These agreements allow for thenet settlement of assets and liabilities arising from different transactions with the same counterparty. Based onthese factors, we consider the risk of counterparty default to be minimal.
Interest Rate Management
Our Company monitors our mix of fixed-rate and variable-rate debt as well as our mix of term debt versusnon-term debt. This monitoring includes a review of business and other financial risks. We also enter intointerest rate swap agreements to manage our mix of fixed-rate and variable-rate debt. Interest rate swapagreements that meet certain conditions required under SFAS No. 133 for fair value hedges are accounted for assuch, with the offset recorded to adjust the fair value of the underlying exposure being hedged. The Companyhad no outstanding interest rate swaps as of December 31, 2006 and 2005. The Company estimates the fair valueof its interest rate derivatives based on quoted market prices. Any ineffective portion, which was not significantin 2006, 2005 or 2004, of the changes in the fair value of these instruments was immediately recognized in netincome.
Foreign Currency Management
The purpose of our foreign currency hedging activities is to reduce the risk that our eventual U.S. dollar netcash inflows resulting from sales outside the United States will be adversely affected by changes in foreigncurrency exchange rates.
We enter into forward exchange contracts and purchase foreign currency options (principally euro andJapanese yen) and collars to hedge certain portions of forecasted cash flows denominated in foreign currencies.The effective portion of the changes in fair value for these contracts, which have been designated as cash flowhedges, was reported in AOCI and reclassified into earnings in the same financial statement line item and in thesame period or periods during which the hedged transaction affects earnings. Any ineffective portion, which wasnot significant in 2006, 2005 or 2004, of the change in the fair value of these instruments was immediatelyrecognized in net income.
Additionally, the Company enters into forward exchange contracts that are effective economic hedges andare not designated as hedging instruments under SFAS No. 133. These instruments are used to offset theearnings impact relating to the variability in foreign currency exchange rates on certain monetary assets andliabilities denominated in nonfunctional currencies. Changes in the fair value of these instruments areimmediately recognized in earnings in the line item other income (loss)—net of our consolidated statements ofincome to offset the effect of remeasurement of the monetary assets and liabilities.
The Company also enters into forward exchange contracts to hedge its net investment position in certainmajor currencies. Under SFAS No. 133, changes in the fair value of these instruments are recognized in foreigncurrency translation adjustment, a component of AOCI, to offset the change in the value of the net investment
95

THE COCA-COLA COMPANY AND SUBSIDIARIES
NOTES TO CONSOLIDATED FINANCIAL STATEMENTS
NOTE 12: HEDGING TRANSACTIONS AND DERIVATIVE FINANCIAL INSTRUMENTS (Continued)
being hedged. For the years ended December 31, 2006, 2005 and 2004, we recorded net gain (loss) in foreigncurrency translation adjustment of approximately $3 million, $(40) million and $(8) million, respectively.
The following table presents the carrying values, fair values and maturities of the Company’s foreigncurrency derivative instruments outstanding as of December 31, 2006 and 2005 (in millions):
Carrying Values Fair ValuesAssets/(Liabilities) Assets/(Liabilities) Maturity
2006Forward contracts $ (21) $ (21) 2007-2008Options and collars 18 18 2007
$ (3) $ (3)
Carrying Values Fair ValuesAssets Assets Maturity
2005Forward contracts $ 28 $ 28 2006Options and collars 11 11 2006
$ 39 $ 39
The Company estimates the fair value of its foreign currency derivatives based on quoted market prices orpricing models using current market rates. These amounts are primarily reflected in prepaid expenses and otherassets in our consolidated balance sheets.
Summary of AOCI
For the years ended December 31, 2006, 2005 and 2004, we recorded a net gain (loss) to AOCI ofapproximately $(31) million, $55 million and $6 million, respectively, net of both income taxes andreclassifications to earnings, primarily related to gains and losses on foreign currency cash flow hedges. Theseitems will generally offset cash flow gains and losses relating to the underlying exposures being hedged in futureperiods. The Company estimates that it will reclassify into earnings during the next 12 months losses ofapproximately $11 million from the after-tax amount recorded in AOCI as of December 31, 2006, as theanticipated cash flows occur.
96

THE COCA-COLA COMPANY AND SUBSIDIARIES
NOTES TO CONSOLIDATED FINANCIAL STATEMENTS
NOTE 12: HEDGING TRANSACTIONS AND DERIVATIVE FINANCIAL INSTRUMENTS (Continued)
The following table summarizes activity in AOCI related to derivatives designated as cash flow hedges heldby the Company during the applicable periods (in millions):
Before-Tax Income After-TaxAmount Tax Amount
2006Accumulated derivative net gains as of January 1, 2006 $ 35 $ (14) $ 21Net changes in fair value of derivatives (38) 15 (23)Net gains reclassified from AOCI into earnings (13) 5 (8)
Accumulated derivative net losses as of December 31, 2006 $ (16) $ 6 $ (10)
Before-Tax Income After-TaxAmount Tax Amount
2005Accumulated derivative net losses as of January 1, 2005 $ (56) $ 22 $ (34)Net changes in fair value of derivatives 135 (53) 82Net gains reclassified from AOCI into earnings (44) 17 (27)
Accumulated derivative net gains as of December 31, 2005 $ 35 $ (14) $ 21
Before-Tax Income After-TaxAmount Tax Amount
2004Accumulated derivative net losses as of January 1, 2004 $ (66) $ 26 $ (40)Net changes in fair value of derivatives (76) 30 (46)Net losses reclassified from AOCI into earnings 86 (34) 52
Accumulated derivative net losses as of December 31, 2004 $ (56) $ 22 $ (34)
The Company did not discontinue any cash flow hedge relationships during the years ended December 31,2006, 2005 and 2004.
NOTE 13: COMMITMENTS AND CONTINGENCIES
As of December 31, 2006, we were contingently liable for guarantees of indebtedness owed by third partiesin the amount of approximately $270 million. These guarantees primarily are related to third-party customers,bottlers and vendors and have arisen through the normal course of business. These guarantees have variousterms, and none of these guarantees was individually significant. The amount represents the maximum potentialfuture payments that we could be required to make under the guarantees; however, we do not consider itprobable that we will be required to satisfy these guarantees.
In December 2003, we granted a $250 million standby line of credit to Coca-Cola FEMSA with normalmarket terms. This standby line of credit expired in December 2006.
We believe our exposure to concentrations of credit risk is limited due to the diverse geographic areascovered by our operations.
97

THE COCA-COLA COMPANY AND SUBSIDIARIES
NOTES TO CONSOLIDATED FINANCIAL STATEMENTS
NOTE 13: COMMITMENTS AND CONTINGENCIES (Continued)
The Company is involved in various legal proceedings. We establish reserves for specific legal proceedingswhen we determine that the likelihood of an unfavorable outcome is probable and the amount of loss can bereasonably estimated. Management has also identified certain other legal matters where we believe anunfavorable outcome is reasonably possible and/or for which no estimate of possible losses can be made.Management believes that any liability to the Company that may arise as a result of currently pending legalproceedings, including those discussed below, will not have a material adverse effect on the financial conditionof the Company taken as a whole.
During the period from 1970 to 1981, our Company owned Aqua-Chem, Inc., now known as Cleaver-Brooks,Inc. (‘‘Aqua-Chem’’). A division of Aqua-Chem manufactured certain boilers that contained gaskets thatAqua-Chem purchased from outside suppliers. Several years after our Company sold this entity, Aqua-Chemreceived its first lawsuit relating to asbestos, a component of some of the gaskets. In September 2002,Aqua-Chem notified our Company that it believed we were obligated for certain costs and expenses associatedwith its asbestos litigations. Aqua-Chem demanded that our Company reimburse it for approximately$10 million for out-of-pocket litigation-related expenses. Aqua-Chem also demanded that the Companyacknowledge a continuing obligation to Aqua-Chem for any future liabilities and expenses that are excludedfrom coverage under the applicable insurance or for which there is no insurance. Our Company disputesAqua-Chem’s claims, and we believe we have no obligation to Aqua-Chem for any of its past, present or futureliabilities, costs or expenses. Furthermore, we believe we have substantial legal and factual defenses toAqua-Chem’s claims. The parties entered into litigation to resolve this dispute, which was stayed by agreementof the parties pending the outcome of litigation filed in Wisconsin by certain insurers of Aqua-Chem. In thatcase, five plaintiff insurance companies filed a declaratory judgment action against Aqua-Chem, the Companyand 16 defendant insurance companies seeking a determination of the parties’ rights and liabilities underpolicies issued by the insurers and reimbursement for amounts paid by plaintiffs in excess of their obligations.That litigation remains pending, and the Company believes it has substantial legal and factual defenses to theinsurers’ claims. Aqua-Chem and the Company subsequently reached a settlement agreement with six of theinsurers in the Wisconsin insurance coverage litigation, and those insurers will pay funds into an escrow accountfor payment of costs arising from the asbestos claims against Aqua-Chem. Aqua-Chem has also reached asettlement agreement with an additional insurer regarding payment of that insurer’s policy proceeds forAqua-Chem’s asbestos claims. Aqua-Chem and the Company will continue to negotiate with the remaininginsurers that are parties to the Wisconsin insurance coverage case and will litigate their claims against suchinsurers to the extent negotiations do not result in settlements. The Company also believes Aqua-Chem hassubstantial insurance coverage to pay Aqua-Chem’s asbestos claimants.
The Company is discussing with the Competition Directorate of the European Commission (the ‘‘EuropeanCommission’’) issues relating to parallel trade within the European Union arising out of comments received bythe European Commission from third parties. The Company is cooperating fully with the European Commissionand is providing information on these issues and the measures taken and to be taken to address any issuesraised. The Company is unable to predict at this time with any reasonable degree of certainty what action, if any,the European Commission will take with respect to these issues.
At the time we acquire or divest our interest in an entity, we sometimes agree to indemnify the seller orbuyer for specific contingent liabilities. Management believes that any liability to the Company that may arise asa result of any such indemnification agreements will not have a material adverse effect on the financial conditionof the Company taken as a whole.
98

THE COCA-COLA COMPANY AND SUBSIDIARIES
NOTES TO CONSOLIDATED FINANCIAL STATEMENTS
NOTE 13: COMMITMENTS AND CONTINGENCIES (Continued)
The Company is involved in various tax matters. We establish reserves at the time that we determine it isprobable we will be liable to pay additional taxes related to certain matters and the amounts of such possibleadditional taxes are reasonably estimable. We adjust these reserves, including any impact on the related interestand penalties, in light of changing facts and circumstances, such as the progress of a tax audit. A number of yearsmay elapse before a particular matter, for which we may have established a reserve, is audited and finallyresolved or when a tax assessment is raised. The number of years with open tax audits varies depending on thetax jurisdiction. While it is often difficult to predict the final outcome or the timing of resolution of anyparticular tax matter, we record a reserve when we determine the likelihood of loss is probable and the amountof loss is reasonably estimable. Such liabilities are recorded in the line item accrued income taxes in theCompany’s consolidated balance sheets. Favorable resolution of tax matters that had been previously reservedwould be recognized as a reduction to our income tax expense, when known.
The Company is also involved in various tax matters where we have determined that the probability of anunfavorable outcome is reasonably possible. Management believes that any liability to the Company that mayarise as a result of currently pending tax matters will not have a material adverse effect on the financial conditionof the Company taken as a whole.
NOTE 14: NET CHANGE IN OPERATING ASSETS AND LIABILITIES
Net cash provided by (used in) operating activities attributable to the net change in operating assets andliabilities is composed of the following (in millions):
Year Ended December 31, 2006 2005 2004
(Increase) in trade accounts receivable $ (214) $ (79) $ (5)(Increase) in inventories (150) (79) (57)(Increase) decrease in prepaid expenses and other assets (152) 244 (397)Increase in accounts payable and accrued expenses 173 280 45(Decrease) increase in accrued taxes (68) 145 (194)(Decrease) in other liabilities (204) (81) (9)
$ (615) $ 430 $ (617)
NOTE 15: STOCK COMPENSATION PLANS
Effective January 1, 2006, the Company adopted SFAS No. 123(R). Our Company adopted SFASNo. 123(R), using the modified prospective method. Based on the terms of our plans, our Company did not havea cumulative effect related to its plans. The adoption of SFAS No. 123(R) did not have a material impact on ourstock-based compensation expense for the year ended December 31, 2006. Further, we believe the adoption ofSFAS No. 123(R) will not have a material impact on our Company’s future stock-based compensation expense.Prior to 2006, our Company accounted for stock option plans and restricted stock plans under the preferable fairvalue recognition provisions of SFAS No. 123.
Our total stock-based compensation expense was approximately $324 million, $324 million and $345 millionin 2006, 2005 and 2004, respectively. These amounts were recorded in selling, general and administrativeexpenses in 2006, 2005 and 2004, respectively. The total income tax benefit recognized in the income statementfor share-based compensation arrangements was approximately $93 million, $90 million and $92 million for2006, 2005 and 2004, respectively. As of December 31, 2006, we had approximately $376 million of total
99

THE COCA-COLA COMPANY AND SUBSIDIARIES
NOTES TO CONSOLIDATED FINANCIAL STATEMENTS
NOTE 15: STOCK COMPENSATION PLANS (Continued)
unrecognized compensation cost related to nonvested share-based compensation arrangements granted underour plans. This cost is expected to be recognized as stock-based compensation expense over a weighted-averageperiod of 1.7 years. This expected cost does not include the impact of any future stock-based compensationawards. Additionally, our equity method investees also adopted SFAS No. 123(R) effective January 1, 2006. Ourproportionate share of the stock-based compensation expense resulting from the adoption of SFAS No. 123(R)by our equity method investees is recognized as a reduction to equity income. The adoption of SFAS No. 123(R)by our equity method investees did not have a material impact on our consolidated financial statements.
During 2005, the Company changed its estimated service period for retirement-eligible participants in itsplans when the terms of their stock-based compensation awards provide for accelerated vesting upon earlyretirement. The full-year impact of this change in our estimated service period was approximately $50 million for2005.
Stock Option Plans
Under our 1991 Stock Option Plan (the ‘‘1991 Option Plan’’), a maximum of 120 million shares of ourcommon stock was approved to be issued or transferred to certain officers and employees pursuant to stockoptions granted under the 1991 Option Plan. Options to purchase common stock under the 1991 Option Planhave been granted to Company employees at fair market value at the date of grant.
The 1999 Stock Option Plan (the ‘‘1999 Option Plan’’) was approved by shareowners in April 1999.Following the approval of the 1999 Option Plan, no grants were made from the 1991 Option Plan, and sharesavailable under the 1991 Option Plan were no longer available to be granted. Under the 1999 Option Plan, amaximum of 120 million shares of our common stock was approved to be issued or transferred to certain officersand employees pursuant to stock options granted under the 1999 Option Plan. Options to purchase commonstock under the 1999 Option Plan have been granted to Company employees at fair market value at the date ofgrant.
The 2002 Stock Option Plan (the ‘‘2002 Option Plan’’) was approved by shareowners in April 2002. Anamendment to the 2002 Option Plan which permitted the issuance of stock appreciation rights was approved byshareowners in April 2003. Under the 2002 Option Plan, a maximum of 120 million shares of our common stockwas approved to be issued or transferred to certain officers and employees pursuant to stock options and stockappreciation rights granted under the 2002 Option Plan. The stock appreciation rights permit the holder, uponsurrendering all or part of the related stock option, to receive common stock in an amount up to 100 percent ofthe difference between the market price and the option price. No stock appreciation rights have been issuedunder the 2002 Option Plan as of December 31, 2006. Options to purchase common stock under the 2002Option Plan have been granted to Company employees at fair market value at the date of grant.
Stock options granted in December 2003 and thereafter generally become exercisable over a four-yearannual vesting period and expire 10 years from the date of grant. Stock options granted from 1999 throughJuly 2003 generally become exercisable over a four-year annual vesting period and expire 15 years from the dateof grant. Prior to 1999, stock options generally became exercisable over a three-year vesting period and expired10 years from the date of grant.
The fair value of each option award is estimated on the date of the grant using a Black-Scholes-Mertonoption-pricing model that uses the assumptions noted in the following table. The expected term of the optionsgranted represents the period of time that options granted are expected to be outstanding and is derived by
100

THE COCA-COLA COMPANY AND SUBSIDIARIES
NOTES TO CONSOLIDATED FINANCIAL STATEMENTS
NOTE 15: STOCK COMPENSATION PLANS (Continued)
analyzing historic exercise behavior. Expected volatilities are based on implied volatilities from traded optionson the Company’s stock, historical volatility of the Company’s stock, and other factors. The risk-free interest ratefor the period matching the expected term of the option is based on the U.S. Treasury yield curve in effect at thetime of the grant. The dividend yield is the calculated yield on the Company’s stock at the time of the grant.
The following table sets forth information about the weighted-average fair value of options granted duringthe past three years and the weighted-average assumptions used for such grants:
2006 2005 2004
Fair value of options at grant date $ 8.16 $ 8.23 $ 8.84Dividend yields 2.7% 2.6% 2.5%Expected volatility 19.3% 19.9% 23.0%Risk-free interest rates 4.5% 4.3% 3.8%Expected term of the option 6 years 6 years 6 years
101

THE COCA-COLA COMPANY AND SUBSIDIARIES
NOTES TO CONSOLIDATED FINANCIAL STATEMENTS
NOTE 15: STOCK COMPENSATION PLANS (Continued)
A summary of stock option activity under all plans for the years ended December 31, 2006, 2005 and 2004,is as follows:
AggregateWeighted-Average Intrinsic
Shares Weighted-Average Remaining Value(In millions) Exercise Price Contractual Life (In millions)
2006Outstanding on January 1, 2006 203 $ 48.50Granted1 2 41.65Exercised (4) 44.53Forfeited/expired2 (15) 48.30Outstanding on December 31, 2006 186 $ 48.52 8.1 years $ 502
Expected to vest at December 31, 2006 182 $ 48.65 8.1 years $ 478
Exercisable on December 31, 2006 141 $ 50.50 8.0 years $ 227
Shares available on December 31, 2006for options that may be granted 64
AggregateWeighted-Average Intrinsic
Shares Weighted-Average Remaining Value(In millions) Exercise Price Contractual Term (In millions)
2005Outstanding on January 1, 2005 183 $ 49.41Granted1 34 41.26Exercised (7) 35.63Forfeited/expired2 (7) 49.11Outstanding on December 31, 2005 203 $ 48.50 8.8 years $ 0
Exercisable on December 31, 2005 131 $ 51.61 8.4 years $ 0
Shares available on December 31, 2005for options that may be granted 58
AggregateWeighted-Average Intrinsic
Shares Weighted-Average Remaining Value(In millions) Exercise Price Contractual Term (In millions)
2004Outstanding on January 1, 2004 167 $ 50.56Granted1 31 41.63Exercised (5) 35.54Forfeited/expired2 (10) 51.64Outstanding on December 31, 2004 183 $ 49.41 9.3 years $ 51
Exercisable on December 31, 2004 116 $ 52.02 8.7 years $ 39
Shares available on December 31, 2004for options that may be granted 85
1 No grants were made from the 1991 Option Plan during 2006, 2005 or 2004.2 Shares forfeited/expired relate to the 1991, 1999 and 2002 Option Plans.
The total intrinsic value of the options exercised during the years ended December 31, 2006, 2005 and 2004,was $11 million, $49 million and $67 million, respectively.
102

THE COCA-COLA COMPANY AND SUBSIDIARIES
NOTES TO CONSOLIDATED FINANCIAL STATEMENTS
NOTE 15: STOCK COMPENSATION PLANS (Continued)
Restricted Stock Award Plans
Under the amended 1989 Restricted Stock Award Plan and the amended 1983 Restricted Stock Award Plan(the ‘‘Restricted Stock Award Plans’’), 40 million and 24 million shares of restricted common stock, respectively,were originally available to be granted to certain officers and key employees of our Company.
On December 31, 2006, approximately 31 million shares remain available for grant under the RestrictedStock Award Plans. Participants are entitled to vote and receive dividends on the shares and, under the 1983Restricted Stock Award Plan, participants are reimbursed by our Company for income taxes imposed on theaward, but not for taxes generated by the reimbursement payment. The shares are subject to certain transferrestrictions and may be forfeited if a participant leaves our Company for reasons other than retirement,disability or death, absent a change in control of our Company.
The following awards were outstanding and nonvested as of December 31, 2006:
• 382,700 shares of time-based restricted stock in which the restrictions lapse upon the achievement ofcontinued employment over a specified period of time. An additional 31,000 shares were promised foremployees based outside of the United States;
• 416,852 shares of performance-based restricted stock in which restrictions lapse upon the achievement ofspecific performance goals over a specified performance period; and
• 2,271,240 performance share unit (‘‘PSU’’) awards which could result in a future grant of restricted stockafter the achievement of specific performance goals over a specified performance period. Such awardsare subject to adjustment based on the final performance relative to the goals, resulting in a minimumgrant of no shares and a maximum grant of 3,370,860 shares.
103

THE COCA-COLA COMPANY AND SUBSIDIARIES
NOTES TO CONSOLIDATED FINANCIAL STATEMENTS
NOTE 15: STOCK COMPENSATION PLANS (Continued)
Time-Based Restricted Stock Awards
The following table summarizes information about time-based restricted stock awards:
2006 2005 2004
Weighted- Weighted- Weighted-Average Average Average
Grant-Date Grant-Date Grant-DateShares Fair Value Shares Fair Value Shares Fair Value
Nonvested on January 1 422,700 $ 36.31 513,700 $ 39.97 1,224,900 $ 45.20Granted1 — — 9,000 41.80 140,000 48.97Vested and released2 (30,000) 58.48 (100,000) 55.62 (296,800) 36.68Cancelled/Forfeited (10,000) 21.91 — — (554,400) 55.57
Nonvested on December 31 382,7001 $ 34.95 422,7001 $ 36.31 513,700 $ 39.97
1 In 2006, the Company promised to grant an additional 21,000 shares with a grant-date fair value of$48.84 per share to an employee upon retirement. In 2005, the Company promised to grant anadditional 10,000 shares to an employee with a grant-date fair value of $42.84 per share uponcompletion of three years of service. These awards are similar to time-based restricted stock,including the payment of dividend equivalents, but were granted in this manner because theemployees were based outside of the United States.
2 The total fair value of time-based restricted shares vested and released during the years endedDecember 31, 2006, 2005 and 2004, was approximately $1.3 million, $4.3 million, and $13.2 million,respectively. The grant date fair value is the quoted market value of the Company stock on therespective grant date.
In the third quarter of 2004, in connection with Douglas N. Daft’s retirement, the CompensationCommittee of the Board of Directors released to Mr. Daft 200,000 shares of restricted stock previously grantedto him during the period from April 1992 to October 1998. The weighted average grant-date fair value was$32.26 per share and the total fair value of shares released was approximately $8.3 million. The terms of thesegrants provided that the restricted shares be released upon retirement after age 62 but not earlier than five yearsfrom the date of grant. The Compensation Committee determined to release the shares in recognition ofMr. Daft’s 27 years of service to the Company and the fact that he would turn 62 in March 2005. Mr. Daftforfeited 500,000 shares of restricted stock granted to him in November 2000, since as of the date of hisretirement, he had not held these shares for five years from the date of grant. In addition, Mr. Daft forfeited1,000,000 shares of performance-based restricted stock, since Mr. Daft retired prior to the completion of theperformance period.
Performance-Based Restricted Stock Awards
In 2001, shareowners approved an amendment to the 1989 Restricted Stock Award Plan to allow for thegrant of performance-based awards. These awards are released only upon the achievement of specificmeasurable performance criteria. These awards pay dividends during the performance period. The majority ofawards have specific earnings per share targets for achievement. If the earnings per share targets are not met,the awards will be cancelled.
104

THE COCA-COLA COMPANY AND SUBSIDIARIES
NOTES TO CONSOLIDATED FINANCIAL STATEMENTS
NOTE 15: STOCK COMPENSATION PLANS (Continued)
The following table summarizes information about performance-based restricted stock awards:
2006 2005 2004
Weighted- Weighted- Weighted-Average Average Average
Grant-Date Grant-Date Grant-DateShares Fair Value Shares Fair Value Shares Fair Value
Nonvested on January 1 713,000 $ 47.37 713,000 $ 47.75 2,507,720 $ 47.93Granted 224,000 43.66 50,000 42.40 — —PSU conversion1 123,852 42.07 — — — —Vested and released2 (50,000) 56.25 — — (110,000) 50.54Cancelled/Forfeited (594,000) 47.18 (50,000) 47.88 (1,684,720) 47.84
Nonvested on December 31 416,852 $ 43.00 713,000 $ 47.37 713,000 $ 47.75
1 Represents issuance of restricted stock to executives from conversion of previously grantedperformance share units due to their retirement during the year. The weighted-average grant-datefair value is based on the fair values of the performance share unit awards’ grant-date fair values.
2 The total fair value of performance-based restricted shares vested and released during the yearsended December 31, 2006 and 2004, was approximately $2.1 million and $5.0 million, respectively.The grant-date fair value is the quoted market value of the Company stock on the respective grantdate.
Performance Share Unit Awards
In 2003, the Company modified its use of performance-based awards and established a program to grantperformance share unit awards under the 1989 Restricted Stock Award Plan to executives. The number ofperformance share units earned shall be determined at the end of each performance period, generally threeyears, based on performance criteria determined by the Board of Directors and may result in an award ofrestricted stock for U.S. participants and certain international participants at that time. The restricted stock maybe granted to other international participants shortly before the fifth anniversary of the original award.Restrictions on such stock generally lapse on the fifth anniversary of the original award date. Generally,performance share unit awards are subject to the performance criteria of compound annual growth in earningsper share over the performance period, as adjusted for certain items approved by the Compensation Committeeof the Board of Directors (‘‘adjusted EPS’’). The purpose of these adjustments is to ensure a consistent year toyear comparison of the specified performance criteria. Performance share units do not pay dividends during theperformance period. Accordingly, the fair value of these units is the quoted market value of the Company stockon the date of the grant less the present value of the expected dividends not received during the performanceperiod.
Performance share unit Target Awards for the 2004-2006, 2005-2007 and 2006-2008 performance periodsrequire adjusted EPS growth in line with our Company’s internal projections over the performance periods. Inthe event adjusted EPS exceeds the target projection, additional shares up to the Maximum Award may begranted. In the event adjusted EPS falls below the target projection, a reduced number of shares as few as theThreshold Award may be granted. If adjusted EPS falls below the Threshold Award performance level, noshares will be granted. Performance share unit awards provide for cash equivalent payments to former executiveswho become ineligible for restricted stock grants due to certain events such as death, disability or termination.
105

THE COCA-COLA COMPANY AND SUBSIDIARIES
NOTES TO CONSOLIDATED FINANCIAL STATEMENTS
NOTE 15: STOCK COMPENSATION PLANS (Continued)
Of the outstanding granted performance share unit awards as of December 31, 2006, 590,964; 787,576; and820,700 awards are for the 2004-2006, 2005-2007 and 2006-2008 performance periods, respectively. In addition,72,000 performance share unit awards, with predefined qualitative performance criteria and release criteria thatdiffer from the program described above, were granted in 2004 and were outstanding as of December 31, 2006.
The following table summarizes information about performance share unit awards:
2006 2005 2004
Weighted- Weighted- Weighted-Average Average Average
Share Grant-Date Share Grant-Date Share Grant-DateUnits Fair Value Units Fair Value Units Fair Value
Outstanding on January 1 2,356,728 $ 40.42 1,583,447 $ 41.83 798,931 $ 46.78Granted 160,000 37.84 835,440 37.71 953,196 38.71Converted to restricted stock1 (123,852) 42.07 — — — —Paid in cash equivalent2 (7,178) 41.87 — — — —Cancelled/Forfeited (114,458) 43.45 (62,159) 40.06 (168,680) 47.62
Outstanding on December 31 2,271,240 $ 39.99 2,356,728 $ 40.42 1,583,447 $ 41.83
1 Represents performance share units converted to restricted stock for certain executives prior toretirement. The vesting of this restricted stock is subject to certification of the applicableperformance periods.
2 Represents share units that converted to cash equivalent payments to former executives who wereineligible for restricted stock grants due to certain events such as death, disability or termination.
Number of Performance ShareUnits Outstanding
December 31, 2006 2005 2004
Threshold Award 1,297,632 1,352,388 950,837Target Award 2,271,240 2,356,728 1,583,447Maximum Award 3,370,860 3,499,092 2,339,171
The Company recognizes compensation expense when it becomes probable that the performance criteriaspecified in the plan will be achieved. The compensation expense is recognized over the remaining performanceperiod and is recorded in selling, general and administrative expenses.
NOTE 16: PENSION AND OTHER POSTRETIREMENT BENEFIT PLANS
Our Company sponsors and/or contributes to pension and postretirement health care and life insurancebenefit plans covering substantially all U.S. employees. We also sponsor nonqualified, unfunded defined benefitpension plans for certain associates. In addition, our Company and its subsidiaries have various pension plansand other forms of postretirement arrangements outside the United States. We use a measurement date ofDecember 31 for substantially all of our pension and postretirement benefit plans.
106

THE COCA-COLA COMPANY AND SUBSIDIARIES
NOTES TO CONSOLIDATED FINANCIAL STATEMENTS
NOTE 16: PENSION AND OTHER POSTRETIREMENT BENEFIT PLANS (Continued)
Effective December 31, 2006, the Company adopted SFAS No. 158, which required the recognition inpension obligations and AOCI of actuarial gains or losses, prior service costs or credits and transition assets orobligations that had previously been deferred under the reporting requirements of SFAS No. 87, SFAS No. 106and SFAS No. 132(R). The following table reflects the effects of the adoption of SFAS No. 158 on ourconsolidated balance sheet as of December 31, 2006. SFAS No. 158 also impacted the reporting of equitymethod investees as described in Note 3.
Before AfterApplication of Application of
December 31, 2006 (in millions) SFAS No. 158 Adjustments SFAS No. 158
Equity method investments $ 6,460 $ (150) $ 6,310Other assets 2,776 (75) 2,701Other intangible assets 1,699 (12) 1,687Total assets 30,200 (237) 29,963Other liabilities 2,039 192 2,231Deferred income taxes 749 (141) 608Total liabilities 12,992 51 13,043Accumulated other comprehensive income (1,003) (288) (1,291)Total shareowners’ equity 17,208 (288) 16,920Total liabilities and shareowners’ equity 30,200 (237) 29,963
Amounts recognized in AOCI consist of the following (in millions, pretax):
Pension Benefits Other Benefits
December 31, 2006 2006
Net actuarial loss (gain) $ 267 $ 97Prior service cost (credit) 37 (5)
$ 304 $ 92
Amounts in AOCI expected to be recognized as components of net periodic pension cost in 2007 are asfollows (in millions, pretax):
Pension Benefits Other Benefits
2007 2007
Net actuarial loss (gain) $ 20 $ 1Prior service cost (credit) 6 —
$ 26 $ 1
Certain amounts in the prior years’ disclosure have been reclassified to conform to the current yearpresentation.
107

THE COCA-COLA COMPANY AND SUBSIDIARIES
NOTES TO CONSOLIDATED FINANCIAL STATEMENTS
NOTE 16: PENSION AND OTHER POSTRETIREMENT BENEFIT PLANS (Continued)
Obligations and Funded Status
The following table sets forth the change in benefit obligations for our benefit plans (in millions):
Pension Benefits Other Benefits
December 31, 2006 2005 2006 2005
Benefit obligation at beginning of year1 $ 2,806 $ 2,592 $ 787 $ 801Service cost 104 88 31 28Interest cost 158 146 46 43Foreign currency exchange rate changes 53 (56) (1) —Amendments 4 2 — —Actuarial (gain) loss (41) 186 (25) (63)Benefits paid2 (127) (123) (23) (25)Business combinations 95 — 10 —Settlements (10) (28) — —Curtailments — (7) — —Other 3 6 3 3
Benefit obligation at end of year1 $ 3,045 $ 2,806 $ 828 $ 787
1 For pension benefit plans, the benefit obligation is the projected benefit obligation. For other benefitplans, the benefit obligation is the accumulated postretirement benefit obligation.
2 Benefits paid from pension benefit plans during 2006 and 2005 included $31 million and $28 million,respectively, in payments related to unfunded pension plans that were paid from Company assets. Allof the benefits paid from other benefit plans during 2006 and 2005 were paid from Company assets.
The accumulated benefit obligation for our pension plans was $2,648 million and $2,428 million atDecember 31, 2006 and 2005, respectively.
For pension plans with projected benefit obligations in excess of plan assets, the total projected benefitobligation and fair value of plan assets were $1,339 million and $642 million, respectively, as of December 31,2006, and $1,156 million and $470 million, respectively, as of December 31, 2005. For pension plans withaccumulated benefit obligations in excess of plan assets, the total accumulated benefit obligation and fair valueof plan assets were $852 million and $278 million, respectively, as of December 31, 2006, and $875 million and$331 million, respectively, as of December 31, 2005.
108

THE COCA-COLA COMPANY AND SUBSIDIARIES
NOTES TO CONSOLIDATED FINANCIAL STATEMENTS
NOTE 16: PENSION AND OTHER POSTRETIREMENT BENEFIT PLANS (Continued)
The following table sets forth the change in the fair value of plan assets for our benefit plans (in millions):
Pension Benefits Other Benefits
December 31, 2006 2005 2006 2005
Fair value of plan assets at beginning of year1 $ 2,406 $ 2,166 $ 19 $ 10Actual return on plan assets 339 213 5 1Employer contributions 94 161 224 8Foreign currency exchange rate changes 36 (35) — —Benefits paid (96) (95) — —Business combinations 68 — — —Other (4) (4) — —
Fair value of plan assets at end of year1 $ 2,843 $ 2,406 $ 248 $ 19
1 Plan assets include 1.6 million shares of common stock of our Company with a fair value of$77 million and $65 million as of December 31, 2006 and 2005, respectively. Dividends received oncommon stock of our Company during 2006 and 2005 were $2.0 million and $1.8 million, respectively.
The pension and other benefit amounts recognized in our consolidated balance sheets are as follows(in millions):
Pension Benefits Other Benefits
December 31, 20061 2005 20061 2005
Funded status — plan assets less than benefit obligations $ (202) $ (400) $ (580) $ (768)Unrecognized net actuarial loss — 512 — 123Unrecognized prior service cost (credit) — 39 — (6)Fourth quarter contribution 3 — — —
Net prepaid asset (liability) recognized $ (199) $ 151 $ (580) $ (651)
Prepaid benefit cost $ 494 $ 581 $ — $ —Accrued benefit liability (693) (570) (580) (651)Intangible asset — 12 — —Accumulated other comprehensive income — 128 — —
Net prepaid asset (liability) recognized $ (199) $ 151 $ (580) $ (651)
1 Effective December 31, 2006, the Company adopted SFAS No. 158.
109

THE COCA-COLA COMPANY AND SUBSIDIARIES
NOTES TO CONSOLIDATED FINANCIAL STATEMENTS
NOTE 16: PENSION AND OTHER POSTRETIREMENT BENEFIT PLANS (Continued)
Components of Net Periodic Benefit Cost
Net periodic benefit cost for our pension and other postretirement benefit plans consisted of the following(in millions):
Pension Benefits Other Benefits
December 31, 2006 2005 2004 2006 2005 2004
Service cost $ 104 $ 88 $ 82 $ 31 $ 28 $ 27Interest cost 158 146 136 46 43 44Expected return on plan assets (179) (154) (141) (5) (1) —Amortization of prior service cost (credit) 7 7 8 — — (1)Recognized net actuarial loss 46 42 35 3 1 3
Net periodic benefit cost1 $ 136 $ 129 $ 120 $ 75 $ 71 $ 73
1 During 2004, net periodic benefit cost for our other postretirement benefit plans was reduced by$12 million due to our adoption of FSP 106-2. Refer to Note 1.
Assumptions
Certain weighted-average assumptions used in computing the benefit obligations are as follows:
Pension Benefits Other Benefits
December 31, 2006 2005 2006 2005
Discount rate 53⁄4% 51⁄2% 6% 53⁄4%Rate of increase in compensation levels 41⁄4% 41⁄4% 41⁄2% 41⁄2%
Certain weighted-average assumptions used in computing net periodic benefit cost are as follows:
Pension Benefits Other Benefits
Year Ended December 31, 2006 2005 2004 2006 2005 2004
Discount rate 51⁄2% 51⁄2% 6% 53⁄4% 6% 61⁄4%Rate of increase in compensation levels 41⁄4% 4% 41⁄4% 41⁄2% 41⁄2% 41⁄2%Expected long-term rate of return on plan assets 8% 8% 8% 81⁄2% 81⁄2% 81⁄2%
The assumed health care cost trend rates are as follows:
December 31, 2006 2005
Health care cost trend rate assumed for next year 9% 9%Rate to which the cost trend rate is assumed to decline (the ultimate trend rate) 5% 51⁄4%Year that the rate reaches the ultimate trend rate 2011 2010
110

THE COCA-COLA COMPANY AND SUBSIDIARIES
NOTES TO CONSOLIDATED FINANCIAL STATEMENTS
NOTE 16: PENSION AND OTHER POSTRETIREMENT BENEFIT PLANS (Continued)
Assumed health care cost trend rates have a significant effect on the amounts reported for thepostretirement health care plans. A one percentage point change in the assumed health care cost trend ratewould have the following effects (in millions):
One Percentage Point One Percentage PointIncrease Decrease
Effect on accumulated postretirement benefit obligationas of December 31, 2006 $ 117 $ (95)
Effect on total of service cost and interest cost in 2006 $ 15 $ (12)
The discount rate assumptions used to account for pension and other postretirement benefit plans reflectthe rates at which the benefit obligations could be effectively settled. These rates were determined using a cashflow matching technique whereby a hypothetical portfolio of high quality debt securities was constructed thatmirrors the specific benefit obligations for each of our primary U.S. plans. The rate of compensation increaseassumption is determined by the Company based upon annual reviews. We review external data and our ownhistorical trends for health care costs to determine the health care cost trend rate assumptions.
Plan Assets
Pension Benefit Plans
The following table sets forth the actual asset allocation and weighted-average target asset allocation forour U.S. and non-U.S. pension plan assets:
Target AssetDecember 31, 2006 2005 Allocation
Equity securities1 62% 63% 61%Debt securities 27 24 29Real estate and other2 11 13 10
Total 100% 100% 100%
1 As of December 31, 2006 and 2005, 3 percent of total pension plan assets were invested in commonstock of our Company.
2 As of December 31, 2006 and 2005, 6 percent of total pension plan assets were invested in real estate.
Investment objectives for the Company’s U.S. pension plan assets, which comprise 75 percent of totalpension plan assets as of December 31, 2006, are to:
(1) optimize the long-term return on plan assets at an acceptable level of risk;
(2) maintain a broad diversification across asset classes and among investment managers;
(3) maintain careful control of the risk level within each asset class; and
(4) focus on a long-term return objective.
111

THE COCA-COLA COMPANY AND SUBSIDIARIES
NOTES TO CONSOLIDATED FINANCIAL STATEMENTS
NOTE 16: PENSION AND OTHER POSTRETIREMENT BENEFIT PLANS (Continued)
Asset allocation targets promote optimal expected return and volatility characteristics given the long-termtime horizon for fulfilling the obligations of the pension plans. Selection of the targeted asset allocation for U.S.plan assets was based upon a review of the expected return and risk characteristics of each asset class, as well asthe correlation of returns among asset classes.
Investment guidelines are established with each investment manager. These guidelines provide theparameters within which the investment managers agree to operate, including criteria that determine eligibleand ineligible securities, diversification requirements and credit quality standards, where applicable. Unlessexceptions have been approved, investment managers are prohibited from buying or selling commodities, futuresor option contracts, as well as from short selling of securities. Furthermore, investment managers agree to obtainwritten approval for deviations from stated investment style or guidelines.
As of December 31, 2006, no investment manager was responsible for more than 10 percent of total U.S.plan assets. In addition, diversification requirements for each investment manager prevent a single security orother investment from exceeding 10 percent, at historical cost, of the individual manager’s portfolio.
The expected long-term rate of return assumption for U.S. plan assets is based upon the target assetallocation and is determined using forward-looking assumptions in the context of historical returns andvolatilities for each asset class, as well as correlations among asset classes. We evaluate the rate of returnassumption on an annual basis. The expected long-term rate of return assumption used in computing 2006 netperiodic pension cost for the U.S. plans was 8.5 percent. As of December 31, 2006, the 10-year annualized returnon U.S. plan assets was 9.0 percent, the 15-year annualized return was 11.0 percent, and the annualized returnsince inception was 12.8 percent.
Plan assets for our pension plans outside the United States are insignificant on an individual plan basis.
Other Benefit Plans
Plan assets associated with other benefits represent funding of the primary U.S. postretirement benefitplans. In late 2006, we established and contributed $216 million to a U.S. Voluntary Employee BeneficiaryAssociation, a tax-qualified trust. As of December 31, 2006, the majority of these funds were held in short-terminvestments pending the implementation of long-term asset allocation strategies. While these assets will remainsegregated from the primary U.S. pension master trust, the investment objectives, asset allocation targets andinvestment guidelines will be determined in a methodology similar to that applied to the U.S. pension plansdescribed above.
112

THE COCA-COLA COMPANY AND SUBSIDIARIES
NOTES TO CONSOLIDATED FINANCIAL STATEMENTS
NOTE 16: PENSION AND OTHER POSTRETIREMENT BENEFIT PLANS (Continued)
Cash Flows
Information about the expected cash flows for our pension and other postretirement benefit plans is asfollows (in millions):
Pension OtherBenefits Benefits
Expected employer contributions:2007 $ 49 $ —Expected benefit payments1:2007 $ 135 $ 302008 133 332009 134 362010 145 392011 142 422012-2016 834 253
1 The expected benefit payments for our other postretirement benefit plans are net of estimatedfederal subsidies expected to be received under the Medicare Prescription Drug, Improvement andModernization Act of 2003. Federal subsidies are estimated to range from $2 million to $3 million in2007 to 2011 and are estimated to be $23 million for the period 2012-2016.
Defined Contribution Plans
Our Company sponsors a qualified defined contribution plan covering substantially all U.S. employees.Under this plan, we match 100 percent of participants’ contributions up to a maximum of 3 percent ofcompensation. Company contributions to the U.S. plan were approximately $25 million, $21 million and$18 million in 2006, 2005 and 2004, respectively. We also sponsor defined contribution plans in certain locationsoutside the United States. Company contributions to those plans were approximately $18 million, $16 millionand $13 million in 2006, 2005 and 2004, respectively.
NOTE 17: INCOME TAXES
Income before income taxes consisted of the following (in millions):
Year Ended December 31, 2006 2005 2004
United States $ 2,126 $ 2,268 $ 2,535International 4,452 4,422 3,687
$ 6,578 $ 6,690 $ 6,222
113

THE COCA-COLA COMPANY AND SUBSIDIARIES
NOTES TO CONSOLIDATED FINANCIAL STATEMENTS
NOTE 17: INCOME TAXES (Continued)
Income tax expense (benefit) consisted of the following for the years ended December 31, 2006, 2005 and2004 (in millions):
United State andStates Local International Total
2006Current $ 608 $ 47 $ 878 $ 1,533Deferred (20) (22) 7 (35)
2005Current $ 873 $ 188 $ 845 $ 1,906Deferred (72) (25) 9 (88)
2004Current $ 350 $ 64 $ 799 $ 1,213Deferred 209 29 (76) 162
We made income tax payments of approximately $1,601 million, $1,676 million and $1,500 million in 2006,2005 and 2004, respectively.
A reconciliation of the statutory U.S. federal tax rate and effective tax rates is as follows:
Year Ended December 31, 2006 2005 2004
Statutory U.S. federal rate 35.0 % 35.0 % 35.0 %State and local income taxes — net of federal benefit 0.7 1.2 1.0Earnings in jurisdictions taxed at rates different from the statutory U.S. federal rate (11.4)1 (12.1)5 (9.4)9,10
Equity income or loss (0.6)2 (2.3) (3.1)11
Other operating charges 0.63 0.46 (0.9)12
Other — net (1.5)4 0.37 (0.5)13
Repatriation under the Jobs Creation Act — 4.78 —
Effective rates 22.8 % 27.2 % 22.1 %
1 Includes approximately $24 million (or 0.4 percent) tax charge related to the resolution of certain taxmatters in various international jurisdictions.
2 Includes approximately 2.4 percent impact to our effective tax rate related to charges recorded by ourequity method investees. Refer to Note 3 and Note 18.
3 Includes the tax rate impact related to the impairment of assets and investments in our bottlingoperations, contract termination costs related to production capacity efficiencies and otherrestructuring charges. Refer to Note 18.
4 Includes approximately 1.8 percent tax rate benefit related to the sale of a portion of our investmentin Coca-Cola FEMSA and Coca-Cola Icecek. Refer to Note 3 and Note 18.
5 Includes approximately $29 million (or 0.4 percent) tax benefit related to the favorable resolution ofcertain tax matters in various international jurisdictions.
6 Includes approximately $4 million tax benefit related to the Philippines impairment charges. Refer toNote 6 and Note 18.
7 Includes approximately $72 million (or 1.1 percent) tax benefit related to the favorable resolution ofcertain domestic tax matters.
8 Related to repatriation of approximately $6.1 billion of previously unremitted foreign earnings underthe Jobs Creation Act, resulting in a tax provision of approximately $315 million.
114

THE COCA-COLA COMPANY AND SUBSIDIARIES
NOTES TO CONSOLIDATED FINANCIAL STATEMENTS
NOTE 17: INCOME TAXES (Continued)9 Includes approximately $92 million (or 1.4 percent) tax benefit related to the favorable resolution of
certain tax matters in various international jurisdictions.10 Includes a tax charge of approximately $75 million (or 1.2 percent) related to the recording of a
valuation allowance on various deferred tax assets recorded in Germany.11 Includes an approximate $50 million (or 0.8 percent) tax benefit related to the realization of certain
foreign tax credits per provisions of the Jobs Creation Act.12 Includes a tax benefit of approximately $171 million primarily related to impairment of franchise
rights at CCEAG and certain manufacturing investments. Refer to Note 18.13 Includes an approximate $36 million (or 0.6 percent) tax benefit related to the favorable resolution of
various domestic tax matters.
Our effective tax rate reflects the tax benefits from having significant operations outside the United Statesthat are taxed at rates lower than the statutory U.S. rate of 35 percent. During 2006, the Company had severalsubsidiaries that benefited from various tax incentive grants. The terms of these grants range from 2010 to 2018.The Company expects each of the grants to be renewed indefinitely. The grants did not have a material effect onthe results of operations for the years ended December 31, 2006, 2005 or 2004.
Undistributed earnings of the Company’s foreign subsidiaries amounted to approximately $7.7 billion atDecember 31, 2006. Those earnings are considered to be indefinitely reinvested and, accordingly, no U.S.federal and state income taxes have been provided thereon. Upon distribution of those earnings in the form ofdividends or otherwise, the Company would be subject to both U.S. income taxes (subject to an adjustment forforeign tax credits) and withholding taxes payable to the various foreign countries. Determination of the amountof unrecognized deferred U.S. income tax liability is not practical because of the complexities associated with itshypothetical calculation; however, unrecognized foreign tax credits would be available to reduce a portion of theU.S. tax liability.
As discussed in Note 1, the Jobs Creation Act was enacted in October 2004. One of the provisions providesa one-time benefit related to foreign tax credits generated by equity investments in prior years. The Companyrecorded an income tax benefit of approximately $50 million as a result of this law change in 2004. The JobsCreation Act also included a temporary incentive for U.S. multinationals to repatriate foreign earnings at anapproximate 5.25 percent effective tax rate. During the first quarter of 2005, the Company decided to repatriateapproximately $2.5 billion in previously unremitted foreign earnings. Therefore, the Company recorded aprovision for taxes on such previously unremitted foreign earnings of approximately $152 million in the firstquarter of 2005. During 2005, the United States Internal Revenue Service and the United States Department ofTreasury issued additional guidance related to the Jobs Creation Act. As a result of this guidance, the Companyreduced the accrued taxes previously provided on such unremitted earnings by $25 million in the second quarterof 2005. During the fourth quarter of 2005, the Company repatriated an additional $3.6 billion, with anassociated tax liability of approximately $188 million. Therefore, the total previously unremitted earnings thatwere repatriated during the full year of 2005 was $6.1 billion with an associated tax liability of approximately$315 million. This liability was recorded in 2005 as federal and state and local tax expenses in the amount of$301 million and $14 million, respectively.
115

THE COCA-COLA COMPANY AND SUBSIDIARIES
NOTES TO CONSOLIDATED FINANCIAL STATEMENTS
NOTE 17: INCOME TAXES (Continued)
The tax effects of temporary differences and carryforwards that give rise to deferred tax assets and liabilitiesconsist of the following (in millions):
December 31, 2006 2005
Deferred tax assets:Property, plant and equipment $ 58 $ 60Trademarks and other intangible assets 75 64Equity method investments (including translation adjustment) 354 445Other liabilities 190 200Benefit plans 866 649Net operating/capital loss carryforwards 593 750Other 224 295
Gross deferred tax assets 2,360 2,463Valuation allowances (678) (786)
Total deferred tax assets1,2 $ 1,682 $ 1,677
Deferred tax liabilities:Property, plant and equipment $ (630) $ (641)Trademarks and other intangible assets (504) (278)Equity method investments (including translation adjustment) (622) (674)Other liabilities (82) (80)Other (200) (170)
Total deferred tax liabilities3 $ (2,038) $ (1,843)
Net deferred tax liabilities $ (356) $ (166)
1 Noncurrent deferred tax assets of $168 million and $192 million were included in the consolidatedbalance sheets line item other assets at December 31, 2006 and 2005, respectively.
2 Current deferred tax assets of $117 million and $153 million were included in the consolidatedbalance sheets line item prepaid expenses and other assets at December 31, 2006 and 2005,respectively.
3 Current deferred tax liabilities of $33 million and $159 million were included in the consolidatedbalance sheets line item accounts payable and accrued expenses at December 31, 2006 and 2005,respectively.
As of December 31, 2006 and 2005, we had approximately $93 million of net deferred tax liabilities and$116 million of net deferred tax assets, respectively, located in countries outside the United States.
116

THE COCA-COLA COMPANY AND SUBSIDIARIES
NOTES TO CONSOLIDATED FINANCIAL STATEMENTS
NOTE 17: INCOME TAXES (Continued)
As of December 31, 2006, we had approximately $2,324 million of loss carryforwards available to reducefuture taxable income. Loss carryforwards of approximately $373 million must be utilized within the next fiveyears; $91 million must be utilized within the next 10 years; and the remainder can be utilized over a periodgreater than 10 years.
An analysis of our deferred tax asset valuation allowances is as follows (in millions):
Year Ended December 31, 2006 2005 2004
Balance, beginning of year $ 786 $ 854 $ 630Additions 50 43 291Deductions (158) (111) (67)
Balance, end of year $ 678 $ 786 $ 854
The Company’s deferred tax asset valuation allowances are primarily the result of uncertainties regardingthe future realization of recorded tax benefits on tax loss carryforwards from operations in various jurisdictions.In 2006, the Company recognized a net decrease in its valuation allowances of $108 million. This decrease wasprimarily related to the reversal of valuation allowances that covered certain deferred tax assets recorded oncapital loss carryforwards. A portion of the capital loss carryforwards was utilized to offset taxable gains on thesale of a portion of the investments in Coca-Cola Icecek and Coca-Cola FEMSA. In 2005, the Companyrecognized a decrease in its valuation allowances of $68 million. This decrease was primarily related to a changein tax rates which resulted in a reduction of certain deferred tax assets and corresponding valuation allowances.In 2004, the Company recognized an increase in its valuation allowances of $224 million. This increase wasprimarily related to the recording of a valuation allowance on Germany’s net operating losses, the recording of avaluation allowance on a deferred tax asset recorded on the basis difference in an equity investment and achange in the valuation allowance in India.
NOTE 18: SIGNIFICANT OPERATING AND NONOPERATING ITEMS
In 2006, our Company recorded charges of approximately $606 million related to our proportionate shareof charges recorded by our equity method investees. Of this amount, approximately $602 million related to ourproportionate share of an impairment charge recorded by CCE for its North American franchise rights. Ourproportionate share of CCE’s charges also included approximately $18 million due to restructuring chargesrecorded by CCE. These charges were partially offset by approximately $33 million related to our proportionateshare of changes in certain of CCE’s state and Canadian federal and provincial tax rates. The charges wererecorded in the line item equity income—net in the consolidated statement of income. All of these charges andchanges impacted our Bottling Investments operating segment. Refer to Note 3.
During 2006, our Company also recorded charges of approximately $112 million, primarily related to theimpairment of assets and investments in our bottling operations, approximately $53 million for contracttermination costs related to production capacity efficiencies and approximately $24 million related to otherrestructuring costs. These charges impacted the Africa, the East, South Asia and Pacific Rim, the EuropeanUnion, the North Asia, Eurasia and Middle East, the Bottling Investments and the Corporate operatingsegments. None of these charges was individually significant. Approximately $4 million of these charges wererecorded in the line item cost of goods sold and approximately $185 million of these charges were recorded inthe line item other operating charges in the consolidated statement of income. Refer to Note 20.
117

THE COCA-COLA COMPANY AND SUBSIDIARIES
NOTES TO CONSOLIDATED FINANCIAL STATEMENTS
NOTE 18: SIGNIFICANT OPERATING AND NONOPERATING ITEMS (Continued)
The Company made a $100 million donation to The Coca-Cola Foundation in 2006, which resulted in acharge to the consolidated statement of income line item selling, general and administrative expenses andimpacted the Corporate operating segment.
In 2006, the Company sold a portion of its Coca-Cola FEMSA shares to FEMSA and recorded a pretaxgain of approximately $175 million to the consolidated statement of income line item other income (loss)—net,which impacted the Corporate operating segment. Refer to Note 3.
The Company sold a portion of our investment in Coca-Cola Icecek in an initial public offering in 2006. OurCompany received net cash proceeds of approximately $198 million and realized a pretax gain of approximately$123 million, which was recorded as other income (loss)—net in the consolidated statement of income andimpacted the Corporate operating segment. Refer to Note 3.
In 2005, our Company received approximately $109 million related to the settlement of a class actionlawsuit concerning price-fixing in the sale of HFCS purchased by the Company during the years 1991 to 1995.Subsequent to the receipt of this settlement amount, the Company distributed approximately $62 million tocertain bottlers in North America. From 1991 to 1995, the Company purchased HFCS on behalf of thesebottlers. Therefore, these bottlers were ultimately entitled to a portion of the proceeds of the settlement. Of theapproximately $62 million we distributed to certain bottlers in North America, approximately $49 million wasdistributed to CCE. The Company’s remaining share of the settlement was approximately $47 million, which wasrecorded as a reduction of cost of goods sold and impacted the Corporate operating segment.
During 2005, we recorded approximately $23 million of noncash pretax gains on the issuances of stock byequity method investees. Refer to Note 4.
The Company recorded approximately $50 million of expense in 2005 as a result of a change in ourestimated service period for the acceleration of certain stock-based compensation awards. Refer to Note 15.
Equity income in 2005 was reduced by approximately $33 million for the Bottling Investments operatingsegment, primarily related to our proportionate share of the tax liability recorded by CCE resulting from itsrepatriation of previously unremitted foreign earnings under the Jobs Creation Act, as well as our proportionateshare of restructuring charges. Those amounts were partially offset by our proportionate share of CCE’s HFCSlawsuit settlement proceeds and changes in certain of CCE’s state and provincial tax rates. Refer to Note 3.
Our Company recorded impairment charges during 2005 of approximately $84 million related to certaintrademarks for beverages sold in the Philippines and approximately $1 million related to impairment of otherassets. These impairment charges were recorded in the consolidated statement of income line item otheroperating charges.
During 2004, our Company’s equity income benefited by approximately $37 million for our proportionateshare of a favorable tax settlement related to Coca-Cola FEMSA. Refer to Note 3.
In 2004, we recorded approximately $24 million of noncash pretax gains on the issuances of stock by CCE.Refer to Note 4.
We recorded impairment charges during 2004 of approximately $374 million, primarily related to theimpairment of franchise rights at CCEAG and approximately $18 million related to other assets. Theseimpairment charges were recorded in the consolidated statement of income line item other operating charges.
118

THE COCA-COLA COMPANY AND SUBSIDIARIES
NOTES TO CONSOLIDATED FINANCIAL STATEMENTS
NOTE 18: SIGNIFICANT OPERATING AND NONOPERATING ITEMS (Continued)
We recorded additional impairment charges in 2004 of approximately $88 million. These impairmentsprimarily related to the write-downs of certain manufacturing investments and an intangible asset. As a result ofoperating losses, management prepared analyses of cash flows expected to result from the use of the assets andtheir eventual disposition. Because the sum of the undiscounted cash flows was less than the carrying value ofsuch assets, we recorded an impairment charge to reduce the carrying value of the assets to fair value. Theseimpairment charges were recorded in the consolidated statement of income line item other operating charges.
Also in 2004, our Company received a $75 million insurance settlement related to the class action lawsuitthat was settled in 2000. The Company donated $75 million to The Coca-Cola Foundation in 2004.
NOTE 19: ACQUISITIONS AND INVESTMENTS
In December 2006, the Company entered into a purchase agreement with San Miguel Corporation and twoof its subsidiaries (collectively, ‘‘SMC’’) to acquire all of the shares of capital stock of Coca-Cola BottlersPhilippines, Inc. (‘‘CCBPI’’) held by SMC, representing 65 percent of all the issued and outstanding capital stockof CCBPI. CCBPI is the Company’s authorized bottler in the Philippines. The transaction is subject to certainconditions. Upon the closing of this transaction, the Company will own 100 percent of the issued andoutstanding capital stock of CCBPI. The total purchase price is expected to be approximately $590 million,subject to adjustment based on the terms and conditions of the purchase agreement. The results of operations ofCCBPI will be included in our consolidated financial statements from the date of the closing.
In December 2006, the Company and Coca-Cola FEMSA entered into an agreement to jointly acquireJugos del Valle, S.A.B. de C.V., the second largest producer of packaged juices, nectars and fruit-flavoredbeverages in Mexico and the largest producer of such beverages in Brazil. The total purchase price is expected tobe approximately $380 million in cash plus the assumption of approximately $90 million in debt. The transactionis subject to certain conditions, including required regulatory approvals.
During 2006, our Company’s acquisition and investment activity, including the acquisition of trademarks,totaled approximately $901 million. In the third quarter of 2006, our Company acquired a controllingshareholding interest in Kerry Beverages Limited (‘‘KBL’’). KBL was formed by the Company and the KerryGroup in 1993 and has a majority ownership in 11 joint ventures that manufacture and distribute Companyproducts across nine provinces in China. KBL also has a minority interest in the joint venture bottler in Beijing.Subsequent to the acquisition, the Company changed KBL’s name to Coca-Cola China Industries Limited(‘‘CCCIL’’). As a result of the transaction, the Company owns 89.5 percent of the outstanding shares of CCCIL,and we have agreed to purchase the remaining 10.5 percent by the end of 2008 at the same price per share as theinitial purchase price plus interest. We have all voting and economic rights over the remaining shares. Thistransaction was accounted for as a business combination, and the results of CCCIL’s operations have beenincluded in the Company’s consolidated financial statements since August 29, 2006. CCCIL is included in theBottling Investments operating segment.
In the third quarter of 2006, our Company signed agreements with J. Bruce Llewellyn and Brucephil, Inc.(‘‘Brucephil’’), the parent company of The Philadelphia Coca-Cola Bottling Company, for the potentialpurchase of the remaining shares of Brucephil not currently owned by the Company. The agreements providefor the Company’s purchase of the shares upon the election of Mr. Llewellyn or the election of the Company.Based on the terms of these agreements, the Company concluded that it must consolidate Brucephil underInterpretation No. 46(R). Brucephil’s financial statements were consolidated effective September 29, 2006.Brucephil is included in our Bottling Investments operating segment.
119

THE COCA-COLA COMPANY AND SUBSIDIARIES
NOTES TO CONSOLIDATED FINANCIAL STATEMENTS
NOTE 19: ACQUISITIONS AND INVESTMENTS (Continued)
Also in the third quarter of 2006, our Company acquired Apollinaris GmbH (‘‘Apollinaris’’). Apollinaris hasbeen selling sparkling and still mineral water in Germany since 1862. This transaction was accounted for as abusiness combination, and the results of Apollinaris’ operations have been included in the Company’sconsolidated financial statements since July 1, 2006. A portion of Apollinaris’ business is included in theEuropean Union operating segment, and the balance is included in the Bottling Investments operating segment.
The combined amount paid or to be paid to complete these third-quarter 2006 transactions totalsapproximately $707 million. As a result of these transactions, the Company recorded approximately $707 millionof franchise rights, approximately $74 million of trademarks and $182 million of goodwill. These amounts reflecta preliminary allocation of the purchase price of the applicable transactions and are subject to refinement. Thefranchise rights and trademarks have been assigned an indefinite life.
In January 2006, our Company acquired a 100 percent interest in TJC Holdings (Pty) Ltd. (‘‘TJC’’), abottling company in South Africa, from Chef Limited and Tom Cook Trust for cash consideration ofapproximately $200 million. This transaction was accounted for as a business combination, with the results ofTJC included in the Company’s consolidated financial statements since the date of acquisition. TJC is includedin our Bottling Investments operating segment. The Company allocated the purchase price, based on estimatedfair values, to all of the assets and liabilities that we acquired. The amount of the purchase price allocated toproperty, plant and equipment was approximately $21 million, franchise rights was approximately $169 millionand goodwill was approximately $59 million. The franchise rights have been assigned an indefinite life.
Assuming the results of these businesses had been included in operations beginning on January 1, 2006, proforma financial data would not be required due to immateriality.
During 2005, our Company’s acquisition and investment activity totaled approximately $637 million andincluded the acquisition of the German bottling company Bremer Erfrischungsgetraenke GmbH (‘‘Bremer’’) forapproximately $160 million from InBev SA. This transaction was accounted for as a business combination, andthe results of Bremer’s operations have been included in the Company’s consolidated financial statementsbeginning in September 2005. The Company recorded approximately $54 million of property, plant andequipment, approximately $85 million of franchise rights and approximately $58 million of goodwill related tothis acquisition. The franchise rights have been assigned an indefinite life, and the goodwill was allocated to theGermany and Nordic reporting unit within the European Union operating segment.
In August 2005, we completed the acquisition of the remaining 49 percent interest in the business of CCDAWaters L.L.C. (‘‘CCDA’’) not previously owned by our Company. Our Company and Danone Waters of NorthAmerica, Inc. (‘‘DWNA’’) had formed CCDA in July 2002 for the production, marketing and distribution ofDWNA’s bottled spring and source water business in the United States. This transaction was accounted for as abusiness combination, and the consolidated results of CCDA’s operations have been included in the Company’sconsolidated financial statements since July 2002. CCDA is included in our North America operating segment.In July 2005, the Company acquired Sucos Mais, a Brazilian juice company. The results of Sucos Mais have beenincluded in our consolidated financial statements since July 2005.
Assuming the results of these businesses had been included in operations beginning on January 1, 2005, proforma financial data would not be required due to immateriality.
On April 20, 2005, our Company and Coca-Cola HBC jointly acquired Multon for a total purchase price ofapproximately $501 million, split equally between the Company and Coca-Cola HBC. The Company’s
120

THE COCA-COLA COMPANY AND SUBSIDIARIES
NOTES TO CONSOLIDATED FINANCIAL STATEMENTS
NOTE 19: ACQUISITIONS AND INVESTMENTS (Continued)
investment in Multon is accounted for under the equity method. Equity income—net includes our proportionateshare of the results of Multon’s operations beginning April 20, 2005.
During 2004, our Company’s acquisition and investment activity totaled approximately $267 million,primarily related to the purchase of trademarks, brands and related contractual rights in Latin America, none ofwhich was individually significant.
NOTE 20: OPERATING SEGMENTS
During 2006, the Company made certain changes to its operating structure, primarily to establish a separateinternal organization for its consolidated bottling operations and its unconsolidated bottling investments. Thisstructure resulted in the reporting of a Bottling Investments operating segment, along with the six existinggeographic operating segments and Corporate, beginning with the first quarter of 2006. Prior to this change inthe operating structure, the financial results of the consolidated bottling operations and our proportionate shareof the earnings of unconsolidated bottling operations had been generally included in the geographic operatingsegments in which they conducted business. As of December 31, 2006, our Company’s operating structureconsisted of the following operating segments: Africa; East, South Asia and Pacific Rim; European Union; LatinAmerica; North America; North Asia, Eurasia and Middle East; Bottling Investments; and Corporate.Prior-year amounts have been reclassified to conform to the new operating structure described above.
Segment Products and Services
The business of our Company is nonalcoholic beverages. Our operating segments derive a majority of theirrevenues from the manufacture and sale of beverage concentrates and syrups and, in some cases, the sale offinished beverages.
Method of Determining Segment Income or Loss
Management evaluates the performance of our operating segments separately to individually monitor thedifferent factors affecting financial performance. Our Company manages income taxes and financial costs, suchas interest income and expense, on a global basis within the Corporate operating segment. We evaluate segmentperformance based on income or loss before income taxes.
121

THE COCA-COLA COMPANY AND SUBSIDIARIES
NOTES TO CONSOLIDATED FINANCIAL STATEMENTS
NOTE 20: OPERATING SEGMENTS (Continued)
Information about our Company’s operations by operating segment for the years ended December 31, 2006,2005 and 2004, is as follows (in millions):
East, NorthSouth Asia,
Asia Eurasiaand and
Pacific European Latin North Middle BottlingAfrica Rim Union America America East Investments Corporate Eliminations Consolidated
2006Net operating revenues:
Third party $ 1,103 $ 795 $ 3,505 $ 2,484 $ 7,013 $ 3,9861 $ 5,109 $ 93 $ — $ 24,088Intersegment 37 77 859 132 16 137 89 — (1,347) —Total net revenues 1,140 872 4,364 2,616 7,029 4,123 5,198 93 (1,347) 24,088
Operating income (loss) 4242 3582 2,2542 1,438 1,683 1,5572 182 (1,424)2,3 — 6,308Interest income — — — — — — — 193 — 193Interest expense — — — — — — — 220 — 220Depreciation and amortization 16 13 100 25 361 55 278 90 — 938Equity income — net — — (4) — — 27 566 23 — 102Income (loss) before income taxes 4132 3582 2,2582 1,434 1,681 1,5792 672,6 (1,212)2,3,4 — 6,578Identifiable operating assets5,7 573 390 2,557 1,516 4,778 1,043 5,953 6,370 — 23,180Investments8 — — 24 — 2 428 6,276 53 — 6,783Capital expenditures 37 10 93 44 421 129 418 255 — 1,407
2005Net operating revenues:
Third party $ 1,107 $ 719 $ 4,104 $ 2,064 $ 6,676 $ 4,0891 $ 4,262 $ 83 $ — $ 23,104Intersegment 13 60 807 94 — 130 — — (1,104) —Total net revenues 1,120 779 4,911 2,158 6,676 4,219 4,262 83 (1,104) 23,104
Operating income (loss) 3969 2849,10 2,2199 1,1769 1,5539 1,7359 (37) (1,241)9,11 — 6,085Interest income — — — — — — — 235 — 235Interest expense — — — — — — — 240 — 240Depreciation and amortization 18 16 86 27 348 43 265 129 — 932Equity income — net — — — — — 20 62412 36 — 680Income (loss) before income taxes 3829 2839,10 2,2259 1,1759 1,5499 1,7489 59012 (1,262)9,11,13 — 6,690Identifiable operating assets5,7 561 339 2,183 1,324 4,645 987 3,842 8,624 — 22,505Investments8 — 1 16 6 — 281 6,538 80 — 6,922Capital expenditures 23 7 78 24 265 89 264 149 — 899
2004Net operating revenues:
Third party $ 961 $ 706 $ 3,913 $ 1,778 $ 6,423 $ 3,8851 $ 3,975 $ 101 $ — $ 21,742Intersegment 10 109 773 69 — 96 — — (1,057) —Total net revenues 971 815 4,686 1,847 6,423 3,981 3,975 101 (1,057) 21,742
Operating income (loss) 336 439 2,126 1,053 1,60614 1,671 (454)14 (1,079)14,15 — 5,698Interest income — — — — — — — 157 — 157Interest expense — — — — — — — 196 — 196Depreciation and amortization 18 14 75 33 347 69 245 92 — 893Equity income — net — — — — — — 58016 41 — 621Income (loss) before income taxes 322 440 2,125 1,059 1,61514 1,667 13114,16 (1,137)14,15,17 — 6,222Identifiable operating assets5,7 575 360 2,300 1,202 4,728 939 4,144 10,941 — 25,189Investments8 — 1 16 5 — 8 6,138 84 — 6,252Capital expenditures 17 7 39 25 247 45 258 117 — 755
Certain prior year amounts have been reclassified to conform to the current year presentation.1 Net operating revenues in Japan represented approximately 11 percent of total net operating revenues in 2006, 13 percent in 2005 and 14 percent in
2004.
122

THE COCA-COLA COMPANY AND SUBSIDIARIES
NOTES TO CONSOLIDATED FINANCIAL STATEMENTS
NOTE 20: OPERATING SEGMENTS (Continued)2 Operating income (loss) and income (loss) before income taxes were reduced by approximately $3 million for Africa, $44 million for East, South Asia
and Pacific Rim, $36 million for the European Union, $17 million for North Asia, Eurasia and Middle East, $88 million for Bottling Investments and$1 million for Corporate primarily due to asset impairments, contract termination costs related to production capacity efficiencies and otherrestructuring costs during 2006. Refer to Note 18.
3 Operating income (loss) and income (loss) before income taxes were reduced by $100 million for Corporate as a result of a donation made to TheCoca-Cola Foundation. Refer to Note 18.
4 Income (loss) before income taxes was increased by approximately $298 million for Corporate as a result of net gains on the sale of Coca-Cola FEMSAshares and the sale of a portion of our investment in Coca-Cola Icecek in an initial public offering. Refer to Note 18.
5 Principally cash and cash equivalents, marketable securities, finance subsidiary receivables, goodwill, trademarks and other intangible assets andproperty, plant and equipment—net.
6 Equity income—net and income (loss) before income taxes were reduced by approximately $587 million for Bottling Investments primarily related toour proportionate share of impairment and restructuring charges recorded by CCE which were partially offset by our proportionate share of changes incertain of CCE’s state and Canadian federal and provincial tax rates (refer to Note 3) and by $19 million due to our proportionate share of restructuringcharges recorded by other equity method investees.
7 Property, plant and equipment—net in Germany represented approximately 19 percent of total property, plant and equipment—net in 2006, 19 percentin 2005 and 20 percent in 2004.
8 Principally equity and cost method investments in bottling companies.9 Operating income (loss) and income (loss) before income taxes were reduced by approximately $3 million for Africa, $3 million for East, South Asia and
Pacific Rim, $3 million for the European Union, $4 million for Latin America, $12 million for North America, $3 million for North Asia, Eurasia andMiddle East, and $22 million for Corporate as a result of accelerated amortization of stock-based compensation expense due to a change in ourestimated service period for retirement-eligible participants. Refer to Note 15.
10 Operating income (loss) and income (loss) before income taxes were reduced by approximately $85 million for East, South Asia and Pacific Rim relatedto the Philippines impairment charges. Refer to Note 18.
11 Operating income (loss) and income (loss) before income taxes benefited by approximately $47 million for Corporate related to the settlement of a classaction lawsuit related to HFCS purchases. Refer to Note 18.
12 Equity income—net and income (loss) before income taxes were reduced by approximately $33 million for Bottling Investments primarily related to ourproportionate share of the tax liability recorded as a result of CCE’s repatriation of unremitted foreign earnings under the Jobs Creation Act andrestructuring charges, offset by CCE’s HFCS lawsuit settlement proceeds and changes in certain of CCE’s state and provincial tax rates and by $4 milliondue to our proportionate share of impairments of certain intangible assets and investments recorded by an equity method investee in the Philippines.Refer to Note 18.
13 Income (loss) before income taxes benefited by approximately $23 million for Corporate due to noncash pretax gains on issuances of stock by Coca-ColaAmatil in connection with the acquisition of SPC Ardmona Pty. Ltd., an Australian fruit company. Refer to Note 4.
14 Operating income (loss) and income (loss) before income taxes were reduced by approximately $18 million for North America, $398 million for BottlingInvestments and $64 million for Corporate as a result of other operating charges recorded for asset impairments. Refer to Note 18.
15 Operating income (loss) and income (loss) before income taxes for Corporate were impacted as a result of the Company’s receipt of a $75 millioninsurance settlement related to the class action lawsuit settled in 2000. The Company subsequently donated $75 million to The Coca-Cola Foundation.
16 Equity income—net and income (loss) before income taxes were increased by approximately $37 million for Bottling Investments as a result of afavorable tax settlement related to Coca-Cola FEMSA. Refer to Note 3.
17 Income (loss) before income taxes was increased by approximately $24 million for Corporate due to noncash pretax gains that were recognized on theissuances of stock by CCE. Refer to Note 4.
123

THE COCA-COLA COMPANY AND SUBSIDIARIES
NOTES TO CONSOLIDATED FINANCIAL STATEMENTS
NOTE 20: OPERATING SEGMENTS (Continued)
Geographic Data (in millions)
Year Ended December 31, 2006 2005 2004
Net operating revenues:United States $ 6,662 $ 6,299 $ 6,084International 17,426 16,805 15,658
Net operating revenues $ 24,088 $ 23,104 $ 21,742
December 31, 2006 2005 2004
Property, plant and equipment—net:United States $ 2,607 $ 2,309 $ 2,371International 4,296 3,522 3,720
Property, plant and equipment—net $ 6,903 $ 5,831 $ 6,091
Five-Year Compound Growth RatesNet
Operating OperatingFive Years Ended December 31, 2006 Revenues Income
Consolidated 6.8% 3.3%
Africa 11.7% 9.0%East, South Asia and Pacific Rim 8.0% 2.8%European Union 2.7% 9.5%Latin America 5.4% 5.0%North America 4.8% 3.2%North Asia, Eurasia and Middle East (0.6)% 1.2%Bottling Investments 28.6% *Corporate * *
* Calculation is not meaningful.
NOTE 21: SUBSEQUENT EVENTS
On January 8, 2007, our Company sold substantially all of our interest in Vonpar Refrescos S.A. (‘‘Vonpar’’),a bottler headquartered in Brazil. Total proceeds from the sale were approximately $238 million, and werecognized a gain on this sale of approximately $71 million. Prior to this sale, our Company ownedapproximately 49 percent of Vonpar’s outstanding common stock and accounted for the investment using theequity method.
On February 1, 2007, our Company entered into an agreement to purchase Fuze Beverage, LLC, maker ofFuze enhanced juices and teas in the U.S. The acquisition, which is subject to regulatory clearance and certainother terms and conditions, includes all Fuze Beverage, LLC brands, including the Vitalize, Refresh, Tea andSlenderize lines under the Fuze trademark, WaterPlus enhanced water products, and license rights to the NOSEnergy Drink brands. If regulatory clearance is obtained, the transfer of ownership is expected to occur withinthe first quarter of 2007.
124

23FEB20042218446024JAN200522210514
25FEB200412544370
REPORT OF MANAGEMENT ON INTERNAL CONTROL OVER FINANCIAL REPORTINGThe Coca-Cola Company and Subsidiaries
Management of the Company is responsible for the preparation and integrity of the consolidated financial statementsappearing in our annual report on Form 10-K. The financial statements were prepared in conformity with generallyaccepted accounting principles appropriate in the circumstances and, accordingly, include certain amounts based on ourbest judgments and estimates. Financial information in this annual report on Form 10-K is consistent with that in thefinancial statements.
Management of the Company is responsible for establishing and maintaining adequate internal control over financialreporting as such term is defined in Rule 13a-15(f) under the Securities Exchange Act of 1934 (‘‘Exchange Act’’). TheCompany’s internal control over financial reporting is designed to provide reasonable assurance regarding the reliability offinancial reporting and the preparation of the consolidated financial statements. Our internal control over financialreporting is supported by a program of internal audits and appropriate reviews by management, written policies andguidelines, careful selection and training of qualified personnel and a written Code of Business Conduct adopted by ourCompany’s Board of Directors, applicable to all Company Directors and all officers and employees of our Company andsubsidiaries.
Because of its inherent limitations, internal control over financial reporting may not prevent or detect misstatementsand even when determined to be effective, can only provide reasonable assurance with respect to financial statementpreparation and presentation. Also, projections of any evaluation of effectiveness to future periods are subject to the riskthat controls may become inadequate because of changes in conditions, or that the degree of compliance with the policiesor procedures may deteriorate.
The Audit Committee of our Company’s Board of Directors, composed solely of Directors who are independent inaccordance with the requirements of the New York Stock Exchange listing standards, the Exchange Act and the Company’sCorporate Governance Guidelines, meets with the independent auditors, management and internal auditors periodically todiscuss internal control over financial reporting and auditing and financial reporting matters. The Audit Committee reviewswith the independent auditors the scope and results of the audit effort. The Audit Committee also meets periodically withthe independent auditors and the chief internal auditor without management present to ensure that the independentauditors and the chief internal auditor have free access to the Audit Committee. Our Audit Committee’s Report can befound in the Company’s 2007 Proxy statement.
Management assessed the effectiveness of the Company’s internal control over financial reporting as of December 31,2006. In making this assessment, management used the criteria set forth by the Committee of Sponsoring Organizations ofthe Treadway Commission (COSO) in Internal Control—Integrated Framework. During 2006, the Company acquired KerryBeverages Limited (subsequently renamed Coca-Cola China Industries Limited), Apollinaris GmbH and TJC Holdings(Pty) Ltd. and began consolidating the operations of Brucephil, Inc. Refer to Note 19 of Notes to Consolidated FinancialStatements for additional information regarding these events. Management has excluded these businesses from itsevaluation of the effectiveness of the Company’s internal control over financial reporting as of December 31, 2006. The netoperating revenues attributable to these businesses represented approximately 1.6 percent of the Company’s consolidatednet operating revenues for the year ended December 31, 2006, and their aggregate total assets represented approximately6.1 percent of the Company’s consolidated total assets as of December 31, 2006. Based on our assessment, managementbelieves that the Company maintained effective internal control over financial reporting as of December 31, 2006.
The Company’s independent auditors, Ernst & Young LLP, a registered public accounting firm, are appointed by theAudit Committee of the Company’s Board of Directors, subject to ratification by our Company’s shareowners. Ernst &Young LLP have audited and reported on the consolidated financial statements of The Coca-Cola Company andsubsidiaries, management’s assessment of the effectiveness of the Company’s internal control over financial reporting andthe effectiveness of the Company’s internal control over financial reporting. The reports of the independent auditors arecontained in this annual report.
E. Neville Isdell Connie D. McDanielChairman, Board of Directors, Vice Presidentand Chief Executive Officer and ControllerFebruary 20, 2007 February 20, 2007
Gary P. FayardExecutive Vice Presidentand Chief Financial OfficerFebruary 20, 2007
125

Report of Independent Registered Public Accounting Firm
Board of Directors and ShareownersThe Coca-Cola Company
We have audited the accompanying consolidated balance sheets of The Coca-Cola Company andsubsidiaries as of December 31, 2006 and 2005, and the related consolidated statements of income, shareowners’equity, and cash flows for each of the three years in the period ended December 31, 2006. These financialstatements are the responsibility of the Company’s management. Our responsibility is to express an opinion onthese financial statements based on our audits.
We conducted our audits in accordance with the standards of the Public Company Accounting OversightBoard (United States). Those standards require that we plan and perform the audit to obtain reasonableassurance about whether the financial statements are free of material misstatement. An audit includesexamining, on a test basis, evidence supporting the amounts and disclosures in the financial statements. An auditalso includes assessing the accounting principles used and significant estimates made by management, as well asevaluating the overall financial statement presentation. We believe that our audits provide a reasonable basis forour opinion.
In our opinion, the financial statements referred to above present fairly, in all material respects, theconsolidated financial position of The Coca-Cola Company and subsidiaries at December 31, 2006 and 2005, andthe consolidated results of their operations and their cash flows for each of the three years in the period endedDecember 31, 2006, in conformity with U.S. generally accepted accounting principles.
As discussed in Note 1 to the consolidated financial statements, in 2006 the Company adopted SFASNo. 158 related to defined benefit pension and other postretirement plans.
We also have audited, in accordance with the standards of the Public Company Accounting Oversight Board(United States), the effectiveness of The Coca-Cola Company and subsidiaries’ internal control over financialreporting as of December 31, 2006, based on criteria established in Internal Control—Integrated Frameworkissued by the Committee of Sponsoring Organizations of the Treadway Commission and our report datedFebruary 20, 2007, expressed an unqualified opinion thereon.
Atlanta, GeorgiaFebruary 20, 2007
126

Report of Independent Registered Public Accounting Firmon Internal Control Over Financial Reporting
Board of Directors and ShareownersThe Coca-Cola Company
We have audited management’s assessment, included in the accompanying Report of Management on Internal ControlOver Financial Reporting, that The Coca-Cola Company and subsidiaries maintained effective internal control overfinancial reporting as of December 31, 2006, based on criteria established in Internal Control—Integrated Framework issuedby the Committee of Sponsoring Organizations of the Treadway Commission (the COSO criteria). The Coca-ColaCompany’s management is responsible for maintaining effective internal control over financial reporting and for itsassessment of the effectiveness of internal control over financial reporting. Our responsibility is to express an opinion onmanagement’s assessment and an opinion on the effectiveness of the Company’s internal control over financial reportingbased on our audit.
We conducted our audit in accordance with the standards of the Public Company Accounting Oversight Board (UnitedStates). Those standards require that we plan and perform the audit to obtain reasonable assurance about whether effectiveinternal control over financial reporting was maintained in all material respects. Our audit included obtaining anunderstanding of internal control over financial reporting, evaluating management’s assessment, testing and evaluating thedesign and operating effectiveness of internal control, and performing such other procedures as we considered necessary inthe circumstances. We believe that our audit provides a reasonable basis for our opinion.
A company’s internal control over financial reporting is a process designed to provide reasonable assurance regardingthe reliability of financial reporting and the preparation of financial statements for external purposes in accordance withgenerally accepted accounting principles. A company’s internal control over financial reporting includes those policies andprocedures that (1) pertain to the maintenance of records that, in reasonable detail, accurately and fairly reflect thetransactions and dispositions of the assets of the company; (2) provide reasonable assurance that transactions are recordedas necessary to permit preparation of financial statements in accordance with generally accepted accounting principles, andthat receipts and expenditures of the company are being made only in accordance with authorizations of management anddirectors of the company; and (3) provide reasonable assurance regarding prevention or timely detection of unauthorizedacquisition, use, or disposition of the company’s assets that could have a material effect on the financial statements.
Because of its inherent limitations, internal control over financial reporting may not prevent or detect misstatements.Also, projections of any evaluation of effectiveness to future periods are subject to the risk that controls may becomeinadequate because of changes in conditions, or that the degree of compliance with the policies or procedures maydeteriorate.
As indicated in the accompanying Report of Management on Internal Control Over Financial Reporting,management’s assessment of and conclusion on the effectiveness of internal control over financial reporting did not includethe internal controls of Kerry Beverages Limited (subsequently renamed Coca-Cola China Industries Limited),Brucephil, Inc., Apollinaris GmbH and TJC Holdings (Pty) Ltd. which are included in the 2006 consolidated financialstatements of The Coca-Cola Company and subsidiaries and constituted approximately 6.1 percent of the Company’sconsolidated total assets as of December 31, 2006 and approximately 1.6 percent of the Company’s consolidated netoperating revenues for the year then ended. Our audit of internal control over financial reporting of The Coca-ColaCompany also did not include an evaluation of the internal control over financial reporting of Kerry Beverages Limited(subsequently renamed Coca-Cola China Industries Limited), Brucephil, Inc., Apollinaris GmbH and TJC Holdings(Pty) Ltd.
In our opinion, management’s assessment that The Coca-Cola Company and subsidiaries maintained effective internalcontrol over financial reporting as of December 31, 2006, is fairly stated, in all material respects, based on the COSOcriteria. Also, in our opinion, The Coca-Cola Company and subsidiaries maintained, in all material respects, effectiveinternal control over financial reporting as of December 31, 2006, based on the COSO criteria.
We also have audited, in accordance with the standards of the Public Company Accounting Oversight Board (UnitedStates), the consolidated balance sheets of The Coca-Cola Company and subsidiaries as of December 31, 2006 and 2005,and the related consolidated statements of income, shareowners’ equity, and cash flows for each of the three years in theperiod ended December 31, 2006, and our report dated February 20, 2007, expressed an unqualified opinion thereon.
Atlanta, GeorgiaFebruary 20, 2007
127

Quarterly Data (Unaudited)First Second Third Fourth
Year Ended December 31, Quarter Quarter Quarter Quarter Full Year
(In millions, except per share data)
2006Net operating revenues $ 5,226 $ 6,476 $ 6,454 $ 5,932 $ 24,088Gross profit 3,500 4,366 4,189 3,869 15,924Net income 1,106 1,836 1,460 678 5,080
Basic net income per share $ 0.47 $ 0.78 $ 0.62 $ 0.29 $ 2.16
Diluted net income per share $ 0.47 $ 0.78 $ 0.62 $ 0.29 $ 2.16
2005Net operating revenues $ 5,206 $ 6,310 $ 6,037 $ 5,551 $ 23,104Gross profit 3,388 4,164 3,802 3,555 14,909Net income 1,002 1,723 1,283 864 4,872
Basic net income per share $ 0.42 $ 0.72 $ 0.54 $ 0.36 $ 2.04
Diluted net income per share $ 0.42 $ 0.72 $ 0.54 $ 0.36 $ 2.04
Our reporting period ends on the Friday closest to the last day of the quarterly calendar period. Our fiscalyear ends on December 31 regardless of the day of the week on which December 31 falls.
The Company’s first quarter of 2006 results were impacted by one less shipping day as compared to the firstquarter of 2005. Additionally, the Company recorded the following transactions which impacted results:
• Impairment charges totaling approximately $42 million primarily related to the impairment of certain assets andinvestments in certain bottling operations in Asia. Refer to Note 18.
• Approximately $3 million of charges primarily related to restructuring in East, South Asia and Pacific Rim. Refer toNote 18.
• An approximate $9 million charge to equity income for our proportionate share of CCE’s restructuring costs. Referto Note 3.
• An income tax benefit of approximately $7 million primarily related to asset impairment and restructuring charges inAsia. Refer to Note 17.
• Approximately $10 million of income tax expense primarily related to increases in tax reserves. Refer to Note 17.
In the second quarter of 2006, the Company recorded the following transactions which impacted results:
• An approximate $123 million net gain related to the sale of a portion of our investment in Coca-Cola Icecek in aninitial public offering. This gain was recorded in the line item other income (loss) — net. Refer to Note 18.
• Charges totaling approximately $31 million primarily related to costs associated with production capacity efficienciesand other restructuring costs in Asia and the European Union. Refer to Note 18.
• An approximate $21 million benefit to equity income for our proportionate share of favorable changes in certain ofCCE’s state and Canadian federal and provincial tax rates. Refer to Note 3.
• Approximately $22 million of income tax expense related to the anticipated future resolution of certain tax matters.Refer to Note 17.
• An income tax benefit of approximately $14 million related to the sale of a portion of our investment in Coca-ColaIcecek. Refer to Note 17.
In the third quarter of 2006, the Company recorded the following transactions which impacted results:
• Approximately $39 million of charges primarily related to the impairment of certain intangible assets andinvestments in certain bottling operations, costs to rationalize production and other restructuring costs in Africa, theEuropean Union and Asia. Refer to Note 18.
128

• An approximate $3 million charge to equity income — net for our proportionate share of items impacting investees.Refer to Note 3.
• An income tax benefit of approximately $41 million related to the reversal of a tax valuation allowance due to thesale of a portion of our equity method investment in Coca-Cola FEMSA, partially offset by a charge for theanticipated future resolution of certain tax matters and a change in the tax rate applicable to a portion of thetemporary difference between the book and tax basis of our investment in Coca-Cola FEMSA. Refer to Note 3.
• An income tax benefit of approximately $12 million associated with impairment charges, costs to rationalizeproduction and other restructuring costs. Refer to Note 17.
The Company’s fourth quarter of 2006 results were impacted by one additional shipping day as compared tothe fourth quarter of 2005. Additionally, the Company recorded the following transactions which impactedresults:
• An approximate $615 million charge to equity income related to the Company’s proportionate share of CCE’simpairment charges and restructuring charges recorded by other equity method investees, partially offset by changesin certain of CCE’s state and Canadian federal and provincial tax rates. Refer to Note 3.
• Approximately $74 million of charges primarily related to restructuring and asset impairments in East, South Asiaand Pacific Rim and certain bottling operations and asset impairments in North Asia, Eurasia and Middle East.Refer to Note 18.
• A $100 million donation made to The Coca-Cola Foundation.
• An approximate $175 million net gain related to the sale of Coca-Cola FEMSA shares. This gain was recorded in theline item other income (loss) — net. Refer to Note 18.
• An income tax benefit of approximately $10 million associated with restructuring costs and impairment charges.Refer to Note 17.
• An income tax benefit of approximately $38 million associated with a donation made to The Coca-Cola Foundation.
• An income tax benefit of approximately $37 million related to the reversal of previously accrued taxes resulting fromthe anticipated future resolution of certain tax matters. Refer to Note 17.
• An income tax benefit of approximately $57 million associated with items impacting investees. Refer to Note 17.
• Approximately $76 million of income tax expense associated with the gain on the sale of Coca-Cola FEMSA shares.Refer to Note 17.
In the first quarter of 2005, the Company recorded the following transactions which impacted results:
• A provision for taxes on unremitted foreign earnings of approximately $152 million. Refer to Note 17.
• Approximately $23 million of noncash pretax gains on issuances of stock by Coca-Cola Amatil in connection with theacquisition of SPC Ardmona Pty. Ltd., an Australian fruit company. Refer to Note 4.
• An income tax benefit of approximately $56 million related to the reversal of previously accrued taxes resulting fromfavorable resolution of tax matters. Refer to Note 17.
• Approximately $50 million of accelerated amortization of stock-based compensation expense related to a change inour estimated service period for retirement-eligible participants. Refer to Note 15.
In the second quarter of 2005, the Company recorded the following transactions which impacted results:
• The receipt of approximately $42 million related to the settlement of a class action lawsuit concerning the purchaseof HFCS. Refer to Note 18.
• An approximate $21 million benefit to equity income for our proportionate share of CCE’s HFCS lawsuitsettlement. Refer to Note 3.
• An income tax benefit of approximately $17 million related to the reversal of previously accrued taxes resulting fromfavorable resolution of tax matters. Refer to Note 17.
129

• An income tax benefit of approximately $25 million as a result of additional guidance issued by the United StatesInternal Revenue Service and the United States Department of the Treasury related to the Jobs Creation Act. Referto Note 17.
In the third quarter of 2005, the Company recorded the following transactions which impacted results:
• Approximately $89 million of impairment charges primarily related to intangible assets (mainly trademark beveragessold in the Philippines market). Approximately $85 million and $4 million of these impairment charges are recordedin the line items other operating charges and equity income — net, respectively. Refer to Note 18.
• Approximately $5 million of a noncash pretax charge to equity income — net due to our proportionate share ofCCE’s restructuring charges. Refer to Note 3.
• An income tax benefit of approximately $18 million related to the reversal of previously accrued taxes resulting fromfavorable resolution of tax matters. Refer to Note 17.
• An income tax benefit of approximately $4 million primarily related to the Philippines impairment charges. Refer toNote 17.
In the fourth quarter of 2005, the Company recorded the following transactions which impacted results:
• The receipt of approximately $5 million related to the settlement of a class action lawsuit concerning the purchase ofHFCS. Refer to Note 18.
• An approximate $49 million reduction to equity income due to our proportionate share of CCE’s tax expense relatedto repatriation of previously unremitted foreign earnings under the Jobs Creation Act and restructuring chargesrecorded by CCE, partially offset by changes in certain of CCE’s state and provincial tax rates and additionalproceeds from CCE’s HFCS lawsuit settlement. Refer to Note 3.
• An income tax benefit of approximately $10 million related to the reversal of previously accrued taxes resulting fromfavorable resolution of tax matters. Refer to Note 17.
• A provision for taxes on unremitted foreign earnings of approximately $188 million. Refer to Note 17.
130

ITEM 9. CHANGES IN AND DISAGREEMENTS WITH ACCOUNTANTS ON ACCOUNTING ANDFINANCIAL DISCLOSURE
Not applicable.
ITEM 9A. CONTROLS AND PROCEDURES
The Company, under the supervision and with the participation of its management, including the ChiefExecutive Officer and the Chief Financial Officer, evaluated the effectiveness of the design and operation of theCompany’s ‘‘disclosure controls and procedures’’ (as defined in Rule 13a-15(e) under the Securities ExchangeAct of 1934, as amended (the ‘‘Exchange Act’’)) as of the end of the period covered by this report. Based on thatevaluation, the Chief Executive Officer and the Chief Financial Officer concluded that the Company’s disclosurecontrols and procedures are effective in timely making known to them material information relating to theCompany and the Company’s consolidated subsidiaries required to be disclosed in the Company’s reports filedor submitted under the Exchange Act.
The report called for by Item 308(a) of Regulation S-K is incorporated herein by reference to Report ofManagement on Internal Control Over Financial Reporting, included in Part II, ‘‘Item 8. Financial Statementsand Supplementary Data’’ of this report. During 2006, the Company acquired Kerry Beverages Limited(subsequently renamed Coca-Cola China Industries Limited), Apollinaris GmbH and TJC Holdings (Pty) Ltd.and began consolidating the operations of Brucephil, Inc. Refer to Note 19 of Notes to Consolidated FinancialStatements for additional information regarding these events. Management has excluded these businesses fromits evaluation of the effectiveness of the Company’s internal control over financial reporting as of December 31,2006. The net operating revenues attributable to these businesses represented approximately 1.6 percent of theCompany’s consolidated net operating revenues for the year ended December 31, 2006, and their aggregate totalassets represented approximately 6.1 percent of the Company’s consolidated total assets as of December 31,2006.
The attestation report called for by Item 308(b) of Regulation S-K is incorporated herein by reference toReport of Independent Registered Public Accounting Firm on Internal Control Over Financial Reporting,included in Part II, ‘‘Item 8. Financial Statements and Supplementary Data’’ of this report.
There has been no change in the Company’s internal control over financial reporting during the quarterended December 31, 2006 that has materially affected, or is reasonably likely to materially affect, the Company’sinternal control over financial reporting.
ITEM 9B. OTHER INFORMATION
Not applicable.
131

PART III
ITEM 10. DIRECTORS, EXECUTIVE OFFICERS AND CORPORATE GOVERNANCE
The information under the headings ‘‘Board of Directors,’’ ‘‘Section 16(a) Beneficial Ownership ReportingCompliance,’’ ‘‘Information About the Board of Directors and Corporate Governance—The Audit Committee’’and ‘‘Information About the Board of Directors and Corporate Governance—The Board and BoardCommittees’’ in the Company’s 2007 Proxy Statement is incorporated herein by reference. See Item X in Part Iof this report for information regarding executive officers of the Company.
The Company has adopted a code of business conduct and ethics applicable to the Company’s Directors,officers (including the Company’s principal executive officer, principal financial officer and controller) andemployees, known as the Code of Business Conduct. The Code of Business Conduct is available on theCompany’s website. In the event that we amend or waive any of the provisions of the Code of Business Conductapplicable to our principal executive officer, principal financial officer or controller that relates to any elementof the code of ethics definition enumerated in Item 406(b) of Regulation S-K, we intend to disclose the same onthe Company’s website at www.thecoca-colacompany.com.
On May 17, 2006, we filed with the New York Stock Exchange (‘‘NYSE’’) the Annual CEO Certificationregarding the Company’s compliance with the NYSE’s Corporate Governance listing standards as required bySection 303A-12(a) of the NYSE Listed Company Manual. In addition, the Company has filed as exhibits to thisannual report and to the annual report on Form 10-K for the year ended December 31, 2005, the applicablecertifications of its Chief Executive Officer and its Chief Financial Officer required under Section 302 of theSarbanes-Oxley Act of 2002, regarding the quality of the Company’s public disclosures.
ITEM 11. EXECUTIVE COMPENSATION
The information under the headings ‘‘Information About the Board of Directors and CorporateGovernance—Director Compensation’’ and the information under the principal headings ‘‘EXECUTIVECOMPENSATION,’’ ‘‘REPORT OF THE COMPENSATION COMMITTEE,’’ and ‘‘COMPENSATIONCOMMITTEE INTERLOCKS AND INSIDER PARTICIPATION’’ in the Company’s 2007 Proxy Statement isincorporated herein by reference.
ITEM 12. SECURITY OWNERSHIP OF CERTAIN BENEFICIAL OWNERS AND MANAGEMENT ANDRELATED STOCKHOLDER MATTERS
The information under the principal heading ‘‘EQUITY COMPENSATION PLAN INFORMATION,’’and the information under the headings ‘‘Ownership of Equity Securities in the Company,’’ ‘‘PrincipalShareowners’’ and ‘‘Ownership of Securities in Investee Companies’’ in the Company’s 2007 Proxy Statement isincorporated herein by reference.
ITEM 13. CERTAIN RELATIONSHIPS AND RELATED TRANSACTIONS, AND DIRECTORINDEPENDENCE
The information under the headings ‘‘Information About the Board of Directors and CorporateGovernance’’ and ‘‘Certain Related Person Transactions’’ and the information under the principal headings‘‘COMPENSATION COMMITTEE INTERLOCKS AND INSIDER PARTICIPATION,’’ and ‘‘CERTAININVESTEE COMPANIES’’ in the Company’s 2007 Proxy Statement is incorporated herein by reference.
ITEM 14. PRINCIPAL ACCOUNTANT FEES AND SERVICES
The information under the heading ‘‘Audit Fees and All Other Fees’’ in the Company’s 2007 ProxyStatement is incorporated herein by reference.
132

PART IV
ITEM 15. EXHIBITS AND FINANCIAL STATEMENT SCHEDULES
(a) The following documents are filed as part of this report:
1. Financial Statements:
Consolidated Statements of Income—Years ended December 31, 2006, 2005 and 2004.
Consolidated Balance Sheets—December 31, 2006 and 2005.
Consolidated Statements of Cash Flows—Years ended December 31, 2006, 2005 and 2004.
Consolidated Statements of Shareowners’ Equity—Years ended December 31, 2006, 2005 and2004.
Notes to Consolidated Financial Statements.
Report of Independent Registered Public Accounting Firm.
Report of Independent Registered Public Accounting Firm on Internal Control OverFinancial Reporting.
2. Financial Statement Schedules:
The schedules for which provision is made in the applicable accounting regulations of the SEC arenot required under the related instructions or are inapplicable and, therefore, have been omitted.
3. ExhibitsExhibit No.
2.1 Control and Profit and Loss Transfer Agreement, dated November 21, 2001, between Coca-Cola GmbHand Coca-Cola Erfrischungsgetraenke AG—incorporated herein by reference to Exhibit 2 of theCompany’s Form 10-Q Quarterly Report for the quarter ended March 31, 2002. (With regard toapplicable cross-references in this report, the Company’s Current, Quarterly and Annual Reports arefiled with the SEC under File No. 1-2217.)
3.1 Certificate of Incorporation of the Company, including Amendment of Certificate of Incorporation,effective May 1, 1996—incorporated herein by reference to Exhibit 3 of the Company’s Form 10-QQuarterly Report for the quarter ended March 31, 1996.
3.2 By-Laws of the Company, as amended and restated through October 19, 2006—incorporated herein byreference to Exhibit 99.1 of the Company’s Form 8-K Current Report, filed October 20, 2006.
4.1 The Company agrees to furnish to the Securities and Exchange Commission, upon request, a copy of anyinstrument defining the rights of holders of long-term debt of the Company and all of its consolidatedsubsidiaries and unconsolidated subsidiaries for which financial statements are required to be filed withthe SEC.
10.1.1 The Key Executive Retirement Plan of the Company, as amended—incorporated herein by reference toExhibit 10.2 of the Company’s Form 10-K Annual Report for the year ended December 31, 1995.*
10.1.2 Third Amendment to the Key Executive Retirement Plan of the Company, dated as of July 9, 1998—incorporated herein by reference to Exhibit 10.1.2 of the Company’s Form 10-K Annual Report for theyear ended December 31, 1999.*
10.1.3 Fourth Amendment to the Key Executive Retirement Plan of the Company, dated as of February 16,1999—incorporated herein by reference to Exhibit 10.1.3 of the Company’s Form 10-K Annual Reportfor the year ended December 31, 1999.*
10.1.4 Fifth Amendment to the Key Executive Retirement Plan of the Company, dated as of January 25, 2000—incorporated herein by reference to Exhibit 10.1.4 of the Company’s Form 10-K Annual Report for theyear ended December 31, 1999.*
133

Exhibit No.
10.1.5 Amendment Number Six to the Key Executive Retirement Plan of the Company, dated as of February 27,2003—incorporated herein by reference to Exhibit 10.3 of the Company’s Form 10-Q Quarterly Reportfor the quarter ended March 31, 2003.*
10.1.6 Amendment Number Seven to the Key Executive Retirement Plan of the Company, dated July 28, 2004,effective as of June 1, 2004—incorporated herein by reference to Exhibit 10.4 of the Company’sForm 10-Q Quarterly Report for the quarter ended September 30, 2004.*
10.2 Supplemental Disability Plan of the Company, as amended and restated effective January 1, 2003—incorporated herein by reference to Exhibit 10.2 of the Company’s Form 10-K Annual Report for theyear ended December 31, 2002.*
10.3 Performance Incentive Plan of the Company, as amended and restated December 13, 2006.*10.4 1991 Stock Option Plan of the Company, as amended and restated through December 13, 2006.*10.5 1999 Stock Option Plan of the Company, as amended and restated through December 13, 2006.*10.6.1 2002 Stock Option Plan of the Company, as amended and restated through December 13, 2006.*10.6.2 Form of Stock Option Agreement in connection with the 2002 Stock Option Plan, as amended—
incorporated by reference to Exhibit 99.1 of the Company’s Form 8-K Current Report filed onDecember 8, 2004.*
10.6.3 Form of Stock Option Agreement for E. Neville Isdell in connection with the 2002 Stock Option Plan, asamended—incorporated by reference to Exhibit 99.1 of the Company’s Form 8-K Current Report filedFebruary 23, 2005.*
10.7 1983 Restricted Stock Award Plan of the Company, as amended through December 13, 2006.*10.8.1 1989 Restricted Stock Award Plan of the Company, as amended through December 13, 2006.*10.8.2 Form of Restricted Stock Agreement (Performance Share Unit Agreement) in connection with the 1989
Restricted Stock Award Plan of the Company—incorporated herein by reference to Exhibit 10.1 of theCompany’s Form 8-K Current Report filed April 19, 2005.*
10.8.3 Form of Restricted Stock Agreement (Performance Share Unit Agreement) in connection with the 1989Restricted Stock Award Plan of the Company, effective as of December 2005—incorporated herein byreference to Exhibit 99.1 of the Company’s Form 8-K Current Report filed December 14, 2005.*
10.8.4 Form of Restricted Stock Agreement (Performance Share Unit Agreement) for E. Neville Isdell inconnection with the 1989 Restricted Stock Award Plan of the Company, as amended—incorporatedherein by reference to Exhibit 99.2 of the Company’s Form 8-K Current Report filed on February 23,2005.*
10.8.5 Form of Restricted Stock Award Agreement for Mary E. Minnick in connection with the 1989 RestrictedStock Award Plan of the Company, as amended—incorporated herein by reference to Exhibit 10.7 ofthe Company’s Form 10-Q Quarterly Report for the quarter ended July 1, 2005.*
10.8.6 Form of Restricted Stock Agreement (Performance Share Unit Agreement) in connection with the 1989Restricted Stock Award Plan of the Company—incorporated herein by reference to Exhibit 99.2 of theCompany’s Form 8-K Current Report filed on February 15, 2006.*
10.8.7 Form of Restricted Stock Agreement (Performance Share Unit Agreement) for E. Neville Isdell inconnection with the 1989 Restricted Stock Award Plan of the Company—incorporated herein byreference to Exhibit 99.1 of the Company’s Form 8-K Current Report filed on February 17, 2006.*
10.9.1 Compensation Deferral & Investment Program of the Company, as amended, including AmendmentNumber Four dated November 28, 1995—incorporated herein by reference to Exhibit 10.13 of theCompany’s Form 10-K Annual Report for the year ended December 31, 1995.*
10.9.2 Amendment Number Five to the Compensation Deferral & Investment Program of the Company,effective as of January 1, 1998—incorporated herein by reference to Exhibit 10.8.2 of the Company’sForm 10-K Annual Report for the year ended December 31, 1997.*
134

Exhibit No.
10.9.3 Amendment Number Six to the Compensation Deferral & Investment Program of the Company, dated asof January 12, 2004, effective January 1, 2004—incorporated herein by reference to Exhibit 10.9.3 of theCompany’s Form 10-K Annual Report for the year ended December 31, 2003.*
10.10.1 Executive Medical Plan of the Company, as amended and restated effective January 1, 2001—incorporated herein by reference to Exhibit 10.10 of the Company’s Form 10-K Annual Report for theyear ended December 31, 2002.*
10.10.2 Amendment Number One to the Executive Medical Plan of the Company, dated April 15, 2003—incorporated herein by reference to Exhibit 10.1 of the Company’s Form 10-Q Quarterly Report for thequarter ended June 30, 2003.*
10.10.3 Amendment Number Two to the Executive Medical Plan of the Company, dated August 27, 2003—incorporated herein by reference to Exhibit 10 of the Company’s Form 10-Q Quarterly Report for thequarter ended September 30, 2003.*
10.10.4 Amendment Number Three to the Executive Medical Plan of the Company, dated December 29, 2004,effective January 1, 2005—incorporated herein by reference to Exhibit 10.10.4 of the Company’sForm 10-K Annual Report for the year ended December 31, 2004.*
10.10.5 Amendment Number Four to the Executive Medical Plan of the Company—incorporated herein byreference to Exhibit 10.6 of the Company’s Form 10-Q Quarterly Report for the quarter ended July 1,2005.*
10.10.6 Amendment Number Five to the Executive Medical Plan of the Company, dated December 20, 2005—incorporated herein by reference to Exhibit 10.10.6 of the Company’s Form 10-K Annual Report for theyear ended December 31, 2005.*
10.11.1 Supplement Benefit Plan of the Company, as amended and restated effective January 1, 2002—incorporated herein by reference to Exhibit 10.11 of the Company’s Form 10-K Annual Report for theyear ended December 31, 2002.*
10.11.2 Amendment One to the Supplemental Benefit Plan of the Company, dated as of February 27, 2003—incorporated herein by reference to Exhibit 10.5 of the Company’s Form 10-Q Quarterly Report for thequarter ended March 31, 2003.*
10.11.3 Amendment Two to the Supplemental Benefit Plan of the Company, dated as of November 14, 2003,effective October 21, 2003—incorporated herein by reference to Exhibit 10.11.3 of the Company’s Form10-K Annual Report for the year ended December 31, 2003.*
10.11.4 Amendment Three to the Supplemental Benefit Plan of the Company, dated April 14, 2004, effective as ofJanuary 1, 2004—incorporated herein by reference to Exhibit 10.3 of the Company’s Form 10-QQuarterly Report for the quarter ended March 31, 2004.*
10.11.5 Amendment Four to the Supplemental Benefit Plan of the Company, dated December 15, 2004, effectiveJanuary 1, 2005—incorporated herein by reference to Exhibit 10.11.5 of the Company’s Form 10-KAnnual Report for the year ended December 31, 2004.*
10.11.6 Amendment Five to the Supplemental Benefit Plan of the Company, dated December 21, 2005—incorporated herein by reference to Exhibit 10.11.6 of the Company’s Form 10-K Annual Report for theyear ended December 31, 2005.*
10.11.7 Amendment Six to the Supplemental Benefit Plan of the Company, dated July 18, 2006—incorporatedherein by reference to Exhibit 10.3 of the Company’s Form 10-Q Quarterly Report for the quarterended June 30, 2006.*
10.13 Deferred Compensation Plan for Non-Employee Directors of the Company, as amended and restatedeffective April 1, 2006—incorporated herein by reference to Exhibit 99.2 of the Company’s Form 8-KCurrent Report filed April 5, 2006.*
10.14 Compensation Plan for Non-Employee Directors of The Coca-Cola Company—incorporated herein byreference to Exhibit 99.1 of the Company’s Form 8-K Current Report filed on April 5, 2006.*
135

Exhibit No.
10.15 Letter Agreement, dated March 4, 2003, between the Company and Stephen C. Jones—incorporatedherein by reference to Exhibit 10.6 of the Company’s Form 10-Q Quarterly Report for the quarterended March 31, 2003.*
10.16.1 Letter Agreement, dated December 6, 1999, between the Company and M. Douglas Ivester—incorporated herein by reference to Exhibit 10.17.1 of the Company’s Form 10-K Annual Report for theyear ended December 31, 1999.*
10.16.2 Letter Agreement, dated December 15, 1999, between the Company and M. Douglas Ivester—incorporated herein by reference to Exhibit 10.17.2 of the Company’s Form 10-K Annual Report for theyear ended December 31, 1999.*
10.16.3 Letter Agreement, dated February 17, 2000, between the Company and M. Douglas Ivester—incorporatedherein by reference to Exhibit 10.17.3 of the Company’s Form 10-K Annual Report for the year endedDecember 31, 1999.*
10.17 Long-Term Performance Incentive Plan of the Company, as amended and restated effective December 13,2006.*
10.18 Executive Incentive Plan of the Company, adopted as of February 14, 2001—incorporated herein byreference to Exhibit 10.19 of the Company’s Form 10-K Annual Report for the year endedDecember 31, 2000.*
10.19 Form of United States Master Bottler Contract, as amended, between the Company and Coca-ColaEnterprises Inc. (‘‘Coca-Cola Enterprises’’) or its subsidiaries—incorporated herein by reference toExhibit 10.24 of Coca-Cola Enterprises’ Annual Report on Form 10-K for the fiscal year endedDecember 30, 1988 (File No. 01-09300).
10.24.1 Deferred Compensation Plan of the Company, as amended and restated December 17, 2003—incorporated herein by reference to Exhibit 10.26.1 of the Company’s Form 10-K Annual Report for theyear ended December 31, 2003.*
10.24.2 Deferred Compensation Plan Delegation of Authority from the Compensation Committee to theManagement Committee, adopted as of December 17, 2003—incorporated herein by reference toExhibit 10.26.2 of the Company’s Form 10-K Annual Report for the year ended December 31, 2003.*
10.24.3 Amendment One to the Deferred Compensation Plan of the Company, as amended and restated effectiveDecember 17, 2003—incorporated herein by reference to Exhibit 10.24.3 of the Company’s Form 10-KAnnual Report for the year ended December 31, 2005.*
10.25 Letter Agreement, dated October 24, 2002, between the Company and Carl Ware—incorporated hereinby reference to Exhibit 10.30 of the Company’s Form 10-K Annual Report for the year endedDecember 31, 2002.*
10.26 The Coca-Cola Export Corporation Employee Share Plan, effective as of March 13, 2002—incorporatedherein by reference to Exhibit 10.31 of the Company’s Form 10-K Annual Report for the year endedDecember 31, 2002.*
10.27 Employees’ Savings and Share Ownership Plan of Coca-Cola Ltd., effective as of January 1, 1990—incorporated herein by reference to Exhibit 10.32 of the Company’s Form 10-K Annual Report for theyear ended December 31, 2002.*
10.28 Share Purchase Plan—Denmark, effective as of 1991—incorporated herein by reference to Exhibit 10.33of the Company’s Form 10-K Annual Report for the year ended December 31, 2002.*
10.29 Letter Agreement, dated June 19, 2003, between the Company and Daniel Palumbo—incorporated hereinby reference to Exhibit 10.2 of the Company’s Form 10-Q Quarterly Report for the quarter endedJune 30, 2003.*
10.30 Consulting Agreement, dated January 22, 2004, effective as of August 1, 2003, between the Company andChatham International Corporation, regarding consulting services to be provided by Brian G. Dyson—incorporated herein by reference to Exhibit 10.32 of the Company’s Form 10-K Annual Report for theyear ended December 31, 2003.*
136

Exhibit No.
10.31.1 The Coca-Cola Company Benefits Plan for Members of the Board of Directors, as amended and restatedthrough April 14, 2004—incorporated herein by reference to Exhibit 10.1 of the Company’s Form 10-QQuarterly Report for the quarter ended March 31, 2004.*
10.31.2 Amendment Number One to the Company’s Benefits Plan for Members of the Board of Directors, datedDecember 16, 2005—incorporated herein by reference to Exhibit 10.31.2 of the Company’s Form 10-KAnnual Report for the year ended December 31, 2005.*
10.32 Letter Agreement, dated March 2, 2004, between the Company and Jeffrey T. Dunn—incorporated hereinby reference to Exhibit 10.2 of the Company’s Form 10-Q Quarterly Report for the quarter endedMarch 31, 2004.*
10.33 Full and Complete Release, dated June 8, 2004, between the Company and Steven J. Heyer—incorporated herein by reference to Exhibit 10.1 of the Company’s Form 10-Q Quarterly Report for thequarter ended June 30, 2004.*
10.34 Employment Agreement, dated as of March 11, 2002, between the Company and Alexander R.C. Allan—incorporated herein by reference to Exhibit 10.3 of the Company’s Form 10-Q Quarterly Report for thequarter ended June 30, 2004.*
10.35 Employment Agreement, dated as of March 11, 2002, between The Coca-Cola Export Corporation andAlexander R.C. Allan—incorporated herein by reference to Exhibit 10.4 of the Company’s Form 10-QQuarterly Report for the quarter ended June 30, 2004.*
10.36 Letter, dated September 16, 2004, from the Company to E. Neville Isdell—incorporated herein byreference to Exhibit 99.1 of the Company’s Form 8-K Current Report filed on September 17, 2004.*
10.37 Stock Award Agreement for E. Neville Isdell, dated September 14, 2004, under the 1989 Restricted StockAward Plan of the Company—incorporated herein by reference to Exhibit 99.2 of the Company’sForm 8-K Current Report filed on September 17, 2004.*
10.38 Stock Option Agreement for E. Neville Isdell, dated July 22, 2004, under the 2002 Stock Option Plan ofthe Company, as amended—incorporated herein by reference to Exhibit 10.3 of the Company’sForm 10-Q Quarterly Report for the quarter ended September 30, 2004.*
10.39 Letter, dated August 6, 2004, from the Chairman of the Compensation Committee of the Board ofDirectors of the Company to Douglas N. Daft—incorporated herein by reference to Exhibit 10.5 of theCompany’s Form 10-Q Quarterly Report for the quarter ended September 30, 2004.*
10.40 Letter, dated January 4, 2006, from the Company to Tom Mattia—incorporated herein by reference toExhibit 10.40 of the Company’s Form 10-K Annual Report for the year ended December 31, 2005.*
10.41 Letter Agreement, dated October 7, 2004, between the Company and Daniel Palumbo—incorporatedherein by reference to Exhibit 10.41 of the Company’s Form 10-K Annual Report for the year endedDecember 31, 2004.*
10.42 Letter, dated February 12, 2005, from the Company to Mary E. Minnick—incorporated herein byreference to Exhibit 99.3 to the Company’s Form 8-K Current Report filed on February 23, 2005.*
10.43 Employment Agreement, dated as of February 20, 2003, between the Company and José Octavio Reyes—incorporated herein by reference to Exhibit 10.43 of the Company’s Form 10-K Annual Report for theyear ended December 31, 2004.*
10.44 Severance Pay Plan of the Company, including Amendments One through Three.*10.45 Employment Agreement, dated as of July 18, 2002, between the Company and Alexander B. Cummings—
incorporated herein by reference to Exhibit 10.45 of the Company’s Form 10-K Annual Report for theyear ended December 31, 2004.*
10.46 Employment Agreement, dated as of July 18, 2002, between The Coca-Cola Export Corporation andAlexander B. Cummings—incorporated herein by reference to Exhibit 10.46 of the Company’sForm 10-K Annual Report for the year ended December 31, 2004.*
137

Exhibit No.
10.47 Letter, dated as of April 1, 2005, from Cynthia P. McCague, Senior Vice President of the Company, toDeval L. Patrick—incorporated herein by reference to Exhibit 99.1 of the Company’s Form 8-K CurrentReport filed on April 7, 2005.*
10.48 Full and Complete Release and Agreement on Competition, Trade Secrets and Confidentiality betweenthe Company and Deval L. Patrick—incorporated herein by reference to Exhibit 99.2 of the Company’sForm 8-K Current Report filed on April 7, 2005.*
10.49 Order Instituting Cease and Desist Proceedings, Making Findings and Imposing a Cease-and-DesistOrder Pursuant to Section 8A of the Securities Act of 1933 and Section 21C of the Securities ExchangeAct of 1934—incorporated herein by reference to Exhibit 99.2 of the Company’s Form 8-K CurrentReport filed on April 18, 2005.
10.50 Offer of Settlement of The Coca-Cola Company—incorporated herein by reference to Exhibit 99.2 of theCompany’s Form 8-K Current Report filed on April 18, 2005.
10.51 Final Undertaking from The Coca-Cola Company and certain of its bottlers, adopted by the EuropeanCommission on June 22, 2005, relating to various commercial practices in the European EconomicArea—incorporated herein by reference to Exhibit 99.1 of the Company’s Form 8-K Current Reportfiled June 22, 2005.
10.52 Employment Agreement, effective as of May 1, 2005, between Refreshment Services, S.A.S. andDominique Reiniche, dated September 7, 2006—incorporated herein by reference to Exhibit 99.1 of theCompany’s Form 8-K Current Report filed on September 12, 2006.*
10.53 Refreshment Services S.A.S. Defined Benefit Plan, dated September 25, 2006—incorporated herein byreference to Exhibit 10.3 of the Company’s Form 10-Q Quarterly Report for the quarter endedSeptember 29, 2006.*
10.54 Share Purchase Agreement among Coca-Cola South Asia Holdings, Inc. and San Miguel Corporation,San Miguel Beverages (L) Pte Limited and San Miguel Holdings Limited in connection with theCompany’s purchase of Coca-Cola Bottlers Philippines, Inc., dated December 23, 2006—incorporatedherein by reference to Exhibit 99.1 of the Company’s Form 8-K Current Report filed on December 29,2006.*
10.55 Cooperation Agreement between Coca-Cola South Asia Holdings, Inc. and San Miguel Corporation inconnection with the Company’s purchase of Coca-Cola Bottlers Philippines, Inc., dated December 23,2006—incorporated herein by reference to Exhibit 99.2 of the Company’s Form 8-K Current Reportfiled on December 29, 2006.*
12.1 Computation of Ratios of Earnings to Fixed Charges for the years ended December 31, 2006, 2005, 2004,2003 and 2002
21.1 List of subsidiaries of the Company as of December 31, 2006.23.1 Consent of Independent Registered Public Accounting Firm.24.1 Powers of Attorney of Officers and Directors signing this report.31.1 Rule 13a-14(a)/15d-14(a) Certification, executed by E. Neville Isdell, Chairman, Board of Directors, and
Chief Executive Officer of The Coca-Cola Company.31.2 Rule 13a-14(a)/15d-14(a) Certification, executed by Gary P. Fayard, Executive Vice President and Chief
Financial Officer of The Coca-Cola Company.32.1 Certifications required by Rule 13a-14(b) or Rule 15d-14(b) and Section 1350 of Chapter 63 of Title 18 of
the United States Code (18 U.S.C. 1350), executed by E. Neville Isdell, Chairman, Board of Directors,and Chief Executive Officer of The Coca-Cola Company and by Gary P. Fayard, Executive VicePresident and Chief Financial Officer of The Coca-Cola Company.
* Management contracts and compensatory plans and arrangements required to be filed as exhibits pursuant toItem 15(c) of this report.
138

SIGNATURES
Pursuant to the requirements of Section 13 or 15(d) of the Securities Exchange Act of 1934, the Registrant has dulycaused this report to be signed on its behalf by the undersigned, thereunto duly authorized.
THE COCA-COLA COMPANY
(Registrant)
By: /s/ E. NEVILLE ISDELL
E. NEVILLE ISDELL
Chairman, Board of Directors, ChiefExecutive Officer
Date: February 21, 2007
Pursuant to the requirements of the Securities Exchange Act of 1934, this report has been signed below by thefollowing persons on behalf of the Registrant and in the capacities and on the dates indicated.
/s/ E. NEVILLE ISDELL *
E. NEVILLE ISDELL CATHLEEN P. BLACK
Chairman, Board of Directors, Chief Executive Officer Directorand a Director(Principal Executive Officer)
February 21, 2007 February 21, 2007
/s/ GARY P. FAYARD *
GARY P. FAYARD BARRY DILLER
Executive Vice President and Chief Financial Officer Director(Principal Financial Officer)
February 21, 2007 February 21, 2007
/s/ CONNIE D. MCDANIEL *
CONNIE D. MCDANIEL DONALD R. KEOUGH
Vice President and Controller (Principal Accounting DirectorOfficer)
February 21, 2007 February 21, 2007
* *
HERBERT A. ALLEN DONALD F. MCHENRY
Director Director
February 21, 2007 February 21, 2007
139

* *
RONALD ALLEN SAM NUNN
Director Director
February 21, 2007 February 21, 2007
* *
JAMES D. ROBINSON III JAMES B. WILLIAMS
Director DirectorFebruary 21, 2007 February 21, 2007
*
PETER V. UEBERROTH
Director
February 21, 2007
By: /s/ CAROL CROFOOT HAYES
CAROL CROFOOT HAYES
Attorney-in-factFebruary 21, 2007
140


L
Printed on Recycled Paper

20FEB200902055832
UNITED STATESSECURITIES AND EXCHANGE COMMISSION
Washington, D.C. 20549
FORM 10-K� ANNUAL REPORT PURSUANT TO SECTION 13 OR 15(d) OF THE SECURITIES
EXCHANGE ACT OF 1934For the fiscal year ended December 31, 2008
OR
� TRANSITION REPORT PURSUANT TO SECTION 13 OR 15(d) OF THE SECURITIESEXCHANGE ACT OF 1934
For the transition period from to Commission File No. 1-2217
(Exact name of Registrant as specified in its charter)
DELAWARE 58-0628465(State or other jurisdiction of (IRS Employerincorporation or organization) Identification No.)
One Coca-Cola PlazaAtlanta, Georgia 30313
(Address of principal executive offices) (Zip Code)Registrant’s telephone number, including area code: (404) 676-2121
Securities registered pursuant to Section 12(b) of the Act:Title of each class Name of each exchange on which registered
COMMON STOCK, $0.25 PAR VALUE NEW YORK STOCK EXCHANGESecurities registered pursuant to Section 12(g) of the Act: None
Indicate by check mark if the Registrant is a well-known seasoned issuer, as defined in Rule 405 of the Securities Act.Yes � No �
Indicate by check mark if the Registrant is not required to file reports pursuant to Section 13 or Section 15(d) of theExchange Act. Yes � No �
Indicate by check mark whether the Registrant (1) has filed all reports required to be filed by Section 13 or 15(d) of theSecurities Exchange Act of 1934 during the preceding 12 months and (2) has been subject to such filing requirements for the past90 days. Yes � No �
Indicate by check mark if disclosure of delinquent filers pursuant to Item 405 of Regulation S-K is not contained herein, andwill not be contained, to the best of Registrant’s knowledge, in definitive proxy or information statements incorporated byreference in Part III of this Form 10-K or any amendment to this Form 10-K. �
Indicate by check mark whether the registrant is a large accelerated filer, an accelerated filer, a non-accelerated filer, or asmaller reporting company. See the definitions of ‘‘large accelerated filer,’’ ‘‘accelerated filer’’ and ‘‘smaller reporting company’’ inRule 12b-2 of the Exchange Act. (Check one):
Large accelerated filer � Accelerated filer � Non-accelerated filer � Smaller reporting company �(Do not check if a smaller reporting company)
Indicate by check mark if the Registrant is a shell company (as defined in Rule 12b-2 of the Exchange Act). Yes � No �The aggregate market value of the common equity held by non-affiliates of the Registrant (assuming for these purposes, but
without conceding, that all executive officers and Directors are ‘‘affiliates’’ of the Registrant) as of June 27, 2008, the last businessday of the Registrant’s most recently completed second fiscal quarter, was $113,780,250,547 (based on the closing sale price of theRegistrant’s Common Stock on that date as reported on the New York Stock Exchange).
The number of shares outstanding of the Registrant’s Common Stock as of February 23, 2009 was 2,314,658,162.DOCUMENTS INCORPORATED BY REFERENCE
Portions of the Company’s Proxy Statement for the Annual Meeting of Shareowners to be held on April 22, 2009, areincorporated by reference in Part III.

Table of Contents
Page
Forward-Looking Statements . . . . . . . . . . . . . . . . . . . . . . . . . . . . . . . . . . . . . . . . . . . . . . . . . . . . . 1
Part I
Item 1. Business . . . . . . . . . . . . . . . . . . . . . . . . . . . . . . . . . . . . . . . . . . . . . . . . . . . . . . . . . . . . . . . . . . . . 1Item 1A. Risk Factors . . . . . . . . . . . . . . . . . . . . . . . . . . . . . . . . . . . . . . . . . . . . . . . . . . . . . . . . . . . . . . . . . 12Item 1B. Unresolved Staff Comments . . . . . . . . . . . . . . . . . . . . . . . . . . . . . . . . . . . . . . . . . . . . . . . . . . . . . 20Item 2. Properties . . . . . . . . . . . . . . . . . . . . . . . . . . . . . . . . . . . . . . . . . . . . . . . . . . . . . . . . . . . . . . . . . . . 20Item 3. Legal Proceedings . . . . . . . . . . . . . . . . . . . . . . . . . . . . . . . . . . . . . . . . . . . . . . . . . . . . . . . . . . . . . 21Item 4. Submission of Matters to a Vote of Security Holders . . . . . . . . . . . . . . . . . . . . . . . . . . . . . . . . . . . . 25Item X. Executive Officers of the Company . . . . . . . . . . . . . . . . . . . . . . . . . . . . . . . . . . . . . . . . . . . . . . . . 25
Part II
Item 5. Market for Registrant’s Common Equity, Related Stockholder Matters and Issuer Purchases ofEquity Securities . . . . . . . . . . . . . . . . . . . . . . . . . . . . . . . . . . . . . . . . . . . . . . . . . . . . . . . . . . . . 29
Item 6. Selected Financial Data . . . . . . . . . . . . . . . . . . . . . . . . . . . . . . . . . . . . . . . . . . . . . . . . . . . . . . . . . 32Item 7. Management’s Discussion and Analysis of Financial Condition and Results of Operations . . . . . . . . . 33Item 7A. Quantitative and Qualitative Disclosures About Market Risk . . . . . . . . . . . . . . . . . . . . . . . . . . . . . . 71Item 8. Financial Statements and Supplementary Data . . . . . . . . . . . . . . . . . . . . . . . . . . . . . . . . . . . . . . . . 72Item 9. Changes in and Disagreements with Accountants on Accounting and Financial Disclosure . . . . . . . . . 147Item 9A. Controls and Procedures . . . . . . . . . . . . . . . . . . . . . . . . . . . . . . . . . . . . . . . . . . . . . . . . . . . . . . . . 147Item 9B. Other Information . . . . . . . . . . . . . . . . . . . . . . . . . . . . . . . . . . . . . . . . . . . . . . . . . . . . . . . . . . . . 147
Part III
Item 10. Directors, Executive Officers and Corporate Governance . . . . . . . . . . . . . . . . . . . . . . . . . . . . . . . . 148Item 11. Executive Compensation . . . . . . . . . . . . . . . . . . . . . . . . . . . . . . . . . . . . . . . . . . . . . . . . . . . . . . . . 148Item 12. Security Ownership of Certain Beneficial Owners and Management and Related Stockholder Matters 148Item 13. Certain Relationships and Related Transactions, and Director Independence . . . . . . . . . . . . . . . . . . 148Item 14. Principal Accountant Fees and Services . . . . . . . . . . . . . . . . . . . . . . . . . . . . . . . . . . . . . . . . . . . . . 148
Part IV
Item 15. Exhibits and Financial Statement Schedules . . . . . . . . . . . . . . . . . . . . . . . . . . . . . . . . . . . . . . . . . . 149Signatures . . . . . . . . . . . . . . . . . . . . . . . . . . . . . . . . . . . . . . . . . . . . . . . . . . . . . . . . . . . . . . . . . . 157

FORWARD-LOOKING STATEMENTS
This report contains information that may constitute ‘‘forward-looking statements.’’ Generally, the words‘‘believe,’’ ‘‘expect,’’ ‘‘intend,’’ ‘‘estimate,’’ ‘‘anticipate,’’ ‘‘project,’’ ‘‘will’’ and similar expressions identify forward-looking statements, which generally are not historical in nature. All statements that address operating performance,events or developments that we expect or anticipate will occur in the future—including statements relating to volumegrowth, share of sales and earnings per share growth, and statements expressing general views about future operatingresults—are forward-looking statements. Management believes that these forward-looking statements are reasonableas and when made. However, caution should be taken not to place undue reliance on any such forward-lookingstatements because such statements speak only as of the date when made. Our Company undertakes no obligation topublicly update or revise any forward-looking statements, whether as a result of new information, future events orotherwise, except as required by law. In addition, forward-looking statements are subject to certain risks anduncertainties that could cause actual results to differ materially from our Company’s historical experience and ourpresent expectations or projections. These risks and uncertainties include, but are not limited to, those described inPart I, ‘‘Item 1A. Risk Factors’’ and elsewhere in this report and those described from time to time in our futurereports filed with the Securities and Exchange Commission.
PART I
ITEM 1. BUSINESS
General
The Coca-Cola Company is the largest manufacturer, distributor and marketer of nonalcoholic beverageconcentrates and syrups in the world. Finished beverage products bearing our trademarks, sold in the UnitedStates since 1886, are now sold in more than 200 countries. Along with Coca-Cola, which is recognized as theworld’s most valuable brand, we market four of the world’s top five nonalcoholic sparkling brands, includingDiet Coke, Fanta and Sprite. In this report, the terms ‘‘Company,’’ ‘‘we,’’ ‘‘us’’ or ‘‘our’’ mean The Coca-ColaCompany and all entities included in our consolidated financial statements.
Our business is nonalcoholic beverages—principally sparkling beverages, but also a variety of stillbeverages. We manufacture beverage concentrates and syrups, which we sell to bottling and canning operations,fountain wholesalers and some fountain retailers, as well as finished beverages, which we sell primarily todistributors. Our Company owns or licenses nearly 500 brands, including diet and light beverages, waters,enhanced waters, juices and juice drinks, teas, coffees, and energy and sports drinks. In addition, we haveownership interests in numerous beverage joint ventures, bottling and canning operations, although most ofthese operations are independently owned and managed.
We were incorporated in September 1919 under the laws of the State of Delaware and succeeded to thebusiness of a Georgia corporation with the same name that had been organized in 1892.
Our Company is one of numerous competitors in the commercial beverages market. Of the approximately54 billion beverage servings of all types consumed worldwide every day, beverages bearing trademarks owned byor licensed to us account for approximately 1.6 billion.
We believe that our success depends on our ability to connect with consumers by providing them with awide variety of choices to meet their desires, needs and lifestyle choices. Our success further depends on theability of our people to execute effectively, every day.
Our goal is to use our Company’s assets—our brands, financial strength, unrivaled distribution system,global reach and the talent and strong commitment of our management and associates—to become morecompetitive and to accelerate growth in a manner that creates value for our shareowners.
1

Operating Segments
The Company’s operating structure is the basis for our internal financial reporting. As of December 31,2008, our operating structure included the following operating segments, the first six of which are sometimesreferred to as ‘‘operating groups’’ or ‘‘groups’’:
• Eurasia and Africa
• Europe
• Latin America
• North America
• Pacific
• Bottling Investments
• Corporate
Our operating structure as of December 31, 2008, reflected changes we made effective July 1, 2008, whenwe reconfigured our former European Union operating segment to include the Adriatic and Balkans businessunit and renamed it the Europe operating segment; and combined the remaining former Eurasia operatingsegment with the former Africa operating segment to form the Eurasia and Africa operating segment. Werevised previously reported operating segment information to conform to our current operating structure.
Except to the extent that differences among operating segments are material to an understanding of ourbusiness taken as a whole, the description of our business in this report is presented on a consolidated basis.
For financial information about our operating segments and geographic areas, refer to Note 5 and Note 21of Notes to Consolidated Financial Statements set forth in Part II, ‘‘Item 8. Financial Statements andSupplementary Data’’ of this report, incorporated herein by reference. For certain risks attendant to ournon-U.S. operations, refer to ‘‘Item 1A. Risk Factors,’’ below.
Products and Distribution
Our Company manufactures and sells beverage concentrates, sometimes referred to as ‘‘beverage bases,’’and syrups, including fountain syrups, and finished beverages.
As used in this report:
• ‘‘concentrates’’ means flavoring ingredients and, depending on the product, sweeteners used to preparesyrups or finished beverages;
• ‘‘syrups’’ means the beverage ingredients produced by combining concentrates and, depending on theproduct, sweeteners and added water;
• ‘‘fountain syrups’’ means syrups that are sold to fountain retailers, such as restaurants, that use dispensingequipment to mix the syrups with sparkling or still water at the time of purchase to produce finishedbeverages that are served in cups or glasses for immediate consumption;
• ‘‘sparkling beverages’’ means nonalcoholic ready-to-drink beverages with carbonation, including energydrinks and carbonated waters and flavored waters;
• ‘‘still beverages’’ means nonalcoholic beverages without carbonation, including noncarbonated waters,flavored waters and enhanced waters, juices and juice drinks, teas, coffees and sports drinks; and
• ‘‘Company Trademark Beverages’’ means beverages bearing our trademarks and certain other beverageproducts licensed to us for which we provide marketing support and from the sale of which we deriveeconomic benefit.
2

We sell the concentrates and syrups for bottled and canned beverages to authorized bottling and canningoperations. In addition to concentrates and syrups for sparkling beverages and flavored still beverages, we alsosell concentrates (in powder form) for purified water products such as Dasani to authorized bottling operations.
Authorized bottlers and canners either combine our syrups with sparkling water or combine ourconcentrates with sweeteners (depending on the product), still water and/or sparkling water to produce finishedsparkling beverages. The finished sparkling beverages are packaged in authorized containers bearing ourtrademarks or trademarks licensed to us—such as cans and refillable and nonrefillable glass and plastic bottles(‘‘bottle/can products’’)—and are then sold to retailers (‘‘bottle/can retailers’’) or, in some cases, wholesalers.
For our fountain products in the United States, we manufacture fountain syrups and sell them to authorizedfountain wholesalers and some fountain retailers. The wholesalers are authorized to sell the Company’s fountainsyrups by a nonexclusive appointment from us that neither restricts us in setting the prices at which we sellfountain syrups to the wholesalers nor restricts the territory in which the wholesalers may resell in the UnitedStates. Outside the United States, fountain syrups typically are manufactured by authorized bottlers fromconcentrates sold to them by the Company. The bottlers then typically sell the fountain syrups to wholesalers ordirectly to fountain retailers.
Finished beverages manufactured by us include a variety of sparkling and still beverages. We sell thesebeverages to authorized bottlers or distributors, wholesalers or directly to retailers. We manufacture and selljuice and juice-drink products and certain water products to retailers and wholesalers in the United States andnumerous other countries, both directly and through a network of business partners, including certain Coca-Colabottlers.
Our beverage products include Coca-Cola, caffeine free Coca-Cola, Cherry Coke, Diet Coke (sold underthe trademark Coca-Cola Light in many countries other than the United States), caffeine free Diet Coke, DietCoke Sweetened with Splenda, Diet Coke with Lime, Diet Cherry Coke, Diet Coke Plus, Coca-Cola Zero (soldunder the trademark Coke Zero in some countries), Fanta, Sprite, Diet Sprite/Sprite Zero (sold under thetrademark Sprite Light in many countries other than the United States), Pibb Xtra, Mello Yello, Tab, Fresca andBarq’s brand sparkling beverages, Powerade, Aquarius, Sokenbicha, Ciel, Bonaqa/Bonaqua, Dasani, Dasanibrand flavored waters, Georgia brand ready-to-drink coffees (sold in Japan), Lift, Thums Up, Kinley, EightO’Clock, Qoo, Mother, Vault, NOS, Full Throttle and other products developed for specific countries. Ourbeverage products also include enhanced water brands such as glacéau vitaminwater and smartwater, soldprimarily in North America, Fuze fortified beverages, enhanced water, tea-flavored beverages, and sports andfruit drinks sold in the United States, and Matte Leao herbal beverages sold in Brazil. In many countries(excluding the United States, among others), our Company’s beverage products also include Schweppes, CanadaDry, Dr Pepper and Crush. Our Company produces, distributes and markets juice and juice-drink products,including Minute Maid juices and juice drinks, Simply Orange and other juices and juice drinks, Cappy juices,Odwalla nourishing health beverages, Five Alive refreshment beverages and Bacardi mixers concentrate(manufactured and marketed under license agreements from Bacardi & Company Limited). We have a licenseto manufacture and sell concentrates for Seagram’s mixers, a line of sparkling beverages, in the United Statesand certain other countries. In addition, in the United States we market Nestea and Enviga products under asublicense agreement with a subsidiary of Nestlé S.A. (‘‘Nestlé’’). Multon, a Russian juice business (‘‘Multon’’)operated as a joint venture with Coca-Cola Hellenic Bottling Company S.A. (‘‘Coca-Cola Hellenic’’),manufactures, markets and sells juice products under various trademarks, including Dobriy, Rich and Nico, inRussia, Ukraine and Belarus. Beverage Partners Worldwide (‘‘BPW’’), the Company’s joint venture with Nestlé,markets ready-to-drink tea products under various trademarks, including Nestea, Enviga, Yang Guang, Nagomi,Frestea, Ten Ren, Yuan Ye, Heaven & Earth, Tian Yu Di, Nestea Vitao and Nestea Cool, in various marketsworldwide, other than the United States and Japan. We manufacture, market and sell packaged juices, nectarsand fruit-flavored beverages under the del Valle trademark through joint ventures with our bottling partners inMexico and Brazil. Ilko Coffee International, S.r.l. (‘‘Ilko’’), a joint venture with illycaffè S.p.A., and Ilko
3

Hellenic Partners GmbH, a joint venture between Ilko and Coca-Cola Hellenic, manufacture, market and sellready-to-drink coffee under the illy issimo brand.
Consumer demand determines the optimal menu of Company product offerings. Consumer demand canvary from one locale to another and can change over time within a single locale. Employing our businessstrategy, and with special focus on core brands, our Company seeks to build its existing brands and, at the sametime, to broaden its historical family of brands, products and services in order to create and satisfy consumerdemand locale by locale.
During 2008, we expanded our still beverage offerings by acquiring from Carlsberg Group Beverages(‘‘Carlsberg’’) the mineral water brands Kildevaeld and Kurvand in Denmark and entering into a licenseagreement regarding mineral water brand Ramlosa in Denmark. As a part of this same transaction, theCompany also expanded its sparkling beverage offerings by acquiring from Carlsberg the soft drink brand HyvaaPaivaa in Finland and entering into a license agreement regarding the energy drink Battery in Finland. Also, inOctober 2008, we entered into agreements for the distribution of Monster Energy trademark beverages,including Monster Energy, Java Monster and Lost Energy, in portions of 21 states in the United States, Canadaand six Western European countries. In addition, during 2008, our Company introduced a variety of new brands,brand extensions and new beverage products. Among numerous examples, in North America, we launchedPowerade Zero in Mixed Berry, Strawberry and Grape flavors, Simply Orange with Mango, Simply Orange withPineapple, Odwalla Mojito Mambo natural juice drink and Odwalla Pomegranate Strawberry, both sweetenedwith Truvia brand sweetener, a natural sweetener made with rebiana, which is derived from the stevia plant, andSprite Green, a new reduced calorie Sprite line extension, sweetened with Truvia. In Latin America, we launchedGladiator energy drink, Aquarius sparkling flavored water, del Valle juice and glacéau vitaminwater. In Europe,new launches included Coca-Cola Light Plus Lemon, Coca-Cola Light with Green Tea and The Spirit ofGeorgia—Blood Orange Prickly Pear. In Africa, we launched Schweppes Novida and Aquarius. In Japan, welaunched Hajime Chaka, Aquarius Zero, Georgia Emerald Mountain Blend Black and Fanta Zero Lemon.
Our Company measures the volume of products sold in two ways: (1) unit cases of finished products and(2) concentrate sales. As used in this report, ‘‘unit case’’ means a unit of measurement equal to 192 U.S. fluidounces of finished beverage (24 eight-ounce servings); and ‘‘unit case volume’’ means the number of unit cases(or unit case equivalents) of Company beverage products directly or indirectly sold by the Company and itsbottling partners (the ‘‘Coca-Cola system’’) to customers. Unit case volume primarily consists of beverageproducts bearing Company trademarks. Also included in unit case volume are certain products licensed to, ordistributed by, our Company, and brands owned by Coca-Cola system bottlers for which our Company providesmarketing support and from the sale of which we derive economic benefit. Such products licensed to, ordistributed by, our Company or owned by Coca-Cola system bottlers account for a minimal portion of total unitcase volume. In addition, unit case volume includes sales by joint ventures in which the Company has an equityinterest. Although most of our Company’s revenues are not based directly on unit case volume, we believe unitcase volume is one of the measures of the underlying strength of the Coca-Cola system because it measurestrends at the consumer level. The unit case volume numbers used in this report are derived based on estimatesreceived by the Company from its bottling partners and distributors. Concentrate sales volume represents theamount of concentrates, syrups, beverage bases and powders (in all cases expressed in equivalent unit cases) soldby, or used in finished beverages sold by, the Company to its bottling partners or other customers. Most of ourrevenues are based on concentrate sales, a primarily wholesale activity. Unit case volume and concentrate salesgrowth rates are not necessarily equal during any given period. Factors such as seasonality, bottlers’ inventorypractices, supply point changes, timing of price increases, new product introductions and changes in product mixcan impact unit case volume and concentrate sales and can create differences between unit case volume andconcentrate sales growth rates. In addition to the items mentioned above, the impact of unit case volume fromcertain joint ventures, in which the Company has an equity interest, but to which the Company does not sellconcentrates, may give rise to differences between unit case volume and concentrate sales growth rates.
4

In 2008, concentrates and syrups for beverages bearing the trademark ‘‘Coca-Cola’’ or any trademark thatincludes ‘‘Coca-Cola’’ or ‘‘Coke’’ (‘‘Coca-Cola Trademark Beverages’’) accounted for approximately 52 percentof the Company’s total concentrate sales.
In 2008, concentrate sales in the United States (‘‘U.S. concentrate sales’’) represented approximately23 percent of the Company’s worldwide concentrate sales. Approximately 56 percent of U.S. concentrate salesfor 2008 was attributable to sales of beverage concentrates and syrups to 74 authorized bottler ownership groupsin 393 licensed territories. Those bottlers prepare and sell Company Trademark Beverages for the food store andvending machine distribution channels and for other distribution channels supplying products for home andimmediate consumption. Approximately 32 percent of 2008 U.S. concentrate sales was attributable to fountainsyrups sold to fountain retailers and to 470 authorized fountain wholesalers, some of which are authorizedbottlers. The remaining approximately 12 percent of 2008 U.S. concentrate sales was attributable to sales by theCompany of finished beverages, including juice and juice-drink products and certain water products. Coca-ColaEnterprises Inc., including its bottling subsidiaries and divisions (‘‘CCE’’), accounted for approximately42 percent of the Company’s U.S. concentrate sales in 2008. At December 31, 2008, our Company held anownership interest of approximately 35 percent in CCE, which is the world’s largest bottler of CompanyTrademark Beverages.
In 2008, concentrate sales outside the United States represented approximately 77 percent of theCompany’s worldwide concentrate sales. The countries outside the United States in which our concentrate saleswere the largest in 2008 were Mexico, Brazil, China and Japan, which together accounted for approximately29 percent of our worldwide concentrate sales. Approximately 89 percent of non-U.S. unit case volume for 2008was attributable to sales of beverage concentrates and syrups to authorized bottlers together with sales by theCompany of finished beverages, other than juice and juice-drink products, in 442 licensed territories.Approximately 5 percent of 2008 non-U.S. unit case volume was attributable to fountain syrups. The remainingapproximately 6 percent of 2008 non-U.S. unit case volume was attributable to juice and juice-drink products.
In addition to conducting our own independent advertising and marketing activities, we may providepromotional and marketing services or funds to our bottlers. In most cases, we do this on a discretionary basisunder the terms of commitment letters or agreements, even though we are not obligated to do so under theterms of the bottling or distribution agreements between our Company and the bottlers. Also, on a discretionarybasis in most cases, our Company may develop and introduce new products, packages and equipment to assist itsbottlers. Likewise, in many instances, we provide promotional and marketing services and/or funds and/ordispensing equipment and repair services to fountain and bottle/can retailers, typically pursuant to marketingagreements. The aggregate amount of funds provided by our Company to bottlers, resellers or other customersof our Company’s products, principally for participation in promotional and marketing programs, wasapproximately $4.4 billion in 2008.
Bottler’s Agreements and Distribution Agreements
Most of our products are manufactured and sold by our bottling partners. We typically sell concentrates andsyrups to our bottling partners, who convert them into finished packaged products which they sell to distributorsand other customers. Separate contracts (‘‘Bottler’s Agreements’’) exist between our Company and each of ourbottling partners regarding the manufacture and sale of Company products. Subject to specified terms andconditions and certain variations, the Bottler’s Agreements generally authorize the bottlers to prepare specifiedCompany Trademark Beverages, to package the same in authorized containers, and to distribute and sell thesame in (but, subject to applicable local law, generally only in) an identified territory. The bottler is obligated topurchase its entire requirement of concentrates or syrups for the designated Company Trademark Beveragesfrom the Company or Company-authorized suppliers. We typically agree to refrain from selling or distributing,or from authorizing third parties to sell or distribute, the designated Company Trademark Beverages throughoutthe identified territory in the particular authorized containers; however, we typically reserve for ourselves or ourdesignee the right (1) to prepare and package such beverages in such containers in the territory for sale outside
5

the territory, and (2) to prepare, package, distribute and sell such beverages in the territory in any other manneror form. Territorial restrictions on bottlers vary in some cases in accordance with local law.
Being a bottler does not create a legal partnership or joint venture between us and our bottlers. Ourbottlers are independent contractors and are not our agents.
The Bottler’s Agreements between us and our authorized bottlers in the United States differ in certainrespects from those in the other countries in which Company Trademark Beverages are sold. As furtherdiscussed below, the principal differences involve the duration of the agreements; the inclusion or exclusion ofcanned beverage production rights; the inclusion or exclusion of authorizations to manufacture and distributefountain syrups; in some cases, the degree of flexibility on the part of the Company to determine the pricing ofsyrups and concentrates; and the extent, if any, of the Company’s obligation to provide marketing support.
Outside the United States
The Bottler’s Agreements between us and our authorized bottlers outside the United States generally are ofstated duration, subject in some cases to possible extensions or renewals of the term of the contract. Generally,these contracts are subject to termination by the Company following the occurrence of certain designated events.These events include defined events of default and certain changes in ownership or control of the bottler.
In certain parts of the world outside the United States, we have not granted comprehensive beverageproduction rights to the bottlers. In such instances, we or our authorized suppliers sell Company TrademarkBeverages to the bottlers for sale and distribution throughout the designated territory, often on a nonexclusivebasis. A majority of the Bottler’s Agreements in force between us and bottlers outside the United Statesauthorize the bottlers to manufacture and distribute fountain syrups, usually on a nonexclusive basis.
Our Company generally has complete flexibility to determine the price and other terms of sale of theconcentrates and syrups we sell to bottlers outside the United States. In some instances, however, we haveagreed or may in the future agree with a bottler with respect to concentrate pricing on a prospective basis forspecified time periods. Outside the United States, in most cases, we have no obligation to provide marketingsupport to the bottlers. Nevertheless, we may, at our discretion, contribute toward bottler expenditures foradvertising and marketing. We may also elect to undertake independent or cooperative advertising andmarketing activities.
Within the United States
In the United States, with certain very limited exceptions, the Bottler’s Agreements for Coca-ColaTrademark Beverages and other cola-flavored beverages have no stated expiration date. Our standard contractsfor other sparkling beverage flavors and for still beverages are of stated duration, subject to bottler renewalrights. The Bottler’s Agreements in the United States are subject to termination by the Company fornonperformance or upon the occurrence of certain defined events of default that may vary from contract tocontract. The ‘‘1987 Contract,’’ described below, is terminable by the Company upon the occurrence of certainevents, including:
• the bottler’s insolvency, dissolution, receivership or the like;
• any disposition by the bottler or any of its subsidiaries of any voting securities of any bottler subsidiarywithout the consent of the Company;
• any material breach of any obligation of the bottler under the 1987 Contract; or
• except in the case of certain bottlers, if a person or affiliated group acquires or obtains any right toacquire beneficial ownership of more than 10 percent of any class or series of voting securities of thebottler without authorization by the Company.
6

Under the terms of the Bottler’s Agreements, bottlers in the United States are authorized to manufactureand distribute Company Trademark Beverages in bottles and cans. However, these bottlers generally are notauthorized to manufacture fountain syrups. Rather, as described above, our Company manufactures and sellsfountain syrups to authorized fountain wholesalers (including certain authorized bottlers) and some fountainretailers. These wholesalers in turn sell the syrups or deliver them on our behalf to restaurants and otherretailers.
In the United States, the form of Bottler’s Agreement for cola-flavored sparkling beverages that covers thelargest amount of U.S. concentrate sales (the ‘‘1987 Contract’’) gives us complete flexibility to determine theprice and other terms of sale of concentrates and syrups for Company Trademark Beverages. In some instances,we have agreed or may in the future agree with a bottler with respect to concentrate pricing on a prospectivebasis for specified time periods. Bottlers operating under the 1987 Contract accounted for approximately94.4 percent of our Company’s total U.S. concentrate sales for bottled and canned beverages in 2008, excludingdirect sales by the Company of juice and juice-drink products and other finished beverages (‘‘U.S. bottle/canconcentrate sales’’). Certain other forms of U.S. Bottler’s Agreements, entered into prior to 1987, provide forconcentrates or syrups for certain Coca-Cola Trademark Beverages and other cola-flavored CompanyTrademark Beverages to be priced pursuant to a stated formula. Bottlers accounting for approximately5.3 percent of U.S. bottle/can concentrate sales in 2008 have contracts for certain Coca-Cola TrademarkBeverages and other cola-flavored Company Trademark Beverages with pricing formulas that generally providefor a baseline price. This baseline price may be adjusted periodically by the Company, up to a maximum indexedceiling price, and is adjusted quarterly based upon changes in certain sugar or sweetener prices, as applicable.Bottlers accounting for the remaining approximately 0.3 percent of U.S. bottle/can concentrate sales in 2008operate under our oldest form of contract, which provides for a fixed price for Coca-Cola syrup used in bottlesand cans. This price is subject to quarterly adjustments to reflect changes in the quoted price of sugar.
We have standard contracts with bottlers in the United States for the sale of concentrates and syrups fornon-cola-flavored sparkling beverages and certain still beverages in bottles and cans, and, in certain cases, forthe sale of finished still beverages in bottles and cans. All of these standard contracts give the Companycomplete flexibility to determine the price and other terms of sale.
Under the 1987 Contract and most of our other standard beverage contracts with bottlers in the UnitedStates, our Company has no obligation to participate with bottlers in expenditures for advertising and marketing.Nevertheless, at our discretion, we may contribute toward such expenditures and undertake independent orcooperative advertising and marketing activities. Some U.S. Bottler’s Agreements that predate the 1987Contract impose certain marketing obligations on us with respect to certain Company Trademark Beverages.
As a practical matter, our Company’s ability to exercise its contractual flexibility to determine the price andother terms of sale of its syrups, concentrates and finished beverages under various agreements described aboveis subject, both outside and within the United States, to competitive market conditions.
Significant Equity Method Investments and Company Bottling Operations
Our Company maintains business relationships with three types of bottlers:
• bottlers in which the Company has no ownership interest;
• bottlers in which the Company has invested and has a noncontrolling ownership interest; and
• bottlers in which the Company has invested and has a controlling ownership interest.
In 2008, bottling operations in which we had no ownership interest produced and distributed approximately24 percent of our worldwide unit case volume. We have equity positions in 43 unconsolidated bottling, canningand distribution operations for our products worldwide. These cost or equity method investees produced anddistributed approximately 54 percent of our worldwide unit case volume in 2008. Controlled and consolidated
7

bottling operations produced and distributed approximately 11 percent of our worldwide unit case volume in2008. The remaining approximately 11 percent of our worldwide unit case volume in 2008 was produced by ourfountain operations and our juice and juice drink, sports drink and other finished beverage operations.
We make equity investments in selected bottling operations with the intention of maximizing the strengthand efficiency of the Coca-Cola system’s production, distribution and marketing capabilities around the world.These investments are intended to result in increases in unit case volume, net revenues and profits at the bottlerlevel, which in turn generate increased concentrate sales for our Company’s concentrate and syrup business.When this occurs, both we and our bottling partners benefit from long-term growth in volume, improved cashflows and increased shareowner value.
The level of our investment generally depends on the bottler’s capital structure and its available resourcesat the time of the investment. Historically, in certain situations, we have viewed it as advantageous to acquire acontrolling interest in a bottling operation, often on a temporary basis. Owning such a controlling interest hasallowed us to compensate for limited local resources and has enabled us to help focus the bottler’s sales andmarketing programs and assist in the development of the bottler’s business and information systems and theestablishment of appropriate capital structures.
In line with our long-term bottling strategy, we may periodically consider options for reducing ourownership interest in a bottler. One such option is to combine our bottling interests with the bottling interests ofothers to form strategic business alliances. Another option is to sell our interest in a bottling operation to one ofour equity method investee bottlers. In both of these situations, our Company continues to participate in thebottler’s results of operations through our share of the strategic business alliances’ or equity method investees’earnings or losses.
In cases where our investments in bottlers represent noncontrolling interests, our intention is to provideexpertise and resources to strengthen those businesses.
Significant investees in which we have noncontrolling ownership interests include the following:
Coca-Cola Enterprises Inc. (‘‘CCE’’). Our ownership interest in CCE was approximately 35 percent atDecember 31, 2008. CCE is the world’s largest bottler of the Company’s beverage products. In 2008, sales ofconcentrates, syrups, mineral waters, juices, sweeteners and finished products by the Company to CCE wereapproximately $6.8 billion. CCE estimates that the territories in which it markets beverage products to retailers(which include portions of 46 states and the District of Columbia in the United States, the U.S. Virgin Islandsand certain other Caribbean islands, Canada, Great Britain, continental France, the Netherlands, Luxembourg,Belgium and Monaco) contain approximately 78 percent of the United States population, 98 percent of thepopulation of Canada, and 100 percent of the populations of Great Britain, continental France, the Netherlands,Luxembourg, Belgium and Monaco. In 2008, CCE’s net operating revenues were approximately $21.8 billion.Excluding fountain products, in 2008, approximately 59 percent of the unit case volume of CCE consisted ofCoca-Cola Trademark Beverages; approximately 34 percent of its unit case volume consisted of other CompanyTrademark Beverages; and approximately 7 percent of its unit case volume consisted of beverage products ofother companies.
Coca-Cola Hellenic Bottling Company S.A. (‘‘Coca-Cola Hellenic’’). At December 31, 2008, our ownershipinterest in Coca-Cola Hellenic was approximately 23 percent. Coca-Cola Hellenic has bottling and distributionrights, through direct ownership or joint ventures, in Armenia, Austria, Belarus, Bosnia-Herzegovina, Bulgaria,Croatia, Cyprus, the Czech Republic, Estonia, Former Yugoslavian Republic of Macedonia, Greece, Hungary,Italy, Kosovo, Latvia, Lithuania, Moldova, Nigeria, Northern Ireland, Poland, Republic of Ireland, Romania,Russia, Serbia, Montenegro, Slovakia, Slovenia, Switzerland and Ukraine. Coca-Cola Hellenic estimates that theterritories in which it markets beverage products contain approximately 90 percent of the population of Italy and100 percent of the populations of the other countries named above in which Coca-Cola Hellenic has bottling anddistribution rights. In 2008, Coca-Cola Hellenic’s net sales of beverage products were approximately $9 billion.
8

In 2008, approximately 41 percent of the unit case volume of Coca-Cola Hellenic consisted of Coca-ColaTrademark Beverages; approximately 54 percent of its unit case volume consisted of other Company TrademarkBeverages; and approximately 5 percent of its unit case volume consisted of beverage products of Coca-ColaHellenic or other companies.
Coca-Cola FEMSA, S.A.B. de C.V. (‘‘Coca-Cola FEMSA’’). Our ownership interest in Coca-Cola FEMSAwas approximately 32 percent at December 31, 2008. Coca-Cola FEMSA is a Mexican holding company withbottling subsidiaries in a substantial part of central Mexico, including Mexico City and southeastern Mexico;greater São Paulo, Campinas, Santos, the state of Matto Grosso do Sul, the state of Minas Gerais and part of thestate of Goias in Brazil; central Guatemala; most of Colombia; all of Costa Rica, Nicaragua, Panama andVenezuela; and greater Buenos Aires, Argentina. Coca-Cola FEMSA estimates that the territories in which itmarkets beverage products contain approximately 48 percent of the population of Mexico, 26 percent of thepopulation of Brazil, 98 percent of the population of Colombia, 47 percent of the population of Guatemala,100 percent of the populations of Costa Rica, Nicaragua, Panama and Venezuela, and 31 percent of thepopulation of Argentina. In 2008, Coca-Cola FEMSA’s net sales of beverage products were approximately$8 billion. In 2008, approximately 64 percent of the unit case volume of Coca-Cola FEMSA consisted ofCoca-Cola Trademark Beverages; approximately 35 percent of its unit case volume consisted of other CompanyTrademark Beverages; and approximately 1 percent of its unit case volume consisted of beverage products ofCoca-Cola FEMSA or other companies.
Coca-Cola Amatil Limited (‘‘Coca-Cola Amatil’’). At December 31, 2008, our Company’s ownershipinterest in Coca-Cola Amatil was approximately 30 percent. Coca-Cola Amatil has bottling and distributionrights, through direct ownership or joint ventures, in Australia, New Zealand, Fiji, Papua New Guinea andIndonesia. Coca-Cola Amatil estimates that the territories in which it markets beverage products contain100 percent of the populations of Australia, New Zealand, Fiji and Papua New Guinea, and 98 percent of thepopulation of Indonesia. In 2008, Coca-Cola Amatil’s net sales of beverage products were approximately$2.9 billion. In 2008, approximately 48 percent of the unit case volume of Coca-Cola Amatil consisted ofCoca-Cola Trademark Beverages; approximately 40 percent of its unit case volume consisted of other CompanyTrademark Beverages; and approximately 12 percent of its unit case volume consisted of beverage products ofCoca-Cola Amatil.
Seasonality
Sales of our ready-to-drink nonalcoholic beverages are somewhat seasonal, with the second and thirdcalendar quarters accounting for the highest sales volumes. The volume of sales in the beverages business maybe affected by weather conditions.
Competition
Our Company competes in the nonalcoholic beverages segment of the commercial beverages industry. Thenonalcoholic beverages segment of the commercial beverages industry is highly competitive, consisting ofnumerous firms. These include firms that, like our Company, compete in multiple geographic areas, as well asfirms that are primarily regional or local in operation. Competitive products include numerous nonalcoholicsparkling beverages; various water products, including packaged, flavored and enhanced waters; juices andnectars; fruit drinks and dilutables (including syrups and powdered drinks); coffees and teas; energy and sportsand other performance-enhancing drinks; dairy-based drinks; functional beverages; and various othernonalcoholic beverages. These competitive beverages are sold to consumers in both ready-to-drink and otherthan ready-to-drink form. In many of the countries in which we do business, including the United States,PepsiCo, Inc. is one of our primary competitors. Other significant competitors include, but are not limited to,Nestlé, Dr Pepper Snapple Group, Inc., Groupe Danone, Kraft Foods Inc. and Unilever. We also competeagainst numerous regional and local firms in various geographic areas in which we operate.
9

Competitive factors impacting our business include, but are not limited to, pricing, advertising, salespromotion programs, product innovation, increased efficiency in production techniques, the introduction of newpackaging, new vending and dispensing equipment, and brand and trademark development and protection.
Our competitive strengths include leading brands with a high level of consumer acceptance; a worldwidenetwork of bottlers and distributors of Company products; sophisticated marketing capabilities; and a talentedgroup of dedicated associates. Our competitive challenges include strong competition in all geographic regionsand, in many countries, a concentrated retail sector with powerful buyers able to freely choose among Companyproducts, products of competitive beverage suppliers and individual retailers’ own store-brand beverages.
Raw Materials
The principal raw materials used by our business are nutritive and non-nutritive sweeteners. In the UnitedStates, the principal nutritive sweetener is high fructose corn syrup, a form of sugar, which is available fromnumerous domestic sources and is historically subject to fluctuations in its market price. The principal nutritivesweetener used by our business outside the United States is sucrose, another form of sugar, which is alsoavailable from numerous sources and is historically subject to fluctuations in its market price. Our Companygenerally has not experienced any difficulties in obtaining its requirements for nutritive sweeteners. In theUnited States, we purchase high fructose corn syrup to meet our and our bottlers’ requirements with theassistance of Coca-Cola Bottlers’ Sales & Services Company LLC (‘‘CCBSS’’). CCBSS is a limited liabilitycompany that is owned by authorized Coca-Cola bottlers doing business in the United States. Among otherthings, CCBSS provides procurement services to our Company for the purchase of various goods and services inthe United States, including high fructose corn syrup.
The principal non-nutritive sweeteners we use in our business are aspartame, acesulfame potassium,saccharin, cyclamate and sucralose. Generally, these raw materials are readily available from numerous sources.However, our Company purchases aspartame, an important non-nutritive sweetener that is used alone or incombination with other important non-nutritive sweeteners such as saccharin or acesulfame potassium in ourlow-calorie sparkling beverage products, primarily from The NutraSweet Company and Ajinomoto Co., Inc.,which we consider to be our primary sources for the supply of this product. We currently purchase acesulfamepotassium from Nutrinova Nutrition Specialties & Food Ingredients GmbH, which we consider to be ourprimary source for the supply of this product. Our Company generally has not experienced any difficulties inobtaining its requirements for non-nutritive sweeteners.
Our Company sells a number of products sweetened with sucralose, a non-nutritive sweetener. We workclosely with Tate & Lyle, our sucralose supplier, to maintain continuity of supply. Although Tate & Lyle is oursingle source for sucralose, we do not anticipate difficulties in obtaining our requirements for sucralose.
With regard to juice and juice-drink products, citrus fruit, particularly orange juice concentrate, is ourprincipal raw material. The citrus industry is subject to the variability of weather conditions. In particular,freezing weather or hurricanes in central Florida may result in shortages and higher prices for orange juiceconcentrate throughout the industry. Due to our ability to also source orange juice concentrate from theSouthern Hemisphere (particularly from Brazil), we normally have an adequate supply of orange juiceconcentrate that meets our Company’s standards.
Patents, Copyrights, Trade Secrets and Trademarks
Our Company owns numerous patents, copyrights and trade secrets, as well as substantial know-how andtechnology, which we collectively refer to in this report as ‘‘technology.’’ This technology generally relates to ourCompany’s products and the processes for their production; the packages used for our products; the design andoperation of various processes and equipment used in our business; and certain quality assurance software.Some of the technology is licensed to suppliers and other parties. Our sparkling beverage and other beverageformulae are among the important trade secrets of our Company.
10

We own numerous trademarks that are very important to our business. Depending upon the jurisdiction,trademarks are valid as long as they are in use and/or their registrations are properly maintained. Pursuant toour Bottler’s Agreements, we authorize our bottlers to use applicable Company trademarks in connection withtheir manufacture, sale and distribution of Company products. In addition, we grant licenses to third partiesfrom time to time to use certain of our trademarks in conjunction with certain merchandise and food products.
Governmental Regulation
Our Company is required to comply, and it is our policy to comply, with applicable laws in the numerouscountries throughout the world in which we do business. In many jurisdictions, compliance with competition lawsis of special importance to us, and our operations may come under special scrutiny by competition lawauthorities due to our competitive position in those jurisdictions.
The production, distribution and sale in the United States of many of our Company’s products are subjectto the Federal Food, Drug, and Cosmetic Act; the Federal Trade Commission Act; the Lanham Act; stateconsumer protection laws; federal, state and local workplace health and safety laws; various federal, state andlocal environmental protection laws; and various other federal, state and local statutes and regulationsapplicable to the production, transportation, sale, safety, advertising, labeling and ingredients of such products.Outside the United States, the production, distribution and sale of our many products and related operations arealso subject to numerous similar and other statutes and regulations.
A California law requires that a specific warning appear on any product that contains a component listed bythe state as having been found to cause cancer or birth defects. This law exposes all food and beverage producersto the possibility of having to provide warnings on their products because it recognizes no generally applicablequantitative thresholds below which a warning is not required. Consequently, even trace amounts of listedcomponents can subject an affected product to the requirement of a warning label. Products containing listedsubstances that occur naturally or that are contributed to such products solely by a municipal water supply aregenerally exempt from the warning requirement. No Company beverages produced for sale in California arecurrently required to display warnings under this law. We are unable to predict whether a component found in aCompany product might in the future be added to the California lists pursuant to this law and the relatedregulations as they currently exist, or as they may be amended. The state has, however, initiated a regulatoryprocess in which caffeine will be evaluated for listing. Furthermore, we are also unable to predict when orwhether the increasing sensitivity of detection methodology might result in the detection of an infinitesimalquantity of a listed substance in a Company beverage produced for sale in California.
Bottlers of our beverage products presently offer and use nonrefillable, recyclable containers in the UnitedStates and various other markets around the world. Some of these bottlers also offer and use refillablecontainers, which are also recyclable. Legal requirements apply in various jurisdictions in the United States andoverseas requiring that deposits or certain ecotaxes or fees be charged for the sale, marketing and use of certainnonrefillable beverage containers. The precise requirements imposed by these measures vary. Other types ofstatutes and regulations relating to beverage container deposits, recycling, ecotaxes and/or product stewardshipalso apply in various jurisdictions in the United States and overseas. We anticipate that additional, similar legalrequirements may be proposed or enacted in the future at local, state and federal levels, both in the UnitedStates and elsewhere.
All of our Company’s facilities and other operations in the United States and elsewhere around the worldare subject to various environmental protection statutes and regulations, including those relating to the use ofwater resources and the discharge of wastewater. Our policy is to comply with all such legal requirements.Compliance with these provisions has not had, and we do not expect such compliance to have, any materialadverse effect on our Company’s capital expenditures, net income or competitive position.
11

Employees
We refer to our employees as ‘‘associates.’’ As of December 31, 2008 and 2007, our Company hadapproximately 92,400 and 90,500 associates, respectively, of which approximately 16,500 and 16,000, respectively,were employed by entities that we have consolidated under the Financial Accounting Standards Board (‘‘FASB’’)Interpretation No. 46 (revised December 2003), ‘‘Consolidation of Variable Interest Entities’’ (‘‘InterpretationNo. 46(R)’’). The increase in the total number of associates in 2008 was primarily due to an increase in bottlingoperations activity, partially offset by a decrease resulting from the sale of certain bottling operations. At the endof 2008 and 2007, our Company had approximately 13,000 and 13,200 associates, respectively, located in theUnited States, of which approximately 85 and 1,300, respectively, were employed by entities that we haveconsolidated under Interpretation No. 46(R).
Our Company, through its divisions and subsidiaries, has entered into numerous collective bargainingagreements. We currently expect that we will be able to renegotiate such agreements on satisfactory terms whenthey expire. The Company believes that its relations with its associates are generally satisfactory.
Securities Exchange Act Reports
The Company maintains a website at the following address: www.thecoca-colacompany.com. Theinformation on the Company’s website is not incorporated by reference in this annual report on Form 10-K.
We make available on or through our website certain reports and amendments to those reports that we filewith or furnish to the Securities and Exchange Commission (the ‘‘SEC’’) in accordance with the SecuritiesExchange Act of 1934, as amended (the ‘‘Exchange Act’’). These include our annual reports on Form 10-K, ourquarterly reports on Form 10-Q and our current reports on Form 8-K. We make this information available onour website free of charge as soon as reasonably practicable after we electronically file the information with, orfurnish it to, the SEC.
ITEM 1A. RISK FACTORS
In addition to the other information set forth in this report, you should carefully consider the followingfactors, which could materially affect our business, financial condition or results of operations. The risksdescribed below are not the only risks facing our Company. Additional risks and uncertainties not currentlyknown to us or that we currently deem to be immaterial also may materially adversely affect our business,financial condition or results of operations.
Obesity and other health concerns may reduce demand for some of our products.
Consumers, public health officials and government officials are becoming increasingly concerned about thepublic health consequences associated with obesity, particularly among young people. In addition, someresearchers, health advocates and dietary guidelines are encouraging consumers to reduce consumption ofcertain types of beverages, especially sugar-sweetened beverages. Increasing public concern about these issues;possible new taxes and governmental regulations concerning the marketing, labeling or availability of ourbeverages; and negative publicity resulting from actual or threatened legal actions against us or other companiesin our industry relating to the marketing, labeling or sale of sugar-sweetened beverages may reduce demand forour beverages, which could affect our profitability.
Water scarcity and poor quality could negatively impact the Coca-Cola system’s production costs and capacity.
Water is the main ingredient in substantially all of our products. It is also a limited resource in many parts ofthe world, facing unprecedented challenges from overexploitation, increasing pollution, poor management andclimate change. As demand for water continues to increase around the world, and as water becomes scarcer andthe quality of available water deteriorates, our system may incur increasing production costs or face capacityconstraints which could adversely affect our profitability or net operating revenues in the long run.
12

Changes in the nonalcoholic beverages business environment could impact our financial results.
The nonalcoholic beverages business environment is rapidly evolving as a result of, among other things,changes in consumer preferences, including changes based on health and nutrition considerations and obesityconcerns; shifting consumer tastes and needs; changes in consumer lifestyles; and competitive product andpricing pressures. In addition, the industry is being affected by the trend toward consolidation in the retailchannel, particularly in Europe and the United States. If we are unable to successfully adapt to this rapidlychanging environment, our net income, share of sales and volume growth could be negatively affected.
The global credit crisis may adversely affect our liquidity and financial performance.
The global credit markets have experienced unprecedented disruptions in recent months. If the currentcredit crisis were to worsen, we may be unable to access credit markets on favorable terms, which could increaseour cost of borrowing. In addition, the current credit crisis may make it more difficult for our bottling partners toaccess financing on terms comparable to those obtained historically, which would affect the Coca-Cola system’sprofitability as well as our share of the income of bottling partners in which we have equity method investments.The current global credit market conditions and their actual or perceived effects on our and our major bottlingpartners’ results of operations and financial condition, along with the deteriorating economic environmentbrought about by the financial crisis, may increase the likelihood that the major independent credit agencies willdowngrade our credit ratings, which could have a negative effect on our borrowing costs. The significant declinein the equity markets and in the valuation of other assets precipitated by the credit crisis and financial systeminstability has affected the value of our pension plan assets. The lower pension plan asset base will negativelyaffect our return on plan assets and thus increase our pension expense. In addition, if the current adverse marketconditions continue for a prolonged period of time or deteriorate further, it could have an additional negativeimpact on our future pension benefit expense. As a result of the decline in the fair value of our pension plansassets and a decrease in the discount rate used to calculate pension benefit obligations, we have made and willconsider making additional contributions to our U.S. and international pension plans in 2009. In addition, theinstability of major financial institutions caused by the credit crisis could increase the counterparty riskassociated with our existing derivative financial instruments and may increase the cost of, or may impair ourability to secure credit-worthy counterparties for, future derivative transactions. The decrease in availability ofconsumer credit resulting from the financial crisis, as well as general unfavorable economic conditions, may alsocause consumers to reduce their discretionary spending, which would reduce the demand for our beverages andnegatively affect our net revenues and the Coca-Cola system’s profitability.
Increased competition could hurt our business.
The nonalcoholic beverages segment of the commercial beverages industry is highly competitive. Wecompete with major international beverage companies that, like our Company, operate in multiple geographicareas, as well as numerous firms that are primarily local in operation. In many countries in which we do business,including the United States, PepsiCo, Inc. is a primary competitor. Other significant competitors include, but arenot limited to, Nestlé, Dr Pepper Snapple Group, Inc., Groupe Danone, Kraft Foods Inc. and Unilever. Inaddition, in certain markets, our competition includes major beer companies. Our ability to gain or maintainshare of sales or gross margins in the global market or in various local markets may be limited as a result ofactions by competitors.
If we are unable to expand our operations in developing and emerging markets, our growth rate could be negativelyaffected.
Our success depends in part on our ability to grow our business in developing and emerging markets, whichin turn depends on economic and political conditions in those markets and on our ability to acquire or formstrategic business alliances with local bottlers and to make necessary infrastructure enhancements to productionfacilities, distribution networks, sales equipment and technology. Moreover, the supply of our products in
13

developing and emerging markets must match consumers’ demand for those products. Due to product price,limited purchasing power and cultural differences, there can be no assurance that our products will be acceptedin any particular developing or emerging market.
Fluctuations in foreign currency exchange could affect our financial results.
We earn revenues, pay expenses, own assets and incur liabilities in countries using currencies other than theU.S. dollar, including the euro, the Japanese yen, the Brazilian real and the Mexican peso. In 2008, we used69 functional currencies in addition to the U.S. dollar and derived approximately 75 percent of our net operatingrevenues from operations outside of the United States. Because our consolidated financial statements arepresented in U.S. dollars, we must translate revenues, income and expenses, as well as assets and liabilities, intoU.S. dollars at exchange rates in effect during or at the end of each reporting period. Therefore, increases ordecreases in the value of the U.S. dollar against other major currencies will affect our net operating revenues,operating income and the value of balance sheet items denominated in foreign currencies. Because of thegeographic diversity of our operations, weaknesses in some currencies might be offset by strengths in others overtime. We also use derivative financial instruments to further reduce our net exposure to currency exchange ratefluctuations. However, we cannot assure you that fluctuations in foreign currency exchange rates, particularly thestrengthening of the U.S. dollar against major currencies or the currencies of large developing countries, wouldnot materially affect our financial results.
If interest rates increase, our net income could be negatively affected.
We maintain levels of debt that we consider prudent based on our cash flows, interest coverage ratio andpercentage of debt to capital. We use debt financing to lower our cost of capital, which increases our return onshareowners’ equity. This exposes us to adverse changes in interest rates. When appropriate, we use derivativefinancial instruments to reduce our exposure to interest rate risks. We cannot assure you, however, that ourfinancial risk management program will be successful in reducing the risks inherent in exposures to interest ratefluctuations. Our interest expense may also be affected by our credit ratings. In assessing our credit strength,credit rating agencies consider our capital structure and financial policies as well as the aggregate balance sheetand other financial information for the Company and certain major bottlers. It is our expectation that the creditrating agencies will continue using this methodology. If our credit ratings were to be downgraded as a result ofchanges in our capital structure; our major bottlers’ financial performance; changes in the credit rating agencies’methodology in assessing our credit strength; the credit agencies’ perception of the impact of the current creditcrisis on our or our major bottlers’ current or future financial performance and financial condition; or for anyother reason, our cost of borrowing could increase. Additionally, if the credit ratings of certain bottlers in whichwe have equity method investments were to be downgraded, such bottlers’ interest expense could increase, whichwould reduce our equity income.
We rely on our bottling partners for a significant portion of our business. If we are unable to maintain good relationshipswith our bottling partners, our business could suffer.
We generate a significant portion of our net operating revenues by selling concentrates and syrups tobottling partners in which we do not have any ownership interest or in which we have a noncontrollingownership interest. In 2008, approximately 78 percent of our worldwide unit case volume was produced anddistributed by bottling partners in which the Company did not have controlling interests. As independentcompanies, our bottling partners, some of which are publicly traded companies, make their own businessdecisions that may not always align with our interests. In addition, many of our bottling partners have the rightto manufacture or distribute their own products or certain products of other beverage companies. If we areunable to provide an appropriate mix of incentives to our bottling partners through a combination of pricing andmarketing and advertising support, they may take actions that, while maximizing their own short-term profits,may be detrimental to our Company or our brands, or they may devote more of their energy and resources to
14

business opportunities or products other than those of the Company. Such actions could, in the long run, havean adverse effect on our profitability. In addition, the loss of one or more major customers by one of our majorbottling partners, or disruptions of bottling operations that may be caused by strikes, work stoppages or laborunrest affecting such bottling partners, could indirectly affect our results.
If our bottling partners’ financial condition deteriorates, our business and financial results could be affected.
We derive a significant portion of our net operating revenues from sales of concentrates and syrups to ourbottling partners and, therefore, the success of our business depends on our bottling partners’ financial strengthand profitability. While under our bottling partners’ agreements we generally have the right to unilaterallychange the prices we charge for our concentrates and syrups, our ability to do so may be materially limited byour bottling partners’ financial condition and their ability to pass price increases along to their customers. Inaddition, we have investments in certain of our bottling partners, which we account for under the equity method,and our operating results include our proportionate share of such bottling partners’ income or loss. Our bottlingpartners’ financial condition is affected in large part by conditions and events that are beyond our control,including competitive and general market conditions in the territories in which they operate and the availabilityof capital and other financing resources on reasonable terms. A deterioration of our bottling partners’ financialcondition or results of operations because of adverse competitive, general economic or capital marketconditions, or due to other unfavorable developments, could adversely affect our net operating revenues fromsales of concentrates and syrups; could result in a decrease in our equity income from equity-methodinvestments; and could negatively affect the carrying values of such investments, resulting in asset write-offs.
If we are unable to renew collective bargaining agreements on satisfactory terms, or we or our bottling partners experiencestrikes, work stoppages or labor unrest, our business could suffer.
Many of our associates at our key manufacturing locations and bottling plants are covered by collectivebargaining agreements. If we are unable to renew such agreements on satisfactory terms, our labor costs couldincrease, which would affect our profit margins. In addition, many of our bottling partners’ employees arerepresented by labor unions. Strikes, work stoppages or other forms of labor unrest at any of our majormanufacturing facilities or at our major bottlers’ plants could impair our ability to supply concentrates andsyrups to our bottling partners or our bottlers’ ability to supply finished beverages to customers, which wouldreduce our revenues and could expose us to customer claims.
Increase in the cost, disruption of supply or shortage of energy could affect our profitability.
Our Company-owned bottling operations and our bottling partners operate a large fleet of trucks and othermotor vehicles. In addition, we and our bottlers use a significant amount of electricity, natural gas and otherenergy sources to operate our concentrate and bottling plants. An increase in the price, disruption of supply orshortage of fuel and other energy sources that may be caused by increasing demand or by events such as naturaldisasters, power outages or the like would increase our and the Coca-Cola system’s operating costs and,therefore, could negatively impact our profitability.
Increase in cost, disruption of supply or shortage of ingredients or packaging materials could harm our business.
We and our bottling partners use various ingredients in our business, including high fructose corn syrup,sucrose, aspartame, saccharin, acesulfame potassium, sucralose, ascorbic acid, citric acid, phosphoric acid andorange juice concentrate, as well as packaging materials such as polyethylene terephthalate (PET or plastic) forbottles and aluminum for cans. The prices for these ingredients and packaging materials fluctuate depending onmarket conditions. Substantial increases in the prices for our or our bottling partners’ ingredients and packagingmaterials, to the extent they cannot be recouped through increases in the prices of finished beverage products,would increase our and the Coca-Cola system’s operating costs and could reduce our profitability. Increases inthe prices of our finished products resulting from higher ingredient and packaging material costs could affect
15

affordability in some markets and reduce Coca-Cola system sales. In addition, some of these ingredients, such asaspartame, acesulfame potassium, sucralose, saccharin and ascorbic acid, as well as some of the packagingcontainers, such as aluminum cans, are available from a limited number of suppliers. We cannot assure you thatwe and our bottling partners will be able to maintain favorable arrangements and relationships with thesesuppliers. An increase in the cost, a sustained interruption in the supply, or a shortage of some of theseingredients, packaging materials or cans and other containers that may be caused by a deterioration of our orour bottling partners’ relationships with suppliers; by supplier quality and reliability issues; or by events such asnatural disasters, power outages, labor strikes or the like, could negatively impact our net revenues and profits.
Changes in laws and regulations relating to beverage containers and packaging could increase our costs and reducedemand for our products.
We and our bottlers currently offer nonrefillable, recyclable containers in the United States and in variousother markets around the world. Legal requirements have been enacted in various jurisdictions in the UnitedStates and overseas requiring that deposits or certain ecotaxes or fees be charged for the sale, marketing and useof certain nonrefillable beverage containers. Other proposals relating to beverage container deposits, recycling,ecotax and/or product stewardship have been introduced in various jurisdictions in the United States andoverseas, and we anticipate that similar legislation or regulations may be proposed in the future at local, stateand federal levels, both in the United States and elsewhere. Consumers’ increased concerns and changingattitudes about solid waste streams and environmental responsibility and related publicity could result in theadoption of such legislation or regulations. If these types of requirements are adopted and implemented on alarge scale in any of the major markets in which we operate, they could affect our costs or require changes in ourdistribution model, which could reduce our net operating revenues or profitability. In addition, container-deposit laws, or regulations that impose additional burdens on retailers, could cause a shift away from ourproducts to retailer-proprietary brands, which could impact the demand for our products in the affectedmarkets.
Significant additional labeling or warning requirements may inhibit sales of affected products.
Various jurisdictions may seek to adopt significant additional product labeling or warning requirementsrelating to the chemical content or perceived adverse health consequences of certain of our products. Thesetypes of requirements, if they become applicable to one or more of our major products under current or futureenvironmental or health laws or regulations, may inhibit sales of such products. One such law is in effect inCalifornia. It requires that a specific warning appear on any product that contains a component listed by thestate as having been found to cause cancer or birth defects. This law recognizes no generally applicablequantitative thresholds below which a warning is not required. Pursuant to this law, the State of California hasinitiated a regulatory process in which caffeine will be evaluated for listing. If a component found in one of ourproducts, such as caffeine, is added to the lists pursuant to this law and related regulations as they currently existor as they may be amended, or if the increasing sensitivity of detection methodology that may become availableresults in the detection of an infinitesimal quantity of a listed substance in one of our beverages produced forsale in California, the resulting warning requirements or adverse publicity could negatively affect our sales.
Unfavorable general economic conditions in the United States or in other major markets could negatively impact ourfinancial performance.
Unfavorable general economic conditions, such as a recession or economic slowdown in the United Statesor in one or more of our other major markets, could negatively affect the affordability of, and consumer demandfor, some of our beverages. Under difficult economic conditions, consumers may seek to reduce discretionaryspending by forgoing purchases of our products or by shifting away from our beverages to lower-priced productsoffered by other companies. Softer consumer demand for our beverages in the United States or in other majormarkets could reduce the Coca-Cola system’s profitability and could negatively affect our financial performance.
16

Recent developments indicate that the United States economy is in recession and that the global economy isexperiencing a slowdown. If current adverse economic conditions were to continue or to worsen, our results ofoperations could suffer.
Unfavorable economic and political conditions in international markets could hurt our business.
We derive a significant portion of our net operating revenues from sales of our products in internationalmarkets. In 2008, our operations outside of the United States accounted for approximately 75 percent of our netoperating revenues. Unfavorable economic and political conditions in certain of our international markets,including civil unrest and governmental changes, could undermine consumer confidence and reduce theconsumers’ purchasing power, thereby reducing demand for our products. In addition, product boycottsresulting from political activism could reduce demand for our products, while restrictions on our ability totransfer earnings or capital across borders which may be imposed or expanded as a result of political andeconomic instability could impact our profitability. Without limiting the generality of the preceding sentence, thecurrent unstable economic and political conditions and civil unrest and political activism in the Middle East,India or the Philippines, the unstable situation in Iraq, or the continuation or escalation of terrorist activitiescould adversely impact our international business.
Changes in commercial and market practices within the European Economic Area may affect the sales of our products.
We and our bottlers are subject to an Undertaking, rendered legally binding in June 2005 by a decision ofthe European Commission, pursuant to which we committed to make certain changes in our commercial andmarket practices in the European Economic Area Member States. The Undertaking potentially applies in 27countries and in all channels of distribution where certain of our sparkling beverages account for over 40 percentof national sales and twice the nearest competitor’s share. The commitments we and our bottlers made in theUndertaking relate broadly to exclusivity, percentage-based purchasing commitments, transparency, targetrebates, tying, assortment or range commitments, and agreements concerning products of other suppliers. TheUndertaking also applies to shelf space commitments in agreements with take-home customers and to financingand availability agreements in the on-premise channel. In addition, the Undertaking includes commitments thatare applicable to commercial arrangements concerning the installation and use of technical equipment (such ascoolers, fountain equipment and vending machines). Adjustments to our business model in the EuropeanEconomic Area Member States as a result of these commitments or of future interpretations of EuropeanUnion competition laws and regulations could adversely affect our sales in the European Economic Areamarkets.
Litigation or legal proceedings could expose us to significant liabilities and damage our reputation.
We are party to various litigation claims and legal proceedings. We evaluate these litigation claims and legalproceedings to assess the likelihood of unfavorable outcomes and to estimate, if possible, the amount ofpotential losses. Based on these assessments and estimates, we establish reserves and/or disclose the relevantlitigation claims or legal proceedings, as appropriate. These assessments and estimates are based on theinformation available to management at the time and involve a significant amount of management judgment. Wecaution you that actual outcomes or losses may differ materially from those envisioned by our currentassessments and estimates. In addition, we have bottling and other business operations in emerging ordeveloping markets with high-risk legal compliance environments. Our policies and procedures require strictcompliance by our associates and agents with all United States and local laws and regulations applicable to ourbusiness operations, including those prohibiting improper payments to government officials. Nonetheless, wecannot assure you that our policies, procedures and related training programs will always ensure full complianceby our associates and agents with all applicable legal requirements. Improper conduct by our associates or agentscould damage our reputation in the United States and internationally or lead to litigation or legal proceedings
17

that could result in civil or criminal penalties, including substantial monetary fines, as well as disgorgement ofprofits.
Adverse weather conditions could reduce the demand for our products.
The sales of our products are influenced to some extent by weather conditions in the markets in which weoperate. Unusually cold or rainy weather during the summer months may have a temporary effect on thedemand for our products and contribute to lower sales, which could have an adverse effect on our results ofoperations for such periods.
If we are unable to maintain our brand image and corporate reputation, our business may suffer.
Our success depends on our ability to maintain brand image for our existing products and effectively buildup brand image for new products and brand extensions. We cannot assure you, however, that additionalexpenditures and our continuing commitment to advertising and marketing will have the desired impact on ourproducts’ brand image and on consumer preferences. Changes in consumers’ media preferences, such as theshift away from traditional mass media to the Internet, may undermine the effectiveness of our mediaadvertising campaigns in reaching consumers and may increase our marketing costs. Product quality issues,actual or perceived, or allegations of product contamination, even when false or unfounded, could tarnish theimage of the affected brands and may cause consumers to choose other products. Allegations of productcontamination, even if untrue, may require us from time to time to recall a beverage or other product from all ofthe markets in which the affected production was distributed. Product recalls could negatively affect ourprofitability and brand image. Also, adverse publicity surrounding obesity concerns, water usage, labor relationsand the like, and campaigns by activists attempting to connect our system to environmental issues, watershortages or workplace or human rights violations in certain developing countries in which we operate, couldnegatively affect our Company’s overall reputation and our products’ acceptance by consumers.
Changes in the legal and regulatory environment in the countries in which we operate could increase our costs or reduceour net operating revenues.
Our Company’s business is subject to various laws and regulations in the numerous countries throughoutthe world in which we do business, including laws and regulations relating to competition, product safety,advertising and labeling, container deposits, recycling or stewardship, the protection of the environment, andemployment and labor practices. In the United States, the production, distribution and sale of many of ourproducts are subject to, among others, the Federal Food, Drug, and Cosmetic Act, the Federal TradeCommission Act, the Lanham Act, state consumer protection laws, the Occupational Safety and Health Act,various environmental statutes, as well as various state and local statutes and regulations. Outside the UnitedStates, the production, distribution, sale, advertising and labeling of many of our products are also subject tovarious laws and regulations. Changes in applicable laws or regulations or evolving interpretations thereof,including increased government regulations to limit carbon dioxide and other greenhouse gas emissions as aresult of concern over climate change, may result in increased compliance costs, capital expenditures and otherfinancial obligations for us and our bottling partners, which could affect our profitability or impede theproduction or distribution of our products, which could affect our net operating revenues.
Changes in accounting standards and taxation requirements could affect our financial results.
New accounting standards or pronouncements that may become applicable to our Company from time totime, or changes in the interpretation of existing standards and pronouncements, could have a significant effecton our reported results for the affected periods. We are also subject to income tax in the numerous jurisdictionsin which we generate net operating revenues. In addition, our products are subject to import and excise dutiesand/or sales or value-added taxes in many jurisdictions in which we operate. Increases in income tax rates could
18

reduce our after-tax income from affected jurisdictions, while increases in indirect taxes could affect ourproducts’ affordability and therefore reduce demand for our products.
If we are not able to achieve our overall long-term goals, the value of an investment in our Company could be negativelyaffected.
We have established and publicly announced certain long-term growth objectives. These objectives werebased on our evaluation of our growth prospects, which are generally based on volume and sales potential ofmany product types, some of which are more profitable than others, and on an assessment of a potential level ormix of product sales. There can be no assurance that we will achieve the required volume or revenue growth orthe mix of products necessary to achieve our long-term growth objectives.
If we are unable to protect our information systems against data corruption, cyber-based attacks or network securitybreaches, our operations could be disrupted.
We rely on information technology networks and systems, including the Internet, to process, transmit andstore electronic information. In particular, we depend on our information technology infrastructure for digitalmarketing activities and electronic communications among our locations around the world and betweenCompany personnel and our bottlers and other customers and suppliers. Security breaches of this infrastructurecan create system disruptions, shutdowns or unauthorized disclosure of confidential information. If we areunable to prevent such breaches, our operations could be disrupted, or we may suffer financial damage or lossbecause of lost or misappropriated information.
We may be required to recognize additional impairment charges.
We assess our goodwill, trademarks and other intangible assets and our long-lived assets as and whenrequired by accounting principles generally accepted in the United States to determine whether they areimpaired. In 2008, we recorded charges of approximately $1.6 billion to equity income, which represented ourproportionate share of impairment charges recorded by CCE. In addition, the Company recorded a charge ofapproximately $81 million related to other-than-temporary declines in the fair value of certain available-for-salesecurities. In 2007, we recorded net charges of approximately $150 million related to our proportionate share ofimpairment and restructuring charges partially offset by our proportionate share of tax rate changes recorded bycertain equity investees. In 2006, we recorded a charge of approximately $602 million to equity income resultingfrom the impact of our proportionate share of an impairment charge recorded by CCE, and impairment chargesof approximately $41 million primarily related to trademarks for beverages sold in the Philippines andIndonesia. Refer to the heading ‘‘Critical Accounting Policies and Estimates—Recoverability of NoncurrentAssets’’ of ‘‘Item 7. Management’s Discussion and Analysis of Financial Condition and Results of Operations’’of this report for additional discussion of impairment charges.
If we do not successfully manage our Company-owned bottling operations, our results could suffer.
While we primarily manufacture, market and sell concentrates and syrups to our bottling partners, fromtime to time we do acquire or take control of bottling operations and have increasingly done so in recent years.As of December 31, 2008, the net operating revenues generated by Company-owned and controlled bottlingoperations (which are included in the Bottling Investments operating segment) represented approximately27 percent of our Company’s consolidated net operating revenues. Often, though not always, these acquiredbottling operations are in underperforming markets where we believe we can use our resources and expertise toimprove performance. Acquisitions and consolidation of controlled bottling operations during 2008 and 2007have resulted in a substantial increase in the number of Company-owned bottling plants included in ourconsolidated financial statements and in the number of our associates. We may incur unforeseen liabilities andobligations in connection with acquiring, taking control of or managing bottling operations and may encounterunexpected difficulties and costs in restructuring and integrating them into our Company’s operating and
19

internal control structures. We may also experience delays in extending our Company’s internal control overfinancial reporting to newly acquired bottling operations which may increase the risk of failure to preventmisstatements in such operations’ financial records. In addition, our financial performance and the strength andefficiency of the Coca-Cola system depend in part on how well we can manage and improve the performance ofCompany-owned or controlled bottling operations. We cannot assure you, however, that we will be able toachieve our strategic and financial objectives for such bottling operations.
Climate change may negatively affect our business.
There is increasing concern that a gradual increase in global average temperatures due to increasedconcentration of carbon dioxide and other greenhouse gases in the atmosphere will cause significant changes inweather patterns around the globe and an increase in the frequency and severity of natural disasters. Decreasedagricultural productivity in certain regions as a result of changing weather patterns may limit availability orincrease the cost of key agricultural commodities, such as sugar cane, corn, beets, citrus, coffee and tea, whichare important ingredients for our products. Increased frequency or duration of extreme weather conditionscould also impair production capabilities, disrupt our supply chain or impact demand for our products. Climatechange may also exacerbate water scarcity and cause a further deterioration of water quality in affected regions,which could limit water availability for our system’s bottling operations. In addition, public expectations forreductions in greenhouse gas emissions could result in increased energy, transportation and raw material costsand may require us and our bottling partners to make additional investments in facilities and equipment. As aresult, the effects of climate change could have a long-term adverse impact on our business and results ofoperations.
Global or regional catastrophic events could impact our operations and financial results.
Because of our global presence and worldwide operations, our business can be affected by large-scaleterrorist acts, especially those directed against the United States or other major industrialized countries; theoutbreak or escalation of armed hostilities; major natural disasters; or widespread outbreaks of infectiousdiseases such as avian influenza or severe acute respiratory syndrome (generally known as SARS). Such eventscould impair our ability to manage our business around the world, could disrupt our supply of raw materials, andcould impact production, transportation and delivery of concentrates, syrups and finished products. In addition,such events could cause disruption of regional or global economic activity, which can affect consumers’purchasing power in the affected areas and, therefore, reduce demand for our products.
ITEM 1B. UNRESOLVED STAFF COMMENTS
Not applicable.
ITEM 2. PROPERTIES
Our worldwide headquarters is located on a 35-acre office complex in Atlanta, Georgia. The complexincludes the approximately 621,000 square foot headquarters building, the approximately 870,000 square footCoca-Cola North America (‘‘CCNA’’) building and the approximately 264,000 square foot Coca-Cola Plazabuilding. The complex also includes several other buildings, including technical and engineering facilities, alearning center and a reception center. Our Company leases approximately 250,000 square feet of office space at10 Glenlake Parkway, Atlanta, Georgia, which we currently sublease to third parties. In addition, we leaseapproximately 218,000 square feet of office space at Northridge Business Park, Dunwoody, Georgia. We own orlease additional real estate, including a Company-owned office and retail building at 711 Fifth Avenue in NewYork, New York. These properties are primarily included in the Corporate operating segment.
The Company has facilities for administrative operations, manufacturing, processing, packaging, packing,storage and warehousing throughout the United States and Canada, including a portion of the Atlanta officecomplex, which are included in our North America operating segment. In addition, in North America, we own
20

nine still beverage production facilities and four bottled water facilities, lease one bottled water facility, and owna facility that manufactures juice concentrates for foodservice use, all of which are included in the NorthAmerica operating segment.
We own or hold a majority interest in or otherwise consolidate under applicable accounting rules bottlingoperations that own 118 principal beverage bottling and canning plants located throughout the world. Theseplants are included in the Bottling Investments operating segment.
We own a facility in Brussels, Belgium, which consists of approximately 315,000 square feet of office andtechnical space. This facility is included in the Europe operating segment. We also own or lease real estate,office space and other facilities throughout the world which are used for administrative facilities, warehousesand retail operations. In addition, as of December 31, 2008, our Company owned and operated 29 principalbeverage concentrate and/or syrup manufacturing plants located throughout the world. These properties aregenerally included in the geographic operating segment in which they are located.
Management believes that our Company’s facilities for the production of our products are suitable andadequate, that they are being appropriately utilized in line with past experience, and that they have sufficientproduction capacity for their present intended purposes. The extent of utilization of such facilities varies basedupon seasonal demand for our products. However, management believes that additional production can beobtained at the existing facilities by adding personnel and capital equipment and, at some facilities, by addingshifts of personnel or expanding the facilities. We continuously review our anticipated requirements for facilitiesand, on the basis of that review, may from time to time acquire additional facilities and/or dispose of existingfacilities.
ITEM 3. LEGAL PROCEEDINGS
The Company is involved in various legal proceedings, including the proceedings specifically discussedbelow. Management of the Company believes that any liability to the Company that may arise as a result of theseproceedings will not have a material adverse effect on the financial condition of the Company and itssubsidiaries taken as a whole.
Carpenters
On October 27, 2000, a class action lawsuit (Carpenters Health & Welfare Fund of Philadelphia & Vicinity v.The Coca-Cola Company, et al.) was filed in the United States District Court for the Northern District ofGeorgia alleging that the Company, M. Douglas Ivester, Jack L. Stahl and James E. Chestnut violated antifraudprovisions of the federal securities laws by making misrepresentations or material omissions relating to theCompany’s financial condition and prospects in late 1999 and early 2000. A second, largely identical lawsuit(Gaetan LaValla v. The Coca-Cola Company, et al.) was filed in the same court on November 9, 2000. Thecomplaints allege that the Company and the individual named officers: (1) forced certain Coca-Cola systembottlers to accept ‘‘excessive, unwanted and unneeded’’ sales of concentrate during the third and fourth quartersof 1999, thus creating a misleading sense of improvement in our Company’s performance in those quarters;(2) failed to write down the value of impaired assets in Russia, Japan and elsewhere on a timely basis, againresulting in the presentation of misleading interim financial results in the third and fourth quarters of 1999; and(3) misrepresented the reasons for Mr. Ivester’s departure from the Company and then misleadingly reassuredthe financial community that there would be no changes in the Company’s core business strategy or financialoutlook following that departure. Damages in an unspecified amount were sought in both complaints.
On January 8, 2001, an order was entered by the United States District Court for the Northern District ofGeorgia consolidating the two cases for all purposes. The Court also ordered the plaintiffs to file a ConsolidatedAmended Complaint. On July 25, 2001, the plaintiffs filed a Consolidated Amended Complaint, which largelyrepeated the allegations made in the original complaints and added Douglas N. Daft as an additional defendant.
21

On September 25, 2001, the defendants filed a Motion to Dismiss all counts of the Consolidated AmendedComplaint. On August 20, 2002, the Court granted in part and denied in part the defendants’ Motion to Dismiss.The Court also granted the plaintiffs’ Motion for Leave to Amend the Complaint. On September 4, 2002, thedefendants filed a Motion for Partial Reconsideration of the Court’s August 20, 2002 ruling. The motion wasdenied by the Court on April 15, 2003.
On June 2, 2003, the plaintiffs filed an Amended Consolidated Complaint. The defendants moved todismiss the Amended Complaint on June 30, 2003. On March 31, 2004, the Court granted in part and denied inpart the defendants’ Motion to Dismiss the Amended Complaint. In its order, the Court dismissed a number ofthe plaintiffs’ allegations, including the claim that the Company made knowingly false statements to financialanalysts. The Court permitted the remainder of the allegations to proceed to discovery. The Court denied theplaintiffs’ request for leave to further amend and replead their complaint. The fact discovery closed onMarch 23, 2007, pursuant to the Court’s order. However, there remained certain unresolved issues relating todiscovery pending before the Court.
In August 2007, the Court heard oral argument on plaintiffs’ motion to certify the class and the Company’sopposition thereto. In October 2007, the Company filed various motions for summary judgment and relatedrelief.
On May 23, 2008, the parties reached an agreement in principle to settle this matter for approximately$138 million, with full releases and no admission of wrongdoing by the Company or the individual parties to thelitigation. On May 26, 2008, the final settlement agreement was signed by the parties and the agreement wasfiled with the Court for approval on July 3, 2008. On October 20, 2008, the Court entered its final orderapproving the settlement. The settlement amount was covered by insurance and, therefore, the settlement hadno impact on the Company’s consolidated financial statements. This matter is now considered closed.
Aqua-Chem Litigation
On December 20, 2002, the Company filed a lawsuit (The Coca-Cola Company v. Aqua-Chem, Inc., CivilAction No. 2002CV631-50) in the Superior Court, Fulton County, Georgia (the ‘‘Georgia Case’’), seeking adeclaratory judgment that the Company has no obligation to its former subsidiary, Aqua-Chem, Inc., now knownas Cleaver-Brooks, Inc. (‘‘Aqua-Chem’’), for any past, present or future liabilities or expenses in connection withany claims or lawsuits against Aqua-Chem. Subsequent to the Company’s filing but on the same day,Aqua-Chem filed a lawsuit (Aqua-Chem, Inc. v. The Coca-Cola Company, Civil Action No. 02CV012179) in theCircuit Court, Civil Division of Milwaukee County, Wisconsin (the ‘‘Wisconsin Case’’). In the Wisconsin Case,Aqua-Chem sought a declaratory judgment that the Company is responsible for all liabilities and expenses notcovered by insurance in connection with certain of Aqua-Chem’s general and product liability claims arisingfrom occurrences prior to the Company’s sale of Aqua-Chem in 1981, and a judgment for breach of contract inan amount exceeding $9 million for costs incurred by Aqua-Chem to date in connection with such claims. TheWisconsin Case initially was stayed, pending final resolution of the Georgia Case, and later was voluntarilydismissed without prejudice by Aqua-Chem.
The Company owned Aqua-Chem from 1970 to 1981. During that time, the Company purchased over$400 million of insurance coverage, of which approximately $350 million is still available to cover Aqua-Chem’scosts for certain product liability and other claims. The Company sold Aqua-Chem to Lyonnaise AmericanHolding, Inc. in 1981 under the terms of a stock sale agreement. The 1981 agreement, and a subsequent 1983settlement agreement, outlined the parties’ rights and obligations concerning past and future claims and lawsuitsinvolving Aqua-Chem. Cleaver-Brooks, a division of Aqua-Chem, manufactured boilers, some of whichcontained asbestos gaskets. Aqua-Chem was first named as a defendant in asbestos lawsuits in or around 1985and currently has more than 100,000 claims pending against it.
The parties agreed in 2004 to stay the Georgia Case pending the outcome of insurance coverage litigationfiled by certain Aqua-Chem insurers on March 26, 2004. In the coverage action, five plaintiff insurance
22

companies filed suit (Century Indemnity Company, et al. v. Aqua-Chem, Inc., The Coca-Cola Company, et al., CaseNo. 04CV002852) in the Circuit Court, Civil Division of Milwaukee County, Wisconsin, against the Company,Aqua-Chem and 16 insurance companies. Several of the policies that were the subject of the coverage action hadbeen issued to the Company during the period (1970 to 1981) when the Company owned Aqua-Chem. Thecomplaint sought a determination of the respective rights and obligations under the insurance policies issuedwith regard to asbestos-related claims against Aqua-Chem. The action also sought a monetary judgmentreimbursing any amounts paid by the plaintiffs in excess of their obligations. Two of the insurers, one with a$15 million policy limit and one with a $25 million policy limit, asserted cross-claims against the Company,alleging that the Company and/or its insurers are responsible for Aqua-Chem’s asbestos liabilities before anyobligation is triggered on the part of the cross-claimant insurers to pay for such costs under their policies.
Aqua-Chem and the Company filed and obtained a partial summary judgment determination in thecoverage action that the insurers for Aqua-Chem and the Company were jointly and severally liable for coverageamounts, but reserving judgment on other defenses that might apply. During the course of the Wisconsincoverage litigation, Aqua-Chem and the Company reached settlements with several of the insurers, includingplaintiffs, who have paid or will pay funds into an escrow account for payment of costs arising from the asbestosclaims against Aqua-Chem. On July 24, 2007, the Wisconsin trial court entered a final declaratory judgmentregarding the rights and obligations of the parties under the insurance policies issued by the remainingdefendant insurers, which judgment was not appealed. The judgment directs, among other things, that eachinsurer whose policy is triggered is jointly and severally liable for 100 percent of Aqua-Chem’s losses up to policylimits.
The court’s judgment concluded the Wisconsin insurance coverage litigation. The Georgia Case remainssubject to the stay agreed to in 2004.
European Union Parallel Trade Matter
The Company has had discussions with the Competition Directorate of the European Commission (the‘‘European Commission’’) about issues relating to parallel trade within the European Union arising out ofcomments received by the European Commission from third parties. The Company has fully cooperated withthe European Commission and has provided information on these issues and the measures taken and to betaken to address them.
The Company is unable to predict at this time with any reasonable degree of certainty what action, if any,the European Commission will take with respect to these issues.
Chapman
On June 30, 2005, Maryann Chapman filed a purported shareholder derivative action (Chapman v. Isdell, etal.) in the Superior Court of Fulton County, Georgia, alleging violations of state law by certain individual currentand former members of the Board of Directors of the Company and senior management, including breaches offiduciary duties, abuse of control, gross mismanagement, waste of corporate assets and unjust enrichment,between January 2003 and the date of filing of the complaint that have caused substantial losses to the Companyand other damages, such as to its reputation and goodwill. The defendants named in the lawsuit include NevilleIsdell, Douglas Daft, Gary Fayard, Ronald Allen, Cathleen Black, Warren Buffett, Herbert Allen, Barry Diller,Donald McHenry, Sam Nunn, James Robinson, Peter Ueberroth, James Williams, Donald Keough, MariaLagomasino, Pedro Reinhard, Robert Nardelli and Susan Bennett King. The Company is also named a nominaldefendant. The complaint further alleges that the September 2004 earnings warning issued by the Companyresulted from factors known by the individual defendants as early as January 2003 that were not adequatelydisclosed to the investing public until the earnings warning. The factors cited in the complaint include (i) aflawed business strategy and a business model that was not working; (ii) a workforce so depleted by layoffs that itwas unable to properly react to changing market conditions; (iii) impaired relationships with key bottlers; and
23

(iv) the fact that the foregoing conditions would lead to diminished earnings. The plaintiff, purportedly onbehalf of the Company, seeks damages in an unspecified amount, extraordinary equitable and/or injunctiverelief, restitution and disgorgement of profits, reimbursement for costs and disbursements of the action, andsuch other and further relief as the Court deems just and proper. The Company’s motion to dismiss thecomplaint and the plaintiff’s response were filed and fully briefed. The Court heard oral argument on theCompany’s motion to dismiss on June 6, 2006. Following the hearing, the Court took the matter underadvisement and the parties are awaiting a ruling. There were no material developments in this case during 2008.
The Company intends to vigorously defend its interests in this matter.
CCE Shareholders Litigation
In February 2006, the International Brotherhood of Teamsters, a purported shareholder of CCE, filed aderivative suit (International Brotherhood of Teamsters v. The Coca-Cola Company, et al.) in the Delaware Courtof Chancery for New Castle County naming the Company and current and former CCE board members,including certain current and former Company officers who serve or served on CCE’s board, as defendants. Theplaintiff alleged that the Company breached fiduciary duties owed to CCE shareholders based upon allegedcontrol of CCE by the Company. The complaint also alleged that the Company had actual control over CCE andthat the Company abused its control by maximizing its own financial condition at the expense of CCE’s financialcondition. Subsequently, two lawsuits virtually identical to Teamsters were filed in the same court: Lang v. TheCoca-Cola Company, et al., filed March 30, 2006, and Gordon v. The Coca-Cola Company, et al., filed April 10,2006. On April 6, 2006, the Company moved to dismiss Teamsters or, in the alternative, for a stay of discovery.On May 19, 2006, the Chancery Court entered an order consolidating Teamsters, Lang and Gordon under thecaption In re Coca-Cola Enterprises, Inc. Shareholders Litigation and requiring the plaintiffs to file an amendedconsolidated complaint in the consolidated action as soon as practicable.
On September 29, 2006, plaintiffs filed their Consolidated Amended Shareholders’ Derivative Complaint(the ‘‘Amended Complaint’’). The Amended Complaint omits certain former Company officers from the groupof individual defendants and defines the ‘‘relevant time period’’ for purposes of the claims as October 15, 2003,through the date of the filing. The original complaint did not identify any specific dates. The AmendedComplaint also includes additional allegations about the conduct of the Company and certain of its executiveofficers, including new allegations about the Company’s purported control over CCE and allegations ofimproper conduct in connection with the establishment of a warehouse delivery system to supply Powerade to amajor customer. On December 7, 2006, the Company filed its motion to dismiss the Amended Complaint andaccompanying brief. The plaintiffs’ reply brief was filed on January 22, 2007. On October 17, 2007, the ChanceryCourt dismissed plaintiffs’ Amended Complaint. The plaintiffs appealed the Chancery Court’s decision to theDelaware Supreme Court. On June 20, 2008, the Delaware Supreme Court affirmed the Chancery Court’sdecision, thereby concluding the case.
American Canyon Matter
The Company received notices of violations from local environmental authorities alleging that certainviolations of the United States Clean Water Act (the ‘‘CWA’’) and applicable local law occurred at theCompany’s production plant in American Canyon, California. That plant treats and discharges wastewater underpermit authority issued under the CWA and local law. The alleged violations related to handling of wastewaterdischarge and required regulatory reporting. The Company cooperated with the local environmental authoritiesand reached a negotiated settlement under which it did not admit to any wrongdoing or fault but agreed to payrestitution and civil penalties. The settlement amount was not material to the Company’s business or financialcondition.
24

ITEM 4. SUBMISSION OF MATTERS TO A VOTE OF SECURITY HOLDERS
Not applicable.
ITEM X. EXECUTIVE OFFICERS OF THE COMPANY
The following are the executive officers of our Company as of February 26, 2009:
Ahmet C. Bozer, 48, is President of the Eurasia and Africa Group. Mr. Bozer joined the Company in 1990 asa Financial Control Manager for Coca-Cola USA and held a number of other roles in the finance organization.In 1994, he joined Coca-Cola Bottlers of Turkey (now Coca-Cola Icecek A.S.), a joint venture among theCompany, The Anadolu Group and Özgörkey Companies, as Chief Financial Officer and was later namedManaging Director in 1998. In 2000, Mr. Bozer was named President of the Eurasia Division of the Company.At the end of 2002, that division was reorganized to include the Middle East Division and was renamed theEurasia and Middle East Division. During the period between 2000 until 2006, the Eurasia and Middle EastDivision was expanded to include 34 countries and, in 2006, Mr. Bozer assumed the additional leadershipresponsibility for the Russia, Ukraine and Belarus Division. Mr. Bozer was appointed President of theCompany’s former Eurasia Group effective January 1, 2007, and became President of the Eurasia and AfricaGroup when it was formed effective July 1, 2008, by combining the former Eurasia Group (other than theAdriatic and Balkans business unit) with the former Africa Group.
Alexander B. Cummings, Jr., 52, is Executive Vice President and Chief Administrative Officer of theCompany. Mr. Cummings began his career in 1982 with The Pillsbury Company and held various positionswithin Pillsbury, the last position being Vice President of Finance and Chief Financial Officer for all ofPillsbury’s international businesses. Mr. Cummings joined the Company in 1997 as Deputy Region Manager,Nigeria, based in Lagos, Nigeria. In 1998, Mr. Cummings was named Managing Director/Region Manager,Nigeria, and in 2000, he became President of the North West Africa Division based in Morocco. In March 2001,Mr. Cummings became President of the Africa Group overseeing the Company’s business in the entire Africancontinent, and served in this capacity until June 2008. Mr. Cummings was appointed Chief AdministrativeOfficer of the Company effective July 1, 2008, and was elected Executive Vice President of the Companyeffective October 15, 2008.
J. Alexander M. Douglas, Jr., 47, is Senior Vice President and President of the North America Group.Mr. Douglas joined the Company in January 1988 as a District Sales Manager for the Foodservice Division ofCoca-Cola USA. In May 1994, he was named Vice President of Coca-Cola USA, initially assuming leadership ofthe CCE Sales and Marketing Group and eventually assuming leadership of the entire North American FieldSales and Marketing Groups. In January 2000, Mr. Douglas was appointed President of the North AmericanDivision within the North America Group. He served as Senior Vice President and Chief Customer Officer ofthe Company from February 2003 until August 2006. Mr. Douglas was appointed President of the NorthAmerica Group in August 2006.
Gary P. Fayard, 56, is Executive Vice President and Chief Financial Officer of the Company. Mr. Fayardjoined the Company in April 1994. In July 1994, he was elected Vice President and Controller. In December1999, he was elected Senior Vice President and Chief Financial Officer. Mr. Fayard was elected Executive VicePresident of the Company in February 2003.
Irial Finan, 51, is Executive Vice President of the Company and President, Bottling Investments and SupplyChain. Mr. Finan joined the Coca-Cola system in 1981 with Coca-Cola Bottlers Ireland, Ltd., where for severalyears he held a variety of accounting positions. From 1987 until 1990, Mr. Finan served as Finance Director ofCoca-Cola Bottlers Ireland, Ltd. From 1991 to 1993, he served as Managing Director of Coca-Cola BottlersUlster, Ltd. He was Managing Director of Coca-Cola Bottlers in Romania and Bulgaria until late 1994. From1995 to 1999, he served as Managing Director of Molino Beverages, with responsibility for expanding markets,including the Republic of Ireland, Northern Ireland, Romania, Moldova, Russia and Nigeria. Mr. Finan served
25

from May 2001 until 2003 as Chief Executive Officer of Coca-Cola Hellenic. Mr. Finan joined the Company andwas named President, Bottling Investments in August 2004. He was elected Executive Vice President of theCompany in October 2004.
E. Neville Isdell, 65, is Chairman of the Board of Directors of the Company. Mr. Isdell joined the Coca-Colasystem in 1966 with the local bottling company in Zambia. In 1972, he became General Manager of Coca-ColaBottling of Johannesburg, the largest Coca-Cola bottler in South Africa at the time. Mr. Isdell was namedRegion Manager for Australia in 1980. In 1981, he became President of Coca-Cola Bottlers Philippines, Inc., thebottling joint venture between the Company and San Miguel Corporation in the Philippines. Mr. Isdell wasappointed President of the Central European Division of the Company in 1985. In January 1989, he was electedSenior Vice President of the Company and was appointed President of the Northeast Europe/Africa Group,which was renamed the Northeast Europe/Middle East Group in 1992. In 1995, Mr. Isdell was named Presidentof the Greater Europe Group. From July 1998 to September 2000, he was Chairman and Chief Executive Officerof Coca-Cola Beverages Plc in Great Britain, where he oversaw that company’s merger with Hellenic Bottlingand the formation of Coca-Cola Hellenic, one of the Company’s largest bottlers. Mr. Isdell served as ChiefExecutive Officer of Coca-Cola Hellenic from September 2000 until May 2001 and served as Vice Chairman ofCoca-Cola Hellenic from May 2001 until December 2001. From January 2002 to May 2004, Mr. Isdell was aninternational consultant to the Company. Mr. Isdell was elected Chairman of the Board of Directors and ChiefExecutive Officer of the Company on June 1, 2004, and served as Chief Executive Officer of the Company untilJune 30, 2008. In December 2008, Mr. Isdell informed the Board of Directors of the Company that he did notintend to stand for re-election to the Board of Directors at the Company’s Annual Meeting of Shareowners inApril 2009.
Glenn G. Jordan S., 52, is President of the Pacific Group. Mr. Jordan joined the Company in 1978 as a fieldrepresentative for Coca-Cola de Colombia where, for several years, he held various positions, including RegionManager from 1985 to 1989. Mr. Jordan served as Marketing Operations Manager, Pacific Group from 1989 to1990 and as Vice President of Coca-Cola International and Executive Assistant to the Pacific Group Presidentfrom 1990 to 1991. Mr. Jordan served as Senior Vice President, Marketing and Operations, for the BrazilDivision from 1991 to 1995, as President of the River Plate Division, which comprised Argentina, Uruguay andParaguay, from 1995 to 2000, and as President of the South Latin America Division, comprising Argentina,Bolivia, Chile, Ecuador, Paraguay, Peru and Uruguay, from 2000 to 2003. In February 2003, Mr. Jordan wasappointed Executive Vice President and Director of Operations for the Latin America Group and served in thatcapacity until February 2006. Mr. Jordan was appointed President of the East, South Asia and Pacific RimGroup in February 2006. The East, South Asia and Pacific Rim Group was reconfigured and renamed the PacificGroup, effective January 1, 2007.
Geoffrey J. Kelly, 64, is Senior Vice President and General Counsel of the Company. Mr. Kelly joined theCompany in 1970 in Australia as manager of the Legal Department for the Australasia Area. From 1970 until2000, Mr. Kelly held a number of key roles, including Senior Counsel for the Pacific Group and subsequently forthe Middle and Far East Group. In 2000, Mr. Kelly was appointed Senior Counsel for International Operations.He became Chief Deputy General Counsel in 2003 and was elected Senior Vice President of the Company inFebruary 2004. In January 2005, he assumed the role of Acting General Counsel to the Company, and in July2005, he was elected General Counsel of the Company.
Muhtar Kent, 56, is President, Chief Executive Officer and a Director of the Company. Mr. Kent joined theCompany in 1978 and held a variety of marketing and operations roles throughout his career with the Company.In 1985, he was appointed General Manager of Coca-Cola Turkey and Central Asia. From 1989 to 1995,Mr. Kent served as President of the East Central Europe Division and Senior Vice President of Coca-ColaInternational. Between 1995 and 1998, he served as Managing Director of Coca-Cola Amatil Limited—Europe,and from 1999 until 2005, he served as President and Chief Executive Officer of Efes Beverage Group and as aboard member of Coca-Cola Icecek. Mr. Kent rejoined the Company in May 2005 as President, North Asia,Eurasia and Middle East Group, was appointed President, Coca-Cola International in January 2006 and was
26

elected Executive Vice President of the Company in February 2006. He was elected President and ChiefOperating Officer of the Company in December 2006 and was elected to the Board of Directors in April 2008.Mr. Kent was elected Chief Executive Officer of the Company effective July 1, 2008. In December 2008, theCompany announced that the Board of Directors intends to elect Mr. Kent to the position of Chairman of theBoard of Directors of the Company following the Company’s Annual Meeting of Shareowners in April 2009.
Robert P. Leechman, 52, is Chief Customer and Commercial Officer of the Company. Prior to joining theCompany, Mr. Leechman held various sales management positions with Mars Inc. Mr. Leechman joined theCompany in 1988 as General Sales Manager for Coca-Cola & Schweppes Beverages in England. In 1990, he wasappointed Region Sales Manager for the Gulf States in the Company’s Middle East Division, and in 1996, hebecame Region Manager for the Gulf States. In 1998, he was appointed General Manager for the OlympicGames, where he led the activation of the Coca-Cola system’s sponsorship activities for the 2000 OlympicGames held in Australia. In 2001, Mr. Leechman was appointed President of the Central Europe and RussiaDivision, and then briefly, President of the Central Europe Division after the creation of the Company’sEuropean Union Group. He was named President, Global Customer and Commercial Leadership, Europe inSeptember 2005. Mr. Leechman was appointed Chief Customer and Commercial Officer of the Companyeffective February 2007 and was a Vice President of the Company between July 2007 and April 2008.Mr. Leechman has agreed to step down from the position of Chief Customer and Commercial Officer of theCompany effective February 28, 2009.
Cynthia P. McCague, 58, is Senior Vice President of the Company and Director of Human Resources.Ms. McCague initially joined the Company in 1982, and since then has worked across the Coca-Cola businesssystem in a variety of human resources and business roles in Europe and the United States. In 1998, she wasappointed to lead the human resources function for Coca-Cola Beverages Plc in Great Britain, which in 2000became Coca-Cola Hellenic, a large publicly-traded Coca-Cola bottler. Ms. McCague rejoined the Company inJune 2004 as Director of Human Resources. She was elected Senior Vice President of the Company in July 2004and has led the global Human Resources function since that time.
Dominique Reiniche, 53, is President of the Europe Group. Ms. Reiniche joined the Company in May 2005as President of the European Union Group, which was reconfigured effective July 1, 2008, to include theAdriatic and Balkans business unit and renamed the Europe Group. Prior to joining the Company, she held anumber of marketing, sales and general management positions with CCE. From May 1998 until December 2002,she served as General Manager of France for CCE, and from January 2003 until May 2005, Ms. Reiniche wasPresident of CCE Europe. Before joining the Coca-Cola system, she was Director of Marketing and Strategywith Kraft Jacobs-Suchard.
José Octavio Reyes, 56, is President of the Latin America Group. Mr. Reyes began his career with TheCoca-Cola Company in 1980 at Coca-Cola de México as Manager of Strategic Planning. In 1987, he wasappointed Manager of the Sprite and Diet Coke brands at Corporate Headquarters. In 1990, he was appointedMarketing Director for the Brazil Division, and later became Marketing and Operations Vice President for theMexico Division. Mr. Reyes assumed the role of Deputy Division President for the Mexico Division in January1996 and was named Division President for the Mexico Division in May 1996. He assumed his position asPresident of the Latin America Group in December 2002.
Joseph V. Tripodi, 53, is Senior Vice President and Chief Marketing and Commercial Officer of theCompany. Prior to joining the Company, Mr. Tripodi served as Senior Vice President and Chief MarketingOfficer for Allstate Insurance Co. Prior to joining Allstate in November 2003, Mr. Tripodi was Chief MarketingOfficer for The Bank of New York. From 1999 until April 2002, he served as Chief Marketing Officer forSeagram Spirits & Wine Group. From 1989 to 1998, he was the Executive Vice President for Global Marketing,Products and Services for MasterCard International. Previously, Mr. Tripodi spent seven years with the MobilOil Corporation in roles of increasing responsibility in planning, marketing, business development andoperations in New York, Paris, Hong Kong and Guam. Mr. Tripodi joined the Company as Chief Marketing and
27

Commercial Officer effective September 2007 and was elected Senior Vice President of the Company in October2007.
Jerry S. Wilson, 54, is Senior Vice President of the Company and has been appointed Chief Customer andCommercial Officer of the Company effective March 1, 2009. Prior to joining the Company, Mr. Wilson heldvarious positions in roles of increasing responsibility in distribution, district management, franchise leadershipand brand management within Volkswagen of America from 1981 to 1988. Mr. Wilson joined the Company in1988 as an Area Account Executive for the Foodservice Division of Coca-Cola USA. From 1990 to 1992, heserved as Manager of Account Executives, and from 1992 to 1994, he served as Manager of Sales Development.Mr. Wilson was promoted to Director of Sales Operations in 1994 and later that year became Director ofStrategic Marketing. In 1995, Mr. Wilson was named Director of Strategic Planning for Coca-Cola USA. In1996, he was promoted to Vice President, Coca-Cola USA Foodservice, West Area, and in 1999, Mr. Wilson wasnamed Vice President of the USA operations within the McDonald’s Division. In April 2003, he was promotedto global Chief Operating Officer of the McDonald’s Division, and in November 2005, Mr. Wilson was electedVice President of the Company and appointed President of the global McDonald’s Division. Mr. Wilson waselected Senior Vice President of the Company in October 2006.
All executive officers serve at the pleasure of the Board of Directors. There is no family relationshipbetween any of the Directors or executive officers of the Company.
28

PART II
ITEM 5. MARKET FOR REGISTRANT’S COMMON EQUITY, RELATED STOCKHOLDER MATTERS ANDISSUER PURCHASES OF EQUITY SECURITIES
The principal United States market in which the Company’s common stock is listed and traded is the NewYork Stock Exchange.
The following table sets forth, for the quarterly periods indicated, the high and low sales prices per share forthe Company’s common stock, as reported on the New York Stock Exchange composite tape, and dividend pershare information:
Common Stock MarketPrices
DividendsHigh Low Declared
2008Fourth quarter $ 55.00 $ 40.29 $ 0.38Third quarter 55.84 49.44 0.38Second quarter 61.84 51.83 0.38First quarter 65.59 56.49 0.38
2007Fourth quarter $ 64.32 $ 56.92 $ 0.34Third quarter 57.78 51.79 0.34Second quarter 53.65 48.05 0.34First quarter 49.00 45.56 0.34
While we have historically paid dividends to holders of our common stock, the declaration and payment offuture dividends will depend on many factors, including, but not limited to, our earnings, financial condition,business development needs and regulatory considerations, and is at the discretion of our Board of Directors.
As of February 23, 2009, there were approximately 274,250 shareowner accounts of record. This figure doesnot include a substantially greater number of ‘‘street name’’ holders or beneficial holders of our common stock,whose shares are held of record by banks, brokers and other financial institutions.
The information under the principal heading ‘‘EQUITY COMPENSATION PLAN INFORMATION’’ inthe Company’s definitive Proxy Statement for the Annual Meeting of Shareowners to be held on April 22, 2009,to be filed with the Securities and Exchange Commission (the ‘‘Company’s 2009 Proxy Statement’’), isincorporated herein by reference.
During the fiscal year ended December 31, 2008, no equity securities of the Company were sold by theCompany that were not registered under the Securities Act of 1933, as amended.
29

The following table presents information with respect to purchases of common stock of the Company madeduring the three months ended December 31, 2008, by the Company or any ‘‘affiliated purchaser’’ of theCompany as defined in Rule 10b-18(a)(3) under the Exchange Act.
Maximum Number ofTotal Number of Shares That May
Shares Purchased Yet Be PurchasedAverage as Part of Publicly Under the Publicly
Total Number of Price Paid Announced Plans Announced PlansPeriod Shares Purchased1 Per Share or Programs2 or Programs
September 27, 2008 through October 24, 2008 — $ — — 220,513,941October 25, 2008 through November 21, 2008 7,540 $ 44.65 — 220,513,941November 22, 2008 through December 31, 2008 103,222 $ 45.61 — 220,513,941
Total 110,762 $ 45.54 —
1 The total number of shares purchased includes: (i) shares purchased pursuant to the 2006 Plan described in footnote 2below, of which there were none for the periods indicated in the table; and (ii) shares surrendered to the Company to paythe exercise price and/or to satisfy tax withholding obligations in connection with so-called stock swap exercises ofemployee stock options and/or the vesting of restricted stock issued to employees, totaling zero shares, 7,540 shares and103,222 shares for the fiscal months of October, November and December 2008, respectively.
2 On July 20, 2006, we publicly announced that our Board of Directors had authorized a plan (the ‘‘2006 Plan’’) for theCompany to purchase up to 300 million shares of our Company’s common stock. This column discloses the number ofshares purchased pursuant to the 2006 Plan during the indicated time periods.
30

25FEB200917264705
Performance Graph
Comparison of Five-Year Cumulative Total Return AmongThe Coca-Cola Company, the Peer Group Index and the S&P 500 Index
Total ReturnStock Price Plus Reinvested Dividends
$0
$50
$100
$150
$250
$200
12/31/03 12/31/04 12/31/05 12/31/06
$102
$144
$ 90
KOPeer Group S&P
12/31/0312/31/0412/31/0512/31/0612/31/0712/31/08
$100$ 84$ 83$103$134$102
$100$120$133$158$188$144
$100$111$116$135$142$ 90
12/31/07 12/31/08
The Coca-ColaCompany
(KO) (FBT)
Peer GroupIndex
(S&P)
TheS&P 500
The total return assumes that dividends were reinvested quarterly and is based on a $100 investment onDecember 31, 2003.
The Peer Group Index is a self-constructed peer group of companies that are included in the Dow Jones Foodand Beverage Group and the Dow Jones Tobacco Group of companies, from which the Company has been excluded.
The Peer Group Index consists of the following companies: Altria Group, Inc., Archer-Daniels-MidlandCompany, Brown-Forman Corporation (Class B Stock), Bunge Limited, Campbell Soup Company, CentralEuropean Distribution Corporation, Chiquita Brands International, Inc., Coca-Cola Enterprises, Inc., ConAgraFoods, Inc., Constellation Brands, Inc., Corn Products International, Inc., Darling International, Inc., DeanFoods Company, Del Monte Foods Company, Dr. Pepper Snapple Group, Inc., Flowers Foods, Inc., Fresh DelMonte Produce, Inc., General Mills, Inc., Hansen Natural Corporation, Herbalife Ltd., H.J. Heinz Company,Hormel Foods Corporation, Kellogg Company, Kraft Foods, Inc., Lancaster Colony Corporation, Lorillard, Inc.,Martek Biosciences Corporation, McCormick & Company, Incorporated, Molson Coors Brewing Company,Monsanto Company, NBTY, Inc., Nu Skin Enterprises, Inc., Nutrisystem, Inc., PepsiAmericas, Inc.,PepsiCo, Inc., Philip Morris International, Inc., Ralcorp Holdings, Inc., Reynolds American, Inc., Sara LeeCorporation, Smithfield Foods, Inc., The Hain Celestial Group, Inc., The Hershey Company, The J.M. SmuckerCompany, The Pepsi Bottling Group, Inc., Tootsie Roll Industries, Inc., TreeHouse Foods, Inc., TysonFoods, Inc., Universal Corporation, UST Inc., and Weight Watchers International, Inc.
Companies included in the Dow Jones Food and Beverage Group and the Dow Jones Tobacco Groupchange periodically. This year, the groups include Central European Distribution Corporation, DarlingInternational, Inc., Dr. Pepper Snapple Group, Inc., Fresh Del Monte Produce, Inc., Lorillard, Inc., MonsantoCompany, and Philip Morris International, Inc., which were not included in the groups last year. Additionally,this year, the groups do not include Anheuser-Busch Companies, Inc., Loews Corporation (Carolina Grouptracking stock), Pilgrim’s Pride Corporation and Wm. Wrigley Jr. Company, all of which were included in thegroups last year.
31

ITEM 6. SELECTED FINANCIAL DATA
The following selected financial data should be read in conjunction with ‘‘Item 7. Management’s Discussionand Analysis of Financial Condition and Results of Operations’’ and consolidated financial statements and notesthereto contained in ‘‘Item 8. Financial Statements and Supplementary Data’’ of this report.
Year Ended December 31, 2008 20071 20062 20053 20043,4
(In millions except per share data)
SUMMARY OF OPERATIONSNet operating revenues $ 31,944 $ 28,857 $ 24,088 $ 23,104 $ 21,742Cost of goods sold 11,374 10,406 8,164 8,195 7,674
Gross profit 20,570 18,451 15,924 14,909 14,068Selling, general and administrative expenses 11,774 10,945 9,431 8,739 7,890Other operating charges 350 254 185 85 480
Operating income 8,446 7,252 6,308 6,085 5,698Interest income 333 236 193 235 157Interest expense 438 456 220 240 196Equity income (loss) — net (874) 668 102 680 621Other income (loss) — net (28) 173 195 (93) (82)Gains on issuances of stock by equity investees — — — 23 24
Income before income taxes 7,439 7,873 6,578 6,690 6,222Income taxes 1,632 1,892 1,498 1,818 1,375
Net income $ 5,807 $ 5,981 $ 5,080 $ 4,872 $ 4,847
Average shares outstanding 2,315 2,313 2,348 2,392 2,426Average shares outstanding assuming dilution 2,336 2,331 2,350 2,393 2,429
PER SHARE DATABasic net income $ 2.51 $ 2.59 $ 2.16 $ 2.04 $ 2.00Diluted net income 2.49 2.57 2.16 2.04 2.00Cash dividends 1.52 1.36 1.24 1.12 1.00Closing market price on December 31 45.27 61.37 48.25 40.31 41.64
TOTAL MARKET VALUE OF COMMON STOCK $ 104,683 $ 142,289 $ 111,857 $ 95,504 $ 100,325
BALANCE SHEET DATACash, cash equivalents and current marketable securities $ 4,979 $ 4,308 $ 2,590 $ 4,767 $ 6,768Property, plant and equipment — net 8,326 8,493 6,903 5,831 6,091Depreciation 993 958 763 752 715Capital expenditures 1,968 1,648 1,407 899 755Total assets 40,519 43,269 29,963 29,427 31,441Long-term debt 2,781 3,277 1,314 1,154 1,157Shareowners’ equity 20,472 21,744 16,920 16,355 15,935
NET CASH PROVIDED BY OPERATING ACTIVITIES $ 7,571 $ 7,150 $ 5,957 $ 6,423 $ 5,968
Certain prior year amounts have been reclassified to conform to the current year presentation.1 In 2007, we adopted FASB Interpretation No. 48, ‘‘Accounting for Uncertainty in Income Taxes’’ and recorded an approximate
$65 million increase in accrued income taxes in our consolidated balance sheet for unrecognized tax benefits, which was accounted foras a cumulative effect adjustment to the January 1, 2007 balance of reinvested earnings.
2 In 2006, we adopted Statement of Financial Accounting Standards (‘‘SFAS’’) No. 158, ‘‘Employers’ Accounting for Defined BenefitPension and Other Postretirement Plans—an amendment of FASB Statements No. 87, 88, 106, and 132(R).’’
3 We adopted FASB Staff Position (‘‘FSP’’) No. 109-2, ‘‘Accounting and Disclosure Guidance for the Foreign Earnings RepatriationProvision within the American Jobs Creation Act of 2004’’ in 2004. FSP No. 109-2 allowed the Company to record the tax expenseassociated with the repatriation of foreign earnings in 2005 when the previously unremitted foreign earnings were actually repatriated.
4 We adopted Interpretation No. 46(R), ‘‘Consolidation of Variable Interest Entities,’’ effective April 2, 2004.
32

ITEM 7. MANAGEMENT’S DISCUSSION AND ANALYSIS OF FINANCIAL CONDITION AND RESULTSOF OPERATIONS
Overview
The following Management’s Discussion and Analysis of Financial Condition and Results of Operations(‘‘MD&A’’) is intended to help the reader understand The Coca-Cola Company, our operations and our presentbusiness environment. MD&A is provided as a supplement to—and should be read in conjunction with—ourconsolidated financial statements and the accompanying notes thereto contained in ‘‘Item 8. FinancialStatements and Supplementary Data’’ of this report. This overview summarizes the MD&A, which includes thefollowing sections:
• Our Business—a general description of our business and the nonalcoholic beverages segment of thecommercial beverages industry, our objective, our strategic priorities, our core capabilities, andchallenges and risks of our business.
• Critical Accounting Policies and Estimates—a discussion of accounting policies that require criticaljudgments and estimates.
• Operations Review—an analysis of our Company’s consolidated results of operations for the three yearspresented in our consolidated financial statements. Except to the extent that differences among ouroperating segments are material to an understanding of our business as a whole, we present thediscussion in the MD&A on a consolidated basis.
• Liquidity, Capital Resources and Financial Position—an analysis of cash flows; off-balance sheetarrangements and aggregate contractual obligations; foreign exchange; an overview of financial position;and the impact of inflation and changing prices.
Our Business
General
We are the largest manufacturer, distributor and marketer of nonalcoholic beverage concentrates andsyrups in the world. Along with Coca-Cola, which is recognized as the world’s most valuable brand, we marketfour of the world’s top five nonalcoholic sparkling brands, including Diet Coke, Fanta and Sprite. Our Companyowns or licenses nearly 500 brands, including diet and light beverages, waters, enhanced waters, juices and juicedrinks, teas, coffees, and energy and sports drinks. Through the world’s largest beverage distribution system,consumers in more than 200 countries enjoy the Company’s beverages at a rate of approximately 1.6 billionservings each day. Our Company generates revenues, income and cash flows by selling beverage concentratesand syrups as well as finished beverages. We generally sell these products to bottling and canning operations,fountain wholesalers and some fountain retailers, and, in the case of finished products, to distributors. Ourbottlers sell our branded products to businesses and institutions including retail chains, supermarkets,restaurants, small neighborhood grocers, sports and entertainment venues, and schools and colleges. Wecontinue to expand our marketing presence and increase our unit case volume in developed, developing andemerging markets. Our strong and stable system helps us to capture growth by manufacturing, distributing andmarketing existing, enhanced and new innovative products to our consumers throughout the world.
While we primarily manufacture, market and sell concentrates and syrups to our bottling partners, fromtime to time we have viewed it as advantageous to acquire a controlling interest in a bottling operation, often ona temporary basis. Often, though not always, these acquired bottling operations are in underperforming marketswhere we believe we can use our resources and expertise to improve performance. Owning such a controllinginterest has allowed us to compensate for limited local resources and has enabled us to help focus the bottler’ssales and marketing programs and assist in the development of the bottler’s business and information systemsand the establishment of appropriate capital structures. Acquisitions and consolidation of controlled bottling
33

operations during 2008 and 2007 have resulted in a substantial increase in the number of Company-ownedbottling plants included in our consolidated financial statements and in the number of our associates. In 2008,net operating revenues generated by Company-owned and consolidated bottling operations (which are includedin the Bottling Investments operating segment) represented approximately 27 percent of our Company’sconsolidated net operating revenues and distributed approximately 11 percent of our worldwide unit casevolume.
We have three types of bottling relationships: bottlers in which our Company has no ownership interest,bottlers in which our Company has a noncontrolling ownership interest and bottlers in which our Company has acontrolling ownership interest. We authorize our bottling partners to manufacture and package products madefrom our concentrates and syrups into branded finished products that they then distribute and sell. In 2008,bottling partners in which our Company has no ownership interest or a noncontrolling ownership interestproduced and distributed approximately 78 percent of our worldwide unit case volume.
We make significant marketing expenditures in support of our brands, including expenditures foradvertising, sponsorship fees and special promotional events. As part of our marketing activities, we, at ourdiscretion, provide retailers and distributors with promotions and point-of-sale displays; our bottling partnerswith advertising support and funds designated for the purchase of cold-drink equipment; and our consumerswith coupons, discounts and promotional incentives. These marketing expenditures help to enhance awarenessof and increase consumer preference for our brands. We believe that greater awareness and preference promotelong-term growth in unit case volume, per capita consumption and our share of worldwide nonalcoholicbeverage sales.
The Nonalcoholic Beverages Segment of the Commercial Beverages Industry
We operate in the highly competitive nonalcoholic beverages segment of the commercial beveragesindustry. We face strong competition from numerous other general and specialty beverage companies. We, alongwith other beverage companies, are affected by a number of factors, including, but not limited to, cost tomanufacture and distribute products, consumer spending, economic conditions, availability and quality of water,consumer preferences, inflation, political climate, local and national laws and regulations, foreign currencyexchange fluctuations, fuel prices and weather patterns.
Our Objective
Our objective is to use our formidable assets—brands, financial strength, unrivaled distribution system,global reach, and a strong commitment by our management and associates worldwide—to achieve long-termsustainable growth. Our vision for sustainable growth includes the following:
• People: Being a great place to work where people are inspired to be the best they can be.
• Portfolio: Bringing to the world a portfolio of beverage brands that anticipates and satisfies people’sdesires and needs.
• Partners: Nurturing a winning network of partners and building mutual loyalty.
• Planet: Being a responsible global citizen that makes a difference.
• Profit: Maximizing return to shareowners while being mindful of our overall responsibilities.
• Productivity: Managing our people, time and money for greatest effectiveness.
Strategic Priorities
We have four strategic priorities designed to create long-term sustainable growth for our Company and theCoca-Cola system and value for our shareowners. These strategic priorities are driving global beverageleadership; accelerating innovation; leveraging our balanced geographic portfolio; and leading the Coca-Cola
34

system for growth. To enable the entire Coca-Cola system so that we can deliver on these strategic priorities, wemust further enhance our core capabilities of consumer marketing; commercial leadership; and franchiseleadership.
Core Capabilities
Consumer Marketing
Marketing investments are designed to enhance consumer awareness and increase consumer preference forour brands. This produces long-term growth in unit case volume, per capita consumption and our share ofworldwide nonalcoholic beverage sales. Through our relationships with our bottling partners and those who sellour products in the marketplace, we create and implement integrated marketing programs, both globally andlocally, that are designed to heighten consumer awareness of and product appeal for our brands. In developing astrategy for a Company brand, we conduct product and packaging research, establish brand positioning, developprecise consumer communications and solicit consumer feedback. Our integrated marketing activities include,but are not limited to, advertising, point-of-sale merchandising and sales promotions.
We have disciplined marketing strategies that focus on driving volume in emerging markets, increasing ourbrand value in developing markets and growing profit in our most developed markets. In emerging markets, weare investing in infrastructure programs that drive volume through increased access to consumers. In developingmarkets, where consumer access has largely been established, our focus is on differentiating our brands. In ourmost developed markets, we continue to invest in brands and infrastructure programs, but at a slower rate thanrevenue growth.
We are focused on affordability and ensuring we are communicating the appropriate message based on thecurrent economic environment.
Commercial Leadership
The Coca-Cola system has millions of customers around the world who sell or serve our products directly toconsumers. We focus on enhancing value for our customers and providing solutions to grow their beveragebusinesses. Our approach includes understanding each customer’s business and needs, whether that customer isa sophisticated retailer in a developed market or a kiosk owner in an emerging market. We focus on ensuringthat our customers have the right product and package offerings and the right promotional tools to deliverenhanced value to themselves and the Company. We are constantly looking to build new beverage consumptionoccasions in our customers’ outlets through unique and innovative consumer experiences, product availabilityand delivery systems, and beverage merchandising and displays. We participate in joint brand-building initiativeswith our customers in order to drive customer preference for our brands. Through our commercial leadershipinitiatives, we embed ourselves further into our retail customers’ businesses while developing strategies forbetter execution at the point-of-sale.
Franchise Leadership
We must continue to improve our franchise leadership capabilities to give our Company and our bottlingpartners the ability to grow together through shared values, aligned incentives and a sense of urgency andflexibility that supports consumers’ always changing needs and tastes. The financial health and success of ourbottling partners are critical components of the Company’s success. We work with our bottling partners toidentify system requirements that enable us to quickly achieve scale and efficiencies, and we share best practicesthroughout the bottling system. Our system leadership allows us to leverage recent acquisitions to expand ourvolume base and enhance margins. With our bottling partners, we work to produce differentiated beverages andpackages that are appropriate for the right channels and consumers. We also design business models forsparkling and still beverages in specific markets to ensure that we appropriately share the value created by these
35

beverages with our bottling partners. We will continue to build a supply chain network that leverages the sizeand scale of the Coca-Cola system to gain a competitive advantage.
Challenges and Risks
Being a global company provides unique opportunities for our Company. Challenges and risks accompanythose opportunities.
Our management has identified certain challenges and risks that demand the attention of the nonalcoholicbeverages segment of the commercial beverages industry and our Company. Of these, four key challenges andrisks are discussed below.
Obesity and Inactive Lifestyles. Increasing concern among consumers, public health professionals andgovernment agencies of the potential health problems associated with obesity and inactive lifestyles represents asignificant challenge to our industry. We recognize that obesity is a complex public health problem. Ourcommitment to consumers begins with our broad product line, which includes a wide selection of diet and lightbeverages, juices and juice drinks, sports drinks and water products. Our commitment also includes adhering toresponsible policies in schools and in the marketplace; supporting programs to encourage physical activity andpromote nutrition education; and continuously meeting changing consumer needs through beverage innovation,choice and variety. We are committed to playing an appropriate role in helping address this issue in cooperationwith governments, educators and consumers through science-based solutions and programs.
Water Quality and Quantity. Water quality and quantity is an issue that increasingly requires ourCompany’s attention and collaboration with the nonalcoholic beverages segment of the commercial beveragesindustry, governments, nongovernmental organizations and communities where we operate. Water is the mainingredient in substantially all of our products. It is also a limited natural resource facing unprecedentedchallenges from overexploitation, increasing pollution and poor management. Our Company is in an excellentposition to share the water-related knowledge we have developed in the communities we serve—water-resourcemanagement, water treatment, wastewater treatment systems, and models for working with communities andpartners in addressing water and sanitation needs. We are actively engaged in assessing the specific water-relatedrisks that we and many of our bottling partners face and have implemented a formal water risk managementprogram. We are working with our global partners to develop water sustainability projects. We are activelyencouraging improved water efficiency and conservation efforts throughout our system. As demand for watercontinues to increase around the world, we expect commitment and continued action on our part will be crucialin the successful long-term stewardship of this critical natural resource.
Evolving Consumer Preferences. Consumers want more choices. We are impacted by shifting consumerdemographics and needs, on-the-go lifestyles, aging populations in developed markets and consumers who areempowered with more information than ever. We are committed to generating new avenues for growth throughour core brands with a focus on diet and light products. We are also committed to continuing to expand thevariety of choices we provide to consumers to meet their needs, desires and lifestyle choices.
Increased Competition and Capabilities in the Marketplace. Our Company is facing strong competition fromsome well-established global companies and many local participants. We must continue to selectively expandinto other profitable segments of the nonalcoholic beverages segment of the commercial beverages industry andstrengthen our capabilities in marketing and innovation in order to maintain our brand loyalty and market share.
All four of these challenges and risks—obesity and inactive lifestyles, water quality and quantity, evolvingconsumer preferences, and increased competition and capabilities in the marketplace—have the potential tohave a material adverse effect on the nonalcoholic beverages segment of the commercial beverages industry andon our Company; however, we believe our Company is well positioned to appropriately address these challengesand risks.
36

See also ‘‘Item 1A. Risk Factors’’ in Part I of this report for additional information about risks anduncertainties facing our Company.
Critical Accounting Policies and Estimates
Our consolidated financial statements are prepared in accordance with accounting principles generallyaccepted in the United States, which require management to make estimates, judgments and assumptions thataffect the amounts reported in the consolidated financial statements and accompanying notes. We believe thatour most critical accounting policies and estimates relate to the following:
• Basis of Presentation and Consolidation
• Recoverability of Noncurrent Assets
• Revenue Recognition
• Income Taxes
• Contingencies
Management has discussed the development, selection and disclosure of critical accounting policies andestimates with the Audit Committee of the Company’s Board of Directors. While our estimates and assumptionsare based on our knowledge of current events and actions we may undertake in the future, actual results mayultimately differ from these estimates and assumptions. For a discussion of the Company’s significant accountingpolicies, refer to Note 1 of Notes to Consolidated Financial Statements.
Basis of Presentation and Consolidation
Our Company consolidates all entities that we control by ownership of a majority voting interest as well asvariable interest entities for which our Company is the primary beneficiary. Our judgment in determining if weare the primary beneficiary of the variable interest entities includes assessing our Company’s level ofinvolvement in setting up the entity, determining if the activities of the entity are substantially conducted onbehalf of our Company, determining whether the Company provides more than half of the subordinatedfinancial support to the entity and determining if we absorb the majority of the entity’s expected losses orreturns.
We use the equity method to account for investments in companies, if our investment provides us with theability to exercise significant influence over operating and financial policies of the investee. Our consolidated netincome includes our Company’s proportionate share of the net income or loss of these companies. Ourjudgment regarding the level of influence over each equity method investment includes considering key factorssuch as our ownership interest, representation on the board of directors, participation in policy-making decisionsand material intercompany transactions.
We account for investments in companies that we do not control or account for under the equity methodeither at fair value or under the cost method, as applicable. Investments in equity securities are carried at fairvalue, if the fair value of the security is readily determinable as defined by and in accordance with Statement ofFinancial Accounting Standards (‘‘SFAS’’) No. 115, ‘‘Accounting for Certain Investments in Debt and EquitySecurities.’’ Equity investments carried at fair value are classified as either trading or available-for-salesecurities. Realized and unrealized gains and losses on trading securities and realized gains and losses onavailable-for-sale securities are included in net income. Unrealized gains and losses, net of deferred taxes, onavailable-for-sale securities are included in our consolidated balance sheets as a component of accumulatedother comprehensive income (loss) (‘‘AOCI’’). Trading securities are reported as marketable securities in ourconsolidated balance sheets. Securities classified as available-for-sale are reported as either marketablesecurities or other investments in our consolidated balance sheets, depending on the length of time we intend tohold the investment. The Company has currently chosen not to elect the fair value option as permitted by SFAS
37

No. 159, ‘‘The Fair Value Option for Financial Assets and Financial Liabilities—Including an amendment ofFASB Statement No. 115,’’ which provides entities the option to measure many financial instruments and certainother items at fair value. Investments in equity securities that do not qualify for fair value accounting, or forwhich the Company has not elected the fair value option, are accounted for under the cost method. Inaccordance with the cost method, our initial investment is recorded at cost and we record dividend income whenapplicable dividends are declared. Cost method investments are reported as other investments in ourconsolidated balance sheets.
Our Company eliminates all significant intercompany transactions, including the intercompany portion oftransactions with equity method investees, from our financial results.
Recoverability of Noncurrent Assets
Management’s assessments of the recoverability and impairment tests of noncurrent assets involve criticalaccounting estimates. These estimates require significant management judgment, include inherent uncertaintiesand are often interdependent; therefore, they do not change in isolation. Factors that management mustestimate include, among others, the economic life of the asset, sales volume, prices, inflation, cost of capital,marketing spending, foreign currency exchange rates, tax rates and capital spending. These factors are evenmore difficult to predict when global financial markets are highly volatile. The estimates we use when assessingthe recoverability of noncurrent assets are consistent with those we use in our internal planning. The estimateswe use when performing impairment tests are management’s best assumptions that a hypothetical marketplaceparticipant would use. Management periodically evaluates and updates the estimates based on the conditionsthat influence these factors. The variability of these factors depends on a number of conditions, includinguncertainty about future events, and thus our accounting estimates may change from period to period. If otherassumptions and estimates had been used in the current period, impairment charges could have resulted. Asmentioned above, these factors do not change in isolation; and therefore, it is not practicable to present theimpact of changing a single factor. Furthermore, if management uses different assumptions or if differentconditions occur in future periods, future impairment charges could result.
Our Company faces many uncertainties and risks related to various economic, political and regulatoryenvironments in the countries in which we operate, particularly in developing or emerging markets. Refer to theheading ‘‘Our Business—Challenges and Risks,’’ above, and ‘‘Item 1A. Risk Factors’’ in Part I of this report. Asa result, management must make numerous assumptions which involve a significant amount of judgment whencompleting recoverability and impairment tests of noncurrent assets in various regions around the world.
We perform recoverability and impairment tests of noncurrent assets in accordance with accountingprinciples generally accepted in the United States. For certain assets, recoverability and/or impairment tests arerequired only when conditions exist that indicate the carrying value may not be recoverable. For other assets,impairment tests are required at least annually, or more frequently, if events or circumstances indicate that anasset may be impaired.
Investments in Equity and Debt Securities
The carrying values of our investments in equity securities are determined using the equity method or thecost method, or at fair value. Refer to the heading ‘‘Critical Accounting Policies and Estimates—Basis ofPresentation and Consolidation,’’ above. Our investments in debt securities are carried at either amortized costor fair value. Investments in debt securities that the Company has the positive intent and ability to hold tomaturity are carried at amortized cost and classified as held-to-maturity. Investments in debt securities that arenot classified as held-to-maturity are carried at fair value, and classified as either trading or available-for-sale.
38

The following table presents the carrying values of our investments in equity and debt securities (inmillions):
PercentageCarrying of Total
December 31, 2008 Value Assets
Equity method investments $ 5,316 13%Securities classified as available-for-sale 522 1Cost method investments 176 *Securities classified as held-to-maturity 74 *Securities classified as trading 49 *
Total $ 6,137 15%
* Accounts for less than 1 percent of the Company’s total assets.
Investments classified as trading securities are not assessed for impairment, since they are carried at fairvalue with the change in fair value included in net income. We review our investments in equity and debtsecurities that are accounted for using the equity method or cost method or that are classified asavailable-for-sale or held-to-maturity each reporting period to determine whether a significant event or changein circumstances has occurred that may have an adverse effect on the fair value of each investment. When suchevents or changes occur, we evaluate the fair value compared to our cost basis in the investment. We alsoperform this evaluation every reporting period for each investment for which our cost basis has exceeded the fairvalue in the prior period. The fair values of most of our Company’s investments in publicly traded companies areoften readily available based on quoted market prices. For investments in nonpublicly traded companies,management’s assessment of fair value is based on valuation methodologies including discounted cash flows,estimates of sales proceeds and appraisals, as appropriate. We consider the assumptions that we believehypothetical marketplace participants would use in evaluating estimated future cash flows when employing thediscounted cash flow or estimates of sales proceeds valuation methodologies. The ability to accurately predictfuture cash flows, especially in developing and emerging markets, may impact the determination of fair value.
In the event the fair value of an investment declines below our cost basis, management is required todetermine if the decline in fair value is other than temporary. If management determines the decline is otherthan temporary, an impairment charge is recorded. Management’s assessment as to the nature of a decline infair value is based on, among other things, the length of time and the extent to which the market value has beenless than our cost basis, the financial condition and near-term prospects of the issuer, and our intent and abilityto retain the investment in the issuer for a period of time sufficient to allow for any anticipated recovery inmarket value.
39

The following table presents the difference between calculated fair values, based on quoted closing prices ofpublicly traded shares, and our Company’s cost basis in publicly traded bottlers accounted for as equity methodinvestments (in millions):
Fair CarryingDecember 31, 2008 Value Value Difference
Coca-Cola FEMSA, S.A.B. de C.V. $ 2,616 $ 877 $ 1,739Coca-Cola Enterprises Inc.1 2,032 — 2,032Coca-Cola Amatil Limited 1,326 638 688Coca-Cola Hellenic Bottling Company S.A. 1,231 1,487 (256)Grupo Continental, S.A.B. 267 152 115Coca-Cola Icecek A.S. 205 114 91Coca-Cola Embonor S.A.2 153 162 (9)Coca-Cola Bottling Co. Consolidated 114 76 38Embotelladoras Coca-Cola Polar S.A. 78 61 17
$ 8,022 $ 3,567 $ 4,4551 The carrying value of our investment in CCE was reduced to zero as of December 31, 2008, primarily
as a result of recording our proportionate share of impairment charges and items impacting AOCIrecorded by CCE.
2 The carrying value of our investment in Coca-Cola Embonor S.A. exceeded its fair value as ofDecember 31, 2008. Management has concluded that this decline in fair value is temporary in nature.
The carrying value of our investment in Coca-Cola Hellenic has exceeded its fair value in each of the lastthree months of 2008; however, the amount by which our carrying value has exceeded its fair value has decreasedin each of those three months. As is the case with most of our equity method investees, we have both the abilityand intent to hold our investment in Coca-Cola Hellenic as a long-term investment. Furthermore, under theterms of a shareholders agreement between the Company and another significant shareholder of Coca-ColaHellenic, the Company is required, unless both parties agree to the contrary, to maintain no less than a20 percent ownership interest in Coca-Cola Hellenic through at least December 31, 2018. Additionally, webelieve that the countries in which Coca-Cola Hellenic has bottling and distribution rights, through directownership or joint ventures, have positive growth opportunities. We also believe that the recent volatility ofCoca-Cola Hellenic’s fair value is at least partly attributable to the volatility in the global financial markets andnot necessarily indicative of a change in long-term value. Based on these factors, management has concludedthat the decline in fair value of our investment in Coca-Cola Hellenic is temporary in nature. We will continue tomonitor our investments in future periods.
As of December 31, 2008, the Company had several investments classified as available-for-sale securities inwhich our cost basis exceeded the fair value of the investment, each of which initially occurred between the endof the second quarter and the beginning of the third quarter of 2008. Management assessed each individualinvestment to determine if the decline in fair value was other than temporary. Based on these assessments,management determined that the decline in fair value of each investment was other than temporary based on anumber of factors, including, but not limited to, uncertainty regarding our intent to hold certain of theseinvestments for a period of time that would be sufficient to recover our cost basis in the event of a marketrecovery; the fact that the fair value of each investment has continued to decline since the time that our costbasis initially exceeded its fair value; and the Company’s uncertainty around the near-term prospects for certainof the investments. As a result of the other-than-temporary decline in fair value of these investments, theCompany recognized impairment charges of approximately $81 million during the fourth quarter of 2008.Certain of these investments are classified as marketable securities, while others are classified as otherinvestments in the consolidated balance sheets. These impairment charges were recorded to other income(loss)—net in the consolidated statement of income. Refer to the heading ‘‘Operations Review—Other Income(Loss)—Net,’’ and Note 10 and Note 19 of Notes to Consolidated Financial Statements.
40

Other Assets
Our Company invests in infrastructure programs with our bottlers that are directed at strengthening ourbottling system and increasing unit case volume. Additionally, our Company advances payments to certaincustomers to fund future marketing activities intended to generate profitable volume and expenses suchpayments over the periods benefited. Advance payments are also made to certain customers for distributionrights. Payments under these programs are generally capitalized and reported as other assets in our consolidatedbalance sheets. As of December 31, 2008, the carrying value of these assets was approximately $1,733 million, or4 percent of our total assets. When facts and circumstances indicate that the carrying value of these assets maynot be recoverable, management assesses the recoverability of the carrying value by preparing estimates of salesvolume and the resulting gross profit and cash flows. These estimated future cash flows are consistent with thosewe use in our internal planning. If the sum of the expected future cash flows (undiscounted and without interestcharges) is less than the carrying amount, we recognize an impairment loss. The impairment loss recognized isthe amount by which the carrying amount exceeds the fair value.
Property, Plant and Equipment
As of December 31, 2008, the carrying value of our property, plant and equipment, net of depreciation, wasapproximately $8,326 million, or 21 percent of our total assets. Certain events or changes in circumstances mayindicate that the recoverability of the carrying amount of property, plant and equipment should be assessed,including, among others, a significant decrease in market value, a significant change in the business climate in aparticular market, or a current period operating or cash flow loss combined with historical losses or projectedfuture losses. When such events or changes in circumstances are present, we estimate the future cash flowsexpected to result from the use of the asset and its eventual disposition. These estimated future cash flows areconsistent with those we use in our internal planning. If the sum of the expected future cash flows (undiscountedand without interest charges) is less than the carrying amount, we recognize an impairment loss. The impairmentloss recognized is the amount by which the carrying amount exceeds the fair value. We use a variety ofmethodologies to determine the fair value of property, plant and equipment, including appraisals and discountedcash flow models, which are consistent with the assumptions we believe hypothetical marketplace participantswould use.
In 2007, our Company recorded a charge of approximately $99 million in equity income (loss)—net. Thischarge was primarily related to our proportionate share of asset impairments recorded by Coca-Cola BottlersPhilippines, Inc. (‘‘CCBPI’’) due to excess and obsolete bottles and cases. These charges impacted the BottlingInvestments operating segment. Refer to the heading ‘‘Operations Review—Equity Income (Loss)—Net,’’ andNote 3 and Note 19 of Notes to Consolidated Financial Statements.
Goodwill, Trademarks and Other Intangible Assets
SFAS No. 142, ‘‘Goodwill and Other Intangible Assets,’’ classifies intangible assets into three categories:(1) intangible assets with definite lives subject to amortization; (2) intangible assets with indefinite lives notsubject to amortization; and (3) goodwill. For intangible assets with definite lives, tests for impairment must beperformed if conditions exist that indicate the carrying value may not be recoverable. For intangible assets withindefinite lives and goodwill, tests for impairment must be performed at least annually or more frequently ifevents or circumstances indicate that assets might be impaired. Our equity method investees also perform suchtests for impairment of intangible assets and/or goodwill. If an impairment charge was recorded by one of ourequity method investees, the Company would record its proportionate share of such charge. However, the actualamount we record with respect to our proportionate share of such charges may be impacted by items such asbasis differences, deferred taxes and deferred gains.
41

The following table presents the carrying values of intangible assets included in our consolidated balancesheet (in millions):
PercentageCarrying of Total
December 31, 2008 Value Assets
Trademarks with indefinite lives $ 6,059 15%Goodwill 4,029 10Bottlers’ franchise rights 1,840 5Definite-lived intangible assets, net 385 1Other intangible assets not subject to amortization 192 *
Total $ 12,505 31%
* Accounts for less than 1 percent of the Company’s total assets.
When facts and circumstances indicate that the carrying value of definite-lived intangible assets may not berecoverable, management assesses the recoverability of the carrying value by preparing estimates of sales volumeand the resulting gross profit and cash flows. These estimated future cash flows are consistent with those we usein our internal planning. If the sum of the expected future cash flows (undiscounted and without interestcharges) is less than the carrying amount, we recognize an impairment loss. The impairment loss recognized isthe amount by which the carrying amount exceeds the fair value. We use a variety of methodologies to determinethe fair value of these assets, including discounted cash flow models, which are consistent with the assumptionswe believe hypothetical marketplace participants would use.
We test intangible assets determined to have indefinite useful lives, including trademarks, franchise rightsand goodwill, for impairment annually, or more frequently if events or circumstances indicate that assets mightbe impaired. We use a variety of methodologies in conducting impairment assessments of indefinite-livedintangible assets, including, but not limited to, discounted cash flow models, which are consistent with theassumptions we believe hypothetical marketplace participants would use. For indefinite-lived intangible assets,other than goodwill, if the fair value is less than the carrying amount, an impairment charge is recognized in anamount equal to that excess.
We perform impairment tests of goodwill at our reporting unit level, which is one level below our operatingsegments. The goodwill impairment test consists of a two-step process, if necessary. The first step is to comparethe fair value of a reporting unit to its carrying value, including goodwill. We typically use discounted cash flowmodels to determine the fair value of a reporting unit. The assumptions used in these models are consistent withthose we believe hypothetical marketplace participants would use. If the fair value of the reporting unit is lessthan its carrying value, the second step of the impairment test must be performed in order to determine theamount of impairment loss, if any. The second step compares the implied fair value of the reporting unitgoodwill with the carrying amount of that goodwill. If the carrying amount of the reporting unit’s goodwillexceeds its implied fair value, an impairment charge is recognized in an amount equal to that excess. The lossrecognized cannot exceed the carrying amount of goodwill, which is assigned to the reporting unit or units thatbenefit from the synergies arising from each business combination.
Intangible assets acquired in recent transactions are naturally more susceptible to impairment, primarilydue to the fact that they are recorded at fair value based on recent operating plans and macroeconomicconditions present at the time of acquisition. Consequently, if operating results and/or macroeconomicconditions deteriorate shortly after an acquisition, it could result in the impairment of the acquired assets. Adeterioration of macroeconomic conditions may not only negatively impact the estimated operating cash flowsused in our cash flow models, but may also negatively impact other assumptions used in our analyses, including,but not limited to, the estimated cost of capital and/or discount rates. Additionally, as discussed above, inaccordance with accounting principles generally accepted in the United States, we are required to ensure that
42

assumptions used to determine fair value in our analyses are consistent with the assumptions a hypotheticalmarketplace participant would use. As a result, the cost of capital and/or discount rates used in our analyses mayincrease or decrease based on market conditions and trends, regardless of whether our Company’s actual cost ofcapital has changed. Therefore, our Company may recognize an impairment of an intangible asset or assets inspite of realizing actual cash flows that are approximately equal to or greater than our previously forecastedamounts. The Company has acquired significant intangible assets in the past several years through assetacquisitions and business combinations, including, among others, the acquisition of brands and licenses inDenmark and Finland from Carlsberg; 18 German bottling and distribution operations; Energy Brands Inc., alsoknown as glacéau; CCBPI; and Kerry Beverages Limited, which was subsequently renamed Coca-Cola ChinaIndustries Limited (‘‘CCCIL’’). Refer to Note 20 of Notes to Consolidated Financial Statements for moredetailed information about recently acquired intangible assets.
As of our most recent annual SFAS No. 142 impairment review, the Company had no significantimpairments of its intangible assets, individually or in the aggregate. However, if macroeconomic conditionscontinue to worsen, it is possible that we may experience significant impairments of some of our intangibleassets, which would require us to recognize impairment charges. Management will continue to monitor the fairvalue of our intangible assets in future periods.
As mentioned above, the Company is required to record its proportionate share of impairment chargesrecorded by our equity method investees. In 2008, we recorded our proportionate share of approximately$7.6 billion pretax ($4.9 billion after-tax) of charges recorded by CCE due to impairments of its North Americanfranchise rights in the second quarter and fourth quarter of 2008. The Company’s proportionate share of thesecharges was approximately $1.6 billion. The decline in the estimated fair value of CCE’s North Americanfranchise rights during the second quarter was the result of several factors including, but not limited to,(1) challenging macroeconomic conditions which contributed to lower than anticipated volume for higher-margin packages and certain higher-margin beverage categories; (2) increases in raw material costs includingsignificant increases in aluminum, high fructose corn syrup (‘‘HFCS’’) and resin; and (3) increased delivery costsas a result of higher fuel costs. The decline in the estimated fair value of CCE’s North American franchise rightsduring the fourth quarter was primarily driven by financial market conditions as of the measurement date thatcaused (1) a dramatic increase in market debt rates, which impacted the capital charge, and (2) a significantdecline in the funded status of CCE’s defined benefit pension plans. In addition, the market price of CCE’scommon stock declined by more than 50 percent between the date of CCE’s interim impairment test (May 23,2008) and the date of CCE’s annual impairment test (October 24, 2008). Our proportionate share of thesecharges was recorded to equity income (loss)—net in our consolidated statement of income and impacted theBottling Investments operating segment. Refer to the heading ‘‘Operations Review—Equity Income (Loss)—Net’’ and Note 3 and Note 19 of Notes to Consolidated Financial Statements.
In 2006, our Company recorded a charge of approximately $602 million in equity income (loss)—net, whichprimarily represented our proportionate share of impairment charges recorded by CCE. These charges impactedthe Bottling Investments operating segment. Refer to the heading ‘‘Operations Review—Equity Income(Loss)—Net’’ and Note 3 and Note 19 of Notes to Consolidated Financial Statements.
In 2006, our Company recorded impairment charges of approximately $41 million, primarily related totrademarks for beverages sold in the Philippines and Indonesia. The Philippines and Indonesia are componentsof the Pacific operating segment. The amount of these impairment charges was determined by comparing thefair values of the intangible assets to their respective carrying values. The fair values were determined usingdiscounted cash flow models. Because the fair values were less than the carrying values of the assets, werecorded impairment charges to reduce the carrying values of the assets to their respective fair values. Theseimpairment charges were recorded in the line item other operating charges in the consolidated statement ofincome.
43

Revenue Recognition
We recognize revenue when persuasive evidence of an arrangement exists, delivery of products hasoccurred, the sales price is fixed or determinable, and collectibility is reasonably assured. For our Company, thisgenerally means that we recognize revenue when title to our products is transferred to our bottling partners,resellers or other customers. In particular, title usually transfers upon shipment to or receipt at our customers’locations, as determined by the specific sales terms of each transaction. Our sales terms do not allow for a rightof return except for matters related to any manufacturing defects on our part.
In addition, our customers can earn certain incentives, which are included in deductions from revenue, acomponent of net operating revenues in the consolidated statements of income. These incentives include, butare not limited to, cash discounts, funds for promotional and marketing activities, volume-based incentiveprograms and support for infrastructure programs. Refer to Note 1 of Notes to Consolidated FinancialStatements. The aggregate deductions from revenue recorded by the Company in relation to these programs,including amortization expense on infrastructure programs, was approximately $4.4 billion, $4.1 billion and$3.8 billion for the years ended December 31, 2008, 2007 and 2006, respectively. In preparing the financialstatements, management must make estimates related to the contractual terms, customer performance and salesvolume to determine the total amounts recorded as deductions from revenue. Management also considers pastresults in making such estimates. The actual amounts ultimately paid may be different from our estimates. Suchdifferences are recorded once they have been determined and have historically not been significant.
Income Taxes
In July 2006, the FASB issued FASB Interpretation No. 48, ‘‘Accounting for Uncertainty in Income Taxes’’(‘‘Interpretation No. 48’’). Interpretation No. 48 clarifies the accounting for uncertainty in income taxesrecognized in an enterprise’s financial statements in accordance with SFAS No. 109, ‘‘Accounting for IncomeTaxes.’’ Interpretation No. 48 prescribes a recognition threshold and measurement attribute for the financialstatement recognition and measurement of a tax position taken or expected to be taken in a tax return.Interpretation No. 48 also provides guidance on derecognition, classification, interest and penalties, accountingin interim periods, disclosure and transition. Our Company adopted the provisions of Interpretation No. 48effective January 1, 2007. As a result of the adoption of Interpretation No. 48, we recorded an approximate$65 million increase in accrued income taxes in our consolidated balance sheet for unrecognized tax benefits,which was accounted for as a cumulative effect adjustment to the January 1, 2007, balance of reinvestedearnings.
Our annual tax rate is based on our income, statutory tax rates and tax planning opportunities available tous in the various jurisdictions in which we operate. Significant judgment is required in determining our annualtax expense and in evaluating our tax positions. We establish reserves to remove some or all of the tax benefit ofany of our tax positions at the time we determine that the positions become uncertain based upon one of thefollowing: (1) the tax position is not ‘‘more likely than not’’ to be sustained, (2) the tax position is ‘‘more likelythan not’’ to be sustained, but for a lesser amount, or (3) the tax position is ‘‘more likely than not’’ to besustained, but not in the financial period in which the tax position was originally taken. For purposes ofevaluating whether or not a tax position is uncertain, (1) we presume the tax position will be examined by therelevant taxing authority that has full knowledge of all relevant information, (2) the technical merits of a taxposition are derived from authorities such as legislation and statutes, legislative intent, regulations, rulings andcase law and their applicability to the facts and circumstances of the tax position, and (3) each tax position isevaluated without considerations of the possibility of offset or aggregation with other tax positions taken. Weadjust these reserves, including any impact on the related interest and penalties, in light of changing facts andcircumstances, such as the progress of a tax audit.
A number of years may elapse before a particular matter for which we have established a reserve is auditedand finally resolved. The number of years with open tax audits varies depending on the tax jurisdiction. The tax
44

benefit that has been previously reserved because of a failure to meet the ‘‘more likely than not’’ recognitionthreshold would be recognized in our income tax expense in the first interim period when the uncertaintydisappears under any one of the following conditions: (1) the tax position is ‘‘more likely than not’’ to besustained, (2) the tax position, amount, and/or timing is ultimately settled through negotiation or litigation, or(3) the statute of limitations for the tax position has expired. Settlement of any particular issue would usuallyrequire the use of cash.
Tax law requires items to be included in the tax return at different times than when these items are reflectedin the consolidated financial statements. As a result, the annual tax rate reflected in our consolidated financialstatements is different than that reported in our tax return (our cash tax rate). Some of these differences arepermanent, such as expenses that are not deductible in our tax return, and some differences reverse over time,such as depreciation expense. These timing differences create deferred tax assets and liabilities. Deferred taxassets and liabilities are determined based on temporary differences between the financial reporting and taxbases of assets and liabilities. The tax rates used to determine deferred tax assets or liabilities are the enacted taxrates in effect for the year and manner in which the differences are expected to reverse. Based on the evaluationof all available information, the Company recognizes future tax benefits, such as net operating losscarryforwards, to the extent that realizing these benefits is considered more likely than not.
We evaluate our ability to realize the tax benefits associated with deferred tax assets by analyzing ourforecasted taxable income using both historical and projected future operating results, the reversal of existingtaxable temporary differences, taxable income in prior carryback years (if permitted) and the availability of taxplanning strategies. A valuation allowance is required to be established unless management determines that it ismore likely than not that the Company will ultimately realize the tax benefit associated with a deferred tax asset.
Additionally, undistributed earnings of a subsidiary are accounted for as a temporary difference, except thatdeferred tax liabilities are not recorded for undistributed earnings of a foreign subsidiary that are deemed to beindefinitely reinvested in the foreign jurisdiction. The Company has formulated a specific plan for reinvestmentof undistributed earnings of its foreign subsidiaries which demonstrates that such earnings will be indefinitelyreinvested in the applicable tax jurisdictions. Should we change our plans, we would be required to record asignificant amount of deferred tax liabilities.
The Company’s effective tax rate is expected to be approximately 23.0 percent to 24.0 percent in 2009. Thisestimated tax rate does not reflect the impact of any unusual or special items that may affect our tax rate in 2009.
Contingencies
Our Company is subject to various claims and contingencies, mostly related to legal proceedings and taxmatters (both income taxes and indirect taxes). Due to their nature, such legal proceedings and tax mattersinvolve inherent uncertainties including, but not limited to, court rulings, negotiations between affected partiesand governmental actions. Management assesses the probability of loss for such contingencies and accrues aliability and/or discloses the relevant circumstances, as appropriate. Management believes that any liability to theCompany that may arise as a result of currently pending legal proceedings, tax matters or other contingencieswill not have a material adverse effect on the financial condition of the Company taken as a whole. Refer toNote 13 of Notes to Consolidated Financial Statements.
Recent Accounting Standards and Pronouncements
Refer to Note 1 of Notes to Consolidated Financial Statements for a discussion of recent accountingstandards and pronouncements.
45

Operations Review
We manufacture, distribute and market nonalcoholic beverage concentrates and syrups. We alsomanufacture, distribute and market finished beverages. Our organizational structure as of December 31, 2008,consisted of the following operating segments, the first six of which are sometimes referred to as ‘‘operatinggroups’’ or ‘‘groups’’: Eurasia and Africa; Europe; Latin America; North America; Pacific; Bottling Investments;and Corporate. We revised previously reported group information to conform to our operating structure ineffect as of December 31, 2008. For further information regarding our operating segments, including adiscussion of changes made to our operating segments effective July 1, 2008, refer to Note 21 of Notes toConsolidated Financial Statements.
Beverage Volume
We measure our sales volume in two ways: (1) unit cases of finished products and (2) concentrate sales. A‘‘unit case’’ is a unit of measurement equal to 192 U.S. fluid ounces of finished beverage (24 eight-ounceservings). Unit case volume represents the number of unit cases of Company beverage products directly orindirectly sold by the Company and its bottling partners (‘‘Coca-Cola system’’) to customers. Unit case volumeprimarily consists of beverage products bearing Company trademarks. Also included in unit case volume arecertain products licensed to, or distributed by, our Company, and brands owned by Coca-Cola system bottlersfor which our Company provides marketing support and from the sale of which we derive economic benefit.Such products licensed to, or distributed by, our Company or owned by Coca-Cola system bottlers account for aminimal portion of total unit case volume. In addition, unit case volume includes sales by joint ventures in whichthe Company has an equity interest. Unit case volume is derived based on estimates supplied by our bottlingpartners and distributors. Concentrate sales volume represents the amount of concentrates, syrups, beveragebases and powders (in all cases expressed in equivalent unit cases) sold by, or used in finished beverages sold by,the Company to its bottling partners or other customers. Most of our revenues are based on concentrate sales, aprimarily wholesale activity. Unit case volume and concentrate sales growth rates are not necessarily equalduring any given period. Factors such as seasonality, bottlers’ inventory practices, supply point changes, timing ofprice increases, new product introductions and changes in product mix can impact unit case volume andconcentrate sales and can create differences between unit case volume and concentrate sales growth rates. Inaddition to the items mentioned above, the impact of unit case volume from certain joint ventures, in which theCompany has an equity interest, but to which the Company does not sell concentrates, may give rise todifferences between unit case volume and concentrate sales growth rates.
Information about our volume growth by operating segment is as follows:
Percentage Change2008 vs. 2007 2007 vs. 2006
Concentrate ConcentrateYear Ended December 31, Unit Cases1,2 Sales Unit Cases1,2 Sales
Worldwide 5% 4% 6% 6%Eurasia & Africa 7 7 12 12Europe 3 0 5 5Latin America 8 6 9 9North America (1) (2) (1) —Pacific 8 8 7 7
Bottling Investments 14 N/A 64 N/A1 Bottling Investments operating segment data reflects unit case volume growth for consolidated
bottlers only.2 Geographic segment data reflects unit case volume growth for all bottlers in the applicable geographic
areas, both consolidated and unconsolidated.
46

Unit Case Volume
Although most of our Company’s revenues are not based directly on unit case volume, we believe unit casevolume is one of the measures of the underlying strength of the Coca-Cola system because it measures ourproduct trends at the consumer level. The Coca-Cola system sold approximately 23.7 billion unit cases of ourproducts in 2008, approximately 22.7 billion unit cases in 2007 and approximately 21.4 billion unit cases in 2006.
In Eurasia and Africa, unit case volume increased 7 percent in 2008 versus 2007, which reflected growth insparkling and still beverages of 4 percent and 21 percent, respectively. Unit case volume growth of 15 percent inTurkey, 14 percent in India and 11 percent in Southern Eurasia drove current year growth. Acquisitionscontributed 6 percent of the unit case volume growth in Turkey during 2008. High single-digit volume growth inNorth and West Africa and 7 percent volume growth in Nigeria also significantly contributed to the group’scurrent year growth. South Africa’s unit case volume increased 1 percent for the year, which included the impactof supply chain issues related to carbon dioxide shortages in the early portion of 2008. Our system has investedin manufacturing capabilities that allow us to produce our own supply of carbon dioxide to mitigate the risk offuture shortages. Russia’s unit case volume was even for the year, primarily due to a more challenging economicenvironment and unseasonable weather during the summer.
Unit case volume in Europe increased 3 percent in 2008 compared to 2007, primarily attributable to highsingle-digit volume growth in Eastern Europe. The group’s unit case volume growth reflected 1 percent growthin sparkling beverages and 11 percent growth in still beverages. The unit case volume growth in sparklingbeverages included 1 percent growth in Trademark Coca-Cola. Also included in the group’s 2008 volume growthwas the impact of a low single-digit volume decline in Iberia, primarily due to the slowing Western Europeaneconomy and a truckers’ strike in Spain during the second quarter of 2008.
In Latin America, unit case volume increased 8 percent in 2008 versus 2007. The group benefited fromstrong volume growth in all key markets, including 9 percent in Mexico, 7 percent in Brazil and 5 percent inArgentina. Acquisitions contributed 3 percent of the group’s total unit case volume growth in 2008. The group’sunit case volume growth consisted of 4 percent growth in sparkling beverages and 40 percent growth in stillbeverages. Sparkling beverage unit case volume growth was primarily attributable to a 4 percent volume growthin Coca-Cola. The successful integration of Jugos del Valle, S.A.B. de C.V. (‘‘Jugos del Valle’’), which weacquired jointly with Coca-Cola FEMSA in 2007, drove still beverage volume growth. Still beverage unit casevolume grew 21 percent during the year, excluding the impact of acquisitions.
Unit case volume in North America decreased 1 percent in 2008 compared to 2007, which reflected theimpact of a difficult U.S. economic environment and significant bottler price increases during the fourth quarterof 2008. The overall unit case volume decline in North America during 2008 consisted of a 3 percent unit casevolume decline in sparkling beverages, partially offset by a 5 percent increase in still beverages. The current yeardecline in sparkling beverages was partly attributable to the softness of our Foodservice business and otheron-premise channels, both of which were negatively impacted by the current economic conditions. The negativeimpact of current macro-economic conditions and bottler price increases was tempered by the successfulexecution of the three-cola strategy (focusing on driving unit case volume growth for Coca-Cola, Coca-ColaZero and Diet Coke). Coca-Cola Zero continued its strong performance, increasing unit case volume 36 percentin 2008. Still beverage unit case volume increased 5 percent in the current year, primarily due to the strongperformance of glacéau, Fuze, Trademark Simply and Minute Maid Enhanced Juices. Acquisitions contributed4 percent of the volume growth in still beverages during 2008. The overall 5 percent unit case volume growth instill beverages also included the impact of volume declines in Trademark Dasani and Trademark Poweradeduring 2008, primarily due to the slowing water and sports drink categories.
In the Pacific, unit case volume increased 8 percent in 2008 versus 2007. The current year unit case volumegrowth was driven by 19 percent volume growth in China, which consisted of growth in both sparkling and stillbeverages. China’s sparkling unit case volume increased 15 percent, primarily attributable to double-digitvolume growth in both Trademark Coca-Cola and Trademark Sprite. Double-digit unit case volume growth in
47

Minute Maid accounted for the majority of China’s 30 percent unit case volume growth in still beverages. Alsocontributing to the volume growth of still beverages in China was the impact of Yuan Ye, an original leaf tea,which was launched earlier in the year. The strong performance in China across our brands is partly attributableto our successful activation of the Beijing 2008 Olympic Games. In Japan, unit case volume was even in 2008.Sparkling beverage unit case volume grew 5 percent for the year, led by 6 percent growth in TrademarkCoca-Cola and 13 percent growth in Trademark Fanta. Unit case volume growth in Trademark Coca-Cola wasprimarily attributable to the continued success of Coca-Cola Zero and the successful execution of the three-colastrategy (focusing on driving unit case volume growth for Coca-Cola, Coca-Cola Zero and Diet Coke orCoca-Cola light). Still beverage unit case volume declined 1 percent in 2008, primarily due to declines inSokenbicha and Aquarius. The impact of these volume declines on still beverages was partially offset by a2 percent unit case volume increase in Georgia Coffee.
Unit case volume for Bottling Investments increased 14 percent in 2008 compared to 2007. The current yearunit case volume growth was primarily attributable to the full year impact of prior year acquisitions, including,but not limited to, 18 bottling and distribution operations in Germany, Nordeste Refrigerantes S.A. (‘‘NORSA’’)and CCBPI. Refer to Note 20 of Notes to Consolidated Financial Statements. Additionally, the unit case volumegrowth reflected the overall improving health of the Company’s consolidated bottling operations. The favorableimpact that the previously mentioned items had on unit case volume growth was partially offset by the sale ofRefrigerantes Minas Gerais Ltda. (‘‘Remil’’), a bottler in Brazil, and the sale of a portion of our ownershipinterest in Coca-Cola Beverages Pakistan Ltd. (‘‘Coca-Cola Pakistan’’), which resulted in its deconsolidation.Refer to the heading ‘‘Operations Review—Other Income (Loss)—Net’’ and Note 3 and Note 19 of Notes toConsolidated Financial Statements.
In Eurasia and Africa, unit case volume increased 12 percent in 2007 compared to 2006. Double-digit unitcase volume growth in South Africa, Russia, India, Turkey, Middle East and Southern Eurasia drove the results.South Africa unit case volume increased 13 percent in 2007, primarily attributable to strong marketing, thereplenishment of trade inventory resulting from the carbon dioxide shortage in the fourth quarter of 2006 andfavorable weather. In India, continued investment in marketing initiatives on the quality and safety of ourproducts and focus on improved execution by the consolidated bottling operations resulted in 14 percent unitcase volume growth. In addition, strong marketing and bottler execution resulted in solid volume growth inNorth and West Africa and in East and Central Africa during 2007.
Unit case volume in Europe increased 5 percent in 2007 compared to 2006, primarily due to unit casevolume growth in most key countries, including double-digit unit case volume growth in Eastern Europe. Theresults reflected the benefits of key initiatives across the group, including Coca-Cola Zero launches and thethree-cola strategy, The Coke Side of Life Campaign, Christmas programs, and activation of the Rugby WorldCup. In addition, the full year impact of the 2006 acquisition of Apollinaris GmbH, a German premium sourcewater brand (‘‘Apollinaris’’), and the 2006 joint acquisition of Fonti del Vulture S.r.l. (‘‘Fonti del Vulture’’), anItalian mineral water company, with Coca-Cola Hellenic contributed to unit case volume growth in 2007. Thegroup’s 2007 unit case volume growth reflected the negative impact of unseasonably cool and rainy summerweather and the favorable impact the World Cup had on volume in 2006.
In Latin America, unit case volume increased 9 percent in 2007 versus 2006, which reflected volume growthof 16 percent in Brazil, 6 percent in Mexico and 9 percent in Argentina. The group’s unit case volume growthincluded a 7 percent growth in Trademark Coca-Cola, primarily due to the introduction of Coca-Cola Zeroduring the first quarter of 2007. The acquisition of Leao Junior, S.A. (‘‘Leao Junior’’) in Brazil also favorablyimpacted the unit case volume in 2007.
Unit case volume in North America decreased 1 percent in 2007 versus 2006, reflecting a 1 percent declinein the Foodservice and Hospitality business due to the challenging restaurant industry environment. Unit casevolume in Retail was even in 2007, reflecting a 1 percent favorable impact from acquisitions primarily related toglacéau. In 2007, the Company transferred the majority of the distribution of glacéau branded products to its
48

existing bottling system with the exception of certain regional glacéau distributors and certain channels. Refer toNote 20 of Notes to Consolidated Financial Statements. Unit case volume for glacéau beverages was 56 millionunit cases in 2006. Retail unit case volume was unfavorably impacted by the difficult sparkling beverage industryenvironment and by a unit case volume decline in warehouse-delivered water resulting from the strategicdecision to refocus resources behind the more profitable Dasani business. Sparkling beverage unit case volumedeclined 2 percent in 2007 compared to 2006, reflecting the expected difficult category environment resultingfrom increased retail pricing. In 2007, Coca-Cola Zero had double-digit unit case volume growth and bothTrademark Dasani and Trademark Powerade volume continued to grow. Warehouse-delivered juice unit casevolume declined due to retail price increases taken to cover higher ingredient costs. This decline was partiallyoffset by continued unit case volume growth in Trademark Odwalla and Trademark Simply juices.
Unit case volume in the Pacific increased 7 percent in 2007 compared to 2006, which reflected volumegrowth of 18 percent in China, 5 percent in the Philippines and 3 percent in Japan. Unit case volume growth inChina was led by double-digit growth in sparkling beverages, Minute Maid and Nestea. In Japan, the increase inunit case volume was primarily due to growth in Trademark Coca-Cola, Trademark Sprite, Sokenbicha and waterbrands. Georgia Coffee volume declined 1 percent in 2007; however, as a result of success with a new marketingcampaign, it returned to growth in the fourth quarter of 2007. Unit case volume growth in the Philippines waslargely attributable to strong volume growth in sparkling beverages, primarily due to investments in keymarketing initiatives, the focus on improving the route-to-market, reshaping and streamlining the supply chainand building sales capabilities. On February 22, 2007, the Company acquired the remaining 65 percentownership interest in CCBPI held by San Miguel Corporation and two of its subsidiaries (collectively, ‘‘SMC’’)and began to implement certain initiatives to address business performance. Refer to Note 20 of Notes toConsolidated Financial Statements.
Unit case volume for Bottling Investments increased 64 percent in 2007 versus 2006. The unit case volumegrowth was primarily attributable to the impact of acquisitions made during 2007, including, but not limited to,18 bottling and distribution operations in Germany, NORSA and CCBPI. Refer to Note 20 of Notes toConsolidated Financial Statements. Unit case volume growth in 2007 also reflected growth across the group.
Concentrate Sales Volume
Company-wide concentrate sales volume and unit case volume grew 4 percent and 5 percent, respectively,in 2008 compared to 2007. The differences between unit case volume and concentrate sales volume growth ratesfor all segments were primarily due to timing of concentrate shipments and the impact of unit case volume fromcertain joint ventures, in which the Company is a partner but to which the Company does not sell concentrate.
Company-wide concentrate sales volume and unit case volume both grew 6 percent in 2007 compared to2006. Differences between unit case volume and concentrate sales volume growth rates for all segments wereprimarily due to timing of concentrate shipments.
49

Analysis of Consolidated Statements of IncomePercent Change
Year Ended December 31, 2008 2007 2006 2008 vs. 2007 2007 vs. 2006(In millions except per share data)
NET OPERATING REVENUES $ 31,944 $ 28,857 $ 24,088 11% 20%Cost of goods sold 11,374 10,406 8,164 9 27
GROSS PROFIT 20,570 18,451 15,924 11 16GROSS PROFIT MARGIN 64.4% 63.9% 66.1%Selling, general and administrative expenses 11,774 10,945 9,431 8 16Other operating charges 350 254 185 * *
OPERATING INCOME 8,446 7,252 6,308 16 15OPERATING MARGIN 26.4% 25.1% 26.2%Interest income 333 236 193 41 22Interest expense 438 456 220 (4) 107Equity income (loss) — net (874) 668 102 * 555Other income (loss) — net (28) 173 195 * *
INCOME BEFORE INCOME TAXES 7,439 7,873 6,578 (6) 20Income taxes 1,632 1,892 1,498 (14) 26Effective tax rate 21.9% 24.0% 22.8%
NET INCOME $ 5,807 $ 5,981 $ 5,080 (3)% 18%
PERCENTAGE OF NET OPERATING REVENUES 18.2% 20.7% 21.1%
NET INCOME PER SHARE:Basic $ 2.51 $ 2.59 $ 2.16 (3)% 20%
Diluted $ 2.49 $ 2.57 $ 2.16 (3)% 19%
* Calculation is not meaningful.
50

Net Operating Revenues
Net operating revenues increased by $3,087 million, or 11 percent, in 2008 compared to 2007 and by$4,769 million, or 20 percent, in 2007 compared to 2006. The following table illustrates, on a percentage basis,the estimated impact of key factors resulting in increases in net operating revenues:
Percent ChangeYear Ended December 31, 2008 vs. 2007 2007 vs. 2006
Increase in concentrate sales volume 4% 6%Structural changes — 8Price and product/geographic mix 3 2Impact of currency fluctuations versus the U.S. dollar 4 4
Total percentage increase 11% 20%
Refer to the heading ‘‘Beverage Volume’’ for a discussion of concentrate sales volume. Also included inconcentrate sales volume is the impact of acquired beverage companies, including, among others, glacéau, andthe acquisition of trademarks.
‘‘Structural changes’’ refers to acquisitions or dispositions of bottling, distribution or canning operationsand consolidation or deconsolidation of bottling and distribution entities for accounting purposes. Structuralchanges had a net zero percent impact on net operating revenues in 2008 compared to 2007. The increase in netoperating revenues attributable to the full year impact of prior year acquisitions, including, but not limited to, 18German bottling and distribution operations, NORSA and CCBPI was offset by the sale of Remil and the sale ofa portion of our ownership interest in Coca-Cola Pakistan, which resulted in its deconsolidation. Refer to Note 3and Note 20 of Notes to Consolidated Financial Statements.
Price and product/geographic mix increased net operating revenues by 3 percent in 2008 compared to 2007,primarily due to favorable pricing and product/package mix across the majority of the operating segments.
The favorable impact of currency fluctuations increased net operating revenues by 4 percent in 2008compared to 2007. The U.S. dollar weakened against certain key currencies in 2008 including, but not limited to,the euro, Japanese yen and Brazilian real. The fluctuations in these currencies favorably impacted the Europe,Pacific, Latin America and Bottling Investments operating segments. The favorable impact of fluctuations in theaforementioned currencies was partially offset by the unfavorable impact of the U.S. dollar strengthening againstthe South African rand and the British pound during 2008. The fluctuations in these currencies unfavorablyimpacted the Eurasia and Africa, Europe and Bottling Investments operating segments. Refer to the heading‘‘Liquidity, Capital Resources and Financial Position—Foreign Exchange.’’
In 2007, structural changes increased net operating revenues by 8 percent compared to 2006. The increasein net operating revenues attributable to structural changes was primarily due to the impact of acquisitions madeduring 2007, including, but not limited to, 18 German bottling and distribution operations, NORSA and CCBPI.In addition to the partial year impact of 2007 acquisitions, the full year impact of the acquisition of CCCIL andthe consolidation of Brucephil, Inc. (‘‘Brucephil’’), the parent company of The Philadelphia Coca-Cola BottlingCompany, during 2006 also contributed to increased net operating revenues during 2007. Refer to Note 20 ofNotes to Consolidated Financial Statements.
Price and product/geographic mix increased net operating revenues by 2 percent in 2007 versus 2006,primarily due to favorable pricing and product/package mix across the majority of the operating segments.
The favorable impact of currency fluctuations increased net operating revenues by 4 percent in 2007compared to 2006. The U.S. dollar weakened against most key currencies during 2007 including, but not limitedto, the euro, Brazilian real and Australian dollar. The fluctuations in these currencies favorably impacted theEurope, Latin America, Pacific and Bottling Investments operating segments. The favorable impact offluctuations in the aforementioned currencies was partially offset by the unfavorable impact of the U.S. dollar
51

strengthening against the Japanese yen and South African rand, which unfavorably impacted the Pacific, Eurasiaand Africa and Bottling Investments operating segments. Refer to the heading ‘‘Liquidity, Capital Resourcesand Financial Position—Foreign Exchange.’’
Information about our net operating revenues by operating segment as a percentage of Company netoperating revenues is as follows:
Year Ended December 31, 2008 2007 2006
Eurasia & Africa 6.7% 6.8% 7.0%Europe 15.0 15.4 16.1Latin America 11.3 10.6 10.3North America 25.7 26.9 29.1Pacific 13.7 13.9 16.5Bottling Investments 27.3 26.2 20.6Corporate 0.3 0.2 0.4
100.0% 100.0% 100.0%
The percentage contribution of each operating segment has changed due to net operating revenues incertain operating segments growing at a faster rate compared to the other operating segments. Net operatingrevenue growth rates are impacted by concentrate sales volume growth rates, structural changes, price andproduct/geographic mix and foreign currency fluctuations.
The size and timing of structural changes, including acquisitions or dispositions of bottling and canningoperations, do not occur consistently from period to period. As a result, anticipating the impact of such eventson future increases or decreases in net operating revenues (and other financial statement line items) usually isnot possible. However, we expect to continue to buy and sell bottling interests in limited circumstances and, as aresult, structural changes will continue to affect our consolidated financial statements in future periods.
Gross Profit
Our gross profit margin increased to 64.4 percent in 2008 from 63.9 percent in 2007. The increase in ourgross profit margin was primarily attributable to favorable price and product mix across the majority ofour operating segments, as well as the favorable impact of the sale of Remil and the sale of a portion of ourownership interest in Coca-Cola Pakistan, which resulted in its deconsolidation. Refer to Note 19 of Notes toConsolidated Financial Statements. Generally, bottling and finished product operations produce higher netrevenues but lower gross profit margins compared to concentrate and syrup operations. The favorable impact ofthe previously mentioned items was partially offset by the full year impact of 2007 acquisitions, including, but notlimited to, 18 German bottling and distribution operations, NORSA, glacéau, CCBPI and Leao Junior. Refer toNote 20 of Notes to Consolidated Financial Statements. In addition to the full year impact of prior yearacquisitions, our 2008 gross profit margin was also unfavorably impacted by increases in the cost of raw materialsand freight.
Our gross profit margin decreased to 63.9 percent in 2007 from 66.1 percent in 2006. The decrease in ourgross profit margin in 2007 was primarily due to the partial year impact of acquisitions made during 2007,including, but not limited to, 18 German bottling and distribution operations, NORSA, glacéau, CCBPI andLeao Junior. In addition to the partial year impact of 2007 acquisitions, the full year impact of the acquisition ofCCCIL and the consolidation of Brucephil during 2006 also contributed to the decline in our 2007 gross profitmargin. Refer to Note 20 of Notes to Consolidated Financial Statements. Our 2007 gross profit margin was alsounfavorably impacted by increases in the cost of raw materials and freight.
52

Selling, General and Administrative Expenses
The following table sets forth the significant components of selling, general and administrative expenses (inmillions):
Year Ended December 31, 2008 2007 2006
Selling expenses $ 5,776 $ 5,029 $ 3,924Advertising expenses 2,998 2,774 2,553General and administrative expenses 2,734 2,829 2,630Stock-based compensation expense 266 313 324
Selling, general and administrative expenses $ 11,774 $ 10,945 $ 9,431
Selling, general and administrative expenses increased $829 million, or 8 percent, in 2008 compared to 2007.This increase was primarily attributable to the impact of foreign currency fluctuations, which accounted forapproximately 4 percent of the total increase in selling, general and administrative expenses. In addition to theimpact of foreign currency fluctuations, the increase in advertising expenses reflected the Company’s continuedinvestment in our brands and building market execution capabilities. Selling expenses increased primarily tosupport our bottling operations. In addition to the previously mentioned items, the increase in selling, generaland administrative expenses in 2008 was also partially attributable to the full year impact of bottlers and brandsacquired during 2007. Refer to Note 20 of Notes to Consolidated Financial Statements. These increases werepartially offset by a decline in general and administrative expenses, primarily due to expense management andproductivity initiatives. In addition, general and administrative expenses during 2008 also benefited from the fullyear impact of amendments made to the U.S. retiree medical plan and other employee benefit related costsduring 2007. Refer to Note 16 of Notes to Consolidated Financial Statements for further discussion of theamendments made to the U.S. retiree medical plan during 2007.
Stock-based compensation expense benefited from the reversal of previously recognized expenses related toperformance based long-term incentive plans due to our revised outlook of the impact of foreign currencyfluctuations in future years. Refer to the heading ‘‘Liquidity, Capital Resources and Financial Position—ForeignExchange’’ for further discussion of the anticipated impact of foreign currency fluctuations.
As of December 31, 2008, we had approximately $368 million of total unrecognized compensation costrelated to nonvested share-based compensation arrangements granted under our plans. This cost is expected tobe recognized over a weighted-average period of 1.7 years as stock-based compensation expense. This expectedcost does not include the impact of any future stock-based compensation awards. Refer to Note 15 of Notes toConsolidated Financial Statements.
The significant decline in the equity markets precipitated by the recent credit crisis and financial systeminstability has negatively affected the value of our pension plan assets. As a result of this decline, along with adecrease in the discount rate, our 2009 pension cost will increase by approximately $100 million. Our pensioncost in years beyond 2009 may also be impacted by these changes. In addition, as a result of the decline in fairvalue of our pension plans assets and a decrease in the discount rate used to calculate pension benefitobligations, we have made and will consider making additional contributions to our U.S. and internationalpension plans in 2009. Refer to the heading ‘‘Liquidity, Capital Resources and Financial Position—Off-BalanceSheet Arrangements and Aggregate Contractual Obligations’’ and Note 16 of Notes to Consolidated FinancialStatements for further discussion.
Selling, general and administrative expenses increased $1,514 million, or 16 percent, in 2007 compared to2006. This increase was primarily related to continued investments in marketing, increased costs to drive growthin our consolidated bottling operations, including a 6 percent increase related to the acquisitions andconsolidations of certain bottling operations (refer to Note 20 of Notes to Consolidated Financial Statements),increased sales and service costs for certain brand acquisitions and a 4 percent increase due to foreign currency
53

fluctuations. Selling and advertising expenses increased 20 percent in 2007 compared to 2006, on a combinedbasis. The increases in selling and advertising expenses were primarily related to increased investments inmarketing and innovation activities, including the reinvestment of certain general and administrative expensesavings derived from productivity initiatives. Selling and advertising expenses also increased due to costs to drivegrowth in our consolidated bottling operations, including a 6 percent increase related to the acquisitions andconsolidations of certain bottling operations and a 4 percent increase due to foreign currency fluctuations.General and administrative expenses increased 8 percent in 2007, primarily due to increased costs in ourconsolidated bottling operations, including a 4 percent impact relating to the acquisitions and consolidations ofcertain bottling operations, increased costs related to our short-term incentive plan based on the Company’sfinancial performance, and a 3 percent increase due to foreign currency fluctuations. These increases in generaland administrative expenses were partially offset by expense savings generated through productivity initiativesand a decrease of approximately $82 million in our annual net periodic benefits costs, primarily due to theimpact of amendments made to the U.S. retiree medical plan during 2007. Refer to Note 16 of Notes toConsolidated Financial Statements for further discussion of the amendments made to the U.S. retiree medicalplan during 2007.
Other Operating Charges
The other operating charges incurred by operating segment were as follows (in millions):
Year Ended December 31, 2008 2007 2006
Eurasia & Africa $ 1 $ 37 $ 3Europe — 33 36Latin America 1 4 —North America 56 23 —Pacific — 3 62Bottling Investments 46 33 83Corporate 246 121 1
Total $ 350 $ 254 $ 185
During 2008, the Company incurred other operating charges of approximately $350 million, consisting ofrestructuring charges, contract termination fees, expenses related to productivity initiatives and assetimpairments.
The Company incurred restructuring costs of approximately $194 million during 2008. These costs wereprimarily related to steps the Company took in 2007 to streamline and simplify its operations globally, whichincluded the closing of a beverage concentrate manufacturing and distribution plant in Drogheda, Ireland, aswell as streamlining activities in other selected business units. The Company has incurred total pretax expensesof approximately $410 million related to these restructuring activities since they commenced. The Company doesnot anticipate recognizing any additional significant expenses as part of this plan. The expected payback periodfor this plan is three to four years. Refer to Note 18 of Notes to Consolidated Financial Statements.
The Company incurred total pretax expenses of approximately $55 million related to productivity initiativessince they commenced in the first quarter of 2008. The Company is targeting $500 million in annualized savingsfrom productivity initiatives by the end of 2011 to provide additional flexibility to invest for growth. The savingsare expected to be generated in a number of areas, and include aggressively managing operating expensessupported by lean techniques; redesigning key processes to drive standardization and effectiveness; betterleveraging our size and scale; and driving savings in indirect costs through the implementation of a‘‘procure-to-pay’’ program. In realizing these savings, the Company expects to incur total costs of approximately$500 million by the end of 2011. Refer to Note 18 of Notes to Consolidated Financial Statements.
54

Other operating charges in 2008 also included approximately $63 million of costs associated with contracttermination fees and approximately $38 million related to asset impairments. The contract termination fees wereprimarily the result of penalties incurred by the Company to terminate existing supply and co-packeragreements. Charges related to asset impairments were primarily due to the write-down of manufacturing linesthat produce product packaging materials. Refer to Note 19 of Notes to Consolidated Financial Statements.
In 2007, the Company incurred other operating charges of approximately $254 million, primarily related torestructuring costs and asset impairments. These restructuring costs and asset impairments included thereorganization of the North American business around three main business units: Sparkling Beverages, StillBeverages and Emerging Brands. They also included the plan to close a beverage concentrate manufacturingand distribution plant in Drogheda, Ireland, as well as individually insignificant streamlining activitiesthroughout many other business units. Refer to Note 18 of Notes to Consolidated Financial Statements. Also in2007, other operating charges included charges related to asset impairments, none of which was individuallysignificant.
During 2006, our Company recorded other operating charges of $185 million. Of these charges,approximately $108 million were primarily related to the impairment of assets and investments in our bottlingoperations, approximately $53 million were the result of contract termination fees related to production capacityefficiencies and approximately $24 million were related to other restructuring costs. None of these charges wasindividually significant. The impairment charges were primarily the result of a revised outlook for certain assetsand bottling operations in Asia, which had been impacted by unfavorable market conditions and declines involume. Refer to the discussion under ‘‘Critical Accounting Policies and Estimates—Goodwill, Trademarks andOther Intangible Assets,’’ and Note 19 of Notes to Consolidated Financial Statements.
Operating Income and Operating Margin
Information about our operating income contribution by operating segment on a percentage basis is asfollows:
Year Ended December 31, 2008 2007 2006
Eurasia & Africa 9.9% 9.2% 9.3%Europe 37.6 38.3 37.4Latin America 24.8 24.1 22.8North America 18.8 23.4 26.7Pacific 22.0 23.4 26.2Bottling Investments 3.1 2.1 0.3Corporate (16.2) (20.5) (22.7)
100.0% 100.0% 100.0%
Information about our operating margin on a consolidated basis and by operating segment is as follows:
Year Ended December 31, 2008 2007 2006
Consolidated 26.4% 25.1% 26.2%
Eurasia & Africa 39.1% 34.4% 35.2%Europe 66.4 62.4 60.9Latin America 57.9 57.0 57.9North America 19.3 21.9 24.0Pacific 42.6 42.5 41.4Bottling Investments 3.0 2.0 0.4Corporate * * *
* Calculation is not meaningful.
55

As demonstrated by the tables above, the percentage contribution to operating income and operatingmargin by each operating segment fluctuated from year to year. Operating income and operating margin byoperating segment were influenced by a variety of factors and events including the following:
• In 2008, foreign currency exchange rates favorably impacted operating income by approximately6 percent, primarily due to a weaker U.S. dollar compared to the euro, Japanese yen and Brazilian real,which had a favorable impact on the Europe, Pacific, Latin America and Bottling Investments operatingsegments. The favorable impact of a weaker U.S. dollar compared to the aforementioned currencies waspartially offset by the impact of a stronger U.S. dollar compared to the South African rand and theBritish pound, which had an unfavorable impact on the Eurasia and Africa, Europe and BottlingInvestments operating segments. Refer to the heading ‘‘Liquidity, Capital Resources and FinancialPosition—Foreign Exchange.’’
• In 2008, price increases across the majority of operating segments had a favorable impact on bothoperating income and operating margins.
• In 2008, increased spending on marketing and innovation activities impacted the majority of theoperating segments’ operating income and operating margins. Refer to the heading ‘‘Selling, General andAdministrative Expenses,’’ above.
• In 2008, increases in the cost of raw materials and product mix, primarily as a result of finished goodsbusinesses, adversely impacted North America’s operating income and operating margin.
• In 2008, our operating margin was unfavorably impacted by the full year impact of acquisitions madeduring 2007, including, but not limited to, 18 German bottling and distribution operations, NORSA,glacéau, CCBPI and Leao Junior. Refer to the heading ‘‘Gross Profit,’’ above. These acquisitionsimpacted the Latin America, North America and Bottling Investments operating segments.
• In 2008, operating income was reduced by approximately $1 million for Eurasia and Africa, $1 million forLatin America, $56 million for North America, $46 million for Bottling Investments and $246 million forCorporate, primarily due to restructuring costs, contract termination fees, productivity initiatives andasset impairments. Refer to the heading ‘‘Other Operating Charges,’’ above.
• In 2007, foreign currency exchange rates favorably impacted operating income by approximately4 percent, primarily related to a weaker U.S. dollar compared to the euro, Brazilian real and Australiandollar, which had a favorable impact on the Europe, Latin America and Bottling Investments operatingsegments. The favorable impact of a weaker U.S. dollar compared to the aforementioned currencies waspartially offset by the impact of a stronger U.S. dollar compared to the Japanese yen and South Africanrand, which had an unfavorable impact on the Eurasia and Africa, Pacific and Bottling Investmentsoperating segments. Refer to the heading ‘‘Liquidity, Capital Resources and Financial Position—ForeignExchange.’’
• In 2007, price increases across the majority of operating segments had a favorable impact on bothoperating income and operating margins.
• In 2007, increased spending on marketing and innovation activities impacted the majority of theoperating segments’ operating income. Refer to the heading ‘‘Selling, General and AdministrativeExpenses,’’ above.
• In 2007, operating income was reduced by approximately $37 million for Eurasia and Africa, $33 millionfor Europe, $4 million for Latin America, $23 million for North America, $3 million for Pacific,$47 million for Bottling Investments and $121 million for Corporate, primarily due to restructuring costsand asset impairments, included in other operating charges and cost of goods sold. Refer to the heading‘‘Other Operating Charges,’’ above.
56

• In 2007, operating income and operating margin for Latin America, North America and Pacific reflectedthe impact of increases in the cost of raw materials primarily in the finished goods businesses.
• In 2007, operating income and operating margin for Bottling Investments reflected the impact ofacquisitions and the consolidation of certain bottling operations. Refer to the heading ‘‘Gross Profit,’’above.
• In 2006, operating income was reduced by approximately $3 million for Eurasia and Africa, $36 millionfor Europe, $62 million for Pacific, $87 million for Bottling Investments and $1 million for Corporateprimarily due to contract termination fees related to production capacity efficiencies, asset impairmentsand other restructuring costs. Refer to the heading ‘‘Other Operating Charges,’’ above.
• In 2006, operating income was reduced by $100 million for Corporate as a result of a donation made toThe Coca-Cola Foundation.
Interest Income and Interest Expense
Our Company monitors our mix of fixed-rate and variable-rate debt as well as our mix of short-term debtversus long-term debt. This monitoring includes a review of business and other financial risks. From time totime, we enter into interest rate swap agreements and other related instruments to manage our mix of fixed-rateand variable-rate debt. Refer to Note 11 of Notes to Consolidated Financial Statements.
Interest income increased by $97 million in 2008 compared to 2007. This increase was primarily due tohigher average short-term investment balances, partially offset by lower interest rates.
Interest expense decreased by $18 million in 2008 compared to 2007. This decrease was primarilyattributable to lower interest rates on short-term debt and a net benefit of approximately $8 million related tothe reclassification of gains and losses on interest rate locks from AOCI to interest expense. This net benefitconsisted of approximately $17 million of previously unrecognized gains related to cash flow hedges that werediscontinued during the second quarter of 2008, as it was no longer probable that we would issue the long-termdebt for which these hedges were designated, which was partially offset by approximately $9 million of lossesrelated to the portion of cash flow hedges that were deemed to be ineffective during 2008. The favorable impactof aforementioned items was partially offset by the impact of higher average short-term and long-term debtbalances. We expect net interest expense to increase in 2009 due to forecasted higher debt balances. Refer to theheading ‘‘Liquidity, Capital Resources and Financial Position.’’
In 2007, interest income increased by $43 million compared to 2006, primarily due to higher averageshort-term investment balances, partially offset by a decline in interest rates.
Interest expense in 2007 increased by $236 million compared to 2006, primarily due to issuance of$1,750 million of notes due November 15, 2017, and higher average balances on commercial paper borrowings inthe U.S., partially offset by a decline in interest rates. The net proceeds of approximately $1,747 million fromthis long-term debt issuance and the increase in commercial paper borrowings were primarily used to finance2007 acquisitions.
Equity Income (Loss)—Net
Equity income (loss)—net represents our Company’s proportionate share of net income or loss from eachof our equity method investments. In 2008, equity income (loss)—net was an equity loss of approximately$874 million compared to equity income of approximately $668 million in 2007, a decrease of $1,542 million.This decrease was primarily attributable to impairment charges recorded by CCE during 2008, of which ourCompany’s proportionate share was approximately $1.6 billion. Refer to the heading ‘‘Critical AccountingPolicies and Estimates—Goodwill, Trademarks and Other Intangible Assets’’ and Note 3 of Notes toConsolidated Financial Statements. In addition to our proportionate share of the charges discussed above, theCompany recorded charges of approximately $60 million to equity income (loss)—net, primarily related to our
57

proportionate share of restructuring charges and asset impairments recorded by certain equity method investees.Refer to Note 3 of Notes to Consolidated Financial Statements. The impact of these charges was partially offsetby our proportionate share of increased net income from certain of our equity method investees, which includedthe favorable impact of foreign exchange fluctuations.
In 2007, equity income (loss)—net was an equity income of approximately $668 million compared to$102 million in 2006, an increase of $566 million. This increase was primarily attributable to an impairmentcharge recorded by CCE during 2006, of which our Company’s proportionate share was approximately$602 million. Refer to heading ‘‘Critical Accounting Policies and Estimates—Goodwill, Trademarks and OtherIntangible Assets,’’ and Note 3 and Note 19 of Notes to Consolidated Financial Statements. Additionally, theincrease in 2007 also reflected our proportionate share of increased net income from certain of our equitymethod investees as a result of the overall improving health of the Coca-Cola bottling system in most of theworld, our proportionate share of tax benefits recorded by CCE and the favorable impact of foreign currencyfluctuations. The favorable impact of these items was partially offset by our proportionate share of impairmentcharges recorded by Coca-Cola Amatil, restructuring charges recorded by CCE, the write-off of excess bottlesand cases at CCBPI and the net impact of acquisitions and divestitures of equity method investments during2007 and 2006. Refer to Note 3 and Note 20 of Notes to Consolidated Financial Statements.
Other Income (Loss)—Net
Other income (loss)—net includes, among other things, the impact of foreign exchange gains and losses,dividend income, rental income, gains and losses related to the disposal of property, plant and equipment,realized and unrealized gains and losses on trading securities, realized gains and losses on available-for-salesecurities, other-than-temporary impairments of available-for-sale securities, the accretion of expense related tocertain acquisitions and minority shareowners’ proportionate share of net income of certain consolidatedsubsidiaries.
In 2008, other income (loss)—net was a loss of $28 million. The Company recognized other-than-temporaryimpairment charges of approximately $81 million on available-for-sale securities. Refer to the heading ‘‘CriticalAccounting Policies and Estimates—Investments in Equity and Debt Securities’’ and Note 10 and Note 19 ofNotes to Consolidated Financial Statements. Other income (loss)—net also included approximately $46 millionof realized and unrealized losses on trading securities. These losses, along with other charges that were notindividually significant, were partially offset by gains on divestitures of approximately $119 million, primarilyrelated to the sale of Remil to Coca-Cola FEMSA and the sale of a portion of the Company’s investment inCoca-Cola Pakistan to Coca-Cola Icecek A.S. (‘‘Coca-Cola Icecek’’). Refer to Note 3 and Note 19 of Notes toConsolidated Financial Statements.
In 2007, other income (loss)—net was income of $173 million. The Company recognized a gain ofapproximately $73 million due to the sale of a portion of the Company’s ownership interest in Coca-ColaAmatil. As a result of this transaction, our ownership interest in Coca-Cola Amatil was reduced fromapproximately 32 percent to 30 percent. In addition, we recognized a gain of approximately $70 million as aresult of the sale of our equity investment in Vonpar Refrescos S.A. (‘‘Vonpar’’) and gains of approximately$84 million due to the sale of real estate in Spain and the United States. Refer to Note 3 and Note 19 of Notes toConsolidated Financial Statements.
In 2006, other income (loss)—net was income of $195 million, primarily attributable to a gain ofapproximately $175 million as a result of the sale of a portion of our Coca-Cola FEMSA shares to FEMSA and again of approximately $123 million due to the sale of a portion of our investment in Coca-Cola Icecek shares inan initial public offering. These gains were partially offset by the accretion of approximately $58 million ofexpense related to the discounted value of our liability to purchase Coca-Cola Erfrischungsgetraenke AG(‘‘CCEAG’’) shares and approximately $15 million in foreign currency exchange losses. Refer to Note 3 andNote 19 of Notes to Consolidated Financial Statements.
58

Income Taxes
Our effective tax rate reflects tax benefits derived from significant operations outside the United States,which are generally taxed at rates lower than the U.S. statutory rate of 35 percent. A change in the mix of pretaxincome from these various tax jurisdictions can have a significant impact on the Company’s periodic effective taxrate.
Our effective tax rate of approximately 21.9 percent for the year ended December 31, 2008, included thefollowing:
• an approximate 20 percent combined effective tax rate on restructuring charges, other-than-temporaryimpairments of available-for-sale securities, contract termination fees, productivity initiatives and assetimpairments recorded by the Company (refer to Note 18 and Note 19 of Notes to Consolidated FinancialStatements);
• an approximate 23 percent combined effective tax rate on our proportionate share of asset impairmentand restructuring charges recorded by equity method investees, primarily related to impairment chargesrecorded by CCE (refer to Note 3 and Note 19 of Notes to Consolidated Financial Statements);
• an approximate 24 percent combined effective tax rate on gains from divestitures (refer to Note 19 ofNotes to Consolidated Financial Statements);
• a tax charge of approximately $10 million related to the recognition of a valuation allowance on deferredtax assets (refer to Note 17 of Notes to Consolidated Financial Statements); and
• a net tax benefit of approximately $5 million, primarily related to amounts required to be recorded forchanges to our uncertain tax positions under Interpretation No. 48, including interest and penalties (referto Note 17 of Notes to Consolidated Financial Statements).
Our effective tax rate of approximately 24.0 percent for the year ended December 31, 2007, included thefollowing:
• an approximate 18 percent combined effective tax rate on restructuring charges and asset impairmentsrecorded by the Company (refer to Note 18 and Note 19 of Notes to Consolidated Financial Statements);
• an approximate 14 percent combined effective tax rate on our proportionate share of restructuringcharges and tax rate changes recorded by CCE, and asset impairments recorded by CCBPI andCoca-Cola Amatil (refer to Note 19 of Notes to Consolidated Financial Statements);
• an approximate 58 percent combined effective tax rate on the sale of a portion of our equity interest inCoca-Cola Amatil and Vonpar (refer to Note 19 of Notes to Consolidated Financial Statements);
• a tax benefit of approximately $19 million related to tax rate changes in Germany (refer to Note 17 ofNotes to Consolidated Financial Statements); and
• a tax charge of approximately $96 million related to amounts required to be recorded for changes to ouruncertain tax positions under Interpretation No. 48, including interest and penalties (refer to Note 17 ofNotes to Consolidated Financial Statements).
Our effective tax rate of approximately 22.8 percent for the year ended December 31, 2006, included thefollowing:
• an approximate 16 percent combined effective tax rate on asset impairments, impairments of investmentsin our bottling operations, contract termination fees and restructuring charges recorded by the Company(refer to Note 19 of Notes to Consolidated Financial Statements);
59

• an approximate 8.8 percent net effective tax rate on our proportionate share of impairment charges,restructuring charges and the impact of certain tax rate changes recorded by CCE (refer to Note 3 andNote 19 of Notes to Consolidated Financial Statements);
• an approximate 1.8 percent tax benefit on the sale of a portion of our investments in Coca-Cola Icecekand Coca-Cola FEMSA. The tax benefit was a result of the reversal of valuation allowances on certaindeferred tax assets recorded related to capital loss carryforwards. In addition to the impact of the reversalof valuation allowances, we also benefited from the reversal of deferred tax liabilities related todifferences between the book and tax bases in the stock sold. The tax benefit associated with theaforementioned items was partially offset by a reduction of deferred tax assets due to the utilization ofthese capital loss carryforwards. The capital loss carryforwards offset the taxable gain on the sale of aportion of our investments in Coca-Cola Icecek and Coca-Cola FEMSA (refer to Note 19 of Notes toConsolidated Financial Statements); and
• a tax charge of approximately $24 million related to the resolution of certain tax matters (refer to Note 17of Notes to Consolidated Financial Statements).
The Company adopted the provisions of Interpretation No. 48 effective January 1, 2007. As a result of theimplementation of Interpretation No. 48, the Company recorded an increase of approximately $65 million inliabilities for unrecognized tax benefits, which was accounted for as a reduction to the January 1, 2007, balanceof reinvested earnings. As of December 31, 2007, the Company had recorded gross unrecognized tax benefits ofapproximately $643 million.
In 2008, agreements were reached between the U.S. government and a foreign government concerning theallocation of income between the two tax jurisdictions. Pursuant to these agreements, we made cash paymentsduring the third quarter of 2008 that constituted payments of tax and interest. These payments were partiallyoffset by tax credits taken in the third quarter and fourth quarter of 2008, and tax refunds and interest onrefunds to be received in 2009. These benefits had been recorded as deferred tax assets in prior periods. Thesettlements did not have a material impact on the Company’s consolidated income statement for the year endedDecember 31, 2008. The impact of these agreements, and other 2008 activity, is reflected in the balances of ourunrecognized tax benefits and deferred tax assets as of December 31, 2008, which are further discussed below.
As of December 31, 2008, the gross amount of unrecognized tax benefits was approximately $369 million. Ifthe Company were to prevail on all uncertain tax positions, the net effect would be a benefit to the Company’seffective tax rate of approximately $174 million. The remaining approximately $195 million, which was recordedas a deferred tax asset, primarily represents tax benefits that would be received in different tax jurisdictions inthe event that the Company did not prevail on all uncertain tax positions. The Company recognizes accruedinterest and penalties related to unrecognized tax benefits in income tax expense. The Company hadapproximately $110 million in interest and penalties related to unrecognized tax benefits accrued as ofDecember 31, 2008. If the Company were to prevail on all uncertain tax positions, the reversal of this accrualwould also be a benefit to the Company’s effective tax rate.
Based on current tax laws, the Company’s effective tax rate in 2009 is expected to be approximately23.0 percent to 24.0 percent before considering the effect of any unusual or special items that may affect our taxrate in future years.
Liquidity, Capital Resources and Financial Position
We believe our ability to generate cash from operating activities is one of our fundamental financialstrengths. The near-term outlook for our business remains strong and we expect to generate substantial cashflows from operations in 2009. As a result of our expected strong cash flows from operations, we have significantflexibility to meet our financial commitments. We typically fund a significant portion of our dividends, capitalexpenditures, contractual obligations, share repurchases and acquisitions with cash generated from operating
60

activities. We rely on external funding for additional cash requirements. The Company does not typically raisecapital through the issuance of stock, instead, we use debt financing to lower our overall cost of capital andincrease our return on shareowners’ equity. Refer to the heading ‘‘Cash Flows from Financing Activities—DebtFinancing,’’ below. Our debt financing includes the use of an extensive commercial paper program as part of ouroverall cash management strategy. Despite the recent disruption to the general credit markets, our liquidityremains strong, and our commercial paper program continues to function each day. We are able to access 60- to90-day terms and have not had a material change to our spreads to benchmark rates; however, there is noassurance that this will not change in the future. The Company is reviewing its optimal mix of short-term andlong-term debt. We may replace a certain amount of commercial paper and short-term debt with longer-termdebt in the future.
On September 3, 2008, we announced our intention to make cash offers to purchase China Huiyuan JuiceGroup Limited, a Hong Kong listed company which owns the Huiyuan juice business throughout China(‘‘Huiyuan’’). Assuming full acceptance of the offers, the transaction is valued at approximately $2.4 billion.Refer to the heading ‘‘Additional Information.’’ Due to this pending transaction, the Company curtailed its sharerepurchase program during the fourth quarter of 2008, and does not anticipate repurchasing shares during 2009.
The significant decline in the equity markets precipitated by the recent credit crisis and financial systeminstability has negatively affected the value of our pension plan assets. As a result of the decline in fair value ofour pension plan assets, we have made and will consider making additional contributions to our U.S. andinternational pension plans in 2009. Refer to the heading ‘‘Aggregate Contractual Obligations’’ and Note 16 ofNotes to Consolidated Financial Statements for further discussion.
The majority of the Company’s cash is held by our international subsidiaries. We have reviewed ourcontingency plans and would be able to access cash held by our international subsidiaries on short notice. Ourapproximate $4.7 billion cash balance as of December 31, 2008, is available and held in liquid, high-quality cashequivalent investments. However, in the event that we required the use of cash held by our internationalsubsidiaries for an extended period of time in the United States, we would be required to treat the cash as havingbeen repatriated and we would incur significant tax liabilities. Refer to the heading ‘‘Critical Accounting Policiesand Estimates—Income Taxes,’’ above.
In addition to the Company’s cash balances and commercial paper program, we also maintain $2.6 billion ofcommitted, currently unused credit facilities from our network of relationship banks. These backup lines ofcredit expire at various times from 2009 through 2013. We have evaluated the financial stability of each bank andbelieve we can access the funds, if needed. Refer to Note 7 of Notes to Consolidated Financial Statements.
Based on all of these factors, the Company believes its current liquidity position is strong, and we willcontinue to meet all of our financial commitments for the foreseeable future.
Cash Flows from Operating Activities
Net cash provided by operating activities for the years ended December 31, 2008, 2007 and 2006 wasapproximately $7,571 million, $7,150 million and $5,957 million, respectively.
Cash flows from operating activities increased $421 million, or 6 percent, in 2008 compared to 2007. Thisincrease was primarily attributable to increased cash collections from customers, driven by the 11 percentincrease in net operating revenues. Refer to heading ‘‘Operations Review—Net Operating Revenues.’’
The impact of increased cash collections from customers was partially offset by increased payments tosuppliers and vendors, increased payments for selling, general and administrative expenses and an increase in taxpayments. The increase in payments to suppliers and vendors was primarily attributable to higher sales volumeand increased marketing and advertising costs to support our brands. The increase in tax payments includedpayments associated with the agreement between the U.S. government and a foreign government. Refer to theheading ‘‘Operations Review—Income Taxes’’ and Note 17 of Notes to Consolidated Financial Statements.
61

Additionally, the Company made approximately $224 million in payments related to streamlining activities andthe costs of productivity initiatives during 2008. Refer to Note 18 of Notes to Consolidated Financial Statements.
On May 26, 2008, the Company and the other defendants reached an agreement with the plaintiffs in a classaction lawsuit (Carpenters Health & Welfare Fund of Philadelphia & Vicinity v. The Coca-Cola Company, et al.) tosettle the lawsuit for approximately $138 million, without admitting any wrongdoing. The settlement amount wascovered by insurance and, therefore, the settlement had no impact on our consolidated statement of income.The payments related to this settlement were made directly from the insurers to the plaintiffs during the thirdquarter and fourth quarter of 2008. As a result, the settlement had no impact on our consolidated statement ofcash flows.
Cash flows from operating activities increased $1,193 million, or 20 percent, in 2007 compared to 2006. Thisincrease was primarily related to increased cash receipts from customers in 2007, which was driven by a20 percent rise in net operating revenues. These higher cash collections were offset in part by increasedpayments to suppliers and vendors in 2007, primarily related to the increased cost of goods sold to support thehigher sales volumes, and secondarily related to higher cash payments for selling, general and administrativerelated costs. Cash flows from operating activities in 2007 were also reduced due to an increase in interestpayments of $193 million and an increase in cash payments for streamlining initiatives of $83 million. Cash flowsfrom operating activities in 2006 included the impact of increased tax payments made related to repatriation offoreign earnings under The American Jobs Creation Act of 2004, a contribution of approximately $216 millionto a U.S. Voluntary Employee Beneficiary Association (‘‘VEBA’’), a tax-qualified trust to fund retiree medicalbenefits and a $100 million donation made to The Coca-Cola Foundation. Refer to Note 16 and Note 19 ofNotes to Consolidated Financial Statements for additional information on the contribution to a VEBA.
Cash Flows from Investing Activities
Our cash flows used in investing activities are summarized as follows (in millions):
Year Ended December 31, 2008 2007 2006
Cash flows (used in) provided by investing activities:Acquisitions and investments, principally beverage and
bottling companies and trademarks $ (759) $ (5,653) $ (901)Purchases of other investments (240) (99) (82)Proceeds from disposals of bottling companies and other
investments 479 448 640Purchases of property, plant and equipment (1,968) (1,648) (1,407)Proceeds from disposals of property, plant and equipment 129 239 112Other investing activities (4) (6) (62)
Net cash used in investing activities $ (2,363) $ (6,719) $ (1,700)
Cash used in investing activities included acquisitions and investments of approximately $759 million in2008, $5,653 million in 2007 and $901 million in 2006.
In 2008, the Company’s acquisition and investment activities included the acquisition of brands and licensesin Denmark and Finland from Carlsberg for approximately $225 million. None of the other acquisitions during2008 was individually significant. Refer to Note 20 of Notes to Consolidated Financial Statements.
Investing activities during 2008 also included proceeds of approximately $275 million, net of the cashbalance as of the disposal date, related to the sale of Remil to Coca-Cola FEMSA. Refer to Note 3 and Note 19of Notes to Consolidated Financial Statements.
In 2007, our Company acquired glacéau, 18 German bottling and distribution operations, FuzeBeverage, LLC (‘‘Fuze’’) and Leao Junior. Our Company also completed the acquisition of the remaining
62

65 percent of the shares of capital stock of CCBPI not previously owned by our Company. In addition, theCompany acquired a 50 percent interest in Jugos del Valle, a 34 percent interest in Tokyo Coca-Cola BottlingCompany (‘‘Tokyo CCBC’’) and an 11 percent interest in NORSA. Refer to Note 20 of Notes to ConsolidatedFinancial Statements. The remaining amount of cash used for acquisitions and investments was primarily relatedto the acquisition of various trademarks and brands, none of which was individually significant.
Investing activities in 2007 also included proceeds of approximately $238 million received from the sale ofour 49 percent equity interest in Vonpar, approximately $143 million received from the sale of a portion of ourinterest in Coca-Cola Amatil, and approximately $106 million in proceeds from the sale of real estate in Spainand in the United States. Refer to Note 19 of Notes to Consolidated Financial Statements.
In 2006, our Company acquired a controlling interest in CCCIL and acquired Apollinaris and TJC Holdings(Pty) Ltd., a South African bottling company (‘‘TJC’’). Refer to Note 20 of Notes to Consolidated FinancialStatements. The remaining amount of cash used for acquisitions and investments was primarily related to theacquisition of various trademarks and brands, none of which was individually significant.
Investing activities in 2006 also included proceeds of approximately $198 million received from the sale ofshares in connection with the initial public offering of Coca-Cola Icecek and proceeds of approximately$427 million received from the sale of a portion of Coca-Cola FEMSA shares to FEMSA. Refer to Note 3 ofNotes to Consolidated Financial Statements.
Net purchases of property, plant and equipment for the years ended December 31, 2008, 2007 and 2006were approximately $1,839 million, $1,409 million and $1,295 million, respectively. These increases wereprimarily related to acquisitions of certain bottling operations in 2007 and 2006. Refer to Note 20 of Notes toConsolidated Financial Statements. Generally, bottling and finished product operations are more capitalintensive compared to concentrate and syrup operations. Additionally, the impact of foreign currencyfluctuations during 2008 also contributed to the increase in reported purchases of property, plant andequipment. Refer to the heading ‘‘Foreign Exchange,’’ below. Our Company currently estimates that netpurchases of property, plant and equipment in 2009 will be approximately $1.8 billion to $2.0 billion.
Total capital expenditures for property, plant and equipment (including our investments in informationtechnology) and the percentage of such totals by operating segment for 2008, 2007 and 2006 were as follows:
Year Ended December 31, 2008 2007 2006
Capital expenditures (in millions) $ 1,968 $ 1,648 $ 1,407
Eurasia & Africa 3.4% 4.5% 3.0%Europe 3.9 4.8 6.7Latin America 2.9 2.8 3.1North America 25.0 20.9 29.9Pacific 9.0 11.6 9.5Bottling Investments 41.6 39.1 29.7Corporate 14.2 16.3 18.1
63

Cash Flows from Financing Activities
Our cash flows used in financing activities were as follows (in millions):
Year Ended December 31, 2008 2007 2006
Cash flows provided by (used in) financing activities:Issuances of debt $ 4,337 $ 9,979 $ 617Payments of debt (4,308) (5,638) (2,021)Issuances of stock 586 1,619 148Purchases of stock for treasury (1,079) (1,838) (2,416)Dividends (3,521) (3,149) (2,911)
Net cash provided by (used in) financing activities $ (3,985) $ 973 $ (6,583)
Debt Financing
Our Company maintains debt levels we consider prudent based on our cash flows, interest coverage ratioand percentage of debt to capital. We use debt financing to lower our overall cost of capital, which increases ourreturn on shareowners’ equity. This exposes us to adverse changes in interest rates. Our interest expense mayalso be affected by our credit ratings.
As of December 31, 2008, our long-term debt was rated ‘‘A+’’ by Standard & Poor’s and ‘‘Aa3’’ by Moody’s,and our commercial paper program was rated ‘‘A-1’’ and ‘‘P-1’’ by Standard & Poor’s and Moody’s, respectively.In assessing our credit strength, both Standard & Poor’s and Moody’s consider our capital structure (includingthe amount and maturity dates of our debt) and financial policies as well as the aggregated balance sheet andother financial information for the Company and certain bottlers, including CCE and Coca-Cola Hellenic. Whilethe Company has no legal obligation for the debt of these bottlers, the rating agencies believe the strategicimportance of the bottlers to the Company’s business model provides the Company with an incentive to keepthese bottlers viable. It is our expectation that the credit rating agencies will continue using this methodology. Ifour credit ratings were to be downgraded as a result of changes in our capital structure, our major bottlers’financial performance, changes in the credit rating agencies’ methodology in assessing our credit strength or forany other reason, our cost of borrowing could increase. Additionally, if certain bottlers’ credit ratings were todecline, the Company’s share of equity income could be reduced as a result of the potential increase in interestexpense for these bottlers.
In October 2008, Standard & Poor’s affirmed the Company’s A+ long-term debt rating, but revised itsoutlook from stable to negative. Moody’s rating of Aa3 for the Company’s long-term debt remains on negativeoutlook, where it has been since 2001. The Company does not believe that a downgrade by either agency wouldhave a material adverse effect on the cost of borrowing.
We monitor our interest coverage ratio and, as indicated above, the rating agencies consider our ratio inassessing our credit ratings. However, the rating agencies aggregate financial data for certain bottlers along withour Company when assessing our debt rating. As such, the key measure to rating agencies is the aggregateinterest coverage ratio of the Company and certain bottlers. Both Standard & Poor’s and Moody’s employdifferent aggregation methodologies and have different thresholds for the aggregate interest coverage ratio.These thresholds are not necessarily permanent, nor are they fully disclosed to our Company.
Our global presence and strong capital position give us access to key financial markets around the world,enabling us to raise funds at a low effective cost. This posture, coupled with active management of our mix ofshort-term and long-term debt and our mix of fixed-rate and variable-rate debt, results in a lower overall cost ofborrowing. Our debt management policies, in conjunction with our share repurchase programs and investmentactivity, can result in current liabilities exceeding current assets.
64

Issuances and payments of debt included both short-term and long-term financing activities. OnDecember 31, 2008, we had approximately $3,462 million in lines of credit and other short-term credit facilitiesavailable, of which approximately $677 million was outstanding. This outstanding amount was primarily relatedto our international operations.
The issuances of debt in 2008 included approximately $4,001 million of issuances of commercial paper andshort-term debt with maturities of greater than 90 days, and approximately $194 million of net issuances ofcommercial paper and short-term debt with maturities of 90 days or less. The payments of debt in 2008 includedapproximately $4,032 million related to commercial paper and short-term debt with maturities of greater than90 days. The Company continues to review its optimal mix of short-term and long-term debt.
The issuances of debt in 2007 included approximately $6,024 million of issuances of commercial paper andshort-term debt with maturities of greater than 90 days, approximately $1,750 million in issuances of long-termnotes due November 15, 2017, and approximately $2,024 million of net issuances of commercial paper andshort-term debt with maturities of 90 days or less. The increase in debt was primarily due to 2007 acquisitions.Refer to Note 20 of Notes to Consolidated Financial Statements. During the fourth quarter of 2007, theCompany replaced a certain amount of commercial paper and short-term debt with longer-term debt. Refer toNote 8 of Notes to Consolidated Financial Statements. The payments of debt in 2007 included approximately$5,514 million related to commercial paper and short-term debt with maturities of greater than 90 days. Includedin these payments was the payment of the outstanding liability to CCEAG shareowners in January 2007 of$1,068 million.
The issuances of debt in 2006 included approximately $484 million of issuances of commercial paper andshort-term debt with maturities of greater than 90 days. The payments of debt in 2006 included approximately$580 million related to commercial paper and short-term debt with maturities of greater than 90 days andapproximately $1,383 million of net repayments of commercial paper and short-term debt with maturities of90 days or less.
Issuances of Stock
The issuances of stock in 2008, 2007 and 2006 primarily related to the exercise of stock options by Companyemployees. In addition, during 2007, certain executive officers and former shareholders of glacéau investedapproximately $179 million of their proceeds from the sale of glacéau in common stock of the Company at thencurrent market prices. These shares of Company common stock were placed in escrow pursuant to the glacéauacquisition agreement.
Share Repurchases
In October 1996, our Board of Directors authorized a plan (‘‘1996 Plan’’) to repurchase up to 206 millionshares of our Company’s common stock through 2006. On July 20, 2006, the Board of Directors of the Companyauthorized a new share repurchase program of up to 300 million shares of the Company’s common stock. Thenew program took effect upon the expiration of the 1996 Plan on October 31, 2006. The table below presentsannual shares repurchased and average price per share:
Year Ended December 31, 2008 2007 2006
Number of shares repurchased (in millions) 18 34 55Average price per share $ 58.01 $ 51.66 $ 45.19
Since the inception of our initial share repurchase program in 1984 through our current program as ofDecember 31, 2008, we have purchased approximately 1.3 billion shares of our Company’s common stock at anaverage price per share of $19.02.
65

The Company curtailed its share repurchase program during the fourth quarter of 2008. Additionally, as aresult of the pending acquisition of Huiyuan, the Company does not anticipate repurchasing shares during 2009.
Dividends
At its February 2009 meeting, our Board of Directors increased our quarterly dividend by 8 percent, raisingit to $0.41 per share, equivalent to a full year dividend of $1.64 per share in 2009. This is our 47th consecutiveannual increase. Our annual common stock dividend was $1.52 per share, $1.36 per share and $1.24 per share in2008, 2007 and 2006, respectively. The 2008 dividend represented a 12 percent increase from 2007, and the 2007dividend represented a 10 percent increase from 2006.
Off-Balance Sheet Arrangements and Aggregate Contractual Obligations
Off-Balance Sheet Arrangements
In accordance with the definition under SEC rules, the following qualify as off-balance sheet arrangements:
• any obligation under certain guarantee contracts;
• a retained or contingent interest in assets transferred to an unconsolidated entity or similar arrangementthat serves as credit, liquidity or market risk support to that entity for such assets;
• any obligation under certain derivative instruments; and
• any obligation arising out of a material variable interest held by the registrant in an unconsolidated entitythat provides financing, liquidity, market risk or credit risk support to the registrant, or engages inleasing, hedging or research and development services with the registrant.
As of December 31, 2008, we were contingently liable for guarantees of indebtedness owed by third partiesin the amount of approximately $238 million. These guarantees primarily are related to third-party customers,bottlers and vendors and have arisen through the normal course of business. These guarantees have variousterms, and none of these guarantees was individually significant. The amount represents the maximum potentialfuture payments that we could be required to make under the guarantees; however, we do not consider itprobable that we will be required to satisfy these guarantees. Management concluded that the likelihood of anymaterial amounts being paid by our Company under these guarantees is not probable. As of December 31, 2008,we were not directly liable for the debt of any unconsolidated entity, and we did not have any retained orcontingent interest in assets as defined above.
Our Company recognizes all derivatives as either assets or liabilities at fair value in our consolidatedbalance sheets. Refer to Note 11 of Notes to Consolidated Financial Statements.
66

Aggregate Contractual Obligations
As of December 31, 2008, the Company’s contractual obligations, including payments due by period, wereas follows (in millions):
Payments Due by Period2014 and
Total 2009 2010-2011 2012-2013 Thereafter
Short-term loans and notespayable1:Commercial paper borrowings $ 5,389 $ 5,389 $ — $ — $ —Lines of credit and other
short-term borrowings 677 677 — — —Current maturities of long-term
debt2 465 465 — — —Long-term debt, net of current
maturities2 2,781 — 620 265 1,896Estimated interest payments3 1,707 163 273 219 1,052Accrued income taxes4 252 252 — — —Purchase obligations5 10,737 7,041 1,221 517 1,958Marketing obligations6 4,464 1,910 1,061 658 835Lease obligations 631 174 231 108 118
Total contractual obligations4 $ 27,103 $ 16,071 $ 3,406 $ 1,767 $ 5,859
1 Refer to Note 7 of Notes to Consolidated Financial Statements for information regarding short-termloans and notes payable. Upon payment of outstanding commercial paper, we typically issue newcommercial paper. Lines of credit and other short-term borrowings are expected to fluctuatedepending upon current liquidity needs, especially at international subsidiaries.
2 Refer to Note 8 of Notes to Consolidated Financial Statements for information regarding long-termdebt. We will consider several alternatives to settle this long-term debt, including the use of cash flowsfrom operating activities, issuance of commercial paper or issuance of other long-term debt.
3 We calculated estimated interest payments for our long-term fixed-rate debt based on the applicablerates and payment dates. We typically expect to settle such interest payments with cash flows fromoperating activities and/or short-term borrowings.
4 Refer to Note 17 of Notes to Consolidated Financial Statements for information regarding incometaxes. As of December 31, 2008, the noncurrent portion of our income tax liability, including accruedinterest and penalties related to unrecognized tax benefits, was approximately $447 million, which wasnot included in the total above. At this time, the settlement period for the noncurrent portion of ourincome tax liability cannot be determined. In addition, any payments related to unrecognized taxbenefits would be partially offset by reductions in payments in other jurisdictions.
5 The purchase obligations include agreements to purchase goods or services that are enforceable andlegally binding and that specify all significant terms, including long-term contractual obligations, openpurchase orders, accounts payable and certain accrued liabilities. We expect to fund these obligationswith cash flows from operating activities.
6 We expect to fund these marketing obligations with cash flows from operating activities.
In accordance with SFAS No. 87, ‘‘Employers’ Accounting for Pensions,’’ and SFAS No. 106, ‘‘Employers’Accounting for Postretirement Benefits Other Than Pensions,’’ as amended by SFAS No. 158, ‘‘Employers’Accounting for Defined Benefit Pension and Other Postretirement Plans—an amendment of FASB StatementsNo. 87, 88, 106, and 132(R),’’ the total accrued benefit liability for pension and other postretirement benefitplans recognized as of December 31, 2008 was approximately $1,620 million. Refer to Note 16 of Notes toConsolidated Financial Statements. This amount is impacted by, among other items, pension expense, fundinglevels, plan amendments, changes in plan demographics and assumptions, investment return on plan assets, andthe application of SFAS No. 158. Because the accrued liability does not represent expected liquidity needs, wedid not include this amount in the contractual obligations table.
67

The Pension Protection Act of 2006 (‘‘PPA’’) was enacted in August 2006 and established, among otherthings, new standards for funding of U.S. defined benefit pension plans. During 2008, the funded status of theCompany’s primary U.S. defined benefit pension plan declined as a result of the overall stock market decline. Inearly 2009, the Company contributed approximately $175 million to this plan. Subsequent to this contribution,the plan is sufficiently funded to maintain maximum flexibility as outlined in the PPA. However, we will consideradditional funding at a later date this year based on asset performance during the beginning of the year. Wegenerally expect to fund all future contributions with cash flows from operating activities.
Our international pension plans are funded in accordance with local laws and income tax regulations. Wedo not expect contributions to these plans to be material in 2009 or thereafter. Therefore, no amounts have beenincluded in the table above.
As of December 31, 2008, the projected benefit obligation of the U.S. qualified pension plans was$1,918 million, and the fair value of plan assets was approximately $1,442 million. The majority of thisunderfunding was due to the negative impact that the recent credit crisis and financial system instability had onthe value of our pension plan assets. As of December 31, 2008, the projected benefit obligation of all pensionplans other than the U.S. qualified pension plans was approximately $1,700 million, and the fair value of allother pension plan assets was approximately $848 million. The majority of this underfunding is attributable to aninternational pension plan for certain non-U.S. employees that is unfunded due to tax law restrictions, as well asour unfunded U.S. nonqualified pension plans. These U.S. nonqualified pension plans provide, for certainassociates, benefits that are not permitted to be funded through a qualified plan because of limits imposed bythe Internal Revenue Code of 1986. The expected benefit payments for these unfunded pension plans are notincluded in the table above. However, we anticipate annual benefit payments to be approximately $40 million in2009 and remain near that level through 2032, decreasing annually thereafter. Refer to Note 16 of Notes toConsolidated Financial Statements.
Deferred income tax liabilities as of December 31, 2008 were approximately $914 million. Refer to Note 17of Notes to Consolidated Financial Statements. This amount is not included in the total contractual obligationstable because we believe this presentation would not be meaningful. Deferred income tax liabilities arecalculated based on temporary differences between the tax bases of assets and liabilities and their respectivebook bases, which will result in taxable amounts in future years when the liabilities are settled at their reportedfinancial statement amounts. The results of these calculations do not have a direct connection with the amountof cash taxes to be paid in any future periods. As a result, scheduling deferred income tax liabilities as paymentsdue by period could be misleading, because this scheduling would not relate to liquidity needs.
On September 3, 2008, we announced our intention to make cash offers to purchase Huiyuan. Assumingfull acceptance of the offers, the transaction is valued at approximately $2.4 billion. Refer to the heading‘‘Additional Information.’’ This amount is excluded from the contractual obligations table, because it is subject topreconditions relating to Chinese regulatory approvals.
As of December 31, 2008, we have recorded approximately $383 million in the consolidated balance sheetline item other liabilities for minority interests related to consolidated entities in which we do not have a100 percent ownership interest. Such minority interests are not liabilities requiring the use of cash or otherresources; therefore, this amount is excluded from the contractual obligations table.
Foreign Exchange
Our international operations are subject to certain opportunities and risks, including currency fluctuationsand governmental actions. We closely monitor our operations in each country and seek to adopt appropriatestrategies that are responsive to changing economic and political environments, and to fluctuations in foreigncurrencies.
68

We use 70 functional currencies. Due to our global operations, weakness in some of these currencies mightbe offset by strength in others. In 2008, 2007 and 2006, the weighted-average exchange rates for foreigncurrencies in which the Company conducted operations (all operating currencies), and for certain individualcurrencies, strengthened (weakened) against the U.S. dollar as follows:
Year Ended December 31, 2008 2007 2006
All operating currencies 5 % 4 % (1)%
Brazilian real 6 % 11 % 10 %Mexican peso 0 0 0Australian dollar 1 10 (1)South African rand (18) (3) (7)British pound (9) 9 1Euro 9 8 1Japanese yen 12 (2) (6)
These percentages do not include the effects of our hedging activities and, therefore, do not reflect theactual impact of fluctuations in exchange rates on our operating results. Our foreign currency managementprogram is designed to mitigate, over time, a portion of the impact of exchange rate changes on our net incomeand earnings per share. The total currency impact on operating income, including the effect of our hedgingactivities, was an increase of approximately 6 percent in 2008 and an increase of approximately 4 percent in 2007.The impact of a stronger U.S. dollar reduced our operating income by approximately 1 percent in 2006. Basedon the anticipated benefits of hedging coverage in place, the Company currently expects currencies to have a10 percent to 12 percent negative impact on operating income in the first quarter of 2009. The foreign exchangeenvironment is very volatile, and the Company cannot reasonably estimate the impact of foreign currencyexchange rate fluctuations for subsequent periods.
Exchange gain (loss)—net was a gain of approximately $24 million in 2008, and losses of approximately$10 million and $15 million in 2007 and 2006, respectively. These amounts were recorded in other income(loss)—net in our consolidated statements of income. Exchange gain (loss)—net includes the remeasurement ofmonetary assets and liabilities from certain currencies into functional currencies and the costs of hedging certainexposures of our consolidated balance sheets. Refer to Note 11 of Notes to Consolidated Financial Statements.
The Company will continue to manage its foreign currency exposure to mitigate, over time, a portion of theimpact of exchange rate changes on net income and earnings per share.
Overview of Financial Position
Our consolidated balance sheet as of December 31, 2008, compared to our consolidated balance sheet as ofDecember 31, 2007, was impacted by the following:
• a decrease in net assets of $2,285 million resulting from translation adjustments in various balance sheetaccounts;
• an increase in cash and cash equivalents of $608 million, primarily related to the timing of borrowings;
• a decrease of $1,637 million in our investment in CCE, primarily due to our proportionate share ofimpairment charges recorded by CCE;
• a decrease of $942 million in other assets, primarily due to the decline in fair value of pension and otherpostretirement benefit plan assets. Prior to this decline in fair value, the plan assets for certain pensionand other postretirement benefit plans exceeded the benefit obligation, which resulted in the recognitionof a prepaid asset. The Company has now recognized a liability for these pension and otherpostretirement benefit plans;
69

• an increase in our trademarks with indefinite lives of $906 million, primarily related to the finalization ofpurchase accounting for glacéau and Fuze and the acquisition of brands and licenses from Carlsberg. Theincrease in trademarks with indefinite lives related to the finalization of purchase accounting for glacéauresulted in a reclassification from goodwill; and
• a decrease in deferred income taxes of $1,013 million, primarily related to the change in deferred taxes onpension and other postretirement benefit obligations and the reversal of deferred tax liabilities on ourinvestment in CCE as a result of our proportionate share of impairment charges recorded by CCE during2008.
Impact of Inflation and Changing Prices
Inflation affects the way we operate in many markets around the world. In general, we believe that, overtime, we are able to increase prices to counteract the majority of the inflationary effects of increasing costs andto generate sufficient cash flows to maintain our productive capability.
Additional Information
On September 3, 2008, we announced our intention to make cash offers to purchase Huiyuan. The makingof the offers is subject to preconditions relating to Chinese regulatory approvals. We are offering HK$12.20 pershare, and making a comparable offer for outstanding convertible bonds and options. We have acceptedirrevocable undertakings from three shareholders for acceptance of the offers, in aggregate representingapproximately 66 percent of the Huiyuan shares, and upon satisfaction of the preconditions the Company plansto commence a tender offer under Hong Kong securities laws for the remaining shares. Assuming fullacceptance of the offers, the transaction is valued at approximately $2.4 billion.
70

ITEM 7A. QUANTITATIVE AND QUALITATIVE DISCLOSURES ABOUT MARKET RISK
Our Company uses derivative financial instruments primarily to reduce our exposure to adverse fluctuationsin interest rates and foreign currency exchange rates, commodity prices and other market risks. We do not enterinto derivative financial instruments for trading purposes. As a matter of policy, all of our derivative positionsare used to reduce risk by hedging an underlying economic exposure. Because of the high correlation betweenthe hedging instrument and the underlying exposure, fluctuations in the value of the instruments are generallyoffset by reciprocal changes in the value of the underlying exposure. The Company generally hedges anticipatedexposures up to 36 months in advance; however, the majority of our derivative instruments expire within24 months or less. Virtually all of our derivatives are straightforward, over-the-counter instruments with liquidmarkets.
Foreign Exchange
We manage most of our foreign currency exposures on a consolidated basis, which allows us to net certainexposures and take advantage of any natural offsets. In 2008, we generated approximately 75 percent of our netoperating revenues from operations outside of the United States; therefore, weakness in one particular currencymight be offset by strengths in other currencies over time. We use derivative financial instruments to furtherreduce our net exposure to currency fluctuations.
Our Company enters into forward exchange contracts and purchases currency options (principally euro andJapanese yen) and collars to hedge certain portions of forecasted cash flows denominated in foreign currencies.Additionally, we enter into forward exchange contracts to offset the earnings impact relating to exchange ratefluctuations on certain monetary assets and liabilities. We also enter into forward exchange contracts as hedgesof net investments in international operations.
Interest Rates
We monitor our mix of fixed-rate and variable-rate debt, as well as our mix of short-term debt versuslong-term debt. From time to time, we enter into interest rate swap agreements to manage our mix of fixed-rateand variable-rate debt.
Value-at-Risk
We monitor our exposure to financial market risks using several objective measurement systems, includingvalue-at-risk models. Our value-at-risk calculations use a historical simulation model to estimate potential futurelosses in the fair value of our derivatives and other financial instruments that could occur as a result of adversemovements in foreign currency and interest rates. We have not considered the potential impact of favorablemovements in foreign currency and interest rates on our calculations. We examined historical weekly returnsover the previous 10 years to calculate our value-at-risk. The average value-at-risk represents the simple averageof quarterly amounts over the past year. As a result of our foreign currency value-at-risk calculations, weestimate with 95 percent confidence that the fair values of our foreign currency derivatives and other financialinstruments, over a one-week period, would decline by not more than approximately $44 million, $20 million and$14 million, respectively, using 2008, 2007 or 2006 average fair values, and by not more than approximately$30 million and $19 million, respectively, using December 31, 2008 and 2007 fair values. According to ourinterest rate value-at-risk calculations, we estimate with 95 percent confidence that any increase in our netinterest expense due to an adverse move in our 2008 average or in our December 31, 2008, interest rates over aone-week period would not have a material impact on our consolidated financial statements. Our December 31,2007 and 2006 estimates also were not material to our consolidated financial statements.
71

ITEM 8. FINANCIAL STATEMENTS AND SUPPLEMENTARY DATA
TABLE OF CONTENTS
Page
Consolidated Statements of Income . . . . . . . . . . . . . . . . . . . . . . . . . . . . . . . . . . . . . . . . . . . . . . . . . . . . 73
Consolidated Balance Sheets . . . . . . . . . . . . . . . . . . . . . . . . . . . . . . . . . . . . . . . . . . . . . . . . . . . . . . . . . . 74
Consolidated Statements of Cash Flows . . . . . . . . . . . . . . . . . . . . . . . . . . . . . . . . . . . . . . . . . . . . . . . . . 75
Consolidated Statements of Shareowners’ Equity . . . . . . . . . . . . . . . . . . . . . . . . . . . . . . . . . . . . . . . . . . 76
Notes to Consolidated Financial Statements . . . . . . . . . . . . . . . . . . . . . . . . . . . . . . . . . . . . . . . . . . . . . . 77
Report of Management on Internal Control Over Financial Reporting . . . . . . . . . . . . . . . . . . . . . . . . . . 141
Report of Independent Registered Public Accounting Firm . . . . . . . . . . . . . . . . . . . . . . . . . . . . . . . . . . 142
Report of Independent Registered Public Accounting Firm on Internal Control Over FinancialReporting . . . . . . . . . . . . . . . . . . . . . . . . . . . . . . . . . . . . . . . . . . . . . . . . . . . . . . . . . . . . . . . . . . . . . . 143
Quarterly Data (Unaudited) . . . . . . . . . . . . . . . . . . . . . . . . . . . . . . . . . . . . . . . . . . . . . . . . . . . . . . . . . . 144
72

THE COCA-COLA COMPANY AND SUBSIDIARIES
CONSOLIDATED STATEMENTS OF INCOME
Year Ended December 31, 2008 2007 2006(In millions except per share data)
NET OPERATING REVENUES $ 31,944 $ 28,857 $ 24,088Cost of goods sold 11,374 10,406 8,164
GROSS PROFIT 20,570 18,451 15,924Selling, general and administrative expenses 11,774 10,945 9,431Other operating charges 350 254 185
OPERATING INCOME 8,446 7,252 6,308Interest income 333 236 193Interest expense 438 456 220Equity income (loss) — net (874) 668 102Other income (loss) — net (28) 173 195
INCOME BEFORE INCOME TAXES 7,439 7,873 6,578Income taxes 1,632 1,892 1,498
NET INCOME $ 5,807 $ 5,981 $ 5,080
BASIC NET INCOME PER SHARE $ 2.51 $ 2.59 $ 2.16
DILUTED NET INCOME PER SHARE $ 2.49 $ 2.57 $ 2.16
AVERAGE SHARES OUTSTANDING 2,315 2,313 2,348Effect of dilutive securities 21 18 2
AVERAGE SHARES OUTSTANDING ASSUMING DILUTION 2,336 2,331 2,350
Refer to Notes to Consolidated Financial Statements.
73

THE COCA-COLA COMPANY AND SUBSIDIARIES
CONSOLIDATED BALANCE SHEETS
December 31, 2008 2007(In millions except par value)
ASSETSCURRENT ASSETS
Cash and cash equivalents $ 4,701 $ 4,093Marketable securities 278 215Trade accounts receivable, less allowances of $51 and $56, respectively 3,090 3,317Inventories 2,187 2,220Prepaid expenses and other assets 1,920 2,260
TOTAL CURRENT ASSETS 12,176 12,105
INVESTMENTSEquity method investments:
Coca-Cola Hellenic Bottling Company S.A. 1,487 1,549Coca-Cola FEMSA, S.A.B. de C.V. 877 996Coca-Cola Amatil Limited 638 806Coca-Cola Enterprises Inc. — 1,637Other, principally bottling companies and joint ventures 2,314 2,301
Other investments, principally bottling companies 463 488
TOTAL INVESTMENTS 5,779 7,777
OTHER ASSETS 1,733 2,675PROPERTY, PLANT AND EQUIPMENT — net 8,326 8,493TRADEMARKS WITH INDEFINITE LIVES 6,059 5,153GOODWILL 4,029 4,256OTHER INTANGIBLE ASSETS 2,417 2,810
TOTAL ASSETS $ 40,519 $ 43,269
LIABILITIES AND SHAREOWNERS’ EQUITYCURRENT LIABILITIES
Accounts payable and accrued expenses $ 6,205 $ 6,915Loans and notes payable 6,066 5,919Current maturities of long-term debt 465 133Accrued income taxes 252 258
TOTAL CURRENT LIABILITIES 12,988 13,225
LONG-TERM DEBT 2,781 3,277OTHER LIABILITIES 3,401 3,133DEFERRED INCOME TAXES 877 1,890SHAREOWNERS’ EQUITY
Common stock, $0.25 par value; Authorized — 5,600 shares;Issued — 3,519 and 3,519 shares, respectively 880 880
Capital surplus 7,966 7,378Reinvested earnings 38,513 36,235Accumulated other comprehensive income (loss) (2,674) 626Treasury stock, at cost — 1,207 and 1,201 shares, respectively (24,213) (23,375)
TOTAL SHAREOWNERS’ EQUITY 20,472 21,744
TOTAL LIABILITIES AND SHAREOWNERS’ EQUITY $ 40,519 $ 43,269
Refer to Notes to Consolidated Financial Statements.
74

THE COCA-COLA COMPANY AND SUBSIDIARIES
CONSOLIDATED STATEMENTS OF CASH FLOWS
Year Ended December 31, 2008 2007 2006(In millions)
OPERATING ACTIVITIESNet income $ 5,807 $ 5,981 $ 5,080Depreciation and amortization 1,228 1,163 938Stock-based compensation expense 266 313 324Deferred income taxes (360) 109 (35)Equity income or loss, net of dividends 1,128 (452) 124Foreign currency adjustments (42) 9 52Gains on sales of assets, including bottling interests (130) (244) (303)Other operating charges 209 166 159Other items 153 99 233Net change in operating assets and liabilities (688) 6 (615)
Net cash provided by operating activities 7,571 7,150 5,957
INVESTING ACTIVITIESAcquisitions and investments, principally
beverage and bottling companies and trademarks (759) (5,653) (901)Purchases of other investments (240) (99) (82)Proceeds from disposals of bottling companies and other investments 479 448 640Purchases of property, plant and equipment (1,968) (1,648) (1,407)Proceeds from disposals of property, plant and equipment 129 239 112Other investing activities (4) (6) (62)
Net cash used in investing activities (2,363) (6,719) (1,700)
FINANCING ACTIVITIESIssuances of debt 4,337 9,979 617Payments of debt (4,308) (5,638) (2,021)Issuances of stock 586 1,619 148Purchases of stock for treasury (1,079) (1,838) (2,416)Dividends (3,521) (3,149) (2,911)
Net cash provided by (used in) financing activities (3,985) 973 (6,583)
EFFECT OF EXCHANGE RATE CHANGES ON CASH AND CASHEQUIVALENTS (615) 249 65
CASH AND CASH EQUIVALENTSNet increase (decrease) during the year 608 1,653 (2,261)Balance at beginning of year 4,093 2,440 4,701
Balance at end of year $ 4,701 $ 4,093 $ 2,440
Refer to Notes to Consolidated Financial Statements.
75

THE COCA-COLA COMPANY AND SUBSIDIARIES
CONSOLIDATED STATEMENTS OF SHAREOWNERS’ EQUITY
Year Ended December 31, 2008 2007 2006(In millions except per share data)
NUMBER OF COMMON SHARES OUTSTANDINGBalance at beginning of year 2,318 2,318 2,369
Stock issued to employees exercising stock options — 8 4Purchases of stock for treasury (18) (35) (55)Treasury stock issued to employees exercising stock options 12 23 —Treasury stock issued to former shareholders of glacéau — 4 —
Balance at end of year 2,312 2,318 2,318
COMMON STOCKBalance at beginning of year $ 880 $ 878 $ 877
Stock issued to employees related to stock compensation plans — 2 1
Balance at end of year 880 880 878
CAPITAL SURPLUSBalance at beginning of year 7,378 5,983 5,492
Stock issued to employees related to stock compensation plans 324 1,001 164Tax (charge) benefit from employees’ stock option and restricted stock plans (1) (28) 3Stock-based compensation 265 309 324Stock purchased by former shareholders of glacéau — 113 —
Balance at end of year 7,966 7,378 5,983
REINVESTED EARNINGSBalance at beginning of year 36,235 33,468 31,299
Adjustment for the cumulative effect on prior years of the measurement provisions of SFASNo. 158 (8) — —
Adjustment for the cumulative effect on prior years of the adoption of Interpretation No. 48 — (65) —Net income 5,807 5,981 5,080Dividends (per share—$1.52, $1.36 and $1.24 in 2008, 2007 and 2006, respectively) (3,521) (3,149) (2,911)
Balance at end of year 38,513 36,235 33,468
ACCUMULATED OTHER COMPREHENSIVE INCOME (LOSS)Balance at beginning of year 626 (1,291) (1,669)
Net foreign currency translation adjustment (2,285) 1,575 603Net gain (loss) on derivatives 1 (64) (26)Net change in unrealized gain on available-for-sale securities (44) 14 43Net change in pension liability (972) 392 —Net change in pension liability, prior to adoption of SFAS No. 158 — — 46
Net other comprehensive income adjustments (3,300) 1,917 666Adjustment to initially apply SFAS No. 158 — — (288)
Balance at end of year (2,674) 626 (1,291)
TREASURY STOCKBalance at beginning of year (23,375) (22,118) (19,644)
Stock issued to employees related to stock compensation plans 243 428 —Stock purchased by former shareholders of glacéau — 66 —Purchases of treasury stock (1,081) (1,751) (2,474)
Balance at end of year (24,213) (23,375) (22,118)
TOTAL SHAREOWNERS’ EQUITY $ 20,472 $ 21,744 $ 16,920
COMPREHENSIVE INCOMENet income $ 5,807 $ 5,981 $ 5,080Net other comprehensive income adjustments (3,300) 1,917 666
TOTAL COMPREHENSIVE INCOME $ 2,507 $ 7,898 $ 5,746
Refer to Notes to Consolidated Financial Statements.
76

THE COCA-COLA COMPANY AND SUBSIDIARIES
NOTES TO CONSOLIDATED FINANCIAL STATEMENTS
NOTE 1: BUSINESS AND SUMMARY OF SIGNIFICANT ACCOUNTING POLICIES
Description of Business
The Coca-Cola Company is predominantly a manufacturer, distributor and marketer of nonalcoholicbeverage concentrates and syrups. We also manufacture, distribute and market finished beverages. In thesenotes, the terms ‘‘Company,’’ ‘‘we,’’ ‘‘us’’ or ‘‘our’’ mean The Coca-Cola Company and all subsidiaries includedin the consolidated financial statements. We primarily sell concentrates and syrups, as well as finished beverages,to bottling and canning operations, distributors, fountain wholesalers and fountain retailers. Our Company ownsor licenses nearly 500 brands, including Coca-Cola, Diet Coke, Fanta and Sprite, and a variety of diet and lightbeverages, waters, enhanced waters, juices and juice drinks, teas, coffees, and energy and sports drinks.Additionally, we have ownership interests in numerous beverage joint ventures, bottling and canning operations.Significant markets for our products exist in all the world’s geographic regions.
While we primarily manufacture, market and sell concentrates and syrups to our bottling partners, fromtime to time we have viewed it as advantageous to acquire a controlling interest in a bottling operation, often ona temporary basis. Often, though not always, these acquired bottling operations are in underperforming marketswhere we believe we can use our resources and expertise to improve performance. Owning such a controllinginterest has allowed us to compensate for limited local resources and has enabled us to help focus the bottler’ssales and marketing programs and assist in the development of the bottler’s business and information systemsand the establishment of appropriate capital structures. Acquisitions and consolidation of controlled bottlingoperations during 2008 and 2007 have resulted in a substantial increase in the number of Company-ownedbottling plants included in our consolidated financial statements and in the number of our associates. In 2008,net operating revenues generated by Company-owned and consolidated bottling operations (which are includedin the Bottling Investments operating segment) represented approximately 27 percent of our Company’sconsolidated net operating revenues and distributed approximately 11 percent of our worldwide unit casevolume.
Basis of Presentation and Consolidation
Our consolidated financial statements are prepared in accordance with accounting principles generallyaccepted in the United States. Our Company consolidates all entities that we control by ownership of a majorityvoting interest as well as variable interest entities for which our Company is the primary beneficiary. Refer to theheading ‘‘Variable Interest Entities,’’ below, for a discussion of variable interest entities.
We use the equity method to account for our investments for which we have the ability to exercisesignificant influence over operating and financial policies. Consolidated net income includes our Company’sproportionate share of the net income or net loss of these companies.
We account for investments in companies that we do not control or account for under the equity methodeither at fair value or under the cost method, as applicable. Investments in equity securities are carried at fairvalue, if the fair value of the security is readily determinable as defined by and in accordance with Statement ofFinancial Accounting Standards (‘‘SFAS’’) No. 115, ‘‘Accounting for Certain Investments in Debt and EquitySecurities.’’ Equity investments carried at fair value are classified as either trading or available-for-salesecurities. Realized and unrealized gains and losses on trading securities and realized gains and losses onavailable-for-sale securities are included in net income. Unrealized gains and losses, net of deferred taxes, onavailable-for-sale securities are included in our consolidated balance sheets as a component of accumulatedother comprehensive income (loss) (‘‘AOCI’’). Trading securities are reported as marketable securities in ourconsolidated balance sheets. Securities classified as available-for-sale are reported as either marketablesecurities or other investments in our consolidated balance sheets, depending on the length of time we intend to
77

THE COCA-COLA COMPANY AND SUBSIDIARIES
NOTES TO CONSOLIDATED FINANCIAL STATEMENTS
NOTE 1: BUSINESS AND SUMMARY OF SIGNIFICANT ACCOUNTING POLICIES (Continued)
hold the investment. The Company has currently chosen not to elect the fair value option as permitted by SFASNo. 159, ‘‘The Fair Value Option for Financial Assets and Financial Liabilities — Including an amendment ofFASB Statement No. 115,’’ which provides entities the option to measure many financial instruments and certainother items at fair value. Investments in equity securities that do not qualify for fair value accounting, or forwhich the Company has not elected the fair value option, are accounted for under the cost method. Inaccordance with the cost method, our initial investment is recorded at cost and we record dividend income whenapplicable dividends are declared. Cost method investments are reported as other investments in ourconsolidated balance sheets.
We eliminate from our financial results all significant intercompany transactions, including theintercompany transactions with variable interest entities and the intercompany portion of transactions withequity method investees.
Certain amounts in the prior years’ consolidated financial statements and notes have been revised toconform to the current year presentation.
Variable Interest Entities
Financial Accounting Standards Board (‘‘FASB’’) Interpretation No. 46 (revised December 2003),‘‘Consolidation of Variable Interest Entities’’ (‘‘Interpretation No. 46(R)’’) addresses the consolidation ofbusiness enterprises to which the usual condition (ownership of a majority voting interest) of consolidation doesnot apply. Interpretation No. 46(R) focuses on controlling financial interests that may be achieved througharrangements that do not involve voting interests. It concludes that in the absence of clear control throughvoting interests, a company’s exposure (variable interest) to the economic risks and potential rewards from thevariable interest entity’s assets and activities is the best evidence of control. If an enterprise holds a majority ofthe variable interests of an entity, it would be considered the primary beneficiary. Upon consolidation, theprimary beneficiary is generally required to include assets, liabilities and noncontrolling interests at fair valueand subsequently account for the variable interest as if it were consolidated based on majority voting interest.
Our consolidated balance sheets include the assets and liabilities of the following:
• all entities in which the Company has ownership of a majority of voting interests; and
• all variable interest entities for which we are the primary beneficiary.
Our Company holds interests in certain entities, primarily bottlers, that are considered variable interestentities. These variable interests relate to profit guarantees or subordinated financial support for these entities.Our Company’s investments, plus any loans and guarantees, related to these variable interest entities totaledapproximately $604 million and $647 million at December 31, 2008 and 2007, respectively, representing ourmaximum exposures to loss. Any creditors of the variable interest entities do not have recourse against thegeneral credit of the Company as a result of including these variable interest entities in our consolidatedfinancial statements. The Company’s investment, plus any loans and guarantees, related to variable interestentities were not significant to the Company’s consolidated financial statements. In addition, assets andliabilities of variable interest entities for which we are the primary beneficiary, and thus are included in ourconsolidated balance sheets, were not significant to the Company’s consolidated financial statements.
78

THE COCA-COLA COMPANY AND SUBSIDIARIES
NOTES TO CONSOLIDATED FINANCIAL STATEMENTS
NOTE 1: BUSINESS AND SUMMARY OF SIGNIFICANT ACCOUNTING POLICIES (Continued)
Use of Estimates and Assumptions
The preparation of our consolidated financial statements requires us to make estimates and assumptionsthat affect the reported amounts of assets, liabilities, revenues and expenses and the disclosure of contingentassets and liabilities in our consolidated financial statements and accompanying notes. Although these estimatesare based on our knowledge of current events and actions we may undertake in the future, actual results mayultimately differ from estimates and assumptions. Furthermore, when testing assets for impairment in futureperiods, if management uses different assumptions or if different conditions occur, impairment charges mayresult.
Risks and Uncertainties
Factors that could adversely impact the Company’s operations or financial results include, but are notlimited to, the following: obesity concerns; water scarcity and quality; changes in the nonalcoholic beveragesbusiness environment; the global credit crisis; increased competition; inability to expand operations indeveloping and emerging markets; fluctuations in foreign currency exchange; interest rate increases; inability tomaintain good relationships with our bottling partners; a deterioration in our bottling partners’ financialcondition; strikes or work stoppages (including at key manufacturing locations); increased cost, disruption ofsupply or shortage of energy; increased cost, disruption of supply or shortage of ingredients or packagingmaterials; changes in laws and regulations relating to our business, including those regarding beveragecontainers and packaging; additional labeling or warning requirements; unfavorable economic and politicalconditions in the United States and international markets; changes in commercial and market practices withinthe European Economic Area; litigation or legal proceedings; adverse weather conditions; an inability tomaintain our brand image and corporate reputation; changes in the legal and regulatory environment in variouscountries in which we operate; changes in accounting and taxation standards, including an increase in tax rates;an inability to achieve our overall long-term goals; an inability to protect our information systems; futureimpairment charges; an inability to successfully manage our Company-owned bottling operations; climatechange; and global or regional catastrophic events.
Our Company monitors our operations with a view to minimizing the impact to our overall business thatcould arise as a result of the risks and uncertainties inherent in our business.
Revenue Recognition
Our Company recognizes revenue when persuasive evidence of an arrangement exists, delivery of productshas occurred, the sales price charged is fixed or determinable, and collectibility is reasonably assured. For ourCompany, this generally means that we recognize revenue when title to our products is transferred to ourbottling partners, resellers or other customers. In particular, title usually transfers upon shipment to or receipt atour customers’ locations, as determined by the specific sales terms of the transactions. Our sales terms do notallow for a right of return except for matters related to any manufacturing defects on our part.
In addition, our customers can earn certain incentives, which are included in deductions from revenue, acomponent of net operating revenues in the consolidated statements of income. These incentives include, butare not limited to, cash discounts, funds for promotional and marketing activities, volume-based incentiveprograms and support for infrastructure programs (refer to the heading ‘‘Other Assets’’). The aggregatedeductions from revenue recorded by the Company in relation to these programs, including amortizationexpense on infrastructure initiatives, was approximately $4.4 billion, $4.1 billion and $3.8 billion for the years
79

THE COCA-COLA COMPANY AND SUBSIDIARIES
NOTES TO CONSOLIDATED FINANCIAL STATEMENTS
NOTE 1: BUSINESS AND SUMMARY OF SIGNIFICANT ACCOUNTING POLICIES (Continued)
ended December 31, 2008, 2007 and 2006, respectively. In preparing the financial statements, management mustmake estimates related to the contractual terms, customer performance and sales volume to determine the totalamounts recorded as deductions from revenue. Management also considers past results in making suchestimates. The actual amounts ultimately paid may be different from our estimates.
Advertising Costs
Our Company expenses production costs of print, radio, television and other advertisements as of the firstdate the advertisements take place. Advertising costs included in selling, general and administrative expenseswere approximately $3.0 billion, $2.8 billion and $2.6 billion for the years ended December 31, 2008, 2007 and2006, respectively. As of December 31, 2008 and 2007, advertising and production costs of approximately$195 million and $224 million, respectively, were recorded in prepaid expenses and other assets in ourconsolidated balance sheets.
Stock-Based Compensation
Our Company currently sponsors stock option plans and restricted stock award plans. Refer to Note 15.Effective January 1, 2006, the Company adopted SFAS No. 123 (revised 2004), ‘‘Share Based Payment’’ (‘‘SFASNo. 123(R)’’). Our Company adopted SFAS No. 123(R) using the modified prospective method. Based on theterms of our plans, our Company did not have a cumulative effect related to our plans. The adoption of SFASNo. 123(R) did not have a material impact on our stock-based compensation expense for the year endedDecember 31, 2006. The fair values of the stock awards are determined using an estimated expected life. TheCompany recognizes compensation expense on a straight-line basis over the period the award is earned by theemployee.
Our equity method investees also adopted SFAS No. 123(R) effective January 1, 2006. Our proportionateshare of the stock-based compensation expense resulting from the adoption of SFAS No. 123(R) by our equitymethod investees is recognized as a reduction of equity income. The adoption of SFAS No. 123(R) by our equitymethod investees did not have a material impact on our consolidated financial statements.
Income Taxes
Income tax expense includes United States, state, local and international income taxes, plus a provision forU.S. taxes on undistributed earnings of foreign subsidiaries not deemed to be indefinitely reinvested. Deferredtax assets and liabilities are recognized for the tax consequences of temporary differences between the financialreporting and the tax basis of existing assets and liabilities. The tax rate used to determine the deferred tax assetsand liabilities is the enacted tax rate for the year and manner in which the differences are expected to reverse.Valuation allowances are recorded to reduce deferred tax assets to the amount that will more likely than not berealized. On January 1, 2007, the Company adopted FASB Interpretation No. 48, ‘‘Accounting for Uncertainty inIncome Taxes’’ (‘‘Interpretation No. 48’’) to account for uncertainty in income taxes recognized in theCompany’s financial statements in accordance with SFAS No. 109, ‘‘Accounting for Income Taxes.’’ Refer toNote 17.
Net Income Per Share
Basic net income per share is computed by dividing net income by the weighted-average number ofcommon shares outstanding during the reporting period. Diluted net income per share is computed similarly to
80

THE COCA-COLA COMPANY AND SUBSIDIARIES
NOTES TO CONSOLIDATED FINANCIAL STATEMENTS
NOTE 1: BUSINESS AND SUMMARY OF SIGNIFICANT ACCOUNTING POLICIES (Continued)
basic net income per share, except that it includes the potential dilution that could occur if dilutive securitieswere exercised. Approximately 59 million, 71 million and 175 million stock option awards were excluded fromthe computations of diluted net income per share in 2008, 2007 and 2006, respectively, because the awards wouldhave been antidilutive for the periods presented.
Cash Equivalents
We classify marketable securities that are highly liquid and have maturities of three months or less at thedate of purchase as cash equivalents. We manage our exposure to counterparty credit risk through specificminimum credit standards, diversification of counterparties and procedures to monitor our credit riskconcentrations. We have established strict counterparty credit guidelines and enter into transactions only withfinancial institutions of investment grade or better. We monitor counterparty exposures daily and review anydowngrade in credit rating immediately.
Trade Accounts Receivable
We record trade accounts receivable at net realizable value. This value includes an appropriate allowancefor estimated uncollectible accounts to reflect any loss anticipated on the trade accounts receivable balances andcharged to the provision for doubtful accounts. We calculate this allowance based on our history of write-offs,the level of past-due accounts based on the contractual terms of the receivables, and our relationships with, andthe economic status of, our bottling partners and customers.
Activity in the allowance for doubtful accounts was as follows (in millions):
Year Ended December 31, 2008 2007 2006
Balance, beginning of year $ 56 $ 63 $ 72Net charges to costs and expenses 17 17 2Write-offs (28) (32) (12)Other1 6 8 1
Balance, end of year $ 51 $ 56 $ 63
1 Other includes acquisitions, divestitures and currency translation.
A significant portion of our net operating revenues is derived from sales of our products in internationalmarkets. Refer to Note 21. We also generate a significant portion of our net operating revenues by sellingconcentrates and syrups to bottlers in which we have a noncontrolling interest, including Coca-ColaEnterprises Inc. (‘‘CCE’’), Coca-Cola Hellenic Bottling Company S.A. (‘‘Coca-Cola Hellenic’’), Coca-ColaFEMSA, S.A.B. de C.V. (‘‘Coca-Cola FEMSA’’) and Coca-Cola Amatil Limited (‘‘Coca-Cola Amatil’’). Refer toNote 3.
Inventories
Inventories consist primarily of raw materials and packaging (which includes ingredients and supplies) andfinished goods (which include concentrates and syrups in our concentrate and foodservice operations, andfinished beverages in our bottling and canning operations). Inventories are valued at the lower of cost or market.We determine cost on the basis of the average cost or first-in, first-out methods. Refer to Note 2.
81

THE COCA-COLA COMPANY AND SUBSIDIARIES
NOTES TO CONSOLIDATED FINANCIAL STATEMENTS
NOTE 1: BUSINESS AND SUMMARY OF SIGNIFICANT ACCOUNTING POLICIES (Continued)
Recoverability of Investments in Equity and Debt Securities
We review our investments in equity and debt securities that are accounted for using the equity method orcost method or that are classified as available-for-sale or held-to-maturity each reporting period to determinewhether a significant event or change in circumstances has occurred that may have an adverse effect on the fairvalue of each investment. When such events or changes occur, we evaluate the fair value compared to our costbasis in the investment. We also perform this evaluation every reporting period for each investment for whichour cost basis has exceeded the fair value in the prior period. The fair values of most of our Company’sinvestments in publicly traded companies are often readily available based on quoted market prices. Forinvestments in nonpublicly traded companies, management’s assessment of fair value is based on valuationmethodologies including discounted cash flows, estimates of sales proceeds and appraisals, as appropriate. Weconsider the assumptions that we believe hypothetical marketplace participants would use in evaluatingestimated future cash flows when employing the discounted cash flow or estimates of sales proceeds valuationmethodologies.
In the event the fair value of an investment declines below our cost basis, management is required todetermine if the decline in fair value is other than temporary. If management determines the decline is otherthan temporary, an impairment charge is recorded. Management’s assessment as to the nature of a decline infair value is based on, among other things, the length of time and the extent to which the market value has beenless than our cost basis, the financial condition and near-term prospects of the issuer, and our intent and abilityto retain the investment in the issuer for a period of time sufficient to allow for any anticipated recovery inmarket value. Refer to Note 10.
Other Assets
Our Company advances payments to certain customers for marketing to fund future activities intended togenerate profitable volume, and we expense such payments over the applicable period. Advance payments arealso made to certain customers for distribution rights. Additionally, our Company invests in infrastructureprograms with our bottlers that are directed at strengthening our bottling system and increasing unit casevolume. When facts and circumstances indicate that the carrying value of these assets may not be recoverable,management assesses the recoverability of the carrying value by preparing estimates of sales volume and theresulting gross profit and cash flows. These estimated future cash flows are consistent with those we use in ourinternal planning. If the sum of the expected future cash flows (undiscounted and without interest charges) isless than the carrying amount, we recognize an impairment loss. The impairment loss recognized is the amountby which the carrying amount exceeds the fair value. Costs of these programs are recorded in prepaid expensesand other assets and noncurrent other assets and are amortized over the remaining periods directly benefited,which range from 1 to 10 years. Amortization expense for infrastructure programs was approximately$162 million, $151 million and $136 million for the years ended December 31, 2008, 2007 and 2006, respectively.Refer to heading ‘‘Revenue Recognition’’ above, and Note 3.
Property, Plant and Equipment
Property, plant and equipment are stated at cost. Repair and maintenance costs that do not improve servicepotential or extend economic life are expensed as incurred. Depreciation is recorded principally by thestraight-line method over the estimated useful lives of our assets, which generally have the following ranges:buildings and improvements: 40 years or less; machinery and equipment: 15 years or less; and containers:
82

THE COCA-COLA COMPANY AND SUBSIDIARIES
NOTES TO CONSOLIDATED FINANCIAL STATEMENTS
NOTE 1: BUSINESS AND SUMMARY OF SIGNIFICANT ACCOUNTING POLICIES (Continued)
10 years or less. Land is not depreciated, and construction in progress is not depreciated until ready for service.Leasehold improvements are amortized using the straight-line method over the shorter of the remaining leaseterm, including renewals that are deemed to be reasonably assured, or the estimated useful life of theimprovement. Depreciation expense, including the depreciation expense of assets under capital lease, totaledapproximately $993 million, $958 million and $763 million for the years ended December 31, 2008, 2007 and2006, respectively. Amortization expense for leasehold improvements totaled approximately $19 million,$21 million and $21 million for the years ended December 31, 2008, 2007 and 2006, respectively. Refer toNote 4.
Certain events or changes in circumstances may indicate that the recoverability of the carrying amount ofproperty, plant and equipment should be assessed, including, among others, a significant decrease in marketvalue, a significant change in the business climate in a particular market, or a current period operating or cashflow loss combined with historical losses or projected future losses. When such events or changes incircumstances are present, we estimate the future cash flows expected to result from the use of the asset and itseventual disposition. These estimated future cash flows are consistent with those we use in our internal planning.If the sum of the expected future cash flows (undiscounted and without interest charges) is less than the carryingamount, we recognize an impairment loss. The impairment loss recognized is the amount by which the carryingamount exceeds the fair value. We use a variety of methodologies to determine the fair value of property, plantand equipment, including appraisals and discounted cash flow models, which are consistent with the assumptionswe believe hypothetical marketplace participants would use.
Goodwill, Trademarks and Other Intangible Assets
In accordance with SFAS No. 142, ‘‘Goodwill and Other Intangible Assets,’’ we classify intangible assetsinto three categories: (1) intangible assets with definite lives subject to amortization; (2) intangible assets withindefinite lives not subject to amortization; and (3) goodwill. For intangible assets with definite lives, tests forimpairment must be performed if conditions exist that indicate the carrying value may not be recoverable. Forintangible assets with indefinite lives and goodwill, tests for impairment must be performed at least annually ormore frequently if events or circumstances indicate that assets might be impaired. Our equity method investeesalso perform such tests for impairment of intangible assets and/or goodwill. If an impairment charge wasrecorded by one of our equity method investees, the Company would record its proportionate share of suchcharge. However, the actual amount we record with respect to our proportionate share of such charges may beimpacted by items such as basis differences, deferred taxes and deferred gains.
When facts and circumstances indicate that the carrying value of intangible assets determined to havedefinite lives may not be recoverable, management assesses the recoverability of the carrying value by preparingestimates of sales volume and the resulting gross profit and cash flows. These estimated future cash flows areconsistent with those we use in our internal planning. If the sum of the expected future cash flows (undiscountedand without interest charges) is less than the carrying amount, we recognize an impairment loss. The impairmentloss recognized is the amount by which the carrying amount exceeds the fair value. We use a variety ofmethodologies to determine the fair value of these assets, including discounted cash flow models, which areconsistent with the assumptions we believe hypothetical marketplace participants would use.
We test intangible assets determined to have indefinite useful lives, including trademarks, franchise rightsand goodwill, for impairment annually, or more frequently if events or circumstances indicate that assets mightbe impaired. We use a variety of methodologies in conducting impairment assessments of indefinite-lived
83

THE COCA-COLA COMPANY AND SUBSIDIARIES
NOTES TO CONSOLIDATED FINANCIAL STATEMENTS
NOTE 1: BUSINESS AND SUMMARY OF SIGNIFICANT ACCOUNTING POLICIES (Continued)
intangible assets, including, but not limited to, discounted cash flow models, which are consistent with theassumptions we believe hypothetical marketplace participants would use. For indefinite-lived intangible assets,other than goodwill, if the fair value is less than the carrying amount, an impairment charge is recognized in anamount equal to that excess.
We perform impairment tests of goodwill at our reporting unit level, which is one level below our operatingsegments. The goodwill impairment test consists of a two-step process, if necessary. The first step is to comparethe fair value of a reporting unit to its carrying value, including goodwill. We typically use discounted cash flowmodels to determine the fair value of a reporting unit. The assumptions used in these models are consistent withthose we believe hypothetical marketplace participants would use. If the fair value of the reporting unit is lessthan its carrying value, the second step of the impairment test must be performed in order to determine theamount of impairment loss, if any. The second step compares the implied fair value of the reporting unitgoodwill with the carrying amount of that goodwill. If the carrying amount of the reporting unit’s goodwillexceeds its implied fair value, an impairment charge is recognized in an amount equal to that excess. The lossrecognized cannot exceed the carrying amount of goodwill, which is assigned to the reporting unit or units thatbenefit from the synergies arising from each business combination.
Impairment charges related to intangible assets are generally recorded in the line item other operatingcharges or, to the extent they relate to equity method investees, as a reduction of equity income (loss)—net inthe consolidated statements of income.
Our Company determines the useful lives of our identifiable intangible assets after considering the specificfacts and circumstances related to each intangible asset. Factors we consider when determining useful livesinclude the contractual term of any agreement, the history of the asset, the Company’s long-term strategy for theuse of the asset, any laws or other local regulations which could impact the useful life of the asset, and othereconomic factors, including competition and specific market conditions. Intangible assets that are deemed tohave definite lives are amortized, primarily on a straight-line basis, over their useful lives, generally ranging from1 to 20 years. Refer to Note 5.
Derivative Financial Instruments
Our Company accounts for derivative financial instruments in accordance with SFAS No. 133, ‘‘Accountingfor Derivative Instruments and Hedging Activities,’’ as amended by SFAS No. 137, ‘‘Accounting for DerivativeInstruments and Hedging Activities—Deferral of the Effective Date of FASB Statement No. 133—anamendment of FASB Statement No. 133,’’ SFAS No. 138, ‘‘Accounting for Certain Derivative Instruments andCertain Hedging Activities—an amendment of FASB Statement No. 133,’’ and SFAS No. 149, ‘‘Amendment ofStatement 133 on Derivative Instruments and Hedging Activities.’’ We recognize all derivative instruments aseither assets or liabilities at fair value in our consolidated balance sheets, with fair values of foreign currencyderivatives estimated based on quoted market prices or pricing models using current market rates. Cash flowsfrom derivative instruments designated as net investment hedges are classified as investing activities. Cash flowsfrom other derivative instruments used to manage interest, commodity or currency exposures are classified asoperating activities. Refer to Note 11.
84

THE COCA-COLA COMPANY AND SUBSIDIARIES
NOTES TO CONSOLIDATED FINANCIAL STATEMENTS
NOTE 1: BUSINESS AND SUMMARY OF SIGNIFICANT ACCOUNTING POLICIES (Continued)
Retirement-Related Benefits
Using appropriate actuarial methods and assumptions, our Company accounts for defined benefit pensionplans in accordance with SFAS No. 87, ‘‘Employers’ Accounting for Pensions,’’ and we account for ournonpension postretirement benefits in accordance with SFAS No. 106, ‘‘Employers’ Accounting forPostretirement Benefits Other Than Pensions,’’ as amended by SFAS No. 158, ‘‘Employers’ Accounting forDefined Benefit Pension and Other Postretirement Plans—an amendment of FASB Statements No. 87, 88, 106,and 132(R).’’ Effective December 31, 2006 for our Company, SFAS No. 158 required that previouslyunrecognized actuarial gains or losses, prior service costs or credits and transition obligations or assets berecognized generally through adjustments to accumulated other comprehensive income and credits to prepaidbenefit cost or accrued benefit liability. As a result of these adjustments, the current funded status of definedbenefit pension plans and other postretirement benefit plans is reflected in the Company’s consolidated balancesheets as of December 31, 2008 and 2007. Refer to Note 16.
Our equity method investees also adopted SFAS No. 158 effective December 31, 2006. Refer to Note 3 forthe impact on our consolidated balance sheet resulting from the adoption of SFAS No. 158 by our equity methodinvestees.
Contingencies
Our Company is involved in various legal proceedings and tax matters. Due to their nature, such legalproceedings and tax matters involve inherent uncertainties including, but not limited to, court rulings,negotiations between affected parties and governmental actions. Management assesses the probability of loss forsuch contingencies and accrues a liability and/or discloses the relevant circumstances, as appropriate. Refer toNote 13.
Business Combinations
In accordance with SFAS No. 141, ‘‘Business Combinations,’’ we account for all business combinations bythe purchase method. Furthermore, we recognize intangible assets apart from goodwill if they arise fromcontractual or legal rights or if they are separable from goodwill.
Recent Accounting Standards and Pronouncements
In December 2007, the FASB issued SFAS No. 141 (revised 2007), ‘‘Business Combinations.’’ SFASNo. 141(R) amends the principles and requirements for how an acquirer recognizes and measures in its financialstatements the identifiable assets acquired, the liabilities assumed, any noncontrolling interest in the acquireeand the goodwill acquired. SFAS No. 141(R) also establishes disclosure requirements to enable the evaluation ofthe nature and financial effects of the business combination. SFAS No. 141(R) is effective for our Company onJanuary 1, 2009, and the Company will apply SFAS No. 141(R) prospectively to all business combinationssubsequent to the effective date. The Company continues to evaluate the impact that the adoption of SFASNo. 141(R) will have on our consolidated financial statements, which mainly depends on the size and nature ofbusiness combinations completed after the date of adoption.
In December 2007, the FASB issued SFAS No. 160, ‘‘Noncontrolling Interests in Consolidated FinancialStatements—an amendment of Accounting Research Bulletin No. 51.’’ SFAS No. 160 establishes accounting andreporting standards for the noncontrolling interest in a subsidiary and for the deconsolidation of a subsidiary.
85

THE COCA-COLA COMPANY AND SUBSIDIARIES
NOTES TO CONSOLIDATED FINANCIAL STATEMENTS
NOTE 1: BUSINESS AND SUMMARY OF SIGNIFICANT ACCOUNTING POLICIES (Continued)
SFAS No. 160 clarifies that a noncontrolling interest in a subsidiary should be accounted for as a component ofequity separate from the parent’s equity, rather than in liabilities or the mezzanine section between liabilitiesand equity. In addition, SFAS No. 160 establishes disclosure requirements that clearly identify and distinguishbetween the controlling and noncontrolling interests and require the separate disclosure of income attributableto controlling and noncontrolling interests. SFAS No. 160 is effective for fiscal years beginning afterDecember 15, 2008. Other than the reclassification of noncontrolling interests as described above, the Companydoes not anticipate that the adoption of SFAS No. 160 will have a material impact on our consolidated financialstatements.
In December 2007, the FASB ratified Emerging Issues Task Force (‘‘EITF’’) Issue No. 07-1, ‘‘Accounting forCollaborative Arrangements.’’ EITF 07-1 defines collaborative arrangements and establishes reportingrequirements for transactions between participants in a collaborative arrangement and between participants inthe arrangement and third parties. It also establishes the appropriate income statement presentation andclassification for joint operating activities and payments between participants, as well as the sufficiency of thedisclosures related to these arrangements. EITF 07-1 is effective for fiscal years beginning after December 15,2008. The Company does not expect the adoption of EITF 07-1 to have a material impact on our consolidatedfinancial statements.
In February 2007, the FASB issued SFAS No. 159, ‘‘The Fair Value Option for Financial Assets andFinancial Liabilities—Including an amendment of FASB Statement No. 115.’’ SFAS No. 159 permits entities tochoose to measure many financial instruments and certain other items at fair value. Unrealized gains and losseson items for which the fair value option has been elected will be recognized in earnings at each subsequentreporting date. SFAS No. 159 was effective for our Company on January 1, 2008. The adoption of SFAS No. 159did not have a material impact on our consolidated financial statements.
In September 2006, the SEC staff published SAB No. 108, ‘‘Considering the Effects of Prior YearMisstatements when Quantifying Misstatements in Current Year Financial Statements.’’ SAB No. 108 addressesquantifying the financial statement effects of misstatements, specifically, how the effects of prior yearuncorrected errors must be considered in quantifying misstatements in the current year financial statements.SAB No. 108 was effective for fiscal years ending after November 15, 2006. The adoption of SAB No. 108 by ourCompany in the fourth quarter of 2006 did not have a material impact on our consolidated financial statements.
As previously discussed, our Company adopted SFAS No. 158 related to defined benefit pension and otherpostretirement plans. Refer to Note 16.
In September 2006, the FASB issued SFAS No. 157, ‘‘Fair Value Measurements.’’ SFAS No. 157 defines fairvalue, establishes a framework for measuring fair value and expands disclosure requirements about fair valuemeasurements. SFAS No. 157 was effective for our Company on January 1, 2008. However, in February 2008, theFASB released a FASB Staff Position (FSP FAS 157-2—Effective Date of FASB Statement No. 157) whichdelayed the effective date of SFAS No. 157 for all nonfinancial assets and nonfinancial liabilities, except thosethat are recognized or disclosed at fair value in the financial statements on a recurring basis (at least annually).The adoption of SFAS No. 157 for our financial assets and liabilities did not have a material impact uponadoption. We do not believe the adoption of SFAS No. 157 for our nonfinancial assets and liabilities, effectiveJanuary 1, 2009, will have a material impact on our consolidated financial statements.
In July 2006, the FASB issued Interpretation No. 48 which clarifies the accounting for uncertainty in incometaxes recognized in an enterprise’s financial statements in accordance with SFAS No. 109, ‘‘Accounting for
86

THE COCA-COLA COMPANY AND SUBSIDIARIES
NOTES TO CONSOLIDATED FINANCIAL STATEMENTS
NOTE 1: BUSINESS AND SUMMARY OF SIGNIFICANT ACCOUNTING POLICIES (Continued)
Income Taxes.’’ Interpretation No. 48 prescribes a recognition threshold and measurement attribute for thefinancial statement recognition and measurement of a tax position taken or expected to be taken in a tax return.Interpretation No. 48 also provides guidance on derecognition, classification, interest and penalties, accountingin interim periods, disclosure and transition. For our Company, Interpretation No. 48 was effective January 1,2007. As a result of the adoption of Interpretation No. 48, we recorded an approximate $65 million increase inaccrued income taxes in our consolidated balance sheet for unrecognized tax benefits, which was accounted foras a cumulative effect adjustment to the January 1, 2007 balance of reinvested earnings. Refer to Note 17.
As previously discussed, our Company adopted SFAS No. 123(R) related to share based payments effectiveJanuary 1, 2006. Refer to Note 15.
NOTE 2: INVENTORIES
Inventories consisted of the following (in millions):
December 31, 2008 2007
Raw materials and packaging $ 1,191 $ 1,199Finished goods 706 789Other 290 232
Inventories $ 2,187 $ 2,220
87

THE COCA-COLA COMPANY AND SUBSIDIARIES
NOTES TO CONSOLIDATED FINANCIAL STATEMENTS
NOTE 3: BOTTLING INVESTMENTS
Coca-Cola Enterprises Inc.
CCE is a marketer, producer and distributor of bottle and can nonalcoholic beverages, operating in eightcountries. As of December 31, 2008, our Company owned approximately 35 percent of the outstanding commonstock of CCE. We account for our investment by the equity method of accounting and, therefore, our net incomeincludes our proportionate share of CCE’s net income or loss.
A summary of financial information for CCE is as follows (in millions):
Year Ended December 31, 2008 2007 2006
Net operating revenues $ 21,807 $ 20,936 $ 19,804Cost of goods sold 13,763 12,955 12,067
Gross profit $ 8,044 $ 7,981 $ 7,737
Operating income (loss) $ (6,299) $ 1,470 $ (1,495)
Net income (loss) $ (4,394) $ 711 $ (1,143)
December 31, 2008 2007
Current assets $ 4,583 $ 4,032Noncurrent assets 11,006 20,067
Total assets $ 15,589 $ 24,099
Current liabilities $ 5,074 $ 5,396Noncurrent liabilities 10,546 13,014
Total liabilities $ 15,620 $ 18,410
Shareowners’ (deficit) equity $ (31) $ 5,689
Company equity investment $ — $ 1,637
A summary of our significant transactions with CCE is as follows (in millions):
Year Ended December 31, 2008 2007 2006
Concentrate, syrup and finished product sales to CCE $ 6,431 $ 5,948 $ 5,378Syrup and finished product purchases from CCE 344 410 415CCE purchases of sweeteners through our Company 357 326 274Marketing payments made by us directly to CCE 626 636 514Marketing payments made to third parties on behalf of CCE 131 123 113Local media and marketing program reimbursements from CCE 316 299 279Payments made to CCE for dispensing equipment repair services 84 78 74Other payments — net 75 102 99
Syrup and finished product purchases from CCE represent purchases of fountain syrup in certain territoriesthat have been resold by our Company to major customers and purchases of bottle and can products. Marketingpayments made by us directly to CCE represent support of certain marketing activities and our participationwith CCE in cooperative advertising and other marketing activities to promote the sale of Company trademark
88

THE COCA-COLA COMPANY AND SUBSIDIARIES
NOTES TO CONSOLIDATED FINANCIAL STATEMENTS
NOTE 3: BOTTLING INVESTMENTS (Continued)
products within CCE territories. These programs are agreed to on an annual basis. Marketing payments made tothird parties on behalf of CCE represent support of certain marketing activities and programs to promote thesale of Company trademark products within CCE’s territories in conjunction with certain of CCE’s customers.Pursuant to cooperative advertising and trade agreements with CCE, we received funds from CCE for localmedia and marketing program reimbursements. Payments made to CCE for dispensing equipment repairservices represent reimbursement to CCE for its costs of parts and labor for repairs on cooler, dispensing, orpost-mix equipment owned by us or our customers. The other payments—net line in the table above representspayments made to and received from CCE that are individually not significant.
In 2008, we recorded our proportionate share of approximately $7.6 billion pretax ($4.9 billion after-tax) ofcharges recorded by CCE due to impairments of its North American franchise rights in the second quarter andfourth quarter of 2008. The Company’s proportionate share of these charges was approximately $1.6 billion. Thedecline in the estimated fair value of CCE’s North American franchise rights during the second quarter was theresult of several factors including, but not limited to, (1) challenging macroeconomic conditions whichcontributed to lower than anticipated volume for higher-margin packages and certain higher-margin beveragecategories; (2) increases in raw material costs including significant increases in aluminum, high fructose cornsyrup (‘‘HFCS’’) and resin; and (3) increased delivery costs as a result of higher fuel costs. The decline in theestimated fair value of CCE’s North American franchise rights during the fourth quarter was primarily driven byfinancial market conditions as of the measurement date that caused (1) a dramatic increase in market debt rates,which impacted the capital charge, and (2) a significant decline in the funded status of CCE’s defined benefitpension plans. In addition, the market price of CCE’s common stock declined by more than 50 percent betweenthe date of CCE’s interim impairment test (May 23, 2008) and the date of CCE’s annual impairment test(October 24, 2008). Our proportionate share of these charges was recorded to equity income (loss)—net in ourconsolidated statement of income and impacted the Bottling Investments operating segment.
In addition to the charges discussed above, our Company reduced equity income (loss)—net in ourconsolidated statement of income by approximately $30 million in 2008, primarily due to our proportionateshare of restructuring charges recorded by CCE. Our proportionate share of these charges impacted the BottlingInvestments operating segment.
As discussed above, in accordance with the equity method of accounting, we record our proportionate shareof net income or loss from equity method investees. When we record our proportionate share of net income, itincreases our carrying value in that investment. Conversely, when we record our proportionate share of a netloss, it decreases our carrying value in that investment. Additionally, the equity method of accounting requiresthe investor to record its proportionate share of items impacting the equity investee’s AOCI. During 2008, thecarrying value of our investment in CCE was reduced by our proportionate share of CCE’s net loss and itemsimpacting AOCI. CCE’s net loss was primarily attributable to the impairment charges discussed above. CCE alsorecorded significant adjustments to AOCI, primarily related to an increase in its pension liability determined inaccordance with SFAS No. 158 and the impact of foreign currency fluctuations. As a result of CCE’s net loss andadjustments to AOCI, our Company reduced the carrying value of its investment in CCE to zero as ofDecember 31, 2008. In accordance with accounting principles generally accepted in the United States, once thecarrying value of an equity investment is reduced to zero, the investor’s proportionate share of net losses anditems impacting AOCI is required to be recorded as a reduction to advances made from the investor to theinvestee. As a result, the Company reduced the carrying value of its investment in infrastructure programs withCCE. Our Company will continue to amortize its investment in these infrastructure programs based on ouroriginal investment; therefore, this adjustment will have no impact on the amortization expense related to these
89

THE COCA-COLA COMPANY AND SUBSIDIARIES
NOTES TO CONSOLIDATED FINANCIAL STATEMENTS
NOTE 3: BOTTLING INVESTMENTS (Continued)
infrastructure programs. The carrying value of our equity investment in CCE will not be adjusted until we haverestored our basis in these infrastructure programs.
In 2007, our equity income related to CCE was increased by approximately $11 million related to ourproportionate share of certain items recorded by CCE. Our proportionate share of these items included anapproximate $35 million increase to equity income, primarily related to tax benefits recorded by CCE. Thisincrease was partially offset by an approximate $24 million decrease to equity income, primarily related torestructuring charges recorded by CCE.
In 2006, our Company’s equity income related to CCE decreased by approximately $587 million, related toour proportionate share of certain items recorded by CCE. Our proportionate share of these items includedapproximately $602 million resulting from the impact of an impairment charge recorded by CCE. CCE recordeda $2.9 billion pretax ($1.8 billion after-tax) impairment of its North American franchise rights. The decline in theestimated fair value of CCE’s North American franchise rights was the result of several factors, including but notlimited to (1) CCE’s revised outlook on 2007 raw material costs driven by significant increases in aluminum andHFCS; (2) a challenging marketplace environment with increased pricing pressures in several high-growthbeverage categories; and (3) increased interest rates contributing to a higher discount rate and correspondingcapital charge. Our proportionate share of CCE’s charges also included approximately $18 million due torestructuring charges recorded by CCE. These charges were partially offset by approximately $33 million relatedto our proportionate share of changes in certain of CCE’s state and Canadian federal and provincial tax rates.All of these charges and changes impacted our Bottling Investments operating segment.
Our Company and CCE have established a Global Marketing Fund, under which we expect to pay CCE$62 million annually through December 31, 2014, as support for certain marketing activities. The term of theagreement will automatically be extended for successive 10-year periods thereafter unless either party giveswritten notice of termination of this agreement. The marketing activities to be funded under this agreement willbe agreed upon each year as part of the annual joint planning process and will be incorporated into the annualmarketing plans of both companies. These amounts are included in the line item marketing payments made byus directly to CCE in the table above.
Our Company previously entered into programs with CCE designed to help develop cold-drinkinfrastructure. Under these programs, our Company paid CCE for a portion of the cost of developing theinfrastructure necessary to support accelerated placements of cold-drink equipment. These payments support acommon objective of increased sales of Company trademark beverages from increased availability andconsumption in the cold-drink channel. In connection with these programs, CCE agreed to:
(1) purchase and place specified numbers of Company-approved cold-drink equipment each year through2010;
(2) maintain the equipment in service, with certain exceptions, for a period of at least 12 years afterplacement;
(3) maintain and stock the equipment in accordance with specified standards; and
(4) annual reporting to our Company of minimum average annual unit case volume throughout theeconomic life of the equipment and other specified information.
CCE must achieve minimum average unit case volume for a 12-year period following the placement ofequipment. These minimum average unit case volume levels ensure adequate gross profit from sales of
90

THE COCA-COLA COMPANY AND SUBSIDIARIES
NOTES TO CONSOLIDATED FINANCIAL STATEMENTS
NOTE 3: BOTTLING INVESTMENTS (Continued)
concentrate to fully recover the capitalized costs plus a return on the Company’s investment. Should CCE fail topurchase the specified numbers of cold-drink equipment for any calendar year through 2010, the parties agreedto mutually develop a reasonable solution. Should no mutually agreeable solution be developed, or in the eventthat CCE otherwise breaches any material obligation under the contracts and such breach is not remedied withina stated period, then CCE would be required to repay a portion of the support funding as determined by ourCompany. In the third quarter of 2004, our Company and CCE agreed to amend the contract to defer theplacement of some equipment from 2004 and 2005, as previously agreed under the original contract, to 2009 and2010. In connection with this amendment, CCE agreed to pay the Company approximately $2 million in 2004,$3 million annually in 2005 through 2008, and $1 million in 2009. In 2005, our Company and CCE agreed toamend the contract for North America to move to a system of purchase and placement credits, whereby CCEearns credit toward its annual purchase and placement requirements based upon the type of equipment itpurchases and places. The amended contract also provides that no breach by CCE will occur even if it does notachieve the required number of purchase and placement credits in any given year, so long as (1) the shortfalldoes not exceed 20 percent of the required purchase and placement credits for that year; (2) a compensatingpayment is made to our Company by CCE; (3) the shortfall is corrected in the following year; and (4) CCEmeets all specified purchase and placement credit requirements by the end of 2010. The payments we made toCCE under these programs are recorded in prepaid expenses and other assets and in noncurrent other assetsand amortized as deductions from revenues over the 10-year period following the placement of the equipment.The amortizable carrying values for these infrastructure programs with CCE were approximately $388 millionand $494 million as of December 31, 2008 and 2007, respectively. The Company has no further commitmentsunder these programs.
On January 1, 2008, CCE adopted the measurement provisions of SFAS No. 158, which require entities tomeasure the funded status of retirement benefit plans as of their fiscal year end. SFAS No. 158 requires acumulative adjustment to be made to the beginning balance of retained earnings in the period of adoption. Wereduced the beginning balance of our retained earnings and our investment basis in CCE by approximately$8 million for our proportionate share of CCE’s adjustment. Refer to Note 9 and Note 16.
Effective December 31, 2006, CCE adopted all of the requirements of SFAS No. 158, with the exception ofthe measurement provisions. Our proportionate share of the impact of CCE’s adoption of SFAS No. 158 was anapproximate $132 million pretax ($84 million after-tax) reduction in both the carrying value of our investment inCCE and our AOCI. Refer to Note 9 and Note 16.
If valued at the December 31, 2008 quoted closing price of CCE shares, the fair value of our investment inCCE would have exceeded our carrying value by approximately $2.0 billion.
Other Equity Method Investments
Our other equity method investments include our ownership interests in Coca-Cola Hellenic, Coca-ColaFEMSA and Coca-Cola Amatil. As of December 31, 2008, we owned approximately 23 percent, 32 percent and30 percent, respectively, of these companies’ common shares.
Operating results include our proportionate share of income (loss) from our equity method investments. Asof December 31, 2008, our investment in our equity method investees in the aggregate, other than CCE,exceeded our proportionate share of the net assets of these equity method investees by approximately$984 million. This difference is not amortized.
91

THE COCA-COLA COMPANY AND SUBSIDIARIES
NOTES TO CONSOLIDATED FINANCIAL STATEMENTS
NOTE 3: BOTTLING INVESTMENTS (Continued)
A summary of financial information for our equity method investees in the aggregate, other than CCE, is asfollows (in millions):
Year Ended December 31, 2008 2007 2006
Net operating revenues $ 34,482 $ 28,112 $ 24,990Cost of goods sold 19,974 16,003 14,717
Gross profit $ 14,508 $ 12,109 $ 10,273
Operating income $ 3,687 $ 3,369 $ 2,697
Net income (loss) $ 1,897 $ 1,868 $ 1,475
Net income (loss) available to common shareowners $ 1,897 $ 1,868 $ 1,455
December 31, 2008 2007
Current assets $ 10,922 $ 10,159Noncurrent assets 23,538 24,682
Total assets $ 34,460 $ 34,841
Current liabilities $ 9,726 $ 8,587Noncurrent liabilities 9,940 10,360
Total liabilities $ 19,666 $ 18,947
Shareowners’ equity $ 14,794 $ 15,894
Company equity investment $ 5,316 $ 5,652
Net sales to equity method investees other than CCE, the majority of which are located outside the UnitedStates, were approximately $9.4 billion in 2008, $8.0 billion in 2007 and $7.6 billion in 2006. Total payments,primarily marketing, made to equity method investees other than CCE were approximately $659 million,$546 million and $512 million in 2008, 2007 and 2006, respectively.
In 2008, the Company recognized gains of approximately $119 million due to divestitures, primarily relatedto the sale of Refrigerantes Minas Gerais Ltda. (‘‘Remil’’), a bottler in Brazil, to Coca-Cola FEMSA and the saleof 49 percent of our interest in Coca-Cola Beverages Pakistan Ltd. (‘‘Coca-Cola Pakistan’’) to Coca-Cola IcecekA.S. (‘‘Coca-Cola Icecek’’). Prior to the sale of Remil, our Company owned 100 percent of the outstandingcommon stock of Remil. Cash proceeds from the sale were approximately $275 million, net of the cash balance,as of the disposal date. Subsequent to the sale of a portion of our interest in Coca-Cola Pakistan, the Companyowns a noncontrolling interest, and will account for our remaining investment under the equity method. Thesegains impacted the Bottling Investments and Corporate operating segments and were included in other income(loss)—net in our consolidated statement of income. Refer to Note 19.
During 2008, the Company recorded a net charge of approximately $30 million to equity income (loss)—netin our consolidated statement of income, primarily related to our proportionate share of restructuring chargesrecorded by our equity method investees other than CCE. None of these items was individually significant.These charges impacted the Europe, North America and Bottling Investments operating segments.
92

THE COCA-COLA COMPANY AND SUBSIDIARIES
NOTES TO CONSOLIDATED FINANCIAL STATEMENTS
NOTE 3: BOTTLING INVESTMENTS (Continued)
In 2007, the Company and Coca-Cola FEMSA jointly acquired Jugos del Valle, S.A.B. de C.V. (‘‘Jugos delValle’’), the second largest producer of packaged juices, nectars and fruit-flavored beverages in Mexico and thelargest producer of such beverages in Brazil. The total purchase price was approximately $370 million plus theassumption of approximately $85 million in debt and was split equally between the Company and Coca-ColaFEMSA. The Company’s investment in Jugos del Valle is accounted for under the equity method. Equity income(loss)—net includes our proportionate share of the results of Jugos del Valle’s operations beginning November2007 and is included in the Latin America operating segment. Refer to Note 20.
During 2007, the Company acquired a 34 percent interest in Tokyo Coca-Cola Bottling Company (‘‘TokyoCCBC’’). The Company’s investment in Tokyo CCBC is accounted for under the equity method. Equity income(loss)—net includes our proportionate share of the results of Tokyo CCBC’s operations beginning July 2007 andis included in the Bottling Investments operating segment. In the third quarter of 2007, the Company alsoacquired an additional interest in Nordeste Refrigerantes S.A. (‘‘NORSA’’). After this acquisition, the Companyowned approximately 60 percent of NORSA. The Company began consolidating this entity from the date weacquired the additional 11 percent interest. The combined purchase price for these third quarter acquisitionswas approximately $203 million. NORSA is included in the Bottling Investments operating segment. Refer toNote 20.
In 2007, the Company sold a portion of its interest in Coca-Cola Amatil for proceeds of approximately$143 million. As a result of this transaction, we recognized a gain of approximately $73 million, which impactedthe Corporate operating segment and was included in other income (loss)—net in our consolidated statement ofincome. Our ownership interest in the total outstanding shares of Coca-Cola Amatil was reduced fromapproximately 32 percent to 30 percent. Refer to Note 19.
During 2007, the Company sold substantially all of its interest in Vonpar Refrescos S.A. (‘‘Vonpar’’), abottler headquartered in Brazil. Total proceeds from the sale were approximately $238 million, and werecognized a gain on this sale of approximately $70 million, which impacted the Corporate segment and isincluded in other income (loss)—net in our consolidated statements of income. Prior to this sale, our Companyowned approximately 49 percent of Vonpar’s outstanding common stock and accounted for the investment usingthe equity method. Refer to Note 19.
In 2007, our equity income was also reduced by approximately $62 million in the Bottling Investmentsoperating segment related to our proportionate share of an impairment recorded by Coca-Cola Amatil as aresult of the sale of its bottling operations in South Korea. Refer to Note 19.
Equity income in 2007 was reduced by approximately $99 million in the Bottling Investments operatingsegment related to our proportionate share of asset write-downs recorded by Coca-Cola BottlersPhilippines, Inc. (‘‘CCBPI’’). The asset write-downs primarily related to excess and obsolete bottles and cases atCCBPI. Refer to Note 19.
In 2003, one of our Company’s equity method investees, Coca-Cola FEMSA, consummated a merger withanother of the Company’s equity method investees, Panamerican Beverages, Inc. At the time of the merger, theCompany and Fomento Economico Mexicano, S.A.B. de C.V. (‘‘FEMSA’’), the major shareowner of Coca-ColaFEMSA, reached an understanding under which this shareowner could purchase from our Company an amountof Coca-Cola FEMSA shares sufficient for this shareowner to regain majority ownership interest in Coca-ColaFEMSA. That understanding expired in May 2006; however, in the third quarter of 2006, the Company and theshareowner reached an agreement under which the Company would sell a number of shares representing
93

THE COCA-COLA COMPANY AND SUBSIDIARIES
NOTES TO CONSOLIDATED FINANCIAL STATEMENTS
NOTE 3: BOTTLING INVESTMENTS (Continued)
8 percent of the capital stock of Coca-Cola FEMSA to FEMSA. As a result of this sale, which occurred in thefourth quarter of 2006, the Company received cash proceeds of approximately $427 million and realized a gainof approximately $175 million, which was recorded in the consolidated statement of income line item otherincome (loss)—net and impacted the Corporate operating segment. Also as a result of this sale, our ownershipinterest in Coca-Cola FEMSA was reduced from approximately 40 percent to approximately 32 percent. Referto Note 19.
In 2006, our Company sold a portion of our investment in Coca-Cola Icecek, an equity method investeebottler incorporated in Turkey, in an initial public offering. Our Company received cash proceeds ofapproximately $198 million and realized a gain of approximately $123 million, which was recorded in theconsolidated statement of income line item other income (loss)—net and impacted the Corporate operatingsegment. As a result of this public offering, our Company’s interest in Coca-Cola Icecek decreased fromapproximately 36 percent to approximately 20 percent. Refer to Note 19.
Effective December 31, 2006, our equity method investees other than CCE, also adopted SFAS No. 158.Our proportionate share of the impact of the adoption of SFAS No. 158 by our equity method investees otherthan CCE was an approximate $18 million pretax ($12 million after tax) reduction in the carrying value of ourinvestments in those equity method investees and our AOCI. Refer to Note 9 and Note 16.
If valued at the December 31, 2008, quoted closing prices of shares actively traded on stock markets, thevalue of our equity method investments in publicly traded bottlers other than CCE would have exceeded ourcarrying value by approximately $2.4 billion.
As of December 31, 2008, the carrying value of the Company’s investment in Coca-Cola Hellenic exceededits fair value by approximately $256 million. The carrying value has exceeded its fair value in each of the lastthree months of 2008; however, the amount by which our carrying value has exceeded its fair value has decreasedin each of those three months. As is the case with most of our equity method investees, we have both the abilityand intent to hold our investment in Coca-Cola Hellenic as a long-term investment. Furthermore, under theterms of a shareholders agreement between the Company and another significant shareholder of Coca-ColaHellenic, the Company is required, unless both parties agree to the contrary, to maintain no less than a20 percent ownership interest in Coca-Cola Hellenic through at least December 31, 2018. Additionally, webelieve that the countries in which Coca-Cola Hellenic has bottling and distribution rights, through directownership or joint ventures, have positive growth opportunities. We also believe that the recent volatility ofCoca-Cola Hellenic’s fair value is at least partly attributable to the volatility in the global financial markets andnot necessarily indicative of a change in long-term value. Based on these factors, management has concludedthat the decline in fair value of our investment in Coca-Cola Hellenic is temporary in nature. We will continue tomonitor our investment in future periods.
Net Receivables and Dividends from Equity Method Investees
The total amount of net receivables due from equity method investees, including CCE, was approximately$823 million and $933 million as of December 31, 2008 and 2007, respectively. The total amount of dividendsreceived from equity method investees, including CCE, was approximately $254 million, $216 million and$226 million for the years ended December 31, 2008, 2007 and 2006, respectively.
94

THE COCA-COLA COMPANY AND SUBSIDIARIES
NOTES TO CONSOLIDATED FINANCIAL STATEMENTS
NOTE 4: PROPERTY, PLANT AND EQUIPMENT
The following table summarizes our property, plant and equipment (in millions):
December 31, 2008 2007
Land $ 657 $ 731Buildings and improvements 3,408 3,539Machinery and equipment 8,936 8,924Containers 698 828Construction in progress 701 422
14,400 14,444Less accumulated depreciation 6,074 5,951
Property, plant and equipment—net $ 8,326 $ 8,493
95

THE COCA-COLA COMPANY AND SUBSIDIARIES
NOTES TO CONSOLIDATED FINANCIAL STATEMENTS
NOTE 5: GOODWILL, TRADEMARKS AND OTHER INTANGIBLE ASSETS
The following tables set forth information for intangible assets subject to amortization and for intangibleassets not subject to amortization (in millions):
December 31, 2008 2007
Amortized intangible assets (various, principally customer relationshipsand trademarks):Gross carrying amount1 $ 560 $ 685Less accumulated amortization 175 192
Amortized intangible assets—net $ 385 $ 493
Unamortized intangible assets:Trademarks2 $ 6,059 $ 5,153Goodwill3 4,029 4,256Bottlers’ franchise rights4 1,840 2,184Other 192 133
Unamortized intangible assets $ 12,120 $ 11,726
1 The decrease in 2008 was primarily related to the finalization of purchase accounting for glacéau andthe effect of translation adjustments. The finalization of purchase accounting for glacéau resulted in areclassification from definite-lived intangible assets to indefinite-lived trademarks. These decreases indefinite-lived intangible assets were partially offset by current year acquisitions. Refer to Note 20.
2 The increase in 2008 was primarily related to the acquisitions of trademarks and brands ofapproximately $409 million and the finalization of purchase accounting for glacéau and FuzeBeverage, LLC (‘‘Fuze’’), maker of Fuze enhanced juices and teas in the U.S. The finalization ofpurchase accounting for glacéau and Fuze resulted in a reclassification from goodwill and definite-lived intangible assets to indefinite-lived trademarks. These increases in indefinite-lived trademarkswere partially offset by the effect of translation adjustments and impairment charges. None of theimpairment charges was individually significant. Refer to Note 20.
3 The decrease in 2008 was primarily related to the finalization of purchase accounting for glacéau andFuze, and the effect of translation adjustments. The finalization of purchase accounting for glacéauand Fuze resulted in a reclassification from goodwill to indefinite-lived trademarks.
4 The decrease in 2008 is primarily related to the effect of translation adjustments and disposals. Noneof the disposals was individually significant. Refer to Note 19.
96

THE COCA-COLA COMPANY AND SUBSIDIARIES
NOTES TO CONSOLIDATED FINANCIAL STATEMENTS
NOTE 5: GOODWILL, TRADEMARKS AND OTHER INTANGIBLE ASSETS (Continued)
Total amortization expense for intangible assets subject to amortization was approximately $54 million,$33 million and $18 million for the years ended December 31, 2008, 2007 and 2006, respectively.
Information about estimated amortization expense for intangible assets subject to amortization for the fiveyears succeeding December 31, 2008, is as follows (in millions):
AmortizationExpense
2009 $ 562010 532011 502012 452013 37
Goodwill by operating segment was as follows (in millions):
December 31, 2008 2007
Eurasia & Africa $ 36 $ 36Europe 739 780Latin America 229 207North America 2,156 2,412Pacific 106 30Bottling Investments 763 791
$ 4,029 $ 4,256
NOTE 6: ACCOUNTS PAYABLE AND ACCRUED EXPENSES
Accounts payable and accrued expenses consisted of the following (in millions):
December 31, 2008 2007
Other accrued expenses $ 1,985 $ 2,379Accrued marketing 1,694 1,749Trade accounts payable 1,370 1,380Accrued compensation 548 696Sales, payroll and other taxes 303 352Container deposits 305 359
Accounts payable and accrued expenses $ 6,205 $ 6,915
NOTE 7: SHORT-TERM BORROWINGS AND CREDIT ARRANGEMENTS
Loans and notes payable consist primarily of commercial paper issued in the United States. As ofDecember 31, 2008 and 2007, we had approximately $5,389 million and $5,420 million, respectively, outstandingin commercial paper borrowings. Our weighted-average interest rates for commercial paper outstanding wereapproximately 1.7 percent and 4.5 percent per year at December 31, 2008 and 2007, respectively. In addition, wehad approximately $3,462 million in lines of credit and other short-term credit facilities available as of
97

THE COCA-COLA COMPANY AND SUBSIDIARIES
NOTES TO CONSOLIDATED FINANCIAL STATEMENTS
NOTE 7: SHORT-TERM BORROWINGS AND CREDIT ARRANGEMENTS (Continued)
December 31, 2008, of which approximately $677 million was outstanding. The outstanding amount wasprimarily related to our international operations. Included in the available credit facilities discussed above, theCompany had $2,550 million in lines of credit for general corporate purposes, including commercial paperbackup. These backup lines of credit expire at various times from 2009 through 2013. There were no borrowingsunder these backup lines of credit during 2008.
These credit facilities are subject to normal banking terms and conditions. Some of the financialarrangements require compensating balances, none of which is presently significant to our Company.
NOTE 8: LONG-TERM DEBT
Long-term debt consisted of the following (in millions):December 31, 2008 2007
53⁄4% U.S. dollar notes due 2009 $ 399 $ 39953⁄4% U.S. dollar notes due 2011 499 49957⁄20% U.S. dollar notes due 2017 1,747 1,74773⁄8% U.S. dollar notes due 2093 116 116Other, due through 20141 485 649
$ 3,246 $ 3,410Less current portion 465 133
Long-term debt $ 2,781 $ 3,277
1 The weighted-average interest rate on outstanding balances was 6.5 percent as of December 31, 2008and 2007.
The above notes include various restrictions, none of which is presently significant to our Company.
As of December 31, 2008, all of our long-term debt had fixed interest rates. The principal amount of ourlong-term debt that had fixed and variable interest rates was approximately $3,409 million and $1 million,respectively, at December 31, 2007. The weighted-average interest rate on the outstanding balances of ourCompany’s long-term debt was 5.7 percent and 5.8 percent for the years ended December 31, 2008 and 2007,respectively.
Total interest paid was approximately $460 million, $405 million and $212 million in 2008, 2007 and 2006,respectively. For a more detailed discussion of interest rate management, refer to Note 11.
Maturities of long-term debt for the five years succeeding December 31, 2008 are as follows (in millions):
Maturities ofLong-Term Debt
2009 $ 4652010 652011 5552012 1412013 124
On November 1, 2007, the Company issued approximately $1,750 million of notes due on November 15,2017. The proceeds from this debt issuance were used to repay short-term debt, including commercial paperissued to finance acquisitions during 2007. Refer to Note 20.
98

THE COCA-COLA COMPANY AND SUBSIDIARIES
NOTES TO CONSOLIDATED FINANCIAL STATEMENTS
NOTE 9: COMPREHENSIVE INCOME
AOCI, including our proportionate share of equity method investees’ AOCI, consisted of the following (inmillions):
December 31, 2008 2007
Foreign currency translation adjustment $ (1,694) $ 591Accumulated derivative net losses (112) (113)Unrealized gain on available-for-sale securities 117 161Adjustment to pension and other benefit liabilities (985) (13)
Accumulated other comprehensive income (loss) $ (2,674) $ 626
A summary of the components of other comprehensive income (loss), including our proportionate share ofequity method investees’ other comprehensive income (loss), for the years ended December 31, 2008, 2007 and2006, is as follows (in millions):
Before-Tax Income After-TaxAmount Tax Amount
2008Net foreign currency translation adjustment $ (2,626) $ 341 $ (2,285)Net gain on derivatives 2 (1) 1Net change in unrealized gain on available-for-sale securities (56) 12 (44)Net change in pension and other benefit liabilities (1,561) 589 (972)
Other comprehensive income (loss) $ (4,241) $ 941 $ (3,300)
Before-Tax Income After-TaxAmount Tax Amount
2007Net foreign currency translation adjustment $ 1,729 $ (154) $ 1,575Net loss on derivatives (109) 45 (64)Net change in unrealized gain on available-for-sale securities 24 (10) 14Net change in pension and other benefit liabilities 605 (213) 392
Other comprehensive income (loss) $ 2,249 $ (332) $ 1,917
Before-Tax Income After-TaxAmount Tax Amount
2006Net foreign currency translation adjustment $ 685 $ (82) $ 603Net loss on derivatives (44) 18 (26)Net change in unrealized gain on available-for-sale securities 53 (10) 43Net change in pension and other benefit liabilities, prior to
adoption of SFAS No. 158 68 (22) 46
Other comprehensive income (loss) $ 762 $ (96) $ 666
99

THE COCA-COLA COMPANY AND SUBSIDIARIES
NOTES TO CONSOLIDATED FINANCIAL STATEMENTS
NOTE 10: FINANCIAL INSTRUMENTS
Certain Debt and Marketable Equity Securities
Investments in debt and marketable equity securities, other than investments accounted for by the equitymethod, are categorized as trading, available-for-sale or held-to-maturity. Our marketable equity investmentsare categorized as trading or available-for-sale with their cost basis determined by the specific identificationmethod. Realized and unrealized gains and losses on trading securities and realized gains and losses onavailable-for-sale securities are included in net income. Unrealized gains and losses, net of deferred taxes, onavailable-for-sale securities are included in our consolidated balance sheets as a component of AOCI. Debtsecurities categorized as held-to-maturity are stated at amortized cost.
As of December 31, 2008 and 2007, trading, available-for-sale and held-to-maturity securities consisted ofthe following (in millions):
Gross UnrealizedEstimated
Cost Gains Losses Fair Value
2008Trading securities1:
Equity securities $ 74 $ — $ (30) $ 44Other securities 7 — (2) 5
$ 81 $ — $ (32) $ 49
Available-for-sale securities1:Equity securities $ 329 $ 193 $ (7) $ 515Other securities 12 — (5) 7
$ 341 $ 193 $ (12) $ 522
Held-to-maturity securities:Bank and corporate debt $ 74 $ — $ — $ 74
1 The fair value of the trading and available-for-sale securities included in the table above were determinedin accordance with SFAS No. 157. Refer to Note 12.
Gross UnrealizedEstimated
Cost Gains Losses Fair Value
2007Trading securities:
Equity securities $ 90 $ 2 $ — $ 92Other securities 12 — (3) 9
$ 102 $ 2 $ (3) $ 101
Available-for-sale securities:Equity securities $ 235 $ 247 $ — $ 482Other securities 17 — (2) 15
$ 252 $ 247 $ (2) $ 497
Held-to-maturity securities:Bank and corporate debt $ 67 $ — $ — $ 67
100

THE COCA-COLA COMPANY AND SUBSIDIARIES
NOTES TO CONSOLIDATED FINANCIAL STATEMENTS
NOTE 10: FINANCIAL INSTRUMENTS (Continued)
As of December 31, 2008 and 2007, these investments were included in the following captions in ourconsolidated balance sheets (in millions):
Available- Held-to-Trading for-Sale Maturity
Securities Securities Securities
2008Cash and cash equivalents $ — $ — $ 73Marketable securities 49 228 1Other investments, principally bottling companies — 287 —Other assets — 7 —
$ 49 $ 522 $ 74
Available- Held-to-Trading for-Sale Maturity
Securities Securities Securities
2007Cash and cash equivalents $ — $ — $ 66Marketable securities 101 113 1Other investments, principally bottling companies — 369 —Other assets — 15 —
$ 101 $ 497 $ 67
The contractual maturities of these investments as of December 31, 2008 were as follows (in millions):
Trading Available-for-Sale Held-to-MaturitySecurities Securities Securities
Fair Fair Amortized FairCost Value Cost Value Cost Value
2009 $ — $ — $ — $ — $ 74 $ 742010-2013 5 4 — — — —2014-2018 — — 2 1 — —After 2018 2 1 10 6 — —Equity securities 74 44 329 515 — —
$ 81 $ 49 $ 341 $ 522 $ 74 $ 74
For the year ended December 31, 2008, gross realized gains and losses on sales of trading andavailable-for-sale securities were approximately $1 million and $18 million, respectively. Additionally, in 2008,the Company realized losses of approximately $81 million due to other-than-temporary impairments of certainavailable-for-sale securities. Refer to Note 19.
For the years ended December 31, 2007 and 2006, gross realized gains and losses on sales of trading andavailable-for-sale securities were not material.
For the years ended December 31, 2008, 2007 and 2006, cash proceeds from sales of trading andavailable-for-sale securities were not material.
101

THE COCA-COLA COMPANY AND SUBSIDIARIES
NOTES TO CONSOLIDATED FINANCIAL STATEMENTS
NOTE 10: FINANCIAL INSTRUMENTS (Continued)
Fair Value of Other Financial Instruments
The carrying amounts of cash and cash equivalents, receivables, accounts payable and accrued expenses,and loans and notes payable approximate their fair values because of the relatively short-term maturity of theseinstruments.
We carry our cost method investments at cost. If a decline in the fair value of a cost method investment isdetermined to be other than temporary, an impairment charge is recorded and the fair value becomes the newcost basis of the investment. We evaluate all of our cost method investments for impairment; however, we arenot required to determine the fair value of our investment unless impairment indicators are present. Whenimpairment indicators exist, we generally use discounted cash flow analyses to determine the fair value.
We estimate that the fair values of cost method investments approximate their carrying amounts. As ofDecember 31, 2008 and 2007, our cost method investments had a carrying value of approximately $176 millionand $119 million, respectively.
We recognize all derivative instruments as either assets or liabilities at fair value in our consolidated balancesheets, with fair values estimated based on quoted market prices or pricing models using current market rates.Virtually all of our derivatives are straightforward, over-the-counter instruments with liquid markets. For furtherdiscussion of our derivatives, including a disclosure of derivative values, refer to Note 11 and Note 12.
The fair value of our long-term debt is estimated based on quoted prices for those or similar instruments.As of December 31, 2008, the carrying amounts and fair values of our long-term debt, including the currentportion, were approximately $3,246 million and $3,402 million, respectively. As of December 31, 2007, thesecarrying amounts and fair values were approximately $3,410 million and $3,416 million, respectively.
NOTE 11: HEDGING TRANSACTIONS AND DERIVATIVE FINANCIAL INSTRUMENTS
When deemed appropriate, our Company uses derivative financial instruments primarily to reduce ourexposure to adverse fluctuations in interest rates and foreign currency exchange rates, commodity prices andother market risks. The Company formally designates and documents the financial instrument as a hedge of aspecific underlying exposure, as well as the risk management objectives and strategies for undertaking the hedgetransactions. The Company formally assesses, both at the inception and at least quarterly thereafter, whether thefinancial instruments that are used in hedging transactions are effective at offsetting changes in either the fairvalue or cash flows of the related underlying exposure. Because of the high degree of effectiveness between thehedging instrument and the underlying exposure being hedged, fluctuations in the value of the derivativeinstruments are generally offset by changes in the fair values or cash flows of the underlying exposures beinghedged. Any ineffective portion of a financial instrument’s change in fair value is immediately recognized inearnings. Virtually all of our derivatives are straightforward over-the-counter instruments with liquid markets.Our Company does not enter into derivative financial instruments for trading purposes.
The fair values of derivatives used to hedge or modify our risks fluctuate over time, and are determined inaccordance with SFAS No. 157. Refer to Note 12. We do not view these fair value amounts in isolation, butrather in relation to the fair values or cash flows of the underlying hedged transactions or other exposures. Thenotional amounts of the derivative financial instruments do not necessarily represent amounts exchanged by theparties and, therefore, are not a direct measure of our exposure to the financial risks described above. Theamounts exchanged are calculated by reference to the notional amounts and by other terms of the derivatives,such as interest rates, foreign currency exchange rates or other financial indices.
102

THE COCA-COLA COMPANY AND SUBSIDIARIES
NOTES TO CONSOLIDATED FINANCIAL STATEMENTS
NOTE 11: HEDGING TRANSACTIONS AND DERIVATIVE FINANCIAL INSTRUMENTS (Continued)
Our Company recognizes all derivative instruments as either assets or liabilities in our consolidated balancesheets at fair value. The accounting for changes in fair value of a derivative instrument depends on whether ithas been designated and qualifies as part of a hedging relationship and, further, on the type of hedgingrelationship. At the inception of the hedging relationship, the Company must designate the instrument as a fairvalue hedge, a cash flow hedge, or a hedge of a net investment in a foreign operation. This designation is basedupon the exposure being hedged.
We have established strict counterparty credit guidelines and enter into transactions only with financialinstitutions of investment grade or better. We monitor counterparty exposures daily and review any downgradein credit rating immediately. If a downgrade in the credit rating of a counterparty were to occur, we haveprovisions requiring collateral in the form of U.S. government securities for substantially all of our transactions.To mitigate presettlement risk, minimum credit standards become more stringent as the duration of thederivative financial instrument increases. To minimize the concentration of credit risk, we enter into derivativetransactions with a portfolio of financial institutions. The Company has master netting agreements with most ofthe financial institutions that are counterparties to the derivative instruments. These agreements allow for thenet settlement of assets and liabilities arising from different transactions with the same counterparty. Based onthese factors, we consider the risk of counterparty default to be minimal.
Interest Rate Management
Our Company monitors our mix of fixed-rate and variable-rate debt as well as our mix of short-term debtversus long-term debt. This monitoring includes a review of business and other financial risks. From time totime, in anticipation of future debt issuances, we may manage our risk to interest rate fluctuations through theuse of derivative financial instruments. During 2008, the Company discontinued a cash flow hedging relationshipon interest rate locks, as it was no longer probable that we would issue the long-term debt for which thesehedges were designated. As a result, the Company reclassified a previously unrecognized gain of approximately$17 million from AOCI to earnings as a reduction to interest expense. Additionally, during 2008 the Companyrecognized losses of approximately $9 million related to the portion of cash flow hedges deemed to be ineffectiveas an increase to interest expense.
Any ineffective portion, which was not significant, of these instruments during 2007 and 2006 wasimmediately recognized in net income.
Foreign Currency Management
The purpose of our foreign currency hedging activities is to reduce the risk that our eventual U.S. dollar netcash inflows resulting from sales outside the United States will be adversely affected by changes in foreigncurrency exchange rates.
We enter into forward exchange contracts and purchase foreign currency options (principally euro andJapanese yen) and collars to hedge certain portions of forecasted cash flows denominated in foreign currencies.The effective portion of the changes in fair value for these contracts, which have been designated as foreigncurrency cash flow hedges, was reported in AOCI and reclassified into earnings in the same financial statementline item and in the same period or periods during which the hedged transaction affects earnings. The Companydid not discontinue any foreign currency cash flow hedging relationships during the years ended December 31,2008, 2007 and 2006. Any ineffective portion, which was not significant in 2008, 2007 or 2006, of the change inthe fair value of these instruments was immediately recognized in net income.
103

THE COCA-COLA COMPANY AND SUBSIDIARIES
NOTES TO CONSOLIDATED FINANCIAL STATEMENTS
NOTE 11: HEDGING TRANSACTIONS AND DERIVATIVE FINANCIAL INSTRUMENTS (Continued)
Additionally, the Company enters into forward exchange contracts that are effective economic hedges andare not designated as hedging instruments under SFAS No. 133. These instruments are used to offset theearnings impact relating to the variability in foreign currency exchange rates on certain monetary assets andliabilities denominated in nonfunctional currencies. Changes in the fair value of these instruments areimmediately recognized in earnings in the line item other income (loss)—net in our consolidated statements ofincome to offset the effect of remeasurement of the monetary assets and liabilities.
The Company also enters into forward exchange contracts to hedge its net investment position in certainmajor currencies. Under SFAS No. 133, changes in the fair value of these instruments are recognized in foreigncurrency translation adjustment, a component of AOCI, to offset the change in the value of the net investmentbeing hedged. For the years ended December 31, 2008, 2007 and 2006, we recorded net gain (loss) in foreigncurrency translation adjustment related to those instruments of approximately $3 million, $(7) million and$3 million, respectively.
Commodities
The Company enters into commodity futures and other derivative instruments to mitigate exposure tofluctuations in commodity prices and other market risks.
We purchase commodity futures to hedge forecasted cash flows related to future purchases of certaincommodities. The effective portion of the changes in fair value for these contracts, which have been designatedas commodity cash flow hedges, are reported in AOCI and reclassified into earnings in the same financialstatement line item and in the same period or periods during which the hedged transaction affects earnings. TheCompany did not discontinue any commodity cash flow hedging relationships during the years endedDecember 31, 2008, 2007 and 2006. Any ineffective portion, which was not significant in 2008, 2007 or 2006, ofthe change in the fair value of these instruments was immediately recognized in net income.
The following tables present the carrying values, fair values and maturities of the Company’s derivativeinstruments outstanding as of December 31, 2008 and 2007 (in millions):
Carrying Values Fair ValuesAssets/(Liabilities)1 Assets/(Liabilities)1 Maturity
2008Foreign currency forward contracts $ (124) $ (124) 2009-2010Foreign currency options and collars 12 12 2009-2010Interest rate locks (43) (43) 2009Commodity futures (42) (42) 2009-2010Other derivative instruments (17) (17) 2009
$ (214) $ (214)
1 Does not include the impact of approximately $8 million of cash collateral held or placed with thesame counterparties.
104

THE COCA-COLA COMPANY AND SUBSIDIARIES
NOTES TO CONSOLIDATED FINANCIAL STATEMENTS
NOTE 11: HEDGING TRANSACTIONS AND DERIVATIVE FINANCIAL INSTRUMENTS (Continued)Carrying Values Fair Values
Assets/(Liabilities) Assets/(Liabilities) Maturity
2007Foreign currency forward contracts $ (58) $ (58) 2008-2009Foreign currency options and collars 46 46 2008Interest rate locks — — N/ACommodity futures 1 1 2008Other derivative instruments 28 28 2008
$ 17 $ 17
The Company estimates the fair values of its derivatives based on quoted market prices or pricing modelsusing current market rates, and records them as prepaid expenses and other assets or accounts payable andaccrued expenses in our consolidated balance sheets. The amounts recorded reflect the effect of legallyenforceable master netting agreements that allow the Company to settle positive and negative positions and cashcollateral held or placed with the same counterparties. As of December 31, 2008, we had approximately$5 million reflected in prepaid expenses and other assets and $211 million reflected in accounts payable andaccrued expenses. Refer to Note 12.
Summary of AOCI
For the years ended December 31, 2008, 2007 and 2006, we recorded a net gain (loss) to AOCI ofapproximately $(6) million, $(59) million and $(31) million, respectively, net of both income taxes andreclassifications to earnings, primarily related to gains and losses on foreign currency cash flow hedges. Theseitems will generally offset the variability of the cash flows relating to the underlying exposures being hedged infuture periods. The Company estimates that it will reclassify into earnings during the next 12 months losses ofapproximately $31 million from the after-tax amount recorded in AOCI as of December 31, 2008, as theanticipated cash flows occur.
105

THE COCA-COLA COMPANY AND SUBSIDIARIES
NOTES TO CONSOLIDATED FINANCIAL STATEMENTS
NOTE 11: HEDGING TRANSACTIONS AND DERIVATIVE FINANCIAL INSTRUMENTS (Continued)
The following table summarizes activity in AOCI related to derivatives designated as cash flow hedges heldby the Company during the applicable periods (in millions):
Before-Tax Income After-TaxAmount Tax Amount
2008Accumulated derivative net gains (losses) as of January 1, 2008 $ (112) $ 43 $ (69)Net changes in fair value of derivatives (62) 23 (39)Net reclassification from AOCI into earnings 53 (20) 33
Accumulated derivative net gains (losses) as of December 31, 2008 $ (121) $ 46 $ (75)
Before-Tax Income After-TaxAmount Tax Amount
2007Accumulated derivative net gains (losses) as of January 1, 2007 $ (16) $ 6 $ (10)Net changes in fair value of derivatives (158) 61 (97)Net reclassification from AOCI into earnings 62 (24) 38
Accumulated derivative net gains (losses) as of December 31, 2007 $ (112) $ 43 $ (69)
Before-Tax Income After-TaxAmount Tax Amount
2006Accumulated derivative net gains (losses) as of January 1, 2006 $ 35 $ (14) $ 21Net changes in fair value of derivatives (38) 15 (23)Net reclassification from AOCI into earnings (13) 5 (8)
Accumulated derivative net gains (losses) as of December 31, 2006 $ (16) $ 6 $ (10)
NOTE 12: FAIR VALUE MEASUREMENTS
Effective January 1, 2008, the Company adopted SFAS No. 157, which defines fair value as the exchangeprice that would be received for an asset or paid to transfer a liability (an exit price) in the principal or mostadvantageous market for the asset or liability in an orderly transaction between market participants at themeasurement date. FSP FAS 157-2 delayed the effective date for all nonfinancial assets and liabilities untilJanuary 1, 2009, except those that are recognized or disclosed at fair value in the financial statements on arecurring basis. SFAS No. 157 establishes a three-level fair value hierarchy that prioritizes the inputs used tomeasure fair value. This hierarchy requires entities to maximize the use of observable inputs and minimize theuse of unobservable inputs. The three levels of inputs used to measure fair value are as follows:
• Level 1 — Quoted prices in active markets for identical assets or liabilities.
• Level 2 — Observable inputs other than quoted prices included in level 1, such as quoted prices forsimilar assets and liabilities in active markets; quoted prices for identical or similar assets and liabilities inmarkets that are not active; or other inputs that are observable or can be corroborated by observablemarket data.
106

THE COCA-COLA COMPANY AND SUBSIDIARIES
NOTES TO CONSOLIDATED FINANCIAL STATEMENTS
NOTE 12: FAIR VALUE MEASUREMENTS (Continued)
• Level 3 — Unobservable inputs that are supported by little or no market activity and that are significantto the fair value of the assets or liabilities. This includes certain pricing models, discounted cash flowmethodologies and similar techniques that use significant unobservable inputs.
The Company’s adoption of SFAS No. 157 did not have a material impact on our consolidated financialstatements. The Company has segregated all financial assets and liabilities that are measured at fair value on arecurring basis (at least annually) into the most appropriate level within the fair value hierarchy based on theinputs used to determine the fair value at the measurement date in the table below.
Effective January 1, 2008, the Company adopted SFAS No. 159, which provides entities the option tomeasure many financial instruments and certain other items at fair value. Entities that choose the fair valueoption will recognize unrealized gains and losses on items for which the fair value option was elected in earningsat each subsequent reporting date. The Company has currently chosen not to elect the fair value option for anyitems that are not already required to be measured at fair value in accordance with accounting principlesgenerally accepted in the United States.
Assets and liabilities measured at fair value on a recurring basis as of December 31, 2008, are summarizedbelow (in millions):
Netting Fair ValueLevel 1 Level 2 Level 31 Adjustment2 Measurements
AssetsTrading securities $ 39 $ 4 $ 6 $ — $ 49Available-for-sale securities 518 4 — — 522Derivatives 5 108 — (108) 5
Total assets $ 562 $ 116 $ 6 $ (108) $ 576
LiabilitiesDerivatives $ 6 $ 288 $ 34 $ (117) $ 211
Total liabilities $ 6 $ 288 $ 34 $ (117) $ 211
1 Gross realized and unrealized gains and losses on level 3 assets and liabilities were not significant forthe year ended December 31, 2008.
2 Amounts represent the impact of legally enforceable master netting agreements that allow theCompany to settle positive and negative positions and also cash collateral held or placed with thesame counterparties. Refer to Note 11.
For additional information on trading and available-for-sale securities, refer to Note 10. For additionalinformation on derivatives, refer to Note 11.
NOTE 13: COMMITMENTS AND CONTINGENCIES
As of December 31, 2008, we were contingently liable for guarantees of indebtedness owed by third partiesin the amount of approximately $238 million. These guarantees primarily are related to third-party customers,bottlers and vendors and have arisen through the normal course of business. These guarantees have variousterms, and none of these guarantees was individually significant. The amount represents the maximum potential
107

THE COCA-COLA COMPANY AND SUBSIDIARIES
NOTES TO CONSOLIDATED FINANCIAL STATEMENTS
NOTE 13: COMMITMENTS AND CONTINGENCIES (Continued)
future payments that we could be required to make under the guarantees; however, we do not consider itprobable that we will be required to satisfy these guarantees.
On September 3, 2008, we announced our intention to make cash offers to purchase China Huiyuan JuiceGroup Limited, a Hong Kong listed company which owns the Huiyuan juice business throughout China(‘‘Huiyuan’’). The making of the offers is subject to preconditions relating to Chinese regulatory approvals. Weare offering HK$12.20 per share, and making a comparable offer for outstanding convertible bonds and options.We have accepted irrevocable undertakings from three shareholders for acceptance of the offers, in aggregaterepresenting approximately 66 percent of the Huiyuan shares, and upon satisfaction of the preconditions theCompany plans to commence a tender offer under Hong Kong securities laws for the remaining shares.Assuming full acceptance of the offers, the transaction is valued at approximately $2.4 billion.
We believe our exposure to concentrations of credit risk is limited due to the diverse geographic areascovered by our operations.
The Company is involved in various legal proceedings. We establish reserves for specific legal proceedingswhen we determine that the likelihood of an unfavorable outcome is probable and the amount of loss can bereasonably estimated. Management has also identified certain other legal matters where we believe anunfavorable outcome is reasonably possible and/or for which no estimate of possible losses can be made.Management believes that any liability to the Company that may arise as a result of currently pending legalproceedings will not have a material adverse effect on the financial condition of the Company taken as a whole.
During the period from 1970 to 1981, our Company owned Aqua-Chem, Inc., now known as Cleaver-Brooks, Inc. (‘‘Aqua-Chem’’). A division of Aqua-Chem manufactured certain boilers that contained gaskets thatAqua-Chem purchased from outside suppliers. Several years after our Company sold this entity, Aqua-Chemreceived its first lawsuit relating to asbestos, a component of some of the gaskets. In September 2002,Aqua-Chem notified our Company that it believed we were obligated for certain costs and expenses associatedwith its asbestos litigations. Aqua-Chem demanded that our Company reimburse it for approximately$10 million for out-of-pocket litigation-related expenses. Aqua-Chem also demanded that the Companyacknowledge a continuing obligation to Aqua-Chem for any future liabilities and expenses that are excludedfrom coverage under the applicable insurance or for which there is no insurance. Our Company disputesAqua-Chem’s claims, and we believe we have no obligation to Aqua-Chem for any of its past, present or futureliabilities, costs or expenses. Furthermore, we believe we have substantial legal and factual defenses toAqua-Chem’s claims. The parties entered into litigation in Georgia to resolve this dispute, which was stayed byagreement of the parties pending the outcome of litigation filed in Wisconsin by certain insurers of Aqua-Chem.In that case, five plaintiff insurance companies filed a declaratory judgment action against Aqua-Chem, theCompany and 16 defendant insurance companies seeking a determination of the parties’ rights and liabilitiesunder policies issued by the insurers and reimbursement for amounts paid by plaintiffs in excess of theirobligations. During the course of the Wisconsin coverage litigation, Aqua-Chem and the Company reachedsettlements with several of the insurers, including plaintiffs, who have or will pay funds into an escrow accountfor payment of costs arising from the asbestos claims against Aqua-Chem. On July 24, 2007, the Wisconsin trialcourt entered a final declaratory judgment regarding the rights and obligations of the parties under theinsurance policies issued by the remaining defendant insurers, which judgment was not appealed. The judgmentdirects, among other things, that each insurer whose policy is triggered is jointly and severally liable forone-hundred percent of Aqua-Chem’s losses up to policy limits. The Georgia litigation remains subject to thestay agreement.
108

THE COCA-COLA COMPANY AND SUBSIDIARIES
NOTES TO CONSOLIDATED FINANCIAL STATEMENTS
NOTE 13: COMMITMENTS AND CONTINGENCIES (Continued)
The Company has had discussions with the Competition Directorate of the European Commission (the‘‘European Commission’’) about issues relating to parallel trade within the European Union arising out ofcomments received by the European Commission from third parties. The Company has fully cooperated withthe European Commission and has provided information on these issues and the measures taken and to betaken to address them. The Company is unable to predict at this time with any reasonable degree of certaintywhat action, if any, the European Commission will take with respect to these issues.
At the time we acquire or divest our interest in an entity, we sometimes agree to indemnify the seller orbuyer for specific contingent liabilities. Management believes that any liability to the Company that may arise asa result of any such indemnification agreements will not have a material adverse effect on the financial conditionof the Company taken as a whole.
The Company is involved in various tax matters, with respect to some of which the outcome is uncertain. Weestablish reserves to remove some or all of the tax benefit of any of our tax positions at the time we determinethat it becomes uncertain based upon one of the following conditions: (1) the tax position is not ‘‘more likelythan not’’ to be sustained, (2) the tax position is ‘‘more likely than not’’ to be sustained, but for a lesser amount,or (3) the tax position is ‘‘more likely than not’’ to be sustained, but not in the financial period in which the taxposition was originally taken. For purposes of evaluating whether or not a tax position is uncertain, (1) wepresume the tax position will be examined by the relevant taxing authority that has full knowledge of all relevantinformation, (2) the technical merits of a tax position are derived from authorities such as legislation andstatutes, legislative intent, regulations, rulings and case law and their applicability to the facts and circumstancesof the tax position, and (3) each tax position is evaluated without consideration of the possibility of offset oraggregation with other tax positions taken. A number of years may elapse before a particular uncertain taxposition is audited and finally resolved or when a tax assessment is raised. The number of years subject to taxassessments varies depending on the tax jurisdiction. The tax benefit that has been previously reserved becauseof a failure to meet the ‘‘more likely than not’’ recognition threshold would be recognized in our income taxexpense in the first interim period when the uncertainty disappears under any one of the following conditions:(1) the tax position is ‘‘more likely than not’’ to be sustained, (2) the tax position, amount, and/or timing isultimately settled through negotiation or litigation, or (3) the statute of limitations for the tax position hasexpired. Refer to Note 17.
NOTE 14: NET CHANGE IN OPERATING ASSETS AND LIABILITIES
Net cash provided by (used in) operating activities attributable to the net change in operating assets andliabilities is composed of the following (in millions):
Year Ended December 31, 2008 2007 2006
(Increase) decrease in trade accounts receivable $ 148 $ (406) $ (214)(Increase) in inventories (165) (258) (150)(Increase) decrease in prepaid expenses and other assets 63 (244) (152)Increase (decrease) in accounts payable and accrued expenses (576) 762 173Increase (decrease) in accrued taxes (121) 185 (68)(Decrease) in other liabilities (37) (33) (204)
$ (688) $ 6 $ (615)
109

THE COCA-COLA COMPANY AND SUBSIDIARIES
NOTES TO CONSOLIDATED FINANCIAL STATEMENTS
NOTE 15: STOCK COMPENSATION PLANS
Effective January 1, 2006, the Company adopted SFAS No. 123(R) using the modified prospective method.Based on the terms of our plans, our Company did not have a cumulative effect related to its adoption. Theadoption of SFAS No. 123(R) did not have a material impact on our stock-based compensation expense for theyear ended December 31, 2006. Prior to 2006, our Company accounted for stock option plans and restrictedstock plans under the preferable fair value recognition provisions of SFAS No. 123.
Additionally, our equity method investees also adopted SFAS No. 123(R) effective January 1, 2006. Ourproportionate share of the stock-based compensation expense resulting from the adoption of SFAS No. 123(R)by our equity method investees is recognized as a reduction to equity income. The adoption of SFAS No. 123(R)by our equity method investees did not have a material impact on our consolidated financial statements.
Our total stock-based compensation expense was approximately $266 million, $313 million and $324 millionin 2008, 2007 and 2006, respectively. These amounts were recorded in selling, general and administrativeexpenses in our consolidated statements of income. The total income tax benefit recognized in the incomestatement for share-based compensation arrangements was approximately $72 million, $91 million and$93 million for 2008, 2007 and 2006, respectively. As of December 31, 2008, we had approximately $368 millionof total unrecognized compensation cost related to nonvested share-based compensation arrangements grantedunder our plans. This cost is expected to be recognized over a weighted-average period of 1.7 years as stock-based compensation expense. This expected cost does not include the impact of any future stock-basedcompensation awards.
Stock Option Plans
Under our 1991 Stock Option Plan (the ‘‘1991 Option Plan’’), a maximum of 120 million shares of ourcommon stock was approved to be issued or transferred, through the grant of stock options, to certain officersand employees. Options to purchase common stock under the 1991 Option Plan have been granted to Companyemployees at fair market value at the date of grant.
The 1999 Stock Option Plan (the ‘‘1999 Option Plan’’) was approved by shareowners in April 1999. Underthe 1999 Option Plan, a maximum of 120 million shares of our common stock was approved to be issued ortransferred, through the grant of stock options, to certain officers and employees. Options to purchase commonstock under the 1999 Option Plan have been granted to Company employees at fair market value at the date ofgrant.
The 2002 Stock Option Plan (the ‘‘2002 Option Plan’’) was approved by shareowners in April 2002. Anamendment to the 2002 Option Plan which permitted the issuance of stock appreciation rights was approved byshareowners in April 2003. Under the 2002 Option Plan, a maximum of 120 million shares of our common stockwas approved to be issued or transferred, through the grant of stock options or stock appreciation rights, tocertain officers and employees. No stock appreciation rights have been issued under the 2002 Option Plan as ofDecember 31, 2008. Options to purchase common stock under the 2002 Option Plan have been granted toCompany employees at fair market value at the date of grant.
The 2008 Stock Option Plan (the ‘‘2008 Option Plan’’) was approved by shareowners in April 2008. Underthe 2008 Option Plan, a maximum of 140 million shares of our common stock was approved to be issued ortransferred to certain officers and employees pursuant to stock options granted under the 2008 Option Plan.Options to purchase common stock under the 2008 Option Plan have been generally granted to Companyemployees at fair market value at the date of grant.
110

THE COCA-COLA COMPANY AND SUBSIDIARIES
NOTES TO CONSOLIDATED FINANCIAL STATEMENTS
NOTE 15: STOCK COMPENSATION PLANS (Continued)
Stock options granted in December 2003 and thereafter generally become exercisable over four years (withapproximately 25 percent of the total grant vesting each year on the anniversary of the grant date) and expire10 years from the date of grant. Stock options granted from 1999 through July 2003 generally became exercisableover four years and expire 15 years from the date of grant. Prior to 1999, stock options generally becameexercisable over a three-year vesting period and expire 10 years from the date of grant. The 1999 Stock OptionPlan and the 2002 Stock Option Plan have been amended to provide a maximum option term of 10 years for allgrants in 2008 and beyond. The 2008 Option Plan provides a maximum option term of 10 years.
The fair value of each option award is estimated on the grant date using a Black-Scholes-Merton option-pricing model that uses the assumptions noted in the following table. The expected term of the optionsrepresents the period of time that options granted are expected to be outstanding and is derived by analyzinghistoric exercise behavior. Expected volatilities are based on implied volatilities from traded options on theCompany’s stock, historical volatility of the Company’s stock, and other factors. The risk-free interest rate forthe period matching the expected term of the option is based on the U.S. Treasury yield curve in effect at thetime of the grant. The dividend yield is the calculated yield on the Company’s stock at the time of the grant.
The shares of common stock to be issued, transferred and/or sold under the stock option plans are madeavailable from authorized and unissued Company common stock or from the Company’s treasury shares. In2007, the Company began issuing common stock under these plans from the Company’s treasury shares.
The following table sets forth information about the weighted-average fair value of options granted duringthe past three years and the weighted-average assumptions used for such grants:
2008 2007 2006
Fair value of options at grant date $ 9.81 $ 8.46 $ 8.16Dividend yields 2.27% 2.6% 2.7%Expected volatility 18.02% 15.4% 19.3%Risk-free interest rates 3.18% 4.6% 4.5%Expected term of the option 6 years 6 years 6 years
111

THE COCA-COLA COMPANY AND SUBSIDIARIES
NOTES TO CONSOLIDATED FINANCIAL STATEMENTS
NOTE 15: STOCK COMPENSATION PLANS (Continued)
A summary of stock option activity under all plans for the years ended December 31, 2008, 2007 and 2006 isas follows:
AggregateWeighted-Average Intrinsic
Shares Weighted-Average Remaining Value(In millions) Exercise Price Contractual Life (In millions)
2008Outstanding on January 1, 2008 182 $ 48.29Granted1 19 57.85Exercised (12) 46.82Forfeited/expired2 (13) 60.35Outstanding on December 31, 2008 176 $ 48.56 7.2 years $ 187
Expected to vest at December 31, 2008 173 $ 48.50 7.2 years $ 186
Exercisable on December 31, 2008 122 $ 47.70 6.8 years $ 156
Shares available on December 31, 2008 foroptions that may be granted 155
AggregateWeighted-Average Intrinsic
Shares Weighted-Average Remaining Value(In millions) Exercise Price Contractual Life (In millions)
2007Outstanding on January 1, 2007 186 $ 48.52Granted1 41 48.06Exercised (31) 46.79Forfeited/expired2 (14) 53.91Outstanding on December 31, 2007 182 $ 48.29 7.6 years $ 2,419
Expected to vest at December 31, 2007 178 $ 48.35 7.6 years $ 2,357
Exercisable on December 31, 2007 121 $ 49.66 7.2 years $ 1,453
Shares available on December 31, 2007 foroptions that may be granted 30
AggregateWeighted-Average Intrinsic
Shares Weighted-Average Remaining Value(In millions) Exercise Price Contractual Life (In millions)
2006Outstanding on January 1, 2006 203 $ 48.50Granted1 2 41.65Exercised (4) 44.53Forfeited/expired2 (15) 48.30Outstanding on December 31, 2006 186 $ 48.52 8.1 years $ 502
Exercisable on December 31, 2006 141 $ 50.50 8.0 years $ 227
Shares available on December 31, 2006 foroptions that may be granted 64
1 No grants were made from the 1991 Option Plan during 2008, 2007 or 2006.2 Shares forfeited/expired relate to the 1991, 1999 and 2002 Option Plans.
The total intrinsic value of the options exercised during the years ended December 31, 2008, 2007 and 2006was $150 million, $284 million and $11 million, respectively.
112

THE COCA-COLA COMPANY AND SUBSIDIARIES
NOTES TO CONSOLIDATED FINANCIAL STATEMENTS
NOTE 15: STOCK COMPENSATION PLANS (Continued)
Restricted Stock Award Plans
Under the amended 1989 Restricted Stock Award Plan and the amended 1983 Restricted Stock Award Plan(the ‘‘Restricted Stock Award Plans’’), 40 million and 24 million shares of restricted common stock, respectively,were originally available to be granted to certain officers and key employees of our Company. As ofDecember 31, 2008, approximately 25 million shares remain available for grant under the Restricted StockAward Plans, when all outstanding awards including promises to grant restricted stock and performance shareunits at the target level are included. For time-based and performance-based restricted stock awards,participants are entitled to vote and receive dividends on the restricted shares. For performance share units,participants generally only receive dividends or dividend equivalents once the performance criteria has beencertified and the restricted stock or promises to grant restricted stock have been issued.
For awards prior to January 1, 2008 under the 1983 Restricted Stock Award Plan, participants arereimbursed by our Company for income taxes imposed on the award, but not for taxes generated by thereimbursement payment. The Company has not granted awards from the 1983 Restricted Stock Plan since 1993.The 1983 Restricted Stock Plan has been amended to eliminate this tax reimbursement for awards afterJanuary 1, 2008. The shares are subject to certain transfer restrictions and may be forfeited if a participant leavesour Company for reasons other than retirement, disability or death, absent a change in control of our Company.
The following awards were outstanding and nonvested as of December 31, 2008:
• 474,478 shares of time-based restricted stock and promises to grant restricted stock in which therestrictions lapse upon the achievement of continued employment over a specified period of time;
• 298,009 shares of performance-based restricted stock and promises to grant restricted stock in whichrestrictions lapse upon the achievement of specific performance goals over a specified performanceperiod;
• 4,533,736 performance share units which could result in a future grant of restricted stock after theachievement of specific performance goals over a specified performance period. Such awards are subjectto adjustment based on the final performance relative to the goals, resulting in a minimum grant of noshares and a maximum grant of 7,011,354 shares; and
• 709,808 shares of restricted stock and promises to grant restricted stock from conversion of performanceshare units.
The Company recognizes compensation expense for awards that are subject to performance criteria, when itis probable that the performance criteria specified in the plan will be achieved. The compensation expense isrecognized on a straight-line basis over the remaining vesting period and is recorded in selling, general andadministrative expenses.
113

THE COCA-COLA COMPANY AND SUBSIDIARIES
NOTES TO CONSOLIDATED FINANCIAL STATEMENTS
NOTE 15: STOCK COMPENSATION PLANS (Continued)
Time-Based Restricted Stock Awards
The following table summarizes information about time-based restricted stock awards:
2008 2007 2006Weighted- Weighted- Weighted-
Average Average AverageGrant-Date Grant-Date Grant-Date
Shares Fair Value Shares Fair Value Shares Fair Value
Nonvested on January 1 479,459 $ 38.81 413,700 $ 35.84 432,700 $ 36.46Granted 25,402 52.36 55,180 56.34 — —Promises to grant — — 20,579 53.35 21,000 48.84Vested and released1 (10,633) 16.82 — — (30,000) 58.48Cancelled/forfeited (19,750) 52.54 (10,000) 42.84 (10,000) 21.91
Nonvested on December 31 474,4782 $ 39.45 479,4592 $ 38.81 413,7002 $ 35.84
1 The total fair value of time-based restricted shares vested and released during the years endedDecember 31, 2008, 2007 and 2006 was approximately $0.7 million, zero and $1.3 million, respectively.The grant-date fair value is the quoted market value of the Company stock on the respective grantdate.
2 The nonvested shares include promises to grant time-based restricted stock of 41,579 onDecember 31, 2008 and 2007 and 31,000 on December 31, 2006. These awards are similar totime-based restricted stock, including the payment of dividend equivalents, but were granted in thismanner because the employees were based outside of the United States.
Performance-Based Restricted Stock Awards
In 2001, shareowners approved an amendment to the 1989 Restricted Stock Award Plan to allow for thegrant of performance-based awards. These awards are released only upon the achievement of specificmeasurable performance criteria. These awards pay dividends during the performance period. The majority ofawards have specific performance targets for achievement. If the performance targets are not met, the awardswill be cancelled.
114

THE COCA-COLA COMPANY AND SUBSIDIARIES
NOTES TO CONSOLIDATED FINANCIAL STATEMENTS
NOTE 15: STOCK COMPENSATION PLANS (Continued)
The following table summarizes information about performance-based restricted stock awards:
2008 2007 2006Weighted- Weighted- Weighted-
Average Average AverageGrant-Date Grant-Date Grant-Date
Shares Fair Value Shares Fair Value Shares Fair Value
Nonvested on January 1 286,800 $ 45.67 293,000 $ 43.40 788,000 $ 47.32Granted — — 28,100 53.43 224,000 43.66Promises to grant 11,209 57.99 15,700 63.77 — —Vested and released1 — — — — (50,000) 56.25Cancelled/forfeited — — (50,000) 42.40 (669,000) 47.15
Nonvested on December 31 298,0092 $ 46.13 286,8002 $ 45.67 293,000 $ 43.40
1 The total fair value of performance-based restricted shares vested and released during the year endedDecember 31, 2006, was approximately $2.1 million. The grant-date fair value is the quoted marketvalue of the Company stock on the respective grant date.
2 The nonvested shares on December 31, 2008 and 2007 include promises to grant performance-basedrestricted stock of 26,909 and 15,700, respectively. These awards are similar to performance-basedrestricted stock, including the payment of dividend equivalents, but were granted in this mannerbecause the employees were based outside of the United States.
Performance Share Unit Awards
In 2003, the Company established a program to grant performance share units under the 1989 RestrictedStock Award Plan to executives. In 2008, the Company expanded the program to award a mix of stock optionsand performance share units to eligible employees in addition to executives. The number of shares earned isdetermined at the end of each performance period, generally three years, based on the actual performancecriteria predetermined by the Board of Directors at the time of grant. If the performance criteria are met, theaward results in a grant of restricted stock or promises to grant restricted stock, which are then generally subjectto a holding period in order for the restricted stock to be released. For performance share units granted before2008, this holding period is generally two years. For performance share units granted in 2008, this holding periodis generally one year. Restrictions on such stock generally lapse at the end of the holding period. Performanceshare units generally do not pay dividends or allow voting rights during the performance period. Accordingly, thefair value of these units is the quoted market value of the Company stock on the date of the grant less thepresent value of the expected dividends not received during the performance period.
Performance share units require achievement of certain financial measures, primarily compound annualgrowth in earnings per share or economic profit. These financial measures are adjusted for certain itemsapproved and certified by the Audit Committee of the Board of Directors. The purpose of these adjustments isto ensure a consistent year to year comparison of the specific performance criteria. Economic profit is our netoperating profit after tax less the cost of the capital used in our business. In the event that the financial resultequals the predefined target, the Company will grant the number of restricted shares equal to the Target Awardin the underlying performance share units agreement. In the event the financial result exceeds the predefinedtarget, additional shares up to the Maximum Award may be granted. In the event the financial result falls belowthe predefined target, a reduced number of shares may be granted. If the financial result falls below theThreshold Award performance level, no shares will be granted. Performance share units are generally settled in
115

THE COCA-COLA COMPANY AND SUBSIDIARIES
NOTES TO CONSOLIDATED FINANCIAL STATEMENTS
NOTE 15: STOCK COMPENSATION PLANS (Continued)
stock, except for certain circumstances such as death or disability, where former employees or their beneficiariesare provided a cash equivalent payment. Of the outstanding granted performance share units as ofDecember 31, 2008, 710,700; 985,168; and 2,667,168 awards are for the 2006-2008, 2007-2009 and 2008-2010performance periods, respectively. Also, outstanding as of December 31, 2008, are 98,700 performance shareunits granted in 2007 with certain financial measures of a business unit of the Company as the performancecriteria. In addition, 72,000 performance share units, with predefined qualitative performance criteria andrelease criteria that differ from the program described above, were granted in 2004 and were outstanding as ofDecember 31, 2008.
The following table summarizes information about performance share units based on the Target Awardamounts in the performance share unit agreements:
2008 2007 2006Weighted- Weighted- Weighted-
Average Average AverageShare Grant-Date Share Grant-Date Share Grant-DateUnits Fair Value Units Fair Value Units Fair Value
Outstanding on January 1 2,780,333 $ 41.50 2,271,240 $ 39.99 2,356,728 $ 40.42Granted 2,756,447 53.08 1,221,578 46.51 160,000 37.84Conversions:
Restricted stock1,4 (471,610) 38.69 (203,609) 45.45 (123,852) 42.07Promises to grant2,4 (276,751) 37.81 (179,292) 46.78 — —
Paid in cash equivalent3 (56,642) 39.29 (23,790) 46.83 (7,178) 41.87Cancelled/forfeited (198,041) 52.84 (305,794) 44.22 (114,458) 43.45
Outstanding onDecember 31 4,533,736 $ 48.59 2,780,333 $ 41.50 2,271,240 $ 39.99
1 Represents performance share units converted to restricted stock based on the certification offinancial results for the 2004-2006 and 2005-2007 performance periods and for certain executives priorto retirement. The vesting of this restricted stock is subject to terms of the performance share unitagreements.
2 Represents performance share units converted to promises to grant restricted stock for executivesbased on the certification of financial results for the 2004-2006 and 2005-2007 performance periods.These awards are similar to restricted stock, including payment of dividend equivalents, but weregranted in this manner because the executives were based outside of the United States. The vesting ofpromises to grant restricted stock is subject to terms of the performance share unit agreements.
3 Represents performance share units that converted to cash equivalent payments of approximately$3.3 million, $1.2 million and $0.3 million in 2008, 2007 and 2006, respectively, to former executiveswho were ineligible for restricted stock grants due to certain events such as death, disability ortermination.
4 The performance share unit conversions during 2008 are presented at the Target Award. Anadditional 207,790 restricted shares and 138,377 of promises to grant restricted shares were awardedduring 2008 based on the certified financial results of the 2005-2007 performance period.
116

THE COCA-COLA COMPANY AND SUBSIDIARIES
NOTES TO CONSOLIDATED FINANCIAL STATEMENTS
NOTE 15: STOCK COMPENSATION PLANS (Continued)
The following table summarizes the number of performance share units at various award levels:
December 31, 2008 2007 2006
Threshold Award 2,352,218 1,627,376 1,297,632Target Award 4,533,736 2,780,333 2,271,240Maximum Award 7,011,354 4,545,750 3,370,860
The following table summarizes information about the conversions of performance share units to restrictedstock and promises to grant restricted stock:
2008 2007Weighted- Weighted-
Average AverageShare Grant-Date Share Grant-DateUnits Fair Value1 Units Fair Value1
Nonvested on January 1 422,238 $ 44.76 123,852 $ 42.07Granted 471,610 38.69 203,609 45.45Promises to grant 276,751 37.81 179,292 46.78Vested and released2 (437,871) 44.22 (59,515) 46.78Cancelled/forfeited (22,920) 43.65 (25,000) 46.78
Nonvested on December 31 709,8083,4 $ 38.38 422,2383 $ 44.76
1 The weighted-average grant-date fair value is based on the fair values of the performance share unitsgrant fair values.
2 The total fair value of restricted shares that were vested and released during the years endedDecember 31, 2008 and 2007 was $22.9 million and $2.9 million, respectively.
3 The nonvested shares as of December 31, 2008 and 2007 include promises to grant restricted stock of253,751 and 179,292. These awards are similar to restricted stock, including the payment of dividendequivalents, but were granted in this manner because the employees were based outside of the UnitedStates.
4 The nonvested shares as of December 31, 2008, are presented at the performance share units TargetAward. An additional 320,140 restricted shares and promises to grant restricted stock wereoutstanding and nonvested as of December 31, 2008.
NOTE 16: PENSION AND OTHER POSTRETIREMENT BENEFIT PLANS
Our Company sponsors and/or contributes to pension and postretirement health care and life insurancebenefit plans covering substantially all U.S. employees. We also sponsor nonqualified, unfunded defined benefitpension plans for certain associates. In addition, our Company and its subsidiaries have various pension plansand other forms of postretirement arrangements outside the United States.
Effective December 31, 2006, the Company adopted SFAS No. 158, which required the recognition inpension obligations and AOCI of actuarial gains or losses, prior service costs or credits and transition assets orobligations that had previously been deferred under the reporting requirements of SFAS No. 87, SFAS No. 106and SFAS No. 132(R). As a result of the adoption, the Company recorded approximately $288 million as anadjustment to AOCI as of December 31, 2006. The applicable December 31, 2008 and 2007 balances included inour consolidated financial statements and footnotes reflect the adoption of SFAS No. 158.
117

THE COCA-COLA COMPANY AND SUBSIDIARIES
NOTES TO CONSOLIDATED FINANCIAL STATEMENTS
NOTE 16: PENSION AND OTHER POSTRETIREMENT BENEFIT PLANS (Continued)
In February and October of 2007, the Company amended its U.S. retiree medical plan to limit theCompany’s exposure to increases in retiree medical costs associated with current and future retirees. Based onthe materiality of the change in liability resulting from the amendments, we remeasured the assets and liabilitiesof the U.S. retiree medical plan effective February 28, 2007 and October 31, 2007. As a result of theremeasurements, the Company reduced its liabilities for the U.S. retiree medical plan by approximately$435 million. In accordance with SFAS No. 158, the Company also recognized the appropriate effects of thechange in AOCI and deferred taxes.
The primary U.S. defined benefit pension plan was amended effective December 31, 2008. The plan willnow have a two-part formula to determine pension benefits. The first part will retain the current final-averagepay structure, where service will freeze as of January 1, 2010, with pay escalating for the lesser of 10 years oruntil termination. The second part of the formula will be a cash balance account which will commence January 1,2010 under which employees will receive credits based on age, service, pay and interest. The plan was alsomodified to allow lump sum distributions. These changes, as well as related changes to other U.S. plans, reducedpension obligations by approximately $21 million. In addition, the U.S. retiree medical plan was amended toclose the plan to new hires effective January 1, 2009.
Certain amounts in the prior years’ disclosure have been reclassified to conform to the current yearpresentation.
Obligations and Funded Status
The following table sets forth the change in benefit obligations for our benefit plans (in millions):
Pension Benefits Other BenefitsDecember 31, 2008 2007 2008 2007
Benefit obligation at beginning of year1 $ 3,517 $ 3,297 $ 438 $ 828Service cost 114 123 20 40Interest cost 205 191 26 34Foreign currency exchange rate changes (141) 117 (3) 1Amendments (13) 48 — (342)Actuarial loss (gain) 125 (189) (20) (95)Benefits paid2 (199) (159) (27) (31)Business combinations — 103 — —Settlements (3) (23) — —Curtailments (1) 1 (6) —Special termination benefits 11 7 — —Other 3 1 2 3
Benefit obligation at end of year1 $ 3,618 $ 3,517 $ 430 $ 438
1 For pension benefit plans, the benefit obligation is the projected benefit obligation. For other benefitplans, the benefit obligation is the accumulated postretirement benefit obligation.
2 Benefits paid to pension plan participants during 2008 and 2007 included approximately $44 millionand $41 million, respectively, in payments related to unfunded pension plans that were paid fromCompany assets. Benefits paid to participants of other benefit plans during 2008 and 2007 includedapproximately $2 million and $13 million, respectively, that were paid from Company assets.
118

THE COCA-COLA COMPANY AND SUBSIDIARIES
NOTES TO CONSOLIDATED FINANCIAL STATEMENTS
NOTE 16: PENSION AND OTHER POSTRETIREMENT BENEFIT PLANS (Continued)
The accumulated benefit obligation for our pension plans was approximately $3,209 million andapproximately $3,080 million as of December 31, 2008 and 2007, respectively.
For pension plans with projected benefit obligations in excess of plan assets, the total projected benefitobligation and fair value of plan assets were approximately $3,416 million and $2,051 million, respectively, as ofDecember 31, 2008, and $1,372 million and $691 million, respectively, as of December 31, 2007. For pensionplans with accumulated benefit obligations in excess of plan assets, the total accumulated benefit obligation andfair value of plan assets were approximately $2,881 million and $1,885 million, respectively, as of December 31,2008, and approximately $996 million and $441 million, respectively, as of December 31, 2007.
The following table sets forth the change in the fair value of plan assets for our benefit plans (in millions):
Pension Benefits Other BenefitsDecember 31, 2008 2007 2008 2007
Fair value of plan assets at beginning of year1 $ 3,428 $ 3,091 $ 246 $ 248Actual return on plan assets (961) 269 (47) 13Employer contributions 96 59 — —Foreign currency exchange rate changes (118) 98 — —Benefits paid (155) (118) (25) (18)Business combinations — 35 — —Settlements (3) (1) — —Other 3 (5) 1 3
Fair value of plan assets at end of year1 $ 2,290 $ 3,428 $ 175 $ 246
1 Plan assets include 1.6 million shares of common stock of our Company with a fair value ofapproximately $74 million and $99 million as of December 31, 2008 and 2007, respectively. Dividendsreceived on common stock of our Company during 2008 and 2007 were approximately $2.5 millionand $2.2 million, respectively.
The pension and other benefit amounts recognized in our consolidated balance sheets are as follows (inmillions):
Pension Benefits Other BenefitsDecember 31, 2008 2007 2008 2007
Funded status — plan assets less than benefit obligations $ (1,328) $ (89) $ (255) $ (192)Fourth quarter contribution — 4 — —
Net liability recognized $ (1,328) $ (85) $ (255) $ (192)
Noncurrent asset $ 37 $ 596 $ — $ —Current liability (39) (42) — (1)Long-term liability (1,326) (639) (255) (191)
Net liability recognized $ (1,328) $ (85) $ (255) $ (192)
119

THE COCA-COLA COMPANY AND SUBSIDIARIES
NOTES TO CONSOLIDATED FINANCIAL STATEMENTS
NOTE 16: PENSION AND OTHER POSTRETIREMENT BENEFIT PLANS (Continued)
The following table sets forth the changes in AOCI for our benefit plans (in millions, pretax):
Pension Benefits Other BenefitsDecember 31, 2008 2007 2008 2007
Beginning balance in accumulated other comprehensiveincome (loss) $ (108) $ (302) $ 297 $ (92)
Recognized prior service cost (credit) 10 7 (61) (42)Recognized net actuarial loss (gain) 24 18 — 1Prior service credit (cost) arising in current year 13 (48) — 342Net actuarial (loss) gain arising in current year (1,335) 227 (47) 88Translation gain (loss) 7 (10) — —
Ending balance in accumulated other comprehensiveincome (loss) $ (1,389) $ (108) $ 189 $ 297
The following table sets forth amounts in AOCI for our benefit plans (in millions, pretax):
Pension Benefits Other BenefitsDecember 31, 2008 2007 2008 2007
Prior service credit (cost) $ (56) $ (79) $ 244 $ 305Net actuarial loss (1,333) (29) (55) (8)
Ending balance in accumulated other comprehensiveincome (loss) $ (1,389) $ (108) $ 189 $ 297
Amounts in AOCI expected to be recognized as components of net periodic pension cost in 2009 are asfollows (in millions, pretax):
Pension Benefits Other Benefits
Amortization of prior service cost (credit) $ 6 $ (61)Amortization of actuarial loss 73 1
$ 79 $ (60)
120

THE COCA-COLA COMPANY AND SUBSIDIARIES
NOTES TO CONSOLIDATED FINANCIAL STATEMENTS
NOTE 16: PENSION AND OTHER POSTRETIREMENT BENEFIT PLANS (Continued)
Components of Net Periodic Benefit Cost
Net periodic benefit cost for our pension and other postretirement benefit plans consisted of the following(in millions):
Pension Benefits Other Benefits
December 31, 2008 2007 2006 2008 2007 2006
Service cost $ 114 $ 123 $ 108 $ 20 $ 40 $ 31Interest cost 205 191 168 26 34 46Expected return on plan assets (249) (231) (191) (20) (20) (5)Amortization of prior service cost (credit) 10 7 7 (61) (42) —Amortization of actuarial loss 10 18 46 — 1 3
Net periodic benefit cost (credit) 90 108 138 (35) 13 75Settlement charge 14 3 1 — — —Curtailment charge — 2 — (6) — —Special termination benefits 11 — — — — —
Total cost (credit) recognized in thestatements of income $ 115 $ 113 $ 139 $ (41) $ 13 $ 75
Assumptions
Certain weighted-average assumptions used in computing the benefit obligations are as follows:
Pension Benefits Other Benefits
December 31, 2008 2007 2008 2007
Discount rate 6% 6% 61⁄4% 61⁄4%Rate of increase in compensation levels 33⁄4% 41⁄4% N/A N/A
Certain weighted-average assumptions used in computing net periodic benefit cost are as follows:
Pension Benefits Other Benefits
December 31, 2008 2007 2006 2008 2007 2006
Discount rate 6% 51⁄2% 51⁄4% 61⁄4% 6% 53⁄4%Rate of increase in compensation levels 41⁄4% 41⁄4% 4% N/A N/A N/AExpected long-term rate of return on plan assets 8% 73⁄4% 73⁄4% 81⁄2% 81⁄2% 81⁄2%
The assumed health care cost trend rates are as follows:
December 31, 2008 2007
Health care cost trend rate assumed for next year 9% 9%Rate to which the cost trend rate is assumed to decline (the ultimate trend rate) 51⁄4% 5%Year that the rate reaches the ultimate trend rate 2012 2012
121

THE COCA-COLA COMPANY AND SUBSIDIARIES
NOTES TO CONSOLIDATED FINANCIAL STATEMENTS
NOTE 16: PENSION AND OTHER POSTRETIREMENT BENEFIT PLANS (Continued)
During 2007, the Company amended its U.S. retiree medical plan to limit the Company’s exposure toincreases in retiree medical costs for both current and future retirees. As a result, the effects of a one percentagepoint change in the assumed health care cost trend rate would not be significant to the Company.
The discount rate assumptions used to account for pension and other postretirement benefit plans reflectthe rates at which the benefit obligations could be effectively settled. Rates for each of our U.S. plans atDecember 31, 2008 were determined using a cash flow matching technique whereby the rates of a yield curve,developed from high-quality debt securities, were applied to the benefit obligations to determine the appropriatediscount rate. For our non-U.S. plans, we base the discount rate on comparable indices within each of thosecountries. The rate of compensation increase assumption is determined by the Company based upon annualreviews. We review external data and our own historical trends for health care costs to determine the health carecost trend rate assumptions.
Plan Assets
Pension Benefit Plans
The following table sets forth the actual asset allocation and weighted-average target asset allocation forour U.S. and non-U.S. pension plan assets:
TargetAsset
December 31, 2008 2007 Allocation
Equity securities1 47% 58% 55%Debt securities 35 29 32Real estate and other2 18 13 13
Total 100% 100% 100%
1 As of December 31, 2008 and 2007, 3 percent of total pension plan assets were invested in commonstock of our Company.
2 As of December 31, 2008 and 2007, 9 percent and 7 percent, respectively, of total pension plan assetswere invested in real estate.
Investment objectives for the Company’s U.S. pension plan assets, which comprise 66 percent of totalpension plan assets as of December 31, 2008, are to:
(1) optimize the long-term return on plan assets at an acceptable level of risk;
(2) maintain a broad diversification across asset classes and among investment managers;
(3) maintain careful control of the risk level within each asset class; and
(4) focus on a long-term return objective.
Asset allocation targets promote optimal expected return and volatility characteristics given the long-termtime horizon for fulfilling the obligations of the pension plans. Selection of the targeted asset allocation for U.S.plan assets was based upon a review of the expected return and risk characteristics of each asset class, as well asthe correlation of returns among asset classes.
122

THE COCA-COLA COMPANY AND SUBSIDIARIES
NOTES TO CONSOLIDATED FINANCIAL STATEMENTS
NOTE 16: PENSION AND OTHER POSTRETIREMENT BENEFIT PLANS (Continued)
Investment guidelines are established with each investment manager. These guidelines provide theparameters within which the investment managers agree to operate, including criteria that determine eligibleand ineligible securities, diversification requirements and credit quality standards, where applicable. Unlessexceptions have been approved, investment managers are prohibited from buying or selling commodities, futuresor option contracts, as well as from short selling of securities. Furthermore, investment managers agree to obtainwritten approval for deviations from stated investment style or guidelines.
As of December 31, 2008, no investment manager was responsible for more than 10 percent of total U.S.plan assets. In addition, diversification requirements for each investment manager prevent a single security orother investment from exceeding 10 percent, at historical cost, of the individual manager’s portfolio.
The expected long-term rate of return assumption for U.S. plan assets is based upon the target assetallocation and is determined using forward-looking assumptions in the context of historical returns andvolatilities for each asset class, as well as correlations among asset classes. We evaluate the rate of returnassumption on an annual basis. The expected long-term rate of return assumption used in computing 2008 netperiodic pension cost for the U.S. plans was 8.5 percent. As of December 31, 2008, the 10-year annualized returnon U.S. plan assets was 3.0 percent, the 15-year annualized return was 7.5 percent, and the annualized returnsince inception was 10.7 percent.
Plan assets for our pension plans outside the United States are insignificant on an individual plan basis.
Other Benefit Plans
Plan assets associated with other benefits represent funding of the primary U.S. postretirement benefit plan.In late 2006, we established and contributed $216 million to a U.S. Voluntary Employee Beneficiary Association(‘‘VEBA’’), a tax-qualified trust. While the VEBA assets will remain segregated from the primary U.S. pensionmaster trust, the current investments were determined in a methodology similar to that applied to the U.S.pension plans described above.
123

THE COCA-COLA COMPANY AND SUBSIDIARIES
NOTES TO CONSOLIDATED FINANCIAL STATEMENTS
NOTE 16: PENSION AND OTHER POSTRETIREMENT BENEFIT PLANS (Continued)
Cash Flows
Information about the expected cash flows for our pension and other postretirement benefit plans is asfollows (in millions):
Pension OtherBenefits Benefits
Expected employer contributions:2009 $ 240 $ 1Expected benefit payments1:2009 $ 207 $ 302010 213 322011 215 352012 229 372013 239 402014-2018 1,404 207
1 The expected benefit payments for our other postretirement benefit plans are net of estimated federalsubsidies expected to be received under the Medicare Prescription Drug, Improvement andModernization Act of 2003. Federal subsidies are estimated to be approximately $2 million in 2009 to2013 and estimated to be approximately $18 million for the period 2014-2018.
Defined Contribution Plans
Our Company sponsors qualified defined contribution plans covering substantially all U.S. employees.Under the primary plan, we match 100 percent of participants’ contributions up to a maximum of 3 percent ofcompensation. Company costs related to the U.S. plans were approximately $22 million, $29 million and$25 million in 2008, 2007 and 2006, respectively. We also sponsor defined contribution plans in certain locationsoutside the United States. Company costs associated with those plans were approximately $20 million,$25 million and $16 million in 2008, 2007 and 2006, respectively.
124

THE COCA-COLA COMPANY AND SUBSIDIARIES
NOTES TO CONSOLIDATED FINANCIAL STATEMENTS
NOTE 17: INCOME TAXES
Income before income taxes consisted of the following (in millions):
Year Ended December 31, 2008 2007 2006
United States $ 5301 $ 2,545 $ 2,126International 6,909 5,328 4,452
$ 7,439 $ 7,873 $ 6,578
1 The decrease in 2008 was primarily attributable to impairment charges recorded by CCE during 2008,of which our Company’s proportionate share was approximately $1.6 billion.
Income tax expense (benefit) consisted of the following for the years ended December 31, 2008, 2007 and2006 (in millions):
United State andStates Local International Total
2008Current $ 691 $ 70 $ 1,232 $ 1,993Deferred (321) (65) 25 (361)
2007Current $ 664 $ 75 $ 1,044 $ 1,783Deferred 98 (13) 24 109
2006Current $ 608 $ 47 $ 878 $ 1,533Deferred (20) (22) 7 (35)
We made income tax payments of approximately $1,942 million, $1,596 million and $1,601 million in 2008,2007 and 2006, respectively.
125

THE COCA-COLA COMPANY AND SUBSIDIARIES
NOTES TO CONSOLIDATED FINANCIAL STATEMENTS
NOTE 17: INCOME TAXES (Continued)
A reconciliation of the statutory U.S. federal tax rate and effective tax rates is as follows:Year Ended December 31, 2008 2007 2006
Statutory U.S. federal tax rate 35.0 % 35.0 % 35.0 %State and local income taxes — net of federal benefit 0.8 0.6 0.7Earnings in jurisdictions taxed at rates different from the
statutory U.S. federal rate (14.3)1,2,3 (10.8)8,9 (11.4)14
Equity income or loss 0.24 (1.3)10,11 (0.6)15
Other operating charges 0.75 0.512 0.616
Other — net (0.5)6,7 0.013 (1.5)17
Effective tax rates 21.9 % 24.0 % 22.8 %
1 Includes approximately $17 million (or 0.2 percent) tax charge related to amounts required to berecorded for changes to our uncertain tax positions under Interpretation No. 48, including interest andpenalties, in various international jurisdictions.
2 Includes approximately 0.2 percent impact on our effective tax rate related to impairments of assetsand investments in our bottling operations. Refer to Note 19.
3 Includes approximately $10 million (or 0.2 percent) impact on our effective tax rate related torecording valuation allowances offsetting deferred tax assets booked in prior periods.
4 Includes approximately 2.7 percent impact to our effective tax rate related to charges recorded by ourequity method investments. Refer to Note 3 and Note 19.
5 Includes approximately 0.7 percent impact to our effective tax rate related to restructuring charges,contract termination fees, productivity initiatives and asset impairments. Refer to Note 19.
6 Includes approximately $22 million (or 0.3 percent) tax benefit related to amounts required to berecorded for changes to our uncertain tax positions under Interpretation No. 48, including interest andpenalties, in certain domestic jurisdictions.
7 Includes approximately (0.2) percent impact to our effective tax rate related to the sale of all or aportion of our investments in certain bottling operations. Refer to Note 3 and Note 19.
8 Includes approximately $19 million (or 0.2 percent) tax benefit related to tax rate change in Germany.9 Includes approximately $85 million (or 1.1 percent) tax charge related to amounts required to be
recorded for changes to our uncertain tax positions under Interpretation No. 48, including interest andpenalties, in various international jurisdictions.
10 Includes approximately 0.4 percent impact to our effective tax rate related to charges recorded by ourequity method investments. Refer to Note 3 and Note 19.
11 Includes approximately 0.4 percent impact to our effective tax rate related to the sale of a portion ofour investment in Coca-Cola Amatil and the sale of our investment in Vonpar. Refer to Note 3 andNote 19.
12 Includes approximately 0.5 percent impact to our effective tax rate related to the impairment of assetsand investments in our bottling operations and other restructuring charges. Refer to Note 18.
13 Includes approximately $11 million (or 0.1 percent) tax charge related to amounts required to berecorded for changes to our uncertain tax positions under Interpretation No. 48, including interestand penalties, in certain domestic jurisdictions.
14 Includes approximately $24 million (or 0.4 percent) tax charge related to the resolution of certain taxmatters in various international jurisdictions.
15 Includes approximately 2.4 percent impact to our effective tax rate related to charges recorded by ourequity method investees. Refer to Note 3 and Note 19.
16 Includes the tax rate impact related to the impairment of assets and investments in our bottlingoperations, contract termination costs related to production capacity efficiencies and otherrestructuring charges. Refer to Note 19.
17 Includes approximately 1.8 percent tax rate benefit related to the sale of a portion of our investmentin Coca-Cola FEMSA and Coca-Cola Icecek. Refer to Note 3 and Note 19.
126

THE COCA-COLA COMPANY AND SUBSIDIARIES
NOTES TO CONSOLIDATED FINANCIAL STATEMENTS
NOTE 17: INCOME TAXES (Continued)
Our effective tax rate reflects the tax benefits from having significant operations outside the United Statesthat are taxed at rates lower than the statutory U.S. rate of 35 percent. During 2008, 2007 and 2006, theCompany had several subsidiaries that benefited from various tax incentive grants. The terms of these grantsrange from 2010 to 2031. The Company expects each of the grants to be renewed indefinitely. The grants did nothave a material effect on the results of operations for the years ended December 31, 2008, 2007 or 2006.
The Company or one of its subsidiaries files income tax returns in the U.S. federal jurisdiction and variousstates and foreign jurisdictions. U.S. tax authorities have completed their federal income tax examinations for allyears prior to 2005.
With respect to state and local jurisdictions and countries outside the United States, with limitedexceptions, the Company and its subsidiaries are no longer subject to income tax audits for years before 2001.Although the outcome of tax audits is always uncertain, the Company believes that adequate amounts of tax,including interest and penalties, have been provided for any adjustments that are expected to result from thoseyears.
The Company adopted the provisions of Interpretation No. 48, effective January 1, 2007. As a result of theimplementation of Interpretation No. 48, the Company recorded an approximate $65 million increase inliabilities for unrecognized tax benefits, which was accounted for as a reduction to the January 1, 2007, balanceof reinvested earnings. As of December 31, 2008, the gross amount of unrecognized tax benefits wasapproximately $369 million. If the Company were to prevail on all uncertain tax positions, the net effect wouldbe a benefit to the Company’s effective tax rate of approximately $174 million, exclusive of any benefits relatedto interest and penalties. The remaining approximately $195 million, which was recorded as a deferred tax asset,primarily represents tax benefits that would be received in different tax jurisdictions in the event that theCompany did not prevail on all uncertain tax positions.
In early July 2008, agreements were reached between the U.S. government and a foreign governmentconcerning the allocation of income between the two tax jurisdictions. Pursuant to these agreements, we madecash payments during the third quarter of 2008 that constituted payments of tax and interest. These paymentswere partially offset by tax credits taken in the third quarter and fourth quarter of 2008, and tax refunds andinterest on refunds to be received in 2009. These benefits had been recorded as deferred tax assets in priorperiods. As a result of these agreements, these deferred tax assets have been reclassified to income tax andinterest receivables. The settlements did not have a material impact on the Company’s consolidated statement ofincome for the year ended December 31, 2008. The impact of these agreements, and other 2008 activity, isreflected in the balances of our unrecognized tax benefits and deferred tax assets as of December 31, 2008,which is further described below.
127

THE COCA-COLA COMPANY AND SUBSIDIARIES
NOTES TO CONSOLIDATED FINANCIAL STATEMENTS
NOTE 17: INCOME TAXES (Continued)
A reconciliation of the changes in the gross balance of unrecognized tax benefits amounts is as follows (inmillions):
Year Ended December 31, 2008 2007
Beginning balance of unrecognized tax benefits $ 643 $ 511Increases related to prior period tax positions 52 22Decreases related to prior period tax positions (4) —Increases due to current period tax positions 47 51Decreases related to settlements with taxing authorities (254) (4)Reductions as a result of a lapse of the applicable statute of limitations (36) (1)Increases (decreases) from effects of exchange rates (79) 64
Ending balance of unrecognized tax benefits $ 369 $ 643
The Company recognizes accrued interest and penalties related to unrecognized tax benefits in income taxexpense. As of December 31, 2008, the Company had approximately $110 million in interest and penaltiesrelated to unrecognized tax benefits accrued, of which approximately $14 million of benefit was recognizedthrough tax expense in 2008. If the Company were to prevail on all uncertain tax positions, the reversal of thisaccrual would also be a benefit to the Company’s effective tax rate.
As of December 31, 2007, the Company had approximately $272 million in interest and penalties related tounrecognized tax benefits accrued, of which approximately $82 million was recognized through tax expense in2007.
It is expected that the amount of unrecognized tax benefits will change in the next twelve months; however,we do not expect the change to have a significant impact on our consolidated statement of income orconsolidated balance sheet. These changes may be the result of settlement of ongoing audits, statute oflimitations expiring, or final settlements in transfer pricing matters that are the subject of litigation. At this time,an estimate of the range of the reasonably possible outcomes cannot be made.
128

THE COCA-COLA COMPANY AND SUBSIDIARIES
NOTES TO CONSOLIDATED FINANCIAL STATEMENTS
NOTE 17: INCOME TAXES (Continued)
Undistributed earnings of the Company’s foreign subsidiaries amounted to approximately $14.1 billion as ofDecember 31, 2008. Those earnings are considered to be indefinitely reinvested and, accordingly, no U.S.federal and state income taxes have been provided thereon. Upon distribution of those earnings in the form ofdividends or otherwise, the Company would be subject to both U.S. income taxes (subject to an adjustment forforeign tax credits) and withholding taxes payable to the various foreign countries. Determination of the amountof unrecognized deferred U.S. income tax liability is not practical because of the complexities associated with itshypothetical calculation; however, unrecognized foreign tax credits would be available to reduce a portion of theU.S. tax liability.
The tax effects of temporary differences and carryforwards that give rise to deferred tax assets and liabilitiesconsist of the following (in millions):
December 31, 2008 2007
Deferred tax assets:Property, plant and equipment $ 33 $ 45Trademarks and other intangible assets 79 76Equity method investments (including translation adjustment) 339 238Other liabilities 447 845Benefit plans 1,171 881Net operating/capital loss carryforwards 494 554Other 532 266
Gross deferred tax assets 3,095 2,905Valuation allowances (569) (611)
Total deferred tax assets1,2 $ 2,526 $ 2,294
Deferred tax liabilities:Property, plant and equipment $ (667) $ (670)Trademarks and other intangible assets (1,974) (1,925)Equity method investments (including translation adjustment) (267) (841)Other liabilities (101) (90)Benefit plans (17) (226)Other (212) (157)
Total deferred tax liabilities3 $ (3,238) $ (3,909)
Net deferred tax liabilities $ (712) $ (1,615)
1 Noncurrent deferred tax assets of approximately $83 million and $66 million were included in theconsolidated balance sheets line item other assets at December 31, 2008 and 2007, respectively.
2 Current deferred tax assets of approximately $119 million and $238 million were included in theconsolidated balance sheets line item prepaid expenses and other assets at December 31, 2008 and2007, respectively.
3 Current deferred tax liabilities of approximately $37 million and $29 million were included in theconsolidated balance sheets line item accounts payable and accrued expenses at December 31, 2008and 2007, respectively.
129

THE COCA-COLA COMPANY AND SUBSIDIARIES
NOTES TO CONSOLIDATED FINANCIAL STATEMENTS
NOTE 17: INCOME TAXES (Continued)
As of December 31, 2008 and 2007, we had approximately $454 million and $610 million, respectively, ofnet deferred tax liabilities located in countries outside the United States.
As of December 31, 2008, we had approximately $2,496 million of loss carryforwards available to reducefuture taxable income. Loss carryforwards of approximately $230 million must be utilized within the next fiveyears, $21 million must be utilized within the next 10 years, and the remainder can be utilized over a periodgreater than 10 years.
An analysis of our deferred tax asset valuation allowances is as follows (in millions):
Year Ended December 31, 2008 2007 2006
Balance, beginning of year $ 611 $ 678 $ 786Additions 99 201 50Deductions (141) (268) (158)
Balance, end of year $ 569 $ 611 $ 678
The Company’s deferred tax asset valuation allowances are primarily the result of uncertainties regardingthe future realization of recorded tax benefits on tax loss carryforwards from operations in various jurisdictions.In 2008, the Company recognized a decrease in its valuation allowances of $42 million, primarily related to theutilization of capital loss carryforwards used to offset taxable gains on the sale of our investment in Remil. Inaddition, the Company also recognized a decrease to the valuation allowance as a result of asset write-offs,pension adjustments and the impact of foreign currency fluctuations in 2008.
In 2007, the Company recognized a net decrease in its valuation allowances of $67 million. This decreasewas primarily related to the reversal of valuation allowances on deferred tax assets recorded on the basisdifference in equity investments. The Company also recognized a decrease in certain deferred tax assets andcorresponding valuation allowances related to a change in German tax rates. In 2006, the Company recognized anet decrease in its valuation allowances of $108 million. This decrease was primarily related to the reversal ofvaluation allowances that covered certain deferred tax assets recorded on capital loss carryforwards. A portionof the capital loss carryforwards was utilized to offset taxable gains on the sale of a portion of the investments inCoca-Cola Icecek and Coca-Cola FEMSA.
NOTE 18: RESTRUCTURING COSTS
Streamlining Initiatives
During 2007, the Company took steps to streamline and simplify its operations globally. In North America,the Company reorganized its operations around three main business units: Sparkling Beverages, Still Beveragesand Emerging Brands. In Ireland, the Company announced a plan to close its beverage concentratemanufacturing and distribution plant in Drogheda, which was closed during the third quarter of 2008. The plantclosure is expected to improve operating productivity and enhance capacity utilization. The costs associated withthis plant closure are included in the Corporate operating segment. Selected other operations also took steps tostreamline their operations to improve overall efficiency and effectiveness.
Employees separated or to be separated from the Company as a result of these streamlining initiatives wereoffered severance or early retirement packages, as appropriate, that included both financial and nonfinancialcomponents. The expenses recorded during the years ended December 31, 2008 and 2007 included costs related
130

THE COCA-COLA COMPANY AND SUBSIDIARIES
NOTES TO CONSOLIDATED FINANCIAL STATEMENTS
NOTE 18: RESTRUCTURING COSTS (Continued)
to involuntary terminations and other direct costs associated with implementing these initiatives. Other directcosts included expenses to relocate employees; contract termination costs; costs associated with thedevelopment, communication and administration of these initiatives; accelerated depreciation; and assetwrite-offs. The Company has incurred total pretax expenses of approximately $410 million related to thesestreamlining initiatives since they commenced in 2007, which were recorded in the line item other operatingcharges in our consolidated statements of income. The Company does not anticipate significant additionalcharges, individually or in the aggregate, related to these initiatives.
The following table summarizes the balance of accrued streamlining expenses and the changes in theaccrued amounts for the years ended December 31, 2008 and 2007 (in millions):
Accrued AccruedCosts Noncash Balance Costs Noncash Balance
Incurred and December 31, Incurred and December 31,in 2007 Payments Exchange1 2007 in 2008 Payments Exchange1 2008
Severance pay and benefits $ 148 $ (72) $ 2 $ 78 $ 89 $ (143) $ (3) $ 21Outside services—legal,
outplacement, consulting 4 (3) — 1 2 (2) — 1Other direct costs 85 (8) (61) 16 82 (41) (49) 8
Total $ 237 $ (83) $ (59) $ 95 $ 173 $ (186) $ (52) $ 30
1 Amounts primarily represent the reclassification of accelerated depreciation included in current period charges.
The total streamlining initiative costs incurred by operating segment were as follows (in millions):
Year Ended December 31, 2008 2007
Eurasia & Africa $ 1 $ 36Europe — 33Latin America 1 4North America 30 23Pacific — 3Bottling Investments 25 29Corporate 116 109
Total $ 173 $ 237
Other Restructuring Activities
During 2008, the Company incurred approximately $21 million of charges related to other restructuringactivities outside the scope of the aforementioned streamlining initiatives, which primarily related to theintegration of the 18 German bottling and distribution operations acquired in 2007. These charges wererecorded in the line item other operating charges in our consolidated statement of income, and impacted theBottling Investments operating segment. This portion of the integration costs did not qualify to be accruedduring purchase accounting. Refer to Note 20.
131

THE COCA-COLA COMPANY AND SUBSIDIARIES
NOTES TO CONSOLIDATED FINANCIAL STATEMENTS
NOTE 18: RESTRUCTURING COSTS (Continued)
Productivity Initiatives
During 2008, the Company announced a transformation effort centered on productivity initiatives that willprovide additional flexibility to invest for growth. The initiatives are expected to impact a number of areas, andinclude aggressively managing operating expenses supported by lean techniques; redesigning key processes todrive standardization and effectiveness; better leveraging our size and scale; and driving savings in indirect coststhrough the implementation of a ‘‘procure-to-pay’’ program.
The Company has incurred total pretax expenses of approximately $55 million related to these productivityinitiatives since they commenced in the first quarter of 2008, which were recorded in the line item otheroperating charges in our consolidated statement of income and impacted the Corporate operating segment.Other direct costs included both internal and external costs associated with the development, communication,administration and implementation of these initiatives. The Company currently expects the total cost of theseinitiatives to be approximately $500 million and anticipates recognizing the remainder of the costs by the end of2011.
The following table summarizes the balance of accrued expenses related to productivity initiatives and thechanges in the accrued amounts for the applicable periods (in millions):
AccruedCosts Noncash Balance
Incurred and December 31,in 2008 Payments Exchange 2008
Severance pay and benefits $ 15 $ (1) $ — $ 14Outside services—legal, outplacement, consulting 35 (32) — 3Other direct costs 5 (5) — —
Total $ 55 $ (38) $ — $ 17
NOTE 19: SIGNIFICANT OPERATING AND NONOPERATING ITEMS
In 2008, we recorded our proportionate share of approximately $7.6 billion pretax ($4.9 billion after-tax) ofcharges recorded by CCE due to impairments of its North American franchise rights. The Company’sproportionate share of these charges was approximately $1.6 billion. In addition to these charges, our Companyalso recorded charges of approximately $30 million, primarily related to our proportionate share of restructuringcosts recorded by CCE. Our Company’s proportionate share of CCE’s asset impairment charges andrestructuring costs were recorded to equity income (loss)—net in our consolidated statement of income andimpacted the Bottling Investments operating segment. Refer to Note 3.
In addition to our proportionate share of charges recorded by CCE discussed above, the Companyrecognized a net charge of approximately $30 million to equity income (loss)—net in our consolidated statementof income in 2008, primarily related to our proportionate share of restructuring charges recorded by our equitymethod investees. None of these items was individually significant. These charges impacted the Europe, NorthAmerica and Bottling Investments operating segments. Refer to Note 3.
During 2008, the Company incurred other operating charges of approximately $350 million, which consistedof approximately $194 million related to restructuring charges, $63 million due to contract termination fees,$55 million attributable to productivity initiatives and $38 million as a result of asset impairments. Refer toNote 18 for additional information related to the restructuring charges and productivity initiatives. The contract
132

THE COCA-COLA COMPANY AND SUBSIDIARIES
NOTES TO CONSOLIDATED FINANCIAL STATEMENTS
NOTE 19: SIGNIFICANT OPERATING AND NONOPERATING ITEMS (Continued)
termination costs were primarily related to penalties incurred by the Company to terminate existing supply andco-packer agreements. Charges related to asset impairments were primarily due to the write-down ofmanufacturing lines that produce product packaging materials. These charges impacted the Eurasia and Africa,Latin America, North America, Bottling Investments and Corporate operating segments.
In 2008, the Company recorded charges of approximately $84 million to other income (loss)—net, whichprimarily consisted of $81 million of other-than-temporary impairment charges. As of December 31, 2008, theCompany had several investments classified as available-for-sale securities in which our cost basis exceededthe fair value of the investment, each of which initially occurred between the end of the second quarter and thebeginning of the third quarter of 2008. Management assessed each individual investment to determine ifthe decline in fair value was other than temporary. Based on these assessments, management determined thatthe decline in fair value of each investment was other than temporary. These impairment charges impacted theNorth America, Bottling Investments and Corporate operating segments. Refer to Note 10.
During 2008, the Company recognized gains of approximately $119 million due to divestitures, primarilyrelated to the sale of Remil to Coca-Cola FEMSA and the sale of 49 percent of our interest in Coca-ColaPakistan to Coca-Cola Icecek. These gains impacted the Bottling Investments and Corporate operatingsegments and are included in other income (loss)—net in our consolidated statement of income. Refer toNote 3.
During 2007, our Company recorded restructuring charges of approximately $237 million and asset write-downs totaling approximately $31 million related to certain assets and investments in bottling operations, noneof which was individually significant. Of this total, approximately $14 million was recorded in cost of goods sold,and approximately $254 million was recorded in other operating charges in our consolidated statement ofincome.
In 2007, the Company sold a portion of its interest in Coca-Cola Amatil for proceeds of approximately$143 million. As a result of this transaction, we recognized a pretax gain of approximately $73 million, whichimpacted the Corporate operating segment and was included in other income (loss)—net in our consolidatedstatement of income. Refer to Note 3.
During 2007, the Company sold substantially all of its interest in Vonpar. Total proceeds from the sale wereapproximately $238 million, and we recognized a pretax gain on this sale of approximately $70 million, whichimpacted the Corporate operating segment and was included in other income (loss)—net in our consolidatedstatement of income. Refer to Note 3.
In 2007, the Company recorded pretax gains of approximately $66 million and $18 million resulting fromthe sales of real estate in Spain and the United States, respectively. The gains were included in other income(loss)—net in the consolidated statement of income and impacted the Corporate operating segment. Totalproceeds amounted to approximately $106 million.
Equity income in 2007 was reduced by approximately $99 million in the Bottling Investments operatingsegment related to our proportionate share of asset write-downs recorded by CCBPI. The asset write-downsprimarily related to excess and obsolete bottles and cases at CCBPI. Refer to Note 3.
In 2007, our equity income was also reduced by approximately $62 million in the Bottling Investmentsoperating segment related to our proportionate share of an impairment recorded by Coca-Cola Amatil as aresult of the sale of its bottling operations in South Korea. Refer to Note 3.
133

THE COCA-COLA COMPANY AND SUBSIDIARIES
NOTES TO CONSOLIDATED FINANCIAL STATEMENTS
NOTE 19: SIGNIFICANT OPERATING AND NONOPERATING ITEMS (Continued)
Equity income was increased in 2007 by approximately $11 million in the Bottling Investments operatingsegment, primarily consisting of our proportionate share of tax benefits recorded by CCE, partially offset by ourproportionate share of restructuring charges recorded by CCE. Refer to Note 3.
In 2006, our Company recorded charges of approximately $606 million related to our proportionate shareof charges recorded by our equity method investees. Of this amount, approximately $602 million related to ourproportionate share of an impairment charge recorded by CCE for its North American franchise rights. Ourproportionate share of CCE’s charges also included approximately $18 million due to restructuring chargesrecorded by CCE. These charges were partially offset by approximately $33 million related to our proportionateshare of changes in certain of CCE’s state and Canadian federal and provincial tax rates. The charges wererecorded in the line item equity income (loss)—net in the consolidated statement of income. All of these chargesand changes impacted our Bottling Investments operating segment. Refer to Note 3.
During 2006, our Company also recorded charges of approximately $112 million, primarily related to theimpairment of assets and investments in our bottling operations, approximately $53 million for contracttermination costs related to production capacity efficiencies and approximately $24 million related to otherrestructuring costs. These charges impacted the Eurasia and Africa, Europe, Pacific, Bottling Investments andCorporate operating segments. None of these charges was individually significant. Approximately $4 million ofthese charges was recorded in the line item cost of goods sold and approximately $185 million of these chargeswas recorded in the line item other operating charges in the consolidated statement of income. Refer to Note 21for the impact on our operating segments.
The Company made a $100 million donation to The Coca-Cola Foundation in 2006, which resulted in acharge to the consolidated statement of income line item selling, general and administrative expenses andimpacted the Corporate operating segment.
In 2006, the Company sold a portion of its Coca-Cola FEMSA shares to FEMSA and recorded a pretaxgain of approximately $175 million in the consolidated statement of income line item other income (loss)—net,which impacted the Corporate operating segment. Refer to Note 3.
The Company sold a portion of our investment in Coca-Cola Icecek in an initial public offering in 2006. OurCompany received net cash proceeds of approximately $198 million and realized a pretax gain of approximately$123 million, which was recorded as other income (loss)—net in the consolidated statement of income andimpacted the Corporate operating segment. Refer to Note 3.
NOTE 20: ACQUISITIONS AND INVESTMENTS
On September 3, 2008, we announced our intention to make cash offers to purchase Huiyuan. The makingof the offers is subject to preconditions relating to Chinese regulatory approvals. Refer to Note 13.
During 2008, our Company’s acquisition and investment activities totaled approximately $759 million,primarily related to the purchase of trademarks, brands and licenses. Included in these investment activities wasthe acquisition of brands and licenses in Denmark and Finland from Carlsberg Group Beverages (‘‘Carlsberg’’)for approximately $225 million. None of the other acquisitions or investments was individually significant.
During 2007, our Company’s acquisition and investment activity, including the acquisition of trademarks,totaled approximately $5,653 million.
134

THE COCA-COLA COMPANY AND SUBSIDIARIES
NOTES TO CONSOLIDATED FINANCIAL STATEMENTS
NOTE 20: ACQUISITIONS AND INVESTMENTS (Continued)
In the fourth quarter of 2007, the Company and Coca-Cola FEMSA jointly acquired Jugos del Valle, thesecond largest producer of packaged juices, nectars and fruit-flavored beverages in Mexico and the largestproducer of such beverages in Brazil. The purchase price was approximately $370 million plus the assumption ofapproximately $85 million in debt and was split equally between the Company and Coca-Cola FEMSA. As ofDecember 31, 2008, the Company owned a 50 percent interest in Jugos del Valle. The Company’s investment inJugos del Valle is accounted for under the equity method. Equity income (loss)—net includes our proportionateshare of the results of Jugos del Valle’s operations beginning November 2007 and is included in the LatinAmerica operating segment.
In order to increase the efficiency of our bottling and distribution operations in the German market, theCompany, through its consolidated German bottling operation Coca-Cola Erfrischungsgetraenke AG(‘‘CCEAG’’), acquired 18 German bottling and distribution operations on September 1, 2007, for a totalpurchase price of approximately $547 million plus transaction costs. Following the acquisition, the Companyowns the franchise rights for all of the German market. The purchase price consisted of approximately17 percent of the outstanding shares of CCEAG valued at approximately $384 million, approximately$151 million in cash and assumed net debt of approximately $12 million. The acquisition agreements alsoprovide the former owners of the 18 German bottling and distribution operations a put option to sell theirrespective shares in CCEAG back to the Company on January 2, 2014, with notification to the Companyrequired by September 30, 2013. In addition, the agreements provide the Company with a call option torepurchase the issued shares of CCEAG back from the former owners of the 18 German bottling anddistribution operations on January 2, 2014, with notification to the former owners of the 18 German bottlers anddistributors by December 15, 2013. The strike price of the call option is approximately 20 percent higher thanthe strike price of the put option. As of the closing date of this transaction, the present value of the amountslikely to be paid under the put and call agreements and guaranteed future cash payments was approximately$384 million. Under the purchase method of accounting, the total purchase price is allocated to the tangibleassets, liabilities and identifiable intangible assets acquired based on their estimated fair values. Any excess ofpurchase price over the aggregate fair value of acquired net assets is recorded as goodwill. The final purchaseprice allocated to franchise rights was approximately $345 million; property, plant and equipment wasapproximately $227 million; deferred tax liabilities was approximately $97 million; and goodwill wasapproximately $153 million. Approximately $33 million of the goodwill is deductible for tax purposes. Thefranchise rights have been assigned an indefinite life. In conjunction with this acquisition, managementformulated a plan to improve the efficiency of the German bottling and distribution operations. Theimplementation of this plan resulted in approximately $45 million in liabilities for anticipated costs related toproduction and distribution facility closings. As of December 31, 2008, the Company has implemented amajority of its plan, and expects the final implementation steps to be completed by the end of the first quarter of2009. This transaction was accounted for as a business combination, with the results of the 18 German bottlingand distribution operations included in the Bottling Investments operating segment since September 1, 2007.
In the third quarter of 2007, the Company acquired a 34 percent interest in Tokyo CCBC. The Company’sinvestment in Tokyo CCBC is accounted for under the equity method. Equity income (loss)—net includes ourproportionate share of the results of Tokyo CCBC’s operations beginning July 2007 and is included in theBottling Investments operating segment. In the third quarter of 2007, the Company also acquired an additional11 percent interest in NORSA. After this acquisition, the Company owned approximately 60 percent of NORSA.The Company began consolidating this entity from the date we acquired the additional 11 percent interest. The
135

THE COCA-COLA COMPANY AND SUBSIDIARIES
NOTES TO CONSOLIDATED FINANCIAL STATEMENTS
NOTE 20: ACQUISITIONS AND INVESTMENTS (Continued)
combined purchase price for these third-quarter acquisitions was approximately $203 million. NORSA isincluded in the Bottling Investments operating segment.
On June 7, 2007, in an effort to expand our still beverage offerings, our Company acquired EnergyBrands Inc., also known as glacéau, the maker of enhanced water brands, such as vitaminwater and smartwater,for approximately $4.1 billion. On the acquisition date, we made a cash payment of approximately $2.9 billionfor a 71.4 percent interest in glacéau and entered into a put and call option agreement with certain entitiesassociated with the Tata Group (‘‘Tata’’) to acquire the remaining 28.6 percent ownership interest in glacéau. Asa result of the terms of these agreements with Tata, the amount to be paid under the put and call optionagreement of $1.2 billion was recorded at the acquisition date as an additional investment in glacéau, with theoffset being recorded as a current liability within loans and notes payable on the consolidated balance sheets. OnOctober 22, 2007, the Company exercised its right to call the remaining interest in glacéau and paid Tata$1.2 billion, such that the Company owned 100 percent of glacéau as of December 31, 2007. Under the purchasemethod of accounting, the total purchase price of glacéau is allocated to the tangible assets, liabilities andidentifiable intangible assets acquired based on their estimated fair values. Any excess of purchase price over theaggregate fair value of acquired net assets is recorded as goodwill. The final purchase price allocation wasapproximately $3.3 billion to trademarks, approximately $2.0 billion to goodwill, approximately $0.1 billion tocustomer relationships and approximately $1.1 billion to deferred tax liabilities. The trademarks have beenassigned indefinite lives. The goodwill resulting from this acquisition is primarily related to our ability tooptimize the route to market and increase the availability of the product, which will result in additional productsales. The goodwill also includes the recognition of deferred tax liabilities associated with the identifiableintangible assets recorded in purchase accounting. The goodwill is not deductible for tax purposes. OnAugust 30, 2007, the Company announced its plans to transition to a new distribution model for glacéauproducts. This new distribution model includes a mix of legacy glacéau distributors and existing Coca-Colasystem bottlers. Also, the Company will retain the distribution rights for certain channels. The implementationof this plan resulted in approximately $0.2 billion in liabilities for anticipated costs to terminate existing glacéaudistribution agreements, which was reflected as an adjustment to the original allocation of acquisition costs.Substantially all of these termination costs were paid by the end of 2008. The acquisition of glacéau wasaccounted for as a business combination, with the results of the acquired entity included in the North Americaoperating segment as of the acquisition date.
In addition, certain executive officers and former shareholders of glacéau invested approximately$179 million of their proceeds from the sale of glacéau in common stock of the Company at then-current marketprices. These shares of Company common stock were placed in escrow pursuant to the glacéau acquisitionagreement.
As discussed below, in the second quarter of 2007, the Company divested a portion of its interest in ScarletIbis Investment 3 (Proprietary) Limited (‘‘Scarlet’’), a bottling company in South Africa.
During the first quarter of 2007, our Company acquired the remaining 65 percent interest in CCBPI fromSan Miguel Corporation (‘‘SMC’’) for consideration of approximately $591 million plus assumed net debt, ofwhich $100 million was placed in escrow until certain matters related to the closing balance sheet audit ofCCBPI were resolved. During the third quarter of 2007, the entire escrow amount was released, and ourCompany recovered $70 million. The adjusted purchase price after the recovery from escrow was approximately$521 million plus assumed debt, net of acquired cash, of approximately $79 million. Of the $521 million ofconsideration, the Company has outstanding notes payable to SMC of approximately $100 million as of
136

THE COCA-COLA COMPANY AND SUBSIDIARIES
NOTES TO CONSOLIDATED FINANCIAL STATEMENTS
NOTE 20: ACQUISITIONS AND INVESTMENTS (Continued)
December 31, 2008. As a result of the acquisition, the Company owns 100 percent of the outstanding stock ofCCBPI. The final amount of purchase price allocated to property, plant and equipment was approximately$319 million; franchise rights was approximately $285 million; and goodwill was approximately $199 million. Thegoodwill is not deductible for tax purposes. The franchise rights have been assigned an indefinite life.Management finalized a plan to improve the efficiency of CCBPI, which included the closing of eight productionfacilities during the third quarter of 2007. The acquisition of CCBPI was accounted for as a businesscombination, with the results of the acquired entity included in the Bottling Investments operating segment as ofthe acquisition date.
First quarter 2007 acquisition and investing activities also included approximately $327 million related tothe purchases of Fuze and Leao Junior S.A. (‘‘Leao Junior’’), a Brazilian tea company, which are included in theNorth America and Latin America operating segments, respectively. The final amount of purchase price, relatedto these acquisitions, allocated to property, plant and equipment was approximately $19 million; identifiableintangible assets, primarily indefinite-lived trademarks, was approximately $265 million; and goodwill wasapproximately $57 million.
The acquisitions of the 18 German bottling and distribution operations, glacéau, CCBPI, Fuze, Leao Junior,NORSA, our 34 percent investment in Tokyo CCBC and our 50 percent investment in Jugos del Valle in 2007were primarily financed through the issuance of commercial paper and long-term debt.
Assuming the results of the businesses acquired in 2007 had been included in operations beginning onJanuary 1, 2006, the estimated pro forma net operating revenues of the Company for the years endedDecember 31, 2007 and 2006 would have been approximately $29.6 billion and $25.9 billion, respectively. Theestimated pro forma net income, excluding the effect of interest expense as a result of financing the acquisitions,for the years ended December 31, 2007 and 2006 would not have been significantly different than the reportedamounts.
During 2006, our Company’s acquisition and investment activity, including the acquisition of trademarks,totaled approximately $901 million. In the third quarter of 2006, our Company acquired a controllingshareholding interest in Kerry Beverages Limited (‘‘KBL’’). KBL was formed by the Company and the KerryGroup in 1993 and has a majority ownership in 11 joint ventures that manufacture and distribute Companyproducts across nine provinces in China. KBL also has a minority interest in the joint venture bottler in Beijing.Subsequent to the acquisition, the Company changed KBL’s name to Coca-Cola China Industries Limited(‘‘CCCIL’’). As a result of the transaction, the Company owned 89.5 percent of the outstanding shares ofCCCIL. The Company purchased the remaining 10.5 percent of the outstanding shares during the fourth quarterof 2008 at the same price per share as the initial purchase price plus interest. This transaction was accounted foras a business combination, and the results of CCCIL’s operations have been included in the Company’sconsolidated financial statements since August 29, 2006. CCCIL is included in the Bottling Investmentsoperating segment.
In the third quarter of 2006, our Company signed agreements with J. Bruce Llewellyn and Brucephil, Inc.(‘‘Brucephil’’), the parent company of The Philadelphia Coca-Cola Bottling Company, for the potentialpurchase of the remaining shares of Brucephil not then owned by the Company. The agreements provide for theCompany’s purchase of the shares upon the election of Mr. Llewellyn or the election of the Company. Based onthe terms of these agreements, the Company concluded that it must consolidate Brucephil under InterpretationNo. 46(R) effective September 29, 2006. During the third quarter of 2008, the Company purchased all remainingshares not previously owned by the Company. As a result, the Company owned 100 percent of Brucephil as of
137

THE COCA-COLA COMPANY AND SUBSIDIARIES
NOTES TO CONSOLIDATED FINANCIAL STATEMENTS
NOTE 20: ACQUISITIONS AND INVESTMENTS (Continued)
December 31, 2008. Brucephil’s financial statements were consolidated effective September 29, 2006 andincluded in our Bottling Investments operating segment.
Also in the third quarter of 2006, our Company acquired Apollinaris GmbH (‘‘Apollinaris’’). Apollinaris hasbeen selling sparkling and still mineral water in Germany since 1862. This transaction was accounted for as abusiness combination, and the results of Apollinaris’ operations have been included in the Company’sconsolidated financial statements since July 1, 2006. A portion of Apollinaris’ business is included in the Europeoperating segment, and the balance is included in the Bottling Investments operating segment.
The combined amount paid to complete these third quarter 2006 transactions totaled approximately$718 million. As a result of these transactions, the Company recorded approximately $707 million of franchiserights, approximately $74 million of trademarks and approximately $182 million of goodwill. The franchise rightsand trademarks have been assigned an indefinite life.
In January 2006, our Company acquired a 100 percent interest in TJC Holdings (Pty) Ltd. (‘‘TJC’’), abottling company in South Africa, from Chef Limited and Tom Cook Trust for cash consideration ofapproximately $200 million. Subsequently, the Company renamed TJC as Scarlet. This transaction wasaccounted for as a business combination, with the results of Scarlet included in the Company’s consolidatedfinancial statements since the date of acquisition. In May 2007, Scarlet issued common shares to a BlackEconomic Empowerment Entity (‘‘BEEE’’) at a price per share equal to the current carrying value of ourinvestment in Scarlet, which was subsequently renamed as Shanduka Beverages (Proprietary) Limited(‘‘Shanduka’’). This issuance reduced the Company’s ownership interest in Shanduka to 30 percent. As a resultof subordinated financial support provided by the Company for the BEEE to complete this transaction, theCompany concluded that we must continue to consolidate Shanduka’s operations under InterpretationNo. 46(R). Shanduka is included in our Bottling Investments operating segment.
Assuming the results of the businesses acquired in 2006 had been included in operations beginning onJanuary 1, 2006, pro forma financial data would not be required due to immateriality.
NOTE 21: OPERATING SEGMENTSDuring 2008, the Company made certain changes to its operating structure to align geographic
responsibility. The European Union operating segment was reconfigured to include the Adriatic and Balkansbusiness unit and was renamed the Europe operating segment; and the remaining Eurasia operating segmentwas combined with the Africa operating segment into the new Eurasia and Africa operating segment. Thechanges in operating structure did not impact the other existing geographic operating segments, BottlingInvestments or Corporate. As of December 31, 2008, our organizational structure consisted of the followingoperating segments: Eurasia and Africa; Europe; Latin America; North America; Pacific; Bottling Investments;and Corporate. Prior-period amounts have been reclassified to conform to the new operating structure describedabove.
Segment Products and ServicesThe business of our Company is nonalcoholic beverages. Our operating segments derive a majority of their
revenues from the manufacture and sale of beverage concentrates and syrups and, in some cases, the sale offinished beverages.
Method of Determining Segment Income or LossManagement evaluates the performance of our operating segments separately to individually monitor the
different factors affecting financial performance. Our Company manages income taxes and financial costs, suchas interest income and expense, on a global basis within the Corporate operating segment. We evaluate segmentperformance based on income or loss before income taxes.
138

THE COCA-COLA COMPANY AND SUBSIDIARIES
NOTES TO CONSOLIDATED FINANCIAL STATEMENTS
NOTE 21: OPERATING SEGMENTS (Continued)
Information about our Company’s operations by operating segment for the years ended December 31, 2008,2007 and 2006, is as follows (in millions):
Eurasia & Latin North BottlingAfrica Europe America America Pacific Investments Corporate Eliminations Consolidated
2008Net operating revenues:
Third party $ 2,135 $ 4,785 $ 3,623 $ 8,205 $ 4,3581 $ 8,731 $ 107 $ — $ 31,944Intersegment 192 1,016 212 75 337 200 — (2,032) —Total net revenues 2,327 5,801 3,835 8,280 4,695 8,931 107 (2,032) 31,944
Operating income (loss) 8342 3,175 2,0992 1,5842 1,858 2642 (1,368)2 — 8,446Interest income — — — — — — 333 — 333Interest expense — — — — — — 438 — 438Depreciation and
amortization 26 169 42 376 78 409 128 — 1,228Equity income (loss) — net (14) (4)3 6 (2)3 (19) (844)3 3 — (874)Income (loss) before income
taxes 8112 3,1823 2,0822 1,5872,3,4 1,836 (625)2,3,4,5 (1,434)2,4,5 — 7,439Identifiable operating assets6 956 3,0127 1,849 10,845 1,444 7,9357 8,699 — 34,740Investments8 395 179 199 4 72 4,873 57 — 5,779Capital expenditures 67 76 58 493 177 818 279 — 1,968
2007Net operating revenues:
Third party $ 1,941 $ 4,447 $ 3,069 $ 7,761 $ 3,9971 $ 7,570 $ 72 $ — $ 28,857Intersegment 168 845 175 75 409 125 — (1,797) —Total net revenues 2,109 5,292 3,244 7,836 4,406 7,695 72 (1,797) 28,857
Operating income (loss) 6679 2,7759 1,7499 1,6969 1,6999 1539 (1,487)9 — 7,252Interest income — — — — — — 236 — 236Interest expense — — — — — — 456 — 456Depreciation and
amortization 23 141 41 359 82 388 129 — 1,163Equity income (loss) — net 37 11 1 4 (14) 63010 (1) — 668Income (loss) before income
taxes 6969 2,7969 1,7529 1,7009 1,6659 7619,10 (1,497)9,11 — 7,873Identifiable operating assets6 1,023 2,9977 1,989 10,510 1,468 8,9627 8,543 — 35,492Investments8 386 111 245 18 23 6,949 45 — 7,777Capital expenditures 74 79 47 344 191 645 268 — 1,648
2006Net operating revenues:
Third party $ 1,680 $ 3,874 $ 2,484 $ 7,013 $ 3,9901 $ 4,954 $ 93 $ — $ 24,088Intersegment 124 703 132 16 128 89 — (1,192) —Total net revenues 1,804 4,577 2,616 7,029 4,118 5,043 93 (1,192) 24,088
Operating income (loss) 59212 2,36112 1,438 1,683 1,65012 1812 (1,434)12,13 — 6,308Interest income — — — — — — 193 — 193Interest expense — — — — — — 220 — 220Depreciation and
amortization 23 101 25 361 60 278 90 — 938Equity income (loss) — net 38 11 (2) 9 (10) 5614 — — 102Income (loss) before income
taxes 61912 2,38012 1,433 1,690 1,63312 6712,14 (1,244)12,13,15 — 6,578Identifiable operating assets6 853 2,5907 1,516 4,778 1,120 5,9537 6,370 — 23,180Investments8 328 97 1 17 16 6,302 22 — 6,783Capital expenditures 42 94 44 421 133 418 255 — 1,407
Certain prior year amounts have been revised to conform to the current year presentation.1 Net operating revenues in Japan represented approximately 9 percent of total consolidated net operating revenues in 2008, 9 percent in 2007 and
11 percent in 2006.2 Operating income (loss) and income (loss) before income taxes were reduced by approximately $1 million for Eurasia and Africa, $1 million for Latin
America, $56 million for North America, $46 million for Bottling Investments and $246 million for Corporate, primarily as a result of restructuringcharges, contract termination fees, expenses related to productivity initiatives and asset impairments. Refer to Note 18 and Note 19.
139

THE COCA-COLA COMPANY AND SUBSIDIARIES
NOTES TO CONSOLIDATED FINANCIAL STATEMENTS
NOTE 21: OPERATING SEGMENTS (Continued)3 Equity income (loss)—net and income (loss) before income taxes was reduced by approximately $19 million for Europe, $8 million for North America
and $1,659 million for Bottling Investments, primarily attributable to our proportionate share of asset impairment charges recorded by equity methodinvestees. Refer to Note 3 and Note 19.
4 Income (loss) before income taxes was reduced by approximately $2 million for North America, $30 million for Bottling Investments and $52 million forCorporate, primarily due to other-than-temporary impairments of available-for-sale securities. Refer to Note 10 and Note 19.
5 Income (loss) before income taxes was increased by approximately $119 million for Bottling Investments and Corporate, primarily due to the gain onthe sale of Remil to Coca-Cola FEMSA and the sale of 49 percent of our interest in Coca-Cola Pakistan to Coca-Cola Icecek. Refer to Note 3.
6 Principally cash and cash equivalents, trade accounts receivable, inventories, goodwill, trademarks and other intangible assets and property, plant andequipment—net.
7 Property, plant and equipment—net in Germany represented approximately 18 percent of total consolidated property, plant and equipment—net in2008, 21 percent in 2007 and 19 percent in 2006.
8 Principally equity method investments, available-for-sale securities and nonmarketable investments in bottling companies.9 Operating income (loss) and income (loss) before income taxes were reduced by approximately $37 million for Eurasia and Africa, $33 million for
Europe, $4 million for Latin America, $23 million for North America, $3 million for Pacific, $47 million for Bottling Investments and $121 million forCorporate, primarily due to asset impairments and restructuring charges. Refer to Note 18 and Note 19.
10 Equity income (loss)—net and income (loss) before income taxes was decreased by approximately $150 million for Bottling Investments, primarily dueto our proportionate share of asset impairments and restructuring costs, net of benefits from tax rate changes, recorded by equity method investees.Refer to Note 19.
11 Income (loss) before income taxes was increased by $227 million for Corporate primarily due to gains on the sale of real estate in Spain and in theUnited States, the sale of our ownership in Vonpar and the sale of Coca-Cola Amatil shares. Refer to Note 19.
12 Operating income (loss) and income (loss) before income taxes were reduced by approximately $3 million for Eurasia and Africa, $36 million forEurope, $62 million for the Pacific, $87 million for Bottling Investments and $1 million for Corporate primarily due to asset impairments, contracttermination costs related to production capacity efficiencies and other restructuring costs. Refer to Note 19.
13 Operating income (loss) and income (loss) before income taxes were reduced by $100 million for Corporate as a result of a donation made to TheCoca-Cola Foundation. Refer to Note 19.
14 Equity income—net and income (loss) before income taxes were reduced by approximately $587 million for Bottling Investments primarily related toour proportionate share of impairment and restructuring charges recorded by CCE which were partially offset by our proportionate share of changes incertain of CCE’s state and Canadian federal and provincial tax rates (refer to Note 3 and Note 19), and were reduced by approximately $19 million dueto our proportionate share of restructuring charges recorded by other equity method investees.
15 Income (loss) before income taxes was increased by approximately $298 million for Corporate as a result of net gains on the sale of Coca-ColaFEMSA shares and the sale of a portion of our investment in Coca-Cola Icecek in an initial public offering. Refer to Note 19.
Geographic Data (in millions)
Year Ended December 31, 2008 2007 2006
Net operating revenues:United States $ 8,014 $ 7,556 $ 6,662International 23,930 21,301 17,426
Net operating revenues $ 31,944 $ 28,857 $ 24,088
December 31, 2008 2007 2006
Property, plant and equipment—net:United States $ 3,161 $ 2,750 $ 2,607International 5,165 5,743 4,296
Property, plant and equipment—net $ 8,326 $ 8,493 $ 6,903
140

25FEB200913564291 26FEB200909212907
21JAN200918403249
REPORT OF MANAGEMENT ON INTERNAL CONTROL OVER FINANCIAL REPORTINGThe Coca-Cola Company and Subsidiaries
Management of the Company is responsible for the preparation and integrity of the consolidated financial statementsappearing in our annual report on Form 10-K. The financial statements were prepared in conformity with generallyaccepted accounting principles appropriate in the circumstances and, accordingly, include certain amounts based on ourbest judgments and estimates. Financial information in this annual report on Form 10-K is consistent with that in thefinancial statements.
Management of the Company is responsible for establishing and maintaining adequate internal control over financialreporting as such term is defined in Rule 13a-15(f) under the Securities Exchange Act of 1934 (‘‘Exchange Act’’). TheCompany’s internal control over financial reporting is designed to provide reasonable assurance regarding the reliability offinancial reporting and the preparation of the consolidated financial statements. Our internal control over financialreporting is supported by a program of internal audits and appropriate reviews by management, written policies andguidelines, careful selection and training of qualified personnel and a written Code of Business Conduct adopted by ourCompany’s Board of Directors, applicable to all officers and employees of our Company and subsidiaries. In addition, ourCompany’s Board of Directors adopted a written Code of Business Conduct for Non-Employee Directors which reflects thesame principles and values as our Code of Business Conduct for officers and employees but focuses on matters of mostrelevance to non-employee Directors.
Because of its inherent limitations, internal control over financial reporting may not prevent or detect misstatementsand, even when determined to be effective, can only provide reasonable assurance with respect to financial statementpreparation and presentation. Also, projections of any evaluation of effectiveness to future periods are subject to the riskthat controls may become inadequate because of changes in conditions, or that the degree of compliance with the policiesor procedures may deteriorate.
The Audit Committee of our Company’s Board of Directors, composed solely of Directors who are independent inaccordance with the requirements of the New York Stock Exchange listing standards, the Exchange Act and the Company’sCorporate Governance Guidelines, meets with the independent auditors, management and internal auditors periodically todiscuss internal control over financial reporting and auditing and financial reporting matters. The Audit Committee reviewswith the independent auditors the scope and results of the audit effort. The Audit Committee also meets periodically withthe independent auditors and the chief internal auditor without management present to ensure that the independentauditors and the chief internal auditor have free access to the Audit Committee. Our Audit Committee’s Report can befound in the Company’s 2009 Proxy Statement.
Management assessed the effectiveness of the Company’s internal control over financial reporting as of December 31,2008. In making this assessment, management used the criteria set forth by the Committee of Sponsoring Organizations ofthe Treadway Commission (COSO) in Internal Control—Integrated Framework. Based on our assessment, managementbelieves that the Company maintained effective internal control over financial reporting as of December 31, 2008.
The Company’s independent auditors, Ernst & Young LLP, a registered public accounting firm, are appointed by theAudit Committee of the Company’s Board of Directors, subject to ratification by our Company’s shareowners. Ernst &Young LLP has audited and reported on the consolidated financial statements of The Coca-Cola Company and subsidiariesand the Company’s internal control over financial reporting. The reports of the independent auditors are contained in thisannual report.
Muhtar Kent Harry L. AndersonPresident and Chief Executive Officer Vice President and ControllerFebruary 26, 2009 February 26, 2009
Gary P. FayardExecutive Vice Presidentand Chief Financial OfficerFebruary 26, 2009
141

Report of Independent Registered Public Accounting Firm
Board of Directors and ShareownersThe Coca-Cola Company
We have audited the accompanying consolidated balance sheets of The Coca-Cola Company andsubsidiaries as of December 31, 2008 and 2007, and the related consolidated statements of income, shareowners’equity, and cash flows for each of the three years in the period ended December 31, 2008. These financialstatements are the responsibility of the Company’s management. Our responsibility is to express an opinion onthese financial statements based on our audits.
We conducted our audits in accordance with the standards of the Public Company Accounting OversightBoard (United States). Those standards require that we plan and perform the audit to obtain reasonableassurance about whether the financial statements are free of material misstatement. An audit includesexamining, on a test basis, evidence supporting the amounts and disclosures in the financial statements. An auditalso includes assessing the accounting principles used and significant estimates made by management, as well asevaluating the overall financial statement presentation. We believe that our audits provide a reasonable basis forour opinion.
In our opinion, the financial statements referred to above present fairly, in all material respects, theconsolidated financial position of The Coca-Cola Company and subsidiaries at December 31, 2008 and 2007, andthe consolidated results of their operations and their cash flows for each of the three years in the period endedDecember 31, 2008, in conformity with U.S. generally accepted accounting principles.
As discussed in Notes 1 and 17 to the consolidated financial statements, in 2007 the Company adoptedFASB Interpretation No. 48 related to accounting for uncertainty in income taxes. Also as discussed in Notes 1and 16 to the consolidated financial statements, in 2006 the Company adopted SFAS No. 158 related to definedbenefit pension and other postretirement plans.
We also have audited, in accordance with the standards of the Public Company Accounting Oversight Board(United States), The Coca-Cola Company’s internal control over financial reporting as of December 31, 2008,based on criteria established in Internal Control—Integrated Framework issued by the Committee of SponsoringOrganizations of the Treadway Commission and our report dated February 26, 2009 expressed an unqualifiedopinion thereon.
Atlanta, GeorgiaFebruary 26, 2009
142

Report of Independent Registered Public Accounting Firmon Internal Control Over Financial Reporting
Board of Directors and ShareownersThe Coca-Cola Company
We have audited The Coca-Cola Company’s internal control over financial reporting as of December 31,2008, based on criteria established in Internal Control—Integrated Framework issued by the Committee ofSponsoring Organizations of the Treadway Commission (the COSO criteria). The Coca-Cola Company’smanagement is responsible for maintaining effective internal control over financial reporting, and for itsassessment of the effectiveness of internal control over financial reporting included in the accompanying Reportof Management on Internal Control Over Financial Reporting. Our responsibility is to express an opinion on theCompany’s internal control over financial reporting based on our audit.
We conducted our audit in accordance with the standards of the Public Company Accounting OversightBoard (United States). Those standards require that we plan and perform the audit to obtain reasonableassurance about whether effective internal control over financial reporting was maintained in all materialrespects. Our audit included obtaining an understanding of internal control over financial reporting, assessingthe risk that a material weakness exists, testing and evaluating the design and operating effectiveness of internalcontrol based on the assessed risk, and performing such other procedures as we considered necessary in thecircumstances. We believe that our audit provides a reasonable basis for our opinion.
A company’s internal control over financial reporting is a process designed to provide reasonable assuranceregarding the reliability of financial reporting and the preparation of financial statements for external purposesin accordance with generally accepted accounting principles. A company’s internal control over financialreporting includes those policies and procedures that (1) pertain to the maintenance of records that, inreasonable detail, accurately and fairly reflect the transactions and dispositions of the assets of the company;(2) provide reasonable assurance that transactions are recorded as necessary to permit preparation of financialstatements in accordance with generally accepted accounting principles, and that receipts and expenditures ofthe company are being made only in accordance with authorizations of management and directors of thecompany; and (3) provide reasonable assurance regarding prevention or timely detection of unauthorizedacquisition, use, or disposition of the company’s assets that could have a material effect on the financialstatements.
Because of its inherent limitations, internal control over financial reporting may not prevent or detectmisstatements. Also, projections of any evaluation of effectiveness to future periods are subject to the risk thatcontrols may become inadequate because of changes in conditions, or that the degree of compliance with thepolicies or procedures may deteriorate.
In our opinion, The Coca-Cola Company maintained, in all material respects, effective internal control overfinancial reporting as of December 31, 2008, based on the COSO criteria.
We also have audited, in accordance with the standards of the Public Company Accounting Oversight Board(United States), the consolidated balance sheets of The Coca-Cola Company and subsidiaries as ofDecember 31, 2008 and 2007, and the related consolidated statements of income, shareowners’ equity, and cashflows for each of the three years in the period ended December 31, 2008, and our report dated February 26, 2009expressed an unqualified opinion thereon.
Atlanta, GeorgiaFebruary 26, 2009
143

Quarterly Data (Unaudited)
First Second Third FourthYear Ended December 31, Quarter Quarter Quarter Quarter Full Year(In millions except per share data)
2008Net operating revenues $ 7,379 $ 9,046 $ 8,393 $ 7,126 $ 31,944Gross profit 4,755 5,884 5,373 4,558 20,570Net income 1,500 1,422 1,890 995 5,807
Basic net income per share $ 0.65 $ 0.61 $ 0.82 $ 0.43 $ 2.51
Diluted net income per share $ 0.64 $ 0.61 $ 0.81 $ 0.43 $ 2.49
2007Net operating revenues $ 6,103 $ 7,733 $ 7,690 $ 7,331 $ 28,857Gross profit 3,958 4,997 4,806 4,690 18,451Net income 1,262 1,851 1,654 1,214 5,981
Basic net income per share $ 0.55 $ 0.80 $ 0.72 $ 0.52 $ 2.59
Diluted net income per share $ 0.54 $ 0.80 $ 0.71 $ 0.52 $ 2.57
Our reporting period ends on the Friday closest to the last day of the quarterly calendar period. Our fiscalyear ends on December 31 regardless of the day of the week on which December 31 falls.
The Company’s first quarter of 2008 results were impacted by one less shipping day as compared to the firstquarter of 2007. Additionally, the Company recorded the following transactions which impacted results:
• Charges of approximately $2 million for North America and $76 million for Corporate, primarily due torestructuring costs and asset write-downs. Refer to Note 18 and Note 19.
• Equity income (loss)—net was increased by approximately $5 million for Bottling Investments due to ourproportionate share of one-time adjustments recorded by our equity method investees. Refer to Note 19.
• A net tax charge of approximately $2 million related to amounts required to be recorded for changes toour uncertain tax positions under Interpretation No. 48, including interest and penalties. Refer toNote 17.
In the second quarter of 2008, the Company recorded the following transactions which impacted results:
• Charges of approximately $4 million for North America, $5 million for Bottling Investments and$88 million for Corporate, primarily due to restructuring costs, contract termination fees and assetimpairments. Refer to Note 18 and Note 19.
• Equity income (loss)—net was reduced by approximately $1.1 billion for Bottling Investments, primarilyas a result of our proportionate share of an impairment charge recorded by CCE. Refer to Note 3 andNote 19.
• Other income (loss)—net was increased by approximately $102 million for Bottling Investments andCorporate, primarily due to the gain on the sale of Remil to Coca-Cola FEMSA. Refer to Note 19.
• A net tax charge of approximately $29 million related to amounts required to be recorded for changes toour uncertain tax positions under Interpretation No. 48, including interest and penalties. Refer toNote 17.
144

In the third quarter of 2008, the Company recorded the following transactions which impacted results:
• Charges of approximately $1 million for Latin America, $6 million for North America, $12 million forBottling Investments and $28 million for Corporate, as a result of restructuring costs and productivityinitiatives. Refer to Note 18 and Note 19.
• Equity income (loss)—net was reduced by approximately a net $3 million for Bottling Investments,primarily due to our proportionate share of restructuring charges recorded by our equity methodinvestees. Refer to Note 19.
• Other income (loss)—net was increased by approximately $16 million for Corporate due to the sale of49 percent of our interest in Coca-Cola Pakistan to Coca-Cola Icecek. Refer to Note 19.
• A net tax charge of approximately $5 million related to amounts required to be recorded for changes toour uncertain tax positions under Interpretation No. 48, including interest and penalties. Refer toNote 17.
The Company’s fourth quarter of 2008 results were impacted by two additional shipping days as comparedto the fourth quarter of 2007. Additionally, the Company recorded the following transactions which impactedresults:
• Charges of approximately $1 million for Eurasia and Africa, $44 million for North America, $21 millionfor Bottling Investments and $42 million for Corporate, primarily as a result of restructuring costs,productivity initiatives, asset impairments and contract termination fees. Refer to Note 18 and Note 19.
• Equity income (loss)—net was reduced by approximately $19 million for Europe, $8 million for NorthAmerica and $529 million for Bottling Investments, primarily attributable to our proportionate share ofasset impairment charges recorded by equity method investees. Refer to Note 19.
• Other income (loss)—net was reduced by approximately $2 million for North America, $30 million forBottling Investments and $52 million for Corporate, primarily due to other-than-temporary impairmentsof available-for-sale securities.
• An approximate $10 million tax expense related to valuation allowances recorded on deferred tax assets.Refer to Note 17.
• A net tax benefit of approximately $41 million related to amounts required to be recorded for changes toour uncertain tax positions under Interpretation No. 48, including interest and penalties. Refer toNote 17.
In the first quarter of 2007, the Company recorded the following transactions which impacted results:
• Approximately $10 million of charges primarily related to restructuring and asset write-downs in Eurasiaand Africa, Bottling Investments and Corporate. Refer to Note 18 and Note 19.
• An approximate $73 million charge to equity income—net primarily related to our proportionate share ofasset write-downs by CCBPI. Refer to Note 19.
• An approximate $137 million net gain primarily due to the sale of real estate in Spain and the sale ofsubstantially all of our ownership interest in Vonpar. Refer to Note 19.
• Approximately $73 million of tax expense related to the gains on the sale of our ownership interest inVonpar and the sale of real estate in Spain, as mentioned above. Refer to Note 17.
• An approximate $11 million tax expense related to amounts required to be recorded for changes to ouruncertain tax positions under Interpretation No. 48, including interest and penalties. Refer to Note 17.
145

In the second quarter of 2007, the Company recorded the following transactions which impacted results:
• Approximately $48 million of charges primarily related to restructuring and asset write-downs in Eurasiaand Africa, Europe, Latin America, Pacific, Bottling Investments and Corporate. Refer to Note 18 andNote 19.
• An approximate $89 million charge to equity income—net primarily related to our proportionate share ofan impairment recorded on investments by Coca-Cola Amatil in bottling operations in South Korea,along with our proportionate share of an asset write-down recorded by CCBPI and our proportionateshare of restructuring charges recorded by CCE. Refer to Note 3 and Note 19.
• An approximate $38 million tax benefit related to restructuring and asset write-downs and ourproportionate share of charges recorded by equity investees, as mentioned above. Refer to Note 17.
• An approximate $30 million tax expense related to amounts required to be recorded for changes to ouruncertain tax positions under Interpretation No. 48. Refer to Note 17.
In the third quarter of 2007, the Company recorded the following transactions which impacted results:
• Approximately $84 million of charges primarily related to restructuring activities and asset write-downs inEurasia and Africa, Europe, Latin America, North America, Bottling Investments and Corporate. Referto Note 18 and Note 19.
• An approximate $73 million net gain related to the sale of a portion of our ownership interest inCoca-Cola Amatil. Refer to Note 3 and Note 19.
• An approximate $21 million increase to equity income—net primarily related to our proportionate shareof tax benefits recorded at CCE, partially offset by asset write-downs and restructuring costs recorded byCCBPI. Refer to Note 3 and Note 19.
• An approximate $15 million tax expense related to amounts required to be recorded for changes to ouruncertain tax positions under Interpretation No. 48. Refer to Note 17.
• A tax charge of approximately $31 million primarily related to the gain on the sale of a portion of ourownership interest in Coca-Cola Amatil, as mentioned above. Refer to Note 17.
• An approximate $19 million tax benefit related to tax rate changes in Germany. Refer to Note 17.
In the fourth quarter of 2007, the Company recorded the following transactions which impacted results:
• Approximately $126 million of charges primarily related to asset write-downs and restructuring activitiesin Eurasia and Africa, Europe, Latin America, North America, Pacific, Bottling Investments andCorporate. Refer to Note 18 and Note 19.
• An approximate $18 million gain related to the sale of real estate in the United States. Refer to Note 19.
• An approximate $9 million charge to equity income—net primarily due to our proportionate share ofasset write-downs and restructuring costs recorded at various equity method investees, offset by taxbenefits recorded by CCE. Refer to Note 3 and Note 19.
• An approximate $40 million tax expense related to amounts required to be recorded for changes to ouruncertain tax positions under Interpretation No. 48. Refer to Note 17.
• An income tax benefit of approximately $19 million primarily related to asset write-downs andrestructuring activities in Eurasia and Africa, Europe, Latin America, North America, Pacific, BottlingInvestments and Corporate. Refer to Note 17.
146

ITEM 9. CHANGES IN AND DISAGREEMENTS WITH ACCOUNTANTS ON ACCOUNTING ANDFINANCIAL DISCLOSURE
Not applicable.
ITEM 9A. CONTROLS AND PROCEDURES
The Company, under the supervision and with the participation of its management, including the ChiefExecutive Officer and the Chief Financial Officer, evaluated the effectiveness of the design and operation of theCompany’s ‘‘disclosure controls and procedures’’ (as defined in Rule 13a-15(e) under the Securities ExchangeAct of 1934, as amended (the ‘‘Exchange Act’’)) as of the end of the period covered by this report. Based on thatevaluation, the Chief Executive Officer and the Chief Financial Officer concluded that the Company’s disclosurecontrols and procedures were effective as of December 31, 2008.
The report called for by Item 308(a) of Regulation S-K is incorporated by reference to Report ofManagement on Internal Control Over Financial Reporting, included in Part II, ‘‘Item 8. Financial Statementsand Supplementary Data’’ of this report.
The report called for by Item 308(b) of Regulation S-K is incorporated by reference to Report ofIndependent Registered Public Accounting Firm on Internal Control Over Financial Reporting, included inPart II, ‘‘Item 8. Financial Statements and Supplementary Data’’ of this report.
There has been no change in the Company’s internal control over financial reporting during the quarterended December 31, 2008 that has materially affected, or is reasonably likely to materially affect, the Company’sinternal control over financial reporting.
ITEM 9B. OTHER INFORMATION
Not applicable.
147

PART III
ITEM 10. DIRECTORS, EXECUTIVE OFFICERS AND CORPORATE GOVERNANCE
The information under the subheadings ‘‘Board of Directors,’’ ‘‘Section 16(a) Beneficial OwnershipReporting Compliance,’’ ‘‘Information About the Board of Directors and Corporate Governance — The AuditCommittee’’ and ‘‘Information About the Board of Directors and Corporate Governance — The Board andBoard Committees’’ under the principal heading ‘‘ELECTION OF DIRECTORS’’ in the Company’s 2009 ProxyStatement is incorporated herein by reference. See Item X in Part I of this report for information regardingexecutive officers of the Company.
The Company has adopted a code of business conduct and ethics applicable to the Company’s officers(including the Company’s principal executive officer, principal financial officer and controller) and employees,known as the Code of Business Conduct. In addition, the Company has adopted a Code of Business Conduct forNon-Employee Directors. Both Codes of Business Conduct are available on the Company’s website. In the eventthat we amend or waive any of the provisions of the Code of Business Conduct applicable to our principalexecutive officer, principal financial officer or controller that relates to any element of the code of ethicsdefinition enumerated in Item 406(b) of Regulation S-K, we intend to disclose the same on the Company’swebsite at www.thecoca-colacompany.com.
On May 14, 2008, we filed with the New York Stock Exchange (‘‘NYSE’’) the Annual CEO Certificationregarding the Company’s compliance with the NYSE’s corporate governance listing standards as required bySection 303A-12(a) of the NYSE Listed Company Manual. In addition, the Company has filed as exhibits to thisannual report and to the annual report on Form 10-K for the fiscal year ended December 31, 2007, theapplicable certifications of its Chief Executive Officer and its Chief Financial Officer required under Section 302of the Sarbanes-Oxley Act of 2002, regarding the quality of the Company’s public disclosures.
ITEM 11. EXECUTIVE COMPENSATION
The information under the principal headings ‘‘DIRECTOR COMPENSATION,’’ ‘‘COMPENSATIONDISCUSSION AND ANALYSIS,’’ ‘‘EXECUTIVE COMPENSATION,’’ ‘‘REPORT OF THECOMPENSATION COMMITTEE,’’ and ‘‘COMPENSATION COMMITTEE INTERLOCKS AND INSIDERPARTICIPATION’’ in the Company’s 2009 Proxy Statement is incorporated herein by reference.
ITEM 12. SECURITY OWNERSHIP OF CERTAIN BENEFICIAL OWNERS AND MANAGEMENT ANDRELATED STOCKHOLDER MATTERS
The information under the principal heading ‘‘EQUITY COMPENSATION PLAN INFORMATION,’’and the information under the subheadings ‘‘Ownership of Equity Securities of the Company’’ and ‘‘PrincipalShareowners’’ below the principal heading ‘‘ELECTION OF DIRECTORS’’ in the Company’s 2009 ProxyStatement is incorporated herein by reference.
ITEM 13. CERTAIN RELATIONSHIPS AND RELATED TRANSACTIONS, AND DIRECTORINDEPENDENCE
The information under the subheadings ‘‘Information About the Board of Directors and CorporateGovernance — Independence Determinations’’ and ‘‘Certain Related Person Transactions’’ under the principalheading ‘‘ELECTION OF DIRECTORS’’ and the information under the principal headings‘‘COMPENSATION COMMITTEE INTERLOCKS AND INSIDER PARTICIPATION,’’ and ‘‘COCA-COLAENTERPRISES INC.’’ in the Company’s 2009 Proxy Statement is incorporated herein by reference.
ITEM 14. PRINCIPAL ACCOUNTANT FEES AND SERVICES
The information under the subheadings ‘‘Audit Fees and All Other Fees’’ and ‘‘Audit CommitteePre-Approval of Audit and Permissible Non-Audit Services of Independent Auditors’’ below the principalheading ‘‘RATIFICATION OF THE APPOINTMENT OF ERNST & YOUNG LLP AS INDEPENDENTAUDITORS’’ in the Company’s 2009 Proxy Statement is incorporated herein by reference.
148

PART IV
ITEM 15. EXHIBITS AND FINANCIAL STATEMENT SCHEDULES
(a) The following documents are filed as part of this report:
1. Financial Statements:
Consolidated Statements of Income — Years ended December 31, 2008, 2007 and 2006.
Consolidated Balance Sheets — December 31, 2008 and 2007.
Consolidated Statements of Cash Flows — Years ended December 31, 2008, 2007 and 2006.
Consolidated Statements of Shareowners’ Equity — Years ended December 31, 2008, 2007and 2006.
Notes to Consolidated Financial Statements.
Report of Independent Registered Public Accounting Firm.
Report of Independent Registered Public Accounting Firm on Internal Control OverFinancial Reporting.
2. Financial Statement Schedules:
The schedules for which provision is made in the applicable accounting regulations of the SEC arenot required under the related instructions or are inapplicable and, therefore, have been omitted.
3. Exhibits
In reviewing the agreements included as exhibits to this report, please remember they are includedto provide you with information regarding their terms and are not intended to provide any otherfactual or disclosure information about the Company or the other parties to the agreements. Theagreements contain representations and warranties by each of the parties to the applicableagreement. These representations and warranties have been made solely for the benefit of theother parties to the applicable agreement and:
• should not in all instances be treated as categorical statements of fact, but rather as a way ofallocating the risk to one of the parties if those statements prove to be inaccurate;
• may have been qualified by disclosures that were made to the other party in connection with thenegotiation of the applicable agreement, which disclosures are not necessarily reflected in theagreement;
• may apply standards of materiality in a way that is different from what may be viewed asmaterial to you or other investors; and
• were made only as of the date of the applicable agreement or such other date or dates as may bespecified in the agreement and are subject to more recent developments.
Accordingly, these representations and warranties may not describe the actual state of affairs as ofthe date they were made or at any other time. Additional information about the Company may befound elsewhere in this report and the Company’s other public filings, which are available withoutcharge through the SEC’s website at http://www.sec.gov.
149

Exhibit No.
2.1 Agreement and Plan of Merger by and among The Coca-Cola Company, Mustang AcquisitionCompany, LLP, Energy Brands Inc. d/b/a Glaceau, and the Stockholder Representatives identified therein,dated as of May 24, 2007 — incorporated herein by reference to Exhibit 2.1 to the Company’s CurrentReport on Form 8-K filed May 31, 2007. In accordance with Item 601(b)(2) of Regulation S-X, thedisclosure schedules to the Agreement and Plan of Merger were not filed. The Agreement and Plan ofMerger contains a list briefly identifying the contents of all omitted disclosure schedules and the Companyhereby agrees to furnish supplementally a copy of any omitted disclosure schedule to the Securities andExchange Commission upon request. (With regard to applicable cross-references in this report, theCompany’s Current, Quarterly and Annual Reports are filed with the SEC under File No. 1-2217.)
3.1 Certificate of Incorporation of the Company, including Amendment of Certificate of Incorporation,effective May 1, 1996 — incorporated herein by reference to Exhibit 3 of the Company’s Quarterly Reporton Form 10-Q for the quarter ended March 31, 1996.
3.2 By-Laws of the Company, as amended and restated through April 17, 2008 — incorporated herein byreference to Exhibit 3.2 of the Company’s Quarterly Report on Form 10-Q for the quarter ended June 27,2008.
4.1 The Company agrees to furnish to the Securities and Exchange Commission, upon request, a copy of anyinstrument defining the rights of holders of long-term debt of the Company and all of its consolidatedsubsidiaries and unconsolidated subsidiaries for which financial statements are required to be filed withthe SEC.
4.2 Form of Note for 5.350% Notes due November 15, 2017 — incorporated herein by reference toExhibit 4.1 to the Company’s Current Report on Form 8-K filed October 31, 2007.
10.1 Supplemental Disability Plan of the Company, as amended and restated effective January 1, 2003 —incorporated herein by reference to Exhibit 10.2 of the Company’s Annual Report on Form 10-K for theyear ended December 31, 2002.*
10.2 Performance Incentive Plan of the Company, amended and restated January 1, 2009.*10.3.1 1999 Stock Option Plan of the Company, amended and restated through February 18, 2009 —
incorporated herein by reference to Exhibit 10.2 to the Company’s Current Report on Form 8-K filedFebruary 18, 2009.*
10.3.2 Form of Stock Option Agreement in connection with the 1999 Stock Option Plan of the Company —incorporated herein by reference to Exhibit 99.1 of the Company’s Current Report on Form 8-K filedFebruary 14, 2007.*
10.3.3 Form of Stock Option Agreement for E. Neville Isdell in connection with the 1999 Stock Option Plan ofthe Company — incorporated herein by reference to Exhibit 99.2 of the Company’s Current Report onForm 8-K filed February 14, 2007.*
10.3.4 Form of Stock Option Agreement for E. Neville Isdell in connection with the 1999 Stock Option Plan ofthe Company, as adopted December 12, 2007 — incorporated herein by reference to Exhibit 10.7 of theCompany’s Current Report on Form 8-K filed February 21, 2008.*
10.3.5 Form of Stock Option Agreement in connection with the 1999 Stock Option Plan of the Company, asadopted December 12, 2007 — incorporated herein by reference to Exhibit 10.8 of the Company’sCurrent Report on Form 8-K filed February 21, 2008.*
10.3.6 Form of Stock Option Agreement in connection with the 1999 Stock Option Plan of the Company, asadopted February 18, 2009 — incorporated herein by reference to Exhibit 10.5 of the Company’s CurrentReport on Form 8-K filed February 18, 2009.*
10.4.1 2002 Stock Option Plan of the Company, amended and restated through February 18, 2009 —incorporated herein by reference to Exhibit 10.3 to the Company’s Current Report on Form 8-K filedFebruary 18, 2009.*
10.4.2 Form of Stock Option Agreement in connection with the 2002 Stock Option Plan, as amended —incorporated herein by reference to Exhibit 99.1 of the Company’s Current Report on Form 8-K filed onDecember 8, 2004.*
150

Exhibit No.
10.4.3 Form of Stock Option Agreement for E. Neville Isdell in connection with the 2002 Stock Option Plan, asamended — incorporated herein by reference to Exhibit 99.1 of the Company’s Current Report onForm 8-K filed February 23, 2005.*
10.4.4 Form of Stock Option Agreement in connection with the 2002 Stock Option Plan, as adoptedDecember 12, 2007 — incorporated herein by reference to Exhibit 10.9 of the Company’s Current Reporton Form 8-K filed on February 21, 2008.*
10.4.5 Form of Stock Option Agreement in connection with the 2002 Stock Option Plan, as adopted February 18,2009 — incorporated herein by reference to Exhibit 10.6 of the Company’s Current Report on Form 8-Kfiled on February 18, 2009.*
10.5.1 2008 Stock Option Plan of the Company as amended and restated, effective February 18, 2009 —incorporated herein by reference to Exhibit 10.4 of the Company’s Current Report on Form 8-K filed onFebruary 18, 2009.*
10.5.2 Form of Stock Option Agreement for grants under the Company’s 2008 Stock Option Plan —incorporated herein by reference to Exhibit 10.1 of the Company’s Current Report on Form 8-K filedJuly 16, 2008.*
10.5.3 Form of Stock Option Agreement for grants under the Company’s 2008 Stock Option Plan, as adoptedFebruary 18, 2009 — incorporated herein by reference to Exhibit 10.7 of the Company’s Current Reporton Form 8-K filed February 18, 2009.*
10.6 1983 Restricted Stock Award Plan of the Company, as amended through December 1, 2007 —incorporated herein by reference to Exhibit 10.6 of the Company’s Annual Report on Form 10-K or theyear ended December 31, 2007.*
10.7.1 1989 Restricted Stock Award Plan of the Company, as amended through February 18, 2009 —incorporated herein by reference to Exhibit 10.1 to the Company’s Current Report on Form 8-K filedFebruary 18, 2009.*
10.7.2 Form of Restricted Stock Agreement (Performance Share Unit Agreement) in connection with the 1989Restricted Stock Award Plan of the Company — incorporated herein by reference to Exhibit 10.1 of theCompany’s Current Report on Form 8-K filed April 19, 2005.*
10.7.3 Form of Restricted Stock Agreement (Performance Share Unit Agreement) in connection with the 1989Restricted Stock Award Plan of the Company, effective as of December 2005 — incorporated herein byreference to Exhibit 99.1 of the Company’s Current Report on Form 8-K filed December 14, 2005.*
10.7.4 Form of Restricted Stock Agreement (Performance Share Unit Agreement) for E. Neville Isdell inconnection with the 1989 Restricted Stock Award Plan of the Company, as amended — incorporatedherein by reference to Exhibit 99.2 of the Company’s Current Report on Form 8-K filed on February 23,2005.*
10.7.5 Form of Restricted Stock Agreement (Performance Share Unit Agreement) in connection with the 1989Restricted Stock Award Plan of the Company — incorporated herein by reference to Exhibit 99.2 of theCompany’s Current Report on Form 8-K filed on February 15, 2006.*
10.7.6 Form of Restricted Stock Agreement (Performance Share Unit Agreement) for E. Neville Isdell inconnection with the 1989 Restricted Stock Award Plan of the Company — incorporated herein byreference to Exhibit 99.1 of the Company’s Current Report on Form 8-K filed on February 17, 2006.*
10.7.7 Form of Restricted Stock Agreement (Performance Share Unit Agreement) in connection with the 1989Restricted Stock Award Plan of the Company — incorporated herein by reference to Exhibit 99.3 of theCompany’s Current Report on Form 8-K filed February 14, 2007.*
10.7.8 Form of Restricted Stock Agreement (Performance Share Unit Agreement) for E. Neville Isdell inconnection with the 1989 Restricted Stock Award Plan of the Company, as adopted December 12, 2007 —incorporated herein by reference to Exhibit 10.4 of the Company’s Current Report on Form 8-K filedFebruary 21, 2008.*
151

Exhibit No.
10.7.9 Form of Restricted Stock Agreement (Performance Share Unit Agreement) in connection with the 1989Restricted Stock Award Plan of the Company, as adopted December 12, 2007 — incorporated herein byreference to Exhibit 10.5 of the Company’s Current Report on Form 8-K filed February 21, 2008.*
10.7.10 Form of Restricted Stock Agreement (Performance Share Unit Agreement) for France in connection withthe 1989 Restricted Stock Award Plan of the Company, as adopted December 12, 2007 — incorporatedherein by reference to Exhibit 10.6 of the Company’s Current Report on Form 8-K filed February 21,2008.*
10.8.1 Compensation Deferral & Investment Program of the Company, as amended, including AmendmentNumber Four dated November 28, 1995 — incorporated herein by reference to Exhibit 10.13 of theCompany’s Annual Report on Form 10-K for the year ended December 31, 1995.*
10.8.2 Amendment Number Five to the Compensation Deferral & Investment Program of the Company,effective as of January 1, 1998 — incorporated herein by reference to Exhibit 10.8.2 of the Company’sAnnual Report on Form 10-K for the year ended December 31, 1997.*
10.8.3 Amendment Number Six to the Compensation Deferral & Investment Program of the Company, dated asof January 12, 2004, effective January 1, 2004 — incorporated herein by reference to Exhibit 10.9.3 of theCompany’s Annual Report on Form 10-K for the year ended December 31, 2003.*
10.9.1 Executive Medical Plan of the Company, as amended and restated effective January 1, 2001 —incorporated herein by reference to Exhibit 10.10 of the Company’s Annual Report on Form 10-K for theyear ended December 31, 2002.*
10.9.2 Amendment Number One to the Executive Medical Plan of the Company, dated April 15, 2003 —incorporated herein by reference to Exhibit 10.1 of the Company’s Quarterly Report on Form 10-Q forthe quarter ended June 30, 2003.*
10.9.3 Amendment Number Two to the Executive Medical Plan of the Company, dated August 27, 2003 —incorporated herein by reference to Exhibit 10 of the Company’s Quarterly Report on Form 10-Q for thequarter ended September 30, 2003.*
10.9.4 Amendment Number Three to the Executive Medical Plan of the Company, dated December 29, 2004,effective January 1, 2005 — incorporated herein by reference to Exhibit 10.10.4 of the Company’s AnnualReport on Form 10-K for the year ended December 31, 2004.*
10.9.5 Amendment Number Four to the Executive Medical Plan of the Company — incorporated herein byreference to Exhibit 10.6 of the Company’s Quarterly Report on Form 10-Q for the quarter ended July 1,2005.*
10.9.6 Amendment Number Five to the Executive Medical Plan of the Company, dated December 20, 2005 —incorporated herein by reference to Exhibit 10.10.6 of the Company’s Annual Report on Form 10-K forthe year ended December 31, 2005.*
10.10.1 Supplemental Pension Plan of the Company (successor plan to the Supplemental Benefit Plan andconstitutes the supplemental pension component previously provided pursuant to the SupplementalBenefit Plan), effective January 1, 2008 — incorporated herein by reference to Exhibit 10.4 of theCompany’s Quarterly Report on Form 10-Q for the quarter ended March 28, 2008.*
10.10.2 Amendment One to the Company’s Supplemental Pension Plan, dated May 5, 2008.*10.10.3 Amendment Two to the Company’s Supplemental Pension Plan, dated June 18, 2008.*10.10.4 Amendment Three to the Company’s Supplemental Pension Plan, dated December 18, 2008.*10.11.1 Supplemental Thrift Plan of the Company (successor plan to the Supplemental Benefit Plan and
constitutes the supplemental thrift component previously provided pursuant to the Supplemental BenefitPlan), effective January 1, 2008 — incorporated herein by reference to Exhibit 10.5 of the Company’sQuarterly Report on Form 10-Q for the quarter ended March 28, 2008.*
10.11.2 Amendment One to the Company’s Supplemental Thrift Plan, dated June 18, 2008.*
152

Exhibit No.
10.12 The Coca-Cola Company Deferred Compensation Plan for Non-Employee Directors, as amended andrestated effective April 1, 2006 — incorporated herein by reference to Exhibit 99.2 of the Company’sCurrent Report on Form 8-K filed April 5, 2006.*
10.13 Compensation Plan for Non-Employee Directors of The Coca-Cola Company, as amended and restatedon December 13, 2007 — incorporated herein by reference to Exhibit 99.1 of the Company’s CurrentReport on Form 8-K filed on December 19, 2007.*
10.14 Long-Term Performance Incentive Plan of the Company, as amended and restated effective December 13,2006 — incorporated herein by reference to Exhibit 10.13 of the Company’s Annual Report on Form 10-Kfor the year ended December 31, 2007.*
10.15 Executive Incentive Plan of the Company, adopted as of February 14, 2001 — incorporated herein byreference to Exhibit 10.19 of the Company’s Annual Report on Form 10-K for the year endedDecember 31, 2000.*
10.16 Form of United States Master Bottler Contract between the Company and Coca-Cola Enterprises Inc.(‘‘Coca-Cola Enterprises’’) or its subsidiaries — incorporated herein by reference to Exhibit 10.24 ofCoca-Cola Enterprises’ Annual Report on Form 10-K for the fiscal year ended December 30, 1988 (FileNo. 01-09300).
10.17.1 Deferred Compensation Plan of the Company, as amended and restated January 1, 2008 — incorporatedherein by reference to Exhibit 10.2 of the Company’s Quarterly Report on Form 10-Q for the quarterended March 28, 2008.*
10.17.2 Deferred Compensation Plan Delegation of Authority from the Compensation Committee to theManagement Committee, adopted as of December 17, 2003 — incorporated herein by reference toExhibit 10.26.2 of the Company’s Annual Report on Form 10-K for the year ended December 31, 2003.*
10.18 The Coca-Cola Export Corporation Employee Share Plan, effective as of March 13, 2002 — incorporatedherein by reference to Exhibit 10.31 of the Company’s Annual Report on Form 10-K for the year endedDecember 31, 2002.*
10.19 Employees’ Savings and Share Ownership Plan of Coca-Cola Ltd., effective as of January 1, 1990 —incorporated herein by reference to Exhibit 10.32 of the Company’s Annual Report on Form 10-K for theyear ended December 31, 2002.*
10.20 Share Purchase Plan — Denmark, effective as of 1991 — incorporated herein by reference toExhibit 10.33 of the Company’s Annual Report on Form 10-K for the year ended December 31, 2002.*
10.21.1 The Coca-Cola Company Benefits Plan for Members of the Board of Directors, as amended and restatedthrough April 14, 2004 — incorporated herein by reference to Exhibit 10.1 of the Company’s QuarterlyReport on Form 10-Q for the quarter ended March 31, 2004.*
10.21.2 Amendment Number One to the Company’s Benefits Plan for Members of the Board of Directors, datedDecember 16, 2005 — incorporated herein by reference to Exhibit 10.31.2 of the Company’s AnnualReport on Form 10-K for the year ended December 31, 2005.*
10.22 Letter, dated September 16, 2004, from the Company to E. Neville Isdell — incorporated herein byreference to Exhibit 99.1 of the Company’s Current Report on Form 8-K filed on September 17, 2004.*
10.23 Stock Award Agreement for E. Neville Isdell, dated September 14, 2004, under the 1989 Restricted StockAward Plan of the Company — incorporated herein by reference to Exhibit 99.2 of the Company’sCurrent Report on Form 8-K filed on September 17, 2004.*
10.24 Stock Option Agreement for E. Neville Isdell, dated July 22, 2004, under the 2002 Stock Option Plan ofthe Company, as amended — incorporated herein by reference to Exhibit 10.3 of the Company’sQuarterly Report on Form 10-Q for the quarter ended September 30, 2004.*
10.25 Letter, dated August 6, 2004, from the Chairman of the Compensation Committee of the Board ofDirectors of the Company to Douglas N. Daft — incorporated herein by reference to Exhibit 10.5 of theCompany’s Quarterly Report on Form 10-Q for the quarter ended September 30, 2004.*
153

Exhibit No.
10.26 Letter, dated January 4, 2006, from the Company to Tom Mattia — incorporated herein by reference toExhibit 10.40 of the Company’s Annual Report on Form 10-K for the year ended December 31, 2005.*
10.27 Letter Agreement, dated October 7, 2004, between the Company and Daniel Palumbo — incorporatedherein by reference to Exhibit 10.41 of the Company’s Annual Report on Form 10-K for the year endedDecember 31, 2004.*
10.28 Letter, dated February 12, 2005, from the Company to Mary E. Minnick — incorporated herein byreference to Exhibit 99.3 to the Company’s Current Report on Form 8-K filed on February 23, 2005.*
10.29 Employment Agreement, dated as of February 20, 2003, between the Company and José Octavio Reyes —incorporated herein by reference to Exhibit 10.43 of the Company’s Annual Report on Form 10-K for theyear ended December 31, 2004.*
10.30 Severance Pay Plan of the Company, as amended and restated, effective January 1, 2008 — incorporatedherein by reference to Exhibit 10.3 of the Company’s Quarterly Report on Form 10-Q for the quarterended March 28, 2008.*
10.31 Severance Pay Plan of the Company, including Amendments One through Three — incorporated hereinby reference to Exhibit 10.30 of the Company’s Annual Report on Form 10-K for the year endedDecember 31, 2007.*
10.32 Order Instituting Cease and Desist Proceedings, Making Findings and Imposing a Cease-and-DesistOrder Pursuant to Section 8A of the Securities Act of 1933 and Section 21C of the Securities ExchangeAct of 1934 — incorporated herein by reference to Exhibit 99.2 of the Company’s Current Report onForm 8-K filed on April 18, 2005.
10.33 Offer of Settlement of The Coca-Cola Company — incorporated herein by reference to Exhibit 99.2 of theCompany’s Current Report on Form 8-K filed on April 18, 2005.
10.34 Final Undertaking from The Coca-Cola Company and certain of its bottlers, adopted by the EuropeanCommission on June 22, 2005, relating to various commercial practices in the European Economic Area— incorporated herein by reference to Exhibit 99.1 of the Company’s Current Report on Form 8-K filedJune 22, 2005.
10.35 Employment Agreement, effective as of May 1, 2005, between Refreshment Services, S.A.S. andDominique Reiniche, dated September 7, 2006 — incorporated herein by reference to Exhibit 99.1 of theCompany’s Current Report on Form 8-K filed on September 12, 2006.*
10.36 Refreshment Services S.A.S. Defined Benefit Plan, dated September 25, 2006 — incorporated herein byreference to Exhibit 10.3 of the Company’s Quarterly Report on Form 10-Q for the quarter endedSeptember 29, 2006.*
10.37 Share Purchase Agreement among Coca-Cola South Asia Holdings, Inc. and San Miguel Corporation,San Miguel Beverages (L) Pte Limited and San Miguel Holdings Limited in connection with theCompany’s purchase of Coca-Cola Bottlers Philippines, Inc., dated December 23, 2006 — incorporatedherein by reference to Exhibit 99.1 of the Company’s Current Report on Form 8-K filed on December 29,2006.*
10.38 Cooperation Agreement between Coca-Cola South Asia Holdings, Inc. and San Miguel Corporation inconnection with the Company’s purchase of Coca-Cola Bottlers Philippines, Inc., dated December 23,2006 — incorporated herein by reference to Exhibit 99.2 of the Company’s Current Report on Form 8-Kfiled on December 29, 2006.*
10.39 Separation Agreement between The Coca-Cola Company and Mary Minnick — incorporated herein byreference to Exhibit 99.1 to the Company’s Current Report on Form 8-K filed on March 6, 2007.*
10.40 Full and Complete Release and Agreement on Competition, Trade Secrets and Confidentiality betweenthe Company and Mary Minnick — incorporated herein by reference to Exhibit 99.2 of the Company’sCurrent Report on Form 8-K filed on March 6, 2007.
10.41 Roll-Over Agreement among Tata Tea (GB) Investments Limited, Tata Limited and Mustang AcquisitionCompany, LLP, dated as of May 24, 2007 — incorporated herein by reference to Exhibit 99.1 to theCompany’s Current Report on Form 8-K filed on May 31, 2007.
154

Exhibit No.
10.42 Put and Call Option Agreement among Tata Tea (GB) Limited, Tata Tea (GB) Investments Limited, TataLimited and The Coca-Cola Company, dated as of May 24, 2007 — incorporated herein by reference toExhibit 99.2 to the Company’s Current Report on Form 8-K filed on May 31, 2007.
10.43 Voting Agreement among Tata Limited, Tata Tea (GB) Investments Limited and The Coca-ColaCompany, dated as of May 24, 2007 — incorporated herein by reference to Exhibit 99.3 to the Company’sCurrent Report on Form 8-K filed on May 31, 2007.
10.44 Supplemental Indemnity Agreement between J. Darius Bikoff and The Coca-Cola Company, datedMay 24, 2007 — incorporated herein by reference to Exhibit 99.4 to the Company’s Current Report onForm 8-K filed on May 31, 2007.
10.45 Form of Investment Agreement, dated as of May 24, 2007, between each of J. Darius Bikoff, MichaelRepole and Michael Venuti and The Coca-Cola Company — incorporated herein by reference toExhibit 99.5 to the Company’s Current Report on Form 8-K filed on May 31, 2007.
10.46 Separation Agreement between the Company and Danny Strickland, dated June 5, 2008 — incorporatedherein by reference to Exhibit 10.2 to the Company’s Quarterly Report on Form 10-Q for the quarterended June 27, 2008.*
10.47.1 Offer Letter dated July 20, 2007 from the Company to Joseph V. Tripodi, including Agreement onConfidentiality, Non-Competition and Non-Solicitation, dated July 20, 2007 — incorporated herein byreference to Exhibit 10.1 to the Company’s Quarterly Report on Form 10-Q for the quarter endedSeptember 28, 2007.*
10.47.2 Agreement between the Company and Joseph V. Tripodi, dated December 15, 2008.*10.48 [Reserved]10.49 Letter, dated July 17, 2008, from Cathleen P. Black, Chair of the Compensation Committee of the Board
of Directors of the Company, to Muhtar Kent — incorporated herein by reference to Exhibit 10.1 of theCompany’s Current Report on Form 8-K filed July 21, 2008.*
10.50 Separation Agreement between the Company and Tom Mattia, dated August 28, 2008 — incorporatedherein by reference to Exhibit 10.3 of the Company’s Quarterly Report on Form 10-Q for the quarterended September 26, 2008.*
10.51 Irrevocable Undertaking by and among Atlantic Industries, China Hui Yuan Juice Holdings Co., Ltd. andMr. Zhu Xinli dated August 31, 2008 — incorporated herein by reference to Exhibit 10.1 of theCompany’s Current Report on Form 8-K filed September 5, 2008.
10.52 Irrevocable Undertaking by and among Atlantic Industries, Danone Asia Pte. Ltd and GroupDanone S.A. dated August 31, 2008 — incorporated herein by reference to Exhibit 10.2 of the Company’sCurrent Report on Form 8-K filed September 5, 2008.
10.53 Irrevocable Undertaking by and among Atlantic Industries, Gourmet Grace International Limited andWarburg Pincus Private Equity IX, LP dated August 31, 2008 — incorporated herein by reference toExhibit 10.3 of the Company’s Current Report on Form 8-K filed September 5, 2008.
10.54 Deed of Non-Competition by and among Mr. Zhu Xinli, China Huiyuan Juice Group Limited andAtlantic Industries dated August 31, 2008 — incorporated herein by reference to Exhibit 10.4 of theCompany’s Current Report on Form 8-K filed September 5, 2008.
10.55 The Coca-Cola Export Corporation Overseas Retirement Plan, as amended and restated, effectiveOctober 1, 2007.*
10.56.1 The Coca-Cola Export Corporation International Thrift Plan, as amended and restated, effectiveOctober 1, 2007.*
10.56.2 Amendment Number One to The Coca-Cola Export Corporation International Thrift Plan, as amendedand restated, effective October 1, 2007.*
12.1 Computation of Ratios of Earnings to Fixed Charges for the years ended December 31, 2008, 2007, 2006,2005 and 2004.
21.1 List of subsidiaries of the Company as of December 31, 2008.
155

Exhibit No.
23.1 Consent of Independent Registered Public Accounting Firm.24.1 Powers of Attorney of Officers and Directors signing this report.31.1 Rule 13a-14(a)/15d-14(a) Certification, executed by Muhtar Kent, President and Chief Executive Officer
of The Coca-Cola Company.31.2 Rule 13a-14(a)/15d-14(a) Certification, executed by Gary P. Fayard, Executive Vice President and Chief
Financial Officer of The Coca-Cola Company.32.1 Certifications required by Rule 13a-14(b) or Rule 15d-14(b) and Section 1350 of Chapter 63 of Title 18 of
the United States Code (18 U.S.C. 1350), executed by Muhtar Kent, President and Chief ExecutiveOfficer of The Coca-Cola Company and by Gary P. Fayard, Executive Vice President and Chief FinancialOfficer of The Coca-Cola Company.
* Management contracts and compensatory plans and arrangements required to be filed as exhibits pursuant toItem 15(c) of this report.
156

SIGNATURES
Pursuant to the requirements of Section 13 or 15(d) of the Securities Exchange Act of 1934, the Registrant has dulycaused this report to be signed on its behalf by the undersigned, thereunto duly authorized.
THE COCA-COLA COMPANY(Registrant)
By: /s/ MUHTAR KENT
MUHTAR KENT
President and Chief Executive Officer
Date: February 26, 2009
Pursuant to the requirements of the Securities Exchange Act of 1934, this report has been signed below by thefollowing persons on behalf of the Registrant and in the capacities and on the dates indicated.
/s/ MUHTAR KENT *
MUHTAR KENT HERBERT A. ALLEN
President, Chief Executive Officer and a Director Director(Principal Executive Officer)
February 26, 2009 February 26, 2009
/s/ GARY P. FAYARD *
GARY P. FAYARD RONALD W. ALLEN
Executive Vice President and Chief Financial Officer Director(Principal Financial Officer)
February 26, 2009 February 26, 2009
/s/ HARRY L. ANDERSON *
HARRY L. ANDERSON CATHLEEN P. BLACK
Vice President and Controller Director(Principal Accounting Officer)
February 26, 2009 February 26, 2009
* *
E. NEVILLE ISDELL BARRY DILLER
Chairman, Board of Directors and a Director Director
February 26, 2009 February 26, 2009
157

* *
ALEXIS M. HERMAN JAMES D. ROBINSON IIIDirector Director
February 26, 2009 February 26, 2009
* *
DONALD R. KEOUGH PETER V. UEBERROTH
Director Director
February 26, 2009 February 26, 2009
* *
MARIA ELENA LAGOMASINO JACOB WALLENBERG
Director Director
February 26, 2009 February 26, 2009
* *
DONALD F. MCHENRY JAMES B. WILLIAMS
Director Director
February 26, 2009 February 26, 2009
*
SAM NUNN
Director
February 26, 2009
*By: /s/ CAROL CROFOOT HAYES
CAROL CROFOOT HAYES
Attorney-in-factFebruary 26, 2009
158

EXHIBIT 31.1
CERTIFICATIONS
I, Muhtar Kent, President and Chief Executive Officer of The Coca-Cola Company, certify that:
1. I have reviewed this annual report on Form 10-K of The Coca-Cola Company;
2. Based on my knowledge, this report does not contain any untrue statement of a material fact or omit tostate a material fact necessary to make the statements made, in light of the circumstances under whichsuch statements were made, not misleading with respect to the period covered by this report;
3. Based on my knowledge, the financial statements, and other financial information included in thisreport, fairly present in all material respects the financial condition, results of operations and cashflows of the registrant as of, and for, the periods presented in this report;
4. The registrant’s other certifying officer(s) and I are responsible for establishing and maintainingdisclosure controls and procedures (as defined in Exchange Act Rules 13a-15(e) and 15d-15(e)) andinternal control over financial reporting (as defined in Exchange Act Rules 13a-15(f) and 15d-15(f)) forthe registrant and have:
(a) Designed such disclosure controls and procedures, or caused such disclosure controls andprocedures to be designed under our supervision, to ensure that material information relating tothe registrant, including its consolidated subsidiaries, is made known to us by others within thoseentities, particularly during the period in which this report is being prepared;
(b) Designed such internal control over financial reporting, or caused such internal control overfinancial reporting to be designed under our supervision, to provide reasonable assuranceregarding the reliability of financial reporting and the preparation of financial statements forexternal purposes in accordance with generally accepted accounting principles;
(c) Evaluated the effectiveness of the registrant’s disclosure controls and procedures and presented inthis report our conclusions about the effectiveness of the disclosure controls and procedures, as ofthe end of the period covered by this report based on such evaluation; and
(d) Disclosed in this report any change in the registrant’s internal control over financial reporting thatoccurred during the registrant’s most recent fiscal quarter (the registrant’s fourth fiscal quarter inthe case of an annual report) that has materially affected, or is reasonably likely to materiallyaffect, the registrant’s internal control over financial reporting; and
5. The registrant’s other certifying officer(s) and I have disclosed, based on our most recent evaluation ofinternal control over financial reporting, to the registrant’s auditors and the audit committee of theregistrant’s board of directors (or persons performing the equivalent functions):
(a) All significant deficiencies and material weaknesses in the design or operation of internal controlover financial reporting which are reasonably likely to adversely affect the registrant’s ability torecord, process, summarize and report financial information; and
(b) Any fraud, whether or not material, that involves management or other employees who have asignificant role in the registrant’s internal control over financial reporting.
Date: February 26, 2009
/s/ MUHTAR KENT
Muhtar KentPresident and Chief Executive Officer

EXHIBIT 31.2
CERTIFICATIONS
I, Gary P. Fayard, Executive Vice President and Chief Financial Officer of The Coca-Cola Company, certify that:
1. I have reviewed this annual report on Form 10-K of The Coca-Cola Company;
2. Based on my knowledge, this report does not contain any untrue statement of a material fact or omit tostate a material fact necessary to make the statements made, in light of the circumstances under whichsuch statements were made, not misleading with respect to the period covered by this report;
3. Based on my knowledge, the financial statements, and other financial information included in thisreport, fairly present in all material respects the financial condition, results of operations and cashflows of the registrant as of, and for, the periods presented in this report;
4. The registrant’s other certifying officer(s) and I are responsible for establishing and maintainingdisclosure controls and procedures (as defined in Exchange Act Rules 13a-15(e) and 15d-15(e)) andinternal control over financial reporting (as defined in Exchange Act Rules 13a-15(f) and 15d-15(f)) forthe registrant and have:
(a) Designed such disclosure controls and procedures, or caused such disclosure controls andprocedures to be designed under our supervision, to ensure that material information relating tothe registrant, including its consolidated subsidiaries, is made known to us by others within thoseentities, particularly during the period in which this report is being prepared;
(b) Designed such internal control over financial reporting, or caused such internal control overfinancial reporting to be designed under our supervision, to provide reasonable assuranceregarding the reliability of financial reporting and the preparation of financial statements forexternal purposes in accordance with generally accepted accounting principles;
(c) Evaluated the effectiveness of the registrant’s disclosure controls and procedures and presented inthis report our conclusions about the effectiveness of the disclosure controls and procedures, as ofthe end of the period covered by this report based on such evaluation; and
(d) Disclosed in this report any change in the registrant’s internal control over financial reporting thatoccurred during the registrant’s most recent fiscal quarter (the registrant’s fourth fiscal quarter inthe case of an annual report) that has materially affected, or is reasonably likely to materiallyaffect, the registrant’s internal control over financial reporting; and
5. The registrant’s other certifying officer(s) and I have disclosed, based on our most recent evaluation ofinternal control over financial reporting, to the registrant’s auditors and the audit committee of theregistrant’s board of directors (or persons performing the equivalent functions):
(a) All significant deficiencies and material weaknesses in the design or operation of internal controlover financial reporting which are reasonably likely to adversely affect the registrant’s ability torecord, process, summarize and report financial information; and
(b) Any fraud, whether or not material, that involves management or other employees who have asignificant role in the registrant’s internal control over financial reporting.
Date: February 26, 2009
/s/ GARY P. FAYARD
Gary P. FayardExecutive Vice President andChief Financial Officer

EXHIBIT 32.1
CERTIFICATION PURSUANT TO18 U.S.C. SECTION 1350,
AS ADOPTED PURSUANT TOSECTION 906 OF THE SARBANES-OXLEY ACT OF 2002
In connection with the annual report of The Coca-Cola Company (the ‘‘Company’’) on Form 10-K for theperiod ended December 31, 2008 (the ‘‘Report’’), I, Muhtar Kent, President and Chief Executive Officer of theCompany and I, Gary P. Fayard, Executive Vice President and Chief Financial Officer of the Company, eachcertify, pursuant to 18 U.S.C. Section 1350, as adopted pursuant to Section 906 of the Sarbanes-Oxley Act of2002, that:
(1) to my knowledge, the Report fully complies with the requirements of Section 13(a) or 15(d) of theSecurities Exchange Act of 1934; and
(2) the information contained in the Report fairly presents, in all material respects, the financial conditionand results of operations of the Company.
/s/ MUHTAR KENT
Muhtar KentPresident and Chief Executive OfficerFebruary 26, 2009
/s/ GARY P. FAYARD
Gary P. FayardExecutive Vice President and
Chief Financial OfficerFebruary 26, 2009

(This page has been left blank intentionally.)

(This page has been left blank intentionally.)

(This page has been left blank intentionally.)


21JAN200914582922Printed on Recycled Paper

ITEM 8. FINANCIAL STATEMENTS AND SUPPLEMENTARY DATA
TABLE OF CONTENTS
Page
Consolidated Statements of Income . . . . . . . . . . . . . . . . . . . . . . . . . . . . . . . . . . . . . . . . . . . . . . . . . . . . 67
Consolidated Balance Sheets . . . . . . . . . . . . . . . . . . . . . . . . . . . . . . . . . . . . . . . . . . . . . . . . . . . . . . . . . . 68
Consolidated Statements of Cash Flows . . . . . . . . . . . . . . . . . . . . . . . . . . . . . . . . . . . . . . . . . . . . . . . . . 69
Consolidated Statements of Shareowners’ Equity . . . . . . . . . . . . . . . . . . . . . . . . . . . . . . . . . . . . . . . . . . 70
Notes to Consolidated Financial Statements . . . . . . . . . . . . . . . . . . . . . . . . . . . . . . . . . . . . . . . . . . . . . . 71
Report of Management on Internal Control Over Financial Reporting . . . . . . . . . . . . . . . . . . . . . . . . . . 125
Report of Independent Registered Public Accounting Firm . . . . . . . . . . . . . . . . . . . . . . . . . . . . . . . . . . 126
Report of Independent Registered Public Accounting Firm on Internal Control Over FinancialReporting . . . . . . . . . . . . . . . . . . . . . . . . . . . . . . . . . . . . . . . . . . . . . . . . . . . . . . . . . . . . . . . . . . . . . . 127
Quarterly Data (Unaudited) . . . . . . . . . . . . . . . . . . . . . . . . . . . . . . . . . . . . . . . . . . . . . . . . . . . . . . . . . . 128
66

THE COCA-COLA COMPANY AND SUBSIDIARIES
CONSOLIDATED STATEMENTS OF INCOME
Year Ended December 31, 2006 2005 2004(In millions except per share data)
NET OPERATING REVENUES $ 24,088 $ 23,104 $ 21,742Cost of goods sold 8,164 8,195 7,674
GROSS PROFIT 15,924 14,909 14,068Selling, general and administrative expenses 9,431 8,739 7,890Other operating charges 185 85 480
OPERATING INCOME 6,308 6,085 5,698Interest income 193 235 157Interest expense 220 240 196Equity income — net 102 680 621Other income (loss) — net 195 (93) (82)Gains on issuances of stock by equity method investees — 23 24
INCOME BEFORE INCOME TAXES 6,578 6,690 6,222Income taxes 1,498 1,818 1,375
NET INCOME $ 5,080 $ 4,872 $ 4,847
BASIC NET INCOME PER SHARE $ 2.16 $ 2.04 $ 2.00
DILUTED NET INCOME PER SHARE $ 2.16 $ 2.04 $ 2.00
AVERAGE SHARES OUTSTANDING 2,348 2,392 2,426Effect of dilutive securities 2 1 3
AVERAGE SHARES OUTSTANDING ASSUMING DILUTION 2,350 2,393 2,429
Refer to Notes to Consolidated Financial Statements.
67

THE COCA-COLA COMPANY AND SUBSIDIARIES
CONSOLIDATED BALANCE SHEETS
December 31, 2006 2005(In millions except par value)
ASSETSCURRENT ASSETS
Cash and cash equivalents $ 2,440 $ 4,701Marketable securities 150 66Trade accounts receivable, less allowances of $63 and $72, respectively 2,587 2,281Inventories 1,641 1,379Prepaid expenses and other assets 1,623 1,778
TOTAL CURRENT ASSETS 8,441 10,205
INVESTMENTSEquity method investments:
Coca-Cola Enterprises Inc. 1,312 1,731Coca-Cola Hellenic Bottling Company S.A. 1,251 1,039Coca-Cola FEMSA, S.A.B. de C.V. 835 982Coca-Cola Amatil Limited 817 748Other, principally bottling companies 2,095 2,062
Cost method investments, principally bottling companies 473 360
TOTAL INVESTMENTS 6,783 6,922
OTHER ASSETS 2,701 2,648PROPERTY, PLANT AND EQUIPMENT — net 6,903 5,831TRADEMARKS WITH INDEFINITE LIVES 2,045 1,946GOODWILL 1,403 1,047OTHER INTANGIBLE ASSETS 1,687 828
TOTAL ASSETS $ 29,963 $ 29,427
LIABILITIES AND SHAREOWNERS’ EQUITYCURRENT LIABILITIES
Accounts payable and accrued expenses $ 5,055 $ 4,493Loans and notes payable 3,235 4,518Current maturities of long-term debt 33 28Accrued income taxes 567 797
TOTAL CURRENT LIABILITIES 8,890 9,836
LONG-TERM DEBT 1,314 1,154OTHER LIABILITIES 2,231 1,730DEFERRED INCOME TAXES 608 352SHAREOWNERS’ EQUITY
Common stock, $0.25 par value; Authorized — 5,600 shares;Issued — 3,511 and 3,507 shares, respectively 878 877
Capital surplus 5,983 5,492Reinvested earnings 33,468 31,299Accumulated other comprehensive income (loss) (1,291) (1,669)Treasury stock, at cost — 1,193 and 1,138 shares, respectively (22,118) (19,644)
TOTAL SHAREOWNERS’ EQUITY 16,920 16,355
TOTAL LIABILITIES AND SHAREOWNERS’ EQUITY $ 29,963 $ 29,427
Refer to Notes to Consolidated Financial Statements.
68

THE COCA-COLA COMPANY AND SUBSIDIARIES
CONSOLIDATED STATEMENTS OF CASH FLOWS
Year Ended December 31, 2006 2005 2004(In millions)
OPERATING ACTIVITIESNet income $ 5,080 $ 4,872 $ 4,847Depreciation and amortization 938 932 893Stock-based compensation expense 324 324 345Deferred income taxes (35) (88) 162Equity income or loss, net of dividends 124 (446) (476)Foreign currency adjustments 52 47 (59)Gains on issuances of stock by equity investees — (23) (24)Gains on sales of assets, including bottling interests (303) (9) (20)Other operating charges 159 85 480Other items 233 299 437Net change in operating assets and liabilities (615) 430 (617)
Net cash provided by operating activities 5,957 6,423 5,968
INVESTING ACTIVITIESAcquisitions and investments, principally trademarks and bottling companies (901) (637) (267)Purchases of other investments (82) (53) (46)Proceeds from disposals of other investments 640 33 161Purchases of property, plant and equipment (1,407) (899) (755)Proceeds from disposals of property, plant and equipment 112 88 341Other investing activities (62) (28) 63
Net cash used in investing activities (1,700) (1,496) (503)
FINANCING ACTIVITIESIssuances of debt 617 178 3,030Payments of debt (2,021) (2,460) (1,316)Issuances of stock 148 230 193Purchases of stock for treasury (2,416) (2,055) (1,739)Dividends (2,911) (2,678) (2,429)
Net cash used in financing activities (6,583) (6,785) (2,261)
EFFECT OF EXCHANGE RATE CHANGES ON CASH AND CASHEQUIVALENTS 65 (148) 141
CASH AND CASH EQUIVALENTSNet (decrease) increase during the year (2,261) (2,006) 3,345Balance at beginning of year 4,701 6,707 3,362
Balance at end of year $ 2,440 $ 4,701 $ 6,707
Refer to Notes to Consolidated Financial Statements.
69

THE COCA-COLA COMPANY AND SUBSIDIARIES
CONSOLIDATED STATEMENTS OF SHAREOWNERS’ EQUITY
Year Ended December 31, 2006 2005 2004(In millions except per share data)
NUMBER OF COMMON SHARES OUTSTANDINGBalance at beginning of year 2,369 2,409 2,442
Stock issued to employees exercising stock options 4 7 5Purchases of stock for treasury1 (55) (47) (38)
Balance at end of year 2,318 2,369 2,409
COMMON STOCKBalance at beginning of year $ 877 $ 875 $ 874
Stock issued to employees exercising stock options 1 2 1
Balance at end of year 878 877 875
CAPITAL SURPLUSBalance at beginning of year 5,492 4,928 4,395
Stock issued to employees exercising stock options 164 229 175Tax benefit from employees’ stock option and restricted stock plans 3 11 13Stock-based compensation 324 324 345
Balance at end of year 5,983 5,492 4,928
REINVESTED EARNINGSBalance at beginning of year 31,299 29,105 26,687
Net income 5,080 4,872 4,847Dividends (per share — $1.24, $1.12 and $1.00 in 2006, 2005 and 2004, respectively) (2,911) (2,678) (2,429)
Balance at end of year 33,468 31,299 29,105
ACCUMULATED OTHER COMPREHENSIVE INCOME (LOSS)Balance at beginning of year (1,669) (1,348) (1,995)
Net foreign currency translation adjustment 603 (396) 665Net gain (loss) on derivatives (26) 57 (3)Net change in unrealized gain on available-for-sale securities 43 13 39Net change in pension liability, prior to adoption of SFAS No. 158 46 5 (54)
Net other comprehensive income adjustments 666 (321) 647Adjustment to initially apply SFAS No. 158 (288) — —
Balance at end of year (1,291) (1,669) (1,348)
TREASURY STOCKBalance at beginning of year (19,644) (17,625) (15,871)
Purchases of treasury stock (2,474) (2,019) (1,754)
Balance at end of year (22,118) (19,644) (17,625)
TOTAL SHAREOWNERS’ EQUITY $ 16,920 $ 16,355 $ 15,935
COMPREHENSIVE INCOMENet income $ 5,080 $ 4,872 $ 4,847Net other comprehensive income adjustments 666 (321) 647
TOTAL COMPREHENSIVE INCOME $ 5,746 $ 4,551 $ 5,494
1 Common stock purchased from employees exercising stock options numbered approximately zero shares, 0.5 shares and 0.4 sharesfor the years ended December 31, 2006, 2005 and 2004, respectively.
Refer to Notes to Consolidated Financial Statements.
70

THE COCA-COLA COMPANY AND SUBSIDIARIES
NOTES TO CONSOLIDATED FINANCIAL STATEMENTS
NOTE 1: BUSINESS AND SUMMARY OF SIGNIFICANT ACCOUNTING POLICIES
Description of Business
The Coca-Cola Company is predominantly a manufacturer, distributor and marketer of nonalcoholicbeverage concentrates and syrups. We also manufacture, distribute and market some finished beverages. Inthese notes, the terms ‘‘Company,’’ ‘‘we,’’ ‘‘us’’ or ‘‘our’’ mean The Coca-Cola Company and all subsidiariesincluded in the consolidated financial statements. We primarily sell concentrates and syrups, as well as somefinished beverages, to bottling and canning operations, distributors, fountain wholesalers and fountain retailers.Our Company owns or licenses more than 400 brands, including Coca-Cola, Diet Coke, Fanta and Sprite, and avariety of diet and light beverages, waters, juice and juice drinks, teas, coffees, and energy and sports drinks.Additionally, we have ownership interests in numerous bottling and canning operations. Significant markets forour products exist in all the world’s geographic regions.
Basis of Presentation and Consolidation
Our consolidated financial statements are prepared in accordance with accounting principles generallyaccepted in the United States. Our Company consolidates all entities that we control by ownership of a majorityvoting interest as well as variable interest entities for which our Company is the primary beneficiary. Refer to theheading ‘‘Variable Interest Entities,’’ below, for a discussion of variable interest entities.
We use the equity method to account for our investments for which we have the ability to exercisesignificant influence over operating and financial policies. Consolidated net income includes our Company’sshare of the net income of these companies.
We use the cost method to account for our investments in companies that we do not control and for whichwe do not have the ability to exercise significant influence over operating and financial policies. In accordancewith the cost method, these investments are recorded at cost or fair value, as appropriate.
We eliminate from our financial results all significant intercompany transactions, including theintercompany transactions with variable interest entities and the intercompany portion of transactions withequity method investees.
Certain amounts in the prior years’ consolidated financial statements and notes have been reclassified toconform to the current year presentation.
Variable Interest Entities
Financial Accounting Standards Board (‘‘FASB’’) Interpretation No. 46 (revised December 2003),‘‘Consolidation of Variable Interest Entities’’ (‘‘Interpretation No. 46(R)’’) addresses the consolidation ofbusiness enterprises to which the usual condition (ownership of a majority voting interest) of consolidation doesnot apply. Interpretation No. 46(R) focuses on controlling financial interests that may be achieved througharrangements that do not involve voting interests. It concludes that in the absence of clear control throughvoting interests, a company’s exposure (variable interest) to the economic risks and potential rewards from thevariable interest entity’s assets and activities is the best evidence of control. If an enterprise holds a majority ofthe variable interests of an entity, it would be considered the primary beneficiary. Upon consolidation, theprimary beneficiary is generally required to include assets, liabilities and noncontrolling interests at fair valueand subsequently account for the variable interest as if it were consolidated based on majority voting interest.
71

THE COCA-COLA COMPANY AND SUBSIDIARIES
NOTES TO CONSOLIDATED FINANCIAL STATEMENTS
NOTE 1: BUSINESS AND SUMMARY OF SIGNIFICANT ACCOUNTING POLICIES (Continued)
In our consolidated financial statements as of December 31, 2003, and prior to December 31, 2003, weconsolidated all entities that we controlled by ownership of a majority of voting interests. As a result ofInterpretation No. 46(R), effective as of April 2, 2004, our consolidated balance sheets include the assets andliabilities of the following:
• all entities in which the Company has ownership of a majority of voting interests; and
• all variable interest entities for which we are the primary beneficiary.
Our Company holds interests in certain entities, primarily bottlers accounted for under the equity methodof accounting prior to April 2, 2004 that are considered variable interest entities. These variable interests relateto profit guarantees or subordinated financial support for these entities. Upon adoption of InterpretationNo. 46(R) as of April 2, 2004, we consolidated assets of approximately $383 million and liabilities ofapproximately $383 million that were previously not recorded on our consolidated balance sheets. We did notrecord a cumulative effect of an accounting change, and prior periods were not restated. The results ofoperations of these variable interest entities were included in our consolidated results beginning April 3, 2004,and did not have a material impact for the year ended December 31, 2004. Our Company’s investment, plus anyloans and guarantees, related to these variable interest entities totaled approximately $429 million and$263 million at December 31, 2006 and 2005, respectively, representing our maximum exposures to loss. Anycreditors of the variable interest entities do not have recourse against the general credit of the Company as aresult of including these variable interest entities in our consolidated financial statements.
Use of Estimates and Assumptions
The preparation of our consolidated financial statements requires us to make estimates and assumptionsthat affect the reported amounts of assets, liabilities, revenues and expenses and the disclosure of contingentassets and liabilities in our consolidated financial statements and accompanying notes. Although these estimatesare based on our knowledge of current events and actions we may undertake in the future, actual results mayultimately differ from estimates and assumptions.
Risks and Uncertainties
Factors that could adversely impact the Company’s operations or financial results include, but are notlimited to, the following: obesity concerns; water scarcity and quality; changes in the nonalcoholic beveragesbusiness environment; increased competition; inability to expand operations in developing and emergingmarkets; fluctuations in foreign currency exchange and interest rates; inability to maintain good relationshipswith our bottling partners; a deterioration in our bottling partners’ financial condition; strikes or work stoppages(including at key manufacturing locations); increased cost of energy; increased cost, disruption of supply orshortage of raw materials; changes in laws and regulations relating to our business, including those regardingbeverage containers and packaging; additional labeling or warning requirements; unfavorable economic andpolitical conditions in international markets; changes in commercial and market practices within the EuropeanEconomic Area; litigation or legal proceedings; adverse weather conditions; an inability to maintain brand imageand product issues such as product recalls; changes in the legal and regulatory environment in various countriesin which we operate; changes in accounting and taxation standards including an increase in tax rates; an inabilityto achieve our overall long-term goals; an inability to protect our information systems; future impairmentcharges; an inability to successfully manage our Company-owned bottling operations; and global or regionalcatastrophic events.
72

THE COCA-COLA COMPANY AND SUBSIDIARIES
NOTES TO CONSOLIDATED FINANCIAL STATEMENTS
NOTE 1: BUSINESS AND SUMMARY OF SIGNIFICANT ACCOUNTING POLICIES (Continued)
Our Company monitors our operations with a view to minimizing the impact to our overall business thatcould arise as a result of the risks and uncertainties inherent in our business.
Revenue Recognition
Our Company recognizes revenue when persuasive evidence of an arrangement exists, delivery of productshas occurred, the sales price charged is fixed or determinable, and collectibility is reasonably assured. For ourCompany, this generally means that we recognize revenue when title to our products is transferred to ourbottling partners, resellers or other customers. In particular, title usually transfers upon shipment to or receipt atour customers’ locations, as determined by the specific sales terms of the transactions.
In addition, our customers can earn certain incentives, which are included in deductions from revenue, acomponent of net operating revenues in the consolidated statements of income. These incentives include, butare not limited to, cash discounts, funds for promotional and marketing activities, volume-based incentiveprograms and support for infrastructure programs (refer to the heading ‘‘Other Assets’’). The aggregatedeductions from revenue recorded by the Company in relation to these programs, including amortizationexpense on infrastructure initiatives, was approximately $3.8 billion, $3.7 billion and $3.6 billion for the yearsended December 31, 2006, 2005 and 2004, respectively.
Advertising Costs
Our Company expenses production costs of print, radio, television and other advertisements as of the firstdate the advertisements take place. Advertising costs included in selling, general and administrative expenseswere approximately $2.6 billion, $2.5 billion and $2.2 billion for the years ended December 31, 2006, 2005 and2004, respectively. As of December 31, 2006 and 2005, advertising and production costs of approximately$214 million and $170 million, respectively, were recorded in prepaid expenses and other assets and innoncurrent other assets in our consolidated balance sheets.
Stock-Based Compensation
Our Company currently sponsors stock option plans and restricted stock award plans. Refer to Note 15.Prior to January 1, 2006, the Company accounted for these plans under the fair value recognition andmeasurement provisions of Statement of Financial Accounting Standards (‘‘SFAS’’) No. 123, ‘‘Accounting forStock-Based Compensation.’’ Effective January 1, 2006, the Company adopted SFAS No. 123 (revised 2004),‘‘Share Based Payment’’ (‘‘SFAS No. 123(R)’’). Our Company adopted SFAS No. 123(R) using the modifiedprospective method. Based on the terms of our plans, our Company did not have a cumulative effect related toour plans. The adoption of SFAS No. 123(R) did not have a material impact on our stock-based compensationexpense for the year ended December 31, 2006. Further, we believe the adoption of SFAS No. 123(R) will nothave a material impact on our Company’s future stock-based compensation expense. The fair values of the stockawards are determined using an estimated expected life. The Company recognizes compensation expense on astraight-line basis over the period the award is earned by the employee.
Our equity method investees also adopted SFAS No. 123(R) effective January 1, 2006. Our proportionateshare of the stock-based compensation expense resulting from the adoption of SFAS No. 123(R) by our equitymethod investees is recognized as a reduction of equity income. The adoption of SFAS No. 123(R) by our equitymethod investees did not have a material impact on our consolidated financial statements.
73

THE COCA-COLA COMPANY AND SUBSIDIARIES
NOTES TO CONSOLIDATED FINANCIAL STATEMENTS
NOTE 1: BUSINESS AND SUMMARY OF SIGNIFICANT ACCOUNTING POLICIES (Continued)
Issuances of Stock by Equity Method Investees
When one of our equity method investees issues additional shares to third parties, our percentageownership interest in the investee decreases. In the event the issuance price per share is higher or lower than ouraverage carrying amount per share, we recognize a noncash gain or loss on the issuance. This noncash gain orloss, net of any deferred taxes, is generally recognized in our net income in the period the change in ownershipinterest occurs.
If gains or losses have been previously recognized on issuances of an equity method investee’s stock andshares of the equity method investee are subsequently repurchased by the equity method investee, gain or lossrecognition does not occur on issuances subsequent to the date of a repurchase until shares have been issued inan amount equivalent to the number of repurchased shares. This type of transaction is reflected as an equitytransaction, and the net effect is reflected in our consolidated balance sheets. Refer to Note 4.
Income Taxes
Income tax expense includes United States, state, local and international income taxes, plus a provision forU.S. taxes on undistributed earnings of foreign subsidiaries not deemed to be indefinitely reinvested. Deferredtax assets and liabilities are recognized for the tax consequences of temporary differences between the financialreporting and the tax basis of existing assets and liabilities. The tax rate used to determine the deferred tax assetsand liabilities is the enacted tax rate for the year in which the differences are expected to reverse. Valuationallowances are recorded to reduce deferred tax assets to the amount that will more likely than not be realized.Refer to Note 17.
Net Income Per Share
Basic net income per share is computed by dividing net income by the weighted average number of commonshares outstanding during the reporting period. Diluted net income per share is computed similarly to basic netincome per share except that it includes the potential dilution that could occur if dilutive securities wereexercised. Approximately 175 million, 180 million and 151 million stock option awards were excluded from thecomputations of diluted net income per share in 2006, 2005 and 2004, respectively, because the awards wouldhave been antidilutive for the periods presented.
Cash Equivalents
We classify marketable securities that are highly liquid and have maturities of three months or less at thedate of purchase as cash equivalents. We manage our exposure to counterparty credit risk through specificminimum credit standards, diversification of counterparties and procedures to monitor our credit riskconcentrations.
Trade Accounts Receivable
We record trade accounts receivable at net realizable value. This value includes an appropriate allowancefor estimated uncollectible accounts to reflect any loss anticipated on the trade accounts receivable balances andcharged to the provision for doubtful accounts. We calculate this allowance based on our history of write-offs,level of past-due accounts based on the contractual terms of the receivables, and our relationships with and theeconomic status of our bottling partners and customers.
74

THE COCA-COLA COMPANY AND SUBSIDIARIES
NOTES TO CONSOLIDATED FINANCIAL STATEMENTS
NOTE 1: BUSINESS AND SUMMARY OF SIGNIFICANT ACCOUNTING POLICIES (Continued)
Activity in the allowance for doubtful accounts was as follows (in millions):
Year Ended December 31, 2006 2005 2004
Balance, beginning of year $ 72 $ 69 $ 61Net charges to costs and expenses 2 17 28Write-offs (12) (12) (19)Other1 1 (2) (1)
Balance, end of year $ 63 $ 72 $ 69
1 Other includes acquisitions, divestitures and currency translation.
A significant portion of our net operating revenues is derived from sales of our products in internationalmarkets. Refer to Note 20. We also generate a significant portion of our net operating revenues by sellingconcentrates and syrups to bottlers in which we have a noncontrolling interest, including Coca-ColaEnterprises Inc. (‘‘CCE’’), Coca-Cola Hellenic Bottling Company S.A. (‘‘Coca-Cola HBC’’), Coca-ColaFEMSA, S.A.B. de C.V. (‘‘Coca-Cola FEMSA’’) and Coca-Cola Amatil Limited (‘‘Coca-Cola Amatil’’). Refer toNote 3.
Inventories
Inventories consist primarily of raw materials and packaging (which includes ingredients and supplies) andfinished goods (which includes concentrates and syrups in our concentrate and foodservice operations, andfinished beverages in our bottling and canning operations). Inventories are valued at the lower of cost or market.We determine cost on the basis of the average cost or first-in, first-out methods. Refer to Note 2.
Recoverability of Equity Method and Cost Method Investments
Management periodically assesses the recoverability of our Company’s equity method and cost methodinvestments. For publicly traded investments, readily available quoted market prices are an indication of the fairvalue of our Company’s investments. For nonpublicly traded investments, if an identified event or change incircumstances requires an impairment evaluation, management assesses fair value based on valuationmethodologies, including discounted cash flows, estimates of sales proceeds and external appraisals, asappropriate. We consider the assumptions that we believe hypothetical marketplace participants would use inevaluating estimated future cash flows when employing the discounted cash flows and estimates of salesproceeds valuation methodologies. If an investment is considered to be impaired and the decline in value isother than temporary, we record a write-down.
Other Assets
Our Company advances payments to certain customers for marketing to fund future activities intended togenerate profitable volume, and we expense such payments over the applicable period. Advance payments arealso made to certain customers for distribution rights. Additionally, our Company invests in infrastructureprograms with our bottlers that are directed at strengthening our bottling system and increasing unit casevolume. When facts and circumstances indicate that the carrying value of the assets may not be recoverable,management evaluates the recoverability of these assets by preparing estimates of sales volume, the resultinggross profit and cash flows. Costs of these programs are recorded in prepaid expenses and other assets and
75

THE COCA-COLA COMPANY AND SUBSIDIARIES
NOTES TO CONSOLIDATED FINANCIAL STATEMENTS
NOTE 1: BUSINESS AND SUMMARY OF SIGNIFICANT ACCOUNTING POLICIES (Continued)
noncurrent other assets and are being amortized over the remaining periods to be directly benefited, whichrange from 1 to 12 years. Amortization expense for infrastructure programs was approximately $136 million,$134 million and $136 million for the years ended December 31, 2006, 2005 and 2004, respectively. Refer toheading ‘‘Revenue Recognition,’’ above, and Note 3.
Property, Plant and Equipment
Property, plant and equipment are stated at cost. Repair and maintenance costs that do not improve servicepotential or extend economic life are expensed as incurred. Depreciation is recorded principally by thestraight-line method over the estimated useful lives of our assets, which generally have the following ranges:buildings and improvements: 40 years or less; machinery and equipment: 15 years or less; containers: 10 years orless. Land is not depreciated, and construction in progress is not depreciated until ready for service andcapitalized. Leasehold improvements are amortized using the straight-line method over the shorter of theremaining lease term, including renewals that are deemed to be reasonably assured, or the estimated useful lifeof the improvement. Depreciation expense totaled approximately $763 million, $752 million and $715 million forthe years ended December 31, 2006, 2005 and 2004, respectively. Amortization expense for leaseholdimprovements totaled approximately $21 million, $17 million and $7 million for the years ended December 31,2006, 2005 and 2004, respectively. Refer to Note 5.
Management assesses the recoverability of the carrying amount of property, plant and equipment if certainevents or changes in circumstances indicate that the carrying value of such assets may not be recoverable, such asa significant decrease in market value of the assets or a significant change in the business conditions in aparticular market. If we determine that the carrying value of an asset is not recoverable based on expectedundiscounted future cash flows, excluding interest charges, we record an impairment loss equal to the excess ofthe carrying amount of the asset over its fair value.
Goodwill, Trademarks and Other Intangible Assets
In accordance with SFAS No. 142, ‘‘Goodwill and Other Intangible Assets,’’ we classify intangible assetsinto three categories: (1) intangible assets with definite lives subject to amortization, (2) intangible assets withindefinite lives not subject to amortization, and (3) goodwill. We test intangible assets with definite lives forimpairment if conditions exist that indicate the carrying value may not be recoverable. Such conditions mayinclude an economic downturn in a geographic market or a change in the assessment of future operations. Werecord an impairment charge when the carrying value of the definite lived intangible asset is not recoverable bythe cash flows generated from the use of the asset.
Intangible assets with indefinite lives and goodwill are not amortized. We test these intangible assets andgoodwill for impairment at least annually or more frequently if events or circumstances indicate that suchintangible assets or goodwill might be impaired. Such tests for impairment are also required for intangible assetswith indefinite lives and/or goodwill recorded by our equity method investees. All goodwill is assigned toreporting units, which are one level below our operating segments. Goodwill is assigned to the reporting unitthat benefits from the synergies arising from each business combination. We perform our impairment tests ofgoodwill at our reporting unit level. Such impairment tests for goodwill include comparing the fair value of therespective reporting unit with its carrying value, including goodwill. We use a variety of methodologies inconducting these impairment tests, including discounted cash flow analyses with a number of scenarios, whereapplicable, that are weighted based on the probability of different outcomes. When appropriate, we consider the
76

THE COCA-COLA COMPANY AND SUBSIDIARIES
NOTES TO CONSOLIDATED FINANCIAL STATEMENTS
NOTE 1: BUSINESS AND SUMMARY OF SIGNIFICANT ACCOUNTING POLICIES (Continued)
assumptions that we believe hypothetical marketplace participants would use in estimating future cash flows. Inaddition, where applicable, an appropriate discount rate is used, based on the Company’s cost of capital rate orlocation-specific economic factors. When the fair value is less than the carrying value of the intangible assets orthe reporting unit, we record an impairment charge to reduce the carrying value of the assets to fair value. Theseimpairment charges are generally recorded in the line item other operating charges or, to the extent they relateto equity method investees, as a reduction of equity income—net, in the consolidated statements of income.
Our Company determines the useful lives of our identifiable intangible assets after considering the specificfacts and circumstances related to each intangible asset. Factors we consider when determining useful livesinclude the contractual term of any agreement, the history of the asset, the Company’s long-term strategy for theuse of the asset, any laws or other local regulations which could impact the useful life of the asset, and othereconomic factors, including competition and specific market conditions. Intangible assets that are deemed tohave definite lives are amortized, generally on a straight-line basis, over their useful lives, ranging from 1 to45 years. Intangible assets with definite lives have estimated remaining useful lives ranging from 1 to 35 years.Refer to Note 6.
Derivative Financial Instruments
Our Company accounts for derivative financial instruments in accordance with SFAS No. 133, ‘‘Accountingfor Derivative Instruments and Hedging Activities,’’ as amended by SFAS No. 137, ‘‘Accounting for DerivativeInstruments and Hedging Activities—Deferral of the Effective Date of FASB Statement No. 133—anamendment of FASB Statement No. 133,’’ SFAS No. 138, ‘‘Accounting for Certain Derivative Instruments andCertain Hedging Activities—an amendment of FASB Statement No. 133,’’ and SFAS No. 149, ‘‘Amendment ofStatement 133 on Derivative Instruments and Hedging Activities.’’ We recognize all derivative instruments aseither assets or liabilities at fair value in our consolidated balance sheets, with fair values of foreign currencyderivatives estimated based on quoted market prices or pricing models using current market rates. Refer toNote 12.
Retirement-Related Benefits
Using appropriate actuarial methods and assumptions, our Company accounts for defined benefit pensionplans in accordance with SFAS No. 87, ‘‘Employers’ Accounting for Pensions,’’ and we account for ournonpension postretirement benefits in accordance with SFAS No. 106, ‘‘Employers’ Accounting forPostretirement Benefits Other Than Pensions,’’ as amended by SFAS No. 158, ‘‘Employers’ Accounting forDefined Benefit Pension and Other Postretirement Plans—an amendment of FASB Statements No. 87, 88, 106,and 132(R).’’ Effective December 31, 2006 for our Company, SFAS No. 158 requires that previouslyunrecognized actuarial gains or losses, prior service costs or credits and transition obligations or assets berecognized generally through adjustments to accumulated other comprehensive income and credits to prepaidbenefit cost or accrued benefit liability. As a result of these adjustments, the current funded status of definedbenefit pension plans and other postretirement benefit plans is reflected in the Company’s consolidated balancesheet as of December 31, 2006. Refer to Note 16.
Our equity method investees also adopted SFAS No. 158 effective December 31, 2006. Refer to Note 3 forthe impact on our consolidated balance sheet resulting from the adoption of SFAS No. 158 by our equity methodinvestees.
77

THE COCA-COLA COMPANY AND SUBSIDIARIES
NOTES TO CONSOLIDATED FINANCIAL STATEMENTS
NOTE 1: BUSINESS AND SUMMARY OF SIGNIFICANT ACCOUNTING POLICIES (Continued)Contingencies
Our Company is involved in various legal proceedings and tax matters. Due to their nature, such legalproceedings and tax matters involve inherent uncertainties including, but not limited to, court rulings,negotiations between affected parties and governmental actions. Management assesses the probability of loss forsuch contingencies and accrues a liability and/or discloses the relevant circumstances, as appropriate. Refer toNote 13.
Business CombinationsIn accordance with SFAS No. 141, ‘‘Business Combinations,’’ we account for all business combinations by
the purchase method. Furthermore, we recognize intangible assets apart from goodwill if they arise fromcontractual or legal rights or if they are separable from goodwill.
Recent Accounting Standards and PronouncementsIn February 2007, the FASB issued SFAS No. 159, ‘‘The Fair Value Option for Financial Assets and
Financial Liabilities—Including an amendment of FASB Statement No. 115.’’ SFAS No. 159 permits entities tochoose to measure many financial instruments and certain other items at fair value. Unrealized gains and losseson items for which the fair value option has been elected will be recognized in earnings at each subsequentreporting date. SFAS No. 159 is effective for our Company January 1, 2008. The Company is evaluating theimpact that the adoption of SFAS No. 159 will have on our consolidated financial statements.
In September 2006, the Securities and Exchange Commission staff published Staff Accounting Bulletin(‘‘SAB’’) No. 108, ‘‘Considering the Effects of Prior Year Misstatements when Quantifying Misstatements inCurrent Year Financial Statements.’’ SAB No. 108 addresses quantifying the financial statement effects ofmisstatements, specifically, how the effects of prior year uncorrected errors must be considered in quantifyingmisstatements in the current year financial statements. SAB No. 108 is effective for fiscal years ending afterNovember 15, 2006. The adoption of SAB No. 108 by our Company in the fourth quarter of 2006 did not have amaterial impact on our consolidated financial statements.
As previously discussed, our Company adopted SFAS No. 158 related to defined benefit pension and otherpostretirement plans. Refer to Note 16.
In September 2006, the FASB issued SFAS No. 157, ‘‘Fair Value Measurements.’’ SFAS No. 157 defines fairvalue, establishes a framework for measuring fair value and expands disclosure requirements about fair valuemeasurements. SFAS No. 157 is effective for our Company January 1, 2008. We believe that the adoption ofSFAS No. 157 will not have a material impact on our consolidated financial statements.
In July 2006, the FASB issued FASB Interpretation No. 48, ‘‘Accounting for Uncertainty in Income Taxes’’(‘‘Interpretation No. 48’’). Interpretation No. 48 clarifies the accounting for uncertainty in income taxesrecognized in an enterprise’s financial statements in accordance with SFAS No. 109, ‘‘Accounting for IncomeTaxes.’’ Interpretation No. 48 prescribes a recognition threshold and measurement attribute for the financialstatement recognition and measurement of a tax position taken or expected to be taken in a tax return.Interpretation No. 48 also provides guidance on derecognition, classification, interest and penalties, accountingin interim periods, disclosure and transition. For our Company, Interpretation No. 48 was effective beginningJanuary 1, 2007, and the cumulative effect adjustment will be recorded in the first quarter of 2007. We believethat the adoption of Interpretation No. 48 will not have a material impact on our consolidated financialstatements.
In May 2005, the FASB issued SFAS No. 154, ‘‘Accounting Changes and Error Corrections, a replacementof Accounting Principles Board (‘‘APB’’) Opinion No. 20 and FASB Statement No. 3.’’ SFAS No. 154 requires
78

THE COCA-COLA COMPANY AND SUBSIDIARIES
NOTES TO CONSOLIDATED FINANCIAL STATEMENTS
NOTE 1: BUSINESS AND SUMMARY OF SIGNIFICANT ACCOUNTING POLICIES (Continued)retrospective application to prior periods’ financial statements of a voluntary change in accounting principleunless it is impracticable. APB Opinion No. 20, ‘‘Accounting Changes,’’ previously required that most voluntarychanges in accounting principle be recognized by including in net income of the period of the change thecumulative effect of changing to the new accounting principle. SFAS No. 154 became effective for our Companyon January 1, 2006. The adoption of SFAS No. 154 did not have a material impact on our consolidated financialstatements.
In December 2004, the FASB issued SFAS No. 153, ‘‘Exchanges of Nonmonetary Assets, an amendment ofAPB Opinion No. 29.’’ SFAS No. 153 is based on the principle that exchanges of nonmonetary assets should bemeasured based on the fair value of the assets exchanged. APB Opinion No. 29, ‘‘Accounting for NonmonetaryTransactions,’’ provided an exception to its basic measurement principle (fair value) for exchanges of similarproductive assets. Under APB Opinion No. 29, an exchange of a productive asset for a similar productive assetwas based on the recorded amount of the asset relinquished. SFAS No. 153 eliminates this exception andreplaces it with an exception for exchanges of nonmonetary assets that do not have commercial substance. SFASNo. 153 became effective for our Company as of July 2, 2005, and did not have a material impact on ourconsolidated financial statements.
As previously discussed, our Company adopted SFAS No. 123(R) related to share based payments. Refer toNote 15.
During 2004, the FASB issued FASB Staff Position 106-2, ‘‘Accounting and Disclosure RequirementsRelated to the Medicare Prescription Drug, Improvement and Modernization Act of 2003’’ (‘‘FSP 106-2’’). FSP106-2 relates to the Medicare Prescription Drug, Improvement and Modernization Act of 2003 (the ‘‘Act’’). TheAct introduced a prescription drug benefit under Medicare known as Medicare Part D. The Act also establisheda federal subsidy to sponsors of retiree health care plans that provide a benefit that is at least actuariallyequivalent to Medicare Part D. During the second quarter of 2004, our Company adopted the provisions of FSP106-2 retroactive to January 1, 2004. The adoption of FSP 106-2 did not have a material impact on ourconsolidated financial statements. Refer to Note 16.
In November 2004, the FASB issued SFAS No. 151, ‘‘Inventory Costs, an amendment of AccountingResearch Bulletin No. 43, Chapter 4.’’ SFAS No. 151 requires that abnormal amounts of idle facility expense,freight, handling costs and wasted materials (spoilage) be recorded as current period charges and that theallocation of fixed production overheads to inventory be based on the normal capacity of the productionfacilities. The Company adopted SFAS No. 151 on January 1, 2006. The adoption of SFAS No. 151 did not havea material impact on our consolidated financial statements.
In October 2004, the American Jobs Creation Act of 2004 (the ‘‘Jobs Creation Act’’) was signed into law.The Jobs Creation Act includes a temporary incentive for U.S. multinationals to repatriate foreign earnings atan approximate 5.25 percent effective tax rate. Issued in December 2004, FASB Staff Position 109-2,‘‘Accounting and Disclosure Guidance for the Foreign Earnings Repatriation Provision within the AmericanJobs Creation Act of 2004’’ (‘‘FSP 109-2’’), indicated that the lack of clarification of certain provisions within theJobs Creation Act and the timing of the enactment necessitated a practical exception to the SFAS No. 109,‘‘Accounting for Income Taxes,’’ requirement to reflect in the period of enactment the effect of a new tax law.Accordingly, enterprises were allowed time beyond 2004 to evaluate the effect of the Jobs Creation Act on theirplans for reinvestment or repatriation of foreign earnings for purposes of applying SFAS No. 109. Accordingly,in 2005, the Company repatriated $6.1 billion of its previously unremitted earnings and recorded an associatedtax expense of approximately $315 million. Refer to Note 17.
In 2004, our Company recorded an income tax benefit of approximately $50 million as a result of therealization of certain tax credits related to certain provisions of the Jobs Creation Act not related to repatriationprovisions. Refer to Note 17.
79

THE COCA-COLA COMPANY AND SUBSIDIARIES
NOTES TO CONSOLIDATED FINANCIAL STATEMENTS
NOTE 2: INVENTORIES
Inventories consisted of the following (in millions):
December 31, 2006 2005
Raw materials and packaging $ 923 $ 704Finished goods 548 512Other 170 163
Inventories $ 1,641 $ 1,379
NOTE 3: BOTTLING INVESTMENTS
Coca-Cola Enterprises Inc.
CCE is a marketer, producer and distributor of bottle and can nonalcoholic beverages, operating in eightcountries. As of December 31, 2006, our Company owned approximately 35 percent of the outstanding commonstock of CCE. We account for our investment by the equity method of accounting and, therefore, our net incomeincludes our proportionate share of income resulting from our investment in CCE. As of December 31, 2006,our proportionate share of the net assets of CCE exceeded our investment by approximately $282 million. Thisdifference is not amortized.
A summary of financial information for CCE is as follows (in millions):
December 31, 2006 2005
Current assets $ 3,691 $ 3,395Noncurrent assets 19,534 21,962
Total assets $ 23,225 $ 25,357
Current liabilities $ 3,818 $ 3,846Noncurrent liabilities 14,881 15,868
Total liabilities $ 18,699 $ 19,714
Shareowners’ equity $ 4,526 $ 5,643
Company equity investment $ 1,312 $ 1,731
Year Ended December 31, 2006 2005 2004
Net operating revenues $ 19,804 $ 18,743 $ 18,190Cost of goods sold 11,986 11,185 10,771
Gross profit $ 7,818 $ 7,558 $ 7,419
Operating (loss) income $ (1,495) $ 1,431 $ 1,436
Net (loss) income $ (1,143) $ 514 $ 596
80

THE COCA-COLA COMPANY AND SUBSIDIARIES
NOTES TO CONSOLIDATED FINANCIAL STATEMENTS
NOTE 3: BOTTLING INVESTMENTS (Continued)
A summary of our significant transactions with CCE is as follows (in millions):
Year Ended December 31, 2006 2005 2004
Concentrate, syrup and finished product sales to CCE $ 5,378 $ 5,125 $ 5,203Syrup and finished product purchases from CCE 415 428 428CCE purchases of sweeteners through our Company 274 275 309Marketing payments made by us directly to CCE 514 482 609Marketing payments made to third parties on behalf of CCE 113 136 104Local media and marketing program reimbursements from CCE 279 245 246Payments made to CCE for dispensing equipment repair services 74 70 63Other payments — net 99 81 19
Syrup and finished product purchases from CCE represent purchases of fountain syrup in certain territoriesthat have been resold by our Company to major customers and purchases of bottle and can products. Marketingpayments made by us directly to CCE represent support of certain marketing activities and our participationwith CCE in cooperative advertising and other marketing activities to promote the sale of Company trademarkproducts within CCE territories. These programs are agreed to on an annual basis. Marketing payments made tothird parties on behalf of CCE represent support of certain marketing activities and programs to promote thesale of Company trademark products within CCE’s territories in conjunction with certain of CCE’s customers.Pursuant to cooperative advertising and trade agreements with CCE, we received funds from CCE for localmedia and marketing program reimbursements. Payments made to CCE for dispensing equipment repairservices represent reimbursement to CCE for its costs of parts and labor for repairs on cooler, dispensing, orpost-mix equipment owned by us or our customers. The Other payments—net line in the table above representspayments made to and received from CCE that are individually not significant.
In 2006, our Company’s equity income related to CCE decreased by approximately $587 million, related toour proportionate share of certain items recorded by CCE. Our proportionate share of these items includedapproximately $602 million resulting from the impact of an impairment charge recorded by CCE. CCE recordeda $2.9 billion pretax ($1.8 billion after tax) impairment of its North American franchise rights. The decline in theestimated fair value of CCE’s North American franchise rights was the result of several factors, including but notlimited to (1) CCE’s revised outlook on 2007 raw material costs driven by significant increases in aluminum andhigh fructose corn syrup (‘‘HFCS’’); (2) a challenging marketplace environment with increased pricing pressuresin several high-growth beverage categories; and (3) increased interest rates contributing to a higher discount rateand corresponding capital charge. Our proportionate share of CCE’s charges also included approximately$18 million due to restructuring charges recorded by CCE. These charges were partially offset by approximately$33 million related to our proportionate share of changes in certain of CCE’s state and Canadian federal andprovincial tax rates. All of these charges and changes impacted our Bottling Investments operating segment.
In 2005, our equity income related to CCE was reduced by approximately $33 million related to ourproportionate share of certain charges and gains recorded by CCE. Our proportionate share of CCE’s chargesincluded an approximate $51 million decrease to equity income, primarily related to the tax liability recorded byCCE in the fourth quarter of 2005 resulting from the repatriation of previously unremitted foreign earningsunder the Jobs Creation Act and approximately $18 million due to restructuring charges recorded by CCE.These restructuring charges were primarily related to workforce reductions associated with the reorganization ofCCE’s North American operations, changes in executive management and elimination of certain positions in
81

THE COCA-COLA COMPANY AND SUBSIDIARIES
NOTES TO CONSOLIDATED FINANCIAL STATEMENTS
NOTE 3: BOTTLING INVESTMENTS (Continued)
CCE’s corporate headquarters. These charges were partially offset by an approximate $37 million increase toequity income in the second quarter of 2005 resulting from CCE’s HFCS lawsuit settlement proceeds andchanges in certain of CCE’s state and provincial tax rates. Refer to Note 18.
In the second quarter of 2004, our Company and CCE agreed to terminate the Sales Growth Initiative(‘‘SGI’’) agreement and certain other marketing funding programs that were previously in place. Due totermination of these agreements, a significant portion of the cash payments to be made by us directly to CCEwas eliminated prospectively. At the termination of these agreements, we agreed that the concentrate price thatCCE pays us for sales made in the United States and Canada would be reduced. Total cash support paid by ourCompany under the SGI agreement prior to its termination was approximately $58 million and approximately$161 million for 2004 and 2003, respectively. These amounts are included in the line item marketing paymentsmade by us directly to CCE in the table above.
In the second quarter of 2004, our Company and CCE agreed to establish a Global Marketing Fund, underwhich we expect to pay CCE $62 million annually through December 31, 2014, as support for certain marketingactivities. The term of the agreement will automatically be extended for successive 10-year periods thereafterunless either party gives written notice of termination of this agreement. The marketing activities to be fundedunder this agreement will be agreed upon each year as part of the annual joint planning process and will beincorporated into the annual marketing plans of both companies. We paid CCE a prorated amount of$42 million for 2004. The prorated amount was determined based on the agreement date. These amounts areincluded in the line item marketing payments made by us directly to CCE in the table above.
Our Company previously entered into programs with CCE designed to help develop cold-drinkinfrastructure. Under these programs, our Company paid CCE for a portion of the cost of developing theinfrastructure necessary to support accelerated placements of cold-drink equipment. These payments support acommon objective of increased sales of Company trademarked beverages from increased availability andconsumption in the cold-drink channel. In connection with these programs, CCE agreed to:
(1) purchase and place specified numbers of Company-approved cold-drink equipment each year through2010;
(2) maintain the equipment in service, with certain exceptions, for a period of at least 12 years afterplacement;
(3) maintain and stock the equipment in accordance with specified standards; and
(4) annual reporting to our Company of minimum average annual unit case volume throughout theeconomic life of the equipment and other specified information.
CCE must achieve minimum average unit case volume for a 12-year period following the placement ofequipment. These minimum average unit case volume levels ensure adequate gross profit from sales ofconcentrate to fully recover the capitalized costs plus a return on the Company’s investment. Should CCE fail topurchase the specified numbers of cold-drink equipment for any calendar year through 2010, the parties agreedto mutually develop a reasonable solution. Should no mutually agreeable solution be developed, or in the eventthat CCE otherwise breaches any material obligation under the contracts and such breach is not remedied withina stated period, then CCE would be required to repay a portion of the support funding as determined by ourCompany. In the third quarter of 2004, our Company and CCE agreed to amend the contract to defer theplacement of some equipment from 2004 and 2005, as previously agreed under the original contract, to 2009 and
82

THE COCA-COLA COMPANY AND SUBSIDIARIES
NOTES TO CONSOLIDATED FINANCIAL STATEMENTS
NOTE 3: BOTTLING INVESTMENTS (Continued)
2010. In connection with this amendment, CCE agreed to pay the Company approximately $2 million in 2004,$3 million annually in 2005 through 2008, and $1 million in 2009. In 2005, our Company and CCE agreed toamend the contract for North America to move to a system of purchase and placement credits, whereby CCEearns credit toward its annual purchase and placement requirements based upon the type of equipment itpurchases and places. The amended contract also provides that no breach by CCE will occur even if they do notachieve the required number of purchase and placement credits in any given year, so long as (1) the shortfalldoes not exceed 20 percent of the required purchase and placement credits for that year; (2) a compensatingpayment is made to our Company by CCE; (3) the shortfall is corrected in the following year; and (4) CCEmeets all specified purchase and placement credit requirements by the end of 2010. The payments we made toCCE under these programs are recorded in prepaid expenses and other assets and in noncurrent other assetsand amortized as deductions from revenues over the 10-year period following the placement of the equipment.Our carrying values for these infrastructure programs with CCE were approximately $576 million and$662 million as of December 31, 2006 and 2005, respectively. The Company has no further commitments underthese programs.
In March 2004, the Company and CCE launched the Dasani water brand in Great Britain. The product wasvoluntarily recalled. During 2004, our Company reimbursed CCE $32 million for product recall costs incurred byCCE.
Effective December 31, 2006, CCE adopted SFAS No. 158. Our proportionate share of the impact of CCE’sadoption of SFAS No. 158 was an approximate $132 million pretax ($84 million after tax) reduction in both thecarrying value of our investment in CCE and our accumulated other comprehensive income (loss) (‘‘AOCI’’).Refer to Note 10 and Note 16.
If valued at the December 31, 2006 quoted closing price of CCE shares, the fair value of our investment inCCE would have exceeded our carrying value by approximately $2.1 billion.
Other Equity Method Investments
Our other equity method investments include our ownership interests in Coca-Cola HBC, Coca-ColaFEMSA and Coca-Cola Amatil. As of December 31, 2006, we owned approximately 23 percent, 32 percent and32 percent, respectively, of these companies’ common shares.
Operating results include our proportionate share of income (loss) from our equity method investments. Asof December 31, 2006, our investment in our equity method investees in the aggregate, other than CCE,exceeded our proportionate share of the net assets of these equity method investees by approximately$1,375 million. This difference is not amortized.
83

THE COCA-COLA COMPANY AND SUBSIDIARIES
NOTES TO CONSOLIDATED FINANCIAL STATEMENTS
NOTE 3: BOTTLING INVESTMENTS (Continued)
A summary of financial information for our equity method investees in the aggregate, other than CCE, is asfollows (in millions):
December 31, 2006 2005
Current assets $ 8,778 $ 7,803Noncurrent assets 21,304 20,698
Total assets $ 30,082 $ 28,501
Current liabilities $ 8,030 $ 7,705Noncurrent liabilities 9,469 8,395
Total liabilities $ 17,499 $ 16,100
Shareowners’ equity $ 12,583 $ 12,401
Company equity investment $ 4,998 $ 4,831
Year Ended December 31, 2006 2005 2004
Net operating revenues $ 24,990 $ 24,389 $ 21,202Cost of goods sold 14,717 14,141 12,132
Gross profit $ 10,273 $ 10,248 $ 9,070
Operating income $ 2,697 $ 2,669 $ 2,406
Net income (loss) $ 1,475 $ 1,501 $ 1,389
Net income (loss) available to common shareowners $ 1,455 $ 1,477 $ 1,364
Net sales to equity method investees other than CCE, the majority of which are located outside the UnitedStates, were approximately $7.6 billion in 2006, $7.4 billion in 2005 and $5.2 billion in 2004. Total supportpayments, primarily marketing, made to equity method investees other than CCE were approximately$512 million, $475 million and $442 million in 2006, 2005 and 2004, respectively.
In 2003, one of our Company’s equity method investees, Coca-Cola FEMSA, consummated a merger withanother of the Company’s equity method investees, Panamerican Beverages, Inc. At the time of the merger, theCompany and Fomento Economico Mexicano, S.A.B. de C.V. (‘‘FEMSA’’), the major shareowner of Coca-ColaFEMSA, reached an understanding under which this shareowner could purchase from our Company an amountof Coca-Cola FEMSA shares sufficient for this shareowner to regain majority ownership interest in Coca-ColaFEMSA. That understanding expired in May 2006; however, in the third quarter of 2006, the Company and theshareowner reached an agreement under which the Company would sell a number of shares representing8 percent of the capital stock of Coca-Cola FEMSA to FEMSA. As a result of this sale, which occurred in thefourth quarter of 2006, the Company received cash proceeds of approximately $427 million and realized a gainof approximately $175 million, which was recorded in the consolidated statement of income line item otherincome (loss)—net and impacted the Corporate operating segment. Also as a result of this sale, our ownershipinterest in Coca-Cola FEMSA was reduced from approximately 40 percent to approximately 32 percent. Referto Note 18.
84

THE COCA-COLA COMPANY AND SUBSIDIARIES
NOTES TO CONSOLIDATED FINANCIAL STATEMENTS
NOTE 3: BOTTLING INVESTMENTS (Continued)
In 2006, our Company sold a portion of our investment in Coca-Cola Icecek A.S. (‘‘Coca-Cola Icecek’’), anequity method investee bottler incorporated in Turkey, in an initial public offering. Our Company received cashproceeds of approximately $198 million and realized a gain of approximately $123 million, which was recorded inthe consolidated statement of income line item other income (loss)—net and impacted the Corporate operatingsegment. As a result of this public offering, our Company’s interest in Coca-Cola Icecek decreased fromapproximately 36 percent to approximately 20 percent. Refer to Note 18.
Our Company owns a 50 percent interest in Multon, a Russian juice business (‘‘Multon’’), which weacquired in April 2005 jointly with Coca-Cola HBC, for a total purchase price of approximately $501 million,split equally between the Company and Coca-Cola HBC. Multon produces and distributes juice products underthe Dobriy, Rich, Nico and other trademarks in Russia, Ukraine and Belarus. Equity income—net includes ourproportionate share of Multon’s net income beginning April 20, 2005. Refer to Note 19.
During the second quarter of 2004, the Company’s equity income benefited by approximately $37 millionfor its share of a favorable tax settlement related to Coca-Cola FEMSA.
In December 2004, the Company sold to an unrelated financial institution certain of its production assetsthat were previously leased to the Japanese supply chain management company (refer to discussion below). Theassets were sold for approximately $271 million, and the sale resulted in no gain or loss. The financial institutionentered into a leasing arrangement with the Japanese supply chain management company. These assets werepreviously reported in our consolidated balance sheet line item property, plant and equipment—net andassigned to our North Asia, Eurasia and Middle East operating segment.
During 2004, our Company sold our bottling operations in Vietnam, Cambodia, Sri Lanka and Nepal toCoca-Cola Sabco (Pty) Ltd. (‘‘Sabco’’) for a total consideration of $29 million. In addition, Sabco assumedcertain debts of these bottling operations. The proceeds from the sale of these bottlers were approximately equalto the carrying value of the investment.
Effective October 1, 2003, the Company and all of its bottling partners in Japan created a nationallyintegrated supply chain management company to centralize procurement, production and logistics operationsfor the entire Coca-Cola system in Japan. As a result of the creation of this supply chain management companyin Japan, a portion of our Company’s business was essentially converted from a finished product business modelto a concentrate business model, thus reducing our net operating revenues and cost of goods sold by the sameamounts. The formation of this entity included the sale of Company inventory and leasing of certain Companyassets to this new entity on October 1, 2003, as well as our recording of a liability for certain contractualobligations to Japanese bottlers. Such amounts were not material to the Company’s results of operations.
Effective December 31, 2006, our equity method investees other than CCE also adopted SFAS No. 158. Ourproportionate share of the impact of the adoption of SFAS No. 158 by our equity method investees other thanCCE was an approximate $18 million pretax ($12 million after tax) reduction in the carrying value of ourinvestments in those equity method investees and our AOCI. Refer to Note 10 and Note 16.
If valued at the December 31, 2006, quoted closing prices of shares actively traded on stock markets, thevalue of our equity method investments in publicly traded bottlers other than CCE would have exceeded ourcarrying value by approximately $3.6 billion.
85

THE COCA-COLA COMPANY AND SUBSIDIARIES
NOTES TO CONSOLIDATED FINANCIAL STATEMENTS
NOTE 3: BOTTLING INVESTMENTS (Continued)
Net Receivables and Dividends from Equity Method Investees
The total amount of net receivables due from equity method investees, including CCE, was approximately$857 million and $644 million as of December 31, 2006 and 2005, respectively. The total amount of dividendsreceived from equity method investees, including CCE, was approximately $226 million, $234 million and$145 million for the years ended December 31, 2006, 2005 and 2004, respectively.
NOTE 4: ISSUANCES OF STOCK BY EQUITY METHOD INVESTEES
In 2006, our equity method investees did not issue any additional shares to third parties that resulted in ourCompany recording any noncash pretax gains.
In 2005, our Company recorded approximately $23 million of noncash pretax gains on issuances of stock byequity method investees. We recorded deferred taxes of approximately $8 million on these gains. These gainsprimarily related to an issuance of common stock by Coca-Cola Amatil, which was valued at an amount greaterthan the book value per share of our investment in Coca-Cola Amatil. Coca-Cola Amatil issued approximately34 million shares of common stock with a fair value of $5.78 each in connection with the acquisition of SPCArdmona Pty. Ltd., an Australian packaged fruit company. This issuance of common stock reduced ourownership interest in the total outstanding shares of Coca-Cola Amatil from approximately 34 percent toapproximately 32 percent.
In 2004, our Company recorded approximately $24 million of noncash pretax gains on issuances of stock byCCE. The issuances primarily related to the exercise of CCE stock options by CCE employees at amountsgreater than the book value per share of our investment in CCE. We recorded deferred taxes of approximately$9 million on these gains. These issuances of stock reduced our ownership interest in the total outstandingshares of CCE from approximately 37 percent to approximately 36 percent.
NOTE 5: PROPERTY, PLANT AND EQUIPMENT
The following table summarizes our property, plant and equipment (in millions):
December 31, 2006 2005
Land $ 495 $ 447Buildings and improvements 3,020 2,692Machinery and equipment 7,333 6,271Containers 556 468Construction in progress 507 306
$ 11,911 $ 10,184Less accumulated depreciation 5,008 4,353
Property, plant and equipment — net $ 6,903 $ 5,831
86

THE COCA-COLA COMPANY AND SUBSIDIARIES
NOTES TO CONSOLIDATED FINANCIAL STATEMENTS
NOTE 6: GOODWILL, TRADEMARKS AND OTHER INTANGIBLE ASSETS
The following tables set forth information for intangible assets subject to amortization and for intangibleassets not subject to amortization (in millions):
December 31, 2006 2005
Amortized intangible assets (various, principally trademarks):Gross carrying amount1 $ 372 $ 314Less accumulated amortization 174 168
Amortized intangible assets — net $ 198 $ 146
Unamortized intangible assets:Trademarks2 $ 2,045 $ 1,946Goodwill3 1,403 1,047Bottlers’ franchise rights3 1,359 521Other 130 161
Unamortized intangible assets $ 4,937 $ 3,675
1 The increase in 2006 is primarily related to business combinations and acquisitions of trademarkswith definite lives totaling approximately $75 million and the effect of translation adjustments, whichwere partially offset by impairment charges of approximately $9 million and disposals. Refer toNote 19.
2 The increase in 2006 is primarily related to business combinations and acquisitions of trademarks andbrands totaling approximately $118 million and the effect of translation adjustments, which werepartially offset by impairment charges of approximately $32 million. Refer to Note 19.
3 The increase in 2006 is primarily related to the acquisition of Kerry Beverages Limited, TJC Holdings(Pty) Ltd. and Apollinaris GmbH, the consolidation of Brucephil, Inc., and the effect of translationadjustments. Refer to Note 19.
Total amortization expense for intangible assets subject to amortization was approximately $18 million,$29 million and $35 million for the years ended December 31, 2006, 2005 and 2004, respectively.
Information about estimated amortization expense for intangible assets subject to amortization for the fiveyears succeeding December 31, 2006, is as follows (in millions):
AmortizationExpense
2007 $ 262008 242009 232010 222011 22
87

THE COCA-COLA COMPANY AND SUBSIDIARIES
NOTES TO CONSOLIDATED FINANCIAL STATEMENTS
NOTE 6: GOODWILL, TRADEMARKS AND OTHER INTANGIBLE ASSETS (Continued)
Goodwill by operating segment was as follows (in millions):
December 31, 2006 2005
Africa $ — $ —East, South Asia and Pacific Rim 22 22European Union 696 593Latin America 119 82North America 141 141North Asia, Eurasia and Middle East 21 21Bottling Investments 404 188
$ 1,403 $ 1,047
In 2006, our Company recorded impairment charges of approximately $41 million primarily related totrademarks for beverages sold in the Philippines and Indonesia. The Philippines and Indonesia are componentsof our East, South Asia and Pacific Rim operating segment. The amount of these impairment charges wasdetermined by comparing the fair values of the intangible assets to their respective carrying values. The fairvalues were determined using discounted cash flow analyses. Because the fair values were less than the carryingvalues of the assets, we recorded impairment charges to reduce the carrying values of the assets to theirrespective fair values. These impairment charges were recorded in the line item other operating charges in theconsolidated statement of income. Refer to Note 18.
In 2005, our Company recorded an impairment charge related to trademarks for beverages sold in thePhilippines of approximately $84 million. The carrying value of our trademarks in the Philippines, prior to therecording of the impairment charges in 2005, was approximately $268 million. The impairment was the result ofour revised outlook for the Philippines, which had been unfavorably impacted by declines in volume and incomebefore income taxes resulting from the continued lack of an affordable package offering and the continuedlimited availability of these trademark beverages in the marketplace. We determined the amount of thisimpairment charge by comparing the fair value of the intangible assets to the carrying value. Fair values werederived using discounted cash flow analyses with a number of scenarios that were weighted based on theprobability of different outcomes. Because the fair value was less than the carrying value of the assets, werecorded an impairment charge to reduce the carrying value of the assets to fair value. This impairment chargewas recorded in the line item other operating charges in the consolidated statement of income.
88

THE COCA-COLA COMPANY AND SUBSIDIARIES
NOTES TO CONSOLIDATED FINANCIAL STATEMENTS
NOTE 7: ACCOUNTS PAYABLE AND ACCRUED EXPENSES
Accounts payable and accrued expenses consisted of the following (in millions):
December 31, 2006 2005
Other accrued expenses $ 1,653 $ 1,413Accrued marketing 1,348 1,268Trade accounts payable 929 902Accrued compensation 550 468Sales, payroll and other taxes 264 215Container deposits 264 209Accrued streamlining costs 47 18
Accounts payable and accrued expenses $ 5,055 $ 4,493
NOTE 8: SHORT-TERM BORROWINGS AND CREDIT ARRANGEMENTS
Loans and notes payable consist primarily of commercial paper issued in the United States and a liability toacquire the remaining approximate 59 percent of the outstanding stock of Coca-Cola Erfrischungsgetraenke AG(‘‘CCEAG’’). As of December 31, 2006, the Company owned approximately 41 percent of CCEAG’s outstandingstock. In February 2002, the Company acquired control of CCEAG and agreed to put/call agreements with theother shareowners of CCEAG, which resulted in the recording of a liability to acquire the remaining shares inCCEAG. The present value of the total amount to be paid by our Company to all other CCEAG shareownerswas approximately $1,068 million at December 31, 2006, and approximately $941 million at December 31, 2005.This amount increased from the initial liability of approximately $600 million due to the accretion of thediscounted value to the ultimate maturity of the liability and the translation adjustment related to this liability,partially offset by payments made to the other CCEAG shareowners during the term of the agreements. Theaccretion of the discounted value to its ultimate maturity value is recorded in the line item other income (loss)—net, and this amount was approximately $58 million, $60 million and $58 million, respectively, for the yearsended December 31, 2006, 2005 and 2004.
As of December 31, 2006 and 2005, we had approximately $1,942 million and $3,311 million, respectively,outstanding in commercial paper borrowings. Our weighted-average interest rates for commercial paperoutstanding were approximately 5.2 percent and 4.2 percent per year at December 31, 2006 and 2005,respectively. In addition, we had $1,952 million in lines of credit and other short-term credit facilities available asof December 31, 2006, of which approximately $225 million was outstanding. The outstanding amount ofapproximately $225 million was primarily related to our international operations. Included in the available creditfacilities discussed above, the Company had $1,150 million in lines of credit for general corporate purposes,including commercial paper backup. There were no borrowings under these lines of credit during 2006.
These credit facilities are subject to normal banking terms and conditions. Some of the financialarrangements require compensating balances, none of which is presently significant to our Company.
89

THE COCA-COLA COMPANY AND SUBSIDIARIES
NOTES TO CONSOLIDATED FINANCIAL STATEMENTS
NOTE 9: LONG-TERM DEBT
Long-term debt consisted of the following (in millions):
December 31, 2006 2005
53⁄4% U.S. dollar notes due 2009 $ 399 $ 39953⁄4% U.S. dollar notes due 2011 499 49973⁄8% U.S. dollar notes due 2093 116 116Other, due through 20141 333 168
$ 1,347 $ 1,182Less current portion 33 28
Long-term debt $ 1,314 $ 1,154
1 The weighted-average interest rate on outstanding balances was 6% for both the years endedDecember 31, 2006 and 2005.
The above notes include various restrictions, none of which is presently significant to our Company.
The principal amount of our long-term debt that had fixed and variable interest rates, respectively, was$1,346 million and $1 million on December 31, 2006. The principal amount of our long-term debt that had fixedand variable interest rates, respectively, was $1,181 million and $1 million on December 31, 2005. The weighted-average interest rate on the outstanding balances of our Company’s long-term debt was 6.0 percent for both theyears ended December 31, 2006 and 2005.
Total interest paid was approximately $212 million, $233 million and $188 million in 2006, 2005 and 2004,respectively. For a more detailed discussion of interest rate management, refer to Note 12.
Maturities of long-term debt for the five years succeeding December 31, 2006, are as follows (in millions):
Maturities ofLong-Term Debt
2007 $ 332008 1752009 4362010 542011 522
90

THE COCA-COLA COMPANY AND SUBSIDIARIES
NOTES TO CONSOLIDATED FINANCIAL STATEMENTS
NOTE 10: COMPREHENSIVE INCOME
AOCI, including our proportionate share of equity method investees’ AOCI, consisted of the following(in millions):
December 31, 2006 2005
Foreign currency translation adjustment $ (984) $ (1,587)Accumulated derivative net losses (49) (23)Unrealized gain on available-for-sale securities 147 104Adjustment to pension and other benefit liabilities (405)1 (163)
Accumulated other comprehensive income (loss) $ (1,291) $ (1,669)
1 Includes adjustment of $(288) million, net of tax, relating to the initial adoption of SFAS No. 158.Refer to Note 16.
A summary of the components of other comprehensive income (loss), including our proportionate share ofequity method investees’ other comprehensive income (loss), for the years ended December 31, 2006, 2005 and2004, is as follows (in millions):
Before-Tax Income After-TaxAmount Tax Amount
2006Net foreign currency translation adjustment $ 685 $ (82) $ 603Net loss on derivatives (44) 18 (26)Net change in unrealized gain on available-for-sale securities 53 (10) 43Net change in pension liability, prior to adoption of SFAS No. 158 68 (22) 46
Other comprehensive income (loss) $ 762 $ (96) $ 666
Before-Tax Income After-TaxAmount Tax Amount
2005Net foreign currency translation adjustment $ (440) $ 44 $ (396)Net gain on derivatives 94 (37) 57Net change in unrealized gain on available-for-sale securities 20 (7) 13Net change in pension liability, prior to adoption of SFAS No. 158 5 — 5
Other comprehensive income (loss) $ (321) $ — $ (321)
Before-Tax Income After-TaxAmount Tax Amount
2004Net foreign currency translation adjustment $ 766 $ (101) $ 665Net loss on derivatives (4) 1 (3)Net change in unrealized gain on available-for-sale securities 48 (9) 39Net change in pension liability, prior to adoption of SFAS No. 158 (81) 27 (54)
Other comprehensive income (loss) $ 729 $ (82) $ 647
91

THE COCA-COLA COMPANY AND SUBSIDIARIES
NOTES TO CONSOLIDATED FINANCIAL STATEMENTS
NOTE 11: FINANCIAL INSTRUMENTS
Certain Debt and Marketable Equity Securities
Investments in debt and marketable equity securities, other than investments accounted for by the equitymethod, are categorized as trading, available-for-sale or held-to-maturity. Our marketable equity investmentsare categorized as trading or available-for-sale with their cost basis determined by the specific identificationmethod. Trading securities are carried at fair value with realized and unrealized gains and losses included in netincome. We record available-for-sale instruments at fair value, with unrealized gains and losses, net of deferredincome taxes, reported as a component of AOCI. Debt securities categorized as held-to-maturity are stated atamortized cost.
As of December 31, 2006 and 2005, trading, available-for-sale and held-to-maturity securities consisted ofthe following (in millions):
Gross UnrealizedEstimated
Cost Gains Losses Fair Value
2006Trading Securities:
Equity securities $ 60 $ 6 $ — $ 66
Available-for-sale securities:Equity securities $ 240 $ 219 $ (1) $ 458Other securities 13 — — 13
$ 253 $ 219 $ (1) $ 471
Held-to-maturity securities:Bank and corporate debt $ 83 $ — $ — $ 83
Gross UnrealizedEstimated
Cost Gains Losses Fair Value
2005Trading Securities:
Equity securities $ — $ — $ — $ —
Available-for-sale securities:Equity securities $ 138 $ 167 $ (2) $ 303Other securities 13 — — 13
$ 151 $ 167 $ (2) $ 316
Held-to-maturity securities:Bank and corporate debt $ 348 $ — $ — $ 348
92

THE COCA-COLA COMPANY AND SUBSIDIARIES
NOTES TO CONSOLIDATED FINANCIAL STATEMENTS
NOTE 11: FINANCIAL INSTRUMENTS (Continued)
As of December 31, 2006 and 2005, these investments were included in the following captions (in millions):
Available- Held-to-Trading for-Sale Maturity
Securities Securities Securities
2006Cash and cash equivalents $ — $ — $ 82Current marketable securities 66 83 1Cost method investments, principally bottling companies — 372 —Other assets — 16 —
$ 66 $ 471 $ 83
Available- Held-to-Trading for-Sale Maturity
Securities Securities Securities
2005Cash and cash equivalents $ — $ — $ 346Current marketable securities — 64 2Cost method investments, principally bottling companies — 239 —Other assets — 13 —
$ — $ 316 $ 348
The contractual maturities of these investments as of December 31, 2006, were as follows (in millions):
Trading Available-for-Sale Held-to-MaturitySecurities Securities Securities
Fair Fair Amortized FairCost Value Cost Value Cost Value
2007 $ — $ — $ — $ — $ 83 $ 832008-2011 — — — — — —2012-2016 — — — — — —After 2016 — — 13 13 — —Equity securities 60 66 240 458 — —
$ 60 $ 66 $ 253 $ 471 $ 83 $ 83
For the years ended December 31, 2006, 2005 and 2004, gross realized gains and losses on sales of tradingand available-for-sale securities were not material. The cost of securities sold is based on the specificidentification method.
Fair Value of Other Financial Instruments
The carrying amounts of cash and cash equivalents, receivables, accounts payable and accrued expenses,and loans and notes payable approximate their fair values because of the relatively short-term maturity of theseinstruments.
We estimate that the fair values of non-marketable cost method investments approximate their carryingamounts.
93

THE COCA-COLA COMPANY AND SUBSIDIARIES
NOTES TO CONSOLIDATED FINANCIAL STATEMENTS
NOTE 11: FINANCIAL INSTRUMENTS (Continued)
We carry our non-marketable cost method investments at cost or, if a decline in the value of the investmentis deemed to be other than temporary, at fair value. Estimates of fair value are generally based upon discountedcash flow analyses.
We recognize all derivative instruments as either assets or liabilities at fair value in our consolidated balancesheets, with fair values estimated based on quoted market prices or pricing models using current market rates.Virtually all of our derivatives are straightforward, over-the-counter instruments with liquid markets. For furtherdiscussion of our derivatives, including a disclosure of derivative values, refer to Note 12.
The fair value of our long-term debt is estimated based on quoted prices for those or similar instruments.As of December 31, 2006, the carrying amounts and fair values of our long-term debt, including the currentportion, were approximately $1,347 million and approximately $1,386 million, respectively. As of December 31,2005, these carrying amounts and fair values were approximately $1,182 million and approximately$1,240 million, respectively.
NOTE 12: HEDGING TRANSACTIONS AND DERIVATIVE FINANCIAL INSTRUMENTS
When deemed appropriate our Company uses derivative financial instruments primarily to reduce ourexposure to adverse fluctuations in interest rates and foreign currency exchange rates, commodity prices andother market risks. Derivative instruments used to manage fluctuations in commodity prices were not material tothe consolidated financial statements for the three years ended December 31, 2006. The Company formallydesignates and documents the financial instrument as a hedge of a specific underlying exposure, as well as therisk management objectives and strategies for undertaking the hedge transactions. The Company formallyassesses, both at the inception and at least quarterly thereafter, whether the financial instruments that are usedin hedging transactions are effective at offsetting changes in either the fair value or cash flows of the relatedunderlying exposure. Because of the high degree of effectiveness between the hedging instrument and theunderlying exposure being hedged, fluctuations in the value of the derivative instruments are generally offset bychanges in the fair values or cash flows of the underlying exposures being hedged. Any ineffective portion of afinancial instrument’s change in fair value is immediately recognized in earnings. Virtually all of our derivativesare straightforward over-the-counter instruments with liquid markets. Our Company does not enter intoderivative financial instruments for trading purposes.
The fair values of derivatives used to hedge or modify our risks fluctuate over time. We do not view thesefair value amounts in isolation, but rather in relation to the fair values or cash flows of the underlying hedgedtransactions or other exposures. The notional amounts of the derivative financial instruments do not necessarilyrepresent amounts exchanged by the parties and, therefore, are not a direct measure of our exposure to thefinancial risks described above. The amounts exchanged are calculated by reference to the notional amounts andby other terms of the derivatives, such as interest rates, foreign currency exchange rates or other financialindices.
Our Company recognizes all derivative instruments as either assets or liabilities in our consolidated balancesheets at fair value. The accounting for changes in fair value of a derivative instrument depends on whether ithas been designated and qualifies as part of a hedging relationship and, further, on the type of hedgingrelationship. At the inception of the hedging relationship, the Company must designate the instrument as a fairvalue hedge, a cash flow hedge, or a hedge of a net investment in a foreign operation. This designation is basedupon the exposure being hedged.
94

THE COCA-COLA COMPANY AND SUBSIDIARIES
NOTES TO CONSOLIDATED FINANCIAL STATEMENTS
NOTE 12: HEDGING TRANSACTIONS AND DERIVATIVE FINANCIAL INSTRUMENTS (Continued)
We have established strict counterparty credit guidelines and enter into transactions only with financialinstitutions of investment grade or better. We monitor counterparty exposures daily and review any downgradein credit rating immediately. If a downgrade in the credit rating of a counterparty were to occur, we haveprovisions requiring collateral in the form of U.S. government securities for substantially all of our transactions.To mitigate presettlement risk, minimum credit standards become more stringent as the duration of thederivative financial instrument increases. To minimize the concentration of credit risk, we enter into derivativetransactions with a portfolio of financial institutions. The Company has master netting agreements with most ofthe financial institutions that are counterparties to the derivative instruments. These agreements allow for thenet settlement of assets and liabilities arising from different transactions with the same counterparty. Based onthese factors, we consider the risk of counterparty default to be minimal.
Interest Rate Management
Our Company monitors our mix of fixed-rate and variable-rate debt as well as our mix of term debt versusnon-term debt. This monitoring includes a review of business and other financial risks. We also enter intointerest rate swap agreements to manage our mix of fixed-rate and variable-rate debt. Interest rate swapagreements that meet certain conditions required under SFAS No. 133 for fair value hedges are accounted for assuch, with the offset recorded to adjust the fair value of the underlying exposure being hedged. The Companyhad no outstanding interest rate swaps as of December 31, 2006 and 2005. The Company estimates the fair valueof its interest rate derivatives based on quoted market prices. Any ineffective portion, which was not significantin 2006, 2005 or 2004, of the changes in the fair value of these instruments was immediately recognized in netincome.
Foreign Currency Management
The purpose of our foreign currency hedging activities is to reduce the risk that our eventual U.S. dollar netcash inflows resulting from sales outside the United States will be adversely affected by changes in foreigncurrency exchange rates.
We enter into forward exchange contracts and purchase foreign currency options (principally euro andJapanese yen) and collars to hedge certain portions of forecasted cash flows denominated in foreign currencies.The effective portion of the changes in fair value for these contracts, which have been designated as cash flowhedges, was reported in AOCI and reclassified into earnings in the same financial statement line item and in thesame period or periods during which the hedged transaction affects earnings. Any ineffective portion, which wasnot significant in 2006, 2005 or 2004, of the change in the fair value of these instruments was immediatelyrecognized in net income.
Additionally, the Company enters into forward exchange contracts that are effective economic hedges andare not designated as hedging instruments under SFAS No. 133. These instruments are used to offset theearnings impact relating to the variability in foreign currency exchange rates on certain monetary assets andliabilities denominated in nonfunctional currencies. Changes in the fair value of these instruments areimmediately recognized in earnings in the line item other income (loss)—net of our consolidated statements ofincome to offset the effect of remeasurement of the monetary assets and liabilities.
The Company also enters into forward exchange contracts to hedge its net investment position in certainmajor currencies. Under SFAS No. 133, changes in the fair value of these instruments are recognized in foreigncurrency translation adjustment, a component of AOCI, to offset the change in the value of the net investment
95

THE COCA-COLA COMPANY AND SUBSIDIARIES
NOTES TO CONSOLIDATED FINANCIAL STATEMENTS
NOTE 12: HEDGING TRANSACTIONS AND DERIVATIVE FINANCIAL INSTRUMENTS (Continued)
being hedged. For the years ended December 31, 2006, 2005 and 2004, we recorded net gain (loss) in foreigncurrency translation adjustment of approximately $3 million, $(40) million and $(8) million, respectively.
The following table presents the carrying values, fair values and maturities of the Company’s foreigncurrency derivative instruments outstanding as of December 31, 2006 and 2005 (in millions):
Carrying Values Fair ValuesAssets/(Liabilities) Assets/(Liabilities) Maturity
2006Forward contracts $ (21) $ (21) 2007-2008Options and collars 18 18 2007
$ (3) $ (3)
Carrying Values Fair ValuesAssets Assets Maturity
2005Forward contracts $ 28 $ 28 2006Options and collars 11 11 2006
$ 39 $ 39
The Company estimates the fair value of its foreign currency derivatives based on quoted market prices orpricing models using current market rates. These amounts are primarily reflected in prepaid expenses and otherassets in our consolidated balance sheets.
Summary of AOCI
For the years ended December 31, 2006, 2005 and 2004, we recorded a net gain (loss) to AOCI ofapproximately $(31) million, $55 million and $6 million, respectively, net of both income taxes andreclassifications to earnings, primarily related to gains and losses on foreign currency cash flow hedges. Theseitems will generally offset cash flow gains and losses relating to the underlying exposures being hedged in futureperiods. The Company estimates that it will reclassify into earnings during the next 12 months losses ofapproximately $11 million from the after-tax amount recorded in AOCI as of December 31, 2006, as theanticipated cash flows occur.
96

THE COCA-COLA COMPANY AND SUBSIDIARIES
NOTES TO CONSOLIDATED FINANCIAL STATEMENTS
NOTE 12: HEDGING TRANSACTIONS AND DERIVATIVE FINANCIAL INSTRUMENTS (Continued)
The following table summarizes activity in AOCI related to derivatives designated as cash flow hedges heldby the Company during the applicable periods (in millions):
Before-Tax Income After-TaxAmount Tax Amount
2006Accumulated derivative net gains as of January 1, 2006 $ 35 $ (14) $ 21Net changes in fair value of derivatives (38) 15 (23)Net gains reclassified from AOCI into earnings (13) 5 (8)
Accumulated derivative net losses as of December 31, 2006 $ (16) $ 6 $ (10)
Before-Tax Income After-TaxAmount Tax Amount
2005Accumulated derivative net losses as of January 1, 2005 $ (56) $ 22 $ (34)Net changes in fair value of derivatives 135 (53) 82Net gains reclassified from AOCI into earnings (44) 17 (27)
Accumulated derivative net gains as of December 31, 2005 $ 35 $ (14) $ 21
Before-Tax Income After-TaxAmount Tax Amount
2004Accumulated derivative net losses as of January 1, 2004 $ (66) $ 26 $ (40)Net changes in fair value of derivatives (76) 30 (46)Net losses reclassified from AOCI into earnings 86 (34) 52
Accumulated derivative net losses as of December 31, 2004 $ (56) $ 22 $ (34)
The Company did not discontinue any cash flow hedge relationships during the years ended December 31,2006, 2005 and 2004.
NOTE 13: COMMITMENTS AND CONTINGENCIES
As of December 31, 2006, we were contingently liable for guarantees of indebtedness owed by third partiesin the amount of approximately $270 million. These guarantees primarily are related to third-party customers,bottlers and vendors and have arisen through the normal course of business. These guarantees have variousterms, and none of these guarantees was individually significant. The amount represents the maximum potentialfuture payments that we could be required to make under the guarantees; however, we do not consider itprobable that we will be required to satisfy these guarantees.
In December 2003, we granted a $250 million standby line of credit to Coca-Cola FEMSA with normalmarket terms. This standby line of credit expired in December 2006.
We believe our exposure to concentrations of credit risk is limited due to the diverse geographic areascovered by our operations.
97

THE COCA-COLA COMPANY AND SUBSIDIARIES
NOTES TO CONSOLIDATED FINANCIAL STATEMENTS
NOTE 13: COMMITMENTS AND CONTINGENCIES (Continued)
The Company is involved in various legal proceedings. We establish reserves for specific legal proceedingswhen we determine that the likelihood of an unfavorable outcome is probable and the amount of loss can bereasonably estimated. Management has also identified certain other legal matters where we believe anunfavorable outcome is reasonably possible and/or for which no estimate of possible losses can be made.Management believes that any liability to the Company that may arise as a result of currently pending legalproceedings, including those discussed below, will not have a material adverse effect on the financial conditionof the Company taken as a whole.
During the period from 1970 to 1981, our Company owned Aqua-Chem, Inc., now known as Cleaver-Brooks,Inc. (‘‘Aqua-Chem’’). A division of Aqua-Chem manufactured certain boilers that contained gaskets thatAqua-Chem purchased from outside suppliers. Several years after our Company sold this entity, Aqua-Chemreceived its first lawsuit relating to asbestos, a component of some of the gaskets. In September 2002,Aqua-Chem notified our Company that it believed we were obligated for certain costs and expenses associatedwith its asbestos litigations. Aqua-Chem demanded that our Company reimburse it for approximately$10 million for out-of-pocket litigation-related expenses. Aqua-Chem also demanded that the Companyacknowledge a continuing obligation to Aqua-Chem for any future liabilities and expenses that are excludedfrom coverage under the applicable insurance or for which there is no insurance. Our Company disputesAqua-Chem’s claims, and we believe we have no obligation to Aqua-Chem for any of its past, present or futureliabilities, costs or expenses. Furthermore, we believe we have substantial legal and factual defenses toAqua-Chem’s claims. The parties entered into litigation to resolve this dispute, which was stayed by agreementof the parties pending the outcome of litigation filed in Wisconsin by certain insurers of Aqua-Chem. In thatcase, five plaintiff insurance companies filed a declaratory judgment action against Aqua-Chem, the Companyand 16 defendant insurance companies seeking a determination of the parties’ rights and liabilities underpolicies issued by the insurers and reimbursement for amounts paid by plaintiffs in excess of their obligations.That litigation remains pending, and the Company believes it has substantial legal and factual defenses to theinsurers’ claims. Aqua-Chem and the Company subsequently reached a settlement agreement with six of theinsurers in the Wisconsin insurance coverage litigation, and those insurers will pay funds into an escrow accountfor payment of costs arising from the asbestos claims against Aqua-Chem. Aqua-Chem has also reached asettlement agreement with an additional insurer regarding payment of that insurer’s policy proceeds forAqua-Chem’s asbestos claims. Aqua-Chem and the Company will continue to negotiate with the remaininginsurers that are parties to the Wisconsin insurance coverage case and will litigate their claims against suchinsurers to the extent negotiations do not result in settlements. The Company also believes Aqua-Chem hassubstantial insurance coverage to pay Aqua-Chem’s asbestos claimants.
The Company is discussing with the Competition Directorate of the European Commission (the ‘‘EuropeanCommission’’) issues relating to parallel trade within the European Union arising out of comments received bythe European Commission from third parties. The Company is cooperating fully with the European Commissionand is providing information on these issues and the measures taken and to be taken to address any issuesraised. The Company is unable to predict at this time with any reasonable degree of certainty what action, if any,the European Commission will take with respect to these issues.
At the time we acquire or divest our interest in an entity, we sometimes agree to indemnify the seller orbuyer for specific contingent liabilities. Management believes that any liability to the Company that may arise asa result of any such indemnification agreements will not have a material adverse effect on the financial conditionof the Company taken as a whole.
98

THE COCA-COLA COMPANY AND SUBSIDIARIES
NOTES TO CONSOLIDATED FINANCIAL STATEMENTS
NOTE 13: COMMITMENTS AND CONTINGENCIES (Continued)
The Company is involved in various tax matters. We establish reserves at the time that we determine it isprobable we will be liable to pay additional taxes related to certain matters and the amounts of such possibleadditional taxes are reasonably estimable. We adjust these reserves, including any impact on the related interestand penalties, in light of changing facts and circumstances, such as the progress of a tax audit. A number of yearsmay elapse before a particular matter, for which we may have established a reserve, is audited and finallyresolved or when a tax assessment is raised. The number of years with open tax audits varies depending on thetax jurisdiction. While it is often difficult to predict the final outcome or the timing of resolution of anyparticular tax matter, we record a reserve when we determine the likelihood of loss is probable and the amountof loss is reasonably estimable. Such liabilities are recorded in the line item accrued income taxes in theCompany’s consolidated balance sheets. Favorable resolution of tax matters that had been previously reservedwould be recognized as a reduction to our income tax expense, when known.
The Company is also involved in various tax matters where we have determined that the probability of anunfavorable outcome is reasonably possible. Management believes that any liability to the Company that mayarise as a result of currently pending tax matters will not have a material adverse effect on the financial conditionof the Company taken as a whole.
NOTE 14: NET CHANGE IN OPERATING ASSETS AND LIABILITIES
Net cash provided by (used in) operating activities attributable to the net change in operating assets andliabilities is composed of the following (in millions):
Year Ended December 31, 2006 2005 2004
(Increase) in trade accounts receivable $ (214) $ (79) $ (5)(Increase) in inventories (150) (79) (57)(Increase) decrease in prepaid expenses and other assets (152) 244 (397)Increase in accounts payable and accrued expenses 173 280 45(Decrease) increase in accrued taxes (68) 145 (194)(Decrease) in other liabilities (204) (81) (9)
$ (615) $ 430 $ (617)
NOTE 15: STOCK COMPENSATION PLANS
Effective January 1, 2006, the Company adopted SFAS No. 123(R). Our Company adopted SFASNo. 123(R), using the modified prospective method. Based on the terms of our plans, our Company did not havea cumulative effect related to its plans. The adoption of SFAS No. 123(R) did not have a material impact on ourstock-based compensation expense for the year ended December 31, 2006. Further, we believe the adoption ofSFAS No. 123(R) will not have a material impact on our Company’s future stock-based compensation expense.Prior to 2006, our Company accounted for stock option plans and restricted stock plans under the preferable fairvalue recognition provisions of SFAS No. 123.
Our total stock-based compensation expense was approximately $324 million, $324 million and $345 millionin 2006, 2005 and 2004, respectively. These amounts were recorded in selling, general and administrativeexpenses in 2006, 2005 and 2004, respectively. The total income tax benefit recognized in the income statementfor share-based compensation arrangements was approximately $93 million, $90 million and $92 million for2006, 2005 and 2004, respectively. As of December 31, 2006, we had approximately $376 million of total
99

THE COCA-COLA COMPANY AND SUBSIDIARIES
NOTES TO CONSOLIDATED FINANCIAL STATEMENTS
NOTE 15: STOCK COMPENSATION PLANS (Continued)
unrecognized compensation cost related to nonvested share-based compensation arrangements granted underour plans. This cost is expected to be recognized as stock-based compensation expense over a weighted-averageperiod of 1.7 years. This expected cost does not include the impact of any future stock-based compensationawards. Additionally, our equity method investees also adopted SFAS No. 123(R) effective January 1, 2006. Ourproportionate share of the stock-based compensation expense resulting from the adoption of SFAS No. 123(R)by our equity method investees is recognized as a reduction to equity income. The adoption of SFAS No. 123(R)by our equity method investees did not have a material impact on our consolidated financial statements.
During 2005, the Company changed its estimated service period for retirement-eligible participants in itsplans when the terms of their stock-based compensation awards provide for accelerated vesting upon earlyretirement. The full-year impact of this change in our estimated service period was approximately $50 million for2005.
Stock Option Plans
Under our 1991 Stock Option Plan (the ‘‘1991 Option Plan’’), a maximum of 120 million shares of ourcommon stock was approved to be issued or transferred to certain officers and employees pursuant to stockoptions granted under the 1991 Option Plan. Options to purchase common stock under the 1991 Option Planhave been granted to Company employees at fair market value at the date of grant.
The 1999 Stock Option Plan (the ‘‘1999 Option Plan’’) was approved by shareowners in April 1999.Following the approval of the 1999 Option Plan, no grants were made from the 1991 Option Plan, and sharesavailable under the 1991 Option Plan were no longer available to be granted. Under the 1999 Option Plan, amaximum of 120 million shares of our common stock was approved to be issued or transferred to certain officersand employees pursuant to stock options granted under the 1999 Option Plan. Options to purchase commonstock under the 1999 Option Plan have been granted to Company employees at fair market value at the date ofgrant.
The 2002 Stock Option Plan (the ‘‘2002 Option Plan’’) was approved by shareowners in April 2002. Anamendment to the 2002 Option Plan which permitted the issuance of stock appreciation rights was approved byshareowners in April 2003. Under the 2002 Option Plan, a maximum of 120 million shares of our common stockwas approved to be issued or transferred to certain officers and employees pursuant to stock options and stockappreciation rights granted under the 2002 Option Plan. The stock appreciation rights permit the holder, uponsurrendering all or part of the related stock option, to receive common stock in an amount up to 100 percent ofthe difference between the market price and the option price. No stock appreciation rights have been issuedunder the 2002 Option Plan as of December 31, 2006. Options to purchase common stock under the 2002Option Plan have been granted to Company employees at fair market value at the date of grant.
Stock options granted in December 2003 and thereafter generally become exercisable over a four-yearannual vesting period and expire 10 years from the date of grant. Stock options granted from 1999 throughJuly 2003 generally become exercisable over a four-year annual vesting period and expire 15 years from the dateof grant. Prior to 1999, stock options generally became exercisable over a three-year vesting period and expired10 years from the date of grant.
The fair value of each option award is estimated on the date of the grant using a Black-Scholes-Mertonoption-pricing model that uses the assumptions noted in the following table. The expected term of the optionsgranted represents the period of time that options granted are expected to be outstanding and is derived by
100

THE COCA-COLA COMPANY AND SUBSIDIARIES
NOTES TO CONSOLIDATED FINANCIAL STATEMENTS
NOTE 15: STOCK COMPENSATION PLANS (Continued)
analyzing historic exercise behavior. Expected volatilities are based on implied volatilities from traded optionson the Company’s stock, historical volatility of the Company’s stock, and other factors. The risk-free interest ratefor the period matching the expected term of the option is based on the U.S. Treasury yield curve in effect at thetime of the grant. The dividend yield is the calculated yield on the Company’s stock at the time of the grant.
The following table sets forth information about the weighted-average fair value of options granted duringthe past three years and the weighted-average assumptions used for such grants:
2006 2005 2004
Fair value of options at grant date $ 8.16 $ 8.23 $ 8.84Dividend yields 2.7% 2.6% 2.5%Expected volatility 19.3% 19.9% 23.0%Risk-free interest rates 4.5% 4.3% 3.8%Expected term of the option 6 years 6 years 6 years
101

THE COCA-COLA COMPANY AND SUBSIDIARIES
NOTES TO CONSOLIDATED FINANCIAL STATEMENTS
NOTE 15: STOCK COMPENSATION PLANS (Continued)
A summary of stock option activity under all plans for the years ended December 31, 2006, 2005 and 2004,is as follows:
AggregateWeighted-Average Intrinsic
Shares Weighted-Average Remaining Value(In millions) Exercise Price Contractual Life (In millions)
2006Outstanding on January 1, 2006 203 $ 48.50Granted1 2 41.65Exercised (4) 44.53Forfeited/expired2 (15) 48.30Outstanding on December 31, 2006 186 $ 48.52 8.1 years $ 502
Expected to vest at December 31, 2006 182 $ 48.65 8.1 years $ 478
Exercisable on December 31, 2006 141 $ 50.50 8.0 years $ 227
Shares available on December 31, 2006for options that may be granted 64
AggregateWeighted-Average Intrinsic
Shares Weighted-Average Remaining Value(In millions) Exercise Price Contractual Term (In millions)
2005Outstanding on January 1, 2005 183 $ 49.41Granted1 34 41.26Exercised (7) 35.63Forfeited/expired2 (7) 49.11Outstanding on December 31, 2005 203 $ 48.50 8.8 years $ 0
Exercisable on December 31, 2005 131 $ 51.61 8.4 years $ 0
Shares available on December 31, 2005for options that may be granted 58
AggregateWeighted-Average Intrinsic
Shares Weighted-Average Remaining Value(In millions) Exercise Price Contractual Term (In millions)
2004Outstanding on January 1, 2004 167 $ 50.56Granted1 31 41.63Exercised (5) 35.54Forfeited/expired2 (10) 51.64Outstanding on December 31, 2004 183 $ 49.41 9.3 years $ 51
Exercisable on December 31, 2004 116 $ 52.02 8.7 years $ 39
Shares available on December 31, 2004for options that may be granted 85
1 No grants were made from the 1991 Option Plan during 2006, 2005 or 2004.2 Shares forfeited/expired relate to the 1991, 1999 and 2002 Option Plans.
The total intrinsic value of the options exercised during the years ended December 31, 2006, 2005 and 2004,was $11 million, $49 million and $67 million, respectively.
102

THE COCA-COLA COMPANY AND SUBSIDIARIES
NOTES TO CONSOLIDATED FINANCIAL STATEMENTS
NOTE 15: STOCK COMPENSATION PLANS (Continued)
Restricted Stock Award Plans
Under the amended 1989 Restricted Stock Award Plan and the amended 1983 Restricted Stock Award Plan(the ‘‘Restricted Stock Award Plans’’), 40 million and 24 million shares of restricted common stock, respectively,were originally available to be granted to certain officers and key employees of our Company.
On December 31, 2006, approximately 31 million shares remain available for grant under the RestrictedStock Award Plans. Participants are entitled to vote and receive dividends on the shares and, under the 1983Restricted Stock Award Plan, participants are reimbursed by our Company for income taxes imposed on theaward, but not for taxes generated by the reimbursement payment. The shares are subject to certain transferrestrictions and may be forfeited if a participant leaves our Company for reasons other than retirement,disability or death, absent a change in control of our Company.
The following awards were outstanding and nonvested as of December 31, 2006:
• 382,700 shares of time-based restricted stock in which the restrictions lapse upon the achievement ofcontinued employment over a specified period of time. An additional 31,000 shares were promised foremployees based outside of the United States;
• 416,852 shares of performance-based restricted stock in which restrictions lapse upon the achievement ofspecific performance goals over a specified performance period; and
• 2,271,240 performance share unit (‘‘PSU’’) awards which could result in a future grant of restricted stockafter the achievement of specific performance goals over a specified performance period. Such awardsare subject to adjustment based on the final performance relative to the goals, resulting in a minimumgrant of no shares and a maximum grant of 3,370,860 shares.
103

THE COCA-COLA COMPANY AND SUBSIDIARIES
NOTES TO CONSOLIDATED FINANCIAL STATEMENTS
NOTE 15: STOCK COMPENSATION PLANS (Continued)
Time-Based Restricted Stock Awards
The following table summarizes information about time-based restricted stock awards:
2006 2005 2004
Weighted- Weighted- Weighted-Average Average Average
Grant-Date Grant-Date Grant-DateShares Fair Value Shares Fair Value Shares Fair Value
Nonvested on January 1 422,700 $ 36.31 513,700 $ 39.97 1,224,900 $ 45.20Granted1 — — 9,000 41.80 140,000 48.97Vested and released2 (30,000) 58.48 (100,000) 55.62 (296,800) 36.68Cancelled/Forfeited (10,000) 21.91 — — (554,400) 55.57
Nonvested on December 31 382,7001 $ 34.95 422,7001 $ 36.31 513,700 $ 39.97
1 In 2006, the Company promised to grant an additional 21,000 shares with a grant-date fair value of$48.84 per share to an employee upon retirement. In 2005, the Company promised to grant anadditional 10,000 shares to an employee with a grant-date fair value of $42.84 per share uponcompletion of three years of service. These awards are similar to time-based restricted stock,including the payment of dividend equivalents, but were granted in this manner because theemployees were based outside of the United States.
2 The total fair value of time-based restricted shares vested and released during the years endedDecember 31, 2006, 2005 and 2004, was approximately $1.3 million, $4.3 million, and $13.2 million,respectively. The grant date fair value is the quoted market value of the Company stock on therespective grant date.
In the third quarter of 2004, in connection with Douglas N. Daft’s retirement, the CompensationCommittee of the Board of Directors released to Mr. Daft 200,000 shares of restricted stock previously grantedto him during the period from April 1992 to October 1998. The weighted average grant-date fair value was$32.26 per share and the total fair value of shares released was approximately $8.3 million. The terms of thesegrants provided that the restricted shares be released upon retirement after age 62 but not earlier than five yearsfrom the date of grant. The Compensation Committee determined to release the shares in recognition ofMr. Daft’s 27 years of service to the Company and the fact that he would turn 62 in March 2005. Mr. Daftforfeited 500,000 shares of restricted stock granted to him in November 2000, since as of the date of hisretirement, he had not held these shares for five years from the date of grant. In addition, Mr. Daft forfeited1,000,000 shares of performance-based restricted stock, since Mr. Daft retired prior to the completion of theperformance period.
Performance-Based Restricted Stock Awards
In 2001, shareowners approved an amendment to the 1989 Restricted Stock Award Plan to allow for thegrant of performance-based awards. These awards are released only upon the achievement of specificmeasurable performance criteria. These awards pay dividends during the performance period. The majority ofawards have specific earnings per share targets for achievement. If the earnings per share targets are not met,the awards will be cancelled.
104

THE COCA-COLA COMPANY AND SUBSIDIARIES
NOTES TO CONSOLIDATED FINANCIAL STATEMENTS
NOTE 15: STOCK COMPENSATION PLANS (Continued)
The following table summarizes information about performance-based restricted stock awards:
2006 2005 2004
Weighted- Weighted- Weighted-Average Average Average
Grant-Date Grant-Date Grant-DateShares Fair Value Shares Fair Value Shares Fair Value
Nonvested on January 1 713,000 $ 47.37 713,000 $ 47.75 2,507,720 $ 47.93Granted 224,000 43.66 50,000 42.40 — —PSU conversion1 123,852 42.07 — — — —Vested and released2 (50,000) 56.25 — — (110,000) 50.54Cancelled/Forfeited (594,000) 47.18 (50,000) 47.88 (1,684,720) 47.84
Nonvested on December 31 416,852 $ 43.00 713,000 $ 47.37 713,000 $ 47.75
1 Represents issuance of restricted stock to executives from conversion of previously grantedperformance share units due to their retirement during the year. The weighted-average grant-datefair value is based on the fair values of the performance share unit awards’ grant-date fair values.
2 The total fair value of performance-based restricted shares vested and released during the yearsended December 31, 2006 and 2004, was approximately $2.1 million and $5.0 million, respectively.The grant-date fair value is the quoted market value of the Company stock on the respective grantdate.
Performance Share Unit Awards
In 2003, the Company modified its use of performance-based awards and established a program to grantperformance share unit awards under the 1989 Restricted Stock Award Plan to executives. The number ofperformance share units earned shall be determined at the end of each performance period, generally threeyears, based on performance criteria determined by the Board of Directors and may result in an award ofrestricted stock for U.S. participants and certain international participants at that time. The restricted stock maybe granted to other international participants shortly before the fifth anniversary of the original award.Restrictions on such stock generally lapse on the fifth anniversary of the original award date. Generally,performance share unit awards are subject to the performance criteria of compound annual growth in earningsper share over the performance period, as adjusted for certain items approved by the Compensation Committeeof the Board of Directors (‘‘adjusted EPS’’). The purpose of these adjustments is to ensure a consistent year toyear comparison of the specified performance criteria. Performance share units do not pay dividends during theperformance period. Accordingly, the fair value of these units is the quoted market value of the Company stockon the date of the grant less the present value of the expected dividends not received during the performanceperiod.
Performance share unit Target Awards for the 2004-2006, 2005-2007 and 2006-2008 performance periodsrequire adjusted EPS growth in line with our Company’s internal projections over the performance periods. Inthe event adjusted EPS exceeds the target projection, additional shares up to the Maximum Award may begranted. In the event adjusted EPS falls below the target projection, a reduced number of shares as few as theThreshold Award may be granted. If adjusted EPS falls below the Threshold Award performance level, noshares will be granted. Performance share unit awards provide for cash equivalent payments to former executiveswho become ineligible for restricted stock grants due to certain events such as death, disability or termination.
105

THE COCA-COLA COMPANY AND SUBSIDIARIES
NOTES TO CONSOLIDATED FINANCIAL STATEMENTS
NOTE 15: STOCK COMPENSATION PLANS (Continued)
Of the outstanding granted performance share unit awards as of December 31, 2006, 590,964; 787,576; and820,700 awards are for the 2004-2006, 2005-2007 and 2006-2008 performance periods, respectively. In addition,72,000 performance share unit awards, with predefined qualitative performance criteria and release criteria thatdiffer from the program described above, were granted in 2004 and were outstanding as of December 31, 2006.
The following table summarizes information about performance share unit awards:
2006 2005 2004
Weighted- Weighted- Weighted-Average Average Average
Share Grant-Date Share Grant-Date Share Grant-DateUnits Fair Value Units Fair Value Units Fair Value
Outstanding on January 1 2,356,728 $ 40.42 1,583,447 $ 41.83 798,931 $ 46.78Granted 160,000 37.84 835,440 37.71 953,196 38.71Converted to restricted stock1 (123,852) 42.07 — — — —Paid in cash equivalent2 (7,178) 41.87 — — — —Cancelled/Forfeited (114,458) 43.45 (62,159) 40.06 (168,680) 47.62
Outstanding on December 31 2,271,240 $ 39.99 2,356,728 $ 40.42 1,583,447 $ 41.83
1 Represents performance share units converted to restricted stock for certain executives prior toretirement. The vesting of this restricted stock is subject to certification of the applicableperformance periods.
2 Represents share units that converted to cash equivalent payments to former executives who wereineligible for restricted stock grants due to certain events such as death, disability or termination.
Number of Performance ShareUnits Outstanding
December 31, 2006 2005 2004
Threshold Award 1,297,632 1,352,388 950,837Target Award 2,271,240 2,356,728 1,583,447Maximum Award 3,370,860 3,499,092 2,339,171
The Company recognizes compensation expense when it becomes probable that the performance criteriaspecified in the plan will be achieved. The compensation expense is recognized over the remaining performanceperiod and is recorded in selling, general and administrative expenses.
NOTE 16: PENSION AND OTHER POSTRETIREMENT BENEFIT PLANS
Our Company sponsors and/or contributes to pension and postretirement health care and life insurancebenefit plans covering substantially all U.S. employees. We also sponsor nonqualified, unfunded defined benefitpension plans for certain associates. In addition, our Company and its subsidiaries have various pension plansand other forms of postretirement arrangements outside the United States. We use a measurement date ofDecember 31 for substantially all of our pension and postretirement benefit plans.
106

THE COCA-COLA COMPANY AND SUBSIDIARIES
NOTES TO CONSOLIDATED FINANCIAL STATEMENTS
NOTE 16: PENSION AND OTHER POSTRETIREMENT BENEFIT PLANS (Continued)
Effective December 31, 2006, the Company adopted SFAS No. 158, which required the recognition inpension obligations and AOCI of actuarial gains or losses, prior service costs or credits and transition assets orobligations that had previously been deferred under the reporting requirements of SFAS No. 87, SFAS No. 106and SFAS No. 132(R). The following table reflects the effects of the adoption of SFAS No. 158 on ourconsolidated balance sheet as of December 31, 2006. SFAS No. 158 also impacted the reporting of equitymethod investees as described in Note 3.
Before AfterApplication of Application of
December 31, 2006 (in millions) SFAS No. 158 Adjustments SFAS No. 158
Equity method investments $ 6,460 $ (150) $ 6,310Other assets 2,776 (75) 2,701Other intangible assets 1,699 (12) 1,687Total assets 30,200 (237) 29,963Other liabilities 2,039 192 2,231Deferred income taxes 749 (141) 608Total liabilities 12,992 51 13,043Accumulated other comprehensive income (1,003) (288) (1,291)Total shareowners’ equity 17,208 (288) 16,920Total liabilities and shareowners’ equity 30,200 (237) 29,963
Amounts recognized in AOCI consist of the following (in millions, pretax):
Pension Benefits Other Benefits
December 31, 2006 2006
Net actuarial loss (gain) $ 267 $ 97Prior service cost (credit) 37 (5)
$ 304 $ 92
Amounts in AOCI expected to be recognized as components of net periodic pension cost in 2007 are asfollows (in millions, pretax):
Pension Benefits Other Benefits
2007 2007
Net actuarial loss (gain) $ 20 $ 1Prior service cost (credit) 6 —
$ 26 $ 1
Certain amounts in the prior years’ disclosure have been reclassified to conform to the current yearpresentation.
107

THE COCA-COLA COMPANY AND SUBSIDIARIES
NOTES TO CONSOLIDATED FINANCIAL STATEMENTS
NOTE 16: PENSION AND OTHER POSTRETIREMENT BENEFIT PLANS (Continued)
Obligations and Funded Status
The following table sets forth the change in benefit obligations for our benefit plans (in millions):
Pension Benefits Other Benefits
December 31, 2006 2005 2006 2005
Benefit obligation at beginning of year1 $ 2,806 $ 2,592 $ 787 $ 801Service cost 104 88 31 28Interest cost 158 146 46 43Foreign currency exchange rate changes 53 (56) (1) —Amendments 4 2 — —Actuarial (gain) loss (41) 186 (25) (63)Benefits paid2 (127) (123) (23) (25)Business combinations 95 — 10 —Settlements (10) (28) — —Curtailments — (7) — —Other 3 6 3 3
Benefit obligation at end of year1 $ 3,045 $ 2,806 $ 828 $ 787
1 For pension benefit plans, the benefit obligation is the projected benefit obligation. For other benefitplans, the benefit obligation is the accumulated postretirement benefit obligation.
2 Benefits paid from pension benefit plans during 2006 and 2005 included $31 million and $28 million,respectively, in payments related to unfunded pension plans that were paid from Company assets. Allof the benefits paid from other benefit plans during 2006 and 2005 were paid from Company assets.
The accumulated benefit obligation for our pension plans was $2,648 million and $2,428 million atDecember 31, 2006 and 2005, respectively.
For pension plans with projected benefit obligations in excess of plan assets, the total projected benefitobligation and fair value of plan assets were $1,339 million and $642 million, respectively, as of December 31,2006, and $1,156 million and $470 million, respectively, as of December 31, 2005. For pension plans withaccumulated benefit obligations in excess of plan assets, the total accumulated benefit obligation and fair valueof plan assets were $852 million and $278 million, respectively, as of December 31, 2006, and $875 million and$331 million, respectively, as of December 31, 2005.
108

THE COCA-COLA COMPANY AND SUBSIDIARIES
NOTES TO CONSOLIDATED FINANCIAL STATEMENTS
NOTE 16: PENSION AND OTHER POSTRETIREMENT BENEFIT PLANS (Continued)
The following table sets forth the change in the fair value of plan assets for our benefit plans (in millions):
Pension Benefits Other Benefits
December 31, 2006 2005 2006 2005
Fair value of plan assets at beginning of year1 $ 2,406 $ 2,166 $ 19 $ 10Actual return on plan assets 339 213 5 1Employer contributions 94 161 224 8Foreign currency exchange rate changes 36 (35) — —Benefits paid (96) (95) — —Business combinations 68 — — —Other (4) (4) — —
Fair value of plan assets at end of year1 $ 2,843 $ 2,406 $ 248 $ 19
1 Plan assets include 1.6 million shares of common stock of our Company with a fair value of$77 million and $65 million as of December 31, 2006 and 2005, respectively. Dividends received oncommon stock of our Company during 2006 and 2005 were $2.0 million and $1.8 million, respectively.
The pension and other benefit amounts recognized in our consolidated balance sheets are as follows(in millions):
Pension Benefits Other Benefits
December 31, 20061 2005 20061 2005
Funded status — plan assets less than benefit obligations $ (202) $ (400) $ (580) $ (768)Unrecognized net actuarial loss — 512 — 123Unrecognized prior service cost (credit) — 39 — (6)Fourth quarter contribution 3 — — —
Net prepaid asset (liability) recognized $ (199) $ 151 $ (580) $ (651)
Prepaid benefit cost $ 494 $ 581 $ — $ —Accrued benefit liability (693) (570) (580) (651)Intangible asset — 12 — —Accumulated other comprehensive income — 128 — —
Net prepaid asset (liability) recognized $ (199) $ 151 $ (580) $ (651)
1 Effective December 31, 2006, the Company adopted SFAS No. 158.
109

THE COCA-COLA COMPANY AND SUBSIDIARIES
NOTES TO CONSOLIDATED FINANCIAL STATEMENTS
NOTE 16: PENSION AND OTHER POSTRETIREMENT BENEFIT PLANS (Continued)
Components of Net Periodic Benefit Cost
Net periodic benefit cost for our pension and other postretirement benefit plans consisted of the following(in millions):
Pension Benefits Other Benefits
December 31, 2006 2005 2004 2006 2005 2004
Service cost $ 104 $ 88 $ 82 $ 31 $ 28 $ 27Interest cost 158 146 136 46 43 44Expected return on plan assets (179) (154) (141) (5) (1) —Amortization of prior service cost (credit) 7 7 8 — — (1)Recognized net actuarial loss 46 42 35 3 1 3
Net periodic benefit cost1 $ 136 $ 129 $ 120 $ 75 $ 71 $ 73
1 During 2004, net periodic benefit cost for our other postretirement benefit plans was reduced by$12 million due to our adoption of FSP 106-2. Refer to Note 1.
Assumptions
Certain weighted-average assumptions used in computing the benefit obligations are as follows:
Pension Benefits Other Benefits
December 31, 2006 2005 2006 2005
Discount rate 53⁄4% 51⁄2% 6% 53⁄4%Rate of increase in compensation levels 41⁄4% 41⁄4% 41⁄2% 41⁄2%
Certain weighted-average assumptions used in computing net periodic benefit cost are as follows:
Pension Benefits Other Benefits
Year Ended December 31, 2006 2005 2004 2006 2005 2004
Discount rate 51⁄2% 51⁄2% 6% 53⁄4% 6% 61⁄4%Rate of increase in compensation levels 41⁄4% 4% 41⁄4% 41⁄2% 41⁄2% 41⁄2%Expected long-term rate of return on plan assets 8% 8% 8% 81⁄2% 81⁄2% 81⁄2%
The assumed health care cost trend rates are as follows:
December 31, 2006 2005
Health care cost trend rate assumed for next year 9% 9%Rate to which the cost trend rate is assumed to decline (the ultimate trend rate) 5% 51⁄4%Year that the rate reaches the ultimate trend rate 2011 2010
110

THE COCA-COLA COMPANY AND SUBSIDIARIES
NOTES TO CONSOLIDATED FINANCIAL STATEMENTS
NOTE 16: PENSION AND OTHER POSTRETIREMENT BENEFIT PLANS (Continued)
Assumed health care cost trend rates have a significant effect on the amounts reported for thepostretirement health care plans. A one percentage point change in the assumed health care cost trend ratewould have the following effects (in millions):
One Percentage Point One Percentage PointIncrease Decrease
Effect on accumulated postretirement benefit obligationas of December 31, 2006 $ 117 $ (95)
Effect on total of service cost and interest cost in 2006 $ 15 $ (12)
The discount rate assumptions used to account for pension and other postretirement benefit plans reflectthe rates at which the benefit obligations could be effectively settled. These rates were determined using a cashflow matching technique whereby a hypothetical portfolio of high quality debt securities was constructed thatmirrors the specific benefit obligations for each of our primary U.S. plans. The rate of compensation increaseassumption is determined by the Company based upon annual reviews. We review external data and our ownhistorical trends for health care costs to determine the health care cost trend rate assumptions.
Plan Assets
Pension Benefit Plans
The following table sets forth the actual asset allocation and weighted-average target asset allocation forour U.S. and non-U.S. pension plan assets:
Target AssetDecember 31, 2006 2005 Allocation
Equity securities1 62% 63% 61%Debt securities 27 24 29Real estate and other2 11 13 10
Total 100% 100% 100%
1 As of December 31, 2006 and 2005, 3 percent of total pension plan assets were invested in commonstock of our Company.
2 As of December 31, 2006 and 2005, 6 percent of total pension plan assets were invested in real estate.
Investment objectives for the Company’s U.S. pension plan assets, which comprise 75 percent of totalpension plan assets as of December 31, 2006, are to:
(1) optimize the long-term return on plan assets at an acceptable level of risk;
(2) maintain a broad diversification across asset classes and among investment managers;
(3) maintain careful control of the risk level within each asset class; and
(4) focus on a long-term return objective.
111

THE COCA-COLA COMPANY AND SUBSIDIARIES
NOTES TO CONSOLIDATED FINANCIAL STATEMENTS
NOTE 16: PENSION AND OTHER POSTRETIREMENT BENEFIT PLANS (Continued)
Asset allocation targets promote optimal expected return and volatility characteristics given the long-termtime horizon for fulfilling the obligations of the pension plans. Selection of the targeted asset allocation for U.S.plan assets was based upon a review of the expected return and risk characteristics of each asset class, as well asthe correlation of returns among asset classes.
Investment guidelines are established with each investment manager. These guidelines provide theparameters within which the investment managers agree to operate, including criteria that determine eligibleand ineligible securities, diversification requirements and credit quality standards, where applicable. Unlessexceptions have been approved, investment managers are prohibited from buying or selling commodities, futuresor option contracts, as well as from short selling of securities. Furthermore, investment managers agree to obtainwritten approval for deviations from stated investment style or guidelines.
As of December 31, 2006, no investment manager was responsible for more than 10 percent of total U.S.plan assets. In addition, diversification requirements for each investment manager prevent a single security orother investment from exceeding 10 percent, at historical cost, of the individual manager’s portfolio.
The expected long-term rate of return assumption for U.S. plan assets is based upon the target assetallocation and is determined using forward-looking assumptions in the context of historical returns andvolatilities for each asset class, as well as correlations among asset classes. We evaluate the rate of returnassumption on an annual basis. The expected long-term rate of return assumption used in computing 2006 netperiodic pension cost for the U.S. plans was 8.5 percent. As of December 31, 2006, the 10-year annualized returnon U.S. plan assets was 9.0 percent, the 15-year annualized return was 11.0 percent, and the annualized returnsince inception was 12.8 percent.
Plan assets for our pension plans outside the United States are insignificant on an individual plan basis.
Other Benefit Plans
Plan assets associated with other benefits represent funding of the primary U.S. postretirement benefitplans. In late 2006, we established and contributed $216 million to a U.S. Voluntary Employee BeneficiaryAssociation, a tax-qualified trust. As of December 31, 2006, the majority of these funds were held in short-terminvestments pending the implementation of long-term asset allocation strategies. While these assets will remainsegregated from the primary U.S. pension master trust, the investment objectives, asset allocation targets andinvestment guidelines will be determined in a methodology similar to that applied to the U.S. pension plansdescribed above.
112

THE COCA-COLA COMPANY AND SUBSIDIARIES
NOTES TO CONSOLIDATED FINANCIAL STATEMENTS
NOTE 16: PENSION AND OTHER POSTRETIREMENT BENEFIT PLANS (Continued)
Cash Flows
Information about the expected cash flows for our pension and other postretirement benefit plans is asfollows (in millions):
Pension OtherBenefits Benefits
Expected employer contributions:2007 $ 49 $ —Expected benefit payments1:2007 $ 135 $ 302008 133 332009 134 362010 145 392011 142 422012-2016 834 253
1 The expected benefit payments for our other postretirement benefit plans are net of estimatedfederal subsidies expected to be received under the Medicare Prescription Drug, Improvement andModernization Act of 2003. Federal subsidies are estimated to range from $2 million to $3 million in2007 to 2011 and are estimated to be $23 million for the period 2012-2016.
Defined Contribution Plans
Our Company sponsors a qualified defined contribution plan covering substantially all U.S. employees.Under this plan, we match 100 percent of participants’ contributions up to a maximum of 3 percent ofcompensation. Company contributions to the U.S. plan were approximately $25 million, $21 million and$18 million in 2006, 2005 and 2004, respectively. We also sponsor defined contribution plans in certain locationsoutside the United States. Company contributions to those plans were approximately $18 million, $16 millionand $13 million in 2006, 2005 and 2004, respectively.
NOTE 17: INCOME TAXES
Income before income taxes consisted of the following (in millions):
Year Ended December 31, 2006 2005 2004
United States $ 2,126 $ 2,268 $ 2,535International 4,452 4,422 3,687
$ 6,578 $ 6,690 $ 6,222
113

THE COCA-COLA COMPANY AND SUBSIDIARIES
NOTES TO CONSOLIDATED FINANCIAL STATEMENTS
NOTE 17: INCOME TAXES (Continued)
Income tax expense (benefit) consisted of the following for the years ended December 31, 2006, 2005 and2004 (in millions):
United State andStates Local International Total
2006Current $ 608 $ 47 $ 878 $ 1,533Deferred (20) (22) 7 (35)
2005Current $ 873 $ 188 $ 845 $ 1,906Deferred (72) (25) 9 (88)
2004Current $ 350 $ 64 $ 799 $ 1,213Deferred 209 29 (76) 162
We made income tax payments of approximately $1,601 million, $1,676 million and $1,500 million in 2006,2005 and 2004, respectively.
A reconciliation of the statutory U.S. federal tax rate and effective tax rates is as follows:
Year Ended December 31, 2006 2005 2004
Statutory U.S. federal rate 35.0 % 35.0 % 35.0 %State and local income taxes — net of federal benefit 0.7 1.2 1.0Earnings in jurisdictions taxed at rates different from the statutory U.S. federal rate (11.4)1 (12.1)5 (9.4)9,10
Equity income or loss (0.6)2 (2.3) (3.1)11
Other operating charges 0.63 0.46 (0.9)12
Other — net (1.5)4 0.37 (0.5)13
Repatriation under the Jobs Creation Act — 4.78 —
Effective rates 22.8 % 27.2 % 22.1 %
1 Includes approximately $24 million (or 0.4 percent) tax charge related to the resolution of certain taxmatters in various international jurisdictions.
2 Includes approximately 2.4 percent impact to our effective tax rate related to charges recorded by ourequity method investees. Refer to Note 3 and Note 18.
3 Includes the tax rate impact related to the impairment of assets and investments in our bottlingoperations, contract termination costs related to production capacity efficiencies and otherrestructuring charges. Refer to Note 18.
4 Includes approximately 1.8 percent tax rate benefit related to the sale of a portion of our investmentin Coca-Cola FEMSA and Coca-Cola Icecek. Refer to Note 3 and Note 18.
5 Includes approximately $29 million (or 0.4 percent) tax benefit related to the favorable resolution ofcertain tax matters in various international jurisdictions.
6 Includes approximately $4 million tax benefit related to the Philippines impairment charges. Refer toNote 6 and Note 18.
7 Includes approximately $72 million (or 1.1 percent) tax benefit related to the favorable resolution ofcertain domestic tax matters.
8 Related to repatriation of approximately $6.1 billion of previously unremitted foreign earnings underthe Jobs Creation Act, resulting in a tax provision of approximately $315 million.
114

THE COCA-COLA COMPANY AND SUBSIDIARIES
NOTES TO CONSOLIDATED FINANCIAL STATEMENTS
NOTE 17: INCOME TAXES (Continued)9 Includes approximately $92 million (or 1.4 percent) tax benefit related to the favorable resolution of
certain tax matters in various international jurisdictions.10 Includes a tax charge of approximately $75 million (or 1.2 percent) related to the recording of a
valuation allowance on various deferred tax assets recorded in Germany.11 Includes an approximate $50 million (or 0.8 percent) tax benefit related to the realization of certain
foreign tax credits per provisions of the Jobs Creation Act.12 Includes a tax benefit of approximately $171 million primarily related to impairment of franchise
rights at CCEAG and certain manufacturing investments. Refer to Note 18.13 Includes an approximate $36 million (or 0.6 percent) tax benefit related to the favorable resolution of
various domestic tax matters.
Our effective tax rate reflects the tax benefits from having significant operations outside the United Statesthat are taxed at rates lower than the statutory U.S. rate of 35 percent. During 2006, the Company had severalsubsidiaries that benefited from various tax incentive grants. The terms of these grants range from 2010 to 2018.The Company expects each of the grants to be renewed indefinitely. The grants did not have a material effect onthe results of operations for the years ended December 31, 2006, 2005 or 2004.
Undistributed earnings of the Company’s foreign subsidiaries amounted to approximately $7.7 billion atDecember 31, 2006. Those earnings are considered to be indefinitely reinvested and, accordingly, no U.S.federal and state income taxes have been provided thereon. Upon distribution of those earnings in the form ofdividends or otherwise, the Company would be subject to both U.S. income taxes (subject to an adjustment forforeign tax credits) and withholding taxes payable to the various foreign countries. Determination of the amountof unrecognized deferred U.S. income tax liability is not practical because of the complexities associated with itshypothetical calculation; however, unrecognized foreign tax credits would be available to reduce a portion of theU.S. tax liability.
As discussed in Note 1, the Jobs Creation Act was enacted in October 2004. One of the provisions providesa one-time benefit related to foreign tax credits generated by equity investments in prior years. The Companyrecorded an income tax benefit of approximately $50 million as a result of this law change in 2004. The JobsCreation Act also included a temporary incentive for U.S. multinationals to repatriate foreign earnings at anapproximate 5.25 percent effective tax rate. During the first quarter of 2005, the Company decided to repatriateapproximately $2.5 billion in previously unremitted foreign earnings. Therefore, the Company recorded aprovision for taxes on such previously unremitted foreign earnings of approximately $152 million in the firstquarter of 2005. During 2005, the United States Internal Revenue Service and the United States Department ofTreasury issued additional guidance related to the Jobs Creation Act. As a result of this guidance, the Companyreduced the accrued taxes previously provided on such unremitted earnings by $25 million in the second quarterof 2005. During the fourth quarter of 2005, the Company repatriated an additional $3.6 billion, with anassociated tax liability of approximately $188 million. Therefore, the total previously unremitted earnings thatwere repatriated during the full year of 2005 was $6.1 billion with an associated tax liability of approximately$315 million. This liability was recorded in 2005 as federal and state and local tax expenses in the amount of$301 million and $14 million, respectively.
115

THE COCA-COLA COMPANY AND SUBSIDIARIES
NOTES TO CONSOLIDATED FINANCIAL STATEMENTS
NOTE 17: INCOME TAXES (Continued)
The tax effects of temporary differences and carryforwards that give rise to deferred tax assets and liabilitiesconsist of the following (in millions):
December 31, 2006 2005
Deferred tax assets:Property, plant and equipment $ 58 $ 60Trademarks and other intangible assets 75 64Equity method investments (including translation adjustment) 354 445Other liabilities 190 200Benefit plans 866 649Net operating/capital loss carryforwards 593 750Other 224 295
Gross deferred tax assets 2,360 2,463Valuation allowances (678) (786)
Total deferred tax assets1,2 $ 1,682 $ 1,677
Deferred tax liabilities:Property, plant and equipment $ (630) $ (641)Trademarks and other intangible assets (504) (278)Equity method investments (including translation adjustment) (622) (674)Other liabilities (82) (80)Other (200) (170)
Total deferred tax liabilities3 $ (2,038) $ (1,843)
Net deferred tax liabilities $ (356) $ (166)
1 Noncurrent deferred tax assets of $168 million and $192 million were included in the consolidatedbalance sheets line item other assets at December 31, 2006 and 2005, respectively.
2 Current deferred tax assets of $117 million and $153 million were included in the consolidatedbalance sheets line item prepaid expenses and other assets at December 31, 2006 and 2005,respectively.
3 Current deferred tax liabilities of $33 million and $159 million were included in the consolidatedbalance sheets line item accounts payable and accrued expenses at December 31, 2006 and 2005,respectively.
As of December 31, 2006 and 2005, we had approximately $93 million of net deferred tax liabilities and$116 million of net deferred tax assets, respectively, located in countries outside the United States.
116

THE COCA-COLA COMPANY AND SUBSIDIARIES
NOTES TO CONSOLIDATED FINANCIAL STATEMENTS
NOTE 17: INCOME TAXES (Continued)
As of December 31, 2006, we had approximately $2,324 million of loss carryforwards available to reducefuture taxable income. Loss carryforwards of approximately $373 million must be utilized within the next fiveyears; $91 million must be utilized within the next 10 years; and the remainder can be utilized over a periodgreater than 10 years.
An analysis of our deferred tax asset valuation allowances is as follows (in millions):
Year Ended December 31, 2006 2005 2004
Balance, beginning of year $ 786 $ 854 $ 630Additions 50 43 291Deductions (158) (111) (67)
Balance, end of year $ 678 $ 786 $ 854
The Company’s deferred tax asset valuation allowances are primarily the result of uncertainties regardingthe future realization of recorded tax benefits on tax loss carryforwards from operations in various jurisdictions.In 2006, the Company recognized a net decrease in its valuation allowances of $108 million. This decrease wasprimarily related to the reversal of valuation allowances that covered certain deferred tax assets recorded oncapital loss carryforwards. A portion of the capital loss carryforwards was utilized to offset taxable gains on thesale of a portion of the investments in Coca-Cola Icecek and Coca-Cola FEMSA. In 2005, the Companyrecognized a decrease in its valuation allowances of $68 million. This decrease was primarily related to a changein tax rates which resulted in a reduction of certain deferred tax assets and corresponding valuation allowances.In 2004, the Company recognized an increase in its valuation allowances of $224 million. This increase wasprimarily related to the recording of a valuation allowance on Germany’s net operating losses, the recording of avaluation allowance on a deferred tax asset recorded on the basis difference in an equity investment and achange in the valuation allowance in India.
NOTE 18: SIGNIFICANT OPERATING AND NONOPERATING ITEMS
In 2006, our Company recorded charges of approximately $606 million related to our proportionate shareof charges recorded by our equity method investees. Of this amount, approximately $602 million related to ourproportionate share of an impairment charge recorded by CCE for its North American franchise rights. Ourproportionate share of CCE’s charges also included approximately $18 million due to restructuring chargesrecorded by CCE. These charges were partially offset by approximately $33 million related to our proportionateshare of changes in certain of CCE’s state and Canadian federal and provincial tax rates. The charges wererecorded in the line item equity income—net in the consolidated statement of income. All of these charges andchanges impacted our Bottling Investments operating segment. Refer to Note 3.
During 2006, our Company also recorded charges of approximately $112 million, primarily related to theimpairment of assets and investments in our bottling operations, approximately $53 million for contracttermination costs related to production capacity efficiencies and approximately $24 million related to otherrestructuring costs. These charges impacted the Africa, the East, South Asia and Pacific Rim, the EuropeanUnion, the North Asia, Eurasia and Middle East, the Bottling Investments and the Corporate operatingsegments. None of these charges was individually significant. Approximately $4 million of these charges wererecorded in the line item cost of goods sold and approximately $185 million of these charges were recorded inthe line item other operating charges in the consolidated statement of income. Refer to Note 20.
117

THE COCA-COLA COMPANY AND SUBSIDIARIES
NOTES TO CONSOLIDATED FINANCIAL STATEMENTS
NOTE 18: SIGNIFICANT OPERATING AND NONOPERATING ITEMS (Continued)
The Company made a $100 million donation to The Coca-Cola Foundation in 2006, which resulted in acharge to the consolidated statement of income line item selling, general and administrative expenses andimpacted the Corporate operating segment.
In 2006, the Company sold a portion of its Coca-Cola FEMSA shares to FEMSA and recorded a pretaxgain of approximately $175 million to the consolidated statement of income line item other income (loss)—net,which impacted the Corporate operating segment. Refer to Note 3.
The Company sold a portion of our investment in Coca-Cola Icecek in an initial public offering in 2006. OurCompany received net cash proceeds of approximately $198 million and realized a pretax gain of approximately$123 million, which was recorded as other income (loss)—net in the consolidated statement of income andimpacted the Corporate operating segment. Refer to Note 3.
In 2005, our Company received approximately $109 million related to the settlement of a class actionlawsuit concerning price-fixing in the sale of HFCS purchased by the Company during the years 1991 to 1995.Subsequent to the receipt of this settlement amount, the Company distributed approximately $62 million tocertain bottlers in North America. From 1991 to 1995, the Company purchased HFCS on behalf of thesebottlers. Therefore, these bottlers were ultimately entitled to a portion of the proceeds of the settlement. Of theapproximately $62 million we distributed to certain bottlers in North America, approximately $49 million wasdistributed to CCE. The Company’s remaining share of the settlement was approximately $47 million, which wasrecorded as a reduction of cost of goods sold and impacted the Corporate operating segment.
During 2005, we recorded approximately $23 million of noncash pretax gains on the issuances of stock byequity method investees. Refer to Note 4.
The Company recorded approximately $50 million of expense in 2005 as a result of a change in ourestimated service period for the acceleration of certain stock-based compensation awards. Refer to Note 15.
Equity income in 2005 was reduced by approximately $33 million for the Bottling Investments operatingsegment, primarily related to our proportionate share of the tax liability recorded by CCE resulting from itsrepatriation of previously unremitted foreign earnings under the Jobs Creation Act, as well as our proportionateshare of restructuring charges. Those amounts were partially offset by our proportionate share of CCE’s HFCSlawsuit settlement proceeds and changes in certain of CCE’s state and provincial tax rates. Refer to Note 3.
Our Company recorded impairment charges during 2005 of approximately $84 million related to certaintrademarks for beverages sold in the Philippines and approximately $1 million related to impairment of otherassets. These impairment charges were recorded in the consolidated statement of income line item otheroperating charges.
During 2004, our Company’s equity income benefited by approximately $37 million for our proportionateshare of a favorable tax settlement related to Coca-Cola FEMSA. Refer to Note 3.
In 2004, we recorded approximately $24 million of noncash pretax gains on the issuances of stock by CCE.Refer to Note 4.
We recorded impairment charges during 2004 of approximately $374 million, primarily related to theimpairment of franchise rights at CCEAG and approximately $18 million related to other assets. Theseimpairment charges were recorded in the consolidated statement of income line item other operating charges.
118

THE COCA-COLA COMPANY AND SUBSIDIARIES
NOTES TO CONSOLIDATED FINANCIAL STATEMENTS
NOTE 18: SIGNIFICANT OPERATING AND NONOPERATING ITEMS (Continued)
We recorded additional impairment charges in 2004 of approximately $88 million. These impairmentsprimarily related to the write-downs of certain manufacturing investments and an intangible asset. As a result ofoperating losses, management prepared analyses of cash flows expected to result from the use of the assets andtheir eventual disposition. Because the sum of the undiscounted cash flows was less than the carrying value ofsuch assets, we recorded an impairment charge to reduce the carrying value of the assets to fair value. Theseimpairment charges were recorded in the consolidated statement of income line item other operating charges.
Also in 2004, our Company received a $75 million insurance settlement related to the class action lawsuitthat was settled in 2000. The Company donated $75 million to The Coca-Cola Foundation in 2004.
NOTE 19: ACQUISITIONS AND INVESTMENTS
In December 2006, the Company entered into a purchase agreement with San Miguel Corporation and twoof its subsidiaries (collectively, ‘‘SMC’’) to acquire all of the shares of capital stock of Coca-Cola BottlersPhilippines, Inc. (‘‘CCBPI’’) held by SMC, representing 65 percent of all the issued and outstanding capital stockof CCBPI. CCBPI is the Company’s authorized bottler in the Philippines. The transaction is subject to certainconditions. Upon the closing of this transaction, the Company will own 100 percent of the issued andoutstanding capital stock of CCBPI. The total purchase price is expected to be approximately $590 million,subject to adjustment based on the terms and conditions of the purchase agreement. The results of operations ofCCBPI will be included in our consolidated financial statements from the date of the closing.
In December 2006, the Company and Coca-Cola FEMSA entered into an agreement to jointly acquireJugos del Valle, S.A.B. de C.V., the second largest producer of packaged juices, nectars and fruit-flavoredbeverages in Mexico and the largest producer of such beverages in Brazil. The total purchase price is expected tobe approximately $380 million in cash plus the assumption of approximately $90 million in debt. The transactionis subject to certain conditions, including required regulatory approvals.
During 2006, our Company’s acquisition and investment activity, including the acquisition of trademarks,totaled approximately $901 million. In the third quarter of 2006, our Company acquired a controllingshareholding interest in Kerry Beverages Limited (‘‘KBL’’). KBL was formed by the Company and the KerryGroup in 1993 and has a majority ownership in 11 joint ventures that manufacture and distribute Companyproducts across nine provinces in China. KBL also has a minority interest in the joint venture bottler in Beijing.Subsequent to the acquisition, the Company changed KBL’s name to Coca-Cola China Industries Limited(‘‘CCCIL’’). As a result of the transaction, the Company owns 89.5 percent of the outstanding shares of CCCIL,and we have agreed to purchase the remaining 10.5 percent by the end of 2008 at the same price per share as theinitial purchase price plus interest. We have all voting and economic rights over the remaining shares. Thistransaction was accounted for as a business combination, and the results of CCCIL’s operations have beenincluded in the Company’s consolidated financial statements since August 29, 2006. CCCIL is included in theBottling Investments operating segment.
In the third quarter of 2006, our Company signed agreements with J. Bruce Llewellyn and Brucephil, Inc.(‘‘Brucephil’’), the parent company of The Philadelphia Coca-Cola Bottling Company, for the potentialpurchase of the remaining shares of Brucephil not currently owned by the Company. The agreements providefor the Company’s purchase of the shares upon the election of Mr. Llewellyn or the election of the Company.Based on the terms of these agreements, the Company concluded that it must consolidate Brucephil underInterpretation No. 46(R). Brucephil’s financial statements were consolidated effective September 29, 2006.Brucephil is included in our Bottling Investments operating segment.
119

THE COCA-COLA COMPANY AND SUBSIDIARIES
NOTES TO CONSOLIDATED FINANCIAL STATEMENTS
NOTE 19: ACQUISITIONS AND INVESTMENTS (Continued)
Also in the third quarter of 2006, our Company acquired Apollinaris GmbH (‘‘Apollinaris’’). Apollinaris hasbeen selling sparkling and still mineral water in Germany since 1862. This transaction was accounted for as abusiness combination, and the results of Apollinaris’ operations have been included in the Company’sconsolidated financial statements since July 1, 2006. A portion of Apollinaris’ business is included in theEuropean Union operating segment, and the balance is included in the Bottling Investments operating segment.
The combined amount paid or to be paid to complete these third-quarter 2006 transactions totalsapproximately $707 million. As a result of these transactions, the Company recorded approximately $707 millionof franchise rights, approximately $74 million of trademarks and $182 million of goodwill. These amounts reflecta preliminary allocation of the purchase price of the applicable transactions and are subject to refinement. Thefranchise rights and trademarks have been assigned an indefinite life.
In January 2006, our Company acquired a 100 percent interest in TJC Holdings (Pty) Ltd. (‘‘TJC’’), abottling company in South Africa, from Chef Limited and Tom Cook Trust for cash consideration ofapproximately $200 million. This transaction was accounted for as a business combination, with the results ofTJC included in the Company’s consolidated financial statements since the date of acquisition. TJC is includedin our Bottling Investments operating segment. The Company allocated the purchase price, based on estimatedfair values, to all of the assets and liabilities that we acquired. The amount of the purchase price allocated toproperty, plant and equipment was approximately $21 million, franchise rights was approximately $169 millionand goodwill was approximately $59 million. The franchise rights have been assigned an indefinite life.
Assuming the results of these businesses had been included in operations beginning on January 1, 2006, proforma financial data would not be required due to immateriality.
During 2005, our Company’s acquisition and investment activity totaled approximately $637 million andincluded the acquisition of the German bottling company Bremer Erfrischungsgetraenke GmbH (‘‘Bremer’’) forapproximately $160 million from InBev SA. This transaction was accounted for as a business combination, andthe results of Bremer’s operations have been included in the Company’s consolidated financial statementsbeginning in September 2005. The Company recorded approximately $54 million of property, plant andequipment, approximately $85 million of franchise rights and approximately $58 million of goodwill related tothis acquisition. The franchise rights have been assigned an indefinite life, and the goodwill was allocated to theGermany and Nordic reporting unit within the European Union operating segment.
In August 2005, we completed the acquisition of the remaining 49 percent interest in the business of CCDAWaters L.L.C. (‘‘CCDA’’) not previously owned by our Company. Our Company and Danone Waters of NorthAmerica, Inc. (‘‘DWNA’’) had formed CCDA in July 2002 for the production, marketing and distribution ofDWNA’s bottled spring and source water business in the United States. This transaction was accounted for as abusiness combination, and the consolidated results of CCDA’s operations have been included in the Company’sconsolidated financial statements since July 2002. CCDA is included in our North America operating segment.In July 2005, the Company acquired Sucos Mais, a Brazilian juice company. The results of Sucos Mais have beenincluded in our consolidated financial statements since July 2005.
Assuming the results of these businesses had been included in operations beginning on January 1, 2005, proforma financial data would not be required due to immateriality.
On April 20, 2005, our Company and Coca-Cola HBC jointly acquired Multon for a total purchase price ofapproximately $501 million, split equally between the Company and Coca-Cola HBC. The Company’s
120

THE COCA-COLA COMPANY AND SUBSIDIARIES
NOTES TO CONSOLIDATED FINANCIAL STATEMENTS
NOTE 19: ACQUISITIONS AND INVESTMENTS (Continued)
investment in Multon is accounted for under the equity method. Equity income—net includes our proportionateshare of the results of Multon’s operations beginning April 20, 2005.
During 2004, our Company’s acquisition and investment activity totaled approximately $267 million,primarily related to the purchase of trademarks, brands and related contractual rights in Latin America, none ofwhich was individually significant.
NOTE 20: OPERATING SEGMENTS
During 2006, the Company made certain changes to its operating structure, primarily to establish a separateinternal organization for its consolidated bottling operations and its unconsolidated bottling investments. Thisstructure resulted in the reporting of a Bottling Investments operating segment, along with the six existinggeographic operating segments and Corporate, beginning with the first quarter of 2006. Prior to this change inthe operating structure, the financial results of the consolidated bottling operations and our proportionate shareof the earnings of unconsolidated bottling operations had been generally included in the geographic operatingsegments in which they conducted business. As of December 31, 2006, our Company’s operating structureconsisted of the following operating segments: Africa; East, South Asia and Pacific Rim; European Union; LatinAmerica; North America; North Asia, Eurasia and Middle East; Bottling Investments; and Corporate.Prior-year amounts have been reclassified to conform to the new operating structure described above.
Segment Products and Services
The business of our Company is nonalcoholic beverages. Our operating segments derive a majority of theirrevenues from the manufacture and sale of beverage concentrates and syrups and, in some cases, the sale offinished beverages.
Method of Determining Segment Income or Loss
Management evaluates the performance of our operating segments separately to individually monitor thedifferent factors affecting financial performance. Our Company manages income taxes and financial costs, suchas interest income and expense, on a global basis within the Corporate operating segment. We evaluate segmentperformance based on income or loss before income taxes.
121

THE COCA-COLA COMPANY AND SUBSIDIARIES
NOTES TO CONSOLIDATED FINANCIAL STATEMENTS
NOTE 20: OPERATING SEGMENTS (Continued)
Information about our Company’s operations by operating segment for the years ended December 31, 2006,2005 and 2004, is as follows (in millions):
East, NorthSouth Asia,
Asia Eurasiaand and
Pacific European Latin North Middle BottlingAfrica Rim Union America America East Investments Corporate Eliminations Consolidated
2006Net operating revenues:
Third party $ 1,103 $ 795 $ 3,505 $ 2,484 $ 7,013 $ 3,9861 $ 5,109 $ 93 $ — $ 24,088Intersegment 37 77 859 132 16 137 89 — (1,347) —Total net revenues 1,140 872 4,364 2,616 7,029 4,123 5,198 93 (1,347) 24,088
Operating income (loss) 4242 3582 2,2542 1,438 1,683 1,5572 182 (1,424)2,3 — 6,308Interest income — — — — — — — 193 — 193Interest expense — — — — — — — 220 — 220Depreciation and amortization 16 13 100 25 361 55 278 90 — 938Equity income — net — — (4) — — 27 566 23 — 102Income (loss) before income taxes 4132 3582 2,2582 1,434 1,681 1,5792 672,6 (1,212)2,3,4 — 6,578Identifiable operating assets5,7 573 390 2,557 1,516 4,778 1,043 5,953 6,370 — 23,180Investments8 — — 24 — 2 428 6,276 53 — 6,783Capital expenditures 37 10 93 44 421 129 418 255 — 1,407
2005Net operating revenues:
Third party $ 1,107 $ 719 $ 4,104 $ 2,064 $ 6,676 $ 4,0891 $ 4,262 $ 83 $ — $ 23,104Intersegment 13 60 807 94 — 130 — — (1,104) —Total net revenues 1,120 779 4,911 2,158 6,676 4,219 4,262 83 (1,104) 23,104
Operating income (loss) 3969 2849,10 2,2199 1,1769 1,5539 1,7359 (37) (1,241)9,11 — 6,085Interest income — — — — — — — 235 — 235Interest expense — — — — — — — 240 — 240Depreciation and amortization 18 16 86 27 348 43 265 129 — 932Equity income — net — — — — — 20 62412 36 — 680Income (loss) before income taxes 3829 2839,10 2,2259 1,1759 1,5499 1,7489 59012 (1,262)9,11,13 — 6,690Identifiable operating assets5,7 561 339 2,183 1,324 4,645 987 3,842 8,624 — 22,505Investments8 — 1 16 6 — 281 6,538 80 — 6,922Capital expenditures 23 7 78 24 265 89 264 149 — 899
2004Net operating revenues:
Third party $ 961 $ 706 $ 3,913 $ 1,778 $ 6,423 $ 3,8851 $ 3,975 $ 101 $ — $ 21,742Intersegment 10 109 773 69 — 96 — — (1,057) —Total net revenues 971 815 4,686 1,847 6,423 3,981 3,975 101 (1,057) 21,742
Operating income (loss) 336 439 2,126 1,053 1,60614 1,671 (454)14 (1,079)14,15 — 5,698Interest income — — — — — — — 157 — 157Interest expense — — — — — — — 196 — 196Depreciation and amortization 18 14 75 33 347 69 245 92 — 893Equity income — net — — — — — — 58016 41 — 621Income (loss) before income taxes 322 440 2,125 1,059 1,61514 1,667 13114,16 (1,137)14,15,17 — 6,222Identifiable operating assets5,7 575 360 2,300 1,202 4,728 939 4,144 10,941 — 25,189Investments8 — 1 16 5 — 8 6,138 84 — 6,252Capital expenditures 17 7 39 25 247 45 258 117 — 755
Certain prior year amounts have been reclassified to conform to the current year presentation.1 Net operating revenues in Japan represented approximately 11 percent of total net operating revenues in 2006, 13 percent in 2005 and 14 percent in
2004.
122

THE COCA-COLA COMPANY AND SUBSIDIARIES
NOTES TO CONSOLIDATED FINANCIAL STATEMENTS
NOTE 20: OPERATING SEGMENTS (Continued)2 Operating income (loss) and income (loss) before income taxes were reduced by approximately $3 million for Africa, $44 million for East, South Asia
and Pacific Rim, $36 million for the European Union, $17 million for North Asia, Eurasia and Middle East, $88 million for Bottling Investments and$1 million for Corporate primarily due to asset impairments, contract termination costs related to production capacity efficiencies and otherrestructuring costs during 2006. Refer to Note 18.
3 Operating income (loss) and income (loss) before income taxes were reduced by $100 million for Corporate as a result of a donation made to TheCoca-Cola Foundation. Refer to Note 18.
4 Income (loss) before income taxes was increased by approximately $298 million for Corporate as a result of net gains on the sale of Coca-Cola FEMSAshares and the sale of a portion of our investment in Coca-Cola Icecek in an initial public offering. Refer to Note 18.
5 Principally cash and cash equivalents, marketable securities, finance subsidiary receivables, goodwill, trademarks and other intangible assets andproperty, plant and equipment—net.
6 Equity income—net and income (loss) before income taxes were reduced by approximately $587 million for Bottling Investments primarily related toour proportionate share of impairment and restructuring charges recorded by CCE which were partially offset by our proportionate share of changes incertain of CCE’s state and Canadian federal and provincial tax rates (refer to Note 3) and by $19 million due to our proportionate share of restructuringcharges recorded by other equity method investees.
7 Property, plant and equipment—net in Germany represented approximately 19 percent of total property, plant and equipment—net in 2006, 19 percentin 2005 and 20 percent in 2004.
8 Principally equity and cost method investments in bottling companies.9 Operating income (loss) and income (loss) before income taxes were reduced by approximately $3 million for Africa, $3 million for East, South Asia and
Pacific Rim, $3 million for the European Union, $4 million for Latin America, $12 million for North America, $3 million for North Asia, Eurasia andMiddle East, and $22 million for Corporate as a result of accelerated amortization of stock-based compensation expense due to a change in ourestimated service period for retirement-eligible participants. Refer to Note 15.
10 Operating income (loss) and income (loss) before income taxes were reduced by approximately $85 million for East, South Asia and Pacific Rim relatedto the Philippines impairment charges. Refer to Note 18.
11 Operating income (loss) and income (loss) before income taxes benefited by approximately $47 million for Corporate related to the settlement of a classaction lawsuit related to HFCS purchases. Refer to Note 18.
12 Equity income—net and income (loss) before income taxes were reduced by approximately $33 million for Bottling Investments primarily related to ourproportionate share of the tax liability recorded as a result of CCE’s repatriation of unremitted foreign earnings under the Jobs Creation Act andrestructuring charges, offset by CCE’s HFCS lawsuit settlement proceeds and changes in certain of CCE’s state and provincial tax rates and by $4 milliondue to our proportionate share of impairments of certain intangible assets and investments recorded by an equity method investee in the Philippines.Refer to Note 18.
13 Income (loss) before income taxes benefited by approximately $23 million for Corporate due to noncash pretax gains on issuances of stock by Coca-ColaAmatil in connection with the acquisition of SPC Ardmona Pty. Ltd., an Australian fruit company. Refer to Note 4.
14 Operating income (loss) and income (loss) before income taxes were reduced by approximately $18 million for North America, $398 million for BottlingInvestments and $64 million for Corporate as a result of other operating charges recorded for asset impairments. Refer to Note 18.
15 Operating income (loss) and income (loss) before income taxes for Corporate were impacted as a result of the Company’s receipt of a $75 millioninsurance settlement related to the class action lawsuit settled in 2000. The Company subsequently donated $75 million to The Coca-Cola Foundation.
16 Equity income—net and income (loss) before income taxes were increased by approximately $37 million for Bottling Investments as a result of afavorable tax settlement related to Coca-Cola FEMSA. Refer to Note 3.
17 Income (loss) before income taxes was increased by approximately $24 million for Corporate due to noncash pretax gains that were recognized on theissuances of stock by CCE. Refer to Note 4.
123

THE COCA-COLA COMPANY AND SUBSIDIARIES
NOTES TO CONSOLIDATED FINANCIAL STATEMENTS
NOTE 20: OPERATING SEGMENTS (Continued)
Geographic Data (in millions)
Year Ended December 31, 2006 2005 2004
Net operating revenues:United States $ 6,662 $ 6,299 $ 6,084International 17,426 16,805 15,658
Net operating revenues $ 24,088 $ 23,104 $ 21,742
December 31, 2006 2005 2004
Property, plant and equipment—net:United States $ 2,607 $ 2,309 $ 2,371International 4,296 3,522 3,720
Property, plant and equipment—net $ 6,903 $ 5,831 $ 6,091
Five-Year Compound Growth RatesNet
Operating OperatingFive Years Ended December 31, 2006 Revenues Income
Consolidated 6.8% 3.3%
Africa 11.7% 9.0%East, South Asia and Pacific Rim 8.0% 2.8%European Union 2.7% 9.5%Latin America 5.4% 5.0%North America 4.8% 3.2%North Asia, Eurasia and Middle East (0.6)% 1.2%Bottling Investments 28.6% *Corporate * *
* Calculation is not meaningful.
NOTE 21: SUBSEQUENT EVENTS
On January 8, 2007, our Company sold substantially all of our interest in Vonpar Refrescos S.A. (‘‘Vonpar’’),a bottler headquartered in Brazil. Total proceeds from the sale were approximately $238 million, and werecognized a gain on this sale of approximately $71 million. Prior to this sale, our Company ownedapproximately 49 percent of Vonpar’s outstanding common stock and accounted for the investment using theequity method.
On February 1, 2007, our Company entered into an agreement to purchase Fuze Beverage, LLC, maker ofFuze enhanced juices and teas in the U.S. The acquisition, which is subject to regulatory clearance and certainother terms and conditions, includes all Fuze Beverage, LLC brands, including the Vitalize, Refresh, Tea andSlenderize lines under the Fuze trademark, WaterPlus enhanced water products, and license rights to the NOSEnergy Drink brands. If regulatory clearance is obtained, the transfer of ownership is expected to occur withinthe first quarter of 2007.
124

23FEB20042218446024JAN200522210514
25FEB200412544370
REPORT OF MANAGEMENT ON INTERNAL CONTROL OVER FINANCIAL REPORTINGThe Coca-Cola Company and Subsidiaries
Management of the Company is responsible for the preparation and integrity of the consolidated financial statementsappearing in our annual report on Form 10-K. The financial statements were prepared in conformity with generallyaccepted accounting principles appropriate in the circumstances and, accordingly, include certain amounts based on ourbest judgments and estimates. Financial information in this annual report on Form 10-K is consistent with that in thefinancial statements.
Management of the Company is responsible for establishing and maintaining adequate internal control over financialreporting as such term is defined in Rule 13a-15(f) under the Securities Exchange Act of 1934 (‘‘Exchange Act’’). TheCompany’s internal control over financial reporting is designed to provide reasonable assurance regarding the reliability offinancial reporting and the preparation of the consolidated financial statements. Our internal control over financialreporting is supported by a program of internal audits and appropriate reviews by management, written policies andguidelines, careful selection and training of qualified personnel and a written Code of Business Conduct adopted by ourCompany’s Board of Directors, applicable to all Company Directors and all officers and employees of our Company andsubsidiaries.
Because of its inherent limitations, internal control over financial reporting may not prevent or detect misstatementsand even when determined to be effective, can only provide reasonable assurance with respect to financial statementpreparation and presentation. Also, projections of any evaluation of effectiveness to future periods are subject to the riskthat controls may become inadequate because of changes in conditions, or that the degree of compliance with the policiesor procedures may deteriorate.
The Audit Committee of our Company’s Board of Directors, composed solely of Directors who are independent inaccordance with the requirements of the New York Stock Exchange listing standards, the Exchange Act and the Company’sCorporate Governance Guidelines, meets with the independent auditors, management and internal auditors periodically todiscuss internal control over financial reporting and auditing and financial reporting matters. The Audit Committee reviewswith the independent auditors the scope and results of the audit effort. The Audit Committee also meets periodically withthe independent auditors and the chief internal auditor without management present to ensure that the independentauditors and the chief internal auditor have free access to the Audit Committee. Our Audit Committee’s Report can befound in the Company’s 2007 Proxy statement.
Management assessed the effectiveness of the Company’s internal control over financial reporting as of December 31,2006. In making this assessment, management used the criteria set forth by the Committee of Sponsoring Organizations ofthe Treadway Commission (COSO) in Internal Control—Integrated Framework. During 2006, the Company acquired KerryBeverages Limited (subsequently renamed Coca-Cola China Industries Limited), Apollinaris GmbH and TJC Holdings(Pty) Ltd. and began consolidating the operations of Brucephil, Inc. Refer to Note 19 of Notes to Consolidated FinancialStatements for additional information regarding these events. Management has excluded these businesses from itsevaluation of the effectiveness of the Company’s internal control over financial reporting as of December 31, 2006. The netoperating revenues attributable to these businesses represented approximately 1.6 percent of the Company’s consolidatednet operating revenues for the year ended December 31, 2006, and their aggregate total assets represented approximately6.1 percent of the Company’s consolidated total assets as of December 31, 2006. Based on our assessment, managementbelieves that the Company maintained effective internal control over financial reporting as of December 31, 2006.
The Company’s independent auditors, Ernst & Young LLP, a registered public accounting firm, are appointed by theAudit Committee of the Company’s Board of Directors, subject to ratification by our Company’s shareowners. Ernst &Young LLP have audited and reported on the consolidated financial statements of The Coca-Cola Company andsubsidiaries, management’s assessment of the effectiveness of the Company’s internal control over financial reporting andthe effectiveness of the Company’s internal control over financial reporting. The reports of the independent auditors arecontained in this annual report.
E. Neville Isdell Connie D. McDanielChairman, Board of Directors, Vice Presidentand Chief Executive Officer and ControllerFebruary 20, 2007 February 20, 2007
Gary P. FayardExecutive Vice Presidentand Chief Financial OfficerFebruary 20, 2007
125

Report of Independent Registered Public Accounting Firm
Board of Directors and ShareownersThe Coca-Cola Company
We have audited the accompanying consolidated balance sheets of The Coca-Cola Company andsubsidiaries as of December 31, 2006 and 2005, and the related consolidated statements of income, shareowners’equity, and cash flows for each of the three years in the period ended December 31, 2006. These financialstatements are the responsibility of the Company’s management. Our responsibility is to express an opinion onthese financial statements based on our audits.
We conducted our audits in accordance with the standards of the Public Company Accounting OversightBoard (United States). Those standards require that we plan and perform the audit to obtain reasonableassurance about whether the financial statements are free of material misstatement. An audit includesexamining, on a test basis, evidence supporting the amounts and disclosures in the financial statements. An auditalso includes assessing the accounting principles used and significant estimates made by management, as well asevaluating the overall financial statement presentation. We believe that our audits provide a reasonable basis forour opinion.
In our opinion, the financial statements referred to above present fairly, in all material respects, theconsolidated financial position of The Coca-Cola Company and subsidiaries at December 31, 2006 and 2005, andthe consolidated results of their operations and their cash flows for each of the three years in the period endedDecember 31, 2006, in conformity with U.S. generally accepted accounting principles.
As discussed in Note 1 to the consolidated financial statements, in 2006 the Company adopted SFASNo. 158 related to defined benefit pension and other postretirement plans.
We also have audited, in accordance with the standards of the Public Company Accounting Oversight Board(United States), the effectiveness of The Coca-Cola Company and subsidiaries’ internal control over financialreporting as of December 31, 2006, based on criteria established in Internal Control—Integrated Frameworkissued by the Committee of Sponsoring Organizations of the Treadway Commission and our report datedFebruary 20, 2007, expressed an unqualified opinion thereon.
Atlanta, GeorgiaFebruary 20, 2007
126

Report of Independent Registered Public Accounting Firmon Internal Control Over Financial Reporting
Board of Directors and ShareownersThe Coca-Cola Company
We have audited management’s assessment, included in the accompanying Report of Management on Internal ControlOver Financial Reporting, that The Coca-Cola Company and subsidiaries maintained effective internal control overfinancial reporting as of December 31, 2006, based on criteria established in Internal Control—Integrated Framework issuedby the Committee of Sponsoring Organizations of the Treadway Commission (the COSO criteria). The Coca-ColaCompany’s management is responsible for maintaining effective internal control over financial reporting and for itsassessment of the effectiveness of internal control over financial reporting. Our responsibility is to express an opinion onmanagement’s assessment and an opinion on the effectiveness of the Company’s internal control over financial reportingbased on our audit.
We conducted our audit in accordance with the standards of the Public Company Accounting Oversight Board (UnitedStates). Those standards require that we plan and perform the audit to obtain reasonable assurance about whether effectiveinternal control over financial reporting was maintained in all material respects. Our audit included obtaining anunderstanding of internal control over financial reporting, evaluating management’s assessment, testing and evaluating thedesign and operating effectiveness of internal control, and performing such other procedures as we considered necessary inthe circumstances. We believe that our audit provides a reasonable basis for our opinion.
A company’s internal control over financial reporting is a process designed to provide reasonable assurance regardingthe reliability of financial reporting and the preparation of financial statements for external purposes in accordance withgenerally accepted accounting principles. A company’s internal control over financial reporting includes those policies andprocedures that (1) pertain to the maintenance of records that, in reasonable detail, accurately and fairly reflect thetransactions and dispositions of the assets of the company; (2) provide reasonable assurance that transactions are recordedas necessary to permit preparation of financial statements in accordance with generally accepted accounting principles, andthat receipts and expenditures of the company are being made only in accordance with authorizations of management anddirectors of the company; and (3) provide reasonable assurance regarding prevention or timely detection of unauthorizedacquisition, use, or disposition of the company’s assets that could have a material effect on the financial statements.
Because of its inherent limitations, internal control over financial reporting may not prevent or detect misstatements.Also, projections of any evaluation of effectiveness to future periods are subject to the risk that controls may becomeinadequate because of changes in conditions, or that the degree of compliance with the policies or procedures maydeteriorate.
As indicated in the accompanying Report of Management on Internal Control Over Financial Reporting,management’s assessment of and conclusion on the effectiveness of internal control over financial reporting did not includethe internal controls of Kerry Beverages Limited (subsequently renamed Coca-Cola China Industries Limited),Brucephil, Inc., Apollinaris GmbH and TJC Holdings (Pty) Ltd. which are included in the 2006 consolidated financialstatements of The Coca-Cola Company and subsidiaries and constituted approximately 6.1 percent of the Company’sconsolidated total assets as of December 31, 2006 and approximately 1.6 percent of the Company’s consolidated netoperating revenues for the year then ended. Our audit of internal control over financial reporting of The Coca-ColaCompany also did not include an evaluation of the internal control over financial reporting of Kerry Beverages Limited(subsequently renamed Coca-Cola China Industries Limited), Brucephil, Inc., Apollinaris GmbH and TJC Holdings(Pty) Ltd.
In our opinion, management’s assessment that The Coca-Cola Company and subsidiaries maintained effective internalcontrol over financial reporting as of December 31, 2006, is fairly stated, in all material respects, based on the COSOcriteria. Also, in our opinion, The Coca-Cola Company and subsidiaries maintained, in all material respects, effectiveinternal control over financial reporting as of December 31, 2006, based on the COSO criteria.
We also have audited, in accordance with the standards of the Public Company Accounting Oversight Board (UnitedStates), the consolidated balance sheets of The Coca-Cola Company and subsidiaries as of December 31, 2006 and 2005,and the related consolidated statements of income, shareowners’ equity, and cash flows for each of the three years in theperiod ended December 31, 2006, and our report dated February 20, 2007, expressed an unqualified opinion thereon.
Atlanta, GeorgiaFebruary 20, 2007
127

Quarterly Data (Unaudited)First Second Third Fourth
Year Ended December 31, Quarter Quarter Quarter Quarter Full Year
(In millions, except per share data)
2006Net operating revenues $ 5,226 $ 6,476 $ 6,454 $ 5,932 $ 24,088Gross profit 3,500 4,366 4,189 3,869 15,924Net income 1,106 1,836 1,460 678 5,080
Basic net income per share $ 0.47 $ 0.78 $ 0.62 $ 0.29 $ 2.16
Diluted net income per share $ 0.47 $ 0.78 $ 0.62 $ 0.29 $ 2.16
2005Net operating revenues $ 5,206 $ 6,310 $ 6,037 $ 5,551 $ 23,104Gross profit 3,388 4,164 3,802 3,555 14,909Net income 1,002 1,723 1,283 864 4,872
Basic net income per share $ 0.42 $ 0.72 $ 0.54 $ 0.36 $ 2.04
Diluted net income per share $ 0.42 $ 0.72 $ 0.54 $ 0.36 $ 2.04
Our reporting period ends on the Friday closest to the last day of the quarterly calendar period. Our fiscalyear ends on December 31 regardless of the day of the week on which December 31 falls.
The Company’s first quarter of 2006 results were impacted by one less shipping day as compared to the firstquarter of 2005. Additionally, the Company recorded the following transactions which impacted results:
• Impairment charges totaling approximately $42 million primarily related to the impairment of certain assets andinvestments in certain bottling operations in Asia. Refer to Note 18.
• Approximately $3 million of charges primarily related to restructuring in East, South Asia and Pacific Rim. Refer toNote 18.
• An approximate $9 million charge to equity income for our proportionate share of CCE’s restructuring costs. Referto Note 3.
• An income tax benefit of approximately $7 million primarily related to asset impairment and restructuring charges inAsia. Refer to Note 17.
• Approximately $10 million of income tax expense primarily related to increases in tax reserves. Refer to Note 17.
In the second quarter of 2006, the Company recorded the following transactions which impacted results:
• An approximate $123 million net gain related to the sale of a portion of our investment in Coca-Cola Icecek in aninitial public offering. This gain was recorded in the line item other income (loss) — net. Refer to Note 18.
• Charges totaling approximately $31 million primarily related to costs associated with production capacity efficienciesand other restructuring costs in Asia and the European Union. Refer to Note 18.
• An approximate $21 million benefit to equity income for our proportionate share of favorable changes in certain ofCCE’s state and Canadian federal and provincial tax rates. Refer to Note 3.
• Approximately $22 million of income tax expense related to the anticipated future resolution of certain tax matters.Refer to Note 17.
• An income tax benefit of approximately $14 million related to the sale of a portion of our investment in Coca-ColaIcecek. Refer to Note 17.
In the third quarter of 2006, the Company recorded the following transactions which impacted results:
• Approximately $39 million of charges primarily related to the impairment of certain intangible assets andinvestments in certain bottling operations, costs to rationalize production and other restructuring costs in Africa, theEuropean Union and Asia. Refer to Note 18.
128

• An approximate $3 million charge to equity income — net for our proportionate share of items impacting investees.Refer to Note 3.
• An income tax benefit of approximately $41 million related to the reversal of a tax valuation allowance due to thesale of a portion of our equity method investment in Coca-Cola FEMSA, partially offset by a charge for theanticipated future resolution of certain tax matters and a change in the tax rate applicable to a portion of thetemporary difference between the book and tax basis of our investment in Coca-Cola FEMSA. Refer to Note 3.
• An income tax benefit of approximately $12 million associated with impairment charges, costs to rationalizeproduction and other restructuring costs. Refer to Note 17.
The Company’s fourth quarter of 2006 results were impacted by one additional shipping day as compared tothe fourth quarter of 2005. Additionally, the Company recorded the following transactions which impactedresults:
• An approximate $615 million charge to equity income related to the Company’s proportionate share of CCE’simpairment charges and restructuring charges recorded by other equity method investees, partially offset by changesin certain of CCE’s state and Canadian federal and provincial tax rates. Refer to Note 3.
• Approximately $74 million of charges primarily related to restructuring and asset impairments in East, South Asiaand Pacific Rim and certain bottling operations and asset impairments in North Asia, Eurasia and Middle East.Refer to Note 18.
• A $100 million donation made to The Coca-Cola Foundation.
• An approximate $175 million net gain related to the sale of Coca-Cola FEMSA shares. This gain was recorded in theline item other income (loss) — net. Refer to Note 18.
• An income tax benefit of approximately $10 million associated with restructuring costs and impairment charges.Refer to Note 17.
• An income tax benefit of approximately $38 million associated with a donation made to The Coca-Cola Foundation.
• An income tax benefit of approximately $37 million related to the reversal of previously accrued taxes resulting fromthe anticipated future resolution of certain tax matters. Refer to Note 17.
• An income tax benefit of approximately $57 million associated with items impacting investees. Refer to Note 17.
• Approximately $76 million of income tax expense associated with the gain on the sale of Coca-Cola FEMSA shares.Refer to Note 17.
In the first quarter of 2005, the Company recorded the following transactions which impacted results:
• A provision for taxes on unremitted foreign earnings of approximately $152 million. Refer to Note 17.
• Approximately $23 million of noncash pretax gains on issuances of stock by Coca-Cola Amatil in connection with theacquisition of SPC Ardmona Pty. Ltd., an Australian fruit company. Refer to Note 4.
• An income tax benefit of approximately $56 million related to the reversal of previously accrued taxes resulting fromfavorable resolution of tax matters. Refer to Note 17.
• Approximately $50 million of accelerated amortization of stock-based compensation expense related to a change inour estimated service period for retirement-eligible participants. Refer to Note 15.
In the second quarter of 2005, the Company recorded the following transactions which impacted results:
• The receipt of approximately $42 million related to the settlement of a class action lawsuit concerning the purchaseof HFCS. Refer to Note 18.
• An approximate $21 million benefit to equity income for our proportionate share of CCE’s HFCS lawsuitsettlement. Refer to Note 3.
• An income tax benefit of approximately $17 million related to the reversal of previously accrued taxes resulting fromfavorable resolution of tax matters. Refer to Note 17.
129

• An income tax benefit of approximately $25 million as a result of additional guidance issued by the United StatesInternal Revenue Service and the United States Department of the Treasury related to the Jobs Creation Act. Referto Note 17.
In the third quarter of 2005, the Company recorded the following transactions which impacted results:
• Approximately $89 million of impairment charges primarily related to intangible assets (mainly trademark beveragessold in the Philippines market). Approximately $85 million and $4 million of these impairment charges are recordedin the line items other operating charges and equity income — net, respectively. Refer to Note 18.
• Approximately $5 million of a noncash pretax charge to equity income — net due to our proportionate share ofCCE’s restructuring charges. Refer to Note 3.
• An income tax benefit of approximately $18 million related to the reversal of previously accrued taxes resulting fromfavorable resolution of tax matters. Refer to Note 17.
• An income tax benefit of approximately $4 million primarily related to the Philippines impairment charges. Refer toNote 17.
In the fourth quarter of 2005, the Company recorded the following transactions which impacted results:
• The receipt of approximately $5 million related to the settlement of a class action lawsuit concerning the purchase ofHFCS. Refer to Note 18.
• An approximate $49 million reduction to equity income due to our proportionate share of CCE’s tax expense relatedto repatriation of previously unremitted foreign earnings under the Jobs Creation Act and restructuring chargesrecorded by CCE, partially offset by changes in certain of CCE’s state and provincial tax rates and additionalproceeds from CCE’s HFCS lawsuit settlement. Refer to Note 3.
• An income tax benefit of approximately $10 million related to the reversal of previously accrued taxes resulting fromfavorable resolution of tax matters. Refer to Note 17.
• A provision for taxes on unremitted foreign earnings of approximately $188 million. Refer to Note 17.
130

ITEM 8. FINANCIAL STATEMENTS AND SUPPLEMENTARY DATA
TABLE OF CONTENTS
Page
Consolidated Statements of Income . . . . . . . . . . . . . . . . . . . . . . . . . . . . . . . . . . . . . . . . . . . . . . . . . . . . 61
Consolidated Balance Sheets . . . . . . . . . . . . . . . . . . . . . . . . . . . . . . . . . . . . . . . . . . . . . . . . . . . . . . . . . . 62
Consolidated Statements of Cash Flows . . . . . . . . . . . . . . . . . . . . . . . . . . . . . . . . . . . . . . . . . . . . . . . . . 64
Consolidated Statements of Shareowners’ Equity . . . . . . . . . . . . . . . . . . . . . . . . . . . . . . . . . . . . . . . . . . 65
Notes to Consolidated Financial Statements . . . . . . . . . . . . . . . . . . . . . . . . . . . . . . . . . . . . . . . . . . . . . . 66
Report of Management on Internal Control Over Financial Reporting . . . . . . . . . . . . . . . . . . . . . . . . . . 115
Report of Independent Registered Public Accounting Firm . . . . . . . . . . . . . . . . . . . . . . . . . . . . . . . . . . 116
Report of Independent Registered Public Accounting Firm on Internal Control OverFinancial Reporting . . . . . . . . . . . . . . . . . . . . . . . . . . . . . . . . . . . . . . . . . . . . . . . . . . . . . . . . . . . . . . . 117
Quarterly Data (Unaudited) . . . . . . . . . . . . . . . . . . . . . . . . . . . . . . . . . . . . . . . . . . . . . . . . . . . . . . . . . . 118
Glossary . . . . . . . . . . . . . . . . . . . . . . . . . . . . . . . . . . . . . . . . . . . . . . . . . . . . . . . . . . . . . . . . . . . . . . . . . 119
60

CONSOLIDATED STATEMENTS OF INCOME
The Coca-Cola Company and Subsidiaries
Year Ended December 31, 2004 2003 2002
(In millions except per share data)
NET OPERATING REVENUES $ 21,962 $ 21,044 $ 19,564Cost of goods sold 7,638 7,762 7,105
GROSS PROFIT 14,324 13,282 12,459Selling, general and administrative expenses 8,146 7,488 7,001Other operating charges 480 573 —
OPERATING INCOME 5,698 5,221 5,458Interest income 157 176 209Interest expense 196 178 199Equity income — net 621 406 384Other income (loss) — net (82) (138) (353)Gains on issuances of stock by equity investees 24 8 —
INCOME BEFORE INCOME TAXES AND CUMULATIVE EFFECT OFACCOUNTING CHANGE 6,222 5,495 5,499
Income taxes 1,375 1,148 1,523
NET INCOME BEFORE CUMULATIVE EFFECT OF ACCOUNTINGCHANGE 4,847 4,347 3,976
Cumulative effect of accounting change for SFAS No. 142, net of income taxes:Company operations — — (367)Equity investees — — (559)
NET INCOME $ 4,847 $ 4,347 $ 3,050
BASIC NET INCOME PER SHARE:Before accounting change $ 2.00 $ 1.77 $ 1.60Cumulative effect of accounting change — — (0.37)
$ 2.00 $ 1.77 $ 1.23
DILUTED NET INCOME PER SHARE:Before accounting change $ 2.00 $ 1.77 $ 1.60Cumulative effect of accounting change — — (0.37)
$ 2.00 $ 1.77 $ 1.23
AVERAGE SHARES OUTSTANDING 2,426 2,459 2,478Effect of dilutive securities 3 3 5
AVERAGE SHARES OUTSTANDING ASSUMING DILUTION 2,429 2,462 2,483
Refer to Notes to Consolidated Financial Statements.
61

CONSOLIDATED BALANCE SHEETS
The Coca-Cola Company and SubsidiariesDecember 31, 2004 2003
(In millions)
ASSETS
CURRENTCash and cash equivalents $ 6,707 $ 3,362Marketable securities 61 120
6,768 3,482Trade accounts receivable, less allowances of $69 in 2004 and $61 in 2003 2,171 2,091Inventories 1,420 1,252Prepaid expenses and other assets 1,735 1,571
TOTAL CURRENT ASSETS 12,094 8,396
INVESTMENTS AND OTHER ASSETSEquity method investments:
Coca-Cola Enterprises Inc. 1,569 1,260Coca-Cola Hellenic Bottling Company S.A. 1,067 941Coca-Cola FEMSA, S.A. de C.V. 792 674Coca-Cola Amatil Limited 736 652Other, principally bottling companies 1,733 1,697
Cost method investments, principally bottling companies 355 314Other assets 3,054 3,322
9,306 8,860
PROPERTY, PLANT AND EQUIPMENTLand 479 419Buildings and improvements 2,853 2,615Machinery and equipment 6,337 6,159Containers 480 429
10,149 9,622Less allowances for depreciation 4,058 3,525
6,091 6,097
TRADEMARKS WITH INDEFINITE LIVES 2,037 1,979
GOODWILL 1,097 1,029
OTHER INTANGIBLE ASSETS 702 981
TOTAL ASSETS $ 31,327 $ 27,342
Refer to Notes to Consolidated Financial Statements.
62

The Coca-Cola Company and SubsidiariesDecember 31, 2004 2003
(In millions except share data)
LIABILITIES AND SHAREOWNERS’ EQUITY
CURRENTAccounts payable and accrued expenses $ 4,283 $ 4,058Loans and notes payable 4,531 2,583Current maturities of long-term debt 1,490 323Accrued income taxes 667 922
TOTAL CURRENT LIABILITIES 10,971 7,886
LONG-TERM DEBT 1,157 2,517
OTHER LIABILITIES 2,814 2,512
DEFERRED INCOME TAXES 450 337
SHAREOWNERS’ EQUITYCommon stock, $0.25 par value
Authorized: 5,600,000,000 shares;issued: 3,500,489,544 shares in 2004 and 3,494,799,258 shares in 2003 875 874
Capital surplus 4,928 4,395Reinvested earnings 29,105 26,687Accumulated other comprehensive income (loss) (1,348) (1,995)
33,560 29,961
Less treasury stock, at cost (1,091,150,977 shares in 2004; 1,053,267,474 shares in 2003) (17,625) (15,871)
15,935 14,090
TOTAL LIABILITIES AND SHAREOWNERS’ EQUITY $ 31,327 $ 27,342
Refer to Notes to Consolidated Financial Statements.
63

CONSOLIDATED STATEMENTS OF CASH FLOWS
The Coca-Cola Company and Subsidiaries
Year Ended December 31, 2004 2003 2002
(In millions)
OPERATING ACTIVITIES
Net income $ 4,847 $ 4,347 $ 3,050Depreciation and amortization 893 850 806Stock-based compensation expense 345 422 365Deferred income taxes 162 (188) 40Equity income (loss), net of dividends (476) (294) (256)Foreign currency adjustments (59) (79) (76)Gains on issuances of stock by equity investees (24) (8) —(Gains) losses on sales of assets, including bottling interests (20) (5) 3Cumulative effect of accounting changes — — 926Other operating charges 480 330 —Other items 437 249 291Net change in operating assets and liabilities (617) (168) (407)
Net cash provided by operating activities 5,968 5,456 4,742
INVESTING ACTIVITIES
Acquisitions and investments, principally trademarks and bottling companies (267) (359) (544)Purchases of investments and other assets (46) (177) (141)Proceeds from disposals of investments and other assets 161 147 243Purchases of property, plant and equipment (755) (812) (851)Proceeds from disposals of property, plant and equipment 341 87 69Other investing activities 63 178 159
Net cash used in investing activities (503) (936) (1,065)
FINANCING ACTIVITIES
Issuances of debt 3,030 1,026 1,622Payments of debt (1,316) (1,119) (2,378)Issuances of stock 193 98 107Purchases of stock for treasury (1,739) (1,440) (691)Dividends (2,429) (2,166) (1,987)
Net cash used in financing activities (2,261) (3,601) (3,327)
EFFECT OF EXCHANGE RATE CHANGES ON CASH AND CASHEQUIVALENTS 141 183 44
CASH AND CASH EQUIVALENTS
Net increase during the year 3,345 1,102 394Balance at beginning of year 3,362 2,260 1,866
Balance at end of year $ 6,707 $ 3,362 $ 2,260
Refer to Notes to Consolidated Financial Statements.
64

CONSOLIDATED STATEMENTS OF SHAREOWNERS’ EQUITY
The Coca-Cola Company and SubsidiariesYear Ended December 31, 2004 2003 2002
(In millions except per share data)
NUMBER OF COMMON SHARES OUTSTANDINGBalance at beginning of year 2,442 2,471 2,486
Stock issued to employees exercising stock options 5 4 3Purchases of stock for treasury1 (38) (33) (14)Adoption of SFAS No. 123 — — (4)
Balance at end of year 2,409 2,442 2,471
COMMON STOCKBalance at beginning of year $ 874 $ 873 $ 873
Stock issued to employees exercising stock options 1 1 1Adoption of SFAS No. 123 — — (1)
Balance at end of year 875 874 873CAPITAL SURPLUSBalance at beginning of year 4,395 3,857 3,520
Stock issued to employees exercising stock options 175 105 111Tax benefit from employees’ stock option and restricted stock plans 13 11 11Stock-based compensation 345 422 365Adoption of SFAS No. 123 — — (150)
Balance at end of year 4,928 4,395 3,857REINVESTED EARNINGSBalance at beginning of year 26,687 24,506 23,443
Net income 4,847 4,347 3,050Dividends (per share—$1.00, $0.88 and $0.80 in 2004, 2003 and 2002, respectively) (2,429) (2,166) (1,987)
Balance at end of year 29,105 26,687 24,506OUTSTANDING RESTRICTED STOCKBalance at beginning of year — — (150)
Adoption of SFAS No. 123 — — 150Balance at end of year — — —ACCUMULATED OTHER COMPREHENSIVE INCOME (LOSS)Balance at beginning of year (1,995) (3,047) (2,638)
Net foreign currency translation adjustment 665 921 (95)Net loss on derivatives (3) (33) (186)Net change in unrealized gain on available-for-sale securities 39 40 67Net change in minimum pension liability (54) 124 (195)
Net other comprehensive income adjustments 647 1,052 (409)Balance at end of year (1,348) (1,995) (3,047)TREASURY STOCKBalance at beginning of year (15,871) (14,389) (13,682)
Purchases of treasury stock (1,754) (1,482) (707)Balance at end of year (17,625) (15,871) (14,389)TOTAL SHAREOWNERS’ EQUITY $ 15,935 $ 14,090 $ 11,800
COMPREHENSIVE INCOMENet income $ 4,847 $ 4,347 $ 3,050Net other comprehensive income adjustments 647 1,052 (409)
TOTAL COMPREHENSIVE INCOME $ 5,494 $ 5,399 $ 2,641
1 Common stock purchased from employees exercising stock options numbered 0.4 million, 0.4 million and 0.2 million shares for theyears ended December 31, 2004, 2003 and 2002, respectively.
Refer to Notes to Consolidated Financial Statements.
65

NOTES TO CONSOLIDATED FINANCIAL STATEMENTS
The Coca-Cola Company and Subsidiaries
NOTE 1: ORGANIZATION AND SUMMARY OF SIGNIFICANT ACCOUNTING POLICIES
Organization
The Coca-Cola Company is predominantly a manufacturer, distributor and marketer of nonalcoholicbeverage concentrates and syrups. In these notes, the terms ‘‘Company,’’ ‘‘we,’’ ‘‘us’’ or ‘‘our’’ meanThe Coca-Cola Company and all subsidiaries included in the consolidated financial statements. Operating in morethan 200 countries worldwide, we primarily sell our concentrates and syrups, as well as some finished beverages, tobottling and canning operations, distributors, fountain wholesalers and fountain retailers. We also market anddistribute juices and juice drinks, sports drinks, water products, teas, coffees and other beverage products.Additionally, we have ownership interests in numerous bottling and canning operations. Significant markets forour products exist in all the world’s geographic regions.
Basis of Presentation and Consolidation
Our consolidated financial statements are prepared in accordance with accounting principles generallyaccepted in the United States. Our Company consolidates all entities that we control by ownership of a majorityvoting interest as well as variable interest entities for which our Company is the primary beneficiary. Refer to theheading ‘‘Variable Interest Entities’’ for a discussion of variable interest entities.
We use the equity method to account for our investments for which we have the ability to exercise significantinfluence over operating and financial policies. Consolidated net income includes our Company’s share of the netearnings of these companies. The difference between consolidation and the equity method impacts certainfinancial ratios because of the presentation of the detailed line items reported in the financial statements.
We use the cost method to account for our investments in companies that we do not control and for whichwe do not have the ability to exercise significant influence over operating and financial policies. In accordancewith the cost method, these investments are recorded at cost or fair value, as appropriate.
We eliminate from our financial results all significant intercompany transactions, including theintercompany transactions with variable interest entities and the intercompany portion of transactions withequity method investees.
Certain amounts in the prior years’ consolidated financial statements have been reclassified to conform tothe current-year presentation.
Variable Interest Entities
In December 2003, the Financial Accounting Standards Board (‘‘FASB’’) issued FASB InterpretationNo. 46 (revised December 2003), ‘‘Consolidation of Variable Interest Entities’’ (‘‘Interpretation 46’’ or‘‘FIN 46’’). Application of this interpretation was required in our consolidated financial statements for the yearended December 31, 2003 for interests in variable interest entities that were considered to be special-purposeentities. Our Company determined that we did not have any arrangements or relationships with special-purposeentities. Application of Interpretation 46 for all other types of variable interest entities was required for ourCompany effective March 31, 2004.
Interpretation 46 addresses the consolidation of business enterprises to which the usual condition(ownership of a majority voting interest) of consolidation does not apply. This interpretation focuses oncontrolling financial interests that may be achieved through arrangements that do not involve voting interests. Itconcludes that in the absence of clear control through voting interests, a company’s exposure (variable interest)
66

NOTES TO CONSOLIDATED FINANCIAL STATEMENTS
The Coca-Cola Company and Subsidiaries
NOTE 1: ORGANIZATION AND SUMMARY OF SIGNIFICANT ACCOUNTING POLICIES (Continued)
to the economic risks and potential rewards from the variable interest entity’s assets and activities are the bestevidence of control. If an enterprise holds a majority of the variable interests of an entity, it would be consideredthe primary beneficiary. Upon consolidation, the primary beneficiary is generally required to include assets,liabilities and noncontrolling interests at fair value and subsequently account for the variable interest as if it wereconsolidated based on majority voting interest.
In our financial statements as of December 31, 2003 and prior to December 31, 2003, we consolidated allentities that we controlled by ownership of a majority of voting interests. As a result of Interpretation 46,effective as of March 31, 2004, our consolidated balance sheet includes the assets and liabilities of:
• all entities in which the Company has ownership of a majority of voting interests; and additionally,
• all variable interest entities for which we are the primary beneficiary.
Our Company holds interests in certain entities, primarily bottlers, previously accounted for under theequity method of accounting that are considered variable interest entities. These variable interests relate toprofit guarantees or subordinated financial support for these entities. Upon adoption of Interpretation 46 as ofMarch 31, 2004, we consolidated assets of approximately $383 million and liabilities of approximately$383 million that were previously not recorded on our consolidated balance sheet. We did not record acumulative effect of an accounting change, and prior periods were not restated. The results of operations ofthese variable interest entities were included in our consolidated results beginning April 1, 2004 and did not havea material impact for the year ended December 31, 2004. Our Company’s investment, plus any loans andguarantees, related to these variable interest entities totaled approximately $313 million at December 31, 2004,representing our maximum exposure to loss. Any creditors of the variable interest entities do not have recourseagainst the general credit of the Company as a result of including these variable interest entities in ourconsolidated financial statements.
Use of Estimates and Assumptions
The preparation of our consolidated financial statements requires us to make estimates and assumptionsthat affect the reported amounts of assets, liabilities, revenues and expenses and the disclosure of contingentassets and liabilities in our consolidated financial statements and accompanying notes. Although these estimatesare based on our knowledge of current events and actions we may undertake in the future, actual results mayultimately differ from estimates and assumptions.
Risks and Uncertainties
The Company’s operations could be adversely affected by restrictions on imports and exports and sources ofsupply; prolonged labor strikes (including any at key manufacturing operations); adverse weather conditions;advertising effectiveness; changes in labeling requirements; duties or tariffs; changes in governmentalregulations; the introduction of additional measures to control inflation; changes in the rate or method oftaxation; the imposition of additional restrictions on currency conversion and remittances abroad; theexpropriation of private enterprise; or product issues such as a product recall. In addition, policy concernsparticular to the United States with respect to a country in which the Company has operations could adverselyaffect our operations. The foregoing list of risks and uncertainties is not exclusive.
Our Company monitors our operations with a view to minimizing the impact to our overall business thatcould arise as a result of the risks inherent in our business.
67

NOTES TO CONSOLIDATED FINANCIAL STATEMENTS
The Coca-Cola Company and Subsidiaries
NOTE 1: ORGANIZATION AND SUMMARY OF SIGNIFICANT ACCOUNTING POLICIES (Continued)
Revenue Recognition
Our Company recognizes revenue when title to our products is transferred to our bottling partners orour customers.
Advertising Costs
Our Company expenses production costs of print, radio, television and other advertisements as of the firstdate the advertisements take place. Advertising costs included in selling, general and administrative expenseswere approximately $2.2 billion in 2004, approximately $1.8 billion in 2003 and approximately $1.7 billion in2002. As of December 31, 2004 and 2003, advertising and production costs of approximately $194 million and$190 million, respectively, were recorded in prepaid expenses and other assets and in noncurrent other assets inour consolidated balance sheets.
Stock-Based Compensation
Our Company currently sponsors stock option plans and restricted stock award plans. Refer to Note 13.Effective January 1, 2002, our Company adopted the preferable fair value recognition provisions of Statement ofFinancial Accounting Standards (‘‘SFAS’’) No. 123, ‘‘Accounting for Stock-Based Compensation.’’ Our Companyselected the modified prospective method of adoption described in SFAS No. 148, ‘‘Accounting for Stock-BasedCompensation—Transition and Disclosure.’’ The fair values of the stock awards are determined using a singleestimated expected life. The compensation expense is recognized on a straight-line basis over the vesting period.The total stock-based compensation expense, net of related tax effects, was $254 million in 2004, $308 million in2003 and $267 million in 2002. These amounts represent the same as that which would have been recognized hadthe fair value method of SFAS No. 123 been applied from its original effective date.
Issuances of Stock by Equity Investees
When one of our equity investees issues additional shares to third parties, our percentage ownership interestin the investee decreases. In the event the issuance price per share is more or less than our average carryingamount per share, we recognize a noncash gain or loss on the issuance. This noncash gain or loss, net of anydeferred taxes, is generally recognized in our net income in the period the change of ownership interest occurs.
If gains have been previously recognized on issuances of an equity investee’s stock and shares of the equityinvestee are subsequently repurchased by the equity investee, gain recognition does not occur on issuancessubsequent to the date of a repurchase until shares have been issued in an amount equivalent to the number ofrepurchased shares. This type of transaction is reflected as an equity transaction, and the net effect is reflected inour consolidated balance sheets. Refer to Note 3.
Net Income Per Share
We compute basic net income per share by dividing net income by the weighted-average number of sharesoutstanding. Diluted net income per share includes the dilutive effect of stock-based compensation awards, if any.
Cash Equivalents
We classify marketable securities that are highly liquid and have maturities of three months or less at thedate of purchase as cash equivalents.
68

NOTES TO CONSOLIDATED FINANCIAL STATEMENTS
The Coca-Cola Company and Subsidiaries
NOTE 1: ORGANIZATION AND SUMMARY OF SIGNIFICANT ACCOUNTING POLICIES (Continued)
Trade Accounts Receivable
We record trade accounts receivable at net realizable value. This value includes an appropriate allowancefor estimated uncollectible accounts to reflect any loss anticipated on the trade accounts receivable balances andcharged to the provision for doubtful accounts. We calculate this allowance based on our history of write-offs,level of past due accounts based on the contractual terms of the receivables and our relationships with andeconomic status of our bottling partners and customers.
Inventories
Inventories consist primarily of raw materials, supplies, concentrates and syrups and are valued at the lowerof cost or market. We determine cost on the basis of average cost or first-in, first-out methods.
Recoverability of Equity Method and Cost Method Investments
Management periodically assesses the recoverability of our Company’s equity method and cost methodinvestments. For publicly traded investments, readily available quoted market prices are an indication of the fairvalue of our Company’s investments. For nonpublicly traded investments, if an identified event or change incircumstances requires an impairment evaluation, management assesses fair value based on valuationmethodologies as appropriate, including discounted cash flows, estimates of sales proceeds and externalappraisals, as appropriate. If an investment is considered to be impaired and the decline in value is other thantemporary, we record an appropriate write-down.
Other Assets
Our Company advances payments to certain customers for marketing to fund future activities intended togenerate profitable volume, and we expense such payments over the applicable period. Advance payments arealso made to certain customers for distribution rights. Additionally, our Company invests in infrastructureprograms with our bottlers that are directed at strengthening our bottling system and increasing unit casevolume. Management periodically evaluates the recoverability of these assets by preparing estimates of salesvolume, the resulting gross profit, cash flows and considering other factors. Costs of these programs arerecorded in prepaid expenses and other assets and noncurrent other assets and are subsequently amortized overthe periods to be directly benefited. Amortization expense for infrastructure programs was approximately$136 million, $156 million and $176 million, respectively, for the years ended December 31, 2004, 2003 and 2002.Refer to Note 2.
Property, Plant and Equipment
We state property, plant and equipment at cost and depreciate such assets principally by the straight-linemethod over the estimated useful lives of the assets. Management assesses the recoverability of the carryingamount of property, plant and equipment if certain events or changes occur, such as a significant decrease inmarket value of the assets or a significant change in the business conditions in a particular market.
Goodwill, Trademarks and Other Intangible Assets
Effective January 1, 2002, our Company adopted SFAS No. 142, ‘‘Goodwill and Other Intangible Assets.’’The adoption of SFAS No. 142 required an initial impairment assessment involving a comparison of the fairvalue of goodwill, trademarks and other intangible assets to current carrying value. Upon adoption, we recorded
69

NOTES TO CONSOLIDATED FINANCIAL STATEMENTS
The Coca-Cola Company and Subsidiaries
NOTE 1: ORGANIZATION AND SUMMARY OF SIGNIFICANT ACCOUNTING POLICIES (Continued)
a loss for the cumulative effect of accounting change for SFAS No. 142, net of income taxes, of $367 million forCompany operations and $559 million for the Company’s proportionate share of impairment losses from itsequity method investees. We did not restate prior periods for the adoption of SFAS No. 142.
Trademarks and other intangible assets determined to have indefinite useful lives are not amortized. Wetest such trademarks and other intangible assets with indefinite useful lives for impairment annually, or morefrequently if events or circumstances indicate that an asset might be impaired. Trademarks and other intangibleassets determined to have definite lives are amortized over their useful lives. We review such trademarks andother intangible assets with definite lives for impairment to ensure they are appropriately valued if conditionsexist that may indicate the carrying value may not be recoverable. Such conditions may include an economicdownturn in a geographic market or a change in the assessment of future operations.
All goodwill is assigned to reporting units, which are one level below our operating segments. Goodwill isassigned to the reporting unit that benefits from the synergies arising from each business combination. Goodwillis not amortized. We perform tests for impairment of goodwill annually, or more frequently if events orcircumstances indicate it might be impaired. Such tests include comparing the fair value of a reporting unit withits carrying value, including goodwill. Impairment assessments are performed using a variety of methodologies,including cash flow analyses, estimates of sales proceeds and independent appraisals. Where applicable, anappropriate discount rate is used, based on the Company’s cost of capital rate or location-specific economicfactors. Refer to Note 4.
Derivative Financial Instruments
Our Company accounts for derivative financial instruments in accordance with SFAS No. 133, ‘‘Accountingfor Derivative Instruments and Hedging Activities,’’ as amended by SFAS No. 137, SFAS No. 138, and SFAS No.149. Our Company recognizes all derivative instruments as either assets or liabilities at fair value in ourconsolidated balance sheets. Refer to Note 10.
Retirement Related Benefits
Using appropriate actuarial methods and assumptions, our Company accounts for defined benefit pensionplans in accordance with SFAS No. 87, ‘‘Employers’ Accounting for Pensions.’’ We account for our nonpensionpostretirement benefits in accordance with SFAS No. 106, ‘‘Employers’ Accounting for Postretirement BenefitsOther Than Pensions.’’ In 2003, we adopted SFAS No. 132 (revised 2003), ‘‘Employers’ Disclosures aboutPensions and Other Postretirement Benefits,’’ (‘‘SFAS 132(R)’’) for all U.S. plans. As permitted by this standard,in 2004 we adopted the disclosure provisions for all foreign plans for the year ended December 31, 2004. SFASNo. 132(R) requires additional disclosures about the assets, obligations, cash flows and net periodic benefit costof defined benefit pension plans and other defined benefit postretirement plans. This statement did not changethe measurement or recognition of those plans required by SFAS No. 87, SFAS No. 88, ‘‘Employers’ Accountingfor Settlements and Curtailments of Defined Benefit Pension Plans and for Termination Benefits,’’ or SFASNo. 106. Refer to Note 14 for a description of how we determine our principal assumptions for pension andpostretirement benefit accounting.
Contingencies
Our Company is involved in various legal proceedings and tax matters. Due to their nature, such legalproceedings and tax matters involve inherent uncertainties including, but not limited to, court rulings,
70

NOTES TO CONSOLIDATED FINANCIAL STATEMENTS
The Coca-Cola Company and Subsidiaries
NOTE 1: ORGANIZATION AND SUMMARY OF SIGNIFICANT ACCOUNTING POLICIES (Continued)
negotiations between affected parties and governmental actions. Management assesses the probability of loss forsuch contingencies and accrues a liability and/or discloses the relevant circumstances, as appropriate. Refer toNote 11.
Business Combinations
In accordance with SFAS No. 141, ‘‘Business Combinations,’’ we account for all business combinations bythe purchase method. Furthermore, we recognize intangible assets apart from goodwill if they arise fromcontractual or legal rights or if they are separable from goodwill.
New Accounting Standards
Effective January 1, 2003, the Company adopted SFAS No. 146, ‘‘Accounting for Costs Associated with Exitor Disposal Activities.’’ SFAS No. 146 addresses financial accounting and reporting for costs associated with exitor disposal activities and nullifies Emerging Issues Task Force (‘‘EITF’’) Issue No. 94-3, ‘‘Liability Recognitionfor Certain Employee Termination Benefits and Other Costs to Exit an Activity (including Certain CostsIncurred in a Restructuring).’’ SFAS No. 146 requires that a liability for a cost associated with an exit or disposalplan be recognized when the liability is incurred. Under SFAS No. 146, an exit or disposal plan exists when thefollowing criteria are met:
• Management, having the authority to approve the action, commits to a plan of termination.
• The plan identifies the number of employees to be terminated, their job classifications or functions andtheir locations, and the expected completion date.
• The plan establishes the terms of the benefit arrangement, including the benefits that employees will receiveupon termination (including but not limited to cash payments), in sufficient detail to enable employees todetermine the type and amount of benefits they will receive if they are involuntarily terminated.
• Actions required to complete the plan indicate that it is unlikely that significant changes to the plan willbe made or that the plan will be withdrawn.
SFAS No. 146 establishes that fair value is the objective for initial measurement of the liability. In caseswhere employees are required to render service beyond a minimum retention period until they are terminated inorder to receive termination benefits, a liability for termination benefits is recognized ratably over the futureservice period. Under EITF Issue No. 94-3, a liability for the entire amount of the exit cost was recognized at thedate that the entity met the four criteria described above. Refer to Note 17.
Effective January 1, 2003, our Company adopted the recognition and measurement provisions of FASBInterpretation No. 45, ‘‘Guarantor’s Accounting and Disclosure Requirements for Guarantees, Including IndirectGuarantees of Indebtedness of Others’’ (‘‘Interpretation 45’’). This interpretation elaborates on the disclosures tobe made by a guarantor in interim and annual financial statements about the obligations under certain guarantees.Interpretation 45 also clarifies that a guarantor is required to recognize, at the inception of a guarantee, a liabilityfor the fair value of the obligation undertaken in issuing the guarantee. The initial recognition and initialmeasurement provisions of this interpretation are applicable on a prospective basis to guarantees issued ormodified after December 31, 2002. We do not currently provide significant guarantees on a routine basis. As aresult, this interpretation has not had a material impact on our consolidated financial statements.
71

NOTES TO CONSOLIDATED FINANCIAL STATEMENTS
The Coca-Cola Company and Subsidiaries
NOTE 1: ORGANIZATION AND SUMMARY OF SIGNIFICANT ACCOUNTING POLICIES (Continued)
During 2004, the FASB issued FASB Staff Position 106-2, ‘‘Accounting and Disclosure RequirementsRelated to the Medicare Prescription Drug, Improvement and Modernization Act of 2003’’ (‘‘FSP 106-2’’). FSP106-2 relates to the Medicare Prescription Drug, Improvement and Modernization Act of 2003 (the ‘‘Act’’)signed into law in December 2003. The Act introduced a prescription drug benefit under Medicare known as‘‘Medicare Part D.’’ The Act also established a federal subsidy to sponsors of retiree health care plans thatprovide a benefit that is at least actuarially equivalent to Medicare Part D. During the second quarter of 2004,our Company adopted the provisions of FSP 106-2 retroactive to January 1, 2004. The adoption of FSP 106-2 didnot have a material impact on our consolidated financial statements. Refer to Note 14.
In October 2004, the American Jobs Creation Act of 2004 (the ‘‘Jobs Creation Act’’) was signed into law.The Jobs Creation Act includes a temporary incentive for U.S. multinationals to repatriate foreign earnings atan effective 5.25 percent tax rate. Such repatriations must occur in either an enterprise’s last tax year that beganbefore the enactment date, or the first tax year that begins during the one-year period beginning on the dateof enactment.
FASB Staff Position 109-2, ‘‘Accounting and Disclosure Guidance for the Foreign Earnings RepatriationProvision within the American Jobs Creation Act of 2004’’ (‘‘FSP 109-2’’), indicates that the lack of clarificationof certain provisions within the Jobs Creation Act and the timing of the enactment necessitate a practicalexception to the SFAS No. 109, ‘‘Accounting for Income Taxes,’’ (‘‘SFAS No. 109’’) requirement to reflect in theperiod of enactment the effect of a new tax law. Accordingly, an enterprise is allowed time beyond the financialreporting period of enactment to evaluate the effect of the Jobs Creation Act on its plan for reinvestment orrepatriation of foreign earnings. FSP 109-2 requires that the provisions of SFAS No. 109 be applied as anenterprise decides on its plan for reinvestment or repatriation of its unremitted foreign earnings.
In 2004, our Company recorded an income tax benefit of approximately $50 million as a result of therealization of certain tax credits related to certain provisions of the Jobs Creation Act not related to repatriationprovisions. Our Company is currently evaluating the details of the Jobs Creation Act and any impact it may haveon our income tax expense in 2005. Refer to Note 15.
In November 2004, the FASB issued SFAS No. 151, ‘‘Inventory Costs, an amendment of AccountingResearch Bulletin No. 43, Chapter 4.’’ SFAS No. 151 requires that abnormal amounts of idle facility expense,freight, handling costs and wasted materials (spoilage) be recorded as current period charges and that theallocation of fixed production overheads to inventory be based on the normal capacity of the productionfacilities. SFAS No. 151 is effective for our Company on January 1, 2006. The Company does not believe that theadoption of SFAS No. 151 will have a material impact on our consolidated financial statements.
In December 2004, the FASB issued SFAS No. 123 (revised 2004), ‘‘Share Based Payment’’ (‘‘SFASNo. 123(R)’’). SFAS No. 123(R) supercedes APB Opinion No. 25, ‘‘Accounting for Stock Issued to Employees,’’and amends SFAS No. 95, ‘‘Statement of Cash Flows.’’ Generally, the approach in SFAS No. 123(R) is similar tothe approach described in SFAS No. 123. SFAS No. 123(R) must be adopted by our Company by the thirdquarter of 2005. Currently, our Company uses the Black-Scholes-Merton formula to estimate the value of stockoptions granted to employees and is evaluating option valuation models, including the Black-Scholes-Mertonformula, to determine which model the Company will utilize upon adoption of SFAS No. 123(R). Our Companyplans to adopt SFAS No. 123(R) using the modified-prospective method. We do not anticipate that adoption ofSFAS No. 123(R) will have a material impact on our Company’s stock-based compensation expense. However,our equity investees are also required to adopt SFAS No. 123(R) beginning no later than the third quarter of
72

NOTES TO CONSOLIDATED FINANCIAL STATEMENTS
The Coca-Cola Company and Subsidiaries
NOTE 1: ORGANIZATION AND SUMMARY OF SIGNIFICANT ACCOUNTING POLICIES (Continued)
2005. Our proportionate share of the stock-based compensation expense resulting from the adoption of SFASNo. 123(R) by our equity investees will be recognized as a reduction to equity income.
In December 2004, the FASB issued SFAS No. 153, ‘‘Exchanges of Nonmonetary Assets, an amendment ofAPB Opinion No. 29.’’ SFAS No. 153 is based on the principle that exchanges of nonmonetary assets should bemeasured based on the fair value of the assets exchanged. APB Opinion No. 29, ‘‘Accounting for NonmonetaryTransactions,’’ provided an exception to its basic measurement principle (fair value) for exchanges of similarproductive assets. Under APB Opinion No. 29, an exchange of a productive asset for a similar productive assetwas based on the recorded amount of the asset relinquished. SFAS No. 153 eliminates this exception andreplaces it with an exception of exchanges of nonmonetary assets that do not have commercial substance. SFASNo. 153 is effective for our Company as of July 1, 2005. The Company will apply the requirements of SFASNo. 153 prospectively.
NOTE 2: BOTTLING INVESTMENTS
Coca-Cola Enterprises Inc.
Coca-Cola Enterprises Inc. (‘‘CCE’’) is a marketer, producer and distributor of bottle and can nonalcoholicbeverages, operating in eight countries. On December 31, 2004, our Company owned approximately 36 percentof the outstanding common stock of CCE. We account for our investment by the equity method of accountingand, therefore, our operating results include our proportionate share of income (loss) resulting from ourinvestment in CCE. As of December 31, 2004, our proportionate share of the net assets of CCE exceeded ourinvestment by approximately $366 million. This difference is not amortized.
73

NOTES TO CONSOLIDATED FINANCIAL STATEMENTS
The Coca-Cola Company and Subsidiaries
NOTE 2: BOTTLING INVESTMENTS (Continued)
A summary of financial information for CCE is as follows (in millions):December 31, 2004 2003
Current assets $ 3,264 $ 3,000Noncurrent assets 23,090 22,700
Total assets $ 26,354 $ 25,700
Current liabilities $ 3,431 $ 3,941Noncurrent liabilities 17,545 17,394
Total liabilities $ 20,976 $ 21,335
Shareowners’ equity $ 5,378 $ 4,365
Company equity investment $ 1,569 $ 1,260
Year Ended December 31, 2004 2003 2002
Net operating revenues $ 18,158 $ 17,330 $ 16,0581
Cost of goods sold 10,771 10,165 9,4581
Gross profit $ 7,387 $ 7,165 $ 6,6001
Operating income $ 1,436 $ 1,577 $ 1,364
Net income $ 596 $ 676 $ 494
Net income available to common shareowners $ 596 $ 674 $ 491
1 These amounts reflect reclassifications related to the January 1, 2003 adoption of EITF Issue No.02-16, ‘‘Accounting by a Customer (Including a Reseller) for Certain Consideration Received from aVendor.’’
A summary of our significant transactions with CCE is as follows (in millions):
2004 2003 2002
Concentrate, syrup and finished products sales to CCE $ 5,203 $ 5,084 $ 4,767Syrup and finished product purchases from CCE 428 403 461CCE purchases of sweeteners through our Company 309 311 325Payments made by us directly to CCE 646 880 837Payments made to third parties on behalf of CCE 104 115 204Local media and marketing program reimbursements from CCE 246 221 264
Syrup and finished product purchases from CCE represent purchases of fountain syrup in certain territoriesthat have been resold by our Company to major customers and purchases of bottle and can products. Paymentsmade by us directly to CCE represent support of certain marketing activities and our participation with CCE incooperative advertising and other marketing activities to promote the sale of Company trademark productswithin CCE territories. These programs are agreed to on an annual basis. Payments made to third parties onbehalf of CCE represent support of certain marketing activities and programs to promote the sale of Companytrademark products within CCE’s territories in conjunction with certain of CCE’s customers. Pursuant tocooperative advertising and trade agreements with CCE, we received funds from CCE for local media andmarketing program expense reimbursements.
74

NOTES TO CONSOLIDATED FINANCIAL STATEMENTS
The Coca-Cola Company and Subsidiaries
NOTE 2: BOTTLING INVESTMENTS (Continued)
In the second quarter of 2004, our Company and CCE agreed to terminate the Sales Growth Initiative(‘‘SGI’’) agreement and certain other marketing funding programs that were previously in place. Due totermination of these agreements, a significant portion of the cash payments to be made by us directly to CCEwas eliminated prospectively. At the termination of these agreements, we agreed that the concentrate price thatCCE pays us for sales made in the United States and Canada would be reduced. Total cash support paid by ourCompany under the SGI agreement prior to its termination was $58 million, $161 million and $150 million for2004, 2003 and 2002, respectively. These amounts are included in the line item payments made by us directly toCCE in the table above.
In the second quarter of 2004, we and CCE agreed to establish a Global Marketing Fund, under which weexpect to pay CCE $62 million annually through December 31, 2014 as support for certain marketing activities.The term of the agreement will automatically be extended for successive 10-year periods thereafter unless eitherparty gives written notice of termination of this agreement. The marketing activities to be funded under thisagreement will be agreed upon each year as part of the annual joint planning process and will be incorporatedinto the annual marketing plans of both companies. We paid CCE a pro rata amount of $42 million for 2004.This amount is included in the line item payments made by us directly to CCE in the table above.
Our Company previously entered into programs with CCE designed to help develop cold-drinkinfrastructure. Under these programs, our Company paid CCE for a portion of the cost of developing theinfrastructure necessary to support accelerated placements of cold-drink equipment. These payments support acommon objective of increased sales of Coca-Cola beverages from increased availability and consumption in thecold-drink channel. In connection with these programs, CCE agreed to:
(1) purchase and place specified numbers of Company approved cold-drink equipment each yearthrough 2010;
(2) maintain the equipment in service, with certain exceptions, for a period of at least 12 yearsafter placement;
(3) maintain and stock the equipment in accordance with specified standards; and
(4) annual reporting to our Company of minimum average annual unit case sales volume throughout theeconomic life of the equipment and other specified information.
CCE must achieve minimum average unit case sales volume for a 12-year period following the placement ofequipment. These minimum average unit case sales volume levels ensure adequate gross profit from sales ofconcentrate to fully recover the capitalized costs plus a return on the Company’s investment. Should CCE fail topurchase the specified numbers of cold-drink equipment for any calendar year through 2010, the parties agreedto mutually develop a reasonable solution. Should no mutually agreeable solution be developed, or in the eventthat CCE otherwise breaches any material obligation under the contracts and such breach is not remedied withina stated period, then CCE would be required to repay a portion of the support funding as determined by ourCompany. In the third quarter of 2004, our Company and CCE agreed to amend the contract to defer theplacement of some equipment from 2004 and 2005, as previously agreed under the original contract, to 2009 and2010. In connection with this amendment, CCE agreed to pay the Company approximately $2 million in 2004,$3 million annually in 2005 through 2008, and $1 million in 2009. Our Company paid or committed to pay$3 million in 2002 to CCE in connection with these infrastructure programs. These payments are recorded inprepaid expenses and other assets and in noncurrent other assets and amortized as deductions in net operatingrevenues over the 10-year period following the placement of the equipment. Our carrying values for these
75

NOTES TO CONSOLIDATED FINANCIAL STATEMENTS
The Coca-Cola Company and Subsidiaries
NOTE 2: BOTTLING INVESTMENTS (Continued)
infrastructure programs with CCE were approximately $759 million and $829 million as of December 31, 2004and 2003, respectively. Effective in 2002 and thereafter, the Company had no further commitments underthese programs.
In March 2004, the Company and CCE launched the Dasani water brand in Great Britain. The product wasvoluntarily recalled. During 2004, our Company reimbursed CCE $32 million for product recall costs incurredby CCE.
In March 2003, our Company acquired a 100 percent ownership interest in Truesdale Packaging CompanyLLC (‘‘Truesdale’’) from CCE. Refer to Note 18.
If valued at the December 31, 2004 quoted closing price of CCE shares, the fair value of our investment inCCE would have exceeded our carrying value by approximately $2.0 billion.
76

NOTES TO CONSOLIDATED FINANCIAL STATEMENTS
The Coca-Cola Company and Subsidiaries
NOTE 2: BOTTLING INVESTMENTS (Continued)
Other Equity Investments
Operating results include our proportionate share of income (loss) from our equity investments. A summaryof financial information for our equity investments in the aggregate, other than CCE, is as follows (in millions):
December 31, 2004 2003
Current assets $ 6,723 $ 6,416Noncurrent assets 19,107 17,394
Total assets $ 25,830 $ 23,810
Current liabilities $ 5,507 $ 5,467Noncurrent liabilities 8,924 9,011
Total liabilities $ 14,431 $ 14,478
Shareowners’ equity $ 11,399 $ 9,332
Company equity investment $ 4,328 $ 3,964
Year Ended December 31, 2004 2003 2002
Net operating revenues $ 21,202 $ 19,797 $ 17,7141
Cost of goods sold 12,132 11,661 10,1121
Gross profit $ 9,070 $ 8,136 $ 7,6021
Operating income $ 2,406 $ 1,666 $ 1,744
Cumulative effect of accounting change2 $ — $ — $ (1,428)
Net income (loss) $ 1,389 $ 580 $ (630)
Net income (loss) available to common shareowners $ 1,364 $ 580 $ (630)
Equity investments include nonbottling investees.1 These amounts reflect reclassifications related to the January 1, 2003 adoption of EITF Issue
No. 02-16, ‘‘Accounting by a Customer (Including a Reseller) for Certain Consideration Receivedfrom a Vendor.’’
2 Accounting change is the adoption of SFAS No. 142.
Net sales to equity investees other than CCE, the majority of which are located outside the United States,were $5.2 billion in 2004, $4.0 billion in 2003 and $3.2 billion in 2002. Total support payments, primarilymarketing, made to equity investees other than CCE were approximately $442 million, $511 million and$488 million for 2004, 2003 and 2002, respectively.
During the second quarter of 2004, the Company’s equity income benefited by approximately $37 millionfor its share of a favorable tax settlement related to Coca-Cola FEMSA, S.A. de C.V. (‘‘Coca-Cola FEMSA’’).
In December 2004, the Company sold certain of its production assets to an unrelated financial institutionthat were previously leased to the Japanese supply chain management company (refer to discussion below). Theassets were sold for $271 million and the sale resulted in no gain or loss. The financial institution entered into aleasing arrangement with the Japanese supply chain management company. These assets were previouslyreported in our consolidated balance sheet caption property, plant and equipment and assigned to our Asiaoperating segment.
77

NOTES TO CONSOLIDATED FINANCIAL STATEMENTS
The Coca-Cola Company and Subsidiaries
NOTE 2: BOTTLING INVESTMENTS (Continued)
During 2004, our Company sold our bottling operations in Vietnam, Cambodia, Sri Lanka and Nepal toCoca-Cola Sabco (Pty) Ltd. (‘‘Sabco’’) for a total consideration of $29 million. In addition, Sabco assumedcertain debts of these bottling operations. The proceeds from the sale of these bottlers were approximately equalto the carrying value of the investment.
Effective May 6, 2003, one of our Company’s equity method investees, Coca-Cola FEMSA consummated amerger with another of the Company’s equity method investees, Panamerican Beverages, Inc. (‘‘Panamco’’). OurCompany received new Coca-Cola FEMSA shares in exchange for all Panamco shares previously held by theCompany. Our Company’s ownership interest in Coca-Cola FEMSA increased from 30 percent to approximately40 percent as a result of this merger. This exchange of shares was treated as a nonmonetary exchange of similarproductive assets, and no gain was recorded by our Company as a result of this merger.
In connection with the merger, Coca-Cola FEMSA management initiated steps to streamline and integrateoperations. This process included the closing of various distribution centers and manufacturing plants.Furthermore, due to the challenging economic conditions and an uncertain political situation in Venezuela,certain intangible assets were determined to be impaired and written down to their fair market value. During2003, our Company recorded a noncash charge of $102 million primarily related to our proportionate share ofthese matters. This charge is included in the consolidated statement of income line item equity income—net.
In December 2003, the Company issued a stand-by line of credit to Coca-Cola FEMSA. Refer to Note 11.
The Company and the major shareowner of Coca-Cola FEMSA have an understanding that will permit thisshareowner to purchase from our Company an amount of Coca-Cola FEMSA shares sufficient for thisshareowner to regain a 51 percent ownership interest in Coca-Cola FEMSA. Pursuant to this understanding,which is in place until May 2006, this shareowner would pay the higher of the prevailing market price per shareat the time of the sale or the sum of approximately $2.22 per share plus the Company’s carrying costs. Bothresulting amounts are in excess of our Company’s carrying value.
In July 2003, we made a convertible loan of approximately $133 million to The Coca-Cola BottlingCompany of Egypt (‘‘TCCBCE’’). The loan is convertible into preferred shares of TCCBCE upon receipt ofgovernmental approvals. Additionally, upon certain defaults under either the loan agreement or the terms of thepreferred shares, we have the ability to convert the loan or the preferred shares into common shares. AtDecember 31, 2004, our Company owned approximately 42 percent of the common shares of TCCBCE. In 2004,we consolidated TCCBCE under the provisions of Interpretation 46.
Effective October 1, 2003, the Company and all of its bottling partners in Japan created a nationallyintegrated supply chain management company to centralize procurement, production and logistics operationsfor the entire Coca-Cola system in Japan. As a result of the creation of this supply chain management companyin Japan, a portion of our Company’s business has essentially been converted from a finished product businessmodel to a concentrate business model, thus reducing our net operating revenues and cost of goods sold. Theformation of this entity included the sale of Company inventory and leasing of certain Company assets to thisnew entity on October 1, 2003, as well as our recording of a liability for certain contractual obligations toJapanese bottlers. Such amounts were not material to the Company’s results of operations.
In November 2003, Coca-Cola Hellenic Bottling Company S.A. (‘‘Coca-Cola HBC’’) approved a sharecapital reduction totaling approximately 473 million euros and the return of 2 euros per share to all shareowners.In December 2003, our Company received our share capital return payment from Coca-Cola HBC equivalent to$136 million, and we recorded a reduction to our investment in Coca-Cola HBC.
78

NOTES TO CONSOLIDATED FINANCIAL STATEMENTS
The Coca-Cola Company and Subsidiaries
NOTE 2: BOTTLING INVESTMENTS (Continued)
Effective February 2002, our Company acquired control of Coca-Cola Erfrischungsgetraenke AG(‘‘CCEAG’’), the largest bottler of our Company’s beverage products in Germany. Prior to acquiring control,our Company accounted for CCEAG under the equity method of accounting. Refer to Note 18.
In the first quarter of 2002, our Company sold our bottling operations in the Baltics to Coca-Cola HBC. Theproceeds from the sale of the Baltic bottlers were approximately equal to the carrying value of the investment.
If valued at the December 31, 2004, quoted closing prices of shares actively traded on stock markets, thevalue of our equity investments in publicly traded bottlers other than CCE exceeded our carrying value byapproximately $2.2 billion.
The total amount of receivables due from equity method investees, including CCE, was approximately$680 million as of December 31, 2004. This amount was primarily reported in our consolidated balance sheetcaption trade accounts receivable.
NOTE 3: ISSUANCES OF STOCK BY EQUITY INVESTEES
In 2004, our Company recorded approximately $24 million of noncash pretax gains on issuances of stock byCCE. The issuances primarily related to the exercise of CCE stock options by CCE employees at amountsgreater than the book value per share of our investment in CCE. We provided deferred taxes of approximately$9 million on these gains. These issuances of stock reduced our ownership interest in the total outstandingshares of CCE common stock by approximately 1 percent to approximately 36 percent.
In 2003, our Company recorded approximately $8 million of noncash pretax gains on issuances of stock byequity investees. These gains primarily related to the issuance by CCE of common stock valued at an amountgreater than the book value per share of our investment in CCE. These transactions reduced our ownershipinterest in the total outstanding shares of CCE common stock by less than 1 percent. No gains or losses onissuances of stock by equity investees were recorded during 2002.
NOTE 4: GOODWILL, TRADEMARKS AND OTHER INTANGIBLE ASSETS
In accordance with SFAS No. 142, goodwill and indefinite-lived intangible assets are no longer amortizedbut are reviewed annually for impairment. Our Company is the owner of some of the world’s most valuabletrademarks. As a result, certain trademarks and franchise rights to bottle and distribute such trademarkedproducts are expected to generate positive cash flows for as long as the Company owns such trademarks andfranchise rights for a particular territory. Given the Company’s more than 100-year history, certain trademarksand the franchise rights to bottle and distribute products under our trademarks have been assigned indefinitelives. Intangible assets that are deemed to have definite lives are amortized over their useful lives. Theamortization provisions of SFAS No. 142 apply to goodwill and intangible assets acquired after June 30, 2001.With respect to goodwill and intangible assets acquired prior to July 1, 2001, the Company began applying thenew accounting rules effective January 1, 2002.
The adoption of SFAS No. 142 required the Company to perform an initial impairment assessment of allgoodwill and indefinite-lived intangible assets as of January 1, 2002. The Company compared the fair value oftrademarks and other intangible assets to the current carrying value. Fair values were derived using discountedcash flow analyses. The assumptions used in these discounted cash flow analyses were consistent with ourinternal planning. Valuations were completed for intangible assets for both the Company and our equity methodinvestees. For the Company’s intangible assets, the cumulative effect of this change in accounting principle in2002 was an after-tax decrease to net income of $367 million. For the Company’s proportionate share of its
79

NOTES TO CONSOLIDATED FINANCIAL STATEMENTS
The Coca-Cola Company and Subsidiaries
NOTE 4: GOODWILL, TRADEMARKS AND OTHER INTANGIBLE ASSETS (Continued)
equity method investees, the cumulative effect of this change in accounting principle in 2002 was an after-taxdecrease to net income of $559 million. The deferred income tax benefit related to the cumulative effect of thischange for the Company’s intangible assets in 2002 was approximately $94 million and for the Company’sproportionate share of its equity method investees was approximately $123 million.
The impairment charges resulting in the after-tax decrease to net income for the cumulative effect of thischange by applicable operating segment as of January 1, 2002 were as follows (in millions):
The Company:Asia $ 108Europe, Eurasia and Middle East 33Latin America 226
$ 367
The Company’s proportionate share of its equity method investees:Africa $ 63Europe, Eurasia and Middle East 400Latin America 96
$ 559
Of the $108 million impairment recorded as of January 1, 2002 for the Company in Asia, $99 million relatedto bottlers’ franchise rights in our consolidated bottlers in our Southeast and West Asia Division. Difficulteconomic conditions impacted our business in Singapore, Sri Lanka, Nepal and Vietnam. As a result, bottlers inthese countries experienced lower than expected volume and operating margins.
Of the Company’s $226 million impairment recorded as of January 1, 2002 for Latin America,approximately $113 million related to Company-owned Brazilian bottlers’ franchise rights. The Brazilianmacroeconomic conditions, the devaluation of the currency and lower pricing impacted the valuation of thesebottlers’ franchise rights. The remainder of the $226 million primarily related to a $109 million impairment forcertain trademarks in Latin America. In early 1999, our Company formed a strategic partnership to market anddistribute such trademarked products. The macroeconomic conditions and lower pricing depressed operatingmargins for these trademarks.
For Europe, Eurasia and Middle East equity method investees, a $400 million impairment was recorded as ofJanuary 1, 2002 for the Company’s proportionate share related to bottlers’ franchise rights. Of this amount,approximately $301 million related to CCEAG. This impairment was due to a prolonged difficult economicenvironment in Germany, resulting in continuing losses for CCEAG in eastern Germany. At that time, the marketfor nonalcoholic beverages was undergoing a transformation. A changing competitive landscape, continuing pricepressure and growing demand for new products and packaging were elements impacting CCEAG. The$400 million impairment also included a $50 million charge for Middle East bottlers’ franchise rights.
In our Africa operating segment, a $63 million charge was recorded for the Company’s proportionate shareof impairments related to equity method investee bottlers’ franchise rights. These Middle East and Africabottlers had challenges as a result of political instability and the resulting economic instability in their respectiveregions, which adversely impacted financial performance.
A $96 million impairment was recorded as of January 1, 2002 for the Company’s proportionate sharerelated to bottlers’ franchise rights of Latin America equity method investees. In southern Latin America, the
80

NOTES TO CONSOLIDATED FINANCIAL STATEMENTS
The Coca-Cola Company and Subsidiaries
NOTE 4: GOODWILL, TRADEMARKS AND OTHER INTANGIBLE ASSETS (Continued)
macroeconomic conditions and devaluation of the Argentine peso significantly impacted the valuation ofbottlers’ franchise rights.
The following tables set forth the information for intangible assets subject to amortization and forintangible assets not subject to amortization (in millions):
December 31, 2004 2003
Amortized intangible assets (various, principally trademarks):Gross carrying amount $ 292 $ 263
Accumulated amortization $ 128 $ 98
Unamortized intangible assets:Trademarks $ 2,037 $ 1,979Goodwill1 1,097 1,029Bottlers’ franchise rights2 374 658Other 164 158
$ 3,672 $ 3,824
1 During 2004, the increase in goodwill primarily resulted from translation adjustments.2 During 2004, the decrease in franchise rights primarily related to the impairment charge of $354
million related to CCEAG’s franchise rights (see discussion below).
Year Ended December 31, 2004 2003
Aggregate amortization expense $ 40 $ 23
Estimated amortization expense:For the year ending:
December 31, 2005 $ 28December 31, 2006 $ 16December 31, 2007 $ 16December 31, 2008 $ 16December 31, 2009 $ 15
The goodwill by applicable operating segment as of December 31, 2004 was as follows (in millions):
December 31, 2004 2003
North America $ 140 $ 142Asia 37 45Europe, Eurasia and Middle East 828 742Latin America 92 100
$ 1,097 $ 1,029
In 2004, acquisition of intangible assets totaled approximately $89 million. This amount is primarily relatedto the Company’s acquisition of trademarks with indefinite lives in the Latin America operating segment.
In 2004, our Company recorded impairment charges related to intangible assets of approximately$374 million. The decrease in franchise rights in 2004 was primarily due to this impairment charge, offset by anincrease due to translation adjustment. These impairment charges primarily were in the Europe, Eurasia and
81

NOTES TO CONSOLIDATED FINANCIAL STATEMENTS
The Coca-Cola Company and Subsidiaries
NOTE 4: GOODWILL, TRADEMARKS AND OTHER INTANGIBLE ASSETS (Continued)
Middle East operating segment and were included in other operating charges in our consolidated statement ofincome. The charge was primarily related to franchise rights at CCEAG. The CCEAG impairment was the resultof our revised outlook for the German market that has been unfavorably impacted by volume declines resultingfrom market shifts related to the deposit law on nonreturnable beverage packages and the corresponding lack ofavailability for our products in the discount retail channel. The deposit laws in Germany have led to discountchains creating proprietary packages that can only be returned to their own stores. These proprietary packagesare continuing to gain market share and customer acceptance.
At the end of 2004, the German government passed an amendment to the mandatory deposit legislationthat will require retailers, including discount chains, to accept returns of each type of non-refillable beveragecontainers which they sell, regardless of where the beverage container type was purchased. In addition, themandatory deposit requirement was expanded to other beverage categories. The amendment allows for atransition period to enable manufacturers and retailers to establish a national take-back system for non-refillablecontainers. The transition period is expected to last at least until mid-2006.
We determined the amount of the 2004 impairment charges by comparing the fair value of the intangibleassets to the current carrying value. Fair values were derived using discounted cash flow analyses with a numberof scenarios that were weighted based on the probability of different outcomes. Because the fair value was lessthan the carrying value of the assets, we recorded an impairment charge to reduce the carrying value of theassets to fair value. These impairment charges were recorded in the line item other operating charges in theconsolidated statement of income for 2004.
In 2003, acquisitions of intangible assets totaled approximately $142 million. Of this amount, approximately$88 million related to the Company’s acquisition of certain intangible assets with indefinite lives, primarilytrademarks and brands in various parts of the world. None of these trademarks and brands was consideredindividually significant. Additionally, the Company acquired certain brands and related contractual rights fromPanamco valued at $54 million in the Latin America operating segment with an estimated useful life of 10 years.
NOTE 5: ACCOUNTS PAYABLE AND ACCRUED EXPENSES
Accounts payable and accrued expenses consist of the following (in millions):
December 31, 2004 2003
Trade accounts payable and other accrued expenses $ 2,238 $ 2,014Accrued marketing 1,194 1,046Accrued compensation 389 311Sales, payroll and other taxes 222 225Container deposits 199 256Accrued streamlining costs (refer to Note 17) 41 206
$ 4,283 $ 4,058
NOTE 6: SHORT-TERM BORROWINGS AND CREDIT ARRANGEMENTS
Loans and notes payable consist primarily of commercial paper issued in the United States. AtDecember 31, 2004 and 2003, we had approximately $4,235 million and $2,234 million, respectively, outstandingin commercial paper borrowings. Our weighted-average interest rates for commercial paper outstanding wereapproximately 2.2 percent and 1.1 percent per year at December 31, 2004 and 2003, respectively. In addition, we
82

NOTES TO CONSOLIDATED FINANCIAL STATEMENTS
The Coca-Cola Company and Subsidiaries
NOTE 6: SHORT-TERM BORROWINGS AND CREDIT ARRANGEMENTS (Continued)
had $1,614 million in lines of credit and other short-term credit facilities available as of December 31, 2004, ofwhich approximately $296 million was outstanding. This entire amount related to our international operations.Included in the available credit facilities discussed above, the Company had $1,150 million in lines of credit forgeneral corporate purposes, including commercial paper back-up. There were no borrowings under these linesof credit during 2004.
These credit facilities are subject to normal banking terms and conditions. Some of the financialarrangements require compensating balances, none of which is presently significant to our Company.
NOTE 7: LONG-TERM DEBT
Long-term debt consists of the following (in millions):
December 31, 2004 2003
Variable rate euro notes due 20041 $ — $ 29657⁄8% euro notes due 2005 663 5914% U.S. dollar notes due 2005 750 74953⁄4% U.S. dollar notes due 2009 399 39953⁄4% U.S. dollar notes due 2011 499 49873⁄8% U.S. dollar notes due 2093 116 116Other, due through 20132 220 191
$ 2,647 $ 2,840Less current portion 1,490 323
$ 1,157 $ 2,517
1 2.4 percent at December 31, 2003.2 Includes $5 million and $27 million fair value adjustment related to interest rate swap agreements in
2004 and 2003, respectively. Refer to Note 10.
The above notes include various restrictions, none of which is presently significant to our Company.
After giving effect to interest rate management instruments, the principal amount of our long-term debtthat had fixed and variable interest rates, respectively, was $1,895 million and $752 million on December 31,2004, and $1,742 million and $1,098 million on December 31, 2003. The weighted-average interest rate on ourCompany’s long-term debt was 4.4 percent and 3.9 percent per annum for the years ended December 31, 2004and 2003, respectively. Total interest paid was approximately $188 million, $180 million and $197 million in 2004,2003 and 2002, respectively. For a more detailed discussion of interest rate management, refer to Note 10.
Maturities of long-term debt for the five years succeeding December 31, 2004 are as follows (in millions):
2005 2006 2007 2008 2009
$ 1,490 $ 43 $ 21 $ 7 $ 406
83

NOTES TO CONSOLIDATED FINANCIAL STATEMENTS
The Coca-Cola Company and Subsidiaries
NOTE 8: COMPREHENSIVE INCOME
Accumulated other comprehensive income (loss), including our proportionate share of equity methodinvestees’ accumulated other comprehensive income (loss), consists of the following (in millions):
December 31, 2004 2003
Foreign currency translation adjustment $ (1,191) $ (1,856)Accumulated derivative net losses (80) (77)Unrealized gain on available-for-sale securities 91 52Minimum pension liability (168) (114)
$ (1,348) $ (1,995)
A summary of the components of accumulated other comprehensive income (loss), including ourproportionate share of equity method investees’ other comprehensive income, for the years ended December 31,2004, 2003 and 2002 is as follows (in millions):
Before-Tax Income After-TaxAmount Tax Amount
2004Net foreign currency translation adjustment $ 766 $ (101) $ 665Net loss on derivatives (4) 1 (3)Net change in unrealized gain on available-for-sale securities 48 (9) 39Net change in minimum pension liability (81) 27 (54)
Other comprehensive income (loss) $ 729 $ (82) $ 647
Before-Tax Income After-TaxAmount Tax Amount
2003Net foreign currency translation adjustment $ 913 $ 8 $ 921Net loss on derivatives (63) 30 (33)Net change in unrealized gain on available-for-sale securities 65 (25) 40Net change in minimum pension liability 181 (57) 124
Other comprehensive income (loss) $ 1,096 $ (44) $ 1,052
Before-Tax Income After-TaxAmount Tax Amount
2002Net foreign currency translation adjustment $ (51) $ (44) $ (95)Net loss on derivatives (284) 98 (186)Net change in unrealized gain on available-for-sale securities 104 (37) 67Net change in minimum pension liability (299) 104 (195)
Other comprehensive income (loss) $ (530) $ 121 $ (409)
84

NOTES TO CONSOLIDATED FINANCIAL STATEMENTS
The Coca-Cola Company and Subsidiaries
NOTE 9: FINANCIAL INSTRUMENTS
Fair Value of Financial Instruments
The carrying amounts reflected in our consolidated balance sheets for cash and cash equivalents,non-marketable cost method investments, trade accounts receivable and loans and notes payable approximatetheir respective fair values. The carrying amount and the fair value of our long-term debt, including the currentportion, as of December 31, 2004 was approximately $2,647 million and $2,736 million, respectively. As ofDecember 31, 2003, the carrying amount and the fair value of our long-term debt, including the current portion,was approximately $2,840 million and $2,942 million, respectively. For additional details about our long-termdebt, refer to Note 7.
Fair values are based primarily on quoted prices for those or similar instruments. Fair values for ourderivative financial instruments are included in Note 10.
Credit Risk
With respect to our cash and cash equivalents balances, we manage our exposure to counterparty credit riskthrough specific minimum credit standards, diversification of counterparties and procedures to monitorconcentration of credit risk. Based on these factors, we consider the risk of counterparty default to be minimal.
Certain Debt and Marketable Equity Securities
Investments in debt and marketable equity securities, other than investments accounted for by the equitymethod, are required to be categorized as either trading, available-for-sale or held-to-maturity. OnDecember 31, 2004 and 2003, we had no trading securities. Securities categorized as available-for-sale are statedat fair value, with unrealized gains and losses, net of deferred income taxes, reported as a component ofAccumulated Other Comprehensive Income (Loss) (‘‘AOCI’’). Debt securities, primarily time deposits,categorized as held-to-maturity are stated at amortized cost.
85

NOTES TO CONSOLIDATED FINANCIAL STATEMENTS
The Coca-Cola Company and Subsidiaries
NOTE 9: FINANCIAL INSTRUMENTS (Continued)
On December 31, 2004 and 2003, available-for-sale and held-to-maturity securities consisted of thefollowing (in millions):
Gross UnrealizedEstimated
December 31, Cost Gains Losses Fair Value
2004Available-for-sale securities:
Equity securities $ 144 $ 146 $ (2) $ 288Other debt securities 5 — (1) 4
$ 149 $ 146 $ (3) $ 292
Held-to-maturity securities:Bank and corporate debt $ 4,479 $ — $ — $ 4,479Other debt securities 107 — — 107
$ 4,586 $ — $ — $ 4,586
Gross UnrealizedEstimated
December 31, Cost Gains Losses Fair Value
2003Available-for-sale securities:
Bank and corporate debt $ 118 $ — $ — $ 118Equity securities 147 97 (12) 232Other debt securities 76 — — 76
$ 341 $ 97 $ (12) $ 426
Held-to-maturity securities:Bank and corporate debt $ 2,162 $ — $ — $ 2,162Other debt securities 1 — — 1
$ 2,163 $ — $ — $ 2,163
86

NOTES TO CONSOLIDATED FINANCIAL STATEMENTS
The Coca-Cola Company and Subsidiaries
NOTE 9: FINANCIAL INSTRUMENTS (Continued)
On December 31, 2004 and 2003, these investments were included in the following captions (in millions):
Available- Held-to-for-Sale Maturity
December 31, Securities Securities
2004Cash and cash equivalents $ — $ 4,586Current marketable securities 61 —Cost method investments, principally bottling companies 229 —Other assets 2 —
$ 292 $ 4,586
Available- Held-to-for-Sale Maturity
December 31, Securities Securities
2003Cash and cash equivalents $ 118 $ 2,162Current marketable securities 120 —Cost method investments, principally bottling companies 185 —Other assets 3 1
$ 426 $ 2,163
The contractual maturities of these investments as of December 31, 2004 were as follows (in millions):
Available-for-Sale Held-to-MaturitySecurities Securities
Fair Amortized FairCost Value Cost Value
2005 $ — $ — $ 4,586 $ 4,5862006-2009 — — — —2010-2014 — — — —After 2014 5 4 — —Equity securities 144 288 — —
$ 149 $ 292 $ 4,586 $ 4,586
For the years ended December 31, 2004, 2003 and 2002, gross realized gains and losses on sales ofavailable-for-sale securities were not material. The cost of securities sold is based on the specific identificationmethod.
NOTE 10: HEDGING TRANSACTIONS AND DERIVATIVE FINANCIAL INSTRUMENTS
Our Company uses derivative financial instruments primarily to reduce our exposure to adverse fluctuationsin interest rates and foreign exchange rates and, to a lesser extent, in commodity prices and other market risks.When entered into, the Company formally designates and documents the financial instrument as a hedge of aspecific underlying exposure, as well as the risk management objectives and strategies for undertaking the hedge
87

NOTES TO CONSOLIDATED FINANCIAL STATEMENTS
The Coca-Cola Company and Subsidiaries
NOTE 10: HEDGING TRANSACTIONS AND DERIVATIVE FINANCIAL INSTRUMENTS (Continued)
transactions. The Company formally assesses, both at the inception and at least quarterly thereafter, whether thefinancial instruments that are used in hedging transactions are effective at offsetting changes in either the fairvalue or cash flows of the related underlying exposure. Because of the high degree of effectiveness between thehedging instrument and the underlying exposure being hedged, fluctuations in the value of the derivativeinstruments are generally offset by changes in the fair values or cash flows of the underlying exposures beinghedged. Any ineffective portion of a financial instrument’s change in fair value is immediately recognized inearnings. Virtually all of our derivatives are straightforward over-the-counter instruments with liquid markets.Our Company does not enter into derivative financial instruments for trading purposes.
The fair values of derivatives used to hedge or modify our risks fluctuate over time. We do not view thesefair value amounts in isolation, but rather in relation to the fair values or cash flows of the underlying hedgedtransactions or other exposures. The notional amounts of the derivative financial instruments do not necessarilyrepresent amounts exchanged by the parties and, therefore, are not a direct measure of our exposure to thefinancial risks described above. The amounts exchanged are calculated by reference to the notional amounts andby other terms of the derivatives, such as interest rates, exchange rates or other financial indices.
Our Company recognizes all derivative instruments as either assets or liabilities in our consolidated balancesheets at fair value. The accounting for changes in fair value of a derivative instrument depends on whether ithas been designated and qualifies as part of a hedging relationship and, further, on the type of hedgingrelationship. At the inception of the hedging relationship, the Company must designate the instrument as a fairvalue hedge, a cash flow hedge, or a hedge of a net investment in a foreign operation. This designation is basedupon the exposure being hedged.
We have established strict counterparty credit guidelines and enter into transactions only with financialinstitutions of investment grade or better. We monitor counterparty exposures daily and review any downgradein credit rating immediately. If a downgrade in the credit rating of a counterparty were to occur, we haveprovisions requiring collateral in the form of U.S. government securities for substantially all of our transactions.To mitigate presettlement risk, minimum credit standards become more stringent as the duration of thederivative financial instrument increases. To minimize the concentration of credit risk, we enter into derivativetransactions with a portfolio of financial institutions. The Company has master netting agreements with most ofthe financial institutions that are counterparties to the derivative instruments. These agreements allow for thenet settlement of assets and liabilities arising from different transactions with the same counterparty. Based onthese factors, we consider the risk of counterparty default to be minimal.
Interest Rate Management
Our Company monitors our mix of fixed rate and variable rate debt, as well as our mix of term debt versusnon-term debt. This monitoring includes a review of business and other financial risks. We also enter intointerest rate swap agreements to manage these risks. These contracts had maturities of less than one year onDecember 31, 2004. Interest rate swap agreements that meet certain conditions required under SFAS No. 133for fair value hedges are accounted for as such, with the offset recorded to adjust the fair value of the underlyingexposure being hedged. During 2004, 2003 and 2002, there has been no ineffectiveness related to fair valuehedges. The fair values of our Company’s interest rate swap agreements were approximately $6 million and$28 million at December 31, 2004 and 2003, respectively. The Company estimates the fair value of its interestrate management derivatives based on quoted market prices.
88

NOTES TO CONSOLIDATED FINANCIAL STATEMENTS
The Coca-Cola Company and Subsidiaries
NOTE 10: HEDGING TRANSACTIONS AND DERIVATIVE FINANCIAL INSTRUMENTS (Continued)
Foreign Currency Management
The purpose of our foreign currency hedging activities is to reduce the risk that our eventual U.S. dollar netcash inflows resulting from sales outside the United States will be adversely affected by changes in exchange rates.
We enter into forward exchange contracts and purchase currency options (principally euro and Japaneseyen) and collars to hedge certain portions of forecasted cash flows denominated in foreign currencies. Theeffective portion of the changes in fair value for these contracts, which have been designated as cash flowhedges, are reported in AOCI and reclassified into earnings in the same financial statement line item and in thesame period or periods during which the hedged transaction affects earnings. Any ineffective portion (which wasnot significant in 2004, 2003 or 2002) of the change in fair value of these instruments is immediately recognizedin earnings. These contracts had maturities up to one year on December 31, 2004.
Additionally, the Company enters into forward exchange contracts that are not designated as hedginginstruments under SFAS No. 133. These instruments are used to offset the earnings impact relating to thevariability in exchange rates on certain monetary assets and liabilities denominated in nonfunctional currencies.Changes in the fair value of these instruments are immediately recognized in earnings in the line item otherincome (loss)—net of our consolidated statements of income to offset the effect of remeasurement of themonetary assets and liabilities.
The Company also enters into forward exchange contracts to hedge its net investment position in certainmajor currencies. Under SFAS No. 133, changes in the fair value of these instruments are recognized in foreigncurrency translation adjustment, a component of AOCI, to offset the change in the value of the net investmentbeing hedged. For the years ended December 31, 2004, 2003 and 2002, approximately $8 million, $29 million and$26 million, respectively, of losses relating to derivative financial instruments were recorded in foreign currencytranslation adjustment.
For the years ended December 31, 2004, 2003 and 2002, we recorded an increase (decrease) to AOCI ofapproximately $6 million, $(31) million and $(151) million, respectively, net of both income taxes andreclassifications to earnings, primarily related to gains and losses on foreign currency cash flow hedges. Theseitems will generally offset cash flow gains and losses relating to the underlying exposures being hedged in futureperiods. The Company estimates that it will reclassify into earnings during the next 12 months losses ofapproximately $35 million from the after-tax amount recorded in AOCI as of December 31, 2004 as theanticipated foreign currency cash flows occur.
The Company did not discontinue any cash flow hedge relationships during the years ended December 31,2004, 2003 and 2002.
89

NOTES TO CONSOLIDATED FINANCIAL STATEMENTS
The Coca-Cola Company and Subsidiaries
NOTE 10: HEDGING TRANSACTIONS AND DERIVATIVE FINANCIAL INSTRUMENTS (Continued)
The following table summarizes activity in AOCI related to derivatives designated as cash flow hedges heldby the Company during the applicable periods (in millions):
Before-Tax Income After-TaxYear Ended December 31, Amount Tax Amount
2004Accumulated derivative net losses as of January 1, 2004 $ (66) $ 26 $ (40)Net changes in fair value of derivatives (76) 30 (46)Net losses reclassified from AOCI into earnings 86 (34) 52
Accumulated derivative net losses as of December 31, 2004 $ (56) $ 22 $ (34)
Before-Tax Income After-TaxYear Ended December 31, Amount Tax Amount
2003Accumulated derivative net losses as of January 1, 2003 $ (15) $ 6 $ (9)Net changes in fair value of derivatives (165) 65 (100)Net losses reclassified from AOCI into earnings 114 (45) 69
Accumulated derivative net losses as of December 31, 2003 $ (66) $ 26 $ (40)
Before-Tax Income After-TaxYear Ended December 31, Amount Tax Amount
2002Accumulated derivative net gains as of January 1, 2002 $ 234 $ (92) $ 142Net changes in fair value of derivatives (129) 51 (78)Net gains reclassified from AOCI into earnings (120) 47 (73)
Accumulated derivative net losses as of December 31, 2002 $ (15) $ 6 $ (9)
90

NOTES TO CONSOLIDATED FINANCIAL STATEMENTS
The Coca-Cola Company and Subsidiaries
NOTE 10: HEDGING TRANSACTIONS AND DERIVATIVE FINANCIAL INSTRUMENTS (Continued)
The following table presents the fair values, carrying values and maturities of the Company’s foreigncurrency derivative instruments outstanding (in millions):
CarryingValues Fair
December 31, Assets Values Maturity
2004Forward contracts $ 27 $ 27 2005Options and collars 12 12 2005
$ 39 $ 39
CarryingValuesAssets Fair
December 31, (Liabilities) Values Maturity
2003Forward contracts $ (25) $ (25) 2004Options and collars 3 3 2004
$ (22) $ (22)
The Company estimates the fair value of its foreign currency derivatives based on quoted market prices orpricing models using current market rates. This amount is primarily reflected in prepaid expenses and otherassets in our consolidated balance sheets.
NOTE 11: COMMITMENTS AND CONTINGENCIES
On December 31, 2004 we were contingently liable for guarantees of indebtedness owed by third parties inthe amount of $257 million. These guarantees are related to third-party customers, bottlers and vendors andhave arisen through the normal course of business. These guarantees have various terms, and none of theseguarantees is individually significant. The amount represents the maximum potential future payments that wecould be required to make under the guarantees; however, we do not consider it probable that we will berequired to satisfy these guarantees.
Additionally, in December 2003, we granted a $250 million standby line of credit to Coca-Cola FEMSA withnormal market terms. As of December 31, 2004 and 2003, no amounts have been drawn against this line ofcredit. This standby letter of credit expires in December 2006.
We believe our exposure to concentrations of credit risk is limited due to the diverse geographic areascovered by our operations.
The Company is also involved in various legal proceedings. We establish reserves for specific legalproceedings when we determine that the likelihood of an unfavorable outcome is probable. Management hasalso identified certain other legal matters where we believe an unfavorable outcome is reasonably possible forwhich no estimate of possible losses can be made. Management believes that any liability to the Company thatmay arise as a result of currently pending legal proceedings, including those discussed below, will not have amaterial adverse effect on the financial condition of the Company taken as a whole.
91

NOTES TO CONSOLIDATED FINANCIAL STATEMENTS
The Coca-Cola Company and Subsidiaries
NOTE 11: COMMITMENTS AND CONTINGENCIES (Continued)
In 2003, the Securities and Exchange Commission (‘‘SEC’’) began conducting an investigation into whetherthe Company or certain persons associated with the Company violated federal securities laws in connection withthe conduct alleged by a former employee of the Company. Additionally, in 2003 the United States Attorney’sOffice for the Northern District of Georgia commenced a criminal investigation of the allegations raised by thesame former employee. The Company is continuing to cooperate with the United States Attorney’s office andthe SEC.
During the period from 1970 to 1981, our Company owned Aqua-Chem, Inc. (‘‘Aqua-Chem’’). A division ofAqua-Chem manufactured certain boilers that contained gaskets that Aqua-Chem purchased from outsidesuppliers. Several years after our Company sold this entity, Aqua-Chem received its first lawsuit relating toasbestos, a component of some of the gaskets. In September 2002, Aqua-Chem notified our Company that itbelieves we are obligated to them for certain costs and expenses associated with the litigation. Aqua-Chemdemanded that our Company reimburse it for approximately $10 million for out-of-pocket litigation-relatedexpenses incurred over the last 18 years. Aqua-Chem has also demanded that the Company acknowledge acontinuing obligation to Aqua-Chem for any future liabilities and expenses that are excluded from coverageunder the applicable insurance or for which there is no insurance. Our Company disputes Aqua-Chem’s claims,and we believe we have no obligation to Aqua-Chem for any of its past, present or future liabilities, costs orexpenses. Furthermore, we believe we have substantial legal and factual defenses to Aqua-Chem’s claims. Theparties entered into litigation to resolve this dispute, which was stayed by agreement of the parties pending theoutcome of litigation filed by certain insurers of Aqua-Chem. In that case, five plaintiff insurance companiesfiled a declaratory judgment action against Aqua-Chem, the Company and 16 defendant insurance companiesseeking a determination of the parties’ rights and liabilities under policies issued by the insurers. That litigationremains pending, and the Company believes it has substantial legal and factual defenses to the insurers’ claims.Aqua-Chem and the Company have reached an agreement in principle to settle with five of the insurers in theWisconsin insurance coverage litigation, and those insurers will pay funds into an escrow account for payment ofcosts arising from the asbestos claims against Aqua-Chem. Aqua-Chem and the Company will continue tolitigate their claims for coverage against the 16 other insurers that are parties to the Wisconsin insurancecoverage case. The Company also believes Aqua-Chem has substantial insurance coverage to pay Aqua-Chem’sasbestos claimants. An estimate of possible losses, if any, cannot be made at this time.
Since 1999, the Competition Directorate of the European Commission (the ‘‘Commission’’) has beenconducting an investigation of various commercial and market practices of the Company and its bottlers inAustria, Belgium, Denmark, Germany and Great Britain. On October 19, 2004, our Company and certain of ourbottlers submitted a formal Undertaking to the Commission, and the Commission accepted the Undertaking.The Undertaking will potentially apply in 27 countries and in all channels of distribution where our carbonatedsoft drinks account for over 40 percent of national sales and twice the nearest competitor’s share. It will takemore than 12 months to fully implement the Undertaking and for the market to react to any resulting changes.The commitments we made in the Undertaking relate broadly to exclusivity, percentage-based purchasingcommitments, transparency, target rebates, tying, assortment or range commitments, and agreementsconcerning products of other suppliers. The Undertaking will also apply to shelf space commitments inagreements with take-home customers and to financing and availability agreements in the on-premise channel.In addition, the Undertaking includes commitments that will be applicable to commercial arrangementsconcerning the installation and use of technical equipment (such as coolers, fountain equipment and vendingmachines). The commitments set forth in the Undertaking have been published for third-party comments.Following the comment period, the Commission presented to the Company certain comments it had received
92

NOTES TO CONSOLIDATED FINANCIAL STATEMENTS
The Coca-Cola Company and Subsidiaries
NOTE 11: COMMITMENTS AND CONTINGENCIES (Continued)
from third parties, as well as certain additional comments from the Commission’s legal staff. The Company is inthe process of addressing these comments with the Commission. The Company anticipates that the formalUndertaking will form the basis of a Commission decision pursuant to Article 9, paragraph 1 of CouncilRegulation 1/2003 to be issued in the second quarter of 2005, bringing an end to the investigation. Thesubmission of the Undertaking does not imply any recognition on the Company’s or the bottlers’ part of anyinfringement of Commission competition rules. We believe that the Undertaking, while imposing restrictions,clarifies the application of competition rules to our practices in Europe and will allow our system to be able tocompete vigorously while adhering to the Undertaking’s provisions.
The Company is also discussing with the Commission issues relating to parallel trade within the EuropeanUnion arising out of comments received by the Commission from third parties. The Company is fullycooperating with the Commission and is providing information on these issues and the measures taken and to betaken to address any issues raised. The Company is unable to predict at this time with any reasonable degree ofcertainty what action, if any, the Commission will take with respect to these issues.
The Spanish competition service made unannounced visits to our offices and those of certain bottlers inSpain in 2000. In December 2003, the Spanish competition service suspended its investigation until theCommission notifies the service of how the Commission will proceed in its aforementioned investigation.
The French Competition Directorate has also initiated an inquiry into commercial practices related to thesoft drink sector in France. This inquiry has been conducted through visits to the offices of the Company;however, no conclusions have been communicated to the Company by the Directorate.
At the time of divesting our interest in a consolidated entity, we sometimes agree to indemnify the buyer forspecific liabilities related to the period we owned the entity. Management believes that any liability to theCompany that may arise as a result of any such indemnification agreements will not have a material adverseeffect on the financial condition of the Company taken as a whole.
The Company is involved in various tax matters. We establish reserves at the time that we determine that itis probable that we will be liable to pay additional taxes related to certain matters. We adjust these reserves,including any impact on the related interest and penalties, in light of changing facts and circumstances, such asthe progress of a tax audit.
A number of years may elapse before a particular matter, for which we may have established a reserve, isaudited and finally resolved or when a tax assessment is raised. The number of years with open tax audits variesdepending on the tax jurisdiction. While it is often difficult to predict the final outcome or the timing ofresolution of any particular tax matter, we record a reserve when we determine the likelihood of loss is probableand the amount of loss is reasonably estimable. Such liabilities are recorded in the line item accrued incometaxes in the Company’s consolidated balance sheets. Favorable resolution of tax matters that had been previouslyreserved would be recognized as a reduction to our income tax expense, when known.
The Company is also involved in various tax matters where we have determined that the probability of anunfavorable outcome is reasonably possible. Management believes that any liability to the Company that mayarise as a result of currently pending tax matters will not have a material adverse effect on the financial conditionof the Company taken as a whole.
The Company is a party to various legal proceedings in which we are seeking to be reimbursed for costs thatwe have incurred in the past. Although none of these reimbursements has been realized at this time, the
93

NOTES TO CONSOLIDATED FINANCIAL STATEMENTS
The Coca-Cola Company and Subsidiaries
NOTE 11: COMMITMENTS AND CONTINGENCIES (Continued)
Company expects final resolution of certain matters in 2005. Management believes that any gains to theCompany that may arise as a result of the final resolutions of these matters will not have a material effect on thefinancial condition of the Company taken as a whole.
NOTE 12: NET CHANGE IN OPERATING ASSETS AND LIABILITIES
Net cash provided by operating activities attributable to the net change in operating assets and liabilities iscomposed of the following (in millions):
2004 2003 2002
Decrease (increase) in trade accounts receivable $ (5) $ 80 $ (83)Decrease (increase) in inventories (57) 111 (49)Decrease (increase) in prepaid expenses and other assets (397) (276) 74Increase (decrease) in accounts payable and accrued expenses 45 (164) (442)Increase (decrease) in accrued taxes (194) 53 20Increase (decrease) in other liabilities (9) 28 73
$ (617) $ (168) $ (407)
NOTE 13: RESTRICTED STOCK, STOCK OPTIONS AND OTHER STOCK PLANS
Prior to 2002, our Company accounted for our stock option plans and restricted stock plans under therecognition and measurement provisions of APB Opinion No. 25 and related interpretations. EffectiveJanuary 1, 2002, our Company adopted the preferable fair value recognition provisions of SFAS No. 123. OurCompany selected the modified prospective method of adoption described in SFAS No. 148. Compensation costrecognized in 2002 was the same as that which would have been recognized had the fair value method of SFASNo. 123 been applied from its original effective date. Refer to Note 1.
In accordance with the provisions of SFAS No. 123 and SFAS No. 148, $345 million, $422 million and$365 million were recorded for total stock-based compensation expense in 2004, 2003 and 2002, respectively.The $345 million and $365 million recorded in 2004 and 2002, respectively, were recorded in selling, general andadministrative expenses. Of the $422 million recorded in 2003, $407 million was recorded in selling, general andadministrative expenses and $15 million was recorded in other operating charges. Refer to Note 17.
Stock Option Plans
Under our 1991 Stock Option Plan (the ‘‘1991 Option Plan’’), a maximum of 120 million shares of ourcommon stock was approved to be issued or transferred to certain officers and employees pursuant to stockoptions granted under the 1991 Option Plan. Options to purchase common stock under the 1991 Option Planhave been granted to Company employees at fair market value at the date of grant.
The 1999 Stock Option Plan (the ‘‘1999 Option Plan’’) was approved by shareowners in April 1999. Followingthe approval of the 1999 Option Plan, no grants were made from the 1991 Option Plan, and shares available underthe 1991 Option Plan were no longer available to be granted. Under the 1999 Option Plan, a maximum of120 million shares of our common stock was approved to be issued or transferred to certain officers and employeespursuant to stock options granted under the 1999 Option Plan. Options to purchase common stock under the 1999Option Plan have been granted to Company employees at fair market value at the date of grant.
94

NOTES TO CONSOLIDATED FINANCIAL STATEMENTS
The Coca-Cola Company and Subsidiaries
NOTE 13: RESTRICTED STOCK, STOCK OPTIONS AND OTHER STOCK PLANS (Continued)
The 2002 Stock Option Plan (the ‘‘2002 Option Plan’’) was approved by shareowners in April 2002. Underthe 2002 Option Plan, a maximum of 120 million shares of our common stock was approved to be issued ortransferred to certain officers and employees pursuant to stock options and stock appreciation rights grantedunder the 2002 Option Plan. The stock appreciation rights permit the holder, upon surrendering all or part ofthe related stock option, to receive common stock in an amount up to 100 percent of the difference between themarket price and the option price. No stock appreciation rights have been issued under the 2002 Stock OptionPlan as of December 31, 2004. Options to purchase common stock under the 2002 Option Plan have beengranted to Company employees at fair market value at the date of grant.
Stock options granted in December 2003 and thereafter generally become exercisable over a four-yearvesting period and expire 10 years from the date of grant. Stock option grants from 1999 through July 2003generally become exercisable over a four-year vesting period and expire 15 years from the date of grant. Prior to1999, stock options generally became exercisable over a three-year vesting period and expired 10 years from thedate of grant.
The following table sets forth information about the fair value of each option grant on the date of grant usingthe Black-Scholes-Merton option-pricing model and the weighted-average assumptions used for such grants:
2004 2003 2002
Weighted-average fair value of options granted $ 8.84 $ 13.49 $ 13.10Dividend yields 2.5% 1.9% 1.7%Expected volatility 23.0% 28.1% 30.2%Risk-free interest rates 3.8% 3.5% 3.4%Expected lives 6 years 6 years 6 years
To ensure the best market-based assumptions were used to determine the estimated fair value of stockoptions granted in 2004, 2003 and 2002, we obtained two independent market quotes. Our Black-Scholes-Merton option-pricing model value was not materially different from the independent quotes.
A summary of stock option activity under all plans is as follows (shares in millions):2004 2003 2002
Weighted- Weighted- Weighted-Average Average AverageExercise Exercise Exercise
Shares Price Shares Price Shares Price
Outstanding on January 1 167 $ 50.56 159 $ 50.24 141 $ 51.16Granted1 31 41.63 24 49.67 29 44.69Exercised (5) 35.54 (4) 26.96 (3) 31.09Forfeited/expired2 (10) 51.64 (12) 51.45 (8) 54.21
Outstanding on December 31 183 $ 49.41 167 $ 50.56 159 $ 50.24
Exercisable on December 31 116 $ 52.02 102 $ 51.97 80 $ 51.72
Shares available on December 31 foroptions that may be granted 85 108 122
1 No grants were made from the 1991 Option Plan during 2004, 2003 or 2002.2 Shares forfeited/expired relate to the 1991, 1999 and 2002 Option Plans.
95

NOTES TO CONSOLIDATED FINANCIAL STATEMENTS
The Coca-Cola Company and Subsidiaries
NOTE 13: RESTRICTED STOCK, STOCK OPTIONS AND OTHER STOCK PLANS (Continued)
The following table summarizes information about stock options at December 31, 2004 (shares in millions):
Outstanding Stock Options Exercisable Stock Options
Weighted-AverageRemaining Weighted-Average Weighted-Average
Range of Exercise Prices Shares Contractual Life Exercise Price Shares Exercise Price
$ 30.00 to $ 40.00 6 0.8 years $ 35.63 6 $ 35.63$ 40.01 to $ 50.00 119 10.3 years $ 46.03 53 $ 47.57$ 50.01 to $ 60.00 48 9.1 years $ 56.25 47 $ 56.30$ 60.01 to $ 86.75 10 3.8 years $ 65.85 10 $ 65.85
$ 30.00 to $ 86.75 183 9.3 years $ 49.41 116 $ 52.02
Restricted Stock Award Plans
Under the amended 1989 Restricted Stock Award Plan and the amended 1983 Restricted Stock Award Plan(the ‘‘Restricted Stock Award Plans’’), 40 million and 24 million shares of restricted common stock, respectively,were originally available to be granted to certain officers and key employees of our Company.
On December 31, 2004, 31 million shares remain available for grant under the Restricted Stock AwardPlans. Participants are entitled to vote and receive dividends on the shares and, under the 1983 Restricted StockAward Plan, participants are reimbursed by our Company for income taxes imposed on the award, but not fortaxes generated by the reimbursement payment. The shares are subject to certain transfer restrictions and maybe forfeited if a participant leaves our Company for reasons other than retirement, disability or death, absent achange in control of our Company.
The following awards were outstanding as of December 31, 2004:
• 513,700 shares of restricted stock in which the restrictions lapse upon the achievement of continuedemployment over a specified period of time (time-based restricted stock awards);
• 713,000 shares of performance-based restricted stock in which restrictions lapse upon the achievement ofspecific performance goals over a specified performance period. An additional 125,000 shares werepromised, based upon achievement of relevant performance criteria, for employees based outside of theUnited States; and
• 1,583,447 performance share unit awards which could result in a future grant of restricted stock after theachievement of specific performance goals over a specified performance period. Such awards are subjectto adjustment based on the final performance relative to the goals, resulting in a minimum grant of noshares and a maximum grant of 2,339,171 shares.
96

NOTES TO CONSOLIDATED FINANCIAL STATEMENTS
The Coca-Cola Company and Subsidiaries
NOTE 13: RESTRICTED STOCK, STOCK OPTIONS AND OTHER STOCK PLANS (Continued)
Time-Based Restricted Stock Awards
The following table summarizes information about time-based restricted stock awards:
Number of Shares
2004 2003 2002
Outstanding on January 1, 1,224,900 1,506,485 1,492,985Granted1 140,000 — 30,000Released (296,800) (254,585) (14,000)Cancelled/Forfeited (554,400) (27,000) (2,500)
Outstanding on December 31, 513,700 1,224,900 1,506,485
1 In 2004 and 2002, the Company granted time-based restricted stock awards with average per sharefair values of $48.97 and $50.99, respectively.
Performance-Based Restricted Stock Awards
In 2001, shareowners approved an amendment to the 1989 Restricted Stock Award Plan to allow for thegrant of performance-based awards. These awards are released only upon the achievement of specificmeasurable performance criteria. These awards pay dividends during the performance period. The majority ofawards had specific earnings per share targets for achievement. If the earnings per share target is not met, theawards will be cancelled.
The following table summarizes information about performance-based restricted stock awards:
Number of Shares
2004 2003 2002
Outstanding on January 1, 2,507,720 2,655,000 2,605,000Granted1 — 52,720 50,000Released (110,000) — —Cancelled/Forfeited (1,684,720) (200,000) —
Outstanding on December 31, 713,0002 2,507,7202 2,655,0002
1 In 2003, 52,720 shares of three-year performance-based restricted stock were granted at an averagefair value of $42.91 per share. In 2002, 50,000 shares of four-year performance-based restricted stockwere granted at an average fair value of $46.88 per share.
2 In 2002, the Company promised to grant an additional 50,000 shares at the end of three years and anadditional 75,000 shares at the end of four years, at an average value of $46.88, if the Companyachieved predefined performance targets over the respective measurement periods. These awards aresimilar to the performance-based restricted stock, including the payment of dividend equivalents, butwere granted in this manner because the employees were situated outside of the United States. As ofDecember 31, 2004, these grants were still outstanding.
The Company did not recognize compensation expense for the majority of these awards, as it is notprobable the performance targets will be achieved.
97

NOTES TO CONSOLIDATED FINANCIAL STATEMENTS
The Coca-Cola Company and Subsidiaries
NOTE 13: RESTRICTED STOCK, STOCK OPTIONS AND OTHER STOCK PLANS (Continued)
Performance Share Unit Awards
In 2003, the Company modified its use of performance-based awards and established a program to grantperformance share unit awards under the 1989 Restricted Stock Award Plan to executives. The number ofperformance share units earned shall be determined at the end of each performance period, generally threeyears, based on performance measurements determined by the Board of Directors and may result in an award ofrestricted stock for U.S. participants and certain international participants at that time. The restricted stock maybe granted to other international participants shortly before the fifth anniversary of the original award.Restrictions on such stock lapse generally on the fifth anniversary of the original award date. Generally,performance share unit awards are subject to the performance criteria of compound annual growth in earningsper share over the performance period, as adjusted for certain items approved by the Compensation Committeeof the Board of Directors (‘‘adjusted EPS’’). The purpose of these adjustments is to ensure a consistent year toyear comparison of the specified performance measure.
Performance share unit Target Awards for the 2004-2006 and 2005-2007 performance periods requireadjusted EPS growth in line with our Company’s internal projections over the performance period. In the eventadjusted EPS exceeds the target projection, additional shares up to the Maximum Award may be granted. In theevent adjusted EPS falls below the target projection, a reduced number of shares as few as the Threshold Awardmay be granted. If adjusted EPS falls below the Threshold Award performance level, no shares will be granted.Of the outstanding granted performance share unit awards as of December 31, 2004, 741,985 and 769,462awards are for the 2004-2006 and 2005-2007 performance periods, respectively. In addition, 72,000 performanceshare unit awards, with predefined qualitative performance measures other than adjusted EPS and other releasecriteria that differ from the program described above, are included in the performance share units grantedin 2004.
The following table summarizes information about performance share unit awards:
Number of Share Units
2004 2003
Outstanding on January 1, 798,931 —Granted1 953,196 798,931Cancelled/Forfeited (168,680) —
Outstanding on December 31, 1,583,447 798,931
Threshold Award 950,837 399,466Target Award 1,583,447 798,931Maximum Award 2,339,171 1,198,397
1 In 2004 and 2003, the Company granted performance share unit awards with average fair values of$38.71 and $46.78, respectively.
The Company did not recognize any compensation expense in 2004 for awards from the 2004-2006performance period, as it is not probable the Threshold Award performance level will be achieved.
98

NOTES TO CONSOLIDATED FINANCIAL STATEMENTS
The Coca-Cola Company and Subsidiaries
NOTE 14: PENSION AND OTHER POSTRETIREMENT BENEFIT PLANS
Our Company sponsors and/or contributes to pension and postretirement health care and life insurancebenefit plans covering substantially all U.S. employees. We also sponsor nonqualified, unfunded defined benefitpension plans for certain members of management. In addition, our Company and its subsidiaries have variouspension plans and other forms of postretirement arrangements outside the United States. We use ameasurement date of December 31 for substantially all of our pension and postretirement benefit plans.
Obligations and Funded Status
The following table sets forth the change in benefit obligations for our benefit plans (in millions):
Pension Benefits Other Benefits
December 31, 2004 2003 2004 2003
Benefit obligation at beginning of year1 $ 2,495 $ 2,182 $ 761 $ 651Service cost 85 76 27 25Interest cost 147 140 44 44Foreign currency exchange rate changes 71 90 1 1Amendments — (2) — (25)Actuarial (gain) loss2 124 142 (11) 86Benefits paid3 (125) (122) (25) (22)Curtailments 3 (23) — (6)Special termination benefits — 12 — 5Other — — 4 2
Benefit obligation at end of year1 $ 2,800 $ 2,495 $ 801 $ 761
1 For pension benefit plans, the benefit obligation is the projected benefit obligation. For other benefitplans, the benefit obligation is the accumulated postretirement benefit obligation.
2 During 2004, our accumulated postretirement benefit obligation was reduced by $67 million due tothe adoption of FSP 106-2. Refer to Note 1.
3 Benefits paid from pension benefit plans during 2004 and 2003 included $25 million and $27 million,respectively, in payments related to unfunded pension plans that were paid from Company assets. Allof the benefits paid from other benefit plans during 2004 and 2003 were paid from Company assets.
The accumulated benefit obligation for our pension plans was $2,440 million and $2,145 million atDecember 31, 2004 and 2003, respectively.
The total projected benefit obligation and fair value of plan assets for the pension plans with projectedbenefit obligations in excess of plan assets were $1,112 million and $388 million, respectively, as of December 31,2004 and $941 million and $311 million, respectively, as of December 31, 2003. The total accumulated benefitobligation and fair value of plan assets for the pension plans with accumulated benefit obligations in excess ofplan assets were $916 million and $341 million, respectively, as of December 31, 2004 and $770 million and$274 million, respectively, as of December 31, 2003.
99

NOTES TO CONSOLIDATED FINANCIAL STATEMENTS
The Coca-Cola Company and Subsidiaries
NOTE 14: PENSION AND OTHER POSTRETIREMENT BENEFIT PLANS (Continued)
The following table sets forth the change in the fair value of plan assets for our benefit plans (in millions):
Pension Benefits Other Benefits
December 31, 2004 2003 2004 2003
Fair value of plan assets at beginning of year1 $ 2,024 $ 1,452 $ — $ —Actual return on plan assets 243 405 1 —Employer contributions 179 208 9 —Foreign currency exchange rate changes 51 54 — —Benefits paid (100) (95) — —
Fair value of plan assets at end of year1 $ 2,397 $ 2,024 $ 10 $ —
1 Plan assets include 1.6 million shares of common stock of our Company with a fair value of$67 million and $82 million as of December 31, 2004 and 2003, respectively. Dividends received oncommon stock of our Company during 2004 and 2003 were $1.6 million and $1.4 million, respectively.
The pension and other benefit amounts recognized in our consolidated balance sheets are as follows(in millions):
Pension Benefits Other Benefits
December 31, 2004 2003 2004 2003
Funded status—plan assets less than benefit obligations $ (403) $ (471) $ (791) $ (761)Unrecognized net actuarial loss 447 429 187 203Unrecognized prior service cost (benefit) 47 55 (6) (7)
Net prepaid asset (liability) recognized $ 91 $ 13 $ (610) $ (565)
Prepaid benefit cost $ 527 $ 407 $ — $ —Accrued benefit liability (595) (519) (610) (565)Intangible asset 15 16 — —Accumulated other comprehensive income 144 109 — —
Net prepaid asset (liability) recognized $ 91 $ 13 $ (610) $ (565)
100

NOTES TO CONSOLIDATED FINANCIAL STATEMENTS
The Coca-Cola Company and Subsidiaries
NOTE 14: PENSION AND OTHER POSTRETIREMENT BENEFIT PLANS (Continued)
Components of Net Periodic Benefit Cost
Net periodic benefit cost for our pension and other postretirement benefit plans consists of the following(in millions):
Pension Benefits Other Benefits
Year Ended December 31, 2004 2003 2002 2004 2003 2002
Service cost $ 85 $ 76 $ 63 $ 27 $ 25 $ 18Interest cost 147 140 132 44 44 38Expected return on plan assets (153) (130) (137) — — —Amortization of prior service cost (benefit) 8 7 6 (1) — 2Recognized net actuarial loss 35 27 8 3 6 —
Net periodic benefit cost1 $ 122 $ 120 $ 72 $ 73 $ 75 $ 58
1 During 2004, net periodic benefit cost for our other postretirement benefit plans was reduced by$12 million due to our adoption of FSP 106-2. Refer to Note 1.
In 2003, the Company recorded a charge of $23 million for special retirement benefits and curtailment costsas part of the streamlining costs discussed in Note 17.
Assumptions
The weighted-average assumptions used in computing the benefit obligations are as follows:
Pension Benefits Other Benefits
December 31, 2004 2003 2004 2003
Discount rate 51⁄2% 6% 6% 61⁄4%Rate of increase in compensation levels 4% 41⁄4% 41⁄2% 41⁄2%
The weighted-average assumptions used in computing net periodic benefit cost are as follows:
Pension Benefits Other Benefits
Year Ended December 31, 2004 2003 2002 2004 2003 2002
Discount rate1 6% 6% 61⁄2% 61⁄4% 61⁄2% 71⁄4%Rate of increase in compensation levels 41⁄4% 41⁄4% 41⁄4% 41⁄2% 41⁄2% 41⁄2%Expected long-term rate of return on plan assets 73⁄4% 73⁄4% 81⁄4% 81⁄2% — —
1 On March 27, 2003, the primary qualified and nonqualified U.S. pension plans, as well as the U.S.postretirement health care plan, were remeasured to reflect the effect of the curtailment resultingfrom the Company’s streamlining initiatives. Refer to Note 17. The discount rate assumption used todetermine 2003 net periodic benefit cost for these U.S. plans was 63⁄4 percent prior to theremeasurement and 61⁄2 percent subsequent to the remeasurement. This change in the discount rate isreflected in the 2003 weighted-average discount rate of 6 percent for all pension benefit plans and 61⁄2percent for other benefit plans.
101

NOTES TO CONSOLIDATED FINANCIAL STATEMENTS
The Coca-Cola Company and Subsidiaries
NOTE 14: PENSION AND OTHER POSTRETIREMENT BENEFIT PLANS (Continued)
The assumed health care cost trend rates are as follows:
December 31, 2004 2003
Health care cost trend rate assumed for next year 91⁄2% 10%Rate to which the cost trend rate is assumed to decline (the ultimate trend rate) 51⁄4% 51⁄4%Year that the rate reaches the ultimate trend rate 2010 2009
Assumed health care cost trend rates have a significant effect on the amounts reported for thepostretirement health care plans. A one percentage point change in the assumed health care cost trend ratewould have the following effects (in millions):
One Percentage Point One Percentage PointIncrease Decrease
Effect on accumulated postretirement benefit obligation asof December 31, 2004 $ 128 $ (111)
Effect on total of service cost and interest cost in 2004 $ 13 $ (11)
The discount rate assumptions used to account for pension and other postretirement benefit plans reflectthe rates at which the benefit obligations could be effectively settled. These rates were determined using a cashflow matching technique whereby a hypothetical portfolio of high quality debt securities was constructed thatmirrors the specific benefit obligations for each of our primary plans. The rate of compensation increaseassumption is determined by the Company based upon annual reviews. We review external data and our ownhistorical trends for health care costs to determine the health care cost trend rate assumptions.
Plan Assets
The following table sets forth the actual asset allocation and weighted-average target asset allocation forour U.S. and non-U.S. pension plan assets:
Target AssetDecember 31, 2004 2003 Allocation
Equity securities1 60% 60% 56%Debt securities 31% 32% 35%Real estate and other2 9% 8% 9%
Total 100% 100% 100%
1 As of December 31, 2004 and 2003, 3 percent and 4 percent, respectively, of total pension plan assetswere invested in common stock of our Company.
2 As of December 31, 2004 and 2003, 4 percent of total pension plan assets were invested in real estate.
Investment objectives for the Company’s U.S. pension plan assets, which comprise 72 percent of totalpension plan assets as of December 31, 2004, are to:
(1) optimize the long-term return on plan assets at an acceptable level of risk;
(2) maintain a broad diversification across asset classes and among investment managers;
(3) maintain careful control of the risk level within each asset class; and
(4) focus on a long-term return objective.
102

NOTES TO CONSOLIDATED FINANCIAL STATEMENTS
The Coca-Cola Company and Subsidiaries
NOTE 14: PENSION AND OTHER POSTRETIREMENT BENEFIT PLANS (Continued)
Asset allocation targets promote optimal expected return and volatility characteristics given the long-termtime horizon for fulfilling the obligations of the pension plans. Selection of the targeted asset allocation for U.S.plan assets was based upon a review of the expected return and risk characteristics of each asset class, as well asthe correlation of returns among asset classes.
Investment guidelines are established with each investment manager. These guidelines provide theparameters within which the investment managers agree to operate, including criteria that determine eligibleand ineligible securities, diversification requirements and credit quality standards, where applicable. Unlessexceptions have been approved, investment managers are prohibited from buying or selling commodities, futuresor option contracts, as well as from short selling of securities. Furthermore, investment managers agree to obtainwritten approval for deviations from stated investment style or guidelines.
As of December 31, 2004, no investment manager was responsible for more than 10 percent of total U.S.plan assets. In addition, diversification requirements for each investment manager prevent a single security orother investment from exceeding 10 percent, at historical cost, of the total U.S. plan assets.
The expected long-term rate of return assumption on U.S. plan assets is based upon the target assetallocation and is determined using forward-looking assumptions in the context of historical returns andvolatilities for each asset class, as well as correlations among asset classes. We evaluate the rate of returnassumption on an annual basis. The expected long-term rate of return assumption used in computing 2004 netperiodic pension cost for the U.S. plans was 8.5 percent. As of December 2004, the 10 year annualized return onU.S. plan assets was 11.8 percent, the 15 year annualized return was 11.0 percent, and the annualized returnsince inception was 12.9 percent.
Plan assets for our pension plans outside the United States are insignificant on an individual plan basis.
Cash Flows
Information about the expected cash flow for our pension and other postretirement benefit plans isas follows:
Pension OtherBenefits Benefits
Expected employer contributions:2005 $ 114 $ 9Expected benefit payments1:2005 130 302006 121 322007 126 352008 128 372009 129 402010-2014 706 236
1 The expected benefit payments for our other postretirement benefit plans do not reflect anyestimated federal subsidies expected to be received under the Medicare Prescription Drug,Improvement and Modernization Act of 2003. Federal subsidies are estimated to range from$2.1 million in 2005 to $2.8 million in 2009 and are estimated to be $18.5 million for the period2010-2014.
103

NOTES TO CONSOLIDATED FINANCIAL STATEMENTS
The Coca-Cola Company and Subsidiaries
NOTE 14: PENSION AND OTHER POSTRETIREMENT BENEFIT PLANS (Continued)
Defined Contribution Plans
Our Company sponsors a qualified defined contribution plan covering substantially all U.S. employees. Underthis plan, we match 100 percent of participants’ contributions up to a maximum of 3 percent of compensation.Company contributions to the U.S. plan were $18 million, $20 million and $20 million in 2004, 2003 and 2002,respectively. We also sponsor defined contribution plans in certain locations outside the United States. Companycontributions to these plans were $8 million, $7 million and $6 million in 2004, 2003 and 2002, respectively.
NOTE 15: INCOME TAXES
Income before income taxes and cumulative effect of accounting change consists of the following(in millions):
Year Ended December 31, 2004 2003 2002
United States $ 2,535 $ 2,029 $ 2,062International 3,687 3,466 3,437
$ 6,222 $ 5,495 $ 5,499
Income tax expense (benefit) consists of the following (in millions):
United State andYear Ended December 31, States Local International Total
2004Current $ 350 $ 64 $ 799 $ 1,213Deferred 209 29 (76) 162
2003Current $ 426 $ 84 $ 826 $ 1,336Deferred (145) (11) (32) (188)
2002Current $ 455 $ 55 $ 973 $ 1,483Deferred 2 23 15 40
We made income tax payments of approximately $1,500 million, $1,325 million and $1,508 million in 2004,2003 and 2002, respectively.
104

NOTES TO CONSOLIDATED FINANCIAL STATEMENTS
The Coca-Cola Company and Subsidiaries
NOTE 15: INCOME TAXES (Continued)
A reconciliation of the statutory U.S. federal rate and effective rates is as follows:Year Ended December 31, 2004 2003 2002
Statutory U.S. federal rate 35.0 % 35.0 % 35.0 %State income taxes—net of federal benefit 1.0 0.9 0.9Earnings in jurisdictions taxed at rates different from the statutory
U.S. federal rate (9.4)1,2 (10.6)7 (6.0)Equity income or loss (3.1)3,4 (2.4)8 (2.0)10
Other operating charges (0.9)5 (1.1)9 —Write-down/sale of certain bottling investments — — 0.7 11
Other—net (0.5)6 (0.9) (0.9)
Effective rates 22.1 % 20.9 % 27.7 %
1 Includes approximately $92 million (or 1.4 percent) tax benefit related to the favorable resolution ofvarious tax issues and settlements.
2 Includes tax charge of approximately $75 million (or 1.2 percent) related to recording of valuationallowance on various deferred tax assets recorded in Germany.
3 Includes approximately $50 million (or 0.8 percent) tax benefit related to the realization of certainforeign tax credits per provisions of the Jobs Creation Act.
4 Includes approximately $13 million (or 0.1 percent) tax charge on our proportionate share of thefavorable tax settlement related to Coca-Cola FEMSA.
5 Primarily related to impairment of franchise rights at CCEAG and certain manufacturing investments.Refer to Note 16.
6 Includes approximately $36 million (or 0.6 percent) tax benefit related to the favorable resolution ofvarious tax issues and settlements.
7 Includes approximately $50 million (or 0.8 percent) tax benefit for the release of tax reserves dueprimarily to the resolution of various tax matters.
8 Includes the tax effect of the write-down of certain intangible assets held by bottling investments inLatin America. Refer to Note 2.
9 Includes the tax effect of the charges for streamlining initiatives. Refer to Note 17.10 Includes the tax effect of the charges by equity investees in 2002. Refer to Note 16.11 Includes gains on the sale of Cervejarias Kaiser Brazil, Ltda and the write-down of certain bottling
investments, primarily in Latin America. Refer to Note 16.
Our effective tax rate reflects the tax benefits from having significant operations outside the United Statesthat are taxed at rates lower than the statutory U.S. rate of 35 percent. In 2003, our effective tax rate reflectsfurther benefit from realization of tax benefits on charges related to streamlining initiatives recorded in locationswith tax rates higher than our effective tax rate.
In 2003, management concluded that it was more likely than not that tax benefits would not be realized onCoca-Cola FEMSA’s write-down of intangible assets in Latin America in connection with its merger withPanamco. Refer to Note 2. In 2002, management concluded that it was more likely than not that tax benefitswould not be realized with respect to principally all of the items disclosed in Note 16. Accordingly, valuation
105

NOTES TO CONSOLIDATED FINANCIAL STATEMENTS
The Coca-Cola Company and Subsidiaries
NOTE 15: INCOME TAXES (Continued)
allowances were recorded to offset the future tax benefit of these items, resulting in an increase in our effectivetax rate.
Undistributed earnings of the Company’s foreign subsidiaries amounted to approximately $9.8 billion atDecember 31, 2004. Those earnings are considered to be indefinitely reinvested and, accordingly, no U.S.federal and state income taxes have been provided thereon. Upon distribution of those earnings in the form ofdividends or otherwise, the Company would be subject to both U.S. income taxes (subject to an adjustment forforeign tax credits) and withholding taxes payable to the various foreign countries. Determination of the amountof unrecognized deferred U.S. income tax liability is not practical because of the complexities associated with itshypothetical calculation; however, unrecognized foreign tax credits would be available to reduce a portion of theU.S. liability.
As discussed in Note 1, the Jobs Creation Act was enacted in October 2004. One of the provisions providesa one time benefit related to foreign tax credits generated by equity investments in prior years. The Companyrecorded an income tax benefit of approximately $50 million as a result of this law change in 2004. The JobsCreation Act also includes a temporary incentive for U.S. multinationals to repatriate foreign earnings at aneffective 5.25 percent tax rate. As of December 31, 2004, management had not decided whether, and to whatextent, we might repatriate foreign earnings under the Jobs Creation Act, and accordingly, the consolidatedfinancial statements do not reflect any provision for taxes on the unremitted foreign earnings that might beremitted under the Jobs Creation Act. Based on our analysis to date, however, it is reasonably possible that wemay repatriate some amount between $0 and $6.1 billion, with the respective tax liability ranging from $0 to$400 million. We expect to be in a position to finalize our assessment by December 31, 2005.
106

NOTES TO CONSOLIDATED FINANCIAL STATEMENTS
The Coca-Cola Company and Subsidiaries
NOTE 15: INCOME TAXES (Continued)
The tax effects of temporary differences and carryforwards that give rise to deferred tax assets and liabilitiesconsist of the following (in millions):
December 31, 2004 2003
Deferred tax assets:Property, plant and equipment $ 71 $ 87Trademarks and other intangible assets 65 68Equity method investments (including translation adjustment) 530 485Other liabilities 149 242Benefit plans 594 669Net operating/capital loss carryforwards 856 711Other 257 195
Gross deferred tax assets 2,522 2,457Valuation allowance (854) (630)
Total deferred tax assets1 $ 1,668 $ 1,827
Deferred tax liabilities:Property, plant and equipment $ (684) $ (737)Trademarks and other intangible assets (247) (247)Equity method investments (including translation adjustment) (612) (468)Other liabilities (71) (55)Other (180) (211)
Total deferred tax liabilities $ (1,794) $ (1,718)
Net deferred tax assets (liabilities) $ (126) $ 109
1 Deferred tax assets of $324 million and $446 million were included in the consolidated balance sheetline item other assets at December 31, 2004 and 2003, respectively.
On December 31, 2004 and 2003, we had approximately $194 million and $160 million, respectively, of netdeferred tax assets located in countries outside the United States.
On December 31, 2004, we had $3,258 million of loss carryforwards available to reduce future taxableincome. Loss carryforwards of $861 million must be utilized within the next five years; $550 million must beutilized within the next 10 years and the remainder can be utilized over a period greater than 10 years.
NOTE 16: SIGNIFICANT OPERATING AND NONOPERATING ITEMS
Operating income in 2004 reflected the impact of $480 million of expenses primarily related to impairmentcharges for franchise rights and certain manufacturing investments. These impairment charges were recorded inthe consolidated statement of income line item other operating charges.
In the second quarter of 2004, we recorded impairment charges totaling approximately $88 million. Theseimpairments primarily related to the write-downs of certain manufacturing investments and an intangible asset.As a result of operating losses, management prepared analyses of cash flows expected to result from the use ofthe assets and their eventual disposition. Because the sum of the undiscounted cash flows was less than thecarrying value of such assets, we recorded an impairment charge to reduce the carrying value of the assets tofair value.
107

NOTES TO CONSOLIDATED FINANCIAL STATEMENTS
The Coca-Cola Company and Subsidiaries
NOTE 16: SIGNIFICANT OPERATING AND NONOPERATING ITEMS (Continued)
In the second quarter of 2004, our Company’s equity income benefited by approximately $37 million for ourproportionate share of a favorable tax settlement related to Coca-Cola FEMSA.
In the third quarter of 2004, we recorded impairment charges of approximately $392 million, which wereprimarily related to the impairment of franchise rights at CCEAG. The CCEAG impairment was the result ofour revised outlook for the German market, which has been unfavorably impacted by volume declines resultingfrom market shifts related to the deposit law on nonreturnable beverage packages and the corresponding lack ofavailability of our products in the discount retail channel. Refer to Note 4.
In the fourth quarter of 2004, our Company received a $75 million insurance settlement related to the class-action lawsuit that was settled in 2000. Also in the fourth quarter of 2004, the Company donated $75 million tothe Coca-Cola Foundation.
In the first quarter of 2003, the Company reached a settlement with certain defendants in a vitamin antitrustlitigation matter. In that litigation, the Company alleged that certain vitamin manufacturers participated in aglobal conspiracy to fix the price of some vitamins, including vitamins used in the manufacture of some of theCompany’s products. During the first quarter of 2003, the Company received a settlement relating to thislitigation of approximately $52 million on a pretax basis, or $0.01 per share on an after-tax basis. The amountwas recorded as a reduction to cost of goods sold.
Refer to Note 2 for disclosure regarding the merger of Coca-Cola FEMSA and Panamco in 2003 and therecording of a $102 million noncash pretax charge to the consolidated statement of income line item equityincome—net.
In the third quarter of 2002, our Company recorded a noncash pretax charge of approximately $33 millionrelated to our share of impairment and restructuring charges taken by certain equity method investees in LatinAmerica. This charge was recorded in the consolidated statement of income line item equity income—net.
Our Company had direct and indirect ownership interests totaling approximately 18 percent in CervejariasKaiser S.A. (‘‘Kaiser S.A.’’). In March 2002, Kaiser S.A. sold its investment in Cervejarias Kaiser Brazil, Ltda toMolson Inc. (‘‘Molson’’) for cash of approximately $485 million and shares of Molson valued at approximately$150 million. Our Company’s pretax share of the gain related to this sale was approximately $43 million, ofwhich approximately $21 million was recorded in the consolidated statement of income line item equityincome—net, and approximately $22 million was recorded in the consolidated statement of income line itemother income (loss)—net.
In the first quarter of 2002, our Company recorded a noncash pretax charge of approximately $157 million(recorded in the consolidated statement of income line item other income (loss)—net), primarily related to thewrite-down of certain investments in Latin America. This write-down reduced the carrying value of theseinvestments in Latin America to fair value. The charge was primarily the result of the economic developments inArgentina during the first quarter of 2002, including the devaluation of the Argentine peso and the severity ofthe unfavorable economic outlook.
NOTE 17: STREAMLINING COSTS
During 2003, the Company took steps to streamline and simplify its operations, primarily in North Americaand Germany. In North America, the Company integrated the operations of three formerly separate NorthAmerican business units—Coca-Cola North America, The Minute Maid Company and Coca-Cola Fountain. InGermany, CCEAG took steps to improve its efficiency in sales, distribution and manufacturing, and our German
108

NOTES TO CONSOLIDATED FINANCIAL STATEMENTS
The Coca-Cola Company and Subsidiaries
NOTE 17: STREAMLINING COSTS (Continued)
Division office also implemented streamlining initiatives. Selected other operations also took steps to streamlinetheir operations to improve overall efficiency and effectiveness. As disclosed in Note 1, under SFAS No. 146, aliability is accrued only when certain criteria are met. All of the Company’s streamlining initiatives met the criteriaof SFAS No. 146 as of December 31, 2003, and all related costs have been incurred as of December 31, 2003.
Employees separated from the Company as a result of these streamlining initiatives were offered severanceor early retirement packages, as appropriate, which included both financial and nonfinancial components. Theexpenses recorded during the year ended December 31, 2003 included costs associated with involuntaryterminations and other direct costs associated with implementing these initiatives. As of December 31, 2003,approximately 3,700 associates had been separated pursuant to these streamlining initiatives. Other direct costsincluded the relocation of employees; contract termination costs; costs associated with the development,communication and administration of these initiatives; and asset write-offs. During 2003, the Company incurredtotal pretax expenses related to these streamlining initiatives of approximately $561 million, or $0.15 per shareafter-tax. These expenses were recorded in the line item other operating charges.
The table below summarizes the costs incurred to date, the balances of accrued streamlining expenses andthe movement in those balances as of and for the years ended December 31, 2003 and 2004 (in millions):
Accrued AccruedCosts Noncash Balance Noncash Balance
Incurred in and December 31, and December 31,Cost Summary 2003 Payments Exchange 2003 Payments Exchange 2004
Severance pay andbenefits $ 248 $ (113) $ 3 $ 138 $ (118) $ (2) $ 18
Retirement relatedbenefits 43 — (14) 29 — (29) —
Outside services—legal,outplacement,consulting 36 (25) — 11 (10) (1) —
Other direct costs 133 (81) (1) 51 (29) 1 23
Total1 $ 460 $ (219) $ (12) $ 229 $ (157) $ (31) $ 41
Asset impairments $ 101
Total costs incurred $ 561
1 As of December 31, 2003 and 2004, $206 million and $41 million, respectively, was included in ourconsolidated balance sheet line item accounts payable and accrued expenses. As of December 31, 2003,approximately $23 million was included in our consolidated balance sheet line item other liabilities. As ofDecember 31, 2004, this amount was reclassified to the pension and postretirement benefit accounts as suchamounts will be paid out in accordance with the Company’s defined benefit and postretirement benefitplans over a number of years.
109

NOTES TO CONSOLIDATED FINANCIAL STATEMENTS
The Coca-Cola Company and Subsidiaries
NOTE 17: STREAMLINING COSTS (Continued)
The total streamlining initiative costs incurred for the year ended December 31, 2003 by operating segmentwere as follows (in millions):
North America $ 273Africa 12Asia 18Europe, Eurasia and Middle East 183Latin America 8Corporate 67
Total $ 561
NOTE 18: ACQUISITIONS AND INVESTMENTS
During 2004, our Company’s acquisition and investment activity totaled approximately $267 million,primarily related to the purchase of trademarks, brands and related contractual rights in Latin America, none ofwhich was individually significant.
During 2003, our Company’s acquisition and investment activity totaled approximately $359 million. Theseacquisitions included purchases of trademarks, brands and related contractual rights of approximately$142 million, none of which was individually significant. Refer to Note 4. Other acquisition and investing activitytotaled approximately $217 million, and with the exception of the acquisition of Truesdale, none was individuallysignificant. In March 2003, our Company acquired a 100 percent ownership interest in Truesdale from CCE forcash consideration of approximately $58 million. Truesdale owns a noncarbonated beverage production facility.The purchase price was allocated primarily to property, plant and equipment acquired. No amount was allocatedto intangible assets. Truesdale is included in our North America operating segment.
During 2002, our Company’s acquisition and investment activity totaled approximately $1,144 million.Included in this $1,144 million, our Company paid $544 million in cash and recorded a note payable ofapproximately $600 million to finance the CCEAG acquisition described below.
In November 2001, we entered into the Control and Profit and Loss Transfer Agreement (‘‘CPL’’) withCCEAG. Under the terms of the CPL, our Company acquired management control of CCEAG. InNovember 2001, we also entered into a Pooling Agreement with certain shareowners of CCEAG that providedour Company with voting control of CCEAG. Both agreements became effective in February 2002, when ourCompany acquired control of CCEAG for a term ending no later than December 31, 2006. CCEAG is includedin our Europe, Eurasia and Middle East operating segment. As a result of acquiring control of CCEAG, ourCompany is working to help focus its sales and marketing programs and assist in developing the business. Thistransaction was accounted for as a business combination, and the results of CCEAG’s operations have beenincluded in the Company’s consolidated financial statements since February 2002. Prior to February 2002, ourCompany accounted for CCEAG under the equity method of accounting. As of December 31, 2002, ourCompany had approximately a 41 percent ownership interest in the outstanding shares of CCEAG. In return forcontrol of CCEAG, pursuant to the CPL we guaranteed annual payments, in lieu of dividends by CCEAG, to allother CCEAG shareowners. These guaranteed annual payments equal 0.76 euro for each CCEAG shareoutstanding. Additionally, all other CCEAG shareowners entered into either a put or a put/call optionagreement with the Company, exercisable at any time up to the December 31, 2006 expiration date. In 2003, oneof the other shareowners exercised its put option which represented approximately 29 percent of the outstanding
110

NOTES TO CONSOLIDATED FINANCIAL STATEMENTS
The Coca-Cola Company and Subsidiaries
NOTE 18: ACQUISITIONS AND INVESTMENTS (Continued)
shares of CCEAG. All payments related to the exercise of the put options will be made in 2006. Our Companyentered into either put or put/call agreements for shares representing approximately a 59 percent interest inCCEAG. The spread in the strike prices of the put and call options is approximately 3 percent.
As of the date of the transaction, the Company concluded that the exercise of the put and/or callagreements was a virtual certainty based on the minimal differences in the strike prices. We concluded thateither the holder of the put option would require the Company to purchase the shares at the agreed-upon putstrike price, or the Company would exercise its call option and require the shareowner to tender its shares at theagreed-upon call strike price. If these puts or calls are exercised, the actual transfer of shares would not occuruntil the end of the term of the CPL. Coupled with the guaranteed payments in lieu of dividends for the term ofthe CPL, these instruments represented the financing vehicle for the transaction. As such, the Companydetermined that the economic substance of the transaction resulted in the acquisition of the remainingoutstanding shares of CCEAG and required the Company to account for the transaction as a businesscombination. Furthermore, the terms of the CPL transferred control and all of the economic risks and rewardsof CCEAG to the Company immediately.
The present value of the total amount likely to be paid by our Company to all other CCEAG shareowners,including the put or put/call payments and the guaranteed annual payments in lieu of dividends, wasapproximately $1,041 million at December 31, 2004. This amount increased from the initial liability ofapproximately $600 million due to the accretion of the discounted value to the ultimate maturity of the liability,as well as approximately $350 million of translation adjustment related to this liability. This liability is includedin the line item other liabilities. The accretion of the discounted value to its ultimate maturity value is recordedin the line item other income (loss)—net, and this amount was approximately $58 million, $51 million and$38 million, respectively, for the years ended December 31, 2004, 2003 and 2002.
In July 2002, our Company and Danone Waters of North America, Inc. (‘‘DWNA’’) formed a new limitedliability company, CCDA Waters, L.L.C. (‘‘CCDA’’), for the production, marketing and distribution of DWNA’sbottled spring and source water business in the United States. In forming CCDA, DWNA contributed assets ofits retail bottled spring and source water business in the United States. These assets included five productionfacilities, a license for the use of the Dannon and Sparkletts brands, as well as ownership of several value brands.Our Company made a cash payment to acquire a controlling 51 percent equity interest in CCDA and is alsoproviding marketing, distribution and management expertise. This transaction was accounted for as a businesscombination, and the consolidated results of CCDA’s operations have been included in the Company’sconsolidated financial statements since July 2002. This business combination expanded our water brands toinclude a national offering in all sectors of the water category with purified, spring and source waters. CCDA isincluded in our North America operating segment.
In January 2002, our Company and Coca-Cola Bottlers Philippines, Inc. (‘‘CCBPI’’) finalized the purchaseof RFM Corp.’s (‘‘RFM’’) approximate 83 percent interest in Cosmos Bottling Corporation (‘‘CBC’’), a publiclytraded Philippine beverage company. CBC is an established carbonated soft-drink business in the Philippinesand is included in our Asia operating segment. The original sale and purchase agreement with RFM was enteredinto in November 2001. As of the date of this sale and purchase agreement, the Company began supplyingconcentrate for this operation. The purchase of RFM’s interest was finalized on January 3, 2002. In March 2002,a tender offer was completed with our Company and CCBPI acquiring all shares of the remaining minorityshareowners except for shares representing a 1 percent interest in CBC. This transaction was accounted for as abusiness combination, and the results of CBC’s operations were included in the Company’s consolidatedfinancial statements from January 2002 to March 2003.
111

NOTES TO CONSOLIDATED FINANCIAL STATEMENTS
The Coca-Cola Company and Subsidiaries
NOTE 18: ACQUISITIONS AND INVESTMENTS (Continued)
The Company and CCBPI agreed to restructure the ownership of the operations of CBC, and thistransaction was completed in April 2003. This transaction resulted in the Company acquiring all the trademarksof CBC, and CCBPI owning approximately 99 percent of the outstanding shares of CBC. Accordingly, CBC wasdeconsolidated by the Company. No gain or loss was recorded by our Company upon completion of thetransaction, as the fair value of the assets exchanged was approximately equal. Additionally, there was no impacton our cash flows related to this transaction.
Our Company acquired controlling interests in CCDA and CBC for a total combined consideration ofapproximately $328 million. As of December 31, 2003, the Company allocated approximately $56 million of thepurchase price for these acquisitions to goodwill and $208 million to other indefinite-lived intangible assets,primarily trademarks, brands and licenses. This goodwill is all related to the CCDA acquisition and is allocatedto our North America operating segment.
The combined 2002 net operating revenues of CCEAG, CBC and CCDA were approximately $1.3 billion.
The acquisitions and investments have been accounted for by the purchase method of accounting. Theirresults have been included in our consolidated financial statements from their respective dates of acquisition.Assuming the results of these businesses had been included in operations commencing with 2002, pro formafinancial data would not be required due to immateriality.
NOTE 19: OPERATING SEGMENTS
Our Company’s operating structure includes the following operating segments: North America; Africa;Asia; Europe, Eurasia and Middle East; Latin America; and Corporate. North America includes the UnitedStates, Canada and Puerto Rico. Prior-period amounts have been reclassified to conform to the current-period presentation.
Segment Products and Services
The business of our Company is nonalcoholic beverages. Our operating segments derive a majority of theirrevenues from the manufacture and sale of beverage concentrates and syrups and, in some cases, the sale offinished beverages. The following table summarizes the contribution to net operating revenues from Companyoperations (in millions):
Year Ended December 31, 2004 2003 2002
Company operations, excluding bottling operations $ 18,871 $ 18,177 $ 17,123Company-owned bottling operations 3,091 2,867 2,441
Consolidated net operating revenues $ 21,962 $ 21,044 $ 19,564
Method of Determining Segment Profit or Loss
Management evaluates the performance of our operating segments separately to individually monitor thedifferent factors affecting financial performance. Segment profit or loss includes substantially all the segment’scosts of production, distribution and administration. Our Company typically manages and evaluates equityinvestments and related income on a segment level. However, we manage certain significant investments, such asour equity interests in CCE, within the Corporate operating segment. Our Company manages income taxes on aglobal basis. We manage financial costs, such as interest income and expense, on a global basis within theCorporate operating segment. Thus, we evaluate segment performance based on profit or loss before incometaxes and cumulative effect of accounting change.
112

NOTES TO CONSOLIDATED FINANCIAL STATEMENTSThe Coca-Cola Company and Subsidiaries
NOTE 19: OPERATING SEGMENTS (Continued)
Information about our Company’s operations by operating segment is as follows (in millions):Europe,
North Eurasia and LatinAmerica Africa Asia Middle East America Corporate Consolidated
2004Net operating revenues $ 6,643 $ 1,067 $ 4,6911 $ 7,195 $ 2,123 $ 243 $ 21,962Operating income (loss)2 1,606 340 1,758 1,898 1,069 (973)3 5,698Interest income 157 157Interest expense 196 196Depreciation and amortization 345 28 133 245 42 100 893Equity income (loss)—net 11 12 83 85 185 4 245 621Income (loss) before income taxes and cumulative
effect of accounting change2 1,629 337 1,841 1,916 1,270 4 (771)3,5 6,222Identifiable operating assets 4,731 789 1,722 5,373 6 1,405 11,055 7 25,075Investments8 116 162 1,401 1,323 1,580 1,670 6,252Capital expenditures 247 28 92 233 38 117 755
2003Net operating revenues $ 6,344 $ 827 $ 5,0521 $ 6,556 $ 2,042 $ 223 $ 21,044Operating income (loss)9 1,282 249 1,690 1,908 970 (878)10 5,221Interest income 176 176Interest expense 178 178Depreciation and amortization 305 27 124 230 52 112 850Equity income (loss)—net 13 13 65 78 (5)11 242 406Income (loss) before income taxes and cumulative
effect of accounting change9 1,326 249 1,740 1,921 975 11 (716)10 5,495Identifiable operating assets 4,953 721 1,923 5,222 6 1,440 7,545 7 21,804Investments8 109 156 1,345 1,229 1,348 1,351 5,538Capital expenditures 309 13 148 198 35 109 812
2002Net operating revenues $ 6,264 $ 684 $ 5,0541 $ 5,262 $ 2,089 $ 211 $ 19,564Operating income (loss) 1,531 224 1,820 1,612 1,033 (762) 5,458Interest income 209 209Interest expense 199 199Depreciation and amortization 266 37 133 193 57 120 806Equity income (loss)—net 15 (25) 60 (18) 131 221 384Income (loss) before income taxes and cumulative
effect of accounting change 1,552 187 1,848 1,540 1,081 (709) 5,499Identifiable operating assets 4,999 565 2,370 4,481 6 1,205 5,795 7 19,415Investments8 142 115 1,150 1,211 1,352 1,021 4,991Capital expenditures 334 18 209 162 37 91 851
Intercompany transfers between operating segments are not material.
Certain prior-year amounts have been reclassified to conform to the current-year presentation.1 Net operating revenues in Japan represented approximately 61 percent of total Asia operating segment net operating revenues in 2004, 67 percent in
2003 and 69 percent in 2002.2 Operating income (loss) and income (loss) before income taxes and cumulative effect of accounting change were reduced by approximately $18 million
for North America, $15 million for Asia, $377 million for Europe, Eurasia and Middle East, $6 million for Latin America and $64 million for Corporateas a result of other operating charges recorded for asset impairments. Refer to Note 16.
3 Operating income (loss) and income (loss) before income taxes and cumulative effect of accounting change for Corporate were impacted as a result ofthe Company’s receipt of a $75 million insurance settlement related to the class-action lawsuit settled in 2000. The Company subsequently donated$75 million to the Coca-Cola Foundation.
4 Equity income (loss)—net and income (loss) before income taxes and cumulative effect of accounting change for Latin America were increased byapproximately $37 million as a result of a favorable tax settlement related to Coca-Cola FEMSA, one of our equity method investees. Refer to Note 2.
5 Income (loss) before income taxes and cumulative effect of accounting change was increased by approximately $24 million for Corporate due to noncashpre-tax gains that were recognized on the issuances of stock by CCE, one of our equity investees. Refer to Note 3.
6 Identifiable operating assets in Germany represent approximately 46 percent of total Europe, Eurasia and Middle East identifiable operating assets in2004 and 50 percent in 2003 and 2002.
7 Principally cash and cash equivalents, marketable securities, finance subsidiary receivables, goodwill, trademarks and other intangible assets andproperty, plant and equipment.
8 Principally equity investments in bottling companies.9 Operating income (loss) and income (loss) before income taxes and cumulative effect of accounting change were reduced by approximately $273 million
for North America, $12 million for Africa, $18 million for Asia, $183 million for Europe, Eurasia and Middle East, $8 million for Latin America and $67million for Corporate as a result of streamlining charges. Refer to Note 17.
10 Operating income (loss) and income (loss) before income taxes and cumulative effect of accounting change were increased by approximately $52 millionfor Corporate as a result of the Company’s receipt of a settlement related to a vitamin antitrust litigation matter. Refer to Note 16.
11 Equity income (loss)—net and income (loss) before income taxes and cumulative effect of accounting change for Latin America were reduced by $102million primarily for a charge related to one of our equity method investees. Refer to Note 2.
113

NOTES TO CONSOLIDATED FINANCIAL STATEMENTS
The Coca-Cola Company and Subsidiaries
NOTE 19: OPERATING SEGMENTS (Continued)
Europe,Eurasia and
Compound Growth Rate North Middle LatinEnded December 31, 2004 America Africa Asia East America Corporate Consolidated
Net operating revenues5 years 4.2% 9.3% 0.5% 11.8% 3.2% 8.0% 5.5%10 years 5.0% 6.5% 4.1% 4.1% 1.0% 19.2% 4.2%
Operating income5 years 2.1% 9.3% 8.0% 15.9% 5.2% * 7.4%10 years 5.7% 5.1% 4.2% 4.3% 3.4% * 4.6%
* Calculation is not meaningful.
114

23FEB20042218446024JAN200522210514
25FEB200412544370
REPORT OF MANAGEMENT ON INTERNAL CONTROL OVER FINANCIAL REPORTINGThe Coca-Cola Company and Subsidiaries
Management of the Company is responsible for the preparation and integrity of the Consolidated Financial Statementsappearing in our Annual Report on Form 10-K. The financial statements were prepared in conformity with generallyaccepted accounting principles appropriate in the circumstances and, accordingly, include certain amounts based on ourbest judgments and estimates. Financial information in this Annual Report on Form 10-K is consistent with that in thefinancial statements.
Management of the Company is responsible for establishing and maintaining adequate internal control over financialreporting as such term is defined in Rules 13a-15(f) under the Securities Exchange Act of 1934 (‘‘Exchange Act’’). TheCompany’s internal control over financial reporting is designed to provide reasonable assurance regarding the reliability offinancial reporting and the preparation of the Consolidated Financial Statements. Our internal control over financialreporting is supported by a program of internal audits and appropriate reviews by management, written policies andguidelines, careful selection and training of qualified personnel and a written Code of Business Conduct adopted by ourCompany’s Board of Directors, applicable to all Company Directors and all officers and employees of our Companyand subsidiaries.
Because of its inherent limitations, internal control over financial reporting may not prevent or detect misstatementsand even when determined to be effective, can only provide reasonable assurance with respect to financial statementpreparation and presentation. Also, projections of any evaluation of effectiveness to future periods are subject to the riskthat controls may become inadequate because of changes in conditions, or that the degree of compliance with the policiesor procedures may deteriorate.
The Audit Committee of our Company’s Board of Directors, composed solely of Directors who are independent inaccordance with the requirements of the New York Stock Exchange listing standards, the Exchange Act and the Company’sCorporate Governance Guidelines, meets with the independent auditors, management and internal auditors periodically todiscuss internal control over financial reporting and auditing and financial reporting matters. The Committee reviews withthe independent auditors the scope and results of the audit effort. The Committee also meets periodically with theindependent auditors and the chief internal auditor without management present to ensure that the independent auditorsand the chief internal auditor have free access to the Committee. Our Audit Committee’s Report can be found in theCompany’s 2005 proxy statement.
Management assessed the effectiveness of the Company’s internal control over financial reporting as of December 31,2004. In making this assessment, management used the criteria set forth by the Committee of Sponsoring Organizations ofthe Treadway Commission (COSO) in Internal Control—Integrated Framework. Based on our assessment, managementbelieves that the Company maintained effective internal control over financial reporting as of December 31, 2004.
The Company’s independent auditors, Ernst & Young LLP, a registered public accounting firm, are appointed by theAudit Committee of the Company’s Board of Directors, subject to ratification by our Company’s shareowners. Ernst &Young LLP have audited and reported on the Consolidated Financial Statements of The Coca-Cola Company andsubsidiaries, management’s assessment of the effectiveness of the Company’s internal control over financial reporting andthe effectiveness of the Company’s internal control over financial reporting. The reports of the independent auditors arecontained in this Annual Report.
E. Neville Isdell Connie D. McDanielChairman, Board of Directors, Vice Presidentand Chief Executive Officer and Controller
February 25, 2005 February 25, 2005
Gary P. FayardExecutive Vice Presidentand Chief Financial Officer
February 25, 2005
115

Report of Independent Registered Public Accounting Firm
Board of Directors and ShareownersThe Coca-Cola Company
We have audited the accompanying consolidated balance sheets of The Coca-Cola Company andsubsidiaries as of December 31, 2004 and 2003, and the related consolidated statements of income, shareowners’equity, and cash flows for each of the three years in the period ended December 31, 2004. Our audits alsoincluded the financial statement schedule listed in the Index at Item 15(a). These financial statements andschedule are the responsibility of the Company’s management. Our responsibility is to express an opinion onthese financial statements and schedule based on our audits.
We conducted our audits in accordance with the standards of the Public Company Accounting OversightBoard (United States). Those standards require that we plan and perform the audit to obtain reasonableassurance about whether the financial statements are free of material misstatement. An audit includesexamining, on a test basis, evidence supporting the amounts and disclosures in the financial statements. An auditalso includes assessing the accounting principles used and significant estimates made by management, as well asevaluating the overall financial statement presentation. We believe that our audits provide a reasonable basis forour opinion.
In our opinion, the financial statements referred to above present fairly, in all material respects, theconsolidated financial position of The Coca-Cola Company and subsidiaries at December 31, 2004 and 2003, andthe consolidated results of their operations and their cash flows for each of the three years in the period endedDecember 31, 2004, in conformity with U.S. generally accepted accounting principles. Also, in our opinion, therelated financial statement schedule, when considered in relation to the basic financial statements taken as awhole, presents fairly in all material respects the information set forth therein.
As discussed in Note 1 to the consolidated financial statements, in 2004 the Company adopted theprovisions of FASB Interpretation No. 46 (revised December 2003) regarding the consolidation of variableinterest entities. As discussed in Notes 1 and 4 to the consolidated financial statements, in 2002 the Companychanged its method of accounting for goodwill and other intangible assets.
We also have audited, in accordance with the standards of the Public Company Accounting Oversight Board(United States), the effectiveness of The Coca-Cola Company and subsidiaries’ internal control over financialreporting as of December 31, 2004, based on criteria established in Internal Control—Integrated Frameworkissued by the Committee of Sponsoring Organizations of the Treadway Commission and our report datedFebruary 25, 2005, expressed an unqualified opinion thereon.
Atlanta, GeorgiaFebruary 25, 2005
116

Report of Independent Registered Public Accounting Firmon Internal Control Over Financial Reporting
Board of Directors and ShareownersThe Coca-Cola Company
We have audited management’s assessment, included in the accompanying Report of Management onInternal Control Over Financial Reporting, that The Coca-Cola Company and subsidiaries maintained effectiveinternal control over financial reporting as of December 31, 2004, based on criteria established in InternalControl—Integrated Framework issued by the Committee of Sponsoring Organizations of the TreadwayCommission (the COSO criteria). The Coca-Cola Company’s management is responsible for maintainingeffective internal control over financial reporting and for its assessment of the effectiveness of internal controlover financial reporting. Our responsibility is to express an opinion on management’s assessment and an opinionon the effectiveness of the Company’s internal control over financial reporting based on our audit.
We conducted our audit in accordance with the standards of the Public Company Accounting OversightBoard (United States). Those standards require that we plan and perform the audit to obtain reasonableassurance about whether effective internal control over financial reporting was maintained in all materialrespects. Our audit included obtaining an understanding of internal control over financial reporting, evaluatingmanagement’s assessment, testing and evaluating the design and operating effectiveness of internal control, andperforming such other procedures as we considered necessary in the circumstances. We believe that our auditprovides a reasonable basis for our opinion.
A company’s internal control over financial reporting is a process designed to provide reasonable assuranceregarding the reliability of financial reporting and the preparation of financial statements for external purposes inaccordance with generally accepted accounting principles. A company’s internal control over financial reportingincludes those policies and procedures that (1) pertain to the maintenance of records that, in reasonable detail,accurately and fairly reflect the transactions and dispositions of the assets of the company; (2) provide reasonableassurance that transactions are recorded as necessary to permit preparation of financial statements in accordancewith generally accepted accounting principles, and that receipts and expenditures of the company are being madeonly in accordance with authorizations of management and directors of the company; and (3) provide reasonableassurance regarding prevention or timely detection of unauthorized acquisition, use, or disposition of thecompany’s assets that could have a material effect on the financial statements.
Because of its inherent limitations, internal control over financial reporting may not prevent or detectmisstatements. Also, projections of any evaluation of effectiveness to future periods are subject to the risk thatcontrols may become inadequate because of changes in conditions, or that the degree of compliance with thepolicies or procedures may deteriorate.
In our opinion, management’s assessment that The Coca-Cola Company and subsidiaries maintainedeffective internal control over financial reporting as of December 31, 2004, is fairly stated, in all materialrespects, based on the COSO criteria. Also, in our opinion, The Coca-Cola Company and subsidiariesmaintained, in all material respects, effective internal control over financial reporting as of December 31, 2004,based on the COSO criteria.
We also have audited, in accordance with the standards of the Public Company Accounting Oversight Board(United States), the consolidated balance sheets of The Coca-Cola Company and subsidiaries as ofDecember 31, 2004 and 2003, and the related consolidated statements of income, shareowners’ equity, and cashflows for each of the three years in the period ended December 31, 2004, and our report dated February 25,2005, expressed an unqualified opinion thereon.
Atlanta, GeorgiaFebruary 25, 2005
117

Quarterly Data (Unaudited)First Second Third Fourth
Year Ended December 31, Quarter Quarter Quarter Quarter Full Year
(In millions, except per share data)2004Net operating revenues $ 5,078 $ 5,965 $ 5,662 $ 5,257 $ 21,962Gross profit 3,325 3,935 3,610 3,454 14,324Net income 1,127 1,584 935 1,201 4,847
Basic net income per share: $ 0.46 $ 0.65 $ 0.39 $ 0.50 $ 2.00
Diluted net income per share: $ 0.46 $ 0.65 $ 0.39 $ 0.50 $ 2.00
2003Net operating revenues $ 4,502 $ 5,695 $ 5,671 $ 5,176 $ 21,044Gross profit 2,885 3,568 3,503 3,326 13,282Net income 835 1,362 1,223 927 4,347
Basic net income per share: $ 0.34 $ 0.55 $ 0.50 $ 0.38 $ 1.77
Diluted net income per share: $ 0.34 $ 0.55 $ 0.50 $ 0.38 $ 1.77
In the first quarter of 2004 as compared to the first quarter of 2003, the results were impacted by four additionalshipping days. The increase in shipping days in the first quarter were largely offset in the fourth quarter of 2004.
In the second quarter of 2004, our Company’s equity income benefited by approximately $37 million for ourproportionate share of a favorable tax settlement related to Coca-Cola FEMSA. Refer to Note 2.
In the second quarter of 2004, our Company recorded impairment charges totaling approximately $88 million primarilyrelated to write-downs of certain manufacturing investments and an intangible asset. Refer to Note 16.
In the second quarter of 2004, our Company recorded approximately $49 million of noncash pretax gains on issuancesof stock by CCE. Refer to Note 3.
In the second quarter of 2004, our Company recorded an income tax benefit of approximately $41 million related tothe reversal of previously accrued taxes resulting from a favorable agreement with authorities. Refer to Note 15.
In the third quarter of 2004, our Company recorded an income tax benefit of approximately $39 million related to thereversal of previously accrued taxes resulting from favorable resolution of tax matters. Refer to Note 15.
In the third quarter of 2004, our Company recorded an income tax expense of approximately $75 million related to therecognition of a valuation allowance on certain deferred taxes of CCEAG. Refer to Note 15.
In the third quarter of 2004, our Company recorded impairment charges totaling approximately $392 million primarilyrelated to franchise rights at CCEAG. Refer to Note 16.
In the fourth quarter of 2004, our Company received a $75 million insurance settlement related to the class-actionlawsuit that was settled in 2000. Also in the fourth quarter of 2004, the Company donated $75 million to the Coca-ColaFoundation. Refer to Note 16.
In the fourth quarter of 2004, our Company recorded an income tax benefit of approximately $48 million related to thereversal of previously accrued taxes resulting from favorable resolution of tax matters. Refer to Note 15.
In the fourth quarter of 2004, our Company recorded an income tax benefit of approximately $50 million related to therealization of certain foreign tax credits per provisions of the Jobs Creation Act. Refer to Note 15.
In the fourth quarter of 2004, our Company recorded approximately $25 million of noncash pretax losses to adjust theamount of the gain recognized in the second quarter of 2004 on issuances of stock by CCE. Refer to Note 3.
Certain amounts previously reported in our 2003 Quarterly Reports on Form 10-Q were reclassified to conform to ouryear-end 2003 presentation.
In the first quarter of 2003, the Company reached a settlement with certain defendants in a vitamin antitrust litigationmatter. The Company received a settlement relating to this litigation of approximately $52 million on a pretax basis. Referto Note 16.
In 2003, the Company took steps to streamline and simplify its operations, primarily in North America and Germany.Selected other operations also took steps to streamline their operations to improve overall efficiency and effectiveness. Thepretax expense of these streamlining initiatives for the three months ended March 31, 2003, June 30, 2003, September 30,2003 and December 31, 2003 was $159 million, $70 million, $43 million and $289 million, respectively. Refer to Note 17.
Effective May 6, 2003, Coca-Cola FEMSA consummated a merger with another of the Company’s equity methodinvestees, Panamerican Beverages, Inc. During the third quarter of 2003, our Company recorded a pretax noncash charge toequity income—net of $95 million primarily related to Coca-Cola FEMSA streamlining initiatives and impairment ofcertain intangible assets. During the fourth quarter of 2003, our Company recorded a pretax noncash charge of $7 millionrelated solely to the streamlining and integration of these operations. Refer to Note 2.
In the fourth quarter of 2003, we favorably resolved various tax matters (approximately $50 million), partially offset byadditional taxes primarily related to the repatriation of funds.
118

GLOSSARY
As used in this report, the following terms have the meanings indicated.
Bottling Partner or Bottler: businesses that buy concentrates (sometimes referred to as beverage bases) or syrupsfrom the Company, convert them into finished packaged products and sell them to customers.
Carbonated Soft Drink: nonalcoholic carbonated beverage (sometimes referred to as soft drinks) containingflavorings and sweeteners. Excludes, among others, waters and flavored waters, juices and juice drinks, sportsdrinks, and teas and coffees.
The Coca-Cola System: the Company and its bottling partners.
Coca-Cola Trademark Beverages: cola-flavored Company Trademark Beverages.
Company: The Coca-Cola Company together with its subsidiaries.
Company Trademark Beverages: beverages bearing our trademarks and certain other beverage products licensedto our Company or owned by our bottling partners and distributors, for which our Company provides marketingsupport and derives profits from the sales.
Concentrate: material manufactured from Company-defined ingredients and sold to bottlers to prepare finishedbeverages through the addition of water and, depending on the product, sweeteners and/or carbonated watermarketed under trademarks of the Company.
Consumer: person who drinks Company products.
Cost of Capital: after-tax blended cost of equity and borrowed funds used to invest in operating capital requiredfor business.
Customer: retail outlet, restaurant or other operation that sells or serves Company products directlyto consumers.
Derivatives: contracts or agreements, the value of which may change based on changes in interest rates,exchange rates, prices of securities, or financial or commodity indices. The Company uses derivatives to reduceour exposure to adverse fluctuations in interest and exchange rates and other market risks.
Fountain: system used by retail outlets to dispense product into cups or glasses for immediate consumption.
Gallons: unit of measurement for concentrates, syrups, beverage bases, finished beverages and powders (in allcases, expressed in equivalent gallons of syrup) for all beverage products which are reportable as unit case volume.
Gross Profit Margin: gross profit divided by net operating revenues.
Market: when used in reference to geographic areas, territory in which the Company and its bottling partnersdo business, often defined by national boundaries.
Net Capital: shareowners’ equity added to net debt.
Net Debt: total debt less the sum of cash, cash equivalents and current marketable securities.
Noncarbonated Beverages: nonalcoholic beverages without carbonation including, but not limited to, waters andflavored waters, juices and juice drinks, sports drinks, and teas and coffees.
Operating Margin: operating income divided by net operating revenues.
Per Capita Consumption: average number of servings consumed per person, per year in a specific market. Percapita consumption of Company beverage products is calculated by multiplying our unit case volume by 24, anddividing by the population.
119

GLOSSARY (Continued)
Return on Average Total Capital: net income before cumulative effect of accounting change (adding back interestexpense, net of related taxes) divided by average total capital.
Return on Average Shareowners’ Equity: net income before cumulative effect of accounting change divided byaverage shareowners’ equity.
Serving: eight U.S. fluid ounces of a finished beverage.
Syrup: concentrate mixed with sweetener and water, sold to bottlers and customers who add carbonated waterto produce finished carbonated soft drinks.
Total Capital: shareowners’ equity plus total debt.
Total Debt: loans and notes payable, current maturities of long-term debt and long-term debt.
Total Market Value of Common Stock: stock price as of a date multiplied by the number of shares outstanding asof the same date.
Unit Case: unit of measurement equal to 192 U.S. fluid ounces of finished beverage (24 eight-ounce servings).
Unit Case Volume, or Volume: the number of unit cases (or unit case equivalents) of Company trademark orlicensed beverage products directly or indirectly sold by the Coca-Cola system to customers. Volume primarilyconsists of beverage products bearing Company trademarks. Also included in volume are certain beverageproducts licensed to our Company or owned by our bottling partners and distributors, for which our Companyprovides marketing support and derives income from the sales. Such beverage products licensed to our Companyor owned by our bottling partners account for a minimal portion of total unit case volume. Unit case volume isderived based on estimates received by the Company from its bottling partners and distributors.
120

The Coca-Cola Company Fact Sheet The Coca-Cola Company is the world’s largest beverage company, refreshing consumers with nearly 500 sparkling and still brands. Along with Coca-Cola®, recognized as the world’s most valuable brand, the Company’s portfolio includes 12 other billion dollar brands, including Diet Coke®, Fanta®, Sprite®, Coca-Cola Zero™, vitaminwater®, POWERADE®, Minute Maid® and Georgia™ Co�ee. Globally, we are the No. 1 provider of sparkling beverages, juices and juice drinks and ready-to-drink teas and co�ees. Through the world’s largest beverage distribution system, consumers in more than 200 countries enjoy the Company’s beverages at a rate of nearly 1.6 billion servings a day. With an enduring commitment to building sustainable communities, our Company is focused on initiatives that protect the environment, conserve resources and enhance the economic development of the communities where we operate. Fast Facts:
• Established: 1886 • Ranking: We own 4 of the world’s top 5 nonalcoholic sparkling beverage brands: Coca-Cola, Diet Coke, Sprite and Fanta• Company Associates: 92,400 worldwide (as of December 31, 2008)• Operational Reach: 200+ countries • Consumer Servings (per day): nearly 1.6 billion • Beverage Variety: We offer more than 3,000 products including diet and regular sparkling beverages, and still beverages such as 100 percent juices, juice drinks, waters, sports and energy drinks, teas and coffees, and milk- and soy-based beverages.• New York Stock Exchange Ticker Symbol: KO
Our Mission:
To refresh the world...• To inspire moments of optimism...• To create value and make a difference.•
Our Commitment to Sustainability – 2007/2008 Highlights:
Respecting People – We offered more than 1,600 training classes to Company associates.• •
Supporting Communities – In 2007, The Coca-Cola Company and The Coca-Cola Foundation made charitable • contributions of $99 million to community initiatives worldwide.Offering Safe, Quality Products – We launched more than 150 low and no-calorie products in 2008, as well as more than 200 juice and juice drink products.
•
2008 Financial Highlights:
Our portfolio includes 13 billion dollar brands.• Unit case volume grew 5% to 23.7 billion unit cases worldwi de.• Net operating revenues grew 11% to $31.9 billion.• More than 70% of our net operating revenues and more than 75% of our unit case volume were generated outside of North • America.
For more information about our Company, please visit our website at www.thecoca-colacompany.co m.
www.thecoca-colacompany.com© 2008 The Coca-Cola Company, all rights reserved

Detailed Performance Review
minimal — not ratedsignificant moderateexcellentProgress Ratings (Self-Assessment):
This chart provides a summary of our self-assessed performance and progress from August 2007 through July 2008. For instances where the data is collected on an annual basis, the data reflects the calendar year of January to December 2007. We have also included our performance rating reported in our 2006 Corporate Responsibility Review, which reflected performance from June 2006 through July 2007 and data for the 2006 calendar year, for comparison.
DeTAileD PeRFoRmAnce RevieW
environment
Performance metric2007 2006
What We Are DoingProgress
Water Use Ratio (efficiency)
•2.47litersofwaterperliterofproductin2007; 2% improvement versus 2006.
•21%improvementinwateruseratiosince2002, when we first reported this ratio externally.
Total Water Use •300billionlitersusedoverallin2007;2%decrease since 2002, when we first reported the number externally.
•Changesinourproductmixmayresultinmorewater-intensive (though not less efficient) operations.
Wastewater Treatment compliance
•Targettoreturn100%ofwastewaterusedinmorethan800 plants in the coca-cola system to the environment atalevelthatsupportsaquaticlifebytheendof2010.
•85%compliancein2007withourownstrictinternalstandards, which meet and often exceed applicable laws; increase of 2% over 2006.
Solid Waste Recycling and Solid Waste Ratio
•Solidwastegenerated:1.3millionmetrictons,whichyieldsasolidwasteratioof10.63gramsperliterofproduct.Thismarksa15%improvementinoursolidwaste ratio since 2002. While our solid waste ratio has improved,wehaveseena5%increaseintheamount of solid waste generated since 2002 because of acquisitionsandvolumegrowth.
•Solidwasterecycledorrecovered:1.05millionmetrictons, which yields a recycling percentage of 82%. This is an 8% improvement over 2002, when we first reported these numbers externally.
Sustainable Packaging •Approximately98%ofourglobalunitcasevolume in 2007 was delivered in refillable, recyclable or concentrated primary packaging systems.
•Investedintheworld’slargestPET(polyethyleneterephthalate) bottle-to-bottle recycling plant in the United States in 2007, bringing our total to six plants globally.
energy Use Ratio (efficiency)
•0.46megajoulesperliterofproductin2007; 4% improvement versus 2006.
•19%improvementinenergyuseratiosince2002, when we first reported this ratio externally.
Total energy Use •55.8billionmegajoulesusedoverallin2007; 2% increase since 2006 due primarily to volume increase (6% volume increase in 2007 versus 2006).
•Estimateour2007energyconsumptionledtodirect and indirect emissions of 4.92 million metric tons of carbon dioxide (co2), an increase of 0.06 million metric tons versus 2006.
The coca-cola company 2007/2008 Sustainability Review