an rmm-based methodology for hypermedia presentation design
TRANSCRIPT
An RMM-Based Methodology for HypermediaPresentation Design
Flavius Frasincar, Geert Jan Houben, and Richard Vdovjak
Eindhoven University of TechnologyEindhoven, The Netherlands
{flaviusf, houben, richardv}@win.tue.nl
Abstract. Due to the rapid growth of the Web, there is an increasingneed for methodologies that support the design of Web-based Informa-tion Systems (WIS). After investigating the application of existing hy-permedia design methodologies in the context of automated hypermediapresentation design we propose a specification framework for this con-text. The framework considers the possibility of dynamically gatheringinformation from a collection of structured, but also possibly heteroge-neous sources (relational or object-oriented databases, XML repositoriesetc.). The methodology associated with the framework shows two levelsof abstraction: the logical level, and the presentation level. At the logicallevel the application diagram captures the design of slices, thus specifyingthe content related grouping of data elements and their relationships. Atthe presentation level, the presentation diagram bridges the logical leveland the actual implementation by specifying how the design of slices istranslated into hypermedia mechanisms, e.g. hyperlinks.
1 Introduction
From its introduction in the early 90’s the World Wide Web (WWW) is in acontinuous development. Its rapid expansion results in an increasing numberof Web-based Information Systems (WIS) [3] being developed, especially withsources that contain frequently changing information such as databases (rela-tional or object-oriented databases, XML repositories etc.). This leads to the factthat there is a higher need to automate, at least partially, the design process ofhypermedia presentations as used in a WIS. Although there are methodologieslike Relationship Management Methodology (RMM) [1] and Object OrientedHypermedia Design Methodology (OOHDM) [2], these methodologies have beenoriginally developed for a manual hypermedia design process, they are not par-ticularly well-suited in the context of automated hypermedia design.
RMM focuses on highly structured applications with high information volatil-ity. Moreover, it provides guidelines that can facilitate the automated designprocess of hypermedia applications. RMM is based on the popular Entity Rela-tionship (E-R) model.
These characteristics are significant for our target application area wheresources contain dynamical information. RMM has a specification at the logical
level, which groups presentation issues (e.g. navigational links) with semanticalissues (e.g. slice attributes). Besides, it lacks a proper specification at the pre-sentation level. In this paper we argue that the separation in two distinct levelsis useful and we address them both in the context of the proposed framework.
The results of this research will be exploited in the HERA [12] project thatinvestigates software architectures for the generation of presentations for (semi-structured) data retrieved from heterogeneous data sources. In order to exper-iment with the proposed methodology a prototype has been built. The proto-type uses XML to store the data and XSL to specify transformations betweenconsequent steps. Similar model-driven Web systems inspired by HypermediaDesign Methodology (HDM) [7] were developed in Autoweb [6] (uses relationaldatabases for data storage) and WebML [5] (uses XML for data storage) projects.
Part of this work is also embedded in the Dynamo project, in which Eind-hoven University of Technology collaborates with Philips and CWI, both in theNetherlands. The Dynamo project targets the (semi-)automatic generation ordesign of multimedia presentations. Characteristic for the generation process isthe support for adaptation.
As results from [4], [10] show, adaptation can be specified by distinguishingthe domain model, the user model, and the adaptation model. The last modeldescribes the actual adaptation being performed (based on the assumed knowl-edge of the user inferred from the user model). In terms of this project it meansthat conditions are specified on the existence of objects that are part of thepresentation.
2 RMM
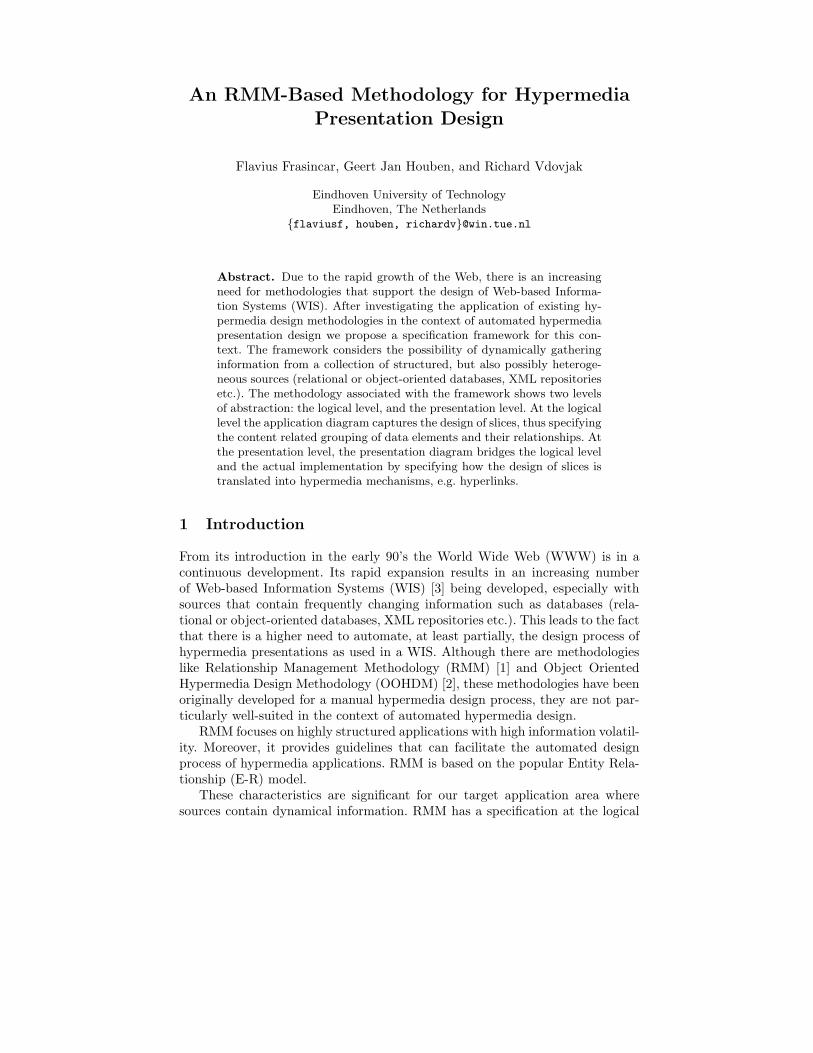
RMM [1], [11], [13], [14], [15] proposes a sequence of steps that have to be followedin the design process. For each step there are design guidelines for the designeror builder of the application. Figure 1 depicts the RMM steps that are reusedin the proposed framework.
Requirements Analysis
E-R Design
Application
Design
. . .
Fig. 1: RMM design methodology
The first design step is to represent the application domain using traditionalE-R modeling techniques.
In the second step, the E-R model is enriched with the concepts of m-slicesand relationships to build a diagram that describes the application. M-slices
[13] are created by grouping together attributes from the E-R diagram; thiscan be done hierarchically using previously defined m-slices: the ’m’ comes from’Matreyshka’, the nested Russian doll, suggesting the possibility to nest slices inone another. In the rest of the paper we will use the term slice instead of m-slice.The most simple type of m-slice is an attribute ensuring thus the uniformity ofthe hierarchical slice model.
3 Methodology
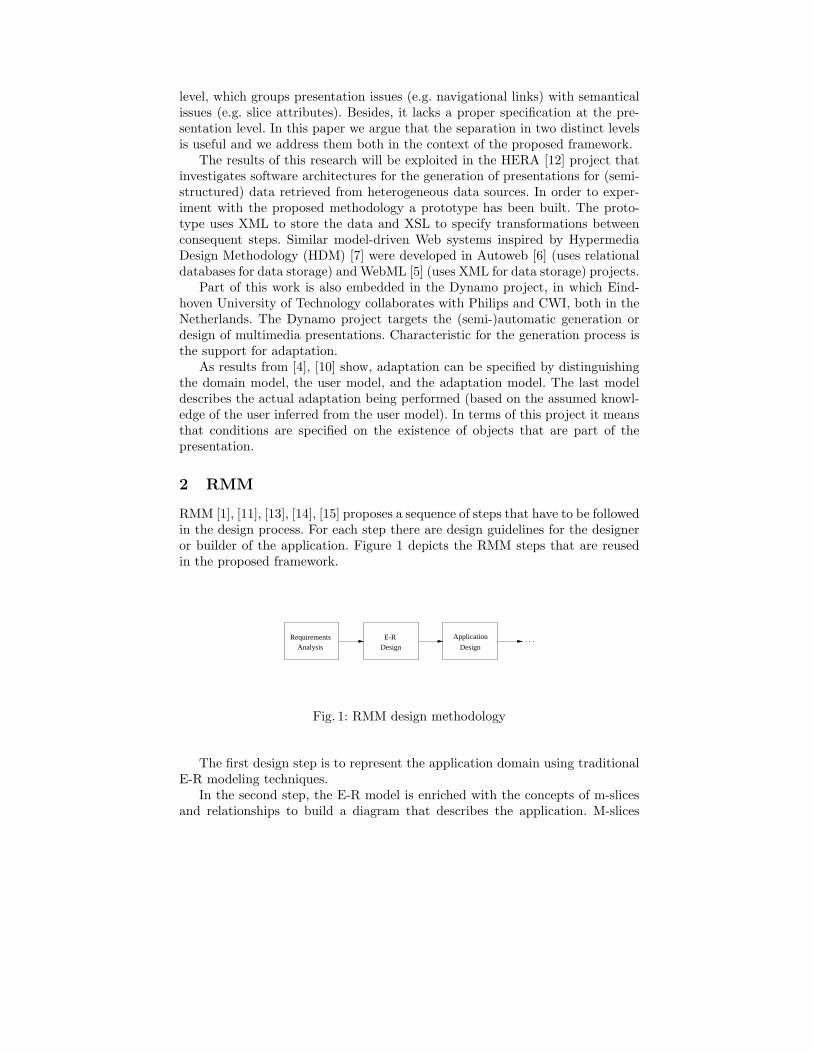
We developed a specification framework based on RMM to support the automa-tion of a hypermedia presentation design. Figure 2 illustrates the methodologyrelated to this framework.
Although requirements analysis, E-R diagram (domain analysis), and imple-mentation are important phases in the software engineering life cycle they arebeyond the scope of this paper.
The arrows in Fig. 2 show the sequence of steps in the process 1. Our method-ology focuses on the design steps shown in the shaded area of Fig. 2: platformindependent application design, platform dependent application design, and pre-sentation design.
The artifacts of each design step in the order in which they appear in themethodology are:
– E-R diagram– platform independent application diagram– (platform dependent) application diagram– presentation diagram
A platform independent application diagram presents common informationof application diagrams that is going to be displayed regardless of the platform.A platform dependent application (also referred as application diagram) takesinto consideration a particular hypermedia platform.
Requirements Analysis
E-R Design Design
Plat. indep.Application
Design Application
Plat. dep.Presentation
DesignImplementation
Logical level Presentation level
Fig. 2: Design methodology
In the methodology we distinguish two levels, the logical level and the pre-sentation level, based on the ’separation of concerns’ principle.1 It is possible to have feedback loops in the process.
3.1 Logical Level
At the logical level the methodology is concerned with providing data and re-lationships/access structures of the information to be presented. Related in-formation is grouped together into meaningful presentation units (slices). Slicerelationships provide a means to access information belonging to different units.The logical level is based on the E-R model, in the sense that it exploits theentity structure (attributes) and the relationships among them.
Relationships derived (based on relation’s transitivity) from the E-R modelare taken into account to minimize the number of slice relationships that needto be traversed in order to reach a meaningful item related to a presentationunit.
The logical level bridges the data source level and the presentation level. Thedesigner is concerned with mapping elements from the data sources (at abstractlevel entities from E-R model) to slices.
Besides structuring information the notion of slice facilitates reuse. A slicecan be reused at application level or even among applications if the applicationsshare the same data model. At application level a previously designed slice canbe nested in another slice so that the design effort involved in a new slice creationis considerably reduced.
The logical level is expressed in the application diagram which will be de-scribed in Sect. 4.
3.2 Presentation Level
The design choices made at the logical level yield a presentation specificationin terms of slices. Such a specification however, stays at the logical level anddoes not describe the presentation in detail. It does not say anything abouthow presentation elements should be organized with respect to each other orwith respect to the screen; it says neither when, nor in which order presentationelements should appear. These kinds of design decisions were usually made adhoc during the implementation phase, though they clearly do not belong there.
The presentation level bridges the logical level and the actual implementa-tion. Complementary to the logical level, where the designer is concerned withorganizing the overall presentation structure and identifying what attributesfrom entities are to be included in slices, at the presentation level the designerspecifies how and when the identified slices should be displayed.
The presentation level should not be considered only as a detailed logical levelbut rather as a view from a slightly different angle. During this process, slicesfrom the logical level are mapped into regions and design decisions are madeto specify a concrete way (navigational, spatial, and temporal) [9] how ratherabstract slice relationships will appear in the presentation. In other words thedesigner specifies in a conceptual way the navigation, layout, and timing of thepresentation.
The presentation level is expressed by means of the presentation diagramwhich will be described in Sect. 5.
4 Application Diagram (AD)
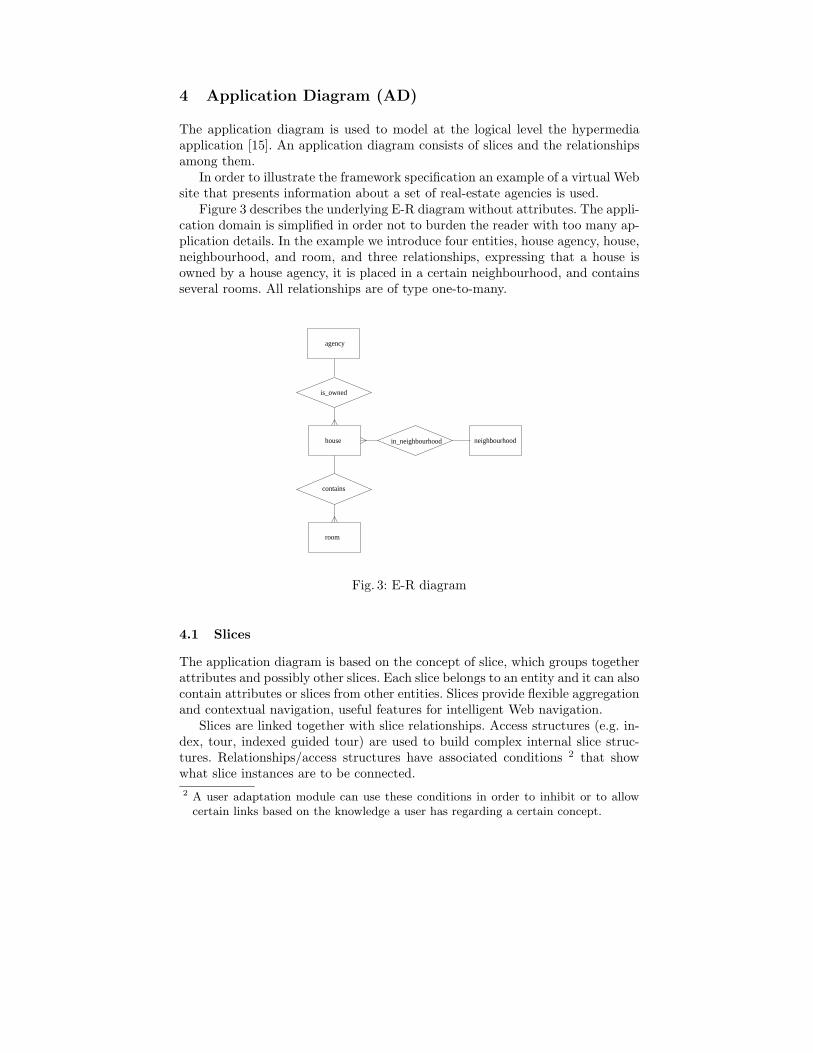
The application diagram is used to model at the logical level the hypermediaapplication [15]. An application diagram consists of slices and the relationshipsamong them.
In order to illustrate the framework specification an example of a virtual Website that presents information about a set of real-estate agencies is used.
Figure 3 describes the underlying E-R diagram without attributes. The appli-cation domain is simplified in order not to burden the reader with too many ap-plication details. In the example we introduce four entities, house agency, house,neighbourhood, and room, and three relationships, expressing that a house isowned by a house agency, it is placed in a certain neighbourhood, and containsseveral rooms. All relationships are of type one-to-many.
contains
in_neighbourhood
is_owned
house
room
neighbourhood
agency
Fig. 3: E-R diagram
4.1 Slices
The application diagram is based on the concept of slice, which groups togetherattributes and possibly other slices. Each slice belongs to an entity and it can alsocontain attributes or slices from other entities. Slices provide flexible aggregationand contextual navigation, useful features for intelligent Web navigation.
Slices are linked together with slice relationships. Access structures (e.g. in-dex, tour, indexed guided tour) are used to build complex internal slice struc-tures. Relationships/access structures have associated conditions 2 that showwhat slice instances are to be connected.2 A user adaptation module can use these conditions in order to inhibit or to allow
certain links based on the knowledge a user has regarding a certain concept.
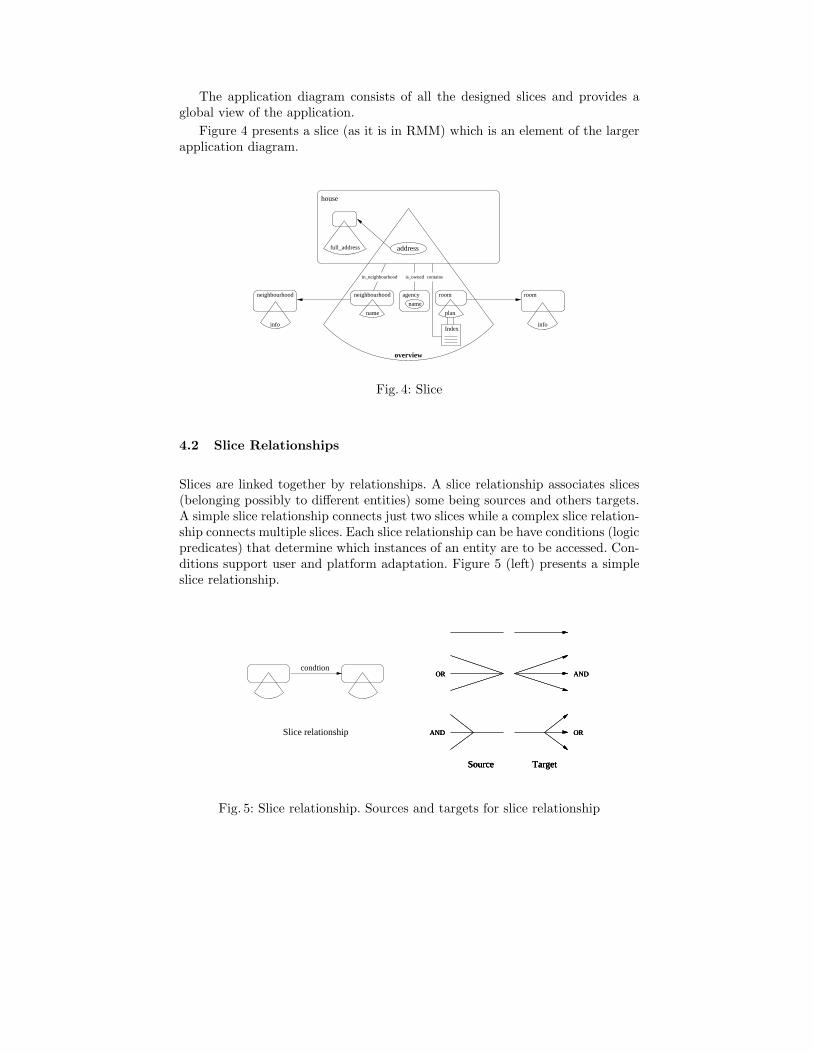
The application diagram consists of all the designed slices and provides aglobal view of the application.
Figure 4 presents a slice (as it is in RMM) which is an element of the largerapplication diagram.
full_address
plan
house
neighbourhood
infoinfoIndex
room
name
overview
in_neighbourhood is_owned contains
address
neighbourhood room
name
agency
Fig. 4: Slice
4.2 Slice Relationships
Slices are linked together by relationships. A slice relationship associates slices(belonging possibly to different entities) some being sources and others targets.A simple slice relationship connects just two slices while a complex slice relation-ship connects multiple slices. Each slice relationship can be have conditions (logicpredicates) that determine which instances of an entity are to be accessed. Con-ditions support user and platform adaptation. Figure 5 (left) presents a simpleslice relationship.
Source
AND
OR
Target
OR
AND
Source
AND
OR
Target
OR
AND
Source
AND
OR
Target
OR
AND
Slice relationship
condtion
Fig. 5: Slice relationship. Sources and targets for slice relationship
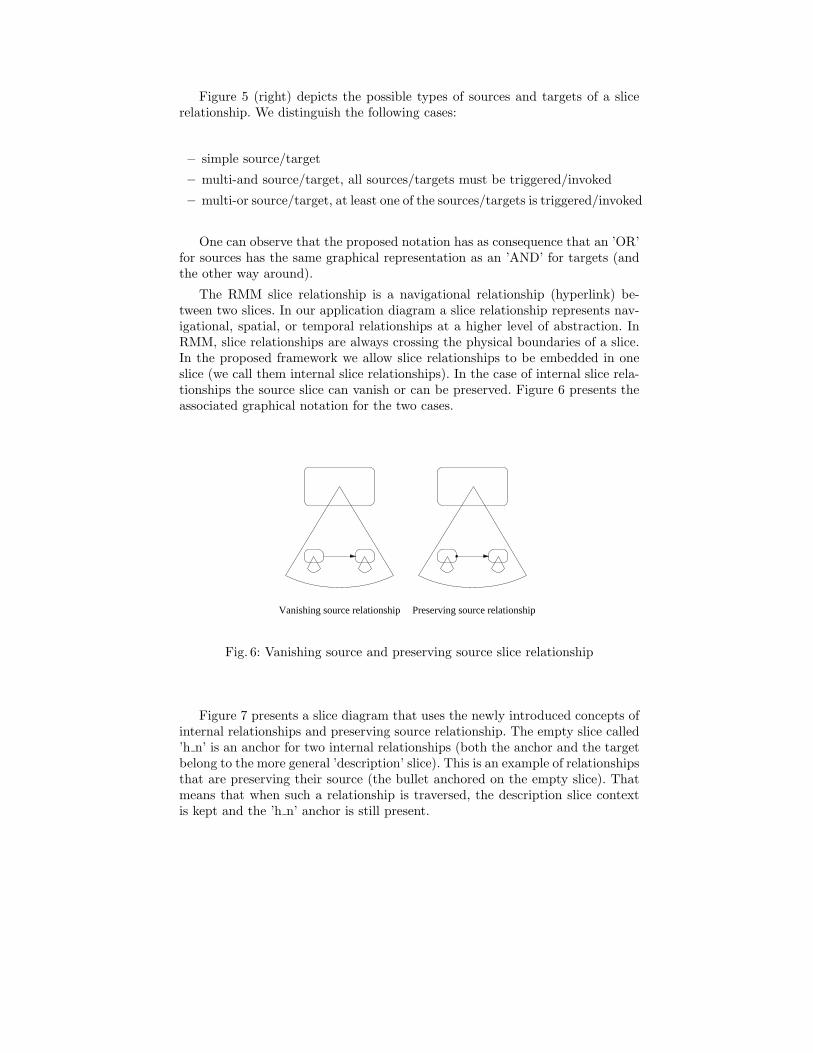
Figure 5 (right) depicts the possible types of sources and targets of a slicerelationship. We distinguish the following cases:
– simple source/target
– multi-and source/target, all sources/targets must be triggered/invoked
– multi-or source/target, at least one of the sources/targets is triggered/invoked
One can observe that the proposed notation has as consequence that an ’OR’for sources has the same graphical representation as an ’AND’ for targets (andthe other way around).
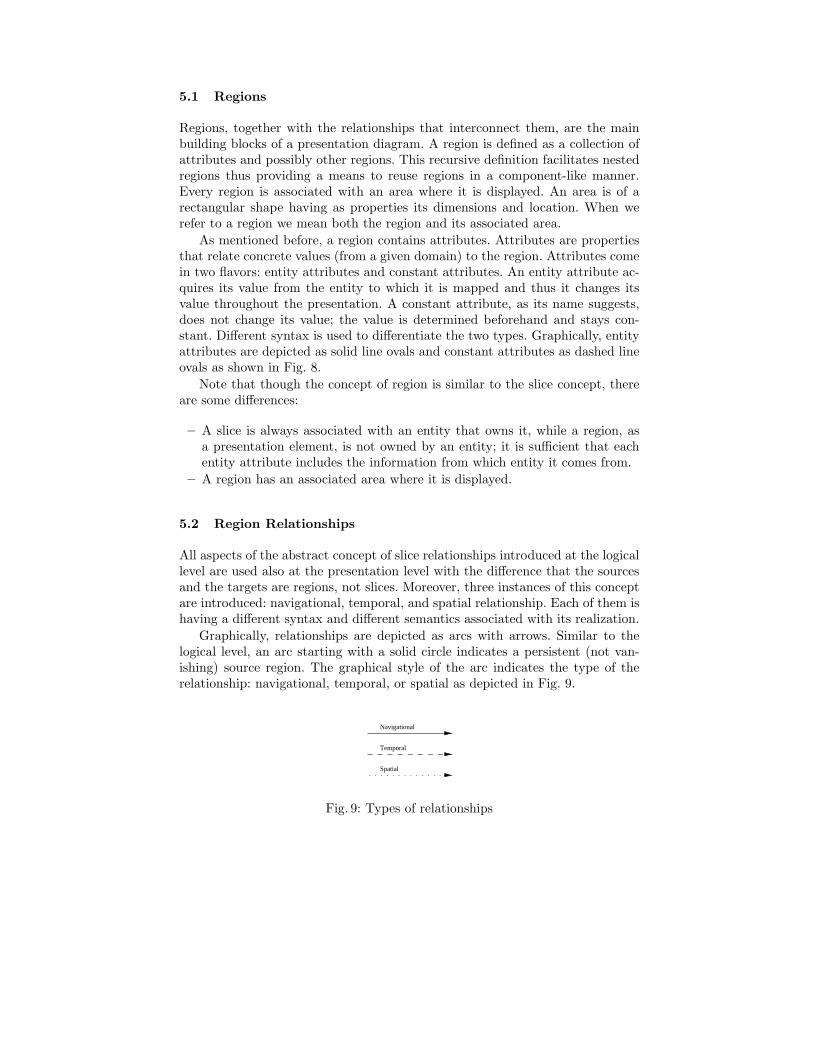
The RMM slice relationship is a navigational relationship (hyperlink) be-tween two slices. In our application diagram a slice relationship represents nav-igational, spatial, or temporal relationships at a higher level of abstraction. InRMM, slice relationships are always crossing the physical boundaries of a slice.In the proposed framework we allow slice relationships to be embedded in oneslice (we call them internal slice relationships). In the case of internal slice rela-tionships the source slice can vanish or can be preserved. Figure 6 presents theassociated graphical notation for the two cases.
Vanishing source relationship Preserving source relationship
Fig. 6: Vanishing source and preserving source slice relationship
Figure 7 presents a slice diagram that uses the newly introduced concepts ofinternal relationships and preserving source relationship. The empty slice called’h n’ is an anchor for two internal relationships (both the anchor and the targetbelong to the more general ’description’ slice). This is an example of relationshipsthat are preserving their source (the bullet anchored on the empty slice). Thatmeans that when such a relationship is traversed, the description slice contextis kept and the ’h n’ anchor is still present.

Index
h_n
Index
name
neighbourhood
name
address
agency
description
ownshouse_in_neigh.
info
house
address
neighbourhood
overview
house
h_n = houses and neighbourhoods
∀
Fig. 7: Slice
5 Presentation Diagram (PD)
Similarly as the logical level is described by means of an application diagram,the presentation level is described by a presentation diagram. A presentationdiagram consists of presentation elements called regions and the relationshipsamong them. The presentation diagram specifies how the regions are organizedfrom the navigational, spatial, and temporal point of view. Figure 8 shows anexample of a presentation diagram composed from several regions.
agent.name agent.addresscontact
Neghbourdoods""Houses and
description
ndx_neighb ndx_house
h_n
Fig. 8: Presentation diagram
During the process of creating the presentation diagram, the slices introducedat the logical level are mapped to regions and possibly new regions are introduced(it is not always a one-to-one mapping, some slices can be split to more regionsand vice versa).
Subsequently, slice relationships from the logical level are materialized withnavigational, spatial, or temporal relationships.
5.1 Regions
Regions, together with the relationships that interconnect them, are the mainbuilding blocks of a presentation diagram. A region is defined as a collection ofattributes and possibly other regions. This recursive definition facilitates nestedregions thus providing a means to reuse regions in a component-like manner.Every region is associated with an area where it is displayed. An area is of arectangular shape having as properties its dimensions and location. When werefer to a region we mean both the region and its associated area.
As mentioned before, a region contains attributes. Attributes are propertiesthat relate concrete values (from a given domain) to the region. Attributes comein two flavors: entity attributes and constant attributes. An entity attribute ac-quires its value from the entity to which it is mapped and thus it changes itsvalue throughout the presentation. A constant attribute, as its name suggests,does not change its value; the value is determined beforehand and stays con-stant. Different syntax is used to differentiate the two types. Graphically, entityattributes are depicted as solid line ovals and constant attributes as dashed lineovals as shown in Fig. 8.
Note that though the concept of region is similar to the slice concept, thereare some differences:
– A slice is always associated with an entity that owns it, while a region, asa presentation element, is not owned by an entity; it is sufficient that eachentity attribute includes the information from which entity it comes from.
– A region has an associated area where it is displayed.
5.2 Region Relationships
All aspects of the abstract concept of slice relationships introduced at the logicallevel are used also at the presentation level with the difference that the sourcesand the targets are regions, not slices. Moreover, three instances of this conceptare introduced: navigational, temporal, and spatial relationship. Each of them ishaving a different syntax and different semantics associated with its realization.
Graphically, relationships are depicted as arcs with arrows. Similar to thelogical level, an arc starting with a solid circle indicates a persistent (not van-ishing) source region. The graphical style of the arc indicates the type of therelationship: navigational, temporal, or spatial as depicted in Fig. 9.
Spatial
Navigational
Temporal
Fig. 9: Types of relationships
Navigational. The navigational relationships were introduced to represent theclassical hyperlinks (so called ’click-able’ links). After the user clicks on thesource region the target region is invoked and the source region either vanishesor stays, depending on its type.
There is a possibility to guard the execution of the link with a condition (thelink is followed only if the condition is satisfied) and the possibility to specifyan event when the link should be followed. The default event for navigationallinks is the mouse-click event, but the designer can choose different events (e.g.mouse-over). Navigational links are graphically depicted with solid arcs.
Temporal. Temporal relationships were introduced in order to express the no-tion of time in the specification of multimedia presentations, while the originalRMM was focused on hypermedia presentations (no notion of time). Temporallinks can be used to describe both intrinsic delay (a duration of a video or au-dio clip [8]) and presentation time (temporal links introduced by the designer).There is a time-out event associated with every temporal relationship; after thetime elapses the relationship is realized (the destination region is invoked) 3.
Although from semantic point of view the temporal relationships can beconsidered similar to the navigational links we suggest to make a distinctionmainly because of the different nature of the two (navigational links requiresome user interaction while temporal links do not).
Temporal links can be organized in parallel or sequential compositions. Thegraphical syntax is rather intuitive; temporal links are graphically described withdashed arcs.
A sequential composition is depicted as a chain of links with one startingnode (starting source region) and a chain where the destination region of onelink is the source region for the next link.
Two temporal relationships are considered to be in parallel composition ifthey are not included in the same sequential composition. In other words whatis not sequential is parallel.
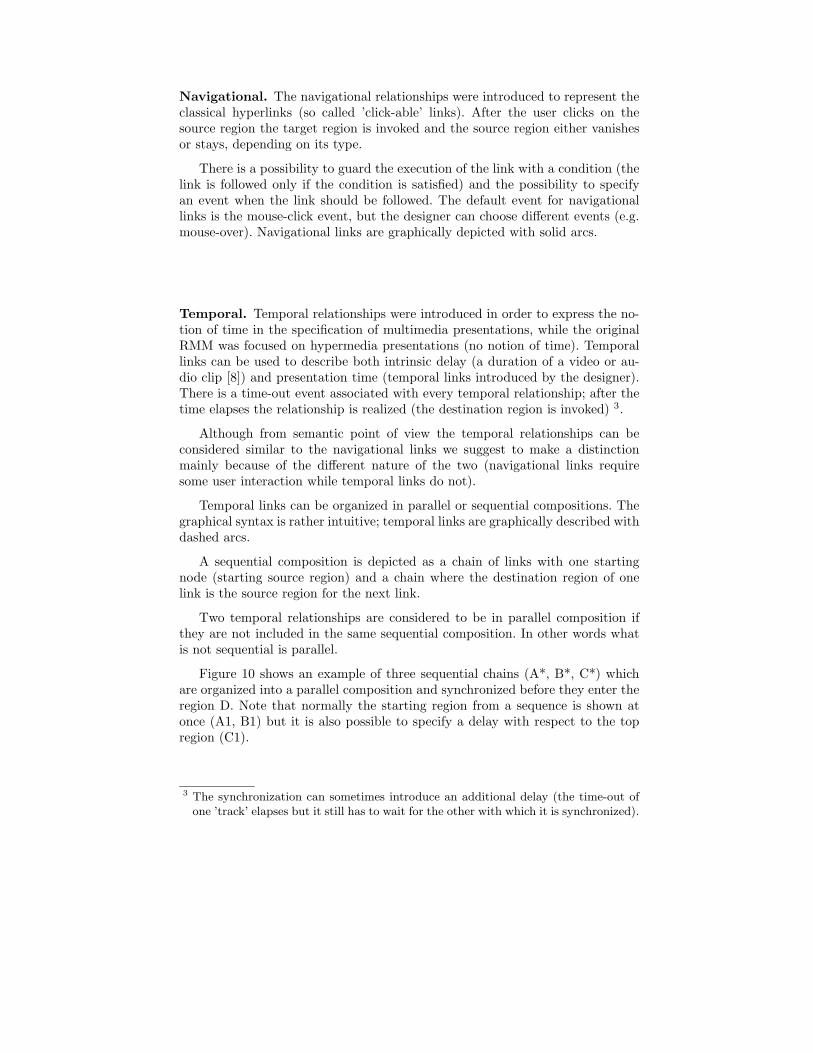
Figure 10 shows an example of three sequential chains (A*, B*, C*) whichare organized into a parallel composition and synchronized before they enter theregion D. Note that normally the starting region from a sequence is shown atonce (A1, B1) but it is also possible to specify a delay with respect to the topregion (C1).
3 The synchronization can sometimes introduce an additional delay (the time-out ofone ’track’ elapses but it still has to wait for the other with which it is synchronized).
A1 A2
B1 B2
C1
DE1 E2
F1
Top
Fig. 10: Sequential and parallel composition with synchronization
Spatial. There are two reasons for introducing spatial links: the first is to pro-vide a means of specifying the layout characteristics of a presentation. The secondreason is to facilitate the description of more complex presentation elements likeindices, guided tours etc. A spatial link describes a spatial relationship betweentwo regions. The meaning of the link orientation is that the link describes arelative position of the target with respect to the source, the point of referencealways being the left upper corner. The semantics of spatial links is slightly dif-ferent compared to the one of navigational and temporal links. The notion offollowing a link is missing here, e.g. both the source and the target of a spatiallink are displayed at once provided the condition and the event associated withthe link permit so.
Spatial links are graphically depicted with dotted arcs.
5.3 Multi-Dimensional Synchronization
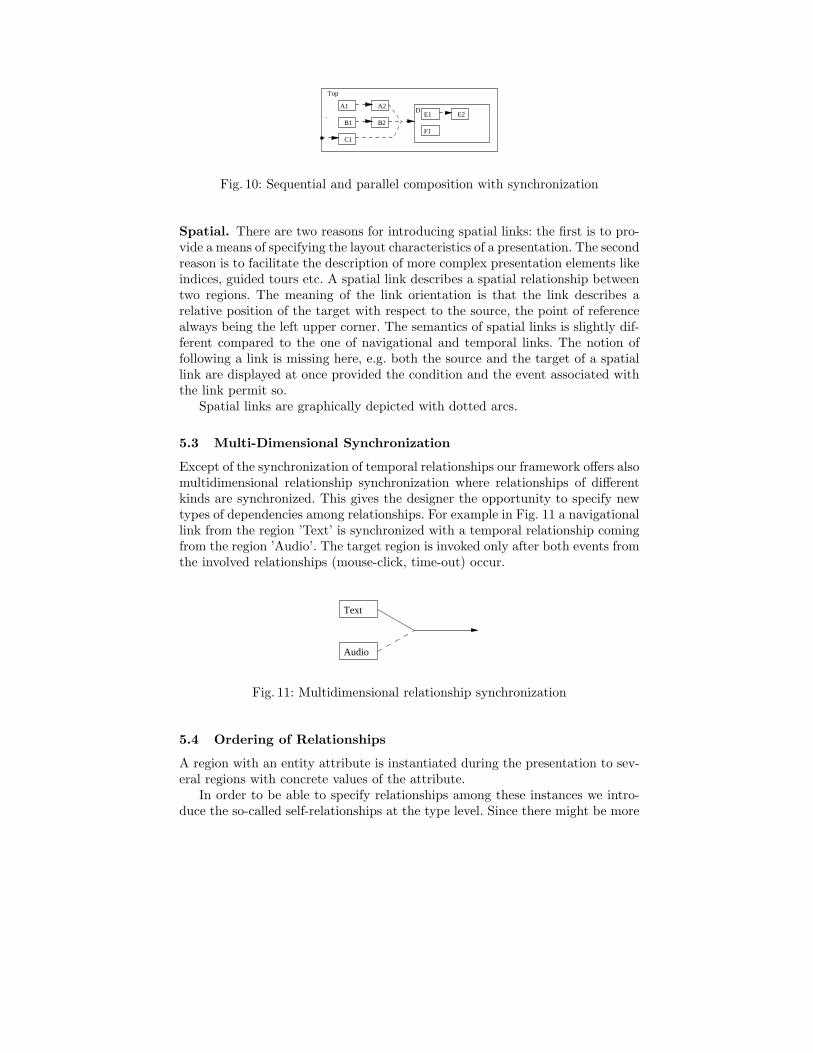
Except of the synchronization of temporal relationships our framework offers alsomultidimensional relationship synchronization where relationships of differentkinds are synchronized. This gives the designer the opportunity to specify newtypes of dependencies among relationships. For example in Fig. 11 a navigationallink from the region ’Text’ is synchronized with a temporal relationship comingfrom the region ’Audio’. The target region is invoked only after both events fromthe involved relationships (mouse-click, time-out) occur.
Audio
Text
Fig. 11: Multidimensional relationship synchronization
5.4 Ordering of Relationships
A region with an entity attribute is instantiated during the presentation to sev-eral regions with concrete values of the attribute.
In order to be able to specify relationships among these instances we intro-duce the so-called self-relationships at the type level. Since there might be more
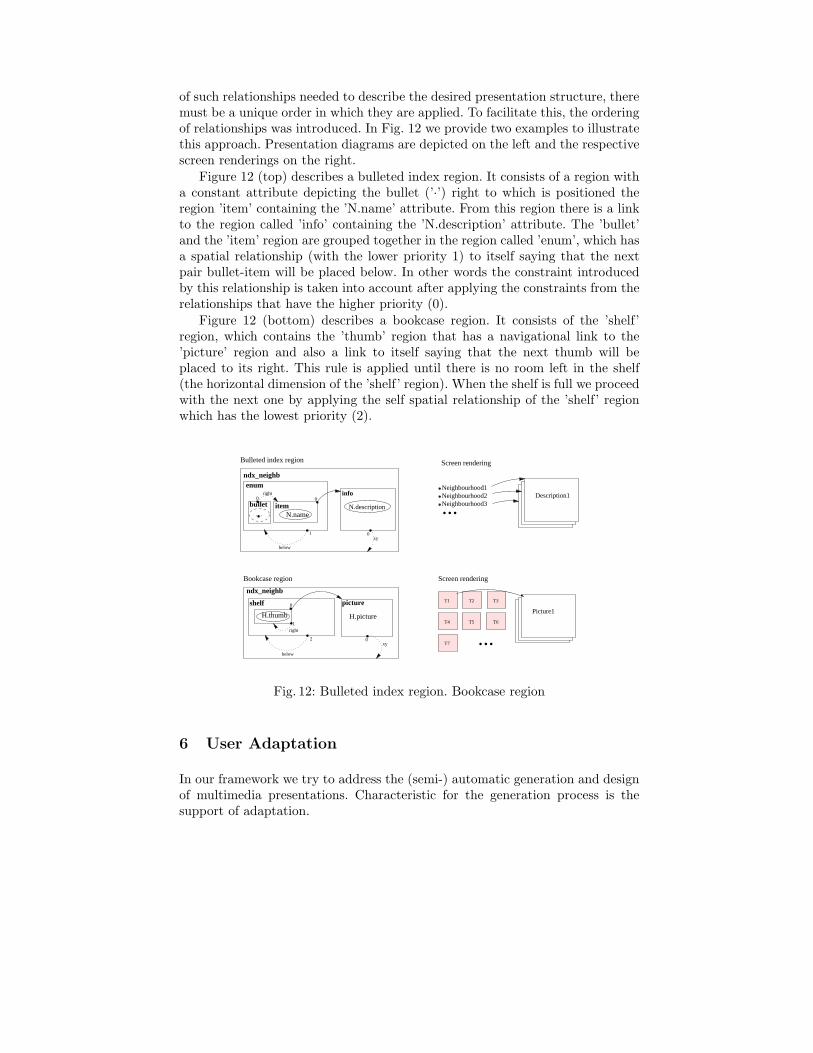
of such relationships needed to describe the desired presentation structure, theremust be a unique order in which they are applied. To facilitate this, the orderingof relationships was introduced. In Fig. 12 we provide two examples to illustratethis approach. Presentation diagrams are depicted on the left and the respectivescreen renderings on the right.
Figure 12 (top) describes a bulleted index region. It consists of a region witha constant attribute depicting the bullet (’·’) right to which is positioned theregion ’item’ containing the ’N.name’ attribute. From this region there is a linkto the region called ’info’ containing the ’N.description’ attribute. The ’bullet’and the ’item’ region are grouped together in the region called ’enum’, which hasa spatial relationship (with the lower priority 1) to itself saying that the nextpair bullet-item will be placed below. In other words the constraint introducedby this relationship is taken into account after applying the constraints from therelationships that have the higher priority (0).
Figure 12 (bottom) describes a bookcase region. It consists of the ’shelf’region, which contains the ’thumb’ region that has a navigational link to the’picture’ region and also a link to itself saying that the next thumb will beplaced to its right. This rule is applied until there is no room left in the shelf(the horizontal dimension of the ’shelf’ region). When the shelf is full we proceedwith the next one by applying the self spatial relationship of the ’shelf’ regionwhich has the lowest priority (2).
info
N.descriptionDescription1
Description1
Bookcase region
0
below
ndx_neighb
xy
item ...Neighbourhood1Neighbourhood2Neighbourhood3
T2
H.picture
below
picture
right
xy
ndx_neighb
shelf
0
T1
2
T3
T4 T5 T6
T7 ...1
enum
0
bullet
1
0
0
Bulleted index region
N.name
H.thumb
Screen rendering
Screen rendering
right
’ ’
Description1
Picture1
Fig. 12: Bulleted index region. Bookcase region
6 User Adaptation
In our framework we try to address the (semi-) automatic generation and designof multimedia presentations. Characteristic for the generation process is thesupport of adaptation.
The system can adapt to the user by considering the user’s browsing behav-ior. By observing the navigation behavior the system can infer (based on intelli-gence specified by the application’s author) the user’s knowledge and adapt thepresentation on the basis of this assumed knowledge.
There is also adaptation to the platform the user is using (platform depen-dence): if for example the system detects that the user is using a PC with a largescreen or a small hand-held device, then the system could adapt the presentationto this platform.
Slices or slice relationships are available or accessible only after the conditionshold. While the specification of the actual adaptation process is beyond the scopeof this paper (AHAM model from [10]), the concepts (in terms of AHAM) arespecified in this framework as slices and slice relationships. Hence, these slicesand slice relationships carry (in the conditions) part of the knowledge on whichthe adaptation is based. In order to specify hypermedia presentations, especiallyin the context of automatic design, it is necessary to describe which conceptsare part of the design. Our framework allows to specify exactly that.
7 Conclusions
The research described in this paper targets the support of automated hyper-media presentation design (in the context of Web-based Information Systems).Specifically, for applications involving data that change frequently, the design ofhypermedia presentations requires a structured approach. This paper discusses amethodology that guides through the process of specifying the presentation gen-eration process. The methodology is inspired by RMM and overcomes some ofRMM’s shortcomings for the application to automated presentation generation.It also shows the specification techniques used in the steps of the methodology.
Our methodology distinguishes three steps in the design process. First, alogical application design is made to organize the data elements at a logicallevel, even independent of the platforms used for the presentation. Secondly,at the logical level some of the specific details related to the platform that isused are taken into consideration: this leads to a platform-dependent logicalapplication diagram. The third step in the process realizes the logical decisionsmade in the first two steps, by carefully choosing representations for the differentconstructs. At this level, the dimensions of hyperlink navigation, space and timeare included in the specification. This paper concentrates on the specification ofthe different design decisions and illustrates them using the diagrams.
In further work we will extend these specification techniques with other con-structs that allow for the specification of some of the other relevant details. Inthe Dynamo project we are experimenting with different kinds of applicationssuch as the Electronic TV-Program Guide. In these experiments we learn howdifferent aspects play a role in the automated hypermedia presentation designprocess. We aim at including more of these aspects in this specification frame-work. One example relates to the use of constraints (rules) in the specificationof spatial relationships. Such constraints might not (easily) lead to a solution,
or even influence other design decisions (made earlier in the design process).Other aspects relate to the combination of different kinds of relationships, orthe construction of ’virtual’ slices or regions.
In the Dynamo project the adaptation is an important feature. The con-ditions associated with slices and regions allow for implementing different as-pects of adaptation, such as user adaptation (navigation) and platform adap-tation. The Hera prototype is developed incrementally, adding new features tothe methodology enables further verifying whether this mechanism suffices inconcrete applications.
References
1. Balasubramanian, P., Isakowitz, T., Stohr, E.A. : RMM: A Methodology for Struc-tured Hypermedia Design. Communications of the ACM, 38(8):33-44, August 1995.
2. Barbosa, S.D.J., Rossi, G., Schwabe, D.: Systematic Hypermedia Application De-sign with OOHDM. Hypertext, 1996.
3. Bieber, M., Isakowitz, T., Vitali, F.: Web Information Systems. Communicationsof the ACM, 41(7):78-80, July 1998.
4. Brusilovsky, P., De Bra, P., Houben, G.J.: Adaptive Hypermedia: From Systems toFrameworks. ACM Computing Surveys, 31(4es), Article No. 12, December 1999.
5. Ceri, S., Fraternali, P., Bongio, A.: Web Modeling Language (WebML): a modelinglanguage for designing Web sites. WWW9, 2000.
6. Fraternali, P., Paolini, P.: Model-Driven Development of Web applications: the Au-toWeb system. ACM Transactions on Information Systems, 18(4):323-382, October2000.
7. Garzotto, F., Paolini, P., Schwabe, D.: HDM - A Model-Based Approach to Hyper-text Application Design. ACM Transactions on Information Systems, 11(1):1-26 ,January 1993.
8. Bulterman, D.C.A., Hardman, Mullender, K.S.L., Rutledge, L., van Ossenbruggen,J.: Do You Have the Time? Composition and Linking in Time-based Hypermedia.Hypertext and Hypermedia, 1999.
9. De Bra, P., Houben, G.J.: Automatic Hypermedia Generation for ad hoc Querieson Semi-Structured Data. Digital Libraries, 2000.
10. De Bra, P., Houben, G.J., Wu, H.: AHAM: A Dexter-based Reference Model forAdaptive Hypermedia. Hypertext and Hypermedia, 1999.
11. Diaz, A., Isakowitz, T.: RMCase: A Tool To Design WWW Applications. FourthInternational World Wide Web Conference, 1995.
12. Houben, G.J.: HERA: Automatically Generating Hypermedia Front-Ends for AdHoc Data from Heterogeneous and Legacy Information Systems. Engineering Fed-erated Information Systems, 2000.
13. Isakowitz, T., Kamis, A., Koufaris, M.: Extending RMM: Russian Dolls and Hy-pertext. HICSS, 1997.
14. Isakowitz, T., Kamis, A., Koufaris, M.: Reconciling Top-Down and Bottom-UpDesign Approaches in RMM. Workshop on Information Technologies and Systems,1997.
15. Isakowitz, T., Kamis, A., Koufaris, M.: The Extended RMM Methodol-ogy for Web Publishing. New York University, 1998. Available online athttp://rmm-java.stern.nyu.edu/rmm/.