an rfm model customizable to product catalogues ... - mdpi
TRANSCRIPT
mathematics
Article
An RFM Model Customizable to Product Catalogues andMarketing Criteria Using Fuzzy Linguistic Models: Case Studyof a Retail Business
Rocío G. Martínez 1,* , Ramon A. Carrasco 1, Cristina Sanchez-Figueroa 2 and Diana Gavilan 1
�����������������
Citation: Martínez, R.G.; Carrasco,
R.A.; Sanchez-Figueroa, C.; Gavilan,
D. An RFM Model Customizable to
Product Catalogues and Marketing
Criteria Using Fuzzy Linguistic
Models: Case Study of a Retail
Business. Mathematics 2021, 9, 1836.
https://doi.org/10.3390/math9161836
Academic Editors:
J.E. Trinidad-Segovia and Miguel
Ángel Sánchez-Granero
Received: 30 June 2021
Accepted: 25 July 2021
Published: 4 August 2021
Publisher’s Note: MDPI stays neutral
with regard to jurisdictional claims in
published maps and institutional affil-
iations.
Copyright: © 2021 by the authors.
Licensee MDPI, Basel, Switzerland.
This article is an open access article
distributed under the terms and
conditions of the Creative Commons
Attribution (CC BY) license (https://
creativecommons.org/licenses/by/
4.0/).
1 Department of Management and Marketing, Complutense University of Madrid, UCM, 28223 Madrid, Spain;[email protected] (R.A.C.); [email protected] (D.G.)
2 Department of Statistics and Applied Economy, UNED University, 28040 Madrid, Spain;[email protected]
* Correspondence: [email protected]; Tel.: +34-607-226-916
Abstract: In the field of strategic marketing, the recency, frequency and monetary (RFM) variablesmodel has been applied for years to determine how solid a database is in terms of spending andcustomer activity. Retailers almost never obtain data related to their customers beyond their purchasehistory, and if they do, the information is often out of date. This work presents a new method, basedon the fuzzy linguistic 2-tuple model and the definition of product hierarchies, which provides alinguistic interpretability giving business meaning and improving the precision of conventionalmodels. The fuzzy linguistic 2-tuple RFM model, adapted by the product hierarchy thanks to theanalytical hierarchical process (AHP), is revealed to be a useful tool for including business criteria,product catalogues and customer insights in the definition of commercial strategies. The result of ourmethod is a complete customer segmentation that enriches the clusters obtained with the traditionalfuzzy linguistic 2-tuple RFM model and offers a clear view of customers’ preferences and possibleactions to define cross- and up-selling strategies. A real case study based on a worldwide leader inhome decoration was developed to guide, step by step, other researchers and marketers. The modelwas built using the only information that retailers always have: customers’ purchase ticket details.
Keywords: RFM model; 2-tuple RFM model; fuzzy linguistic modelling; multicriteria decisionmaking; AHP; customer segmentation; customer loyalty in retail; product catalogue management;PCA; k-means
1. Introduction
We live in a fast-changing digital world. In today’s age, customers expect sellers to talkdirectly with them and offer the perfect product, with the right message and at the correcttime. Big Data analytics have an immense potential to empower customer experiencemanagement, as they can help organizations to achieve a better and faster understandingof the customer journey and make decisions to improve the customer experience (Wedeland Kannan [1]).
There are many organizations still learning how to capture data from the multitudeof available touchpoints, devices, media and applications (Maechler et al. [2]). In somecases, even if they have the data, organizations still face difficulties in understanding andmanaging those data and generating relevant insights (Said et al. [3]). Information aboutcustomers is achieved through the use of analytics (Wedel and Kannan [1]), and despite itsuse becoming more common, many companies still use basic and poor analytics to extractinformation from their customers (Moorman [4]; Ramsbotham et al. [5]).
Digital transformation has been a revolution in the way companies manage their busi-ness and also in the way they manage relationships with customers, employees, suppliers,and other stakeholders (Bresciani et al. [6]; Scuotto et al. [7]).
Mathematics 2021, 9, 1836. https://doi.org/10.3390/math9161836 https://www.mdpi.com/journal/mathematics
Mathematics 2021, 9, 1836 2 of 31
Digitalization is changing the relationship between consumers and companies (Taimi-nen and Karjaluoto [8]). Consumers have the possibility to actively communicate with otherconsumers and businesses on their customer journey (Verhoef et al. [9]) and dynamic capa-bilities foster the digital transformation of customer value creation (Matarazzo et al. [10]).
With an ever-increasing mobility and connectivity and an ever-faster pace of life, theability to attract customers, as well as the attention span of consumers and the time theyhave, is decreasing daily (Kartajaya et al. [11]).
Liu et al. [12] define digital transformation or “digitalization” as “the integrationof digital technologies into business processes”. Part of this digital transformation isbased on the need to study and understand consumer behaviour, which analyses howgroups, individuals, and organizations behave and how they choose products, services orexperiences to fulfil their needs (Chen and Popovich [13]; Kuchinka et al. [14]; Sirgy [15];Yuan et al. [16]). This has been driven by the increase in online transactions and changes inthe profiles of online customers (Eger et al. [17]).
Customer behaviour analysis is driven by relationship marketing management asit is trying to focus marketing by ensuring the importance of the relationship with thecustomer (Rahman and Reynolds [18]). The recency, frequency and monetary (RFM)model is related to the acquisition, retention and relationship management of the mostprofitable customers for a business; therefore, it is important to marketing departments tobe able to develop more efficient targeted marketing campaigns (Hughes [19]; Bult andWansbeek [20]; Yeh et al. [21]).
In marketing, customer lifetime value (CLV) is the value that a customer contributesto a business over the entire lifetime of a company. It can also be defined as the net presentvalue of the cash flows attributed to the relationship with a customer, and consequently, itemulates a customer’s future profitability (Gupta et al. [22]; Kumar and Reinartz [23]). Itis a useful metric used by marketing managers, especially when they focus on customeracquisition and retention. In this study, we worked with the RFM model and calculatedthe customer lifetime value based on the RFM values, which we call the RFMScore.
Retailers almost never have data related to their customers beyond their purchasehistory, and if they do, the information is often out of date. Therefore, the only customerinformation we used for this investigation is that of historical transactional data related topurchases and products.
In this work, a detailed review of the literature related to the RFM model and itsextensions is presented. From this review, we highlight the contribution of the authorsHeldt et al. [24] and Moghaddam et al. [25] as the only authors who have taken the productinto account in the extension of the model. Heldt et al. [24] developed the RFMP model(recency, frequency, monetary, and product) including the product dimension to improvethe accuracy of CLV prediction. They worked at the product level but did not considerthe product catalogue hierarchies. The fact that it requires the calculation of the CLV pereach product and each customer seems to be unrealistic for retailers that normally havemillions of customers and products. The other approximation to the RFM model enrichedwith product information was conducted by Moghaddam et al. [25], who introduced theRFMV model (recency, frequency, monetary and variety), which only includes the varietyof products purchased by the customer.
Considering that we only have customers’ purchase data and calculating a customer’svalue for each product can be too expensive, our main goal for this research is to find asolution to these two issues. Therefore, the question of our research is how to improvethe efficiency of the current models to define the marketing strategy of a retailer, usingexclusively sales and product data, maintaining the customer-centric focus enriched withthe information that resides only in a product catalogue, which is contained within thehistorical sales repository.
This research is an improvement of the fuzzy linguistic 2-tuple RFM model by in-cluding the information related to the product catalogue to help organizations calculatethe CLV and segment the customer database. Using the different weights defined by the
Mathematics 2021, 9, 1836 3 of 31
AHP model, we generated a customizable tool according to business needs, commercialcalendars and any unexpected issue. The product catalogue was hierarchised, applying theprincipal component analysis (PCA), which revealed the patterns’ defined by customerswhen they make a purchase.
It is very important to understand that not all products have the same purchaseprocess or implications from the customer’s point of view. Some of these can be purchasedfollowing an impulsive feeling (Virvilaite and Saladiene [26]; Chen [27]), but others arevery complex products to buy, and demand an extremely high effort from the customers interms of planning, decision making or even monetary effort. A sales team is interested inanalysing which products are normally co-purchased (Chang and Tsai [28]), and marketingmanagers should be interested in elements such as determining the potential buyers for acertain product. Obviously, all of them should be interested in determining the frequency,monetary and recency value for each customer. Therefore, both models, the traditional RFMand the new one, which includes the RFMScore per product hierarchy, will be very usefultools to help areas of the company and build an effective customer-product managementsystem.
Customers’ RFMScores per product hierarchy will be segmented to define the hiddenprofiles on customers’ purchase behaviours, and the traditional RFMScore, built with onlythree attributes—recency, frequency and monetary—will be used to enrich the new model.
The experimental analysis was based on a worldwide leader in home furniture anddecoration that sells online and offline. Data were collected throughout 4 years, includ-ing all purchases for customers belonging to their loyalty club during that period. Thisensured the possibility of linking all historical purchases to each customer. The dataset had25 million records of ticket lines related to more than 250,000 different customers.
The analysis was conducted using R and Python languages embedded in nodes ofKnime 4.3.2 (https://www.knime.com/, accessed on 30 July 2021), an open source software,recognized by Gartner as one of the leaders in data science and machine learning platforms.
The rest of this paper is organized as follows. In Section 2, we review the materials andmethods, including the literature review and the preliminary knowledge to be applied insubsequent sections. In Section 3, the proposed model is presented showing the developedapproach, the economic and mathematical model and a very detailed implementation ofthe model in real-world data. Section 4 contains the discussion and limitations of the modeland issues for future research and to close the document, Section 5 details the researchconclusions.
2. Materials and Methods
In this section, we summarize the literature review, including a timeline with im-portant improvements for the RFM model; we also include the theoretical contents andprevious works that we consider essential to be able to follow our proposal.
2.1. Literature Review
The RFM model is a very well-known technique that is defined by three measures(recency, frequency and monetary), which are normally divided into five equal quintiles(20% group) and combined into a three-digit RFM cell code (Bult and Wansbeek [20]; Bitranand Mondschein [29]; Miglautsch [30]; Chang et al. [31]; Miglautsch [32]). According toour experience and prior findings, RFM values could be firm-specific and are based onthe nature of the products and customers’ behaviour (Lumsden et al. [33]). Many authorshave attempted to improve the original RFM model. Wei et al. [34] prepared a summary ofthese improvements covering RFM different versions until 2010, and Ernawati et al. [35]continued that work and summarized new versions and improvements to the RFM modelfrom 2015 to 2021. One of the proved improvements of the traditional RFM model was thefuzzy linguistic 2-tuple RFM model (Carrasco et al. [36,37]; Martínez et al. [38]).
As we already mentioned, CLV is the value a customer contributes to a businessover their entire lifetime at the company. By making use of CLV, companies tend to
Mathematics 2021, 9, 1836 4 of 31
place emphasis on long-term customer satisfaction and loyalty instead of maximizingshort-term relations and sales (Gupta et al. [22]; Kumar [39]; Fader et al. [40]). There aremany publications related to other models that attempt to calculate customers’ behaviour(Bolton [41]; Baesens et al. [42]; Malthouse [43]; Berry and Linoff [44]; Malthouse andBlattberg [45]; Rud [46]; Zhang et al. [47]), but CLV estimation based on recency, frequencyand monetary (RFM) values remains the most used.
Our proposal is an extension of the fuzzy linguistic 2-tuple RFM model, and it isapplied to both historical and current products purchased by customers, to calculate thecustomer value based on the RFMScore. Wong and Wei [48] calculated the weightedRFMScore. The weight determination for each variable of the RFM to create the RFMScoredepends on the factor’s importance in the application (Dursun and Caber [49]; Pekeret al. [50]); some authors applied the same weights to each attribute (Peker et al. [50];Hamdi and Zamiri [51]; Weng [52]), but other researchers applied the analytical hierarchicalprocess (AHP) to define the correspondence weights, such as Moghaddam et al. [25],He and Li [53], Rezaeinia and Rahmani [54], Marisa et al. [55], Patel et al. [56], Hosseiniand Mohammadzadeh [57], Dachyar et al. [58] and Monalisa et al. [59]. We will takeadvantage of their findings and use AHP to define the different weights of each RFMScoreper product category, obtaining a more complete approach to customer preferences andcustomer value.
Taking advantage of customers’ purchase behaviour, we define a new hierarchyof products that better responds to customers’ needs, not only to business needs, andwill help retailers to better determine their customers’ preferences. We applied PCA todiscover patterns in product original hierarchies and aggregated a huge number of productdimensions into a more manageable number that fitted customers preferences (Mackiewicz,and Ratajczak [60]; Karamizadeh et al. [61]; Abdi and Williams [62]; Paul et al. [63]; Bryantand Yarnold [64]).
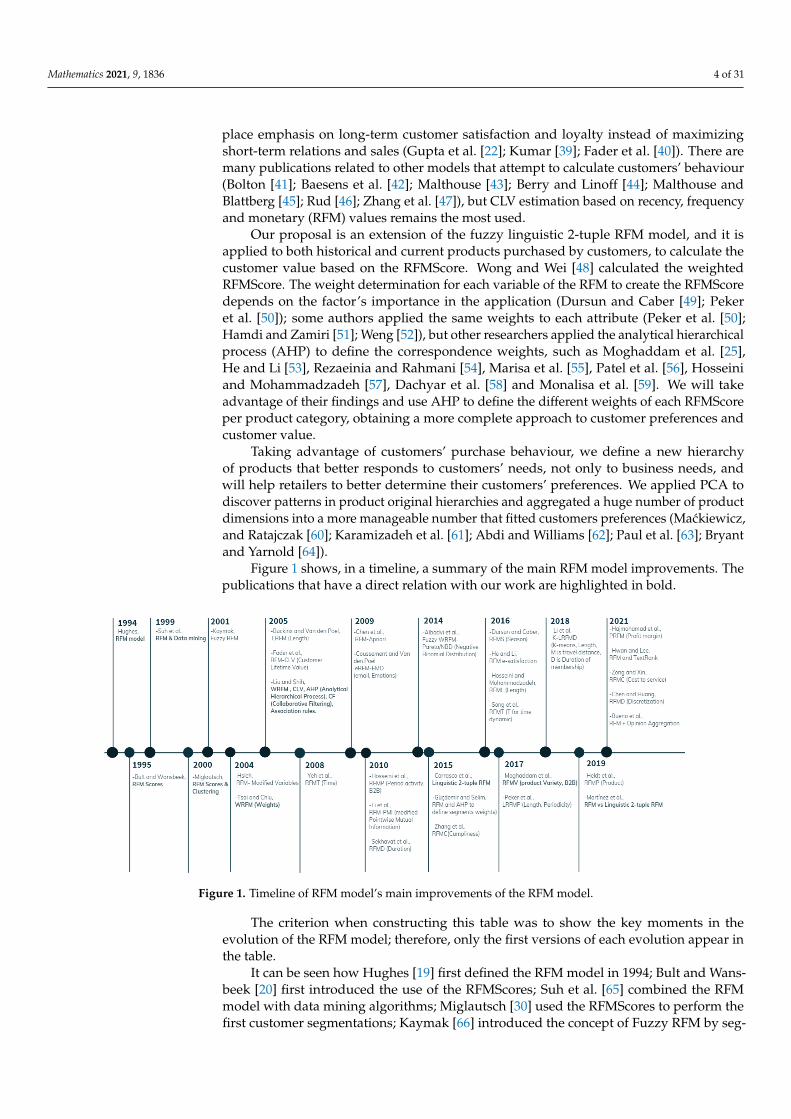
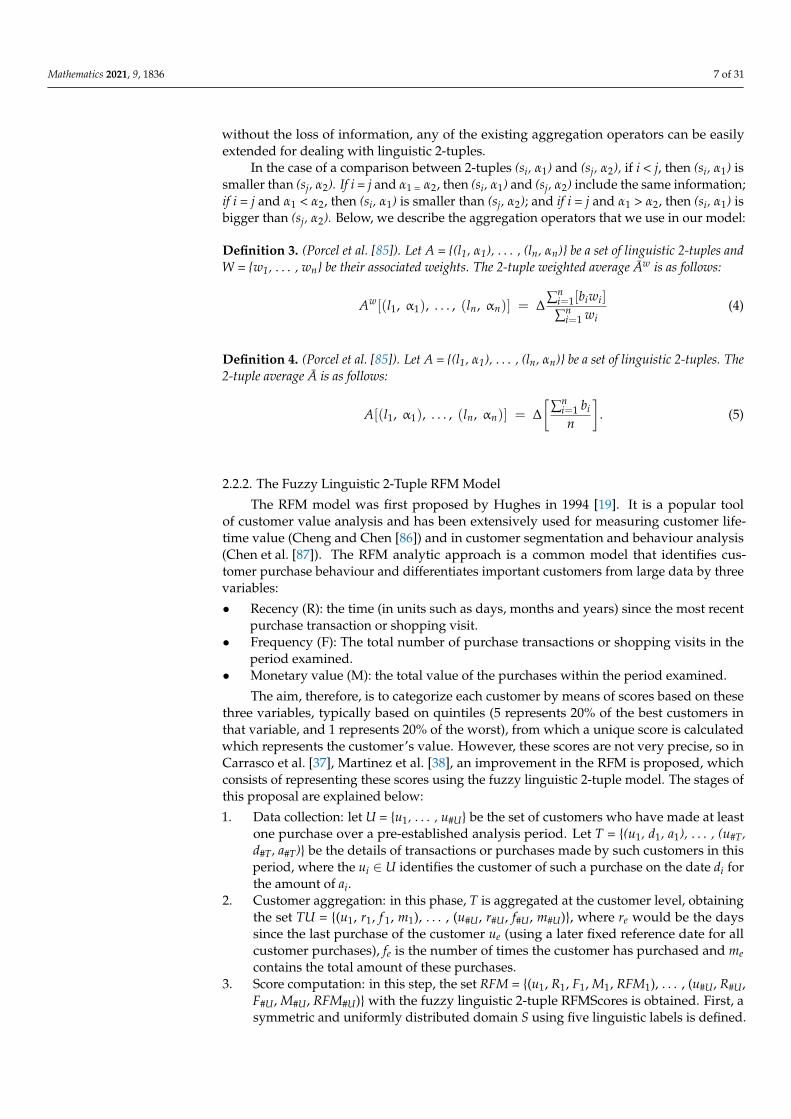
Figure 1 shows, in a timeline, a summary of the main RFM model improvements. Thepublications that have a direct relation with our work are highlighted in bold.
Mathematics 2021, 9, x FOR PEER REVIEW 8 of 32
have attempted to improve the original RFM model. Wei et al. [34] prepared a summary of these improvements covering RFM different versions until 2010, and Ernawati et al. [35] continued that work and summarized new versions and improvements to the RFM model from 2015 to 2021. One of the proved improvements of the traditional RFM model was the fuzzy linguistic 2-tuple RFM model (Carrasco et al. [36,37]; Martínez et al. [38]).
As we already mentioned, CLV is the value a customer contributes to a business over their entire lifetime at the company. By making use of CLV, companies tend to place em-phasis on long-term customer satisfaction and loyalty instead of maximizing short-term relations and sales (Gupta et al. [22]; Kumar [39]; Fader et al. [40]). There are many publi-cations related to other models that attempt to calculate customers’ behaviour (Bolton [41]; Baesens et al. [42]; Malthouse [43]; Berry and Linoff [44]; Malthouse and Blattberg [45]; Rud [46]; Zhang et al. [47]), but CLV estimation based on recency, frequency and monetary (RFM) values remains the most used.
Our proposal is an extension of the fuzzy linguistic 2-tuple RFM model, and it is ap-plied to both historical and current products purchased by customers, to calculate the cus-tomer value based on the RFMScore. Wong and Wei [48] calculated the weighted RFM-Score. The weight determination for each variable of the RFM to create the RFMScore de-pends on the factor’s importance in the application (Dursun and Caber [49]; Peker et al. [50]); some authors applied the same weights to each attribute (Peker et al. [50]; Hamdi and Zamiri [51]; Weng [52]), but other researchers applied the analytical hierarchical pro-cess (AHP) to define the correspondence weights, such as Moghaddam et al. [25], He and Li [53], Rezaeinia and Rahmani [54], Marisa et al. [55], Patel et al. [56], Hosseini and Mo-hammadzadeh [57], Dachyar et al. [58] and Monalisa et al. [59]. We will take advantage of their findings and use AHP to define the different weights of each RFMScore per product category, obtaining a more complete approach to customer preferences and customer value.
Taking advantage of customers’ purchase behaviour, we define a new hierarchy of products that better responds to customers’ needs, not only to business needs, and will help retailers to better determine their customers’ preferences. We applied PCA to discover patterns in product original hierarchies and aggregated a huge number of product dimen-sions into a more manageable number that fitted customers preferences (Maćkiewicz, and Ratajczak [60]; Karamizadeh et al. [61]; Abdi and Williams [62]; Paul et al. [63]; Bryant and Yarnold [64]).
Figure 1 shows, in a timeline, a summary of the main RFM model improvements. The publications that have a direct relation with our work are highlighted in bold.
Figure 1. Timeline of RFM model’s main improvements of the RFM model. Figure 1. Timeline of RFM model’s main improvements of the RFM model.
The criterion when constructing this table was to show the key moments in theevolution of the RFM model; therefore, only the first versions of each evolution appear inthe table.
It can be seen how Hughes [19] first defined the RFM model in 1994; Bult and Wans-beek [20] first introduced the use of the RFMScores; Suh et al. [65] combined the RFMmodel with data mining algorithms; Miglautsch [30] used the RFMScores to perform thefirst customer segmentations; Kaymak [66] introduced the concept of Fuzzy RFM by seg-
Mathematics 2021, 9, 1836 5 of 31
menting with the fuzzy c-means algorithm; Hsieh [67] was the first to modify the variablesR, F and M to ensure the application of this model to a particular business. In the sameyear, Tsai and Chiu [68] introduced the concept of weighted RFM. In 2005, Buckinx andVan den Poel [69] introduced the length dimension to the model; Fader et al. [40] describedenriching it with the CLV; and Liu and Shih applied the AHP to calculate the weights ofthe variables R, F and M to define CLV and applied the results to customer segmentation.They also calculated association rules for the construction of a collaborative recommendersystem.
In 2008, Yeh et al. [21] added the variable of time. In 2009, Coussement and Van denPoel [70] introduced emotions in the model; Chen et al. [71] enriched the model with theApriori algorithm; in 2010, Hosseini et al. [72] applied the model to a B2B business andentered the variable period for client activity; Li et al. [73] introduced pointwise mutualinformation; and Sekhavat et al. [74] added the duration variable. In 2014, significant im-provements were made by Albadvi et al. [75] who applied fuzzy WRFM with a pareto/NBDdistribution to segment and estimate the future CLV. In 2015, Carrasco et al. [36] introducedthe linguistic 2-tuple RFM model; Güçdemir and Selim [76] applied the AHP model inan interesting way to weight the customer segments they obtained; and Zhang et al. [47]enriched the model with cumpliness.
In 2016, the segment of Dursun and Caber [49] included the dimension of seasonality;He and Li [53] enriched it by entering users’ satisfaction into e-commerce websites; Hosseiniand Mohammadzadeh [57] included length in the model; and Song et al. [77] introducedan interesting element, time, as a dynamic dimension. In 2017, an interesting contributionfor our research occurred: Moghaddam et al. [25] introduced product information althoughonly through the variable V related to the variety of products. Peker et al. [50] addedlength and periodicity. In 2018, Li et al. [78] applied k-means to segment clients withthe enriched model thanks to the length and membership duration. In 2019, Heldt et al.first directly described the product [24]. They estimated the future CLV for each product.Martinez et al. [38] demonstrated the improvement in the results of customer segmentationattributable to the linguistic 2-tuple model. In 2021, we have models, such as the PRFM ofHajmohamad et al. [79], which works on the profit margin, and that of Hwan and Lee [80],which applies the TexRank algorithm to improve the RFM by including website-specificweights and is thus able to work with clients without their purchase history. Chen andHuang [81] introduced the discretization of variables as an improvement to the model, andBueno et al. [82] improved it by introducing opinion aggregations.
2.2. Theoretical Fundamentals2.2.1. The 2-Tuple Fuzzy Linguistic Model
The fuzzy linguistic 2-tuple approach (Herrera and Martínez [83]) is a continuousmodel of information representation (Herrera and Herrera [84]) that has been used in manybusiness and management applications. This model carries out processes of “computingwith words” without a loss of information, which is typical of other fuzzy linguisticapproaches. Henceforth, we explain the basic notations and operational details to explainour proposal.
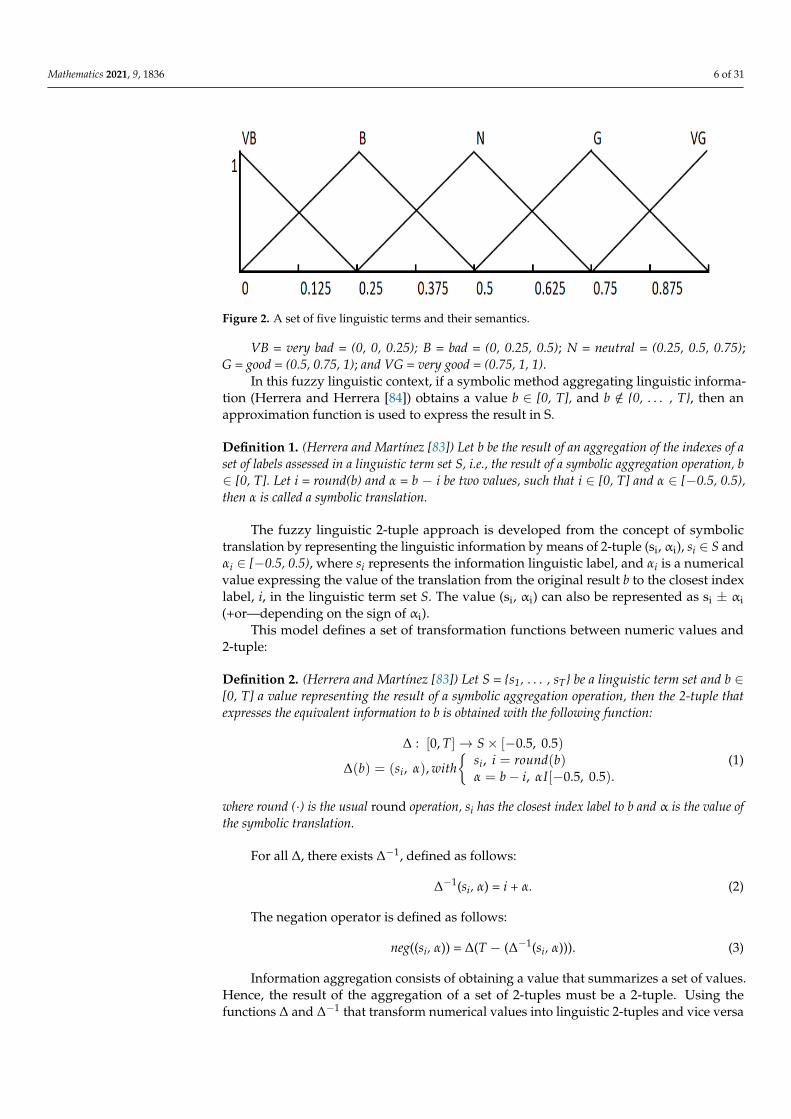
Let S = {s0, . . . , sT} be a linguistic term set with odd cardinality, where the mid-termrepresents the neutral value, and the rest of the terms are symmetric with respect to it. Weassume that the semantics of labels are given by means of triangular membership functionµSi, [0, 1]→ [0, 1], and consider all terms distributed on a scale on which a total order isdefined, i.e., si ≤ sj ⇔ i < j. This portrayal is accomplished by the 3-tuple (i,j,k), wherej is the mark where the membership is 1, and i and k are the left and right limits of thedefinition domain of the triangular membership function, respectively. Figure 2 representsthe semantics assigned in five terms via triangular membership function, where:
Mathematics 2021, 9, 1836 6 of 31
Mathematics 2021, 9, x FOR PEER REVIEW 8 of 32
defined, i.e., si ≤ sj ⇔ i < j. This portrayal is accomplished by the 3-tuple (i,j,k), where j is the mark where the membership is 1, and i and k are the left and right limits of the definition domain of the triangular membership function, respectively. Figure 2 represents the se-mantics assigned in five terms via triangular membership function, where:
VB = very bad = (0, 0, 0.25); B = bad = (0, 0.25, 0.5); N = neutral = (0.25, 0.5, 0.75); G = good = (0.5, 0.75, 1); and VG = very good = (0.75, 1, 1).
Figure 2. A set of five linguistic terms and their semantics.
In this fuzzy linguistic context, if a symbolic method aggregating linguistic infor-mation (Herrera and Herrera [84]) obtains a value b ∈ [0, T], and b ∉ {0, …, T}, then an approximation function is used to express the result in S.
Definition 1. (Herrera and Martínez [83]) Let b be the result of an aggregation of the indexes of a set of labels assessed in a linguistic term set S, i.e., the result of a symbolic aggregation operation, b ∈ [0, T]. Let i = round(b) and α = b − i be two values, such that i ∈ [0, T] and α ∈ [−0.5, 0.5), then α is called a symbolic translation.
The fuzzy linguistic 2-tuple approach is developed from the concept of symbolic translation by representing the linguistic information by means of 2-tuple (si, αi), si ∈ S and αi ∈ [−0.5, 0.5), where si represents the information linguistic label, and αi is a numerical value expressing the value of the translation from the original result b to the closest index label, i, in the linguistic term set S. The value (si, αi) can also be represented as si ± αi (+or—depending on the sign of αi).
This model defines a set of transformation functions between numeric values and 2-tuple:
Definition 2. (Herrera and Martínez [83]) Let S = {s1, …, sT} be a linguistic term set and b ∈ [0, T] a value representing the result of a symbolic aggregation operation, then the 2-tuple that ex-presses the equivalent information to b is obtained with the following function:
[ ] [ )
( ) ( )( )
[ )
: 0, 0.5, 0.5
, ,
, 0.
5, 0.5
,
.i
i
T S
s i round bb s with
b i ?α
α α
→ × −
==
= − −
Δ
Δ
(1)
where round () is the usual round operation, si has the closest index label to b and α is the value of the symbolic translation.
For all ∆, there exists ∆−1, defined as follows:
∆−1(si, α) = i + α. (2)
The negation operator is defined as follows:
Figure 2. A set of five linguistic terms and their semantics.
VB = very bad = (0, 0, 0.25); B = bad = (0, 0.25, 0.5); N = neutral = (0.25, 0.5, 0.75);G = good = (0.5, 0.75, 1); and VG = very good = (0.75, 1, 1).
In this fuzzy linguistic context, if a symbolic method aggregating linguistic informa-tion (Herrera and Herrera [84]) obtains a value b ∈ [0, T], and b /∈ {0, . . . , T}, then anapproximation function is used to express the result in S.
Definition 1. (Herrera and Martínez [83]) Let b be the result of an aggregation of the indexes of aset of labels assessed in a linguistic term set S, i.e., the result of a symbolic aggregation operation, b∈ [0, T]. Let i = round(b) and α = b − i be two values, such that i ∈ [0, T] and α ∈ [−0.5, 0.5),then α is called a symbolic translation.
The fuzzy linguistic 2-tuple approach is developed from the concept of symbolictranslation by representing the linguistic information by means of 2-tuple (si, αi), si ∈ S andαi ∈ [−0.5, 0.5), where si represents the information linguistic label, and αi is a numericalvalue expressing the value of the translation from the original result b to the closest indexlabel, i, in the linguistic term set S. The value (si, αi) can also be represented as si ± αi(+or—depending on the sign of αi).
This model defines a set of transformation functions between numeric values and2-tuple:
Definition 2. (Herrera and Martínez [83]) Let S = {s1, . . . , sT} be a linguistic term set and b ∈[0, T] a value representing the result of a symbolic aggregation operation, then the 2-tuple thatexpresses the equivalent information to b is obtained with the following function:
∆ : [0, T]→ S× [−0.5, 0.5)
∆(b) = (si, α), with{
si, i = round(b)α = b− i, αI[−0.5, 0.5).
(1)
where round (·) is the usual round operation, si has the closest index label to b and α is the value ofthe symbolic translation.
For all ∆, there exists ∆−1, defined as follows:
∆−1(si, α) = i + α. (2)
The negation operator is defined as follows:
neg((si, α)) = ∆(T − (∆−1(si, α))). (3)
Information aggregation consists of obtaining a value that summarizes a set of values.Hence, the result of the aggregation of a set of 2-tuples must be a 2-tuple. Using thefunctions ∆ and ∆−1 that transform numerical values into linguistic 2-tuples and vice versa
Mathematics 2021, 9, 1836 7 of 31
without the loss of information, any of the existing aggregation operators can be easilyextended for dealing with linguistic 2-tuples.
In the case of a comparison between 2-tuples (si, α1) and (sj, α2), if i < j, then (si, α1) issmaller than (sj, α2). If i = j and α1 = α2, then (si, α1) and (sj, α2) include the same information;if i = j and α1 < α2, then (si, α1) is smaller than (sj, α2); and if i = j and α1 > α2, then (si, α1) isbigger than (sj, α2). Below, we describe the aggregation operators that we use in our model:
Definition 3. (Porcel et al. [85]). Let A = {(l1, α1), . . . , (ln, αn)} be a set of linguistic 2-tuples andW = {w1, . . . , wn} be their associated weights. The 2-tuple weighted average Aw is as follows:
Aw[(l1, α1), . . . , (ln, αn)] = ∆∑n
i=1[biwi]
∑ni=1 wi
(4)
Definition 4. (Porcel et al. [85]). Let A = {(l1, α1), . . . , (ln, αn)} be a set of linguistic 2-tuples. The2-tuple average A is as follows:
A[(l1, α1), . . . , (ln, αn)] = ∆[
∑ni=1 bi
n
]. (5)
2.2.2. The Fuzzy Linguistic 2-Tuple RFM Model
The RFM model was first proposed by Hughes in 1994 [19]. It is a popular toolof customer value analysis and has been extensively used for measuring customer life-time value (Cheng and Chen [86]) and in customer segmentation and behaviour analysis(Chen et al. [87]). The RFM analytic approach is a common model that identifies cus-tomer purchase behaviour and differentiates important customers from large data by threevariables:
• Recency (R): the time (in units such as days, months and years) since the most recentpurchase transaction or shopping visit.
• Frequency (F): The total number of purchase transactions or shopping visits in theperiod examined.
• Monetary value (M): the total value of the purchases within the period examined.
The aim, therefore, is to categorize each customer by means of scores based on thesethree variables, typically based on quintiles (5 represents 20% of the best customers inthat variable, and 1 represents 20% of the worst), from which a unique score is calculatedwhich represents the customer’s value. However, these scores are not very precise, so inCarrasco et al. [37], Martinez et al. [38], an improvement in the RFM is proposed, whichconsists of representing these scores using the fuzzy linguistic 2-tuple model. The stages ofthis proposal are explained below:
1. Data collection: let U = {u1, . . . , u#U} be the set of customers who have made at leastone purchase over a pre-established analysis period. Let T = {(u1, d1, a1), . . . , (u#T,d#T, a#T)} be the details of transactions or purchases made by such customers in thisperiod, where the ui ∈ U identifies the customer of such a purchase on the date di forthe amount of ai.
2. Customer aggregation: in this phase, T is aggregated at the customer level, obtainingthe set TU = {(u1, r1, f 1, m1), . . . , (u#U, r#U, f#U, m#U)}, where re would be the dayssince the last purchase of the customer ue (using a later fixed reference date for allcustomer purchases), fe is the number of times the customer has purchased and mecontains the total amount of these purchases.
3. Score computation: in this step, the set RFM = {(u1, R1, F1, M1, RFM1), . . . , (u#U, R#U,F#U, M#U, RFM#U)} with the fuzzy linguistic 2-tuple RFMScores is obtained. First, asymmetric and uniformly distributed domain S using five linguistic labels is defined.
Mathematics 2021, 9, 1836 8 of 31
These labels have a semantic meaning for the variables of the RFM model referring tothe degree of agreement with the goodness of the variable:Let S = {s0, . . . , sT} be with T = 4: s0 = very bad = VB; s1 = bad = B; s2 = neutral = N; s3 =good = G; and s4 = very good = VG, with the definition shown in Figure 2.
Therefore, the following variables are calculated: Re, Fe, Me, RFMi ∈ S × [−0.5, 0.5).For each customer ue, i = 1, . . . , #U, we obtain Ae = (Ae1, Ae2, Ae3) with Ae1 = Re, Ae2 = Feand Ae3 = Me. First, customers are sorted in ascending order according to each of theindividual components Be = (Be1, Be2, Be3), with Be1 = re, Be2 = fe and Be3 = me, contained inTU. Now, we define rankei ∈ {1, . . . , #U} as the ranking of each client with respect to eachof these variables:
percent_rankei = (rankei − 1)/(n − 1) (6)
with percent_rankei ∈ [0, 1], e = 1, . . . , #U and i = 1, . . . , 3. The final 2-tuple score Aei is obtainedas follows:
Aei =
{∆((percent_rankei), i f i 6= 1neg(∆(percent_rankei)), i f i = 1
(7)
where ∆(·) and neg(·) are defined in Section 2.2.1 (Equations (1) and (3)). We use thenegation function on recency, as the larger scores represent the most recent buyers. The2-tuple RFMe, which characterizes together the Re, Fe and Me scores, is calculated for eachcustomer using Equation (5) as RFMe = Aw [Aei], with the user-defined weights W = {wR,wF, wM} previously defined by the marketing experts.
2.2.3. Analytical Hierarchical Process (AHP)
This technique is a systematic and hierarchical method to help the decision maker tosolve complex multicriteria decision making (MCDM) problems, which involves rankingalternatives. The AHP model has been widely used to calculate the customer lifetime valueby applying the AHP to define the importance of the RFM variables (Liu and Shih [88]).To adopt the AHP method for the objective of this work, the following steps proposed bySaaty [89] and Carrasco et al. [37] are followed.
Structuring of the Decision Problem into a Hierarchical Model
This consists of the decomposition of the decision problem into elements, accordingto their common characteristics, visually constructing a hierarchical model of differentinterrelated criteria, facilitating their understanding and evaluation. The first level alwayscontains the goal of the problem; the second level is constituted by the criteria, which canbe subdivided into sub-criteria; and the last level contains different alternatives. Thus, inthis step, we define the alternatives set A = {a1, . . . , a#A} and the hierarchical criteria forassessing them C. C1 = {c11, . . . , c1#C1}, each of these criteria c1i can, in turn, be subdividedinto sub-criteria, at several levels, c1ij = {c1i1, . . . , c1#Cij}, and thus recursively.
Making Pairwise Comparisons and Obtaining the Judgmental Matrix
In this step, the opinion of the decision makers is used to compare parts of elementsof a particular level with respect to a specific element at the immediate superior level.Let PW = (pwij)nxn be a pairwise comparison matrix where element pwij represents theimportance of criterion i over criterion j evaluated by the decision makers, which judgethe relative importance of one criterion over another with respect to the goal. The relativeimportance of one sub-criterion over another with respect to the main dimension will alsobe calculated. Every judgment will be represented from the predefined rating scale of thenumbers of Table 1. Each entry aij of the judgmental matrix is governed by the three rules:pwij > 0; pwij = 1/pwji reciprocal property; and pwii = 1 for all i.
Mathematics 2021, 9, 1836 9 of 31
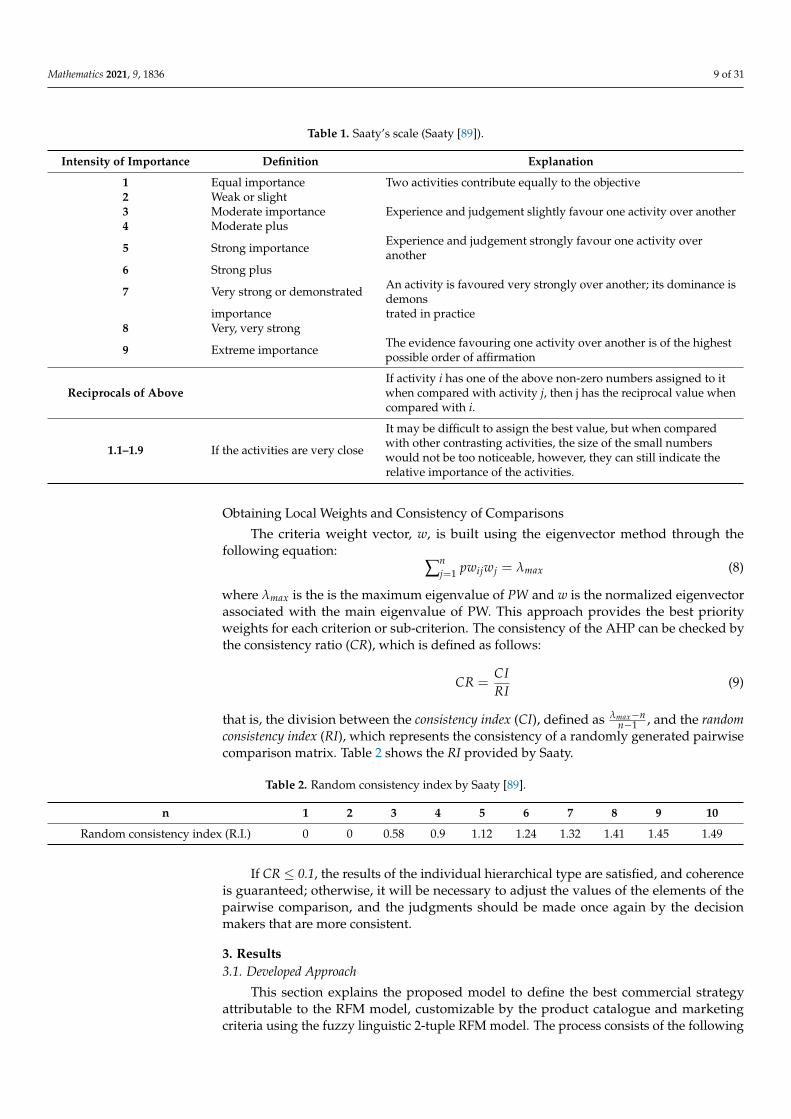
Table 1. Saaty’s scale (Saaty [89]).
Intensity of Importance Definition Explanation
1 Equal importance Two activities contribute equally to the objective2 Weak or slight3 Moderate importance Experience and judgement slightly favour one activity over another4 Moderate plus
5 Strong importance Experience and judgement strongly favour one activity overanother
6 Strong plus
7 Very strong or demonstrated An activity is favoured very strongly over another; its dominance isdemons
importance trated in practice8 Very, very strong
9 Extreme importance The evidence favouring one activity over another is of the highestpossible order of affirmation
Reciprocals of AboveIf activity i has one of the above non-zero numbers assigned to itwhen compared with activity j, then j has the reciprocal value whencompared with i.
1.1–1.9 If the activities are very close
It may be difficult to assign the best value, but when comparedwith other contrasting activities, the size of the small numberswould not be too noticeable, however, they can still indicate therelative importance of the activities.
Obtaining Local Weights and Consistency of Comparisons
The criteria weight vector, w, is built using the eigenvector method through thefollowing equation:
∑nj=1 pwijwj = λmax (8)
where λmax is the is the maximum eigenvalue of PW and w is the normalized eigenvectorassociated with the main eigenvalue of PW. This approach provides the best priorityweights for each criterion or sub-criterion. The consistency of the AHP can be checked bythe consistency ratio (CR), which is defined as follows:
CR =CIRI
(9)
that is, the division between the consistency index (CI), defined as λmax−nn−1 , and the random
consistency index (RI), which represents the consistency of a randomly generated pairwisecomparison matrix. Table 2 shows the RI provided by Saaty.
Table 2. Random consistency index by Saaty [89].
n 1 2 3 4 5 6 7 8 9 10
Random consistency index (R.I.) 0 0 0.58 0.9 1.12 1.24 1.32 1.41 1.45 1.49
If CR ≤ 0.1, the results of the individual hierarchical type are satisfied, and coherenceis guaranteed; otherwise, it will be necessary to adjust the values of the elements of thepairwise comparison, and the judgments should be made once again by the decisionmakers that are more consistent.
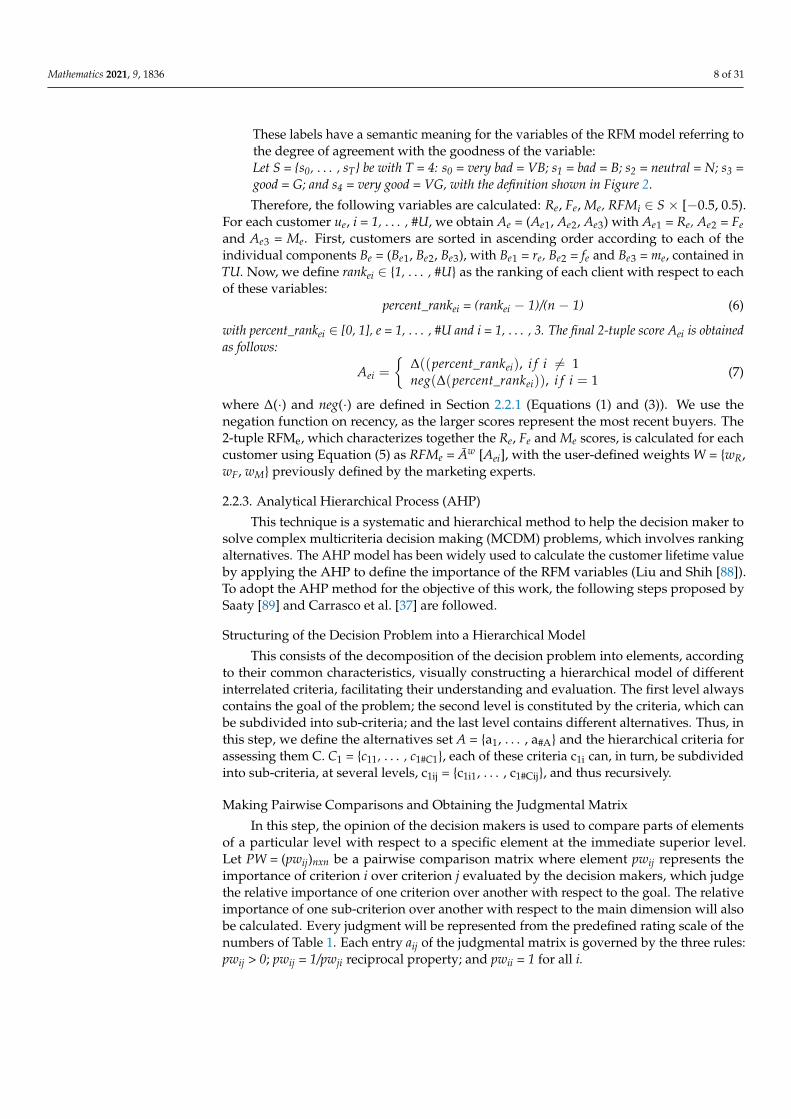
3. Results3.1. Developed Approach
This section explains the proposed model to define the best commercial strategyattributable to the RFM model, customizable by the product catalogue and marketingcriteria using the fuzzy linguistic 2-tuple RFM model. The process consists of the following
Mathematics 2021, 9, 1836 10 of 31
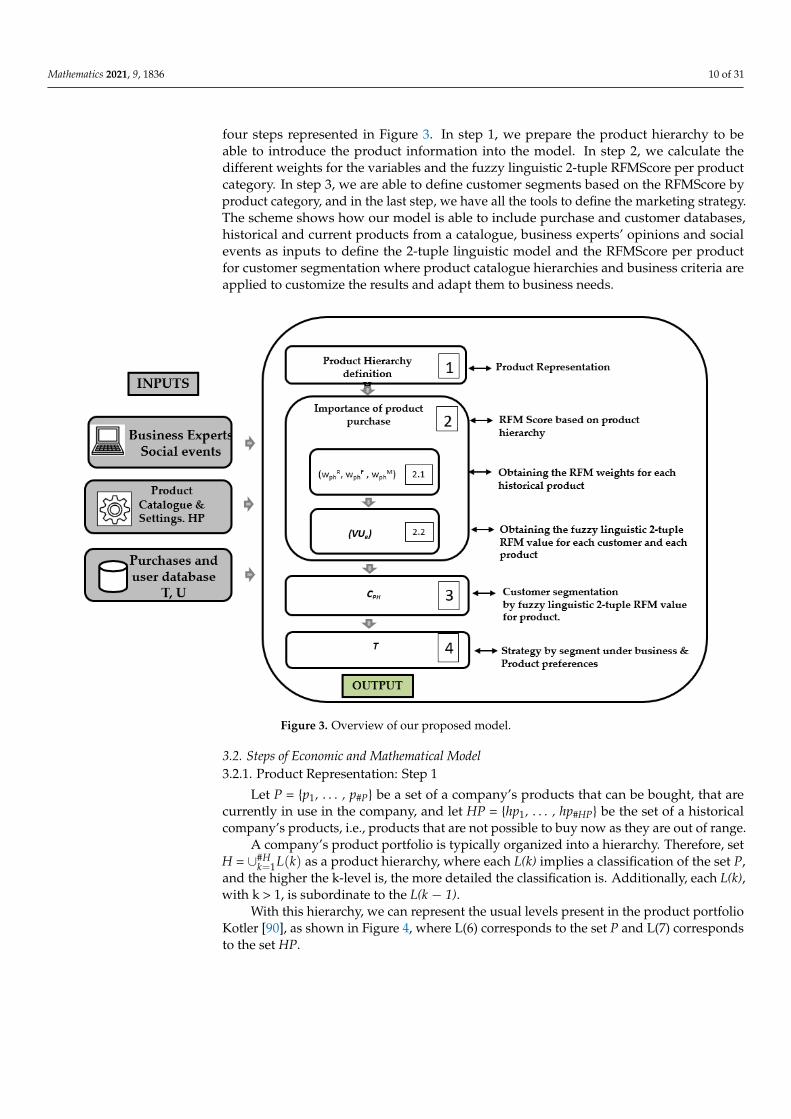
four steps represented in Figure 3. In step 1, we prepare the product hierarchy to beable to introduce the product information into the model. In step 2, we calculate thedifferent weights for the variables and the fuzzy linguistic 2-tuple RFMScore per productcategory. In step 3, we are able to define customer segments based on the RFMScore byproduct category, and in the last step, we have all the tools to define the marketing strategy.The scheme shows how our model is able to include purchase and customer databases,historical and current products from a catalogue, business experts’ opinions and socialevents as inputs to define the 2-tuple linguistic model and the RFMScore per productfor customer segmentation where product catalogue hierarchies and business criteria areapplied to customize the results and adapt them to business needs.
Mathematics 2021, 9, x FOR PEER REVIEW 8 of 32
weights for the variables and the fuzzy linguistic 2-tuple RFMScore per product category. In step 3, we are able to define customer segments based on the RFMScore by product category, and in the last step, we have all the tools to define the marketing strategy. The scheme shows how our model is able to include purchase and customer databases, histor-ical and current products from a catalogue, business experts’ opinions and social events as inputs to define the 2-tuple linguistic model and the RFMScore per product for customer segmentation where product catalogue hierarchies and business criteria are applied to cus-tomize the results and adapt them to business needs.
Figure 3. Overview of our proposed model.
3.2. Steps of Economic and Mathematical Model 3.2.1. Product Representation: Step1
Let P = {p1, …, p#P} be a set of a company’s products that can be bought, that are cur-rently in use in the company, and let HP = {hp1, …, hp#HP} be the set of a historical company’s products, i.e., products that are not possible to buy now as they are out of range.
A company’s product portfolio is typically organized into a hierarchy. Therefore, set H = ⋃# as a product hierarchy, where each L(k) implies a classification of the set P, and the higher the k-level is, the more detailed the classification is. Additionally, each L(k), with k > 1, is subordinate to the L(k − 1).
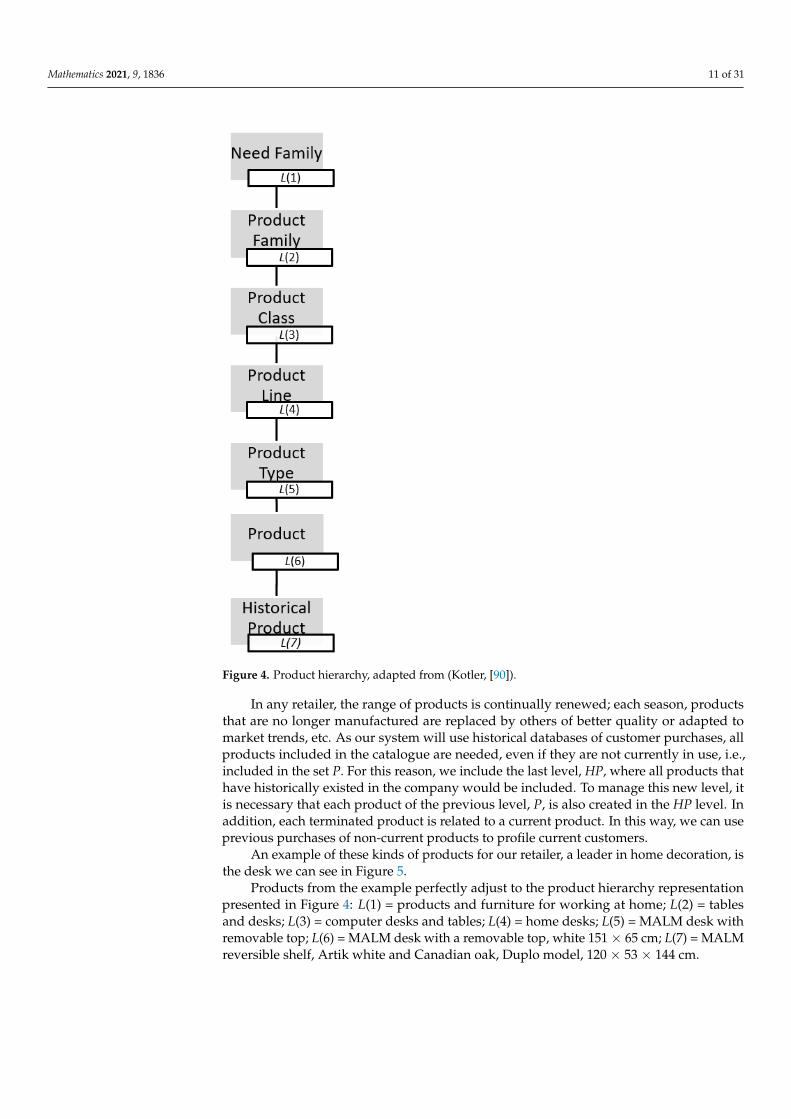
With this hierarchy, we can represent the usual levels present in the product portfolio Kotler [90], as shown in Figure 4, where L(6) corresponds to the set P and L(7) corresponds to the set HP.
Figure 3. Overview of our proposed model.
3.2. Steps of Economic and Mathematical Model3.2.1. Product Representation: Step 1
Let P = {p1, . . . , p#P} be a set of a company’s products that can be bought, that arecurrently in use in the company, and let HP = {hp1, . . . , hp#HP} be the set of a historicalcompany’s products, i.e., products that are not possible to buy now as they are out of range.
A company’s product portfolio is typically organized into a hierarchy. Therefore, setH = ∪#H
k=1L(k) as a product hierarchy, where each L(k) implies a classification of the set P,and the higher the k-level is, the more detailed the classification is. Additionally, each L(k),with k > 1, is subordinate to the L(k − 1).
With this hierarchy, we can represent the usual levels present in the product portfolioKotler [90], as shown in Figure 4, where L(6) corresponds to the set P and L(7) correspondsto the set HP.
Mathematics 2021, 9, 1836 11 of 31Mathematics 2021, 9, x FOR PEER REVIEW 8 of 32
Figure 4. Product hierarchy, adapted from (Kotler, [90]).
In any retailer, the range of products is continually renewed; each season, products that are no longer manufactured are replaced by others of better quality or adapted to market trends, etc. As our system will use historical databases of customer purchases, all products included in the catalogue are needed, even if they are not currently in use, i.e., included in the set P. For this reason, we include the last level, HP, where all products that have historically existed in the company would be included. To manage this new level, it is necessary that each product of the previous level, P, is also created in the HP level. In addition, each terminated product is related to a current product. In this way, we can use previous purchases of non-current products to profile current customers.
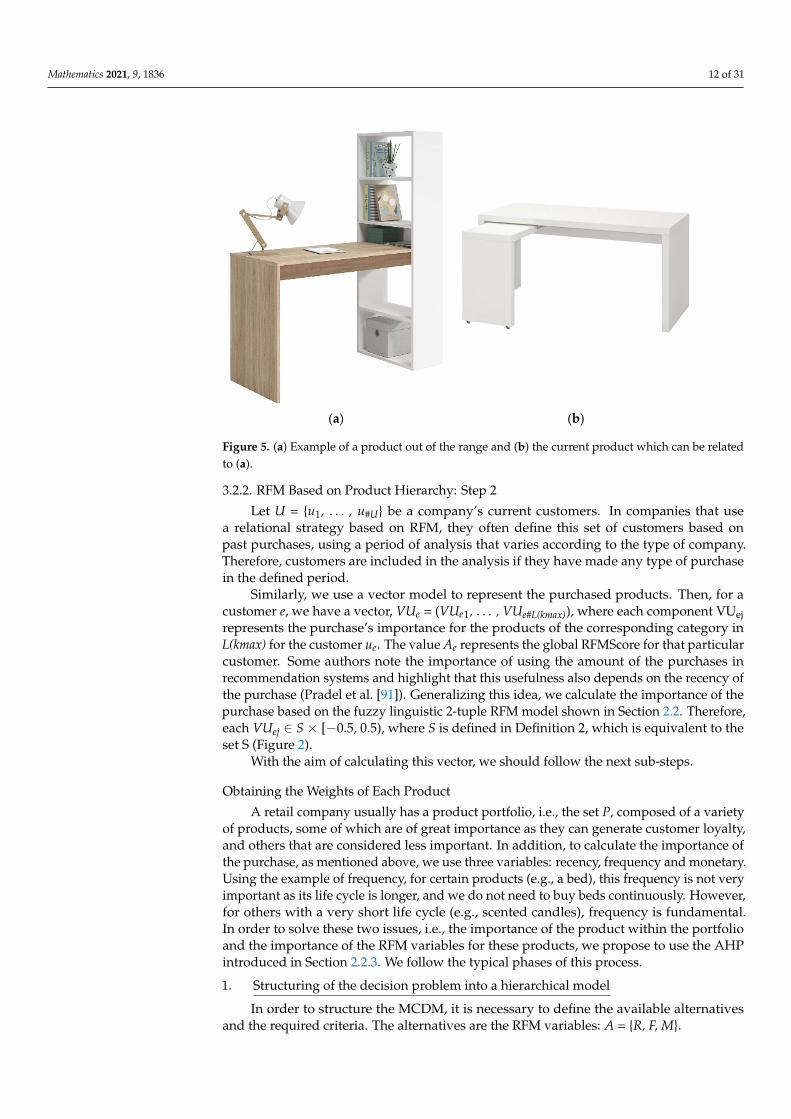
An example of these kinds of products for our retailer, a leader in home decoration, is the desk we can see in Figure 5.
Figure 4. Product hierarchy, adapted from (Kotler, [90]).
In any retailer, the range of products is continually renewed; each season, productsthat are no longer manufactured are replaced by others of better quality or adapted tomarket trends, etc. As our system will use historical databases of customer purchases, allproducts included in the catalogue are needed, even if they are not currently in use, i.e.,included in the set P. For this reason, we include the last level, HP, where all products thathave historically existed in the company would be included. To manage this new level, itis necessary that each product of the previous level, P, is also created in the HP level. Inaddition, each terminated product is related to a current product. In this way, we can useprevious purchases of non-current products to profile current customers.
An example of these kinds of products for our retailer, a leader in home decoration, isthe desk we can see in Figure 5.
Products from the example perfectly adjust to the product hierarchy representationpresented in Figure 4: L(1) = products and furniture for working at home; L(2) = tablesand desks; L(3) = computer desks and tables; L(4) = home desks; L(5) = MALM desk withremovable top; L(6) = MALM desk with a removable top, white 151 × 65 cm; L(7) = MALMreversible shelf, Artik white and Canadian oak, Duplo model, 120 × 53 × 144 cm.
Mathematics 2021, 9, 1836 12 of 31Mathematics 2021, 9, x FOR PEER REVIEW 8 of 32
(a) (b)
Figure 5. (a) Example of a product out of the range and (b) the current product which can be related to (a).
Products from the example perfectly adjust to the product hierarchy representation presented in Figure 4: L(1) = products and furniture for working at home; L(2) = tables and desks; L(3) = computer desks and tables; L(4) = home desks; L(5) = MALM desk with re-movable top; L(6) = MALM desk with a removable top, white 151 × 65 cm; L(7) = MALM reversible shelf, Artik white and Canadian oak, Duplo model, 120 × 53 × 144 cm.
3.2.2. RFM Based on Product Hierarchy: Step 2 Let U = {u1, …, u#U} be a company’s current customers. In companies that use a rela-
tional strategy based on RFM, they often define this set of customers based on past pur-chases, using a period of analysis that varies according to the type of company. Therefore, customers are included in the analysis if they have made any type of purchase in the de-fined period.
Similarly, we use a vector model to represent the purchased products. Then, for a customer e, we have a vector, VUe = (VUe1, …, VUe#L(kmax)), where each component VUej rep-resents the purchase’s importance for the products of the corresponding category in L(kmax) for the customer ue. The value Ae represents the global RFMScore for that particular customer. Some authors note the importance of using the amount of the purchases in rec-ommendation systems and highlight that this usefulness also depends on the recency of the purchase (Pradel et al. [91]). Generalizing this idea, we calculate the importance of the purchase based on the fuzzy linguistic 2-tuple RFM model shown in Section 2.2. Therefore, each VUej ∈ S × [−0.5, 0.5), where S is defined in Definition 2, which is equivalent to the set S (Figure 2).
With the aim of calculating this vector, we should follow the next sub-steps.
Obtaining the Weights of Each Product A retail company usually has a product portfolio, i.e., the set P, composed of a variety
of products, some of which are of great importance as they can generate customer loyalty, and others that are considered less important. In addition, to calculate the importance of the purchase, as mentioned above, we use three variables: recency, frequency and mone-tary. Using the example of frequency, for certain products (e.g., a bed), this frequency is not very important as its life cycle is longer, and we do not need to buy beds continuously. However, for others with a very short life cycle (e.g., scented candles), frequency is funda-mental. In order to solve these two issues, i.e., the importance of the product within the
Figure 5. (a) Example of a product out of the range and (b) the current product which can be relatedto (a).
3.2.2. RFM Based on Product Hierarchy: Step 2
Let U = {u1, . . . , u#U} be a company’s current customers. In companies that usea relational strategy based on RFM, they often define this set of customers based onpast purchases, using a period of analysis that varies according to the type of company.Therefore, customers are included in the analysis if they have made any type of purchasein the defined period.
Similarly, we use a vector model to represent the purchased products. Then, for acustomer e, we have a vector, VUe = (VUe1, . . . , VUe#L(kmax)), where each component VUejrepresents the purchase’s importance for the products of the corresponding category inL(kmax) for the customer ue. The value Ae represents the global RFMScore for that particularcustomer. Some authors note the importance of using the amount of the purchases inrecommendation systems and highlight that this usefulness also depends on the recency ofthe purchase (Pradel et al. [91]). Generalizing this idea, we calculate the importance of thepurchase based on the fuzzy linguistic 2-tuple RFM model shown in Section 2.2. Therefore,each VUej ∈ S × [−0.5, 0.5), where S is defined in Definition 2, which is equivalent to theset S (Figure 2).
With the aim of calculating this vector, we should follow the next sub-steps.
Obtaining the Weights of Each Product
A retail company usually has a product portfolio, i.e., the set P, composed of a varietyof products, some of which are of great importance as they can generate customer loyalty,and others that are considered less important. In addition, to calculate the importance ofthe purchase, as mentioned above, we use three variables: recency, frequency and monetary.Using the example of frequency, for certain products (e.g., a bed), this frequency is not veryimportant as its life cycle is longer, and we do not need to buy beds continuously. However,for others with a very short life cycle (e.g., scented candles), frequency is fundamental.In order to solve these two issues, i.e., the importance of the product within the portfolioand the importance of the RFM variables for these products, we propose to use the AHPintroduced in Section 2.2.3. We follow the typical phases of this process.
1. Structuring of the decision problem into a hierarchical model
In order to structure the MCDM, it is necessary to define the available alternativesand the required criteria. The alternatives are the RFM variables: A = {R, F, M}.
Mathematics 2021, 9, 1836 13 of 31
The aim is to obtain the importance of each of these variables for each of the productsin the catalogue, historical or otherwise, i.e., P and HP. Therefore, the criteria could bethe P set of products in use. This would make the problem unmanageable, due to theirhigh number. Fortunately, companies usually have a well-structured product catalogue, asseen in Section 3.1. To define the criteria, we use a portion of the hierarchical portfolio, H,defined in the section.
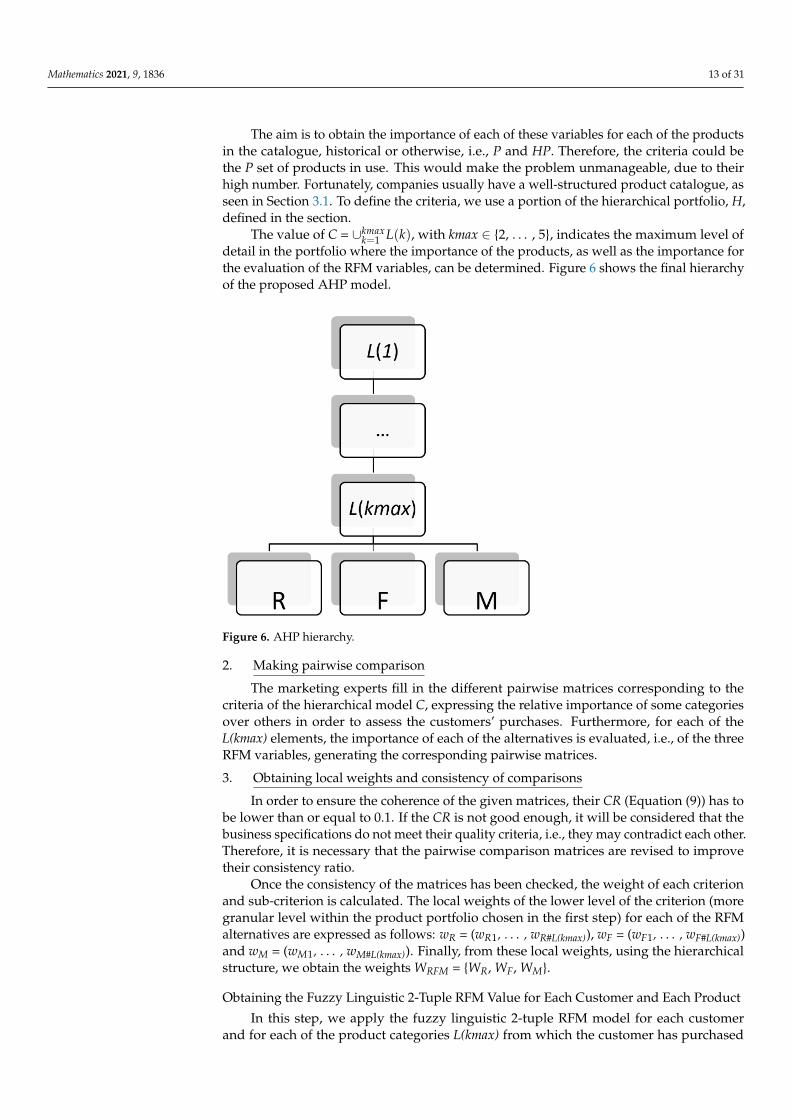
The value of C = ∪kmaxk=1 L(k), with kmax ∈ {2, . . . , 5}, indicates the maximum level of
detail in the portfolio where the importance of the products, as well as the importance forthe evaluation of the RFM variables, can be determined. Figure 6 shows the final hierarchyof the proposed AHP model.
Mathematics 2021, 9, x FOR PEER REVIEW 8 of 32
portfolio and the importance of the RFM variables for these products, we propose to use the AHP introduced in Section 2.2.3. We follow the typical phases of this process. 1. Structuring of the decision problem into a hierarchical model
In order to structure the MCDM, it is necessary to define the available alternatives and the required criteria. The alternatives are the RFM variables: A = {R, F, M}.
The aim is to obtain the importance of each of these variables for each of the products in the catalogue, historical or otherwise, i.e., P and HP. Therefore, the criteria could be the P set of products in use. This would make the problem unmanageable, due to their high number. Fortunately, companies usually have a well-structured product catalogue, as seen in Section 3.1. To define the criteria, we use a portion of the hierarchical portfolio, H, de-fined in the section.
The value of C = ⋃ , with kmax ∈ {2, …, 5}, indicates the maximum level of detail in the portfolio where the importance of the products, as well as the importance for the evaluation of the RFM variables, can be determined. Figure 6 shows the final hierarchy of the proposed AHP model.
Figure 6. AHP hierarchy.
2. Making pairwise comparison The marketing experts fill in the different pairwise matrices corresponding to the cri-
teria of the hierarchical model C, expressing the relative importance of some categories over others in order to assess the customers’ purchases. Furthermore, for each of the L(kmax) elements, the importance of each of the alternatives is evaluated, i.e., of the three RFM variables, generating the corresponding pairwise matrices. 3. Obtaining local weights and consistency of comparisons
In order to ensure the coherence of the given matrices, their CR (Equation (9)) has to be lower than or equal to 0.1. If the CR is not good enough, it will be considered that the business specifications do not meet their quality criteria, i.e., they may contradict each other. Therefore, it is necessary that the pairwise comparison matrices are revised to im-prove their consistency ratio.
Once the consistency of the matrices has been checked, the weight of each criterion and sub-criterion is calculated. The local weights of the lower level of the criterion (more granular level within the product portfolio chosen in the first step) for each of the RFM
Figure 6. AHP hierarchy.
2. Making pairwise comparison
The marketing experts fill in the different pairwise matrices corresponding to thecriteria of the hierarchical model C, expressing the relative importance of some categoriesover others in order to assess the customers’ purchases. Furthermore, for each of theL(kmax) elements, the importance of each of the alternatives is evaluated, i.e., of the threeRFM variables, generating the corresponding pairwise matrices.
3. Obtaining local weights and consistency of comparisons
In order to ensure the coherence of the given matrices, their CR (Equation (9)) has tobe lower than or equal to 0.1. If the CR is not good enough, it will be considered that thebusiness specifications do not meet their quality criteria, i.e., they may contradict each other.Therefore, it is necessary that the pairwise comparison matrices are revised to improvetheir consistency ratio.
Once the consistency of the matrices has been checked, the weight of each criterionand sub-criterion is calculated. The local weights of the lower level of the criterion (moregranular level within the product portfolio chosen in the first step) for each of the RFMalternatives are expressed as follows: wR = (wR1, . . . , wR#L(kmax)), wF = (wF1, . . . , wF#L(kmax))and wM = (wM1, . . . , wM#L(kmax)). Finally, from these local weights, using the hierarchicalstructure, we obtain the weights WRFM = {WR, WF, WM}.
Obtaining the Fuzzy Linguistic 2-Tuple RFM Value for Each Customer and Each Product
In this step, we apply the fuzzy linguistic 2-tuple RFM model for each customerand for each of the product categories L(kmax) from which the customer has purchased
Mathematics 2021, 9, 1836 14 of 31
during the chosen analysis period. Therefore, we follow the step explained in Section 2.2.individually for each historical product obtaining its corresponding category in L(kmax)and the corresponding VUe value, which would give us the global RFMScore for each ofthe categories of that level. From this vector, we can obtain the value Ae that represents theglobal RFM value for the client using the WRFM weight matrix by means of the operatorAw (Equation (4)).
3.2.3. Customer Segmentation by 2-Tuple RFM Value per Product: Step 3
The RFMScores per product obtained in 3.2.2 (VUe) are used to define clusters ofcustomers with the same patterns. There are many clustering algorithms for this, but theRFM model works well with the k-means algorithm. The main objective is to obtain kclusters CHP = {CHP1, . . . , CHPk} with their correspondents k centroids, vs. = (vs1, vs2, . . . ,vs#(Lmax)), which is the s = 1 . . . k, one for each cluster. The values of these centroids couldbe expressed using the model fuzzy linguistic 2-tuple model; thus, we achieve a betterlinguistic interpretability.
3.2.4. Strategy by Segment under Business and Product Preferences: Step 4
Once we defined the set of clusters CHP, different strategies should be designed tomatch business needs with customers’ needs and therefore, customers’ lifecycles will belonger and business will consequently improve.
3.3. Case of the Model Implementation
This work was elaborated with a real transactional dataset from an online and offlineretailer, a worldwide leader in home furnishing and decoration.
The dataset contains more than 25 million ticket lines concerning purchases from May2014 to May 2020.
The most common situation for retailers is to not have access to socio-demographicalinformation about their customers, or in the case they have it, data are usually out of date asno one remembers to update their own data when something changes. Therefore, the onlyinformation about customers we used for this investigation was historical transactionaldata, which will ensure the usefulness of the experiment for other retailers as they willalso have the same details. As detailed in Section 3.1, data will be detailed at the L(7)product level, which means that the dataset will include historical products, HP, andcurrent products, P.
Data were analysed using the Knime Analytics Platform, intuitive, low code and opensource software for creating data science. Our intention was to help other researchersand business professionals to understand their data and define machine learning modelsaccessible for everyone.
In this work, we solved a real business problem. Business experts were involved tomake decisions and ensure the obtained results make sense for real situations.
Following the scheme shown in Figure 3, each step of the scheme is detailed.
3.3.1. Step 1: Product Hierarchy Definition
Retailers have a huge number of products, which are organised into a structure inorder to make them manageable. This classifies a company’s products and services bytheir essential components into a logical structure. The product hierarchy is defined toanswer business needs, but customers’ purchasing behaviour does not have to follow thatstructure.
Observing the definition of the product catalogue made previously, and the examplealready introduced in Section 3.1, the current catalogue of the company, with its HP and Pproducts, adapts perfectly to the hierarchy’s defined scheme.
To bring to light the products’ hierarchy defined based on customer purchase patterns,we define a new hierarchy, denoted as H, and we carried out a principal component analysisof customer transactional data.
Mathematics 2021, 9, 1836 15 of 31
Starting from the customer’s purchase ticket details, we must create a new dataset inwhich each client will be classified following the new hierarchy, which will be defined byanalysing customer behaviour patterns.
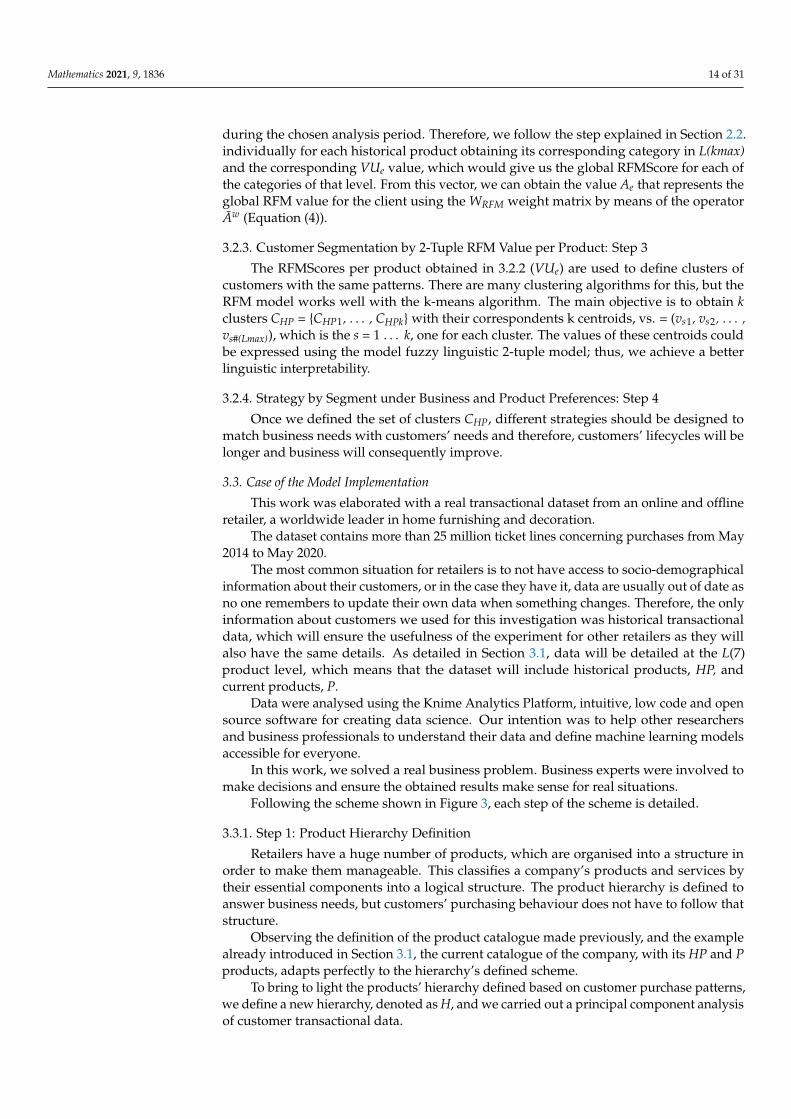
In the first step, KMO (Kaiser–Meyer–Olkin) and Bartlett’s (BTS) tests were appliedin order to check whether there was a certain redundancy between the variables that canbe summarized with a few factors. These new factors define the product hierarchy that ishidden in customer buying patterns. Both tests were calculated by comparing the observedcorrelation matrix to the identity matrix. The KMO test was associated with the degree ofcommon variance. Bartlett’s test determines whether the correlation matrix is an identitymatrix (Ocal et al. [92]; Hair et al. [93]; Ali et al. [94]).
Bartlett’s test resulted in a p-value of 0.0, so we concluded that the correlation matrixbetween the original product areas is not the identity matrix, and the KMO test resulted inan overall MSA of 0.98, so it was clear that we could reduce the original structure into anew, more manageable one, which will form a new product hierarchy that will reflect theway customers make purchases. Figure 7 shows the new aggregation.
Mathematics 2021, 9, x FOR PEER REVIEW 8 of 32
business needs, but customers’ purchasing behaviour does not have to follow that struc-ture.
Observing the definition of the product catalogue made previously, and the example already introduced in Section 3.1, the current catalogue of the company, with its HP and P products, adapts perfectly to the hierarchy’s defined scheme.
To bring to light the products’ hierarchy defined based on customer purchase pat-terns, we define a new hierarchy, denoted as H, and we carried out a principal component analysis of customer transactional data.
Starting from the customer’s purchase ticket details, we must create a new dataset in which each client will be classified following the new hierarchy, which will be defined by analysing customer behaviour patterns.
In the first step, KMO (Kaiser–Meyer–Olkin) and Bartlett’s (BTS) tests were applied in order to check whether there was a certain redundancy between the variables that can be summarized with a few factors. These new factors define the product hierarchy that is hidden in customer buying patterns. Both tests were calculated by comparing the observed correlation matrix to the identity matrix. The KMO test was associated with the degree of common variance. Bartlett’s test determines whether the correlation matrix is an identity matrix (Ocal et al. [92]; Hair et al. [93]; Ali et al. [94]).
Bartlett’s test resulted in a p-value of 0.0, so we concluded that the correlation matrix between the original product areas is not the identity matrix, and the KMO test resulted in an overall MSA of 0.98, so it was clear that we could reduce the original structure into a new, more manageable one, which will form a new product hierarchy that will reflect the way customers make purchases. Figure 7 shows the new aggregation.
Figure 7. New product hierarchy H.
All main furniture areas were strongly correlated with accessories, i.e., when a cus-tomer buys a bed and mattress, they also buy accessories, such as pillows, bedlinen and cushions. To differentiate main furniture from these “easy to buy accessories”, it was de-cided to create an “artificial” dimension only for accessories that are purchased in a very different way, and this was called the impulsive products category.
Critic products include all furniture products with a very long decision journey as they are more expensive, difficult to buy and designed by the client and they imply great trust
Figure 7. New product hierarchy H.
All main furniture areas were strongly correlated with accessories, i.e., when a cus-tomer buys a bed and mattress, they also buy accessories, such as pillows, bedlinen andcushions. To differentiate main furniture from these “easy to buy accessories”, it wasdecided to create an “artificial” dimension only for accessories that are purchased in a verydifferent way, and this was called the impulsive products category.
Critic products include all furniture products with a very long decision journey as theyare more expensive, difficult to buy and designed by the client and they imply great trustin the brand. These products create loyal customers as once the customer buys one ofthese critic products, the brand associated with these products will always be present in thecustomer’s life.
Reflexive products were an isolated group of products that are important, but not asdifficult to purchase as the critic ones.
Evolving products were products related to children. They will change as childrengrow up.
Mathematics 2021, 9, 1836 16 of 31
Seasonal products also became isolated, and this is an interesting category as it will bevery useful to generate a sensation of novelty and create traffic to the stores seasonally forall kinds of customers.
3.3.2. Step 2: RFMScore Definition Based on Product Hierarchy
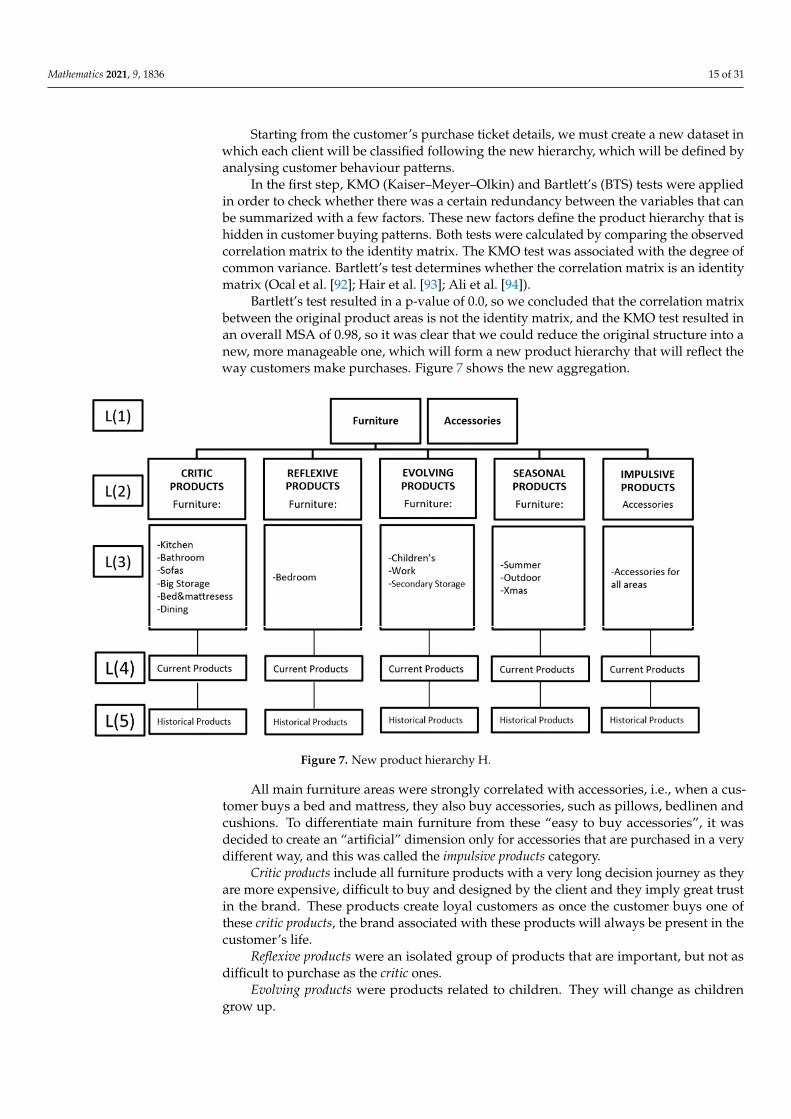
The dataset used in this step contains all the historical purchase information related to219.199 (#U) customers with more than 25 million ticket lines concerning purchases fromMay 2014 to May 2020.
As retailers do not usually have socio-demographical information about their cus-tomers, they need to find a new way to learn more about their clients to support theirbusiness decisions. Figure 8 shows an example of the customer information available onany retailer.
Mathematics 2021, 9, x FOR PEER REVIEW 8 of 32
in the brand. These products create loyal customers as once the customer buys one of these critic products, the brand associated with these products will always be present in the cus-tomer’s life.
Reflexive products were an isolated group of products that are important, but not as difficult to purchase as the critic ones.
Evolving products were products related to children. They will change as children grow up.
Seasonal products also became isolated, and this is an interesting category as it will be very useful to generate a sensation of novelty and create traffic to the stores seasonally for all kinds of customers.
3.3.2. Step 2: RFMScore Definition Based on Product Hierarchy The dataset used in this step contains all the historical purchase information related
to 219.199 (#U) customers with more than 25 million ticket lines concerning purchases from May 2014 to May 2020.
As retailers do not usually have socio-demographical information about their custom-ers, they need to find a new way to learn more about their clients to support their business decisions. Figure 8 shows an example of the customer information available on any retailer.
Figure 8. Example of data in an operational database from a retailer.
The information available is the customer ID, the date of the purchase, the product identification number and the amount paid for each product that each customer has pur-chased on each visit.
Step 2.1: Obtaining the RFM Weights for Each Historical Product To facilitate the understanding of the following sections, we enumerated the different
tasks that each one of them encompasses. 1. Structuring the decision problem into a hierarchical model
In Section 4.1, step 1, we proceeded to define a more suitable catalogue H for market-ing decisions; these specifications can be carried out only using levels 1 and 2, i.e., kmin = kmax = 2, which indicates that C = L(2) with #L(2) = 5, C = {Critic, Reflexive, Evolving, Seasonal, Impulsive}.
The hierarchical AHP model is shown in Figure 9.
Figure 8. Example of data in an operational database from a retailer.
The information available is the customer ID, the date of the purchase, the productidentification number and the amount paid for each product that each customer haspurchased on each visit.
Step 2.1: Obtaining the RFM Weights for Each Historical Product
To facilitate the understanding of the following sections, we enumerated the differenttasks that each one of them encompasses.
1. Structuring the decision problem into a hierarchical model
In Section 4.1, step 1, we proceeded to define a more suitable catalogue H for marketingdecisions; these specifications can be carried out only using levels 1 and 2, i.e., kmin = kmax= 2, which indicates that C = L(2) with #L(2) = 5, C = {Critic, Reflexive, Evolving, Seasonal,Impulsive}.
The hierarchical AHP model is shown in Figure 9.
Mathematics 2021, 9, 1836 17 of 31Mathematics 2021, 9, x FOR PEER REVIEW 8 of 32
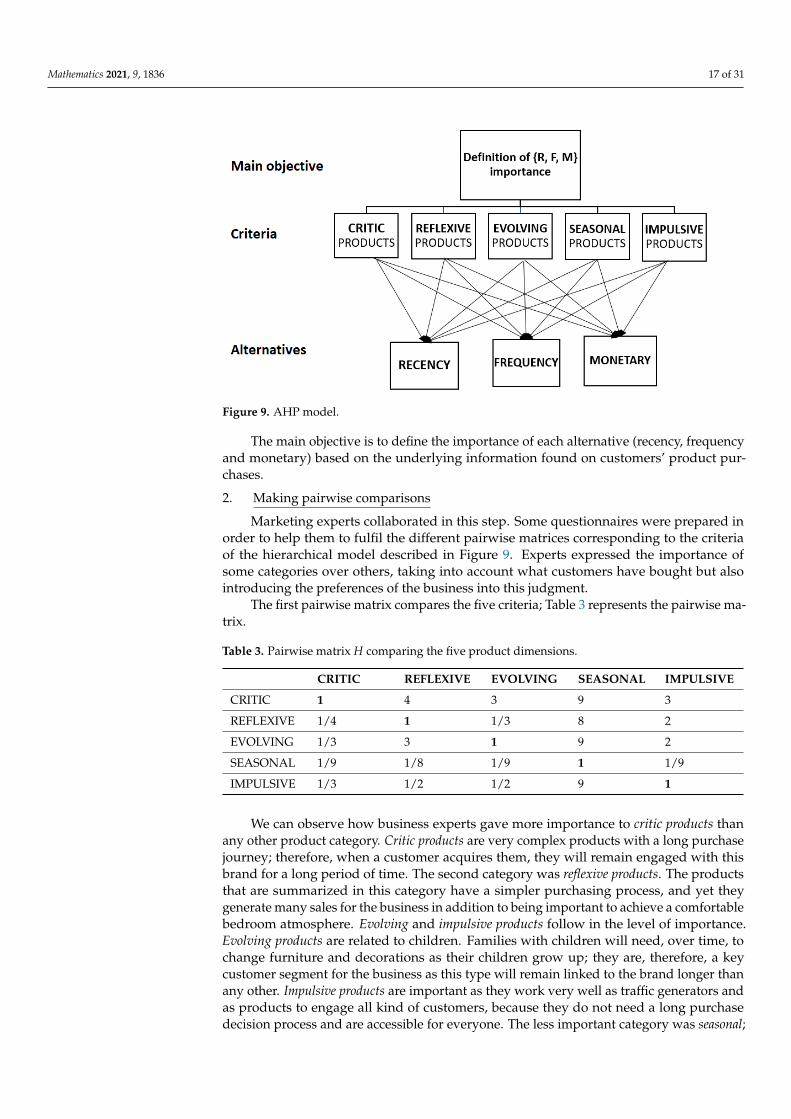
Figure 9. AHP model.
The main objective is to define the importance of each alternative (recency, frequency and monetary) based on the underlying information found on customers’ product pur-chases. 2. Making pairwise comparisons
Marketing experts collaborated in this step. Some questionnaires were prepared in order to help them to fulfil the different pairwise matrices corresponding to the criteria of the hierarchical model described in Figure 9. Experts expressed the importance of some categories over others, taking into account what customers have bought but also introduc-ing the preferences of the business into this judgment.
The first pairwise matrix compares the five criteria; Table 3 represents the pairwise matrix.
Table 3. Pairwise matrix H comparing the five product dimensions.
CRITIC REFLEXIVE EVOLVING SEASONAL IMPULSIVE CRITIC 1 4 3 9 3 REFLEXIVE 1/4 1 1/3 8 2 EVOLVING 1/3 3 1 9 2 SEASONAL 1/9 1/8 1/9 1 1/9 IMPULSIVE 1/3 1/2 1/2 9 1
We can observe how business experts gave more importance to critic products than any other product category. Critic products are very complex products with a long purchase journey; therefore, when a customer acquires them, they will remain engaged with this brand for a long period of time. The second category was reflexive products. The products that are summarized in this category have a simpler purchasing process, and yet they gen-erate many sales for the business in addition to being important to achieve a comfortable bedroom atmosphere. Evolving and impulsive products follow in the level of importance. Evolving products are related to children. Families with children will need, over time, to change furniture and decorations as their children grow up; they are, therefore, a key cus-tomer segment for the business as this type will remain linked to the brand longer than any other. Impulsive products are important as they work very well as traffic generators and as products to engage all kind of customers, because they do not need a long purchase decision process and are accessible for everyone. The less important category was seasonal; products belonging to this category are useful for creating a novelty feeling and catalogue refreshment but are smaller in sales that any other category.
Figure 9. AHP model.
The main objective is to define the importance of each alternative (recency, frequencyand monetary) based on the underlying information found on customers’ product pur-chases.
2. Making pairwise comparisons
Marketing experts collaborated in this step. Some questionnaires were prepared inorder to help them to fulfil the different pairwise matrices corresponding to the criteriaof the hierarchical model described in Figure 9. Experts expressed the importance ofsome categories over others, taking into account what customers have bought but alsointroducing the preferences of the business into this judgment.
The first pairwise matrix compares the five criteria; Table 3 represents the pairwise ma-trix.
Table 3. Pairwise matrix H comparing the five product dimensions.
CRITIC REFLEXIVE EVOLVING SEASONAL IMPULSIVE
CRITIC 1 4 3 9 3
REFLEXIVE 1/4 1 1/3 8 2
EVOLVING 1/3 3 1 9 2
SEASONAL 1/9 1/8 1/9 1 1/9
IMPULSIVE 1/3 1/2 1/2 9 1
We can observe how business experts gave more importance to critic products thanany other product category. Critic products are very complex products with a long purchasejourney; therefore, when a customer acquires them, they will remain engaged with thisbrand for a long period of time. The second category was reflexive products. The productsthat are summarized in this category have a simpler purchasing process, and yet theygenerate many sales for the business in addition to being important to achieve a comfortablebedroom atmosphere. Evolving and impulsive products follow in the level of importance.Evolving products are related to children. Families with children will need, over time, tochange furniture and decorations as their children grow up; they are, therefore, a keycustomer segment for the business as this type will remain linked to the brand longer thanany other. Impulsive products are important as they work very well as traffic generators andas products to engage all kind of customers, because they do not need a long purchasedecision process and are accessible for everyone. The less important category was seasonal;
Mathematics 2021, 9, 1836 18 of 31
products belonging to this category are useful for creating a novelty feeling and cataloguerefreshment but are smaller in sales that any other category.
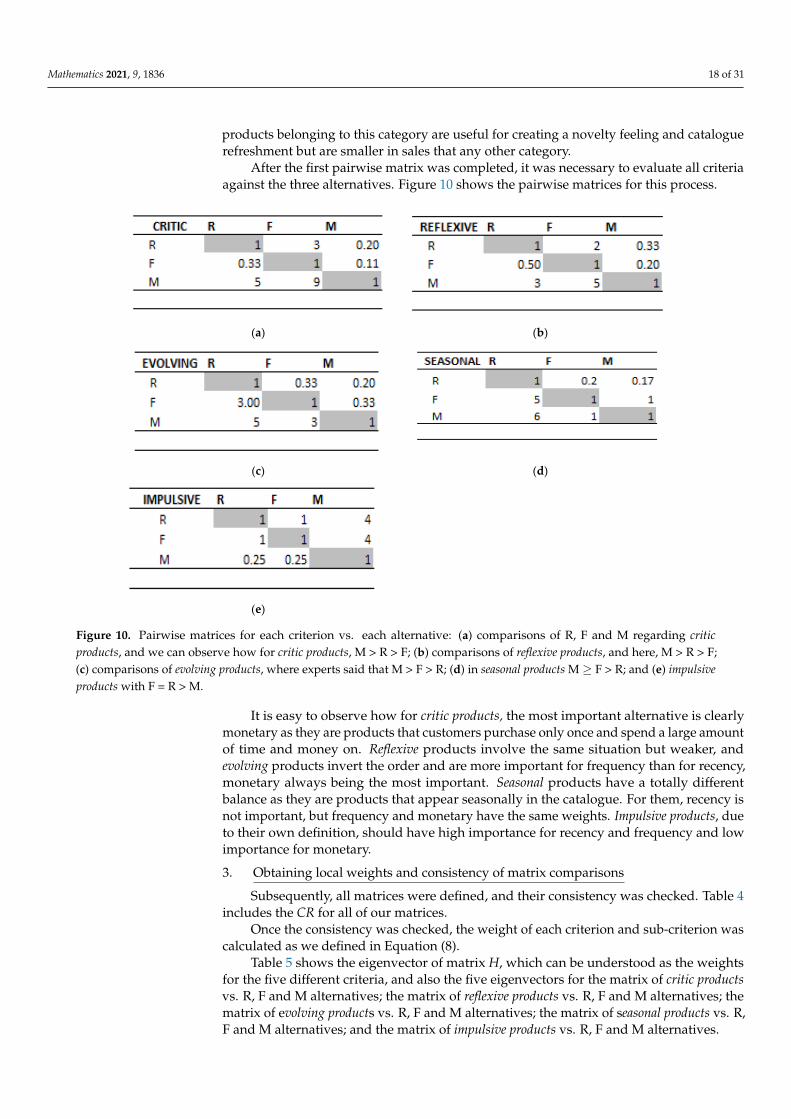
After the first pairwise matrix was completed, it was necessary to evaluate all criteriaagainst the three alternatives. Figure 10 shows the pairwise matrices for this process.
Mathematics 2021, 9, x FOR PEER REVIEW 8 of 32
After the first pairwise matrix was completed, it was necessary to evaluate all criteria against the three alternatives. Figure 10 shows the pairwise matrices for this process.
(a) (b)
(c) (d)
(e)
Figure 10. Pairwise matrices for each criterion vs. each alternative: (a) comparisons of R, F and M regarding critic products, and we can observe how for critic products, M >R > F; (b) comparisons of reflexive products, and here, M > R > F; (c) compar-isons of evolving products, where experts said that M > F > R; (d) in seasonal products M ≥ F > R; and (e) impulsive products with F = R > M.
It is easy to observe how for critic products, the most important alternative is clearly monetary as they are products that customers purchase only once and spend a large amount of time and money on. Reflexive products involve the same situation but weaker, and evolving products invert the order and are more important for frequency than for re-cency, monetary always being the most important. Seasonal products have a totally differ-ent balance as they are products that appear seasonally in the catalogue. For them, recency is not important, but frequency and monetary have the same weights. Impulsive products, due to their own definition, should have high importance for recency and frequency and low importance for monetary. 3. Obtaining local weights and consistency of matrix comparisons
Subsequently, all matrices were defined, and their consistency was checked. Table 4 includes the CR for all of our matrices.
Table 4. Consistency ratio for all pairwise matrices.
Matrix H Matrix
CRITIC Matrix REFLEX-
IVE Matrix EVOLV-
ING Matrix SEA-
SONAL Matrix ACCESSO-
RIES Consistency Ratio 0.089 0.030 0.004 0.037 0.004 0.000
<0.1 <0.05 <0.05 <0.05 <0.05 <0.05
Figure 10. Pairwise matrices for each criterion vs. each alternative: (a) comparisons of R, F and M regarding criticproducts, and we can observe how for critic products, M > R > F; (b) comparisons of reflexive products, and here, M > R > F;(c) comparisons of evolving products, where experts said that M > F > R; (d) in seasonal products M ≥ F > R; and (e) impulsiveproducts with F = R > M.
It is easy to observe how for critic products, the most important alternative is clearlymonetary as they are products that customers purchase only once and spend a large amountof time and money on. Reflexive products involve the same situation but weaker, andevolving products invert the order and are more important for frequency than for recency,monetary always being the most important. Seasonal products have a totally differentbalance as they are products that appear seasonally in the catalogue. For them, recency isnot important, but frequency and monetary have the same weights. Impulsive products, dueto their own definition, should have high importance for recency and frequency and lowimportance for monetary.
3. Obtaining local weights and consistency of matrix comparisons
Subsequently, all matrices were defined, and their consistency was checked. Table 4includes the CR for all of our matrices.
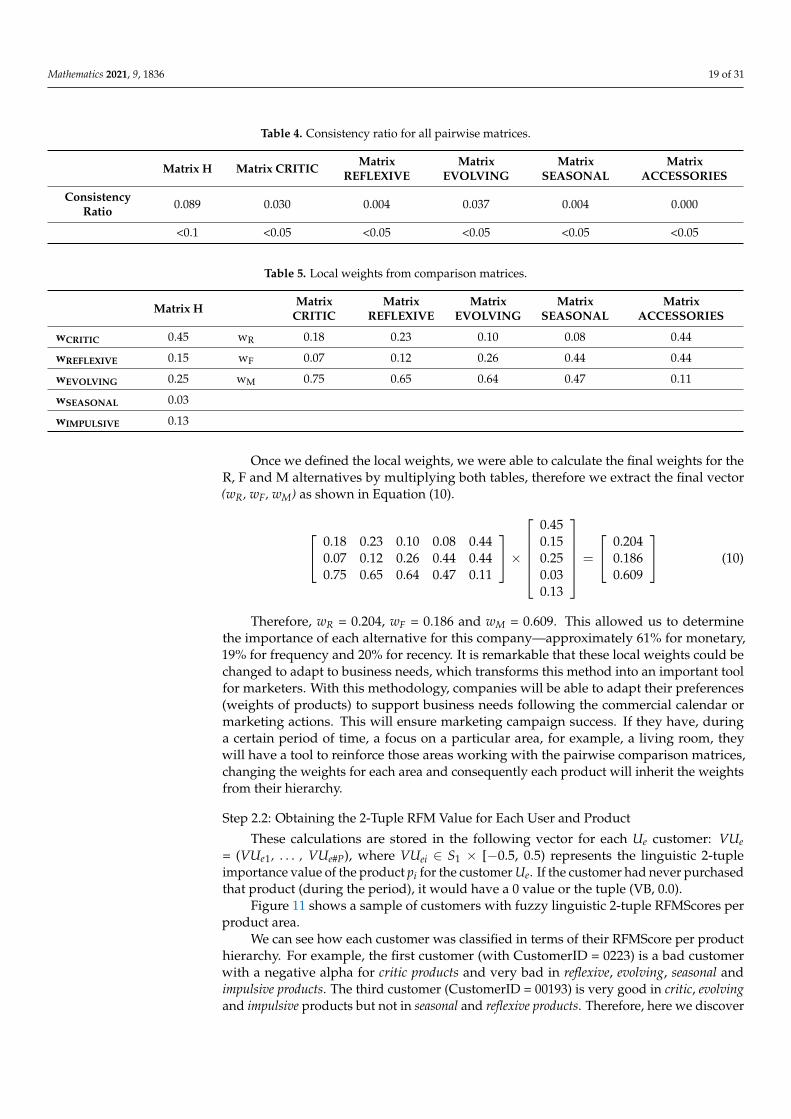
Once the consistency was checked, the weight of each criterion and sub-criterion wascalculated as we defined in Equation (8).
Table 5 shows the eigenvector of matrix H, which can be understood as the weightsfor the five different criteria, and also the five eigenvectors for the matrix of critic productsvs. R, F and M alternatives; the matrix of reflexive products vs. R, F and M alternatives; thematrix of evolving products vs. R, F and M alternatives; the matrix of seasonal products vs. R,F and M alternatives; and the matrix of impulsive products vs. R, F and M alternatives.
Mathematics 2021, 9, 1836 19 of 31
Table 4. Consistency ratio for all pairwise matrices.
Matrix H Matrix CRITIC MatrixREFLEXIVE
MatrixEVOLVING
MatrixSEASONAL
MatrixACCESSORIES
ConsistencyRatio 0.089 0.030 0.004 0.037 0.004 0.000
<0.1 <0.05 <0.05 <0.05 <0.05 <0.05
Table 5. Local weights from comparison matrices.
Matrix H MatrixCRITIC
MatrixREFLEXIVE
MatrixEVOLVING
MatrixSEASONAL
MatrixACCESSORIES
wCRITIC 0.45 wR 0.18 0.23 0.10 0.08 0.44
wREFLEXIVE 0.15 wF 0.07 0.12 0.26 0.44 0.44
wEVOLVING 0.25 wM 0.75 0.65 0.64 0.47 0.11
wSEASONAL 0.03
wIMPULSIVE 0.13
Once we defined the local weights, we were able to calculate the final weights for theR, F and M alternatives by multiplying both tables, therefore we extract the final vector(wR, wF, wM) as shown in Equation (10).
0.18 0.23 0.10 0.08 0.440.07 0.12 0.26 0.44 0.440.75 0.65 0.64 0.47 0.11
×
0.450.150.250.030.13
=
0.2040.1860.609
(10)
Therefore, wR = 0.204, wF = 0.186 and wM = 0.609. This allowed us to determinethe importance of each alternative for this company—approximately 61% for monetary,19% for frequency and 20% for recency. It is remarkable that these local weights could bechanged to adapt to business needs, which transforms this method into an important toolfor marketers. With this methodology, companies will be able to adapt their preferences(weights of products) to support business needs following the commercial calendar ormarketing actions. This will ensure marketing campaign success. If they have, duringa certain period of time, a focus on a particular area, for example, a living room, theywill have a tool to reinforce those areas working with the pairwise comparison matrices,changing the weights for each area and consequently each product will inherit the weightsfrom their hierarchy.
Step 2.2: Obtaining the 2-Tuple RFM Value for Each User and Product
These calculations are stored in the following vector for each Ue customer: VUe= (VUe1, . . . , VUe#P), where VUei ∈ S1 × [−0.5, 0.5) represents the linguistic 2-tupleimportance value of the product pi for the customer Ue. If the customer had never purchasedthat product (during the period), it would have a 0 value or the tuple (VB, 0.0).
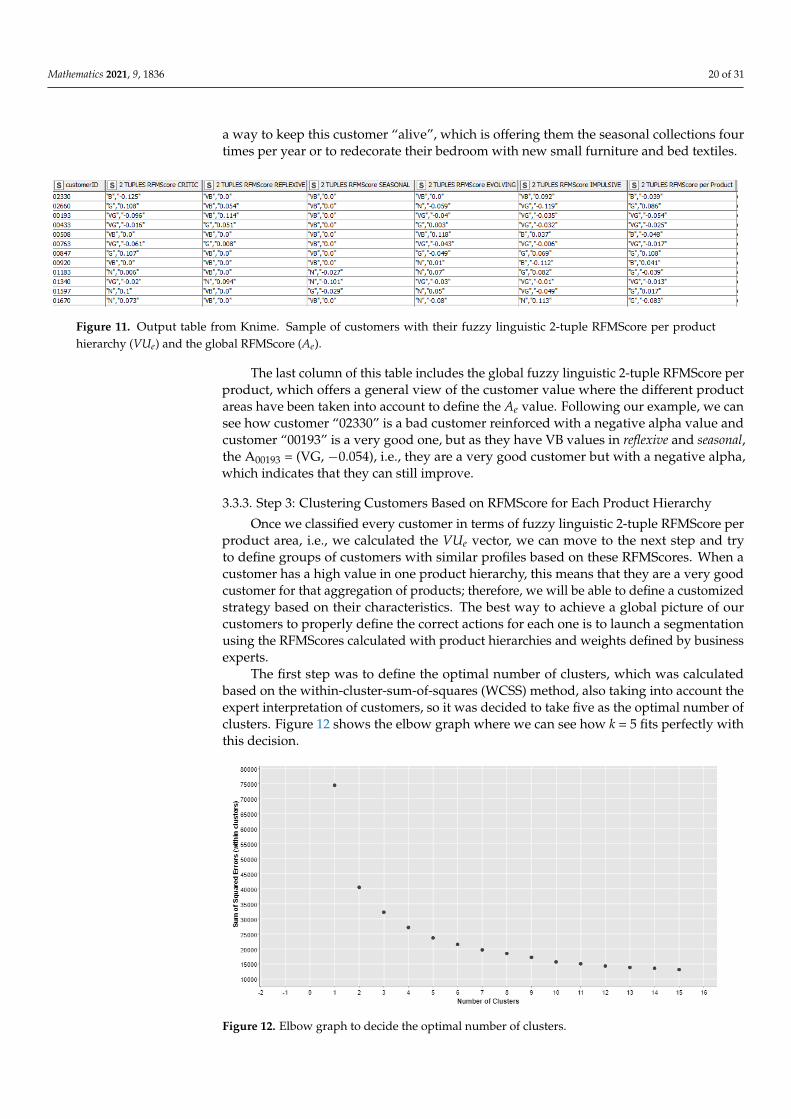
Figure 11 shows a sample of customers with fuzzy linguistic 2-tuple RFMScores perproduct area.
We can see how each customer was classified in terms of their RFMScore per producthierarchy. For example, the first customer (with CustomerID = 0223) is a bad customerwith a negative alpha for critic products and very bad in reflexive, evolving, seasonal andimpulsive products. The third customer (CustomerID = 00193) is very good in critic, evolvingand impulsive products but not in seasonal and reflexive products. Therefore, here we discover
Mathematics 2021, 9, 1836 20 of 31
a way to keep this customer “alive”, which is offering them the seasonal collections fourtimes per year or to redecorate their bedroom with new small furniture and bed textiles.
Mathematics 2021, 9, x FOR PEER REVIEW 8 of 32
Once the consistency was checked, the weight of each criterion and sub-criterion was calculated as we defined in Equation (8).
Table 5 shows the eigenvector of matrix H, which can be understood as the weights for the five different criteria, and also the five eigenvectors for the matrix of critic products vs. R, F and M alternatives; the matrix of reflexive products vs. R, F and M alternatives; the matrix of evolving products vs. R, F and M alternatives; the matrix of seasonal products vs. R, F and M alternatives; and the matrix of impulsive products vs. R, F and M alternatives.
Table 5. Local weights from comparison matrices.
Matrix H Matrix CRITIC Matrix REFLEXIVE Matrix EVOLVING Matrix SEASONAL Matrix ACCESSORIES wCRITIC 0.45 wR 0.18 0.23 0.10 0.08 0.44 wREFLEXIVE 0.15 wF 0.07 0.12 0.26 0.44 0.44 wEVOLVING 0.25 wM 0.75 0.65 0.64 0.47 0.11 wSEASONAL 0.03 wIMPULSIVE 0.13
Once we defined the local weights, we were able to calculate the final weights for the R, F and M alternatives by multiplying both tables, therefore we extract the final vector (wR, wF, wM) as shown in Equation (10).
0.18 0.23 0.10 0.08 0.440.07 0.12 0.26 0.44 0.440.75 0.65 0.64 0.47 0.11 × 0.450.150.250.030.13 = 0.2040.1860.609 (10)
Therefore, wR = 0.204, wF = 0.186 and wM = 0.609. This allowed us to determine the im-portance of each alternative for this company—approximately 61% for monetary, 19% for frequency and 20% for recency. It is remarkable that these local weights could be changed to adapt to business needs, which transforms this method into an important tool for marketers. With this methodology, companies will be able to adapt their preferences (weights of prod-ucts) to support business needs following the commercial calendar or marketing actions. This will ensure marketing campaign success. If they have, during a certain period of time, a focus on a particular area, for example, a living room, they will have a tool to reinforce those areas working with the pairwise comparison matrices, changing the weights for each area and consequently each product will inherit the weights from their hierarchy.
Step 2.2: Obtaining the 2-Tuple RFM Value for Each User and Product These calculations are stored in the following vector for each Ue customer: VUe = (VUe1,
…, VUe#P), where VUei ∈ S1 × [−0.5, 0.5) represents the linguistic 2-tuple importance value of the product pi for the customer Ue. If the customer had never purchased that product (dur-ing the period), it would have a 0 value or the tuple (VB, 0.0).
Figure 11 shows a sample of customers with fuzzy linguistic 2-tuple RFMScores per product area.
Figure 11. Output table from Knime. Sample of customers with their fuzzy linguistic 2-tuple RFMScore per product hier-archy (VUe) and the global RFMScore (Ae). Figure 11. Output table from Knime. Sample of customers with their fuzzy linguistic 2-tuple RFMScore per producthierarchy (VUe) and the global RFMScore (Ae).
The last column of this table includes the global fuzzy linguistic 2-tuple RFMScore perproduct, which offers a general view of the customer value where the different productareas have been taken into account to define the Ae value. Following our example, we cansee how customer “02330” is a bad customer reinforced with a negative alpha value andcustomer “00193” is a very good one, but as they have VB values in reflexive and seasonal,the A00193 = (VG, −0.054), i.e., they are a very good customer but with a negative alpha,which indicates that they can still improve.
3.3.3. Step 3: Clustering Customers Based on RFMScore for Each Product Hierarchy
Once we classified every customer in terms of fuzzy linguistic 2-tuple RFMScore perproduct area, i.e., we calculated the VUe vector, we can move to the next step and tryto define groups of customers with similar profiles based on these RFMScores. When acustomer has a high value in one product hierarchy, this means that they are a very goodcustomer for that aggregation of products; therefore, we will be able to define a customizedstrategy based on their characteristics. The best way to achieve a global picture of ourcustomers to properly define the correct actions for each one is to launch a segmentationusing the RFMScores calculated with product hierarchies and weights defined by businessexperts.
The first step was to define the optimal number of clusters, which was calculatedbased on the within-cluster-sum-of-squares (WCSS) method, also taking into account theexpert interpretation of customers, so it was decided to take five as the optimal number ofclusters. Figure 12 shows the elbow graph where we can see how k = 5 fits perfectly withthis decision.
Mathematics 2021, 9, x FOR PEER REVIEW 8 of 32
We can see how each customer was classified in terms of their RFMScore per product hierarchy. For example, the first customer (with CustomerID = 0223) is a bad customer with a negative alpha for critic products and very bad in reflexive, evolving, seasonal and im-pulsive products. The third customer (CustomerID = 00193) is very good in critic, evolving and impulsive products but not in seasonal and reflexive products. Therefore, here we discover a way to keep this customer “alive”, which is offering them the seasonal collections four times per year or to redecorate their bedroom with new small furniture and bed textiles.
The last column of this table includes the global fuzzy linguistic 2-tuple RFMScore per product, which offers a general view of the customer value where the different product areas have been taken into account to define the Ae value. Following our example, we can see how customer “02330” is a bad customer reinforced with a negative alpha value and customer “00193” is a very good one, but as they have VB values in reflexive and seasonal, the A00193 = (VG, −0.054), i.e., they are a very good customer but with a negative alpha, which indicates that they can still improve.
3.3.3. Step 3: Clustering Customers Based on RFMScore for Each Product Hierarchy Once we classified every customer in terms of fuzzy linguistic 2-tuple RFMScore per
product area, i.e., we calculated the VUe vector, we can move to the next step and try to define groups of customers with similar profiles based on these RFMScores. When a cus-tomer has a high value in one product hierarchy, this means that they are a very good customer for that aggregation of products; therefore, we will be able to define a customized strategy based on their characteristics. The best way to achieve a global picture of our cus-tomers to properly define the correct actions for each one is to launch a segmentation using the RFMScores calculated with product hierarchies and weights defined by business ex-perts.
The first step was to define the optimal number of clusters, which was calculated based on the within-cluster-sum-of-squares (WCSS) method, also taking into account the expert interpretation of customers, so it was decided to take five as the optimal number of clusters. Figure 12 shows the elbow graph where we can see how k = 5 fits perfectly with this decision.
Figure 12. Elbow graph to decide the optimal number of clusters.
Clustering was performed using the k-means algorithm. Variables used to define cus-tomer clusters were the fuzzy linguistic 2-tuple RFMScore per each product hierarchy. Fig-ure 13 shows the radar plot for each cluster.
Figure 12. Elbow graph to decide the optimal number of clusters.
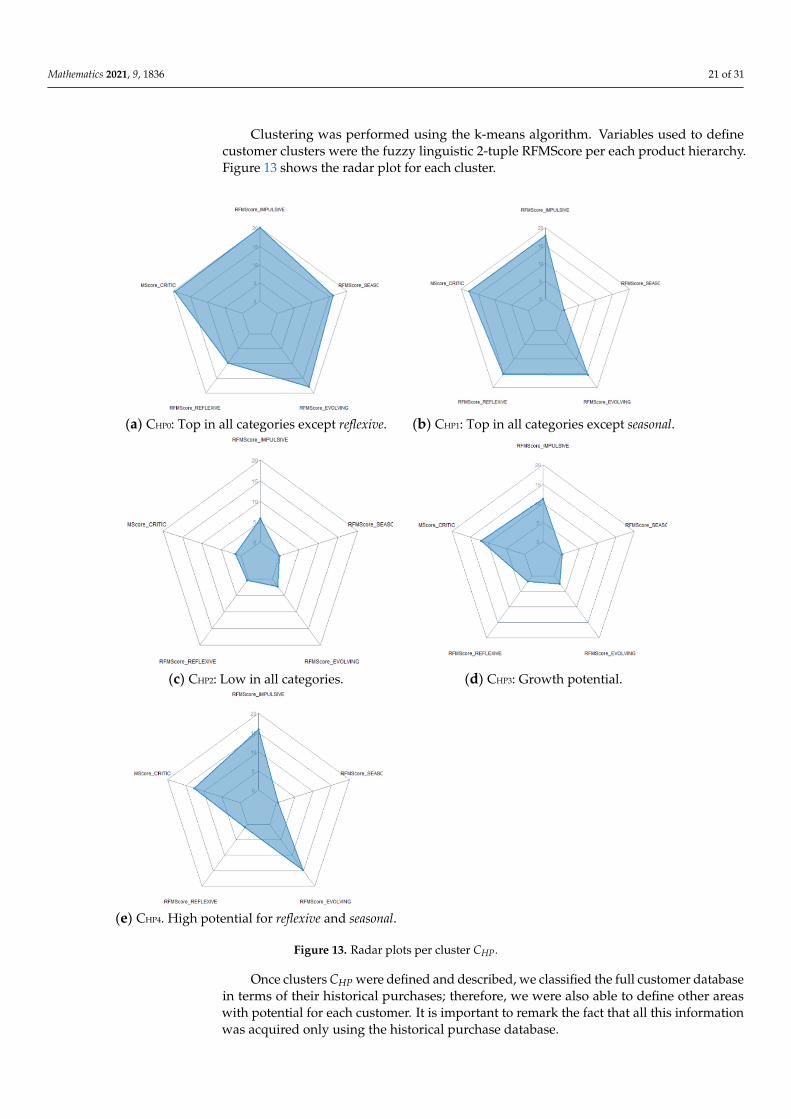
Mathematics 2021, 9, 1836 21 of 31
Clustering was performed using the k-means algorithm. Variables used to definecustomer clusters were the fuzzy linguistic 2-tuple RFMScore per each product hierarchy.Figure 13 shows the radar plot for each cluster.
Mathematics 2021, 9, x FOR PEER REVIEW 8 of 32
(a) CHP0: Top in all categories except reflexive. (b) CHP1: Top in all categories except seasonal.
(c) CHP2: Low in all categories. (d) CHP3: Growth potential.
(e) CHP4. High potential for reflexive and seasonal.
Figure 13. Radar plots per cluster CHP.
Once clusters CHP were defined and described, we classified the full customer data-base in terms of their historical purchases; therefore, we were also able to define other areas with potential for each customer. It is important to remark the fact that all this information was acquired only using the historical purchase database.
3.3.4. Step 4: Strategy by Segment under Business and Product Preferences At this point, we developed our proposal to be able to improve strategic marketing
decisions based on the fuzzy linguistic 2-tuple RFM model per product hierarchy. The lin-guistic labels offer better interpretability to better understand the data. It is remarkable that local weights defined per product category could be changed to follow business needs, which transforms this method into an important tool for marketers. With this methodol-ogy, companies will be able to adapt their preferences (weights of products) to support business needs following the commercial calendar or marketing actions.
Figure 13. Radar plots per cluster CHP.
Once clusters CHP were defined and described, we classified the full customer databasein terms of their historical purchases; therefore, we were also able to define other areaswith potential for each customer. It is important to remark the fact that all this informationwas acquired only using the historical purchase database.
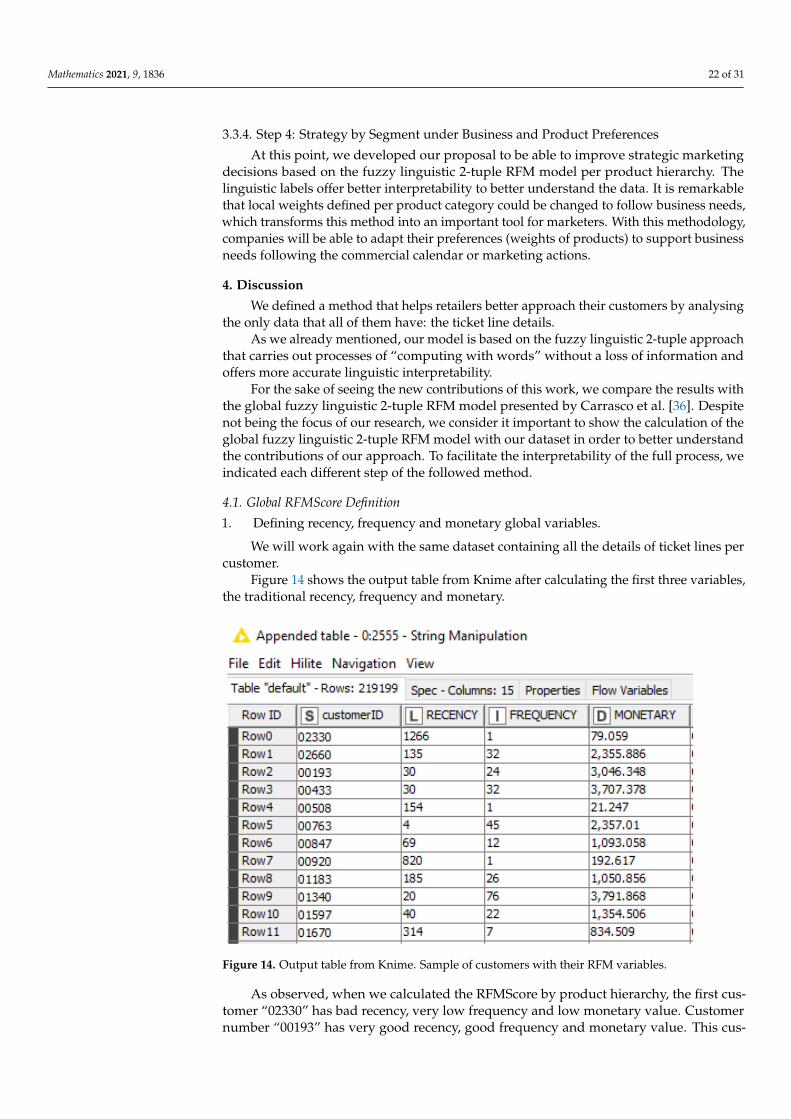
Mathematics 2021, 9, 1836 22 of 31
3.3.4. Step 4: Strategy by Segment under Business and Product Preferences
At this point, we developed our proposal to be able to improve strategic marketingdecisions based on the fuzzy linguistic 2-tuple RFM model per product hierarchy. Thelinguistic labels offer better interpretability to better understand the data. It is remarkablethat local weights defined per product category could be changed to follow business needs,which transforms this method into an important tool for marketers. With this methodology,companies will be able to adapt their preferences (weights of products) to support businessneeds following the commercial calendar or marketing actions.
4. Discussion
We defined a method that helps retailers better approach their customers by analysingthe only data that all of them have: the ticket line details.
As we already mentioned, our model is based on the fuzzy linguistic 2-tuple approachthat carries out processes of “computing with words” without a loss of information andoffers more accurate linguistic interpretability.
For the sake of seeing the new contributions of this work, we compare the results withthe global fuzzy linguistic 2-tuple RFM model presented by Carrasco et al. [36]. Despitenot being the focus of our research, we consider it important to show the calculation of theglobal fuzzy linguistic 2-tuple RFM model with our dataset in order to better understandthe contributions of our approach. To facilitate the interpretability of the full process, weindicated each different step of the followed method.
4.1. Global RFMScore Definition
1. Defining recency, frequency and monetary global variables.
We will work again with the same dataset containing all the details of ticket lines percustomer.
Figure 14 shows the output table from Knime after calculating the first three variables,the traditional recency, frequency and monetary.
Mathematics 2021, 9, x FOR PEER REVIEW 8 of 32
4. Discussion We defined a method that helps retailers better approach their customers by analysing
the only data that all of them have: the ticket line details. As we already mentioned, our model is based on the fuzzy linguistic 2-tuple approach
that carries out processes of “computing with words” without a loss of information and offers more accurate linguistic interpretability.
For the sake of seeing the new contributions of this work, we compare the results with the global fuzzy linguistic 2-tuple RFM model presented by Carrasco et al. [36]. Despite not being the focus of our research, we consider it important to show the calculation of the global fuzzy linguistic 2-tuple RFM model with our dataset in order to better understand the contributions of our approach. To facilitate the interpretability of the full process, we indicated each different step of the followed method.
4.1. Global RFMScore Definition 1. Defining recency, frequency and monetary global variables.
We will work again with the same dataset containing all the details of ticket lines per customer.
Figure 14 shows the output table from Knime after calculating the first three variables, the traditional recency, frequency and monetary.
Figure 14. Output table from Knime. Sample of customers with their RFM variables.
As observed, when we calculated the RFMScore by product hierarchy, the first cus-tomer “02330” has bad recency, very low frequency and low monetary value. Customer number “00193” has very good recency, good frequency and monetary value. This customer was classified as very good for critic, evolving and impulsive hierarchies and they were very bad for reflexive and seasonal products. They belonged to CHP4, which has been labelled as “High potential for Reflexive and Seasonal”; therefore, here, we have a tool to engage and develop this customer by offering them seasonal and reflexive products to maintain the cus-tomer’s engagement and enlarge their customer lifetime. Working with only ticket details, we were able to develop a tool to better known customers, but we do not know right now how active they are, which means, on top of having good or bad behaviour in terms of prod-uct hierarchies, the question that arises is: is this customer active or not? 2. Obtaining fuzzy linguistic 2-tuple RFM model.
Figure 14. Output table from Knime. Sample of customers with their RFM variables.
As observed, when we calculated the RFMScore by product hierarchy, the first cus-tomer “02330” has bad recency, very low frequency and low monetary value. Customernumber “00193” has very good recency, good frequency and monetary value. This cus-
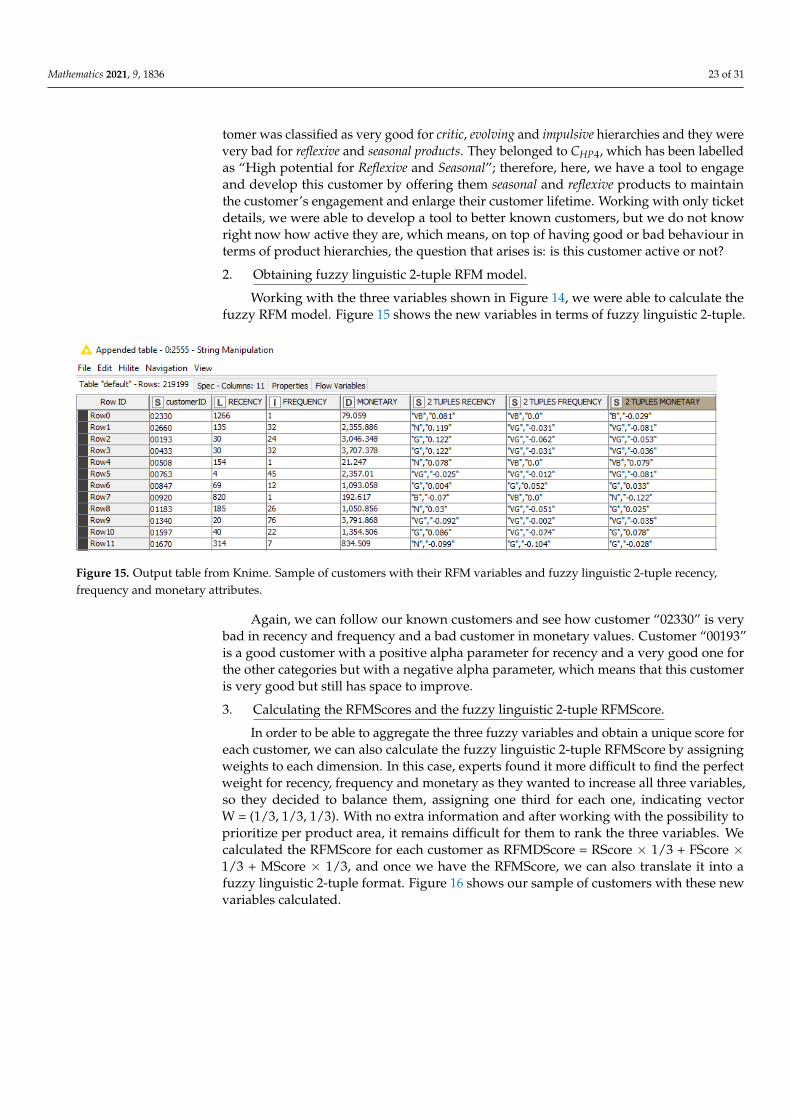
Mathematics 2021, 9, 1836 23 of 31
tomer was classified as very good for critic, evolving and impulsive hierarchies and they werevery bad for reflexive and seasonal products. They belonged to CHP4, which has been labelledas “High potential for Reflexive and Seasonal”; therefore, here, we have a tool to engageand develop this customer by offering them seasonal and reflexive products to maintainthe customer’s engagement and enlarge their customer lifetime. Working with only ticketdetails, we were able to develop a tool to better known customers, but we do not knowright now how active they are, which means, on top of having good or bad behaviour interms of product hierarchies, the question that arises is: is this customer active or not?
2. Obtaining fuzzy linguistic 2-tuple RFM model.
Working with the three variables shown in Figure 14, we were able to calculate thefuzzy RFM model. Figure 15 shows the new variables in terms of fuzzy linguistic 2-tuple.
Mathematics 2021, 9, x FOR PEER REVIEW 8 of 32
Working with the three variables shown in Figure 14, we were able to calculate the fuzzy RFM model. Figure 15 shows the new variables in terms of fuzzy linguistic 2-tuple.
Figure 15. Output table from Knime. Sample of customers with their RFM variables and fuzzy linguistic 2-tuple recency, frequency and monetary attributes.
Again, we can follow our known customers and see how customer “02330” is very bad in recency and frequency and a bad customer in monetary values. Customer “00193” is a good customer with a positive alpha parameter for recency and a very good one for the other categories but with a negative alpha parameter, which means that this customer is very good but still has space to improve. 3. Calculating the RFMScores and the fuzzy linguistic 2-tuple RFMScore.
In order to be able to aggregate the three fuzzy variables and obtain a unique score for each customer, we can also calculate the fuzzy linguistic 2-tuple RFMScore by assigning weights to each dimension. In this case, experts found it more difficult to find the perfect weight for recency, frequency and monetary as they wanted to increase all three variables, so they decided to balance them, assigning one third for each one, indicating vector W = (1/3, 1/3, 1/3). With no extra information and after working with the possibility to prioritize per product area, it remains difficult for them to rank the three variables. We calculated the RFM-Score for each customer as RFMDScore = RScore × 1/3 + FScore × 1/3 + MScore × 1/3, and once we have the RFMScore, we can also translate it into a fuzzy linguistic 2-tuple format. Figure 16 shows our sample of customers with these new variables calculated.
Figure 15. Output table from Knime. Sample of customers with their RFM variables and fuzzy linguistic 2-tuple recency,frequency and monetary attributes.
Again, we can follow our known customers and see how customer “02330” is verybad in recency and frequency and a bad customer in monetary values. Customer “00193”is a good customer with a positive alpha parameter for recency and a very good one forthe other categories but with a negative alpha parameter, which means that this customeris very good but still has space to improve.
3. Calculating the RFMScores and the fuzzy linguistic 2-tuple RFMScore.
In order to be able to aggregate the three fuzzy variables and obtain a unique score foreach customer, we can also calculate the fuzzy linguistic 2-tuple RFMScore by assigningweights to each dimension. In this case, experts found it more difficult to find the perfectweight for recency, frequency and monetary as they wanted to increase all three variables,so they decided to balance them, assigning one third for each one, indicating vectorW = (1/3, 1/3, 1/3). With no extra information and after working with the possibility toprioritize per product area, it remains difficult for them to rank the three variables. Wecalculated the RFMScore for each customer as RFMDScore = RScore × 1/3 + FScore ×1/3 + MScore × 1/3, and once we have the RFMScore, we can also translate it into afuzzy linguistic 2-tuple format. Figure 16 shows our sample of customers with these newvariables calculated.
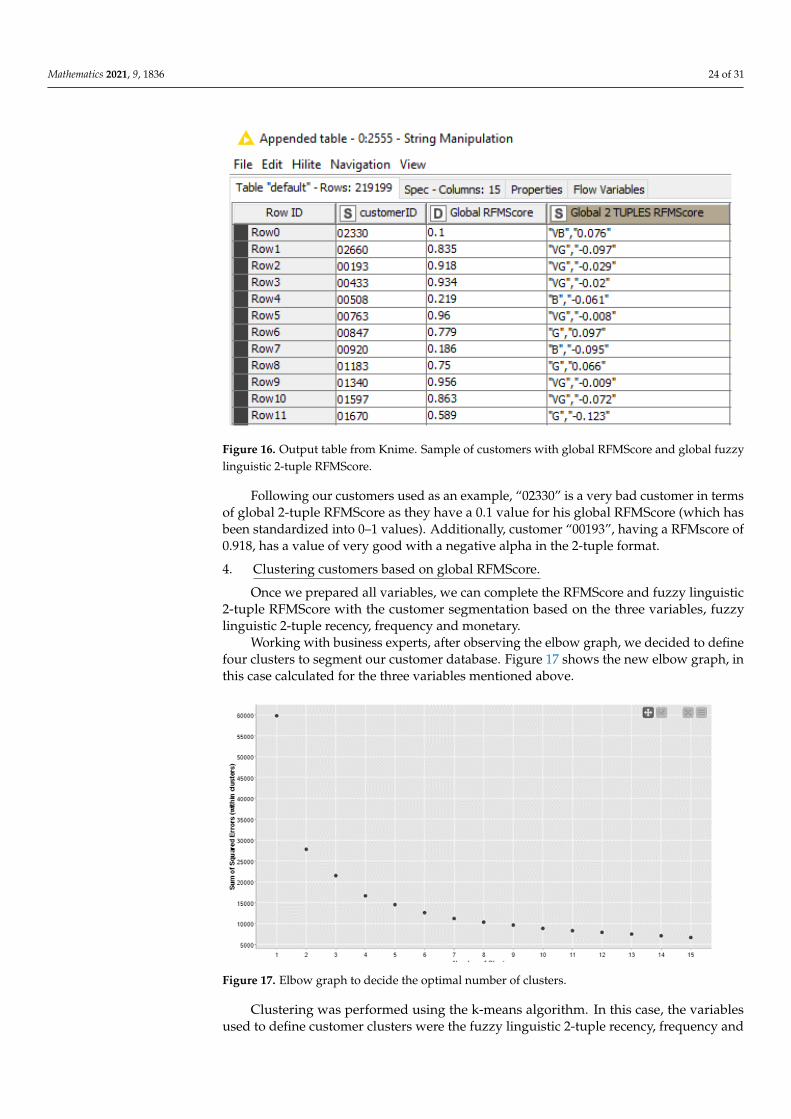
Mathematics 2021, 9, 1836 24 of 31
Mathematics 2021, 9, x FOR PEER REVIEW 8 of 32
Working with the three variables shown in Figure 14, we were able to calculate the fuzzy RFM model. Figure 15 shows the new variables in terms of fuzzy linguistic 2-tuple.
Figure 15. Output table from Knime. Sample of customers with their RFM variables and fuzzy linguistic 2-tuple recency, frequency and monetary attributes.
Again, we can follow our known customers and see how customer “02330” is very bad in recency and frequency and a bad customer in monetary values. Customer “00193” is a good customer with a positive alpha parameter for recency and a very good one for the other categories but with a negative alpha parameter, which means that this customer is very good but still has space to improve. 3. Calculating the RFMScores and the fuzzy linguistic 2-tuple RFMScore.
In order to be able to aggregate the three fuzzy variables and obtain a unique score for each customer, we can also calculate the fuzzy linguistic 2-tuple RFMScore by assigning weights to each dimension. In this case, experts found it more difficult to find the perfect weight for recency, frequency and monetary as they wanted to increase all three variables, so they decided to balance them, assigning one third for each one, indicating vector W = (1/3, 1/3, 1/3). With no extra information and after working with the possibility to prioritize per product area, it remains difficult for them to rank the three variables. We calculated the RFM-Score for each customer as RFMDScore = RScore × 1/3 + FScore × 1/3 + MScore × 1/3, and once we have the RFMScore, we can also translate it into a fuzzy linguistic 2-tuple format. Figure 16 shows our sample of customers with these new variables calculated.
Figure 16. Output table from Knime. Sample of customers with global RFMScore and global fuzzylinguistic 2-tuple RFMScore.
Following our customers used as an example, “02330” is a very bad customer in termsof global 2-tuple RFMScore as they have a 0.1 value for his global RFMScore (which hasbeen standardized into 0–1 values). Additionally, customer “00193”, having a RFMscore of0.918, has a value of very good with a negative alpha in the 2-tuple format.
4. Clustering customers based on global RFMScore.
Once we prepared all variables, we can complete the RFMScore and fuzzy linguistic2-tuple RFMScore with the customer segmentation based on the three variables, fuzzylinguistic 2-tuple recency, frequency and monetary.
Working with business experts, after observing the elbow graph, we decided to definefour clusters to segment our customer database. Figure 17 shows the new elbow graph, inthis case calculated for the three variables mentioned above.
Mathematics 2021, 9, x FOR PEER REVIEW 8 of 32
Figure 16. Output table from Knime. Sample of customers with global RFMScore and global fuzzy linguistic 2-tuple RFMScore.
Following our customers used as an example, “02330” is a very bad customer in terms of global 2-tuple RFMScore as they have a 0.1 value for his global RFMScore (which has been standardized into 0–1 values). Additionally, customer “00193”, having a RFMscore of 0.918, has a value of very good with a negative alpha in the 2-tuple format. 4. Clustering customers based on global RFMScore.
Once we prepared all variables, we can complete the RFMScore and fuzzy linguistic 2-tuple RFMScore with the customer segmentation based on the three variables, fuzzy lin-guistic 2-tuple recency, frequency and monetary.
Working with business experts, after observing the elbow graph, we decided to define four clusters to segment our customer database. Figure 17 shows the new elbow graph, in this case calculated for the three variables mentioned above.
Figure 17. Elbow graph to decide the optimal number of clusters.
Clustering was performed using the k-means algorithm. In this case, the variables used to define customer clusters were the fuzzy linguistic 2-tuple recency, frequency and monetary. The process uncovers four clusters called Ci. Figure 18 shows the radar plots for each cluster.
(a) C0: Top. (b) C1: Churn.
Figure 17. Elbow graph to decide the optimal number of clusters.
Clustering was performed using the k-means algorithm. In this case, the variablesused to define customer clusters were the fuzzy linguistic 2-tuple recency, frequency and
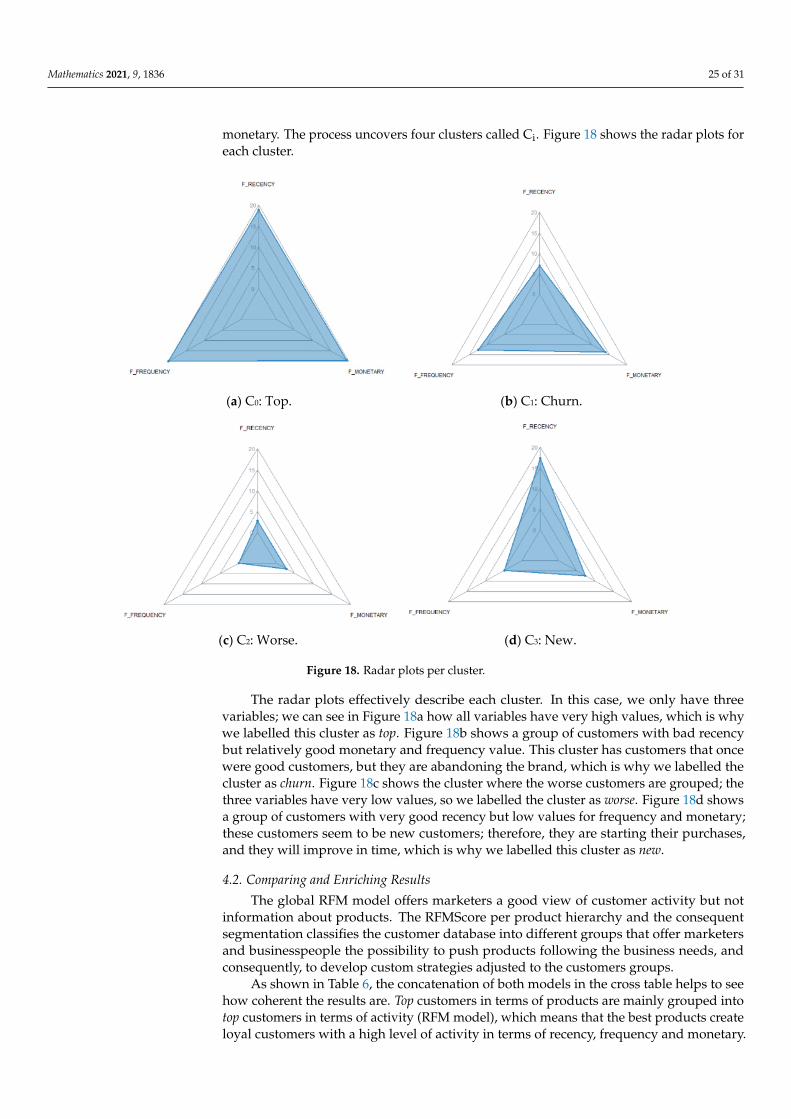
Mathematics 2021, 9, 1836 25 of 31
monetary. The process uncovers four clusters called Ci. Figure 18 shows the radar plots foreach cluster.
Mathematics 2021, 9, x FOR PEER REVIEW 8 of 32
Figure 16. Output table from Knime. Sample of customers with global RFMScore and global fuzzy linguistic 2-tuple RFMScore.
Following our customers used as an example, “02330” is a very bad customer in terms of global 2-tuple RFMScore as they have a 0.1 value for his global RFMScore (which has been standardized into 0–1 values). Additionally, customer “00193”, having a RFMscore of 0.918, has a value of very good with a negative alpha in the 2-tuple format. 4. Clustering customers based on global RFMScore.
Once we prepared all variables, we can complete the RFMScore and fuzzy linguistic 2-tuple RFMScore with the customer segmentation based on the three variables, fuzzy lin-guistic 2-tuple recency, frequency and monetary.
Working with business experts, after observing the elbow graph, we decided to define four clusters to segment our customer database. Figure 17 shows the new elbow graph, in this case calculated for the three variables mentioned above.
Figure 17. Elbow graph to decide the optimal number of clusters.
Clustering was performed using the k-means algorithm. In this case, the variables used to define customer clusters were the fuzzy linguistic 2-tuple recency, frequency and monetary. The process uncovers four clusters called Ci. Figure 18 shows the radar plots for each cluster.
(a) C0: Top. (b) C1: Churn.
Mathematics 2021, 9, x FOR PEER REVIEW 8 of 32
(c) C2: Worse. (d) C3: New.
Figure 18. Radar plots per cluster.
The radar plots effectively describe each cluster. In this case, we only have three var-iables; we can see in Figure 18a how all variables have very high values, which is why we labelled this cluster as top. Figure 18b shows a group of customers with bad recency but relatively good monetary and frequency value. This cluster has customers that once were good customers, but they are abandoning the brand, which is why we labelled the cluster as churn. Figure 18c shows the cluster where the worse customers are grouped; the three variables have very low values, so we labelled the cluster as worse. Figure 18d shows a group of customers with very good recency but low values for frequency and monetary; these customers seem to be new customers; therefore, they are starting their purchases, and they will improve in time, which is why we labelled this cluster as new.
4.2. Comparing and Enriching Results The global RFM model offers marketers a good view of customer activity but not in-
formation about products. The RFMScore per product hierarchy and the consequent seg-mentation classifies the customer database into different groups that offer marketers and businesspeople the possibility to push products following the business needs, and conse-quently, to develop custom strategies adjusted to the customers groups.
As shown in Table 6, the concatenation of both models in the cross table helps to see how coherent the results are. Top customers in terms of products are mainly grouped into top customers in terms of activity (RFM model), which means that the best products create loyal customers with a high level of activity in terms of recency, frequency and monetary. Customers in the group labelled as low in all categories are grouped into worse customers (low recency, low frequency and low monetary) or new customers (good recency but low frequency and monetary). On the other hand, if we focus on the vertical component of the table, we see how customers labelled as churn in terms of RFM are behaving in terms of product hierarchies, and we have a great tool to try to reactivate the most interesting ones.
Table 6. Cross table to enrich 2-tuple RFMScore per product hierarchy cluster with the global fuzzy RFM clusters.
Global Fuzzy Linguistic 2-Tuple RFM Clusters
Fuzzy linguistic 2-tuple RFMScore per product hierarchy clusters
WORSE NEW CHURN TOP Total % CRITIC REFLEXIVE EVOLVING SEASONAL IMPULSIVE
TOP ALL BUT NOT REFLEXIVE
55 464 5669 6188 3% ↑ ↓ ↑ ↑ ↑
TOP ALL BUT NO SEASONAL
52 1354 5006 22,597 29,009 13% ↑ ↑ ↑ ↓ ↑
LOW IN ALL CATEGORIES 55,064 18,706 11,022 750 85,542 39% ↓ ↓ ↓ ↓ ↓ GROWTH POTENTIAL 5150 13,190 20,112 8730 47,182 22% → ↓ ↓ ↓ → HIGH POTENTIAL FOR REFLEXIVE AND SEASONAL
465 7194 15,156 28,463 51,278 23% → ↓ ↑ ↓ →
Total 60,731 40,499 51,760 66,209 219,199 100%
Figure 18. Radar plots per cluster.
The radar plots effectively describe each cluster. In this case, we only have threevariables; we can see in Figure 18a how all variables have very high values, which is whywe labelled this cluster as top. Figure 18b shows a group of customers with bad recencybut relatively good monetary and frequency value. This cluster has customers that oncewere good customers, but they are abandoning the brand, which is why we labelled thecluster as churn. Figure 18c shows the cluster where the worse customers are grouped; thethree variables have very low values, so we labelled the cluster as worse. Figure 18d showsa group of customers with very good recency but low values for frequency and monetary;these customers seem to be new customers; therefore, they are starting their purchases,and they will improve in time, which is why we labelled this cluster as new.
4.2. Comparing and Enriching Results
The global RFM model offers marketers a good view of customer activity but notinformation about products. The RFMScore per product hierarchy and the consequentsegmentation classifies the customer database into different groups that offer marketersand businesspeople the possibility to push products following the business needs, andconsequently, to develop custom strategies adjusted to the customers groups.
As shown in Table 6, the concatenation of both models in the cross table helps to seehow coherent the results are. Top customers in terms of products are mainly grouped intotop customers in terms of activity (RFM model), which means that the best products createloyal customers with a high level of activity in terms of recency, frequency and monetary.
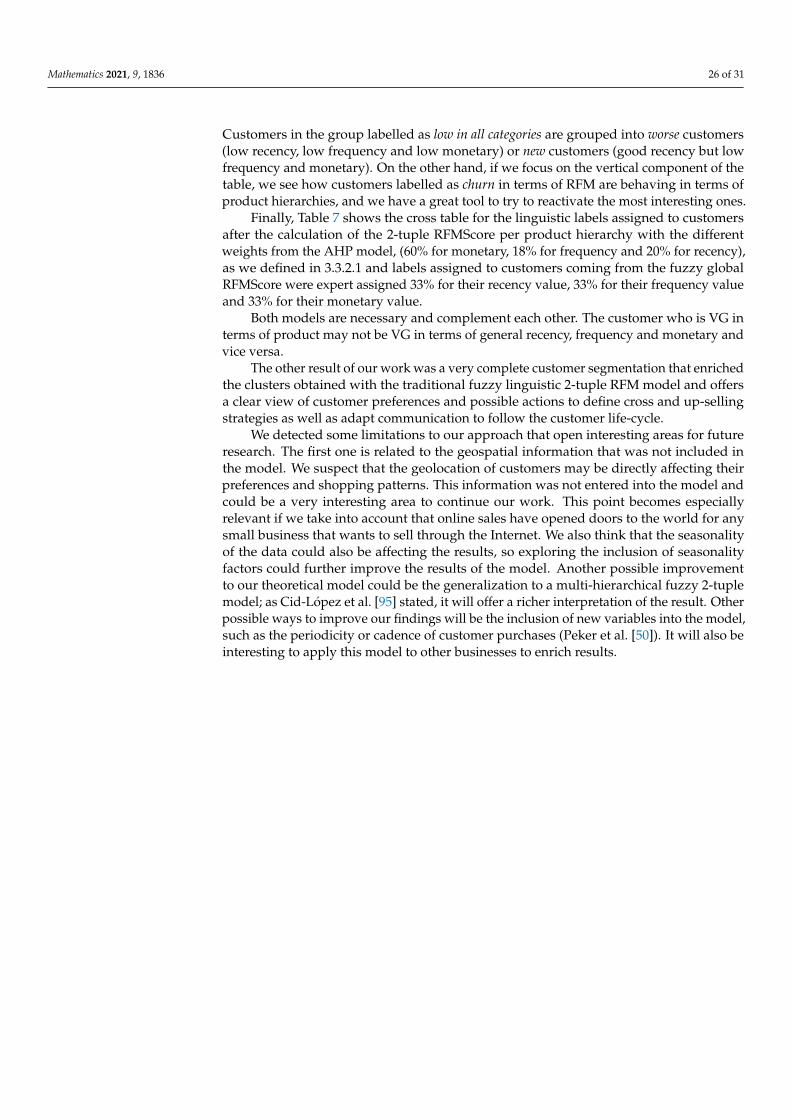
Mathematics 2021, 9, 1836 26 of 31
Customers in the group labelled as low in all categories are grouped into worse customers(low recency, low frequency and low monetary) or new customers (good recency but lowfrequency and monetary). On the other hand, if we focus on the vertical component of thetable, we see how customers labelled as churn in terms of RFM are behaving in terms ofproduct hierarchies, and we have a great tool to try to reactivate the most interesting ones.
Finally, Table 7 shows the cross table for the linguistic labels assigned to customersafter the calculation of the 2-tuple RFMScore per product hierarchy with the differentweights from the AHP model, (60% for monetary, 18% for frequency and 20% for recency),as we defined in 3.3.2.1 and labels assigned to customers coming from the fuzzy globalRFMScore were expert assigned 33% for their recency value, 33% for their frequency valueand 33% for their monetary value.
Both models are necessary and complement each other. The customer who is VG interms of product may not be VG in terms of general recency, frequency and monetary andvice versa.
The other result of our work was a very complete customer segmentation that enrichedthe clusters obtained with the traditional fuzzy linguistic 2-tuple RFM model and offersa clear view of customer preferences and possible actions to define cross and up-sellingstrategies as well as adapt communication to follow the customer life-cycle.
We detected some limitations to our approach that open interesting areas for futureresearch. The first one is related to the geospatial information that was not included inthe model. We suspect that the geolocation of customers may be directly affecting theirpreferences and shopping patterns. This information was not entered into the model andcould be a very interesting area to continue our work. This point becomes especiallyrelevant if we take into account that online sales have opened doors to the world for anysmall business that wants to sell through the Internet. We also think that the seasonalityof the data could also be affecting the results, so exploring the inclusion of seasonalityfactors could further improve the results of the model. Another possible improvementto our theoretical model could be the generalization to a multi-hierarchical fuzzy 2-tuplemodel; as Cid-López et al. [95] stated, it will offer a richer interpretation of the result. Otherpossible ways to improve our findings will be the inclusion of new variables into the model,such as the periodicity or cadence of customer purchases (Peker et al. [50]). It will also beinteresting to apply this model to other businesses to enrich results.
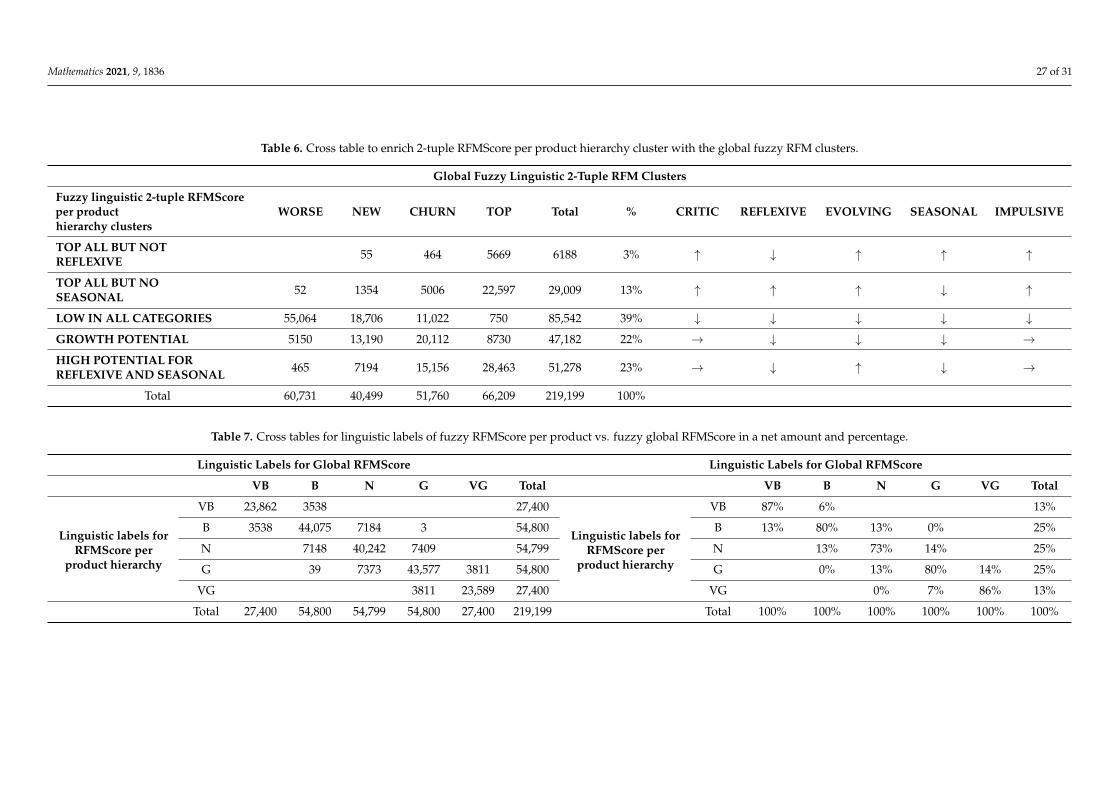
Mathematics 2021, 9, 1836 27 of 31
Table 6. Cross table to enrich 2-tuple RFMScore per product hierarchy cluster with the global fuzzy RFM clusters.
Global Fuzzy Linguistic 2-Tuple RFM Clusters
Fuzzy linguistic 2-tuple RFMScoreper producthierarchy clusters
WORSE NEW CHURN TOP Total % CRITIC REFLEXIVE EVOLVING SEASONAL IMPULSIVE
TOP ALL BUT NOTREFLEXIVE 55 464 5669 6188 3% ↑ ↓ ↑ ↑ ↑
TOP ALL BUT NOSEASONAL 52 1354 5006 22,597 29,009 13% ↑ ↑ ↑ ↓ ↑
LOW IN ALL CATEGORIES 55,064 18,706 11,022 750 85,542 39% ↓ ↓ ↓ ↓ ↓GROWTH POTENTIAL 5150 13,190 20,112 8730 47,182 22% → ↓ ↓ ↓ →HIGH POTENTIAL FORREFLEXIVE AND SEASONAL 465 7194 15,156 28,463 51,278 23% → ↓ ↑ ↓ →
Total 60,731 40,499 51,760 66,209 219,199 100%
Table 7. Cross tables for linguistic labels of fuzzy RFMScore per product vs. fuzzy global RFMScore in a net amount and percentage.
Linguistic Labels for Global RFMScore Linguistic Labels for Global RFMScore
VB B N G VG Total VB B N G VG Total
Linguistic labels forRFMScore per
product hierarchy
VB 23,862 3538 27,400
Linguistic labels forRFMScore per
product hierarchy
VB 87% 6% 13%
B 3538 44,075 7184 3 54,800 B 13% 80% 13% 0% 25%
N 7148 40,242 7409 54,799 N 13% 73% 14% 25%
G 39 7373 43,577 3811 54,800 G 0% 13% 80% 14% 25%
VG 3811 23,589 27,400 VG 0% 7% 86% 13%
Total 27,400 54,800 54,799 54,800 27,400 219,199 Total 100% 100% 100% 100% 100% 100%
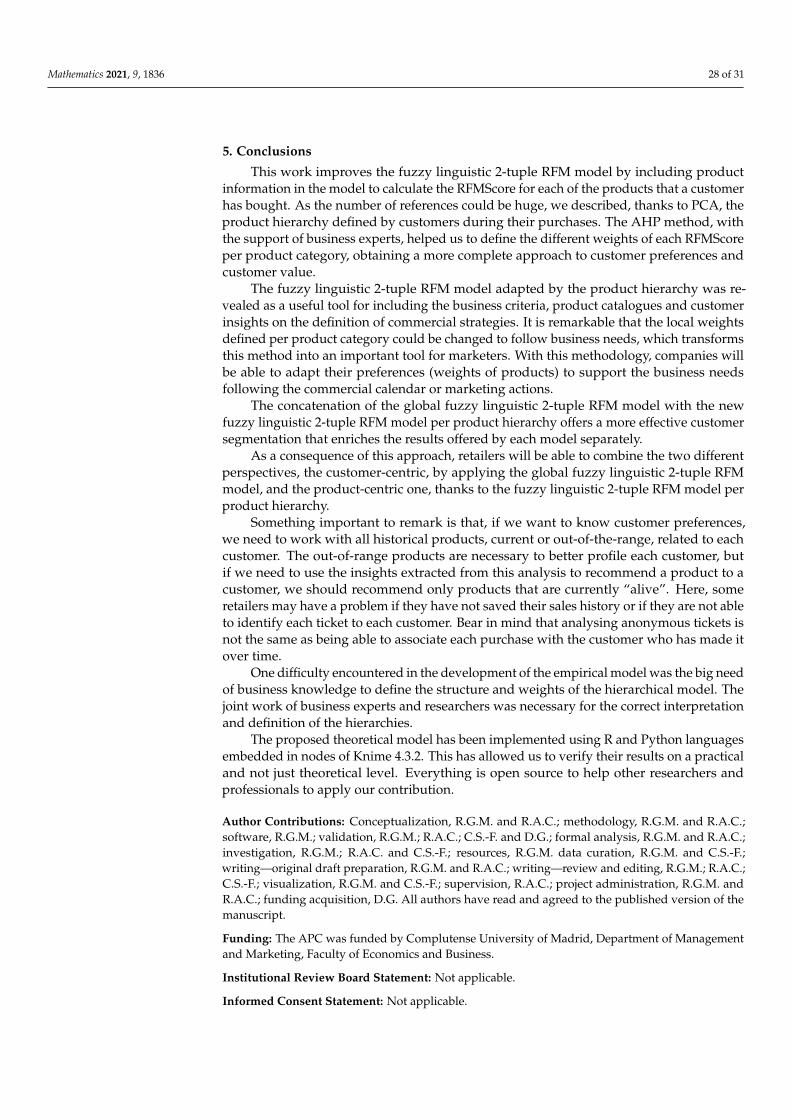
Mathematics 2021, 9, 1836 28 of 31
5. Conclusions
This work improves the fuzzy linguistic 2-tuple RFM model by including productinformation in the model to calculate the RFMScore for each of the products that a customerhas bought. As the number of references could be huge, we described, thanks to PCA, theproduct hierarchy defined by customers during their purchases. The AHP method, withthe support of business experts, helped us to define the different weights of each RFMScoreper product category, obtaining a more complete approach to customer preferences andcustomer value.
The fuzzy linguistic 2-tuple RFM model adapted by the product hierarchy was re-vealed as a useful tool for including the business criteria, product catalogues and customerinsights on the definition of commercial strategies. It is remarkable that the local weightsdefined per product category could be changed to follow business needs, which transformsthis method into an important tool for marketers. With this methodology, companies willbe able to adapt their preferences (weights of products) to support the business needsfollowing the commercial calendar or marketing actions.
The concatenation of the global fuzzy linguistic 2-tuple RFM model with the newfuzzy linguistic 2-tuple RFM model per product hierarchy offers a more effective customersegmentation that enriches the results offered by each model separately.
As a consequence of this approach, retailers will be able to combine the two differentperspectives, the customer-centric, by applying the global fuzzy linguistic 2-tuple RFMmodel, and the product-centric one, thanks to the fuzzy linguistic 2-tuple RFM model perproduct hierarchy.
Something important to remark is that, if we want to know customer preferences,we need to work with all historical products, current or out-of-the-range, related to eachcustomer. The out-of-range products are necessary to better profile each customer, butif we need to use the insights extracted from this analysis to recommend a product to acustomer, we should recommend only products that are currently “alive”. Here, someretailers may have a problem if they have not saved their sales history or if they are not ableto identify each ticket to each customer. Bear in mind that analysing anonymous tickets isnot the same as being able to associate each purchase with the customer who has made itover time.
One difficulty encountered in the development of the empirical model was the big needof business knowledge to define the structure and weights of the hierarchical model. Thejoint work of business experts and researchers was necessary for the correct interpretationand definition of the hierarchies.
The proposed theoretical model has been implemented using R and Python languagesembedded in nodes of Knime 4.3.2. This has allowed us to verify their results on a practicaland not just theoretical level. Everything is open source to help other researchers andprofessionals to apply our contribution.
Author Contributions: Conceptualization, R.G.M. and R.A.C.; methodology, R.G.M. and R.A.C.;software, R.G.M.; validation, R.G.M.; R.A.C.; C.S.-F. and D.G.; formal analysis, R.G.M. and R.A.C.;investigation, R.G.M.; R.A.C. and C.S.-F.; resources, R.G.M. data curation, R.G.M. and C.S.-F.;writing—original draft preparation, R.G.M. and R.A.C.; writing—review and editing, R.G.M.; R.A.C.;C.S.-F.; visualization, R.G.M. and C.S.-F.; supervision, R.A.C.; project administration, R.G.M. andR.A.C.; funding acquisition, D.G. All authors have read and agreed to the published version of themanuscript.
Funding: The APC was funded by Complutense University of Madrid, Department of Managementand Marketing, Faculty of Economics and Business.
Institutional Review Board Statement: Not applicable.
Informed Consent Statement: Not applicable.
Mathematics 2021, 9, 1836 29 of 31
Data Availability Statement: Not applicable.
Conflicts of Interest: The authors declare no conflict of interest.
References1. Wedel, M.; Kannan, P.K. Marketing Analytics for Data-Rich Environments. J. Mark. 2016, 80, 97–121. [CrossRef]2. Maechler, N.; Neher, K.; Park, R. From touchpoints to journeys: Seeing the world as customers do. McKinsey Q. 2016, 2, 2–10.3. Said, E.; Macdonald, E.K.; Wilson, H.N.; Marcos, J. How organizations generate and use customer insight. J. Mark. Manag. 2015,
31, 1158–1179. [CrossRef]4. Moorman, C. Top Ten Results from the CMO Survey—August 2019. Available online: https://tinyurl.com/yx75qt3f (accessed on
21 December 2019).5. Ransbotham, S.; Kiron, D.; Prentice, P.K. Minding the analytics gap. MIT Sloan Manag. Rev. 2015, 56, 63–68.6. Bresciani, S.; Ferraris, A.; Del Giudice, M. The management of organizational ambidexterity through alliances in a new context of
analysis: Internet of Things (IoT) smart city projects. Technol. Forecast. Soc. Chang. 2018, 136, 331–338. [CrossRef]7. Scuotto, V.; Arrigo, E.; Candelo, E.; Nicotra, M. Ambidextrous innovation orientation effected by the digital transformation. Bus.
Process Manag. J. 2019, 26, 1121–1140. [CrossRef]8. Taiminen, H.M.; Karjaluoto, H. The usage of digital marketing channels in SMEs. J. Small Bus. Enterp. Dev. 2015, 22, 633–651.
[CrossRef]9. Verhoef, P.C.; Broekhuizen, T.; Bart, Y.; Bhattacharya, A.; Dong, J.Q.; Fabian, N.; Haenlein, M. Digital transformation: A
multidisciplinary reflection and research agenda. J. Bus. Res. 2021, 122, 889–901. [CrossRef]10. Matarazzo, M.; Penco, L.; Profumo, G.; Quaglia, R. Digital transformation and customer value creation in Made in Italy SMEs: A
dynamic capabilities perspective. J. Bus. Res. 2021, 123, 642–656. [CrossRef]11. Kartajaya, H.; Setiawan, I.; Kotler, P. Marketing 4.0. LID Editorial. 2018. Available online: https://www.ucentral.edu.co/sites/
default/files/inline-files/WP03_Lavirtualidad_zapata_Web.pdf (accessed on 1 June 2021).12. Liu, D.Y.; Chen, S.W.; Chou, T.C. Resource fit in digital transformation lessons learned from the CBC Bank global e-banking
ptoject. Manag. Decis. 2011, 49, 1728–1742. [CrossRef]13. Chen, I.J.; Popovich, K. Understanding customer relationship management (CRM). Bus. Process Manag. J. 2003, 9, 672–688.
[CrossRef]14. Kuchinka, D.G.J.; Balazs, S.; Gavriletea, M.D.; Djokic, B.-B. Consumer Attitudes toward Sustainable Development and Risk to
Brand Loyalty. Sustainability 2018, 10, 997. [CrossRef]15. Sirgy, M.J. Self-congruity theory in consumer behavior: A little history. J. Glob. Sch. Mark. Sci. 2018, 28, 197–207. [CrossRef]16. Yuan, X.; Li, D.; Mohapatra, D.; Elhoseny, M. Automatic removal of complex shadows from indoor videos using transfer learning
and dynamic thresholding. Comput. Electr. Eng. 2018, 70, 813–825. [CrossRef]17. Eger, L.; Komárková, L.; Egerová, D.; Micík, M. The effect of COVID-19 on consumer shopping behaviour: Generational cohort
perspective. J. Retail. Consum. Serv. 2021, 61, 102542. [CrossRef]18. Rahman, I.; Reynolds, D. The influence of values and attitudes on green consumer behavior: A conceptual model of green hotel
patronage. Int. J. Hosp. Tour. Adm. 2017, 20, 47–74. [CrossRef]19. Hughes, A.M. Strategic Database Marketing; Probus Publishing Company: Chicago, IL, USA, 1994.20. Bult, J.R.; Wansbeek, T. Optimal Selection for Direct Mail. Mark. Sci. 1995, 14, 378–394. [CrossRef]21. Yeh, I.-C.; Yang, K.-J.; Ting, T.-M. Knowledge discovery on RFM model using Bernoulli sequence. Expert Syst. Appl. 2009, 36,
5866–5871. [CrossRef]22. Gupta, S.; Hanssens, D.; Hardie, B.; Kahn, W.; Kumar, V.; Lin, N.; Ravishanker, N.; Sriram, S. Modeling customer lifetime value. J.
Service Res. 2006, 9, 139–155. [CrossRef]23. Kumar, V.; Reinartz, W. Creating Enduring Customer Value. J. Mark. 2016, 80, 36–68. [CrossRef]24. Heldt, R.; Silveira, C.S.; Luce, F.B. Predicting customer value per product: From RFM to RFM/P. J. Bus. Res. 2021, 127, 444–453.
[CrossRef]25. Moghaddam, S.Q.; Abdolvand, N.; Harandi, S.R. A RFMV model and customer segmentation based on variety of products. Inf.
Syst. Telecommun. 2017, 5, 155.26. Virvilaite, R.; Saladiene, V. Models investigation of factors affecting consumer impulsive purchase behaviour in retail envi-
ronment. Econ. Manag. 2012, 17, 664–670. [CrossRef]27. Chen, T. Impulse purchase varied by products and marketing channels. J. Int. Manag. Stud. 2008, 3, 154–161.28. Chang, H.-C.; Tsai, H.-P. Group RFM analysis as a novel framework to discover better customer consumption behavior. Expert
Syst. Appl. 2011, 38, 14499–14513. [CrossRef]29. Bitran, G.R.; Mondschein, S.V. Mailing Decisions in the Catalog Sales Industry. Manag. Sci. 1996, 42, 1364–1381. [CrossRef]30. Miglautsch, J.R. Thoughts on RFM scoring. J. Database Mark. Cust. Strat. Manag. 2000, 8, 67–72. [CrossRef]31. Chang, E.-C.; Huang, S.-C.; Wu, H.-H. Using K-means method and spectral clustering technique in an outfitter’s value analysis.
Qual. Quant. 2009, 44, 807–815. [CrossRef]32. Miglautsch, J.R. Application of RFM principles: What to do with 1-1-1 customers? J. Database Mark. 2002, 9, 319–324. [CrossRef]33. Lumsden, S.-A.; Beldona, S.; Morrison, A.M. Customer Value in an All-Inclusive Travel Vacation Club: An Application of the
RFM Framework. J. Hosp. Leis. Mark. 2008, 16, 270–285. [CrossRef]
Mathematics 2021, 9, 1836 30 of 31
34. Wei, J.T.; Lin, S.Y.; Wu, H.H. A review of the application of RFM model. Afr. J. Bus. Manag. 2010, 4, 4199–4206.35. Ernawati, E.; Baharin, S.S.K.; Kasmin, F. A review of data mining methods in RFM-based customer segmentation. J. Phys. Conf.
Ser. 2021, 1869, 012085. [CrossRef]36. Carrasco, R.A.; Blasco, F.; Herrera-Viedma, E. A 2-tuple Fuzzy Linguistic RFM Model and Its Implementation. Procedia Comput.
Sci. 2015, 55, 1340–1347. [CrossRef]37. Carrasco, R.A.; Blasco, M.F.; García-Madariaga, J.; Herrera-Viedma, E. A Fuzzy Linguistic RFM Model Applied to Campaign
Management. Int. J. Interact. Multimed. Artif. Intell. 2019, 5, 21. [CrossRef]38. Martínez, R.G.; Carrasco, R.A.; Garcia-Madariaga, J.; Gallego, C.P.; Herrera-Viedma, E. A comparison between Fuzzy Linguistic
RFM Model and traditional RFM model applied to Campaign Management. Case study of retail business. Procedia Comput. Sci.2019, 162, 281–289. [CrossRef]
39. Kumar, V. Customer Lifetime Value: The Path to Profitability; Now Publishers Inc.: Norwell, MA, USA, 2008.40. Fader, P. Customer Centricity: Focus on the Right Customers for Strategic Advantage; Wharton Digital Press: Philadelphia, PA, USA,
2020.41. Bolton, R. A Dynamic Model of the Duration of the Customer’s Relationship with a Continuous Service Provider: The Role of
Satisfaction. Mark. Sci. 1998, 17, 45–65. [CrossRef]42. Baesens, B.; Viaene, S.; Poel, D.V.D.; Vanthienen, J.; Dedene, G. Bayesian neural network learning for repeat purchase modelling
in direct marketing. Eur. J. Oper. Res. 2002, 138, 191–211. [CrossRef]43. Malthouse, E.C. Scoring Models. In Kellogg on Integrated Marketing; Iacobucci, D., Calder, B., Eds.; John Wiley & Sons, Inc.:
Hoboken, NJ, USA, 2003; pp. 227–249.44. Berry, M.J.; Linoff, G.S. Data Mining Techniques, 2nd ed.; Wiley Publishing, Inc.: Indianapolis, IN, USA, 2004.45. Malthouse, E.C.; Blattberg, R.C. Can we predict customer lifetime value? J. Interact. Mark. 2005, 19, 2–16. [CrossRef]46. Rud, O.P. Data Mining Cookbook: Modeling Data for Marketing, Risk, and Customer Relationship Management; John Wiley & Sons:
Hoboken, NJ, USA, 2001.47. Zhang, Y.; Bradlow, E.T.; Small, D.S. Predicting Customer Value Using Clumpiness: From RFM to RFMC. Mark. Sci. 2015, 34,
195–208. [CrossRef]48. Wong, E.; Wei, Y. Customer online shopping experience data analytics: Integrated customer segmentation and customised
services prediction model. Int. J. Retail Distrib. Manag. 2018, 46, 406–420. [CrossRef]49. Dursun, A.; Caber, M. Using data mining techniques for profiling profitable hotel customers: An application of RFM analysis.
Tour. Manag. Perspect. 2016, 18, 153–160. [CrossRef]50. Peker, S.; Kocyigit, A.; Eren, P.E. LRFMP model for customer segmentation in the grocery retail industry: A case study. Mark.
Intell. Plan. 2017, 35, 544–559. [CrossRef]51. Hamdi, K.; Zamiri, A. Identifying and segmenting customers of pasargad insurance company through RFM model (RFM). Int.
Bus. Manag. 2016, 10, 4209–4214.52. Weng, C.-H. Knowledge discovery of digital library subscription by RFC itemsets. Electron. Libr. 2016, 34, 772–788. [CrossRef]53. He, X.; Li, C. The Research and Application of Customer Segmentation on E-Commerce Websites. In Proceedings of the 2016 6th
International Conference on Digital Home (ICDH), Guangzhou, China, 2–4 December 2016; pp. 203–208. [CrossRef]54. Rezaeinia, S.M.; Rahmani, R. Recommender system based on customer segmentation (RSCS). Kybernetes 2016, 45, 946–961.
[CrossRef]55. Marisa, F.; Ahmad, S.S.S.; Yusof, Z.I.M.; Fachrudin, F.; Akhriza, T.M. Segmentation Model of Customer Lifetime Value in Small
and Medium Enterprise (SMEs) using K-Means Clustering and LRFM Model. Int. J. Integr. Eng. 2019, 11. [CrossRef]56. Patel, Y.S.; Agrawal, D.; Josyula, L.S. The RFM-based ubiquitous framework for secure and efficient banking. In Proceedings of
the 2016 International Conference on Innovation and Challenges in Cyber Security (ICICCS-INBUSH), Greater Noida, India, 3–5February 2016; pp. 283–288.
57. Hosseini, Z.Z.; Mohammadzadeh, M. Knowledge discovery from patients’ behavior via clustering-classification algorithms basedon weighted eRFM and CLV model: An empirical study in public health care services. Iran. J. Pharm. Res. 2016, 15, 355.
58. Dachyar, M.; Esperanca, F.M.; Nurcahyo, R. Loyalty Improvement of Indonesian Local Brand Fashion Customer Based onCustomer Lifetime Value (CLV) Segmentation. IOP Conf. Ser. Mater. Sci. Eng. 2019, 598, 012116. [CrossRef]
59. Monalisa, S.; Nadya, P.; Novita, R. Analysis for Customer Lifetime Value Categorization with RFM Model. Procedia Comput. Sci.2019, 161, 834–840. [CrossRef]
60. Mackiewicz, A.; Ratajczak, W. Principal components analysis (PCA). Comput. Geosci. 1993, 19, 303–342. [CrossRef]61. Karamizadeh, S.; Abdullah, S.M.; Manaf, A.A.; Zamani, M.; Hooman, A. An overview of principal component analysis. J. Signal
Inf. Process. 2013, 4, 173. [CrossRef]62. Abdi, H.; Williams, L.J. Principal component analysis. Wiley Interdiscip. Rev. Comput. Stat. 2010, 2, 433–459. [CrossRef]63. Paul, L.C.; Suman, A.A.; Sultan, N. Methodological analysis of principal component analysis (PCA) method. Int. J. Comput. Eng.
Manag. 2013, 16, 32–38.64. Bryant, F.B.; Yarnold, P.R. Principal-Components Analysis and Exploratory and Confirmatory Factor Analysis; American Psychological
Association: Washington, DC, USA, 1995.65. Suh, E.; Noh, K.; Suh, C. Customer list segmentation using the combined response model. Expert Syst. Appl. 1999, 17, 89–97.
[CrossRef]
Mathematics 2021, 9, 1836 31 of 31
66. Kaymak, U. Fuzzy target selection using RFM variables. In Proceedings of the Joint 9th IFSA World Congress and 20th NAFIPSInterna-tional Conference (Cat. No. 01TH8569), Vancouver, BC, Canada, 25–28 July 2001; pp. 1038–1043.
67. Hsieh, N.C. An integrated data mining and behavioural scoring model for analysing bank customers. Expert Syst. Appl. 2004, 27,623–633. [CrossRef]
68. Tsai, C.-Y.; Chiu, C.-C. A purchase-based market segmentation methodology. Expert Syst. Appl. 2004, 27, 265–276. [CrossRef]69. Buckinx, W.; Poel, D.V.D. Customer base analysis: Partial defection of behaviourally loyal clients in a non-contractual FMCG
retail setting. Eur. J. Oper. Res. 2005, 164, 252–268. [CrossRef]70. Coussement, K.; Poel, D.V.D. Improving customer attrition prediction by integrating emotions from client/company interaction
emails and evaluating multiple classifiers. Expert Syst. Appl. 2009, 36, 6127–6134. [CrossRef]71. Chen, Y.L.; Kuo, M.H.; Wu, S.Y.; Tang, K. Discovering recency, frequency, and monetary (RFM) sequential patterns from customers’
purchasing data. Electron. Commer. Res. Appl. 2009, 8, 241–251. [CrossRef]72. Hosseini, S.M.S.; Maleki, A.; Gholamian, M.R. Cluster analysis using data mining approach to develop CRM methodology to
assess the customer loyalty. Expert Syst. Appl. 2010, 37, 5259–5264. [CrossRef]73. Li, Y.-M.; Lin, C.-H.; Lai, C.-Y. Identifying influential reviewers for word-of-mouth marketing. Electron. Commer. Res. Appl. 2010,
9, 294–304. [CrossRef]74. Sekhavat, Y.A.; Fathian, M.; Gholamian, M.R.; Alizadeh, S. Mining important association rules based on the RFMD tech-nique.
Int. J. Data Anal. Tech. Strateg. 2010, 2, 1–21. [CrossRef]75. Albadvi, A.; Norouzi, A.; Sepehri, M.M.; Amin Naseri, M.R. An Integrated Pareto/NBD-fuzzy weighted RFM model for customer
segmentation in non-contractual setting. J. Bus. Manag. 2014, 6, 417–440.76. Güçdemir, H.; Selim, H. Integrating multi-criteria decision making and clustering for business customer segmentation. Ind.
Manag. Data Syst. 2015, 115, 1022–1040. [CrossRef]77. Song, M.; Zhao, X.E.H.; Ou, Z. Statistic-based CRM approach via time series segmenting RFM on large scale data. In Proceedings
of the 9th International Conference on Utility and Cloud Computing, Shanghai, China, 6–9 December 2016; pp. 282–291.78. Li, H.; Yang, X.; Xia, Y.; Zheng, L.; Yang, G.; Lv, P. K-LRFMD: Method of customer value segmentation in shared trans-portation
filed based on improved K-means algorithm. J. Phys. Conf. Ser. 2018, 1060, 012012. [CrossRef]79. Hajmohamad, M.M.; Rahimi, N.; Sasanizadeh, B. PRFM Model Developed for the Separation of Enterprise Customers Based on
the Distribution Companies of Various Goods and Services. J. Syst. Manag. 2021, 6, 77–99. [CrossRef]80. Hwang, S.; Lee, Y. Identifying customer priority for new products in target marketing: Using RFM model and TexRank. Marketing
2021, 17, 125–136.81. Chen, Q.; Huang, M. Rough fuzzy model based feature discretization in intelligent data preprocess. J. Cloud Comput. 2021, 10,
1–13. [CrossRef]82. Bueno, I.; Carrasco, R.A.; Porcel, C.; Kou, G.; Herrera-Viedma, E. A linguistic multi-criteria decision making methodology for the
evaluation of tourist services considering customer opinion value. Appl. Soft Comput. 2021, 101, 107045. [CrossRef]83. Herrera, F.; Martinez, L. A model based on linguistic 2-tuples for dealing with multigranular hierarchical linguistic contexts in
multi-expert decision-making. IEEE Trans. Syst. Man Cybern. Part B 2001, 31, 227–234. [CrossRef]84. Herrera, F.; Herrera-Viedma, E. Aggregation operators for linguistic weighted information. IEEE Trans. Syst. Man Cybern. Part A
Syst. Hum. 1997, 27, 646–656. [CrossRef]85. Porcel, C.; Tejeda-Lorente, A.; Martínez, M.A.; Herrera-Viedma, E. A hybrid recommender system for the selective dis-semination
of research resources in a technology transfer office. Inf. Sci. 2012, 184, 1–19. [CrossRef]86. Cheng, C.-H.; Chen, Y.-S. Classifying the segmentation of customer value via RFM model and RS theory. Expert Syst. Appl. 2009,
36, 4176–4184. [CrossRef]87. Chen, D.; Sain, S.L.; Guo, K. Data mining for the online retail industry: A case study of RFM model-based customer seg-mentation
using data mining. J. Database Mark. Cust. Strategy Manag. 2012, 19, 197–208. [CrossRef]88. Liu, D.-R.; Shih, Y.-Y. Integrating AHP and data mining for product recommendation based on customer lifetime value. Inf.
Manag. 2005, 42, 387–400. [CrossRef]89. Saaty, T.L. Decision making with the analytic hierarchy process. Int. J. Serv. Sci. 2008, 1, 83. [CrossRef]90. Kotler, P.T. Marketing Management; Pearson Education: London, UK, 2019.91. Pradel, B.; Sean, S.; Delporte, J.; Guérif, S.; Rouveirol, C.; Usunier, N.; Dufau-Joel, F. A case study in a recommender system based
on purchase data. In Proceedings of the 17th ACM SIGKDD International Conference on Knowledge Discovery and Data Mining,San Diego, CA, USA, 21–24 August 2011; pp. 377–385.
92. Öcal, M.E.; Oral, E.L.; Erdis, E.; Vural, G. Industry financial ratios—Application of factor analysis in Turkish construction industry.Build. Environ. 2007, 42, 385–392. [CrossRef]
93. Hair, J.F.; Anderson, R.E.; Babin, B.J.; Black, W.C. Multivariate Data Analysis: A Global Perspective; Pearson Education: London, UK,2010.
94. Ali, S.B.; Mahdi, A.; Malihe, J. The effect of employees’ performance appraisal procedure on their intrinsic motivation. Int. J. Acad.Res. Bus. Soc. Sci. 2012, 2, 161.
95. Cid-López, A.; Hornos, M.J.; Carrasco, R.A.; Herrera-Viedma E y Chiclana, F. Linguistic model of multi-criteria decision makingwith expressive richness output variable. Expert Syst. Appl. 2017, 83, 350–362. [CrossRef]