an overview of marketing of ghana natural products
TRANSCRIPT

New Jersey Agricultural Experiment Station P-15009-1-06
November 2006
An Overview of Marketing of Ghana Natural Products
Ramu Govindasamy Benjamin Onyango
Venkata Puduri James Simon
H. Rodolfo Juliani
Juliana Asante-Dartey, Hanson Arthur,
Bismarck Diawuo and
Dan Acquaye
Department of Agricultural, Food and Resource Economics Rutgers Cooperative Extension
New Jersey Agricultural Experiment Station Cook College
Rutgers, The State University of New Jersey New Brunswick, New Jersey 08901

An Overview of Marketing of Ghana Natural Products
Ramu Govindasamy Benjamin Onyango
Venkata Puduri James Simon
H. Rodolfo Juliani
Juliana Asante-Dartey, Hanson Arthur,
Bismarck Diawuo and
Dan Acquaye
Ramu Govindasamy is Associate Professor, Dept. of Agricultural, Food and Resource Economics, Rutgers University, New Brunswick, NJ 08901; Benjamin Onyango is Research Associate, Food Policy Institute, ASB 3 Rutgers PlazaNew Brunswick, NJ 08901-8520; Venkata Puduri is Post Doctoral Associate, Dept. of Agricultural, Food and Resource Economics, Rutgers University, New Brunswick, NJ 08901; James Simon is Professor, Dept. of Plant Sciences and New Use Agriculture and Natural Plant Products Program Rutgers University, New Brunswick, NJ 08901, USA; H. Rodolfo Juliani is Research Associate, Dept. of Plant Sciences, Rutgers University, New Brunswick, NJ 08901; Juliana Asante-Dartey , Hanson Arthur, Bismarck Diawuo and Dan Acquaye, ASNAPP-Ghana, P.M.B. (18) Kanda, Accra, H/NO C 205/29, Mempeasem, East Legon, Accra, Ghana;
Correspondence Address
Ramu Govindasamy, Associate Professor Department of Agricultural, Food and Resource Economics
Cook College Rutgers, The State University of New Jersey
55 Dudley Road, New Brunswick, New Jersey 08901-8520 Phone: (732) 932-9171 ext. 254

Acknowledgements
We thank the Ghanaian individuals with whom we interviewed for sharing their
information with us. We thank the USAID for providing funds to support this survey
work and our ASNAPP and PFID/NP programs. Specifically, we thank Carol Wilson,
USAID Cognizant Technical Officer of our Partnership for Food and Industry in Natural
Products (PFID/NP), a university led program supported by the Office of Economic
Growth, Agriculture and Trade (EGAT/AG) of the USAID (Contract Award No. AEG-
A-00-04-00012-00) in support of their global economic development programs. We also
thank Jerry Brown, USAID-Southern Africa and project officer, for his support and
encouragement on our ASNAPP programs and organization. Finally, we thank the New
Use Agriculture and Natural Plant Products Program (NUANPP) and the New Jersey
Agricultural Experiment Station, Rutgers University. For further information, see
pfidnp.org; and www.asnapp.org.
i

Table of Contents Acknowledgements.............................................................................................................. i
Table of Contents................................................................................................................ ii
List of Tables ..................................................................................................................... iii
Abstract .............................................................................................................................. iv
1. Introduction..................................................................................................................... 1
2. Survey and Analytical Methods...................................................................................... 4
3. Survey design.................................................................................................................. 5
4. Results and discussion .................................................................................................... 6
4.1. Operators Characteristics ....................................................................................... 6
4.2. Business Characteristics......................................................................................... 7
4.3. Respondent Views on Herbal Products Business Constraints ............................. 9
4.4. Respondent Views on the Herbal Business Future prospects.............................. 11
5. Commonly Traded Natural Products and Perceived Uses............................................ 13
6. Regression analysis....................................................................................................... 14
7. Conclusions................................................................................................................... 17
8. References:.................................................................................................................... 18
ii

List of Tables
Table 1: Wholesale Retail Business operators Characteristics ........................................ 7
Table 2: Business Characteristics .................................................................................... 8
Table3: Herbal cosmetic Industry Constraints (in percent) ........................................... 10
Table 4: Future Prospects of the herbal cosmetic industry (in percent) ........................ 12
Table 5: Distribution of Top Ten Natural/Herbal Products by Ghanaian Wholesalers/
Retailers ........................................................................................................... 14
Table 6: Descriptive Statistics of Explanatory Variables Used in the Regression
Analysis............................................................................................................ 15
Table 7: Regression Model Results ............................................................................... 16
iii

Abstract The study finds strong correlations between natural products business performance and
the impeding factors. The impediments include access to finance and markets, lack of
herbal market information especially relating to external markets. Additionally, there is
lack of processing capacity, while at the same time most if not all the natural products
business operators lack technical training relating to product handling. However, there is
big potential for success, the top ten traded natural products, may be exploited initially,
both domestically and for export market, given range of perceived use. The constraints
identified require concerted efforts from all stakeholders to recognize the importance of
this sub-sector in providing opportunities to successful development.
iv

An Overview of Marketing of Ghana Natural Products
1. Introduction For most of the African countries agriculture still remains the mainstay of the economies
supplying both food and incomes via marketable surpluses. However, many odds against
agriculture such as low productivity, poor prices, and drought among others make it
unsustainable. Results thus far show that such dependence has contributed little to neither
economic development nor growth. Still many of its people living on and from
agriculture remain poor, and are susceptible to hunger and malnutrition. Additionally,
over-reliance on a few traditional exports such coffee, tea, and cocoa etc., products whose
world prices keep declining has not helped either. At most, this is a futile response to
raising incomes of its people, if not spurs any meaningful development. Agricultural may
still contribute to development, if the countries could diversify from traditional products
to the untapped areas.
The continent’s rich botanical heritage offers an excellent opportunity to diversify
away from traditional exports. The natural products have a greater appeal to consumers
especially in the rich west. Thus, development of natural products as alternative or
complimentary to the current mix of tradable products will positively impact the social
and economic lives of many people, especially those in the rural areas. Additionally,
diversification of the production systems to include natural plants provides a superior
route to creating viable agribusinesses in rural communities currently lacking. Natural
products happen to have enormous advantages; First, indigenous African plants occur
1

naturally and so are relatively easy to cultivate commercially. Second, natural plant
production is labor intensive rather than capital intensive; a production alternative that
minimizes need for capital investment but at the same time maximizing job-creation
potential. Third, African communities have extensive knowledge of indigenous plants,
creating a natural competitive advantage.
ASNAPP (Agribusiness in Sustainable Natural African Plants Products) a non-
profit organization formed in 1999 with funding from USAID (United States Agency for
International Development) through Partnership in Food Industry Development in
Natural Products (PFID/NP) program and Germplasm initiative in non-traditional crops
(through International Institute for Tropical Agriculture (IITA) and Higher Education for
Development (HED)) is helping create and develop successful African agribusinesses in
the natural plant products sector. The organization focuses on the development of high-
value natural plant products that will enable African agribusinesses to compete in local,
regional and international markets. These products include herbal teas, culinary herbs and
spices, essential and press oils, as well as medicinal plants. Currently, ASNAPP operates
in five countries, namely South Africa, Ghana, Rwanda, Senegal and Zambia, working
with about 25 agri-enterprises that represent more than 2000 small-scale natural plant
suppliers.
The prospects for natural products market is very bright, for example the global
nutraceutical market alone is estimated to be worth $60 billion annually in sales of
dietary and meal supplements, as well as specialty products. Demand for organic and
natural products such as herbal teas, essential oils, herbs and spices, phytomedicines and
phytocosmetics is equally good. This growth has been supported by a global swing away
2

from synthetic products to those that are natural, healthy, sustainably produced and fairly
traded. In the context of world trade in natural products, African country’s natural forests
supply more herbs, medicinal plants and natural food ingredients. The Americans and
Europeans are the major consumers of natural products in the global market. Products
such as the herbal teas, essential oils, cosmetic and spices have readily available markets.
Natural product sales was estimated $34 billion in 2001, it is estimated that Global sales
for organic and natural products will reach about $100 billion by 2008 at an annual
growth rate of 20-30% (Organic Natural Health, 2001; Marty T. S., and Patrick R., 2004).
The United States happens to be the largest user of essential oils and flavor and fragrance,
with the aroma therapeutic market segment alone growing from a $316 million dollar
business in 1996 to over $454 million in 2001(Alberta Essential Oils, 1996; Datamonitor,
2002).
Indeed there is an untapped natural product potential ranging from raw products
to processed ones, to fetch better farmers’ returns. However, only a few large enterprises
are active in the sector at the expense of rural communities who had in fact been the first
to discover the health and nutritional properties of indigenous plants. The ASNAPP
Ghana program which commenced in 2000 is currently working on essential oils, lippia
tea, grains of paradise, cryptolepis, kombo butter, shea butter and Artemisia, with the
focus on the Eastern, Central, Ashanti, Volta, Greater Accra and Northern regions of
Ghana.
The natural products industry in Ghana is characterized by low input- low output;
mostly operated by small-scale farmers (suppliers) with low levels of levels of formal
education and agricultural production knowledge. Thus the current situation on the
3

supply side may be summarized as lacking regular supplies, of good quality and
timeliness. Organizationally, the scale of the operations may be a bottleneck on one hand,
but also equally important is lack of information, capital; product quality and assurance
mechanisms hindering successful commercialization.
The domestic markets are largely at the low levels of commercialization; the
operators have limited technical knowledge about natural products, and limited capital to
expand their businesses and exploit the readily available foreign markets. Thus, on the
demand side, there may be lack of consumer information as to the range of products,
where to find them and what remedies they offer.
Preliminary results from the Ghana business survey show that seven out of ten of
the businesses are retailer operated, whose two-thirds supply is dependent on the small-
scale farmers. The results also show that virtually all the traders have not received any
technical, financial or trade assistance from any organization. At most only 1 out of ten
businesses have ventured into external trade. The preliminary results show tremendous
potential, however a lot need to be done to tap on this potential.
This paper has the objective of highlighting the marketing impediments facing the
natural products market in the retail and wholesale portions of the chain in Ghana.
Specifically, (i) profile the technical, financial, organizational, etc., constraints the traders
face (domestically and externally), (ii) profile the natural product range and their
functions (iii) suggest policy interventions.
2. Survey and Analytical Methods Rutgers University and the collaborating partners in the five countries (South Africa,
Ghana, Rwanda, Senegal and Zambia) initially under PFID/NP and HED/IITA project
4

prepared separate survey instruments (farmers and traders) jointly to elicit information on
production and marketing. The survey instruments were pre-tested for country specific
production and marketing conditions, in this study the focus is on traders. Data collected
covered the market chain portions of production; wholesale and retail with additional
information obtained on export trade as well. In addition, the survey collected
information on traders’ socio-economic data. Additionally an empirical model is
developed to estimate the relationship between the wholesaler/retailers Natural Products
business annual turnover and socio-economic attributes.
0 1 2 3 4
5 6 7
17 36 50BUSTRNOVR BELOW AGE GENDER AGE SECSCHOOLTECHSPRT CMPRTY SUPLYCONST
β β β β ββ β β ε
= + + + − ++ + +
+
Where the variables definitions are as in Table 6.
3. Survey design
A sample of 55 traders was randomly selected from Accra and Kumasi, the two major
cities of Ghana. The cities were selected as the sampling frame based on their
cosmopolitan nature, and the fact that they account for the bulk of natural plant Products
trade (exports, wholesaling, distribution, and retailing in the country. Trained personnel
personally administered the interviews from the collaborators at the country office. The
respondents were assured of confidentiality, by letting them know that the respondents
were to be identified by a survey number, as an input to the summary results. Of the 55
respondents chosen, 50(90%) agreed to be interviewed. The surveys were conducted
between August and December 2005.
5

4. Results and discussion
This analysis is based on a sample of 50 wholesale-retail operators engaged in the natural
plant (herbal) products trade.
4.1. Operators Characteristics
Table 1 presents results on the economic and demographic attributes of the business
operators. The results show that out of the 50 respondents 37(74%) were categorized as
retailers, 10(20%) were operating both as retailers and wholesaler, with the remaining
3(6%) being wholesalers.
From the table it can be seen that females were the dominant operators (82%).
The majority age group were those in the (36-50 years) category (54%), followed by
those in the 21-35 years age category (22%), respondents who were >65 years and <20
years were least represented.
The results show that most of the operators had primary school education (1-7th
grade) representing 44% of the respondents. Almost 16% had no education at all, with
only 14% of the respondents having college and university education.
Eight out of the ten operators were married, 60% of them having at least 3
children. Almost 68% of the households were of 6-person size. In terms of residence,
42% of the operators indicated that they lived in the same neighborhood for more than 20
years, with 32% and 28% having lived in the same neighborhood for <10years, and
between10 and 19 years, respectively. In terms of off-business employment, only 5
percent of the operators indicated to have been employed elsewhere.
6
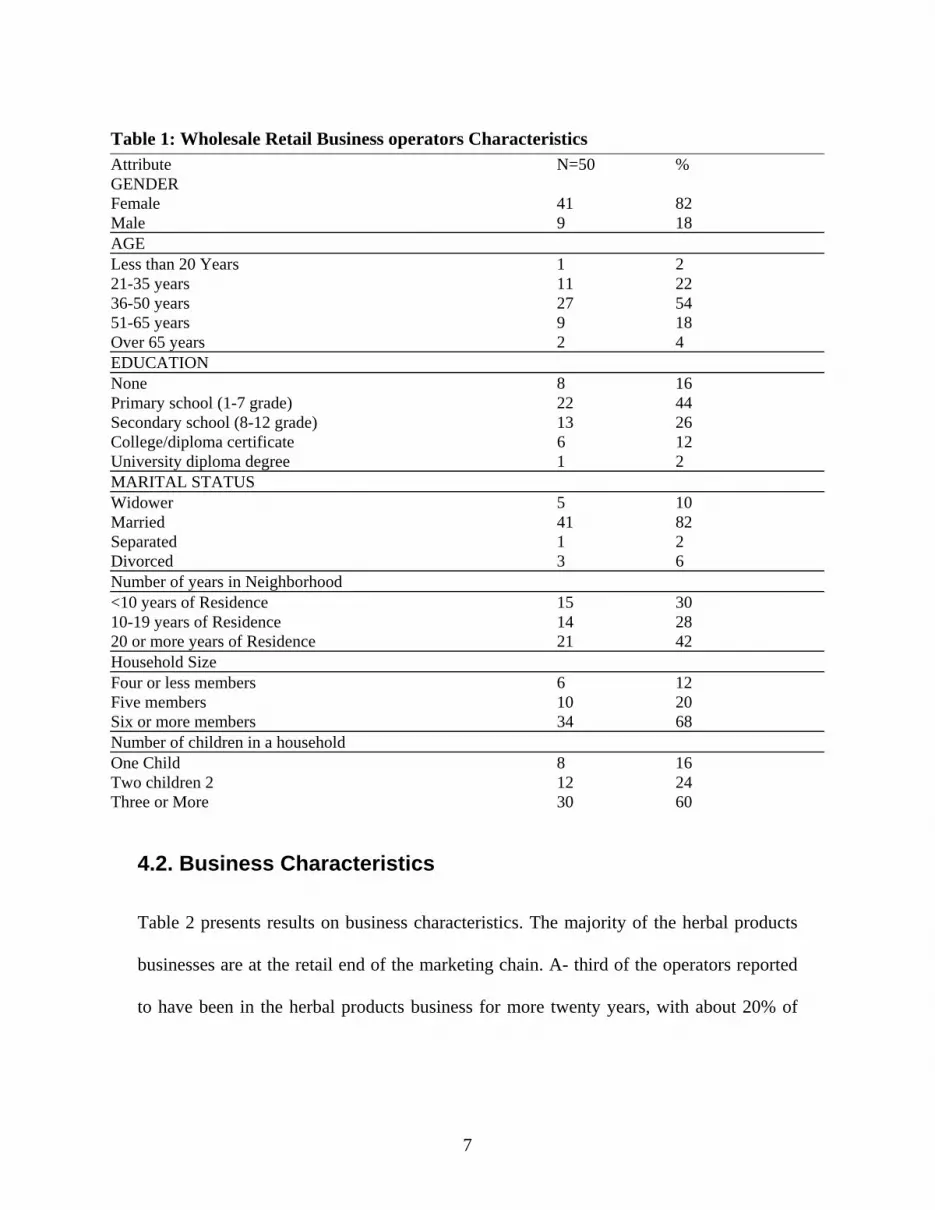
Table 1: Wholesale Retail Business operators Characteristics Attribute N=50 % GENDER Female 41 82 Male 9 18 AGE Less than 20 Years 1 2 21-35 years 11 22 36-50 years 27 54 51-65 years 9 18 Over 65 years 2 4 EDUCATION None 8 16 Primary school (1-7 grade) 22 44 Secondary school (8-12 grade) 13 26 College/diploma certificate 6 12 University diploma degree 1 2 MARITAL STATUS Widower 5 10 Married 41 82 Separated 1 2 Divorced 3 6 Number of years in Neighborhood <10 years of Residence 15 30 10-19 years of Residence 14 28 20 or more years of Residence 21 42 Household Size Four or less members 6 12 Five members 10 20 Six or more members 34 68 Number of children in a household One Child 8 16 Two children 2 12 24 Three or More 30 60
4.2. Business Characteristics
Table 2 presents results on business characteristics. The majority of the herbal products
businesses are at the retail end of the marketing chain. A- third of the operators reported
to have been in the herbal products business for more twenty years, with about 20% of
7

the respondents reporting to have operated such a business for <8 years, 9-14 and 15-19
years, respectively.
Table 2: Business Characteristics Attribute N=50 % Ownership Wholesaler 3 6 Retailer 37 74 Retailer/Wholesaler 10 20 Number of year in business 8 or less years in business 13 26 9 to 14 years in business 11 22 15-19 years in business 11 22 20 or more years in herbal business 15 30 Business Location Urban 47 94 Sub-urban 3 6 Possible supply sources Farmers 46 94 Agents 2 4 People directly 1 2 Actual Supply sources for the herbal products Farmers 1 2 Forest 1 2 Agents 16 32 Middlemen 30 60 Messa Heraal Centre 1 2 Nigeria 1 2 Family Labor unpaid At most one member of the family works unpaid for the business 30 60 At least 2 members work for the business without pay 20 40 Paid Labor No labor 41 82 At most one paid labor 2 4 At least two paid employee 7 14 Annual TURNOVER Annual turnover <7450000 Cedis 12 24 Annual Turnover between 7450000 -11999999 12 24 Annual Turnover>12000000 26 52 In US $, 7450000=812.8; 11999999=1309 @. 000109$=1 Cedi Off business employment YES 5 10 NO 45 90
8

The respondents described their business location as largely urban (94%); the
reaming 6% described their location as sub-urban, interestingly, there was no single
business located in a rural area.
The predominant herbal product suppliers were middlemen and agents, supplying
60% and 32 % of the merchandise, respectively. Farmers and forest sources of
merchandise virtually non-existed, however, some of the operators reported to have
vendors from outside the country (e.g., Nigeria and Mecca). The herbal businesses were
largely operated by a family member with little or no hired labor (about 14% of the
respondents indicated that they hired paid labor). Importantly, the turnover for most
operators ranged from as low as 1.2 to 2.3 million Cedis (U.S dollars $800 to about
$1400).
4.3. Respondent Views on Herbal Products Business Constraints
Table 3 presents results on factors impeding herbal products trade. Overall, 86-96%
respondents reported that before the ASNAAP/PFID_NP/ALO/IITA project,
prerequisites for exploiting the herbal trade lacked; these included absence of technical
advise, financial assistance, herbal business related information, inadequate or total lack
of processing capacity and market access, above all absence of any kind of herbal
business training. On a positive note, the situation seems to be improving after the
ASNAAP/PFID_NP/ALO/IITA project was launched, given that the projects’ overriding
objective is to address such problem, to facilitate capacity building for successful
entrepreneurship.
9

Table3: Herbal cosmetic Industry Constraints (in percent) Before the Project: Business Constraints YES NO Ever received trade-finance or technical training 14% 86% Technical advise 12% 88% Processing and marketing 2% 98% Information training 14% 86% Financial assistance 4% 96% Vocational training 4% 96% Supply Chain Issues Is local processing infrastructure adequate? 6% 94% Needs for improving distribution chain 92% 8% Do you share information with buyers/retailers/consumers? 84% 16% Government Regulation and Licensing Problems? YES NO 6% 94% What trade problems do you face? YES NO Stiff regulation, high risk of rejection 98% 2%
Ranking Business Constraints HIGH AVERAGE LOW
Human Resources 0% 16% 84% Access to Finance 82% 10% 8% Access to Information 40% 48% 12% Access to markets 36% 32% 32% Labor and Logistics 6% 28% 66% Taxes 4% 28% 68% Management 32% 14% 54% Technical support 38% 18% 44% After The project: Impact of the Project Does your business have current support? 100% 0% If yes to above then Technical advise 78% 22% Processing and marketing 96% 4% Short/seminar courses 100% 0% Financial assistance 94% 6% Agricultural certification 96% 4% Other project Assistance One-stop office for National Herbalist association 2% 98% Research 2% 98% To Sell under Sheds 2% 98%
Respondents were asked to express and rank their views on factors impeding the
herbal products business. On top of the range, 82% of the respondents identified access
to finance as the most constraining factor, with access to information being ranked
10

second (40%). Other impeding factors included; technical support, access to markets and
management, with about 30% of the respondents viewing them as a problem.
The Ghanaians herbal business operators did not view human resources, labor,
and taxes as a high priority problem. Almost 84%, 66%, and 68 % of the respondents felt
that human resources, labor and taxes were low priority problem, respectively.
Issues pertaining to supply chain i.e., sharing of information between suppliers
and traders, development of long term partnering supplier relationships and development
of quality standards, if absent, will ultimately impede successful launching of internal and
export trade in herbal products. However, the Ghanaian operators reported to be sharing
herbal trade information with their vendors, albeit at low levels compared to well
coordinated supply chain systems in the west.
The results show that the herbal products business operators rarely ventured into
the exported trade, only about 2% of them reported to have exported to some European
countries and to the Far East, particularly to China. A similar proportion, had tried to
export to US, however the results are encouraging, given the US market demands, in
terms of quality, regularity of supplies and quantities. Contributing to the dismal
performance of export trade were factors such as lack of business contacts in such
countries, inexperience in export trade and limited operational capital.
4.4. Respondent Views on the Herbal Business Future prospects
Table 4 presents results on the respondent views about the future of the herbal industry.
Although the ASNAPP the project has been on the ground for not long enough to carry
out some meaningful evaluation, the respondent viewed its presence positively, and gives
11

Table 4: Future Prospects of the herbal cosmetic industry (in percent)
Good Neither good nor Bad Not sure
Future prospects of the herbal cosmetic industry? 96% 2% 2% Decrease No Change Increase What do you expect happen to turnover in 1-2 years 8% 4% 88% What do you expect happen to Staff employed in 1-2 years 0% 52% 48% What do you expect happen to profit in 1-2 years 4% 4% 92% Do you export your produce? YES NO 0.02% 0.98%
Exports to other countries German China Switzerland Spain
% of business exporting 4% 2% 2% 2% Ever exported to USA? YES NO 0.02% 0.98% What was your US contact? Trade showsNone 0.02% 0.98%
Number of organizations exported to in the U.S Yes exported NO
Number of organizations exported to in the U.S Yes exported NO
6% 94% Do you now have ANY business representative in the U.S? YES NO 0% 100% Did you meet their Import requirements Yes Did not apply 2% 98% Reasons for not meeting US IMPORT Standards Don’t Know 94% Financial Constraints, no direct representative 2% No direct representative 2% Not Export Ready 2% Compared to US How will you rate your business?
In terms of …. Better Same Worse Don’t Know
Quality 84% 8% 8% 0% Price 94% 4% 2% 0% Package 4% 94% 2% 0% Variety 68% 12% 18% 2% Availability 64% 12% 24% 0% Labeling 0% 0% 96% 4% Supply consistency 42% 32% 22% 0%
12

them a high sense of optimism. Almost nine out of ten respondents view the future of the
industry to be bright. Almost 88% of the respondents see their turnover increasing, with
92% hoping that that their profits will increase.
When the Ghanaian operators compare themselves with US, they view their
products to be of better quality and better priced. Further, the results show that, they
have better varieties, which are readily available compared to the US. The results
indicate that Ghanaian herbal products traders admit the US labeling of such products is
better.
5. Commonly Traded Natural Products and Perceived Uses
Table 5 presents results on the types of natural products commonly traded and the
perceived uses. The results show that multi-uses for the most of the natural products and
largely the uses are medicinal. Across all the business, Khaya senegalensis was the top
ranked natural product; with a diversity of perceived uses ranging from being used to
treat stomach ulcers to being used as an appetizer. Lower category products included
among others: terminalia ivorensis (perceived to treat diarrhea, menstruation pains and
ulcers); Akata (perceived uses included treating malaria and other fevers). However,
there also a number of natural products, though not heavily traded, were providing some
special remedies.
13

Table 5: Distribution of Top Ten Natural/Herbal Products by Ghanaian Wholesalers/ Retailers
Rank Product Name Uses
Average Quantity Distributed /Sold by Wholesaler/Retailer
(Metric Tons)
Average Price Per Metric Ton(Cedi/ton)
1 Khaya senegalensis
Appetizer, Blood tonic, Fever, Malaria, Stomachache, Stomach Ulcers, Waist Pains, Fresh Delivery, Menstrual Pains, Headache, Ulcers
1.08 2290.16
2 Alstonia boonei
Convulsion, Ulcer, Fresh Delivery, Measles, Measles, Stomach Ulcer 0.34 2633.33
3 Paullinia pinnata
Bone Diseases, Fertility Enhancer, Fracture, Rheumatism, Joint Diseases, Waist and Joint Pains, Stomach Ulcer
0.26 1873.44
4 Enantia polycarpa.
Fever, Malaria Fever, Stomach Ulcer 0.13 4650.00
5 Kokrodoso Fresh Delivery, Ulcer, Stomach Ulcer, Menstrual Pains, Post partum, Fresh Delivery
0.32 2725.93
6 Pycnanthus angolensis
Blood Tonic, Constipation, Menstrual Pains, Unstable Pregnancy, Stomach Ulcer
0.28 1414.81
7 Terminalia ivorensis
Diarrhea, Menstruation Pains, Ulcer 0.28 1889.63
8 Rauwolfia vomitoria
Phrodisiac, Piles, Blood Cleansing, Stroke & Kooko 0.16 1539.05
9 Ricinodendron heudelotii
Elasticity of the Womb, Increased Fertility, Menstrual Disorder & Pains
0.05 2431.11
10 Akata Fever, Malaria Fever 0.05 2000.00
6. Regression analysis Table 6 and 7 present the regression results that related natural products business
turnover to the operators’ socioeconomic and other value attributes. The results show
that the socio-economic variables associated with presence of young people in a
14
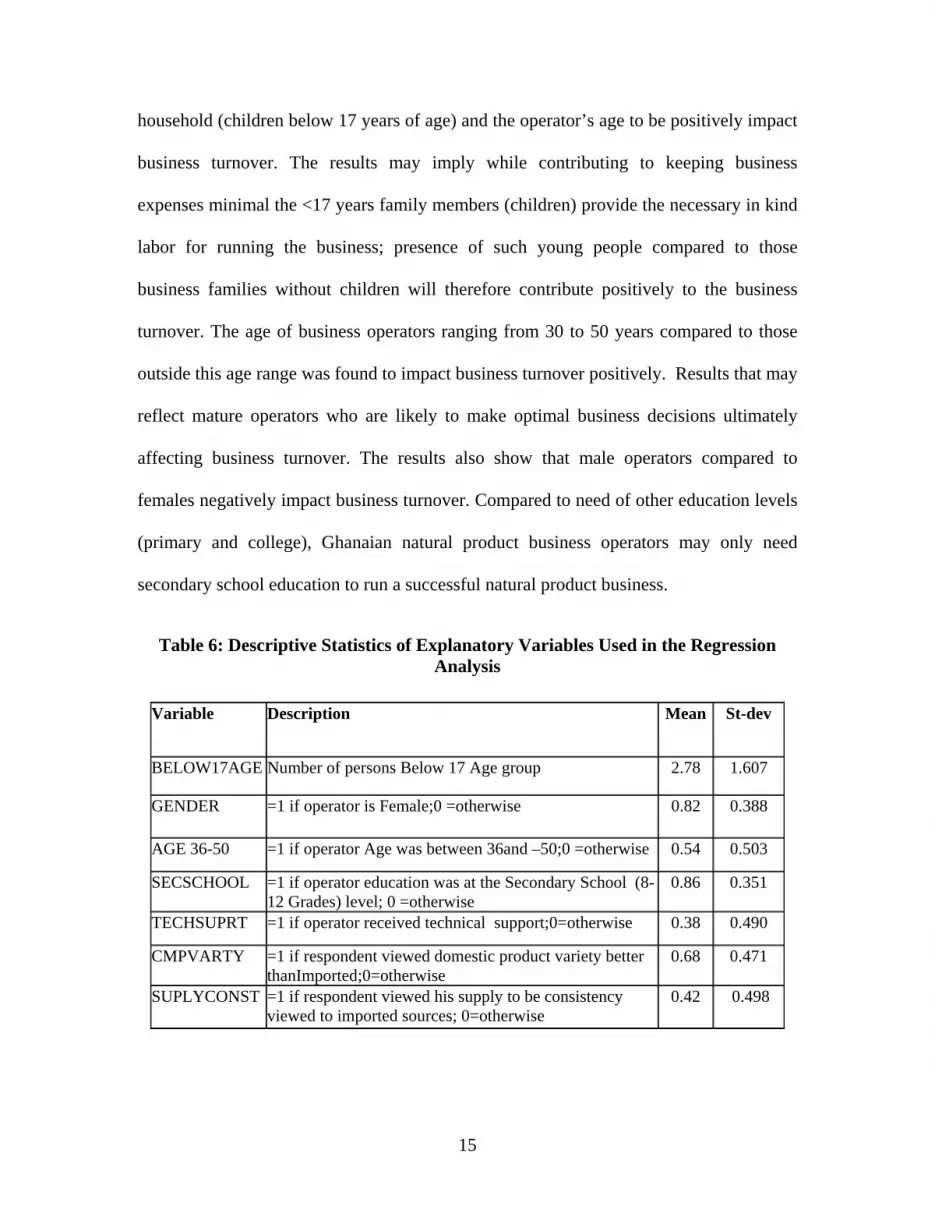
household (children below 17 years of age) and the operator’s age to be positively impact
business turnover. The results may imply while contributing to keeping business
expenses minimal the <17 years family members (children) provide the necessary in kind
labor for running the business; presence of such young people compared to those
business families without children will therefore contribute positively to the business
turnover. The age of business operators ranging from 30 to 50 years compared to those
outside this age range was found to impact business turnover positively. Results that may
reflect mature operators who are likely to make optimal business decisions ultimately
affecting business turnover. The results also show that male operators compared to
females negatively impact business turnover. Compared to need of other education levels
(primary and college), Ghanaian natural product business operators may only need
secondary school education to run a successful natural product business.
Table 6: Descriptive Statistics of Explanatory Variables Used in the Regression Analysis
Variable Description Mean St-dev
BELOW17AGE Number of persons Below 17 Age group 2.78 1.607
GENDER =1 if operator is Female;0 =otherwise 0.82 0.388
AGE 36-50 =1 if operator Age was between 36and –50;0 =otherwise 0.54 0.503
SECSCHOOL =1 if operator education was at the Secondary School (8-12 Grades) level; 0 =otherwise
0.86 0.351
TECHSUPRT =1 if operator received technical support;0=otherwise 0.38 0.490
CMPVARTY =1 if respondent viewed domestic product variety better thanImported;0=otherwise
0.68 0.471
SUPLYCONST =1 if respondent viewed his supply to be consistency viewed to imported sources; 0=otherwise
0.42 0.498
15
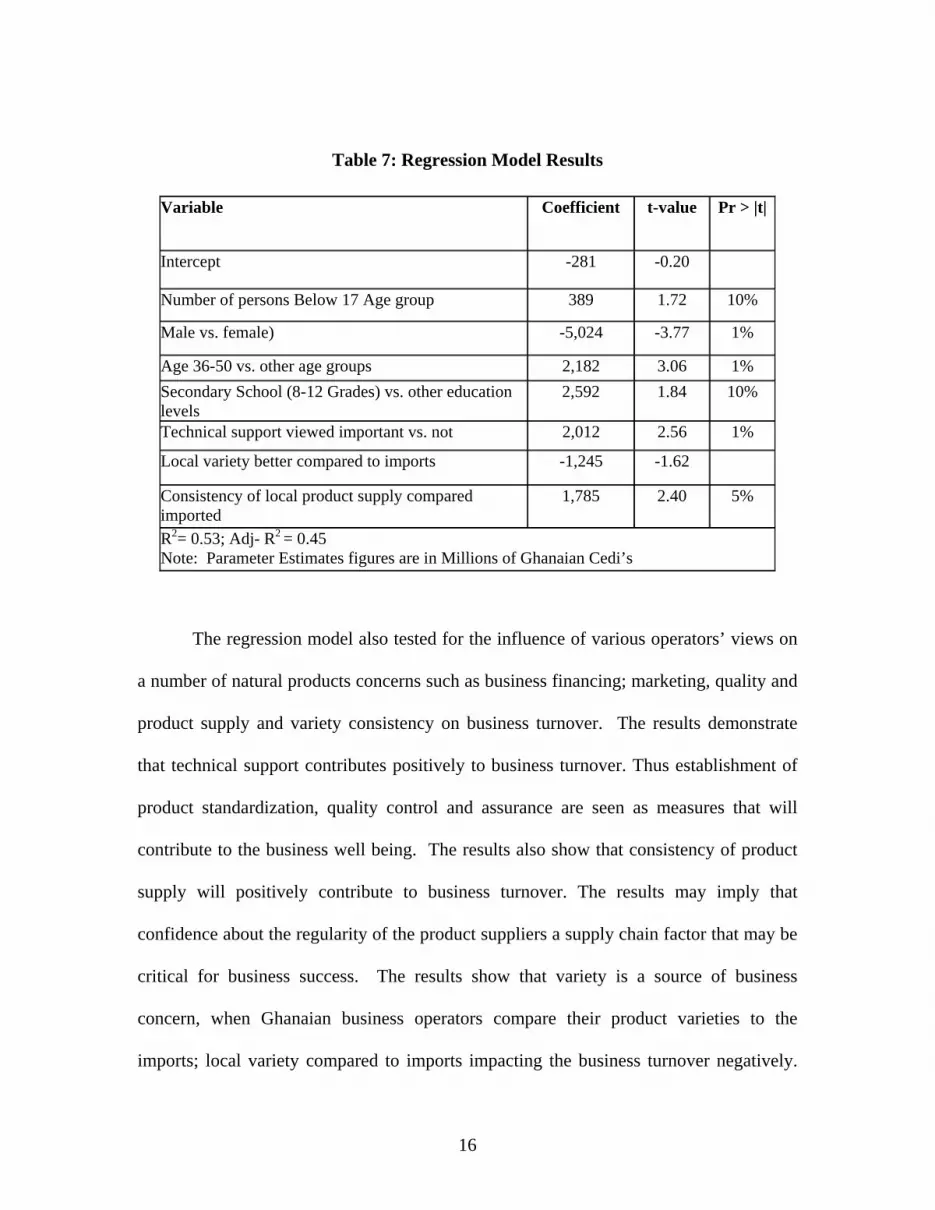
Table 7: Regression Model Results
Variable Coefficient t-value Pr > |t|
Intercept -281 -0.20
Number of persons Below 17 Age group 389 1.72 10%
Male vs. female) -5,024 -3.77 1%
Age 36-50 vs. other age groups 2,182 3.06 1% Secondary School (8-12 Grades) vs. other education levels
2,592 1.84 10%
Technical support viewed important vs. not 2,012 2.56 1%
Local variety better compared to imports -1,245 -1.62
Consistency of local product supply compared imported
1,785 2.40 5%
R2= 0.53; Adj- R2 = 0.45 Note: Parameter Estimates figures are in Millions of Ghanaian Cedi’s
The regression model also tested for the influence of various operators’ views on
a number of natural products concerns such as business financing; marketing, quality and
product supply and variety consistency on business turnover. The results demonstrate
that technical support contributes positively to business turnover. Thus establishment of
product standardization, quality control and assurance are seen as measures that will
contribute to the business well being. The results also show that consistency of product
supply will positively contribute to business turnover. The results may imply that
confidence about the regularity of the product suppliers a supply chain factor that may be
critical for business success. The results show that variety is a source of business
concern, when Ghanaian business operators compare their product varieties to the
imports; local variety compared to imports impacting the business turnover negatively.
16

The implications is that a lot need to be done in this area of quality control to attain
competitive edge to match other producers of natural products.
7. Conclusions The study analyzed Ghanaian natural (herbal) products market with focus on the
wholesale-retail end of the marketing chain. The results show evidence of real factors
impeding the natural products (herbal) business in Ghana. The impediments include
access to finance and markets, lack of herbal market information especially relating to
external markets. There is lack of processing capacity, above all the operators lack
technical training relating to herbal products handling. There are a number of commonly
traded natural products that have potential for future developments once the constraints
are addressed.
The regression results collaborate these results in that technical support, supply
consistency and quality standards influence business turnover. Similarly, the age of the
operator, education and labor have a bearing also on the turnover. Strengthening technical
support and efforts to establish continuity and regularity of the supplies as well as quality
standard will contribute positively to the success of the Ghanaian natural products
business.
The constraints identified calls for concentrated efforts from all stakeholders for
successful exploitation developmental opportunities offered by natural products market.
On the part of the operators, they are upbeat about the future given the presence of
ASNAPP that has started addressing some of the issues.
17

8. References: Alberta Agriculture, Food, and Rural Development, Herb/Spice Industry Fact Sheet. Compiled by Dennis Dey. AG-Ventures, Agdex 263/830-1, www.agric.gov.ab.ca, September 1996. Datamonitor, Nov 15, 2002. Marty T. S., and Patrick R., “Natural Product Sales Top $42 Billion” Natural Foods Merchandiser, 2004, volume XXV/number 6/ p. 1 Organic Natural health, 2001. http://www.health-report.co.uk/organic-cosmetics-usa- opportunity.htm#Organic/natural%20industry%20profile
18