an independent assessment of the irish beef
TRANSCRIPT
AN INDEPENDENT ASSESSMENT OF THE IRISH BEEF INDUSTRY
AN IN
DEPENDEN
T ASSESSMEN
T OF THE IRISH BEEF IN
DUSTRYJim
Power Econom
ics
AbstractThis report was commissioned
by the IFA to examine the current challenges facing beef
production in Ireland.March 2020
IFA-BeedStudy-A4-Feb20-Cover-v1.indd 1IFA-BeedStudy-A4-Feb20-Cover-v1.indd 1 02/03/2020 10:3202/03/2020 10:32
AN INDEPENDENT ASSESSMENT OF THE IRISH BEEF INDUSTRYMarch 2020
IFA-BeedStudy-A4-Feb20-Cover-v1.indd 2IFA-BeedStudy-A4-Feb20-Cover-v1.indd 2 02/03/2020 10:3202/03/2020 10:32
TABLE OF CONTENTSEXECUTIVE SUMMARY 1
INTRODUCTION 11
SECTION 1THE CONTEXT FOR AGRICULTURE IN THE IRISH ECONOMYTHE CURRENT CONTRIBUTION OF THE AGRI-FOOD SECTOR 12
THE FUTURE CONTRIBUTION OF THE AGRI-FOOD SECTOR – FOOD WISE 2025 12
SECTION 2THE CURRENT ENVIRONMENT FOR AGRICULTUREFARM OPERATING SURPLUS 15INPUT AND OUTPUT PRICE TRENDS 16FAMILY FARM INCOMES 17FARM VIABILITY 18DEPENDENCE ON DIRECT PAYMENTS 20FARM STRUCTURES 21
SECTION 3KEY ISSUES FOR THE BEEF SECTORGLOBAL BEEF MARKETS 22THE EU-MERCOSUR TRADE DEAL 25ENVIRONMENTAL CONCERNS 26DOMESTIC MARKET CHALLENGES 28RETAIL REGULATOR 28
SECTION 4THE CONTEXT FOR THE IRISH BEEF SECTORCONTRIBUTION OF THE BEEF SECTOR 30THE SUCKLER HERD 30
SECTION 5PRICE TRENDS IN THE BEEF SECTORGLOBAL FOOD PRICES 36FACTORY GATE PRICES IN IRELAND 37RETAIL PRICES IN IRELAND 37RETAIL PRICE TRENDS FOR BEEF IN THE UK 40PRICE TRANSPARENCY IN THE BEEF SECTOR 41
SECTION 6THE STRUCTURE OF THE BEEF PROCESSING SECTOR THE BEEF SUPPLY CHAIN 43MARKET STRUCTURE OF THE PROCESSING SECTOR 44
CONCLUDING COMMENTS 47
SECTION 7STRENGTHENING THE POSITION OF FARMERS IN THE SUPPLY CHAINWEAK POSITION OF FARMERS IN SUPPLY CHAIN 48
PRODUCER AND INTERBRANCH ORGANISATIONS 48
DIRECTIVE ON UNFAIR TRADING PRACTICES 50
THE CONTEXT FOR IRELAND 51
THE TERMS OF REFERENCE 52
APPENDIX 1 89
APPENDIX 2 97
REFERENCES & NOTES 99
IFA-BeefStudy-A4-Mar20-Contents-v4.indd 1IFA-BeefStudy-A4-Mar20-Contents-v4.indd 1 02/03/2020 14:0402/03/2020 14:04
1 | P a g e
EXECUTIVE SUMMARY
KEY POINTS ON IRISH BEEF PRODUCTION
x� Beef production in Ireland is an incredibly emotive subject that elicits very strong responses from beef producers, beef processors, consumers, those who have deep environmental concerns and the political system. This has been vividly evidenced by the farmer protests targeting beef processing plants and retailers in 2019. However, such protests are nothing new and have been a feature of the beef industry in Ireland over many years.
x� Beef farming is the dominant farming type and use of agricultural land in Ireland. There are over 100,000 farms that stock beef animals in Ireland, but within that number, CSO data suggest that there are 78,300 specialist beef cattle farms. Ireland exports over 91% of its beef production, €2.5 billion, and consequently is very heavily exposed to global market forces and issues. Almost 50% of beef exports go to the UK market, which creates a very dangerous exposure in the context of sterling weakness and Brexit.
x� The Irish beef farming sector is characterised by smaller than average farm sizes, relatively poor-quality land, older farmers, and greater prevalence of part-time farming and low farm incomes.i Beef farming in Ireland contributes almost 30% to agricultural goods output at basic prices, which is much higher than any other EU country.
x� The reality is that beef production is a very challenging sector in general, but in Ireland in particular, due to the nature of the supply chain. The beef sector in Ireland is characterised by price compression at the retail level; a very concentrated processing industry; and a wide variation of beef farmer technical expertise, productivity and efficiency. Beef farmers are very dependent on direct payments, and without those payments, a large segment of beef producers would not be economically viable or sustainable.
x� Specialist Beef Production is categorised as either ‘Cattle Rearing’ or ‘Cattle Other’. The Teagasc definition of ‘Cattle Rearing’ is ‘particular types (specialist cattle – rearing and fattening) where greater than or equal to 50% of the system output is from suckler cows’. ‘Cattle Other’ is defined as ‘particular types (specialist cattle – rearing and fattening) where less than 50% of the system output is from suckler cows. In 2018, just 11% of cattle rearing enterprises or 2,835 farm enterprises, and 26% of Cattle Other enterprises or 7,342 enterprises were regarded as viable. This means that 22,986 Cattle Rearing Enterprises and 20,897 Cattle Other enterprises were categorised as either sustainable or vulnerable.
2 | P a g e
x� The beef sector is very heavily dependent on direct payments. Direct payments accounted for 74% of average farm incomes in 2018, with a figure of 158% for cattle rearing, and 111% for other cattle activities. These figures demonstrate just how vulnerable beef farming in particular is to any reductions in farm support in the post 2020 CAP regime.
x� While the economics of the beef production sector are very challenging, the reality is
that beef production and processing make a very significant contribution to Irish economic activity, and particularly to rural economic activity. It is a high value-added activity in the sense that many of the inputs to beef production are sourced in the local economy and those have a very high local multiplier effect. It supports thousands of rural jobs. Research from Hennessy et al suggests that a €1 million increase in beef sector output generates a further €2.11 million in the wider economy and supports an additional 16 jobs. The beef sector is very dependent on direct payments, but Hennessy et al suggest that every €1 of direct payments to cattle farmers supports €4.28 of output in the wider economy as farmers use these payments to purchase inputs and to generate output that leads to further economic activity.
x� There is considerable regional variation in the significance of the suckler cow herd. Of the total suckler herd, 22.7% is in the West of Ireland; 16.6% is in the Border region; and 16.3% is in the Mid-West. The suckler cow herd makes up 62.5% of the total cow herd in the Border region; 79.3% in the West and 54.2% in the Midland region. The West, Border and Midland regions have a very heavy strong dependence on the suckler cow herd, and as such its decline poses a significant economic and social risk to those regions.
x� Irish beef producers are deeply unhappy with the market dynamics of their sector. They key issues that they are concerned about include CAP reform; Brexit; the EU-Mercosur trade deal; the In-Spec bonus system; the concentrated nature of the processing sector; the power of retailers; the environmental agenda; the lack of transparency in the supply chain; the impact of factory feedlots; and the low price that beef producers get for their product.
x� Dairying is by far the most profitable farming enterprise. Since the abolition of quotas, many beef farmers have switched to dairying. However, for many beef farmers this is not an option due to farm, land quality and fragmentation. Suckler beef is the only option.
x� Irish suckler beef production sector is challenged. Policy makers have to decide if it is a sector worth supporting. If stronger support is not forthcoming, many existing operators will go out of business, with very negative consequences for economic and social life in large swathes of rural Ireland, the natural landscape, and Irish agri-food exports.
3 | P a g e
IMPACT OF CAP REFORM ON IRISH FARMERS
x� Ireland opted for full decoupling and so all direct payments for cattle, sheep and arable crops were fully decoupled from production from 1st January 2005. In the CAP reforms since 2014, farmers with per hectare payments below the national average had their payment per hectare increased by an amount equal to one third of the difference between their actual payment level and 90% of the national average, with each farmer’s per hectare payment being brought up to at least 60% of the national average. It is estimated that the cost of bringing these farmers up was €104m. This was funded by reducing the per hectare payments of farmers above the average payment per hectare, regardless of how few hectares they had. Further convergence is planned to bring all per hectare payments up to at least 75% of the national average by 2027. However, the problem is that current proposals suggest that the CAP will be reduced. Consequently, it will be difficult to achieve upward only convergence.
x� Since 1990, there has been a steady decline in CAP expenditure as % of the overall EU budget; a move away from export refunds and other market supports; the growing importance of rural development, environmental payments, and decoupled payments. This has scattered payments away from commercial beef producers.
FACTORY FEEDLOTS
x� Beef farmers clearly believe that the factory feedlots are used to influence supply and the price that the farmer ultimately gets. However, it is important to point out that when the factory feedlots are buying cattle from farmers at marts or directly, they create a demand for cattle and have a positive business impact on those farmers who do not finish cattle.
x� As is the case with many aspects of the supply chain, there is a significant level of distrust between farmers and processors in relation to feedlots. Greater transparency would help alleviate some of this mistrust. It proved impossible to get data on the number of cattle in both factory-owned and factory-controlled feedlots. The figure of 90,000 relates to factory-owned feedlots, there may be other factory-controlled feedlots in the system.
x� If the figure of 90,000 cattle in factory owned feedlots is correct, then the overall impact on cattle prices would be limited in a market where over 1.9 million animals are slaughtered. Issues of concern for the Irish beef industry is that the growth of feedlots could risk damaging the grass-fed status of Irish beef. Furthermore, during certain times of the year, the sudden release of a large number of cattle from feedlots can depress price. In Ireland, there is nothing illegal about factory feedlots.
4 | P a g e
WHAT DO THE PURCHASERS OF IRISH BEEF REQUIRE?
x� The Irish beef processing sector has been transformed from a frozen commodity business a couple of decades ago to what is today a key fresh food supplier to blue-chip retail and food service customers across the UK, Europe and increasingly to the rest of the world. It is clear that the development of these new higher-value markets has been driven by a strategy of giving the customer what the customer wants.
x� As a beef producing country that exports over 91% of the beef that it produces, and given that Ireland is a tiny beef producer in a global context and that the international market for beef is highly competitive, satisfying the requirements of the actual and potential customers of Irish beef is essential. If Irish beef producers do not do this, then other international competitors will.
x� Beef farmers believe that many of the standards and regulations imposed on them are unnecessary and threaten their livelihoods by putting them at a serious competitive disadvantage. It is all well and good to suggest that some of these conditions should be relaxed, but it is vital to take into consideration what the customers for Irish beef are demanding.
x� In the supply chain, the processors are selling to the retailers, who in turn are selling to consumers. The retailer is arguably the most powerful link in the supply chain, as they exercise considerable power over the prices paid to processors, and in turn producers. Of course, retailers are driven to a significant extent by consumers.
x� Consumer behaviour in relation to beef consumption is currently being driven by many factors. These include income and affordability, the health qualities of the product, the provenance of the product, animal welfare and the environment. It is also important to recognise that the market for proteins is a highly competitive one, with pork and chicken providing very strong and generally cheap competition for beef, particularly chicken.
x� The bottom line is that consumers at retail and food-service level are increasingly
demanding sustainably produced quality food. Given how much of their product Irish beef producers export, satisfying the requirements of buyers may be demanding, but there is little choice if the sector is to survive.
BEEF PRICE INDEX
x� In the beef supply chain, there are three main components – the producer, the processor and the retail grocery sector. At the top of this supply chain, retail prices are being compressed by consumer preferences and intense competition from discounters. The processor is being squeezed by these pressures to some extent, but the farmer is at the bottom of the supply chain and is being squeezed to the greatest extent. This is not an unusual situation for primary producers.
5 | P a g e
x� The creation of various beef price indices by Bord Bia is a welcome development. However, it is not clear what the creation of such an index will achieve in terms of improving the price commanded by the beef producer. By definition, the beef price index is historical or backward looking in nature. However, one of the big problems to date has been the lack of transparency in the sector. The various indices should give beef producers more transparency and some trust in the supply chain.
x� What the various indices show at the moment is that Irish producers have been typically paid less than their UK or EU counterparts, but the gap has narrowed significantly in recent months and disappeared in some cases.
BREXIT
x� The UK left the EU on the 31st of January 2020. In early March, trade negotiations between the EU and the UK will get underway in relation to the future trade relationship. A transition period now applies, meaning that the UK is no longer a member of the EU, but will continue to enjoy the same access to the EU single market and the customs union. An eleven-month window is now looking likely for the transition period. It can be extended, but the UK would have to apply for such an extension by July 1st 2020, but this is highly unlikely. In the Withdrawal Bill, it was specified that an extension to the transition period would not be sought beyond 31st December 2020, and the UK government has subsequently hardened its stance on this. This does pose a potentially significant problem at the end of 2020. It seems likely the UK will exit the transition mechanism on 31st December 2020 regardless of what sort of trade deal is done with the EU, if indeed any deal manages to be done. The UK’s chief Brexit negotiator, David Frost, has outlined the very strong approach to the negotiations that his government will adopt. He has stated bluntly that the UK would never agree to EU oversight of its rulemaking in exchange for a post-Brexit trade deal. He believes that the whole purpose of leaving the EU was to become an independent country once again and that acceptance of EU supervision on so-called level playing field issues would defeat the purpose of the whole exercise that was put in motion back in June 2016.
x� Simultaneously, the French and the Irish governments are exerting pressure on the EU to adopt a more stringent stance with the UK and insist on the UK adhering to food safety standards, and EU environmental, tax and labour-related rules as they are developed over the coming years. The EU approach thus far has been a willingness to accept the rules as they stand at the end of 2020. The differences that these two positions would represent are pretty significant and fundamental. The news flow from the trade talks will be watched with very keen interest over the coming months. The big question is just how realistic it is to suggest that a deal can be done by the end of the year, thereby ending the transition period. It seems inconceivable that such dramatic progress could be made in just 11 months. The UK could crash out of the transition mechanism at the end of 2020 and WTO trade rules could then apply. This would not be good news for the Irish beef sector. The Brexit uncertainty seems destined to rumble on.
6 | P a g e
x� One of the problems for the beef sector is that beef does not have a ‘brand’ and consequently, would be more vulnerable to the imposition of tariffs than a product with a strong brand.
x� It is important to bear in mind that the European Commission has a mechanism for sectoral interventions or so-called special measures. These were utilised during the Russian ban crisis. In 2019, the EU commission allocated €50 million to the Irish beef sector affected by Brexit. The Irish government was given a choice in return for this funding to either reduce beef production; make commitments on environmental sustainability measures; or encourage market diversification. Greatly increased measures will be required in the event of a no-deal Brexit, but they are likely to come with conditions attached.
RECOMMENDATIONS
CAP
x� From a social, natural and economic perspective, the suckler herd is worth preserving. A strong targeted suckler cow payment would go a long way to ensuring the sustainability of the suckler herd. Given the importance of the suckler herd to certain regions such as the West of Ireland, and the multiplier impact of direct payments in the beef sector, strong targeted payments are justified. The suckler herd is a key driver of economic and social stability in regions of the country where the land is not conducive to dairy farming.
x� It is essential that in the next CAP funding round, Irish beef farmers are given increased support to help offset the damage done to the sector since decoupling. CAP payments to beef farmers have to be at least maintained in real terms and any extra asks on the environmental side have to be paid for. Extra money could allow for coupled payments for beef farmers.
BREXIT
x� It is essential that the UK is not allowed to do beef trade deals with third markets with different standards, while at the same time being allowed full access to the EU market. If the UK wants to trade freely in the EU, it must be obliged to adhere to EU standards and regulations in all of its trading relations with third countries. Even if tariff-free access is given to the UK and if the UK gives free access to lower food standard countries, it could be flooded with increased volumes of cheap imports from third Countries, which would do serious damage to the value Irish and other beef exporters to the UK. In the upcoming trade negotiations, such a situation must be avoided.
7 | P a g e
PROTECTED GEOGRAPHICAL INDICATION (PGI) STATUS FOR IRISH SUCKLER BEEF
x� The suckler herd is vital to the future success of the Irish beef sector. Suckler calves are reared by their mother and are grass fed for most of the year. This sends out a clear message about the clean, green and grass-fed image of Irish beef. Suckler farming is often located in areas of geographical disadvantage, particularly in the West of Ireland and is a very important component of rural social and economic activity. In addition, suckler cows and their calves are good for the natural landscape and biodiversity.
x� The suckler herd is under pressure from low prices; high production costs; CAP changes; Brexit; increase protein competition and the climate agenda. Suckler farming is heavily dependent on direct payments and this support is likely to come under increased pressure in the next round of CAP funding.
x� It would also be important to create and market a strong ‘Irish Suckler Beef’ brand. The Irish government should seek to get Protected Geographical Indication (PGI) status for Irish suckler beef. PGI would designate a product originating in a specific place, region or country, whose given quality, reputation or other characteristic is essentially attributable to its geographical origin and at least one of the production steps of which takes place in the geographical region.
x� PGI status can be given only to those products that demonstrate ‘a consolidated and codified production tradition, an inseparable tie with the area of origin, an appropriate socio-entrepreneurial fabric and which succeed in achieving high qualitative levels, certified by external bodies of control, may aspire to obtaining and retaining the sought-after European Community designations and inscription in European register of PDO and PGI products’. Irish suckler beef could fulfil the requisite criteria, which would help create a strong brand and a higher value-added product.
REWARD FARMERS FOR ENVIRONMENTAL PROGRESS AND EXISTING CREDENTIALS
x� Irish beef production has strong environmental credentials. A dual approach is essential in helping farmers promote the essential environmental agenda. Firstly, the progress that farmers have made to date in terms of carbon sink must be recognised and rewarded. If this is not done, there is a danger that the strong progress that has been made to date could be lost. Secondly, it is essential that beef farmers are adequately rewarded for the environmental progress that they are being forced to make. Farmers need to get assistance with the production of genetic merit animal production in order to achieve scientifically-based reductions in GHGs.
x� The debate around the environmental impact of beef farming needs to become more realistic and ideologically driven agendas need to be resisted.
x� The developing science around the contribution of methane to global warming potential needs to be given full consideration in future policy discussions around the environmental impact of beef production.
8 | P a g e
GREATER TRANSPARENCY IN SUPPLY CHAIN
x� The importance of beef to Irish exports, to the national economic performance and to the economic and social sustainability of rural economies has to be recognised and nurtured. In order to sustain the beef industry, it is essential that the three components of the supply chain are acting in a co-ordinated way for the greater good of the Irish economy. The distrust that currently exists in the supply chain, that is leading to a very adversarial industry, has to be addressed. Greater transparency on all aspects of the supply chain and responsible behaviour from all actors in the supply chain have to be insisted upon, through regulation if necessary. UTP legislation has to be part of the solution, but a more open and transparent approach from all elements of the supply chain is essential.
x� A serious impediment to understanding the price mechanism in the market is a lack of data on the prices paid to the processors by the retailers. It is essential that the recently commissioned study from Grant Thornton obtains this information.
x� The absence of transparency just serves to nurture the view that there is collusion in the processing sector. If there is collusion, it is clear that the pricing impact is marginal, as Irish prices are not significantly out of line with international prices. There are bigger issues facing the beef producers than alleged collusion, but the lack of transparency just exacerbates the issue.
x� To address the deep suspicions of farmers in relation to collusive behaviour, it would be worthwhile for the CCPC to launch a full investigation into the processing industry to clarify the situation beyond all doubt. This would help restore trust in the overall beef sector.
IN-SPEC BONUS CRITERIA
x� The current focus of the debate about the in-spec requirements and whether these are being demanded by the retailers, is likely to be overtaken by environmental pressures to reduce the slaughter age. As well as that, in most finishing systems earlier slaughter normally means lower cost and higher margins for the farmers.
x� The current pricing system where farmers receive a bonus from meat processors for
meeting in specification requirements is frustrating farmers. If a farmer meets four out of the five requirements, the farmer does not receive any of the 12c per kg bonus/differential. This is a particular concern for the QA scheme, membership of which is one of the five criteria. It means that despite a farmer going to the trouble of complying with the QA scheme they may receive no price premium on some of their animals. It is important that farmers see a reward for participating in the QA Scheme. This is vital for the future of the scheme. Accordingly, the in-spec bonus system should be amended to give some meaningful bonus to all animals coming from QA herds.
x� In addition, the current binary system where there is a 12c differential based on an animal being over or under 30 months should be looked at. A more graduated/tiered bonus based on encouraging earlier slaughter would be more sophisticated and reflect the new challenges the sector is facing.
9 | P a g e
MERCOSUR AND OTHER TRADE DEALS
x� The protected EU market for beef is now being increasingly opened up through trade deals such as Mercosur. Beef is a vulnerable sector that is vital to Ireland and the EU. The EU cannot give away any more of its market to third countries that do not adhere to the same high standards of production and strict rules that EU countries have to adhere to. If the Mercosur trade deal is ratified by the EU, it is essential that Mercosur beef sold into the EU must be produced under the same standards, regulations and controls that are imposed on EU beef producers. The playing field must be level. Despite assurances from the EU in this regard, there is justifiable and deep scepticism about how this policing would work in practice. The EU imported 269,000 tonnes of beef from the Mercosur countries in 2018 and there is already deep scepticism about how this trade is being policed.
HELP INDIVIDUAL FARM PROFITABILITY
x� Beef farmers need to be given significant support and assistance from state agencies, particularly Teagasc, to improve their efficiency and profitability. Having a more efficient and profitable beef sector is good for the economy and is good for the environment.
CONSUMER TRENDS
x� While the individual consumption of beef is falling, aggregate consumption at a global level will continue to expand due to demographic factors. Ireland produces beef in an environmentally sustainable way relative to many other beef producing countries. Rather than cutting down forests to produce beef in Mercosur and other countries, Irish farmers should be encouraged to fully utilise their land and satisfy the domestic and external demand for beef.
FOOD STRATEGY FOR 2030
x� The reality is that the beef sector is characterised by low profitability at farm level and a significant dependence on direct payments. While the aspirations contained in Food Harvest 2025 are noble, the reality is that there is a marked absence of a clear policy to make beef farming profitable for farmers and there is an on-going failure to deliver a fair income back to farmers. This was a deep flaw in Food Wise 2025, and it must be addressed in the 2030 strategy that is now starting to be developed. If beef farmers are to deliver ongoing ambitious targets, there must be explicit recognition of the income problem and measures must be put in place to ensure that they receiver an adequate return – otherwise they will be forced out of beef production.
10 | P a g e
INTRODUCTION
RETAIL REGULATOR
x� There are calls from many sources for the setting up of some form of regulator for the retail sector. It is not clear what this might achieve or how it might operate. The retail grocery sector already has a very transparent pricing structure, so retail price transparency is not an issue. More transparency on how much the retailer is paying the processor for beef would be very beneficial, and is arguably a necessary pre-condition for restoring trust to the whole supply chain.
x� A ban on below cost selling should be explored as it is unacceptable that farmers are paid below the cost of production because retailers are engaged in below cost selling of beef and using the commodity as a loss leader. Unsustainable discounting should not be allowed as it is not in the interests of farmers, processors or consumers.
FARMERS AND PROCESSORS NEED TO WORK CLOSELY TOGETHER
x� The success of the Irish beef sector is totally dependent on farmers being able to achieve a fair price for their product. That is not the situation at the moment. Teagasc research suggests that for a farmer to break even for bringing a suckler calf to beef, €4.17 per kg would be required. Teagasc conveyed some key messages to suckler farmers, including the point that improving efficiency still pays; current beef prices make all suckling systems loss making; and with low beef prices, the strategy has to be to cut all costs wherever possible. The suggestions include reducing the meal bill to a minimum; having a very basic fertiliser programme; no reseeding; no new investment in machinery or stock; cut maintenance costs to essentials; and examine all health costs critically. While these suggestions make certain sense, it is not clear that they are compatible with preserving the Irish suckler herd.
x� Processors must realise the importance of the high quality of the product that they buy from farmers and which is essential to their success. Processors need to press for higher prices for the product that they sell and work more closely with farmers to achieve this. Irish suckler beef is a premium product and processors should be able to achieve a price that would make beef production viable for farmers. For a farmer, covering the cost of production (which should include a normal profit) is essential to stay in business. It is in the interests of processors to work with farmers to achieve this.
11 | P a g e
INTRODUCTION
The author of this report was commission by the Irish Farmers Association (IFA) to conduct an ‘independent’ assessment of the beef industry in Ireland.
The terms of reference of the study included:
x� An assessment of the impact of CAP reform on the incomes of beef farmers; x� Exploration of the possibility of developing a Beef Price Index; x� An exploration of the value of the ‘5th Quarter’; x� An assessment of the impact of Factory Feedlots; x� Beef specifications and other requirements; x� The oversight and effectiveness of the Department of Agriculture, Food and the
Marine (DAFM) in areas such as carcase classification; and x� The potential impact of Brexit.
Exploration of many of these issues is not straightforward or clear cut, largely due to the fact that there is a lack of transparency in the supply chain, which means that there is a paucity of reliable and trustworthy data. In addition, the supply chain is characterised by an intense level of mistrust and animosity. This is not a recipe for a healthy business model and industry.
The author would like to acknowledge the help and support given by many stakeholders. These include the IFA President and National Officers; the Chairman and members of the National Livestock Committee; IFA staff; IFA members around the country; the livestock marts; the beef processing sector; Teagasc; ICBF; the Department of Agriculture, Food and the Marine; the Irish Farmers Journal; Meat Industry Ireland (MII); and the European Commission. Particular thanks are due to TCD student and IFA Summer Intern, Dónal Sheehan, who clearly has a very bright future ahead of him, in whatever career path he chooses.
At the end of the day, the report is the sole responsibility of the author. It is intended to be a fair, independent and objective assessment of the challenges facing beef production in Ireland. It does not and cannot provide all of the answers to what are very complicated, and in some cases, intractable problems facing the beef sector. However, it seeks to highlight many of the realities and challenges facing the sector and poses a serious question about what policymakers, processors and producers should be doing if they want to preserve a viable beef industry in Ireland.
Jim Power
March 2020
12 | P a g e
SECTION 1
THE CONTEXT FOR AGRICULTURE IN THE IRISH ECONOMY
THE CURRENT CONTRIBUTION OF THE AGRI-FOOD SECTOR
Agriculture is an important component of the Irish economy and particularly for rural and regional economic activity. The sector encompasses primary agricultural production (Agriculture, Fishing & Forestry), Food and Beverages, and the Wood Processing sector.
In 2018, the sector accounted for 7.5% of GNI* (Modified Gross National Income).ii Agri-food exports totalled €13.7 billion, accounting for 10% of total exports. Between 2009 and 2018, exports from the sector increased by 73%.iii Employment in the Agri-food sector accounted for 173,000 jobs or 7.7% of total employment on average during 2018. Of this total, food processing accounted for 55,360; beverages for 6,920; wood processing for 5,190; and the remaining 105,530 were employed in primary agriculture, forestry and fishing.iv
The Agri-food sector was instrumental in pulling the Irish economy out of deep recession after 2008 and its real significance to the economy was generally recognised after a decade of being a victim rather than a beneficiary of the ‘Celtic Tiger’ economy. The sector inherited all of the high costs that evolved during the Celtic Tiger period, but enjoyed limited benefits.
Policy makers now recognise the contribution that the sector already makes, and also that it will make an even more important contribution to the national economy in the future. Ambitious long-term targets have been set for the sector in Food Wise 2025.
THE FUTURE CONTRIBUTION OF THE AGRI-FOOD SECTOR – FOOD WISE 2025
Food Wise 2025 is a 10-year strategy for the Agri-food sector that was launched in 2015. The growth strategy for the sector is based on three guiding principles. Namely, Irish food and drink exporters will find their greatest opportunities where they provide offerings that target different life-stage requirements; fit into the lifestyle choices associated with convenience and well-being; and provide products with clear nutritional and health benefits.
The key targets in the strategy include:
x� Grow annual export values to €19 billion per annum, which would represent an 85% increase from the 2012-2014 three-year average. Dairy, beef, seafood, and consumer food and drink are identified as the sub-sectors that will be key to attaining these growth objectives;
x� A focus on value-added products in delivering innovative food solutions to consumers in existing mature markets such as the UK or emerging markets such as China, would be expected to contribute to projected growth of 70% in Gross Value Added to in excess of €13 billion for the sector by 2025, from a 2012 baseline;
x� Increase the value of Primary Production by 65% to almost €10 billion; and
13 | P a g e
x� The creation of an additional 23,000 direct jobs in the agri-food sector all along the supply chain, from primary production to high value-added product development.
To deliver this growth, it was recognised that some key areas will need to be the focus of attention. These include:
x� The attraction, retention, and development of talent along the supply chain, supported by training that will foster the necessary technical and entrepreneurial skill sets;
x� A greater focus on market development that is consumer-insight driven, to ensure Irish products are targeted at the right markets, and the right segments within those markets. These consumer insights will help the sector understand where its opportunities lie in emerging market opportunities, allowing business to focus on exports that deliver the best returns; productivity improvements that are driven by innovation and the adoption of the latest technologies; and
x� Adding value to sustainably produced materials, which will support local employment growth, ensure the viability of local producers and protect the environment and natural resources.
Food Wise 2025 makes a number of recommendations under the headings of human capital, competitiveness, market development and innovation.
The strategy for the food sector is quite explicit in its recognition that the agri-food sector will only achieve its full growth potential if it can address the skills needs within the industry. This will involve investment in people currently working in the sector, a commitment to knowledge transfer that brings technological and process advances to the industry, and recognition of the need to attract people with the relevant skills into roles within the industry.
Research, development and innovation are recognised as key drivers of competitiveness. However, it is recognised that there are challenges in translating research into commercial products and in ensuring that at both the producer and consumer level there is sufficient capacity to absorb new research into innovation. The overriding theme is that in order to achieve the ambitious targets contained in Food Wise 2025 there is a need for ongoing improvements at both the producer and processing levels. Specifically, at the producer level it is recognised that future profitability and viability will be driven by productivity improvements through the ‘adoption and application of cutting-edge sustainable processes and technologies.’
A guiding principle in Food Wise 2025 is that environmental protection and economic competitiveness are equal and complementary, and that one will not be achieved without the other. The three pillars of sustainability – social, economic and environmental – are viewed as being of equal importance and should carry commensurate weight.
14 | P a g e
In July 2019, the Department of Agriculture, Food and the Marine published the fourth annual progress report on Food Wise 2025.v It report that of the 414 actions in Food Wise 2025, 376 were due to commence by 2019 or are ongoing actions. Of these 376 actions, 87% have been achieved or substantial action has been undertaken.
In terms of the various 2025 projections, exports have grown by 19.9%; primary production has grown by 13.3%; the sector’s value addition to the economy has grown by 24.1%; and the agri-food sector accounts for 172,800 jobs in the economy.
The value of exports has increased by 70% over the past decade, but the value of primary production has increased by less than 50%. The strong growth in exports is not having a proportionate impact at farm level.
In order to achieve the ambitious targets contained in Food Wise 2025, it is important that the sector and policymakers are aware of the challenges facing the sector and to identify the strategies needed to address those challenges.
Food Wise 2025 and the Beef Sector
In relation to the meat sector in general, Food Wise 2025 based its growth projections on the opportunities that will be provided through increased global demand for protein from meat and increased economic prosperity in many emerging markets.
The strong reputation of Irish grass-fed beef production in traditional markets is identified as an asset that can be further exploited and leveraged to ensure greater penetration of high value markets both in the EU and third countries. The strategy recognised that the expansion of the dairy herd would have a knock-on effect on the beef sector, and that it could have the potential to increase beef output by between 5% and 10%. It highlighted that the best available breeding technologies should be used to ensure that the value of the increased output is maximised.
It is made quite explicit in the strategy that beef from the suckler herd has principally driven Ireland’s success on international retail markets. Consequently, it is pointed out that it is very important that suckler cow numbers are at least maintained at close to current levels, but that this requires improved profitability at farm level through maximising returns from the penetration of premium markets.
However, the reality is that the beef sector is characterised by low profitability at farm level and a significant dependence on direct payments. While the aspirations contained in Food Harvest 2025 are noble, the reality is that there is a marked absence of a clear policy to make beef farming profitable for farmers and there is an on-going failure to deliver a fair income back to farmers. This was a deep flaw in Food Wise 2025 and it must be addressed in the 2030 strategy that is now starting to be developed. If beef farmers are to deliver ongoing ambitious targets, there must be explicit recognition of the income problem and measures must be put in place to ensure that they receiver an adequate return – otherwise they will be forced out of beef production.
15 | P a g e
SECTION 2
THE CURRENT ENVIRONMENT FOR AGRICULTURE
The operating environment for the agri-food sector in general and the primary production sector in particular is challenging at the moment.
FARM OPERATING SURPLUS
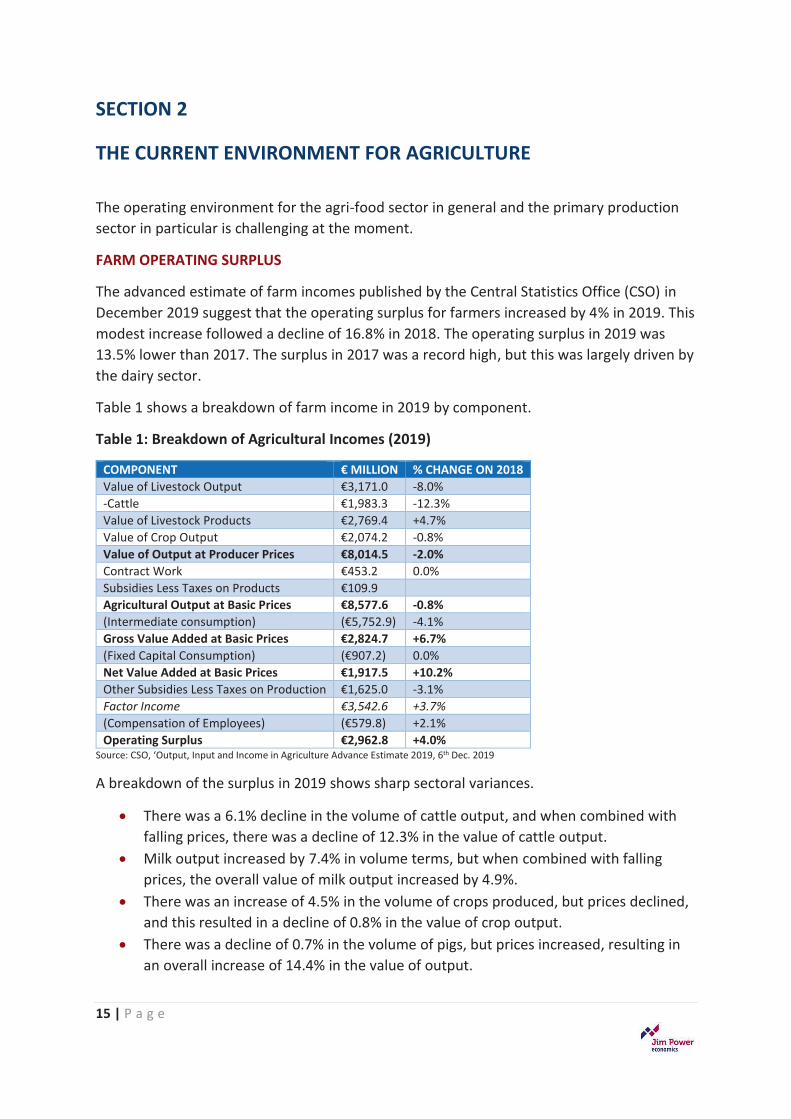
The advanced estimate of farm incomes published by the Central Statistics Office (CSO) in December 2019 suggest that the operating surplus for farmers increased by 4% in 2019. This modest increase followed a decline of 16.8% in 2018. The operating surplus in 2019 was 13.5% lower than 2017. The surplus in 2017 was a record high, but this was largely driven by the dairy sector.
Table 1 shows a breakdown of farm income in 2019 by component.
Table 1: Breakdown of Agricultural Incomes (2019)
COMPONENT € MILLION % CHANGE ON 2018 Value of Livestock Output €3,171.0 -8.0% -Cattle €1,983.3 -12.3% Value of Livestock Products €2,769.4 +4.7% Value of Crop Output €2,074.2 -0.8% Value of Output at Producer Prices €8,014.5 -2.0% Contract Work €453.2 0.0% Subsidies Less Taxes on Products €109.9 Agricultural Output at Basic Prices €8,577.6 -0.8% (Intermediate consumption) (€5,752.9) -4.1% Gross Value Added at Basic Prices €2,824.7 +6.7% (Fixed Capital Consumption) (€907.2) 0.0% Net Value Added at Basic Prices €1,917.5 +10.2% Other Subsidies Less Taxes on Production €1,625.0 -3.1% Factor Income €3,542.6 +3.7% (Compensation of Employees) (€579.8) +2.1% Operating Surplus €2,962.8 +4.0%
Source: CSO, ‘Output, Input and Income in Agriculture Advance Estimate 2019, 6th Dec. 2019
A breakdown of the surplus in 2019 shows sharp sectoral variances.
x� There was a 6.1% decline in the volume of cattle output, and when combined with falling prices, there was a decline of 12.3% in the value of cattle output.
x� Milk output increased by 7.4% in volume terms, but when combined with falling prices, the overall value of milk output increased by 4.9%.
x� There was an increase of 4.5% in the volume of crops produced, but prices declined, and this resulted in a decline of 0.8% in the value of crop output.
x� There was a decline of 0.7% in the volume of pigs, but prices increased, resulting in an overall increase of 14.4% in the value of output.
16 | P a g e
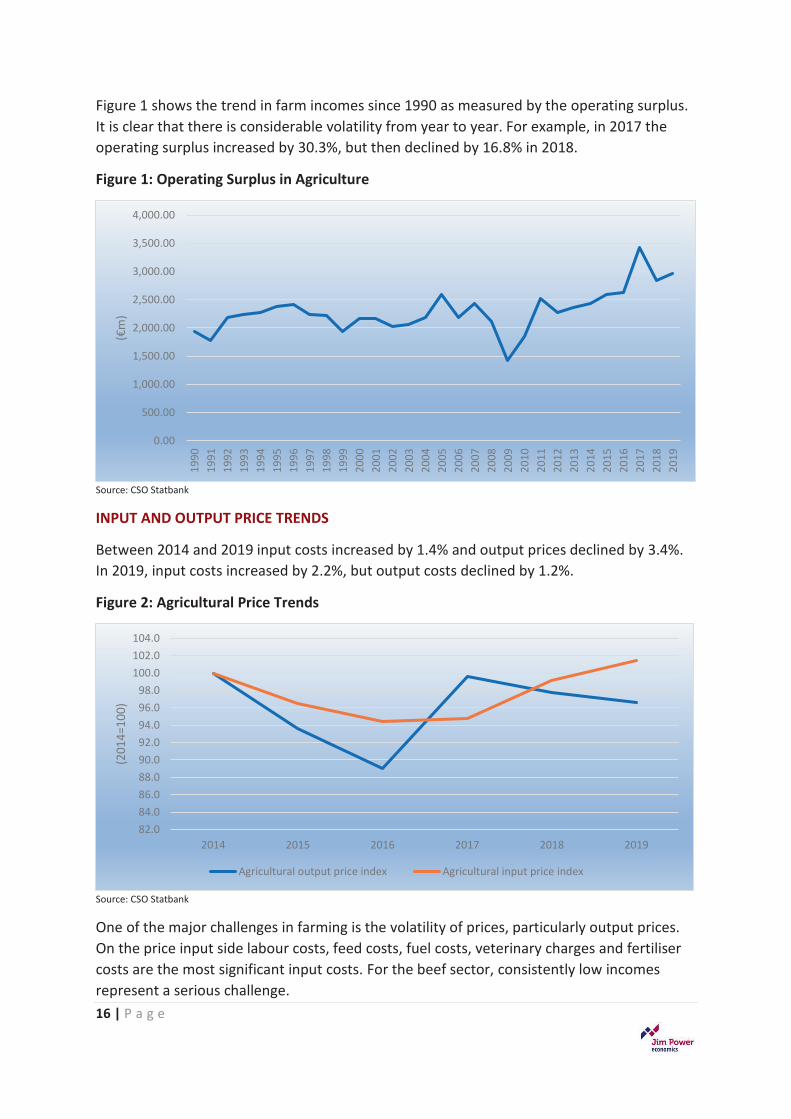
Figure 1 shows the trend in farm incomes since 1990 as measured by the operating surplus. It is clear that there is considerable volatility from year to year. For example, in 2017 the operating surplus increased by 30.3%, but then declined by 16.8% in 2018.
Figure 1: Operating Surplus in Agriculture
Source: CSO Statbank
INPUT AND OUTPUT PRICE TRENDS
Between 2014 and 2019 input costs increased by 1.4% and output prices declined by 3.4%. In 2019, input costs increased by 2.2%, but output costs declined by 1.2%.
Figure 2: Agricultural Price Trends
Source: CSO Statbank
One of the major challenges in farming is the volatility of prices, particularly output prices. On the price input side labour costs, feed costs, fuel costs, veterinary charges and fertiliser costs are the most significant input costs. For the beef sector, consistently low incomes represent a serious challenge.
0.00
500.00
1,000.00
1,500.00
2,000.00
2,500.00
3,000.00
3,500.00
4,000.00
1990
1991
1992
1993
1994
1995
1996
1997
1998
1999
2000
2001
2002
2003
2004
2005
2006
2007
2008
2009
2010
2011
2012
2013
2014
2015
2016
2017
2018
2019
(€m
)
82.084.086.088.090.092.094.096.098.0
100.0102.0104.0
2014 2015 2016 2017 2018 2019
(201
4=10
0)
Agricultural output price index Agricultural input price index
17 | P a g e
FAMILY FARM INCOMES
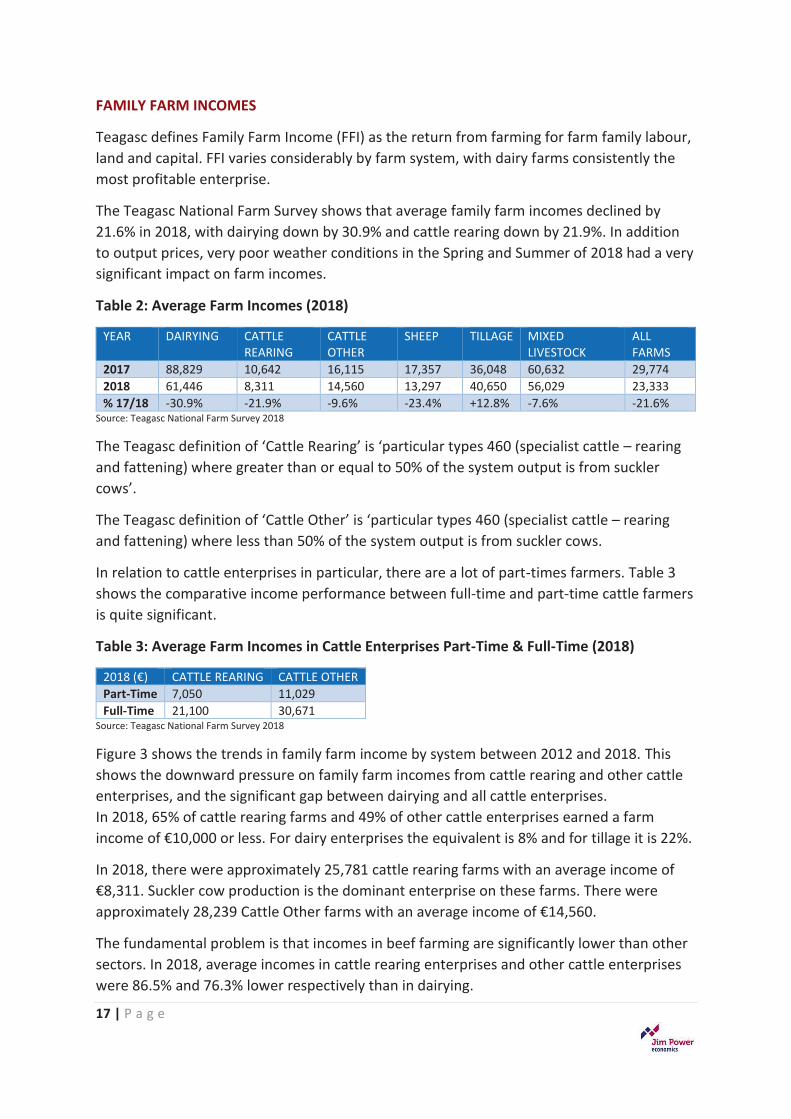
Teagasc defines Family Farm Income (FFI) as the return from farming for farm family labour, land and capital. FFI varies considerably by farm system, with dairy farms consistently the most profitable enterprise.
The Teagasc National Farm Survey shows that average family farm incomes declined by 21.6% in 2018, with dairying down by 30.9% and cattle rearing down by 21.9%. In addition to output prices, very poor weather conditions in the Spring and Summer of 2018 had a very significant impact on farm incomes.
Table 2: Average Farm Incomes (2018)
YEAR DAIRYING CATTLE REARING
CATTLE OTHER
SHEEP TILLAGE MIXED LIVESTOCK
ALL FARMS
2017 88,829 10,642 16,115 17,357 36,048 60,632 29,774 2018 61,446 8,311 14,560 13,297 40,650 56,029 23,333 % 17/18 -30.9% -21.9% -9.6% -23.4% +12.8% -7.6% -21.6%
Source: Teagasc National Farm Survey 2018
The Teagasc definition of ‘Cattle Rearing’ is ‘particular types 460 (specialist cattle – rearing and fattening) where greater than or equal to 50% of the system output is from suckler cows’.
The Teagasc definition of ‘Cattle Other’ is ‘particular types 460 (specialist cattle – rearing and fattening) where less than 50% of the system output is from suckler cows.
In relation to cattle enterprises in particular, there are a lot of part-times farmers. Table 3 shows the comparative income performance between full-time and part-time cattle farmers is quite significant.
Table 3: Average Farm Incomes in Cattle Enterprises Part-Time & Full-Time (2018)
2018 (€) CATTLE REARING CATTLE OTHER Part-Time 7,050 11,029 Full-Time 21,100 30,671
Source: Teagasc National Farm Survey 2018
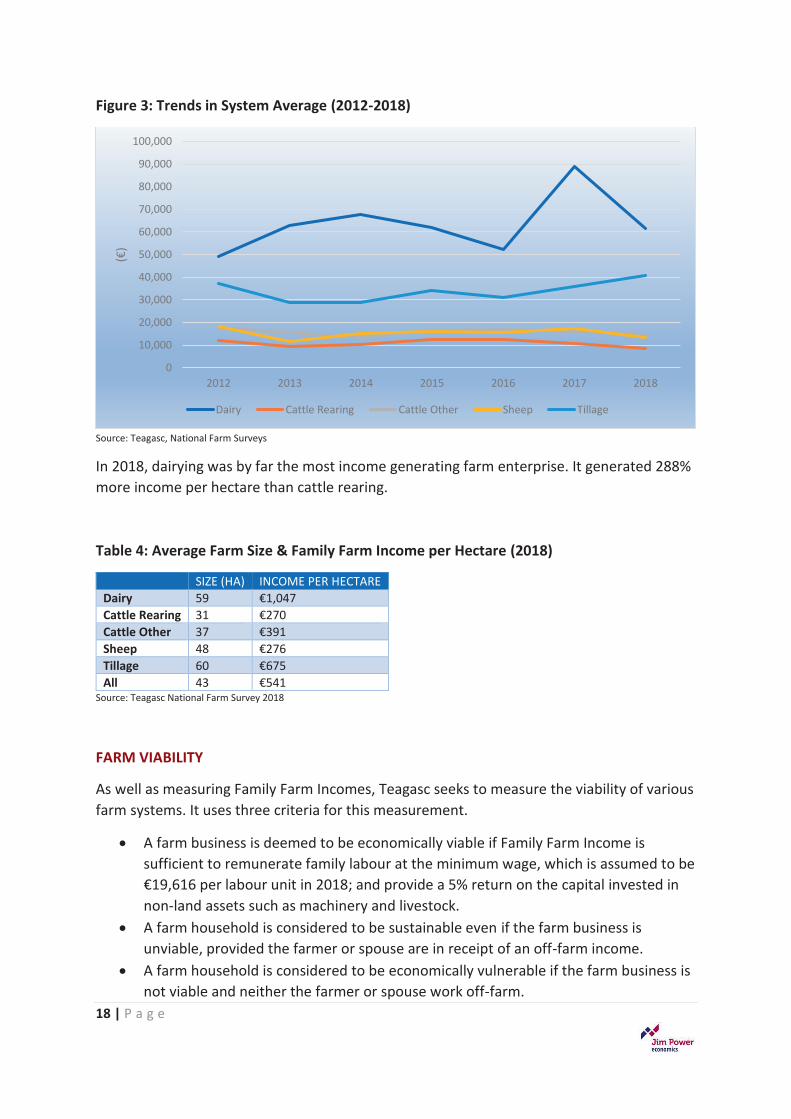
Figure 3 shows the trends in family farm income by system between 2012 and 2018. This shows the downward pressure on family farm incomes from cattle rearing and other cattle enterprises, and the significant gap between dairying and all cattle enterprises. In 2018, 65% of cattle rearing farms and 49% of other cattle enterprises earned a farm income of €10,000 or less. For dairy enterprises the equivalent is 8% and for tillage it is 22%.
In 2018, there were approximately 25,781 cattle rearing farms with an average income of €8,311. Suckler cow production is the dominant enterprise on these farms. There were approximately 28,239 Cattle Other farms with an average income of €14,560.
The fundamental problem is that incomes in beef farming are significantly lower than other sectors. In 2018, average incomes in cattle rearing enterprises and other cattle enterprises were 86.5% and 76.3% lower respectively than in dairying.
18 | P a g e
Figure 3: Trends in System Average (2012-2018)
Source: Teagasc, National Farm Surveys
In 2018, dairying was by far the most income generating farm enterprise. It generated 288% more income per hectare than cattle rearing.
Table 4: Average Farm Size & Family Farm Income per Hectare (2018)
SIZE (HA) INCOME PER HECTARE Dairy 59 €1,047 Cattle Rearing 31 €270 Cattle Other 37 €391 Sheep 48 €276 Tillage 60 €675 All 43 €541
Source: Teagasc National Farm Survey 2018
FARM VIABILITY
As well as measuring Family Farm Incomes, Teagasc seeks to measure the viability of various farm systems. It uses three criteria for this measurement.
x� A farm business is deemed to be economically viable if Family Farm Income is sufficient to remunerate family labour at the minimum wage, which is assumed to be €19,616 per labour unit in 2018; and provide a 5% return on the capital invested in non-land assets such as machinery and livestock.
x� A farm household is considered to be sustainable even if the farm business is unviable, provided the farmer or spouse are in receipt of an off-farm income.
x� A farm household is considered to be economically vulnerable if the farm business is not viable and neither the farmer or spouse work off-farm.
0
10,000
20,000
30,000
40,000
50,000
60,000
70,000
80,000
90,000
100,000
2012 2013 2014 2015 2016 2017 2018
(€)
Dairy Cattle Rearing Cattle Other Sheep Tillage
19 | P a g e
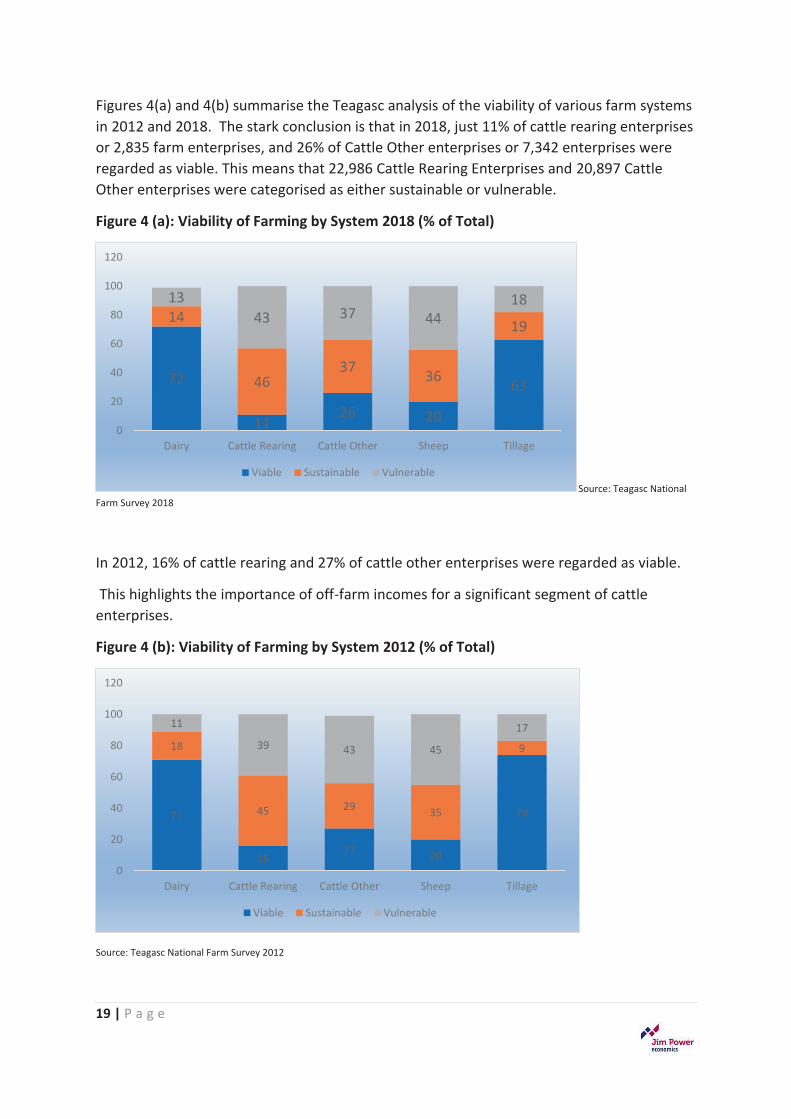
Figures 4(a) and 4(b) summarise the Teagasc analysis of the viability of various farm systems in 2012 and 2018. The stark conclusion is that in 2018, just 11% of cattle rearing enterprises or 2,835 farm enterprises, and 26% of Cattle Other enterprises or 7,342 enterprises were regarded as viable. This means that 22,986 Cattle Rearing Enterprises and 20,897 Cattle Other enterprises were categorised as either sustainable or vulnerable.
Figure 4 (a): Viability of Farming by System 2018 (% of Total)
Source: Teagasc National Farm Survey 2018
In 2012, 16% of cattle rearing and 27% of cattle other enterprises were regarded as viable.
This highlights the importance of off-farm incomes for a significant segment of cattle enterprises.
Figure 4 (b): Viability of Farming by System 2012 (% of Total)
Source: Teagasc National Farm Survey 2012
72
1126 20
63
14
4637 36
19
1343 37 44
18
0
20
40
60
80
100
120
Dairy Cattle Rearing Cattle Other Sheep Tillage
Viable Sustainable Vulnerable
71
1627 20
74
18
45 29 35
9
11
39 43 45
17
0
20
40
60
80
100
120
Dairy Cattle Rearing Cattle Other Sheep Tillage
Viable Sustainable Vulnerable
20 | P a g e
DEPENDENCE ON DIRECT PAYMENTS
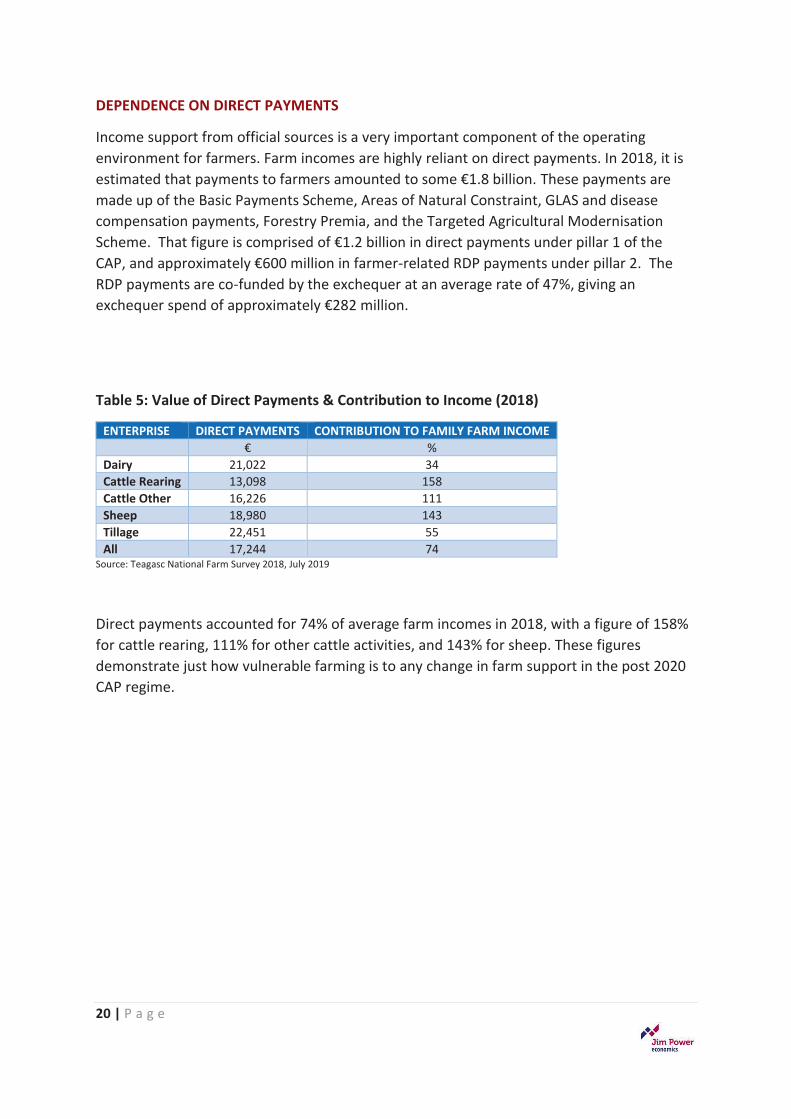
Income support from official sources is a very important component of the operating environment for farmers. Farm incomes are highly reliant on direct payments. In 2018, it is estimated that payments to farmers amounted to some €1.8 billion. These payments are made up of the Basic Payments Scheme, Areas of Natural Constraint, GLAS and disease compensation payments, Forestry Premia, and the Targeted Agricultural Modernisation Scheme. That figure is comprised of €1.2 billion in direct payments under pillar 1 of the CAP, and approximately €600 million in farmer-related RDP payments under pillar 2. The RDP payments are co-funded by the exchequer at an average rate of 47%, giving an exchequer spend of approximately €282 million.
Table 5: Value of Direct Payments & Contribution to Income (2018)
ENTERPRISE DIRECT PAYMENTS CONTRIBUTION TO FAMILY FARM INCOME € % Dairy 21,022 34 Cattle Rearing 13,098 158 Cattle Other 16,226 111 Sheep 18,980 143 Tillage 22,451 55 All 17,244 74
Source: Teagasc National Farm Survey 2018, July 2019
Direct payments accounted for 74% of average farm incomes in 2018, with a figure of 158% for cattle rearing, 111% for other cattle activities, and 143% for sheep. These figures demonstrate just how vulnerable farming is to any change in farm support in the post 2020 CAP regime.
21 | P a g e
FARM STRUCTURES
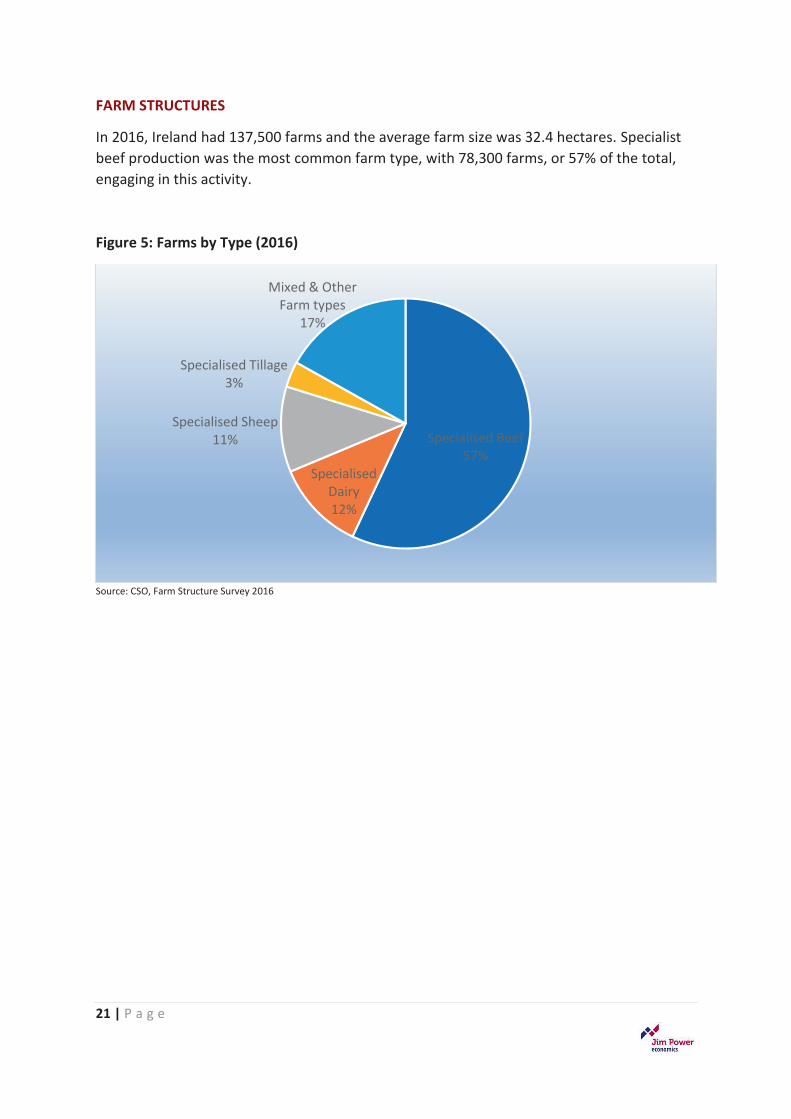
In 2016, Ireland had 137,500 farms and the average farm size was 32.4 hectares. Specialist beef production was the most common farm type, with 78,300 farms, or 57% of the total, engaging in this activity.
Figure 5: Farms by Type (2016)
Source: CSO, Farm Structure Survey 2016
Specialised Beef57%
Specialised Dairy12%
Specialised Sheep11%
Specialised Tillage3%
Mixed & Other Farm types
17%
22 | P a g e
SECTION 3
KEY ISSUES FOR THE BEEF SECTOR
The Irish beef producing sector is experiencing difficult market conditions at the moment. It is being hit with a combination of negative forces. These include CAP reform, Brexit, EU and global beef market conditions, the proposed Mercosur trade deal, environmental considerations, the weak position of beef producers in the domestic supply chain, and the growth of beef animals from the dairy herd.
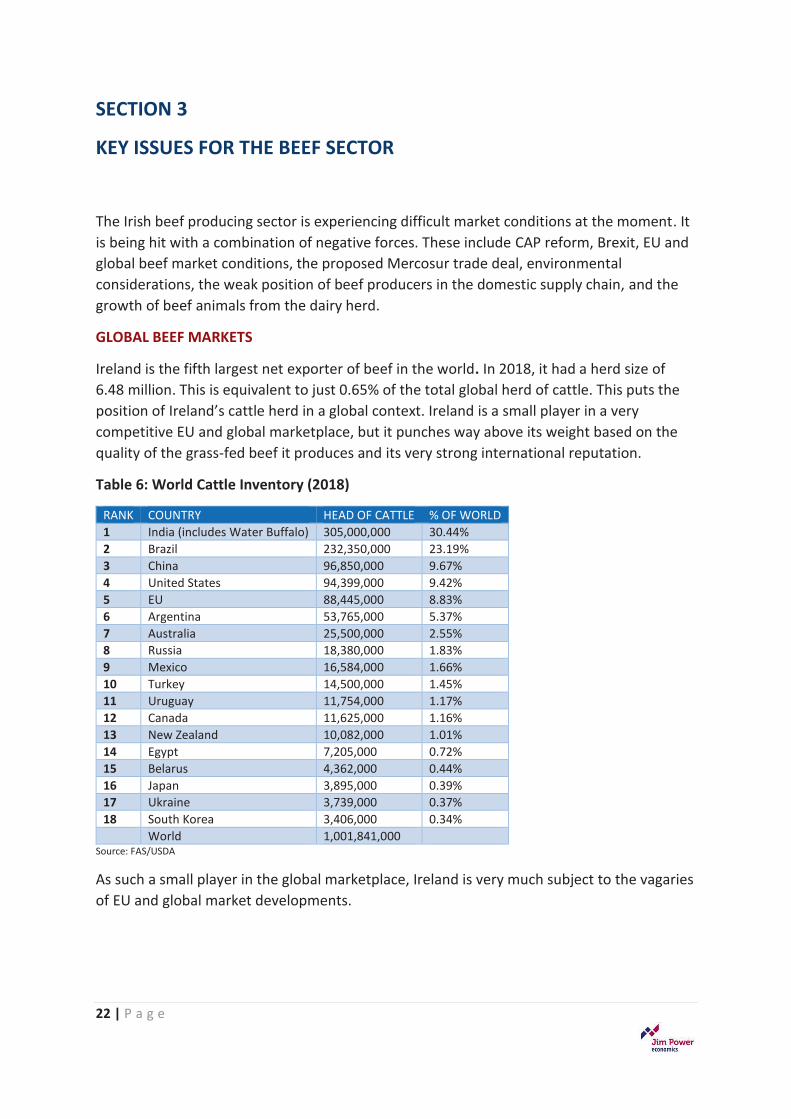
GLOBAL BEEF MARKETS
Ireland is the fifth largest net exporter of beef in the world. In 2018, it had a herd size of 6.48 million. This is equivalent to just 0.65% of the total global herd of cattle. This puts the position of Ireland’s cattle herd in a global context. Ireland is a small player in a very competitive EU and global marketplace, but it punches way above its weight based on the quality of the grass-fed beef it produces and its very strong international reputation.
Table 6: World Cattle Inventory (2018)
RANK COUNTRY HEAD OF CATTLE % OF WORLD 1 India (includes Water Buffalo) 305,000,000 30.44% 2 Brazil 232,350,000 23.19% 3 China 96,850,000 9.67% 4 United States 94,399,000 9.42% 5 EU 88,445,000 8.83% 6 Argentina 53,765,000 5.37% 7 Australia 25,500,000 2.55% 8 Russia 18,380,000 1.83% 9 Mexico 16,584,000 1.66% 10 Turkey 14,500,000 1.45% 11 Uruguay 11,754,000 1.17% 12 Canada 11,625,000 1.16% 13 New Zealand 10,082,000 1.01% 14 Egypt 7,205,000 0.72% 15 Belarus 4,362,000 0.44% 16 Japan 3,895,000 0.39% 17 Ukraine 3,739,000 0.37% 18 South Korea 3,406,000 0.34% World 1,001,841,000
Source: FAS/USDA
As such a small player in the global marketplace, Ireland is very much subject to the vagaries of EU and global market developments.
23 | P a g e
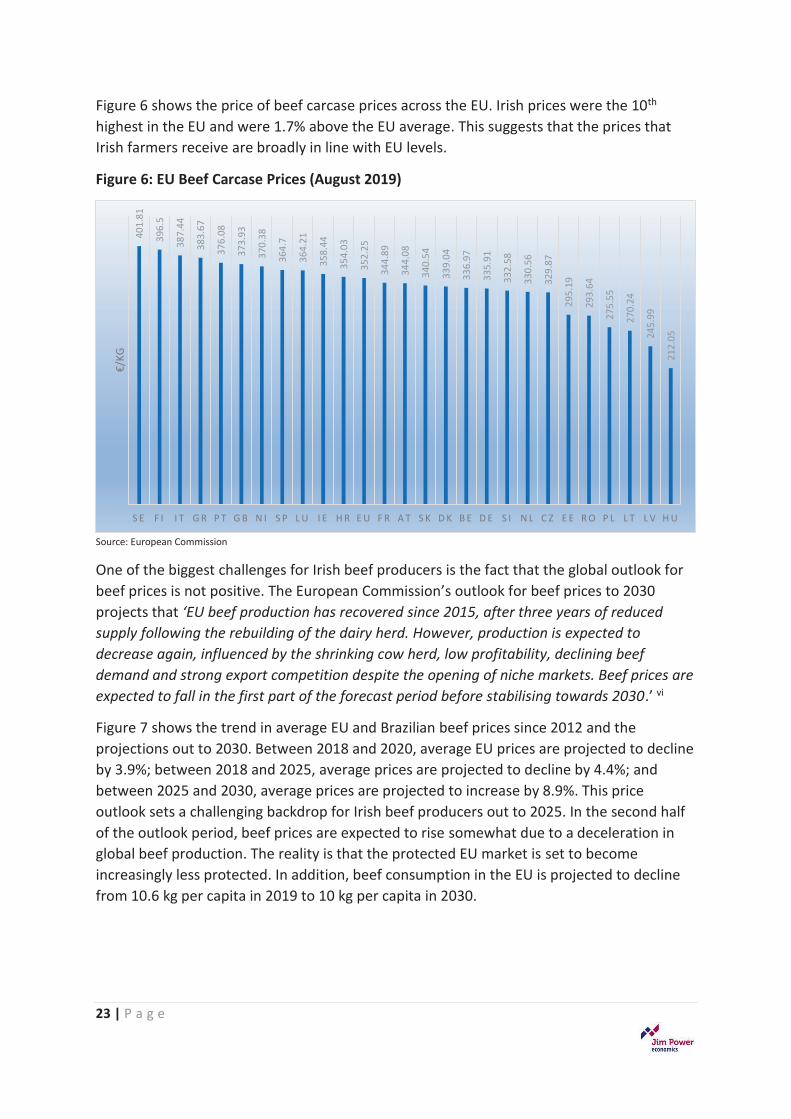
Figure 6 shows the price of beef carcase prices across the EU. Irish prices were the 10th highest in the EU and were 1.7% above the EU average. This suggests that the prices that Irish farmers receive are broadly in line with EU levels.
Figure 6: EU Beef Carcase Prices (August 2019)
Source: European Commission
One of the biggest challenges for Irish beef producers is the fact that the global outlook for beef prices is not positive. The European Commission’s outlook for beef prices to 2030 projects that ‘EU beef production has recovered since 2015, after three years of reduced supply following the rebuilding of the dairy herd. However, production is expected to decrease again, influenced by the shrinking cow herd, low profitability, declining beef demand and strong export competition despite the opening of niche markets. Beef prices are expected to fall in the first part of the forecast period before stabilising towards 2030.’ vi
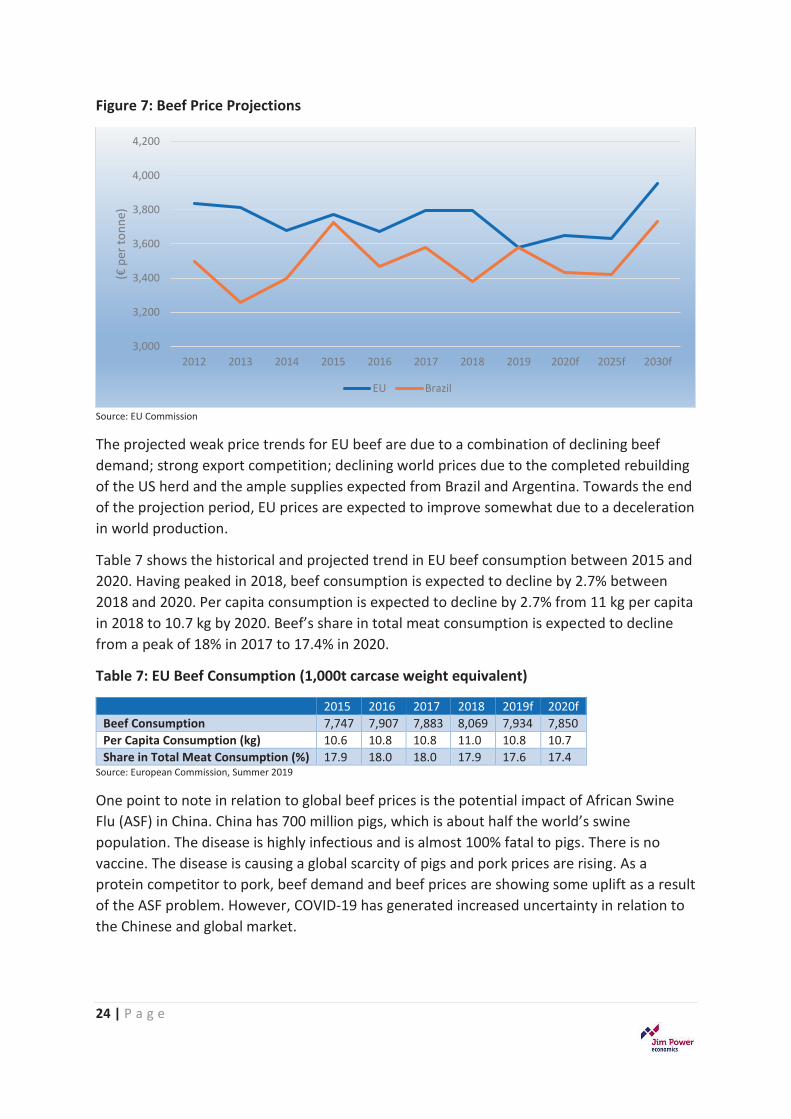
Figure 7 shows the trend in average EU and Brazilian beef prices since 2012 and the projections out to 2030. Between 2018 and 2020, average EU prices are projected to decline by 3.9%; between 2018 and 2025, average prices are projected to decline by 4.4%; and between 2025 and 2030, average prices are projected to increase by 8.9%. This price outlook sets a challenging backdrop for Irish beef producers out to 2025. In the second half of the outlook period, beef prices are expected to rise somewhat due to a deceleration in global beef production. The reality is that the protected EU market is set to become increasingly less protected. In addition, beef consumption in the EU is projected to decline from 10.6 kg per capita in 2019 to 10 kg per capita in 2030.
401.
81
396.
5
387.
44
383.
67
376.
08
373.
93
370.
38
364.
7
364.
21
358.
44
354.
03
352.
25
344.
89
344.
08
340.
54
339.
04
336.
97
335.
91
332.
58
330.
56
329.
87
295.
19
293.
64
275.
55
270.
24
245.
99
212.
05
S E F I I T G R P T G B N I S P L U I E H R E U F R A T S K D K B E D E S I N L C Z E E R O P L L T L V H U
€/KG
24 | P a g e
Figure 7: Beef Price Projections
Source: EU Commission
The projected weak price trends for EU beef are due to a combination of declining beef demand; strong export competition; declining world prices due to the completed rebuilding of the US herd and the ample supplies expected from Brazil and Argentina. Towards the end of the projection period, EU prices are expected to improve somewhat due to a deceleration in world production.
Table 7 shows the historical and projected trend in EU beef consumption between 2015 and 2020. Having peaked in 2018, beef consumption is expected to decline by 2.7% between 2018 and 2020. Per capita consumption is expected to decline by 2.7% from 11 kg per capita in 2018 to 10.7 kg by 2020. Beef’s share in total meat consumption is expected to decline from a peak of 18% in 2017 to 17.4% in 2020.
Table 7: EU Beef Consumption (1,000t carcase weight equivalent)
2015 2016 2017 2018 2019f 2020f Beef Consumption 7,747 7,907 7,883 8,069 7,934 7,850 Per Capita Consumption (kg) 10.6 10.8 10.8 11.0 10.8 10.7 Share in Total Meat Consumption (%) 17.9 18.0 18.0 17.9 17.6 17.4
Source: European Commission, Summer 2019
One point to note in relation to global beef prices is the potential impact of African Swine Flu (ASF) in China. China has 700 million pigs, which is about half the world’s swine population. The disease is highly infectious and is almost 100% fatal to pigs. There is no vaccine. The disease is causing a global scarcity of pigs and pork prices are rising. As a protein competitor to pork, beef demand and beef prices are showing some uplift as a result of the ASF problem. However, COVID-19 has generated increased uncertainty in relation to the Chinese and global market.
3,000
3,200
3,400
3,600
3,800
4,000
4,200
2012 2013 2014 2015 2016 2017 2018 2019 2020f 2025f 2030f
(€ p
er to
nne)
EU Brazil
25 | P a g e
THE EU-MERCOSUR TRADE DEAL
The EU has negotiated a trade agreement with the four founding member countries of Mercosur – Argentina, Brazil, Paraguay and Uruguay. This grouping is also known as the Common Market of the South. The four countries have a combined population of over 264 million people and the grouping represents the world’s fifth largest economy outside the EU, with output valued at €2.2 trillion.
Negotiations on the deal began 28th June 1999, were then suspended, and restarted in 2010. Political agreement was reached on 29th June 2019. The European Commission negotiated on behalf of the EU in line with a mandate granted by the governments of the EU-28.
It is not clear yet, if the deal will be ratified, but similar agreements concluded by the EU in the past required a validation by all Member states according to their national constitutional procedures, in addition to the European Parliament and the ministers’ vote in the Council.
Mercosur has traditionally been a difficult market to sell into due to extensive trade barriers such as high import duties, burdensome procedures, currency fluctuations, and technical regulations and standards that differ from international standards. It has very complex procedures to prove that EU products meet Mercosur’s technical requirements or standards for food safety, and animal and plant health.
The EU is adamant that the trade deal will not change European standards for food, agricultural and fishery products. In theory this will include EU food safety and animal and plant health legislation; the strict EU approach on health protection for any food safety matter, including genetically modified organisms (GMOs); and the EU will maintain its right to set maximum levels of residues for pesticides, veterinary medicines and contaminants. Both sides have also agreed that the trade deal must support existing environmental standards and the deal contains commitments on sustainable fisheries and sustainable forest management. It is envisaged that the commitments on trade and sustainable development will be enforceable through a dispute settlement mechanism
That will include:
x� External review by an independent panel of experts x� A role for civil society, including representatives of employers and trade unions at all
stages x� The ability to call on the expertise of international bodies such as the International
Labour Organisation.
The trade deal will open up the EU market to exports from Mercosur, but will set quantitative limits on imports of sensitive agricultural products such as beef, ethanol, pork, honey, sugar and poultry.
26 | P a g e
Under the terms of the Mercosur deal, 99,000 tonnes of Mercosur beef will have access to the EU market, incurring an import duty of 7.5%. Stakeholders in the Irish beef sector are not happy with this prospect, but the reality is that Irish beef is the ultimate beneficiary of free trade and is not in a strong position to object. However, from an environmental perspective, the air miles associated with bringing beef from South America to Europe, and the expansion of beef production in the Mercosur countries that is resulting in serious environmental damage in the Amazonian rain forests, does not make sense.
If the Mercosur trade deal is ratified by the EU, it is essential that Mercosur beef sold into the EU must be produced under the same standards, regulations and controls that are imposed on EU beef producers. The playing field must be level. Despite assurances from the EU in this regard, there is justifiable and deep scepticism about how this policing would work in practice. The EU imported €269,000 tonnes of beef from the Mercosur countries in 2018 and there is already deep scepticism about how this trade is being policed.
The Mercosur deal will take some years to get over the line, if the process proceeds smoothly. However, there will be serious difficulties involved in getting agreement at both the EU level and the Mercosur country level. Its completion is far from certain.
There are much more serious and much more imminent issues facing Irish beef farmers than Mercosur.
ENVIRONMENTAL CONCERNS
Climate change is now justifiably top of the global policy agenda. For anybody who has in the past or who continues to doubt the reality of and the global implications of climate change from both a human, social and economic perspective, the evidence that is being presented on a daily basis should provide a strong reality check. Climate change represents the most fundamental challenge that humankind has ever faced and the window of opportunity to address it in a real and meaningful way is rapidly closing.
Under the Paris Agreement, which was adopted on December 12th 2015 and which came into effect in November 2016, the EU committed to a reduction of at least 40% in greenhouse gas emissions by 2030, relative to 1990 levels.
There is a growing perception that global beef consumption is a major contributor to climate change and pressure is growing to reduce consumption. For example, a recent piece from Bloombergvii argued that global meat consumption has more than doubled since the 1960s and that livestock is responsible for 12% of man-made greenhouse gas emissions, more than the entire aviation industry. On a per calories basis, cattle are responsible for vastly more emissions than chickens and pigs, in part because their digestive systems produce methane, which is a potent greenhouse gas. The editorial also points out that cattle take up a lot of space, with large swaths of the Amazon being cut down to make room for cattle ranches, releasing huge amounts of trapped carbon. The main argument in the piece is that people who care about climate change and the environment should cut back on beef consumption.
27 | P a g e
In contrast, a number of experts from the University of Oxford, the University of Reading, and the University of Victoria, warned the UNFCCC in late 2018 that the measurement rules in the draft text at COP 24 could make it impossible to assess mitigation measures against a long-term temperature goal.viii They assert that CO2-equivalent metric as presented ‘seriously misrepresents the climate impact of methane emissions’ as methane does not accumulate in the atmosphere over time as CO2 does. The specific argument from this work is that methane dissipates in the atmosphere after 12 years, while CO2 takes tens of thousands of years.
Whatever one’s view of the science, the reality is that there is a growing perception about the climate implications of methane emitted from cattle, which is altering consumer behaviour.
Despite its small size, Ireland will have to play a key role in addressing the global challenge. Emissions from agriculture, transport, the built environment, and small industry are in the non-Emissions Trading System (ETS). These are dealt with by EU member states through legally binding targets for emissions reductions. Ireland’s non-ETS targets are to achieve a 20% reduction in non-ETS sector emissions by 2020 and 30% by 2030, relative to 2005 levels.
Agriculture generates a third of Ireland’s total Greenhouse Gas (GHG) emissions.ix The Climate Action Plan (2019) recognises the reality that Irish agriculture has strong green credentials and a positive international reputation in terms of the carbon intensity of its dairy and beef output, helped in no small way by the Origin Green carbon audits. Maintaining this reputation is vital for a sector that is very dependent on exports and recognising that there is growing pressure from the public for agricultural product that is produced in an environmentally sustainable way. The challenge for Irish agriculture is to help meet the national policy objective of an approach to carbon neutrality that does not compromise the capacity of the sector for sustainable food production.
The Joint Research Centre of the European Commission conducted an analysis of the carbon footprint of a range of agricultural products across the EU-28 member states. It concluded that Ireland had the joint lowest carbon footprint for milk production and the fifth lowest for beef production in the EU.x
Teagasc attributes this positive performance to the on-going gains in resource use efficiency by Irish agriculture since 1990. Its researchxi shows that the carbon footprint of Irish produce has been reduced by circa 15% since1990 and that the nitrogen footprint of Irish produce has been reduced by around 25%.
Any discussion around the environmental aspects of Irish agricultural production has to be viewed in a global context. Research from the UK Government Office for Sciencexii highlighted the pressures on global food production from a global population that will rise to over 9 billion by 2050; increased demand for a more varied, high-quality diet from an increasingly wealthy population, requiring additional resources to produce; and increased competition for land, water and energy. All of this will have to be handled against a background of the global imperative to reduce greenhouse gas emissions. Five challenges are identified:
28 | P a g e
1)� Balancing future demand and supply sustainably, to ensure that food supplies are affordable;
2)� Ensuring that there is adequate stability in food supplies – and protecting the most vulnerable from the volatility that does occur;
3)� Achieving global access to food and ending hunger. This recognises that producing enough food in the world so that everyone can potentially be fed is not the same thing as ensuring food security for all;
4)� Managing the contribution of the food system to the mitigation of climate change; and
5)� Managing biodiversity and ecosystem services while feeding the world.
It is clear that the global demand for food will increase significantly over the coming years, and beef will constitute a significant component of this increased demand. If one accepts that the global demand for beef will increase, particularly from China, then Ireland is well placed to contribute.
Grass-fed Irish beef is produced in a relatively sustainable way and beef production is being increasingly driven by environmentally-friendly policies such as GLAS, Origin Green and the ongoing policy priorities of the CAP.
DOMESTIC MARKET CHALLENGES
The domestic market challenges for Irish beef production include the rapid expansion of the dairy herd and the consequent impact on the suckler herd; the increasingly negative consumer perceptions of beef on both environmental and health grounds; competition from cheap protein sources such as chicken and pork; the increasing concentration of the retail grocery sector and particularly the growing market penetration of the discounters, which is resulting in retail price compression; and the concentrated nature of the processing sector.
Most damagingly, there is a total lack of trust in the beef supply chain, much of which is being driven by a total lack of transparency. A number of solutions have been suggested, but it is far from clear how these might solve the problem.
RETAIL REGULATOR
There are calls from many sources for the setting up of some form of regulator for the retail sector. It is not clear what this might achieve or how it might operate. The retail grocery sector already has a very transparent pricing structure, so retail price transparency is not an issue. More transparency on how much the retailer is paying the processor for beef would be very beneficial, and is arguably a necessary pre-condition for restoring trust to the whole supply chain.
A ban on below cost selling should be explored as it is unacceptable that farmers are paid below the cost of production because retailers are engaged in below cost selling of beef and using the commodity as a loss leader.
29 | P a g e
The one area where a retail regulator might have a positive impact is to ensure that the EU agenda relating to unfair trading practices (UTPs) is strictly adhered to and implemented.
A story in the Farmers Journal (14th December 2019) suggests that supermarkets can earn gross profit margins of up to 45% on fresh meat. It reported profit margins of 17% for beef mince; 18% for sirloin steak; and 33% for beef and round roast.
In marked contrast, a professor of marketing at Smurfit Graduate Business School at University College Dublin, Damien McLoughlin, stated on RTE radio (6th August 2019) that ‘the idea that a retailer is making a tonne of money or a tonne of profit on beef is not true’.
Analysis of the average retail price of beef contained elsewhere in this report suggests retail compression over the past decade. There is certainly some evidence that retailers are using beef as a loss leader.
The participation of the retailers at the Beef Taskforce in January 2020 is to be welcomed and the hope is that it could and should lead to greater transparency about exactly what retailers are making on beef. The Grant Thornton report recently commissioned by the Department of Agriculture, Food and the Marine will be of great interest.
30 | P a g e
SECTION 4
THE CONTEXT FOR THE IRISH BEEF SECTOR
CONTRIBUTION OF THE BEEF SECTOR
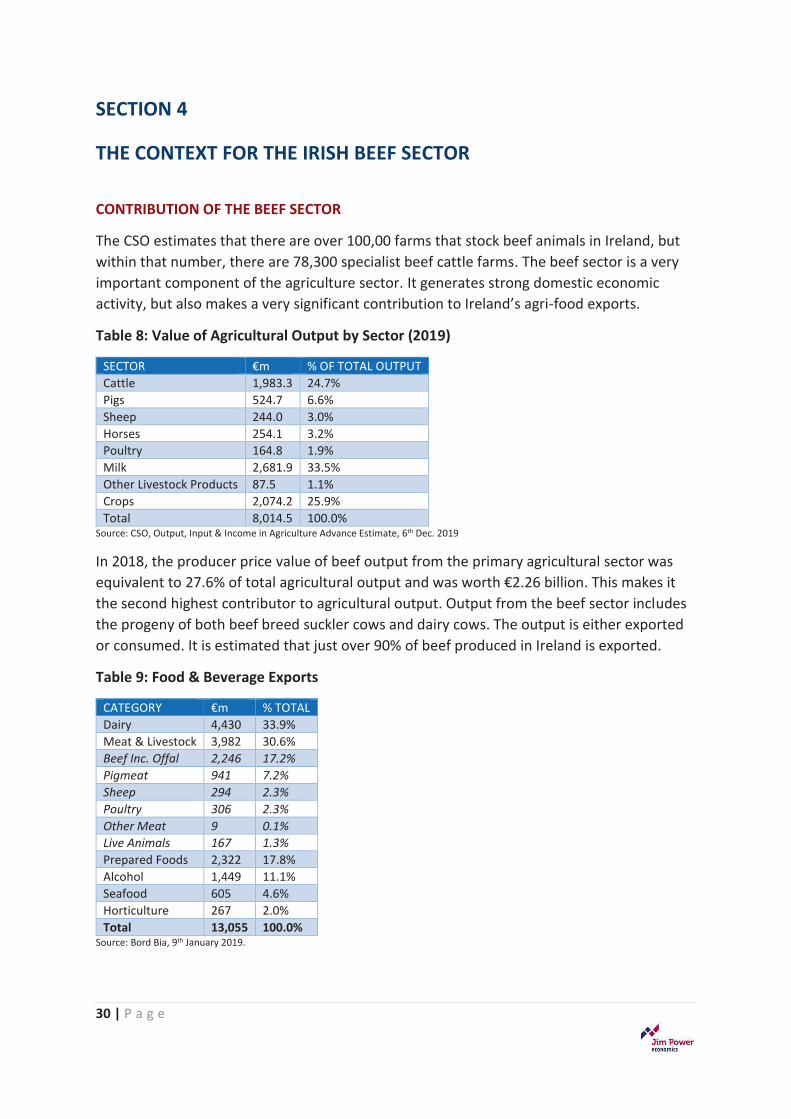
The CSO estimates that there are over 100,00 farms that stock beef animals in Ireland, but within that number, there are 78,300 specialist beef cattle farms. The beef sector is a very important component of the agriculture sector. It generates strong domestic economic activity, but also makes a very significant contribution to Ireland’s agri-food exports.
Table 8: Value of Agricultural Output by Sector (2019)
SECTOR €m % OF TOTAL OUTPUT Cattle 1,983.3 24.7% Pigs 524.7 6.6% Sheep 244.0 3.0% Horses 254.1 3.2% Poultry 164.8 1.9% Milk 2,681.9 33.5% Other Livestock Products 87.5 1.1% Crops 2,074.2 25.9% Total 8,014.5 100.0%
Source: CSO, Output, Input & Income in Agriculture Advance Estimate, 6th Dec. 2019
In 2018, the producer price value of beef output from the primary agricultural sector was equivalent to 27.6% of total agricultural output and was worth €2.26 billion. This makes it the second highest contributor to agricultural output. Output from the beef sector includes the progeny of both beef breed suckler cows and dairy cows. The output is either exported or consumed. It is estimated that just over 90% of beef produced in Ireland is exported.
Table 9: Food & Beverage Exports
CATEGORY €m % TOTAL Dairy 4,430 33.9% Meat & Livestock 3,982 30.6% Beef Inc. Offal 2,246 17.2% Pigmeat 941 7.2% Sheep 294 2.3% Poultry 306 2.3% Other Meat 9 0.1% Live Animals 167 1.3% Prepared Foods 2,322 17.8% Alcohol 1,449 11.1% Seafood 605 4.6% Horticulture 267 2.0% Total 13,055 100.0%
Source: Bord Bia, 9th January 2019.
31 | P a g e
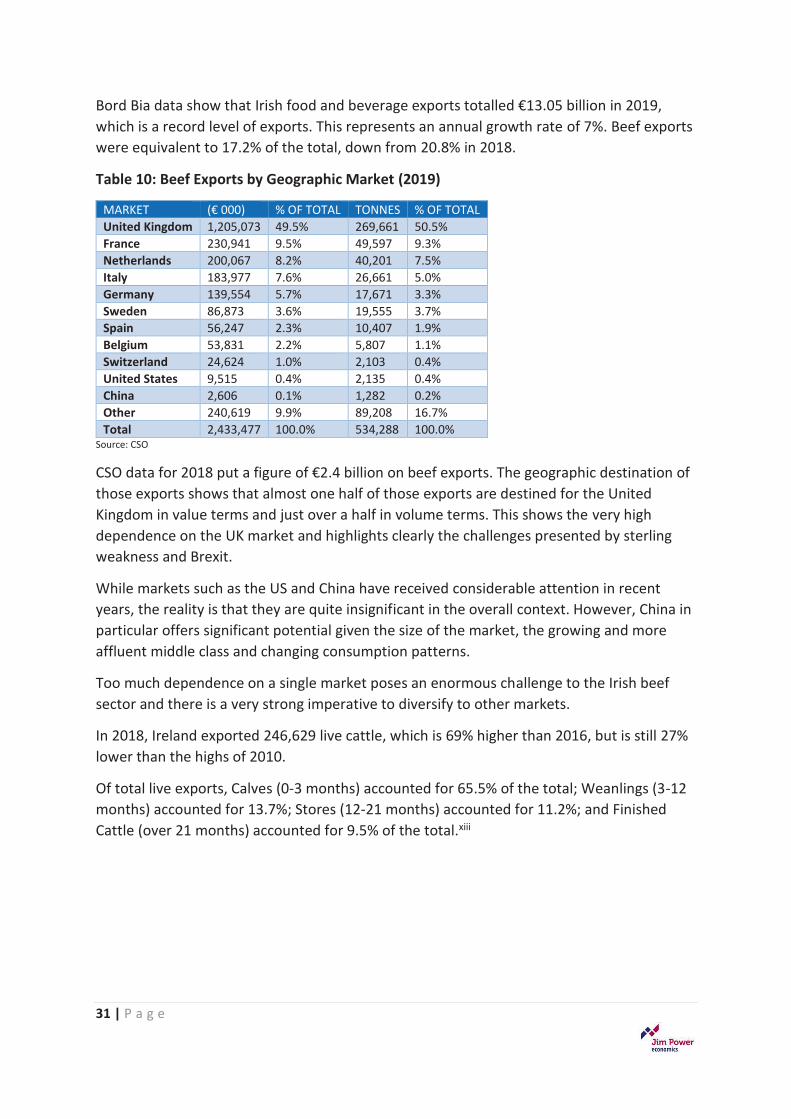
Bord Bia data show that Irish food and beverage exports totalled €13.05 billion in 2019, which is a record level of exports. This represents an annual growth rate of 7%. Beef exports were equivalent to 17.2% of the total, down from 20.8% in 2018.
Table 10: Beef Exports by Geographic Market (2019)
MARKET (€ 000) % OF TOTAL TONNES % OF TOTAL United Kingdom 1,205,073 49.5% 269,661 50.5% France 230,941 9.5% 49,597 9.3% Netherlands 200,067 8.2% 40,201 7.5% Italy 183,977 7.6% 26,661 5.0% Germany 139,554 5.7% 17,671 3.3% Sweden 86,873 3.6% 19,555 3.7% Spain 56,247 2.3% 10,407 1.9% Belgium 53,831 2.2% 5,807 1.1% Switzerland 24,624 1.0% 2,103 0.4% United States 9,515 0.4% 2,135 0.4% China 2,606 0.1% 1,282 0.2% Other 240,619 9.9% 89,208 16.7% Total 2,433,477 100.0% 534,288 100.0%
Source: CSO
CSO data for 2018 put a figure of €2.4 billion on beef exports. The geographic destination of those exports shows that almost one half of those exports are destined for the United Kingdom in value terms and just over a half in volume terms. This shows the very high dependence on the UK market and highlights clearly the challenges presented by sterling weakness and Brexit.
While markets such as the US and China have received considerable attention in recent years, the reality is that they are quite insignificant in the overall context. However, China in particular offers significant potential given the size of the market, the growing and more affluent middle class and changing consumption patterns.
Too much dependence on a single market poses an enormous challenge to the Irish beef sector and there is a very strong imperative to diversify to other markets.
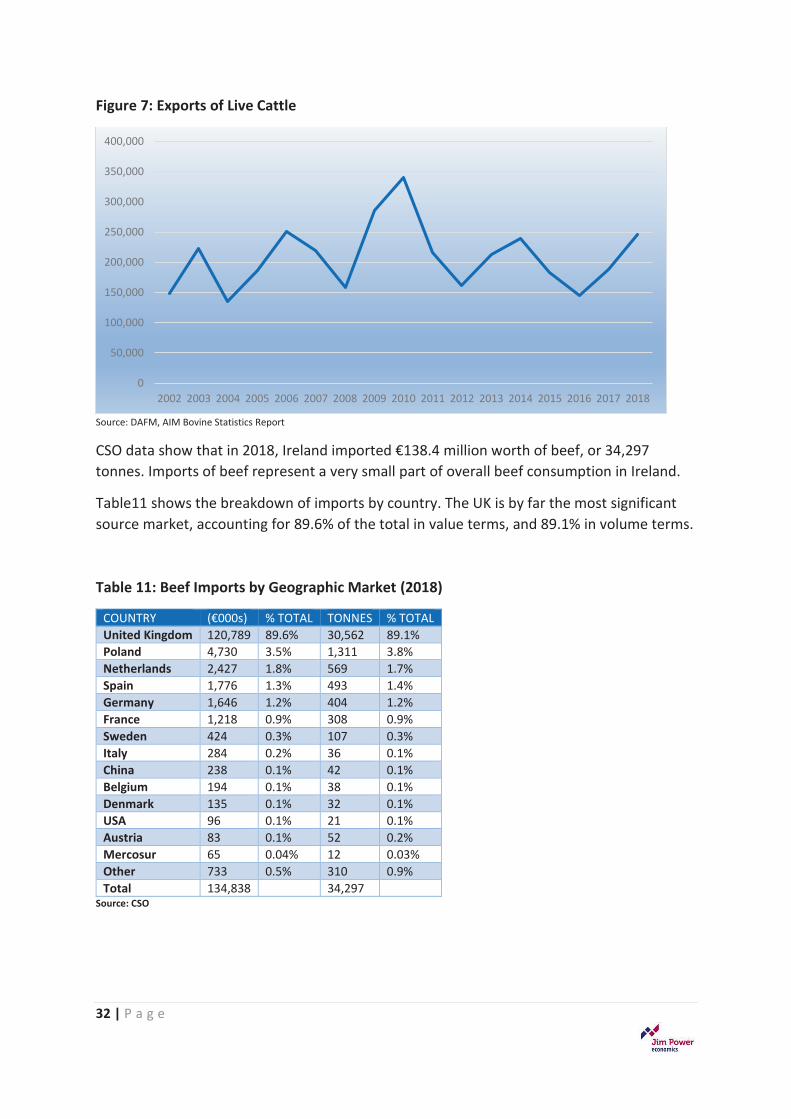
In 2018, Ireland exported 246,629 live cattle, which is 69% higher than 2016, but is still 27% lower than the highs of 2010.
Of total live exports, Calves (0-3 months) accounted for 65.5% of the total; Weanlings (3-12 months) accounted for 13.7%; Stores (12-21 months) accounted for 11.2%; and Finished Cattle (over 21 months) accounted for 9.5% of the total.xiii
32 | P a g e
Figure 7: Exports of Live Cattle
Source: DAFM, AIM Bovine Statistics Report
CSO data show that in 2018, Ireland imported €138.4 million worth of beef, or 34,297 tonnes. Imports of beef represent a very small part of overall beef consumption in Ireland.
Table11 shows the breakdown of imports by country. The UK is by far the most significant source market, accounting for 89.6% of the total in value terms, and 89.1% in volume terms.
Table 11: Beef Imports by Geographic Market (2018)
COUNTRY (€000s) % TOTAL TONNES % TOTAL United Kingdom 120,789 89.6% 30,562 89.1% Poland 4,730 3.5% 1,311 3.8% Netherlands 2,427 1.8% 569 1.7% Spain 1,776 1.3% 493 1.4% Germany 1,646 1.2% 404 1.2% France 1,218 0.9% 308 0.9% Sweden 424 0.3% 107 0.3% Italy 284 0.2% 36 0.1% China 238 0.1% 42 0.1% Belgium 194 0.1% 38 0.1% Denmark 135 0.1% 32 0.1% USA 96 0.1% 21 0.1% Austria 83 0.1% 52 0.2% Mercosur 65 0.04% 12 0.03% Other 733 0.5% 310 0.9% Total 134,838 34,297
Source: CSO
0
50,000
100,000
150,000
200,000
250,000
300,000
350,000
400,000
2002 2003 2004 2005 2006 2007 2008 2009 2010 2011 2012 2013 2014 2015 2016 2017 2018
33 | P a g e
THE SUCKLER HERD
Ireland has a strong reputation as an exporter of high-quality prime beef and live cattle. The suckler herd is of fundamental importance to this strong reputation. Burke (2016)xiv points out that cattle bred from the suckler herd tend to be significantly more valuable than dairy-bred animals on account of their superior grading profile and heavier weight for age. He suggests that these advantages are due to their superior beef genetics and having access to their mothers’ milk pre-weaning.
Burke suggests that the high-quality carcasses produced from the suckler herd result in superior carcass classification in terms of conformation and the resulting yield of saleable meat. These higher yielding carcasses generate a higher proportion of high-value meat cuts and consequently a lesser quantity of fat and bone. These factors formed the basis of the introduction of the Quality Payments System (QPS), which is designed to reward producers for animals of better conformation and appropriate fat cover.
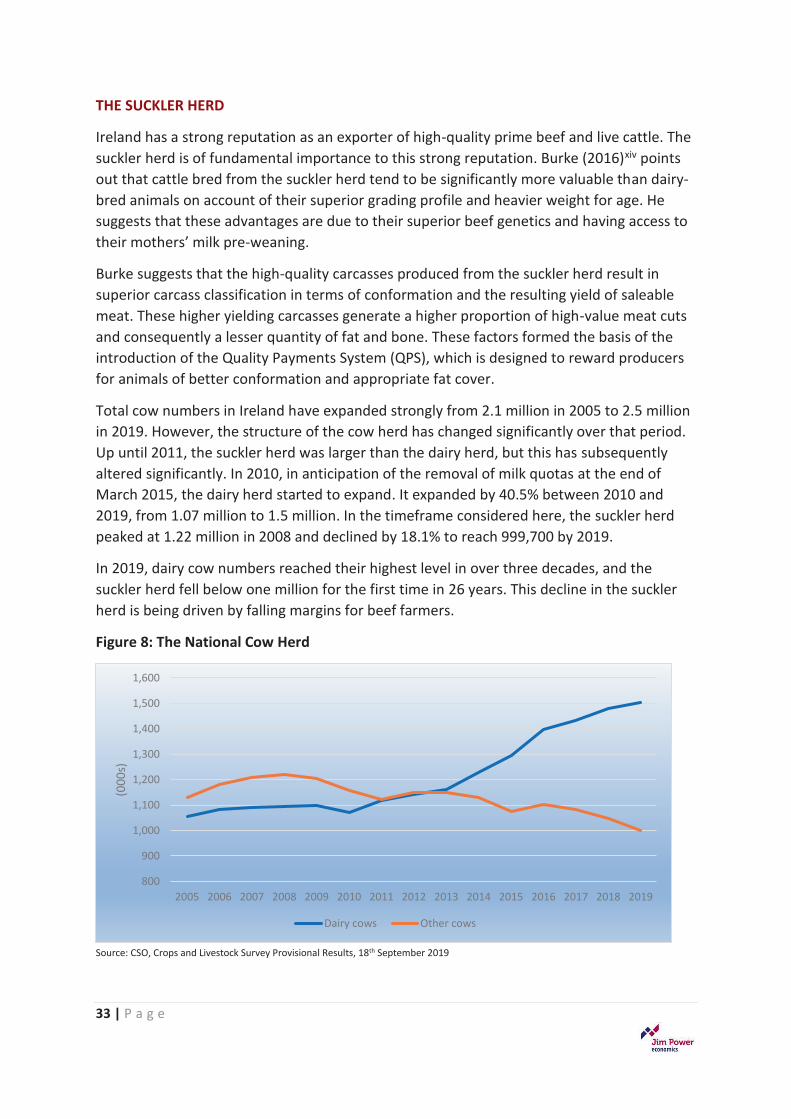
Total cow numbers in Ireland have expanded strongly from 2.1 million in 2005 to 2.5 million in 2019. However, the structure of the cow herd has changed significantly over that period. Up until 2011, the suckler herd was larger than the dairy herd, but this has subsequently altered significantly. In 2010, in anticipation of the removal of milk quotas at the end of March 2015, the dairy herd started to expand. It expanded by 40.5% between 2010 and 2019, from 1.07 million to 1.5 million. In the timeframe considered here, the suckler herd peaked at 1.22 million in 2008 and declined by 18.1% to reach 999,700 by 2019.
In 2019, dairy cow numbers reached their highest level in over three decades, and the suckler herd fell below one million for the first time in 26 years. This decline in the suckler herd is being driven by falling margins for beef farmers.
Figure 8: The National Cow Herd
Source: CSO, Crops and Livestock Survey Provisional Results, 18th September 2019
800
900
1,000
1,100
1,200
1,300
1,400
1,500
1,600
2005 2006 2007 2008 2009 2010 2011 2012 2013 2014 2015 2016 2017 2018 2019
(000
s)
Dairy cows Other cows
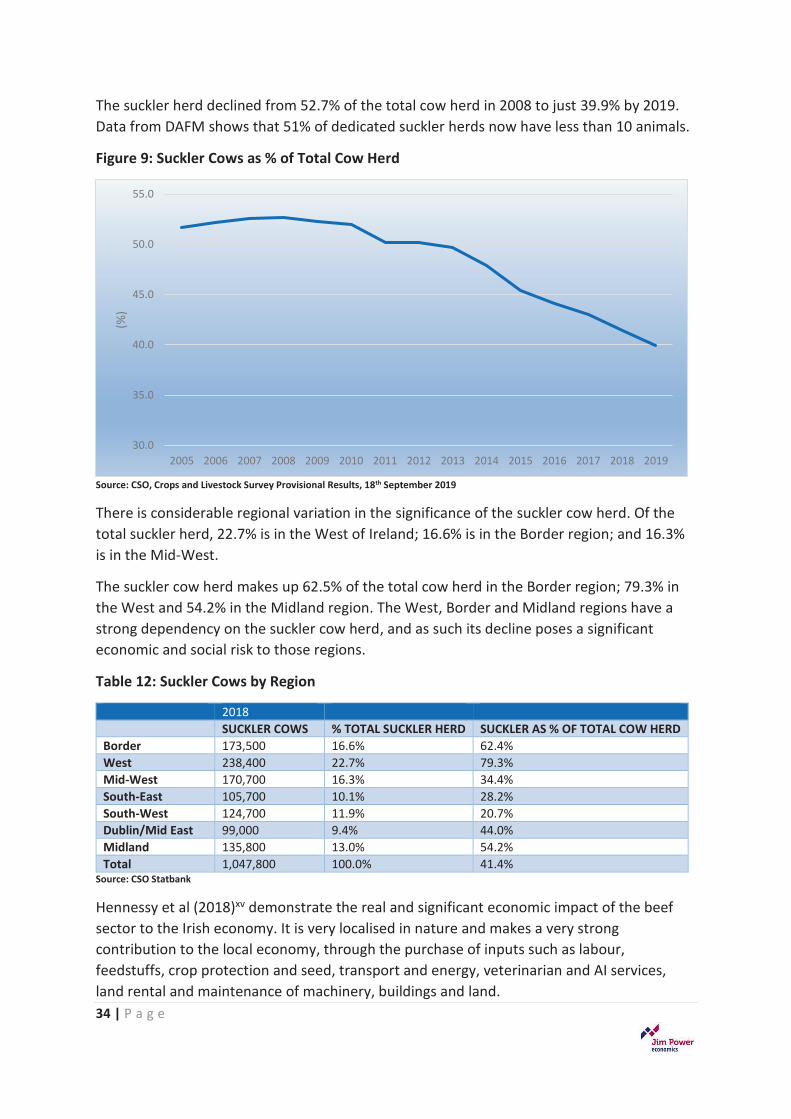
34 | P a g e
The suckler herd declined from 52.7% of the total cow herd in 2008 to just 39.9% by 2019. Data from DAFM shows that 51% of dedicated suckler herds now have less than 10 animals.
Figure 9: Suckler Cows as % of Total Cow Herd
Source: CSO, Crops and Livestock Survey Provisional Results, 18th September 2019
There is considerable regional variation in the significance of the suckler cow herd. Of the total suckler herd, 22.7% is in the West of Ireland; 16.6% is in the Border region; and 16.3% is in the Mid-West.
The suckler cow herd makes up 62.5% of the total cow herd in the Border region; 79.3% in the West and 54.2% in the Midland region. The West, Border and Midland regions have a strong dependency on the suckler cow herd, and as such its decline poses a significant economic and social risk to those regions.
Table 12: Suckler Cows by Region
2018 SUCKLER COWS % TOTAL SUCKLER HERD SUCKLER AS % OF TOTAL COW HERD Border 173,500 16.6% 62.4% West 238,400 22.7% 79.3% Mid-West 170,700 16.3% 34.4% South-East 105,700 10.1% 28.2% South-West 124,700 11.9% 20.7% Dublin/Mid East 99,000 9.4% 44.0% Midland 135,800 13.0% 54.2% Total 1,047,800 100.0% 41.4%
Source: CSO Statbank
Hennessy et al (2018)xv demonstrate the real and significant economic impact of the beef sector to the Irish economy. It is very localised in nature and makes a very strong contribution to the local economy, through the purchase of inputs such as labour, feedstuffs, crop protection and seed, transport and energy, veterinarian and AI services, land rental and maintenance of machinery, buildings and land.
30.0
35.0
40.0
45.0
50.0
55.0
2005 2006 2007 2008 2009 2010 2011 2012 2013 2014 2015 2016 2017 2018 2019
(%)
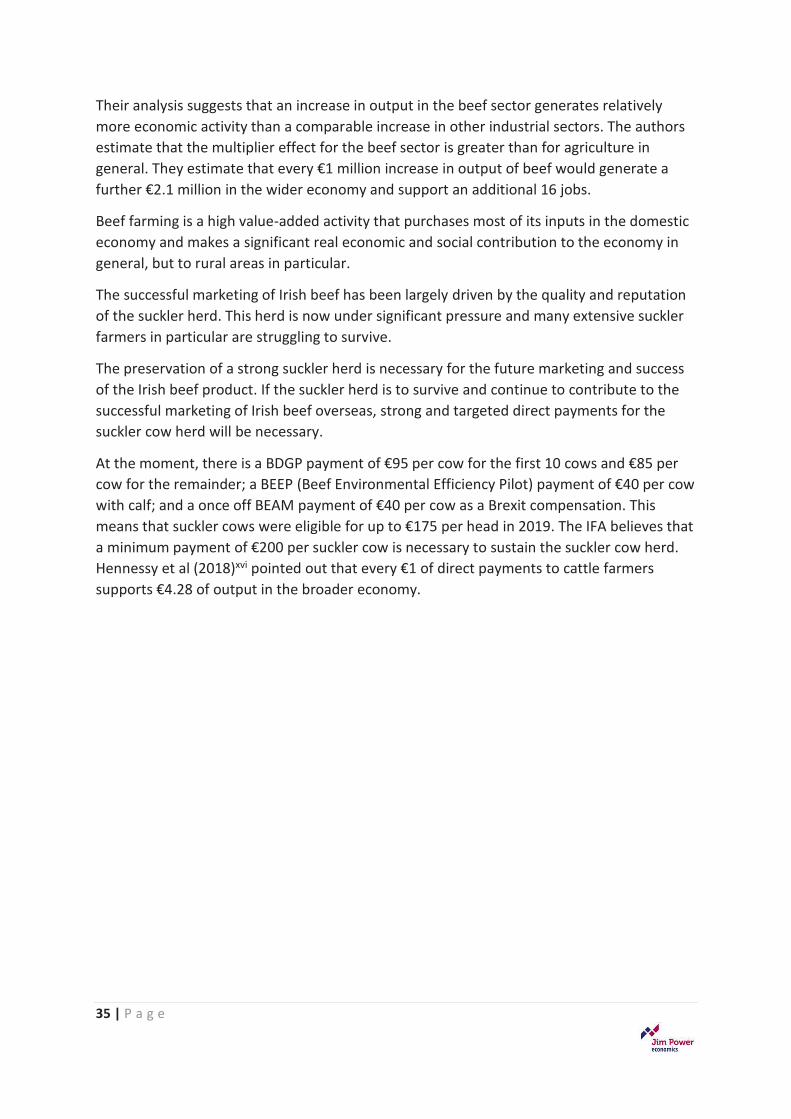
35 | P a g e
Their analysis suggests that an increase in output in the beef sector generates relatively more economic activity than a comparable increase in other industrial sectors. The authors estimate that the multiplier effect for the beef sector is greater than for agriculture in general. They estimate that every €1 million increase in output of beef would generate a further €2.1 million in the wider economy and support an additional 16 jobs.
Beef farming is a high value-added activity that purchases most of its inputs in the domestic economy and makes a significant real economic and social contribution to the economy in general, but to rural areas in particular.
The successful marketing of Irish beef has been largely driven by the quality and reputation of the suckler herd. This herd is now under significant pressure and many extensive suckler farmers in particular are struggling to survive.
The preservation of a strong suckler herd is necessary for the future marketing and success of the Irish beef product. If the suckler herd is to survive and continue to contribute to the successful marketing of Irish beef overseas, strong and targeted direct payments for the suckler cow herd will be necessary.
At the moment, there is a BDGP payment of €95 per cow for the first 10 cows and €85 per cow for the remainder; a BEEP (Beef Environmental Efficiency Pilot) payment of €40 per cow with calf; and a once off BEAM payment of €40 per cow as a Brexit compensation. This means that suckler cows were eligible for up to €175 per head in 2019. The IFA believes that a minimum payment of €200 per suckler cow is necessary to sustain the suckler cow herd. Hennessy et al (2018)xvi pointed out that every €1 of direct payments to cattle farmers supports €4.28 of output in the broader economy.
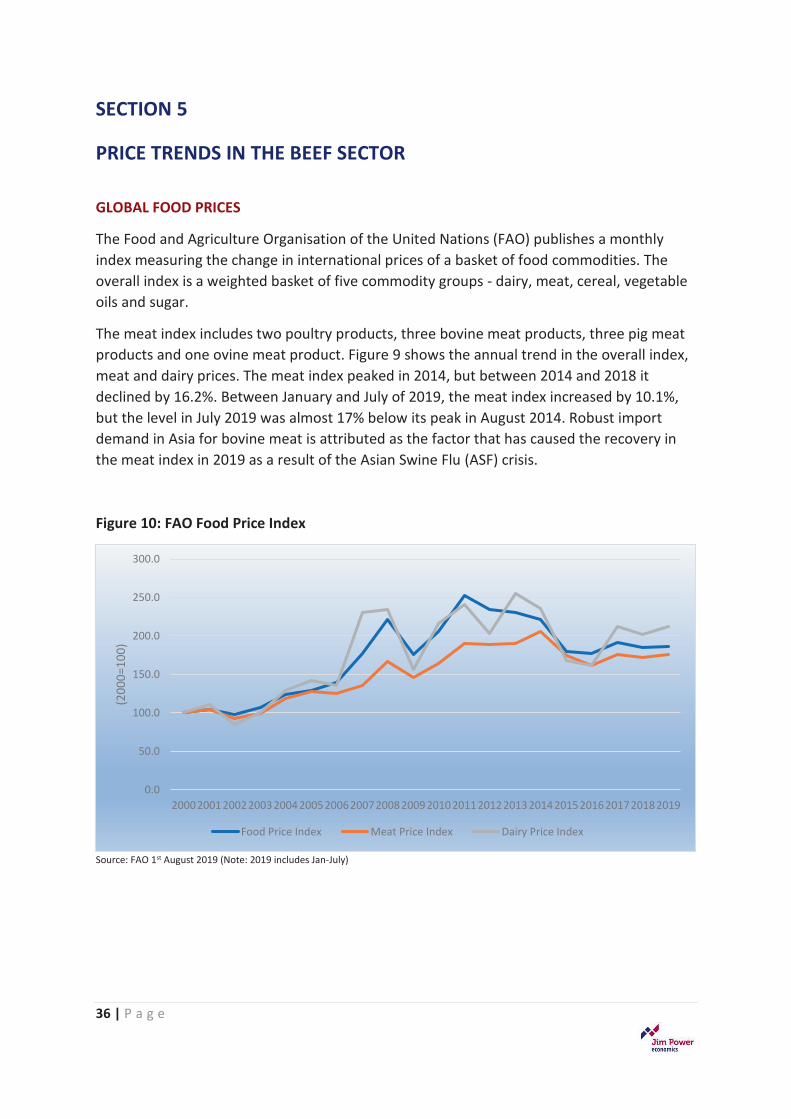
36 | P a g e
SECTION 5
PRICE TRENDS IN THE BEEF SECTOR
GLOBAL FOOD PRICES
The Food and Agriculture Organisation of the United Nations (FAO) publishes a monthly index measuring the change in international prices of a basket of food commodities. The overall index is a weighted basket of five commodity groups - dairy, meat, cereal, vegetable oils and sugar.
The meat index includes two poultry products, three bovine meat products, three pig meat products and one ovine meat product. Figure 9 shows the annual trend in the overall index, meat and dairy prices. The meat index peaked in 2014, but between 2014 and 2018 it declined by 16.2%. Between January and July of 2019, the meat index increased by 10.1%, but the level in July 2019 was almost 17% below its peak in August 2014. Robust import demand in Asia for bovine meat is attributed as the factor that has caused the recovery in the meat index in 2019 as a result of the Asian Swine Flu (ASF) crisis.
Figure 10: FAO Food Price Index
Source: FAO 1st August 2019 (Note: 2019 includes Jan-July)
0.0
50.0
100.0
150.0
200.0
250.0
300.0
20002001200220032004200520062007200820092010201120122013201420152016201720182019
(200
0=10
0)
Food Price Index Meat Price Index Dairy Price Index
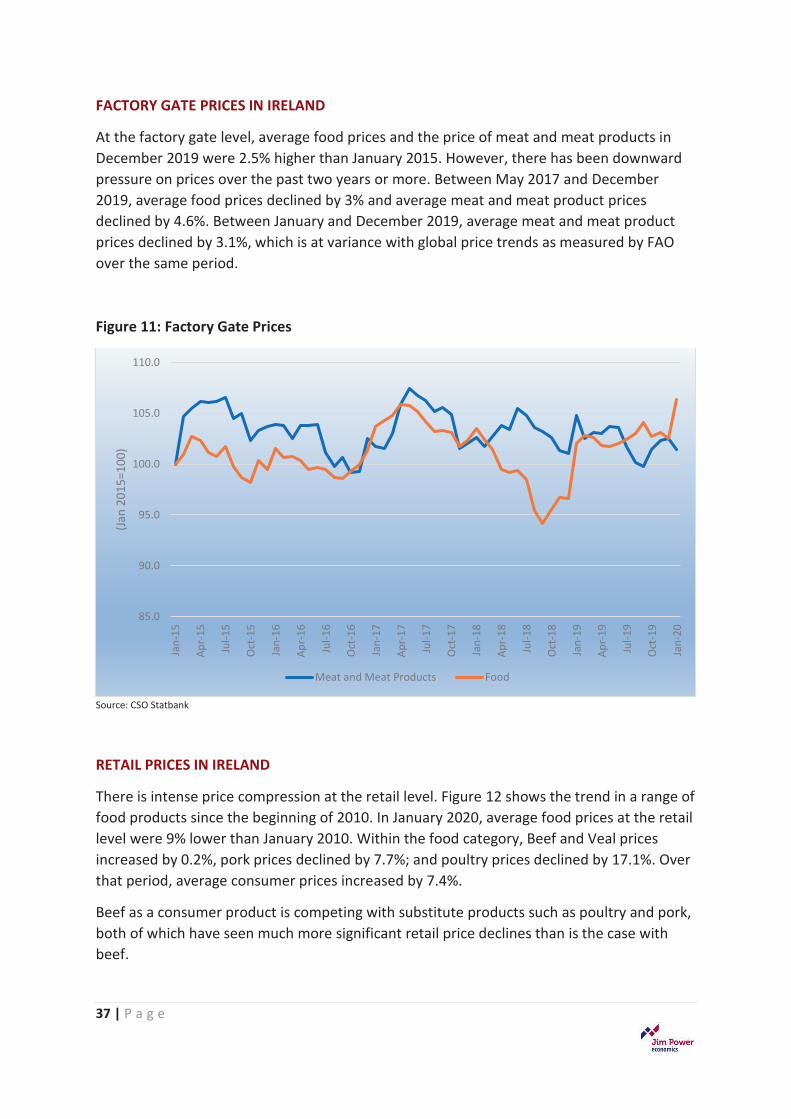
37 | P a g e
FACTORY GATE PRICES IN IRELAND
At the factory gate level, average food prices and the price of meat and meat products in December 2019 were 2.5% higher than January 2015. However, there has been downward pressure on prices over the past two years or more. Between May 2017 and December 2019, average food prices declined by 3% and average meat and meat product prices declined by 4.6%. Between January and December 2019, average meat and meat product prices declined by 3.1%, which is at variance with global price trends as measured by FAO over the same period.
Figure 11: Factory Gate Prices
Source: CSO Statbank
RETAIL PRICES IN IRELAND
There is intense price compression at the retail level. Figure 12 shows the trend in a range of food products since the beginning of 2010. In January 2020, average food prices at the retail level were 9% lower than January 2010. Within the food category, Beef and Veal prices increased by 0.2%, pork prices declined by 7.7%; and poultry prices declined by 17.1%. Over that period, average consumer prices increased by 7.4%.
Beef as a consumer product is competing with substitute products such as poultry and pork, both of which have seen much more significant retail price declines than is the case with beef.
85.0
90.0
95.0
100.0
105.0
110.0
Jan-
15
Apr-
15
Jul-1
5
Oct
-15
Jan-
16
Apr-
16
Jul-1
6
Oct
-16
Jan-
17
Apr-
17
Jul-1
7
Oct
-17
Jan-
18
Apr-
18
Jul-1
8
Oct
-18
Jan-
19
Apr-
19
Jul-1
9
Oct
-19
Jan-
20
(Jan
2015
=100
)
Meat and Meat Products Food
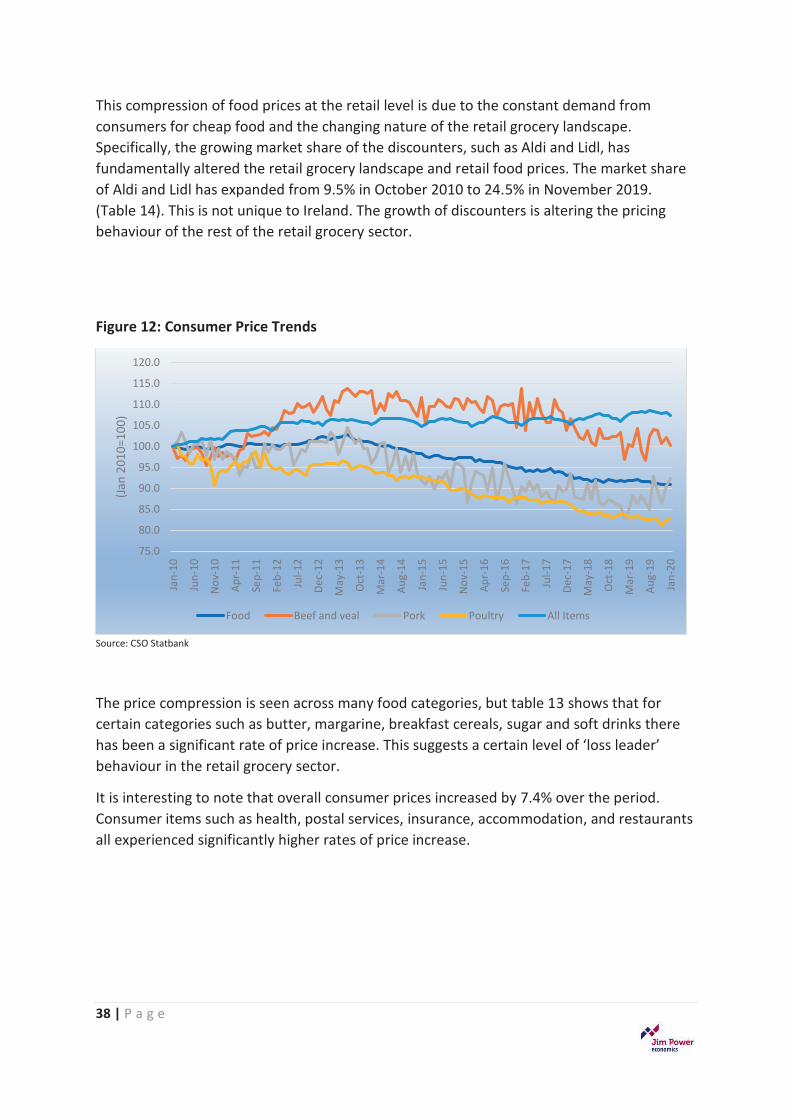
38 | P a g e
This compression of food prices at the retail level is due to the constant demand from consumers for cheap food and the changing nature of the retail grocery landscape. Specifically, the growing market share of the discounters, such as Aldi and Lidl, has fundamentally altered the retail grocery landscape and retail food prices. The market share of Aldi and Lidl has expanded from 9.5% in October 2010 to 24.5% in November 2019. (Table 14). This is not unique to Ireland. The growth of discounters is altering the pricing behaviour of the rest of the retail grocery sector.
Figure 12: Consumer Price Trends
Source: CSO Statbank
The price compression is seen across many food categories, but table 13 shows that for certain categories such as butter, margarine, breakfast cereals, sugar and soft drinks there has been a significant rate of price increase. This suggests a certain level of ‘loss leader’ behaviour in the retail grocery sector.
It is interesting to note that overall consumer prices increased by 7.4% over the period. Consumer items such as health, postal services, insurance, accommodation, and restaurants all experienced significantly higher rates of price increase.
75.0
80.0
85.0
90.0
95.0
100.0
105.0
110.0
115.0
120.0
Jan-
10
Jun-
10
Nov
-10
Apr-
11
Sep-
11
Feb-
12
Jul-1
2
Dec-
12
May
-13
Oct
-13
Mar
-14
Aug-
14
Jan-
15
Jun-
15
Nov
-15
Apr-
16
Sep-
16
Feb-
17
Jul-1
7
Dec-
17
May
-18
Oct
-18
Mar
-19
Aug-
19
Jan-
20
(Jan
2010
=100
)
Food Beef and veal Pork Poultry All Items
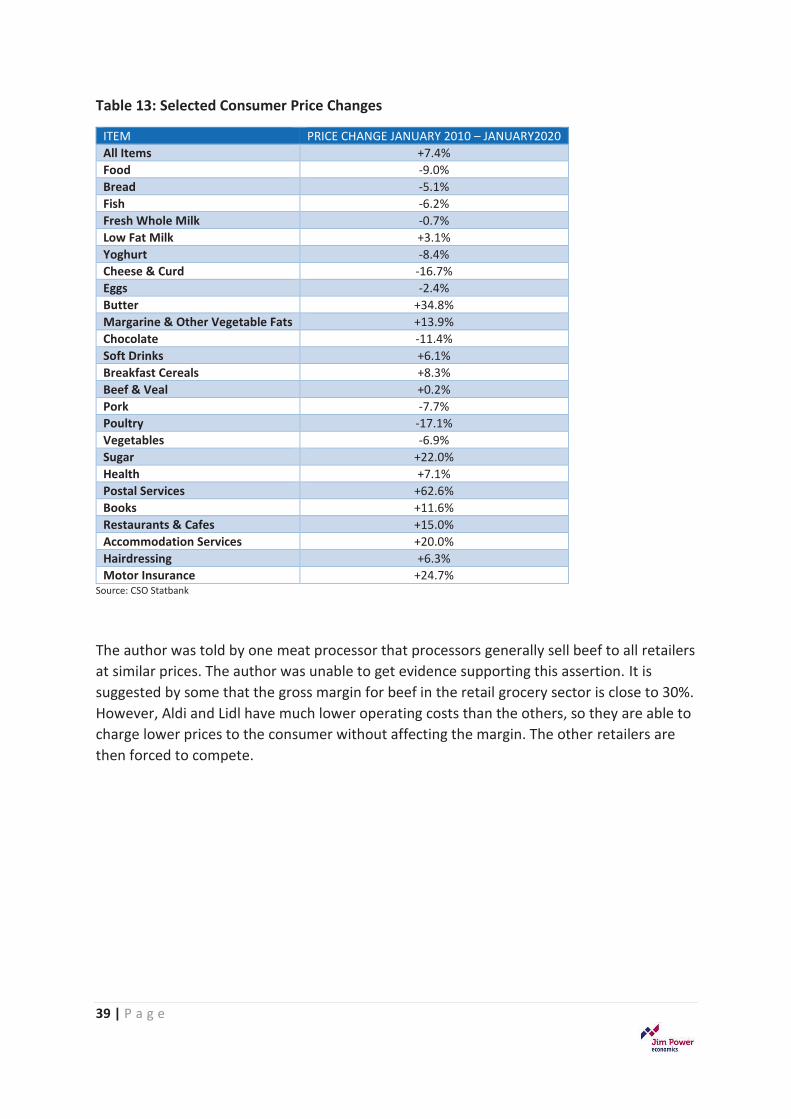
39 | P a g e
Table 13: Selected Consumer Price Changes
ITEM PRICE CHANGE JANUARY 2010 – JANUARY2020 All Items +7.4% Food -9.0% Bread -5.1% Fish -6.2% Fresh Whole Milk -0.7% Low Fat Milk +3.1% Yoghurt -8.4% Cheese & Curd -16.7% Eggs -2.4% Butter +34.8% Margarine & Other Vegetable Fats +13.9% Chocolate -11.4% Soft Drinks +6.1% Breakfast Cereals +8.3% Beef & Veal +0.2% Pork -7.7% Poultry -17.1% Vegetables -6.9% Sugar +22.0% Health +7.1% Postal Services +62.6% Books +11.6% Restaurants & Cafes +15.0% Accommodation Services +20.0% Hairdressing +6.3% Motor Insurance +24.7%
Source: CSO Statbank
The author was told by one meat processor that processors generally sell beef to all retailers at similar prices. The author was unable to get evidence supporting this assertion. It is suggested by some that the gross margin for beef in the retail grocery sector is close to 30%. However, Aldi and Lidl have much lower operating costs than the others, so they are able to charge lower prices to the consumer without affecting the margin. The other retailers are then forced to compete.
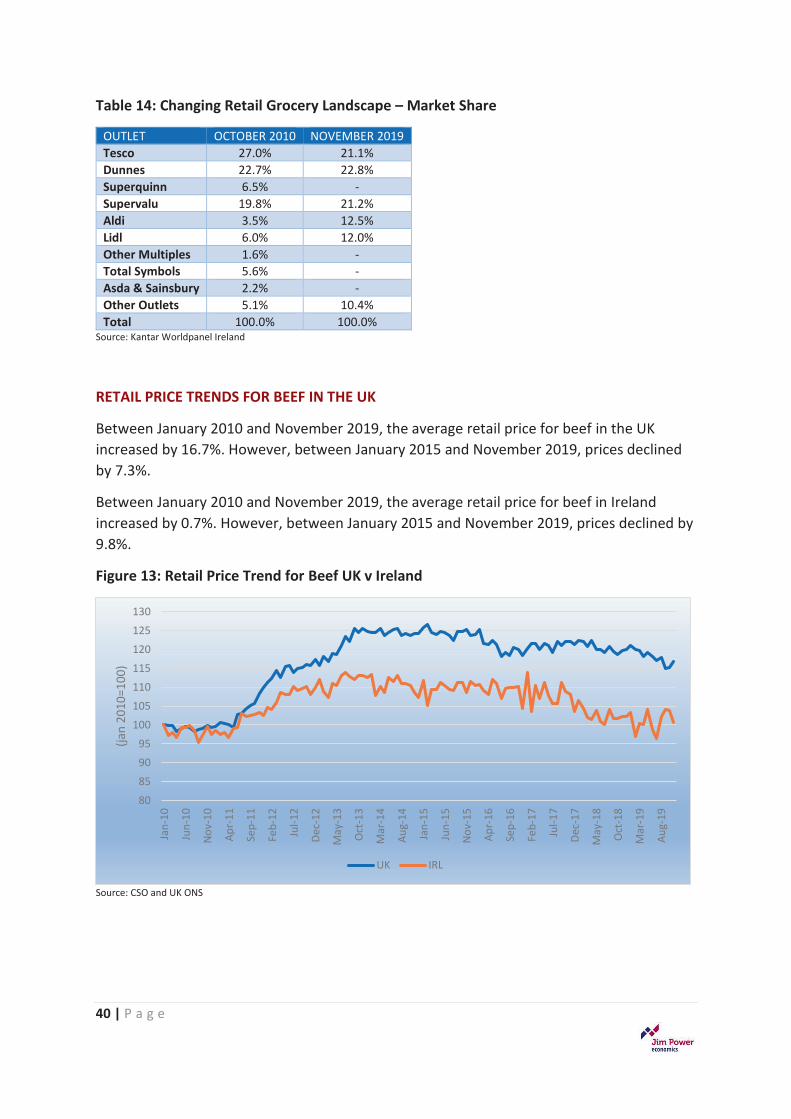
40 | P a g e
Table 14: Changing Retail Grocery Landscape – Market Share
OUTLET OCTOBER 2010 NOVEMBER 2019 Tesco 27.0% 21.1% Dunnes 22.7% 22.8% Superquinn 6.5% - Supervalu 19.8% 21.2% Aldi 3.5% 12.5% Lidl 6.0% 12.0% Other Multiples 1.6% - Total Symbols 5.6% - Asda & Sainsbury 2.2% - Other Outlets 5.1% 10.4% Total 100.0% 100.0%
Source: Kantar Worldpanel Ireland
RETAIL PRICE TRENDS FOR BEEF IN THE UK
Between January 2010 and November 2019, the average retail price for beef in the UK increased by 16.7%. However, between January 2015 and November 2019, prices declined by 7.3%.
Between January 2010 and November 2019, the average retail price for beef in Ireland increased by 0.7%. However, between January 2015 and November 2019, prices declined by 9.8%.
Figure 13: Retail Price Trend for Beef UK v Ireland
Source: CSO and UK ONS
80859095
100105110115120125130
Jan-
10
Jun-
10
Nov
-10
Apr-
11
Sep-
11
Feb-
12
Jul-1
2
Dec-
12
May
-13
Oct
-13
Mar
-14
Aug-
14
Jan-
15
Jun-
15
Nov
-15
Apr-
16
Sep-
16
Feb-
17
Jul-1
7
Dec-
17
May
-18
Oct
-18
Mar
-19
Aug-
19
(jan
2010
=100
)
UK IRL
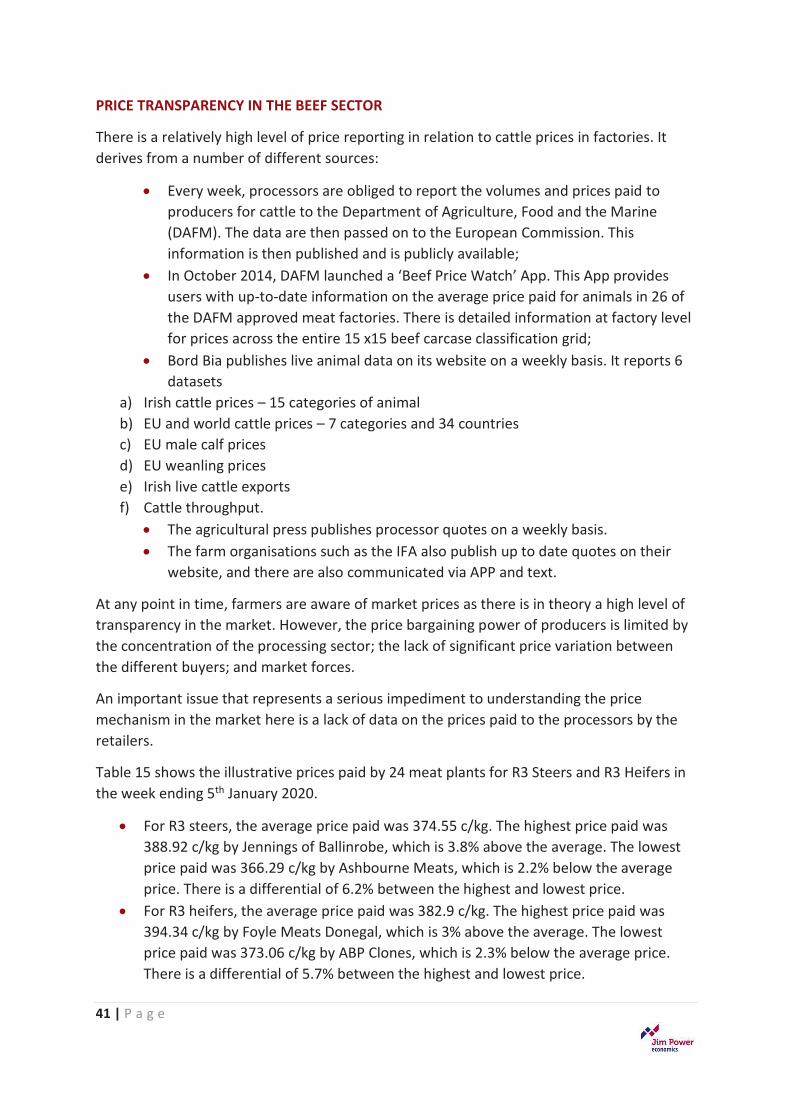
41 | P a g e
PRICE TRANSPARENCY IN THE BEEF SECTOR
There is a relatively high level of price reporting in relation to cattle prices in factories. It derives from a number of different sources:
x� Every week, processors are obliged to report the volumes and prices paid to producers for cattle to the Department of Agriculture, Food and the Marine (DAFM). The data are then passed on to the European Commission. This information is then published and is publicly available;
x� In October 2014, DAFM launched a ‘Beef Price Watch’ App. This App provides users with up-to-date information on the average price paid for animals in 26 of the DAFM approved meat factories. There is detailed information at factory level for prices across the entire 15 x15 beef carcase classification grid;
x� Bord Bia publishes live animal data on its website on a weekly basis. It reports 6 datasets
a)� Irish cattle prices – 15 categories of animal b)� EU and world cattle prices – 7 categories and 34 countries c)� EU male calf prices d)� EU weanling prices e)� Irish live cattle exports f)� Cattle throughput.
x� The agricultural press publishes processor quotes on a weekly basis. x� The farm organisations such as the IFA also publish up to date quotes on their
website, and there are also communicated via APP and text.
At any point in time, farmers are aware of market prices as there is in theory a high level of transparency in the market. However, the price bargaining power of producers is limited by the concentration of the processing sector; the lack of significant price variation between the different buyers; and market forces.
An important issue that represents a serious impediment to understanding the price mechanism in the market here is a lack of data on the prices paid to the processors by the retailers.
Table 15 shows the illustrative prices paid by 24 meat plants for R3 Steers and R3 Heifers in the week ending 5th January 2020.
x� For R3 steers, the average price paid was 374.55 c/kg. The highest price paid was 388.92 c/kg by Jennings of Ballinrobe, which is 3.8% above the average. The lowest price paid was 366.29 c/kg by Ashbourne Meats, which is 2.2% below the average price. There is a differential of 6.2% between the highest and lowest price.
x� For R3 heifers, the average price paid was 382.9 c/kg. The highest price paid was 394.34 c/kg by Foyle Meats Donegal, which is 3% above the average. The lowest price paid was 373.06 c/kg by ABP Clones, which is 2.3% below the average price. There is a differential of 5.7% between the highest and lowest price.
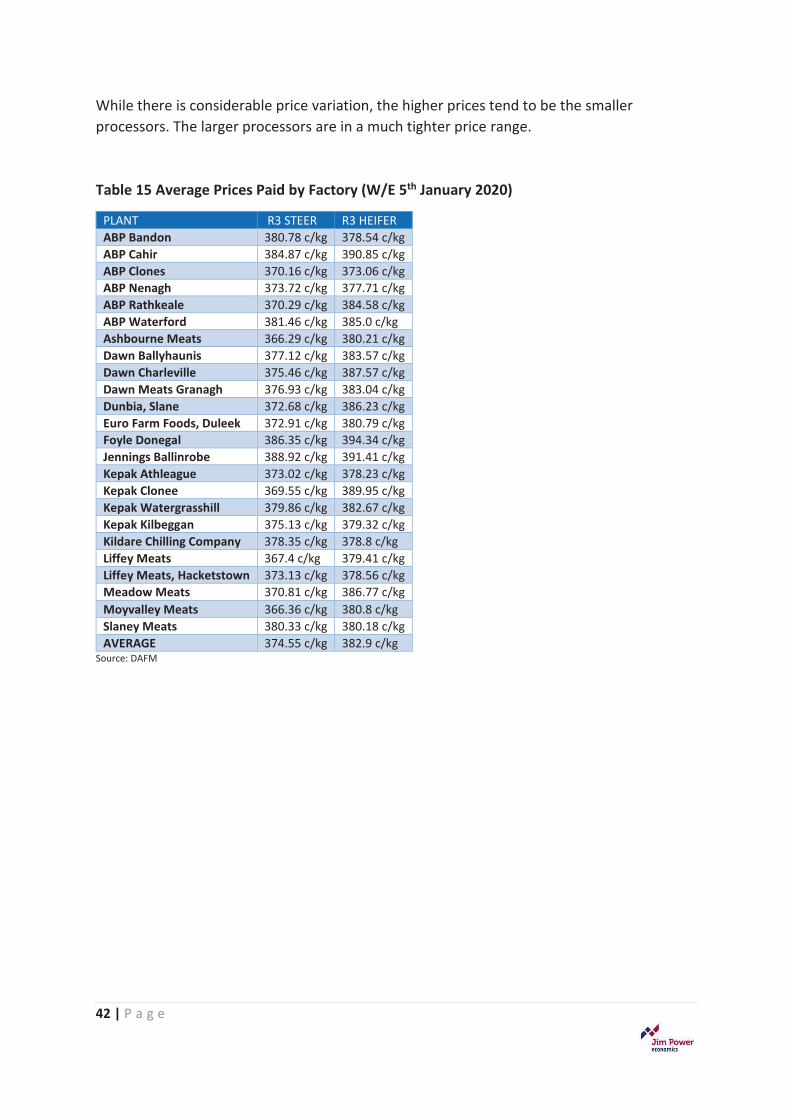
42 | P a g e
While there is considerable price variation, the higher prices tend to be the smaller processors. The larger processors are in a much tighter price range.
Table 15 Average Prices Paid by Factory (W/E 5th January 2020)
PLANT R3 STEER R3 HEIFER ABP Bandon 380.78 c/kg 378.54 c/kg ABP Cahir 384.87 c/kg 390.85 c/kg ABP Clones 370.16 c/kg 373.06 c/kg ABP Nenagh 373.72 c/kg 377.71 c/kg ABP Rathkeale 370.29 c/kg 384.58 c/kg ABP Waterford 381.46 c/kg 385.0 c/kg Ashbourne Meats 366.29 c/kg 380.21 c/kg Dawn Ballyhaunis 377.12 c/kg 383.57 c/kg Dawn Charleville 375.46 c/kg 387.57 c/kg Dawn Meats Granagh 376.93 c/kg 383.04 c/kg Dunbia, Slane 372.68 c/kg 386.23 c/kg Euro Farm Foods, Duleek 372.91 c/kg 380.79 c/kg Foyle Donegal 386.35 c/kg 394.34 c/kg Jennings Ballinrobe 388.92 c/kg 391.41 c/kg Kepak Athleague 373.02 c/kg 378.23 c/kg Kepak Clonee 369.55 c/kg 389.95 c/kg Kepak Watergrasshill 379.86 c/kg 382.67 c/kg Kepak Kilbeggan 375.13 c/kg 379.32 c/kg Kildare Chilling Company 378.35 c/kg 378.8 c/kg Liffey Meats 367.4 c/kg 379.41 c/kg Liffey Meats, Hacketstown 373.13 c/kg 378.56 c/kg Meadow Meats 370.81 c/kg 386.77 c/kg Moyvalley Meats 366.36 c/kg 380.8 c/kg Slaney Meats 380.33 c/kg 380.18 c/kg AVERAGE 374.55 c/kg 382.9 c/kg
Source: DAFM
43 | P a g e
SECTION 6
THE STRUCTURE OF THE BEEF PROCESSING SECTOR
THE BEEF SUPPLY CHAIN
Approximately 85% to 90% of the cattle produced in Ireland are slaughtered in Ireland. The remainder are exported as live cattle.
The supply chain process for slaughtered cattle is typically as follows:
x� Cattle are born and reared by the farmer or sold to other farmers as weanlings and stores;
x� They are then brought to an abattoir/slaughterhouse either directly by the farmer or through an agent who buys on behalf of the processor;
x� The cattle are slaughtered and the carcass is de-boned to produce various cuts of beef as well as other material such as the offal and other by-products. Depending on the business model, the de-boning may take place in the factory where the cattle are slaughtered, at another processor’s plant or at a separate boning hall, which does not slaughter cattle;
x� Cuts of beef are sent to manufacturers of beef products for further processing, or are further processed into smaller cuts for the retail trade or the food service sector. This can be done by the processor, a butcher, or by an intermediary on behalf of a retailer.
x� The beef is then sold in the domestic market or exported to external markets. x� The by-product materials (the 5th Quarter) are what remains after meat has been
removed for human consumption. Some of these by-products can be used for non-human food purposes such as pet food or leather. However, there is a growing international market for parts of the animal that would not traditionally have been used for human consumption, such as eyes and testicles. The remainder is then rendered through a process of heat and pressure treatment to produce fats, proteins and tallow.
x� The by-product material that is classified as high risk, may then be incinerated or some other processes that are approved for destruction of high-risk products. This can represent an extra cost to the factories.
Farmers tend to be the source of a large proportion of animals supplied to processors, somewhere in the region of 90% to 95%. Processors typically buy the cattle directly from farmers through their procurement team. There are generally no written contracts between farmers and processors and the transaction tends to be a spot business, where prices can change from day to day.
44 | P a g e
Agents
Self-employed Cattle Agents can act as an intermediary in the supply chain. Agents are paid a fee by the processor to procure cattle for slaughter; they act as an intermediary to agree a price for the cattle; they may arrange transportation; but they do not take ownership of the cattle. Some agents work exclusively for a single processor, while others act on behalf of a number of different processors. Most agents effectively work for the processors.
Livestock Marts
The livestock marts play a significant role in the overall beef supply chain, as they facilitate a market for calves, weanlings and stores. There are currently 74 livestock marts in the Republic of Ireland.
Producer Groups
There are also producer groups in the Irish beef supply chain. This is a collection of individual farmers who sell cattle individually but have collectively agreed a bonus with the processor. The individual cattle producer forecasts the amount of cattle that they intend to supply per month for the coming year and in return the processor agrees to pay a bonus for the cattle supplied. The individual farmers within the producer group are not contractually bound to sell to the processor on the terms and conditions agreed, and price negotiations are generally the same as with individual farmers. The difference is the additional bonus paid. Producer Groups are not the same as Producer Organisations.
MARKET STRUCTURE OF THE PROCESSING SECTOR
Meat Industry Ireland (MII) is the IBEC sector association that represents the beef, lamb, pigmeat and poultry processing sectors in Ireland. According to MIIxvii, approximately 15,000 jobs are directly provided by the processing sector, but many more jobs are supported in transport, distribution and various services. The sector has a broad regional and rural footprint and is an important contributor to rural economic activity and employment.
In 2018, the industry processed 1.8 million cattle and exported 579,000 tonnes of beef, valued at around €2.5 billion.
Data on market share within the beef processing sector is difficult to verify. In its judgement on the joint acquisition of Slaney Foods JV and Slaney Proteins by ABP Group and Fane Valley, the European Commission produced data based on estimates provided by the notifying parties.
In 2015, the combined ABP/Slaney entity estimated to have around 20-30% of the market; Dawn and Kepak 1-20% each; Liffey, Kildare and Dunbia 5-10% each.
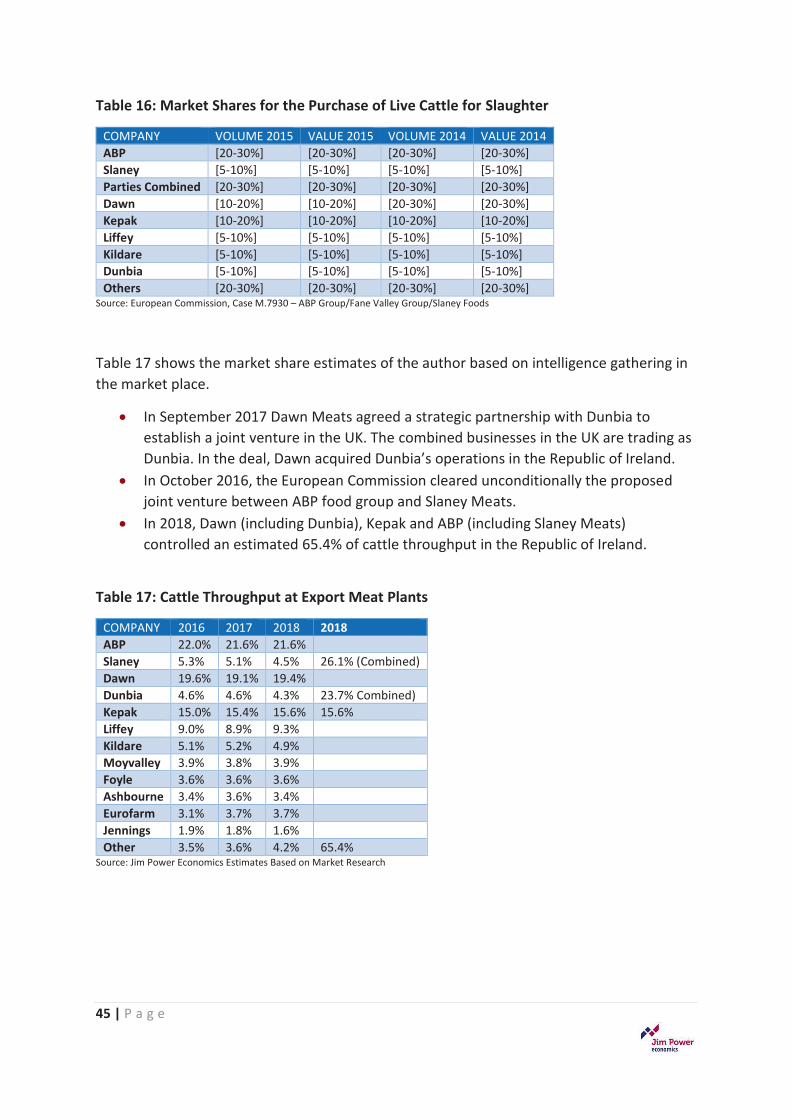
45 | P a g e
Table 16: Market Shares for the Purchase of Live Cattle for Slaughter
COMPANY VOLUME 2015 VALUE 2015 VOLUME 2014 VALUE 2014 ABP [20-30%] [20-30%] [20-30%] [20-30%] Slaney [5-10%] [5-10%] [5-10%] [5-10%] Parties Combined [20-30%] [20-30%] [20-30%] [20-30%] Dawn [10-20%] [10-20%] [20-30%] [20-30%] Kepak [10-20%] [10-20%] [10-20%] [10-20%] Liffey [5-10%] [5-10%] [5-10%] [5-10%] Kildare [5-10%] [5-10%] [5-10%] [5-10%] Dunbia [5-10%] [5-10%] [5-10%] [5-10%] Others [20-30%] [20-30%] [20-30%] [20-30%]
Source: European Commission, Case M.7930 – ABP Group/Fane Valley Group/Slaney Foods
Table 17 shows the market share estimates of the author based on intelligence gathering in the market place.
x� In September 2017 Dawn Meats agreed a strategic partnership with Dunbia to establish a joint venture in the UK. The combined businesses in the UK are trading as Dunbia. In the deal, Dawn acquired Dunbia’s operations in the Republic of Ireland.
x� In October 2016, the European Commission cleared unconditionally the proposed joint venture between ABP food group and Slaney Meats.
x� In 2018, Dawn (including Dunbia), Kepak and ABP (including Slaney Meats) controlled an estimated 65.4% of cattle throughput in the Republic of Ireland.
Table 17: Cattle Throughput at Export Meat Plants
COMPANY 2016 2017 2018 2018 ABP 22.0% 21.6% 21.6% Slaney 5.3% 5.1% 4.5% 26.1% (Combined) Dawn 19.6% 19.1% 19.4% Dunbia 4.6% 4.6% 4.3% 23.7% Combined) Kepak 15.0% 15.4% 15.6% 15.6% Liffey 9.0% 8.9% 9.3% Kildare 5.1% 5.2% 4.9% Moyvalley 3.9% 3.8% 3.9% Foyle 3.6% 3.6% 3.6% Ashbourne 3.4% 3.6% 3.4% Eurofarm 3.1% 3.7% 3.7% Jennings 1.9% 1.8% 1.6% Other 3.5% 3.6% 4.2% 65.4%
Source: Jim Power Economics Estimates Based on Market Research
46 | P a g e
It is clear that the beef processing sector is highly concentrated and that competition is limited in the market. The Competition and Consumer Protection Commission (CCPC) has stated that there is no evidence of a cartel at work in the beef industry. In 2016 the CCPC received one complaint; four in 2017 and one in 2018. There was insufficient evidence to open a full investigation, as it was viewed that there was not enough evidence that a cartel was in existence. It pointed out that in markets that are very transparent, prices do tend to converge at a market level.
Despite this assertion from the CCPC, many farmers are convinced that there is collusion. Indeed, in the compilation of this report, the author heard many assertions about collusive behaviour, but they were not able to produce hard evidence. If such evidence exists, the CCPC has the power to investigate.
The CCPC is an independent statutory body with a dual mandate to enforce competition and consumer protection law in Ireland. Its mission is to use its knowledge, skills and statutory powers to promote competition and enhance consumer welfare. Its vision is to have open and competitive markets where consumers are protected and businesses actively compete. There is a belief amongst many farmers that the CCPC has too much focus on consumers and not enough on producers. This is the role that the CCPC has been given in law. However, the producer needs to be given greater importance in its considerations, in line with that attaching to the consumer.
To address the deep disquiet of farmers about collusive behaviour, it would be worthwhile for the CCPC to launch a full investigation into the processing industry. This would help restore trust in the overall beef sector.
Organic Beef Processing
Producers of organic beef have serious concerns about the level of competition and concentration in the organic beef processing sector. At present there are only two main purchasers of Irish beef and one stakeholder is the majority shareholder in both. The two main processors for organic cattle are Good Herdsman and ABP. ABP has built up a large percentage ownership in Good Herdsmen, and organic beef farmers believe that there is no competition in the sector and farmers are suffering as a consequence.
Organic producers believe that due to the lack of competition, organic animals are ending up in conventional channels, mixed in with the conventionally produced animals, with the result that no price premium is received to cover the extra costs of production. As a consequence, organic beef farming in Ireland is seriously lagging behind the rest of the EU.
47 | P a g e
CONCLUDING COMMENTS
The beef processing sector in Ireland is very concentrated and has become increasingly concentrated over the years. There is an inevitability about such a trend, because the economies of scale in beef processing are very significant and the capital investment required acts as a barrier to entry.
There is a total lack of transparency in relation to the processing sector due to the fact that they are private businesses and do not publish accounts. It appears that significant profits are driven by the volume of throughput, rather than by wide margins.
Beef processing is a contestable market, so if wide margins were available, more competitors would come into the market. This is not happening and in fact the sector is consolidating rather than expanding. The question arises that if beef processing is so profitable, then why have we not seen the emergence of successful and sustainable farmer beef co-operatives?
There is a high level of price transparency in relation to cattle prices, but there is no information available on the prices paid to processors by retailers and other customers. This is creating considerable mistrust and allegations. It is in the interests of the whole industry to provide detailed information.
The consultancy firm Grant Thornton has been commissioned as part of the Beef Taskforce to carry out an independent review of market and consumer requirements, especially in relation to whether there is a strong relationship between consumer demands and in-spec bonus criteria.
Grant Thornton will also seek to map the supply chain for Irish beef, in an effort to identify benchmark price points at various stages along the supply chain for component parts and into each market segment. The success of this exercise will be totally dependent on commercially sensitive data being made available to the consultant.
To bring more trust into the beef supply chain and eliminate much of the damaging confrontation in the sector, a much greater level of transparencty is essential. The creation of a beef price index by Bord Bia, the attendance of retailers at the Beef Taskforce talks, and the consultancy work being carried out by Grant Thornton do represent steps in the right direction, but the task of rebuilding trust in the sector is an immense one.
48 | P a g e
SECTION 7
STRENGTHENING THE POSITION OF FARMERS IN THE SUPPLY CHAIN
WEAK POSITION OF FARMERS IN SUPPLY CHAIN
Farming is a reasonably close approximation of a ‘perfect competition’ market structure – there is a large number of similar producers selling a very similar product; individual farmers have no pricing power and are effectively price takers; the EU and global markets effectively determines prices; there is quite a lot of information on prices and market intelligence in the public domain; and profit margins are generally quite thin with no scope for supernormal profits.
In an Irish context, there are over 100,000 farms with specialist or mixed beef systems. Those farmers are dealing in a marketplace where 3 retail grocery multiples control 64.5% of the retail grocery market and 2 discounters control a further 24.7% of the market. On the processing size, three groups now control 65.4% of the market. While over 90% of Irish beef is exported, this export market is dominated by a small number of processors. Hence it is clear that Irish beef farmers are operating in a very concentrated supply chain, and they represent the part of the chain with the least power. This market reality is not unique to Ireland.
There are 11 million farmers in the EU, many of whom are operating from small family farms and operate independently of each other. They are selling into a market where there is a far high concentration amongst both processors and retailers. This imbalanced market structure means that farmers have very little negotiating power in the supply chain.
In recognition of these realities, the European Commission is seeking to strengthen the position of farmers in the supply chain. The EU initiatives include Omnibus Regulation which increases legal certainty for producer organisations (POs) and associations of producer organisations (APOs); the adoption of a directive on unfair trading practices; measures to increase market transparency; and CAP reform which includes sectoral interventions.
PRODUCER AND INTERBRANCH ORGANISATIONS
In recognition of market realities in the supply chain, the EU is supporting farmers who wish to work together in producer organisations. The EU also supports those farmers who wish to work with their partners from the manufacturing and trading side of the food supply chain as part of what are known as ‘interbranch organisations’.
Regulation 1308/2013 acknowledges the role of producer organisations (POs), associations of producer organisations (APOs) and interbranch organisations (IBOs) in strengthening the position of producers and positively impacting the functioning of food chains.
49 | P a g e
The EU believes that POs or APOs can become important players in the food supply chain. By working together, farmers can reduce transaction costs and collaborate when processing and marketing their products.
As a general rule, EU competition law prohibits agreements between two or more independent market operators which restrict competition. For example, such prohibitions would include agreements to limit or control production markets, technical development, investment or sources of supply. However, there are exemptions from the general competition rules for farmers as part of the regulation on common market organisation.
The EUxviii contention is that producer organisations strengthen the collective bargaining power of farmers in a number of ways:
x� Concentrating supply; x� Improving marketing; x� Providing technical and logistical assistance to their members; x� Helping with quality management; x� Transferring knowledge.
In recognition of the potential contribution that producer organisations can make in what is a very imbalanced market, the EU requires producer organisations to ask for recognition from the EU country that they are based in. They can take many different forms, including agricultural co-operatives.
Once recognised, POs can benefit in a number of ways:
x� Exemptions from EU competition rules for certain activities, such as collective negotiations on behalf of their members, planning of production or for certain supply management measures;
x� In the fruit and vegetables sector, access to EU funding within operational programmes such as supporting collective investment in logistics to the benefit of their members.
In order to be recognised, a producer organisation in any agricultural sector must:
x� Have been set up on the initiative of producers; x� Be made up of and controlled by producers of a specific agricultural sector; x� File a request with the EU country it is based in; x� Carry out at least one of the activities listed by EU law, such as joint processing,
distribution, transportation or packaging; x� Follow at least one of the specific aims mentioned in agricultural legislation, such
as optimising production costs or developing initiatives in the area of promotion or marketing.
They also may have to have a minimum number of members and/or covering a minimum volume or value of products.
50 | P a g e
POs are entitled to a range of supports under the CAP. In 2017, there were around 3,400 recognised POs in the EU. Knowledge of POs in Ireland is not high, but two beef POs have now been registered in Ireland.
The European Commission is moving to progress the effectiveness of POs and to protect the position of farmers in the supply chain. On 1st January 2018, the Omnibus Regulation moved to increase the legal certainty for POs and APOs.
DIRECTIVE ON UNFAIR TRADING PRACTICES
In April 2019, the Commission adopted the Directive on Unfair Trading Practices in the Agri-food supply chain. In addition, a key ongoing part of the EU’s agenda is to push measures that will increase transparency in the market and the supply chain.
The Directive on Unfair Trading Practices was adopted in April 2019. It is intended that it should be transposed into national law 24 months after entry into force. It gets its legal basis under Article 43 TFEU.
The Directive seeks to protect weaker suppliers against stronger buyers (B2B) against UFPs (Unfair Trading Practices) occurring in the food supply chain.
The proposal from the EU Commission distinguishes between black and grey UTPs. Black UTPs are prohibited, whatever the circumstances, while grey UTPs are prohibited if the parties do not clearly and unambiguously agree beforehand.
Black UTPs prohibited include the following:
x� Payments later than 30 days for perishable agricultural and food products; x� Payment later than 60 days for other agri-food products; x� Short-notice cancellations of perishable agri-food products; x� Unilateral contract changes by the buyer; x� Money not related to a specific transaction; x� Risk of loss and deterioration transferred to the supplier; x� Refusal of a written confirmation of a supply agreement by the buyer, despite
request of the supplier; x� Misuse of trade secrets by the buyer; x� Commercial retaliation by the buyer; x� Transferring the costs of examining customer complaints to the supplier.
Grey UTPs prohibited include the following:
x� Unsold products; x� Payment of the supplier for stocking, display and listing; x� Payment of the supplier for promotion; x� Payment of the supplier for marketing; x� Payment of the supplier for advertising; x� Payment of the supplier for staff of the buyer or for the fitting out premises.
51 | P a g e
THE CONTEXT FOR IRELAND
Irish farmers are dealing with a marketplace where retailers and processors have considerable market power. The IFA has registered with DAFM as an approved beef producer organisation facilitator and is available to assist any group of farmer members who wish to set up a producer organisation in any sector.
Following an IFA seminar held in February 2019, the IFA wrote to the Minister for Agriculture, Food and the Marine pointing out that the rules around POs were too complex and that the funding was insufficient. These issues need to be addressed to make them more attractive to farmers.
The first two producer organisations were set up in September 2019. The POs will seek to negotiate with processors and others on behalf of members and no member will be permitted to sell cattle that fall within the relevant category, other than through the PO.
Producer Organisations are not the panacea for all of the ills befalling the primary producers of beef, but they do offer farmers some potential for greater control over the product that they produce. However, at the end of the day, the price that retailers will pay whoever supplies the beef will be determined by competitive forces in the marketplace and the willingness of consumers to pay higher prices for food. This willingness is not high at the moment.
52 | P a g e
SECTION 8
THE TERMS OF REFERENCE
There are six key items included the terms of reference for this study, as follows:
(1)�The impact on livestock farmers’ incomes of recent CAP policy changes and reforms: (2)�A Beef Price Index; (3)�Factory Feedlots; (4)�Specification requirements; (5)�Oversight; and (6)�Brexit.
THE COMMON AGRICULTURAL POLICY (CAP)
The EU intervenes in agricultural markets through the CAP. The objectives of the CAP are outlined in the Treaty of European Union and are as follows:
x� To increase agricultural productivity by promoting technical progress and by ensuring the rational development of agricultural production and the optimum utilisation of all factors of production, particularly labour;
x� To ensure a fair standard of living for the agricultural community, in particular by increasing the individual earnings of persons engaged in agriculture;
x� To stabilise markets; x� To provide certainty of supplies; and x� To ensure that supplies reach consumers at reasonable prices.
EVOLUTION OF CAP
The original CAP was based on market interventions, including import tariffs, market intervention to support prices, and export subsidies. The CAP has subsequently evolved in a very different direction. The following are some of the key milestones;
1992 McSharry Reforms x� That reform can be viewed as a watershed, marking the transition from an era of
major dependence on price and market support as a basis of underpinning farm incomes to an era characterised by a lower price regime and direct payments.
Agenda 2000 Agreement x� It emphasised the crucial importance of compensatory/direct payments in farm
income formation and conditional on the protection of the environment. x� The agreement also included a strengthening of structural, environmental and rural
development policies and their incorporation into a ’Second Pillar’ tasked with responsibility for rural development and the multi-functionality of farming.
x� ‘Modulation’ was also introduction on a discretionary basis whereby funds could be transferred from Pillar 1(market support and direct payments) to rural development
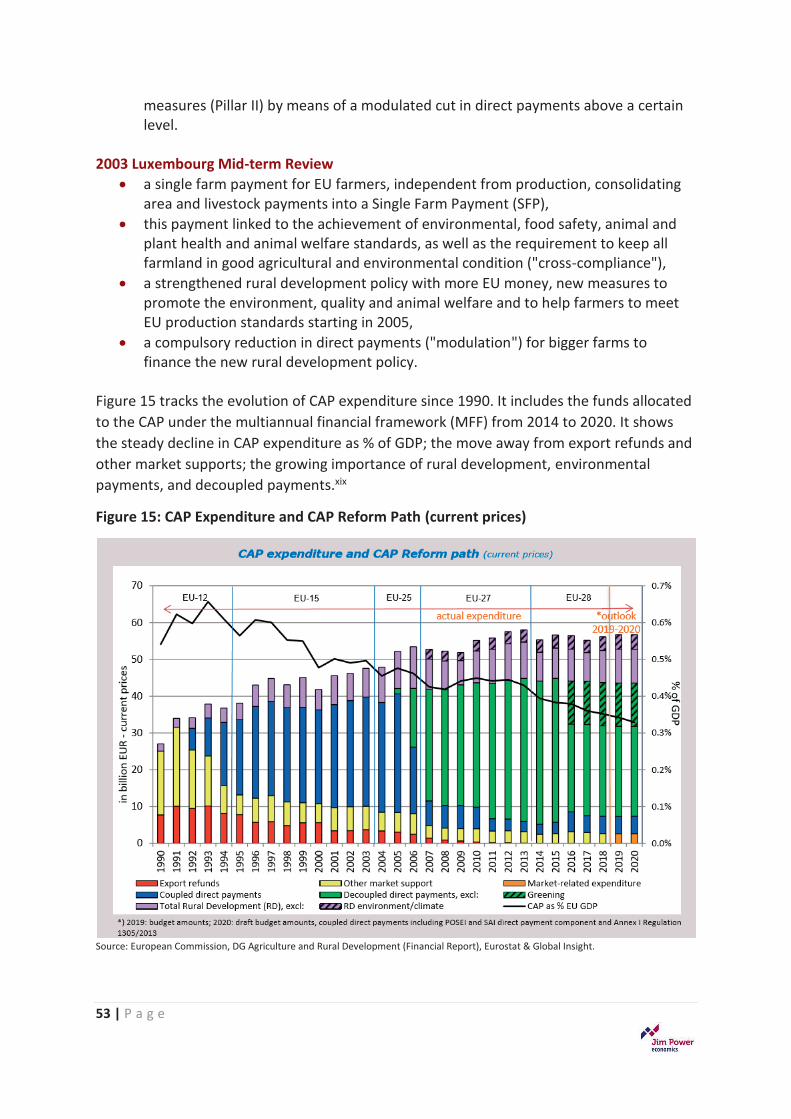
53 | P a g e
measures (Pillar II) by means of a modulated cut in direct payments above a certain level.
2003 Luxembourg Mid-term Review x� a single farm payment for EU farmers, independent from production, consolidating
area and livestock payments into a Single Farm Payment (SFP), x� this payment linked to the achievement of environmental, food safety, animal and
plant health and animal welfare standards, as well as the requirement to keep all farmland in good agricultural and environmental condition ("cross-compliance"),
x� a strengthened rural development policy with more EU money, new measures to promote the environment, quality and animal welfare and to help farmers to meet EU production standards starting in 2005,
x� a compulsory reduction in direct payments ("modulation") for bigger farms to finance the new rural development policy.
Figure 15 tracks the evolution of CAP expenditure since 1990. It includes the funds allocated to the CAP under the multiannual financial framework (MFF) from 2014 to 2020. It shows the steady decline in CAP expenditure as % of GDP; the move away from export refunds and other market supports; the growing importance of rural development, environmental payments, and decoupled payments.xix
Figure 15: CAP Expenditure and CAP Reform Path (current prices)
Source: European Commission, DG Agriculture and Rural Development (Financial Report), Eurostat & Global Insight.
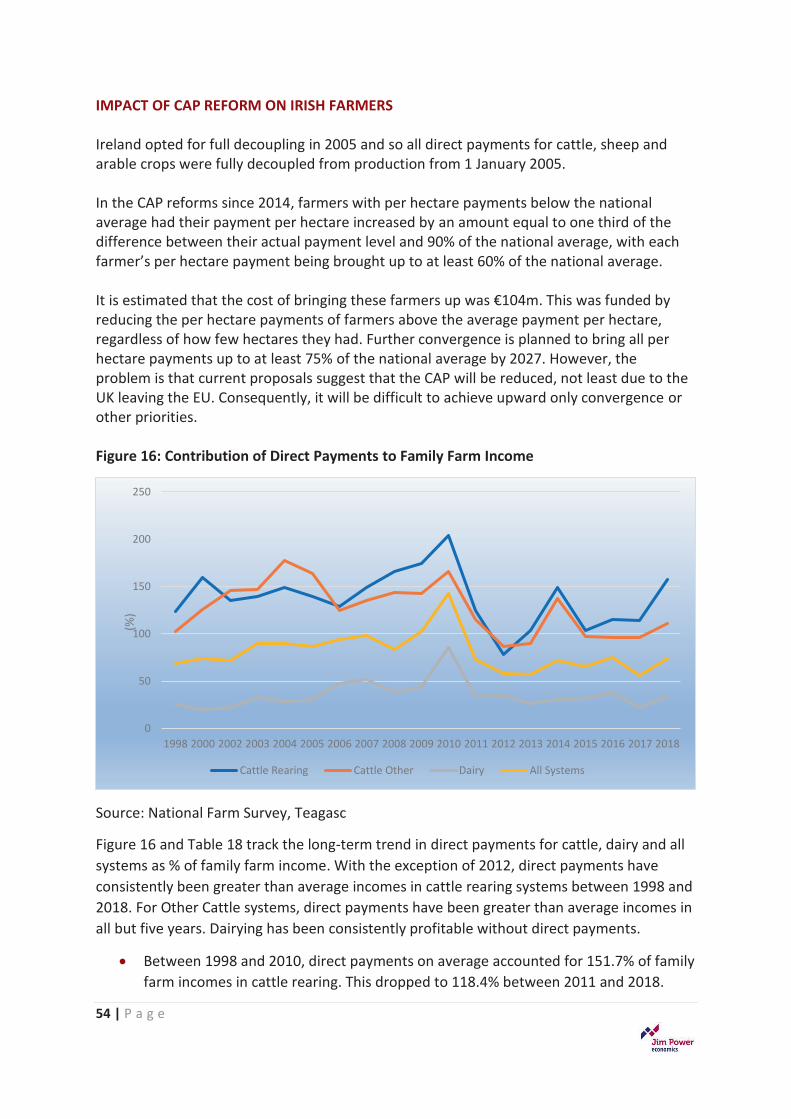
54 | P a g e
IMPACT OF CAP REFORM ON IRISH FARMERS Ireland opted for full decoupling in 2005 and so all direct payments for cattle, sheep and arable crops were fully decoupled from production from 1 January 2005. In the CAP reforms since 2014, farmers with per hectare payments below the national average had their payment per hectare increased by an amount equal to one third of the difference between their actual payment level and 90% of the national average, with each farmer’s per hectare payment being brought up to at least 60% of the national average. It is estimated that the cost of bringing these farmers up was €104m. This was funded by reducing the per hectare payments of farmers above the average payment per hectare, regardless of how few hectares they had. Further convergence is planned to bring all per hectare payments up to at least 75% of the national average by 2027. However, the problem is that current proposals suggest that the CAP will be reduced, not least due to the UK leaving the EU. Consequently, it will be difficult to achieve upward only convergence or other priorities. Figure 16: Contribution of Direct Payments to Family Farm Income
Source: National Farm Survey, Teagasc
Figure 16 and Table 18 track the long-term trend in direct payments for cattle, dairy and all systems as % of family farm income. With the exception of 2012, direct payments have consistently been greater than average incomes in cattle rearing systems between 1998 and 2018. For Other Cattle systems, direct payments have been greater than average incomes in all but five years. Dairying has been consistently profitable without direct payments.
x� Between 1998 and 2010, direct payments on average accounted for 151.7% of family farm incomes in cattle rearing. This dropped to 118.4% between 2011 and 2018.
0
50
100
150
200
250
1998 2000 2002 2003 2004 2005 2006 2007 2008 2009 2010 2011 2012 2013 2014 2015 2016 2017 2018
(%)
Cattle Rearing Cattle Other Dairy All Systems
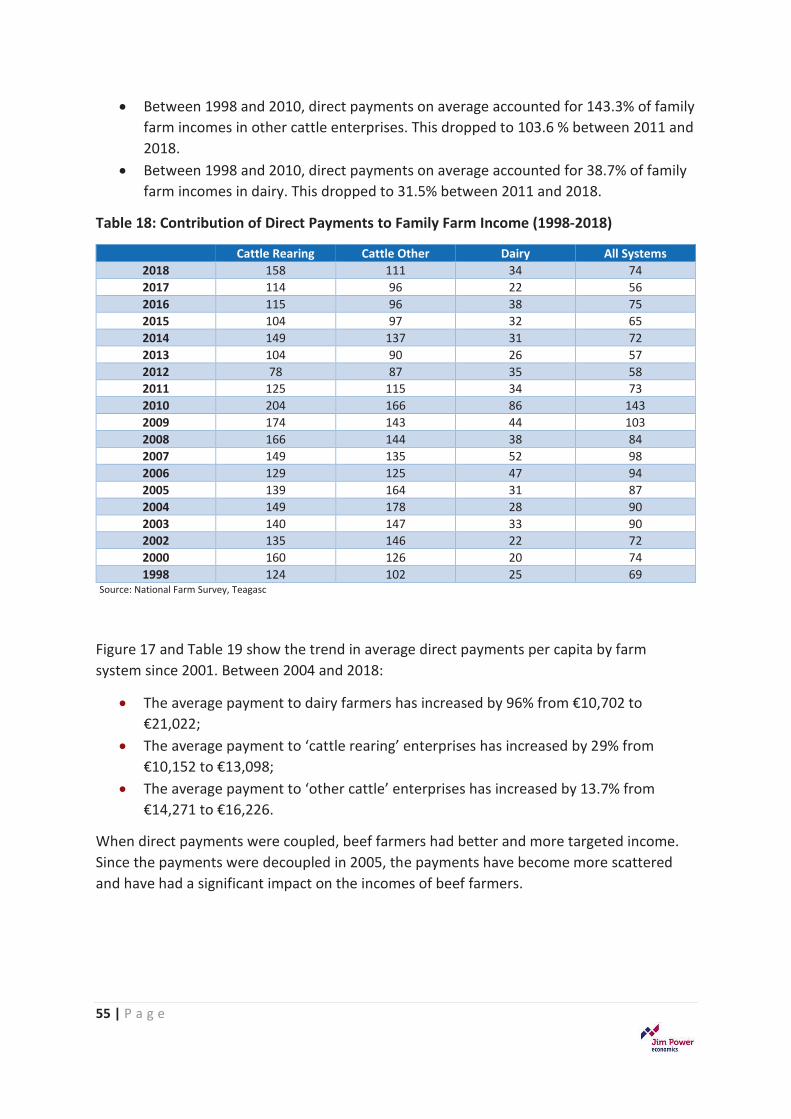
55 | P a g e
x� Between 1998 and 2010, direct payments on average accounted for 143.3% of family farm incomes in other cattle enterprises. This dropped to 103.6 % between 2011 and 2018.
x� Between 1998 and 2010, direct payments on average accounted for 38.7% of family farm incomes in dairy. This dropped to 31.5% between 2011 and 2018.
Table 18: Contribution of Direct Payments to Family Farm Income (1998-2018)
Cattle Rearing Cattle Other Dairy All Systems 2018 158 111 34 74 2017 114 96 22 56 2016 115 96 38 75 2015 104 97 32 65 2014 149 137 31 72 2013 104 90 26 57 2012 78 87 35 58 2011 125 115 34 73 2010 204 166 86 143 2009 174 143 44 103 2008 166 144 38 84 2007 149 135 52 98 2006 129 125 47 94 2005 139 164 31 87 2004 149 178 28 90 2003 140 147 33 90 2002 135 146 22 72 2000 160 126 20 74 1998 124 102 25 69
�Source: National Farm Survey, Teagasc
Figure 17 and Table 19 show the trend in average direct payments per capita by farm system since 2001. Between 2004 and 2018:
x� The average payment to dairy farmers has increased by 96% from €10,702 to €21,022;
x� The average payment to ‘cattle rearing’ enterprises has increased by 29% from €10,152 to €13,098;
x� The average payment to ‘other cattle’ enterprises has increased by 13.7% from €14,271 to €16,226.
When direct payments were coupled, beef farmers had better and more targeted income. Since the payments were decoupled in 2005, the payments have become more scattered and have had a significant impact on the incomes of beef farmers.
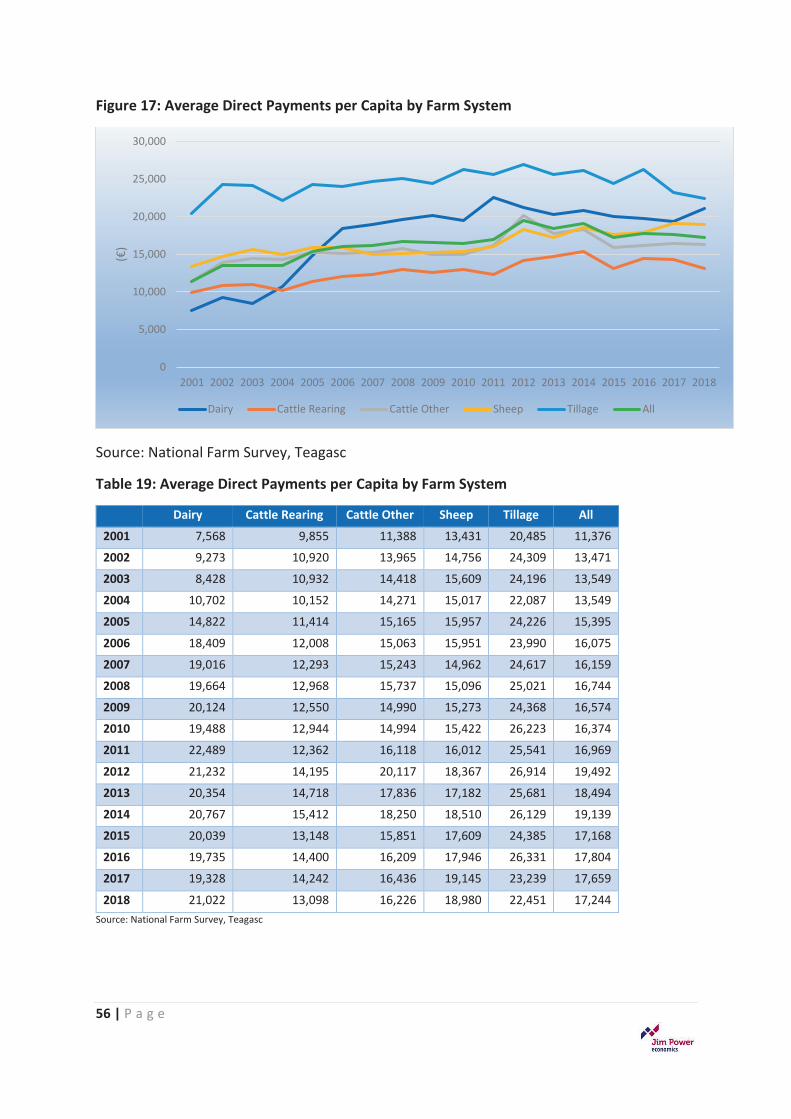
56 | P a g e
Figure 17: Average Direct Payments per Capita by Farm System
Source: National Farm Survey, Teagasc
Table 19: Average Direct Payments per Capita by Farm System �
Dairy Cattle Rearing Cattle Other Sheep Tillage All
2001 7,568 9,855 11,388 13,431 20,485 11,376
2002 9,273 10,920 13,965 14,756 24,309 13,471
2003 8,428 10,932 14,418 15,609 24,196 13,549
2004 10,702 10,152 14,271 15,017 22,087 13,549
2005 14,822 11,414 15,165 15,957 24,226 15,395
2006 18,409 12,008 15,063 15,951 23,990 16,075
2007 19,016 12,293 15,243 14,962 24,617 16,159
2008 19,664 12,968 15,737 15,096 25,021 16,744
2009 20,124 12,550 14,990 15,273 24,368 16,574
2010 19,488 12,944 14,994 15,422 26,223 16,374
2011 22,489 12,362 16,118 16,012 25,541 16,969
2012 21,232 14,195 20,117 18,367 26,914 19,492
2013 20,354 14,718 17,836 17,182 25,681 18,494
2014 20,767 15,412 18,250 18,510 26,129 19,139
2015 20,039 13,148 15,851 17,609 24,385 17,168
2016 19,735 14,400 16,209 17,946 26,331 17,804
2017 19,328 14,242 16,436 19,145 23,239 17,659
2018 21,022 13,098 16,226 18,980 22,451 17,244 Source: National Farm Survey, Teagasc
0
5,000
10,000
15,000
20,000
25,000
30,000
2001 2002 2003 2004 2005 2006 2007 2008 2009 2010 2011 2012 2013 2014 2015 2016 2017 2018
(€)
Dairy Cattle Rearing Cattle Other Sheep Tillage All
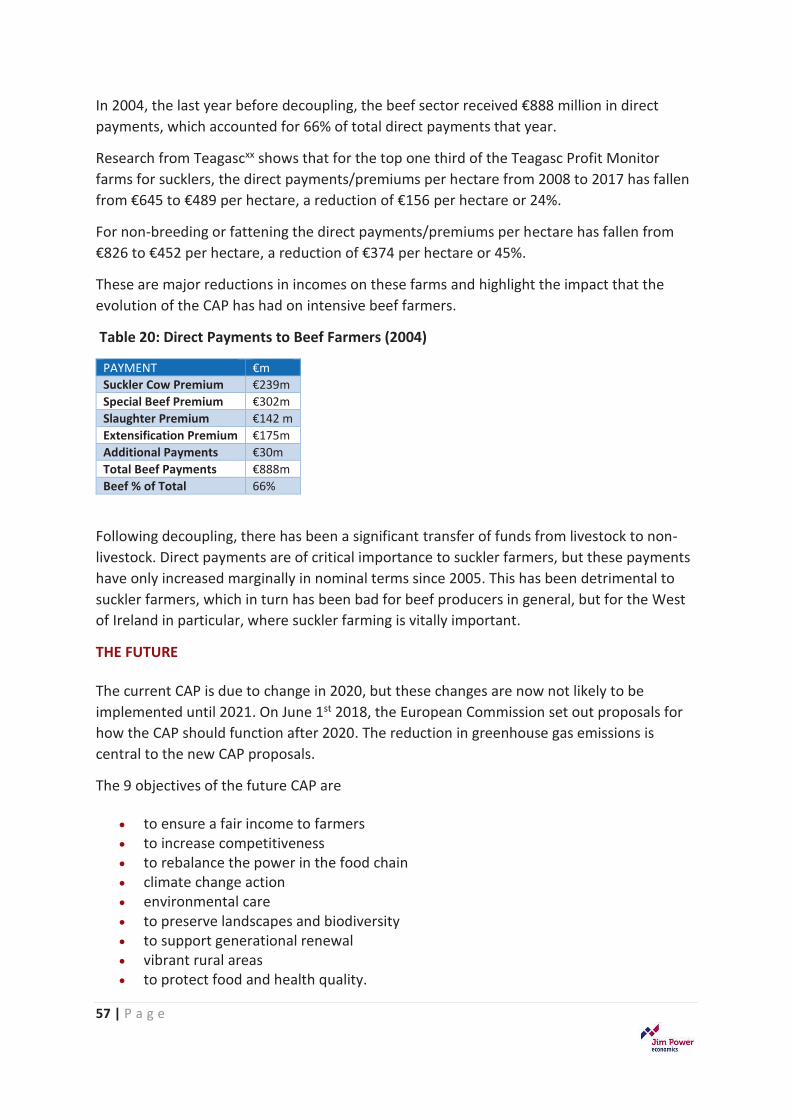
57 | P a g e
In 2004, the last year before decoupling, the beef sector received €888 million in direct payments, which accounted for 66% of total direct payments that year.
Research from Teagascxx shows that for the top one third of the Teagasc Profit Monitor farms for sucklers, the direct payments/premiums per hectare from 2008 to 2017 has fallen from €645 to €489 per hectare, a reduction of €156 per hectare or 24%.
For non-breeding or fattening the direct payments/premiums per hectare has fallen from €826 to €452 per hectare, a reduction of €374 per hectare or 45%.
These are major reductions in incomes on these farms and highlight the impact that the evolution of the CAP has had on intensive beef farmers.
Table 20: Direct Payments to Beef Farmers (2004)
PAYMENT €m Suckler Cow Premium €239m Special Beef Premium €302m Slaughter Premium €142 m Extensification Premium €175m Additional Payments €30m Total Beef Payments €888m Beef % of Total 66%
Following decoupling, there has been a significant transfer of funds from livestock to non-livestock. Direct payments are of critical importance to suckler farmers, but these payments have only increased marginally in nominal terms since 2005. This has been detrimental to suckler farmers, which in turn has been bad for beef producers in general, but for the West of Ireland in particular, where suckler farming is vitally important.
THE FUTURE The current CAP is due to change in 2020, but these changes are now not likely to be implemented until 2021. On June 1st 2018, the European Commission set out proposals for how the CAP should function after 2020. The reduction in greenhouse gas emissions is central to the new CAP proposals.
The 9 objectives of the future CAP are
x� to ensure a fair income to farmers x� to increase competitiveness x� to rebalance the power in the food chain x� climate change action x� environmental care x� to preserve landscapes and biodiversity x� to support generational renewal x� vibrant rural areas x� to protect food and health quality.
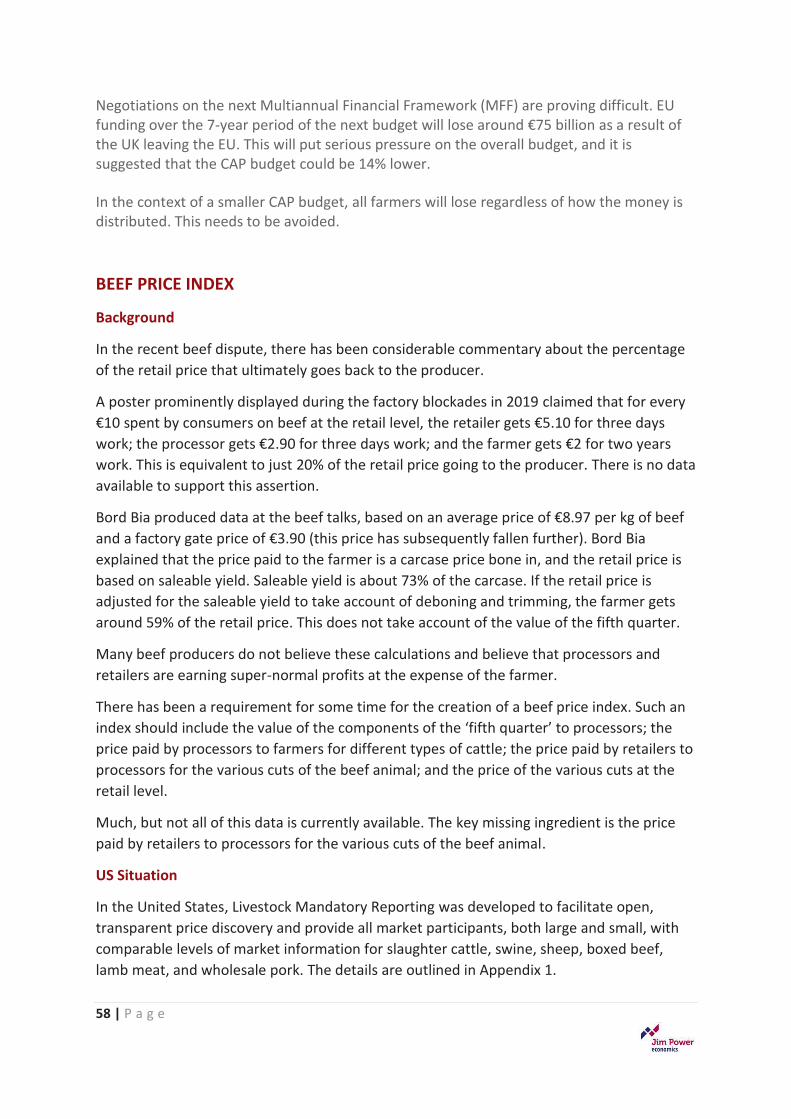
58 | P a g e
Negotiations on the next Multiannual Financial Framework (MFF) are proving difficult. EU funding over the 7-year period of the next budget will lose around €75 billion as a result of the UK leaving the EU. This will put serious pressure on the overall budget, and it is suggested that the CAP budget could be 14% lower.
In the context of a smaller CAP budget, all farmers will lose regardless of how the money is distributed. This needs to be avoided.
BEEF PRICE INDEX
Background
In the recent beef dispute, there has been considerable commentary about the percentage of the retail price that ultimately goes back to the producer.
A poster prominently displayed during the factory blockades in 2019 claimed that for every €10 spent by consumers on beef at the retail level, the retailer gets €5.10 for three days work; the processor gets €2.90 for three days work; and the farmer gets €2 for two years work. This is equivalent to just 20% of the retail price going to the producer. There is no data available to support this assertion.
Bord Bia produced data at the beef talks, based on an average price of €8.97 per kg of beef and a factory gate price of €3.90 (this price has subsequently fallen further). Bord Bia explained that the price paid to the farmer is a carcase price bone in, and the retail price is based on saleable yield. Saleable yield is about 73% of the carcase. If the retail price is adjusted for the saleable yield to take account of deboning and trimming, the farmer gets around 59% of the retail price. This does not take account of the value of the fifth quarter.
Many beef producers do not believe these calculations and believe that processors and retailers are earning super-normal profits at the expense of the farmer.
There has been a requirement for some time for the creation of a beef price index. Such an index should include the value of the components of the ‘fifth quarter’ to processors; the price paid by processors to farmers for different types of cattle; the price paid by retailers to processors for the various cuts of the beef animal; and the price of the various cuts at the retail level.
Much, but not all of this data is currently available. The key missing ingredient is the price paid by retailers to processors for the various cuts of the beef animal.
US Situation
In the United States, Livestock Mandatory Reporting was developed to facilitate open, transparent price discovery and provide all market participants, both large and small, with comparable levels of market information for slaughter cattle, swine, sheep, boxed beef, lamb meat, and wholesale pork. The details are outlined in Appendix 1.
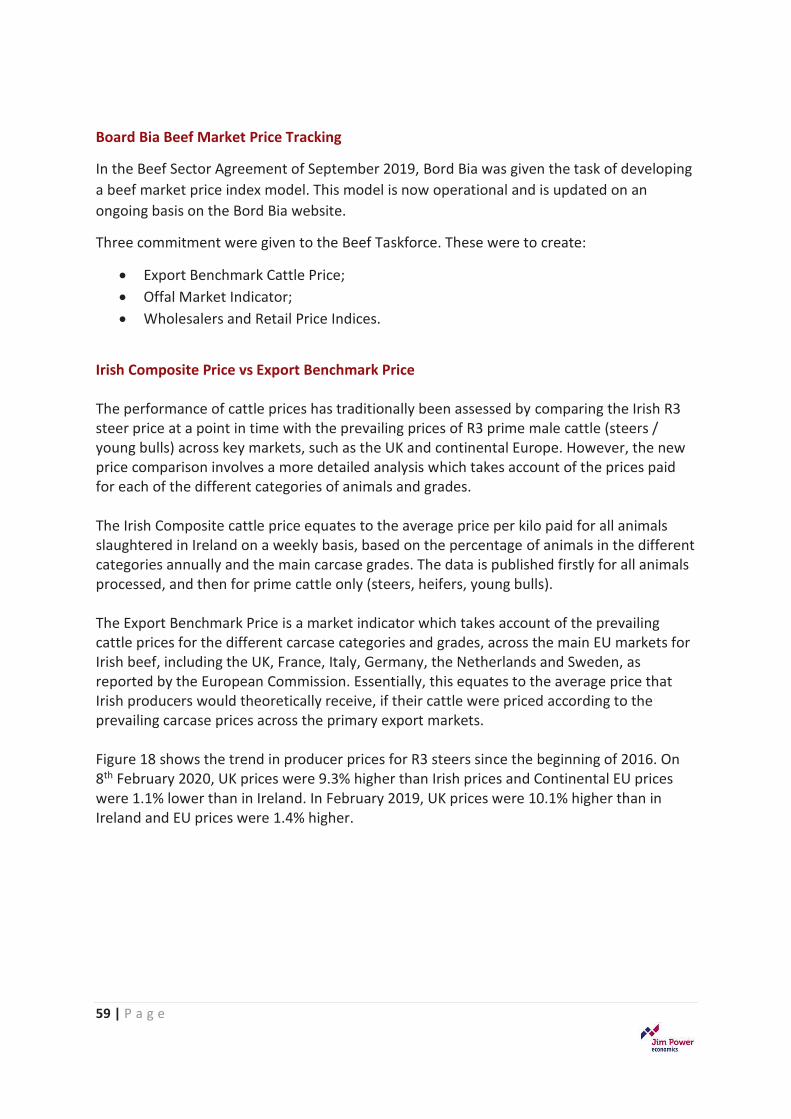
59 | P a g e
Board Bia Beef Market Price Tracking
In the Beef Sector Agreement of September 2019, Bord Bia was given the task of developing a beef market price index model. This model is now operational and is updated on an ongoing basis on the Bord Bia website.
Three commitment were given to the Beef Taskforce. These were to create:
x� Export Benchmark Cattle Price; x� Offal Market Indicator; x� Wholesalers and Retail Price Indices.
Irish Composite Price vs Export Benchmark Price
The performance of cattle prices has traditionally been assessed by comparing the Irish R3 steer price at a point in time with the prevailing prices of R3 prime male cattle (steers / young bulls) across key markets, such as the UK and continental Europe. However, the new price comparison involves a more detailed analysis which takes account of the prices paid for each of the different categories of animals and grades. The Irish Composite cattle price equates to the average price per kilo paid for all animals slaughtered in Ireland on a weekly basis, based on the percentage of animals in the different categories annually and the main carcase grades. The data is published firstly for all animals processed, and then for prime cattle only (steers, heifers, young bulls). The Export Benchmark Price is a market indicator which takes account of the prevailing cattle prices for the different carcase categories and grades, across the main EU markets for Irish beef, including the UK, France, Italy, Germany, the Netherlands and Sweden, as reported by the European Commission. Essentially, this equates to the average price that Irish producers would theoretically receive, if their cattle were priced according to the prevailing carcase prices across the primary export markets. Figure 18 shows the trend in producer prices for R3 steers since the beginning of 2016. On 8th February 2020, UK prices were 9.3% higher than Irish prices and Continental EU prices were 1.1% lower than in Ireland. In February 2019, UK prices were 10.1% higher than in Ireland and EU prices were 1.4% higher.
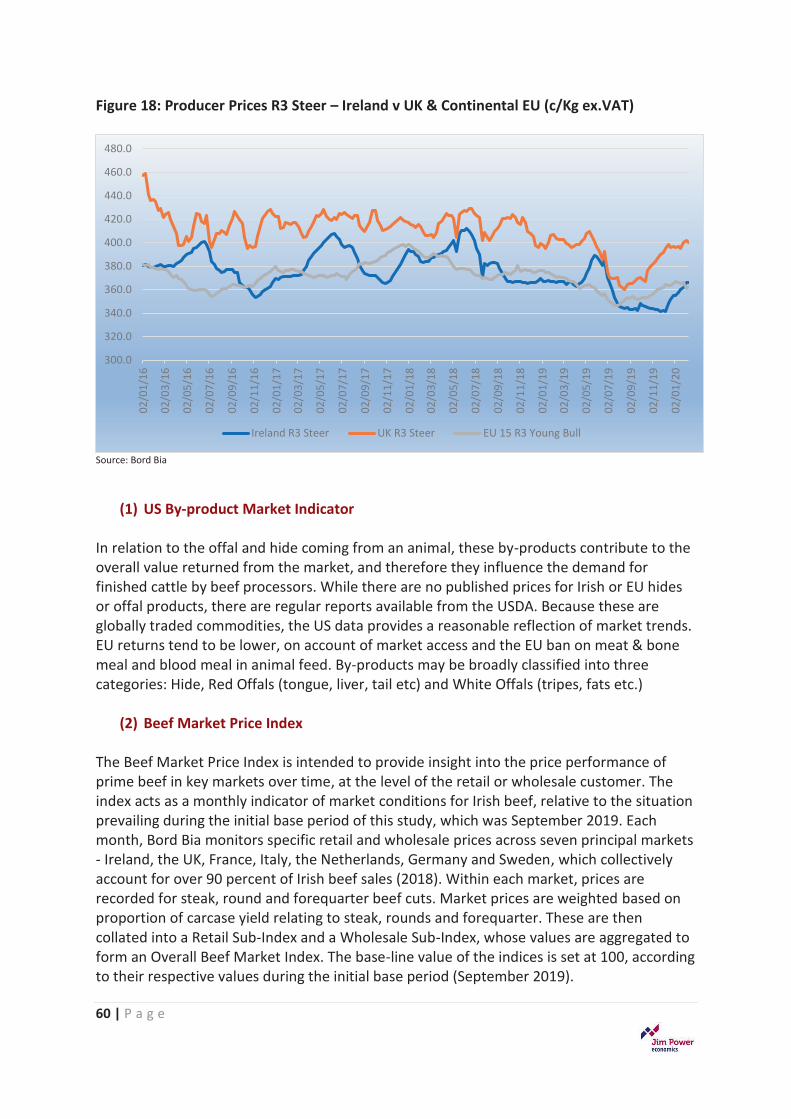
60 | P a g e
Figure 18: Producer Prices R3 Steer – Ireland v UK & Continental EU (c/Kg ex.VAT)
Source: Bord Bia
(1)�US By-product Market Indicator
In relation to the offal and hide coming from an animal, these by-products contribute to the overall value returned from the market, and therefore they influence the demand for finished cattle by beef processors. While there are no published prices for Irish or EU hides or offal products, there are regular reports available from the USDA. Because these are globally traded commodities, the US data provides a reasonable reflection of market trends. EU returns tend to be lower, on account of market access and the EU ban on meat & bone meal and blood meal in animal feed. By-products may be broadly classified into three categories: Hide, Red Offals (tongue, liver, tail etc) and White Offals (tripes, fats etc.)
(2)�Beef Market Price Index
The Beef Market Price Index is intended to provide insight into the price performance of prime beef in key markets over time, at the level of the retail or wholesale customer. The index acts as a monthly indicator of market conditions for Irish beef, relative to the situation prevailing during the initial base period of this study, which was September 2019. Each month, Bord Bia monitors specific retail and wholesale prices across seven principal markets - Ireland, the UK, France, Italy, the Netherlands, Germany and Sweden, which collectively account for over 90 percent of Irish beef sales (2018). Within each market, prices are recorded for steak, round and forequarter beef cuts. Market prices are weighted based on proportion of carcase yield relating to steak, rounds and forequarter. These are then collated into a Retail Sub-Index and a Wholesale Sub-Index, whose values are aggregated to form an Overall Beef Market Index. The base-line value of the indices is set at 100, according to their respective values during the initial base period (September 2019).
300.0
320.0
340.0
360.0
380.0
400.0
420.0
440.0
460.0
480.002
/01/
16
02/0
3/16
02/0
5/16
02/0
7/16
02/0
9/16
02/1
1/16
02/0
1/17
02/0
3/17
02/0
5/17
02/0
7/17
02/0
9/17
02/1
1/17
02/0
1/18
02/0
3/18
02/0
5/18
02/0
7/18
02/0
9/18
02/1
1/18
02/0
1/19
02/0
3/19
02/0
5/19
02/0
7/19
02/0
9/19
02/1
1/19
02/0
1/20
Ireland R3 Steer UK R3 Steer EU 15 R3 Young Bull
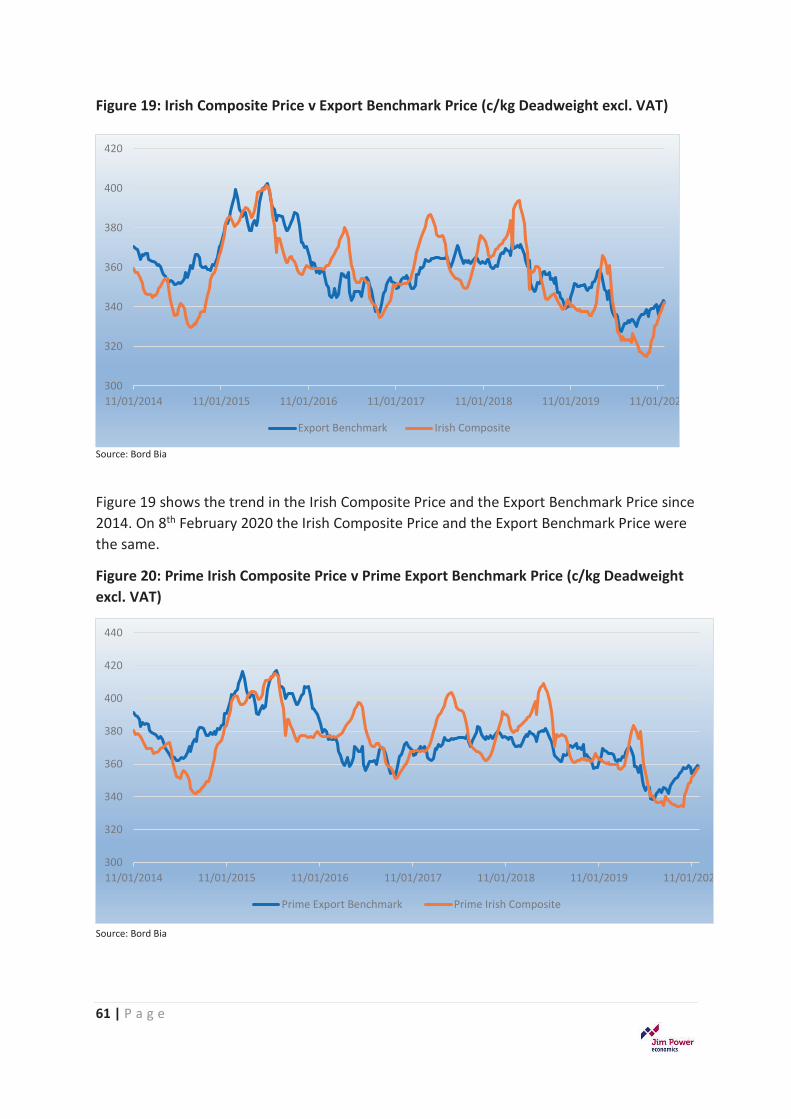
61 | P a g e
Figure 19: Irish Composite Price v Export Benchmark Price (c/kg Deadweight excl. VAT)
Source: Bord Bia
Figure 19 shows the trend in the Irish Composite Price and the Export Benchmark Price since 2014. On 8th February 2020 the Irish Composite Price and the Export Benchmark Price were the same.
Figure 20: Prime Irish Composite Price v Prime Export Benchmark Price (c/kg Deadweight excl. VAT)
Source: Bord Bia
300
320
340
360
380
400
420
11/01/2014 11/01/2015 11/01/2016 11/01/2017 11/01/2018 11/01/2019 11/01/2020
Export Benchmark Irish Composite
300
320
340
360
380
400
420
440
11/01/2014 11/01/2015 11/01/2016 11/01/2017 11/01/2018 11/01/2019 11/01/2020
Prime Export Benchmark Prime Irish Composite
62 | P a g e
Figure 20 shows the trend in the Prime Export Benchmark Price and the Prime Irish Composite Price. On Feb 8th 2020, the export benchmark was at the same level as the prime Irish composite price.
Conclusions
The creation of various beef price indices by Bord Bia is a welcome development. However, it is not clear what the creation of such an index would achieve in terms of improving the price commanded by the beef processor. By definition, the beef price index would be historical or backward looking in nature. However, one of the big problems to date has been the lack of transparency in the sector. The various indices should give beef producers more transparency and trust in the supply chain.
VALUING THE FIFTH QUARTER
The value of the fifth quarter has become a source of considerable controversy in recent years. Beef producers believe that the processors are now garnering considerable value added from the parts of the animal that previously cost money to be disposed of and the farmer is not receiving any monetary benefit.
The processors and Bord Bia have sourced markets in Asian in particular, where parts of the animal that would not be consumed in the West, such as eyes and testicles, have a strong appeal to consumers. Other constituents of the offal, including livers, hearts and kidneys are sold in the EU.
When a beef animal is progressing through the slaughtering process, it is split into two sides, and each side is then split across the middle when it enters the boning hall. This effectively means that the animal is now split into four quarters. However, the offal and other by-products are harvested from the carcase before they pass the factory weighing scales and these parts of the animal are referred to as the ‘fifth quarter’.
Data suggests that in 2017, the value of beef offal exports was €230 million and it is estimated at €395.4 million from the beef industry in 2018. The offal figures from the CSO are for more than 50 classifications of offal, and it cannot be determined whether this data refers exclusively to offal and parts of the carcase that are not being used for meat production. The Minister for Agriculture has stated that the figure of €395.4 million likely overstates the exact amount of offal exports.xxi
The processors argue that is an oversimplification to suggest that the value of offal is an automatic profit as there is a cost to harvesting, storing and swelling offal, and that in practice meat factories reflect the value of offal in what they decide to pay for beef carcases.xxii
The problem here, as in many aspects of the whole beef supply chain, is that there is a total lack of transparency. Producers have no idea about what goes in during the processing process and how values are determined for the whole of the animal and the carcase.
63 | P a g e
In the United States, the USDA publishes daily information on stocks and values of all component parts of the animal, including offal.
The USDA calculates the value of the fifth quarter and updates its data on a daily basis, and it relates to the overall value back to its contribution per hundredweight (50 kg / 112 lbs). It publishes daily prices for the hide; two types of tallow, edible and packer bleachable; tongues; cheek meat; head meat; oxtail; hearts; lips; livers; two types of tripe, edible and honeycomb bleached; lungs; melts; meat and bone meal; and blood meal.
The USDA refers to an average prime beef animal weighing 1,325 lbs at slaughter. The most recent data (4th October 2019) from the USDA values the fifth quarter at $97 (€89). Similar data are not published in the EU, but the USDA prices reflect world market prices for those parts of the animal.
Beef killed in Ireland has a higher level of Specified Risk Material (SRM) than in the US, which is a legacy of BSE. This material has to be destroyed, which has the effect of making the 5th Quarter less valuable than in the US. Following the discovery of a five-year-old dairy cow in County Louth with classic or typical BSE in 2019, the World Organisation of Animal Health re-classified Ireland from ‘negligible risk status’ to ‘controlled’.
To bring some element of trust to the supply chain, farmers should be given complete information on what happens the parts of their livestock after they drop them off at the factory lairage.
FACTORY FEEDLOTS
Feedlots have become a topic of deep controversy in beef farming circles. There is a belief that factory-controlled feedlots are used by the processors exert undue influence on the market supply of beef and hence the price that beef farmers are able to command.
Like many other aspects of the beef supply chain, there is a serious lack of reliable data to describe what the situation actually is. The main issue is that there are different types of feedlots and a lack of information and a lack of transparency on who controls and owns the cattle in the feedlots.
OFFICIAL FEEDLOT STATUS / CONTROLLED FINISHING UNITS
As part of the TB eradication programme, beef finishing herds, if they meet the necessary criteria, are allowed to avail of a special status, termed “Feedlot”. When a herd meets the criteria to be regarded as a ‘Feedlot’ under the TB Eradication Programme, the herd is restricted under the TB Regulations and a special official supervisory and testing protocol is established.
Such herds are not exempted from testing, reactor removal or disinfection requirements. Restricted Feedlots are TB tested at least once per year. This feedlot status arrangement allows the delivery of an effective level of disease risk management while controlling the risk of further disease spread in compliance with animal health legislation, and enabling
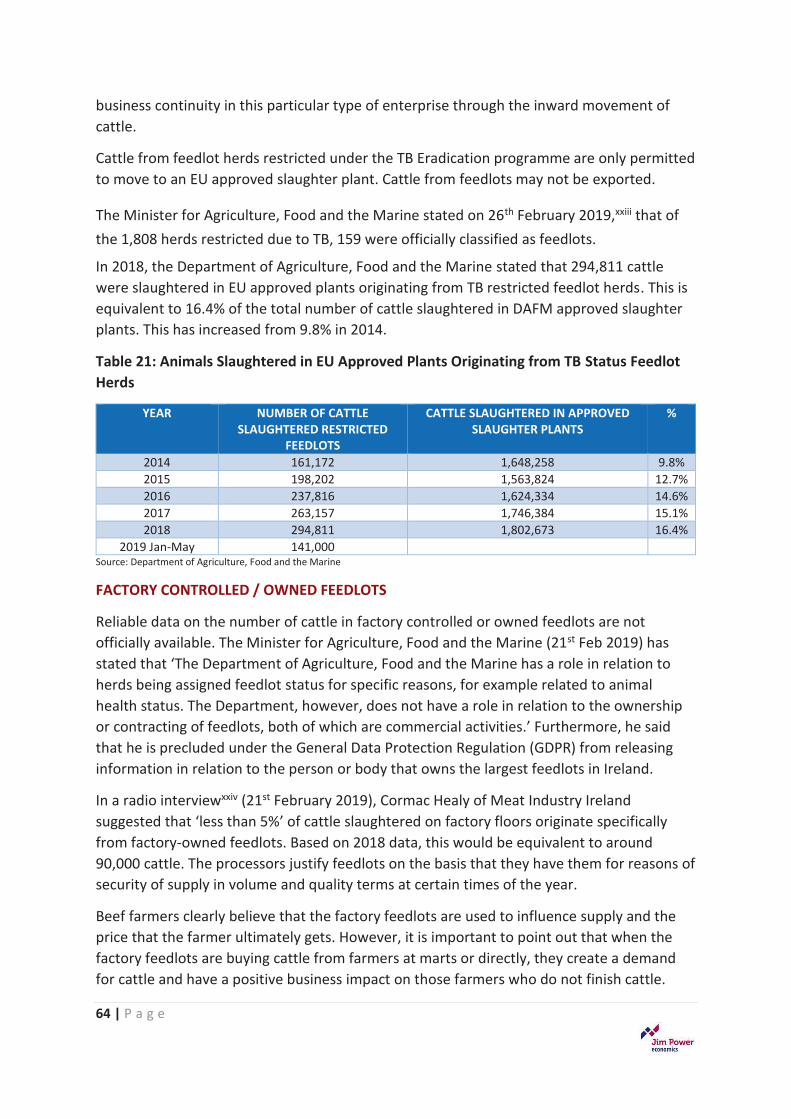
64 | P a g e
business continuity in this particular type of enterprise through the inward movement of cattle.
Cattle from feedlot herds restricted under the TB Eradication programme are only permitted to move to an EU approved slaughter plant. Cattle from feedlots may not be exported.
The Minister for Agriculture, Food and the Marine stated on 26th February 2019,xxiii that of the 1,808 herds restricted due to TB, 159 were officially classified as feedlots.
In 2018, the Department of Agriculture, Food and the Marine stated that 294,811 cattle were slaughtered in EU approved plants originating from TB restricted feedlot herds. This is equivalent to 16.4% of the total number of cattle slaughtered in DAFM approved slaughter plants. This has increased from 9.8% in 2014.
Table 21: Animals Slaughtered in EU Approved Plants Originating from TB Status Feedlot Herds
YEAR NUMBER OF CATTLE SLAUGHTERED RESTRICTED
FEEDLOTS
CATTLE SLAUGHTERED IN APPROVED SLAUGHTER PLANTS
%
2014 161,172 1,648,258 9.8% 2015 198,202 1,563,824 12.7% 2016 237,816 1,624,334 14.6% 2017 263,157 1,746,384 15.1% 2018 294,811 1,802,673 16.4%
2019 Jan-May 141,000 Source: Department of Agriculture, Food and the Marine
FACTORY CONTROLLED / OWNED FEEDLOTS
Reliable data on the number of cattle in factory controlled or owned feedlots are not officially available. The Minister for Agriculture, Food and the Marine (21st Feb 2019) has stated that ‘The Department of Agriculture, Food and the Marine has a role in relation to herds being assigned feedlot status for specific reasons, for example related to animal health status. The Department, however, does not have a role in relation to the ownership or contracting of feedlots, both of which are commercial activities.’ Furthermore, he said that he is precluded under the General Data Protection Regulation (GDPR) from releasing information in relation to the person or body that owns the largest feedlots in Ireland.
In a radio interviewxxiv (21st February 2019), Cormac Healy of Meat Industry Ireland suggested that ‘less than 5%’ of cattle slaughtered on factory floors originate specifically from factory-owned feedlots. Based on 2018 data, this would be equivalent to around 90,000 cattle. The processors justify feedlots on the basis that they have them for reasons of security of supply in volume and quality terms at certain times of the year.
Beef farmers clearly believe that the factory feedlots are used to influence supply and the price that the farmer ultimately gets. However, it is important to point out that when the factory feedlots are buying cattle from farmers at marts or directly, they create a demand for cattle and have a positive business impact on those farmers who do not finish cattle.
65 | P a g e
As is the case with many aspects of the supply chain, there is a significant level of distrust between farmers and processors in relation to feedlots. Greater transparency would help alleviate some of this mistrust. It proved impossible to get data on the number of cattle in both factory-owned and factory-controlled feedlots. The figure of 90,000 relates to factory -owned feedlots, there may be other factory-controlled feedlots in the system.
If the figure of 90,000 cattle in factory owned feedlots is correct, then the overall impact on cattle prices would be limited in a market where over 1.9 million animals are slaughtered. Issues of concern for the Irish beef industry is that the growth of feedlots could risk damaging the grass-fed status of Irish beef, and it is clear that at certain periods significant numbers of cattle can be released from factory feedlots and this can have the effect of depressing the price paid to ordinary beef farmers. In Ireland, there is nothing illegal about factory feedlots.
SPECIFICATION REQUIREMENTS AND OVERSIGHT
This section looks at the issues concerning quality standards, specification requirements, customer requirements, and regulation. Specifically, it examines the role of Bord Bia and the Department of Agriculture, Food and the Marine (DAFM), the controversial 30-Month rule, the Quality Payments System, the quality assurance standards in the UK and the attitudes of the main buyers of Irish beef.
It is clear that if Irish beef producers are to continue to successfully sell their beef into overseas markets and attain the highest prices possible, they will have to satisfy the requirements of their customers. Quality and sustainability are essential ingredients for continued success and are increasing becoming the main focus of consumers and purchasers of beef.
Bord Bia and the Department of Agriculture, Food and the Marine both play a crucial role in ensuring that Irish beef producers and processors deliver a product that is sustainable, of a very high standard, and which meets the requirements of the customers for Irish beef.
THE ROLE OF THE DEPARTMENT OF AGRICULTURE, FOOD AND THE MARINE
The Department of Agriculture, Food and the Marine (DAFM) has key responsibility for the regulation of the sector. Its main role is to lead the sustainable development of the agri-food, forestry and marine sector and to optimise its contribution to national economic development and the natural environment.
The Department is also the national accredited paying agency for the disbursal of EU funds which play a crucial role in supporting policy implementation and in underpinning efforts to achieve the objectives set out in industry development strategies.xxv
66 | P a g e
Objectives of DAFM
The objectives of the Department are:
x� To progress the economic development of the agri-food, forestry and marine sectors, including facilitating the achievement of Food Wise 2025;
x� To promote and enhance, include through regulation and enforcement, the already high standards of food safety, consumer protection, animal health and welfare and plant health;
x� To promote economic, social and environmentally sustainable farming, fishing and forestry;
x� To deliver schemes and services effectively and efficiently, providing a quality service to all of its clients.xxvi
Animal Identification and Movement
The animal identification systems used by DAFM are intended to trace animal movements for cattle, pigs, sheep and goats, in order to reassure consumers that the food they eat can be traced back to its source.
DAFM maintains cattle traceability records on a central database known as the Animal Identification and Movement system (AIM). The AIM system records all births, movements and disposals in accordance with EU requirements and therefore traces all bovine from birth to slaughter. The traceability system is aimed at providing assurances to customers and consumers at home and abroad about the origin and traceability of beef, protects animal and human health, and secures and maintains markets for Irish cattle and beef.
The key elements of the identification and movement system are:
x� All calves born on a holding must have two identically numbered yellow plastic ear tags within 20 days of birth. The tags must be supplied by a tag provider approved by DAFM.
x� Keepers are required to register the birth of each calf on a central birth registration database. On receipt of a completed and valid registration application, the registration agency issues the keeper with a passport for the animal concerned.
x� Keepers of cattle are required to maintain a herd register of all bovine animals on their holding. The herd register must be kept up to date and must record information in relation to all calves born on the holding, together with details of all animals entering or leaving the herd and of animal deaths on the holding.
x� The AIM system records all bovine births, movements and disposals. It captures details of all animal movements and this information is used to verify the origin, identity and life history of cattle entering the food chain. It is also used to check compliance of cattle with eligibility criteria of the Single Farm Payment scheme. The AIM system is also used to assist in the identification and tracking of bovines that may have come in contact with infectious diseases, and for veterinary certification.
67 | P a g e
Farm Payments
The DAFM plays a key role in direct payments to farmers. Cross Compliance is central to this activity. To receive a payment under the Basic Payment Scheme (BPS), farmers must follow a variety of regulations on the environment, climate change, good agricultural condition of land, public, animal and plant health; and animal welfare.
Cross compliance is implemented under two main areas;
x� Statutory Management Requirements (SMRs) - there are 13 legislative requirements in the field of environment, food safety, animal and plant health and animal welfare.
x� Good Agricultural and Environmental Condition (GAEC) – an obligation to keep land in good agricultural and environmental condition. This refers to a range of standards related to soil, the protection and maintenance of soil organic matter, avoiding the deterioration of habitats and water protection.
In relation to beef farming, there is a strict code for how cattle are to be treated.xxvii These criteria are guided by the principle that good animal welfare has been an integral part of Irish livestock farming, which is largely grass based and extensive by nature. The guidelines are based on five basic needs:
x� Freedom from thirst, hunger and malnutrition; x� Freedom from discomfort; x� Freedom from pain, injury and disease; x� Freedom to express normal patterns of behaviour; x� Freedom from fear and distress.
THE ROLE OF BORD BIA
Bord Bia has a key role to play in the marketing of and standards of Irish agri-food production. Its role in the Irish agri-food sector is to act as a link between Irish food, drink and horticulture suppliers on the one hand and existing and potential customers throughout the world on the other. Its purpose is to bring Ireland’s food, drink and horticulture to the world, thus enabling the growth and sustainability of producers.
The Mission Statement of Bord Bia is ‘to drive through market insight and, in partnership with industry, the commercial success of a world class Irish food, drink and horticulture industry’.
Sustainability is now one of the key requirements of both the customer and consumer of food globally. Ireland has a strong reputation for producing food in a sustainable way. But it is clear that this reputation will have to be supported and enhanced by a strong policy background.
‘Food sustainability means shared responsibility for the production, supply and consumption of a safe and nutritious food within a viable industry that simultaneously protects and enhances or natural environment and quality of life now and in the future’. xxviii
68 | P a g e
The overall agenda of Bord Bia is to drive this sustainability imperative and ensure that the country produces food that meets the requirements of customers and consumers of Irish produce. The Origin Green Programme and Bord Bia’s Quality Assurance Schemes are the two key components of Bord Bia’s marketing strategy.
For farmers, participation in Bord Bia’s Quality Assurance Schemes ensures membership of Origin Green. For food businesses, signing up to the relevant Origin Green charter and passing the membership process is the first step to producing an independently verifiable sustainability plan.
There are four key elements of the Bord Bia strategy to drive export growth forward.xxix
(1)�Drive success and growth in the market. This involves trying to integrate Bord Bia teams and skills in order to provide clients with market-leading services in their journey to the relevant markets. It seeks to develop and provide clients with an understanding the criteria for success in any market and help provide insight to accurately judge where the winning opportunities reside; help clients with lead generation in various markets; ensure that core competencies throughout the organisation and industry are developed and maintained to enable growth; and establish professionals on the ground in various markets in order to connect clients to opportunities.
(2)�Develop the necessary insights to drive growth. (3)�Building a reputation that will enable growth, through creating an understanding of
the qualities and uniqueness of the Food Ireland Brand. This will involve the development of Origin Green further in order help differentiate and make Irish food more compelling to the world’s consumers and trade partners.
(4)�Fostering an entrepreneurial culture and skills, which is a recognition of the importance of having a skilled and capable workforce.
The role of Bord Bia is first and foremost to promote Irish food, drink and horticulture in overseas markets. Arguably it has achieved considerable success in this regard. In 2019, Ireland’s exports of food and drink expanded by 7% to reach a record level of €13 billion. Between 2009 and 2019, the value of exports increased by 96%.
One of the challenges is that while Bord Bia is successfully promoting Irish food overseas, the return to primary producers in Ireland is constantly under pressure. If primary producers are not viable, then that will ultimately limit the ability to continue to grow Irish exports and achieve the targets contained in Foodwise 2025. However, it is not clear how Bord Bia can be held responsible for the difficulties besetting Irish beef producers at the moment. All stakeholders, including Bord Bia, need to work together in a collaborative fashion to help sustain a cohort of viable Irish beef farmers who can make a decent income and produce a top-quality product that meets the demands of its customers.
69 | P a g e
The Origin Green Programme
Ireland exports over 90% of the beef that it produces and so it is vital that the product satisfies the increasing growing trend towards and demand for sustainably produced beef. Bord Bia’s Origin Green Programme was established in 2012. The programme was in response to the international perception of Ireland as a producer of sustainably produced food. The aim of the initiative is to measure, monitor and lead environmental improvements to support claims that Irish food and drink is sustainably produced, and to drive the country’s leadership in sustainable food production.
Origin Green is a voluntary programme that brings together farmers, food manufacturers, retailers and foodservice operators with the common goal of sustainable food production. It enables the food industry set and achieve measurable sustainability targets that respect the environment and serve local communities.
Farmers are recognised as the essential first link in Origin Green. Those farmers who are certified members of the Bord Bia Quality Assurance programme and who participate in farm sustainability assessments as part of their audit are part of Origin Green. The audit involves looking at the practices that are used to produce beef. Issues such as the length of the grazing season; average daily weight gains; the age that heifers give birth for the first time; the fertility or calving rate; the efficiency of fertiliser use; and the use of slurry or farmyard manure are key elements of the audit. Irish beef production already has a low carbon footprint, but by addressing the aforementioned issues it is believed that it can be reduced further.
Food and drink manufacturing companies who wish to become members of Origin Green also have to commit to certain requirements;
x� They have to sign up to the programme charter; x� Having established a baseline year, they have to set targets in areas such as raw
material sourcing, manufacturing and social sustainability; x� Prepare a 3-5-year plan to deliver the targets; x� Submit annual progress reports to Bord Bia for independent verification.
In 2016 the programme was extended to the retail and food service sectors, using a similar mechanism. Participants are obliged to sign up to a Retail and Food Service Sustainability Charter, which has to include plans covering for target areas:
x� Sustainable sourcing – commitment to source from manufacturers that are verified members of Origin Green; commitment to source from suppliers with recognised sustainability certification; and development of sustainability initiatives with suppliers.
x� Operations – areas such as transport, refrigeration, lighting, product packaging, food waste and emissions.;
x� Health and nutrition – areas such as reductions in fat, sugar, salt, colourings and portion size.
70 | P a g e
x� Social sustainability – areas such as the company’s role in the local community and employee wellbeing.
Farmers believe that the requirement placed on them are very onerous compared to the other links in the supply chain. Given that farmers represent the most important link in the food chain, this appears inevitable. However, farmers need to be adequately rewarded for playing such an important role in the food chain.
The Quality Assurance Scheme (QAS)
Bord Bia operates accredited Quality Assurance Schemes (QAS) for beef, eggs, edible horticulture produce, non-edible horticultural plants, lamb, pigmeat, poultry and feed. It also has a scheme for Retail Butcher Counters.
The objectives of the Quality Assurance Schemes are clear and compelling:
x� To support the Irish food industry; x� To re-assure consumers on food safety, traceability, and origin; x� To enable promotion; and x� To gain market entry as it is a market entry requirement in most cases.
Bord Bia has developed a Quality Mark logo designed to inform the public about the characteristics of agricultural products. The logo can only be used on products produced by members of the various Bord Bia Quality Assurance Schemes. For example, to use the Quality Mark on beef products at the retail level, the farmer, the abattoir and the processing plant must all be members of the appropriate quality assurance scheme. Where a QAS logo is to be used on products, all links in the production of the finished product must be QAS Certified members.
Purchasers of Irish meat products are increasingly looking for proof that meat is produced sustainably on farms that are certified members of an accredited Quality Assurance Scheme which is based on principles of sustainability that incorporate environmental, social and economic aspects.
In April 2017, Bord Bia launched a new Sustainable Beef and Lamb Assurance Scheme (SBLAS). The new scheme was designed in collaboration with stakeholders in the sector to meet the demands of global buyers of Irish beef and lamb for verifiable proof of Ireland’s sustainability claims.
Sustainable agriculture is defined as ‘the productive, competitive and efficient production of safe agricultural products, while protecting and improving the natural environment and the socio-economic conditions of farmers and local communities, and while safeguarding the health and welfare of all farmed species.’
To satisfy the requirements of the international customers of Irish beef, sustainability initiatives such as minimising greenhouse gas emissions, conservation of water, good soil management, improving biodiversity, and enhancing social and economic performance are
71 | P a g e
essential. The role of Bord Bia in relation to these criteria is to collect data throughout the supply chain, which includes amongst other things, audits of farms and processors.
The standard, and the scheme based on the standard, are accredited to the International Standard for Product Certification (ISO 17065) by the Irish National Accreditation Board (INAB). When Bord Bia is assessing an applicant, the compliance of the Applicant/Producer in areas relating to legal, quality and customer requirements relevant to traceability, food safety, hygiene, health and safety, and welfare is assessed in relation to the assurance criteria in the Quality Assurance Standard. A report on the level of compliance achieved is then prepared for the Applicant/Processor.
The objective of the scheme is to create a single, independently-certified standard that covers the quality and sustainability of Irish beef and lamb. The environmental, social and economic principles of sustainability are embedded in the requirements of SBLAS. It also draws on data provided on-farm to establish the carbon footprint of enterprises under the Origin Green programme.
The primary objectives of SBLAS are:xxx
x� To demonstrate to customers that quality beef and lamb are produced sustainably under an accredited scheme;
x� To provide a uniform mechanism for recording and monitoring quality assurance criteria and sustainability criteria for beef and sheep farms;
x� To set out the criteria for best practice in Irish beef and lamb farming; and x� To provide an on-going means of demonstrating best practice at farmer level.
The key features of the scheme include a close-out period, during which farmers will have a month to rectify non-compliance at audit, without losing their certification status; a helpdesk facility to assist farmers to prepare for audits and with close-out of non-compliance; and standards for the use of pesticides on farms.
Bord Bia believes that for farmers, producing food in a sustainable manner will deliver economic benefits through lower costs of production as it involves minimising the amount of resources such as energy, feed and water, as well as implementing measures that enhance the environmental performance of farms.
Bord Bia also believes that for the industry, the benefits will derive from a belief that beef and lamb sourced from sustainable farms will gain access to markets that demand certification. This will help to create a preference for Irish beef and lamb among valuable customers with stated sustainability targets.
THE QUALITY PAYMENT SYSTEM (QPS) – THE BEEF GRID
The Quality Payment System (QPS) is a scheme that was scientifically designed by Teagasc to reward farmers for higher meat yield.
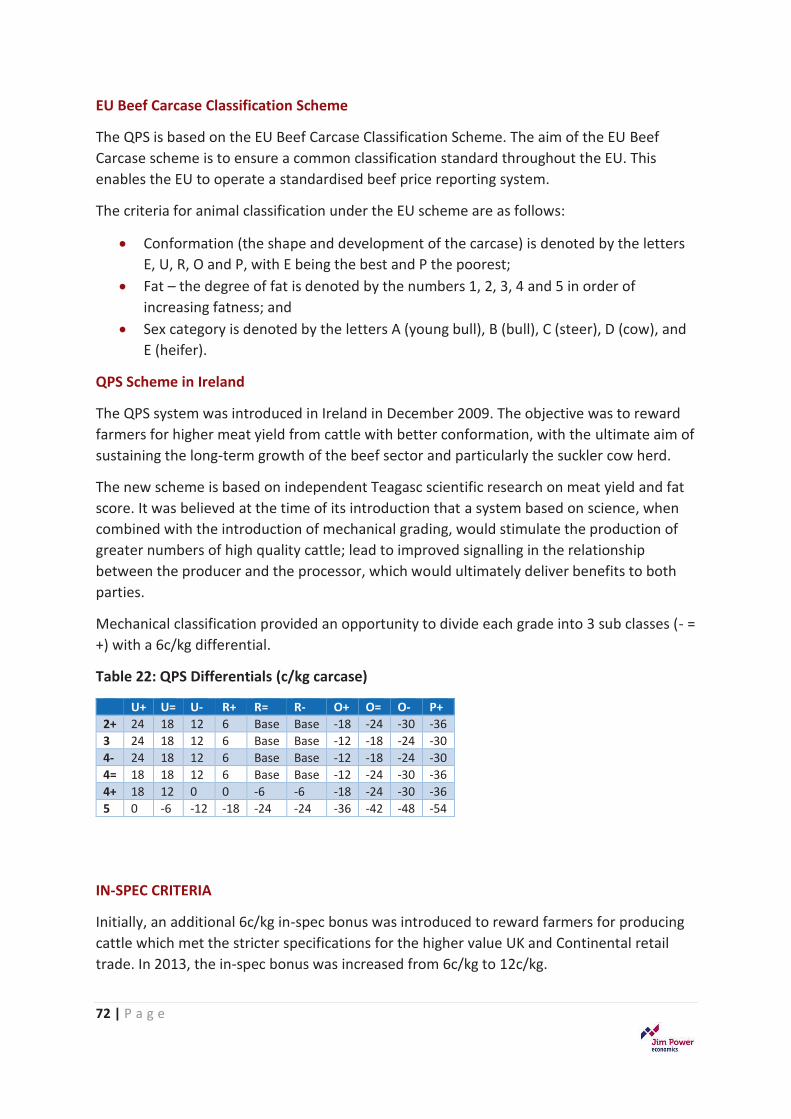
72 | P a g e
EU Beef Carcase Classification Scheme
The QPS is based on the EU Beef Carcase Classification Scheme. The aim of the EU Beef Carcase scheme is to ensure a common classification standard throughout the EU. This enables the EU to operate a standardised beef price reporting system.
The criteria for animal classification under the EU scheme are as follows:
x� Conformation (the shape and development of the carcase) is denoted by the letters E, U, R, O and P, with E being the best and P the poorest;
x� Fat – the degree of fat is denoted by the numbers 1, 2, 3, 4 and 5 in order of increasing fatness; and
x� Sex category is denoted by the letters A (young bull), B (bull), C (steer), D (cow), and E (heifer).
QPS Scheme in Ireland
The QPS system was introduced in Ireland in December 2009. The objective was to reward farmers for higher meat yield from cattle with better conformation, with the ultimate aim of sustaining the long-term growth of the beef sector and particularly the suckler cow herd.
The new scheme is based on independent Teagasc scientific research on meat yield and fat score. It was believed at the time of its introduction that a system based on science, when combined with the introduction of mechanical grading, would stimulate the production of greater numbers of high quality cattle; lead to improved signalling in the relationship between the producer and the processor, which would ultimately deliver benefits to both parties.
Mechanical classification provided an opportunity to divide each grade into 3 sub classes (- = +) with a 6c/kg differential.
Table 22: QPS Differentials (c/kg carcase)
U+ U= U- R+ R= R- O+ O= O- P+ 2+ 24 18 12 6 Base Base -18 -24 -30 -36 3 24 18 12 6 Base Base -12 -18 -24 -30 4- 24 18 12 6 Base Base -12 -18 -24 -30 4= 18 18 12 6 Base Base -12 -24 -30 -36 4+ 18 12 0 0 -6 -6 -18 -24 -30 -36 5 0 -6 -12 -18 -24 -24 -36 -42 -48 -54
IN-SPEC CRITERIA
Initially, an additional 6c/kg in-spec bonus was introduced to reward farmers for producing cattle which met the stricter specifications for the higher value UK and Continental retail trade. In 2013, the in-spec bonus was increased from 6c/kg to 12c/kg.
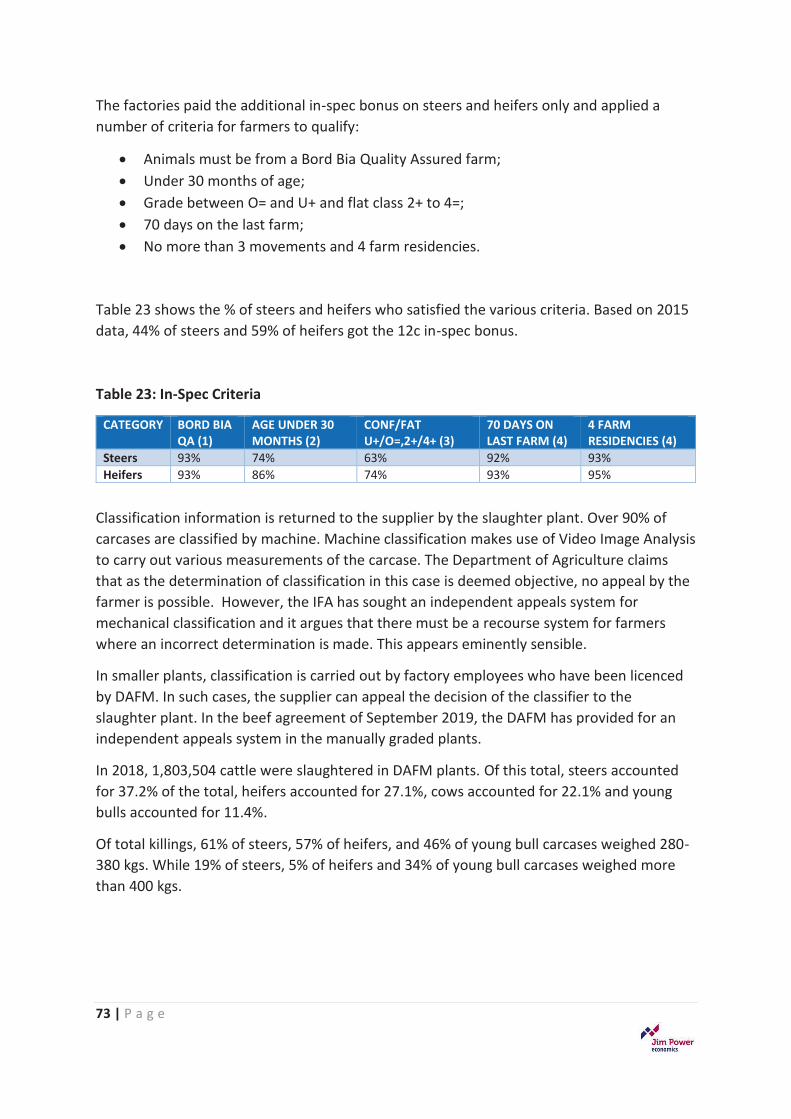
73 | P a g e
The factories paid the additional in-spec bonus on steers and heifers only and applied a number of criteria for farmers to qualify:
x� Animals must be from a Bord Bia Quality Assured farm; x� Under 30 months of age; x� Grade between O= and U+ and flat class 2+ to 4=; x� 70 days on the last farm; x� No more than 3 movements and 4 farm residencies.
Table 23 shows the % of steers and heifers who satisfied the various criteria. Based on 2015 data, 44% of steers and 59% of heifers got the 12c in-spec bonus.
Table 23: In-Spec Criteria
CATEGORY BORD BIA QA (1)
AGE UNDER 30 MONTHS (2)
CONF/FAT U+/O=,2+/4+ (3)
70 DAYS ON LAST FARM (4)
4 FARM RESIDENCIES (4)
Steers 93% 74% 63% 92% 93% Heifers 93% 86% 74% 93% 95%
Classification information is returned to the supplier by the slaughter plant. Over 90% of carcases are classified by machine. Machine classification makes use of Video Image Analysis to carry out various measurements of the carcase. The Department of Agriculture claims that as the determination of classification in this case is deemed objective, no appeal by the farmer is possible. However, the IFA has sought an independent appeals system for mechanical classification and it argues that there must be a recourse system for farmers where an incorrect determination is made. This appears eminently sensible.
In smaller plants, classification is carried out by factory employees who have been licenced by DAFM. In such cases, the supplier can appeal the decision of the classifier to the slaughter plant. In the beef agreement of September 2019, the DAFM has provided for an independent appeals system in the manually graded plants.
In 2018, 1,803,504 cattle were slaughtered in DAFM plants. Of this total, steers accounted for 37.2% of the total, heifers accounted for 27.1%, cows accounted for 22.1% and young bulls accounted for 11.4%.
Of total killings, 61% of steers, 57% of heifers, and 46% of young bull carcases weighed 280-380 kgs. While 19% of steers, 5% of heifers and 34% of young bull carcases weighed more than 400 kgs.
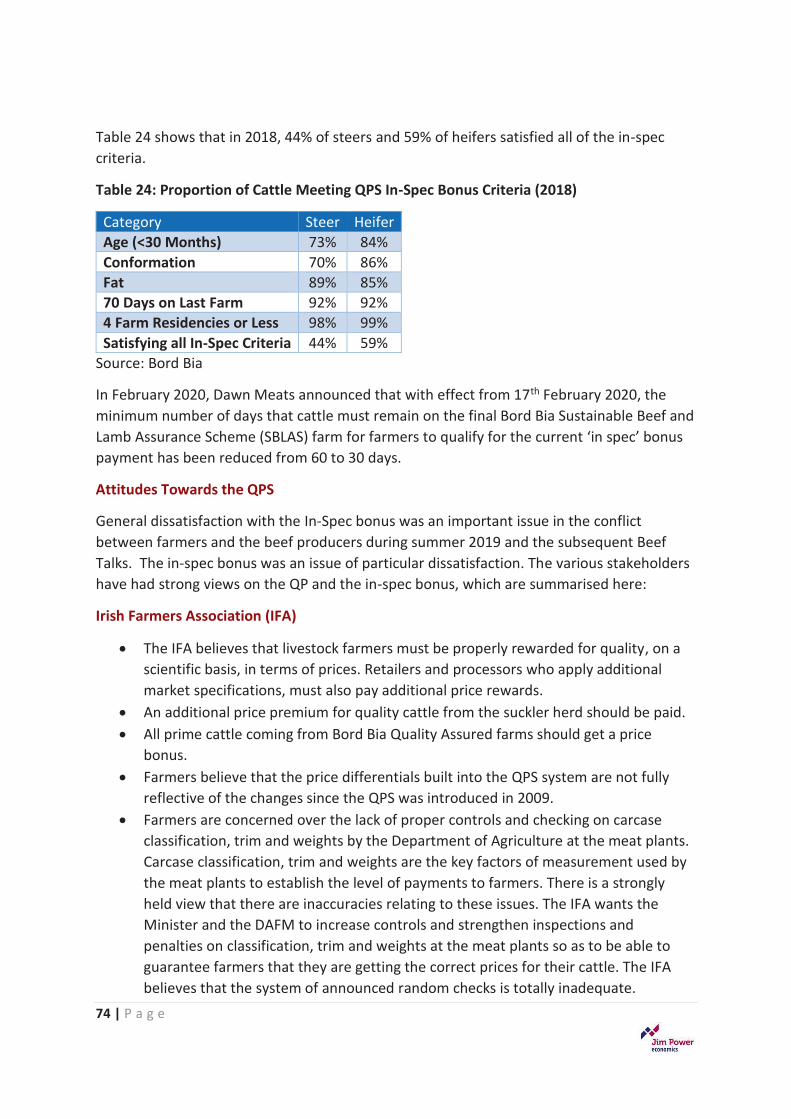
74 | P a g e
Table 24 shows that in 2018, 44% of steers and 59% of heifers satisfied all of the in-spec criteria.
Table 24: Proportion of Cattle Meeting QPS In-Spec Bonus Criteria (2018)
Category Steer Heifer Age (<30 Months) 73% 84% Conformation 70% 86% Fat 89% 85% 70 Days on Last Farm 92% 92% 4 Farm Residencies or Less 98% 99% Satisfying all In-Spec Criteria 44% 59%
Source: Bord Bia
In February 2020, Dawn Meats announced that with effect from 17th February 2020, the minimum number of days that cattle must remain on the final Bord Bia Sustainable Beef and Lamb Assurance Scheme (SBLAS) farm for farmers to qualify for the current ‘in spec’ bonus payment has been reduced from 60 to 30 days.
Attitudes Towards the QPS
General dissatisfaction with the In-Spec bonus was an important issue in the conflict between farmers and the beef producers during summer 2019 and the subsequent Beef Talks. The in-spec bonus was an issue of particular dissatisfaction. The various stakeholders have had strong views on the QP and the in-spec bonus, which are summarised here:
Irish Farmers Association (IFA)
x� The IFA believes that livestock farmers must be properly rewarded for quality, on a scientific basis, in terms of prices. Retailers and processors who apply additional market specifications, must also pay additional price rewards.
x� An additional price premium for quality cattle from the suckler herd should be paid. x� All prime cattle coming from Bord Bia Quality Assured farms should get a price
bonus. x� Farmers believe that the price differentials built into the QPS system are not fully
reflective of the changes since the QPS was introduced in 2009. x� Farmers are concerned over the lack of proper controls and checking on carcase
classification, trim and weights by the Department of Agriculture at the meat plants. Carcase classification, trim and weights are the key factors of measurement used by the meat plants to establish the level of payments to farmers. There is a strongly held view that there are inaccuracies relating to these issues. The IFA wants the Minister and the DAFM to increase controls and strengthen inspections and penalties on classification, trim and weights at the meat plants so as to be able to guarantee farmers that they are getting the correct prices for their cattle. The IFA believes that the system of announced random checks is totally inadequate.
75 | P a g e
In addition, the more modern methods of hanging the carcase has rendered the DAFM checking system on classification much less relevant. IFA wants a permanent DAFM presence to monitor carcase trim at all times in the meat plant; that the monitoring and controls on carcase classification be increased to guarantee accuracy; that a proper independent appeals system be introduced; and that classification images be made available to farmers. xxxi
Meat Industry Ireland (MII)
Meat Industry Ireland argues that the current beef grid structure is based on science and yield and that the carcase grading system that is in operation in Ireland is the most comprehensive approach to ensuring objective and consistent beef carcase classification in accordance with the European Commission’s EUROP grading system. The representative body for the meat processing sector also argues that the carcase grading system continues to be monitored and overseen by DAFM officials and that the Department will ‘shortly’ publish an independent expert report on a trial that it conducted to assess an ‘overall systems upgrade of the technology that will future-proof its successful operation to high standards in Ireland’.xxxii
In the Beef Sector Agreement of September 2019, Teagasc was given responsibility to conduct a scientific review of the Quality Payment Grid. This move has to be welcomed.
THE 30-MONTH SPECIFICATION REQUIREMENT
The Thirty Month Scheme is a scheme to keep older cattle out of the food chain. It was introduced at the height of the BSE epidemic as a consumer confidence boosting measure. BSE affected older animals and this measure was to reassure consumers that the meat on the market was from younger animals only. At one stage in the UK all animals over 30 months were excluded from the food chain and destroyed.
The rule has nothing to do with meat quality but 30 months has become entrenched in most customer specifications now. Corporate memory has forgotten why it was introduced and some buyers still think that it relates to tenderness or efficiency (animals finishing earlier).
To change it would not be easy as many international clients for Irish beef have it in their purchasing specification and the retailers have their customers conditioned to believe that under 30-month beef is better.
China has been identified as a key destination for Irish beef going forward. Under 30 months is a requirement to supply Irish beef to China. An export target of 25,000 tonnes (CWE) has been set for 2020. This would require approved Irish beef plants to recover and export 40 kg (CWE) from 90% of the eligible carcases that they process (i.e. <30 months and from TB-clear herds.
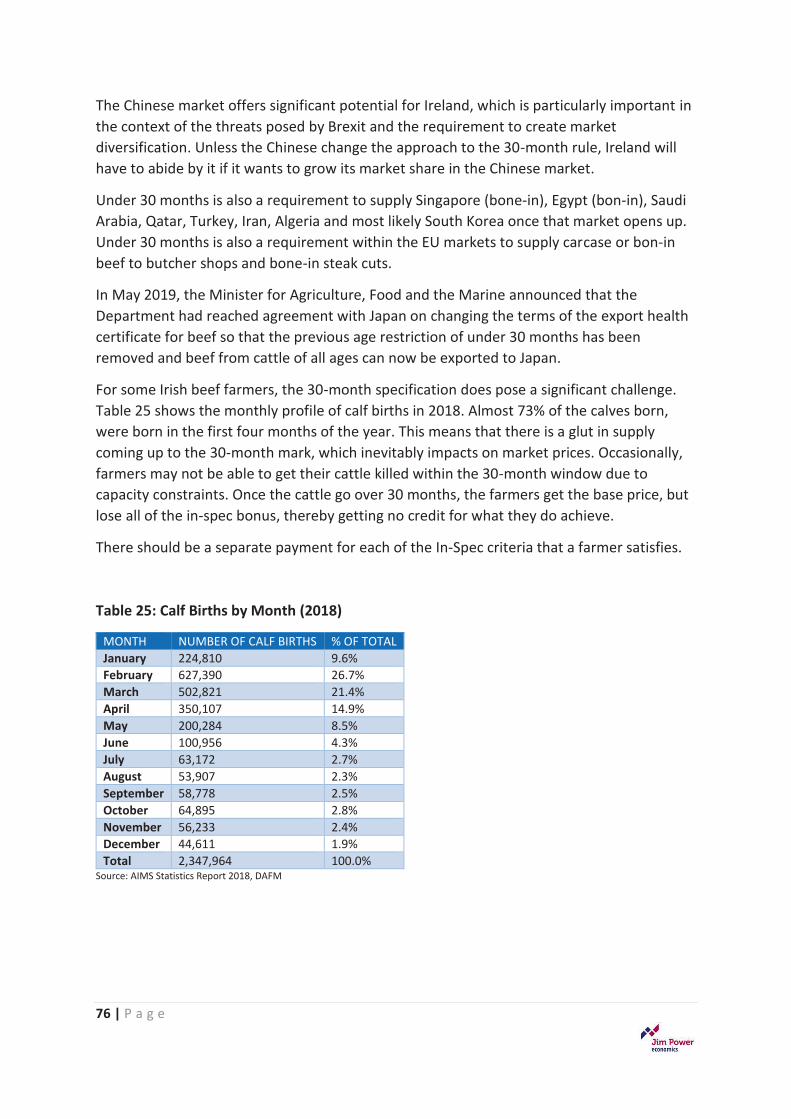
76 | P a g e
The Chinese market offers significant potential for Ireland, which is particularly important in the context of the threats posed by Brexit and the requirement to create market diversification. Unless the Chinese change the approach to the 30-month rule, Ireland will have to abide by it if it wants to grow its market share in the Chinese market.
Under 30 months is also a requirement to supply Singapore (bone-in), Egypt (bon-in), Saudi Arabia, Qatar, Turkey, Iran, Algeria and most likely South Korea once that market opens up. Under 30 months is also a requirement within the EU markets to supply carcase or bon-in beef to butcher shops and bone-in steak cuts.
In May 2019, the Minister for Agriculture, Food and the Marine announced that the Department had reached agreement with Japan on changing the terms of the export health certificate for beef so that the previous age restriction of under 30 months has been removed and beef from cattle of all ages can now be exported to Japan.
For some Irish beef farmers, the 30-month specification does pose a significant challenge. Table 25 shows the monthly profile of calf births in 2018. Almost 73% of the calves born, were born in the first four months of the year. This means that there is a glut in supply coming up to the 30-month mark, which inevitably impacts on market prices. Occasionally, farmers may not be able to get their cattle killed within the 30-month window due to capacity constraints. Once the cattle go over 30 months, the farmers get the base price, but lose all of the in-spec bonus, thereby getting no credit for what they do achieve.
There should be a separate payment for each of the In-Spec criteria that a farmer satisfies.
Table 25: Calf Births by Month (2018)
MONTH NUMBER OF CALF BIRTHS % OF TOTAL January 224,810 9.6% February 627,390 26.7% March 502,821 21.4% April 350,107 14.9% May 200,284 8.5% June 100,956 4.3% July 63,172 2.7% August 53,907 2.3% September 58,778 2.5% October 64,895 2.8% November 56,233 2.4% December 44,611 1.9% Total 2,347,964 100.0%
Source: AIMS Statistics Report 2018, DAFM
77 | P a g e
From the perspective of maximum efficiency in production, Teagasc research shows that that once cattle go over 30 months, significant cost efficiency is lost and the environmental consequences are negative.
The Beef Environmental Efficiency Pilot (BEEP) run by the IBCF is an attempt to identify the most efficient suckler cows and breeding future generations of replacement females from them in order to have a significant environmental impact. The guiding principle is that breeding a more efficient cow which meets the necessary weight and fertility targets will significantly reduce the amount of greenhouse gases (GHG) generated per kg of beef produced. A mid-sized cow of approximately 600-700 kg that weans a calf of approximately 300-350 kg is the optimum.
Research from AbacusBio Limited xxxiii conducted a study to assess the carbon gains from earlier slaughter of animals using data from ICBF. The focus of the research was on the difference in average GHG emissions between finishing systems (e.g. 20-, 24-, 28-month, and 30-month + steer systems), and from animals of different breed make up, with different genetic merit, number of movements, and age at slaughter within and between systems. The conclusions reached were that there is significant opportunity at the system level to reduce enteric CH4 CO2e emissions/kg CWT within the Irish beef industry.
For example, the research shows that:
x� Shifting the Angus x Dairy sector of the industry from the current average to something reflecting an ABP or Blade integrated 20-month system would yield reductions in enteric CH4 CO2e emissions per kg of carcase weight of 25-26%. When compared to the 30-month + system, the 20-month system would offer reductions of 32% in enteric CH4 CO2e emissions per kg of carcase weight;
x� Within the commercial beef industry sector, the Limousin x Beef suggests that enteric CH4 CO2e emissions per kg of carcase weight could be reduced by 29%, by shifting from the industry average to a 20-month system. When compared to the 30-month + system, the 20-month system would offer reductions of 36% in enteric CH4
CO2e emissions per kg of carcase weight.
The overall conclusion is that improving animal management to shorten finishing time and increasing rates of genetic gain can significantly reduce the enteric CH4 CO2e emissions per kg of carcase weight from the Irish beef industry.
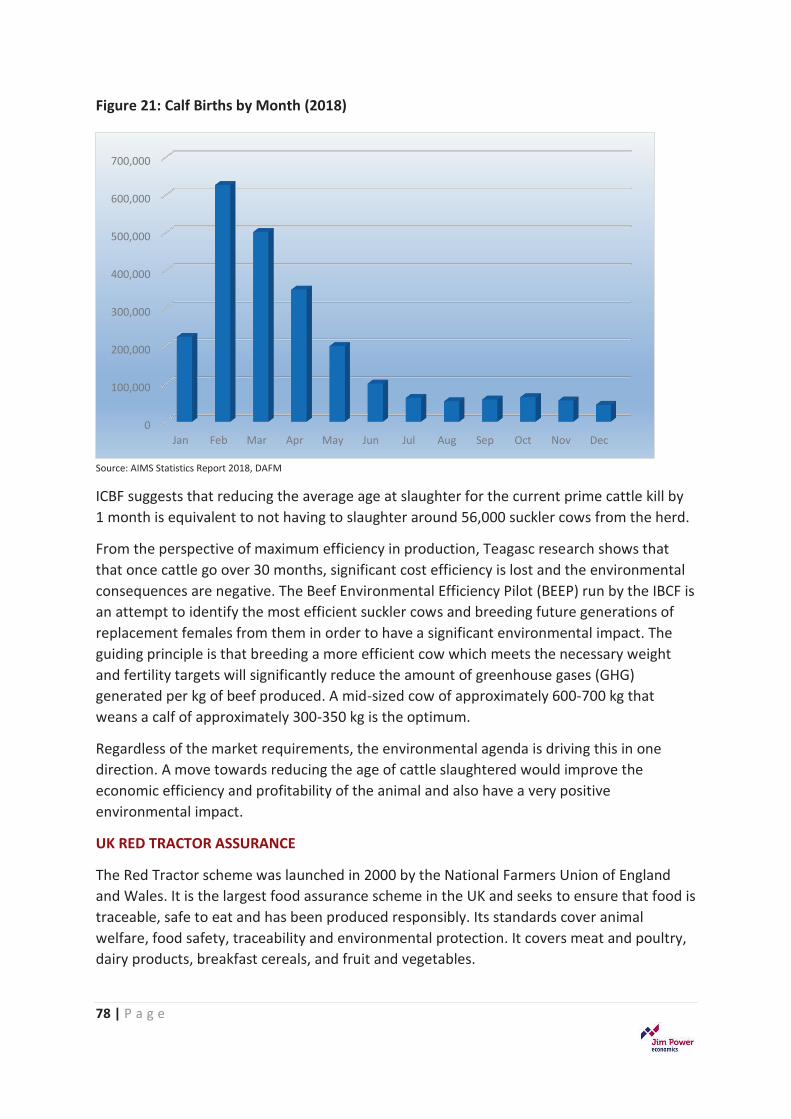
78 | P a g e
Figure 21: Calf Births by Month (2018)
Source: AIMS Statistics Report 2018, DAFM
ICBF suggests that reducing the average age at slaughter for the current prime cattle kill by 1 month is equivalent to not having to slaughter around 56,000 suckler cows from the herd.
From the perspective of maximum efficiency in production, Teagasc research shows that that once cattle go over 30 months, significant cost efficiency is lost and the environmental consequences are negative. The Beef Environmental Efficiency Pilot (BEEP) run by the IBCF is an attempt to identify the most efficient suckler cows and breeding future generations of replacement females from them in order to have a significant environmental impact. The guiding principle is that breeding a more efficient cow which meets the necessary weight and fertility targets will significantly reduce the amount of greenhouse gases (GHG) generated per kg of beef produced. A mid-sized cow of approximately 600-700 kg that weans a calf of approximately 300-350 kg is the optimum.
Regardless of the market requirements, the environmental agenda is driving this in one direction. A move towards reducing the age of cattle slaughtered would improve the economic efficiency and profitability of the animal and also have a very positive environmental impact.
UK RED TRACTOR ASSURANCE
The Red Tractor scheme was launched in 2000 by the National Farmers Union of England and Wales. It is the largest food assurance scheme in the UK and seeks to ensure that food is traceable, safe to eat and has been produced responsibly. Its standards cover animal welfare, food safety, traceability and environmental protection. It covers meat and poultry, dairy products, breakfast cereals, and fruit and vegetables.
0
100,000
200,000
300,000
400,000
500,000
600,000
700,000
Jan Feb Mar Apr May Jun Jul Aug Sep Oct Nov Dec
79 | P a g e
The aim is to assure food safety, animal welfare, hygiene and environmental protection through every part of the food supply chain.
In relation to cattle, there are extensive criteria to be satisfied, including the following:xxxiv
x� Cattle must be identified and records kept to maintain traceability. They must be double tagged within 20 days of birth and have a UK passport; Births, deaths and movements must be maintained in up-to-date herd records and notified to the national database within 27 days of birth, 7 days of death and 3 days of movement; and imported livestock must be tagged and recorded in accordance with legislation.
x� Traceability must be maintained through to delivery. Cattle must be accompanied by their passport; documentation must be carried for all journeys on/off farm (unless less than 50 km by the member transporting own livestock) that states movement details (holdings moved from and to, number of livestock, movement date, vehicle identification). Food Chain information must accompany each consignment of livestock sent to slaughter, including those going via a livestock market.
x� Controls must be in place to ensure assurance status of livestock being sold as assured. To be sold as farm assured, a number of criteria must be satisfied. Livestock sent for slaughter must meet the minimum required residency period, which is 90 days for cattle; during the residency period, livestock must stay on the farm for the whole time period or checks must be made that the previous owner was farm assured; if livestock are purchased from a market, the market must be assured; if livestock passes through a collection centre, the collection centre must be assured; and vehicles used to transport livestock must be assured, either under the farm scheme if transporting the farm’s own livestock, or the Red Tractor Livestock Transport scheme (or equivalent) and hauliers’ membership numbers are known.
x� It is recommended that bought-in livestock are bought from a farm assured farm. Checks are made to verify the holding that livestock originates from is assured.
x� Records of the health and performance of livestock must be maintained.
The key objective of Red Tractor is to satisfy the increasing demand for traceability of food, growing consumer awareness of animal welfare issues in livestock production, and a need to minimise pesticide residues.
In the UK market, Irish beef exports are competing with Red Tractor standards and will have to at least match these standards and if possible, surpass them.
80 | P a g e
WHAT DO THE PURCHASERS OF IRISH BEEF REQUIRE?
The Irish beef processing sector has been transformed from a frozen commodity business a couple of decades ago to what is today a key fresh food supplier to blue-chip retail and food service customers across the UK, Europe and increasingly to the rest of the world. It is clear that the development of these new higher-value markets has been driven by a strategy of giving the customer what the customer wants.
As a beef producing country that exports over 91% of the beef that it produces, and given that Ireland is a tiny beef producer in a global context and that the international market for beef is highly competitive, satisfying the requirements of the actual and potential customers of Irish beef is essential. If Irish beef producers do not do this, then other international competitors will.
Beef farmers believe that many of the standards and regulations imposed on them are unnecessary and threaten their livelihoods by putting them at a serious competitive disadvantage. It is all well and good to suggest that some of these conditions should be relaxed, but it is vital to take into consideration what the customers for Irish beef are demanding.
In the supply chain, the processors are selling to the retailers, who in turn are selling to consumers. The consumer is arguably the most powerful link in the supply chain, and if retailers do not respond to consumer needs, then consumers may not buy the product.
Consumer behaviour in relation to beef consumption is currently being driven by many factors. These include income and affordability, the health qualities of the product, the provenance of the product, animal welfare and the environment. It is also important to recognise that the market for proteins is a highly competitive one, with pork and chicken providing very strong and generally cheap competition, particularly chicken.
The bottom line is that consumers at retail and food-service level are increasingly demanding sustainably produced quality food. Given how much of their product Irish beef producers export, satisfying the requirements of buyers may be demanding, but there is little choice if the sector is to survive.
The Domestic Beef Market
Annual beef consumption in the Irish market is around 94,000 tonnes, which equates to under 15% of Irish beef production. Retail channels account for the majority of sales. The most notable feature of the retail market for beef is the ongoing growth in the market share of the discounters. Aldi and Lidl had 24.1% of the beef market in 2015, but by 2019 this had jumped to 28.3%. This is mirroring what is happening in the overall retail grocery market.
At the Beef Taskforce meeting in January 2020, a number of retailers clarified their position in regards to the under 30-month requirement. Tesco requires under 30-month for steaks and joints, but mince is acceptable up to 36 months; Aldi has an under 30-month requirement; Lidl up to 36 months; Dunnes up to 36 months and Supervalu under 30
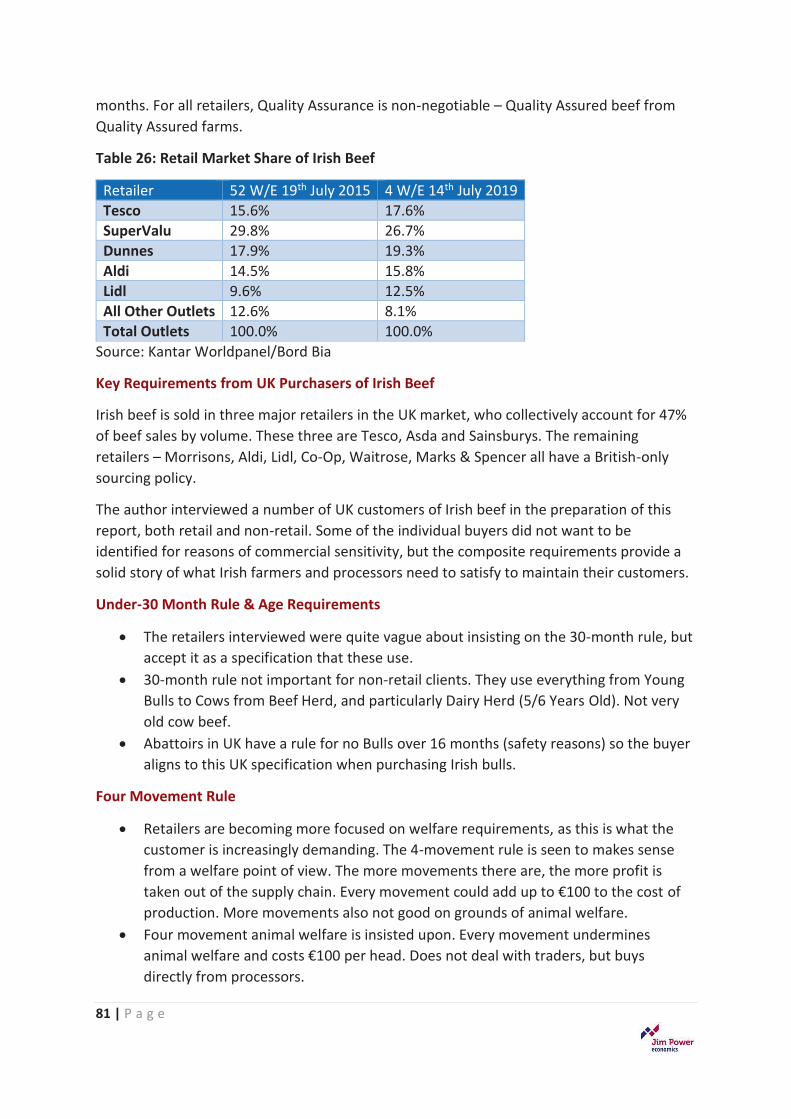
81 | P a g e
months. For all retailers, Quality Assurance is non-negotiable – Quality Assured beef from Quality Assured farms.
Table 26: Retail Market Share of Irish Beef
Retailer 52 W/E 19th July 2015 4 W/E 14th July 2019 Tesco 15.6% 17.6% SuperValu 29.8% 26.7% Dunnes 17.9% 19.3% Aldi 14.5% 15.8% Lidl 9.6% 12.5% All Other Outlets 12.6% 8.1% Total Outlets 100.0% 100.0%
Source: Kantar Worldpanel/Bord Bia
Key Requirements from UK Purchasers of Irish Beef
Irish beef is sold in three major retailers in the UK market, who collectively account for 47% of beef sales by volume. These three are Tesco, Asda and Sainsburys. The remaining retailers – Morrisons, Aldi, Lidl, Co-Op, Waitrose, Marks & Spencer all have a British-only sourcing policy.
The author interviewed a number of UK customers of Irish beef in the preparation of this report, both retail and non-retail. Some of the individual buyers did not want to be identified for reasons of commercial sensitivity, but the composite requirements provide a solid story of what Irish farmers and processors need to satisfy to maintain their customers.
Under-30 Month Rule & Age Requirements
x� The retailers interviewed were quite vague about insisting on the 30-month rule, but accept it as a specification that these use.
x� 30-month rule not important for non-retail clients. They use everything from Young Bulls to Cows from Beef Herd, and particularly Dairy Herd (5/6 Years Old). Not very old cow beef.
x� Abattoirs in UK have a rule for no Bulls over 16 months (safety reasons) so the buyer aligns to this UK specification when purchasing Irish bulls.
Four Movement Rule
x� Retailers are becoming more focused on welfare requirements, as this is what the customer is increasingly demanding. The 4-movement rule is seen to makes sense from a welfare point of view. The more movements there are, the more profit is taken out of the supply chain. Every movement could add up to €100 to the cost of production. More movements also not good on grounds of animal welfare.
x� Four movement animal welfare is insisted upon. Every movement undermines animal welfare and costs €100 per head. Does not deal with traders, but buys directly from processors.
82 | P a g e
x� Prior to BSE, cattle could have 10-12 movements with no controls > no traceability. x� There is a limit of no more than four herd to herd movements on an animal. The
movements of animals between farms risk detrimental effects on animal welfare, food safety and meat quality. It also significantly affects performance of the animals. To decrease these risks, the retailer insists on a limit of no more than four farms and a minimum of 30 days on the last farm. Movements between farms under the same ownership and Farm Assurance will be counted as one farm.
x� All animals must be kept on assured holdings for at least 90 days prior to slaughter if they have come from a non-assured holding. If the animal has come from an assured holding, it must remain on the final farm for a minimum of 30 days prior to slaughter.
x� Red Tractor has 90-day residency rule, so that sets the standard for all beef.
Quality Assurance
x� Integrity of meat is very important – understanding the systems of suppliers re-assures the customer. Traceability is vital and the Bord Bia Quality Assurance Scheme is very important.
x� For one non-retail purchaser, quality is more important than price. Quality includes the execution at factory level (high standards expected); no foreign bodies; grading is not important as fat and bone taken out before being ground.
x� Factory Hygiene and quality of Beef are paramount. The retailer has an independent audit company that carries out annual audits unannounced.
x� One retailer sources its beef from Red Tractor and expects same standards from Irish beef supplied. Red Tractor standards are mimicked as far as possible.
x� One retailer said that the Red Tractor standard is well known in the UK, but does not put logo on meat as customer base expects and understands that it will get high quality product. Bord Bia standard accepted as being very high.
x� The customer will only buy beef that has a national quality scheme and customer will accept all national QA schemes.
x� Bord Bia is regarded as being ahead of Red Tractor as it works closely with farmers, factories, customers and Government, unlike Red Tractor. One retailer believes that Red Tractor is aware of superiority of Bord Bia systems.
Welfare Standards
x� One retailer has its own welfare standards in place which cover farm, transport and slaughter. There is a food manufacturing standard which covers the factory and the processing. The processors and supplying producers must meet the standards that are in place and they are regularly audited to these standards. Irrespective of country of origin, all suppliers and producers must meet the same standards.
x� High animal welfare standards are expected. Retailer expects high quality standards, because this is what customers now expect. This retailer insists on same standards from all markets.
83 | P a g e
Other Issues Identified by Retailers Interviewed
x� The retailer view is that the farmer perception that factories are making massive profits is wrong. Factory has to source animal, cut it up, remove bone, pack it, purchase SKUs etc, but of course every company and every factory is different.
x� Retailer has an approved supplier list for Beef, Fish & Poultry. Full visibility on where raw material comes from. The list is reviewed regularly. Regular audits on all elements of the supply chain – Farm, Factory slaughtering, transport etc. It conducts GAP analysis on supply chain against set criteria.
x� One retailer does not differentiate between dairy and suckler beef as long as the product is in-spec. Weight of animal causes a big issue.
x� Focus in the UK is very much focused on what the retailer wants, which is not as apparent in Ireland. Irish farmers need to get into a mindset of producing what the consumer wants. Retailers will not survive if they do not have that mindset.
x� Specification is very important. The focus of customers has shifted and the trend now is to buy cuts that are ready to cook, with a fixed weight at a fixed price.
x� Retail price charged is being increasingly influenced by the discounters. Consumer and retailer behaviours are changing.
x� One sources UK beef where possible, but not at the price of quality. The Irish market is quite important. Preference is to source fresh beef from the UK or Ireland.
x� Consistency of product is key. Retailers need to match consumer expectations and different tiering of prices necessary. In general, consumers are eating less meat, but chicken and pork are providing intense competition to beef. Beef and lamb are regarded as more of a premium product. People eating less beef, so when they do, they need to make sure it is better and different and of a very high quality. Experience is that, steak in particular has to be of the highest quality and if the experience in shop is not good, it may take three weeks for customer to return to store.
x� Retailer does not want to buy beef from cattle with a ‘massive rear end’ as quality consistency is not as strong.
x� Retailer is not breed specific, but breed is being increasingly used as a marketing ploy, e.g.: Angus Steaks. Not concerned about using dairy beef.
x� No problem sourcing beef supply satisfying the various requirements. The customer is looking for more and more beef to satisfy growing demand for its product. 50% of its beef is sourced in the UK & 50% sourced in Ireland.
x� The customer likes the Irish product – Irish beef industry has progressed significantly over the years and is now amongst the best in the world. No difference between Irish and UK beef.
x� On the UK retail grocery market, the Discounters are driving consumer and retail behaviour and are basically dictating retail price in market. Other retailers are being forced to invest in price.
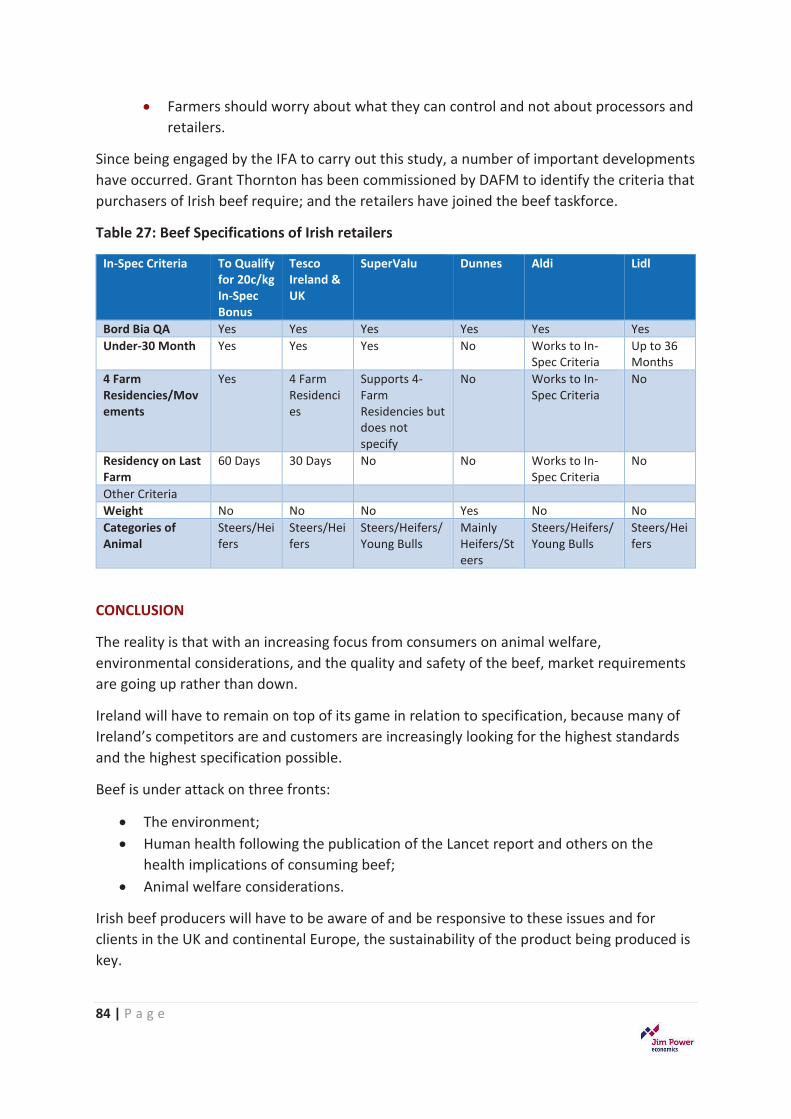
84 | P a g e
x� Farmers should worry about what they can control and not about processors and retailers.
Since being engaged by the IFA to carry out this study, a number of important developments have occurred. Grant Thornton has been commissioned by DAFM to identify the criteria that purchasers of Irish beef require; and the retailers have joined the beef taskforce.
Table 27: Beef Specifications of Irish retailers
In-Spec Criteria To Qualify for 20c/kg In-Spec Bonus
Tesco Ireland & UK
SuperValu Dunnes Aldi Lidl
Bord Bia QA Yes Yes Yes Yes Yes Yes Under-30 Month Yes Yes Yes No Works to In-
Spec Criteria Up to 36 Months
4 Farm Residencies/Movements
Yes 4 Farm Residencies
Supports 4-Farm Residencies but does not specify
No Works to In-Spec Criteria
No
Residency on Last Farm
60 Days 30 Days No No Works to In-Spec Criteria
No
Other Criteria Weight No No No Yes No No Categories of Animal
Steers/Heifers
Steers/Heifers
Steers/Heifers/Young Bulls
Mainly Heifers/Steers
Steers/Heifers/Young Bulls
Steers/Heifers
CONCLUSION
The reality is that with an increasing focus from consumers on animal welfare, environmental considerations, and the quality and safety of the beef, market requirements are going up rather than down.
Ireland will have to remain on top of its game in relation to specification, because many of Ireland’s competitors are and customers are increasingly looking for the highest standards and the highest specification possible.
Beef is under attack on three fronts:
x� The environment; x� Human health following the publication of the Lancet report and others on the
health implications of consuming beef; x� Animal welfare considerations.
Irish beef producers will have to be aware of and be responsive to these issues and for clients in the UK and continental Europe, the sustainability of the product being produced is key.
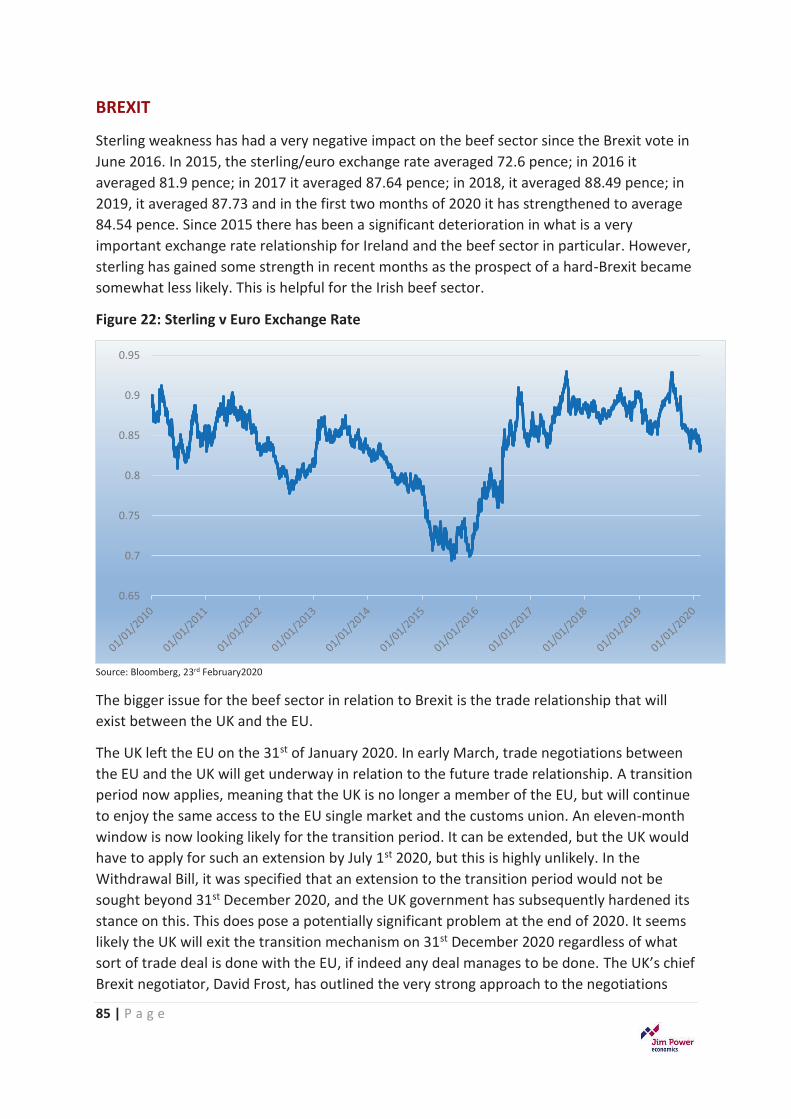
85 | P a g e
BREXIT
Sterling weakness has had a very negative impact on the beef sector since the Brexit vote in June 2016. In 2015, the sterling/euro exchange rate averaged 72.6 pence; in 2016 it averaged 81.9 pence; in 2017 it averaged 87.64 pence; in 2018, it averaged 88.49 pence; in 2019, it averaged 87.73 and in the first two months of 2020 it has strengthened to average 84.54 pence. Since 2015 there has been a significant deterioration in what is a very important exchange rate relationship for Ireland and the beef sector in particular. However, sterling has gained some strength in recent months as the prospect of a hard-Brexit became somewhat less likely. This is helpful for the Irish beef sector.
Figure 22: Sterling v Euro Exchange Rate
Source: Bloomberg, 23rd February2020
The bigger issue for the beef sector in relation to Brexit is the trade relationship that will exist between the UK and the EU.
The UK left the EU on the 31st of January 2020. In early March, trade negotiations between the EU and the UK will get underway in relation to the future trade relationship. A transition period now applies, meaning that the UK is no longer a member of the EU, but will continue to enjoy the same access to the EU single market and the customs union. An eleven-month window is now looking likely for the transition period. It can be extended, but the UK would have to apply for such an extension by July 1st 2020, but this is highly unlikely. In the Withdrawal Bill, it was specified that an extension to the transition period would not be sought beyond 31st December 2020, and the UK government has subsequently hardened its stance on this. This does pose a potentially significant problem at the end of 2020. It seems likely the UK will exit the transition mechanism on 31st December 2020 regardless of what sort of trade deal is done with the EU, if indeed any deal manages to be done. The UK’s chief Brexit negotiator, David Frost, has outlined the very strong approach to the negotiations
0.65
0.7
0.75
0.8
0.85
0.9
0.95
86 | P a g e
that his government will adopt. He has stated bluntly that the UK would never agree to EU oversight of its rulemaking in exchange for a post-Brexit trade deal. He believes that the whole purpose of leaving the EU was to become an independent country once again and that acceptance of EU supervision on so-called level playing field issues would defeat the purpose of the whole exercise that was put in motion back in June 2016.
Simultaneously, the French and Irish governments are trying to push the EU to adopt a more stringent stance with the UK and insist on the UK staying in line with EU environmental, tax and labour-related rules as they are developed over the coming years. The EU approach thus far has been a willingness to accept the rules as they stand at the end of 2020. The differences that these two positions would represent are pretty significant and fundamental. The news flow from the trade talks will be watched with very keen interest over the coming months. The big question is just how realistic it is to suggest that a deal can be done by the end of the year, thereby ending the transition period. It seems inconceivable that such dramatic progress could be made in just 11 months. The UK could crash out of the transition mechanism at the end of 2020 and WTO trade rules could then apply. This would not be good news for the Irish beef sector.
One of the problems for the beef sector is that beef does not have a ‘brand’ and consequently would be more vulnerable to the imposition of tariffs than a product with a strong brand.
It is important to bear in mind that the European Commission has a mechanism for sectoral interventions or so-called special measures. These were utilised during the Russian ban crisis. In 2019, the EU commission allocated €50 million to the Irish beef sector affected by Brexit. The Irish government was given a choice in return for this funding to either reduce beef production; make commitments on environmental sustainability measures; or encourage market diversification. Such measures will be possible in the event of a no-deal Brexit, but they will likely come with conditions attached.
87 | P a g e
CONCLUSIONS
Agriculture plays a very important role in the Irish economy and is particularly important for rural economic and social activity. Within the agricultural sector, beef is a very important component and makes a very significant contribution to agri-food exports and employment.
The Irish beef production sector is in a very difficult situation at the moment and is facing immense challenges going forward. These challenges include a difficult market environment and a poor outlook for EU beef market prices; a retail grocery sector that is delivering significant price compression for beef, in response to consumer demands; a processing sector that is very concentrated and lacks transparency; cheap competition from other protein sources such as pork and chicken; environmental concerns around beef production; a shift in consumer tastes away from beef, which is driven by health and dietary concerns; a rapid expansion of the dairy herd, and dairy beef animals as a consequence; Brexit; CAP reform; and the threat of increased competition in the until-now protected EU beef market.
There are fundamentally three factors that determine the income of beef farmers:
x� The costs of production; x� The price that the producer is paid; and x� Direct payments from the CAP.
The costs of production have been rising consistently, the price paid to producers is under serious pressure, and direct payments have been almost stagnant since 2004 and now account for a disproportionate share of beef farmer incomes. Without direct payments, a large segment of beef farmers would not be viable and would go out of business.
In the beef supply chain, there are three main components – the producer, the processors and the retail grocery sector. At the top of this supply chain, retail prices are being compressed by consumer preferences and intense competition from discounters. The processor is being squeezed by these pressures to some extent, but the farmer is at the bottom of the supply chain and is being squeezed to the greatest extent.
Beef producers are extremely unhappy with the regulations and standards that they are being forced to comply with, and they believe that they are not being adequately rewarded for the efforts they are forced to make to produce a quality product. However, the customers for Irish beef insist on high quality standards, because that is what their customers are in turn looking for. If Irish farmers and processors want to continue to sell Irish beef, they will have to satisfy those requirements, unless the purchasers can be persuaded to change those standards.
Beef farmers lack power in the supply chain, and it is difficult to see how this position can be strengthened. Following the conclusion of the beef talks in September 2019, a number of recommendations were made and actions agreed to. It remains to be seen how effective
88 | P a g e
the proposals will be, but the reality is that Irish beef farmers are producing a product that is going into a very difficult marketplace at the moment.
Details of the Irish Beef Sector Agreement dated 15th September 2019 are outlined in Appendix 2. Most of the issues of concern to beef farmers are covered in the agreement, apart from a base price. It remains to be seen how the agreement might help beef farmers, but the reality is that the economics of the beef industry are difficult and are likely to remain difficult.
Recent research from Teagascxxxv suggests that for a farmer to break even for bringing a suckler calf to beef, €4.17 per kg would be required. Teagasc conveyed some key messages to suckler farmers:
x� Improving efficiency still pays x� Current beef prices make all suckling systems loss making x� With low beef prices, the strategy has to be to cut all costs wherever possible. The
suggestions include reducing the meal bill to a minimum; having a very basic fertiliser programme; no reseeding; no new investment in machinery or stock; cut maintenance costs to essentials; and examine all health costs critically.
While these suggestions make sense, it is not clear that they are compatible with preserving the Irish suckler herd. The reality is that if policy makers want to preserve a suckler herd, interventions will be required to subsidise production. In the absence of this, we could conceivably be left with the approximately one third of beef farmers who have sufficient scale and are efficient, and the remainder could go out of business or switch to alternative enterprises.
The author of this report has never experienced a supply chain with such a basic lack of trust, and this is not a good place from which to build a successful beef industry.
A collaborative approach to meeting the challenges in the sector is essential. This will require a much greater level of transparency, and unless such transparency is forthcoming from the processing and retail sectors in particular, it will be difficult to make progress and achieve success.
89 | P a g e
APPENDIX 1
US BEEF PRICE INDEX LEGISLATION RELEVANT TO CATTLE
Subpart A—General Provisions
General administrative provisions
(a) Reporting by packers and importers. A packer or importer shall report all information required under this part on an individual lot basis.
(b) Reporting schedule. Whenever a packer or importer is required to report information on transactions of livestock and livestock products under this part by a set time, all covered transactions up to within one half hour of the reporting
deadline shall be reported. Transactions completed during the one-half hour prior to the previous reporting time, but not reported in the previous report, shall be reported at the next scheduled reporting time.
(c) Regional reporting and aggregation. The Secretary shall make information obtained under this part available to the public only in a manner that:
(1) Ensures that the information is published on a national and a regional or state-wide basis as the Secretary determines to be appropriate;
(2) Ensures that the identity of a reporting person or the entity which they represent is not disclosed; and
(3) Market information reported to the Secretary by packers and importers shall be aggregated in such a manner that the market reports issued will not disclose the identity of persons, packers and importers, including parties to a
contract and packer's and importer's proprietary information.
(d) Adjustments. Prior to the publication of any information required under this part, the Secretary may make reasonable adjustments in information reported by packers and importers to reflect price aberrations or other unusual or unique occurrences that the Secretary determines would distort the published information to the detriment of producers,
packers, or other market participants.
(e) Reporting of activities on weekends and holidays. Livestock and livestock products committed to a packer, or importer, or purchased, sold, or slaughtered by a packer or importer on a weekend day or holiday shall be reported to the
Secretary in accordance with the provisions of this Part and reported by the Secretary on the immediately following reporting day. A packer shall not be required to report such actions more than once on the immediately following
reporting day.
(f) Reporting methods. Whenever information is required to be reported under this part, it shall be reported by electronic means and shall adhere to a standardized format established by the Secretary to achieve the objectives of this
part, except in emergencies or in cases when an alternative method is agreeable to the entity required to report and AMS.
Recordkeeping
(a) In general. Each packer or importer required to report information to the Secretary under the Act and this Part shall maintain for 2 years and make available to the Secretary the following information on request:
(1) The original contracts, agreements, receipts, and other records associated with any transaction relating to the purchase, sale, pricing, transportation, delivery, weighing, slaughter, or carcass characteristics of all livestock or livestock
products; and
(2) Such records or other information as is necessary or appropriate to verify the accuracy of the information required to be reported under the Act and this Part.
(b) Purchases of cattle and swine and sales of boxed beef cuts. A record of a purchase of a lot of cattle or swine, or a sale of a unit of boxed beef cuts, by a packer shall evidence whether the purchase or sale occurred:
90 | P a g e
(1) Before 10 a.m. central time;
(2) Between 10 a.m. and 2 p.m. central time; or
(3) After 2 p.m. central time.
(c) Purchases of lambs. A record of a purchase of a lot of lambs by a packer shall evidence whether the purchase occurred:
(1) Before 2 p.m. central time; or
(2) After 2 p.m. central time.
(d) Sales of lamb carcasses and sales of boxed lamb cuts. A record of a sale by a packer of lamb carcasses and cuts, shall evidence time and date the sale occurred:
(1) Before 2 p.m. central time; or
(2) After 2 p.m. central time.
A record of sale by an importer of lamb cuts shall evidence the date the sale occurred.
(e) Reporting sales of boxed beef cuts and sales of boxed lamb cuts. (1) Beef packers must report all sales of boxed beef items by the applicable Institutional Meat Purchase Specifications (IMPS) item number or the boxed beef items'
cutting and trimming specifications.
(2) Lamb packers and importers must report all sales of boxed lamb items by the applicable Institutional Meat Purchase Specifications (IMPS) item number or the boxed lamb items' cutting and trimming specifications.
(f) Reporting sales of wholesale pork. A record of a sale of wholesale pork by a packer shall evidence whether the sale occurred:
(1) Before 10:00 a.m. central time;
(2) Between 10:00 a.m. and 2:00 p.m. central time; or
(3) After 2:00 p.m. central time.
[73 FR 28633, May 16, 2008, as amended at 77 FR 50573, Aug. 22, 2012
Definitions
The following definitions apply to this part.
Act. The term “Act” means Subtitle B of the Agricultural Marketing Act of 1946, as amended; 7 U.S.C. 1635-1636h.
Base price. The term “base price” means the price paid for livestock, delivered at the packing plant, before application of any premiums or discounts, expressed in dollars per hundred pounds of hot carcass weight.
Basis level. The term “basis level” means the agreed-on adjustment to a future price to establish the final price paid for livestock.
Current slaughter week. The term “current slaughter week” means the period beginning Monday, and ending Sunday, of the week in which a reporting day occurs.
91 | P a g e
Discount. The term “discount” means the adjustment, expressed in dollars per one hundred pounds, subtracted from the base price due to weight, quality characteristics, yield characteristics, livestock class, dark cutting, breed, dressing
percentage, or other characteristic.
Exported. The term “exported” means livestock or livestock products that are physically shipped to locations outside of the 50 States.
F.O.B. The term “F.O.B.” means free on board, regardless of the mode of transportation, at the point of direct shipment by the seller to the buyer (e.g., F.O.B. Plant, F.O.B. Feedlot) or from a common basis point to the buyer (e.g.,
F.O.B. Omaha).
Imported. The term “imported” means livestock that are raised to slaughter weight outside of the 50 States or livestock products produced outside of the 50 States.
Institutional Meat Purchase Specifications. Specifications describing various meat cuts, meat products, and meat food products derived from all livestock species, commonly abbreviated “IMPS”, and intended for use by any meat
procuring activity. Copies of the IMPS may be obtained from the U.S. Department of Agriculture, Agricultural Marketing Service, Livestock and Seed Program located at Room 2603 South Building, 1400 Independence Ave., SW., Washington, DC
20250. Phone (202) 260-8295 or Fax (202) 720-1112. Copies may also be obtained over the Internet at http://www.ams.usda.gov/AMSv1.0/LivestockStandardizationIMPS.
Livestock. The term “livestock” means cattle, swine, and lambs.
Lot. (1) When used in reference to livestock, the term “lot” means a group of one or more livestock that is identified for the purpose of a single transaction between a buyer and a seller;
(2) When used in reference to lamb carcasses, the term “lot” means a group of one or more lamb carcasses sharing a similar weight range category and comprising a single transaction between a buyer and seller; or
(3) When used in reference to boxed beef, wholesale pork, and lamb, the term ‘lot’ means a group of one or more boxes of beef, wholesale pork, or lamb items sharing cutting and trimming specifications and comprising a single
transaction between a buyer and seller.
Marketing. The term “marketing” means the sale or other disposition of livestock, livestock products, or meat or meat food products in commerce.
Negotiated purchase. The term “negotiated purchase” means a cash or spot market purchase by a packer of livestock from a producer under which the base price for the livestock is determined by seller-buyer interaction and
agreement on a delivery day. The livestock are scheduled for delivery to the packer not more than 14 days after the date on which the livestock are committed to the packer.
Negotiated grid purchase. The term “negotiated grid purchase” in reference to cattle means the negotiation of a base price, from which premiums are added and discounts are subtracted, determined by seller-buyer interaction and
agreement on a delivery day. The livestock are scheduled for delivery to the packer not more than 14 days after the date on which the livestock are committed to the packer.
Negotiated sale. The term “negotiated sale” means a cash or spot market sale by a producer of livestock to a packer under which the base price for the livestock is determined by seller-buyer interaction and agreement on a delivery day. The
livestock are scheduled for delivery to the packer not later than 14 days after the date on which the livestock are committed to the packer. When used in reference to sales of boxed beef or lamb cuts or lamb carcasses the term
“negotiated sale” means a sale by a packer selling boxed beef or lamb cuts or lamb carcasses to a buyer of boxed beef or lamb cuts or lamb carcasses under which the price for the boxed beef or lamb cuts or lamb carcasses is determined by
seller-buyer interaction and agreement on a day.
Origin. The term “origin” means the State where the livestock were fed to slaughter weight.
Percent lean. The term “percent lean” means the value equal to the average percentage of the carcass weight comprised of lean meat.
92 | P a g e
Person. The term “person” means any individual, group of individuals, partnership, corporation, association, or other entity.
Premium. The term “premium” means the adjustment, expressed in dollars per one hundred pounds, added to the base price due to weight, quality characteristics, yield characteristics, livestock class, and breed.
Priced. The term “priced” means the time when the final price is determined either through buyer-seller interaction and agreement or as a result of some other price determining method.
Prior slaughter week. The term prior “slaughter week” means the Monday through Sunday prior to a reporting day.
Producer. The term “producer” means any person engaged in the business of selling livestock to a packer for slaughter (including the sale of livestock from a packer to another packer).
Purchased. The term “purchased” means the agreement on a price, or the method for calculating a price, determined through buyer-seller interaction and agreement.
Reporting day. The term “reporting day” means a day on which a packer conducts business regarding livestock committed to the packer, or livestock purchased, sold, or slaughtered by the packer; the Secretary is required to make such
information available to the public; and the Department of Agriculture is open to conduct business.
Secretary. The term “Secretary” means the Secretary of Agriculture of the United States or any other officer or employee of the Department of Agriculture to whom authority has been delegated or may hereafter be delegated to act in
the Secretary's stead.
State. The term “State” means each of the 50 States.
[73 FR 28633, May 16, 2008, as amended at 77 FR 50573, Aug. 22, 2012]
Subpart B—Cattle Reporting
Definitions
The following definitions apply to this subpart.
Boxed beef. The term “boxed beef” means those carlot-based portions of a beef carcass including fresh and frozen primals, subprimals, cuts fabricated from subprimals (excluding portion-control cuts such as chops and steaks similar to those portion cut items described in the Institutional Meat Purchase Specifications (IMPS) for Fresh Beef Products Series
100), thin meats (e.g. inside and outside skirts, pectoral meat, cap and wedge meat, and blade meat), and fresh and frozen ground beef, beef trimmings, and boneless processing beef.
Branded. The term “branded” means boxed beef cuts produced and marketed under a corporate trademark (for example, products that are marketed on their quality, yield, or breed characteristics), or boxed beef cuts produced and
marketed under one of USDA's Meat Grading and Certification Branch, Certified Beef programs.
Carcass characteristics. The term “carcass characteristics” means the range and average carcass weight in pounds, the quality grade and yield grade (if applicable), and the average cattle dressing percentage.
Carlot-based. The term “carlot-based” means any transaction between a buyer and a seller destined for two or less delivery stops consisting of one or more individual boxed beef items. When used in reference to cow and bull boxed beef items, the term “carlot-based” means any transaction between a buyer and seller consisting of 2,000 pounds or more of
one or more individual items.
Cattle committed. The term “cattle committed” means cattle that are scheduled to be delivered to a packer within the 7-day period beginning on the date of an agreement to sell the cattle.
Cattle type. The term “cattle type” means the following types of cattle purchased for slaughter:
93 | P a g e
(1) Fed steers;
(2) Fed heifers;
(3) Fed Holsteins and other fed dairy steers and heifers;
(4) Cows; and
(5) Bulls.
Established. The term “established”, when used in connection with prices, means that point in time when the buyer and seller agree upon a net price.
Formula marketing arrangement.
(1) When used in reference to live cattle, the term “formula marketing arrangement” means the advance commitment of cattle for slaughter by any means other than through a negotiated purchase or a forward contract, using a
method for calculating price in which the price is determined at a future date.
(2) When used in reference to boxed beef, the term “formula marketing arrangement” means the advance commitment of boxed beef by any means other than through a negotiated purchase or a forward contract, using a method
for calculating price in which the price is determined at a future date.
Forward contract. (1) When used in reference to live cattle, the term “forward contract” means an agreement for the purchase of cattle, executed in advance of slaughter, under which the base price is established by reference to prices
quoted on the Chicago Mercantile Exchange, or other comparable publicly available prices.
(2) When used in reference to boxed beef, the term “forward contract” means an agreement for the sale of boxed beef, executed in advance of manufacture, under which the base price is established by reference to publicly available
quoted prices.
Packer. The term “packer” means any person engaged in the business of buying cattle in commerce for purposes of slaughter, of manufacturing or preparing meats or meat food products from cattle for sale or shipment in commerce, or of
marketing meats or meat food products from cattle in an unmanufactured form acting as a wholesale broker, dealer, or distributor in commerce. For any calendar year, the term “packer” includes only a federally inspected cattle processing
plant that slaughtered an average of 125,000 head of cattle per year during the immediately preceding 5 calendar years. Additionally, in the case of a cattle processing plant that did not slaughter cattle during the immediately preceding 5
calendar years, it shall be considered a packer if the Secretary determines the processing plant should be considered a packer under this subpart after considering its capacity.
Packer-owned cattle. The term “packer-owned cattle” means cattle that a packer owns for at least 14 days immediately before slaughter.
Prices for cattle. The term “prices for cattle” includes the price per hundredweight; the purchase type; the quantity on a live and a dressed weight basis; the estimated live weight range; the average live weight; the estimated percentage of
cattle of a USDA quality grade Choice or better; beef carcass classification; any premiums or discounts associated with weight, quality grade, yield grade, or type of purchase; cattle State of origin; estimated cattle dressing percentage; and
price basis as F.O.B. feedlot or delivered at the plant.
Terms of trade. The term “terms of trade” means, with respect to the purchase of steers and heifers for slaughter:
(1) Whether a packer provided any financing agreement or arrangement with regard to the steers and heifers;
(2) Whether the delivery terms specified the location of the producer or the location of the packer's plant;
(3) Whether the producer is able to unilaterally specify the date and time during the business day of the packer that the cattle are to be delivered for slaughter; and
94 | P a g e
(4) The percentage of steers and heifers purchased by a packer as a negotiated purchase that are scheduled to be delivered to the plant for slaughter not later than 14 days and the percentage of slaughter steers and heifers purchased by
a packer as a negotiated purchase that are scheduled to be delivered to the plant for slaughter more than 14 days, but fewer than 30 days.
Type of purchase. The term “type of purchase” with respect to cattle, means a negotiated purchase, negotiated grid purchase, a formula market arrangement, and a forward contract.
Type of sale. The term “type of sale” with respect to boxed beef, means a negotiated sale, a formula market arrangement, and a forward contract.
White cow. Cow on a ration that tends to produce white fat.
Mandatory daily reporting for steers and heifers.
(a) In general. The corporate officers or officially designated representatives of each steer and heifer packer processing plant shall report to the Secretary at least two times each reporting day not later than 10 a.m. central time and
not later than 2 p.m. central time the following information, inclusive since the last reporting, categorized to clearly delineate domestic from imported market purchases as described in §59.10(b).
(1) The prices for cattle (per hundredweight) established on that day, categorized by:
(i) The type of purchase;
(ii) The quantity of cattle purchased on a live weight basis;
(iii) The quantity of cattle purchased on a dressed weight basis;
(iv) The estimated weights of cattle purchased;
(v) An estimate of the percentage of the cattle purchased that were of a quality grade of Choice or better; and
(vi) Any premiums or discounts associated with weight, quality grade, yield grade, or other characteristic expressed in dollars per hundredweight on a dressed basis.
(2) The quantity of cattle delivered to the packer (quoted in numbers of head) on that day, categorized by:
(i) The type of purchase;
(ii) The quantity of cattle delivered on a live weight basis; and
(iii) The quantity of cattle delivered on a dressed weight basis.
(3) The quantity of cattle committed to the packer (quoted in numbers of head) as of that day, categorized by:
(i) The type of purchase;
(ii) The quantity of cattle committed on a live weight basis; and
(iii) The quantity of cattle committed on a dressed weight basis.
(4) The terms of trade regarding the cattle, as applicable.
(b) Publication. The Secretary shall make the information available to the public not less frequently than three times each reporting day.
95 | P a g e
Mandatory daily reporting for cows and bulls
(a) In General. The corporate officers or officially designated representatives of each cow and bull packer processing plant shall report to the Secretary each reporting day the following information for each cattle type, inclusive since the last
reporting, categorized to clearly delineate domestic from imported market purchases as described in §59.10(b).
(1) The base bid price (per hundredweight) intended to be paid for slaughter cow and bull carcasses on that day not later than 10 a.m. central time categorized by:
(i) Weight; and
(ii) For slaughter cows, percent lean (e.g., breaker, boner, cutter (lean)).
(2) The prices for cattle (per hundredweight) purchased during the previous day not later than 2 p.m. central time categorized by:
(i) The type of purchase;
(ii) The quantity of cattle purchased on a live weight basis;
(iii) The quantity of cattle purchased on a dressed weight basis;
(iv) The estimated weight of the cattle purchased;
(v) The quality classification; and
(vi) Any premiums or discounts associated with weight or quality expressed in dollars per hundredweight on a dressed basis.
(3) The volume of cows and bulls slaughtered the previous day.
(b) Publication. The Secretary shall make the information available to the public within one hour of the required reporting time on the reporting day on which the information is received from the packer.
Mandatory weekly reporting for steers and heifers.
(a) In general. The corporate officers or officially designated representatives of each steer and heifer packer processing plant shall report to the Secretary on the first reporting day of each week, not later than 9 a.m. central time, the
following information applicable to the prior slaughter week, categorized to clearly delineate domestic from imported market purchases:
(1) The quantity of cattle purchased through a negotiated basis that were slaughtered;
(2) The quantity of cattle purchased through a negotiated grid basis that were slaughtered;
(3) The quantity of cattle purchased through forward contracts that were slaughtered;
(4) The quantity of cattle delivered under a formula marketing arrangement that were slaughtered;
(5) The quantity and carcass characteristics of packer-owned cattle that were slaughtered;
(6) The quantity, basis level, basis level month, and delivery month and year for all cattle purchased through forward contracts;
(7) The range and average of intended premiums and discounts (including those associated with weight, quality grade, yield grade, or type of cattle) that are expected to be in effect for the current slaughter week.
96 | P a g e
(b) Publication. The Secretary shall make available to the public the information obtained under paragraph (a) of this section on the first reporting day of the current slaughter week by 10 a.m. central time.
Mandatory reporting of boxed beef sales.
(a) Daily reporting. The corporate officers or officially designated representatives of each packer processing plant shall report to the Secretary at least twice each reporting day (once by 10 a.m. central time, and once by 2 p.m. central
time) the following information on total boxed beef domestic and export sales established on that day inclusive since the last reporting as described in §59.10(b):
(1) The price for each lot of each boxed beef sale, quoted in dollars per hundredweight on a F.O.B. plant basis;
(2) The quantity for each lot of each sale, quoted by number of pounds sold; and
(3) The information regarding the characteristics of each sale is as follows:
(i) The type of sale;
(ii) The branded product characteristics, if applicable;
(iii) The grade for steer and heifer beef (e.g., USDA Prime, USDA Choice or better, USDA Choice, USDA Select, ungraded no-roll product);
(iv) The grade for cow beef or packer yield and/or quality sort for cow beef (e.g., Breakers, Boners, White Cow, Cutters (lean));
(v) The cut of beef, referencing the most recent version of the Institutional Meat Purchase Specifications (IMPS), when applicable;
(vi) The trim specification;
(vii) The weight range of the cut;
(viii) The product delivery period; and
(ix) The beef type (steer/heifer, dairy steer/heifer, or cow).
(b) Publication. The Secretary shall make available to the public the information obtained under paragraph (a) of this section not less frequently than twice each reporting day.
97 | P a g e
APPENDIX 2
IRISH BEEF SECTOR AGREEMENT 15th SEPTEMBER 2019 Strand One: Immediate benefits for farmers Strand One of the Agreement involves a number of interventions which will provide immediate benefit for beef producers. The following interventions were agreed: x� The immediate introduction of a new bonus of 8c/kg for steers and heifers aged between 30 to 36 months, which
meet all non-age related existing in-spec criteria, and which up to now have not received any bonus. x� An immediate increase of two-thirds in the current in-spec bonus for steers and heifers, from 12c/kg to 20c/kg. x� The introduction of a new in-spec bonus of 12c/kg for steers and heifers under 30 months in the categories of grade
O- and fat score 4+, which currently do not qualify for any bonus.
x� The in-spec 70-day residency requirement will be reduced to 60 days on the last farm.
x� Bord Bia will develop a beef market price index model based on 3 components: cattle price index, beef market price index (retail and wholesale) and an offal price indicator, which will be introduced week commencing 16 September.
x� An immediate scientific review of the Quality Payment Grid by Teagasc; the first stage of the review, a desktop analysis of the pricing structure of the grid on the basis of meat yield/conformation, to be completed by end October.
x� The establishment of a Beef Market Taskforce. Strand Two: Strategic Structural Reforms: Strand Two of the Agreement sets out the strategic measures which seek to address structural imbalances in the beef sector. Market Scrutiny Initiatives aimed at improving information along the supply chain will include the immediate commissioning of the following reports, with a view to publishing before the end of 2019: x� an independent review of market and customer requirements, specifically in relation to the four in-spec bonus
criteria currently in operation in the Irish beef sector; x� an independent examination of the price composition of the total value of the animal, including the fifth quarter,
along the supply chain. The results will inform future actions as necessary. The beef industry will co-operate in providing data; and
x� a summary of competition law issues as relevant to the Irish beef sector. Beef Market Taskforce As part of Strand One and underpinning Strand Two, a Beef Market Task Force will be established to provide leadership to develop a sustainable pathway for the future of the beef sector in terms of economic, environmental and social sustainability. The Taskforce will be independently chaired by an appointee of the Minister, and will include DAFM, relevant State agencies and nominees from farm organisations and the meat industry. The Taskforce will provide for a robust implementation structure for commitments entered into in this Agreement, with timelines and stakeholder engagement. Furthermore, the Beef Market Taskforce will offer a suitable platform for strategic engagement with key stakeholders including retailers, regulatory authorities etc. The Task Force will review and bring forward measures that can support farmers transitioning from lower grade animals towards higher-spec categories through innovation and new technologies. Promotion x� Bord Bia will further intensify promotional activity for Irish beef across key EU markets and China. x� DAFM and Bord Bia are actively engaging with the EU Commission on the development of a Protected Geographical
Indication for Irish beef. Transparency x� In advance of the implementation of a new EU Regulation on price reporting across the EU, DAFM will
provide additional detailed price reporting on the Beef PriceWatch app. EU experts will be invited to brief the Task Force on the expanded EU meat market observatory methodology.
x� Key retail customers will be invited to brief the Task Force on their market requirements.
98 | P a g e
x� The Task Force will examine transparency models in other jurisdictions.
x� A consultation process will be launched shortly on the transposition of the Unfair Trading Practices (UTP) Directive, including consideration of the requirement for an independent regulator.
x� DAFM will report its carcass classification inspection results on a regular basis. An expert report on mechanical carcass classification will be published in the near future. An appeals system for manual grading factories is being introduced.
x� Teagasc will review the hot/cold weighing system.
x� FSAI and DAFM will ensure strict enforcement of EU labelling laws.
Strengthening the position of the farmer in the supply chain DAFM is proactively engaging with several potential beef Producer Organisations and providing guidance on the application process. Live exports are a critical outlet to improve competition in the sector. DAFM is committed to a continued strategic focus in facilitating and developing this trade on a sustainable basis, taking account of stringent animal health and welfare standards. Miscellaneous industry commitments
x� Meat industry confirmed that the base price at individual plant level applies to all steers and heifers regardless of age or breed.
x� No change in weight limits without a minimum of four months’ notice to the farmer.
x� Farmers have the right to access their carcass images.
x� Lairage weighing services will be provided on request, which may incur a nominal charge.
x� Written confirmation of terms of sale, where requested.
x� Farmers can opt out of the insurance scheme for animals delivered to factories.
99 | P a g e
REFERENCES & NOTES
i ‘Transparency in Beef Markets in Ireland’, Dr Kevin Hanrahan, Teagasc, May 30/31, 2018. ii The CSO developed a new national economic indicator called modified Gross National Income (GNI) or GNI*. This is defined as GNI less the impact of re-domiciled companies and the depreciation attributable to relocated capital assets. In effect, the new indicator seeks to exclude the globalisation effects that disproportionately affect the measurement of the size of the Irish economy.
iii Trade Factsheet, Department of Agriculture, Food & the Marine, December 2019.
iv Factsheet on Irish Agriculture, Department of Agriculture, Food & the Marine, December 2019.
v Food Wise 2025, Steps to Success 2019, Department of Agriculture, Food and the Marine, July 2019.
vi EC (2019) EU Agricultural Outlook for Markets and Income, 2019-2030. European Commission, DG Agriculture & Rural Development, Brussels. vii ‘Give up Meat (for a Day, at Least)’ Bloomberg Editorial Board, 22nd September 2019. viii https://www.oxfordmartin.ox.ac.uk/news/cop24-climate-metrics/ ix Climate Action Plan 2019. Government of Ireland. x Leip. A., Weiss, F., Wasseenar, T., Perez, L., Fellman, T., Loudjani, P., Tubiello, F., Grandgirard, D., Monni, S. and Biala, K., 2010. ‘Evaluation of the livestock sector’s contribution to the EU greenhouse gas emissions (GGELS) – final report. European Commission, Joint Research Centre. xi Teagasc Greenhouse Gas Working Group, Gary J. Lanigan & Trevor Donnellan (eds), ‘An Analysis of Abatement Potential of Greenhouse Gas Emissions in Irish Agriculture 2021-2030. June 2018. xii Government Office for Science, Foresight, ‘The Future of Food and Farming – Challenges and Choices for Global Sustainability.’ xiii ‘Beef Carcase Classification and Price Reporting – Annual Report 2018, DAFM. xiv Beef Marketing, Joe Burke, Teagasc Beef Manual, October 2016.
xv ‘The Economic and Societal Importance of the Irish Suckler Beef Sector’. Hennessy, Thia; Doran, Justin; Bogue, Joe & Repar, Lana, 2018. xvi ‘The Economic and Societal Importance of the Irish Suckler and Beef Sector’, Hennessy, Doran, Bogue & Repar, (2018). xvii www.meatindustryireland.ie
xviii European Commission, Producer and Interbranch Organisations.
xix CAP Expenditure and CAP Reform Path Post-2013’ European Commission, July 2019.
xx Teagasc eProfit Monitor Analysis, September 2019. xxi Michael Creed TD, Dáil answer to Charlie McConalogue TD, April 2019. xxii ‘Role of Offal in the Price of Beef’, The Farmers Journal, 20th January 2018. xxiii Department of Agriculture, Food and the Marine, Written Answers, 5th March 2019. xxiv ‘Today with Sean O’Rourke’, RTE Radio 1, 21st February 2019. xxv www.agriculture.gov.ie xxvi Department of Agriculture, Food and the Marine Corporate Governance Framework, April 2016. xxvii ‘Animal Welfare Guidelines for Beef Farmers,’, DAFM xxviii Origin Green Ireland, Strategy 2019-2021, Bord Bia.
xxix ‘Building Differentiation, Winning Growth’, 2019-2021 Bord Bia Statement of Strategy.
100 | P a g e
xxx https://www.bordbia.ie/farmers-growers/farmers/quality-assurance-schemes/sustainable-beef-and-lamb-assurance-scheme-sblas/ xxxi IFA Submission to the Joint Committee on Agriculture, Food and the Marine on the Future of the Beef Sector, March 2019. xxxii ‘Science ad Markets will remain core to beef grid – factories’, Irish Farmers Journal, 25th June 2019. xxxiii AbacusBio Limited, ‘GHG Efficiency in Irish Beef Finishing Systems’, Prepared for Dean Holroyd, Stephen Connolly & Andrew Cromie , ABP Food Group and ICBF, 7th August 2019. xxxiv Red Tractor Assurance, Beef & Lamb Standards, 1st October 2017 (updated 1st June 2018). xxxv Beef Systems Analysis, Teagasc/IFA Seminar, Kilkenny, 3rd September 2019.

NOTES
IFA-BeefStudy-A4-Mar20-Contents-v4.indd 2IFA-BeefStudy-A4-Mar20-Contents-v4.indd 2 02/03/2020 14:0402/03/2020 14:04

AN INDEPENDENT ASSESSMENT OF THE IRISH BEEF INDUSTRYMarch 2020
IFA-BeedStudy-A4-Feb20-Cover-v1.indd 2IFA-BeedStudy-A4-Feb20-Cover-v1.indd 2 02/03/2020 10:3202/03/2020 10:32

AN INDEPENDENT ASSESSMENT OF THE IRISH BEEF INDUSTRY
AN IN
DEPENDEN
T ASSESSMEN
T OF THE IRISH BEEF IN
DUSTRYJim
Power Econom
ics
AbstractThis report was commissioned
by the IFA to examine the current challenges facing beef
production in Ireland.March 2020
IFA-BeedStudy-A4-Feb20-Cover-v1.indd 1IFA-BeedStudy-A4-Feb20-Cover-v1.indd 1 02/03/2020 10:3202/03/2020 10:32