an ict perspective - vuw research archive
TRANSCRIPT

The Development of Learning Regions in New
Zealand: an ICT perspective
By
Janet Mary Toland
A thesis submitted to the Victoria University of Wellington
in fulfilment of the requirements for the degree of
Doctor of Philosophy in Information Systems
Victoria University of Wellington
2010


i
ABSTRACT
The term “Learning Region” is used to identify a region which is innovative,
economically successful, and inhabited by citizens who are active members of their
local community. Such regions are characterised by strong links between local
businesses, community groups, and education providers. Within a regional area
interaction and exchange of information is easier and cheaper than in a national or
international context. The success of an individual organisation is directly related to the
quality of information available locally. Information technology can be an important
tool in improving the flow of knowledge between the stakeholders within a region.
The study examines the role that information and communication technologies (ICTs)
play in the development of learning regions in New Zealand, and how they can be used
to improve the quality of information flows both within the region itself, and between
the region and the outside world. In particular the research considers what contribution
ICTs make to organisational learning and innovation.
Historical methods are used to build up a picture of the significant changes that have
taken place within two contrasting regions of New Zealand between 1985 and 2005. The
two selected regions are Southland and Wellington. Data was collected by searching
regional newspapers, and conducting interviews with key figures in each region. A “6-
I”framework of the “ideal” features of a learning region was developed from the
literature review and this was used to analyse the data.
The findings show a clear linear progression in terms of the development of hard ICT
based networks, but a less clear pattern in terms of soft social networks where the same
issues were revisited a number of times over the years. Though there was evidence of a
relationship between the soft networks that existed at the regional level and the
utilisation of hard ICT networks within a region it was difficult to quantify. Hard and
soft networks evolve differently over time and the relationship between the two is
nuanced. Both regions were successful in setting up high quality ICT networks.
However, with the exception of the education sector, both regions struggled to co-
ordinate their soft networks. Though good social capital existed in each region,
especially in Southland, it was located in different interest groups and was not easy to

ii
bring together. This lack of co-ordination meant that the possibilities opened up by ICT
infrastructure in terms of increasing innovation were not fully realised. Both regions
demonstrated many of the characteristics of learning regions but neither region was
able to bring all aspects together to reach their full potential. The thesis demonstrates
the important role that soft social networks play in the successful utilisation of ICT
networks within a regional setting.

iii
I dedicate this thesis to my parents Thomas and Kathleen Kennedy, my mother and
father-in-law Norah and Jim Toland, and my grandparents Archie and Frances Fryer
and Thomas and Annie Kennedy for their love, support and encouragement.
ACKNOWLEDGMENTS
I would like to thank my supervisors Professor Pak Yoong and Associate Professor
Peter Murphy for their assistance in developing this thesis. Their guidance and critical
thinking was invaluable in improving the quality of my research.
My thesis has had a number of false starts and I would like to thank the people who
helped along the way, Andy Gillespie, University of Newcastle Upon Tyne, Nimal
Jayaratna at Sheffield Hallam University, and Tony Adams and Dharmendra Sharma at
University of the South Pacific.
I thank Victoria University of Wellington for supporting my research. I would also like
to acknowledge the assistance I have had from University of the South Pacific,
University of Newcastle upon Tyne, and the University of Northumbria at Newcastle.
I would like to thank the participants in my research for their time and insights, and also
the staff at the National Library for their assistance with finding research materials. I
would also like to thank the examiners whose questioning insights have helped to
strengthen this thesis.
Thanks to the academic and administrative staff at the School of Information
Management for their support, and in particular to my colleagues Tony Hooper and
David Mason who helped to lighten my teaching load during the final stage of thesis
preparation. Also a big thank you to the members of the PhD Learning Set for their
friendship and encouragement.
Last but not least a very special thank you to my family for their patience over the years;
to my children Eleanor, Rory & Frankie and especially my husband Martin.
iv
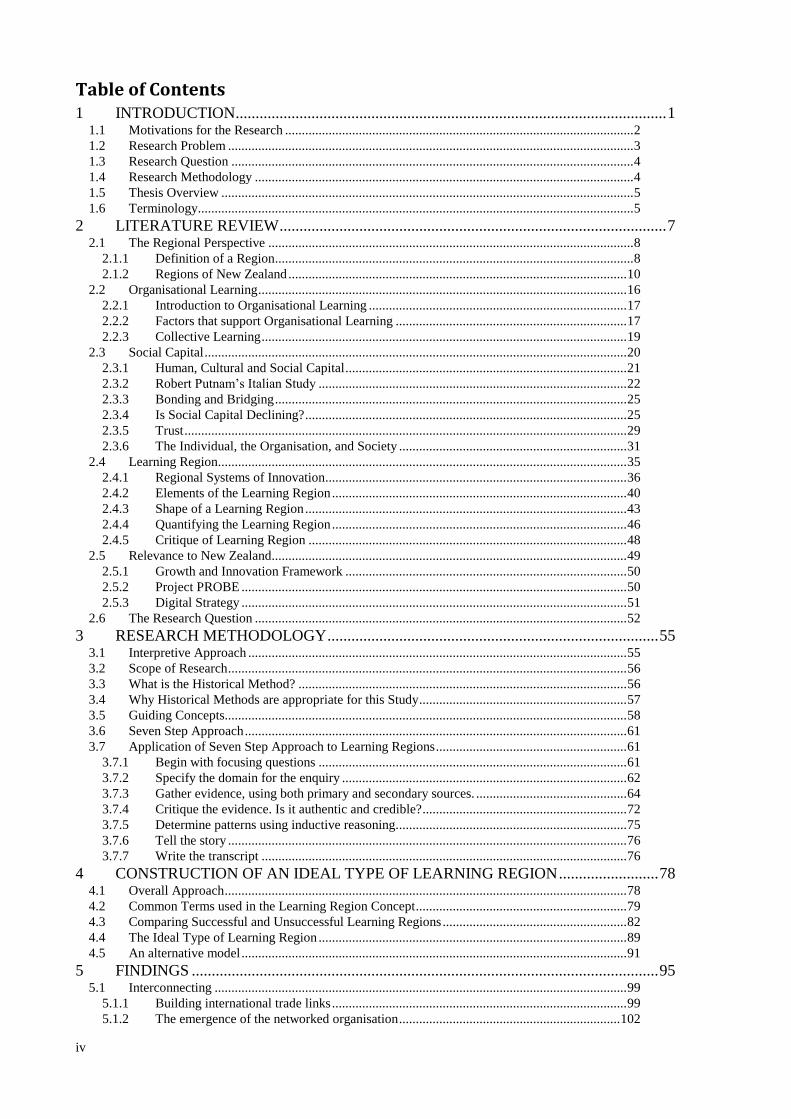
Table of Contents 1 INTRODUCTION ............................................................................................................ 1
1.1 Motivations for the Research ........................................................................................................ 2 1.2 Research Problem ......................................................................................................................... 3 1.3 Research Question ........................................................................................................................ 4 1.4 Research Methodology ................................................................................................................. 4 1.5 Thesis Overview ........................................................................................................................... 5 1.6 Terminology .................................................................................................................................. 5
2 LITERATURE REVIEW ................................................................................................. 7 2.1 The Regional Perspective ............................................................................................................. 8
2.1.1 Definition of a Region ........................................................................................................... 8 2.1.2 Regions of New Zealand ..................................................................................................... 10
2.2 Organisational Learning .............................................................................................................. 16 2.2.1 Introduction to Organisational Learning ............................................................................. 17 2.2.2 Factors that support Organisational Learning ..................................................................... 17 2.2.3 Collective Learning ............................................................................................................. 19
2.3 Social Capital .............................................................................................................................. 20 2.3.1 Human, Cultural and Social Capital .................................................................................... 21 2.3.2 Robert Putnam‟s Italian Study ............................................................................................ 22 2.3.3 Bonding and Bridging ......................................................................................................... 25 2.3.4 Is Social Capital Declining? ................................................................................................ 25 2.3.5 Trust .................................................................................................................................... 29 2.3.6 The Individual, the Organisation, and Society .................................................................... 31
2.4 Learning Region .......................................................................................................................... 35 2.4.1 Regional Systems of Innovation .......................................................................................... 36 2.4.2 Elements of the Learning Region ........................................................................................ 40 2.4.3 Shape of a Learning Region ................................................................................................ 43 2.4.4 Quantifying the Learning Region ........................................................................................ 46 2.4.5 Critique of Learning Region ............................................................................................... 48
2.5 Relevance to New Zealand.......................................................................................................... 49 2.5.1 Growth and Innovation Framework .................................................................................... 50 2.5.2 Project PROBE ................................................................................................................... 50 2.5.3 Digital Strategy ................................................................................................................... 51
2.6 The Research Question ............................................................................................................... 52 3 RESEARCH METHODOLOGY ................................................................................... 55
3.1 Interpretive Approach ................................................................................................................. 55 3.2 Scope of Research ....................................................................................................................... 56 3.3 What is the Historical Method? .................................................................................................. 56 3.4 Why Historical Methods are appropriate for this Study .............................................................. 57 3.5 Guiding Concepts........................................................................................................................ 58 3.6 Seven Step Approach .................................................................................................................. 61 3.7 Application of Seven Step Approach to Learning Regions ......................................................... 61
3.7.1 Begin with focusing questions ............................................................................................ 61 3.7.2 Specify the domain for the enquiry ..................................................................................... 62 3.7.3 Gather evidence, using both primary and secondary sources. ............................................. 64 3.7.4 Critique the evidence. Is it authentic and credible? ............................................................. 72 3.7.5 Determine patterns using inductive reasoning. .................................................................... 75 3.7.6 Tell the story ....................................................................................................................... 76 3.7.7 Write the transcript ............................................................................................................. 76
4 CONSTRUCTION OF AN IDEAL TYPE OF LEARNING REGION ......................... 78 4.1 Overall Approach ........................................................................................................................ 78 4.2 Common Terms used in the Learning Region Concept ............................................................... 79 4.3 Comparing Successful and Unsuccessful Learning Regions ....................................................... 82 4.4 The Ideal Type of Learning Region ............................................................................................ 89 4.5 An alternative model ................................................................................................................... 91
5 FINDINGS ..................................................................................................................... 95 5.1 Interconnecting ........................................................................................................................... 99
5.1.1 Building international trade links ........................................................................................ 99 5.1.2 The emergence of the networked organisation .................................................................. 102

v
5.1.3 Gaining access to national and international networks ..................................................... 104 5.1.4 Networks, joint ventures and clusters ............................................................................... 107 5.1.5 Evaluation ......................................................................................................................... 113
5.2 Informing .................................................................................................................................. 115 5.2.1 Skills shortages ................................................................................................................. 115 5.2.2 Investing in education ....................................................................................................... 120 5.2.3 Promoting the use of technology ...................................................................................... 126 5.2.4 The use of information technology in education............................................................... 129 5.2.5 Evaluation ......................................................................................................................... 137
5.3 Innovating ................................................................................................................................. 139 5.3.1 Climate and culture ........................................................................................................... 140 5.3.2 Entrepreneurs.................................................................................................................... 146 5.3.3 Entrepreneurs in information technology ......................................................................... 151 5.3.4 Adoption of information and communication technologies .............................................. 156 5.3.5 Growth of electronic commerce ....................................................................................... 161 5.3.6 Entrepreneurs in the rural sector ....................................................................................... 166 5.3.7 Evaluation ......................................................................................................................... 169
5.4 Interacting ................................................................................................................................. 171 5.4.1 Regional culture................................................................................................................ 171 5.4.2 Voluntary, professional social and women‟s groups ........................................................ 180 5.4.3 Mãori, Pacific Island and Asian Issues ............................................................................. 185 5.4.4 Evaluation ......................................................................................................................... 191
5.5 Infrastructure ............................................................................................................................ 193 5.5.1 Telecommunications ......................................................................................................... 193 5.5.2 Transport .......................................................................................................................... 206 5.5.3 Regional development ...................................................................................................... 208 5.5.4 Evaluation ......................................................................................................................... 212
5.6 Income ...................................................................................................................................... 214 5.6.1 The economy .................................................................................................................... 214 5.6.2 Rural sector ...................................................................................................................... 221 5.6.3 Information technology sector .......................................................................................... 225 5.6.4 Unemployment ................................................................................................................. 230 5.6.5 Investment ........................................................................................................................ 232 5.6.6 Evaluation ......................................................................................................................... 235
6 CROSS CASE ANALYSIS ......................................................................................... 236 6.1 Rationale................................................................................................................................... 236 6.2 Analysis .................................................................................................................................... 238 6.3 Summary................................................................................................................................... 244
7 CONCLUSIONS .......................................................................................................... 247 7.1 Reflections on this research ...................................................................................................... 247
7.1.1 The Regional Perspective - revisited ................................................................................ 248 7.1.2 Organisational Learning – revisited .................................................................................. 249 7.1.3 Social Capital – revisited .................................................................................................. 250 7.1.4 Learning region – revisited ............................................................................................... 252 7.1.5 “6-I” model – revisited ..................................................................................................... 253
7.2 Has the Research Question been answered? ............................................................................. 255 7.3 Limitations ................................................................................................................................ 258 7.4 Contribution of this research .................................................................................................... 259
7.4.1 Implications for theory ..................................................................................................... 259 7.4.2 Implications for practice ................................................................................................... 259
7.5 Directions for future research ................................................................................................... 260 7.6 The moral of the story .............................................................................................................. 260

vi
APPENDICES
Appendix A: Sources for references in Table 5……………………………………….……………....268
Appendix B: Newspaper sources for historical data…………………………………………….….....270
Appendix C: National and regional reports…………………………………………………………...331
Appendix D: Newspaper search terms………………………………………………………………...336
Appendix E: Meta-matrices for the cross case analysis…………………………………….………....337
Appendix F: Human ethics approval for interviews…………………………………………………...354
LIST OF FIGURES
Figure 1: Overview of Literature Review ..................................................................................................... 7 Figure 2: Patterns of Early Settlement (Belich, 1996, p.274) ..................................................................... 11 Figure 3: Provinces, 1853-76 (from Grey, 1994, p. 167) ............................................................................ 13 Figure 4: Wellington Regional Council (http://resource.localgovt.co.nz retrieved from the Internet
12/09/2003)......................................................................................................................................... 14 Figure 5: Regions of New Zealand as of 1989 (source Statistics New Zealand www.stats.govt.nz) .......... 15 Figure 6: Social Capital in the Creation of Intellectual Capital (adapted from Nahapiet & Ghoshal 1998
p.251) .................................................................................................................................................. 32 Figure 7: Information Flow within a Learning Region (adapted from Oughton et al, 2002) ...................... 38 Figure 8: Elements of National Innovative Capacity Framework (Porter & Stern, 2001 p.29) .................. 42 Figure 9: New Zealand Digital Strategy Framework (Ministry of Economic Development, 2004, p. 23 p.
23) ....................................................................................................................................................... 52 Figure 10: The Learning Region: inputs, processes and outputs ................................................................ 53 Figure 11: Southland Region (source Statistics New Zealand www.stats.govt.nz) ..................................... 62 Figure 12: Greater Wellington Region (source Statistics New Zealand www.stats.govt.nz) ...................... 63 Figure 13: Example of material in the Access database .............................................................................. 68 Figure 14: Example of abstract report from Access database ..................................................................... 70 Figure 15: Internal and External Criticism (from Neuman, 2003, p.421) ................................................... 73 Figure 16: Unemployment rate 1986 - 2005 (Statistics New Zealand, 2006) ........................................... 124 Figure 17: Prison inmates 1880-2005 (Statistics New Zealand, 2006) ..................................................... 172 Figure 18: Recorded crimes between 1878 - 2005 (Statistics New Zealand, 2006).................................. 173 Figure 19: Civil Unions as a percentage of Marriages by region, derived from Statistics New Zealand .. 178 Figure 20: Consumer price index 1977-2007 (Statistics New Zealand, 2008b) ....................................... 215 Figure 21: Current account balance 1955-2005 (Statistics New Zealand, 2006) ...................................... 216

vii
LIST OF TABLES
Table 1: The 6-I Framework ...................................................................................................................... 52 Table 2: Seven Step Approach to Historical Methods (Mason et al, 1997) ............................................... 60 Table 3: Location and role of interviewees ................................................................................................ 64 Table 4: Newspaper statistics for 1985 to 2005 ......................................................................................... 69 Table 5: Ranked List of Features of Learning Regions .............................................................................. 79 Table 6: Grouped List of Learning Region Features .................................................................................. 80 Table 7: Features of Successful Learning Regions ..................................................................................... 84 Table 8: Features of Unsuccessful Learning Regions ................................................................................. 84 Table 9: Factors Contributing to the Success of Silicon Valley ................................................................. 87 Table 10: Factors which Differentiate Successful Learning Regions ......................................................... 87 Table 11: A Revised List of Learning Region Features ............................................................................. 89 Table 12: Divergence in national systems of innovation, 1980s (Cook & Memedovic, 2003) .................. 92 Table 13: Comparison of Cook/Freeman and “7-I” models ....................................................................... 93 Table 14: The Final 6-I Framework ........................................................................................................... 94 Table 15: Exports to major trading partners as a percentage of total exports (from Statistics New Zealand)
............................................................................................................................................................ 99 Table 16: Population statistics (Source Statistics New Zealand) .............................................................. 115 Table 17: Immigration/ migration numbers (source Statistics New Zealand) .......................................... 115 Table 18: Spending on education (source NZ Official Yearbook) ........................................................... 120 Table 19: Tertiary enrolment figures (Statistics New Zealand) ................................................................ 124 Table 20: Tertiary attainment for age group 25-66 (as a % of the population of that age group)
(Organisation for Economic Co-operation & Development, 2006b) ................................................ 124 Table 21: Student numbers at Southern Institute of Technology (Southland Times, 12/7/2005) ............. 125 Table 22: Spending on research & development as % of GDP (Statistics New Zealand) ........................ 140 Table 23: Applications for patents, trademarks and designs (Statistics New Zealand) ............................ 140 Table 24: Patents filed with computing or software in the title (Intellectual Property Office of New
Zealand http://www.iponz.govt.nz on 9/9/2009) .............................................................................. 140 Table 25: Researchers per thousand employed, full time equivalent (Organisation for Economic Co-
operation & Development, 2006b) ................................................................................................... 140 Table 26: Ethnicity as a percentage of total population (from census information Statistics New Zealand)
.......................................................................................................................................................... 185 Table 27: Gross Domestic Product (millions) Source Statistics New Zealand (various) ......................... 214 Table 28: Cross case analysis for "Interconnecting" ................................................................................ 238 Table 29: Cross case analysis for "Informing" ......................................................................................... 240 Table 30: Cross case analysis for "Innovating" ........................................................................................ 241 Table 31: Cross case analysis for "Interacting" ........................................................................................ 242 Table 32: Cross case analysis for "Infrastructure" ................................................................................... 242 Table 33: Cross case analysis for "Income" ............................................................................................. 243 Table 34: Cross case analysis for "Interconnecting" ................................................................................ 338 Table 35: Cross case analysis for "Informing" ......................................................................................... 341 Table 36: Cross case analysis for "Innovating" ........................................................................................ 345 Table 37: Cross case analysis for "Interacting" ........................................................................................ 348 Table 38: Cross case analysis for "Infrastructure" ................................................................................... 350 Table 39: Cross case analysis for "Income" ............................................................................................. 353


1
CHAPTER ONE
1 INTRODUCTION
This thesis tells a story. It tells the story of a small country on the edge of the world, and
its attempt to use information and communication technology (ICT) to overcome
barriers of distance and isolation. The country has a lot going for it; it has a stable
economy and political system, and is rated as the least corrupt country in the world1. It is
an area of great natural beauty and a popular destination for tourists from around the
globe. Its citizens are literate, cultured and liberal, civic minded and willing to give their
time to a wide range of voluntary activities. They have a reputation for being innovative,
and are motivated by a pioneering spirit.
Working against the country is the fact that it doesn‟t have as much money as it would
like. The economy relies too heavily on agriculture and its remote location means
transport costs are high. The domestic market is small and local businesses struggle to
break into the international market. Its most talented citizens have a marked tendency to
leave the country for more lucrative opportunities elsewhere.
Citizens of the country have always been quick to take advantage of new technology,
from the introduction of refrigeration to Web 2.0. The opportunities offered by ICT have
been of interest since the first computer arrived in the country in 19602. This story
focuses on two regions of the country, one urban and liberal, the other rural and more
traditional, and tells the story of their attempts to use ICT to both build up their own
regions, and to reach out to the rest of the world. The country is New Zealand. The story
is about ICT.
The introduction outlines the motivations for the research, sets out the research problem
and introduces the central research question. History is the telling of stories, and the
choice of historical methods as a research methodology is explained. This is followed by
two short sections which give an overview of the structure of the thesis, and a list of
terminologies used in it.
1 Transparency International 2009 survey of 180 countries (TransparencyInternational, 2009)
2 Treasury installed the first computer in the country in 1960 (Williams, 1985)

2
1.1 Motivations for the Research
The research began with an interest in the effects of physical location and broadened to
consider both the impacts of geography and history on location. The researcher has a
first degree in geography and a long standing curiosity about the potential of new
technology to overcome barriers of distance (Cairncross, 1997). By global standards
New Zealand is an isolated country and the use of ICT to overcome the problems this
isolation causes is a particularly relevant issue for local researchers. New Zealand‟s
remote location has an international and a national dimension; as well as the country
being a long way from the rest of the world; there are poor communications and
transport links between regions within the country. This is a particular problem for
remote rural regions. This issue has been recognised by the New Zealand government,
and in 2002 it launched the Project PROBE initiative to bring broadband to every rural
school in the country. The aim was to use ICT to share scarce resources and to overcome
the barriers of rural isolation.
The relationship between telecommunications infrastructure and economic growth is
well established, though the exact nature of that relationship is still under investigation
(Adams, 2005; National Selection Committee, 2004; Parker, 2000). With the exception
of a few cynics (B. Howell, 2006) there is a widespread belief in New Zealand that the
introduction of high speed, affordable broadband will bring economic benefits, the
“build it and they will come3” approach. This view is shared by many other countries,
notably Korea and Canada (Kelly, Gray, & Minges, 2003; Zilber, Schneider, & Djwa,
2005). Research carried out on the concept of IT value (McKeen & Smith, 2009) has
shown that IT value is multi-layered; it can take several years before all the benefits of a
new IT system are realised, and full benefits are rarely achieved. Project PROBE was
regarded as successful; broadband was delivered to the schools within the time plan and
under the set budget. However, very little of the potential value of the project has been
realised. Some rural schools have benefited from the use of videoconferencing, but there
was very little take up of broadband by the wider rural community which was one of the
initial aims of the project.
3 Reference to the movie “Field of Dreams” in which the main character hears a voice telling him that if he
builds a baseball field on his remote farm, spectators will arrive

3
This thesis challenges the “build it and they will come” approach, and argues that in
order to unlock the full value of ICT regions need to take a more nuanced approach. In
particular the social networks that exist in regions have a critical role to play in
maximising the economic and social benefits that can be achieved from ICT.
There is no doubt that ICT does have a contribution to make to regional development in
New Zealand, both in remote rural regions and in more centrally located urban regions.
In order to investigate how best to achieve the full value of ICT the concept of the
“Learning Region” was borrowed from economic geography. This concept focuses on
factors such as innovation, learning and economic success. A major focus of the
research is on the relationship between hard ICT based networks and soft people based
networks in the context of a learning region. As the research progressed it became
evident that regionally based soft networks take time to develop and that in order to
obtain a meaningful picture of what was going on in the regions it was necessary to look
at the past as well as the present.
The research utilises the insights offered by both history and geography to study the
development and interaction of hard and soft networks in two regions of New Zealand.
The soft networks operate mainly at the regional level, but the hard networks operate at
regional, national and international levels. Both types of networks are affected to
differing extents by their interaction with the regional context. This research explores
the role of soft and hard networks in a regional setting, and investigates what regions
can do to obtain maximum value from the use of ICTs.
1.2 Research Problem
The term “Learning Region” is used to identify regions that have been economically
successful over a period of time, and that have successfully adapted to changed
circumstances. Such regions are characterised by the following: a competitive strategy
based on learning; intense intra-regional linkages; capacity for innovation; creativity in
both arts and sciences; efficient information flows; and regional norms and values that
provide stability (Lash & Urry, 1994; Storper, 1995). ICTs have the potential to make
an important contribution to the development of each of these factors.

4
The term learning region was first coined by academic authors (Florida, 1995; Morgan,
1997; Storper, 1995) working in the fields of innovation studies and economic
geography. The concept of the “Learning Region” is ambiguous and found in a variety
of different contexts. There is no single definition of a learning region, however a
common strand in the literature is that such regions have an explicit commitment to
placing innovation and learning at the core of development (Larsen, 1999). A learning
region would generally consist of a network of inter-firm relationships, supported by
social capital and trust, and kept dynamic by a continuous process of interactive
learning. The idea of a learning region has developed out of previous research on
“Regional Systems of Innovation” (Cooke & Morgan, 1998).
Little is known about the role of ICT in enhancing learning regions. The presence of
“institutional thickness” has been shown to be an important indicator of regional success
(Amin & Thrift, 1994). This can be identified by lively interactions between firms,
business associations, development agencies, innovation centres, unions and community
groups. The use of ICT opens up the potential for “digital institutional thickness” by
providing the technology to facilitate the exchange of information.
1.3 Research Question
The central research question is:
What role do information and communication technologies play in the development
of learning regions?
1.4 Research Methodology
The research was carried out under the interpretive paradigm; the overarching emphasis
was on obtaining a deep understanding of the research problem. Historical methods
were selected as the most appropriate methodology to address the research question. The
use of historical methods enables the researcher to understand the changes within a
region over a substantial period of time. Their use leads to an in-depth understanding of
the context in which the patterns of connection within a region emerge. Two regions of
New Zealand; one urban and one rural, were compared over a twenty year period from
1985 to 2005.

5
1.5 Thesis Overview
The thesis is divided into seven chapters. This introduction is the first chapter. The
second chapter is a literature review, the third chapter covers the research methodology,
the fourth analyses the literature review to develop the “6-I” framework which was used
to collect and analyse data. Each of the “I”s represents a key feature of a learning region.
In the fifth chapter the findings are ordered and analysed using the “6-I” framework, and
the development of each of the six factors over the period from 1985 to 2005 is tracked.
As the research was carried out in two regions, the sixth chapter uses cross case analysis
to compare the results across both regions. In the seventh chapter the findings are
compared against expectations raised in the literature review to arrive at some overall
conclusions.
1.6 Terminology
The terms Information Technology (IT) and Information and Communications
Technology (ICT) are both used throughout the thesis. In general IT is used when
referring to the IT industry itself and ICT is used when referring to telecommunications
networks and associated information systems. The distinction between IT and ICT is not
always clear and in many cases the two terms can be considered interchangeable.
Acronyms used in the thesis are listed below:
ADSL- Asymmetric Digital Subscriber Line
ANZAC- Australia and New Zealand Army Corps
ANZUS – Australia, New Zealand, United States Security Treaty
ASEAN – Association of south East Asian nations
BIAA - Beijing Institute of Aeronautics and Astronautics
CBD – Central Business District
CAD/CAM – Computer Aided Design/ Computer Aided Manufacturing
CCTV – Close Circuit Television
CIO – Chief Information Officer
CIT – Central Institute of Technology
DSIR – Department of Scientific and Industrial Research
EEC- European Economic Community

6
EFTPOS – Electronic Funds Point of Sale
GDP – Gross Domestic Product
GPS – Global Positioning System
HTML – Hyper Text Mark-up Language
IMF – International Monetary Fund
ISPANZ- Internet Service Providers of New Zealand
LFR – Less Favoured Region
MAF – Ministry of Agriculture and Forestry
MDL – Microprocessor Development Limited
NID – New Industrial District
NZ – New Zealand
OECD – Organisation for Economic and Co-operative Development
OOS – Occupational Overuse Syndrome
PABX – Private automatic Branch Exchange
PC – Personal Computer
Project PROBE – Provincial Broadband extension Project
RFID – Radio Frequency Identification
SIT – Southland Institute of Technology
SME – Small and Medium sized Enterprise
TUANZ – Telecommunications User Group of New Zealand
UK – United Kingdom
USA – United States of America
USSR – Union of Soviet Socialist Republics
WCN – Wellington Community Net
YMCA – Young Men‟s Christian Association
7
CHAPTER TWO
2 LITERATURE REVIEW
Before beginning a story the author has to plan the plot, and decide on the sequence of
events. This chapter introduces the reader to the main characters in the plot, and gives
their “back stories” by covering the literature that underpins their development.
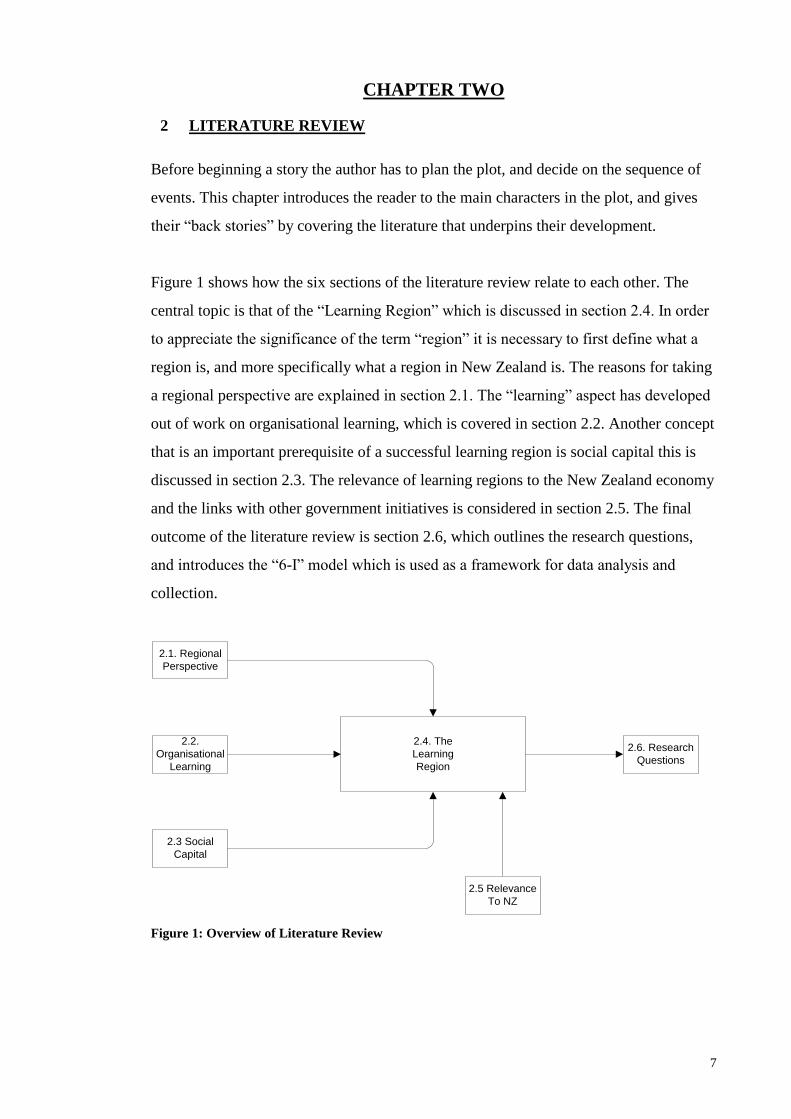
Figure 1 shows how the six sections of the literature review relate to each other. The
central topic is that of the “Learning Region” which is discussed in section 2.4. In order
to appreciate the significance of the term “region” it is necessary to first define what a
region is, and more specifically what a region in New Zealand is. The reasons for taking
a regional perspective are explained in section 2.1. The “learning” aspect has developed
out of work on organisational learning, which is covered in section 2.2. Another concept
that is an important prerequisite of a successful learning region is social capital this is
discussed in section 2.3. The relevance of learning regions to the New Zealand economy
and the links with other government initiatives is considered in section 2.5. The final
outcome of the literature review is section 2.6, which outlines the research questions,
and introduces the “6-I” model which is used as a framework for data analysis and
collection.
2.1. Regional
Perspective
2.2.
Organisational
Learning
2.3 Social
Capital
2.4. The
Learning
Region
2.6. Research
Questions
2.5 Relevance
To NZ
Figure 1: Overview of Literature Review
8
2.1 The Regional Perspective
This section places the research in its regional setting. As a starting point the different
meanings that can be attached to the word “region” are discussed. The use of the term
region in the context of New Zealand is explained by reviewing the history of the
settlement patterns of both Mãori and Pakeha/European New Zealanders, and
identifying the influence of New Zealand‟s geomorphology on its economic
development. New Zealand is a New World country, and in common with Australia the
pattern of settlement has depended on the availability of safe ports. This availability has
resulted in a scattered pattern of settlement with growth being concentrated around a
few nodal points. Internal communications were traditionally poor, and this led to
regions developing independently from each other.
2.1.1 Definition of a Region
The term region generally defines a broad geographical area distinguished by similar
features. A region generally refers to sub-units within a country, broadly equivalent to
the state level in Australia and the United States, a lander in Germany, a canton in
Switzerland, or a county in England. It should be noted that a region can either sub-
divide a country or cut across national boundaries, for example the Ǿresund region is in
two countries, Sweden and Denmark, and the Great Lakes is in both Canada and the
USA.
The term region can also refer to a geographical area that covers many countries, such as
the South Pacific region. There can also be a tendency to use the term regional to mean
rural, for example recent research into the digital divide in Australia (Marshall, Taylor,
& Yu, 2003) uses the term regional to refer to disadvantaged, rural economies. This
variation in the definition of a region is not imprecision; it reflects the different
geographic scales at which economic change can occur (Malecki, 1997). Geography,
culture, economic activities and political boundaries can all be factors in defining
regions. Regions are built environments rather than natural ones formed by societies
building distinct economies and political systems. Regions tend to change over time in
size, shape, and significance.

9
Cooke and Morgan (1998) use the concepts of “regionalisation” and “regionalism” to
explain the difference between regions that are defined by external factors and those that
are defined by internal factors. Regionalisation is the external and top down process,
where a super-ordinate political administrative body, such as the state, delimits a supra-
local territory. In contrast regionalism is an internal, bottom-up approach, where
political demands build up from below, often for culturally defined territorial autonomy
in response to perceived discrimination by the super-ordinate authority. Regionalism
tends to produce a collective social order, which can form a basis for trust relations
among firms, organisations and individuals.
“Regionalism is the consciousness of a resident population about its commonalities
across a geographical space and in distinction to groups in other regions.”
(Markusen, 1987 p. 238)
Regions are different from nations in that they are more “open”. A larger proportion of
the region‟s economy depends on flows of imports from and exports to other regions.
These flows are often difficult to measure due to the lack of formal borders and customs
barriers (Malecki, 1997).
Preto (1995) explains that the evolution of the concept of a region can be traced to the
progressive expansion of the fields it has been applied to:
a) A region can be defined by its physical geography and particular
geomorphologic features;
b) A region can be defined anthropologically, by the habits, customs, cultures
and lifestyles of the ethnic groups that inhabit it;
c) A region can be defined in terms of its economy; a space may be used for a
particular activity, such as a type of agriculture or mining;
d) A region can be viewed as a system that is organised on the basis of the
relations that exist between multiple functions (e.g. production, market,
consumption).

10
What is common to all four definitions are the features of spatial continuity and the
existence of a boundary. The first three cases are based on the criterion of homogeneity,
and are useful for the purposes of description and statistical measurement. The last
definition is representative of a theory that attempts to explain a particular phenomenon,
and tries to describe a socio-economic sub-system in precise spatial terms. Cooke and
Morgan (1998) support this definition, and argue that a region should be viewed as
nexus of processes rather than a static entity.
A useful working definition of a region is given by economic geographer Ann Markusen
(1987):
“A region is a historically evolved, contiguous territorial society that possesses a
physical environment, a socio-economic, political and cultural milieu and a spatial
structure distinct from other regions and from other major territorial units, city and
nation.” (p. 16)
Ohmae (1995) defines region states as having a population of between 5 and 20 million,
small enough that the citizens share common interests, but large enough to justify the
infrastructure required such as an international airport and a good harbour. This raises
the question of whether the focus of the current study, New Zealand, with a population
of about 4 million, can be meaningfully sub-divided into smaller regions. For example
one study of learning regions (Sokol, 2002) used Slovakia and Scotland as its sample
regions. In a similar vein Cooke and Morgan (1998) argue that though learning is
generally best organised at a regional level, in the case of small countries such as
Denmark it might be more practical to view the nation state as a region.
2.1.2 Regions of New Zealand
In New Zealand/ Aotearoa, original settlement was by the indigenous Mãori who
developed their own regional structures based on tribes. Mãori settlement appears to
have been coastal, and overwhelmingly in the North Island, though it has to be noted
that this coastal pattern may have been overemphasised as the earliest written
descriptions of Mãori were restricted to coastal observations (Grey, 1994). The
distribution of Mãori reflected the localised nature of subsistence. People were divided
into small groups with political links beyond the level of the hapu (a group of related
families that had a territorial expression) being weak. The iwi (tribe) was the basis of

11
group ideology, but was not a truly functional entity. Young Mãori memorised local and
tribal boundaries as part of their education. Figure 2 shows the patterns of Mãori
settlement at the time of European arrival (Belich, 1996). The general pattern of the
human ecology was one of coastal settlements associated with cleared areas. As
resources were widely scattered, seasonal movement was characteristic of local
economies. Local and distance trade were important, and helped to compensate for the
restricted variety of food (Belich, 1996; Grey, 1994; King, 2003).
Figure 2: Patterns of Early Settlement (Belich, 1996, p.274)

12
By 1769, when British explorer James Cook first visited New Zealand, the country
exhibited a diversity of local and regional economies relating to the constraints and
opportunities of its many different physical environments. Most Mãori lived in the
agriculturally favoured districts of Northland, the Waikato, Taranaki, Bay of Plenty, and
Hawkes Bay. Hunters, fishers and gatherers thinly populated the rest of the country.
Sporadic inter-tribal warfare took place, however until contact with Europeans
introduced Mãori to the musket gun, combat was restricted to the summer months, and
usually resulted in only a handful of fatalities (King, 2003). Trade, rather than political
power, provided such links as existed beyond village level. Despite the risks posed by
the harsh climate and periodic warfare, Mãori were prepared to travel long distances for
minerals and food, as evidenced by the wide distribution of pounamu4, basalt and
obsidian (King, 2003). Ocean-going craft had disappeared by this time, but canoes were
used extensively for river, lake and coastal transport.
New Zealand is a mountainous country; only a quarter of the land surface is suitable for
European style agriculture. The scattered arrangement of this land lies behind much of
the country‟s human geography. The mountains present a major barrier to movement
between the West and the East coasts, particularly in the South Island. The rivers are
short and steep in profile, and provide poor or no access to the interior from the sea.
(Grey, 1994). At the start of European colonisation, the shape of the land influenced the
location of the earliest settlements. Safe ports with promising hinterlands were few. The
country grew outwards from a few nodal points established by the geography of first
arrival and by the nature of the land itself. Agriculture in the two countries developed as
a technology driven enterprise, employing a relatively low percentage of the settler
population. The low number of workers in agriculture meant that the population
clustered in the coastal cities, reinforcing the effect of the physical geography. New
Zealand cities have been nodes for intellectual capital from the beginning, and the
economy relied on this. The cities were centres for the management of the postal and rail
systems that enabled capital-intensive, thinly populated, export orientated agrarian and
extractive economies. By 1860 the four main centres (Auckland, Wellington,
Christchurch and Dunedin) were well established (Grey, 1994).
4 Also known as greenstone, a form of green nephrite jade

13
In 1852 New Zealand was given a federal structure, which divided the country into six
main colonies as shown in Figure 3 (Fox, 1851). Each of the six main settlements had a
different origin, physical geography, and cultural and economic character. Inter- regional
communications were very poor, the road pattern pushed out from each settlement to its
hinterland, but left the colonies as unconnected as ever, their only link to the outside
world was through an external and unreliable salt water highway (Grey, 1994). A
journey from Dunedin to Auckland would take a minimum of two weeks by sea.
Figure 3: Provinces, 1853-76 (from Grey, 1994, p. 167)
The six provincial divisions proved too large for the communications systems of the
day, and by 1873 there were 10 separate areas. However in 1876 the provinces were

14
demoted to land districts, the real power in land development was now concentrated in
the new capital at Wellington. This differentiates New Zealand from the other New
World countries of Australia, Canada, South Africa, and the United States which all still
use a three-tier model of government, in which national, state and local levels are
represented, and individual states have considerable autonomy.
After 1885, New Zealand developed its agricultural sector. As farming expanded, cities
and towns grew, and as these grew they became less dependent on their hinterlands, and
connected more to the international world. As rail and road transport improved, the
inland cities of Hamilton, and Palmerston North were able to develop (Grey, 1994).
As previously mentioned, New Zealand has not had a federal system of government
since 1876. However, for administration purposes the country is divided up into 12
regional and 4 unitary councils; each regional council contains of a number of territorial
authorities. For example, as shown in Figure 4, the Wellington area is one regional
council, and consists of 8 territorial authorities including Wellington City and Porirua
City.
Figure 4: Wellington Regional Council (http://resource.localgovt.co.nz retrieved from the Internet
12/09/2003)
In 1988 New Zealand had 705 local authorities, in 1989 these were rationalised into 73
territorial local authorities, 13 regional councils, and 6 special purpose authorities (D.
Smith, 1999). 159 communities and community boards were also established within 49
15
of the territorial authority districts, the purpose of the community boards was to give
self-governance to communities within the large territorial authorities. The structure set
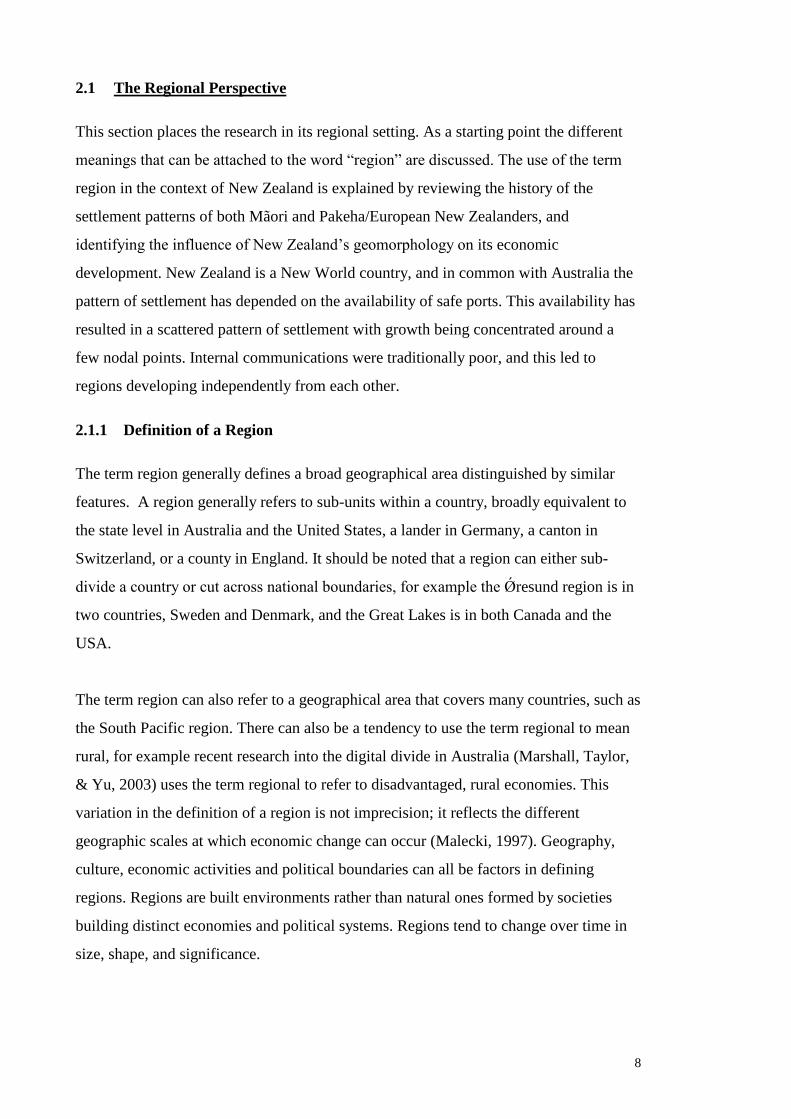
up in 1989 largely remains in place today. There are currently 12 regional councils, and
4 unitary councils as shown in Figure 5, Statistics New Zealand uses these 16 areas (plus
an extra category to cover the Chatham Islands, Kermadec Islands, etc.) for the purpose
of collecting data about each region.
Figure 5: Regions of New Zealand as of 1989 (source Statistics New Zealand www.stats.govt.nz)
There is no hierarchical arrangement between regional councils and territorial
authorities; each sector is given a different set of functions. Regional councils are
defined by the geomorphology of the country, to cover a particular water catchment
area, or type of environment. Regional councils are responsible for environmental
standards and transport planning, and regional civil defence whereas territorial local
authorities look after such matters as land use, public health licensing, car parking,
waste disposal, economic development and business/tourist promotion. There have been
claims that due to a focus on regulatory functions rather than more visible service

16
delivery functions, the role of regional councils, outside of Wellington and Auckland, is
unclear. Regional authorities lack the close contact with the daily lives of citizens that
characterises local government, a feature that was shown to be critical to success in the
work of Robert Putnam (1993). They also lack the media attention that is devoted to
national affairs. The regional authorities are therefore probably less visible to the public
than the levels of government above and below them.
Though New Zealand is a thinly populated country, the mountainous terrain of the land,
and the limited number of suitable ports, has resulted in regions developing fairly
independently. It is only in recent times that the internal transport system has improved
to open up inland areas. However internal road and rail links are still very limited when
compared to Europe, and domestic air travel is a significant form of internal transport.
Due to this comparative lack of linkage, it does make sense to view the different regions
of New Zealand separately, as both Mãori and European settlers alike have used the land
areas in different ways. However due to the low population the issue of critical mass is
important; for New Zealand‟s economy to develop each region needs to consider ways
of reaching international markets.
A typical New Zealand region is based around a city with good international transport
links usually including a deep water port and an international airport. The city is
surrounded by an agricultural hinterland, and there are good transport links between the
hinterland and the city. The commuting time from the hinterland to the core is generally
less than one hour. Each region sees itself as having a unique cultural identity, which
has developed from the original Mãori pattern of settlement, and been changed by the
migration of different ethnic groups to various parts of the country. Poor internal
communications led to limited contacts between each region, and allowed distinctive
regional cultures to develop.
2.2 Organisational Learning
This section explains the concept of organisational learning, and identifies some factors
that support organisational learning. In particular it introduces the concept of “third
places” neutral territory where meetings between individuals from different
organisations can take place. The critical role of collaboration in developing learning
and knowledge is discussed.

17
2.2.1 Introduction to Organisational Learning
The learning region concept is a development of ideas about learning organisations
advocated by Drucker and Nonaka. Organisational learning is the:
“capacity or processes within an organisation to maintain or improve performance
based on experience.”
Argyris (1999) argues that organisational learning is a competence that all organisations
should develop. The better organisations are at learning the more likely it is that they
will be able to detect and correct errors, and to identify when they are unable to detect
and correct errors. An error is defined as mismatch between what is planned and what
actually happens. The more effective an organisation is at learning the more likely it is
that they will be innovative. It must be noted though, that accidental errors can be an
important part of innovation.
Huber (1991 p.3) provides the following definition of organisational learning:
“An organisation has learned if any of its components have acquired information and
have this information available for use, either by other components or by itself on
behalf of the organisation.”
Organisational learning is viewed as a systems level phenomenon, meaning that it stays
within the organisation even if individual employees leave. Learning is considered to be
as much a task as the production and delivery of goods and services. Three factors have
been identified as being fundamental to a successful learning organisation (Nevis,
DiBella, & Gould, 1995), these are:
1) Well developed core competencies;
2) An attitude that supports continuous improvement;
3) An ability to fundamentally renew or revitalise.
2.2.2 Factors that support Organisational Learning
Senge (1992) presents six factors that can be used to identify the types of organisations
that function as enablers of productive learning:

18
1) Flat, decentralised organisational structure;
2) Information systems that provide fast feedback on organisational
performance;
3) Mechanisms for encouraging systemic programs of experimental inquiry;
4) Measures of organisational performance;
5) Systems of incentives aimed at promoting organisational learning;
6) Ideologies associated with such measures, such as total quality and continuous
learning.
For the purposes of this research these factors need to be refocused at the regional level
rather than the organisational level. The first factor, the flat decentralised organisational
structure, would be apparent in a region with a number of interacting small businesses
without a clear hierarchical structure, however unlike the organisational level,
businesses may not automatically come into contact with each other in their normal
course of business, so it is usually necessary to have a hub around which information
exchange can take place, hence the importance of what Castells and Hall (1994) identify
as “third places”, neutral territory where meetings between individuals from different
organisations take place. Third places can be formal organisations such as the
gentlemen‟s clubs of London, or informal meeting places such as a pizza restaurant, golf
club or a bar. The importance of such meeting places for sharing ideas, and building
social capital was recognised as long ago as the eighteenth century, as shown by the
following comment on the coffee houses of the time.
“ I have had pointed out to me in several coffee houses a couple of lords, a baronet, a
shoemaker, a tailor, a wine merchant, and some others of the same sort, all sitting
round the same table and discussing familiarly the news of the court and town. The
government’s affairs are as much the concern of the people as of the great. Every
man has the right to discuss them freely.” (Abbé Prevost quoted in (Lewis, 2002))

19
The second factor is to have information systems that provide fast feedback on
organisational performance. Obviously at a regional level there is only certain
information that organisations will want to share. It will be important to distinguish
between information that is of common benefit to all organisations when shared, and
information with competitive value that organisations will want to keep to themselves.
The third factor is to have mechanisms for encouraging systemic programs of
experimental inquiry. As research (DeBresson, 1996) has shown that innovation is most
likely to result from interfirm collaboration, this factor is highly relevant and
mechanisms need to be set in place to encourage this to happen at a regional level. The
fourth factor, measures of organisational performance, is much more apt at the regional
level than the second factor. Initiatives to promote regional learning can be measured by
a number of economic and social indicators e.g. percentage of the population with a
tertiary qualification, numbers of patents applied for, and so on. The fifth factor, systems
of incentives, would involve setting up an infrastructure where organisations feel they
are rewarded for collaboration. This may involve financial incentives, such as the local
council encouraging grant applications from groups of businesses, rather than
individuals. It could also be a result of a number of small businesses getting the benefit
of economies of scale, for example by sharing a marketing or design service. Another
example could be local students obtaining a placement in a local business, which
improves the quality of their learning, and also gives the business the benefit of the
student project. The sixth factor, the presence of ideologies such as total quality and
continuous learning, is again highly relevant at the regional level, and would require a
social entrepreneur, such as a key local personality or the local council to promote it. In
particular the concept of lifelong learning is crucial to the development of a learning
region, and this involves learning at the individual, organisational, and regional levels
(Senge, 1992).
2.2.3 Collective Learning
All organisations engage in some form of collective learning. The most basic form of
learning is single loop learning, which involves developing methods and tools to
improve what is already being done. Double loop learning takes this a stage further, and
looks at the underlying assumptions. The nature of learning and the way it occurs are
determined by organisational culture. Basic assumptions about culture lead to different
ways of learning, some may be formal others more informal. The concept of the learning

20
organisation is perceived as important as, according to Lundvall and Johnson (1994),
contemporary capitalism has arrived at a point: “where knowledge is the most strategic
resource, and learning the most important process.”
The level of aggregation of organisational learning should be considered (Argyris,
1999). Does learning take place at the level of interpersonal inquiry, within
organisational sub-groups, or at an organisational wide level? Obviously the concept of
the learning region takes the level of aggregation a stage further. These three levels of
aggregation show causal linkages. Organisational learning cannot be explained without
referring to individual and interpersonal processes of inquiry. Regional learning must
build on the individual and organisational learning that takes place within its area.
Regional learning takes place when there are collaborative interactions between
producer firms, user firms and public bodies within a particular geographical area.
Regional learning can involve either the dissemination of existing knowledge, or the
creation of new knowledge – innovation. Innovation can be product innovation (the
development of new goods or services), or process innovation (either organisational or
technological). Edquist (2002) argues that product innovation will tend to increase
employment, whereas process innovation tends to reduce employment. Therefore
product innovation is more critical for improving the lives of individuals within a
region.
2.3 Social Capital
An understanding of the significance of social capital is critical to the study of regional
economic development. This section begins by defining human, cultural, and social
capital and explaining the relationship between them. A notable author in the field of
social capital is Robert Putnam (1993) and his classic work on the differences between
regional governments in North and South Italy is used to introduce the topic. Social
capital can have a bonding, bridging or linking dimension. Bonding reinforces
relationships within existing groups, whereas bridging links previously unconnected
groups. Linking refers to connections between individuals of different status. There are a
number of schools of thought about whether social capital is growing or declining, and
of the relative value of high and low social capital; the differing opinions of Putnam
(2000), Richard Florida (2002) and Francis Fukayama (1995) are presented. The final

21
section introduces a framework developed by Nahapiet and Ghoshal (1998) that shows
how social capital can lead to the formation of intellectual capital in an organisational
setting. This is followed by a discussion of how this framework can be applied at the
regional level.
2.3.1 Human, Cultural and Social Capital
There is evidence (Fukuyama, 1995; Putnam, 1993; Woolcock, 1998) that a region‟s
innovative capacity is directly related to measures of social capital, and that this
relationship is the missing link in the economic equation that so far has been unable to
accurately predict economic performance from the standard measures of physical,
human, financial and environmental capital.
Human capital has been defined by the OECD (2001b p.18) as:
“the knowledge, skills and attributes embodied in individuals that facilitate the
creation of personal, social and economic well-being; and these are developed by
learning in formal and informal settings.”
In general the level and standard of education achieved are clearly associated with
higher earnings and lower unemployment. Recent studies (Barro, 2000; Frederick &
Carswell, 2001; Organisation for Economic Co-operation & Development, 2001a) have
shown that the quantity and quality of education available within a country is associated
with overall economic growth. However, human capital alone is not a good predictor of
regional success. Cultural capital is the set of values, history, traditions and behaviours
which link a specific group of people together (Spellerberg, Robinson, Cody, &
Williams, 2001). When cultural capital is strong, citizens experience a sense of identity
and belonging to their society.
Social capital has a wide variety of definitions and should be regarded as an evolving
concept. An OECD definition is:
“networks together with shared norms, values and understandings that facilitate co-
operation with or among groups.” (Organisation for Economic Co-operation &
Development, 2001b p. 41)

22
It refers to connections among individuals, the social networks that develop and the
norms of reciprocity and trustworthiness that arise from them. Robert Putnam (2000)
notes that social capital is closely related to the idea of “civic virtue”, but that civic
virtue is only fully effective when embedded in a dense network of reciprocal social
relations. A society of many virtuous, but isolated individuals is not necessarily rich in
social capital. A well-connected person in a poorly connected society is not as
productive as a well-connected person in a well-connected society.
2.3.2 Robert Putnam’s Italian Study
The classic study of social capital was carried out in Italy by Robert Putnam (1993). In
the early 1970s twenty new regional governments were established, and given
responsibility for such areas as: housing, health, agriculture and economic development.
Each regional government was given roughly equal powers and funding. By the
beginning of the 1990s these new governments were spending nearly a tenth of Italy‟s
gross domestic product. The central question of Putnam‟s research was: “What are the
conditions for creating strong, responsive, effective representative institutions?” He
carried out an in-depth investigation of 6 of the 20 regions over a period of nearly 20
years. He wanted to look at whether the performance of an institution was explained by:
the structure of the government itself (in his study this was a constant across all the
regions), socio-economic factors (i.e. does modernity itself lead to better government),
or socio-cultural factors (does the government depend on the disposition of its citizens).
Putnam developed a set of 12 metrics in order to measure institutional performance.
These varied from counting the number of committees operating in each region, to
looking at what statistical and information services were available and to measuring the
expenditure on local health. For many of the metrics all regions had the same
opportunity to access central government funds to implement a policy, but there were
marked differences in which regions obtained them. For instance by 1983 Emilia-
Romanga had set up one day care centre for every 400 children, whereas Campania had
only one day care centre per 12,560 children, despite the fact that both regional
governments had equal opportunities to access government funds. The findings revealed
a high consistency between all 12 indicators of performance; some regions were ranked
highly by virtually every yardstick, whereas other regions are unsuccessful by almost
every measure. Ordinary Italian citizens were also surveyed to see how satisfied they

23
were with their regional government. There was a remarkably strong concordance
between this and the 12 indicators of performance.
The study revealed dramatic differences in institutional performance between the North
and South of Italy. This gap could be partly explained by socio-economic conditions, as
the North of Italy is generally richer than the South. However, no direct relationship
between wealth and successful government could be found. Modernity is clearly
associated with high performance in public institutions, but it is not clear whether
modernity is caused by performance or vice-versa or whether both are influenced by a
third factor. Putnam measured how civic each region was by measuring the number of
associational groups, readership of newspapers, and patterns of voting. The results
showed that the regions with the most “civic” citizens had the most successful regional
governments.
Though theorists, notably Ferdinand Tonnies (2001)5 with his notion of “Gemeinschaft”
(traditional small scale community) and “Gesellschaft” (modern rationalistic impersonal
society), have associated civic virtue with the close knit pre-modern world, and have
suggested that modernity is the enemy of civility, Putnam‟s study shows the opposite,
the least civic areas of Italy are the traditional southern villages. He argues that the
reasons for this can be traced back one thousand years to two different styles of political
regimes that were set up. In North and Central Italy a form of communal republicanism
developed, described by one historian (Daniel Waley) as ”the paradise of the committee
man” e.g. Siena with 5,000 adult males had 360 part time city posts. In the South,
Frederik II set up a powerful state, which was successful, but remained highly
autocratic. Despite the differing fortunes of the North and South through history, the
same pattern of civic engagement in the North and mistrust and a system of patronism in
the South remained constant. The civic regions of the North did not begin wealthier, and
they have not always been wealthier; however they have remained steadfastly more civic
since the 11th
century. These civic conditions have gradually brought socio-economic
conditions into alignment, so that by the 1970s socio-economic modernity was very
closely correlated with the civic community.
5 A translation from the 1887 original

24
Social capital has both a public and a private face. Individuals form connections that
benefit their own interests, for example networking to obtain a job. However not all the
benefits of social connections accrue to the person making the contact. If an area has an
active neighbourhood watch scheme, then even an individual who never speaks to their
neighbours will benefit. Some of the benefits of social capital will go to bystanders.
Networks of community engagement foster sturdy norms of reciprocity. Reciprocity can
be either specific or generalised, Putnam (2000 p. 21) gives the example of a fire-
fighters fund-raiser which used the slogan “Come to our breakfast, we’ll come to your
fire”, it raised a smile as the public know the fire-fighters will put out a fire whether or
not the victims have been to the fund-raising breakfast. A society that is characterised by
generalised reciprocity is more efficient than a distrustful society, just as money is more
efficient than barter. If it is not necessary to instantly balance every exchange a lot more
gets done.
Putnam‟s concept of social capital has been criticised for being too narrow (Spellerberg,
et al., 2001). James Coleman used a wider concept of social capital in that he included
vertical associations as well as horizontal ones. People may invest authority in a
particular individual who is given the power to solve common problems. Singapore is a
good example of this as it is a successful learning city, in which the state (as personified
by the Prime Minister) plays a crucial arbitrating role. In terms of New Zealand the
inclusion of vertical relations in a model of social capital takes into account traditional
Mãori values. Research has shown that social capital in a Mãori context emphasises
different aspects from the Pakeha/European New Zealander view of social capital
(Spellerberg, et al., 2001). Mãori place more importance on extended family
relationships, and values such as whakapono (trust), tika (integrity) and manaaki
(support). A person‟s knowledge of who they are depends on the networks they are part
of, and how they relate to others in their society. The relationships themselves are of
primary importance, their actual functionality is of secondary importance. For Mãori
there is no distinction between cultural and social capital. Cultural capital provides the
sense of identity which is an essential part of social capital (Spellerberg, et al., 2001).
25
2.3.3 Bonding and Bridging
Social capital has been traditionally viewed as having both a bridging and a bonding
dimension. The bonding dimension is inward looking and reinforces exclusive identities
and homogeneous groups, which can be very useful for specific reciprocity and
mobilising solidarity. For example, dense networks in ethnic enclaves can help less
fortunate members of the community. The dark side is that the same forces that create
strong in-group loyalty may also create strong out-group antagonism, resulting in
NIMBY6 type movements, and organisations like the Ku Klux Klan. Being a member of
a group may help someone to get started, but may hinder long-term economic growth.
When Korean immigrants arrive in south central Los Angeles, their entry into the
immigrant community gives them access to financial and personal support, enabling
them to start a small business. However if the business is successful there will come a
time when the ethnic community is neither large nor heterogeneous enough to provide
the product and factor markets necessary for growth (Woolcock, 1998). Bonding is
facilitated by homophily, the tendency of people to interact with their own kind; this
may be as a result of preference, or the result of opportunity constraints. The bridging
dimension is outward looking, and includes diverse social groups; this can be useful for
linking to external assets and wider information diffusion. Xavier de Souza Briggs sums
up the differences between the two dimensions in a useful quote:
“Bonding social capital is good for “getting by”, but bridging social capital is crucial
for “getting ahead.” (cited in Putnam, 2000 p23)
Bonding and bridging are not either/or categories, many groups simultaneously bond
across some social dimensions, while bridging across others e.g. the black church in
America brings together people of the same race and religion across class lines.
Other authors (Florida, Cushing, & Gates, 2002; Granovetter, 1973) use the terms strong
and weak ties to describe how an individual relates to other people in their social
network, strong ties broadly equate to bonding and weak ties to bridging.
2.3.4 Is Social Capital Declining?
Putnam‟s view is that social capital in America has been declining since the 1950s and
1960s. He has carried out detailed research, which shows that there has been a
6 Not In My Back Yard (meaning not wanted close to where you live)

26
significant decline in the active membership of associations such as PTAs, football
teams and community groups, and a corresponding increase in individualised leisure
activities. The title of his 2000 book “Bowling Alone” refers to fact that there has been a
drop of 40% in the number of people involved in league bowling, and a growth of 10%
in individual bowling. The result is that social capital is weakened. Putnam identifies
four reasons for this:
1) Longer working hours giving people less leisure time;
2) Increase in suburban sprawl which make it more difficult and time
consuming to get around;
3) Increase in time spent watching television;
4) A shift from the more civic-minded generation of World War 2 to the “me”
generation.
Critics of Putnam argue that American civic life is not so much in decline, but
“churning”, and that though some organisations have lost members others have sprung
up in their place (Ladd, 1999; Lenkowsky, 2000). Though participation has fallen off in
old-style organisations like bowling leagues and Elk lodges, new-style organisations
have come onto the scene e.g. youth soccer memberships for children are up from
127,000 to more than 2.4 million in two decades, and there is rapidly increasing
membership in environmental organisations (Lemann (1996) cited in Florida (2002)).
However the detailed evidence assembled by Putnam is impressive, and does provide
support for his theories (M. K. Smith, 2000).
Research into sustainable development in New Zealand has shown that rates of
volunteering in the form of unpaid work are relatively high compared to other OECD
countries and have remained stable over time (Statistics New Zealand, 2008a). However
the form of volunteering has changed with people being more ready to commit to
episodic volunteering for a one off event rather than being prepared to make a long-term
commitment to a particular organisation (Centre of Philanthropy and Nonprofit Studies,
2006; Evans & Saxton, 2005; Merrill, 2006).

27
Richard Florida has built on Putnam‟s work, but has taken his ideas in an alternative
direction (2002; Florida, et al., 2002). He argues that high social capital can actually
stifle economic growth. He compared levels of social capital and levels of innovation in
hundreds of metropolitan areas in America. He found that innovative areas such as
Seattle and San Francisco Bay area had weak social capital, whereas areas with high
social capital like Cleveland and Dakota had very low levels of innovation. Strong ties
(or bonding) can create a level of conformity that stifles innovation, while areas with
weak ties (or bridging) tend to be more accepting of diversity. The concept of social
capital has become a tautology. While social capital can reinforce belonging and
community, it can just as easily shut out newcomers, raise barriers to entry, and retard
innovation. Places with looser networks and weaker ties are more open to newcomers,
and thus promote novel combinations of resources and ideas. Florida classified
American cities into four types:
1) Classic Social Capital Communities which were high on social capital, and
low on diversity, innovation and high technology;
2) Organisational Age Communities, these are working class centres with
average social capital, low diversity and low innovation;
3) Nerdistans such as Silicon Valley, which have rapid economic growth, but
are polluted and congested. They have low social capital, high technology,
and average diversity;
4) Creative Centres such as San Francisco and Boston, which have high levels
of innovation, high technology, high diversity, and lower than average social
capital (Florida, 2002, pp. 274-275).
It is interesting to consider whether these classifications apply to New Zealand. A lot of
rural New Zealand fits to some extent into the Classic Social Capital category, however
in terms of innovation there is a lot of variation between different parts of the country.
Despite their idyllic image, some rural communities are the poorest areas in the country.
For example the Wairarapa is one of the lowest ranked regions when it comes to socio-
economic indicators such as children‟s health, and educational levels. In contrast regions

28
such as Nelson and Otago, which are seen as attractive lifestyle areas, tend to attract a
number of highly qualified individuals. An asset mapping exercise carried out for the
Southland Connecting Communities pilot project discovered that many people in rural
Otago had excellent IT skills (Lal, 2003). New Zealanders, particularly in rural areas
have a history of creating innovative solutions with available technology, whether that
technology is No. 8 wire7 or ICT (Frederick & Carswell, 2001).
New Zealanders have always been ingenious, and the country has produced many
original thinkers and achievers. A 2001 survey placed New Zealand as one of the top
three countries in the world for innovation (Frederick & Carswell, 2001). However such
statistics should be treated with caution, other indexes that look at indicators such as the
number of scientific patents applied for, or the number of Nobel prizes awarded, rate
New Zealand among the top 20 countries, but certainly not in the top 3 (Furman, Porter,
& Stern, 2002). The No. 8 wire approach has also been criticised as a low-tech lash up
approach that may be part of the country‟s mythology, but is outdated and irrelevant in
modern day New Zealand. The 2004 chairman of Creative New Zealand argued that the
No. 8 wire dictum should be dropped:
“I would like to extinguish that image completely from our national psyche. It’s
simply a pioneering make-do device. While it’s got cute resonances I think its not
suited to modern New Zealand.” (Bergh, 2004)
The pro No. 8 wire camp includes Richard Taylor, the co-founder of Weta Workshop8,
who attributes the success of his organisation to the fact that he employs staff from rural
backgrounds who come up with creative solutions, using limited resources. Though the
ability of rural New Zealanders to innovate and improvise clearly has an influence on
the country‟s economy, the history of innovation and technology shows that the vast
majority of innovations come out of cities rather than rural areas (Murray, 2003).
Organisational age communities are present in New Zealand in working class areas of
industrialisation such as the lower Hutt Valley. The only city which could qualify as a
Nerdistan would be Auckland which matches the features of high economic growth,
7 Term used in New Zealand to refer to the fact that the original rural pioneers used No 8 wire and other
basic resources to create most of the equipment they needed. 8 Award winning New Zealand design & manufacturing company creating props for the creative
industries.

29
traffic congestion, low social capital (with relatively high rates of crime in West and
South Auckland) and high technology. Wellington (like Auckland) has a well developed
IT sector, and an ethnically diverse population (also like Auckland) which could make it
a possible Creative Centre, however social capital is quite high. The Nelson area has a
reputation for innovation in the arts sector, but there is no significant use of technology,
and the fact that many people retire to this area to run “lifestyle” businesses means that
owners are often already financially comfortable and may not be motivated to expand
their businesses.
The nature of what Florida (2002) terms “diversity” would have to be defined in terms
of New Zealand, since often the areas that are the most ethnically diverse, in terms of
having large Mãori and Pacific Island communities, are the poorest areas. However
those regions that are diverse in terms of being able to attract economic immigrants
from Asia and Europe are the most economically successful areas.
Florida looked at two ways of measuring an area‟s openness to diversity: the gay index,
which estimates the proportion of gay couples as a percentage of the population; and the
bohemian index which determines the proportion of musicians, dancers, writers, and
painters in the labour force. He found that that the regions that scored highly on the gay
index and the bohemian index were also those with high levels of innovation. He argues
that creative people do not want to live in high social capital areas, but in cities and
college towns, which are open to diversity, where they can fit in quickly.
2.3.5 Trust
In his 1995 book “Trust”, Francis Fukuyama also finds that social capital in America is
declining. His view is that the move to a more individualistic society can be seen in the
rise of violent crime, the breakdown of the family, and the decline of intermediate social
structures such as unions, churches, and clubs (Fukuyama, 1995). The ability of people
to work together depends on the degree to which communities share norms and values,
and are able to subordinate their individual interests to those of larger groups. Out of
such shared values comes trust, and Fukuyama‟s argument is that trust has a large and
measurable economic value. Trust is the expectation that arises within a community of
regular, honest, and co-operative behaviour based on the part of other members of that
community. Though there is a tendency to see economic activity as separate from social

30
and political life, it is inextricably linked to both of them, as nearly all economic activity
requires the social collaboration of human beings. Economic activity represents a crucial
part of social life and is knit together by a wide variety of norms, rules, and moral
obligations that together shape society. A nation‟s well being and ability to compete is
conditioned by a single pervasive cultural characteristic: the level of trust inherent in the
society.
Fukuyama examines trust at a national level; he distinguishes between group-orientated
societies such as Japan and Germany, individualistic societies such as America, and
familistic societies such as Taiwan, Italy, and China. Countries in which the family is
the basic unit of economic organisation may experience difficulties in trying to establish
large organisations that go beyond the family. The most useful type of social capital is
not the ability to work under the authority of a traditional community, but the capacity to
form new associations, what is termed “spontaneous sociability” (Fukuyama, 1995). A
classic sociological study (Young & Wilmott, 1962) carried out in the UK in the 1960s
illustrates this. The research looked at the progress of a working class community living
in traditional two up-two down9 housing in the East End of London, as they were
transferred to new accommodation in high rise blocks. The original community had
strong social bonds, but these were completely lost in the new community. Individuals
had never learnt how to make friends, because they had never had to. Their social
contacts were already set up for them, so they had no skills available to help them adapt
to a new situation. This confirms the importance of bridging. Those who are good at
making friends in a world filled with strangers are those who do not have strong bonds.
If people who have to work together in an enterprise trust one another, doing business
costs less. In contrast people who do not trust each other will end up co-operating only
under a system of formal rules and regulations, which entails a “transaction cost”.
Widespread distrust in a society imposes an implicit tax on all forms of economic
activities. A high trust society can organise its workplace on a more flexible and group
orientated basis with more responsibility delegated to lower levels of the organisation.
Low trust societies by contrast must fence in and isolate their workers with a series of
bureaucratic rules. High trust societies that rely on strong ties, though, can inhibit
9 Low cost terraced housing consisting of two rooms downstairs and two rooms downstairs with outside
toilet facilities

31
innovation and flexibility because of the obligations that those ties imply (Fukuyama,
1995).
In international surveys New Zealand has consistently been rated as one of the least
corrupt counties in the world, and in 2009 topped the annual index produced annually by
Transparency International (Goldsmith, 2009; Henderson, Cave, & Petrie, 2003;
TransparencyInternational, 2009). Though there are individual cases of corruption, there
is no evidence of systemic and large scale corruption, social norms favour honesty and
the population is small and relatively cohesive (Henderson, et al., 2003).
2.3.6 The Individual, the Organisation, and Society
Social capital can be examined at individual, organisational, inter-organisational and
societal levels. The previous sections have considered the impact of social capital at the
national and individual level. Sumantra Ghoshal has carried out research which looks at
the impact of social capital at the organisational level (Nahapiet & Ghoshal, 1998;
Wenpin & Ghoshal, 1998). Ghoshal‟s hypothesis is that an institutional setting is
conducive to the development of high levels of social capital, and that social capital
facilitates the creation of new intellectual capital. The paper identifies four different
types of knowledge: individual explicit knowledge; individual tacit knowledge; social
explicit knowledge; and social tacit knowledge which make up an organisation‟s
intellectual capital. Any new intellectual capital is created through a combination and
exchange of these existing intellectual resources.
Figure 6 shows how social capital facilitates the development of intellectual capital by
affecting the conditions necessary for exchange and combination of information to
occur. Social capital has been grouped into three clusters; the structural, cognitive and
relational dimensions. The structural dimension of social capital influences the
development of intellectual capital primarily through the ways in which its various
facets affect access to parties for exchanging knowledge.

32
Structural
Dimension
Cognitive
Dimension
Relational
Dimension
Access to
Parties
Anticipation
of Value
Motivation
Combination
Capability
New Intellectual
Capital Created
Social
Capital
Exchange of Intellectual
Capital
Creation of New
Intellectual Capital
Figure 6: Social Capital in the Creation of Intellectual Capital (adapted from Nahapiet & Ghoshal
1998 p.251)
There are three aspects to the structural dimension:
1) Network ties, which provide access to resources with valuable information,
and confirm that sources are reliable;
2) Network configuration is important; density, connectivity, and hierarchy are
all features associated with flexibility and ease of information exchange, for
example a sparse network with few redundant contacts can provide more
information benefits for less cost than a denser network;
3) Appropriable organisation - can the social capital developed in one context
be transferred to another, for example transfer of trust from family to work
situation? This is the same as Fukuyama‟s (1995) concept of spontaneous
sociability (Nahapiet & Ghoshal, 1998, pp. 252-253).
The cognitive dimension refers to resources which provide shared representations and
systems of meaning. Under this dimension intellectual capital is viewed as a social
artefact; knowledge and meaning are embedded in a social context. There are two main
ways they can be shared:

33
1) Shared language and codes - if people share a common language it facilitates
their ability to gain access to others in the organisation. It can also be used to
keep people apart and restrict access. A shared language also acts as a filter;
terms that exist in the language are allowed in, and terms that do not exist in
the language are kept out;
2) Shared narratives such as myths, stories and metaphors can provide powerful
means in communities for creating, exchanging and preserving rich sets of
meanings. The emergence of shared narratives within a community enables
the creation and transfer of new interpretations of events, doing so in a way
that facilitates the combination of different forms of knowledge including
those that are largely tacit (Nahapiet & Ghoshal, 1998, pp. 253-254).
The relational dimension looks at how information can most easily be exchanged
between parties. It involves the access to the relevant people, the anticipation of value
through exchange and combination, and the motivation of the parties to exchange in
knowledge creation. Four factors are important:
1) Trust. When relationships are high in trust, people are more willing to
engage in social exchange in general and co-operative interaction in
particular. Trust increases the potential of a system to cope with complexity
and diversity, factors known to be important in the development of new
intellectual capital;
2) Norms: these represent a degree of consensus in the social system. Norms
can be positive such as openness, and valuing diversity. However they can
also be restrictive, and a real inhibitor for the development of intellectual
capital;
3) Obligations and expectations: These are likely to influence the access to
people required for the exchange and combination of knowledge, and also
the motivation to combine and exchange such knowledge;

34
4) Identification of individuals with a group: They may feel part of the group or
view it as a reference group that they measure their behaviour against
(Nahapiet & Ghoshal, 1998, p. 255).
The roots of intellectual capital are deeply embedded in social relations, and in the
structure of those relations. The differences in performance between firms may represent
differences in their ability to create and exploit social capital. Nahapiet and Ghoshal‟s
analysis concentrated mainly on how social capital facilitates the creation of new
intellectual capital. Though institutions facilitate some forms of exchange and
combination, they limit the scope of others; therefore a constant balancing of opposing
forces is required. The costs of maintaining linkages in a social structure usually
increase exponentially as a social network increases in size. Although technology may
make it possible to stretch the conventional limits of networks of social capital, the
significance of interdependence, interaction and closure suggest that there still remain
important upper limits.
Though Putnam (1993, 2000), Florida and Fukuyama consider social capital at a
society-wide level, and Nahapiet and Ghoshal look at social capital at the organisational
level, some common themes emerge. Fukuyama (1995) stresses the economic benefits
of trust in the wider society, and trust is also seen as essential to productive information
exchange at the organisational level. Florida (2002) talks about how high social capital
can actually stifle innovation at the organisational level. This relates to the network
configuration for the exchange of knowledge within the firm, and how a sparse network
with few redundant contacts can be a more efficient way of obtaining information than a
dense network with a lot of overlap. All authors recognise the value of social capital for
economic stability, and appreciate that a balance needs to be achieved between a
creating a closely-knit cohesive community, while still retaining an openness to change.
Of particular interest for this research is to look at how the Nahapiet and Ghoshal (1998)
framework works in a regional scenario. The structural dimension in Nahapiet and
Ghoshal‟s framework is related to the structure and use of the network. At the regional
level a network between different organisations does not automatically exist. A network
would have to be consciously created by a social entrepreneur; the most efficient
structure for a regional network needs to be thought about carefully, taking into account

35
the character of the region and the different types of business operating within it. A
dense network may be the most suitable pattern for a region containing mainly
agricultural type businesses, whereas a region focusing on high technology production
may be more suited to a sparser network. In the cognitive dimension, shared language
and shared narratives can be a powerful aide to information exchange at both the
organisational and the regional level. Within a region there is a common pool of cultural
capital that can be drawn on to facilitate co-operation. The relational dimension is
important as both parties involved in sharing information have to feel there is value in it
for them. At the regional level this has to be carefully managed. Organisations may be
willing to share some information openly, but other information must be kept within the
organisation. There also needs to be a physical place where these relationships can be
developed, hence the importance of the already mentioned “third places” (Castells &
Hall, 1994). At a regional level the output of the framework should be seen in the form
of new intellectual capital that will create innovation.
2.4 Learning Region
The previous three sections have all explained important ideas that underlie the concept
of the learning region: Section 2.1 looked at the importance of the geographical setting;
Section 2.2 looked at how collective learning takes place; and Section 2.3 explained the
role that is played by social capital. The following section is a discussion of the central
topic of the research, the learning region itself. The section begins by exploring why
regions are important economic drivers in the 21st century. Stakeholders within a region
share a common culture which facilitates the sharing of tacit knowledge. The second
section identifies factors that should be present in a learning region, such as soft and
hard infrastructure. The classic form of the learning region is that of the new industrial
district (NID), which consists of small innovative firms embedded within a regionally
co-operative system of industrial governance. The dominance of the NID model has
been questioned by Markusen (1996). Her arguments are presented in Section 2.4.3 and
their relevance to New Zealand is considered. There are number of ways in which a
region‟s success can be quantified, for example measuring spending on research and
development, or the numbers participating in voluntary organisations. Section 2.4.4
explores some of the potential benchmarks. The section concludes with a critique of the
learning region concept.

36
2.4.1 Regional Systems of Innovation
The period since the 1970s has been one of radical restructuring, with movements from
mass production to flexible specialisation; Fordism to post-Fordism; organised to
disorganised capitalism; and industrial capitalism to the informational age (MacLeod,
2000). Storper (1995), in investigating regional economic development, identifies that
the territorial ordering of product innovation, learning technologies and social
interaction networks helps to define learning orientated production systems, within
districts such as NE Central Italy and Ille de France.
Storper is not alone in this as many authors, particularly in the field of economic
geography, identify regions as the most important sites in which to capitalise on the
flows of knowledge that abound in contemporary globalisation. Regional coalitions
create economic and social relations to facilitate interactive learning, innovation
networks, institutional thickness and soft social capital. Kenichi Ohmae (1995) argues
that region states develop around regional centres such as the Bay area around Silicon
Valley, and Southern China around Hong Kong. Saxenian (1994a) in a comparative
study of Route 128 in Massachusetts and Silicon Valley in California argues that the
success of the latter owes as much to its rich technical and commercial relationships as
to the competitive rivalries and initiative of individual entrepreneurs.
Morgan (1997) uses a network paradigm to show that flows of knowledge and social
capital can be most appropriately nurtured at a regional level where regular interactions
can be sustained over time. Storper (1995) introduces the concept of untraded
dependencies. These include institutional norms and values such as trust, reciprocity and
cooperation, as well as regional conventions inherent in labour markets and public
institutions. These interdependencies are vital to economic and organisational learning
and co-ordination. They are based on collective tacit knowledge that cannot be removed
from its human, cultural and social context. In other words, it is knowledge that is
territorially specific. Storper (1995) views untraded dependencies as the most significant
form of scarcity in contemporary capitalism, largely because they are non-codifiable.
Soft infrastructures such as conventions, trust-based interactions and civic cultures are
inherently esoteric and intricate and harder to identify than more visible public
infrastructures such as roads, schools, training colleges, or the formulation of inward

37
investment strategies. Florida (1995) visualises the learning region as a large-scale
version of a knowledge intensive firm. Regions must adopt the principles of learning in
the provision of a series of inter-related infrastructures in production, human capital,
physical and digital communications, alongside an effective system of industrial
governance. Amin and Thrift (1994) use the idea of institutional thickness to highlight
the way that the capacity to territorially embed global processes in place is becoming
increasingly dependent upon a whole series of social, cultural, and institutional forms.
Institutional thickness is identified by a lively interaction between firms, business
associations, development agencies, innovation centres, unions and voluntary bodies.
The use of ICT to assist with the development of institutional thickness is of particular
relevance to this research.
In order to understand what it takes to make an area a learning region, it is interesting to
compare the fortunes of different places over a period of time. In a classic and widely
cited study Jane Jacobs (1972) compared the fortunes of two British cities during the
industrial revolution. In the 1840s industrial Manchester was seen as superior to
Birmingham, because of its efficient cotton industry, whereas Birmingham‟s industry
consisted of an unplanned and diverse collection of small businesses. However when the
cotton industry collapsed Manchester was left with no other skills to fall back on, but in
Birmingham industries continued to grow, diversify and prosper (Jacobs, 1972).
Birmingham can be viewed as a more successful learning city than Manchester as it
enjoyed more consistent economic success over a significant period of time. In part this
was due to the fact that the development of the local economy in Birmingham was
disorderly: inefficiency and some overlapping of work create more fruitful conditions
for innovation than a highly planned, efficiently run economy. An important role is
played by “breakaway” businesses, formed when skilled workers leave their parent
company to form a business of their own, often adding a new twist to the business that
leads to innovation (Jacobs, 1972).
Knowledge flows are important to regional innovation systems. Tacit knowledge is
more easily transferred within a regional context where constant interaction and
exchange is easier and cheaper and tacit assumptions are more easily decoded, than in a
national or international context. The innovative capacity of the regional firm is directly
related to the learning ability of a region (Oughton, Landabaso, & Morgan, 2002). The

38
learning that takes place between the businesses in a region depends on there being a
pool of business intelligence that will trigger demand for new knowledge, and the access
and availability of that knowledge. Usually regional government plays a key role in
facilitating the development of a successful learning region, and well founded co-
operation between the private and public sectors is critical in building the networking
culture required for inter organisational learning (Morgan, 1997).
Universities
Regional
GovernmentSectoral
Associations
SMEs SMEs
Suppliers
Customers
Large
Firms
Technology
Centres
Business
services
Chamber of
Commerce
Figure 7: Information Flow within a Learning Region (adapted from Oughton et al, 2002)
Figure 7 illustrates some of the possibilities for flows of information within a learning
region. The focus of this research is to look at the role ICT can play in facilitating these
knowledge flows. Both the public and private sectors and their interactions are sustained
by networks, there are “soft networks” for social interaction, and also “hard networks”
that plug into the internet (Malecki, 2002). The competitiveness of firms depends not
only on the degree to which they are embedded within local networks of suppliers, but
also on the presence of links to external markets. Successful regions, like successful
companies, maintain connections with other places in the global economy. However,

39
although scanning the external environment is a common activity within firms, this
seems to be far less common among cities and regions (Malecki, 2002).
In order for regional networks to operate effectively, a social entrepreneur is required.
This could be an individual, such as a local business owner, or a collective role, for
instance a local economic development agency. Social entrepreneurs act as gatekeepers
in knowledge networks. They serve as a bridge between organisations and across
sectors, translating information across discipline specific terminologies and
organisational cultures (Malecki, 2002). Frederick Terman is widely considered to be
the social entrepreneur responsible for the rise of Silicon Valley. As Dean of
Engineering at Stanford University during World War II, he encouraged his students to
start up their own electronics companies, resulting in the formation of Hewlett-Packard
and Varian Associates. At the same time he also attracted the military-financed research
and development that would keep the new businesses in work (Sturgeon, 2000).
Globalisation has resulted in an increase in international business collaboration. By
locating various activities in different regions and countries, organisations can gain
economic benefits from a deepened division of labour. This in turn may provide new
opportunities for less favoured regions and countries (Maskell & Tornqvist, 1999).
These huge national differences in labour costs are likely to remain, as labour is still a
largely immobile factor of production (apart from within the USA), while the cost of
other industrial inputs will become similar. This could possibly provide advantages for
New Zealand, as labour costs are cheaper here than in Europe or the USA, but there are
also other countries where labour costs are even lower. However the quality of work that
can be purchased for a given labour cost is obviously an issue. In 1871, Menger stated
that “What everyone has can never constitute an advantage” (Menger, 1871), meaning
that the possession of everyday resources will not help an organisation to prosper.
Organisations‟ most valuable inputs will be those that are scarce, e.g. unique resources,
a unique patent, or fishing rights, or having the ability to do something better than their
competitors. By being localised in a region, organisations are able to utilise factors in
their surroundings that are not accessible to their competitors. One approach is to try to
create a competitive advantage through learning, and this is most successful when done
at a regional rather than an organisational level. In a 1996 study of 1,641 Canadian
innovations from 1945 to 1970, it was found that less than 10% of them came from in-

40
house ideas only (DeBresson, 1996). The sharing of the tacit knowledge concentrated in
a particular geographical area results in a cross-fertilisation of ideas that creates an
innovative regional culture. There is a general agreement that in order to develop
learning regions more effort needs to be put into promoting inter-organisational flows of
information and knowledge (Morgan, 1997). A learning region does not rely on labour
as a principle factor of production, but on knowledge. New Zealand and Australia
emerged as leading primary producers due to the fact that they had relatively few hands
on the farm, but lots of brains in the science labs working on technology-driven
applications to keep reducing the labour component of industry.
2.4.2 Elements of the Learning Region
Maskell (1999) proposes that to develop a learning region 5 key elements need to be in
place:
1) Critical and knowledgeable customers;
2) Competent suppliers;
3) Trustful inter-firm relations and networks;
4) High degree of intra-industry rivalry;
5) Good regional receiving system, which helps firms identify and utilise
technological innovation.
Regional learning takes place between the organisation and its customers; between the
organisation and its suppliers; and between the different organisations in a region. The
regional receiving system will help firms identify relevant knowledge, and may be based
in the public or private sector or a combination of both. Though the five factors
identified above are important, they concentrate on the features that are relevant to
business, without considering the underlying social, economic and environmental
characteristics of a region. It is also relevant to consider human, social, and cultural
capital, both from the point of view of the competence of the available workforce, and
also because of “quality of life” issues that are important when trying to attract talented
immigrants to a region (Florida, 2002).

41
Another framework that identifies the factors that contribute to innovative capacity has
been developed by Porter and Stern (2001). This framework is shown as Figure 8.
Though their framework is pitched at the national level, it can also be used at the
regional level. The framework includes three main elements, common innovative
infrastructure, cluster-specific environment for innovation and quality of linkages. The
common innovation infrastructure relates to the factors that support innovation
throughout the regional economy. There needs to be both appropriate human capital and
financial resources for research and development to take place. The regional economy
needs to be sufficiently technologically developed, and public policy needs to support
innovative activity. The second element in the framework is the cluster specific
environment for innovation. Innovation has been shown to occur most often in clusters
of interconnected companies. The attributes that affect innovation within clusters are
shown as the well-known “diamond” framework, the presence of high quality inputs, a
context that encourages investment together with local rivalry sophisticated local
demand and the presence of related and supporting industries. The innovative capacity
of a particular cluster depends on the quality of the diamond that exists in its region. The
third element is the quality of the linkages that exist between clusters and the common
innovation infrastructure. These consist of a number of different formal and informal
networks; one of the most critical is the existence of linkages between universities and
business organisations within a region. Just because the right environment for
innovation is present within a region does not necessarily mean that companies will take
advantage of it. However, marked differences in the numbers of innovations between
different locations, suggest that the quality of the infrastructure and linkages that exist in
a particular location exerts a strong influence (Porter & Stern, 2001).
Both Maskell (1999) and Porter and Stern (2001) identify a similar set of elements that
contribute to successful learning regions; both stress the importance of relationships
with customers and suppliers, the role of competition and the importance of networks.
Another common point is that the regional infrastructure must be set up in such a way
that innovative activity is encouraged.

42
Figure 8: Elements of National Innovative Capacity Framework (Porter & Stern, 2001 p.29)
A learning region should have demonstrated consistent economic success. It should
have the ability to attract and retain highly qualified human capital. It should have
demonstrated the ability to be flexible, and achieved success in more than one economic
sector. There should be evidence of networks between businesses, between business and
education providers, and between businesses and local institutions. A critical factor is
the presence of a social entrepreneur in some form who is consciously trying to
implement a policy to improve regional co-ordination. A learning region should show
consistent improvement in social capital.
An illustration of the types of interactions required in order for a region to benefit
economically from an innovation can be gained by considering how New Zealand
adapted to take advantage of freezer ship technology. Farming practices had to alter to
rationalise land holdings, and improve productivity. Dairy factories and abattoirs were
needed to process meat and dairy products. The government had to provide an overall
quality control mechanism, and to provide the capital for research into increasing
agricultural productivity (Ministry of Economic Development, 2004). The technology of
refrigeration did not lead to economic benefits by itself, local businesses needed to be

43
flexible and alter their processes, with the aid of co-ordination and capital provided by
government.
2.4.3 Shape of a Learning Region
The classic model of the learning region is the new industrial district (NID) based on the
Emilio-Romanga district in Italy, which operates in a manner similar to the situation
Jacobs (1972) described in 19th
Century Birmingham. A NID consists of small
innovative firms embedded within a regionally co-operative system of industrial
governance. An industrial district is a spatially delimited area of trade-orientated
economic activity which has a distinctive specialisation, which could be resource
related, or based on manufacturing or service industries (Markusen, 1996). Cooke
(1996) argues that small firms in industrial districts gain substantially from operating in
a collaborative networked business milieu. They have been shown to be able to offer
higher levels of employment, better wage levels, and higher rates of growth than firms
in the same industry not operating in a district type setting.
This networking model has been successfully implemented in Denmark (Cooke, 1996)
which in terms of geographical area and population size (5.1 million) is similar to New
Zealand. In 1989 the Danish Technological Institute established a “Network
Programme” which channelled government support to firms willing to co-operate in
certain business activities. In one case history, seven furniture makers from Jutland
found their local markets shrinking, so they used the Network Program to create a
trading company. They divided up key tasks, so that design for all the firms was done by
two designers, and each firm specialised in a particular production phase. The company
now exports high quality furniture to the European Union and beyond. Many regions are
trying to set up network models of economic development. They are looking to develop
an innovative infrastructure of vertical and lateral network linkages between large and
small firms, research institutions, and public technology, and information transfer
agencies.
However one of the major thinkers in the area of regional development Ann Markusen
(1996) is critical of the dominance of the NID model, and argues that there are at least
three other organisational forms that have demonstrated resiliency in advanced capitalist
countries in the post war period. She argues that these alternative models demonstrate

44
the continued power of the state and multinational corporations to shape and anchor
industrial growth. Markusen researched the regional economies of North America
looking for a number of features generally associated with NIDs (e.g. up and down
stream industrial linkages) and a number of other features (e.g. long-term development
dynamic of major industries). The research did identify NIDS, but also found three other
successful industrial spatial types: hub and spoke industrial districts, satellite platforms,
and state anchored districts.
Hub and spoke industrial districts consist of a number of key firms and/or facilities that
act as anchors or hubs to the regional economy, with suppliers and related activities
spread out around them like spokes of a wheel. A simple version would be where a
single large firm (e.g. Boeing in Seattle, Ford in Detroit, or Toyota in Toyota City) buys
from both local and external customers who may be large, or form masses of individual
consumers. Markedly lacking is the co-operation among competitor firms to share risk,
stabilise the market and share innovation. Strategic alliances on the part of the larger
firms are more apt to be forged with partners outside the region. Workers loyalties are to
core firms first, then to the district, and only after that to small firms. If jobs open up in
hub firms, workers will often abandon smaller employers to get onto the hub firms
payroll.
Satellite platforms are a congregation of branch facilities of externally based multiplant
firms. They are often created by government intervention as a way of both stimulating
regional development in outlying areas and simultaneously lowering the cost of business
for competitively squeezed firms bristling under relatively high urban wages, rents and
taxation. Business structure is dominated by large, externally situated firms that make
key investment decisions. Their most conspicuous feature is the absence of any
connections or networks within the regions. Personnel exchanges are common between
branch operations and the headquarters firm, but not locally with other branch facilities.
There will be high rates of labour migration in and out of the district at the managerial,
professional and technical levels.
State anchored districts are where a public or non-profit entity, e.g. a military base,
prison complex or government office is the key anchor tenant in the district. It can look
like the hub and spoke model. Labour markets will be tailored to the particular state

45
activity hosted. Workers‟ loyalties will be devoted to large state institutions and/or state-
dependent facilities first, then to the district second, then finally to the firms.
Many localities, especially larger metropolitan areas are “sticky mixes” exhibiting
elements of all four models. Silicon valley, for instance, hosts an industrial district in
electronics, but also revolves around several important hubs (Lockheed Space &
Missiles, Hewlett Packard, Stanford University) as well as hosting large “platform” type
branch plants of US, Japanese, Korean & European companies (IBM, Oki, Hyundai,
Samsung). Silicon Valley is also the fourth largest recipient of military spending
contracts in the nation, a fact that shapes its defence electronics and communications
sector. The decision of the United States Congress in the 1920s to site most of its naval
bases on the Pacific Coast was the basis of the Californian sea-coast region‟s
development as a super economy. A typical outcome of this policy was the decision to
dot the San Francisco Bay Area with bases. These bases formed the drivers of Silicon
Valley, and formed a huge market for semi-conductors.
Though Markusen has a good point when she argues that certain sectors of the economy,
for example the production of aircraft, are not likely to happen in small businesses, it is
not really proven that all the organisational forms she identifies are conducive to
innovation. As previously discussed, DeBresson (1996) has observed that 90% of
innovations are a result of interactions outside the firm. Large organisations, such as
Ford Motor Company, have a habit of internalising innovation which leads to
diminishing returns in the long-term. The hub and spoke model seems to be successful
in some cases but not in others, and the satellite industrial platform seems unlikely to
lead to any lasting innovation. The classic NID model does seem to be the most relevant
in terms of New Zealand‟s economy which is dominated by SMEs. However it is
important not to assume that because the business in a region has another form, that
automatically means that innovation is unlikely to occur.
Eileen Trauth (2000) looked at the development of Ireland during the period from 1970
to the late 1990‟s as a “second wave” economy, that had leapfrogged from a pastoral to
an information economy, without going through a manufacturing stage. In some ways
Ireland faced some of the same issues as New Zealand: emigration of the brightest, an
economy based on agriculture, and a history of colonial domination by the UK. Both
46
countries have a well-developed infrastructure, a stable political system, relatively low
wages, and an English-speaking population, which make them attractive to foreign
multinationals. However Ireland has the extra advantage of providing access to the large
European market. The Irish government used tax breaks and other financial incentives to
attract foreign businesses to Ireland. They expected this to lead to the development of
breakaway businesses, and the growth of a Silicon Valley type economy, but this did not
initially happen. The satellite firms were used by their foreign owners for routine
assembly work, and not for research and development or decision making type work.
This did not develop the skills of the local workforce, and there were few linkages with
the local economy.
In the early 1980s the strategy of attracting satellite branches of foreign-owned
companies was refined, to ensure that such companies did actually improve the local
economy. There was a move away from low-waged assembly type work towards
computer services and software development, together with the promotion of greater
linkages between indigenous and multinational firms. At the same time there was an
increasing emphasis on educating and producing skilled workers, and also a move to
strengthen the telecommunications infrastructure. These changes resulted in much
higher numbers of breakaway businesses being generated by former workers at satellite
branches (Trauth, 2000). This shows that satellite branches of a multinational
corporation are unlikely to produce learning region type growth if left to their own
devices. However, the Irish example did show that if the conditions under which
satellite branches are operating are carefully controlled, they can provide lasting
economic benefit to the region.
2.4.4 Quantifying the Learning Region
At a 2002 OECD conference (Keating, Badenhorst, & Szlachetko, 2002) it was
concluded that at present there are no pure learning regions. However, the concept is
important for the overall economic prosperity of regions. Certain conditions were
identifies as conducive to the development of a learning region, and there is a high
degree of synergy between those conditions that lead to economic competitiveness and
growth and those that promote the social inclusion of all members of society. Four

47
themes were identified as benchmarks against which progress towards a learning region
can be measured:
1) Sustainable economic growth including the expansion of high quality jobs;
2) Social inclusion and the building of social capital;
3) The role of different education and training strategies in fostering learning
regions;
4) An integrated approach to achieving good governance (Keating, et al., 2002).
More specifically, Antonio Acosta writing in a report prepared for the OECD (Rio,
2001) identified a number of variables that, taken as a whole, can help to determine
whether an area exhibits or lacks the profile of a learning region. Innovation can be
quantified to some extent by looking at the level of spending on research and
development by the government, business, and institutional sectors. The level of
computerisation is another measure of technological development, as is the number of
technology patents issued. The control that a region has over research and development
policies is also relevant, as is the question of whether a region has the capacity to
develop its own innovation policies. The percentage of the population with tertiary
education is another important variable, and it is also relevant to look at whether the
majority of these qualifications are technical and professional in nature, rather than
academic. Another indicator is the number of research groups operating in a region. It is
also important to try to gauge qualitative aspects such as the readiness of the local
inhabitants to change, and whether they are willing to engage in ongoing training. There
are many models for measuring social capital, which typically look at factors such as
crime rates, and participation in voluntary groups. Cultural capital can be gauged by
looking at indicators such as library consultations, museum visits, or number of speakers
of Te Reo10
. Other relevant variables are migration movements, is the region a
“magnet” region which is attractive to outsiders in terms of the quality of life it offers?
10
Most common dialect of Maori language – one of the three official languages of New Zealand, the other
two being English and sign language

48
2.4.5 Critique of Learning Region
The learning region concept is popular in both academic and policy-making circles.
Learning how to prosper is attractive for national bodies with squeezed public finances
(Sokol, 2002). Critics of the learning region concept point out that viewing knowledge
as the most important factor in regional economic prosperity gives a very limited
understanding. In order to understand underlying causal processes, knowledge has to be
seen together with and in interaction with wealth and power.
The learning region is characterised by the use of various kinds of knowledge within and
between organisations - use of tacit knowledge, learning and hybrids of face-to-face and
ICT mediated communication. The promise of the information society is that firms in
less favoured regions (LFRs) can successfully use telecommunications to re-define their
markets, or to re-position themselves within existing markets. This envisages the
networking of SMEs in order to derive external economies of scale or to facilitate
flexible specialisation. However evidence suggests that ICT underpins processes of
globalisation rather than supporting the re-emergence of industrial districts. New
developments do not seem to be challenging the concentrations of economic power in
core regions. The most highly valued service activities remain in core regions, lower
value added activities are dispersed to LFRs. Where new products and processes are
developed face-to-face contact is crucial for the transmission of ideas and knowledge.
ICTs serve as mechanism for enhancing the ability of these central places in core
regions to extend their spatial reach both by controlling less sophisticated parts of the
production and exporting their own products “over the wire”. It should be noted that
core regions may themselves be learning regions, for example the San Francisco Bay
area is both a learning region and an ICT hub. Reflecting on the previous work of
Markusen, this shows why a regional business pattern such as the satellite platform is
unlikely to lead to long-term economic development for a region, unless there is specific
government intervention as in the case of Ireland.
The information society clearly opens opportunities for some LFRs to benefit from the
increased mobility of routine and codified work. However there are also equally clear
limits to those opportunities, which tend to be best suited to regions that can offer a
large differentiated and under utilised labour force at low costs and have a reasonably

49
well developed basic transport and other infrastructure. It is increasingly argued that for
high value added activities the key regional requirement is not information (codified
data) but knowledge and in particular tacit knowledge. One answer to this is the use of a
learning region strategy. Though individual learning is important, the concept of
learning region implies a focus on the issue of broad institutional learning within the
regional economy. The focus on tacit knowledge reinforces the need for proximity and
hybridity of technology with traditional face-to-face communication. In order to get the
most from computer networks there needs to be a particular form of social network in
place.
2.5 Relevance to New Zealand
New Zealand‟s geographical location as a small country at the bottom of the South
Pacific poses particular problems for the national economy‟s integration into the global
economy. Primary industries dominate, and exports of meat and dairy products make a
large contribution to New Zealand‟s economy. However industries such as forestry,
horticulture, fishing, manufacturing and tourism have become increasingly significant,
and over the past decades, many new industries have emerged and grown strongly,
including software, biotechnology, electronics, marine, education exports, media/film
and wine. New Zealand‟s isolation and physical distance from major trading partners‟
means that New Zealand‟s predominantly small firms wanting to move into export
markets face big costs. Regions are affected as technological innovation and increased
competition lead to business centralisation. Also industry rationalisation and market
deregulation have encouraged skilled people to leave rural regions for broader
educational and employment opportunities in major cities (Schollman, O'Neill, Doczi, &
Kelly, 2002).
Additionally enhancements and upgrades of physical infrastructure in rural centres have
not kept pace with technological progress (due to small market sizes, lack of critical
mass, and no population growth) and have led to further population out migration. This
has caused problems for some of New Zealand‟s rural regions, and in some cases to a
vicious cycle of decline. In urban regions all New Zealand cities have low-income areas
and pockets of deprivation. In both urban and rural areas, Mãori and Pacific Islanders
are disproportionately represented in the disadvantaged population.

50
The New Zealand government has implemented several initiatives to help to develop a
knowledge society, encourage innovation, build up regional economic development, and
improve usage and access to ICT. The overarching aim is to return New Zealand‟s per
capita income to the top half of the OECD rankings and maintain that standing. The use
of ICT is seen as central to all of these developments. Current initiatives most relevant
to this research are discussed below.
2.5.1 Growth and Innovation Framework
The Growth and Innovation Framework, was set up to enhance the existing innovation
framework, develop people‟s innovation skills, increase global connectedness, and focus
initiatives in areas which can have maximum impact. Three areas that were chosen to
focus on were biotechnology, ICTs, and the creative industries as they had the potential
to grow in their own right and also to improve productivity across the economy (Office
of the Prime Minister, 2002).
2.5.2 Project PROBE
Project PROBE was a joint initiative between the Ministry of Education and the
Ministry of Economic Development which aimed to roll out broadband communications
to schools and provincial communities. The goal was to close the broadband gap
between urban and rural New Zealand, and in particular to address the huge disparity
between urban and rural schools. In rural areas it was generally agreed that some
involvement of local or national government to build ICT infrastructure is necessary
(Australian Economic Commerce Centre & Partners, 2004; Zilber, et al., 2005).
PROBE had two parallel objectives: to make broadband available to every school in the
country, and to get broadband out to as much of the wider community as possible
(iStart, 2004). The government divided up the country into 14 regions which roughly
equated to the regional government structure shown in Figure 5, with the addition of a
15th region to provide satellite access to the most remote areas of the country. It should
be noted that the money provided for PROBE was for set up only. There was no ongoing
funding, and the only exception to this is a subsidy for those schools where the more
expensive satellite access is the only option.

51
At the beginning of PROBE there were 2,700 schools and 900 of these were not able to
receive broadband. Now broadband is available to all schools and as of 2006
approximately 50% of them have taken up the option of having a broadband
connection11
. One of the results of PROBE is that broadband access is now available to
all towns, even the small ones, and in the rural areas, as of 2006, there was 50%
coverage. Though all schools now have the potential to access broadband, it is still up to
each school to decide whether they have the financial and human resources to make
getting connected worthwhile.
The key aim of PROBE was to build infrastructure, so that broadband services were
available at a reasonable cost in rural areas. The project was not so concerned with the
actual take up by schools and local businesses. Now that that access has been provided
there is a need to move on and integrate the access with learning and applications, but
that thinking is only just starting to happen.
2.5.3 Digital Strategy
The Digital Strategy brings together many of the current and former initiatives of the
New Zealand Government in one unifying vision (Ministry of Economic Development,
2004). The purpose of the strategy is to work out the most beneficial way of utilising
ICT to maximise the benefits to national and local government, communities and
business. The three main goals are: to enable effective use of ICT by communities; to
encourage innovation by business; and to improve government service. Figure 9 shows
the three areas where action is required in order to achieve the social, economic and
cultural benefits of ICT. Relevant content must be provided, by making information
from national archives, government, business, and community groups available via
digital networks. All sectors of society need to have the confidence to use ICT
effectively. Connection to the ICT infrastructure needs to be available and affordable.
Each of these three dimensions interact with each other, and are mutually reinforcing
(Ministry of Economic Development, 2004).
11
In 2010 the NZ government announced an initiative to make ultra-fast broadband available to 97% of
schools

52
The digital strategy explores the relationships between commerce, culture, and learning,
and how the use of ICT can improve the networks that make these relationships work.
The strategy document comments that:
“The ability to share information strengthens all communities, makes research and
development more efficient, and enables the spread of innovations throughout the
economy.” (Ministry of Economic Development, 2004, p. 11)
Figure 9: New Zealand Digital Strategy Framework (Ministry of Economic Development, 2004, p.
23 p. 23)
2.6 The Research Question
INTERCONNECTING
The existence of networks between businesses, customers, suppliers,
community groups and local authorities
INFORMING
Features related to learning such as the presence of embedded tacit
knowledge, transfer of best practice, and presence of knowledge
workers
INNOVATING
Evidence of ability to create or adopt innovations, the presence of
entrepreneurs, and a competitive culture
INTERACTING
The presence of strong social capital, high levels of trust, a common
regional culture, and professional networks
INFRASTRUCTURE
Hard infrastructure in terms of transport and telecommunications
links, plus soft infrastructure in terms of regional norms and
conventions
INCOME
Economic features such as per capita income and employment levels
Table 1: The 6-I Framework

53
Table 1 introduces the 6-I framework, which draws together the different factors
discussed in the literature review. The 6-I framework will be used as a basis for data
collection and analysis. The rationale behind the development of this framework is
discussed in detail in Chapter 4. The framework groups characteristics that a learning
region should possess into 6 categories: interconnecting, informing, innovating,
interacting, infrastructure and income. Figure 10 uses an input, process, output diagram
to explain the interconnections between these different features.
Individual
Learning
Human
Capital
Social
Capital
Organisation
al Learning
Cultural
Capital
History
REGIONAL
LEARNING
SYSTEM
Networks
Institutions
Investment in
Learning
Investment in
Research
Third
Places
Cluster
Cluster
Social
Entrepreneur
National
Links
Innovation
Social
Cohesion
International
Links
Economic
Development
Competitive
Individuals
Figure 10: The Learning Region: inputs, processes and outputs
Individual learning feeds into human capital, which provides the competitive individuals
who, if brought into contact with each other through appropriate networks, can produce
innovations. When combined with appropriate cultural capital, human capital also
allows social capital to be formed. The cultural capital of a region is a result of each
area‟s unique history, and ethnic make up. Culture is significant on two levels: a
region‟s culture can be a marketable commodity in terms of tourist attractions and
culture also gives each region its own unique way of doing things. Regional learning
takes place by utilising existing practices and procedures, and adapting them to new
problems. The phrase adopted by the Otara Digital Opportunity Group “walking
backwards to go forwards” sums this up nicely (Symington, 2003, p. 11). Regions need
to learn how best to exploit their existing cultural capital in order to be successful in the

54
knowledge society. High levels of social capital and trust within society will cross over
into individual organisations, providing good conditions for the development of
organisational learning. Another important input to the regional learning system is the
social entrepreneur who maintains social networks throughout the region. The social
entrepreneur does not fall neatly into the one of the categories in the 6-I framework, as
they form a link between interconnecting and interacting by carrying out a brokering
role that mobilises the social capital required to make networks effective.
The processes within the regional learning system itself are characterised by the
existence of networks, institutions, and by a commitment to learning. The system may
contain various clusters of SMEs that are involved in various networks. The networks
are critical to a regions success, as it is through interaction between the different actors
that innovation occurs. The outputs of a successful regional learning system will be
innovation, leading to economic development and social cohesion. Within the regional
learning system itself strong bonds will exist between the SMEs and other actors within
the region. It is also important that bridging links stretching beyond the region, both
nationally and internationally are present. Bridging is essential for regions to develop
and find markets for their innovations, and it is in the development and maintenance of
both bonding and bridging that ICT can contribute to the development of learning
regions.
The central research question is:
What role do information and communication technologies play in the development
of learning regions?

55
CHAPTER THREE
3 RESEARCH METHODOLOGY
Stories can be written in different styles. There are thrillers, romances, comedies and
horror stories. Each different genre has its own techniques and conventions. This story is
about information systems and this chapter explains how the conventions of the
discipline have been used to investigate the story.
This chapter outlines the reasons for the adoption of the interpretive paradigm, and the
significance of positioning the research at the meso level. The chapter then goes on to
introduce historical methods and explains why this approach was selected for this
research. The use of historical methods involves the collection of both primary and
secondary sources of data, these are analysed to try to establish relationships between
cause and effect. The most well known work on historical methods in information
systems was carried out by Mason et al (R. O. Mason, McKenney, & Copeland, 1997a,
1997b). Their definition of the three key historical roles of leader, maestro and
supertech, and their seven step approach to using historical methods is explained. The
chapter finishes by explaining how the seven step approach was applied in this research.
3.1 Interpretive Approach
In interpretive research the researcher interacts with the phenomena being studied,
acknowledging that their own value set is a lens, which gives them a unique view of the
phenomena. Inductive thinking is used so that the categories to be researched emerge
from the data gathered. The style used to write up the research will be personal and
informal (Creswell, 1994). Interpretive research is based on the hermeneutic tradition,
which literally means “making the obscure plain”; it consists of the detailed reading of a
text, in order to discover embedded meanings (Neuman, 2003). A text does not literally
have to be written words; the “text” could be an item such as a conversation; a movie; or
a photograph. A central premise is that everybody has a reason for what they are doing,
and if somebody appears to be acting “irrationally” the researcher needs to go back to
the interpretant and interpret the text more closely (Lee, 1999). In the interpretive
paradigm theory is usually deployed in one of three ways, it can be used as framework
that provides a broad explanation as in quantitative research, a theoretical lens can be

56
used to guide questions the researcher might like to address or theory can become the
endpoint rather than the starting point of research. For example in the case of the
inductive process of developing patterns from data collected during the course of the
research. Pattern theory involves establishing the relationships between concepts, using
metaphors and analogies to make sense of the interconnections observed (Creswell,
2003).
3.2 Scope of Research
Another factor that needs to be considered when selecting a suitable theoretical method
is the scope of the research. Neumann (2003) distinguishes between micro-level, meso-
level, and macro-level theories. With the selection of the appropriate level being based
on time-span, numbers of people involved, and geographical area covered. The larger
the level of the theory, the more abstract the concepts it deals with. Micro-level theories
would be used to explain the interactions between small numbers of individuals,
whereas macro-level theories explain society-wide issues. The intention was that the
scope of this research, which is located in a regional context, should be geographically
located at the meso-level, which provides a link between the micro (individual) and
macro (national) levels, and therefore connects the particular with the general. However
in practice it proved difficult to separate the three levels. The integration of micro and
macro level data is traditionally a feature of historical comparative research. Issues are
considered at both a society wide and at an individual level (Neuman, 2003). For this
research the impacts of macro level national policy around issues such as local
government restructuring and availability of broadband had to be considered alongside
the meso level.
3.3 What is the Historical Method?
Historical methods consist of a collection of techniques and approaches which draw on
both traditional history, and social research. The methodology was first developed in the
nineteenth century by social thinkers such as Marx, Durkheim, and Weber (Neuman,
2003). There has been a resurgence of interest in historical methods since the 1970s,
when researchers began to recognise the limitations of methodologies such as structural
functionalism and economic determinism, which take a static view of society. Increasing

57
political conflict between Western nations meant that researchers became interested in
exploring social change, and looked for a methodology that took into account historical
and cultural contexts. Historical methods provide a powerful set of tools for addressing
broad, big picture questions (Neuman, 2003).
The first information systems researchers to use historical methods were Mason et al
(1997a, 1997b), who based their argument for the use of historical methods on the work
of Joseph Schumpeter who saw capitalism as being characterised by “gales of creative
destruction” where the economy is radically altered by innovations in products and/or
processes, resulting in a fifty-five year cycle of creation, growth, and destruction, known
as a Kondratieff wave. Schumpeter‟s theories were based in turn on the work of Nikolai
Kondratieff, who argued that the possibilities of any given generation of technologies
become exhausted approximately every fifty-five years (Hall, 1998). As the
developments in information and communications technology form the most powerful
force of creative destruction in the last fifty-five years, and can be regarded as the fifth
Kondratieff Wave, this is of direct relevance to researchers in the field of information
systems.
3.4 Why Historical Methods are appropriate for this Study
Schumpeter thought that research should consist of four kinds of knowledge, empirical
data, theories and paradigms, ethics and history. History provides a temporal and
contextual meaning for each of the other three forms of knowledge. In any organization,
the understanding of the present is facilitated by studying the past, and gaining an
awareness of the long-term economic, social and political forces that shape events
(Gorman, 1997; R. O. Mason, et al., 1997a; Porra, Hirschheim, & Parks, 2006).
Though there are some similarities between the use of case studies and historical
methods, there are a number of significant differences between the techniques. Case
studies may use history to provide background information, but the focus is on the
present or recent events. The historical method has a perspective of decades or even
centuries, with the focus being on finding the underlying as well as the immediate
causes. The context of historical methods is broader than that of the case study, which
typically examines one event or situation (Porra, et al., 2006). The use of a case study

58
will bring insight into a particular situation, whereas the use of historical methods is an
attempt to prove a causal analysis of change beyond all reasonable doubt (Porra, et al.,
2006). This idea of establishing proof may seem to be at odds with the interpretive
approach, but “beyond all reasonable doubt” means that something has been shown to
be highly likely, rather scientifically proven. The benefit of using historical methods
rather than a case study is that a much deeper and wider insight will be gained into the
area being researched. For the study of learning regions the long time perspective, which
considers the development of social capital, cultural values, and the building up of
networks makes historical methods the more suitable of the two techniques.
3.5 Guiding Concepts
Mason et al. (1997a) identify three key historical roles relevant in the field of
organisational IS, the leader, the maestro (who combines business and technical skills)
and the supertech. By emphasising the roles of these three individuals, they introduce
the postmodernist approach of “multiperspectivalism”, which offers three different
lenses through which the history of an organisation can be interpreted. The people who
adopt the roles of leader, maestro and supertech all view information technology as a
solution to the challenges that organizations face. They have been described as “insiders
looking out” (R. O. Mason, et al., 1997a p 6) as they are aware of both the internal
operations of the organizations and the changes in the external environment that may
pose future obstacles. In other words, each of the people in these three roles is able to
utilise bridging social capital. This idea of the three key roles is unique to Mason et al,
and has not been widely tested. Their development of these three roles is based on
Schumpeter‟s notion of the heroic entrepreneur as the agent of change. Their research
identified the importance of these three roles at the organisational level.
This research is located at the regional level, and though certain key individuals clearly
made major contributions to regional development, the distinction between who was a
leader, a maestro or a supertech could not be made clearly, and it was decided that it
would be more useful to have one broad category, that of the social entrepreneur. This
merging of roles raises the issue of whether the research is devalued by the loss of
multiple perspectives. In Mason et al.‟s work, the study of the organisations is driven by
the views of the leader, maestro and supertech, in this research the driving mechanism
for data collection is the “6-I” framework, and though the opinions of social

59
entrepreneurs are part of this they do not lead it. Therefore this adaptation of Mason et
al.‟s model does not significantly affect this research.
Whether the role is identified as that of a maestro, a leader or a social entrepreneur
whoever takes on the role guides an organization through the phases of an historical
process which is called the “cascade”. The cascade is a process of change and
adjustment through which an organization may reach their dominant design. A dominant
design is generally reached through radical as opposed to evolutionary innovation, and
will result in an organisation becoming a leader in their field. Examples of dominant
designs are Ford‟s Model T and Douglas‟ DC-3. The concepts of dominant design,
roles and cascade are used as Weberian ideal types.
The sociologist Max Weber (1978) developed a key conceptual tool, the notion of the
“ideal type”. He argued that it was impossible for any scientific system to replicate
reality. Therefore, whether it was explicit or not, all science involved selection as well
as abstraction. Concepts need to be selected. However if the concepts selected are too
general their distinctive features may be left out, and if one particular example is used, it
is difficult to compare it with other phenomena. In contrast, the ideal type constructs
certain elements of reality into a logically precise conception. The ideal type is very
different from the average, and is best thought of as an “archetype”. For example the
ideal type of social entrepreneur will be very different from the average social
entrepreneur, and though a particular individual who is held up as an iconic social
entrepreneur will probably possess many of the features of the ideal type, there will not
be an exact match.
For this research, the concept of the ideal type was used to build a framework
highlighting six features that an “ideal” learning region would possess. This framework
was used as basis for organising and analysing the data collected.

60
STEP ACTIVITIES
1) Begin with focusing
questions.
The questions asked are going to be about change, as history is
primarily the story of change. Inductive thinking is generally
associated with the interpretive paradigm, and involves the
researcher identifying categories, or patterns in data, that seem
suitable candidates for further investigation.
2) Specify the domain for the
enquiry.
In the studies carried out by Mason et al (1997a) and (Porra, et
al., 2006) the primary unit of analysis is an individual
organisation. The researcher needs make decisions about what
will be included in the domain, and what is the appropriate time
span for the study.
3) Gather evidence, using
both primary and secondary
sources.
Primary sources are those that came into existence during the
time to which they refer, and secondary sources are those
written by historians about a period in the past. Primary sources
can be public documents such as annual reports, statistics and
academic articles, which are organised around a timeline.
Secondary sources can be slotted into this timeline and include
less public information such as letters, budgets, and data
collected from individual interviews. The result of this step
should be to establish a chronology of events with reference to
the geographical locations in which they occurred.
4) Critique the evidence. Is it
authentic and credible?
It is common to find that evidence is contradictory, irrelevant or
incomplete. Many of the best storytellers favour accuracy less
than they favour a gripping narrative. Techniques such as
counting the number of times an observation was made,
determining the credibility of sources, and establishing whether
there are meaningful relationships between the different parts of
the evidence can be used to assist with this.
5) Determine patterns using
inductive reasoning.
This is one of the central steps, though one of the most difficult.
The task is to explain what happened, and how and why it
happened. This can be done using a number of different tools;
three of the most popular are conceptual frameworks, causal
chain analysis, and establishing empathy with the main
participants. A conceptual framework can be used to organise
facts, and to concentrate attention on the essential areas to be
explained. A causal chain is a type of conceptual framework
that shows the sequence of events that produced the effects,
results or consequences observed. Conceptual frameworks and
causal chains can be developed in advance independently of the
phenomena to be explained, and used as an explanatory
framework, or they can be used as ideal types around which
historical data can be organised. A third approach is to try to
achieve empathy with the characters in the study. This means
imagining how events might have appeared to those who
actually experienced them.
6) Tell the story. This entails bringing together the results of evidence gathering,
empathy, and causal chain analysis to form a narrative.
Identifying times of intense change, which will form the focal
points of the story, usually does this.
7) Write the transcript.
The historical method is part of the hermeneutic tradition in that
it treats the world as a script. Every written account takes its
place in the context of a network of other written accounts that
attempt to explain the relationships between living generations
and their predecessors.
Table 2: Seven Step Approach to Historical Methods (Mason et al, 1997)

61
3.6 Seven Step Approach
Mason et al (1997a) have developed a seven-step approach for applying the historical
method to MIS research, which is outlined in Table 2. Though these steps are presented
in a linear fashion, when carrying out real-world research, there will always be an
overlap and iteration between the steps
3.7 Application of Seven Step Approach to Learning Regions
This seven step model was used by Mason et al (1997a) to study the Bank of America,
and by Porra et al (2006) to look at Texaco. In both cases the research was focused on a
single organisation. This research uses the same seven step model, but applies it at the
regional meso level and at the national macro level.
3.7.1 Begin with focusing questions
Focusing questions were arrived at by an inductive process of searching the literature,
relating to the New Zealand context, and using the questions asked in the study of
Texaco (Porra, et al., 2006) as a guideline. The resulting questions judged to be relevant
for this research were:
- What are the significant changes in the New Zealand economy since 1985 and
200512
?
- What have been the significant changes in information and communications
technology between 1985 and 2005?
- How have these new developments in information and communications
technology been adopted in New Zealand?
- What significant changes have occurred in human, social, cultural and
intellectual capital in New Zealand since 1985 to 2005?
- What significant changes have come about in public policy towards regional
development in New Zealand at both a national and regional level?
- What is the pattern of innovation in New Zealand between 1985 and 2005?
- What significant changes have taken place in tertiary and vocational education
between 1985 and 2005?
- What have been the significant changes in the roles of regional bodies such as
Chambers of Commerce?

62
3.7.2 Specify the domain for the enquiry
The domain for inquiry operates at two levels, the national macro level and the regional
meso level. As discussed in Section 2.1.1 as a country with a population of only four
million New Zealand itself could be considered a region. At the meso level two
contrasting regions have been selected one urban region, Wellington and one rural
region, Southland. Data will be collected about these two regions in their own right; the
regional data will also complement the data collected at the national level, by providing
information about both urban and rural New Zealand.
The date that has been selected as a starting point for data collection is 1985, shortly
after David Lange‟s labour government introduced the sweeping economic changes
known as “Rogernomics” (Clifton, 2004). The end date for data collection is 2005,
when New Zealand became the first country in the world to launch a Digital Strategy
(Ministry of Economic Development, 2005).
Figure 11: Southland Region (source Statistics New Zealand www.stats.govt.nz)
Southland is a remote rural area located at the bottom of the South Island, as shown in
Figure 11. Invercargill is the major city in the region. Farming is the mainstay of the
local economy; the region also has the country‟s only aluminium smelter at Tiwai Point
near Bluff. Southland Frozen Meat is also a major employer. Three Southland firms
regularly make it into the Deloitte's ranking of New Zealand‟s top 200 companies. These
are the Alliance Group, an Invercargill based company formed by farmers to sell high
quality meat to international markets, Southland Dairy Co-operative and Bluff-based
Southport New Zealand. Southland has many areas of great natural beauty, such as
12
The reasons for selecting this period are explained under Step 2

63
Stewart Island and tourism is of increasing importance to the region. Southland also
contains methane gas, oil and lignite deposits with commercial potential.
Figure 12: Greater Wellington Region (source Statistics New Zealand www.stats.govt.nz)
The Greater Wellington Region (hereafter referred to as Wellington) as shown in Figure
12 is located at the bottom of the North Island and includes the capital city, Wellington.
The three local authorities closest to the capital, Porirua, Lower Hutt and Upper Hutt
would be classed as suburban, while Kapiti, Masterton, Carterton and the Wairarapa are
more rural areas. The region includes a wide range of different socio-economic groups;
there are some high income areas but also areas of deprivation. As Wellington is a
capital city, the public sector is of particular importance, as is the service sector.
Wellington is the second most important centre for the IT industry in the country after
Auckland. The Hutt Valley‟s economy was traditionally based around manufacturing
though this was declining throughout the period studied. As in Southland, tourism is of
growing importance to the region, and is often associated with events such as the Rugby
Sevens or the Arts Festival.
New Zealand‟s major exports are primary products and the rural sector has traditionally
been the most important area of the economy. As a rural region Southland will provide
data about how the rural economy changed over the twenty year period studied. At the
same time the country was attempting to diversify its export base, and IT and
biotechnology were viewed as offering great potential. As an important centre for the IT
industry, Wellington will provide data about changes during the period studied.
The second reason for selecting these two regions was that they both had a strong
reputation throughout the country for being innovative adopters of ICT networks. In

64
1995, Wellington was one of the first cities in the world to set up a broadband network
in its central business district, and in 2003 Southland made a bold decision to implement
a wireless broadband network throughout the region.
3.7.3 Gather evidence, using both primary and secondary sources.
First round of data collection
Data to validate the model was collected by a range of means. During the first round of
data collection in 2006, twelve in-depth semi-structured interviews were conducted with
key figures involved in the adoption of ICT networks as show in Table 3 . The interview
questions addressed a common set of themes including availability of infrastructure, the
extent of linkages between local organisations, regional culture, commitment to learning
within the region, and the adoption of innovative ideas. The interviewees worked for a
range of organisations including local and regional councils, telecommunications
providers, schools, and community groups. Some of the interviewees were selected for
their knowledge of the local situation in Southland or Wellington; others had a national
focus. The Human Ethics Approval for the interviews including details of example
questions is included as APPENDIX F.
Identifier Location Focus Role
A Wellington National Telecommunications consultant
B Wellington National Rural telecommunications expert
C Auckland National Rural telecommunications expert
D Southland Southland Manager - Local Government
E Southland Southland ICT policy – Local Government
F Southland Southland Community sector – Local Government
G Southland Southland Telecommunications provider
H Wellington Wellington Consultant – Wellington Regional Strategy
I Wellington Wellington Manager – Local Government
J Wellington Wellington ICT policy – Local Government
K Wellington Wellington Community sector – Local Government
L Wellington Wellington School – ICT Teacher
Table 3: Location and role of interviewees
In addition to the interviews further documentary evidence such as reports, survey
results, statistics and web pages were collected as supporting data. Attendance at three
65
New Zealand conferences13
, one on Digital Cities and Regional Networks, a second on
ICT in the Workplace and Communities with the third being a TUANZ14
Rural
Broadband Symposium, also provided much relevant material in which to frame the
interview data.
Each interview was transcribed, and sent back to the interviewees for corrections and
additions. Most of the interviewees became quite involved in correcting and adding to
their transcripts confirming the accuracy of the data collected. Then NVivo was used to
code the data. The “6-I”15
model was used as a basis for coding, with each of the “I”s
being set up as a node in NVivo. In order to identify the factors that were unique to the
two regions, the data under each of the “I”s was coded separately for Southland and
Wellington. A third section was used to store data that covered New Zealand-wide
issues. After the interview transcripts had been coded, the data collected at each node
was analysed. The purpose of this was to see if the interviewees were highlighting issues
that seemed pertinent to each of the six nodes, and also to identify the different themes
that were emerging around each node. The data under each node was grouped into sub-
categories. The process of grouping the data also acted as a double check on the
accuracy of the coding; as the interview statements collected at each code were
reconsidered, some were removed from the category, while others were moved into a
different category. During the writing up of this data further refinement took place.
Duplications and overlaps were identified and the categories were regrouped and
consolidated accordingly. As a result clearer and tighter definitions of each of the “6-I”
categories emerged.
The purpose of this initial analysis of the data was to reflect on the information that had
been collected and to develop strategies for further data collection. New data could be
tested out against expected findings, and alternative ideas could be explored to see if
they would fit the emerging findings better (Miles & Huberman, 1994). In this case the
“6-I” model proved a useful framework for data analysis and it was retained for the next
round of data collection.
13
Digital Cities and Regional Networks, 23 November 2005, Wellington, NZ
ICT in the Workplace and Communities, 28 April 2006, Wellington, NZ
TUANZ Rural Broadband Symposium, 29-31 March 2006, Timaru, NZ 14
Telecommunications Users Association of New Zealand https://www.tuanz.org.nz 15
At this stage of the research the “7-I” model was still being used

66
Second round of data collection
The second round of data collection focused much more strongly on the regional level
and also brought in the historical aspects. The aim was to build up a history of the
development of ICT networks in the regions of Wellington and Southland in the twenty
years between 1985 and 2005. The strategy adopted was to carry out both macro and
micro level analyses of events in both regions over a 20 year period (Rooney, 1996).
Primary sources were used to give an overall picture of developments in each region
over the twenty year period, and for three selected years 1985, 1995 and 2005; a more
detailed micro analysis was carried out. For each of those dates a selection of regional
publications was searched for material that was relevant to each category of the “6-I”
model, for example, evidence of any innovative activity in both regions during each of
those three years. The idea was to see how those factors that had been identified as
being relevant to the development of learning regions were changing in each region
during the period covered by this research.
Primary sources for this material included regional newspapers such as the Southland
Times, Dominion Post, Dominion and Evening Post, magazines such as National
Business Review and NZ Farmer and regional reports carried out by market research
company TNS. The Index New Zealand database maintained by the National Library
was also a useful source of information. For 2005 and some of 1995 these publications
could be searched electronically using the Newztext Plus database, but very little
information was available in electronic form for 1985. However, the Alexander
Turnbull Library held copies of regional and national newspaper and magazines on
microfiche that covered this period. Statistics New Zealand was also a useful source of
material, though they have only been collecting information at the regional level since
the late 1980s. Regional statistics organised around electoral boundaries were also
available from the Parliamentary library.
Two initial approaches were attempted to develop search strategies. The first was to go
through the list of headings in the Index New Zealand database and identify those that
seemed relevant to this research. These terms were then grouped according to the
relevant category in the “6-I” model, for example “Continuing Education”, “Literacy”
and “Rural Education” along with other terms were grouped under “Informing” These
subject headings were then used to search the IndexNZ database for 1985, 1995 and

67
2005; those subject terms which resulted in irrelevant hits were discarded. The materials
brought up by each search term were scanned and the abstracts of relevant publications
were selected. This approach was found to result in an unbalanced selection of material
as very little data was available for 1985, as compared to 2005. The second search
strategy was to use each of the “6-I”categories to develop search terms that would have
been used by the press to describe phenomena relevant to that category. For example
words like “community spirit”, “regional culture”, “social capital” and “quality of life”
are likely to have been used to describe regional events that were relevant to the
“Interacting” category. Candidate search terms were tested out on the Newztext Plus
database to see if they provided good quality hits. These tests were also used to identify
new search terms not thought of in the initial analysis. This strategy also resulted in a
major imbalance in terms of little material for the earlier period and too much for the
more recent period. Many of the search terms such as “Income” or “Research” were also
far too general and resulted in far too many irrelevant hits.
In order to obtain a more even amount of material for each of the three selected years,
and to cope with the problem of information overload it was decided to restrict the
search to three regional newspapers and one national magazine. For Southland the main
source of information would be the Southland Times, for Wellington it would be the
Evening Post and Dominion for 1985 and 1995, and the Dominion Post16
for 2005. The
advantage of using newspapers is that they provided a breadth of coverage that was not
available from other sources. Initial analysis of these publications showed that they did
provide a wide range of articles covering business and community events within their
region that were relevant to the research question. They also had the advantage of being
full text. Though the intention was to use these publications to build up a picture of the
recent history of each region, initial searches revealed that they also had a lot of articles
that were relevant to the national context. It was decided to collect this information as
well, and to supplement it by carrying out searches in National Business Review. This
publication was chosen as it had been recommended by a number of librarians as being
likely to contain material about regional development initiatives.
16
The Evening Post ceased publication in 2002 and was combined with the Dominion to become the
Dominion Post

68
The material from the newspapers was complemented by national and regional reports
produced by a range of organisations such as independent economic consultants, non-
governmental organisations, professional societies and voluntary groups. Some of these
have been explicitly referenced others were used as general background information.
The reports used are listed in APPENDIX C: National and regional reports.
InterconnectingWellington1985
RefNo Publication Date Title Full text
8 Dominion 14/01/1985 MOW gets National Computer No
870 NBR 25/02/1985 Other potential in Parliament's Digital "printers" Yes
144 Dominion 6/06/1985 Key to library success No
151 Dominion 13/06/1985 Commerce students switch countries No
217 Dominion 12/08/1985 High-tech zones aren't built in a day Yes
224 Dominion 13/08/1985 Petone organises youth skills project No
369 Dominion 5/12/1985 Computer link opened No
Figure 13: Example of material in the Access database
For 1985 for the Dominion, Evening Post and National Business Review, and 1985 and
1995 for the Southland Times searches had to be carried out using microfiche. Abstracts
of relevant articles were entered into a Microsoft Access database as shown in Figure
13, details of publication name, date, “6-I” category and whether the news item had a
national or local focus where also recorded. If an article was of particular interest the
full text was printed out. One limitation of using Access was that each article could only
belong to one of the “6-I” categories even though many actually overlapped two or three
different categories. As the process of analysing and writing up the findings took place
the initial coding was refined and some articles were reassigned to different categories
or classified as irrelevant.
The initial database held 3,033 items and when coding was completed this was reduced
to 2,442 items. The breakdown of the number of articles for each category and region is
shown in Table 4 (note that in 2005 one of the regional newspapers for Wellington was
no longer in print which partly explains the drop in numbers). What is interesting to note
is that even though the two newspapers were regional, more than half of the articles
selected had a national rather than a regional focus. The fact that Wellington is the
capital of New Zealand is also significant. Generally initiatives by the national
government were categorised as national rather than regional even though they were
located in Wellington. The numbers of articles collected for each category give a broad

69
indication of the category‟s importance. Though these numbers are of no hard scientific
value, counting the number of times a point is mentioned is one of the techniques used
in historical research to establish trustworthiness. Counting is also a technique
recommended by Miles and Huberman (1994) as a tactic for generating meaning. The
same story was often reported in a number of publications, and there were often multiple
articles about the same event.
Table 4: Newspaper statistics for 1985 to 2005
The data collected in the first round was analysed using NVivo, which wasn‟t suitable
for this phase. The possibility of establishing a link between NVivo and Access so that
the two sets of data could be analysed together was investigated, but as it seemed overly
complicated it was not followed up. The advantage of using Access was that a
reasonable large amount of text could be stored in the abstract field and that the data
could easily be sorted into categories and sub-categories which assisted analysis.
However there were some disadvantages, as the data was written up, the coding was
refined and many articles were assigned to different categories or removed altogether. It
was then necessary to go back to the Access database and recode the article or enter a
null value. With hindsight it would probably have been more efficient to enter details of
the newspaper articles in an Endnotes database.
1985 1995 2005 Overall
Total
Nat S W Tot Nat S W Tot Nat S W Tot
Interconn 97 16 27 140 44 11 43 98 41 13 5 59 297
Informing 95 39 46 180 32 45 74 151 37 24 11 72 403
Innovating 123 21 38 182 104 18 34 156 112 28 32 172 510
Interacting 33 53 69 155 7 35 77 119 4 29 12 45 319
Infrastruct 53 45 58 156 8 43 56 107 58 40 23 121 384
Income 163 42 64 269 41 83 39 163 48 23 26 97 529
Total 564 216 302 1082 236 235 323 794 300 157 109 566 2442

70
Figure 14: Example of abstract report from Access database
The abstracts and full print articles for each “6-I” category were printed out and pattern
matching (Miles & Huberman, 1994) was used to establish sub-categories for each of
the different categories. An example of the information printed in each abstract report is
shown as Figure 14. Once these sub-categories had been decided on for the 1985 data
they were set up in the Access database and used to code the 1995 and 2005 data. In
general the sub-categories identified in 1985 remained relevant for 1995 and 2005,
though some new sub-categories were added and a few were removed. For example in
1985 the “Infrastructure” category had a sub-section for the “Post Office” which was
responsible for telecommunications at the time. As of 1991 Telecom took over
telecommunications and the Post Office sub-section became irrelevant and was
combined into a “Telecommunications” sub-section. Once categories and sub-categories
had been finalised, the articles relevant to each section were sorted into each region, i.e.
National, Southland or Wellington. Referencing each individual newspaper article

71
would be too cumbersome, but statements made in the text do need to be linked to their
sources. APPENDIX B: Newspaper Sources for Historical Data lists all newspaper
sources used for each sub-section of the findings, grouped according to category, sub-
category, year and region. A standard numbering system has been followed in
APPENDIX B, APPENDIX E, and Chapter 5 in order to facilitate cross-referencing of
the material.
For the period covered by the Newztext database, searches for the Dominion, Evening
Post, Dominion Post and Southland Times (all Fairfax publications) were developed
using the subject index for each newspaper. The use of the subject index helped to
overcome the problem of information overload; if a term such as “Research” was used
as a general keyword it would result in an unmanageable number of hits, but using
“Scientific Research” in the subject index ensured that only the most relevant articles
were found. Though the initial goal was to produce a set of search terms that would be
replicable by other researchers, it proved impossible to develop that amount of rigour, as
each newspaper varied in the subject terms it used for indexing. For example the term
“Innovation” was used in the subject index by some Fairfax publications such as The
Press based in Christchurch, but not by others such as the Dominion and Evening Post.
Therefore a less scientific approach had to be taken to the selection of subject terms, by
observing what terms individual newspapers actually used, which resulted in a
reasonable number of relevant hits. Details of the actual searches used are included as
APPENDIX D. Subject index searching was not available for the National Business
Review, but as this is a weekly rather than a daily publication the information overload
problem was not such an issue and using the Newztext database it was possible to scan
headlines and select those that were of interest. For the online publications relevant
articles were pasted to a word document, they were then assigned to the relevant
category of the “6-I” model, and classified as being either of national or regional
relevance.
After the searches had been carried out the next step was to build up a picture of the
situation in each region for each of the three years using the “6-I” model as a
framework. This was done by combining the results of the searches ordered by category,
sub-category and year for each of the two regions and the national situation. This data
was used as a basis to describe developments in that region during 1985 to 2005. As

72
with the first round of data collection further refinement took place during the writing
up process, duplications and overlaps were identified and articles were reassigned to
different categories as appropriate.
Consolidation of the findings
The first set of findings reported on the interviews carried out in 2006 and were
analysed using NVivo, the second set reported on the newspaper and magazine articles
and was analysed using an Access database. Both sets of findings were analysed using
the “6-I” model, however, there was no exact match between the two. For example in
the first set of findings, an analysis of the “Informing” category produced two sub-
categories, “Lifelong learning” and “School based learning” whereas in the second set of
findings “Informing” had four sub-categories “Skills shortages”, “Investing in
education”, “Promoting the use of technology”, and “The use of IT in Education”.
It was decided that the thesis would be strengthened by the consolidation of these two
sets of data. The interviews carried out in 2006 mainly referred to events in 2005 and
could be used to supplement the newspaper articles for this period. As more data had
been collected using the newspapers this was regarded as the most important set of
findings and drove the consolidation of the research material. Information from
interviews was recoded in line with the sub-categories established for the newspaper
articles, and where this was not possible information was discarded. This resulted in a
more concise and elegant findings chapter.
3.7.4 Critique the evidence. Is it authentic and credible?
Historical source material consists of primary and secondary sources. Historians select
the events and people that they consider important. By doing so they don‟t so much
recreate the past as rediscover it, and to some extent colour it with their own set of value
judgements. The historical researcher‟s most important role is to choose reliable
sources, in order to create reliable narratives about the past (M. Howell & Prevenier,
2001). There needs to be a systematic approach to gathering data, as collecting only the
most compelling evidence can result in material that is unrepresentative (Wenger &
Snyder, 2000). Utilising the authoritative source only is not a wise approach. Evidence
should be collected from a wide range of sources, each of which will have their own
strengths and weaknesses (Tosh, 2000). Any source material collected should be

73
subjected to both external and internal criticism. The authenticity of the evidence is
determined by external criticism, whereas credibility is established by internal criticism
(Shafer, 1980). The use of external criticism involves establishing whether a document
can be traced back to the purported originator, establishing whether it is consistent with
known facts, and studying the form of the document (Tosh, 2000). Internal criticism
consists of trying to establish the author‟s meaning and making a judgement as to the
intentions and prejudices of the writer (Tosh, 2000). An overview of the two techniques
is shown as Figure 15.
Figure 15: Internal and External Criticism (from Neuman, 2003, p.421)
Authenticity
Regional newspapers are an authentic primary source. The location and time of
reporting are recorded, and for many of the later articles the author is also recorded.
Statistics from organisations such as Statistics New Zealand and the OECD can also be
regarded as authentic as they have official national and international approval. They
also tend to have good response rates, for example Statistics New Zealand surveys
generally get a greater than 80% response rate. The statistics were used to cross check
and confirm assertions made in the newspaper articles. As previously mentioned the
large number of articles used increases authenticity, the articles can be counted, if an
issue was significant it would be reported on a number of times, both within one
newspaper and across different newspapers. The interviewees in the first round of data
collection were selected for their knowledge of the issues being investigated in the
research and their ability to provide informed insights. Many had been recommended by
others as experts in their particular area.

74
Credibility
The use of newspapers for historical research raises questions about whether such
materials are a good source for historical truth, as reporting can be biased and
inaccurate. Some steps were taken to address this, such as cross checking events across
a range of publications, and using reports produced by independent bodies such as those
in APPENDIX C, but it does need to be acknowledged that newspapers can be fallible.
The novelist Nicholson Baker, who based his 2008 novel about World War Two on
newspaper reportage from the period, justified his decision to use such material on the
grounds that the coverage of a reporter who is present as events unfold can bring bare
facts to life (Baker, 2008). Newspapers have “vividness” and the ability to give “a
flavour of the zeitgeist” that is often lacking in other materials.
In New Zealand there are no national newspapers, each region has its own newspaper(s)
and the focus is on local events. Newspapers don‟t have the strong political biases that
might be associated with European publications such as the “Guardian” in England or
“Le Monde” in France. However there is undoubtedly some bias and inaccuracy,
especially in opinion pieces and editorials. The trustworthiness of qualitative research is
always open to question; newspapers have an advantage over data collected by
techniques such as interviews or focus groups, in that they are in the public eye.
Newspapers can face libel if they publish inaccurate information therefore journalists
take some steps to check their facts, and readers have a feedback mechanism in the form
of the letters page.
Contradictions were found. Different articles on the same topic often contained
conflicting facts and figures; claims made by politicians weren‟t supported by the
statistical evidence. Every effort was made to try and resolve these contradictions by
cross-checking data from a number of sources, but in many cases this was not possible
and data was presented as found.
The interviews in the first round of data collection concentrated on collecting
information about the then (2006) present and the very recent past so issues of recall
were not a major issue. Also issues raised in interviews could be checked against
documentation such as annual reports, surveys and web pages, as well as the newspaper
articles themselves.

75
Transferability
There are two aspects to transferability. Firstly would another researcher using the “6-I”
framework pick out the same set of newspaper articles as relevant? Secondly could the
same research technique be transferred to another context?
It is unlikely that two different researchers would choose exactly the same articles. The
inclusion of the researcher‟s point of view is recognised as an unavoidable part of
historical research. The researcher‟s interpretation of the past is influenced by their
current location in the present, and their view of events is fundamentally different to
those who were experiencing the events at the time (Neuman, 2003). In this case the
researcher is a middle aged English female with liberal left leaning views, who has
extensive experience of the IT industry mainly in an academic environment and moved
to Wellington in 2001. As the researcher arrived in New Zealand relatively recently her
view is that of an outsider who is emotionally detached from events such as the
economic reforms of the 1984 Lange government, which most New Zealanders hold
strong views about.
The number of articles used helps to mitigate this variation to some extent. If an issue
was important there would be a number of articles across different publications and
different researchers would find at least some of them, so a similar set of major issues
should be identified by different researchers.
The “6-1” framework and the technique of using newspapers as a data source could be
transferred to any country where regional newspapers were available. It could be
meaningfully used to investigate other regions in New Zealand, or to research the role
ICT plays in regional development in other countries, for example Australia.
3.7.5 Determine patterns using inductive reasoning.
Mason et al (1997b) identify three different methods for determining patterns:
conceptual frameworks; causal chain analysis and establishing empathy. With the
conceptual framework and causal chain analysis generally a model or analysis would be
developed before collecting the data, and then the material collected would be compared
against the original model. The establishing empathy approach attempts to build an
understanding of the motivations of the key historical figures in the study, and is

76
generally carried out after data collection. Mason et al.‟s research (R. O. Mason, 2004;
R. O. Mason, et al., 1997a, 1997b; McKenney, Copeland, & Mason, 1995; McKenney,
Mason, & Copeland, 1997) was conducted at the organisational level and generally used
the approach of establishing empathy with individuals in those organisations. This
approach was also used by Hirschheim et al (2003) in explaining the history of Texaco
through the eyes of its Chief Information Officers.
This research is being conducted at the regional level, and the establishing empathy
approach is problematic due to the large number of individuals who contribute to
regional development in widely different roles. The approach chosen for this research is
the conceptual framework, which uses the concept of an ideal type to organise and
interpret the data (R. O. Mason, et al., 1997a, 1997b). An ideal type, as previously
discussed, is modelled using the concepts of the dominant design and cascade. The
development of the ideal type of learning region is discussed in detail in Chapter 4. The
ideal type is presented as the “6-I” model, and the data collected is categorised using this
model, within the context of both time and geographical location.
3.7.6 Tell the story
The narrative tells the story of the economic and social development of two regions in
New Zealand with a particular focus on the role of hard and soft networks in regional
development.
The narrative approach tells a story in chronological order, presented in a way that is
entertaining to read and gives readers a feel for the issues of a different era. Having said
that, the approach does have acknowledged weaknesses; in particular causal theories are
often hidden, and it often makes little contribution to general knowledge (Neuman,
2003).
3.7.7 Write the transcript
The transcript produced needs to be placed within the context of previous work. This
research brings together ideas from both economic geography and history and owes a
debt to both subject areas. The story of learning regions in New Zealand should be
viewed in the context of international research carried out on learning regions and
regional systems of innovation mostly in Europe and the United States. This transcript
77
adds to that knowledge by focussing on New Zealand and also by examining the role of
ICTs in the learning region context.
The research also builds on the work on historical methods in information systems
carried out by Mason et al (R. O. Mason, et al., 1997a, 1997b) by applying it at a
regional rather than at an organisational level.
Historical research is often incomplete and provisional , it provides a rich thick
description of events, that is particular and descriptive rather than being analytical and
general (Neuman, 2003). A major goal of historical research is organising and giving
new meaning to evidence rather than providing an authoritative account. This research
fits in with this tradition, by providing a detailed examination of the use of ICT in two
regions of New Zealand over a fairly limited period of time. It makes a contribution, but
that contribution needs to be considered alongside other similar research on ICT and
regional development, before the authoritative account can be written.

78
CHAPTER FOUR
4 CONSTRUCTION OF AN IDEAL TYPE OF LEARNING REGION
The most gripping stories have a compelling main character. This chapter introduces the
main character of this story, the ideal learning region. Our character is an idealised hero,
and like many fictional characters would be very unlikely to exist in real life. However,
just as the readers of a book will compare themselves to a fictional hero, real life regions
can also be evaluated against the ideal region.
This chapter follows on from the previous one to further develop the historical methods
approach. The concept of the ideal type has been selected as the most appropriate
technique for data collection and analysis. Regions will be benchmarked by comparing
them to a model of an ideal type of learning region. The model is built up using a
combination of two approaches. The first is to search the literature for the most
commonly used terms to describe learning regions; the second is to compare and
contrast successful regions with unsuccessful regions. The results are combined to
identify seven key characteristics of learning regions. These are firstly developed into a
“7-I” framework, and then refined into a “6-I” framework.
4.1 Overall Approach
In order to construct an “Ideal Type” of learning region, two approaches were used. One
approach was to review a number of articles that covered the concept of the learning
region, identifying common terms and themes. The second approach was to compare
and contrast successful learning regions with unsuccessful ones. The aim was to
triangulate the task of building the model by approaching the topic from two separate
directions.
For her PhD project, Patrice Braun (2003) from the University of Ballarat used action
research to investigate the adoption and diffusion of internet technologies in a regional
tourism network. To provide a loose framework to help to analyse her data, she
identified seven recurring themes in her literature review; change, connectivity,
clustering, communication, collaboration, community and co-operation. She used these
themes to construct a 7- C framework to assist her in analysing the barriers, drivers, and

79
pathways for innovation and change in the tourism network. A similar approach was
used to build an ideal type; the literature on learning regions was searched for recurring
themes, which were used to build a framework for data collection and analysis.
4.2 Common Terms used in the Learning Region Concept
Twenty three key references which discussed learning regions in some depth were
selected for further analysis (Christie & Hepworth, 2001; Cornford, 2000; Florida, 1995;
Hudson, 1999; Keating, et al., 2002; Lagendijk & Cornford, 2000; Larsen, 1999; Lever
& Turok, 1999; MacLeod, 2000; Malecki, 2002; Maskell, 1999; Maskell & Tornqvist,
1999; Morgan, 1997; Oinas & Malecki, 1999; Organisation for Economic Co-operation
& Development, 2001a; Rio, 2001; Saxenian, 1994a; Schollman, et al., 2002; Sokol,
2002; Storper, 1995; Thompson, 2002; Wolfe, 2000, 2002). Keywords that were used to
describe the features of learning regions were identified, and the number of times they
occurred across the different references was tallied up. Terms that were used in one
article only were discarded and the remaining 22 terms were ranked according to the
number of references, which mentioned them, and are listed in Table 5. Details of
which key terms where found in which of the articles are available in APPENDIX A.
KEY TERM TIMES OCCURING Innovation 15
Partnerships and networking 14
Embedded tacit knowledge 12
Regional norms and conventions 10
Good infrastructure 8
High social capital 7
Trust 6
Lifelong learning 6
Presence of knowledge workers 5
Input of universities and consultants 5
Critical & knowledgeable customers 4
Quality of life 4
Competitive culture 4
Ability to “unlearn” and be flexible 4
Entrepreneurship 4
Clustering 3
Bottom up approach 3
Access to external economies 3
Transfer of best practice 3
Common regional culture 3
Presence of competent suppliers 2
Social entrepreneurs 2
Table 5: Ranked List of Features of Learning Regions

80
Some terms were composite, and included a range of similar factors. The term
“Regional norms and conventions” also covered references to “embeddedness” and
“institutional thickness”. Infrastructure covered both the transport and the
telecommunications infrastructure as most authors felt they were equally important.
References to “demand side” issues were combined with those about “critical and
knowledgeable customers”, similarly “supply side” issues were put together with
“presence of competent suppliers”. Judged by ranked order, the top six most important
features of learning regions are; the ability to innovate, the presence of partnerships and
networks, the existence of embedded tacit knowledge, well developed regional norms
and conventions, a good transport and telecommunications infrastructure and strong
social capital within the region.
Partnerships and networking 14
Input of universities and consultants 5
NETWORKING (34) Critical customers 4
Clustering 3
Access to external economies 3
Social entrepreneurs 3
Presence of competent suppliers 2
Embedded tacit knowledge 12
Lifelong learning 6
LEARNING (33) Presence of knowledge workers 5
Ability to “unlearn” and be flexible 4
Transfer of best practice 3
Bottom up approach 3
Innovation 15
INNOVATION (23) Entrepreneurship 4
Competitive culture 4
High social capital 7
SOCIAL Trust 6
CAPITAL (20) Quality of life 4
Common regional culture 3
SOFT & HARD Regional norms and conventions 10
INFRASTRUCTURE (18) Good infrastructure 8
Table 6: Grouped List of Learning Region Features
In order to make the task of developing a model of an ideal type more manageable, the
22 terms were then grouped into five different categories as shown in Table 6. The first
group of terms relates to networking, whether through region-wide networks, the

81
clustering of certain business sectors or through specific partnerships. Organisations can
build up links with their suppliers or with their customers. Networks may be built up
specifically to encourage innovation. For example, organisations may form research
focused partnerships with their local university. Social entrepreneurs were placed in the
networking category, but in reality, they form a link between the networking and the
social capital categories, as they perform a brokering role by mobilising the social
capital required to make networks effective.
The second group of terms are related to factors associated with learning in one form or
another. The geographical proximity of organisations within a region offers the
advantage of being able to utilise local tacit knowledge. This knowledge is unique to the
region, and offers the potential for the region to gain a competitive advantage. A
commitment to lifelong learning, both at the level of the individual and at the
organisational level is also critical. The skills and knowledge that are relevant at one
point in time will be out of date in five years. Education and training needs to be a
continuous process, constantly adapting to regional needs. The availability of skilled
workers within a region is important, particularly if these workers move from one
organisation to another, passing on their skills as they move. Though strong intra-
regional networks are a feature of learning regions, they can become constricting, and
result in “institutional lock in”, where a region will continue with a certain pattern of
behaviour long after the economic benefits of this particular approach have disappeared.
To work against this, a region needs to develop the ability to reinvent itself by
“unlearning” out-of-date behaviours, and being flexible enough to respond to new
opportunities. The most effective learning systems are developed internally within a
region using a “bottom up” approach, rather than being imported from the outside.
Innovation leads to economic success and evidence of innovation in the form of patents
and copyright applications help to prove that a region is successful. The diffusion of
innovation can be judged by the number of conferences, conventions, and exhibitions
held in the region, and how well these are attended. Can the area be considered a
“magnet” region which attracts many visiting experts? Entrepreneurship, at either an
individual or a group level, can be seen by the numbers of new companies that are set
up, and how many of these new companies make a profit over a sustained period of
time. A number of authors (Lagendijk & Cornford, 2000; MacLeod, 2000; Maskell &
82
Tornqvist, 1999; Saxenian, 1994a) argue that the best way to stimulate innovation is by
encouraging organisations to compete with each other. Some local authorities offer
certain economic incentives or grants on a “challenge” basis to motivate organisations
within their region. Though networking is important, if organisations within a region co-
operate too closely it may provide little incentive for individual creativity. A situation of
competitive co-operation needs to be achieved which balances the benefits of regional
networking against the improvements in economic performance that can be gained by a
competitive culture.
A region that has high social capital will benefit on a number of levels. The fact that it is
perceived as a pleasant place to live with high quality of life will mean it should be able
to retain a large proportion of its existing residents, and also attract new skilled
migrants. If organisations within a region have built up strong, trusting relationships, it
will result in lower transaction costs in their dealings with each other. Organisations
within a region share a common culture, and have similar economic goals; this shared
understanding encourages co-operation between organisations, and facilitates the
economic growth of the whole region.
A well-developed physical infrastructure in terms of road, rail, and air links is felt to be
an essential prerequisite for the economic development of a region by a number of
researchers (Christie & Hepworth, 2001; Cornford, 2000; Florida, 1995; Lever & Turok,
1999; MacLeod, 2000; Malecki, 2002; Schollman, et al., 2002; Wolfe, 2002).
Telecommunications networks are often developed alongside existing transport links,
once present telecommunications increase the level of transactions and negotiations, and
stimulate the mobility of people and goods. Wheels and wires have a symbiotic
existence in industrial economies (Christie & Hepworth, 2001). As well as these hard
networks, soft networks in the form of regional norms and conventions that are shared
by all the players within a region are also critical.
4.3 Comparing Successful and Unsuccessful Learning Regions
The second approach used to build up a picture of the ideal type of learning region was
to compare and contrast successful and unsuccessful regions. There are a number of
regions that are frequently mentioned in the literature as exemplars of successful
learning regions, such as; Silicon Valley, Emilia-Romanga in Italy, Baden-Württemberg

83
in Germany, the M4 corridor in England, the San Francisco Bay area and Hong Kong/
Southern China region. Other regions appear to be consistently unsuccessful when
measured by criteria such as income per head of population and unemployment rates
(Morgan, 1997; Saxenian, 1994a). There are difficulties with this approach, as every
region is unique, and it is not possible to make straightforward comparisons. Success
can be measured in different ways. A less favoured region that starts at a disadvantage
may improve dramatically, yet will still be regarded as “unsuccessful” when compared
to other regions. Conversely, an economically successful region may remain wealthy
relative to other regions, despite degradation in its performance. Regions may also be
affected, both positively and negatively, by external factors over which they have little
or no control; exchange rates will fluctuate, world markets will alter, there may be
economic upturns and downturns. Due to these issues, the historical time dimension
becomes important; the only way to measure a region‟s success or failure is obtain
information about economic performance over a period of time. Any measurement
needs to take account both the changes in a region‟s own performance and changes in its
performance relative to other regions.
Successful learning regions are characterised by their excellent economic performance.
They show high levels of innovation, and business clusters play a significant role in the
local economy. The relationships between institutions within the region are
characterised by a networking approach. There are linkages within cluster groups,
between business and tertiary education providers, between business and community
groups and between business and local government (Lagendijk & Cornford, 2000).
Successful regions display technological competence, entrepreneurial competency, and
learning ability (Morgan, 1997). There will be evidence that learning is taking place at
the individual level, the organisational level, the inter-organisational level and the
regional level (Lagendijk & Cornford, 2000). The region will have demonstrated
flexibility and adaptability by remaining consistently successful over a period of time.
These features are summarised in Table 7.

84
1 Excellent economic performance
2 High levels of innovation
3 Presence of business clusters
4 Evidence of widespread networking
5 Learning at individual, organisational & inter-organisational levels
6 Able to adapt to change
Table 7: Features of Successful Learning Regions
Unsuccessful learning regions are those regions which fail to learn from previous
experiences they are characterised by such features as; low income per head, high
unemployment, a lack of physical infrastructure, the absence of qualified workers and
no research and technology development (Morgan, 1997). Such regions generally have
poor social capital to draw on, with little community-based interaction. There is a lack
of receptivity on the “demand-side”, with local firms being resistant to the take up of
new ideas, and displaying a general inability to learn. Unsuccessful regions often fall
victim to “institutional lock in”. Such a region may have been successful at one period
of time, perhaps by exploiting a natural resource such as coal, but when the resource
runs out, or the price for their particular commodity drops on the world market, they fail
to adapt to their changed circumstances. The regional institutions keep operating in the
same way they always did, even though the economic model they are now following is
no longer profitable (Morgan, 1997). These features are summarised in Table 8.
1 Low per capita income
2 High unemployment
3 Inadequate physical infrastructure
4 Lack of skilled labour
5 No research & development
6 Low social capital
7 Resistance to change
Table 8: Features of Unsuccessful Learning Regions
Annalee Saxenian (1994a) compared the fortunes of Silicon Valley and Boston‟s Route
128 over a period of time. Both regions attracted international acclaim as world-class
electronics centres in the 1970s, and were renowned for their technological vitality,
entrepreneurship, and strong economic growth. Both regions initially benefited from
post Second World War military spending, and both managed to utilise the research of
their local universities. During the 1980s both regions experienced crises. Japanese
competitors took most of the market for semiconductor memory away from Silicon
Valley, and the shift from workstations to personal computers affected the Route 128

85
minicomputer companies. The two regions reacted to these crises in markedly different
ways. Route 128 seemed to lose its competitive edge and go into a decline, whereas in
Silicon Valley a new generation of semi-conductor and computer firms, such as Sun
Microsystems emerged. Saxenian (1994a) explores the reasons behind the differing
fortunes of the two regions.
Silicon Valley has a decentralised structure, and is organised around regional networks.
Most companies have adopted a flat management structure based on the Hewlett
Packard model, which emphasizes teamwork and participation. Local knowledge and
relationships are utilised to create new products and markets. The work environment is
characterised by dense social networks that exist in the professional and technical
arenas. The labour market is very open, with an employee‟s main loyalty being towards
their profession rather than their employer, resulting in high staff mobility between the
different businesses within the region. As one semiconductor engineer puts it:
“Here in Silicon Valley there’s a far greater loyalty to one’s craft than to one’s
company. A company is just a vehicle that allows you to work. If you’re a circuit
designer, it’s most important for you to do excellent work. If you can’t in one firm,
you’ll move on to another one.” (Saxenian, 1994a p. 45)
Competition is intense, both at the individual and the organisational level. However,
because the overriding attachment is to the profession rather than one individual
workplace, company knowledge is shared, with the result that learning takes place. Most
companies were founded by non-locals, and were initially staffed mainly by young,
white males who moved into Silicon Valley specifically for the job opportunities it
offers. As a result of this social networks were organised around weak tie networks
focused on work interests rather than around family (Saxenian, 1994a). Since Saxenian
wrote her initial analysis of Silicon Valley in 1994, the make up of the workforce has
changed, but the importance of weak tie networks still remains. Skilled immigrants from
Taiwan, China and India now account for one-third of the workforce in most technology
firms (Saxenian, 2000). For these immigrants the membership of alumni associations,
such as that of the National Taiwan University, has become more significant than they
were at home, and form an important basis for networking. Though there is no statistical
evidence of a difference in income between immigrants and locals, many Chinese and
Indians believe in the existence of a glass ceiling that inhibits their progress. Their

86
solution to this perceived problem is to take the traditional Silicon Valley approach and
start up their own breakaway companies; notable examples are Qume, Recortec and
Lam Research. The Chinese and Indian engineering communities have created more
than a dozen different ethnic professional associations such as the Chinese Software
Professionals Association. These weak tie networks combine elements of immigrant
culture with high technology practice (Saxenian, 2000). Many provide opportunities for
start-up companies to match up with “angel” investors. Immigrant entrepreneurs are also
utilising their strong tie networks to their own countries to open up links to foreign
expertise, new markets, and cost-saving labour.
Route 128 is dominated by a small number of highly self-sufficient organisations;
independence and secrecy are highly valued. As a result of this companies have sought
to maintain their independence by internalising a wide range of activities. Most
companies are founded by locals, and staffed by locals, and there is an emphasis on
“being in it for the long-term” that discourages the job-hopping that occurs in Silicon
Valley. Social networks are organised around strong tie networks based on home,
family, and hobbies, rather than work. Most companies have a traditional hierarchical
structure that discourages flexibility, and information sharing (Saxenian, 1994a).
Though companies specialising in electronics have existed in the San Francisco Bay
Area since 1910 (Sturgeon, 2000), prior to the 1940s Silicon Valley did not have a
strong history of industrial traditions. The region‟s founders created a technological
community that was much more flexible than the Route 128 area, which had a two
century old manufacturing tradition. The Silicon Valley industrial system was organised
around the region, and its professional and technical networks, rather than around the
individual firm. In particular it was organised around recent graduates from university,
or adventurous re-locators from the US East Coast. This flexible network structure
proved to be a lot more adaptable than the hierarchical individual approach. During the
manufacturing slump of the 1980s. Silicon Valley start-up companies returned to the
principles of co-operation and collective innovation by using the region‟s social and
technical networks. They also outsourced the actual manufacturing of semiconductors in
order to avoid high costs and risks. The Route 128 firms found it much harder to adapt
to changed economic circumstances. Their self-sufficient structures, and hierarchical
style of organisation made it much harder for them to change (Saxenian, 1994a).

87
1 Decentralised organisational structures
2 Social networks organised around professional interests
3 Open mobile labour market
4 Lean organisations
5 Interfirm co-operation for innovation
6 Competition
Table 9: Factors Contributing to the Success of Silicon Valley
This comparison of the Silicon Valley and Route 128 regions has highlighted some extra
factors that contributed to the success of Silicon Valley. These are summarised in
Table 9.
The comparison has also identified eighteen of factors that can be used to differentiate a
successful learning region from an unsuccessful one. These are summarised in Table 10.
1 High levels of innovation
2 Presence of clusters
3 Use of a networking approach
4 Flexible and able to adapt to change
5 Presence of a good infrastructure
6 Presence of qualified workers
7 Interfirm cooperation for innovation
8 Competition
9 High social capital
10 High income per head of population
11 Research and technology development
12 Low unemployment rates
13 Ability to learn at the individual, organisational, extra-organisational & regional levels
14 Open mobile labour market
15 Local firms willing to adopt new ideas and approaches
16 Social networks organised around professional rather than family interests
17 Decentralised organisational structures
18 Lean organisations
Table 10: Factors which Differentiate Successful Learning Regions
The first ten terms have already been identified in the previous review of the literature,
which helps to confirm their importance. Terms eleven to eighteen, shown in italics,
represent eight new factors that were picked up by this exercise; a number of them only
became apparent when considering unsuccessful regions. One new category suggests
that economic criteria, the income per head of population, and rates of unemployment
will give an indication of a region‟s economic success. These two factors will need to be
considered, relative to other regions, and also over a period of time. Evidence of
research and development activities should be present in a learning region, this will
contribute to innovation. Lifelong learning was one of the factors that came out of the
literature review, and this can now be added to make it clear that lifelong learning
88
should be present not only at the individual level, but also within organisations, between
organisations, and at the region wide level. The importance of an open mobile labour
market can also be added into the learning category, as this is one way that best practice
can be transferred from one organisation to another. Another new factor which falls
under the innovation category concerns the willingness of local firms to accept new
ideas. They must have an organisational culture that is open to change. The importance
of social capital has already been identified in the literature review, but this can now be
developed to show which types of social networks are most critical to success. Both
Route 128 and Silicon Valley had high social capital, but the social networks of Route
128 were organised around family and social interests. They proved to be less effective
at adapting to changed economic circumstances than the professional networks that
operated in Silicon Valley. In other words, social capital based on weak tie networks is
more critical than social capital based on strong tie networks.
Two new factors, which didn‟t come out of the previous exercise, were concerned with
the type of organisational form that contributes the most to the learning region. These
two points form a category in their own right. Decentralised organisational structures,
together with a flat, lean organisational form, were seen as the most desirable attributes
(Saxenian, 1994a), though this could only be relevant in certain types of industry
sectors.
Table 6 was amended to take account of these extra categories and features, and the
combined information is shown as Table 11. New additions to the table are shown in
italics. The categories were renamed to produce a “7- I” framework of the ideal type of
learning region. The plan was to use the “7- I” framework as a basis for organising data
collection, coding and analysis.

89
Partnerships and networking
Input of universities and consultants
Critical customers
NETWORKING Clustering
(INTERCONNECTING) Access to external economies
Presence of competent suppliers
Social entrepreneurs
Embedded tacit knowledge
Lifelong learning
LEARNING Presence of knowledge workers
(INFORMING) Ability to “unlearn” and be flexible
Transfer of best practice
Bottom up approach
Individual, organisational, and regional learning
Open mobile labour market
Innovation
INNOVATION Entrepreneurship
(INNOVATING) Competitive culture
Local firms open to change
Research & technology development
High social capital
SOCIAL Trust
CAPITAL Quality of life
(INTERACTING) Common regional culture
Professionally orientated social networks
SOFT & HARD Regional norms and conventions
INFRASTRUCTURE
(INFRASTRUCTURE)
Good infrastructure
ORGANISATIONAL FORM Decentralised organisational structure
(INDUSTRY) Lean organisations
ECONOMIC High per capita income
(INCOME) High unemployment
Table 11: A Revised List of Learning Region Features
4.4 The Ideal Type of Learning Region
Table 11 can be used as a basis to construct an ideal type of learning region, which will
display the following seven characteristics. The ideal form of each of these
characteristics is defined below.
1) INTERCONNECTING – Active networks will exist within the region in a
number of areas. There will be research focused partnerships between tertiary

90
education providers and organisations. Organisations in the same sector will
have formed clusters. There will be linkages between organisations and both
their customers and suppliers. There will be interactions between businesses and
community groups. Region-wide networks will be present, facilitated by such
bodies as the local council or the Chamber of Commerce. These networks will
be strong within the region, and will also extend beyond the region, giving
access to external economies. There will be, or will have been, key individuals
or organisations within the region who facilitate the development of these
linkages.
2) INFORMING – There will be a bottom-up approach to tacit knowledge sharing
developed within the region, which will be made visible by the transfer of best
practices between organisations. There will be evidence of an ongoing
commitment to learning at the individual, organisational, and regional levels. A
highly skilled workforce, mobile within the regional setting, will be present.
Organisations will have demonstrated the ability to adapt to changing economic
circumstances.
3) INNOVATING - Organisations within a region will have demonstrated an
innovative approach. They will have been innovative in terms of both their
products and processes. There will be a significant number of entrepreneurs
operating within the region, and the local culture will encourage the presence of
interfirm competition. There will be a history of breakaway companies forming.
There will be openness to new ideas and change in local SMEs. There will be
evidence of ongoing activity in research and technology development.
4) INTERACTING – Individuals and organisations within a region will share a
common set of cultural and economic goals. The region will be perceived as an
attractive place to live, and will retain its own population whilst also being
appealing to migrants. Social capital will be strong, but also welcoming to new
ideas and alternative lifestyles. Crime rates will be low, and transactions between
organisations will be conducted on the basis of trust. There will be active social
networks operating through work, schools, churches, sports associations, cultural
groups, community groups and other interest groups.

91
5) INFRASTRUCTURE – The region will have a well developed transport
infrastructure that facilitates movement of goods and people within the region,
and allows good access to markets and suppliers outside the region. Access to
telecommunications services, such as mobile telephony and broadband, will be at
a high standard in all parts of the region. The region will demonstrate
institutional thickness by the presence of lively interactions between firms,
development agencies, innovation centres, education providers, and voluntary
groups
6) INDUSTRY – Organisations within the region will have a flat management
structure, and decision making processes will be decentralised. Organisations
will concentrate on their core competencies, and non core activities will be
outsourced.
7) INCOME - It will have been consistently economically successful since the
1970s, as indicated by high per capita income and low unemployment rates.
4.5 An alternative model
A similar but slightly different framework to the “7-I” model was developed by Philip
Cook, an economic geographer who writes widely on regional innovation systems
(Cook & Memedovic, 2003). He builds on work carried out by Freeman (1995) to
attempt to categorize key innovation system indicators; in Table 12 he identifies six key
innovation indicators which he uses to assess national innovation systems in Korea and
Brazil.
These six indicators can be compared with the indicators used in the “7-I” model as
illustrated in Table 13. The first indicator is “Education” which matches up with
“Informing”, though Cook‟s indicator is narrower in focus, looking mainly at graduate
output in disciplines such as engineering. The concept of “Informing” covers this, but
also includes factors such as the presence of embedded tacit knowledge and transfer of
best practice. Cook has “Knowledge Transfer” as his second category, which would
cover issues such as transfer of best practice, but also includes issues such as the
presence of professional networks, that are covered under the category “Interacting”.
There is a close match between “Business R & D” and “Innovating”. Both are concerned

92
with the development of new products and processes. Also the category “Linkages” is
very similar to the “Interconnecting” indicator in the “6-I” model. Cook‟s category of
“Investment” covers the amount of money invested in the economy both by the national
government and international governments. This has a different focus from “Income”
which focuses on data about income and employment levels. Investment was identified
as a significant issue by many of the interviewees and it was decided to bring this factor
into the model. “Communications” links up well with “Infrastructure” though in Cook‟s
classification only hard communications infrastructure such as telecommunications
networks are considered, whereas the “7-I” model also includes soft infrastructure such
as regional norms. Cook has no category for “Industry”.
Innovation system
indicators
Republic of Korea Brazil
Education Expanding universal system,
high tertiary and engineering
graduate output
Deteriorating education
system with low output of
engineers
Knowledge transfer High imports with local
integration and rising firm
R&D
High imports from United
States but weak local
integration and firm-level
R&D
Business R&D Rising to >50% of all R&D Remains below 25% of all
R&D
Linkages Strong science & technology
infrastructure linked to R&D
Weakening science &
technology infrastructure
and poor company linkages
Investment High and supplemented by
Japanese inward FDI. High
learning from Japan
Decline of United States
investment, low internal
investment and low learning
from abroad
Communications High investment in advanced
telecommunications
infrastructure. High growth in
electronics, high exports and
user-feedback.
Slow development of
modern telecommunications.
Weak electronics, low
exports, low learning.
Table 12: Divergence in national systems of innovation, 1980s (Cook & Memedovic, 2003)
After considering Cook‟s framework it was decided to refine the “7-I” model. The scope
of the category “Infrastructure” was initially narrowed to concentrate on hard
infrastructure only, with the intention that issues about soft infrastructures such as
regional norms and conventions would be covered in the “Interacting” category.
However, as data collection proceeded this view was revised; there was a large amount
of data about local and regional government which seemed to be most relevant to

93
“Infrastructure”, so a category for soft infrastructure in the form of regional
development was reintroduced.
Cook/Freeman
model
“7-I” model Comparison
Education Informing Partial match. Both focus on education,
Cook model concentrates on statistical
information about numbers and types of
graduates, 6-I model looks at learning more
broadly
Knowledge transfer Interacting Partial match. Both include professional
networks for transfer of best practice, 6-I
model also includes embedded tacit
knowledge, and presence of knowledge
workers
Business R&D Innovating Close match. Both are concerned with new
products and processes
Linkages Interconnecting Partial match. Both are concerned with
networks, Cook model concentrates on
science and technology networks, 7-1
model also considers networks within the
broader community
Investment Income No match. Cook model considers money
invested in the region, 7- 1 model
considers income and employment levels
Communications Infrastructure Partial match. Both focus on hard
infrastructures such as transport and
telecommunications, 6-I model also
considers soft infrastructures such as
regional norms and conventions
Industry No match. No equivalent in Cook model
Table 13: Comparison of Cook/Freeman and “7-I” models
The scope of the category “Income” was widened to include money invested in the
region, for example by the government or philanthropy, as well as income and
employment levels. The category “Industry” was initially left in, and data was collected
for this category. However, after analysis it was felt that few significant insights
emerged from this category and it was dropped, making the “7-I” model a “6-I” model
(see Table 14). The majority of businesses in New Zealand are small and medium sized
enterprises which by their very nature have a flat management structure, and the larger
businesses that do exist tend to each have their own unique needs, as Venture Southland
discovered when they surveyed all the organisations in their region (Otago Southland
Broadband Communications Committee, 2001). However the data that was collected
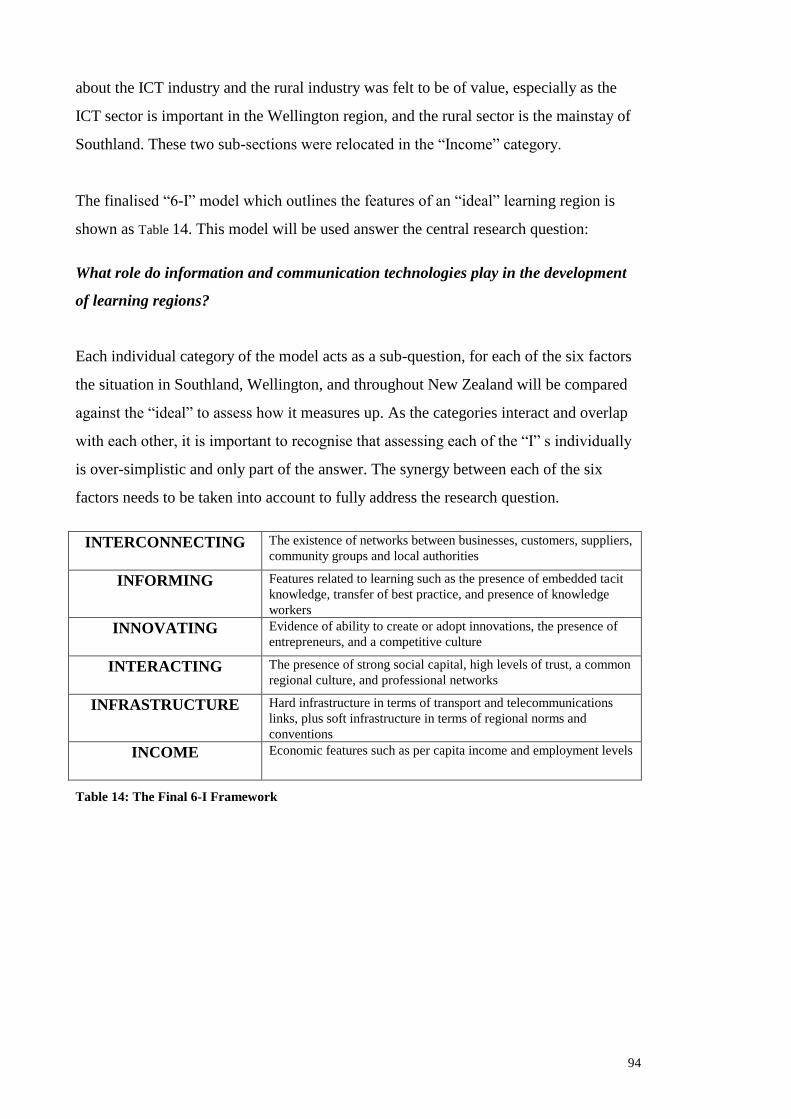
94
about the ICT industry and the rural industry was felt to be of value, especially as the
ICT sector is important in the Wellington region, and the rural sector is the mainstay of
Southland. These two sub-sections were relocated in the “Income” category.
The finalised “6-I” model which outlines the features of an “ideal” learning region is
shown as Table 14. This model will be used answer the central research question:
What role do information and communication technologies play in the development
of learning regions?
Each individual category of the model acts as a sub-question, for each of the six factors
the situation in Southland, Wellington, and throughout New Zealand will be compared
against the “ideal” to assess how it measures up. As the categories interact and overlap
with each other, it is important to recognise that assessing each of the “I” s individually
is over-simplistic and only part of the answer. The synergy between each of the six
factors needs to be taken into account to fully address the research question.
INTERCONNECTING
The existence of networks between businesses, customers, suppliers,
community groups and local authorities
INFORMING
Features related to learning such as the presence of embedded tacit
knowledge, transfer of best practice, and presence of knowledge
workers
INNOVATING
Evidence of ability to create or adopt innovations, the presence of
entrepreneurs, and a competitive culture
INTERACTING
The presence of strong social capital, high levels of trust, a common
regional culture, and professional networks
INFRASTRUCTURE
Hard infrastructure in terms of transport and telecommunications
links, plus soft infrastructure in terms of regional norms and
conventions
INCOME
Economic features such as per capita income and employment levels
Table 14: The Final 6-I Framework

95
CHAPTER FIVE
5 FINDINGS
Every story has a beginning, the middle and an end. This story begins in 1985 shortly
after David Lange‟s labour government implemented the sweeping economic changes
known as “Rogernomics” (Clifton, 2004). The middle is in 1995, a period of relative
stability and prosperity. The story ends in 2005, when New Zealand became the first
country in the world to launch a Digital Strategy (Ministry of Economic Development,
2005).
The central research question is:
What role do information and communication technologies play in the development
of learning regions?
The “6-I” model has been developed as a framework that can be used to benchmark the
six key features that have been identified in the literature as being critical to the
development of a learning region. The first stage of data collection involved carrying out
interviews with key people working in regional development and telecommunications in
both regions. This exploratory stage of the research had two objectives:
1) To collect some provisional answers to the research question;
2) To asses the utility of the “6-I” model as a framework to analyse the data.
The interviews were carried out during 2006 when the issue of “Infrastructure” was very
topical in New Zealand. There was widespread support for the idea that a well
developed broadband infrastructure would boost economic performance. This view is
widely supported by the international literature (Kelly, et al., 2003; National Selection
Committee, 2004; Zilber, et al., 2005) despite the fact that there is little hard evidence
available, and that some researchers are cynical about the contribution that broadband
can make (Firth & Mellor, 2005; B. Howell, 2006). The central government has played a
major role in trying to stimulate the growth of telecommunications through a number of
national and regional initiatives. Various local government bodies have also become
involved in trying to improve telecommunications in their region in the belief that it will
stimulate the local economy.

96
“Infrastructure” was considered to be a critical issue by most interviewees. Despite the
governments attempts to develop a knowledge economy, New Zealand still relies
heavily on primary production for most of its export earnings, and the lack of reliable,
affordable broadband for the rural sector was strongly felt to be holding back
development of the rural economy. Having said that, as of 2006, central government had
indicated a strong commitment to improve telecommunications infrastructure by such
actions as forcing Telecom New Zealand to unbundle the local loop, and providing
money for community based telecommunication providers via the Digital Strategy.
Certain areas of New Zealand, such as Wellington‟s central business district which is
served by the CityLink network, have had access to high quality telecommunications for
over 20 years. These advanced services have been mainly used by large businesses,
universities and crown research institutes. The stated aim of the community
telecommunications providers is to make broadband available to the whole of their
communities, rather than just cherry picking the big value customers. Their approach
will surely help to build up their communities, but it remains to be seen whether the
expense of rolling out broadband to very remote areas will pay off in terms of adding
value to the New Zealand economy. Interviewee B pointed out that while there may be a
significant difference between 50% coverage and 90% coverage, it was questionable
whether the difference between 90% coverage and 100% coverage was really critical in
terms of the rural economy. There may be a tipping point beyond which further
investment in telecommunications won‟t produce a payback. Having said that, some
interviewees were very firm in the view that 100% coverage was the only option that
should be considered for their region. However, though there may be debate about the
optimum level of coverage, there was a consensus among the interviewees that more
widespread availability of affordable broadband would be an advantage to rural and
suburban businesses. All the interviewees regarded telecommunications infrastructure as
a vital issue for New Zealand.
The “Interconnecting” category was also found to be important in the New Zealand
context. In both regions studied examples of networks were found, these were mainly
sector based with the local council often forming the hub of the network. Networking
was more common in the public than the private sector. Within the regional setting
networks are generally focused on community issues such as health and unemployment,

97
research based networks tend to be national. ICT was being employed to facilitate
communication via these networks; collaboration software was widely used in rural
schools and in dairy farming. At the regional level some networks such as the CIO
Forum17
made fairly minimal use of ICT, however at the national level the use of ICT
was more advanced with access grid technologies being used to link the universities and
research institutes. One trend that had the potential to make a difference to regional
economies was the increasing use of local peering exchanges, these provided a cheap
way of sharing data over the internet within a region, and could potentially facilitate the
development of more local content which would stimulate the local economy.
“Informing” was also found to be a relevant category particularly in the education
sector. The Project PROBE initiative has resulted in significant use of technologies such
as videoconferencing and interactive whiteboards to share resources between rural
schools. These technologies were viewed as offering significant advantages over
traditional correspondence learning, but were not seen as a total replacement for face-to-
face instruction. There was a preference for videoconferencing to be regionally based, so
that face-to-face sessions could be organised occasionally, offering the opportunity for
blended learning. Other linkages had been formed within regions to facilitate learning by
the unemployed or disadvantaged ethnic groups. Learning was taking place within the
regional setting but the examples found were of fairly low level skills based learning
Some evidence was found to support the use of the category “Innovating”, the focus was
on innovation in terms of adopting new ideas rather than initiating an innovation. In
both regions evidence of innovative activities were found, varying from setting up space
exploration in Southland to putting e-democracy in place in Wellington. For both of
those initiatives the widespread availability of a high quality ICT network was critical.
However interviewees A and D both made the point that the role of a local champion is
crucial. ICT alone doesn‟t trigger innovation, a social entrepreneur is needed to make
innovation happen and sustain motivation. The social entrepreneur role could be taken
on by one individual or an organisation such as an active economic development
agency.
17
Wellington based network of senior public sector ICT workers

98
Within the “Interacting” category social capital and regional culture were identified as
important issues. Evidence was found of strong intra-regional ties, usually the strongest
ties were between organisations in the same sector, less evidence was found, at this
stage of the research, of strong international links operating directly from regions, these
tended to be coordinated through national networks. ICT was viewed as offering
opportunities to strengthen regional interaction, with the caveat that it should work
alongside traditional face-to-face interactions.
Few factors relevant to the Income category were discussed during the interviews, and it
was apparent that further statistical data would need to be collected for this category.
The “6-I” model proved to be a useful framework for analysing the data. As the process
of writing up these initial findings progressed it became obvious that there was a lot of
duplication and overlapping material, the same points were being discussed under a
number of different categories. This prompted some careful thinking about each of the
six categories in the framework, the literature review was revisited to review the original
thinking behind each of the categories, and to reconsider the scope of each category in
the light of the initial data collected.
The second more comprehensive stage of data collection involved collecting material
from the regional newspapers; the findings from the two stages of data collection have
been combined to enable a more concise and structured reporting of the results. The
following sections discuss each of the six categories of the “6-I”model for 1985, 1995
and 2005, finishing off with an overall conclusion. The national situation is discussed
first, followed by the material specific to each region. Due to the large number of
newspaper articles used, space limitations make it impossible to cite every individual
article, APPENDIX B: Newspaper Sources for Historical Data provides a breakdown of
which articles were used as sources for each sub-section of this chapter. The numbering
system used within this chapter has also been followed in APPENDIX B and also in
APPENDIX E: Meta-matrices for Cross Case Analysis in order to facilitate cross-
referencing of the material.

99
INTERCONNECTING
5.1 Interconnecting
If a region is “interconnected”, active networks will exist within the region in a number
of areas. There will be research-focused partnerships between tertiary education
providers and business. Organisations in the same sector will have formed clusters.
There will be linkages between organisations and both their customers and suppliers.
There will be interactions between businesses and community groups. Region-wide
networks will be present, facilitated by such bodies as the local council or the Chamber
of Commerce. These networks will be strong within the region, and will also extend
beyond the region, giving access to external economies. There will be, or will have
been, key individuals or organisations within the region that facilitate the development
of these linkages.
Analysis of the regional data revealed four significant trends around the area of
interconnections at both the national and the regional levels. There was evidence of a
continuing push to develop international trading linkages with new partners in Asia,
Russia and the Middle East to compensate for the decline in the trade with New
Zealand‟s traditional partner, the United Kingdom (UK). Information technology was
making a major impact on organisational form in both the public and private sectors.
New Zealand was becoming more connected, as access to both national and
international information networks increased. Throughout the period both the business
and community sectors provided examples of clusters, joint ventures and networks. The
following sections provide a more detailed analysis of each of these four trends.
5.1.1 Building international trade links
UK Australia Japan USA Korea China Other
1985 9% 15% 15% 14% 3% 2% 42%
1990 7% 20% 16% 13% 3% 1% 40%
1995 6% 21% 16% 10% 5% 3% 39%
2000 6% 21% 13% 14% 5% 3% 38%
2005 5% 21% 11% 14% 4% 5% 40%
Table 15: Exports to major trading partners as a percentage of total exports
(from Statistics New Zealand)

100
From the 19th
century, New Zealand‟s traditional export market was the UK. Initially
wool was the most important product traded, but as refrigeration developed butter,
cheese and frozen lamb also became significant. From the late 1950s the prospect of the
UK joining the European Economic Community (EEC) and adopting the Community‟s
protectionist policies for agriculture began to be a concern. The objective for New
Zealand became diversification both in terms of markets and the range of goods
exported. In the early 1950s 90% of New Zealand‟s exports went to the UK, however by
the time the UK joined the EEC in 1973 less than 20% of exports went there. During the
same period exports became more varied, though much of the diversification was still
within the agricultural sector, for example an increased range of dairy products and the
growth of beef exports (Hawke, 1994). As Table 15 shows, this trend continued. Over
the period studied, exports to the UK continued to drop while exports to the ASEAN
countries such as Korea, China and Japan increased. Efforts to develop these new export
markets were evident through newspaper reports of trade visits to and from other
countries.
1985
In 1985 New Zealand hosted trade delegations from the Soviet Union, China and Iran,
and trade delegations from New Zealand visited Japan and Bahrain. In Southland a
delegation from China visited the Southgas natural gas drilling plant and state coal
mines. Trade with the ASEAN countries, the USSR and the Middle East was growing
substantially (Statistics New Zealand, 1987). Though the EEC was New Zealand‟s
largest trading partner accounting for 19% of exports, new EEC regulations meant sales
of beef, mutton and lamb to Europe were falling. Sheep farmers were particularly
affected with September 1985 seeing a 40% drop in the minimum price for sheep meat,
and wool exporters reporting that the last four months of 1985 was the hardest period in
living memory.
A variety of industries were trying to expand into new markets. New Zealand Forest,
Feltex, and Watties were all considering diversification moves into Australia. With their
eyes on the Asian market the Dairy Board announced a joint venture in Singapore. Wool
exporters also sealed a $35 million deal with Iran to supply raw materials for the
manufacture of Persian carpets. Though there was a drive to diversify exports, the
traditional export commodities of dairy products, meat and wool remained the backbone
of the export trade.

101
1995
In 1990 the five northern Asian counties of South Korea, China, Hong Kong, Japan and
Taiwan accounted for 26% of total exports. The South Pacific countries, particularly
Fiji, were also becoming an important market taking 3.7% of New Zealand exports. The
most significant value export items were wood, boilers and machinery, paper and
paperboard, wool, live horses, electrical machinery and appliances and mineral fuels and
oils (Statistics New Zealand, 1992).
By 1995 exports to Asia (including Japan) had increased to 38.2% of all exports. This
was reflected in increased overall export income (Statistics New Zealand, 1996). South
Korea was about to overtake the UK as New Zealand‟s fourth biggest export market.
Articles discussed initiatives to strengthen trade links with China, Japan, India,
Singapore, Taiwan, Thailand and Vietnam. The move to build up trading links with
Asia had strengthened to the extent that the Ministry of Foreign Affairs and Trade felt
the need to warn exporters not to become so obsessed with Asia that they missed
opportunities in their traditional European markets
Ex-patriot Asians based in New Zealand used their connections in their home countries
to set up trading links; for example the Asian owned company Apple Fields exported
apples to Malaysia. In Wellington the Immigration Department ran a programme to
encourage Chinese immigrants to start new businesses. Asian companies were building
up their investments in the commercial property market. In Wellington two large hotels
were bought by Asian investors. However a visiting Japanese academic, Matake
Kamiya, claimed that New Zealanders were still Euro- centric and couldn‟t care less
about Asia, and a National Business Review poll showed that 8 out of 10 New
Zealanders did not see their country as being part of Asia
2005
In 2005 international trade was still growing, with an increase of 2.5% on the previous
year. China was now New Zealand‟s fourth largest trading partner, displacing the UK
(Statistics New Zealand, 2006). The government made $6.7 million available through a
new export development scheme to help companies increase offshore sales. As
consumer fears over eating beef abated, New Zealand‟s grass fed product was selling
well in the USA and Asia. Dairy company Fonterra was trying to overcome Asian
distaste for cheese by enticing consumers with chocolate covered cheese slices.

102
In Wellington, an international campus was set up to offer Australian University
qualifications to Asian students. In Southland, the Plantation Forest Company was
celebrating its first shipment of woodchip to Japan, and Invercargill based Crown Sheet
Metal was making good progress in the Australian market.
Critical Reflection
Building up international trade links was a pressing issue for New Zealand during the
period studied. The reduction in traditional export markets made it necessary to look for
new markets and also to find new products to sell. The strong growth in many Asian
economies during this period provided an opportunity that New Zealand was quick to
take advantage of. Exports to Asian countries increased; trade links were improved
through visits by trade delegations; and export links were established by Asian business
people based in New Zealand. New Zealand was not alone in this, many countries were
keen to develop trade links with the Asian tiger economies, but New Zealand‟s relative
proximity to Asia gave it (along with Australia) an added incentive. However there was
a fear of an “Asian Takeover” that still exists to the present day, and Asian investments
in the New Zealand economy were seen as a mixed blessing.
Though trade with Asia grew strongly, Australia was New Zealand‟s top export market
and trade with the UK remained significant. The success in reaching new export markets
was not matched by an increased diversification in the range of products on offer.
Primary products, particularly agricultural products, still made up the bulk of exports.
The agricultural sector utilised New Zealand‟s “clean, green image” to make sure its
products appealed to affluent consumers in overseas markets, dairy farming in particular
became increasingly streamlined and successful. This success did not allay the ongoing
concerns of successive national governments and their economic advisors that an
economy based heavily on primary products was too exposed to the vagaries of the
global marketplace.
5.1.2 The emergence of the networked organisation
1985
In 1985 the use of ICT was beginning to have a major impact on organisational form
with a wide range of businesses and government organisations setting up networks to
link branch offices around the country. Newspaper articles commented on ten different

103
organisations that were either implementing or considering implementing a network.
Examples included New Zealand Forest Services linking 50 different offices, the Stock
Exchange putting out a request for proposals for a system to link with brokers around
the country and New Zealand Co-op Dairy installing a VAX based network. The first
step towards “joined up” electronic government took place when word processing
equipment in Minister‟s offices was linked to similar equipment in government
departments, allowing documents to be sent back and forth electronically.
1995
By 1995, most larger organisations already had a computer network and the emphasis
was on upgrading existing systems. The TAB, the Meteorological Service, Health
Waikato, BOC Gases, Wellington and Auckland City Councils, Auckland and Otago
Universities all announced major spending on their IT networks. Many of the upgrades
were necessary due to the increase in network traffic caused by internet usage; others
such as the one at TAB, were due to the switch to new multimedia based systems. In the
Beehive, the Information Technology Minister, Maurice Williamson, installed a PC
based local area network, with internet access. Work was also underway on a set of
Government web pages to provide information on New Zealand, its history, government
and people.
2005
In 2005 the trend for spending significant amounts on upgrading IT infrastructure
continued. Nelson Marlborough District Health Board announced a $4 million upgrade,
and the Ministry of Foreign Affairs and Trade committed to a $4.4 million spend on
upgrading its financial software in 41 diplomatic posts around the world. Some of the
upgrades involved integrating information and making it available in electronic form,
for instance, the new clinical information system at Waitemata District Health Board
gave specialists immediate access to electronic versions of patients‟ lab reports and
notes from other doctors, and the Social Development agency was switching to client
management software in order to streamline bureaucracy. Other upgrades focused on
improving network capacity, for example Auckland University of Technology became
the first tertiary institution to install a full internet protocol network, and the national
grid operator Transpower was also replacing its telecommunications infrastructure.

104
Critical reflection
The emergence of the networked organisation was a global trend. Throughout the period
studied the use of ICTs by organisations became so widespread, that by 2005, it was
unusual to find a business that did not make some use of a computer. There is no
evidence that what was happening in New Zealand was significantly different from what
was happening in many other countries around the world.
5.1.3 Gaining access to national and international networks
1985
In 1985 what the press termed the “information explosion” was beginning to impact
New Zealand. The information flow worked both ways; as well as the influx of
international information entering the country; New Zealand was also able to send its
own domestic information out to the rest of the world. Examples of international
networks that became available in New Zealand in 1985 include the AP-Dow Jones
Telerate system for the financial sector and the Bloodstock and Racing Data System for
the horse racing sector. Reuters reported that New Zealand was its fastest growing
market for economic information services. A New Zealand company, BPI systems,
developed the country‟s first public database, Aditel, which provided business with
immediate round the clock access to volatile information worldwide with a focus on
both the commercial sector and agriculture. Within the Pacific region, the Pacific Island
Information Network was set up to facilitate business and communication within and
between Pacific Island countries.
A significant trend in New Zealand was the widespread adoption of videotex18
systems
across a wide range of sectors including agriculture, tourism, finance, horse racing and
public libraries (this is discussed in more detail in 5.3.4). The tourist industry used the
Taaris videotex system to create an electronic infrastructure. Fonterra used a videotex
system to communicate production statistics to suppliers. The Wheat Board opened up a
videotex service to give wheat producers access to up-to-date market intelligence which
would enable them to become more competitive.
18
Videotex services use the public switched telephone network to access computer based data storage
facilities, the retrieved data is displayed on a modified television receiver

105
Other significant developments included the linking together of National Library‟s
network with the Department of Statistics INFOSYS database to increase access to
statistical information for the research community, business and the general public. The
Department of Scientific and Industrial Research (DSIR) also announced plans to open
up its networks to universities and the private sector in order to encourage collaborative
research and development.
At the regional level access to information was also opening up with public libraries,
such as the one located at Porirua in the Wellington region being linked in to the NZ
Bibliographic Network, which provided electronic access to more than three million
book titles. Southland and Wellington both provided examples of the physical transfer
of people to complement the electronic movement of information, with student
exchanges between Wellington and Zimbabwe, and Southland and Japan, and a School
Principal being awarded funds for a fact finding trip to America.
1995
By 1995 the internet had taken over from videotex as the main conduit for information
exchange and its use was growing rapidly. Use of the internet is also discussed in
Section 5.3.4 which focuses on innovative uses of the internet, whereas this section
concentrates on its use as a connection tool, though admittedly the distinction between
these two areas is somewhat blurred.
According to a 1994 survey the growth in the number of computers connected to the
internet in New Zealand was second only to the USA, there was a 441% increase with
31,215 computers directly connected to the internet. Another report put it in fifth place
behind Iceland, Finland, the USA and Norway with 43,864 computers connected to the
internet as compared to 1193 in 1991. While these two sets of statistics and rankings do
not quite match up, there was no doubt that the use of the internet was growing more
rapidly in New Zealand than in most of the rest of the world. The internet was being
used as both an information provider and a marketing tool. Industrial Research Ltd., one
of the Crown Research Institutes, offered local companies online access to its science
and technology library. The National Library also offered 35 New Zealand related
resources to subscribers through its online information service, KiwiNet, and TradeNZ
planned to develop an online export market information network. The Business Network
was using the internet to boost interest in New Zealand commerce; the Biznet web page

106
would make information about registered businesses available to around 40 million
commercial surfers. Companies such as Union Shipping were beginning to make
information available to their customers 24/7 through the use of interactive voice
response (IVR) systems that were able to access the company‟s databases. The Internet
Society of New Zealand was formed to address issues such as the allocation of domain
names, which had been formerly carried out by Victoria and Waikato Universities.
The availability of the internet to the general public was increasing. Auckland Central
library launched a pilot project to offer internet access to the general public. In
Wellington, Victoria University offered internet access to the local business community
through its subsidiary Netlink, Roasters Coffee house became the first Internet Café and
Old Bailey Tavern the first Internet Bar. Victoria University was also the location for the
country‟s first SunSite, a cluster of donated Sun Microsystems machines that form an
internet Site. Around the country CompuServe Pacific installed 12 public access
terminals as a pilot project. Twelve Visitor Information Centres were also being
provided with terminals which could be used by tourists to access a database providing
information about over 2200 New Zealand tourism services. One Wellington internet
provider was reported as logging 60,000 calls in a week. With this level of internet
usage a free service was no longer an option, and towards the end of the year Wellington
City Council began to reduce its free public access internet service in preparation for a
total close down in March 1996.
The internet was also making a contribution to democracy with politicians, including the
Prime Minister Jim Bolger, using email to protest about French nuclear testing. The
general public were also offered the opportunity to contact 195 different central
government agencies by email. Wellington Mayoral candidate Stephen Rainbow was the
first New Zealand politician to use the internet as part of his campaign, and in Porirua a
community group set up an online network to offer people too nervous to ask questions
face-to-face an alternative means of communicating with Government Departments.
2005
In 2005 the Government were developing two major national networks as an outcome of
the Digital Strategy (see section 2.5.3); $14 million had been approved for the
development of a shared voice and data network that would link up all government
agencies with the dual aims of cutting costs and enabling collaboration. Also under

107
development was an Advanced Network, which would provide gigabyte data links
between universities and research institutes. In Wellington an AC Neilsen survey
showed that 90% of people now had access to the internet, up from 72% in 2001.
In both regions student exchanges were still a popular way of contributing to
international networks. In Wellington, the newly introduced Asia New Zealand Future
Leaders scholarships gave two Victoria University students the opportunity to spend a
year in South Korea, and Southland hosted school students from both the Maldives and
Utah in the USA.
Critical reflection
The data revealed a real hunger for information and new developments in ICT,
particularly the internet, were eagerly seized upon as a means of improving contact with
the rest of the world. Time and time again New Zealand stood out as a very fast adopter
of new technologies when compared to other countries. More and more information
came into the country, however the flow of information out from New Zealand to the
rest of the world was much smaller, and the use of ICTs tended to amplify this
imbalance. There was evidence of a physical movement of people which complemented
the links made through ICT. New Zealand students spent time in other countries, and
overseas students were hosted in New Zealand. The increased mobility of people
reflected global trends as air travel became relatively more affordable and people
became more affluent.
The Digital Strategy launched in 2005 continued to recognise the importance of ICT
networks to the economy. New Zealand had by now fallen behind many other OECD
countries19
in terms of take up of broadband; however the government was still
committed to the development of fast broadband networks.
5.1.4 Networks, joint ventures and clusters
1985
At the both national and regional levels business and government were working together
to combat unemployment. Nineteen private businesses formed the Alliance of Business
in order to help school leavers find jobs. In the Wellington region the Chamber of

108
Commerce was urging the business community to give educationalists a clear idea of
what they look for in school leavers in order to help combat unemployment. Wellington
Regional Council proposed setting up a hotline to match skilled unemployed workers
with suitable employers. Networking was also taking place in the Hutt Valley with
schools, colleges and local employers collaborating in order to help school leavers find
jobs
Local computer businesses were being urged to network with each other in order to
lobby government and compete more effectively in the international market.
The DSIR published a discussion paper recommending that joint research ventures be
set up particularly in the area of biological processing techniques, where it was felt that
New Zealand had a competitive advantage that could be lost without new research. The
discussion paper was followed up by the appointment of two commercial managers to
the biology division of DISR with a brief to commercialise technology by encouraging
joint ventures between DISR and the private sector.
Four examples were found of New Zealand companies collaborating with international
partners. One was the Wellington based Lower Hutt based company Progeni, which
formed a joint venture with the Beijing Institute of Aeronautics and Astronautics
(BIAA) to open up the potential for multi-million dollar contracts for fourth generation
computer learning systems throughout China and South East Asia. BIAA would be
responsible for hardware with Progeni developing the software.
In Wellington local businessmen proposed setting up a regional development
organisation to promote the areas business interests. A steering committee was set up to
look at how such an organisation would work as an alternative to Wellington Regional
Council. In the meantime the Regional Council had established an economic
development unit that was offering an in-depth economic analysis service to businesses
wanting to set up or expand their operations in the region. In the Hutt Valley moves
were already underway to establish a “high technology zone”. Mr. Ian Macfarlane,
President of the Hutt Valley Chamber of Commerce, hosted a breakfast for
19
In 2005 New Zealand was ranked 22nd
for take up of broadband as compared to other OECD countries
(http://www.oecd.org/document/16/0,2340,en_2649_34225_35526608_1_1_1_1,00.html)

109
representatives from the local authorities, DSIR, managers from local high technology
companies and the media. The breakfast launched the Hutt Technology Zone and was
commemorated with a plaque in Petone Borough Councils new town centre. The
immediate goal of the breakfast was to establish a working committee which would
work towards establishing the high tech zone. Jim Allen, a Councillor from Petone,
criticised the breakfast as “an ego building stunt” and argued that it should have been
driven by Wellington Regional Council rather than the Chamber of Commerce. Despite
these arguments over ownership Hutt Valley MPs arranged a series of meetings with
local organisation with stakes in high technology such as software company Progeni,
and pushed the idea of making the Central Institute of Technology (CIT) at Heretaunga,
a centre for research to assist local manufacturers. The Hutt Valley Chamber of
Commerce also considered establishing its own office in Lower Hutt rather than just
relying on facilities in Wellington.
Southland provided a number of examples of networks mostly focused around rural
issues. Southland Association of Small Farmers offered both friendship and practical
assistance to rural people. Another more ad hoc network was set up when Invercargill
City Council put together a committee including representatives from Federated
Farmers, Chamber of Commerce and the local council to assess the short-term impact of
the current economic climate on the region. Federated Farmers also formed a joint
committee with Southland County Council to specifically investigate ways of easing the
financial problems of Southland farmers. A partnership between two SMEs, one of
which made greenhouses, and the other which produced lamb warmers, resulted in the
opening of a shared factory
1995
A 1995 survey of networking practices by the National Business Review discovered that
60% of businesses preferred to use formal channels, while 40% favoured informal
networking. There were opportunities for both face-to-face and virtual networking,
businesses could sign up to the Business Link online network, or join Business Network
which brought senior executives together in person.
The Wellington region provided examples of a range of different networks; Tech Link
was a group of independent wholesalers who worked together to increase their buying
power, and Artslink, launched by the Wellington Community Arts Council, brought

110
together 300 individuals and groups. Two organisations were using ICTs to facilitate
networking; the Virtual Consulting Group brought together 20 independent consultants
who communicated by email, and Wellington Community Network Trust was
developing a virtual community centre to provide a meeting place for schools and
community groups.
The merger of the Wellington Manufacturers Association with the Chamber of
Commerce was to be completed by the end of the year; there were also discussions
about combining the five local Polytechnics and the Teacher Training College into one
regional tertiary institute. Wellington Polytechnic proposed that a knowledge, business
and residential park be set up in Mount Cook in order to promote linkages between the
Polytechnic and local knowledge based industries.
In Southland the NZ Education Business Partnership Trust was encouraging the
business and education centres to develop mutually beneficial partnerships, such as the
programme at Aparima College which placed 96 students in work programmes with
local businesses.
2005
In 2005 a number of clusters were active at both the national and regional levels.
Auckland Regional Council started the “Accelerating Auckland” programme to address
the ICT skills shortage, establishing a taskforce consisting of representatives from
industry, government and universities. Agricultural technology companies were also
collaborating to sell dairy production and processing knowledge to China.
There was interest in using clustering to enable cost savings. The NZ Trade and
Enterprise Board was exploring the possibility of electronics and ICT companies
coming together to jointly source components in order to compete with Asia. In
Southland, Otago and Southland district health boards were using the Oracle Financial
and Procurement system in order to pool their purchasing of clinical supplies.
ICT-NZ was set up as an umbrella group of nine ICT industry groups including TUANZ
and InternetNZ in order to increase impact and decrease administration costs. Internet
Service Providers also formed an association (ISPANZ) in order to facilitate
competition against Telecom and obtain better access to the Telecom network.

111
The newspaper searches provided seven examples of joint ventures, most of them led by
either national or local government. For example Outsource2NewZealand (O2NZ) was
being set up to market Kiwi IT services to British firms. In Wellington, Business Hutt
Valley was a joint venture between the Hutt Valley Chamber of Commerce and the
CBD+ (a council sponsored body representing retail interests in the central business
area). In Southland, a joint venture between Southland Institute of Technology and local
employers saw Business Information Technology students developing software for local
businesses.
In both Southland and Wellington local councils took a systematic approach to the
development of ICT networks in their regions by carrying out surveys to identify the
needs of different organisations. Venture Southland carried out their survey in 2001
(Otago Southland Broadband Communications Committee, 2001) and Hutt City, Upper
Hutt city and Porirua City Councils surveyed local businesses in 2003. Venture
Southland‟s research set out to identify the common needs in the tourism, education,
farming, health and residential sectors. An attempt was also made do this for large
businesses, but no common needs were identified as each business was unique. What
came out very strongly was a desire for collaboration in the educational sector, with
82% of schools in the region wanting to develop partnerships with other schools. Unlike
the other sectors surveyed, thinking about linkages was well developed, with schools
being able to clearly identify potential partner schools
The role of the education sector as a key initiator of a wide variety of linkages and
partnerships was reinforced by interviewees from both regions. Primary, intermediate
and secondary schools were linking up to collaborate for a variety of reasons. Some
groupings were formed with the intention of sharing teacher resources through
videoconferencing. Others had more of a community of practice approach where
teachers got together to share ideas and build up confidence in using ICT. Primary and
intermediate level schools in New Zealand were forming ICT clusters. The Ministry of
Education encouraged this trend by formally setting up two “Working Smarter with
Data” clusters in Auckland and Lower Hutt. These had funding to bring in outside
expertise to raise achievement levels. For example, schools could share the resources of
a technician.

112
Wellington provided many examples of networks in the education sector with schools
forming partnerships with local businesses, community groups and local authorities.
Interviewee L described how a computer games design company mentored a group of 15
year olds at a local Secondary School for boys. Often these links between schools and
businesses came about as a parent worked for the business, or because a business was
located in close geographical proximity to the school.
In the Wellington region the government is a major employer and an example of a
network of public sector ICT workers was the CIO Forum. Chief Information Officers
employed in the public sector met informally every six weeks to discuss common issues
and concerns. Ideas were shared on a face-to-face basis. No ICT was involved and no
notes or minutes were taken, (Paredes, 2006).
In the farming sector the use of the internet was increasing collaboration between local
farmers. One example was the Cowshed software20
which was developed by Venture
Southland and the Centre for Advanced Engineering21
, five Southland dairy farms were
fitted out with data logging equipment that measured the performance of energy saving
equipment in the dairy shed; the aim was to reduce energy costs. The data was made
available to all local farmers, who could post comments and questions using a bulletin
board facility. In 2001, the Southern Wood Council22
was set up to promote and
coordinate the sustainable economic development of the forest products industry in the
Otago and Southland regions of New Zealand. The Council included major forest
owners, large wood processing and manufacturing companies, the port authorities and
relevant economic development agencies.
Critical reflection
The growth in clustering and networking was a global trend, and many countries were
exploring the benefits of these approaches. These strategies offer the benefits of
economies of scale for small businesses who want to compete in global markets. They
also enable research and development costs to be shared by a group of organisations. As
small businesses make up a large percentage of the New Zealand economy the potential
advantages offered by clustering are of particular interest.
20
http://www.cowshed.org.nz 21
The Cowshed research is funded by DairyInSight and the Sustainable Farming Fund 22
http://www.southernwoodcouncil.co.nz/

113
Both Wellington and Southland contained active networks, though there was a tendency
for these to be sector-based rather than connecting up different regional players, public
sector organisations linked up with other public sector organisations, schools linked
with other schools. Where cross sector networks were present they had typically been
initiated by the local economic development agency, for example, a partnership with
tertiary education institutions in order to develop initiatives to tackle local
unemployment.
Networks that encouraged research and innovation were mainly present at the national
level, linking universities, crown research institutes, and large private and public sector
organisations. At the regional level the focus was on building up networks to develop
the local community, such as building links between schools and local employers to
provide work experience and employment opportunities.
The picture that emerged in Wellington and Southland was one of opportunities that
were only partially realised; though clusters and networks were in evidence at certain
points during the period studied they did not remain consistently successful. However it
should be noted that in the case of the Southern Wood Council which was only
established in 2001, it is too early to make a judgement.
5.1.5 Evaluation
An interconnected region will have active networks operating at international, national
and regional levels. Throughout the period studied New Zealand developed more
international connections, and ICT made a major contribution to the build up of
international, national and regional networks. ICT had a major effect on organisational
form as businesses and public sector organisations throughout the country became more
networked. Research based networks linking universities, crown research institutes and
large organisations were present at the national level. Active networks were found in
both regions, though these tended to be based in a particular sector for example the
education sector. Those regional networks that went across a number of sectors tended
to focus on unemployment and retraining and had often been initiated by local
government. Though there was evidence of clusters for example the effort by Hutt
Chamber of Commerce in the Wellington region to form a high technology zone, and

114
the formation of the Southern Wood Council in 2001, no such initiatives had been
consistently maintained throughout the period studied.
To summarise the results for this category were generally positive, New Zealand did
become more connected at global, national and regional levels, and ICTs played a major
role in facilitating these connections.

115
INFORMING
5.2 Informing
Informing involves the following characteristics; a bottom up approach to tacit
knowledge-sharing within the region made visible by transfer of best practice between
organisations, evidence of ongoing commitment to learning at the individual,
organisational and regional level and the presence of a highly skilled workforce.
Four major trends were identified for the Informing category. The loss of skills as a
result of out-migration by what would now be termed “knowledge workers” was an area
of concern. One way of addressing this issue was to grow new “knowledge workers” by
investing in education, and this is covered in the second section. Alongside investment
in education by the government, there was a push to promote the use of technology by
various pressure groups around the country. The use of computers in schools increased
throughout the period and is covered in the fourth section.
5.2.1 Skills shortages
1986 1991 1996 2001 2006
Overall
Population
3.3m 3.3m 3.6m 3.7m 4m
Wellington 395,610 401,892 416,019 440,200 466,300
Southland 105,512 103,442 100,756 93,300 93,200
Table 16: Population statistics (Source Statistics New Zealand)
Arrivals Departures Net gain/loss
1980 41,607 76,024 (-34,417)
1984 40,705 34,147 +6,558
1985 36,243 44,327 (-8,084)
1986 35,983 57,595 (-21,613)
1991 52,001 56,019 (-4,018)
1996 80,288 50,456 +29,832
2001 66,465 79,065 (-12,600)
2006 80,125 70,386 +9,739
Table 17: Immigration/ migration numbers (source Statistics New Zealand)

116
1985
In 1985 migration out of New Zealand was increasing, and there were serious skill
shortages. As Table 17 shows net migration loss for the year was 8,084. One article
spoke of the “brain drain becoming a torrent”. The Institute of Economic Research was
concerned that businesses were experiencing record difficulties in recruiting both skilled
and semi-skilled labour. There were high levels of unemployment, but as the
Employment Minister of the day, Mr. Burke explained there was still a shortage of
skilled and experienced workers. So, for example. despite there being 4,983 unemployed
people registered as seeking farm jobs, farmers were still asking for immigration rules to
be changed to let in agricultural workers, as those on the register where not the right
match for the jobs available. Australia was identified as the leading destination for
migrating New Zealanders, with the Australian High Commission in Wellington
reporting that “New Zealanders were leaving the country in droves”. The migration
trend was strongest for professional and technical workers such as doctors, nurses,
engineers, accountants and scientists. The sectors most mentioned in the press as
experiencing skill shortages were health, education and information technology. In
Wellington there was a severe shortage of secretarial staff.
The computer industry was identified as suffering from unique staffing problems due to
the scarcity of experienced staff and the surge in demand for IT people, particularly
from Australia. The public sector felt this most acutely as it also had to compete for staff
against the private sector. In Wellington State Services Commission reported a 62%
turnover in Systems Analysts. Even an overseas recruitment drive failed to find staff to
fill the 40 IT positions vacant in the public sector.
Staff shortages in the public sector were not just limited to IT. Nationally 3000 staff left
the public sector in the first three months of 1985, and the number of unfilled jobs
soared by 60%. The situation was mainly caused by poaching by the private sector and
was felt most acutely in Auckland. In August the State Services Commission tabled a
report in Parliament to highlight the gap between public and private sector salaries.
The health sector had a history of skill shortages. However, this ongoing trend was
exacerbated in 1985 by both the general increase in migration and the fact that within
the country, staff were being lured into the private sector by better pay and conditions.

117
There were serious shortages of doctors, nurses and medical technicians, nationally and
across both regions, though Southland faced particular difficulties in attracting health
sector staff due to its remote location. In Wellington, private hospitals in Central
Wellington such as Bowen did not even find it necessary to advertise for staff, but
public hospitals and smaller private hospitals in the Hutt Valley experienced difficulty
recruiting nurses. This resulted in an increase in waiting list times and the closure of
surgical wards. The government attempted to address the situation by introducing a
number of measures; a budget of $240,000 was approved to recruit doctors from
overseas, junior doctors‟ salaries were increased by 15% and immigration controls were
relaxed for nurses.
In the education sector universities and polytechnics reported that many staff were
heading overseas and that vacancies were becoming harder to fill. This was especially
marked in the fields of commerce, computing science, engineering and medicine, and it
was the senior positions were the most problematic. The Association of University Staff
felt that the quality of education being offered in university was threatened due to
serious understaffing, and Otago University proposed cutting all first year courses as a
solution to the staffing crisis.
In the school sector a shortage of teachers was a national problem. In response the
government announced the creation of 1,000 new teaching jobs and launched a
$500,000 campaign to persuade former teachers to return to the classroom. This
initiative is discussed more fully in section 5.2.2.
The problem of lack of teachers had the biggest impact on Southland. As the Assistant
Director General of Education of the day, Mr John Yuill commented, teacher staffing
shortages were not a new issue, and when shortages did occur they showed up in
Southland first. Elizabeth Clarkson, the Principal of Southland Girls High, was so
frustrated by the ongoing staff shortages that she cited it as one of the major reasons for
giving in her resignation after 20 years service. Teachers in Southland were paid an
extra $600 a year and given cheap state housing as incentives to move to the area.
Teachers wanted to increase the incentive to $2,600 a year, and when the government
refused they protested by organising a one hour strike every week. By December 1985

118
the situation had not improved and one article predicted that there would be at least 33
empty posts in Southland secondary schools in 1986.
There was some good news for Southland; the population of Invercargill had increased
slightly since 1981, against the general trend of falling populations in most South Island
cities. A survey of graduate women in Southland carried out by the Federation of
University Women revealed an increase in the range of degrees and professions in which
women are involved. It also showed that younger women were increasingly prepared to
move to Southland to take up job opportunities for themselves rather than just following
their husbands.
1995
Several articles mentioned skill shortages but the implementation of the Skill New
Zealand23
strategy had resulted in an increase in the both the numbers of employees
being trained and the range of courses being offered. Shortages of software engineers
and primary school teachers were mentioned. There was concern about the fact that half
of all rural men had no school qualifications, as compared to 9% of rural women and
39% of urban men.
In Wellington there was a shortage of engineering workers and teachers. There was a
move to try to attract new immigrants to Wellington rather than Auckland. In Southland
Invercargill City Council had a hard time persuading potential employees to move south.
The region was trying to help itself by up-skilling the local population, 50 unemployed
Southlanders were being retrained to fill positions at the aluminium smelter. Most
Southland Secondary schools were fully staffed, though there was a shortage of relief
teachers. However a survey showed that 61% of Southland teachers were stressed due to
increasing workloads and would leave if they could.
2005
In 2005 skill shortages were an issue, particularly in the IT and health sectors; the
tourism sector was also mentioned. The number of New Zealanders moving to Australia
had risen by 57% on the previous year, and there was a view that immigration policies
were not delivering the skilled migrants employers required. IT graduates were moving
overseas for better jobs and a more supportive industry, and Telecom had to recruit
overseas to find staff with suitable IT skills. One initiative to address this problem was

119
the government-funded HiGrowth Project which was designed to help develop a skilled
workforce for the future IT industry. Speaking at a Careers Fair, Director Garth Biggs
noted that in order to meet government targets the IT workforce needed to triple by
2011.
In Wellington an IT consultancy felt that the government needed to be much more
proactive in addressing the IT skills shortage. There were a number of concerns about
staff shortages in the health sector and Wellington City Council was also losing key
staff.
In Southland the health sector was a major concern, with a Medical Council report
showing that Southland had the second lowest number of General Practitioners per head
of population. The police were also experiencing difficulties in attracting new recruits to
the region. On a positive note, Invercargill School Principals‟ reported that local schools
were now fully staffed and local employers were hopeful that initiatives to address
labour shortages in the construction and transport industries would pay off. Immigration
policy aimed to encourage migrants to settle in the regions by awarding extra points to
those who applied to settle outside Auckland; however the number of migrants arriving
in Southland remained fairly stable.
Critical reflection
Salaries in New Zealand are lower than in Australia and the UK and the country has
always struggled to retain highly skilled people especially in rural areas, and the reality
is that this issue is unlikely to go away. New Zealand does have lifestyle as a strong
draw card, but for every person who is attracted to Wellington as a “mini San
Francisco”, or to Southland‟s remote and rugged landscape, there will be two that decide
to leave for a larger pay packet. The only region in New Zealand where there is
significant population growth is the Auckland region, neither Wellington nor Southland
could be classified as “magnet regions” as both struggle to maintain their population and
keep their most highly skilled residents. However during the period studied both regions
did manage to reduce out-migration and stabilise their populations. This is particularly
noticeable in the case of Southland where considerable effort was put into improving the
regions image, and innovative measures such as introducing a zero fees policy at
23
SkillNZ was a joint initiative between government, Business NZ and the NZ Council of Trade Unions to

120
Southern Institute of Technology (discussed in the following section) were put in place
to attract new people to the region.
5.2.2 Investing in education
Net education
expenditure
(millions)
Proportion of
GDP
Net
government
expenditure
(millions)
Proportion of
net
government
expenditure
1975 526.3 5.3% - 16.4%
1981 1,292 5.3% 92,456 14.1%
1985 1,728.6 4.5% 15,317.6 11.3%
1990 4,044.8 5.8% 25,686.2 15.7%
1995 4,949 5.3% 31,743 15.6%
2000 6,136 5.8% 36,699 16.7%
2005 8,683 5.5% 48,449 17.9%
Table 18: Spending on education (source NZ Official Yearbook)
1985
In 1985 the labour government claimed to have a strong commitment to improving the
educational system, despite the economic difficulties of the time. In the June 1985
budget $20 million was set aside to implement new educational policies, with funding
earmarked for more teachers, multicultural education and computer studies. The
education minister claimed that this was the largest amount for a decade; however Table
18 shows that in 1985 spending on education as a proportion of GDP and as proportion
of net government expenditure was at the lowest level for some years. Despite this,
many new teaching positions were created. Five hundred new jobs were created for
primary school teachers, with the aim of reducing the staff pupil ratio to 1:20. Four
hundred and five new posts were promised at the secondary school level, and three new
secondary teacher training courses were set up, with the education minister predicting a
big increase in enrolments for these courses. Improving early childhood education in
particular was stressed as a key policy. Alongside these initiatives $1 million was
committed to developing a national network of resource centres to provide in-service
training for practising teachers.
In the university sector it was noted that there had been a 47% increase in the number of
students between 1974 and 1984. The number of international students was also
develop workplace learning opportunities

121
growing. In Wellington, Victoria University recruited an extra 60 overseas students
from ASEAN countries, bringing the total number of international students at the
university to 162.
Educational initiatives were not just limited to the traditional sectors. A Planning
Council report noted that more school leavers were entering the workforce as low
skilled or unskilled workers as compared to ten years ago, with apprenticeships falling
by a third. The same report also noted that youth unemployment would only be solved
by introducing more flexible training opportunities for young people. $2.6 million was
made available to the country‟s 21 polytechnics, community colleges and technical
institutes to employ over 90 new tutors. The main focus was on programmes to
transition young people from school to work. Rising unemployment highlighted the
need for more trade based training.
In Wellington the tertiary sector was expanding, Wellington Polytechnic was in the early
stages of a multi-million dollar expansion project, and a new community college with a
focus on nursing education was being mooted for Porirua, the CIT was also planning to
expand.
In Southland the issue of falling school rolls came up in a number of articles. Primary
schools were losing teachers due to lack of enrolments. However, the secondary schools
in Invercargill were showing an increase in numbers. Southland Community College
was the only institution in the country unable to fill vocational courses for aspiring
technicians, data processing staff and accountants. However the college did report an
increase of more than 200 students taking part time recreational classes.
1995
In 1995 tertiary sector funding was receiving attention in the press, with University Vice
Chancellors complaining about under funding, and the polytechnics in particular feeling
the effects of increases in student fees.
In Wellington the tertiary education sector was volatile, with some institutions
expanding and others struggling to survive. At the time one University (Victoria) and
four polytechnics (CIT, Whitireia Polytechnic, Wellington Polytechnic and Hutt Valley
Polytechnic) were operating in the region. All were affected by cuts in government

122
funding, and at Victoria University the Dean of Education resigned over the issue. CIT
was expanding by opening a new campus in Wellington City; enrolments were
increasing for the fourth year running with business and tourism courses proving
popular. In Porirua Whitireia Polytechnic was due to celebrate its tenth anniversary in
1996 and was building up strengths in creative arts and tourism. At Victoria University
growth in undergraduate student numbers was slowing and more postgraduates were
being targeted.
In some cases institutions were cooperating, for example, CIT and Victoria University
offered four joint degree courses. However, in other cases institutions such as CIT and
Wellington Polytechnic were felt to be competing for the same pool of students. In 1984
tertiary institutes in the region spent over $1 million on advertising which gives an
indication of the competitive nature of tertiary education at the time.
Funding was also tight for Secondary schools, with two thirds of schools reporting that
they had over run their budget. There was evidence of diversification, as a second
Rudolf Steiner School24
opened in the region, as did a school specialising in Jewish
education. Enrolments also increased at a new private school for gifted children.
Differences between state funded secondary schools in the region were increasing, with
richer state schools being compared to private schools. Wellington College was
charging parents $450 in “voluntary fees” and expected to raise $500,000, while Porirua
College charged only $30 and expected to raise $7,000. These disparities led the Deputy
Head of Porirua College, Susan Cave, to call for free food and healthcare for less well
off school students. Around 25 of the poorer schools in the region were given $10,000
in 1996 in an attempt to address some of these issues.
Despite low unemployment (see Figure 16) education and training schemes for the
unemployed were strongly in evidence throughout the region, with Wellington City
Council planning to spend $400,000 on tackling unemployment, and job training
schemes running in Hutt Valley, Upper Hutt, Porirua and Waikanae.
24
Independent educational movement based on the ideas of Austrian educator Rudolf Steiner. Teaching
takes place within an holistic framework where human skills such as imagination and self-reliance are as
highly values as numeracy and literacy

123
Southland had just a single Polytechnic, and as in Wellington, funding cuts were causing
problems. It was estimated that student fees were likely to double over the next four
years. Southland Polytechnic spent 76% of its annual budget on staff costs, the highest
in the country. Despite this, staff morale was low, and five staff were suspended for
offering private training courses outside the institution. By September, Southland
Polytechnic was concerned about losing government funding if it failed to reach its
target number of students. The strong economy was having a negative affect on
enrolments, as many students were leaving to take up employment; Invercargill‟s falling
population was also a factor. The Polytechnic ended the year on a low note, in debt for
the first time ever, with eight staff facing redundancy.
Financial matters were also a concern for schools, though here the picture was less clear
cut. Though Southland Schools called for more money, they were above-average for the
country in keeping to their budgets. The government also announced $3 million worth
of new funding for rural schools, though schools complained that it would not
compensate for lack of teachers. However Southland Secondary schools were to be
allocated an additional 17 teachers. Some Secondary schools had started to recruit
international students, often from Asian countries, though Principals were very wary of
doing this for financial reasons. Government plans to close schools with less than 35
pupils were causing concern in Southland where over 30 schools were affected.
Seventeen of the smaller schools were asked to consider merging.
2005
In 2005 the tertiary sector was experiencing a slight dip in enrolments due to the lowest
unemployment rates in years (see Figure 16) though as Table 19 illustrates, tertiary
enrolments increased over the period in line with the worldwide trends shown in Table
20. The global popularity of English language based commerce degrees meant that New
Zealand universities were able to use the profit created by commerce subjects to off set
costs in other less popular areas.
In Southland there were two major issues; one was the restructuring of local secondary
schools, and the other was the ongoing viability of the zero fees policy at the Southland
Institute of Technology (SIT). In 2003 it was decided to merge several Invercargill
Secondary schools, and though plans to do this were well under way, the whole issue of
school mergers was hotly debated at meetings with national and local politicians. Local

124
MP Bill English was also concerned about cuts to training programmes at rural
polytechnics in the region.
Figure 16: Unemployment rate 1986 - 2005 (Statistics New Zealand, 2006)
1985 1990 1995 2000 2004 2006 University
enrolments
59,868 78,919 104,525 122,727 138,583 165,571
Polytechnic &
Teacher Training
College enrolments
11,059* 58,448 100,518 99,481 128,621 221,302
Total 70,927 137,367 205,403 222,208 267,204 386,837
As % of total
population
2.1% 4.1% 5.6% 5.75% 6.6% 9.6%
* In 1985 this figure was for Technical Colleges, from 1995 onwards for Polytechnics
Table 19: Tertiary enrolment figures (Statistics New Zealand)
1991 1995 2000 2003
New Zealand 22.9 25.3 28.0 30.9
Australia 21.8 24.3 27.5 31.3
Canada 29.9 34.9 40.0 44.0
UK 16.3 21.9 25.7 28.0
Ireland 15.9 19.9 21.8 26.3
Table 20: Tertiary attainment for age group 25-66 (as a % of the population of that age group)
(Organisation for Economic Co-operation & Development, 2006b)
In 2001, SIT introduced a zero fees policy in order to attract more students to Southland;
Table 21 shows the positive effect on enrolments. This move was funded by sponsors in
the local community who hoped such a move would attract highly skilled young people
to the area, and also provide a major boost to the local economy. In 2004 the
Government put a cap on student community funding, which meant that payments to

125
tertiary institutions were no longer directly related to student numbers. This change
resulted in the loss of $3million worth of funding for SIT, despite increasing
enrolments. Though this change threatened the zero fees policy, Chief Executive Penny
Simmonds was “cautiously optimistic” that it would continue.
2000 2002 2003 2004 2005
Number of
full time
equivalent
students
1781
2597
3376
4528
4200
Table 21: Student numbers at Southern Institute of Technology (Southland Times, 12/7/2005)
No references to falling school rolls were found. As Table 16 shows, the population of
Southland stabilised between 2001 and 2006, and out migration from the region was not
such a significant issue as in the earlier part of the period.
Interviewees in both regions gave examples of connections being made between local
councils, community groups and local education providers at the grassroots level, in
order to facilitate learning. The learning was of a fairly basic nature, such as
introductory ICT skills, and was often aimed at disadvantaged groups such as the
unemployed, minority ethnic groups or children in low decile schools. Initiatives around
community learning were often related to specific economic outcomes, like reducing
unemployment. An example was the Tech Mentor Scheme based in Southland.
Community workers identified individuals within a community who already had good
ICT skills. These people then became “Tech Mentors” who went on to train others in
their community. The Tech Mentors offered one-on-one training; they went into
people‟s homes and taught them on their own computers at their own level. The main
objective was to train people to go back into the workforce.
In a survey carried out in Southland in 2001, the results showed that people aged 43 and
below were the group that was comfortable with ICTs. Above that age respondents were
less confident (Otago Southland Broadband Communications Committee, 2001). This
split is of particular relevance for the rural sector where, as of 2005, the average age of
farmers was 57. Another sector which tends to have a high concentration of older people
is the community sector. Often these are voluntary workers who are in a position where
they have to take on new ways of working. They have a tendency to resist ICT as they

126
perceive it as a threat to the “people” element of their work. Community ICT training
programmes are one way of overcoming this resistance. In Southland the Cyber
Communities training has resulted in people in their forties, fifties and sixties
discovering chat rooms and Trade Me25
. Many have become so enthused that they ended
up buying their own computers. In one town the trainees were all older people who were
actively involved in their community and who used their new ICT skills in their
volunteer work.
Critical reflection
Investment in education increased during the period studied in line with general trends
in OECD countries. More people were attending university, and there was growing
demand for “knowledge” workers. The education sector became more diversified, with a
rise in the number of specialised schools for minority groups. The tertiary population
also became more diverse as the number of international students grew. There was also
a growing gap between the performance of student in state schools in richer areas and
those in less well off areas. Both these trends could also be observed in other countries.
Two factors stood out as being unique to the New Zealand situation. One was the
volatility of the non university tertiary education sector where different polytechnics and
colleges struggled for funding and competed for a limited pool of potential students. The
other was the bold decision of the Southern Institute of Technology to introduce a zero
fees policy in 2001, this was a whole of community decision that was designed to attract
new people to the region and grow the local economy, as two consultants reports show
(Infometrics Consulting, 2000, 2002) the initiative was successful. Student numbers
grew, and their contribution to the regional economy provided a significant boost for
local business.
5.2.3 Promoting the use of technology
1985
During 1985 there were a range of initiatives to promote the use of both technology in
general and information technology in particular. The most widely reported initiative
was Information Technology week, which was a nationwide programme held in August
25
New Zealand online auction site similar to eBay

127
to improve public awareness and understanding of IT. This was jointly promoted by the
New Zealand Computer Society and the Technology Advancement Trust.
The use of personal computers by the general public was growing (see 5.3.4). Though
about 20% of owners classified themselves as “blue collar workers”; most owners were
well off and only 5% earned less than $20,000. The digital divide had already been
flagged as an issue in New Zealand and the YMCA had developed an innovative mobile
computer education programme to reach disadvantaged groups. The mobile unit spent
the year travelling around the country delivering a range of material, from simple after-
school introductory courses for school children to more advanced courses for farmers
and small businesses. Special attention was given to more remote locations where no
other computer courses were available.
Other initiatives were targeted more specifically at the business community. The New
Zealand Technology Advancement Trust set up a series of Go Technology seminars
designed to promote the productive use of technology by business. In October the
Industrial Technology Forum held its inaugural conference which aimed to encourage
the use of technology in local business and to provide a link between the private and
public sectors. In Wellington, the Chamber of Commerce sponsored a half day seminar
for local businesses which explored the use of videotex, Eftpos and office automation
systems.
As well as promoting specific technologies long-term strategic issues were also being
considered. In Wellington the University held a half day seminar, led by Professor
Herbert Dordick, which considered how best New Zealand‟s heavy investment in IT and
telecommunications could be leveraged to stimulate economic growth. The immediate
challenge for the IT sector was to help primary, manufacturing and service industries to
become more competitive (Dordick, 1985). The DSIR was also thinking about how IT
could develop the nation as a whole, particularly by contributing to research and
development. A discussion paper aimed at the general public gave a thorough overview
of the use of IT in various local industry sectors and identified strengths and
weaknesses. One of the major concerns of the paper was the lack of long-term strategic
research on the impacts of information technology.

128
1995
In 1995 the internet and mobile phones were being promoted at the National
Agricultural Field Day event held at Mystery Creek, an international conference on
Nursing Informatics was being held in Auckland, and over 1000 people registered for
the annual TUANZ conference, “Communications 95”.
In Wellington, Interactive New Zealand presented a three day event “Multimedia makes
Sense” aimed at introducing both industry and the general public to e-mail, the world
wide web and the internet. The New Zealand Computer society and the Digital
Equipment Corporation Users Group (DECUS) combined to hold a joint conference in
Wellington attended by 250 to 300 people; various new technologies were
demonstrated, including Windows 95, and a notebook with a detachable screen for
overhead presentations. Windows 95 was also on the agenda when Microsoft‟s $1.5
million travelling computer road show hit the capital.
2005
In 2005 three articles reported on government funded initiatives to promote technology.
The Research, Science and Technology Ministry put up $1 million to form Joule, which
aimed to help technology companies market their products. The government also piloted
a Danish programme which gave businesses and Crown Research Institutes access to a
global pool of 20,000 experts to answer technology questions. The Foundation for
Research, Science and Technology were partnering with Microsoft to fund a million
dollar initiative to showcase New Zealand‟s health technology. High-tech airport
equipment was also being showcased internationally at a global conference in Auckland.
Advanced technology was also being showcased in Southland, when electronics
company Philips filmed a case study profile of the high-tech medical equipment being
used at the local hospital to show to potential customers around the world.
Critical reflection
National government, non-governmental organisations and professional bodies such as
New Zealand Computer Society and TUANZ were all active in promoting the benefits
of information technology. As early as 1985 there was recognition that IT had the
potential to make a major contribution to the New Zealand economy, and along with
biotechnology the sector continued to be promoted by successive national governments.
The potential of ICT‟s was obviously of interest to many countries, but in New Zealand

129
it was seized upon with particular enthusiasm. Software was regarded as a weightless
commodity that could be easily transported and ICT networks also provided a way of
overcoming barriers of distance for all types of businesses, not just those specialising in
IT.
5.2.4 The use of information technology in education
1985
In 1985 the use of computers in schools was fairly widespread. A report from CED, the
sole Apple distributor in New Zealand, claimed that all but three secondary schools in
the country now used computers, and estimated that there were around 4,000 computers
in secondary schools. Computers were also being used in intermediate and primary
schools, Takapuna Normal Intermediate in Auckland had one of the most advanced
laboratories in the country with 10 Apple 11C computers. The teacher who set it up,
Graham Prentice had just returned from a year in Houston, Texas where he worked as
director of computers in a large private school. At Epuni primary school in the
Wellington region parents and teachers sat down to carefully plan out the educational
benefits of computers before buying them. Outside of school, computer camps for six to
nine year olds were being advertised.
At the policy level, lobby groups such as the Schools Committees Federation criticised
the ad hoc way that computers were being introduced in schools, and called for a more
planned approach. The Minister of Education of the day, Mr Russell Marshall, made it
clear that the government was not able to foot the entire bill for putting computers in
schools; however, they were prepared to put up $700,000 for an 18 month programme of
research into micro computer use in schools. Teachers were invited to prepare research
proposals and out of 100 submitted, 24 were selected to go forward. The selected
projects included the use of computers to develop language and reading skills, the
development of problem solving skills and the use of computers to develop
communication between schools. Independent local research was also taking place. A
teacher at Christchurch Girls High School, Margaret McLeod demonstrated that
computers were not just for the mathematics class by showing that the use of word
processors in English lessons improved pupils‟ writing.

130
Though the president of the NZ Computing Services Association warned that local
children were in danger of becoming computer illiterate when compared to countries
such as Japan and the USA, and the General Manager of Databank advised that
investment in computer technology for schools needed to be on a large scale, other
commentators recommended a more cautious approach. One report from the USA
questioned whether computers had any educational value at all, while another visitor
from the States, Dr. Richard Ennals gave a talk to the NZ Computer Society in
Auckland in which he opined that the USA had been far too technology centric in its
introduction of computers in schools. He felt that New Zealand should learn from these
mistakes and make sure their emphasis was firmly on learning.
The issue of whether computers would increase or decrease existing divides within
society was under debate with views being expressed on both sides of the fence. Mrs
Anne Gluckman, Principal of Nga Tapuwae school in the Auckland suburb of Mangare,
(which had a roll of predominantly Mãori and Polynesian students) predicted that
computers could be a great equaliser as far as children from less privileged areas are
concerned. However, Colin Boswell, president of the NZ Computer Society, warned that
information technology would widen racial divisions in New Zealand unless non-
Europeans were deliberately catered for in computer education. New technologies could
result in non-skilled and low-skilled workers disappearing from the workforce.
There was enough activity in the education sector to make it an attractive market for a
number of different computer suppliers. IBM was making a strong push into the
education market with Auckland firm, Microprocessor Developments Ltd. (MDL) as
their preferred supplier. Philips NZ also announced their intention to vie for a share of
the school computer market, with a new personal computer and full school network
system. Apple were in the market with their 11e computer system. In Lower Hutt,
Progeni had developed the Poly 2 Learning System, which consisted of a complete
classroom set of networked computers and printers.
The potential of information and communications technology to overcome the barriers
of distance was widely recognised at both national and regional levels. In Wellington,
the PEACENET satellite network was operated out of Wellington Polytechnic, to share
information about health, education and social welfare between Wellington and 25 other
131
locations, mostly in the Pacific Islands. At the national level the Correspondence School
broadcast its annual break-up using television for the first time rather than radio. The
inaugural conference of the Distance Education Association of New Zealand was held in
Hokitika. The conference focused on taking advantage of those new technologies, which
increased access to learning for those living in remote areas.
The teleconference system being operated by the Otago University Extension was
widely reported on. The system linked Dunedin with Invercargill and Gore and other
centres in Otago and Southland. At the time the system was an audio link only, though
the addition of graphics was under discussion. The system was well used and there were
plans to expand it in the next few years. Examples of the use of the Otago system for
distance learning included Southland Community College holding a series of nine
teleconference seminars for volunteer social workers, and a series for doctors and their
staff on “Working together in General Practice”. The Otago University system was also
used to host an agricultural conference for 200 participants in six different locations.
The Agriculture Under-Secretary, David Butcher, gave the opening address from
Wellington. For the first time in New Zealand the teleconference had the benefit of an
online visual aid capability in the form of videotex. Two telephone lines were involved
at each centre, one to the Aditel database in Wellington, the other to the
teleconferencing system for voice communications. Videotex also played a role pre- and
post-conference by being used to display background discussion papers before the
conference, and to conduct and compile the results of surveys after the conference.
1995
In 1995, use of ICTs by schools, polytechnics and universities was widespread; Waikato
University was using multimedia technology to market itself to potential students, a
fibre optic network was installed at a Whangarei Primary School, Massey University
launched the countries first online course Auckland University was installing a
telemedicine system; and video-conferencing was being used to reach students in some
of the country‟s remotest regions. The use of video-conferencing for distance learning
was pioneered by Waikato Polytechnic in 1992, and by 1995, the falling cost of
equipment had put it within the reach of secondary schools. ICT education was also
taking place in the community sector. SeniorNet aimed to teach computing skills to the
over 55s. The first club was set up in Wellington in 1992, and by 1995 had 400
members. The Ministry of Education was using spare capacity in its own computer

132
system to host a trial network linking 600 primary and secondary schools. The network
offered email, access to the internet and mediated discussion forums. The
Correspondence school was also planning to deliver use satellite technology to reach
over 100 schools by 1996.
As use of the internet became more widespread cost became an issue, with Auckland
and Otago Universities deciding to charge students for internet access due to rising costs
(other universities already charged students), and 600 schools cooperating to appoint a
single bargaining agent to negotiate reduced costs for internet access
In Wellington, six courses made available on the internet for free by the CIT received
three million hits, and praise from the US Navy. At Victoria University a statistics
Professor made his notes available to students online, and the Politics department
launched an online journal. Both Wellington Polytechnic and CIT decided to offer
multimedia courses. Wainuiomata College raised $31,000 to give all their students
access to computers and the internet, and primary pupils in Newtown used the internet
to link up with Inuit children in Alaska. A school in a deprived area (Cannons Creek)
where most families did not even own a telephone hosted a technology day to give
pupils experience of modern technology.
Southland schools in lower socio-economic areas were also struggling to keep up with
the demands for technology created by changes in the curriculum. Five Southland
schools worked with Dunedin College of Education to trial an audio visual conferencing
system. However secondary school principals were concerned that the government
might be trying to replace teachers with computers and emphasized that they could not
operate without core staffing. As in Wellington, IT education was also being offered to
the wider community through community education night classes in computing and
advanced word processing.
2005
By 2005 the use of IT in schools had become ubiquitous, and spending on IT was a
significant part of the school budget, with one school in ten spending a quarter of its
entire budget on computers and information technology. The Ministry of Education
supplied all state primary and secondary teachers with portable laptop computers, it also
committed several million dollars to encourage schools to purchase new school

133
management software. A Ministry plan to spend $11 million on state-of –the-art
computer networks for 300 small schools met with mixed reactions from School
Principals, especially those whose schools would be ineligible for funding because they
had already put together basic networks.
2005 also saw Microsoft announcing the expansion of its “Partners in Learning”
programme to New Zealand, which was planned to provide $2 million worth of
assistance to schools over the next 5 years. At the same time both the school and
tertiary sectors were investigating open source products, with the Open Polytechnic
leading a move by a consortium of polytechnics to adopt Moodle26
as their learning
management system, and the Ministry of Education signing an 18 month contract with
Novell New Zealand to provide open source software for schools. In Wellington, a
training centre at Wainuiomata was trying to raise $2 million from Government and
private sources to develop open source software development in the area.
One study showed that schools had become more enthusiastic about the value of ICT,
but few were using it directly in the delivery of lessons. A project to develop a new
digital curriculum for senior secondary school students received widespread backing
from the IT industry. A Ministry of Education review of four Digital Opportunities
programmes which ran between 2001 and 2004 showed that all the expected benefits
were not being delivered. The programmes were designed to reduce the digital divide
and raise student achievement, particularly in mathematics, technology and sciences.
Though the overall results were positive, with participating students reporting that their
ICT skills and confidence improved, none of the projects made a significant impact in
encouraging more students to take up mathematics or science or to stay on at school
longer.
Many schools did not have an ICT specialist. This caused problems, as the available
software was not yet user-friendly enough for the average teacher to set up a website
without assistance. Though most teachers had basic ICT skills, there were many who
found it hard to move beyond email and word processing, as interviewee E commented:
“Everybody goes “Oh I’ll stop using Microsoft Word, convert to HTML, and set up a
website” at which point they realise it doesn’t work.”
26
An open source educational content management system

134
ICT was being used to meet the needs of students who could not or did not want to be in
school, for example children who were long-term hospital patients used wireless internet
connections to keep up with their studies. NOTSCHOOL was set up as a $2.5 million e-
teaching initiative to educate 13 to 16 year old drop outs in their homes; however, it was
cancelled by the government after a few months. An electronic tracking system was
being developed to keep an eye on truants and alert parents to their absences using text
messages.
In the community education sector SeniorNet was offering members the facility to send
text messages to mobiles around the world from their PCs, and the 2020 Trust ran the
first computing course for refugees.
ICT collaboration software was being used to develop interconnections in the education
and rural sectors. The two examples of collaboration software most mentioned by
interviewees were Telecom‟s SchoolZone and Fonterra‟s Fencepost (see section 5.3.5).
SchoolZone was a managed online environment for schools that consisted of email and
web pages. The full version also included videoconferencing. The videoconferencing
option was taken up in particular by small rural schools who found that regular contact
with “live” teachers made distance learning easier.
One of the drivers for Project PROBE (see section 2.5.2) was the desire on the part of
rural schools to use videoconferencing to share teacher resources, in order to offer a
wider range of subjects to secondary level pupils. This was seen as a way of addressing
the problem of declining pupil numbers in rural schools. Southland, Central Otago and
Coromandel were mentioned as regions that were successfully using videoconferencing
in order to keep students in school. Previously students would either move on to a
boarding school outside the region, or leave education altogether to take up a low skilled
job. Both keeping students in schools for longer and keeping them within the region
were seen as contributing to regional development.
Though there were examples of best practice, the use of collaboration software by
schools was seen as patchy and spasmodic; it tended to be more popular in the regions
than in the cities. This was partly due to the fact that rural schools need to share
teachers, but it was also driven by other benefits that rural schools derived from

135
clustering, such as sharing knowledge and resources. Though there was enthusiasm for
the idea of using ICT to enhance learning, there was also a resistance to the idea that
ICT could replace face-to-face contact. Many interviewees talked about the limitations
of videoconferencing. It was seen as a big effort for a rural school to set up good quality
videoconferencing. As of 2006, the equipment costs were around $20,000, plus the cost
of cabling inside the school, and the cost of the broadband connection. Even where
videoconferencing was available it was often not used because of the effort required to
co-ordinate meetings. Interviewee A thought that smaller communities had more success
in finding the resources to set up videoconferences as they had more community spirit.
The main emphasis of PROBE was on education, but it was expected that the
availability of nationwide broadband would benefit regional businesses and would also
lead to improvements in other government services such as health, policing, social
services and conservation. The hope was that as broadband access was made available
to schools in rural areas, local businesses would pick up on the opportunity and adopt
broadband themselves, creating benefits for the wider community. It should be noted
that few new businesses in local areas have come about as the result of the availability
of a broadband connection. It is hard to convince geographically spread small businesses
of the advantages of using ICTs to connect when they see time taken to learn ICT skills
as time taken away from everyday work. As of 2005, there was a lack of applications
which were of direct benefit to rural customers.
The extra funding made available through the Digital Strategy was intended to stimulate
the development of these applications. PROBE was widely regarded as an efficiently
managed project. It did make broadband available in rural areas. However, its
effectiveness in terms of increasing the use of broadband by the broader rural
community is more questionable.
In the Wellington region Victoria University and the Pacific Island Forum formed a link
to facilitate regional learning. The School of Mathematics, Statistics and Computer
Science linked with the Pacific Island Community in Porirua to offer a ten week
introductory courses in basic mathematics and computing skills. The objective was to
give community members an introduction to study at the university level. A private
Wellington secondary school, Scots College, webcast live streaming of sports matches,
136
so that parents who couldn‟t attend could watch their sons play. A state school,
Wellington Girls College, was regarded as a pioneer in using IT. School Principal
Margaret McLeod, who had been active in IT education for 20 years, was appointed to a
high profile growth and innovation think tank. Students used computers to work
simultaneously with teenagers in other cities on assignments such as making movies or
creating websites. Whitireia Polytechnic invested in a $7.5 million learning centre so
that students would be able to access the latest in learning technologies.
In Southland, the Invercargill Licensing trust contributed $1.5 million to install 120
interactive whiteboards in local schools. Interactive whiteboards were seen as superior
to videoconferencing, as they share applications, which is more useful in the long-term.
As well as being used for collaboration, they can also be used for everyday classroom
teaching. Southland was the first region in the country to make widespread use of
interactive whiteboards and this pioneering use of technology in the classroom drew
praise from a visiting Massey University Professor.
A 2001 survey showed that 82% of Southland schools wanted to set up collaborations,
and most had identified the other schools they wanted to link with (Otago Southland
Broadband Communications Committee, 2001). Venture Southland decided to put the
educational sector first when developing their ideas around collaborative software, and
they were a major player in the decision to use interactive whiteboards. Venture
Southland continued to drive the adoption of ICT in schools by evaluating potential
software applications and running workshops for teachers. They also offered IT training
seminars for small businesses in the region on topics such as security.
Critical reflection
The education sector was a pioneer in the use of ICTs, in both the school and tertiary
sectors there was early recognition of the potential of ICTs, and enthusiastic uptake.
This was a general trend in many countries around the world. What was a little different
about New Zealand was that schools were often used as a gateway into a local
community, particularly in rural areas. For example with Project PROBE broadband was
made available to schools around the country in the hope that businesses located near
the school would also hook up to broadband. This strategy has had some success, but in
many areas take up of broadband around the gateway school was disappointing, the

137
approach has also been criticised by rural residents located too far from a school to
benefit (S. Mason, 2010).
Schools were also the sector that was most enthusiastic about collaboration, and clusters
sprang up around all the country and were present in both regions studied.
Videoconferencing offered particular benefits for rural schools as it could be used to
share specialist teachers. It is difficult to judge whether New Zealand was behind or
ahead of general global trends in this area without carrying out further research.
5.2.5 Evaluation
In an informed region there will be a commitment to learning and evidence of
knowledge sharing between different organisations within the region. There was a
strong commitment to education that came through at both the national and regional
levels, and as with interconnecting, ICT played a major role. At the regional level ICT
was used by schools to build networks and to share resources; at the national level the
education sector was viewed as the leader for new developments.
In the education sector, knowledge sharing was enhanced by the use of collaboration
software such as videoconferencing and interactive whiteboards. The use of
collaboration software demonstrated that tacit as well as explicit knowledge was being
exchanged. However, many interviewees made it clear the technologies such as
videoconferencing could complement but would never replace face-to-face contact,
indicating that there were limitations on the use of ICT networks to exchange tacit
knowledge.
Another factor that should be found in a learning region is evidence of a bottom -up
approach to knowledge sharing and transfer of best practice. This was definitely evident
in the education sector in both regions studied. In Lower Hutt, Primary and Intermediate
schools under the direction of the Ministry of Education had formed an ICT cluster in
order to share ideas and resources. In Southland a survey carried out prior to broadband
adoption showed a strong desire on the part of local schools for collaboration.
Commitment to learning at individual, organisational and regional level is another
feature of a learning region. The commitment to learning was found most strongly at the

138
regional level particularly in Southland, with Venture Southland demonstrating a strong
commitment to improving the educational level of regional residents.
The one weak area was skills shortages, at both regional and national levels. Out-
migration of skilled workers in sectors such as health and IT was a major issue. This
migration was strongly influenced by economic conditions. When times were good
people stayed, but in lean times they looked for better opportunities offshore. Though
the problem of staff shortages was felt across the country, it was clear that the problem
was much worse for the rural region of Southland. However Southland worked hard to
address this issue by a number of initiatives, one of which was the introduction of zero
fees at Southern Institute of Technology in 2001, these efforts paid off and by 2005 the
population of Southland had stabilised.
In summary, the results for this category were generally positive. Throughout the period
skill shortages decreased and investment in education grew. There was evidence of ICT
enabled regional knowledge sharing in both regions.

139
INNOVATING
5.3 Innovating
Innovating is the ability to create or adopt new ideas. Statistics New Zealand uses the
following definition of innovation, which is originally from the OECD:
“An innovation is the implementation of a new or significantly improved product
(good or service) or process, a new marketing method, or a new organisational
method in business practices, workplace organisation or external relations.”
(Statistics New Zealand, 2005)
Evidence of innovative activity within a region could be measured by factors such as the
number of patents applied for, prizes won and awards granted or the number of new
start-up businesses. On a more micro level it can be looked at as the enthusiasm that
organisations within a region have for taking on board new ideas and initiatives. This
community-based approach may not result in the immediate economic benefits that the
discovery of a new technology might bring, but it has been argued that “bottom-up”
innovation which involves adopting ideas from elsewhere to the local context brings
more benefits to regional communities in the long-term (Gurstein, 2006).
Data was divided into six different sub-categories. A number of newspaper articles and
interviewees took a broad look at innovation, for example, visiting speakers would give
advice about innovative practices. This information is discussed in the first section on
climate and culture, which explores the influence of the general economic climate and
national and regional policies on innovation. The next five sections report on specific
examples of either innovation itself or the adoption of innovation. The first one looks at
entrepreneurs in general, the next focuses on entrepreneurs in the IT sector. There are
two separate sections covering the internet and the growth of electronic commerce. The
borders between these sections are rather porous, IT entrepreneurship could obviously
involve using the internet, and the internet was also central to the development of
electronic commerce, however, articles were placed in the section which seemed most
appropriate. The last section specifically focuses on innovation in the rural sector.

140
5.3.1 Climate and culture
1983 1990 1995 2000 2005 2008
R&D spend 1.13% ? 0.9% 0.99% 1.16% 1.20
Table 22: Spending on research & development as % of GDP (Statistics New Zealand)
Patents Trademarks Designs
1985 3,932 5,731 722
1990 4,582 8,327 656
1995 4,503 12,325 807
2000 6,269 22,771 967
2005 6,397 27,937 1,321
Table 23: Applications for patents, trademarks and designs (Statistics New Zealand)
1985 1990 1995 2000 2005
Computing
patents filed
1
23
26
42
41
Table 24: Patents filed with computing or software in the title (Intellectual Property Office of New
Zealand http://www.iponz.govt.nz on 9/9/2009)
1991 1995 2001 2004
New Zealand 4.0 4.7 9.1 10.2
Australia 6.8 (1992) 7.3 (1996) 7.3 (2000) 7.8 (2002)
Canada 5.1 6.4 7.5 -
UK 4.6 5.3 5.5 (1998) -
Ireland 4.4 4.5 5.0 5.8
Table 25: Researchers per thousand employed, full time equivalent (Organisation for Economic Co-
operation & Development, 2006b)
Table 22 shows spending on research and development as a proportion of GDP. Table
23 shows the numbers of applications for patents, trademarks and designs and Table 24
shows the numbers of computing related patents filed. Table 25 compares the number of
researchers employed across a number of OECD countries.
1985
Growing innovation in New Zealand was widely discussed in 1985. The decline in trade
with traditional markets meant the country was on the lookout for new opportunities.
Developing innovative new products was seen as one way of entering new markets.
Opinion varied as to whether the climate of the day encouraged or discouraged
innovation. Bob Jones, then New Zealand Party leader, criticised the “tall poppy27
”
syndrome in the country and argued that the environment was good for entrepreneurs:
27
The tendency to criticise those who are successful as in cutting down tall poppies

141
“the climate is right, the money is there, and there’s no competition.” His views were
shared by Malcolm McConnell the Managing Director of the McConnell Dowell
companies who stated at a Science and Technology Conference at Parliament that:
“enterprising young New Zealanders will become brilliantly successful in seeking
new opportunities with the right climate.” However, Nature magazine ran an article in
which it described New Zealand science as being in “dire straits”. While the article
praised individual ingenuity, it attacked the government for running down spending on
research, and criticised industry for not realising the benefits of long-term projects. The
Science and Technology spokesman for the Opposition, Simon Upton, accused the
government of neglecting technology and failing to see its role in the country‟s future
economy, in particular he pointed to the fact that there was no policy for science and
technology. Policy was also felt to be lacking at the organisational level by Dr John
Troughton, Assistant Director General at the DSIR, who saw the lack of stated policies
on technology research and development by New Zealand companies as a major cause
of market failure.
A visiting American consultant, Steven Burrill, argued New Zealand innovators lacked
the market focus, and needed to focus more on the “D” end of research and development
rather than the “R” end. As he put it:
“the United States developer of technology is doing it because he wants to get rich.
The New Zealander seems to be doing it from a desire for independence, a desire to
sidestep the bureaucracy. You finish up with a different kind of entrepreneur, with
different factors governing the growth of the business and different market factors.”
Commenting on New Zealand‟s venture capital industry, Tony Lorenz, the Managing
Director of Equity Capital for Industry, based in London, said that in order to survive it
needed a regular supply of entrepreneurs coming through. Those small businesses that
were successful should be given plenty of publicity to inspire others, “Greed is a
marvellous motivator.” An editorial in the Dominion also talked about New Zealanders‟
ambivalent attitude towards technology. There was a discussion of how on the one hand
there was an eagerness to innovate and reap the rewards of innovation, for example in
agriculture technological advances had brought huge economic benefits. Yet on the
other hand there was a resistance to innovation, especially the sort that makes traditional
skills redundant.

142
Some sectors of the economy were singled out as having export potential. The visiting
Vice President of Philips, Gerrit Jeelof, felt that the electronic industry was an example
as long as local talent could be persuaded to stay in the country. The Overseas Trade and
Marketing minister, Mike Moore saw the potential for specialist small scale New
Zealand technology in hydro electric and geothermal energy generation, pastoral
development and livestock improvements. Clifford Alderton, president of the
International Seed Federation, felt the country could become a production point for plant
varieties from around the world.
1985 saw a number of specific initiatives aimed at increasing innovation. One of the
most widely reported was the Science and Technology for Development conference held
in May which aimed to show how science and technology could be combined with
marketing and economic development. The conference brought together the private and
public sector, financiers, scientists and government representatives. The role of research
associations and partnerships to promote research in a particular industry sector was
widely discussed. Another conference organised by the Society of Accountants explored
new markets where local companies could potentially find venture capital to finance
growth. At the inaugural meeting of the Industrial Technology Forum one of the topics
under discussion was how to understand and manage the links in the chain that bring an
invention to market. The Technology Advancement Trust was set up as a multinational
backed organisation which aimed to increase awareness of technology at all levels and
to improve technology transfer.
The amount of money spent on research and development was also under debate. A
survey carried out by the Manufacturers Federation and the DSIR found that
manufacturers were ploughing more money into research and development to develop
new and better products; however it was still not enough to catch up with overseas
spending. The Association of University Teachers was also lobbying for more funding
for research claiming that New Zealand spent a much smaller proportion of GDP on
university research, as compared to other countries (refer to Table 22). The National
Research Advisory council also wanted spending on scientific research and development
to be lifted to 2.3% of GDP. In November the government tried to encourage more
research by announcing 100% tax deductibility for all research and development carried
out by business. In the opinion of Stephen Bell writing for the National Business
143
Review, this was not enough on its own. He pointed out that there was no direct line
from the scientific researcher to the market place.
The DSIR, together with some representatives from the private sector, was exploring
how other countries were encouraging technology; visits had taken place to Australia
and Canada. Gordon Dunlop, a former New Zealander now based in Sweden, was on a
one year secondment to the DSIR as a Senior Research Fellow and was able to give an
insight into how Sweden had built up its IT industry by close co-operation between
government, management, unions, science and education.
In the Wellington Region, Ian McFarlane, the President of the Hutt Valley Chamber of
Commerce and Industry aimed to promote the Hutt Valley as New Zealand‟s answer to
Silicon Valley, as mentioned in section 5.1.4. The recent opening of the Physics and
Engineering Laboratory‟s silicon wafer manufacturing plant added to a number of
organisations at the cutting edge of technology located in the Hutt Valley, giving the
region good grounds to argue its case for becoming New Zealand‟s leading high
technology centre. The Hutt Valley was home to Progeni Systems, New Zealand‟s
leading exporter of information processing technology, as well as Standard Telephone
and Cables, Harding Signals and Philips. The Chamber of Commerce wanted to grow
the Hutt Valley as the hub of the nation‟s high technology effort, and in particular to
assist with technology transfer. The Upper Hutt Promotion and Development Council
was also working to encourage more innovation in the region and organised a series of
lectures on product development technology and international finance for local exporters
and manufacturers.
1995
In 1995, Dr Laurie Hammond, Chief Executive of the Foundation for Research, Science
and Technology, was concerned about the level of spending on research. Though 0.9%
of GDP (refer to Table 22) was a reasonable level of investment, this was below the
OECD average, and well below the ambitious plans of Asian countries such as Korea
who were spending 5% of GDP on research. He was also felt that companies lacked
technological awareness. Only 10% of business leaders had degrees in the fields of
engineering, science and technology. Most managers were accountants and lawyers.
Poor levels of private sector spending on research were due to the legacy of
protectionism, according to Basil Walker, Chief Executive of the Ministry of Research,

144
Science and Technology. There was also a view that New Zealanders tended to turn on
businesses that were successful (tall poppy syndrome). On a positive note the annual
World Competitiveness Report ranked New Zealand as the eighth most competitive
nation in the world. Competitiveness was defined as the ability to generate wealth in
international markets, and was assessed on eight different factors, New Zealand scored
very highly in the areas of government and management, mainly for the way it had
recovered from a severe economic slowdown in the domestic economy. Another article
suggested that New Zealand was failing to exploit its competitive advantage and had a
lot more potential to persuade overseas businesses to base themselves here.
Opportunities were also offered by the growing software industry, which earned more
export dollars than wine but received none of the publicity.
In Wellington, low cost seminars aiming to help businesses grow were being held on the
Kapiti Coast, and Victoria University introduced a joint commerce and science degree
(BCA/BSc) to develop the business minded scientists required by industry.
2005
A 2005 analysis of the 50 biggest revenue earners in the fields of high-tech
manufacturing, software and biotechnology showed that New Zealand based companies
have long growth cycles compared to similar companies in the northern hemisphere
because of size of the domestic market and geographic isolation. This means “high
growth” companies face problems in securing long-term funding, keeping value in the
business and retaining staff. The analysis, carried out by the Technology Investment
Network, also showed that high-tech manufacturing companies struggle when faced
with the costs of international distribution, and software companies find it hard to deal
with global sales and marketing. These are often the reasons why “high growth”
companies are acquired by foreign companies in their second decade. A well as the
problem of geographic isolation, the small size of New Zealand businesses meant that
staff within them often felt lonely, and NZ Trade and Enterprise though that isolation
and the lack of people to share ideas with was the biggest problem facing local
businesses, with 86% of registered companies employing less than five people. The
University of Canterbury was encouraging the transformation of academic ideas into
practical innovations with a $50,000 prize pool, and the Department of Trade and
Industry in the UK was looking to set up technology transfer programmes with
innovative New Zealand companies.

145
Interviewees who had been involved with the development of new initiatives had
generally looked overseas for inspiration, with the USA, UK and Australia being
popular sources of new ideas. Australia in particular, probably because of its
geographical proximity, was frequently mentioned. New ideas came from a wide
variety of sources, personal meetings, conferences, the internet, magazines and journals.
Often these ideas came from an individual who had spent time in Australia, either an
Australian who had come over to work in New Zealand, or a New Zealander returning
from a period of employment in Australia.
People looked at literature, and were aware of the major “thinkers” in their field, but
what was most useful to them were practical examples of similar organisations overseas
who had already adopted the innovation they were considering. So for example when
Wellington City Council was considering new initiatives around e-democracy policy
advisors looked at what other local councils were doing internationally.
The importance of carrying out some background research before proceeding with a
project was recognised. For example the Smartlinx328
initiative in the Wellington region
was kick-started by both surveying local organisations to find out what their needs were,
and by visiting regional community telecommunication projects in Australia and New
Zealand which had been identified as best practice cases29
. This enabled informed
decisions to be made using both internal and external information. Similarly, in
Southland extensive research was carried out into the needs of local organisations before
any decisions were made (Otago Southland Broadband Communications Committee,
2001).
Initiatives to encourage innovation were often targeted at young people and built around
prizes and awards, or the visits of a VIP. Venture Southland had “Spirit on Screen”
awards to help develop film editing and production skills in young people. A digital
animation about a tuatara was developed to be premiered during a visit by the then
Prime Minister, Helen Clark. Venture Southland, also encouraged scientists visiting the
region to give public lectures as part of a drive to promote science and research to young
people.
28
Community telecommunications provider in Wellington region discussed in more detail in Section 5.5.1
Infrastructure/Telecommunications/2005

146
Often a particular innovation came out of a long history of involvement. For example
the adoption of the Woosh wireless network in Southland came out of a history of
involvement in a range of projects relating to communications, such as VHF radio for
safety communications and broadcast TV to rural areas. This long-term association
resulted in the build-up of social capital, so that when a new opportunity comes along
there are people ready to seize it. For example, when Venture Southland was offered the
opportunity to buy a redundant telecommunications dish for $1, they were able to
quickly pull together a team of volunteer engineers to transport and reassemble it for use
in a planned space research project.
Critical reflection
There was a general feeling that as far as innovation was concerned that successive
national governments “talked the talk” but didn‟t “walk the walk”. There was a
widespread encouragement of innovation with seminars, visiting speakers and the like,
but when it came to investing in research and development New Zealand lagged behind
similar countries, such as Australia. Innovation was also hampered by the “tall poppy
syndrome” which was a tendency to turn on those individuals who were perceived as
being too successful.
Most innovative activity involved taking ideas from other countries, particularly
Australia, and adapting them to the New Zealand context. Often this transfer came about
as a result of individuals “job hopping” between the two countries. Ideas were more
likely to be adapted if representatives from the region were able to visit a practical
working example of a “best practice” case.
5.3.2 Entrepreneurs
A number of articles were identified that either talked about entrepreneurship in general
or gave an example of a specific entrepreneur. Entrepreneurial activity in the fields of IT
is discussed in sections 5.3.3, 5.3.4, 5.3.5, and agriculture in 5.3.6 this section covers all
the other sectors.
29
Southland, Central Waikato, Counties Manakau, Bendigo

147
1985
Two articles in the National Business Review discussed the role that entrepreneurs play
in the New Zealand economy. In one article they interviewed a number of Kiwi
entrepreneurs and identified some common characteristics they shared. All had an
unwavering certainty in the worth of their idea and were convinced that they would
eventually be successful if they could only sit things out. Despite this none of them were
wild dreamers and all had good pragmatic knowledge of their market. In the second
article, Professor Bjorn Bjerke argued that in order for the economy to thrive in the
modern world, new ways of working must be found which encouraged people to be
more creative.
Articles reported on firms who invented new products, firms who were among the first
in New Zealand to adopt new technology, and firms who were able to win major
international contracts. For example, a small forestry firm, Northern Pump, was the first
in the world to produce a new type of reconstituted board, which it believed to be an
important development in wood processing. In Wellington, Walker Scientific Ltd was
the first company in New Zealand to bring in CAD/CAM equipment from the USA. In
Invercargill a local sign writer was the first person in Southland to adopt a computerised
graphics system. On the international front Plessey won a $5 million contract to design
and manufacture a sophisticated telemetry system for Indonesia‟s national electricity
supply authority. AWA, a radio telephone design and production company based in
Porirua in the Wellington region, also won a large $1 million contract to supply high
frequency air traffic control equipment to the Australian Department of Aviation. In
some new areas such as micrographics New Zealand firms attempted to keep up with
new developments, while recognising that they couldn‟t support them all. Some
businesses were going through a process of rapid expansion. For example Northrup
Instruments and Systems, which opened a new headquarters in Wellington in 1985, had
become a $20 million high technology marketing and manufacturing business
specialising in forestry implementation in only six years. In the South Island, Dunedin
based Donaghy Industries Ltd unveiled plans for a series of innovative export-orientated
developments and it was anticipated that their Invercargill subsidiary, Stafix, which
specialised in electric fencing and other farm products would play a large part in these
new developments.

148
Other articles reported on initiatives by individual entrepreneurs. Some were very small
scale, like the Wellington man who invented a new board game, or the Porirua man who
operated a cottage industry from home making kit sets for model aeroplanes. Others
were a little more established. In Southland, a woman had been able to set up a
glassware decoration venture with the aid of a $17,000 regional development loan. Also
in Southland, two men set up a company, Morrisfield Developments, to produce a
greenhouse specifically designed for New Zealand conditions. Some entrepreneurs were
doing very well. Martin Lenart and Roy Edwards, who had sold their microcomputer
dealership and consulting business to Powercorp for “megabucks”, were in the process
of starting up two new companies, The Learning Experience and Champagne
Consultants. Wellington City Council planned to complete its third new venture factory
in 1985, which would provide 20 start up units for small entrepreneurs.
The winning of awards and prizes is a good indication of innovative activity. In 1985
New Zealanders won awards for wine, innovative low-budget advertising in America,
and author Keri Hulme won the Booker Prize. State Services Commission planned to
boost their suggestion scheme for government departments. It had already seen more
than $30,000 awarded to innovative civil servants.
In the Wellington region Hutt Valley entrepreneur Frank Brugger won an Air NZ
Enterprise award for his welding company. In Southland, local company A J Boult,
together with the Southland Times, ran a “Bright Ideas” contest were local people were
asked to come up with innovative ideas to improve the region.
1995
In 1995, Steve Flynn set up the National Innovation Centre as an independent body to
help inventors bring their ideas to market. Inventions such as a golf foot, an anti-theft
device for cars and a new type of metal fence post were advertised in a $2.5 million
seed-capital fund prospectus. Though the response was disappointing, contracts were
negotiated on ten of the inventions advertised. There was a call to alter tax law rules
which were felt to hamper entrepreneurs starting new businesses.
In Wellington the press reported on a number of small start-up businesses, two of which
were set up by women who had previously been made redundant. In Porirua, a week

149
long event was being held to celebrate the diverse range of innovative businesses in the
city.
1995 saw four Wellington teachers win Royal Society awards, and tourism operators in
Southland and Otago dominate the New Zealand tourism awards. In Southland four
students were awarded scholarships from forestry company, Rayonier.
2005
The role of the social entrepreneur as the catalyst who initiates interaction was
mentioned by many of the interviewees. A social entrepreneur can be a particular
individual, or a group of people. In the case of New Zealand the social entrepreneur role
is often taken on by local government.
A strong leader who can stand up to criticism was seen as critical to building successful
interaction within a region. As interviewee D put it:” You’ve got to have fairly broad
shoulders and expect to be clobbered a few times but the outcome is worth it.”
Interviewee A confirmed this: “Local champions are a vital issue in New Zealand; if
you don’t have a local champion things don’t work.” Local networks can be tapped
into to find existing community leaders. Many interviewees named particular people in
their regions who they saw as key to the development of various initiatives.
Interviewee A explained that the reason for the success of Project PROBE in some
schools and not others was often down to the enthusiasm of individuals at the local
level. Though there was some overall direction from the Ministry of Education, local
support was needed to actually make things happen. However it should be noted that the
size of the school was also a factor as it took financial resources to set up broadband.
Therefore adoption is more common in the larger wealthier city-based schools.
One enthusiastic individual can make the difference between success and failure at the
organisational level; at the regional level their role is also critical. Often the reason that
particular PROBE regions such as the West Coast and Taranaki were successful was due
to the efforts of one particular person establishing and maintaining partnerships within
the region. In other regions with huge potential, very little has been done, as though
groups have formed, they were not sustainable. In successful regions well established
partnerships were often in place long before the ICT project came along. This meant the

150
existing social network could mobilise quickly to take full advantage of the
opportunities offered by the digital network.
Though the role of the local champion was seen as critical by a number of interviewees,
another noted that in terms of the statistics the patterns of linking up to broadband and
dial up are exactly the same. The connections per head of population are highest in the
main centres like Auckland and Wellington and lowest in the smaller regions like the
West Coast, Southland and Timaru. Despite the lower number of actual connections two
of the smaller regions, the West Coast and Southland, were widely cited as success
stories within the New Zealand telecommunications community.
Nationally, young entrepreneurs were being honoured at the inaugural Incubator
Awards. Five young business people, including two from Wellington, walked away with
prizes. In Wellington itself, the NZ Innovation Festival showcased around 50 innovative
companies and held seminars for SMEs on how to grow their business. The first
graduates were moving on from the Creative HQ incubator. The incubator was started
up in 2003 to help start-up companies with advice on intellectual property, finance,
marketing, tax and legal matters. The five graduating companies were involved in
software design, publishing, and developing language teaching programmes.
Venture Southland was hoping the regions clear skies would help it win a bid to be part
of a deep space telescope project, potentially worth around $15 million to the local
economy. Southland had been running a Young Enterprise scheme for 14 years and
former winners were being brought together to share their stories.
Critical reflection
Entrepreneurs were found in both Wellington and Southland most of the examples were
of fairly small scale businesses. One issue that emerged strongly from the interviews
was the critical role of local champions or “social entrepreneurs” in ensuring the success
of a project, and it was noted that this role was often taken on by a local development
body such as Venture Southland.
151
5.3.3 Entrepreneurs in information technology
1985
Articles provided plenty of evidence of innovative activity in the IT field, including both
development of home grown software and hardware, and adoption of new products
developed overseas. The general manager of Databank claimed that New Zealand was
the third highest per capita user of computer equipment in the world after the USA and
Japan. On a visit to Invercargill, Dr John Bell also claimed that Kiwis‟ traditional ability
with DIY gave them an edge when it came to developing computer programmes and
applications. High technology, in particular software, was viewed as being one of
potential saviours of the economy.
Christchurch firm Adata Software developed and patented the Exsys software systems
generator. It had already attracted four major local users, and was trying to break into the
US market by means of a promotion tour. Another company, Kiwisoft Programme Ltd,
had developed a computerised image editing system called Colourgraphics and were
looking to Digital Equipment Corporation (DEC) for venture capital to develop the
system further. In December, DEC announced another initiative; a technology transfer
project which it hoped would generate $1 million in the first year. An advanced
applications centre was to be set up in New Zealand to develop computer fault-finding
software for use around the world.
An Auckland company developed an innovative computer mapping system designed for
use by local authorities. Also in Auckland, chemist Harvey Lockie designed a
computerised dispensary system for his pharmacy, which became so popular that he
moved into selling software full time. Also in the health sector, Foundation Systems Ltd
based in Rotorua had taken only six years to become one of the largest value-added
computer retailers in the country. Its business was writing software for the medical,
pharmaceutical and dental sectors. Another innovative organisation was Ruakura
Agricultural Research Centre who developed a computer program for pest control that
could simulate any of the climate types found in New Zealand.
There was plenty of evidence of innovative activity in the Greater Wellington Region.
The Inform Group launched the Complete Legal Office accounting and office
automation package, which was adopted by Wellington law firm, Castle Pope. In

152
Petone, Datatech Ltd had spent the previous two years developing a low cost colour
terminal. Dispersed Data Network Consultants a Lower Hutt based company, set up on a
shoestring budget four years ago by three former Dairy Board employees, was expected
to turn over $1 million this year as a result of inventing the JEMS software package for
manufacturing jewellers. Another successful Wellingtonian in the IT sector was Michael
Newberry, a systems programmer at Victoria University of Wellington, who wrote a
programme to connect an Apple Macintosh to an IBM mainframe, and sold it to Yale
University and Apple Computers itself. Neurologist Dr David Fung developed a
Chinese language word processor which had potential for the Asian market. The
Department of Labour in Wellington piloted a computerised scheme to match job
seekers to jobs. A Wellington technical college became the first place in the country to
use an educational robot to answer the telephone, in order to give students practical
experience of robotics
No examples of innovation in IT were found for the Southland region, but it should be
noted this may be partly due to the fact that the Wellington newspaper the Dominion had
a weekly supplement, InfoTech, which reported on local and national information
technology news, whereas the Southland Times only had a small weekly column on
Computing News that mainly reported international news.
As well as developing their own home grown hardware and software New Zealanders
were also innovative adopters of new systems developed elsewhere. The Union Steam
Ship Company was the first business in the country to install an on-board
microprocessor based ship management system in eight of its ships. Later in the year
another shipping company, United Shipping, installed a similar system aboard 12 ships.
The Broadcasting Corporation set up an information systems directorate to investigate
new ways of using IT in broadcasting, such as scheduling assignments of news crews,
using electronic diaries, and composing and editing news stories on computers. One
member of the BCNZ directorate Selwyn Crane was sent on a four month study tour of
the UK to collect new ideas. The police were also looking at how new technology could
assist with investigations, and planned to set up a system for cross checking information
by the end of the year. In banking, three Trustee banks were among the first to install an
office automation system. In the public sector Internal Affairs were busy preparing a
new Dictionary of New Zealand for the 150th
anniversary of the country in 1990. The

153
editor, Professor Oliver thought that this was probably the first time a major national
dictionary had been prepared using a computerised database.
There was awareness of new developments in IT, with articles reporting on the release
of new systems which combined computing and telecommunications technologies, such
as the product from Siemens, ICLs One per Desk and the Universal Office Terminal.
The Post Office became the New Zealand dealer for ICLs One Per Desk, but was
attacked for operating a monopoly which stifled competition.
1995
1995 saw vibrant activity in the area of information technology, with the adoption of
new ideas being particularly marked in the public sector. A contract for a $4 million
revamp of Parliamentary information systems involving 250 new PCs all connected to
the internet was awarded to Unisys. Child, Youth and Family piloted the use of portable
laptop computers by front-line social workers. Internal Affairs commissioned a touch-
screen application in an attempt to make government information more accessible.
Geographic information systems were being used by the Ministry of Mãori
Development to build a database of Mãori land ownership. Statistics New Zealand were
also developing a database that would give more accurate indications of regional
variations and pressure points in the economy. In Auckland, public libraries were being
equipped with multimedia systems, and the mobile library was piloting a wireless
internet link to the main library catalogue. In Wellington, money allocated for the new
national museum was earmarked for the development of hi-tech exhibits, and the
Alexander Turnbull library spent $250,000 on a state of the art imaging system. In the
health sector, Health Waikato was embarking on a telemedicine project to assess the
effectiveness of remote patient diagnosis, and a medical centre based at Whakapapa ski
field was using mobile computing to collect statistic on mountain injuries. The Meat
Industry Research Institute was upgrading software programmes that modelled
refrigeration in order to improve energy efficiency, and the Civil Aviation Authority
commissioned a $700,000 computer system to improve air safety. There was also one
notable case of non adoption when the justice department decided not to proceed with a
multi-million dollar project to computerise public registries, including birth, death and
marriage records and land titles. Justice Minister Doug Graham explained that the
project would be too costly to set up and run and so would not achieve the
Government‟s objective of a better service at a lower cost to the public.

154
In the private sector, there was interest in videoconferencing, with reports of two
businesses, Dynamic Communications and Eagle Technologies, moving into this area.
Eagle Technologies also won a major contract to install local area networks for British
based BOC Gas. The growing film industry resulted in California based visual
computing specialist Silicon Graphics deciding to set up offices in Auckland and
Wellington. Credit information firm Dun & Bradsheet used computer aided telephony to
assemble a database with information on 150,000 New Zealand companies that they
hoped to sell for marketing purposes. In the travel industry, Jetset, an Australian
company 50% owned by Air New Zealand launched a paperless travel booking system,
Worldmaster, and the automated system used by the travel industry diversified into
email and the internet to increase the range of services available to clients.
Terabyte was set up as a new company to market CD ROMs, a Dunedin software
developer wrote a server software package that was snapped up by Apple Computers.
Successful entrepreneur Jolyon Ralston launched a new company, Palladium
Technologies, to market a range of products including advanced accounting software
and a three dimensional fax which enabled 30 pages of data to be sent on a single sheet.
A former All Black rugby player, John Kirwan, linked up with a South African
counterpart to set up Timetech, which would produce the Microcard, a palm sized black
box for transport fleet management.
New Zealanders‟ willingness to adopt new technologies was illustrated by the country‟s
selection as the first site in the world for the launch of Windows ‟95 and the strong
business support for the launch of an electronic job search facility in the information
technology sector.
Wellington provided examples of successful businesses working in the areas of radio
communications, email paging and computerised accounting. One local company
developed a database that could be used to match tertiary students to potential
employers. Michael Sutton, Executive Director of AWACS, which developed the
paging software stressed that New Zealand software developers needed to put more
effort into legal protection and patent their software if they want to be successful. State-
of-the-art technology was installed in a local warehouse. Wellington was being
promoted as an “Info City” by the local council (see section 5.5.1); the city‟s traffic
155
wardens were issued with waterproof notebook computers to enable them to issue
parking tickets in all weathers. One local newspaper, The Evening Post, moved one step
further along the information super highway by opening its letters page up to email
contributions.
In Southland, Vide Management International developed a computer programme
capable of producing a high-clarity visual identification system which they planned to
market globally, and Invercargill based Watkins Engineering opened two new branches
within the country mainly due to their development of a computerised wheel balancing
device. Invercargill City council decided to use computers to assist with local elections,
and electricity company, Powernet, planned to spend $3 million on geographic
information system for its Southland network.
2005
In 2005 there was plenty of evidence of both the development of new software within
New Zealand and the enthusiastic adoption of ideas from elsewhere. In the agricultural
sector a system had been developed to track meat from the farm gate to the supermarket
shelves, and a biometrics firm raised $1 million to develop and market genetic research
software. The Foundation of Research, Science and Technology gave Auckland
software firm ITL a $1.34 million grant to further develop its award winning travel
management system. An Auckland IT consultancy developed a mobile application to
use hand held computers to stack shelves for an Australian greeting card company.
Three more software developers produced applications for mobile phones. One
application was for mobile banking, another was an interactive first aid manual, and the
third combined directory services, phone synchronisation and social networking. Other
new IT products included a program to analyse software code for potential
vulnerabilities, a new approach to data warehousing and a simulation system for surgical
procedures. New technologies such as podcasting were being adopted; sports teams
were investigating the potential of IT to give them a competitive edge, and the fire
service trialled a high-tech mobile command unit. The Electoral Enrolment Centre
decided to switch to open source software in order to cut operating costs.
ICT research in the country was given a boost when Otago Innovation (the University of
Otago‟s commercial arm) teamed up with venture capitalist TMT Ventures to take over
Medialab South Pacific; this was expected to increase collaborative research between

156
universities and the commercial sector. Microsoft was also encouraging new ideas
through its innovation centre and in 2005 awards were given for a remote identification
device for the police and software to speed up ministerial communications.
In Wellington, email archiving specialists AfterMail were hitting the headlines for
achieving an international award at the Microsoft Worldwide Partner Awards, and were
winning major contracts in Luxembourg and the USA. Another Wellington firm,
iStation, won a contract to install its touch screen system in tourist centres throughout
the country. An IT specialist won a prestigious US$100,000 scholarship for an
American university, and Wellington schoolgirls were rewarded with a trip to Montgego
Bay for a prize winning web site design. In rural Southland the IT industry was not as
developed. However, one Invercargill man, Bruce Hill, developed a software program to
customise picture frames.
Critical reflection
Throughout the period there was a lot of activity in the IT sector, with Auckland,
Christchurch and Wellington standing out as major centres for the industry. IT
innovation in Wellington was helped by the presence of the public sector, which often
led the way in the adoption of new ideas. Though the IT sector was successful, it did not
make the contribution to the economy that was originally anticipated, and targets had to
be rescaled. The reasons for this need further investigation. Where the original targets
just too ambitious? Was it due to a shortage of suitably skilled staff? Was it just the
result of movements in world markets that a small country was unable to influence? Is it
possible to identify anything that could have been done differently in order meet those
original targets?
5.3.4 Adoption of information and communication technologies
1985
A 1985 survey of over 800 home personal computer users found that the average home
computer user in New Zealand was relatively young, affluent and likely to be an impulse
buyer. About 5% of homes had personal computers and the largest number were in
homes where the breadwinner was in the 30-40 age bracket and had an income in excess
of $30,000. The most popular use of home computers was to play games, with four
times as many games being sold as any other software package.

157
During the late 1970s and early 1980s teletext30
and videotex were developed in the UK.
In New Zealand the initial motivation for teletext was to provide captioned television
for the hearing impaired. In 1984, the first operational videotex system was introduced
in New Zealand, and as of 1985 there was rapid adoption of this new technology across
a number of sectors. A significant reason for this is its user friendly menu response
driven access approach. Articles reported on videotex systems being implemented or
strongly considered by a range of organisations including Federated Farmers, NZ News,
Dairy Board, Ministry of Agriculture and Fisheries, Travel Agents Association, Bank of
New Zealand, ANZ Banking Group and the Racing Industry. The three main players in
the videotex industry at the time were BPI Systems, Datacom and ICL. The Post Office
agreed to support all three types of systems on its packet switched communications
network. In Auckland, MDL was commissioned by AT & T, one of the biggest names in
international telecommunications to design a Prestel Viewdata terminal. A North Island
fertiliser company set up a novel promotion for videotex, where farmers who ordered a
tonne of fertiliser could purchase the Aditel videotex services plus a micro computer for
$900.
For the home user, videotex offered the potential for electronic news, home banking,
computerized shopping and entertainment. In New Zealand, a teletext home information
service had been available since 1984; its uptake has been impressive by international
standards. However, among the hearing impaired, who were the initial target market,
uptake was slow.
1995
The internet was first introduced to New Zealand in 1989 (Newman, 2008), and by 1995
commercial use was beginning to take off. As mentioned in section 5.1.3, a survey by
the Internet Society showed there were 31,215 computers directly connected to the
internet in 1994. Wellington based research company IDC estimated that businesses
accounted for about 50% of those computers, government 28% and educational
institutions 11%. The main growth areas for businesses were international data transfer
and electronic mail. An article reviewing the key issues for IT users in 1985 quoted
George MacGibbon, IT Manager at Fletcher Challenge: “It seems to be a year when the
internet started to become of commercial age.” His view was supported by Cyril Snow,
30
Teletext is the over the air distribution of print and graphic information using the vertical blanking
interval in the television picture.
158
Auckland HealthCare‟s General Manager of Information Services who reported that his
department had experienced a huge increase in demand for electronic mail:
“Everybody’s now saying I need to be on the network, I need to have mail.” Reg
Hammond, Manager of Information technology Policy at the Commerce Ministry,
recalled that the internet was not even mentioned at an IT briefing organised for Prime
Minister Jim Bolger‟s enterprise council in 1993, whereas at a similar event in 1995 the
internet seemed to be the only word mentioned: “That’s just an indication of where it’s
gone in such a short period,” he said. The appearance of books such as “Internet: a
New Zealand Users Guide” and articles entitled “Five models to help relocate your
business on the World Wide Web” were also an indication of growing public awareness
of cyberspace.
A diverse group of organisations established World Wide Web home pages in 1995
including law practices, public relations firms and the media, large companies like
Fletcher Challenge and Pilkington Glass, and smaller organisations such as Royal New
Zealand Ballet and Sealord fishing company. In the public sector, the National Library
and the Treasury set up web pages. Richard Ram, Marketing Manager of the Internet
Company of New Zealand, a commercial internet gateway based in Auckland, believed
most use of the internet was experimental, with email being the most popular service.
There was evidence that businesses were starting to use the internet due to customer
demand, for example a travel agents located near Waikato University adopted the
internet as many of its clients were academics who routinely used email. Hotels also
reported that international visitors were demanding email facilities while on holiday. A
move to the internet could also be prompted by a desire to keep up with competitors,
Law practice Russell McVeagh McKenzie Bartlett were quick to follow competitor Bell
Gully Buddle Weir in putting up a home page.
A page set up on the internet with a real time link to a web camera on volcanic Mount
Ruapehu received 700,000 hits in its first two and a half months. Videoconferencing
was used to set up a link with Australia for a criminal jury trial. Artists and musicians
were also experimenting with the internet. An Auckland art gallery mounted an
exhibition of electronic art over the internet, and local musicians such as Dave Dobbyn
began to put their performances out live on the net and use web pages to market their
work. In the media InfoTech Weekly was the first newspaper in the country to be made

159
available online. Genealogists were also enthusiastic about the use of the web to
research family history.
The increasing popularity of the internet meant that governance had to be introduced
around registration of domain names. This had previously been carried out by Waikato
and Victoria Universities, but in May the Internet Society of New Zealand was formed
to take over the administration of the internet.
A survey of New Zealand web users found that the average surfer was a 34 year-old
male earning a high salary who spent most of his time at overseas web sites. Half of the
1009 web users surveyed used it for work, and half for personal reasons. The web was
responsible for a surge in sales of home computers and up to 65,000 were expected to be
sold in 1995. Prompted by the increase in demand for personal computers by both home
and business users, home appliance firm Noel Leeming opened two computer stores in
Auckland and Wellington and planned to open four more by the end of the year.
2005
By the end of 2004 there were 2.45 million internet users in the country, according to
technology research firm Research and Markets, 900,000 used dial up and 165,000
broadband. Research conducted as part of the Hewlett Packard Connected Lives
programme tracking the technology use of 8000 households, showed that 91% of
participants used the internet every day. 94% of people logged on at home and 57% at
work, 7% used Internet Cafes and 2% Wi-Fi hotspots. ICT was used in a wide variety of
everyday activities, 80% used it to manage their money, 72% to manage work, 64% to
organise travel, 63% to run their social life and 44% to coordinate family activities. A
further online survey of 1500 people by Conversa Global found 79% of respondents
were sending up to 20 emails a day, for 54% of them up to three quarters of the emails
were personal.
As in 1995 more and more organisations were developing an online presence. In some
cases these were new, in others it was a case of extending or revamping existing sites.
Hawkes Bay fruit growers set up a website to find fruit pickers, the Humanities Society
set up a one stop shop website for people seeking information on arts and social
sciences, New Zealand had the world‟s top rated dinosaur news site according to Google
rankings, NZ Education Trust launched a new site aimed at international students, New

160
Zealand embassies around the world went online and the government put up a website
to attract expatriate New Zealanders back home. Te Ara31
was launched by the Ministry
of Culture and Heritage as the country‟s first online encyclopedia. Local Government
Online revamped its web portal and built on additional services such as an online
tendering system, a recruitment service and emergency management information.
Publishers Fairfax upgraded their job recruitment site, and Archives NZ set up a
searchable electronic index. Websites were becoming more interactive; National
Business Review launched a weblog for discussion of Chinese issues, the National
Library spearheaded a project to fund and host original New Zealand digital content, an
estate agent put up an online questionnaire and psychometric test for potential job
applicants and a cattery set up web cams so owners could monitor their pet‟s progress
while on holiday.
Internet and email were becoming available on long haul bus services, train and ferry
services, and there were moves to make it available to air travellers. Hotels were also
making broadband services available to their guests. Interviewee D described how when
a group of international engineers visited Southland to plan a new velodrome. The first
question they asked was whether their hotel had broadband; they needed it to move all
their technical drawings around.
In Wellington, web design company Shift developed an interactive site about ANZAC
day for the Ministry of Culture and Heritage, and Victoria Universities Electronic Text
Centre adopted new topic map technology for its revamped web site. The regional
councils public transport website was upgraded, as was the Kapiti Health service site,
and the local Fringe festival included a cyber show. The Roberts family were one of 25
families selected to be given $6,000 worth of computer equipment as part of the Hewlett
Packard Connected Lives project.
Southland also saw increasing use of the internet, with local councils and libraries
coming on board. Online dating was also popular in the region, and Southlanders were
using the web to join a campaign against loud car exhaust systems. In Invercargill, the
Brocks became the country‟s most connected family by gaining top marks in the 12
technology based challenges in the Hewlett Packard Connected Lives project.
31
The Pathway
161
Critical reflection
The data collected shows that New Zealand has consistently been a fast adopter of new
ICT based technologies, whether that technology is Videotex, the internet or email. This
eagerness for new technology could be observed both at the level of the individual
citizen, and also at the organisational level. Though New Zealand has a small population
it has consistently been well ahead of the rest of the world in terms of the take up of
ICTs
5.3.5 Growth of electronic commerce
1985
February 1985 saw the birth of electronic commerce in New Zealand, when the trading
banks launched an eight month trial of Eftpos. At a cost of around two to three million
dollars to themselves, the banks provided free terminals to stores in a bid to attract their
initial customers. Eftpos took off throughout the country and from August to October
over $1 million worth of transactions were recorded. Some customers expressed concern
that their “electronic footprint” could be tracked, but the banks reassured them by
stressing they had neither the time nor the inclination to follow customer‟s movements.
Once the trial ended in October, Eftpos was launched nationwide, and stores now had to
buy their own terminals. However, the banks predicted there would be little drop off.
New Zealand company MDL manufactured the terminals and was also beginning to
market them internationally.
There was also evidence of the beginnings of e-government, with Hamilton City
Council planning a completely integrated computer system, and the possibility of using
e-voting during Parliamentary debates was being explored. Home banking, bill
payments and electronic shopping were also being piloted by Development Finance
Corporation using their Screenlink videotex system. The NZ Stock Exchange planned to
be fully computerised by the end of the year.
In the rural sector, a video auction of embryo-implanted goats in Oamaru was an
example of the early use of electronic commerce in agriculture.
1995
In 1995 there was still scepticism about electronic commerce with trust, credibility and
access being major issues. However, the increasing profile of electronic commerce was
demonstrated by the formation of New Zealand Electronic Commerce as a special

162
interest group of TUANZ. The group replaced the Electronic Data Interchange
Association and planned to move away from a focus on technical standards to look at
how technologies such as fax-on-demand, email enabled applications, and active and
interactive media could be used by business. New Zealanders were amongst the highest
users of cellular phones in the world. There were also developments in both the areas of
business-to-business and business-to-consumer electronic commerce. The wood
products industry was hoping to save millions by using a locally developed electronic
wood products exchange. Data General linked up with Wellington based Electronic
Document Management to offer their services to companies wanting to set up in
electronic commerce. Online shopping was emerging as a key trend in the retail
industry, and supermarket chain Foodtown planned to make grocery shopping available
on the internet. ANZ bank was also attempting to persuade more customers to switch to
online banking by increasing fees for manual banking. Multimedia based presentations
were proving popular with companies hoping to boost sales, and in the real estate
industry the internet was expected to make major changes to the way property was
promoted. In Auckland a consulting company developed a system that would allow
email to be sent to a digital phone.
Different online payment systems were being piloted; NZ Post was considering offering
smart card services, though the idea of a national smart card for welfare and health
services was squashed by Prime Minister, Jim Bolger. Retail chain Farmers entered into
an agreement with internet service provider Voyager to allow customers without credit
cards to make payments online using store cards. Cheque guarantor TeleCheck Payment
Systems also repurchased its New Zealand franchises. Other businesses were developing
the idea of mobile Eftpos terminals.
Wellington residents were both buying and selling online, for example the museum Te
Papa opened a cyber store. Two computer consultants set up an online store to sell
computing equipment. The School of Design at Wellington Polytechnic offered a course
on “Managing an Interactive Multimedia Project” and Victoria University developed an
interactive CD to market the campus to prospective students.
In Southland there was a lot of interest in telephone banking from the rural community.
In both regions, the positive and negative sides of mobile phones were receiving

163
attention. In Southland cell phone coverage was being extended, and a local fisherman
was able to alert rescuers by mobile phone when he was stuck in a lagoon. However,
there were concerns about the ethics of selling mobile phones for as little as $1 to people
who had no idea about ongoing charges. One article reported the tale of a beneficiary
who had run up a $25,000 bill after buying a $1 phone. In Wellington the hospital
widened its ban on cell phones amid concerns they might interfere with electronic
equipment.
2005
Despite reports that New Zealand had dropped two places to number 19 in the world e-
readiness rankings, 2005 saw a dramatic increase in the use of electronic commerce.
Consumers were able to check the history of a used car using the Automobile
Associations online “Lemon Check” service, car ownership could be transferred online
using the Land Transport website, cargo insurance could be arranged online, a website
could be used to subscribe to a magazine, trampers could book mountain huts online,
and golfers used the internet to book their time on the course. Online auction site
TradeMe32
was now the most popular site in the country according to web researcher
Hitwise, though Telecom were giving it some competition with the launch of their e-
commerce portal, Ferrit. E-commerce was being used by both large and small retailers.
At one end of the scale supermarket chain Pak „n Save was installing self scanning
systems and electronic shelf labels in nine of its stores, and at the opposite end of the
scale boutique wineries and a lavender grower were using the internet to sell their
products. A Dunedin firm was offering free e-commerce software and web hosting to
2,000 small businesses. Charitable trust E-Regions was helping over 130 small
businesses to market their products globally through their Comet scheme which
provided free e-commerce software and web hosting. However Inland Revenue put
plans to buy supplies over the internet on hold.
Another trend was the interest in electronic forms and smart cards. The government
started to issue biometric e-passports, and customs were investigating self-service
border control kiosks. The Ministry of Economic Development issued staff with a smart
card to access its network services, and Datacom were awarded the contract to develop a
32
Online auction site used by general public to buy and sell new and used goods

164
secure single logon for all government services. The Fisheries Ministry were also
trialling the use of e-forms so observers could input catch information while out at sea.
Mobile technology was also being used to make life more convenient in both the public
and the private sectors. Doctors and Nurses at a Christchurch hospital emergency
department were able to take phone calls while on the move using voice activated
pendants connected to the hospitals wireless network. Wood manufacturer Carter Holt
Harvey gave its sales representatives notebook computers equipped with mobile data
cards so they could take orders while on the move, the Police were also considering
equipping frontline officers with handheld computers. Supermarket chain Progressive
Enterprises installed Wi-Fi networks in 200 of its stores so staff could carry out stock
checks using wireless handheld computers. Mobile banking was popular, though IT firm
Unisys claimed that New Zealand banks were lagging behind the rest of the world.
Camper van rental company Kea installed personal computers in its mobile homes as
international tourists now expected to have access to the internet.
A pilot project to make tourist information available on mobile phones was also being
trialled in the Wellington area. Mobile telephones were also being used to reach out to
people. The Electoral Enrolment Centre found it had improved take-up from young
voters when it used text messages to encourage them to enrol and in Southland free
mobile calls to a health line were being used to increase participation.
The use of mobile technology was not without its inconveniences; 80,000 businesses
were affected by a nationwide Eftpos outage and the Vodafone network was hit by
technical problems for two weekends in a row.
Geographic Positioning Systems (GPS) and Radio Frequency Identification (RFID)
were also being used. The Corrections Department was trialling the use of GPS systems
to track offenders by satellite, and travel publisher Jason‟s added GPS to its website.
Retail giant the Warehouse was considering the use of RFID technology in its stores,
and Manakau City Council was looking at introducing it in public libraries.
In Wellington, the Wireless Forum held a conference to showcase new technology. At
the airport a wireless network was installed for the baggage handling system. The ASB

165
bank experimented with the use of a virtual receptionist. Wellington City Council
launched an e-democracy initiative which was the first of its type by local government in
New Zealand. The council researched the use of e-democracy initiatives by different
local councils internationally and picked out best practice examples to introduce to the
Wellington region. The goal was to increase the involvement of citizens in Council
processes, and to use ICT to overcome social, geographic, physical and economic
barriers to participation. The e-democracy initiative would make council information
more transparent by showing the progress of consultations, and providing information
on past consultations, archived web casts of council meetings would be made available,
and elected members would be able to produce blogs and electronic newsletters to
communicate directly with the public. A variety of ICT enabled avenues would be
provided for citizens to engage with elected members and council officials on issues
affecting the city, such as electronic petitions, interactive forums and online surgeries in
secure chat rooms.
In rural areas such as Southland, the Fencepost website33
operated by dairy co-operative
Fonterra was being widely used. It consisted of a range of information and tools relevant
to the dairying community, such as accurate regional weather forecasts, agricultural
news, classified advertising and a rural jobs marketplace. There were a number of
discussion boards where any topic relevant to the rural community could be debated;
subjects ranged from detailed question and answer sessions on dairy herd management
to more general debates on work/life balance. The site also included a knowledge base
of 350 agricultural articles which was searchable using keywords. Farmers could sign up
for a package which would let them benchmark their production figures against other
New Zealand farmers. Most users were Fonterra suppliers, who logged on daily to enter
their milk production figures.
Critical reflection
As in the previous section when it came to the use of new technologies such as mobile
phones, Eftpos and online shopping New Zealanders proved to be fast and enthusiastic
adopters. There was evidence of the quick take up of electronic commerce by
individuals, business and government. This was widespread right across the country,
and present in both rural and urban areas.
33
http://www.FencePost.com

166
5.3.6 Entrepreneurs in the rural sector
1985
Farmers were experimenting with new trends, such as farming deer and goats to reach
out to new niche markets. In 1985 mohair exports were predicted to reach $2 million
and as a product aimed at the top end of the market it was seen as unlikely to be affected
by recession. In Southland a joint venture between Invermay Agricultural Research
Centre, Sir James Fletcher, and an English Marquis was set up to research the value of a
rare type of deer to the New Zealand farming industry. The government provided a
major incentive for this diversification by providing over $200 million in the form of tax
write-offs for farmers to set up new ventures such as deer farms.
There were also initiatives to add value to traditional agricultural products, by producing
boneless lamb roasts and boneless chicken breasts. Pacific Meats launched a new line of
convenience sheep meat products aimed at the Asian market where lamb is traditionally
disliked. For example, Satay meatballs with a disguised smell. Initiatives such as this
were helped by the DSIR food research centre established in Singapore which adapted
New Zealand horticultural and fish products to Asian tastes.
New technology was seen as having great potential to add value in the agricultural
sector. A survey of computer education in adult education carried out by educator Dr.
Barbara Bibby revealed that farmers were the most active group in asking for and using
computer education, this was especially marked in the South Island. Federated Farmers
had carried out an evaluation of the two leading viewdata systems; the British Prestel
system and the French Teletel system and decided to standardise on Prestel for its
members. The Elders group also planned to extend the services it offered to farmers by
introducing new technologies such as videotex, video livestock auctions, and computer
based selling of wool.
The Minister of Science, Mr Tizard, predicted that the use of technology could boost the
value of export fish products to $1 billion by 1990. The Ministry of Agriculture and
Fisheries computerised its fertiliser advisory scheme, making 30 years of expert advice
from soil scientists available to individual farmers. The Dairy Board was close to
completing a complex information system for production and herd improvement
intended to improve both productivity and the quality of the product. IT also brought the
ability to streamline flock records to improve breeding, and a Timaru company had

167
developed SIRES a computerised stud recording system. The Kellogg Farm
Management Unit at Lincoln College developed a computer programme to make farm
budgeting easier. Ruakura Agricultural Research Centre combined CCTV and
computing technologies to develop a system to show the composition of a carcass in
terms of fat, meat and bone, which could be used by freezing plant workers.
Collaboration between government and private industry resulted in two new products.
One was a meter to measure lamb fat developed by Delphi Industries, the second was a
pasture probe developed by Design Electronics, which could accurately measure the
amount of dry pasture matter in a paddock. Government also encouraged innovation in
other ways, the DSIR held a week long seminar in Lower Hutt to promote more research
into how plants are affected by chemical sprays and pollution.
In Southland a local farmer‟s frustration with the lack of efficient lamb warmers led him
to design one of his own, which was marketed under the Dinkum label. Southland
farmers were diversifying; angora goat breeders were successful in achieving top prices
in a national sale, and an eight person steering group was set up to develop a goat
breeding scheme. Local venison farmers organised a regional seminar to explore
different ways to market their product and a new deer selling facility opened at Northern
Selling Centre‟s sale yards at Castlerock. The deer farmers were critical of a government
proposal to repeal tax incentives for development expenditure which they claimed could
bring their industry “to its knees.”
1995
In 1995 a former AgResearch scientist, Tom Watson, claimed that agricultural research
in New Zealand was going backwards due to lack of funding. Farmers were still trying
out new stock and produce. There was a lot of interest in ostrich farming throughout the
country and in both Wellington and Southland ostrich and emu farms were being set up.
Deer farming was also becoming more popular in Southland, and there was also an
example of a successful organic farm.
There was evidence of increasing interest in the use of information technology in
agriculture. More than 200 scientists and farmers attended a seminar on research and
technology in the sheep industry. The Ministry of Agriculture and Forestry (MAF) was
offering farmers access to a new Agribase database which would provide detailed

168
information on a range of farming and rural based activities. Farmers would input
details about their properties and the data would be used to assist with disease control
programmes, rural emergencies and market access. In the dairy industry, consultancy
group Agricultural Testing services were developing software for dairy farmers, and the
Meat Industry Information Service used the internet to give meat exporters access to a
range of information including health and hygiene regulations, trade guides and industry
profiles. In Southland, AgResearch piloted a soil fertility software programme in Gore.
2005
As of 2001 there were 110,000 farmers in New Zealand, around 40,000 of that number
were lifestylers and small scale hobby farmers (Statistics New Zealand, 2001). Of the
70,000 working farmers there was a core group of 30,000 who were turning over
$300,000+ a year and producing 48% of export earnings. As interviewee B put it: “these
guys are punching way over their weight.”
By 2005 farmers were using the internet frequently in order to reduce costs and enhance
profits. Telecom estimated that 70% of dairy farmers log on to the internet at least once
a week, and that 50% of farmers overall were using it to source industry data, daily
news, send e-mail or to compare prices and services online. It was also the year Telecom
launched the eFarmer of the year competition. The winner Brent Paterson used various
mobile and broadband technologies to run three businesses from his farm; he sold 20
rams to first time customers within a week of opening his website. The Dairy farmer‟s
industry body was developing a database which would enable farmers to pool vital
statistics and compare their performance against one another. A private company, Red
Sky was also developing business performance analysis software for farmers. The
increasing use of IT in the rural sector had prompted Agriculture Industry Training
Organisation to establish a range of resources to help people cope with the demands of
new technology.
Biotechnology had become a significant sector in New Zealand. Between 40 and 45
companies employed around 4,000 people with an estimated annual turnover of $250
million. South Canterbury had a biotech cluster and in Palmerston North a new bio-
commerce business incubator was opened. Massey University was involved in the
development of both a low impact soil management technology and a tool to measure
pasture while travelling around farm paddocks on a quad bike. An electronic ear tag
scheme for farm stock was being touted as the solution to recurring foot and mouth

169
outbreaks; however the cost was a major deterrent. A national Rural Excellence award
was held annually to recognise innovative agricultural practices.
In Wellington, the Wallaceville Animal Research Centre at Upper Hutt celebrated its
centenary and was expanded with the opening of a new centre concerned with bio-
security.
In Southland a deer focus farm was used to spread new ideas to southern deer farmers.
Deer industry leaders visited the region to present a seminar, and a company planning to
breed an elite deer herd bought a local farm. Despite this interest, rural bank Rarobank
was concerned that the supply of venison may have outgrown its market. There was a
trial to see if organic arnica could be commercially grown in the region.
Critical reflection
In the rural sector three different ways of improving innovation were observed. These
were; identifying new niche markets for agricultural products, adding value to products
and using information technology to increase efficiency.
Agriculture is the major player in the New Zealand economy and was responsible for
48% of export earnings in 2005. In the dairy faming sector the highly successful
Fonterra co-operative used ICT applications such as the Fencepost website to streamline
its operations, take up was good with 50% of dairy farmers reporting that they logged on
daily in 2005. In other areas of agriculture there was less use of ICT, this was partly due
to problems of inadequate and unreliable infrastructure that will be explored in more
depth in section 5.5.1, but there was also a feeling that more widespread use of ICT
would not start to happen without a “killer application” that was seen by farmers to add
real value to their business.
5.3.7 Evaluation
In an innovative region there will be evidence of new ideas, in terms of both products
and processes, and the local culture will encourage competition. There should be
evidence of entrepreneurial activity and a strong commitment to research and
development. A broad definition of innovation was used, which included adopting
innovative ideas from other regions or other countries; this was felt to be most
appropriate for the regional context.

170
Though there was some evidence of innovation, especially in the IT sector, and certainly
strong evidence that New Zealanders were world leaders in terms of adopting new ICT
technology, neither region demonstrated the density of innovative activity that would be
expected in a learning region. The success of individual IT companies such as Progeni
and Microprocessor Developments Ltd. was not built on and developed. This was not
helped by the low investment in research and development at the national level.
Though the government‟s financial commitment to research and development could be
questioned, there was strong evidence of entrepreneurial activity in New Zealand,
though as Table 23 and Table 24 show there did seem to be a slowdown in the rate of
patent applications between 2000 and 2005, despite a growth in the number of
researchers. It is difficult to get an accurate measure of innovation levels, many software
companies don‟t bother to apply for patents, this is one of the reasons Statistics New
Zealand now uses the numbers of people working in research as a measure of innovative
activity.
In pure economic terms individuals and businesses in the more populated urban regions
of New Zealand were much more likely to be adopters of new ideas and technologies
such as broadband than those in the less populated rural regions, even taking account of
population size. However, social capital also makes an impact. If a strong social
network is in place with an active local champion, a new idea is much more likely to
take off.
In both regions studied there was some evidence of innovation, and also evidence of the
adoption of innovations from outside the region. In the opinions of interviewees the two
regions were innovative, and both regions had won strong reputations throughout the
country for certain projects e.g. Southland for the Woosh wireless scheme. However
there was a lack of hard data to back this up. The evidence does seem to indicate that the
capacity for innovation is directly related to population size, with the most populated
regions being the most innovative.
To summarise the findings for this category were mixed, there was evidence of
innovation nationally and in both regions, but it was not present at the high levels that
would be expected in a classical learning region.

171
INTERACTING
5.4 Interacting
The category Interacting is concerned with soft factors such as the presence of social
capital within a region, the level of trust between organisations within the region, and
the existence of a common regional culture. Do individuals and organisations within the
region share a common set of cultural and economic goals?
This category differed from the other five in that much more material was found which
was relevant to the regional rather than the national situation. This spread is not
unexpected, as this category is concerned with issues such as social capital and regional
culture which manifest themselves more strongly at the local rather than the national
level.
Three major trends were identified for this category. The most significant trend was
around the area of regional culture, which included factors such as crime levels, the
growth and/or decline of community spirit, and initiatives by local government to
develop their regional communities. The activities of voluntary, professional and
women‟s groups are discussed in the second section. The third section reports on the
rising pressure from Mãori and Pacific Islanders to address the issues that were relevant
to their own communities. As from 1995 this category was broadened to include the
growing Asian population.
5.4.1 Regional culture
1985
In 1985, two major reports on the state of the nation were published. The Statistics
Department released the results of a survey of carried out in 1981 to assess the quality of
everyday life. The results showed that most people were happy with their lives, and
content with their jobs. Relationships with both family and neighbours were good, with
more than 70% having at least weekly contact. Most New Zealanders trusted the police.
One third of the 7000 respondents reported belonging to a job related organisation such
as a trade union or professional organisation, 5% belonged to an interest or a pressure
group and 10% were members of a cultural organisation. The Social Monitoring Group
also released their first report which took a broad look at social trends and revealed that

172
from birth onwards, inequalities are evident among children based on family, social and
economic circumstances, with Mãori and Pacific Islanders being particularly
disadvantaged (New Zealand Planning Council Social Monitoring Group, 1985). Two
other articles painted a bleaker picture of the national mood during 1985. One reported
on major increases in violent crime, and the other looked at New Zealand‟s rising
suicide rates and speculated that they could be linked to high unemployment.
Figure 17: Prison inmates 1880-2005 (Statistics New Zealand, 2006)
Crime was also an issue at the regional level; violent incidents were reported in both
regions. In Wellington a number of articles reported on gang violence in Upper Hutt,
teenage glue sniffers in Central Wellington and vandalism in Porirua. In the first half of
1985 serious crime increased by one third in Lower Hutt and by 8% in Wellington.
Wellington also had the worst record of any region for school vandalism in 1984. A
number of community initiatives were being set up to address this issue. The police
sponsored the “Blue Light Activities Programme” for young people in both regions.
Youth centres were opened in both Upper and Lower Hutt, and the Centre for
Community Initiatives, designed to give people more control of their lives, opened in
Wellington. In Southland well attended public meetings were held in both Invercargill
and Gore with the aim of setting up neighbourhood support groups. In Invercargill the

173
Kotahi Tanga34
youth centre was set up by volunteers to cater for wayward teenagers,
and a support group for parents whose children were in trouble with the law was started
by an Invercargill mother of five. Like crime, poor health is often viewed as an indicator
of social problems, and in the Southland region, Central Gore was identified in a
Department of Health study as being one of the 29 areas of New Zealand with a special
need for preventative health services. In Wellington, the Hutt Valley was reported as
having the highest rate of asthma in the country, while Central Wellington had the
lowest.
Figure 18: Recorded crimes between 1878 - 2005 (Statistics New Zealand, 2006)
Wellington City Council became the first employer in the country outside State Services
Commission to appoint an equal opportunities officer; this was reported as an attempt to
34
Unite as one

174
break the mono-cultural male culture of the City Council. Hutt Valley High School was
one of the first schools in the country to elect a student representative to sit on the
School Board. Wellington Central MP Fran Wilde put up the Homosexual Law Reform
Bill35
, but other sections of the regional community, such as the Principal of Hutt Valley
Secondary School, and the Salvation Army were opposed to it. In Lower Hutt, the
president of the Public Relations Office, Frank Graham, complained that there was a
lack of community spirit and that organisations in the area weren‟t pulling together. An
alternative view was expressed by Sir John Kennedy-Good, Mayor of Lower Hutt who
described it as a garden and science city with a close knit community and the best
selection of voluntary groups in the country. In Porirua there was a heated debate over
whether the area needed a community services officer. In the end, a strong lobby from
community organisations won out over resistance from Porirua City Council and the
officer was appointed. Petone also appointed a community relations officer.
In Southland the traditional rural culture was given as the reason for the region having
the highest percentage of Scouts in the country. A different aspect of the traditional
culture was shown by the petition against homosexual law reform being organised by
the Invercargill MP, Mr. Norman Jones. Some conflicting aspects of regional culture
were commented on by the Secretary of the Temperance Alliance, Thomas Quayle, who
noted that the alliance‟s strongest support came from Southland, despite the region‟s
“rugby, beer and racing” image. A local newspaper survey of the nearby small town of
Balclutha in Otago revealed that respondents were contemptuous of politicians, and only
31% considered David Lange to be a competent Prime Minister. Just 16.3% favoured
homosexual law reform, and 60% supported the All Blacks tour of South Africa36
.
As in the Wellington region, a lack of community spirit was sometimes reported; a
questionnaire sent out to Otatara residents about a new village hall had a disappointing
response rate. Organisers of the Calvary Hospital appeal to raise money for flats for the
elderly raised far less than they hoped for and local farmers were criticised by Southland
County Council for their lack of support of local rural businesses.
35
The Homosexual Law Reform Act was passed in 1986 36
This was controversial as anti-apartheid campaigners were against the tour

175
On a more positive note, a number of initiatives were in place to encourage the
involvement of young people in their local communities. Invercargill City Council set
up a Junior Council of twelve members aged between 15 and 17 to advise them on
youth issues. The Rotary club also organised a week long leadership camp in
Queenstown for 40 young people from the Southern South Island. The Rural Education
Activities Programme was also developing innovative programmes to create a stronger
linkage between schools and parents. Two areas of particular interest were Mãori
language and teaching computer skills.
1995
In 1995 concerns about crime rates were again a major issue in both regions. Following
national trends the crime rates in both Wellington and Southland had reduced from the
previous year, but there were increases in violent crime. As Figure 18 shows the
numbers of recorded crimes increased significantly between 1985 and 1995, but then
began to drop. However, as Figure 17 shows the number of prison inmates rose sharply
from 1987 onwards, and as of 2005 New Zealand had the 7th
highest imprisonment rate
in the OECD, with 155 prisoners per 100,000 of population.
In Wellington city centre violent crime and burglaries had increased, and in Southland
there was a rise in domestic violence call outs. In both regions the increase in offences
by young people was a major concern. In Southland, more than half the crimes
committed in 1994 were carried out by under 20 year olds. Teenage drug use was also a
concern, in Lower Hutt there was a push to set up a residential centre for adolescents
addicted to drugs or alcohol and in Southland there was a worry that the existing
adolescent drug rehabilitation centre at Colyers Island was likely to close due to lack of
funding. As in 1985 the Police were working with at-risk young people in Porirua, and a
new centre was being opened in Newtown for teenagers who had been involved in
crime. Both regions were in the process of setting up safer community councils to co-
ordinate crime prevention and support agencies. Victim and neighbourhood support
groups were also active.
In 1995 Wellington was becoming more culturally diverse, with Greek, Polish and
Italian festivals planned for Petone, and Gay and Lesbian events in Wellington City.
There was some resistance to the changing demographics, with Wellington residents
objecting to plans to build a new Mosque in the city. In Southland cultural diversity was

176
not so evident but there were some indications of liberalisation; School Principals
opposed the reintroduction of corporal punishment and the local access radio channel
introduced a “Wimmin” programme. Wellingtons‟ Public Libraries were the busiest in
the country per head of population, with 2.4 million visits to the 13 outlets in 1994,
while the problems of the rural economy saw Invercargill take the record for the busiest
Citizens Advice Bureau with 17,574 enquiries in 1994.
In the Wellington region there was a lot of evidence of development and investment in
terms of new buildings. Projects included a new leisure centre and $4 million upgrade of
the city centre for Porirua, a new community centre for Paraparaumu, a library,
community and recreation centre for Kilbirnie, and an $800 million upgrade of the
waterfront, a new stadium and refurbishment of the St James Theatre for Wellington. In
Southland, the only reference was to a planned aquatic centre for Invercargill.
However Wellington was not without its problems. There were sharp divides in socio-
economic background between different parts of the region, which directly influenced
school certificate results. Articles reported on chronic overcrowding in Porirua state
houses and problems with motorcycle gangs and juvenile crime in the inner city. The
health service in the Hutt Valley was rated he worst in the country. The Wellington City
Council was also concerned about the growing underclass and recommended that
community development work should be targeting this group.
An opinion piece in the Southland Times attempted to describe the “true Southlander”
and decided that the key characteristic was “hardy”. According to Gerrard Forde,
Southlanders are prepared for life‟s ups and downs and don‟t expect an easy time, they
are family orientated and not into extremes of lifestyle. A Southlander is rated not just
on personal success but on how they behave. There is also a strong community spirit;
this, however, can stifle creativity as it‟s difficult to experiment and make mistakes
when everybody knows each other.
Both regions were working on marketing themselves. In Southland the Invercargill
Licensing Trust pushed for more effort to be put into promoting the region to overcome
the negative ideas many people had about Southland. The Mayor Tim Shadbolt even
went as far as trying to organise a meeting with the Rolling Stones, who were playing in

177
Auckland, with the intention of persuading Keith Richards to revisit his 1965
description of Invercargill as: “the arsehole of the world.” His invitation was not taken
up by Mr. Richards. In Wellington region the Hutt Valley Chamber of Commerce
developed a new slogan: “Right up my Hutt Valley”, to publicise the region, which
created some controversy with local MP Paul Swain calling it embarrassing and refusing
to use it.
2005
In 2005, as in the previous years, articles discussed crime levels and initiatives to
address them, such as the education and social services centre being set up by an ex-
gang member in Lower Hutt. A Wainuiomata School Principal engaged local youth in a
school holiday programme by involving successful former residents of the area such as
All Black captain Tana Umaga. In Southland there were plans to create a new centre for
local teenagers, and Environment Southland created a forum especially for young people
to give them more of a say in the future of the Southland region.
In Wellington, Porirua celebrated 40 years as a city, and Southland‟s four local
authorities collaborated to produce a community outcomes report, “Our Way Southland”
which promoted “Southland as a great place to live” (Our Way Southland Project Team,
2005). Invercargill Mayor Tim Shadbolt worked to promote Southland by appearing on
the television show “Dancing with the Stars” as part of his campaign to “put Invercargill
on the map”, and even featured as a “Southland Icon” in a booklet of postage stamps.
Forty years on, the negative comments made by the Rolling Stones about Invercargill
were still an item of discussion in the local newspaper. Wellington‟s culture also had its
downside, with an AC Neilsen survey of 450 residents showing that almost half felt they
had little say in the running of the city.
As discussed in Section 2.3.4 Richard Florida (2002) uses the gay index (which
estimates the proportion of gay couples as a percentage of the population) to measure an
areas openness to diversity. Other research (Corrales, 2010) ranks world cities
according to their “gay friendliness”, by working out the number of reported gay,
lesbian, bisexual and transgender owned businesses as compared to population size. As
cities with fewer than 500,000 inhabitants were excluded, the only New Zealand city in
the rankings was Auckland, which was ranked 15th
out of 180 world cities. For

178
comparison Sydney was ranked 21st, and Melbourne 40
th. The top ten cities were all
European.
2005 2006 2007 2008
Auckland 1.23% 1.95% 1.57% 1.61%
Wellington 2.18% 3.13% 2.53% 2.37%
Rest of North Island 0.75% 1.18% 1.03% 1.00%
Canterbury 1.16% 1.72% 1.36% 1.55%
Rest of South Island 1.41% 1.08% 1.33% 1.36%
Figure 19: Civil Unions as a percentage of Marriages by region, derived from Statistics New
Zealand
In April 2005 the Civil Union Act, which enabled same sex couples37
to formalise their
relationship, came into effect but celebrants in Southland reported that there had been
little interest. Statistics as shown in Figure 19 support this comment; in the South Island
(excluding Canterbury) civil unions were 1.4% as a percentage of marriages as
compared to 2.18% in Wellington. It would be expected that a city would be more
tolerant of same-sex relationships than a rural area; however, what is interesting is that
the percentage of civil unions is consistently higher for Wellington than for the other
large cities of Auckland and Canterbury. This seems odd as even a cursory read of New
Zealand‟s most widely read gay and lesbian newspaper, “Gay Express” makes it
apparent that the gay scene is a lot more active in Auckland than Wellington. Further
investigation is beyond the scope of this thesis, however the data does indicate that New
Zealand generally was more open to diversity than most other countries, and that
Wellington was relatively more liberal than most of the rest of the country.
One aspect of interaction is that it is not about just about improving economic
performance; it is also about building up the community. Both a strong economy and a
healthy community are essential for the development of a learning region. Interviewee K
commented that at the national level the business sector and the community sector tend
to be large professional organisations and there is little connection between the two
sectors. However, in a small town they are very connected. The same people who own
the local dairy will also be running the girl guides and the Plunket38
. In many ways the
small business sector faces the same issues that community groups do. One Australian
37
It was also an alternative to marriage for heterosexual couples 38
Plunket is a New Zealand not for profit organisation which provides support services for under-fives
and their families

179
survey showed that only 45% of small businesses had an internet connection, whereas
over 80% of community groups were connected (Zorn, 2006). Many of the initiatives
developed around helping the community will also help small business.
Interviewees felt that building infrastructure alone will not result in changes. Alongside
the infrastructure you need education and willpower. It‟s only when the social structures
change that things happen. Interviewee B who worked for a telecommunications
provider reflected that he had held “that fairy tale view” that once broadband was
introduced to a region, all the farmers would flock to it and start to create community
notice boards, but that‟s not what happens. Rural people have yet to find the community
of interest that would motivate them to use ICT for social interaction. The assumption
could be made that the need for interaction would be stronger in isolated rural areas, and
rural lobby groups have made a strong case for their need for good effective ICT
infrastructure (e.g. high quality broadband) in order to communicate effectively.
However, to date, the farming community uses ICT for economic reasons rather than to
interact socially.
Local councils were very aware of the important role that strong social networks played
in the successful adoption of new ideas and initiatives by a community. Wellington City
Council took steps to consult with the wider community before putting its ICT strategy
for the community out for general consideration; again they used existing structures by
working with the Wellington 2020 Trust which already had strong links with
community groups on the area. Venture Southland itself is funded by different local
authorities and is able to use the networks already in place to reach out to the
community. Local councils recognised the importance of identifying key community
people and working with them through Marae and other community organisations.
Wellington City Council saw ICT as way of strengthening interaction within the region
by offering an opportunity for local residents to participate more in the democratic
process through the use of electronic forums and petitions. The City Council also
developed an e-community policy to specifically target disadvantaged areas. The areas
with low ICT use were the same areas that showed up in the deprivation index and in
the areas of housing need. The hope was that good ICT networks would assist with
building up social capital in these areas.

180
Smaller regions were seen as being more cohesive in terms of mobilising social capital.
Southland was viewed to have a “Go ahead attitude”, facilitated by great co-operation
between local authorities and major funders. What was clear was that there was no
blanket solution to improving economic development that could be applied to all
regions. Something that is successful in one region will not necessarily work in another,
and several interviewees mentioned a strong regional culture as a factor that can be
critical for success. For example the adoption of broadband by a school often depends
on the school being able to call on the local community for the extra funding required;
interviewees in Southland commented that remote rural schools in their region generally
had strong community support.
Critical reflection
In line with other countries such as Australia and the UK, New Zealand was becoming
more liberal, and more ethnically diverse. Homosexual law reform happened at a similar
time to other countries. However, New Zealand did demonstrate strong leadership in the
area of social reform when it became one of the first countries to legalise prostitution,
with the passing of the 2003 Prostitution Law Reform Act. In global terms New Zealand
can be regarded as a liberal, progressive and tolerant country, which is open to new
ideas and accepting of alternative lifestyles.
Interviewees confirmed the importance of regional culture and indicated that cultural
identity was often stronger in the less populated more remote regions. Strong ties were
found within both regions. Usually, these were sector based with the local council often
acting as the network hub. In Southland a picture emerged of a traditional rural culture
with conservative values. Both regions became more liberal over the period studied,
however as would be expected urban Wellington was more tolerant and ethnically
diverse than rural Southland.
5.4.2 Voluntary, professional social and women’s groups
1985
1985 articles mentioned a wide range of different voluntary groups from the New
Zealand Computer Society to the Red Cross to the Women‟s Division of Federated
Farmers.

181
In Auckland the New Zealand Computer Society celebrated its 25th
anniversary with a
four day conference featuring prominent local and overseas speakers. The society also
published a book “Looking Back to Tomorrow” (Williams, 1985) which reflected on the
changes brought by 25 years of computing technology in New Zealand. Another IT
initiative which relied on voluntary activity was the New Zealand Information
Technology week, which was run by volunteers from the Computer Society and the
Technology Advancement Trust.
Nationally Women‟s issues were to the fore as the government had appointed a Minister
for Women‟s Affairs, Mrs Hercus, who was busy collating information from forums
held countrywide to identify women‟s priorities and concerns such as job sharing,
flexible working hours and part time work. Wellington City Council developed an equal
opportunities policy to encourage women to apply for non traditional jobs. A “Women
and Employment in Science and Technology” symposium was held to encourage more
women into science related careers. The “Positive Action for Women” campaign had
similar aims, and ran successfully in Wellington. An international “old girls” network
was set up in order to enable businesswomen to reach new markets. The local branch of
the YMCA put on courses to empower young women, and a local museum, The Dowse,
put on an exhibition to celebrate the role of women in New Zealand society. There was
some resistance to these moves, with male councillors in Petone complaining that
offering training for women only was “sexist” and unfair to men and the NZ Educational
Institute rejecting the possibility of hiring an officer for women.
The level of voluntary activity in Southland was generally high; however, there were
some instances of low participation. The Invercargill Red Cross, complained of a lack of
volunteers, the Invercargill Youth Centre was closed down due to lack of both patronage
and finance, and the Director of the Otago University Extension Programme was
disappointed when no Southland women signed up for a teleconference on “Women,
Politics and Power”. On the other hand the Wairio Red Cross reported an increase in
membership, especially from younger members, and in Gore, 35 people attended a 10
week course on “Introduction to Community Service” with the intention of becoming
volunteers.

182
Rural women‟s groups were particularly active in Southland. More than 240 women
attended “Edna‟s Future”, a one day seminar held in Invercargill which looked at the
profile of rural women in the community. This was a follow up to another seminar held
in 1984, “Edna‟s Day Out”. Both were organised by a team of six women who were
concerned that rural women may be under stress due to physical and social isolation.
One member of the team, Kellogg Rural Leadership award winner Vivienne Allan,
worked with the Rural Education Activities Programme to carry out the first survey of
rural women in Southland (Allan, 1985). Over 230 women completed the survey and the
results showed that rural women were very concerned about recent moves by the
government which affected the financial viability of farming. In terms of their personal
situations, the majority of women felt that they were equal partners with their men folk
and reported that they had a high level of participation in farm management and decision
making, and in both physical and administrative work. Most women felt they led full
and active lives and more than 60% of the sample held office in a voluntary organisation
such as Cot Death Society, Federated Farmers, Plunket, or various church and sporting
groups (Allan, 1985). Other articles from 1985 showed that rural women were well
connected to both local and national networks; local women attended the National
Council of Women conference, and two Southland women were selected to attend the
Kellogg Rural Leadership course. An old girls network set up through Verdon College
forged links with schools in the Cook Islands and raised funds to send typewriters to
them. Women‟s church groups hosted national conferences for both Presbyterians and
Catholics. The region also hosted a visit from Elsie McInnes, the president of the
women‟s division of Federated Farmers. Jean McDonald, president of the Eastern
Southland Federation of Country Women, expressed the opinion that contrary to popular
belief, rural women have always had active and fulfilling lives.
1995
In 1995 voluntary groups were still very much in evidence. Articles mentioned Grey
Power, the Citizens Advice Bureau, Newtown Residents Association, Waikanae 200039
,
Homeless Shelter, Women‟s Groups and Employment Trusts. Invercargill Volunteer
Centre reported that voluntary activity was rising due to limited employment
opportunities; Victoria University Masters student Debbie Peterson surveyed 1400
39
A group set up to promote development of the town of Waikanae in the Wellington Region

183
volunteers placed by the Wellington Volunteer Centre and found 65% had found paid
employment as a result of volunteering.
As in 1995 women‟s groups were active in both regions. In Wellington, a new Women‟s
Centre was officially opened in Upper Hutt, 135 business women attended a seminar on
entrepreneurship at Parliament, a network for local business women had 1200 members,
and a breakfast for women was being organised by Hutt Valley Chamber of Commerce.
In Southland the Women Interested in Self Employment group held its first meeting and
the Invercargill Women‟s Refuge had a good response to its annual appeal.
In both regions voluntary groups struggled for funding. Newtown Residents Association
approached Wellington City Council for financial aid, and Porirua City Council asked
Central Government for help to keep the Citizens Advice Bureau going. In Southland
the Volunteer Centre itself was closing down as funding from the central government
dried up.
2005
In 2005 articles women‟s groups, particularly rural women‟s groups were significant. At
the national level Women in Technology, the society set up to promote female IT
workers, was active. Vodafone, Datacom and Auckland University of Technology had
jointly developed a web based skills exchange system to match their staff to volunteer
opportunities.
Community groups needed to keep in touch with each other, and ICT was a good tool
for this particularly for geographically spread groups. In 2005 the use of ICT in the
community sector was already widespread. Research showed that 80% of community
groups in Australia had internet access (Zorn, 2006). Interviewee K who worked in the
community sector commented that basic access was no longer an issue in New Zealand,
though there were still problems with slow dial up access and downloading large files.
Interviewees in both regions made the point that the aim of developing locally-based
telecommunications was strongly rooted in a desire to make high speed ICT connections
available to the whole of the community. The reasons for developing a community
owned telecommunications provider were not just about providing cheap
telecommunications but also about strengthening the community over the long-term.

184
Though ICT can assist with building up linkages within local communities, it is just one
of a basket of tools that are available and interviewees saw it as a complement rather
than a replacement for face- to-face communication. Strong social networks within a
region will drive innovation. ICT can enhance these networks, but ICT on its own
cannot build them.
In Wellington, a Women‟s Convention was held at the Town Hall, and as in 1995
articles gave examples of voluntary work being used as a stepping stone to full time
employment. Local community groups shared a web hosting service funded by the
Wellington City Council. Wellington Community Net (WCN)40
was a free web page
hosting service that provided access, content, support and training to community groups
and people in the Wellington region. As of 2006, 580 organisations had websites on the
network. WCN was established and managed by Wellington Regional 2020 Trust and
was funded by Wellington City Council. The WCN used internet technologies to
facilitate and promote the work of not-for-profit organisations and individuals, for the
purpose of sharing information within the Wellington region. WCN aimed to promote
participation in civic life and to contribute to the community socially, culturally and
economically (Dashfield, 2006).
In Southland the voluntary sector was active, with Community Trust of Southland
praising the efforts of local volunteers. The activities of several different groups for rural
women were noted, including Women in Dairying, Rural Women New Zealand,
Women in Farming and Rural Women in Business. Rural Women NZ celebrated its 80th
birthday and Chairwoman Rhonda Riddle reflected that although today the organisation
was talking about getting broadband into rural areas, many of the issues discussed by the
group had remained the same over the years, such as health, isolation and school
closures. One article gave an example of a farmer‟s wife with a full time job in
Invercargill using the Women in Dairying website to keep in touch with other rural
women.
Critical reflection
The data collected provides strong evidence that New Zealand has a high level of social
capital, and this was consistent throughout the entire period studied. Though it is not
40
http://www.wcn.net.nz

185
possible to directly compare levels of social capital with other countries, anecdotal
evidence suggests that the level of volunteering in New Zealand is markedly above what
is usual. The voluntary sector was active in both Wellington and Southland, but the
close knit networks of the rural women‟s groups in Southland stood out as being
particularly significant.
5.4.3 Mãori, Pacific Island and Asian Issues
1986
NZ
1996
NZ
1996-
Well
1996
South
2006
NZ
2006
Well
2006
South
European 81.2 71.7 71.8 84.4 67.6 69.8 78.6
Mãori 12.4 14.5 12.0 11.0 14.6 12.8 11.8
Pacific
Island
3.7 4.8 6.2 1.16 6.9 8.0 1.7
Asian 1.5 4.4 5.27 0.67 9.2 8.2 1.2
Table 26: Ethnicity as a percentage of total population (from census information Statistics New
Zealand)
Table 26 shows how the ethnic make up of the population changed between 1985 and
2005. The country was becoming more ethnically diverse, as both the Pacific Island and
Asian populations grew, particularly in urban areas.
1985
In 1985 there was increasing pressure from the Mãori and Pacific Island communities
for their voices to be heard. Teachers from technical institutes throughout New Zealand
attended a Hui41
in Rotorua to discuss how to best meet the needs of bicultural New
Zealand. A Hui was also set up to involve Mãori more in the tourism industry. As one
National Business Review article put it, they needed to: “Move out of the song groups
and into the suites of power.” The Secretary for Mãori Affairs, Dr. Tamati Reedy, also
urged the Mãori people to take charge of their own tourist developments. A Mãori
women‟s Secretariat was to be set up within the Ministry of Women‟s Affairs. The
Waitangi Tribunal was considering a claim to give equal status to the Mãori language in
all spheres of public life, a claim that was eventually granted in 1987. On a visit to the
country, Richard Thomas, the Director of Television for the Australian Broadcasting
Commission judged New Zealand television service to be more multi-cultural than those
of Australia, and much more open to community input. However the Waitangi Tribunal
41
Maori term for a meeting

186
disagreed and criticised the Broadcasting Corporation for failing to meet the needs of
Mãori people.
Action was being taken to revive the Mãori language Te Reo. Hoani Waititi Marae, the
first entirely Mãori medium school, opened in Auckland. This was a private initiative
which was helped by a lottery board grant of $10,000. In the same year the government
funded a Mãori language education package worth $3.7 million which included
provision for the appointment of 35 fluent Mãori teachers.
Mãori were questioning whether it was appropriate for non-Mãori to carry out research
into the Mãori community. The appointment of an Englishman with no experience of
Mãori culture to oversee a research project investigating Mãori language education was
heavily criticised, and resulted in the appointee, Dr Robert Woods, resigning just days
after taking up his post. The Mãori council wanted more control over educational
research funds and asked for part of the Council for Education research funds to be
shifted to a separate Mãori body.
Job training for school leavers was also an issue; current training programmes were not
felt to be meeting the needs of Mãori and Pacific Islanders, especially if they were
female and from rural areas. A recommendation was made for a network of community
training colleges. In June the Minister of Education allocated $1.25 million for a special
employment package for Mãori and Pacific Islanders.
In Wellington, Mãori students at Victoria University were trying to set up their own
representative body to work alongside the University Students Association. A Victoria
University Council meeting debated the issue of the low numbers of Mãori (less than
3%) students at the university; however the Council was adamant that it was not
prepared to lower entrance standards. A more flexible view was taken by the retiring
General Secretary of the Association of Teachers in Technical Institutes, Mt Ray
Fargher who urged for learning environments needed to be changed to suit the needs of
Mãori, women and the young unemployed. There was some positive news from Victoria
University. A Hui was held to celebrate a record number of Mãori graduates, 28 as
compared to 6 in 1984. Te Puni Wahine was launched as an initiative by female Mãori

187
students who gave lectures on their own perspectives as part of a women‟s studies
course.
The Pacific Island community in Porirua were also attempting to have a bigger say in
the field of education, and nominated 40 representatives from their community when the
Education Department announced that a 14 member board was to be set up to work on
proposals for a new community college. The college would focus on the needs of the
Porirua community, 60% of whom were Mãori or Pacific Islanders. The prospectus
would include bridging courses for Mãori and Pacific Islanders for programmes such as
nursing education.
The multicultural make up of Porirua was seen as a potential tourist attraction, with
entertainment such as the “Polynesia by Night” show being offered at a local tavern
every Saturday. The Samoan community in Porirua received consent to build their own
church, and the Samoan language was introduced as a final year subject at Mana
Secondary College. The Polynesian women‟s‟ group in Porirua was pleased to celebrate
the first birthday of their permanent base, Pacifica House.
The Principal of Aotea College in Porirua, where 20% of students were Pacific
Islanders, was concerned that they were becoming a group of “lost souls” and suggested
introducing Pacific Island languages, particularly Samoan, into the school curriculum.
The library in Porirua turned multicultural theory into reality by making all signage and
instructions available in the seven main languages spoken by the local community. All
the translation work was done by local people.
One visible sign of the growing recognition of Mãori culture was the construction of
Marae in the Ministry of Foreign Affairs, Victoria University and Porirua College. Not
everyone was in favour of these moves, with Wellington City Councillor Bryan
Weyburne expressing concern over the “force feeding” of Mãori culture.
In Southland the Mãori community was very active, particularly in looking after their
young people. February saw the opening of a new Marae at Bluff which was built using
voluntary labour. One Invercargill couple, Tony & Whai Brown, who had years of
experience as foster carers received some funds from the government to set up the Te

188
Awhina Family Trust to provide shelter for young people. Another initiative associated
with fostering was Maatua Whangi which allowed young Mãori to be fostered in homes
close to their own. There were also calls by Mãori elders for more support from the local
community for young Mãori coming to the region to find work.
In Southland the visiting president of the New Zealand Educational Institute, Mr David
Kerr, praised the Te Kohanga Reo Mãori culture programmes being introduced in
Southland schools. He also commented that he was interested to find such a large Mãori
and Polynesian population in Southland.
Other issues that concerned Mãori in Southland were similar to those being brought up
at the national level. There was a move to revive the Mãori language, as evidenced by a
two day course on Mãori language and culture being offered by Southland Community
College to coincide with Mãori Language week. There was also a call for a stronger
political voice for Mãori, with campaigners in Wallace County arguing that an increase
in the Mãori population demonstrated the need for Mãori issues to be included in the
Council‟s district review scheme, and Southland Catchment Board appointing an
advisor on Mãori affairs to liaise between Mãori landowners and the local authorities.
1995
A 1995 National Business Review Poll showed that New Zealanders were not too keen
on immigrants from the Pacific Islands and Asia, 57% of people thought there were too
many Pacific Islanders and 51% too many Asians. There was less resistance to white
immigrants from Australia, the UK and South Africa. Statistics showed that Samoans
were now the largest Pacific Island group in the country. Another survey showed that
eight out of ten New Zealanders didn‟t view the country as being part of Asia.
The Chief Executive of the Pacific Island Business Development Trust, Frances Hartnell
was trying to encourage more islanders to start up their own businesses. Pacific
Islanders had the highest unemployment among the countries ethnic groups at 21%, with
only 3% in their own business. Since the trust started operating in 1993 it had helped
Islanders to establish over 70 new businesses
The internet was being used to make resources related to Mãori culture more widely
available, Wellington lawyer Tom Bennion made his Mãori Law review available using

189
the Wellington City Council server, and the Council for Education Research gave the
public access to its Mãori Lexical Computer Database which allows users to enter an
English term and find the Mãori equivalent or vice versa.
1995 was Mãori language year “He Taonga Te Reo”, and in Wellington the Public
Library hosted a series of cultural events. The capital city also hosted a Pacific
Languages Forum and a Mãori Summit. At the summit concerns were expressed about
how the number of fluent Mãori speakers has plummeted since the 1970s. A Mãori
language school opened in Lower Hutt and a Mãori group set up a centre in
Wainuiomata Secondary School to provide after school education, healthcare,
counselling and teaching of Mãori. One article claimed some Hutt Valley schools were
experiencing “white flight” as parents shifted their children to Pakeha dominated
schools. At Victoria University five members of one high achieving Mãori family all
graduated at the same ceremony, an event no one could remember happening before.
In Wellington, Pacific Islanders were making a contribution to the cultural life of the
capital with a festival in the City Centre, a fundraising performance for Save the
Children and an art exhibition in Porirua. Pacific Islanders were continuing to become
more involved in local politics, with nine Pacific Islanders standing for the Porirua local
elections and six standing in Cannons Creek. Wellington City Council was targeting
employment spending at Pacific Islanders along with young people and the long-term
unemployed. There was some trouble over the use of the Wellington Multicultural
Educational Resource Centre, with other ethnic groups claiming that Pacific Islanders
were trying to shut them out. The City Council had scrapped its Mãori Unit and standing
Mãori Committee and intended to replace by establishing a Mãori Mayoral Forum.
Southland was also improving employment prospects for Pacific Islanders by running a
business course aimed at encouraging Pacific Island people in business, hosted by the
Pacific Island Advisory and Cultural Trust. The Trust was also carrying out a survey of
the 300+ Pacific Island families living in Southland to establish their social and welfare
needs.
On Waitangi Day there was a small protest march by Mãori through Invercargill,
Trouble flared at Waiau College in Western Southland with the school being accused of

190
racism and treating Mãori students differently, and a Mãori teacher claiming there was
no support from the Principal and other teachers. This was a symptom of a wider
concern about Mãori language programmes being under threat in Southland.
2005
2005 saw the launch of an online database containing the names and iwi affiliation of
98,000 Mãori, to make it easier to keep in touch with whanau42
. A conference for
Pacific Islanders noted that the average weekly income for Pacific people was $412, as
compared to $637 for New Zealanders of European descent, and unemployment was
6.5% as compared to 2.5%. Speakers urged Pacific Islanders to break the cycle of
dependency on the state, develop more political clout and start up their own businesses.
In 2005 racism was still an issue. In Wellington a man was found guilty of harassment
after sending hate mail letters to Muslim women, and in the wake of race riots in
Sydney, posters appeared around the capital city trying to incite similar riots here. On a
more positive note, Upper Hutt held an International Festival to celebrate ethnic
diversity and Southland Multi-Nations Council was working to make immigrants feel at
home in the region. In Southland, a community outcomes report noted that 87.2% of
people were European, 10.5% Mãori, 1.3% Pacific Island and 0.9% Asian.
In Wellington the Mayor of Lower Hutt, David Ogden, wanted the city to have a Mãori
ward to ensure Mãori representation on the council. He also wanted to start a debate
over changing the name of the city to reflect its Mãori heritage. In Southland names
were also on the agenda with Ngai Tahu gifting the name Te Rohe Potae O Murihiku43
to the district council.
In 2005 one article mentioned that the Open Polytechnic was hiring a local IT firm to
customise the Moodle open source learning management system by developing modules
in Te Reo and Samoan. In Southland, Mãori language courses being offered in Bluff
were attracting large numbers of students, and SIT was presented with a korowai44
which represented the story of the institution.
42
Family 43
We share the land, we share the community, we share the future of our young people 44
Bird feather cloak

191
Critical reflection
There was growing pressure to recognise the rights of indigenous people in many
countries around the world during the period studied. Moves to revive indigenous
languages and preserve culture were also widespread. New Zealand is a bi-cultural
country and the Treaty of Waitangi45
signed in 1840 recognises the rights of Mãori
people. Throughout the period studied the voice of Mãori and Pacific Islanders became
stronger and they were increasingly involved in the political and cultural life of the
country.
The growth in the Asian population also reflects an increasing mobility that was
happening worldwide. Though some evidence of racism was found this seemed to be
less prevalent in New Zealand than in other countries such as Australia and the UK.
5.4.4 Evaluation
In an interactive region individuals within the region will share a common culture,
social capital will be high and crime rates will be low. There will also be evidence of
active social networks through work, sport, voluntary groups and similar. There is
strong and consistent evidence of high social capital in New Zealand at both the national
and the regional levels. There was a strong cultural identity in Southland; in Wellington
cultural loyalties tended to be to the local authority area rather than to the region.
By the end of the period community groups had become well aware of the contribution
ICT could make to regional development. In 1985 and 1995 ICT networks were mainly
used by the government and private business. By 2005, ICT was widely used in the
voluntary and community sectors. This trend was observed in both regions and was
reinforced at a national level by the publication of the government‟s Digital Strategy
(Ministry of Economic Development, 2005). Community groups were using hard ICT
networks to complement and reinforce existing soft networks.
By 2005 information technology was being increasingly used by the not-for-profit sector
and Mãori groups. However, though ICT networks were identified as playing a role in
45
The Treaty of Waitangi was signed on 6 February 1840, by representatives of the British Crown and
various Mãori chiefs . The Treaty established a British governor in New Zealand, and gave Māori the
rights of British subjects and recognised Māori land ownership.

192
building interaction within a region they were seen as a complementary to rather than as
a replacement for face-to-face contact.
To summarise, the results for this category were very strongly positive, at both the
national and regional levels there was plenty of evidence of good social capital, and
active citizen involvement in civic life.

193
INFRASTRUCTURE
5.5 Infrastructure
Infrastructure includes both hard and soft infrastructure. The first two categories cover
the hard infrastructures of telecommunications and transport, and the third covers soft
infrastructure in the form of regional development. A learning region should have a well
developed transport infrastructure, both within the region and to markets and suppliers
outside the region. The quality of telecommunications services available throughout the
region is critical and forms a major focus of discussion here.
5.5.1 Telecommunications
1985
In 1985 telecommunications were looked after by the Post Office which had a number
of initiatives in place; it was developing a major new network for handling electronic
data, the Digital Data Network, customer records and services were being computerised
and it had also developed plans to supply the new electronic funds transfer network. In
this last initiative it faced competition as a private organisation, Databank, had also
made it clear that they were interested in the Eftpos network.
The Post Office, which operated as a monopoly at the time, was recorded as making a
profit of over $200 million in the 1984 financial year, of which the government took
more than $185 million. There was increasing pressure for the Post Office to be
privatised. The Post Office was also beginning to feel pressure from consumers, with the
newly formed New Zealand Telecommunication Users Association (NZTUA)46
acting
as an advocate for customers. The New Zealand Computer Society was also speaking
out against the Post Office. The Society published a position paper which expressed the
view that a monopoly was not in the national interest and was making the country less
competitive in world markets. The paper called for partial deregulation and a full review
of the Post Office‟s role in new telecommunications service areas.
In the Wellington region the Post Office announced that it planned to spend $46 million
on telecommunications development in the next financial year. Though optical fibre had
previously been used for the telephone network, 1985 saw the installation of the first

194
optical fibre network link for a local business application. The network was going to be
used to transmit information between the Government Printing Office and Parliament,
and would potentially form the basis of a Parliamentary Office Information System.
In Southland widespread upgrading of the local telephone service was taking place, as
Subscriber Toll Dialling and International Subscriber Dialling were introduced to the
region via the Invercargill telephone exchange. Technicians were reported to be working
around the clock to introduce the service by the end of the year. By 1987 Stewart Island
would also have the benefit of an automatic telephone exchange. Invercargill council
was upgrading its telephone system by replacing all the telephones in the Civic
Administration building with a new PABX system.
One issue that was receiving attention was the Post Office‟s decision to charge farmers
business rates for calls, despite the fact that their telephones were for personal use as
well as business. The Post Office confirmed that as from July about 70,000 farmers
would be charged business rentals. Federated Farmers argued that all farmers should pay
only residential rates, not just those on party lines and manual exchanges.
1985 saw the beginning of mobile telecommunications, with both Swedish company
Ericsson and the New Zealand Post Office showing interest in this area. The Post Office
announced plans to introduce a mobile telephone service in Auckland by 1987,
extending it to Wellington and Christchurch in 1988. The Post Office was also
investigating whether mobile services might provide a cheaper alternative to traditional
services for rural areas. In 1991 Telecom was launched as a public company and the
Post Office had no more involvement in telecommunications.
Satellite technology was being used in 1985 for both television and telecommunications.
Satellites were becoming increasingly popular for providing television services; TVNZ
signed a contract which guaranteed access to satellites in the Pacific and the Atlantic to
provide content from the USA and UK. A third Aussat satellite was planned for launch
in 1986 which would improve both broadcast and telecommunications services
throughout New Zealand and the South West Pacific.
46
NZTUA later changed its name to TUANZ
195
In Wellington the 14 year old PEACENET satellite operated by Wellington Polytechnic
to connect schools and education groups around the Pacific (as previously discussed in
section 5.2.4) was about to be replaced. A new satellite earth station was also close to
completion, though most of its capacity would be used for television broadcasting.
There would also be a data exchange trunk between Wellington and Auckland.
Clear skies made Southland one of the best areas in the world for long distance radio
reception, and amateur radio operators were praised for the efficient way they handled
their hobby, which linked them with other operators from all over the world. On the
broadcasting front 1985 saw items from Southland being televised directly to the region
for the first time ever during the annual telethon.
1995
1995 saw growth in telecommunications links both within the country and between New
Zealand and the rest of the world. Much of this expansion was a response to increasing
use of the internet. The main internet link to the USA was NZGate, based at Waikato
University, which doubled its capacity in May and expected to have 100,000 users by
the end of the year. Waikato University was also spearheading the development of a
nationwide high speed broadband network. New Internet Service Providers were setting
up networks around the country. Telecom itself had also noted the rise of internet traffic
over the telephone lines and announced its intention to set up a broadband network for
business customers. This was shortly followed by a similar announcement from Clear
Communications.
In 1991 Telecom was listed on the New Zealand and New York stock exchanges at $2 a
share. By 1995 share prices had trebled while net earnings had doubled. The company
was on target to make a $630 million profit by March 1985. This success brought
criticism from other telecommunications companies and an accusation of “breathtaking
greed” from MP Jim Anderton when line rentals increased by 4%. The
telecommunications market was competitive and dynamic. Telecom‟s main rival was
Clear Communications and there were many smaller companies, such as BellSouth, who
set up a new mobile phone service. Telecom was also under pressure from users lobby
group TUANZ who were concerned about disruptions to services.

196
The vision of Wellington Mayor Fran Wilde for an “InfoCity” was being put into place
with the setting up of City Link as an agency to provide a high speed broadband links
throughout the central business district. CityLink47
was a single 13 square mile local
area network (LAN) that covered Wellington‟s CBD. CityLink was based on a fibre
optic cable network that offered an open networking model for all “Service Providers”
and “Clients”. This meant that any provider could offer services over the network, and
any client was able to choose from a range of providers. All network traffic was peered
on a local peering exchange, which meant that local business to business traffic stayed
local and was free.
The future of the World Communication Laboratory was in doubt as it neared the end of
its three years of government funding. The Lab had been set up with the idea of
encouraging overseas companies to use New Zealand‟s deregulated environment to
experiment with broadband, and projects had included telemedicine and video-
conferencing. Another local project was the setting up of a video surveillance system in
Porirua City Centre.
In Southland the main issue was building a reliable network. Party lines were phased out
as remote parts of the region were connected to computerised exchanges, and Telecom
was working to reduce the overload on its cell phone network.
Cable television had become a significant player in the broadcasting market, and there
was opposition from other companies when Telecom attempted to enter the market by
buying 25% of cable television company Sky. Radio New Zealand was to be offered for
sale and new FM frequencies were offered for commercial use. In both Southland and
Wellington regional television channels were being set up. In Wellington, Porirua was
the first part of the region to get Telecom‟s cable television station, and a local company
was busy developing interactive television advertising. In Southland, local radio
operators were buying up the new FM frequencies on offer. There were also concerns
when the region‟s only Mãori radio station went off the air.
47
: http://www.citylink.co.nz

197
2005
In 2005 telecommunications was a “hot topic”, as evidenced by the increase in the
number of articles found (see Table 4). There was pressure from both consumers and the
government to make high speed broadband available throughout the whole country, and
the launch of the IPSTAR satellite made broadband available to remote rural areas.
There was intense competition in both the broadband and mobile telephony markets.
The key player in both was Telecom, which managed to increase profits by 19% on the
previous year. In the broadband market Telecom‟s main rival was Telstra Clear, plus a
number of smaller providers, Woosh, Counties Power, iHug and CallPlus. In the mobile
sector the main challenger was Vodafone. Both Telecom and Telstra Clear were accused
of unfair competition by the other telecommunications providers. Challenging
Telecom‟s dominance of the market could be expensive. Woosh lost $18.9 million in
2005 even though it claimed to be picking up 40% of all new broadband connections;
the loss was due to the costs involved in setting up its own wireless infrastructure.
New Zealand‟s success in rolling out broadband to the whole country was a matter of
debate. The country jumped up two places in the ICT world rankings compiled by the
World Economic Forum, and British researchers reported that broadband penetration in
New Zealand grew faster than in Australia, Western Europe and North America in the
first half of 2005. However according to the OECD rankings New Zealand was still only
22nd
in the league table that measured household take-up of broadband. As of 2006,
following pressure from the business sector and telecommunications providers, the
Government announced legislation to unbundle the local loop, a move that was
anticipated to make the telecommunications sector more competitive and thereby result
in cheaper faster broadband provision, though there was some debate about the impact
this would have in the less profitable rural areas.
Interviewees all felt that improving ICT infrastructure and access would bring economic
benefits. However, no-one could give an example of a direct relationship between ICT
and improved regional income. As interviewee B put it:
“It’s a chicken and egg thing – broadband uptake follows economic performance,
improved economic performance will be one consequence of having broadband.”

198
Those interviewees from local and regional government regarded the setting up of
telecommunications networks as a form of infrastructure development similar to
building roads, railway networks or a sewage system. The applications that will run on
the network were compared to the trucks on a road. Interviewee E made the following
comment:
“You don’t really know what people are going to do with the road after you build it,
but you know intuitively that it’s a good thing to do.’’
However, interviewee C felt that there had been too much focus on building
infrastructure, instead of building useful applications for that infrastructure. The
comments from these two interviewees are indicative of the two different schools of
thought that existed in New Zealand at the time of the research. The majority were of
the “build it and they will come” school and believed that setting up broadband
infrastructure was in itself a good thing, and that it would automatically lead to
economic and social benefits. However a vocal minority argued that any development of
infrastructure should be driven by demand for applications, and merely making the
infrastructure available would not automatically lead to it being widely used (B. Howell,
2006).
Interviewee E explained that a telecommunications network differed from a gas or
electricity network. With a utility network if one person is not connected it affects only
them, but with a communications network, if one person is not connected it
disadvantages everyone else. For example, if one customer is not connected to an
electricity network it doesn‟t directly affect other customers or the provider. However,
with a communications network if a message can‟t reach 100% of customers, then an
alternative method must be found of getting messages to those who aren‟t connected.
Interviewee E provided an example to illustrate this. In the 1990s, New Zealand Post
decided to charge for rural deliveries. The reaction of the farmers in Southland was to
cancel their deliveries. Initially only the farmers themselves were disadvantaged, but
when the 20th
of the next month came around all the businesses in town needed to post
out invoices to the farmers and they couldn‟t do it. So New Zealand Post quickly got the
message not just from the farmers, but also from the townsfolk. This is why the goal of
local councils is to get 100% coverage, even if it means taking the network out to some
really remote areas. Though it can be expensive to take a telecommunications network

199
out to rural areas, there was a broad agreement by interviewees that it was a good thing
to do.
Interviewee A took the view that though broadband was definitely of benefit to the New
Zealand economy potential uses could not be predicted:
“You need bigger pipes to do all sorts of things that people haven’t even though of
doing. If bandwidth cost nothing what would you do with it?”
Interviewee A also pointed out that it may be a decade or more before the social and
economic benefits of ICT infrastructure appear and other interviewees questioned
whether broadband would add value to the economy at all without suitable value adding
applications. Where a sector saw a real benefit in adopting broadband, for example the
Fonterra dairy farmers who linked up to Fencepost (see section 5.3.5) adoption rates
were high. For other sectors the “take it out there and they will come” attitude did not
necessarily follow. Often those who had broadband were using it for entertainment
purposes rather than to add any value to the economy. The most visited local site in New
Zealand was TradeMe48
, and most of the international traffic in and out of New Zealand
was taken up by peer-to-peer applications such as music and video. Though it was only
a small proportion of users, it was a high proportion of bandwidth.
The rural sector is vital to the New Zealand economy, and broadband offers the
opportunity to add value to agricultural products (Oram, 2006). In the view of
interviewees who were involved in the rural sector, New Zealand economic policy tends
to be driven by “Auckland Centric” or “Wellington Centric” thinking. Policy makers are
seen to be completely out of touch with provincial New Zealand. This was exacerbated
by the fact that at the time of the research the Labour Party, which had been traditionally
viewed by farmers as favouring urban New Zealand, had been in power for three terms.
Interviewee B criticised telecommunications providers for failing to perceive farms as
the large businesses they actually were:
“There was a complete lack of any idea of what rural New Zealand was about. Just
a complete lack.”
On the other side evidence from the interviews and other sources (Locke, 2006; Oram,
2006) suggested that most farmers had a narrow view of the potential of ICT, and didn‟t
48
Online auction site used by general public to buy and sell new and used goods

200
understand how a technology like broadband could add value to their business. A
contributing factor was the fact that in 2005 the average age of farmers was 57, which
meant that most of them had not grown up with ICT.
Though there was widespread agreement that telecommunications were making a huge
impact on the rural sector, there were concerns that Telecom had a poor record of
delivering services in rural areas, with a Federated Farmers survey showing that 50% of
farmers found it hard to maintain a connection to the internet and that almost 75%
considered their connection speed to be slow. In a typical scenario a farmer might turn
on the computer in the morning, log on to the internet, start off the download of an Xtra
homepage, then go away to have breakfast and make coffee, then go back and check the
computer. If they were lucky the download might be complete. This had given most
farmers a very narrow view of the potential of broadband.
Interviewee B commented that when farmers are shown packages such as Fencepost
they are amazed. They hadn‟t thought of the internet as something that could add value
to their business. The few that had were more than happy to go out and invest in a
satellite dish, and they would have worked out in advance exactly what they were going
to do when they were connected. Broadband could make a huge difference even to
everyday buying and selling, and farmers did a lot of that. As interviewee B put it “they
make $1000 decisions everyday.” Interviewees B, C and E felt that if being hooked up
to broadband brought farmers some critical extra information. It could make a world of
difference, and one broadband enabled business deal could potentially pay for ten years
of broadband access. Farmers‟ wives were also mentioned as being often very quick
adopters of new technology.
Though many farmers were not clear about which applications would add value until
they tried them, there were a few who had well thought-out ideas about how they could
use ICT. What they were interested in were applications like online banking, specific
farming packages, or specialist agricultural websites like Fencepost. Rural people went
online specifically to look for information relevant to their daily work. For example,
interviewees D and E both confirmed that the weather site at Venture Southland was
very popular: as interviewee D put it “Weather is number one.” Farmers also liked to
check wool prices, cattle exports and similar. Another popular site was the Alliance

201
Freezing works company that priced the lamb. All those sites affected how farmers were
running their business on a day to day basis, whether they were going to sell their lambs
or not today.
When farmers did see clear benefits they were fast adopters; the Fonterra farmers only
started buying broadband two years ago (in 2004) and already had 32% take up, and by
2007 that take up will be up to 45 or 50%49
(Walker, 2006). Brent Paterson, the 2005 E-
Farmer of the year, used a range of software applications; his pasture management
system alone saved him thousands on fertiliser. He was not interested in whether it was
broadband or video streaming; all he needed was connectivity and reliable access to his
main applications (Paterson, 2006).
Interviewee E viewed Southland farmers as being caught in a triple bind; they have
hopeless dial up, they are distance challenged and they can‟t get economical broadband.
In some cases farmers who had access to broadband lost it when Telecom had to lift
their specifications, effectively dropping them off the end of the line.
As one of the larger city councils, Wellington has a history of being involved in
initiatives around ICT. During 2006 Wellington, like all local councils was developing a
Long-term Community Plan. This was a ten-year plan structured around seven strategic
areas based on the local government act. Four areas covered the local council‟s need to
be responsible for the social, economic, environmental and cultural well-being of their
communities. The other three areas are transport, urban development and governance.
ICT seemed to fall under three of those areas, building a broadband network came under
economic development, initiatives that involve using ICT for community development
fell under the social area, and e-democracy type initiatives were in the governance area.
Wellington City Council recognised that ICT issues cut across three different areas;
economic development, community development and improving citizen participation in
council decision making through e-democracy. By early 2006 they had produced ICT
strategies for community development and e-democracy, but as of early 2010 no strategy
had yet been produced for economic development (Wellington City Council, 2006).
49
The actual broadband take up by Fonterra farmers in 2006 was 75%
http://www.istart.co.nz/index/HM20/AL29454/AR28829

202
Telecom announced that it was boosting its investment in Wellington by 45% due to
strong growth in the region. However, broadband still hadn‟t reached some of the more
remote parts of the Wellington region such as in the Wairarapa area.
CityLink were still going strong, though a move to extend their network out to the
Wellington suburbs was dropped by the city council Hutt, Upper Hutt and Porirua were
setting up their own version of CityLink, as a public/private partnership called
Smartlinx3. In Wellington, as in Southland, the aim of developing locally based
telecommunications was strongly rooted in a desire to make high speed ICT connections
available to the whole of the community. To date few areas of New Zealand had actually
managed to make community owned telecommunications work, especially where a
mixture of public and private funding was involved. Smartlinx3 recognised the role of
the community by setting aside two places on the board for representatives of
community groups who would not have the financial resources to become shareholders.
One issue faced by Smartlinx3 was that public sector organisations such as the
education and health sectors tended to be organised in silos. For example, one company
may cover all the telecommunication needs of the health providers in the North Island.
That made it difficult to persuade a local health provider to sign up to a regional
network, as the key decision maker was located outside the region. As interviewee I
commented;
“The biggest benefit that central government could bring to Smartlinx3 would be for
the key central government departments located within the region to become clients of
Smartlinx3.”
The silo issue also worked against regional community telecommunications projects.
When Hutt City Council was setting up Smartlinx3, it had the experience of being
approached by Telecom and offered a new contract based on forming a silo with other
local councils up and down the country. Though this would have resulted in cheaper
telecommunications, accepting the deal would have worked against the council‟s desire
to develop regional linkages. However it can be a contentious issue for a local council,
as paying higher prices for telecommunications will impact on the ratepayers of the
region, and incumbent providers are usually keen to advertise that fact to local voters.

203
Southland experienced similar issues. As interviewee D pointed out, it became apparent
at an early stage that if you looked at just the local business, the local traffic and the
local use of the internet, there was insufficient activity to justify regional investment.
One potential solution was to persuade the national government to offer the region part
of its business at a regional level, rather than contracting services vertically throughout
the country. In this case the Economic Development Agency managed to persuade
national government to do this.
“So that was quite a paradigm shift from the government state sector perspective to
offer those services at a regional level as part of a demand aggregation. The theory
was that if you could offer a slice of the government financial activity at a regional
level then you could make investment possible in a region like Southland.”
As interviewee H explained, the responsibility for funding the development of
telecommunication networks within a regional setting is not always clear. It falls partly
under the responsibilities of the regional councils and also of the local councils. The role
of regional councils is to manage environmental issues such as land use, air quality,
water discharge and transport. Telecommunications isn‟t something that has been
traditionally part of what regional councils do. However, there is some latitude in the
legislation, as regional councils are mandated to act in the interests of regional
ratepayers. So some regional councils such as Auckland have been proactive in
promoting connectivity within their region, whereas other regional councils, such as
Wellington have chosen to;
“stick to their knitting in the sense that they’re about air discharges, water, land and
public transport and not anything else.”
Building a telecommunications network is a large strategic project; it is common for
local councils to band together to create a regional vision and to pool their resources to
achieve it. For example Venture Southland looks after telecommunications projects for
three local authorities. Smartlinx3 is an example of a joint initiative between three local
councils. The three councils considered pooling resources to create demand aggregation,
but rejected this idea due to the fact that there was no unbundled local loop at that time,
and also because of high wholesale price offerings. Different community
telecommunication initiatives have adopted different funding models. Smartlinx3 is a
public/private partnership; the primary focus is on business, but there is also a

204
commitment to community groups and residential customers. CityLink in Wellington
started off with a similar model, but when the initial shareholders left, it moved to a
pure business model. Technically the two models are identical, but they have differences
in their strategic goals, with Smartlinx3 having more of a community focus.
As of 2005, the government was recommending that community telecommunications
adopt an open access structure, where the network itself is owned by the community, but
any provider may offer services over the network (Ministry of Economic Development,
2005). This vindicated the model adopted for the Smartlinx3 project.
The concerns of rural customers about the quality of their telecommunications services
have already been discussed. In 1990 Telecom New Zealand was privatised and
interviewees in Southland noticed that from that time there appeared to be a general
degradation of services into rural areas. Though independent research carried out in
2000 by Amos Aked Swift indicated that all was fine in rural areas, this did not seem to
match up with the complaints about low quality telecommunications that the Southland
local authorities were receiving from their residents. Southland‟s vision for the region
was dependent on rural people being able to engage with the rural economy. The region-
wide availability of good quality communication was essential to underpin this. When
Project PROBE funding (see section 2.5.2) was put out to tender in Southland, it was
awarded to Woosh, which came as a shock to Telecom NZ, who were viewed to have
largely forgotten about the rural areas. Their reaction was to start rolling out their
network to all the small towns in Southland, so the metropolitan and urban areas are
now covered by Jetstream50
, but ADSL doesn‟t extend beyond that.
Southland was the only region to choose Woosh as its broadband provider as part of the
Project PROBE initiative and in 2006 the company was busy rolling out its wireless
network throughout the region. Venture Southland manger Steve Canny claimed that:
“Southland is now the most connected region” (New Zealand Trade & Enterprise,
2005). As of 2006, 85% of Southland was covered by the Woosh wireless network51
,
with another three sites still to go in. The goal was to get 92 to 98% coverage in the
50
Telecom New Zealand‟s broadband product http://jetstream.xtra.co.nz 51
Woosh wireless (formerly Walker Wireless) a private sector portable broadband provider
http://www.woosh.com

205
region; in the remoter parts of the region this required the use of specialised equipment
such as of booster antennae and external director vents. The majority of customers that
Woosh was picking up in Southland were from the rural sector; the reason is that a lot of
the dairy farmers were required to go on the internet a couple of times a day to post
information back to Fonterra using the Fencepost website
The telecommunications networks in both Southland and Wellington used peering
exchanges to route communications locally rather than sending them via Auckland or
San Francisco. In Invercargill the peering exchange was situated in the library, which
was felt to be appropriate as the library is the hub of information. Venture Southland
wanted to take this idea further, and had designed a fibre optic cable network for the
City of Invercargill, that could tie in with the peering exchange and could also be used
to hook into the Advanced Network currently being developed to link the Universities,
Crown Research Institutes and National Library.
Critical reflection
What really stands out over the period is the explosive growth in telecommunications
services throughout the entire country. There was a strong belief by both national and
local government that high quality telecommunications could add value to the New
Zealand economy; broadband was viewed as an integral part of the drive towards
developing a knowledge economy. New Zealand was not alone in this
telecommunications services were expanding world wide, and most countries regarded
telecommunications as a cornerstone of economic development. The issue of whether
telecommunications should be a monopoly or open to private competition was being
faced around the world and the advantages and disadvantages each approach were
widely debated. In global terms New Zealand was relatively late in fully opening up
telecommunications to private competition, the decision to “unbundle the local loop52
”
wasn‟t taken until 2006.
52 Local loop unbundling (LLU) is the regulatory process of allowing multiple telecommunications
operators to use connections from the telephone exchange's central office to the customer's premises. The
physical wire connection between customer and company is known as a "local loop", and it is owned by
the incumbent local exchange carrier. To increase competition, other providers are granted unbundled
access.

206
Wellington was a strong innovator in this area as one of the first cities in the World to
set up a broadband network in its central business district, and New Zealanders had
generally regarded themselves as being “ahead of the game” when it came to
telecommunications. However the country received a nasty shock in 2005 when an
OECD report (Organisation for Economic Co-operation & Development, 2006a)
revealed that New Zealand ranked 22nd
out of 30 OECD countries. This widely reported
statistic was a major “wake up call” which generated widespread debate, and was one of
the triggers for the national Governments decision to unbundle the local loop.
In both Wellington and Southland, building telecommunications infrastructure was
being tackled at the regional level by a partnership between three local authorities. The
two projects studied received funding from a mixture of regional and national sources.
Ideally, the regional and national funds should complement each other, but the lack of
clarity about who should be responsible for the development of telecommunications
networks did cause some confusion.
One question raised in the literature review was whether it is appropriate to focus on
New Zealand at the regional level, or in a country with only four million people is a
national focus more appropriate. Some interviewee‟s argued strongly that in terms of
building actual infrastructure a national focus was the most appropriate. The national
focus is more efficient in terms of economies of scale, however the regional focus can
be argued to bring more direct benefit to the regions themselves.
5.5.2 Transport
1985
Nationally New Zealand was on one hand improving its connections with the rest of the
world by increasing the number of weekly flights to London to three and approving the
setting up of a second international airline, Pacific Air Freight. On the other hand it was
reducing them; with plans to cut back on its own flag shipping line. The Interislander
ferry link between Christchurch and the North Island was also replaced by a ferry
service between Wellington and Picton.
In Wellington transport was a hot topic, with air, rail and road travel all taking up
column inches in the local newspapers. There was pressure from local MPs and the City

207
Council for a new domestic terminal at Wellington Airport, which was approved by the
government in October. Activity at the airport was increasing, with two flights per day
to Australia, and a couple of small private operators entering the domestic market. The
management of the airport was under debate, with national, regional and local
government all being interested stakeholders. Rail services in the region made a loss and
the government stepped in to cover some of the costs to ease the burden on rate payers.
There was also concern that Wellington‟s trolley buses would become uneconomic if
the price of electricity continued to rise. Several new developments were being planned
for the road network, and shipping across the Cook Strait was also being expanded, with
Pacifica Shipping offering a new nightly sailing, and the ferry terminal being upgraded.
There was some evidence of friction between Wellington City Council and the Regional
Council, with the City Council being critical of the transport plan developed by the
regional council, and disagreement over who should manage the airport.
In Southland, the most pressing issue was the threatened closure of the ferry service to
Stewart Island, which prompted the local community to lobby both local and national
government. The national government did provide a one off payment of $330,000,
which was used to set up an interim ferry service, but the issue of affordable transport
for themselves and their supplies remained a major worry for Stewart Islanders. On a
more positive note the Southern Air Service to Stewart Island reported profits after
recovering from a difficult financial situation two years ago.
The rest of the Southland region also felt disadvantaged on the transport front, Ian
Guise, the Chief Executive of Southland Frozen Meat Ltd, expressed concern that high
land transport costs and uncoordinated airline timetables created major disadvantages
for Southland businesses trying to supply fresh or chilled products to international
markets.
1995
In 1995 Air New Zealand was performing well, recording a fifth consecutive record
profit since privatisation in 1989, to become one of the worlds top three performing
carriers. The ports were also prospering as the economy improved, with the Port of
Auckland reporting a 33% profit increase. As links between New Zealand and Asia

208
developed, Air China was looking at the feasibility of extending its range to cover New
Zealand.
In Wellington, there was pressure to upgrade state highways to improve links with the
rest of the country; an inner city bypass was also mooted as was a light rail system to
link to the airport. As in Auckland, the Port of Wellington increased profits, and a new
fast ferry, the Lynx, arrived for the Cook Strait.
In Southland the beginning of the year saw pressure to make Invercargill airport
international. However, by the end of the year the airport was in serious financial trouble
with a $2 million shortfall. Air New Zealand and Ansett cut flights to Invercargill which
seriously affected the lobster industry. As in Wellington the port was doing well,
winning significant trade from the Tiwai Point Aluminium Smelter.
2005
In Wellington there was a push for long haul flights to use the airport, the port reported
a 17% rise in profit and $400 million was earmarked for road improvements in the
region. In Southland there was still pressure to make Invercargill an international
airport, and a new air freight service running out of Christchurch was felt to open up
possibilities in international markets for southern exporters. Unlike Wellington, the
local port was making a loss.
Critical reflection
Following global trends air transport became increasingly important throughout the
period; both regions were trying to upgrade their airports. Wellington was disadvantaged
by its short runway, which ruled out larger aircraft, and Invercargill airport wanted to
expand in order to cater for international traffic. New Zealand‟s rugged geography
meant that road and rail networks tended to be relatively sparse, with domestic air travel
being more widely used than in many other countries.
5.5.3 Regional development
1985
Nationally the government announced plans to restructure regional government and
make it more autonomous. A task force was set up with three main aims; firstly to
achieve greater co-operation, secondly to look at the scope for change and thirdly to

209
advance regional identity. In both regions plans for local government restructuring
resulted in much public debate. The Local Government Commission had asked all the
local bodies in the country to investigate the possibility of sharing resources and
services with their neighbouring local authorities. They were all to report back by
October 1st. The national government view, as expressed by Local Government
Commissioner Brian Elwood, was that smaller units of local government where not
equipped to meet the needs of modern New Zealand.
In December the national government approved a system of incentives for regional
governments who showed significant improvements in their operating systems. The
Local Government Minister, Michael Bassett, announced that the role of regional
government would widen and that they would be encouraged to take over many of
central government‟s functions.
Wellington Mayor Ian Lawrence previewed 1985 by announcing a number of new
developments, such as a new hotel and a new centre for the performing arts. The
Minister of Regional Development, Mr Burke urged Wellingtonians to think about how
they want the region to develop. He pointed out that the Wellington region was unique
in that despite the fact that it was losing population at a proportionately higher rate than
the rest of the country, there was a high rate of employment and high income per capita.
In Wellington the local councils at Eastbourne, Petone and Lower Hutt met to discuss
the benefits and disadvantages of possible council unions for the people of the region. In
general there was an attitude of resistance to any proposed changes, with the Mayor of
Lower Hutt, John Kennedy-Good, proposing that consultants be employed to study the
financial implications of the amalgamation of local councils. The majority of councillors
in Lower Hutt rejected the arguments for local authority amalgamation, and both Upper
Hutt and Porirua were concerned that they might lose their representation on the
Wellington Regional Council. Tawa favoured remaining independent, and relations
between Upper Hutt and neighbouring district of Heretaunga-Pinehaven became
strained. There was more evidence of turf wars between Wellington City Council and
Wellington Regional Council, with the City Council wanting to increase its
representation on the Regional Council from six seats to seven, but being turned down,

210
and the Regional Council reporting that it was often left out of meetings on important
regional matters.
In Southland the opposition to the proposed restructuring of local government was
intense. In a series of six articles, Southland Times reporter Willy Stern discussed the
implications of the proposed changes for the region. At the time Southland had 17
territorial authorities, many of them small, and most of the council officials and local
residents seemed happy with the status quo. “Proximity of responsibility” was felt to be
an important factor, or in other words an official who shops at the same grocery store as
the residents they serve is more likely to understand and be sympathetic to the local
community‟s problems. The more local the authority the more personal is the service.
An example was given of a borough council in a small Southland town that always sent
someone round to collect cheques from a certain old lady who was unable to post them.
The options offered by the Local Government Act of 1974 were to set up district
councils, district community councils or community councils, with the district council
being the only option with real power. The smaller territorial authorities were worried
that they would be downgraded to district community councils or community councils
due to their low population. This would take away much of their autonomy. For
example they wouldn‟t be able to borrow money, make a rate, make a bylaw, enter into
a contract, hold or dispose of property, or appoint or remove staff. Southland local
authorities were given the opportunity to voice these concerns to the chair of the Local
Government Commission, Brian Elwood, at a special meeting in Mataura, held in
October. However, Mr Elwood‟s own view was that Southland might be better off with
a single territorial authority.
The health sector in Southland was also looking at amalgamation, and there was a
recommendation that six hospital boards south of Waitaki should combine as the first
step towards a regionalised health service. Local organisations were also coming
together to set up Southland Promotions Inc., which would develop the Southland
region as an attractive venue for conferences, tourism and business, at the same time as
working to enhance regional identity and attract talented people to the region.

211
1995
In the Wellington region the Kapiti Coast area was experiencing the second highest
growth rate of any district in the country. Local politicians developed the “Wellington
Charter”, which aimed to improve the quality of life for all people in the city. $2.5
million was earmarked for helping young people find employment, and in Porirua
capital works planned over the next 12 years were estimated to cost $30 million.
An amalgamation between Lower Hutt and Petone was being considered. Hutt City was
setting up Community Boards. A proposal for a new development unit to promote
Upper Hutt was criticised by local business people. The local Government Commission
cut the size of Wellington City Council from 22 to 19. In October, right-wing candidate
Mark Blumsky became Mayor of Wellington in a landslide victory, with Kerry
Prendergast as Deputy. The newly elected Mayor of Hutt Valley, John Terris,
encouraged his constituents to have a more positive image of the area and declared that:
“Hutt City is not a wart on Wellington’s bottom.”
In Southland a new body was being set up to promote tourism in the region, Tourism
Southland was replacing Southland Promotions. New staff were being appointed and the
mood was positive. Invercargill City Council was also setting up an economic
development unit. Invercargill City had the cheapest rates in the country. The current
Mayor, Tim Shadbolt, announced he wouldn‟t stand for another term, and then changed
his mind, only to be defeated by a right-wing candidate. Frana Cardno was re-elected as
the Southland District Mayor.
2005
In Wellington the Regional Strategy Forum was launched as an attempt to provide a
vision for developing greater Wellington and the Wairarapa. Though the Wellington
region was strong economically there were concerns that it was not keeping up with
growth rates in the rest of the country. In 2004 the regional GDP was the highest in the
country at $36,700 per head, 14% higher than the national average. However, between
1998 and 2003, GDP per head rose by 1.6% per year compared to a national average of
2.6% growth. Eight local councils, plus the Greater Wellington Council were involved
in drawing up the strategy. The aim was for Wellington to be recognised as one of the
top Asia-Pacific cities by 2025, with attributes of strong leadership, a prosperous

212
community, innovation, a healthy environment, a sense of place and strong
communities.
In Southland, Venture Southland had been set up in 2000 as the joint enterprise, tourism
and community development committee of the Invercargill City and Southland and Gore
district councils. The body was under fire from local farmers who felt it lacked any
knowledge of primary industry technologies, and resented funding it through their rates.
They were particularly annoyed by a reference to farming as a “twilight industry” in the
annual report produced by Venture Southland. Environment Southland was also
concerned that Venture Southland was duplicating much of its work. There was also
trouble over a Deloitte‟s survey, commissioned by Venture Southland to find out how
Invercargill and Southland were perceived by the rest of New Zealand. In December it
was announced that an independent review of venture Southland would be carried out in
March 2006. The major project under development was a new velodrome.
Critical reflection
The restructuring of local and regional government was not unique to New Zealand;
national governments around the world were keen to reduce costs by rationalising
infrastructure. The protests of local residents who felt their autonomy was being taken
away was a typical response to these changes.
The soft infrastructure of both regions showed evidence of “turf wars” between both
national and local government and regional and local government. There was friction
between local government and ratepayers, and in the case of Southland, between the
local development body and farmers. In Southland, a series of organisations were set up
to promote collaboration between local government and private industry, and to improve
both the social and economic aspects of the region. In 1985 Southland Promotions Inc
was started. This was replaced by Tourism Southland in 1995 and by Venture Southland
in 2000. In Wellington, 2005 saw the launch of a regional strategy which aimed to
improve co-operation within the region.
5.5.4 Evaluation
The ideal learning region will have a well developed telecommunications and transport
infrastructure, together with institutional thickness, as demonstrated by lively
interactions between different organisations in the region. In New Zealand the issue of

213
infrastructure seems to be of more importance than in other countries with more
developed infrastructure, such as Europe and the USA. A well developed infrastructure
tends to be taken for granted; it is when there are gaps that it becomes a more pressing
issue. As Kerry Prendergast, Mayor of Wellington stated:
“Broadband technologies and airports are the two most significant investments that
cities can make to enable them to compete in the global economy.”(Prendergast,
2005)
At both national and regional levels there was significant investment in
telecommunications infrastructure. Despite complaints that New Zealand was not
keeping up in global terms, it was clear that successive governments were committed to
developing telecommunications and believed it would strengthen the economy. In both
regions there were constant requests to upgrade airports that were never fully addressed;
however at the national level air transport was of a good standard.
In both regions there were frictions between local and regional government, which
worked against the development of institutional thickness. There was evidence of
interaction between the different organisations within a region. However, frequent
changes caused by local politics meant it was difficult for these networks to develop and
grow.
To summarise the results for this category were mixed. Though telecommunications
were recognised as crucial to the economy, New Zealand‟s low population means that it
is always going to be more expensive to build up infrastructure than in more densely
populated countries. New Zealand is always going to struggle to improve its position in
the OECD rankings when it comes to features such as broadband adoption. There was
also a tension between the different levels of government that at times seemed to inhibit
progress.

214
INCOME
5.6 Income
This category looks at indicators of economic performance, such as per capita income
and unemployment; it also considers the level of investment in research and
development. A learning region should demonstrate consistent economic success as
evidenced by high per capita income, low unemployment and investment in research and
development. The analysis of the newspaper articles was divided into five sub-
categories. The first section looks at the economy; the second section focuses on the
rural sector, which is of particular relevance to the Southland region and the third on the
IT sector, which is more relevant to the Wellington region. The fourth section covers
unemployment, and the final section looks at what investment was being made into the
economy.
5.6.1 The economy
Figure 20, Figure 21, Figure 16 and Table 27 give an overview of some of the key
changes in the economy between 1985 and 2005. Table 27 shows gross domestic
product (GDP) which represents income earned from production in New Zealand.
Figure 16 shows the unemployment rate, which rose to over 10% between 1985 and
1990, but dropped by 1995, and in 2005, was back to less than 4%. Figure 20 uses the
consumer price index to show the rate of inflation, which was high in the early part of
the period, but levelled off from 1991 onwards. Figure 21 shows the current account
balance as a proportion of GDP. This measures the country‟s net provision or
acquisition of resources to or from abroad as a proportion of the value of annual output.
New Zealand has incurred persistent current account deficits since the mid 1970s
(Statistics New Zealand, 2006).
1985 1990 1995 2000 2005
39,528 71,549 87,908 109,696 148,558
Table 27: Gross Domestic Product (millions) Source Statistics New Zealand (various)

215
Figure 20: Consumer price index 1977-2007 (Statistics New Zealand, 2008b)
1985
The economic reforms introduced by Roger Douglas, known as “Rogernomics”,
generated much discussion in newspaper editorials and meetings up and down the
country. Headlines such as:” Two more years of economic ills”; “Labour’s bold
reforms await payoff” and “A scary ride on the economic ghost train” give a flavour
of the debate. The general message given out by the government and supported by
bodies such as the National Business Review, the Reserve Bank and the Institute of
Economic Research, was that the short-term downturn in the economy was an
unpleasant but necessary medicine to swallow if long-term economic health was to be
achieved. By the time of the June budget the government had managed to reduce the
deficit to $1.3 billion less than half of the 1984 figure. The reforms were praised
internationally, with organisations such as the OECD and IMF agreeing with the
government that the short-term disadvantages of rising unemployment and double figure
inflation would be well worth it in the final analysis. The magazine Euromoney gave Mr
Douglas the “Finance Minister of the Year” award for: “his boldness and clear vision
in stripping away a regulatory system that would have been the pride of an Eastern
Bloc county.”

216
Figure 21: Current account balance 1955-2005 (Statistics New Zealand, 2006)
These views were not shared by organisations within the country that were bearing the
full brunt of the negative effects of economic reform; the ten largest companies began
the year badly with a negative share market return. The Wool Board, Federated Farmers,
the Manufacturers Association, Local Authorities and Consolidated Metals all attacked
the government‟s handling of the economy. An editorial in the Southland Times
commented on how the overseas praise for Roger Douglas didn‟t sit well with all the
internal problems the country was facing.
The economic reforms put pressure on the business sector to restructure in order to
become more market orientated. At the 1985 annual Chamber of Commerce conference
Prime Minister David Lange challenged the business community to accept the realities
of the modern New Zealand economy. The response was cautious Don Rowland, Chief
Executive of Fisher and Paykel, was generally supportive of the changes in Government
policy, such as changes in export incentives, the free market and the floating of the
dollar, but felt they were being introduced far too quickly. He commented that:
“Somehow the Government expects industry to cope with massive changes and
overturning the way we’ve done business for 50 years.” He was also very critical of the

217
Government‟s lack of support for research and development. Another article commented
that there was a shortage of managers who would be able to move their businesses into
the new market economy. Most still thought in terms of production and sales.
The devaluation of the New Zealand dollar on March 4th
was arguably the most
significant economic event of 1985, with one business reporter commentating; “that
single act will sit in history as the spur to the true internationalisation of New
Zealand.” The flotation ended a series of moves by the government to deregulate the
monetary system, such as removing exchange controls. Before the devaluation the value
of the dollar had hit a record low of one dollar to 44 US cents. Immediately after
deregulation, the value of the dollar rose to 55 US cents, causing an increase in interest
rates to 26% which did cause concern for the government. At one point in October,
interest rates for large short-term deposits soared from 40% to 90%. However the
government was determined not to intervene to lower the dollar‟s value despite a
warning from Manufacturer‟s Federation president Earl Richardson that the combination
of low export returns and high internal interest rates meant that many export companies
were on the verge of collapse. In November, Spencer Russell, the Governor of the
Reserve Bank commented that it was still too early to make a judgement on the merits
of the float. In December, the dollar began to fall back to a value below 50 US cents,
which David Lange claimed vindicated the government‟s economic policies and created
opportunities for manufacturers to export their goods at competitive rates.
In Southland, the Invercargill Chamber of Commerce were concerned about the gloomy
business climate for the region, as this was the first time both the aluminium and
farming industries had hit downturns at the same time. The effect on the region was
illustrated by the report from Southland Harbour Board that it had operated at a net
deficit of $1.2 million for the financial year, mainly due to declines in alumina and
petroleum imports and a reduction in grain exports.
In a move described as “putting his head in the lion’s den” Roger Douglas accepted an
invitation to address a meeting of Southland farmers and the rural community in
November, and was given a good hearing by over 600 people packed into Lumsden
Memorial Hall.

218
In Wellington the situation was less clear cut, even though the President of the Hutt
Valley Pensioners and Beneficiaries association, Bill Dunning, said that poverty among
old people was as bad as during the depression. Many Wellington businesses appeared
to be surviving; some retailers even reported a mini boom in sales of whiteware and
electrical equipment. The Wellington Chamber of Commerce reported that there was
still a degree of optimism in the business community however businesses were going
through a period of consolidation and were wary of starting up any new lines of
business. One area of growth was the Hutt Valley, with 52 new industries and 1123 new
jobs created in the year ended February. The unemployment rate was 1.9%, one of the
lowest in the country. The biggest growth was in the manufacturing sector, with the
hospitality sector also performing strongly. In contrast the Wairarapa reported a sharp
drop in trade, with low sales of cars and farm machinery and a steady decline in land
values, though the General Manager of the Masterton Licensing Trust, Bernie Teahan,
challenged this gloomy picture and argued that economic growth in the Wairarapa was
steady, and not just reliant on farmers‟ incomes. Both Wellington City Council and
Lower Hutt Council were in good financial shape and ended the financial year in profit.
As the year wore on Wellington businesses became more pessimistic, with over half of
respondents to the New Zealand Institute of Economic Research September survey
reporting that business confidence was continuing to fall. Manufacturers and builders
reported a substantial decline in domestic business activity and only 14% of merchants
reported growth. A proposed increase in rates of up to 49% was causing concern right
across the region. Power charges, rail and bus fares, and taxi charges were also rising by
more than 10%. Council house rents were increasing by up to 40% in some cases.
Articles also reported on more people needing food parcels and visiting second hand
shops.
1995
By 1995 the New Zealand economy was in much better shape, with most companies
making a profit, an increase of 4% in gross domestic product (GDP), and a decrease in
inflation. A global survey found New Zealand cities the cheapest in the world to do
business with. Despite the robust economy, the average family did not have enough
savings to feel financially secure, and there were concerns that economic growth was
stronger in Australia. Retail statistics also revealed a sharp contrast between North and

219
South Islands, with sales in the South down 1% compared to last year while sales in
Auckland rose by 11%.
The Kiwi dollar was strong on the international currency markets and had almost
reached parity with the Australian dollar; this was causing problems for exporters such
as wool processors, as their prices were less competitive on international markets.
The newly created Wellington Central electorate was the richest in the country, with
10% of constituents earning above $50,000, compared to 4% nationally. One of the
reasons for this was that Wellingtonians were better qualified. However, though they
earned more they spent less. Firms in the Wellington region were more confident than in
the rest of the country, and there was less insolvency. As the year progressed there was a
slowdown in economic activity, but this was felt less strongly in Wellington than in
other regions which had experienced more rapid economic growth.
In Southland a survey by the National Bank revealed a conflicting pattern. Though the
business community was very upbeat, consumer confidence was at its lowest ebb in
two-and-a-half years. Property values had doubled in the last three years showing the
strongest growth in the country. However, wages had declined slightly. It was a good
year for dairy farmers, with milk production 35% up on 1994, but sheep farmers were
struggling and around two thirds were not expected to make a profit. This drop in farm
income was having a knock-on effect on the rest of the rural economy, and Anne
Stoddart, the manager of Southland Foodbank reported that the number of people who
had been helped with food parcels had “sky rocketed.” Sue Coulman, CEO for
Southland Chamber of Commerce, was concerned that even though the region produced
17% of New Zealand s exports and 18% of gross national product, its contribution to the
economy went largely unrecognised. She was also concerned about the “brain drain”
and the fact that local young people perceived they had two choices, to stay, get married
and never leave, or to go to university and never come back.
2005
In 2005 the rate of economic growth was slowing, and there were warnings of a possible
recession ahead. Businesses were generally pessimistic and the forestry and

220
manufacturing sectors were not doing well. There were also growing concerns about
how the ageing population would affect the economy in the future.
In March, the Wellington Regional Outlook report showed that the capitals economic
growth was lagging behind the national average, with GDP growing at a rate of 2.1% as
compared to 3.9% nationally. The largest contributions to GDP came from property,
finance, insurance, government, defence, communications and manufacturing. The
regional economy was biased towards the service sector, which made it less vulnerable
to external shocks like a strong kiwi dollar, but also meant the economy was less likely
to get a boost from higher commodity prices. By August, Wellington‟s economy was
showing strong growth helped by new building developments and a $14 million cash
injection as a result of the British and Irish Lions rugby tour. Property values were
rising. However by the end of the year a Chamber of Commerce survey revealed that
local businesses were following the national trend, with 49% expecting the economy to
get worse in the next six months.
In 2004 the regions local councils set up the Wellington Regional Strategy Forum to
work on an economic blueprint for the future and by 2005 over 800 pages of
consultants‟ reports had been produced (see 5.5.3). A four-pronged approach was
recommended for the future growth of the region:
1) Effective leadership and partnerships between local government and
business;
2) “A great place to live” with well designed cities and transport infrastructure
plus a sense of community;
3) “Unlocking economic potential”, the region needed to identify its strengths
and grow more “world class” businesses;
4) To encourage more offshore trade only 14% of products made in Wellington
were exported.
In February the Southland economy was given a “fair to middling” rating by the ASB
Bank; however, by August the rating had moved to “healthy”. The City of Invercargill
was doing well, with a stronger economic growth than the rest of the region. By
November the region was one of only two in the country to record negative growth. As

221
in Wellington local businesses were concerned about the future, with 32% expecting
business conditions to deteriorate in the next six months.
Critical reflection
New Zealand was one of the first countries to “modernise” its economy by a series of
sweeping reforms that stripped away government subsidies and opened up private
competition. These changes received a very mixed press, there was praise from
international organisations such as the International Monetary Fund, but within the
country the transformation of the economy resulted in rising prices, high interest rates
and high unemployment. Other countries made similar moves to restructure their
economies much later, for example it wasn‟t until 1997 that Tony Blair‟s New Labour
government made similar reforms to the UK economy. It could be argued that New
Zealand did obtain economic advantages by being a first mover.
Over the course of the period the economy improved considerably, unemployment rates
dropped and interest rates steadied. However, by 2005 there were signs of an economic
slowdown. These later changes reflected widespread global trends.
The economies of Wellington and Southland often struggled to keep up with national
growth, even though Wellington was relatively rich its economic growth was not strong,
particularly when compared to Auckland, and the sheep farming sector in Southland was
in difficulties. However despite the fact that both regions were challenged they did both
manage to keep their economies on an even keel.
5.6.2 Rural sector
1985
1985 saw problems for the rural economy throughout New Zealand. At a meeting in
Christchurch, Peter Elworthy, the President of Federated Farmers said that agriculture
was having its worst crisis since the 1930s and announced that: “Federated Farmers
honeymoon period with the government is over.” Research carried out by Federated
Farmers showed that nearly 2,000 sheep and beef farmers would have to sell up and that
plummeting farm incomes would cost the country more that 70,000 jobs over the next
five years. This view was supported in the annual report issued by Pyne, Gould,
Guinness Ltd. which reported that farming was bearing the brunt of the government‟s

222
economic policies. The strengthening NZ dollar and the removal of farmer support
mechanisms meant that a crisis was looming. Farmers threatened to use their economic
clout as never before in order to put pressure on the government for faster tariff reform
and to free up the labour market. Farm workers were also concerned about compulsory
unionism and organised ten special meetings around the country to consider the issue.
Agriculture minister Colin Moyle responded to these claims by explaining that the
predicted crisis would only occur if inflation, interest rates and the value of the dollar
remained high. However the Rural Bank and MAF both issued strong statements in
support of farmers, and Colin Moyle approached Treasury to try to get support for a
relief package. He admitted that the situation was so bad that more than 500 farmers
would need financial assistance just to quit farming. He also indicated that the
government was likely to write off the $700 million debt amassed by the meat industry
over the past three years. The government also gave the Meat Board $20 million to
spend on subsidies for sheep farmers in the current killing season.
Not all commentators were on the side of the farmers, and it should be pointed out that
despite the removal of many subsidies taxpayers were still giving farmers more than
$400 million per year. A special supplement in the National Business Review concluded
that the current reforms would lead to a “leaner, stronger farming industry”. A key
recommendation was for greater use of new technology in agriculture. In his final
speech before retiring the Chairman of the Waikato Manufacturers Association
announced that: “the feather bed days were over for farmers and they had better stop
screaming for special treatment.” Westpac Banking Corporation was also in favour of
the continued reform of the farming sector despite the short-term hardship it was
causing. Former cabinet minister Derek Quigley was another who felt that the fading
importance of farming was positive, as it signalled a move to a more broadly based
economy. Meat, wool and dairy exports would provide 40% of New Zealand‟s overseas
earnings in 1985 as compared to 85% in 1955. In 1995 this was expected to reduce to
30%, the remainder would be made up by internationally competitive alternative
exports.
Throughout the year the government introduced a number of measures to assist farmers.
Statistics from the Rural Bank showed that younger farmers were more productive than

223
the average, and the Bank expressed concern that there should be more help to let this
group get settled. This was partly addressed in an announcement by David Lange that
newly settled farmers and farmers heavily in debt over land development would get
interest rate concessions. Assistance with interest payments and loan terms was also
offered through the rural bank. In December, after much pressure, the government
announced a relief package to help farmers in financial difficulties restructure their debt
or move out of farming.
Another issue that was under debate throughout the year was the public ownership of the
Meat Board. The government wanted the country‟s largest export industry sheep meat
marketing to be progressively returned to private enterprise and were offering a large
financial “carrot” to facilitate this. The National Business Review reported that a number
of private sector companies were getting together to try and take over control of sheep
meat exports and make it competitive and unsubsidised. The government together with
the Meat Industry Council, wanted farmer owned companies to join together in a major
cooperative venture. In November the Meat Board announced that its control of sheep
meat marketing would cease on December 21st and that future meat marketing would be
based on competitive private enterprise.
There was also considerable debate as to whether to lift the nine-year ban on the export
of live sheep in order to open up trade with the Middle East. Those in favour argued that
the country needed to take advantage of every market opportunity to ease the crisis faced
by farmers.
As a rural region, Southland was acutely affected by these issues. A MAF survey
predicted that the average Southland sheep and beef farmer would face a cash reduction
of over $6000 in two years time. The New Zealand Institute of Valuers estimated that
farm property values in Southland had declined by as much as 33% in some areas. The
Southland Times estimated that over 50% of farmers would be unable to balance their
books this year; Norman Jones, MP for Invercargill, predicted that at least 10% of
farmers wouldn‟t be able to cover their mortgage payments, and in a meeting at
Manapouri, opposition spokesman Rob Storey warned that the coming year would be
one of the toughest farmers had ever experienced. The government held firmly to their

224
view that farmers should be taxed in the same way as any other business, as two labour
government spokesmen told a December meeting of 500 farmers in Gore.
There was considerable local opposition to the government‟s reforms; a meeting of the
Eastern Southland Branch of Federated Farmers came to the conclusion that local
farmers had shouldered increases long enough. At another local meeting, 80 newly
settled young farmers formed a lobby group to make the government aware of their
financial plight. A June meeting at Tokanui resulted in 200 local farmers passing a
resolution to postpone their mortgage payments in response to the financial difficulties
they were facing. However, despite their difficulties, Southland Farmers were cautious
when it came to taking up the government‟s offer of interest free loans through the Rural
Bank.
1995
In Southland, the combined pressures of a drought and low prices for lambs and wool
meant that sheep farmers were struggling. Federated Farmers estimated that as many as
seven out of ten were unlikely to make a profit this season. A storm in September which
killed 50,000 lambs exacerbated the situation. Pig farmers in the region were also
having a hard time. The dairy sector was more profitable, and 55 Southland farms
converted to dairying in the 1995-96 season. Southland Dairy Co-operative also opened
a milk powder plant, and was planning a $175 million expansion of further powder
plants and cheese making over the next four years. However the Co-operative placed a
limit on the number of cows that could be imported into the region in 1996, stifling the
rate of dairy conversions.
The Southland President of Federated Farmers, Lindsay Wards was concerned that
corporate dairy farming was establishing too strong a foot hold in the region and
squeezing out family farms. However Southland Rural Strategy Group Chairman,
Kathie Henderson, felt that: “the family farm was alive and well in Southland”, most
farms in the region were owned by husband and wife teams working in partnership, but
there was an increasing trend for one partner, usually the wife, to work off the farm,
which had to be accepted as part of modern farming. One survey of 750 farms revealed
that 73% had some outside income of between $11,000 and $19,000 per year.

225
2005
In 2005, dairy farming was continuing to prosper, with dairy farm values rising by 25%
in 2004, and strong confidence in the Fonterra Co-operative Group. In Southland
interest in farming was still strong, and Sheep Council sponsored seminars on getting
started in farming were well attended. Though demand for farmland was less than the
national average it was still high. The downside of this was that it was becoming
increasingly difficult for young people to start out in farming. The importance of
agriculture to the local economy was illustrated the fact that the Southland town of Gore
had the second highest number of rural suppliers in the country.
Critical reflection
The economic reforms of 1985 hit rural Southland particularly hard, as farmers lost
many of their government subsidies. The major trends observed over the period were a
switch from sheep farming to the more profitable dairy sector, and a growth in the
number of large corporate farms.
5.6.3 Information technology sector
1985
1985 saw New Zealand‟s information technology sector in a healthy position. Despite a
slump in the IT industry worldwide, the local computing industry was growing at a
phenomenal rate. According to a survey by Arthur Hobby & Associates, the IT industry
was valued at $626.9 million, a 49.9% increase on the previous year, largely due to the
increase in demand for microcomputers. In the state sector computers were beginning to
be regarded as just another standard office item like calculators and typewriters, and
bulk supply deals for computer components were being organised rather than elaborate
separate tenders.
Despite the downturn in computer sales worldwide, the National Business Review
predicted that a more cautious historical growth in the data processing sector together
with crucial differences between the American and New Zealand markets would see the
country bypassing the problems that had affected computer suppliers in the US. WANG
also reported that while its USA operation was crippled by the slump, it‟s New Zealand
and Australian subsidiaries remained buoyant. However an article in the Dominion Post
warned that New Zealand and Australia would eventually be affected by the situation in
the US.

226
A seminar at Victoria University of Wellington led by Professor Herbert Dordick (as
previously discussed in 5.2.3) brought together a number of interested parties to discuss
the contribution that information technology and particularly telecommunications could
make to economic growth in New Zealand. The advantages and disadvantages of direct
and indirect government intervention were considered (Dordick, 1987).
Within the IT sector itself, there was considerable activity. A shortage of skilled workers
resulted in a growing acceptance of contract workers. Local companies Interactive
Application Ltd and Progeni reported that they were getting more than half their income
from overseas markets in Australia, South Africa and the USA. Commodore announced
a $2 million public share issue on the basis that New Zealand was a late developer in the
home computing market, with only 5% of homes currently owning a computer, which
meant that there was plenty of room for market expansion. Gil Simpson, the
Christchurch based developer of the internationally successful LINC 4GL software
system, reported receiving overtures to leave the country from companies in both
Australia and the US. The French videotex service was also being launched, and New
Zealand was seen as offering a potential market for several thousand videotex terminals
in the next few years.
Other IT companies were restructuring Tim Cullinane, Managing Director of ICL
announced that the company would change from a regionally based organisation to a
national one organised by functions. Control Data announced that it would sell up and
shut down its subsidiary. Other companies changed direction in order to become more
competitive. MDL announced it would stop selling Olivetti computers directly and
instead market them through value added retailers.
There was evidence that the use of IT was growing in a number of different sectors; in
the rural sector Businessworld Computers Ltd. were demonstrating at the Agribusiness
‟85 show, in the media Independent Newspapers were set for a big push into new
technology in banking deregulation had opened up the way for new technologies such as
Eftpos and electronic banking. The state sector was particularly active; MAF was
requesting a million dollar computer system for its animal health division, Customs
were using a computer system to produce an automated list of tariff decisions. The costs
saved by this one application covered the cost of the whole network. The Energy

227
Ministry‟s electricity division also found new microcomputers a powerful incentive to
improve and integrate information systems.
The use of computers within the state sector was under review by a committee chaired
by State services Commissioner Don Hunn. The report found that the use of computers
was now essential for the maintenance of many public services. The public service was
the country‟s largest user of information technology, spending more than $100 million a
year on installing and running computers, telecommunications and advanced office
systems, with growth rates being predicted at 40% a year. More than 1100 staff worked
on the design and implementation of computer systems and their operations, with many
more using computers in their daily work. The focus of the Hunn report was on how IT
was being used as a management tool by government, and whether the local IT industry
was getting a “fair go” in providing equipment and services to government. The Hunn
Report was approved by cabinet in October; its main recommendation was that
individual government departments should have greater autonomy in deciding how to
use computers. It recommended that central control of electronic data processing be
dismantled and the responsibility given to heads of departments. It also recommended
the setting up of an autonomous agency called Government Computer Services, which
would compete with the private sector to provide services to government departments.
The National Business Review expressed concern that the Government Computer
Service was likely to face difficulty in its three cornered competition with the private
sector and government departments wishing to buy their own systems. The Public
Service Association were also critical of what they regarded as an example of a market
forces approach to the public service. The report was held responsible for a multi
million dollar hump in computer buying by government departments, as they selected
their own computer equipment free from central control. A follow on committee to the
Hunn report chaired by MP Fran Wilde revisited the issue of whether local IT firms had
a fair chance to compete for government contracts.
There was plenty of activity in the IT sector in Wellington; Databank moved to its new
central processing centre, the biggest in the Southern Hemisphere. It planned to run the
Eftpos system from here. IBM announced it would build a new computer centre in
Petone. Leading US CAD.CAM specialist Intergraph Corporation also announced that it
would set up offices in Wellington. A British manufacturer of IT hardware decided to

228
base all its Pacific and Asian operations in Wellington as a result of selling their
videotex system to the Post Office. Two Wellington firms were successful in winning
multi million dollar export contracts; Philips Electrical sold its SBX small business
telephone exchange system to Australia and Progeni was the first New Zealand software
company to record more than $US 1 million sales in the United States.
In Southland there was some activity; Computer Systems Southland ran a promotional
feature in the Southland Times on how computers can help farmers.
1995
In 1995 IT companies were generally doing well, computer services company Wang,
increased revenues by 34% and electronic card specialist the Advantage Group also had
a 22.8% increase. Computerworld magazine placed appliance manufacturer Fisher and
Paykel and the Inland Revenue Department in the top 100 IT users worldwide.
Christchurch software company Aoraki Corporation had to reduce staff by a fifth, but
owner Gil Simpson was confident their new Jade software would lead to increased
profits. In the retail sector IT was being used to implement smart card and loyalty
schemes. Firms who had outsourced their IT operations were expressing concerns over
losing control of their core business.
In the personal computer market, Dell set themselves up as a new player in New
Zealand, adding to the pressure on local firm PC Direct, which had already abandoned
the Australian market. In Southland four small hardware and software suppliers merged
to form Clive Wilson Computers Ltd, who were the main IT suppliers for Southern
Health, the Aluminium Smelter and Invercargill Licensing Trust.
In Wellington, computer hardware company Sun Microsystems established their
presence in the city by securing naming rights for a 15 storey building.
2005
Despite the fact that IT exports had fallen in 2004, there was still plenty of activity in the
IT sector. In particular the use of IT in the health sector was earmarked as having good
export potential. There were many examples of software companies winning overseas
contracts; Auckland software developers PST Software was providing the German
version of yellow pages, Automation and Electronics, a high-tech software control

229
company, increased overseas sales by 400%, SimWorks sold mobile anti-virus software
in Germany and payment solutions exporter Cadmus Systems was expanding into Asia.
However an initiative to link local ICT exporters to customers in developing countries
was refused government funding.
A Statistics New Zealand survey of IT spending by businesses and consumers showed
an 11.2% increase in 1994. There was steady demand for IT workers, and software firms
such as EDS, Optimation and Unisys were doing well. The IT sector was international,
with major international software companies such as IBM, Microsoft, SAP and Oracle
having offices in the country. Local IT company Ectus was bought out by Norwegians,
IT work from the UK was being outsourced to Simpl, and IT work from New Zealand
was being outsourced to India.
David Cunliffe was appointed Minister of Communications and Information
Technology, and promised a fairer deal for small local companies trying to sell to the
government sector. He was also keen to encourage overseas companies who wanted to
carry out IT development work in the country.
Garth Biggs, the newly appointed head of the government funded HIGrowth project,
was working with NZ Trade and Industry and Microsoft NZ to perform a stock take of
the local IT industry. The survey of 400 IT companies, published in 2006 (Griffin &
Muller, 2006) revealed that software vendors were the largest group. One significant
difference between local and multi-national companies was the lack of penetration local
companies had within international markets. The sole focus of local IT companies was
on Australia, where market penetration was good. Multi-national companies
demonstrated a distinct preference for the government sector, and local vendors for
manufacturing and professional services.
The same survey showed that out of the 400 IT companies who responded, 20.5% were
based in Wellington and had on average (indicative) revenue of $15.7 million, and 1.8%
were based in Southland, with average revenue of $0.5 million. Wellington had the
second largest number of IT companies after Auckland, which had 55.3% of IT
companies with an average revenue of $32.8 million (Griffin & Muller, 2006). However

230
larger IT users were most likely to be based in Wellington, with 40% of the top users in
the annual MIS magazine survey located in the capital, as opposed to 36% in Auckland.
In Wellington, Maximum Availability was providing a disaster recovery service for IBM
computers to over 100 clients worldwide, IT services firm Equinox won a contract to
build the national dog registration database, 120 new jobs were being created at a local
call centre, “Geeks to the Rescue” was launched as a mobile computer help service, the
demand for IT workers was steady and an IT recruitment agency claimed that
Wellington IT workers were paid as much and sometimes more than their Auckland
counterparts. The New Zealand Supercomputing Centre set up by film maker Peter
Jackson‟s special effects shop, Weta Digital, together with Telecom was attracting
business from the USA and Canada.
Critical reflection
In 1985 the IT sector was doing well, and there were high hopes that it, together with
biotechnology, would become major growth areas for the economy. However though IT
continued to be an important part of the economy, the rate of growth was not as rapid as
hoped for, as evidenced by the HIGrowth project revisiting its targets. As of 2005
agriculture was still the mainstay of the New Zealand economy, accounting for around
50% of exports.
5.6.4 Unemployment
1985
Unemployment was an issue throughout the country, with a report by a planning council
estimating that 20,000 new jobs needed to be created each year for the next 15 years to
prevent an increase in unemployment. The total number of unemployed people rose by
38,646 in 1984, and the problem was exacerbated by the slow-down in population
growth, with less young people and more working age and elderly people. Mãori were
identified as the group most affected by unemployment. The government did not want to
address the problem by reducing wage levels, as New Zealand was already seen as a low
wage country. As the economy slowed down unemployment was increased, electronic
workers in Auckland lost their jobs due to a slump in TV and video sales, and hundreds
of manufacturing employees were laid off when the rising exchange rate affected
exports. The government introduced a $300 million job training package in December.

231
In Southland unemployment rates were above the national average but were dropping
slightly in Invercargill, and more school leavers were finding jobs than in 1984.
However the Labour Department district supervisor Gary Ayers predicted that
unemployment in Invercargill would get worse before it got better, and the situation was
bleak for 110 Knight Tailor‟s workers who were laid off from their jobs. Southland
Student Job Search was also unable to find summer work for over 70 tertiary students.
March saw unemployment drop 30% in Wellington, Porirua and the Hutt Valley, but
that was thought to be mainly due to seasonal fluctuations. A Professor of Economics at
Victoria University expressed concern about the high unemployment being generated by
the government‟s economic policies. Students also experienced difficulty finding
employment with 500 being unemployed in November.
1995
As shown by Figure 16 unemployment was the lowest it had been for a number of years
at 6.6%. However, there were still concerns about the number of young people who
were out of work and the long-term unemployed. There were also labour shortages in
areas that could not be filled by the current pool of unemployed people due to lack of
suitable skills. In 1994, a Prime Ministerial taskforce had issued a report on employment
which encouraged groups from business, local and central government and community
organisations to work together to increase employment.
In Wellington unemployment rates were falling faster than in the rest of the country. The
region was also showing the strongest growth in the country for job advertisements.
However there were still moves going on to help those who were unemployed.
Wellington City Council were considering spending $2.5 million over the next two
years to set up a cadetship scheme to help young people gain employment. Hutt Valley
Chamber of Commerce was working together with Hutt City Council to form the Hutt
Employment Action Task Force. Despite the buoyant economy there were job losses
throughout the region, as organisations either shut down, or reduced their workforce.
Examples were office equipment suppliers, Telecom, the Inland Revenue Department,
Coca Cola bottling plant, hosiery manufacturers and Capital Power.
In Southland the unemployment rate was half of what it was in 1994 at 5.9%, and 3,900
new jobs had been advertised in the region since September 1994. The high number of

232
seasonal workers in the region did cause fluctuations, with the unemployment rate rising
over the winter period. As in Wellington there were job losses notably at AgResearch in
Gore, MetService, electricity companies, construction firms and sawmills.
2005
In 2005 unemployment was low but there were still some redundancies. In Wellington, a
local manufacturer closed with the loss of 270 jobs, and the City Council began a work
experience programmes for refugees and migrants. In Southland unemployment figures
were low and a scheme to keep meat workers in off-season farm jobs was proving
successful.
Critical reflection
In 1985 the newly introduced economic reforms had led to widespread unemployment,
by 1995 the economy was enjoying a boom and the situation had improved radically and
in 2005 unemployment was still low. In general employment figures in New Zealand are
good when compared to other OECD countries.
5.6.5 Investment
1985
A series of four articles in the National Business Review analysing research and
development in New Zealand written by David Penny pointed out that out of the 20
OECD countries New Zealand was one of the four with the lowest per capital income,
and like the other three countries spent the lowest proportion of GDP on research and
development. In 1984 New Zealand spent 0.88% of GDP on research as compared to an
OECD average of 2.01%. As well as the low overall spending on research and
development, the country had an unusual distribution pattern with high spending on
research in the Government sector and low spending in both the private and university
sectors. The effectiveness of the country‟s research and development effort was
measured by examining the number of scientific and technical based papers by New
Zealand based workers recorded in the annual Science Citation Index. The two major
findings were the high proportion of medical papers published and the relatively good
performance of the university sector relative to the government sector. However, by
world standards the universities needed to improve their research performance. The
articles suggested that this could be aided by a number of reforms including allowing
university scientists a fair chance to access to money for both basic and applied research.

233
In December, the Science and Technology Minister Bob Tizard did present a paper
advising that funding for research associations was to increase.
In the beginning of 1985, Challenge Venture Capital was trying to raise $6 million to
invest in local companies with good ideas in high technology. By the end of the year
venture capitalists had joined forces to form the New Zealand Venture Capital
Association, making $100 million available for investment in growth ventures. The
DSIR also produced the Venture Capital Directory which gave details of investment
companies and brokers who are prepared to invest in higher risk mainly technological
industrial products.
An article in the Dominion Post identified tourism and biotechnology as two sunrise
industries where venture capitalists were being sought. In other areas, such as biological
research, investment was felt to be inadequate. In the case of the film industry the
treasury had decided to stop financial support and tax breaks. Sometimes it was the
pattern rather than the amount of funding that was the problem. A wood processing
conference in Auckland concluded that there was plenty of research on how to grow
trees but very little on how to add value after harvesting. The DSIR were also worried
about the impact of the new “user pays” policy which would require it to find $21
million of its $90 million budget from commercial sources on basic and strategic
scientific research. Regional Development Minister Kerry Burke also commented that
the focus of regional development grants needed to change to provide a catalyst for
overall development rather than focusing on specific small businesses.
The Wellington region received $50,000 in grants from the Medical Research Council,
and a new investment bank, FAS Macquarie Ltd. set up in the central business district.
In Southland, 52 permanent job opportunities had been provided through Southland
Regional Development Council loans. Most applications were from small enterprises in
engineering, agricultural and timber processing.
1995
In 1995 foreign investors, particularly from Asia were becoming more interested in New
Zealand, though one article commented that New Zealand had too few resources and not
enough people to attract significant Japanese investment. Singaporeans were investing
in electronic retailer Noel Leeming, and Chinese investors were interested in hotels. The

234
Tiong family from Malaysia invested $170 million into the local economy and was
expecting to spend more. There was some local resistance to the idea of foreign
ownership of New Zealand assets, with some commentators referring to an “Asian
invasion”; however, Asian investment was only 18% of total investment.
In Southland, local MP Bill English was strongly critical of locals who tried to block
foreign investment in the region, and was keen to encourage local people to promote
overseas investment in Southland. The region was doing well, with both the Southland
Building and Investment Society and the Invercargill Licensing Trust recording record
profits. A development boom also meant that around $375 million was likely to be
invested into the local economy over the nest few years.
In Wellington a Singaporean investor bought up a hotel complex, and local
schoolchildren were taking part in a share market investing simulation.
2005
The venture capital and private equity industry increased investments by 80% in 2004,
with $158 million invested across 59 deals. The majority of the capital raised came from
retail funds. Investors were following global trends by creating networks such as Ice
Angels or Canterbury Investor Network rather than investing in start-up firms as
individuals. Two sectors that were receiving significant investment were ICT and
biotechnology. The government made $17 million available to universities for ICT
research, and a new investment fund for biotechnology was announced with up to $100
million available from a mixture of local and offshore money.
On the international front the Kiwi Expat Association launched a new website to
provide local high-tech companies with access to potential expatriate investors.
Critical reflection
Investment in research and development was low in New Zealand as compared to the
rest of the OECD; however, it did increase slightly over time. Any funding that was
available tended to be focused on high technology such as ICTs and biotechnology.

235
5.6.6 Evaluation
The ideal learning region is consistently economically successful, with low
unemployment rates. Though the economy of both regions improved over the period
studied, alongside reduced levels of unemployment, neither region exhibited the
exceptional economic performance that would be expected of a learning region.
Though the findings for this section are a little disappointing, it should be noted that as a
small country, located at some distance from major world markets New Zealand faces a
more difficult task than many other countries in developing its economy. The fact that
the country has managed to make progress despite these challenges needs to be
recognised.

236
CHAPTER SIX
6 CROSS CASE ANALYSIS
The story has just taken us on a journey through time. The scene now shifts to focus on
location. This chapter tells the story of the two regions of Southland and Wellington, by
using a cross case analysis. The first section explains the rationale for using a cross case
analysis, the second section is the analysis itself, and the final section summarises the
main findings.
6.1 Rationale
Historical methods share many of the characteristics of case studies. Though there are
clear differences, as explained in section 3.4, many of the techniques developed by case
study researchers to improve the authenticity and credibility of case study research
(Eisenhardt, 1989; Miles & Huberman, 1994; Neuman, 2003; Yin, 1984) are also
appropriate for historical methods.
Cross case analysis is one technique used to increase transferability of findings and/or to
deepen understanding and explanation (Miles & Huberman, 1994; Yin, 1984). As this
research has focused on only two regions, the argument for transferability is not strong.
However, looking for similarities and differences between the two regions will deepen
understanding and strengthen the explanation of the findings.
It should be noted that qualitative interpretive research is often criticised for being weak
in the area of generalisability. In a classic paper, Lee and Baskerville (2003) challenge
this view and point out that there are many different kinds of generalisability, and that
being able to transfer findings from one population to another is only one approach. This
research is attempting to generalise the findings to a theory, in this case the “6-I”
framework. Data was collected at the national macro level and at the meso level from
two regions, Wellington and Southland. A cross comparison of the findings from these
three sets of data has been carried out, but another important goal of this research is to
use the data to evaluate the appropriateness of the “6-I” framework.
Cultural context research (Neuman, 2003) was used to select two regions with different
cultural settings, one rural and one urban. These two regions complement each other and

237
provide data about two different aspects of the New Zealand economy. Southland is a
remote rural region, whereas Wellington is mostly urban and suburban. Another reason
for their selection was that both regions had a history of innovation in the use of ICT
networks. The reasons behind their innovative approaches came from different places, in
Southland it was driven by dissatisfaction with existing telecommunications service, in
Wellington the innovation was driven by forward thinking local champions who seized
on an opportunity to make the most of the city‟s compact geography. As discussed in
chapter 4, a high standard of telecommunications infrastructure would be one of the
characteristics of an “ideal” learning region, so at least one of the six indicators was
known to be strongly present in both regions.
Case studies can involve single or multiple cases and numerous levels of analysis
(Eisenhardt, 1989; Yin, 1984). Though the intention of this research was to look at the
two cases at the regional meso level, as the data was collected, it became apparent that
two levels of analysis were more appropriate. As well as the regional level, an analysis
of the national macro level was also of value. As a small country New Zealand itself
could be defined as a region (as previously discussed in section 2.1.1). This use of
multiple levels adds value to the research. The integration of micro, meso and macro
level data is a feature of historical comparative research, where different levels of reality
are linked. For example, at the micro level the winning of an international study award
by an individual teacher would be linked with a macro level national policy to increase
international trade (Neuman, 2003). The national situation has already been extensively
discussed in Chapter 5, so the cross case analysis will concentrate on the regional meso
level, and compare and contrast the two regions of Southland and Wellington.
The original data from the newspaper articles was used to build up six meta-matrices for
each category and sub-category in the “6-I” framework. These meta-matrices listed all
the information for each region from 1985 to 2005 and are shown in APPENDIX E. A
meta matrix is used to assemble descriptive data from multiple cases in a standard
format. The aim is to include all relevant data as for any findings to be meaningful each
case needs to be considered as a complete entity rather than broken down into
independent variables (Miles & Huberman, 1994). Though a useful source of reference
the meta-matrix is large and unwieldy and doesn‟t give an accessible overview of the
data. The next step is to produce a more streamlined matrix. This was done using two

238
techniques, firstly the data was coded according to the major sectors involved e.g. was it
from the business, education or local government sector, did it illustrate cultural
diversity or the use of ICTs? The second technique was to compare the degrees of
influence of each sector, was it high medium or low? Positive and negative influences
were noted with the use of plus and minus signs. This produced the six tables shown
below which allow a finer grained comparative analysis of the outcomes and provide a
more digestible visual summary. The next step is to search for patterns and themes, and
to make contrasts and comparisons (Miles & Huberman, 1994).
6.2 Analysis
1985 1995 2005
Southland Wellington Southland Wellington Southland Wellington
Int
Tra
de
Bus (H) LGov (M). Educ (M)
LGov (M)
Educ (M)
LGov (M)
Bus (M)
Bus (M) Educ (L)
Net
Org
Gov (L) Gov (M)
Int
Net
wo
rk School (M) Comm (L)
School (L)
.
ICT (H)
LGov (M)
School (L) ICT (M)
Uni (L)
Net
wo
rks
& C
lust
ers
Rur (H)
Bus (L)
.
LGov (H)
Bus (M).
Bus (L)
Educ (L).
Bus (M)
Comm (M)
School(M)
LGov (H)
Bus (M)
Rur (L)
School (L).
LGov (H)
School (M)
Bus (H)
Table 28: Cross case analysis for "Interconnecting"
Codes – Airport, Bank (Banking Sector), Bus (Business Sector), Comm (Community Sector), Comp
(Competition), Confidence (Confidence in Economy), Crime, Distance (Distance Education),
Diverse (Diversification), Educ (Education), Ferry, Govt (National Government), Hardship
(Economic Hardship), Health (Health Sector), ICT (Information & Communication Technology),
Immig (Immigration), Internet, Lib (Liberalisation), Invest (Investment), LGov (Local
Government), Mãori (Mãori Issues),Mobile (Mobile Commerce), PI (Pacific Island Issues), Poly
(Polytechnic), Pop (Population), Port, Racism, Road, Rur (Rural), Research, Restruct
(Restructuring), Retrain (Retraining Programmes), School (School), Slowdown (Slowdown of
Economy), Telco (Telecommunications), Trad Val (Traditional Values), Unemp (Unemployment),
Uni (University), Women (Women’s issues)
H (High), M (Medium), L (Low), + (Positive), - (Negative)
As illustrated in Table 28, the cross case analysis for “Interconnecting” shows that in
terms of building links for international trade (Int Trade) both regions were following a
similar pattern, with local government, business and the education sectors all involved
in developing overseas links. Evidence of the development of the networked

239
organisation (Net Org) was found only in the Wellington region and mainly in national
government. Both regions helped develop national and international networks (Int
Network) by means of student exchanges; however, from 1995, onwards Wellington
used the internet extensively to build national and international networks, whereas no
similar data was found for Southland. Both regions provided evidence of networks
(Networks & Clusters) that existed throughout the period in the business and education
sectors, and in Southland rural networks were particularly active. By 2005 local
government in both regions had conducted surveys of local organisations to identify
common needs and issues.
Table 29 summarises the findings for “Informing”. In 1985 skill shortages (Skill
Shortages) were an issue right across the country and this is reflected in the findings for
both regions, though problems were more severe for rural Southland, particularly in the
school sector. In 1995 and 2005 the situation improved, though there were still staff
shortages in some areas, notably the health sector in Southland and the ICT sector in
Wellington. 1995 was a time of change for the education sector (Invest in Education) in
both regions; Southland Polytechnic faced a funding crisis and there was intense
competition between tertiary institutions in the Wellington region. More specialised
schools were opening and the gap between rich and poor state schools was increasing.
By 2005 the situation had stabilised. Southland Polytechnic was now the Southern
Institute of Technology and had introduced a zero fees policy which improved
enrolment numbers. In Wellington there had been rationalisation of the tertiary sector.
Southland had also set up a number of retraining courses to address unemployment and
partial employment in the region. ICT was generally heavily promoted (Prom Tech) in
the Wellington region, though there is a gap in the data for 2005. However in Southland
there was very little promotion of technology. In the education sector IT (IT in Ed) was
widely used in both regions. In Southland it was seen as a way of combining the
resources of small rural schools. In 2005 Southland pioneered the use of interactive
white boards in New Zealand.

240
1985 1995 2005
Southland Wellington Southland Wellington Southland Wellington S
kil
l
Sh
ort
ag
es
Rur (H -)
Educ (H -)
Health (H -)
Pop (L +)
ICT (H -)
Gov (H -)
Uni (L -)
Bus (L-)
LGov (M -)
Retrain (L)
Bus (M -)
Educ (M -)
Immig
(L +)
.
Health
(M -)
LGov (L -)
Immig
(L -)
ICT (M -)
LGov (M -)
Health (M -)
Inv
est
in
Ed
uca
tio
n Pop (H -) Uni (H)
Poly (H)
Poly (H -)
School (M)
Comp (H)
Diverse
(H + & -)
Poly (H +)
School (M)
LGov (H)
Retrain (M)
Diverse (M)
Poly (L)
Pro
m
Tec
h Rur (L)
Women (L)
ICT (H)
Women (L)
Comm (L)
ICT (M)
Women (L)
Health (L)
IT i
n
Ed
Distance (M)
School (L)
Distance (L)
School (M)
School (M)
Comm (L)
Internet (H) Internet (H) Internet (H)
Comm (L)
Table 29: Cross case analysis for "Informing"
Factors relating to “Innovating” are shown in Table 30. As far as climate and culture
(Climate & Culture) go the promotion of innovation in terms of seminars and
expositions was present in Wellington but not Southland. Both regions provided
examples of small scale entrepreneurs (Ents), but apart from one or two Southland
examples entrepreneurship in the field of ICT (Ents in IT) was only found in
Wellington. The adoption of ICT (Adoption of ICTs) was also stronger in Wellington,
but the difference was not so significant. By 2005, use of the internet was widespread in
both regions. The data for the adoption of electronic commerce applications (EComm)
such as online and telephone banking, the Fencepost website for dairy farmers and the
use of mobile phones shows that adoption was just as strong , if not stronger, in rural
Southland as in Wellington. This indicates that when the rural community saw clear
benefits from a technology, for instance, in terms of saving travel time to a bank, or
having access to accurate weather forecasts, they were quick adopters. In both regions,
but more notably in Southland, there was experimentation with different stock and
produce lines in the agricultural sector (Rural Ents).

241
1985 1995 2005
Southland Wellington Southland Wellington Southland Wellington
Cli
ma
te &
Cu
ltu
re
Bus (M)
LGov (M)
Bus (L)
Educ (L)
Bus (M)
En
ts
Bus (H)
LGov (M)
Bus (L)
Bus (L) Bus (M)
LGov (L)
Bus (L)
En
ts
in
IT
ICT (H) ICT (M). ICT (H) ICT (L). ICT (H)
Ad
op
tio
n
of
IC
Ts
ICT (L)
Rur (L)
ICT (H)
Rur (L)
ICT (L) ICT (L)
Internet (H) Internet (H)
EC
om
m Bank (H) Bank (M) Bank (L)
Mobile (M).
Educ (M)
Bus (M)
Rural (M)
Mobile (L)
Mobile (M)
LGov (L)
Ru
ral
En
ts
Diverse (H)
Research (L)
Research (L)
Diverse (L)
ICT (L) Diverse (L) Diverse (M) Research (L)
Table 30: Cross case analysis for "Innovating"
Codes – Airport, Bank (Banking Sector), Bus (Business Sector), Comm (Community Sector), Comp
(Competition), Confidence (Confidence in Economy), Crime, Distance (Distance Education),
Diverse (Diversification), Educ (Education), Ferry, Govt (National Government), Hardship
(Economic Hardship), Health (Health Sector), ICT (Information & Communication Technology),
Immig (Immigration), Internet, Lib (Liberalisation), Invest (Investment), LGov (Local
Government), Mãori (Mãori Issues),Mobile (Mobile Commerce), PI (Pacific Island Issues), Poly
(Polytechnic), Pop (Population), Port, Racism, Road, Rur (Rural), Research, Restruct
(Restructuring), Retrain (Retraining Programmes), School (School), Slowdown (Slowdown of
Economy), Telco (Telecommunications), Trad Val (Traditional Values), Unemp (Unemployment),
Uni (University), Women (Women’s issues)
H (High), M (Medium), L (Low), + (Positive), - (Negative)
A summary of the findings for the “Interacting” category is shown as Table 31. Though
crime was a common concern in both regions, with the other issues some clear
differences emerged between urban Wellington and rural Southland. As might be
expected, the urban region demonstrated more evidence of liberal values and cultural
diversity, while the rural region had stronger traditional values and was less open to
change (Regional Culture). However the voluntary sector (Voluntary Groups),
particularly rural women‟s‟ groups, was very significant in Southland. In both regions
there was a growing awareness of the needs of Mãori and Pacific Islanders (Mãori, PI &
Asian Issues), with a revival of the Mãori language and increasing involvement of ethnic
groups in civic life. Evidence of racism was found in both regions, but in general
progress was being made.

242
1985 1995 2005
Southland Wellington Southland Wellington Southland Wellington R
egio
na
l
Cu
ltu
re
Crime (H)
Trad Val
(H)
Comm (L)
Crime (H)
Lib (M)
Comm (M)
Crime (M)
Lib (M)
Trad Val (L)
Crime (M)
Diverse (L)
Comm (M)
LGovt (M)
Comm (L)
Diverse (L)
Crime (L)
Diverse (M)
Comm (M)
ICT (L)
Vo
lun
tary
Gro
up
s
Comm (H)
Women (H)
Rural (H)
Comm (M)
Women (L)
Women (M)
Bus (M)
Comm (L)
Comm (H)
Women (H)
Rural (H)
Comm (L)
Mã
ori
PI
& A
sia
n
Issu
es
Mãori (H +) Mãori
(M + & -)
PI (M +)
Uni
(M + & -)
Mãori (H -)
PI (M)
Bus (L)
School (H)
PI
(H + & -)
LGovt (M)
Comm (L)
Racism (L)
Mãori
(H + & -)
Poly (M)
Racism (M)
Mãori (L)
Diverse (L)
Table 31: Cross case analysis for "Interacting"
1985 1995 2005
Southland Wellington Southland Wellington Southland Wellington
Tel
co Telco (H) Telco (H) Telco (L)
Mobile (M)
.
Telco (H) Telco (H)
LGovt (M)
Govt (L)
Telco (H)
LGovt (L)
Tra
nsp
ort
Ferry (M - ) Airport (M)
Airport
(M + & -)
Port (M +)
Road (L)
Port (M +)
Airport (M)
Port (L -)
Airport (L)
Port (L +)
Reg
ion
al
Dev
elo
p
LGovt (H -)
Restruct (M)
LGovt (H -)
Immig (L -)
LGovt (M)
Restruct (M)
Restruct (H) Restruct (H)
Rural (M -)
Restruct (M)
Table 32: Cross case analysis for "Infrastructure"
Table 32 details the results of the analysis of “Infrastructure”. Interest in
telecommunications (Telco) was generally high throughout the period in both regions.
Towards the end of the period, local and national government was playing an increasing
role in promoting the development of telecommunications infrastructure in both regions.
In terms of transport (Transport) the development of international air links was seen as
important in both regions. Shipping links through ports were also significant, in
Wellington the Port continued to show a profit, but in Southland 2005 saw the Port
make a loss. In 1985 there was a national restructuring of local government, which was
strongly resisted in both regions (Regional Develop). Change continued throughout the

243
period, with the set up and dismantling of various regional development organisations
and the production of various strategies and charters by local government bodies.
1985 1995 2005
Southland Wellington Southland Wellington Southland Wellington
Eco
no
my
Rural (H)
Bus (H)
Bus (M)
Hardship (M)
Bus (M)
Hardship (L)
Bus (M)
Confidence
(H)
Slowdown
(M)
Slowdown
(L)
Confidence
(L)
Ru
ral
Sec
tor
Hardship (H -
)
Rural
(H + & -)
Diverse (H)
Rural
(H +)
IT S
ecto
r ICT (L) ICT (H) ICT (L) ICT (M) ICT (L) ICT (H)
Un
emp
Unemp (H -)
Unemp (M -) Unemp (M +) Unemp (H +)
Retrain (M)
LGovt (H)
Rates low.
Retrain (L)
Rates low.
Retrain (L)
Inv
est
Invest (M)
LGovt (M)
Invest (M) Racism (M) Invest (L)
Table 33: Cross case analysis for "Income"
Codes – Airport, Bank (Banking Sector), Bus (Business Sector), Comm (Community Sector), Comp
(Competition), Confidence (Confidence in Economy), Crime, Distance (Distance Education),
Diverse (Diversification), Educ (Education), Ferry, Govt (National Government), Hardship
(Economic Hardship), Health (Health Sector), ICT (Information & Communication Technology),
Immig (Immigration), Internet, Lib (Liberalisation), Invest (Investment), LGov (Local
Government), Mãori (Mãori Issues),Mobile (Mobile Commerce), PI (Pacific Island Issues), Poly
(Polytechnic), Pop (Population), Port, Racism, Road, Rur (Rural), Research, Restruct
(Restructuring), Retrain (Retraining Programmes), School (School), Slowdown (Slowdown of
Economy), Telco (Telecommunications), Trad Val (Traditional Values), Unemp (Unemployment),
Uni (University), Women (Women’s issues)
H (High), M (Medium), L (Low), + (Positive), - (Negative)
The final analysis is shown in Table 33, which lists the different factors for “Income”. In
1985 the economy (Economy) was in difficulty in both regions, but rural Southland was
particularly hard hit. Later in the period the situation improved and Southland was able
to steady its loss of population. However, by 2005, economic growth in both regions
was lagging behind the national average. The rural sector (Rural Sector) in Southland
managed to recover mainly by switching from sheep farming to more profitable dairy
farming. In Wellington the IT sector (IT Sector) was a significant part of the local
economy throughout the twenty year period. Unemployment rates (Unemp) followed
the national pattern in both regions, being high in 1985 then improving in 1995 and
2005. However, unemployment was generally lower than the national average in

244
Wellington. There was some evidence of investment (Invest) in both regions but not at a
significant level.
6.3 Summary
The economic reforms introduced by the 1985 Labour government shook the entire
economy and rural Southland was badly affected. With a more diverse economy based
on IT and services, Wellington was better placed to ride out the recession. 1985 also saw
a “brain drain” due to better opportunities overseas; this affected the IT sector in
Wellington and the education and health sectors in Southland. Over the course of the
twenty year period the economy improved and skill shortages became less of an issue
for both regions.
In 1985 IT was already a strength of the Wellington economy, and its importance grew
throughout the period, but not as much as had been hoped for. In Southland there was a
switch from sheep farming to the more profitable dairy farming. Both regions
recognised the importance of good ICT infrastructure. In 1995 Wellington set up
CityLink as a fast broadband network in the CBD, and it was joined by Smartlinx3 in
2005. In 2003 Southland selected telecommunications provider Woosh to build a
wireless broadband network across the region.
The common factors between the two regions are that they both followed the national
pattern of developing international links through business visits, sister city relationships
and student exchanges. Both were also able to build strong networks in their education
sector and later in the period used ICTs to strengthen these networks. Local government
in both regions played a significant role in setting up these ICT networks and was also
heavily involved with telecommunications. Both regions were fast adopters of new
technologies that had clear quantifiable benefits such as Eftpos and mobile banking. In
both regions more attention was being paid to the needs of Mãori and Pacific Islanders,
with both groups becoming increasingly involved in civic life. Improvements in air
transport were seen as significant to economic success in both regions. The economy in
both Southland and Wellington was generally following the same pattern as the rest of
the country.

245
Historical comparative research takes a more contingent than determinist view of
causality. Case studies can be analysed to show that if A, B and C appear together in one
place then D is likely to result, but it generally cannot be said with any certainty that A
caused B which caused C which then caused D (Neuman, 2003). One of the reasons for
the selection of these two regions was that they were both adopters of innovative
telecommunications networks, and one of the reasons for carrying out a cross case
analysis is to attempt to identify common factors that led to this adoption. Those
common factors would seem to be an intense interest in building telecommunication
networks throughout the period studied, together with heavy involvement of local
government bodies. In urban Wellington these telecommunication networks were
developed much earlier than in rural Southland. In both regions, the education sector
was a key player in the development of these ICT networks, and both regions were quick
to take advantage of the Project PROBE initiative launched by national government.
The major reason for developing telecommunication networks is to improve economic
performance. No strong evidence for improved economic performance was found in
either region, though there was significant innovation in the IT sector in Wellington
throughout the period studied.
The model of a learning region developed in Figure 10 also identifies the role of the
social entrepreneur as critical in facilitating the development of regional linkages. At
certain points throughout the period certain individuals within a region could be clearly
identified as important enablers of change. For example, Fran Wilde, Mayor of
Wellington, and Richard Naylor who worked for Wellington City Council played a
strong leadership role in the implementation of the CityLink network. Similarly in
Southland, Tim Shadbolt worked hard to improve the image of the regions. However,
the role of the social entrepreneur was also often taken on by a regional body such as
local government or the Chamber of Commerce, rather than an individual.
Liberal and culturally diverse Wellington fits the description of a Creative Centre, as
described by Richard Florida in section 2.3.4. Therefore, theoretically its looser
networks and weaker ties should make it a more innovative environment. There was
evidence of innovation in the ICT sector and Wellington City was one of the first places
in the world to install a broadband network in its central business district. However this
innovation did not lead to above average economic success. According to Florida‟s

246
model (2002), Southland with its traditional rural values would be a Classic Social
Capital Community with strong ties that is low on diversity, innovation and high
technology. Though it is true that less evidence of innovation was found in Southland,
the region seemed to be able to effectively use strong tie networks to solve technological
problems. For example, Venture Southland was able to bring a team of volunteer
engineers together to reassemble a redundant telecommunications dish for a space
research project. The strong ties that existed between local schools were also an asset
rather than a barrier when linking the schools in an ICT network. The fact that networks
exist at all would seem to be more significant than whether they consist of strong or
weak ties. Both types can be used to effectively implement successful ICT networks, if
there is a social entrepreneur willing to take on a leadership role.
In a 2008 report, researchers used data from the Global Entrepreneurship Monitor
initiative53
to try to assess the entrepreneurial advantage of world cities (Acs, Bosma, &
Sternberg, 2008). Using a number of different indices to measure innovation the
researchers evaluated the performance of 34 major world cities between 2001 and 2006.
They compared city-level data against country-level data in order to see whether world
cities stood out as the leading centres of entrepreneurship in their countries. The
findings showed that, as predicted by the literature (Florida, 2002; Jacobs, 1972), most
large cities were more entrepreneurial than the country they were located in. However
there were notable exceptions, for example Tokyo had a much lower ranking than Japan
as a whole. Auckland was the only New Zealand city included in the research, and it is
of interest to note that on most of the factors studied the rates of entrepreneurial activity
in Auckland were slightly below the New Zealand average, and where they were higher
than the country average it was only a slight difference. If this can be taken to indicate
that levels of innovation in New Zealand are not notably higher in the cities, but are
fairly evenly spread out across the country, then it would seem to confirm the findings
of this research which discovered more similarities than differences between the two
regions studied.
53
http://www.gemconsortium.org

247
CHAPTER SEVEN
7 CONCLUSIONS
In the introduction to this thesis the reader was promised a story. Well now the story has
been told, and it is time to reflect on what has been learned during the telling of the tale.
This final chapter revisits the research question and reviews the main findings of the
research in the light of issues raised in the literature review. The limitations of the
research are outlined, as are the contributions of the research to both theory and practice,
and some suggestions about directions for future research. The thesis is rounded up with
a discussion of the “moral of the story”.
7.1 Reflections on this research
The central research question is:
What role do information and communication technologies play in the development
of learning regions?
To unpack the research question, the first issue that must be addressed is whether
Southland, Wellington or, at the macro level, New Zealand itself, can be classified as
learning regions. In chapter 6, the two regions and the national situation are compared
against the “6-I” model, which represents an ideal learning region. Though the picture
was mostly positive, there were shortcomings on some of the key indicators. Two of the
most important benchmarks for learning regions are that they are highly innovative, and
that they are economically successful.
Over the period studied, the national government was keen to diversify the country‟s
export base. Part of this strategy was to increase innovation. Throughout the 1980s and
1990s New Zealanders were enthusiastic adopters of new technologies such as Eftpos
and the internet, and there were great hopes for the growing IT industry. However the
drop in IT exports by the end of the period is an indication that this drive for
diversification was not working as well as anticipated. As of 2005 the country was still
heavily dependent on primary products for most of its export income. There was also no
clear evidence of significant economic improvement in either of the regions or
nationally.

248
Having said that there were many areas of the framework where the country measured
up, and there were significant pockets of success in both regions. The task now is to
consider the contribution of ICT, and the value achieved through its use.
In the literature review (chapter 2) three features which underpin the concept of the
learning region were introduced; the regional perspective itself, organisational learning
and social capital. These three topics, along with the literature on the learning region
and the contribution of the “6-I” model itself, will now be revisited and reviewed in the
light of the findings.
7.1.1 The Regional Perspective - revisited
A distinction is made between regionalisation, where regions are imposed from the top
down, and regionalism, where a region is created from the bottom up by political
pressure from its inhabitants. The implication is that with regionalism there will be more
trust and co-operation between organisations and individuals. The Greater Wellington
region contains six different local councils, and the Southland region has three. At the
level of the local council there was evidence that citizens felt they were part of a
homogenous community. However, at the regional level this was weaker and there was
evidence of conflict between the local councils within a region. This was particularly
marked in Wellington, where there was considerable disparity between the local
councils, and evidence of ongoing rivalry between the Hutt Valley and Wellington City
itself. In 1995 the incoming mayor of Lower Hutt had to remind his constituents “Hutt
City is not a wart on Wellington’s bottom.” Such labelling, whether positive or
negative, tended to occur at the level of the local council; Wellington was the “Creative
Capital”; Invercargill was “the arsehole of the world”. This is an indication that there are
limitations to the level of trust that exists at the regional level. Citizens‟ natural loyalty
is to their local council; this also helps to explain the reasons underlying the infighting
between the local councils within a region that often hamper progress.
The level at which to pitch the research is problematic. As New Zealand has only four
million inhabitants is it meaningful to focus on the regional (meso) level or is the
national (macro) level more appropriate? Historical methods traditionally combine
micro and macro levels, by considering the impacts of change, both at the level of the

249
individual citizen and at the level of the state. As the research progressed, analysis was
carried out at three levels: macro (national); meso (regional) and micro (individual).
The use of these multiple perspectives brings a richness to the research that would be
lost if analysis was conducted at one level alone.
New Zealand‟s transport infrastructure has a very different shape than that of a typical
European country and is much sparser; transport typically developed from a port city to
its hinterland and internal communications were poor. As wheels and wires tend to co-
exist this has also affected the development of the telecommunications infrastructure.
7.1.2 Organisational Learning – revisited
A number of factors contribute to organisational learning, including the existence of
third places, core competencies, collaboration and support for continuous improvement.
A third place is neutral territory where ideas can be shared. The compact geography of
Wellington City lends itself to social meetings, such as the get-togethers of the CIO
network described in section 5.1.4, and the coffee houses of the terrace54
can definitely
be regarded as third places. There is also a long standing digital third place in terms of
the CityLink network which has covered the central business district since 1995. In
more recent years the Hutt Valley and Porirua have developed SmartLinx3 as a digital
network, and Venture Southland also have plans to provide a high powered broadband
network for central Invercargill. These third places, both physical and electronic, tend to
be restricted to central points in a region.
In terms of core competencies both regions have areas of specialisation; for Southland
they are farming, tourism and the aluminium smelter; for Wellington it is the public
sector, IT and service industries.
Interfirm collaboration has been shown to contribute directly to innovation within a
region. Evidence of collaboration was found in both regions studied. Collaboration was
often sector based and facilitated by the local council. Collaboration was more common
in the public than the private sector. Within the regional setting collaborations mainly
occurred around community issues, such as health and unemployment; collaboration for

250
research or within a particular industry sector tended to be national. ICT was being used
to facilitate networking and collaboration software was widely used in rural schools and
in dairy farming.
One area where strong evidence of regional co-operation was found was in the
education sector in both regions, but particularly in Southland, where secondary schools
and the tertiary sector worked together to use ICT networks to overcome barriers of
distance and to share limited resources. The Project PROBE initiative resulted in
significant use of technologies such as videoconferencing and interactive whiteboards to
share resources between rural schools. These technologies were viewed as offering
significant advantages over traditional correspondence learning, but were not viewed as
a total replacement for face-to-face instruction.
There was some evidence of support for continuous improvement at the regional level,
with Venture Southland providing training courses which aimed to up skill small
business owners.
7.1.3 Social Capital – revisited
Organisational learning becomes regional learning when social capital spills beyond the
boundaries of one organisation. In New Zealand, human, cultural and social capital are
high, and have consistently been so. Trust is also high with the country being ranked as
one of the least corrupt countries in the world. There was evidence of bonding within
regions; usually the strongest ties were between organisations in the same sector. There
was also evidence of bridging; some international links operated directly from regions,
though it was more common for these to be coordinated through national networks. ICT
was viewed as offering opportunities to strengthen regional interaction, with the caveat
that it should work alongside traditional face-to-face interactions.
During the period studied attitudes became more liberal, and as the country became
more ethnically diverse, Pacific Islanders and Mãori were increasingly involved in civic
life. New Zealand was reflecting the two macro trends identified by Manuel Castells as
characterising the Information Age; the globalisation of economy, technology and
54
The centre of the CBD, an area with a dense concentration of high rise tower blocks, containing the
offices of many different organisations
251
communication and the parallel affirmation of identity as the source of meaning
(Castells, 1997).
Nahapiet & Ghoshal (1998) developed a model which demonstrated how social capital
could be converted into intellectual capital. They identified three dimensions of social
capital that affect the way knowledge is exchanged; the structural, cognitive and
relational dimensions. All of these dimensions were present to some extent in both
regions. The structural dimension covers opportunities for exchanging knowledge, and
includes; network ties, network configuration and appropriable organisation. Network
ties, both physical and digital, are present in both regions; all interviewees demonstrated
that they had a good knowledge of “who‟s who” in their regions and knew who to go to
for appropriate advice. The configuration of these social networks was dense; people
working in one organisation within a region knew who the significant contacts were in
other regional organisations. As discussed in the literature review, this type of
configuration has fewer benefits for information exchange than a sparse network. This
was ameliorated to some extent by contacts local councils made overseas, particularly in
Australia, and the fact that when new projects were being worked on, fresh ideas from
overseas were actively sought out. Digital networks were also used. However, when
they were used for information exchange it was generally at a national level or sector-
based rather than in a regional context. The exceptions were schools and community
groups. Wellington Community Net (section 5.4.2) was used by not-for-profit groups
within the Wellington region to share information online, and schools in Southland used
ICT to share information and resources. Appropriable organisation is the ability to
transfer trust developed in one setting to another. This was present to some extent, but
political changes in local and regional government often meant that the good will
developed when working on one project was not always transferred to the next one.
In the cognitive dimension there are two main resources that can be used to share
knowledge: shared narratives, and shared language and codes. The inhabitants of
Southland and Wellington shared common stories about their regions; this was
particularly marked in Southland, where there was a shared understanding of the
characteristics of a “true Southerner”. English and Te Reo are the two official languages
of New Zealand, and there are no real differences between regions in terms of shared
languages and codes. This difference is more like to come out at the sector level, where

252
those working in education, health, tourism or farming may have their own terminology
and jargon.
The relational dimension focuses on the exchange of information. Factors that are
important are; trust, norms, obligations and identifying with a group. As has been
previously discussed, New Zealand has a good reputation for honesty and trust is
generally high. However, within the regional setting, there was evidence of mistrust and
“turf wars” between different local bodies. There were a few issues such as addressing
crime and tackling youth unemployment that would bring everybody together, but in
other areas there was a lack of co-operation. There was evidence of norms, for instance,
in Wellington they were more liberal and open to diversity and change; in Southland
they were more traditional and closed. There was no evidence of obligations and as far
as identifying with a group goes, people identified with their region, especially in
Southland, but they also identified with their profession and leisure interests.
Dense social networks and regional norms meant it was easy to exchange information
within a region. In the areas of education and not-for-profit groups there were also
digital regional networks. However, when new information was required to create new
intellectual capital, there was a need to reach out beyond the region, usually overseas, in
order to obtain that information.
7.1.4 Learning region – revisited
One of the key characteristics of a learning region is the presence of institutional
thickness, as evidenced by lively interaction between different regional bodies; of
particular interest for this research is the presence of digital institutional thickness,
where ICT is used to facilitate the exchange of information within a region. As
mentioned in the previous section, both regions were found to have dense social
networks, and there was interaction between different regional bodies, usually facilitated
by local government, and occasionally by the Chamber of Commerce. The most
significant interactions were between schools and community groups.
The infrastructure for building digital institutional thickness was present in Wellington
in the form of the CityLink broadband network established in 1995. However, it should
be noted that this network was restricted to the central business district, and plans to

253
extend it to suburban areas had not been followed up. Also within the Wellington
region, SmartLinx3 provided a digital network between Upper and Lower Hutt and
Porirua. In Southland, Venture Southland wanted to extend the peering exchange
situated in the central Invercargill library by building a fibre optic cable network for the
city, that could also be used to hook into the Advanced Network being developed to link
the Universities, Crown Research Institutes and National Library.
However, the presence of the infrastructure does not in itself lead to digital institutional
thickness. Though digital networks were present and being planned in both regions this
does not necessarily mean they were being used for local interactions. Seventy percent
of traffic over the CityLink network is international, 20% is national and only 10% is
local (Naylor, 2007). Though the aim of networks such as CityLink and SmartLinx3 is
to increase local traffic, there is still a long way to go.
Markusen (1996) identifies four different shapes for learning regions. Do Southland and
Wellington fit well with the patterns she described? As the capital city Wellington fits
the description of a state anchored district, with government offices acting as the key
anchor tenant in the region, though it also has features of the sticky mix model with both
small and large businesses active in the service and IT sectors. For Southland the hub
and spoke model, where a number of key firms act as hubs with suppliers and related
activities spread around them is the most appropriate model, with the aluminium
smelter, the freezing works, Southport and the Dairy Co-operative forming the hubs.
7.1.5 “6-I” model – revisited
The “6-1” model was used to collect and analyse data; the main findings are presented
in Chapter 5. The “6-I” model defined the characteristics that would be present in an
“ideal” learning region; the actual regions were then evaluated using this ideal as a
benchmark. As discussed in section 3.2 this research was multi-layered; data was
collected at both the national macro level and the regional meso level. The most
positive findings were in the areas of interconnecting, informing and interacting. The
least positive were in innovating and income, with infrastructure coming somewhere in
the middle.

254
Interconnecting
Changes in global economic markets meant that New Zealand was under pressure to
diversify its economy and build trade links with new economic partners. The country
was very successful in reducing its dependence on the UK and developing new export
markets in Asia. It was less successful in reducing the economy‟s heavy dependence on
primary products. New Zealanders exhibited a strong desire for improved connections to
the rest of the world and were very fast adopters of any technology that would
strengthen these connections.
Informing
At both the national and the regional level there was a strong and consistent
commitment to learning. ICTs were viewed as a useful tool that could facilitate learning,
especially but not exclusively, in rural areas. The school sector stood out as a fast
adopter of new technology, schools were keen to collaborate with each other using
technologies such as videoconferencing. Government initiatives often used schools as a
gateway to bring ICTs into local communities.
Interacting
There was good evidence of strong social capital in both regions, the rural women‟s
networks in Southland stood out as being particularly influential, but the situation
throughout the entire country was positive.
Infrastructure
As a country with a low population and difficult terrain, New Zealand has more to gain
from good telecommunications infrastructure relative to other countries. However the
population size and terrain make setting up such infrastructure more costly than in other
countries. The importance of good telecommunications to the economy was recognised
at both the national and regional levels, but the relatively high cost meant that New
Zealand struggled to keep up with other OECD countries.
Innovation
There was evidence of innovative thinking in both regions; two initiatives that stand out
are the pioneering development of the CityLink network in Wellington, and the bold
decision to introduce a zero fees policy at Southland Institute of Technology. New
Zealand also stood out as a very fast innovative adopter of new ICT based technologies.

255
However innovative products and processes were not being developed at the levels that
would be expected in a successful learning region.
Income
In 1984 New Zealand made a series of daring and controversial moves in order to
deregulate its economy. Over the period studied the economy stabilised and employment
improved. Both regions managed to hold their economies steady. In the early part of the
period studied the out-migration of skilled workers was a major problem for Southland,
but by the end of the period the population was stable. However there was no evidence
of the strong economic performance that would be the hallmark of a successful learning
region.
Critical reflection
Two of the most important indicators of a learning region are evidence of innovation
and consistent economic success. At both the national and the regional level New
Zealand was failing to show a strong performance on either of these indicators. Despite
this there were many positive factors; high social capital, a strong commitment to
learning, fast adoption of new technologies and an increasing engagement with the
global economy. Both external and internal factors influenced the country‟s economy.
External factors are mainly geographical; there is small domestic market and New
Zealand‟s remote location gives it a disadvantage in the export market. Internal factors
are lack of ability to achieve regional learning across different sectors, inability to retain
skilled people, lack of commitment to research and development and turf wars between
local and regional councils. The impact of external versus internal factors is unknown.
Even if a region ticked all the right boxes it might not be enough to overcome global
economic forces.
7.2 Has the Research Question been answered?
What role is ICT playing in the development of learning regions? Is it assisting in the
areas where regions are doing well, and does it have the potential to make a difference
to areas where regions are underperforming?
The positive areas were interconnecting, informing and interacting and ICT was found
to be making a contribution in all three areas. Between 1985 and 2005, organisations

256
became much more interlinked in terms of their ICT networks, and information
technology opened up access to the rest of the world. ICT was used to increase
interconnection at the regional level, particularly in the dairy farming, education and
community sectors. These interconnections opened up new opportunities for regional
learning and innovation. Both regions were successful in setting up high quality ICT
networks, most notably in the education sector in Southland and the community sector
in Wellington.
However, though ICT contributed to positive developments in these areas, it could not
operate in a vacuum. The existence of good social networks and strong local champions
were critical to regional development. ICT could complement these social networks but
was no replacement for them.
Though many examples were found of positive initiatives in both regions it was difficult
for initiatives to gain momentum and achieve lasting change. At various points
throughout the twenty year period, initiatives were set up around establishing clusters,
developing a regional strategy, setting up high technology zones or developing
partnerships between education and business, but there was no evidence that such
initiatives built steadily over the years. Proposed changes at a regional level seemed to
be met with infighting and local resistance, which inhibited any steady long-term
development. So though the soft networks formed by clusters, joint venture and
networks were present, no clear pattern of development could be observed.
In terms of infrastructure the general picture that emerged is of a clear linear progression
in terms of the development of hard networks, but a more attenuated pattern in terms of
soft networks where the same issues were revisited a number of times over the years.
Though there was evidence of a relationship between the soft networks that existed at
the regional level and the utilisation of hard ICT networks within a region, it was
difficult to quantify. Rural women‟s groups might discuss broadband as a potential tool
for overcoming rural isolation, but that in itself did not directly influence the rate of
adoption of broadband in their region.
A learning region is typically characterised by high levels of innovation, which in turn
lead to economic success. Though New Zealanders have a reputation for being

257
innovative, and examples were found of successful individual companies, neither region
managed to develop anything close to a regional innovation system. The issues
previously discussed are part of the reason. The findings of the research show that hard
and soft networks evolve differently over time and that the relationship between the two
is nuanced. Though good social capital existed in both regions, especially in Southland,
it was located in different interest groups and was not easy to bring together. This lack
of co-ordination meant that the possibilities opened up by ICT infrastructure in terms of
increasing innovation were not fully realised. Both regions did demonstrate a strong
commitment to learning, but this learning had yet to be translated into economic
success.
The national government hoped that making broadband available in rural areas to
schools and community groups through initiatives such as Project PROBE and the
Digital Strategy would result in a “spill over” effect, with broadband being taken up by
local businesses throughout the region. There was little evidence that this approach was
working, there was good innovative use of broadband by schools and community
groups, but this learning had not been passed on to different sectors within a region.
Both Southland and Wellington had developed ICT strategies (Otago Southland
Broadband Communications Committee, 2001; Wellington City Council, 2006) and at
the national level there was the Digital Strategy (Ministry of Economic Development,
2005). All three documents had a strong focus on education and the community sector.
However, in terms of the potential contribution ICT could make to economic
development they were weak. Developing innovative uses of ICT in the education and
community sectors will not necessarily lead to innovative uses of ICT in the business
sector. At both the national and the regional level more direct effort needs to be put into
developing the use of ICT by the business sector with the aim of increasing innovation.
To summarise, it is clear that ICT is making a significant contribution to regional
development in a number of areas, but its full potential is not being realised. The
learning that is taking place in education and community sectors needs to be leveraged
so that it can benefit an entire region. If fully supportive social networks are put in place
alongside the ICT networks then ICT may be able to unlock the potential that
undoubtedly exists within regional New Zealand, and help to create innovative and
economically successful learning regions.

258
7.3 Limitations
The research is limited by how much data can realistically be collected by one person in
the time period of a PhD thesis. The scope of the project is large, and ideally much more
data should have been collected from each region. Data from the interviews and
newspaper articles could have been supplemented by surveys and company reports. The
findings would have been strengthened by carrying out further interviews to confirm
their accuracy.
The fact that the data from the regional newspapers was only collected at ten year
intervals means there are significant gaps in the story. This thesis by no means
represents a comprehensive history of events in the two regions studied. One of the
techniques of historical research is to listen for “silences”, in other words to work out
what is missing from the data. For example, the regional newspapers did not provide
good coverage of the industries in their regions, and initiatives such as the formation of
business clusters tended to be under reported.
The two regions selected highlighted different aspects of the New Zealand economy, but
it would have also been useful to compare like with like. If the research had compared
two urban regions such as Wellington and Auckland alongside two rural regions such as
Southland and Northland the findings would have been more transferable.
Though the research uses historical methods, most historians would consider looking
back only twenty years as barely touching the tip of the iceberg. To some extent this can
be justified by the fact that ICT is a fairly recent phenomenon. However, in terms of the
social networks it would have been useful to dig further back into the history of each
region.
Another weakness is the fact that page numbers were not collected for the 1985
newspaper articles. Once this oversight was realised, it was corrected and page numbers
were collected the 1995 and 2005 articles. As the 1985 articles are only available on
microfiche, it was not practical to go back and collect the page numbers due to the
length of time it would take.

259
7.4 Contribution of this research
This research has deepened understanding of the complex inter-relationship between
hard ICT based networks and soft social networks, by exploring their development in a
regional setting over a twenty year period. The research is an addition to the literature
which supports the argument that in order for the full potential of telecommunication
networks to be achieved, supportive social networks also need to be in place. Its
particular contribution has been to study these factors in the context of regional New
Zealand.
7.4.1 Implications for theory
This research has contributed to theory by borrowing the concept of the learning region
from another discipline, economic geography, and using it in the context of information
systems. The development of the “6-I” framework makes a contribution to research on
learning regions by providing a model that can be used to assess the contribution of ICT
to regional development in other locations.
It has also taken a little-used research method, historical methods, which has so far only
been used to study individual organisations and applied it in a new context, the regional
meso level. In doing so it has confirmed the utility and value of the historical method.
One of the findings of the research was that New Zealanders are innovative adopters of
new ideas from elsewhere. This thesis has followed that tradition by taking the historical
methods approach, developed in the USA and adapting it to the local context.
7.4.2 Implications for practice
The New Zealand government has launched a number of initiatives to make quality
broadband available in rural area. In March 2010 investment of $300 million was
announced to roll-out ultra fast broadband to 75% of the country within the next ten
years, and to improve broadband services in rural areas (Keall, 2010). At the regional
level, the Wellington Regional Strategy (Wellington Regional Strategy, 2010) also has a
“connected community” and an “entrepreneurial and innovative community” as two of
its key general performance indicators. This thesis provides valuable insights to national
and regional government about how to maximise the benefits of investments in
broadband infrastructure. The importance of getting different regional stakeholders to

260
work co-operatively over a longer time span than the typical three year political cycle is
critical. In order to increase innovation there also needs to be more focus on the benefits
broadband can bring to the business sector.
New Zealand is not alone in using broadband to stimulate economic development in
rural areas. Similar projects are also in place in countries such as Australia and Canada,
and the findings of this research are also applicable in other countries.
7.5 Directions for future research
This research opens up many possibilities for further work. The “6-I” model could be
applied to different regions within New Zealand or throughout the world. More
widespread use of the model would result in further refinements and development of the
framework.
7.6 The moral of the story
When New Zealand and its regions are assessed according to the lessons gleaned from
the literature on improving regional development, the country comes out well. New
Zealand has shown itself to be a consistent fast adopter of new technologies. Citizens
have always had a strong desire for contact with the rest of the world and ICTs have
been seized on as a tool that can facilitate this. The strength of social capital in the
country is outstanding in both urban and rural areas. New Zealanders are liberal, literate
and trustworthy. Over time the country has become more culturally diverse and open.
With all these factors in place, there should be, according to the literature, increased
innovation and improved economic performance. Though evidence of innovation was
found, together with improvements in economic performance they were not present at
anything like the levels that would be expected of a globally competitive regional
economy such as Silicon Valley.
As a low population country with few natural resources, located at a distance from
major world markets New Zealand is subject to the vagaries of the world economy.
Even a region that follows every lesson in the text book, may still struggle to achieve
economic success if world markets are against it. In many ways the country and its
regions are doing well by simply managing to keep pace with the global economy

261
despite the disadvantages of low population and remote location. This research has
shown that the regions of New Zealand do have the capacity to learn. However this
learning has yet to translate into widespread innovation and improved economic
performance. New Zealand needs to learn how to effectively “leverage” the learning
region in order achieve those goals.

262
REFERENCES
Acs, Z., Bosma, N., & Sternberg, R. (2008). The Entrepreneurial Advantage of World Cities; Evidence
from Global Entrepreneurship Monitor Data (No. H200810): Global Entrepreneurship Monitor.
Adams, G. (2005). Fast Internet: making the business case Retrieved 16 November, 2005, from
http://www.istart.co.nz
Allan, V. (1985). Southland Rural Women: An aspect of change. Invercargill: Rural Education Activities
Programme.
Amin, A., & Thrift, N. (1994). Living in the Global. In A. Amin & N. Thrift (Eds.), Globalisation,
Institutions and Regional Development in Europe (pp. 1-22). Oxford: Oxford University Press.
Argyris, C. (1999). On Organisational Learning (2nd ed.). Oxford, UK: Blackwell Business.
Australian Economic Commerce Centre, & Partners, D. (2004). Demand Aggregation Manual: Improving
Broadband Services in Regional Australia: Australian Electronic Commerce Centre, Department
of Communications, Information Technology and the Arts.
Baker, N. (2008). Human Smoke: the beginnings of World War II and the end of civilisation: Simon &
Schuster.
Barro, R. (2000). Education and Economic Growth: Harvard University Press.
Belich, J. (1996). Making Peoples: A History of the New Zealanders. Auckland: Penguin.
Bergh, R. V. D. (2004, June 28 2004). Call to Dump No 8 Wire Philosophy. The Dominion Post,
Braun, P. (2003). .comUnity: A Study on the Adoption and Diffusion of Internet Technologies in a
Regional Tourism Network. Unpublished PhD, University of Ballarat, Ballarat.
Cairncross, F. (1997). The Death of Distance: how the communications revolution will change our lives.
Boston, Massachusetts: Harvard Business School Press.
Castells, M. (1997). The Information Age: Economy, Society & Culture. Cambridge, MA: Blackwell.
Castells, M., & Hall, P. (1994). Technopoles of the World. London: Routeledge.
Centre of Philanthropy and Nonprofit Studies (2006). Bounce-Back of Episodic Volunteers: What makes
episodic volunteers return? : Centre of Philanthropy and Nonprofit Studies, Queensland
University of Technology.
Christie, I., & Hepworth, M. (2001). Towards the Sustainable E-region. In J. Wilsdon (Ed.), Digital
Futures: Living in a dot com World: Earthscan.
Clifton, J. (2004, July 24 2004). Days of Thunder. Listener, 20-24.
Cook, P., & Memedovic, O. (2003). Strategies for Regional Innovation Systems: Learning Transfer and
Applications. Policy Papers Retrieved 5 July, 2005, from www.unido.org/file-
storage/download/?file-id=11898
Cooke, P. (1996). Reinventing the Region: Firms, clusters and networks in economic development. In P.
W. Daniels & W. F. Lever (Eds.), The Global Economy in Transition. Harlow, England: Addison
Wesley Longman Limited.
Cooke, P., & Morgan, K. (1998). The Associational Economy. Oxford: Oxford University Press.
Cornford, J. (2000). The Evolution of the Information Society & Regional Development in Europe. Oslo,
Norway: Norwegian Regional Development Ministry.
Corrales, J. (2010). The Gay-Friendliness Index of World Cities. In J. Corrales & M. Pecheny (Eds.), The
Politics of Sexuality in Latin America: A Reader on Lesbian, Gay, Bisexual and Transgender
Rights. Pittsburgh: University of Pittsburgh Press.
Creswell, J. (1994). Research Design: Qualitative & Quantitative Approaches. California, USA: Sage.
Creswell, J. (2003). Research Design: Qualitative, Quantitative, and Mixed Methods Approaches (2nd
ed.). Thousand Oaks: Sage.
Dashfield, W. (2006). How Not-for-Profit organisations in the Wellington region use Information and
Communications Technology. Unpublished Master of Information Management, Victoria
University of Wellington, Wellington.
DeBresson, C. (1996). Economic Interdependence and Innovative Activity. Cheltenham: Edward Elgar.
Dordick, H. S. (1985). Information Technology and Economic Growth: A presentation and discussion of
industry and telecommunications policies, issues and options. Paper presented at the Afternoon
Seminar.
Dordick, H. S. (1987). Information Technology & Economic Growth in New Zealand. Wellington:
Victoria University Press for the Institute of Policy Studies.
Edquist, C. (2002, 14-15 October 2002). Innovation, Learning & Regional Economic Growth: Setting the
Scene. Paper presented at the Learning Cities & Regions, Melbourne, Australia.
Eisenhardt, K. M. (1989). Building Theories from Case Study Research. The Academy of Management
Review, 14(4), 532-550.
Evans, E., & Saxton, J. (2005). The 21st Century Volunteer. London: The Scout Association.

263
Firth, L., & Mellor, D. (2005). Broadband: benefits and problems. Telecommunications Policy, 29, 223-
236.
Florida, R. (1995). Toward the Learning Region. Futures, 25(5), 527-536.
Florida, R. (2002). The Rise of the Creative Class: and How its Transforming Work, Leisure, Community
& Everyday Life.
Florida, R., Cushing, R., & Gates, G. (2002). When Social Capital Stifles Innovation. Harvard Business
Review, 20.
Fox, W. (1851). The Six Colonies of New Zealand. London: Dunedin, Hocken Library.
Frederick, H. H., & Carswell, P. J. (2001). Global Entrepreneurship Monitor. New Zealand: New Zealand
Centre for Innovation and Entrepreneurship.
Freeman, C. (1995). The "National System of Innovation" in historical perspective. Cambridge Journal of
Economics(19), 5-24.
Fukuyama, F. (1995). Trust: The Social Virtues & the Creation of Prosperity. New York: The Free Press.
Furman, J. L., Porter, M. E., & Stern, S. (2002). The Determinants Of National Innovative Capacity.
Research Policy, 31(6), 899.
Goldsmith, B. (2009, Wed, Nov 18 2009). New Zealand tops Denmark as world's least corrupt nation.
Reuters, from http://www.reuters.com/assets/print?aid=USTRE5AH0HA20091118
Gorman, L. (1997). Historical Investigation in Information Organisations. In G. E. Gorman & P. Clayton
(Eds.), Qualitative Research for the Information System Professional: Library Association
Publishing.
Granovetter, M. (1973). The Strength of Weak Ties. American Journal of Sociology, 78(6), 1360-1380.
Grey, A. (1994). Aotearoa and New Zealand. Canterbury, New Zealand: Canterbury University Press.
Griffin, J., & Muller, G. (2006). The HIGrowth Project: New Zealand ICT Sector Profile. Auckland: IDC.
Gurstein, M. (2006). Community Innovation and Community Informatics: Building National Innovation
Capability from the Bottom Up.Unpublished manuscript.
Hall, P. (1998). Cities in Civilisation: Weidenfield & Nicholson.
Hawke, G. R. (1994). The Economy. In S. N. Zealand (Ed.), New Zealand Official Yearbook 1994.
Wellington: Statistics New Zealand.
Henderson, J., Cave, S., & Petrie, M. (2003). Transparency International Country Study Report: New
Zealand. Berlin, Germany: Transparency International.
Hirschheim, R., Porra, J., & Parks, M. S. (2003). The Evolution of the Corporate IT Function and the
Role of the CIO at Texaco - How do Perceptions of IT's Performance Get Formed. The DATA
BASE for Advances in Information Systems, 34(4), 8-27.
Howell, B. (2006). Submission: Telecommunications Amendment Bill Presented to the Finance and
Expenditure Select Committee. Wellington: New Zealand Institute for the Study of Competition
and Regulation Inc.
Howell, M., & Prevenier, W. (2001). From Reliable Sources: An Introduction to Historical Methods.
Ithaca, London: Cornell University Press.
Huber, G. P. (1991). Organisational Learning: The contributing processes and the literature.
Organizational Science, 2(1), 88-115.
Hudson, R. (1999). The Learning Economy, the Learning Firm, and the Learning Region: A Sympathetic
Critique of the Limits to Learning. European Urban & Regional Development Studies, 6(1), 59-
72.
Infometrics Consulting (2000). Economic Impact on Invercargill of SIT's Proposed Zero Fees Policy:
Southern Institute of Technology.
Infometrics Consulting (2002). Economic Impact on Invercargill of SIT's Zero Fees Policy: Southern
Institute of Technology.
iStart (2004). Broadband for All - Project Probe explained. iStart. Retrieved from http://www.istart.co.nz
Jacobs, J. (1972). The Economy of Cities. Harmondsworth, England: Pelican.
Keall, C. (2010, 16th March). Govt rural telco plan finalised - and it's bad news for Telecom. National
Business Review, from http://www.nbr.co.nz/print/120139
Keating, J., Badenhorst, A., & Szlachetko, T. (2002). Victoria as a Learning Region: Background Report.
Melbourne Victoria: OECD.
Kelly, T., Gray, V., & Minges, M. (2003). Broadband Korea: Internet Case Study: International
Telecommunication Union.
King, M. (2003). The Penguin History of New Zealand. Auckland: Penguin.
Ladd, E. C. (1999, March 1 1999). The American way - civic engagement - thrives contrary to cynical
conventional wisdom, US citizens are not increasingly "bowling alone". Christian Science
Monitor, p. 9,
Lagendijk, A., & Cornford, J. (2000). Regional institutions and knowledge - tracking new forms of
regional development policy. Geoforum, 31(2), 209-218.

264
Lal, V. (2003). Pilot Project: Southland. Paper presented at the Connecting Communities, Wellington,
New Zealand.
Larsen, K. (1999). Learning cities: The new recipe in regional development. Organisation for Economic
Coooperation and Development:, The OECD Observer, Summer 1999, 73-76.
Lash, S., & Urry, J. (1994). Economies of Signs and Space. London: Sage Publications.
Lee, A. S. (1999). Researching MIS. In W. L. Currie & B. Galliers (Eds.), Rethinking Management
Information Systems (pp. 7-27). Oxford: Oxford.
Lee, A. S., & Baskerville, R. L. (2003). Generalizing Generalizability in Information Systems Research.
Information Systems Research, 14(3), 221-243.
Lemann, N. (1996, April 1996). Kicking in Groups. The Atlantic Monthly, 277, 22-26.
Lenkowsky, L. (2000, October 2000). Still "Bowling Alone". Commentary, New York, 110, 57-61.
Lever, W. F., & Turok, I. (1999). Competitive Cities: Introduction to the Review. Urban Studies, 36(5-6),
791-793.
Lewis, R. (2002). Learning Communities - Old and New. Auckland, New Zealand: IEEE New York.
Locke, S. (2006, 28 April). ICT use in Rural New Zealand. Paper presented at the Information and
Communication Technologies in the Workplace and Communities, Wellington.
Lundvall, B. A., & Johnson, B. (1994). The Learning Economy. Journal of Industrial Studies, 1(2), 23-
42.
MacLeod, G. (2000). The learning region in an age of austerity: capitalizing on knowledge,
entrepreneurialism, and reflexive capitalism. Geoforum, 31, 219-236.
Malecki, E. J. (1997). Technology and Economic Development: The Dynamics of Local, Regional and
National; Competitiveness (2nd ed.): Longman.
Malecki, E. J. (2002). Hard and Soft Networks for Urban Competitiveness. Urban Studies, 39(5-6), 929-
945.
Markusen, A. (1987). Regions: The Economics and Politics of Territory. New Jersey: Rowman &
Littlefield.
Markusen, A. (1996). Sticky Places in Slippery Space: A Typology of Industrial Districts. Economic
Geography, 72(3), 293-313.
Marshall, S., Taylor, W., & Yu, X. (2003). Closing the Digital Divide: Transforming Regional
Economies and Communities with Information Technology. Westport: Greenwood Press.
Maskell, P. (1999). Globalisation and Industrial Competitiveness: The Process and Consequences of
Ubiquitification. In E. J. Malecki & P. Oinas (Eds.), Making Connections: Technological
Learning and Regional Economic Change (pp. 35-59): Ashgate Publishing Ltd.
Maskell, P., & Tornqvist, T. (1999). Building a Cross-Border Learning Region: Emergence of the North
European Oresund Region: Copenhagen Business School Press.
Mason, R. O. (2004). The Legacy of LEO: Lessons Learned from an English Tea and Cake Company's
Pioneering Efforts in Information Systems. Journal of the Association for Information Systems,
5(5), 183-219.
Mason, R. O., McKenney, J. L., & Copeland, D. G. (1997a). Developing an Historical Tradition in MIS
research. MIS Quarterly, 21(3), 257-278.
Mason, R. O., McKenney, J. L., & Copeland, D. G. (1997b). An Historical Method for MIS research:
Steps and Assumption. MIS Quarterly, 21(3), 307-320.
Mason, S. (2010). Rural Broadband: a universal service proposal: Rural Women New Zealand.
McKeen, J. D., & Smith, H. A. (2009). IT Strategy in Action. Upper Saddle River, New Jersey: Pearson
Education International.
McKenney, J. L., Copeland, D. C., & Mason, R. O. (1995). Waves of Change: Business Evolution
Through Information Technology. Cambridge, Massachusetts: Harvard Business School Press.
McKenney, J. L., Mason, R. O., & Copeland, D. G. (1997). Bank of America: The Crest and Trough of
Technological Leadership. MIS Quarterly, 21(3), 321-353.
Menger, C. (1871). Grundsatze ver Volkswitshaftslehre. Wein, Germany: Holder-Pichler-Tempsky.
Merrill, M. V. (2006). Global Trends and the Challenges for Volunteering. The International Journal of
Volunteer Administration, 24(1), 9-14.
Miles, M., & Huberman, A. (1994). Qualitative Data Analysis (2nd ed.). Thousand Oaks: Sage.
Ministry of Economic Development (2004). Digital Strategy: a Draft New Zealand Strategy for
Consultation. Wellington: Ministry of Economic Development.
Ministry of Economic Development (2005). The Digital Strategy: Creating our Digital Future.
Wellington.
Morgan, K. (1997). The Learning Region: Institutions, Innovation and Regional Renewal. Regional
Studies, 31(5), 491-503.
Murray, C. (2003). Human Accomplishment: The Pursuit of Excellence in the Arts and Sciences 800 BC
to 1950: HarperCollins.

265
Nahapiet, J., & Ghoshal, S. (1998). Social Capital, Intellectual Capital & the Organisational Advantage.
Academy of Management Review, 23(2), 242-266.
National Selection Committee (2004). Stronger Communities for a Stronger Canada: The Promise of
Broadband: National Selection Committee.
Naylor, R. (2007). Webcasting Update. Paper presented at the New Zealand Computer Society Wellington
Management Breakfast.
Neuman, W. L. (2003). Social Research Methods: Qualitative and quantitative approaches (5th ed.).
Boston: Allyn & Bacon.
Nevis, E. C., DiBella, A. J., & Gould, J. M. (1995). Understanding Organisations as Learning Systems.
Sloan Management Review, 36(2), 73-85.
New Zealand Planning Council Social Monitoring Group (1985). From Birth to Death. Wellington NZ.
New Zealand Trade & Enterprise (2005). Major Regional Initiatives: Highlighting Success in New
Zealand's Regions. Wellington, New Zealand.
Newman, K. (2008). Connecting the Clouds: the Internet in New Zealand: Activity Press.
Office of the Prime Minister (2002). Growing an Innovative New Zealand. Wellington.
Ohmae, K. (1995). The End of the Nation State: The Rise of Regional Economies. New York: Free Press.
Oinas, P., & Malecki, E. J. (1999). Spatial Innovation Systems. In E. J. Malecki & P. Oinas (Eds.),
Making Connections: Technological Learning and Regional Economic Change: Ashgate
Publishing Ltd.
Oram, R. (2006, 29-31 March). Keynote Speech. Paper presented at the TUANZ Rural Broadband
Symposium, Timaru.
Organisation for Economic Co-operation & Development (2001a). Cities and Regions in the New
Learning Economy. Paris: Organisation for Economic Co-operation & Development.
Organisation for Economic Co-operation & Development (2001b). Human and Social Capital. Paris:
Organisation for Economic & Co-operative Development.
Organisation for Economic Co-operation & Development (2006a). Broadband portal, from
http://www.oecd.org/document/54/0,3343,en_2649_34225_38690102_1_1_1_1,00.html
Organisation for Economic Co-operation & Development (2006b). OECD Factbook 2006: Economic,
Environmental and Social Statistics. Paris: Organisation for Economic & Co-operative
Development.
Otago Southland Broadband Communications Committee (2001). Blazing the Trail to the Information
Highway. Invercargill: Otago Southland Broadband Communications Committee.
Oughton, C., Landabaso, M., & Morgan, K. (2002). The Regional Innovation Paradox: Innovation Policy
& Industrial Policy. The Journal of Technology Transfer, 27(2), 97-110.
Our Way Southland Project Team (2005). Community Outcomes Report: Our Way Southland.
Paredes, D. (2006, December/January). Communicating Excellence. CIO New Zealand, 15-23.
Parker, E. (2000). Closing the digital divide in rural America. Telecommunications Policy, 24, 281-290.
Paterson, B. (2006, 29-31 March). Practical Applications on the Farm. Paper presented at the TUANZ
Rural Broadband Symposium, Timaru.
Porra, J., Hirschheim, R., & Parks, M. S. (2006). Forty Years of the Corporate Information Technology
Function at Texaco Inc. - A history. Information and Organization, 16(1), 82-107.
Porter, M. E., & Stern, S. (2001). Innovation: Location Matters. MIT Sloan Management Review, 42(4),
28-36.
Prendergast, K. (2005). Mayors Welcome. Paper presented at the Digital Cities & Regional Networks,
Wellington, New Zealand.
Preto, G. (1995). The Region as an Evolutive System. In C. Bertuglia, M. Fischer & G. Preto (Eds.),
Technological Change, Economic Development and Space (pp. 257-276). Berlin: Springer-
Verlag.
Putnam, R. (1993). Making Democracy Work: Civic Traditions in Modern Italy. Princetown, New Jersey:
Princeton University Press.
Putnam, R. (2000). Bowling Alone: The Collapse & Revival of American Community. New York: Simon
& Schuster.
Rio, C. R. d. (2001). Learning to Innovate: Learning Regions. Andalucia: Organisation for Economic Co-
operation and Development /Institute for Regional Development.
Rooney, D. (1996). Playing Second Fiddle: A history of the relationship between technology and
organisation in the Australian music economy (1901-1990). Unpublished PhD, Griffith
University, Brisbane.
Saxenian, A. (1994a). Regional Advantage: Culture and Competition in Silicon Valley and Route 128.
Cambridge, M A.: Harvard University Press.
Saxenian, A. (1994b). Lessons from Silicon Valley. Technology Review, 97(5), 42-51.

266
Saxenian, A. (2000). Silicon Valley's New Immigrant Entrepreneurs.Unpublished manuscript, La Jolla,
California.
Schollman, A., O'Neill, D., Doczi, M., & Kelly, F. (2002). Regional Innovation, Learning & Governance
- Rediscovering New Zealand's Regions: A Central Government Perspective. Paper presented at
the Learning Cities and Regions, Melbourne.
Senge, P. M. (1992). The 5th Discipline: The Art & Practice of the Learning Organisation. London:
Random House.
Shafer, R. J. (1980). A Guide to Historical Method (3rd ed.): The Dorsey Press.
Smith, D. (1999, 18 November 1999). Local Government Reform: The New Zealand Experience -
Problems, Principles, Process, Outcome and Future. Paper presented at the Japan Management
Association Municipality "Electronisation" Symposium, Tokyo.
Smith, M. K. (2000, 5 November 2002). Social Capital: civic community, organisation and education
Retrieved 6 August 2003, 2003, from http://www.infed.org/biblio/social_capital.htm
Sokol, M. (2002). Regional Dimensions of the Knowledge Economy: Implications for the "New Europe".
Unpublished PhD, University of Newcastle upon Tyne, Newcastle upon Tyne.
Spellerberg, A., Robinson, D., Cody, J., & Williams, T. (2001). Framework for the Measurement of
Social Capital in New Zealand. Wellington: Statistics New Zealand.
Statistics New Zealand (1987). New Zealand Official Yearbook 1986-87. Wellington: Statistics New
Zealand.
Statistics New Zealand (1992). New Zealand Official Yearbook 1992. Wellington: Statistics New Zealand.
Statistics New Zealand (1996). New Zealand Official Yearbook 1996. Wellington: Statistics New Zealand.
Statistics New Zealand (2001). Census. Wellington: New Zealand Statistics.
Statistics New Zealand (2005). Innovation in New Zealand. Wellington: Statistics New Zealand.
Statistics New Zealand (2006). New Zealand Official Yearbook 2006. Wellington: Statistics New Zealand.
Statistics New Zealand (2008a). Measuring New Zealand's Progress using a Sustainable Development
Approach. Wellington: Statistics New Zealand.
Statistics New Zealand (2008b). New Zealand Official Yearbook 2008. Wellington: Statistics New
Zealand.
Storper, M. (1995). The resurgence of regional economics, ten years later: the region as a nexus of
untraded interdependencies. European Urban & Regional Development Studies, 2(3), 191-221.
Sturgeon, T. J. (2000). How Silicon Valley Came to Be. In M. Kenney (Ed.), Understanding Silicon
Valley: Anatomy of an Entrepreneurial Region: Stanford University Press.
Symington, J. (2003). Connecting Communities. Paper presented at the Connecting Communities,
Wellington, New Zealand.
Thompson, H. (2002). Creating and Sustaining Online Communities - Replicable Web-Based Services
Meeting the Diverse Needs of Regional and Rural Australia. Paper presented at the Learning
Cities and Regions, Melbourne, Australia.
Tonnies, F. (2001). Community and Civil Society (Gemeinschaft und Gesellschaft) (J. Harris & M. Hollis,
Trans.). New York: Cambridge University Press.
Tosh, J. (2000). The Pursuit of History: Aims, Methods and New Directions in the Study of Modern
History (3rd ed.). Harlow: Pearson Education Limited.
TransparencyInternational (2009). Corruption Perceptions Index 2009. Retrieved from
http://www.transparency.org/layout/set/print/policy_research/surveys_indices/cpi
Trauth, E. M. (2000). The Culture of an Information Economy: Influences & Impacts in the Republic of
Ireland: Kluwer Academic Publishers.
Walker, D. (2006). Practical Applications on the Farm. Paper presented at the TUANZ Rural Broadband
Symposium.
Weber, M. (1978). Economy and Society: An Outline of Interpretative Sociology (G. Roth & C. Wittich,
Trans.). Berkeley: University of California Press.
Wellington City Council (2006). Information and Communications Technology Policy. Wellington.
Wellington Regional Strategy (2010). Wellington Regional Strategy, from http://www.wrs.govt.nz/
Wenger, E. C., & Snyder, W. M. (2000). Communities of Practice: The Organisational Frontier. Harvard
Business Review, 139-145.
Wenpin, T., & Ghoshal, S. (1998). Social Capital and Value Creation: The Role of Intrafirm Networks.
Academy of Management Review, 41(4), 464.
Williams, W. R. (Ed.). (1985). Looking Back to Tomorrow: reflections on twenty-five years of computers
in New Zealand. Wellington: New Zealand Computer Society.
Wolfe, D. A. (2000). Globalization, Information and Communication Technologies and Local and
Regional Systems of Innovation. In K. Robenson & H. Schuetze (Eds.), Transition to the
Knowledge Society (pp. 147-162). Vancouver: Vancouver Institute for European Studies,
University of British Columbia.

267
Wolfe, D. A. (2002). Social Capital and Cluster Development in Learning Regions. In J. A. Holbrook &
D. A. Wolfe (Eds.), Knowledge, Clusters and Learning Regions: Economic Development in
Canada (pp. 11-38). Kingston: School of Policy Studies, Queen's University.
Woolcock, M. (1998). Social capital and economic development: Toward a theoretical synthesis and
policy framework. Theory and Society, 27, 151-208.
Yin, R. K. (1984). Case Study Research: Design & Methods (2nd ed.). Beverley Hills, California: Sage.
Young, M., & Wilmott, P. (1962). Family and Kinship in East London. London: Penguin.
Zilber, J., Schneider, D., & Djwa, P. (2005). You Snooze, You Lose: The Economic Impact of Broadband
in the Peace River and Similkameen Regions: 7th Floor Media, Simon Fraser University.
Zorn, T. (2006, 28th April). Survey of Community and Voluntary sector use of ICTs. Paper presented at
the Information and Communication Technologies in the Workplace and Communities,
Wellington.

268
APPENDIX A
APPENDIX A: Sources for References in Table 5
KEY TERM REFERENCE
Innovation -15 (Florida, 1995; Keating, et al., 2002;
Lagendijk & Cornford, 2000; Larsen, 1999;
Maskell, 1999; Maskell & Tornqvist, 1999;
Morgan, 1997; Oinas & Malecki, 1999;
Organisation for Economic Co-operation &
Development, 2001a; Rio, 2001; Saxenian,
1994b; Schollman, et al., 2002; Sokol, 2002;
Storper, 1995; Wolfe, 2000)
Partnerships and networking - 14 (Cornford, 2000; Hudson, 1999; Keating, et
al., 2002; Lagendijk & Cornford, 2000;
Larsen, 1999; Malecki, 2002; Morgan, 1997;
Oinas & Malecki, 1999; Organisation for
Economic Co-operation & Development,
2001a; Rio, 2001; Saxenian, 1994a;
Schollman, et al., 2002; Wolfe, 2000, 2002)
Embedded tacit knowledge -12 (Cornford, 2000; Florida, 1995; Hudson,
1999; Lagendijk & Cornford, 2000; Maskell,
1999; Maskell & Tornqvist, 1999; Morgan,
1997; Oinas & Malecki, 1999; Organisation
for Economic Co-operation & Development,
2001a; Rio, 2001; Wolfe, 2000, 2002)
Regional norms and conventions - 10 (Florida, 1995; Larsen, 1999; MacLeod,
2000; Malecki, 2002; Oinas & Malecki,
1999; Rio, 2001; Schollman, et al., 2002;
Sokol, 2002; Storper, 1995; Wolfe, 2002)
Good infrastructure - 8 (Christie & Hepworth, 2001; Cornford,
2000; Florida, 1995; Lever & Turok, 1999;
MacLeod, 2000; Malecki, 2002; Schollman,
et al., 2002; Wolfe, 2002)
High social capital - 7 (Christie & Hepworth, 2001; Larsen, 1999;
MacLeod, 2000; Oinas & Malecki, 1999;
Organisation for Economic Co-operation &
Development, 2001a; Rio, 2001; Wolfe,
2002)
Trust - 6 (MacLeod, 2000; Maskell, 1999; Maskell &
Tornqvist, 1999; Morgan, 1997; Oinas &
Malecki, 1999; Wolfe, 2002)
Lifelong learning - 6 (Cornford, 2000; Florida, 1995; Lagendijk &
Cornford, 2000; Larsen, 1999; Oinas &
Malecki, 1999; Sokol, 2002)
Presence of knowledge workers -5 (Christie & Hepworth, 2001; Florida, 1995;
Keating, et al., 2002; Lever & Turok, 1999;
Wolfe, 2002)
Input of universities and
consultants-5
(Cornford, 2000; Lagendijk & Cornford,
2000; Morgan, 1997; Oinas & Malecki,
1999; Wolfe, 2002)
Critical & knowledgeable
customers - 4
(Florida, 1995; Marshall, et al., 2003; Wolfe,
2000, 2002)
Quality of life - 4 (Christie & Hepworth, 2001; Florida, 1995;
Keating, et al., 2002; Lever & Turok, 1999)
Competitive culture - 4 (Lagendijk & Cornford, 2000; MacLeod,
2000; Marshall, et al., 2003; Saxenian,
1994a)
Ability to “unlearn” and be
flexible – 4
(Maskell & Tornqvist, 1999; Saxenian,
1994a; Schollman, et al., 2002; Storper,

269
1995)
Entrepreneurship - 4 (Lagendijk & Cornford, 2000; Saxenian,
1994b; Sokol, 2002; Wolfe, 2000)
Clustering - 3 (Christie & Hepworth, 2001; Keating, et al.,
2002; Oinas & Malecki, 1999)
Bottom up approach - 3 (Lagendijk & Cornford, 2000; Schollman, et
al., 2002; Thompson, 2002)
Access to external economies - 3 (Florida, 1995; Lever & Turok, 1999; Oinas
& Malecki, 1999)
Transfer of best practice - 3 (Hudson, 1999; Lagendijk & Cornford,
2000; Oinas & Malecki, 1999)
Common regional culture - 3 (Florida, 1995; Larsen, 1999; Wolfe, 2002)
Presence of competent suppliers - 2 (Lagendijk & Cornford, 2000; Maskell &
Tornqvist, 1999)
Social entrepreneurs -2 (Malecki, 2002; Wolfe, 2000)

270
APPENDIX B
APPENDIX B: Newspaper Sources for Historical Data
Articles for Dominion 1985, Evening Post 1985, National Business Review 1985 & Southland Times
1985 & 1995 obtained from microfiche files at Alexander Turnbull Library, Wellington
Articles for Dominion 1995, Dominion Post 2005, Evening Post 1995, National Business Review 1995 &
2005, and Southland Times 2005 obtained from The Knowledge Basket: Research Archives at
http://www.knowledge-basket.co.nz.helicon.vuw.ac.nz/
5.1 Interconnecting
5.1.1 Building international trade links
1985
National
Trade expansion sought. (1985, January 09). Dominion
Japanese visit. (1985, January 18). Dominion
Survey shows dramatic changes in exporting. (1985, January 26). Dominion
Gyson demonstrates network. (1985, January 28). Dominion
Chinese communist part chief to visit NZ. (1985, February 02). Dominion
Trade barrier talks on agenda. (1985, February 11). Dominion
Whopping Losses in Meat Industry. (1985, February 19). Southland Times
Trouble ahead for New Zealand's beef, mutton & lamb. (1985, February 25). NBR
Iran says yes to more NZ butter. (1985, March 06). Dominion
$1 billion exports now face US duty. (1985, March 09). Dominion
Lamb Returns May Drop. (1985, April 08). Southland Times
Market niche search in Asia worth the NZ effort. (1985, April 15). NBR
Changing Patterns of Trade. (1985, May 08). Southland Times
Iran trade trip first for Moore. (1985, May 22). Dominion
NZ extends diplomatic links to Emirates. (1985, May 22). Dominion
Businesses urged to chip in. (1985, May 24). Southland Times
New Zealand food exports succeed in Asian markets. (1985, May 27). NBR
Russia buys mutton - price secret. (1985, June 11). Evening Post
Sheepmeat carves niche in Japan. (1985, June 11). Dominion
NZFP, FELTEX move towards fresh fields. (1985, June 14). Dominion
Wattie spends $1m on Australian television campaign. (1985, June 17). Dominion
Another blooming export venture. (1985, June 19). Dominion
Moore "rapt" with Iran wool deal. (1985, June 21). Dominion
Global outlook needed. (1985, June 24). Dominion
Pacific Links Paramount. (1985, June 26). Southland Times
NZ company aims software at billion dollar US market. (1985, June 27). Dominion
NZ Designers Unite for Export Push. (1985, July 01). Southland Times
NZI Finance steps into Hong Kong. (1985, July 11). Dominion
Post in Vanuatu Likely Soon. (1985, July 23). Southland Times
New venture to grab Australian opportunities. (1985, July 27). Evening Post
NZI regional branch opens in Thailand. (1985, July 30). Dominion
Singapore's diet swing offers new meat markets. (1985, August 05). NBR
Australian imports from NZ rise. (1985, August 06). Southland Times
Unresolved issues test CER ministers. (1985, August 10). Evening Post
Costs may force overseas move. (1985, August 10). Dominion
Prices should fall. (1985, August 16). Southland Times
CER may stretch to Asia, Pacific. (1985, August 29). Evening Post
NZ fashion experience well received in Australia. (1985, August 31). Southland Times
20,000 export jobs threatened by economic downturn. (1985, September 11). Southland Times

271
Sheik begins week long visit. (1985, September 17). Dominion
Bahrain eager to increase NZ trade. (1985, September 18). Dominion
Joint venture dairy project in Singapore. (1985, September 20). Southland Times
Businessmen warned of China change. (1985, September 26). Dominion
Sheepmeat prices drop 40pc. (1985, September 26). Southland Times
Wicat visits suggest business possibilities. (1985, September 30). Dominion
Peoples Republic of China. (1985, October 01). Dominion
Prices for NZ wool still depressed. (1985, October 04). Southland Times
Mission to push trade in Gulf States. (1985, October 10). Southland Times
Tables turned on trans-Tasman trade. (1985, October 14). NBR
NZ mission in Abu Dhabi. (1985, October 16). Southland Times
NZ trade success more likely in Chinese provinces. (1985, October 21). NBR
Saudis look set to favour NZ produce. (1985, October 21). Dominion
Lamb deal with Poland. (1985, October 28). Southland Times
Lange, business differ on Anzuz. (1985, October 30). Dominion
DSIR to open centre in Singapore. (1985, November 01). Southland Times
Canada link widens market. (1985, November 04). NBR
NZ dollar puts pinch on fish exporters. (1985, November 14). Dominion
Wool exporters describe past four months as hardest time. (1985, November 26). Dominion
Businesses seek more information. (1985, December 09). Dominion
Bankrupt figures rise sharply. (1985, December 18). Dominion
Dramatic rise in bankruptcies. (1985, December 18). Southland Times
Southland
Southern Exports to Rise Dramatically. (1985, January 25). Southland Times
Planning Company in California. (1985, February 02). Southland Times
Chinese to Visit Ohai. (1985, May 16). Southland Times
Knight Tailors to keep overseas links. (1985, November 07). Southland Times
Direct China link. (1985, November 07). Southland Times
Wellington
CER disappointment for chamber chief. (1985, February 26). Evening Post
Washington tie advocated. (1985, March 05). Evening Post
Another city "better". (1985, March 06). Evening Post
Sister cities link. (1985, March 09). Evening Post
Cook Islands set up diplomatic post in city. (1985, June 12). Evening Post
1995
National
From little apples, Asian export market will grow. (1995, February 03). NBR, p.7.
NZ rediscovering the importance of trade ties with Europe. (1995, March 03). NBR, p.21.
This is history, it's not bunk and it's here, not in Washington. (1995, March 31). NBR, p.13.
Commitment to Asia to be tested . (1995, May 05). NBR, p.26.
Sun shines on the Taiwan/NZ relationship. (1995, May 19). NBR, p.22.
Dairy Board planning to nearly double sales to South Africa. (1995, June 02). NBR, p.75.
Payment increase as exporters penetrate developing markets. (1995, June 02). NBR, p.53.
Kiwi exporters slow to exploit opportunities in Singapore. (1995, August 11). NBR, p.45.
Asian services role possible for NZ. (1995, September 22). NBR, p.5.
NZ slated on Asia attitude. (1995, September 22). NBR, p.12.
Rapidly advancing India ripe for New Zealand trade. (1995, October 20). NBR, p.29.
Powerful Thai economy offers opportunities. (1995, October 20). NBR, p.60.
NZ deer industry takes aim at Asian middle-class market. (1995, October 27). NBR, p.12.
Korea rapidly becoming major market for New Zealand trade. (1995, November 17). NBR, p.27.
Patience essential - Vietnam not for fainthearted investors. (1995, December 01). NBR, p.51.
New Zealanders very busy with overseas business. (1995, December 08). NBR, p.34.

272
Southland
Work in Japan beckons. (1995, April 05). Southland Times, p.2.
Principal on Europe enrolment drive. (1995, April 29). Southland Times, p.11.
Gore High taps into Asian student pool. (1995, June 07). Southland Times, p.10.
Council delegation studying Wyong sister city link. (1995, June 10). Southland Times, p.10.
Little Southland interest in Queen's Dunedin visit. (1995, October 28). Southland Times, p.11.
Photo of Southland Boys Rector Rowly Currie. (1995, December 28). Southland Times, p.10.
Wellington
Paremata motor lodge sold to Japanese. (1995, January 24). Evening post, p.3.
Charges may affect exports. (1995, January 30). Evening post, p.13.
Aid offered to tap S Pacific market. (1995, February 20). Evening post, p.3.
Mayor seeks Japan link. (1995, March 27). Evening post, p.16.
Sister-city link. (1995, May 13). Dominion, p.3.
Internet link for businesses. (1995, May 22). Dominion, p.1.
Exchange first of many. (1995, July 10). Evening post, p.16.
Sale marks more Asian investment. (1995, July 11). Evening post, p.3.
New degree majors offered. (1995, October 17). Evening post, p.18.
Black Power member performs haka for Queen. (1995, November 03). Evening post, p.1.
Chinese to get business help. (1995, November 16). Dominion, p.22.
Mandela's visit `the most lovely thrill'. (1995, November 16). Evening post, p.1.
High hopes for delegation's visit. (1995, December 19). Evening post, p.16.
2005
National
Decade-old ties begin to bear fruit for sister cities. (2005, February 11). NBR, p.19-01.
Maori entrepreneurs target Dubai. (2005, February 18). NBR, p.41-03.
EXPORTING: Kiwi attitude switch urged toward Asia. (2005, April 22). NBR, p.50-02.
Trade deal attracts Australia's attention. (2005, June 08). Dominion Post, p. 7.
Exporting: NBR Special Review: ASIAN IMPORTS: Kiwi beef on a roll around Pacific Rim
countries. (2005, June 10). NBR, p.26-02.
Exporting: NBR Special Review: FOREIGN EXCHANGE EARNINGS: Development scheme
under-funded. (2005, June 10). NBR, p.26-01.
NZ hosts Asian ICT meeting. (2005, November 21). Dominion Post, p. 9.
Tech resellers who don't sell. (2005, November 28). Dominion Post, p.12.
Chocolate cheese on a roll in Asia. (2005, December 20). Southland Times, p.16.
Southland
Japanese doll, barrel of sake to mark woodchip first. (2005, March 09). Southland Times, p.19.
Investment in woodchip forestry bearing fruit. (2005, March 11). Southland Times, p. 3.
City company active in Aust. (2005, September 02). Southland Times, p.19.
Wellington
EDUCATION: Australians target Asia with Upper Hutt campus. (2005, March 04). NBR, p.36-01.
5.1.2 The emergence of the networked organisation
1985
National
Digital sets up $4m network. (1985, February 04). Dominion
Future dealers eye electronic data services. (1985, February 04). NBR
Oxford debate proves grand forum for Lange. (1985, March 04). Dominion
Stock exchange calls for computer network plans. (1985, March 04). NBR
Huge new network for dairy co-op. (1985, April 15). Dominion
Digital gets $2m nod from energy ministry. (1985, April 26). Dominion
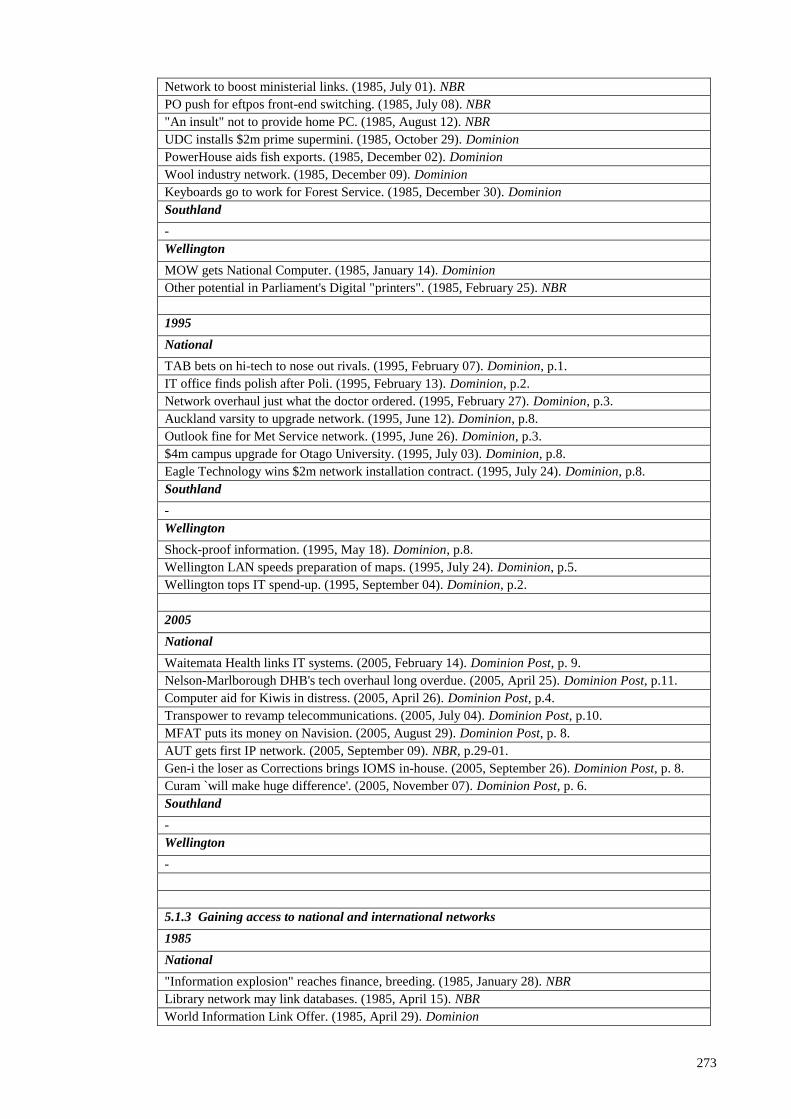
273
Network to boost ministerial links. (1985, July 01). NBR
PO push for eftpos front-end switching. (1985, July 08). NBR
"An insult" not to provide home PC. (1985, August 12). NBR
UDC installs $2m prime supermini. (1985, October 29). Dominion
PowerHouse aids fish exports. (1985, December 02). Dominion
Wool industry network. (1985, December 09). Dominion
Keyboards go to work for Forest Service. (1985, December 30). Dominion
Southland
-
Wellington
MOW gets National Computer. (1985, January 14). Dominion
Other potential in Parliament's Digital "printers". (1985, February 25). NBR
1995
National
TAB bets on hi-tech to nose out rivals. (1995, February 07). Dominion, p.1.
IT office finds polish after Poli. (1995, February 13). Dominion, p.2.
Network overhaul just what the doctor ordered. (1995, February 27). Dominion, p.3.
Auckland varsity to upgrade network. (1995, June 12). Dominion, p.8.
Outlook fine for Met Service network. (1995, June 26). Dominion, p.3.
$4m campus upgrade for Otago University. (1995, July 03). Dominion, p.8.
Eagle Technology wins $2m network installation contract. (1995, July 24). Dominion, p.8.
Southland
-
Wellington
Shock-proof information. (1995, May 18). Dominion, p.8.
Wellington LAN speeds preparation of maps. (1995, July 24). Dominion, p.5.
Wellington tops IT spend-up. (1995, September 04). Dominion, p.2.
2005
National
Waitemata Health links IT systems. (2005, February 14). Dominion Post, p. 9.
Nelson-Marlborough DHB's tech overhaul long overdue. (2005, April 25). Dominion Post, p.11.
Computer aid for Kiwis in distress. (2005, April 26). Dominion Post, p.4.
Transpower to revamp telecommunications. (2005, July 04). Dominion Post, p.10.
MFAT puts its money on Navision. (2005, August 29). Dominion Post, p. 8.
AUT gets first IP network. (2005, September 09). NBR, p.29-01.
Gen-i the loser as Corrections brings IOMS in-house. (2005, September 26). Dominion Post, p. 8.
Curam `will make huge difference'. (2005, November 07). Dominion Post, p. 6.
Southland
-
Wellington
-
5.1.3 Gaining access to national and international networks
1985
National
"Information explosion" reaches finance, breeding. (1985, January 28). NBR
Library network may link databases. (1985, April 15). NBR
World Information Link Offer. (1985, April 29). Dominion

274
DSIR network may plug into commerce. (1985, May 06). NBR
DSIR network access setting a precedent. (1985, May 13). NBR
New Zealand market soaks up Reuter‟s economic information. (1985, June 07). Dominion
Women establish media link for conference news service. (1985, July 15). Dominion
Global knowledge bank visualised based in NZ. (1985, August 09). Evening Post
Satis plans may bring library break. (1985, August 12). NBR
Rejigged DSIR group aims to be centre of a web. (1985, September 23). NBR
NZ hackers tap world computers. (1985, November 27). Evening Post
Southland
Students Back from Japan. (1985, January 31). Southland Times
Principal wins study trip. (1985, October 19). Southland Times
Wellington
Library looks to computer. (1985, March 22). Evening Post
Key to library success. (1985, June 06). Dominion
Commerce students switch countries. (1985, June 13). Dominion
Elected to world engineering body. (1985, September 23). Evening Post
Computer link opened. (1985, December 05). Dominion
1995
National
Internet growth in New Zealand second only to US. (1995, February 27). Dominion, p.1.
Information network for exporters planned. (1995, March 06). Dominion, p.2.
Union system sets up a wave of new information. (1995, March 27). Dominion, p.8.
Nelson's attractions go global on the Net. (1995, April 10). Dominion, p.1.
Tourist services database set up for visitor centres. (1995, May 31). Dominion, p.15.
ONLINE PROTEST. (1995, July 14). Dominion, p.2.
Tests trigger an e-mail protest wave. (1995, July 17). Dominion, p.1.
Online science and technology library vital resource for NZ firms. (1995, July 24). Dominion, p.8.
Biznet the buzz word for New Zealand businesses. (1995, September 04). Dominion, p.3.
Government departments reach out to the public. (1995, October 09). Dominion, p.1.
Government Within Reach project takes first step. (1995, October 24). Dominion, p.1.
E-mail poised to speed up visas and permits. (1995, October 24). Dominion, p.2.
Gov't goes on Internet. (1995, October 25). Southland Times, p.4.
Kiwinet expands. (1995, November 06). Dominion, p.20.
Hi-tech talk _ no need for intimidation. (1995, November 13). Dominion, p.3.
Public Internet terminals installed. (1995, November 27). Dominion, p.2.
Kiwis catch on to the Internet attraction. (1995, December 04). Dominion, p.1.
Southland
-
Wellington
Coffee and a byte of Internet. (1995, January 21). Evening post, p.1.
`Milk, sugar, Internet?‟ (1995, January 24). Dominion, p.1.
Victoria University location for New Zealand's Internet SunSite. (1995, January 30). Dominion, p.3.
Network to help deal with bureaucracy. (1995, March 01). Evening post, p.2.
`A pint and 10 minutes on the Net, please'. (1995, April 03). Dominion, p.1.
Jobs information. (1995, April 29). Evening post, p.3.
Slurping coffee and surfing the Net. (1995, July 13). Evening post, p.17.
Porirua residents have information at their call. (1995, August 07). Dominion, p.8.
Mayoral candidate on the campaign trail in cyberspace. (1995, September 18). Dominion, p.1.
Council to shut Internet link. (1995, November 23). Dominion, p.2.
Council to wind down free Internet service. (1995, November 24). Evening post, p.2.

275
2005
National
Cabinet to decide on network. (2005, May 23). Dominion Post, p.7.
Advanced Network to kick off by year's end. (2005, May 30). Dominion Post, p.12.
CityLink hopes to be backbone for Government Shared Network. (2005, June 06). Dominion Post,
p.12.
Government Shared Network gets nod. (2005, August 08). Dominion Post, p.6.
Expatriate tech experts targeted. (2005, September 16). NBR, p.42-01.
Telstra to supply research network. (2005, December 05). Dominion Post, p.8.
Southland
College awaits word. (2005, January 04). Southland Times, p. 5.
`Recreation capital of world' draws 35 students from Utah. (2005, February 03). Southland Times,
p.16.
Wellington
Students head to Korea. (2005, February 23). Dominion Post, p.7.
5.1.4 Networks joint ventures and clusters
1985
National
Speed urged in NZ biotechnology research. (1985, February 18). NBR
Information network built into technology tower. (1985, March 25). NBR
Group helping jobless. (1985, April 16). Evening Post
Locals must compete. (1985, April 22). Dominion
Uncertainties threaten special partnerships. (1985, April 24). Southland Times
Feltex joins F & P to form finance firm. (1985, July 25). Dominion
British parent swallows DRG. (1985, September 04). Dominion
Expertise in macadamias to be sold overseas. (1985, October 07). NBR
Wood-to-ethanol process finds an opening in Canada. (1985, October 14). NBR
DSIR commercial moves extend to biology. (1985, October 21). NBR
Information flows between forestry competition. (1985, November 04). NBR
Wool-scouring joint venture widens export net. (1985, November 25). NBR
China developing as major wool market. (1985, December 07). Southland Times
Eagle's nest grows bigger. (1985, December 09). Dominion
Southland
Joint Venture at salmon Farm. (1985, January 25). Southland Times
Promotion of Gore Discussed. (1985, March 13). Southland Times
Library popular meeting place. (1985, August 09). Southland Times
NZ "built" on small businesses. (1985, August 24). Southland Times
Forest park for Southland. (1985, September 07). Southland Times
Southland Association of small farmers. (1985, September 17). Southland Times
Committee to investigate farmers' plight. (1985, October 11). Southland Times
Economic climate for review. (1985, October 23). Southland Times
H and J Smith joins RTS. (1985, December 10). Southland Times
Wellington
Naenae pupils for "Ergo" job experience. (1985, February 11). Evening Post
Businessmen ponder pushing Wellington. (1985, March 21). Evening Post
Job hotline mooted. (1985, March 25). Evening Post
Hutt mayors unite on high tech title. (1985, August 12). Evening Post
Tertiary eye-opener ahead. (1985, August 12). Evening Post
High-tech zones aren't built in a day. (1985, August 12). Dominion

276
Petone organises youth skills project. (1985, August 13). Dominion
Hi-tech a "sham". (1985, August 14). Evening Post
Businesses urged to say what's wanted in education. (1985, September 11). Evening Post
Economic analysis offered by council. (1985, September 19). Evening Post
Chinese check computer ware. (1985, October 02). Evening Post
NZ, China sign computer accord. (1985, October 05). Evening Post
Valley MPs promote CIT research role. (1985, November 02). Evening Post
Chamber may open in Hutt. (1985, December 03). Evening Post
NZ computer firm enters China market. (1985, December 18). Evening Post
1995
National
Business put networks to good use. (1995, January 20). NBR, p.44.
Business database introduced. (1995, April 13). Dominion, p.14.
Business Network grows. (1995, August 25). NBR, p.8.
Southland
Businesses urged to help education. (1995, February 17). Southland Times, p.8.
Activist sees networking as a skill to help people. (1995, February 21). Southland Times, p.6.
Closure imminent for business centre. (1995, March 28). Southland Times, p.3.
Aparima College developing work programme. (1995, June 26). Southland Times, p.12.
Southern hospitality proves a winner. (1995, November 08). Southland Times, p.12.
Wellington
Polytech plan meets opposition from residents. (1995, March 16). Evening post, p.15.
Tertiary merger under discussion. (1995, March 20). Dominion, p.3.
Polytechnic distances itself from plan for regional body. (1995, March 21). Dominion, p.9.
Research institute offers consultancy services. (1995, March 28). Evening Post, p.18.
Merger may boost tourism expertise. (1995, April 04). Evening post, p.15.
Tech-Link proving its worth. (1995, April 27). Evening post, p.31.
Business group merger may attract others. (1995, May 20). Evening post, p.17.
Small business scheme `must stay'. (1995, May 26). Evening post, p.13.
Service to link artists. (1995, June 03). Evening post, p.47.
Proposed merger with chamber slows. (1995, June 13). Evening post, p.13.
Database for arts launched. (1995, July 08). Dominion, p.7.
Business groups merger near. (1995, July 10). Evening post, p.11.
Chamber has lead role in fundraising. (1995, August 03). Dominion, p.19.
Business groups choose project manager. (1995, September 09). Evening post, p.19.
A virtual consulting group. (1995, September 18). Dominion, p.8.
Info-highway community centre planned. (1995, November 20). Dominion, p.2.
2005
National
Partners in mapping. (2005, January 24). Dominion Post, p. 6.
Buying co-ops mooted. (2005, January 31). Dominion Post, p.7.
ICT-NZ formed to give industry clout. (2005, March 14). Dominion Post, p.10.
Norsewear taps student brain power. (2005, April 26). Dominion Post, p.1.
RURAL BUSINESS: China shown more ways to milk a cow. (2005, April 29). NBR, p.24-01.
Leg up for Kiwi venture. (2005, July 11). Dominion Post, p. 8.
ISPs UNITE. (2005, August 01). Dominion Post, p.9.
Auckland woos students. (2005, August 01). Dominion Post, p.10.
Southland
DHBs hope to save thousands. (2005, January 24). Dominion Post, p.8.
Southern boards join forces to save dollars. (2005, March 26). Southland Times, p. 8.
$250m lab contract could cost 45 jobs. (2005, June 06). Southland Times, p. 1.

277
Businesswoman extols virtues of industry clustering system. (2005, July 01). Southland Times, p.16.
Southland, Otago boards in merger work. (2005, August 02). Southland Times, p. 1.
Board defends `regionalisation'. (2005, September 05). Southland Times, p. 5.
Technology students gather information. (2005, September 20). Southland Times, p.17.
IT students find solutions in software. (2005, November 08). Southland Times, p. 5.
Wellington
Jackson teams up with Korean firm. (2005, March 21). Dominion Post, p.5.
BUSINESS PROMOTION: Hutt Valley goes alone. (2005, May 20). NBR, p.55-02.
Hutt Valley targeted to boost exports. (2005, September 19). Dominion Post, p.3.

278
5.2 Informing
5.2.1 Skills shortages
1985
National
Kiwi exodus to Australia. (1985, January 18). Evening Post
Professionals in big demand. (1985, January 28). Dominion
20 year reliance on immigrants broken. (1985, February 15). Dominion
Canadians come here for NZ software expertise. (1985, February 18). NBR
More leave NZ in 1984 than arrive. (1985, February 21). Dominion
Forget full employment - Burke. (1985, March 11). Dominion
Farmers seek migrant workers. (1985, March 15). Dominion
Varsity teachers joining exodus. (1985, March 16). Dominion
Universities desperate to fill several marketing vacancies. (1985, March 25). NBR
Australia beckons EDP staff. (1985, May 06). Dominion
Computer industry suffers unique staffing problems. (1985, June 03). NBR
Journalists from overseas not needed. (1985, June 03). Evening Post
Hospitals short of 1400 nurses. (1985, June 11). Dominion
Fatter pay packets lure state staff. (1985, June 12). Evening Post
Learning to live with New Zealand's drift west. (1985, June 12). NBR
Hospitals run short of specialist technicians. (1985, June 18). Dominion
Shortage of staff worries lecturers. (1985, June 24). Dominion
Difficult to recruit university staff. (1985, June 27). Southland Times
Public service exodus: 3000 in three months. (1985, June 27). Evening Post
Tradesmen shortage widespread. (1985, July 19). Dominion
To recruit Doctors from overseas. (1985, August 02). Southland Times
Research chief watches staff leave. (1985, August 03). Dominion
Survey shows record shortage of labour. (1985, August 05). Dominion
University teachers get up to 36pc more. (1985, September 10). Dominion
Severe shortage of technologists cited. (1985, September 10). Dominion
Teacher campaign launched. (1985, September 14). Dominion
Private-sector rates woo university computer staff. (1985, September 30). NBR
"Brain drain" swells to torrent. (1985, October 08). Dominion
"Brain Drain" worsening. (1985, October 08). Southland Times
Junior doctors to get 15% rise. (1985, October 18). Southland Times
Emigration highest since 1981. (1985, October 23). Dominion
Godzone lifestyle attracts banker. (1985, November 11). NBR
Research Brain Drain feared. (1985, December 07). Southland Times
Southland
Doctor Again for Bluff. (1985, January 07). Southland Times
Post Office Looking for Staff. (1985, January 23). Southland Times
Country Schools Rely on Cheap Housing. (1985, January 25). Southland Times
Teachers may take action. (1985, February 13). Southland Times
30 Nurses Needed. (1985, February 13). Southland Times
Teachers try for Southland incentive pay. (1985, February 15). Dominion
Hard to Attract Specialists. (1985, March 21). Southland Times
Survey made of graduate women in the south. (1985, July 06). Southland Times
Staffing crisis in Commerce faculty. (1985, July 08). Southland Times
Teacher Drive This Month. (1985, July 09). Southland Times
Teacher Shortages not New Issue. (1985, July 12). Southland Times
Teacher shortage no surprise. (1985, August 08). Southland Times
Principal Resigns. (1985, August 16). Southland Times
Population of city up. (1985, August 23). NBR
Support for Teachers. (1985, August 28). Southland Times

279
Teachers to start protest action. (1985, September 19). Southland Times
Southland Secondary Schools. (1985, September 23). Southland Times
Teachers applaud campaign. (1985, October 01). Southland Times
"Bit of a Gamble" pays off for Danny. (1985, October 05). Southland Times
Telegrams draw little response. (1985, October 18). Southland Times
Staff shortages continuing. (1985, November 06). Southland Times
Southland's teacher shortage not new. (1985, November 27). Southland Times
33 vacancies in teaching. (1985, December 06). Southland Times
Should "sell" Southland to teachers. (1985, December 07). Southland Times
Wellington
Teachers' prospects brighter. (1985, January 10). Evening Post
School-leavers join jobs queue. (1985, January 18). Evening Post
Computer jobs begging. (1985, January 28). Evening Post
Staff shortages delay telex fitting. (1985, February 09). Evening Post
Staff shortages tipped to last. (1985, March 04). Dominion
Teachers are turned away. (1985, March 06). Evening Post
Teacher courses refuse hundreds. (1985, March 07). Dominion
Empty beds as nurses not replaced. (1985, April 06). Evening Post
Private hospitals win; nurses flock for jobs. (1985, April 08). Evening Post
Staff lack causes waiting list crisis. (1985, May 09). Evening Post
Private hospital nurses needed. (1985, May 14). Evening Post
5000 earning less than $10,000 pa in public service. (1985, August 08). Evening Post
Nursing shortage - "drastic" counter. (1985, August 08). Evening Post
Nursing shortage causes surgery admission hold. (1985, August 09). Dominion
Secretaries in short supply paid top rates. (1985, August 13). Evening Post
Staff gap "desperate". (1985, August 15). Evening Post
Hospital radiology staff leave. (1985, August 23). Dominion
Clerical staff impose bans. (1985, September 16). Evening Post
45 wanted for region. (1985, September 25). Evening Post
Polytechnic in staff and pay bind. (1985, September 26). Evening Post
Staff shortages tipped to last. (1985, October 14). Dominion
1995
National
Education needs to benefit all. (1995, June 02). NBR, p.15.
Still too few teachers, says union. (1995, August 28). Evening post, p.3.
Many rural men lack school qualifications. (1995, September 07). Southland Times, p.15.
Skills strategy boosts industry training. (1995, September 15). NBR, p.21.
Business off the agenda at University of Auckland. (1995, September 15). NBR, p.26.
Graduates make big contribution. (1995, October 06). NBR, p.15.
Software firm finds staff. (1995, November 24). NBR, p.13.
Many Southland teachers want to quit. (1995, December 11). Southland Times, p.3.
Southland
Schools mostly fully staffed. (1995, January 26). Southland Times, p.3.
Lack of relieving teachers in South. (1995, February 17). Southland Times, p.8.
Upgrade work for jobless. (1995, March 18). Southland Times, p.1.
Rural principals considering pullout from association. (1995, April 07). Southland Times, p.8.
Primary principals pulling pin. (1995, May 30). Southland Times, p.1.
Aussie teacher plan will not solve crisis. (1995, June 23). Southland Times, p.5.
Hard-sell persuades staff to come south. (1995, August 17). Southland Times, p.3.
Wellington
Point migrants to Wellington'. (1995, February 24). Evening post, p.3.
More teachers, but not till next year. (1995, March 15). Evening post, p.1.

280
Kapiti to get 20 more teachers. (1995, March 16). Evening post, p.13.
Staff move, contract lost. (1995, March 18). Evening post, p.2.
Porirua principals angry at staff cuts. (1995, April 12). Evening post, p.1.
Victoria to remove arts course limits. (1995, June 20). Dominion, p.7.
Skills shortages show up. (1995, August 08). Evening post, p.13.
Survey identifies skills shortage. (1995, November 29). Dominion, p.11.
Report highlights industry problems. (1995, December 02). Evening post, p.21.
Teacher shortage in Wellington area, too. (1995, December 07). Evening post, p.3.
British teachers fill gaps in Kapiti. (1995, December 28). Evening post, p.3.
2005
National
ICT grads want research jobs. (2005, January 24). Dominion Post, p.9.
Entrepreneurs backed. (2005, March 28). Dominion Post, p. 8.
Nurses may still opt to work overseas despite pay rise. (2005, March 29). Southland Times, p.17.
Women dominate IT courses but more men get degrees. (2005, April 04). Dominion Post, p. 7.
SKILLS SHORTAGE: Businesses told to stop whingeing. (2005, June 03). NBR, p.05-01.
New Zealand flush with IT jobs. (2005, July 04). Dominion Post, p. 8.
Recruiting Barmy Army IT corps. (2005, July 18). Dominion Post, p.10.
Harvesting years of experience. (2005, August 01). Dominion Post, p.10.
HiGrowth funding ICT mag. (2005, August 15). Dominion Post, p. 6.
Staff shortages stymie tourism industry growth. (2005, September 23). NBR, p.56-01.
AUSSIE AUSSIE AUSSIE. (2005, October 07). NBR, p.01-02.
Telecom to recruit overseas for IT skills. (2005, November 17). Dominion Post, p. 2.
Workforce must triple warns project head. (2005, November 21). Dominion Post, p. 9.
Southland
Schools fully staffed to handle influx. (2005, January 10). Southland Times, p. 9.
$20k doctor recruit plan. (2005, April 18). Southland Times, p. 3.
Serious staff shortage in south. (2005, April 27). Southland Times, p. 3.
Southland District's low GP ratio revealed in report. (2005, May 24). Southland Times, p.19.
Police confirm problem in drawing staff south. (2005, June 20). Southland Times, p. 5.
Well-learned couple query lack of jobs. (2005, June 23). Southland Times, p.18.
Most prefer to settle away from regions, figures show. (2005, August 17). Southland Times, p. 5.
Temporary migrant numbers to south up. (2005, August 17). Southland Times, p. 5.
Plan to boost careers in labour-strapped industries. (2005, December 26). Southland Times, p. 4.
Wellington
Staff shortage delays surgery. (2005, February 19). Dominion Post, p.20.
Top council staff quit for Auckland. (2005, May 10). Dominion Post, p.8.
Warning of global battle for IT talent. (2005, August 01). Dominion Post, p.10.
Emergency nurse turnover reached 35pc in past year. (2005, September 19). Dominion Post, p.11.
300 patients can't find doctors. (2005, December 09). Dominion Post, p.4.
5.2.2 Investing in education
1985
National
More flexible training needed. (1985, March 04). Evening Post
Job lack turns focus on training. (1985, March 04). Dominion
Education satisfies most, but survey finds big variations. (1985, April 24). Evening Post
Teacher training given boost. (1985, May 13). Dominion
Funds for Tutor Training. (1985, May 23). Southland Times

281
500 primary school jobs guaranteed. (1985, May 27). Dominion
500 new jobs for teachers. (1985, May 27). Southland Times
405 more teachers for high schools. (1985, May 29). Dominion
$2.6m to take on 90 tutors. (1985, June 07). Evening Post
More teachers, computers. (1985, June 14). Evening Post
Education boost biggest for decade. (1985, June 15). Dominion
Tourism training leads world. (1985, June 21). Dominion
Big boost in teacher training. (1985, August 09). Dominion
University numbers up 47pc in decade. (1985, October 17). Evening Post
More people going to universities. (1985, October 18). Southland Times
Massey course to foster entrepreneurial talent. (1985, November 25). NBR
Diversity urged in tertiary education. (1985, December 02). Dominion
Lange stresses need for good child care. (1985, December 05). Dominion
More teacher courses set up. (1985, December 14). Dominion
Southland
Some Schools Losing Teaching positions. (1985, January 30). Southland Times
Secondary Schools Increase Rolls. (1985, January 31). Southland Times
College Roll Climbs. (1985, February 01). Southland Times
Technical Course Enrolments at College at All-time Low. (1985, February 12). Southland Times
NZEI Backs Early Start on New staff Ratio. (1985, March 01). Southland Times
Evening Classes in Doubt. (1985, March 09). Southland Times
Apprentice Class Numbers Up. (1985, March 12). Southland Times
Teacher Resource Centre for Southland. (1985, May 10). Southland Times
Wellington
Tech expansion still in planning. (1985, February 19). Evening Post
Victoria gets 60 extra overseas students. (1985, February 26). Dominion
Varsity staff swap founders. (1985, March 09). Dominion
Planned arts school seeks state funds. (1985, March 13). Evening Post
Nursing education courses. (1985, March 22). Evening Post
Porirua chases education. (1985, March 25). Evening Post
Polytechs may ease Gilby shock. (1985, March 27). Evening Post
Now 25, CIT is looking good - and expansive. (1985, April 20). Evening Post
Capital allocated 27 new teachers. (1985, June 12). Evening Post
Arts school for HV jobless gets funds. (1985, June 21). Evening Post
College in detail. (1985, July 02). Evening Post
Arts and crafts workshop granted funding. (1985, July 30). Evening Post
Newtown to get employment, guidance centre. (1985, August 05). Evening Post
Tutors threatened by improved job market. (1985, August 05). Evening Post
Jobless spurn skill training. (1985, August 13). Dominion
Jobless "can't" afford training. (1985, August 16). Dominion
Interest lack kills courses. (1985, August 21). Evening Post
Masterton plans mobile college. (1985, September 12). Evening Post
Communications chair pleases. (1985, October 12). Dominion
1995
National
Vice chancellors take wrong side of education argument. (1995, March 31). NBR, p.39.
Tertiary education plays a part in keeping restructuring going. (1995, April 13). NBR, p.14.
Give us supple, accessible, polytechs and we'll prosper. (1995, May 05). NBR, p.12.
Fall in new enrolments at most varsities. (1995, August 07). Evening post, p.2.
35 cut-off for rural schools. (1995, October 10). Southland Times, p.3.
Universities will be fighting for share of smaller student pool. (1995, November 03). NBR, p.34.
Polytechs to become more demanding. (1995, November 20). Southland Times, p.3.
MBA courses proliferate as graduates are snapped up. (1995, November 24). NBR, p.27.

282
Southland
Polytech to explore funding options. (1995, January 11). Southland Times, p.1.
Schools wary of enrolling Asians. (1995, January 16). Southland Times, p.3.
Polytech review of costs, courses. (1995, January 26). Southland Times, p.2.
Polytechnic tutors suspended. (1995, February 11). Southland Times, p.1.
Good enrolment figures in Southland & Otago. (1995, February 18). Southland Times, p.16.
Small schools under threat. (1995, February 21). Southland Times, p.3.
Correspondence School numbers up in South. (1995, March 02). Southland Times, p.18.
School mergers considered. (1995, March 21). Southland Times, p.2.
Centre's funds cut. (1995, April 01). Southland Times, p.3.
Polytech finances healthy. (1995, May 04). Southland Times, p.14.
Morale low at polytech. (1995, May 25). Southland Times, p.3.
Rural schools still "losers" with pool. (1995, June 02). Southland Times, p.8.
School rolls drop against national trend. (1995, June 10). Southland Times, p.9.
Polytech fees could double in four years. (1995, July 04). Southland Times, p.16.
Survey: Polytechnic a big spender on staff. (1995, July 20). Southland Times, p.12.
Varsity fee increase likely. (1995, July 28). Southland Times, p.8.
Southland schools call for more money. (1995, August 04). Southland Times, p.7.
Alan Duff begins books scheme. (1995, August 17). Southland Times, p.2.
Closure confirmed. (1995, August 19). Southland Times, p.1.
Student shortfall costly for polytech. (1995, September 05). Southland Times, p.5.
Polytech rivals attract students. (1995, September 06). Southland Times, p.13.
Allowance cut to hit polytechnic. (1995, September 08). Southland Times, p.18.
Population decline could be costly for polytech. (1995, September 23). Southland Times, p.9.
New business aid programme timely. (1995, September 27). Southland Times, p.15.
Most schools gain under bulk funding. (1995, October 08). Southland Times, p.1.
30 schools face axe. (1995, October 11). Southland Times, p.1.
Low rolls a problem at schools. (1995, October 12). Southland Times, p.1.
Polytech fees soar. (1995, October 17). Southland Times, p.1.
Secondary schools to gain more teachers. (1995, October 17). Southland Times, p.4.
Polytechnic funding cut. (1995, November 01). Southland Times, p.1.
Polytech to end year $86,000 in the red. (1995, December 13). Southland Times, p.1.
Redundancies on cards for polytechnic staff. (1995, December 16). Southland Times, p.3.
Eight redundant at Polytech. (1995, December 21). Southland Times, p.1.
Wellington
Steiner school copes with influx of converts. (1995, February 13). Evening post, p.17.
Student numbers rise as CIT eyes record. (1995, February 17). Evening post, p.10.
$4m decentralised education centre for Kapiti. (1995, March 02). Evening post, p.1.
College opens new block. (1995, March 03). Evening post, p.2.
CIT to increase degree courses. (1995, March 03). Evening post, p.2.
Call for free food and healthcare in schools. (1995, March 08). Evening post, p.14.
Rich state schools `more like private'. (1995, March 10). Dominion, p.5.
Council to spend $400,000 on jobless. (1995, March 17). Evening post, p.3.
Poor primary schools to lose staff. (1995, March 18). Dominion, p.7.
Drumming up business skills. (1995, March 24). Evening post, p.2.
Varsity slows growth, targets postgrads. (1995, March 29). Evening post, p.21.
UH scheme to run job programme. (1995, April 03). Evening post, p.14.
Tertiary institution advertising tops $1 million. (1995, April 04). Dominion, p.2.
Polytech will survive - Weaver. (1995, April 05). Evening post, p.12.
Encouraging young women into business. (1995, April 06). Evening post, p.5.
More schools on cards - report. (1995, April 13). Evening post, p.2.
Private school for bright children runs out of room. (1995, May 05). Evening post, p.15.
Creative plans for Waikanae. (1995, May 11). Evening post, p.13.

283
Big demand for tertiary courses on Kapiti Coast. (1995, May 12). Evening post, p.5.
School needed for Kapiti Coast. (1995, May 17). Dominion, p.7.
Heeding needs of the jobless. (1995, May 17). Evening post, p.29.
Hutt's jobless get must-come invites. (1995, May 22). Evening post, p.13.
Integrated school rapidly expanding. (1995, May 23). Evening post, p.5.
Lindale will be place of learning. (1995, May 29). Evening post, p.1.
CIT offers latest in theatre facilities. (1995, May 30). Dominion, p.14.
Subjects reflect economy's growth areas. (1995, June 12). Dominion, p.13.
School focuses on Jewish beliefs. (1995, June 30). Dominion, p.23.
CIT, polytech may be competing for students. (1995, July 08). Evening post, p.8.
Whitireia strong in creative arts. (1995, July 28). Dominion, p.3.
Five secondary schools in debt; most others strapped for cash. (1995, July 31). Evening post, p.2.
CIT city campus. (1995, August 15). Dominion, p.3.
CIT sets up new campus in Capital. (1995, August 15). Evening post, p.15.
Polytech to celebrate. (1995, August 23). Evening post, p.9.
New campus. (1995, October 06). Dominion, p.2.
Poorer schools to be given extra funding. (1995, October 09). Evening post, p.9.
Smaller schools may be closed. (1995, October 09). Evening post, p.1.
Aotea plans tertiary arts step. (1995, October 11). Evening post, p.4.
Funding cut for region's tertiary institutions. (1995, October 26). Evening post, p.2.
Students `will still get into courses'. (1995, October 27). Evening post, p.2.
Steiner school. (1995, October 31). Evening post, p.3.
Rudolf Steiner school to open in January. (1995, November 03). Evening post, p.14.
VUW's dean of education resigns. (1995, December 12). Evening post, p.2.
Learning centre proposal for Kapiti dropped. (1995, December 20). Evening post, p.4.
2005
National
New Zealand not on global MBA radar. (2005, February 11). NBR, p.28-01.
Upskilling will fuel real growth in economy. (2005, May 18). Dominion Post, p.5.
Business schools: NBR Special Review: COMMERCE: Why we don't rate on global MBA lists. (2005,
July 01). NBR, p.33-01.
Universities and polytechnics see big drop in enrolments. (2005, September 16). NBR, p.03-02.
Southland
Schools `make it work'. (2005, January 10). Southland Times, p. 9.
SIT enrolments increase by 200. (2005, March 04). Southland Times, p. 5.
SIT funding loss $3m, says CEO. (2005, March 11). Southland Times, p. 2.
Gore training programme fails due to lack of support. (2005, May 19). Southland Times, p. 5.
SIT students promised a sound education. (2005, May 26). Southland Times, p. 5.
English concerned about cuts to rural training in south. (2005, June 17). Southland Times, p. 5.
SIT guideline plan shocks funders. (2005, July 12). Southland Times, p. 3.
Big decisions for SIT. (2005, July 12). Southland Times, p. 1.
Venture plans to help business. (2005, July 12). Southland Times, p.16.
On course for off-season skills. (2005, August 02). Southland Times, p.15.
$26,000 for college study centre. (2005, August 17). Southland Times, p. 5.
SIT chief `cautiously optimistic' on zero fees. (2005, August 25). Southland Times, p. 5.
Zero fees just SIT marketing slogan. (2005, August 29). Southland Times, p. 6.
School issue quick to arise at forum. (2005, August 31). Southland Times, p. 4.
World class, literally, in Invercargill. (2005, September 27). Southland Times, p. 7.
Trade-based graduates hailed by business circle. (2005, October 15). Southland Times, p.10.
Wellington
Language school gets big grant to diversify. (2005, January 26). Dominion Post, p.14.
$9m lifeline for struggling WelTec. (2005, August 04). Dominion Post, p.5.

284
5.2.3 Promoting the use of technology
1985
National
Week promotes awareness. (1985, January 26). Dominion
Go-tech seminars to focus on productive technology use. (1985, January 28). NBR
Technology gap putting NZ industry at risk. (1985, February 18). Evening Post
Trust sponsors five technology seminars. (1985, February 18). Dominion
High hopes from technology talks. (1985, February 25). NBR
Giving everyone a "hands-on" chance. (1985, May 20). NBR
Technology week planned. (1985, May 20). Dominion
Televising Parliament would cost $2.25m. (1985, May 23). Southland Times
Education show debut for PC? (1985, July 01). NBR
Machining cell progresses. (1985, August 12). Dominion
Chance to get to know high tech. (1985, August 12). Dominion
Home computer price war heats up. (1985, October 02). Dominion
Forum to talk technology. (1985, October 21). NBR
Slow-start trust swings into action to push high-tech. (1985, December 02). NBR
A new attempt to interest us in IT. (1985, December 09). NBR
The young and the computer literate? Miami bytes? (1985, December 09). NBR
Southland
-
Wellington
Chamber unhappy with education plea answer. (1985, March 25). Evening Post
Whiz builds own computer but too young for show. (1985, July 22). Dominion
Seminar planned to inform elderly. (1985, August 19). Dominion
Computers' role in industry highlighted. (1985, August 22). Evening Post
Conference told to use technology to help world. (1985, September 02). Dominion
Seminar agenda includes videotex. (1985, September 16). Dominion
Information Technology and Economic growth. (1985, December 02). Dominion
1995
National
Technology focus at Mystery Creek. (1995, June 15). Southland Times, p.9.
Tuanz conference the biggest yet. (1995, July 31). Dominion, p.1.
Nurses conference. (1995, August 03). Dominion, p.6.
Southland
-
Wellington
A blast from the future. (1995, April 06). Evening post, p.2.
On threshold of multimedia revolution. (1995, April 26). Evening post, p.22.
Work while watching TV. (1995, August 21). Evening post, p.17.
Portability a key feature. (1995, August 21). Evening post, p.18.
Macintosh market covered at expo. (1995, August 21). Evening post, p.17.
NZCS/Decus conference will be `extremely rich'. (1995, August 21). Dominion, p.1.
Windows '95 and Internet to feature. (1995, August 21). Evening post, p.16.
Societies hold joint conference. (1995, August 21). Dominion, p.31.
Computer show hits capital tomorrow. (1995, August 28). Evening post, p.9.
Seminar shows women managers how to do business on the Internet. (1995, September 04). Dominion,
p.8.

285
2005
National
$1m bid to tackle IT skills shortage. (2005, May 02). Dominion Post, p.9.
Pool of experts. (2005, July 25). Dominion Post, p. 6.
Kiwis showcase health IT. (2005, August 08). Dominion Post, p. 8.
Kiwi innovations to star at airport conference. (2005, October 14). NBR, p.55-01.
Southland
Southland Hospital technology to be seen around world. (2005, December 16). Southland Times, p. 7.
Wellington
-
5.2.4 The use of information technology in education
1985
National
Schools tap policy gap. (1985, January 17). Evening Post
Computer policy in school. (1985, January 17). Dominion
Video book partnership seeks cash. (1985, February 01). Dominion
Gibson seeks $1.3m for children's video series. (1985, February 10). Dominion
Video book scheme prompts film industry fears of tax reaction. (1985, February 25). NBR
Distance Education Body Formed. (1985, May 20). Southland Times
Academics question school computers. (1985, May 20). Dominion
Facilities poor in technical teaching field. (1985, May 21). Evening Post
Learn to compute. (1985, July 08). NBR
Education: IBM attack, school trials. (1985, July 15). NBR
Keen pupils‟ line up for more. (1985, August 05). Dominion
No money for computers. (1985, August 09). Southland Times
The computer and efficiency. (1985, August 23). Dominion
Computers great equalizers in schooling. (1985, August 24). Southland Times
Philips joins fight for share of school market. (1985, September 02). Dominion
NZ told to learn from US mistake. (1985, September 09). Dominion
English class works on screen. (1985, September 16). Dominion
Video "books" may lead to look-alikes. (1985, September 23). NBR
Apple takes big slice of education field. (1985, October 14). Dominion
Business Computers to supply polytechnics. (1985, October 14). Dominion
Computer education needed for all. (1985, October 18). Southland Times
High-tech race fears expressed. (1985, October 18). Dominion
Computer use under study. (1985, November 08). Southland Times
$700,000 computer study checks school uses. (1985, November 09). Dominion
Children face "computer illiteracy". (1985, November 13). Dominion
Computer camps give your child a chance to excel. (1985, December 09). NBR
TV bridges gap for long-distance pupils. (1985, December 11). Dominion
School thinks before buying. (1985, December 16). Dominion
Southland
Teleconference on reading. (1985, February 15). Southland Times
Teleconferences popular. (1985, March 22). Southland Times
Audience stays at home. (1985, July 22). Dominion
Teleconference Seminars. (1985, August 24). Southland Times
Video book creator visits South. (1985, September 14). Southland Times
Next social work course by teleconference. (1985, November 13). Southland Times
Bluff School receives computer prize. (1985, December 12). Southland Times

286
Wellington
Extramural course useful. (1985, January 04). Dominion
Poly 2 goes into classroom. (1985, January 14). Dominion
Elsa's satellite link with Pacific. (1985, January 14). Dominion
For school computer: "think big”, forum told. (1985, January 22). Evening Post
Schools using computer "toys". (1985, January 25). Evening Post
Computer Learning Centre (Advertisement). (1985, January 25). Dominion
University job draws interest. (1985, March 30). Evening Post
Starting young on computers. (1985, May 21). Evening Post
Techno-revolution on the way. (1985, October 11). Evening Post
1995
National
Multimedia strengthens campus call. (1995, June 06). Dominion, p.7.
Gov't plans satellite school link. (1995, June 26). Southland Times, p.12.
Corran turns itself into leading information-technology school. (1995, June 30). NBR, p.20.
Put those needles down: The Net calls. (1995, July 17). Dominion, p.26.
Polytechnic offering cheap Internet fees. (1995, August 14). Dominion, p.7.
Auckland University may become telemedicine site. (1995, August 28). Dominion, p.5.
Massey to offer soil course over the Net. (1995, September 11). Dominion, p.2.
Cutting-edge technology brings education to remote businesses. (1995, September 15). NBR, p.21.
Ministry to connect 125 more schools to network. (1995, October 02). Dominion, p.2.
Rising costs pull plug on Internet access for students. (1995, October 02). Dominion, p.5.
Moving into an electronic classroom. (1995, October 12). Dominion, p.11.
Networking proving a classroom hit. (1995, December 04). Dominion, p.1.
Educators unite for Internet use. (1995, December 14). Dominion, p.6.
Southland
Students rapt by flow of information. (1985, July 03). Southland Times, p.8.
COMMUNITY EDUCATION - Adult Courses 1995 Term 1. (1995, January 21). Southland Times,
p.3.
Schools need computer funds. (1995, March 08). Southland Times, p.12.
Core staffing needed in country schools. (1995, April 03). Southland Times, p.5.
Lumsden students extend computer links. (1995, May 16). Southland Times, p.4.
Wellington
A `hands-on' glimpse at multimedia magic. (1995, May 08). Dominion, p.5.
Professor taking leaf out of Internet book. (1995, July 03). Dominion, p.6.
Wainuiomata College cuts back to go online. (1995, July 24). Dominion, p.1.
Varsity puts world affairs on Internet. (1995, August 14). Dominion, p.6.
Kids grasp new technology. (1995, August 22). Evening post, p.10.
Worldwide demand for CIT's courses on the Web. (1995, September 25). Dominion, p.8.
US Navy plugs into CIT computer courses. (1995, November 01). Evening post, p.4.
Wellington CIT Internet course earns top marks. (1995, November 06). Dominion, p.7.
School pupils go north to Alaska by cyberspace. (1995, November 06). Dominion, p.1.
Information technology degree course will include multi-media. (1995, December 22). Evening post,
p.9.
2005
National
Back to the books but not to school. (2005, February 01). Dominion Post, p.3.
Notschool's out. (2005, April 11). Dominion Post, p.8.
Electronic crackdown on truancy. (2005, April 14). Dominion Post, p.6.
Polytechs migrate to Moodle. (2005, April 18). Dominion Post, p.9.
Microsoft aid worth $2 million. (2005, May 09). Dominion Post, p.11.

287
2000 schools asked to upgrade. (2005, May 09). Dominion Post, p.8.
SeniorNet users get PC texting help. (2005, May 23). Dominion Post, p.9.
Mum keys in. (2005, May 25). Dominion Post, p. 6.
Industry backs IT curriculum. (2005, July 04). Dominion Post, p.10.
Schools ink deal for open source. (2005, July 18). Dominion Post, p. 7.
Teachers lapping up their new teaching tools. (2005, July 27). Southland Times, p.21.
Digital Opportunities falls short of ideal. (2005, September 05). Dominion Post, p.11.
School funding doesn't please all. (2005, September 05). Dominion Post, p.8.
Notschool students back at school. (2005, September 26). Dominion Post, p.12.
Schools struggle to find ICT funds. (2005, December 03). Dominion Post, p.14.
Schools see value of ICT - study. (2005, December 12). Dominion Post, p. 7.
Southland
Learning language of computers. (2005, January 12). Southland Times, p.14.
Schools on board. (2005, May 17). Southland Times, p. 6.
Use of technology praised. (2005, May 19). Southland Times, p.19.
Interactive whiteboards to boost teacher effectiveness. (2005, June 27). Southland Times, p. 6.
Taking distance education literally. (2005, September 06). Southland Times, p.17.
SIT tackles cheating. (2005, October 12). Southland Times, p.10.
Whiteboard widens an interactive curve. (2005, October 25). Southland Times, p.21.
Tips to beat bugs online. (2005, October 28). Southland Times, p.20.
Wellington
Can't make it to son's game? See it online. (2005, April 11). Dominion Post, p.8.
Pupils push limits of creative ICT. (2005, May 25). Dominion Post, p. 7.
Whitireia polytech opens hi-tech learning centre. (2005, June 01). Dominion Post, p.7.
Wainui backs Linux. (2005, September 12). Dominion Post, p.4.

288
5.3 Innovating
5.3.1 Climate and culture
1985
National
Ripe for entrepreneurs says Jones. (1985, February 20). Dominion
Farm computers: new breed looks to software. (1985, February 22). Dominion
Moore sees role for small scale NZ technology. (1985, February 25). Dominion
Exporting electronic expertise could keep talent here. (1985, April 01). NBR
Seminars urge Kiwis to become "entrepreneurial". (1985, April 03). Evening Post
R & D Spending Up but not Enough. (1985, May 06). Southland Times
Conference sets future course. (1985, May 07). Dominion
Minister shows the way. (1985, May 07). Dominion
Research policies lacking. (1985, May 08). Evening Post
Right climate, Kiwis, recipe for success. (1985, May 09). Evening Post
Technology Challenge. (1985, May 09). Dominion
Research gains expounded at technology conference. (1985, May 13). NBR
Australian research ahead of New Zealand. (1985, June 29). Southland Times
Swedish technology leap "the way to go". (1985, July 15). Dominion
Trust picks up brief for technology transfer. (1985, July 22). Dominion
NZ science "in dire straits". (1985, July 24). Dominion
NZ lags behind in CAD/CAM. (1985, July 29). Dominion
More University research urged. (1985, August 23). Dominion
Creative Kiwis "streets ahead" of Australians. (1985, September 07). Dominion
NZ workers "creative". (1985, September 07). Southland Times
Growth conference. (1985, September 23). Dominion
Overseas R & D incentive schemes under scrutiny. (1985, September 30). NBR
Innovative company in receivership. (1985, October 16). Dominion
Industry caution and commitment criticised. (1985, October 28). NBR
The myth of a direct line from science to marketplace. (1985, November 18). NBR
Our innovators are not the right kind. (1985, November 25). NBR
Innovators needed for elephant input. (1985, December 02). NBR
More science funding urged. (1985, December 04). Dominion
Technology neglected - Upton. (1985, December 09). Dominion
NZ should become "production point" for world plants. (1985, December 11). Southland Times
Southland
-
Wellington
Hutt promoted as hi-tech home. (1985, May 06). Dominion
Hutt considered natural centre. (1985, May 20). Dominion
UH lectures to boost local industry. (1985, July 24). Evening Post
The Hutt: about to fight for the silicon valley title. (1985, August 19). NBR
1995
National
New Zealanders too quick to turn on those who profit. (1995, July 07). NBR, p.66.
Low R&D spending is legacy of protectionism, science boss says. (1995, September 01). NBR, p.10.
New Zealand eight most competitive nation. (1995, September 07). Southland Times, p.11.
New Zealand fails to exploit its competitive advantage. (1995, September 22). NBR, p.9.
Spending on research vital for industry. (1995, October 06). NBR, p.54.
NZ further down the track to becoming a 'clever country'. (1995, October 20). NBR, p.12.
Boffins can budget - Industrial Research proves the point. (1995, October 27). NBR, p.53.
Asia offers golden technological opportunities to New Zealand. (1995, November 03). NBR, p.44.

289
Southland
-
Wellington
Levin hosts seminars. (1995, February 25). Evening post, p.14.
Course helps people start a small business. (1995, March 03). Evening post, p.16.
Combined commerce-science degree proposed. (1995, October 19). Dominion, p.20.
2005
National
The widespread threat of isolation. (2005, March 07). Dominion Post, p. 4.
TRADE: UK technology companies target Kiwi innovators. (2005, May 13). NBR, p.17-01.
TECHNOLOGY: Selling up to export. (2005, June 03). NBR, p.10-02.
TECHNOLOGY: The secrets of high-tech success. (2005, June 03). NBR, p.19-01.
Business schools: NBR Special Review: INNOVATION: Practical passion. (2005, July 01). NBR, p.2-
02.
Southland
-
Wellington
Innovative companies show wares at expo. (2005, April 18). Dominion Post, p.5.
ENTERPRISE: Growth seminars target SMEs. (2005, April 22). NBR, p.6-02.
Giving NZ an edge in global market. (2005, April 28). Dominion Post, p.3.
5.3.2 Entrepreneurs
1985
National
NZ wines earn 22 medals at exhibition. (1985, April 13). Dominion
NZ takes award. (1985, July 15). Dominion
Kiwifruit wines take gold medals. (1985, September 02). Dominion
Meanwhile, the entrepreneurs are getting on with it. (1985, October 07). NBR
New technology puts us in tune with tomorrow. (1985, October 07). Dominion
Releasing a creative energy to end stagflation. (1985, October 14). NBR
Plessey wins $5m contract. (1985, October 21). Dominion
First in world with new wood. (1985, October 28). NBR
Win staggers Hulme. (1985, November 01). Dominion
Old partners begin afresh. (1985, November 04). Dominion
Innovation rewards for civil servants. (1985, November 04). Evening Post
Southland
City Man Awarded Designmark. (1985, March 07). Southland Times
Southland Journalist Wins Top Award. (1985, March 22). Southland Times
City Doctor Awarded Fellowship. (1985, May 02). Southland Times
Local Noxious Plants Officer Wins Awards. (1985, May 03). Southland Times
Innovative Plans by Donaghys. (1985, May 03). Southland Times
Bursary established for women in agriculture. (1985, May 25). Southland Times
Kiwi ingenuity & know how. (1985, August 23). Southland Times
Signwriters harness silicon chip. (1985, September 11). Southland Times
Quality work by glass decorator. (1985, October 03). Southland Times
Plenty of bright ideas for Southland. (1985, December 28). Southland Times
Wellington
Kiwi Board Game passes acid test. (1985, January 24). Dominion
Venture factory units succeed expand. (1985, March 05). Evening Post
Hospital and holiday - package tour for foreigners. (1985, March 13). Evening Post

290
Walker beefs up profile. (1985, April 15). Dominion
Northrop's new home marks rapid ascent. (1985, June 04). Dominion
New venture factory to open soon. (1985, July 17). Evening Post
Garry's a model businessman. (1985, August 02). Dominion
Porirua firm wins $1m contract. (1985, August 06). Dominion
Hutt engineer wins $2000. (1985, September 24). Evening Post
Nurtured welding firm secures top award. (1985, October 04). Evening Post
1995
National
National Innovation Centre is undaunted by poor response. (1995, June 30). NBR, p.43.
Paykel puts new spin on the old family business. (1995, July 21). NBR, p.38.
Let's give entrepreneurs a tax break. (1995, September 15). NBR, p.60.
Southland
Rayonier Scholarships. (1995, April 19). Southland Times
South tops in tourism. (1995, November 04). Southland Times, p.1.
Wellington
Women getting down to business. (1995, January 05). Evening post, p.5.
Kapiti entrepreneur dies. (1995, January 09). Evening post, p.1.
Week-long promotion highlights diversity. (1995, March 09). Evening post, p.22.
Small-business centre near completion. (1995, March 21). Evening post, p.11.
Young enterpriser guest speaker. (1995, April 04). Evening post, p.9.
Set to join Harvard high fliers. (1995, April 17). Evening post, p.21.
The new at work behind the old. (1995, May 11). Evening post, p.11.
Polystyrene building blocks used to create a winner. (1995, July 25). Evening Post, p.14.
Victoria maths man solves 25-year puzzle. (1995, September 11). Evening Post, p.6.
Jobless woman sewing to success. (1995, October 17). Evening post, p.9.
Wellington teachers win Royal Society fellowships. (1995, December 13). Evening Post, p.4.
2005
National
INNOVATION: Lasers offer gas detection potential. (2005, March 24). NBR, p.07-01.
Syft goes sniffing for a fortune. (2005, October 28). NBR, p.26-02.
Southland
Scholarship for nurse. (2005, January 03). Southland Times, p.10.
Entrepreneurs invited to share experiences. (2005, February 05). Southland Times, p. 6.
South nurses shine at Sydney conference. (2005, February 28). Southland Times, p. 4.
Graduates . . . where are you? (2005, February 28). Southland Times, p.15.
Scientist gets top award. (2005, April 09). Southland Times, p.10.
Southern farmers snatch top awards. (2005, April 09). Southland Times, p.10.
Young entrepreneurs launch money makers. (2005, May 21). Southland Times, p. 8.
Sparkling growth allows city man to franchise window cleaning business. (2005, June 07). Southland
Times, p.16.
Business accolade `richly deserved'. (2005, August 12). Southland Times, p. 1.
Enterprising pair launch new eatery. (2005, October 14). Southland Times, p. 3.
Girls' team sensational success at Young Enterprise awards. (2005, October 22). Southland Times, p. 6.
Southland part of hosting bid for space telescope. (2005, December 15). Southland Times, p.16.
SIT trio $1000 richer in Spree. (2005, December 21). Southland Times, p.22.
Wellington
Learning to be a best seller. (2005, April 18). Dominion Post, p.5.
Bright sparks enjoy spotlight. (2005, April 27). Dominion Post, p.3.
Incubator creates its first graduates. (2005, June 30). Dominion Post, p.3.

291
Ugliness offends young designer. (2005, November 18). Dominion Post, p.6.
5.3.3 Entrepreneurs in information technology
1985
National
New Epoch has arrived in the world of office communications. (1985, January 16). Southland Times
Users in NZ rank 3rd in world. (1985, February 18). Dominion
Four locals back Exsys export drive. (1985, February 25). NBR
Exsys seeking patent protection. (1985, March 04). NBR
Post Office gains edge with OPD. (1985, March 18). Dominion
Microsystem for ships. (1985, April 22). Dominion
Technology wing prepares broadcasting for future. (1985, April 24). Dominion
A picture which tells a story. (1985, June 17). Dominion
Computerphone shapes up as telephone-and-a-half. (1985, June 26). NBR
Ships sail away with Microplan. (1985, July 08). Dominion
Computer ends map drudgery. (1985, July 26). Evening Post
Banks go for office automation. (1985, August 12). Dominion
Post office control policy defended. (1985, August 26). NBR
Computer analysis of real estate planned. (1985, August 27). Dominion
Seller surprised at lack of forex voice logging. (1985, September 23). NBR
Chemist's computer brainchild succeeds. (1985, October 07). Dominion
Police probes to use more hi-tech. (1985, October 11). Dominion
Program acts like weather. (1985, November 04). Dominion
Medical field makes strong Foundation. (1985, November 11). Dominion
Digital NZ to export repair expertise. (1985, December 09). Dominion
Southland
Kiwi Ingenuity helps with computers. (1985, June 18). Southland Times
Wellington
Legal Office System launched. (1985, January 28). Dominion
Computer to match jobs and seekers. (1985, March 20). Evening Post
Computer breakthrough stems from "ignorance". (1985, May 03). Evening Post
Word Processor for Chinese has Potential. (1985, May 09). Southland Times
Historic dictionary goes on computer. (1985, July 22). Dominion
Package invented for jewellers. (1985, July 29). Dominion
Data-tech pins high hopes on green screen. (1985, September 02). Dominion
Taking software to the limits. (1985, September 13). Dominion
Robot handles all calls. (1985, September 18). Evening Post
Terminal connector arouses US interest. (1985, October 14). Dominion
Firm leaves "garage" origins behind. (1985, October 29). Dominion
Law firm plugs into system. (1985, November 09). Dominion
Library buys BRS/Search text retrieval. (1985, December 16). Dominion
1995
National
$50m grant to create hi-tech museum exhibits. (1995, January 20). Dominion, p.1.
$700,000 system spend tipped to reduce air crashes. (1995, February 07). Dominion, p.3.
Unisys wins vote for $4m parliamentary IT revamp. (1995, March 13). Dominion, p.3.
Hot visual-effects computing specialist arrives down under. (1995, March 24). NBR, p.26.
Eagle Technology's new business set to soar. (1995, March 27). Dominion, p.2.
Justice pulls the plug on registries automation. (1995, April 10). Dominion, p.1.
Laptops give social workers more time in the community. (1995, April 10). Dominion, p.5.
Taking full service to the streets. (1995, April 10). Dominion, p.17.

292
Government records plan put on hold. (1995, April 11). Dominion, p.2.
Ministry database maps out Maori land ownership records. (1995, May 08). Dominion, p.2.
Database marketing next development. (1995, May 19). NBR, p.61.
Turnbull putting heritage online. (1995, May 22). Dominion, p.1.
Jet set promises to take off again as it moves into paperless world. (1995, June 09). NBR, p.51.
Meat chiller software upgrades save money. (1995, July 14). NBR, p.39.
Auckland's public libraries moving into electronic age. (1995, July 17). Dominion, p.4.
Computers with drive. (1995, July 21). NBR, p.46.
Megabyte to Terabyte - and hi-tech company still has room to grow. (1995, July 28). NBR, p.26.
Video conferencing `with all the extras'. (1995, August 07). Dominion, p.12.
Dunedin software developer's mail server catches Apple's eye. (1995, August 14). Dominion, p.5.
Waikato embarks on telemedicine pilot. (1995, September 04). Dominion, p.2.
New technology provides escape to lucrative future. (1995, September 08). NBR, p.29.
Businesses jump on board NZ InfoTech Weekly's JobNet. (1995, September 11). Dominion, p.1.
Work on GST database development may go faster. (1995, September 22). NBR, p.8.
Embracing bedside computing. (1995, September 25). Dominion, p.1.
Dynamic stakes claim in video-conferencing market. (1995, October 02). Dominion, p.5.
Government settles over PRA project failure. (1995, October 02). Dominion, p.1.
JK sees the light and moves into info technology. (1995, October 06). NBR, p.55.
Crisis management at the touch of a teleconferencing button. (1995, October 27). NBR, p.32.
Government now in reach on touch-screen. (1995, November 06). Dominion, p.3.
Reservation systems will soon surf the Internet. (1995, November 24). NBR, p.43.
Frenzy as Windows 95 issued first in NZ. (1995, December 15). NBR, p.23.
Southland
Watkins Managing Director Bruce Watkins - successful computerised wheel balancing device. (1995,
January 19). Southland Times, p.19.
Powernet to electronically map network. (1995, April 18). Southland Times, p.8.
Computer will speed count. (1995, September 06). Southland Times, p.13.
Software system breakthrough. (1995, September 08). Southland Times, p.17.
Wellington
Big profits out of small talk. (1995, March 15). Evening post, p.17.
Computerised accounting adds up. (1995, April 13). Evening post, p.15.
Computers offer NZ growth for N Leeming. (1995, July 11). Evening post, p.17.
Computer technology saves runaround time. (1995, July 31). Evening post, p.17.
TICKET COMPUTERS. (1995, September 05). Dominion, p.8.
Private software delivers e-mail to laptops. (1995, September 18). Dominion, p.8.
Careerline help for job-seeking students. (1995, October 30). Dominion, p.8.
INFOTECH BRIEFS. (1995, November 27). Evening Post, p.2.
Post e-mail. (1995, December 02). Evening post, p.1.
The advantages of going electronic. (1995, December 06). Evening post, p.6.
2005
National
Online service aimed at direct mailers. (2005, March 07). Dominion Post, p.10.
Innovations sought. (2005, March 21). Dominion Post, p. 7.
Firms matched to worthy causes. (2005, March 28). Dominion Post, p. 8.
Syft sniffs out $2m Aussie border deal. (2005, April 11). Dominion Post, p.5.
DHB trials open source software. (2005, April 11). Dominion Post, p.11.
Facial recognition here now. (2005, May 02). Dominion Post, p.9.
TECHNOLOGY: Research merger will boost ICT sector. (2005, May 20). NBR, p.51-01.
Technology scores in sporting world. (2005, May 23). Dominion Post, p.10.
Greeting card company uses handhelds to stock shelves. (2005, June 06). Dominion Post, p.12.
On the meat cut trail back to farm gate. (2005, June 23). Dominion Post, p.11.
RBNZ improves document system. (2005, July 11). Dominion Post, p. 8.

293
TECHNOLOGY: Transactions of tomorrow. (2005, July 15). NBR, p.10-02.
More funding for new projects. (2005, July 18). Dominion Post, p. 9.
TECHNOLOGY: Modern day solution to modern day problem. (2005, July 22). NBR, p.25-01.
PODCASTING: Radio on demand is here, there and everywhere. (2005, July 22). NBR, p.32-01.
A vote for open source. (2005, July 25). Dominion Post, p. 9.
Simulators in army's sights. (2005, August 01). Dominion Post, p. 7.
ONLINE BOOKING: Firm gets big opportunity to go global. (2005, August 26). NBR, p.51-01.
Wainui backs Linux. (2005, September 12). Dominion Post, p. 4.
CodeScan looks for weaknesses. (2005, September 12). Dominion Post, p. 8.
Local firm makes data warehousing look easy. (2005, September 30). NBR, p.26-01.
Biotech firm nets $1 million. (2005, October 03). Dominion Post, p. 8.
Health wants disability database. (2005, October 10). Dominion Post, p. 8.
Fire Service goes hi-tech for disasters. (2005, October 31). Dominion Post, p. 5.
Army buys firing simulator. (2005, December 05). Dominion Post, p. 6.
Practising surgery by computer. (2005, December 09). NBR, p.10-01.
Southland
Framing software generates buzz. (2005, December 08). Southland Times, p.18.
Wellington
Girls conserve energy for prize trip to Montego Bay. (2005, February 25). Dominion Post, p. 6.
E-mail archiver signs overseas contracts. (2005, April 18). Dominion Post, p.9.
Police scandal boost for AfterMail. (2005, May 02). Dominion Post, p.13.
Mobile first aid manual. (2005, May 16). Dominion Post, p.10.
IT specialist wins first scholarship to US. (2005, June 29). Dominion Post, p. 9.
Aftermail wins gold. (2005, July 18). Dominion Post, p.8.
Mother and son in study. (2005, July 20). Dominion Post, p.7.
A virtual stroll through 3D capital. (2005, August 20). Dominion Post, p.17.
Tool for watching the watchers. (2005, September 12). Dominion Post, p.10.
Info kiosks numbers to grow. (2005, October 17). Dominion Post, p. 7.
Wellingtonian helps set IT services standard. (2005, December 05). Dominion Post, p. 7.
French connection for motel Internet. (2005, December 19). Dominion Post, p.5.
5.3.4 Adoption of information and communication technologies
1985
National
Farmers choose viewdata. (1985, January 14). Dominion
Dairy board renews interest in videotex. (1985, January 21). NBR
Disabled left behind in teletex "mini-boom". (1985, February 11). NBR
Multi-level interaction the key to videotex future. (1985, February 25). NBR
AT & T draws up Viewdata project. (1985, March 11). Dominion
Travel agents take Viewdata. (1985, March 18). Dominion
Videotex may aid agricultural sharing. (1985, March 18). NBR
Super-link to tie up tourists. (1985, March 25). NBR
Videotex to aid of paper slip brigade. (1985, April 08). NBR
Post Office host for local body Viewdata. (1985, April 09). Dominion
Post Office gathers Viewdata strength. (1985, April 15). Dominion
Time right for farmers to move. (1985, April 29). Dominion
Travel agents take TARRIS. (1985, April 29). Dominion
Viewdata grows at spectacular speed. (1985, April 29). Dominion
Portrait of a computer buyer. (1985, May 13). Dominion
Plans afoot to set up library databases. (1985, June 10). Dominion
Farmer videotex project. (1985, June 13). Dominion
New videotex system for farmers demonstrated. (1985, June 26). Southland Times

294
Post office to support third videotex protocol. (1985, July 08). NBR
Videotex magic word in proposed tourism link up. (1985, July 15). NBR
BNZ leads off with Teledata system. (1985, July 15). Dominion
Wheat Videotex. (1985, July 18). Southland Times
Videotex some years away. (1985, August 06). Southland Times
Post office poised to push videotex to business user. (1985, August 12). NBR
ANZ plugs in videotex service. (1985, September 09). Dominion
NZ News to provide electronic information. (1985, October 10). Evening Post
Videotex bid on back of smartcard. (1985, November 04). NBR
Southland
-
Wellington
Racing data system launched. (1985, January 28). Dominion
Deer farmer boosts profits with videotex. (1985, December 02). Dominion
BPI founder sets up videotex shop. (1985, December 09). Dominion
Local body monies move to Videotext. (2007, April 04). Dominion
1995
National
Thousands catch a ride on the Internet waves. (1995, January 24). Dominion, p.1.
Tourists eye access to the Internet. (1995, February 13). Dominion, p.3.
Bell Gully sets up Internet link with home page. (1995, March 20). Dominion, p.2.
A big boost for business. (1995, March 27). Dominion, p.6.
The Internet `free lunch' is over. (1995, April 10). Dominion, p.1.
Funding key issue facing NZ Internet Society meeting. (1995, May 01). Dominion, p.2.
Gallery puts its art out on the Net. (1995, May 08). Dominion, p.1.
Making music on the Net. (1995, June 06). Dominion, p.1.
Think through the issues before you connect your system to Internet. (1995, June 16). NBR, p.24.
More lawyers catch the Net wave. (1995, June 19). Dominion, p.1.
Moving on to Internet. (1995, July 04). Southland Times, p.20.
NZ companies dip a tentative toe into Internet waters…. (1995, July 21). NBR, p.24.
Computers net lawyers. (1995, July 28). NBR, p.66.
Look ahead for a technology-driven redistribution of wealth. (1995, August 04). NBR, p.8.
Big business: is it ready to ride the Net? (1995, August 07). Dominion, p.4.
Treasury `opens its books' through Internet site. (1995, August 09). Dominion, p.23.
Bolger sends InfoTech Net-bound. (1995, August 14). Dominion, p.1.
Boom in computers and Internet kits. (1995, August 17). Dominion, p.14.
Five models to help relocate your business on the World Wide Web. (1995, August 25). NBR, p.38.
Finding NZ business on the web. (1995, August 25). NBR, p.39.
Library offers Internet access. (1995, September 11). Dominion, p.8.
Internet gives new meaning to real estate's walk in, walk out. (1995, September 29). NBR, p.53.
Ruapehu rumbles on to the Net. (1995, October 09). Dominion, p.1.
Sales spice up Internet access market. (1995, October 24). Dominion, p.1.
Concert to go out live across the Internet. (1995, October 26). Dominion, p.12.
Internet Society in trouble over early demand to pay fees. (1995, October 30). Dominion, p.2.
INL newspapers now accessible through home page. (1995, November 06). Dominion, p.1.
Clear systems architect new Internet Society chairman. (1995, November 20). Dominion, p.2.
PR firms enlisting help from Internet. (1995, November 20). Dominion, p.5.
Video evidence given. (1995, November 25). Evening post, p.4.
Clear hooks up with Internet partner. (1995, December 08). NBR, p.70.
National Library opens its virtual doors to world. (1995, December 11). Dominion, p.3.
A year when the Internet came of commercial age. (1995, December 11). Dominion, p.6.
Dobbyn going `live' on the Internet. (1995, December 11). Dominion, p.1.
Kiwi surfer spends most time overseas. (1995, December 18). Dominion, p.2.

295
Survey: average World Wide Web user is a well-off bloke. (1995, December 18). Dominion, p.2.
Southland
-
Wellington
Genealogy buffs switch on to Internet links. (1995, May 11). Evening post, p.30.
2005
National
Grower website set up to find pickers. (2005, January 15). Dominion Post, p. 4.
Arts website. (2005, January 17). Dominion Post, p. 6.
NBR launches weblog. (2005, January 21). NBR, p.8-02.
NZ Net users on the rise. (2005, January 28). Dominion Post, p.2.
NZ goes online. (2005, February 12). Dominion Post, p. 2.
Te Ara world first. (2005, February 14). Dominion Post, p. 7.
Electronic health records off agenda. (2005, March 07). Dominion Post, p. 8.
Let us educate you. (2005, March 07). Dominion Post, p. 8.
Embassies online. (2005, March 14). Dominion Post, p. 9.
Hospice adopts broadband. (2005, March 28). Dominion Post, p.9.
Hotel guests get access to broadband. (2005, May 09). Dominion Post, p.10.
Public cash for NZ Web content on the cards. (2005, June 06). Dominion Post, p.13.
Kea adds PCs to mobile homes away from home. (2005, June 20). Dominion Post, p. 9.
LGOL undergoes significant shakeup. (2005, July 11). Dominion Post, p.10.
Passengers can surf onboard. (2005, July 18). Dominion Post, p.7.
Survey shows Kiwis' DIY attitude. (2005, July 18). Dominion Post, p. 9.
NZ website caters to dinosaur buffs. (2005, July 18). Dominion Post, p. 9.
Fairfax revamps Jobstuff. (2005, July 25). Dominion Post, p. 8.
Rating plan for directors. (2005, August 26). Dominion Post, p. 3.
Consumers turn to laptops as prices fall. (2005, August 29). Dominion Post, p.10.
LJ Hooker says job simulator a `first'. (2005, August 29). Dominion Post, p. 9.
Web diagnosis of gambling problems. (2005, September 05). Dominion Post, p.12.
Archives NZ now offers online index searcher. (2005, September 12). Dominion Post, p. 9.
Moggies online at cattery. (2005, October 03). Dominion Post, p. 8.
WiFi link for commuters. (2005, October 31). Dominion Post, p.5.
Fairfax agrees deal for technology upgrade. (2005, November 03). Dominion Post, p. 3.
Inflight Internet a step closer. (2005, November 28). Dominion Post, p.9.
Website plugs cheaper condoms to lure expats home. (2005, December 05). Dominion Post, p. 3.
Southland
Riverton gets website. (2005, January 06). Southland Times, p.12.
Computers boost library service. (2005, February 05). Southland Times, p. 6.
Council likely to help with website. (2005, February 10). Southland Times, p. 5.
Thousands of Southlanders look for love online. (2005, February 14). Southland Times, p. 9.
Spokeswoman says website ignores Gold Guitar Awards. (2005, May 23). Southland Times, p. 5.
Interest in website gains speed with 400 registering anger at noisy cars. (2005, September 15).
Southland Times, p.19.
Brocks family takes most-connected title. (2005, September 29). Southland Times, p.18.
Wellington
Log on before you travel. (2005, January 31). Dominion Post, p. 7.
Health help online. (2005, February 15). Dominion Post, p. 7.
Cyber-show explores intimacy. (2005, February 18). Dominion Post, p.12.
Anzac Day online. (2005, April 25). Dominion Post, p.11.
Topic maps alter surfing habits. (2005, May 09). Dominion Post, p.12.
Kiwi family has Internet fun. (2005, May 16). Dominion Post, p.9.
Hotel fit-out. (2005, June 13). Dominion Post, p.8.

296
5.3.5 Growth of electronic commerce
1985
National
Banks electronic team reports back. (1985, February 04). Dominion
"Electronic footprints" fear scotched by banks. (1985, February 04). Evening Post
Cautious response to electronic shopping. (1985, February 18). NBR
MDL to export cashless terminal. (1985, March 04). Dominion
Cashless sales hit common protocol hitch. (1985, March 18). Dominion
Electronic voting urged in Parliament. (1985, June 08). Southland Times
Trusteebank tries electronic shopping. (1985, July 15). Evening Post
More shots fly in banking technology battle. (1985, July 29). NBR
Local body work "revolutionised". (1985, August 05). Dominion
Cashless shopping low priority. (1985, September 30). Southland Times
Cashless trading from Monday. (1985, October 05). Southland Times
Little drop-off expected as eftpos ends trial run. (1985, October 21). NBR
On Friday night, go home, put your feet up and go shopping. (1985, October 25). Evening Post
Eftpos collects $2 million. (1985, December 02). Dominion
Electronic message service next month. (1985, December 10). Evening Post
Southland
ATMs Popular in South. (1985, January 05). Southland Times
Video Auction of Goats Planned. (1985, April 26). Southland Times
Point of sale banking. (1985, November 12). Southland Times
Wellington
Holiday rush for pushbutton cash. (1985, January 03). Evening Post
Wellington specialities on the programme. (1985, February 11). Evening Post
Computerised exchange hopes. (1985, February 14). Evening Post
PO tells of high-tech rush. (1985, February 14). Evening Post
Electronic Shopping Not Priority. (1985, July 02). Southland Times
Home banking does away with queues. (1995, October 29). Dominion
1995
National
Fee hike in push to electronic banking. (1995, March 14). Southland Times, p.10.
NZ Post looking at smart card services. (1995, April 18). Dominion, p.1.
Focus on how multimedia can help boost sales. (1995, June 02). NBR, p.2.
Data General tries its hand at electronic commerce. (1995, June 06). Dominion, p.2.
Internet unlikely to dominate marketing. (1995, July 20). Dominion, p.21.
EDI replaced by NZ Electronic Commerce. (1995, July 31). Dominion, p.9.
Watch for home-shopping trend. (1995, August 11). NBR, p.47.
Cheques may bounce but are good business. (1995, August 11). NBR, p.40.
Electronic commerce lacks credibility. (1995, August 21). Dominion, p.9.
E-mail to GSM digital phone system unveiled. (1995, September 25). Dominion, p.7.
Bolger squashes call for smart cards. (1995, October 11). Southland Times, p.4.
Art galleries enter a hi-tech dimension. (1995, November 20). Dominion, p.3.
Electronic transactions company seeks advantages in Australia. (1995, November 24). NBR, p.6.
Groceries on the Internet. (1995, December 01). NBR, p.9.
Local electronic wood products exchange spells huge savings. (1995, December 08). NBR, p.83.
Farmers, Voyager ink access payment deal. (1995, December 18). Dominion, p.5.
Mount Ruapehu home page still running hot. (1995, December 18). Dominion, p.5.

297
Southland
Telephone banking gaining interest. (1995, August 05). Southland Times, p.8.
Cheap cellphones trap for unwary. (1995, August 26). Southland Times, p.12.
Cellphone call saved fisherman. (1995, October 08). Southland Times, p.1.
Beneficiary uses $1 cellphone to ring up $25,000 bill. (1995, October 18). Southland Times, p.1.
Cellular coverage to be increased. (1995, December 05). Southland Times, p.2.
Wellington
Interactive media a hit on campus. (1995, June 19). Dominion, p.3.
Hospital to widen ban on cellphones. (1995, June 20). Dominion, p.3.
Cyberstore now open for business. (1995, August 14). Dominion, p.6.
Cyberspace visitors shopping at Museum of New Zealand. (1995, September 11). Dominion, p.1.
Managing multi-media. (1995, November 23). Dominion, p.24.
Internet saves Gliding Club plenty of flying hours. (1995, December 18). Dominion, p.3.
2005
National
Pak'N Save spends up on IT. (2005, January 17). Dominion Post, p.7.
Datacom wins Government ID project. (2005, January 17). Dominion Post, p.6.
CHH plugs in its sales reps. (2005, January 24). Dominion Post, p.8.
Drivers can trade cars online. (2005, February 21). Dominion Post, p. 9.
Cargo insurance online. (2005, February 28). Dominion Post, p.10.
Car buyers' check. (2005, March 21). Dominion Post, p. 4.
Hands up for free software. (2005, March 28). Dominion Post, p.10.
Trial of GPS monitoring of offenders nears. (2005, April 11). Dominion Post, p.8.
NZ less ready. (2005, April 25). Dominion Post, p.11.
Telco business solutions: NBR Special Review: MOBILE SOLUTIONS: Local success key to Run The
Red. (2005, April 29). NBR, p.26-01.
E-COMMERCE: Scrapping over the bargains. (2005, April 29). NBR, p.29-01.
Cover comes off e-passports. (2005, May 02). Dominion Post, p.9.
Fisheries trials e-forms. (2005, May 02). Dominion Post, p.13.
IRD puts e-supplies on hold. (2005, May 09). Dominion Post, p.9.
Sell online enticement draws in 40 small firms. (2005, May 23). Dominion Post, p.9.
Supermarkets get WiFi. (2005, May 23). Dominion Post, p.8.
Hospital goes hands-free. (2005, May 23). Dominion Post, p.7.
Texting increases number of young wanting to enrol. (2005, May 23). Southland Times, p.12.
Another texting meltdown. (2005, June 06). Dominion Post, p.1.
MED deals out security cards. (2005, June 13). Dominion Post, p.10.
Virtual Natasha plays host. (2005, June 16). Dominion Post, p. 3.
Police look ahead. (2005, June 27). Dominion Post, p. 5.
TradeMe outstrips the competition. (2005, July 01). NBR, p.58-02.
Trampers can book DOC huts online. (2005, July 04). Dominion Post, p. 8.
Trade Me now most popular site. (2005, July 11). Dominion Post, p. 8.
Jasons adds GPS to updated website. (2005, July 11). Dominion Post, p. 9.
Trade Me connects to TelstraClear. (2005, July 25). Dominion Post, p.7.
E-commerce help timely for grower. (2005, August 01). Dominion Post, p. 9.
Cellphones one-click tourist tool. (2005, August 01). Dominion Post, p. 8.
Too much paper in banks. (2005, August 08). Dominion Post, p. 9.
Improved website aims to boost magazine subscriptions. (2005, August 12). NBR, p.34-02.
Golfers can tee up games over Internet. (2005, August 22). Dominion Post, p.10.
CLEARED. (2005, October 03). Dominion Post, p. 5.
Customs eyes self-service. (2005, October 03). Dominion Post, p. 5.
Warehouse studies radio tags. (2005, October 12). Dominion Post, p. 6.
Morning eftpos failure hits 80,000 businesses. (2005, October 14). Dominion Post, p.3.
Telecom shopping secrets revealed. (2005, October 14). NBR, p.01-01.

298
Fee rise for e-passports. (2005, November 01). Dominion Post, p. 3.
Gattung's e-party gets crowded. (2005, November 04). NBR, p.01-01.
Trusted travellers. (2005, November 14). Dominion Post, p. 7.
`Fantastic' opportunity. (2005, November 28). Dominion Post, p. 9.
Wider use of RFID likely in libraries. (2005, December 05). Dominion Post, p. 7.
Southland
Cellphone service likely to boost calls to Healthline. (2005, June 25). Southland Times, p.15.
Wellington
Developments in wireless put on show. (2005, April 28). Dominion Post, p.3.
Virtual receptionist ready to help. (2005, August 08). Dominion Post, p. 6.
IBM network for airport. (2005, August 08). Dominion Post, p.8.
Run The Red outsources its IT. (2005, September 12). Dominion Post, p. 8.
5.3.6 Entrepreneurs in the rural sector
1985
National
Entrepreneur builds deer stud. (1985, February 01). Dominion
Dairy Board advance on herd output information. (1985, February 04). NBR
Potential for NZ to take the lead. (1985, February 08). Dominion
Success of lamb roasts may require second plant sooner. (1985, February 11). NBR
Farmers seeking computer education. (1985, February 25). NBR
Farmers slowly coming to grips with computers. (1985, March 25). Dominion
MAF Fertilizer Scheme Computerized. (1985, April 06). Southland Times
Computers need time says expert. (1985, April 12). Dominion
Learn how to use computers. (1985, April 12). Southland Times
Mohair farms potential noted. (1985, May 13). Dominion
Mohair exports should reach $2 million. (1985, May 31). Dominion
Farmers told to note time cost. (1985, July 22). Dominion
Technology holds key to $1 billion fish trade. (1985, August 17). Southland Times
New Kellogg computer programme. (1985, September 06). Southland Times
Australian interest speeding meat technology. (1985, October 07). NBR
Probe designed to read soil dryness. (1985, October 14). Dominion
Scientists adapt NZ food for Asians. (1985, October 19). Dominion
Meat assessing system tested. (1985, December 02). Dominion
Douglas's $200m "gift" to farmers. (1985, December 14). Dominion
Joint export drive to Southeast Asia brightens sheepmeat future. (1985, December 31). Dominion
Southland
Major Invermay Study of Pere David Deer. (1985, January 18). Southland Times
South May Get Roast Plant. (1985, February 22). Southland Times
NZ Ideal Test Ground. (1985, March 08). Southland Times
Filleted Chicken Breasts Latest New Product. (1985, March 29). Southland Times
Help for Women on Farms. (1985, July 09). Southland Times
Frustration led farmer to design lamb warmer. (1985, August 23). Southland Times
Computer aids stud recording. (1985, November 15). Southland Times
Wellington
Southland Couple in New Farm Concept. (1985, March 01). Southland Times
1995
National
NZ going backwards in research. (1995, February 10). Southland Times, p.10.
Technology essential for sheep farming. (1995, February 17). Southland Times, p.10.
Data to give insight. (1995, May 25). Southland Times, p.13.

299
System provides meaty information. (1995, July 24). Dominion, p.1.
Dairy software tried. (1995, September 07). Southland Times, p.15.
Ostrich returns set to tumble as imports rise. (1995, September 22). NBR, p.65.
Will the ostrich industry fly? (1995, September 29). NBR, p.56.
Ostrich opening on offer. (1995, November 17). NBR, p.80.
Ostriches flavour of investor year. (1995, December 15). NBR, p.33.
Southland
Organics well worth the effort. (1995, January 27). Southland Times, p.8.
Gore launch for new computer soil program. (1995, February 17). Southland Times, p.10.
Deer industry pioneer retires. (1995, March 31). Southland Times, p.12.
Fledgling ostrich, emu firm hatches. (1995, April 22). Southland Times, p.3.
Ostriches due from Canada. (1995, June 15). Southland Times, p.9.
Deer farming increasing. (1995, September 04). Southland Times, p.3.
Correspondence learning has appeal for students. (1995, October 10). Southland Times, p.6.
Wellington
Kapiti gardeners reap a valuable new harvest. (1995, January 28). Evening post, p.22.
U Hutt emu farm planned. (1995, February 25). Evening post, p.23.
2005
National
Rural excellence award lets farmers show skills and win. (2005, January 08). Southland Times, p.16.
Tills ring often for biotech exporters. (2005, January 28). NBR, p.13-02.
Biotech industry grows up. (2005, March 18). NBR, p.19-01.
Dairy database in sight. (2005, March 21). Dominion Post, p.10.
RURAL BUSINESS: Bio-commerce gets another boost. (2005, March 24). NBR, p.12-01.
Low impact technology for farms goes global. (2005, April 08). NBR, p.25-01.
Stock tag scheme to cut cost of outbreak. (2005, May 30). Dominion Post, p. 1.
Sledge measures pasture on move. (2005, June 23). Dominion Post, p.11.
BIOTECHNOLOGY: Biotech babies get wakeup call to plug into capital markets. (2005, June 24).
NBR, p.14-02.
Southland
Deer focus farm concept sparks keen interest. (2005, May 10). Southland Times, p.14.
Organic arnica production being studied in south. (2005, June 21). Southland Times, p.12.
Innovative inventor remembered at Winton. (2005, July 27). Southland Times, p. 7.
RURAL INVESTMENT: Elite deer herd for Southland. (2005, July 29). NBR, p.40-02.
NZ deer rethink urged as industry outgrows markets. (2005, October 11). Southland Times, p.12.
Future profit from deer seminar heading south. (2005, October 18). Southland Times, p.14.
Wellington
100 years of research to be celebrated. (2005, March 22). Southland Times, p.14.
Biosecurity centre to emerge at Wallaceville. (2005, August 30). Dominion Post, p.7.

300
5.4 Interacting
5.4.1 Regional culture
1985
Big increase in violence alarms police. (1985, March 07). Dominion
Survey finds most Kiwis trust police. (1985, April 18). Evening Post
Jobless link in suicide increase. (1985, June 29). Dominion
Major report surveys inequalities. (1985, July 22). Evening Post
Southland
140 attend Gore NSG meeting. (1984, September 04). Southland Times
Blue Light Rage at Manapouri. (1985, January 10). Southland Times
Vandalism Rife in City. (1985, January 15). Southland Times
League Short of Funds. (1985, January 31). Southland Times
Community Arts Council Mooted. (1985, February 18). Southland Times
Police Raid City Gang HQ. (1985, April 15). Southland Times
Central Gore Special Need area for Health. (1985, April 16). Southland Times
Junior Council Idea Wins Support. (1985, April 17). Southland Times
Smalltown NZ shows anti-Big Brother trait. (1985, April 24). Evening Post
Junior Council Going Ahead. (1985, May 01). Southland Times
Hall Survey Lacked Support. (1985, May 01). Southland Times
Leadership Camp. (1985, May 02). Southland Times
Disappointed With Public Response. (1985, May 18). Southland Times
Temperance support strong in South. (1985, May 28). Southland Times
Invercargill life caught. (1985, May 29). Southland Times
Southland Survey of Rural Women. (1985, July 13). Southland Times
Junior Council to Meet. (1985, July 20). Southland Times
Two NSGs to be set up in city. (1985, August 14). Southland Times
Gore support groups likely. (1985, September 03). Southland Times
100 at meeting on support groups. (1985, September 05). Southland Times
Parents' Support Group Formed. (1985, September 16). Southland Times
Centre catering for City's wayward. (1985, September 23). Southland Times
Biggest petition. (1985, September 24). Southland Times
Support urged for rural businesses. (1985, October 11). Southland Times
REAP meeting at Winton. (1985, October 21). Southland Times
Rural people need say in matter. (1985, December 09). Southland Times
Three NSGs at Gore. (1985, December 13). Southland Times
Wellington
Council takes job-front lead. (1985, January 08). Evening Post
Petone considers new officer. (1985, February 06). Evening Post
Gang member shot. (1985, February 20). Evening Post
Mob convoy roadblocked. (1985, February 25). Evening Post
Vandals take to Tokelau centre. (1985, March 11). Evening Post
Student sits on school board. (1985, March 12). Evening Post
Petone, you're a beaut. (1985, March 13). Evening Post
Communities win praise. (1985, March 14). Evening Post
Lower Hutt's Blue Light glows bright. (1985, March 19). Evening Post
Homosexual bill alarms Valley Head. (1985, March 27). Evening Post
Wilde says Church "dishonest". (1985, March 29). Evening Post
"Blue Light" disco date. (1985, April 08). Evening Post
Asthma deaths highest in Hutt. (1985, May 01). Evening Post
City mall terrorised by glue sniffing kids. (1985, May 01). Evening Post
Cuba Mall "is no worse". (1985, May 03). Evening Post
Frontline police chase kids. (1985, May 13). Evening Post
Student rep gets mufti proposal past board. (1985, May 14). Evening Post

301
City must face up to "street kid" cult. (1985, May 16). Evening Post
Turning on a blue light for Wellington youth. (1985, May 17). Evening Post
Armed youths fear attacks. (1985, June 13). Evening Post
Naenae street kids no dangerous "army". (1985, June 14). Evening Post
Lower Hutt Living: growing city captures hearts. (1985, June 27). Evening Post
Police, Gang Battle. (1985, July 05). Evening Post
Porirua community job bid lost. (1985, July 18). Dominion
Lower Hutt support lacking. (1985, August 13). Dominion
Offences in Hutt up by a third. (1985, August 21). Evening Post
Satan's sign in church vandal raids. (1985, August 26). Evening Post
Girls beaten in serious daylight attack. (1985, September 09). Dominion
City knife fight - man dies in gang eruption. (1985, September 14). Evening Post
Capital worst for school vandalism. (1985, October 02). Evening Post
District suffers "alarming" crime leap. (1985, October 09). Evening Post
Council support given to LH youth centre idea. (1985, October 11). Evening Post
Porirua job "too demanding". (1985, October 24). Dominion
Community officer appointed. (1985, October 24). Evening Post
Porirua plans neighbourhood support grid. (1985, November 06). Evening Post
Initiative Centre for taking control. (1985, November 13). Evening Post
SC survey: Well-off kids do better. (1985, December 17). Evening Post
New UH centre provides focus for local youth. (1985, December 27). Evening Post
1995
National
-
Southland
Police called to 18 domestics. (1995, January 07). Southland Times, p.5.
Youth crime escalating. (1995, January 14). Southland Times, p.2.
Public votes for safer community. (1995, January 26). Southland Times, p.3.
Teen programme looks set to close. (1995, March 02). Southland Times, p.1.
City CAB among busiest. (1995, March 02). Southland Times, p.4.
Southern schools against corporal punishment being reintroduced. (1995, March 03). Southland
Times, p.2.
Drop in crime in 1994. (1995, March 09). Southland Times, p.2.
Government agencies investigating city trusts. (1995, March 30). Southland Times, p.1.
Maori trust inquiry widens. (1995, March 31). Southland Times, p.1.
Radio Wimmin on air. (1995, April 06). Southland Times, p.4.
Message for Stones. (1995, April 17). Southland Times, p.3.
Shadbolt: Southlanders aggressive in business. (1995, June 24). Southland Times, p.1.
Its hard to put a finger on that person, the true Southlander. (1995, August 05). Southland Times, p.6.
Community needs to wake up to problem teenagers. (1995, September 02). Southland Times, p.2.
Vandals run amok in city. (1995, September 02). Southland Times, p.3.
Police head sick of unruly youths. (1995, September 12). Southland Times, p.1.
Gore's image takes a battering. (1995, September 14). Southland Times, p.1.
Youth offending rife. (1995, September 22). Southland Times, p.1.
Promotion of south upheld. (1995, December 01). Southland Times, p.12.
Wellington
Support network attracts interest. (1995, January 02). Evening post, p.2.
Overcrowding in Porirua at alarming levels. (1995, January 10). Evening post, p.3.
Gang associates arrested. (1995, January 13). Evening post, p.3.
Capital libraries busy. (1995, January 14). Evening pos t, p.2.
Young Mongrel Mob affiliates worry Porirua police. (1995, January 20). Evening post, p.3.
Petone to stage ethnic festivals. (1995, January 30). Evening post, p.16.
Leisure development urged for Porirua. (1995, February 01). Evening post, p.3.

302
Here comes the annual look-at-me orgy. (1995, February 01). Evening post, p.6.
Residents object to planned hilltop mosque in Newtown. (1995, February 07). Evening post, p.12.
Funds axe hits Newtown group, community spirit. (1995, February 08). Evening post, p.7.
Taggers and vandals force police and council to fight back. (1995, February 10). Evening post, p.3.
$2m centre proposed for Kilbirnie. (1995, February 15). Evening post, p.2.
21pc drop in Hutt burglaries. (1995, March 09). Evening post, p.3.
Wellington region follows national trend. (1995, March 09). Dominion, p.3.
Hutt CHE rated lowest. (1995, March 11). Evening post, p.3.
Council report on community work prompts protest. (1995, March 25). Evening post, p.2.
Gang plan worries Kapiti residents. (1995, April 03). Dominion, p.6.
Neighbourhood system working despite death. (1995, April 04). Dominion, p.5.
Fed-up residents act to silence noisy gang. (1995, April 05). Evening post, p.1.
Crime drops, patrols on hold. (1995, April 11). Evening post, p.3.
Inner-city crime targeted. (1995, April 22). Evening post, p.1.
Booming demand for Porirua centre. (1995, April 25). Evening post, p.4.
Nightly parent patrols eyed for vandal-hit school. (1995, April 26). Evening post, p.3.
First gay flick fest kicks off. (1995, May 11). Evening post, p.20.
Big rise in city burglaries. (1995, May 15). Evening post, p.6.
Newtown centre aims to help at-risk youth. (1995, May 15). Evening post, p.5.
Under-class worries councillors. (1995, May 16). Evening post, p.4.
School vandals strike again despite security guards. (1995, May 24). Evening post, p.15.
Safer community plan given backing. (1995, June 22). Dominion, p.15.
Eventful city image will stand race loss - managers. (1995, July 05). Evening post, p.1.
Stadium plan calls for $18.6m from firms. (1995, July 18). Evening post, p.13.
$800m plan for harbour. (1995, July 19). Evening post, p.1.
$18m plan to boost St James Theatre. (1995, July 25). Evening post, p.1.
$1000 gift to keep gangs out of Kapiti. (1995, July 27). Evening post, p.3.
$250,000 grant for aquatic centre. (1995, July 28). Evening post, p.17.
Pacific street market in Porirua gets thumbs down. (1995, August 05). Evening post, p.3.
Donation eases police effort for at-risk kids. (1995, August 17). Evening post, p.5.
Push for Hutt care centre for teen addicts. (1995, August 24). Evening post, p.3.
Porirua's city centre goes under cover. (1995, August 29). Evening post, p.2.
Armed battles in suburbs after video game dispute escalates. (1995, September 09). Evening post,
p.3.
Region's crime down, violence up in Capital. (1995, September 13). Evening post, p.1.
Wellington offences up but Kapiti, Hutt down. (1995, September 14). Dominion, p.3.
Library use in Capital highest in NZ. (1995, October 03). Evening post, p.11.
Gang tensions erupt at concert. (1995, October 04). Evening post, p.1.
Sticker links Hutt cities. (1995, October 07). Evening post, p.3.
New slogan not up everyone's alley. (1995, October 14). Evening post, p.1.
Centre passes last hurdle. (1995, October 19). Evening post, p.16.
NZ Ballet to stay in the Capital. (1995, October 31). Evening post, p.3.
MP unimpressed by Hutt chamber slogan. (1995, November 06). Evening post, p.13.
2005
National
-
Southland
Interest shown in youth venue project. (2005, February 15). Southland Times, p.10.
New forum for young people. (2005, March 28). Southland Times, p.12.
Mayor Tim's natural dancing talent shines. (2005, May 02). Southland Times, p. 3.
Mayor Tim keeps chances alive. (2005, May 16). Southland Times, p. 3.
Bottom of the world. (2005, May 30). Southland Times, p. 6.
Few civil unions in south. (2005, July 09). Southland Times, p. 7.

303
Don't look back to the future: that's the way for south Community report described as blueprint.
(2005, August 12). Southland Times, p. 5.
Spirits lowered by city crimes. (2005, August 17). Southland Times, p. 3.
Mayor Tim to feature on stamps. (2005, September 28). Southland Times, p. 5.
Wellington
Heroes at the heart of their community. (2005, January 25). Dominion Post, p.4.
Hutt police fear for their safety. (2005, April 07). Dominion Post, p.1.
Porirua marks 40 years as a city. (2005, September 30). Dominion Post, p.6.
Ex-gang member to set up social centre. (2005, October 17). Dominion Post, p.9.
Wellingtonians feel powerless. (2005, October 25). Dominion Post, p.4.
5.4.2 Voluntary, professional, social and women’s groups
1985
National
Report out on women's forums. (1985, January 03). Evening Post
Women's officer job gets NZEI's "No". (1985, May 14). Evening Post
Hercus urges NZEI officer for women. (1985, May 15). Evening Post
Technology week relies on volunteers. (1985, August 19). Dominion
Society plans birthday conference. (1985, August 26). Dominion
NCW should be positive force. (1985, October 01). Southland Times
Old girls network set up. (1985, October 21). NBR
Southland
Overcoming Rural Isolation. (1985, February 27). Southland Times
Rural Leadership Course Valuable. (1985, March 02). Southland Times
Focus on Local People for Photo Record. (1985, March 05). Southland Times
Invercargill Youth Centre Closes. (1985, March 21). Southland Times
WDFF President On Visit to southland. (1985, March 26). Southland Times
June Seminar for Rural Women. (1985, May 02). Southland Times
Course Well Attended. (1985, May 16). Southland Times
Church Groups active in Southland. (1985, May 29). Southland Times
Southland Leader in Foster Care. (1985, June 01). Southland Times
Rural women attend seminar. (1985, June 08). Southland Times
Amazed no- one has enrolled. (1985, July 11). Southland Times
More Scouts in Southland. (1985, July 19). Southland Times
Survey "worth while". (1985, October 11). Southland Times
Volunteers needed by Red Cross. (1985, October 16). Southland Times
Perception of rural women refuted. (1985, October 26). Southland Times
Reality of faring shown in women's survey. (1985, October 30). Southland Times
Red Cross growing. (1985, November 07). Southland Times
Old girl network helps Cook Island Students. (1985, December 03). Southland Times
Community input good for health care. (1985, December 05). Southland Times
Wellington
Four awards to Wellington. (1985, March 25). Dominion
Women urged to find new jobs. (1985, April 02). Evening Post
Dowse display celebrates 100 years of womanhood. (1985, May 15). Evening Post
Women wanted. (1985, May 23). Evening Post
Calling women. (1985, June 06). Evening Post
Y''s power classes put women in control. (1985, October 14). Evening Post
Action campaign for women works well. (1985, October 18). Evening Post
Sexist seminar raises hackles. (1985, December 12). Evening Post

304
1995
National
-
Southland
Volunteer work gaining steam. (1995, January 21). Southland Times, p.11.
Wise women gather at the city library. (1995, June 22). Southland Times, p.10.
Good response in city. (1995, July 26). Southland Times, p.2.
City volunteer centre closing. (1995, August 26). Southland Times, p.8.
Wellington
Group committed to town's development. (1995, February 10). Evening post, p.18.
Grey Power opens Wellington office. (1995, February 13). Evening post, p.3.
Jobless use skills to spruce up school hall. (1995, March 07). Evening post, p.2.
Residents' association seeks council funding. (1995, March 17). Evening post, p.2.
Funding call for bureaus. (1995, March 23). Evening post, p.15.
Women's business seminars. (1995, April 12). Evening post, p.5.
Volunteers find work leads to jobs - survey. (1995, April 22). Evening post, p.14.
Shelter celebrates 25th anniversary. (1995, May 18). Evening post, p.3.
Women's centre. (1995, July 27). Evening post, p.3.
Women hooked on networking. (1995, August 08). Evening post, p.13.
Mixed blessings for women's centre. (1995, September 01). Evening post, p.2.
Businesswomen meet. (1995, September 22). Evening post, p.9.
Business women walk different paths. (1995, October 02). Evening post, p.9.
2005
National
Women get together. (2005, February 14). Dominion Post, p. 7.
Skills Exchange for subscribers. (2005, September 26). Dominion Post, p.11.
Southland
Meetings for women in dairying. (2005, March 08). Southland Times, p.13.
Breakfast raises $600. (2005, March 09). Southland Times, p. 5.
Dual conference for dairy women. (2005, May 03). Southland Times, p.14.
Cromwell van to assist community. (2005, May 07). Southland Times, p. 3.
Support for rural women. (2005, May 12). Southland Times, p.14.
Western Southland to host seminar for Rural Women in Business. (2005, May 31). Southland Times,
p.15.
Rural Women's Week `hugely successful'. (2005, June 03). Southland Times, p.16.
Issues remain same after 80 years of Rural Women. (2005, June 28). Southland Times, p.14.
Second seminar for rural women. (2005, July 26). Southland Times, p.15.
Past and present members of Cromwell Rural Women to celebrate 75 years. (2005, August 13).
Southland Times, p. 9.
Volunteers important. (2005, September 15). Southland Times, p.24.
Why farming women's work is never done. (2005, October 18). Southland Times, p.13.
Forum to give women on-farm knowledge. (2005, November 22). Southland Times, p.14.
Church leader working with communities. (2005, November 22). Southland Times, p.19.
Three cheers for volunteers: funding agency. (2005, December 10). Southland Times, p. 6.
Wellington
School holiday help for troubled teens. (2005, January 14). Dominion Post, p.6.
Volunteering proves a step up on work ladder. (2005, January 20). Dominion Post, p.6.
Women look back, move forward. (2005, June 06). Dominion Post, p.3.

305
5.4.3 Mãori, Pacific Island and Asian Issues
1985
Hui for Technical Institute Teachers. (1983, March 01). Southland Times
Maori & Polynesian needs not met. (1985, January 17). Dominion
Maori language classes flourish. (1985, January 19). Evening Post
Maoris' look at education post choice. (1985, March 08). Dominion
Maori language research proposal. (1985, March 12). Dominion
UK man quits in education job row. (1985, April 15). Evening Post
Maori teacher need urgent. (1985, May 13). Evening Post
Secretariat offers means for change - Shields. (1985, May 15). Evening Post
Learning needs must be matched. (1985, May 23). Evening Post
NZ leads Australia in Multi-cultural TV. (1985, June 04). Southland Times
67 new jobs teaching Maori. (1985, June 14). Evening Post
Extra 35 teachers of Maori. (1985, June 15). Dominion
Maori, Island job plans get $1.25m. (1985, June 19). Evening Post
Call for more Maori in state service. (1985, June 28). Evening Post
Maoris "cheated" by radio, television. (1985, June 28). Evening Post
A chance to save a language. (1985, July 19). Dominion
Maori Approach to Tourism Sought. (1985, July 23). Southland Times
Egmont dubbed "Taranaki". (1985, August 07). Evening Post
First private Maori primary school opens. (1985, September 14). Dominion
Maori School Opened. (1985, September 16). Southland Times
Out of the song groups, into the suites of power. (1985, October 07). NBR
Maori tongue revival new conciliator's aim. (1985, December 23). Evening Post
Southland
New Marae Opened at Bluff. (1985, February 11). Southland Times
Gov't Grant for City Couple. (1985, April 11). Southland Times
Te Awhina Family Trust: Love for Children Expanded. (1985, May 02). Southland Times
Support Needed for Young Maoris. (1985, May 11). Southland Times
Maori issues need consideration. (1985, June 29). Southland Times
Maori Course at Lumsden. (1985, July 26). Southland Times
Maori Advisor Appointed. (1985, December 07). Southland Times
Wellington
Powhiri for new library. (1984, April 23). Evening Post
Nod for Pacific arts centre. (1985, February 21). Evening Post
University entry views concern. (1985, March 26). Evening Post
Open door to university. (1985, March 28). Evening Post
Community college word awaited. (1985, April 11). Dominion
Hui to honour 28 Maori graduates. (1985, April 24). Evening Post
Porirua's Samoans excited by council consent for church. (1985, May 09). Evening Post
Youth scheme "not working". (1985, May 09). Evening Post
City Marae ceremony to match Te Maori. (1985, May 20). Evening Post
Porirua gets own community college. (1985, May 31). Dominion
Class teaches itself. (1985, June 01). Dominion
Tension in Valley, says school head. (1985, June 15). Evening Post
Porirua pushes for broad council voice. (1985, July 02). Dominion
"Forcefed" Maori worries councillor. (1985, July 06). Evening Post
Seven-language library. (1985, July 20). Dominion
Maori on air for the week. (1985, July 22). Evening Post
Maori student body wanted. (1985, July 24). Dominion
Entertainment Polynesia Style. (1985, July 24). Dominion
Islanders are losing identity - school head. (1985, July 24). Evening Post
Marae hopes at Victoria. (1985, July 24). Evening Post
Up and running - Porirua's Pacifica women applauded. (1985, August 13). Evening Post

306
College teaches Samoan. (1985, August 22). Evening Post
Marae inside Porirua school. (1985, September 28). Evening Post
1995
National
Maori issues available on the Internet. (1995, April 24). Dominion, p.3.
Samoans outnumber other islanders living in NZ. (1995, July 19). Southland Times
More Pacific Islanders beat the dole stats to turn entrepreneur. (1995, August 18). NBR, p.36.
Hi-tech in Maori on the Net. (1995, October 24). Dominion, p.6.
Kiwis more racist. (1995, October 27). NBR, p.1.
Xenophobia alive and well in New Zealand. (1995, October 27). NBR, p.12.
Most New Zealanders say we're not part of Asia. (1995, November 03). NBR, p.10.
Southland
Business course aimed at Pacific Islanders. (1995, January 21). Southland Times, p.11.
Maori take protest to Mayor. (1995, February 07). Southland Times, p.3.
Southland schools battling to keep Maori classes. (1995, February 16). Southland Times, p.18.
Survey information to help Pacific Islanders. (1995, April 08). Southland Times, p.17.
School racist say Maori. (1995, May 24). Southland Times, p.1.
Schools have racism problem. (1995, May 25). Southland Times, p.3.
Racism not an issue, schools say. (1995, May 27). Southland Times, p.9.
College review praises Maori programme. (1995, May 30). Southland Times, p.3.
Maori teacher quits. (1995, June 16). Southland Times, p.3.
Maori programmes threatened. (1995, June 24). Southland Times, p.11.
Maori language staff shortages likely to ease. (1995, July 07). Southland Times, p.8.
Waitutu deal gets nod. (1995, October 25). Southland Times, p.1.
Wellington
Pacific art and culture flourish in Porirua. (1995, March 07). Evening post, p.18.
Group to assist Maori students. (1995, April 10). Evening post, p.1.
Maori language year. (1995, April 15). Evening post, p.4.
Ethnic groups cry foul over education centre. (1995, April 25). Evening post, p.10.
Pacific Islanders reject Tamil claim. (1995, May 12). Evening post, p.20.
WCC to target spending on jobs. (1995, June 16). Evening post, p.19.
Pacific cultures concert. (1995, June 17). Evening post, p.56.
Capital to host languages forum. (1995, July 05). Dominion, p.17.
Claims of white flight among Hutt Valley schools. (1995, August 28). Evening post, p.3.
Islanders in race for ethnic vote. (1995, September 02). Evening post, p.12.
Pacific Island festival to be held. (1995, October 05). Dominion, p.18.
Maori language school to open in Lower Hutt. (1995, November 22). Evening post, p.10.
Maori mayoral forum proposed. (1995, December 08). Dominion, p.12.
Family of achievers celebrates success at university Marae. (1995, December 13). Evening post, p.3.
Number of fluent Maori speakers plummets. (1995, December 13). Evening post, p.10.
2005
National
Maori database goes online. (2005, September 26). Dominion Post, p. 9.
Pacific people urged to do it for themselves. (2005, December 02). NBR, p.47-01.
Southland
Immigrants need to be welcomed. (2005, June 02). Southland Times, p. 8.
SIT chief warns on fund plan. (2005, July 18). Southland Times, p. 9.
Whare programmes helping to keep community focus on Bluff. (2005, September 15). Southland
Times, p.24.
SIT story woven into korowai. (2005, December 01). Southland Times, p.10.

307
Maori name gifted to SDC Council role as people's protector reflected. (2005, December 01).
Southland Times, p.10.
Wellington
Mayor wants Maori ward and name for Lower Hutt. (2005, January 19). Dominion Post, p.8.
Sender of Muslim hate mail convicted. (2005, July 21). Dominion Post, p.5.
Cultural ties. (2005, November 12). Dominion Post, p.5.
Call to ignore racist posters. (2005, December 16). Dominion Post, p.2.

308
5.5 Infrastructure
5.5.1 Telecommunications
1985
National
US Now Linked to South Pole by Satellite. (1985, January 04). Southland Times
South Pole gets first satellite link. (1985, January 04). Dominion
TVNZ gains satellite access. (1985, January 09). Dominion
Satellite tracking costs rise. (1985, January 16). Dominion
Private radio inquiry begins. (1985, January 24). Dominion
Satellite TV near. (1985, January 28). NBR
Academic to Head Commission. (1985, February 01). Southland Times
Ericsson looks next to mobile RT, phone exchanges. (1985, February 04). NBR
Scott base satellite idea explored. (1985, March 04). Dominion
Post Office chases fund transfer network. (1985, March 25). Dominion
New Data Link in Antarctic. (1985, April 10). Southland Times
Backlash in rural areas predicted. (1985, April 16). Dominion
Telephone Rental Up for Farmers. (1985, April 16). Southland Times
Satellite changes improve services. (1985, April 22). Dominion
Phone Service Computer. (1985, May 14). Southland Times
Satellite glamour versus down-to-earth optics. (1985, June 17). NBR
Major New Data Network soon. (1985, June 19). Southland Times
Post Office starts new data network. (1985, June 24). Dominion
Farmers want uniform phone bill. (1985, June 27). Dominion
Aussat takes time to court our "TV3" hopefuls. (1985, July 01). NBR
Fat profit for PO. (1985, July 29). Evening Post
Mobile telephone service on the way. (1985, September 04). Dominion
Mobile Telephone system coming. (1985, September 04). Southland Times
Society challenges Post Office monopoly. (1985, September 09). Dominion
Govt takes $185m of record PO profit. (1985, September 11). Dominion
Post Office Profit almost $209m. (1985, September 11). Southland Times
Post Office responds to "monopoly" criticism. (1985, September 16). Dominion
Information flow advantage of group. (1985, September 16). NBR
Post office asked to hold down packet charge. (1985, September 16). NBR
Post Office set for review. (1985, September 21). Dominion
Privatisation rumour denied. (1985, September 23). Dominion
No focus yet for unhappy telecommunications users. (1985, September 23). NBR
NZPO may take back seat in mobile telephone project. (1985, September 30). NBR
Guild attacks TV "monopoly". (1985, October 05). Dominion
Satellite use possible. (1985, October 12). Southland Times
Post Office negotiates for satellite use. (1985, October 12). Dominion
No special deals for radio telephone network. (1985, October 14). NBR
Satellite television watchers face a bleak screen. (1985, November 18). NBR
Southland
Promoting Invercargill by Means of Radio. (1985, January 05). Southland Times
Direct Dialling Before End of Year. (1985, January 24). Southland Times
Queenstown needs new exchange. (1985, April 04). Southland Times
Extra Switchboards for Exchange. (1985, April 17). Southland Times
Mrs Pearce with her old switchboard. (1985, May 18). Southland Times
More Air Time for Southland. (1985, June 19). Southland Times
New Phone Exchange. (1985, July 06). Southland Times
Technicians Working Around Clock: STD target end of year. (1985, July 10). Southland Times
Concern about telephones at Glenorchy. (1985, July 11). Southland Times
Lumsden goes automatic. (1985, September 21). Southland Times

309
Wellington
Optical fibre cable work progresses. (1985, May 13). Dominion
Peacesat users prepare for link change. (1985, July 26). Dominion
Region to get $46m PO outlay. (1985, September 25). Evening Post
Satellite dish set in place. (1985, December 18). Evening Post
1995
National
NZ police boss eyes satellites. (1985, October 07). Evening Post
Telecom makes $158m. (1995, February 16). Southland Times, p.11.
Telecom concerns to be aired at the top. (1995, March 24). NBR, p.1.
Telecom problems mere aberrations, Tuanz told. (1995, March 31). NBR, p.7.
i-Max _ latest Internet provider on the block. (1995, April 10). Dominion, p.8.
Smaller centres to get Internet access. (1995, April 10). Dominion, p.8.
Clear 'obsessed' says a relenting Telecom. (1995, April 21). NBR, p.3.
Netway to upgrade Tuianet. (1995, April 24). Dominion, p.2.
NZ's main Internet link capacity to be doubled. (1995, May 15). Dominion, p.2.
Waikato aims for nationwide ATM network. (1995, May 29). Dominion, p.1.
Telecom buy-in offers Sky new cable opportunities. (1995, July 07). NBR, p.3.
Wired-up, dial-up world foreseen by Telecom's strategy manager. (1995, July 14). NBR, p.49.
Cash-rich Telecom should forget capital repayment and get going. (1995, July 28). NBR, p.67.
Kiwi Cable opposes Sky buy. (1995, August 04). NBR, p.3.
Competition for Telecom, Clear. (1995, August 04). NBR, p.7.
Strong first quarter for Telecom. (1995, August 04). NBR, p.65.
Telecom's Sky buy a difficult decision. (1995, August 18). NBR, p.5.
Frequencies to be freed. (1995, September 08). NBR, p.2.
Telecom and Clear still have to get down to brass tacks on price. (1995, September 15). NBR, p.16.
Iprolink looks at alternative connection to Internet. (1995, September 25). Dominion, p.1.
Telecom deal misses deadline. (1995, September 29). NBR, p.6.
Telecom reveals plans for business customers. (1995, October 02). Dominion, p.1.
Telecom keeping eye on growth of Internet traffic over phone network. (1995, October 02).
Dominion, p.2.
Broadband network geared to go in 1996. (1995, October 09). Dominion, p.1.
Telecom Internet service on the way. (1995, October 16). Dominion, p.2.
Waikato installing second Internet circuit. (1995, October 16). Dominion, p.2.
$50m spent on Clear-Telecom dispute. (1995, October 20). NBR, p.21.
Telecom profits report 'flawed'. (1995, October 20). NBR, p.25.
Telcos face up to Internet threat. (1995, October 24). Dominion, p.8.
On the path of revolutionary change. (1995, October 27). NBR, p.31.
Up to businesses to understand and take advantage of telecommunications. (1995, October 27). NBR,
p.31.
Government is trapped in telecommunications row. (1995, October 27). NBR, p.33.
BellSouth, Telecom up the ante in sophisticated cellphone war. (1995, October 27). NBR, p.34.
Innovative Telecom rides crest of new communications wave. (1995, October 27). NBR, p.40.
Telco's online strategy has industry worried. (1995, November 06). Dominion, p.1.
Telecom accused of "breath taking greed". (1995, November 20). Southland Times, p.2.
Australian grabs hold of Internet niche. (1995, November 24). Dominion, p.14.
Clear goes to court on Telecom TV deal. (1995, December 15). NBR, p.9.
Radio NZ for sale. (1995, December 15). NBR, p.22.
$10m upgrade for digital network. (1995, December 18). Dominion, p.1.
Southland
Radio operators buy southern frequencies. (1995, April 08). Southland Times, p.15.
City company hoping to set up TV station. (1995, April 19). Southland Times, p.9.
Maori radio station gear repossessed. (1995, May 12). Southland Times, p.1.

310
Hope for early return of city Maori radio. (1995, May 13). Southland Times, p.1.
Telephone upgrade ends party lines. (1995, June 10). Southland Times, p.11.
Telecom working on cellphone congestion. (1995, September 21). Southland Times, p.3.
Wellington
Capital's regional TV channel sorts out programming. (1995, January 26). Evening post, p.5.
Viewing mix on regional TV. (1995, January 26). Evening post, p.2.
Warming up to take interactive television - and advertising. (1995, February 24). NBR, p.56.
Telecom systems not up to scratch, claims rival. (1995, March 14). Evening post, p.3.
Videos spies to monitor city centre. (1995, March 28). Evening post, p.1.
School veto kills mast. (1995, April 28). Dominion, p.6.
Wellington considers CityNet closure. (1995, May 01). Dominion, p.2.
Cloud hangs over World Communications Laboratory. (1995, May 01). Dominion, p.6.
Fibre grand plan for Wellington. (1995, May 22). Dominion, p.1.
Wellington moves on high-speed network. (1995, June 12). Dominion, p.1.
INL gets CityLink fibre ball rolling. (1995, July 31). Dominion, p.1.
Firms plan to wire Wellington. (1995, August 28). Dominion, p.1.
City Link decision day for WCC. (1995, September 18). Dominion, p.1.
Kiwi Cable plans expansion. (1995, September 25). Dominion, p.1.
Council delays fibre optic network decision. (1995, September 25). Evening post, p.14.
WCC defers decision on Wellington network. (1995, September 25). Dominion, p.1.
Plans for Hutt network go ahead. (1995, September 27). Evening post, p.19.
Site of cellphone transmitter upsets Ngaio residents. (1995, October 05). Evening post, p.15.
Fibre-optic initiative secures council nod. (1995, October 16). Dominion, p.1.
Wellington forges ahead with ground-breaking cables. (1995, October 27). NBR, p.39.
Ngaio cellphone site. (1995, November 09). Dominion, p.9.
Telecom's cable TV targets Porirua first. (1995, November 28). Evening post, p.4.
2005
National
Wired Country caps access. (2005, January 17). Dominion Post, p.9.
Woosh loses $18.9m. (2005, January 24). Dominion Post, p.6.
Broadband price tumbles in new Woosh campaign. (2005, February 02). Southland Times, p. 3.
Telecom result announced today. (2005, February 04). NBR, p.02-04.
Woosh said to get 40% of new broadbanders. (2005, February 04). NBR, p.38-03.
Telecom on target for broadband. (2005, February 04). NBR, p.08-02.
Gattung lauds strong growth in broadband. (2005, February 05). Dominion Post, p.3.
Customer tuned out of broadband. (2005, February 07). Dominion Post, p.7.
Farmers find Net too slow. (2005, February 21). Dominion Post, p.10.
Depeering move `Balkanisation' of the Net. (2005, February 28). Dominion Post, p.10.
NZ jumps two spots in world ICT rankings. (2005, March 28). Dominion Post, p.10.
TELECOMMUNICATIONS: Broadband option 'still on'. (2005, April 01). NBR, p.19-02.
TELECOMMUNICATIONS: Opinions split on OECD phone ranking. (2005, April 08). NBR, p.04-
01.
Woosh buys 180 wireless base stations. (2005, April 18). Dominion Post, p.10.
LOCAL GOVERNMENT SPENDING: Council fails to beat Telecom at own game. (2005, April 29).
NBR, p.03-01.
Woosh makes plans for two more cities. (2005, May 09). Dominion Post, p.11.
Cunliffe gives cash for Mush. (2005, May 16). Dominion Post, p.9.
TELECOMMUNICATIONS & TECHNOLOGY: Government commits more to getting broadband
moving. (2005, May 20). NBR, p.03-03.
Mush money may not go far. (2005, May 23). Dominion Post, p.8.
NZ Post IP network to save $2m. (2005, May 23). Dominion Post, p.9.
Mush money may not go far. (2005, May 23). Dominion Post, p.8.
TELECOMMUNICATIONS: Vodafone rides rollercoaster: profit up, share down. (2005, May 27).

311
NBR, p.03-02.
Vodafone's 3G network extends to smaller regional centres. (2005, May 30). Dominion Post, p.8.
TELECOMMUNICATIONS: Woosh supplier change. (2005, June 03). NBR, p.06-02.
TELECOMMUNICATIONS: Telecom ups the ante for broadband mobile. (2005, June 10). NBR,
p.04-02.
TELECOMMUNICATIONS: All eyes on Telstra developments. (2005, June 10). NBR, p.04-01.
Telecom fault delays trading for two hours. (2005, June 14). Dominion Post, p.1.
Digital strategy advisers named. (2005, June 27). Dominion Post, p. 5.
TELECOMMUNICATIONS: Industry slammed in coming-out speech. (2005, July 01). NBR, p.10-
01.
TELECOMMUNICATIONS: Telecom threatened with operations split. (2005, July 01). NBR, p.03-
01.
Satellite launch to boost rural broadband. (2005, July 11). Dominion Post, p.7.
TELECOMMUNICATIONS: Woosh shareholder numbers grow in rejig ahead of IPO. (2005, July
15). NBR, p.08-01.
TELECOMMUNICATIONS: CallPlus tipped to buy Wired Country. (2005, August 26). NBR, p.01-
02.
Telecom sets out $1.4b phone revamp plan. (2005, August 31). Dominion Post, p.3.
Woosh calling. (2005, September 16). NBR, p.10-02.
Remote areas to get broadband via satellite. (2005, September 26). Dominion Post, p.3.
NZ getting there with broadband. (2005, September 26). Dominion Post, p.12.
Finally, big chunks of bandwidth for business. (2005, October 07). NBR, p.12-01.
Criteria for $40m ICT funds agreed. (2005, October 10). Dominion Post, p.7.
New director named for Woosh. (2005, October 12). Southland Times, p.19.
Woosh doubles net download speed. (2005, October 21). Southland Times, p. 4.
Woosh not keen to talk on fate of float. (2005, October 21). Dominion Post, p.1.
Kiwis stick with dial-up. (2005, October 24). Dominion Post, p. 1.
Carers NZ seeks uses for broadband. (2005, October 31). Dominion Post, p.8.
Woosh might fetch '$20m'. (2005, October 31). Dominion Post, p.6.
Anonymous ads urge switch to broadband. (2005, November 02). Dominion Post, p.3.
Satellite broadband coming soon. (2005, November 04). NBR, p.50-02.
Mush meeting for capital. (2005, November 14). Dominion Post, p.6.
Geek speak in speech from throne. (2005, November 14). Dominion Post, p.8.
Cunliffe urges broadband use. (2005, November 24). Dominion Post, p.1.
End tipped for some ISPs. (2005, November 28). Dominion Post, p.10.
Rivals call for bite of Telecom pie. (2005, December 14). Dominion Post, p.3.
Ihug pushes for cheaper broadband. (2005, December 17). Dominion Post, p.2.
Telecom holding our future to ransom. (2005, December 17). Dominion Post, p.2.
Woosh phones a viable alternative. (2005, December 19). Dominion Post, p.6.
Broadband and Telecom. (2005, December 21). Dominion Post, p.1.
Rural `risk' from Net ruling. (2005, December 29). Dominion Post, p.4.
Southland
Response to plan pleases TelstraClear. (2005, February 05). Southland Times, p. 9.
Woosh fails to convince tramping club: president. (2005, February 09). Southland Times, p. 2.
Woosh tower consent bid free of opposition. (2005, February 12). Southland Times, p. 7.
Thousands hit by Telecom cut. (2005, February 17). Southland Times, p. 1.
Objections to towers cause delay. (2005, March 10). Southland Times, p. 6.
Woosh buys more time in Southland. (2005, March 28). Dominion Post, p.9.
Woosh and out. (2005, March 29). Southland Times, p. 8.
Word from Whoosh. (2005, April 11). Southland Times, p. 8.
Objectors force Woosh rethink. (2005, April 22). Southland Times, p.11.
Woosh comes to Otatara. (2005, May 04). Southland Times, p.14.
Waikaia residents may have broadband soon. (2005, June 17). Southland Times, p.16.
Woosh continues rollout with four new sites. (2005, June 17). Southland Times, p.16.
Internet service may cost extra. (2005, July 20). Southland Times, p. 8.
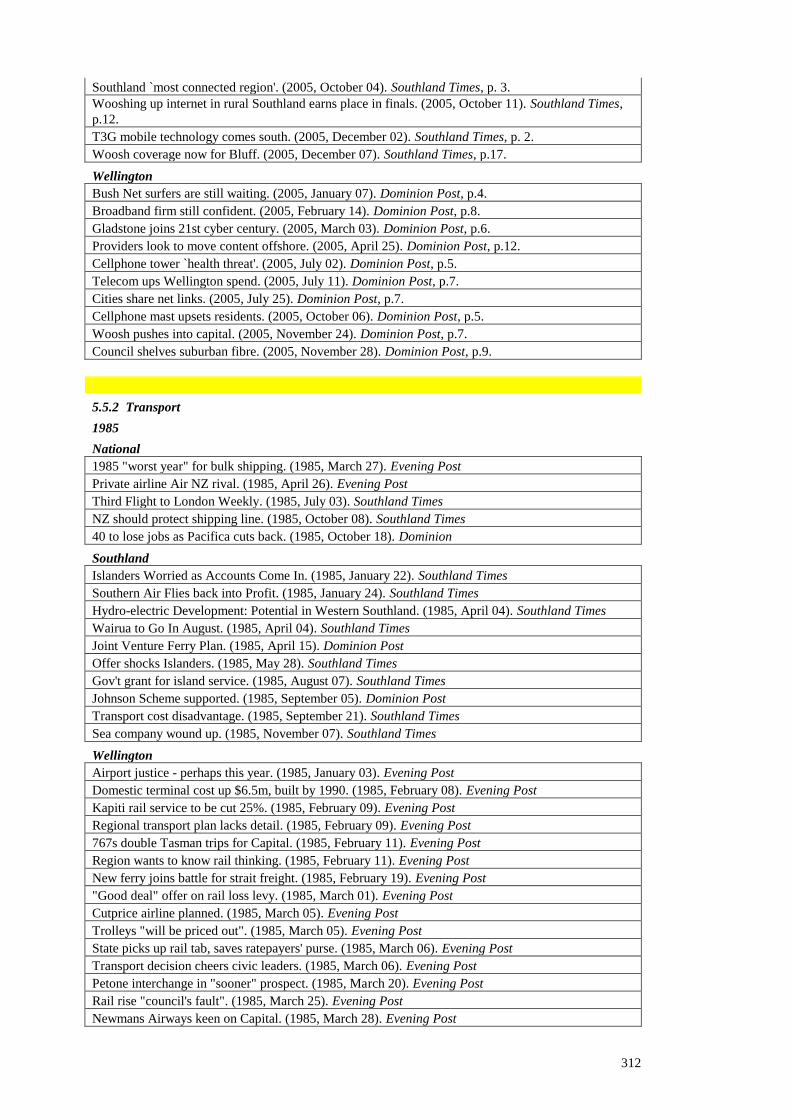
312
Southland `most connected region'. (2005, October 04). Southland Times, p. 3.
Wooshing up internet in rural Southland earns place in finals. (2005, October 11). Southland Times,
p.12.
T3G mobile technology comes south. (2005, December 02). Southland Times, p. 2.
Woosh coverage now for Bluff. (2005, December 07). Southland Times, p.17.
Wellington
Bush Net surfers are still waiting. (2005, January 07). Dominion Post, p.4.
Broadband firm still confident. (2005, February 14). Dominion Post, p.8.
Gladstone joins 21st cyber century. (2005, March 03). Dominion Post, p.6.
Providers look to move content offshore. (2005, April 25). Dominion Post, p.12.
Cellphone tower `health threat'. (2005, July 02). Dominion Post, p.5.
Telecom ups Wellington spend. (2005, July 11). Dominion Post, p.7.
Cities share net links. (2005, July 25). Dominion Post, p.7.
Cellphone mast upsets residents. (2005, October 06). Dominion Post, p.5.
Woosh pushes into capital. (2005, November 24). Dominion Post, p.7.
Council shelves suburban fibre. (2005, November 28). Dominion Post, p.9.
5.5.2 Transport
1985
National
1985 "worst year" for bulk shipping. (1985, March 27). Evening Post
Private airline Air NZ rival. (1985, April 26). Evening Post
Third Flight to London Weekly. (1985, July 03). Southland Times
NZ should protect shipping line. (1985, October 08). Southland Times
40 to lose jobs as Pacifica cuts back. (1985, October 18). Dominion
Southland
Islanders Worried as Accounts Come In. (1985, January 22). Southland Times
Southern Air Flies back into Profit. (1985, January 24). Southland Times
Hydro-electric Development: Potential in Western Southland. (1985, April 04). Southland Times
Wairua to Go In August. (1985, April 04). Southland Times
Joint Venture Ferry Plan. (1985, April 15). Dominion Post
Offer shocks Islanders. (1985, May 28). Southland Times
Gov't grant for island service. (1985, August 07). Southland Times
Johnson Scheme supported. (1985, September 05). Dominion Post
Transport cost disadvantage. (1985, September 21). Southland Times
Sea company wound up. (1985, November 07). Southland Times
Wellington
Airport justice - perhaps this year. (1985, January 03). Evening Post
Domestic terminal cost up $6.5m, built by 1990. (1985, February 08). Evening Post
Kapiti rail service to be cut 25%. (1985, February 09). Evening Post
Regional transport plan lacks detail. (1985, February 09). Evening Post
767s double Tasman trips for Capital. (1985, February 11). Evening Post
Region wants to know rail thinking. (1985, February 11). Evening Post
New ferry joins battle for strait freight. (1985, February 19). Evening Post
"Good deal" offer on rail loss levy. (1985, March 01). Evening Post
Cutprice airline planned. (1985, March 05). Evening Post
Trolleys "will be priced out". (1985, March 05). Evening Post
State picks up rail tab, saves ratepayers' purse. (1985, March 06). Evening Post
Transport decision cheers civic leaders. (1985, March 06). Evening Post
Petone interchange in "sooner" prospect. (1985, March 20). Evening Post
Rail rise "council's fault". (1985, March 25). Evening Post
Newmans Airways keen on Capital. (1985, March 28). Evening Post

313
Master transport plan gathers more impetus. (1985, June 11). Evening Post
Region may help city run airport. (1985, July 08). Evening Post
Airport review starts. (1985, July 11). Evening Post
Push for Coast highway. (1985, July 17). Evening Post
Green light for ferry terminal; fares jump. (1985, July 22). Evening Post
Hutt County may disband. (1985, July 23). Evening Post
Treasury "blocking" Capital's terminal. (1985, September 03). Evening Post
Upgrade air terminal, MPs say. (1985, September 06). Evening Post
Green light for terminal. (1985, October 10). Evening Post
Regional council to seek urgent talks on airport venture. (1985, November 12). Evening Post
$19.5m gas pipeline for Hutt Valley opening on Monday. (1985, December 05). Evening Post
UH City's high pace breathes optimism. (1985, December 09). Evening Post
1995
National
Air China studying move into NZ. (1995, April 28). NBR, p.41.
Ports prosper on the back of improving economy. (1995, September 08). NBR, p.61.
Air New Zealand world's third-best performing carrier. (1995, September 15). NBR, p.34.
Air New Zealand taps key markets. (1995, October 27). NBR, p.26.
Southland
Asians could be deciding factor. (1995, January 09). Southland Times, p.2.
Airport proponents seek plan provision. (1995, February 01). Southland Times, p.5.
Invercargill could have direct air service to Queenstown. (1995, March 04). Southland Times, p.9.
SEPS gifted to province. (1995, March 29). Southland Times, p.1.
City plans to sell Invergas. (1995, April 06). Southland Times, p.1.
Otago plans to counter Bluff move. (1995, April 12). Southland Times, p.5.
Power Trust wanted. (1995, May 23). Southland Times, p.1.
Power idea endorsed by councils. (1995, May 24). Southland Times, p.1.
Council sells Invergas. (1995, June 14). Southland Times, p.1.
SEPS ownership returning south. (1995, June 30). Southland Times, p.1.
5000 call for ownership referendum. (1995, July 17). Southland Times, p.1.
Ansett cutting Whisper Jet. (1995, August 25). Southland Times, p.1.
South Port wins trade wars. (1995, August 31). Southland Times, p.3.
Air NZ cuts 737 flights. (1995, September 20). Southland Times, p.1.
Extra flights a bonus of Air NZ decision. (1995, September 21). Southland Times, p.1.
Lobster exports hit. (1995, September 22). Southland Times, p.2.
Airport in need of $2m cash. (1995, October 12). Southland Times, p.1.
City airport company looks at options to raise cash. (1995, October 31). Southland Times, p.1.
Gas company sale delayed. (1995, December 05). Southland Times, p.1.
City airport fees up as income falls. (1995, December 21). Southland Times, p.1.
Wellington
Light rail may link to airport. (1995, January 30). Evening post, p.2.
SH2 realignment vital to boost Hutt, says mayor. (1995, February 08). Evening post, p.7.
Highway upgrade could cost $30m. (1995, February 10). Evening post, p.1.
Harbour ferry subsidy refused. (1995, February 10). Dominion, p.10.
Classic Air grounded as business assessed. (1995, March 07). Evening post, p.9.
Gully highway top priority, says committee. (1995, March 27). Evening post, p.8.
Thumbs up for inner-city bypass. (1995, March 27). Evening post, p.3.
Fiji air link.. (1995, April 08). Evening post, p.1.
Capital's port may be in danger. (1995, August 15). Evening post, p.12.
Award winning Lynx may service strait year round. (1995, September 16). Evening post, p.3.
Buoyant economy lifts port profits to $10m. (1995, September 30). Dominion, p.9.
Kapiti to get $30m-plus arterial route. (1995, October 07). Dominion, p.3.
Kapiti-Auckland link to be more frequent. (1995, November 11). Evening post, p.10.

314
Lynx arrives. (1995, November 28). Evening post, p.1.
Capital denied extra flights. (1995, December 01). Evening post, p.13.
Takeoff for cut-price airline. (1995, December 13). Evening post, p.14.
2005
National
-
Southland
Airport key to marketing plan. (2005, January 29). Southland Times, p.11.
South Port sees no easy fix. (2005, February 05). Southland Times, p. 5.
Exporters relish new air freighter. (2005, February 05). Southland Times, p. 8.
Govt officials look into Stewart Island costs. (2005, March 17). Southland Times, p. 3.
PM `wasting our time' islanders. (2005, March 18). Southland Times, p. 1.
No cheque for Stewart Island. (2005, April 06). Southland Times, p. 3.
$5.28m profit posted. (2005, July 07). Southland Times, p. 1.
South Port profit down on last year. (2005, September 03). Southland Times, p.10.
South Port says cash will buoy dividend. (2005, October 07). Dominion Post, p.3.
South Port eyes Tasman service Company in big push for more business. (2005, October 07).
Southland Times, p. 5.
Wellington
CentrePort $3m profit boosts growth hopes. (2005, April 14). Dominion Post, p.3.
Push for long-haul 787 flights from capital. (2005, June 24). Dominion Post, p.1.
$400m for commuter roads. (2005, June 27). Dominion Post, p.3.
$50m for Hutt highway upgrade. (2005, August 11). Dominion Post, p.1.
Commuter ferry to link Wellington and Petone. (2005, August 12). Dominion Post, p.8.
Link road costs up by $78m. (2005, October 25). Dominion Post, p.5.
City's chamber of commerce backs Transmission Gully. (2005, November 07). Dominion Post, p.3.
5.5.3 Regional Development
1985
National
Regional shake-up. (1985, January 09). Evening Post
Labour's Plan For the Regions. (1985, January 11). Southland Times
Regional Councils Hampered by Lack of Resources. (1985, February 14). Southland Times
Regional Gov't To Be Promoted. (1985, March 15). Southland Times
Task group to push regions. (1985, March 15). Evening Post
Forums fail to lead regional renaissance. (1985, May 06). NBR
Welfare to go regional. (1985, November 11). Dominion
Grants, Bill to boost regional government. (1985, December 11). NBR
Better planning needed in rural services. (1985, December 11). Southland Times
Local government role to widen. (1985, December 11). Dominion
Southland
Riverton Not Changing to District Community Council. (1985, February 19). Southland Times
Otatara May Get Council Soon. (1985, March 21). Southland Times
Regional Thrust Required on Unemployment. (1985, April 11). Southland Times
Regionalized Health Service Will Eventuate. (1985, May 18). Southland Times
Change wanted by Minister. (1985, July 06). Southland Times
Southland Promotions given full support. (1985, July 10). Southland Times
Important Decision for Roxburgh. (1985, July 20). Southland Times
Doctors opposed to regional scheme. (1985, August 09). Southland Times
Counties oppose Gore proposal. (1985, August 30). Southland Times
Town, Country split by discussions. (1985, September 06). Southland Times

315
United Council Frustrated at being ignored by Gov't. (1985, September 10). Southland Times
Gore proposal upsets neighbours. (1985, September 21). Southland Times
City Council seeking to extend jurisdiction. (1985, September 21). Southland Times
Special meeting at Mataura. (1985, October 01). Southland Times
Local Bodies in a Ferment. (1985, October 01). Southland Times
If It Isn't Broken Don't Fix It. (1985, October 02). Southland Times
For local bodies "adapt or die". (1985, October 03). Southland Times
Local bodies fear status. (1985, October 10). Southland Times
Ten Commandments to Guide. (1985, October 11). Southland Times
Merger being considered. (1985, October 12). Southland Times
Single Authority hinted at. (1985, October 16). Southland Times
Changes urged by experts. (1985, November 08). Southland Times
Report called "timely". (1985, November 12). Southland Times
Gore-centred district "most logical". (1985, December 02). Southland Times
Mataura wants autonomy. (1985, December 12). Southland Times
Wellington
Mayor previews 1985. (1985, January 02). Evening Post
Rural residents not keen on Hutt County. (1985, February 10). Evening Post
Capital's future concern Govt. (1985, February 26). Evening Post
Government Centre is possibility for Lower Hutt. (1985, March 05). Evening Post
Lawrence backs "regional nature". (1985, June 04). Evening Post
"City needs more representation at regional level". (1985, June 05). Evening Post
Elwood: Small local bodies will not survive. (1985, August 06). Dominion
Tawa urged to consider links with city councils. (1985, August 08). Evening Post
Umbrella council proposed for Hutt. (1985, August 20). Evening Post
Valley council to discuss union. (1985, August 20). Dominion
Harbour Board floats concept of "free port". (1985, August 21). Evening Post
Regional council upset at being passed over. (1985, August 29). Evening Post
Tawa link-up "welcome". (1985, September 02). Evening Post
Tawa favours independence. (1985, September 03). Evening Post
"Dissatisfied" LH stops grant to regional publicity. (1985, September 17). Evening Post
Porirua resists alterations to regional council. (1985, September 19). Dominion
Capital's WRC bid defeated. (1985, September 25). Evening Post
Region reviews local body representation. (1985, September 25). Dominion
Regional council staff morale low. (1985, October 03). Evening Post
LH mayor wants independent study. (1985, October 17). Evening Post
Hutt councillors reject amalgamation. (1985, October 22). Dominion
LH move "strain" on Petone relations. (1985, October 30). Evening Post
Harmony the key to Hutt county boundaries. (1985, November 27). Evening Post
Wainui's stand strong: Elwood. (1985, December 06). Evening Post
"Take over" plan annoys. (1985, December 06). Evening Post
Upper Hutt seeks bits from county. (1985, December 06). Evening Post
Council ward boundaries overturned. (1985, December 27). Evening Post
1995
National
-
Southland
Economic Unit to open. (1995, January 12). Southland Times, p.3.
Shadbolt will not seek re-election. (1995, February 01). Southland Times, p.1.
Shadbolt to quit . (1995, February 01). Dominion, p.3.
Potential excites promotions officer. (1995, February 01). Southland Times, p.2.
Leaders agree Mayor Tim will leave mark. (1995, February 02). Southland Times, p.4.
Tim Shadbolt to depart scene. (1995, February 02). Southland Times, p.6.

316
Manager named for economic development unit. (1995, February 15). Southland Times, p.12.
Councils agree on promotions plan. (1995, February 20). Southland Times, p.1.
New chapter in southern business development. (1995, April 05). Southland Times, p.17.
Company plan stirs debt fears. (1995, April 08). Southland Times, p.1.
City rates among the lowest. (1995, April 13). Southland Times, p.1.
Ian Tulloch standing down as Gore Mayor. (1995, May 04). Southland Times, p.1.
Councils take over. (1995, July 01). Southland Times, p.11.
Shadbolt does a U-turn. (1995, August 30). Southland Times, p.1.
Cardno unopposed. (1995, September 02). Southland Times, p.1.
A tick for conservatism: Harrington crushes Shadbolt, Gore opts for Ogg. (1995, October 16).
Southland Times, p.1.
Regional council approves $600,000 office expansion. (1995, November 09). Dominion Post, p.5.
Wellington
Sir John backs LH, Petone unification. (1985, August 01). Evening Post, p..
Hutt merger would save cash - Elwood. (1985, October 01). Evening Post, p..
Chance for HCC to improve its image. (1995, January 27). Evening post, p.16.
Job strategy. (1995, February 02). Dominion, p.2.
Too many councillors - claim. (1995, February 17). Evening post, p.3.
$30m capital works planned for Porirua. (1995, March 10). Dominion, p.5.
Council cut to size. (1995, March 29). Evening post, p.1.
Coast still luring Wellingtonians. (1995, April 13). Dominion, p.15.
Council heeds autonomy demand for promotion body. (1995, May 08). Evening post, p.16.
Community boards could get shake-up. (1995, May 19). Evening post, p.16.
Charter crosses political barriers. (1995, July 12). Evening post, p.6.
Growing pains on the Kapiti Coast. (1995, September 28). Evening post, p.4.
Surprise at size of Blumsky win. (1995, October 16). Dominion, p.13.
Gearing up for a Capital 1998. (1995, October 20). Evening post, p.6.
Mayor Blumsky sworn in. (1995, October 30). Dominion, p.3.
Hutt City urged to `wake up'. (1995, November 02). Dominion, p.3.
Tour promotes local businesses. (1995, November 17). Evening post, p.18.
Regional council may soon make own rate collection. (1995, December 15). Evening post, p.17.
2005
National
SSC E-Government Unit faces July restructure. (2005, April 18). Dominion Post, p.8.
Southland
Talk Venture over cuppa – Carter. (2005, February 24). Southland Times, p. 3.
Velodrome plans on track despite $800,000 shortfall. (2005, May 03). Southland Times, p.24.
The price and issues of progress. (2005, May 09). Southland Times, p. 9.
Farmers saying no to Venture Southland. (2005, May 24). Southland Times, p. 4.
Farmers slam Venture proposal. (2005, May 31). Southland Times, p. 2.
Venture, ES row rages. (2005, May 31). Southland Times, p. 1.
Farmers gain little from Venture plan. (2005, June 13). Southland Times, p. 6.
Reduce Venture funds, Fed Farmers say. (2005, July 05). Southland Times, p.14.
Venture set for smaller review team. (2005, July 05). Southland Times, p. 5.
Venture defends nationwide survey. (2005, August 05). Southland Times, p. 8.
Venture impressive says business expert. (2005, August 12). Southland Times, p.16.
Councillor urges rethink of $1.4m grant to Venture. (2005, December 07). Southland Times, p. 3.
Venture Southland set for wide-ranging independent review Team named, draft report due in March.
(2005, December 20). Southland Times, p. 5.
Wellington
V8 Supercar race survey before vote. (2005, January 26). Dominion Post, p.3.
V8 street race: `bring it on'. (2005, February 19). Dominion Post, p.1.
Catchy phrase for capital. (2005, February 26). Dominion Post, p.10.

317
Sanctuary and aquarium proposals move ahead. (2005, March 11). Dominion Post, p.8.
Regional growth plan coached into life. (2005, August 16). Dominion Post, p.5.
Blinkered vision for region. (2005, August 18). Dominion Post, p.4.
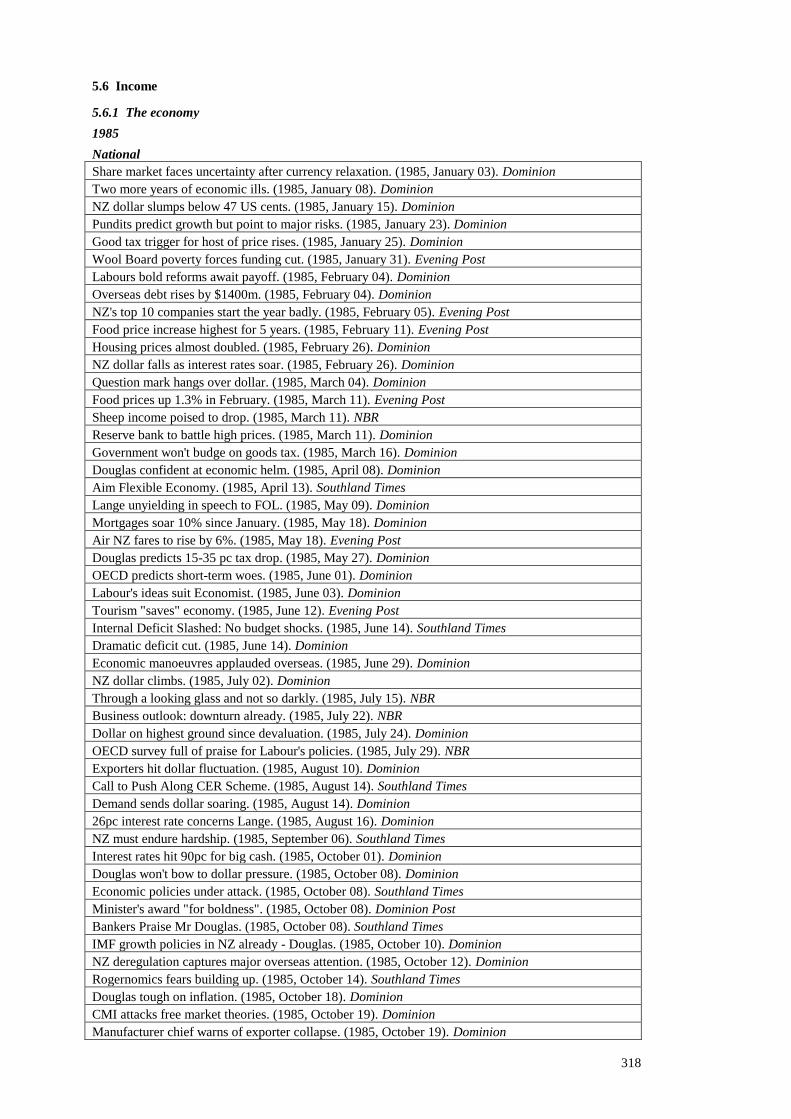
318
5.6 Income
5.6.1 The economy
1985
National
Share market faces uncertainty after currency relaxation. (1985, January 03). Dominion
Two more years of economic ills. (1985, January 08). Dominion
NZ dollar slumps below 47 US cents. (1985, January 15). Dominion
Pundits predict growth but point to major risks. (1985, January 23). Dominion
Good tax trigger for host of price rises. (1985, January 25). Dominion
Wool Board poverty forces funding cut. (1985, January 31). Evening Post
Labours bold reforms await payoff. (1985, February 04). Dominion
Overseas debt rises by $1400m. (1985, February 04). Dominion
NZ's top 10 companies start the year badly. (1985, February 05). Evening Post
Food price increase highest for 5 years. (1985, February 11). Evening Post
Housing prices almost doubled. (1985, February 26). Dominion
NZ dollar falls as interest rates soar. (1985, February 26). Dominion
Question mark hangs over dollar. (1985, March 04). Dominion
Food prices up 1.3% in February. (1985, March 11). Evening Post
Sheep income poised to drop. (1985, March 11). NBR
Reserve bank to battle high prices. (1985, March 11). Dominion
Government won't budge on goods tax. (1985, March 16). Dominion
Douglas confident at economic helm. (1985, April 08). Dominion
Aim Flexible Economy. (1985, April 13). Southland Times
Lange unyielding in speech to FOL. (1985, May 09). Dominion
Mortgages soar 10% since January. (1985, May 18). Dominion
Air NZ fares to rise by 6%. (1985, May 18). Evening Post
Douglas predicts 15-35 pc tax drop. (1985, May 27). Dominion
OECD predicts short-term woes. (1985, June 01). Dominion
Labour's ideas suit Economist. (1985, June 03). Dominion
Tourism "saves" economy. (1985, June 12). Evening Post
Internal Deficit Slashed: No budget shocks. (1985, June 14). Southland Times
Dramatic deficit cut. (1985, June 14). Dominion
Economic manoeuvres applauded overseas. (1985, June 29). Dominion
NZ dollar climbs. (1985, July 02). Dominion
Through a looking glass and not so darkly. (1985, July 15). NBR
Business outlook: downturn already. (1985, July 22). NBR
Dollar on highest ground since devaluation. (1985, July 24). Dominion
OECD survey full of praise for Labour's policies. (1985, July 29). NBR
Exporters hit dollar fluctuation. (1985, August 10). Dominion
Call to Push Along CER Scheme. (1985, August 14). Southland Times
Demand sends dollar soaring. (1985, August 14). Dominion
26pc interest rate concerns Lange. (1985, August 16). Dominion
NZ must endure hardship. (1985, September 06). Southland Times
Interest rates hit 90pc for big cash. (1985, October 01). Dominion
Douglas won't bow to dollar pressure. (1985, October 08). Dominion
Economic policies under attack. (1985, October 08). Southland Times
Minister's award "for boldness". (1985, October 08). Dominion Post
Bankers Praise Mr Douglas. (1985, October 08). Southland Times
IMF growth policies in NZ already - Douglas. (1985, October 10). Dominion
NZ deregulation captures major overseas attention. (1985, October 12). Dominion
Rogernomics fears building up. (1985, October 14). Southland Times
Douglas tough on inflation. (1985, October 18). Dominion
CMI attacks free market theories. (1985, October 19). Dominion
Manufacturer chief warns of exporter collapse. (1985, October 19). Dominion

319
Too early to judge NZ dollar float - Russell. (1985, November 01). Dominion
A scary ride on the economic ghost train. (1985, November 04). Dominion
Economy remains main worry. (1985, November 07). Southland Times
IER finds pessimism rife. (1985, November 08). Dominion
New banks allowed. (1985, November 11). Southland Times
PM alters finance policy emphasis. (1985, November 12). Dominion
Rogernomics beds in and it doesn't look so bad ahead after all. (1985, November 25). NBR
Community Projects at Risk. (1985, December 11). Southland Times
Import duty cut brings fear of Christmas ruin. (1985, December 13). Dominion
Dollar keeps on sliding. (1985, December 14). Dominion
Editorial: Is Rogernomics working?. (1985, December 16). NBR
Lange's challenge on dollar tumble. (1985, December 17). Dominion
NZ currency plunges further. (1985, December 17). Dominion
Dollar float takes winners laurel. (1985, December 23). Dominion
Southland
Gloomy business climate concerns chamber. (1985, October 22). Southland Times
$1.2m deficit for harbour board. (1985, November 06). Southland Times
Mr Douglas given good hearing. (1985, November 14). Southland Times
Some answers from Mr Douglas. (1985, November 23). Southland Times
Wellington
49% rent rise appears likely. (1985, January 29). Evening Post
Porirua rates may force residents out. (1985, February 16). Evening Post
Porirua revises rating system. (1985, February 20). Evening Post
Councils estimating rates rises 10-15% blames wage order, taxes & levies. (1985, February 28).
Evening Post
Hutt rate for power up 26.9%. (1985, March 01). Evening Post
Rate moves in Porirua "not huge". (1985, March 06). Evening Post
Big rate rise in store says Mayor. (1985, March 09). Dominion
15% rates rise looms. (1985, March 19). Evening Post
Rail fares up 20% - it‟s a shocker. (1985, March 20). Evening Post
Mini-boom for retailers on videos & fridges. (1985, March 27). Evening Post
Profitable year for Wellington. (1985, April 06). Evening Post
Local rail fares up 15% on May 29. (1985, April 09). Evening Post
Council to decide bus fares jump. (1985, April 10). Evening Post
Upper Hutt considers 12.99% rate increase. (1985, April 12). Evening Post
15pc bus fare tipped by council. (1985, April 16). Evening Post
Hutt rates likely to increase y 11.8%. (1985, April 23). Evening Post
Council has $1m surplus. (1985, April 23). Evening Post
Porirua budget cuts hold rates increase to 8.9pc. (1985, May 07). Evening Post
Big Red bus fares up 11.6 percent. (1985, May 08). Evening Post
Rents up 27 percent on average for city council tenants. (1985, May 09). Evening Post
Capital's average rate rise sub - 10%. (1985, May 14). Evening Post
City rates go up 11% - but effect varies. (1985, May 16). Dominion
More need food help as price rises hit. (1985, May 16). Evening Post
Taxi fares climb again by up to 20pc. (1985, May 17). Evening Post
Poverty among aged "now equals 1930s". (1985, May 23). Evening Post
Petone rate rises cut back to 15%. (1985, May 29). Evening Post
Pensioner flat rents to go up 20 percent. (1985, June 05). Evening Post
Petone to lift rates 14.93pc. (1985, June 12). Evening Post
Ratepayers riled. (1985, June 18). Evening Post
High rents hit suburbs, too. (1985, July 08). Evening Post
"Rent hike will hurt" say Hutt pensioners. (1985, July 10). Evening Post
Hutt City tenants pay more. (1985, July 23). Evening Post
Wellington jobless total falls. (1985, August 16). Dominion

320
Hutt County rates rise by up to 15%. (1985, August 23). Evening Post
Huge rates rises tipped for Hutt. (1985, September 17). Dominion
Voluntary agencies face funding crises. (1985, September 19). Evening Post
Not all economic forecasts gloomy. (1985, October 04). Evening Post
Poor rush old clothes. (1985, October 15). Evening Post
Wairarapa: The bite hurts. (1985, October 17). Evening Post
"Resurgence" in Hutt jobs. (1985, October 18). Evening Post
It's not all gloom in the Wairarapa, says its business community. (1985, October 21). Evening Post
Upper Hutt faces 20pc rate increase. (1985, October 22). Dominion
Capital in consolidation period. (1985, October 24). Evening Post
Capital's traders hit two-year low. (1985, December 18). Evening Post
1995
National
Adam Smith's wisdom and New Zealand's economic miracle. (1995, February 03). NBR, p.28.
Buoyant economy evident in recent company results. (1995, February 24). NBR, p.72.
Recovery the key word in companies' half-year profit announcements. (1995, March 03). NBR, p.61.
NZ's economic performance is far worse than Australia's. (1995, March 10). NBR, p.14.
New Zealand will feel the currency backlash. (1995, March 24). NBR, p.34.
Kiwi multinationals brace as dollar soars. (1995, March 24). NBR, p.1.
Rising exchange rate necessary for the economy's greater good. (1995, April 13). NBR, p.60.
Market solid as overseas buyers keep confident. (1995, April 13). NBR, p.58.
Kiwi dollar to beat Aussie. (1995, April 28). NBR, p.75.
Rising NZ dollar and economic slowing augur poorly for results. (1995, July 07). NBR, p.69.
Did the economic forecast come first - or the business opinion?. (1995, August 04). NBR, p.61.
Strong kiwi dollar 'disastrous' for wool processors, exporters. (1995, September 08). NBR, p.59.
Striking contrast between North and South islands. (1995, September 15). NBR, p.79.
Three NZ cities rate as cheapest to do business. (1995, October 06). NBR, p.60.
Better year for wool exports but new season demand down 6%. (1995, October 20). NBR, p.83.
Kiwis feel insecure despite strong economic growth. (1995, December 08). NBR, p.28.
Southland
Conflicting messages in bank's economic survey. (1985, March 16). Southland Times, p.26.
Mayor Tim entices couple to move from Wellington. (1995, January 06). Southland Times, p.1.
District values double. (1995, January 07). Southland Times, p.1.
Rural rate rise finished. (1995, January 09). Southland Times, p.1.
Southland houses 31% less affordable. (1995, January 18). Southland Times, p.11.
City house prices up. (1995, January 25). Southland Times, p.10.
Councillors say no to pay rise. (1995, January 27). Southland Times, p.1.
Consumer confidence drops in Southland. (1995, January 27). Southland Times, p.11.
Farmers cut spending. (1995, February 01). Southland Times, p.3.
Rural ratepayers face 15% general rate hike. (1995, February 16). Southland Times, p.1.
Businesses bear brunt of farming downturn. (1995, March 02). Southland Times, p.3.
Good season for dairy co-operative. (1995, June 03). Southland Times, p.1.
Southlanders cashing in on strong dollar. (1995, June 07). Southland Times, p.3.
Retailers brace for cut in rural spending. (1995, June 23). Southland Times, p..
Province's contribution to economy "unrecognised". (1995, July 18). Southland Times, p.6.
Food bank use "staggering". (1995, July 19). Southland Times, p.3.
City now No 11. (1995, September 22). Southland Times, p.1.
Property values soar in Gore. (1995, October 30). Southland Times, p.1.
The big problem with Southland. (1995, November 18). Southland Times, p.6.
Wellington
City's net debt $94.5m. (1995, January 10). Evening Post, p.3.
Rates up 12pc over five years - WRC. (1995, January 13). Evening Post, p.3.
Relief given to 170 ratepayers. (1995, January 14). Evening Post, p.3.

321
Ratepayers may face big hike. (1995, January 17). Evening Post, p.7.
Capital earners poor spenders. (1995, January 26). Evening Post, p.3.
Confidence runs high for Wellington firms. (1995, January 26). Dominion, p.2.
Slower growth may help Capital. (1995, January 27). Evening Post, p.11.
Building boom misses Wellington. (1995, February 03). Evening Post, p.13.
Porirua council has spare $6m. (1995, February 17). Evening Post, p.6.
Residents group condemns rates report. (1995, February 23). Dominion, p.3.
Rating issues confronted. (1995, February 23). Evening Post, p.6.
Rates `heaviest for poor' under taskforce plan. (1995, February 25). Evening Post, p.3.
Council may put big rates rise on to residents. (1995, March 28). Dominion, p.3.
WCC the biggest spender. (1995, April 06). Evening Post, p.17.
Porirua rates up 3.68 percent. (1995, April 08). Evening Post, p.3.
Economic health report mixed. (1995, April 19). Evening Post, p.17.
Chamber opposes Hutt ratepayers funding stadium. (1995, April 22). Dominion, p.9.
U Hutt rates rise 2.5pc in draft plan. (1995, April 22). Evening Post, p.52.
Regional council plans 2.2pc rates rise. (1995, April 27). Evening Post, p.3.
Chamber calls for link between rates, benefits. (1995, May 26). Dominion, p.18.
Capital's economic growth slows. (1995, June 13). Evening Post, p.13.
Central is richest electorate. (1995, June 19). Evening Post, p.3.
Council fixes 16pc rates rise. (1995, July 29). Dominion, p.3.
Region's house prices rise. (1995, August 04). Evening Post, p.2.
Fewer insolvencies good news for region. (1995, August 15). Evening Post, p.9.
Rates duel could cost $150,000. (1995, August 21). Evening Post, p.4.
Business cash bankrolls challenge. (1995, September 18). Evening Post, p.10.
Firms back challenge. (1995, October 02). Evening Post, p.13.
Wellington tops affordability survey. (1995, October 26). Evening Post, p.15.
Tougher time for poor in Capital. (1995, November 01). Evening Post, p.1.
Gap widens between rich, poor. (1995, November 02). Dominion, p.12.
Hutt chamber to push for city's debt review. (1995, December 28). Evening Post, p.3.
2005
National
TRACKING THE ECONOMY. (2005, January 28). NBR, p.17-03.
THE AGEING POPULATION: The greying of New Zealand. (2005, May 20). NBR, p.08-01.
THE ECONOMY: More pain likely as economic risk grows. (2005, July 01). NBR, p.01-01.
Why we can't just copy Irish recipe for success. (2005, December 16). NBR, p.23-01.
Southland
City outstripping rural south: Berl. (2005, January 12). Southland Times, p. 3.
Southland economy `middling' . (2005, February 19). Southland Times, p. 9.
SIT students report big increases since last year. (2005, February 23). Southland Times, p.14.
Invercargill's rates to rise. (2005, March 11). Southland Times, p. 3.
Invercargill `faces healthy future'. (2005, April 08). Southland Times, p. 1.
Economic activity falls 0.3pc. (2005, May 20). Southland Times, p. 5.
Multi-faceted economy set to weather downturn. (2005, July 13). Southland Times, p.18.
The cheapest houses in New Zealand. (2005, August 06). Dominion Post, p.3.
Southland rated `healthy'. (2005, August 17). Southland Times, p.19.
South rated top for growth. (2005, August 18). Southland Times, p. 1.
Rural town `on the rise'. (2005, September 08). Southland Times, p.23.
Business confidence in South Island high but growth in doubt. (2005, October 12). Southland Times,
p.21.
Southland reports negative growth. (2005, November 18). Southland Times, p. 3.
Wellington
REGIONAL DEVELOPMENT: Business backs new Wellington move. (2005, March 04). NBR,
p.34-01.

322
Regional rates rise proposed. (2005, March 15). Dominion Post, p.3.
Report says Capital growth lagging. (2005, March 22). Dominion Post, p.1.
Australians shop in capital. (2005, April 19). Dominion Post, p.6.
Council actions blamed for business exodus. (2005, May 28). Dominion Post, p.14.
Wellington rates up 7pc. (2005, June 25). Dominion Post, p.13.
Wellington's economy in growth spurt. (2005, August 08). Dominion Post, p.1.
$3.8m surplus for capital. (2005, September 01). Dominion Post, p.2.
Wellington's future shock. (2005, September 10). Dominion Post, p.3.
Labour-led government good for rental investor. (2005, October 04). Dominion Post, p.3.
Business confidence continues to slide. (2005, December 06). Dominion Post, p.1.
Lions fans pour $14m into capital. (2005, December 10). Dominion Post, p.6.
Property party rages o. (2005, December 12). Dominion Post, p.1.
5.6.2 Rural sector
1985
National
Young settlers considered essential to NZ farming. (1985, January 09). Dominion
Swing to Private Operators: Meat Change Looming. (1985, May 06). Southland Times
New group out to break Meat Board trading monopoly. (1985, May 06). NBR
Elders to Expand Services to NZ Farmers. (1985, May 10). Southland Times
Some Farmers to Get Concessions. (1985, July 17). Southland Times
Farm workers consider compulsory unionism. (1985, August 19). Southland Times
$20m more for farmers. (1985, August 30). Southland Times
Forestry must be more market orientated. (1985, September 03). Southland Times
Gov't offers Meat Board "carrot". (1985, September 17). Southland Times
Farmers to go militant. (1985, September 23). NBR
Joint Meat Venture. (1985, September 25). Southland Times
Moyle approves live sheep exports. (1985, September 26). Dominion
2000 farmers will have to sell up says survey. (1985, September 26). Dominion
Gov't lifts ban on live sheep exports. (1985, September 26). Southland Times
$700m debt write-off likely. (1985, September 27). Dominion
70,000 jobs at risk - farm study. (1985, October 01). Dominion
Farmer crisis as bad as 30s - Elworthy. (1985, October 05). Dominion
Economy will avert farm crisis - Moyle. (1985, October 07). Dominion
Bank and ministry highlight farm woe. (1985, October 22). Dominion
A leaner, stronger farming industry in the making. (1985, October 28). NBR
Rural aid package expected to be toned down. (1985, October 28). NBR
Farm blame admitted says McLay. (1985, October 29). Dominion
Rural bank help for farmers. (1985, November 06). Southland Times
Fading importance of farming healthy. (1985, November 07). Southland Times
Farmers will use economic clout. (1985, November 08). Southland Times
"Feather Bed Days" over for farmers. (1985, November 08). Southland Times
Sheepmeat marketing: board gives up control. (1985, November 09). Southland Times
Board quitting meat trade for good. (1985, November 12). Southland Times
South's opposition "proved correct". (1985, November 12). Southland Times
Farmers still get $400m support. (1985, November 27). Dominion
Continued reform of farming urged. (1985, November 28). Dominion
Farming "bears brunt" of economic policies. (1985, December 02). Dominion
Farm Package Today. (1985, December 12). Southland Times
Farm tax altered, tariffs slashed. (1985, December 13). Dominion
Package to help farmers. (1985, December 13). Southland Times

323
Southland
Last City Wool Sale. (1985, January 10). Southland Times
Plans for Third Salmon Farm. (1985, January 26). Southland Times
Island Fishermen Concerned. (1985, January 31). Southland Times
Farm Values on Decline. (1985, February 02). Southland Times
$6000 Reduction for Farmers. (1985, February 09). Southland Times
Farmers Have Shouldered Increases Long Enough. (1985, February 16). Dominion Post
Southland Angora Breeders Get Good Prices. (1985, February 18). Southland Times
Young Farmers Tell of Financial Plight. (1985, February 26). Southland Times
Farmers Criticise Financial Policies. (1985, March 16). Dominion Post
Deer pavilion to be officially opened. (1985, May 31). Southland Times
Farmers may hold back mortgage payments. (1985, June 17). Southland Times
Further processing key to future. (1985, August 09). Southland Times
Venison Seminar Timely. (1985, August 09). Southland Times
Farmers told toughest year ahead. (1985, August 15). Southland Times
Cashmere industry promoted in Southland. (1985, August 16). Southland Times
Farmers in Trouble. (1985, September 06). Southland Times
Case for live sheep shipments pleaded. (1985, September 24). Southland Times
Sheep exports opposed. (1985, September 26). Southland Times
Good chance for Bluff. (1985, September 30). Southland Times
Live sheep exports please farmers. (1985, October 12). Southland Times
Ewe boycott proposed. (1985, October 15). Southland Times
10pc of farmers will quit. (1985, October 19). Southland Times
Sheepmeat marketing: Local pool suggested. (1985, November 13). Southland Times
Meat workers to join protest. (1985, December 13). Southland Times
Meat firms differ on live sheep trade. (1985, December 17). Southland Times
To tax agriculture like any other business. (1985, December 17). Southland Times
Workers ready to protest. (1985, December 19). Southland Times
Deer Farmers Worried. (1985, December 23). Southland Times
Wellington
-
1995
National
Off farm income common. (1995, November 08). Southland Times, p.13.
Southland
Drought, low meat prices hit farmers. (1995, January 21). Southland Times, p.1.
$18m boost from dairying. (1995, January 25). Southland Times, p.1.
Corporate farms not encouraged. (1995, February 24). Southland Times, p.10.
Farmers back Alliance deal. (1995, April 11). Southland Times, p.1.
Farmers unlikely to profit. (1995, April 26). Southland Times, p.1.
South Port buys out Southland Farmers. (1995, April 29). Southland Times, p.3.
Tough times for south's sheep farmers. (1995, May 03). Southland Times, p.15.
Southland farms dry. (1995, May 04). Southland Times, p..
Days of family farms at end. (1995, May 29). Southland Times, p.3.
Family farms fine in south. (1995, June 01). Southland Times, p.11.
More partners working off farm. (1995, June 09). Southland Times, p..
Consultant to tackle sheep farms. (1995, July 10). Southland Times, p.1.
Southland pig farmers feeling pinch. (1995, July 13). Southland Times, p.11.
$63m plant opened. (1995, July 22). Southland Times, p.1.
Council to get $500,000. (1995, July 27). Southland Times, p.2.
Snow crippling south's farmers. (1995, August 01). Southland Times, p.1.
Brakes put on dairy boom. (1995, August 08). Southland Times, p.1.

324
260 to lose jobs. (1995, August 16). Southland Times, p.1.
Farming outlook positive. (1995, August 17). Southland Times, p.1.
High interest rates stop farmers hiring. (1995, September 06). Southland Times, p.16.
50,000 lambs die in storms. (1995, September 09). Southland Times, p.1.
50,000 lambs estimated dead. (1995, September 27). Southland Times, p.1.
Bankers helping southern farmers. (1995, October 05). Southland Times, p.1.
Dairy co-operative profit eases back. (1995, October 18). Southland Times, p.2.
Southland Dairy Coop ready to put on fat . (1995, October 20). NBR, p.5.
Dairy co-op "strapped for cash". (1995, October 20). Southland Times, p.1.
Big Glory floats $5 million plan. (1995, November 21). Southland Times, p.1.
Mussel industry gaining strength. (1995, November 22). Southland Times, p.1.
Dairy co-op pays $13m for month. (1995, November 22). Southland Times, p.3.
Dairy co-op planned $175m expansion. (1995, December 08). Southland Times, p.1.
Farmers support expansion. (1995, December 11). Southland Times, p.1.
Island community backs mussel farming venture. (1995, December 19). Southland Times, p.1.
Southern dairy farms rate poorly in survey. (1995, December 30). Southland Times, p.3.
Wellington
-
2005
National
DAIRYING: Bigger farms, markets and payouts. (2005, March 11). NBR, p.13-01.
Dairy database in sight. (2005, March 21). Dominion Post, p.10.
eFarmer results eagerly awaited. (2005, May 24). Southland Times, p.17.
RURAL BUSINESS: Farmers will adopt if Telecom delivers. (2005, June 24). NBR, p.14-01.
Rural business: NBR Special Review: SOFTWARE: Answering the 'what if' performance questions.
(2005, July 08). NBR, p.29-01.
Rural achiever believes farm succession problem in south. (2005, August 23). Southland Times, p.14.
Internet playing greater role. (2005, September 06). Southland Times, p.14.
Southland
Cold, wet summer impacts on farming activities in the south. (2005, January 19). Southland Times,
p.20.
Interest in Getting Started seminars prompts two more. (2005, February 15). Southland Times, p.14.
Demand for farms strong. (2005, February 23). Southland Times, p.18.
Southland farm sales dip against NZ trend. (2005, June 28). Southland Times, p.18.
Tuatapere folks despair Sawmill's future still undecided. (2005, August 05). Southland Times, p. 1.
Rural service strong in Gore. (2005, September 01). Southland Times, p.15.
Literacy resources set up to provide range of support. (2005, September 06). Southland Times, p.14.
Wellington
-
5.6.3 Information technology sector
1985
National
Computer contractors: now they're respectable. (1985, March 11). NBR
Offshore income passes halfway. (1985, March 25). Dominion
Computer market due to expand says Commodore. (1985, April 23). Dominion
LINC considers move overseas. (1985, May 13). Dominion
Computing for the rural sector. (1985, May 16). Dominion
State computing reviewed again. (1985, May 25). Dominion
Videotext in sales battle. (1985, May 27). Dominion
French see big videotext future. (1985, June 06). Dominion

325
Industry growth confounds trend. (1985, July 08). Dominion
Independent Newspapers set for big push into new technology. (1985, July 11). Dominion
New Zealand likely to ride computer slump waves. (1985, July 15). NBR
Bulk supply deals for government computer needs. (1985, July 22). NBR
Wang NZ untouched by slump. (1985, July 29). Dominion
US computer slump will hit NZ markets. (1985, August 05). Dominion
Animal health computer wanted. (1985, August 10). Dominion
Views aired on information technology strategies. (1985, September 02). NBR
Leaner ICL emerges from shakeup. (1985, September 16). Dominion
Control Data to sell off remaining branch. (1985, September 23). Dominion
MDL plans end to direct selling. (1985, September 23). Dominion
Public service computing review. (1985, October 02). Dominion
New Computing Service Agency Set Up. (1985, October 02). Southland Times
Computers take over. (1985, October 04). Evening Post
Computing service may draw critics and problems. (1985, October 07). NBR
Customs decisions move faster thanks to computers. (1985, October 07). NBR
PSA chief sees danger in Hunn report. (1985, October 07). Dominion
Fighting fires with computer. (1985, October 10). Evening Post
Electricity moves towards new information system. (1985, October 21). NBR
Databank set for banking revolution. (1985, November 13). Dominion
Huge buy-up strains new computer services body. (1985, November 18). NBR
Information technology & economic growth. (1985, December 02). NBR
Parliament reviews state computing. (1985, December 16). Dominion
Southland
Computers provide tomorrows answers today for farmers. (1985, June 18). Southland Times
Wellington
Databank moves house. (1985, March 04). Dominion
Naenae plant grabs Australian contract. (1985, May 07). Evening Post
Intergraph on the way. (1985, June 04). Dominion
Computer firm cracks states. (1985, June 05). Evening Post
Computer centre for Petone. (1985, July 16). Evening Post
Bigger computer for rates changes. (1985, July 18). Evening Post
Outdated computer attracts solitary bid. (1985, July 29). Dominion
Bishopsgate sets up regional base in NZ. (1985, August 12). Dominion
1995
National
IT companies in NZ show vigour. (1995, February 24). NBR, p.39.
Kiwi firms named in top 100 IT users worldwide. (1995, May 19). NBR, p.60.
High-tech guru puts emphasis on Jade. (1995, July 21). NBR, p.15.
Contracting IT proves costly. (1995, August 04). NBR, p.2.
What IT can and can't do. (1995, September 01). NBR, p.2.
PC counterfeiters up market heat. (1995, October 06). NBR, p.3.
NZ Post smartens its bottom line. (1995, November 24). NBR, p.3.
Software house sold. (1995, December 01). Southland Times, p.15.
New kid on the block targets top spot in computer market. (1995, December 15). NBR, p.47.
Southland
Two leading computer companies merge. (1995, December 06). Southland Times, p.10.
Wellington
Computer firm takes naming rights. (1995, August 22). Evening Post, p.15.

326
2005
National
Steady demand ahead for Kiwi jobs. (2005, January 17). Dominion Post, p.9.
ICT groups welcome Cunliffe as minister. (2005, January 17). Dominion Post, p.9.
Cunliffe promises industry support. (2005, January 31). Dominion Post, p.7.
Unisys' business picks up. (2005, February 28). Dominion Post, p.12.
SOFTWARE: Indian takeaway for Kiwi IT firm. (2005, March 04). NBR, p.12-01.
TECHNOLOGY: Export opportunities abound in health IT. (2005, March 11). NBR, p.13-02.
Big win for Optimation. (2005, April 04). Dominion Post, p.8.
Seek hopes to raise A$170m. (2005, April 04). Dominion Post, p. 9.
IT sales increase to $7.02 billion. (2005, April 21). Dominion Post, p.3.
SOFTWARE: Big enterprise application provider seeks local base. (2005, April 22). NBR, p.27-01.
IT spending up 11.2pc. (2005, April 25). Dominion Post, p.11.
Intralot to use NZ office as launch pad. (2005, May 23). Dominion Post, p.9.
EDS on roll with $44.8m profit. (2005, June 01). Dominion Post, p. 7.
ICT lobby groups debate the future. (2005, June 13). Dominion Post, p.10.
Sights lowered. (2005, June 13). Dominion Post, p. 8.
PST rings up German win. (2005, June 27). Dominion Post, p. 6.
EXPORTING: Research pays off for niche manufacturer. (2005, July 01). NBR, p.23-02.
MIS100 shows confidence high. (2005, July 04). Dominion Post, p. 8.
Services focus pays off. (2005, July 17). Dominion Post, p. 7.
SimWorks sells cell anti-virus to German firm. (2005, July 18). Dominion Post, p. 7.
Siebel hangs open sign in NZ. (2005, September 05). Dominion Post, p.11.
Govt demands map of `fuzzy' ICT sector. (2005, September 12). Dominion Post, p. 9.
Axon expands as contracts roll in. (2005, September 16). NBR, p.65-01.
Norwegians buy Kiwi IT company Ectus for $10m. (2005, October 05). Dominion Post, p. 2.
Export idea killed by funding refusal. (2005, October 17). Dominion Post, p. 6.
UK firm outsources jobs to New Zealand. (2005, October 28). NBR, p.30-01.
EDS sets sights on smaller firms. (2005, November 07). Dominion Post, p. 9.
Unisys won't ditch smaller clients. (2005, November 07). Dominion Post, p.10.
Repatriation success for ANZ. (2005, November 21). Dominion Post, p. 8.
Cadmus sets up Asian footprint for Eftpos sales. (2005, December 09). NBR, p.06-02.
Southland
-
Wellington
Equinox wins deal to build dog database. (2005, January 24). Dominion Post, p. 6.
Plugging the power of Weta. (2005, February 14). Dominion Post, p. 7.
Hospital IT head quits after system glitches. (2005, March 04). Dominion Post, p.4.
IBM reviews Petone HQ. (2005, March 14). Dominion Post, p.9.
120 jobs at TelstraClear's Paraparaumu call centre. (2005, May 02). Dominion Post, p.9.
Capital IT workers can earn more. (2005, May 30). Dominion Post, p.12.
Unisys has big plans for Kapiti. (2005, June 06). Dominion Post, p.12.
Datacentre to double in size. (2005, June 13). Dominion Post, p.11.
Supercomputer in demand. (2005, August 15). Dominion Post, p. 8.
Geeks to the rescue for dazed computer users. (2005, December 19). Dominion Post, p. 1.
Most roles hard to fill. (2005, December 19). Dominion Post, p. 5.
5.6.4 Unemployment
1985
National
Fewer leave school to go on dole. (1985, January 18). Dominion
Employed total up 38,646 in one year. (1985, February 02). Dominion

327
20,000 new jobs needed each year. (1985, February 20). Dominion
More elderly and workers in population. (1985, February 20). Dominion
Maori needs dominate jobs summit. (1985, March 13). Dominion
NZ already "Low wage country". (1985, March 28). Dominion
Slowing economy squeezes new jobs. (1985, May 14). Dominion
Fijian Workers not coming to NZ. (1985, May 30). Southland Times
Jobs go begging. (1985, June 01). Evening Post
Small drop in NZ unemployment. (1985, September 20). Southland Times
Sales drop puts 37 out of work. (1985, October 07). Dominion
Hundreds laid off as dollar climbs. (1985, October 23). Dominion
$10 million cut proposed for job schemes. (1985, November 09). Dominion
Work Scheme cuts to hit hard. (1985, December 12). Southland Times
Jobless numbers up 1992 to 51,103. (1985, December 20). Dominion
$300m job package gets mixed reaction. (1985, December 20). Dominion
Southland
Invercargill has fewer jobless. (1985, January 18). Southland Times
Easier for Young to Find Jobs. (1985, January 22). Southland Times
Fewer Jobless in Southland. (1985, March 09). Southland Times
Work schemes cut by government. (1985, June 01). Southland Times
Unemployment up in Invercargill. (1985, October 17). Southland Times
Job Outlook Bleak. (1985, October 22). Southland Times
Bleak outlook for jobs in South. (1985, November 27). Southland Times
Jobless summer blights search. (1985, December 16). Southland Times
Wellington
City's number of unemployed fell. (1985, February 26). Evening Post
Wellington region cuts unemployed. (1985, March 09). Dominion
Lower jobless figures reflect economic upturn. (1985, April 18). Evening Post
Vow to rid Hutt of joblessness. (1985, May 04). Evening Post
Wellington's jobless drop bucks trend. (1985, August 15). Evening Post
Government economic policy lacks coherence - Philpott. (1985, September 27). Dominion
Jobless total drops. (1985, October 09). Evening Post
Drastic cut in store for city job schemes. (1985, November 29). Evening Post
500 students out of work. (1985, November 30). Dominion
Surge reflected by Wellington centres. (1985, December 20). Evening Post
1995
National
Birch to tackle unemployment. (1995, May 28). NBR, p.1.
Nothing to crow about as jobless figures reach their bottom limit. (1995, June 02). NBR, p.66.
Prince's vision for unemployment caught by New Zealand trio. (1995, July 14). NBR, p.39.
Ethnic barriers foil zero unemployment. (1995, October 27). NBR, p.16.
Southland
Job losses likely with AgResearch cutbacks. (1995, January 19). Southland Times, p.4.
AgResearch Gore site supported. (1995, January 27). Southland Times, p.8.
PowerNet could cut 75 staff. (1995, February 01). Southland Times, p.1.
PowerNet announcement stuns workers. (1995, February 02). Southland Times, p.2.
PowerNet jobs go . (1995, February 02). Dominion, p.3.
Southern jobless rate 5.9%. (1995, February 17). Southland Times, p.1.
Doubtful forecast for city MetService. (1995, March 06). Southland Times, p.1.
All seven staff lose jobs. (1995, March 16). Southland Times, p.3.
More redundancies likely at Bluff port. (1995, March 16). Southland Times, p.1.
Jobless not going into business. (1995, March 31). Southland Times, p.9.
Jobs could be lost at Niagra Sawmilling. (1995, April 08). Southland Times, p.3.

328
Trade training for jobless. (1995, April 08). Southland Times, p.1.
Job fears for meat workers. (1995, May 19). Southland Times, p.3.
Job market prospers. (1995, May 19). Southland Times, p.1.
Staff cuts continue at United. (1995, June 08). Southland Times, p.1.
CTU wants councils to create jobs. (1995, June 10). Southland Times, p.10.
Fletchers closing city office. (1995, June 30). Southland Times, p.1.
City jobless up 546. (1995, July 14). Southland Times, p.3.
Unemployed rise in Invercargill. (1995, August 18). Southland Times, p.4.
30 to lose jobs in Che move. (1995, September 16). Southland Times, p.1.
Job trends encouraging. (1995, September 20). Southland Times, p.5.
Tuatapere mill sheds 10 jobs. (1995, November 14). Southland Times, p.1.
Unemployment rate in Southland falls. (1995, November 21). Southland Times, p.1.
Tiwai employs record number of students. (1995, November 22). Southland Times, p.1.
Wellington
Deka closure leaves 22 Porirua staff jobless. (1995, January 07). Evening Post, p.3.
Office supplier goes bust. (1995, January 12). Evening Post, p.15.
New scheme to get jobs for youth. (1995, January 31). Dominion, p.8.
Council considers $2.5m for jobs. (1995, January 31). Evening Post, p.1.
Council jobs plan not on. (1995, February 03). Evening Post, p.6.
Capital job ads up 0.8pc. (1995, February 10). Evening Post, p.12.
August the real deadline for Coke factory closure. (1995, March 17). Evening Post, p.3.
Telecom staff get closure date. (1995, March 18). Evening Post, p.3.
Job losses loom for Porirua hotel staff. (1995, March 21). Evening Post, p.3.
No interest from teens in joinery offer. (1995, March 28). Evening Post, p.2.
Better prospects for Capital job seekers. (1995, April 13). Evening Post, p.15.
Region's jobless number tumbles. (1995, April 20). Evening Post, p.2.
Job schemes dropped. (1995, April 27). Dominion, p.15.
Push to find work for long-term jobless. (1995, April 27). Evening Post, p.20.
Staff trimmed. (1995, May 03). Evening Post, p.18.
Hutt sets up joint employment group. (1995, June 13). Dominion, p.4.
Hutt registered jobless drop 25pc. (1995, June 16). Dominion, p.2.
Capital Power cuts 41 jobs. (1995, June 30). Evening Post, p.21.
Capital jobless down. (1995, July 13). Evening Post, p.1.
All about jobs. (1995, July 28). Dominion, p.3.
Hutt employment plan. (1995, August 01). Evening Post, p.2.
Hutt City turns Heat on unemployment. (1995, August 03). Dominion, p.19.
Porirua jobs go. (1995, August 18). Dominion, p.3.
Bonds to slash 36 jobs in Porirua. (1995, August 18). Evening Post, p.9.
Seventy IRD jobs to go in Capital. (1995, August 25). Evening Post, p.3.
Employment still limited in Porirua - survey. (1995, September 12). Dominion, p.8.
Employment still limited in Porirua - survey. (1995, September 12). Dominion, p.8.
Redundancies likely at Buttle Wilson. (1995, September 27). Evening Post, p.20.
Job search. (1995, October 16). Evening Post, p.3.
Work chance for jobless. (1995, October 23). Evening Post, p.15.
Nine Kenepuru nurses lose jobs. (1995, November 09). Evening Post, p.19.
Fewer jobless. (1995, November 21). Evening Post, p.3.
Army steps in to help the jobless. (1995, November 22). Evening Post, p.2.
2005
National
Peace lays off 55 staff after completing project. (2005, April 04). Dominion Post, p. 7.
IBM NZ jobs safe. (2005, May 09). Dominion Post, p.8.
Southland
Benefits `obscure true unemployed numbers'. (2005, March 29). Southland Times, p. 2.

329
Farm-job pilot scheme great success. (2005, August 30). Southland Times, p.13.
Wellington
Factory closure costs 270 jobs. (2005, February 09). Dominion Post, p.3.
Migrants to get work experience at council. (2005, May 14). Dominion Post, p.21.
5.6.5 Investment
1985
National
Sources of risk finance in directory. (1985, January 02). Evening Post
Second venture capital plan. (1985, January 18). Evening Post
Venture-capitalists in market locally for "Ideas people". (1985, February 11). NBR
Treasury no to film aid - but are its facts right?. (1985, February 25). NBR
Finance difficult for innovators. (1985, March 11). Evening Post
R&D: More research and better management needed. (1985, April 01). NBR
Research and development: Does NZ really need it?. (1985, April 08). NBR
The expensive downward thrust of third rate universities. (1985, April 15). NBR
A research policy for New Zealand: a personal view. (1985, April 22). NBR
More venture capital sought. (1985, May 28). Dominion
High hopes for Venturecorp. (1985, June 22). Evening Post
Burke thinks the regions need catalysts, not cash. (1985, September 30). NBR
Wood processors need research if they are to cope. (1985, November 25). NBR
Neglect, lack of funding afflict biological research. (1985, November 25). NBR
Venture capitalists join forces. (1985, December 02). NBR
DSIR unhappy over "handicapping" user-pays policy. (1985, December 02). NBR
Research associations target of funding push. (1985, December 09). NBR
Southland
Small business benefits. (1985, August 10). Southland Times
Wellington
New bank opens. (1985, July 30). Evening Post
$1.5m given for medical research. (1985, October 07). Evening Post
1995
National
Xenophobes take note - foreign investment began in the 1840s. (1995, April 13). NBR, p.61.
Foreign investment causes a froth-over. (1995, May 12). NBR, p.14.
Investment philosophy attracted reluctant business leader. (1995, July 14). NBR, p.40.
Singaporean mulls raising Noel Leeming investment. (1995, July 14). NBR, p.55.
New venture helps business thrive. (1995, July 21). NBR, p.50.
Chinese entrepreneur picking big growth in hotels, tourism. (1995, July 21). NBR, p.36.
Overseas billionaires pump millions into New Zealand. (1995, July 21). NBR, p.8.
Asian investment only 18% of total. (1995, July 28). NBR, p.16.
No wimmin's solidarity in finance markets. (1995, September 01). NBR, p.7.
NZ "too small" for investors. (1995, November 01). Southland Times, p.4.
Singapore company has dynastic plans for New Zealand offshoot. (1995, November 03). NBR, p.59.
Southland
Foreign investors put off Southland. (1995, June 14). Southland Times, p.13.
SBIS records $7.6 million pre-tax profit. (1995, June 22). Southland Times, p.1.
Fewer students leaving courses for employment. (1995, June 26). Southland Times, p.3.
City licensing trust makes $2.2 million. (1995, August 17). Southland Times, p.2.
Lending growth boosts profit. (1995, November 27). Southland Times, p.1.
Big money injected into South. (1995, December 09). Southland Times, p.1.

330
Wellington
Big deals can't disguise tighter margins in 1995 market. (1995, February 10). NBR, p.49.
Investors start young in Capital. (1995, March 09). Evening post, p.1.
2005
National
INNOVATION: Angel investors form regional networks. (2005, February 25). NBR, p.51-02.
Venture capital hits new highs. (2005, April 29). NBR, p.02-01.
BIOTECH 2005: Double fillip for Kiwi biotechnology. (2005, June 24). NBR, p.04-01.
Government Shared Network gets nod. (2005, August 08). Dominion Post, p. 6.
Varsities get grants. (2005, August 22). Dominion Post, p. 8.
Southland
BANKING: Southlander keeps ahead of rivals. (2005, May 13). NBR, p.08-01.
Wellington
-
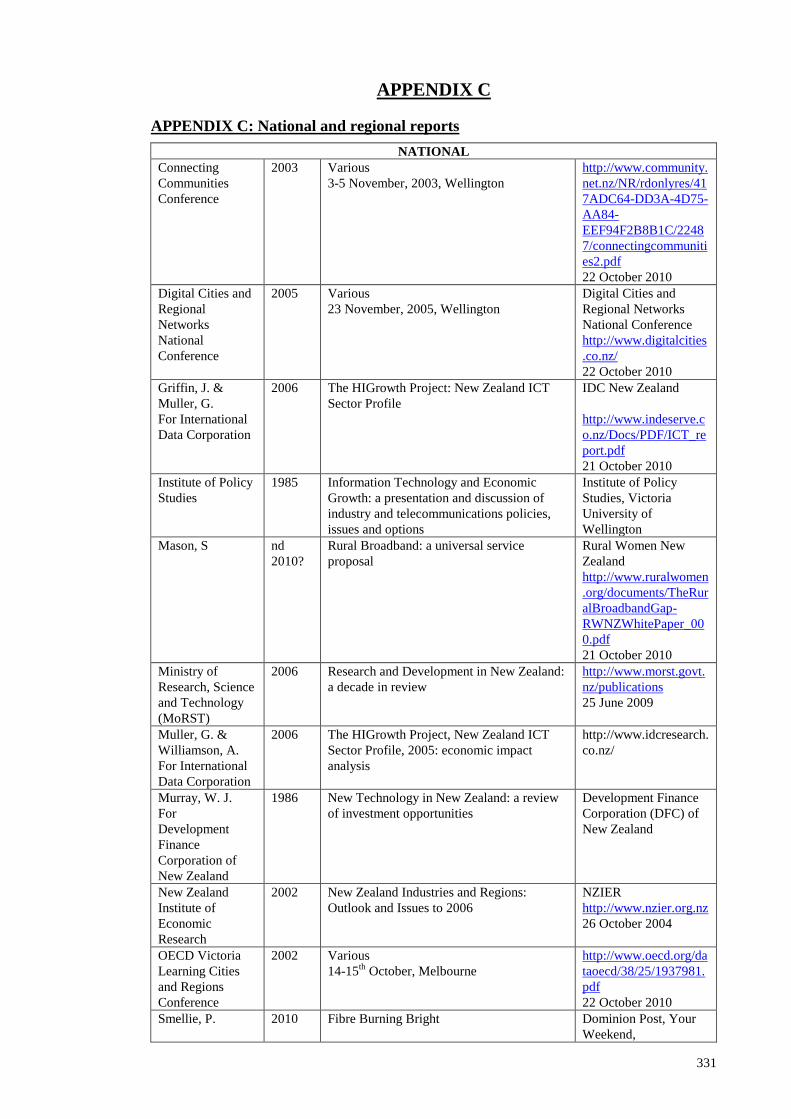
331
APPENDIX C
APPENDIX C: National and regional reports
NATIONAL
Connecting
Communities
Conference
2003 Various
3-5 November, 2003, Wellington
http://www.community.
net.nz/NR/rdonlyres/41
7ADC64-DD3A-4D75-
AA84-
EEF94F2B8B1C/2248
7/connectingcommuniti
es2.pdf
22 October 2010
Digital Cities and
Regional
Networks
National
Conference
2005 Various
23 November, 2005, Wellington
Digital Cities and
Regional Networks
National Conference
http://www.digitalcities
.co.nz/
22 October 2010
Griffin, J. &
Muller, G.
For International
Data Corporation
2006 The HIGrowth Project: New Zealand ICT
Sector Profile
IDC New Zealand
http://www.indeserve.c
o.nz/Docs/PDF/ICT_re
port.pdf
21 October 2010
Institute of Policy
Studies
1985 Information Technology and Economic
Growth: a presentation and discussion of
industry and telecommunications policies,
issues and options
Institute of Policy
Studies, Victoria
University of
Wellington
Mason, S nd
2010?
Rural Broadband: a universal service
proposal
Rural Women New
Zealand
http://www.ruralwomen
.org/documents/TheRur
alBroadbandGap-
RWNZWhitePaper_00
0.pdf
21 October 2010
Ministry of
Research, Science
and Technology
(MoRST)
2006 Research and Development in New Zealand:
a decade in review
http://www.morst.govt.
nz/publications
25 June 2009
Muller, G. &
Williamson, A.
For International
Data Corporation
2006 The HIGrowth Project, New Zealand ICT
Sector Profile, 2005: economic impact
analysis
http://www.idcresearch.
co.nz/
Murray, W. J.
For
Development
Finance
Corporation of
New Zealand
1986 New Technology in New Zealand: a review
of investment opportunities
Development Finance
Corporation (DFC) of
New Zealand
New Zealand
Institute of
Economic
Research
2002 New Zealand Industries and Regions:
Outlook and Issues to 2006
NZIER
http://www.nzier.org.nz
26 October 2004
OECD Victoria
Learning Cities
and Regions
Conference
2002 Various
14-15th
October, Melbourne
http://www.oecd.org/da
taoecd/38/25/1937981.
22 October 2010
Smellie, P. 2010 Fibre Burning Bright Dominion Post, Your
Weekend,

332
9/10/2010,pp. 13 -18
Statistics New
Zealand
2006 Information and Communication Technology
in New Zealand
http://www.stats.govt.n
z/browse_for_stats/ind
ustry_sectors/informati
on_technology_and_co
mmunications/informati
on-commucation-
technology-in-nz-
2006.aspx
21 October 2010
Statistics New
Zealand
2009 Innovation in New Zealand: 2009 http://www.stats.govt.n
z/browse_for_stats/busi
nesses/business_growth
_and_innovation/innov
ation-in-new-zealand-
2009.aspx
21 October 2010
Statistics New
Zealand
2008 Measuring New Zealand‟s Progress using a
Sustainable Development Approach
http://www.stats.govt.n
z/browse_for_stats/envi
ronment/sustainable_de
velopment/sustainable-
development.aspx
21 October 2010
Statistics New
Zealand
nd
2003?
New Zealand: an urban/rural profile –
historical context
http://www.stats.govt.n
z/browse_for_stats/peo
ple_and_communities/g
eographic_regions/urba
n-rural-
profile/historical-
context.aspx
3 May 2007
Statistics New
Zealand
2008 Research and Development in New Zealand http://www.stats.govt.n
z/browse_for_stats/busi
nesses/research_and_de
velopment/research-
development-in-new-
zealand-2008.aspx
21 October 2010
Telecommunicati
ons Users of New
Zealand
(TUANZ) Rural
Broadband
Symposium
2006 Various
29- 31 March 2006, Timaru
http://www.tuanz.org.n
z/content/c535942d-
a384-4720-9890-
08206d48c821.html
22 October 2010
Information and
Communication
Technologies in
the Workplace
and Communities
Conference
2006 Various
28 April, 2006, Wellington
University of Waikato
http://wms-
soros.mngt.waikato.ac.
nz/ICT/Research+Pape
rs.htm#ICTsandComm
unities
(related papers)
22 October 2010

333
SOUTHLAND
Allan V 1985 Southland Rural Women: an aspect of change Rural Education
Activities Programme
Business and
Economic
Research Ltd
2005 The Contribution of the Forest and Wood-
Processing Sector to Otago and Southland
http://www.berl.co.nz/
330a1.page
20 October 2010
CityLink 2010 Various reports http://www.citylink.co.
nz/
22 October 2010
Infometrics
Consulting/
Southern Institute
of Technology
2000 Economic Impact on Invercargill of SIT‟s
Proposed Zero Fees Policy
http://www.sit.ac.nz/do
cuments/PDF/2000%2
0Projected%20Econo
mic%20Impact%20Re
port.pdf
20 October 2010
Infometrics
Consulting/
Southern Institute
of Technology
2002 Economic Impact on Invercargill of SIT‟s
Zero Fees Policy
http://www.sit.ac.nz/do
cuments/PDF/2002%2
0Actual%20Economic
%20Impact%20Report
28 October 2002
North & South 2001 Southern Spirit: Southland revival Sept 2001, pp 40-53
Otago Southland
Broadband
Communications
Committee
2001 Blazing the Trail to the Information Highway Venture Southland
Parliamentary
Library
2001 Electorate Profile Clutha-Southland http://www.parliament.
nz/en-
NZ/MPP/Electorates/
20 October 2010
Parliamentary
Library
2005 Electorate Profile Invercargill http://www.parliament.
nz/en-
NZ/MPP/Electorates/
20 October 2010
Perry M 2005 Conditions for Business Cluster Development:
a profile of four timber industry projects
New Zealand Centre
for Small & Medium
Enterprise Research,
Massey University
Statistics New
Zealand
2003 Southland Region Community Profile http://www2.stats.govt.
nz/domino/external/we
b/commprofiles.nsf/0/7
97208b54a248f5ccc25
6d31007ad93d?OpenD
ocument
21 October 2010
Southland Times 2006 Farm Energy Project Launched 21/2/2006
Venture
Southland/
Infometrics
Consulting/
Business and
Training Services,
SIT
2005 Assessment of the Economic and Social
Impacts of Tiwai Point Aluminium Smelter of
the Southland Economy
http://www.infometrics
.co.nz/reports/tiwai_po
int.pdf
20 October 2010
Venture
Southland
2008 Draft Southland Digital Strategy: connecting
to our future
http://www.southlandn
z.com/Portals/0/Docu
ments/Business/Region
al%20Initiatives/South
land%20Digital%20Str
ategy%
20 October 2010

334
WELLINGTON
Arnold, S 2005 Wellington Regional Strategy: focus areas
Wellington Regional Strategy
Background Papers
http://www.wrs.govt.nz/docs/1
922_SimonArnoldRepor_s363
8.pdf
8 March 2007
Brash, J. 2005 Smartlinx3 – Public/Private Partnership
Model
Digital Cities and Regional
Networks National Conference
http://www.digitalcities.co.nz/
presentations/index.html
22 October 2010
CityScope
Consultants
2005 Wellington Regional Strategy: development
of focus areas
Wellington Regional Strategy
Background Papers
http://www.wrs.govt.nz/docs/1
925_CityScopeReport_s3641.
8 March 2007
Fitzsimons, T 2010 Wired Welly Dominion Post, Your
Weekend, 9/10/2010,pp. 8 -12
Huff, S.L. 1996 Wired Wellington: the info city project and
the City Link network
http://hbr.org/
22 October 2010
Hutt City Council 2002 Final Report Broadband Strategy Project August 2002
Hutt City Council,
Porirua City
Council & Upper
Hutt City Council
2003 Smartlinx3 Report Draft 1.1 11 November 2003
Hutt City Council,
Porirua City
Council & Upper
Hutt City Council
2003 Telecommunications Aggregation Project:
results of postal survey
11 February 2003
Kemp, D. 2005 Wellington Regional Strategy Project:
recommended key economic and urban
development focus areas
Wellington Regional Strategy
Background Papers
http://www.wrs.govt.nz/docs/1
866_ThewholeDKreport_s354
4.pdf
8 March 2007
McDermott Miller 2005 Wellington Regional Strategy: regional
growth initiatives
Wellington Regional Strategy
Background Papers
http://www.wrs.govt.nz/docs/1
930_McDermottMillerR_s364
4.pdf
8 March 2007
Macdonald, N. 2010 Where to now for our fair city? Dominion Post 12/6/2010, D1-
D2
Parliamentary
Library
2005 Electoral Profile Wellington Central http://www.parliament.nz/en-
NZ/MPP/Electorates/EPHistor
y/c/5/c/c5cba0a56f6c47fbbc32
64cddbaebf59.htm
22 October 2010

335
Philips Fox nd Constitution of Smartlinx3 Limited
Company Number 1506089
Digital Cities and
Regional Networks
National Conference
http://www.digitalcities
.co.nz/presentations/ind
ex.html
22 October 2010
Positively
Wellington
Business
2006 Transforming Wellington: Tertiary
Education‟s Economic Contribution
http://www.positivelyw
ellingtonbusiness.co.nz/
mainsite/research.html
27 November 2006
Sanderson, K.
& Leung-Wai, J.
For
Business and
Economic
Research Ltd
(BERL)
2005 Report to Wellington Regional Strategy
Group: rationale for focus areas
Wellington Regional
Strategy Background
Papers
http://www.wrs.govt.nz
/docs/1921_berlBackgr
oundRe_s3637.pdf
8 March 2007
SGS Economics
& Planning
2005 Wellington Regional Strategy: key policy
levers – urban form and economic
development
Wellington Regional
Strategy Background
Papers
http://www.wrs.govt.nz
/docs/1924_SGSReport
_s3640.pdf
8 March 2007
Smartlinx3 2010 Various reports http://www.smartlinx3.
co.nz/
Statistics New
Zealand
2003 Wellington Region Community Profile http://www2.stats.govt.
nz/domino/external/we
b/CommProfiles.nsf/Fi
ndInfobyArea/09-rc
22 October 2010
Urbanista Ltd 2005 Wellington Regional Strategy: selection of
focus areas
Wellington Regional
Strategy Background
Papers
http://www.wrs.govt.nz
/docs/1919_UrbanistaR
eport_s3635.pdf
8 March 2007
Wellington City
Council
2006 Information and Communications
Technology Policy
http://www.wellington.
govt.nz/plans/policies/i
ct/pdfs/ictpolicy.pdf
30 October 2006
Wellington
Regional Strategy
2006 Internationally Competitive Wellington: a
sustainable economic growth framework for
our region - discussion documents (x2)
Wellington Regional
Strategy
Wellington
Regional Strategy
Information &
Techniques
Working Party
2004 Regional Stocktake: taking the temperature
of the Wellington Region today
http://www.wrs.govt.nz
/docs/a_stocktake__intr
o_and_section__sized.
22 October 2010

336
APPENDIX D
APPENDIX D: Newspaper Search Terms
THE DOMINION 1995 (Not Wellington)
(networks <in> subjects OR information services <in> subjects)
THE DOMINION 1995
(Southland <in> subjects OR Invercargill city <in> subjects OR Invercargill <in> subjects)
THE DOMINION 1995
(Wellington area <in> subjects OR Wellington City <in> subjects)
THE DOMINION POST 2005 Information Services (Not Wellington)
(information services <in> subjects)
THE DOMINION POST 2005
(Information Technology <in> subjects OR computers <in> subjects)
THE DOMINION POST 2005 Networks (Not Wellington)
(networks <in> subjects)
THE DOMINION POST 2005
(Southland <in> subjects OR Invercargill city <in> subjects OR Invercargill <in> subjects)
THE DOMINION POST 2005
(Wellington area <in> subjects OR Wellington City <in> subjects)

3
37
APPENDIX E
Appendix E: Meta-matrices for Cross Case Analysis
5.1 INTERCONNECTING
1985 1995 2005
Southland Wellington Southland Wellington Southland Wellington
5.1
.1 In
tern
atio
na
l Tra
de
Chinese delegation
visit gas & coal mines.
Direct shipping link
from Bluff to China.
Business in USA built
through ex-pat
connection
Sister city relationships
with San Francisco,
Washington & Port
Moresby.
Secondary schools
recruit international
Asian & European
students.
Southlanders awarded
scholarships to Japan.
Sister city relationship
with Australia &
Japan.
Vic Uni introduces
Asian Studies Major.
Asian companies
investing in property.
Capital Development
Agency builds links in
South Pacific.
Hutt City sister city
relationship with
Japan.
Exchanges between
Wellington & Beijing.
Forest company ships
woodchip to Japan.
Sheet Metal company
exporting to Australia.
Australian Uni sets up
international campus
for Asian students.
5.1
.2 N
etwo
rked
Org
an
isatio
n
Parliament begins to
become networked.
Earthquake emergency
management & Dept of
Survey & Land install
networks.

3
38
5.1
.3 In
tern
atio
na
l Netw
ork
Student exchange with
Japan.
School principal
awarded funds for trip
to USA.
Local libraries linked
to national network.
Student exchanges with
Zimbabwe.
Internet access through
Vic Uni, Café & bar.
ISP logs 60,000 calls
per week.
Free access no longer
viable.
Mayoral candidate uses
Internet for campaign.
Porirua city council
$2m computer system.
Southland schools host
students from Maldives
& USA.
90% have access to
Internet.
2 Vic Uni students
spend a year in South
Korea.
5.1
.4 N
etwo
rks &
Clu
sters
Rural networks for
friendship & practical
advice.
Mergers.
SMEs share facilities.
Chamber of Commerce
& Regional Council set
up links between
businesses and
unemployed.
Software company,
Progeni, forms link
with China.
High tech zone
established in Hutt
Valley.
Business & education
urged to provide
mutually beneficial
partnerships.
Number of different
networks operating e.g.
Techlink, Artslink.
Mergers in education
sector.
2001 survey to
establish needs of local
business.
Cowshed software used
to link 5 dairy farms.
First employers‟ forum
for BIT students.
Southland & Otago
DHBs pool resources
using Oracle financial
& procurement
systems.
2003 survey in Hutt to
establish needs of local
business.
Networks in education
e.g. “Working smarter
with data”.
Film maker Peter
Jackson teams with
South Korean firm.
Business Hutt Valley
joint venture between
Chamber of Commerce
& CBD+.
One stop shop
manufacturing centre
set up in Hutt Valley
Table 34: Cross case analysis for "Interconnecting"

3
39
5.2 INFORMING
1985 1995 2005
Southland Wellington Southland Wellington Southland Wellington
5.2
.1 S
kill S
ho
rtag
es
Severe staff shortages
in rural health sector
& Secondary
Schools.
Population of
Invercargill increases
slightly.
Strong demand for
programmers.
State Services
Commission have
62% turnover in
Systems Analyst.
Public sector losing
staff.
Senior Uni
positions hardest to
fill.
Severe shortage
secretarial staff.
City council has hard
job persuading
potential employees to
move South.
Unemployed retrained
to fill vacant positions.
Shortage of engineering
workers & teachers.
Move to attract new
immigrants to
Wellington rather than
Auckland.
Staff shortages in health
& police.
Schools fully staffed.
Despite extra points few
new immigrants opt to
settle in region.
Staff shortages in IT,
health and local
government.

3
40
5.2
.2 In
vestm
ent in
Ed
uca
tion
Falling school rolls Vic Uni recruits 60
international
students from
ASEAN countries.
Tertiary sector
expanding.
Vic Uni appoints
first chair of
communications.
Polytechnic faces
funding crisis and low
staff morale.
Polytechnic losing
students due to strong
job market.
Secondary schools
recruit Asian students.
Alan Duff‟s Books in
Homes scheme starts in
2 Southland schools.
Volatile competitive
tertiary sector.
Differences between
state schools
increasing.
Call for free food &
health care for poorer
schools.
More diversity with
Jewish & Steiner
schools opening.
Zero fees policy at SIT.
Merger of Secondary
schools.
Tech Mentor scheme.
JADE kids programme at
SIT.
SIT enrolments increase
by 2000.
MP concerned about cuts
in rural training.
Venture Southland
launching enterprise
training workshops e.g.
how to keep computers
secure.
Seasonal careers course
to enable seasonal
workers to find off
season work.
Chamber of Commerce
hold graduation
ceremony for trade
qualifications.
English language school
in Kapiti gets govt grant.
Weltec receives govt
grant to keep trade based
courses going.

3
41
5.2
.3 P
rom
otin
g T
ech
no
log
y
Field days for women
in agriculture include
use of computers.
Vic Uni holds
seminar on IT and
economic growth.
Elders‟ seminar on
IT.
Symposium for
women on science
& tech.
Chamber of
Commerce sponsor
seminar on
videotext, EFTPOS
& office
automation.
IT conferences hosted.
Seminar on Internet for
female managers.
High tech medical
equipment at local
hospital showcased
world wide.
5.2
.4 IT
in E
du
catio
n
Teleconferencing
used for distance
learning & virtual
conference.
Bluff school wins
computer in
competition.
PEACENET
satellite links
polytechnic and
Pacific Islands.
2 Masterton schools
buy networked labs
of Poly 2 Learning
system.
Course in computer
skills for 6-9 yr
olds.
Concerns computers
may replace teachers.
IT education offered to
wider community.
Schools keen to
collaborate.
Use of Internet in
tertiary & secondary
schools.
Multimedia lecture
theatre for CIT.
Statistics course notes
put on Internet at Vic
Uni.
Vic Uni politics dept
offers electronic
journal.
Use of interactive
whiteboards in schools.
SIT buys anti-plagiarism
software.
SIT lecturer travels
world to study distance
education.
Wellington Girls College
regarded as pioneer in
use of IT.
Vic Uni links with wider
community.
Whitireia Poly has $7.5m
learning centre.
Live streaming of rugby
games at private school.
Table 35: Cross case analysis for "Informing"

3
42
5.3 INNOVATING
1985 1995 2005
Southland Wellington Southland Wellington Southland Wellington
5.3
.1 C
lima
te & C
ultu
re
Hutt Valley being
promoted as NZs
Silicon Valley.
Conference for
Upper Hutt
exporters &
manufacturers on
product
development &
int finance.
Seminars for business.
Joint BCA/BSc at Vic
Uni
Inaugural Telecom NZ
incubator expo.
Annual icehouse SME
owner growth seminars.
5.3
.2 E
ntr
epre
neu
rs
Small scale
entrepreneurs.
Vent-a-Matic to
open & close
greenhouse
windows developed
by engineer wins
prizes.
Southland Times
Bright Ideas contest
has good range of
entries.
City council
complete 3rd
Venture factory.
Small scale
entrepreneurs
(board games &
kitset aeroplanes).
Small start up
businesses
Graduates of young
enterprise invited to
share knowledge.
Small start up businesses.
Deep space telescope
project.
First graduates of
Creative HQ incubator.
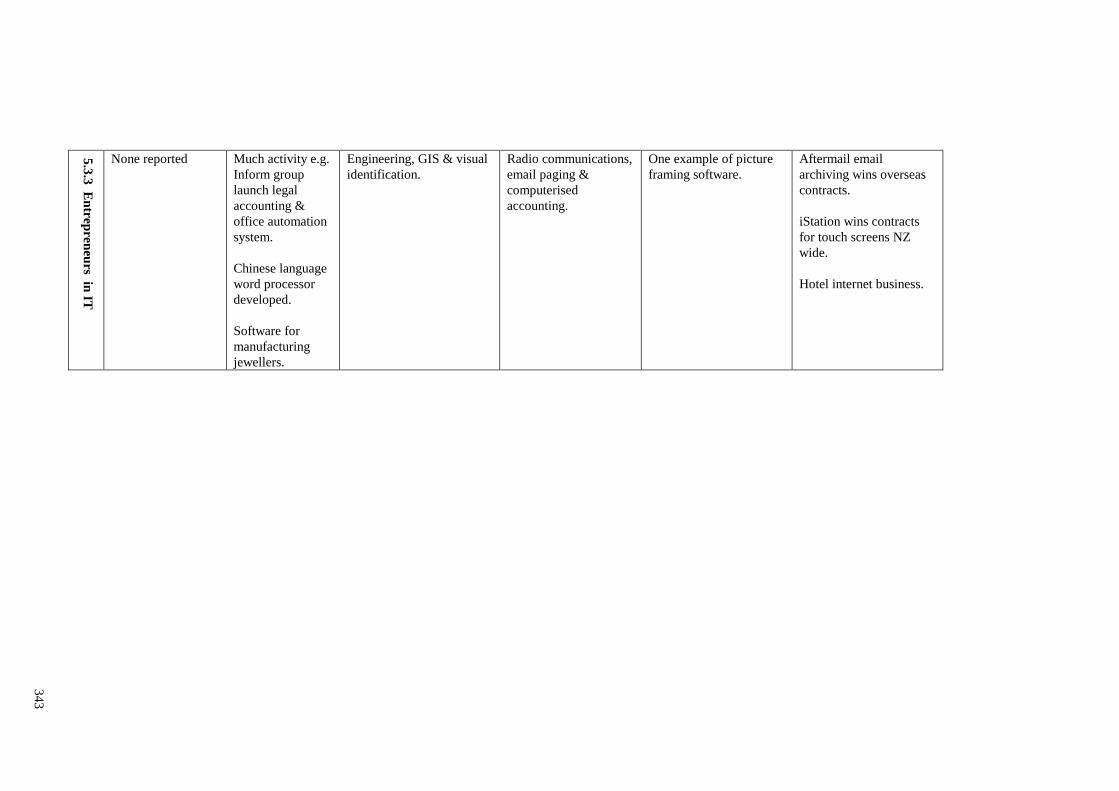
3
43
5.3
.3 E
ntr
epre
neu
rs in IT
None reported Much activity e.g.
Inform group
launch legal
accounting &
office automation
system.
Chinese language
word processor
developed.
Software for
manufacturing
jewellers.
Engineering, GIS & visual
identification.
Radio communications,
email paging &
computerised
accounting.
One example of picture
framing software.
Aftermail email
archiving wins overseas
contracts.
iStation wins contracts
for touch screens NZ
wide.
Hotel internet business.

3
44
5.3
.4 A
do
ptio
n o
f ICT
s
Sign writer uses
silicon chip.
Sheep breeder
adopts
computerised
system developed in
Timaru
BPI systems
develop Viewdata
link for NZ
racing.
Wairarapa deer
farmer takes part
in videotext trial.
Storefront
videotext parlour
set up on Lambton
Quay.
Nat Lib buys full
text retrieval
service.
Shareholding firm
uses videotext for
investors.
Stock exchange
fully
computerised.
Powernet adopts electronic
mapping system.
Traffic wardens using
notebook computers to
issue tickets.
Use of internet by local
govt & libraries.
Online dating used by
thousands.
e-petition for loud
exhausts attracts 400
signatures.
Brocks family wins most
connected family comp.
Variety of organisations
using internet e.g.
regional council, arts
festival,
ANZAC day.

3
45
5.3
.5 E
lectron
ic Co
mm
erce
ATM machine in
Invercargill highest
throughput in
country.
Southlanders
appreciate out of
hours banking.
Trustee Bank
Southland launches
EFTPOS system.
ATMs heavily
used over holiday
period.
Retailers not in
hurry to expand e-
shopping.
Interest in telephone
banking.
Cell phone coverage
extended.
Multimedia courses
offered.
Buying & selling
online.
Te Papa opens cyber
store.
Fonterra‟s FencePost site
for dairy farmers widely
used.
Free cell phone calls
available to healthline.
Wireless forum
showcases new
technology.
Wireless network to track
baggage at airport.
City council launches e-
democracy initiative.
5.3
.6 R
ura
l
En
trep
ren
eurs
Experimentation
with angora goats &
deer.
Links with MAF
research centre.
DSIR holds
seminar on
chemical sprays in
agric.
Local farm turned
into tourist
attraction.
Soil fertility software
piloted.
Emu farm opened as
tourist attraction.
Deer focus farm opened.
Organic arnica trial
Wallaceville Animal
Research centre
celebrates centenary.
Table 36: Cross case analysis for "Innovating"

3
46
5.4 INTERACTING
1985 1995 2005
Southland Wellington Southland Wellington Southland Wellington
5.4
.1 R
egio
na
l Cu
lture
Concern about youth
crime.
Blue Light police
sponsored activities
for young people.
Neighbourhood
support groups set
up.
Junior Council set
up.
Traditional rural
culture.
Temperance Alliance
strongest support in
Southland despite
rugby, racing & beer
image.
MP organises
petition against
Homosexual Law
Reform (largest ever
presented to
parliament).
Concern about
youth crime.
Blue light
discos.
First employer
to appoint equal
opportunities
officer.
Community
relations
officers
appointed for
Petone &
Porirua.
Centre for
community
initiatives
opens.
MP put up
Homosexual
Law Reform
bill, criticised
by School
Principal &
Salvation Army.
Crime down but domestic
violence increasing.
Some liberalisation.
CAB busiest in country.
Access radio has
“wimmin” programme.
True Southlander is
“hardy”.
Crime down but
violent crime
increasing.
Neighbourhood
support groups for
women.
More cultural
diversity.
Libraries busiest in
country.
Hutt Valley Health
rated worst in country.
Porirua Community
Centre growing.
“Right up my Hutt
Valley” slogan not
popular.
Little interest in civil
unions.
Local councils work
together to promote
Southland.
New forum for young
people.
“Arsehole of world” title
still stings.
Our Way Southland
report.
Highest % civil unions in
country.
City council uses ICT to
promote citizen
interaction.
All blacks help with
school holiday
programme.
Ex-gang member sets up
social centre.
Porirua marks 40 years
as city.
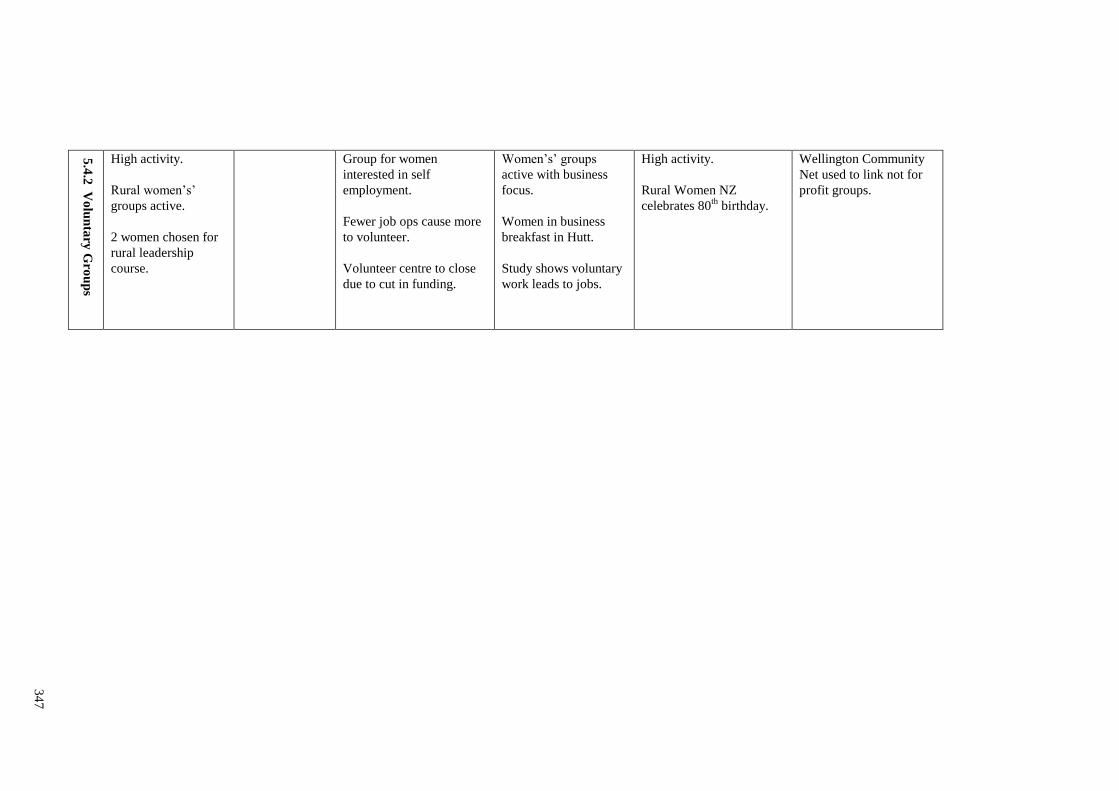
3
47
5.4
.2 V
olu
nta
ry G
rou
ps
High activity.
Rural women‟s‟
groups active.
2 women chosen for
rural leadership
course.
Group for women
interested in self
employment.
Fewer job ops cause more
to volunteer.
Volunteer centre to close
due to cut in funding.
Women‟s‟ groups
active with business
focus.
Women in business
breakfast in Hutt.
Study shows voluntary
work leads to jobs.
High activity.
Rural Women NZ
celebrates 80th
birthday.
Wellington Community
Net used to link not for
profit groups.
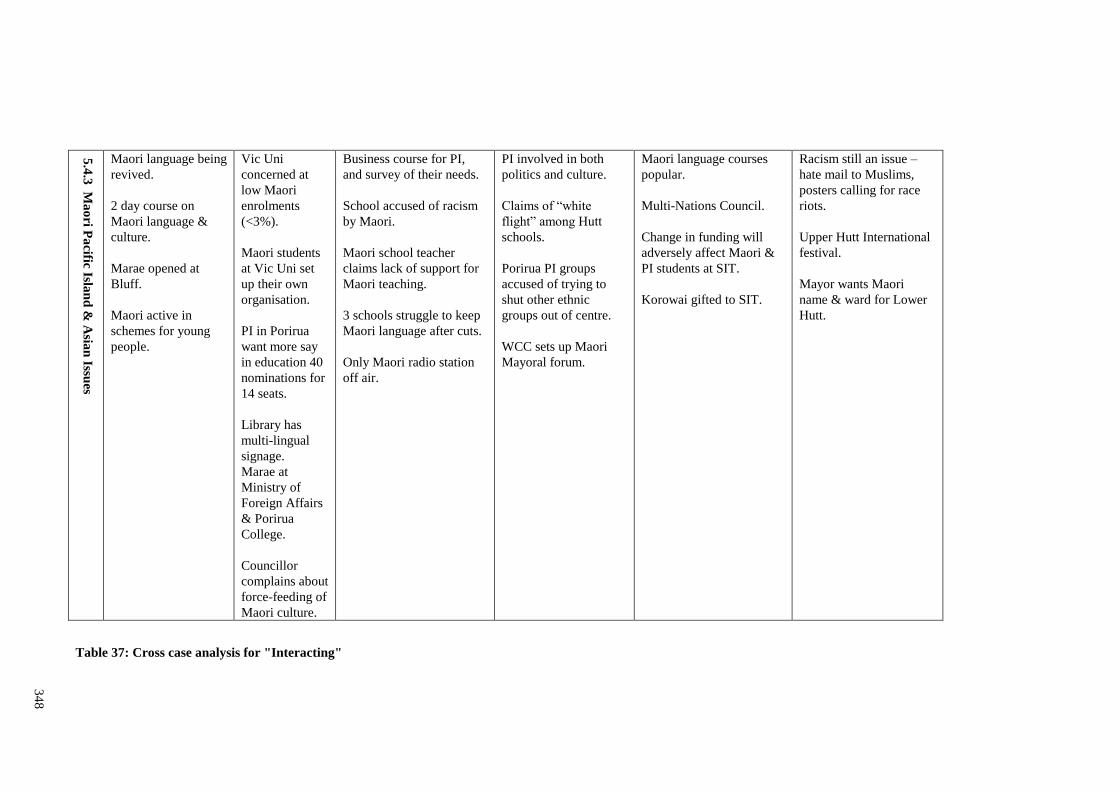
3
48
5.4
.3 M
ao
ri Pa
cific Islan
d &
Asia
n Issu
es
Maori language being
revived.
2 day course on
Maori language &
culture.
Marae opened at
Bluff.
Maori active in
schemes for young
people.
Vic Uni
concerned at
low Maori
enrolments
(<3%).
Maori students
at Vic Uni set
up their own
organisation.
PI in Porirua
want more say
in education 40
nominations for
14 seats.
Library has
multi-lingual
signage.
Marae at
Ministry of
Foreign Affairs
& Porirua
College.
Councillor
complains about
force-feeding of
Maori culture.
Business course for PI,
and survey of their needs.
School accused of racism
by Maori.
Maori school teacher
claims lack of support for
Maori teaching.
3 schools struggle to keep
Maori language after cuts.
Only Maori radio station
off air.
PI involved in both
politics and culture.
Claims of “white
flight” among Hutt
schools.
Porirua PI groups
accused of trying to
shut other ethnic
groups out of centre.
WCC sets up Maori
Mayoral forum.
Maori language courses
popular.
Multi-Nations Council.
Change in funding will
adversely affect Maori &
PI students at SIT.
Korowai gifted to SIT.
Racism still an issue –
hate mail to Muslims,
posters calling for race
riots.
Upper Hutt International
festival.
Mayor wants Maori
name & ward for Lower
Hutt.
Table 37: Cross case analysis for "Interacting"
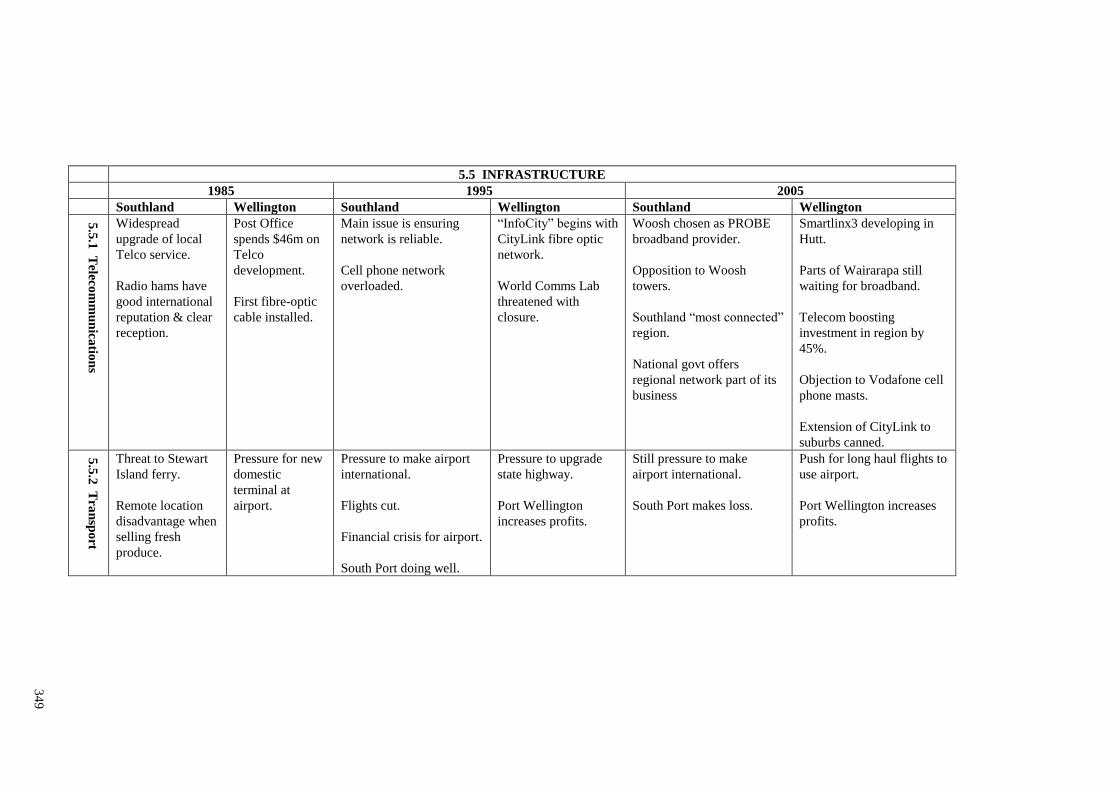
3
49
5.5 INFRASTRUCTURE
1985 1995 2005
Southland Wellington Southland Wellington Southland Wellington
5.5
.1 T
eleco
mm
un
icatio
ns
Widespread
upgrade of local
Telco service.
Radio hams have
good international
reputation & clear
reception.
Post Office
spends $46m on
Telco
development.
First fibre-optic
cable installed.
Main issue is ensuring
network is reliable.
Cell phone network
overloaded.
“InfoCity” begins with
CityLink fibre optic
network.
World Comms Lab
threatened with
closure.
Woosh chosen as PROBE
broadband provider.
Opposition to Woosh
towers.
Southland “most connected”
region.
National govt offers
regional network part of its
business
Smartlinx3 developing in
Hutt.
Parts of Wairarapa still
waiting for broadband.
Telecom boosting
investment in region by
45%.
Objection to Vodafone cell
phone masts.
Extension of CityLink to
suburbs canned.
5.5
.2 T
ran
spo
rt
Threat to Stewart
Island ferry.
Remote location
disadvantage when
selling fresh
produce.
Pressure for new
domestic
terminal at
airport.
Pressure to make airport
international.
Flights cut.
Financial crisis for airport.
South Port doing well.
Pressure to upgrade
state highway.
Port Wellington
increases profits.
Still pressure to make
airport international.
South Port makes loss.
Push for long haul flights to
use airport.
Port Wellington increases
profits.
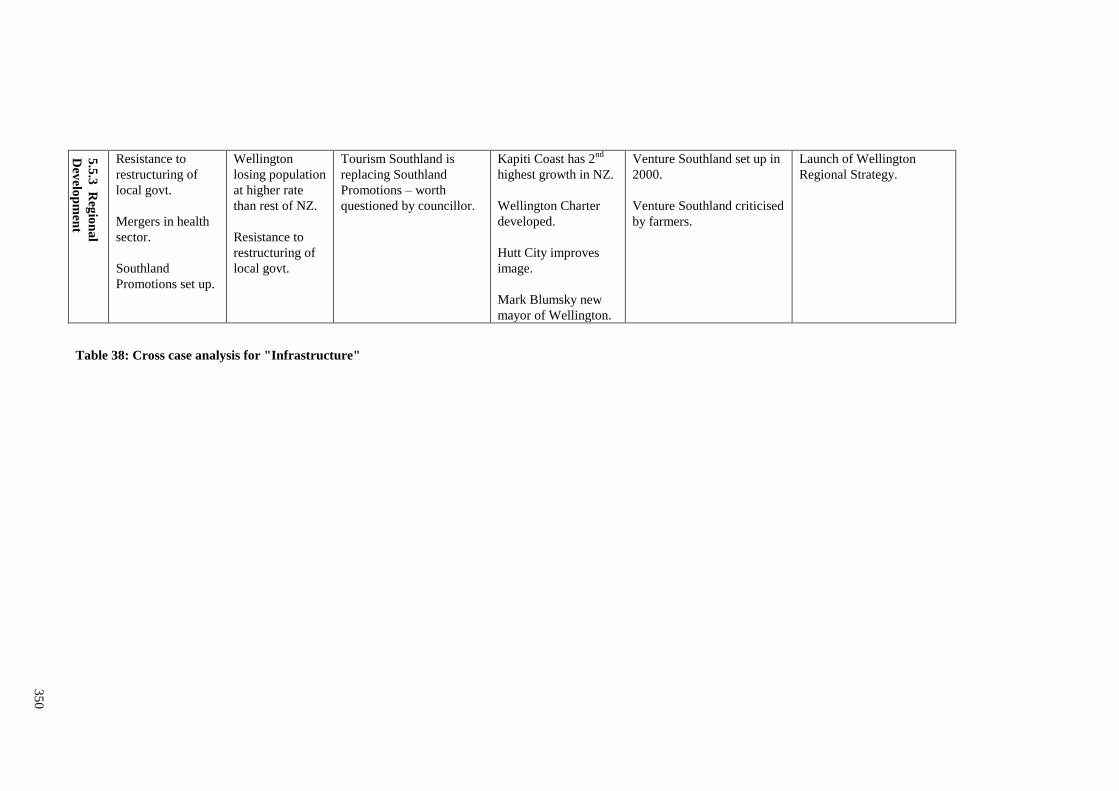
3
50
5.5
.3 R
egio
na
l
Dev
elop
men
t
Resistance to
restructuring of
local govt.
Mergers in health
sector.
Southland
Promotions set up.
Wellington
losing population
at higher rate
than rest of NZ.
Resistance to
restructuring of
local govt.
Tourism Southland is
replacing Southland
Promotions – worth
questioned by councillor.
Kapiti Coast has 2nd
highest growth in NZ.
Wellington Charter
developed.
Hutt City improves
image.
Mark Blumsky new
mayor of Wellington.
Venture Southland set up in
2000.
Venture Southland criticised
by farmers.
Launch of Wellington
Regional Strategy.
Table 38: Cross case analysis for "Infrastructure"

3
51
5.6 INCOME
1985 1995 2005
Southland Wellington Southland Wellington Southland Wellington
5.6
.1 E
con
om
y
Both aluminium &
farming sectors hit
downturns
Businesses
generally
surviving.
Hutt Valley is
growth area.
More people
need food
parcels.
Poverty for
pensioners as
bad as 1930s.
Business confident, but
consumers pessimistic.
Property values doubled
in last 3 years (strongest
in country).
Number of food parcels
has skyrocketed.
Wellington Central electorate
richest in NZ.
Business confidence high in
Wellington.
Manufacturing badly hit by
high exchange rate.
Invercargill stronger
growth than rest of region
with stable population.
One of only 2 regions to
show negative growth in
first ¼ up in second ¼.
Property cheapest in
country.
Growth lagging behind
national average.
Property, finance,
insurance, government,
defence, comms &
manufacturing
contributing most to
GDP.
Australians buying
property in capital.
Barmy Army tour
provides $14m cash
injection.
As year ends business
confidence slides.
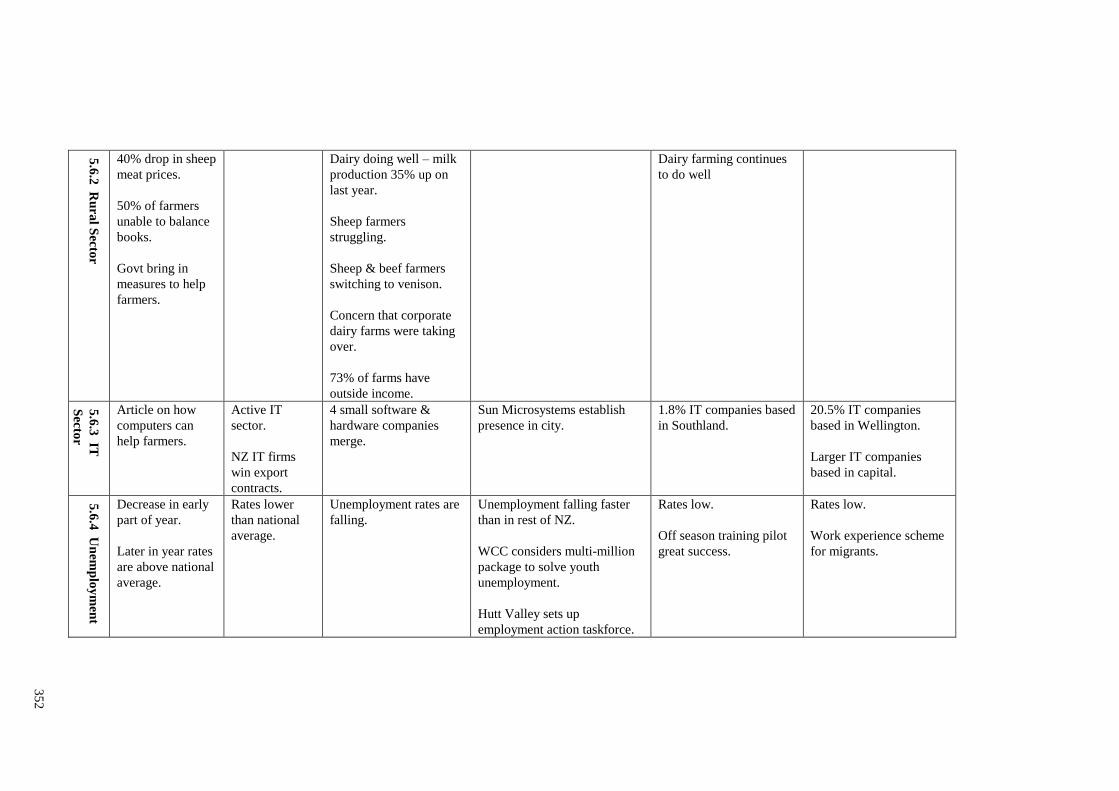
3
52
5.6
.2 R
ura
l Sec
tor
40% drop in sheep
meat prices.
50% of farmers
unable to balance
books.
Govt bring in
measures to help
farmers.
Dairy doing well – milk
production 35% up on
last year.
Sheep farmers
struggling.
Sheep & beef farmers
switching to venison.
Concern that corporate
dairy farms were taking
over.
73% of farms have
outside income.
Dairy farming continues
to do well
5.6
.3 IT
Secto
r
Article on how
computers can
help farmers.
Active IT
sector.
NZ IT firms
win export
contracts.
4 small software &
hardware companies
merge.
Sun Microsystems establish
presence in city.
1.8% IT companies based
in Southland.
20.5% IT companies
based in Wellington.
Larger IT companies
based in capital.
5.6
.4 U
nem
plo
ym
ent
Decrease in early
part of year.
Later in year rates
are above national
average.
Rates lower
than national
average.
Unemployment rates are
falling.
Unemployment falling faster
than in rest of NZ.
WCC considers multi-million
package to solve youth
unemployment.
Hutt Valley sets up
employment action taskforce.
Rates low.
Off season training pilot
great success.
Rates low.
Work experience scheme
for migrants.

3
53
5.6
.5 In
vestm
ent
Southland
Regional
Development
loans create 52
jobs.
Grants from
Medical
Research
Council.
New
investment
bank
established
MP criticises locals who
try to block foreign
investment.
Singaporean investor buys
hotel complex.
Table 39: Cross case analysis for "Income"

354
APPENDIX F
APPENDIX F: Human Ethics Application
INFORMATICS HUMAN ETHICS COMMITTEE
Application for Approval of Research Projects
Please email applications to your supervisor, who will then email it to an Informatics HEC member for a
preliminary review.
Note: The Human Ethics Committee attempts to have all applications approved within 6 working days,
but a longer period may be necessary if applications require substantial revision.
1 NATURE OF PROPOSED RESEARCH:
(a) Student Research
(b) If Student Research Degree ……PhD Course Code …Info 690……………
(c) Project Title: …The Role of Information and Communication Technologies in Enhancing the
Development of Learning Regions
2 INVESTIGATORS:
(a) Principal Investigator
Name ……………Janet Toland………………………………………
e-mail address ………[email protected]……………………………
School/Dept/Group …School of Information Management, ………………
(b) Other Researchers Name Position
(c) Supervisor (in the case of student research projects)
……Dr Pak Yoong, & Dr Peter Murphy………………………
3 DURATION OF RESEARCH
(a) Proposed starting date for data collection – After HEC approval has been granted.
(Note: that NO part of the research requiring ethical approval may commence prior to
approval being given)
(b) Proposed date of completion of project as a whole ………December 2006
4 PROPOSED SOURCE/S OF FUNDING AND OTHER ETHICAL
CONSIDERATIONS
(a) Sources of funding for the project
Please indicate any ethical issues or conflicts of interest that may arise because of sources of funding
e.g. restrictions on publication of results

355
……………n/a……………………………………………………………………………...
………………………………………………………………………………………………….
(b) Is any professional code of ethics to be followed N
If yes, name ……………………………………………………………………………………
(c) Is ethical approval required from any other body N
If yes, name and indicate when/if approval will be given
………………………………………………………………………………………………….
5 DETAILS OF PROJECT
Briefly Outline:
(a) The objectives of the project
The main objective of the study is to examine how information and communication technologies can
enhance the efforts of regions in New Zealand to achieve sustainable economic success, by improving the
quality of information flows that enable knowledge sharing and building, both within the region itself, and
between the region and the outside world.
This human ethics application is to cover the first stage of the research process, where the desired
outcome is to obtain a broad appreciation of the relevant issues. The questions asked at this stage are of an
overview nature.
(b) Method of data collection
Much of the material necessary can be collected through searching literature, media archives, and
statistical databases. This approach will be adopted wherever possible. However in order to supplement
this information individual one hour interviews will be carried out with people who will be able to provide
information about certain aspects of economic development in their region. Interviews will be tape
recorded and transcribed
(c) The benefits and scientific value of the project
The research will increase understanding of the factors that contribute to successful learning regions. The
findings will be significant for both those regions that are already economically successful, and those
regions that are economically underdeveloped. The focus of the research is on New Zealand, and one of
the benefits will be the application of ideas that have been developed in Europe and the USA to the local
situation.
The research will also discover how ICT can best be utilised to improve knowledge flows within a region.
Improved knowledge sharing leads to innovation and economic success. The research should help to
undercover the ways in which ICT can be used to improve communications between co-located
organisations. The findings of the research will raise awareness of the role that ICT can play in economic
development.
(d) Characteristics of the participants
A wide variety of participants will be contacted. There are five different groups of interview questions; the
aim will be to carry out two or three interviews for each group of questions, making a total of about 10 to
15 interviews. All participants selected will be people who have some knowledge of factors relating to
regional development in New Zealand since 1970. Participants could be working (or will have previously
worked) for organisations such as: local government; chambers of commerce, NGOs, community groups
and education providers. Participants will be at a senior or middle management level and will be selected
as likely to have a broad overview of the activities of their particular organisation, and knowledge of how
it interacts with other organisations.

356
The general method for selecting participants will be to seek out those individuals who are regarded as
having a significant impact on the social and economic development of their region. Such participants
have often been recommended during exploratory interviews. As the emphasis of the research is on best
practice the goal is to select exceptional rather than typical participants. For each different group of
interview questions at least two interviewees with different backgrounds will be selected in order to
minimise the possibility of bias.
Participants will be interviewed for their individual opinions, rather than as representatives of any
organisation they may be currently working for, or have worked for in the past. If they are currently
working for an organisation it may be necessary for them to inform their employer that they are taking part
in this research.
(e) Method of recruitment
Participants will be directly invited to take part in an interview; they could be initially approached either
by email, letter, telephone, or face-to–face. Once participants have agreed in principle to be interviewed
they will be sent a formal letter detailing the background to the project, and the consent form.
(f) Payments that are to be made/expenses to be reimbursed to participants
…………n/a…………………………………………………………………………………...
(g) Other assistance (e.g. meals, transport) that is to be given to participants
…………n/a…………………………………………………………………………………...
(h) Any special hazards and/or inconvenience (including deception) that
participants will encounter
Possible inconvenience in terms of time lost through participation in interviews
(i) State whether consent is for: (Please indicate as many as it applies)
(i) the collection of data Y
(ii) attribution of opinions or information N
(iii) release of data to others N
(iv) use for a conference report or a publication Y
(v) use for some particular purpose (specify) N
…………………………………………………………………………………………………
Attach a copy of any questionnaire or interview schedule to the application
(j) How is informed consent to be obtained (see paragraphs 4.31(g), 5.2, 5.5 and 5.61 of
the Guidelines)
(i) the research is strictly anonymous, an information sheet is supplied and
informed consent is implied by voluntary participation in filling out a questionnaire for example (include a
copy of the information sheet)
N
(ii) the research is not anonymous but is confidential and informed consent will be
obtained through a signed consent form (include a copy of the consent form and information sheet)
Y

357
(iii) the research is neither anonymous nor confidential and informed consent will
be obtained through a signed consent form (include a copy of the consent form and information sheet)
N
(iv) informed consent will be obtained by some other method (please specify and
provide details) N
………………………………………………………………………………………………….
………………………………………………………………………………………………….
With the exception of anonymous research as in (i), if it is proposed that written consent will not
be obtained, please explain why
………………………n/a…………………………………………………………………...
………………………………………………………………………………………………….
………………………………………………………………………………………………….
(k) If the research will not be conducted on a strictly anonymous basis state how issues of
confidentiality of participants are to be ensured if this is intended. (See paragraph 4.3.1(e) of the
Guidelines). (e.g. who will listen to tapes, see questionnaires or have access to data). Please ensure that
you distinguish clearly between anonymity and confidentiality. Indicate which of these are applicable.
(i) access to the research data will be restricted to the investigator
N
(ii) access to the research data will be restricted to the investigator and their
supervisor (student research) Y
(iii) all opinions and data will be reported in aggregated form in such a way that
individual persons or organisations are not identifiable Y
(iv) Other (please specify)
…………………………………………………………………………………………….……..(l)
Procedure for the storage of, access to and disposal of data, both during and at the conclusion of
the research. (see section 7 of the guidelines). Indicate which are applicable:
(i) all written material (questionnaires, interview notes, etc) will be
kept in a locked file and access is restricted to the investigator Y
(ii) all electronic information will be kept in a password-protected file and access
will be restricted to the investigator Y
(iii) all questionnaires, interview notes and similar materials will be destroyed:
(a) at the conclusion of the research N
or (b) ___2___ years after the conclusion of the research Y
(iv) any audio or video recordings will be returned to participants and/or
electronically wiped Y
(v) other procedures (please specify):
………………………………………………………………………………………………….
………………………………………………………………………………………………….
If data and material are not to be destroyed please indicate why and the procedures envisaged for
ongoing storage and security
………………………………………………………………………………………………….
………………………………………………………………………………………………….

358
(m)Feedback procedures (See section 8 of the Guidelines). You should indicate whether
feedback will be provided to participants and in what form. If feedback will not be given, indicate the
reasons why.
Candidates will be sent a copy of the interview transcript and given the opportunity to revise any
inaccuracies or misunderstandings.
On the conclusion of the research all participants will be offered the opportunity to receive a short report
outlining the main findings
(n) Reporting and publication of results. Please indicate which of the following are appropriate.
The proposed form of publications should be indicated on the information sheet and/or consent form.
(i) publication in academic or professional journals Y
(ii) dissemination at academic or professional conferences Y
(iii) deposit of the research paper or thesis in the University Library (student
research) Y
(iv) a case study used for teaching purposes Y
(v) other (please specify)

359

360
Interview Schedule
Please note that as the participants in interviews will come from a variety of backgrounds only a
sub-set of these questions will be used at any one interview. Prior to the interview, the interviewer
will select the questions that are most pertinent to any one particular interviewee.
1) Questions relating to economy & public policy
What are the significant changes in the New Zealand economy since 1970?
What have been the significant changes in public policy towards regional development in New Zealand at
both a national and regional level?
What have been the major shifts in weak strong linkages between different sectors throughout New
Zealand since 1970?
2) Questions relating to networking & SMEs
What are the significant economic networks that have been operating within this region since 1970?
What have been the significant changes in the methods of managing SMEs since 1970?
What have been the significant changes in the roles of regional bodies such as Chambers of Commerce?
3) Questions relating to information & communications technologies
What have been the significant changes in information and communications technology since 1970?
How have these new developments in information and communications technology been adopted in New
Zealand?
4) Questions relating to education & human capital
What have been the significant changes in human, social, cultural and intellectual capital in New Zealand
since 1970?
What have been the significant changes in tertiary and vocational education since 1970?
5) Questions relating to innovation
- What is the pattern of product and process innovation in New Zealand since 1970?

361
INFORMATION SHEET
Project Title: The Role of Information and Communication Technologies in Enhancing the
Development of Learning Regions
Researcher: Janet Toland, Lecturer in Information Systems, School of Information Management, Victoria
University of Wellington
I am currently studying for a PhD in Information Systems. I am researching the role of information and
communication technologies in enhancing the development of learning regions. The term “Learning
Region” is used to identify regions that are innovative, economically successful, and inhabited by active
and engaged citizens. Such regions are characterised by strong linkages between local businesses,
community groups, and education providers. Information and communication technologies can be an
important tool in improving the flow of knowledge between the stakeholders within a region. The main
objectives of the proposed study are to:
1. Assess how information and communication technologies can be used to facilitate the
development of learning regions;
2. Identify and improve the information flows between organisations within a particular region.
I am inviting individuals who can contribute some background information to participate in my research..
Participants will be invited to take part in a one-hour interview. The University requires that human ethics
approval be obtained for research involving human participants. Permission will be requested to record
the interview. After the interview, participants will have an opportunity to read and check the
transcription.
Participation is voluntary, and the participant should carefully read the consent form and sign it if he/she
wishes to participate. Should any participants feel the need to withdraw from the project, they may do so
without question up until 31st December 2005. If participants choose to withdraw no part of any material
they have provided will be included in the research.
Responses collected will form the basis of my research project and will be put into a written report on a
confidential basis. No other person besides my PhD supervisors, Dr. Pak Yoong and Dr. Peter Murphy
and myself will see the interview transcript. The final thesis will be lodged in the Victoria University of
Wellington library. All interview transcripts and tapes will be destroyed by 31st December 2007. A report
detailing the main findings of the research will be available to participants on request.
If you have any questions, please contact me at [email protected] or on 04-463-6861.
Alternatively you can contact my primary supervisor, Associate Professor Pak Yoong
[email protected] on 04-463-5878
Thank you
Janet Toland Signed:

362
CONSENT FORM
VICTORIA UNIVERSITY OF WELLINGTON CONSENT TO PARTICIPATION IN
RESEARCH
Title of Project: The Role of Information and Communication Technologies in Enhancing the
Development of Learning Regions
[Please mark each box with a tick to indicate agreement]
□ I have been given and have understood an explanation of this research project.
□ I have had an opportunity to ask questions and have them answered to my satisfaction.
□ I understand that any information I provide will be kept confidential to the researcher, and the
supervisors. I understand that if I give permission the interview will be tape-recorded.
□ I understand that I will have an opportunity to check the transcript of the interview.
□ I understand that the data I provide will not be used for any other purpose or released to others without
my written consent.
□ I understand that I have the right to withdrawal from this project at any time up until 31 December
2005, and that all data collected (tapes and interview transcripts) will be destroyed two years after the
completion of the project. .
I confirm that I:
DO….□ DO NOT….□
Consent to take part in this research
DO….□ DO NOT….□
Have approval by my employer to participate in this research project.
Agree to have interviews tape-recorded
YES….□ NO.…□
Signed:
Name of Participant: Date:
(Please print clearly)
□ Please tick here if you would like to receive a report on the main findings of the research