an exogenous pre-storage melatonin alleviates chilling
TRANSCRIPT
�����������������
Citation: Bhardwaj, R.; Pareek, S.;
Domínguez-Avila, J.A.; Gonzalez-
Aguilar, G.A.; Valero, D.; Serrano, M.
An Exogenous Pre-Storage Melatonin
Alleviates Chilling Injury in Some
Mango Fruit Cultivars, by Acting on
the Enzymatic and Non-Enzymatic
Antioxidant System. Antioxidants
2022, 11, 384. https://doi.org/
10.3390/antiox11020384
Academic Editor: Monica Rosa
Loizzo
Received: 23 January 2022
Accepted: 10 February 2022
Published: 14 February 2022
Publisher’s Note: MDPI stays neutral
with regard to jurisdictional claims in
published maps and institutional affil-
iations.
Copyright: © 2022 by the authors.
Licensee MDPI, Basel, Switzerland.
This article is an open access article
distributed under the terms and
conditions of the Creative Commons
Attribution (CC BY) license (https://
creativecommons.org/licenses/by/
4.0/).
antioxidants
Article
An Exogenous Pre-Storage Melatonin Alleviates Chilling Injuryin Some Mango Fruit Cultivars, by Acting on the Enzymatic andNon-Enzymatic Antioxidant SystemRenu Bhardwaj 1 , Sunil Pareek 1,* , J. Abraham Domínguez-Avila 2 , Gustavo A. Gonzalez-Aguilar 2 ,Daniel Valero 3 and Maria Serrano 4,*
1 Department of Agriculture and Environmental Sciences, National Institute of Food TechnologyEntrepreneurship and Management, Kundli, Sonepat 131028, Haryana, India; [email protected]
2 Coordinacion de Tecnología de Alimentos de Origen Vegetal, Centro de Investigación en Alimentación yDesarrollo A.C. (CIAD), Carretera Gustavo Enrique Astiazaran Rosas No. 46, Hermosillo 83304, Mexico;[email protected] (J.A.D.-A.); [email protected] (G.A.G.-A.)
3 Department of Food Technology, Escuela Politécnica Superior de Orihuela, University Miguel Hernández,Ctra. Beniel km. 3.2, 03312 Alicante, Spain; [email protected]
4 Department of Applied Biology, Escuela Politécnica Superior de Orihuela, University Miguel Hernández,Ctra. Beniel km. 3.2, 03312 Alicante, Spain
* Correspondence: [email protected] (S.P.); [email protected] (M.S.);Tel.: +91-705-672-1483 (S.P.); +34-966-749-616 (M.S.)
Abstract: Melatonin (MT) treatment (100 µM, 2 h) was applied to four mango fruit cultivars (‘Langra’,‘Chaunsa’, ‘Dashehari’, and ‘Gulab Jamun’), before being stored at 5 ± 1 ◦C for 28 d, in orderto alleviate chilling injury (CI). Maximum CI reduction was observed in ‘Langra’ mangoes, andminimum in ‘Gulab Jamun’ mangoes. This positive effect on quality preservation was associated withan increased concentration of endogenous MT, which prevented the accumulation of reactive oxygenspecies (H2O2 and O2
.−) and stimulated non-enzymatic antioxidants (total phenolic compoundsand total flavonoids), possibly due to higher activity of phenylalanine ammonia lyase and tyrosineammonia lyase. Increased antioxidant activity was also documented in MT-treated ‘Langra’ mangoes,according to four different assays (DPPH, TEAC, FRAP, and CUPRAC) and higher activity of sixantioxidant enzymes (superoxide dismutase, catalase, peroxidase, ascorbate peroxidase, glutathionereductase, and dehydroascorbate reductase). In contrast, ‘Gulab Jamun’ mangoes showed minimalor no positive effects on the aforementioned variables in response to the exogenous MT application.‘Chaunsa’ and ‘Dashehari’ mangoes had some intermediate effects on their antioxidant system(enzymatic and non-enzymatic) and alleviation of CI, when treated with exogenous MT. We concludethat exogenous MT exerts a cultivar-dependent stimulating effect on the antioxidant system ofmangoes, which results in an increase in the fruits’ resistance to low temperature.
Keywords: antioxidant enzymes; cold storage; Mangifera indica; phenolics; phenylalanine ammonia-lyase;quality preservation; ROS
1. Introduction
Mango (Mangifera indica L.) is a tropical fruit, liked across the globe due to its nu-tritional value and excellent aroma and flavour [1]. It is a climacteric fruit that can beharvested at physiological maturity before ripening. Due to continued evolution of ethy-lene production and high respiration rates, mangoes take about 9 to 12 d to ripen afterharvest, depending on their maturity stage [2]. These processes result in a short shelf life;thus, proper postharvest handling and pre-storage treatments are often necessary to extendtheir availability period.
Low temperature storage slows down cellular metabolism, and is one of the mostcommon ways to extend the availability of various fruits; however, temperatures <13 ◦C
Antioxidants 2022, 11, 384. https://doi.org/10.3390/antiox11020384 https://www.mdpi.com/journal/antioxidants
Antioxidants 2022, 11, 384 2 of 28
will result in chilling injury (CI) in tropical fruit such as mango [3]. Fruit that develop CIshow some characteristic signs, such as uneven ripening, skin browning, surface pitting,and water-soaked lesions [4]. Therefore, techniques that allow to store mangoes at lowtemperatures, while also alleviating CI, are useful to extend their shelf life, availabilityperiod, and maintenance of export chain.
Numerous approaches have been undertaken to prevent CI in mangoes stored at lowtemperatures, such as pre-storage applications of methyl jasmonate [5], ethrel [6], oxalic acidand salicylic acid [7], 2,4-dichlorophenoxyacetic acid [8], nitric oxide [9], low temperatureconditioning [10], and chitosan and polyamine coating [11]. Although some have showninteresting results, they still have some drawbacks. For example, high concentrations of2,4-dichlorophenoxyacetic acid are potentially toxic for humans [8], while nitric oxide [9]and chitosan and polyamine coating [10] lead to a reduction in respiration and ethyleneproduction, and thus a poor colour development in mangoes. On contrary, the ripeningprocess was enhanced through application of methyl jasmonate [5], ethrel [6], and lowtemperature conditioning [11]. Therefore, there is still a need for more natural and reliablemethods that can not only enhance cold tolerance of mangoes, but also maintain theiroverall quality under these conditions.
Melatonin (N-acetyl-5-methoxytryptamine, MT) is an amphiphilic, low molecularweight, indolic compound ubiquitous in living organisms [12]. It acts as a bio-stimulant,antioxidant, and powerful regulator of growth and development under biotic and abioticstress conditions [13]. Postharvest MT applications on banana [14], broccoli [15], apple [16],and strawberry [17] fruit have highlighted its role in quality improvement, delaying senes-cence, preventing browning, and reducing fungal infection, respectively. MT has alsoshown a significant effect against CI in peach [18], tomato [19], and pomegranate [20] fruit.
The positive effects of its application are associated with the accumulation of endoge-nous MT, which acts as an antioxidant [17] by stimulating the free radical scavengingsystem [21], inducing activity of the pentose phosphate pathway [22], and maintaining thesaturated-to-unsaturated ratio of membrane phospholipids at low levels [22]. It has alsobeen shown to inhibit the synthesis of ethylene biosynthesising enzymes [14], promotingthe GABA shunt, and regulating intracellular energy production, polyamine, and prolineaccumulation [18].
We have reported the effects of an exogenous MT application in mangoes in anearlier study, which showed that they are cultivar-dependent, and that its efficacy isclosely associated with proline metabolism [4] and γ-aminobutyric acid shunt pathway [23].Thus, according to the literature and to our previous experiments, we hypothesise that apre-storage MT application may exert cultivar-dependent effects to alleviate CI signs inmango, which may be associated with changes in the fruits’ enzymatic and non-enzymaticantioxidant system.
The objectives of the present study were to (a) evaluate the effects of pre-storage MTapplication on CI signs of four cultivars of mango fruit stored at 5 ± 1 ◦C, (b) evaluatethe effects of an exogenous MT on endogenous MT content, and (c) elucidate the relationbetween CI and enzymatic and non-enzymatic antioxidant metabolism of mango fruit.
2. Materials and Methods2.1. Plant Material and Treatment
Four mango fruit cultivars were used in the present study, namely, ‘Langra’, ‘Chaunsa’,‘Dashehari’ and ‘Gulab Jamun’. Fruits were handpicked at physiological maturity butunripened, from an orchard of a local producer located in Sonepat, Haryana, India, andimmediately transported to the laboratory. Once there, fruits with apparent signs of injuryor defects were discarded, while the remaining ones were disinfected by dipping them in a1% (v/v) sodium hypochlorite solution for 2 min. For each cultivar, 200 disinfected fruitswere then randomly divided into two lots of 100 fruit each. The first lot was dipped indistilled water (control group), and the second one in a 100 µM MT solution for 2 h, underlow light conditions, at 26 ± 2 ◦C (treated group). Both MT concentration and dipping
Antioxidants 2022, 11, 384 3 of 28
duration were optimised with preliminary experiments, where the concentration of 100µM and dipping time of 2 h were found to be the best combination, and were in agreementwith previous studies by Cao et al. [18,21] and Liu et al. [17].
All fruit in the control and treated groups were air-dried for 2 h, and stored at 5 ± 1 ◦Cwith 85–90% relative humidity for a total of 28 d. After 0, 7, 14, 21, and 28 d of cold storage3 samples of 3 fruits (replicates) were taken at random and left for 3 days at 20 ◦C. Analyseswere performed in triplicates, with each replicate consisting of three fruits. Peel and fleshtissue samples were taken for each replicate and then frozen with liquid nitrogen at thetime of observation, and stored at −80 ◦C for subsequent analyses.
2.2. Chilling Injury Index (CII)
The assessment of CI index (CII) was conducted according to the method described byConcellón et al. [24], with some modifications. For this, a ranking scale was used accordingto visual CI signs (greyish scald, pitting, skin discoloration, etc.), where rank 0 denotes none,rank 1 denotes 1 to 20%, rank 2 denotes 21 to 40%, rank 3 denotes 41 to 60%, rank 4 denotes61 to 80%, and rank 5 denotes 81 to 100% CI signs over the surface of fruit. CII was reportedas percent (%), according to the sum of product of rank and number of fruit in that scale,divided by the total number of fruit observed, according to the following formula:
CII =∑(rank score × number o f f ruit recieving in each CI rank)
total number o f f ruit
2.3. Endogenous MT Content
Endogenous MT content was quantified according to Ma et al. [25], with some modifi-cation. For this, 0.1 g of fruit tissue (peel or pulp) was ultrasonicated (PHUC-100, Phoenix,Bengaluru, India) with 1 mL methanol, at 45 ◦C, for 30 min. The ultrasonicated mixturewas then centrifuged (3-18KS, Sigma, Ostrode, Germany) at 12,000× g, at 4 ◦C, for 15 min.The supernatant was recovered and used for the determination of endogenous MT content,with an enzyme-linked immunosorbent assay (ELISA) kit (Melatonin ELISA, GenAsia,Shanghai, China), as per the protocol described by the manufacturer.
2.4. H2O2 Content
The H2O2 content was determined according to the method of Sergiev et al. [26], withsome modifications. For this, 1 g of fruit tissue (peel or pulp) was homogenised (IKA T18Digital Ultra-Turrax, Cole-Parmer, India) in 10 mL of a chilled 0.1% (v/v) trichloroaceticacid (TCA) solution. The homogenate was centrifuged at 12,000× g, at 4 ◦C, for 15 min, andthe supernatant obtained was used to quantify H2O2. The reaction mixture consisted of10 mM potassium phosphate buffer (pH 7.0), 1 M KI and the previously obtained su-pernatant. The reaction was monitored at 390 nm (Specord200plus, AnalytikJena, Jena,Germany), and a standard curve of H2O2 was used to calculate the content of this moleculein the samples. Results were expressed as nM of fresh weight.
2.5. Superoxide Anion (O2.−) Content
The content of superoxide anion (O2.−) was determined according to the method of
Elstner [27], with some modifications. An extract was prepared using 1 g of fruit tissue(peel or pulp), which was homogenised in 50 mM potassium phosphate buffer (pH 7.8)and centrifuged at 12,000× g, at 4 ◦C, for 20 min. The supernatant was recovered and usedfor further analysis.
An assay mixture was prepared, which contained 1 M hydroxylammonium chlorideand the supernatant. The mixture was incubated for 1 h at 25 ◦C, and 2 mL of ether was thenadded to prevent chlorophyll interference. After incubation, the solution was centrifugedat 12,000× g for 10 min. The water layer was mixed with 1 mL of 7 mM α-naphthylamine(3:1, v/v solution in glacial acetic acid/water) and 17 mM p-aminophenylsulphonic acid(3:1, v/v solution in glacial acetic acid/water). The mixture was incubated for 20 min at
Antioxidants 2022, 11, 384 4 of 28
25 ◦C, followed by immediate measurement of its absorbance at 530 nm. A sodium nitratecurve was used to calculate O2
.− production, which was expressed as µM fresh weight.
2.6. Total Phenolic Content (TPC)
The total phenolic content (TPC) was quantified according to the method of Singletonand Rossi [28], with some modifications. Extraction was performed from 1 g of fruittissue (peel or pulp), which was homogenised in 10 mL of 80% (v/v) ethanol, followed bycentrifugation at 10,000× g, at 4 ◦C, for 15 min. The supernatant was recovered, and 100 µLwere added to the reaction mixture, which contained 1 mL of 10% (v/v) Folin–Ciocalteureagent and 15% (v/v) sodium carbonate. After a 90 min incubation at room temperature,its absorbance was recorded at 765 nm. Results were calculated with a gallic acid standardcurve, and expressed as mg gallic acid equivalents (GAE) kg−1 of fresh weight.
2.7. Total Flavonoid Content (TFC)
The TFC was quantified in the same extract described for TPC, according to the methodof Chang et al. [29] with some modifications. For this, 100 µL of 1 M potassium acetate,10% (w/v) of aluminium chloride and crude extract was made up to 3 mL with distilledwater in an assay tube. After a 45 min incubation under dark conditions at room temper-ature, the solution’s absorbance was recorded at 510 nm. Results were expressed as g ofquercetin equivalents (QE) kg−1 fresh weight.
2.8. Extracts for Antioxidant Activity
An extract was prepared and used to measure antioxidant activity. For this, 1 gof fruit tissue (peel or pulp) was homogenised in 10 mL of 80% (v/v) methanol. Thehomogenate was centrifuged at 12,000× g, at 4 ◦C, for 20 min. The analyses of the freehydrophilic antioxidant fraction were conducted using the 2,2-diphenyl picrylhydrazyl(DPPH) and Trolox equivalent antioxidant capacity (TEAC) methods, whereas the boundantioxidant fraction was analysed with the ferric reducing antioxidant power (FRAP) andcupric reducing antioxidant power (CUPRAC) methods.
2.8.1. Scavenging Activity of the Free Antioxidant Fraction2,2-Diphenyl Picrylhydrazyl (DPPH)
The scavenging ability of antioxidants towards the stable DPPH radical was measuredaccording to the method of Brand-Williams et al. [30], with some modifications. Thereaction mixture contained 3.9 mL of DPPH solution made in 95% (v/v) methanol, and0.1 mL of the extract. The solution was incubated for 30 min, and its absorbance wasthen measured at 515 nm. The absorbances of the control (with no sample added) andsamples were used to calculate the percentage of DPPH radical inhibition, according to thefollowing formula:
Radical inhibition (%) =
(
Abscontrol − Abssample
)Abscontrol
× 100
Trolox Equivalent Antioxidant Capacity (TEAC)
The TEAC assay was performed with the 2,2′-azino-bis(3-ethylbenzothialozine-6-sulphonic acid) (ABTS) radical (ABTS*+), according to the method reported by Re et al. [31],with some modifications. A 7 mM ABTS*+ radical solution was initially prepared usingan oxidising agent (2.45 mM potassium persulphate). The reaction mixture consisted ofthe extract and ABTS*+ radical solution, which was then incubated for 10 min at 30 ◦C.Its absorbance was recorded at 734 nm after the incubation period, and the data used tocalculate its scavenging activity, according to the formula described for DPPH. Data isreported as percentage of ABTS radical inhibition.
Antioxidants 2022, 11, 384 5 of 28
2.8.2. Antioxidant Activity of the Bound Antioxidant FractionFerric Reducing Antioxidant Power (FRAP)
The FRAP assay was measured, according to the method of Benzie and Strain [32],with some modifications. FRAP reagent was prepared by mixing 300 mM acetate buffer(pH 3.6), 10 mM 2,4,6-Tris(2-pyridyl)-s-triazine (TPTZ) in 40 mM HCl and 20 mM FeCl3in a 10:1:1 (v/v/v) ratio. The assay mixture contained 2.9 mL of FRAP reagent and0.1 mL of extract, which were incubated for 30 min at 37 ◦C. Its absorbance was readat 593 nm after the incubation period, during which an intense blue colour develops as theferric-tripyridyltriazine complex is reduced to the ferrous state. Absorbances were usedto calculate antioxidant potential and were expressed as g of Trolox equivalents (TE) kg−1
fresh weight.
Cupric Reducing Antioxidant Power (CUPRAC)
The CUPRAC assay was performed according to the method of Apak et al. [33], withsome modifications. The reaction mixture contained of cupric chloride (1.0 × 10⁻² M) solu-tion, ammonium acetate buffer (1 M, pH 7.0), neocuproine alcoholic solution(7.5× 10⁻³ M) and the extract. The mixture was incubated for 30 min, and its absorbancewas recorded thereafter at 450 nm. Results were expressed as g of TE kg−1 fresh weight, ascalculated with a Trolox standard curve.
2.9. Extracts for Phenylalanine Ammonia Lyase (PAL) and Tyrosine Ammonia Lyase (TAL)
Both phenylalanine ammonia lyase (PAL, EC 4.3.1.5) and tyrosine ammonia lyase(TAL, EC 4.3.1.25) were assayed, according to the protocol reported by Khan et al. [34], withsome modifications. An extract was initially performed, where 1 g of mango fruit tissue(peel or pulp) was homogenised in ice-cooled Tris-HCl buffer (50 mM, pH 8.5) containing5% (w/v) polyvinylpolypyrrolidone (PVPP) and 14.4 mM β-mercaptoethanol. The mixturewas centrifuged at 10,000× g, at 4 ◦C, for 20 min, and the supernatant recovered was usedto quantify PAL and TAL activities.
2.9.1. Phenylalanine Ammonia Lyase (PAL)
The reaction mixture to quantify PAL activity consisted of 800 µL of Tris-HCl buffer(0.5 mM, pH 8.0), 600 mM of L-phenylalanine, and 100 µL of enzyme extract. The mixturewas incubated for 1 h at 40 ◦C, and 100 µL of 5 N HCl was then added to stop the reaction.The absorbance of this solution was read at 290 nm and used to calculate enzyme activity.Results were expressed as U kg−1 of protein, where a unit of enzyme activity was definedas the amount of enzyme that produces 1 nmole of cinnamic acid min−1.
2.9.2. Tyrosine Ammonia Lyase (TAL)
The reaction mixture to quantify TAL activity contained 800 µL of Tris-HCl buffer(0.5 mM, pH 8.0), 100 µL of 5.5 µM of L-tyrosine, and 100 µL of enzyme extract. The mixturewas incubated for 1 h at 40 ◦C, and 100 µL of 5 N HCl were then added to stop the reaction.The absorbance of this solution was read at 333 nm and used to calculate enzyme activity.Results were expressed as U kg−1 of protein, where a unit of enzyme activity was definedas the amount of enzyme that produces 1 nmole of coumaric acid min−1.
2.10. Extracts for Superoxide Dismutase (SOD), Catalase (CAT), Peroxidase (POX), AscorbatePeroxidase (APX), Glutathione Reductase (GR) and Dehydroascorbate Reductase (DHAR)
An extract was initially prepared by homogenising 1 g of fruit tissue (peel or pulp)in pre-cooled 0.1 M potassium phosphate buffer (pH 7.0). The mixture was centrifugedat 12,000× g, at 4 ◦C, for 20 min, and the supernatant recovered was used to quantifythe activity of the antioxidant enzymes, namely, superoxide dismutase (SOD), catalase(CAT), peroxidase (POX), ascorbate peroxidase (APX), glutathione reductase (GR) anddehydroascorbate reductase (DHAR).
Antioxidants 2022, 11, 384 6 of 28
2.10.1. Superoxide Dismutase (SOD)
The activity of SOD (EC 1.15.1.1) was quantified according to the nitroblue tetrazolium(NBT) reduction method described by Kono [35], with some modifications. The reactionmixture contained 50 mM sodium carbonate buffer (pH 10), 0.1 M NBT, and 0.6% (v/v)triton-X. The reaction was initiated by adding 20 mM hydroxylamine hydrochloride (pH6.0), and its absorbance was recorded at 540 nm after 2 min of incubation after the enzymeextract was added. A unit of SOD activity was defined as the amount of enzyme requiredto inhibit chromogen production by 50%, and expressed as U kg−1 of protein.
2.10.2. Catalase (CAT)
The activity of CAT (EC 1.11.1.6) was quantified according to the H2O2 decompositionmethod reported by Aebi [36], with some modifications. The reaction mixture contained0.1 M phosphate buffer (pH 7.0) and 150 mM H2O2. The reaction was started by addingthe enzyme extract, and was continuously monitored for 1 min at 240 nm. A unit of CATactivity was defined as the amount of enzyme required to catalyse half of the H2O2 presentin the solution, and was expressed as U kg−1 of protein, using 6.3 × 10⁻³ mM−1 cm−1 asthe extinction coefficient.
2.10.3. Peroxidase (POD)
The activity of POD (EC 1.11.1.7) was quantified by measuring the production ofan oxidised compound using guaiacol as substrate, according to the method reported byPutter [37], with some modifications. The reaction mixture contained 0.1 M phosphatebuffer (pH 7.0), 20 mM guaiacol, 12.3 mM H2O2, and the enzyme extract. The reaction wasmonitored at 436 nm for the formation of guaiacol dehydrogenation product (GDHP) asend product. A unit of POD activity was defined as the amount of enzyme required toproduce 1.0 µmol GDHP min−1. The activity of POD was expressed as U kg−1 of protein,using 25 mM−1 cm−1 as the extinction coefficient.
2.10.4. Ascorbate Peroxidase (APX)
The activity of APX (EC 1.11.1.11) was quantified according to the ascorbate oxidationmethod reported by Nakano and Asada [38], with some modifications. The reaction mixturecontained 0.1 M phosphate buffer (pH 7.0), 5 mM ascorbate, 0.5 mM H2O2, and the enzymeextract. The reaction was monitored at 290 nm for 1 min, and the change in absorbance wasused to quantify the activity of APX. Results were expressed as U kg−1 of protein, using2.8 mM−1 cm−1 as extinction coefficient, where a unit of APX activity was defined as theamount of enzyme required to produce 1 nmol of oxidised ascorbate min−1.
2.10.5. Glutathione Reductase (GR)
The activity of GR (EC 1.6.4.2) was quantified according to the oxidation of NADPHreported by Calberg and Mannervik [39], with some modifications. The reaction mixturecontained 50 mM phosphate buffer (pH 7.0), 3 mM ethylene diamine tetraacetic acid (EDTA)disodium salt, 0.1 mM NADPH, 1 mM oxidised glutathione (GSSG), and the enzymeextract. The reaction was monitored at 340 nm for 1 min, and the change in absorbancewas used to quantify the activity of GR. Results were expressed as U kg−1 of protein, using6.22 mM−1 cm−1 as extinction coefficient, where a unit of GR activity was defined as theamount of enzyme that catalyses the oxidation of 1 nmol of NADPH min−1.
2.10.6. Dehydroascorbate Reductase (DHAR)
The activity of DHAR (EC 1.8.5.1) was quantified according to the dehydroascorbatereduction method reported by Dalton et al. [40], with some modifications. The reaction mix-ture contained 0.1 M phosphate buffer (pH 7.0), 1 mM EDTA, 15 mM reduced glutathione(GSH), 2 mM dehydroascorbate, and the enzyme extract. The reaction was monitored at265 nm for 1 min. The change in absorbance was used to quantify the activity of DHAR.Results were expressed as U kg−1 of protein, using 14 mM−1 cm−1 as extinction coefficient,
Antioxidants 2022, 11, 384 7 of 28
where a unit of DHAR activity was defined as the amount of enzyme required to form1.0 µmol of reduced ascorbate min−1.
2.11. Protein Concentration
Protein concentration of the extract was determined according to the Bradford [41]method, with some modifications. For this, 1 g of fruit tissue (peel or pulp) was ho-mogenised in 10 mL of chilled 50 mM sodium phosphate buffer containing polyvinylpolyp-yrrolidone (PVPP), 0.5 mM magnesium chloride, and 2 mM phenylmethylsulphonyl fluo-ride (PMSF). The mixture was centrifuged at 12,000× g, at 4 ◦C, for 15 min, and the obtainedsupernatant was used as crude extract. For the analysis, 5 mL of Bradford’s reagent wereadded to 0.1 mL of crude extract, and its absorbance was read at 595 nm, after 5 minof incubation. Absorbance data was used to calculate protein concentration, by using acalibration curve of bovine serum albumin (BSA) as standard protein.
2.12. Statistical Analyses
All experiments described were performed in triplicate, using a completely random-ized design (CRD). A one-way analysis of variance (ANOVA) and Duncan’s test wereused to determine differences between treatments. Analyses were performed in SPSS(Version 20), with a 0.05 level of significance.
3. Results3.1. Chilling Injury Index (CII)
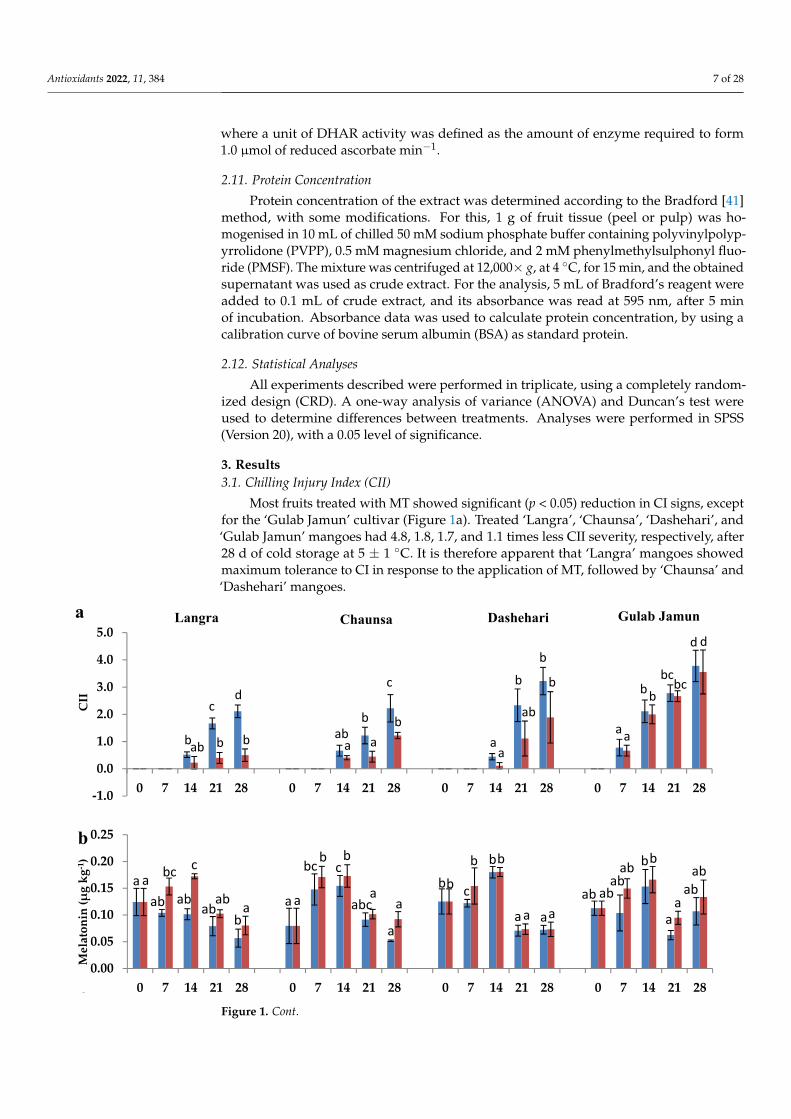
Most fruits treated with MT showed significant (p < 0.05) reduction in CI signs, exceptfor the ‘Gulab Jamun’ cultivar (Figure 1a). Treated ‘Langra’, ‘Chaunsa’, ‘Dashehari’, and‘Gulab Jamun’ mangoes had 4.8, 1.8, 1.7, and 1.1 times less CII severity, respectively, after28 d of cold storage at 5 ± 1 ◦C. It is therefore apparent that ‘Langra’ mangoes showedmaximum tolerance to CI in response to the application of MT, followed by ‘Chaunsa’ and‘Dashehari’ mangoes.
Antioxidants 2022, 11, x FOR PEER REVIEW 8 of 29
any significant response (p > 0.05) to the treatment in either tissue (Figure 2e,h). In contrast, the peel of MT-treated ‘Gulab Jamun’ mangoes had a higher O2.− content throughout the observation period (Figure 2g).
The effect of MT treatment on H2O2 content was significant only for the ‘Langra’ cul-tivar, in which lower values of H2O2 were observed in the pulp during the whole storage. However, for the remaining cultivars the peel and pulp of mangoes did not show any significant response to the MT treatment, regarding their H2O2 content (Figure 3c,d).
Figure 1. (a) Chilling injury index (CII), (b) endogenous melatonin (MT) content in peel and (c) pulp of ‘Langra’, ‘Chaunsa’, ‘Dashehari’ and ‘Gulab Jamun’ mangoes, as affected by 100 µM melatonin (MT) for 2 h during storage at 5 ± 1 °C plus 3 d of shelf life at room temperature. Data are the mean of three replicates ± standard error. Different lowercase letters indicate significant differences be-tween control and treated fruit for each sampling date (p < 0.05).
-1.0
0.0
1.0
2.0
3.0
4.0
5.0
0 7 14 21 28 0 7 14 21 28 0 7 14 21 28 0 7 14 21 28
CII
Langra Chaunsa Dashehari Gulab Jamun
bab
c
b
d
b aba
b
a
c
baa
b
ab
b
b
aa
bbbcbc
d d
a
0.00
0.05
0.10
0.15
0.20
0.25
0 7 14 21 28 0 7 14 21 28 0 7 14 21 28 0 7 14 21 28
Mel
aton
in (µ
g kg
-1)
a
bab ab
ab
a bc c
ab a aa
bcb cb
abca
a
abb c
b bb
aa aaab ab
abab bb
aa
abab
b
c
0.00
0.05
0.10
0.15
0 7 14 21 28 0 7 14 21 28 0 7 14 21 28 0 7 14 21 28
Mel
aton
in (µ
g kg
-1)
Storage duration (Day)Control Treated
bb
aa
b
b
abab
aba aa a
ab b
b
aa aa a a ab
bbabab
aaa
aa aa
a a
aa aa
Figure 1. Cont.
Antioxidants 2022, 11, 384 8 of 28
Antioxidants 2022, 11, x FOR PEER REVIEW 8 of 29
any significant response (p > 0.05) to the treatment in either tissue (Figure 2e,h). In contrast, the peel of MT-treated ‘Gulab Jamun’ mangoes had a higher O2.− content throughout the observation period (Figure 2g).
The effect of MT treatment on H2O2 content was significant only for the ‘Langra’ cul-tivar, in which lower values of H2O2 were observed in the pulp during the whole storage. However, for the remaining cultivars the peel and pulp of mangoes did not show any significant response to the MT treatment, regarding their H2O2 content (Figure 3c,d).
Figure 1. (a) Chilling injury index (CII), (b) endogenous melatonin (MT) content in peel and (c) pulp of ‘Langra’, ‘Chaunsa’, ‘Dashehari’ and ‘Gulab Jamun’ mangoes, as affected by 100 µM melatonin (MT) for 2 h during storage at 5 ± 1 °C plus 3 d of shelf life at room temperature. Data are the mean of three replicates ± standard error. Different lowercase letters indicate significant differences be-tween control and treated fruit for each sampling date (p < 0.05).
-1.0
0.0
1.0
2.0
3.0
4.0
5.0
0 7 14 21 28 0 7 14 21 28 0 7 14 21 28 0 7 14 21 28
CII
Langra Chaunsa Dashehari Gulab Jamun
bab
c
b
d
b aba
b
a
c
baa
b
ab
b
b
aa
bbbcbc
d d
a
0.00
0.05
0.10
0.15
0.20
0.25
0 7 14 21 28 0 7 14 21 28 0 7 14 21 28 0 7 14 21 28
Mel
aton
in (µ
g kg
-1)
a
bab ab
ab
a bc c
ab a aa
bcb cb
abca
a
abb c
b bb
aa aaab ab
abab bb
aa
abab
b
c
0.00
0.05
0.10
0.15
0 7 14 21 28 0 7 14 21 28 0 7 14 21 28 0 7 14 21 28
Mel
aton
in (µ
g kg
-1)
Storage duration (Day)Control Treated
bb
aa
b
b
abab
aba aa a
ab b
b
aa aa a a ab
bbabab
aaa
aa aa
a a
aa aa
Figure 1. (a) Chilling injury index (CII), (b) endogenous melatonin (MT) content in peel and (c) pulpof ‘Langra’, ‘Chaunsa’, ‘Dashehari’ and ‘Gulab Jamun’ mangoes, as affected by 100 µM melatonin(MT) for 2 h during storage at 5± 1 ◦C plus 3 d of shelf life at room temperature. Data are the mean ofthree replicates ± standard error. Different lowercase letters indicate significant differences betweencontrol and treated fruit for each sampling date (p < 0.05).
3.2. Endogenous Melatonin (MT) CONTENT
The exogenous MT had a significant influence on the endogenous concentration of thiscompound in the peel and pulp of most cultivars, except for ‘Gulab Jamun’ (Figure 1b,c).This is in line with the inference made for CII mentioned in the previous section, where‘Gulab Jamun’ mangoes had a minimal-to-null response to the application of MT.
3.3. O2.− and H2O2 Content
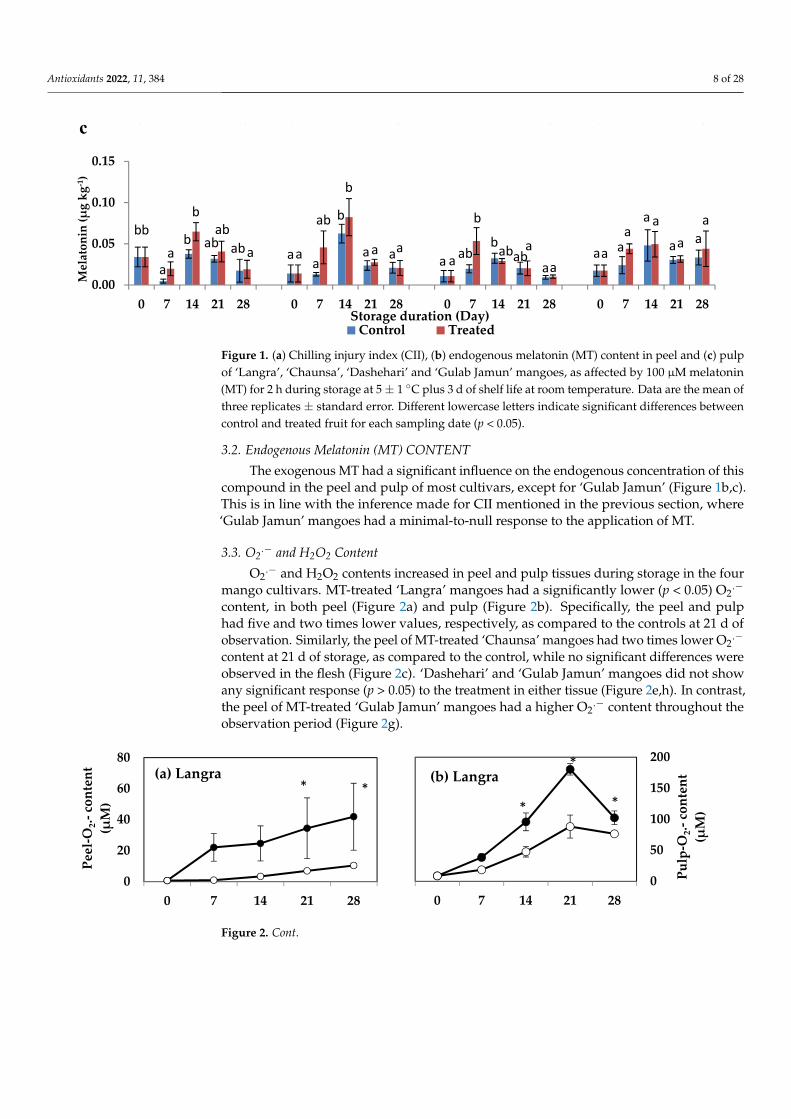
O2.− and H2O2 contents increased in peel and pulp tissues during storage in the four
mango cultivars. MT-treated ‘Langra’ mangoes had a significantly lower (p < 0.05) O2.−
content, in both peel (Figure 2a) and pulp (Figure 2b). Specifically, the peel and pulphad five and two times lower values, respectively, as compared to the controls at 21 d ofobservation. Similarly, the peel of MT-treated ‘Chaunsa’ mangoes had two times lower O2
.−
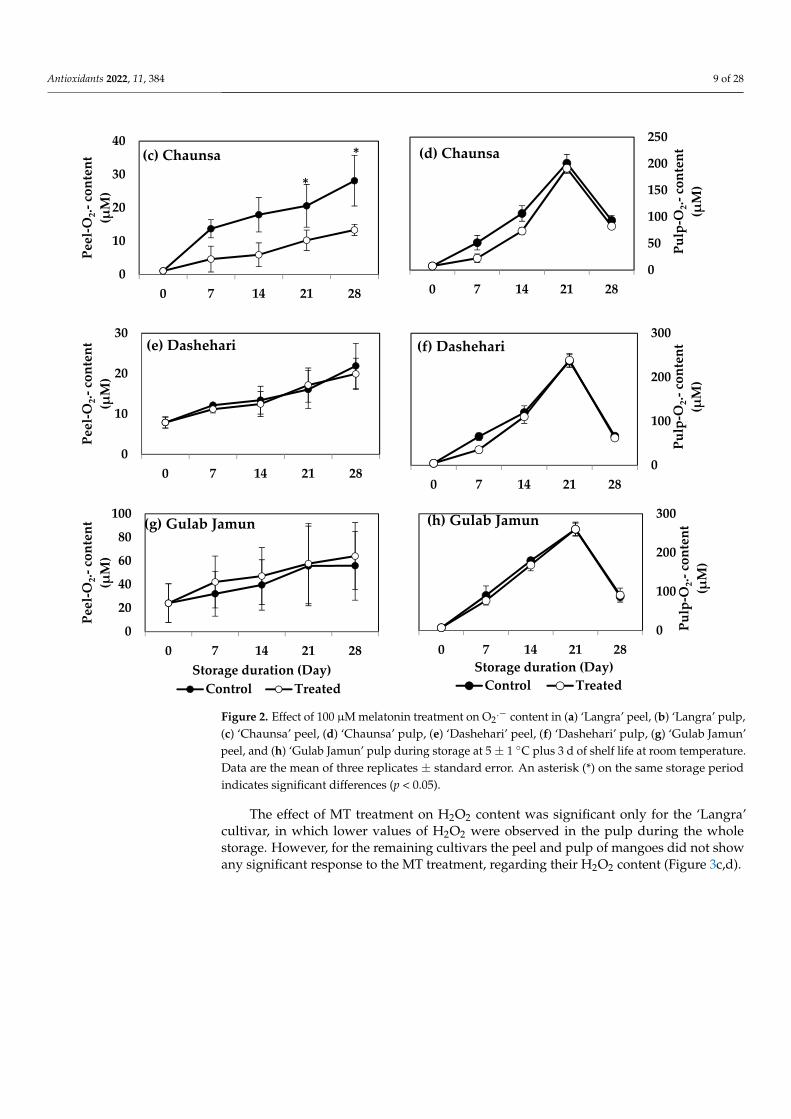
content at 21 d of storage, as compared to the control, while no significant differences wereobserved in the flesh (Figure 2c). ‘Dashehari’ and ‘Gulab Jamun’ mangoes did not showany significant response (p > 0.05) to the treatment in either tissue (Figure 2e,h). In contrast,the peel of MT-treated ‘Gulab Jamun’ mangoes had a higher O2
.− content throughout theobservation period (Figure 2g).
Antioxidants 2022, 11, x FOR PEER REVIEW 9 of 29
Figure 2. Effect of 100 µM melatonin treatment on O2.− content in (a) ‘Langra’ peel, (b) ‘Langra’ pulp, (c) ‘Chaunsa’ peel, (d) ‘Chaunsa’ pulp, (e) ‘Dashehari’ peel, (f) ‘Dashehari’ pulp, (g) ‘Gulab Jamun’ peel, and (h) ‘Gulab Jamun’ pulp during storage at 5 ± 1 °C plus 3 d of shelf life at room temperature. Data are the mean of three replicates ± standard error. An asterisk (*) on the same storage period indicates significant differences (p < 0.05).
0
20
40
60
80
0 7 14 21 28
Peel
-O2.-
cont
ent
(µM
)
* *(a) Langra
0
50
100
150
200
0 7 14 21 28
Pulp
-O2.-
cont
ent
(µM
)* *
*(b) Langra
0
10
20
30
40
0 7 14 21 28
Peel
-O2.-
cont
ent
(µM
)
*
*
(c) Chaunsa
0
50
100
150
200
250
0 7 14 21 28
Pulp
-O2.-
cont
ent
(µM
)
(d) Chaunsa
0
10
20
30
0 7 14 21 28
Peel
-O2.-
cont
ent
(µM
)
(e) Dashehari
0
100
200
300
0 7 14 21 28
Pulp
-O2.-
cont
ent
(µM
)
(f) Dashehari
0
20
40
60
80
100
0 7 14 21 28
Peel
-O2.-
cont
ent
(µM
)
Storage duration (Day)Control Treated
(g) Gulab Jamun
0
100
200
300
0 7 14 21 28
Pulp
-O2.-
cont
ent
(µM
)
Storage duration (Day)Control Treated
(h) Gulab Jamun
Figure 2. Cont.
Antioxidants 2022, 11, 384 9 of 28
Antioxidants 2022, 11, x FOR PEER REVIEW 9 of 29
Figure 2. Effect of 100 µM melatonin treatment on O2.− content in (a) ‘Langra’ peel, (b) ‘Langra’ pulp, (c) ‘Chaunsa’ peel, (d) ‘Chaunsa’ pulp, (e) ‘Dashehari’ peel, (f) ‘Dashehari’ pulp, (g) ‘Gulab Jamun’ peel, and (h) ‘Gulab Jamun’ pulp during storage at 5 ± 1 °C plus 3 d of shelf life at room temperature. Data are the mean of three replicates ± standard error. An asterisk (*) on the same storage period indicates significant differences (p < 0.05).
0
20
40
60
80
0 7 14 21 28Pe
el-O
2.-co
nten
t (µ
M)
* *(a) Langra
0
50
100
150
200
0 7 14 21 28
Pulp
-O2.-
cont
ent
(µM
)* *
*(b) Langra
0
10
20
30
40
0 7 14 21 28
Peel
-O2.-
cont
ent
(µM
)
*
*
(c) Chaunsa
0
50
100
150
200
250
0 7 14 21 28
Pulp
-O2.-
cont
ent
(µM
)
(d) Chaunsa
0
10
20
30
0 7 14 21 28
Peel
-O2.-
cont
ent
(µM
)
(e) Dashehari
0
100
200
300
0 7 14 21 28
Pulp
-O2.-
cont
ent
(µM
)
(f) Dashehari
0
20
40
60
80
100
0 7 14 21 28
Peel
-O2.-
cont
ent
(µM
)
Storage duration (Day)Control Treated
(g) Gulab Jamun
0
100
200
300
0 7 14 21 28
Pulp
-O2.-
cont
ent
(µM
)
Storage duration (Day)Control Treated
(h) Gulab Jamun
Figure 2. Effect of 100 µM melatonin treatment on O2.− content in (a) ‘Langra’ peel, (b) ‘Langra’ pulp,
(c) ‘Chaunsa’ peel, (d) ‘Chaunsa’ pulp, (e) ‘Dashehari’ peel, (f) ‘Dashehari’ pulp, (g) ‘Gulab Jamun’peel, and (h) ‘Gulab Jamun’ pulp during storage at 5 ± 1 ◦C plus 3 d of shelf life at room temperature.Data are the mean of three replicates ± standard error. An asterisk (*) on the same storage periodindicates significant differences (p < 0.05).
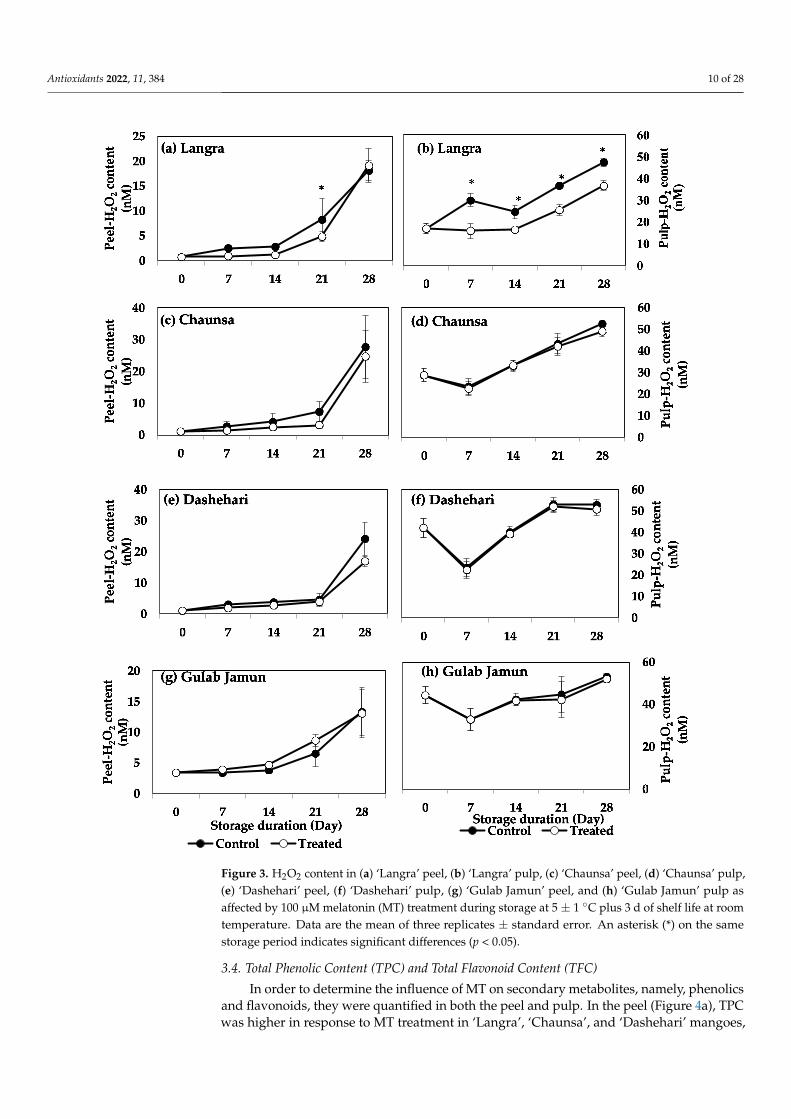
The effect of MT treatment on H2O2 content was significant only for the ‘Langra’cultivar, in which lower values of H2O2 were observed in the pulp during the wholestorage. However, for the remaining cultivars the peel and pulp of mangoes did not showany significant response to the MT treatment, regarding their H2O2 content (Figure 3c,d).
Antioxidants 2022, 11, 384 10 of 28Antioxidants 2022, 11, x FOR PEER REVIEW 10 of 29
Figure 3. H2O2 content in (a) ‘Langra’ peel, (b) ‘Langra’ pulp, (c) ‘Chaunsa’ peel, (d) ‘Chaunsa’ pulp, (e) ‘Dashehari’ peel, (f) ‘Dashehari’ pulp, (g) ‘Gulab Jamun’ peel, and (h) ‘Gulab Jamun’ pulp as affected by 100 µM melatonin (MT) treatment during storage at 5 ± 1 °C plus 3 d of shelf life at room temperature. Data are the mean of three replicates ± standard error. An asterisk (*) on the same storage period indicates significant differences (p < 0.05).
Figure 3. H2O2 content in (a) ‘Langra’ peel, (b) ‘Langra’ pulp, (c) ‘Chaunsa’ peel, (d) ‘Chaunsa’ pulp,(e) ‘Dashehari’ peel, (f) ‘Dashehari’ pulp, (g) ‘Gulab Jamun’ peel, and (h) ‘Gulab Jamun’ pulp asaffected by 100 µM melatonin (MT) treatment during storage at 5 ± 1 ◦C plus 3 d of shelf life at roomtemperature. Data are the mean of three replicates ± standard error. An asterisk (*) on the samestorage period indicates significant differences (p < 0.05).
3.4. Total Phenolic Content (TPC) and Total Flavonoid Content (TFC)
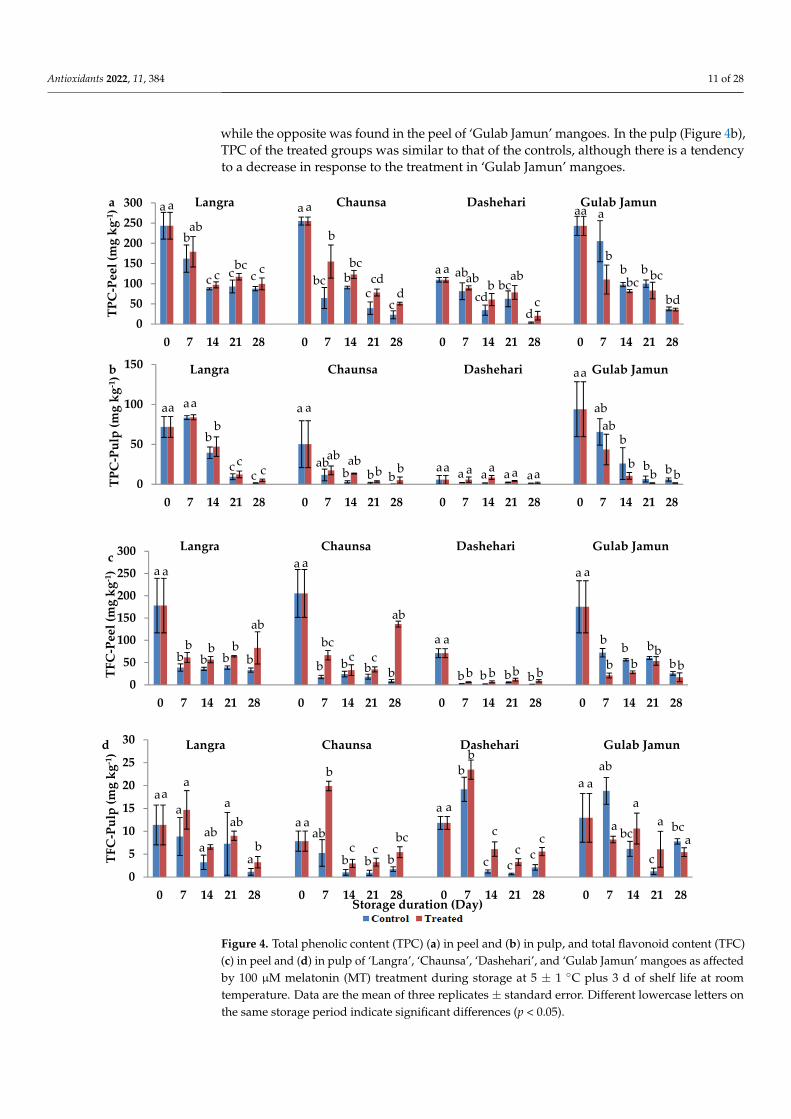
In order to determine the influence of MT on secondary metabolites, namely, phenolicsand flavonoids, they were quantified in both the peel and pulp. In the peel (Figure 4a), TPCwas higher in response to MT treatment in ‘Langra’, ‘Chaunsa’, and ‘Dashehari’ mangoes,
Antioxidants 2022, 11, 384 11 of 28
while the opposite was found in the peel of ‘Gulab Jamun’ mangoes. In the pulp (Figure 4b),TPC of the treated groups was similar to that of the controls, although there is a tendencyto a decrease in response to the treatment in ‘Gulab Jamun’ mangoes.
Antioxidants 2022, 11, x FOR PEER REVIEW 11 of 29
3.4. Total Phenolic Content (TPC) and Total Flavonoid Content (TFC) In order to determine the influence of MT on secondary metabolites, namely, phenol-
ics and flavonoids, they were quantified in both the peel and pulp. In the peel (Figure 4a), TPC was higher in response to MT treatment in ‘Langra’, ‘Chaunsa’, and ‘Dashehari’ man-goes, while the opposite was found in the peel of ‘Gulab Jamun’ mangoes. In the pulp (Figure 4b), TPC of the treated groups was similar to that of the controls, although there is a tendency to a decrease in response to the treatment in ‘Gulab Jamun’ mangoes.
The TFC of peel was significantly higher in MT-treated fruit at the 28 d of observation in ‘Langra’ mangoes, and all observed days in ‘Chaunsa’ mangoes (Figure 4c). In contrast, no statistically significant effect was apparent on MT-treated ‘Dashehari’ or ‘Gulab Jamun’ mangoes on 21 and 28 d of observation. In the pulp of MT-treated mangoes (Figure 4d), TFC increased on some days of observation in ‘Langra’ and ‘Chaunsa’ mangoes, no effect was found on ‘Dashehari’ mangoes, and a decrease on some days was found on ‘Gulab Jamun’ mangoes.
According to this data, it is apparent that the effect of the MT treatment on TPC and TFC was cultivar- and tissue-dependent. Some significant responses were apparent on ‘Langra’, ‘Chaunsa’ and ‘Dashehari’ mangoes, with minimal-to-null significant responses on ‘Gulab Jamun’ mangoes.
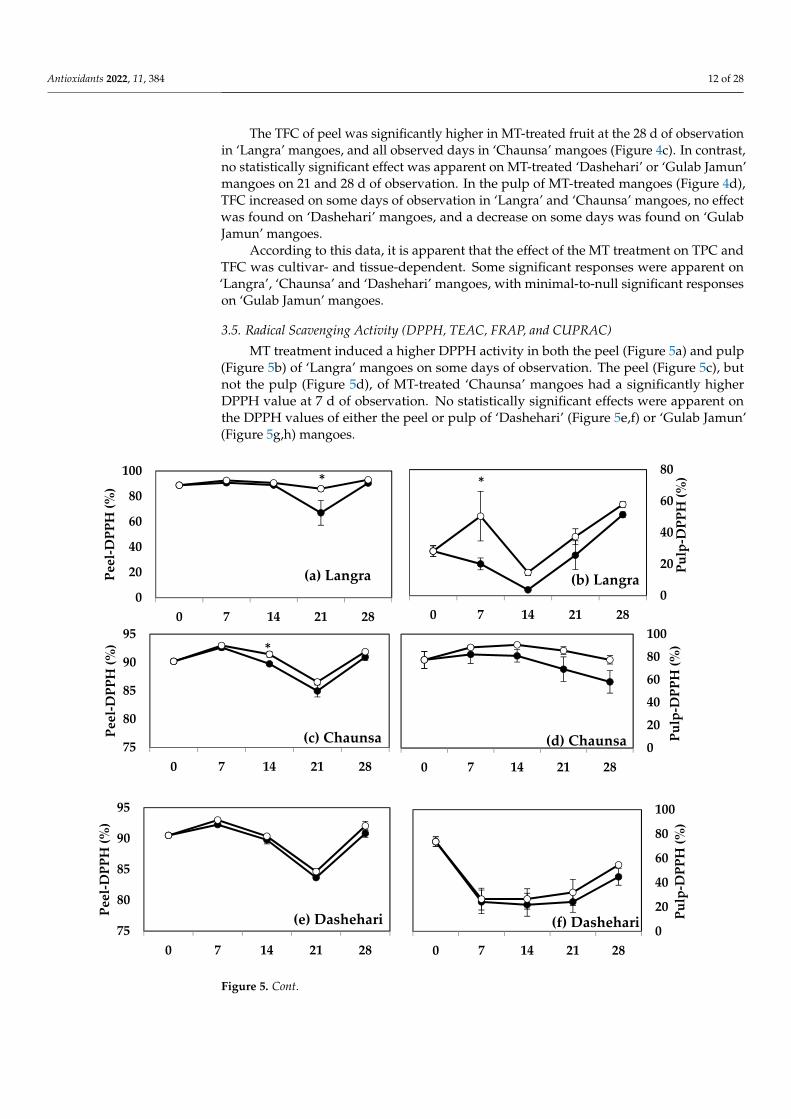
3.5. Radical Scavenging Activity (DPPH, TEAC, FRAP, and CUPRAC) MT treatment induced a higher DPPH activity in both the peel (Figure 5a) and pulp
(Figure 5b) of ‘Langra’ mangoes on some days of observation. The peel (Figure 5c), but not the pulp (Figure 5d), of MT-treated ‘Chaunsa’ mangoes had a significantly higher DPPH value at 7 d of observation. No statistically significant effects were apparent on the DPPH values of either the peel or pulp of ‘Dashehari’ (Figure 5e,f) or ‘Gulab Jamun’ (Fig-ure 5g,h) mangoes.
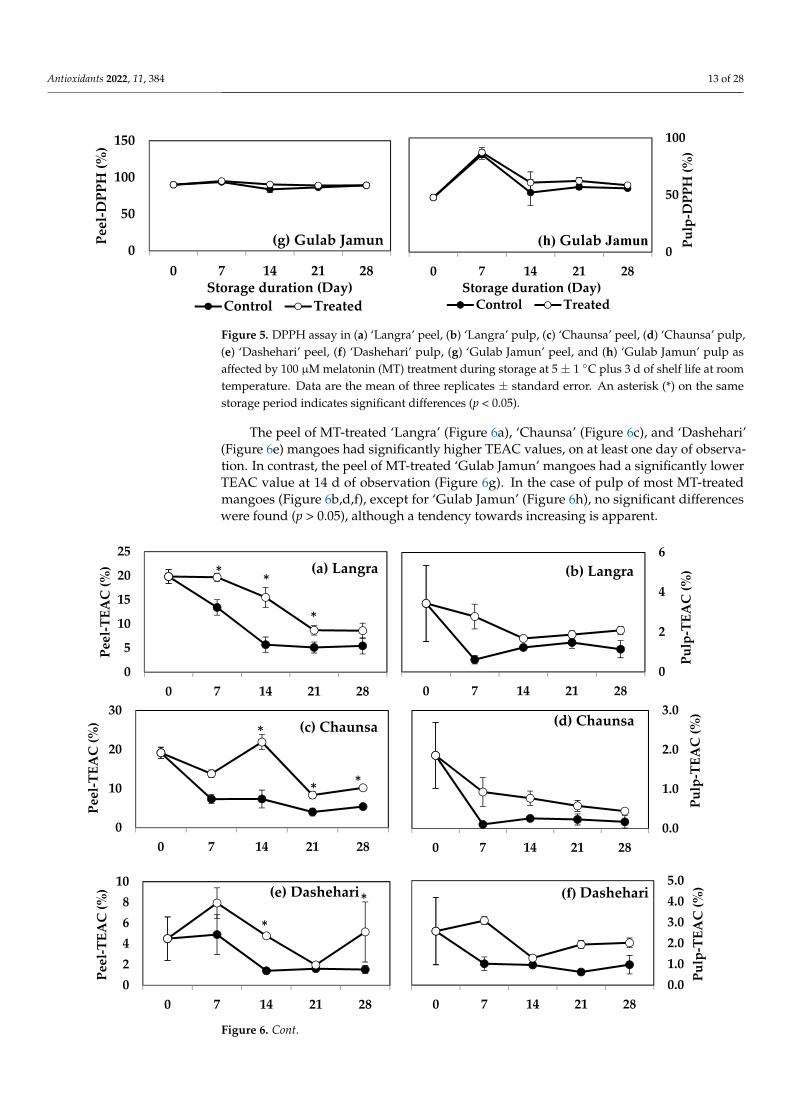
The peel of MT-treated ‘Langra’ (Figure 6a), ‘Chaunsa’ (Figure 6c), and ‘Dashehari’ (Figure 6e) mangoes had significantly higher TEAC values, on at least one day of obser-vation. In contrast, the peel of MT-treated ‘Gulab Jamun’ mangoes had a significantly lower TEAC value at 14 d of observation (Figure 6g). In the case of pulp of most MT-treated mangoes (Figure 6b,d,f), except for ‘Gulab Jamun’ (Figure 6h), no significant dif-ferences were found (p > 0.05), although a tendency towards increasing is apparent.
FRAP values for the peel and pulp of MT-treated ‘Langra’ (Figure 7a,b) and ‘Chaunsa’ (Figure 7c,d) mangoes were significantly higher (p < 0.05), while no effect was apparent on ‘Dashehari’ (Figure 7e,f) and ‘Gulab Jamun’ (Figure 7g,h) mangoes (p > 0.05). Most MT-treated mangoes had higher CUPRAC values in both the peel and pulp (Figure 8), with the exception of the pulp of ‘Gulab Jamun’ mangoes (Figure 8h).
According to these findings, it is apparent that each method to quantify antioxidant capacity yielded different behaviours and responded differently to each tissue or cultivar. For example, changes in DPPH and TEAC were with tissue-dependent, changes in FRAP were cultivar-dependent, while all tissues and cultivars exerted changes in CUPRAC val-ues.
050
100150200250300
0 7 14 21 28 0 7 14 21 28 0 7 14 21 28 0 7 14 21 28
TPC
-Pee
l (m
g kg
-1) Langra Chaunsa Dashehari Gulab Jamun
c c c cbcc
aba a
b
a a
bc
b
bbc
ccd
cd
a a ababcd
b bcab
dc
aa a
bbbc
b bc
bd
a
Antioxidants 2022, 11, x FOR PEER REVIEW 12 of 29
Figure 4. Total phenolic content (TPC) (a) in peel and (b) in pulp, and total flavonoid content (TFC) (c) in peel and (d) in pulp of ‘Langra’, ‘Chaunsa’, ‘Dashehari’, and ‘Gulab Jamun’ mangoes as af-fected by 100 µM melatonin (MT) treatment during storage at 5 ± 1 °C plus 3 d of shelf life at room temperature. Data are the mean of three replicates ± standard error. Different lowercase letters on the same storage period indicate significant differences (p < 0.05).
0
50
100
150
0 7 14 21 28 0 7 14 21 28 0 7 14 21 28 0 7 14 21 28
TPC
-Pul
p (m
g kg
-1) Langra Chaunsa Dashehari Gulab Jamun
aa aa
bb
c cc c
a a
ababbab
bb bb aa a a aa a a aa
aa
abab
b
b bb bb
b
0
50
100
150
200
250
300
0 7 14 21 28 0 7 14 21 28 0 7 14 21 28 0 7 14 21 28
TFC
-Pee
l (m
g kg
-1)
Langra Chaunsa Dashehari Gulab Jamun
a a a a
bb
bb
bb
b
ab
b
bc
bcb
cb
ab
bb bb bb b b
b
bb
bbb
bb
a a
a ac
0
5
10
15
20
25
30
0 7 14 21 28 0 7 14 21 28 0 7 14 21 28 0 7 14 21 28
TFC
-Pul
p (m
g kg
-1)
Storage duration (Day)
Langra Chaunsa Dashehari Gulab Jamun
aaa
a
aab
aab
ab
a aab
b
bc
bc
b
bc
a a
bb
c
c
cc c
c
a aab
a
a
bca
ca
bc
d
0
20
40
60
80
100
0 7 14 21 28
Peel
-DPP
H (%
) *
(a) Langra0
20
40
60
80
0 7 14 21 28
Pulp
-DPP
H (%
)*
(b) Langra
Figure 4. Total phenolic content (TPC) (a) in peel and (b) in pulp, and total flavonoid content (TFC)(c) in peel and (d) in pulp of ‘Langra’, ‘Chaunsa’, ‘Dashehari’, and ‘Gulab Jamun’ mangoes as affectedby 100 µM melatonin (MT) treatment during storage at 5 ± 1 ◦C plus 3 d of shelf life at roomtemperature. Data are the mean of three replicates ± standard error. Different lowercase letters onthe same storage period indicate significant differences (p < 0.05).
Antioxidants 2022, 11, 384 12 of 28
The TFC of peel was significantly higher in MT-treated fruit at the 28 d of observationin ‘Langra’ mangoes, and all observed days in ‘Chaunsa’ mangoes (Figure 4c). In contrast,no statistically significant effect was apparent on MT-treated ‘Dashehari’ or ‘Gulab Jamun’mangoes on 21 and 28 d of observation. In the pulp of MT-treated mangoes (Figure 4d),TFC increased on some days of observation in ‘Langra’ and ‘Chaunsa’ mangoes, no effectwas found on ‘Dashehari’ mangoes, and a decrease on some days was found on ‘GulabJamun’ mangoes.
According to this data, it is apparent that the effect of the MT treatment on TPC andTFC was cultivar- and tissue-dependent. Some significant responses were apparent on‘Langra’, ‘Chaunsa’ and ‘Dashehari’ mangoes, with minimal-to-null significant responseson ‘Gulab Jamun’ mangoes.
3.5. Radical Scavenging Activity (DPPH, TEAC, FRAP, and CUPRAC)
MT treatment induced a higher DPPH activity in both the peel (Figure 5a) and pulp(Figure 5b) of ‘Langra’ mangoes on some days of observation. The peel (Figure 5c), butnot the pulp (Figure 5d), of MT-treated ‘Chaunsa’ mangoes had a significantly higherDPPH value at 7 d of observation. No statistically significant effects were apparent onthe DPPH values of either the peel or pulp of ‘Dashehari’ (Figure 5e,f) or ‘Gulab Jamun’(Figure 5g,h) mangoes.
Antioxidants 2022, 11, x FOR PEER REVIEW 12 of 29
Figure 4. Total phenolic content (TPC) (a) in peel and (b) in pulp, and total flavonoid content (TFC) (c) in peel and (d) in pulp of ‘Langra’, ‘Chaunsa’, ‘Dashehari’, and ‘Gulab Jamun’ mangoes as af-fected by 100 µM melatonin (MT) treatment during storage at 5 ± 1 °C plus 3 d of shelf life at room temperature. Data are the mean of three replicates ± standard error. Different lowercase letters on the same storage period indicate significant differences (p < 0.05).
0
50
100
150
0 7 14 21 28 0 7 14 21 28 0 7 14 21 28 0 7 14 21 28
TPC
-Pul
p (m
g kg
-1) Langra Chaunsa Dashehari Gulab Jamun
aa aa
bb
c cc c
a a
ababbab
bb bb aa a a aa a a aa
aa
abab
b
b bb bb
b
0
50
100
150
200
250
300
0 7 14 21 28 0 7 14 21 28 0 7 14 21 28 0 7 14 21 28TF
C-P
eel (
mg
kg-1
)
Langra Chaunsa Dashehari Gulab Jamun
a a a a
bb
bb
bb
b
ab
b
bc
bcb
cb
ab
bb bb bb b b
b
bb
bbb
bb
a a
a ac
0
5
10
15
20
25
30
0 7 14 21 28 0 7 14 21 28 0 7 14 21 28 0 7 14 21 28
TFC
-Pul
p (m
g kg
-1)
Storage duration (Day)
Langra Chaunsa Dashehari Gulab Jamun
aaa
a
aab
aab
ab
a aab
b
bc
bc
b
bc
a a
bb
c
c
cc c
c
a aab
a
a
bca
ca
bc
d
0
20
40
60
80
100
0 7 14 21 28
Peel
-DPP
H (%
) *
(a) Langra0
20
40
60
80
0 7 14 21 28
Pulp
-DPP
H (%
)*
(b) LangraAntioxidants 2022, 11, x FOR PEER REVIEW 13 of 29
Figure 5. DPPH assay in (a) ‘Langra’ peel, (b) ‘Langra’ pulp, (c) ‘Chaunsa’ peel, (d) ‘Chaunsa’ pulp, (e) ‘Dashehari’ peel, (f) ‘Dashehari’ pulp, (g) ‘Gulab Jamun’ peel, and (h) ‘Gulab Jamun’ pulp as affected by 100 µM melatonin (MT) treatment during storage at 5 ± 1 °C plus 3 d of shelf life at room temperature. Data are the mean of three replicates ± standard error. An asterisk (*) on the same storage period indicates significant differences (p < 0.05).
75
80
85
90
95
0 7 14 21 28
Peel
-DPP
H (%
) *
(c) Chaunsa0
20
40
60
80
100
0 7 14 21 28
Pulp
-DPP
H (%
)
(d) Chaunsa
75
80
85
90
95
0 7 14 21 28
Peel
-DPP
H (%
)
(e) Dashehari0
20
40
60
80
100
0 7 14 21 28
Pulp
-DPP
H (%
)
(f) Dashehari
0
50
100
150
0 7 14 21 28
Peel
-DPP
H (%
)
Storage duration (Day)Control Treated
(g) Gulab Jamun0
50
100
0 7 14 21 28
Pulp
-DPP
H (%
)
Storage duration (Day)Control Treated
(h) Gulab Jamun
0
5
10
15
20
25
0 7 14 21 28
Peel
-TEA
C (%
) * *
*
(a) Langra
0
2
4
6
0 7 14 21 28
Pulp
-TEA
C (%
)(b) Langra
Figure 5. Cont.
Antioxidants 2022, 11, 384 13 of 28
Antioxidants 2022, 11, x FOR PEER REVIEW 13 of 29
Figure 5. DPPH assay in (a) ‘Langra’ peel, (b) ‘Langra’ pulp, (c) ‘Chaunsa’ peel, (d) ‘Chaunsa’ pulp, (e) ‘Dashehari’ peel, (f) ‘Dashehari’ pulp, (g) ‘Gulab Jamun’ peel, and (h) ‘Gulab Jamun’ pulp as affected by 100 µM melatonin (MT) treatment during storage at 5 ± 1 °C plus 3 d of shelf life at room temperature. Data are the mean of three replicates ± standard error. An asterisk (*) on the same storage period indicates significant differences (p < 0.05).
75
80
85
90
95
0 7 14 21 28
Peel
-DPP
H (%
) *
(c) Chaunsa0
20
40
60
80
100
0 7 14 21 28
Pulp
-DPP
H (%
)
(d) Chaunsa
75
80
85
90
95
0 7 14 21 28Pe
el-D
PPH
(%)
(e) Dashehari0
20
40
60
80
100
0 7 14 21 28
Pulp
-DPP
H (%
)
(f) Dashehari
0
50
100
150
0 7 14 21 28
Peel
-DPP
H (%
)
Storage duration (Day)Control Treated
(g) Gulab Jamun0
50
100
0 7 14 21 28
Pulp
-DPP
H (%
)
Storage duration (Day)Control Treated
(h) Gulab Jamun
0
5
10
15
20
25
0 7 14 21 28
Peel
-TEA
C (%
) * *
*
(a) Langra
0
2
4
6
0 7 14 21 28
Pulp
-TEA
C (%
)(b) Langra
Figure 5. DPPH assay in (a) ‘Langra’ peel, (b) ‘Langra’ pulp, (c) ‘Chaunsa’ peel, (d) ‘Chaunsa’ pulp,(e) ‘Dashehari’ peel, (f) ‘Dashehari’ pulp, (g) ‘Gulab Jamun’ peel, and (h) ‘Gulab Jamun’ pulp asaffected by 100 µM melatonin (MT) treatment during storage at 5 ± 1 ◦C plus 3 d of shelf life at roomtemperature. Data are the mean of three replicates ± standard error. An asterisk (*) on the samestorage period indicates significant differences (p < 0.05).
The peel of MT-treated ‘Langra’ (Figure 6a), ‘Chaunsa’ (Figure 6c), and ‘Dashehari’(Figure 6e) mangoes had significantly higher TEAC values, on at least one day of observa-tion. In contrast, the peel of MT-treated ‘Gulab Jamun’ mangoes had a significantly lowerTEAC value at 14 d of observation (Figure 6g). In the case of pulp of most MT-treatedmangoes (Figure 6b,d,f), except for ‘Gulab Jamun’ (Figure 6h), no significant differenceswere found (p > 0.05), although a tendency towards increasing is apparent.
Antioxidants 2022, 11, x FOR PEER REVIEW 13 of 29
Figure 5. DPPH assay in (a) ‘Langra’ peel, (b) ‘Langra’ pulp, (c) ‘Chaunsa’ peel, (d) ‘Chaunsa’ pulp, (e) ‘Dashehari’ peel, (f) ‘Dashehari’ pulp, (g) ‘Gulab Jamun’ peel, and (h) ‘Gulab Jamun’ pulp as affected by 100 µM melatonin (MT) treatment during storage at 5 ± 1 °C plus 3 d of shelf life at room temperature. Data are the mean of three replicates ± standard error. An asterisk (*) on the same storage period indicates significant differences (p < 0.05).
75
80
85
90
95
0 7 14 21 28
Peel
-DPP
H (%
) *
(c) Chaunsa0
20
40
60
80
100
0 7 14 21 28
Pulp
-DPP
H (%
)
(d) Chaunsa
75
80
85
90
95
0 7 14 21 28
Peel
-DPP
H (%
)
(e) Dashehari0
20
40
60
80
100
0 7 14 21 28
Pulp
-DPP
H (%
)
(f) Dashehari
0
50
100
150
0 7 14 21 28
Peel
-DPP
H (%
)
Storage duration (Day)Control Treated
(g) Gulab Jamun0
50
100
0 7 14 21 28
Pulp
-DPP
H (%
)
Storage duration (Day)Control Treated
(h) Gulab Jamun
0
5
10
15
20
25
0 7 14 21 28
Peel
-TEA
C (%
) * *
*
(a) Langra
0
2
4
6
0 7 14 21 28Pu
lp-T
EAC
(%)(b) Langra
Antioxidants 2022, 11, x FOR PEER REVIEW 14 of 29
Figure 6. Effect of 100 µM melatonin (MT) treatment on Trolox equivalent antioxidant capacity (TEAC) assay in (a) ‘Langra’ peel, (b) ‘Langra’ pulp, (c) ‘Chaunsa’ peel, (d) ‘Chaunsa’ pulp, (e) ‘Dashehari’ peel, (f) ‘Dashehari’ pulp, (g) ‘Gulab Jamun’ peel, and (h) ‘Gulab Jamun’ pulp t during storage at 5 ± 1 °C plus 3 d of shelf life at room temperature. Data are the mean of three replicates ± standard error. An asterisk (*) on the same storage period indicates significant differences (p < 0.05).
0
10
20
30
0 7 14 21 28
Peel
-TEA
C (%
) *
* *
(c) Chaunsa
0.0
1.0
2.0
3.0
0 7 14 21 28
Pulp
-TEA
C (%
)(d) Chaunsa
02468
10
0 7 14 21 28
Peel
-TEA
C (%
)
*
*(e) Dashehari
0.01.02.03.04.05.0
0 7 14 21 28
Pulp
-TEA
C (%
)(f) Dashehari
0
10
20
30
40
0 7 14 21 28
Peel
-TEA
C (%
)
Storage duration (Day)Control Treated
*
(g) Gulab Jamun
0
5
10
0 7 14 21 28
Pulp
-TEA
C (%
)
Storage duration (Day)Control Treated
(h) Gulab Jamun
Figure 6. Cont.
Antioxidants 2022, 11, 384 14 of 28
Antioxidants 2022, 11, x FOR PEER REVIEW 14 of 29
Figure 6. Effect of 100 µM melatonin (MT) treatment on Trolox equivalent antioxidant capacity (TEAC) assay in (a) ‘Langra’ peel, (b) ‘Langra’ pulp, (c) ‘Chaunsa’ peel, (d) ‘Chaunsa’ pulp, (e) ‘Dashehari’ peel, (f) ‘Dashehari’ pulp, (g) ‘Gulab Jamun’ peel, and (h) ‘Gulab Jamun’ pulp t during storage at 5 ± 1 °C plus 3 d of shelf life at room temperature. Data are the mean of three replicates ± standard error. An asterisk (*) on the same storage period indicates significant differences (p < 0.05).
0
10
20
30
0 7 14 21 28
Peel
-TEA
C (%
) *
* *
(c) Chaunsa
0.0
1.0
2.0
3.0
0 7 14 21 28
Pulp
-TEA
C (%
)(d) Chaunsa
02468
10
0 7 14 21 28Pe
el-T
EAC
(%)
*
*(e) Dashehari
0.01.02.03.04.05.0
0 7 14 21 28
Pulp
-TEA
C (%
)(f) Dashehari
0
10
20
30
40
0 7 14 21 28
Peel
-TEA
C (%
)
Storage duration (Day)Control Treated
*
(g) Gulab Jamun
0
5
10
0 7 14 21 28
Pulp
-TEA
C (%
)
Storage duration (Day)Control Treated
(h) Gulab Jamun
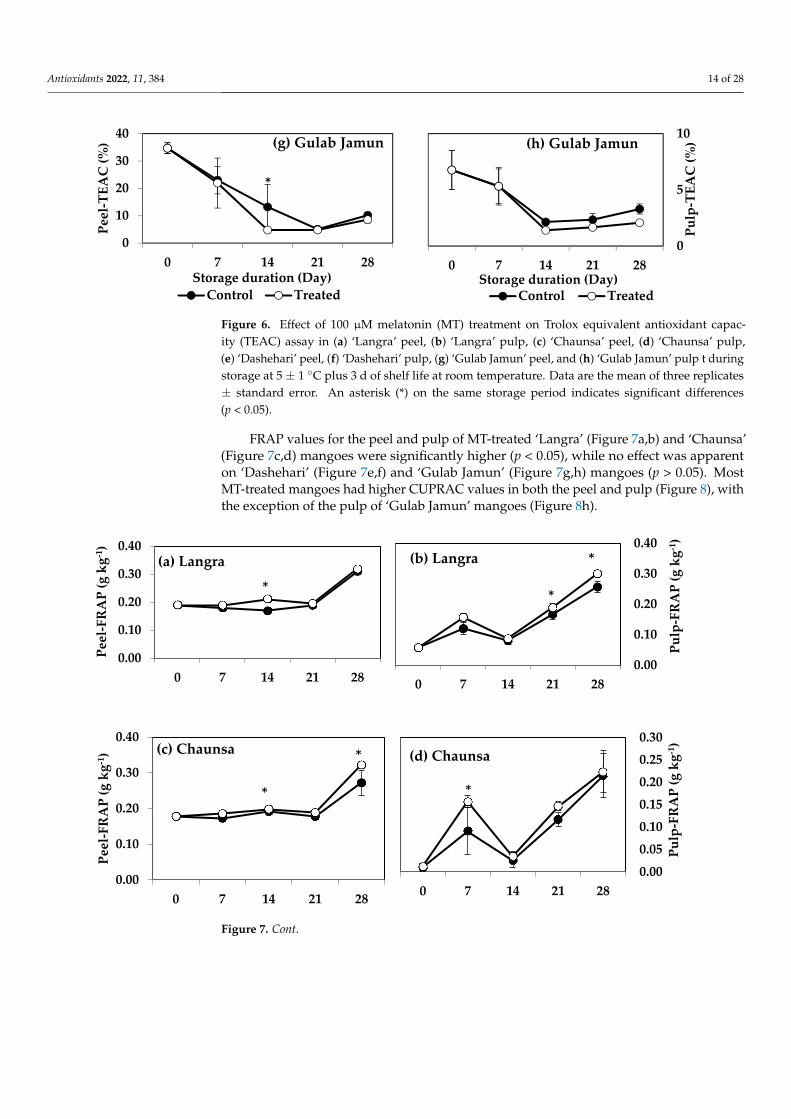
Figure 6. Effect of 100 µM melatonin (MT) treatment on Trolox equivalent antioxidant capac-ity (TEAC) assay in (a) ‘Langra’ peel, (b) ‘Langra’ pulp, (c) ‘Chaunsa’ peel, (d) ‘Chaunsa’ pulp,(e) ‘Dashehari’ peel, (f) ‘Dashehari’ pulp, (g) ‘Gulab Jamun’ peel, and (h) ‘Gulab Jamun’ pulp t duringstorage at 5 ± 1 ◦C plus 3 d of shelf life at room temperature. Data are the mean of three replicates± standard error. An asterisk (*) on the same storage period indicates significant differences(p < 0.05).
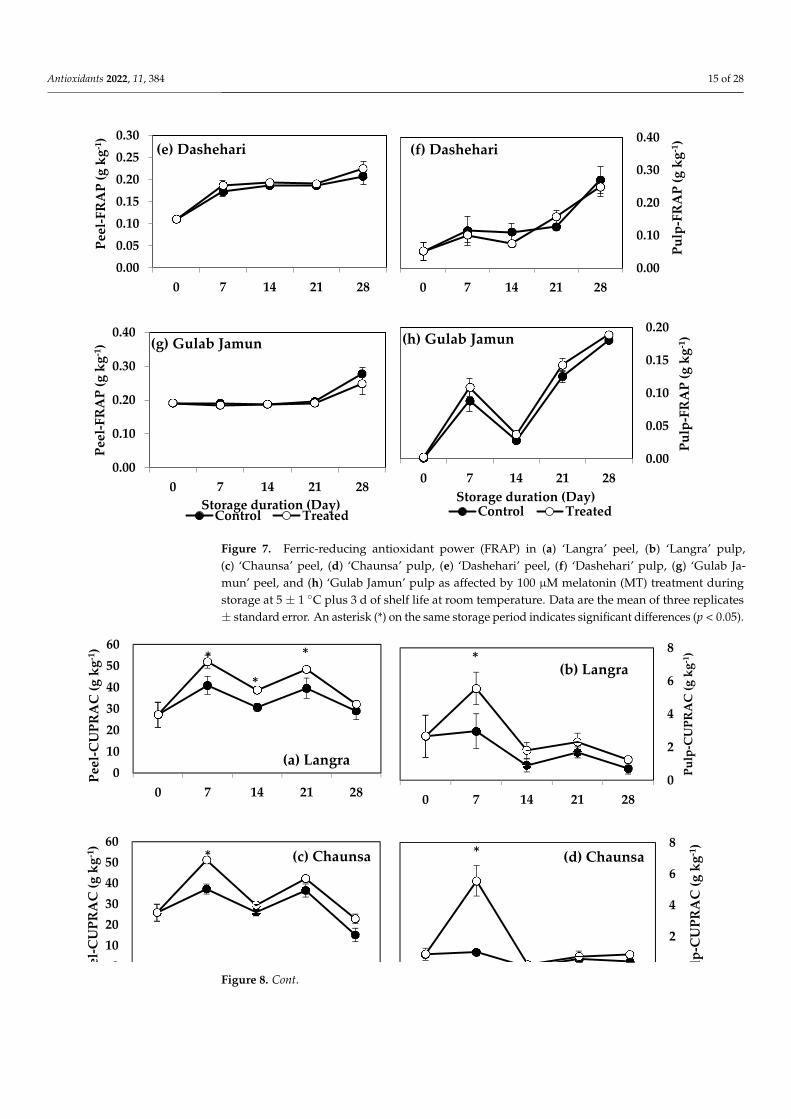
FRAP values for the peel and pulp of MT-treated ‘Langra’ (Figure 7a,b) and ‘Chaunsa’(Figure 7c,d) mangoes were significantly higher (p < 0.05), while no effect was apparenton ‘Dashehari’ (Figure 7e,f) and ‘Gulab Jamun’ (Figure 7g,h) mangoes (p > 0.05). MostMT-treated mangoes had higher CUPRAC values in both the peel and pulp (Figure 8), withthe exception of the pulp of ‘Gulab Jamun’ mangoes (Figure 8h).
Antioxidants 2022, 11, x FOR PEER REVIEW 15 of 29
0.00
0.10
0.20
0.30
0.40
0 7 14 21 28
Peel
-FR
AP
(g k
g-1)
*
(a) Langra
0.00
0.10
0.20
0.30
0.40
0 7 14 21 28Pu
lp-F
RA
P (g
kg-1
)
*
*(b) Langra
0.00
0.10
0.20
0.30
0.40
0 7 14 21 28
Peel
-FR
AP
(g k
g-1)
*
*(c) Chaunsa
0.000.050.100.150.200.250.30
0 7 14 21 28
Pulp
-FR
AP
(g k
g-1)
*
(d) Chaunsa
0.000.050.100.150.200.250.30
0 7 14 21 28
Peel
-FR
AP
(g k
g-1)
(e) Dashehari
0.00
0.10
0.20
0.30
0.40
0 7 14 21 28
Pulp
-FR
AP
(g k
g-1)(f) Dashehari
0.00
0.10
0.20
0.30
0.40
0 7 14 21 28
Peel
-FR
AP
(g k
g-1)
Storage duration (Day)Control Treated
(g) Gulab Jamun
0.00
0.05
0.10
0.15
0.20
0 7 14 21 28
Pulp
-FR
AP
(g k
g-1)
Storage duration (Day)Control Treated
(h) Gulab Jamun
Figure 7. Ferric-reducing antioxidant power (FRAP) in (a) ‘Langra’ peel, (b) ‘Langra’ pulp, (c) ‘Chaunsa’ peel, (d) ‘Chaunsa’ pulp, (e) ‘Dashehari’ peel, (f) ‘Dashehari’ pulp, (g) ‘Gulab Jamun’ peel, and (h) ‘Gulab Jamun’ pulp as affected by 100 µM melatonin (MT) treatment during storage at 5 ± 1 °C plus 3 d of shelf life at room temperature. Data are the mean of three replicates ± standard error. An asterisk (*) on the same storage period indicates significant differences (p < 0.05).
Figure 7. Cont.
Antioxidants 2022, 11, 384 15 of 28
Antioxidants 2022, 11, x FOR PEER REVIEW 15 of 29
0.00
0.10
0.20
0.30
0.40
0 7 14 21 28
Peel
-FR
AP
(g k
g-1)
*
(a) Langra
0.00
0.10
0.20
0.30
0.40
0 7 14 21 28
Pulp
-FR
AP
(g k
g-1)
*
*(b) Langra
0.00
0.10
0.20
0.30
0.40
0 7 14 21 28Pe
el-F
RA
P (g
kg-1
)
*
*(c) Chaunsa
0.000.050.100.150.200.250.30
0 7 14 21 28
Pulp
-FR
AP
(g k
g-1)
*
(d) Chaunsa
0.000.050.100.150.200.250.30
0 7 14 21 28
Peel
-FR
AP
(g k
g-1)
(e) Dashehari
0.00
0.10
0.20
0.30
0.40
0 7 14 21 28
Pulp
-FR
AP
(g k
g-1)(f) Dashehari
0.00
0.10
0.20
0.30
0.40
0 7 14 21 28
Peel
-FR
AP
(g k
g-1)
Storage duration (Day)Control Treated
(g) Gulab Jamun
0.00
0.05
0.10
0.15
0.20
0 7 14 21 28
Pulp
-FR
AP
(g k
g-1)
Storage duration (Day)Control Treated
(h) Gulab Jamun
Figure 7. Ferric-reducing antioxidant power (FRAP) in (a) ‘Langra’ peel, (b) ‘Langra’ pulp, (c) ‘Chaunsa’ peel, (d) ‘Chaunsa’ pulp, (e) ‘Dashehari’ peel, (f) ‘Dashehari’ pulp, (g) ‘Gulab Jamun’ peel, and (h) ‘Gulab Jamun’ pulp as affected by 100 µM melatonin (MT) treatment during storage at 5 ± 1 °C plus 3 d of shelf life at room temperature. Data are the mean of three replicates ± standard error. An asterisk (*) on the same storage period indicates significant differences (p < 0.05).
Figure 7. Ferric-reducing antioxidant power (FRAP) in (a) ‘Langra’ peel, (b) ‘Langra’ pulp,(c) ‘Chaunsa’ peel, (d) ‘Chaunsa’ pulp, (e) ‘Dashehari’ peel, (f) ‘Dashehari’ pulp, (g) ‘Gulab Ja-mun’ peel, and (h) ‘Gulab Jamun’ pulp as affected by 100 µM melatonin (MT) treatment duringstorage at 5 ± 1 ◦C plus 3 d of shelf life at room temperature. Data are the mean of three replicates± standard error. An asterisk (*) on the same storage period indicates significant differences (p < 0.05).
Antioxidants 2022, 11, x FOR PEER REVIEW 16 of 29
1
0102030405060
0 7 14 21 28
Peel
-CU
PRA
C (g
kg-1
) *
*
*
(a) Langra0
2
4
6
8
0 7 14 21 28
Pulp
-CU
PRA
C (g
kg-1
)*(b) Langra
0102030405060
0 7 14 21 28
Peel
-CU
PRA
C (g
kg-1
)
* (c) Chaunsa
0
2
4
6
8
0 7 14 21 28
Pulp
-CU
PRA
C (g
kg-1
)* (d) Chaunsa
0
10
20
30
40
50
0 7 14 21 28
Peel
-CU
PRA
C (g
kg-1
)
* (e) Dashehari
0123456
0 7 14 21 28 Pulp
-CU
PRA
C (g
kg-1
)
* (f) Dashehari
0
20
40
60
1 2 3 4 5
Peel
-CU
PRA
C (g
kg-1
)
Storage duration (Day)Control Treated
*
*
(g) Gulab Jamun
0
2
4
6
0 7 14 21 28
Pulp
-CU
PRA
C (g
kg-1
)
Storage duration (Day)Control Treated
* (h) Gulab Jamun
Figure 8. Cupric-reducing antioxidant power (CUPRAC) assay in (a) ‘Langra’ peel, (b) ‘Langra’ pulp, (c) ‘Chaunsa’ peel, (d) ‘Chaunsa’ pulp, (e) ‘Dashehari’ peel, (f) ‘Dashehari’ pulp, (g) ‘Gulab Jamun’ peel, and (h) ‘Gulab Jamun’ pulp as affected by 100 µM melatonin (MT) treatment during storage at 5 ± 1 °C plus 3 d of shelf life at room temperature. Dta are the mean of three replicates ± standard error. An asterisk (*) on the same storage period indicates significant differences (p < 0.05).
Figure 8. Cont.
Antioxidants 2022, 11, 384 16 of 28
Antioxidants 2022, 11, x FOR PEER REVIEW 16 of 29
1
0102030405060
0 7 14 21 28
Peel
-CU
PRA
C (g
kg-1
) *
*
*
(a) Langra0
2
4
6
8
0 7 14 21 28
Pulp
-CU
PRA
C (g
kg-1
)*(b) Langra
0102030405060
0 7 14 21 28Pe
el-C
UPR
AC
(g k
g-1)
* (c) Chaunsa
0
2
4
6
8
0 7 14 21 28
Pulp
-CU
PRA
C (g
kg-1
)* (d) Chaunsa
0
10
20
30
40
50
0 7 14 21 28
Peel
-CU
PRA
C (g
kg-1
)
* (e) Dashehari
0123456
0 7 14 21 28 Pulp
-CU
PRA
C (g
kg-1
)
* (f) Dashehari
0
20
40
60
1 2 3 4 5
Peel
-CU
PRA
C (g
kg-1
)
Storage duration (Day)Control Treated
*
*
(g) Gulab Jamun
0
2
4
6
0 7 14 21 28
Pulp
-CU
PRA
C (g
kg-1
)
Storage duration (Day)Control Treated
* (h) Gulab Jamun
Figure 8. Cupric-reducing antioxidant power (CUPRAC) assay in (a) ‘Langra’ peel, (b) ‘Langra’ pulp, (c) ‘Chaunsa’ peel, (d) ‘Chaunsa’ pulp, (e) ‘Dashehari’ peel, (f) ‘Dashehari’ pulp, (g) ‘Gulab Jamun’ peel, and (h) ‘Gulab Jamun’ pulp as affected by 100 µM melatonin (MT) treatment during storage at 5 ± 1 °C plus 3 d of shelf life at room temperature. Dta are the mean of three replicates ± standard error. An asterisk (*) on the same storage period indicates significant differences (p < 0.05).
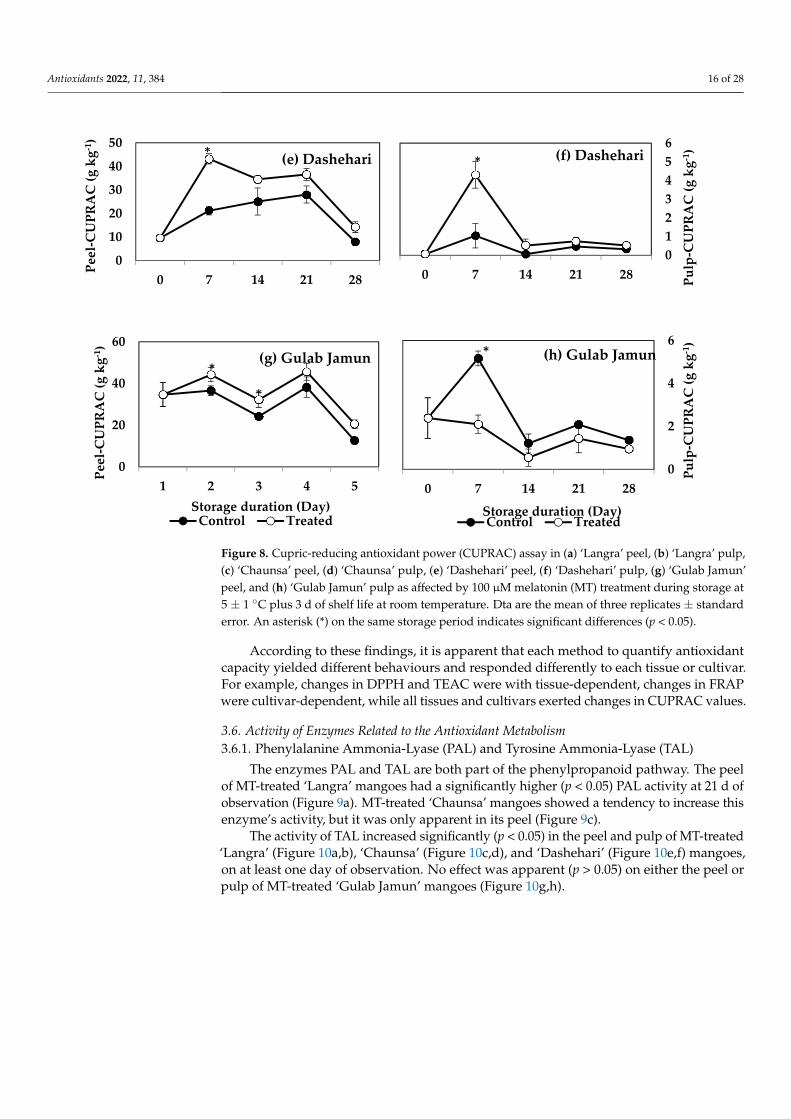
Figure 8. Cupric-reducing antioxidant power (CUPRAC) assay in (a) ‘Langra’ peel, (b) ‘Langra’ pulp,(c) ‘Chaunsa’ peel, (d) ‘Chaunsa’ pulp, (e) ‘Dashehari’ peel, (f) ‘Dashehari’ pulp, (g) ‘Gulab Jamun’peel, and (h) ‘Gulab Jamun’ pulp as affected by 100 µM melatonin (MT) treatment during storage at5 ± 1 ◦C plus 3 d of shelf life at room temperature. Dta are the mean of three replicates ± standarderror. An asterisk (*) on the same storage period indicates significant differences (p < 0.05).
According to these findings, it is apparent that each method to quantify antioxidantcapacity yielded different behaviours and responded differently to each tissue or cultivar.For example, changes in DPPH and TEAC were with tissue-dependent, changes in FRAPwere cultivar-dependent, while all tissues and cultivars exerted changes in CUPRAC values.
3.6. Activity of Enzymes Related to the Antioxidant Metabolism3.6.1. Phenylalanine Ammonia-Lyase (PAL) and Tyrosine Ammonia-Lyase (TAL)
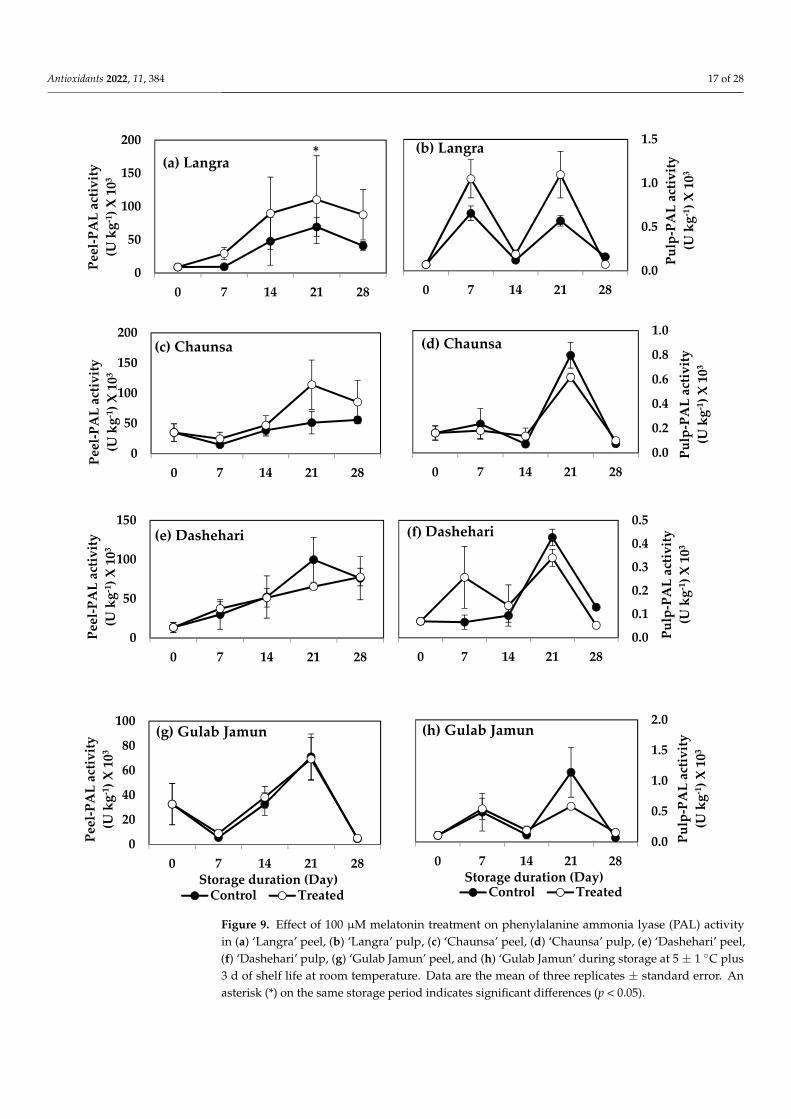
The enzymes PAL and TAL are both part of the phenylpropanoid pathway. The peelof MT-treated ‘Langra’ mangoes had a significantly higher (p < 0.05) PAL activity at 21 d ofobservation (Figure 9a). MT-treated ‘Chaunsa’ mangoes showed a tendency to increase thisenzyme’s activity, but it was only apparent in its peel (Figure 9c).
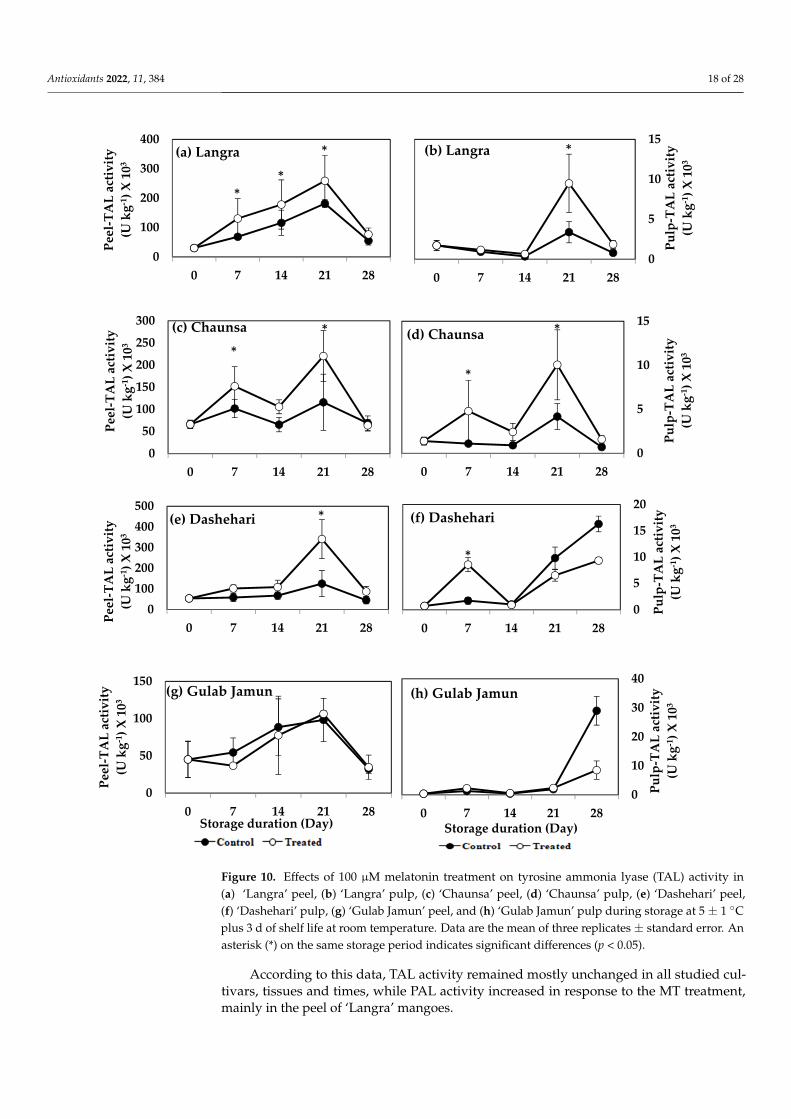
The activity of TAL increased significantly (p < 0.05) in the peel and pulp of MT-treated‘Langra’ (Figure 10a,b), ‘Chaunsa’ (Figure 10c,d), and ‘Dashehari’ (Figure 10e,f) mangoes,on at least one day of observation. No effect was apparent (p > 0.05) on either the peel orpulp of MT-treated ‘Gulab Jamun’ mangoes (Figure 10g,h).
Antioxidants 2022, 11, 384 17 of 28Antioxidants 2022, 11, x FOR PEER REVIEW 18 of 29
Figure 9. Effect of 100 µM melatonin treatment on phenylalanine ammonia lyase (PAL) activity in (a) ‘Langra’ peel, (b) ‘Langra’ pulp, (c) ‘Chaunsa’ peel, (d) ‘Chaunsa’ pulp, (e) ‘Dashehari’ peel, (f) ‘Dashehari’ pulp, (g) ‘Gulab Jamun’ peel, and (h) ‘Gulab Jamun’ during storage at 5 ± 1 °C plus 3 d of shelf life at room temperature. Data are the mean of three replicates ± standard error. An asterisk (*) on the same storage period indicates significant differences (p < 0.05).
0
50
100
150
200
0 7 14 21 28
Peel
-PA
L ac
tivity
(U
kg-1
) X 1
03
*(a) Langra
0.0
0.5
1.0
1.5
0 7 14 21 28
Pulp
-PA
L ac
tivity
(U
kg-1
) X 1
03
(b) Langra
0
50
100
150
200
0 7 14 21 28
Peel
-PA
L ac
tivity
(U
kg-1
) X 1
03
(c) Chaunsa
0.0
0.2
0.4
0.6
0.8
1.0
0 7 14 21 28
Pulp
-PA
L ac
tivity
(U
kg-1
) X 1
03
(d) Chaunsa
0
50
100
150
0 7 14 21 28
Peel
-PA
L ac
tivity
(U
kg-1
) X 1
03
(e) Dashehari
0.0
0.1
0.2
0.3
0.4
0.5
0 7 14 21 28Pu
lp-P
AL
activ
ity
(U k
g-1) X
103
(f) Dashehari
0
20
40
60
80
100
0 7 14 21 28
Peel
-PA
L ac
tivity
(U
kg-1
) X 1
03
Storage duration (Day)Control Treated
(g) Gulab Jamun
0.0
0.5
1.0
1.5
2.0
0 7 14 21 28
Pulp
-PA
L ac
tivity
(U
kg-1
) X 1
03
Storage duration (Day)Control Treated
(h) Gulab Jamun
Figure 9. Effect of 100 µM melatonin treatment on phenylalanine ammonia lyase (PAL) activityin (a) ‘Langra’ peel, (b) ‘Langra’ pulp, (c) ‘Chaunsa’ peel, (d) ‘Chaunsa’ pulp, (e) ‘Dashehari’ peel,(f) ‘Dashehari’ pulp, (g) ‘Gulab Jamun’ peel, and (h) ‘Gulab Jamun’ during storage at 5 ± 1 ◦C plus3 d of shelf life at room temperature. Data are the mean of three replicates ± standard error. Anasterisk (*) on the same storage period indicates significant differences (p < 0.05).
Antioxidants 2022, 11, 384 18 of 28Antioxidants 2022, 11, x FOR PEER REVIEW 19 of 29
Figure 10. Effects of 100 µM melatonin treatment on tyrosine ammonia lyase (TAL) activity in (a) ‘Langra’ peel, (b) ‘Langra’ pulp, (c) ‘Chaunsa’ peel, (d) ‘Chaunsa’ pulp, (e) ‘Dashehari’ peel, (f) ‘Dashehari’ pulp, (g) ‘Gulab Jamun’ peel, and (h) ‘Gulab Jamun’ pulp during storage at 5 ± 1 °C plus 3 d of shelf life at room temperature. Data are the mean of three replicates ± standard error. An asterisk (*) on the same storage period indicates significant differences (p < 0.05).
0
100
200
300
400
0 7 14 21 28
Peel
-TA
L ac
tivity
(U
kg-1
) X 1
03
**
*(a) Langra
0
5
10
15
0 7 14 21 28
Pulp
-TA
L ac
tivity
(U
kg-1
) X 1
03
*(b) Langra
0
50
100
150
200
250
300
0 7 14 21 28
Peel
-TA
L ac
tivity
(U
kg-1
) X 1
03 **(c) Chaunsa
0
5
10
15
0 7 14 21 28
Pulp
-TA
L ac
tivity
(U
kg-1
) X 1
03
*
*(d) Chaunsa
0100200300400500
0 7 14 21 28
Peel
-TA
L ac
tivity
(U
kg-1
) X 1
03
*(e) Dashehari
0
5
10
15
20
0 7 14 21 28
Pulp
-TA
L ac
tivity
(U
kg-1
) X 1
03
*
(f) Dashehari
0
50
100
150
0 7 14 21 28
Peel
-TA
L ac
tivity
(U
kg-1
) X 1
03
Storage duration (Day)
(g) Gulab Jamun
0
10
20
30
40
0 7 14 21 28
Pulp
-TA
L ac
tivity
(U
kg-1
) X 1
03
Storage duration (Day)
(h) Gulab Jamun
Figure 10. Effects of 100 µM melatonin treatment on tyrosine ammonia lyase (TAL) activity in(a) ‘Langra’ peel, (b) ‘Langra’ pulp, (c) ‘Chaunsa’ peel, (d) ‘Chaunsa’ pulp, (e) ‘Dashehari’ peel,(f) ‘Dashehari’ pulp, (g) ‘Gulab Jamun’ peel, and (h) ‘Gulab Jamun’ pulp during storage at 5 ± 1 ◦Cplus 3 d of shelf life at room temperature. Data are the mean of three replicates ± standard error. Anasterisk (*) on the same storage period indicates significant differences (p < 0.05).
According to this data, TAL activity remained mostly unchanged in all studied cul-tivars, tissues and times, while PAL activity increased in response to the MT treatment,mainly in the peel of ‘Langra’ mangoes.
Antioxidants 2022, 11, 384 19 of 28
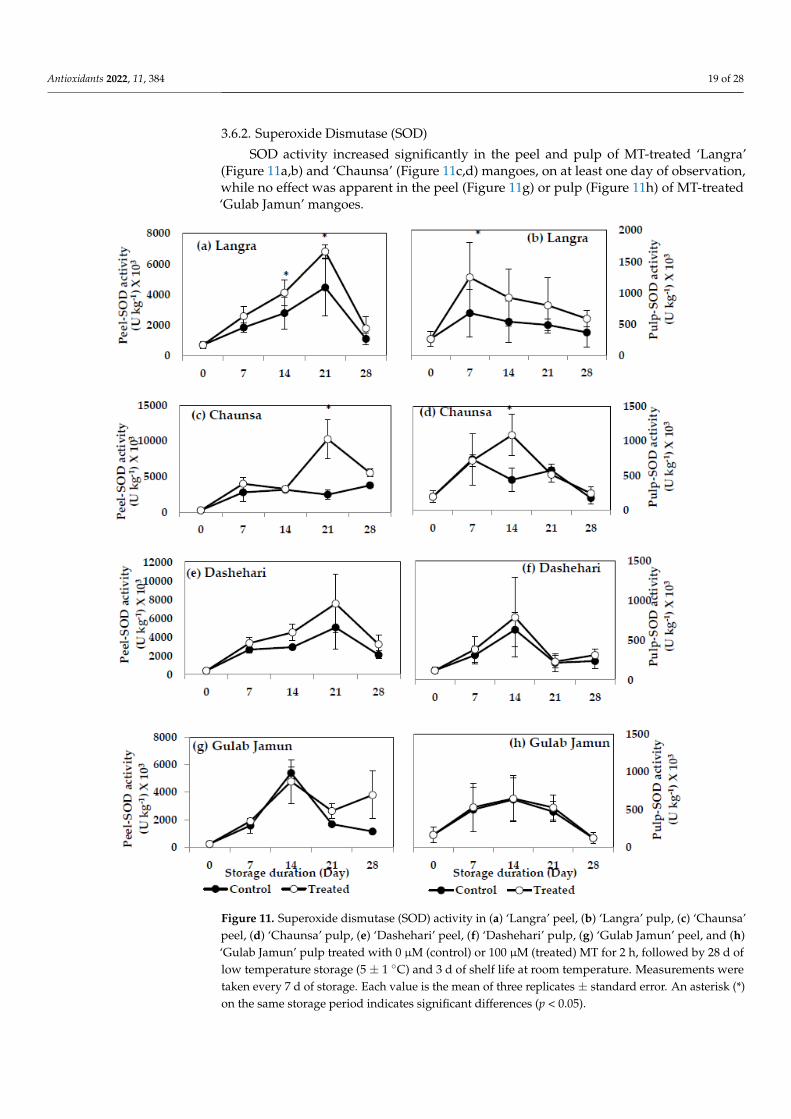
3.6.2. Superoxide Dismutase (SOD)
SOD activity increased significantly in the peel and pulp of MT-treated ‘Langra’(Figure 11a,b) and ‘Chaunsa’ (Figure 11c,d) mangoes, on at least one day of observation,while no effect was apparent in the peel (Figure 11g) or pulp (Figure 11h) of MT-treated‘Gulab Jamun’ mangoes.
Antioxidants 2022, 11, x FOR PEER REVIEW 20 of 29
Figure 11. Superoxide dismutase (SOD) activity in (a) ‘Langra’ peel, (b) ‘Langra’ pulp, (c) ‘Chaunsa’ peel, (d) ‘Chaunsa’ pulp, (e) ‘Dashehari’ peel, (f) ‘Dashehari’ pulp, (g) ‘Gulab Jamun’ peel, and (h) ‘Gulab Jamun’ pulp treated with 0 µM (control) or 100 µM (treated) MT for 2 h, followed by 28 d of low temperature storage (5 ± 1 °C) and 3 d of shelf life at room temperature. Measurements were taken every 7 d of storage. Each value is the mean of three replicates ± standard error. An asterisk (*) on the same storage period indicates significant differences (p < 0.05).
Figure 11. Superoxide dismutase (SOD) activity in (a) ‘Langra’ peel, (b) ‘Langra’ pulp, (c) ‘Chaunsa’peel, (d) ‘Chaunsa’ pulp, (e) ‘Dashehari’ peel, (f) ‘Dashehari’ pulp, (g) ‘Gulab Jamun’ peel, and (h)‘Gulab Jamun’ pulp treated with 0 µM (control) or 100 µM (treated) MT for 2 h, followed by 28 d oflow temperature storage (5 ± 1 ◦C) and 3 d of shelf life at room temperature. Measurements weretaken every 7 d of storage. Each value is the mean of three replicates ± standard error. An asterisk (*)on the same storage period indicates significant differences (p < 0.05).
Antioxidants 2022, 11, 384 20 of 28
3.6.3. Catalase (CAT)
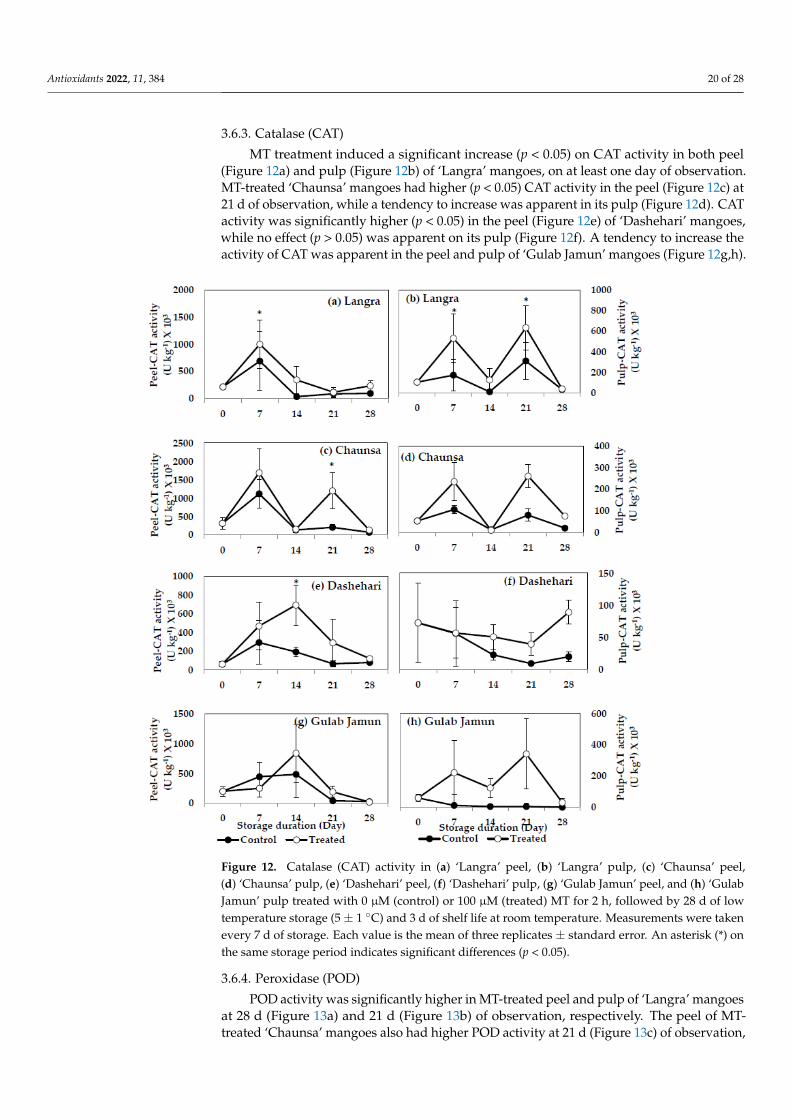
MT treatment induced a significant increase (p < 0.05) on CAT activity in both peel(Figure 12a) and pulp (Figure 12b) of ‘Langra’ mangoes, on at least one day of observation.MT-treated ‘Chaunsa’ mangoes had higher (p < 0.05) CAT activity in the peel (Figure 12c) at21 d of observation, while a tendency to increase was apparent in its pulp (Figure 12d). CATactivity was significantly higher (p < 0.05) in the peel (Figure 12e) of ‘Dashehari’ mangoes,while no effect (p > 0.05) was apparent on its pulp (Figure 12f). A tendency to increase theactivity of CAT was apparent in the peel and pulp of ‘Gulab Jamun’ mangoes (Figure 12g,h).
Antioxidants 2022, 11, x FOR PEER REVIEW 21 of 29
Figure 12. Catalase (CAT) activity in (a) ‘Langra’ peel, (b) ‘Langra’ pulp, (c) ‘Chaunsa’ peel, (d) ‘Chaunsa’ pulp, (e) ‘Dashehari’ peel, (f) ‘Dashehari’ pulp, (g) ‘Gulab Jamun’ peel, and (h) ‘Gulab Jamun’ pulp treated with 0 µM (control) or 100 µM (treated) MT for 2 h, followed by 28 d of low temperature storage (5 ± 1 °C) and 3 d of shelf life at room temperature. Measurements were taken every 7 d of storage. Each value is the mean of three replicates ± standard error. An asterisk (*) on the same storage period indicates significant differences (p < 0.05).
Figure 12. Catalase (CAT) activity in (a) ‘Langra’ peel, (b) ‘Langra’ pulp, (c) ‘Chaunsa’ peel,(d) ‘Chaunsa’ pulp, (e) ‘Dashehari’ peel, (f) ‘Dashehari’ pulp, (g) ‘Gulab Jamun’ peel, and (h) ‘GulabJamun’ pulp treated with 0 µM (control) or 100 µM (treated) MT for 2 h, followed by 28 d of lowtemperature storage (5 ± 1 ◦C) and 3 d of shelf life at room temperature. Measurements were takenevery 7 d of storage. Each value is the mean of three replicates ± standard error. An asterisk (*) onthe same storage period indicates significant differences (p < 0.05).
3.6.4. Peroxidase (POD)
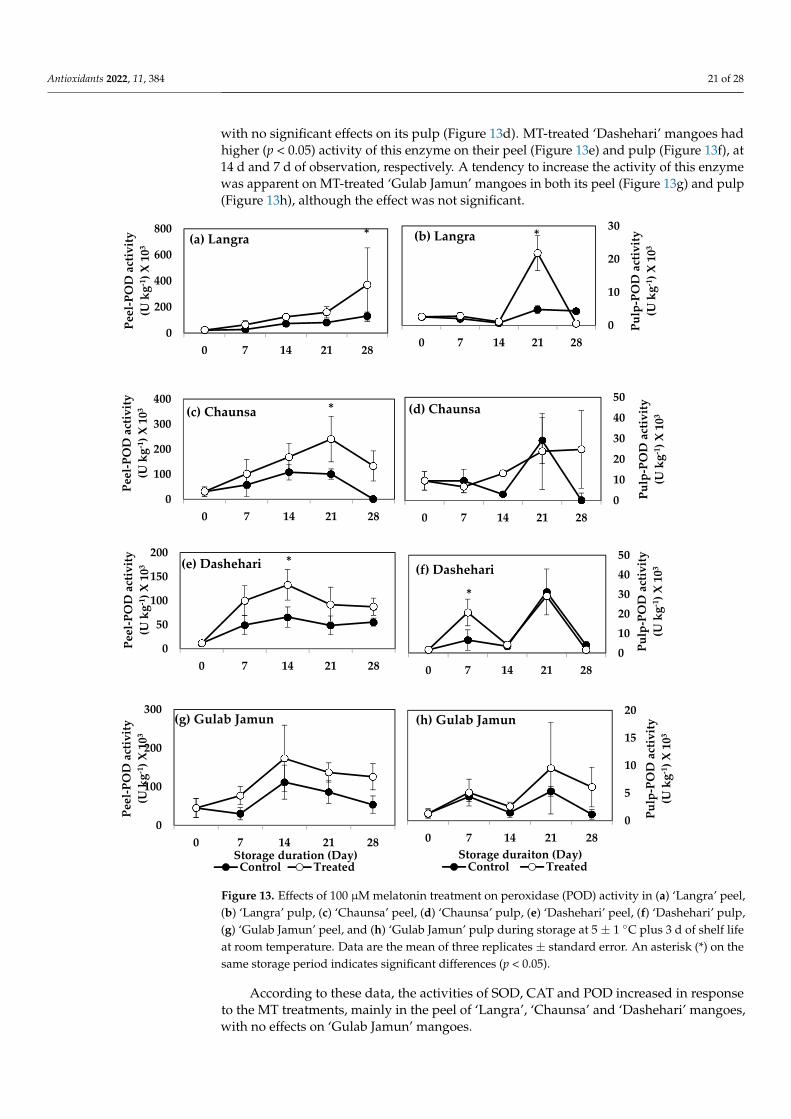
POD activity was significantly higher in MT-treated peel and pulp of ‘Langra’ mangoesat 28 d (Figure 13a) and 21 d (Figure 13b) of observation, respectively. The peel of MT-treated ‘Chaunsa’ mangoes also had higher POD activity at 21 d (Figure 13c) of observation,
Antioxidants 2022, 11, 384 21 of 28
with no significant effects on its pulp (Figure 13d). MT-treated ‘Dashehari’ mangoes hadhigher (p < 0.05) activity of this enzyme on their peel (Figure 13e) and pulp (Figure 13f), at14 d and 7 d of observation, respectively. A tendency to increase the activity of this enzymewas apparent on MT-treated ‘Gulab Jamun’ mangoes in both its peel (Figure 13g) and pulp(Figure 13h), although the effect was not significant.
Antioxidants 2022, 11, x FOR PEER REVIEW 22 of 29
1
0
200
400
600
800
0 7 14 21 28
Peel
-PO
D a
ctiv
ity
(U k
g-1) X
103
*(a) Langra
0
10
20
30
0 7 14 21 28
Pulp
-PO
D a
ctiv
ity
(U k
g-1) X
103
*(b) Langra
0
100
200
300
400
0 7 14 21 28
Peel
-PO
D a
ctiv
ity
(U k
g-1) X
103 *(c) Chaunsa
0
10
20
30
40
50
0 7 14 21 28
Pulp
-PO
D a
ctiv
ity
(U k
g-1) X
103(d) Chaunsa
0
50
100
150
200
0 7 14 21 28
Peel
-PO
D a
ctiv
ity
(U k
g-1) X
103 *(e) Dashehari
01020304050
0 7 14 21 28
Pulp
-PO
D a
ctiv
ity
(U k
g-1) X
103
*
(f) Dashehari
0
100
200
300
0 7 14 21 28
Peel
-PO
D a
ctiv
ity
(U k
g-1) X
103
Storage duration (Day)Control Treated
(g) Gulab Jamun
0
5
10
15
20
0 7 14 21 28
Pulp
-PO
D a
ctiv
ity
(U k
g-1) X
103
Storage duraiton (Day)Control Treated
(h) Gulab Jamun
Figure 13. Effects of 100 µM melatonin treatment on peroxidase (POD) activity in (a) ‘Langra’ peel, (b) ‘Langra’ pulp, (c) ‘Chaunsa’ peel, (d) ‘Chaunsa’ pulp, (e) ‘Dashehari’ peel, (f) ‘Dashehari’ pulp, (g) ‘Gulab Jamun’ peel, and (h) ‘Gulab Jamun’ pulp during storage at 5 ± 1 °C plus 3 d of shelf life at room temperature. Data are the mean of three replicates ± standard error. An asterisk (*) on the same storage period indicates significant differences (p < 0.05).
Figure 13. Effects of 100 µM melatonin treatment on peroxidase (POD) activity in (a) ‘Langra’ peel,(b) ‘Langra’ pulp, (c) ‘Chaunsa’ peel, (d) ‘Chaunsa’ pulp, (e) ‘Dashehari’ peel, (f) ‘Dashehari’ pulp,(g) ‘Gulab Jamun’ peel, and (h) ‘Gulab Jamun’ pulp during storage at 5 ± 1 ◦C plus 3 d of shelf lifeat room temperature. Data are the mean of three replicates ± standard error. An asterisk (*) on thesame storage period indicates significant differences (p < 0.05).
According to these data, the activities of SOD, CAT and POD increased in responseto the MT treatments, mainly in the peel of ‘Langra’, ‘Chaunsa’ and ‘Dashehari’ mangoes,with no effects on ‘Gulab Jamun’ mangoes.
Antioxidants 2022, 11, 384 22 of 28
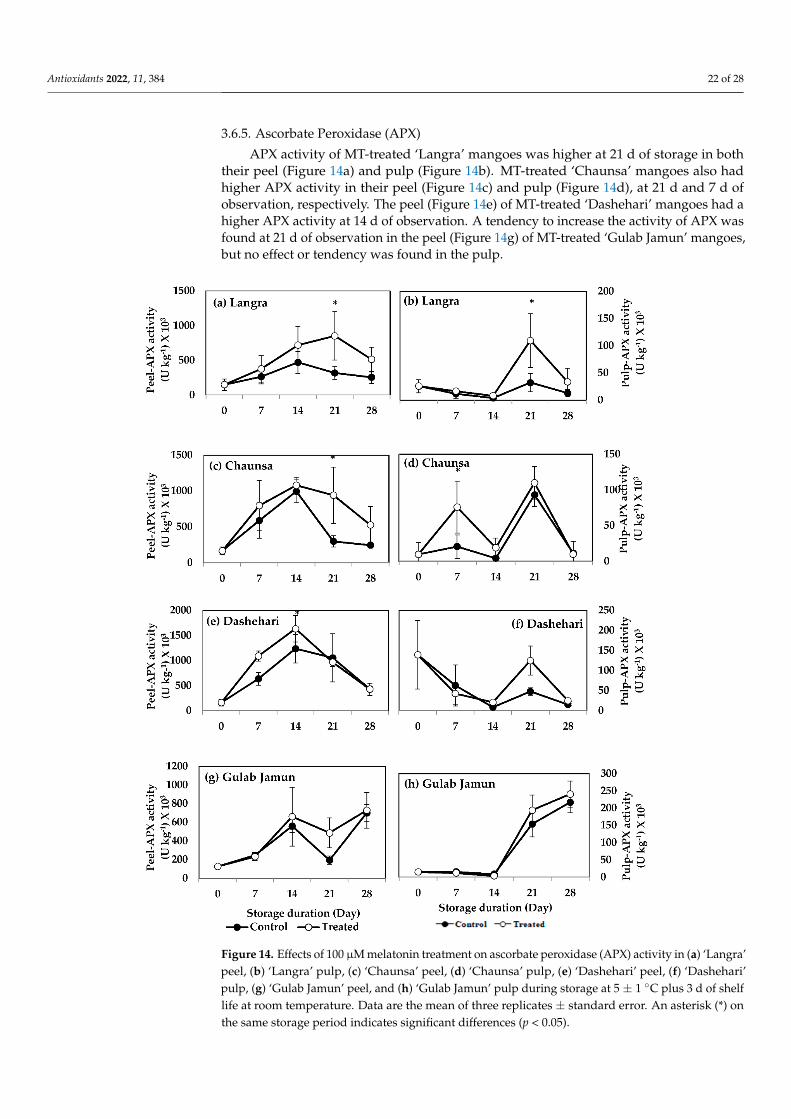
3.6.5. Ascorbate Peroxidase (APX)
APX activity of MT-treated ‘Langra’ mangoes was higher at 21 d of storage in boththeir peel (Figure 14a) and pulp (Figure 14b). MT-treated ‘Chaunsa’ mangoes also hadhigher APX activity in their peel (Figure 14c) and pulp (Figure 14d), at 21 d and 7 d ofobservation, respectively. The peel (Figure 14e) of MT-treated ‘Dashehari’ mangoes had ahigher APX activity at 14 d of observation. A tendency to increase the activity of APX wasfound at 21 d of observation in the peel (Figure 14g) of MT-treated ‘Gulab Jamun’ mangoes,but no effect or tendency was found in the pulp.
Antioxidants 2022, 11, x FOR PEER REVIEW 23 of 29
3.6.5. Ascorbate Peroxidase (APX) APX activity of MT-treated ‘Langra’ mangoes was higher at 21 d of storage in both
their peel (Figure 14a) and pulp (Figure 14b). MT-treated ‘Chaunsa’ mangoes also had higher APX activity in their peel (Figure 14c) and pulp (Figure 14d), at 21 d and 7 d of observation, respectively. The peel (Figure 14e) of MT-treated ‘Dashehari’ mangoes had a higher APX activity at 14 d of observation. A tendency to increase the activity of APX was found at 21 d of observation in the peel (Figure 14g) of MT-treated ‘Gulab Jamun’ man-goes, but no effect or tendency was found in the pulp.
Figure 14. Effects of 100 µM melatonin treatment on ascorbate peroxidase (APX) activity in (a) ‘Lan-gra’ peel, (b) ‘Langra’ pulp, (c) ‘Chaunsa’ peel, (d) ‘Chaunsa’ pulp, (e) ‘Dashehari’ peel, (f)
Figure 14. Effects of 100 µM melatonin treatment on ascorbate peroxidase (APX) activity in (a) ‘Langra’peel, (b) ‘Langra’ pulp, (c) ‘Chaunsa’ peel, (d) ‘Chaunsa’ pulp, (e) ‘Dashehari’ peel, (f) ‘Dashehari’pulp, (g) ‘Gulab Jamun’ peel, and (h) ‘Gulab Jamun’ pulp during storage at 5 ± 1 ◦C plus 3 d of shelflife at room temperature. Data are the mean of three replicates ± standard error. An asterisk (*) onthe same storage period indicates significant differences (p < 0.05).
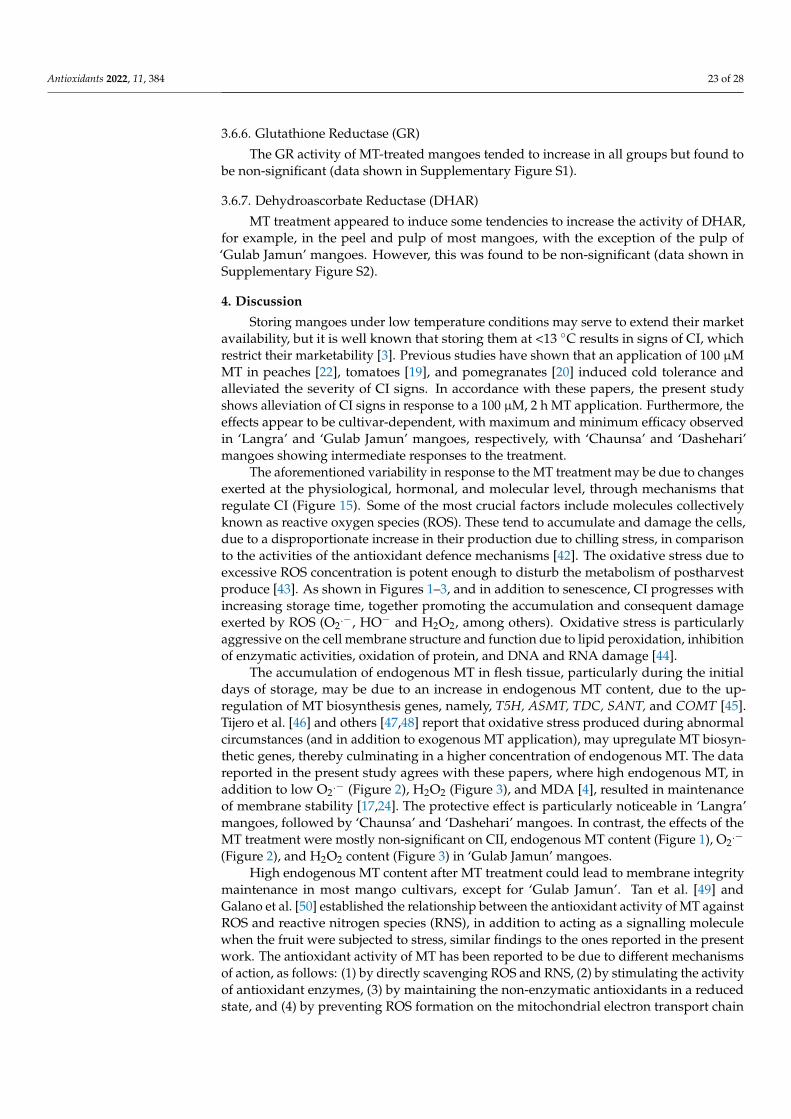
Antioxidants 2022, 11, 384 23 of 28
3.6.6. Glutathione Reductase (GR)
The GR activity of MT-treated mangoes tended to increase in all groups but found tobe non-significant (data shown in Supplementary Figure S1).
3.6.7. Dehydroascorbate Reductase (DHAR)
MT treatment appeared to induce some tendencies to increase the activity of DHAR,for example, in the peel and pulp of most mangoes, with the exception of the pulp of‘Gulab Jamun’ mangoes. However, this was found to be non-significant (data shown inSupplementary Figure S2).
4. Discussion
Storing mangoes under low temperature conditions may serve to extend their marketavailability, but it is well known that storing them at <13 ◦C results in signs of CI, whichrestrict their marketability [3]. Previous studies have shown that an application of 100 µMMT in peaches [22], tomatoes [19], and pomegranates [20] induced cold tolerance andalleviated the severity of CI signs. In accordance with these papers, the present studyshows alleviation of CI signs in response to a 100 µM, 2 h MT application. Furthermore, theeffects appear to be cultivar-dependent, with maximum and minimum efficacy observedin ‘Langra’ and ‘Gulab Jamun’ mangoes, respectively, with ‘Chaunsa’ and ‘Dashehari’mangoes showing intermediate responses to the treatment.
The aforementioned variability in response to the MT treatment may be due to changesexerted at the physiological, hormonal, and molecular level, through mechanisms thatregulate CI (Figure 15). Some of the most crucial factors include molecules collectivelyknown as reactive oxygen species (ROS). These tend to accumulate and damage the cells,due to a disproportionate increase in their production due to chilling stress, in comparisonto the activities of the antioxidant defence mechanisms [42]. The oxidative stress due toexcessive ROS concentration is potent enough to disturb the metabolism of postharvestproduce [43]. As shown in Figures 1–3, and in addition to senescence, CI progresses withincreasing storage time, together promoting the accumulation and consequent damageexerted by ROS (O2
.−, HO− and H2O2, among others). Oxidative stress is particularlyaggressive on the cell membrane structure and function due to lipid peroxidation, inhibitionof enzymatic activities, oxidation of protein, and DNA and RNA damage [44].
The accumulation of endogenous MT in flesh tissue, particularly during the initialdays of storage, may be due to an increase in endogenous MT content, due to the up-regulation of MT biosynthesis genes, namely, T5H, ASMT, TDC, SANT, and COMT [45].Tijero et al. [46] and others [47,48] report that oxidative stress produced during abnormalcircumstances (and in addition to exogenous MT application), may upregulate MT biosyn-thetic genes, thereby culminating in a higher concentration of endogenous MT. The datareported in the present study agrees with these papers, where high endogenous MT, inaddition to low O2
.− (Figure 2), H2O2 (Figure 3), and MDA [4], resulted in maintenanceof membrane stability [17,24]. The protective effect is particularly noticeable in ‘Langra’mangoes, followed by ‘Chaunsa’ and ‘Dashehari’ mangoes. In contrast, the effects of theMT treatment were mostly non-significant on CII, endogenous MT content (Figure 1), O2
.−
(Figure 2), and H2O2 content (Figure 3) in ‘Gulab Jamun’ mangoes.High endogenous MT content after MT treatment could lead to membrane integrity
maintenance in most mango cultivars, except for ‘Gulab Jamun’. Tan et al. [49] andGalano et al. [50] established the relationship between the antioxidant activity of MT againstROS and reactive nitrogen species (RNS), in addition to acting as a signalling moleculewhen the fruit were subjected to stress, similar findings to the ones reported in the presentwork. The antioxidant activity of MT has been reported to be due to different mechanismsof action, as follows: (1) by directly scavenging ROS and RNS, (2) by stimulating the activityof antioxidant enzymes, (3) by maintaining the non-enzymatic antioxidants in a reducedstate, and (4) by preventing ROS formation on the mitochondrial electron transport chain
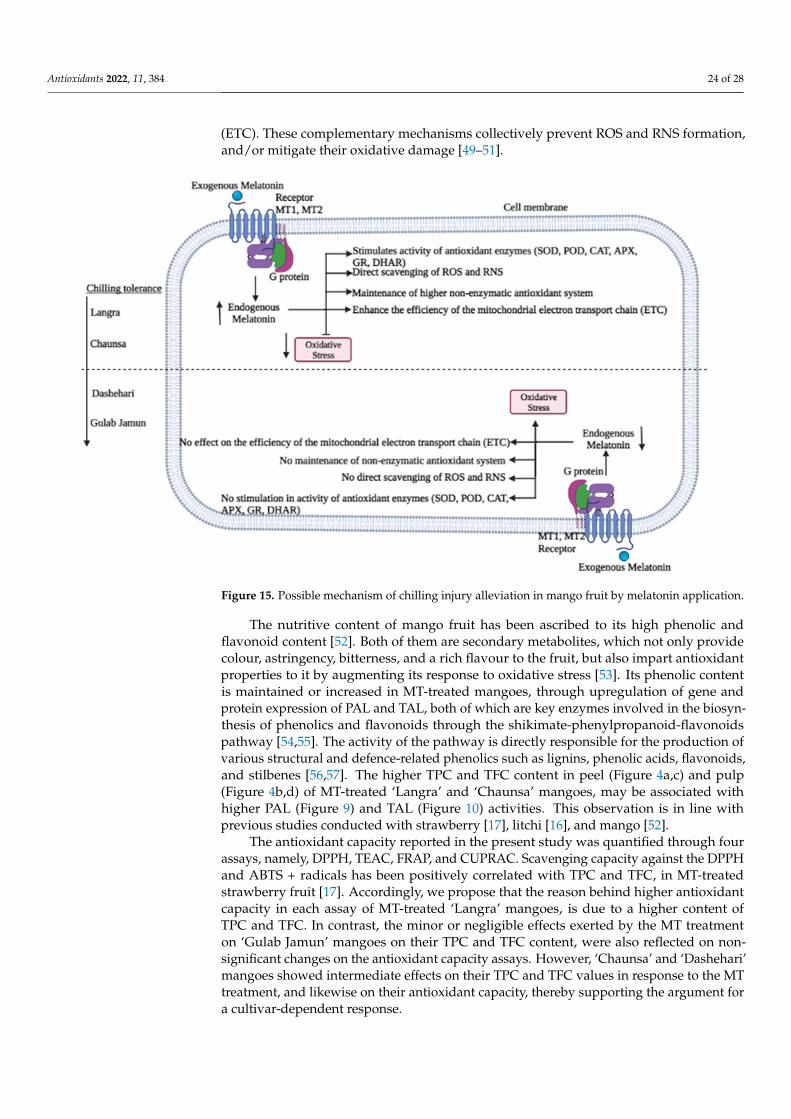
Antioxidants 2022, 11, 384 24 of 28
(ETC). These complementary mechanisms collectively prevent ROS and RNS formation,and/or mitigate their oxidative damage [49–51].
Antioxidants 2022, 11, x FOR PEER REVIEW 25 of 29
Figure 15. Possible mechanism of chilling injury alleviation in mango fruit by melatonin application.
High endogenous MT content after MT treatment could lead to membrane integrity maintenance in most mango cultivars, except for ‘Gulab Jamun’. Tan et al. [49] and Galano et al. [50] established the relationship between the antioxidant activity of MT against ROS and reactive nitrogen species (RNS), in addition to acting as a signalling molecule when the fruit were subjected to stress, similar findings to the ones reported in the present work. The antioxidant activity of MT has been reported to be due to different mechanisms of action, as follows: (1) by directly scavenging ROS and RNS, (2) by stimulating the activity of antioxidant enzymes, (3) by maintaining the non-enzymatic antioxidants in a reduced state, and (4) by preventing ROS formation on the mitochondrial electron transport chain (ETC). These complementary mechanisms collectively prevent ROS and RNS formation, and/or mitigate their oxidative damage [49–51].
The nutritive content of mango fruit has been ascribed to its high phenolic and flavo-noid content [52]. Both of them are secondary metabolites, which not only provide colour, astringency, bitterness, and a rich flavour to the fruit, but also impart antioxidant proper-ties to it by augmenting its response to oxidative stress [53]. Its phenolic content is main-tained or increased in MT-treated mangoes, through upregulation of gene and protein expression of PAL and TAL, both of which are key enzymes involved in the biosynthesis of phenolics and flavonoids through the shikimate-phenylpropanoid-flavonoids pathway [54,55]. The activity of the pathway is directly responsible for the production of various structural and defence-related phenolics such as lignins, phenolic acids, flavonoids, and stilbenes [56,57]. The higher TPC and TFC content in peel (Figure 4a,c) and pulp (Figure 4b,d) of MT-treated ‘Langra’ and ‘Chaunsa’ mangoes, may be associated with higher PAL (Figure 9) and TAL (Figure 10) activities. This observation is in line with previous studies conducted with strawberry [17], litchi [16], and mango [52].
The antioxidant capacity reported in the present study was quantified through four assays, namely, DPPH, TEAC, FRAP, and CUPRAC. Scavenging capacity against the DPPH and ABTSꞏ+ radicals has been positively correlated with TPC and TFC, in MT-
Figure 15. Possible mechanism of chilling injury alleviation in mango fruit by melatonin application.
The nutritive content of mango fruit has been ascribed to its high phenolic andflavonoid content [52]. Both of them are secondary metabolites, which not only providecolour, astringency, bitterness, and a rich flavour to the fruit, but also impart antioxidantproperties to it by augmenting its response to oxidative stress [53]. Its phenolic contentis maintained or increased in MT-treated mangoes, through upregulation of gene andprotein expression of PAL and TAL, both of which are key enzymes involved in the biosyn-thesis of phenolics and flavonoids through the shikimate-phenylpropanoid-flavonoidspathway [54,55]. The activity of the pathway is directly responsible for the production ofvarious structural and defence-related phenolics such as lignins, phenolic acids, flavonoids,and stilbenes [56,57]. The higher TPC and TFC content in peel (Figure 4a,c) and pulp(Figure 4b,d) of MT-treated ‘Langra’ and ‘Chaunsa’ mangoes, may be associated withhigher PAL (Figure 9) and TAL (Figure 10) activities. This observation is in line withprevious studies conducted with strawberry [17], litchi [16], and mango [52].
The antioxidant capacity reported in the present study was quantified through fourassays, namely, DPPH, TEAC, FRAP, and CUPRAC. Scavenging capacity against the DPPHand ABTS + radicals has been positively correlated with TPC and TFC, in MT-treatedstrawberry fruit [17]. Accordingly, we propose that the reason behind higher antioxidantcapacity in each assay of MT-treated ‘Langra’ mangoes, is due to a higher content ofTPC and TFC. In contrast, the minor or negligible effects exerted by the MT treatmenton ‘Gulab Jamun’ mangoes on their TPC and TFC content, were also reflected on non-significant changes on the antioxidant capacity assays. However, ‘Chaunsa’ and ‘Dashehari’mangoes showed intermediate effects on their TPC and TFC values in response to the MTtreatment, and likewise on their antioxidant capacity, thereby supporting the argument fora cultivar-dependent response.
Antioxidants 2022, 11, 384 25 of 28
The MT treatment exerted some positive and significant effects on the activity ofantioxidant enzymes (SOD, CAT, POD), most notably, in the peel and pulp of ‘Langra’mangoes. In contrast, the effects were non-significant or negative in ‘Gulab Jamun’ mangoes,with ‘Chaunsa’ and ‘Dashehari’ mangoes once again showing an intermediate response.
The increased activity of antioxidant enzymes in response to the MT treatment isin accordance with the redox network model [47], where they induce O2
.− and H2O2elimination and reduction in their concentration. Other studies have been performed oneggplants [58], pears [59], and strawberries 17], where an exogenous MT also resulted inclearing ROS, by enhancing the gene expression of antioxidant enzymes.
Ascorbic acid (AsA) and GSH are other important elements to control ROS concen-tration, according to their role in the AsA-GSH cycle, which aims to counter oxidativestress [60]. Enzymes such as APX, DHAR, GR, and monodehydroascorbate reductase (MD-HAR), are also critically involved in the AsA-GSH cycle. The content of AsA is regulatedthrough its synthesis by APX, and is recycled by DHAR and MDHAR. DHAR oxidisesGSH to GSSH to mitigate oxidative stress, while subsequent reduction to GSH is performedby GR, in order to preserve a pool of this compound in its reduced form [61]. APX isa pivotal enzyme in chloroplast H2O2 detoxification through the formation of AsA. Itsactivity increased in response to an exogenous MT application, in both the peel and pulp of‘Langra’ and ‘Chaunsa’ mangoes. The decrease in O2
− and H2O2 concentration reported inthe present study resulted in an increase in AsA and GSH concentration, possibly due to aconcomitant increase in GR activity. Although this was only evident in the peel and pulpof ‘Langra’ mangoes, whereas the other cultivars only showed a significant response to thetreatment on GR activity in the peel. Finally, DHAR activity was higher in the peel andpulp of most MT-treated cultivars, with the exception of ‘Gulab Jamun’. The influence ofMT on enzymes related to the AsA-GSH cycle was in accordance with the study conductedby Tan et al. [49], performed on Chinese flowering cabbage.
5. Conclusions
Pre-storage MT (100 µM, 2 h) was applied to four mango cultivars, which werethen stored at 5 ± 1 ◦C for 28 d, in order to determine its effect on alleviation of CI.‘Langra’ mangoes showed maximum response to the treatment and, therefore, had a higherCI alleviation. The increased chilling tolerance in response to the MT application wasattributed to a higher endogenous MT accumulation, which then stimulated the enzymaticand non-enzymatic antioxidant system. The resulting enhanced antioxidant system appearsto have maintained cellular homeostasis by decreasing ROS concentration, which increasedthe fruits’ stress tolerance. This was not apparent in ‘Gulab Jamun’ mangoes, whichresponded minimally or not at all to the MT treatment, and were therefore unable todevelop chilling tolerance as a consequence of MT treatment. ‘Chaunsa’ and ‘Dashehari’mangoes showed an intermediate response to the treatment and, likewise, a response to CIthat was between the one described for ‘Langra’ and ‘Gulab Jamun’ mangoes. This wasdue to a moderate response of their enzymatic and non-enzymatic antioxidant system.
Supplementary Materials: The following supporting information can be downloaded at: https://www.mdpi.com/article/10.3390/antiox11020384/s1, Figure S1. Glutathione reductase (GR) activityin (a) ‘Langra’ peel, (b) ‘Langra’ pulp, (c) ‘Chaunsa’ peel, (d) ‘Chaunsa’ pulp, (e) ‘Dashehari’ peel,(f) ‘Dashehari’ pulp, (g) ‘Gulab Jamun’ peel, and (h) ‘Gulab Jamun’ pulp treated with 0 µM (control)or 100 µM (treated) MT for 2 h, followed by 28 d of low temperature storage (5 ± 1 ◦C) and 3 d ofshelf life at room temperature. Measurements were taken every 7 d of storage. Each value is the meanof three replicates ± standard error. An asterisk (*) on the same storage period indicates significantdifferences (p < 0.05). Figure S2. Dehydroascorbate reductase (DHAR) activity in (a) ‘Langra’ peel,(b) ‘Langra’ pulp, (c) ‘Chaunsa’ peel, (d) ‘Chaunsa’ pulp, (e) ‘Dashehari’ peel, (f) ‘Dashehari’ pulp,(g) ‘Gulab Jamun’ peel, and (h) ‘Gulab Jamun’ pulp treated with 0 µM (control) or 100 µM (treated)MT for 2 h, followed by 28 d of low temperature storage (5 ± 1 ◦C) and 3 d of shelf life at roomtemperature. Measurements were taken every 7 d of storage. Each value is the mean of three
Antioxidants 2022, 11, 384 26 of 28
replicates± standard error. An asterisk (*) on the same storage period indicates significant differences(p < 0.05).
Author Contributions: R.B. contributed to the set up of the experiment, analyses of the data, datacollection, interpretation and drafting the article. S.P. contributed to the formalization of the concept,experimental design, interpretation, reviewing the manuscript, supervision, and coordination. G.A.G.-A., J.A.D.-A., M.S. and D.V. provided technical inputs, reviewed the manuscript, improved the overalllanguage, and contributed to the presentation, editing, and finalization of the manuscript. All authorshave read and agreed to the published version of the manuscript.
Funding: National Institute of Food Technology Entrepreneurship and Management (NIFTEM),Ministry of Food Processing Industries, Government of India and Spanish Ministry of Economyand Competitiveness through Projects AGL2015-63986R and RTI2018-099664-B-100 and EuropeanCommission with FEDER funds.
Data Availability Statement: Data is contained within the article and supplementary material.
Acknowledgments: The authors are thankful to the National Institute of Food Technology En-trepreneurship and Management (NIFTEM), India for providing facilities and support. Additionally,we would like to thank Sarvanan Mani and Ankur Kumar, Lab in-charge of Biochemistry and CentralInstrumentation Laboratory, NIFTEM, for providing their constant support throughout the work.The authors also expressed thanks to Ashutosh Upadhyay, J.S. Rana and C. Sarvanan for time-to-timereviewing of the work.
Conflicts of Interest: The authors declare no conflict of interest.
References1. Kim, Y.; Brecht, J.K.; Talcott, S.T. Antioxidant phytochemical and fruit quality changes in mango (Mangifera indica L.) following
hot water immersion and controlled atmosphere storage. Food Chem. 2007, 105, 1327–1334. [CrossRef]2. Herianus, J.D.; Singh, L.Z.; Tan, S.C. Aroma volatiles production during fruit ripening of Kensington Pride mango. Postharvest
Biol. Technol. 2003, 27, 323–336. [CrossRef]3. Acosta, R.M.; Neito, A.D.; Mena, N.G.; Teliz, O.D.; Vaquera, H.H.; Nieto, A.R. Effect of post-harvest temperatures on the
development of internal darkening in mango fruits (Mangifera indica L.) cv. Haden and their quality. Acta Hortic. 1999, 509,401–412. [CrossRef]
4. Bhardwaj, R.; Pareek, S.; Gonzalez-Aguilar, G.A.; Dominguez-Avila, J.A. Changes in the activity of proline metabolising enzymesis associated with increased cultivar-dependent chilling tolerance in mangos, in response to pre-storage melatonin application.Postharvest Biol. Technol. 2021, 182, 11702. [CrossRef]
5. González-Aguilar, G.A.; Fortiz, J.; Cruz, R.; Baez, R.; Wang, C.Y. Methyl jasmonate reduces chilling injury and maintainspostharvest quality of mango fruit. J. Agric. Food Chem. 2000, 48, 515–519. [CrossRef] [PubMed]
6. Nair, S.; Singh, Z.; Tan, S.C. Aroma volatiles emission in relation to chilling injury in ‘Kensington Pride’ mango fruit. J. Hortic. Sci.Biotechnol. 2003, 78, 866–873. [CrossRef]
7. Ding, Z.S.; Tian, S.P.; Zheng, X.L.; Zhou, Z.W.; Xu, Y. Responses of reactive oxygen metabolism and quality in mango fruit toexogenous oxalic acid or salicylic acid under chilling temperature stress. Physiol. Plant. 2007, 130, 112–121. [CrossRef]
8. Wang, B.; Wang, J.; Liang, H.; Yi, J.; Zhang, J.; Lin, L.; Wu, Y.; Feng, X.; Cao, J.; Jiang, W. Reduced chilling injury in mango fruit by2,4-dichlorophenoxyacetic acid and the antioxidant response. Postharvest Biol. Technol. 2008, 48, 172–181. [CrossRef]
9. Zaharah, S.S.; Singh, Z. Postharvest nitric oxide fumigation alleviates chilling injury, delays fruit ripening and maintains qualityin cold-stored ‘Kensington Pride’ mango. Postharvest Biol. Technol. 2011, 60, 202–210. [CrossRef]
10. Zahedi, S.M.; Hosseini, M.S.; Karimi, M.; Ebrahimzadeh, A. Effects of postharvest polyamine application and edible coating onmaintaining quality of mango (Mangifera indica L.) cv. Langra during cold storage. Food Sci. Nutr. 2019, 7, 433–441. [CrossRef][PubMed]
11. Zhang, Z.; Zhu, Q.; Hu, M.; Gao, Z.; An, F.; Li, M.; Jiang, Y. Low-temperature conditioning induces chilling tolerance in storedmango fruit. Food Chem. 2017, 219, 76–84. [CrossRef] [PubMed]
12. Hardeland, R.; Cardinali, D.P.; Srinivasan, V.; Spence, D.W.; Brown, G.M.; Pandi-Perumal, S.R. Melatonin—A pleiotropic,orchestrating regulator molecule. Prog. Neurobiol. 2011, 93, 350–384. [CrossRef] [PubMed]
13. Debnath, B.; Islam, W.; Li, M.; Sun, Y.; Lu, X.; Mitra, S.; Hussain, M.; Liu, S.; Qiu, D. Melatonin mediates enhancement of stresstolerance in plants. Int. J. Mol. Sci. 2019, 20, 1040. [CrossRef] [PubMed]
14. Hu, W.; Yang, H.; Tie, W.; Yan, Y.; Ding, Z.; Liu, Y.; Wu, C.; Wang, J.; Reiter, R.J.; Tan, D.X.; et al. Natural variation in bananavarieties highlights the role of melatonin in postharvest ripening and quality. J. Agric. Food Chem. 2017, 65, 9987–9994. [CrossRef][PubMed]
15. Zhu, L.; Hu, H.; Luo, S.; Wu, Z.; Li, P. Melatonin delaying senescence of postharvest broccoli by regulating respiratory metabolismand antioxidant activity. Trans. Chin. Soc. Agric. Eng. 2018, 34, 300–308.
Antioxidants 2022, 11, 384 27 of 28
16. Zhang, H.; Liu, X.; Chen, T.; Ji, Y.; Shi, K.; Wang, L.; Zheng, X.; Kong, J. Melatonin in apples and juice: Inhibition of browning andmicroorganism growth in apple juice. Molecules 2018, 23, 521. [CrossRef] [PubMed]
17. Liu, C.; Zheng, H.; Sheng, K.; Liu, W.; Zheng, L. Effects of melatonin treatment on the postharvest quality of strawberry fruit.Postharvest Biol. Technol. 2018, 139, 47–55. [CrossRef]
18. Cao, S.; Song, C.; Shao, J.; Bian, K.; Chen, W.; Yang, Z. Exogenous melatonin treatment increases chilling tolerance and inducesdefense response in harvested peach fruit during cold storage. J. Agric. Food Chem. 2016, 64, 5215–5222. [CrossRef] [PubMed]
19. Azadshahraki, F.; Jamshidi, B.; Mohebbi, S. Postharvest melatonin treatment reduces chilling injury and enhances antioxidantcapacity of tomato fruit during cold storage. Adv. Hortic. Sci. 2018, 32, 299–309. [CrossRef]
20. Jannatizadeh, A. Exogenous melatonin applying confers chilling tolerance in pomegranate fruit during cold storage. Sci. Hortic.2019, 246, 544–549. [CrossRef]
21. Cao, S.; Bian, K.; Shi, L.; Chung, H.H.; Chen, W.; Yang, Z. Role of melatonin in cell-wall disassembly and chilling tolerance incold-stored peach fruit. J. Agric. Food Chem. 2018, 66, 5663–5670. [CrossRef] [PubMed]
22. Gao, H.; Lu, Z.; Yang, Y.; Wang, D.; Yang, T.; Cao, M.; Cao, W. Melatonin treatment reduces chilling injury in peach fruit throughits regulation of membrane fatty acid contents and phenolic metabolism. Food Chem. 2018, 245, 659–666. [CrossRef] [PubMed]
23. Bhardwaj, R.; Pareek, S.; Saravanan, C.; Yahia, E.M. Contribution of pre-storage melatonin application to chilling tolerance ofsome mango fruit cultivars and relationship with polyamines metabolism and γ-aminobutyric acid shunt pathway. Environ. Exp.Bot. 2022, 194, 104691. [CrossRef]
24. Concellón, A.; Añón, M.C.; Chaves, A.R. Effect of chilling on ethylene production in eggplant fruit. Food Chem. 2005, 92, 63–69.[CrossRef]
25. Ma, Q.; Zhang, T.; Zhang, P.; Wang, Z.Y. Melatonin attenuates postharvest physiological deterioration of cassava storage roots. J.Pineal Res. 2016, 60, 424–434. [CrossRef] [PubMed]
26. Sergiev, I.; Alexieva, V.; Karanov, E. Effect of spermine, atrazine and combination between them on some endogenous protectivesystems and stress markers in plants. Comp. Rend. Acad. Bulg. Sci. 1997, 51, 121–124.
27. Elstner, E.F. Inhibition of nitrite formation by hydroxyammonium chloride: A simple assay for superoxide dismutase. Anal.Biochem. 1976, 70, 616–620. [CrossRef]
28. Singleton, V.L.; Rossi, J.A. Colorimetry of total phenolics with phosphomolybdic-phosphotungstic acid reagents. Am. J. Enol.Vitic. 1965, 16, 144–158.
29. Chang, C.C.; Yang, M.H.; Wen, H.M.; Chern, J.C. Estimation of total flavonoid content in propolis by two complementarycolorimetric methods. J. Food Drug Anal. 2002, 10, 3. [CrossRef]
30. Brand-Williams, W.; Cuvelier, M.E.; Berset, C.L.W.T. Use of a free radical method to evaluate antioxidant activity. LWT Food Sci.Technol. 1995, 28, 25–30. [CrossRef]
31. Re, R.; Pellegrini, N.; Proteggente, A.; Pannala, A.; Yang, M.; Rice-Evance, C. Antioxidant activity applying an improved ABTSradical cation decolorization assay. Free Radic. Biol. Med. 1999, 26, 1231–1237. [CrossRef]
32. Benzie, I.F.; Strain, J.J. The ferric reducing ability of plasma (FRAP) as a measure of “antioxidant power”: The FRAP assay. Anal.Biochem. 1996, 239, 70–76. [CrossRef]
33. Apak, R.; Güçlü, K.; Demirata, B.; Özyürek, M.; Çelik, S.E.; Bektasoglu, B.; Berker, K.I.; Özyurt, D. Comparative evaluation ofvarious total antioxidant capacity assays applied to phenolic compounds with the CUPRAC assay. Molecules 2007, 12, 1496–1547.[CrossRef]
34. Khan, W.; Prithiviraj, B.; Smith, D.L. Chitosan and chitin oligomers increase phenylalanine ammonia-lyase and tyrosine ammonia-lyase activities in soybean leaves. J. Plant Physiol. 2003, 160, 859–863. [CrossRef] [PubMed]
35. Kono, Y. Generation of superoxide radical during autoxidation of hydroxylamine and an assay for superoxide dismutase. Arch.Biochem. Biophys. 1987, 186, 189–195. [CrossRef]
36. Aebi, H. Catalase. In Methods of Enzymatic Analysis; Academic Press: Cambridge, MA, USA, 1974; pp. 673–684. [CrossRef]37. Pütter, J. Peroxidases. In Methods of Enzymatic Analysis; Academic Press: Cambridge, MA, USA, 1974; pp. 685–690. [CrossRef]38. Nakano, Y.; Asada, K. Hydrogen peroxide is scavenged by ascorbate-specific peroxidase in spinach chloroplasts. Plant Cell Physiol.
1981, 22, 867–880. [CrossRef]39. Carlberg, I.N.C.E.R.; Mannervik, B.E.N.G.T. Purification and characterization of the flavoenzyme glutathione reductase from rat
liver. J. Biol. Chem. 1975, 250, 5475–5480. [CrossRef]40. Dalton, D.A.; Russell, S.A.; Hanus, F.J.; Pascoe, G.A.; Evans, H.J. Enzymatic reactions of ascorbate and glutathione that prevent
peroxide damage in soybean root nodules. Proc. Natl. Acad. Sci. USA 1986, 83, 3811–3815. [CrossRef] [PubMed]41. Bradford, M.M. A rapid and sensitive method for the quantitation of microgram quantities of protein utilizing the principle of
protein-dye binding. Anal. Biochem. 1976, 72, 248–254. [CrossRef]42. Hodges, D.M.; Lester, G.E.; Munro, K.D.; Toivonen, P.M. Oxidative stress: Importance for postharvest quality. HortScience 2004,
39, 924–929. [CrossRef]43. Scandalios, J.G. Oxygen stress and superoxide dismutases. Plant Physiol. 1993, 101, 7–12. [CrossRef]44. Sevillano, L.; Sanchez-Ballesta, M.T.; Romojaro, F.; Flores, F.B. Physiological, hormonal, and molecular mechanisms regulating
chilling injury in horticultural species: Postharvest technologies applied to reduce its impact. J. Sci. Food Agric. 2009, 89, 555–573.[CrossRef]
Antioxidants 2022, 11, 384 28 of 28
45. Wang, F.; Zhang, X.; Yang, Q.; Zhao, Q. Exogenous melatonin delays postharvest fruit senescence and maintains the quality ofsweet cherries. Food Chem. 2019, 301, 125311. [CrossRef] [PubMed]
46. Tijero, V.; Muñoz, P.; Munné-Bosch, S. Melatonin as an inhibitor of sweet cherries ripening in orchard trees. Plant Physiol. Biochem.2019, 140, 88–95. [CrossRef] [PubMed]
47. Arnao, M.B.; Hernández-Ruiz, J. Melatonin: A new plant hormone and/or a plant master regulator? Trends Plant Sci. 2019, 24,38–48. [CrossRef]
48. Zhao, Y.; Tan, D.X.; Lei, Q.; Chen, H.; Wang, L.; Li, Q.T.; Gao, Y.; Kong, J. Melatonin and its potential biological functions in thefruits of sweet cherry. J. Pineal Res. 2013, 55, 79–88. [CrossRef] [PubMed]
49. Tan, D.X.; Reiter, R.J.; Manchester, L.C.; Yan, M.T.; El-Sawi, M.; Sainz, R.M.; Mayo, J.C.; Kohen, R.; Allegra, M.C.; Hardeland, R.Chemical and physical properties and potential mechanisms: Melatonin as a broad spectrum antioxidant and free radicalscavenger. Curr. Top. Med. Chem. 2002, 2, 181–197. [CrossRef]
50. Galano, A.; Tan, D.X.; Reiter, R.J. Melatonin as a natural ally against oxidative stress: A physicochemical examination. J. PinealRes. 2011, 51, 1–16. [CrossRef] [PubMed]
51. Rodriguez, C.; Mayo, J.C.; Sainz, R.M.; Antolin, I.; Herrera, F.; Martin, V.; Reiter, R.J. Regulation of antioxidant enzymes: Asignificant role for melatonin. Pineal Res. 2004, 36, 1–9. [CrossRef]
52. Rastegar, S.; Khankahdani, H.H.; Rahimzadeh, M. Effects of melatonin treatment on the biochemical changes and antioxidantenzyme activity of mango fruit during storage. Sci. Hortic. 2020, 259, 108835. [CrossRef]
53. Valero, D.; Serrano, M. Postharvest Biology and Technology for Preserving Fruit Quality; CRC Press: Boca Raton, FL, USA, 2010.54. Sun, D.; Lu, X.; Hu, Y.; Li, W.; Hong, K.; Mo, Y.; Cahill, D.M.; Xie, J. Methyl jasmonate induced defense responses increase
resistance to Fusarium oxysporum f. sp. cubense race 4 in banana. Sci. Hortic. 2013, 164, 484–491. [CrossRef]55. Tsai, C.J.; Harding, S.A.; Tschaplinski, T.J.; Lindroth, R.L.; Yuan, Y. Genome-wide analysis of the structural genes regulating
defense phenylpropanoid metabolism in Populus. New Phytol. 2006, 172, 47–62. [CrossRef] [PubMed]56. Chen, J.; Zou, X.; Liu, Q.; Wang, F.; Feng, W.; Wan, N. Combination effect of chitosan and methyl jasmonate on controlling
Alternaria alternata and enhancing activity of cherry tomato fruit defense mechanisms. Crop Prot. 2014, 56, 31–36. [CrossRef]57. Shadle, G.L.; Wesley, S.V.; Korth, K.L.; Chen, F.; Lamb, C.; Dixon, R.A. Phenylpropanoid compounds and disease resistance in
transgenic tobacco with altered expression of L-phenylalanine ammonia-lyase. Phytochemistry 2003, 64, 153–161. [CrossRef]58. Wu, X.; Zhu, Z.; Zhang, A.; Xu, S.; Yao, J.; Zha, D. Effects of exogenous melatonin on the growth, photosynthesis and antioxidant
system in eggplant (Solanum melongena L.) seedlings under low temperature stress. Acta Bot. Boreali Occident. Sin. 2017, 37,2427–2434.
59. Zhai, R.; Liu, J.; Liu, F.; Zhao, Y.; Liu, L.; Fang, C.; Wang, H.; Li, X.; Wang, Z.; Ma, F.; et al. Melatonin limited ethylene production,softening and reduced physiology disorder in pear (Pyrus communis L.) fruit during senescence. Postharvest Biol. Technol. 2018,139, 38–46. [CrossRef]
60. Marcén, M.; Cebrián, G.; Ruiz-Artiga, V.; Condón, S.; Mañas, P. Protective effect of glutathione on Escherichia coli cells upon lethalheat stress. Food Res. Int. 2019, 121, 806–811. [CrossRef]
61. Jahan, M.S.; Shu, S.; Wang, Y.; Chen, Z.; He, M.; Tao, M.; Sun, J.; Guo, S. Melatonin alleviates heat-induced damage of tomatoseedlings by balancing redox homeostasis and modulating polyamine and nitric oxide biosynthesis. BMC Plant Biol. 2019, 19, 414.[CrossRef] [PubMed]